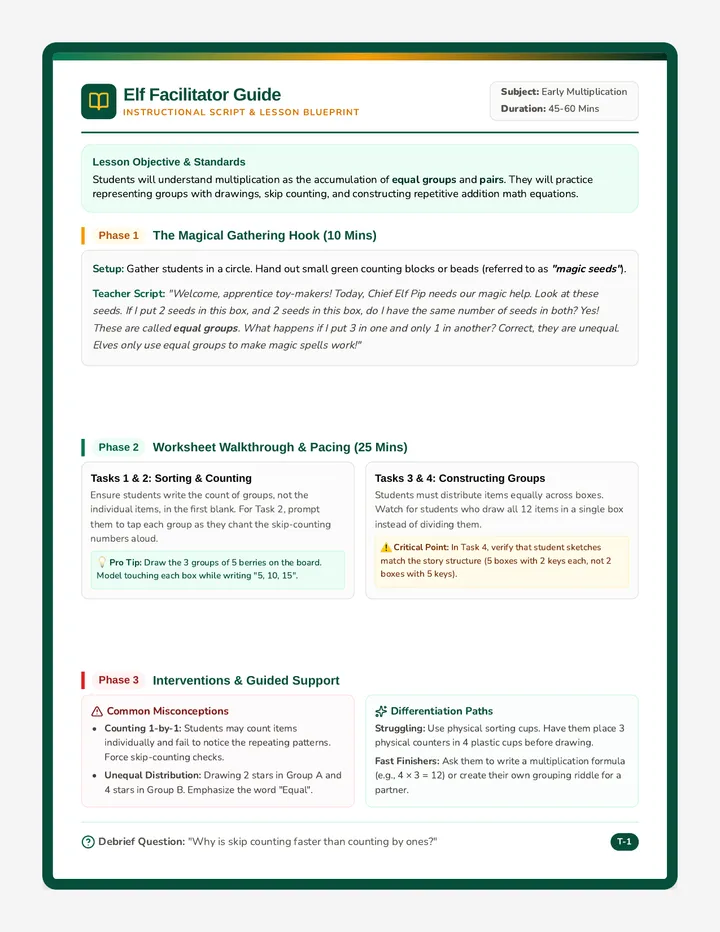
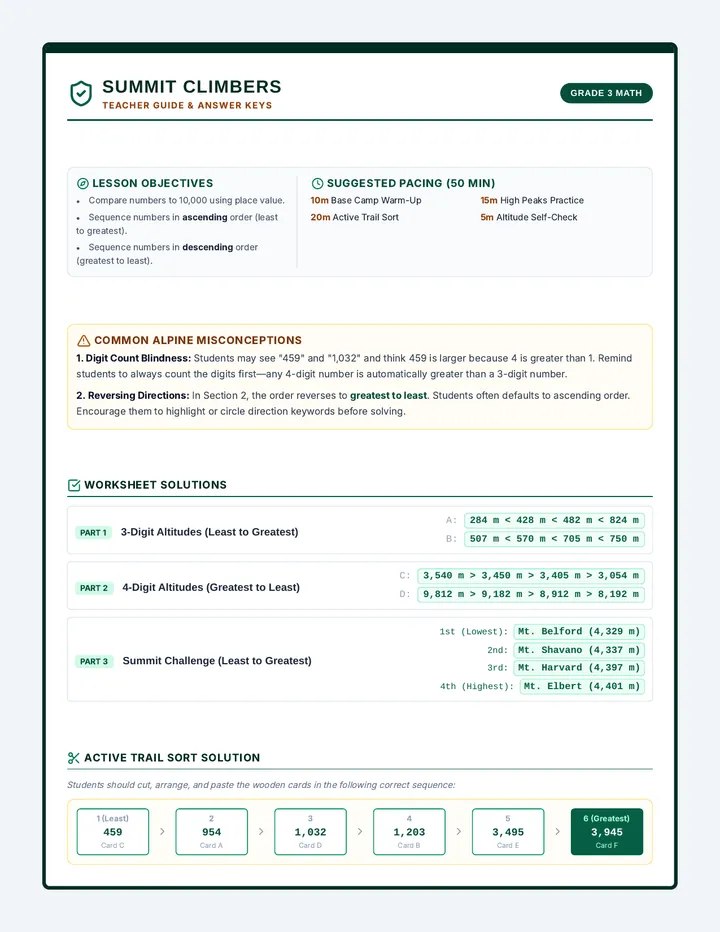
Market Masters Teacher Guide
A comprehensive facilitator guide for the Market Masters lesson, featuring warm-ups, direct instruction notes, collaborative station ideas, and common misconceptions for Grade 3 STAAR prep.
Market Masters Slides
An engaging slide presentation for Grade 3 math covering data analysis, input-output tables, and financial literacy. Features clear visuals, STAAR strategies, and conceptual explanations.
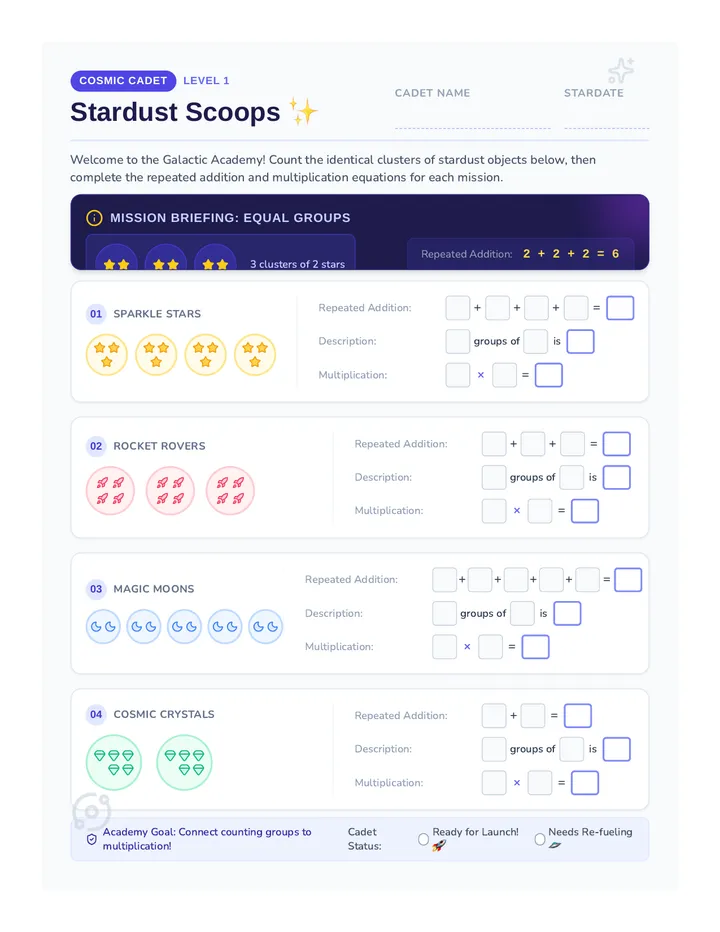
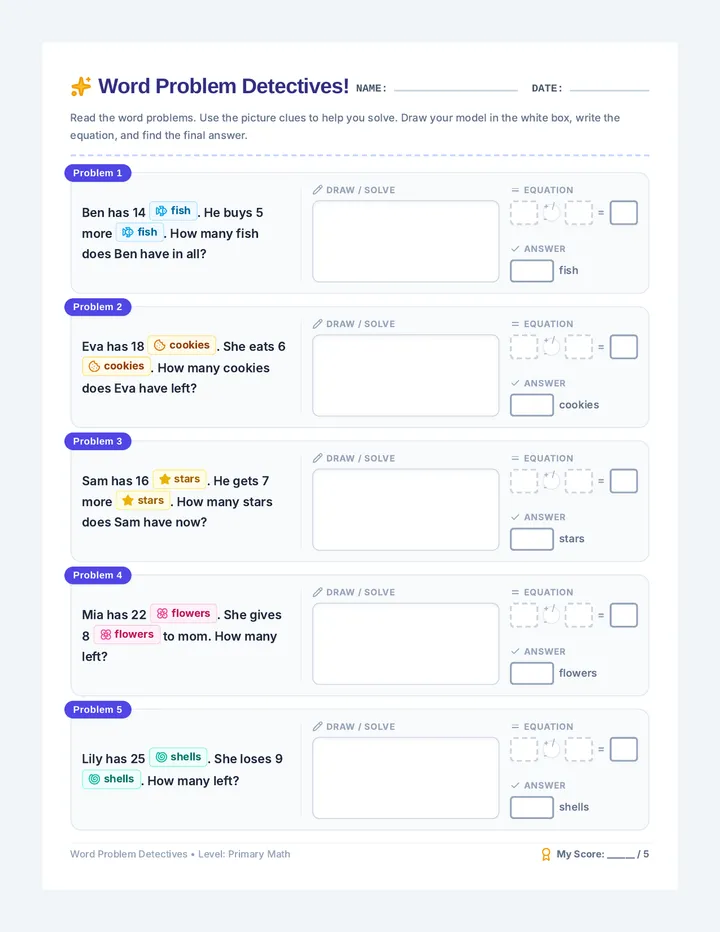
Market Masters Lab Worksheet
A practice worksheet for Grade 3 math focusing on data analysis (dot plots, tables) and numerical patterns (input-output tables), designed for student completion with clear workspaces.
Financial Freedom Scenarios
A financial literacy activity sheet for Grade 3 math covering human capital, scarcity, credit, saving, and donating through real-world scenarios. aligned with TEKS 3.9A-F.
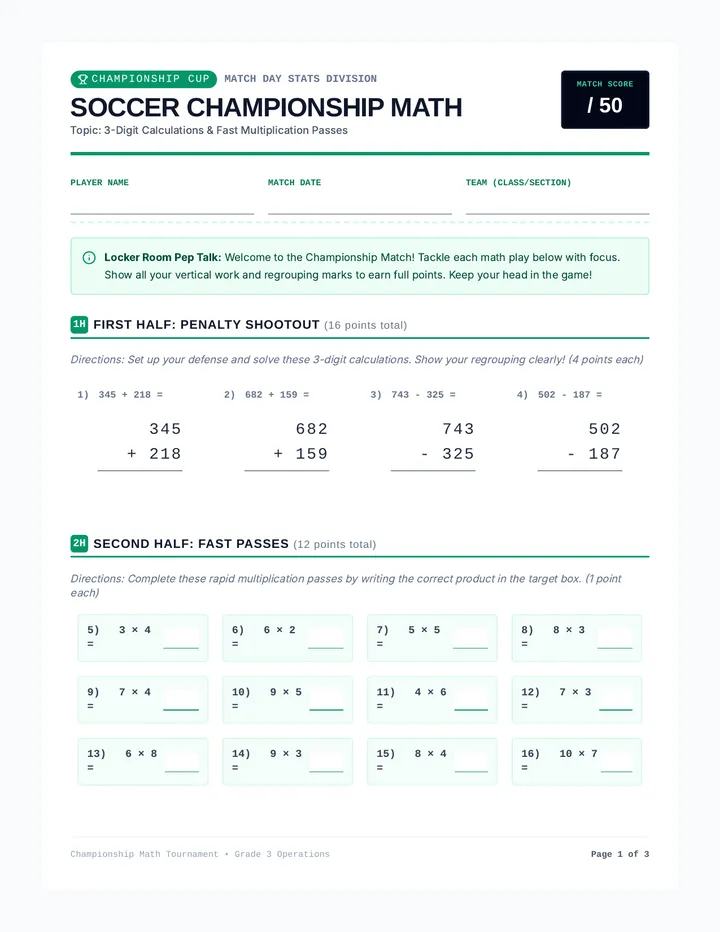
STAAR Showdown Practice Test
A STAAR-style practice assessment for Grade 3 math featuring 8 questions on data analysis, input-output tables, and financial literacy, including technology-enhanced item (TEI) formats.
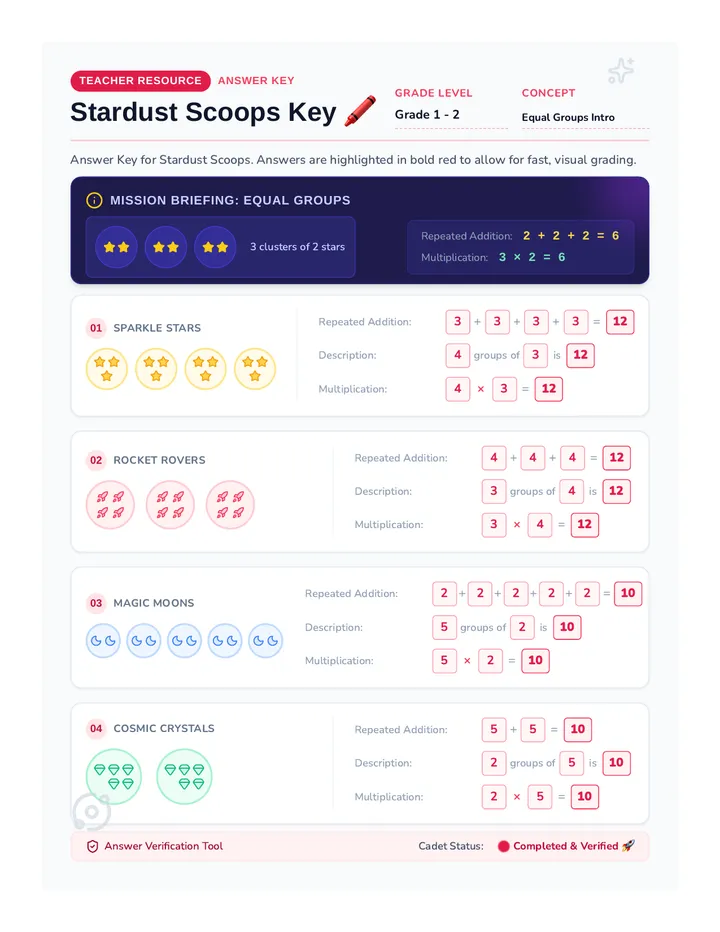
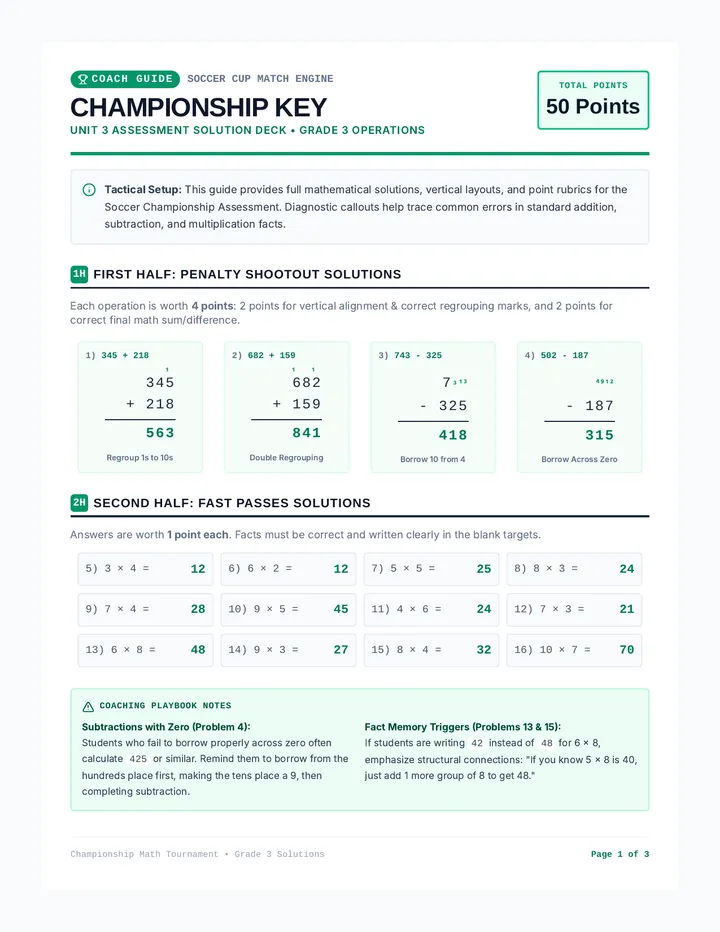
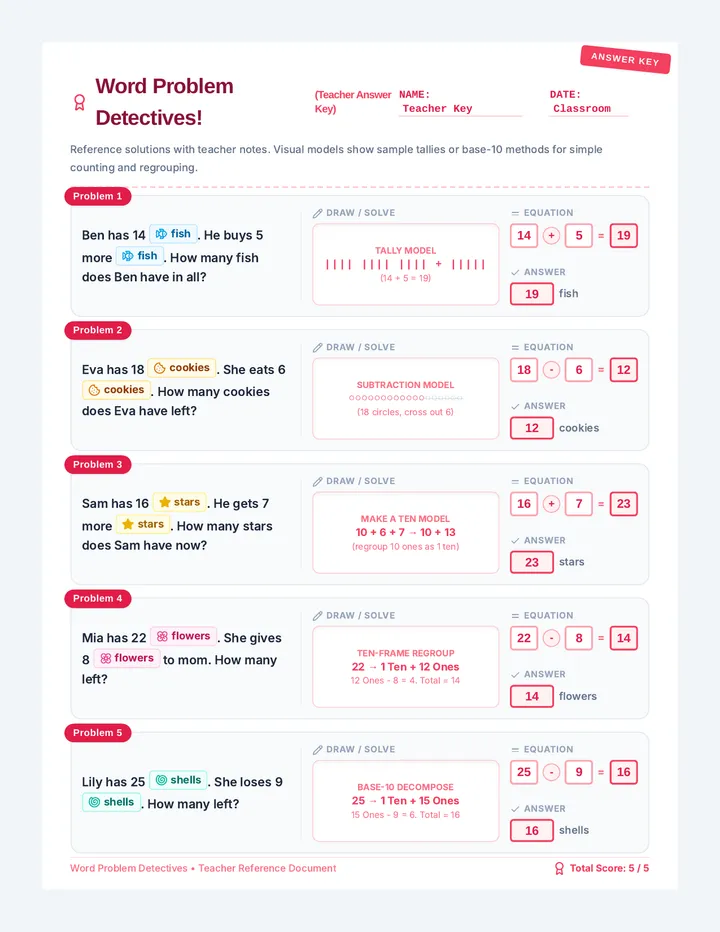
Market Masters Answer Key
A comprehensive answer key for the Market Masters lesson, providing solutions and TEKS alignments for the lab worksheet, practice test, and financial literacy scenarios.