Focusing on the middle 50% of data to understand consistency using housing market data and box plots.
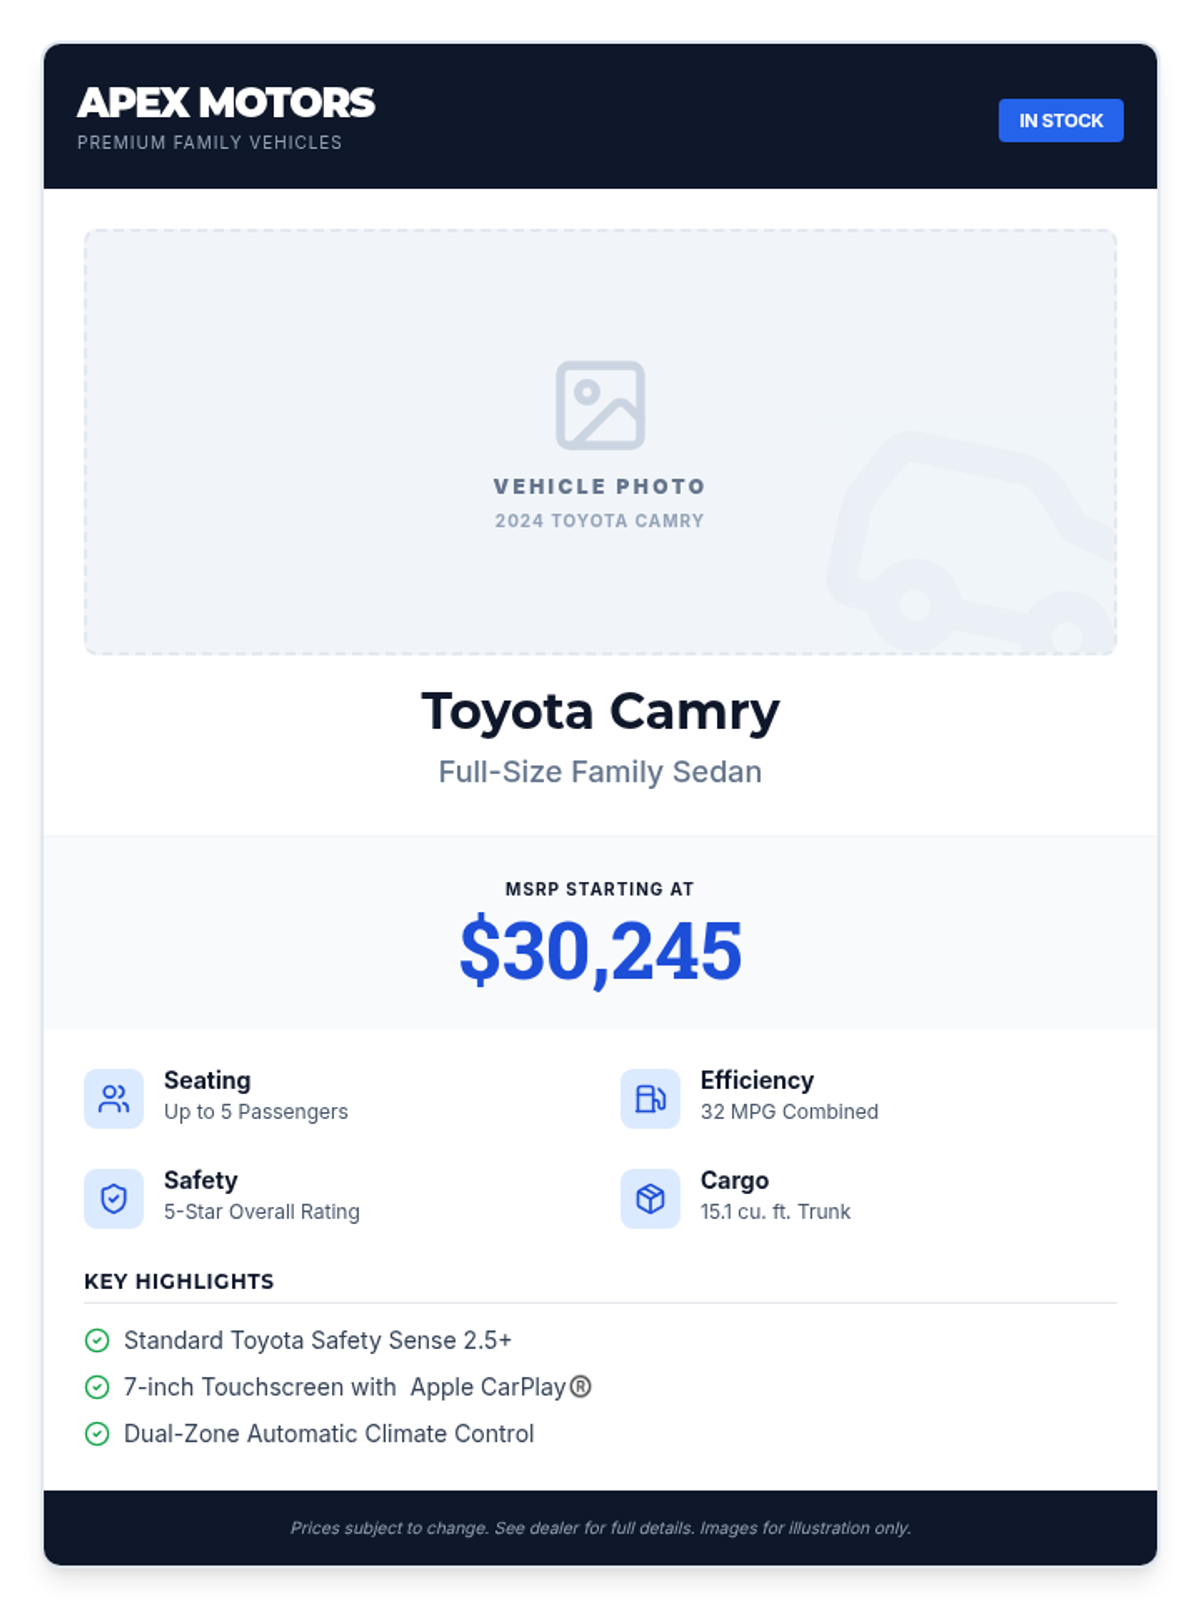
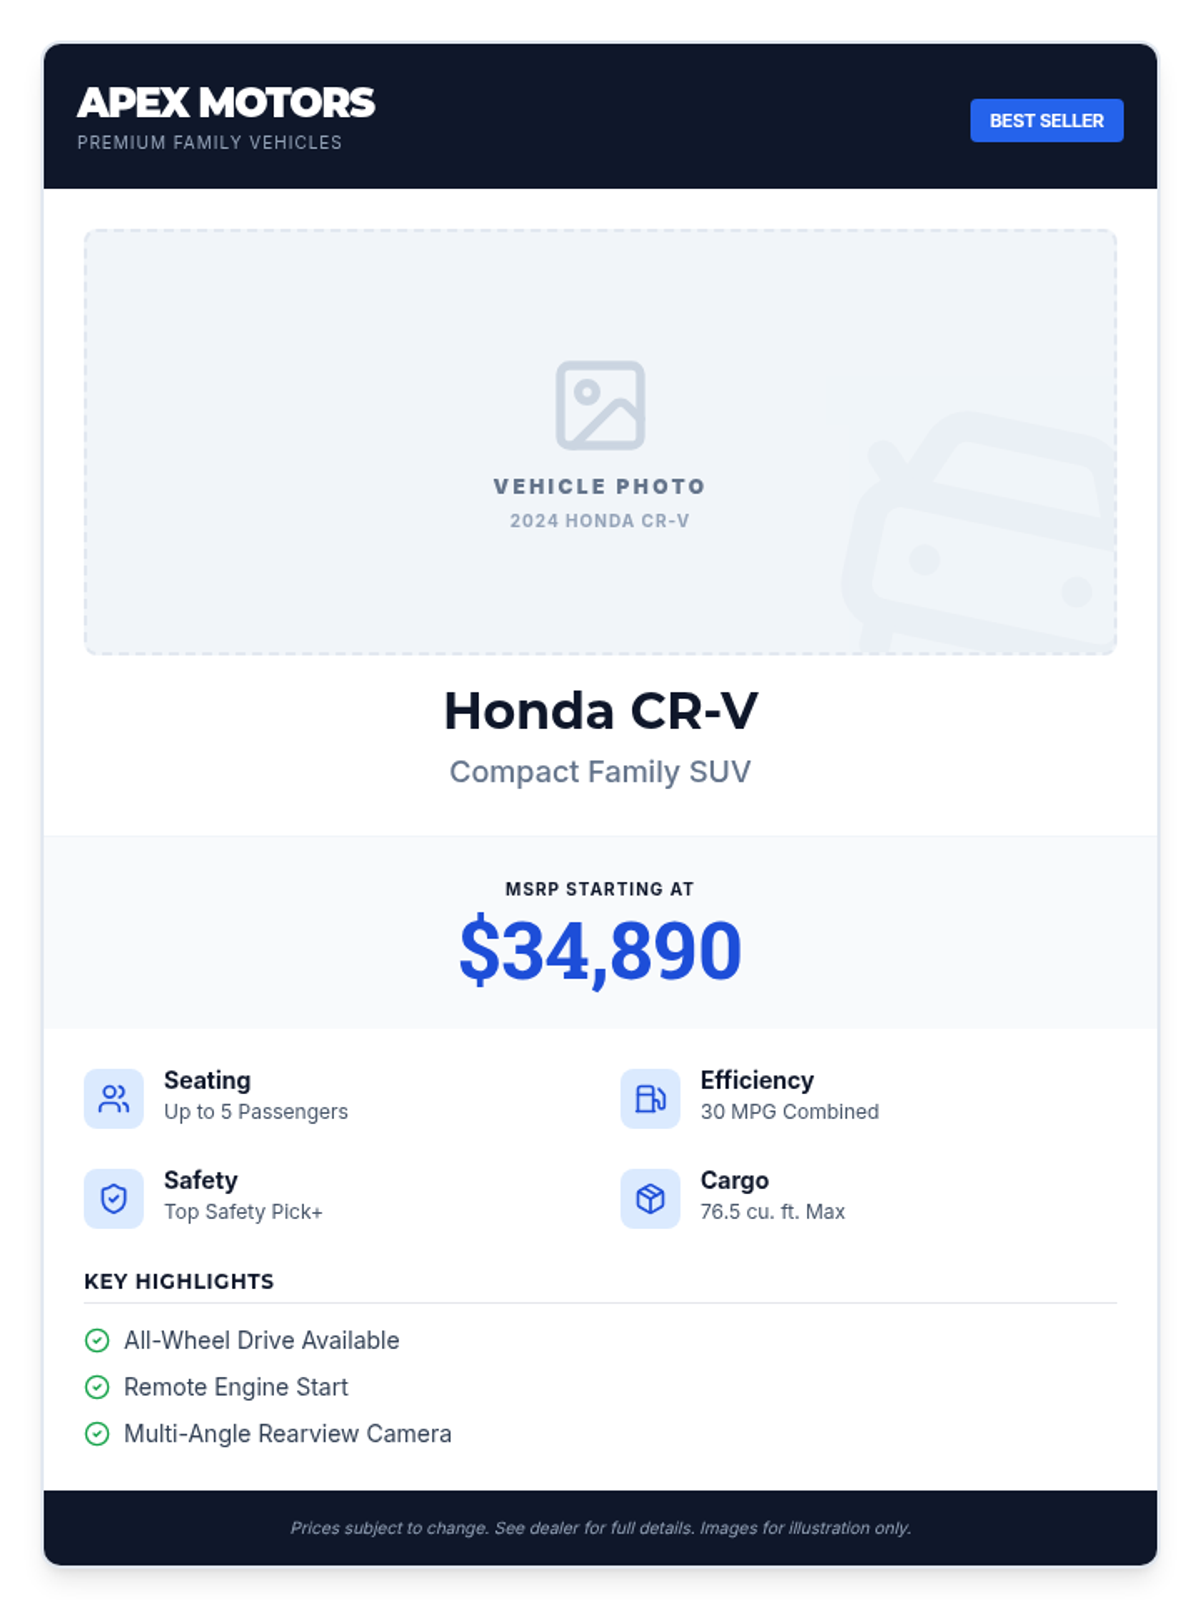
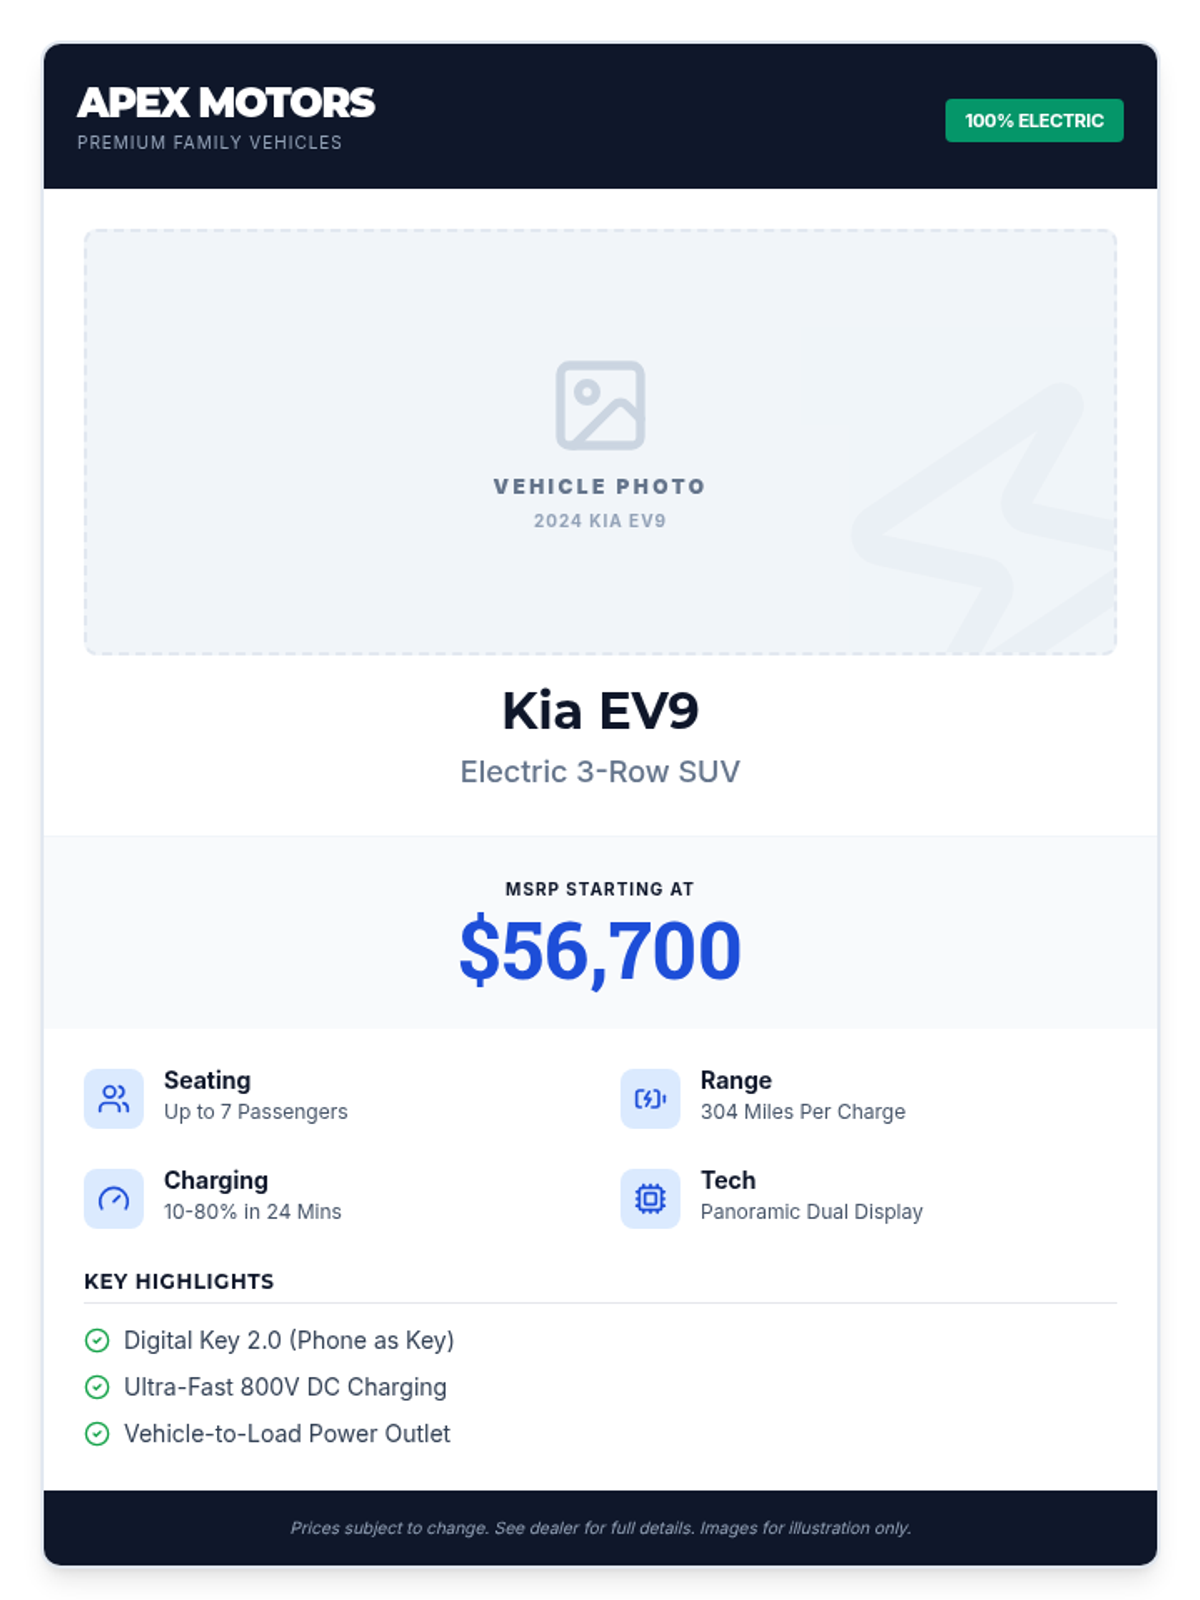
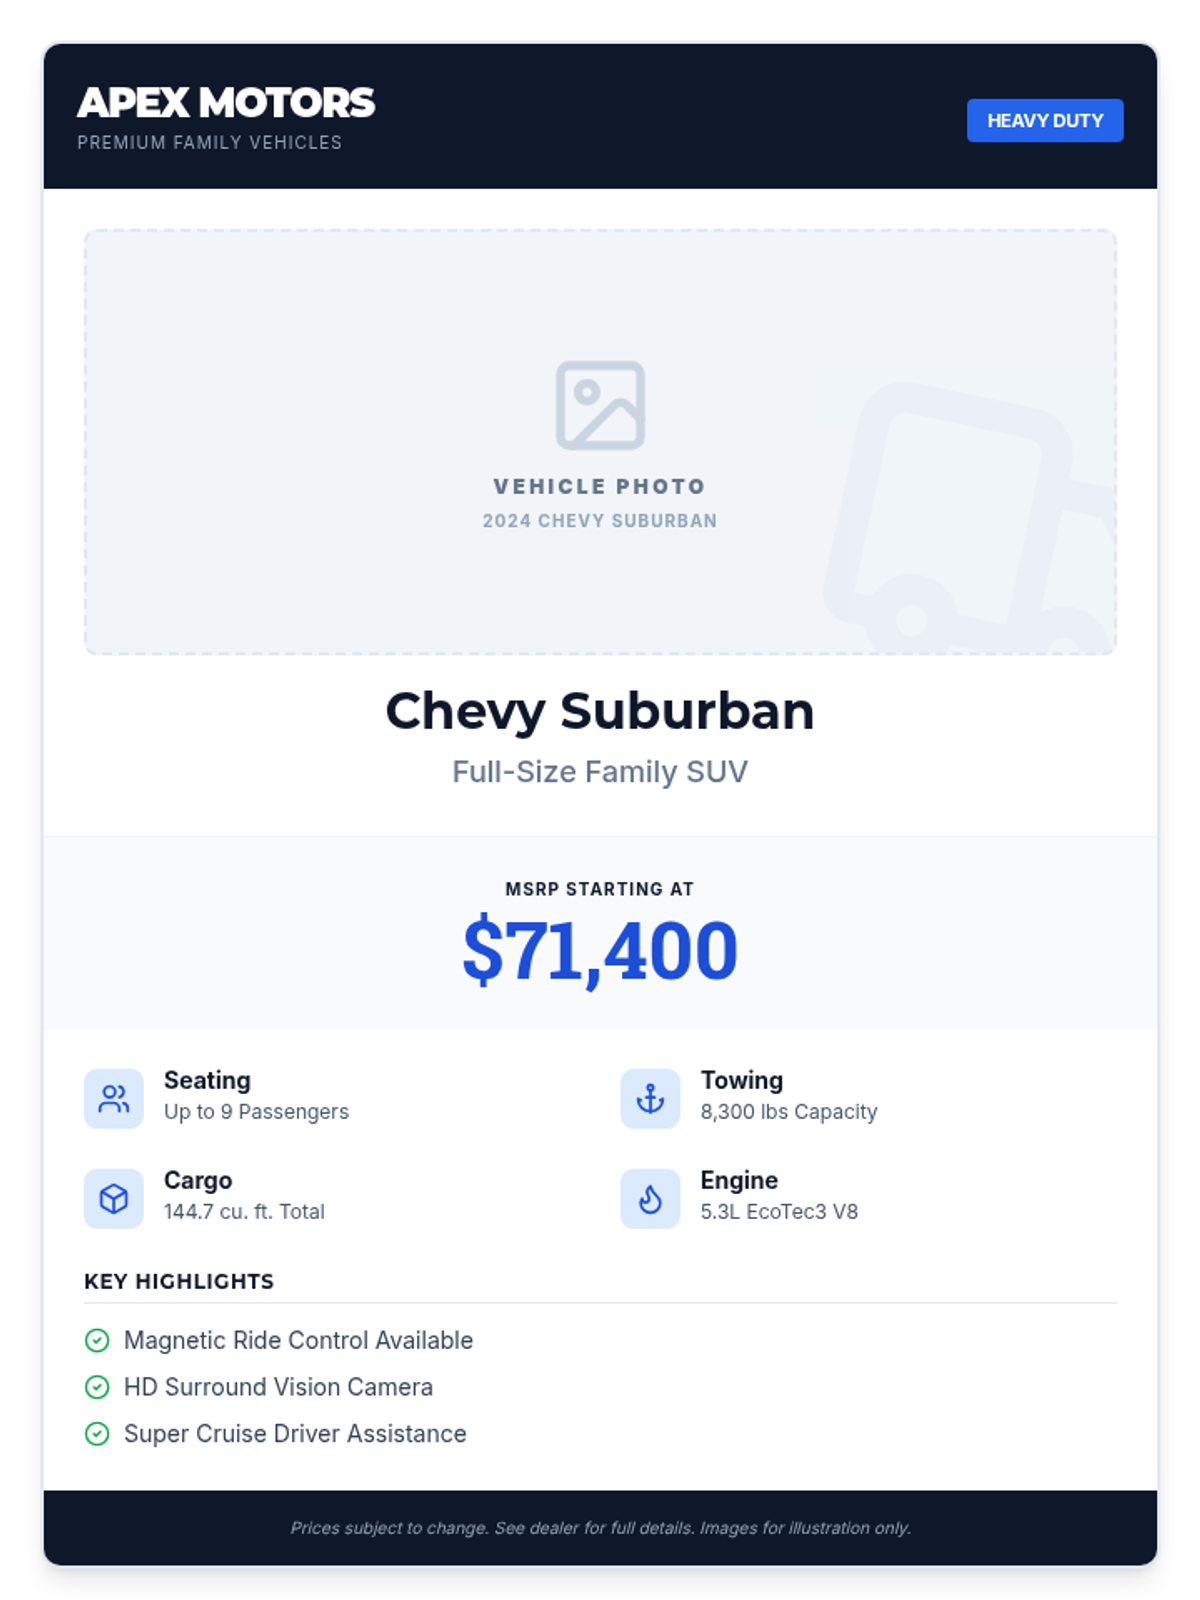
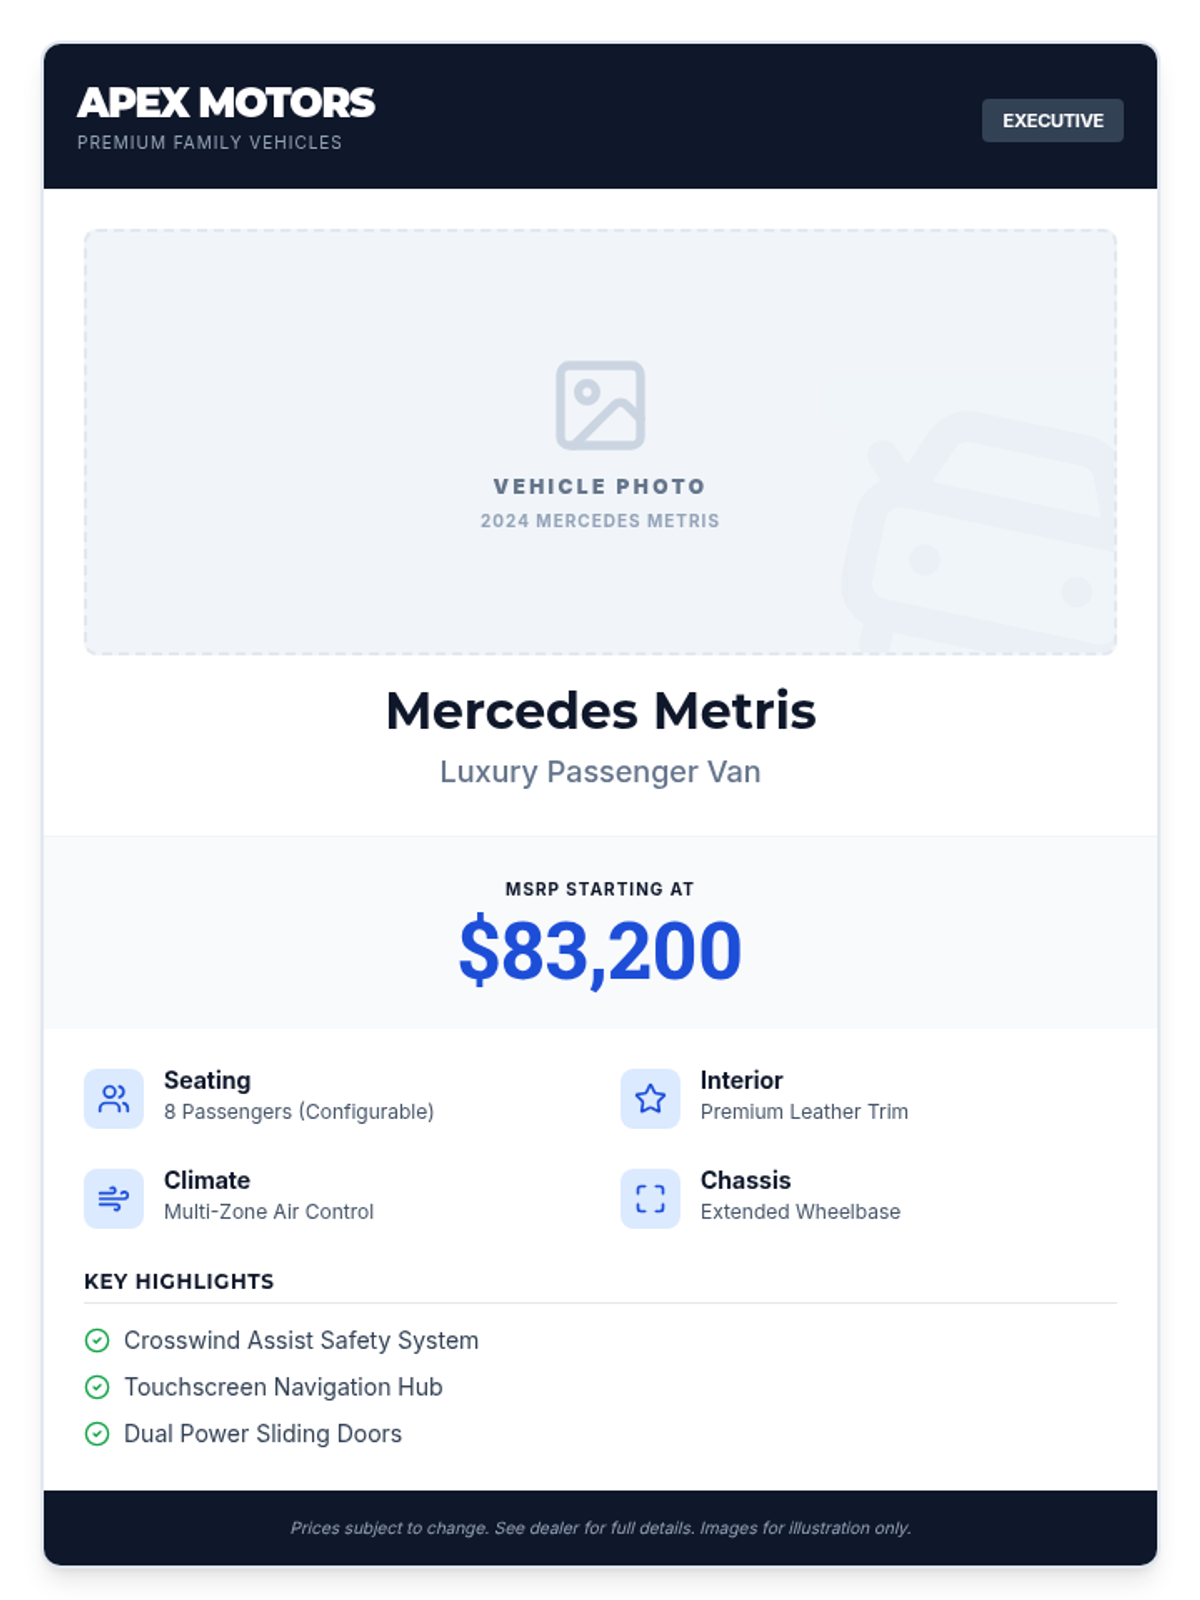
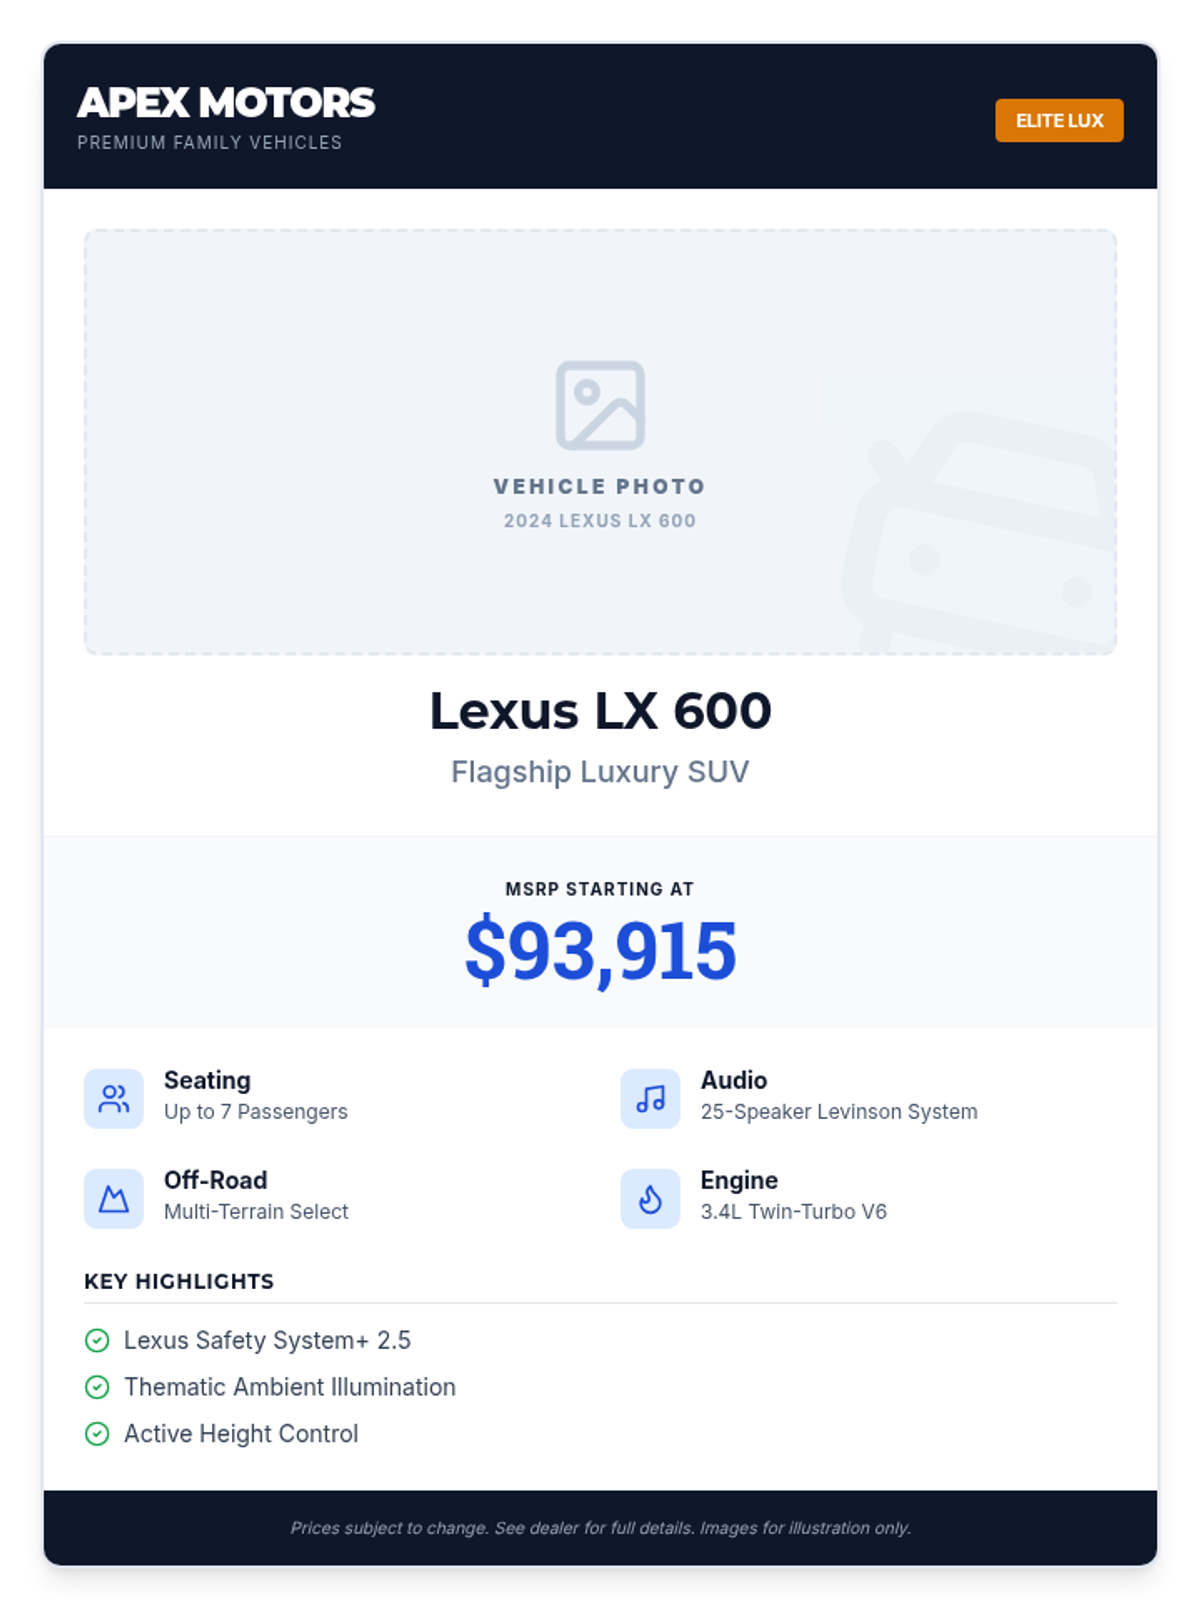
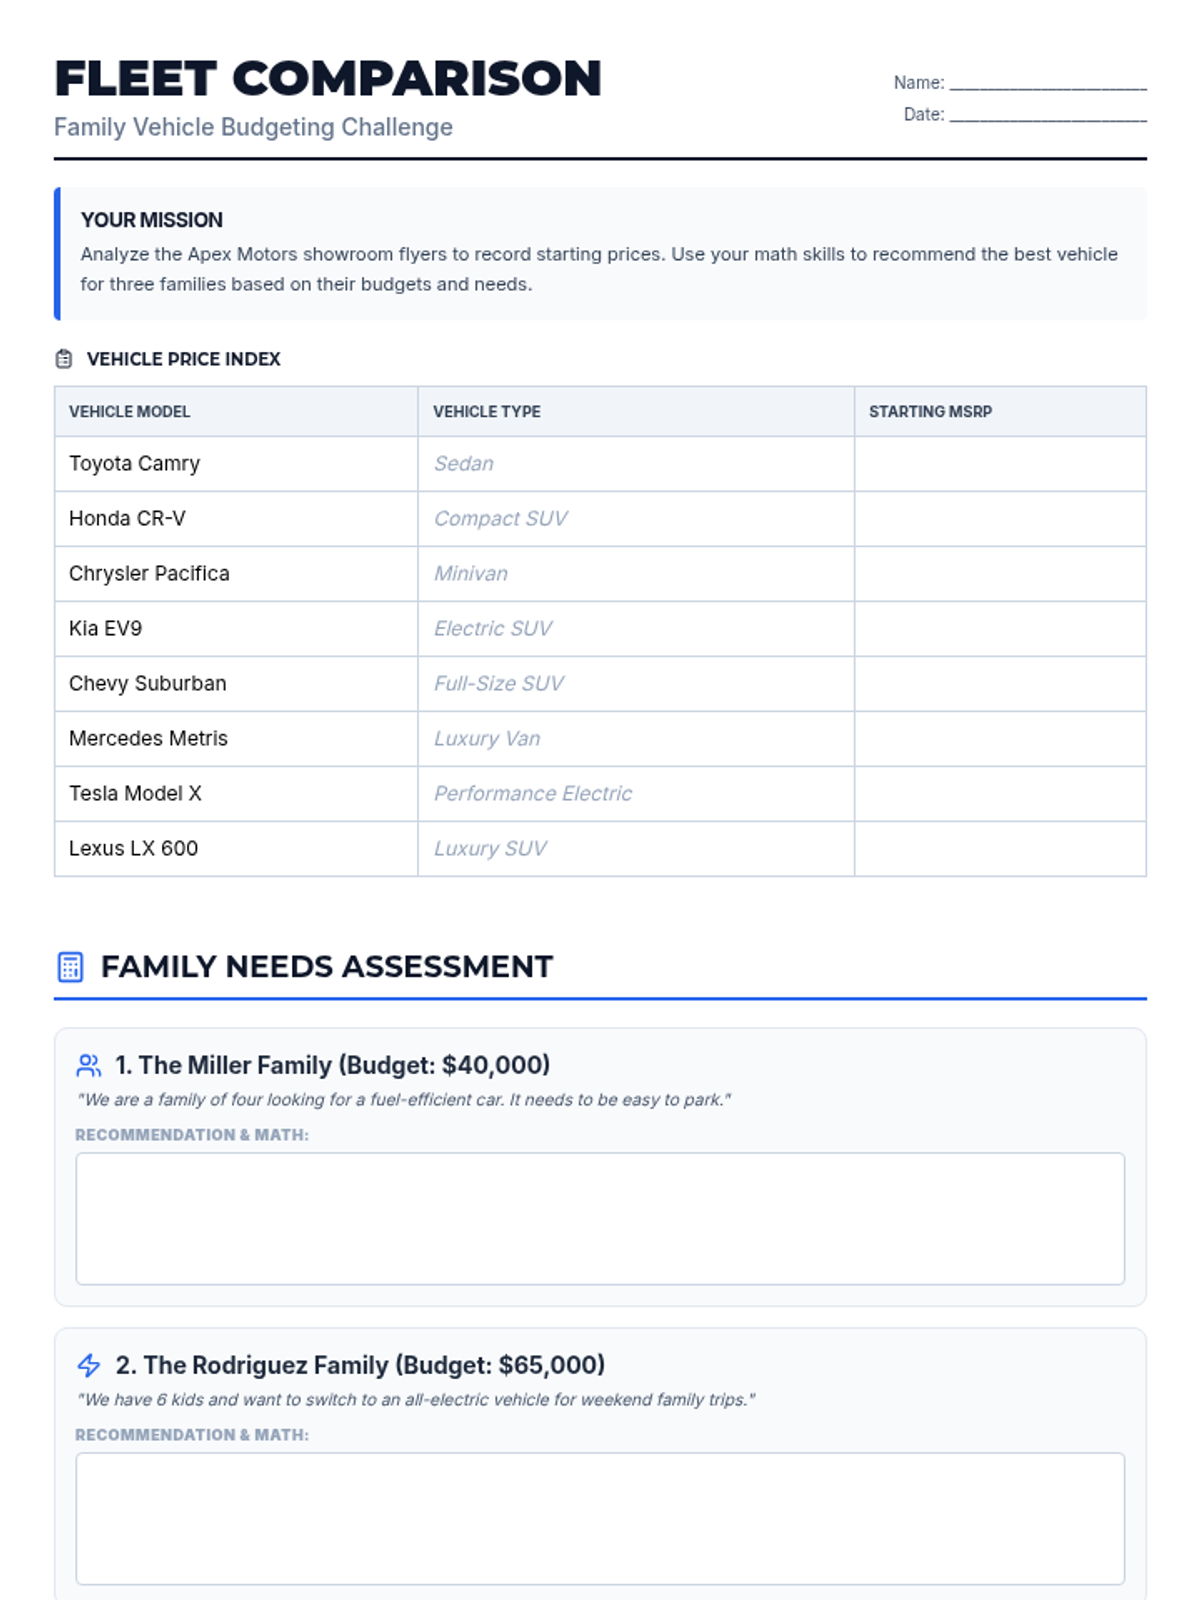
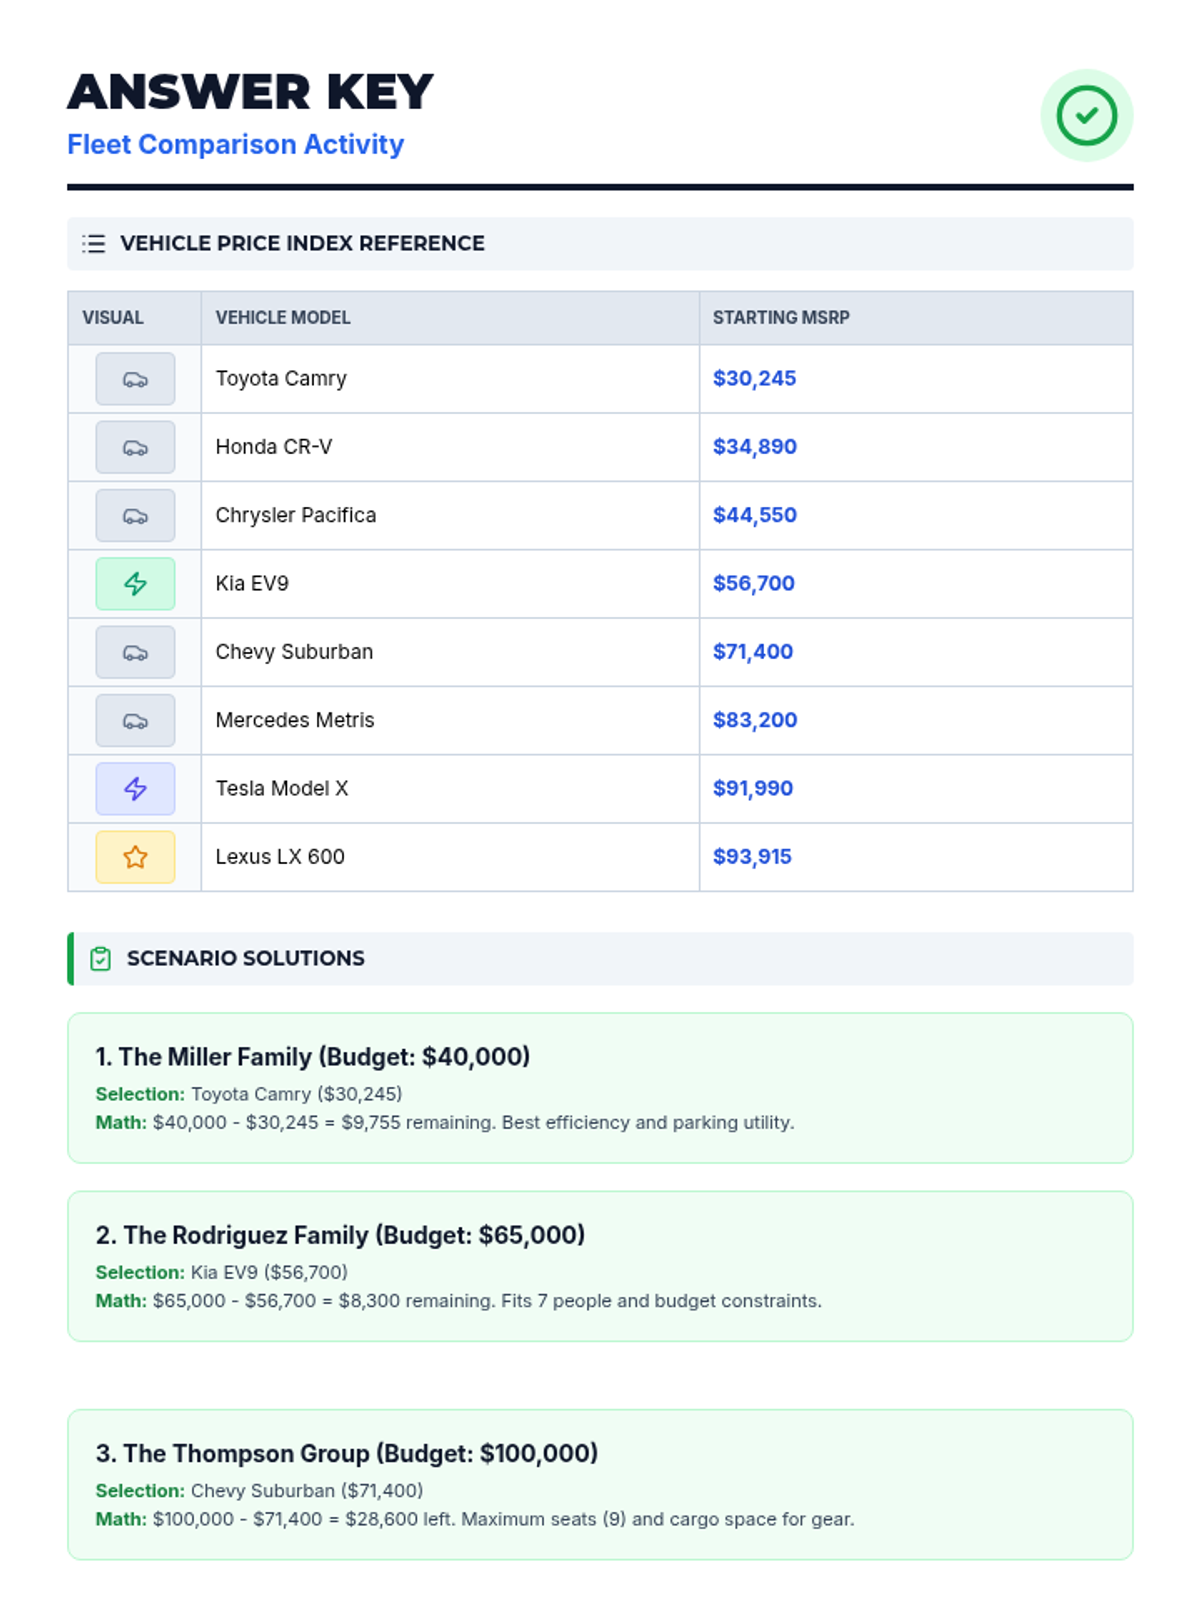
A hands-on math lesson where students analyze vehicle pricing, features, and budgeting for family-sized transport. Students use a series of showroom flyers to compare costs and make purchasing decisions based on specific family needs.
A collection of professionally designed real estate listing posters featuring unique properties with detailed descriptions, pricing, and specifications.
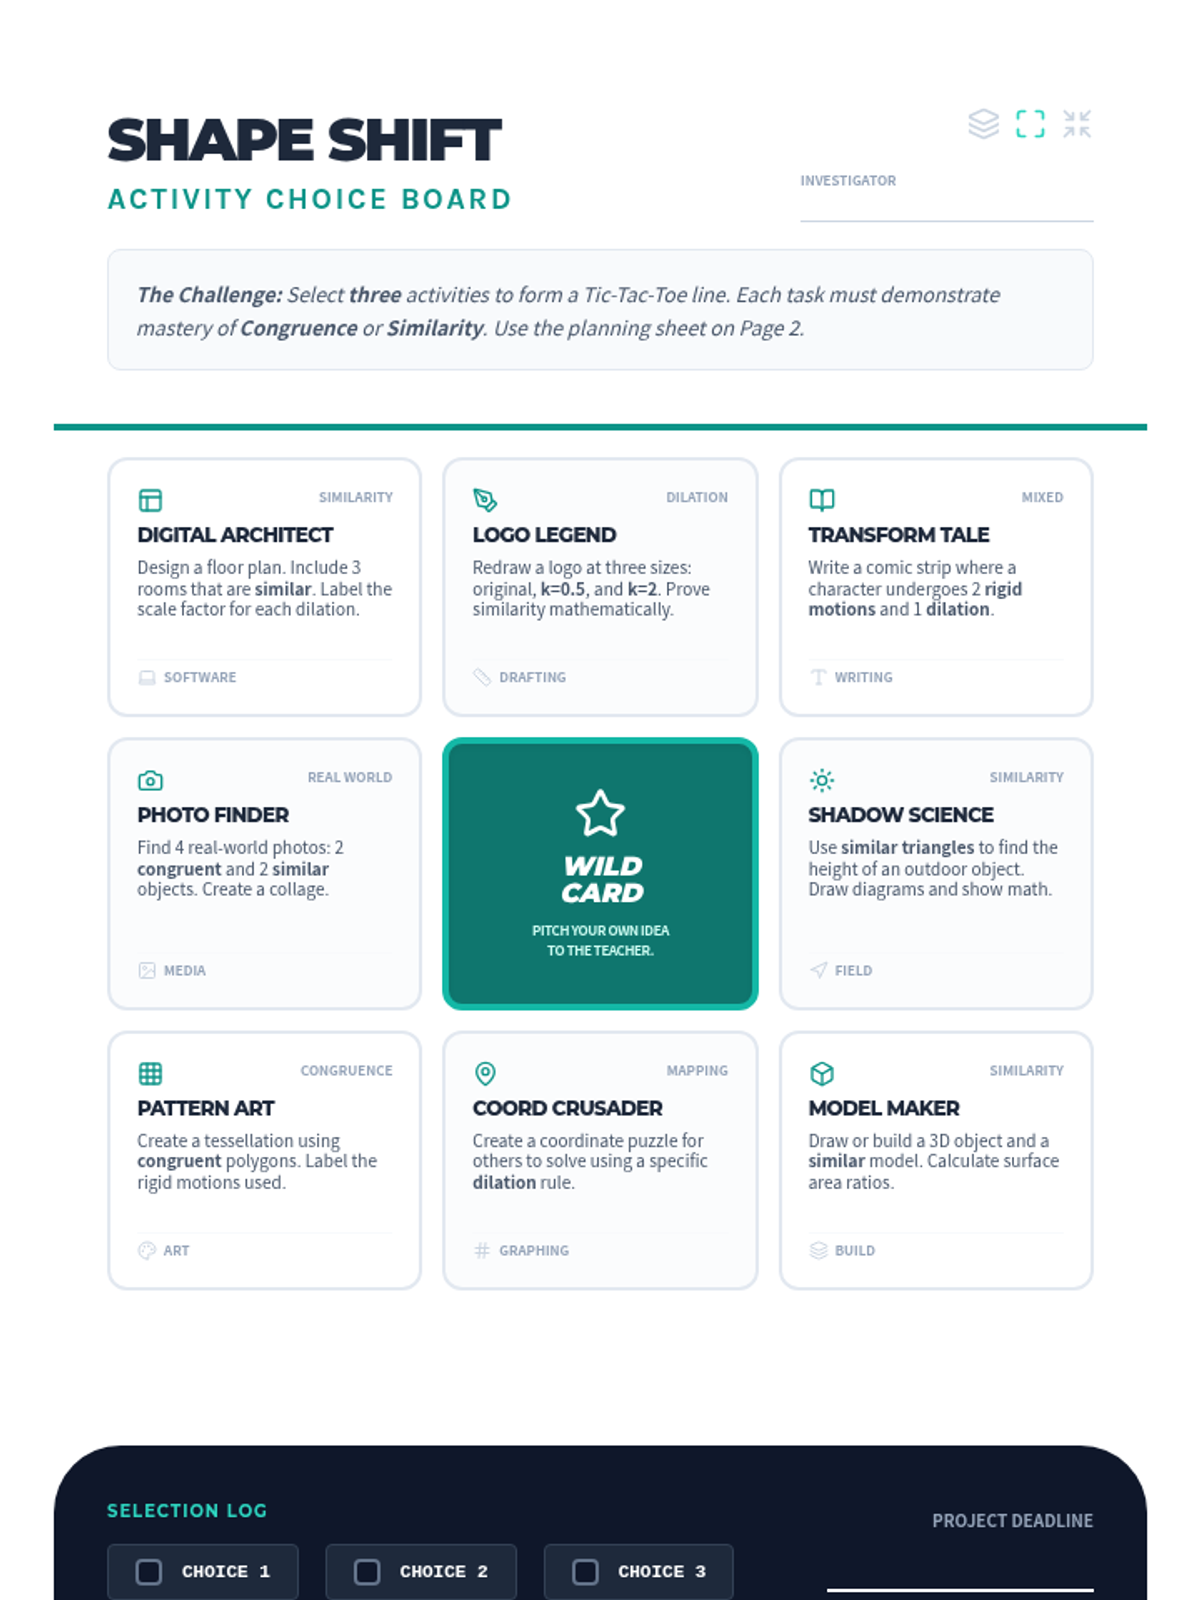
A hands-on project exploration where 8th-grade students investigate the geometric relationships between congruent and similar shapes through creative tasks and real-world applications.
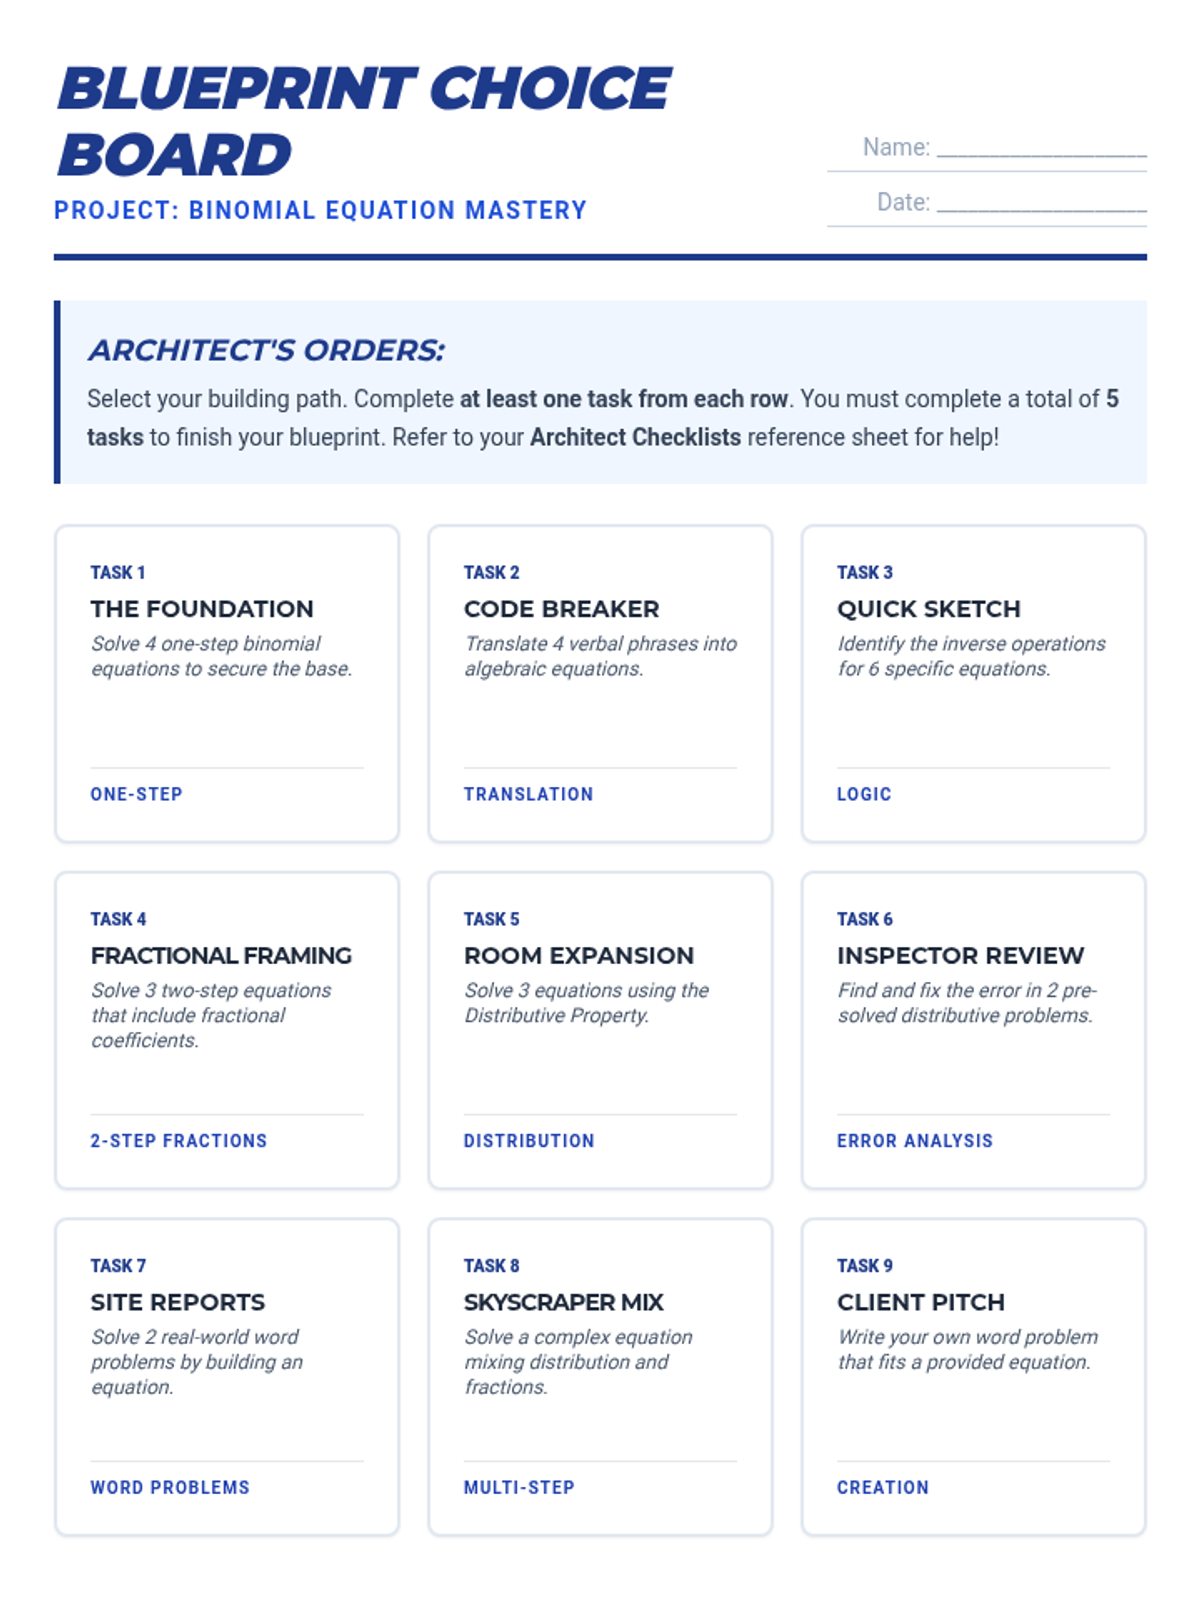
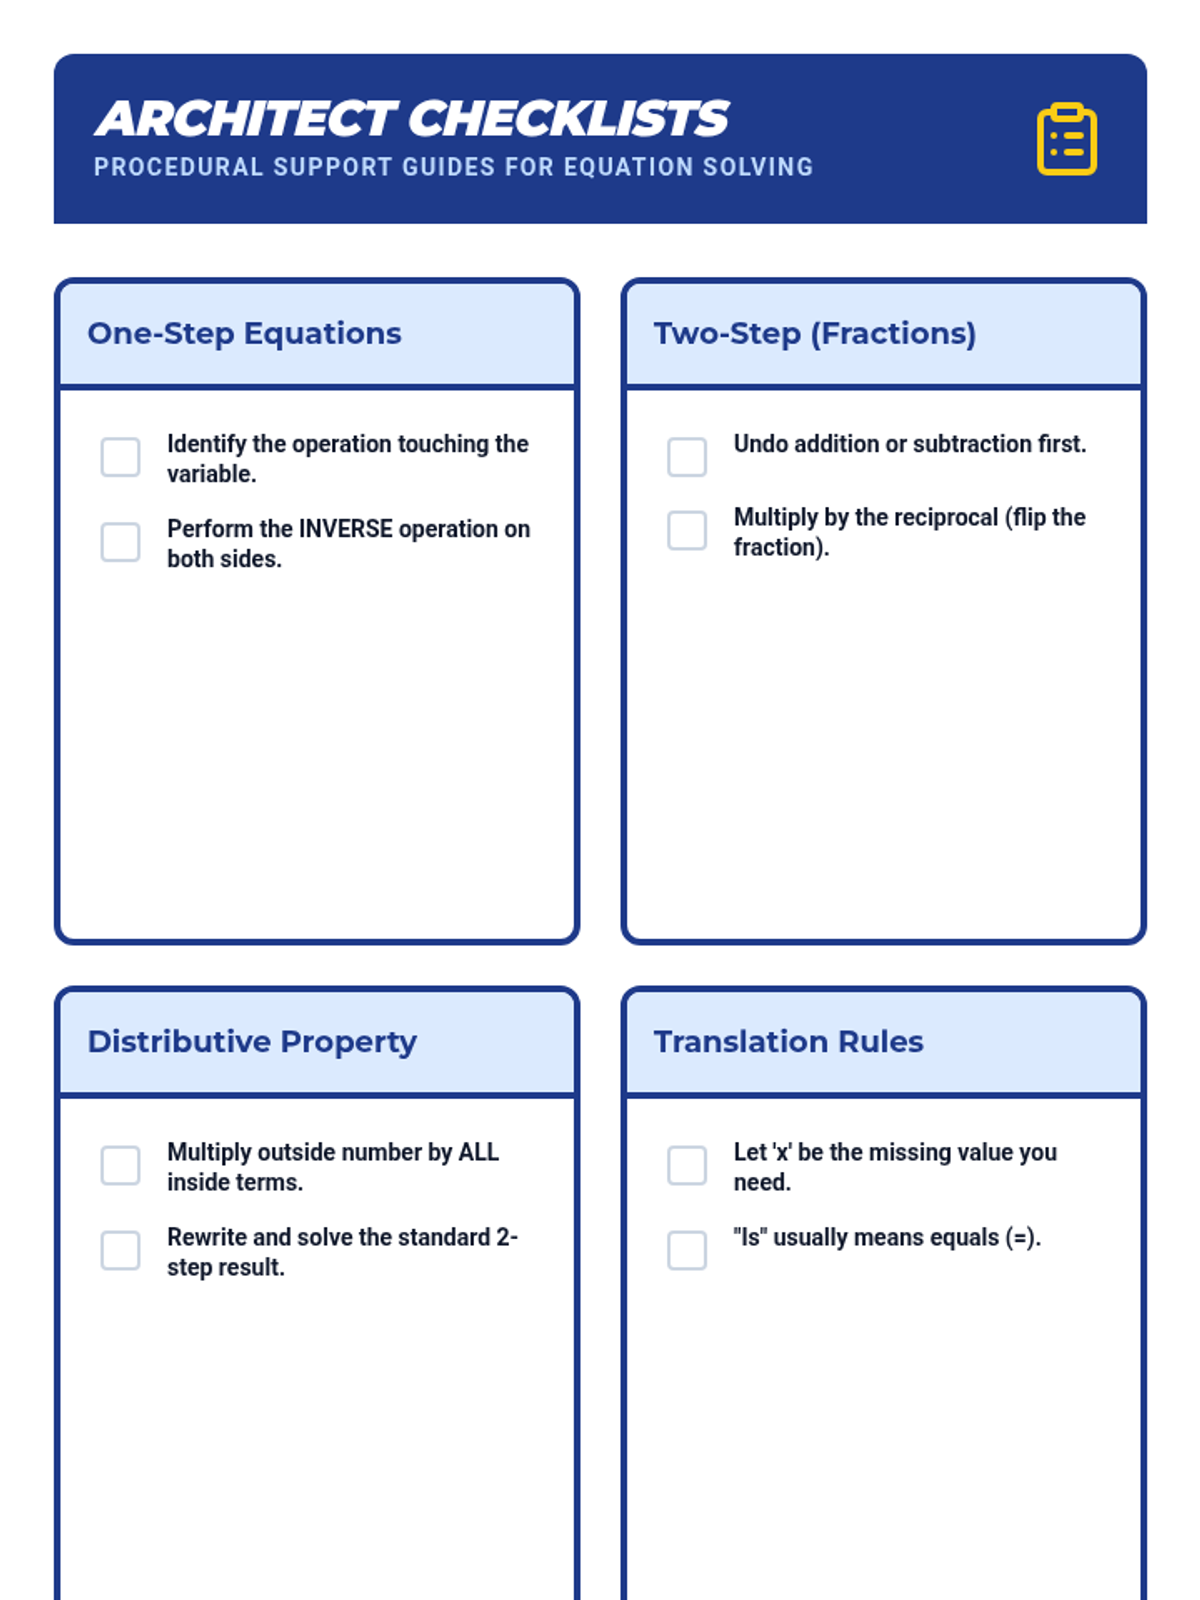
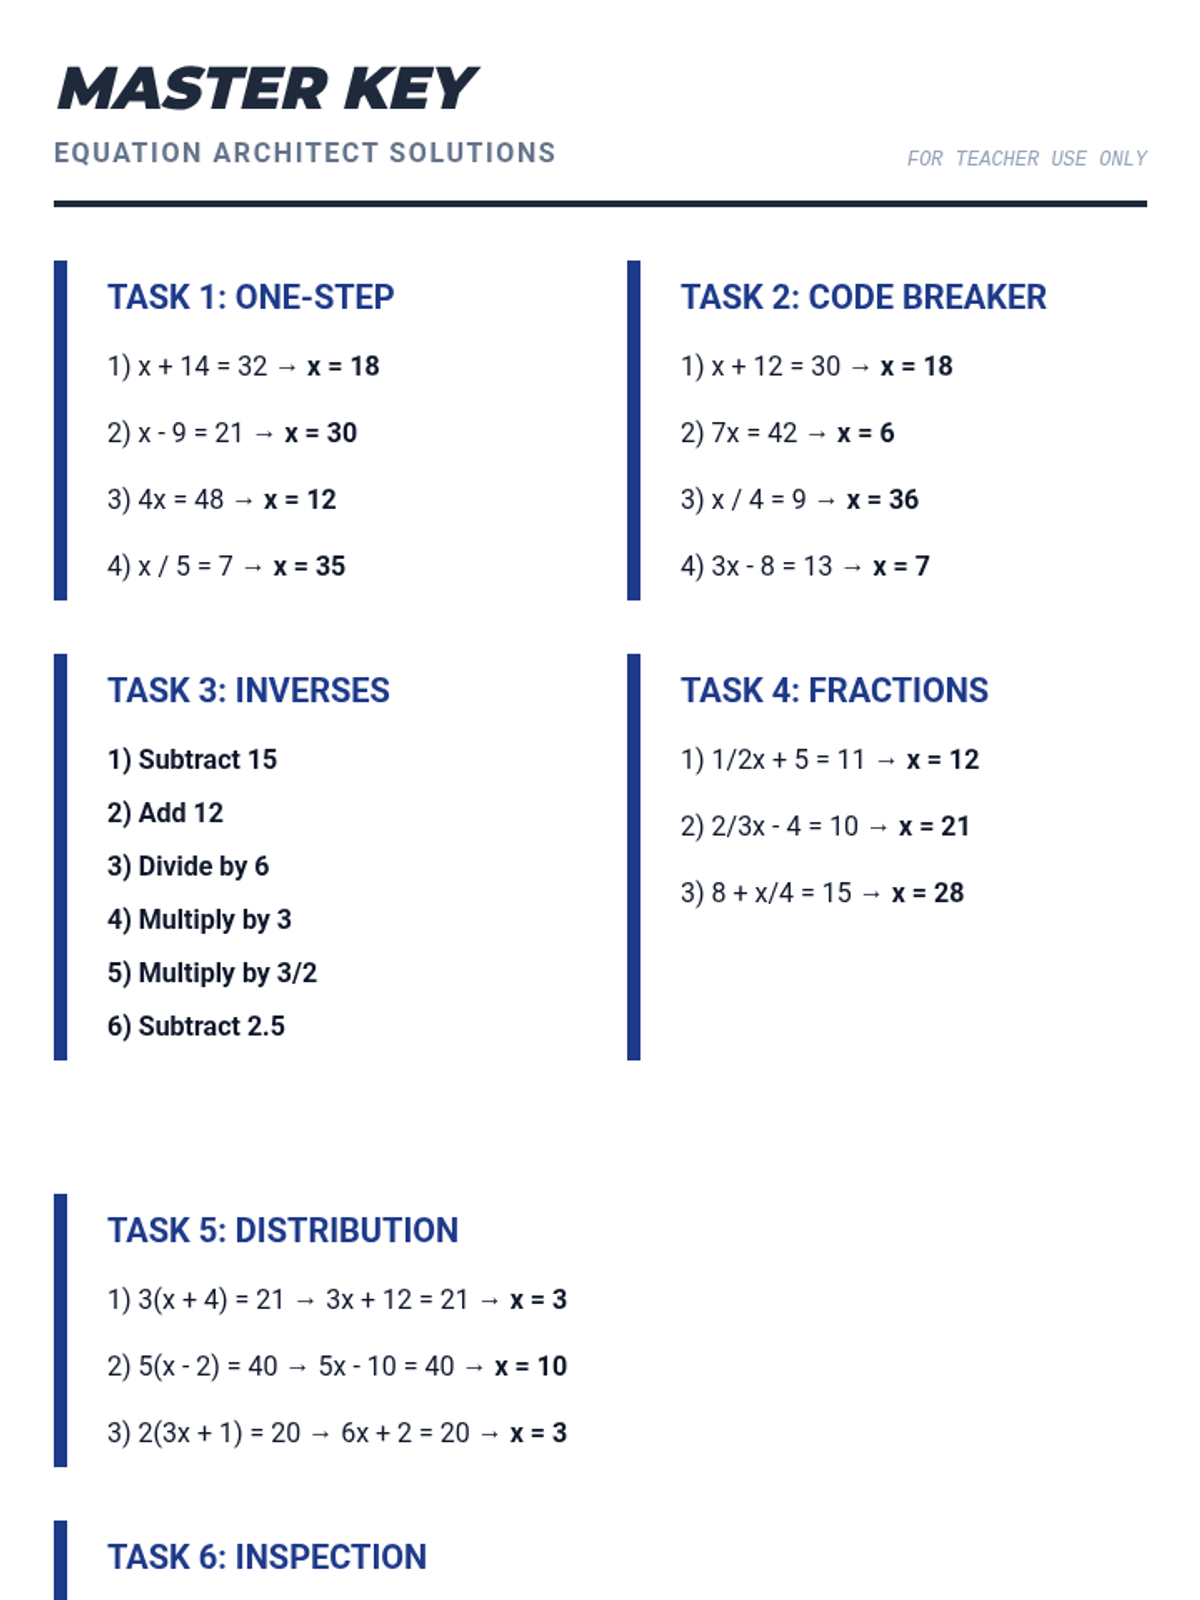
A self-paced activity where students practice solving various types of binomial equations through a choice-based architecture theme. Includes step-by-step checklists to support diverse learners.
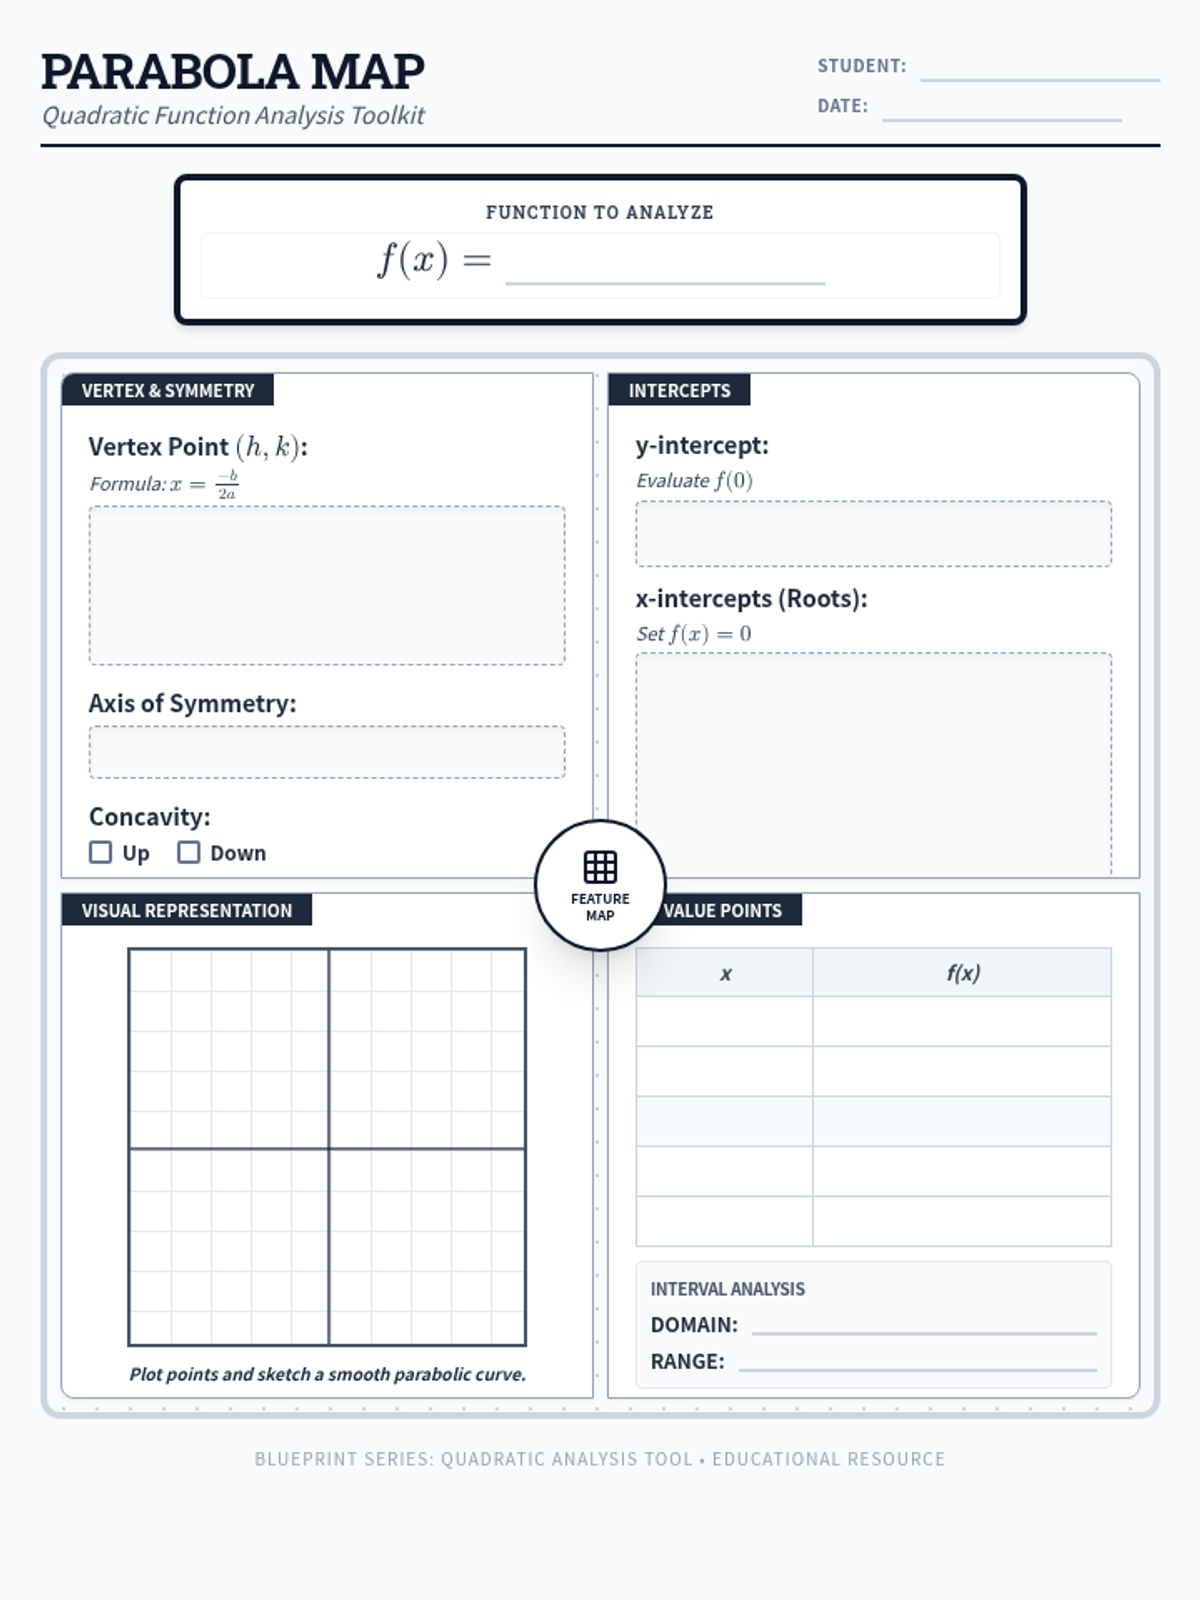
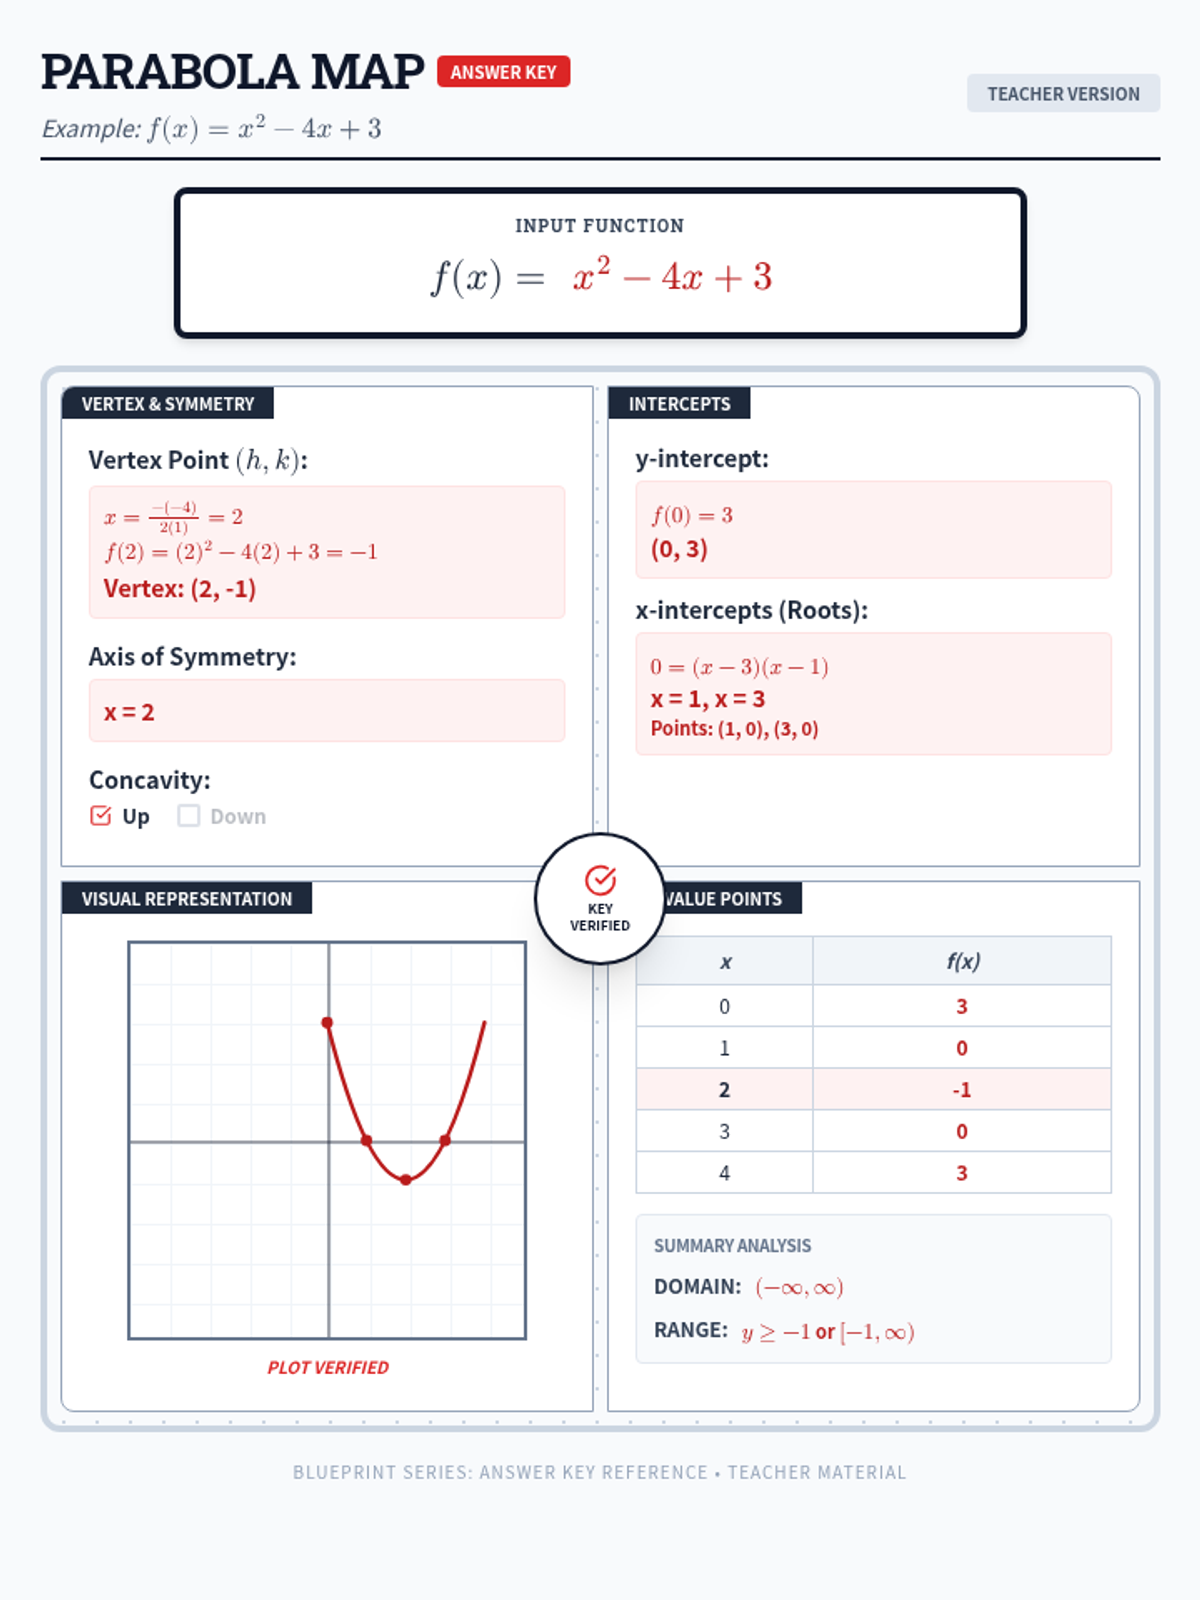
This lesson introduces students to the key features of quadratic functions using a structured graphic organizer. Students will identify and calculate the vertex, axis of symmetry, and intercepts to better understand the behavior of parabolas.
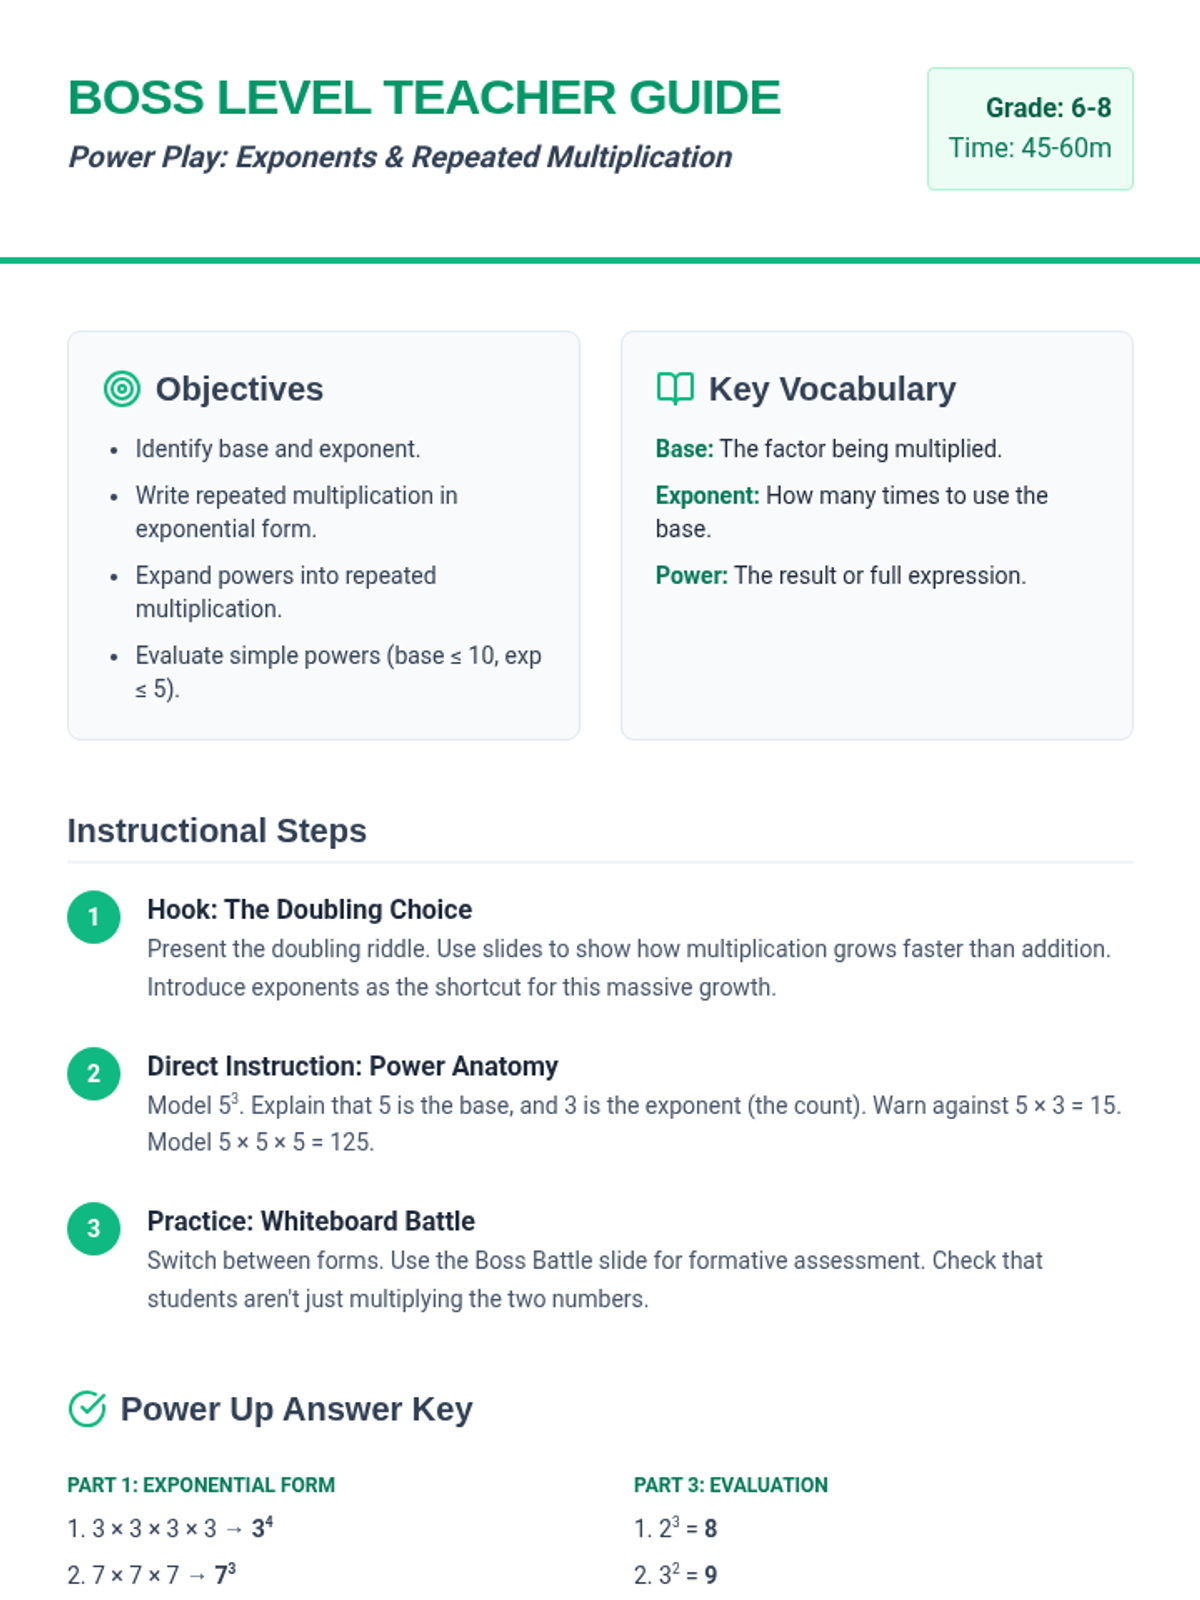
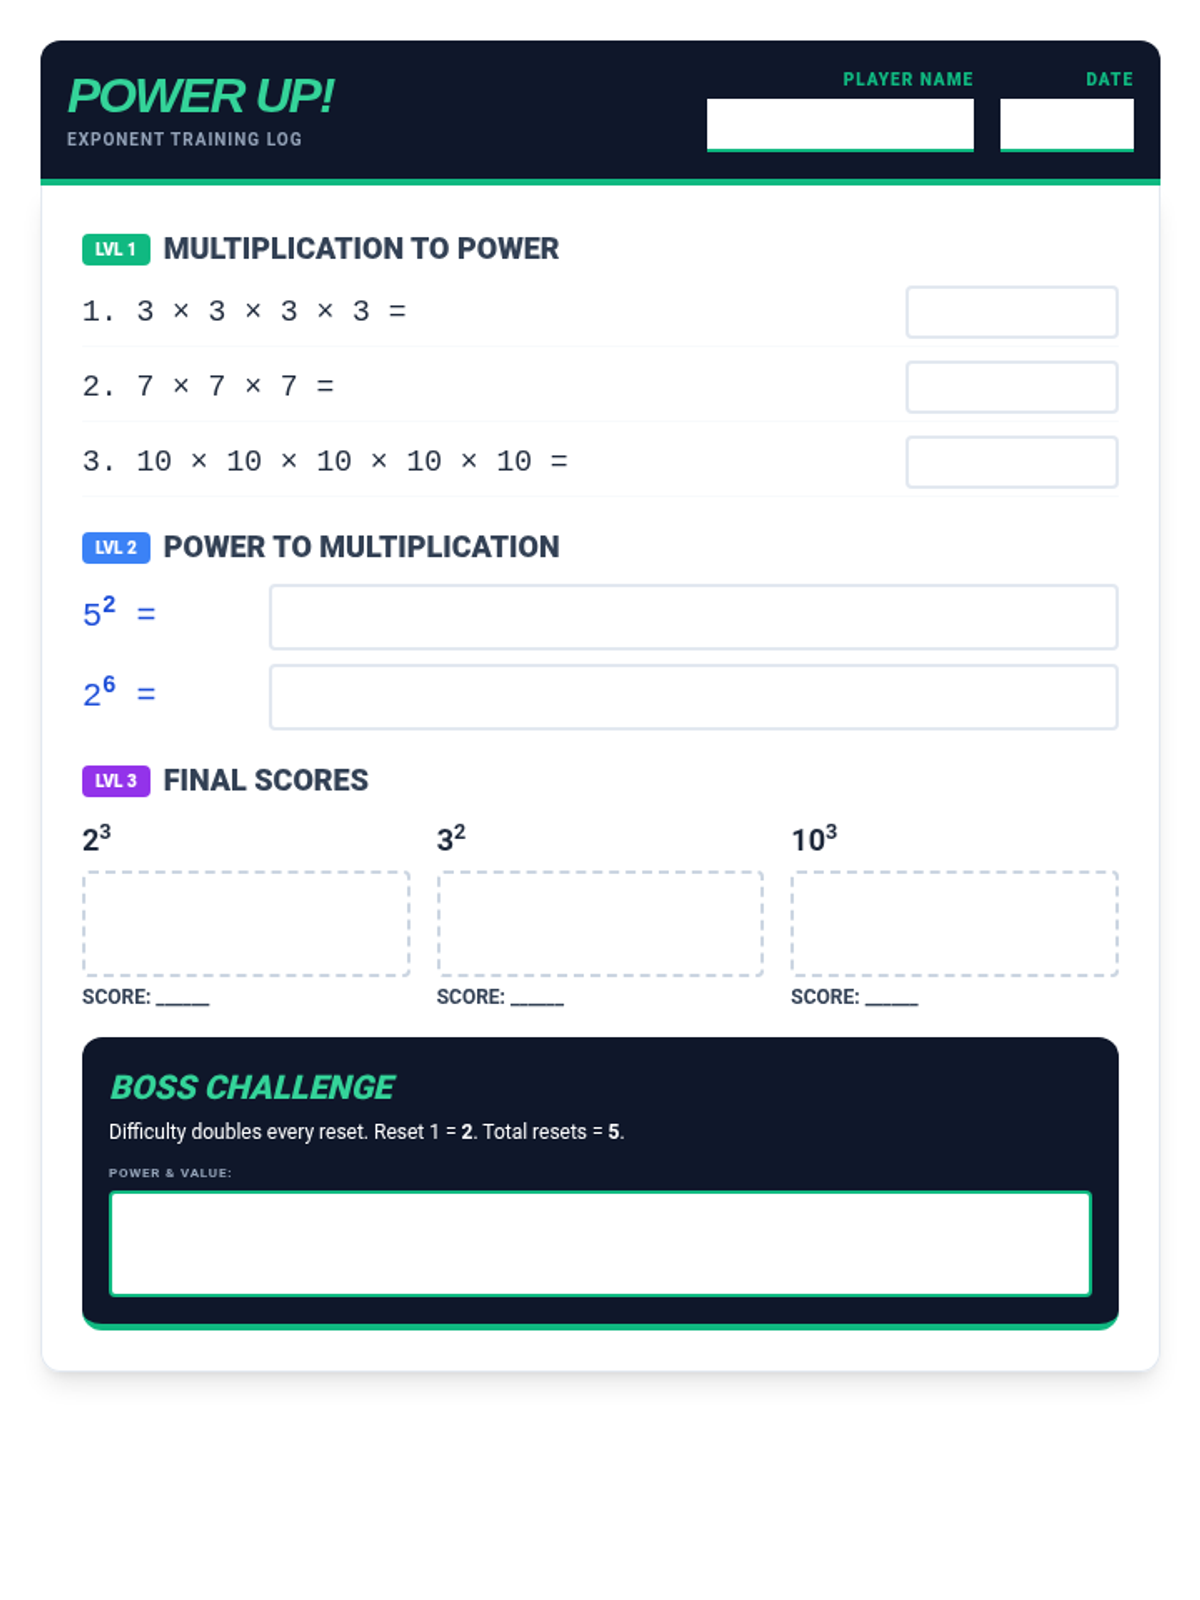
An introductory lesson on exponents focusing on the relationship between repeated multiplication and exponential notation through a retro arcade theme.
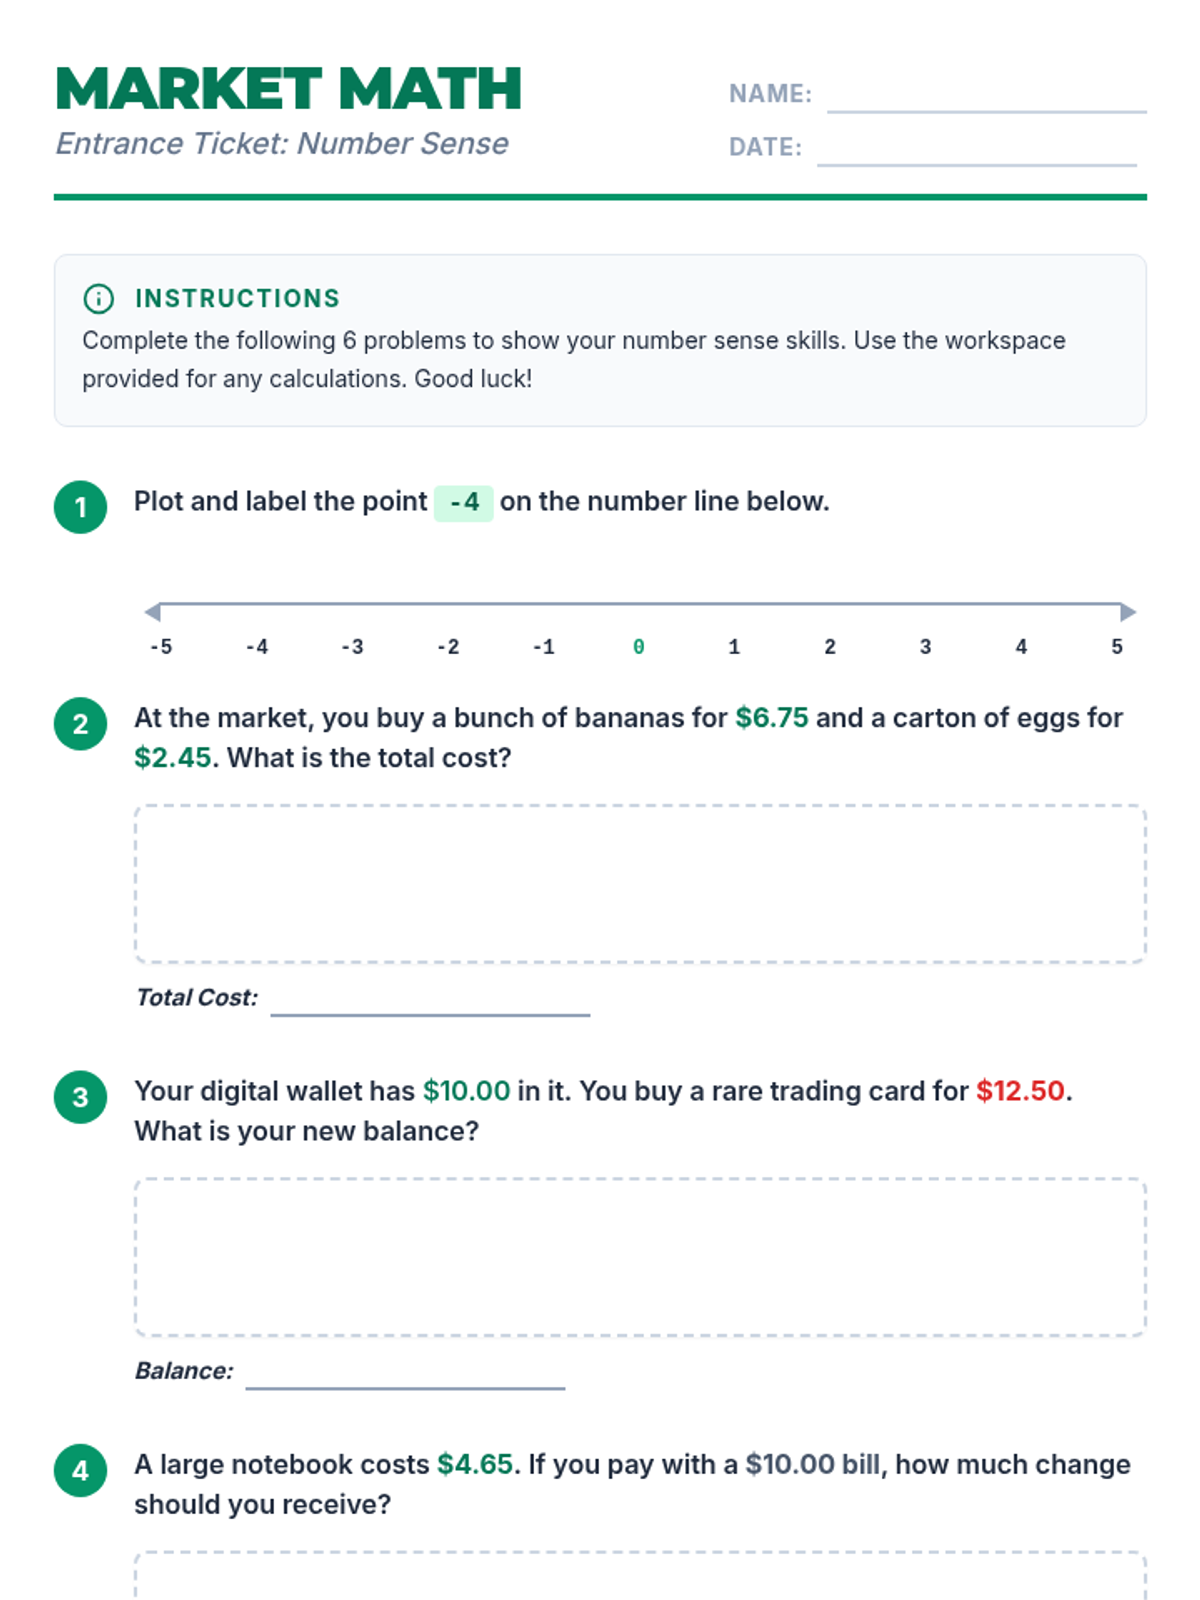
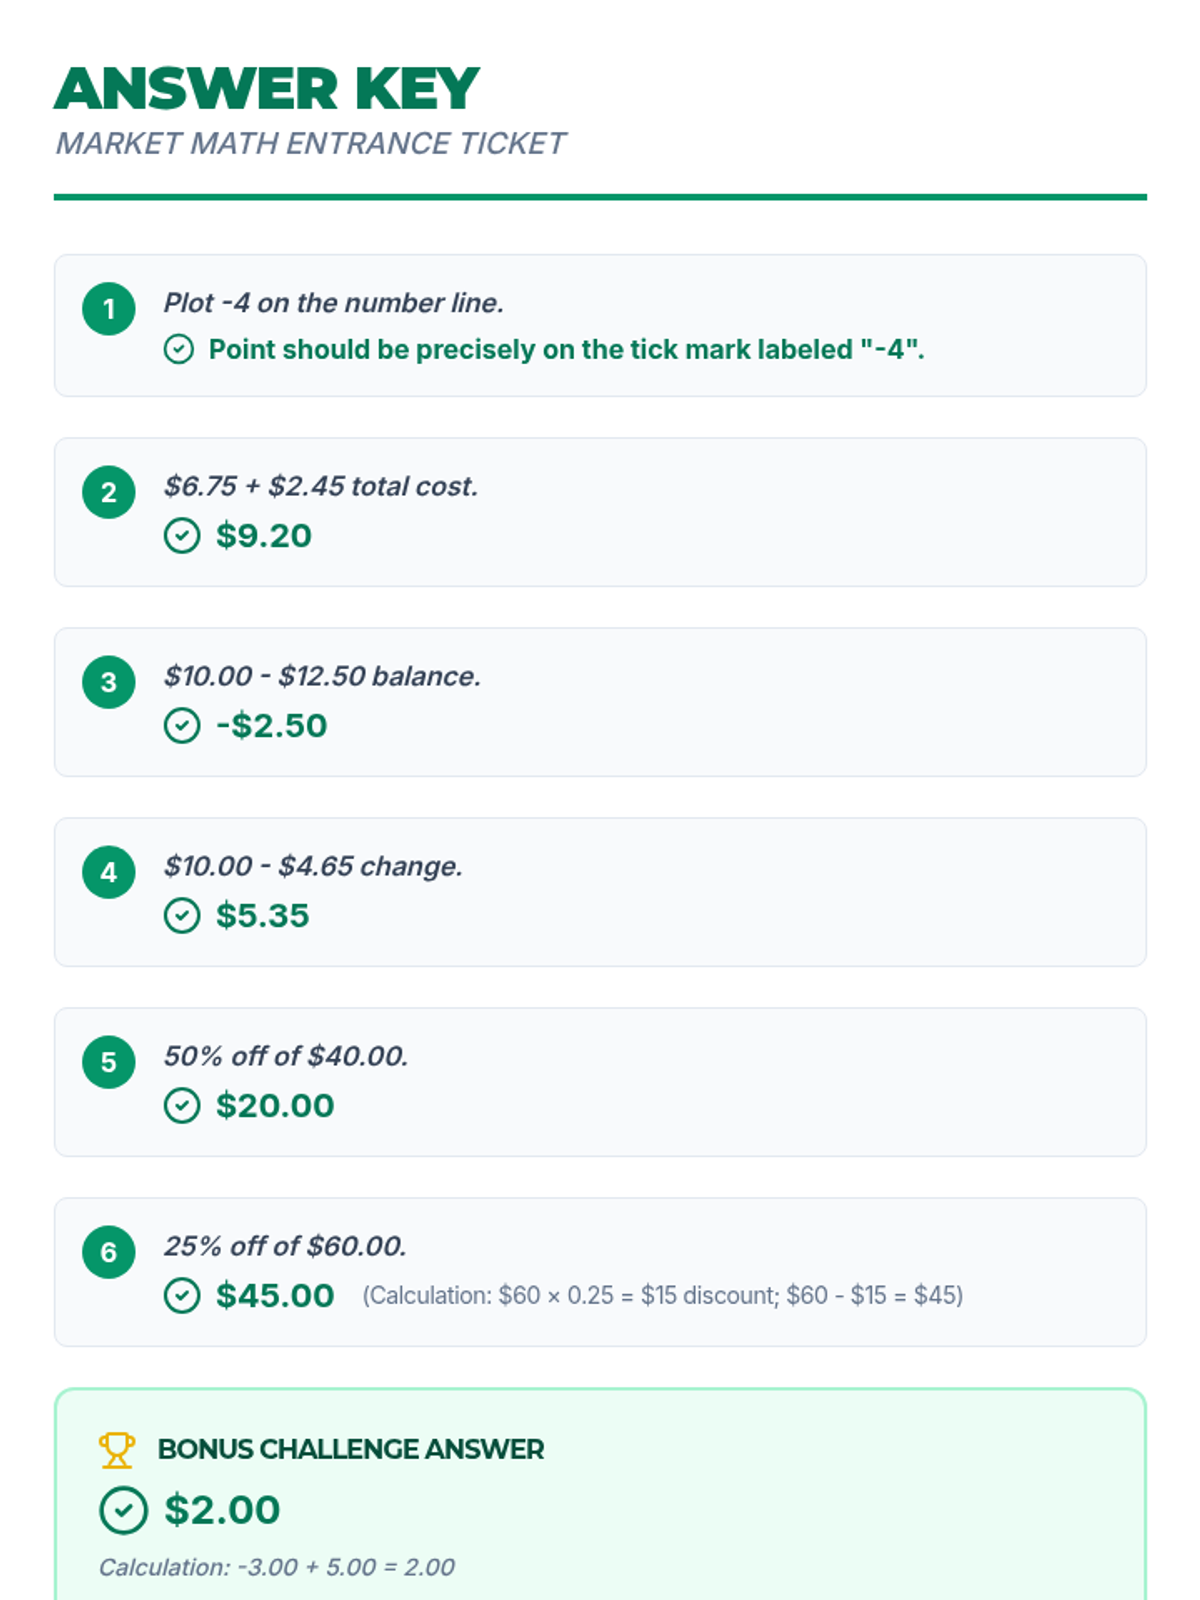
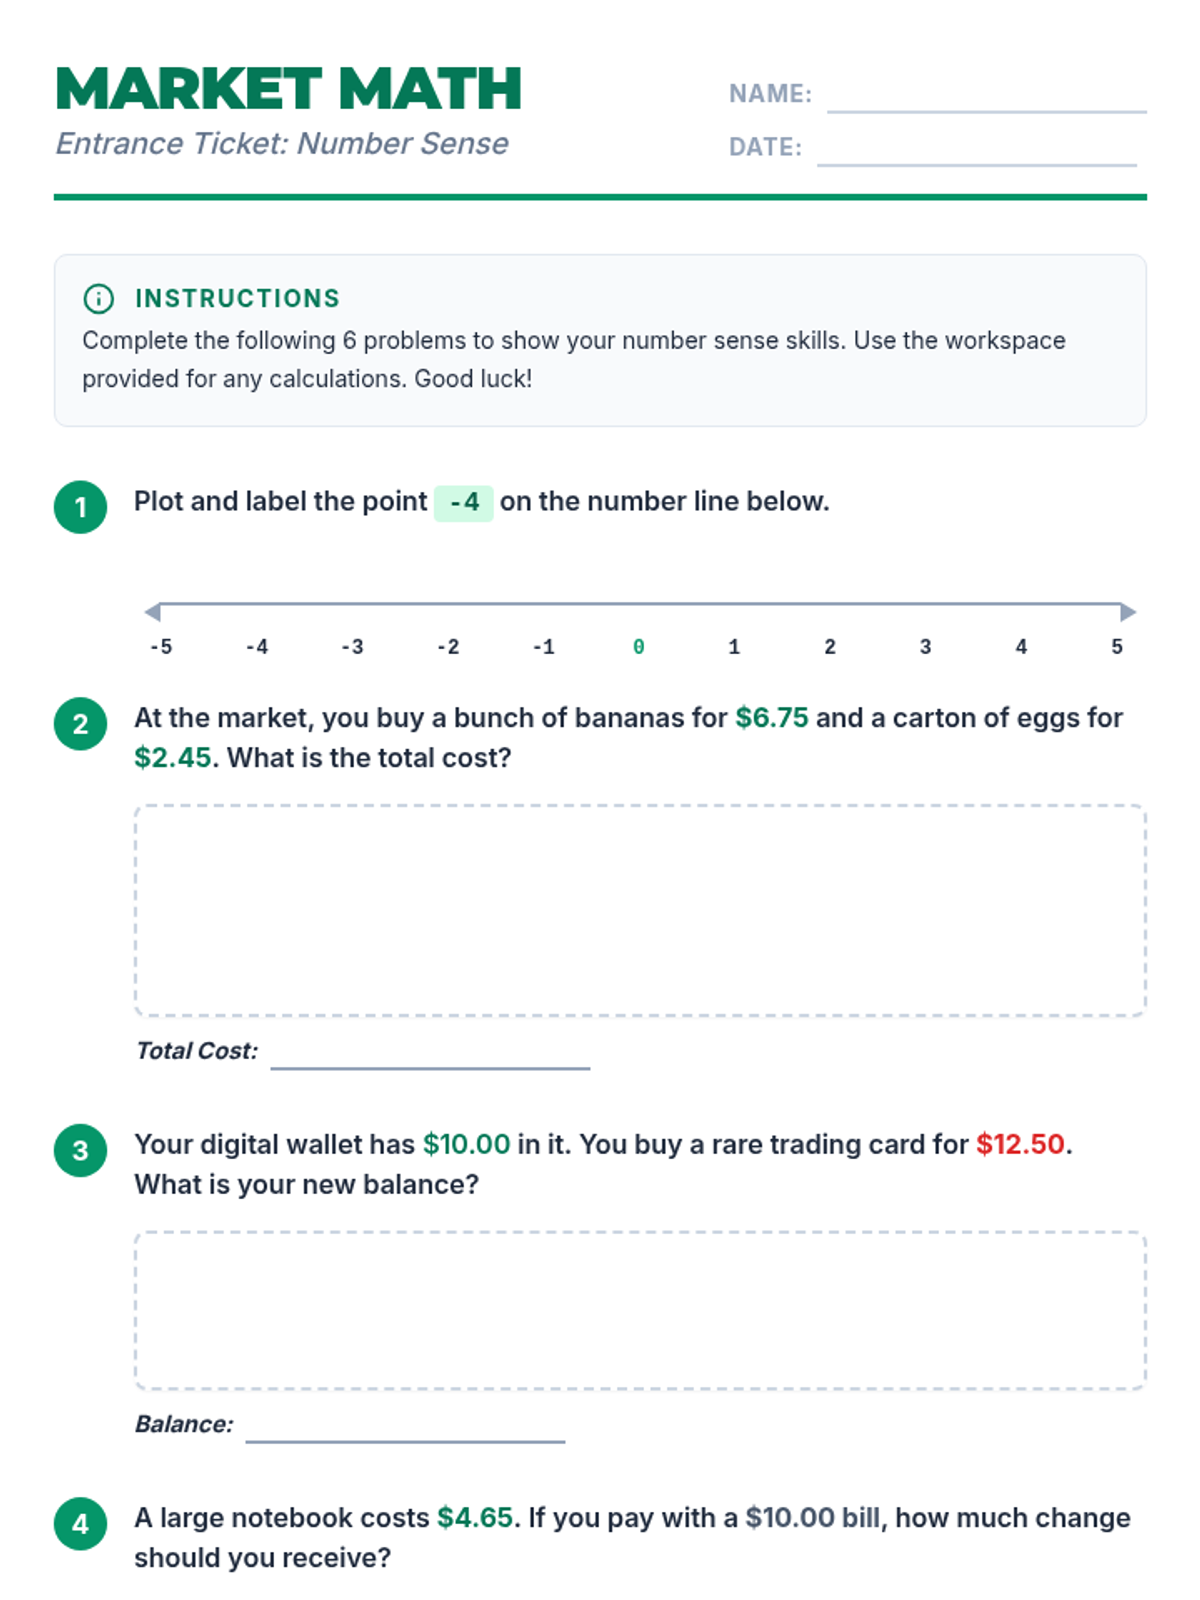
A quick formative assessment focusing on foundational number sense, including negative numbers, decimals, and percentages within real-world shopping contexts.
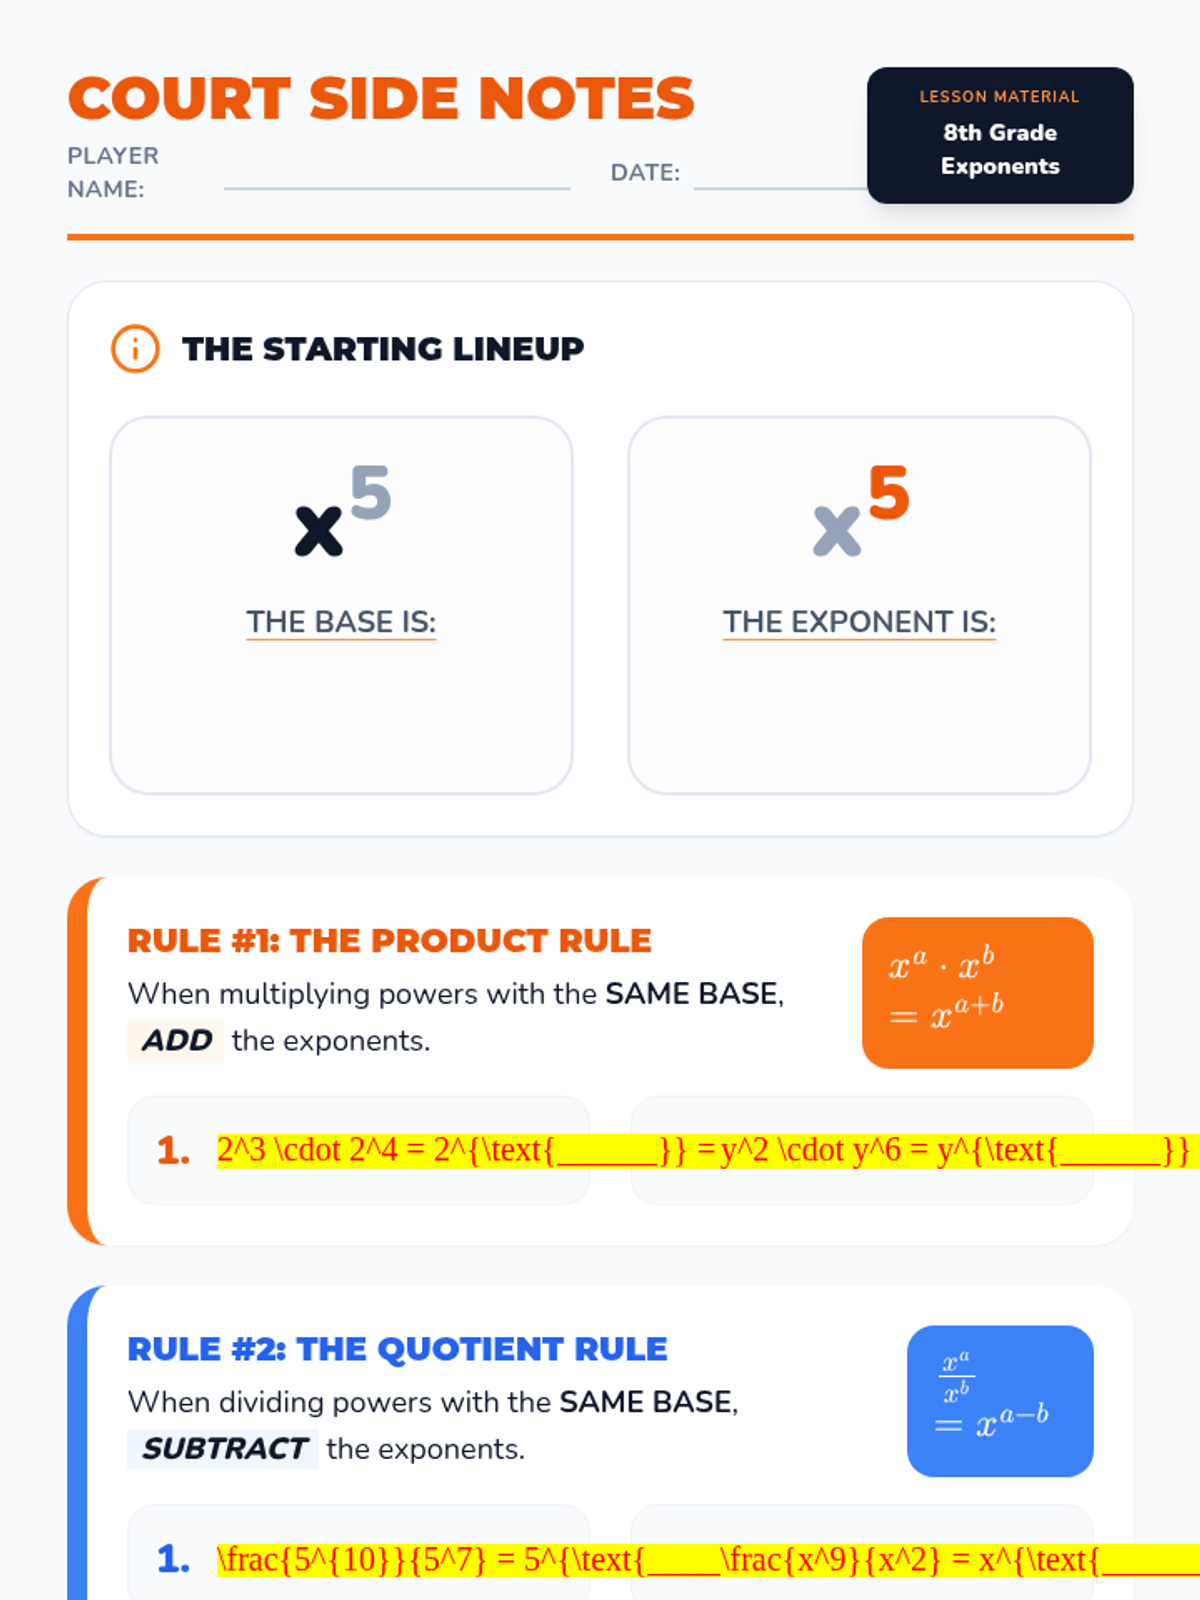
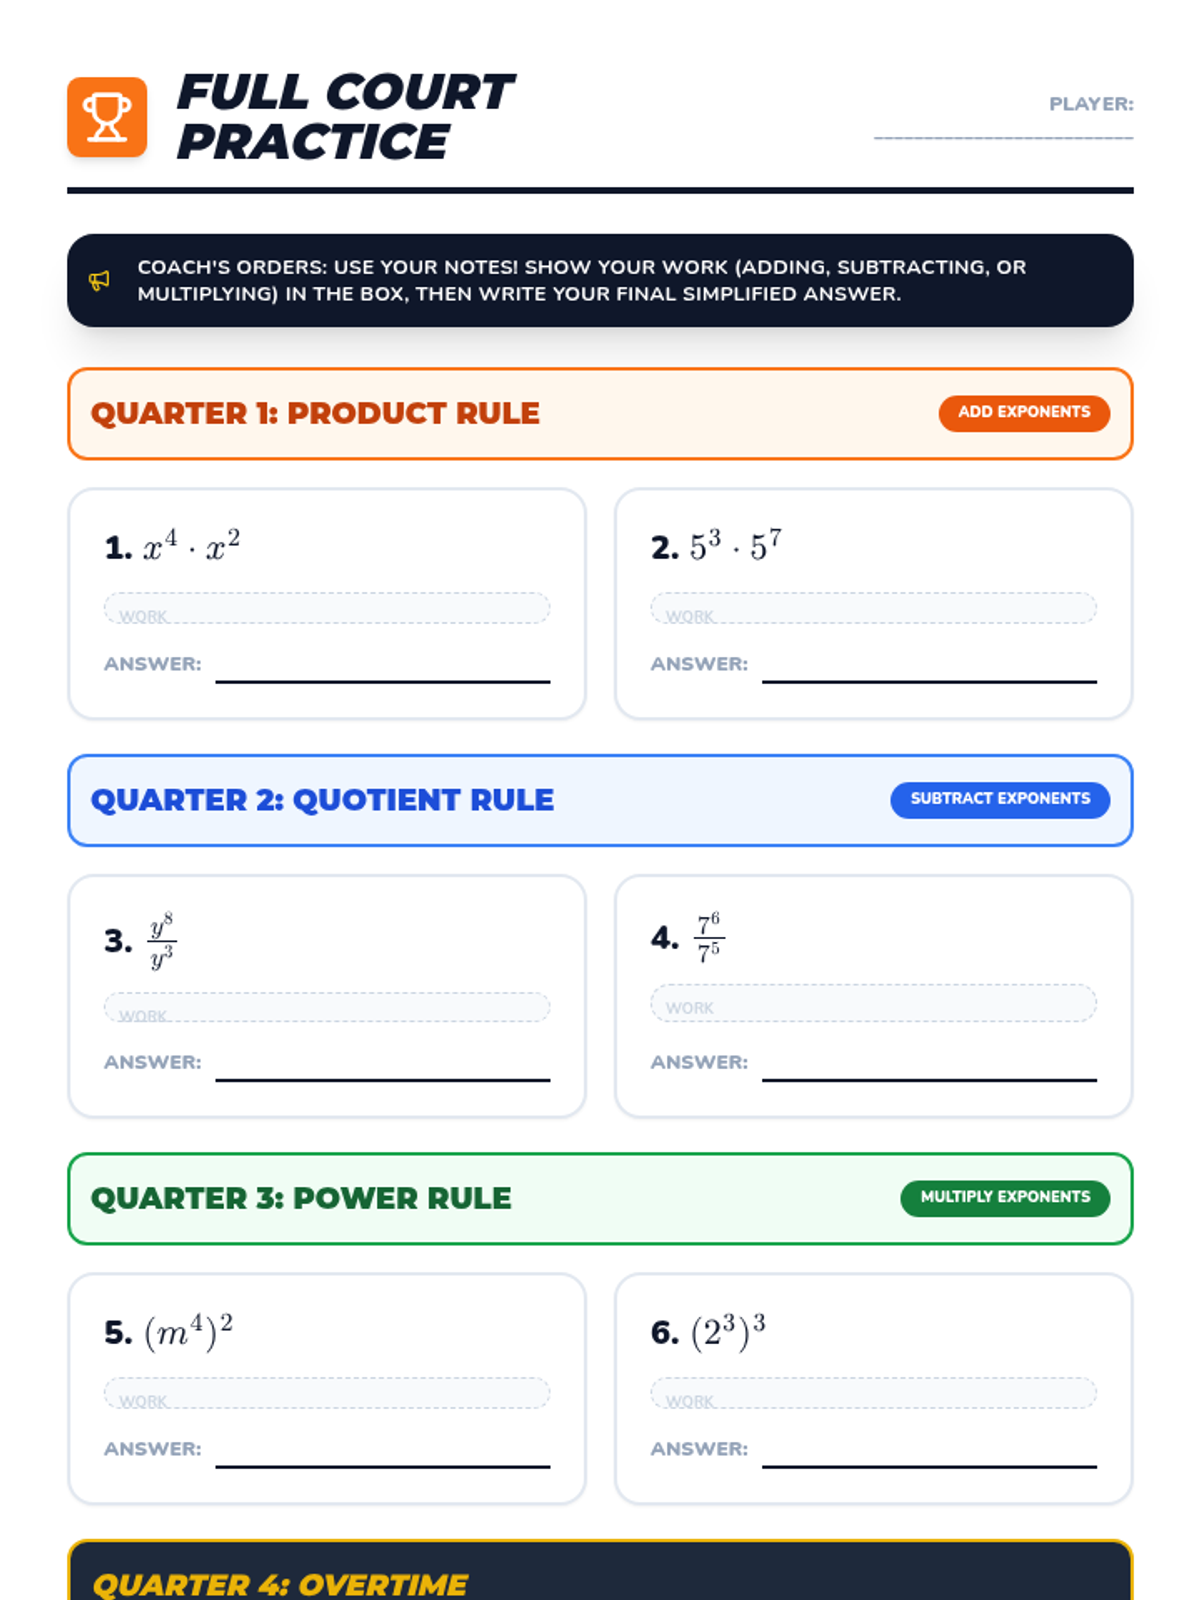
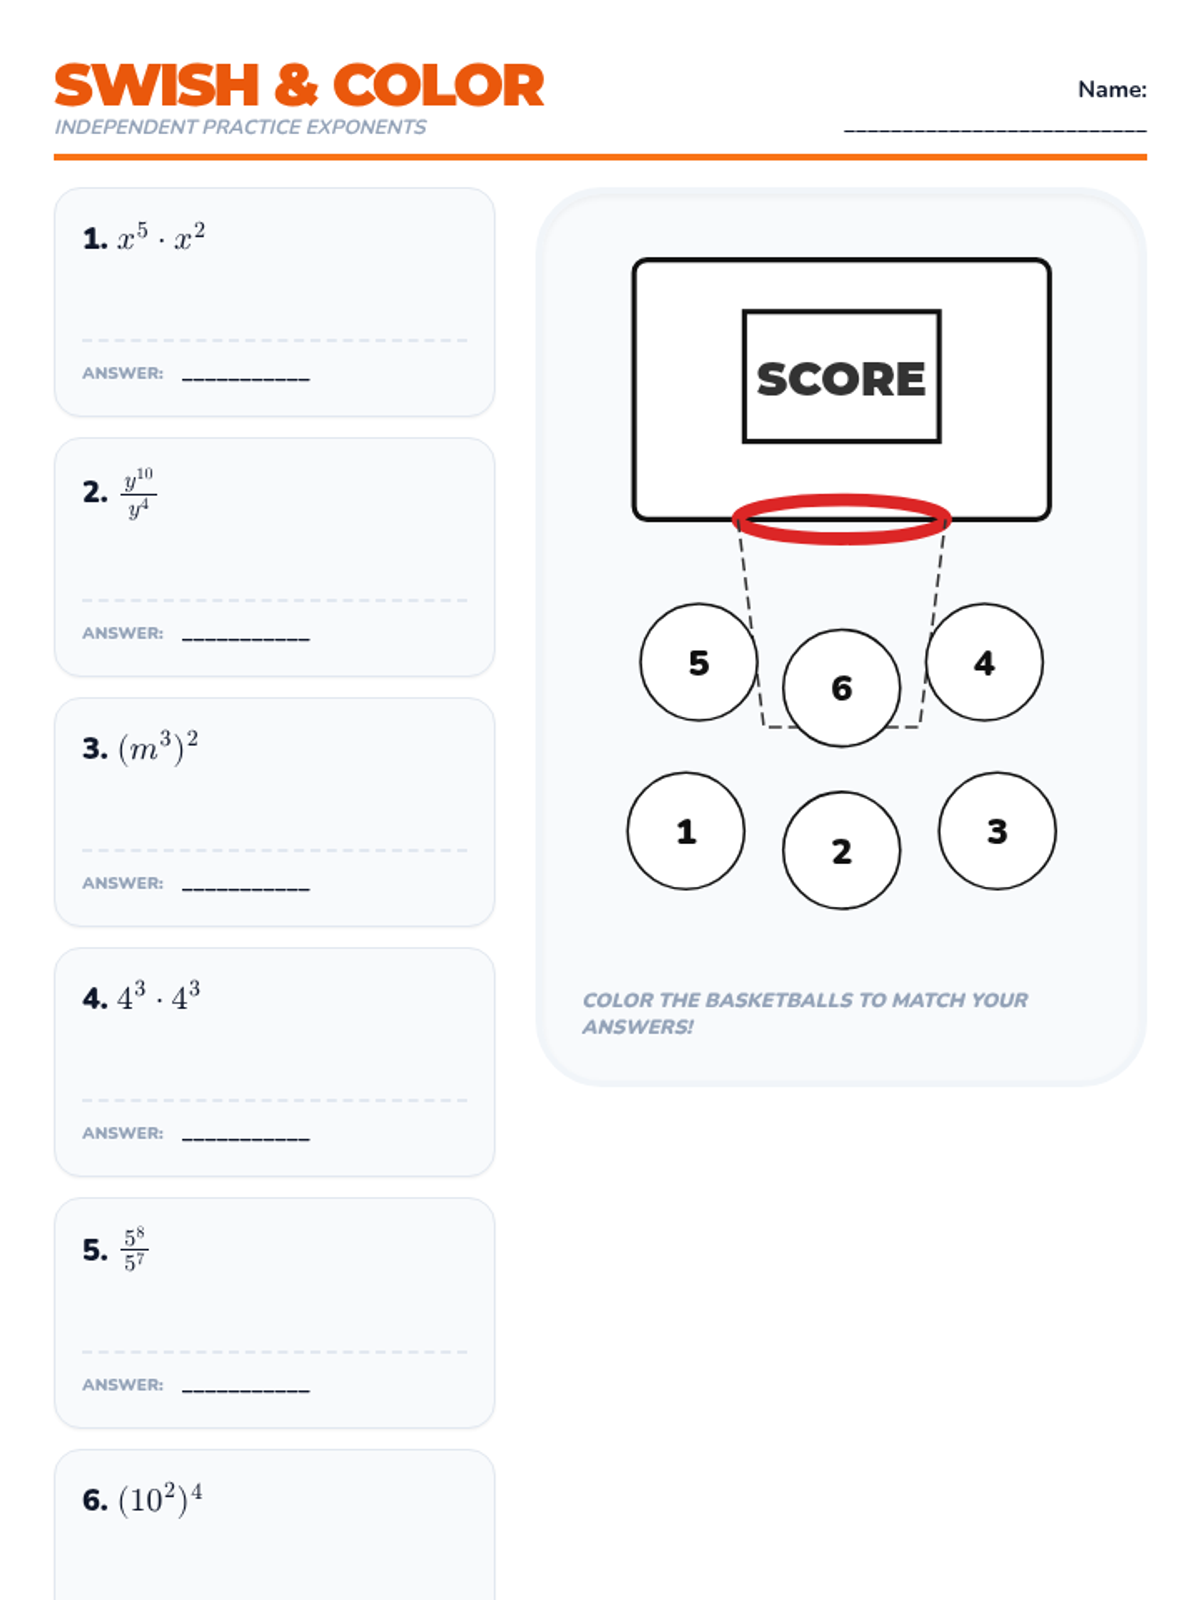
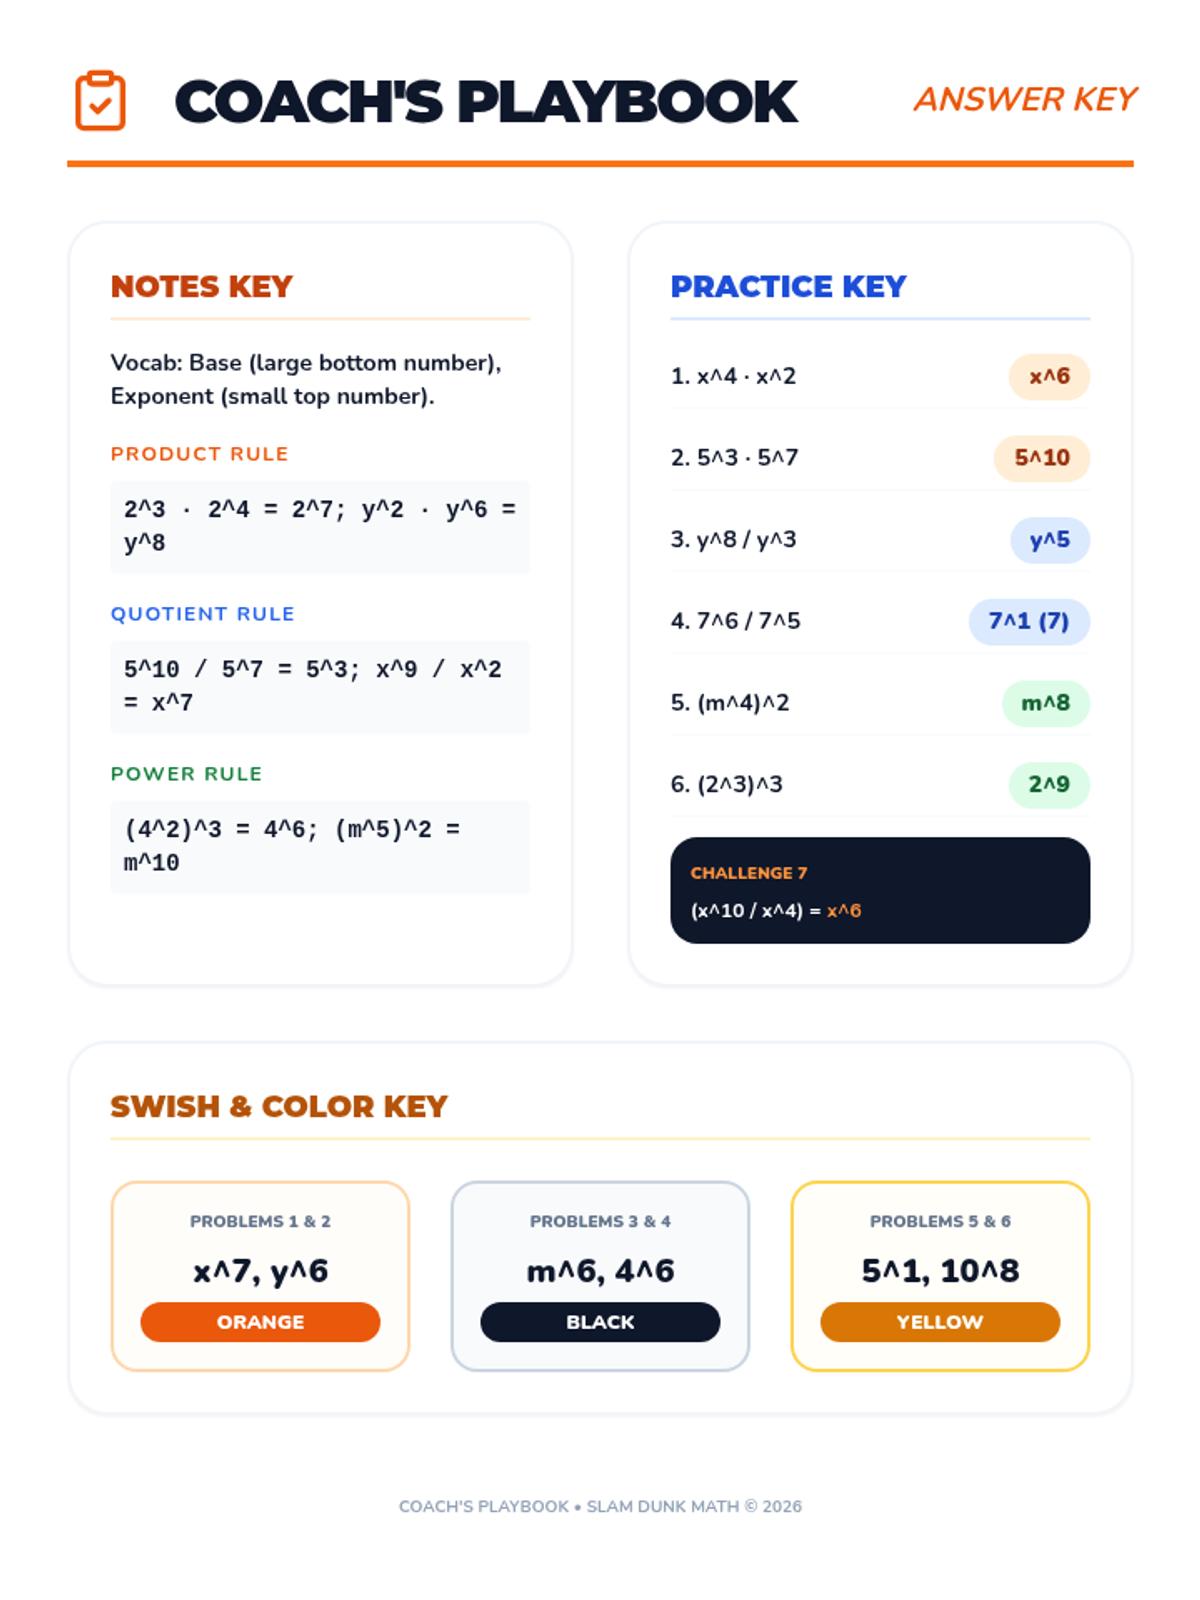
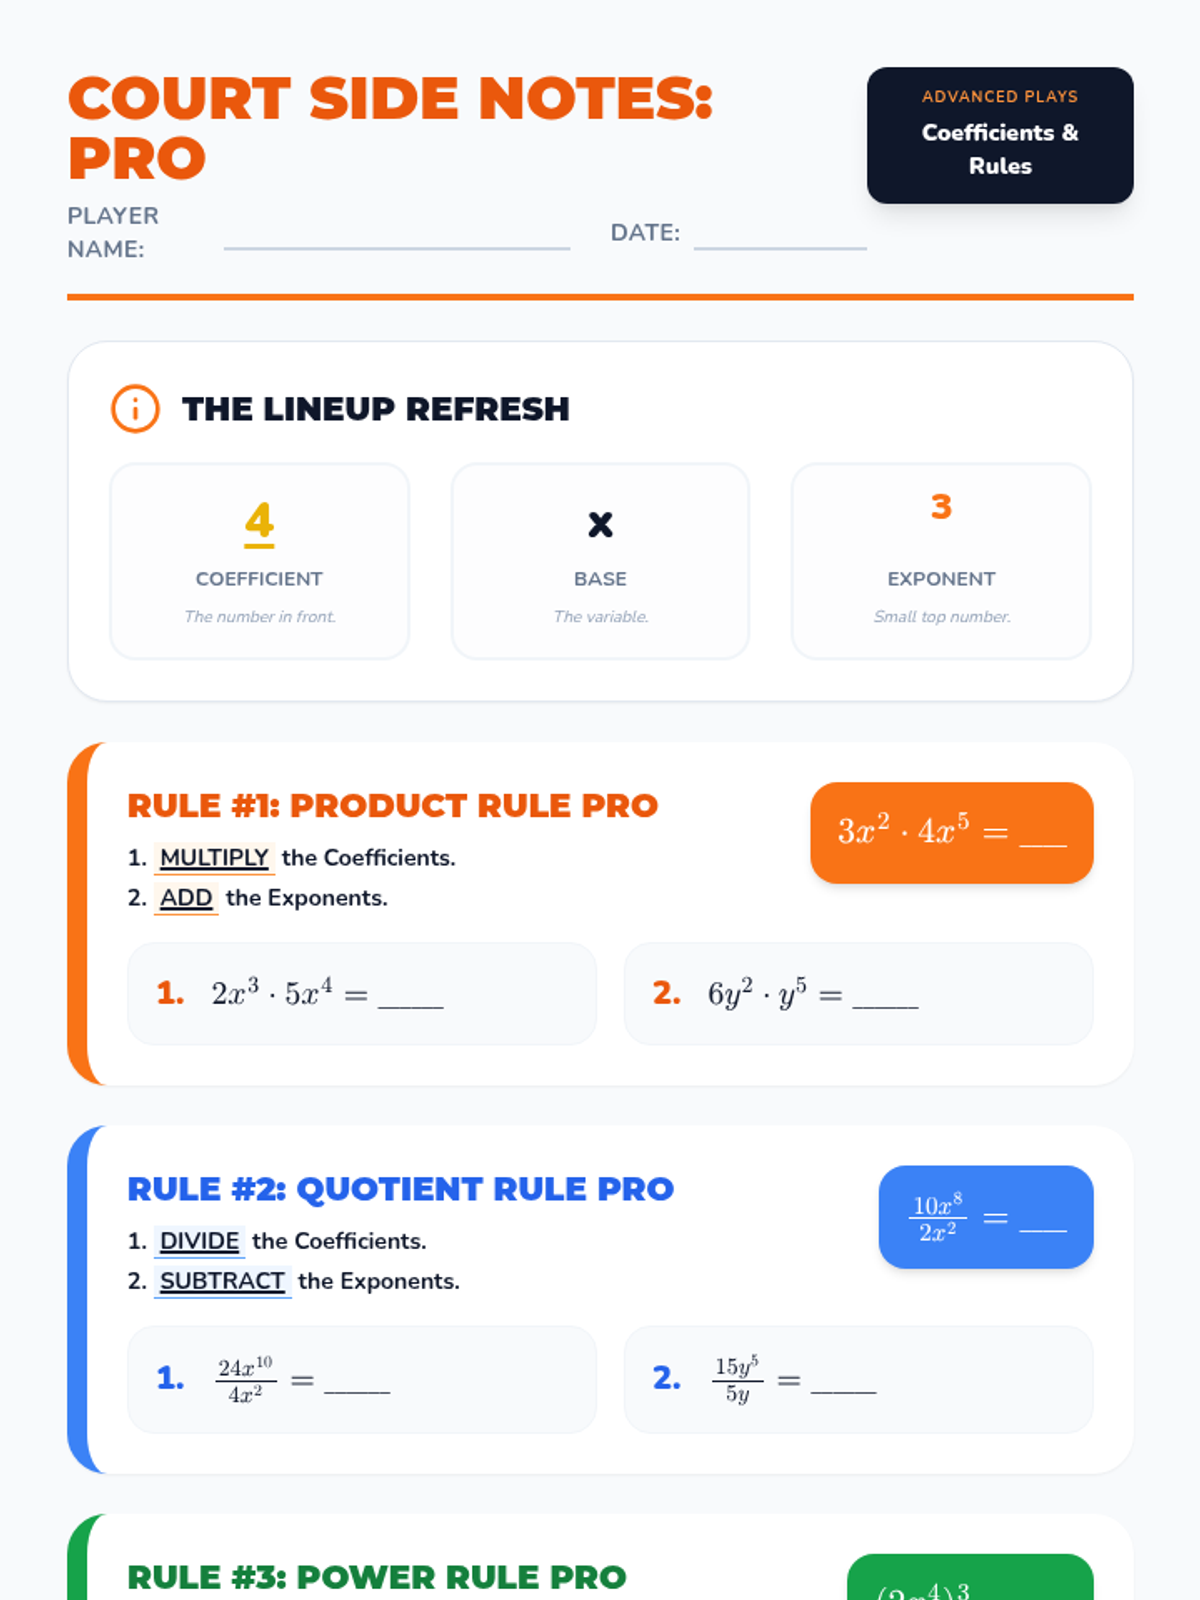
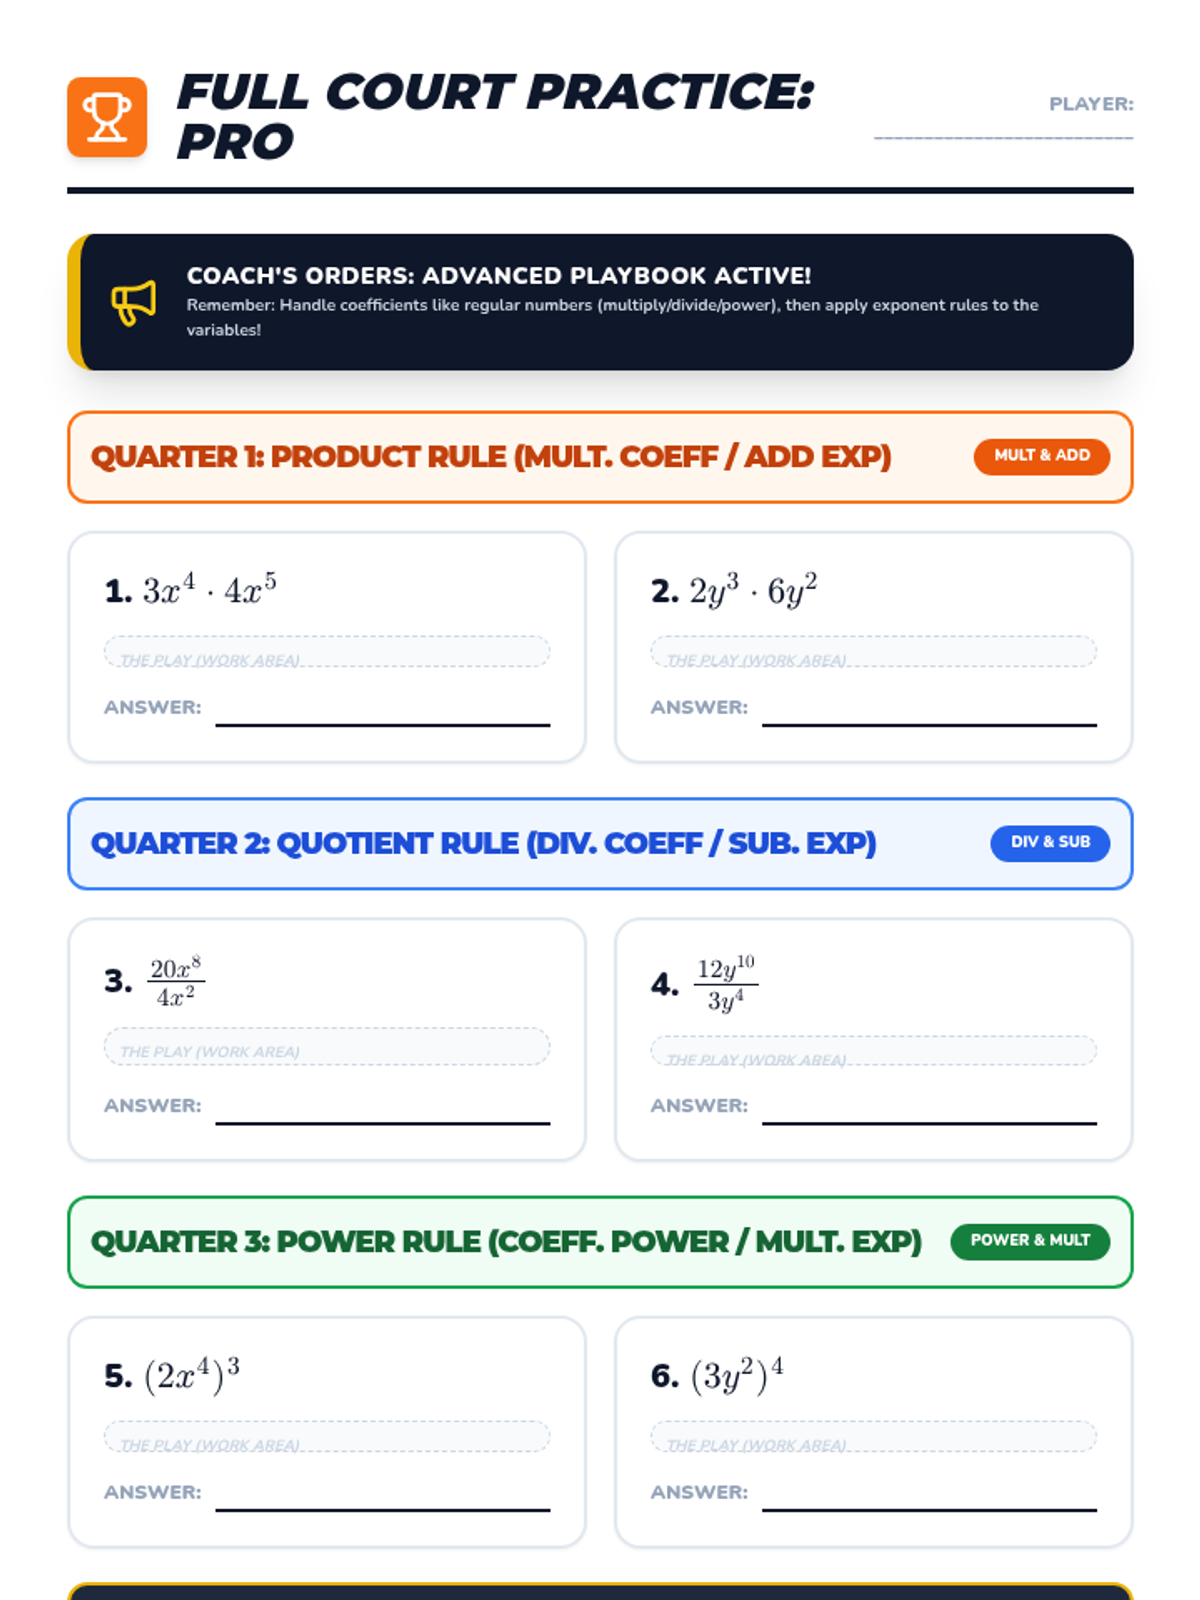
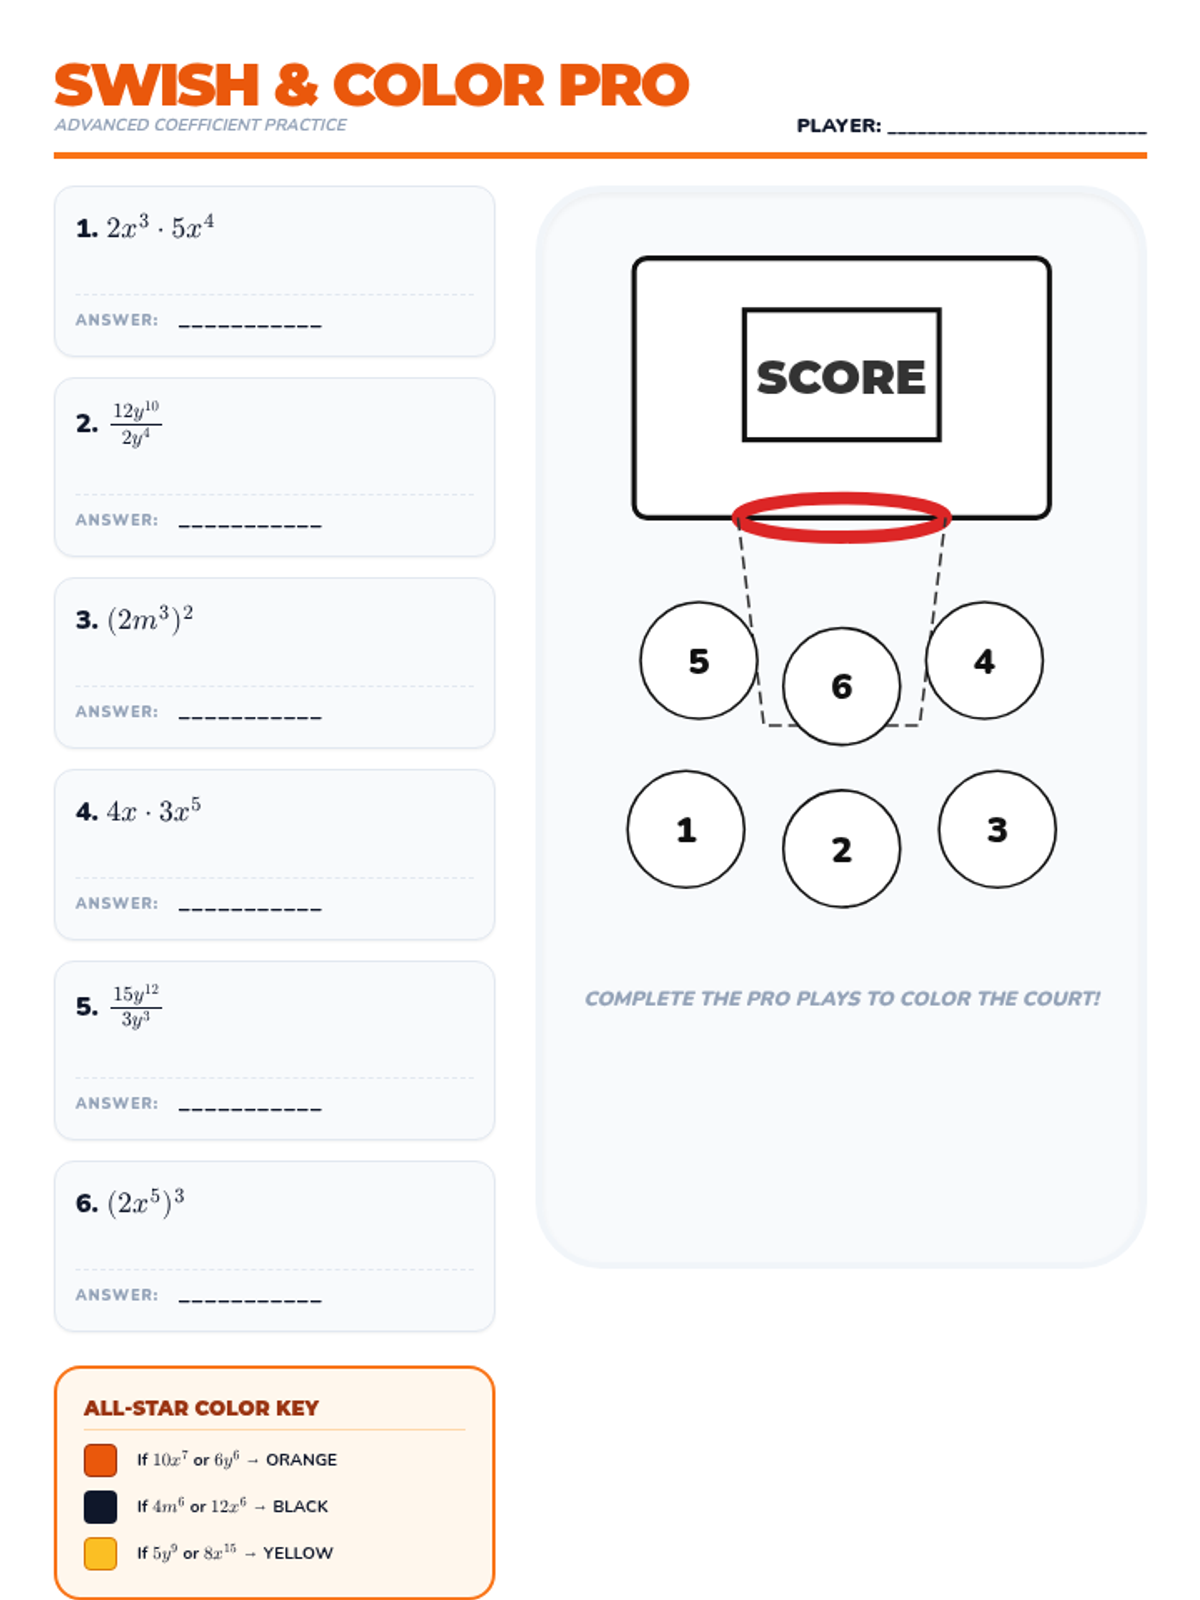
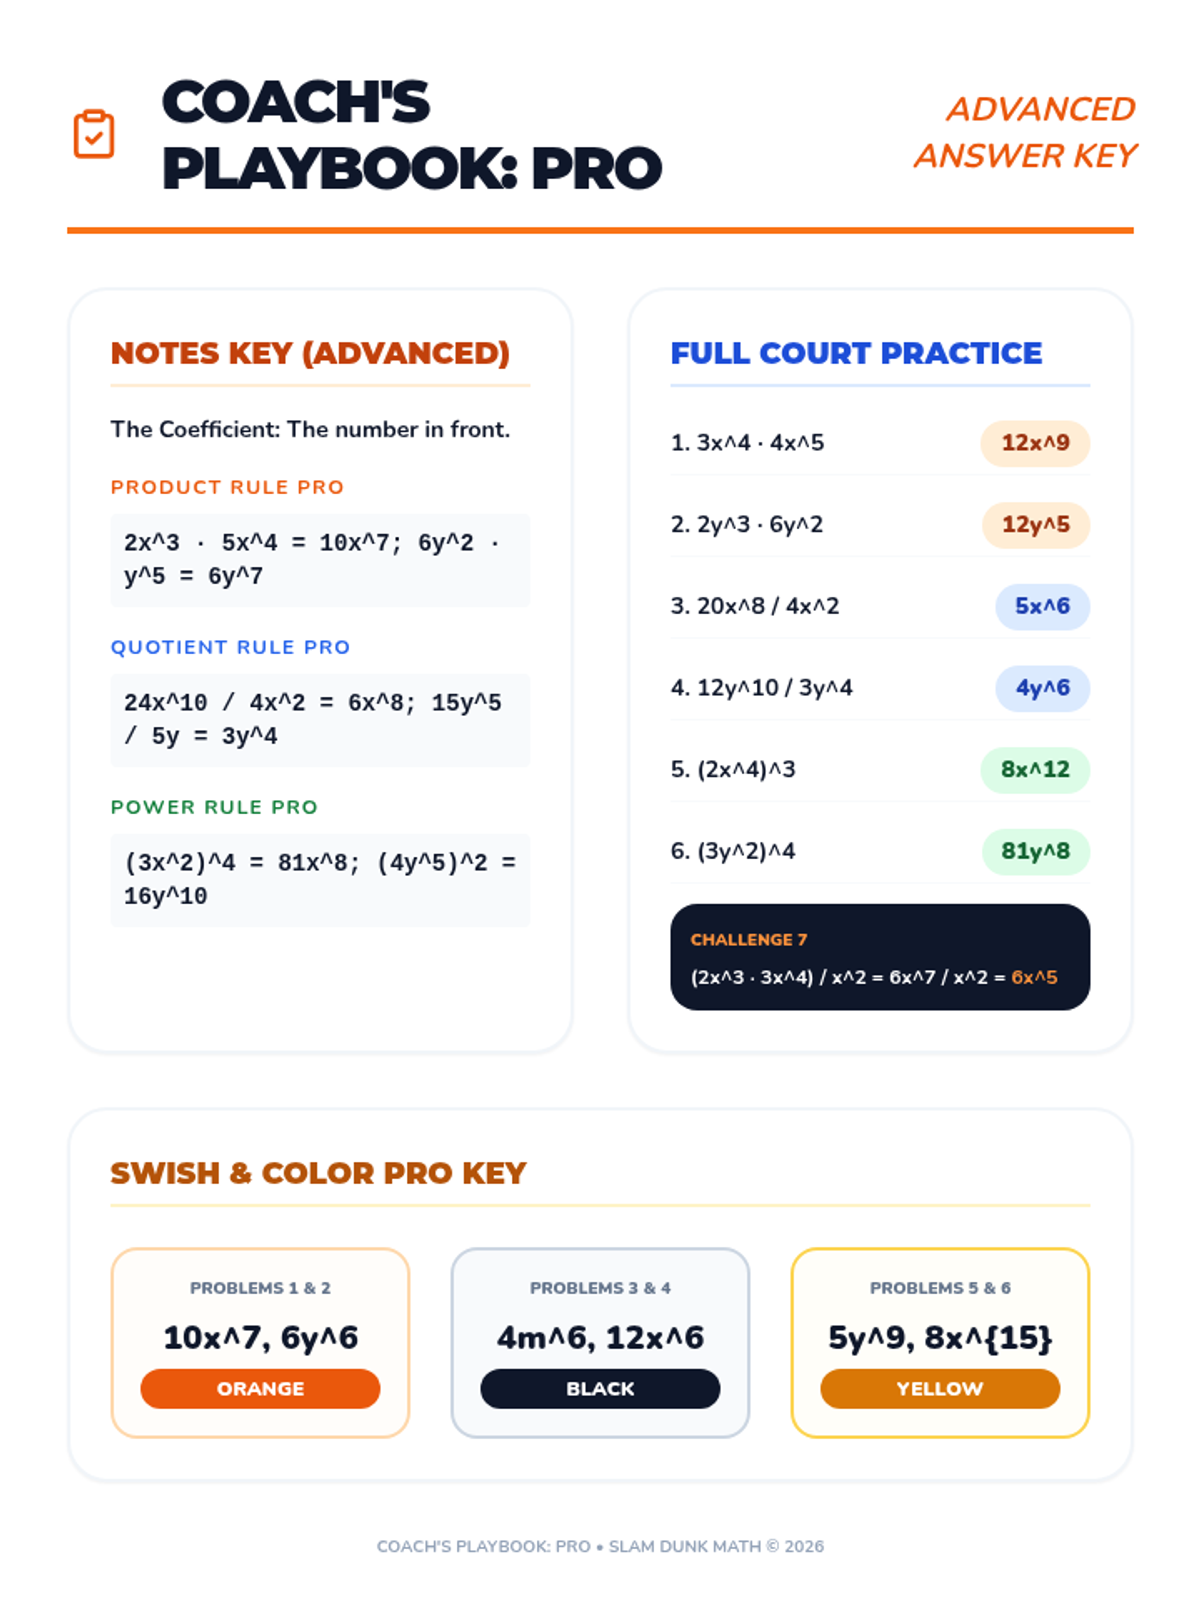
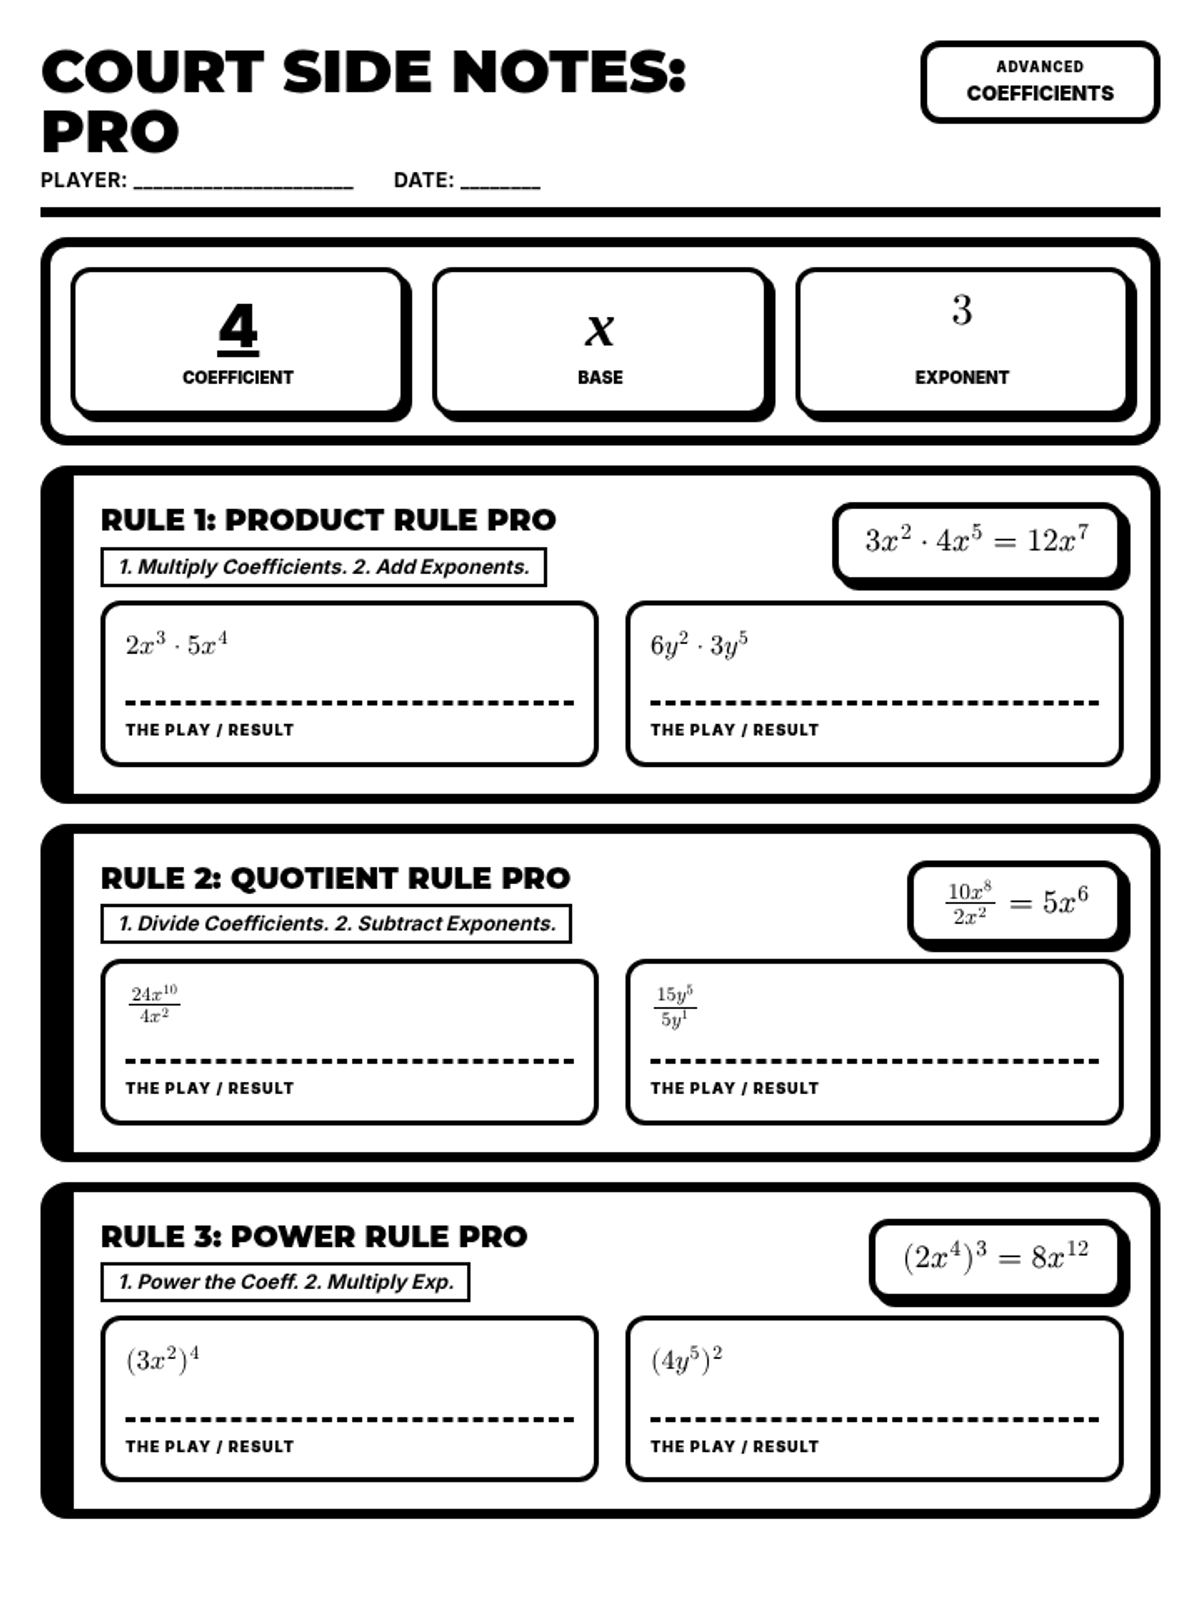
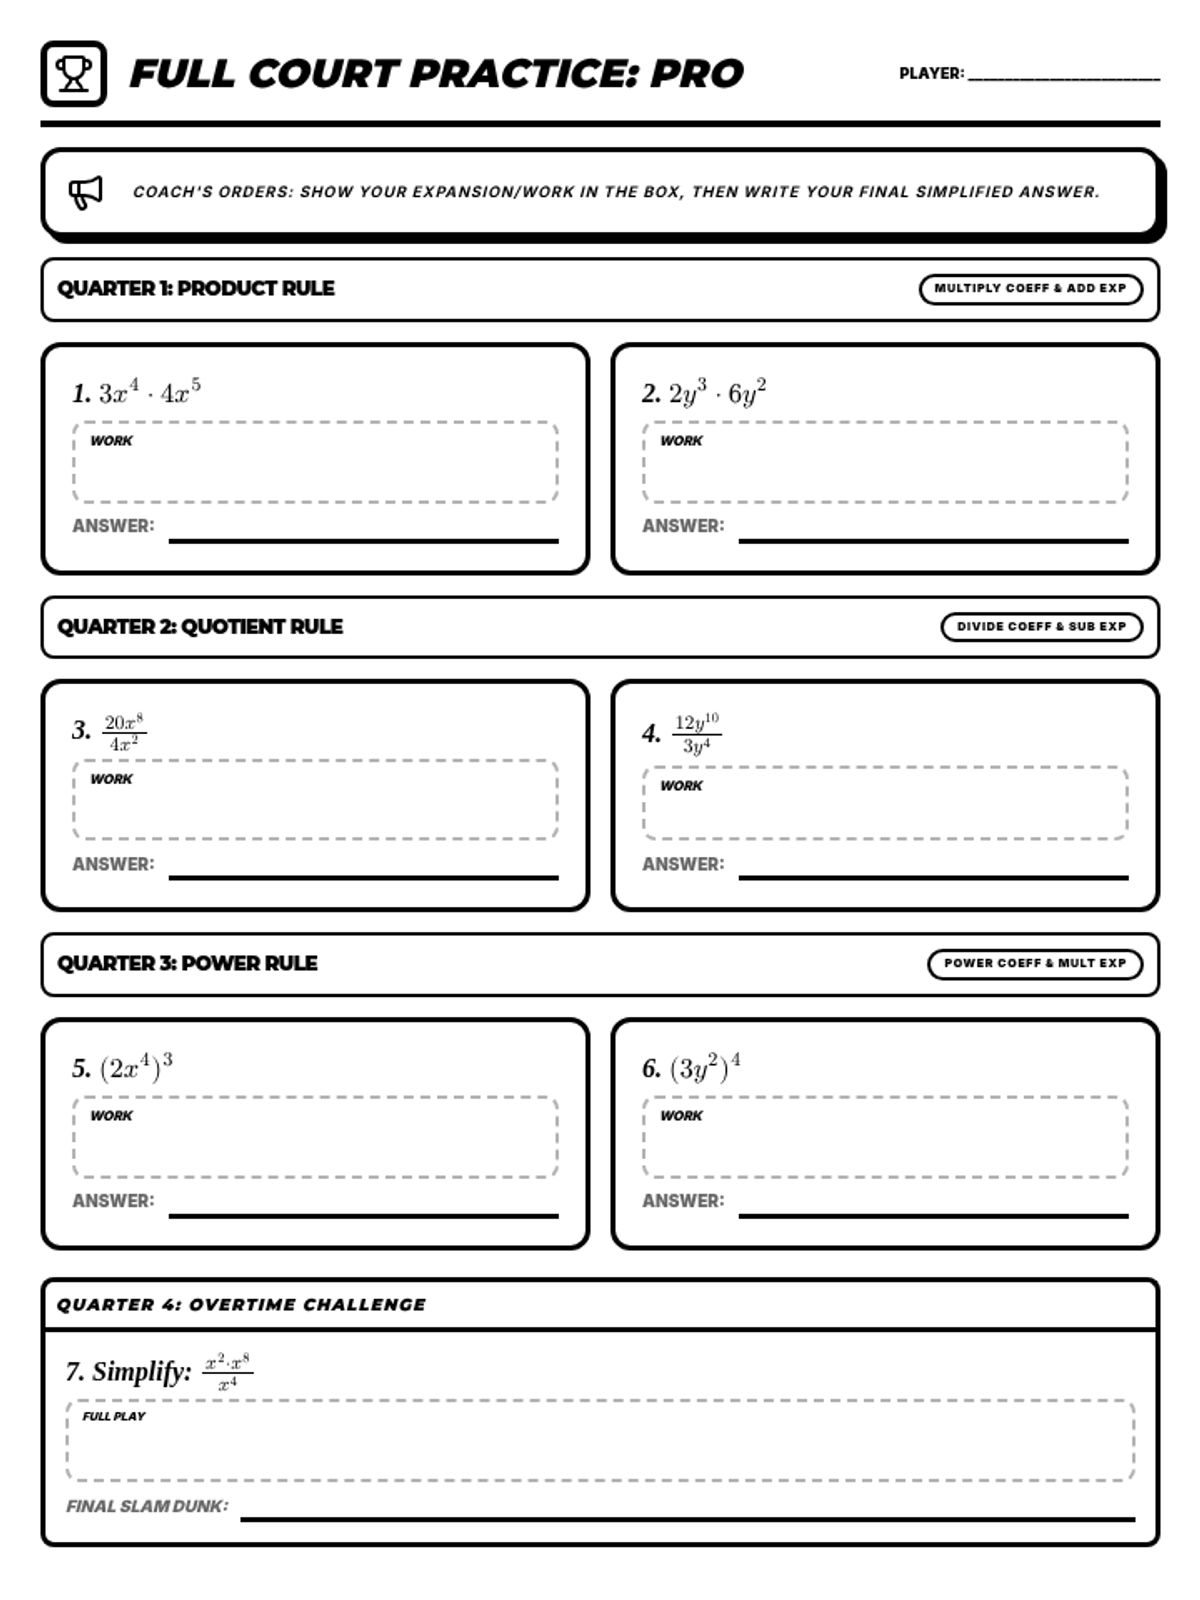
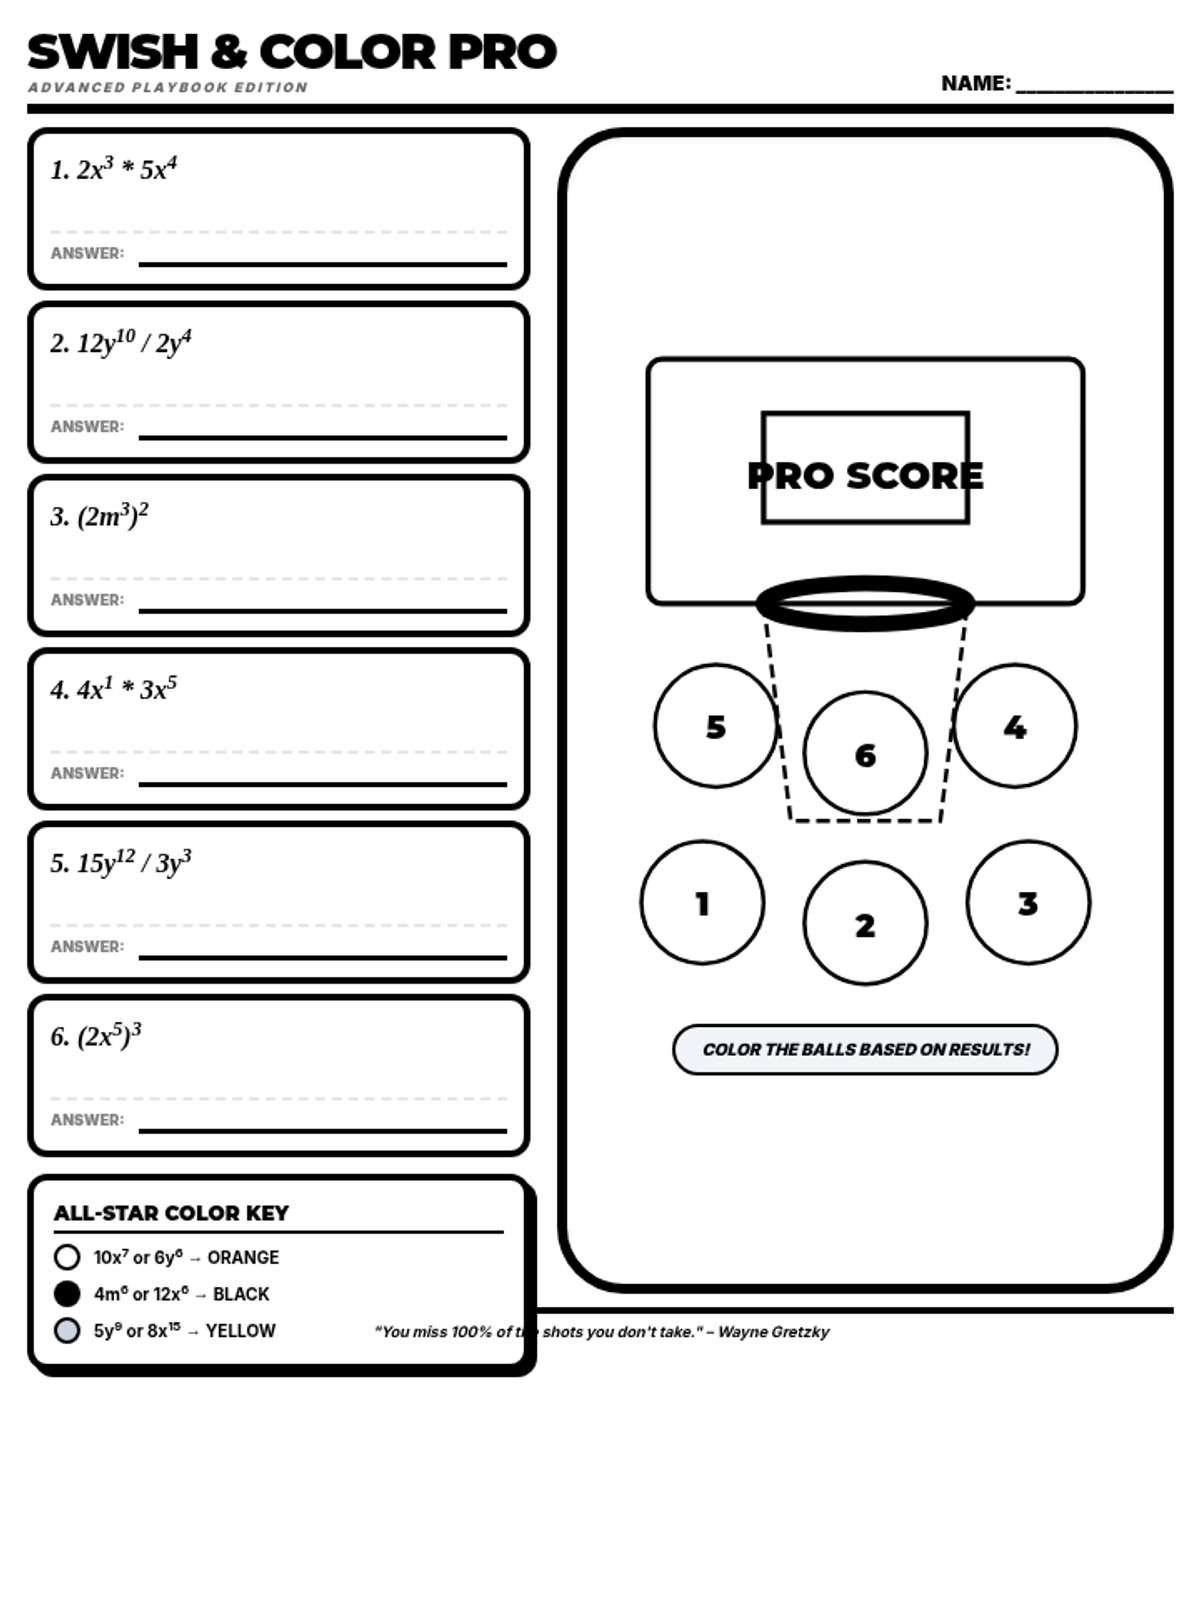
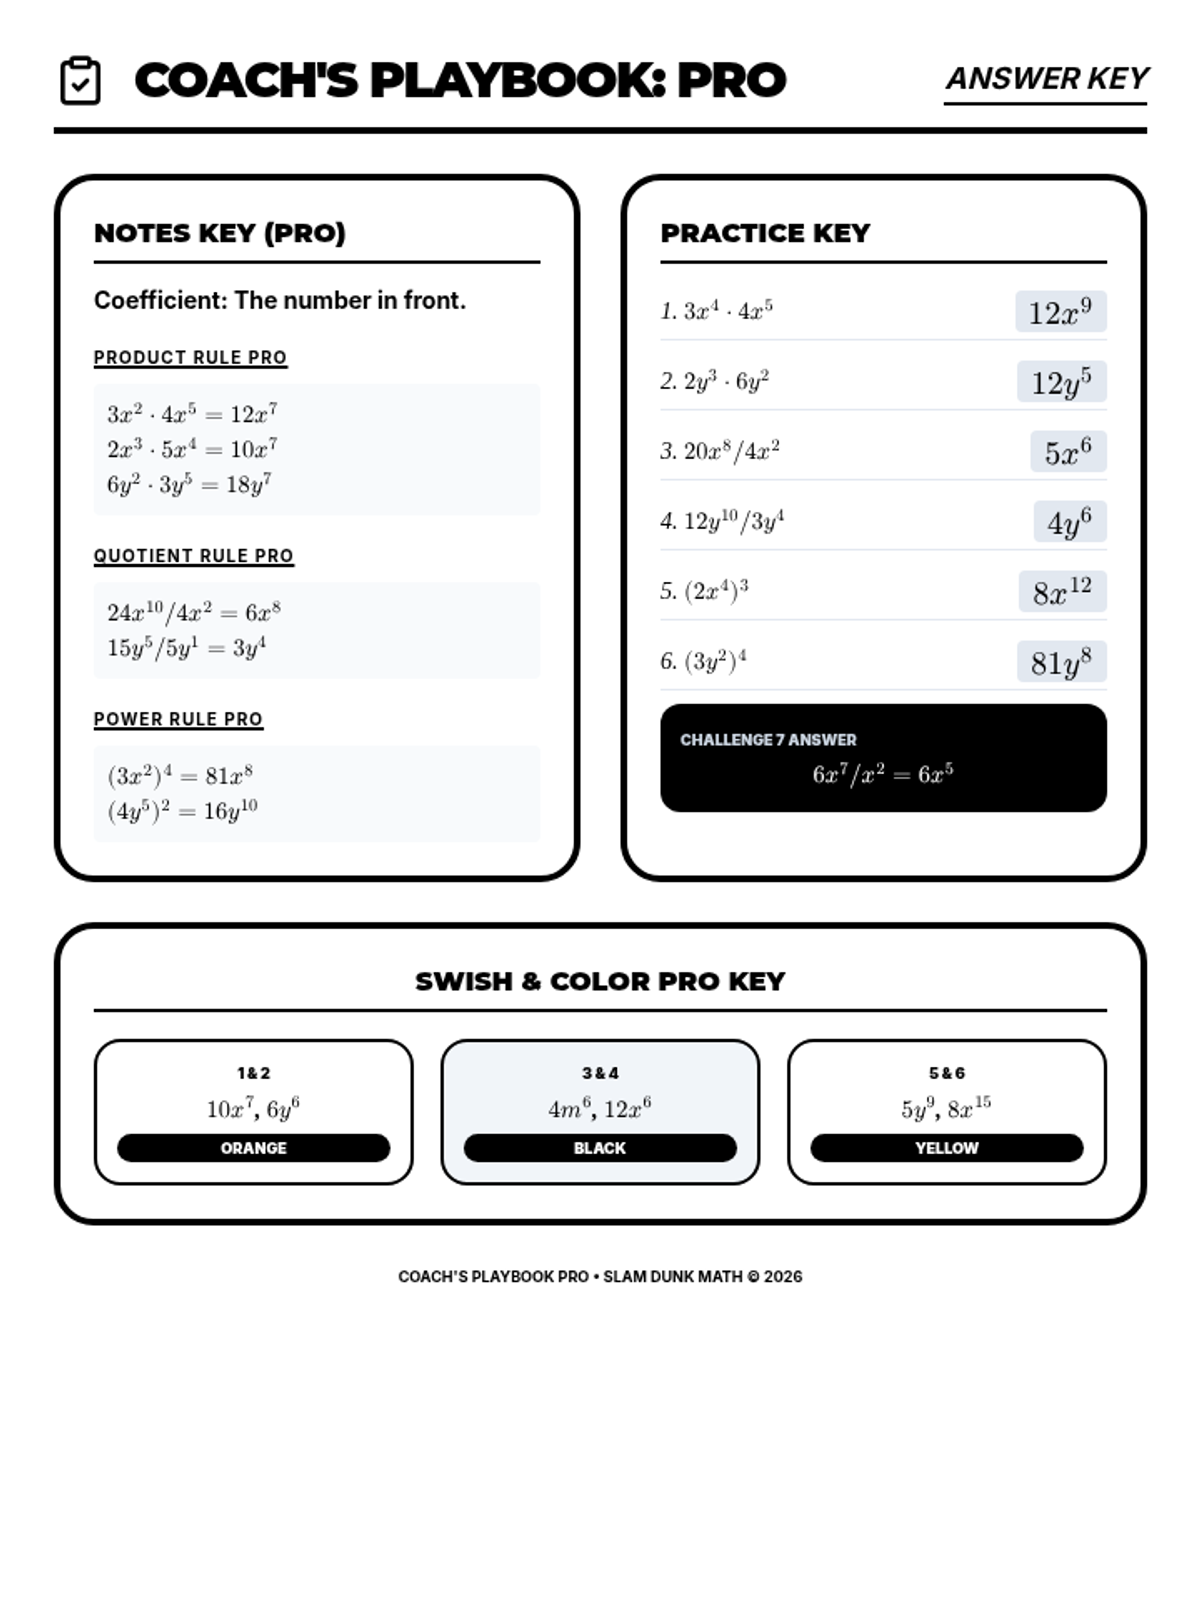
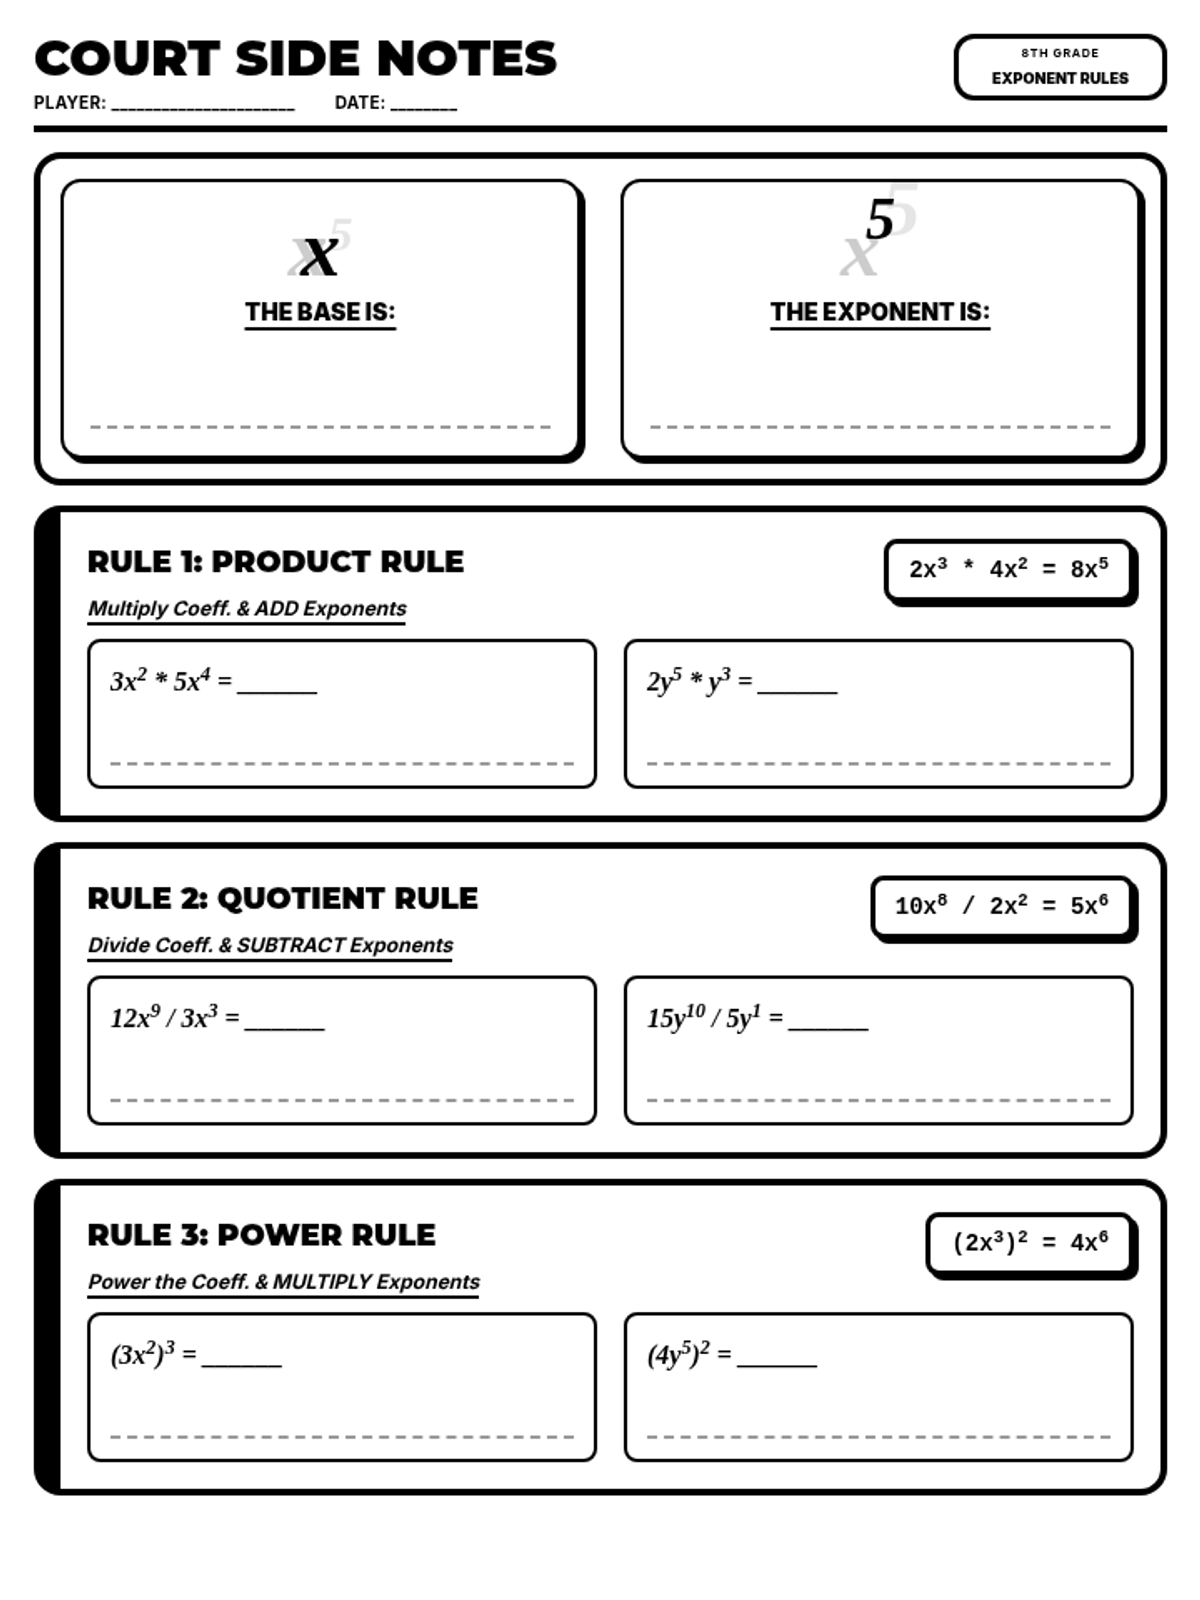
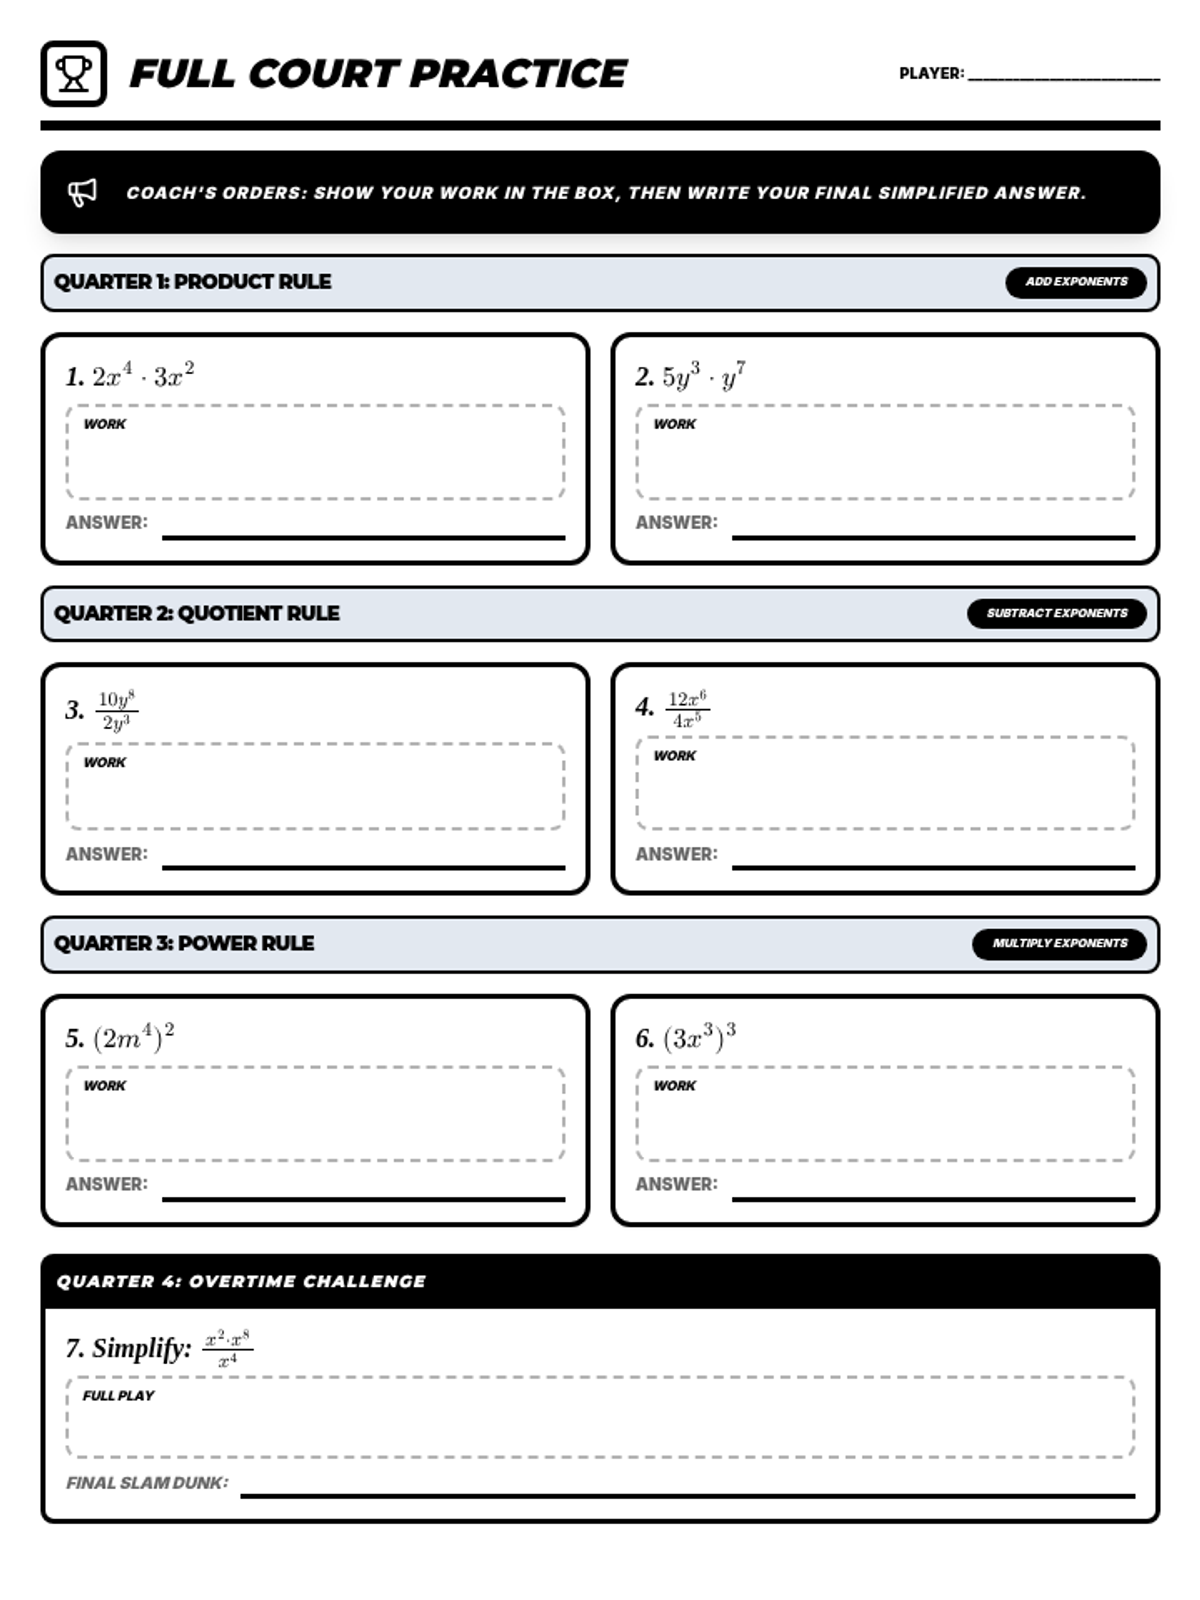
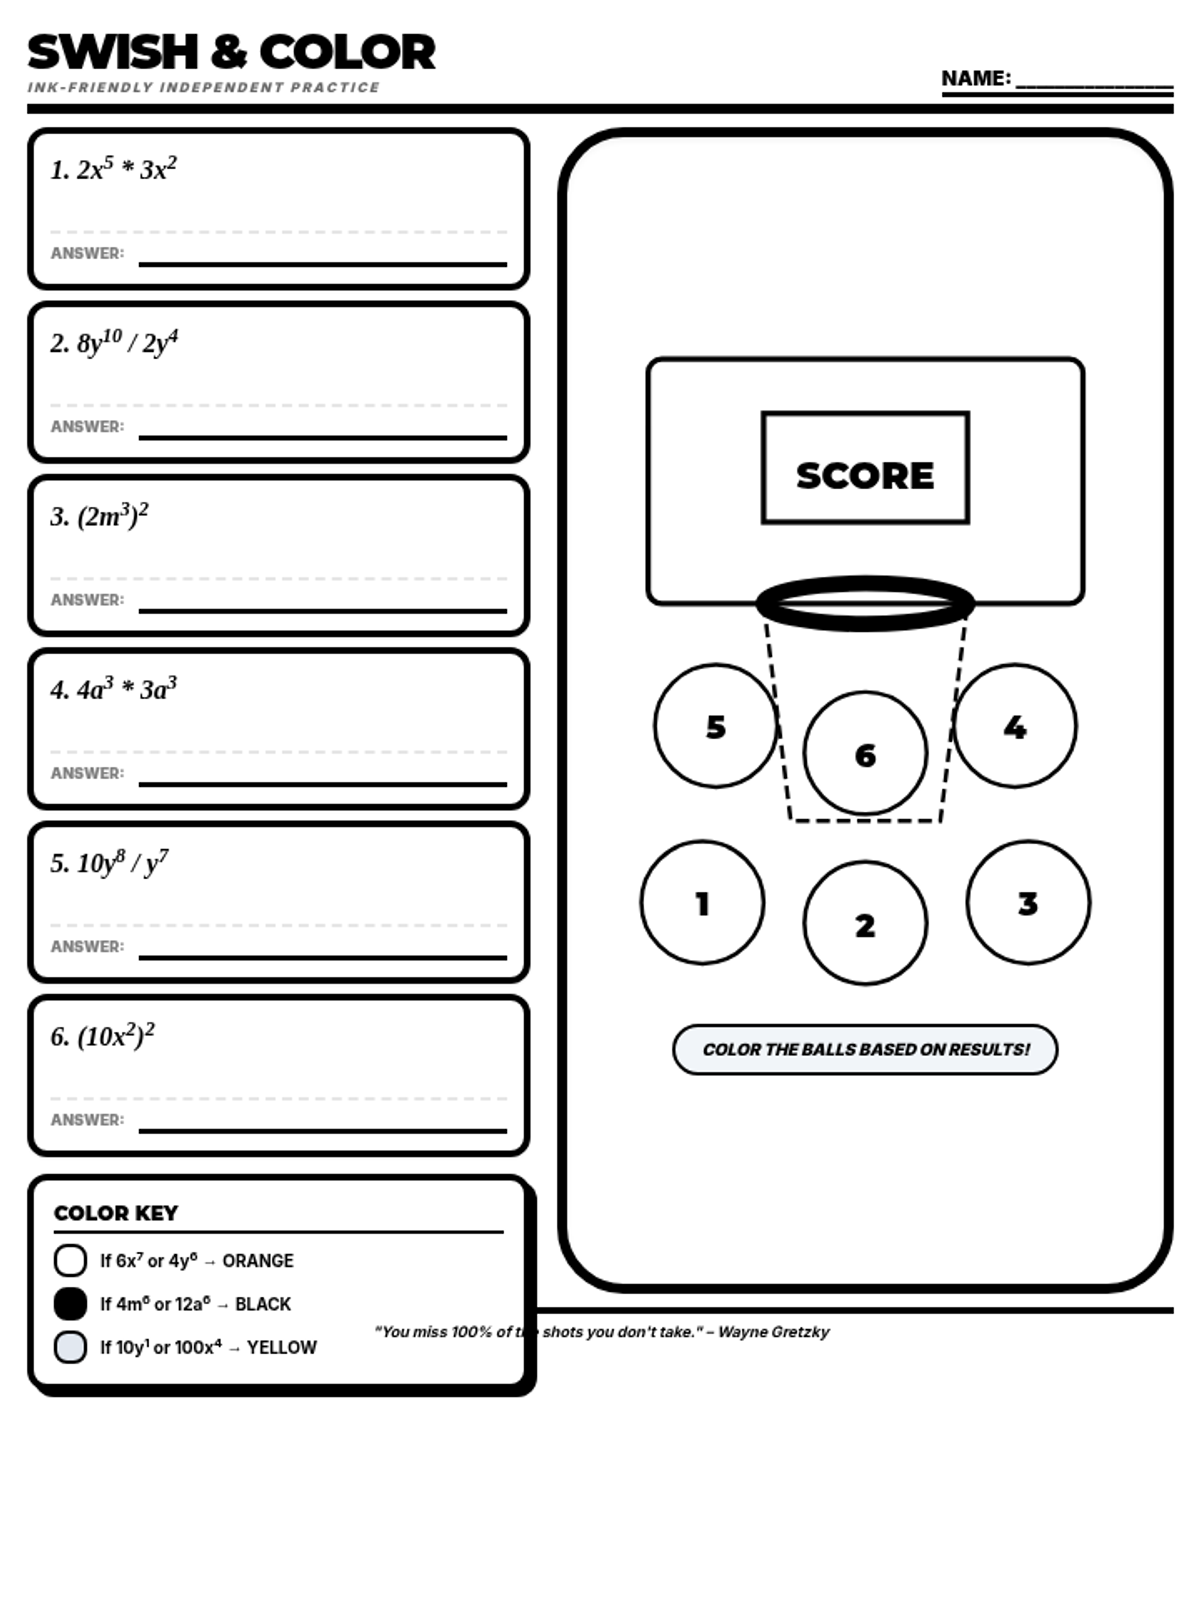
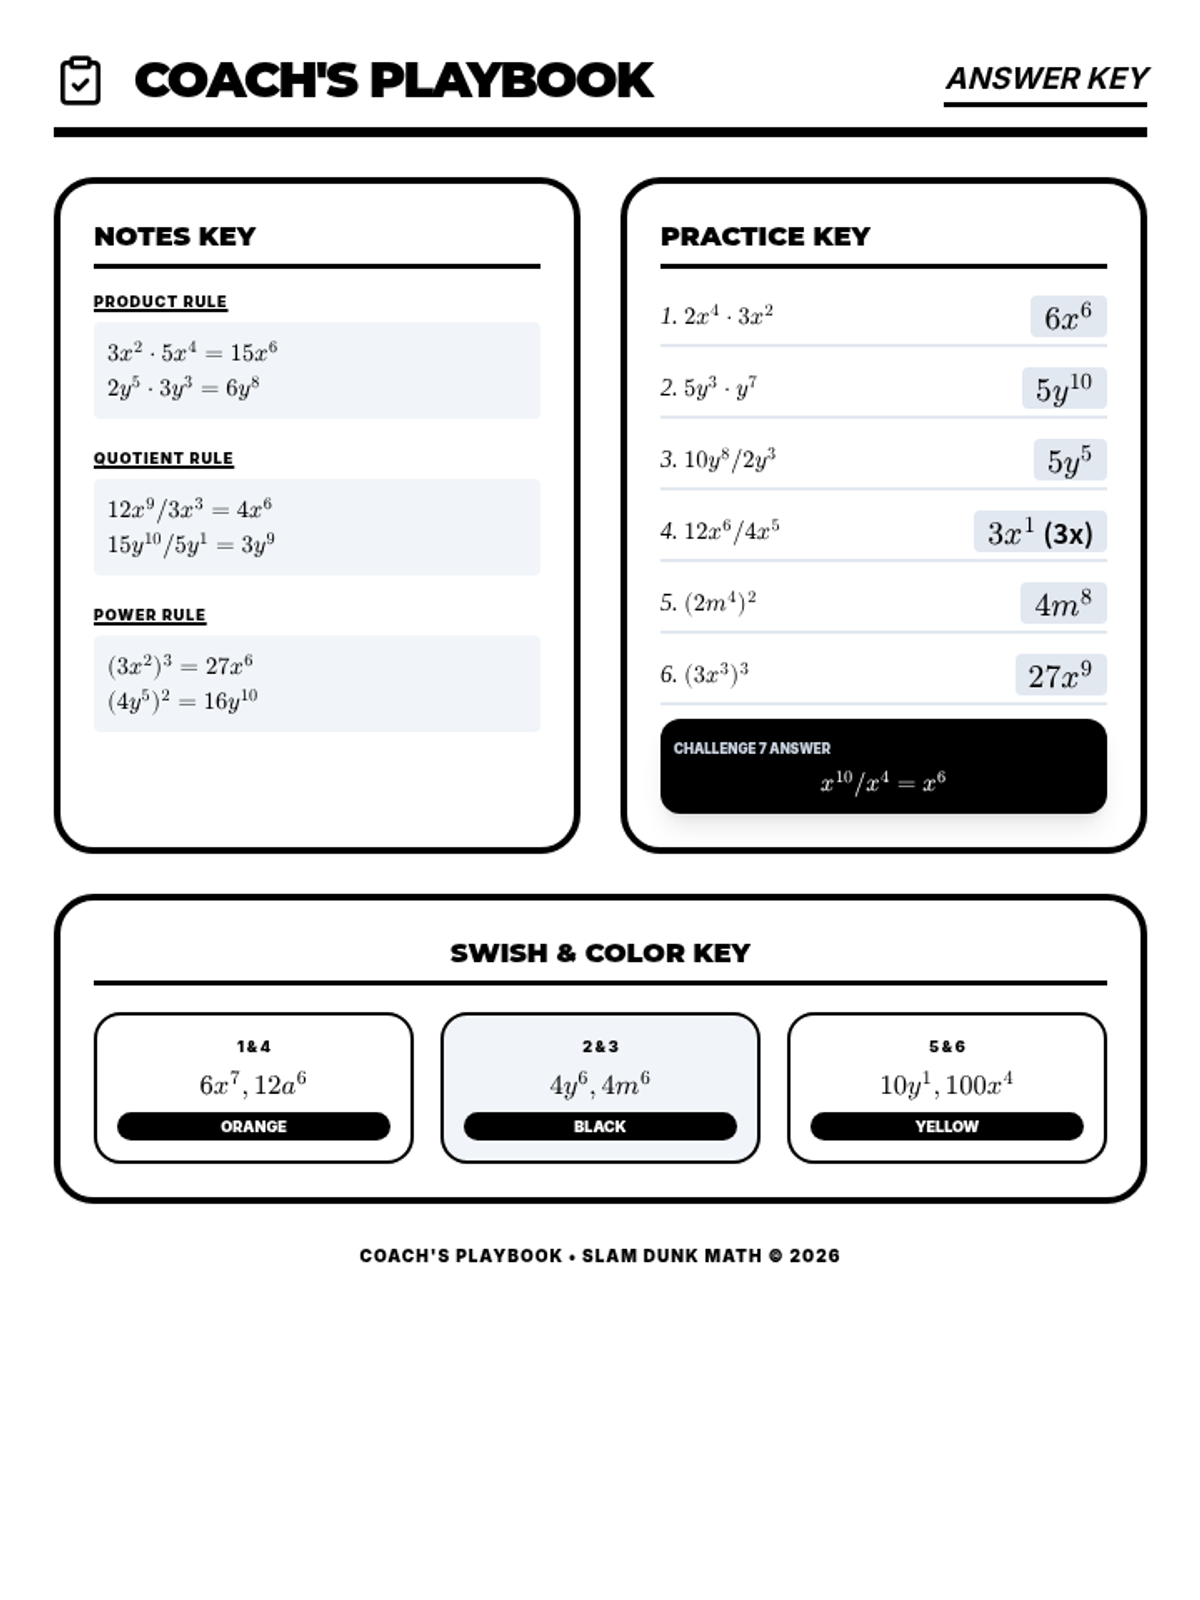
A basketball-themed lesson for 8th grade students covering the product, quotient, and power rules of exponents with both numbers and variables. The lesson includes instructional slides, guided notes, and differentiated practice.
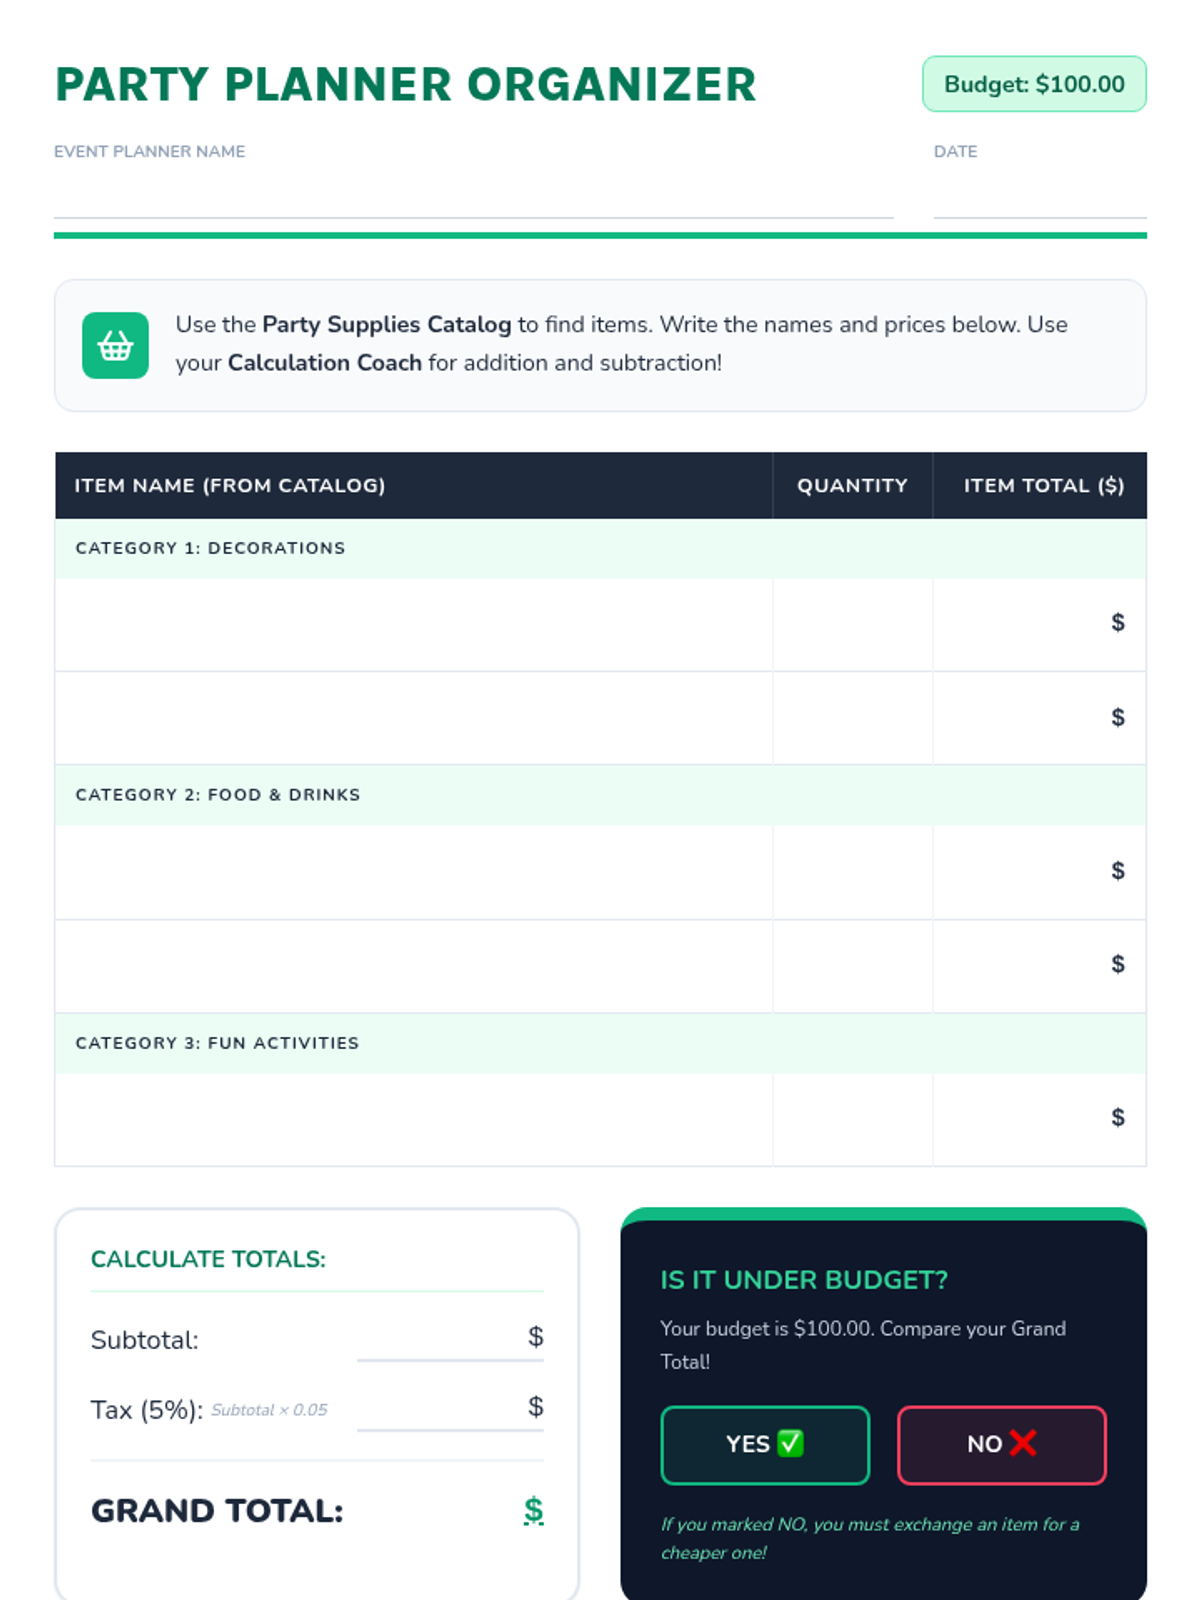
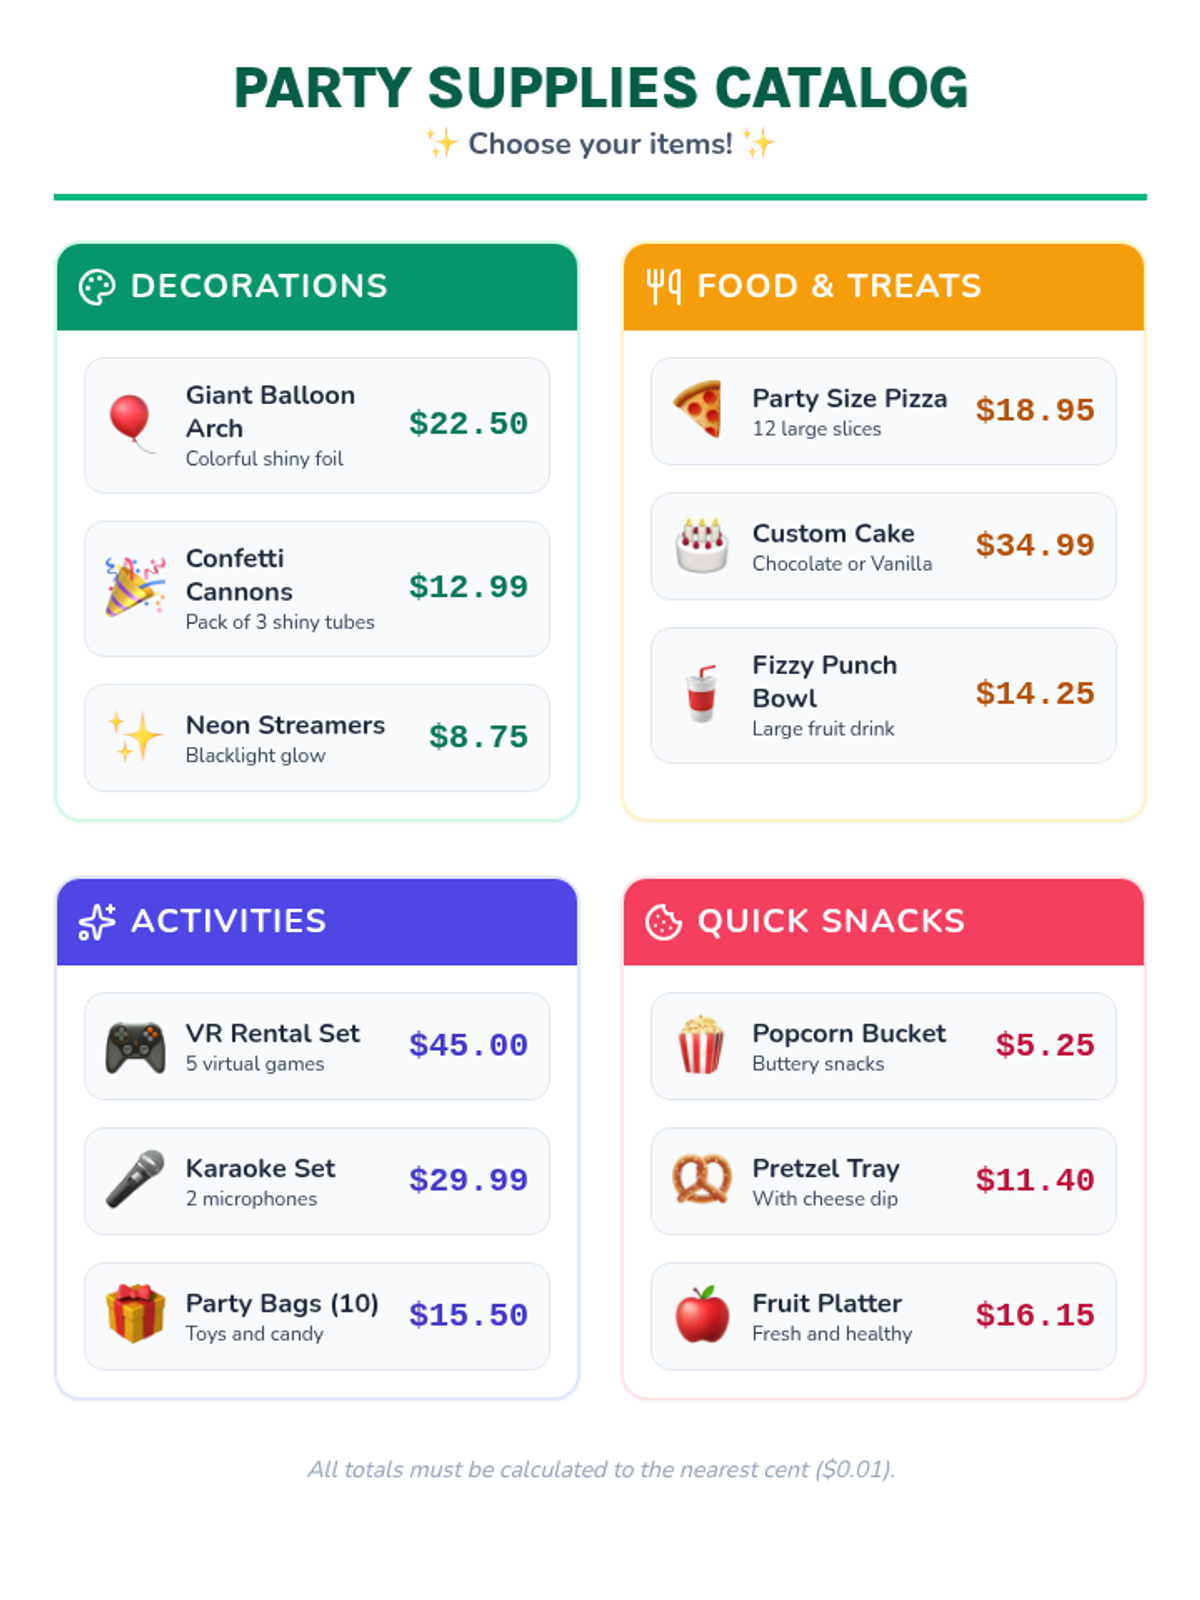
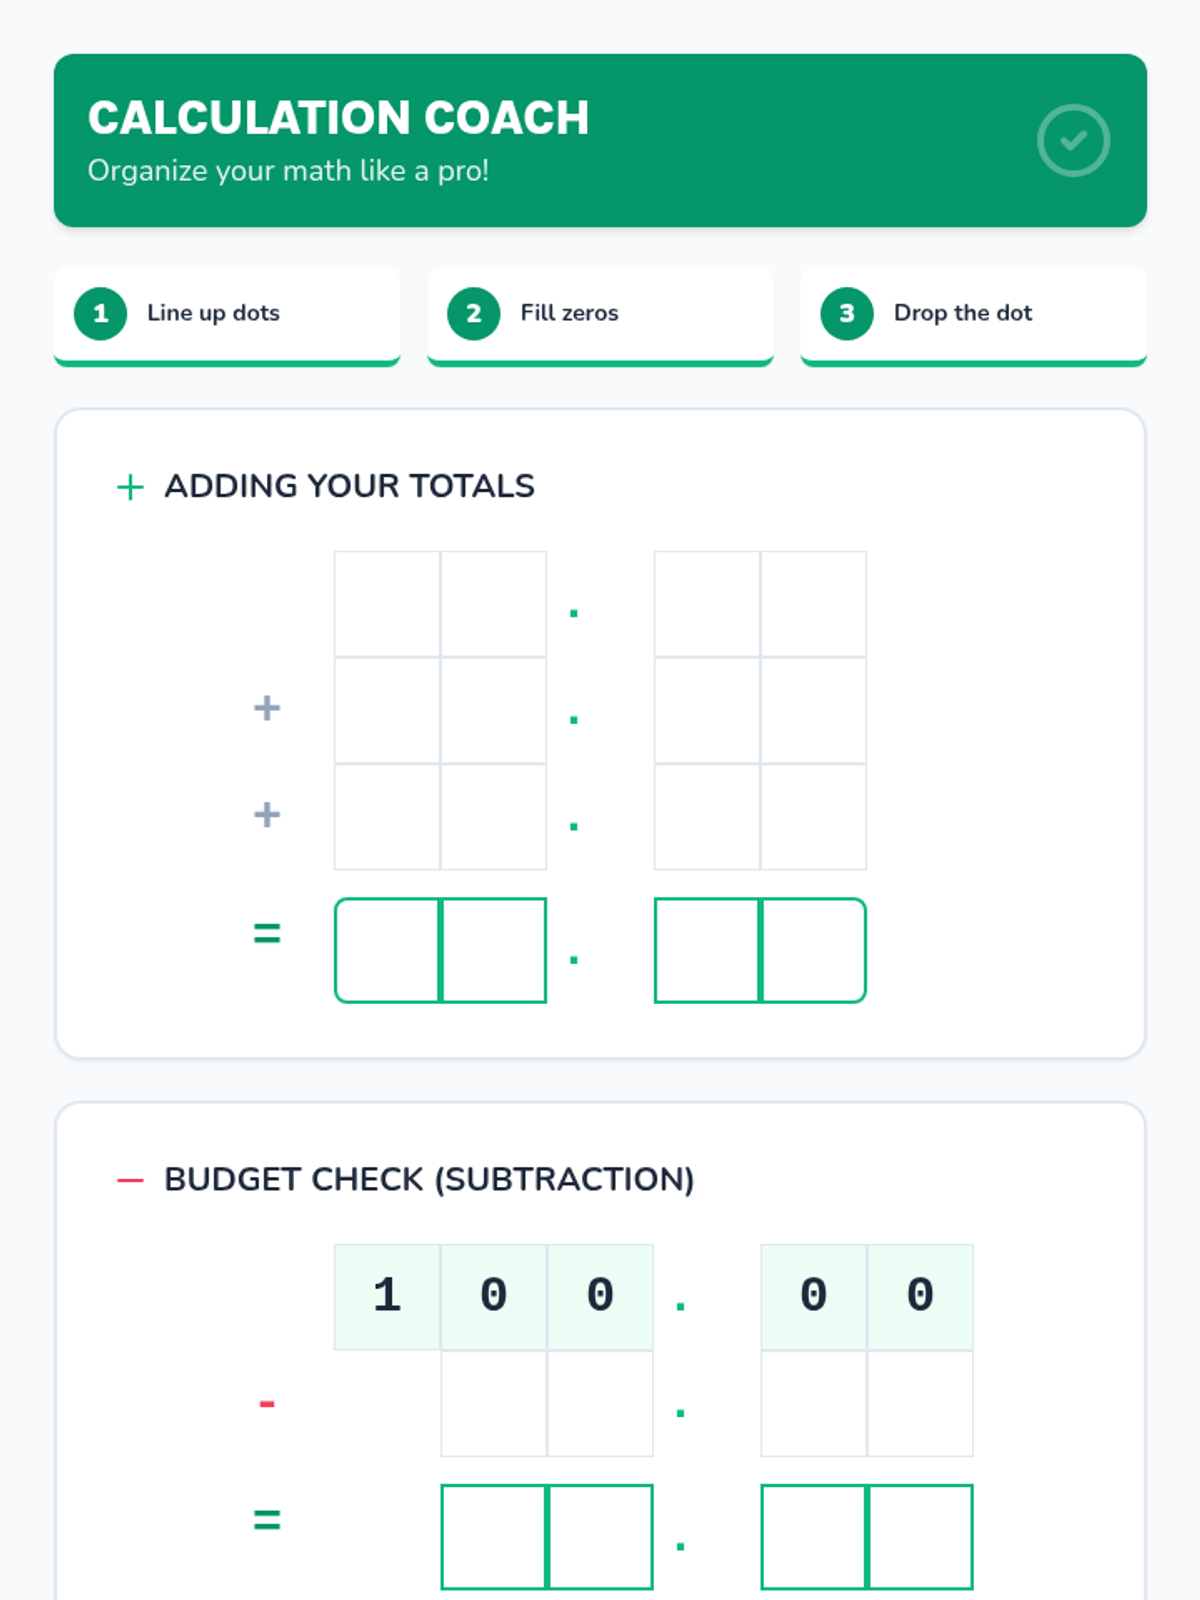
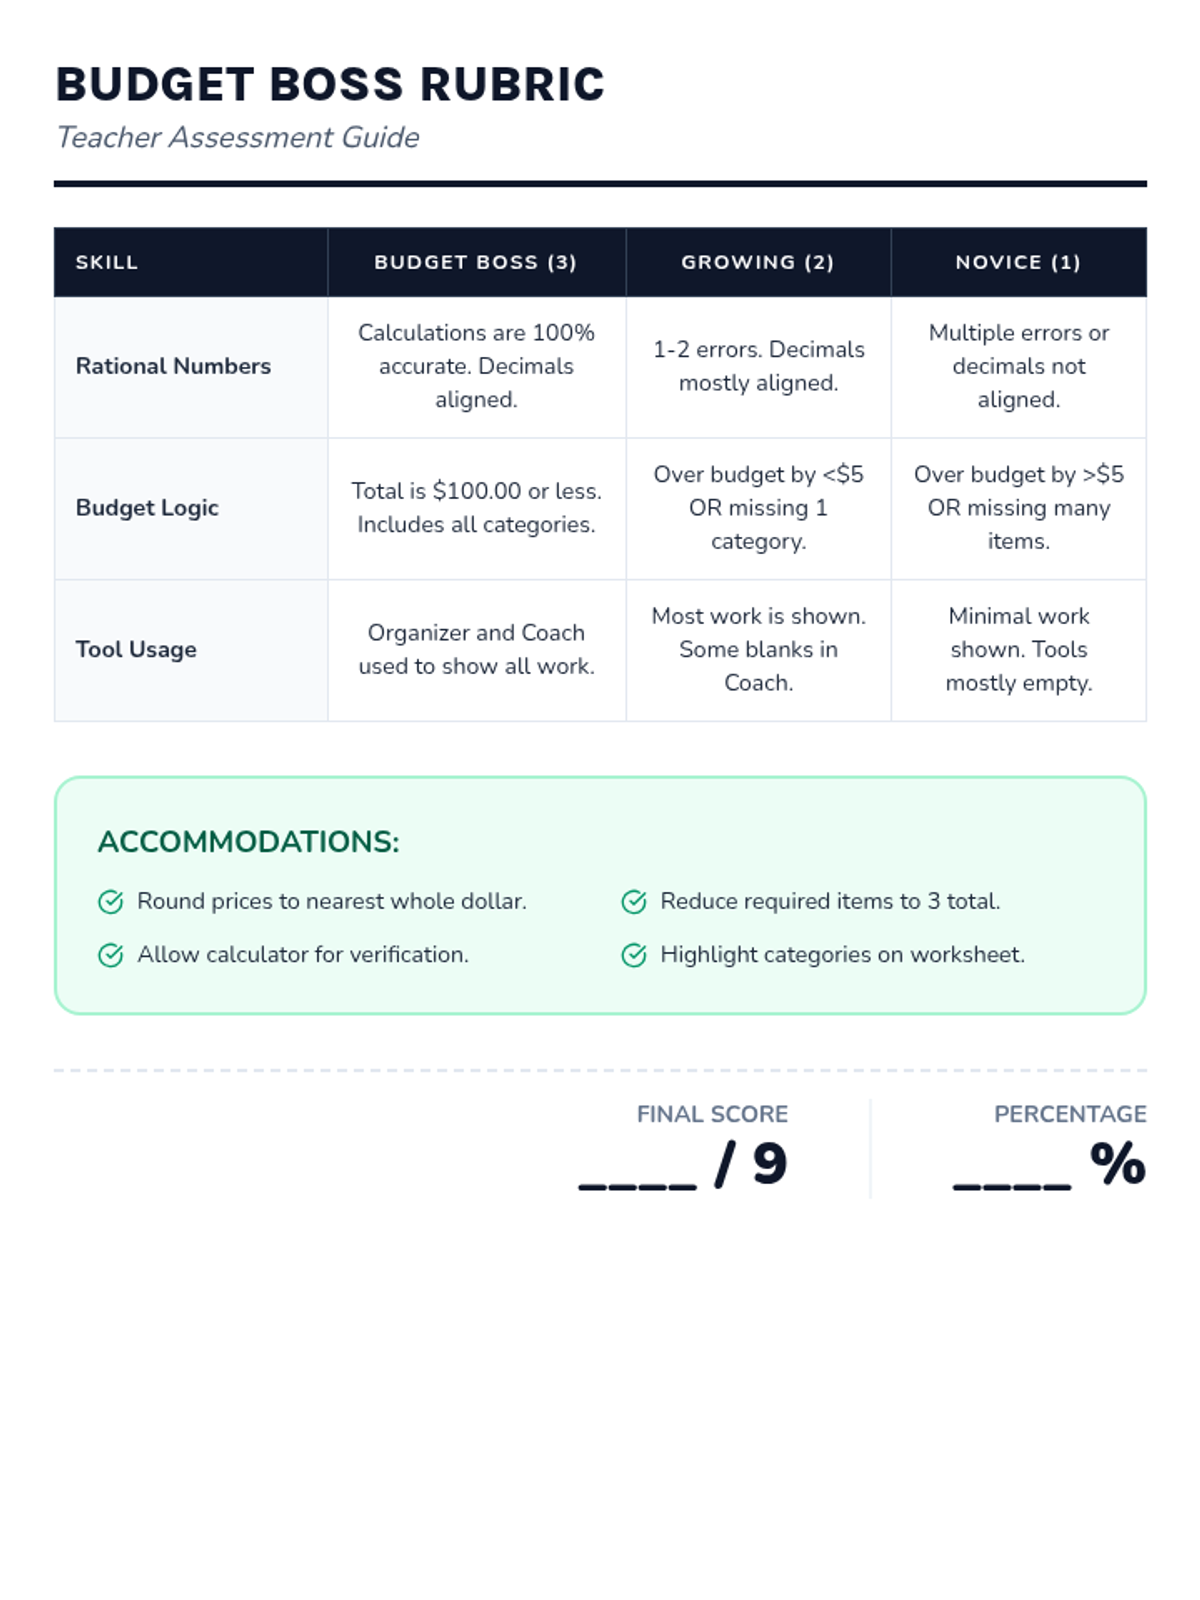
A hands-on performance task where students apply rational number operations to plan a party budget. Students use visual graphic organizers to track spending, calculate totals, and ensure they stay within a set budget.
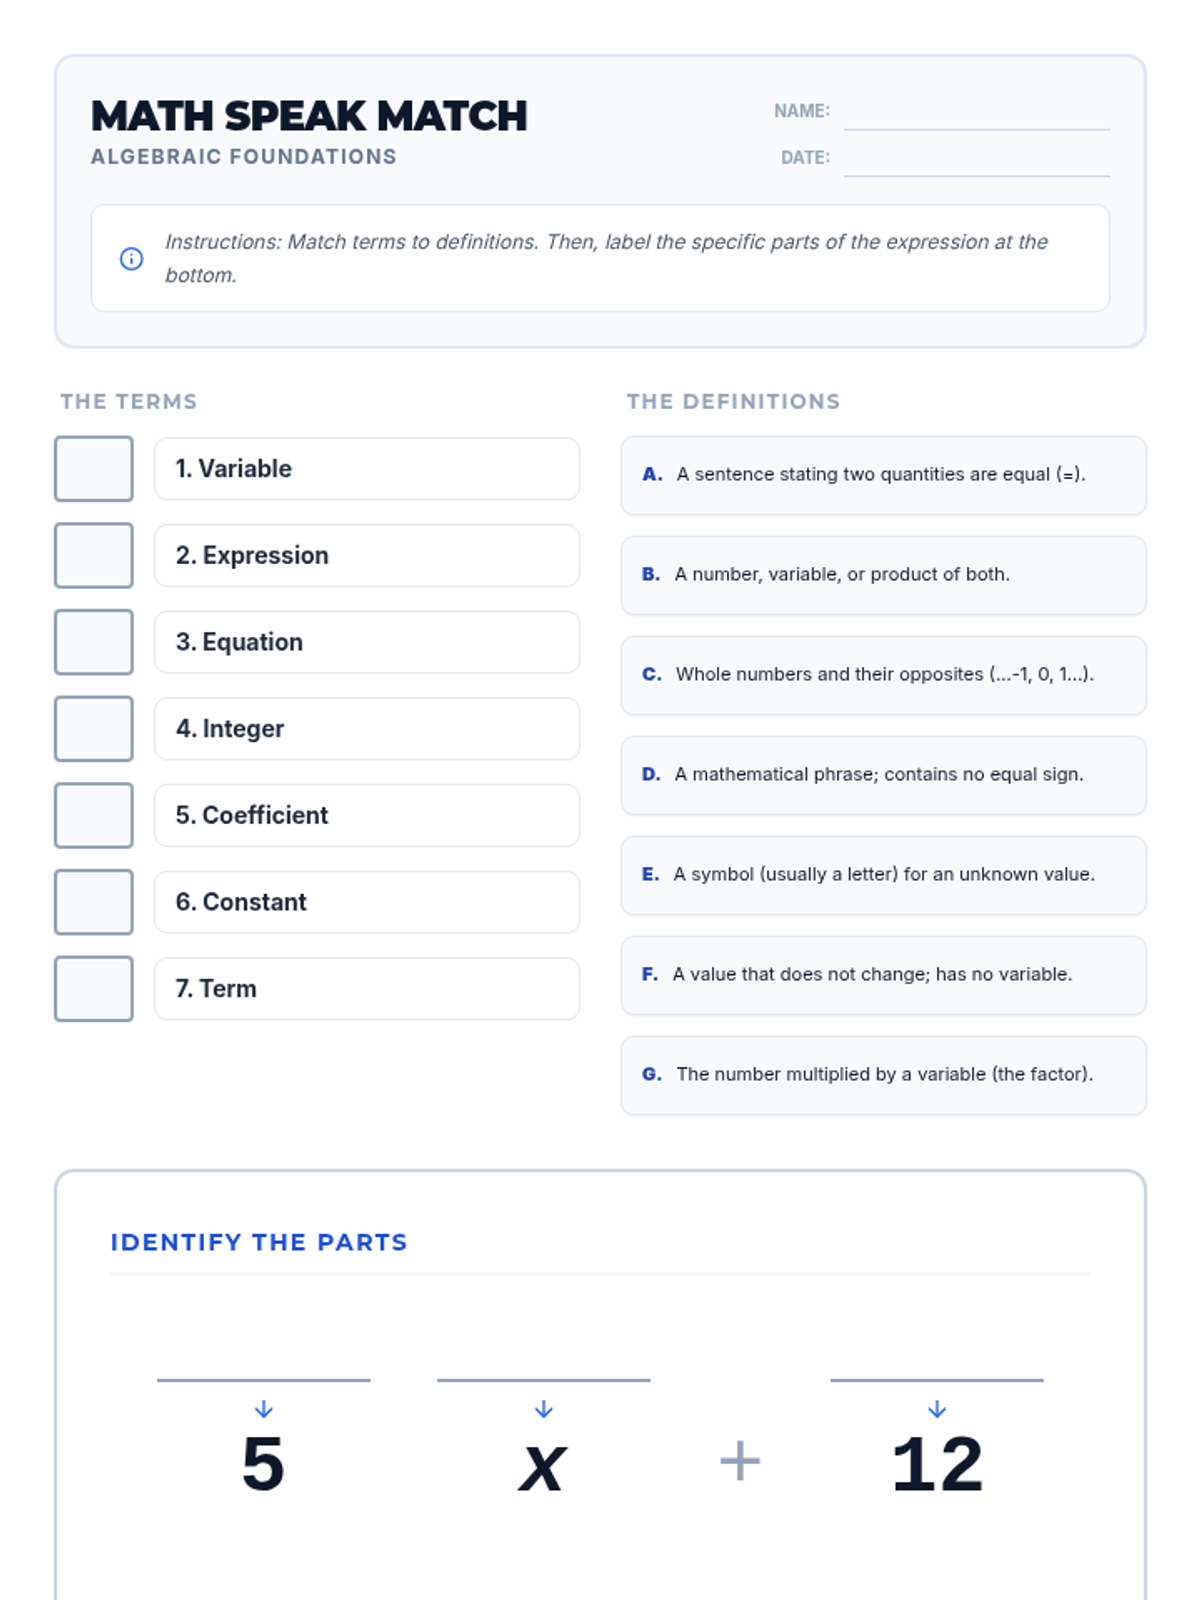
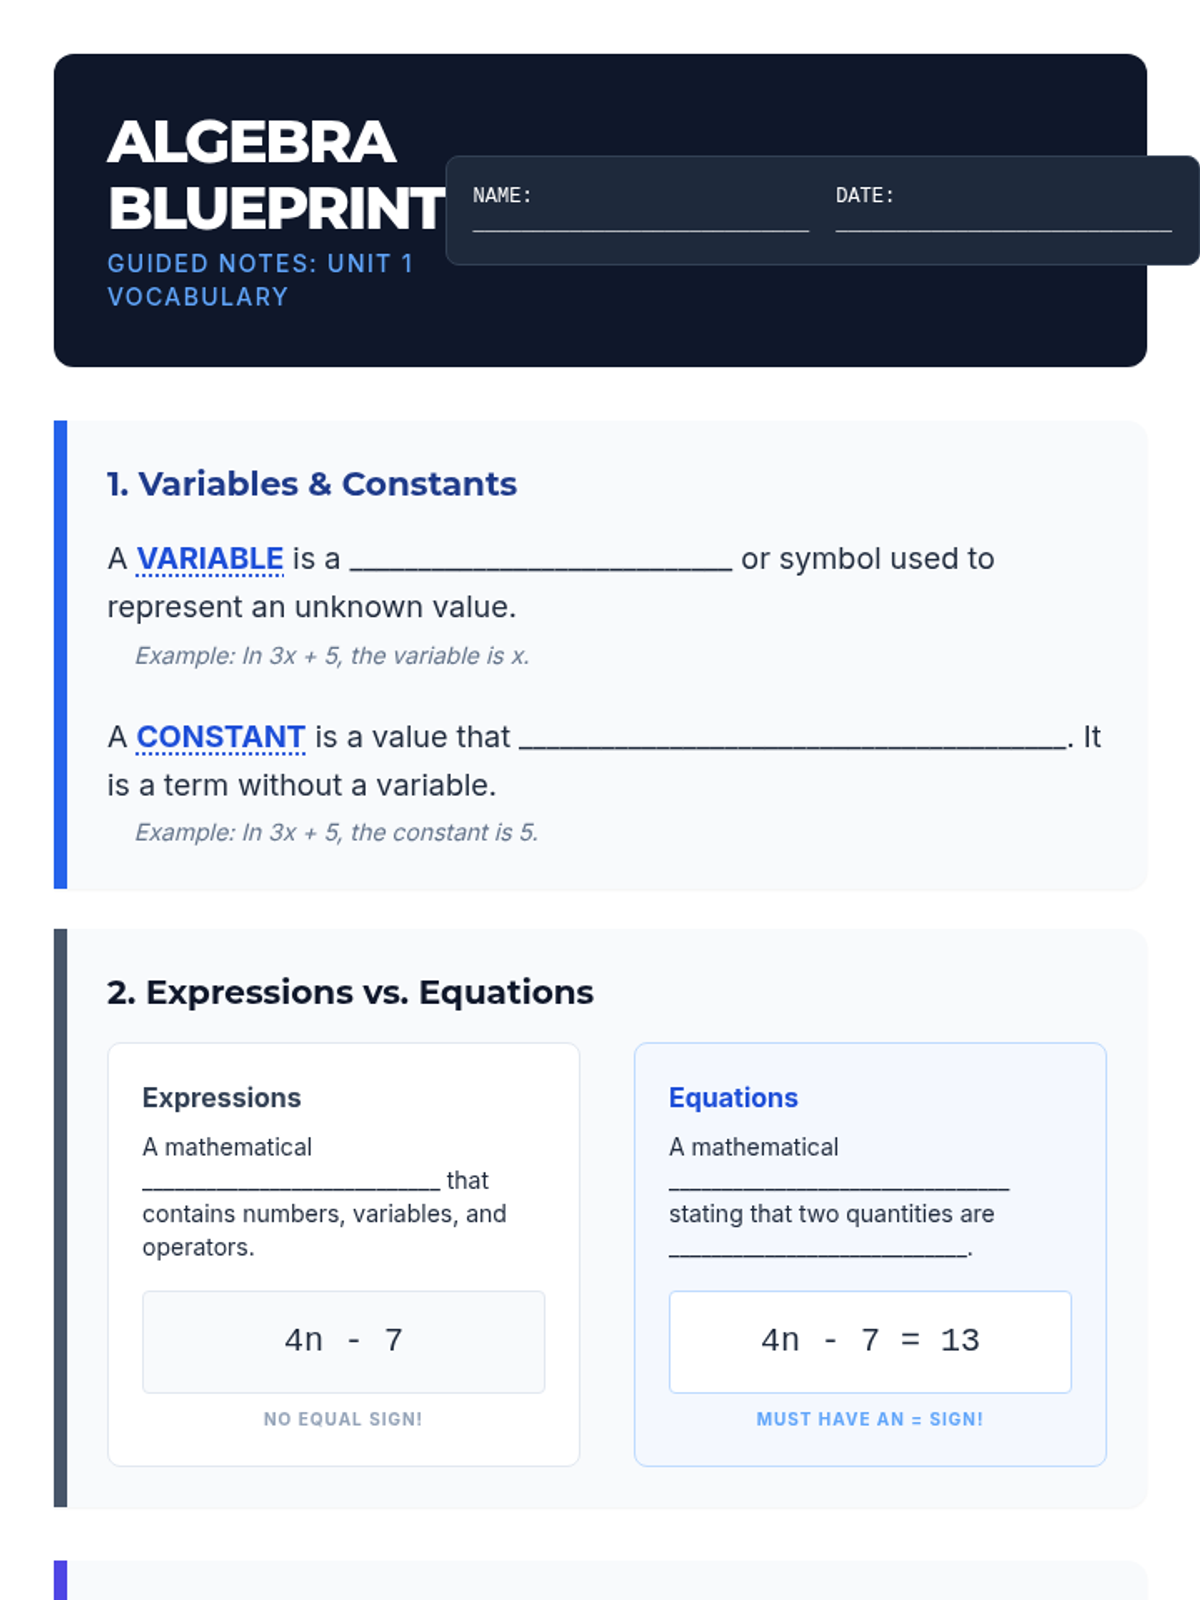
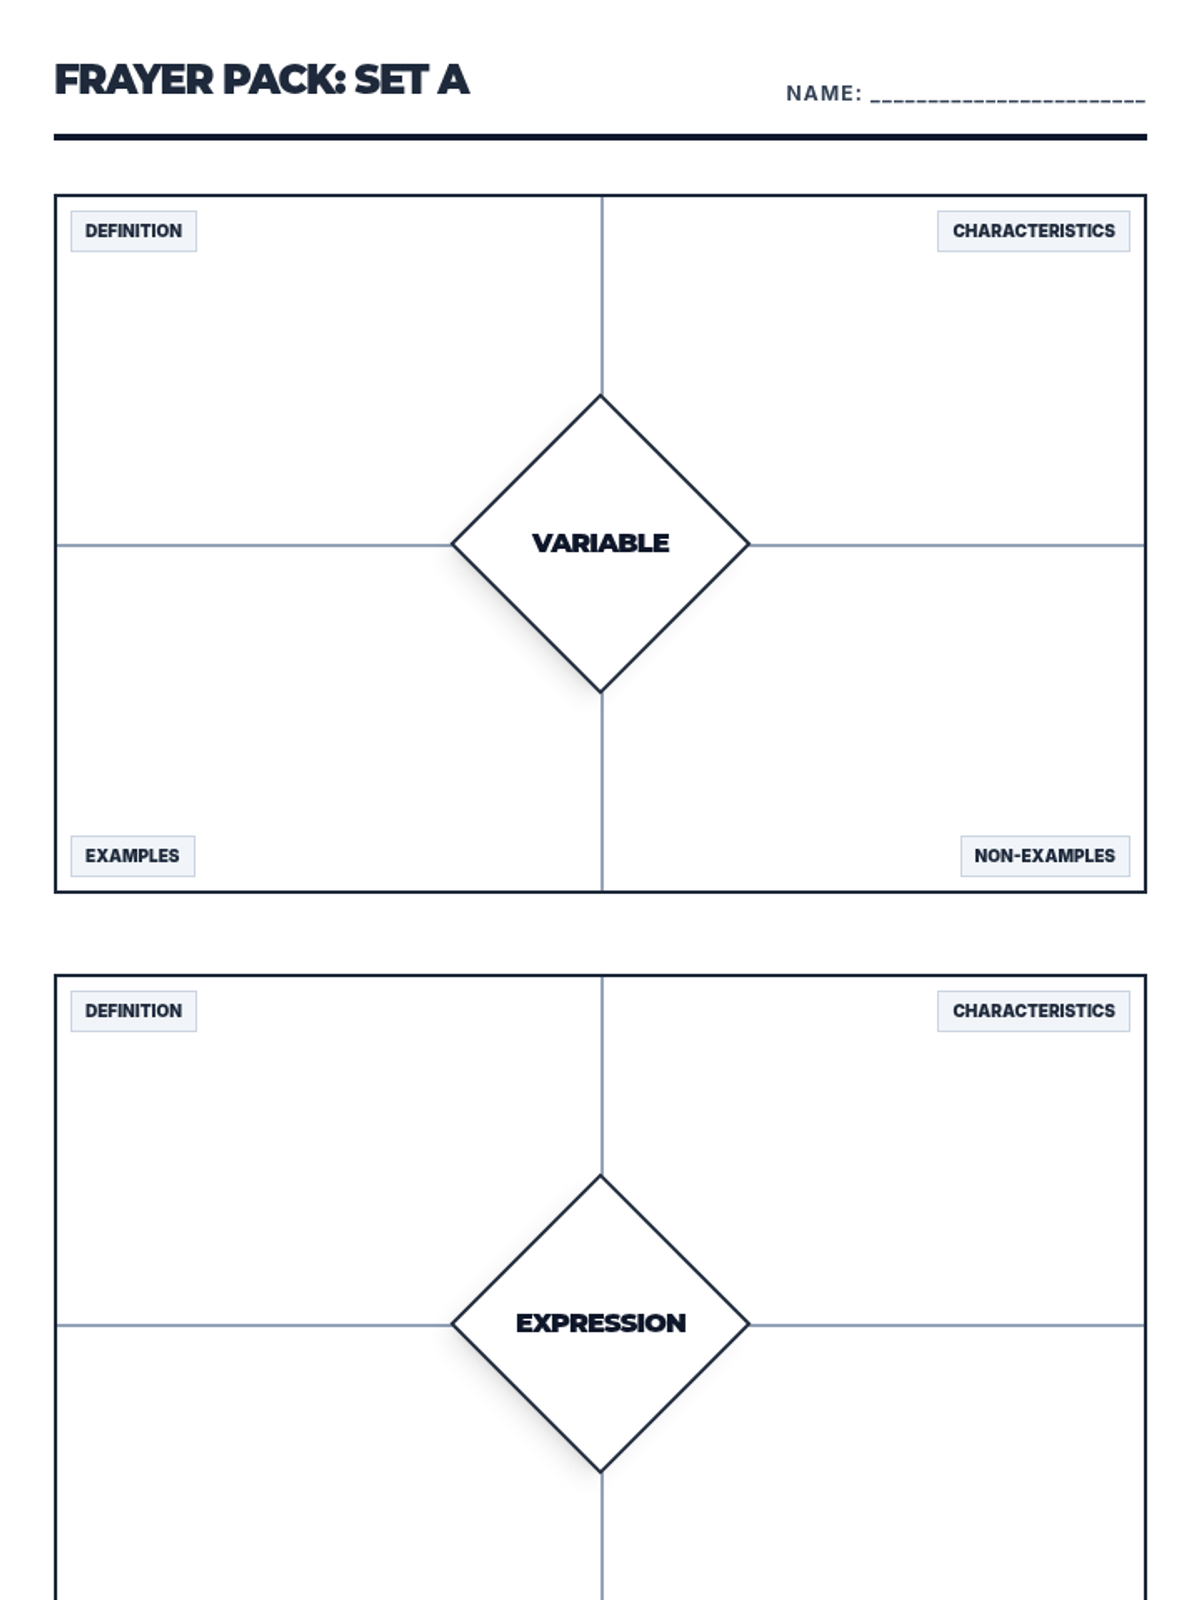
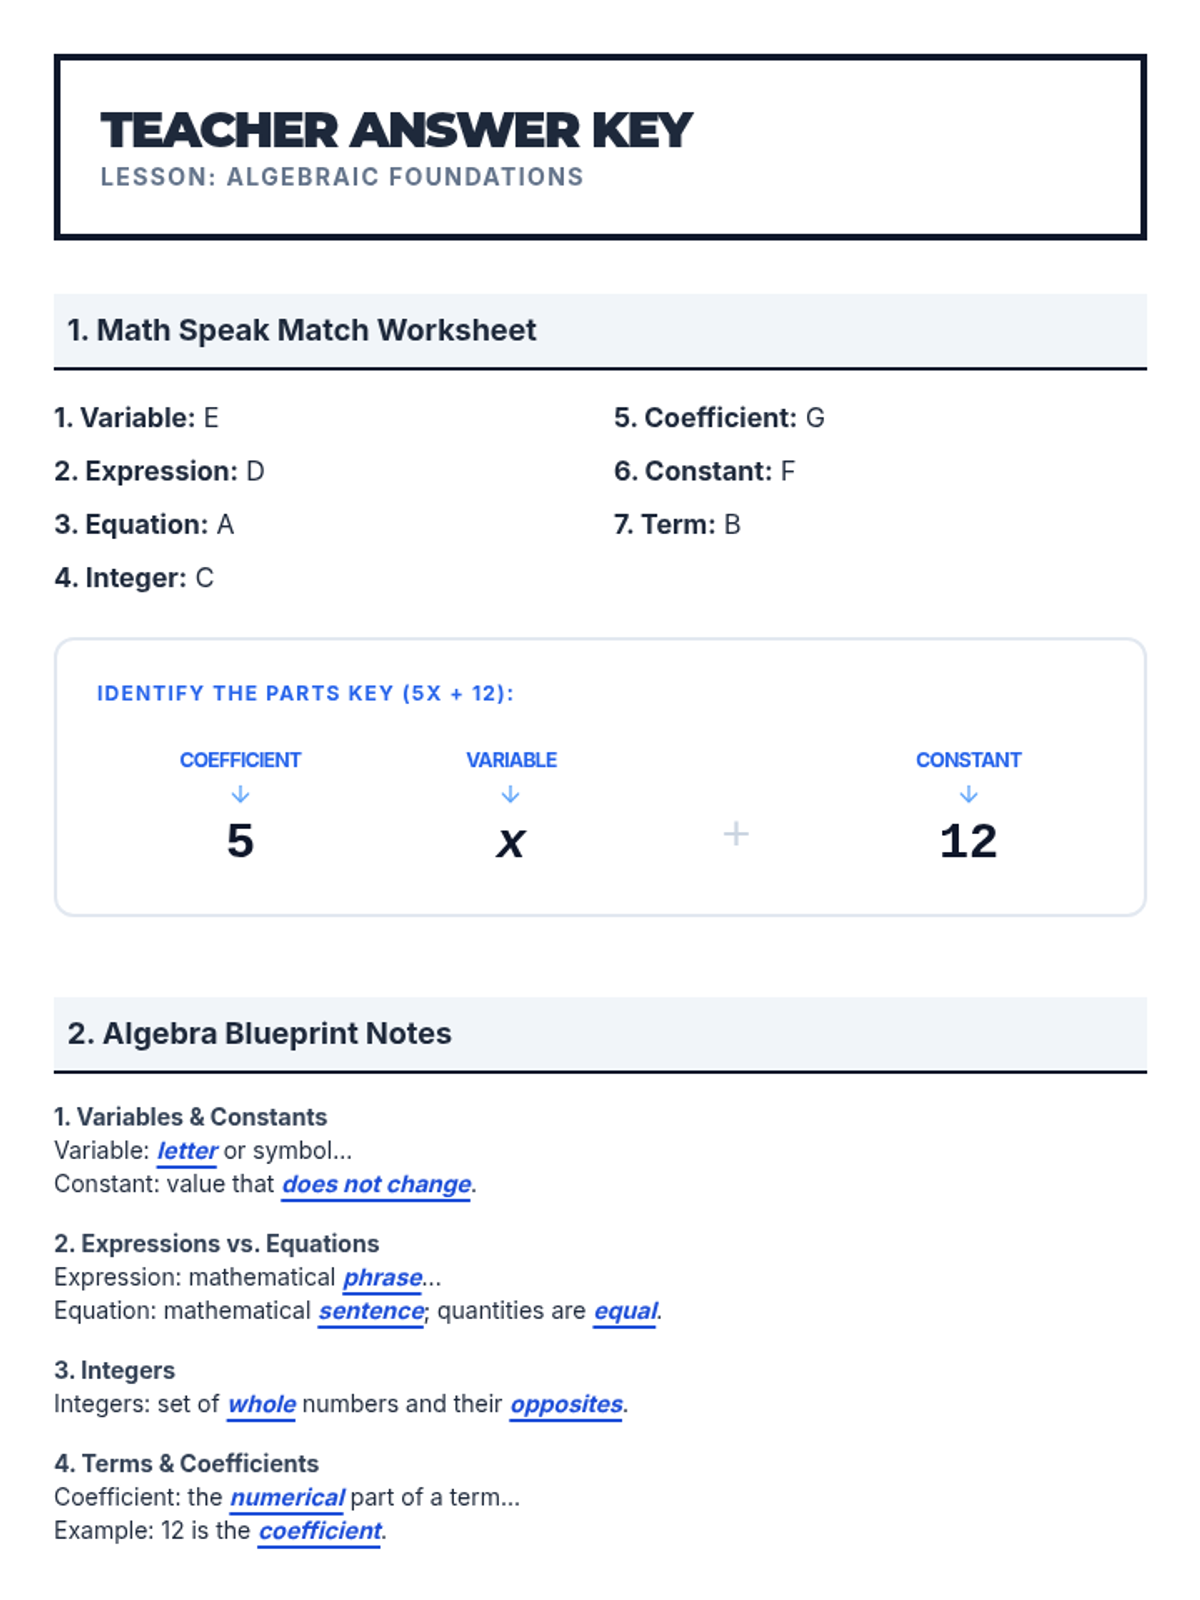
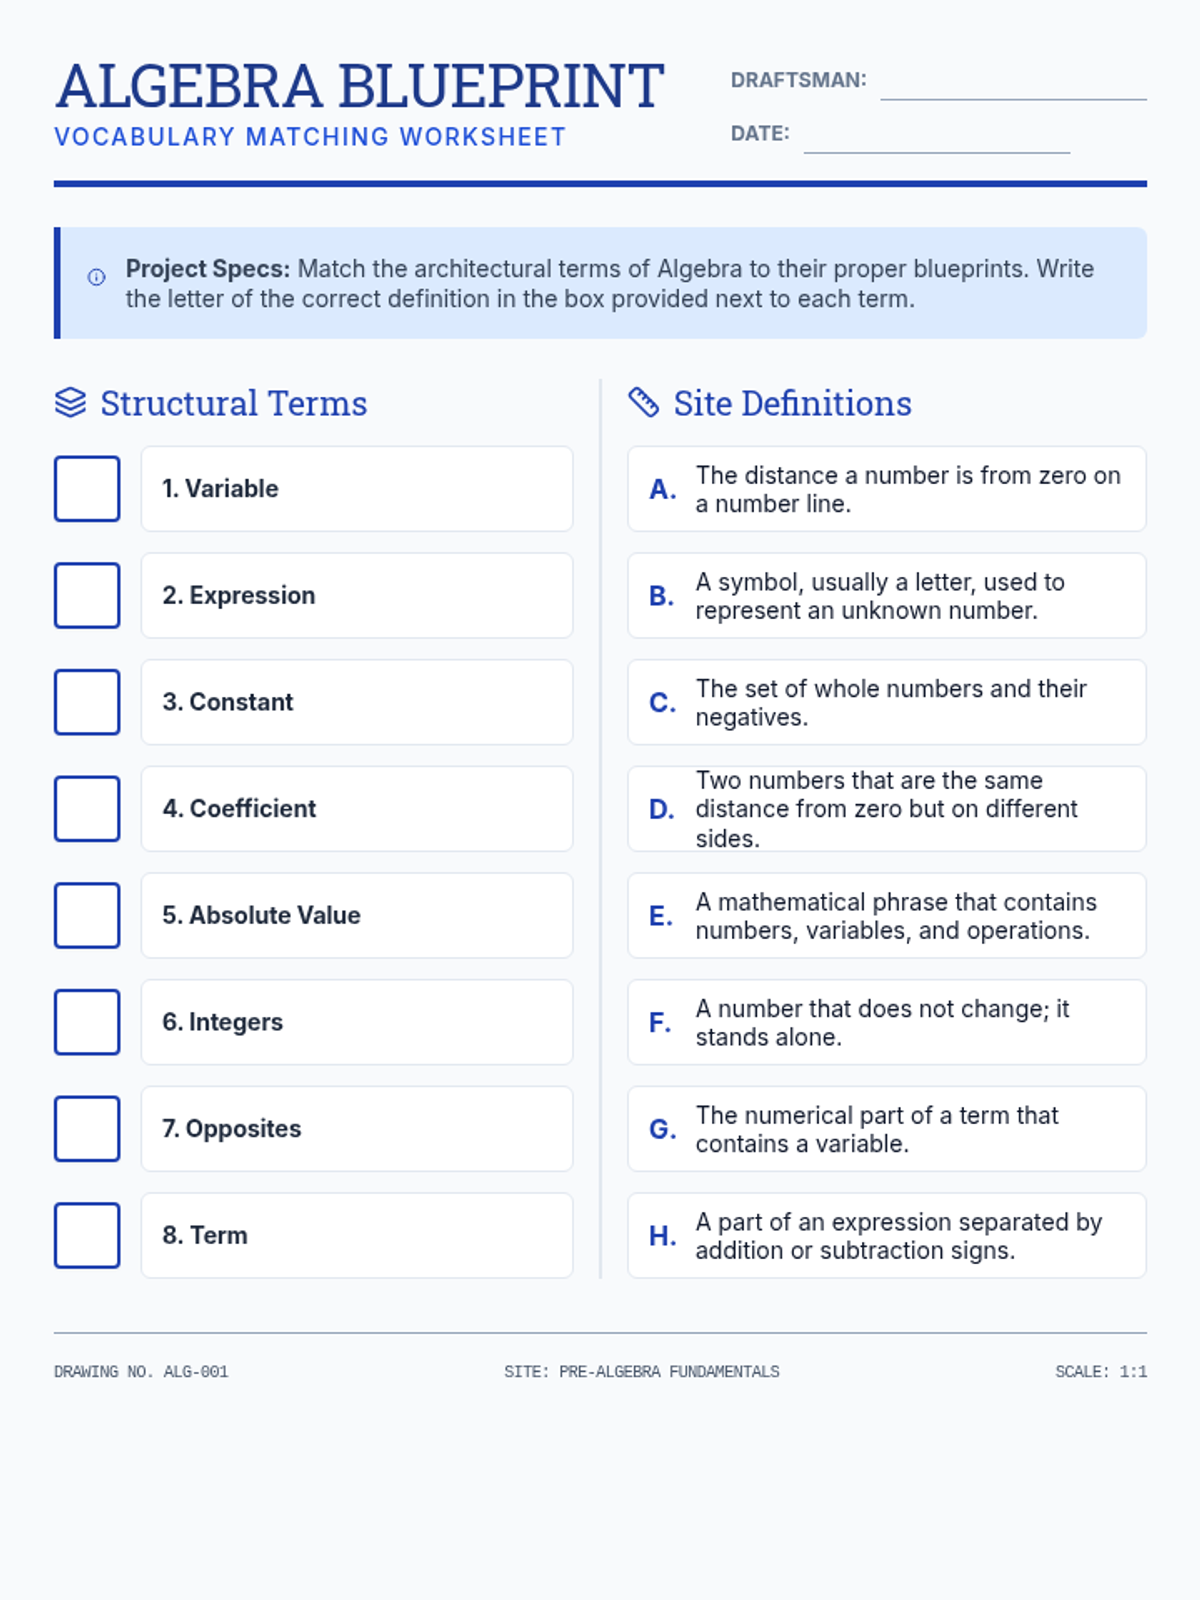
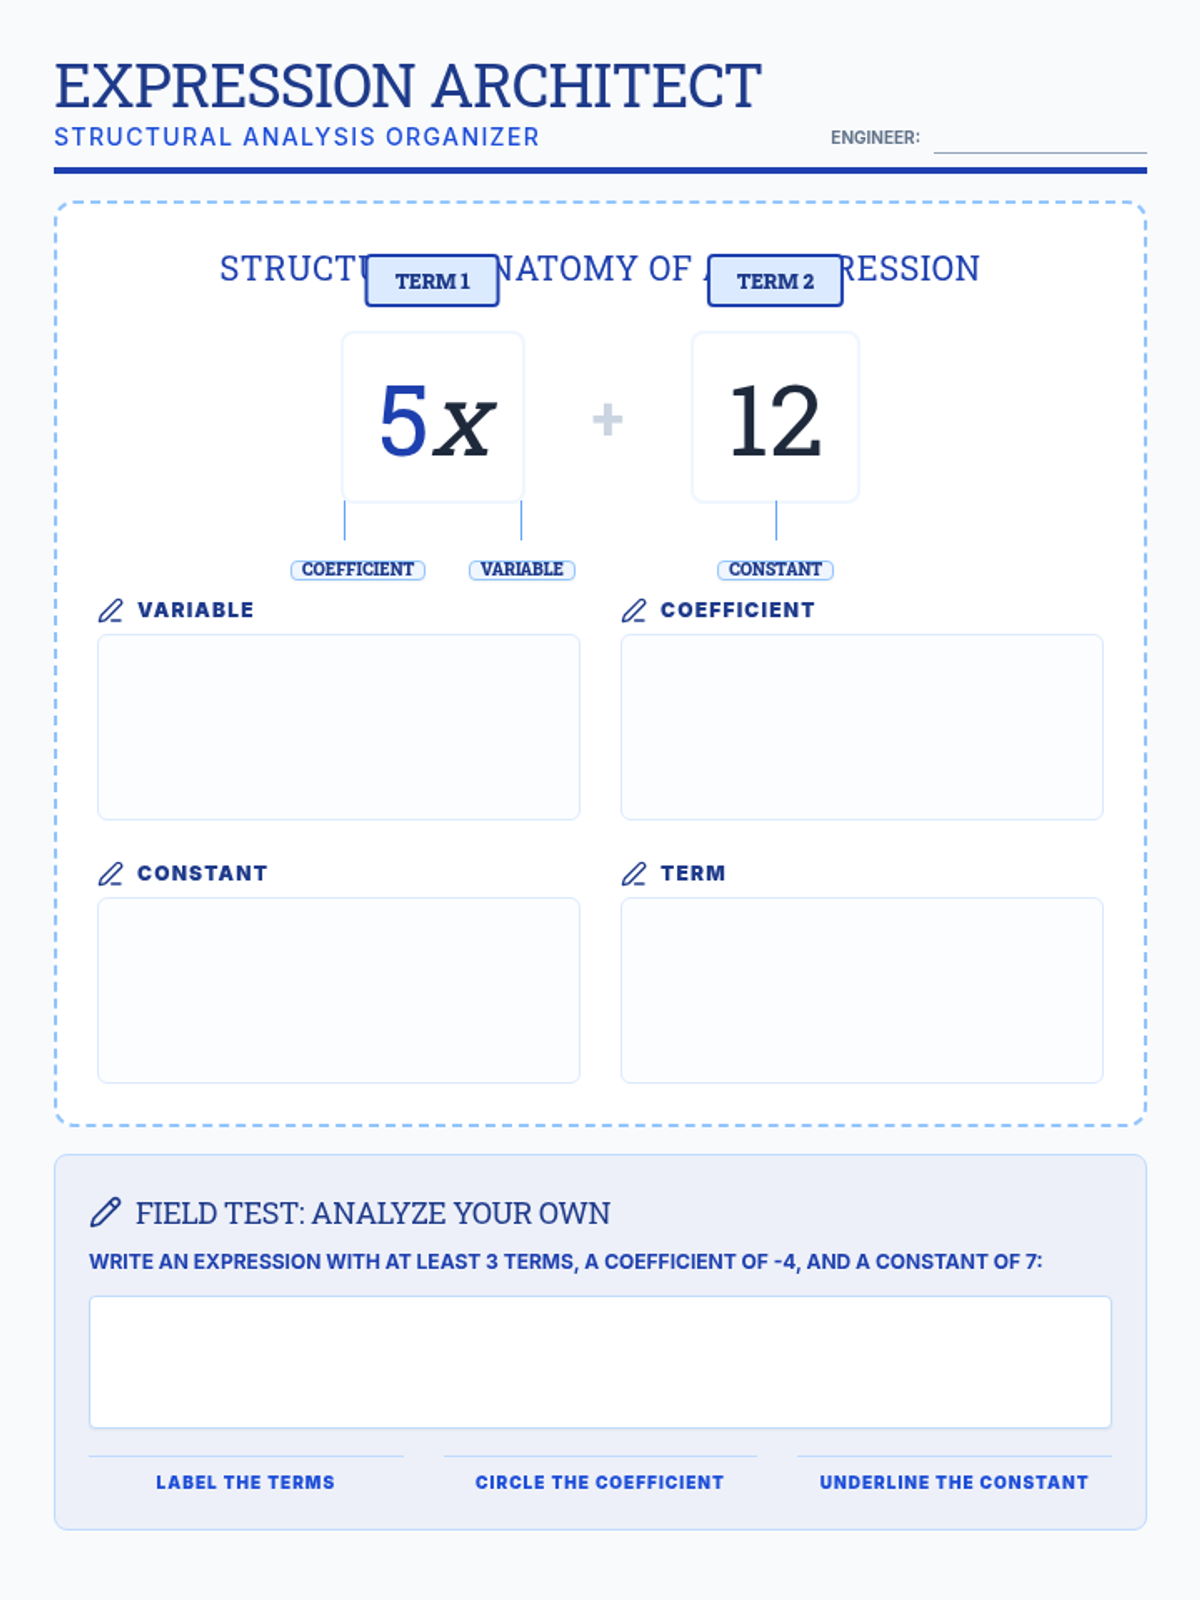
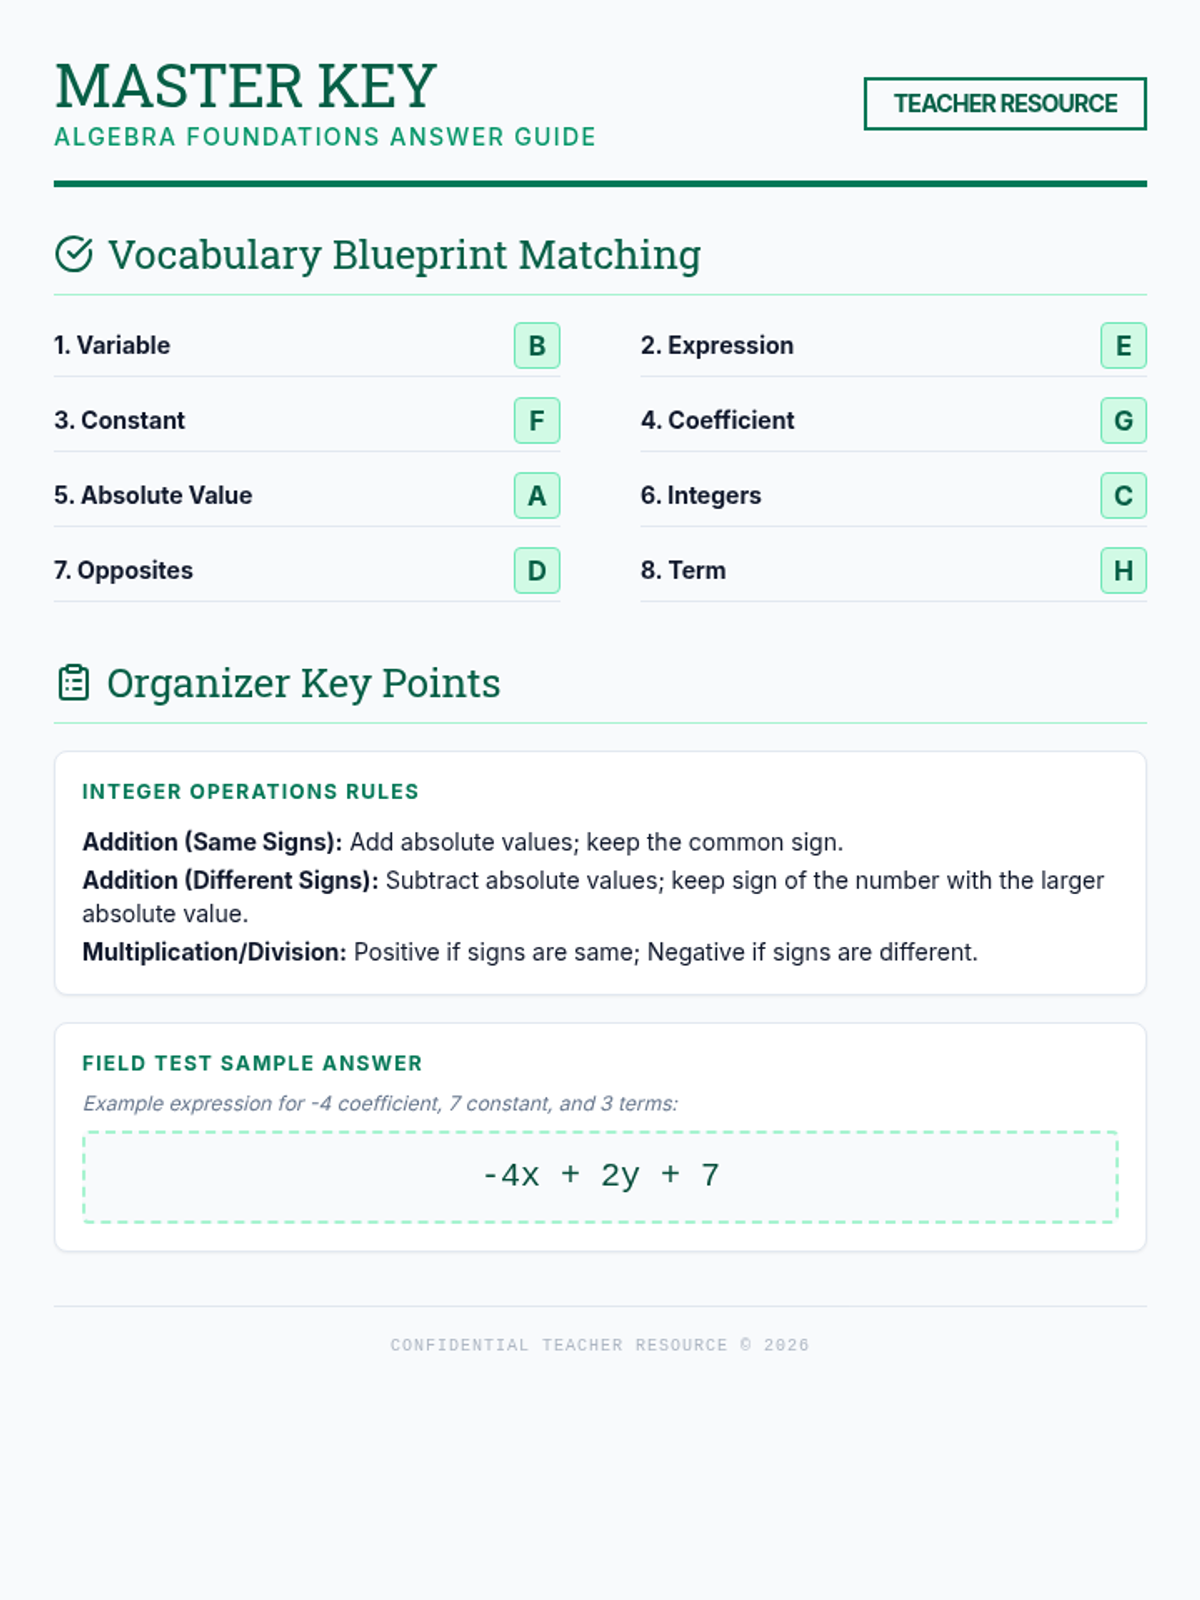
A foundational lesson introducing essential algebra vocabulary: variables, expressions, equations, and integers. Students will learn to distinguish between these terms and apply them to mathematical phrases.
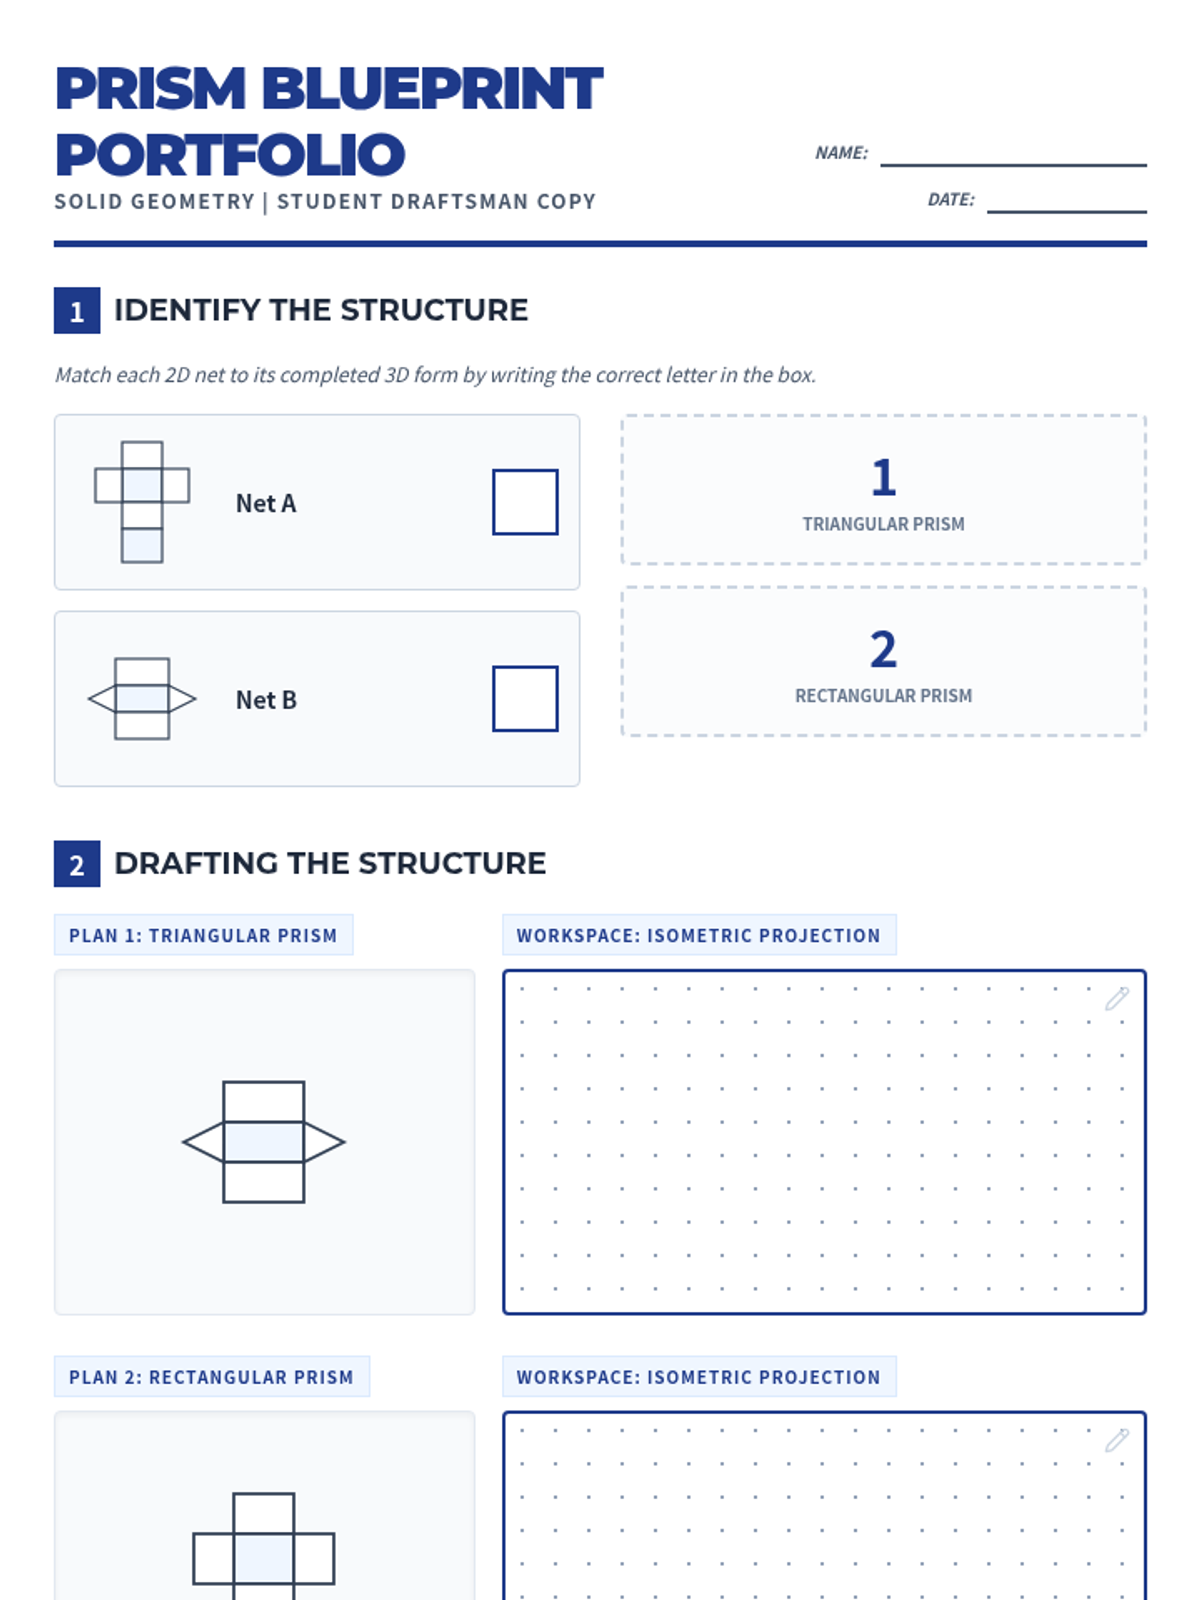
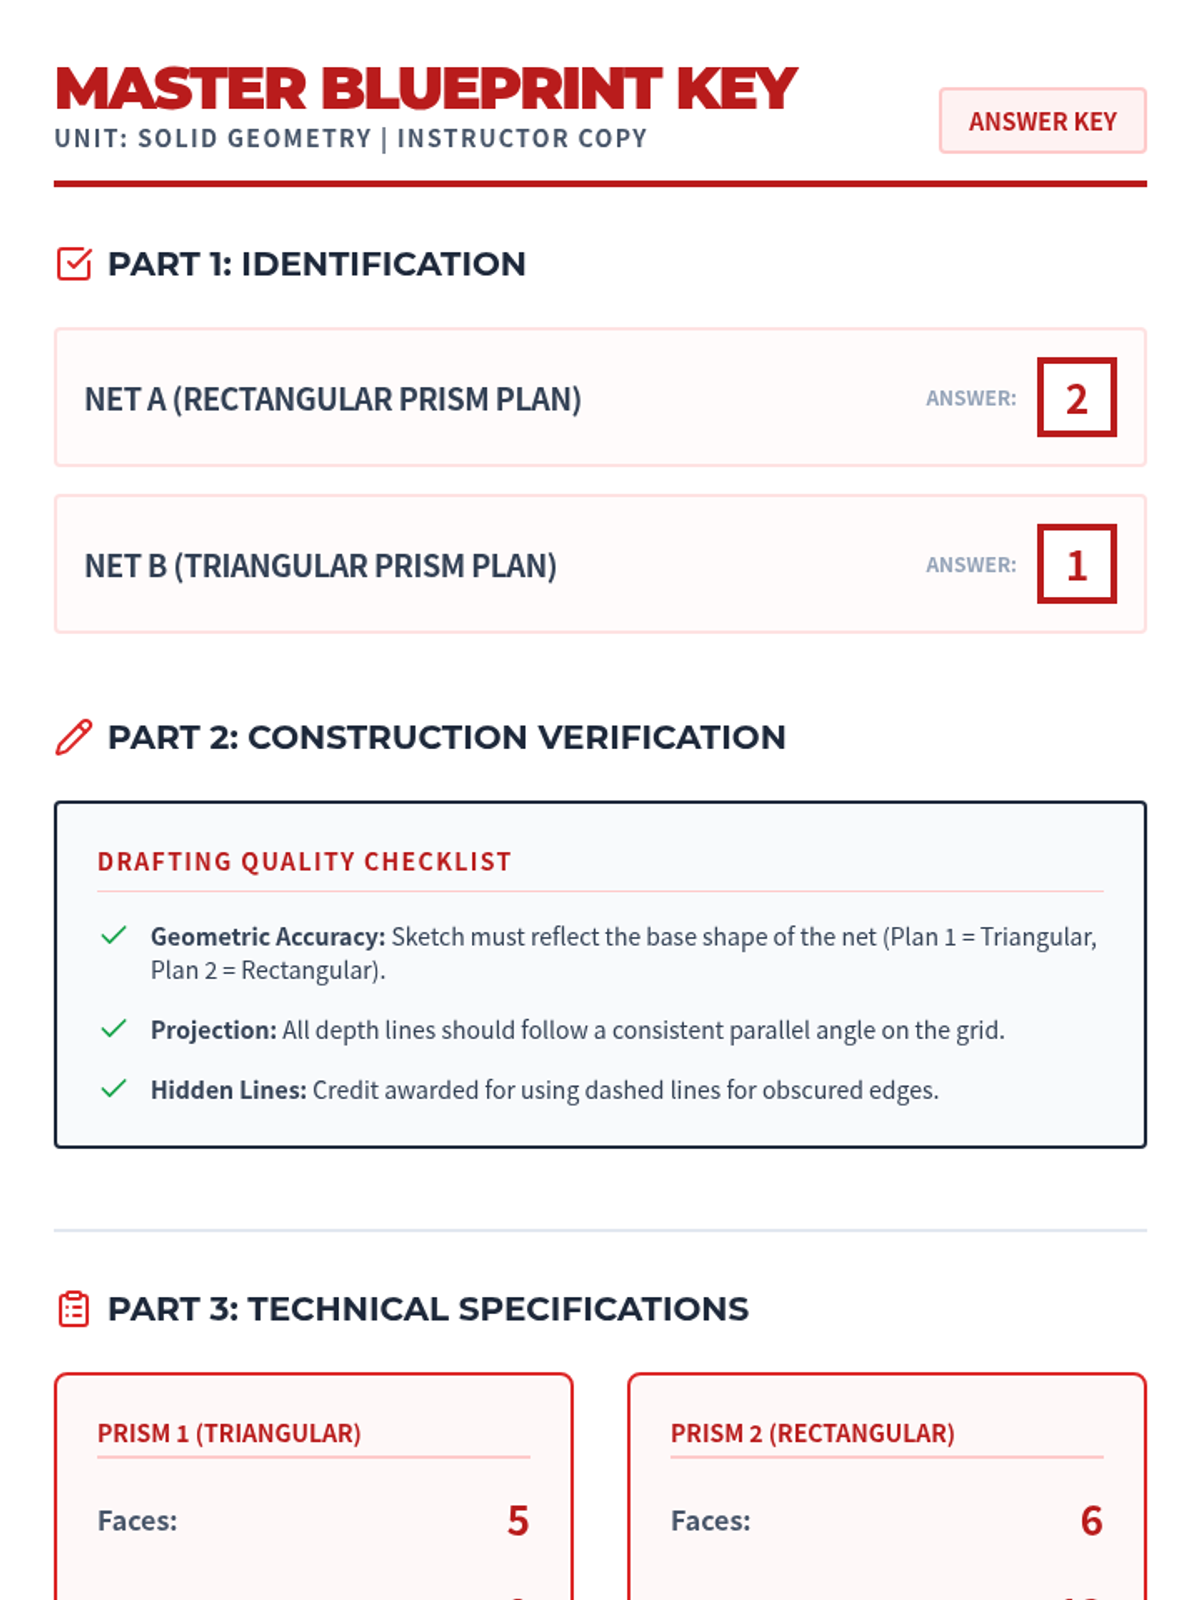
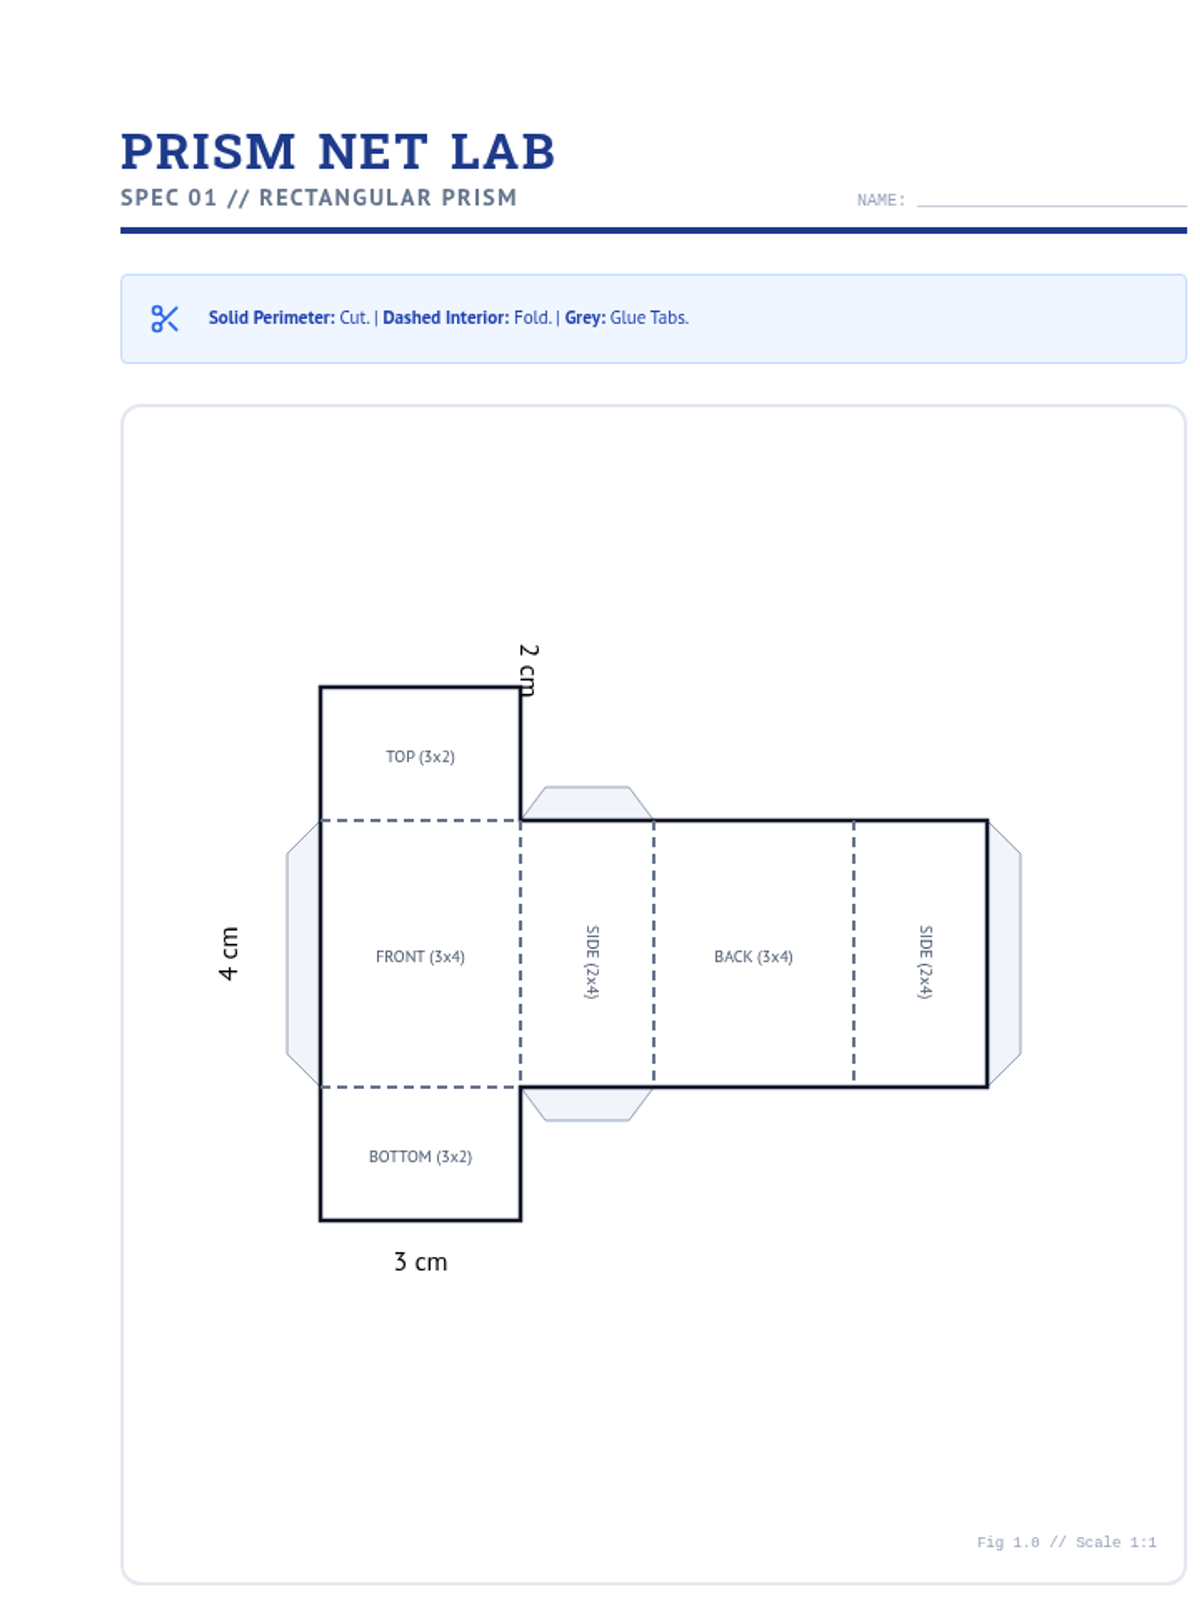
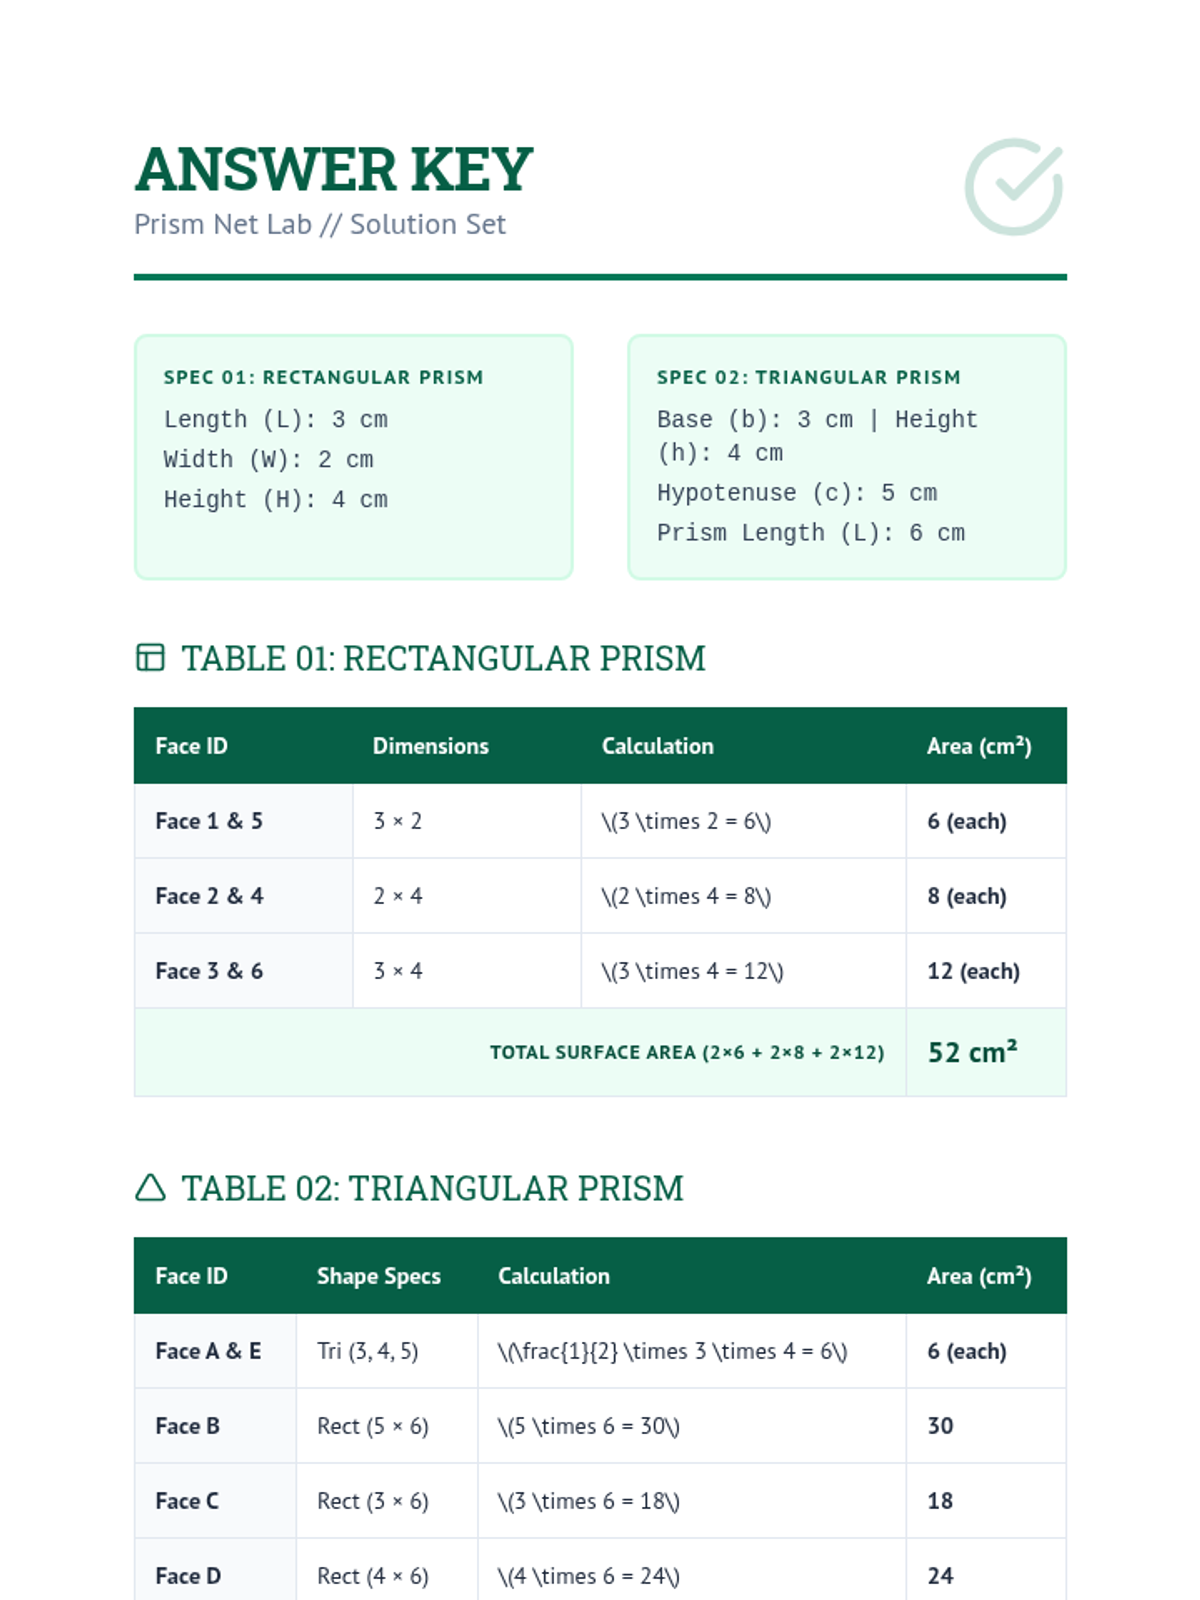
A hands-on lesson focusing on the transition from 2D nets to 3D prism constructions, specifically targeting rectangular and triangular prisms through visualization and drawing techniques.
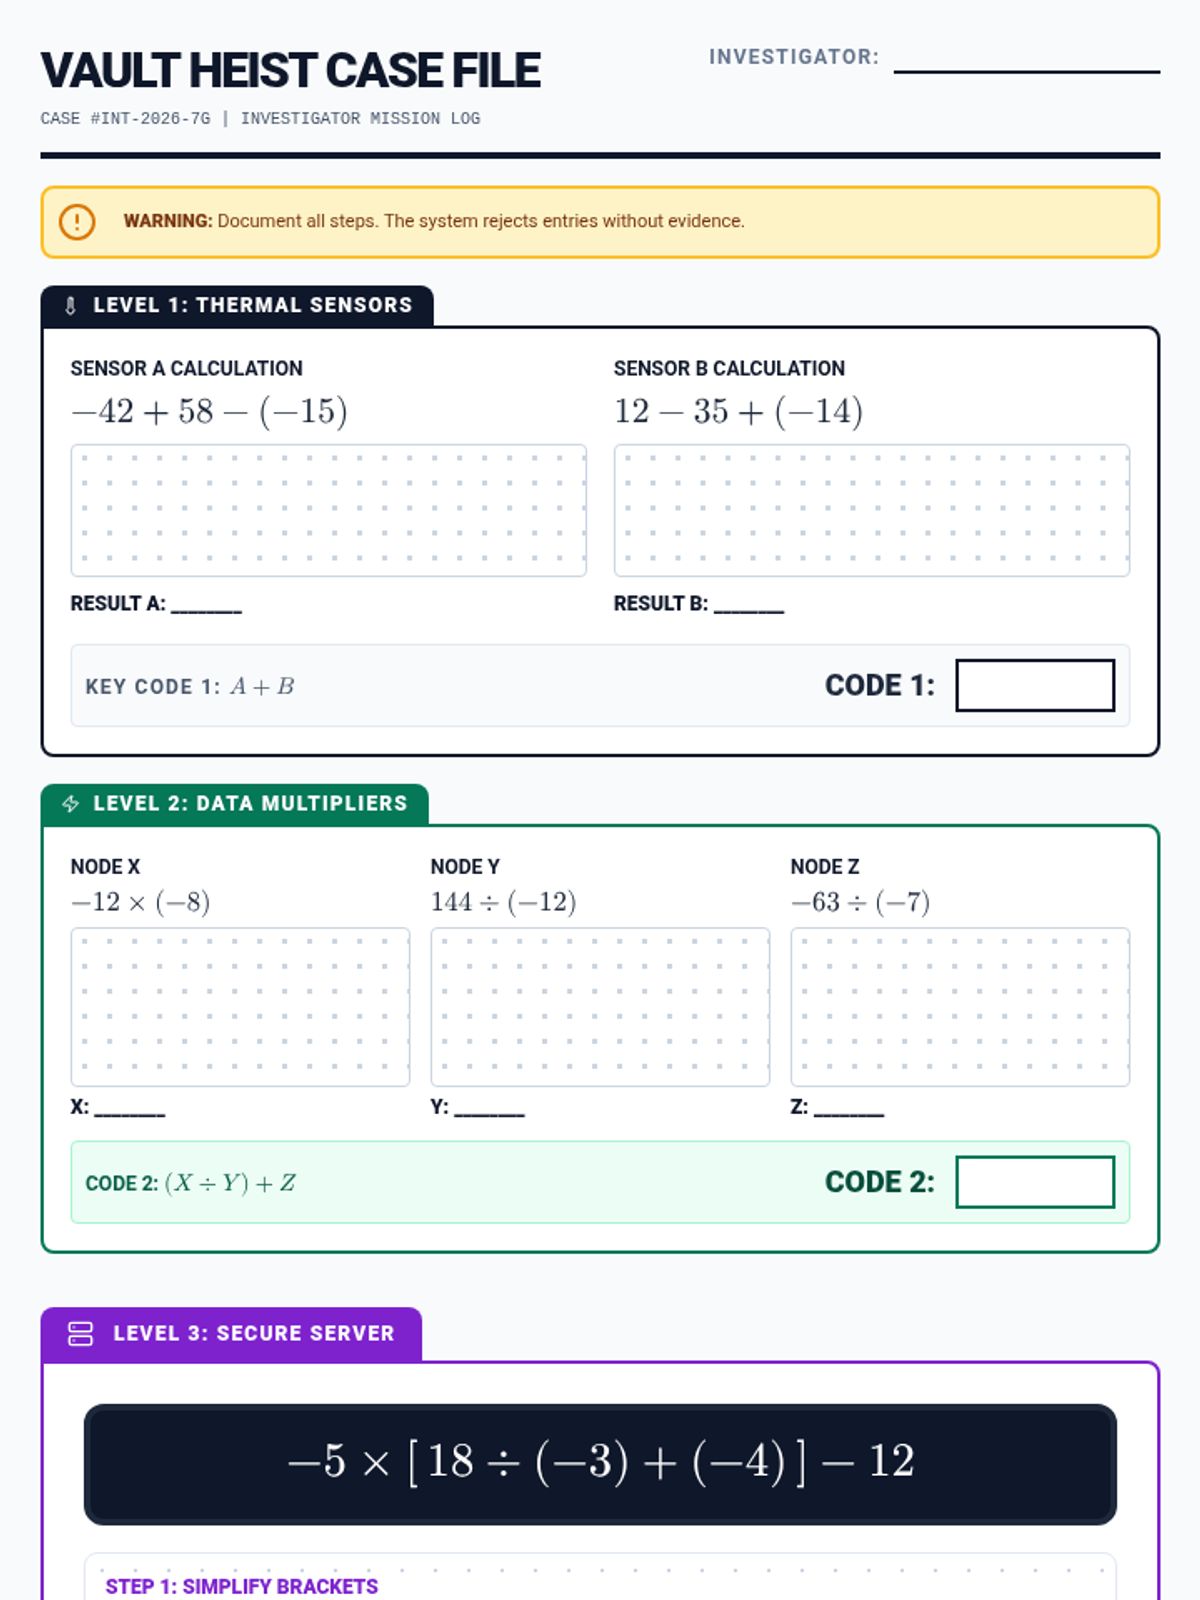
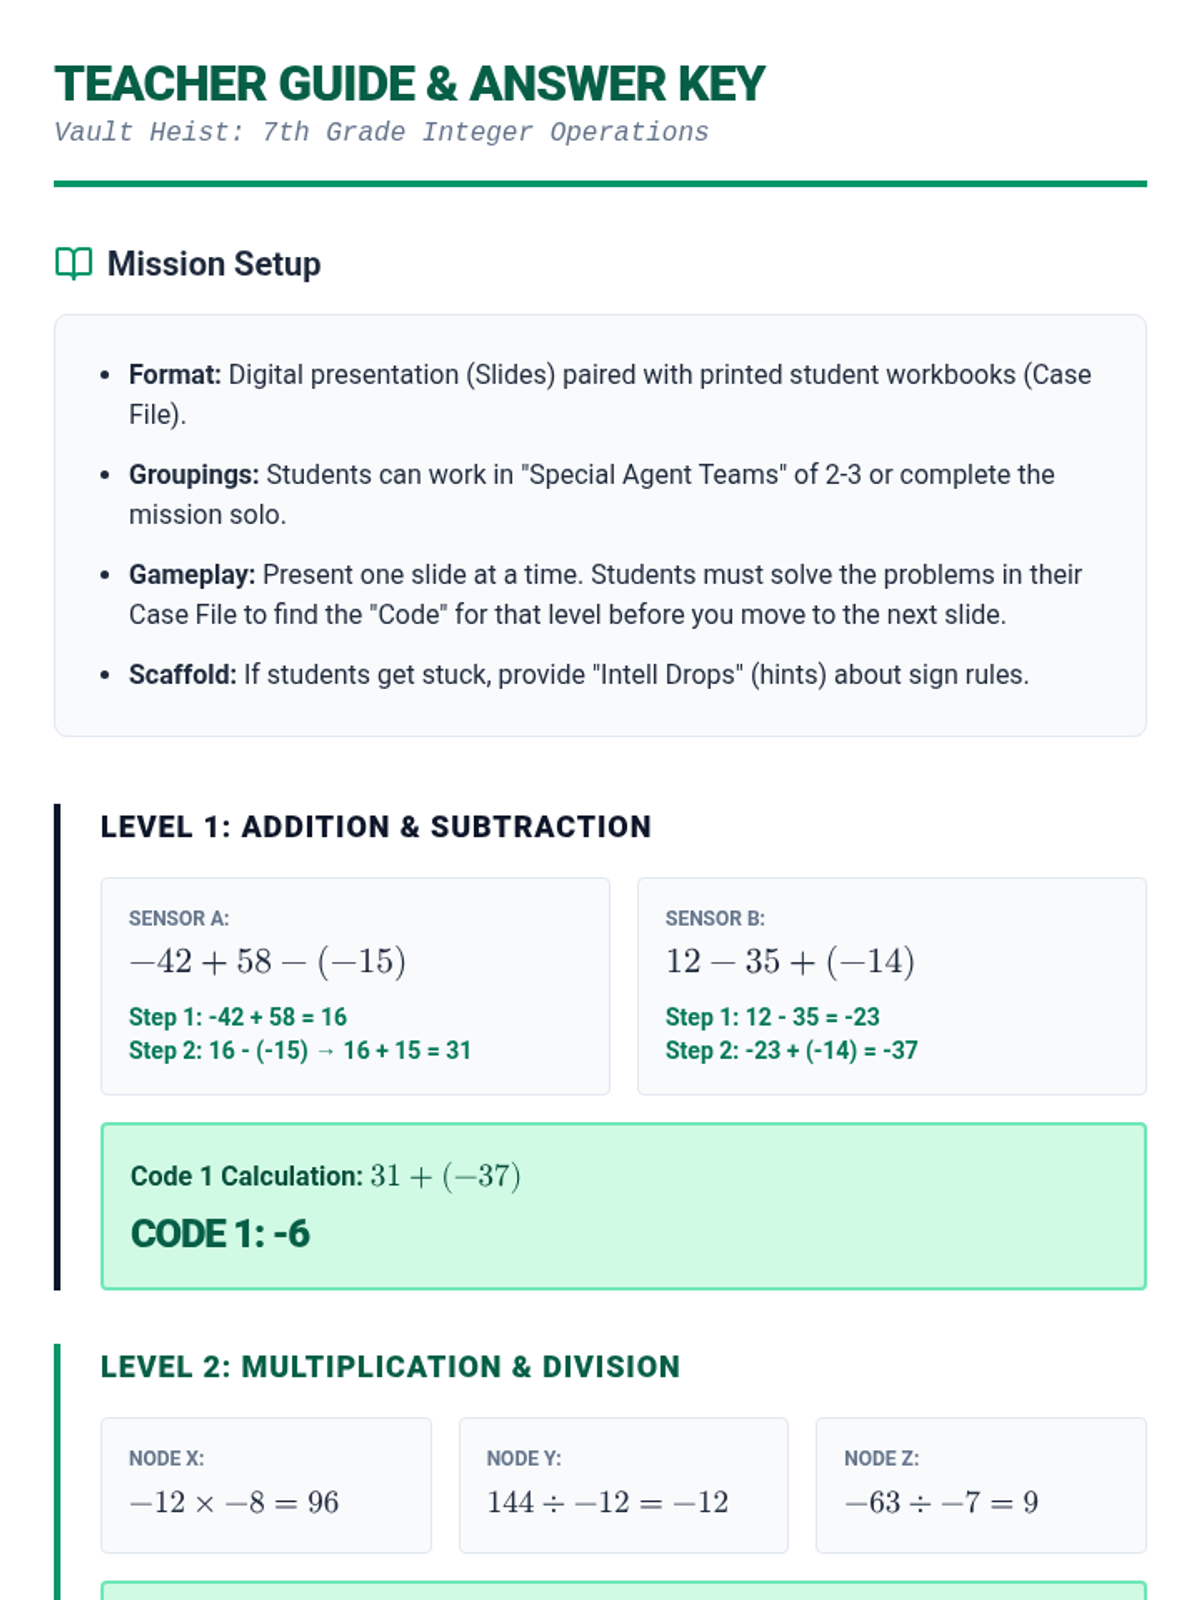
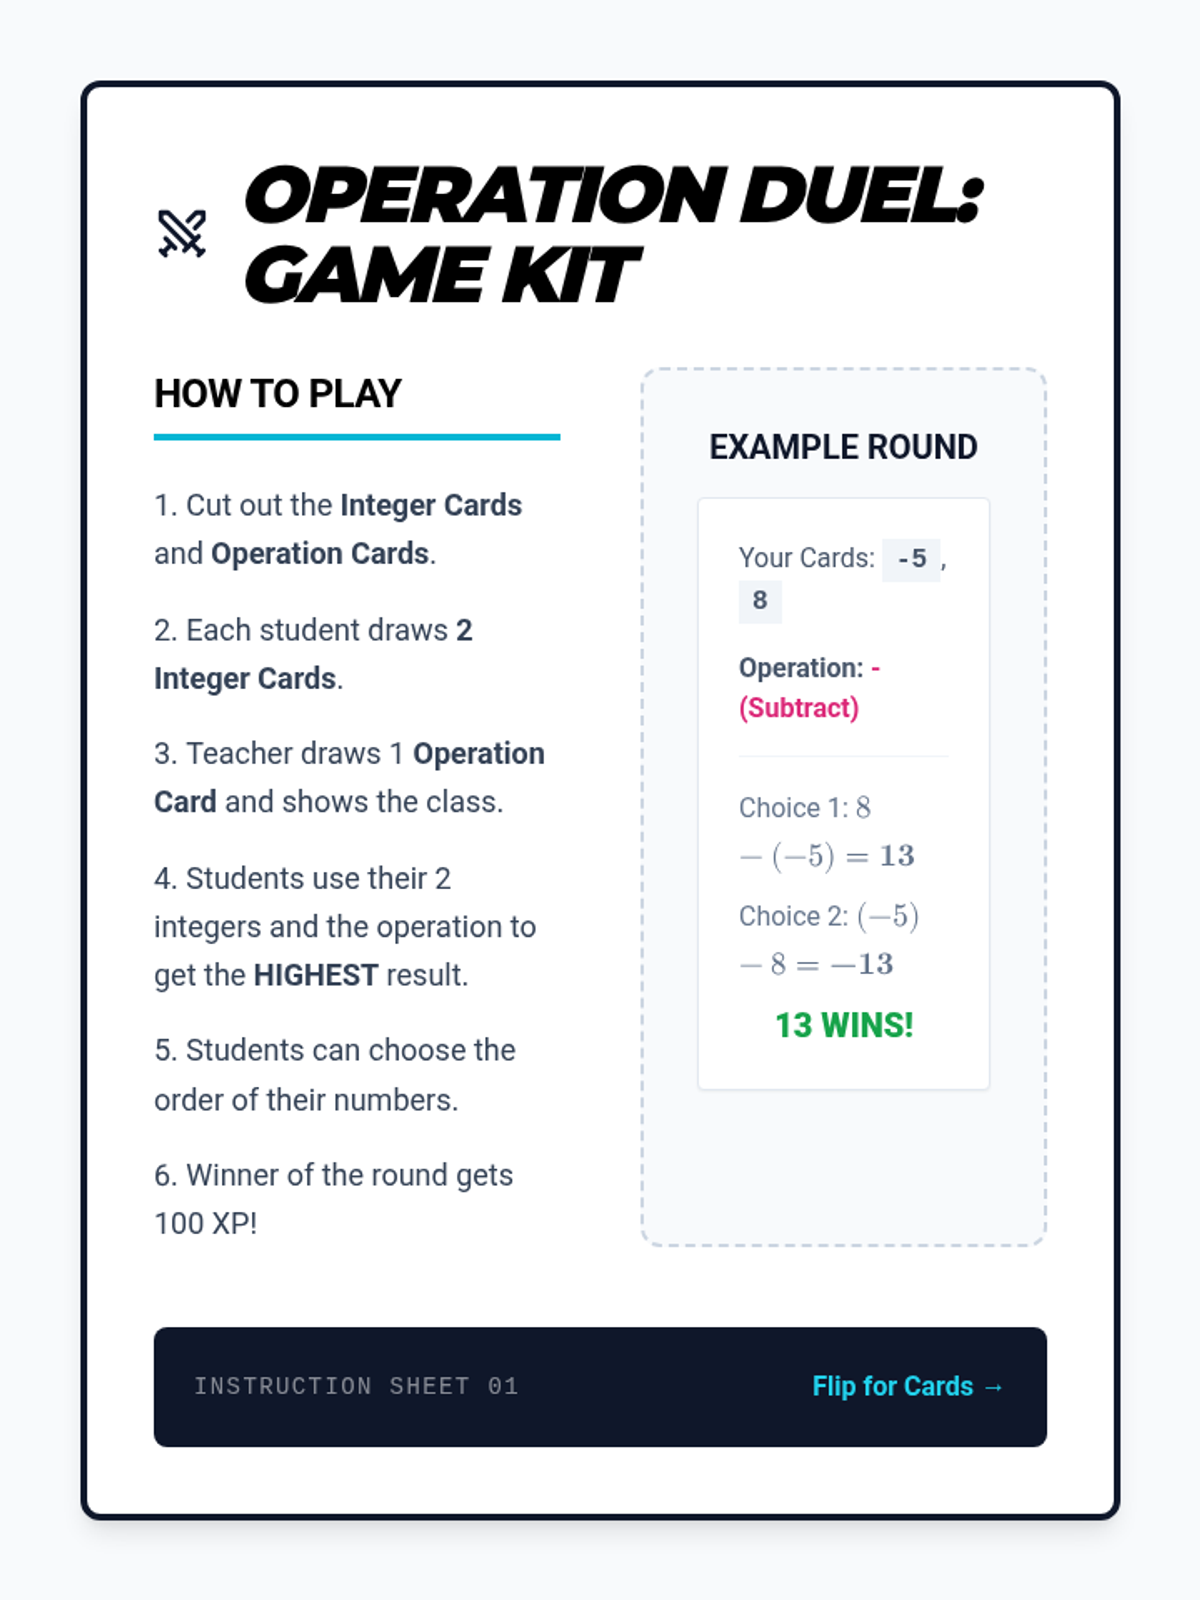
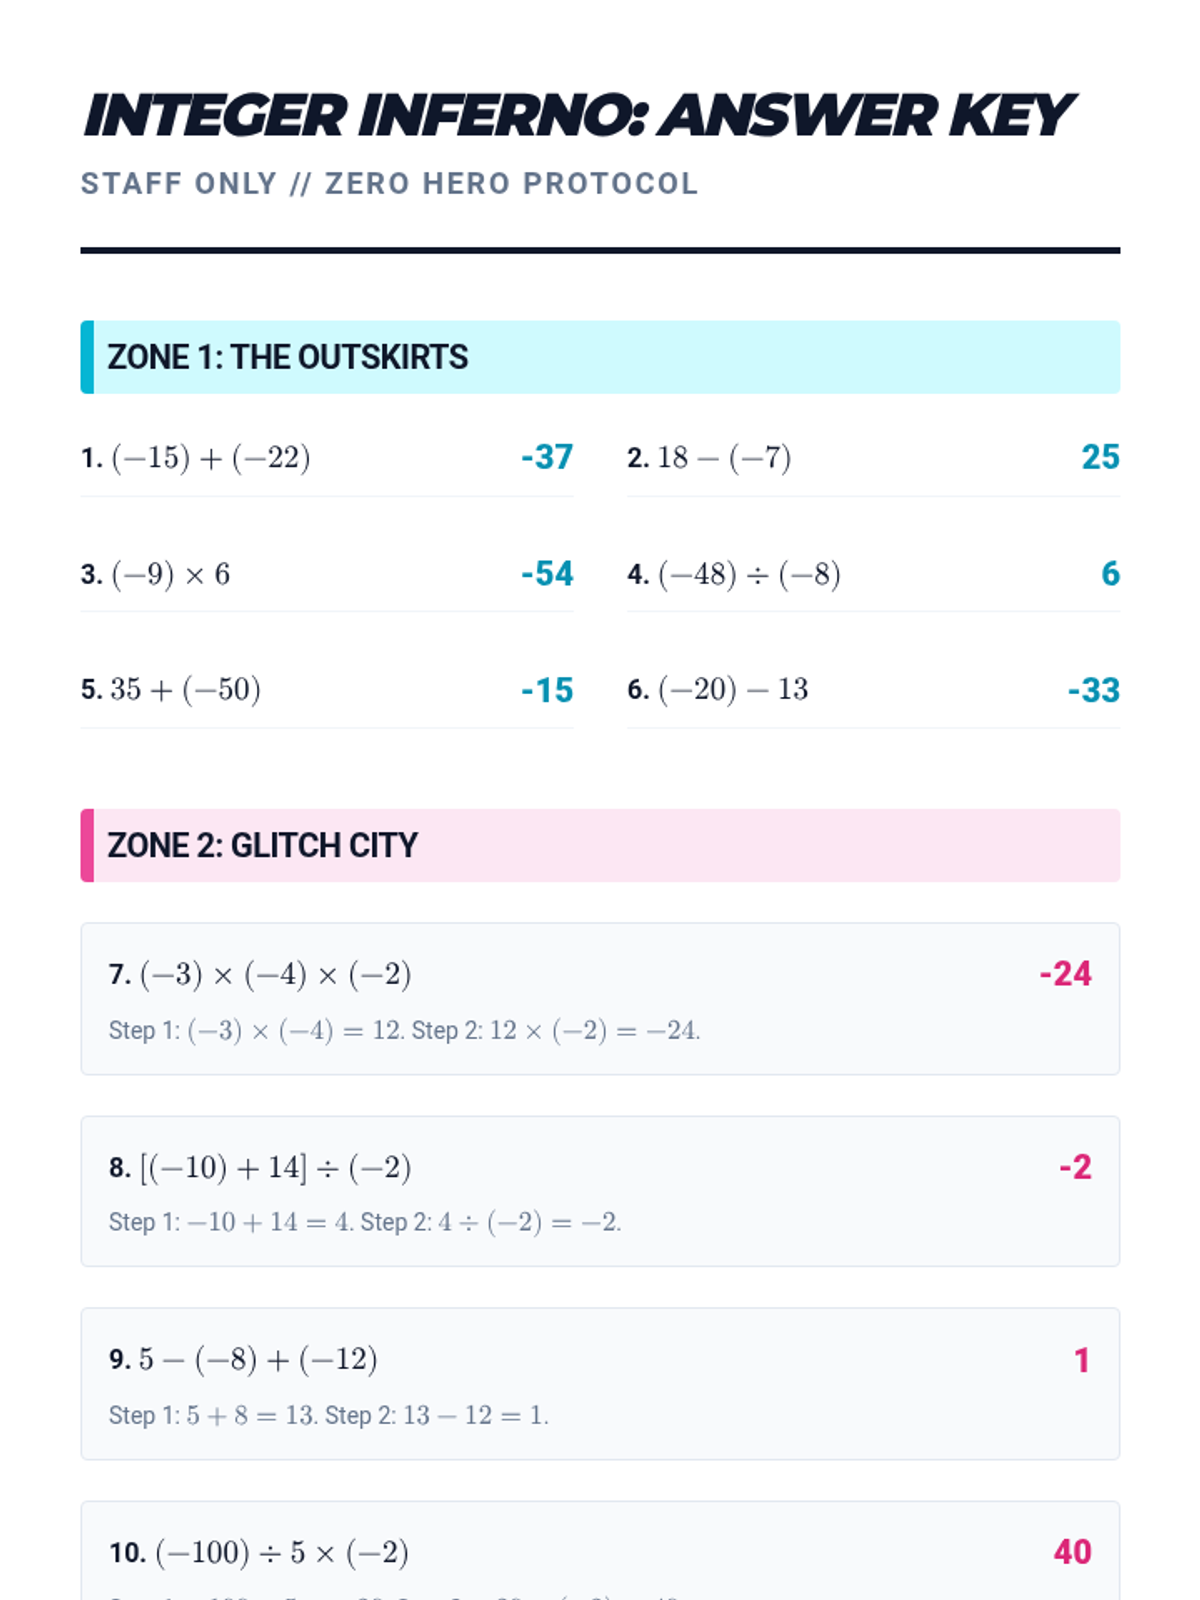
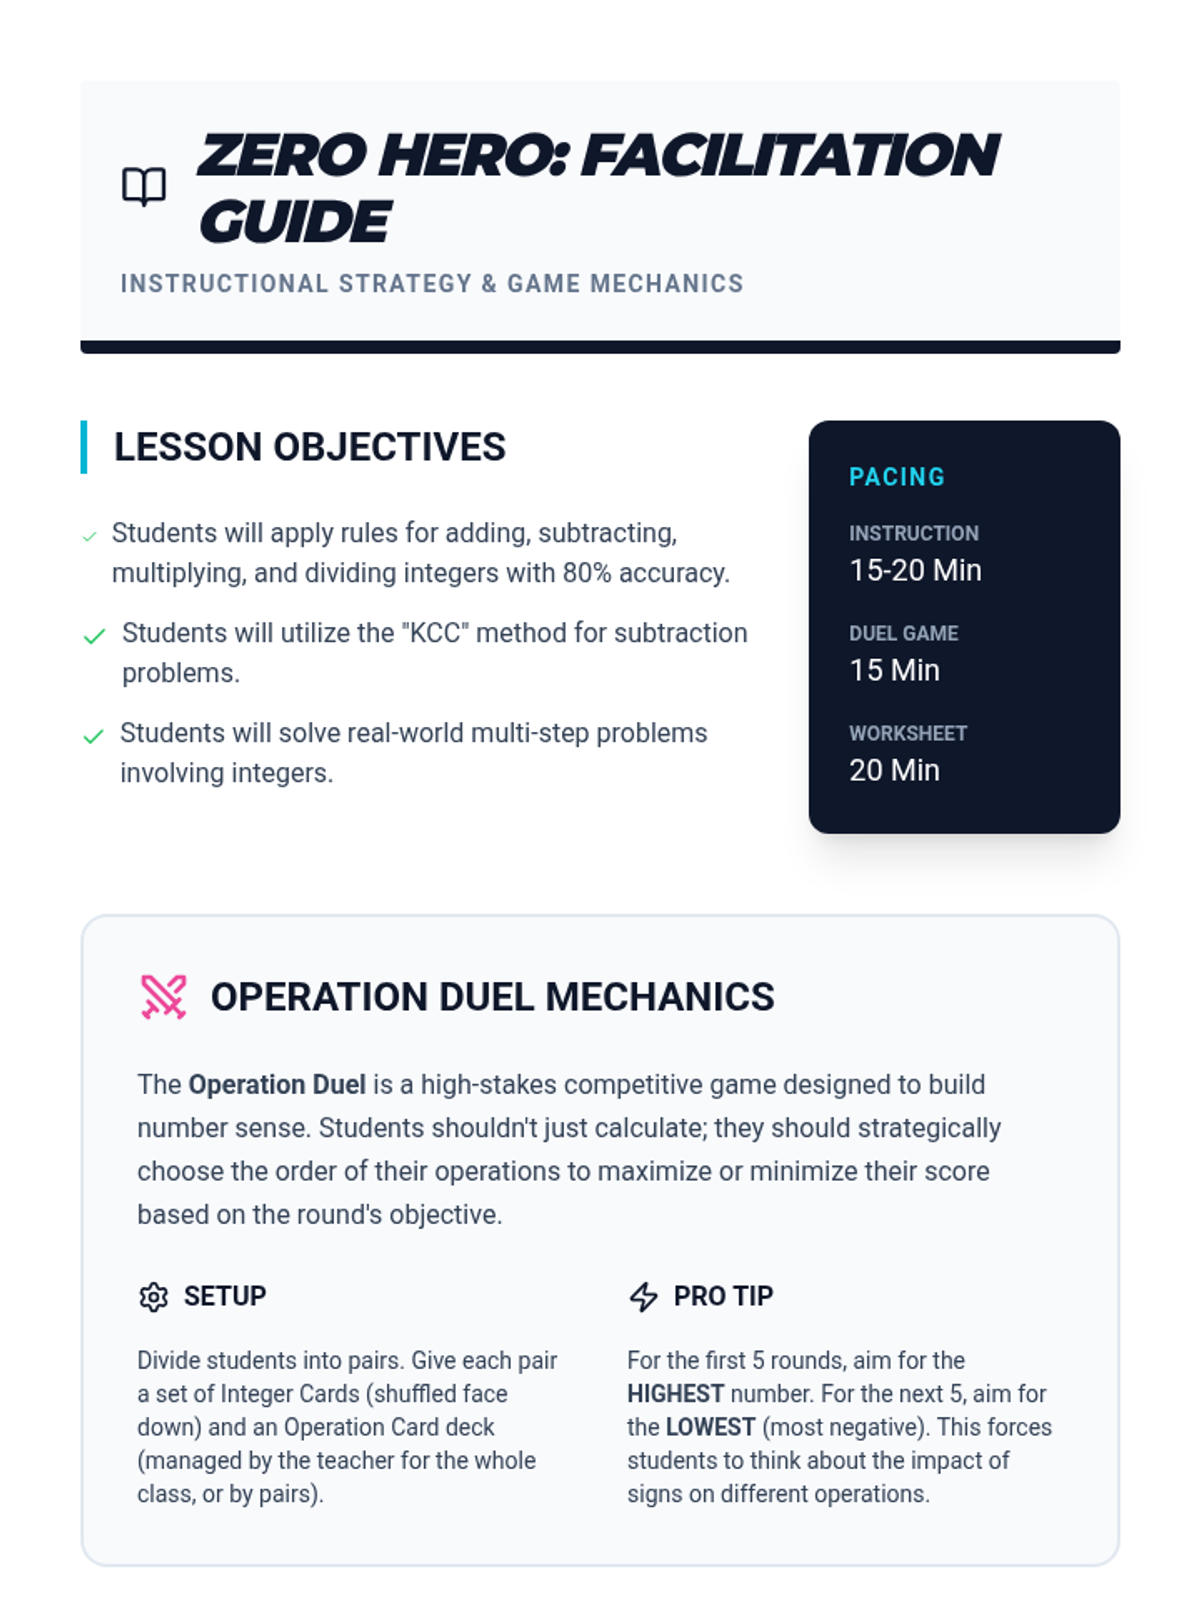
A high-stakes integer review game where students act as investigators to crack a high-security vault. Students solve problems involving addition, subtraction, multiplication, and division of integers to unlock clues and escape.
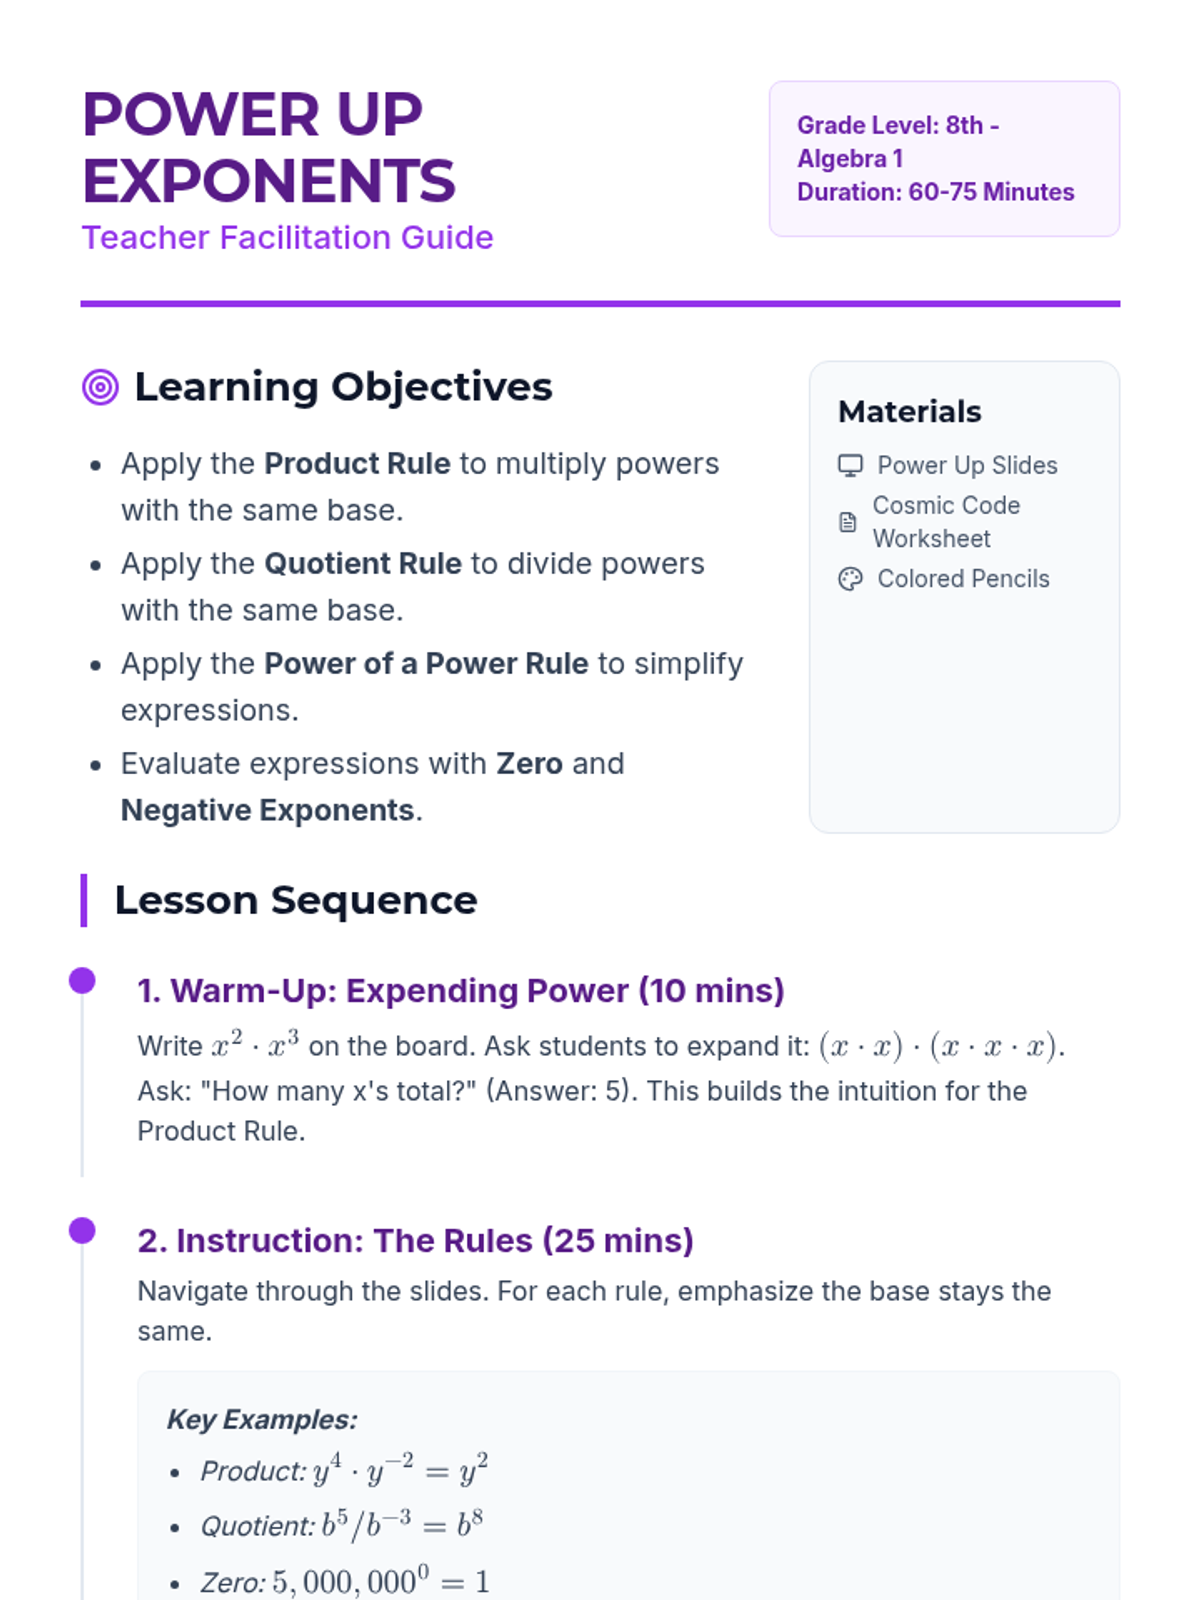
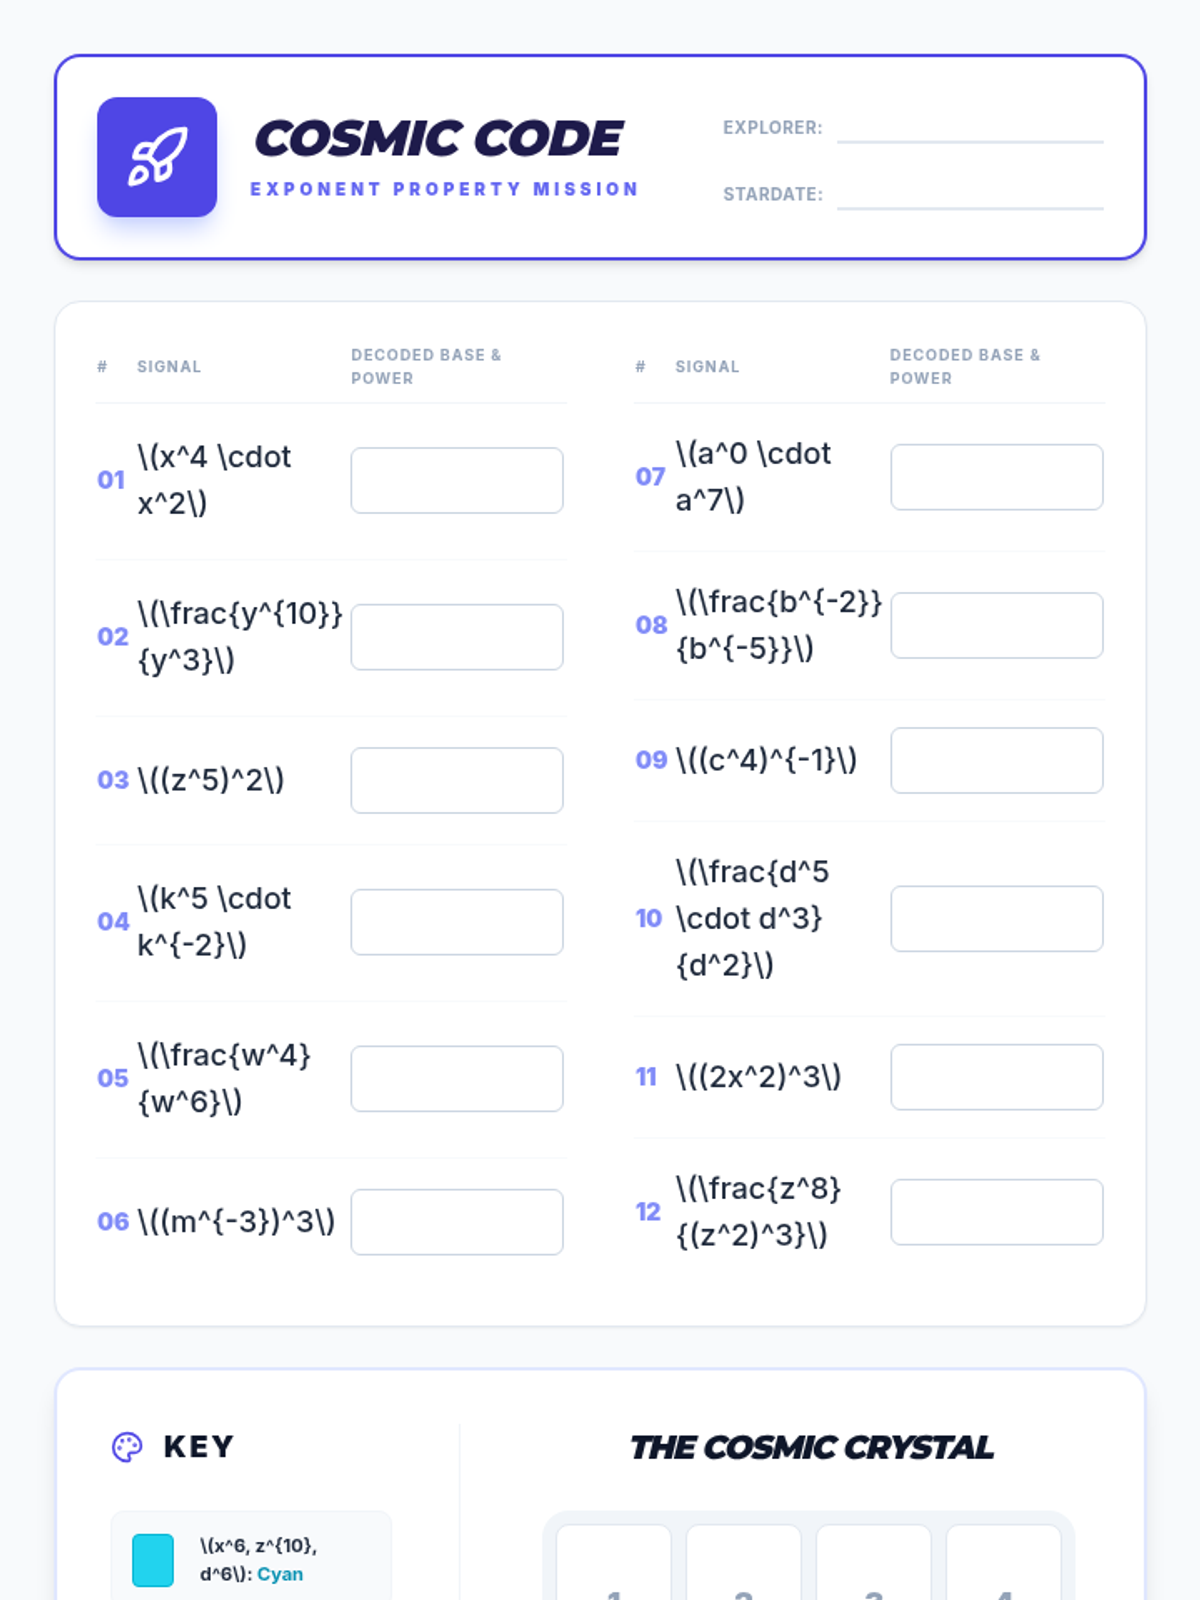
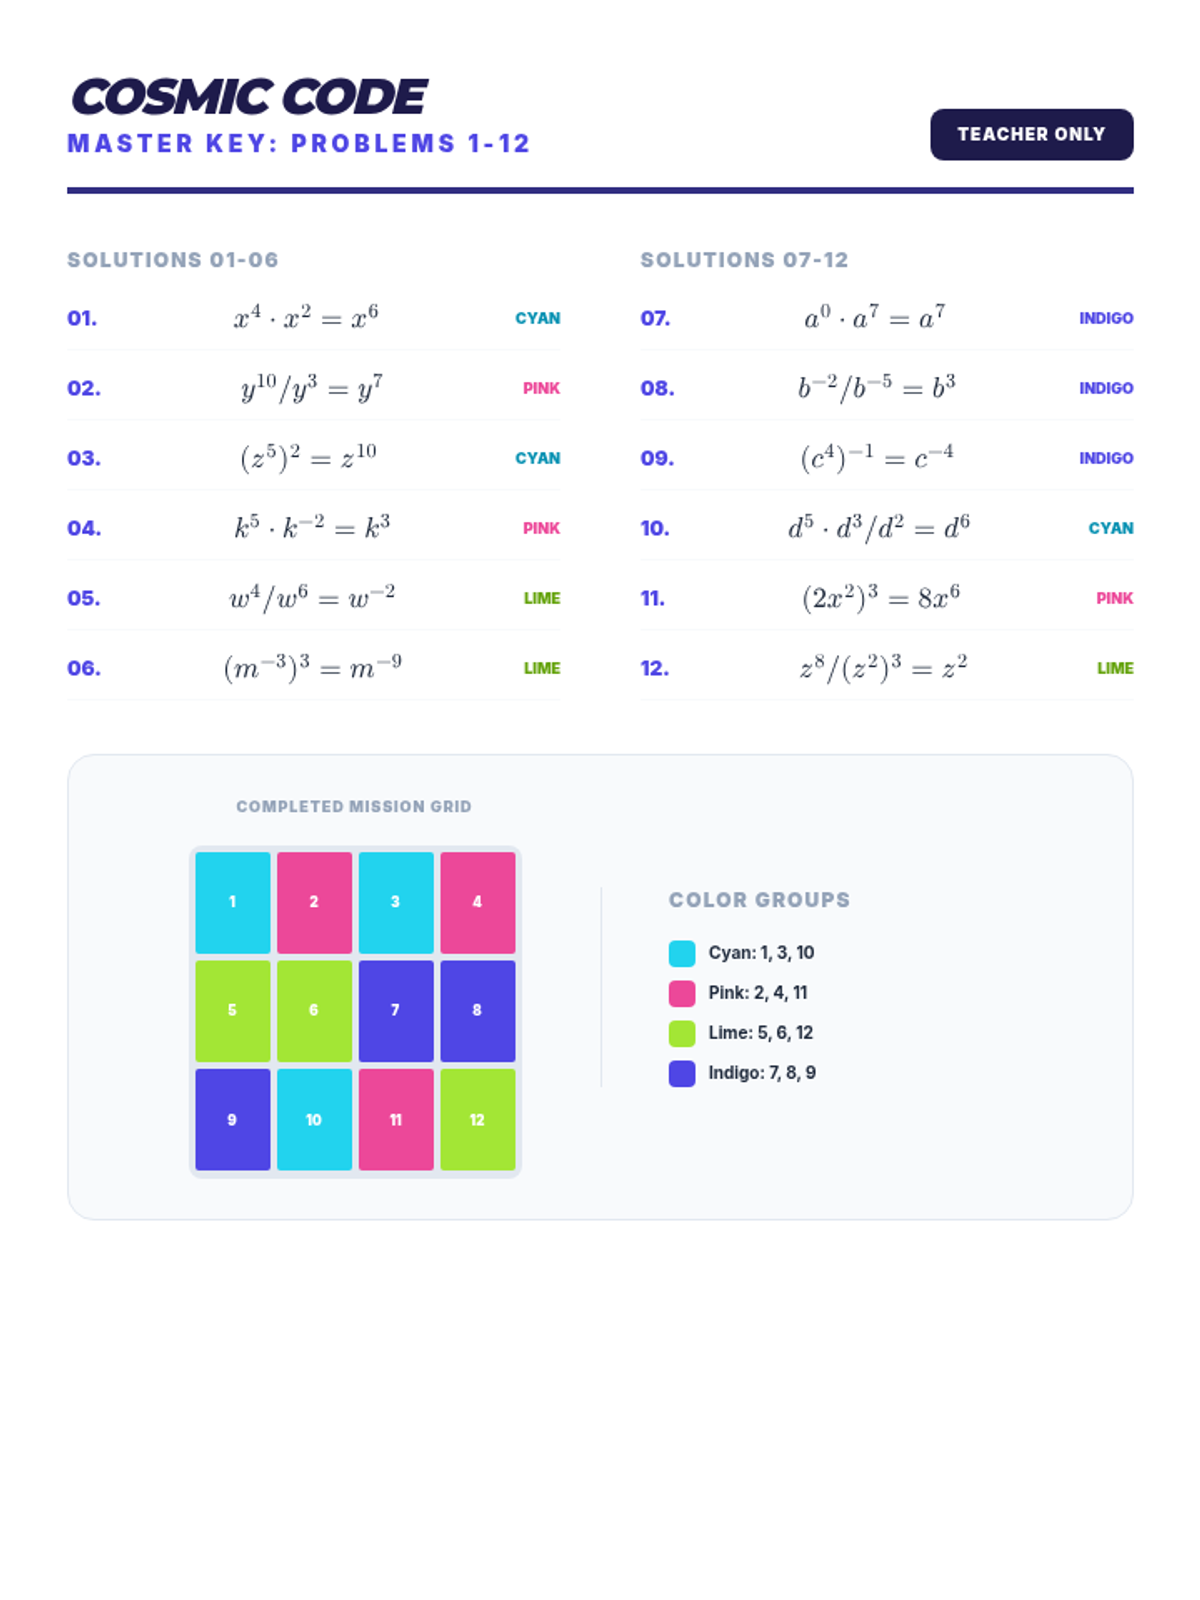
A comprehensive lesson on exponent rules featuring a cosmic arcade theme, covering product, quotient, power-to-power, zero, and negative exponent rules.
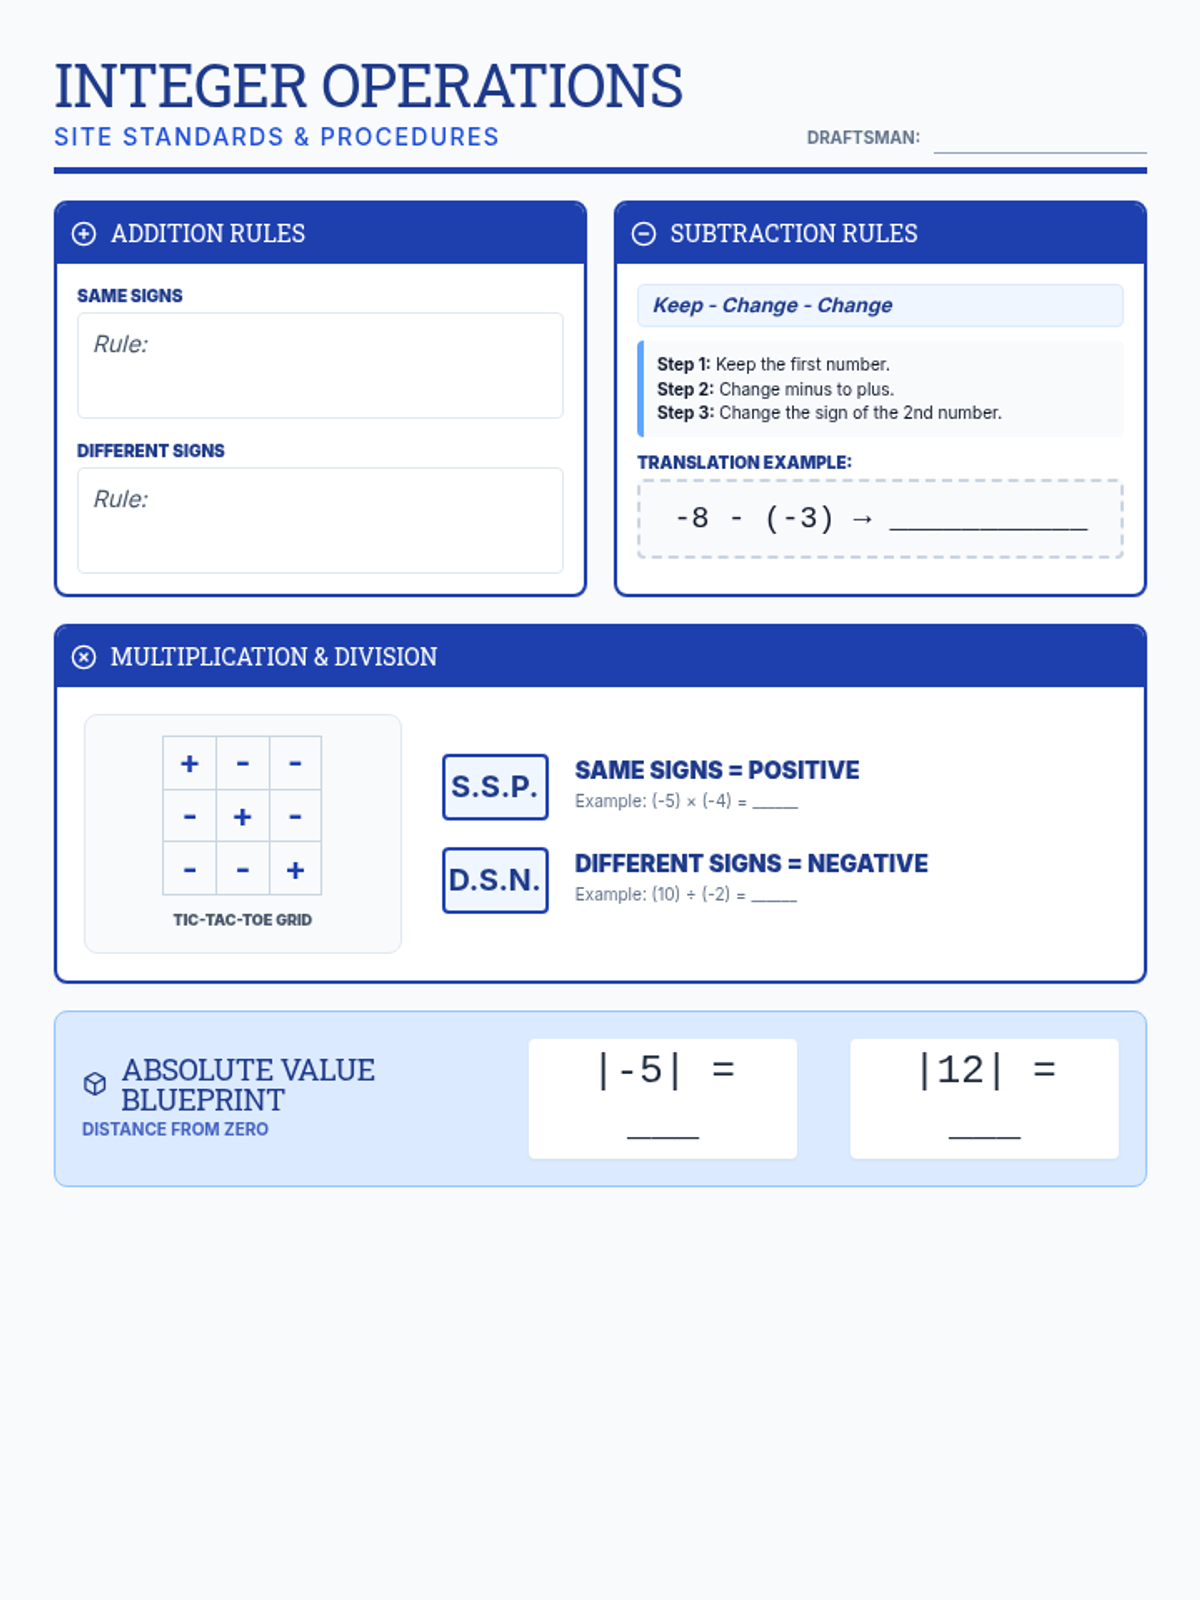
A foundational lesson covering the essential vocabulary and concepts for Pre-Algebra, focusing on algebraic expressions and integer operations.
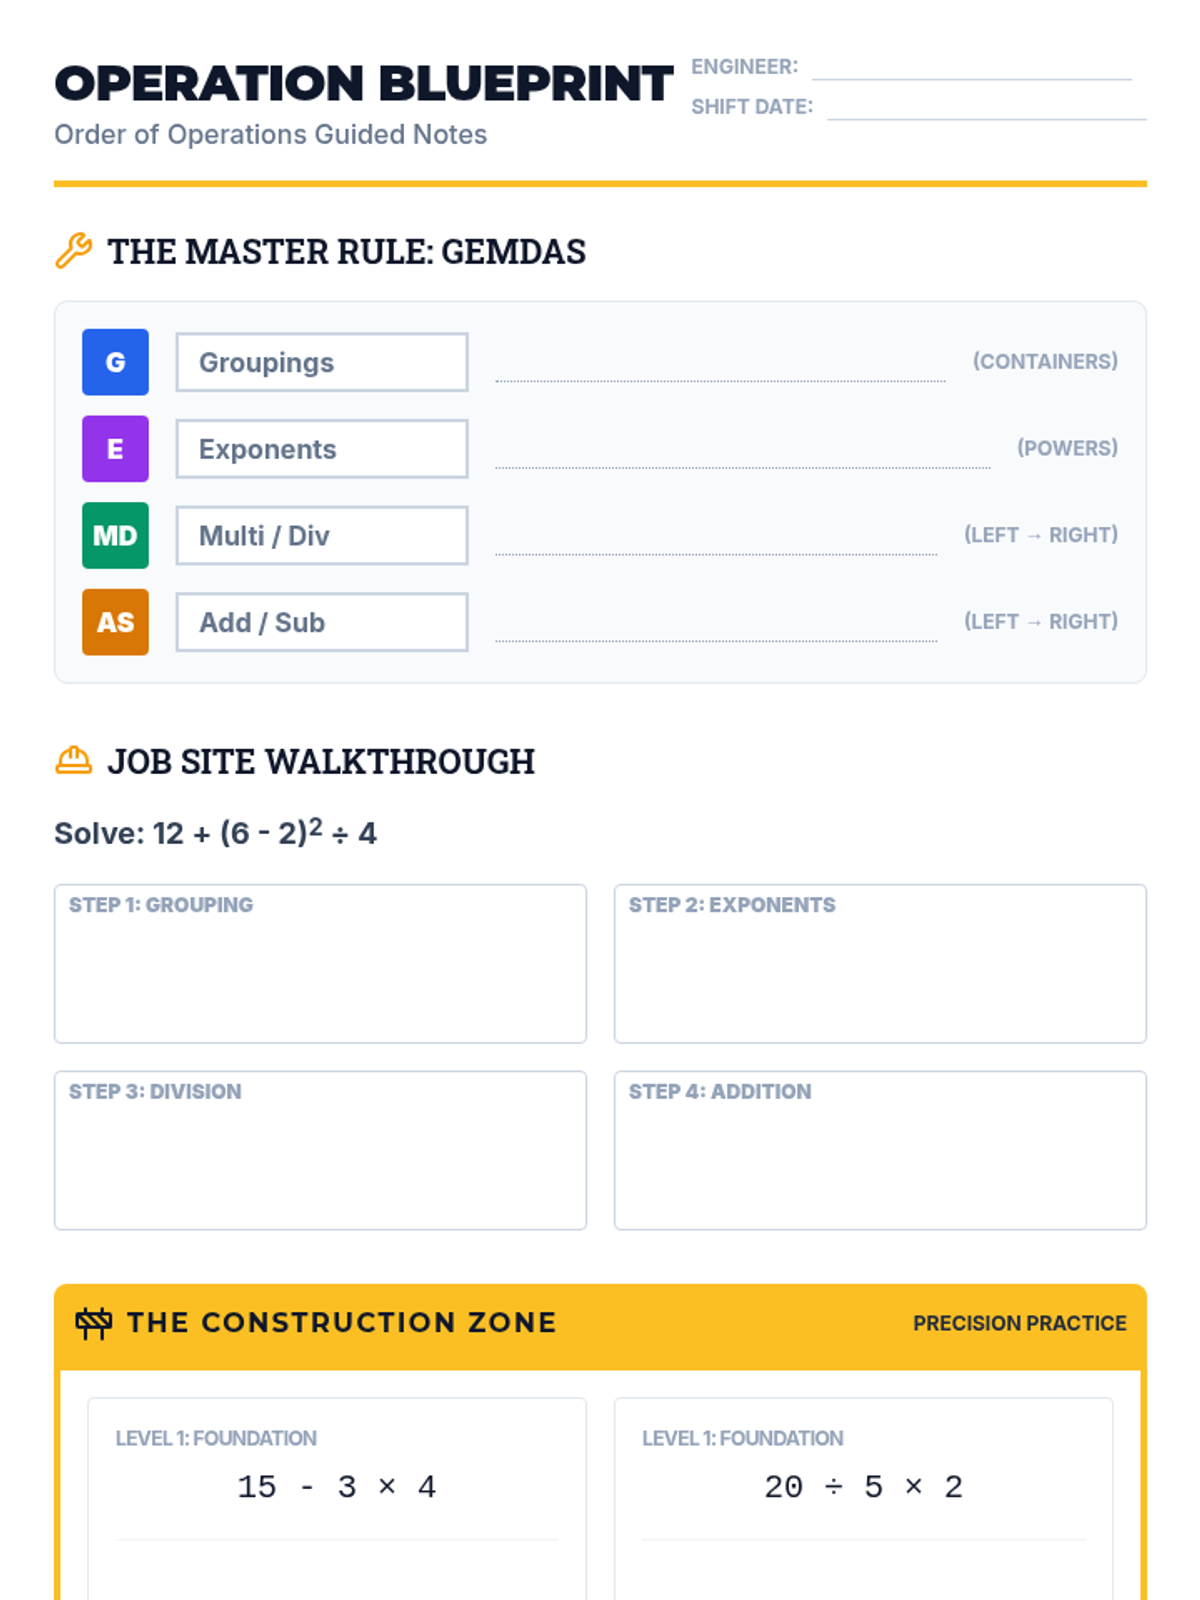
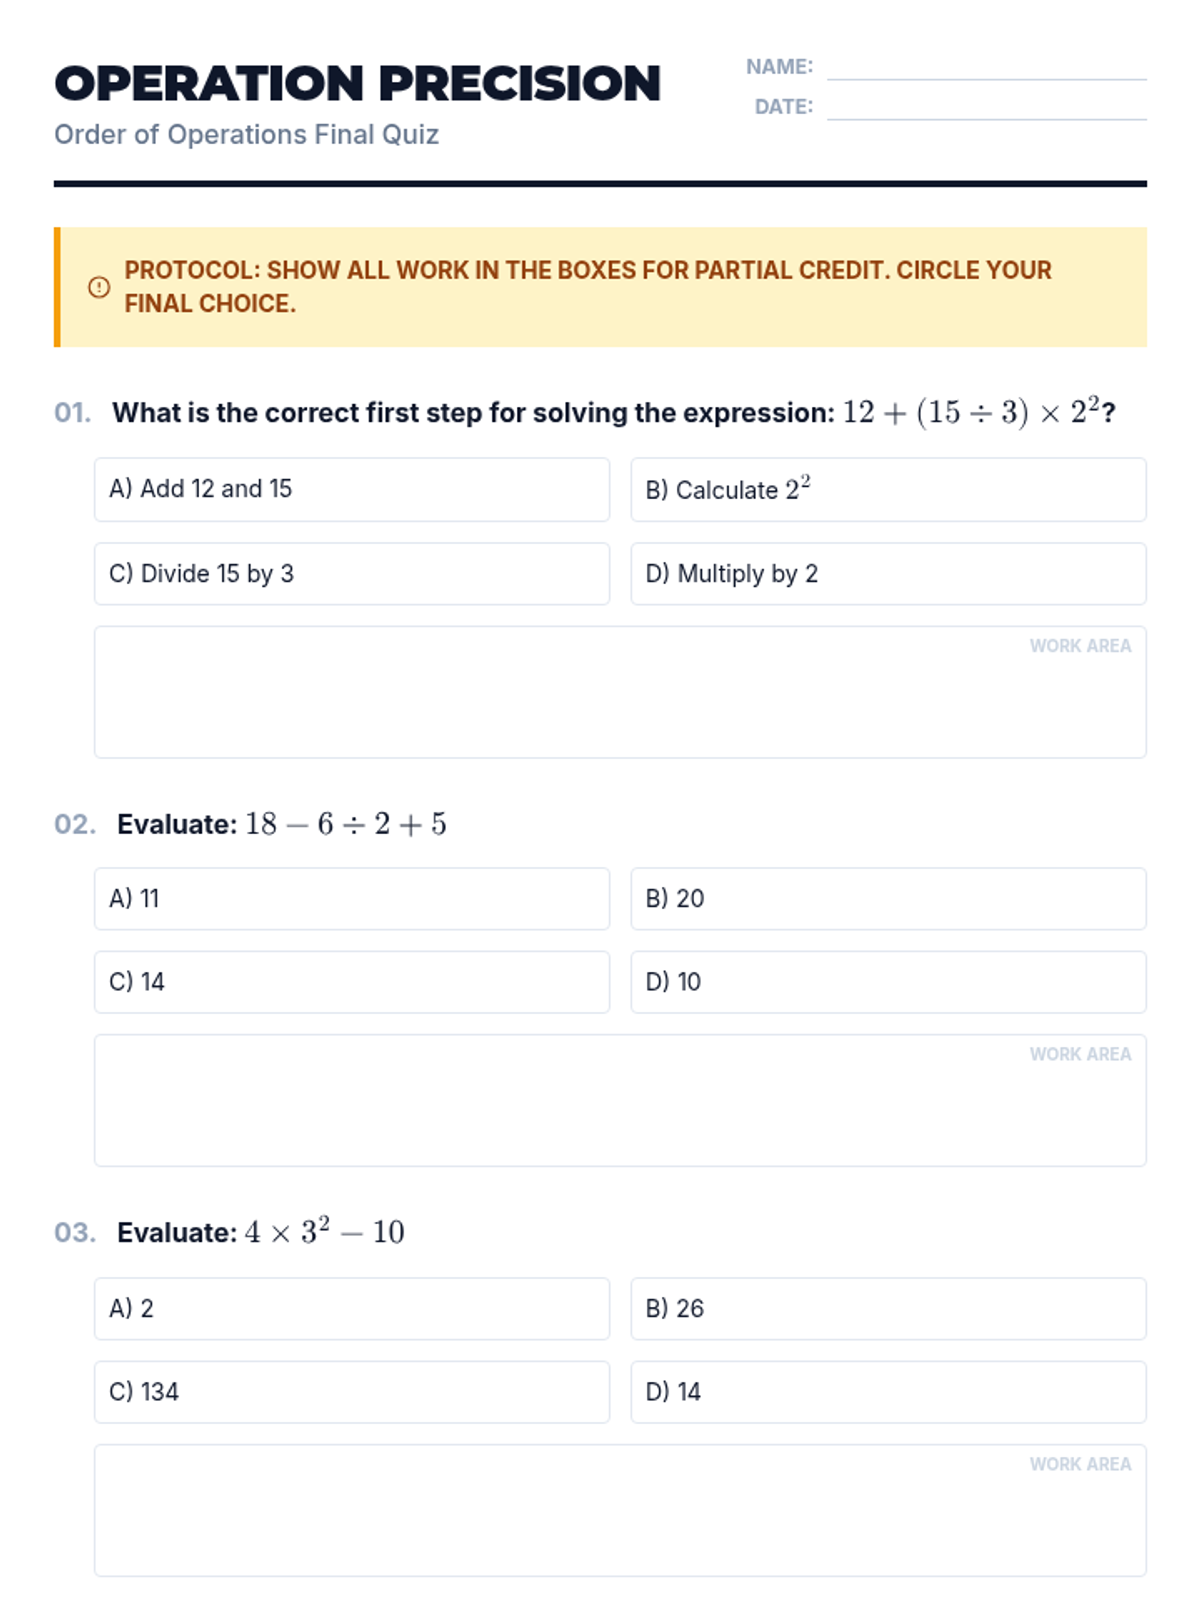
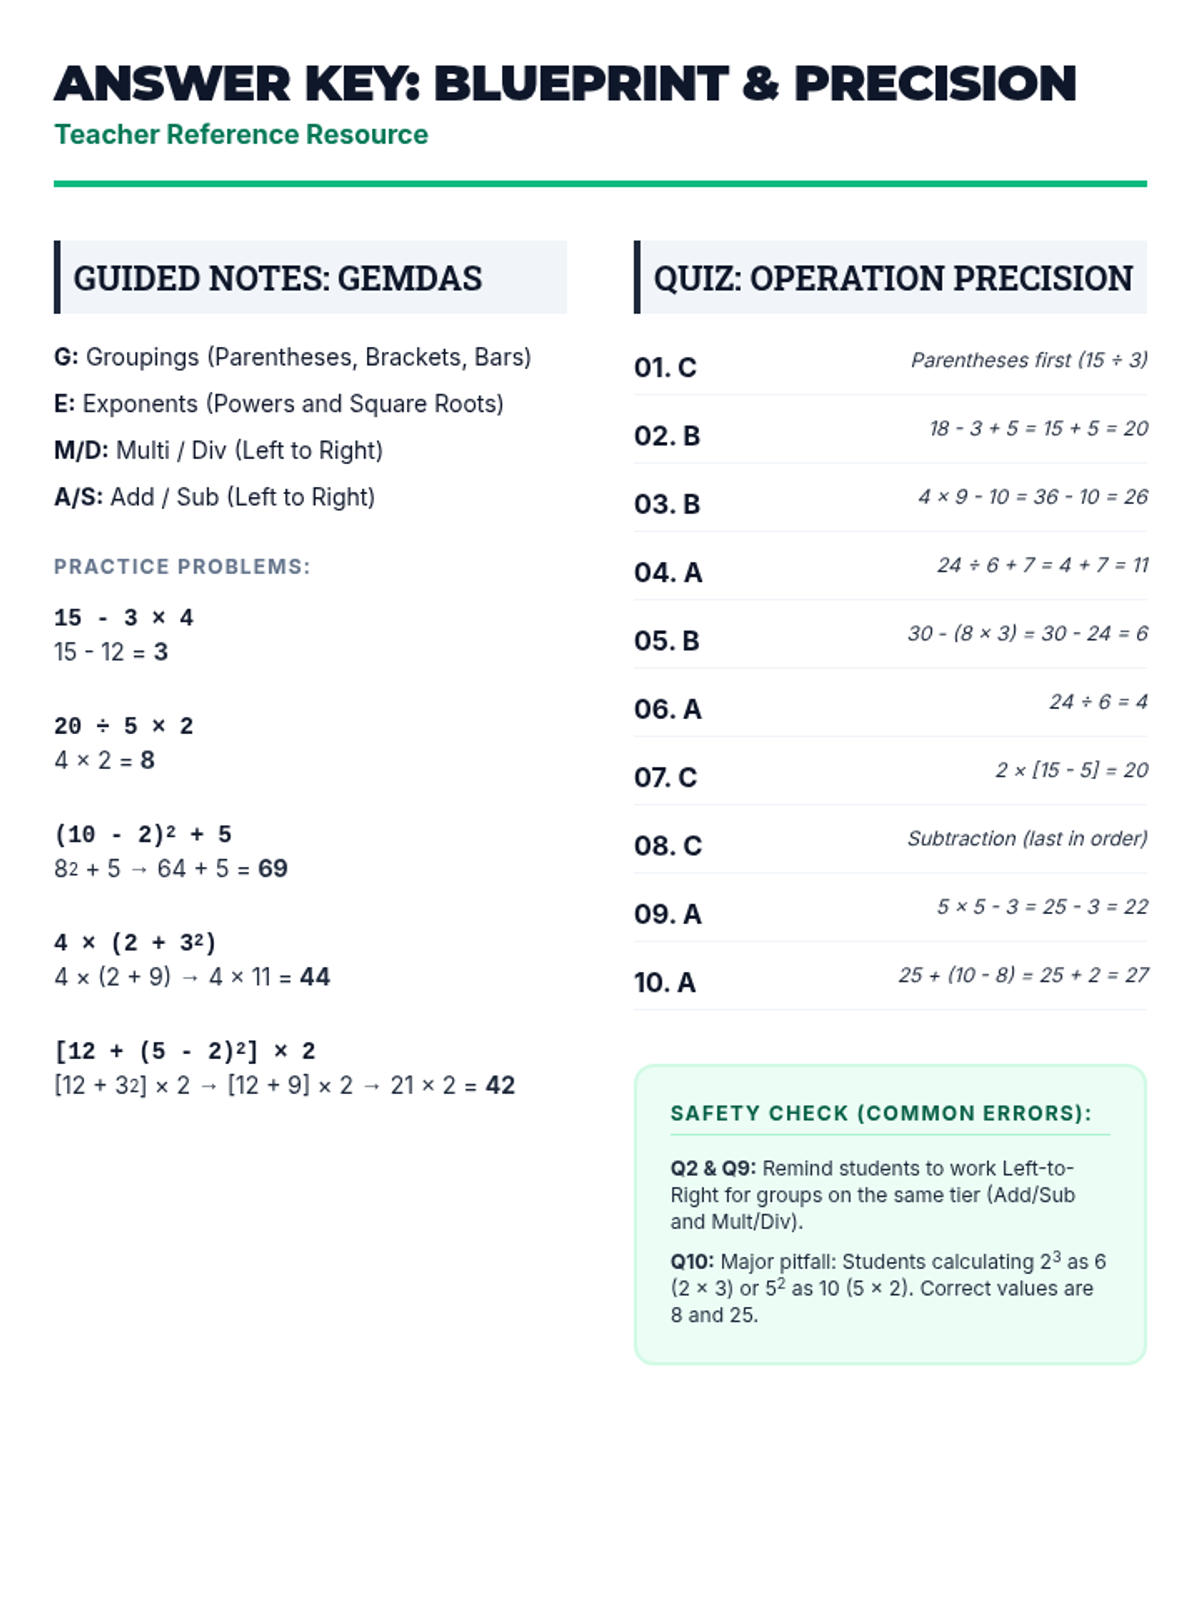
A comprehensive introduction to the Order of Operations (GEMDAS) using a construction blueprint theme to emphasize precision and sequence.
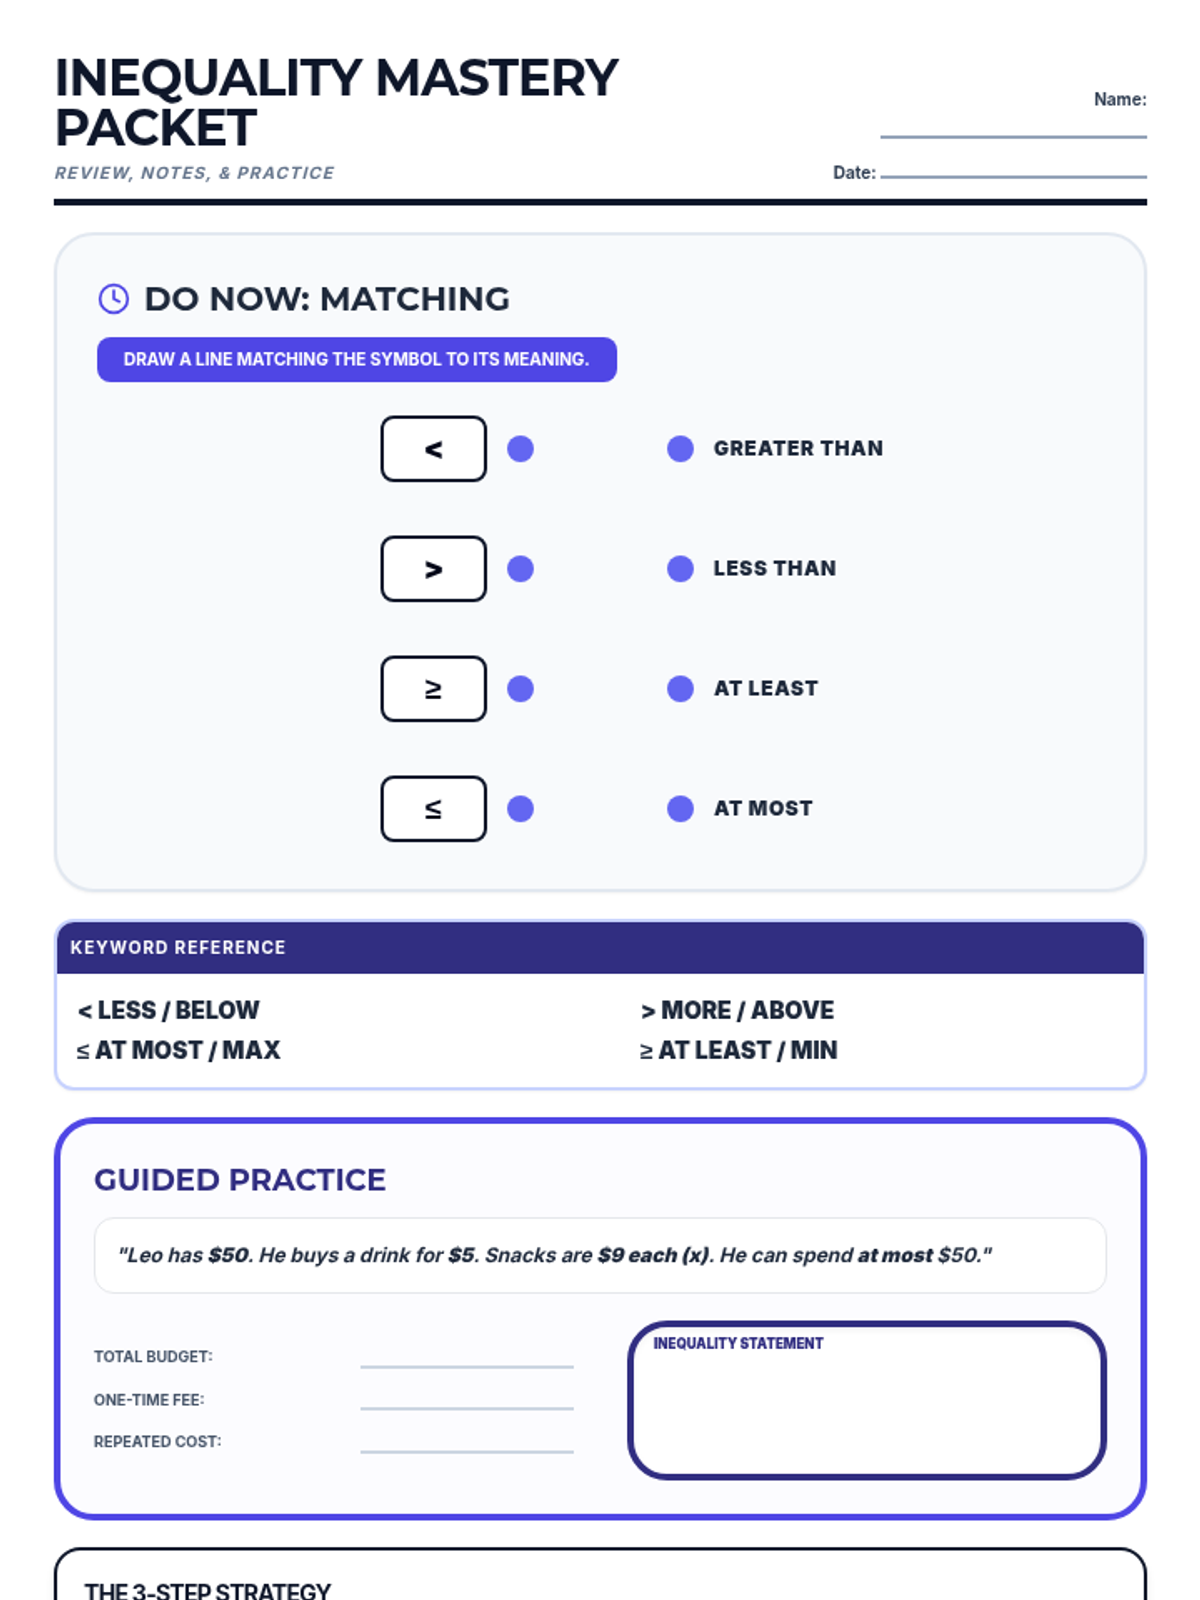
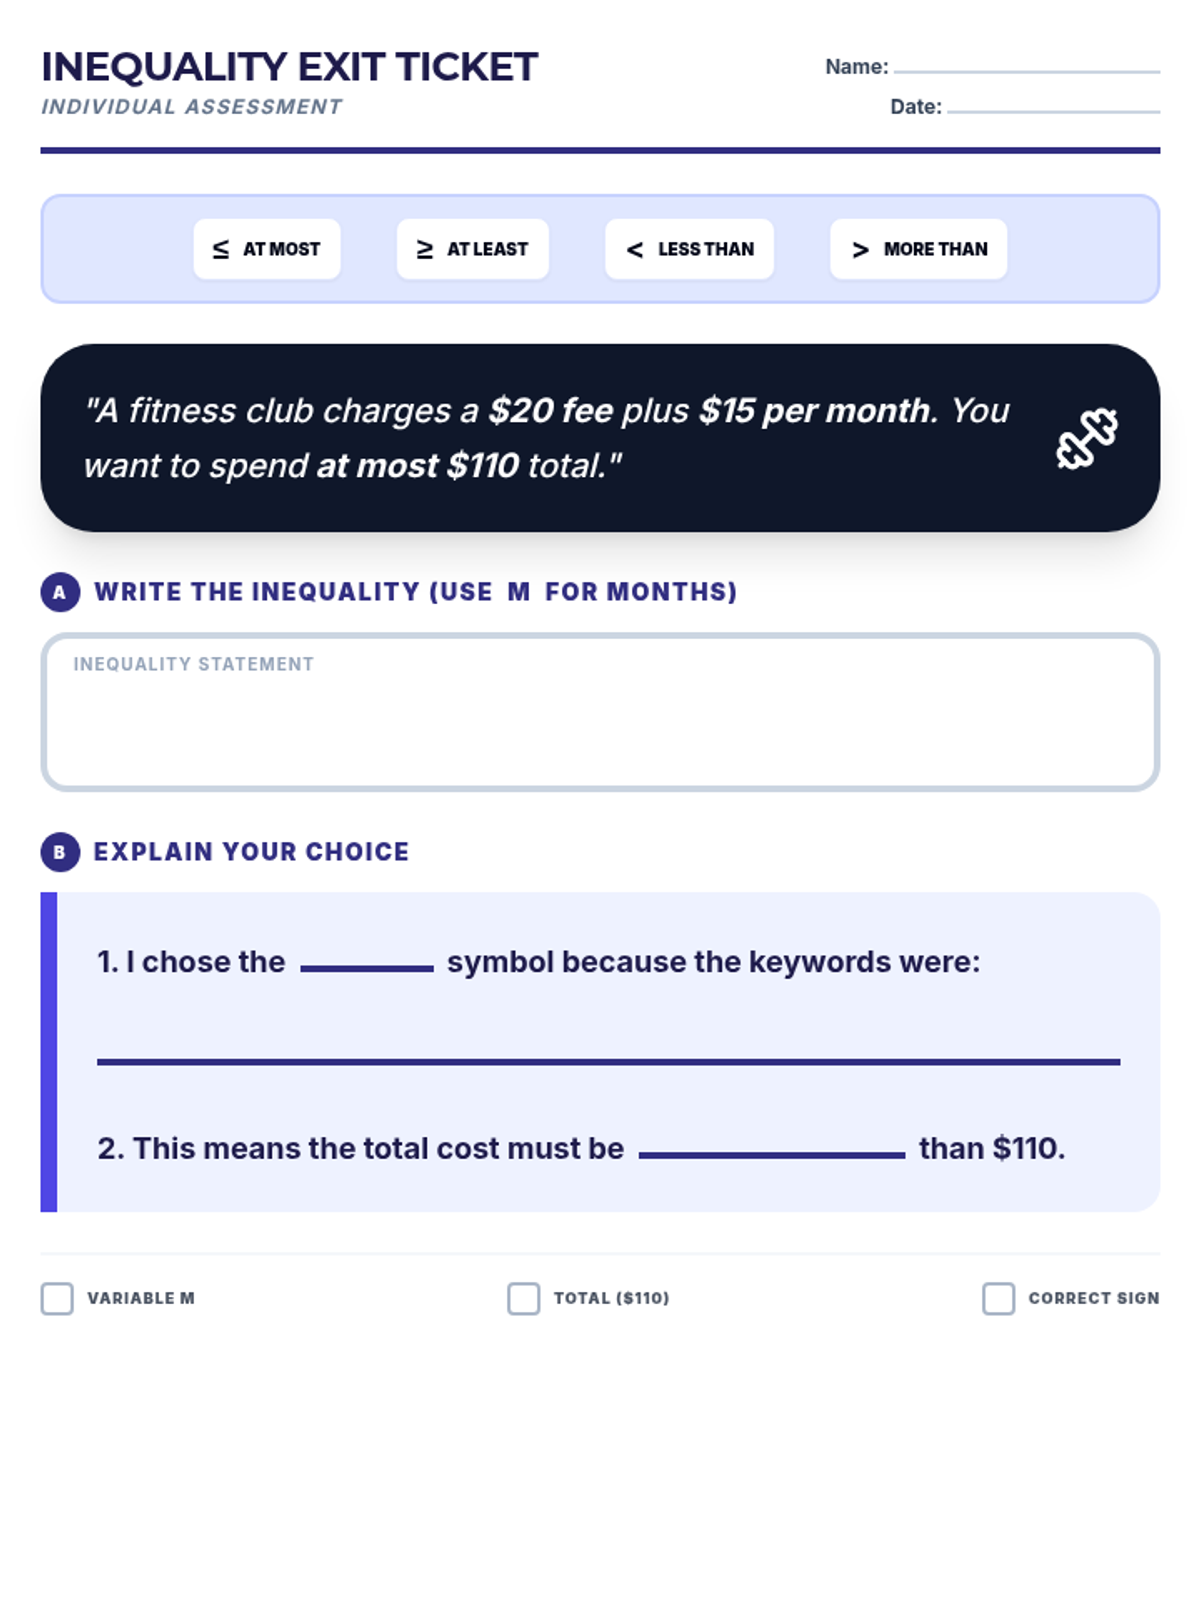
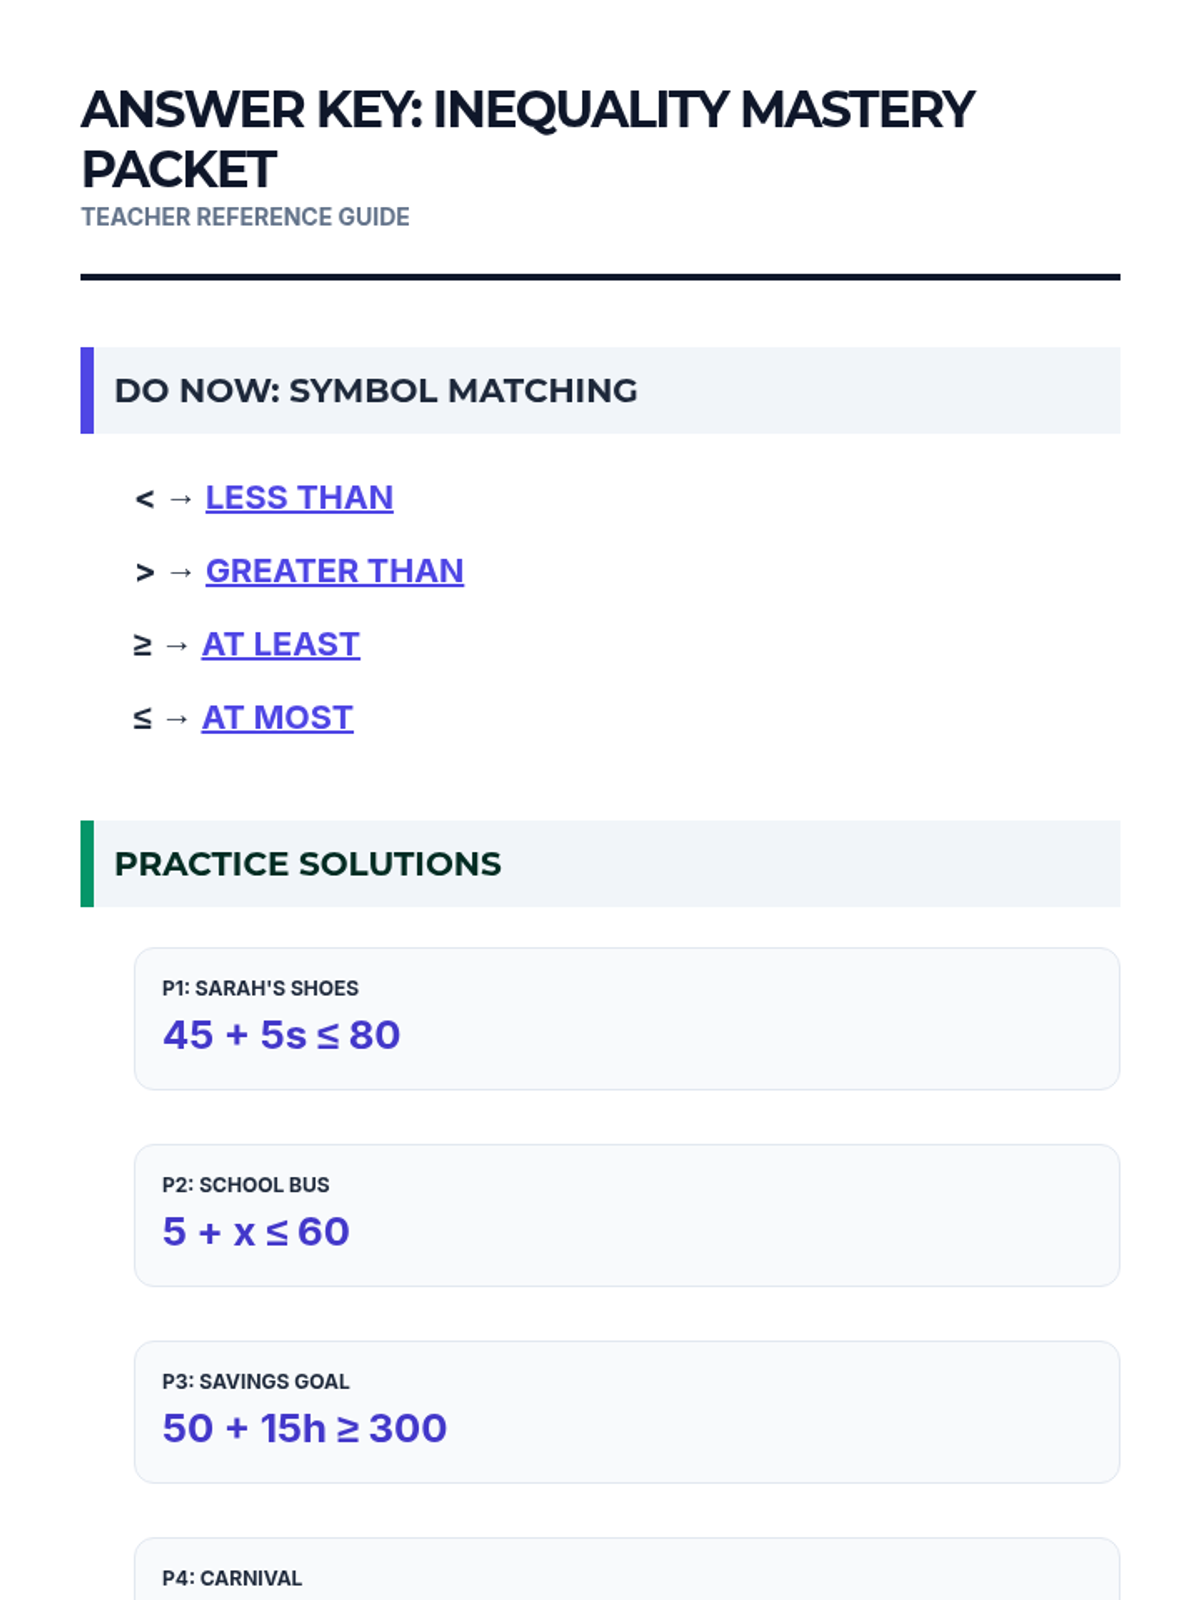
A scaffolded practice lesson for 9th and 10th-grade special education students to reinforce writing linear inequalities from word problems. The lesson includes a review of keyword signals, guided translation steps, and independent practice with real-world scenarios.
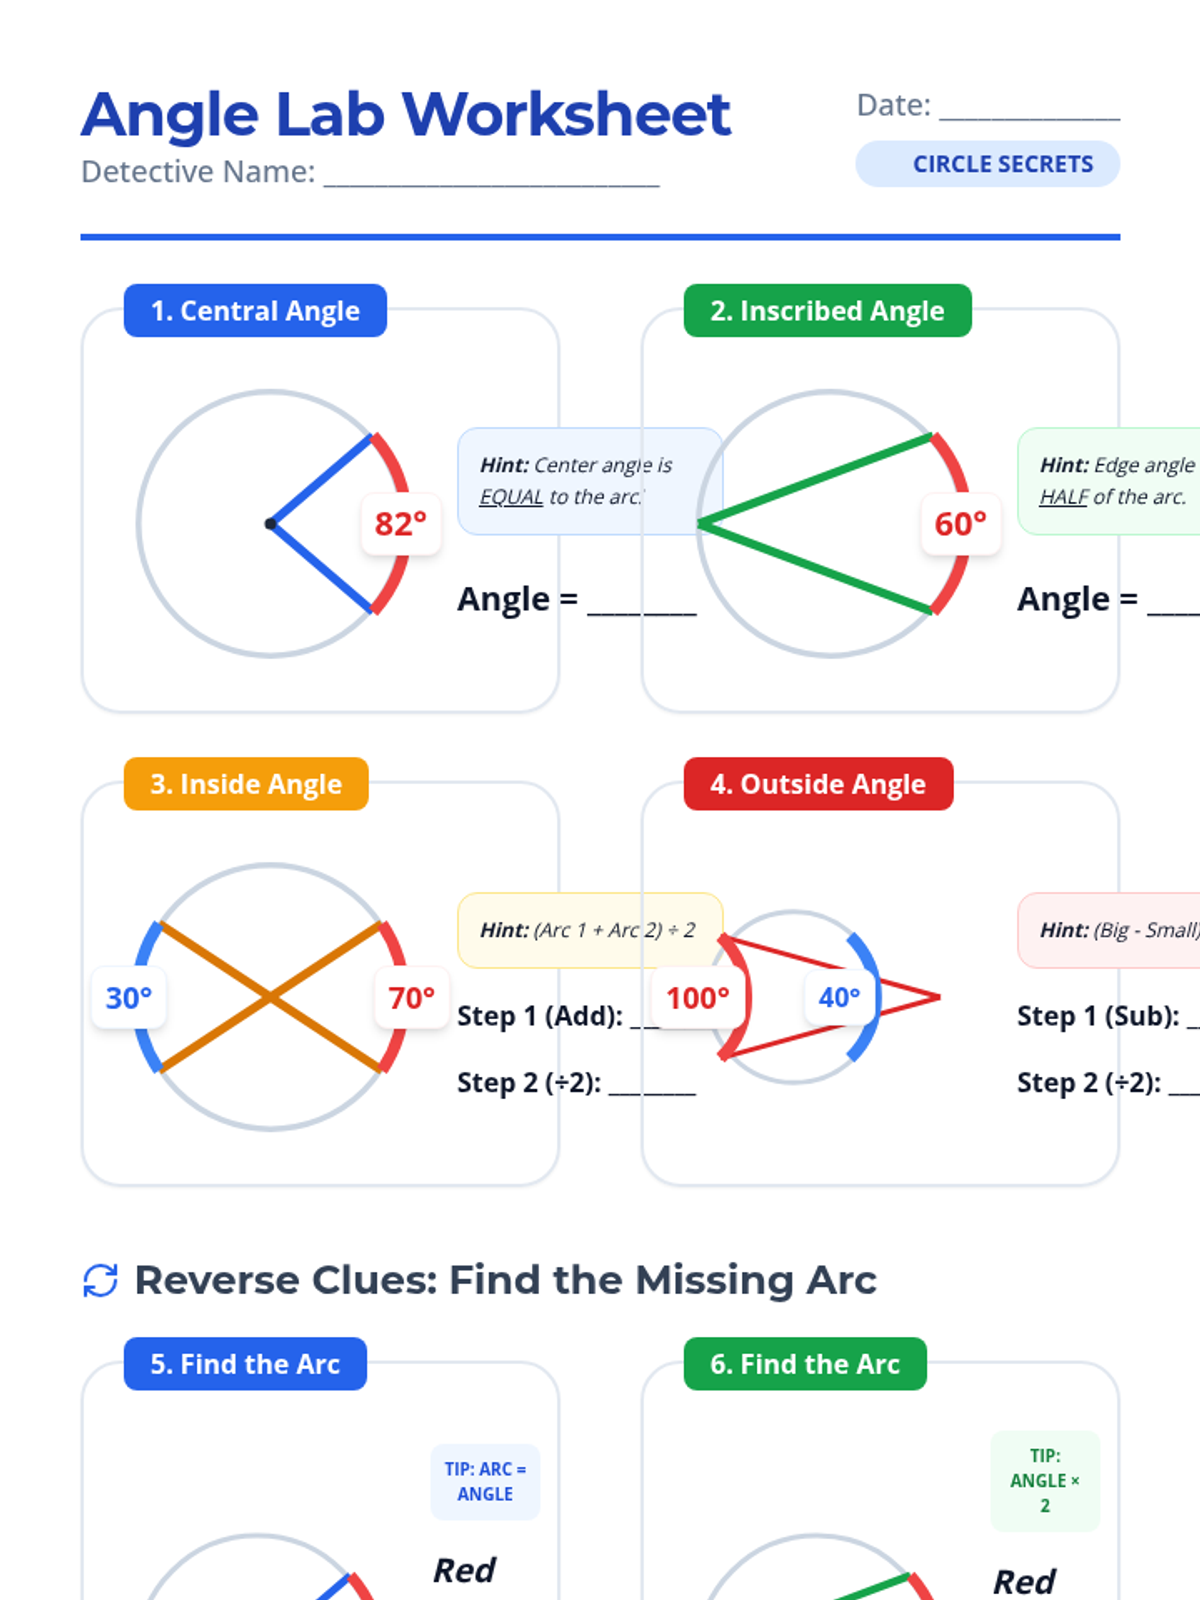
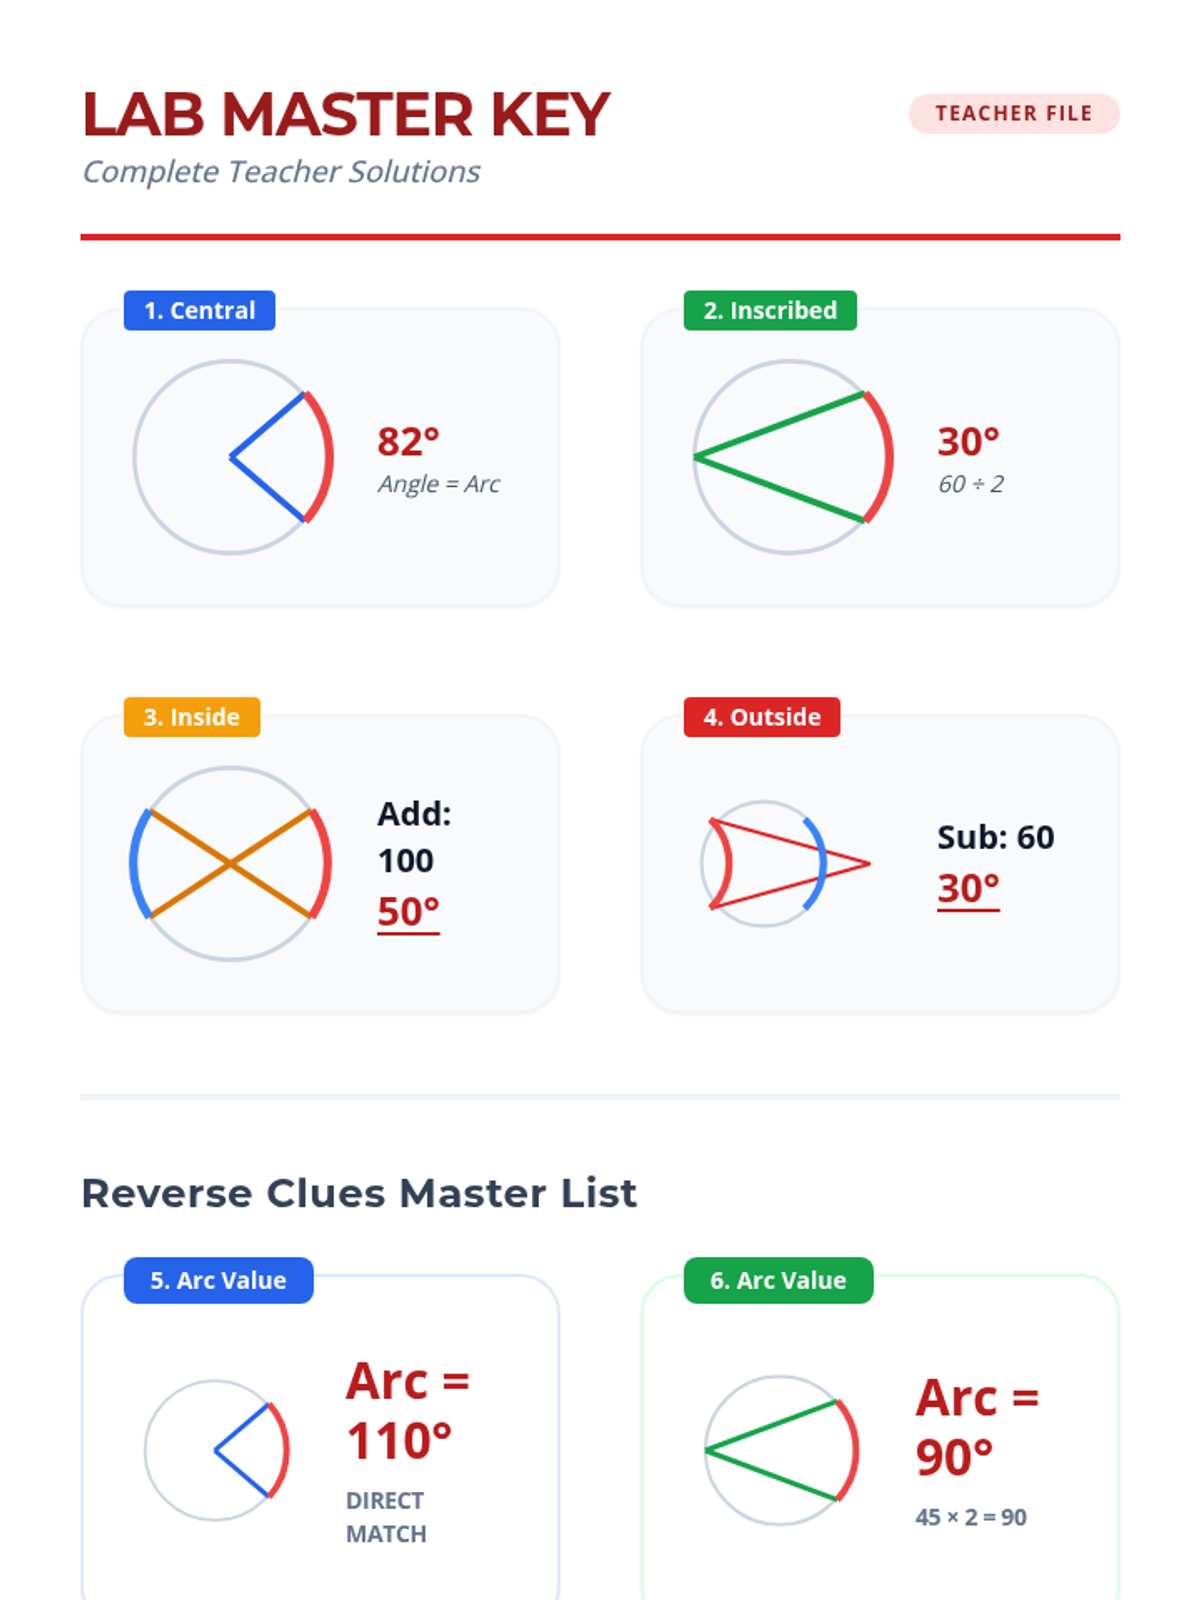
A guided exploration of circle angle relationships (central, inscribed, interior, and exterior) specifically designed with visual scaffolds and hints for students in a special education setting.
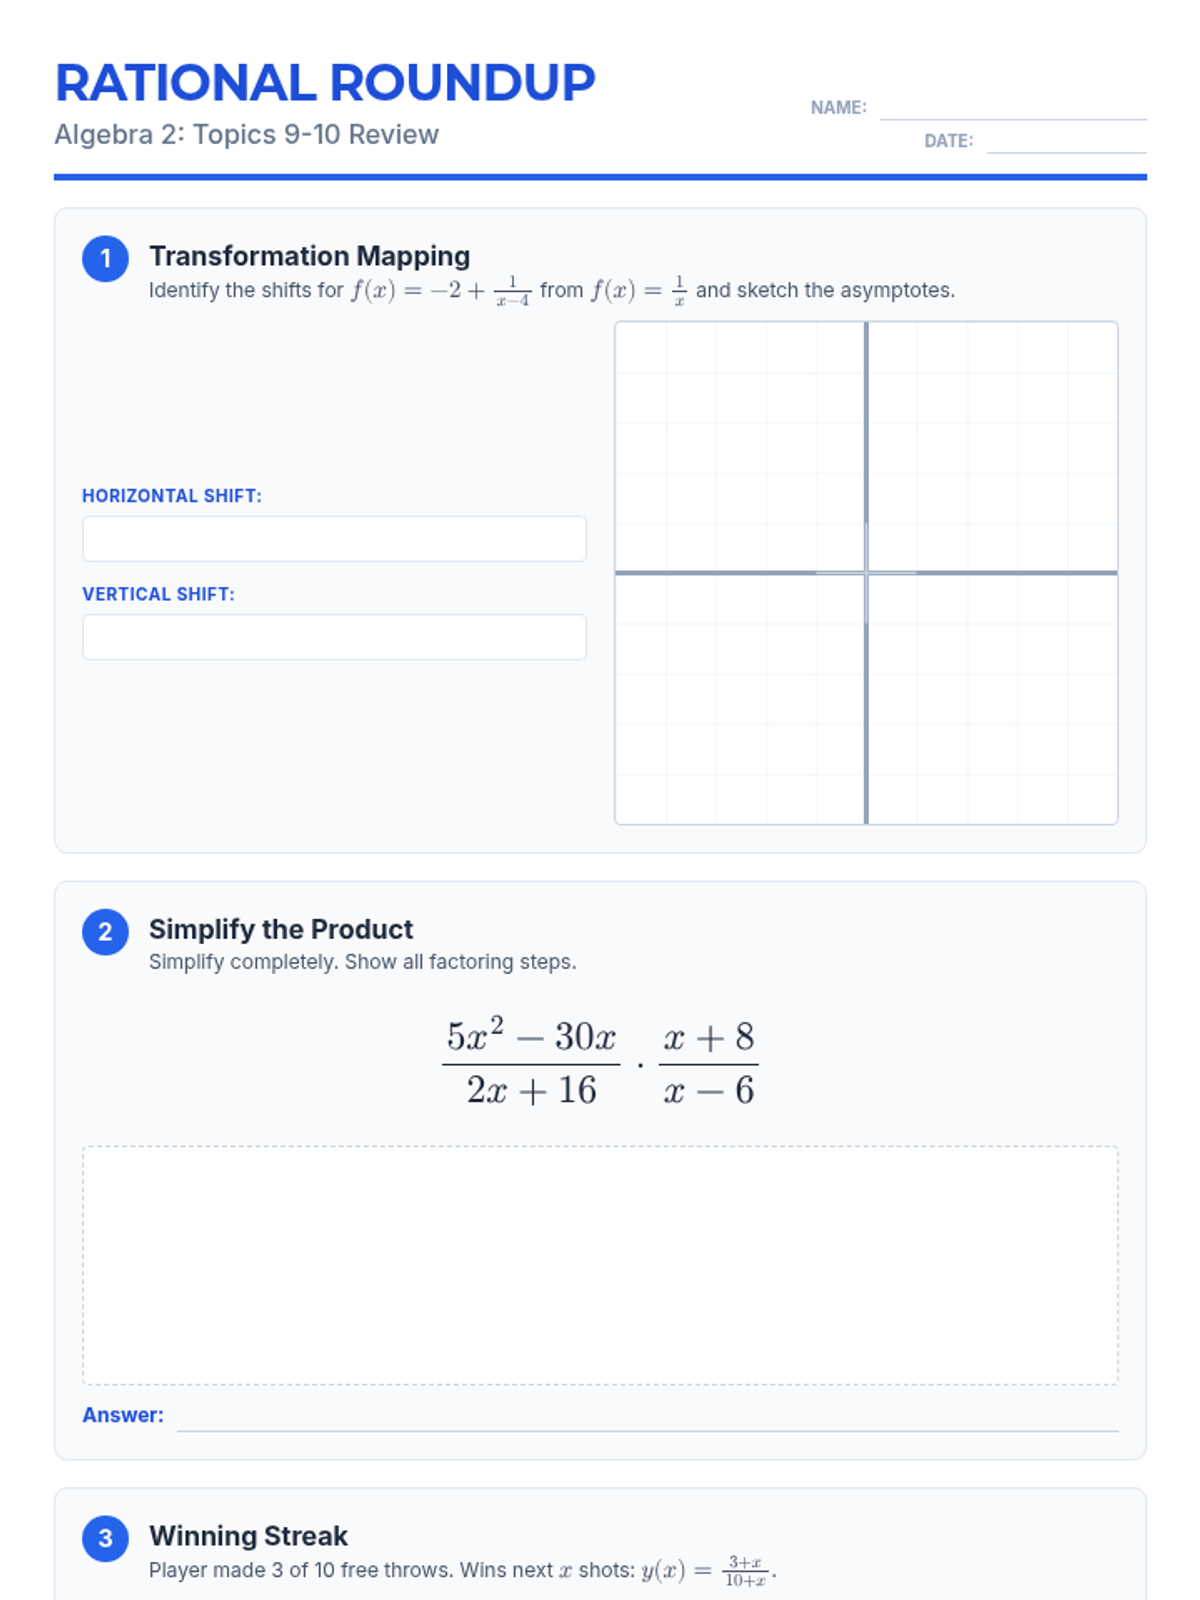
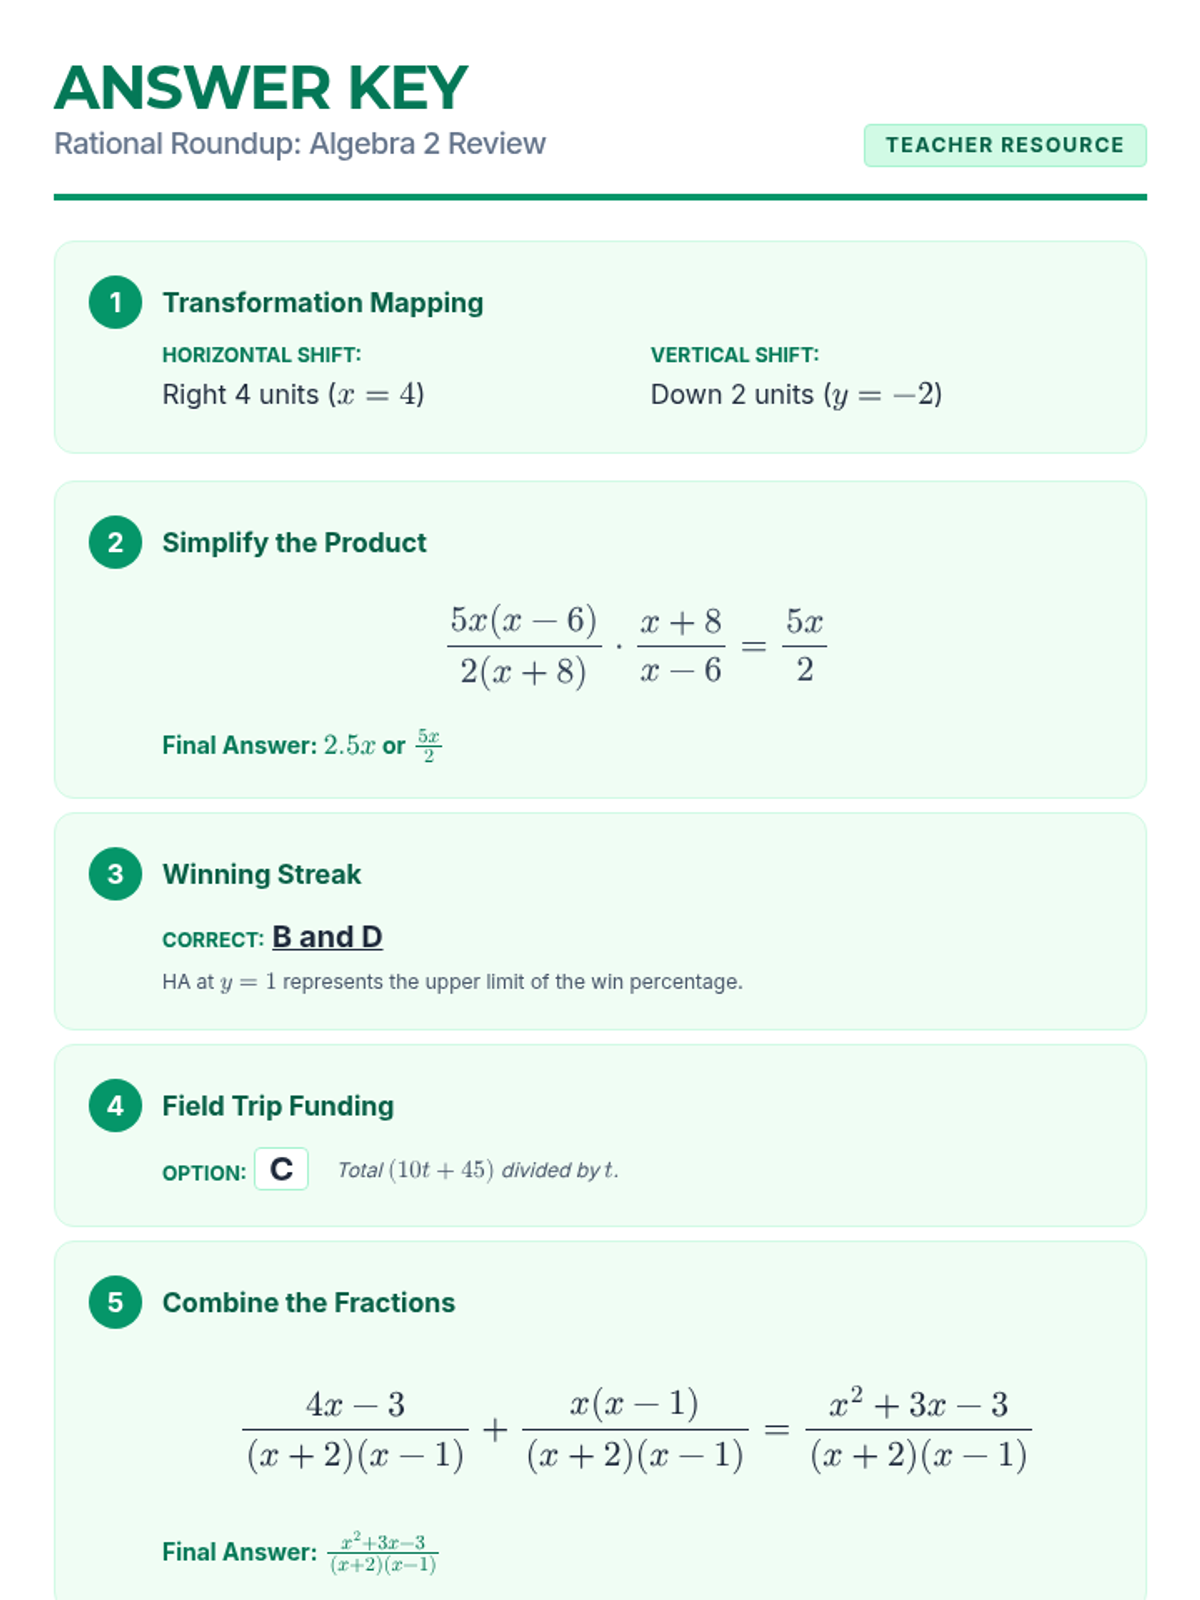
A review lesson focused on transformations, simplifying, adding, and modeling with rational expressions based on district assessment standards.
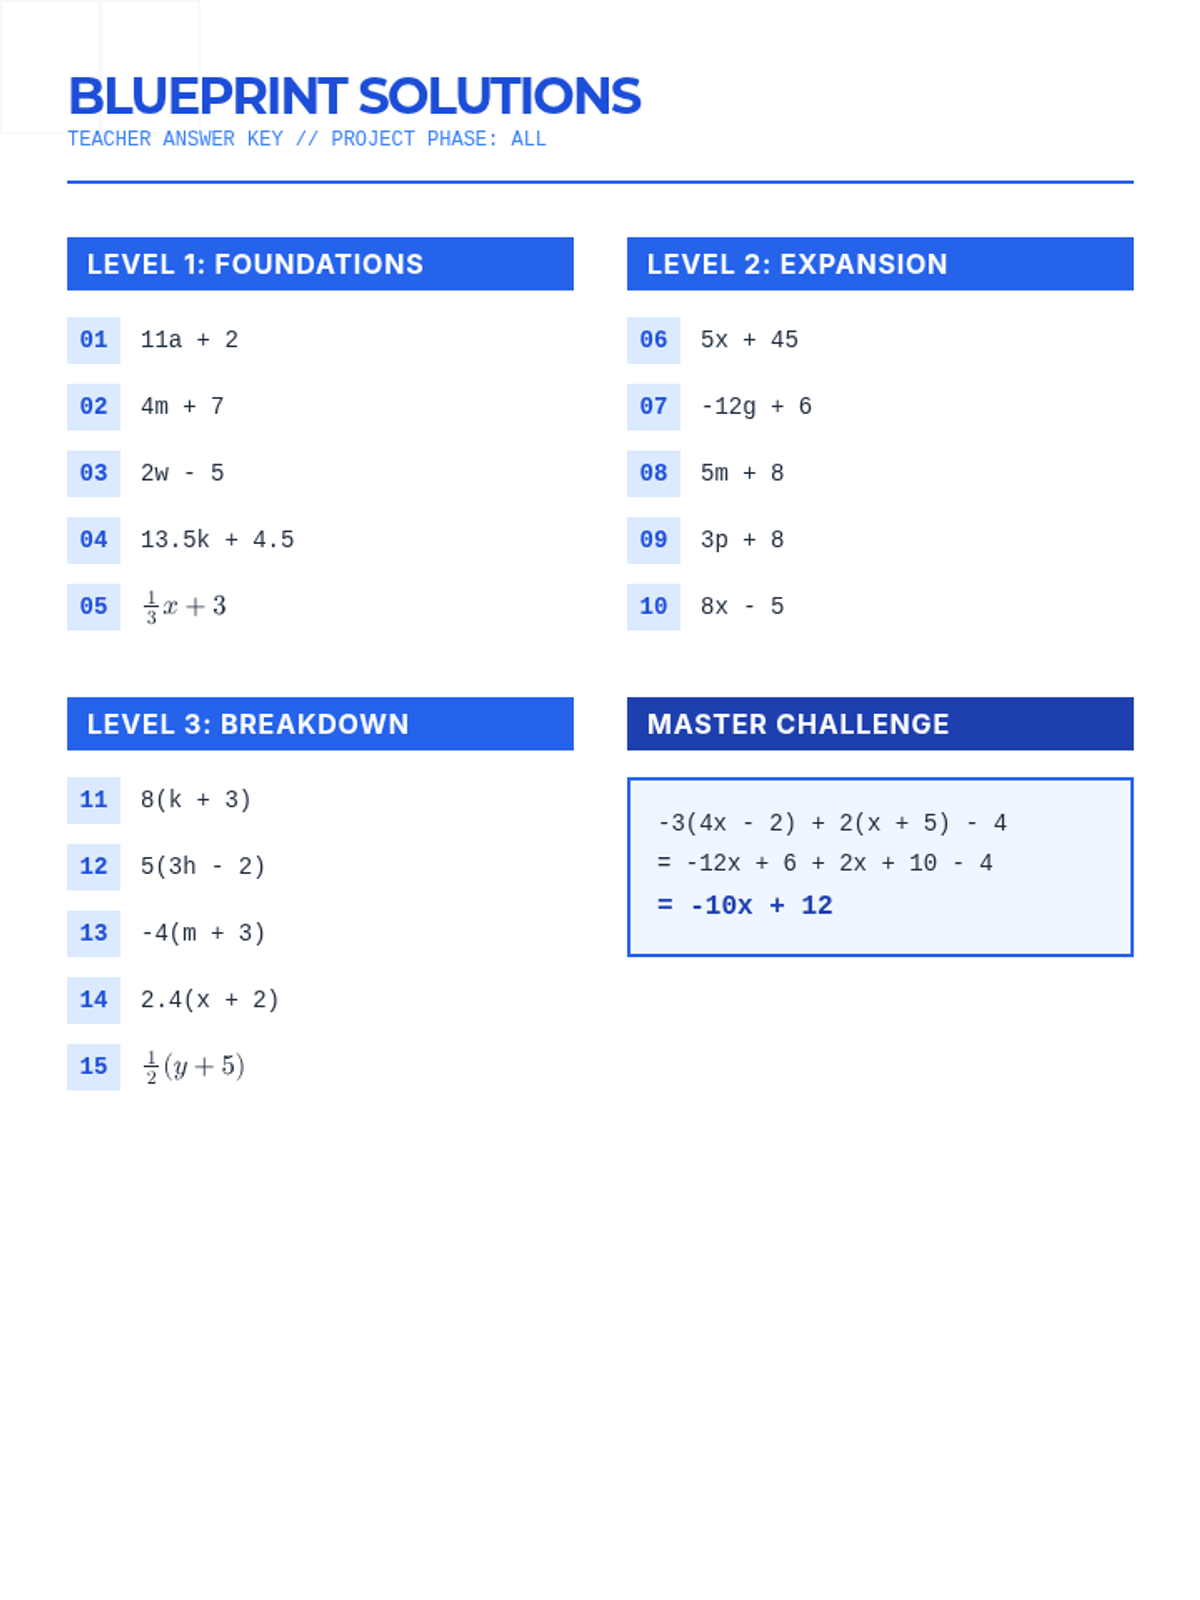
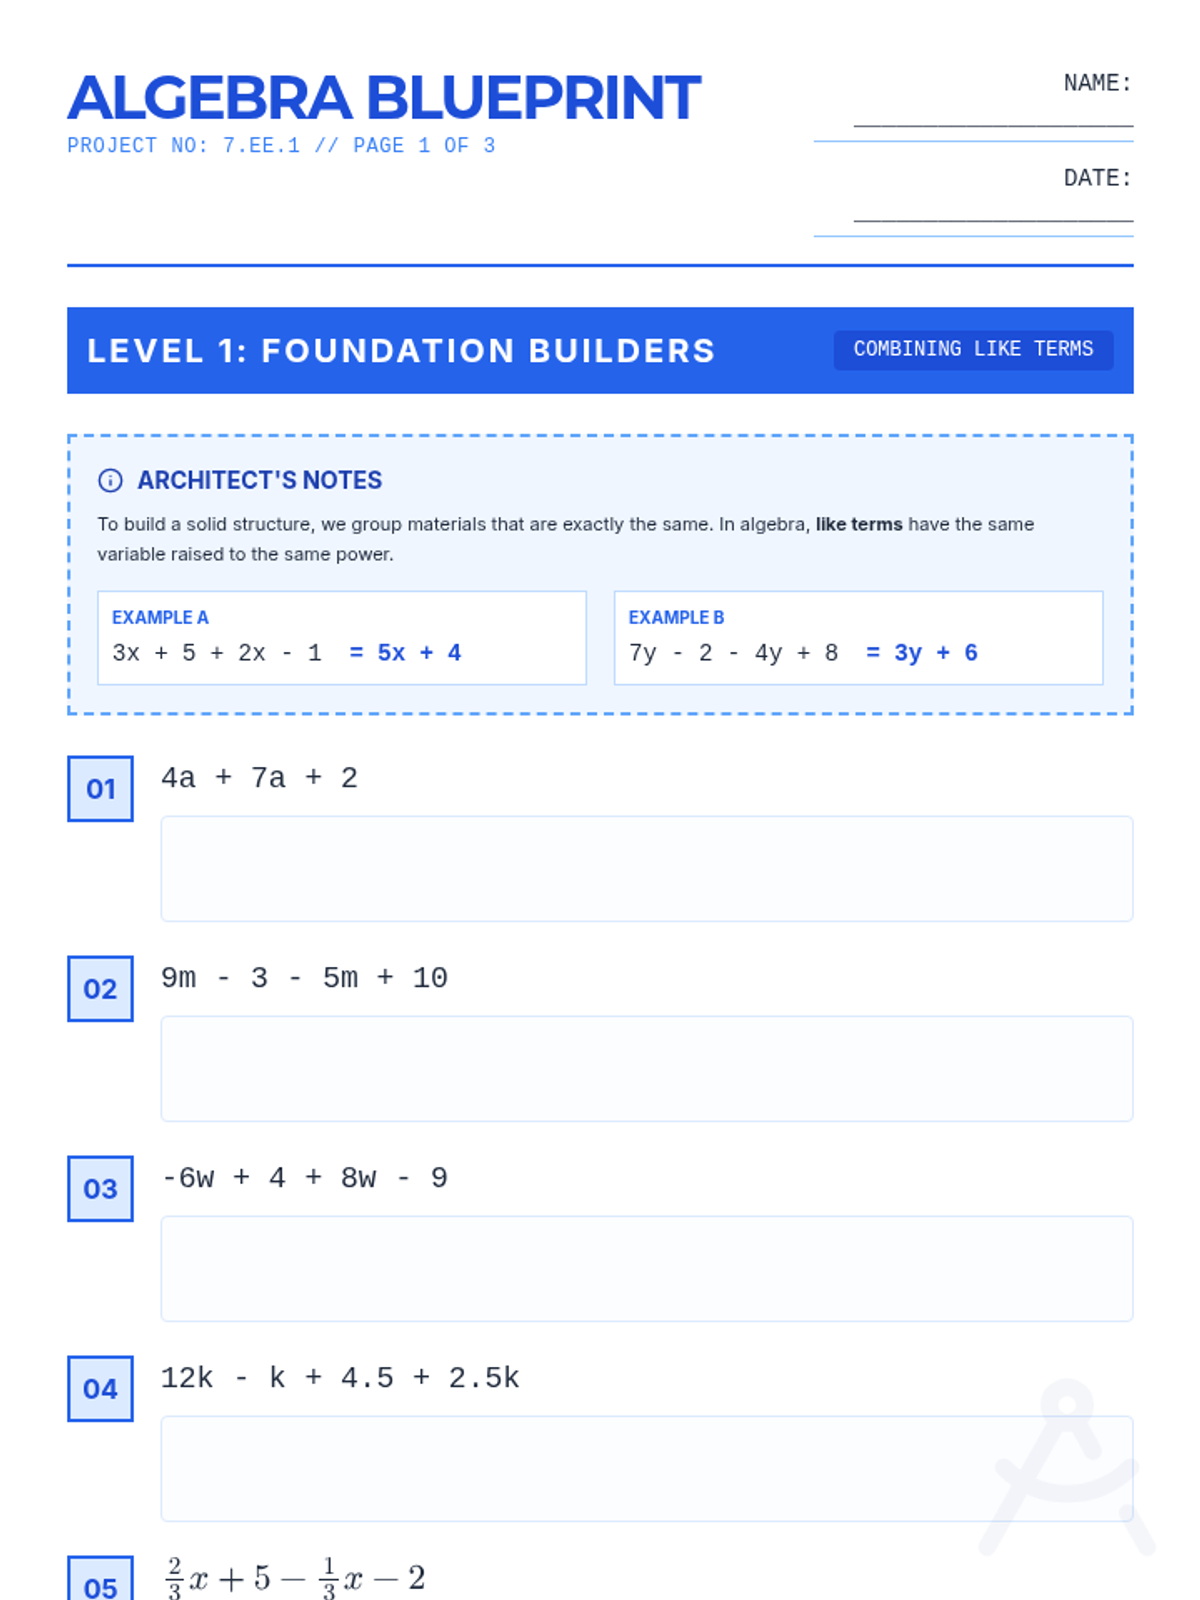
A 3-level practice packet focused on simplifying linear expressions through combining like terms, distributive property, and factoring. Each level increases in complexity to build student mastery of 7.EE.1.
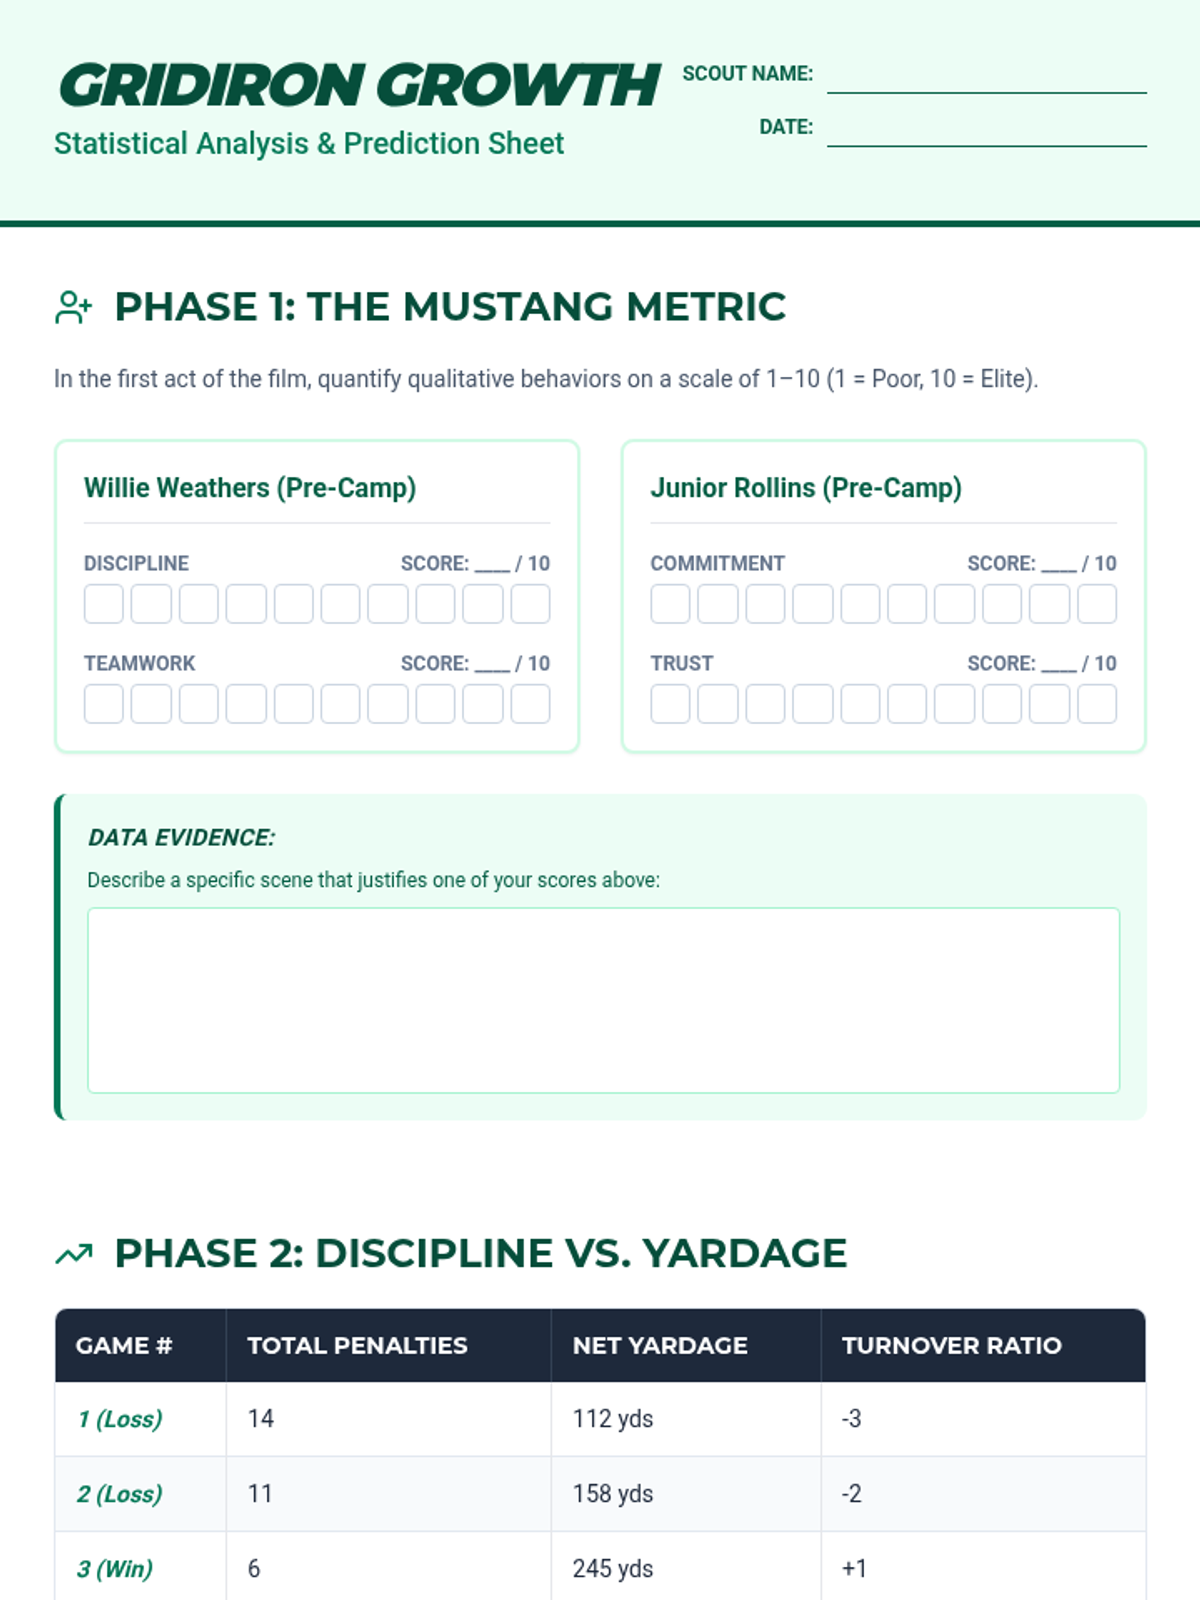
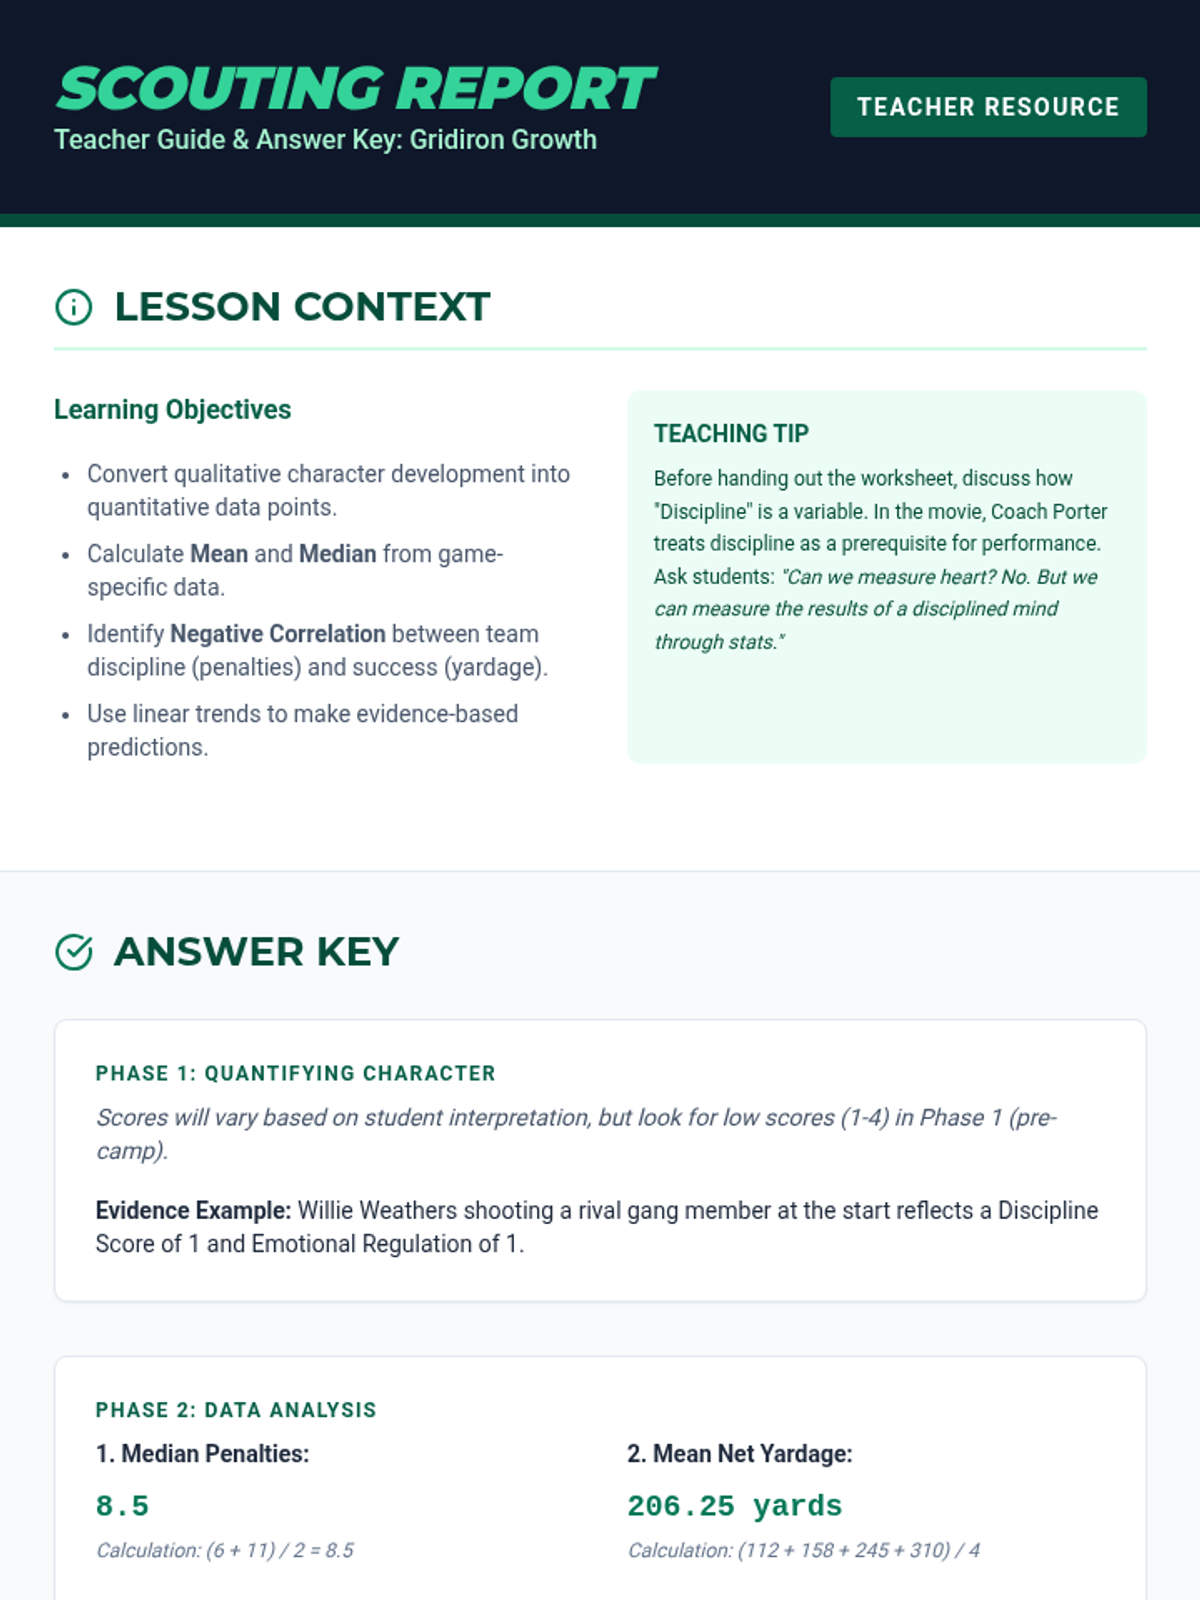
A high school lesson that uses the film Gridiron Gang to teach statistical analysis and data-driven predictions based on character development and team performance. Students will quantify qualitative character traits and use team statistics to forecast game outcomes.
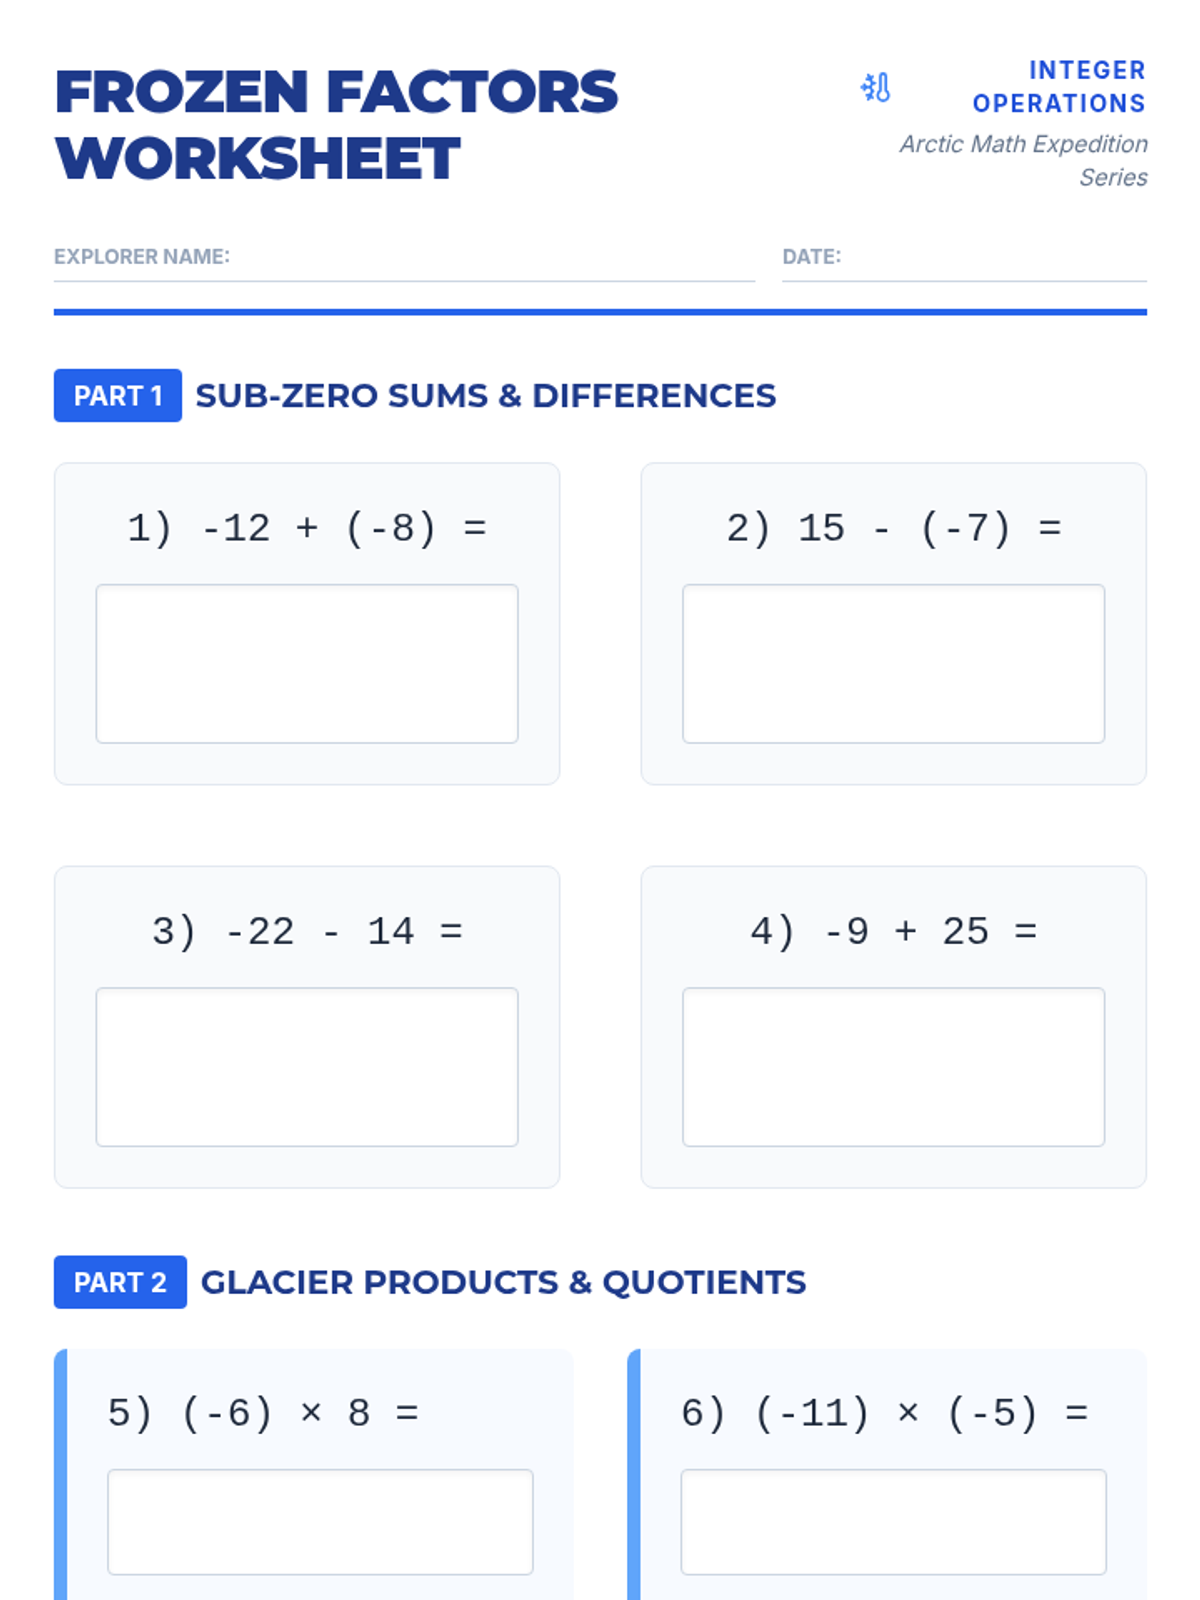
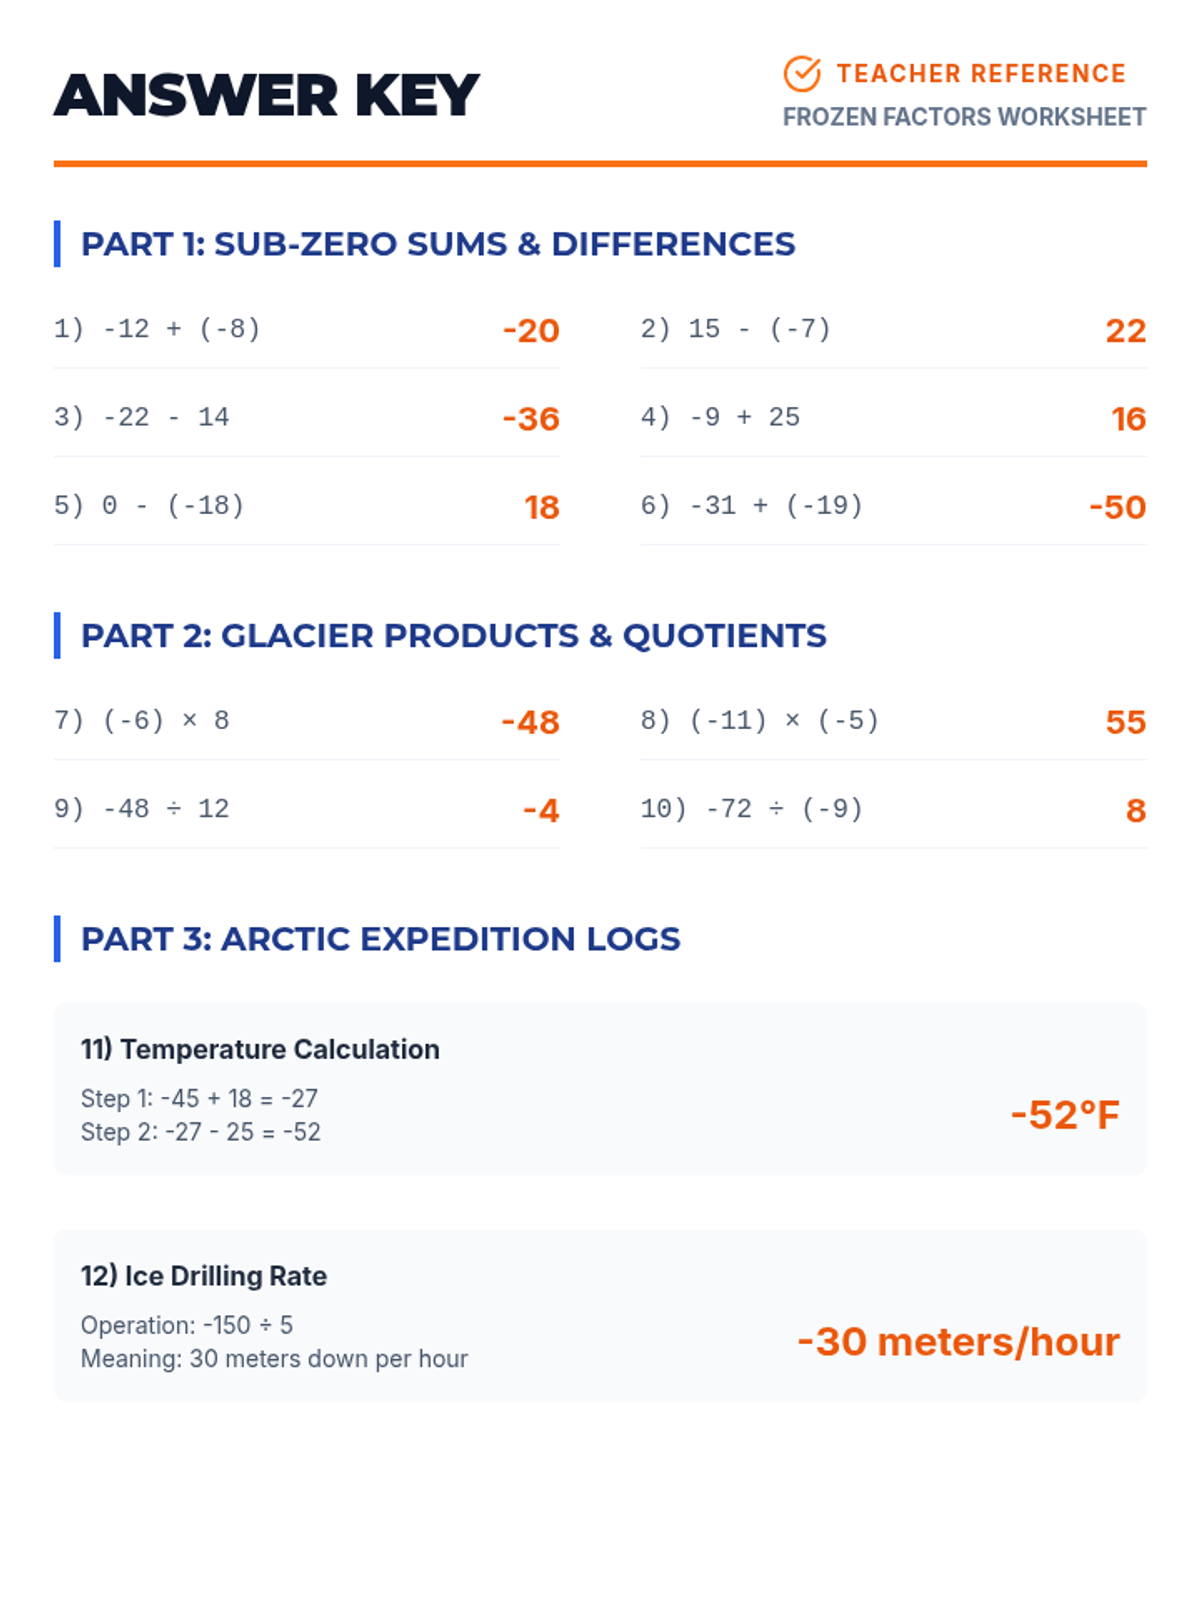
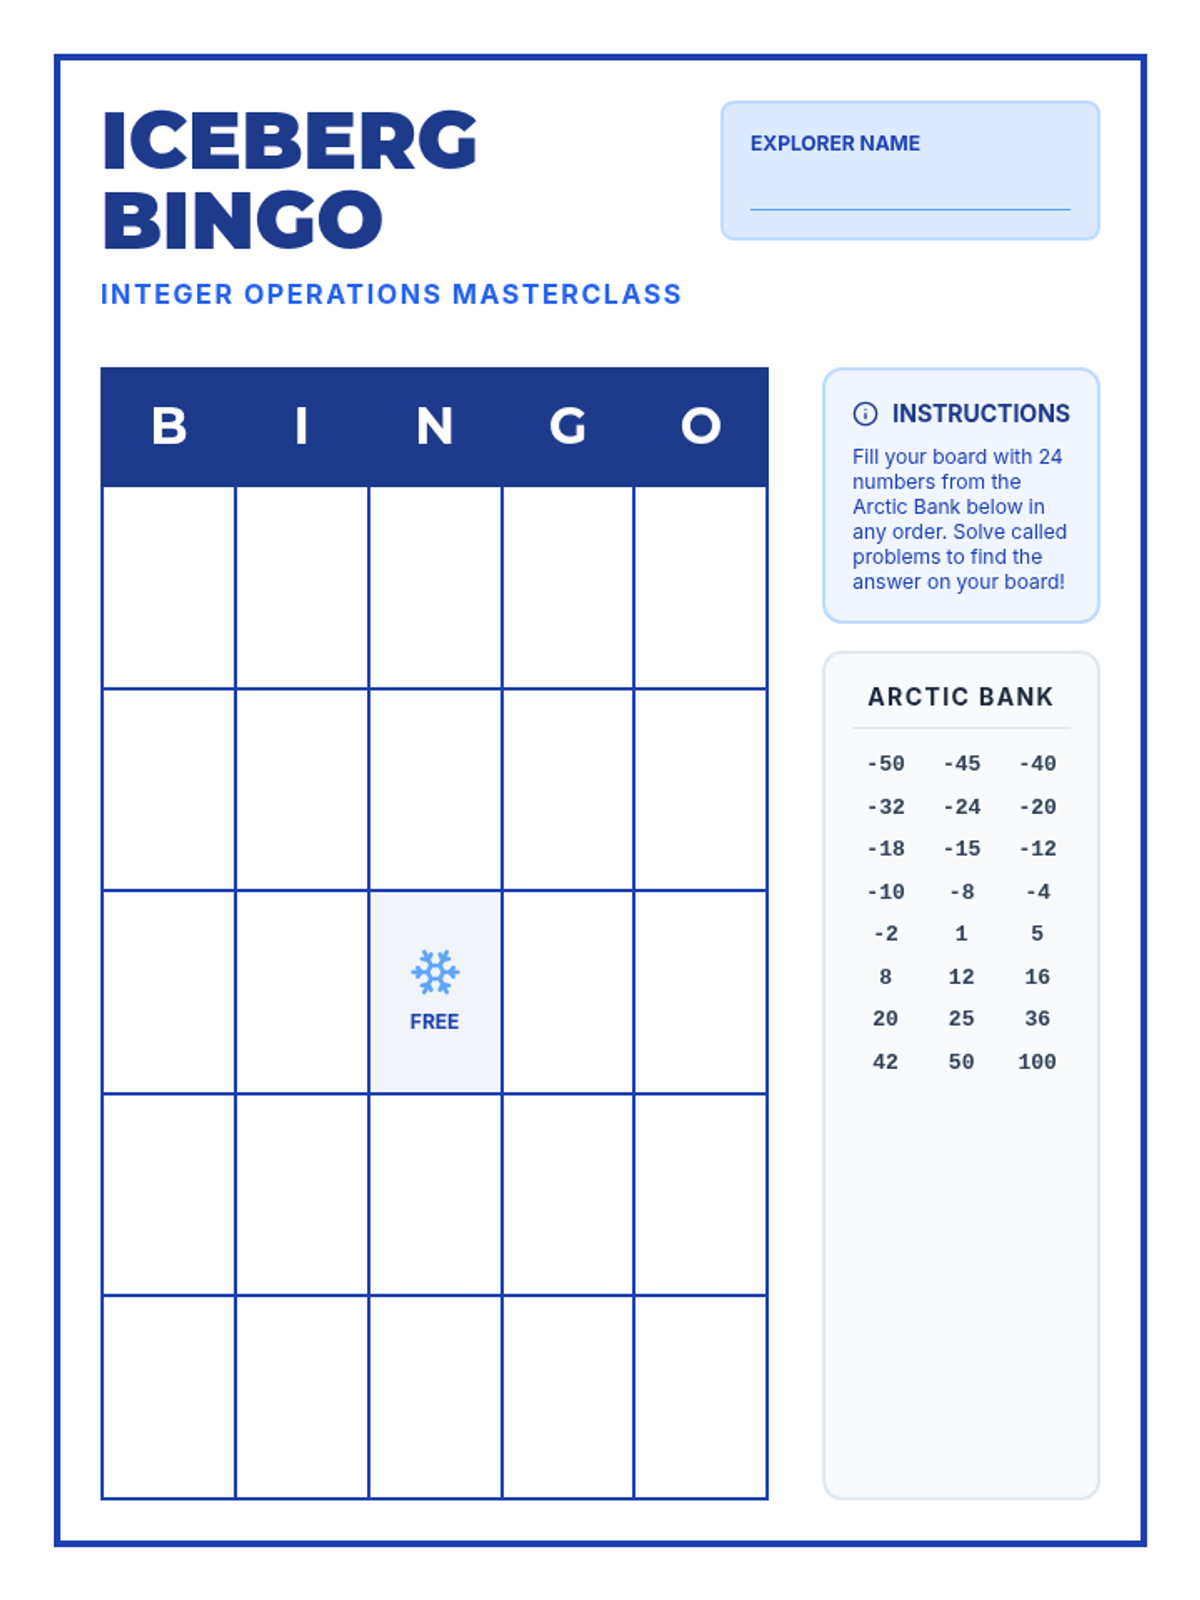
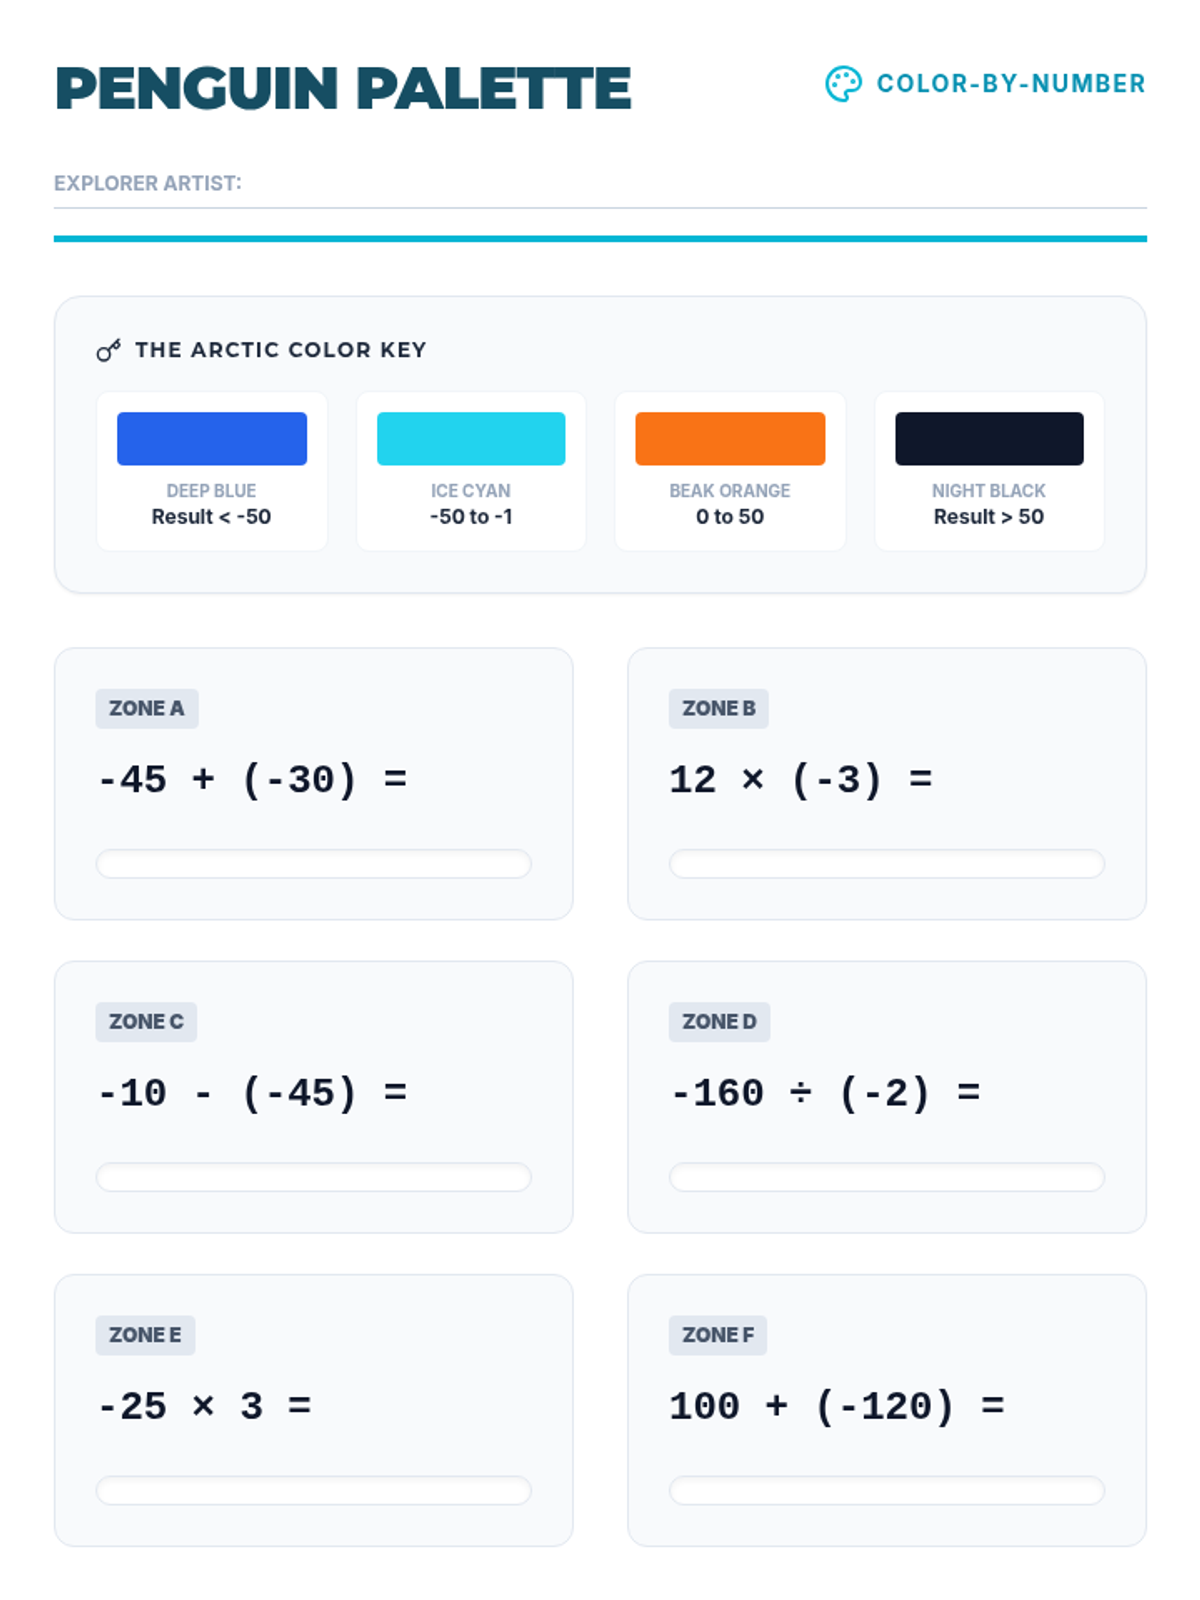
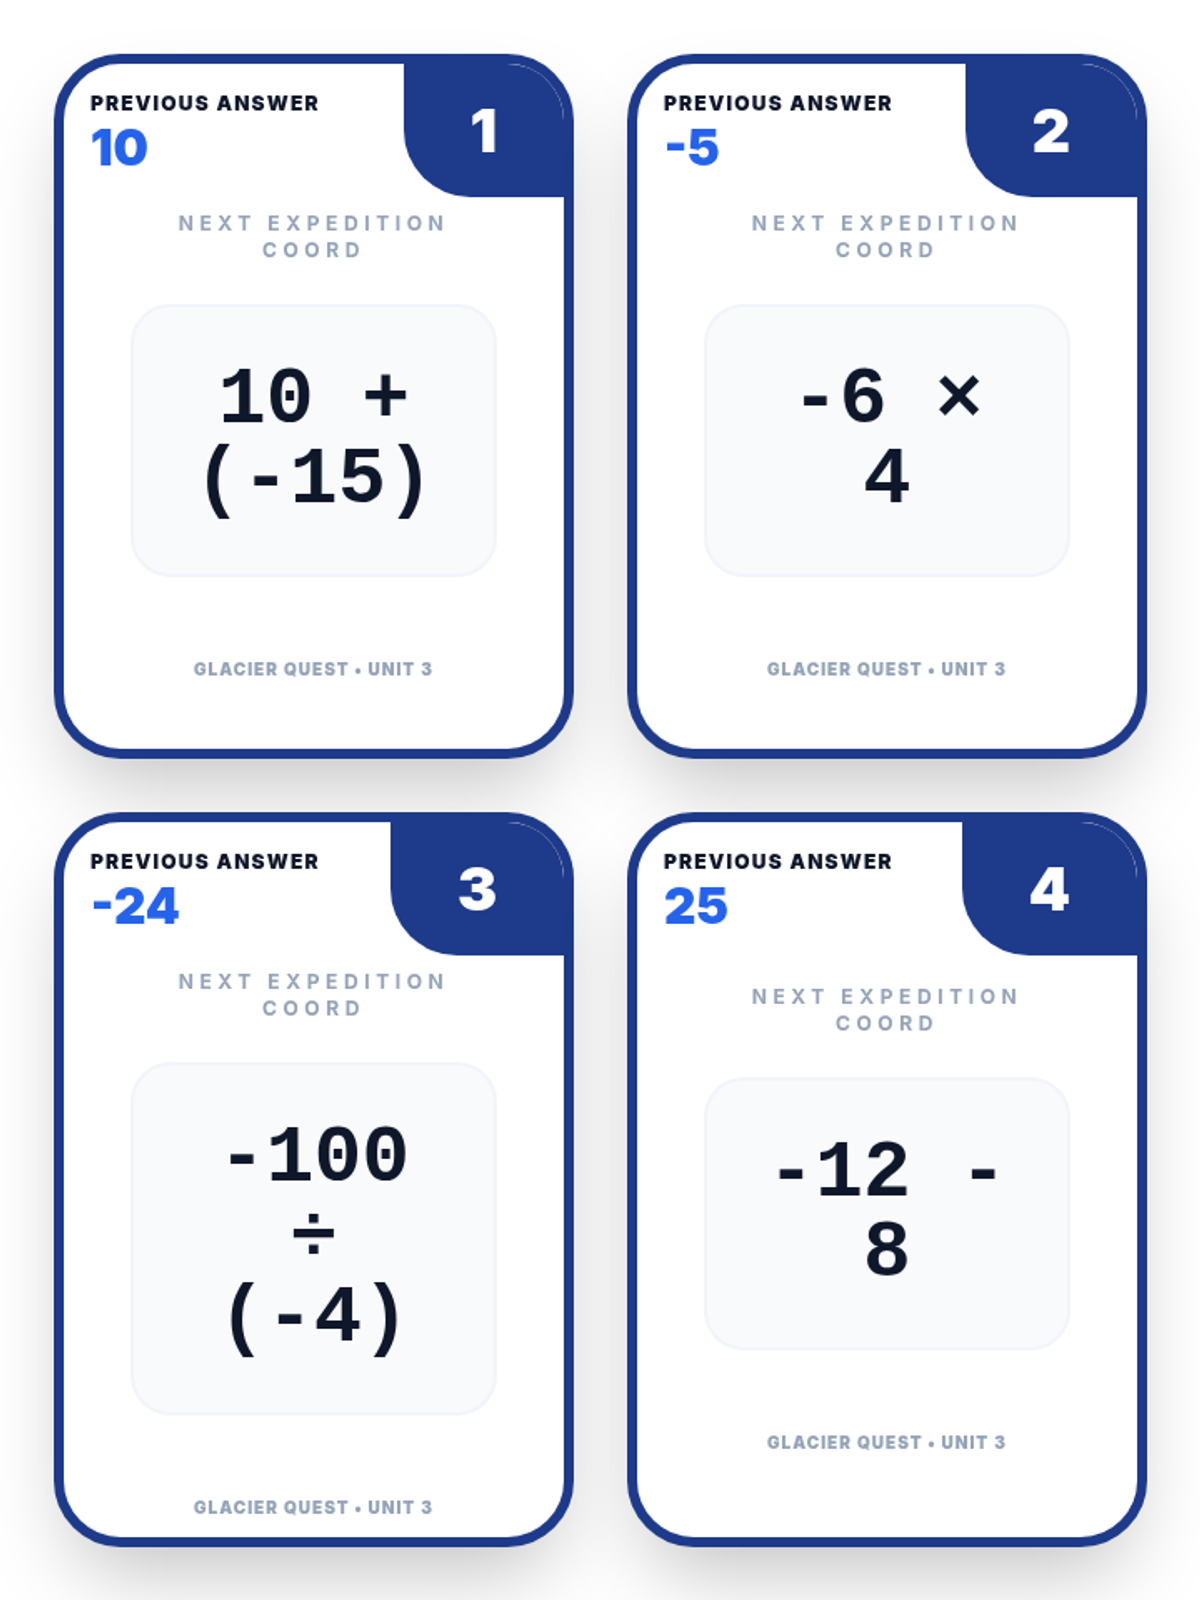
A comprehensive lesson on integer operations (addition, subtraction, multiplication, and division) themed as an Arctic expedition. Students practice fluency through a variety of engaging activities including a scavenger hunt, bingo, and a color-by-number worksheet.
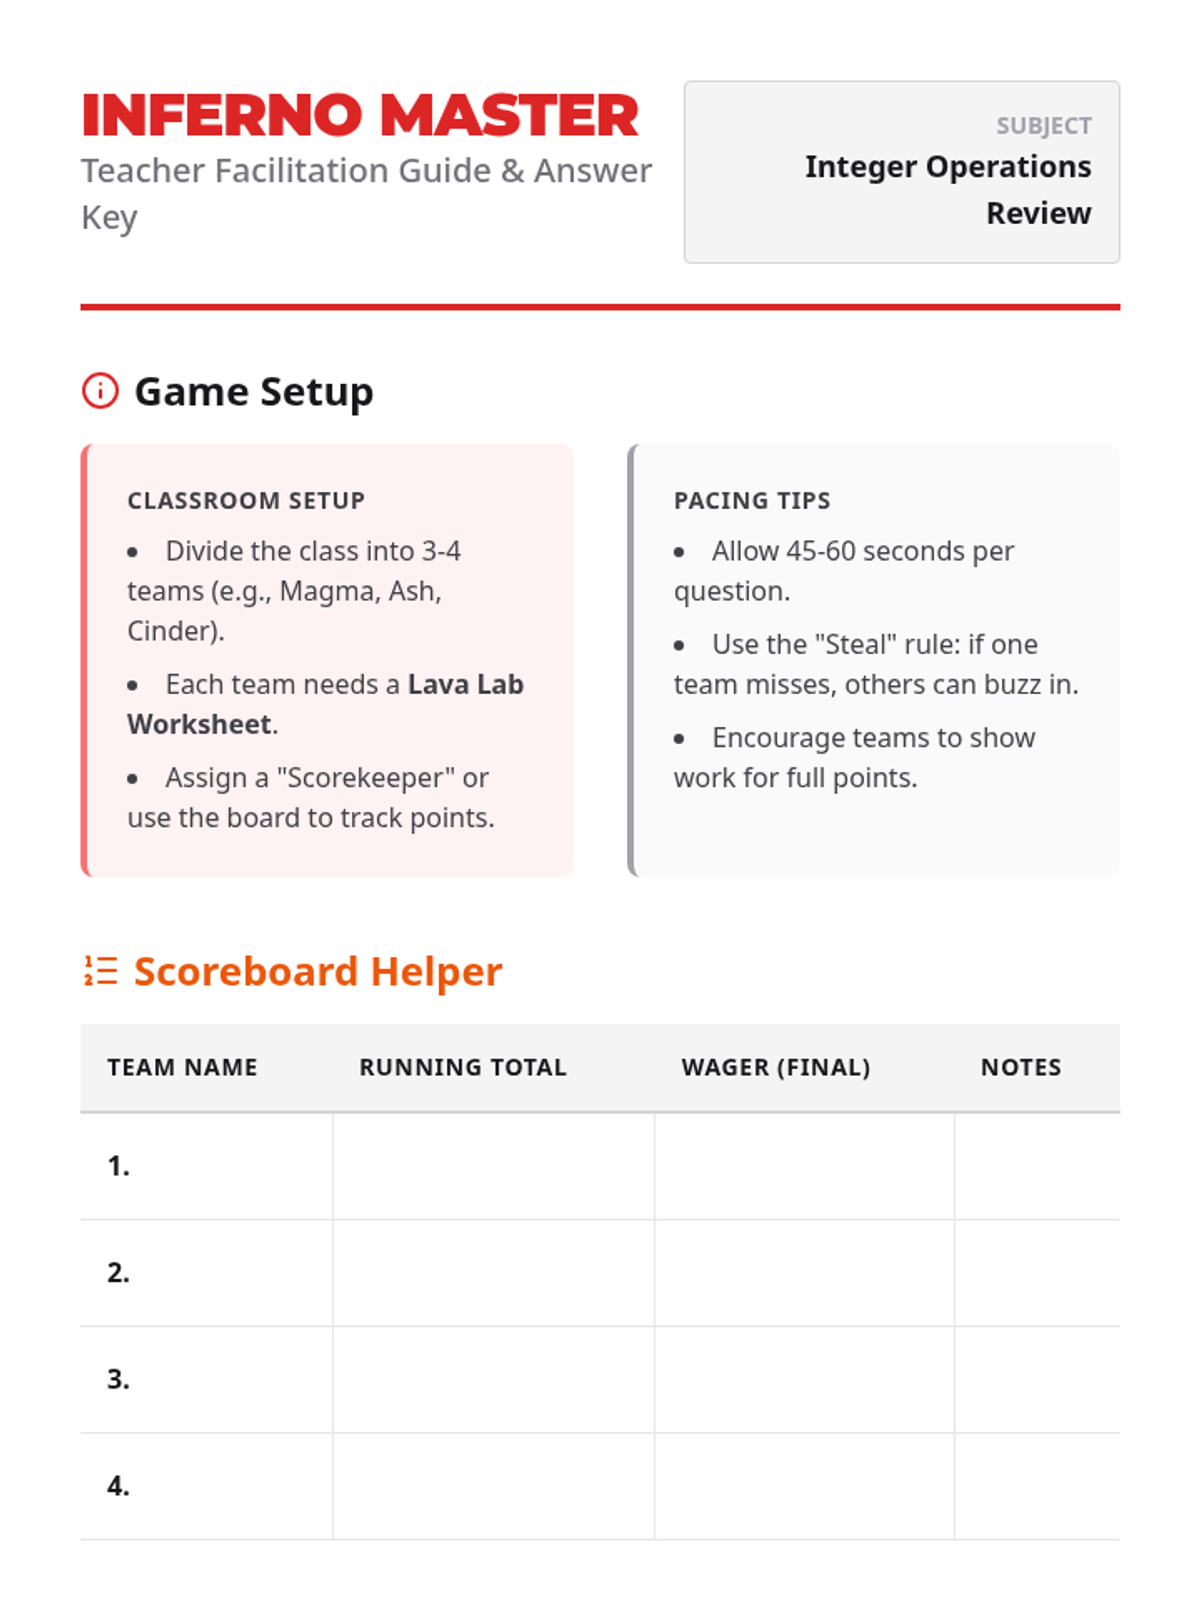
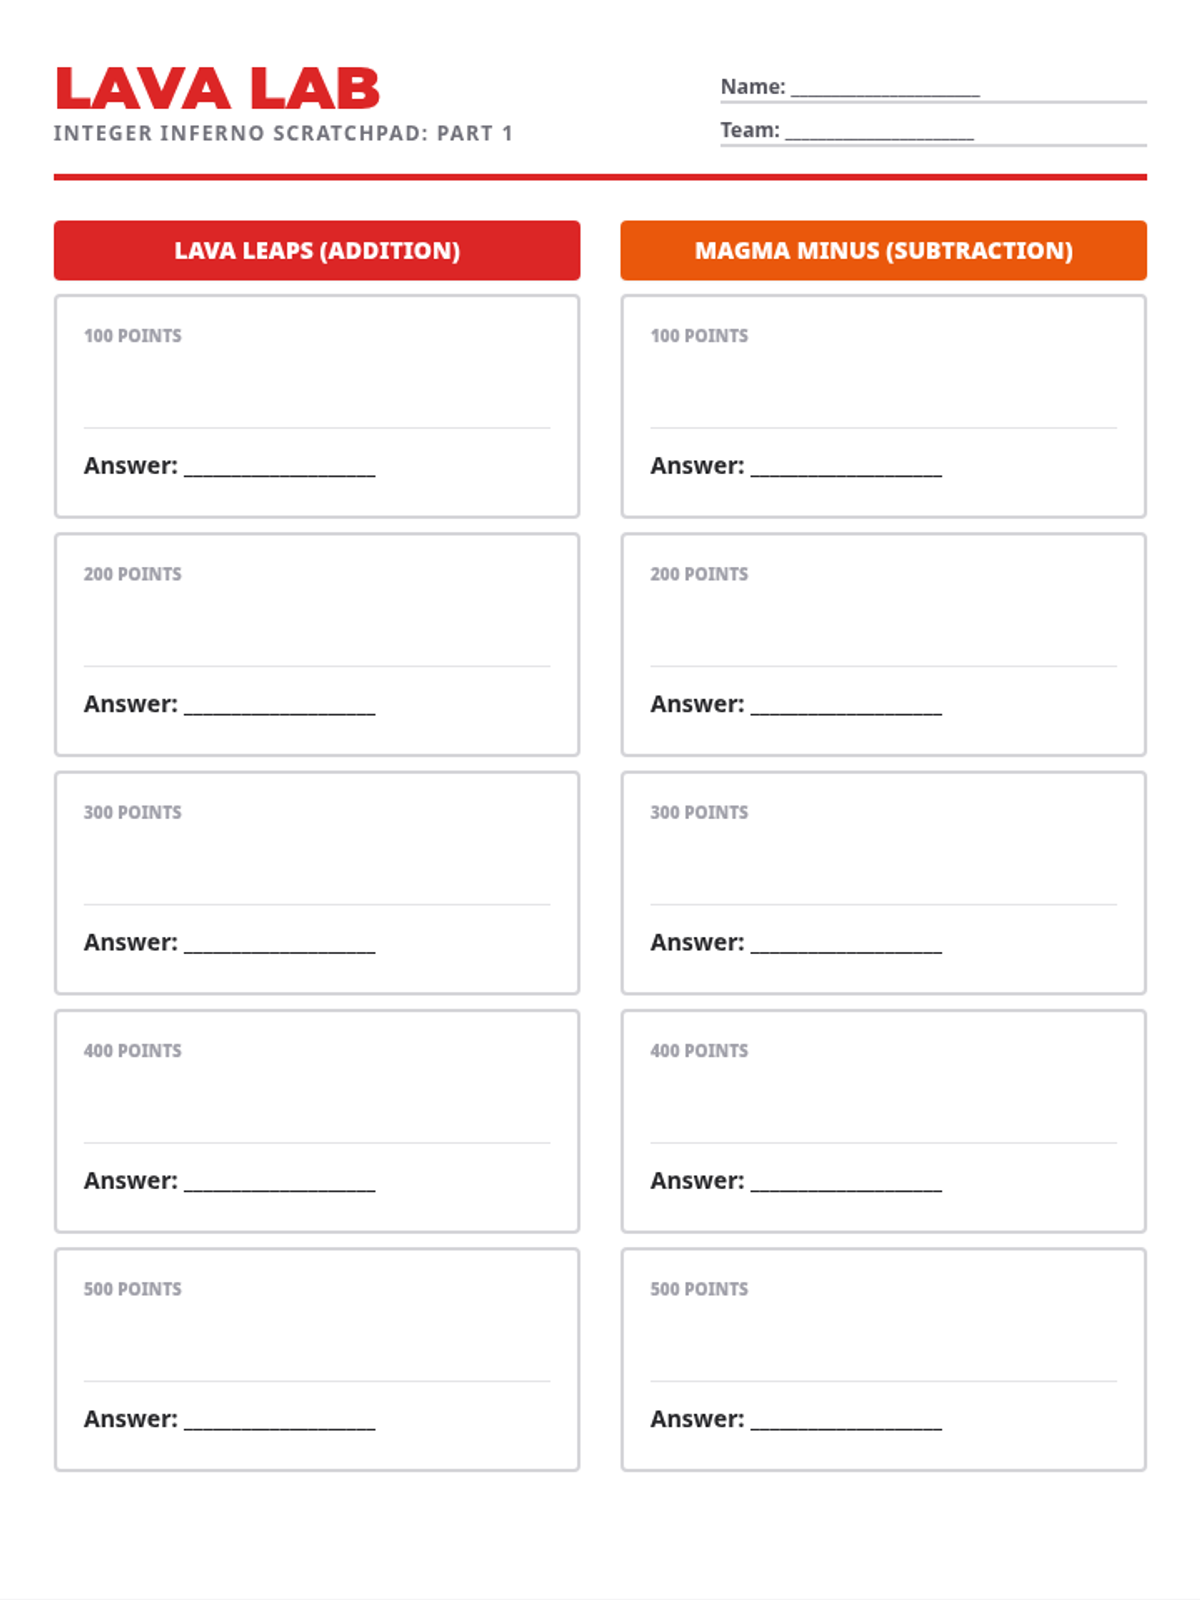
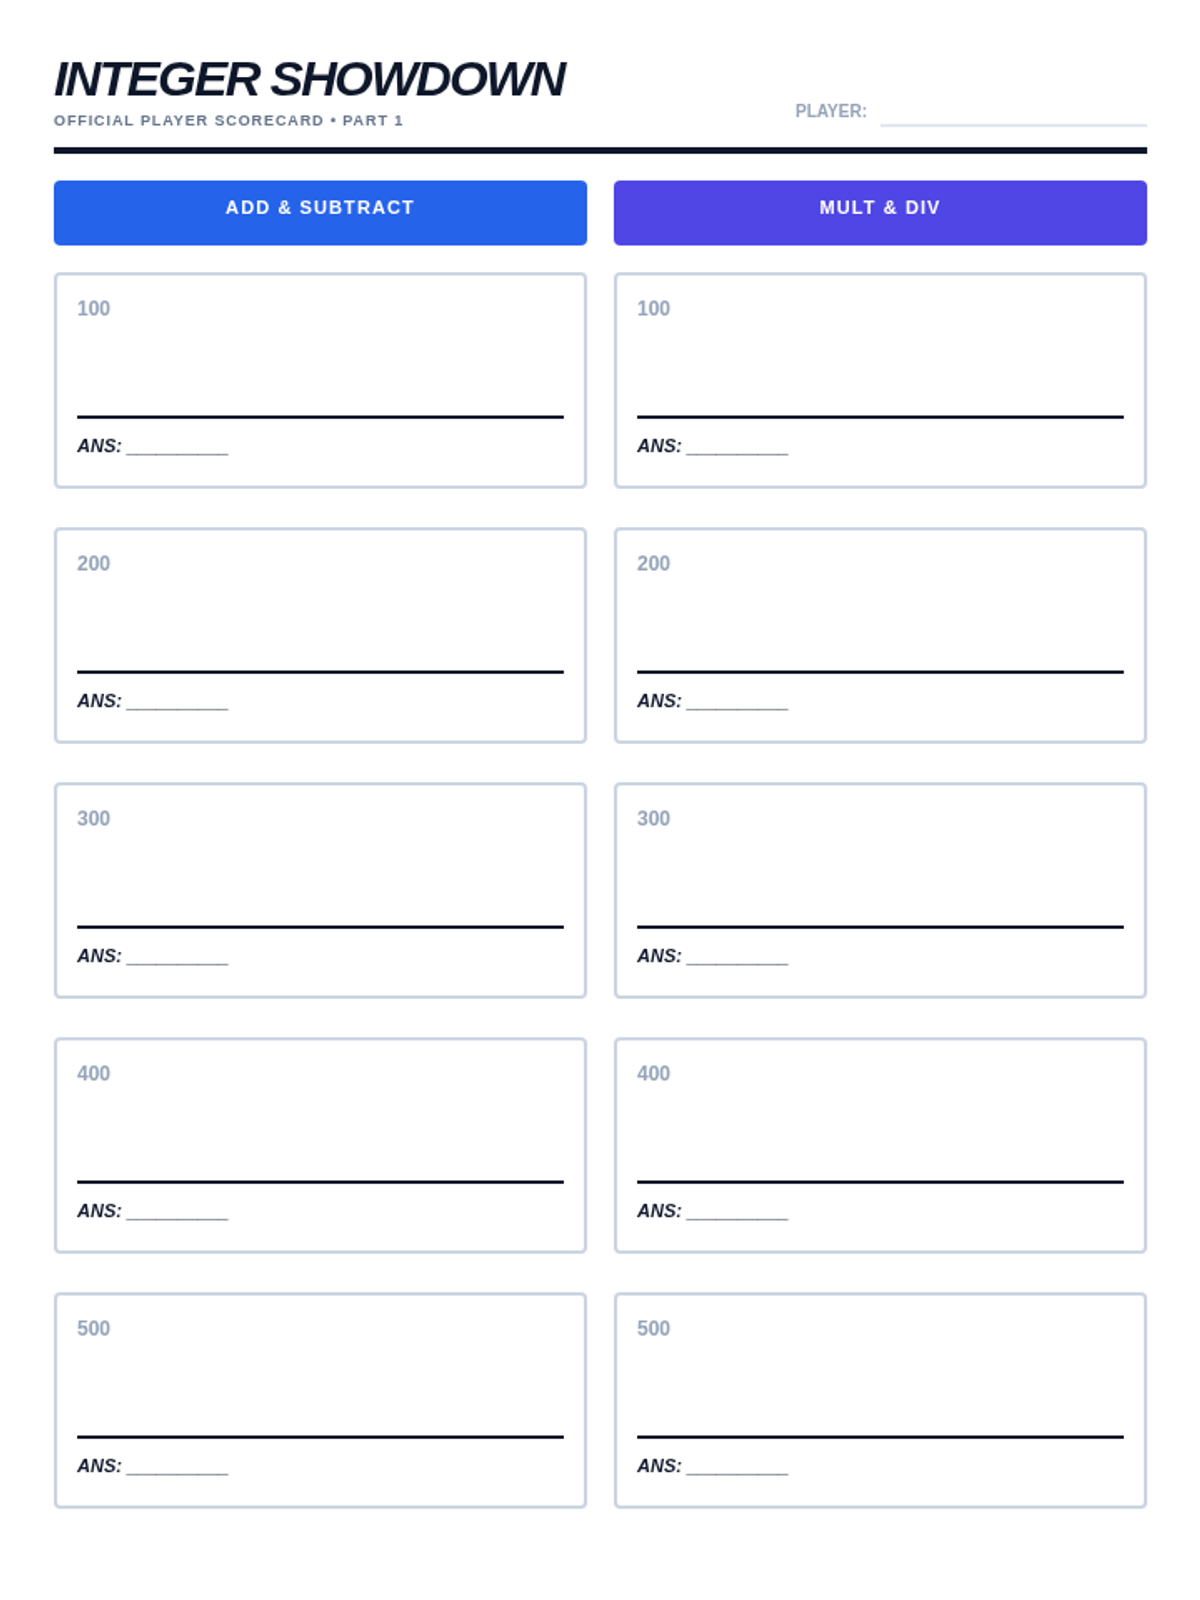
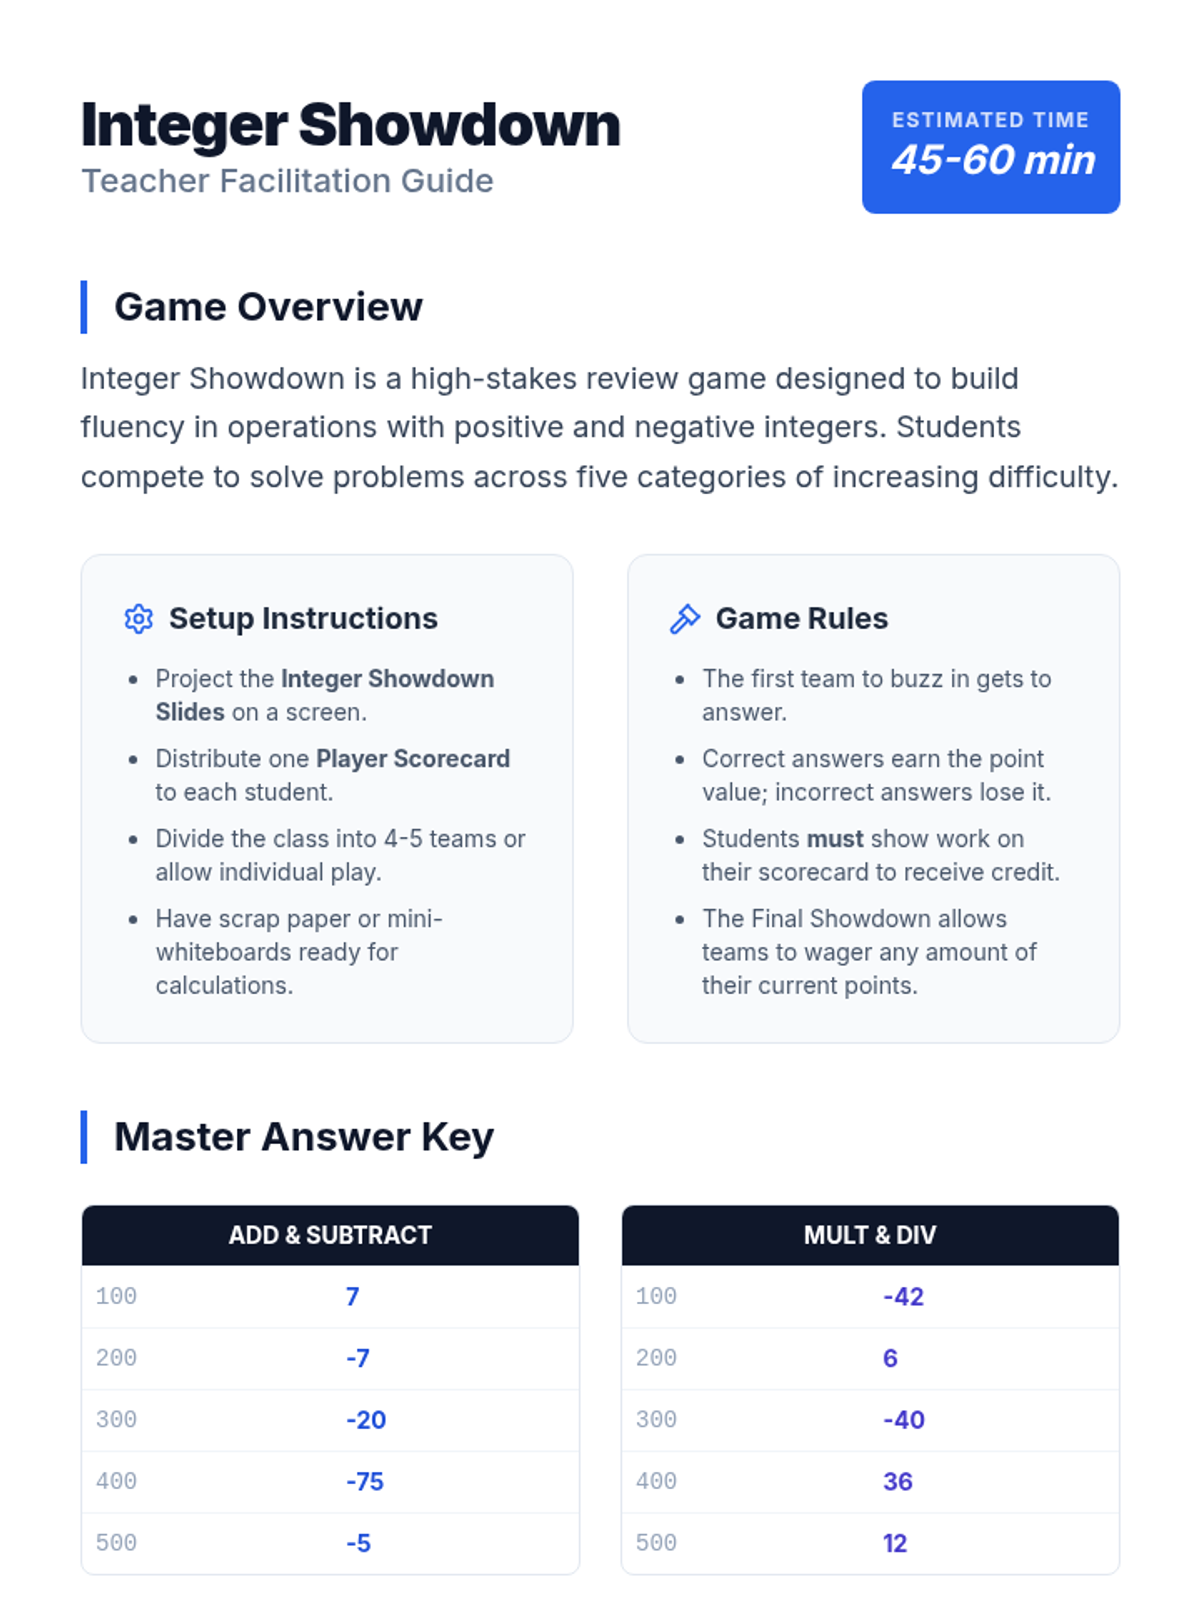
A high-energy, volcano-themed review game covering addition, subtraction, multiplication, and division of integers through a Jeopardy-style competition.
A high-energy, competitive review session covering addition, subtraction, multiplication, and division of integers through a gamified challenge.
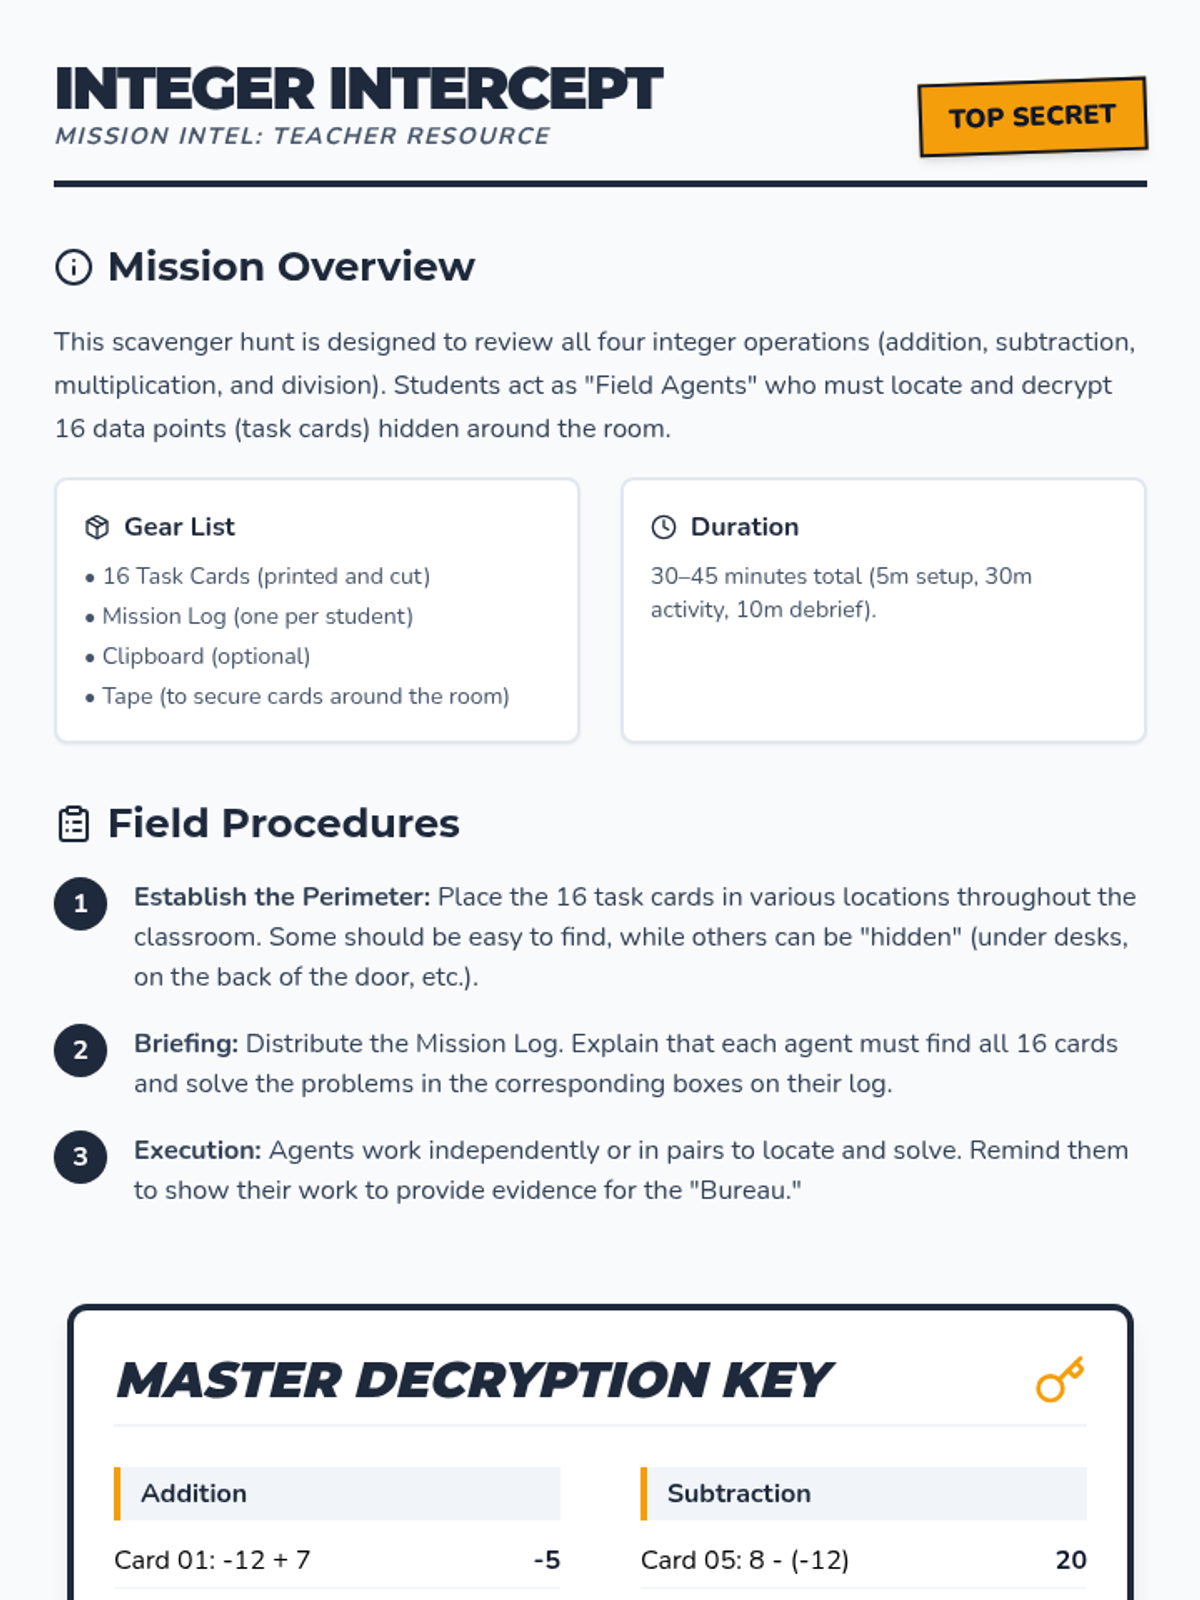
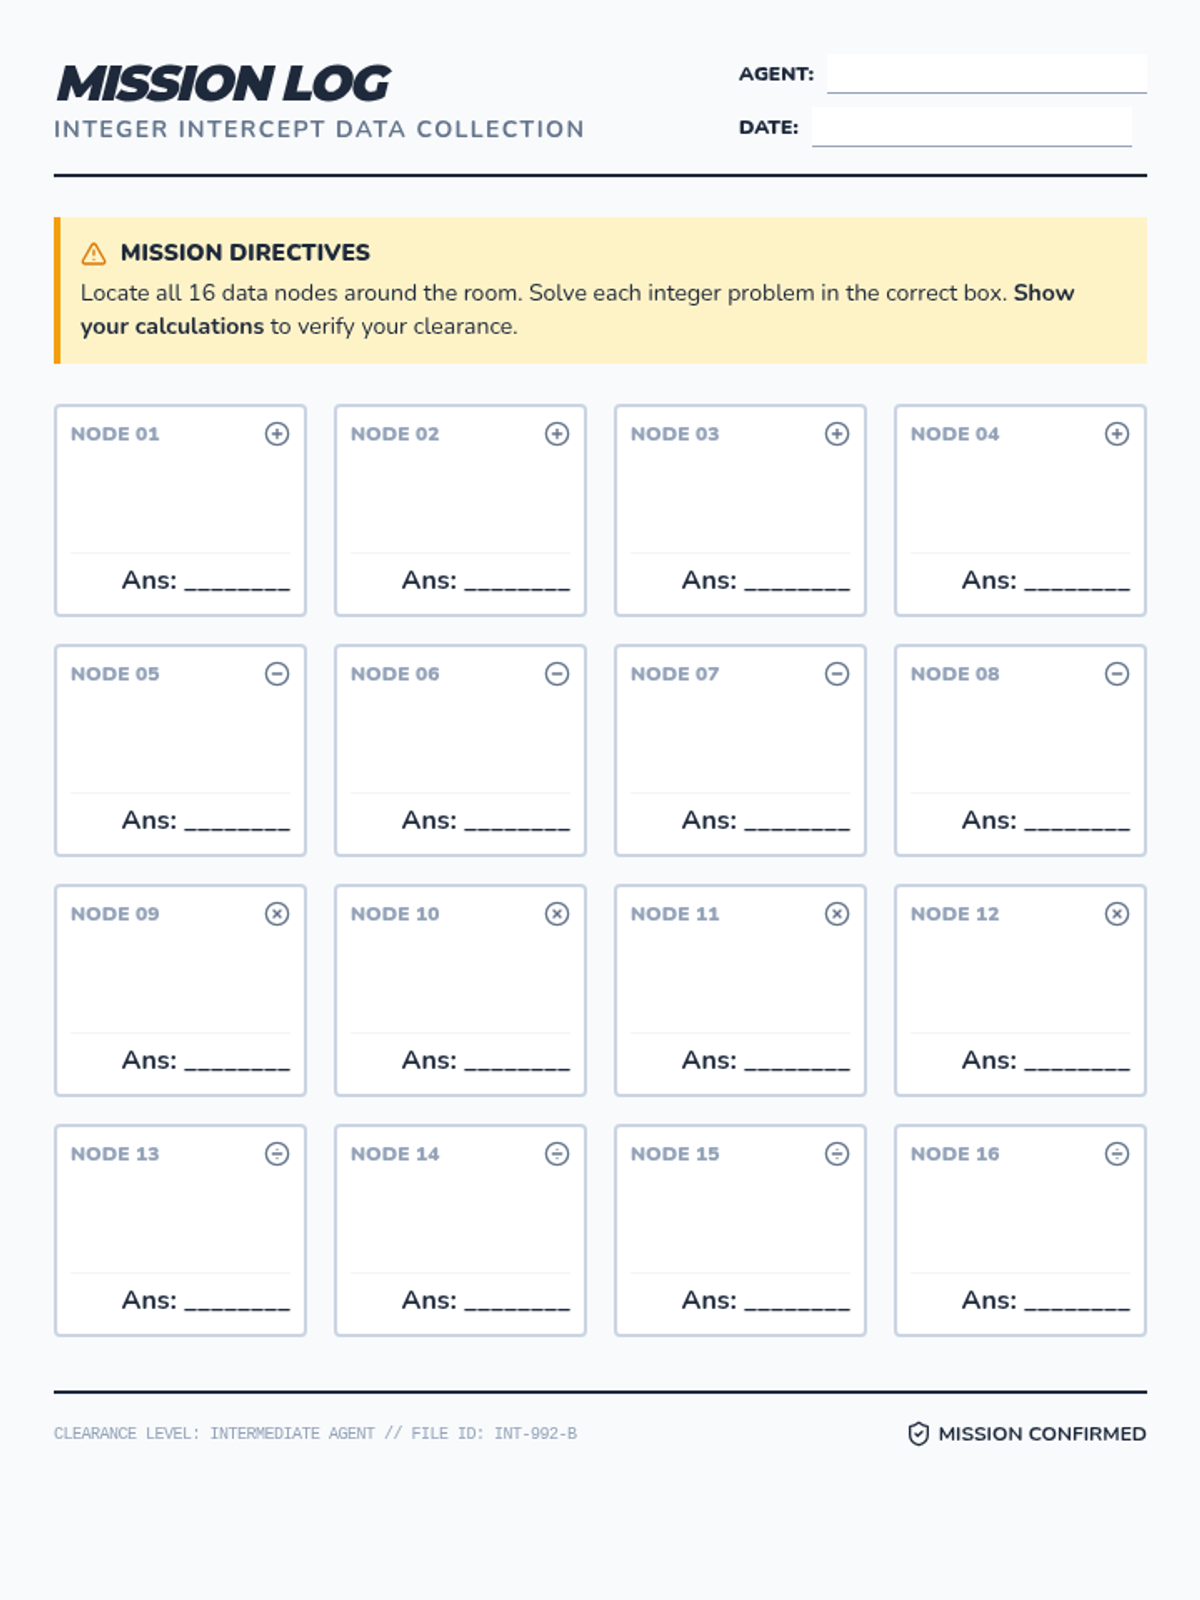
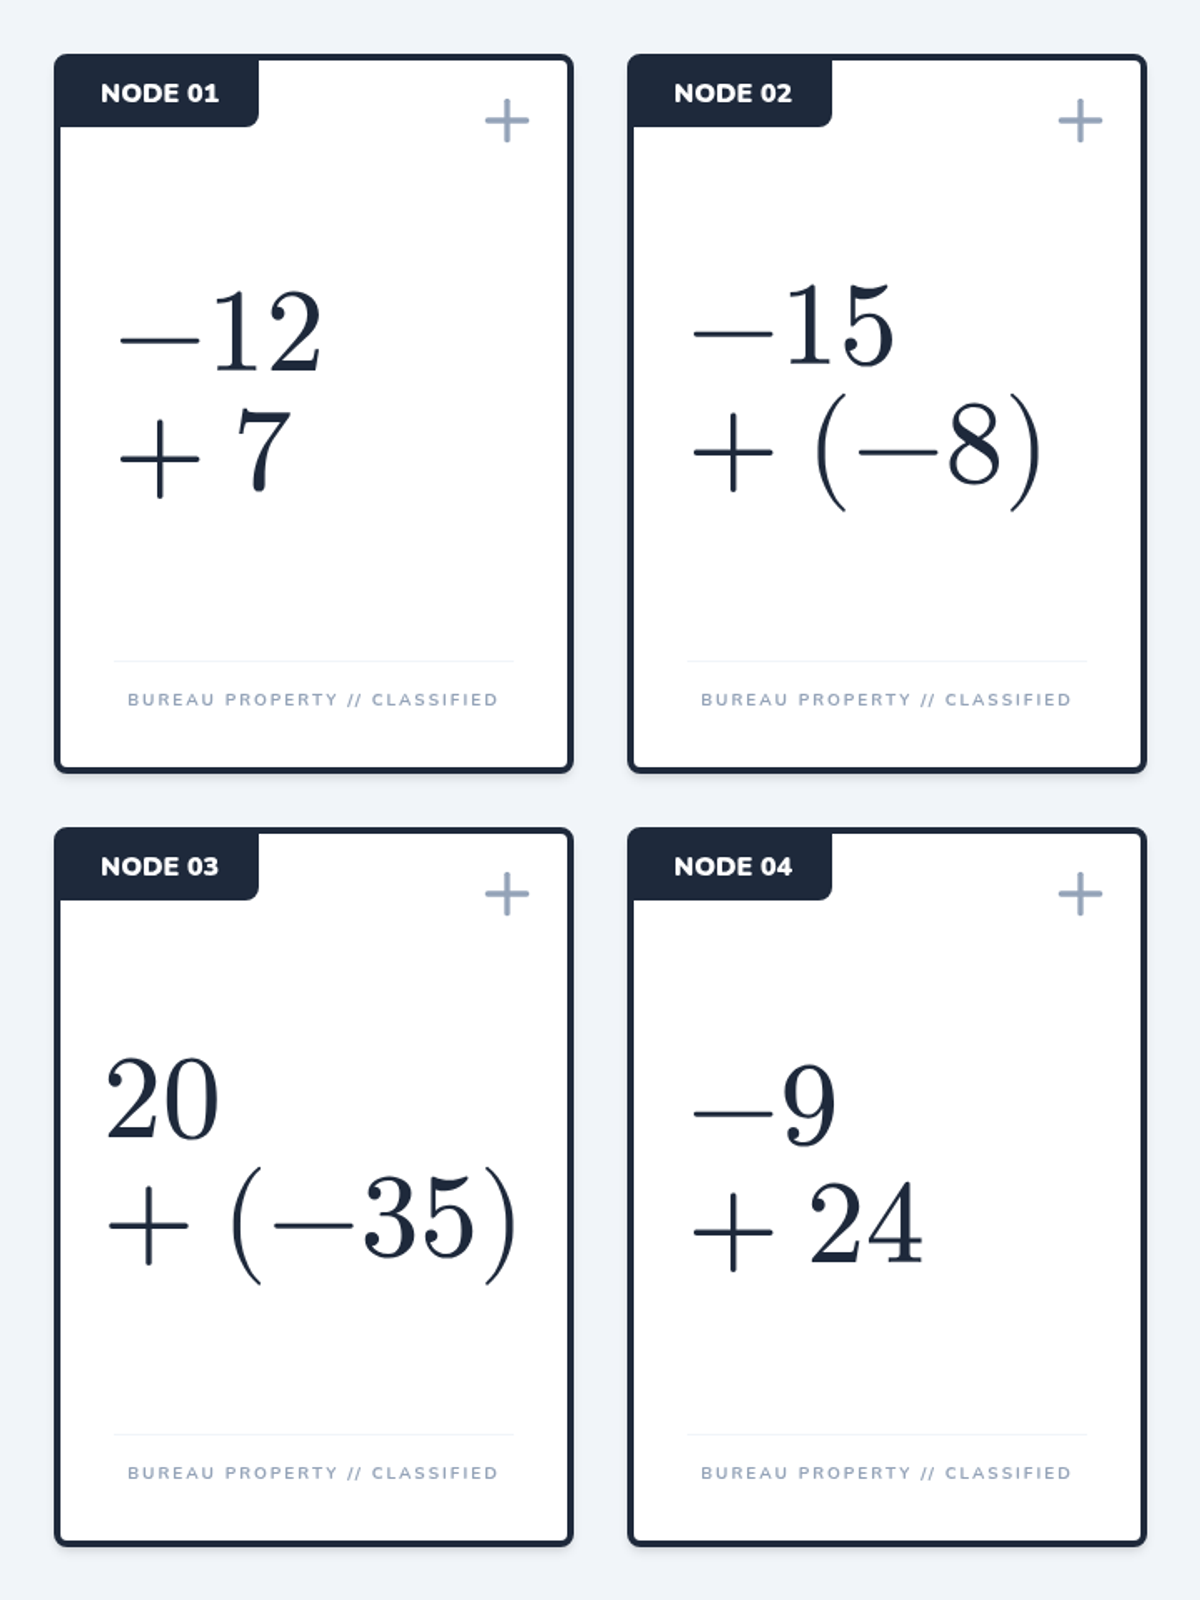
A high-energy scavenger hunt where students solve integer operation problems (addition, subtraction, multiplication, and division) to complete their 'mission log'. Includes task cards, a student recording sheet, and a teacher guide.
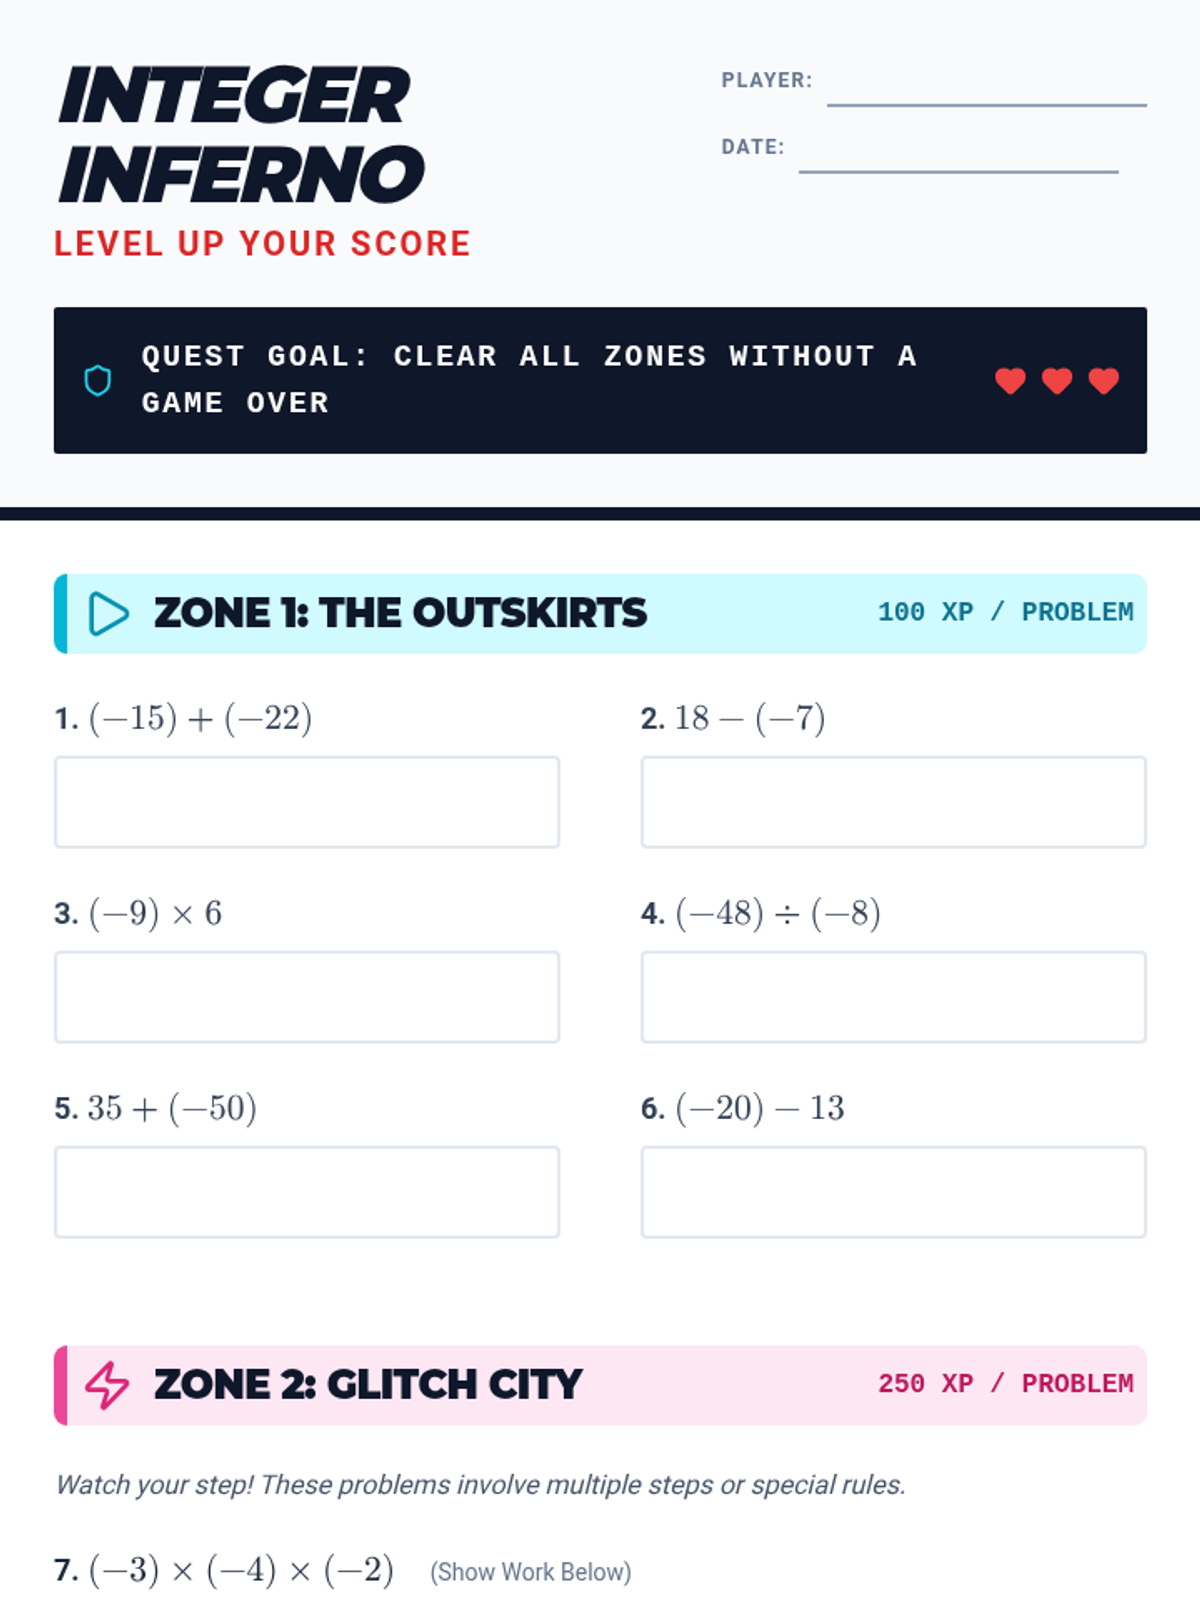
A comprehensive review of integer operations (addition, subtraction, multiplication, and division) through a retro-arcade themed lesson featuring guided instruction, practice, and a competitive game.
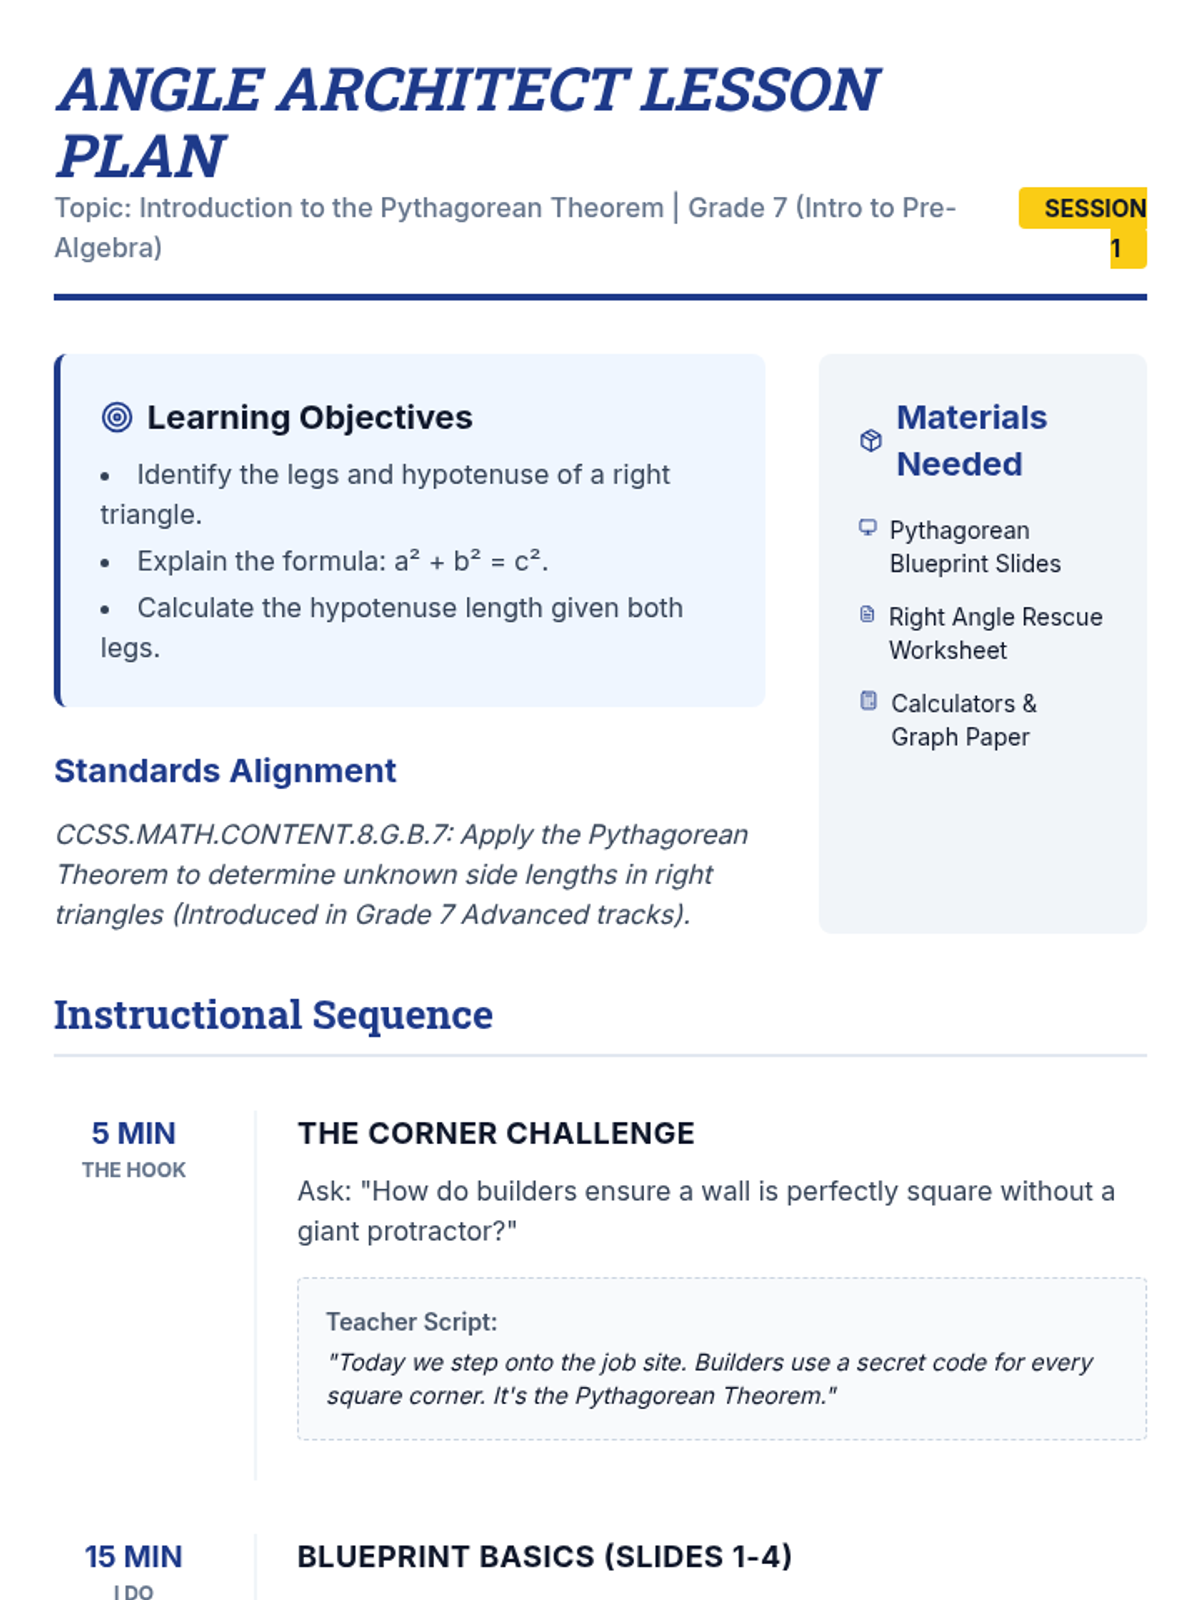
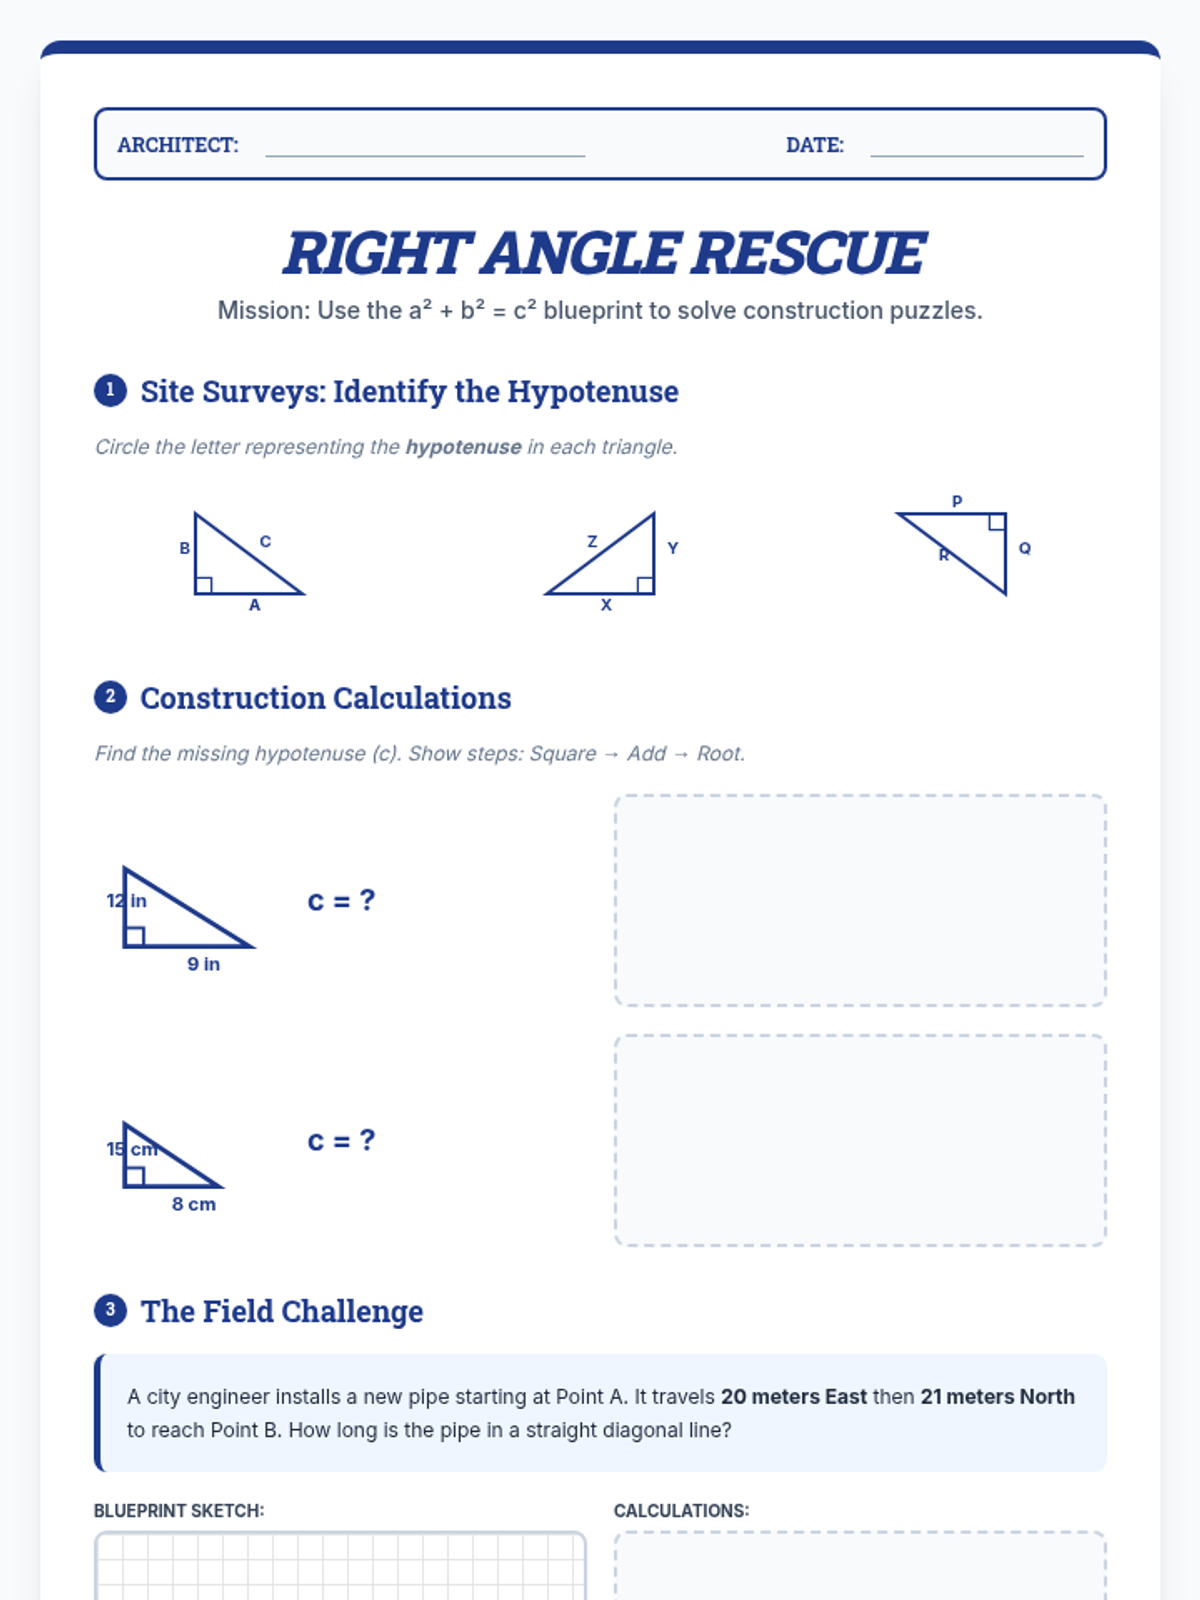
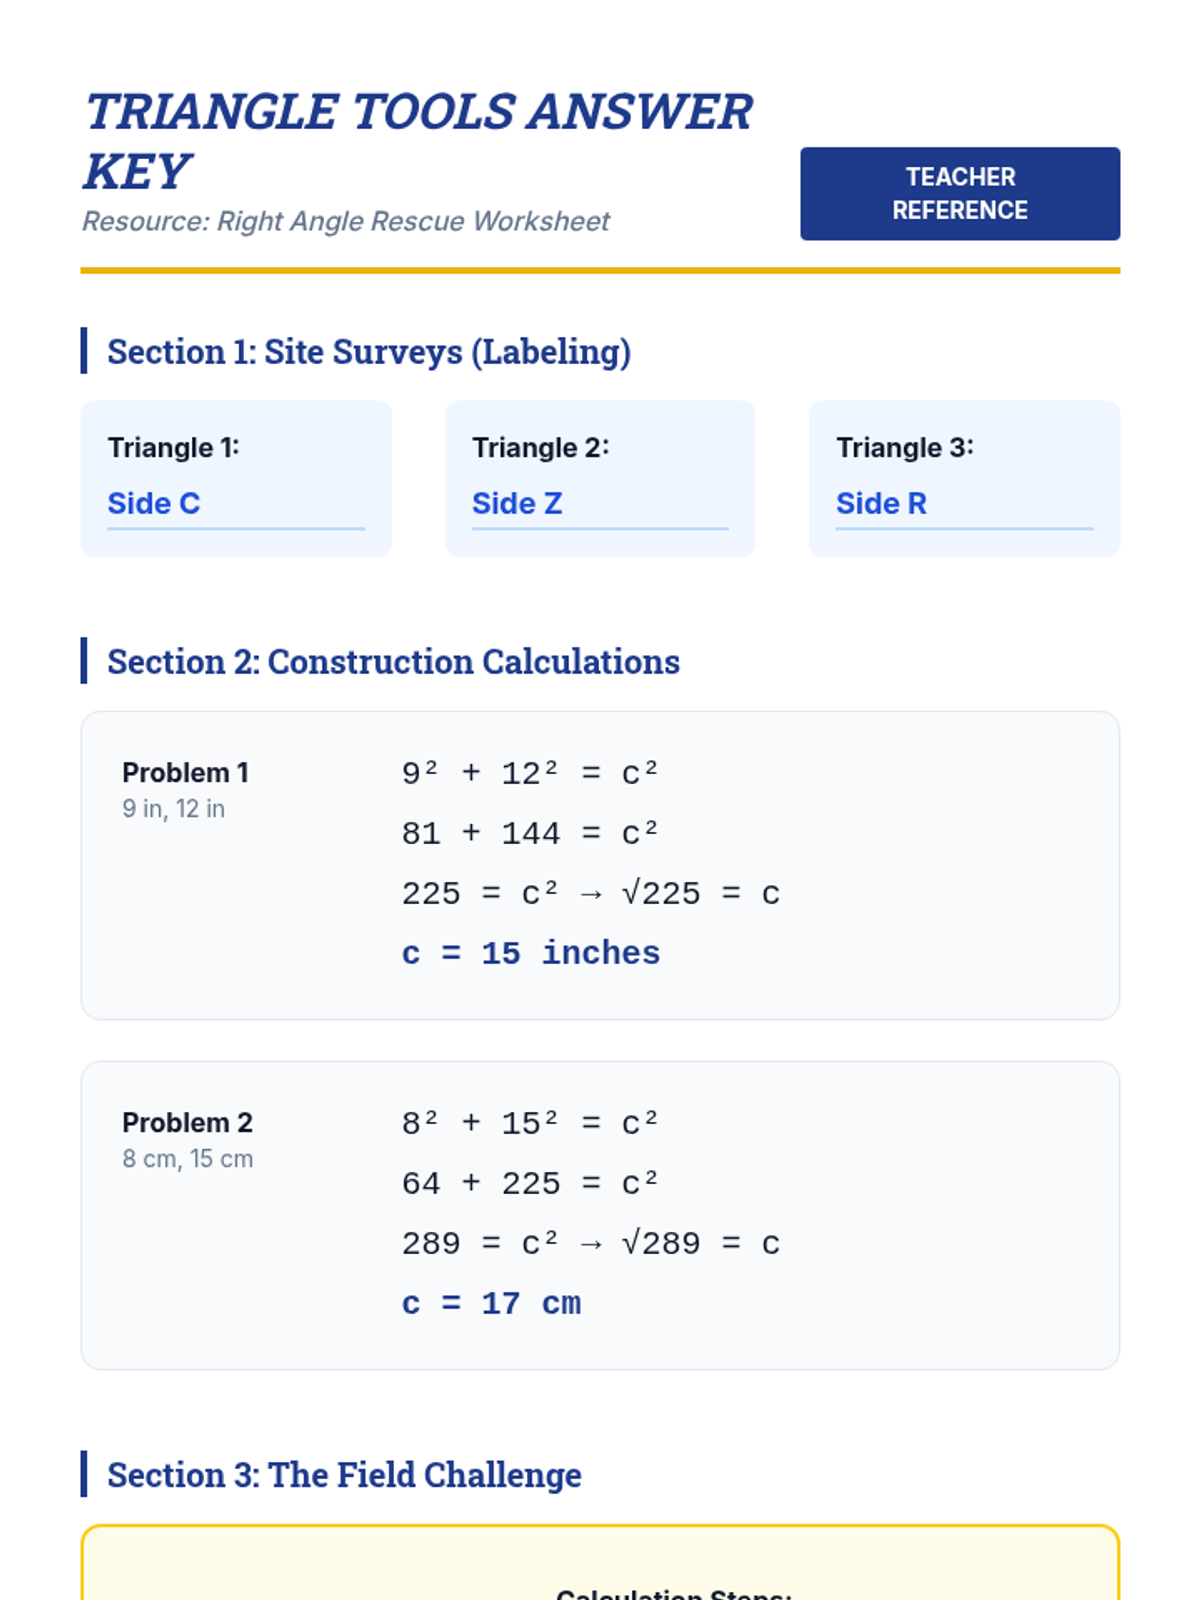
An introductory lesson on the Pythagorean Theorem, focusing on identifying right triangles, understanding the relationship between sides, and calculating the hypotenuse through a construction-themed lens.
Students bridge the gap between 2D geometry and 3D space by constructing physical models of rectangular and triangular prisms. They identify faces, measure dimensions, and calculate total surface area through hands-on assembly.
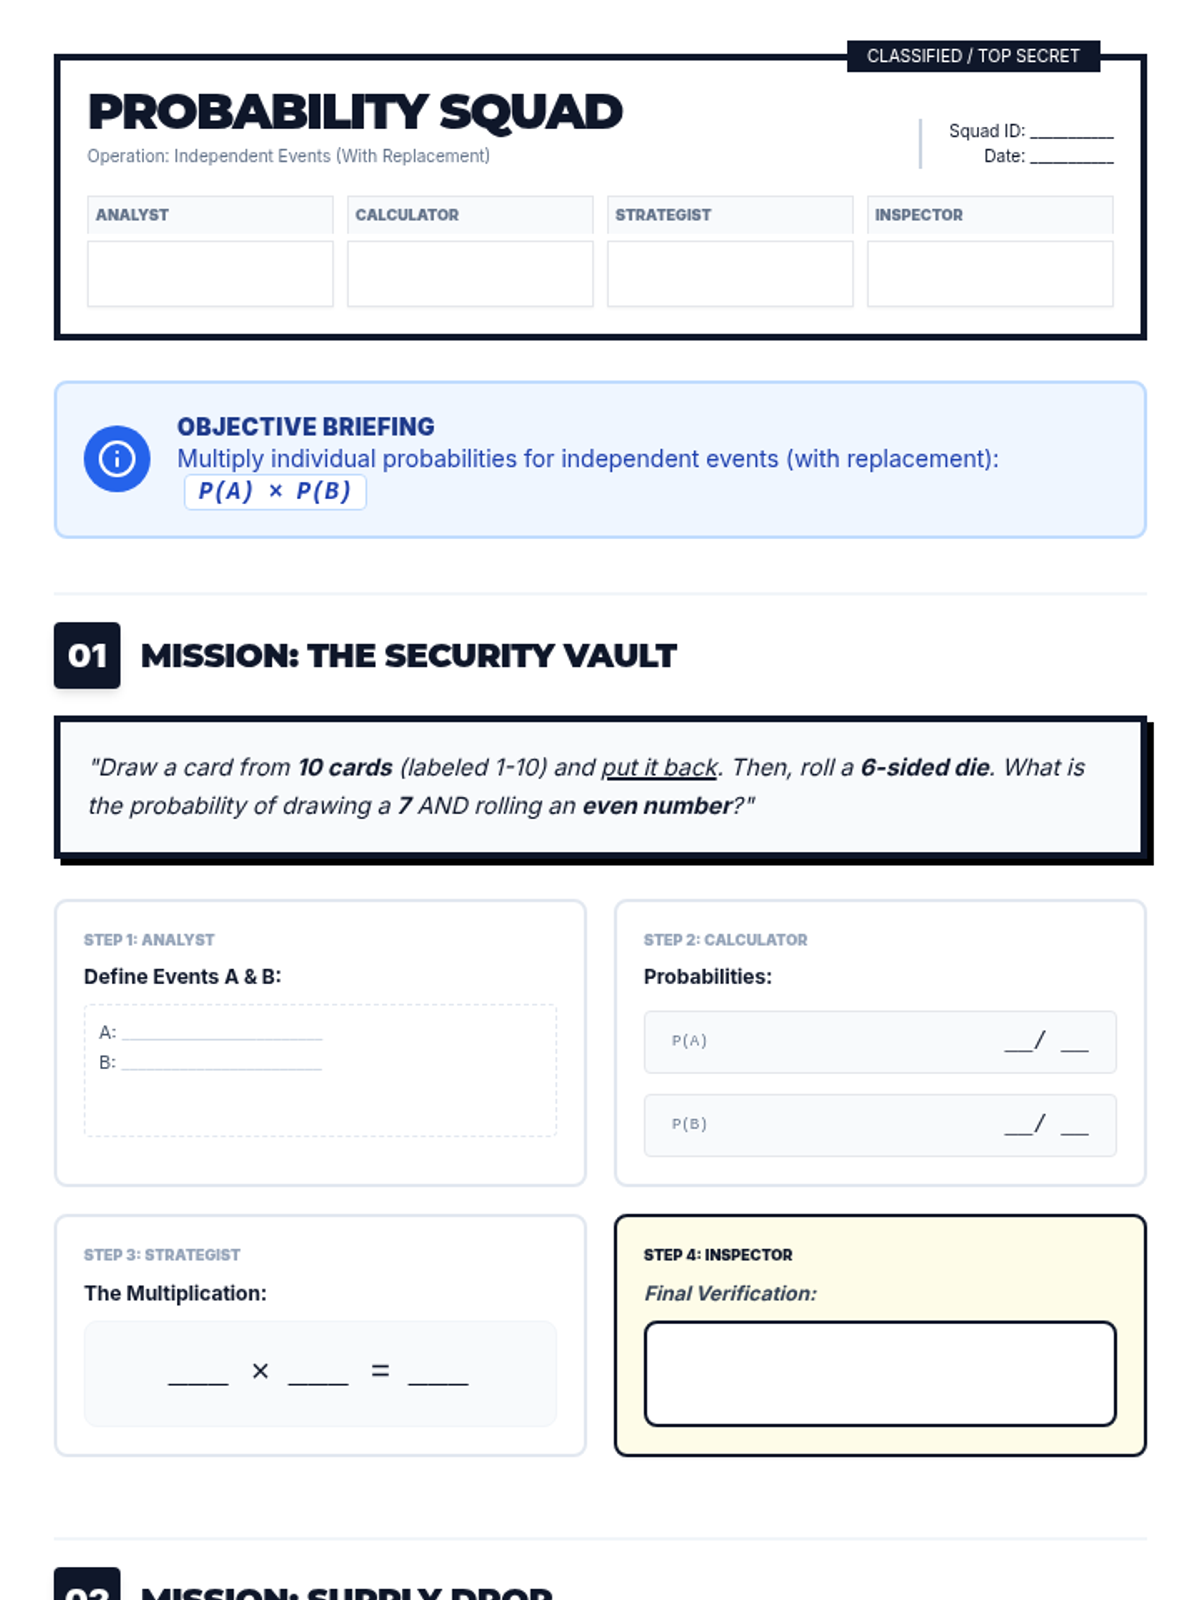
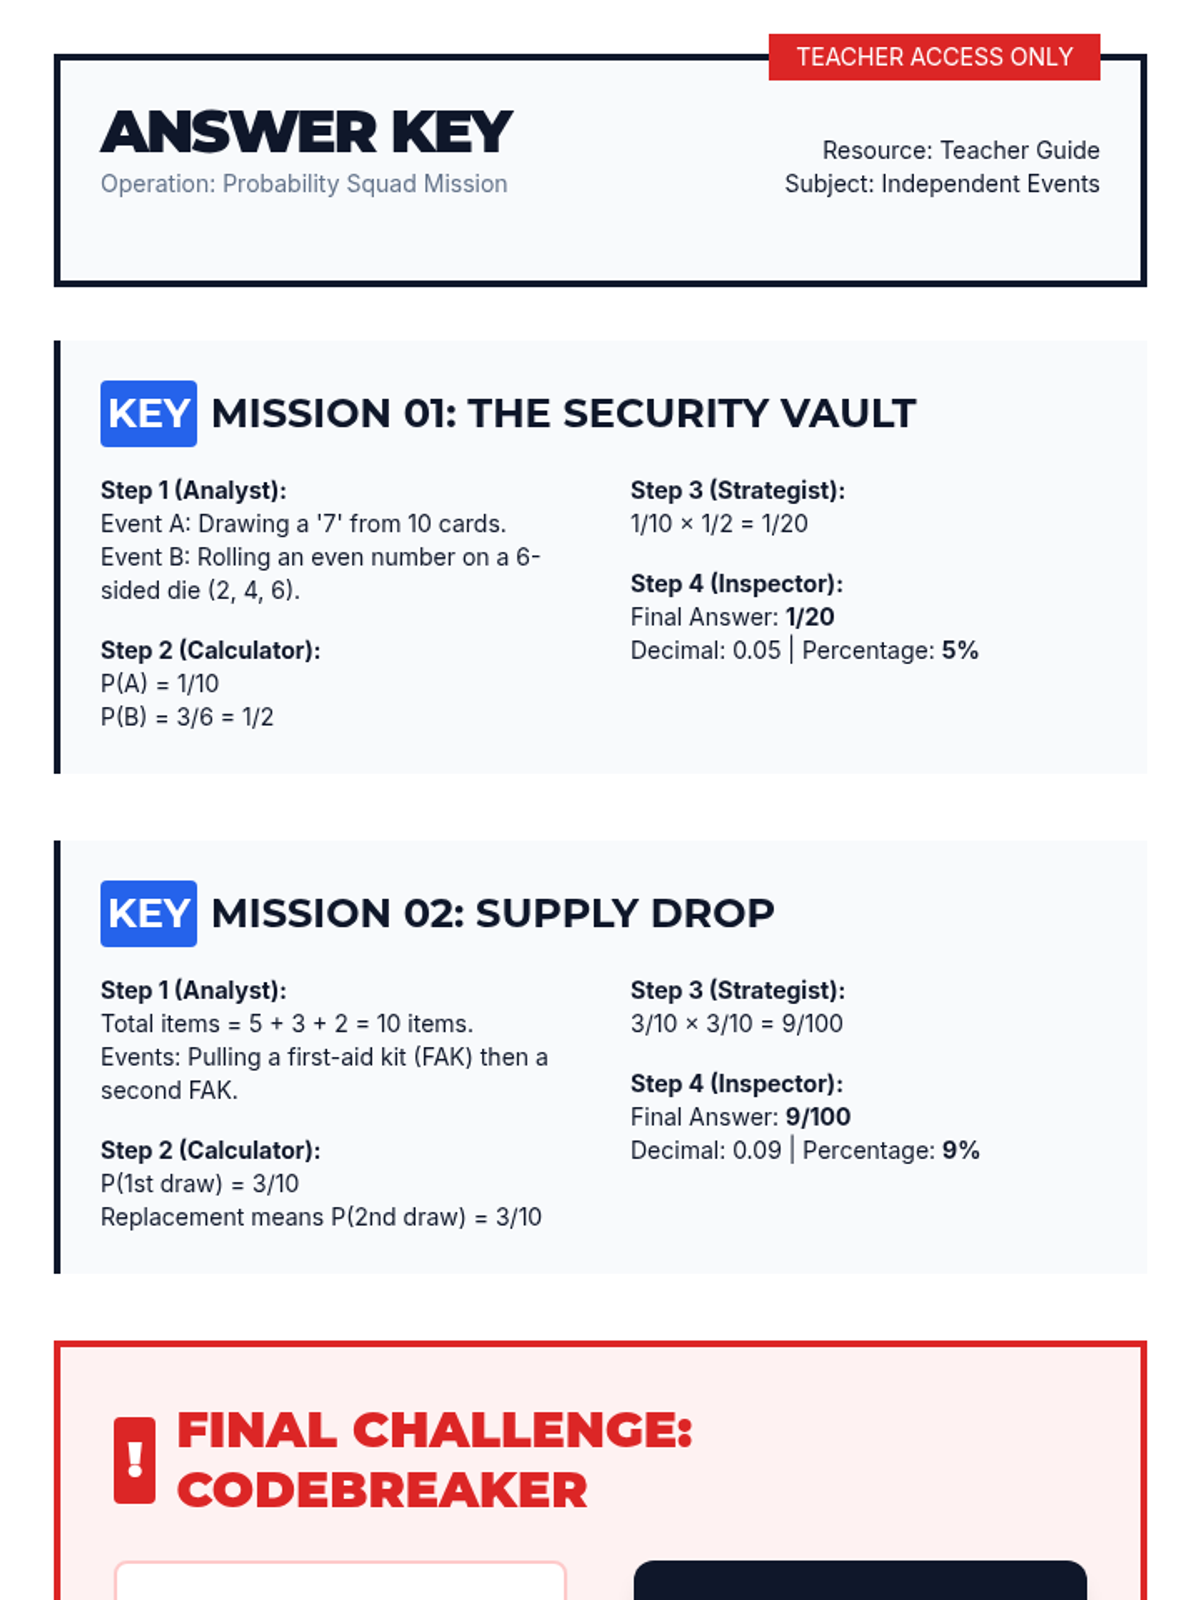
A collaborative lesson where students work in specialized roles to master compound probability of independent events with replacement through step-by-step mission scenarios.