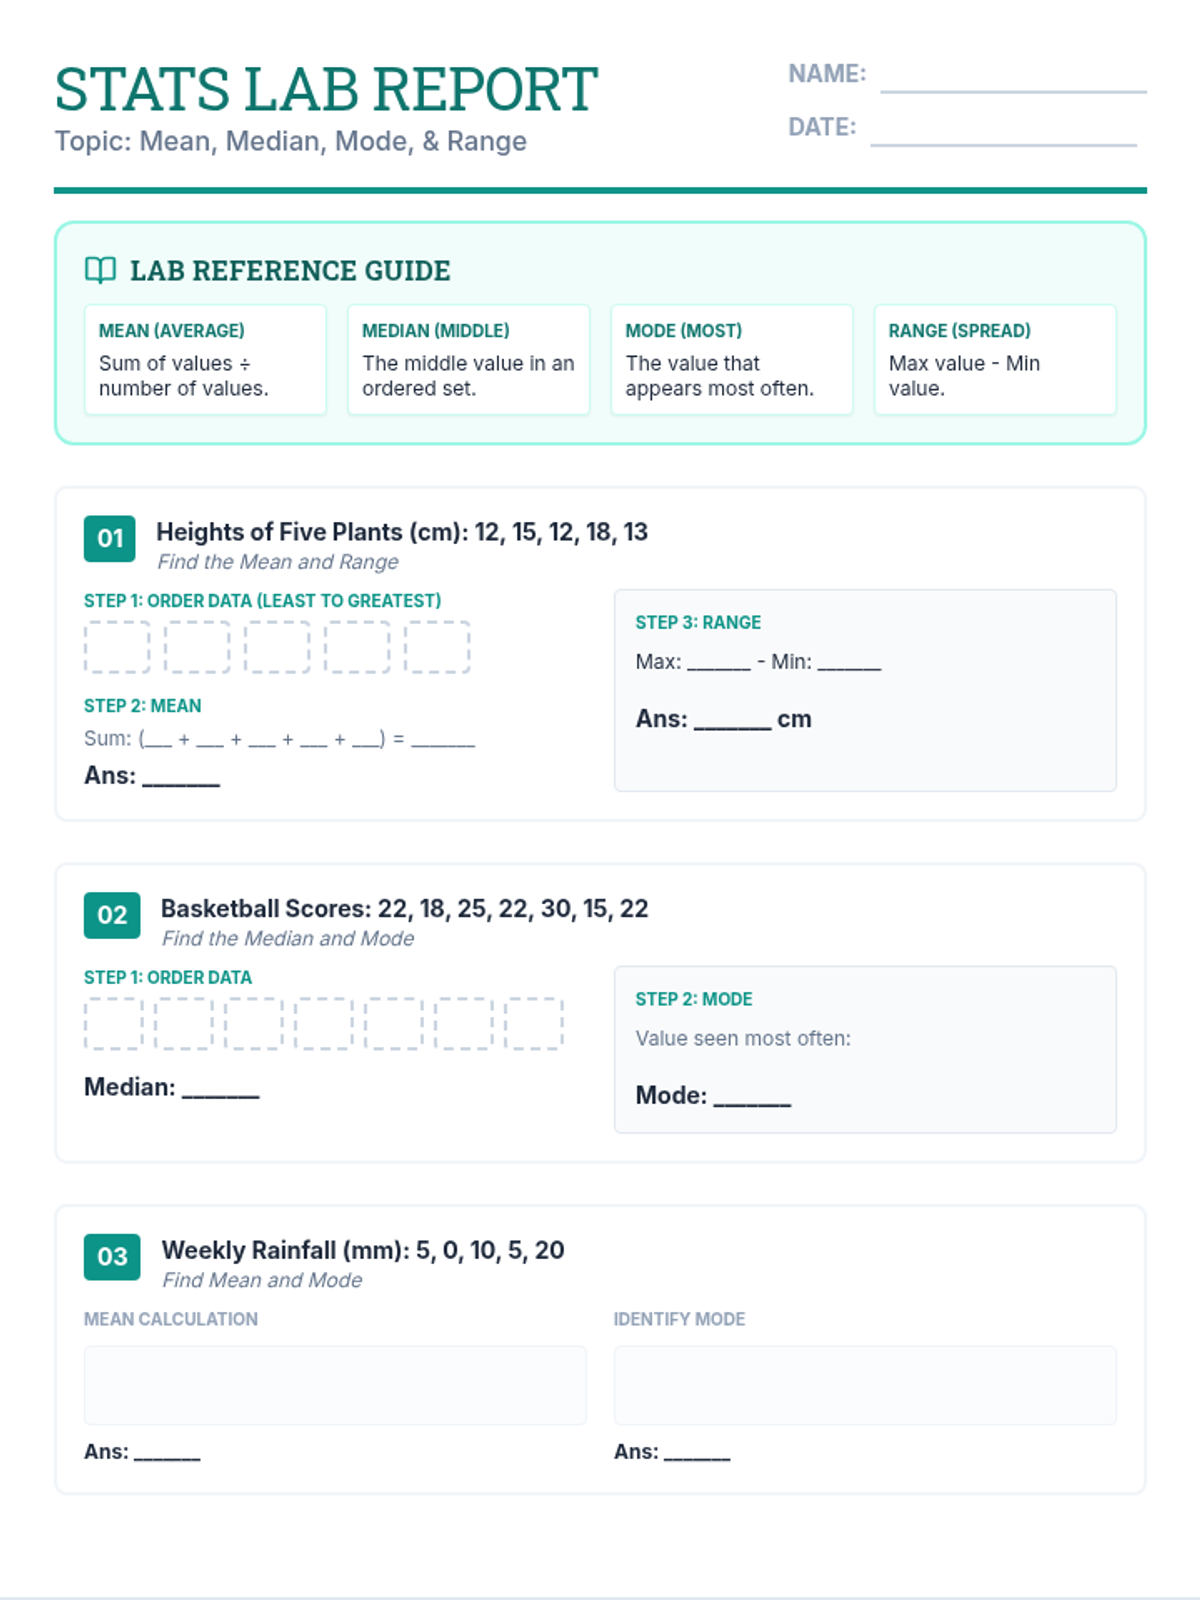
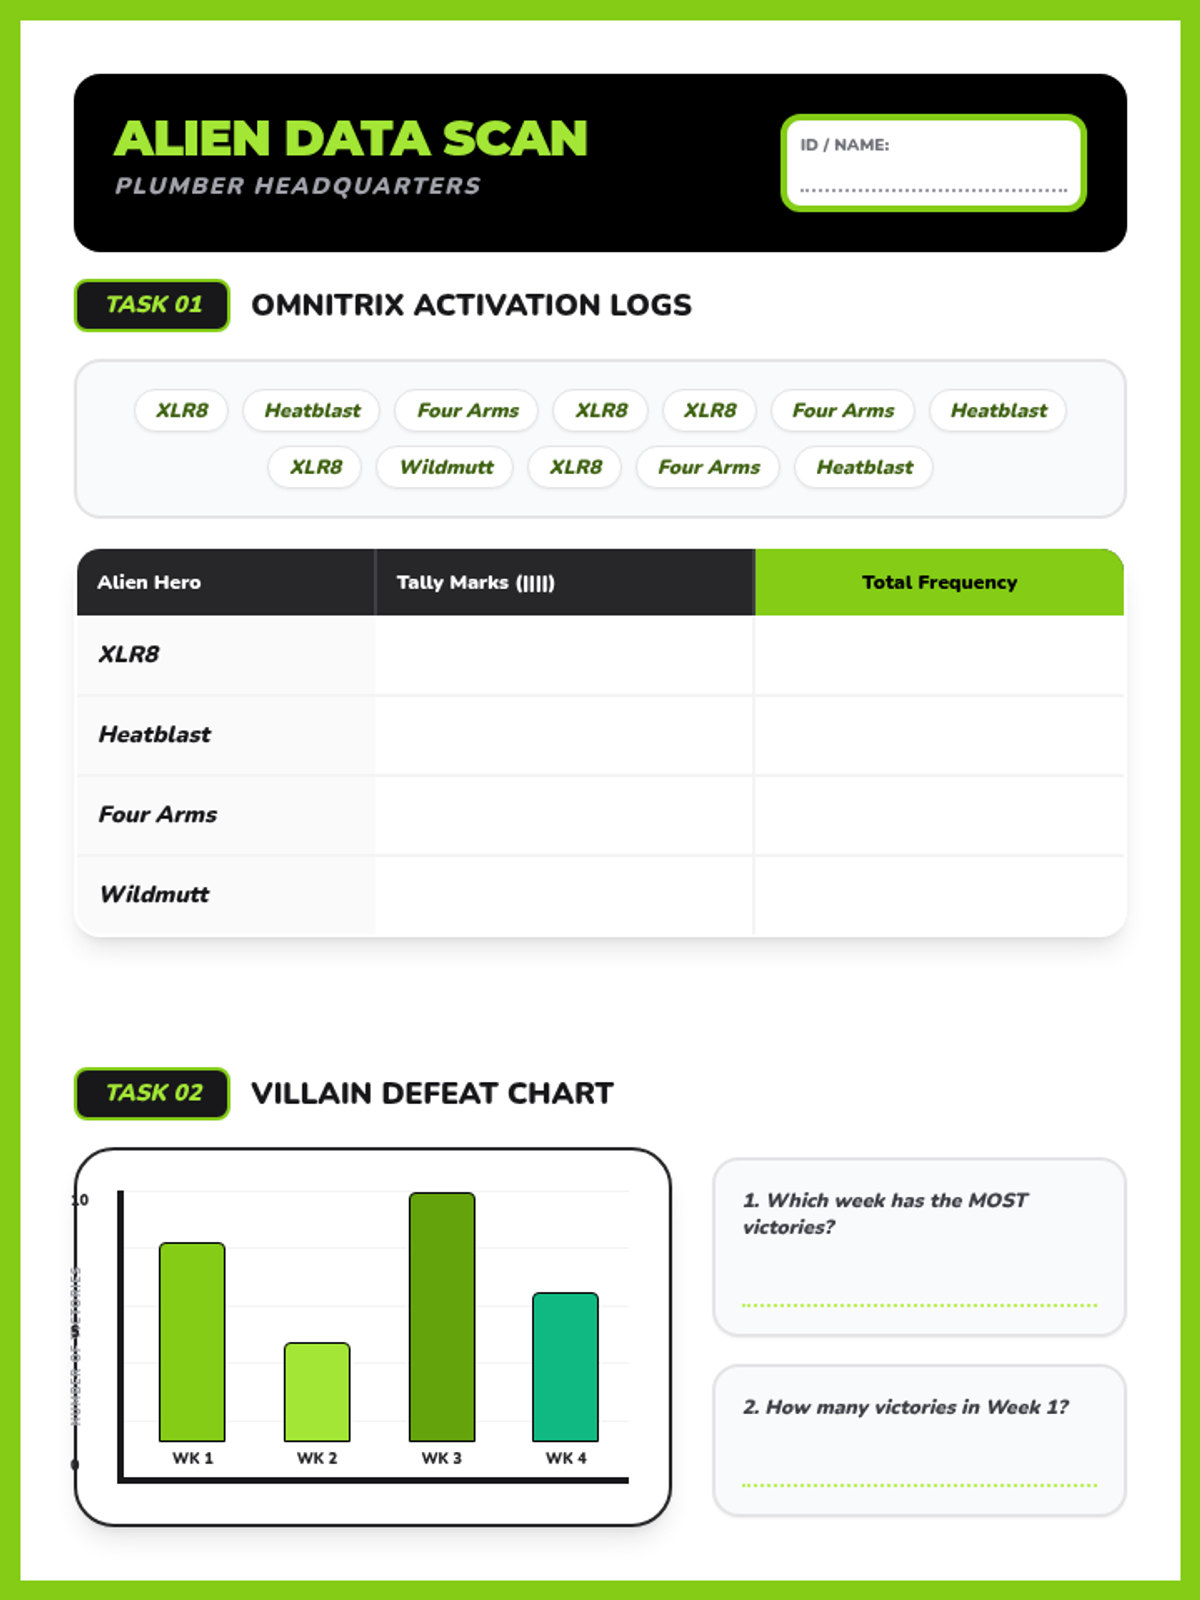
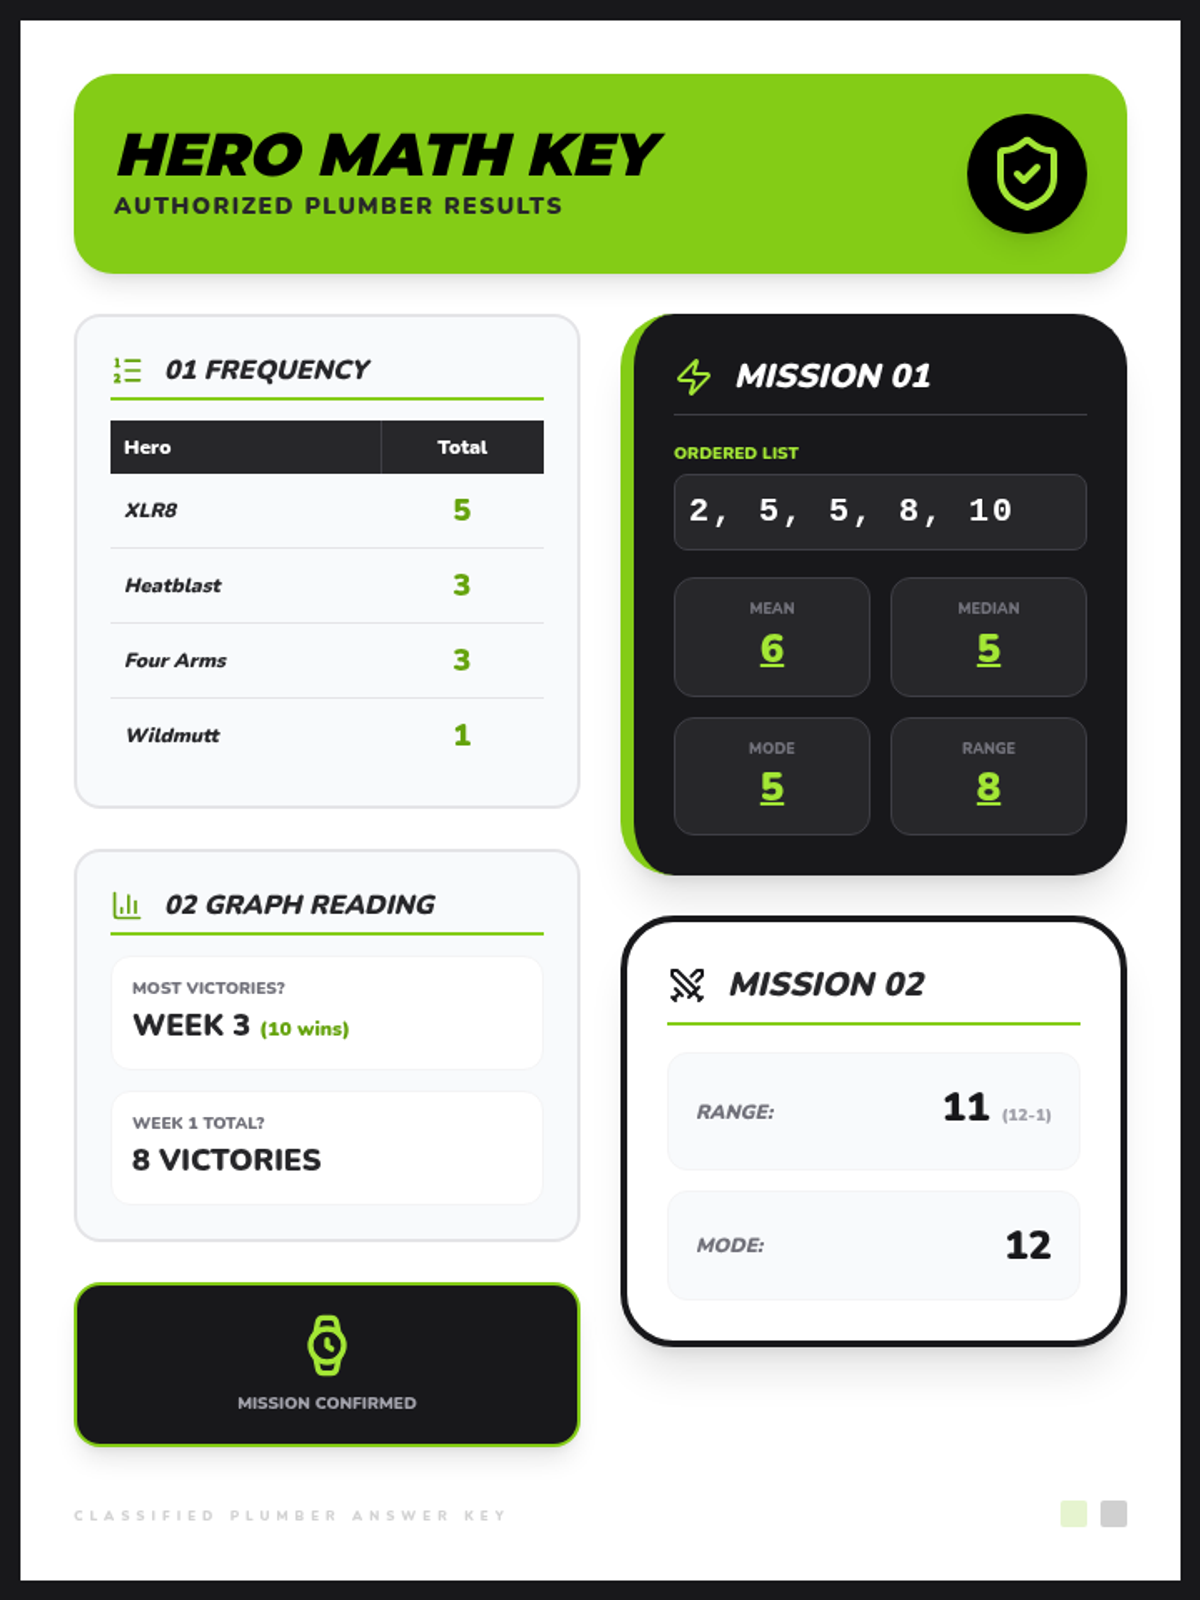
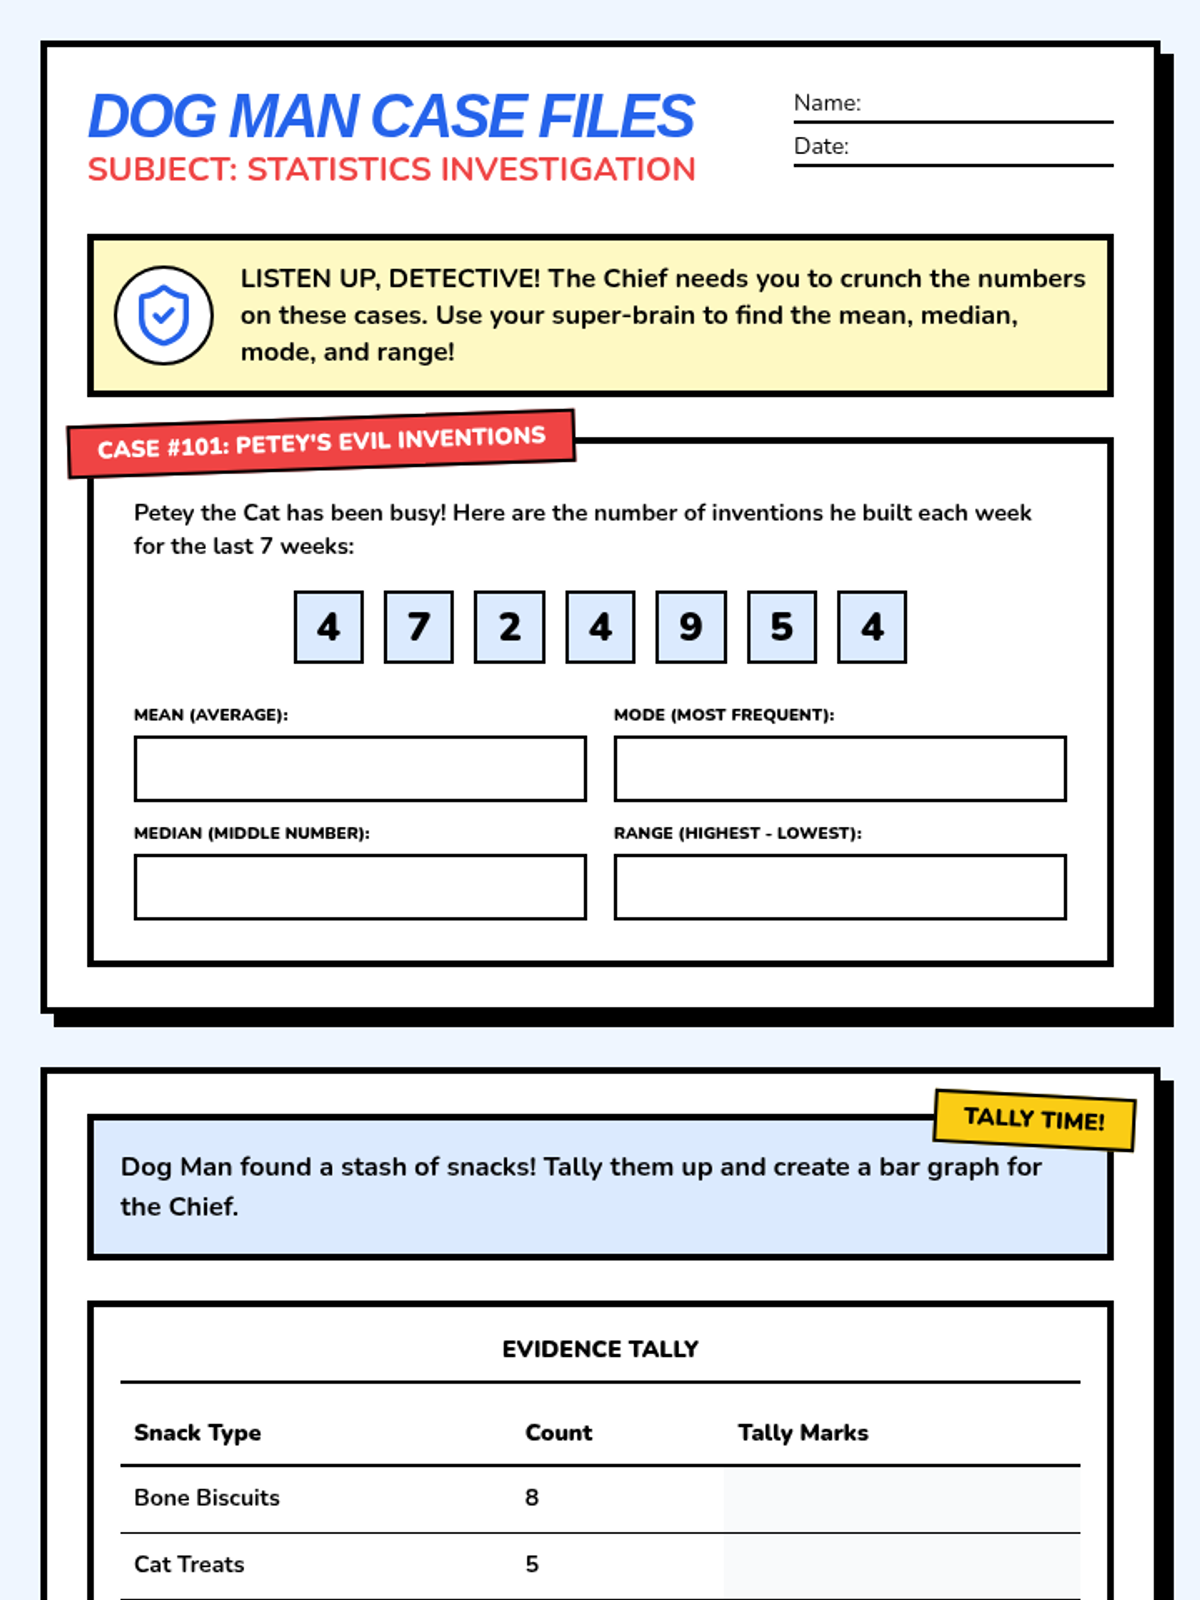
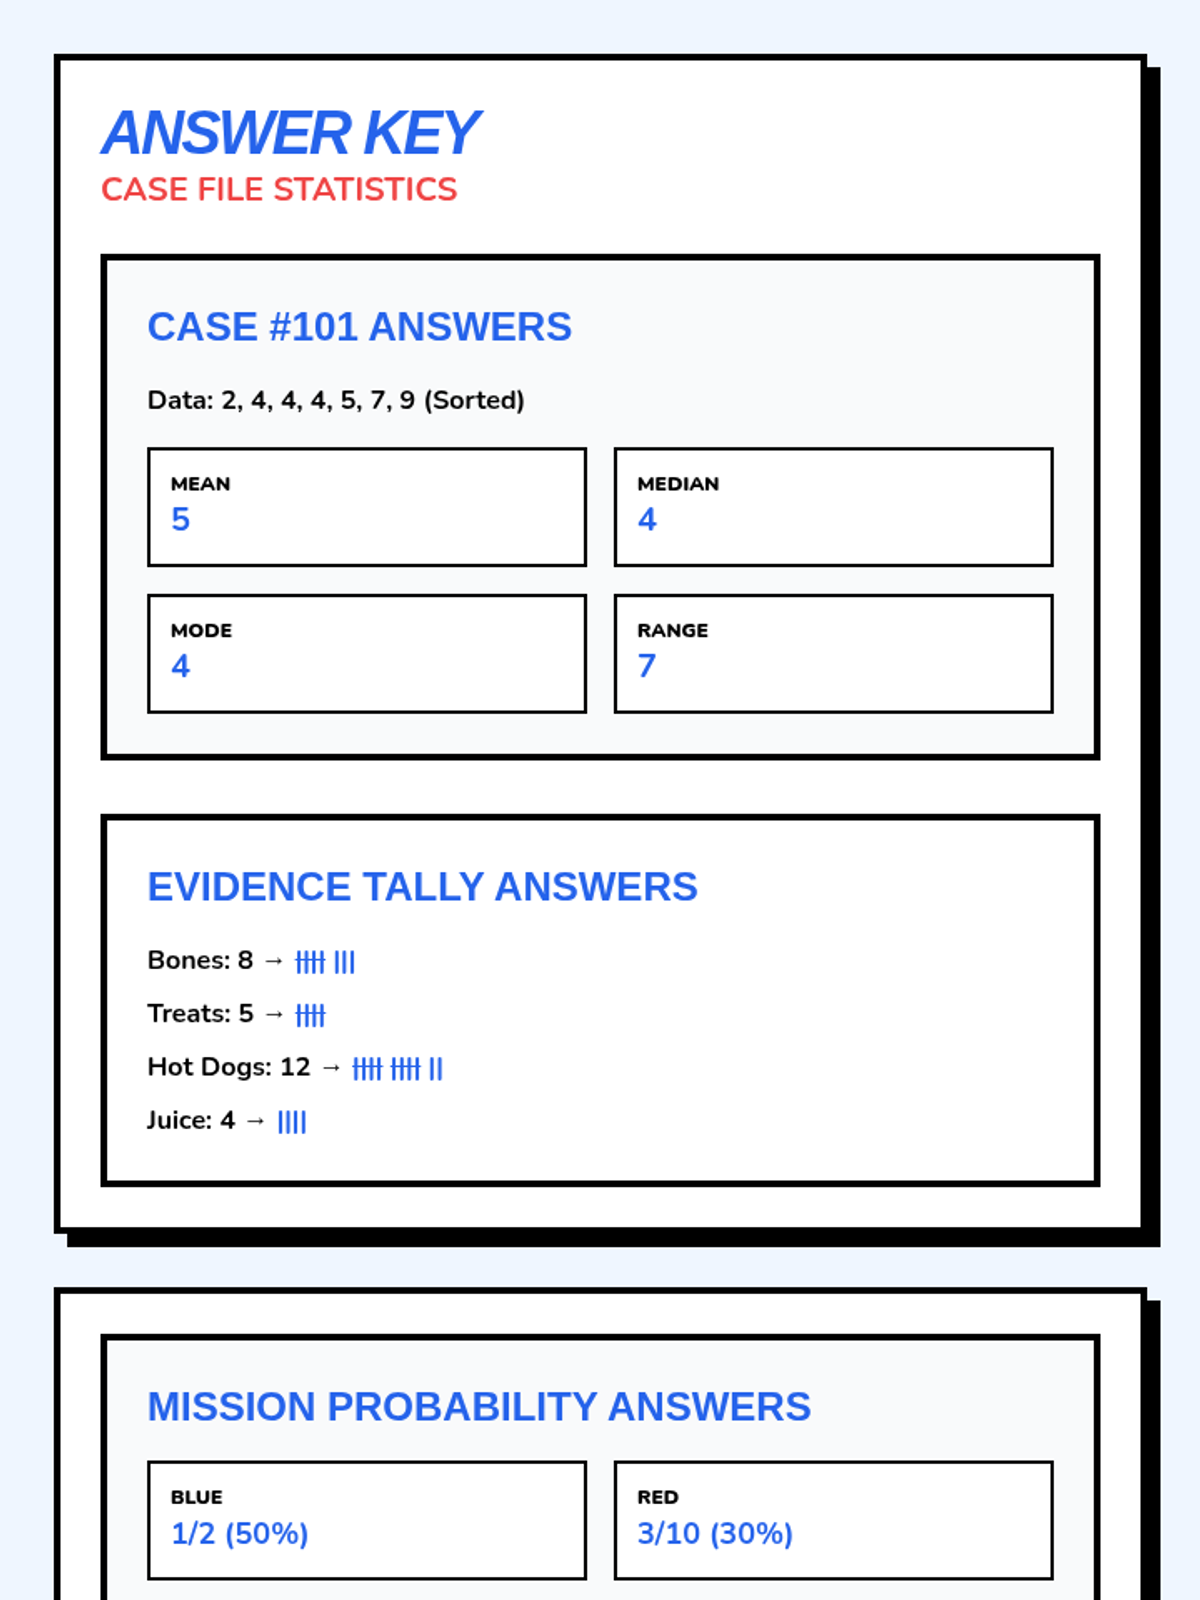
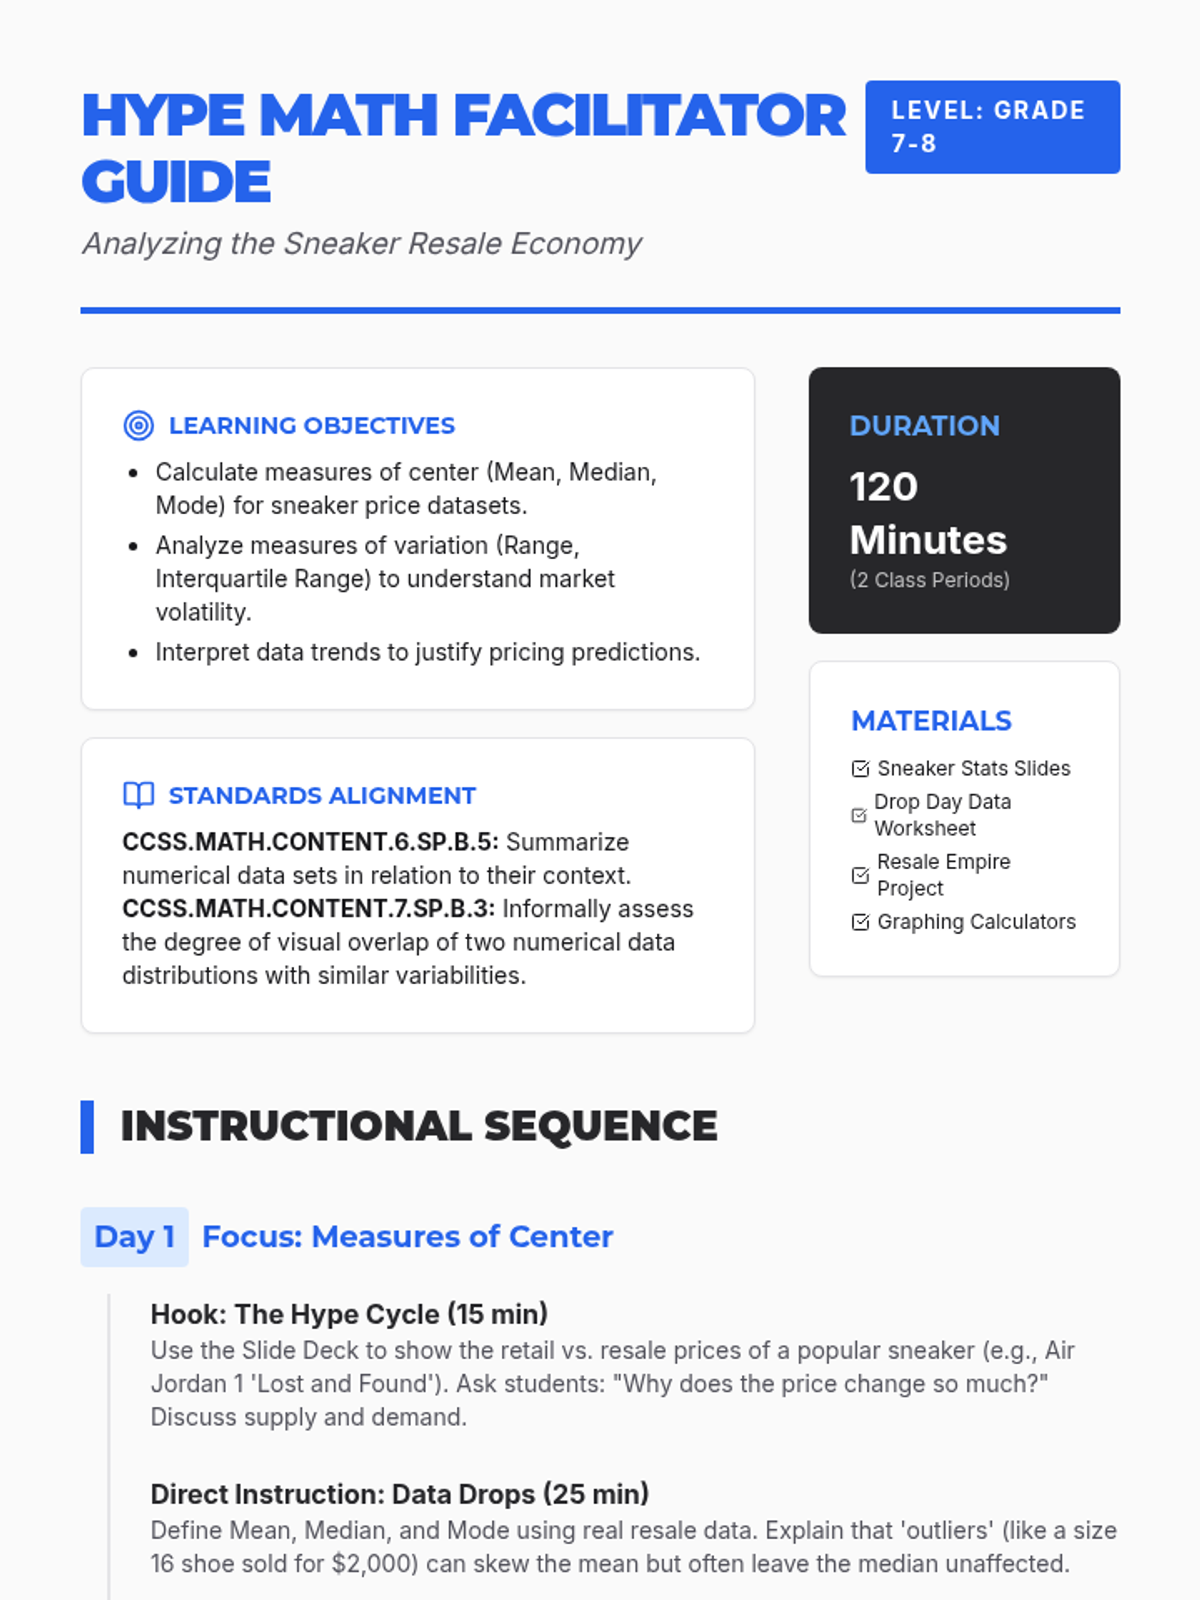
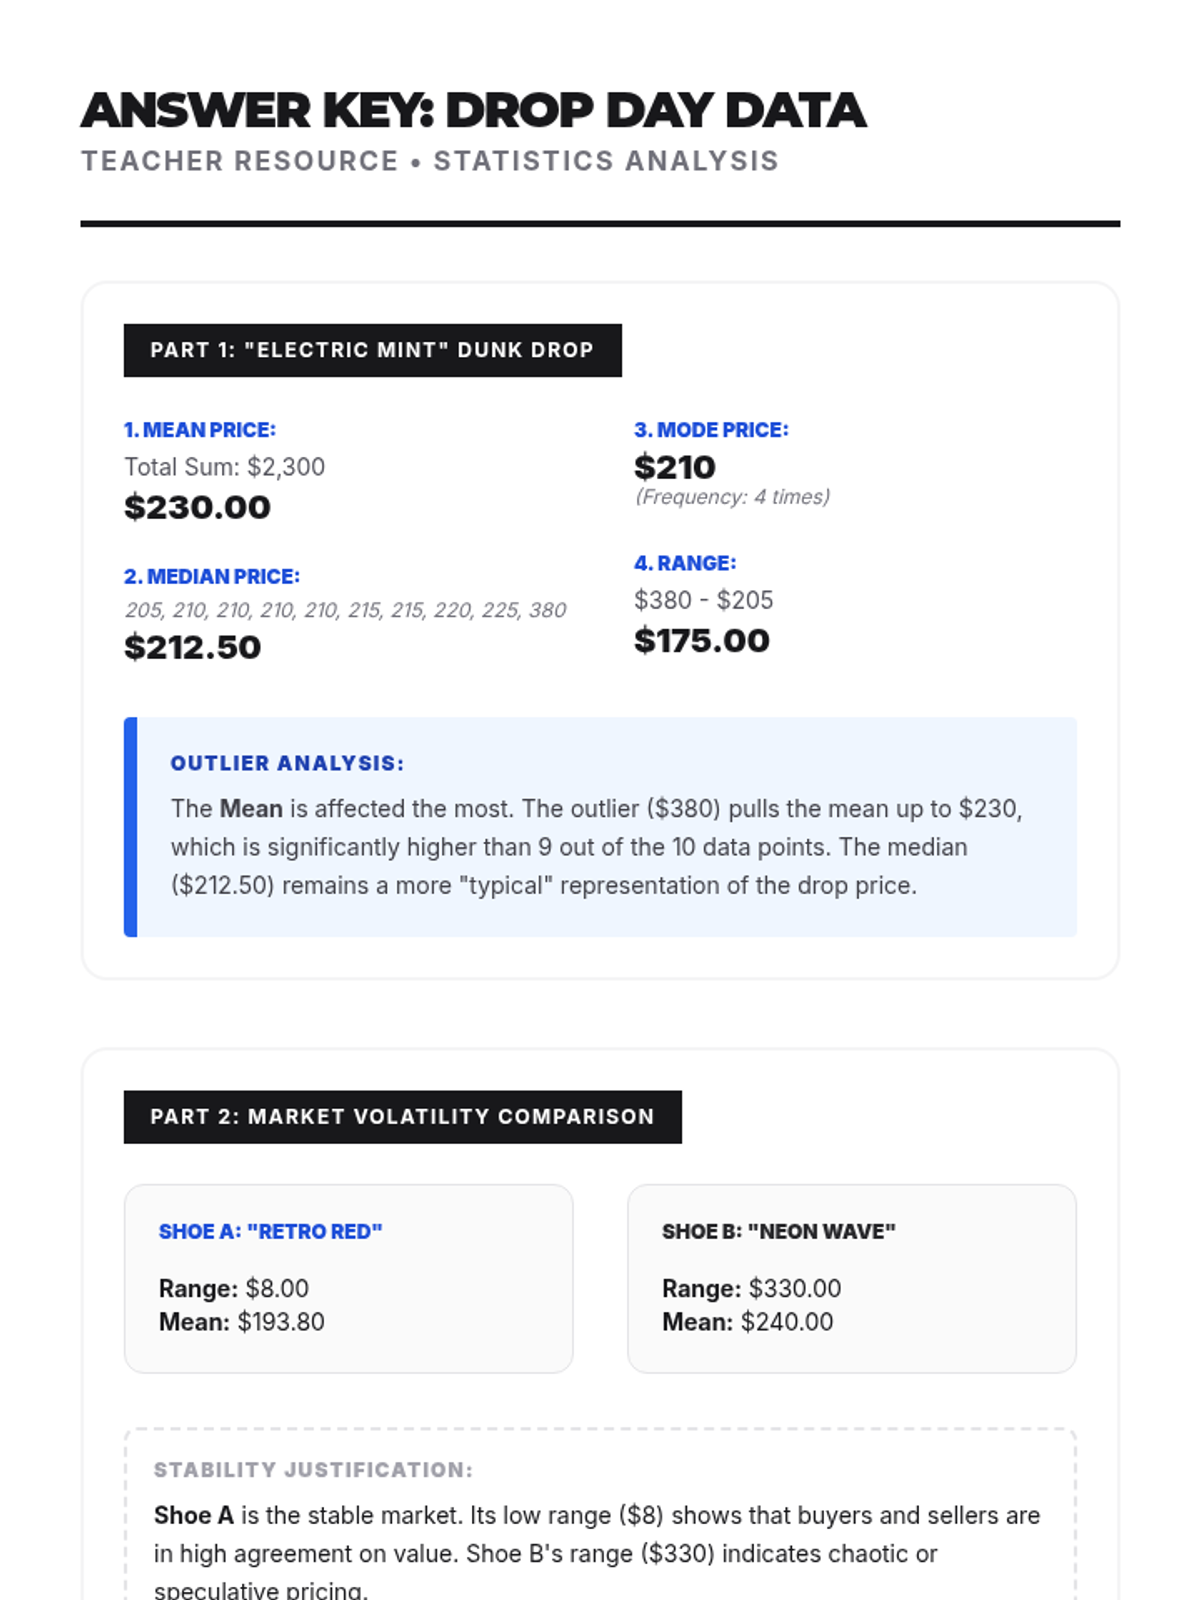
Students take on the role of data detectives to master central tendency and variation. This lesson covers calculating mean, median, mode, and range through engaging real-world scenarios.
A comprehensive lesson on interpreting dot plots, box plots, stem-and-leaf plots, and line graphs through the lens of a data investigation. Includes instructional slides and a 10-question practice set modeled after state assessment standards.
A lesson focused on visualizing academic progress data through line graphs and identifying key trends in student performance.
A comprehensive practice session on mean, median, mode, and range using real-world data scenarios and step-by-step scaffolding.
A modified lesson for IEP students to practice plotting points on a four-quadrant coordinate plane to reveal a mystery animal outline. includes visual supports, step-by-step checklists, and color-coded axes.
A focused lesson on calculating unit rates by multiplying by the reciprocal, specifically designed to help students master the "keep-change-flip" strategy for fractional rates.
A comprehensive 5-page review packet covering 7th-grade proportional relationship standards through scaffolding and visual modeling. Students move from unit rates to solving complex word problems and interpreting graphs.
A statistics lesson themed around Ben 10, focusing on central tendency (mean, median, mode, range) and data visualization through frequency tables and bar graphs. Designed with heavy visual supports for students with diverse learning needs.
A statistics lesson themed around Dog Man, covering central tendency, data visualization, probability, and box plots using structured comic-style layouts.
A scaffolded introduction to plotting coordinates in four quadrants, culminating in a creative picture-making activity designed for IEP accessibility.
A comprehensive lesson for grades 7-12 focusing on data literacy, ethical visualization, and identifying misleading statistics in media. Students learn to decode 'chartjunk' and create their own honest data stories.
A comprehensive lesson on adding and subtracting mixed numbers with unlike denominators, using a culinary theme to ground abstract concepts in real-world measurements.
A high-energy review of Box and Whisker plots, focusing on the five-number summary, IQR, and data interpretation for students who have already been introduced to the concept.
A statistics lesson for 7th-8th graders exploring measures of center and variation through the lens of the sneaker resale market. Students analyze pricing data from platforms to calculate mean, median, mode, and range to predict future market trends.
Students take on the role of event planners to organize a classroom pizza party. They must navigate a $100 budget, compare unit prices for the best deals, and calculate Arizona sales tax to ensure they stay within their financial limits.
A foundational lesson on plotting points in all four quadrants, specifically designed with scaffolds for students with IEPs. Students will create four different images: a house, an emoji, a pumpkin, and a letter.
A comprehensive math assessment covering middle-grade concepts including algebraic expressions, numerical operations, fractions, decimals, and geometry. This lesson focuses on evaluating student proficiency across RIT 211-220 criteria through a structured quiz and detailed answer key.
A high-energy, 60-minute review lesson on comparing and ordering integers using a submarine exploration theme. Students will master number line placement and inequality symbols through a fast-paced game and guided practice.
Students apply geometry and arithmetic to design a sustainable school garden, calculating area for planting beds and managing a $500 budget for soil and seeds.
A comprehensive lesson on interpreting circle graphs, box plots, and proportional relationships within a City Engineering context, focused on 7th grade MCAS standards.