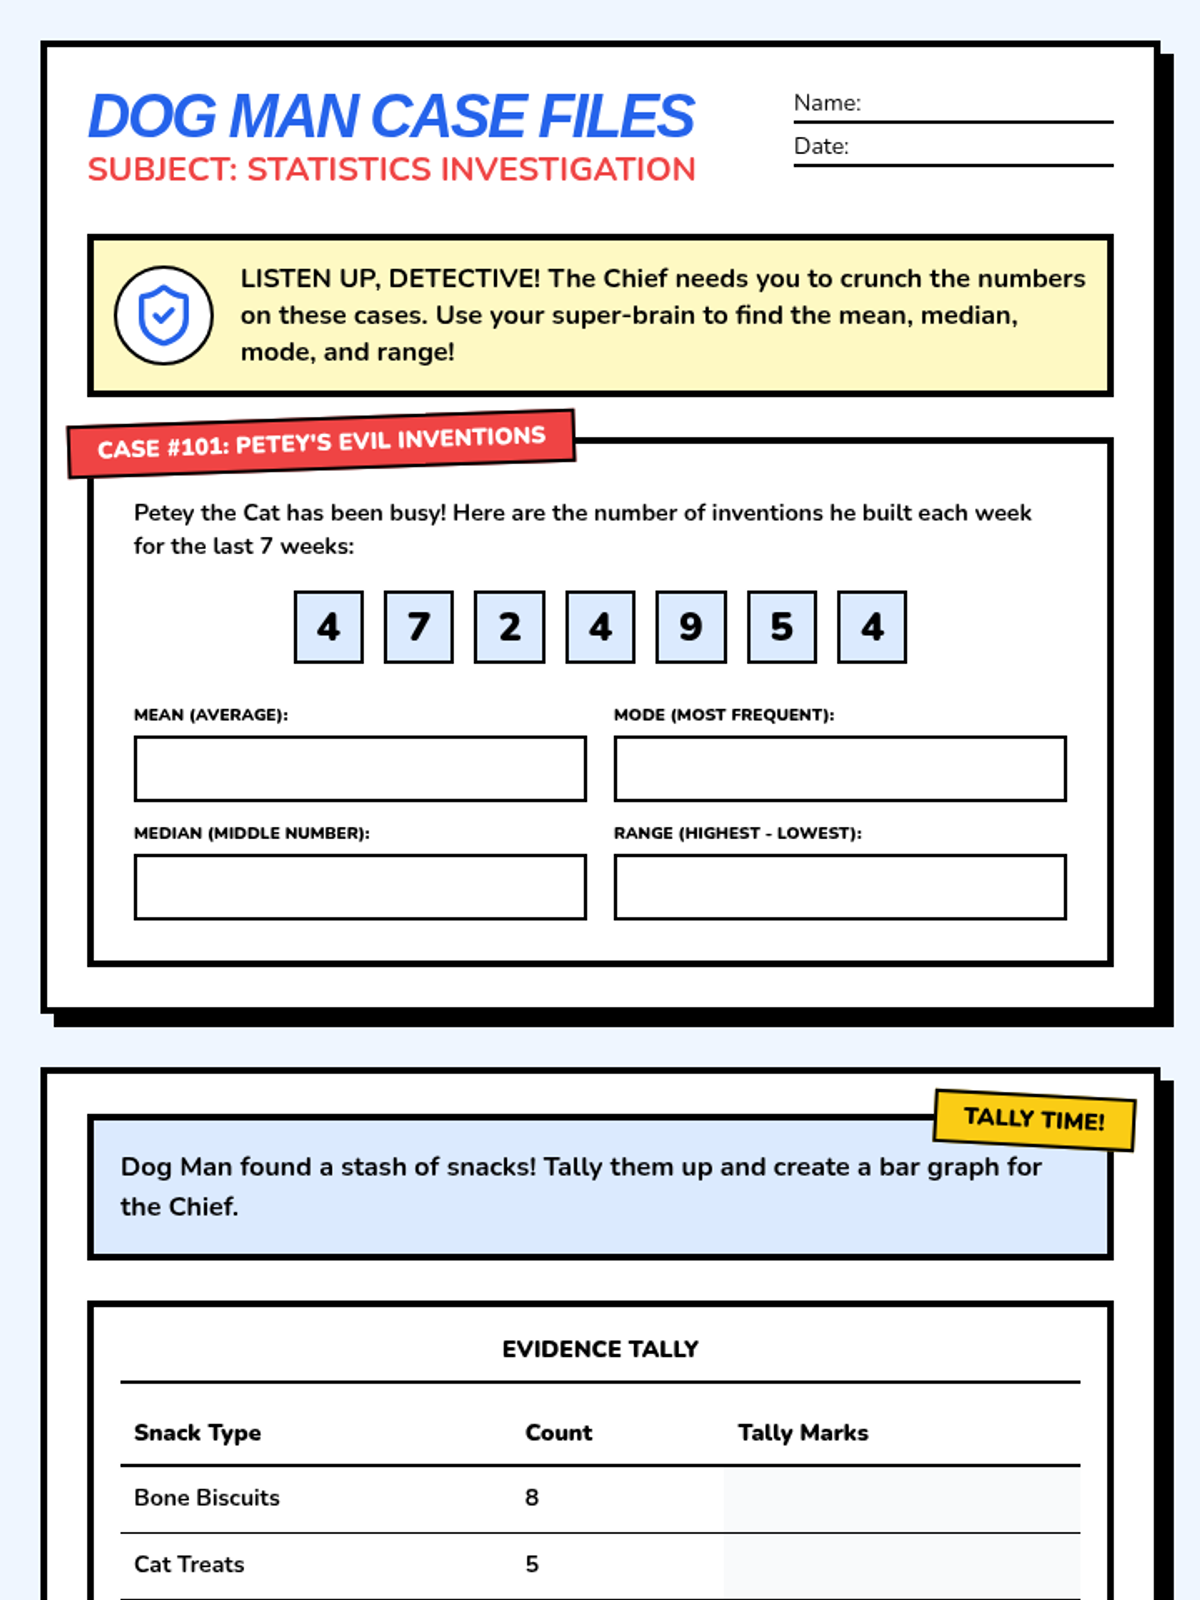
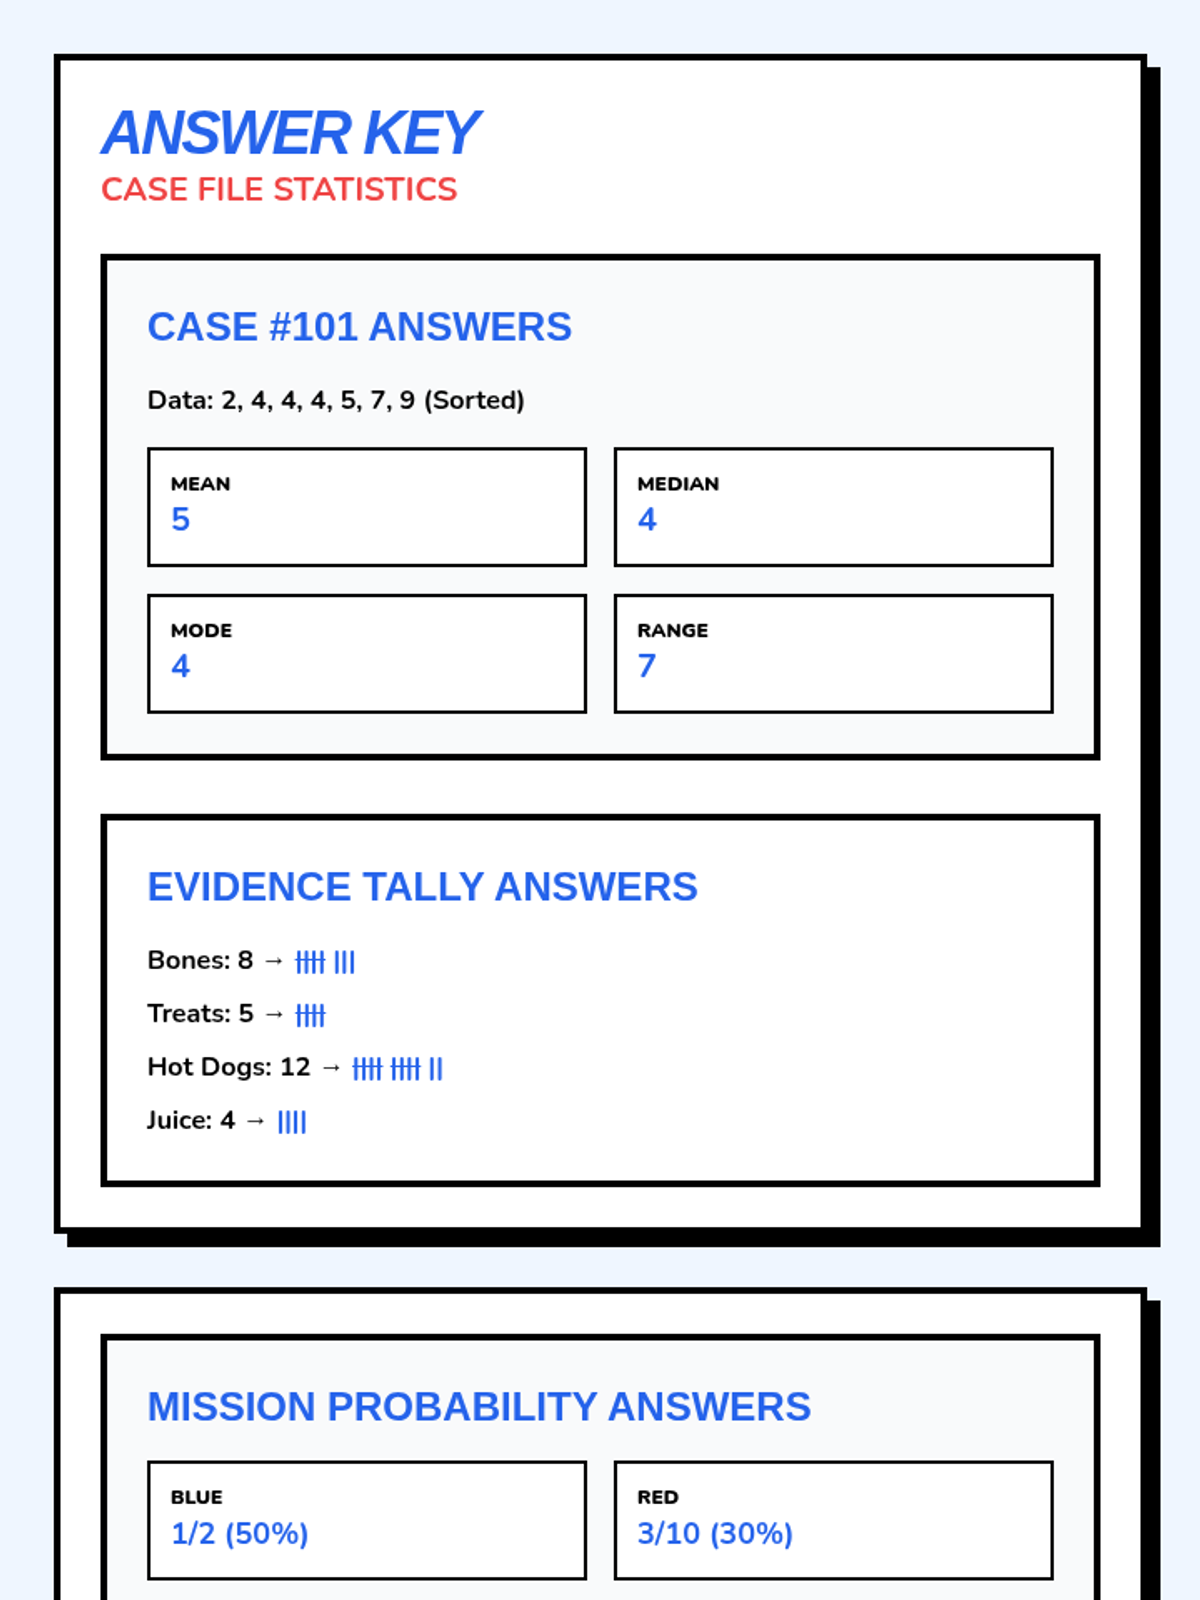
A statistics lesson themed around Ben 10, focusing on central tendency (mean, median, mode, range) and data visualization through frequency tables and bar graphs. Designed with heavy visual supports for students with diverse learning needs.
A statistics lesson themed around Ben 10, focusing on central tendency (mean, median, mode, range) and data visualization through frequency tables and bar graphs. Designed with heavy visual supports for students with diverse learning needs.