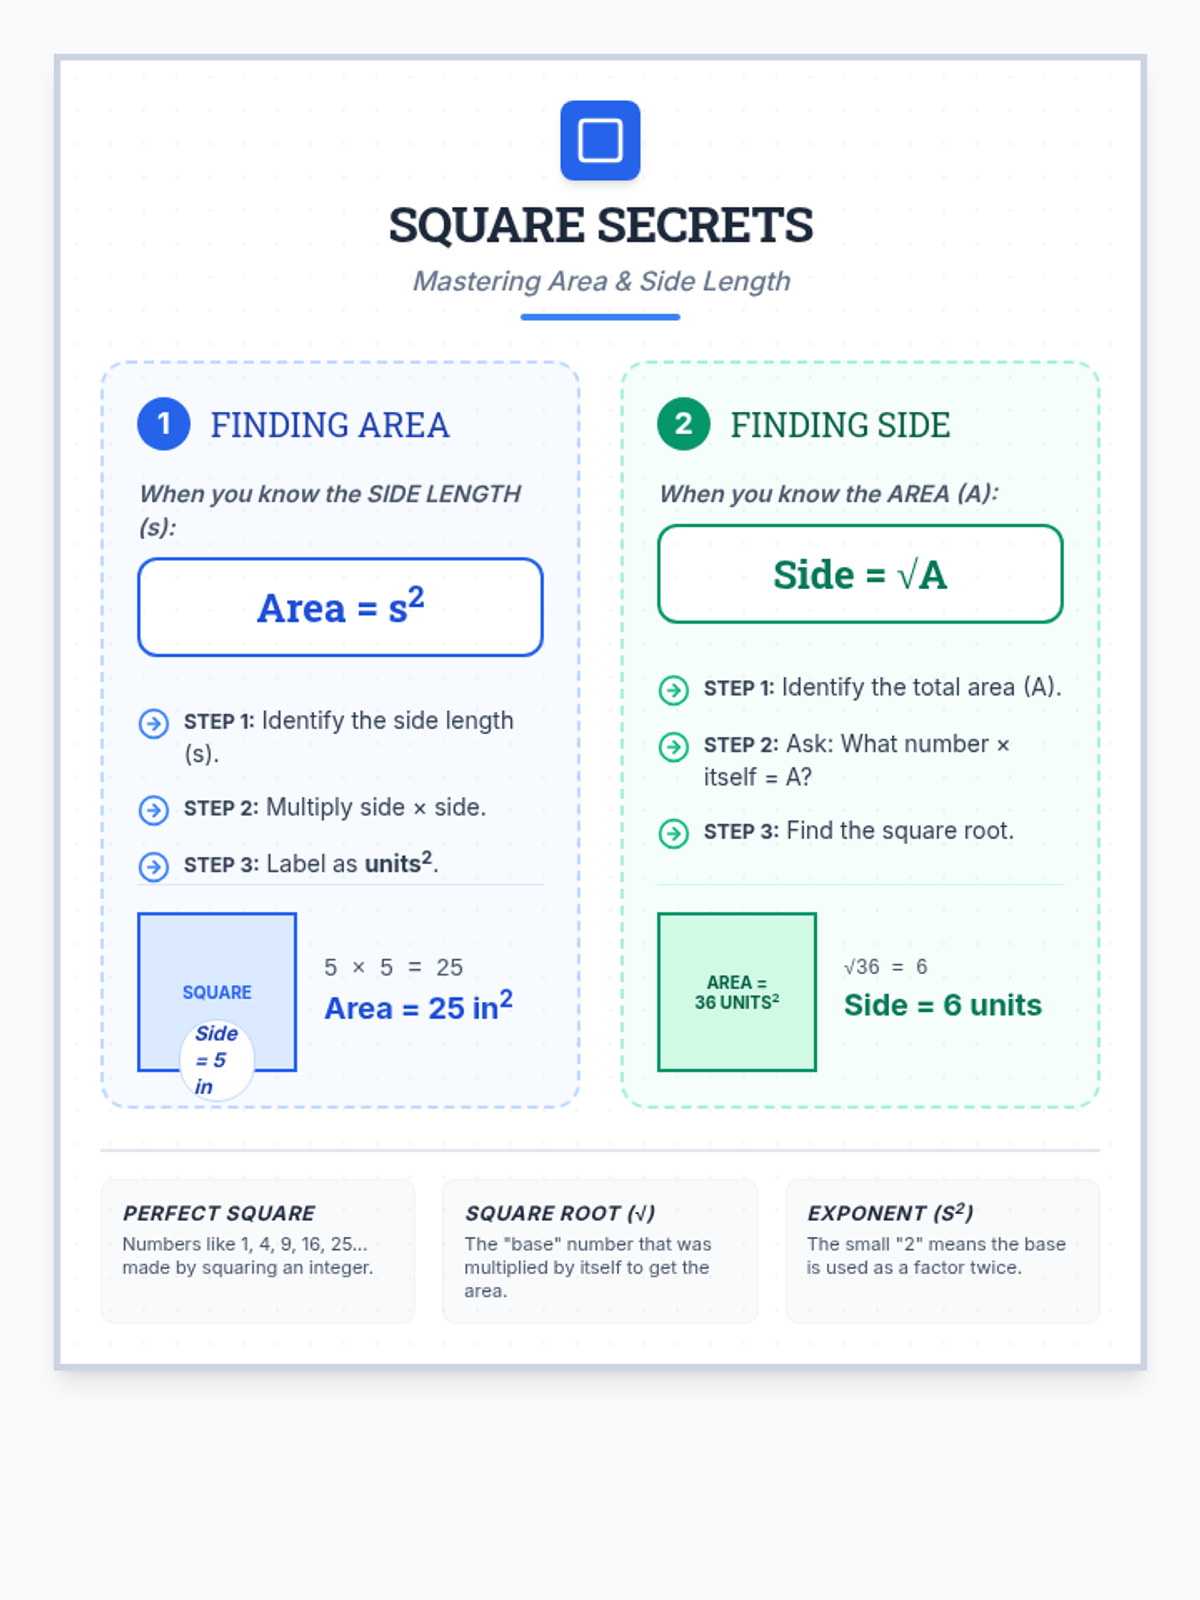
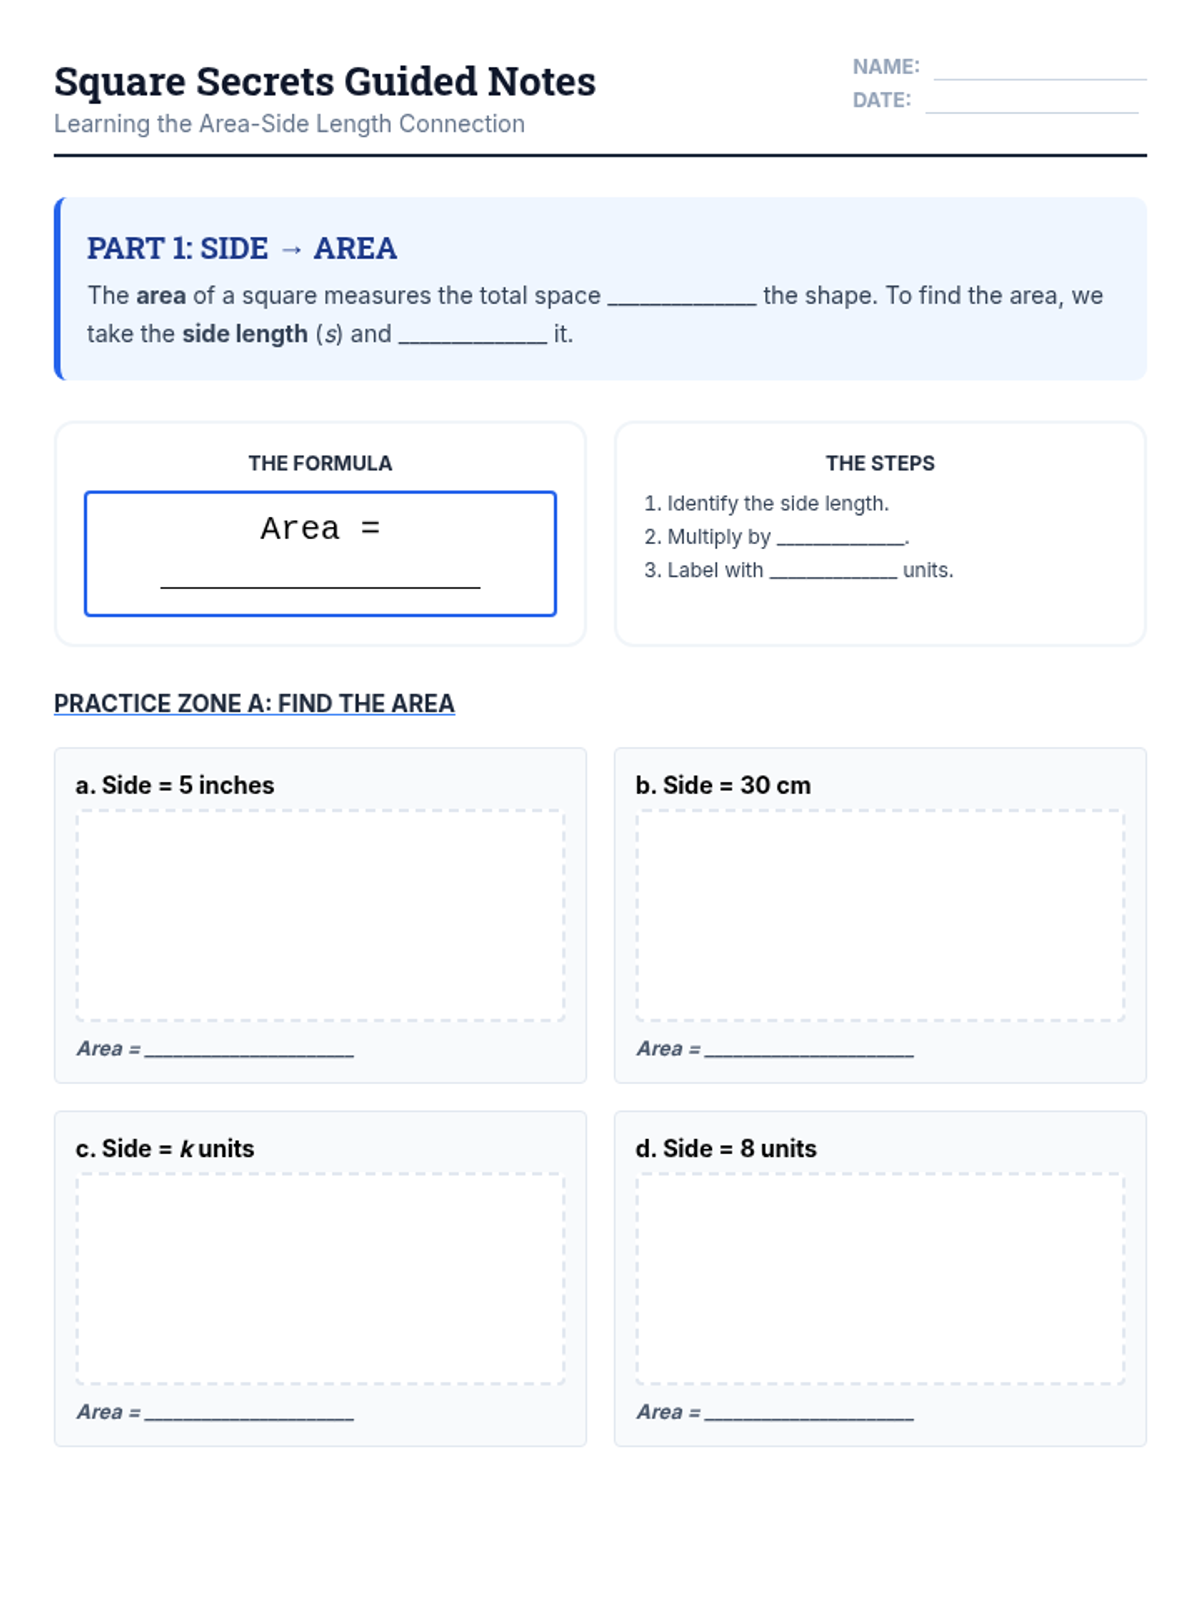
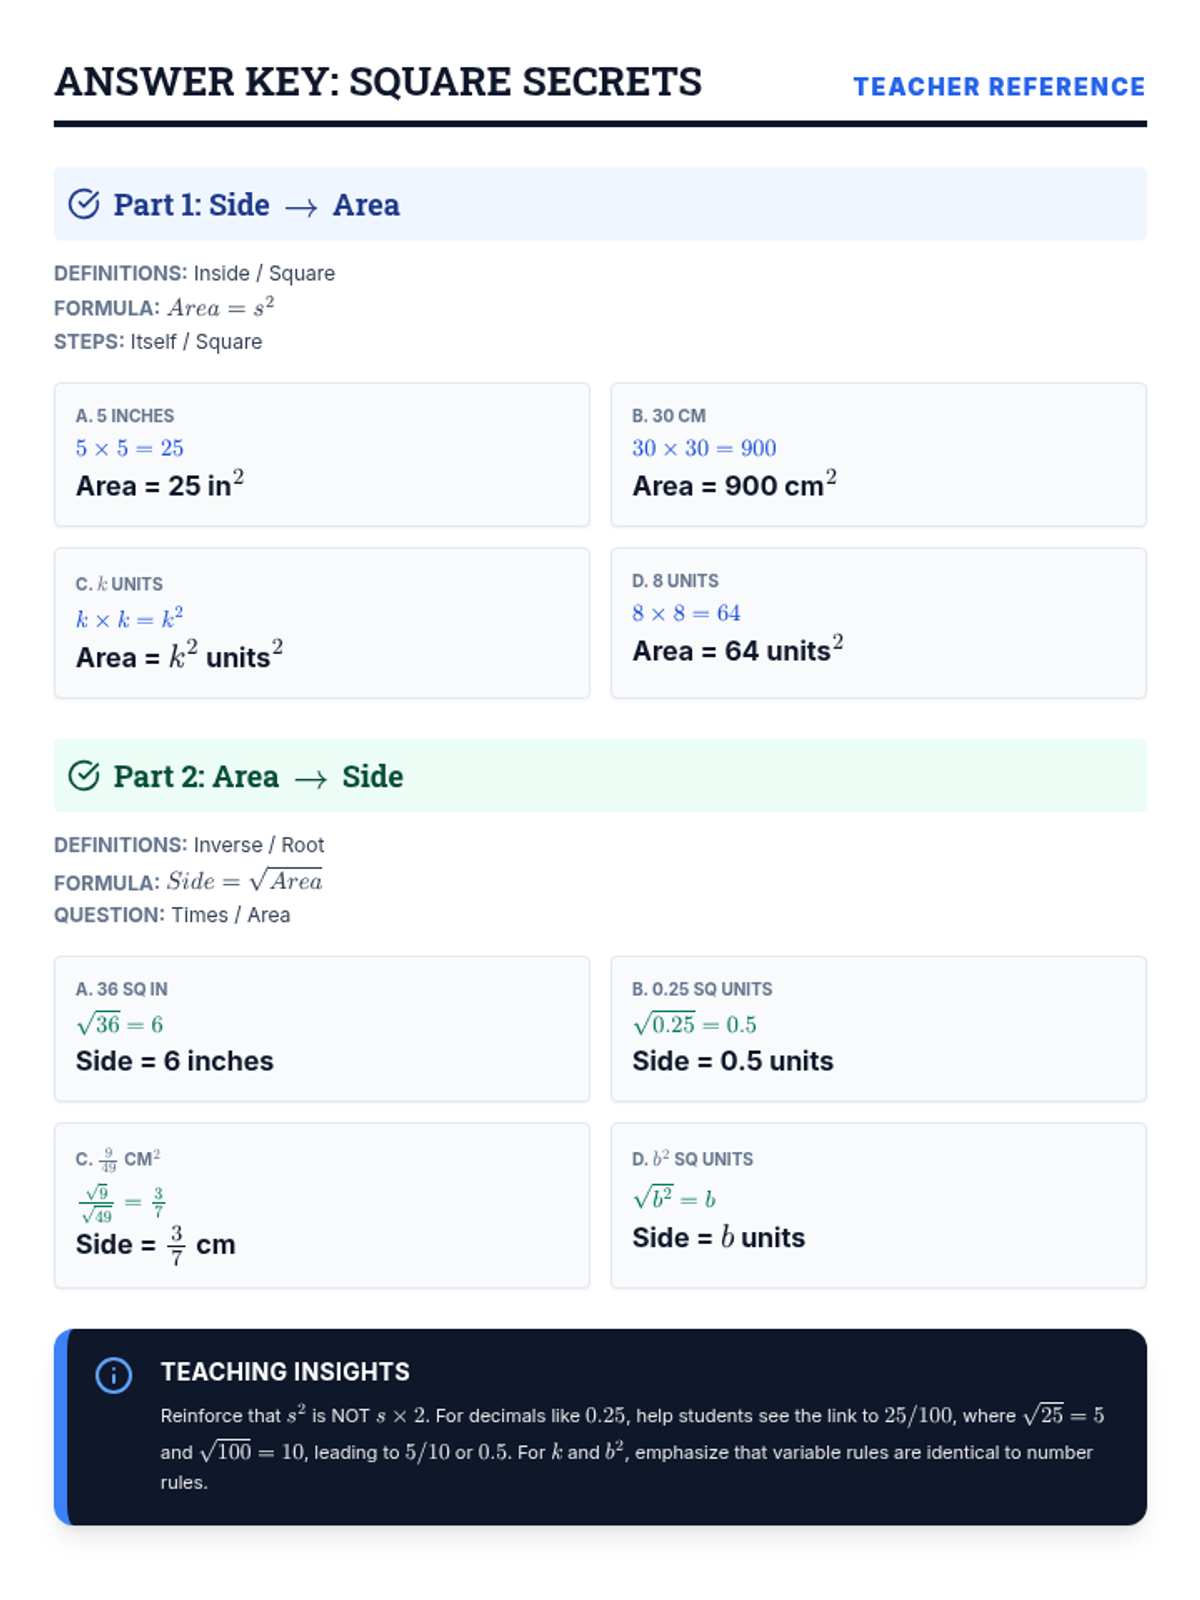
A scaffolded lesson on calculating square areas and estimating square roots using color-coded visual aids and guided graphic organizers.
A lesson teaching the relationship between a square's side length and its area, focusing on squaring and square roots.
A lesson focused on calculating the area of composite figures using rectangles, squares, and triangles in real-world scenarios.
A 30-minute introductory lesson on statistical vs. non-statistical questions and data sets, themed around basketball analytics. Students learn to identify variability in questions and data.
A comprehensive assessment and review of dividing fractions, covering unit fractions, whole numbers, and advanced concepts like mixed numbers.
A focused lesson on finding the Least Common Denominator (LCD) for rational expressions involving binomials and trinomials, emphasizing factoring techniques.
A scaffolded lesson on adding and subtracting fractions with unlike denominators, designed for IEP students using visual models and multiplication charts.
A statistics assessment themed around Cartoon Network characters, focusing on data interpretation, central tendency, and probability with high visual support for autistic students.
A comprehensive assessment covering measures of central tendency, probability, frequency tables, standard deviation, and outliers. This lesson evaluates student mastery of key statistical concepts through various question formats.
A high-engagement lesson on sine, cosine, and tangent ratios through the lens of construction and architecture. Students apply trigonometric concepts to real-world structural challenges like roof pitches and ADA ramp compliance.
A comprehensive statistics workbook themed after Teen Titans Go!, covering mean, median, mode, graphing, and probability with 9th-grade rigor and visual supports.
A statistics packet themed around Teen Titans Go, covering central tendency, graphing, probability, and data collection with high visual support.
A comprehensive lesson teaching students how to plot polygons on the coordinate plane and use absolute value to calculate horizontal and vertical side lengths.
A lesson focused on identifying angle relationships and calculating missing values using geometric properties and algebraic equations.
A comprehensive lesson on plotting and connecting coordinates in all four quadrants to create geometric shapes. Students will learn to navigate the coordinate plane, identify polygons, and calculate side lengths.
A comprehensive lesson on probability outcomes, theoretical/experimental calculations, compound events, and sampling methods.
A comprehensive lesson on data analysis covering scatter plots, lines of fit, two-way tables, and selecting appropriate data displays based on Chapter 9 of Big Ideas Math 8.
A comprehensive lesson on probability and statistics, covering outcomes, experimental and theoretical probability, sample spaces, compound events, and population comparisons.
A 60-minute lesson where students act as lead researchers in a data laboratory. They will master constructing and interpreting dot plots, histograms, and box plots to analyze scientific findings.
An introductory lesson on place value and rounding, featuring a guided graphic organizer and a matching card game to support multilingual learners in navigating complex numbers.