Students investigate the distinct features of bar graphs, such as the x-axis, y-axis, labels, title, and scale intervals. They compare bar graphs to tally charts to understand the advantages of using bars to visualize quantity differences.
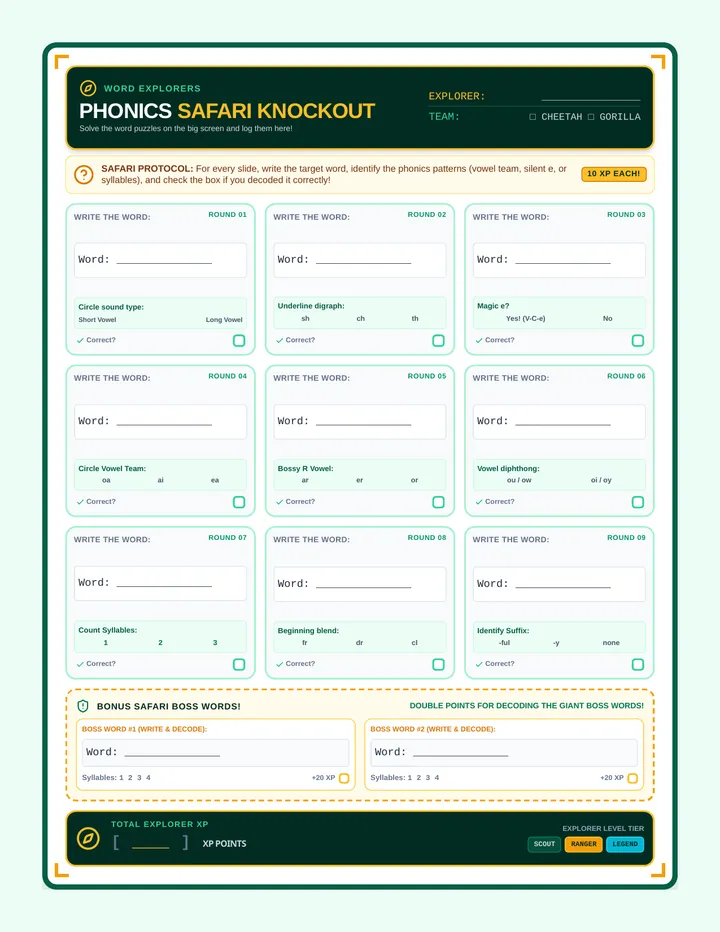
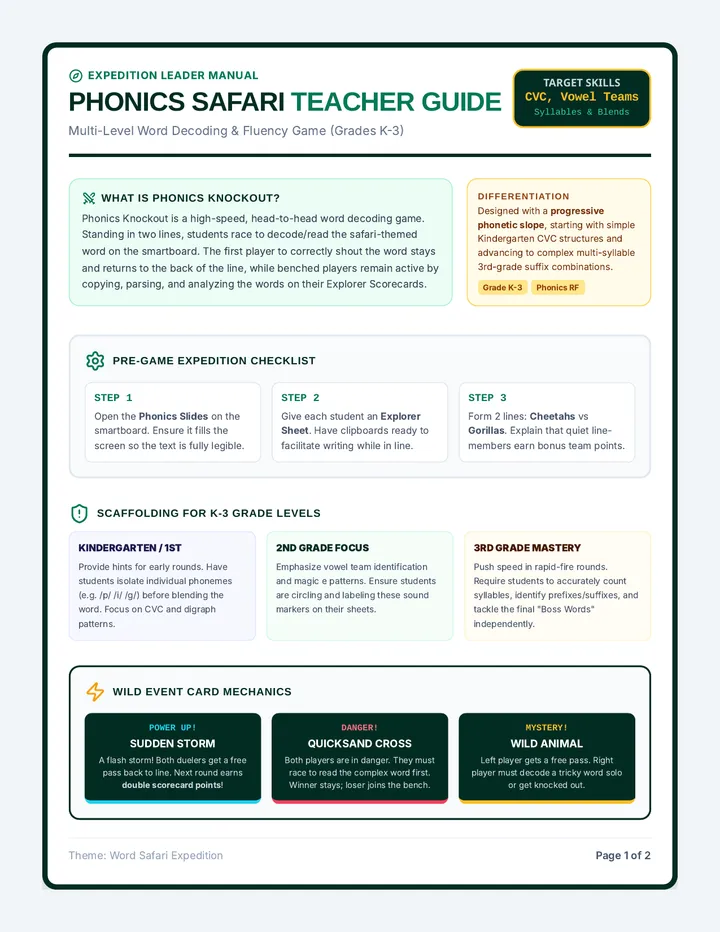
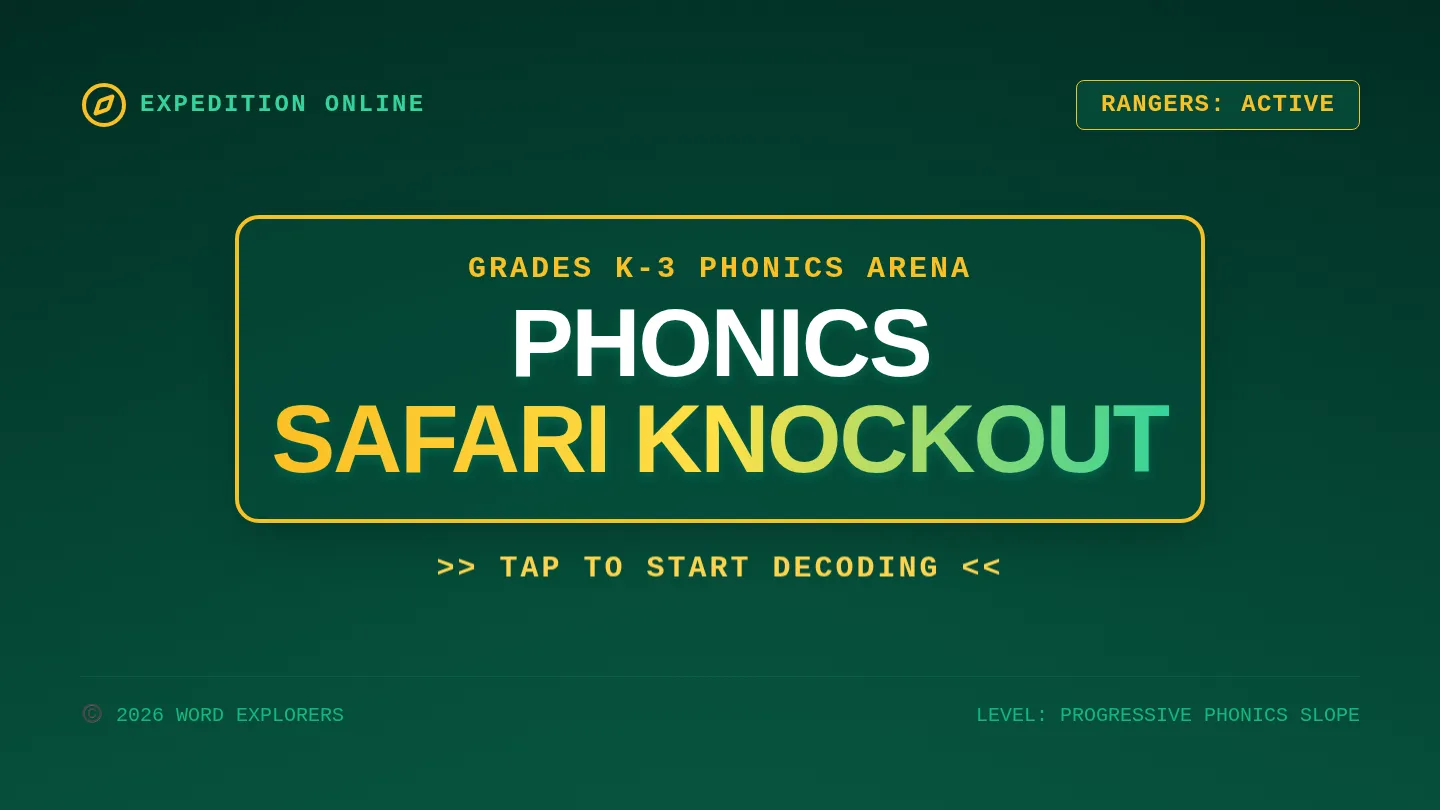
A high-energy, wild safari-themed classroom game for K-3 students focusing on key phonics skills including CVC words, silent 'e', vowel teams, and multi-syllable decoding. This lesson includes a widescreen smartboard presentation, a teacher facilitation guide with word keys, and an active-participation student tracker sheet.
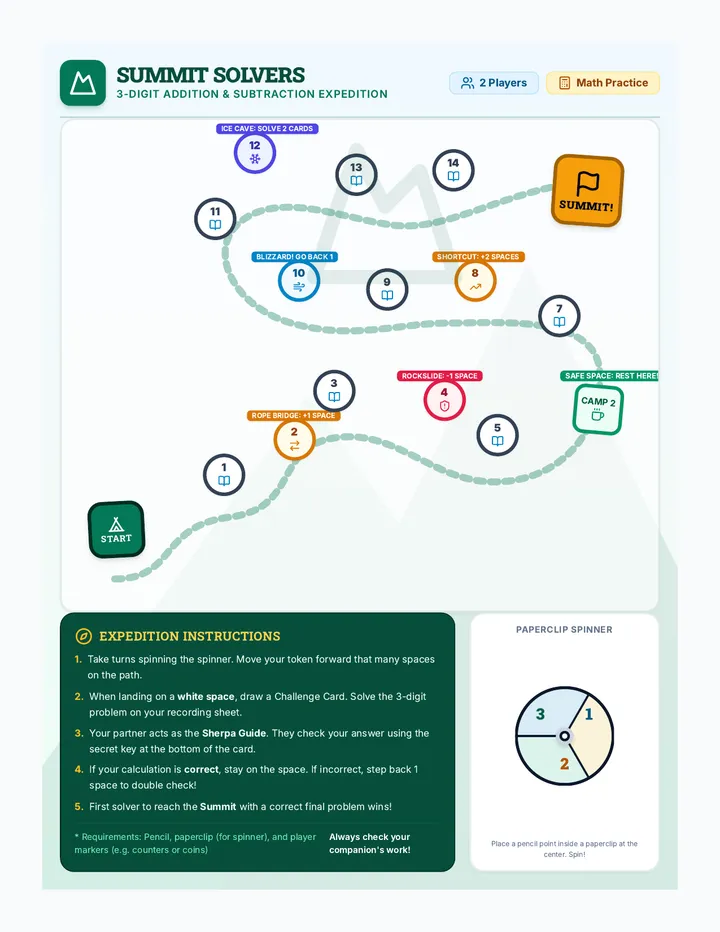
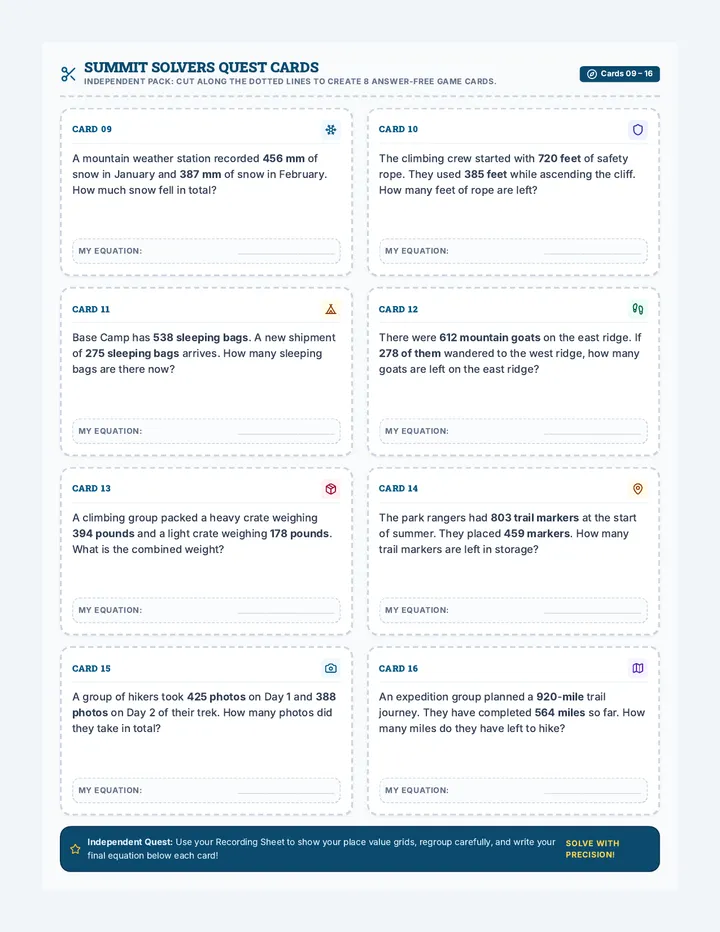
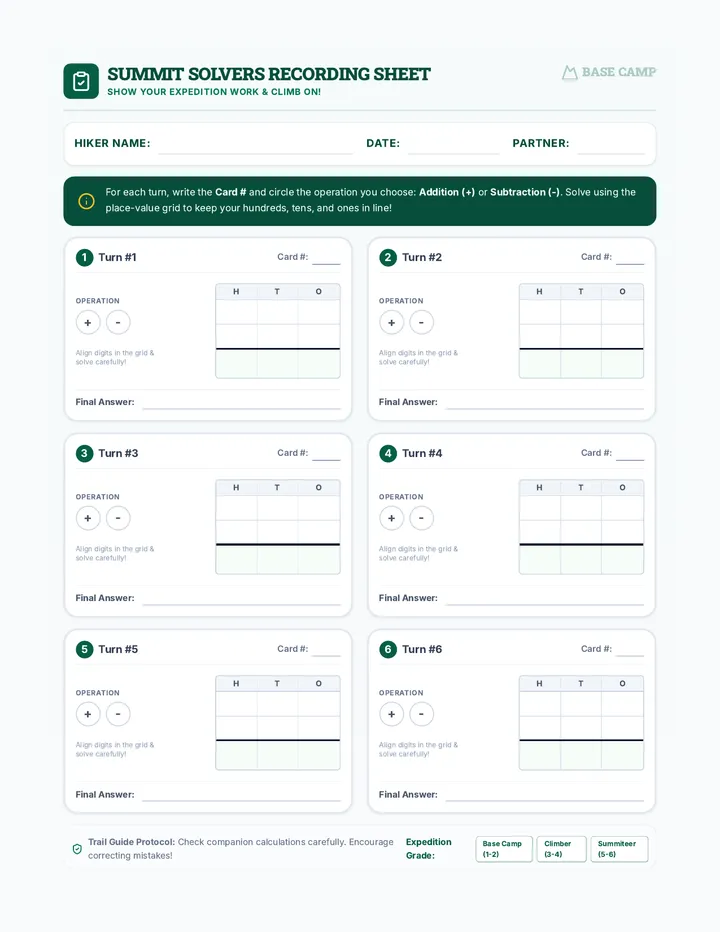
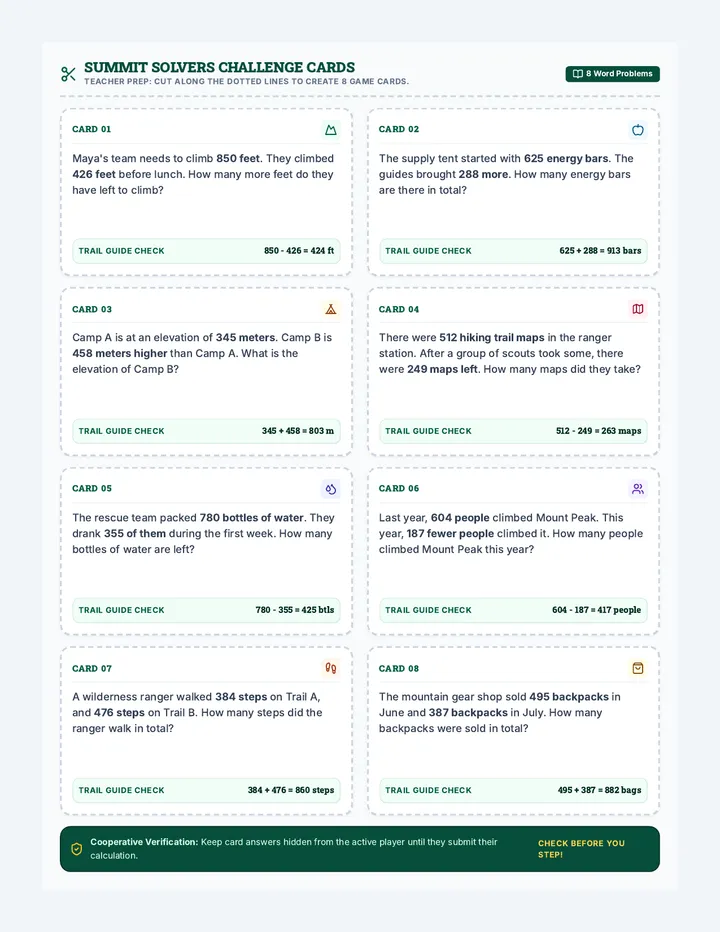
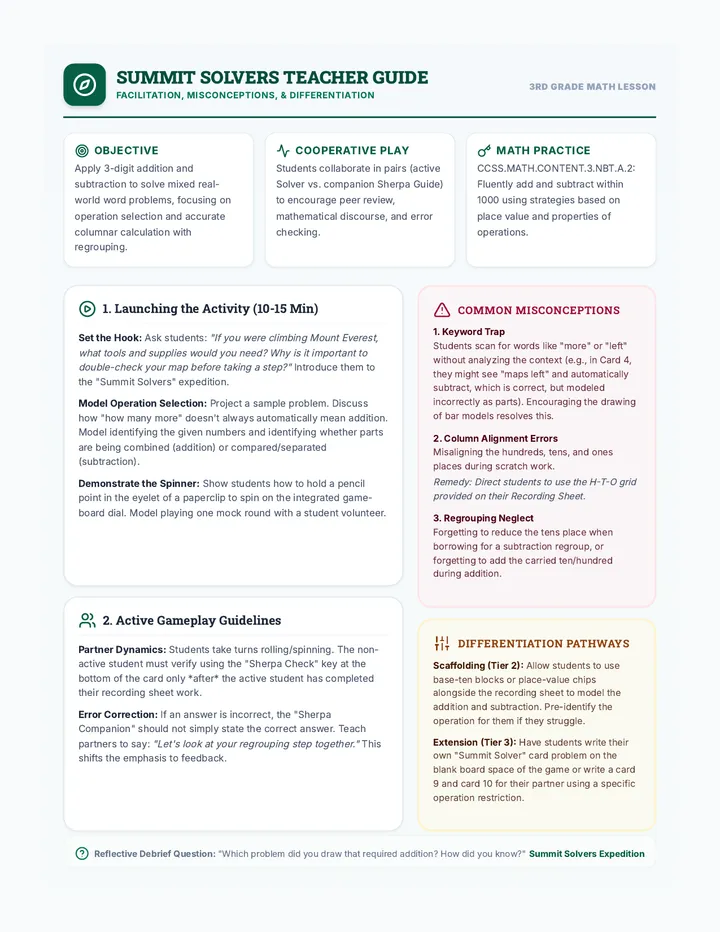
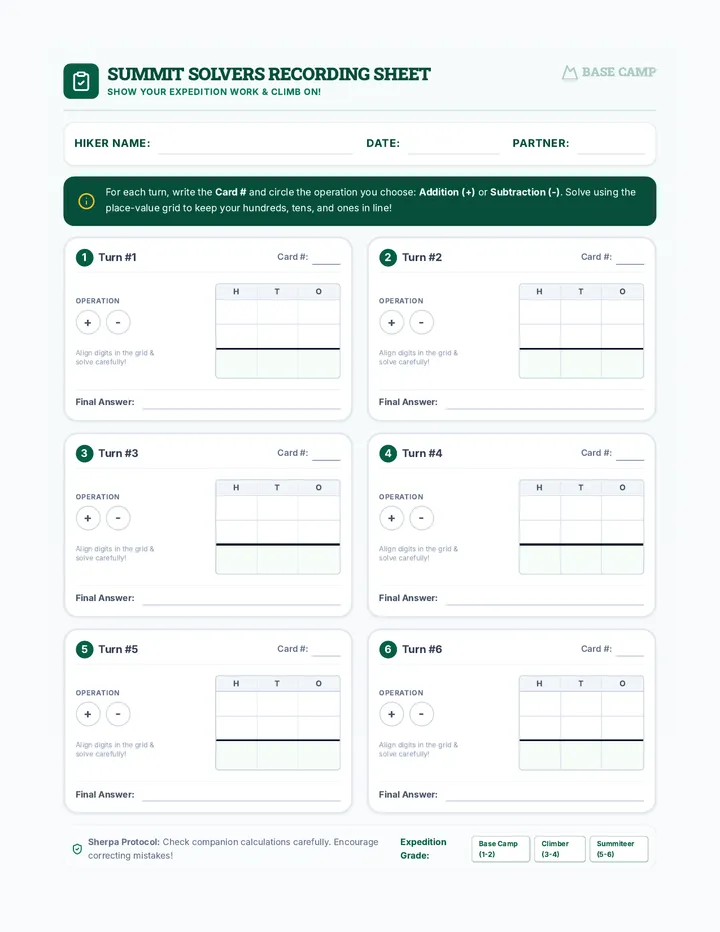
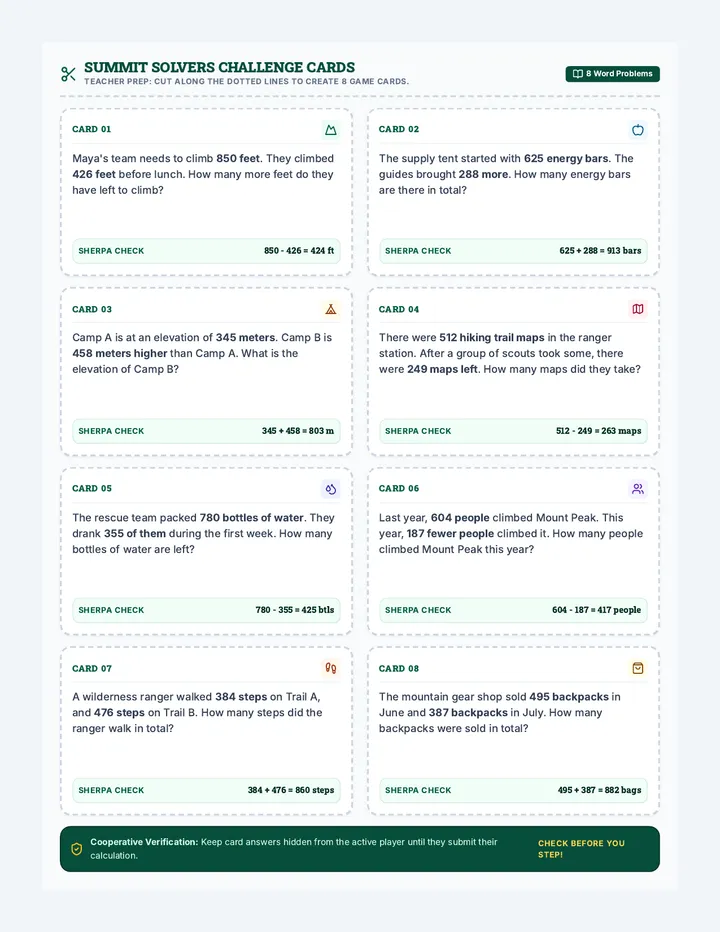
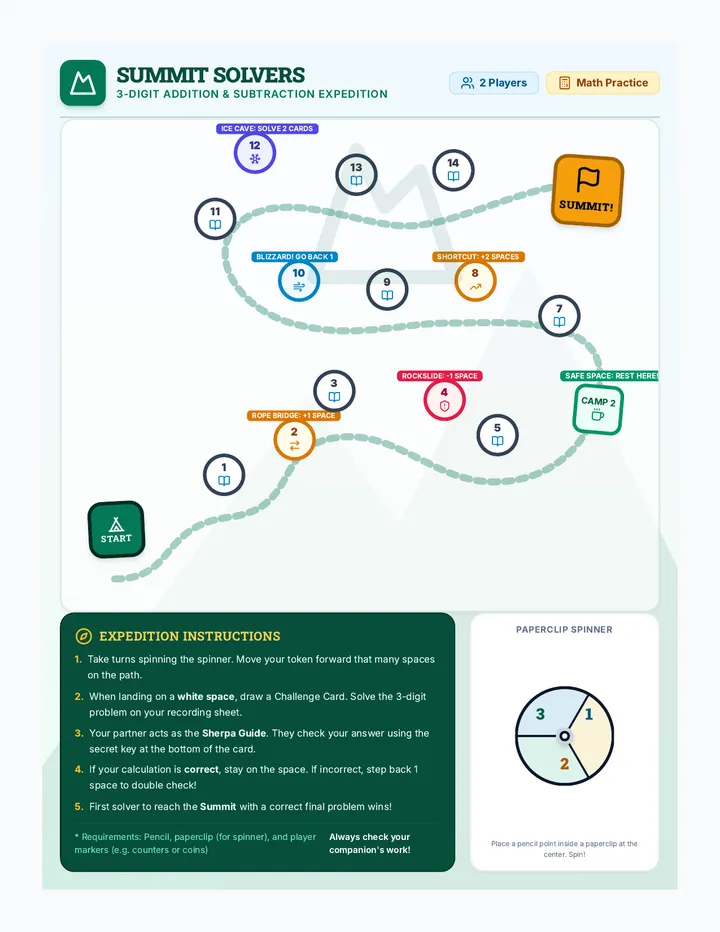
A collaborative third-grade board game focused on solving 3-digit addition and subtraction mixed word problems. Students climb a mountain by selecting correct operations, calculating precisely, and verifying answers with peer-checking challenge cards.
A collaborative third-grade board game focused on solving 3-digit addition and subtraction mixed word problems. Students climb a mountain by selecting correct operation, calculating precisely, and verifying answers with peer-checking challenge cards.
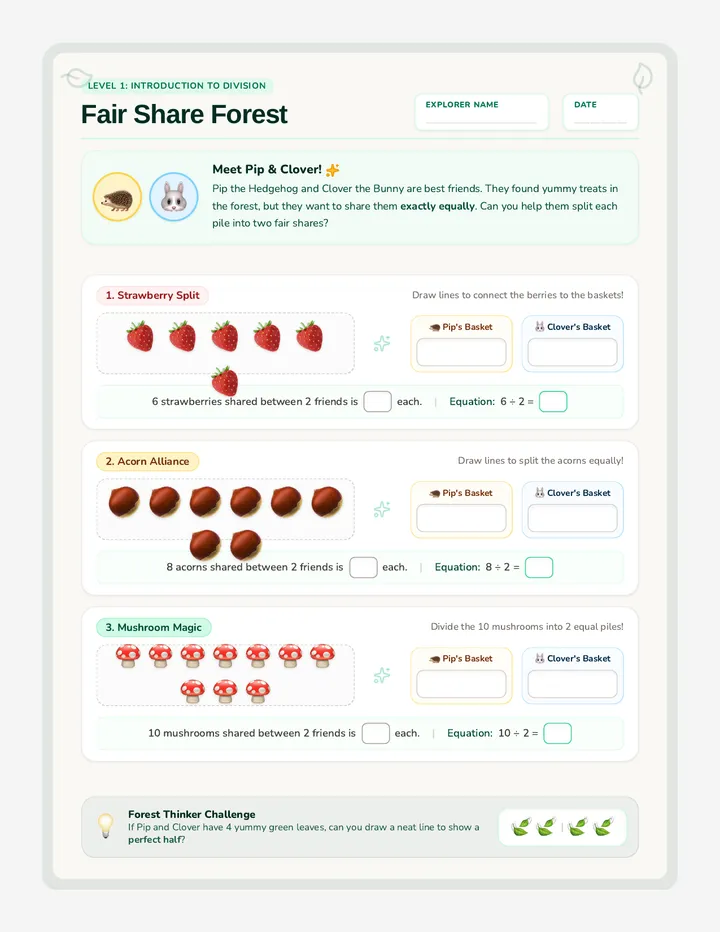
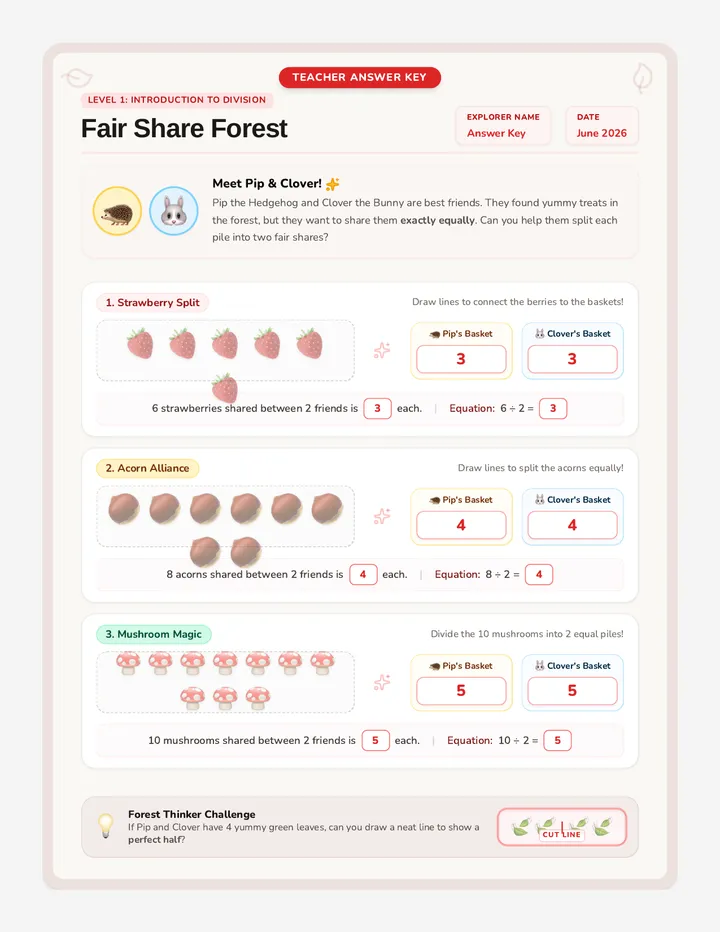
An introductory lesson on division as equal sharing. Students help two friendly woodland creatures share forest treasures equally between them.
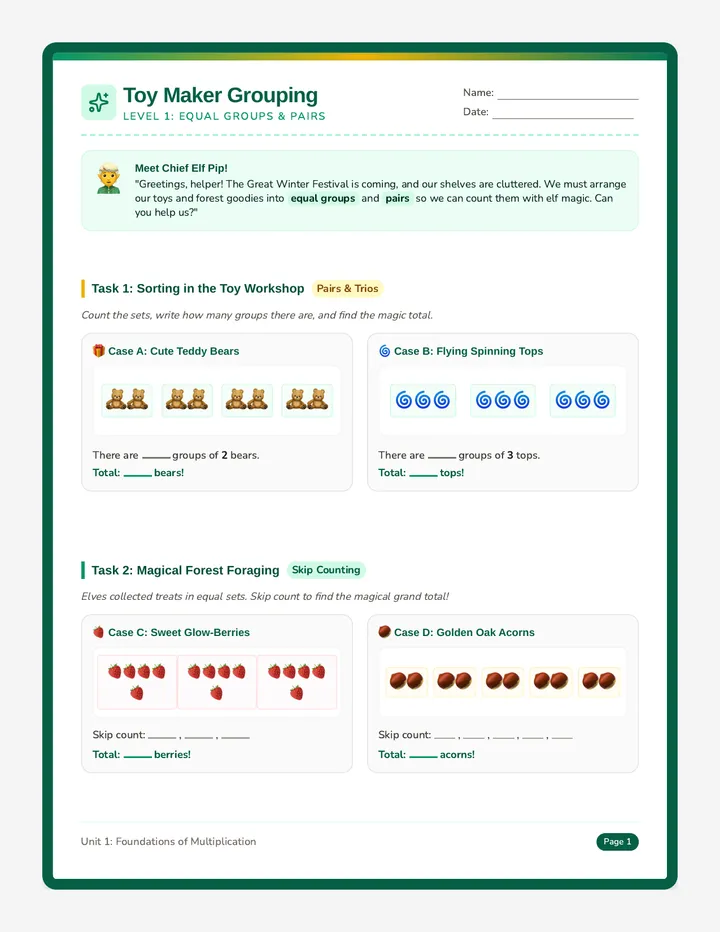
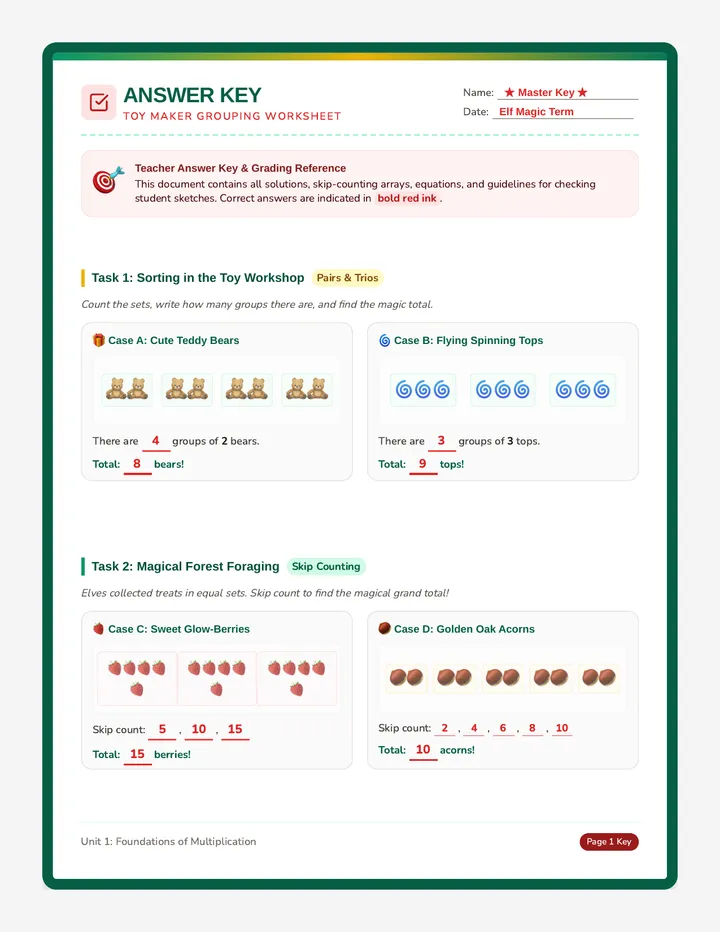
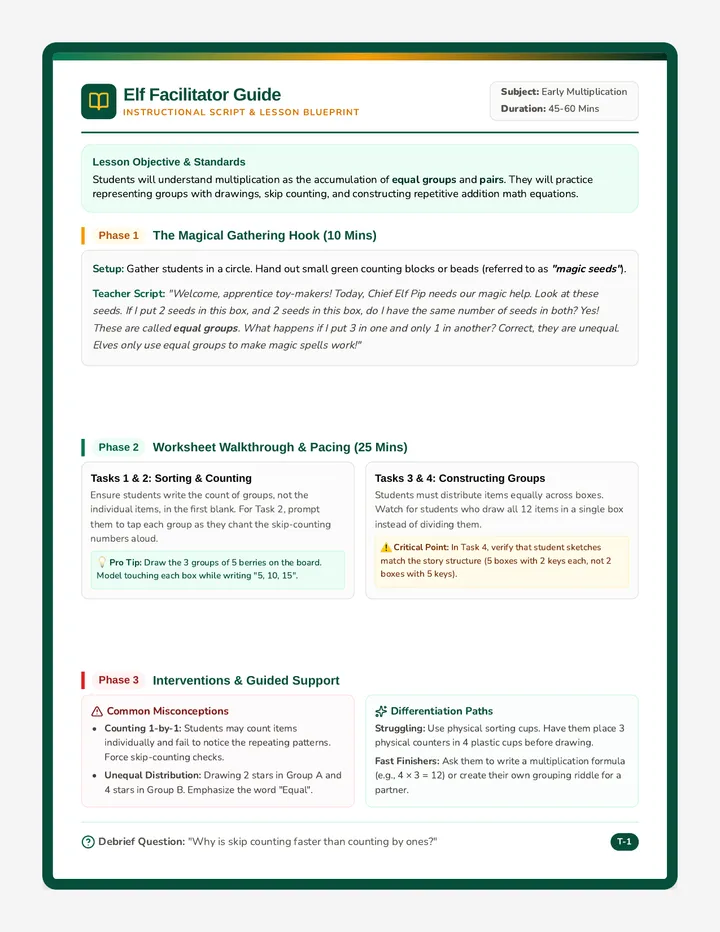
An introductory lesson on multiplication using equal groups and pairs, themed around magical elves making toys, foraging in the forest, and packing items. Students transition from concrete counting to skip counting and basic multiplication concepts.
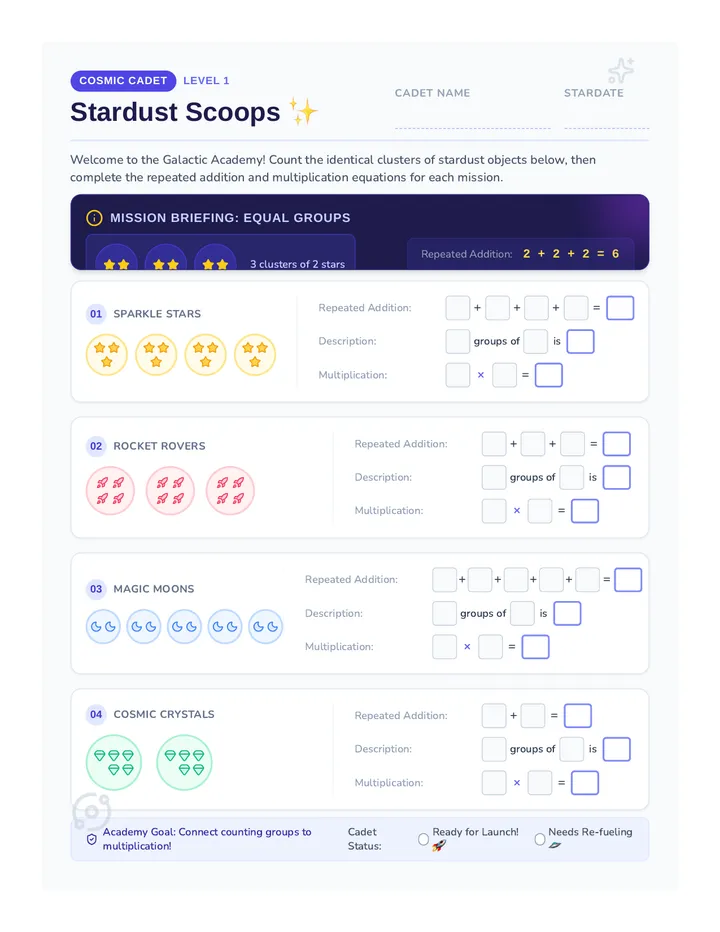
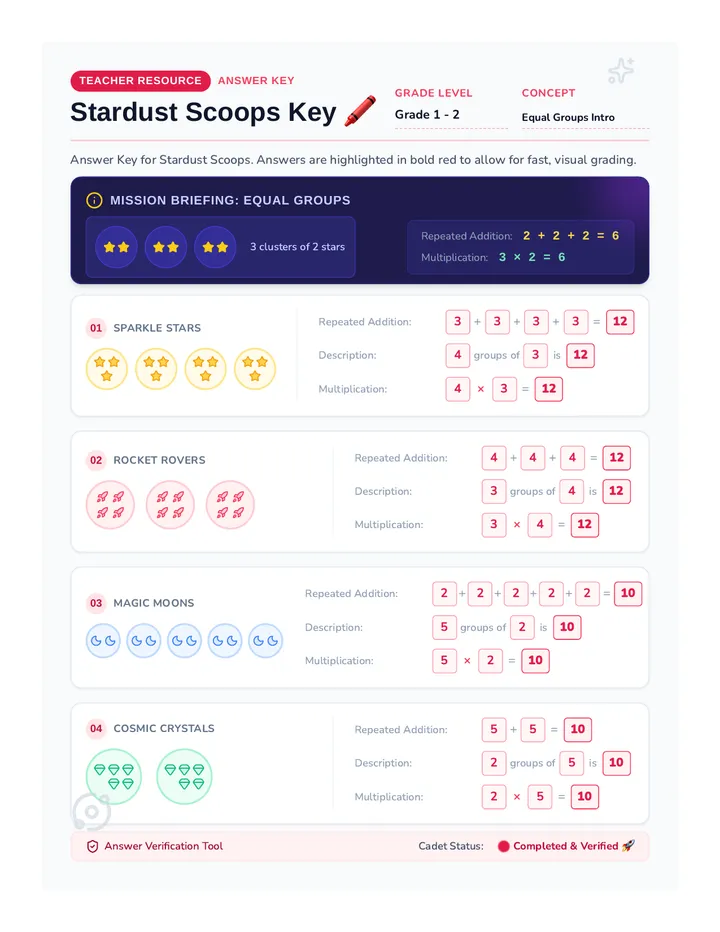
An introductory lesson to multiplication using equal groups and visual representations. Students learn to connect repeated addition to multiplication using starry-themed groups.
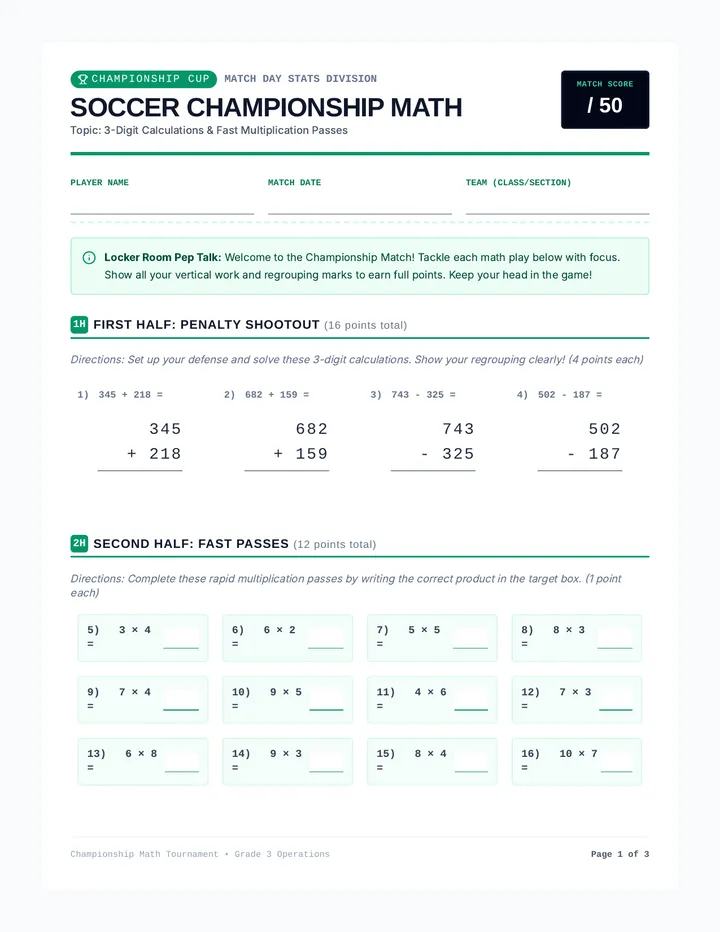
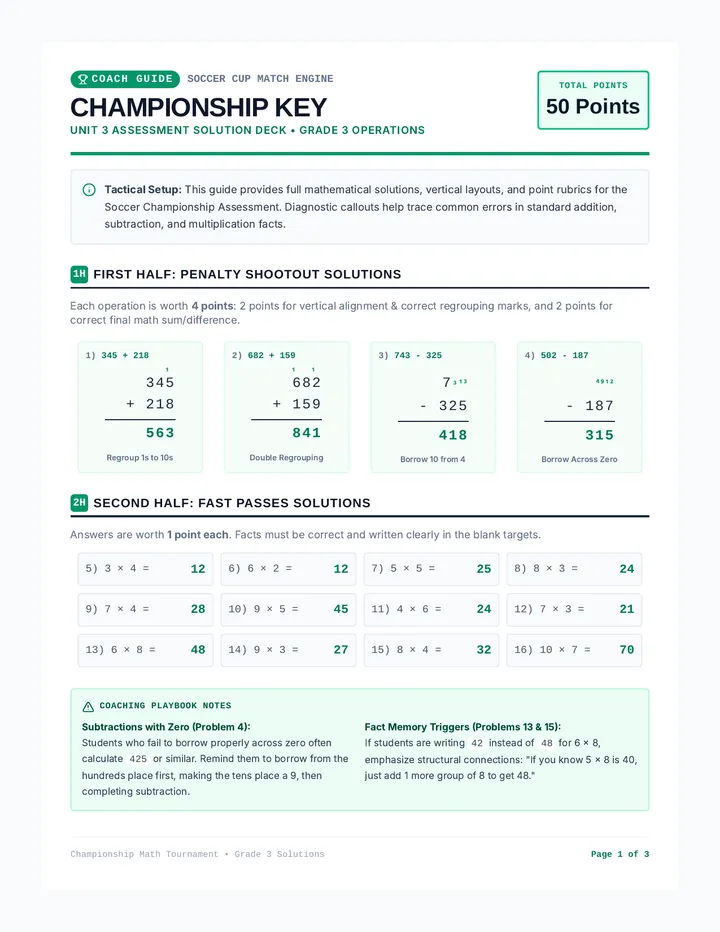
A summative assessment lesson designed for 3rd-grade students to demonstrate mastery of 3-digit operations and basic multiplication, themed around a thrilling soccer championship. Includes a student-facing test and a comprehensive teacher guide with solutions and grading rubrics.
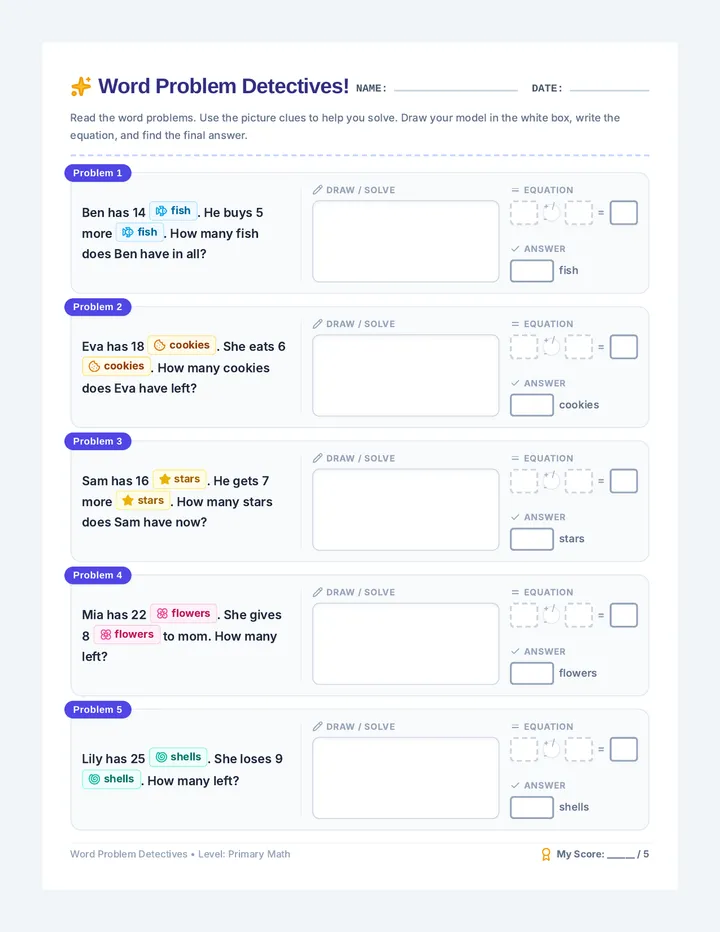
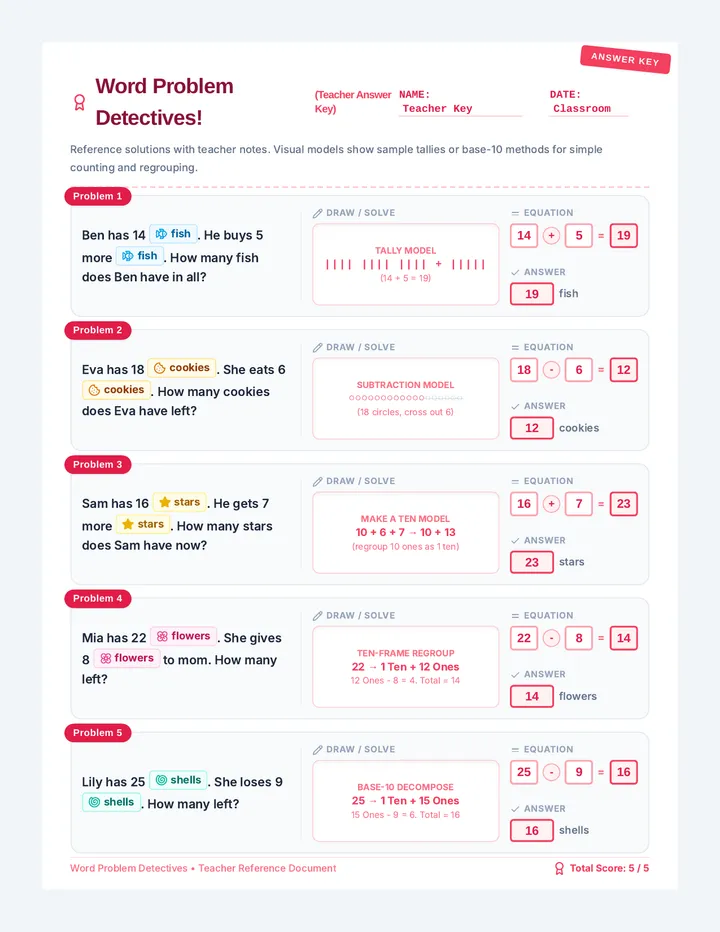
A lesson focused on solving one-step word problems involving addition and subtraction. Students practice recognizing active language cues, modeling their thinking, and writing equations.
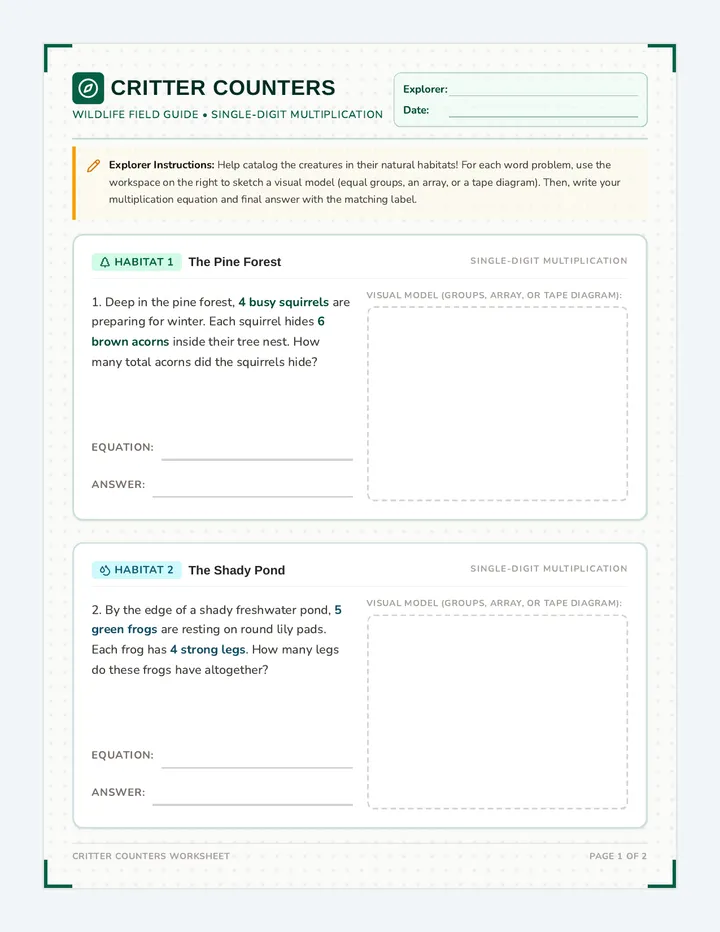
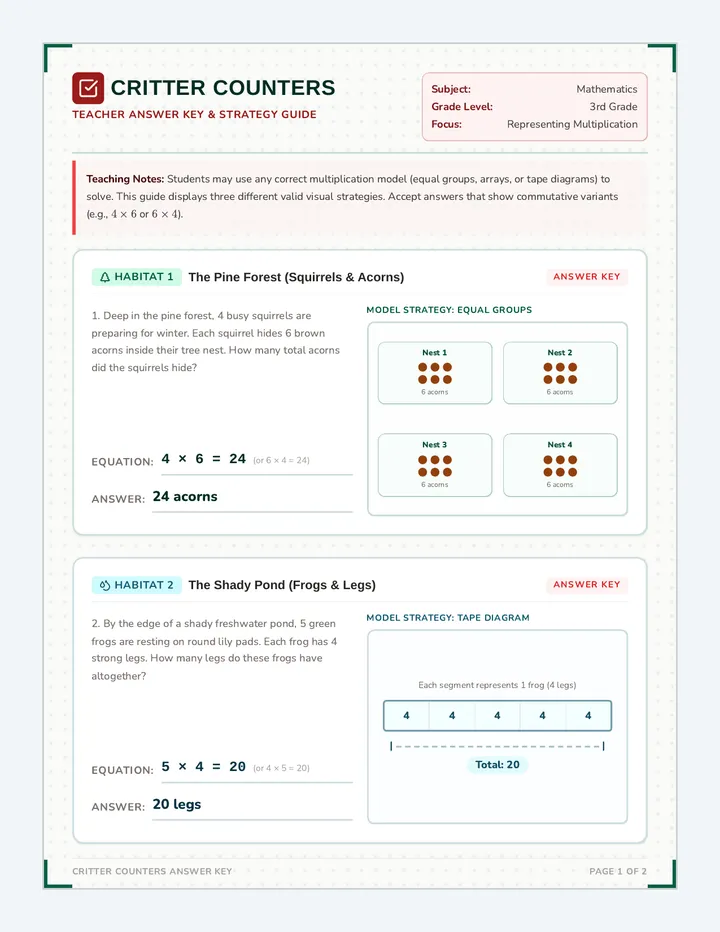
A single-digit multiplication lesson centered around animal counts and habitat scenarios. Students solve word problems using visual representations like arrays, equal groups, and tape diagrams.
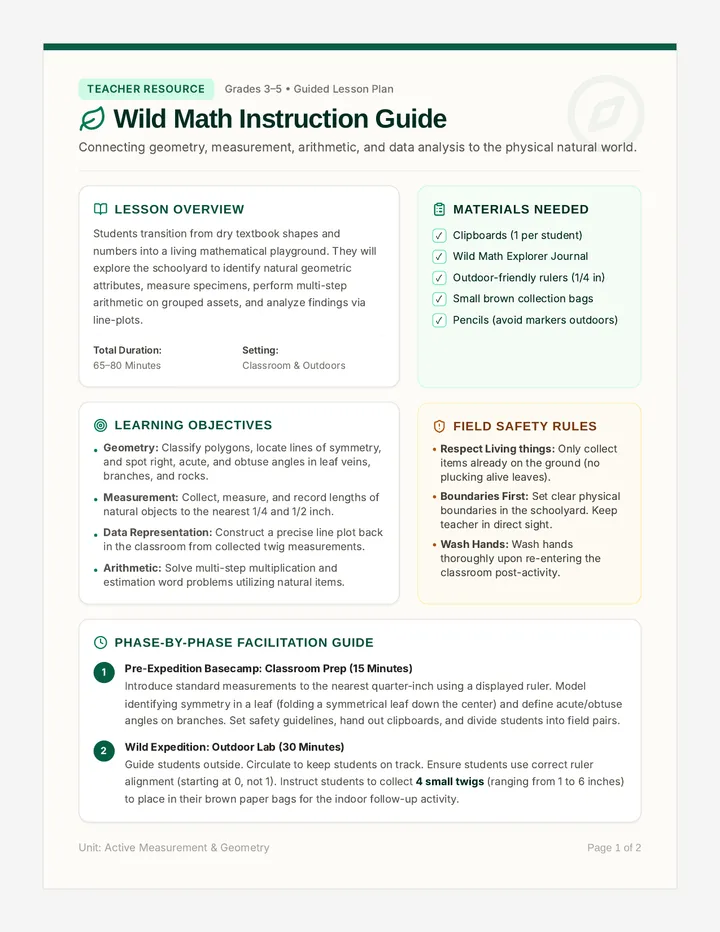
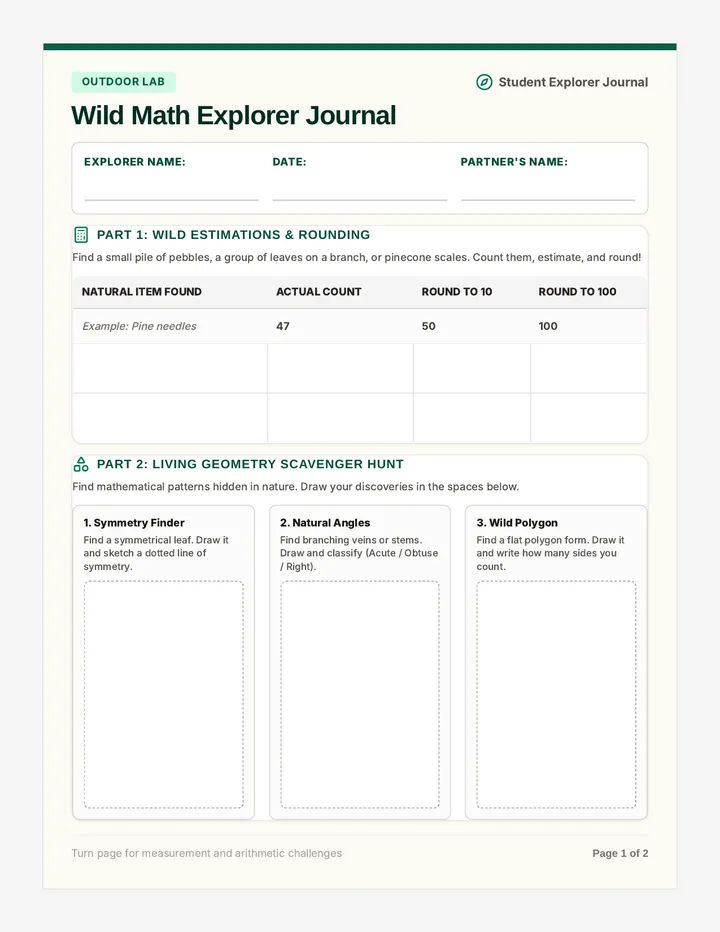
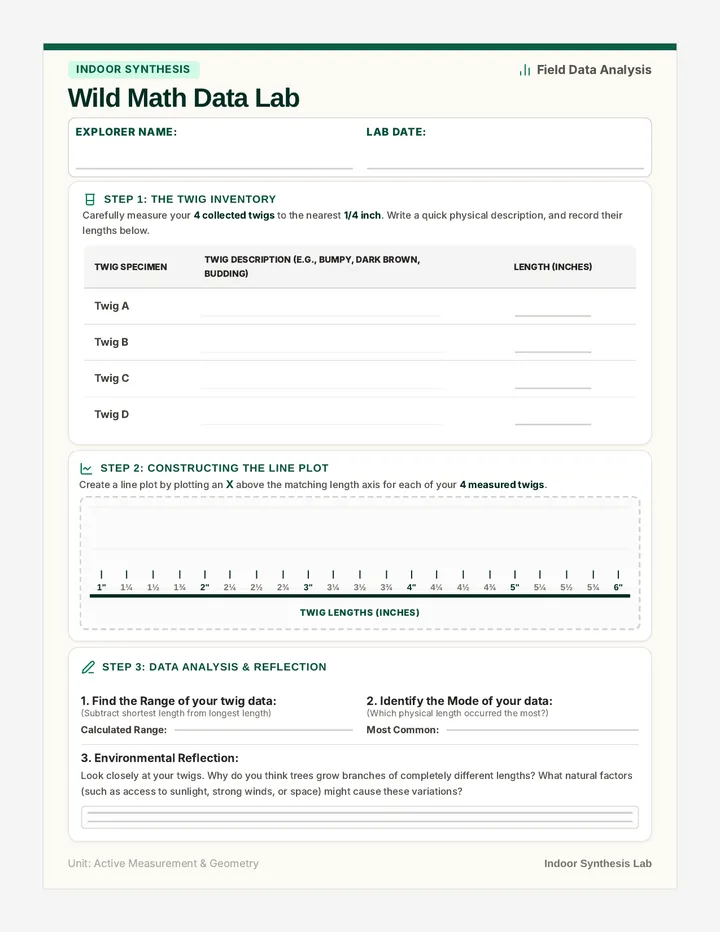
A complete outdoor learning experience where students explore mathematical concepts in the natural world. This lesson bundle connects geometry, measurement, estimation, and word problems directly to physical nature finds, followed by an indoor data-analysis session.
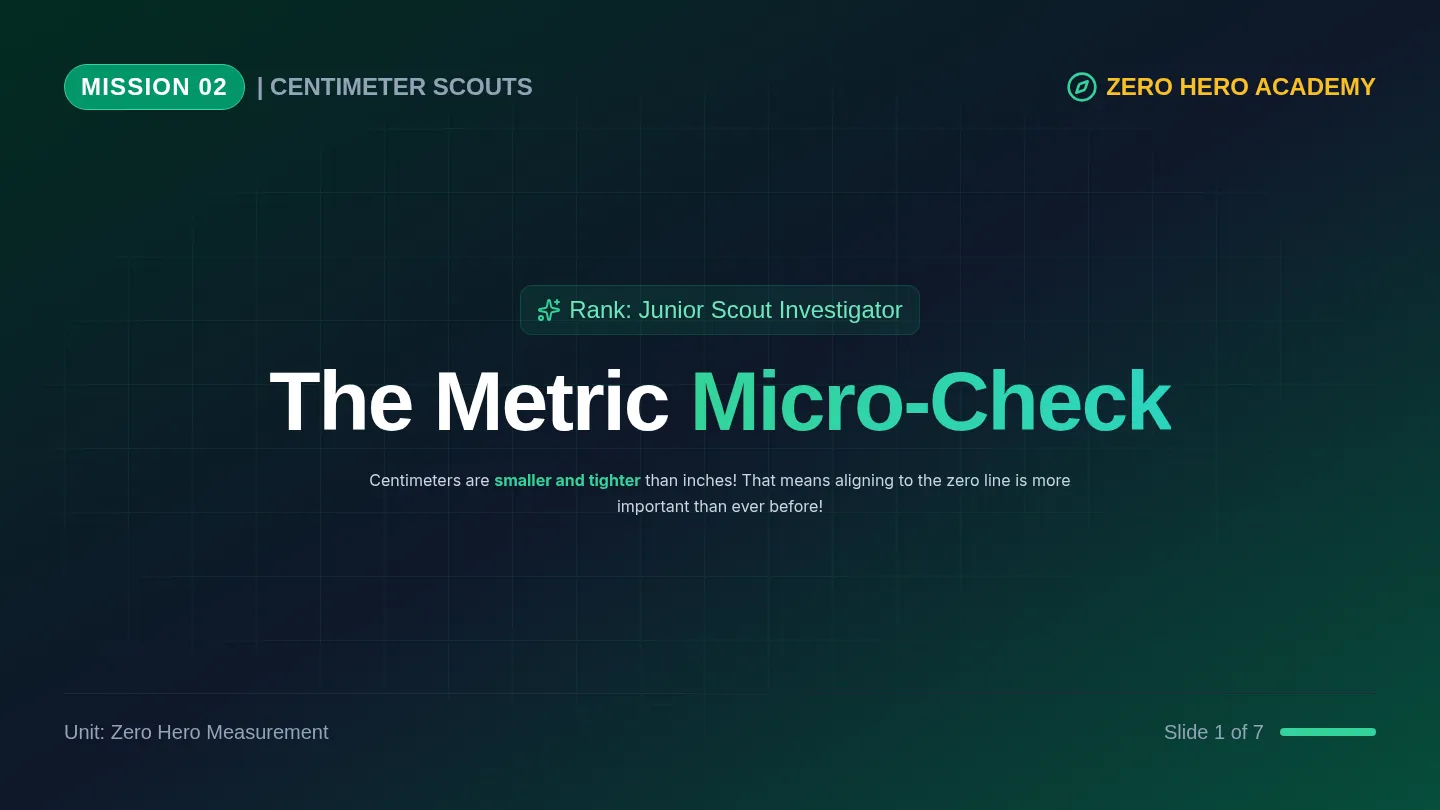
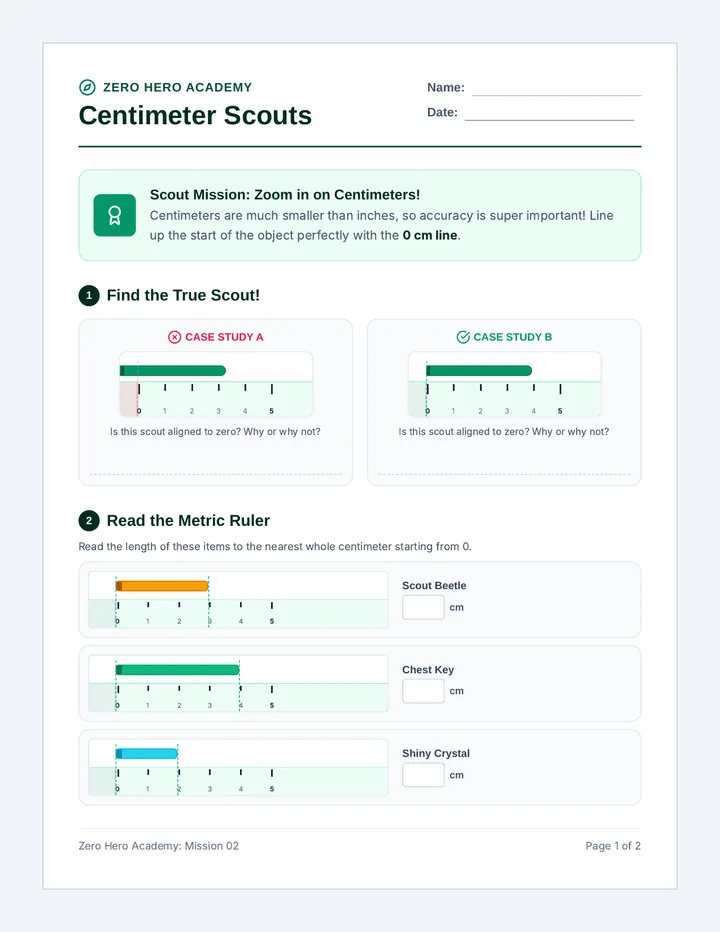
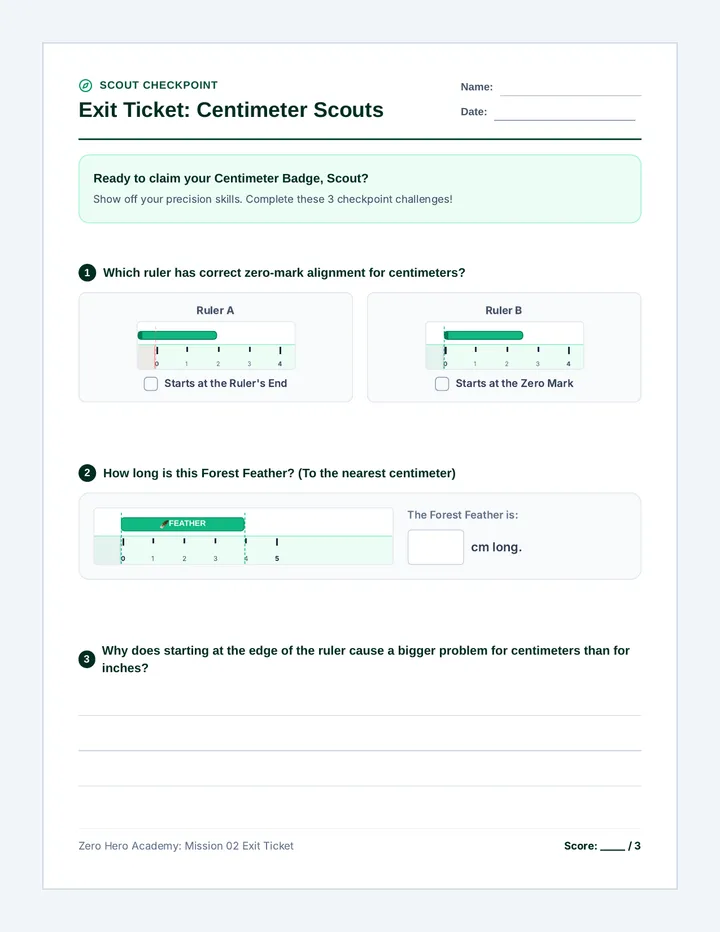
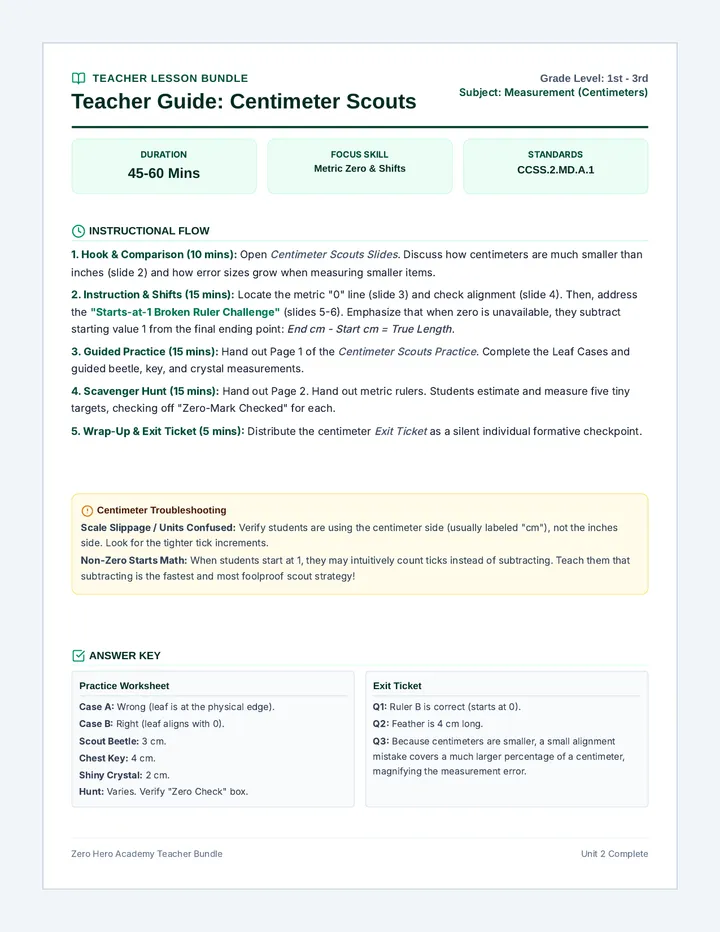
Students apply their measurement skills to the metric system, learning about centimeters and practicing precise measurement starting at the zero mark.
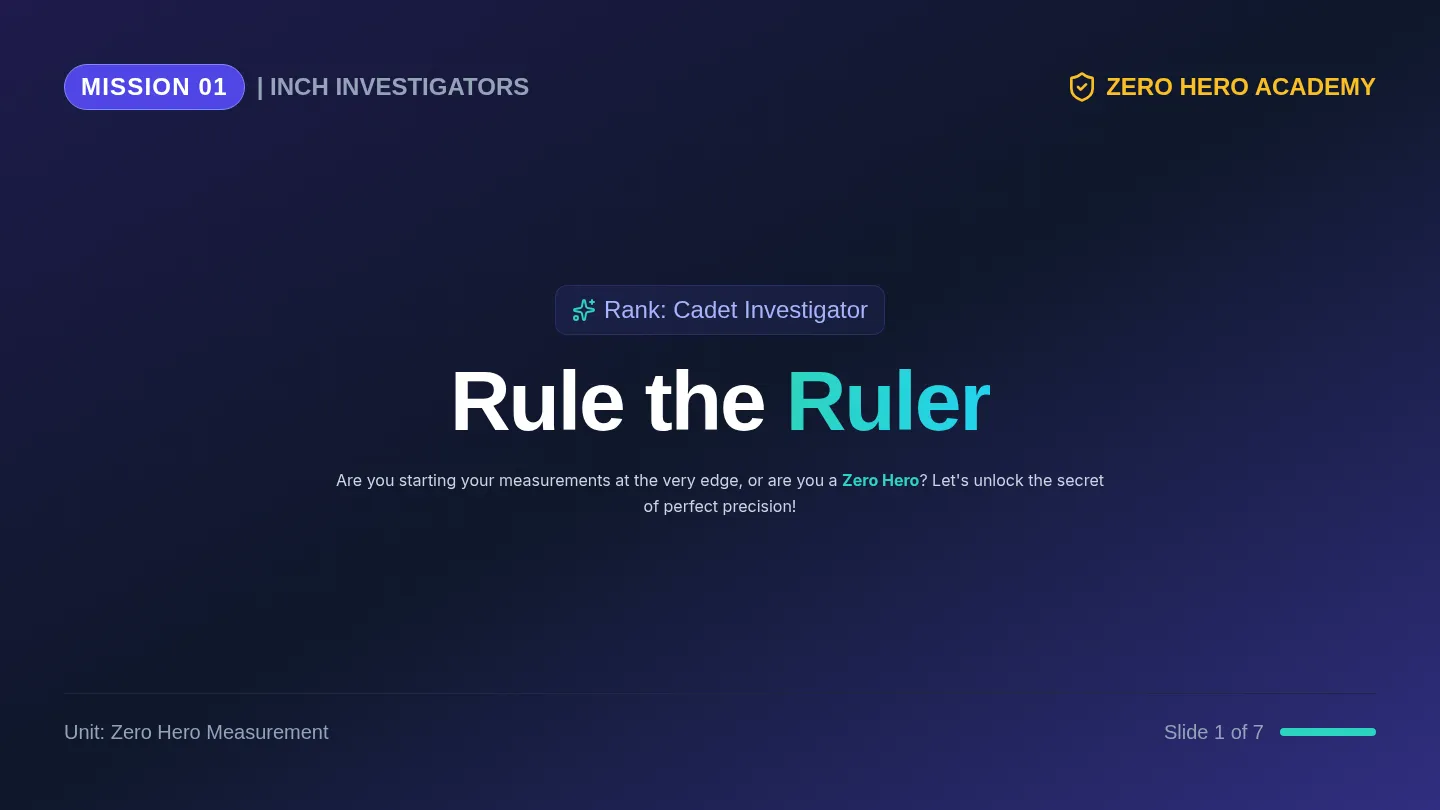
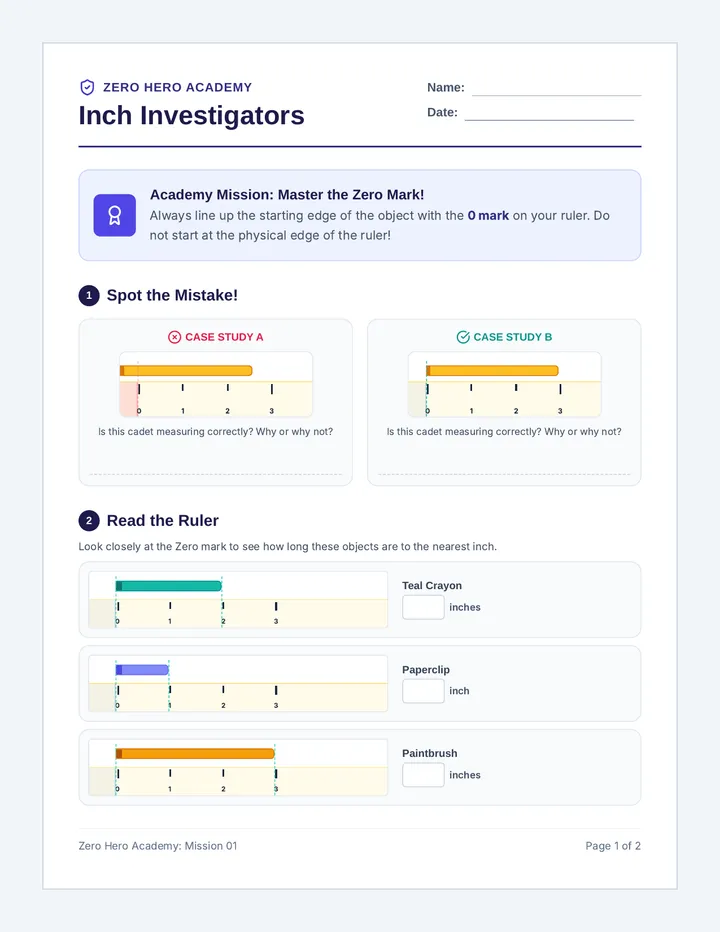
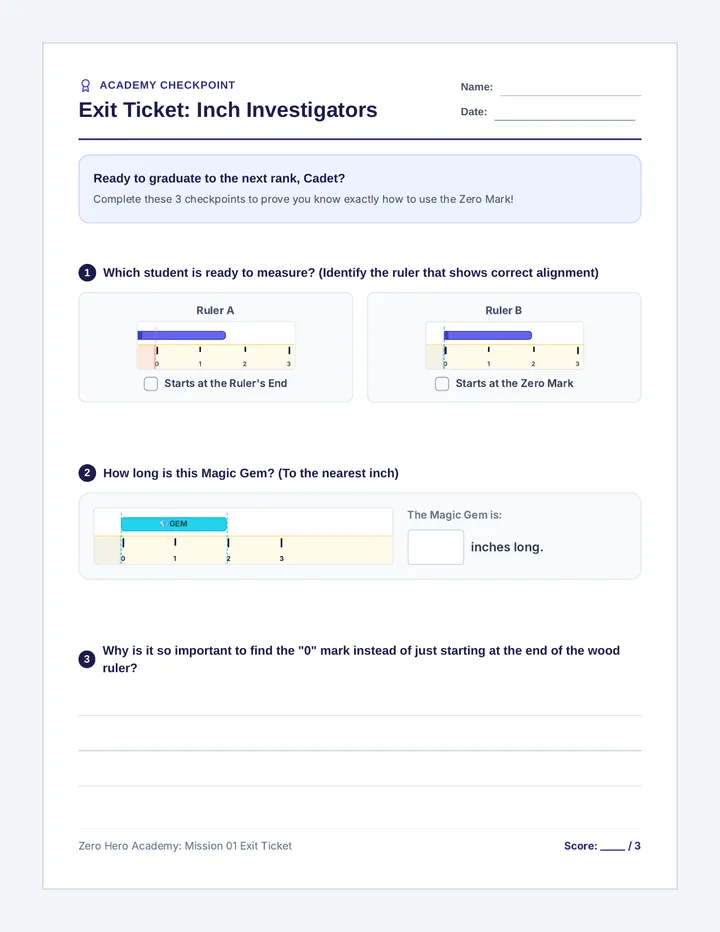
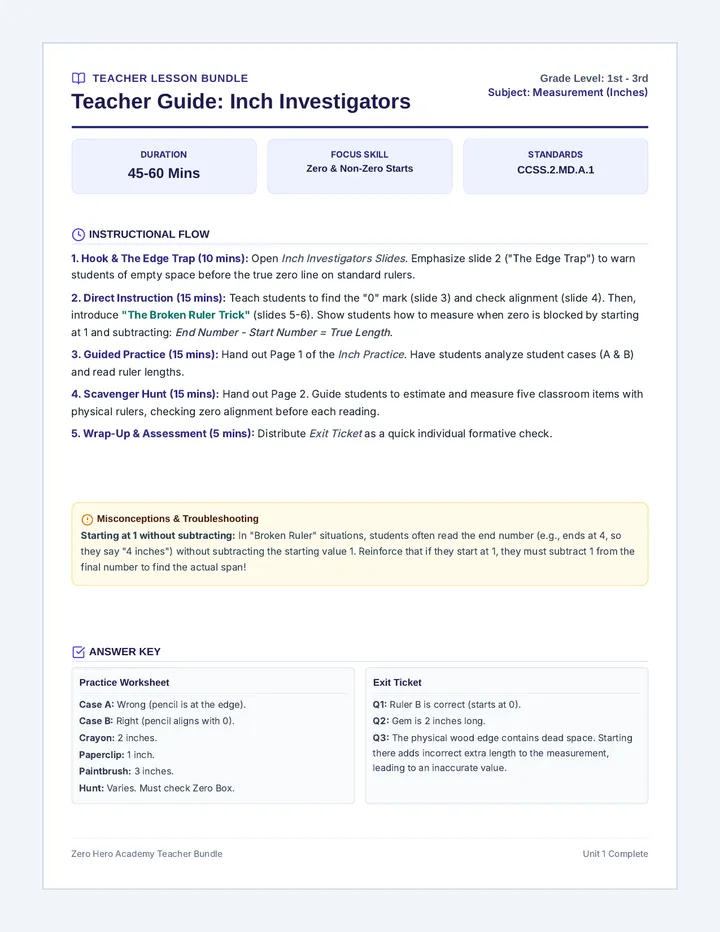
Students learn to measure to the nearest inch using custom visual rulers. The lesson emphasizes locating the true starting zero mark instead of starting at the physical edge of the ruler.
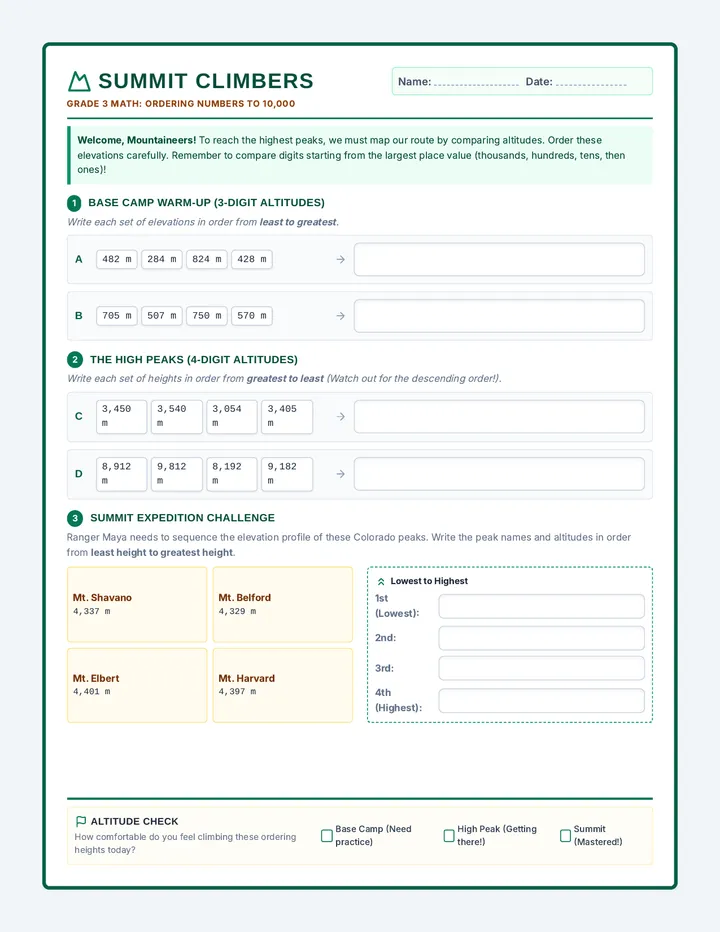
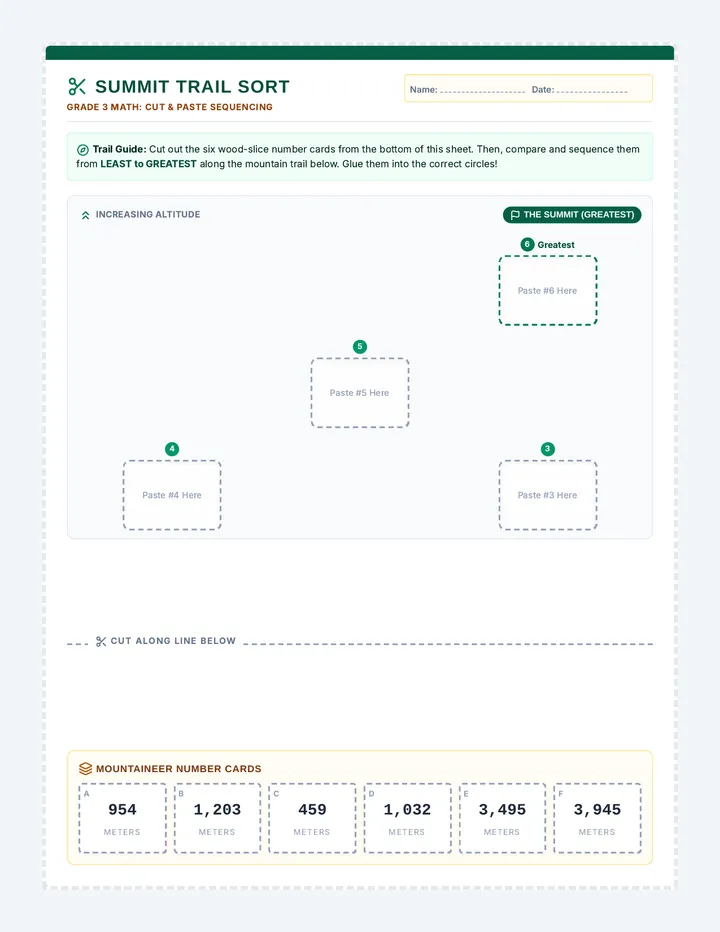
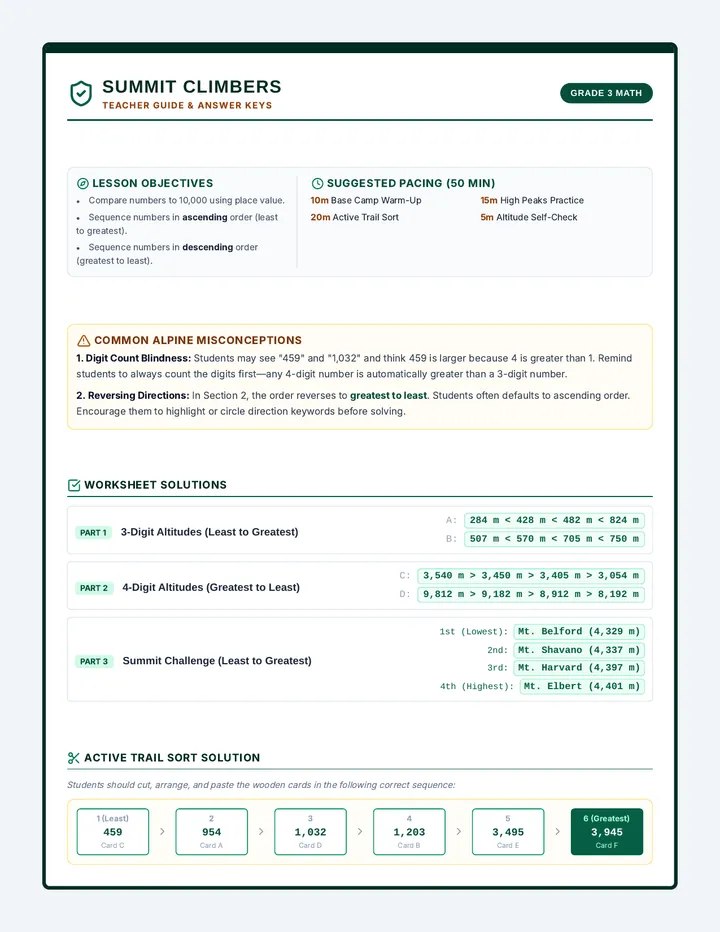
A high-elevation math lesson where Grade 3 students master ordering 3-digit and 4-digit numbers within 10,000. Through standard ordering lists, visual height challenges, and an interactive cut-and-paste sorting activity, students build strong place-value skills.