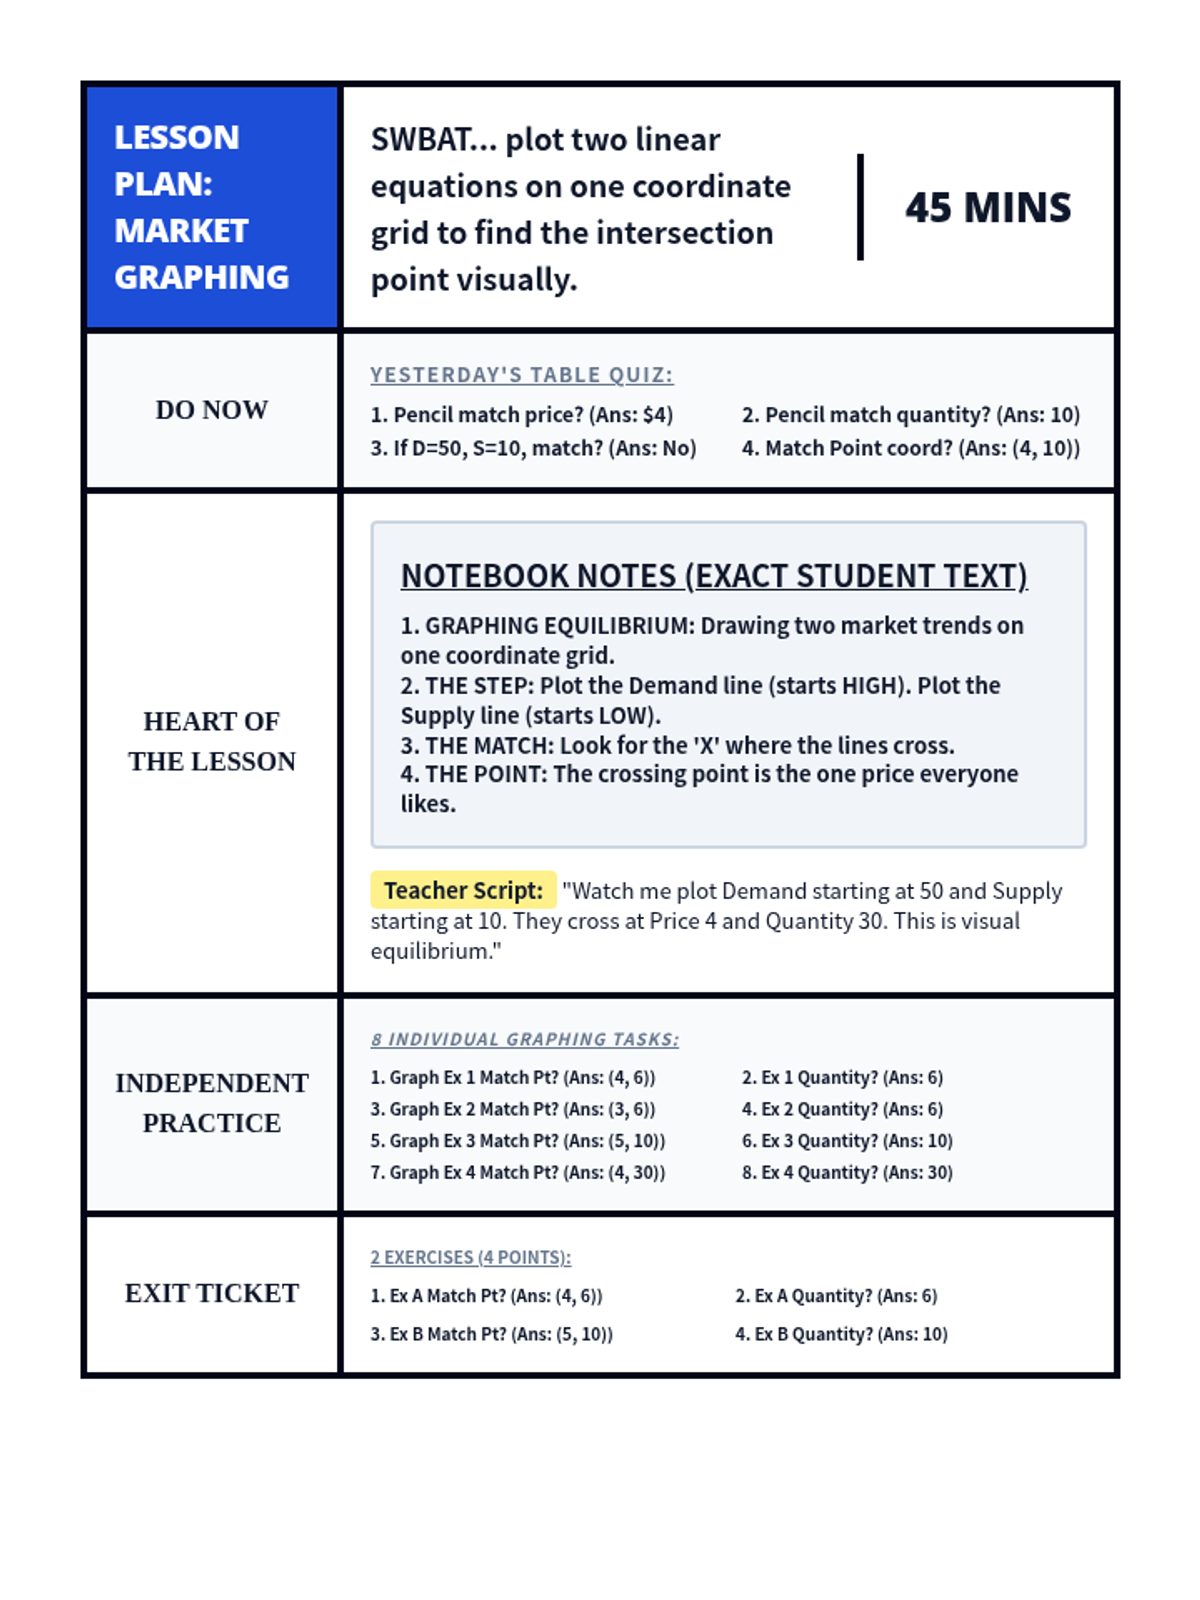
A detailed 60-minute teacher lesson plan for 9th-grade Algebra (Unit 8.6) focused on writing systems of linear equations to model situations, featuring teacher prompts, expected answers, and a STAMP learning section.
A comprehensive teacher resource containing answer keys for the worksheet and guided notes, plus instructional strategies, common student misconceptions, and tips for effective lesson delivery.
A practice worksheet for calculating area and circumference from a given radius. Includes computational problems and a real-world word problem, all within a clean architectural blueprint aesthetic.
Student guided notes handout that mirrors the Circle Secrets slide deck. Includes fill-in-the-blank definitions, formula boxes, and a structured example problem area.
Instructional slide deck for teaching area and circumference of circles using radius. Features a professional blueprint theme with clear formula breakdowns and example problems.
An answer key for the Data Patterns Worksheet, providing formal definitions for sampling distributions and histograms, along with scoring considerations for teachers.
A worksheet containing two definition-based questions focused on sampling distributions and histograms, with lined spaces for student responses.
The answer key for the Normal Curve Analysis worksheet, providing correct multiple-choice selections and step-by-step mathematical solutions for each problem.
A 4-question multiple-choice worksheet on normal distribution and z-scores, including space for students to show their work. Inspired by textbook problems on abstract variables and medical blood data. Optimized for 2-page printing.
Revised Student Handout for Market Meaning. Fixed ID brace issue. Corrected directions kerning, fixed logical axes on the graph (Price on X), and ensured all 8 IP tasks and 4 Exit Ticket questions fit on Page 2 without overflow using break-inside-avoid. Darkened Notebook Notes lines and optimized for SPED students.
Revised Student Handout for Market Graphing. Expanded to 3 pages to ensure all tasks and the Exit Ticket fit without overlapping or being cut off. Transitioned input data from linear equations to 4 distinct table-based scenarios (Tasks 1-4) with associated 5-row tables. Standardized coordinates to (Quantity, Price) following economic conventions. Provided darkened grid lines for visibility. Corrected footer pagination.
A comprehensive teacher facilitation guide containing setup instructions, supply lists, a pacing timeline, and the answer key for the 'Shadow Agency' activity. Corrected page breaks.
Four full-page station posters to be hung around the classroom. Corrected page breaks, symbols, and layout. Corrected Station D logic options.
A student field log designed as a classified dossier where students record their findings from each station, culminating in a final master code assembly. Corrected page break and work area issues.
A visually striking slide deck to introduce the 'Shadow Agency' theme, explain the mission, and present the different types of cryptographic methods students will encounter. Corrected slide bleed issues.
A visual presentation for students explaining the properties of normal distributions, the empirical rule, and the basics of control charts. Updated for maximum visibility and correct symbol rendering.
Detailed answer key for the Stat Lab Final Exam, providing correct answers, step-by-step calculations, and a grading rubric for teachers. Updated for clarity and layout.
A comprehensive 10-question final exam covering normal distribution concepts, calculations using the empirical rule, and interpretation of statistical graphs. Updated with improved symbols and layout.
Revised Lesson 3 Handout for Market Graphing. Fixed grid rendering issues (added explicit grid-div borders), corrected kerning in directions, and removed blank 3rd page. Darkened footer text and increased work area clarity for SPED students. Corrected pagination.
Revised lesson plan for 'Market Graphing'. Features exactly 4 components with a table-based Do Now, a 4-task graphing-based IP from table data, and a 4-point Exit Ticket. Includes student Notebook Notes and teacher modeling scripts. Standardizes coordinates to (Quantity, Price) following economic conventions. Standardizes sidebar-less layout.