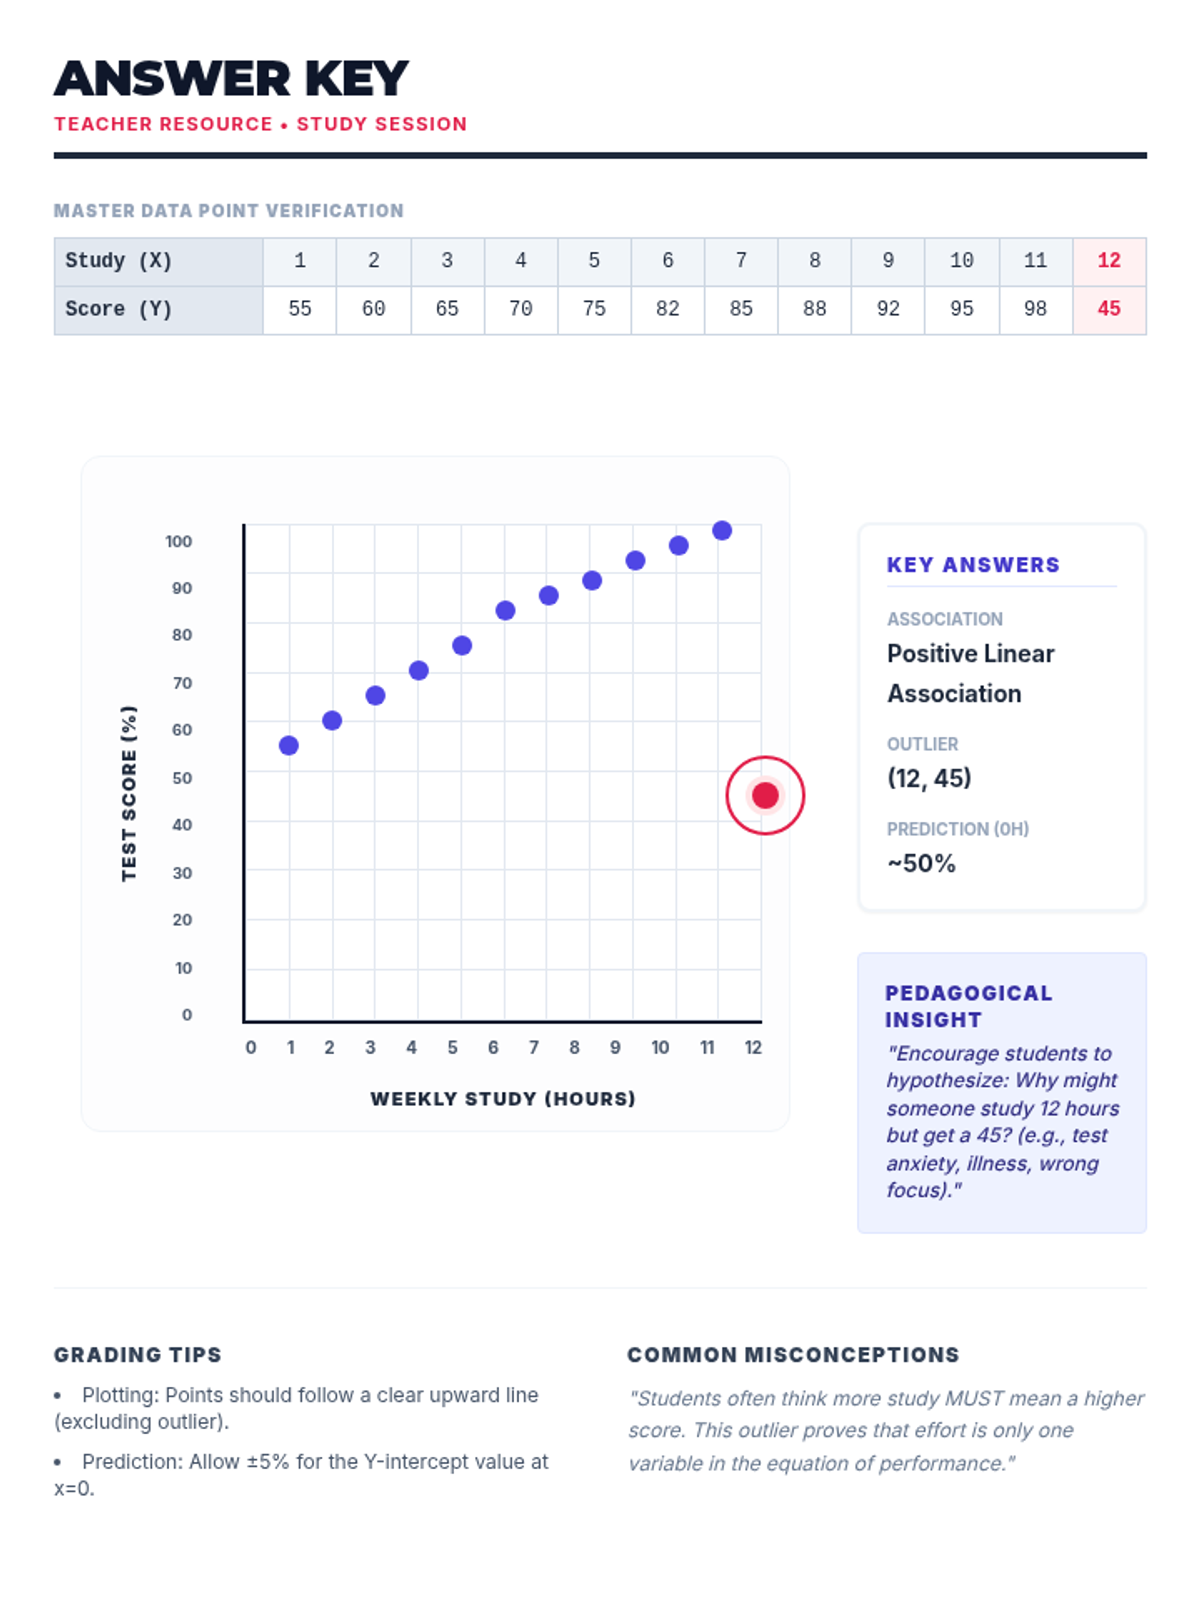
A practice worksheet where students plot bivariate data relating weekly study hours to test scores. It features a positive association and a significant outlier representing high effort but low results.
A teacher answer key for the Study Session worksheet, featuring a completed scatter plot with a positive association and a circled outlier at (12, 45).
A teacher answer key for the Screen Scramble worksheet, featuring a completed scatter plot with a negative association and a circled outlier at (7, 120).
A practice worksheet where students plot bivariate data relating daily screen time to physical activity minutes. It features a negative association and a distinct outlier representing high usage and high activity.
A teacher answer key for the Mood Map worksheet, featuring a completed scatter plot with labeled outliers, correct association identification, and sample explanations.
A practice worksheet where students plot bivariate data relating hours of sleep to mood scores. It includes a coordinate grid, a data table with a clear outlier, and analysis questions to identify trends and explain anomalies.
A complete answer key for the Circle Logic Packet, providing step-by-step solutions for calculation practice and word problems. Includes rounding guidance and bonus challenge resolution. Revised for improved page flow and legibility. Standardized to two decimal places.
A high-energy, amusement park-themed packet for calculating the area of a circle. Students explore the Midway and Thrill Rides while solving radius and diameter problems using visual aids and calculators. Revised for the Carnival Circles theme.
A high-density one-page reference sheet for rational functions. Includes essential steps for finding holes, asymptotes, and intercepts, plus a fully worked complex example.
A teacher answer key for the Slope Hunter Expedition Worksheet, providing full step-by-step solutions and interpretations for coordinate calculation, special cases, and real-world modeling.
A student worksheet activity for calculating slope from coordinates, identifying special cases (zero/undefined), and interpreting real-world rates of change with a field-report theme.
Advanced slides for teaching slope as a rate of change, introducing the coordinate-based slope formula, zero and undefined anomalies, and real-world unit analysis. Includes a challenging drone case study.
A comprehensive teacher guide for the "Data Detectives" lesson. Includes lesson objectives, a detailed pacing guide, instructional strategies for slides and activities, common misconceptions, and differentiation tips for supporting and challenging students. Revised to fix layout, spacing, and page break issues.
A hands-on sorting activity for measures of center. Students calculate the mean for 12 data cards (Case Files) and sort them into folders based on their values. Includes workspace for calculations and a thematic detective-inspired sorting mat. Revised to fix page breaks and student work area layout.
A thematic vocabulary reference sheet for measures of center. Includes clear definitions and "Investigation Tips" for mean, median, mode, and range, along with a dossier of supplementary statistical terms like outliers, distribution, and skewed data. Revised to fix page breaks and include more terms.
Complete 2-page answer key for Version B of the One-Step Equation Challenge, featuring 24 solutions with inverse operations shown and emerald green styling to match the student worksheet.
Version B of the One-Step Equation Challenge worksheet, featuring 24 new addition and subtraction problems involving whole numbers, decimals, and fractions, including two word problems. It maintains the same structure and difficulty as Version A but with emerald green accents for differentiation.
Answer key for Version B of the Equation Lab Quiz, showing equations and solutions for all 24 problems.
Revised Version B of the Equation Lab Quiz, addressing layout issues, page breaks, and providing more robust student work areas for word problems.
Revised Answer Key for Test B with streamlined grid layout (1-10 in col 1, 11-20 in col 2), improved text contrast, and refined grading summary. Provides quick reference for all 20 questions.
Revised 20-question Test B with improved spacing for student work, consistent question distribution (7-7-6), and fixed formatting to prevent diagram overlap. Includes visual modeling and word problems.
A detailed answer key for the "Final Verdict" assessment and "Case Closed" escape room. Provides step-by-step solution paths for mean, median, and missing value problems. Revised to fix page breaks, degree symbol rendering, and layout consistency.
A two-part assessment on measures of center. Part I focuses on summarizing data using mean and median calculations with time and group size contexts. Part II challenges students to find missing data values given the mean. Revised to fix page breaks, footer placement, and work area sizing.
A four-station "Data Detective" escape room activity. Students solve puzzles involving mean (time data), median (negative temperature data), mode (group sizes), and a missing value challenge to unlock "vault codes." Includes workspace for calculations and distinct thematic sections for each puzzle. Revised to fix page breaks, contrast, and box sizing.