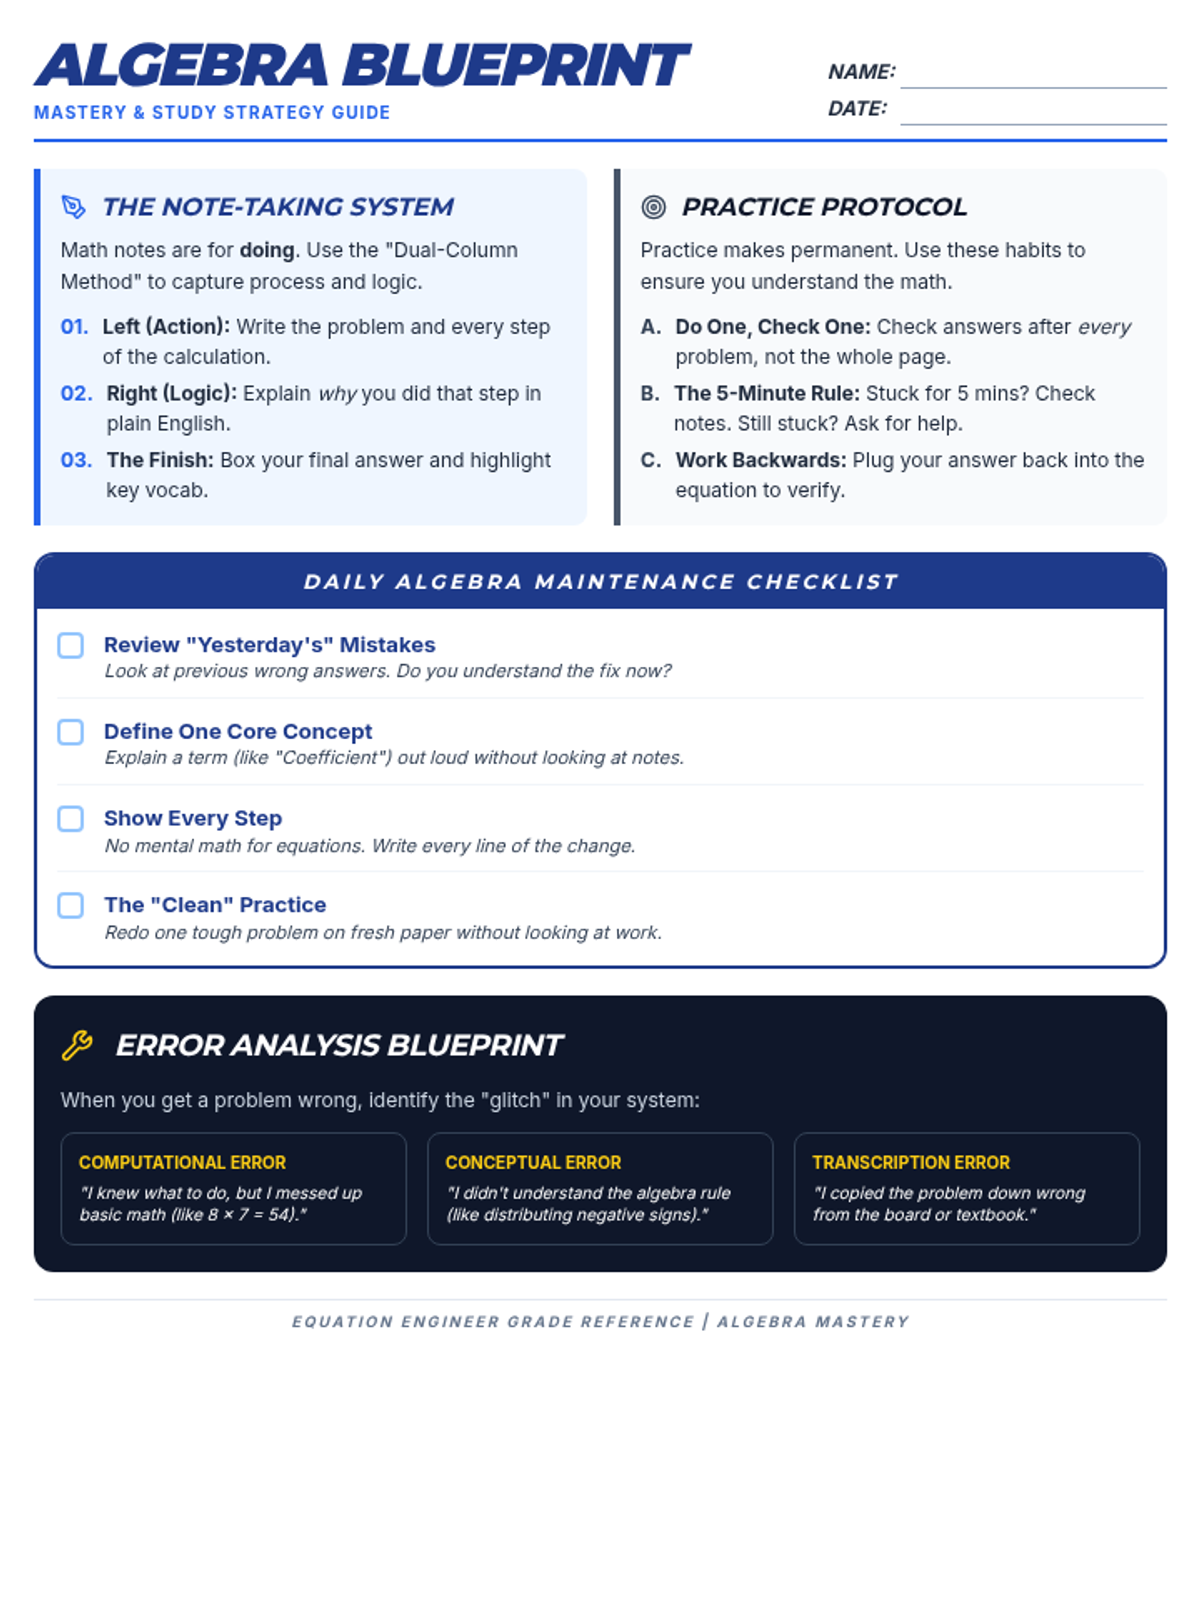
An updated one-page reference sheet that now includes a section on Tables and Graphs (frequency/probability tables, histograms, and dot plots) in addition to all previous unit formulas. The layout has been optimized for maximum density while maintaining clear visual hierarchy and high-contrast styling. All variables and mathematical expressions are rendered using LaTeX. Revision fixes minor rendering issues with variables and icons.