The first of 10 evidence samples for MCAS-Alt, focused on rounding money to the nearest dollar. Features a clean layout with dollar signs positioned to the far left of the response area to allow maximum handwriting space.
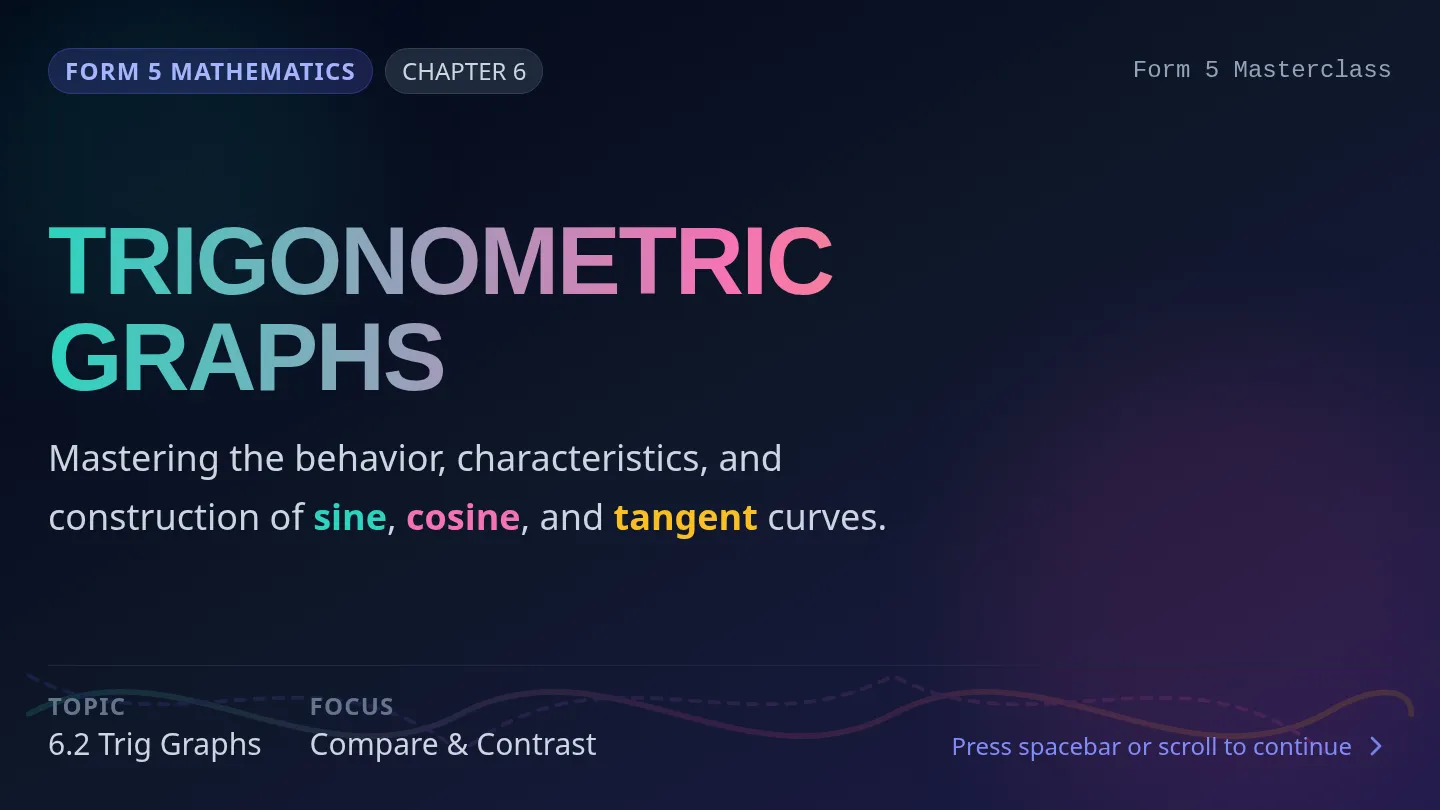
A master sequence containing curriculum-aligned lessons for Malaysian secondary school students. It covers Form 5 Mathematics and Form 2 English UASA revision.
A comprehensive introductory lesson set for the SAM Podcast Project-Based Learning program. This lesson incorporates critical parent communication tools alongside specialized teacher lesson plans linking core academic subjects like KSSM Mathematics to real-world digital podcast applications.
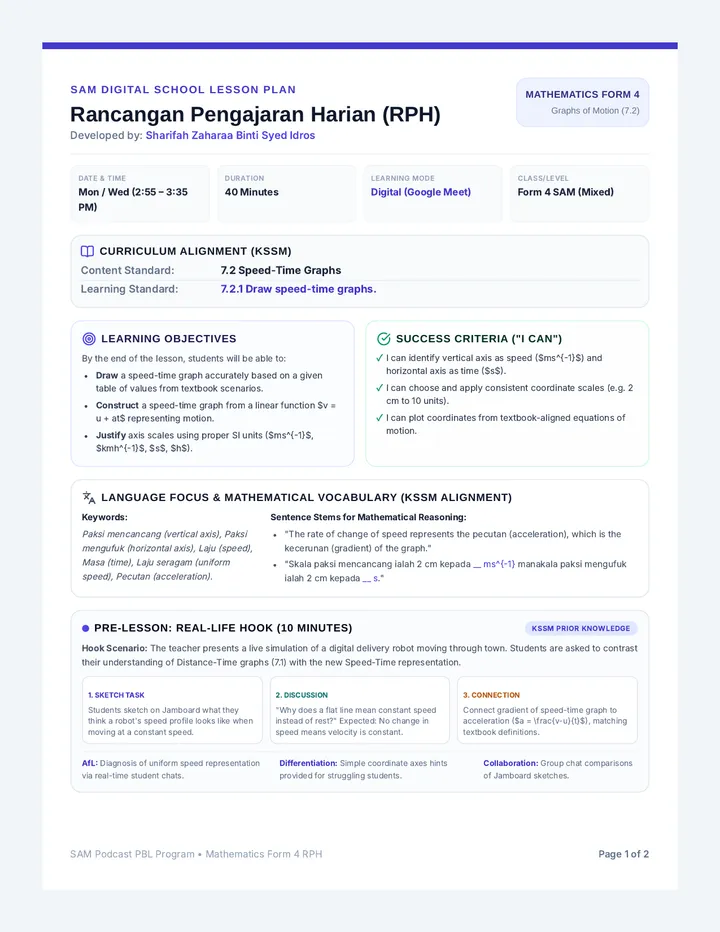
Rancangan Pengajaran Harian (RPH) Matematik KSSM Tingkatan 4 (Bab 7: Graf Gerakan) untuk sub-standard 7.2.1 Melukis Graf Laju-Masa. Dokumen ini diselaraskan sepenuhnya dengan Contoh 10 & 11 Buku Teks Matematik Tingkatan 4 KSSM.
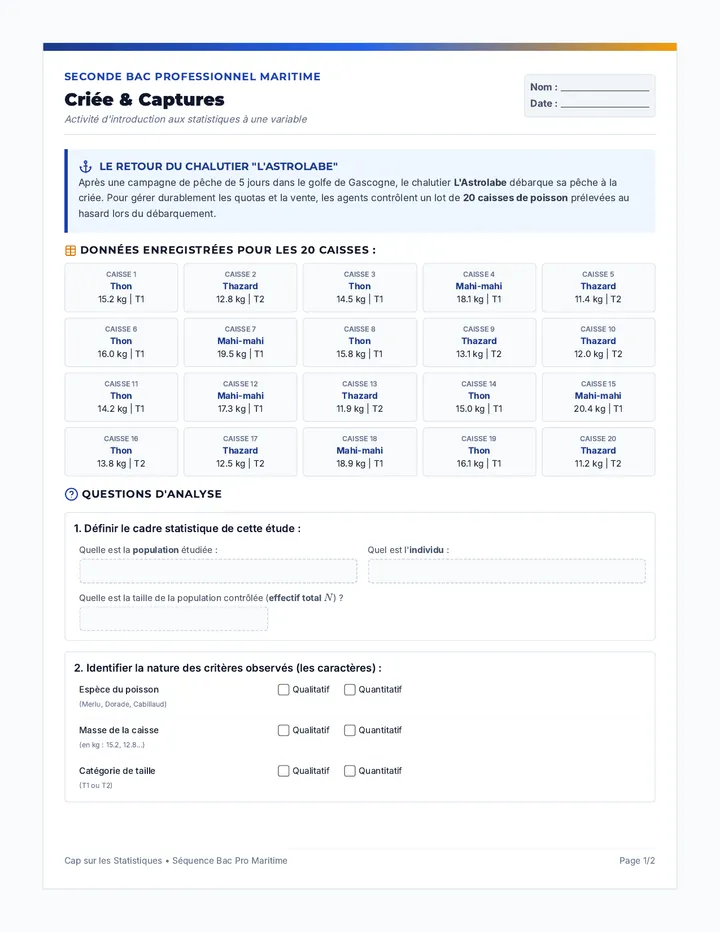
Séquence clé en main sur le module de chimie « Comment caractériser une solution ? » du programme de Seconde Bac Pro, contextualisée dans l'univers de la marine et de l'analyse des eaux.
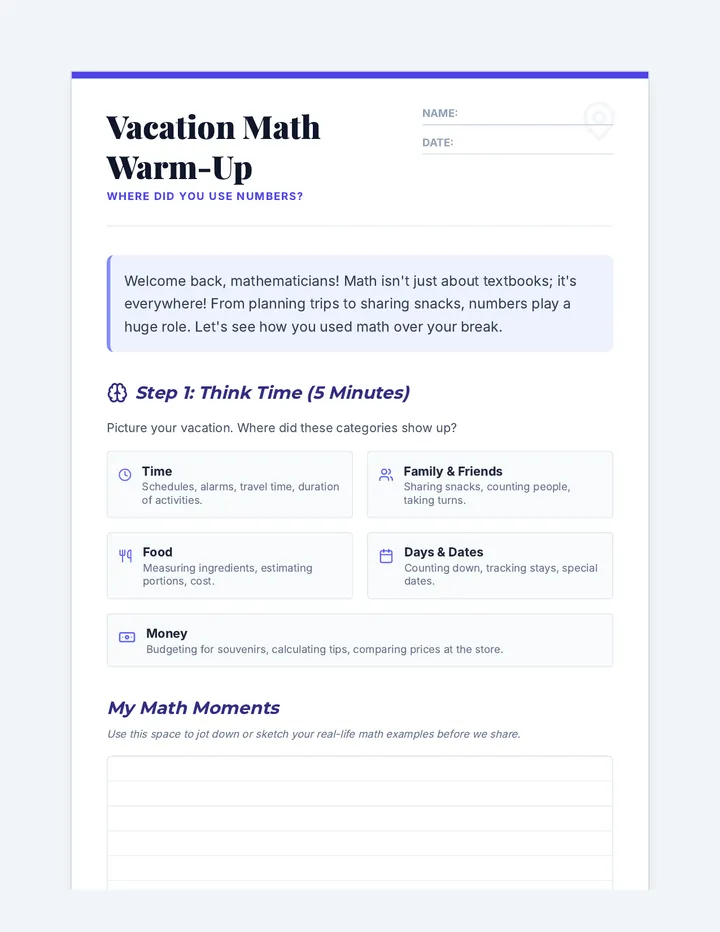
A quick and engaging 15-minute warm-up for 7th-grade students to bridge the gap between vacation and the classroom by identifying real-world math applications in their own lives.
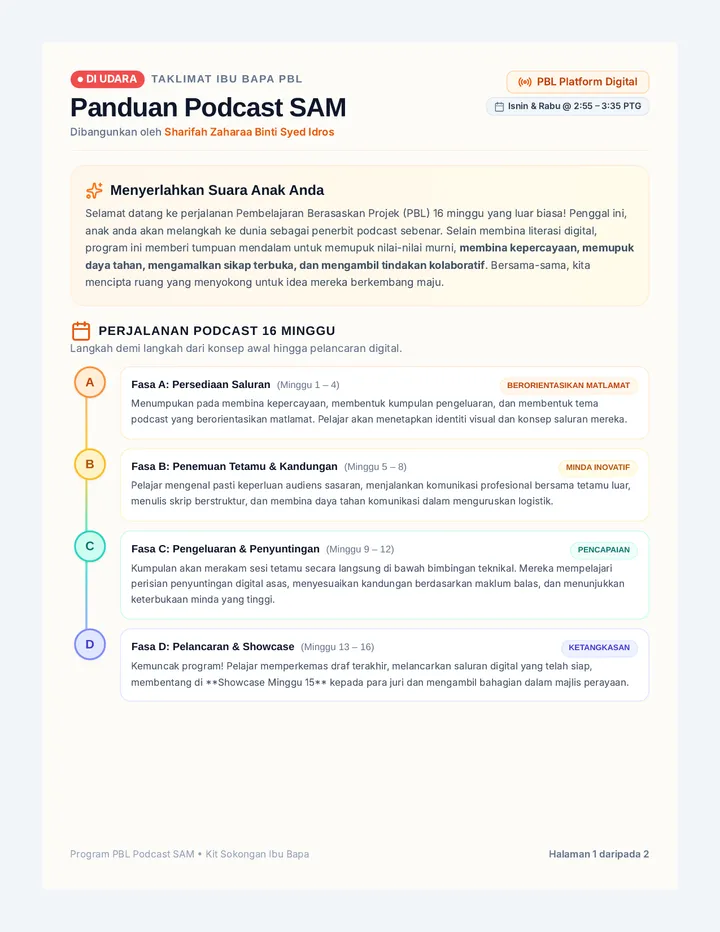
Satu Panduan Taklimat Ibu Bapa dan Kit WhatsApp Sedia-Salin 2 halaman yang komprehensif, mesra, dan penuh inspirasi dalam Bahasa Melayu untuk program Pembelajaran Berasaskan Projek (PBL) Projek Podcast SAM. Merangkumi peta jalan visual 16 minggu, butiran jadual kelas (Isnin & Rabu jam 2:55-3:35 petang), panduan sokongan rumah, dan templat mesej siaran mudah alih yang dioptimumkan.
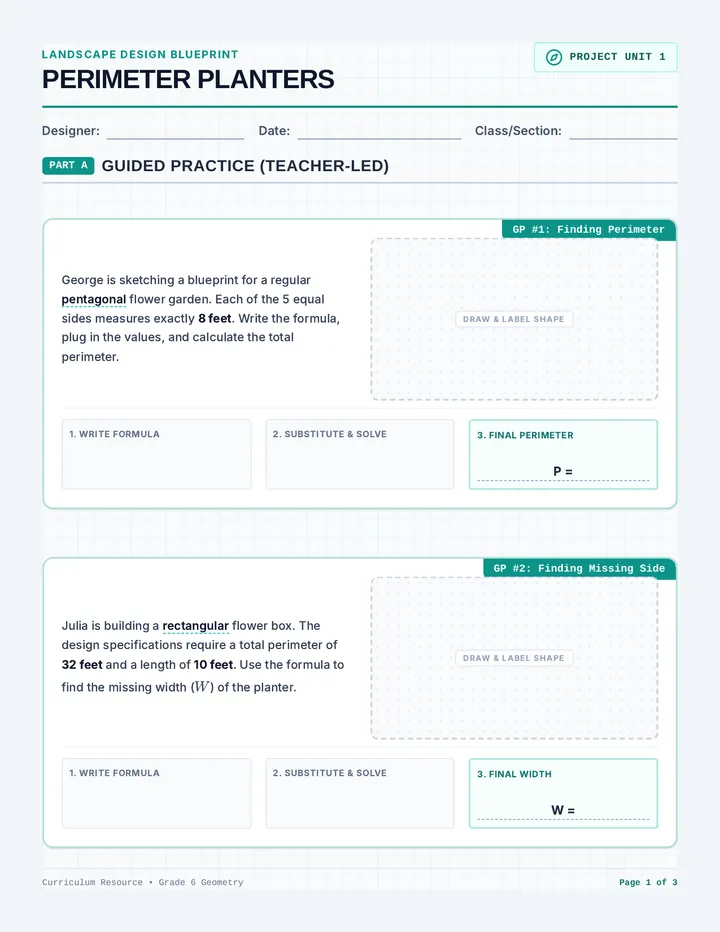
A comprehensive 6th-grade math unit that applies area and perimeter formulas to real-world garden planter designs. Students sketch architectural blueprints, calculate boundaries, determine surface coverage, and solve for missing dimensions across squares, rectangles, triangles, parallelograms, circles, and pentagons.
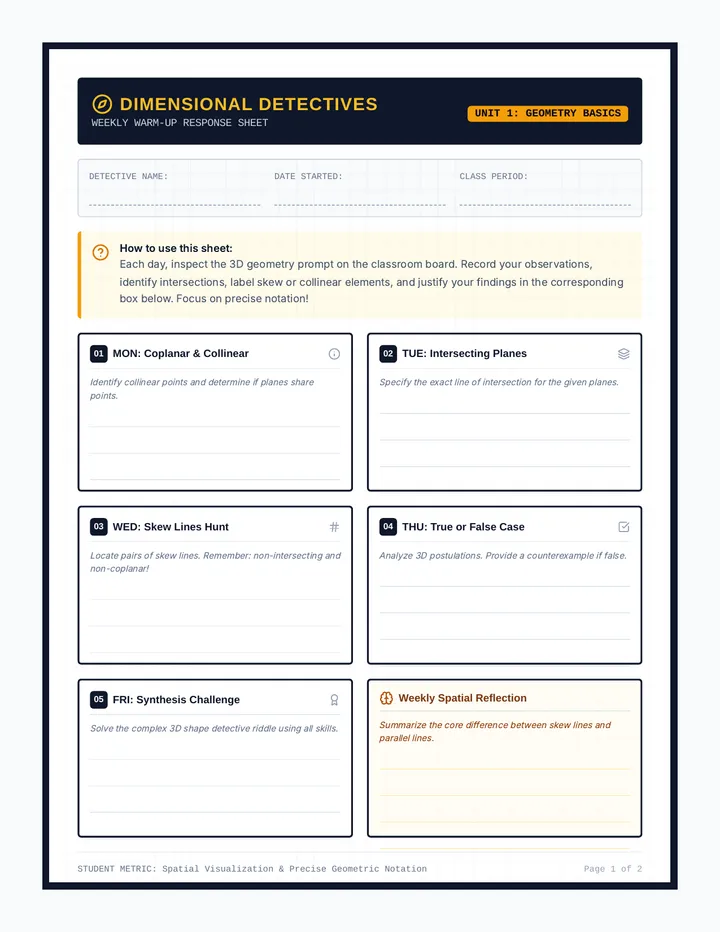
A geometry lesson focusing on visualizing 3D relationships, including intersecting planes, collinear points, coplanar lines, and skew lines in space. Includes projection-ready slide decks, task cards, and a weekly response sheet.
A visual presentation to guide the class through the Vacation Math Warm-Up, featuring categories, brainstorming prompts, and sharing examples.
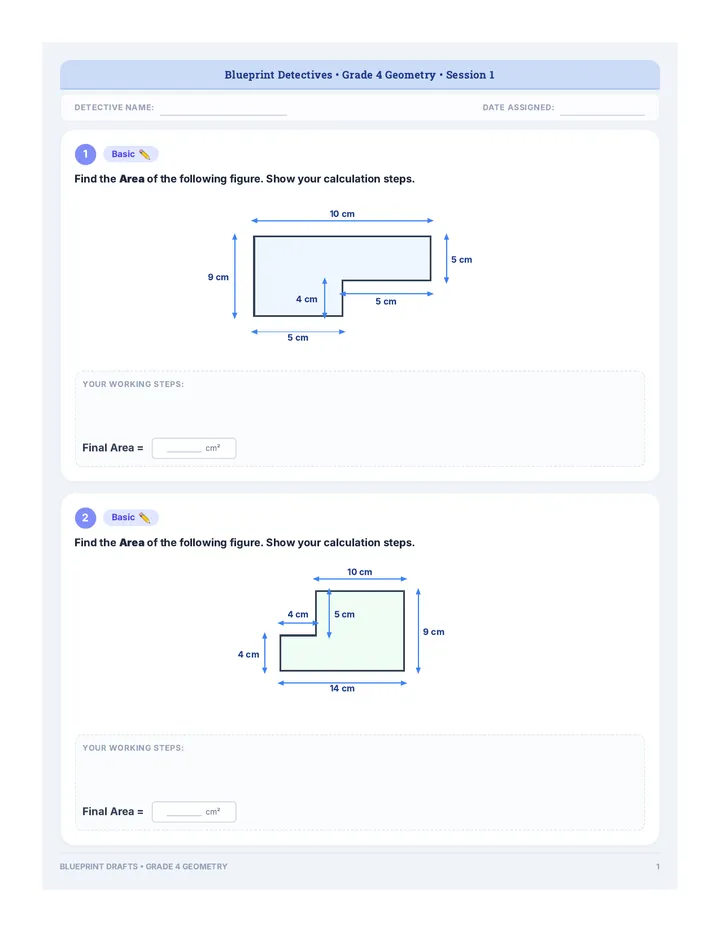
A comprehensive 1-week curriculum sequence for Grade 4 students to master area and perimeter, progressing from grid foundations to complex composite shapes and missing dimension puzzles.
Form 2 English lesson focusing on the UASA Information Transfer format. Teaches scanning, keywording, and exact-phrase transcription strategies through real-world texts, hands-on graphic organizers, peer collaboration, and a post-lesson assessment.
A student-facing handout designed to guide 7th graders through identifying and visualizing real-world math applications from their vacation.