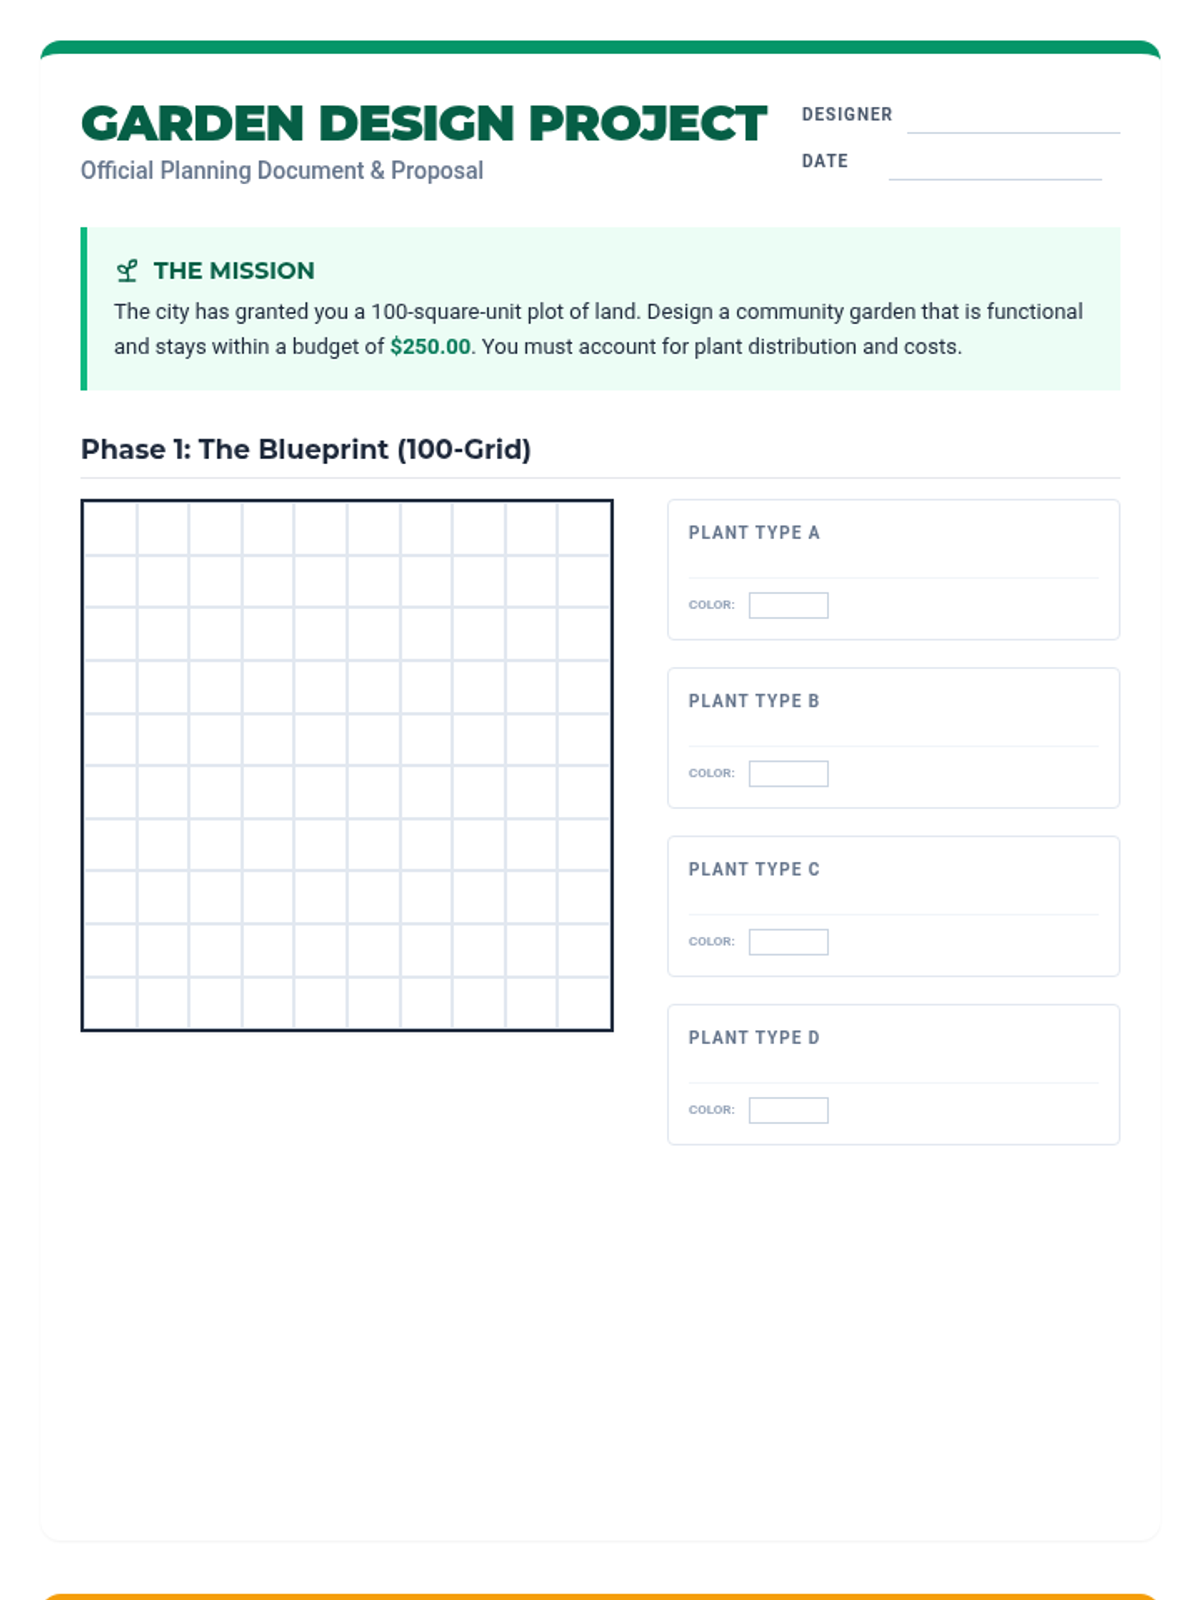
Investigation worksheet for Lesson 3 that uses visual grid overlays to help students conceptualize why common denominators are necessary for adding unlike fractions.
A comprehensive teacher's guide for the Spend Quest simulation, including pacing tips, 'Life Event' prompts, and an updated assessment rubric for high-efficiency budgeting.
A structured project packet for students to track their spending spree, including rules, a large budget ledger, and life event tracking with clean work areas.
A vibrant presentation to introduce the Spend Quest budget simulation, covering the scenario, rules, and multi-step math processes required for the project.
Measurement Unit Slides - Lessons 3 & 4: Mixed Fractions and Line Plots. Recreated and translated into Japanese with advanced instructional visuals, worm and leaf data examples, and rigorous synthesis prompts. Revisions made for page breaks and math rendering. Fixed 'X' alignment on plots and matched cool-down options. Fixed comma alignment and dark blue highlights.
Measurement Unit Slides - Lesson 2: Inch Fourths. Recreated and translated into Japanese with professional instructional design, clear visuals of rulers, and interactive-style prompts. Revisions made for page breaks and math rendering. Fixed wrapping for 'inches'. Fixed paperclip alignment and ruler consistency. Improved mixed number visualization.
Measurement Unit Slides - Lesson 1: Inch Halves. Recreated and translated into Japanese with clean visuals, clear diagrams, and appropriate pedagogical structure. Revisions made for page breaks and math rendering. Fixed ruler zero positioning. Fixed eraser width to 1.5 units and improved layout. Corrected fraction terminology.
A visual example and mockup of a completed 'Evidence Board' poster for Case 202, demonstrating how students should present their visual plot, statistics, verdict, and outlier analysis. Revised for single-page layout.
An answer key for the Distribution Debrief Exit Ticket, providing correct answers and brief pedagogical explanations.
A brief end-of-lesson assessment checking student understanding of how outliers affect mean vs median and when to use specific statistical measures. Two tickets per page for efficient printing. Revised for layout and uniform answer choices.
A guide for the collaborative poster activity featuring specific case studies for students to analyze and 'peer review' cards for a gallery walk. Revised with larger peer review cards and better layout.
An answer key for the Case Notes handout, providing calculations for mean and median and clear explanations of why certain measures are preferred in symmetric vs skewed data. Revised for layout and clarity.
A student practice worksheet with two real-world scenarios comparing symmetric data to data with an outlier, requiring students to calculate measures and justify their selection. Layout optimized for 8.5x11 printing. Revised for single-page fit.
Visual presentation for the lesson including outlier identification, impact on mean vs median, and selection criteria for symmetric vs skewed data.
A detailed 90-minute teacher guide for a 6th grade math lesson on statistical measures and outliers, featuring a 'Data Detective' theme with a clear timeline, learning objectives, and teaching tips. Revised for better page breaks.
A printer-friendly set of 12 thematic task cards for 4th-grade math and a 2-page recording sheet. Optimized heights and spacing ensure all content fits on the page for clean printing. Includes cutting guides and clear student work areas.
A 3-page project-based learning guide for garden design. Layout updated for printer-friendliness, consistent student work area styling, and logical task instructions. Spacing optimized for physical writing.
Set of 30 unique, randomized pre-filled Bingo cards for the Stat Squad activity, formatted with two cards per 8.5 x 11 sheet. Each card features randomized numbers from the variability evidence pool and a central 'FREE' space.
Bingo activity presentation for calling variability problems in class. Features large, readable data sets and distinct case numbers to match the teacher's calling guide. Includes step-by-step solution slides.
Teacher Calling Sheet for Stat Squad Bingo. Features a complete answer key for Case #01 through #30, facilitation tips, and an expanded Evidence Pool reference.
Teacher's answer key for the "Variability Vitals" worksheet, providing step-by-step solutions for MAD and IQR calculations. Optimized to fit on a single page.
A high-quality 6th-grade math worksheet titled "Variability Vitals" focused on calculating MAD and IQR with structured work areas for students. Optimized to fit on a single 8.5 x 11 page. Improved header sizes and work area spacing.
Updated slide deck for Variability Vitals, now including detailed step-by-step examples for Mean Absolute Deviation and Interquartile Range to facilitate teacher explanation.
A detailed 90-minute lesson plan for 6th grade math covering Mean Absolute Deviation and Interquartile Range with a "Stat Squad" theme. Updated with requested title and single-page layout.
A teacher-facing guide for the Green Thumb Architects lesson, including TEKS alignment, grading rubric, project answer keys, and task card solutions.