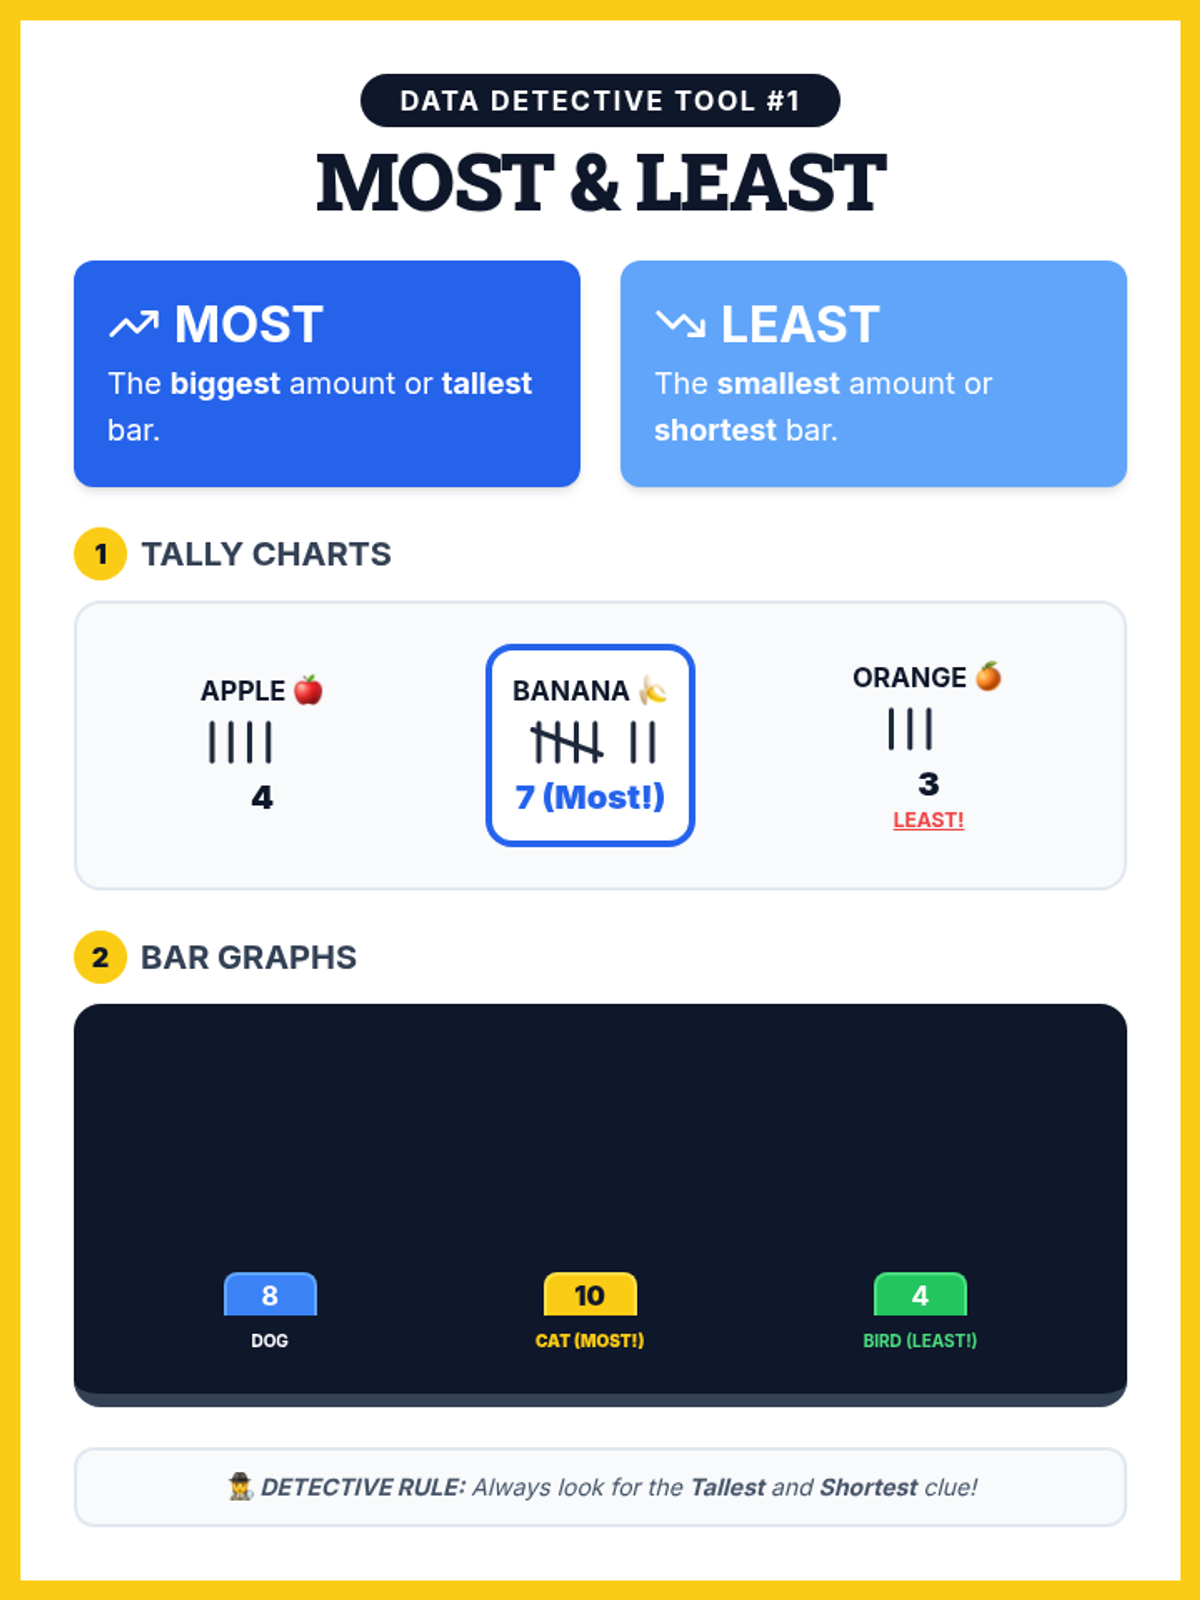
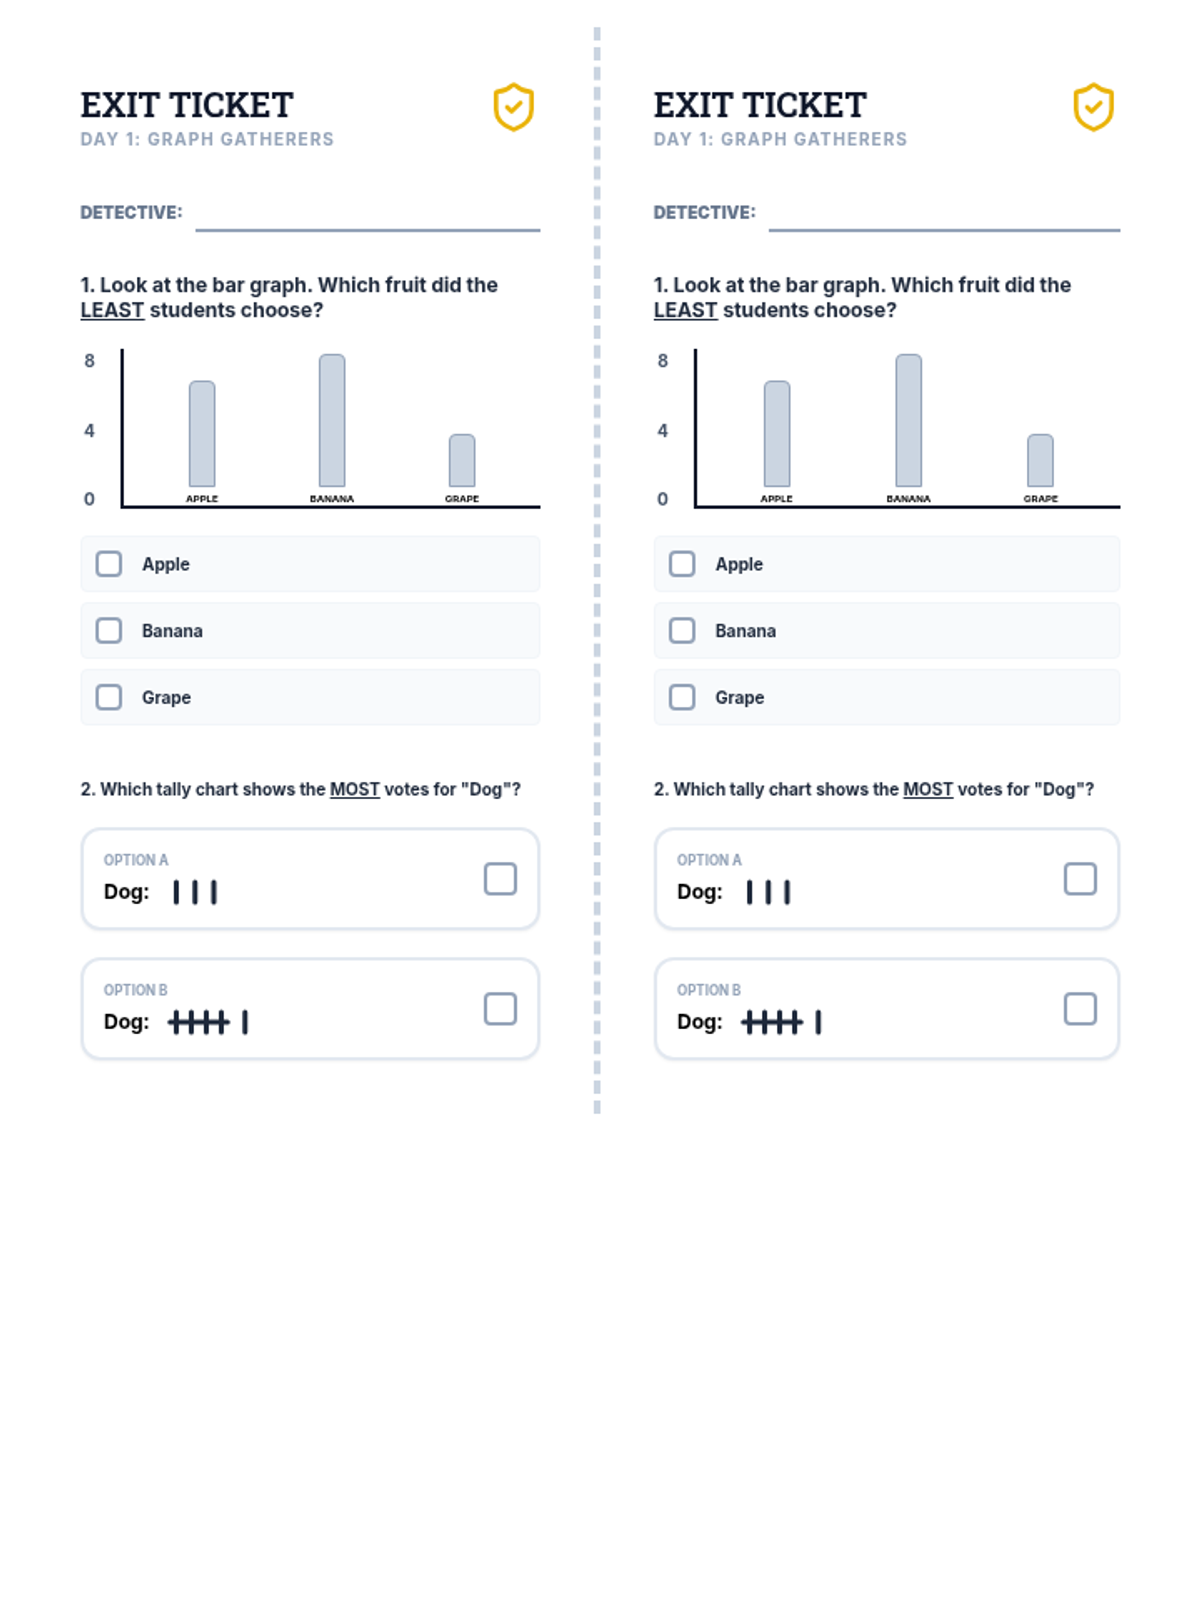
A practice worksheet for Day 1. students read tally charts and bar graphs to identify which categories have the 'most' and 'least' values. revised for a guaranteed single-page side-by-side layout.
A practice worksheet for Day 1. students read tally charts and bar graphs to identify which categories have the 'most' and 'least' values. revised for a guaranteed single-page side-by-side layout.