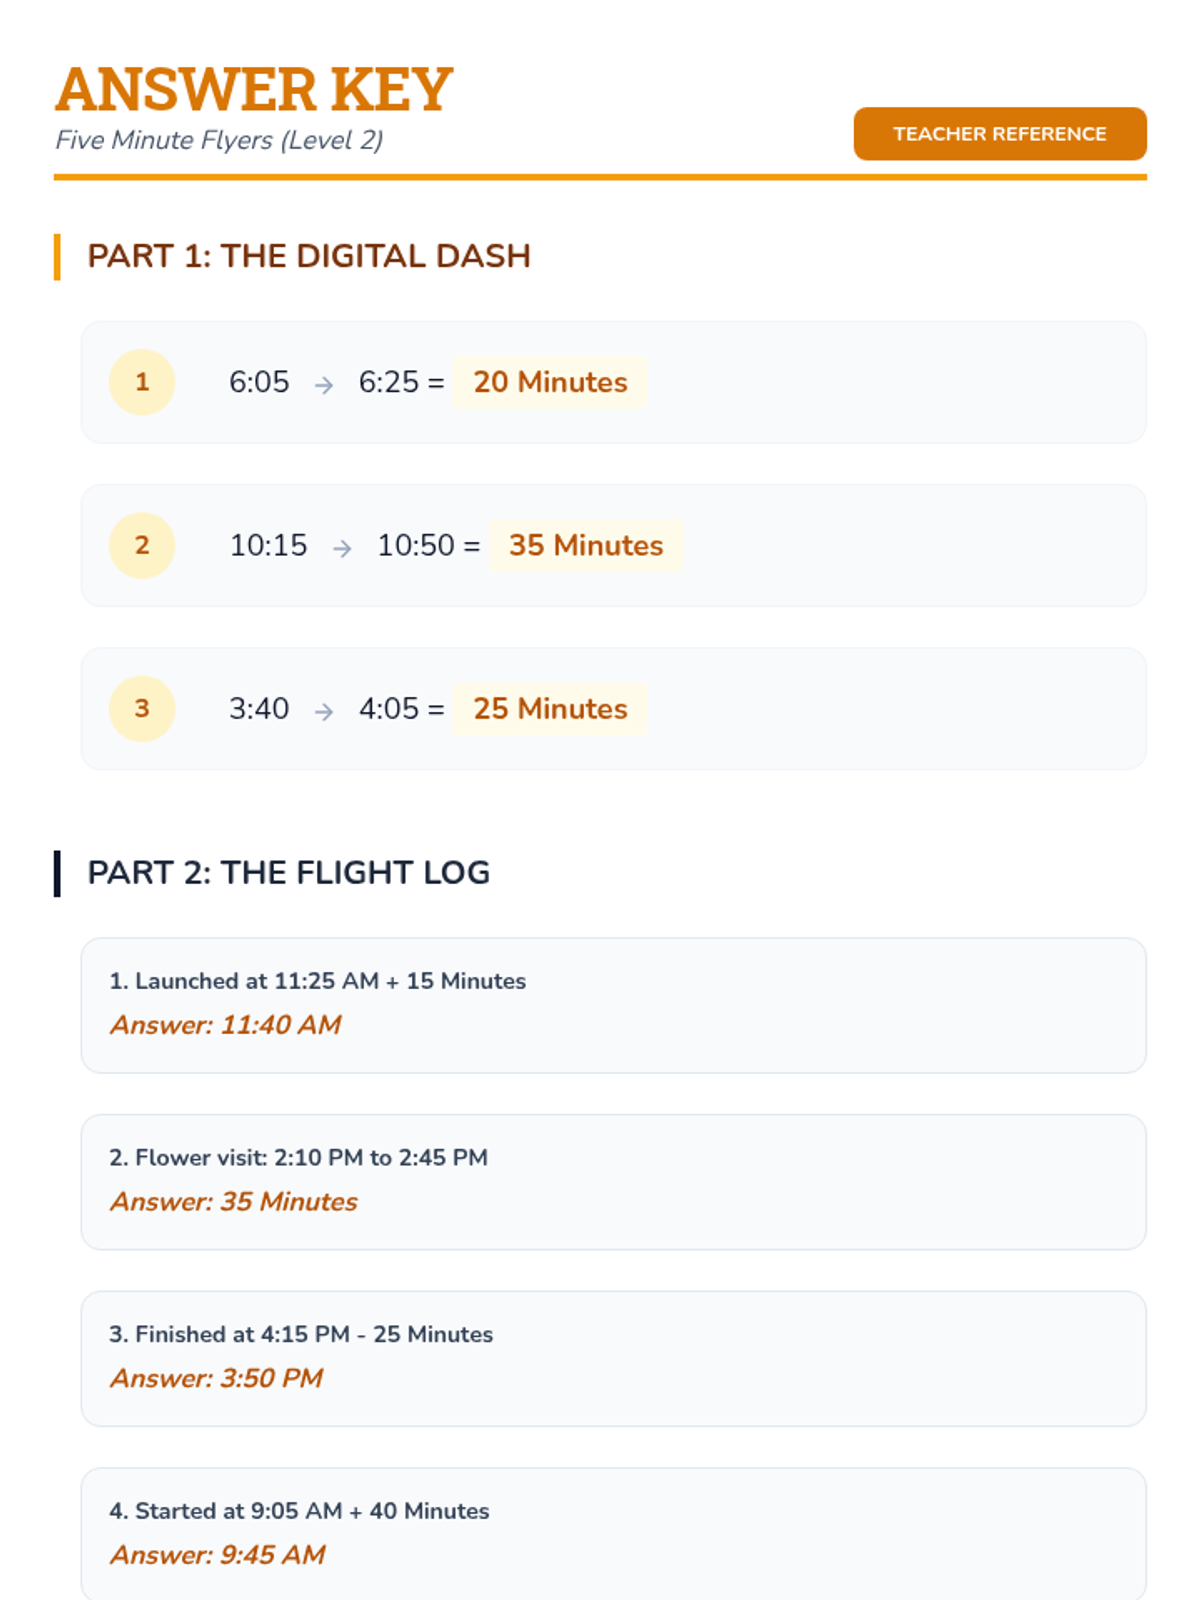
A Level 2 worksheet centered on calculating elapsed time in 5-minute increments. Features visual clock support with all 12 numbers and flight-themed word problems.
A teacher-facing facilitation guide and answer key for the Math Mission Rescue lesson. Includes instructional objectives, common misconceptions for IEP students, scaffolding strategies, and step-by-step solutions for all worksheet problems.
A scaffolded 3rd-grade math worksheet featuring 2-step addition and subtraction word problems with a 'Space Repair' theme. Includes a 4-step checklist for each problem and separate workspaces for each step to support students with IEPs.
A visual slide deck designed for 3rd-grade students with IEPs, introducing a structured 4-step checklist (Read, Plan, Solve, Check) for solving multi-step addition and subtraction word problems within a space-themed 'Mission Control' context.
A visual observation puzzle where students tally pizza toppings to solve a freezer unlock code. Scrambled tally list and clarified size-based sorting logic. Fixed page break and opacity.
A revised 1-page answer key. Replaces non-rendering arrow glyphs with Lucide icons and consolidates the solutions and grading rubric into a single-page teacher resource.
A revised 2-page student worksheet. Includes fixed page breaks to keep the 'Perfect Plate' drawing area intact, improved text contrast for instructions, and standard icons for pattern flow.
A revised 3-page printable game set. Includes improved page breaks to keep extension pieces together, dashed borders on item cards for easier cutting guidance, and higher-contrast pattern labels.
A revised 6-slide instructional presentation. Includes standardized answer choice styling on slide 3, fixed arrow rendering on slide 2, and improved visual grouping of pattern labels on slide 5.
A revised 2-page teacher guide for the picnic lesson. Includes consolidated instructional steps, improved grid alignment for materials, and better contrast for teaching tips and assessment notes.
Day 2 homework assignment where students convert tally marks into numerical data and complete a partially constructed bar graph. Includes a reflection question on data-driven decision making.
A worksheet for Day 2 where students conduct a class survey, tally the results, and construct their own bar graph from scratch. Includes a checklist for essential graph components.
A creative spring-themed foldable craft for the interactive notebook. Includes pop-up bar graph elements stylized as sports equipment and a garden-themed background for mounting.
Instructional slides for Day 2: Building the Box Score. Guides students through the process of surveying classmates, tallying data, and constructing their own bar graphs, ending with instructions for a spring-themed craft.
Day 1 homework assignment featuring a bar graph analysis task with a scale of 2. Includes questions on data interpretation, comparison, and a challenge problem.
Interactive notebook guided notes and a data analysis worksheet focused on interpreting a spring-themed bar graph. Includes fill-in-the-blank terminology and comparative questions.
Instructional slides for Day 1: Analyzing Action. Covers the anatomy of a bar graph, understanding scales and intervals, and comparative data analysis.
An answer key for the Five Minute Flyers worksheet, providing solutions for elapsed time problems in 5-minute increments.