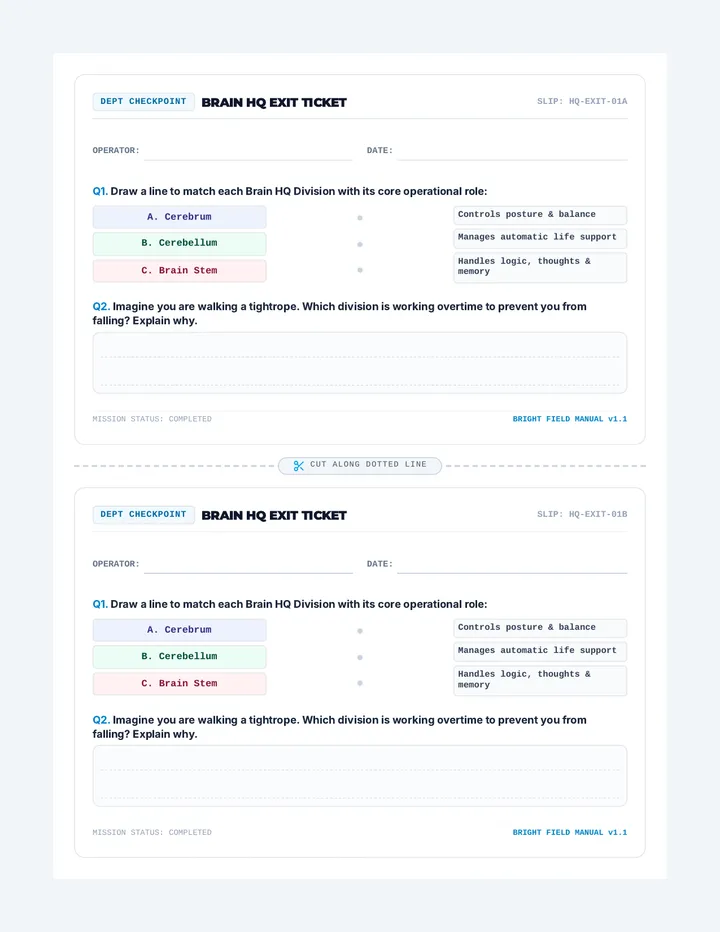
A set of four printable exit tickets for each session of the module, designed for quick formative assessment of key concepts like matter distribution, rotation, tilt, and tides.
A comprehensive teacher facilitation guide for Operation Earth. Includes a mission timeline for document deployment, specific support strategies for bilingual/ELL students, inquiry prompts, and presentation ideas. Simplified language is used for easy educator reference.
A simplified tactical worksheet to help students narrow their research focus. Uses simple language like 'Where?', 'Who?', and 'Why?' to guide bilingual students through picking a specific research target. Light backgrounds are used in all work areas for handwriting legibility.
A mission-themed brainstorming worksheet for Operation Earth with simplified language for bilingual students. Scaffolds inquiry from basic facts to 'hard' questions using a question ladder and a central mind map.
A teacher guide containing the answer keys for the worksheet and task cards, along with instructional tips and scaffolding strategies for teaching symbiotic relationships.
A graphic organizer featuring a relationship matrix for definitions and symbols, and a visualization tool for mapping specific symbiotic interactions. Includes writing lines and word bank support.
Eight task cards featuring unique animal and plant interaction scenarios. Students must classify each as mutualism, commensalism, or parasitism. Perfect for scavenger hunts or small group work. Polished for high-quality printing.
A two-page 'Field Report' worksheet where students identify and reason about symbiotic relationships using provided case studies. Includes a scaffolded word bank with definitions and clear horizontal writing lines within reasoning boxes for improved student response areas. consolidated to fit exactly two pages.
An introductory slide deck for the 'Wild Bonds' lesson, defining symbiosis and explaining mutualism, commensalism, and parasitism with clear visual cues and examples.
A teacher's resource containing answer keys for the sorting activity and assessment, along with instructional tips and common misconceptions.
A two-page summative assessment featuring visual identification questions, multiple-choice scenarios, and short-answer comparisons.
A two-page cut-and-paste activity where students sort examples into structural and behavioral adaptation categories.
A set of two visual anchor charts defining structural and behavioral adaptations, with specific focus on camouflage, mimicry, and habitat-specific examples.
An expanded two-page student worksheet featuring detailed descriptions of the ocean, rainforest, and grassland biomes, with a dedicated second page for selection and written explanation.
An instructional guide for teachers providing learning objectives, discussion prompts, and a rubric to support the Biome Discovery lesson.
A two-page sorting activity where students match organisms from the Arctic, Desert, and Coral Reef to their correct ecosystems and identify producers.
A visual slide deck exploring energy flow in extreme ecosystems (Arctic, Desert, Reef) and introducing the concept of wildlife crossings.
A creative two-page design activity where students draft a wildlife bridge to solve habitat fragmentation and analyze its impact on energy flow.
An aquatic food web worksheet where students identify producers/consumers and draw energy flow arrows for a pond ecosystem.
A two-page cut-and-paste activity where students build a terrestrial food web for a forest ecosystem and draw energy flow arrows.
A visual slide deck introducing food webs, the difference between food chains and webs, and contrasting terrestrial and aquatic energy foundations.
A one-page reading passage about energy flow and trophic levels, followed by four multiple-choice comprehension questions.
A comprehensive single-page teacher-facing resource providing the answer key for all student activities, including the new wildlife bridge design project and the habitat hike.
A comprehensive matching and identification worksheet focusing on trophic level vocabulary, including a fixed 4-level diagram lab for color-coding.
A colorful two-page cut-and-paste activity where students assemble an energy pyramid using trophic labels and specific prairie organisms.
A visual slide deck introducing energy pyramids, trophic levels (producers to tertiary consumers), and the 10% energy transfer rule.
A participant handout for Lesson 2 (Decomposition) with a Rally Coach section for low-lift tasks, a Professional Blueprint for classroom application, and a reflective Coach's Corner connecting early exposure to long-term CS success.
A 5-slide presentation for Lesson 2 (Decomposition) featuring the Allison Cuttler quote, the video intro, Rally Coach instructions, and professional application examples across storytelling, standards, and math.
Updated facilitation guide for Lesson 2 (Decomposition), featuring quotes from Krauss & Prottsman and Allison Cuttler, a Rally Coach instructional strategy, and cross-curricular connections from literacy to industrial tech.
Dynamic slides for Lesson 27, teaching students how to sort, filter, and apply conditional formatting to identify market segments. Includes the 'Needle Test' hook and visual logic demonstrations. Fixed tracking and contrast issues.
A professional student reference sheet for sorting, filtering, and identifying market trends. Includes visual examples of conditional formatting and a step-by-step segment search guide. Fixed exit ticket placeholder.
Detailed teacher guide for Lesson 27, teaching students how to sort, filter, and apply conditional formatting to survey data to identify market trends.
Dynamic slides for Lesson 26, exploring the power of spreadsheet formulas. Covers the equals sign, cell referencing vs. static numbers, and the Big Three functions (=SUM, =AVERAGE, =COUNT). Fixed minor typographical and contrast issues.
A high-quality technical reference sheet for spreadsheet formulas (=SUM, =AVERAGE, =COUNT). Includes visual guides for cell referencing and the fill handle.
Comprehensive teacher guide for Lesson 26, focusing on introductory spreadsheet formulas (=SUM, =AVERAGE, =COUNT) and the concept of cell referencing. Fixed minor spacing issues in pacing list.
Dynamic slides for Lesson 25, explaining real-time data syncing between forms and sheets, the importance of file organization, and the technical steps for freezing header rows. Fixed tracking and spacing issues in headers and action items.
A student technical reference for Lesson 25, explaining the automated link between forms and spreadsheets, the concept of the 'database chain', and a checklist for the Data Sprint activity.
A detailed teacher facilitation guide for Lesson 25, focusing on linking forms to spreadsheets, the concept of real-time syncing, and the technical skill of freezing rows for data management.
Dynamic slides for Lesson 24, featuring the biased question hook, definitions of quantitative and qualitative data, and technical setup for survey deployment. Fixed tracking, layout spacing, and checklist completeness.
A student reference sheet and checklist for professional survey design. Covers quantitative vs. qualitative data, how to avoid bias, and the 5-question framework for market research. Optimized for a single page.
A detailed teacher facilitation guide for Lesson 24, focusing on survey design principles, avoiding bias, and the technical setup of market research forms. Fixed placeholder text and redundant labels.
Dynamic slides for Lesson 23, introducing the 'Data Grid' concept with the Jellybean Challenge, Battleship navigation, and technical instruction for resizing and fill colors. Fixed tracking, contrast, and diagram alignment.
A professional student reference sheet for Lesson 23, explaining the 'Battleship' address system, column/row orientation, and essential formatting shortcuts for Google Sheets and Excel. Optimized for a single-page print.
A detailed teacher facilitation guide for Lesson 23, introducing spreadsheet software via the Jellybean Challenge, Battleship navigation analogies, and basic table formatting.