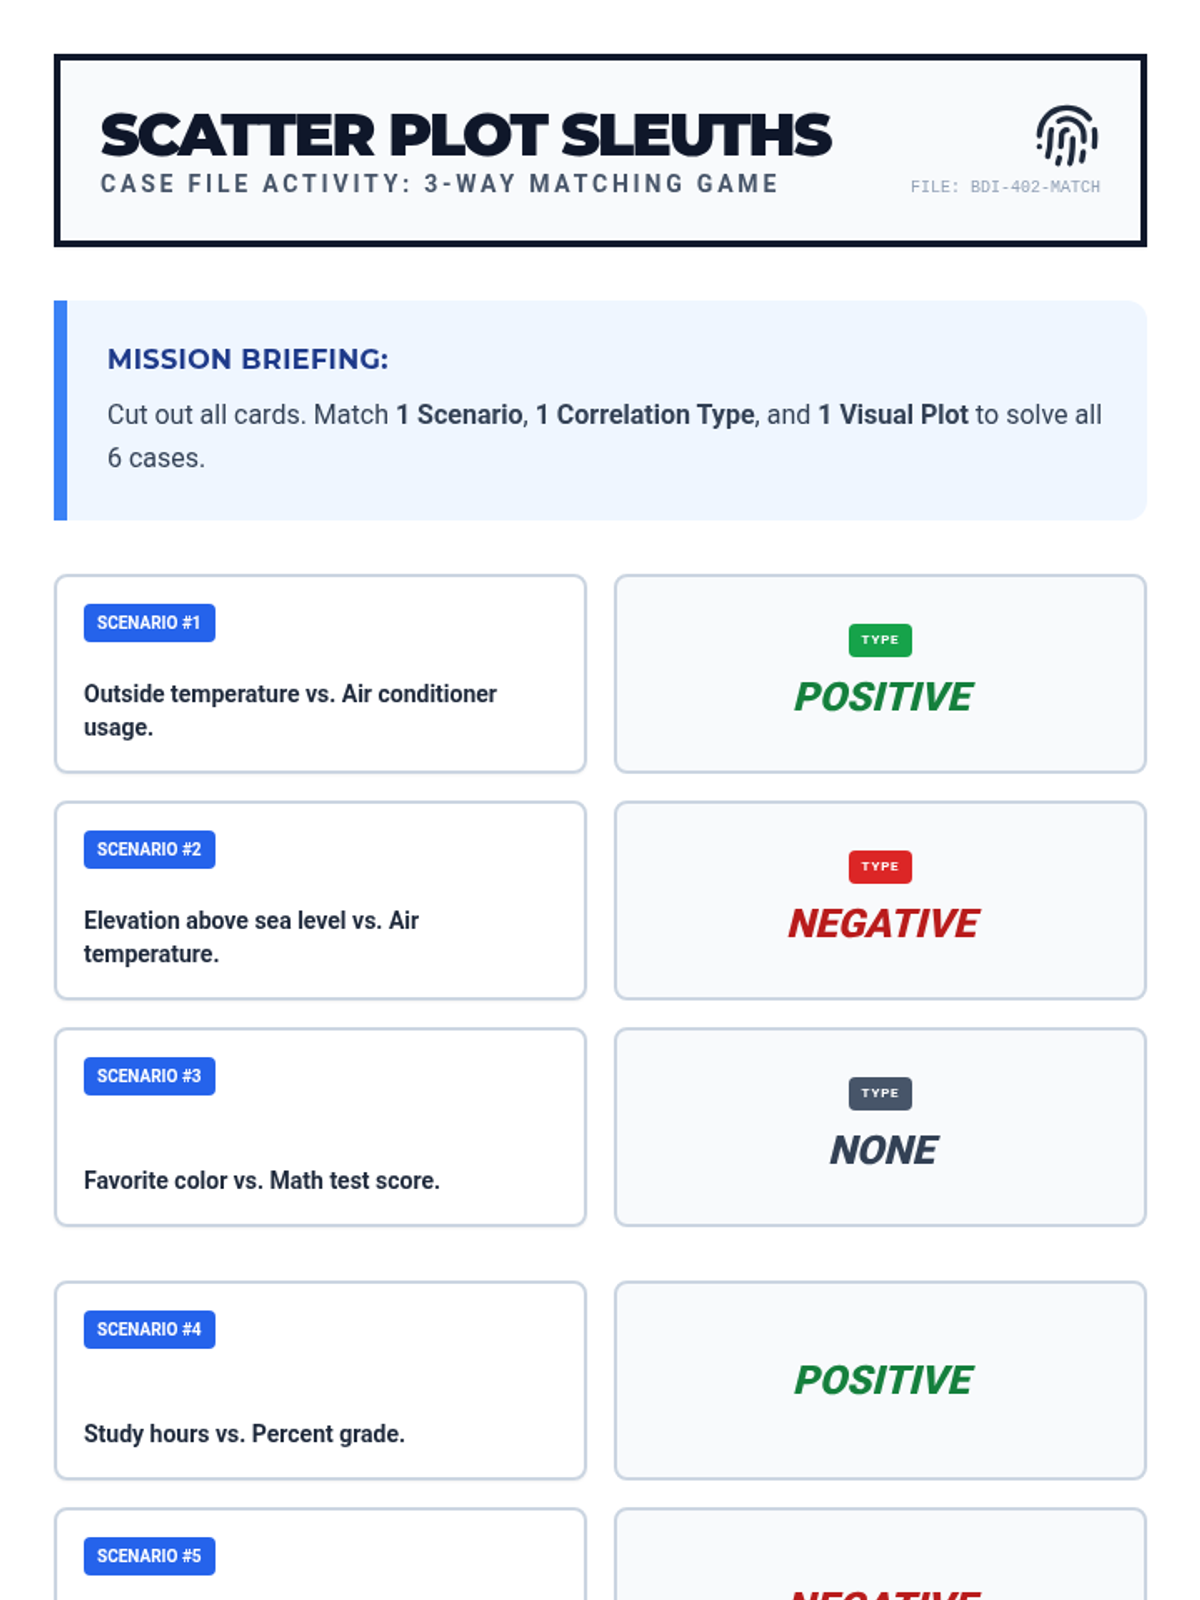
A hands-on matching activity where students pair real-world scenarios with their corresponding scatter plot graphs and identify the correlation type.
A quick assessment tool where students translate data from a dot plot into a five-number summary and a box-and-whisker plot.
A professional-grade statistics worksheet where students analyze basketball scores by creating ordered lists, 5-number summaries, and dual data visualizations.
An essential teacher reference guide providing answer keys for all student activities and worksheets, along with grading rubrics and discussion prompts for specific mathematical pitfalls.
A quick assessment tool for the end of the lesson, checking students' ability to compare medians and IQRs, identify skewness, and apply the concept of consistency in a real-world context.
A quick assessment tool for the end of the lesson, featuring three questions to check for understanding of positive and negative correlation trends.
A concise exit ticket to assess student understanding of trend lines and the difference between interpolation and extrapolation at the end of the lesson.
A class-wide data collection and visualization activity where students survey each other on screen time and collectively build statistical models.
An independent practice worksheet containing two real-world scenarios (phone battery life and commute times) requiring students to analyze and compare multiple box plots. Focuses on consistency, variation, and data-driven decision making.
An independent practice worksheet where students apply their knowledge of trend lines to make specific data predictions, identifying and performing both interpolation and extrapolation.
An independent practice worksheet where students plot real-world data points on coordinate planes, identify correlation types, and write conclusion statements based on their findings.
A sleek, dark-themed presentation for the assessment lesson, including an instructional arc, a warm-up activity, and testing protocols.
A student worksheet for the 'Spaghetti Trend Line' activity, where learners use physical noodles to find the best-fit line on scatter plots before tracing them for analysis.
A matching game activity where students pair real-world data scenarios with their corresponding correlation types (positive, negative, or none) to reinforce conceptual understanding.
A guided practice activity where students compare two box plots representing test scores from different classes. Students calculate IQR, identify five-number summaries, and provide data-driven arguments for performance and consistency.
A teacher's answer key for the Analysis Showdown Test, including rationales, calculated answers, and a grading rubric.