Data representation, distributions, and statistical variability using sampling and inference techniques. Integrates probability models, compound events, bivariate patterns, and linear models to guide data-driven decision making.
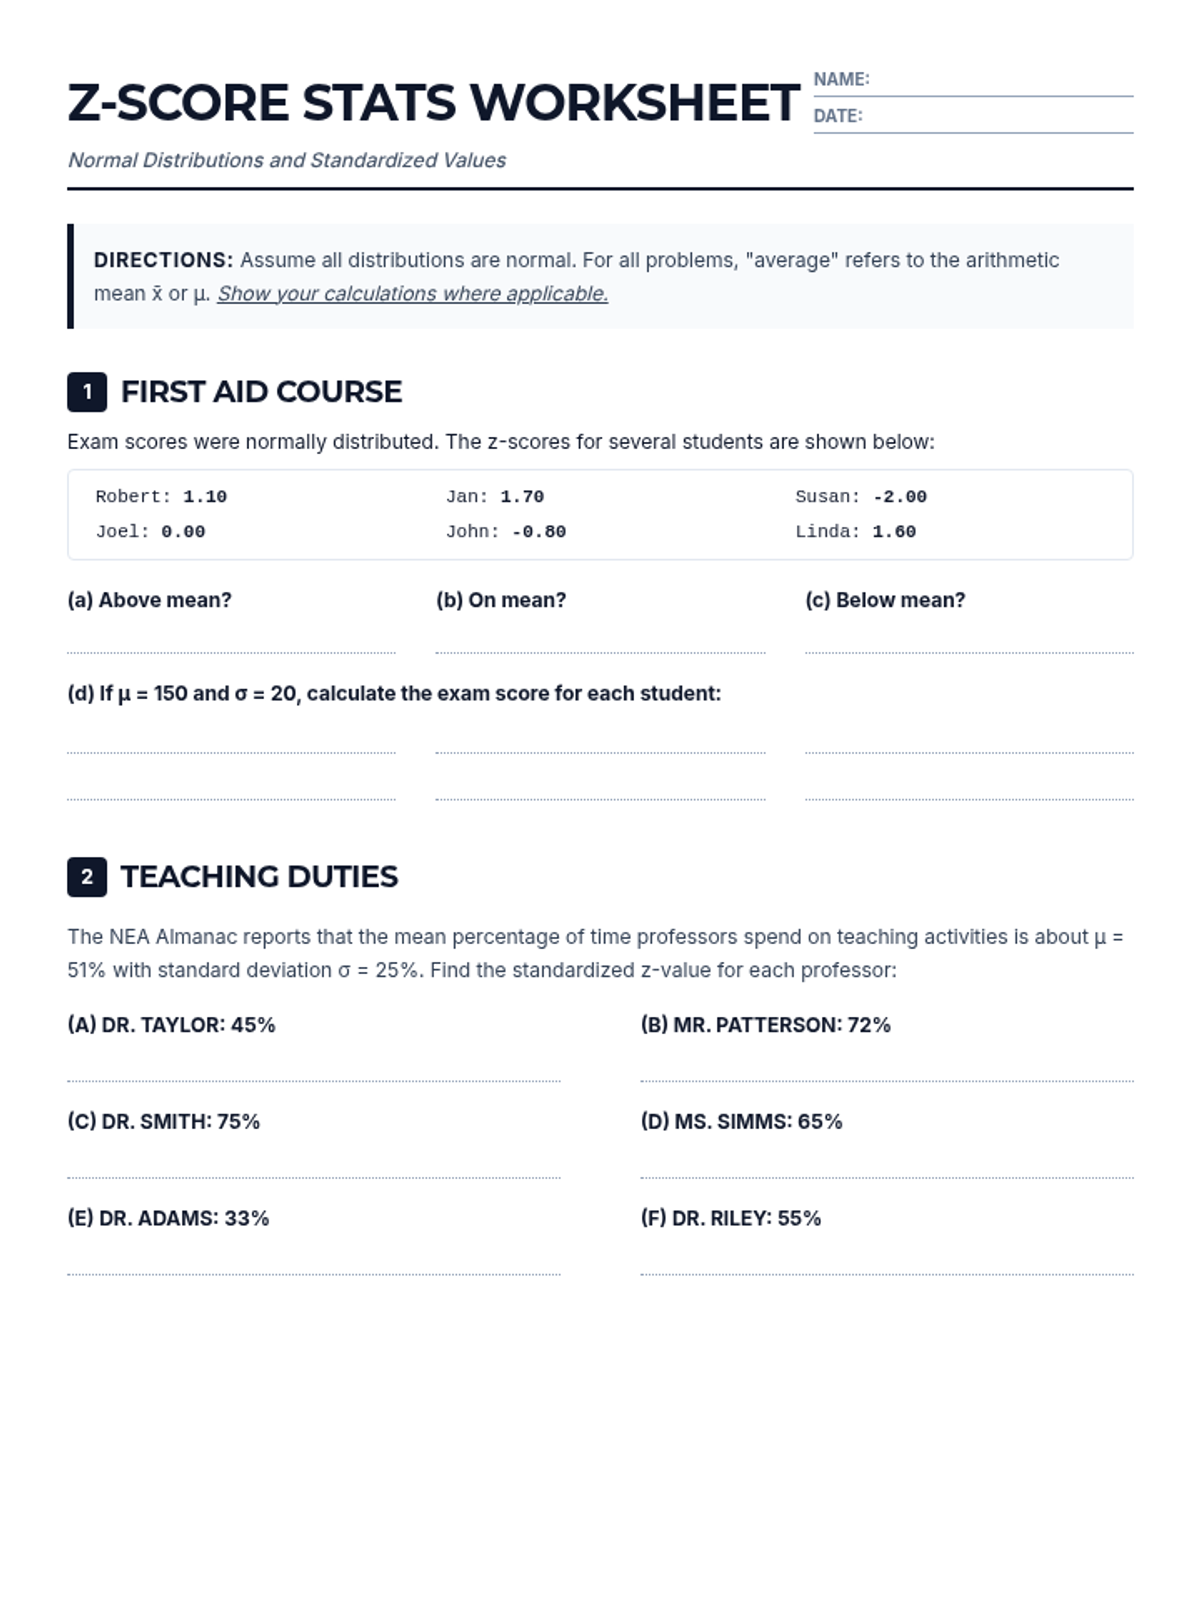
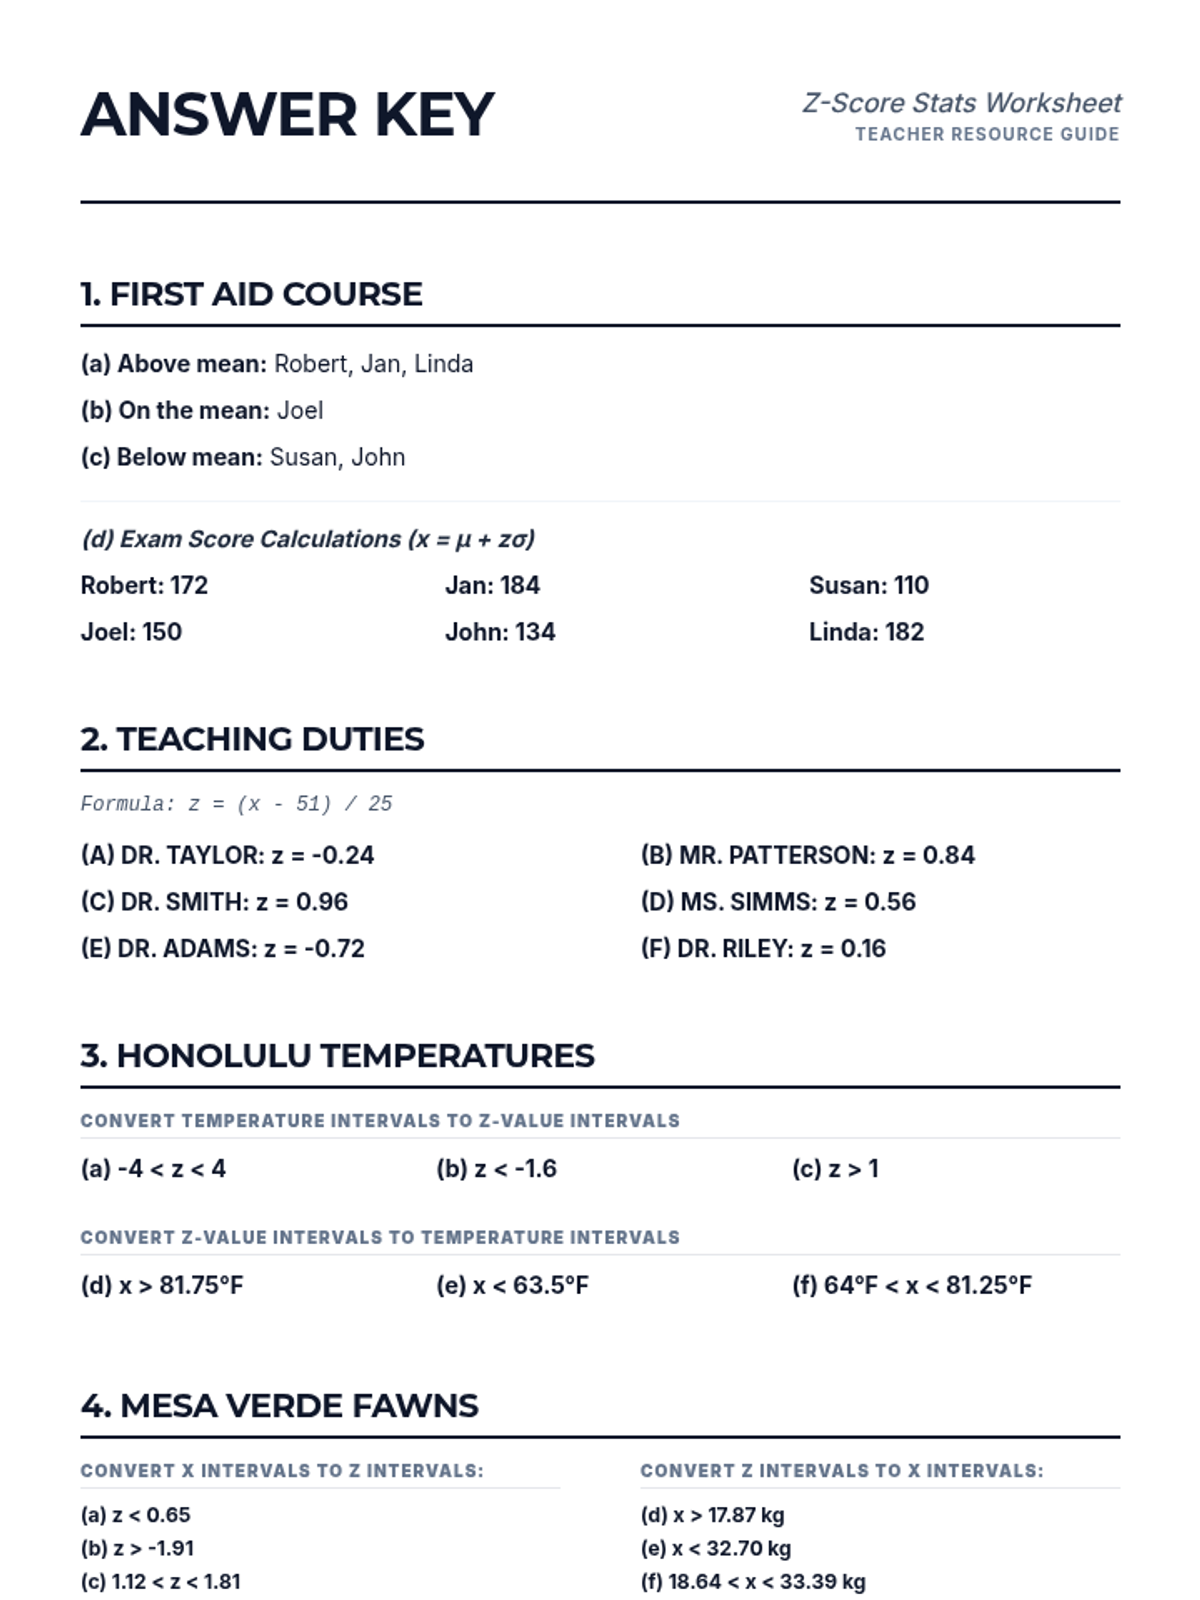
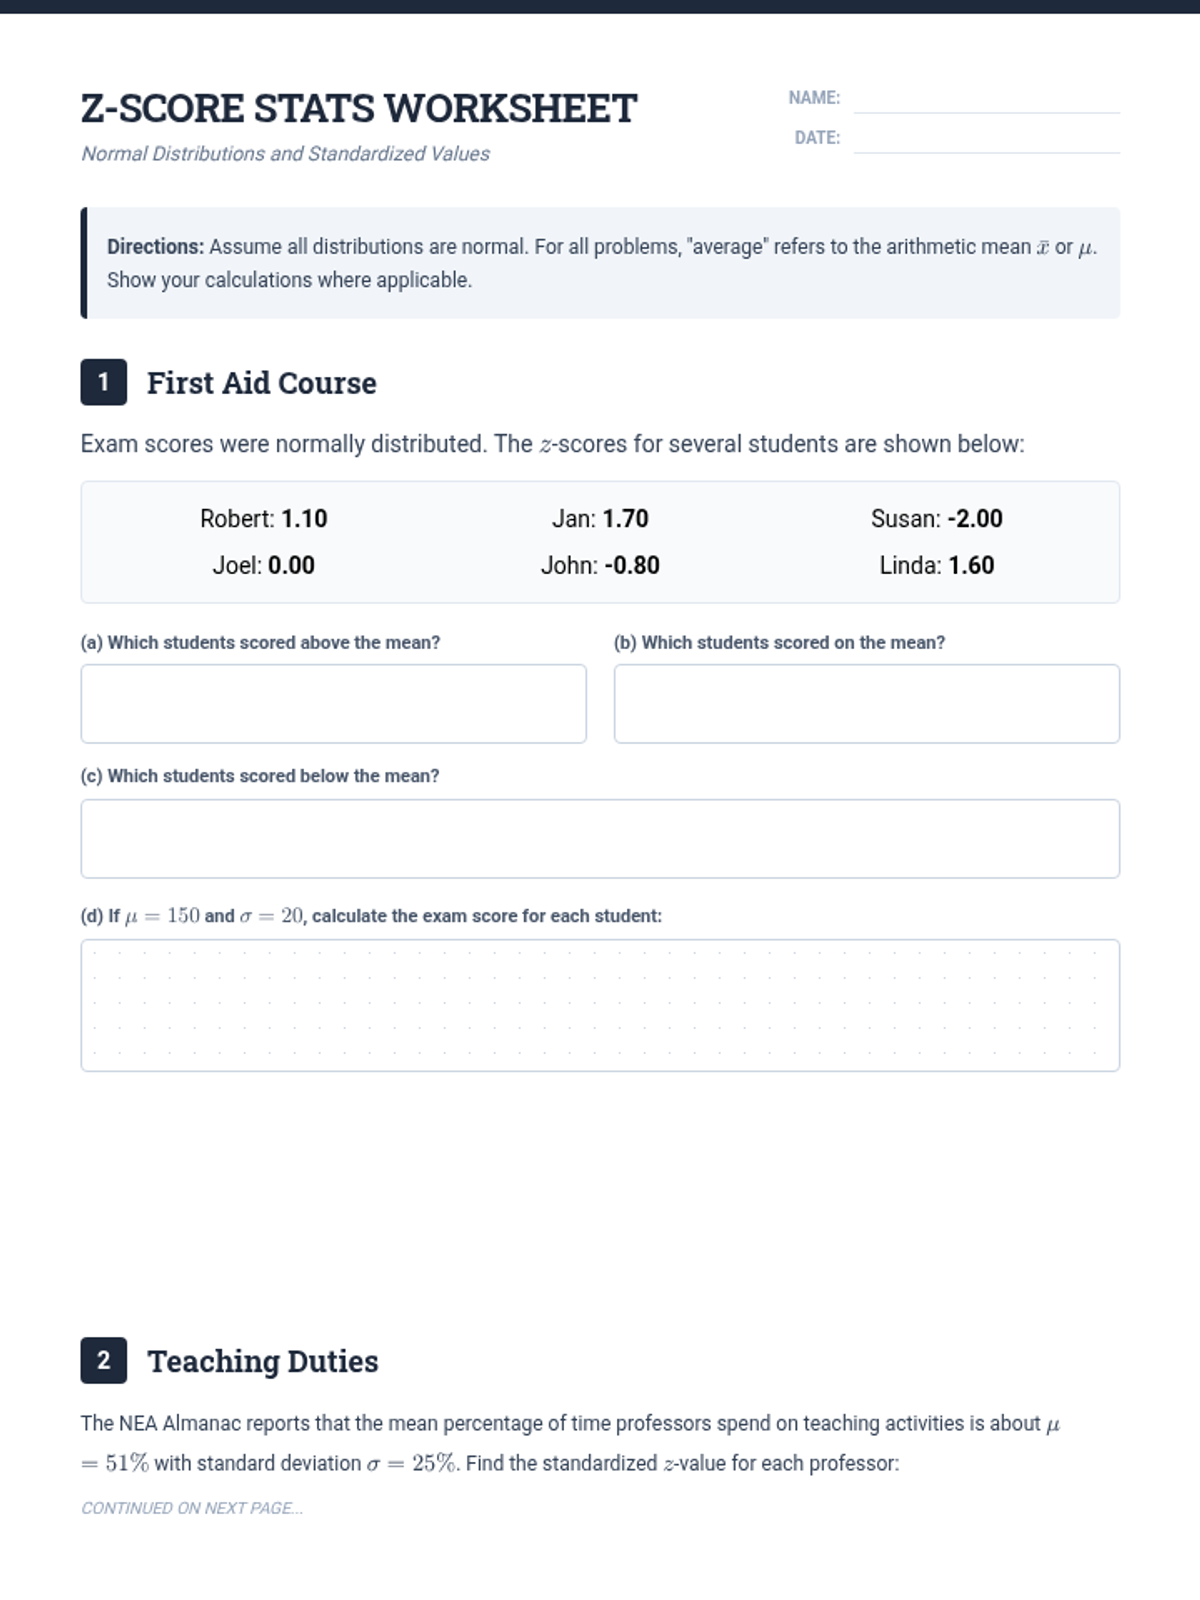
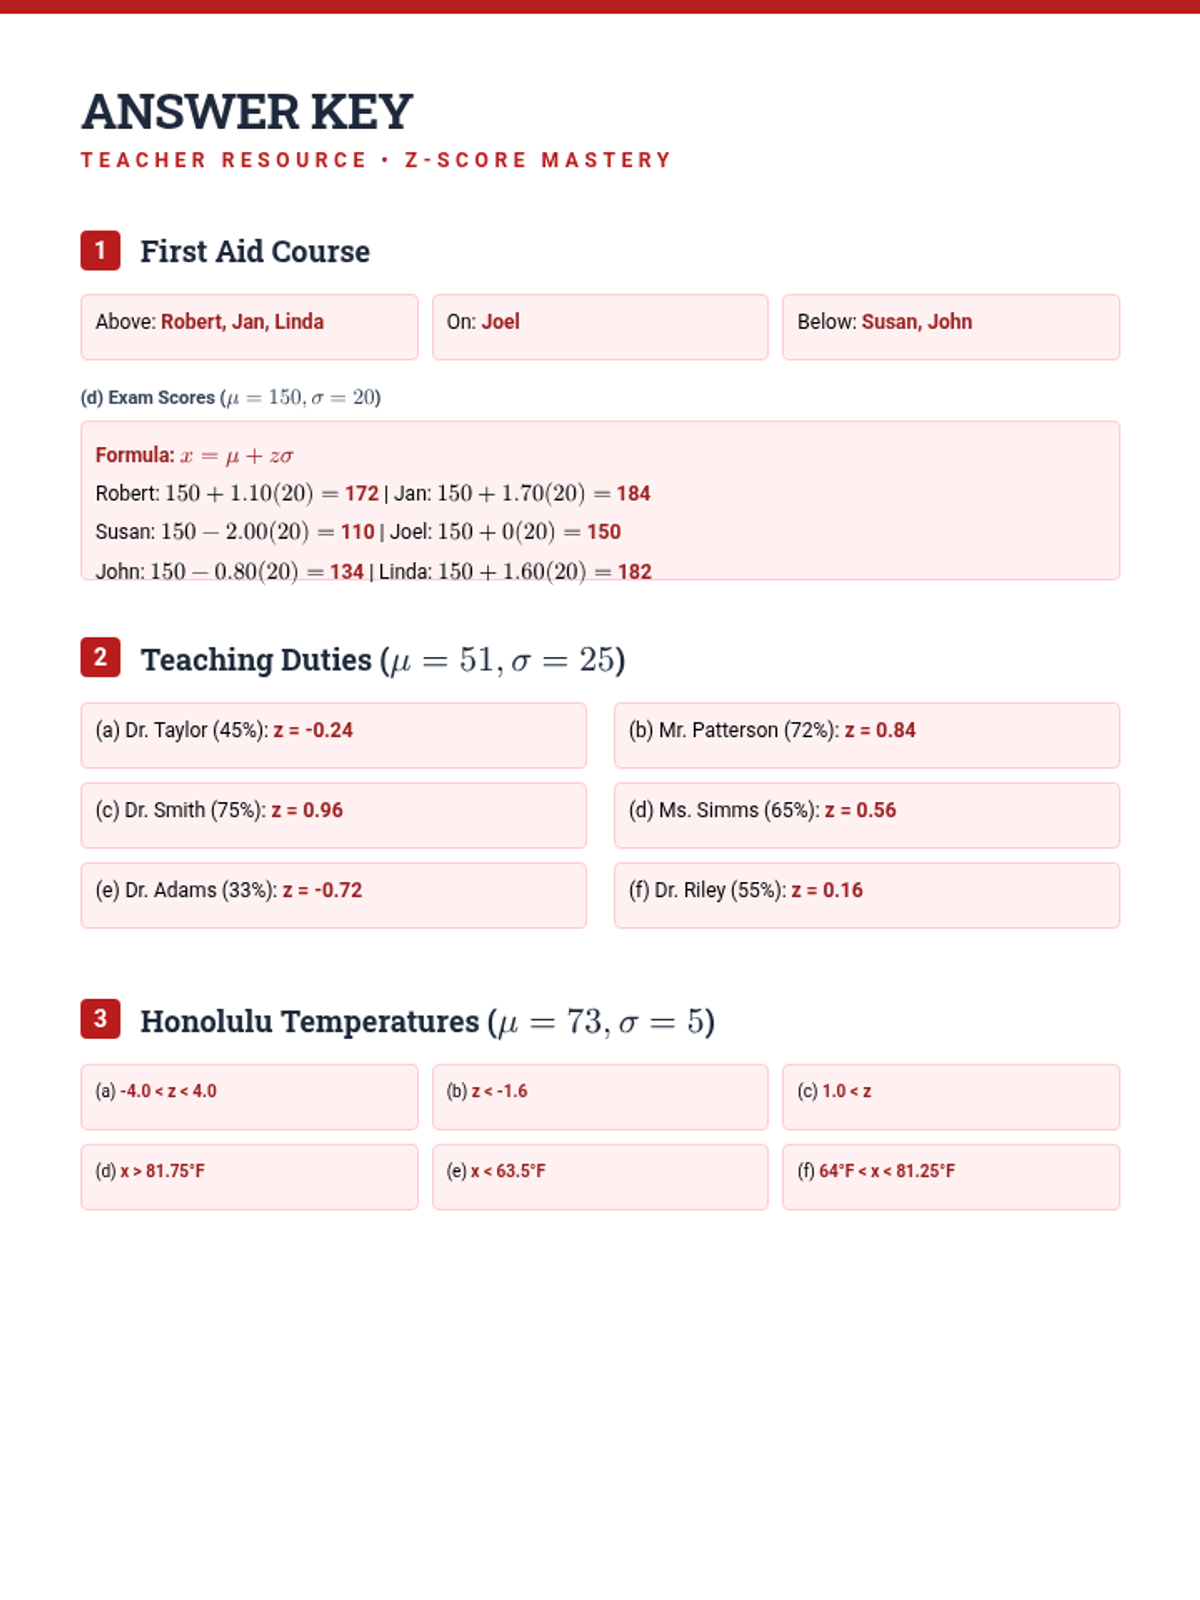
A lesson focused on understanding and applying z-scores to compare values from different normal distributions and interpret real-world statistical data.
A lesson focused on calculating and interpreting z-scores within the context of normal distributions, featuring real-world data from ecology to education.
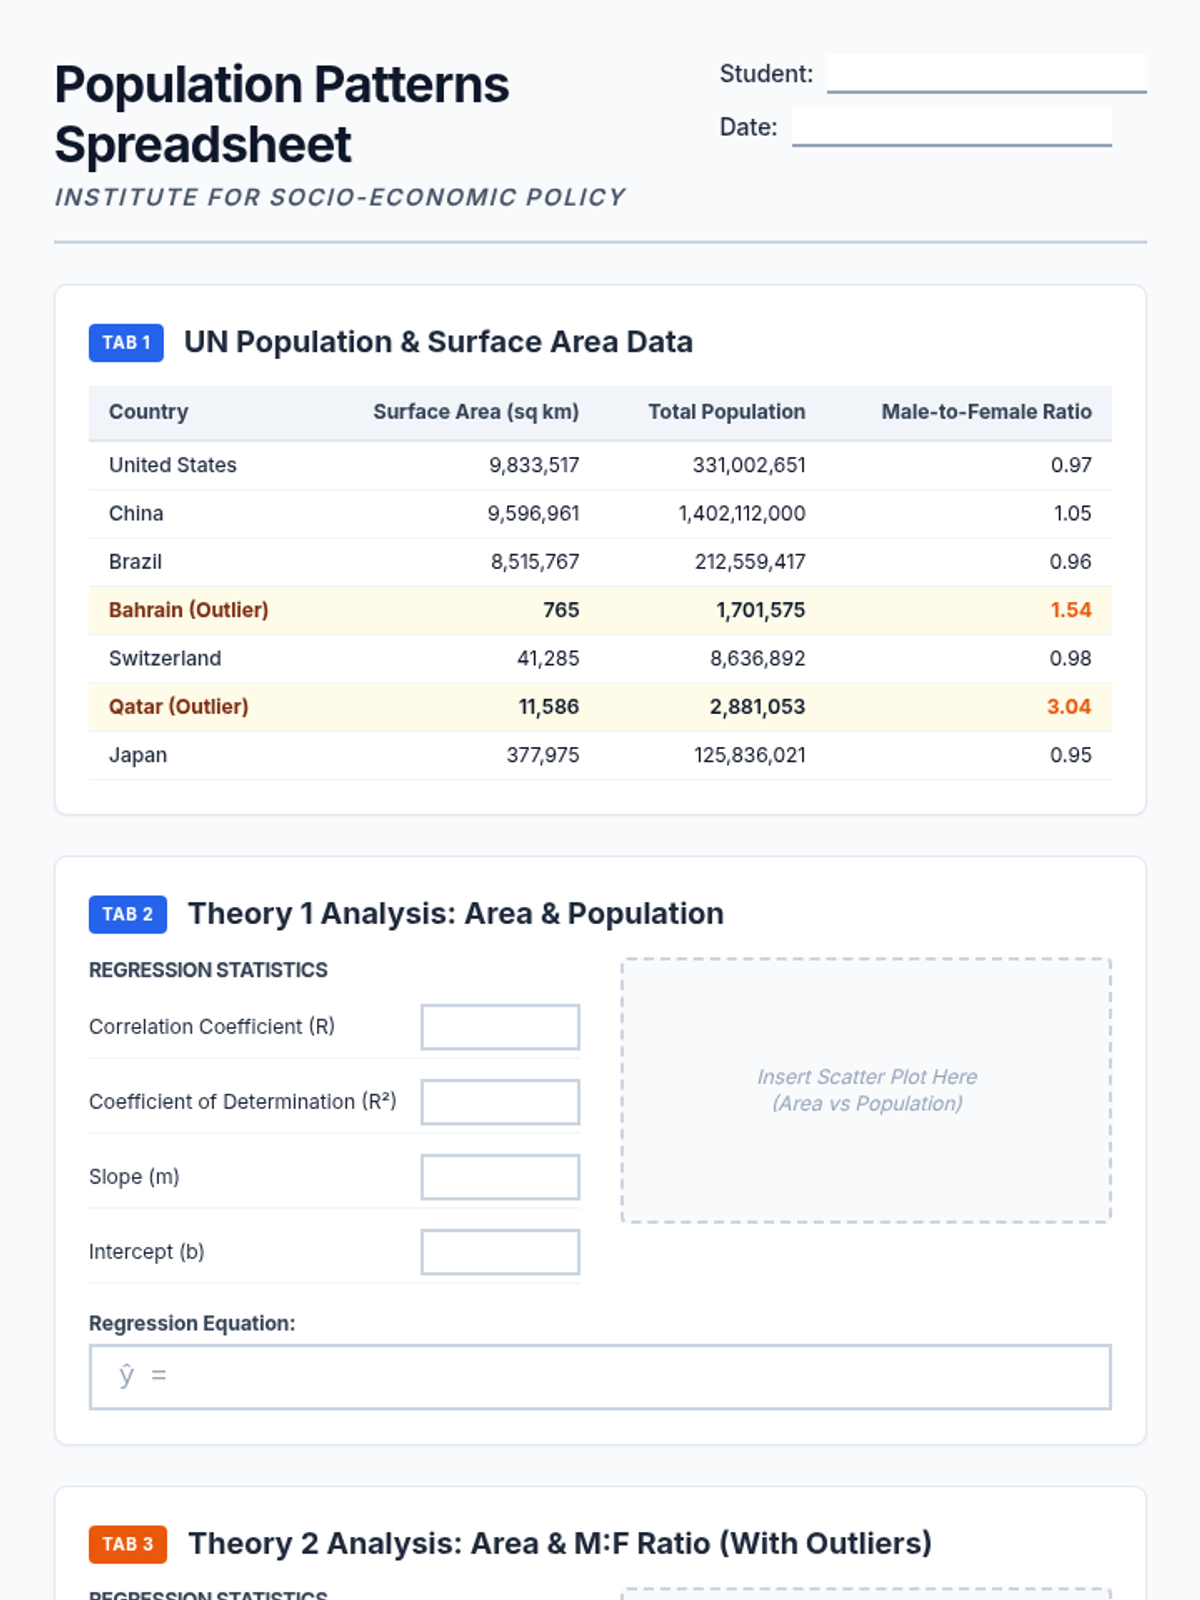
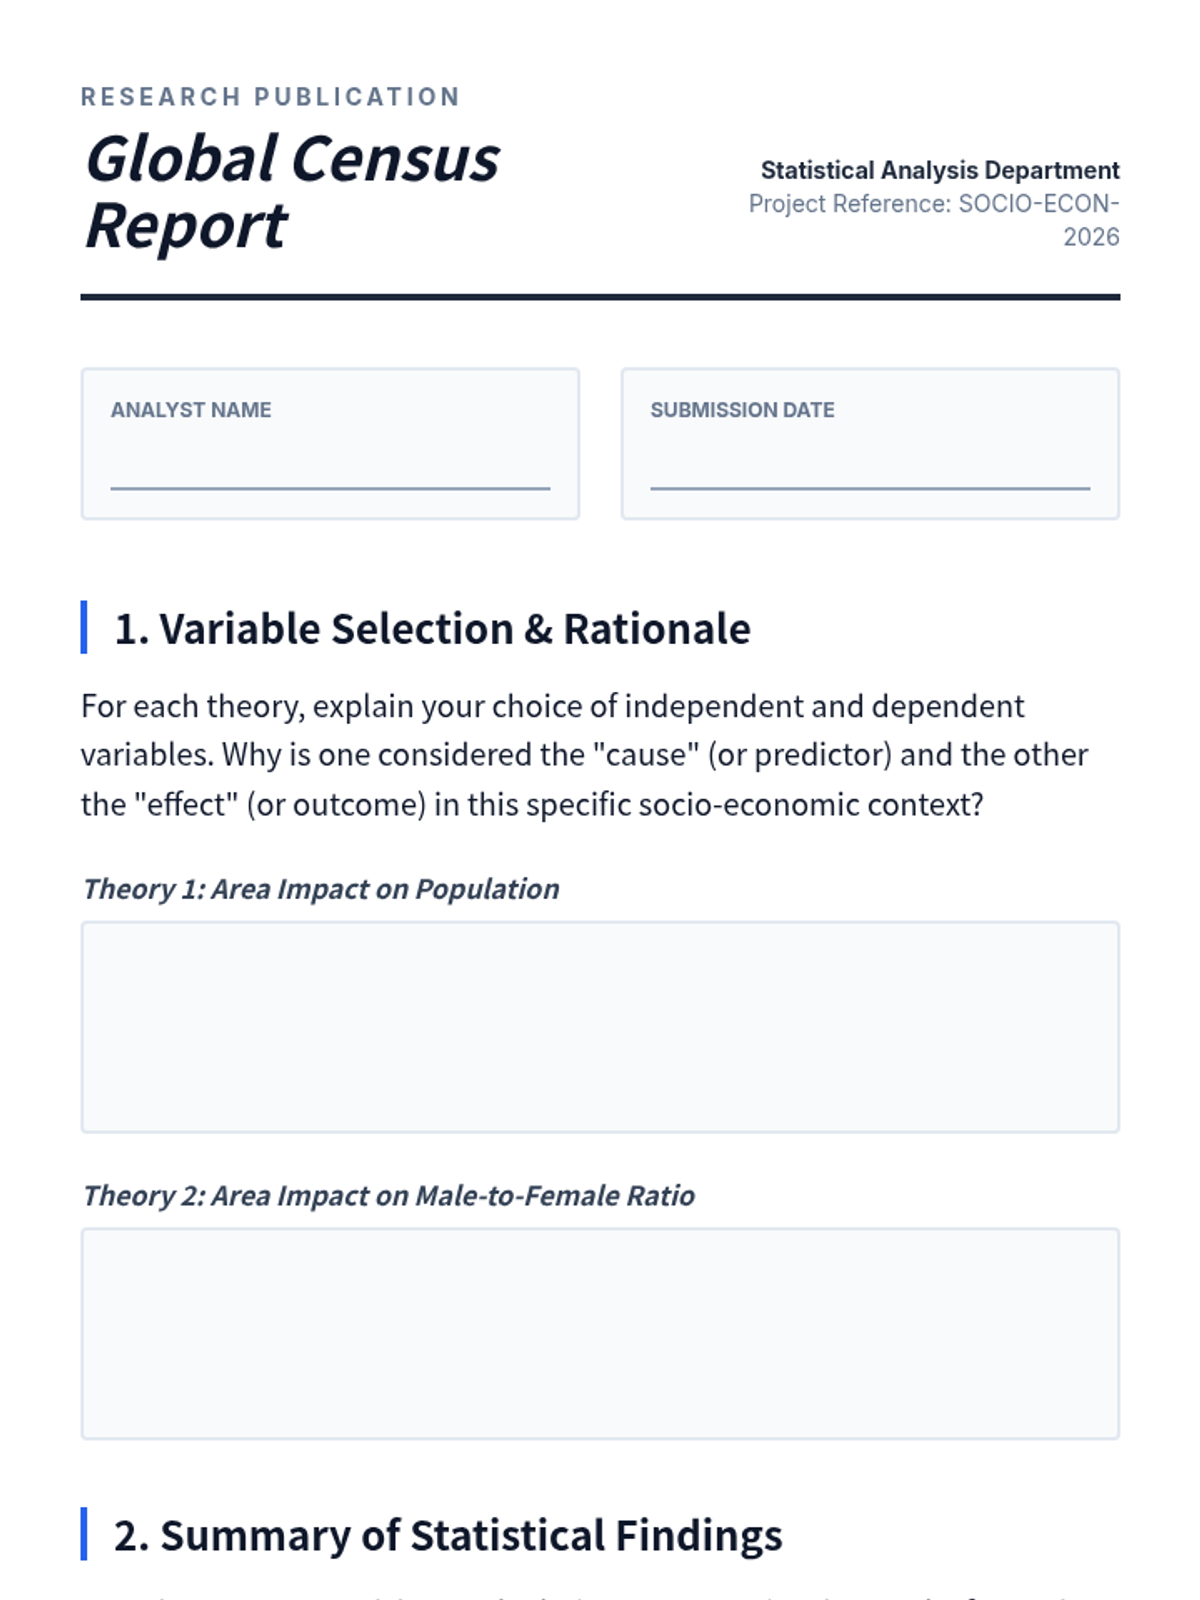
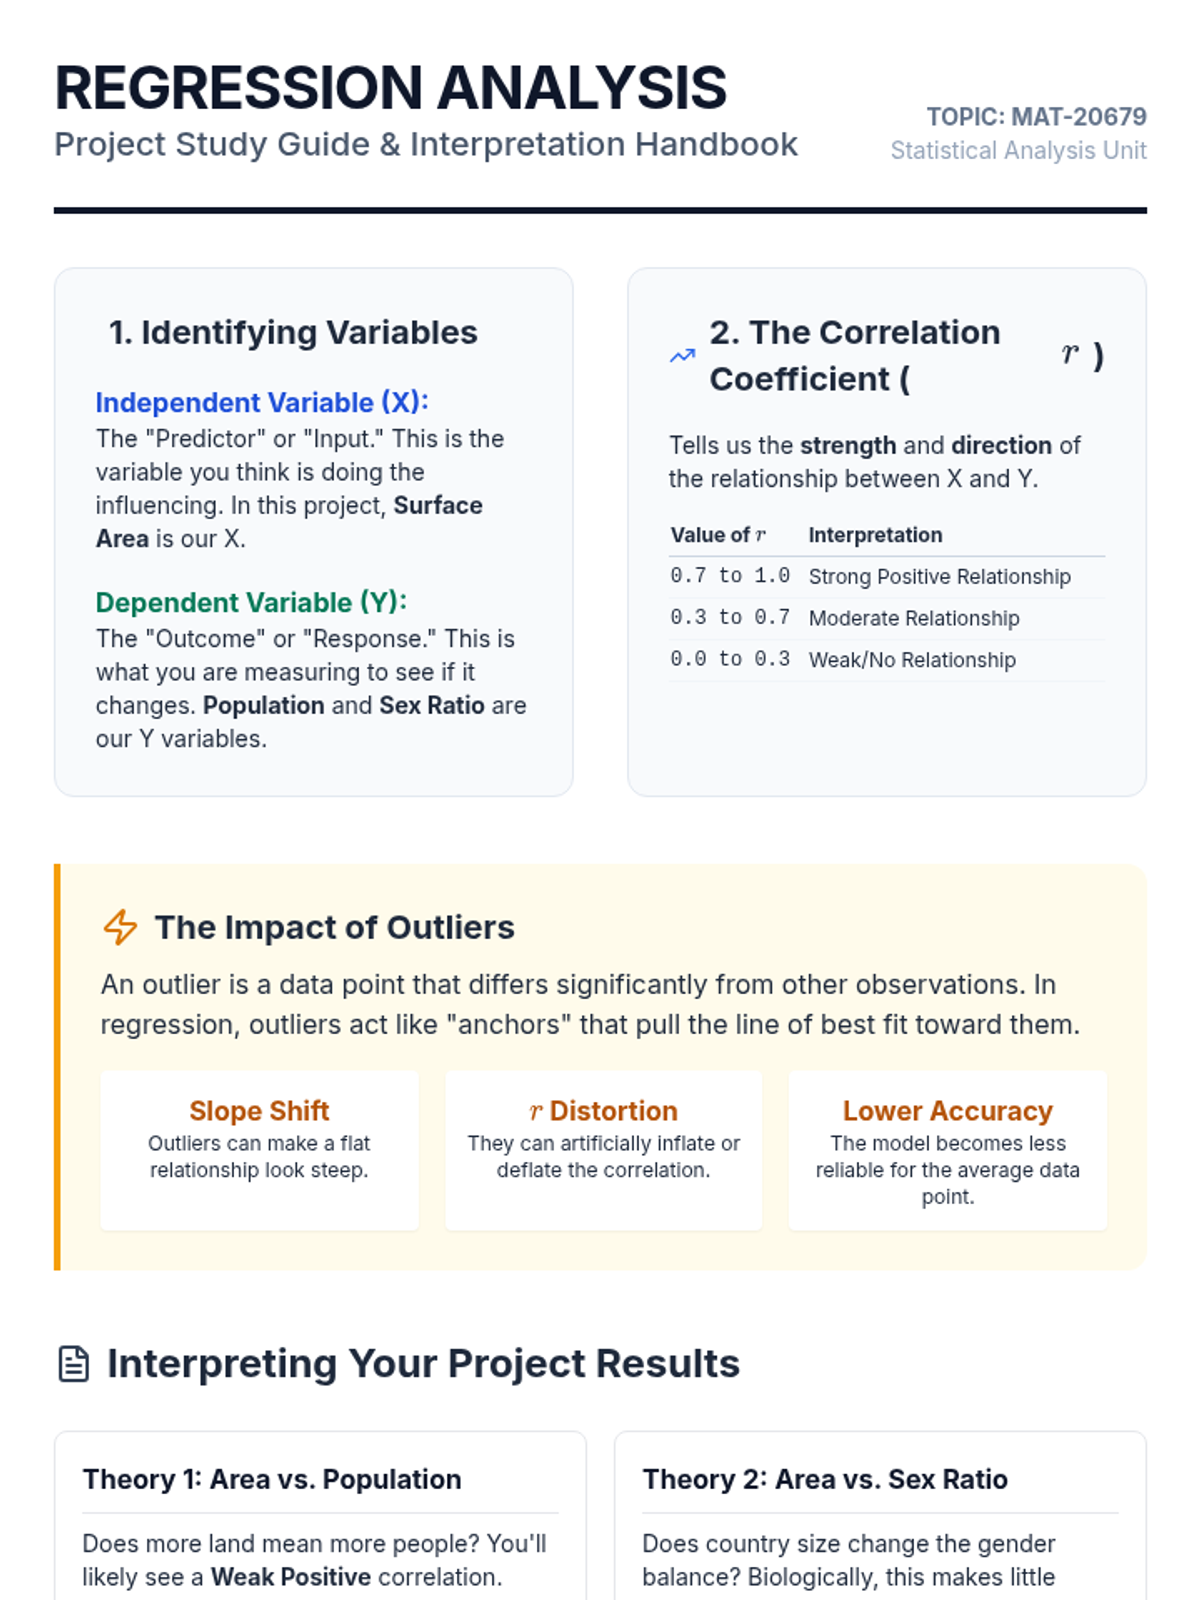
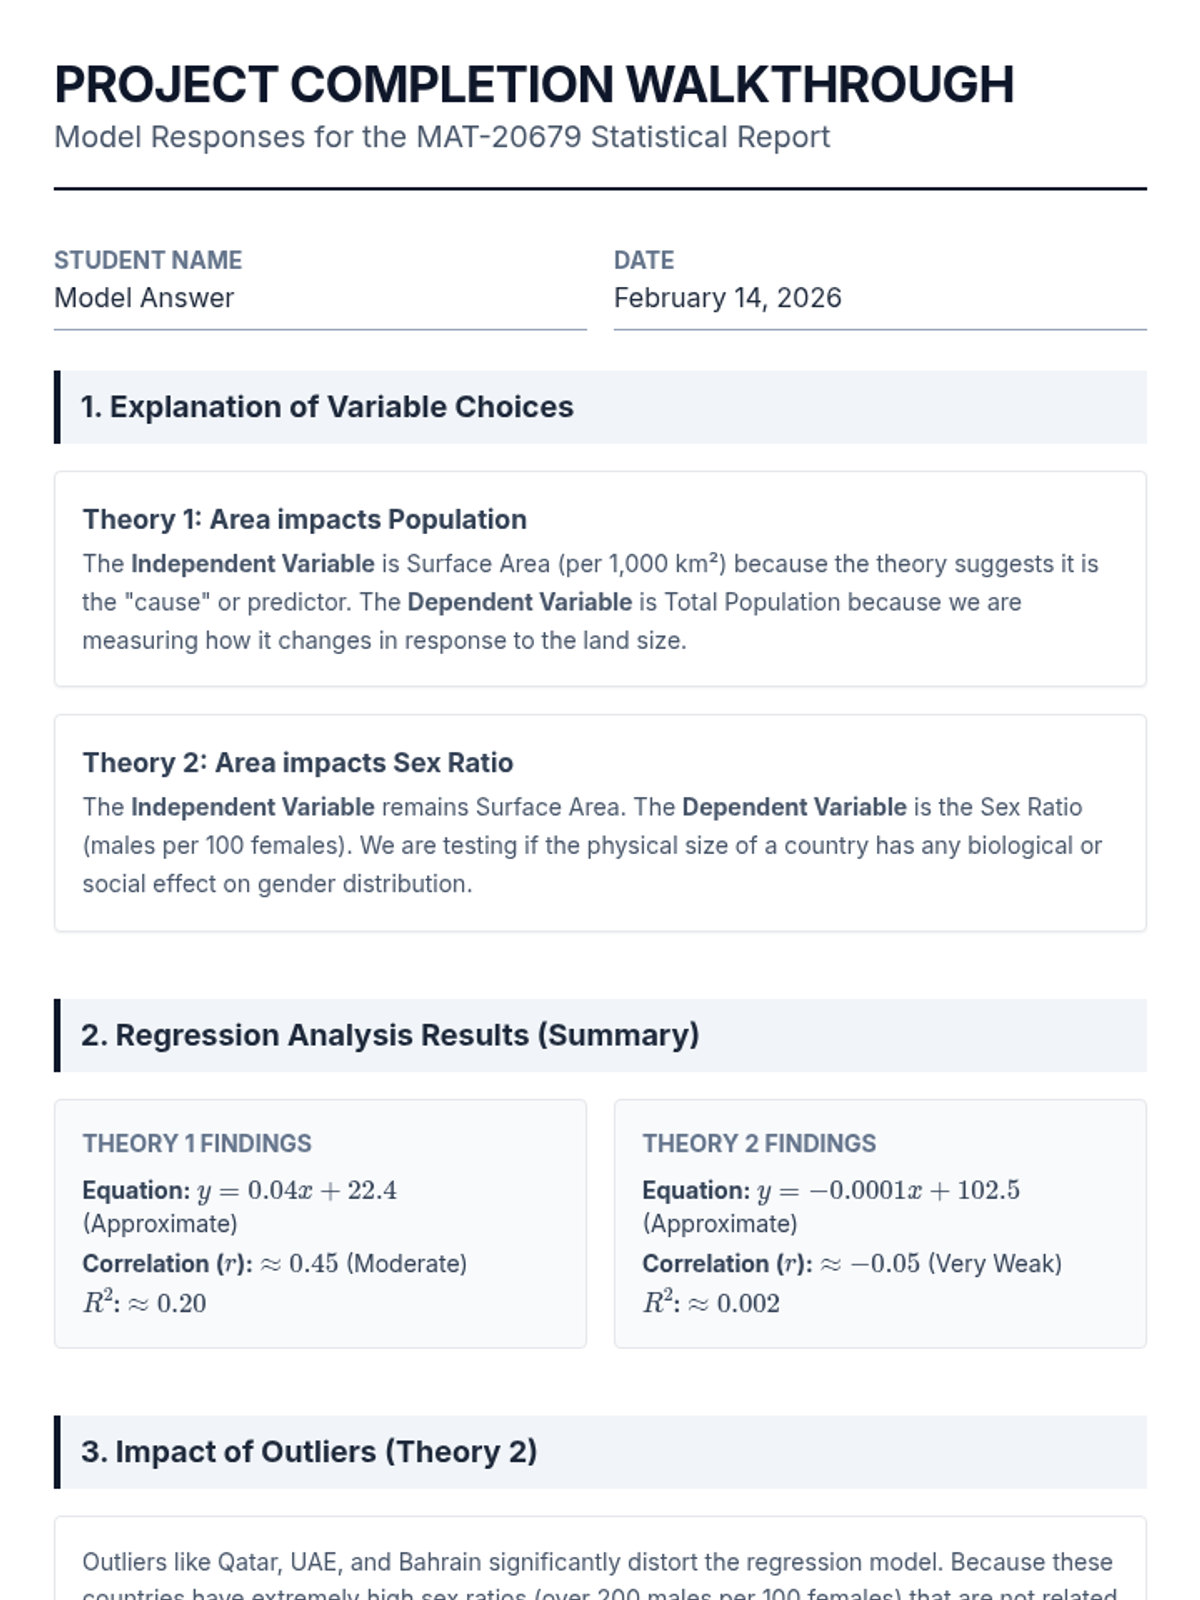
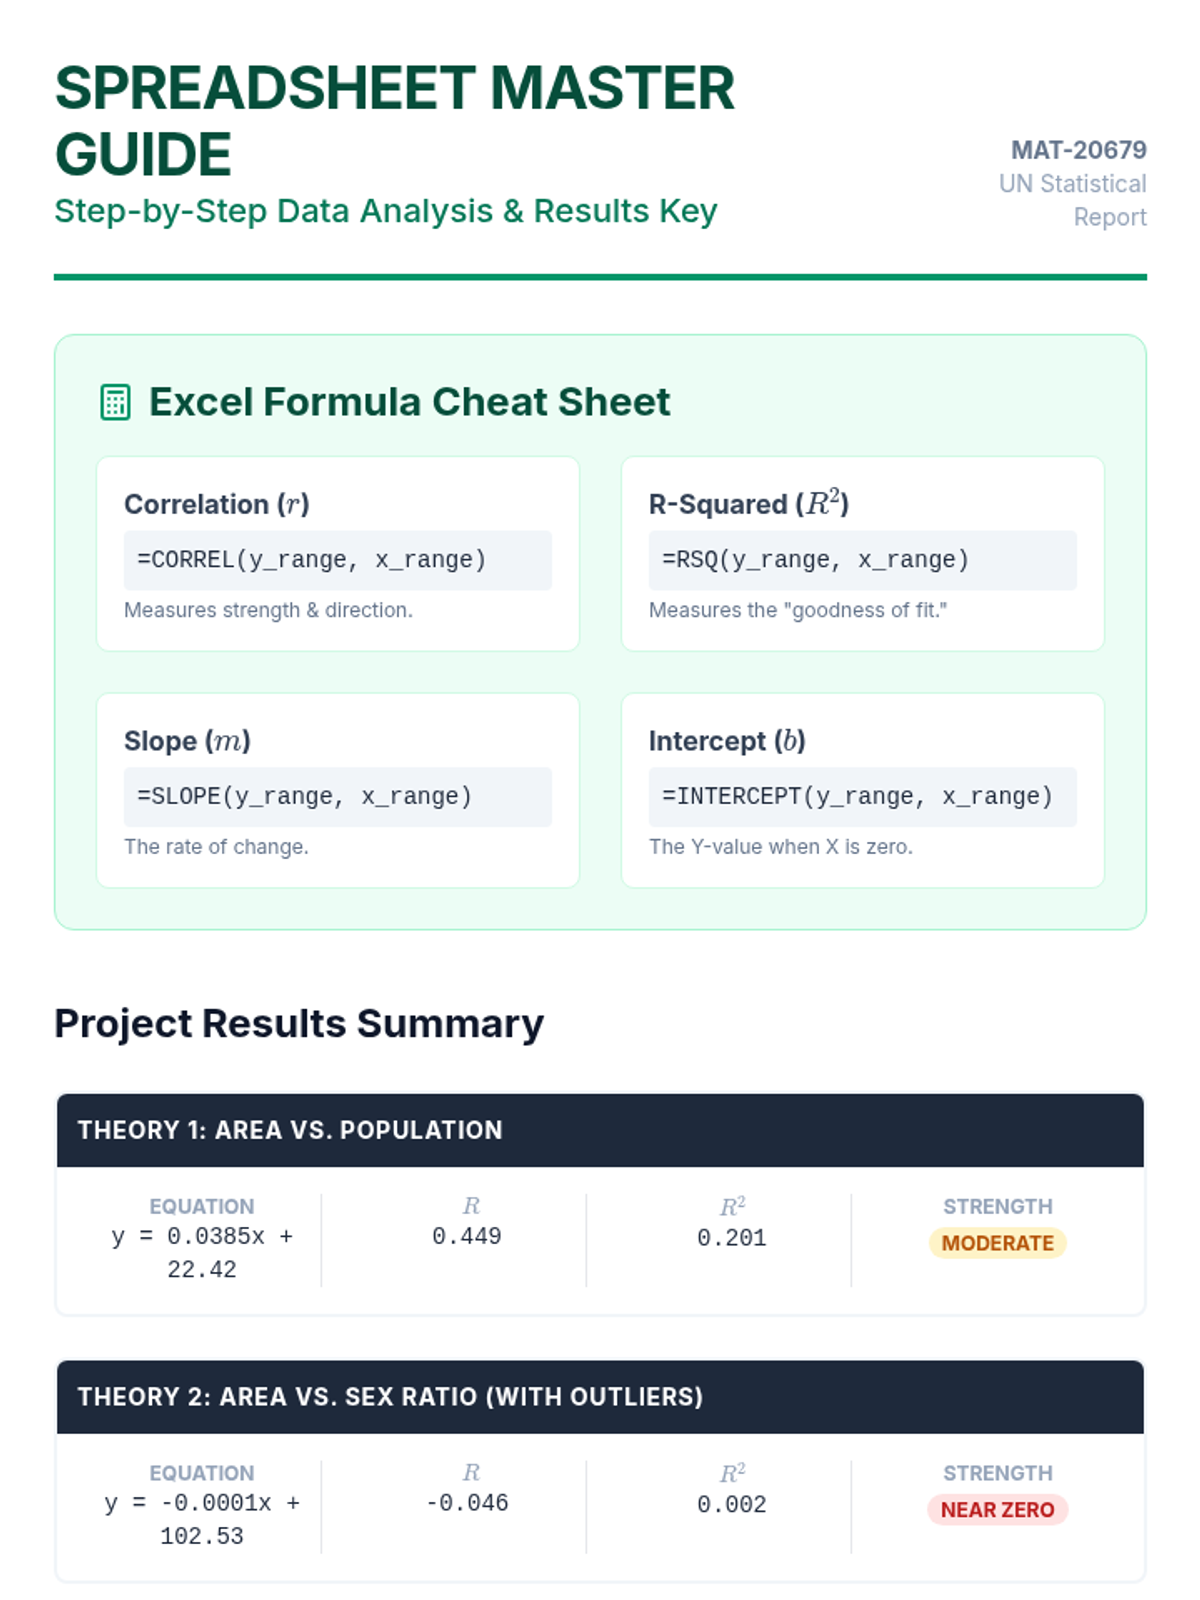
A project-based lesson on performing linear regression analysis using United Nations population and surface area data to test socio-economic theories.
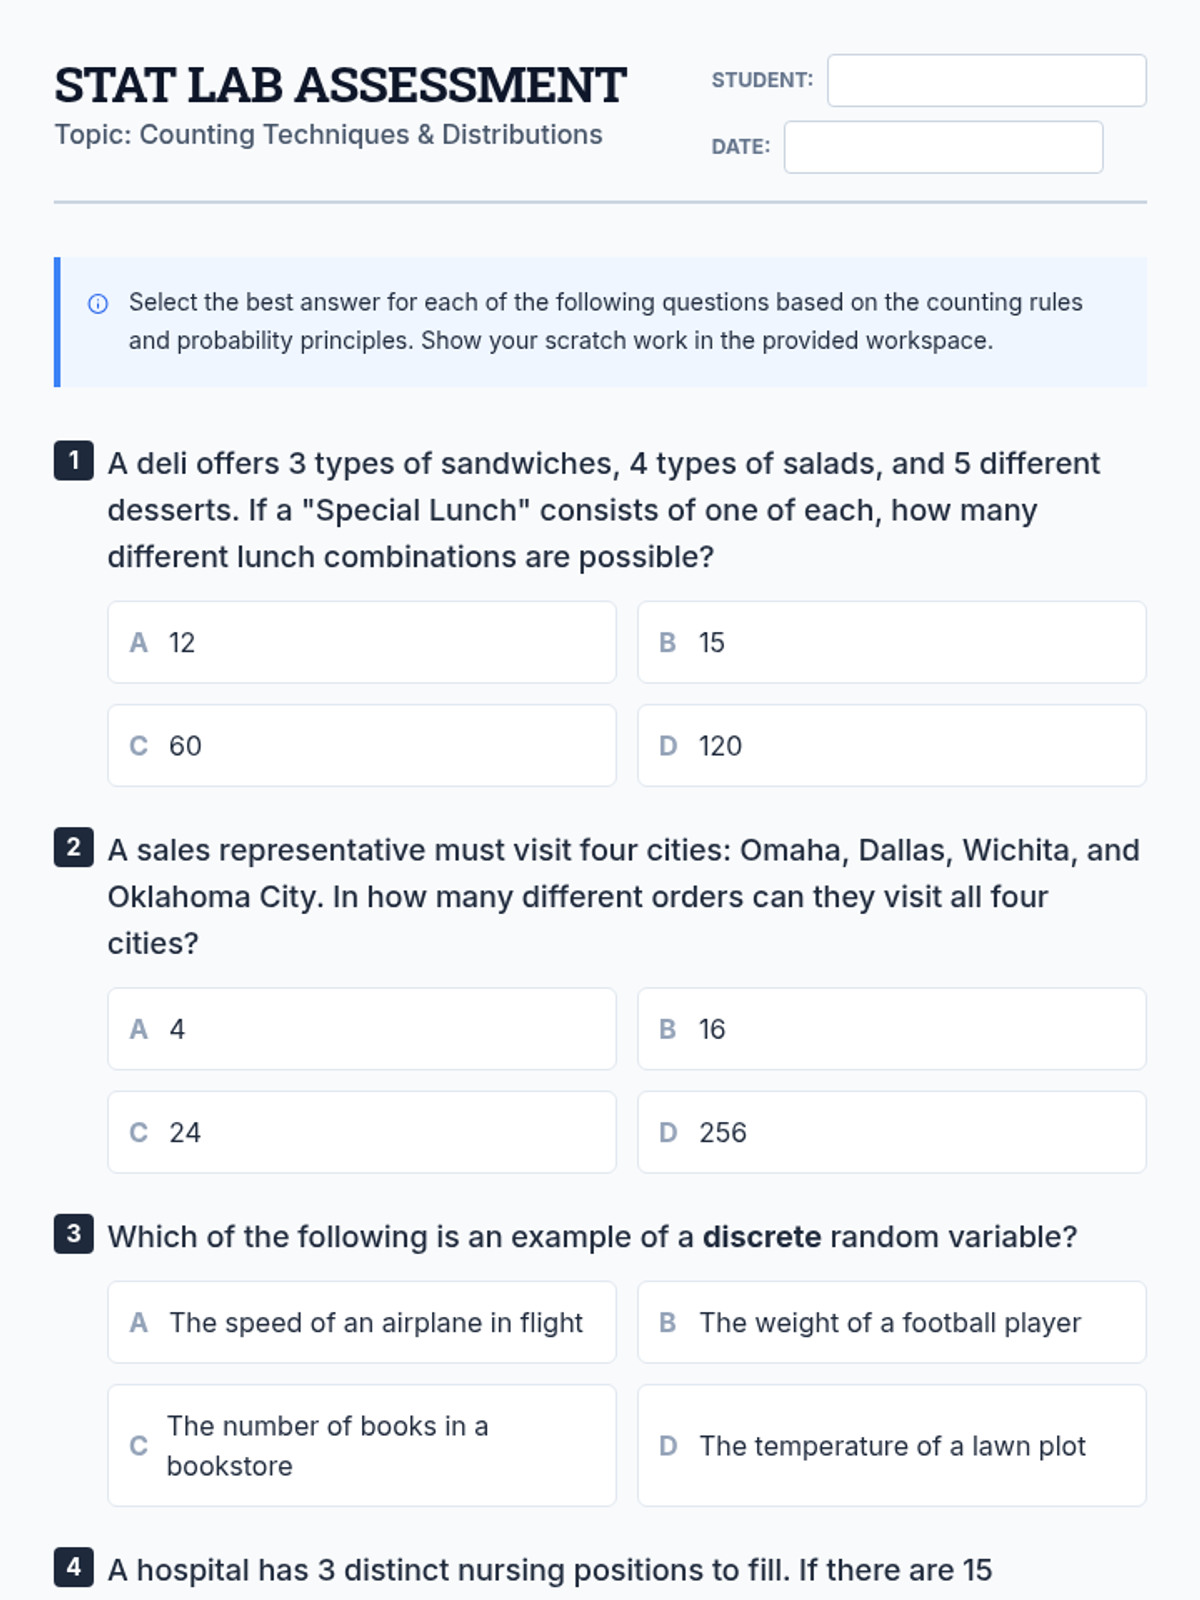
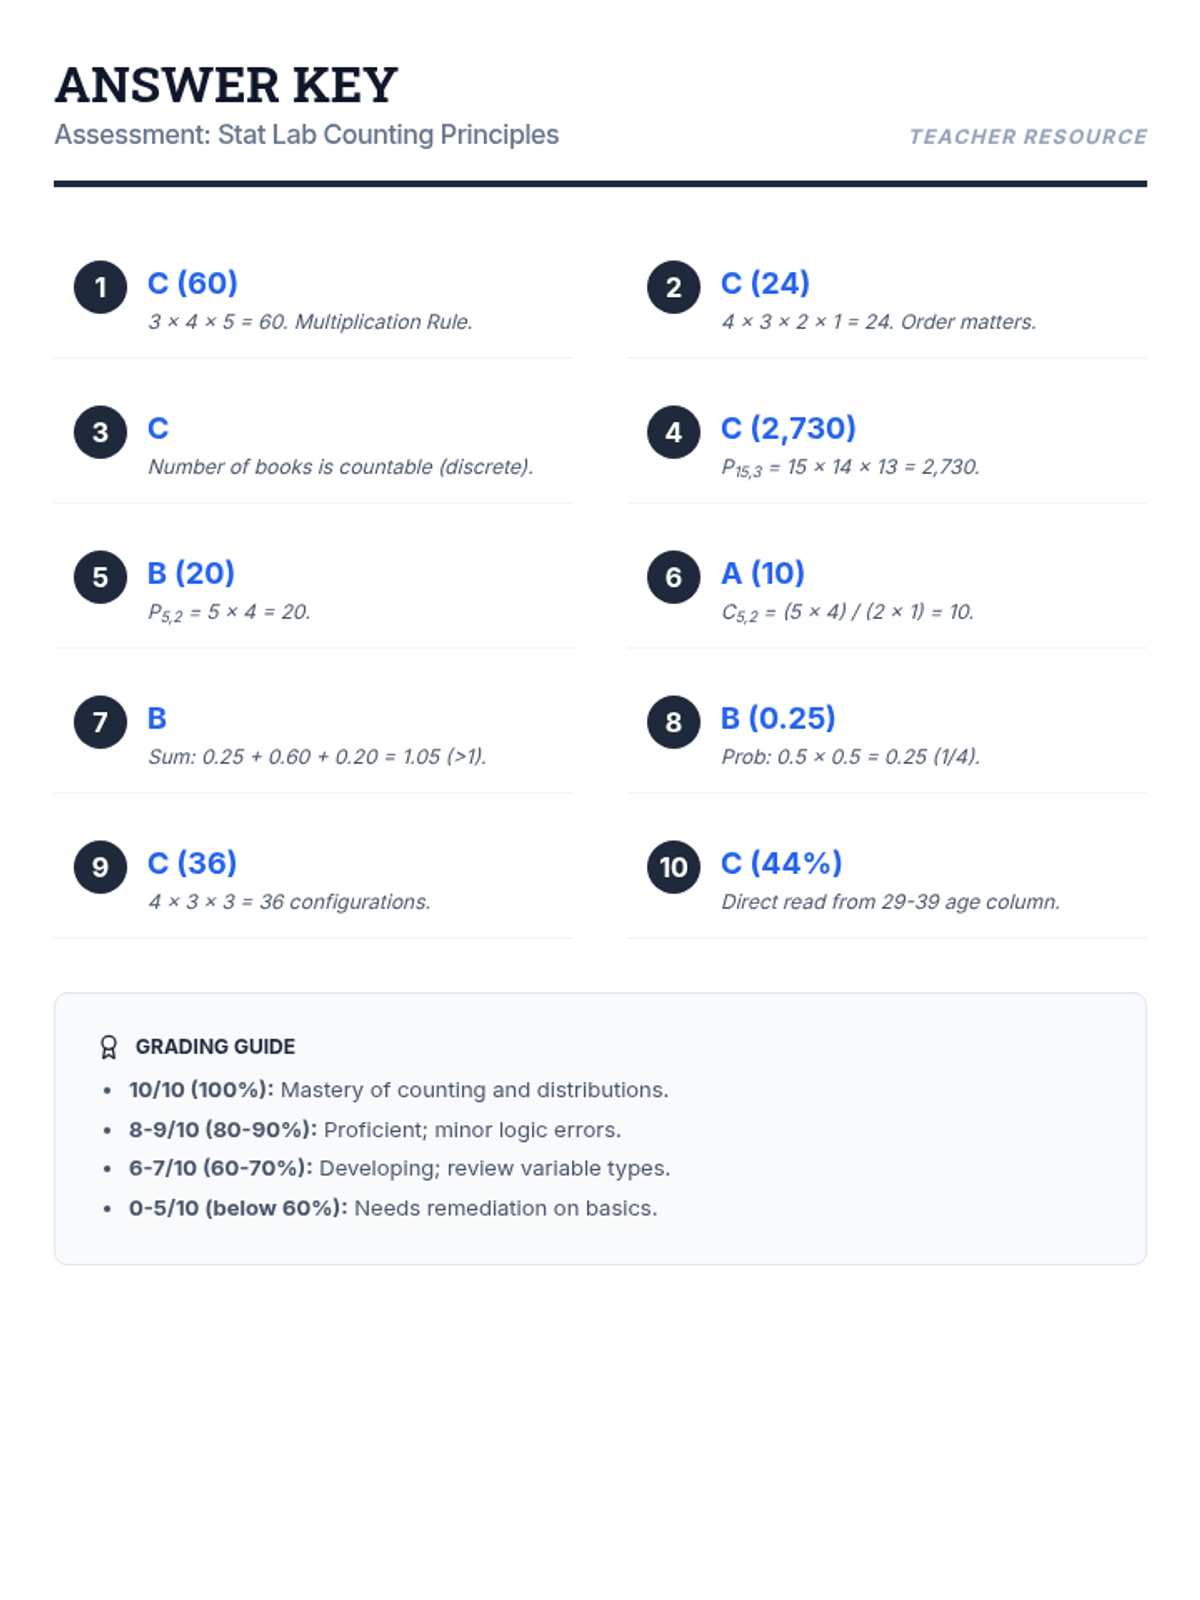
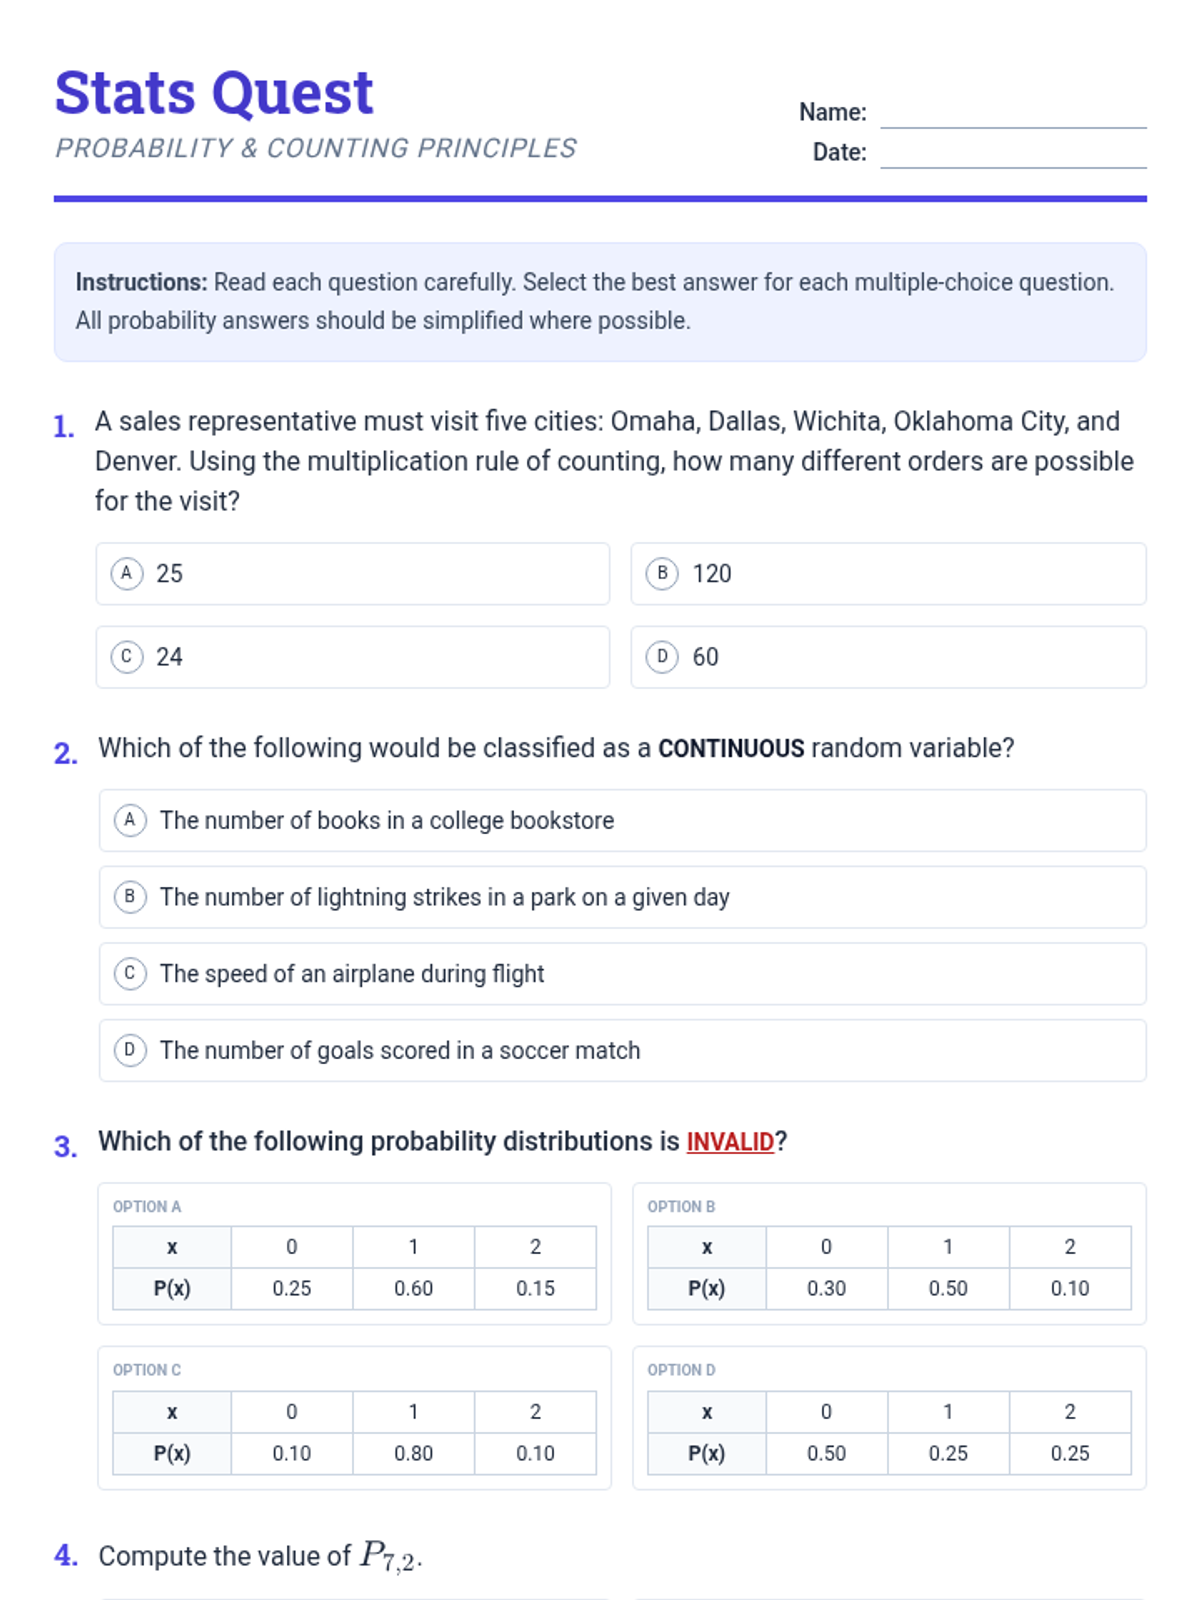
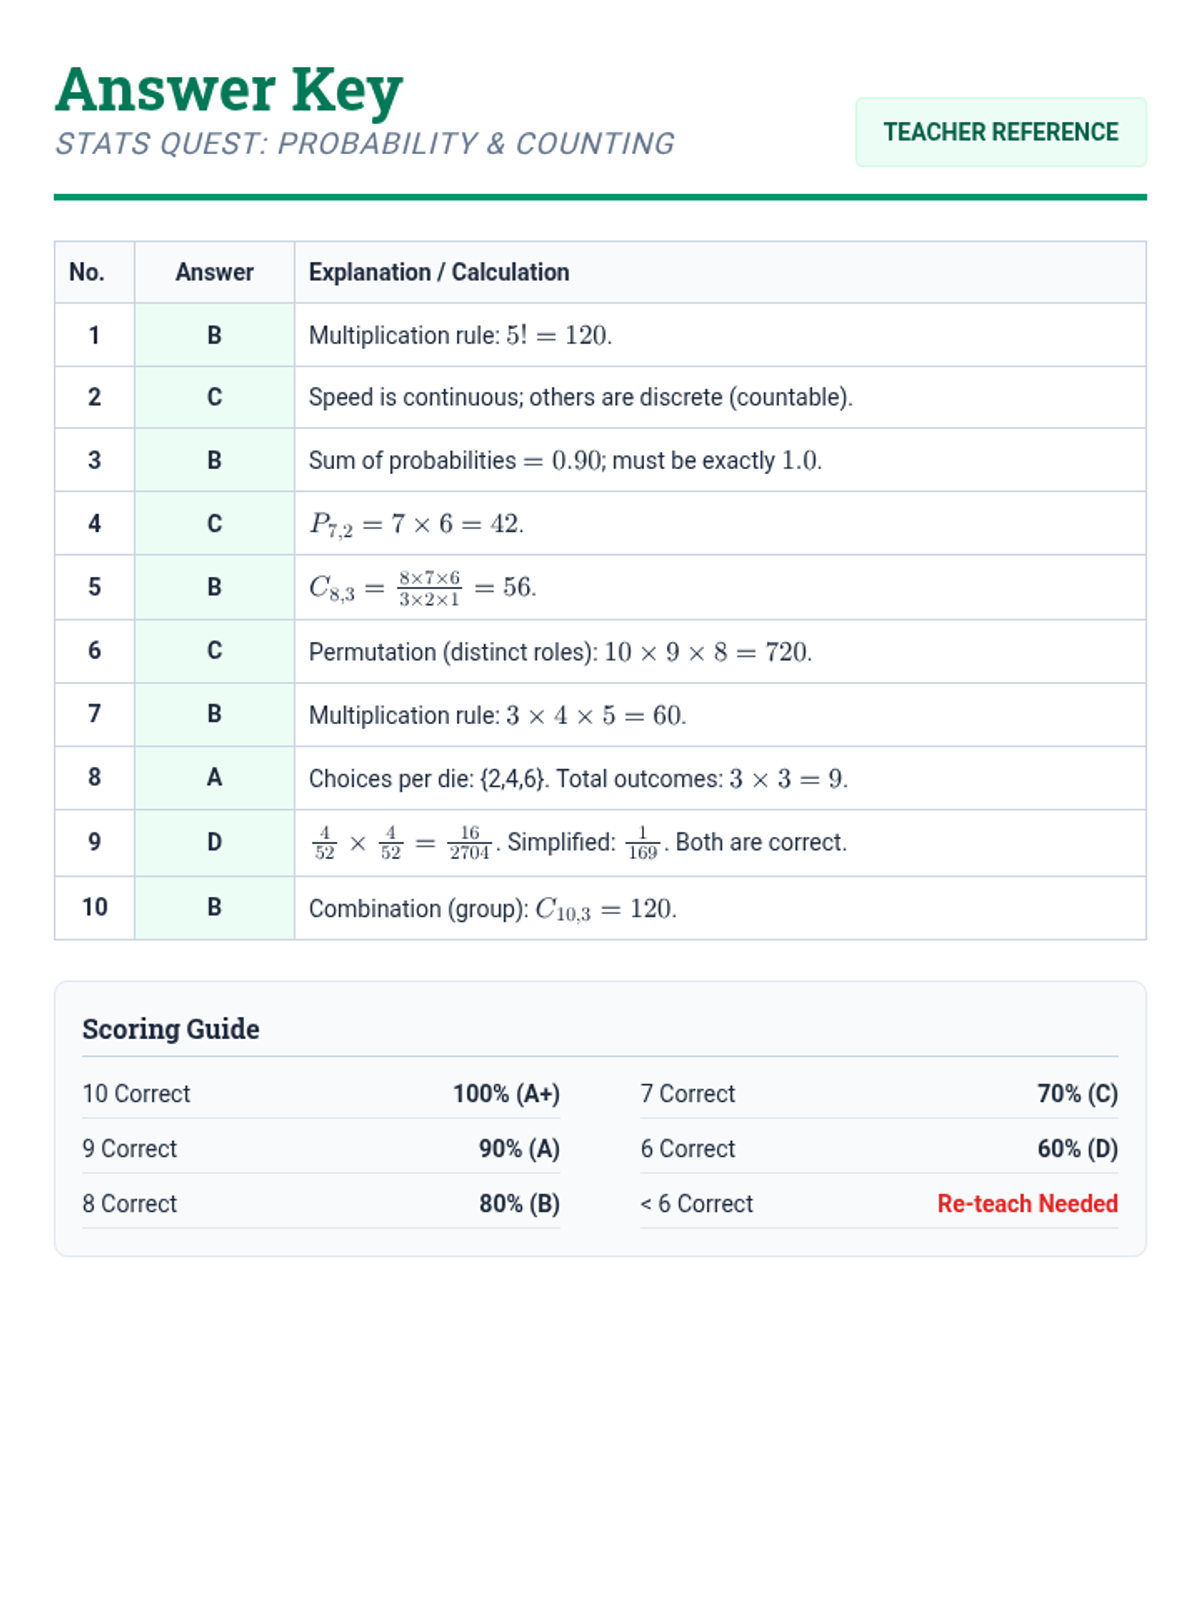
A comprehensive lesson covering counting techniques, permutations, combinations, and basic probability distributions based on statistical principles.
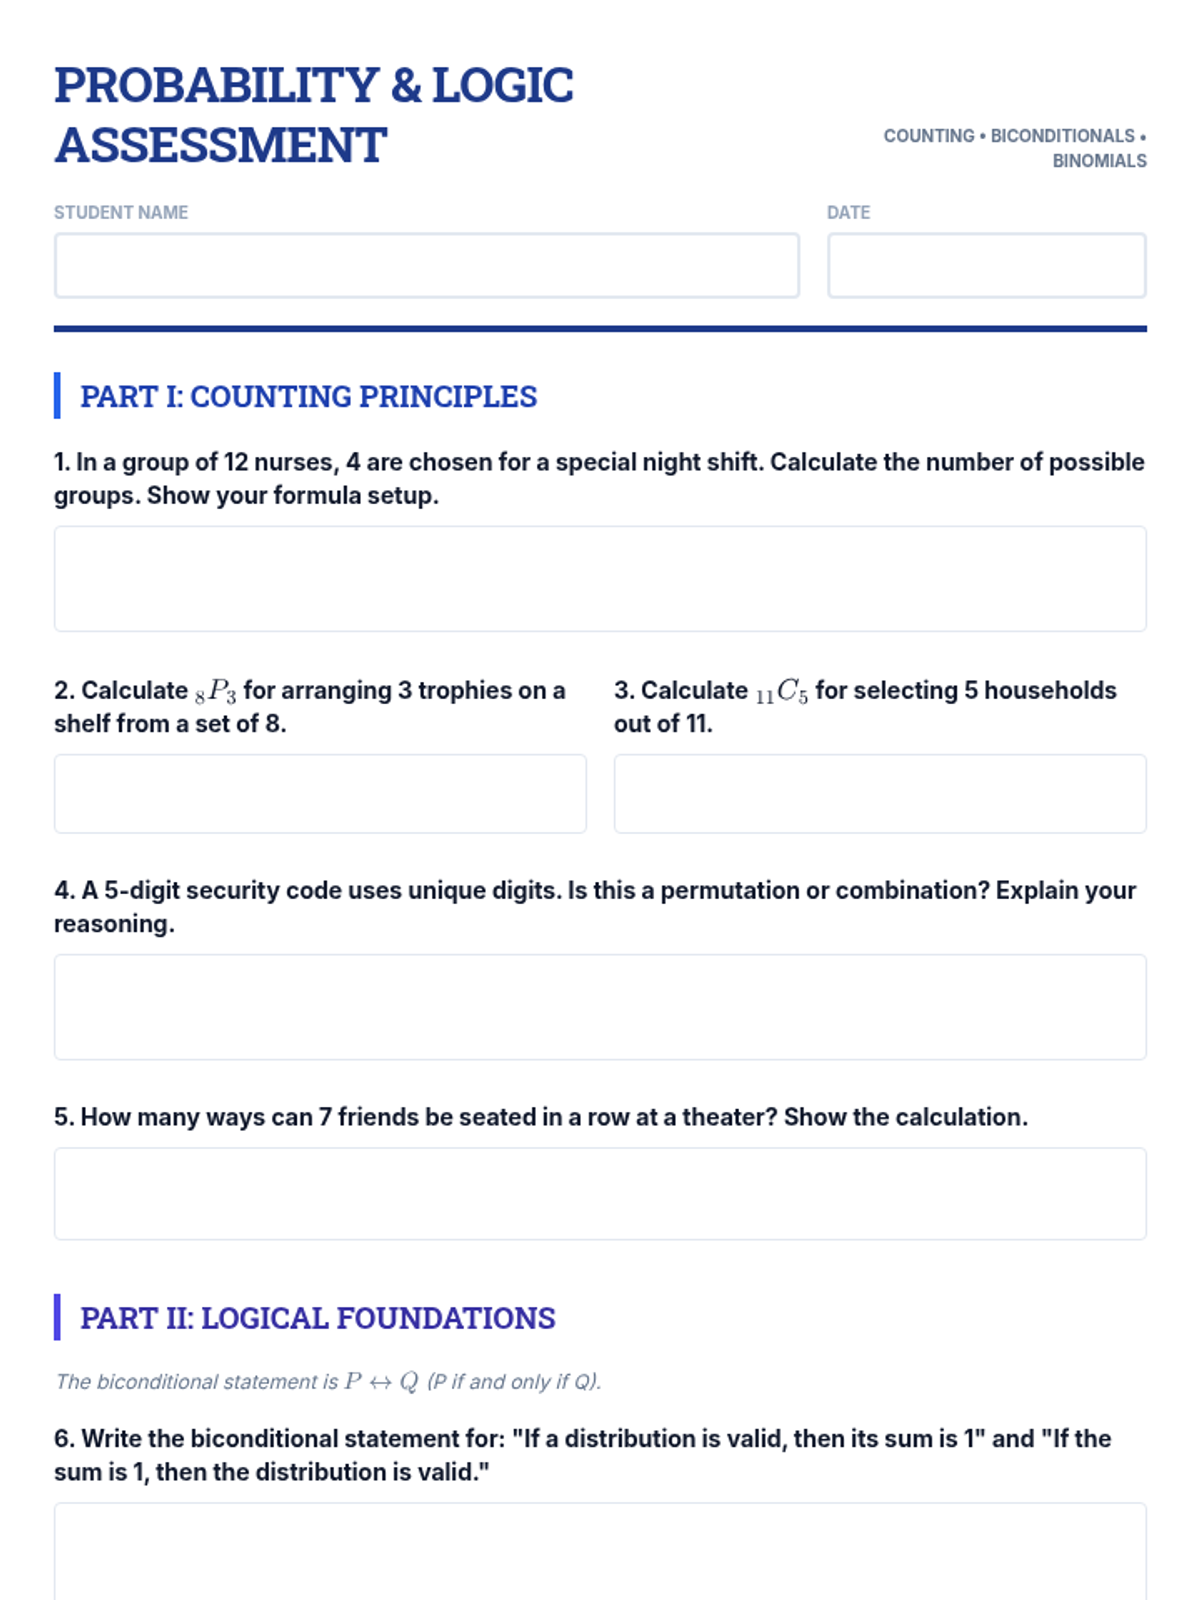
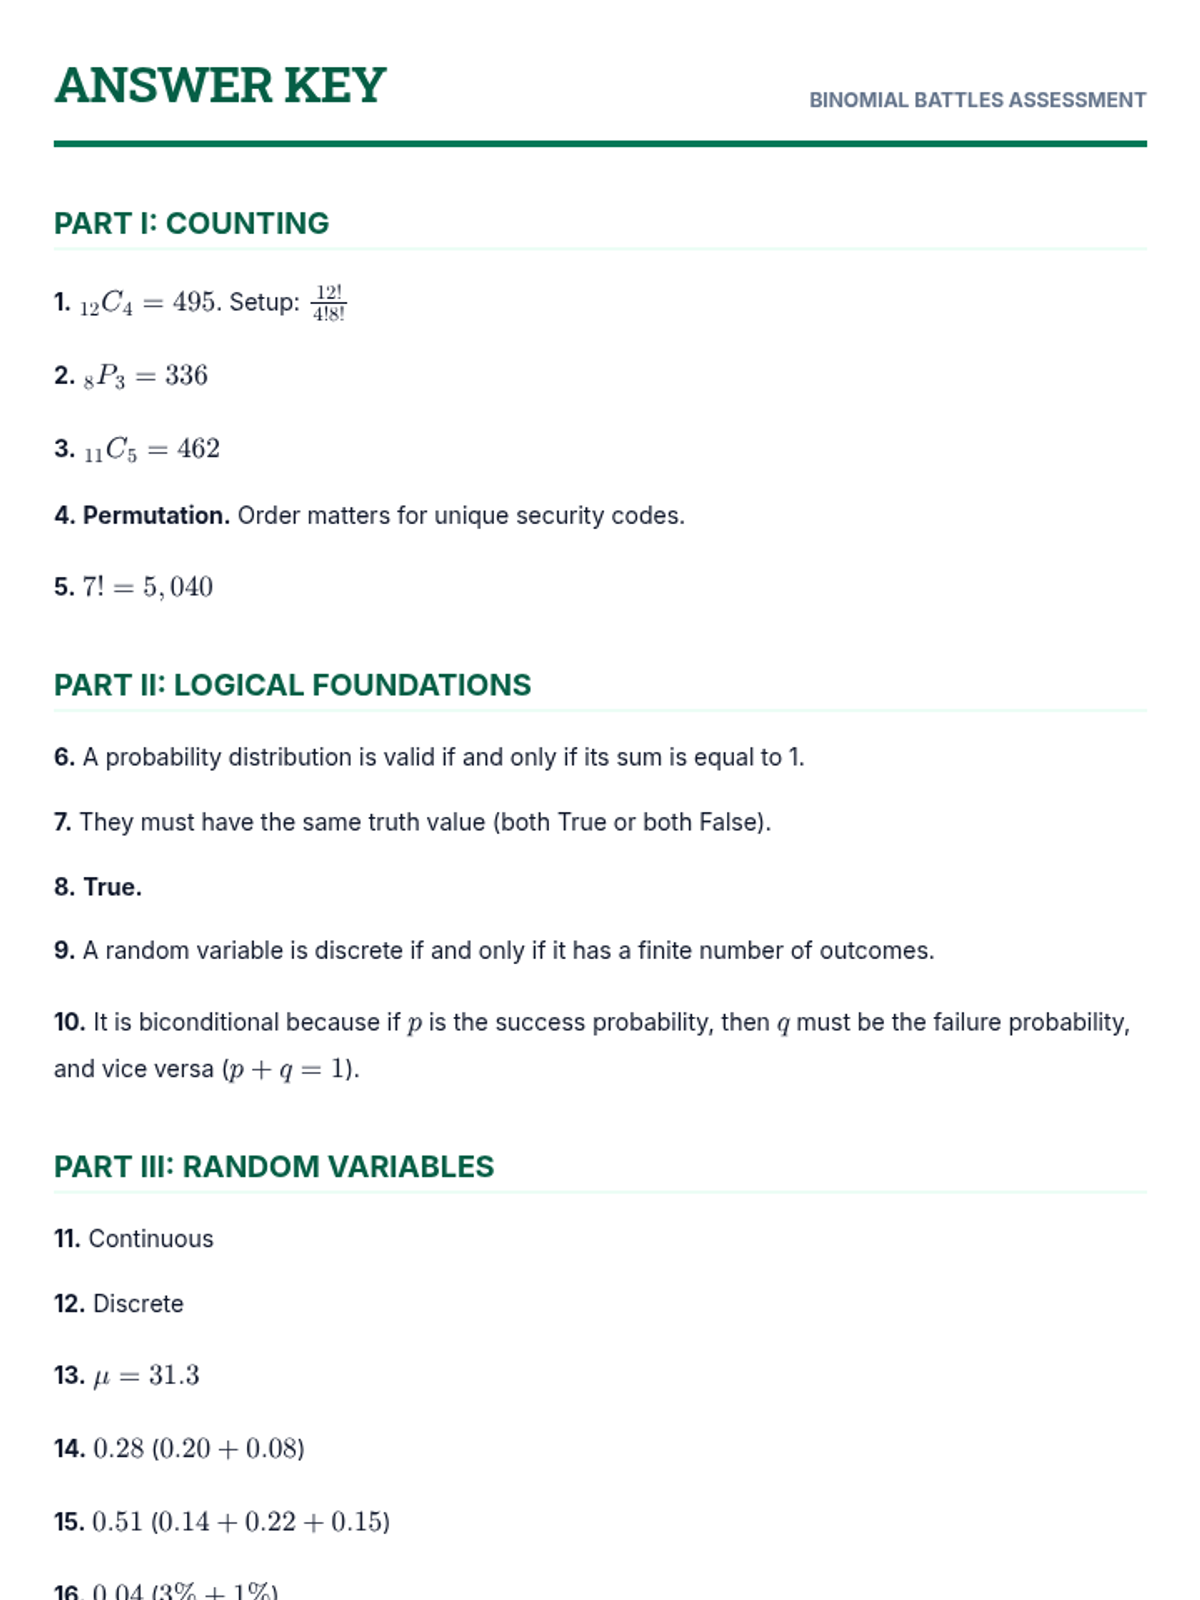
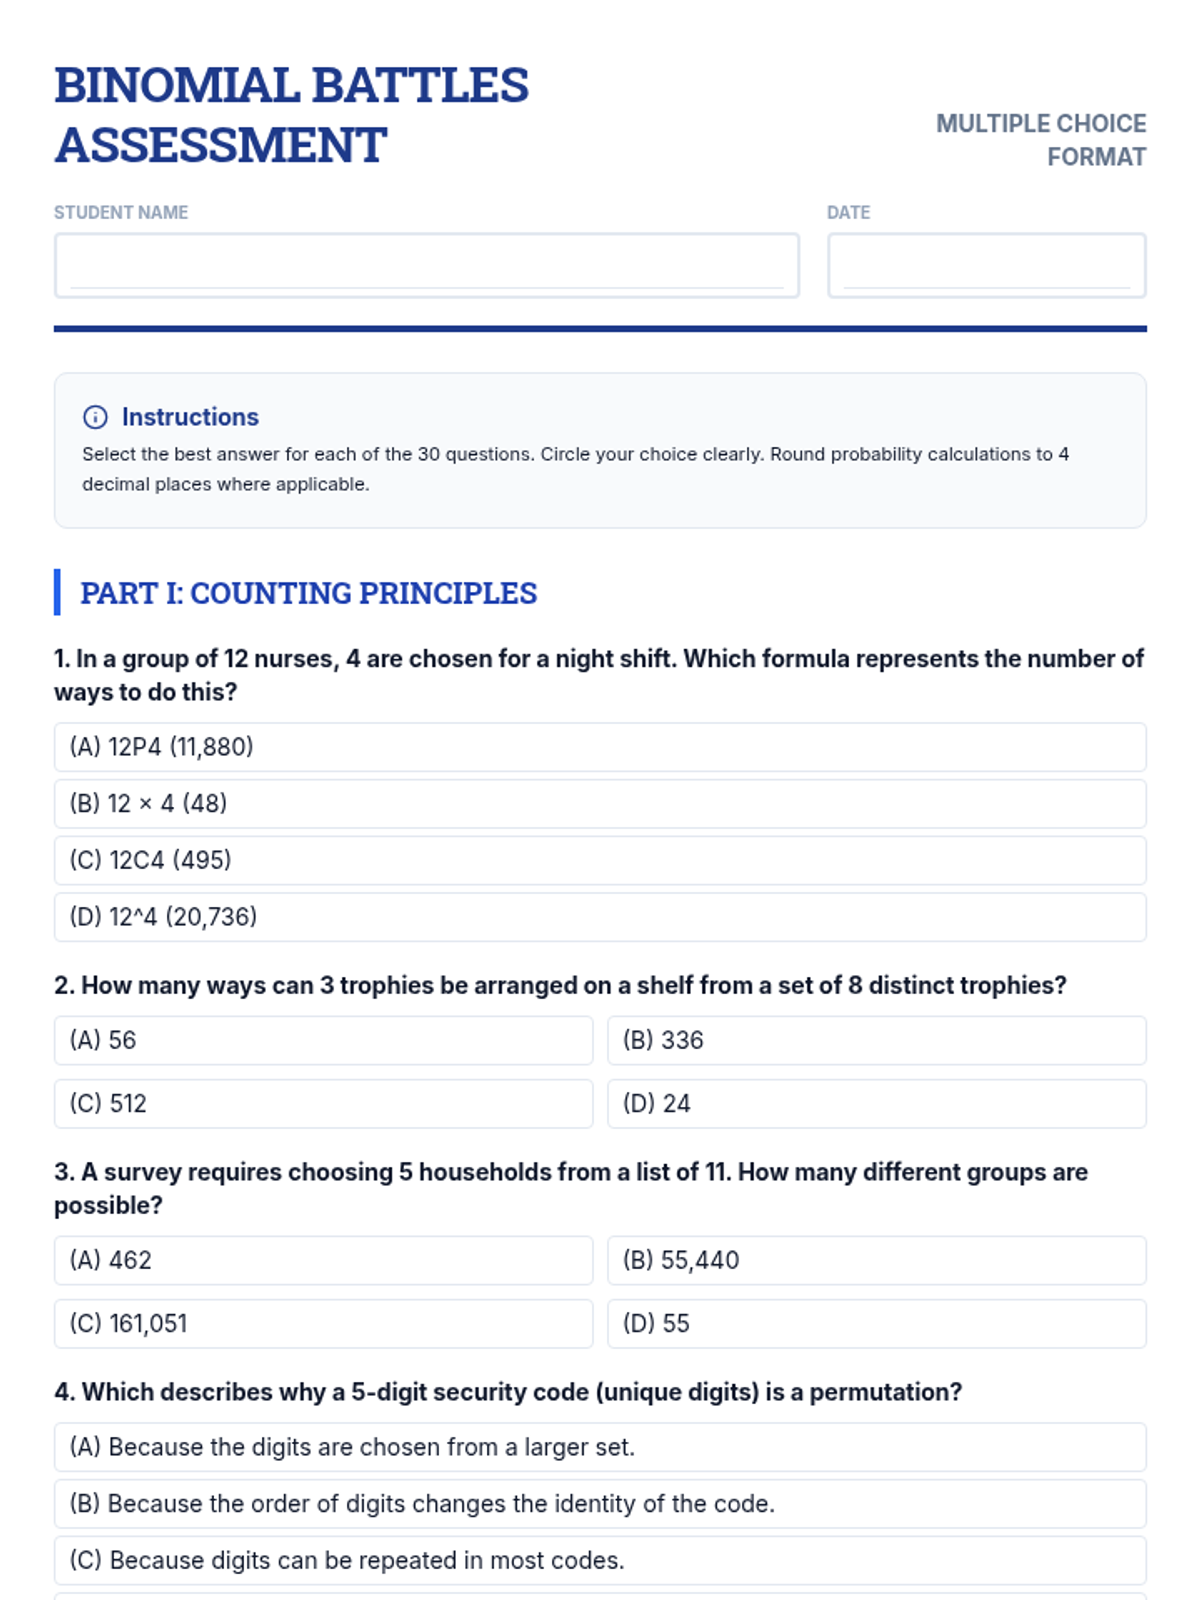
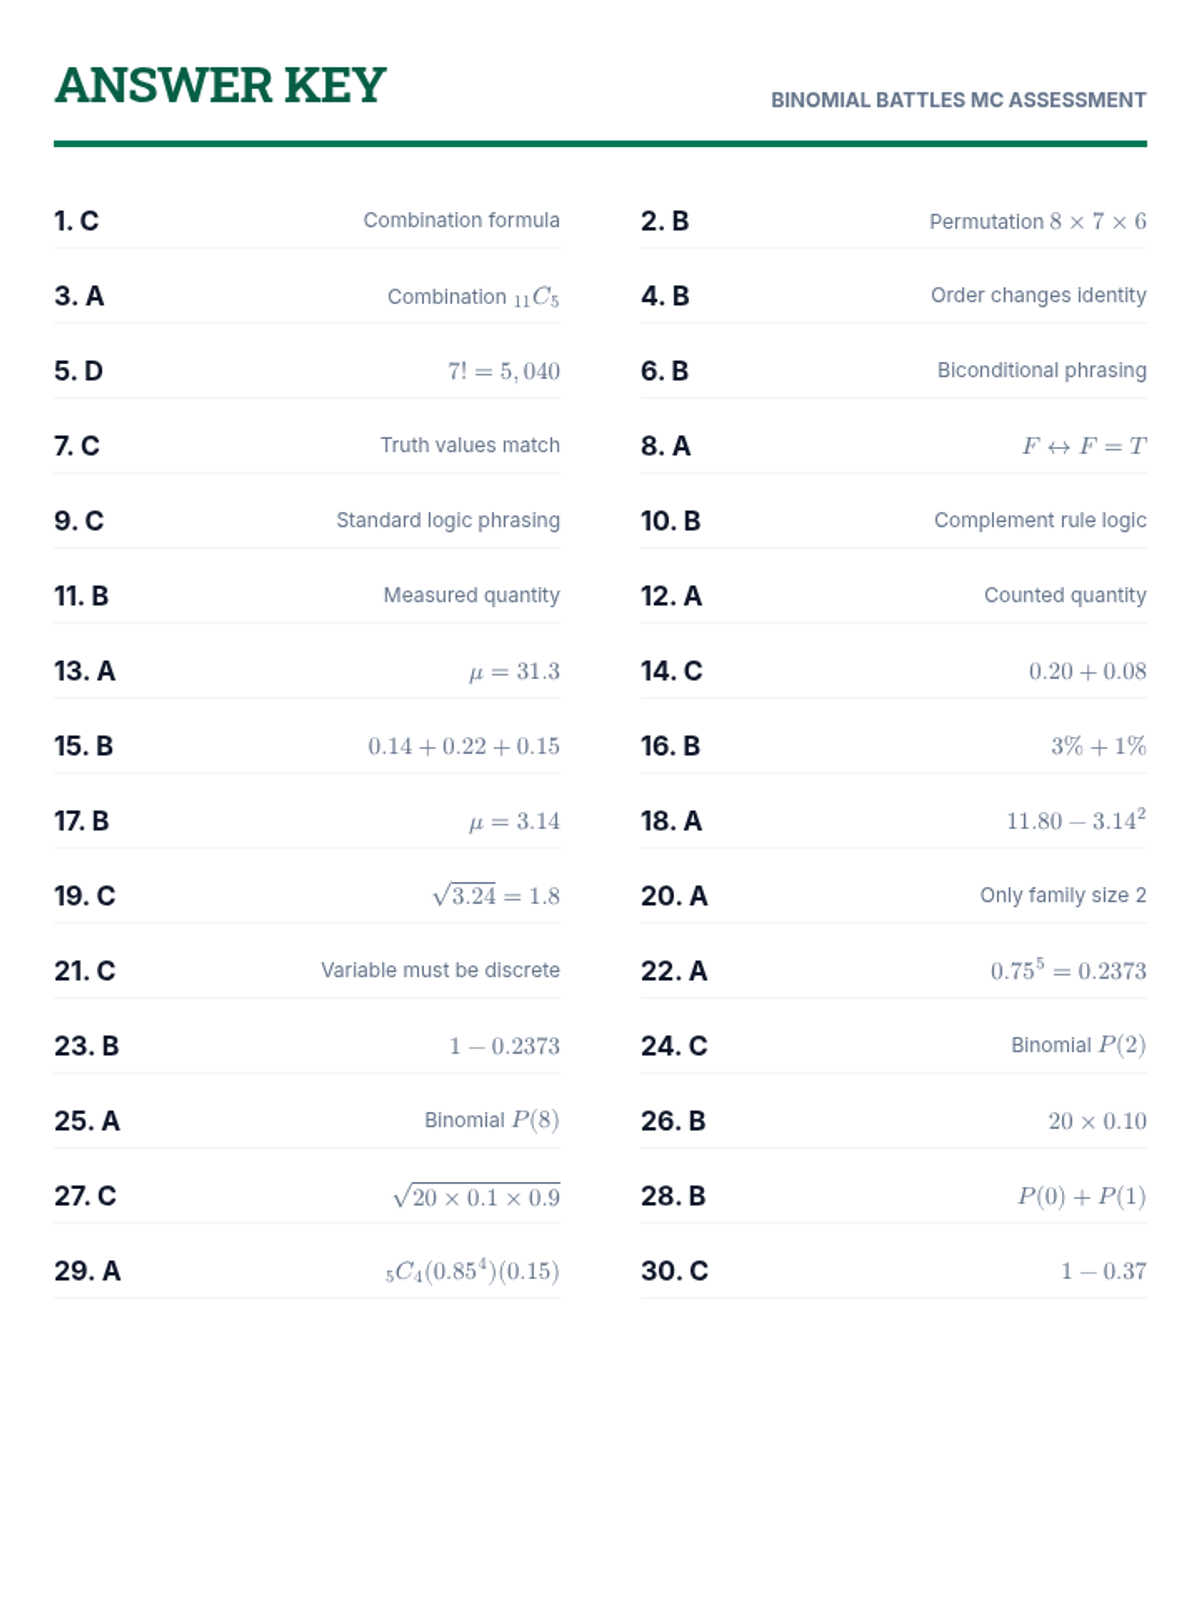
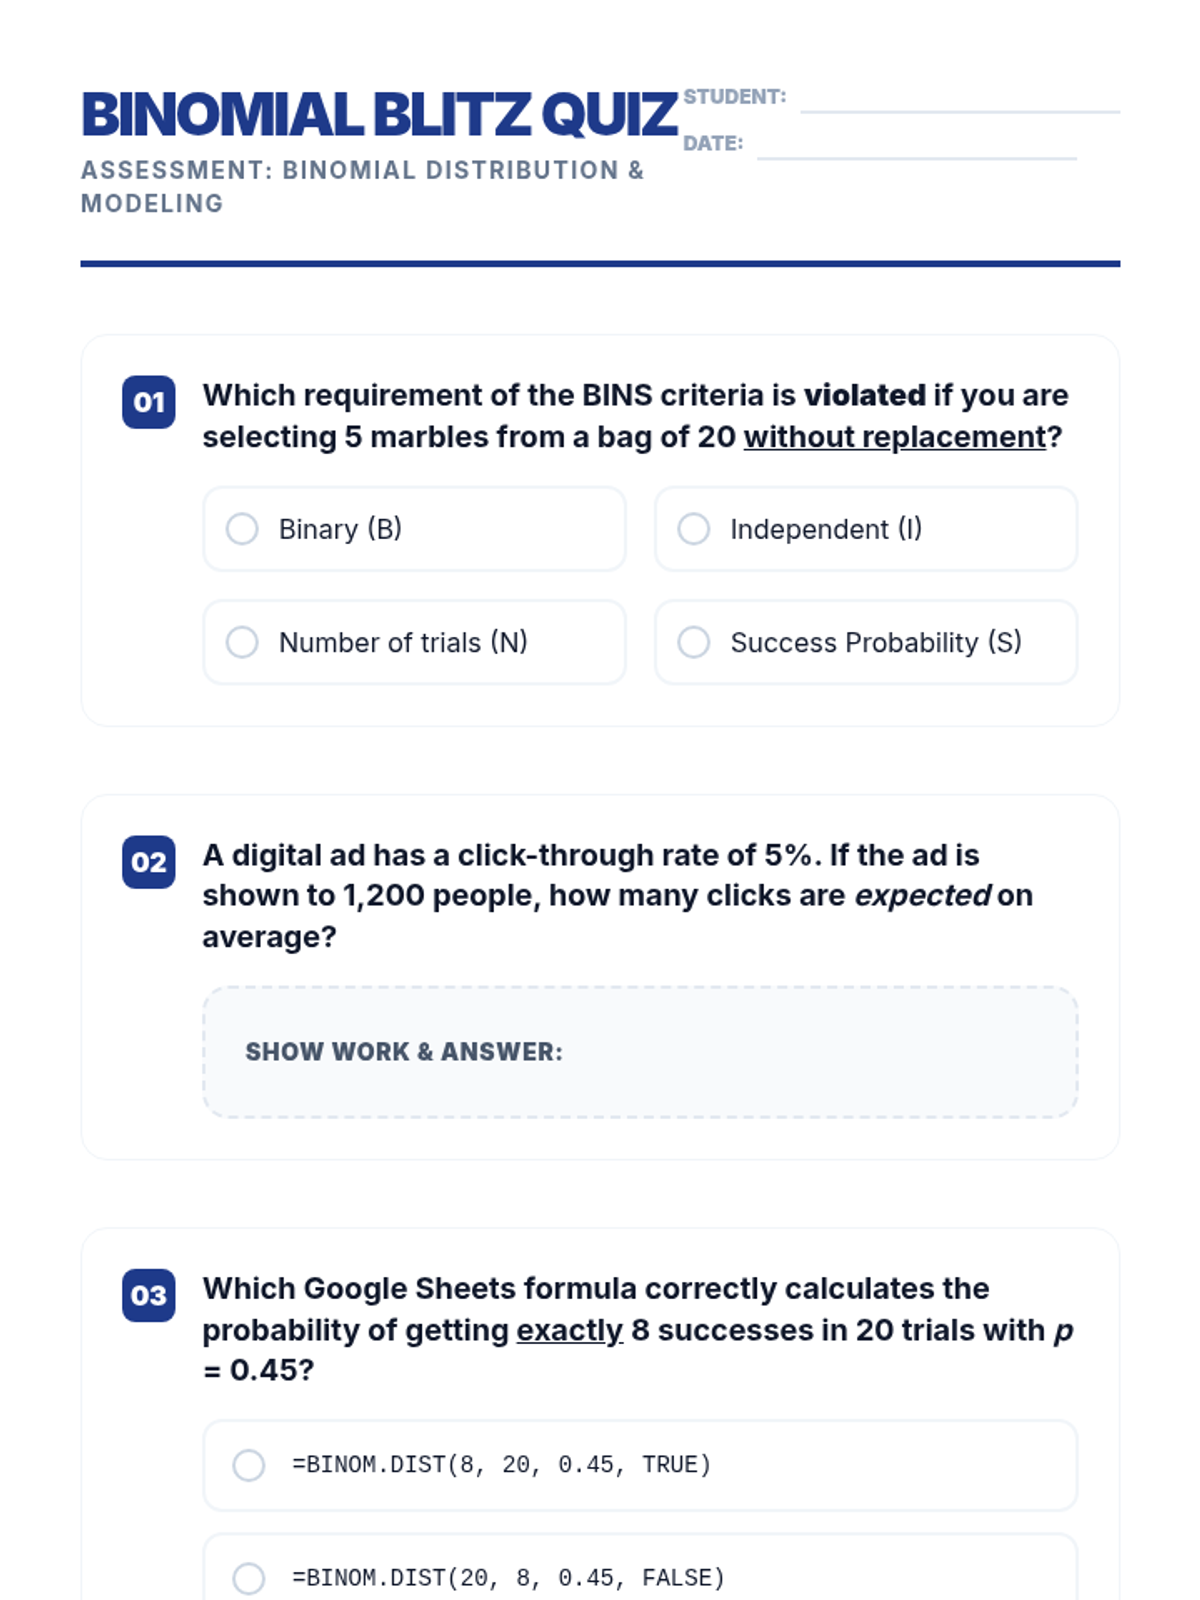
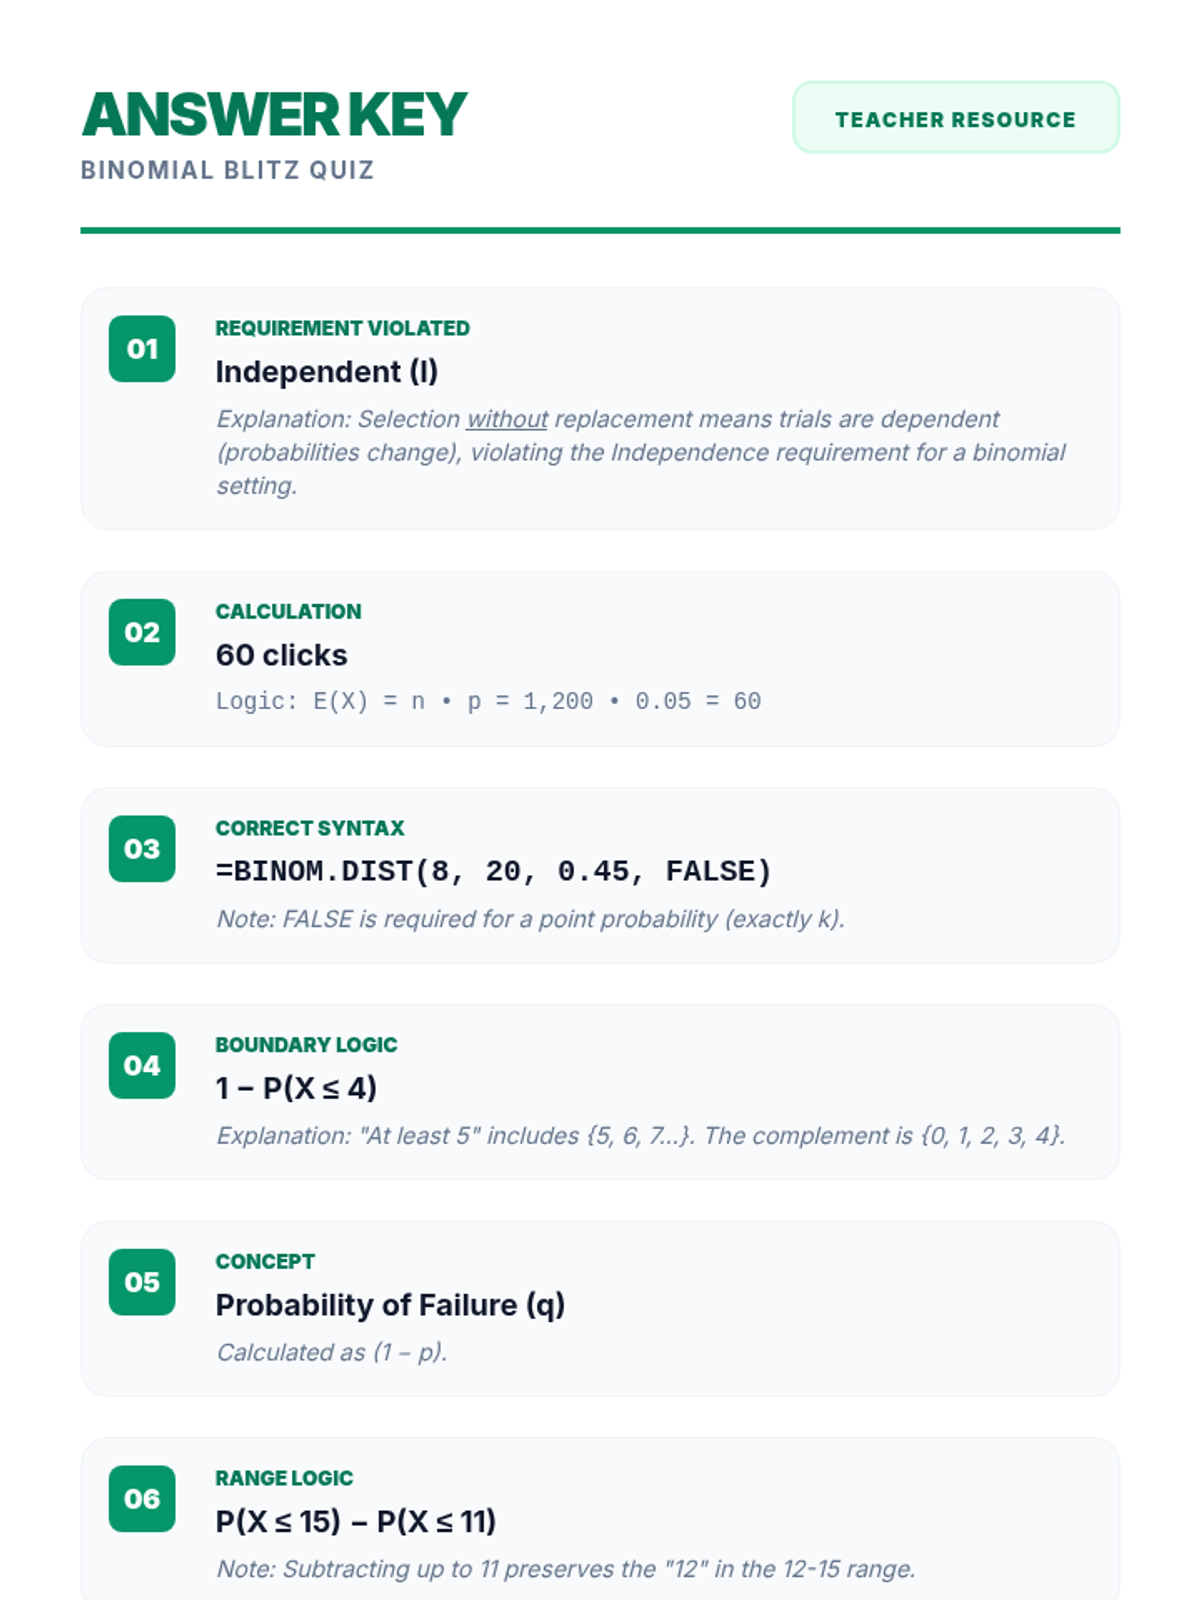
A comprehensive assessment covering discrete random variables, permutations, combinations, and the binomial probability distribution based on real-world statistical data.
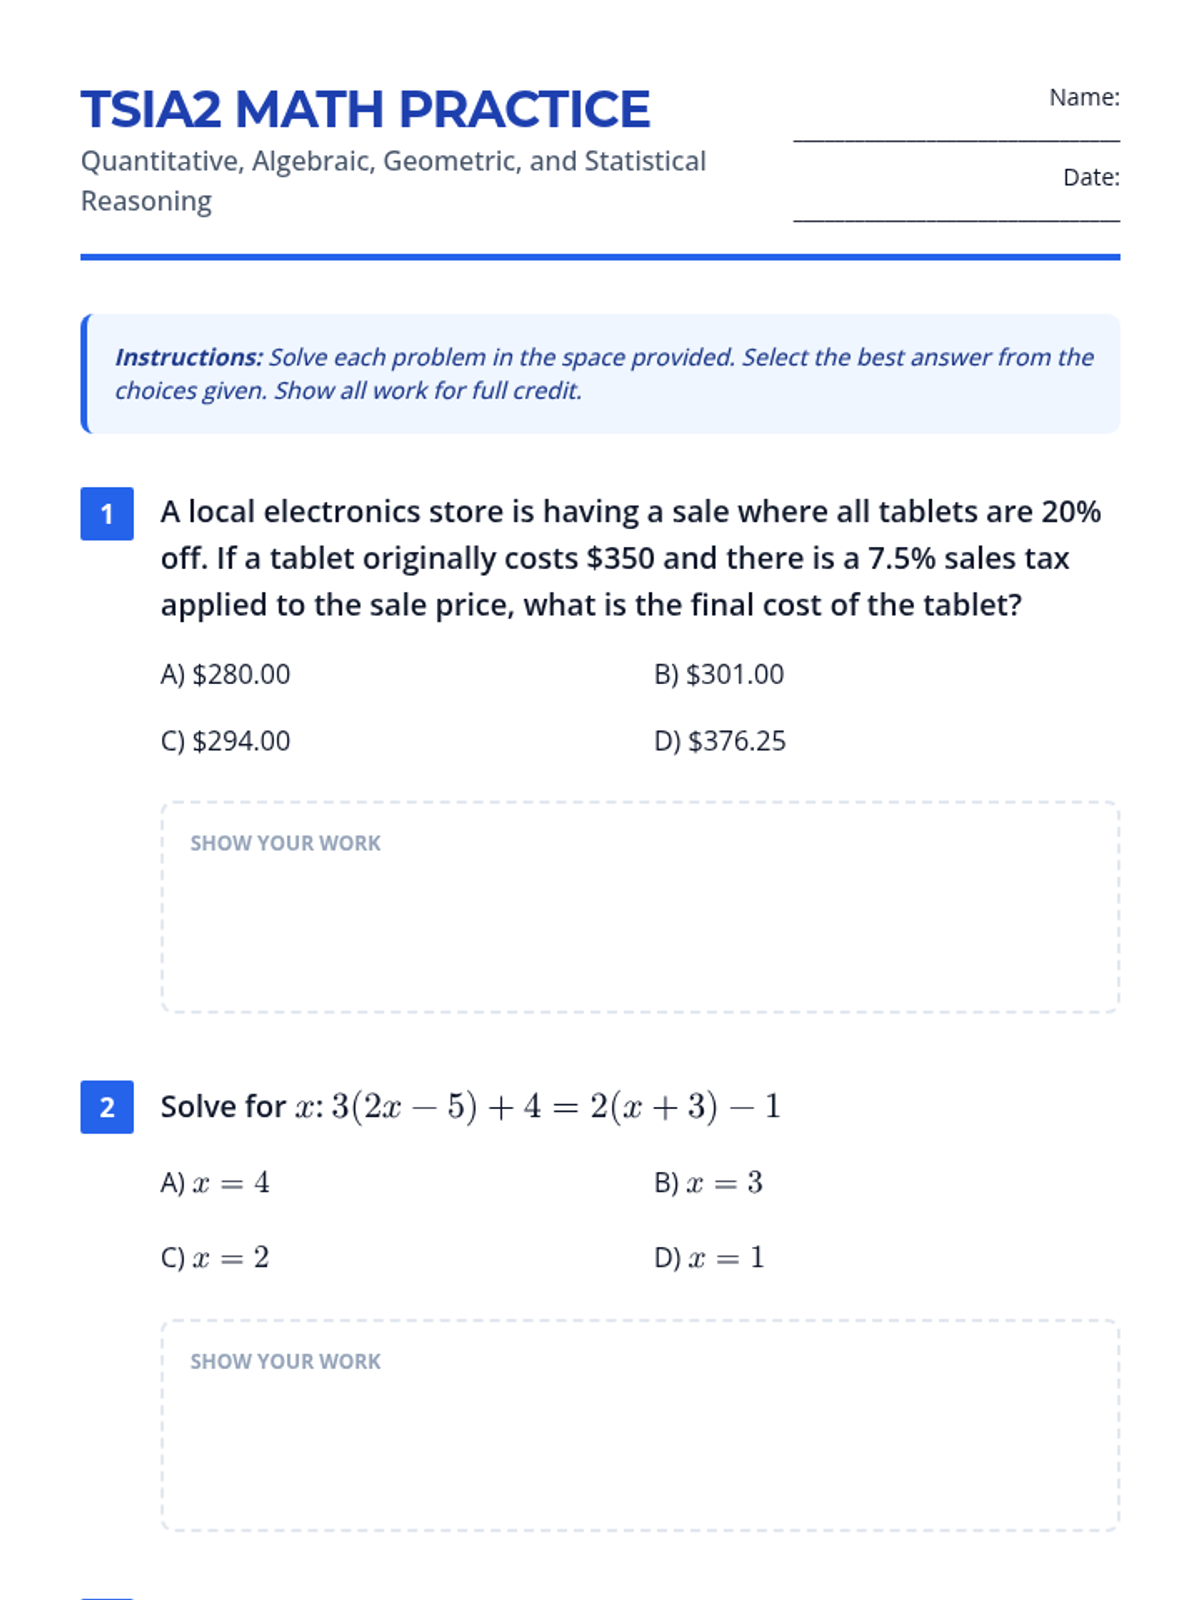
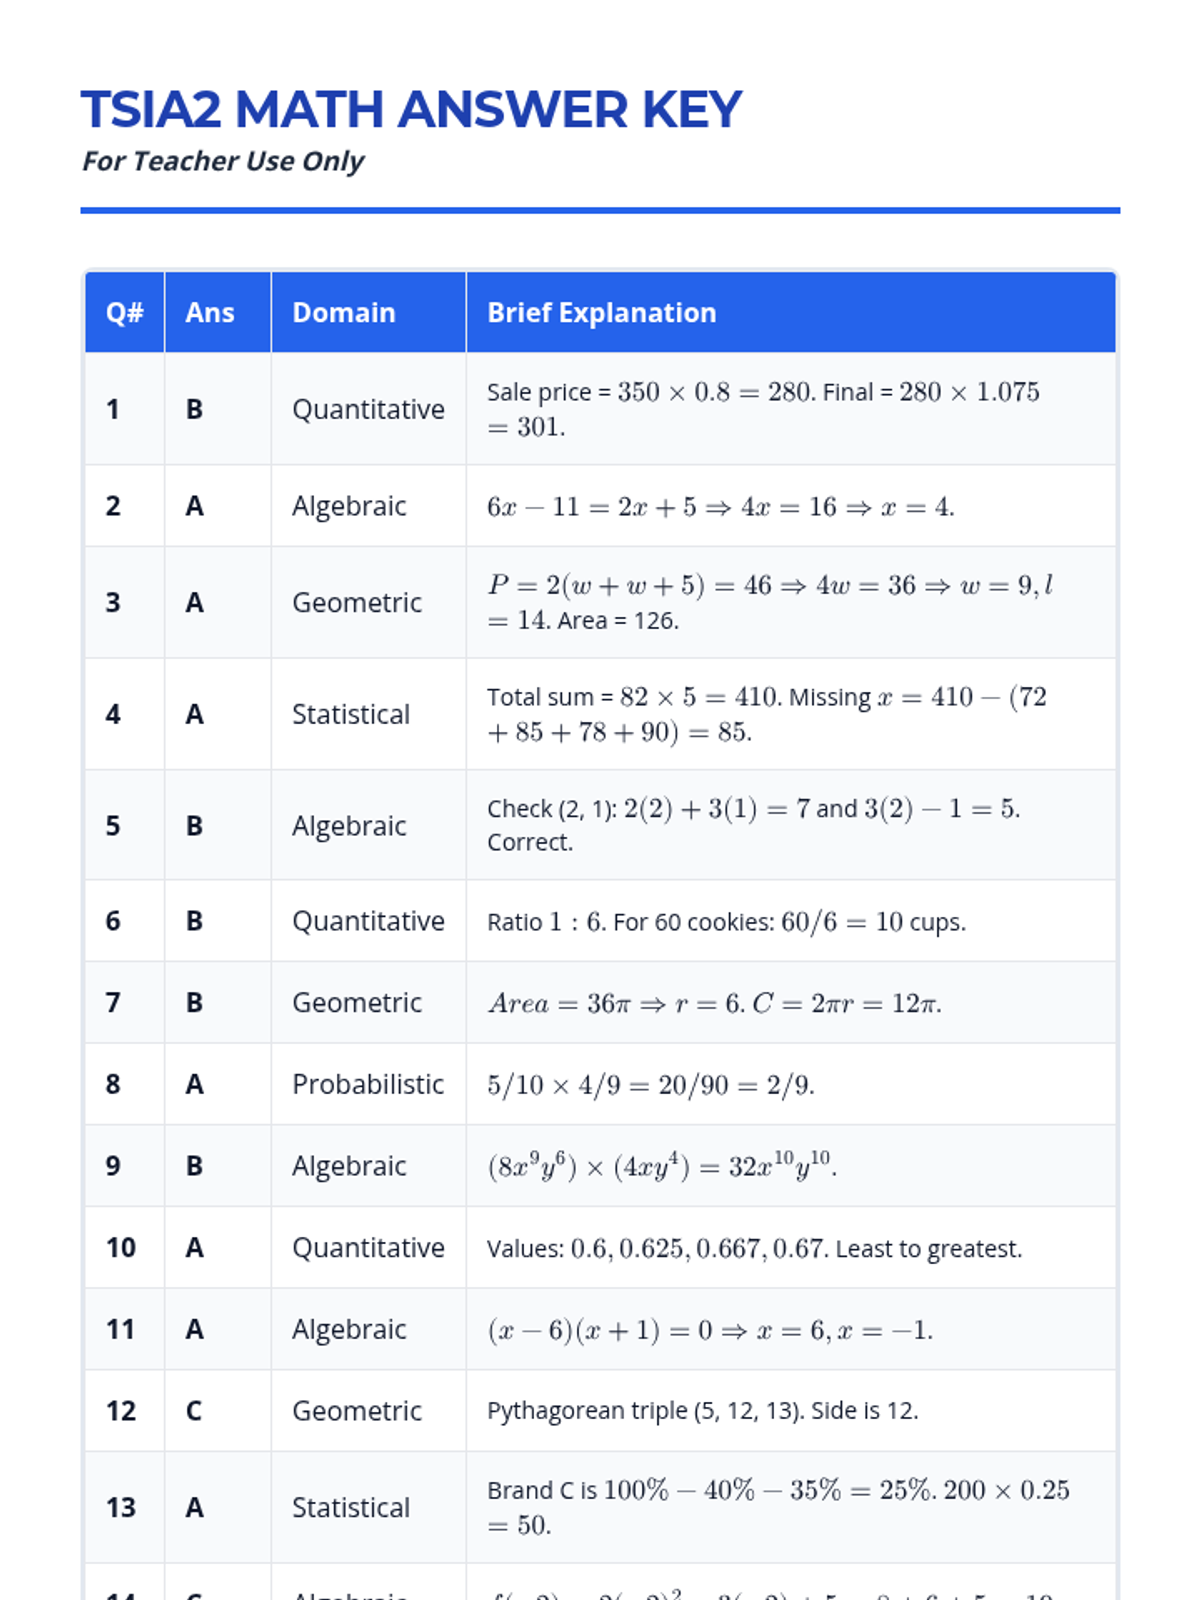
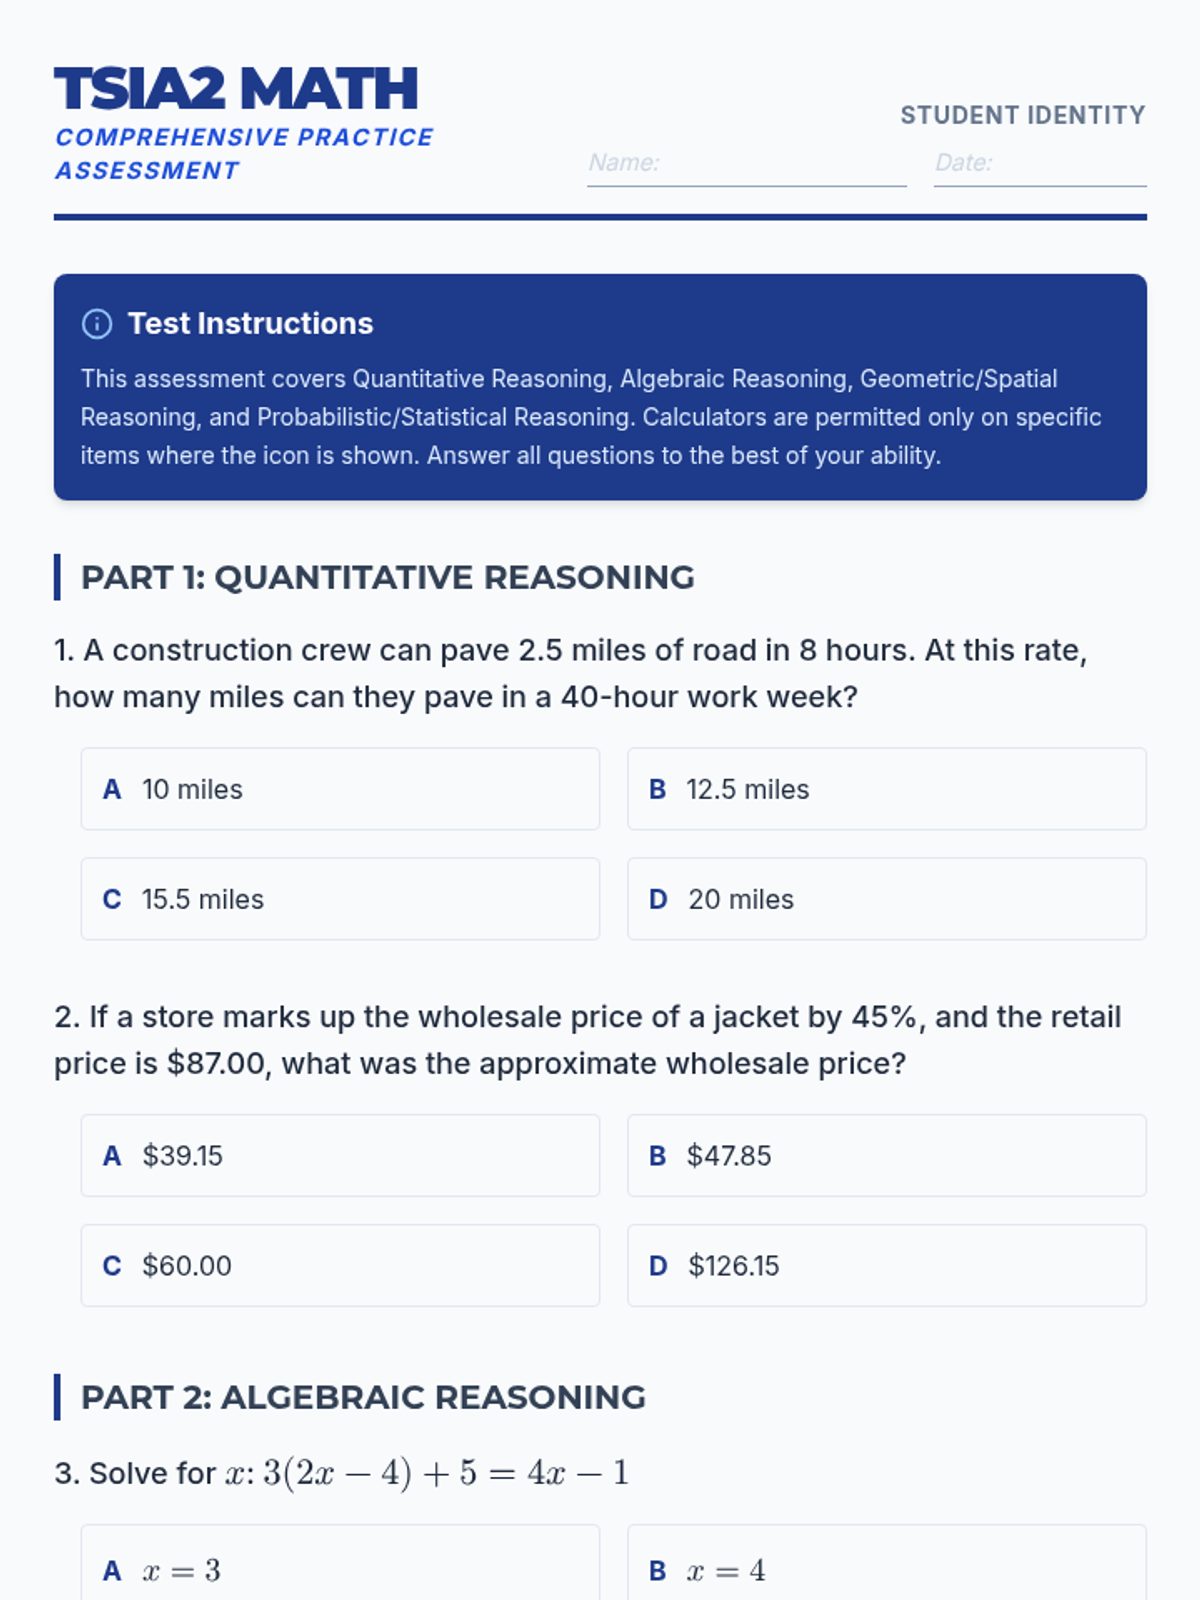
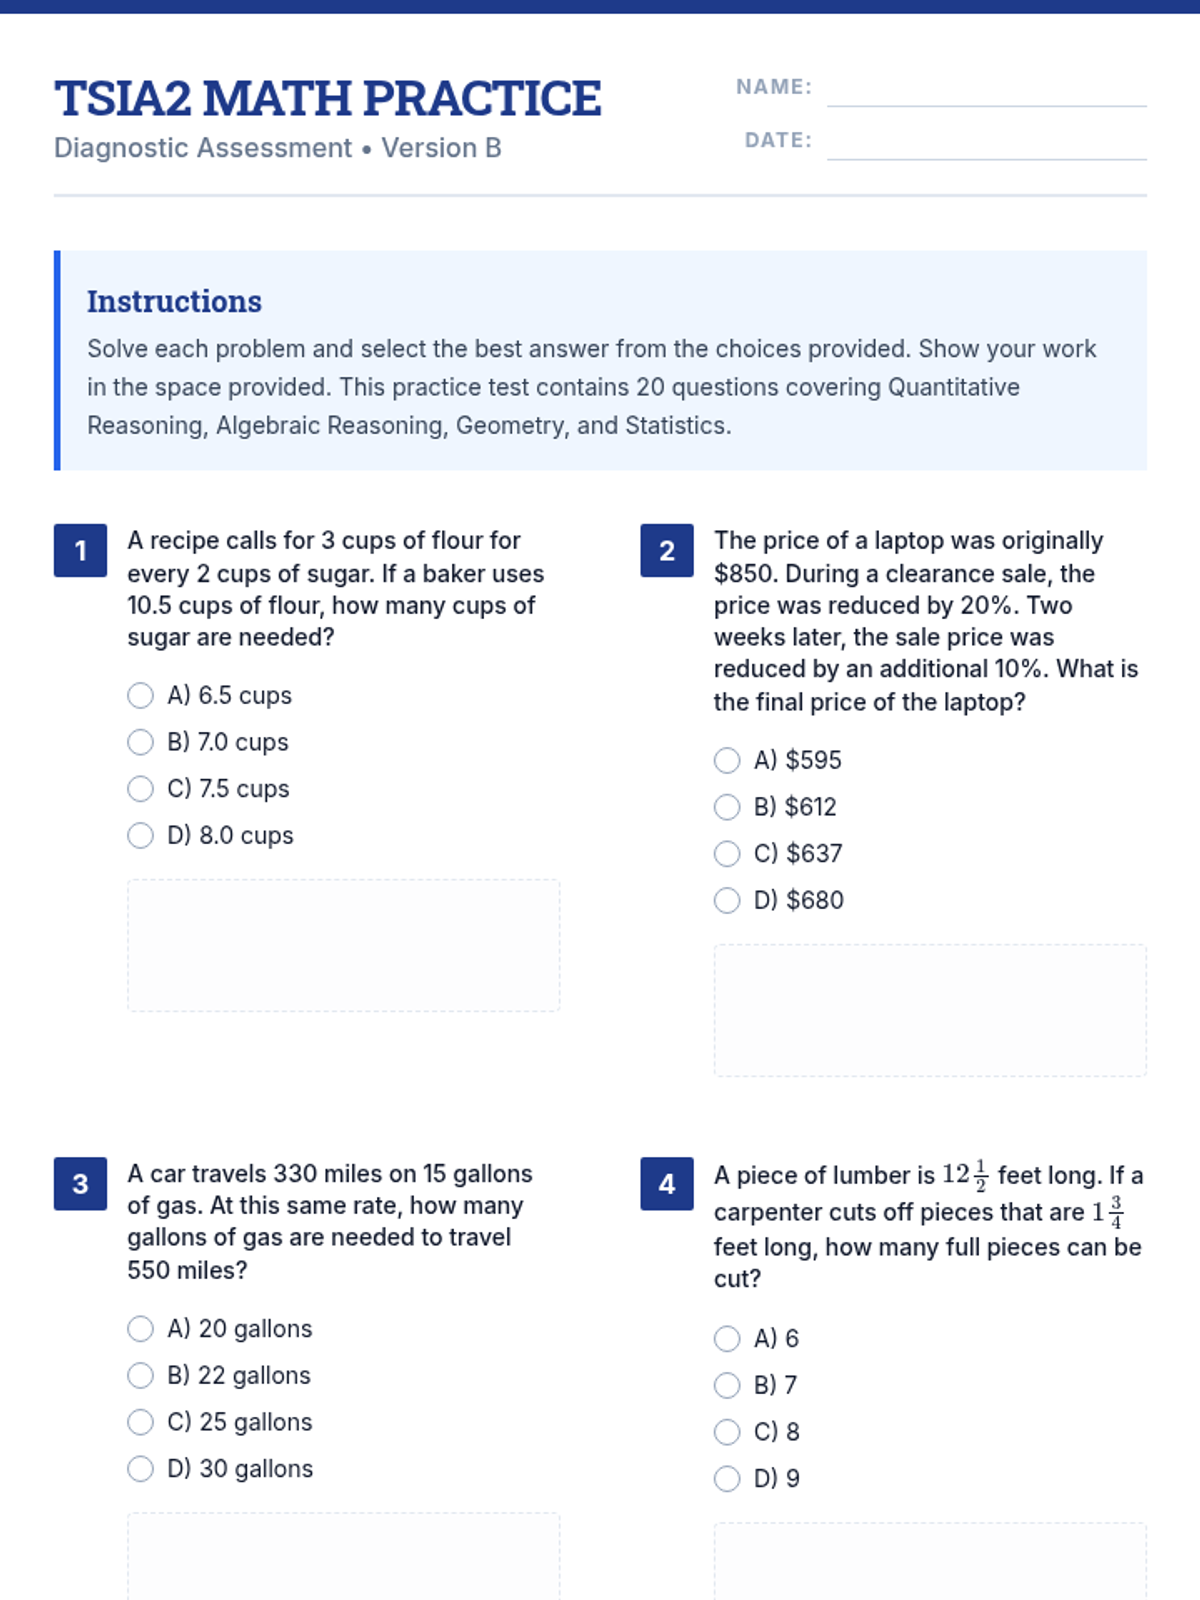
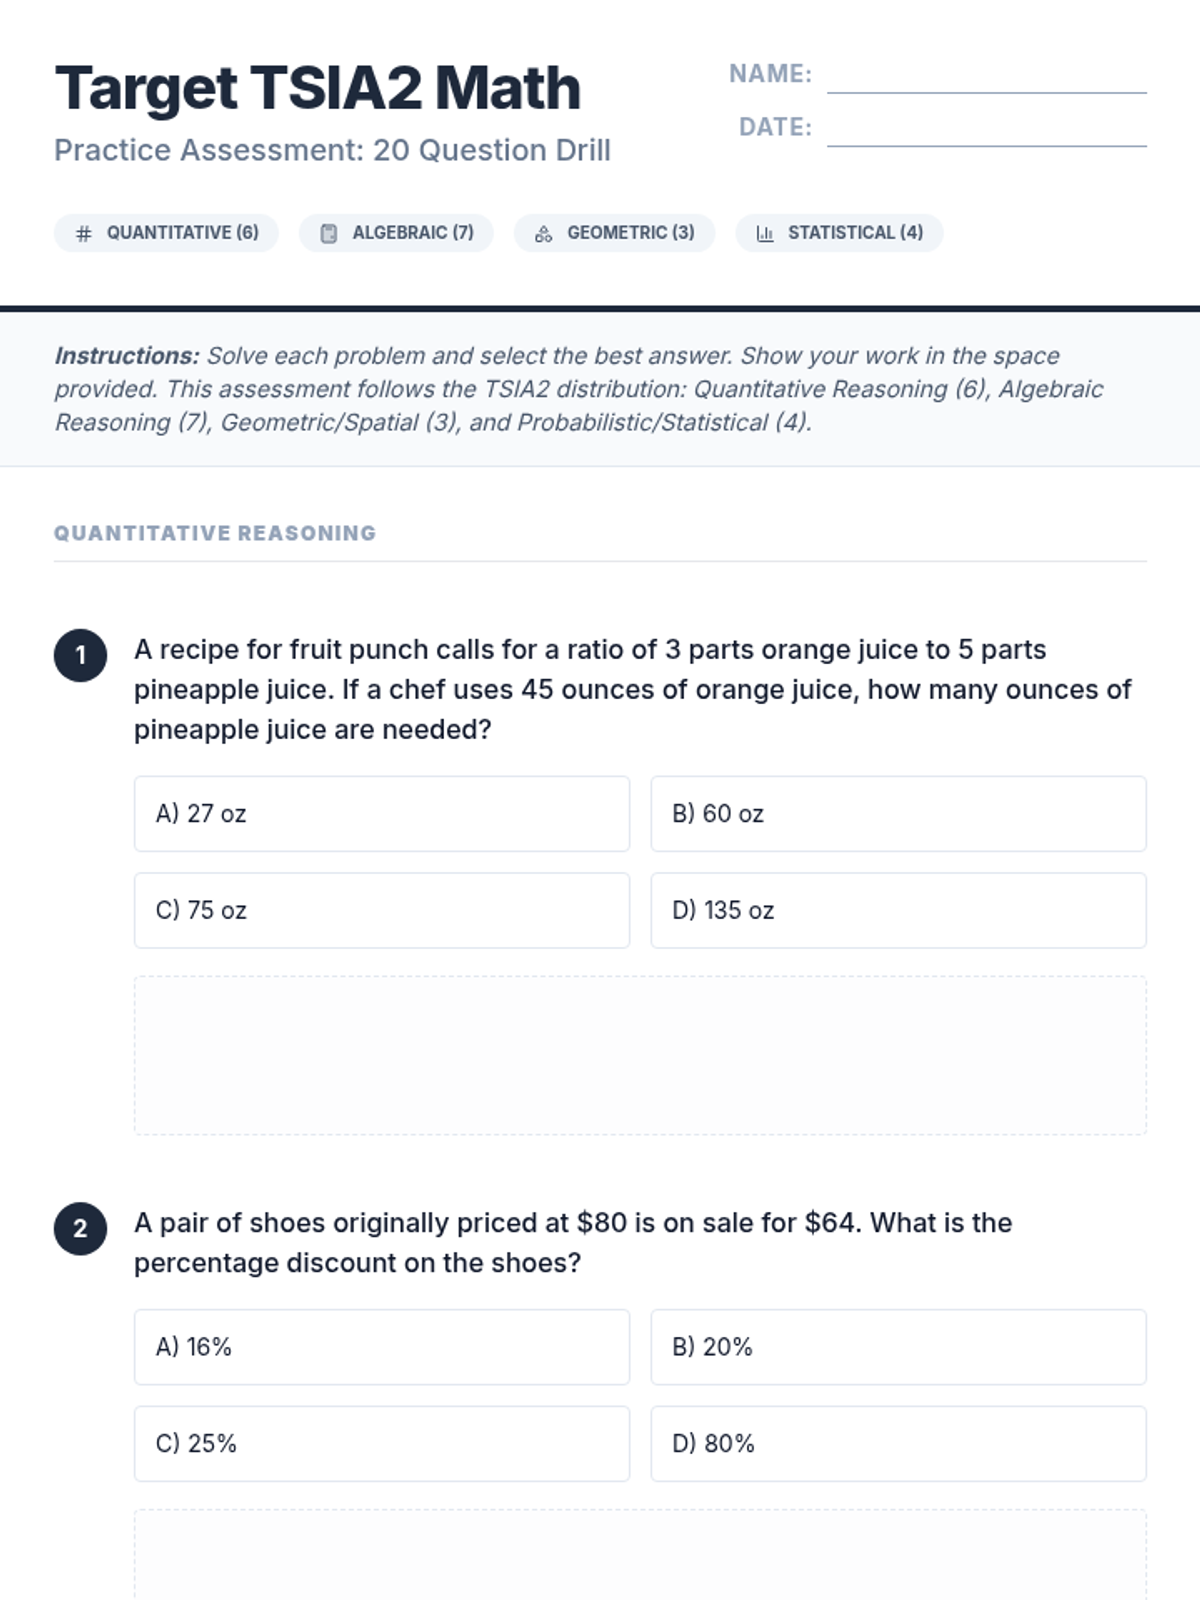
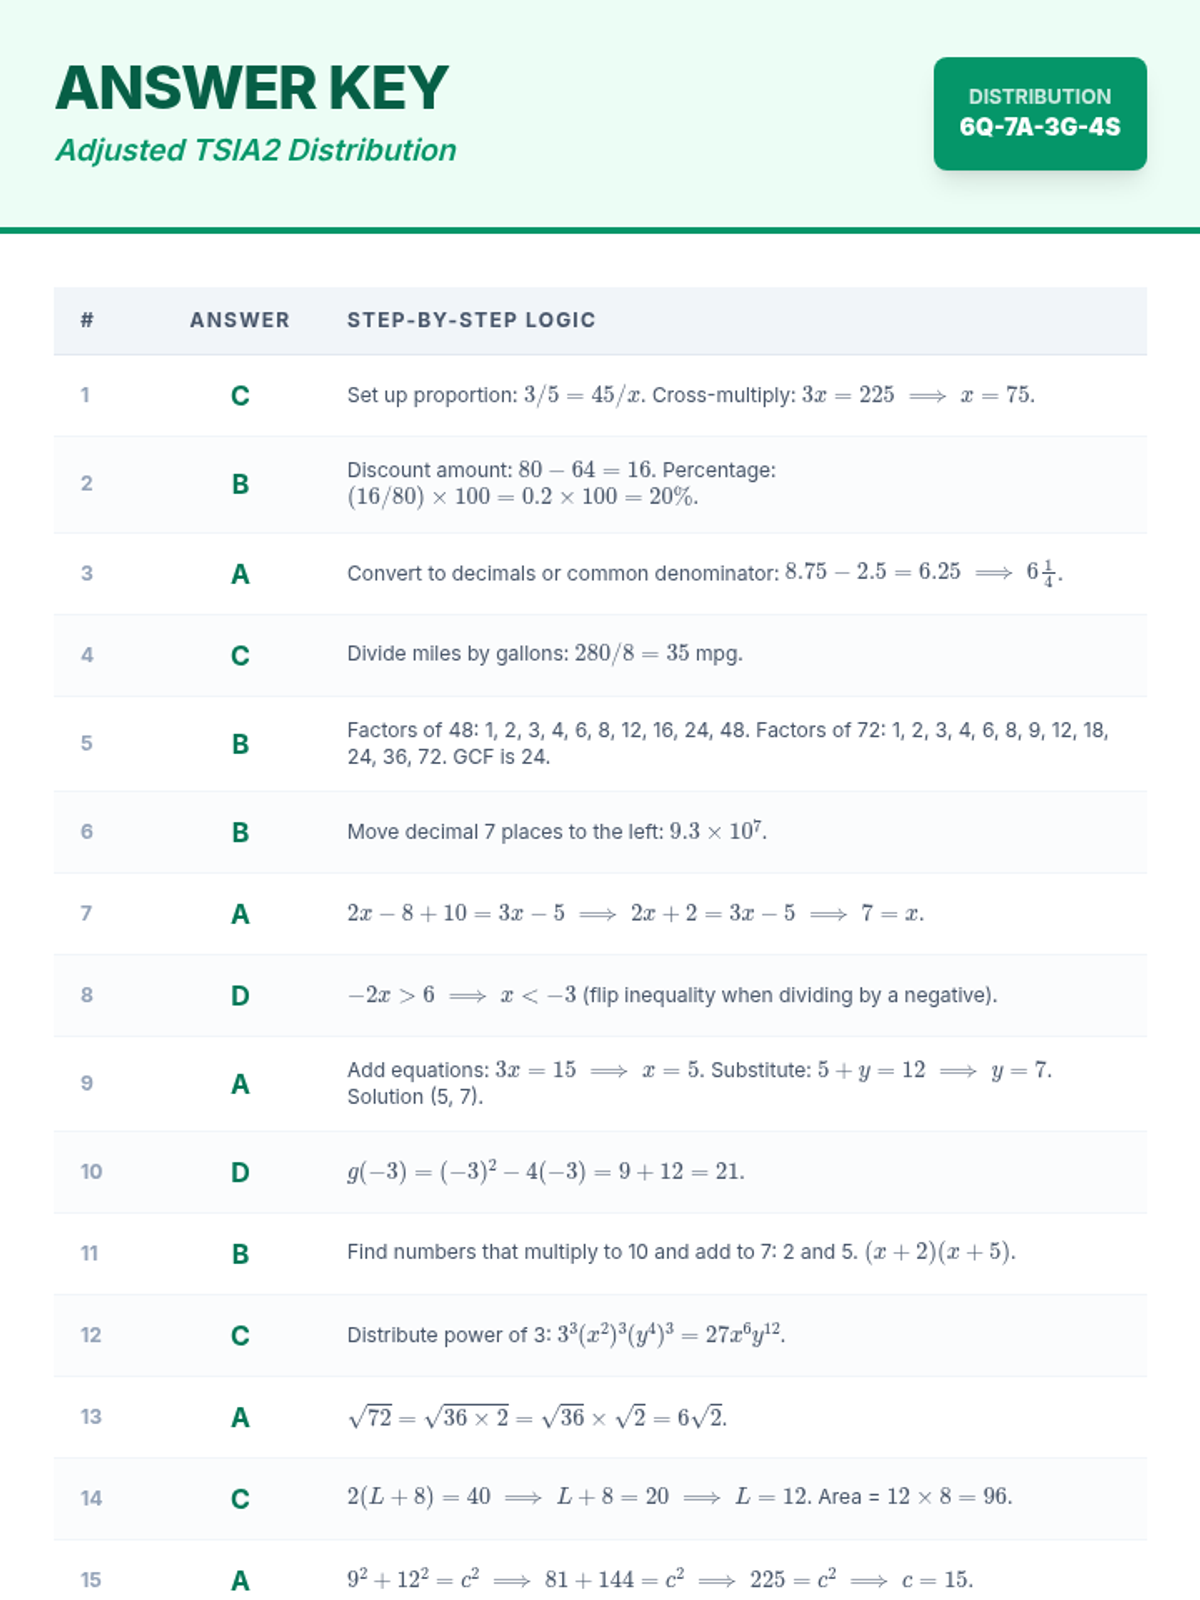
A comprehensive practice set and review presentation for the TSIA2 Math exam, covering Quantitative, Algebraic, Geometric, and Statistical reasoning.
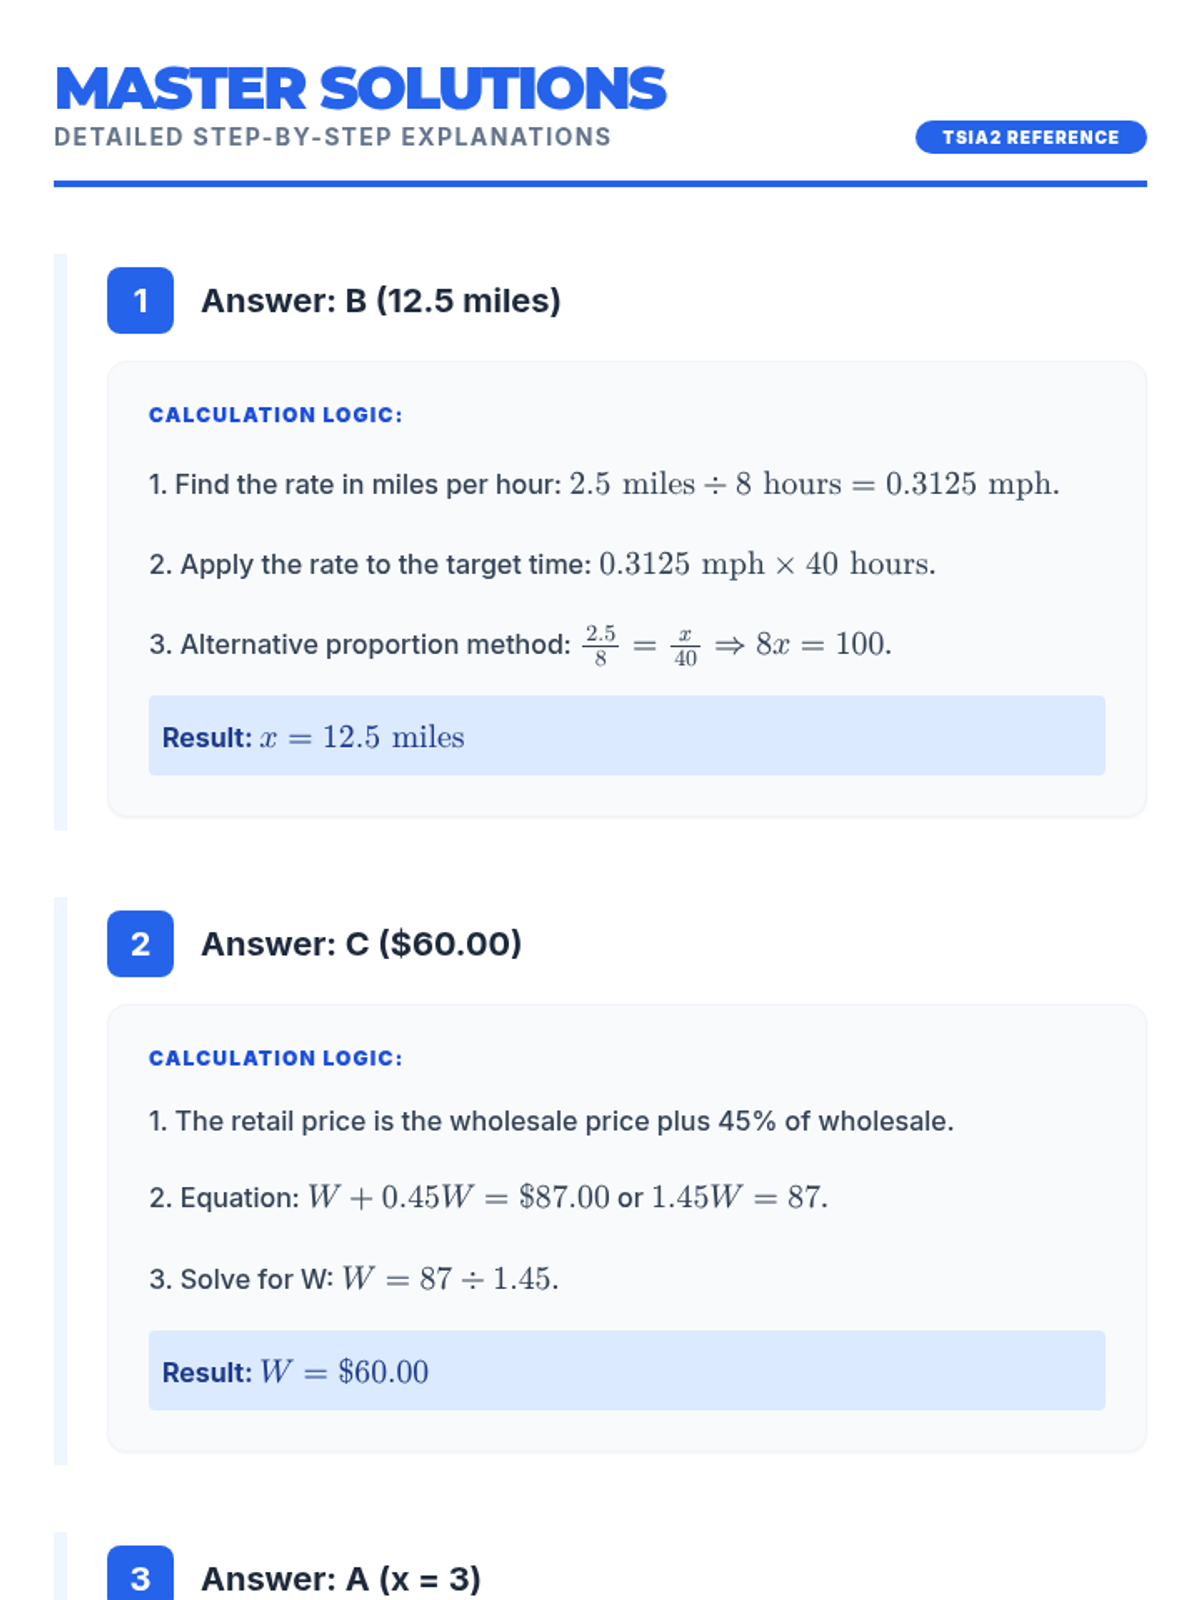
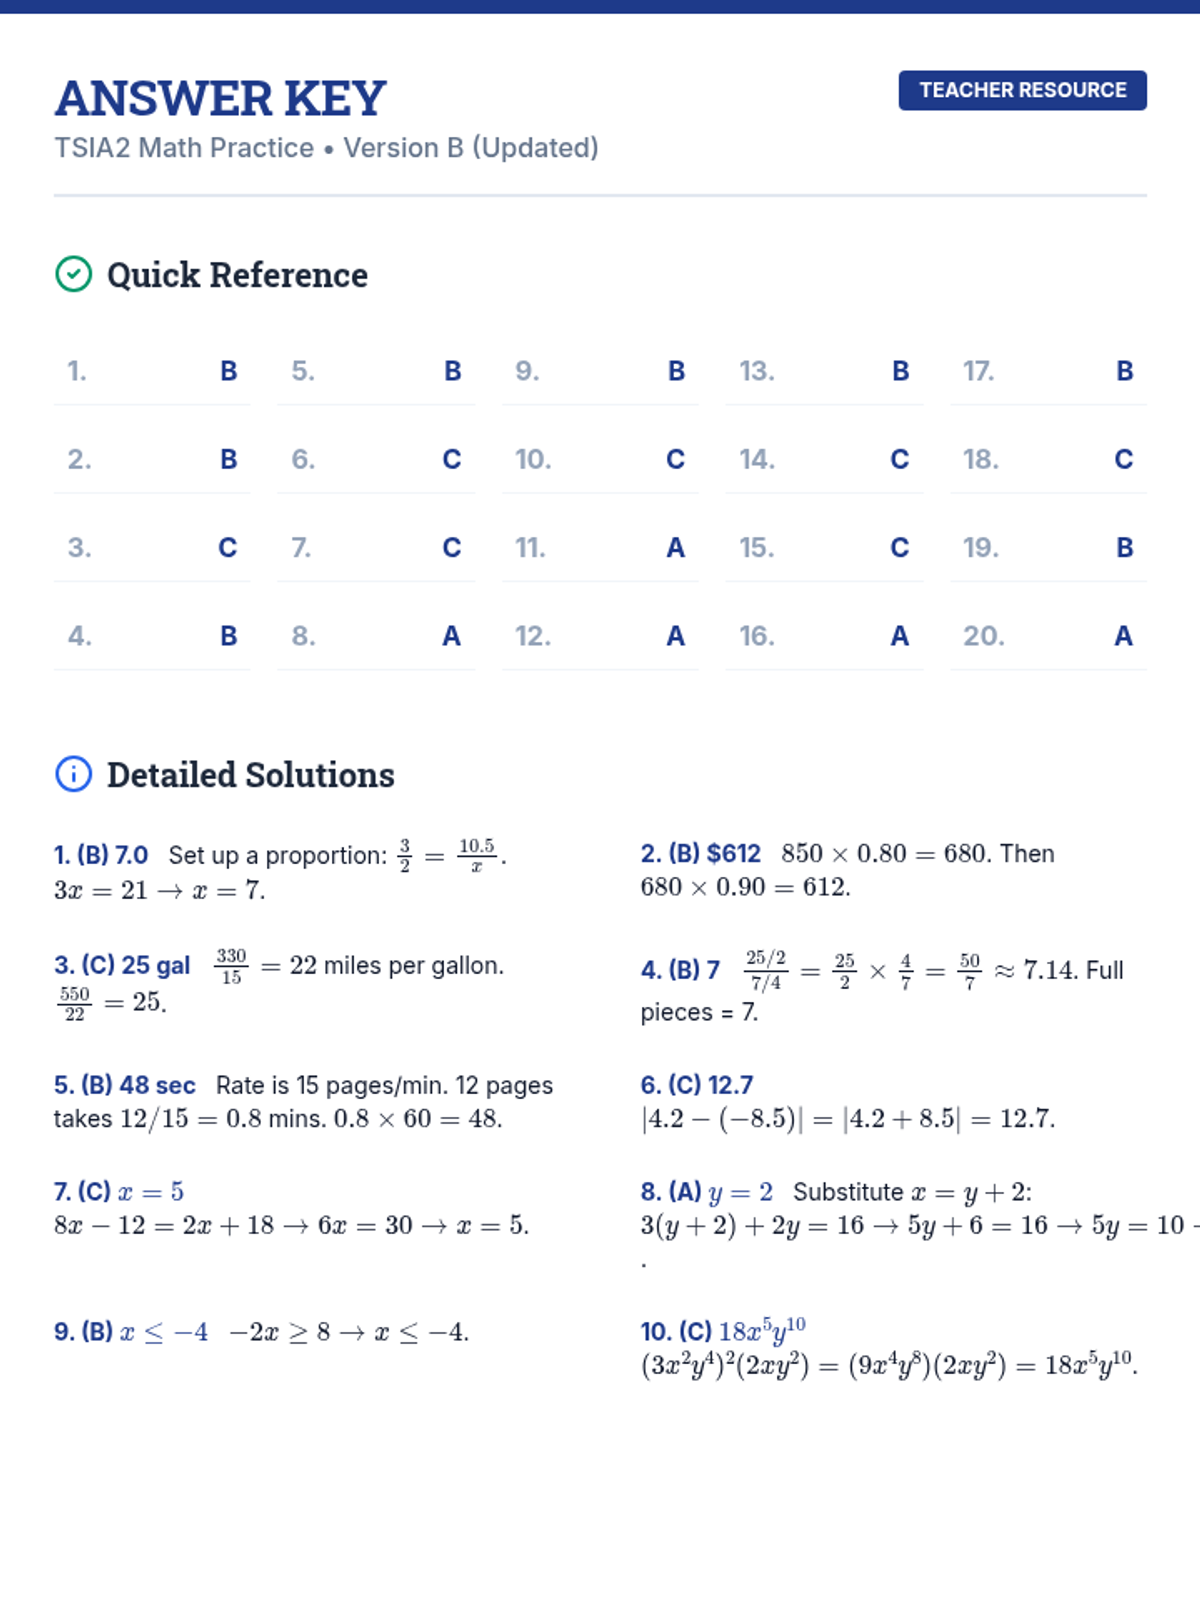
A comprehensive preparation set for the TSIA2 Mathematics assessment, featuring a full-length practice test, detailed step-by-step solutions, and a strategic review presentation.
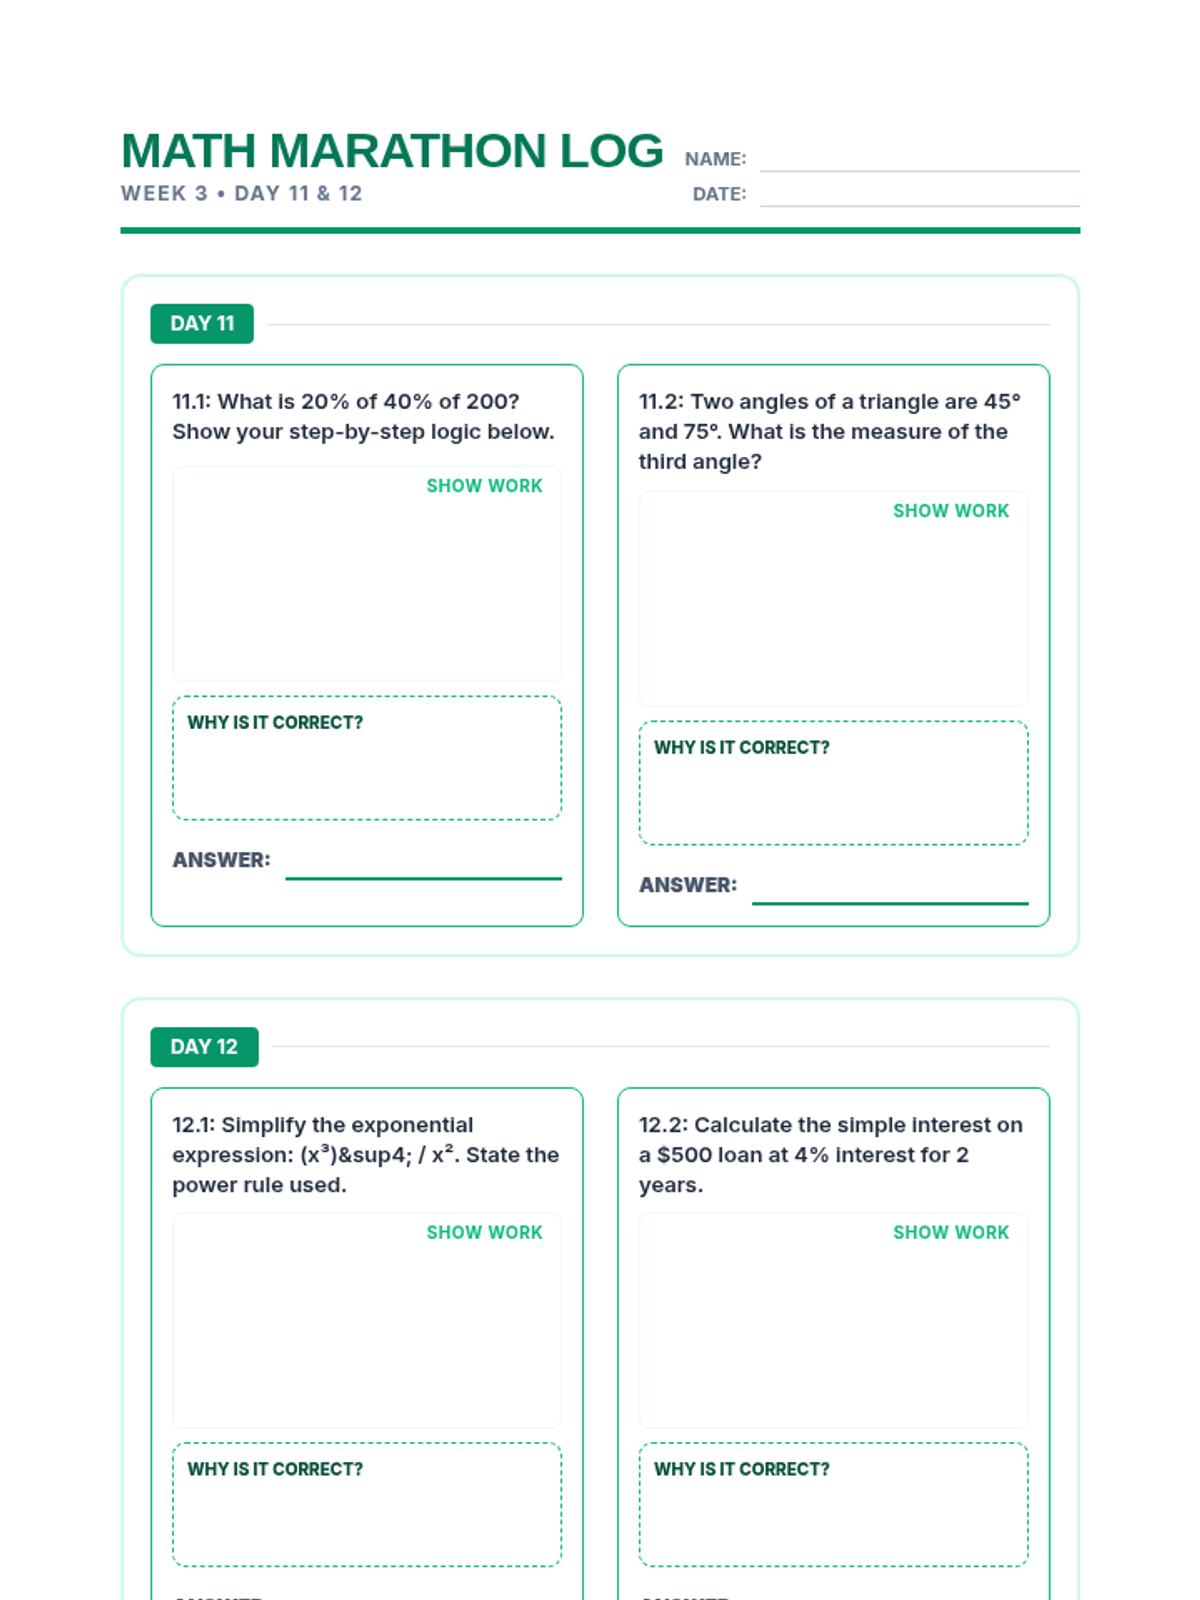
The final week of the TSIA2 Math Marathon, reviewing complex problems and multi-step reasoning.
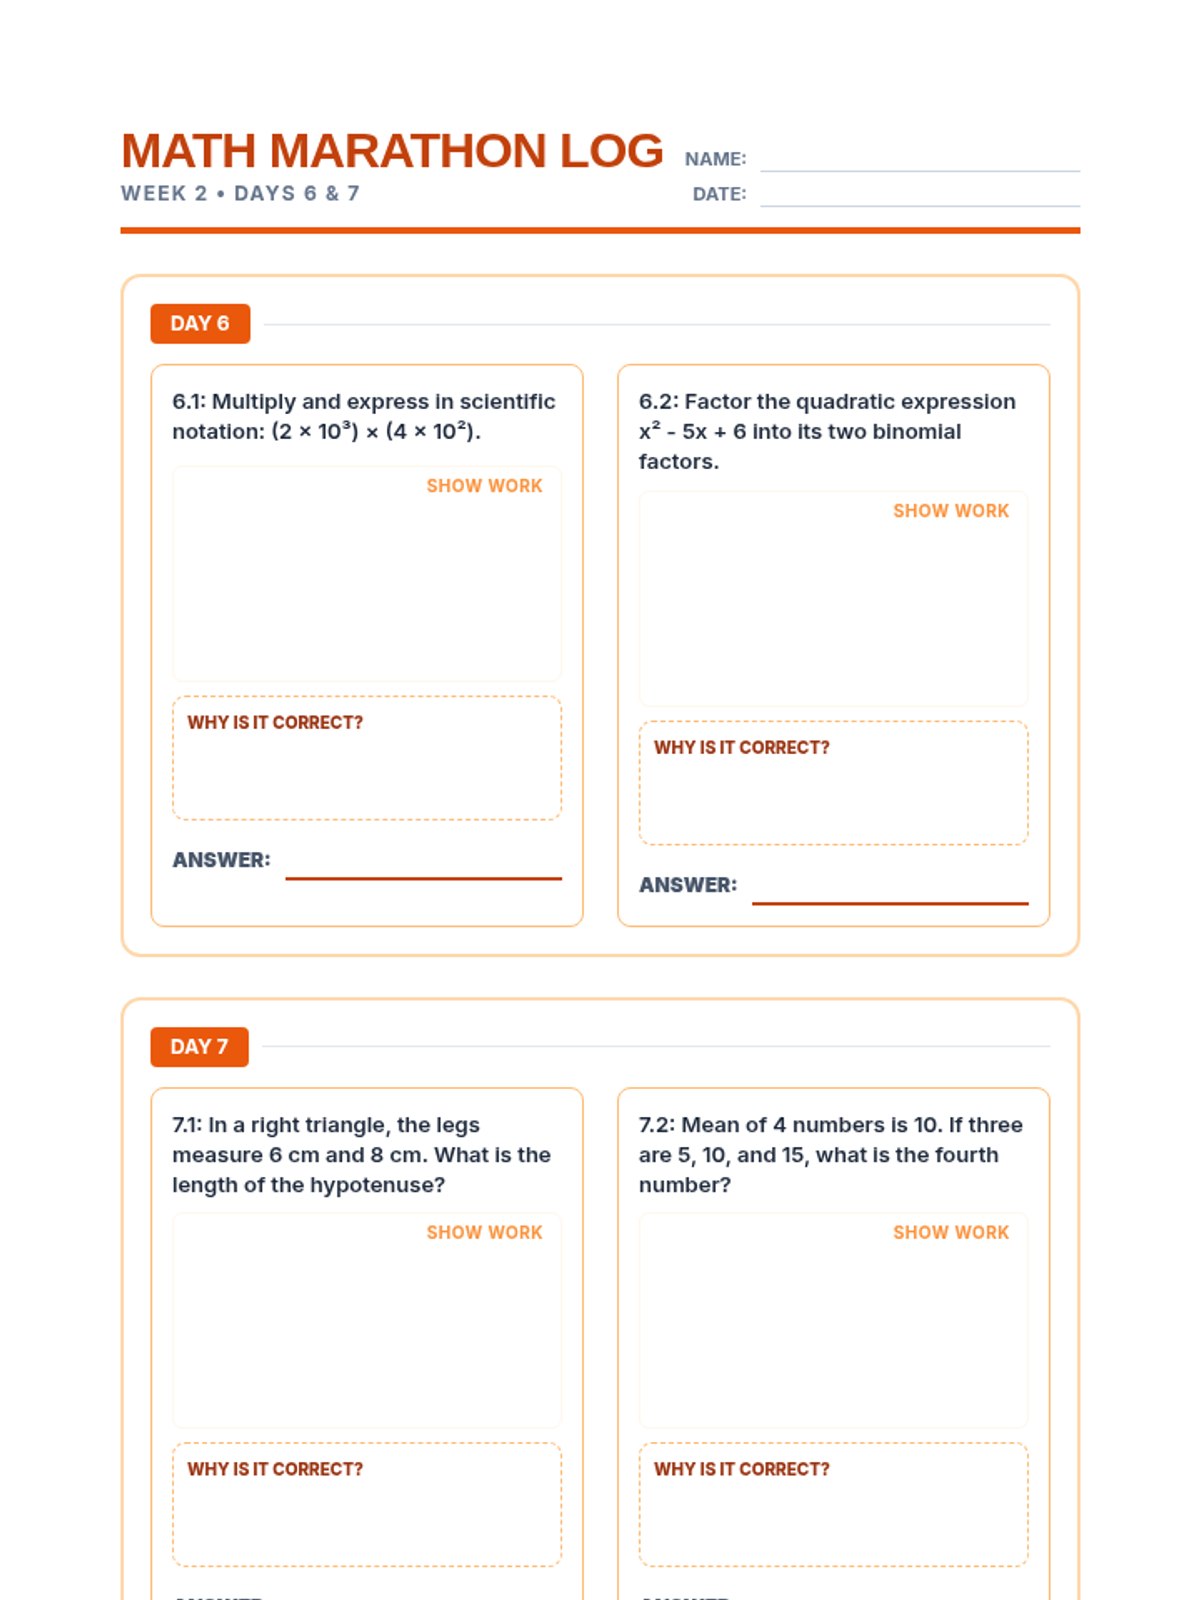
The second week of the TSIA2 Math Marathon, expanding into geometric and statistical reasoning.
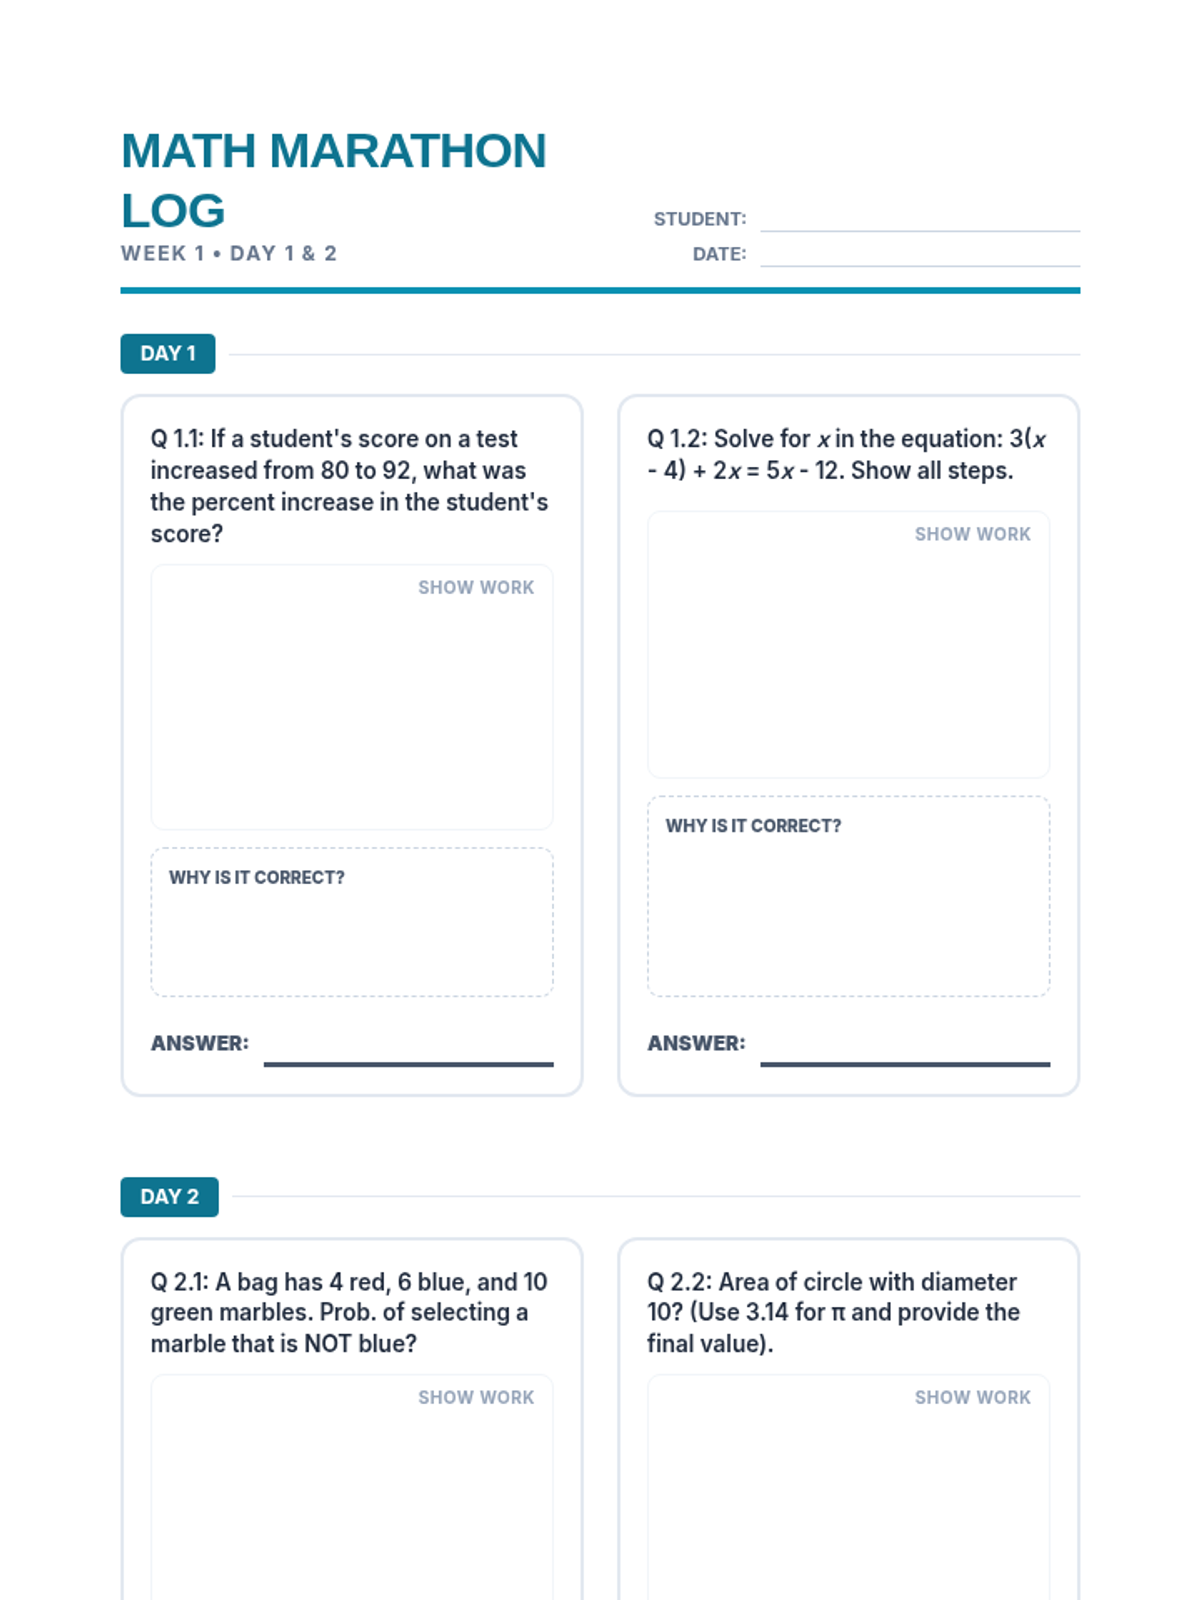
The first week of the TSIA2 Math Marathon, focusing on foundational algebraic and quantitative reasoning.
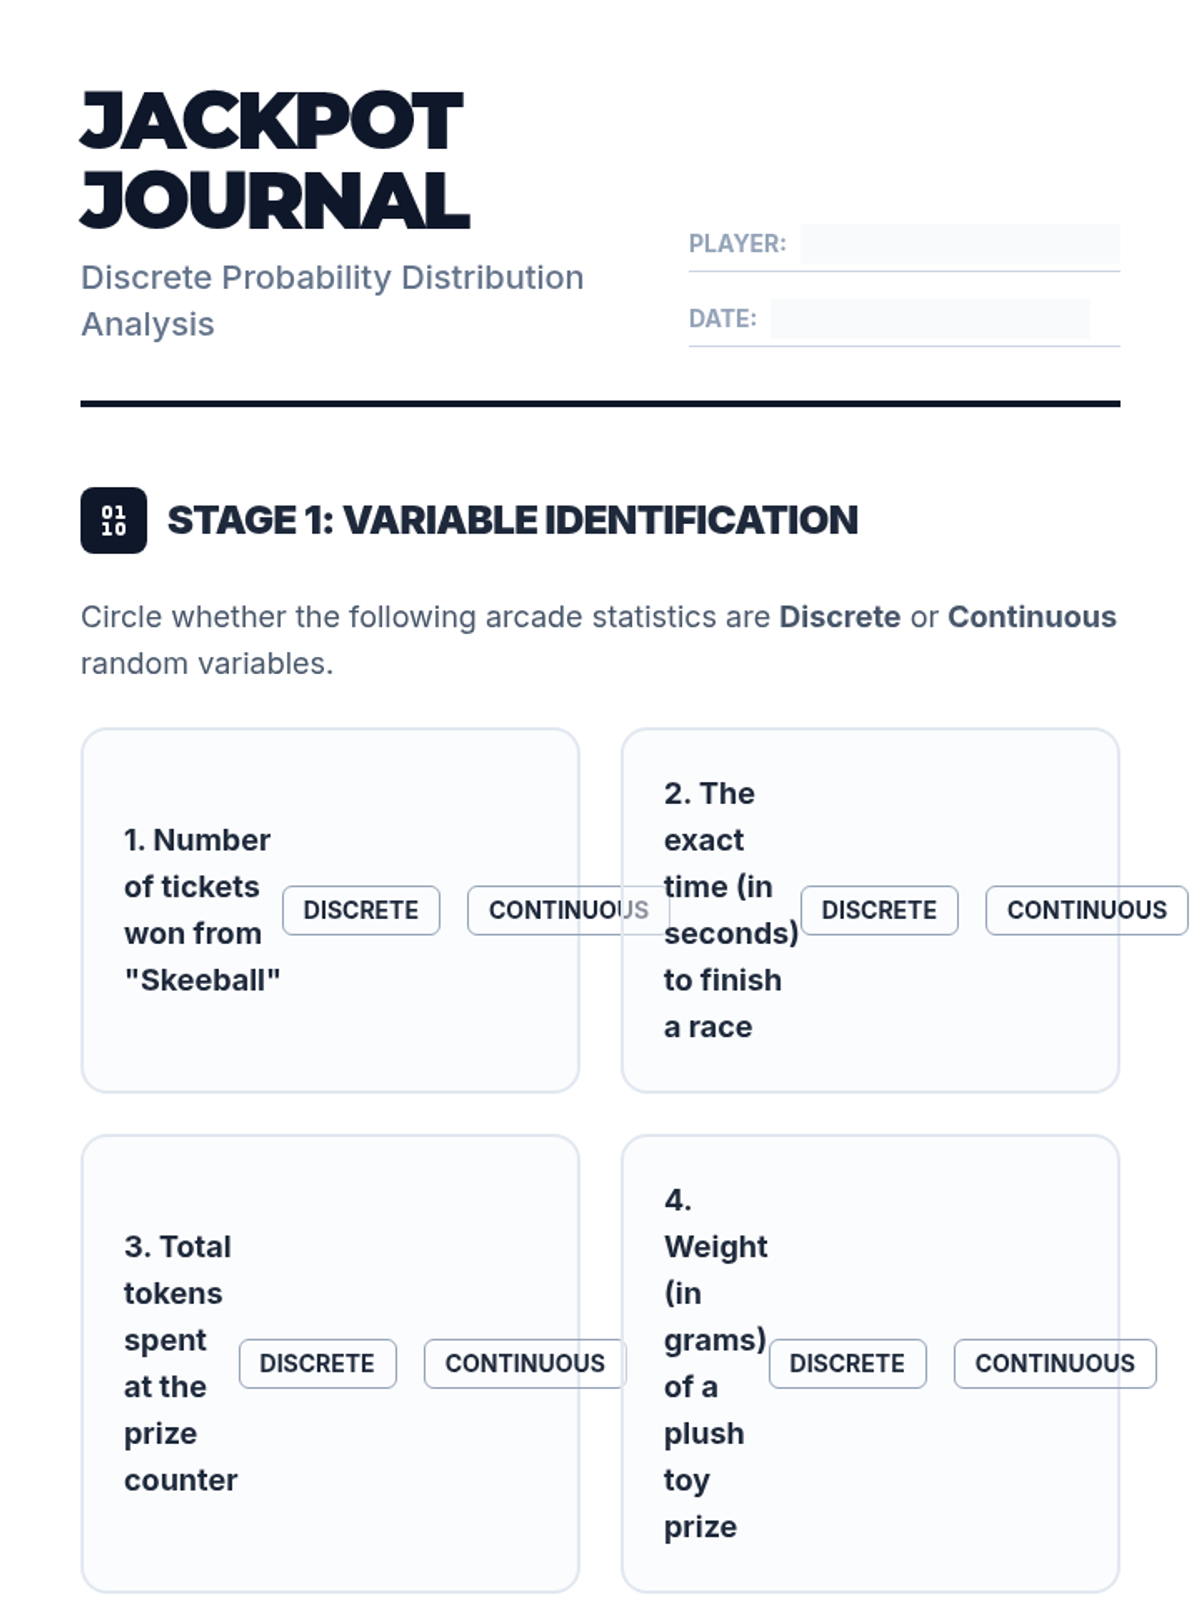
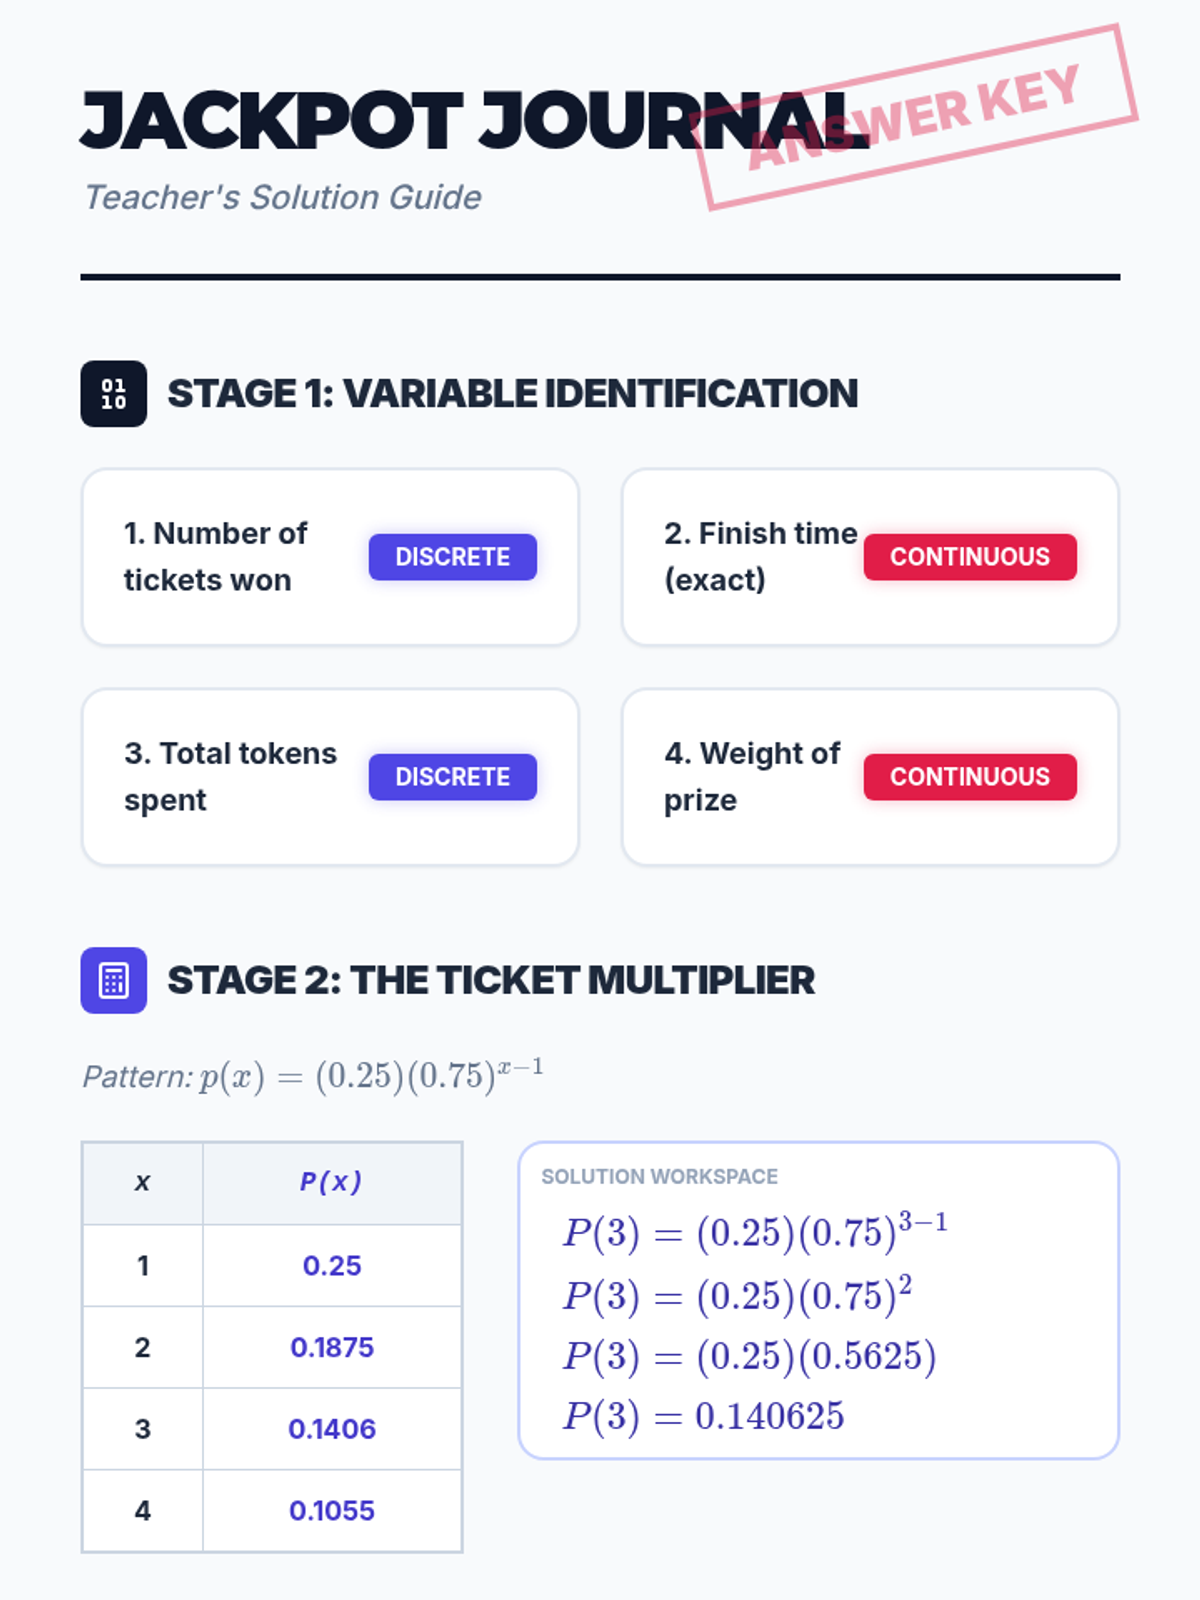
Students explore discrete probability distributions through the lens of arcade games and challenges, learning to model random events and calculate probabilities.
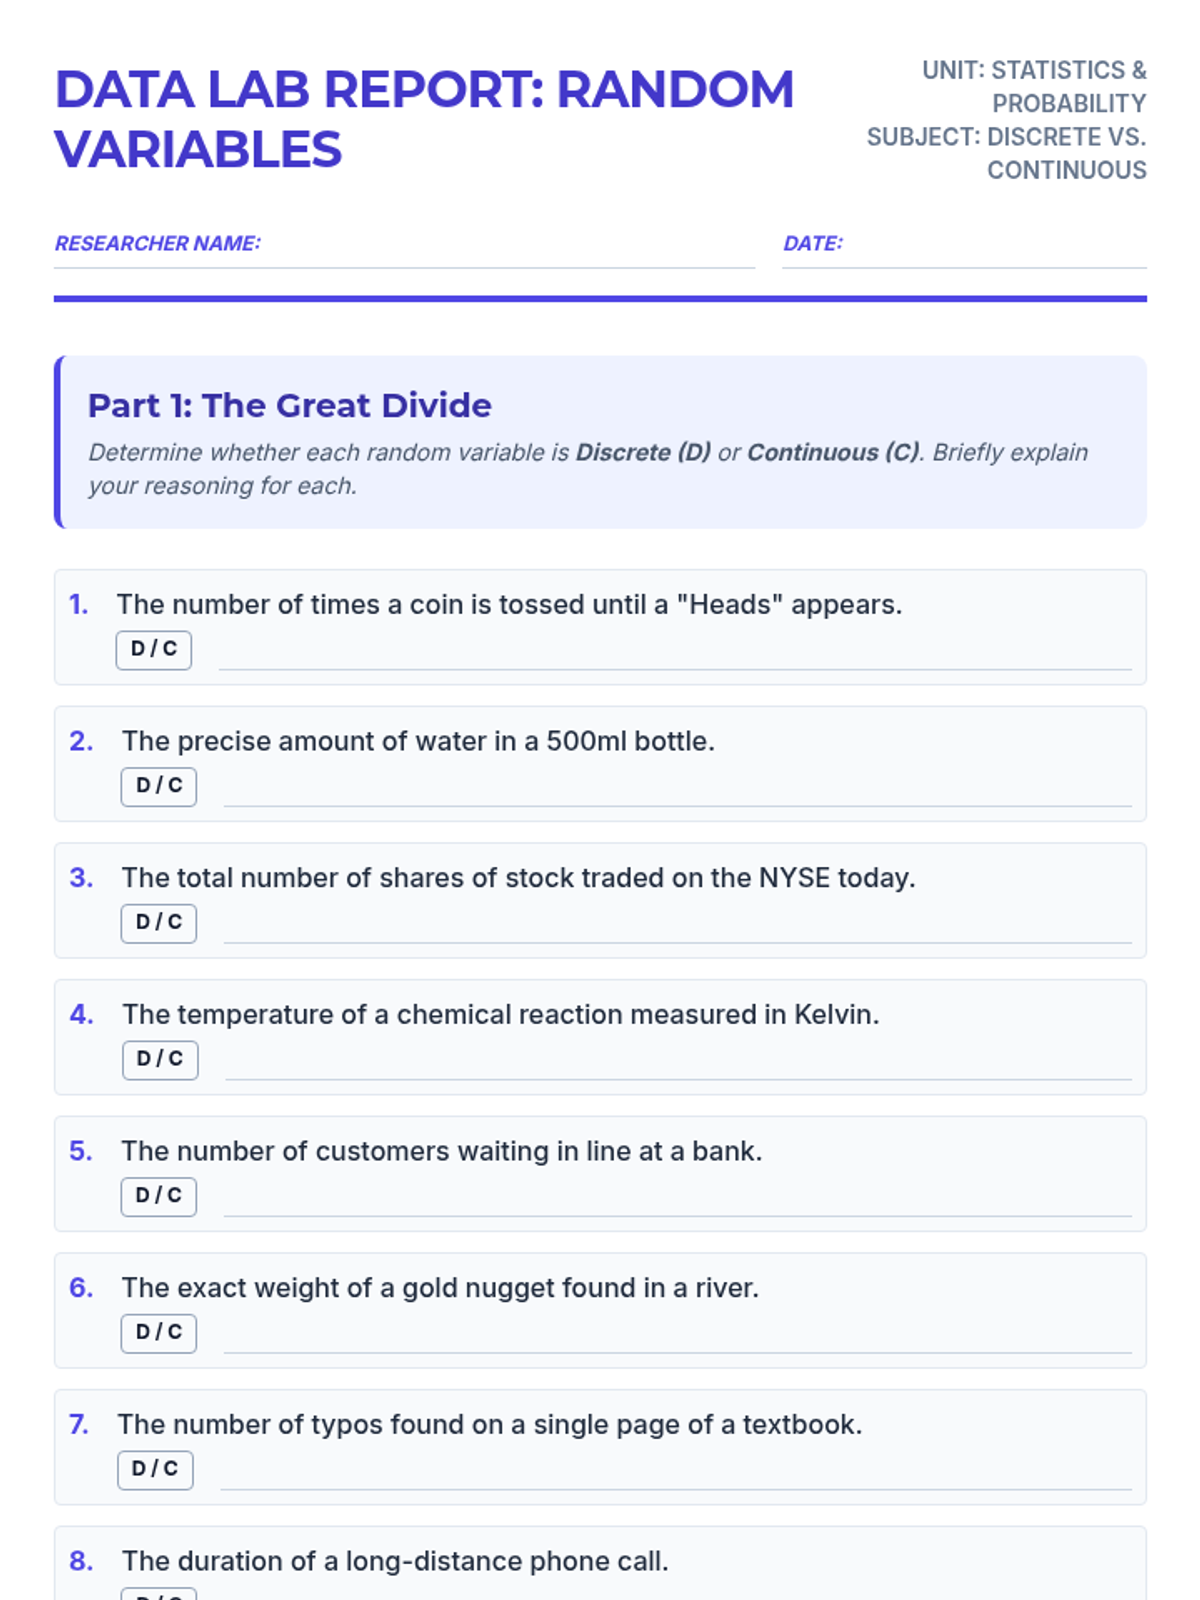
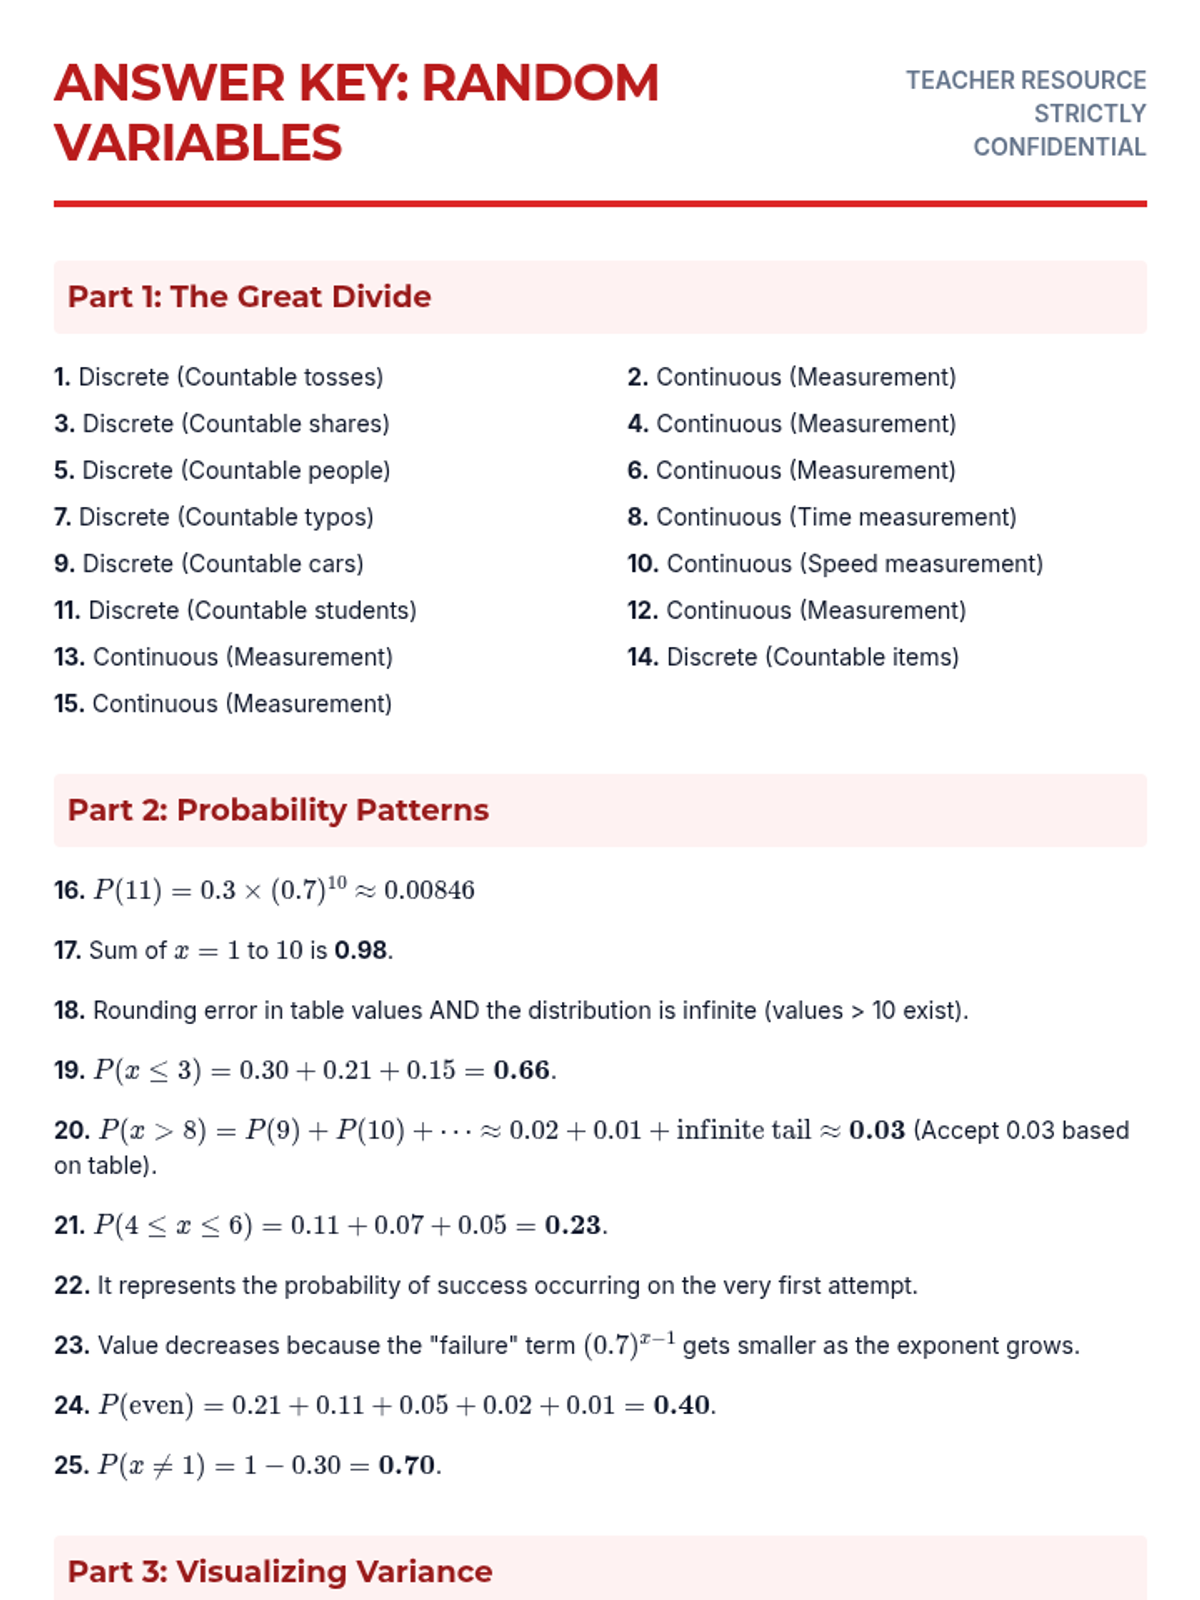
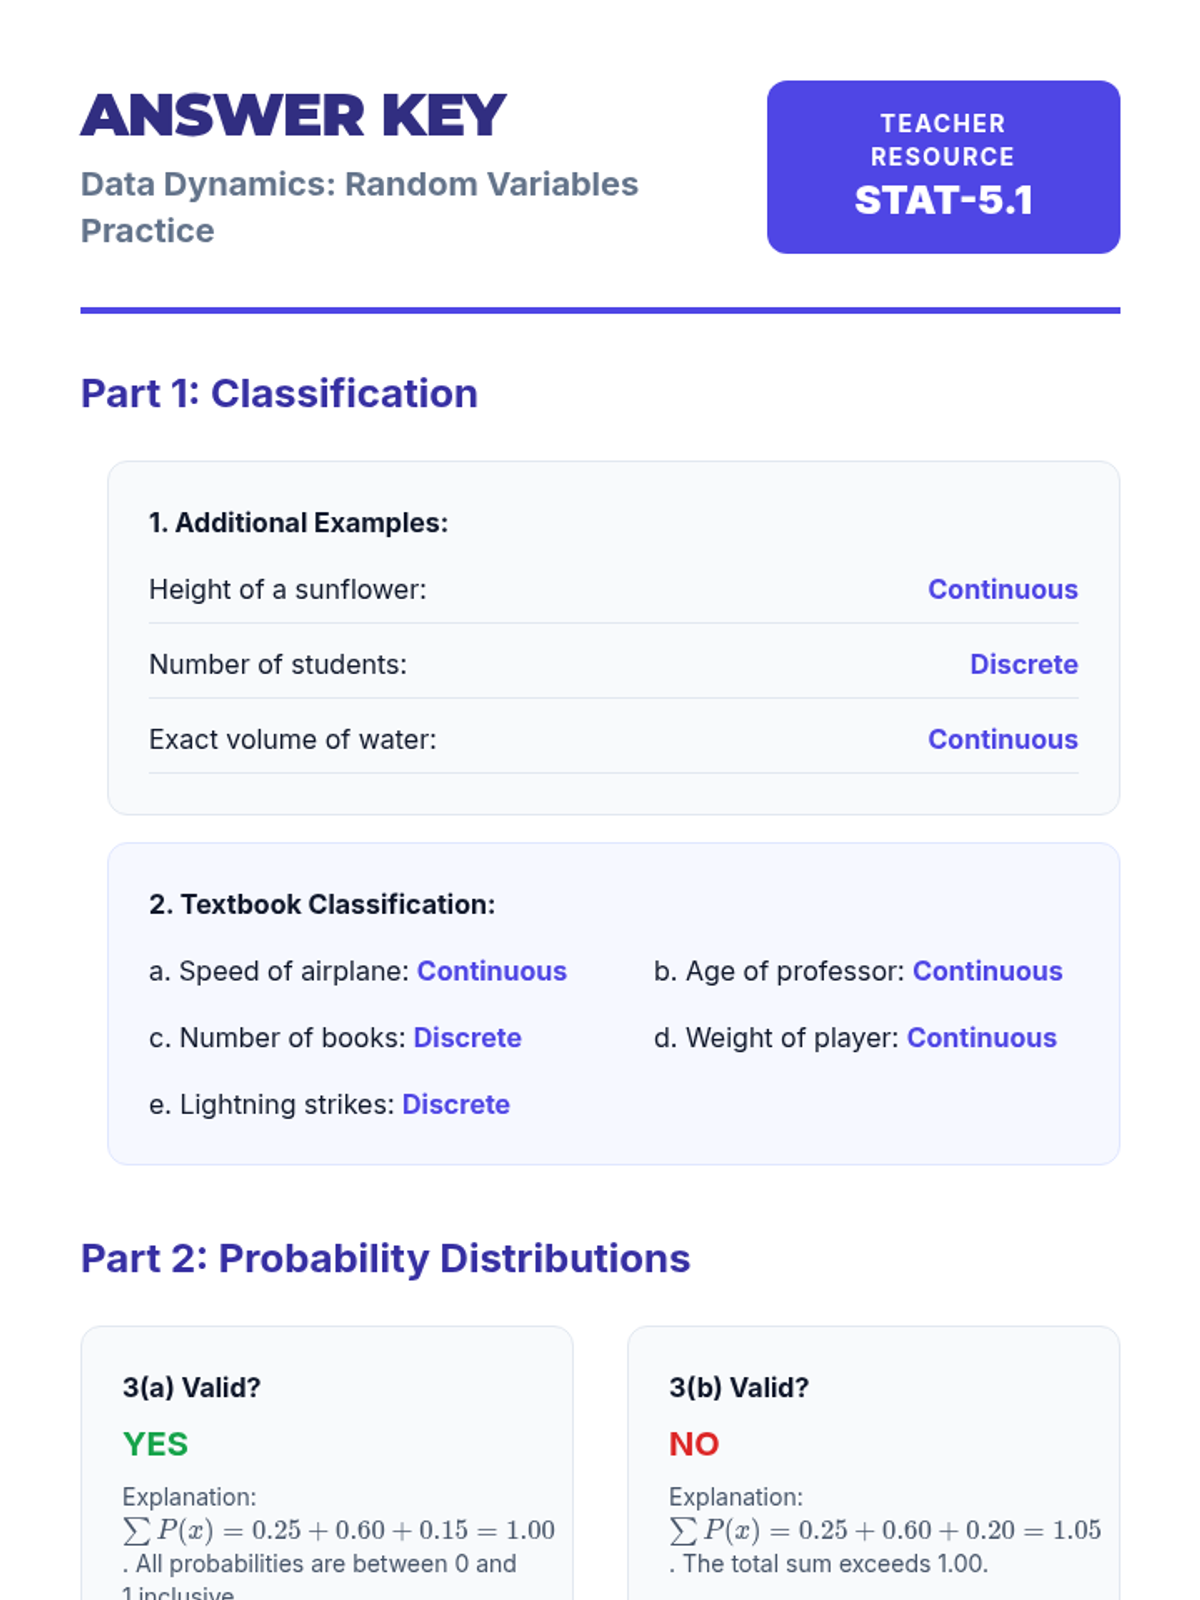
A comprehensive lesson on identifying random variable types, working with discrete probability distributions, and visualizing data through histograms.
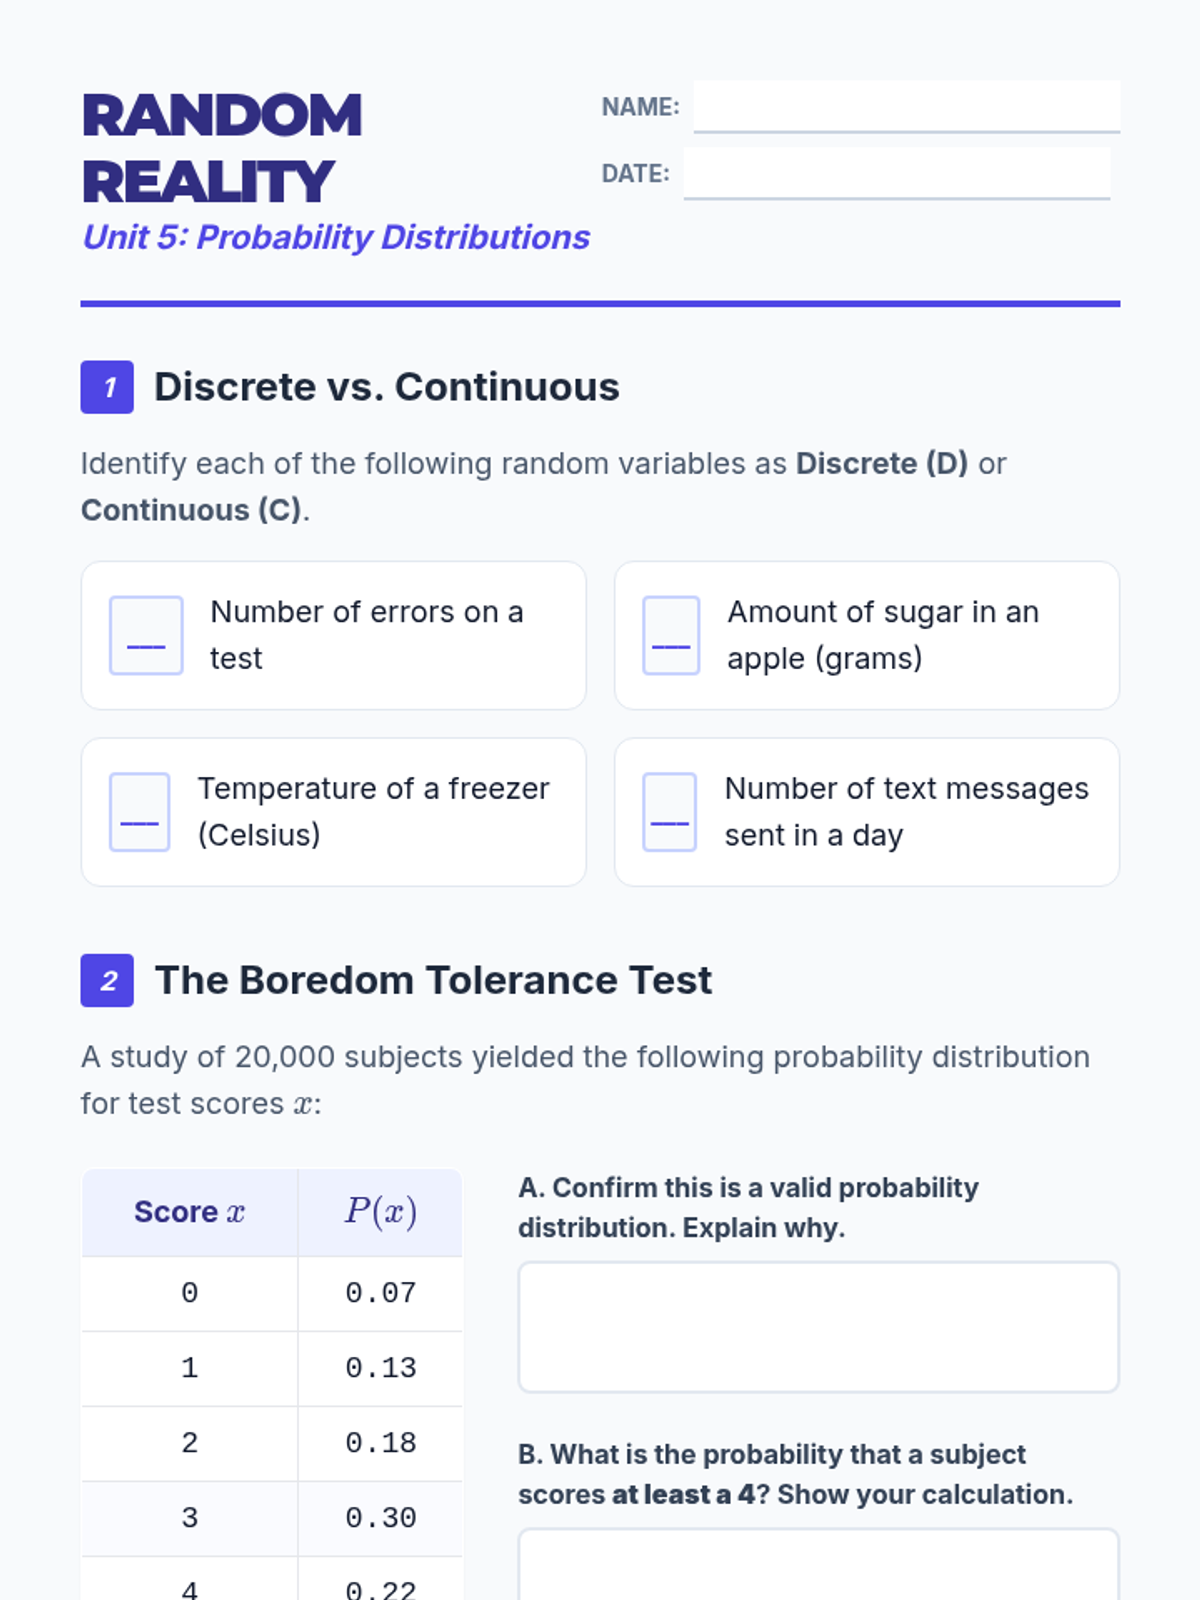
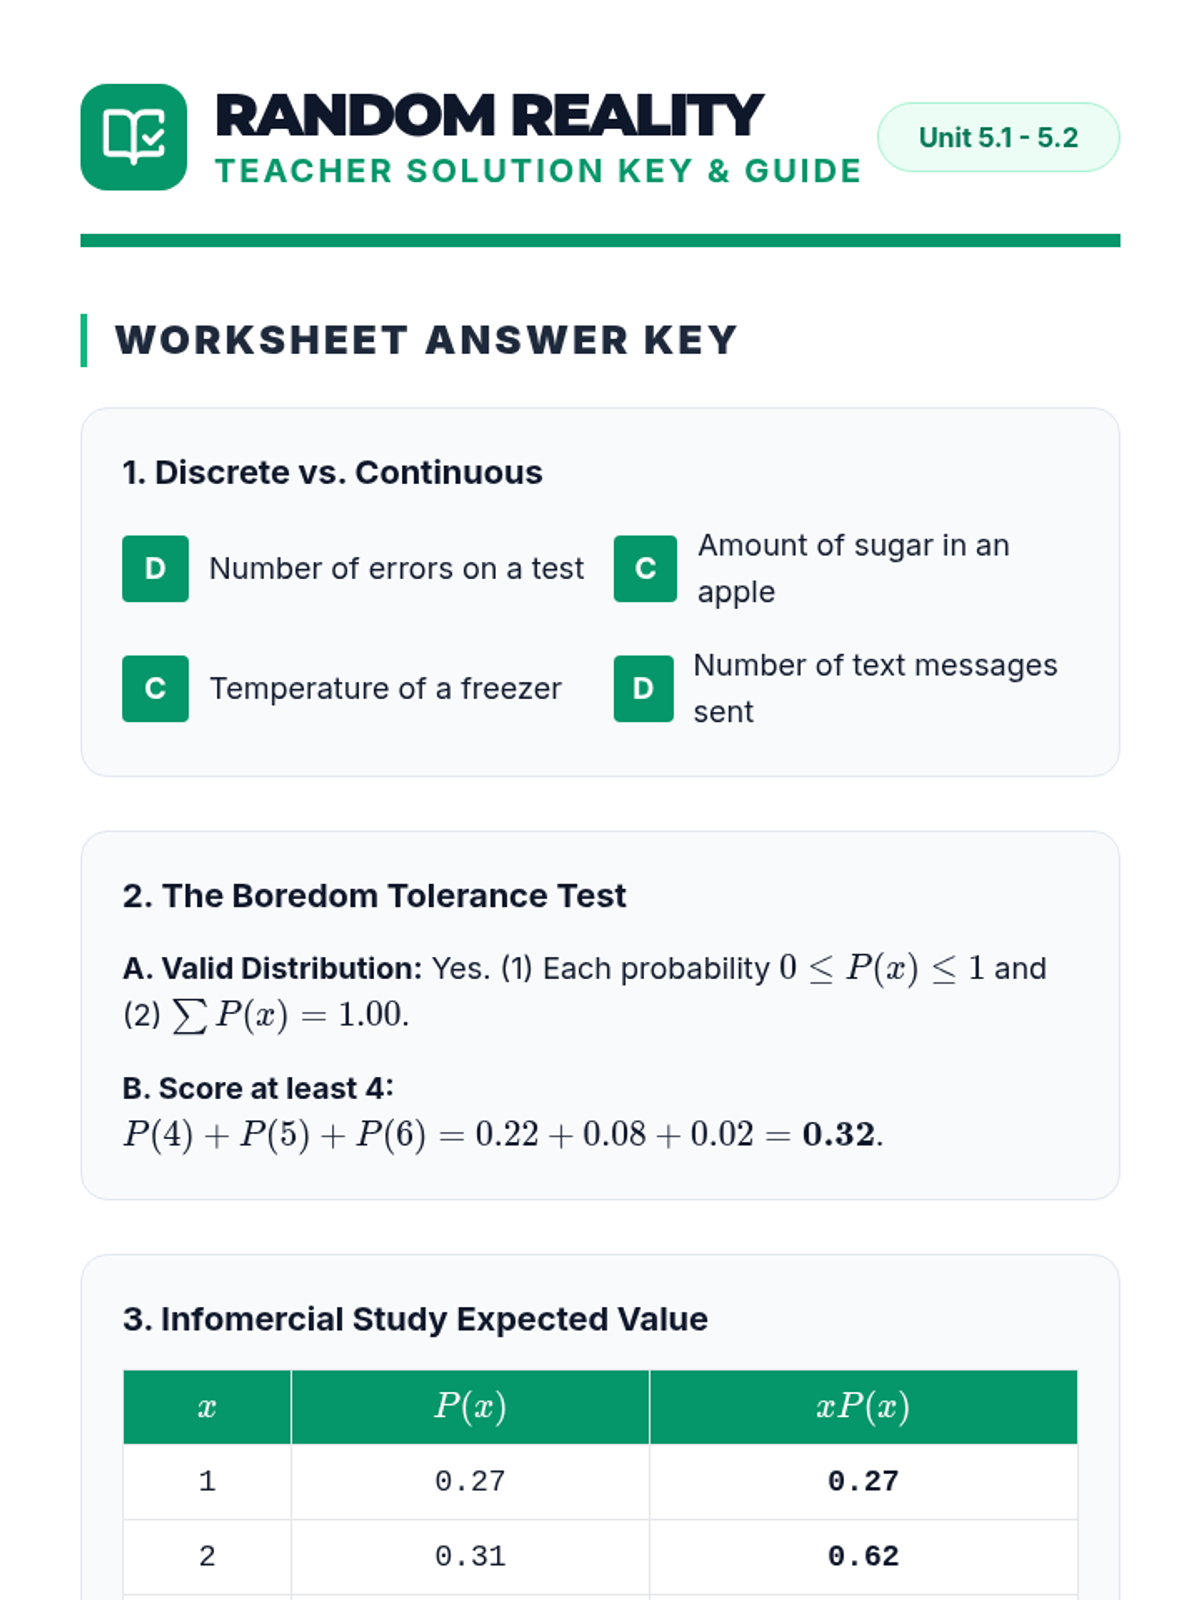
An introductory exploration of random variables, probability distributions, and statistical measurements including mean, standard deviation, and linear transformations.
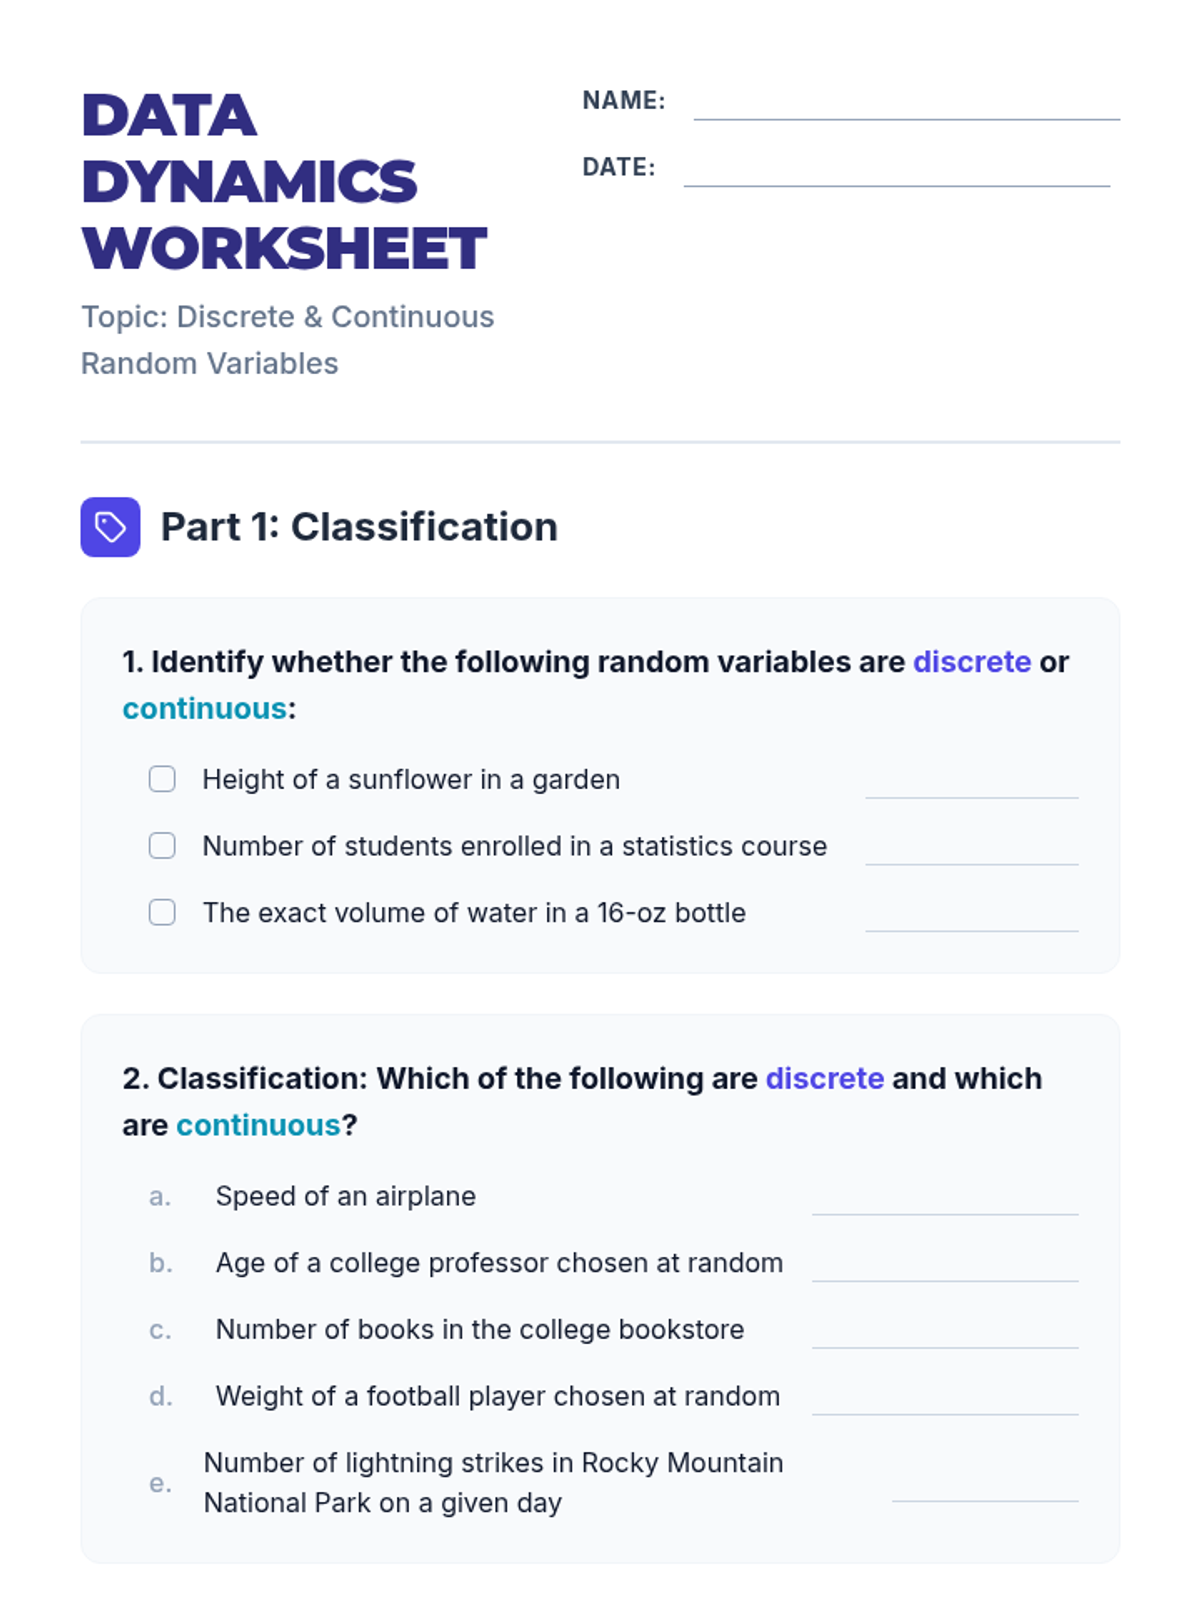
An introduction to random variables, distinguishing between discrete and continuous types, graphing probability distributions, and calculating mean and standard deviation.
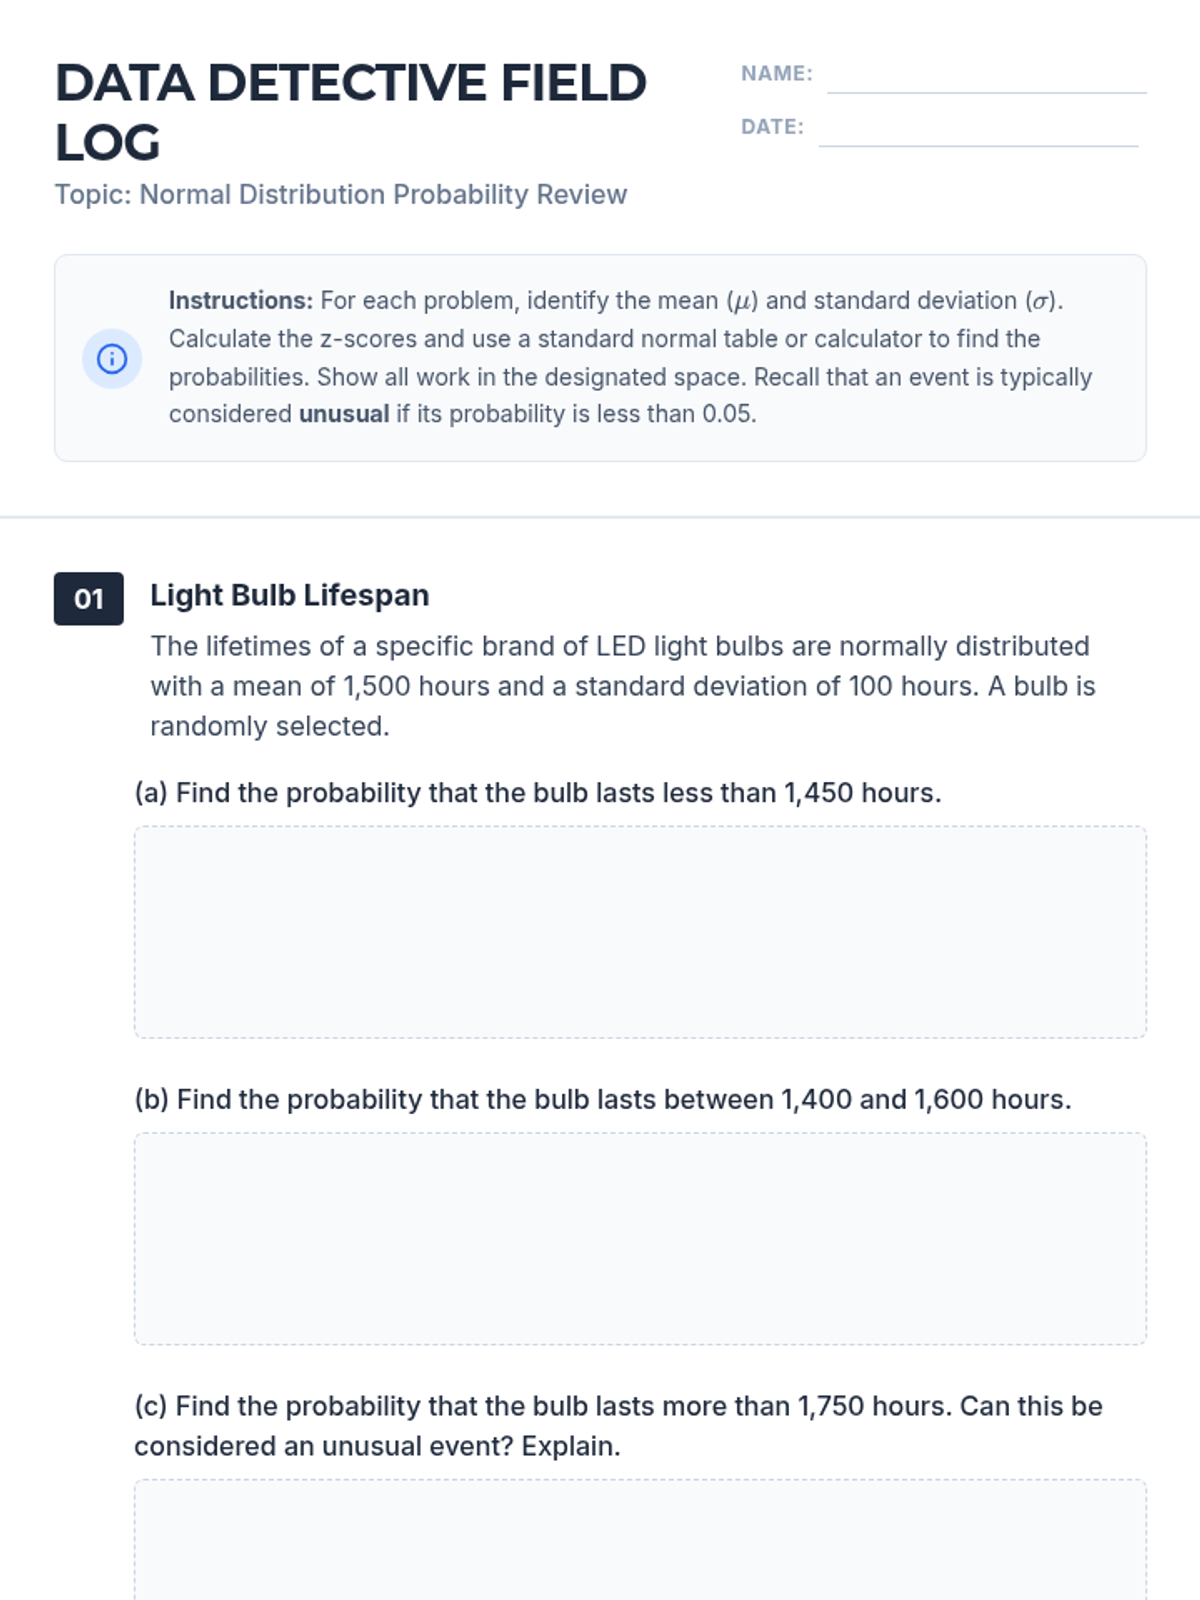
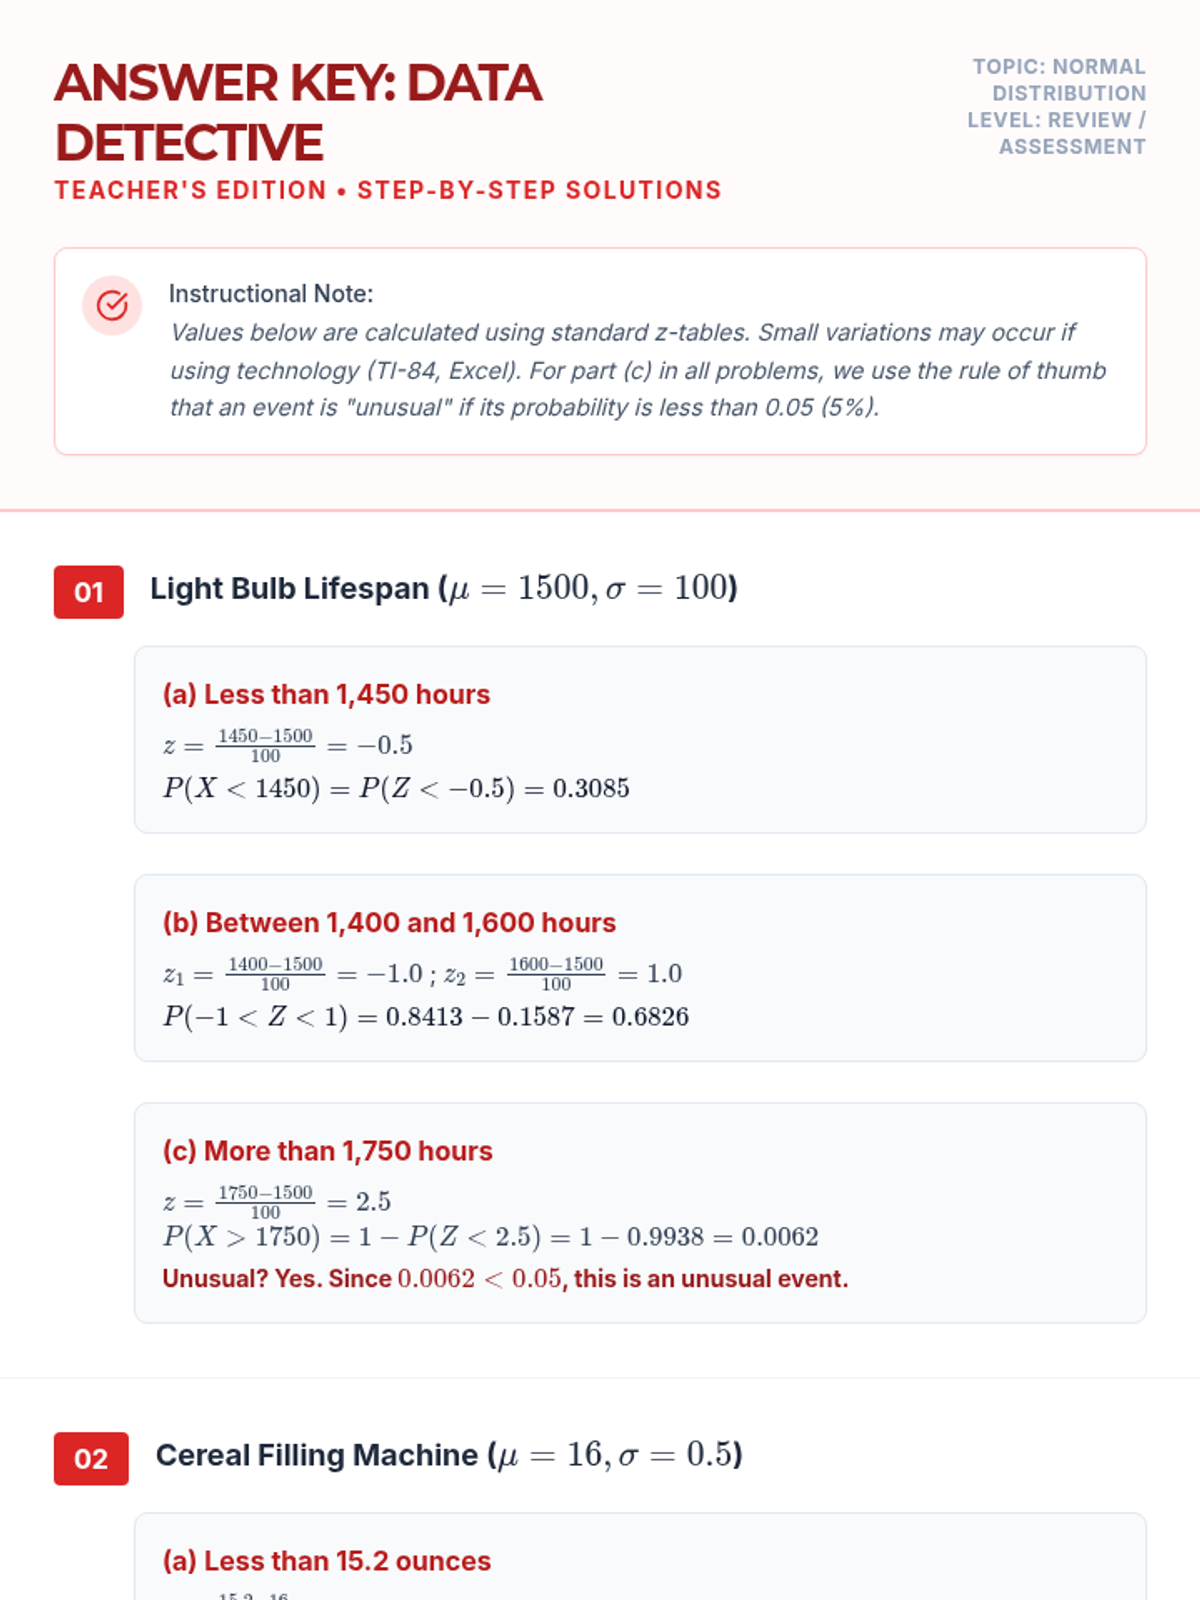
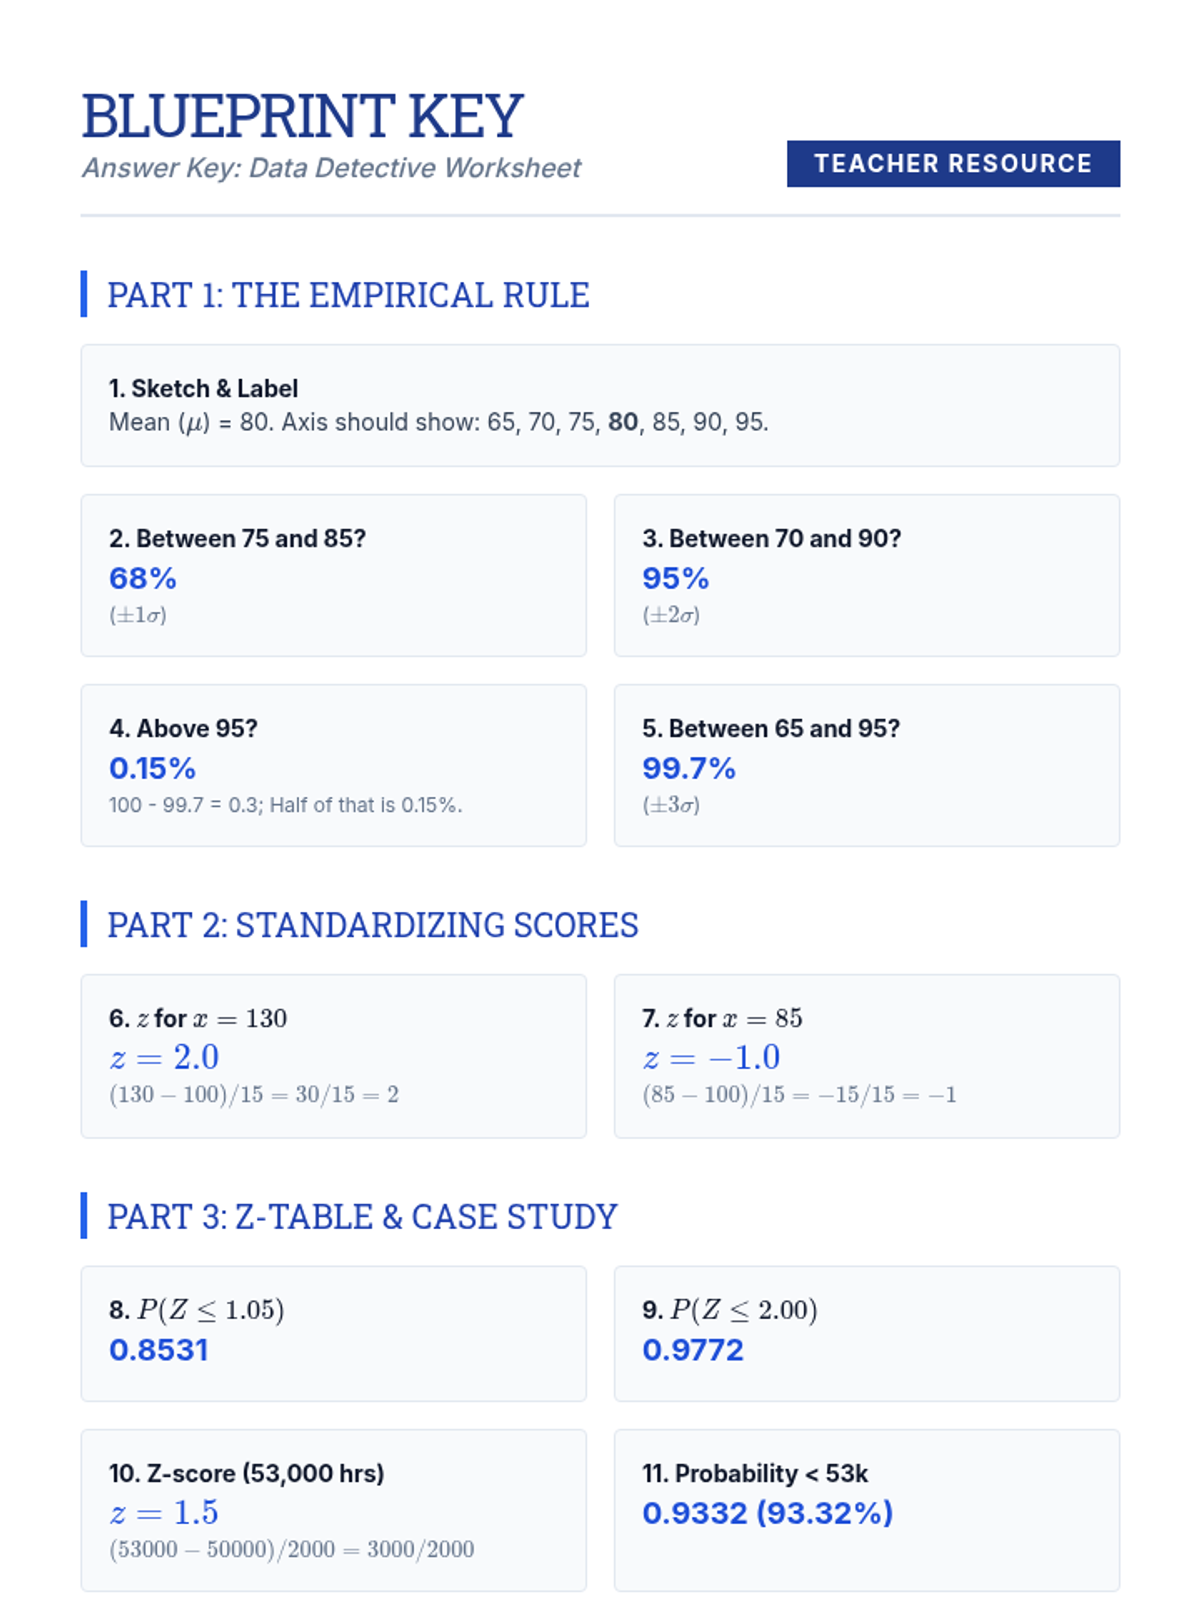
A comprehensive review of normal distribution calculations, including z-score conversion and probability determination for various real-world scenarios. Students will calculate left-tail, right-tail, and interval probabilities and evaluate the rarity of events.
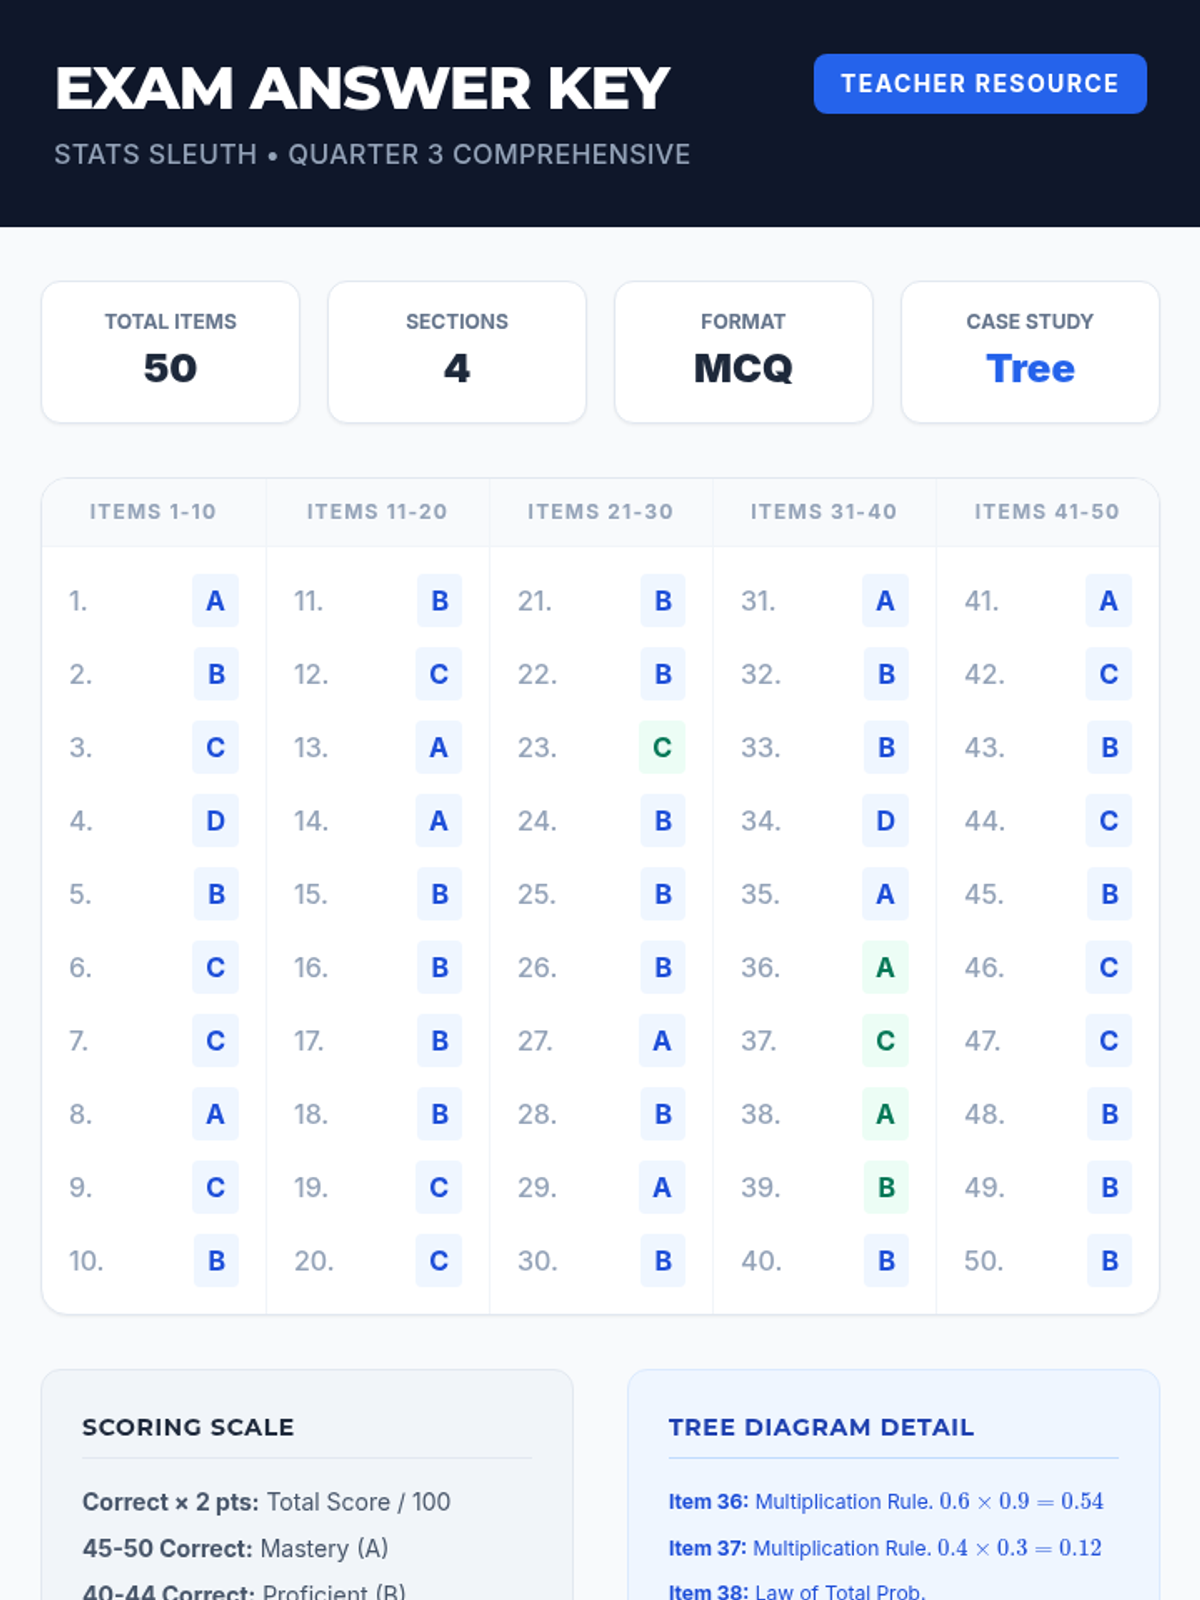
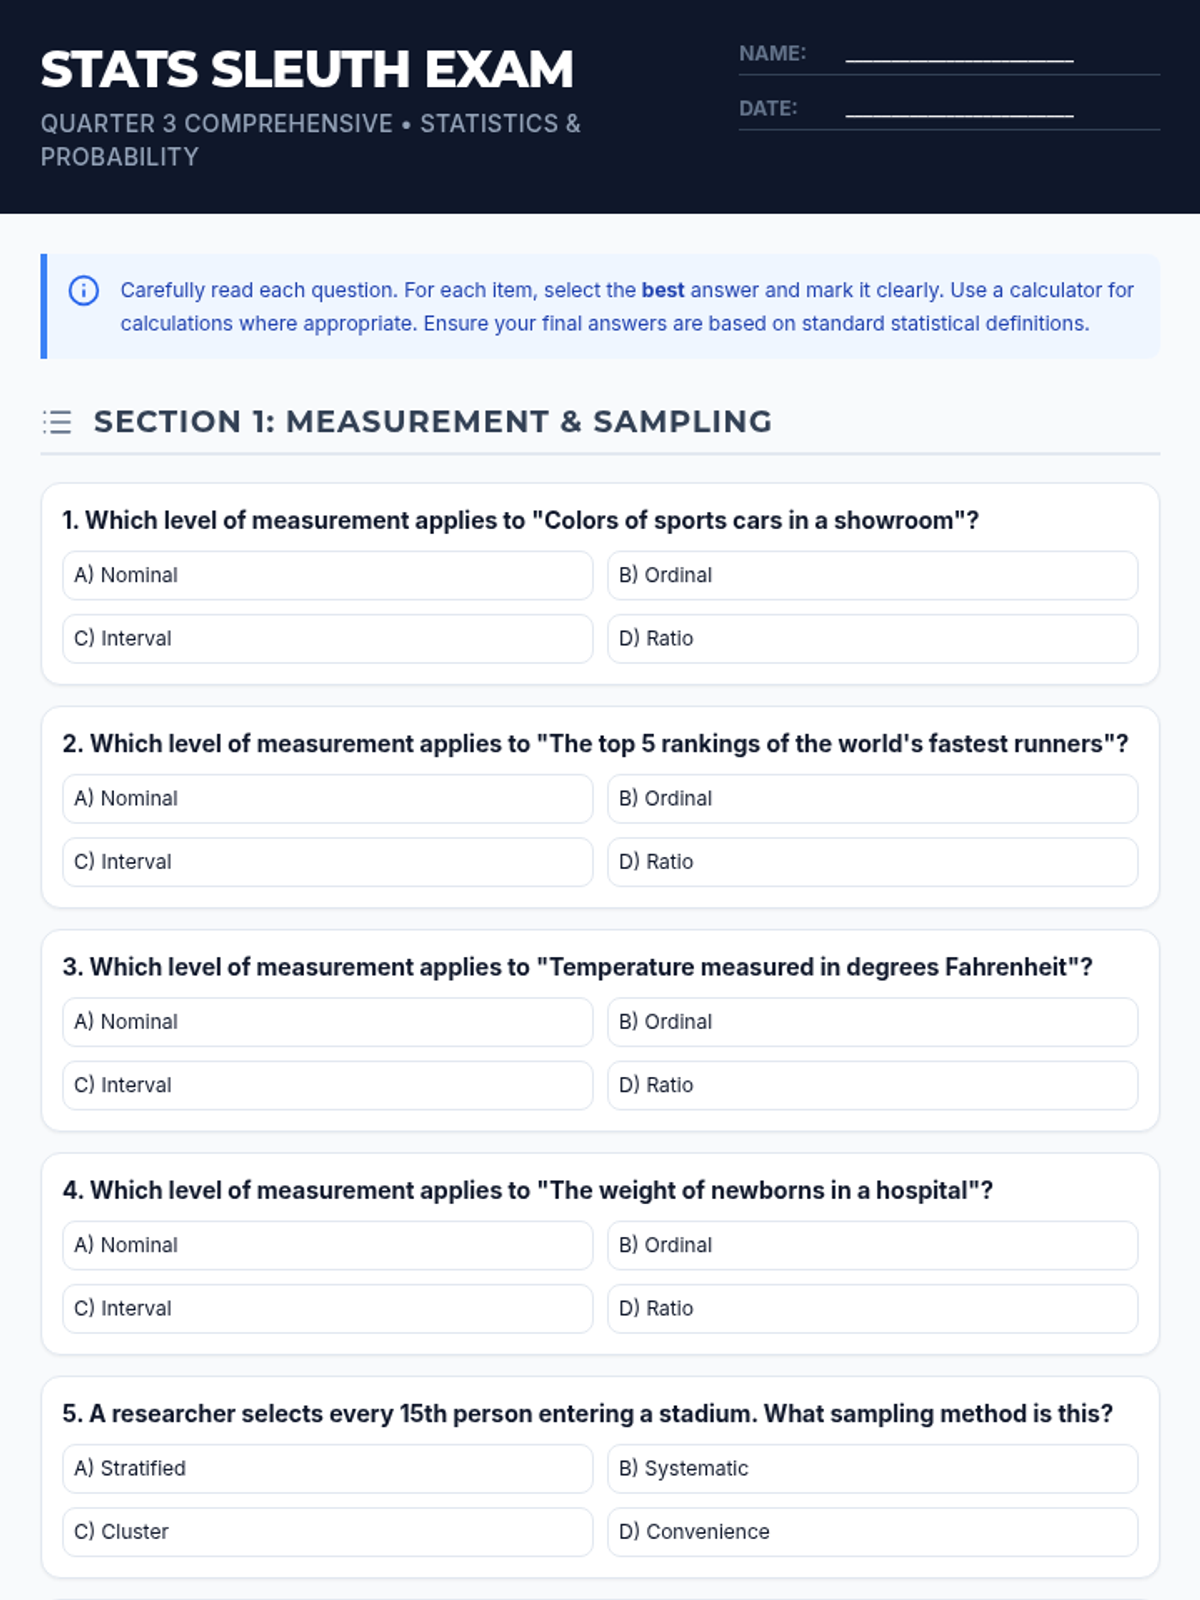
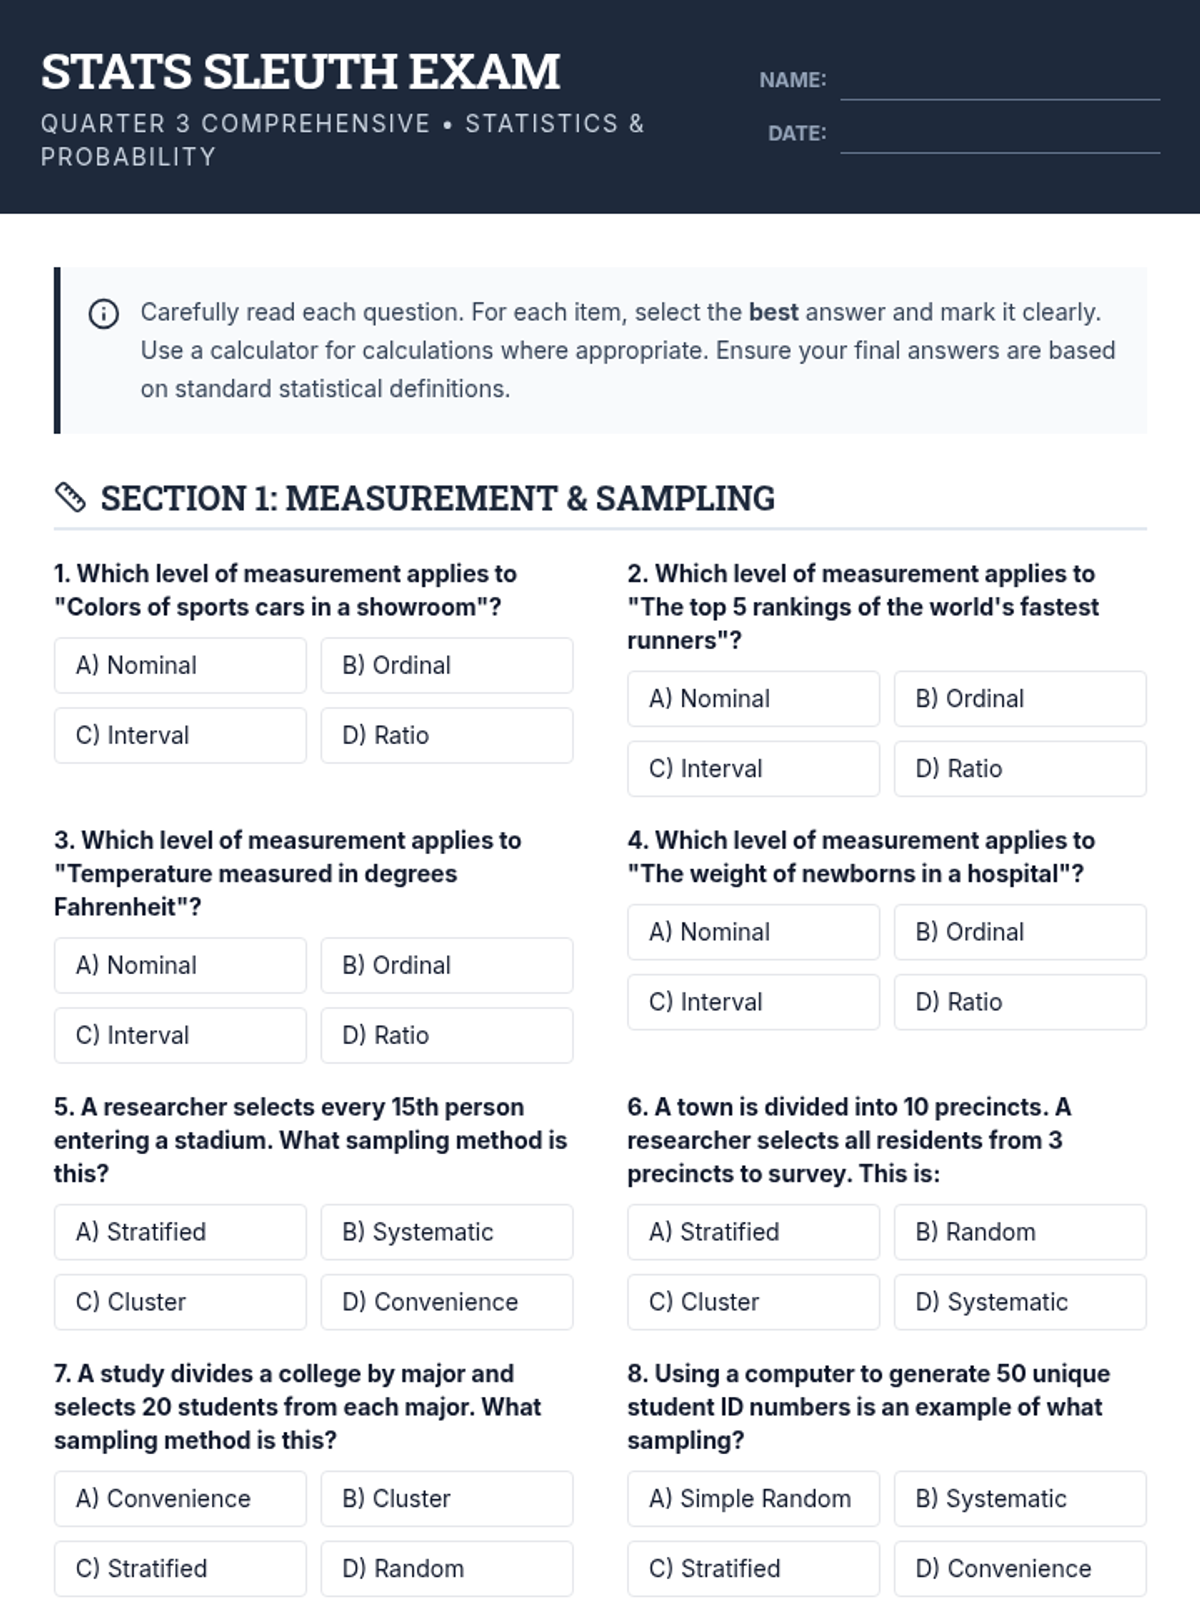
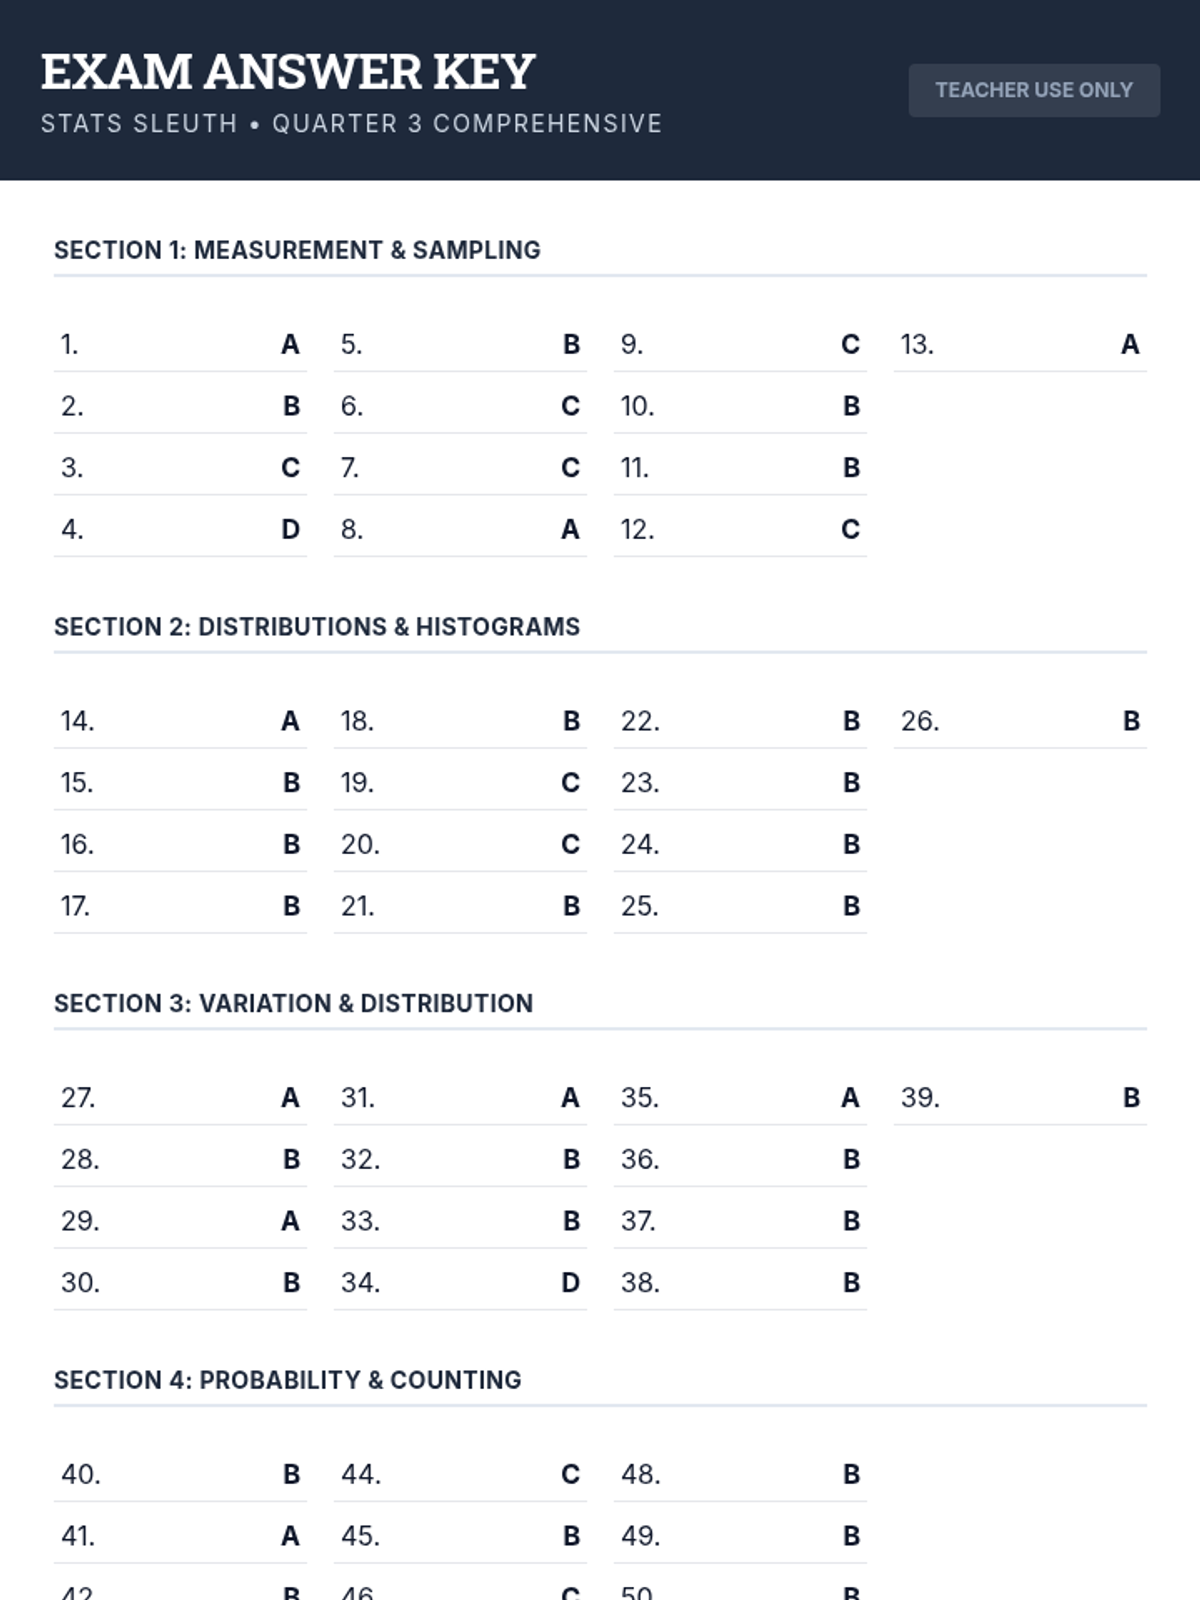
A comprehensive assessment covering descriptive statistics, data distributions, measures of variation, and basic probability theory including tree diagrams.
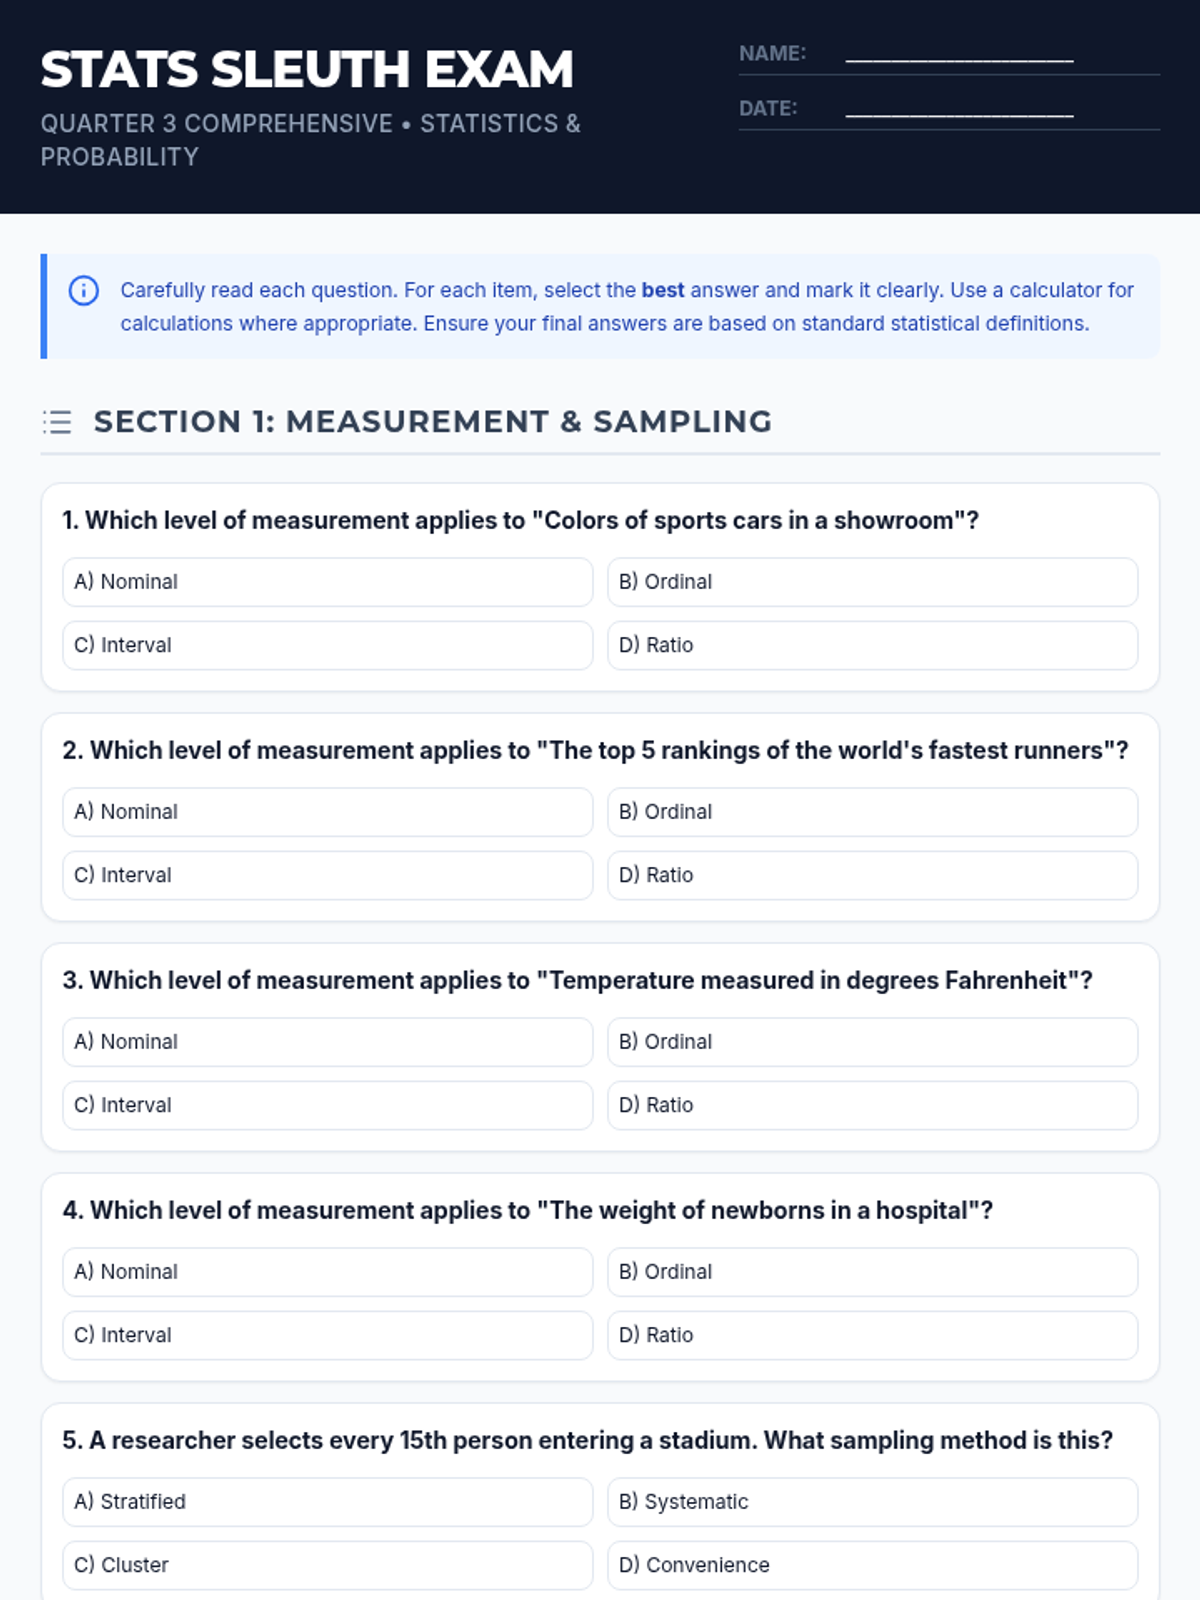
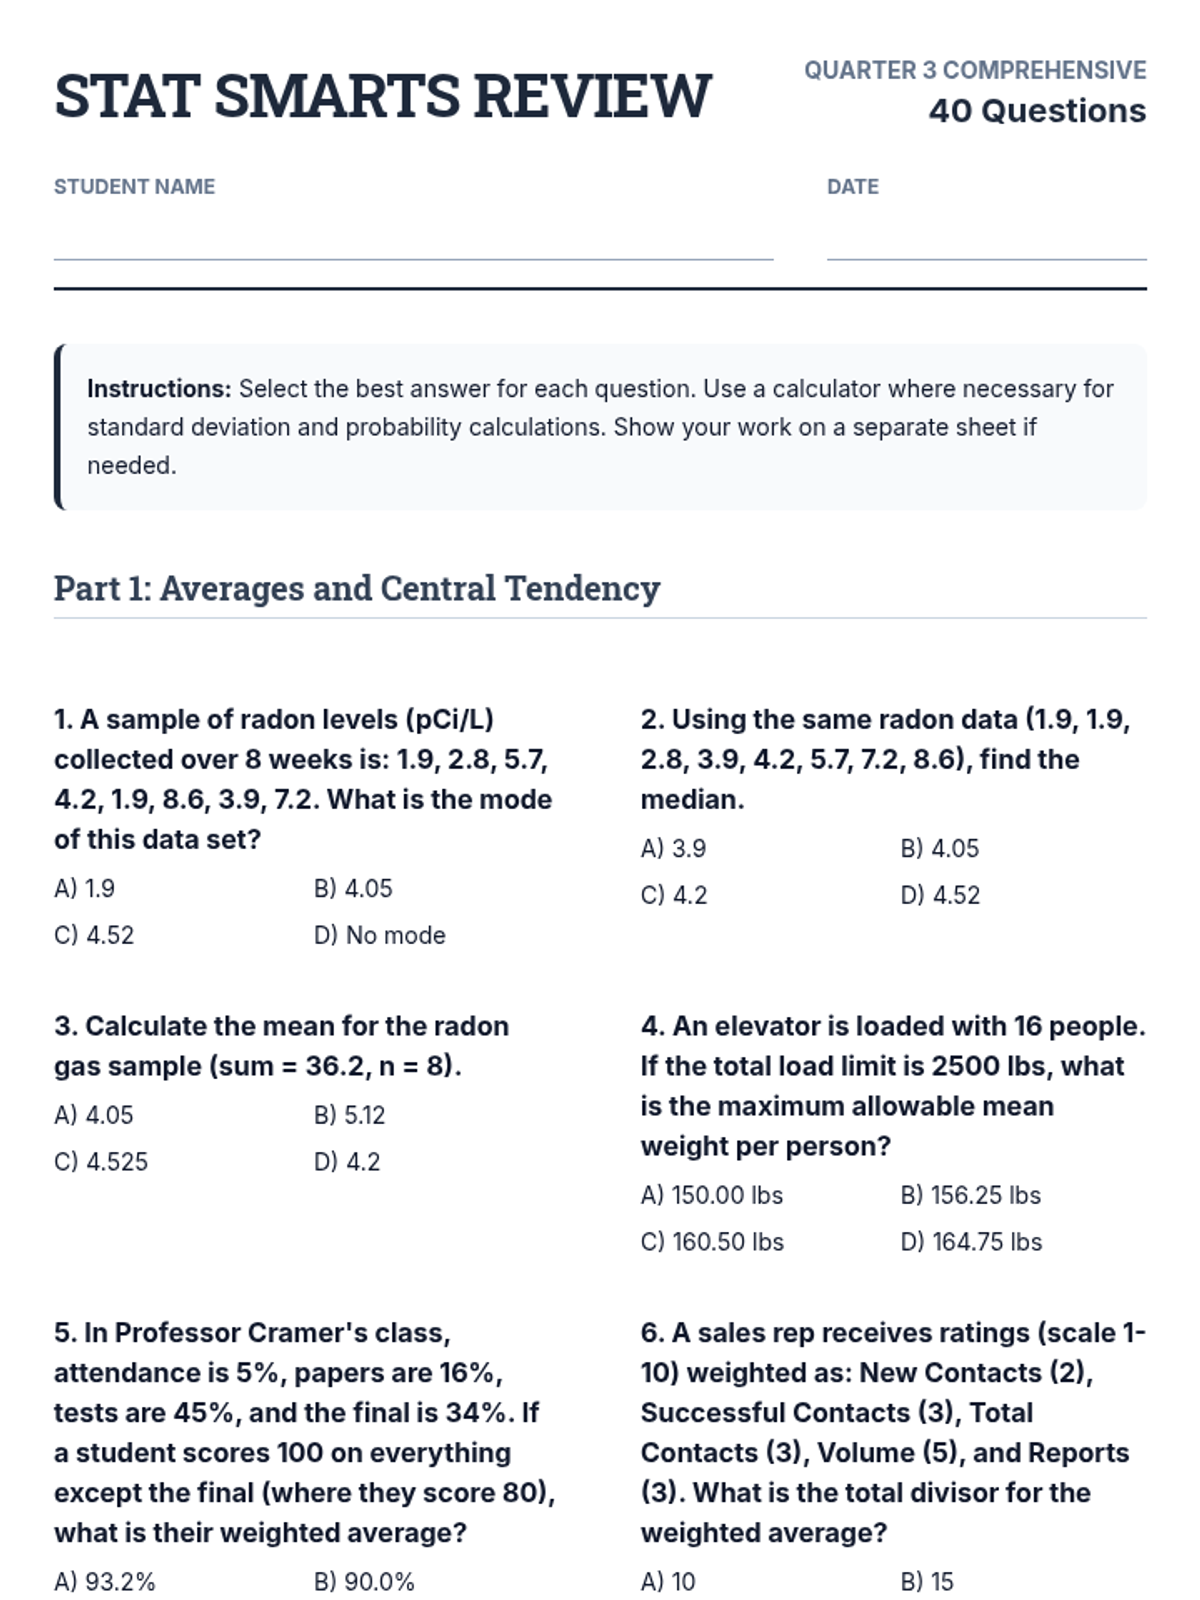
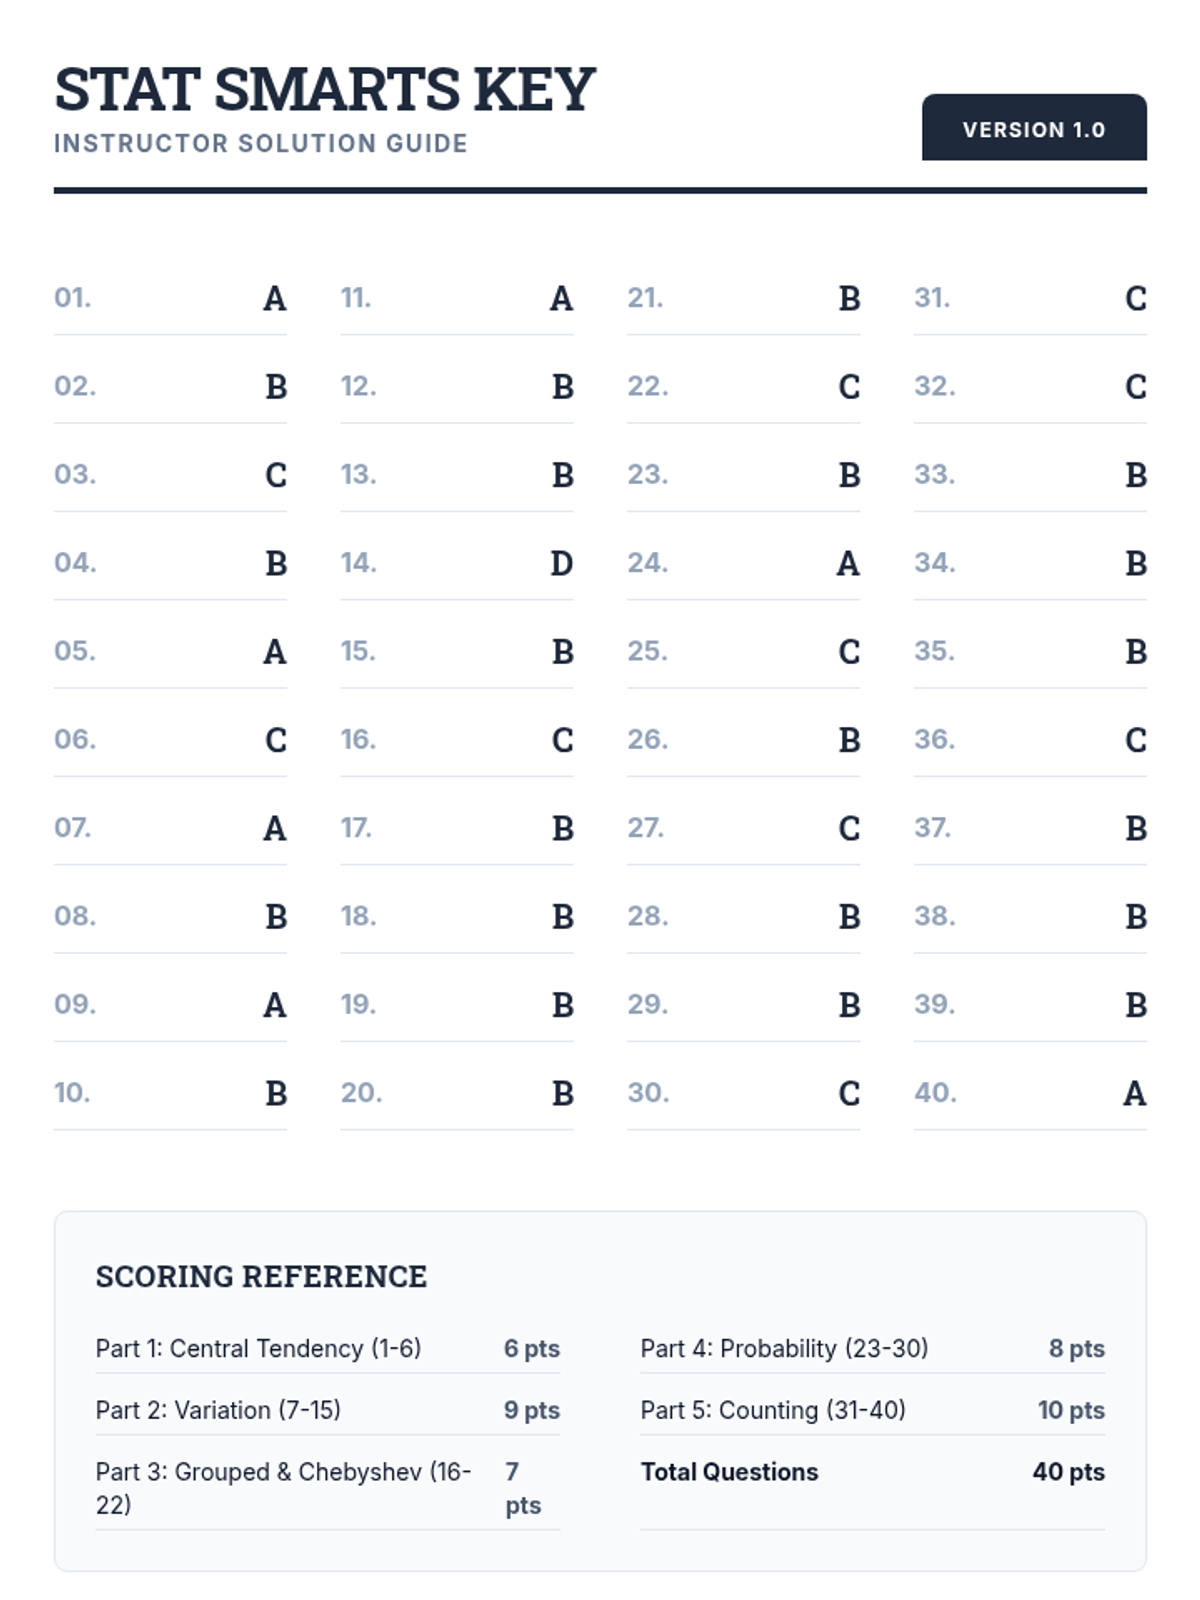
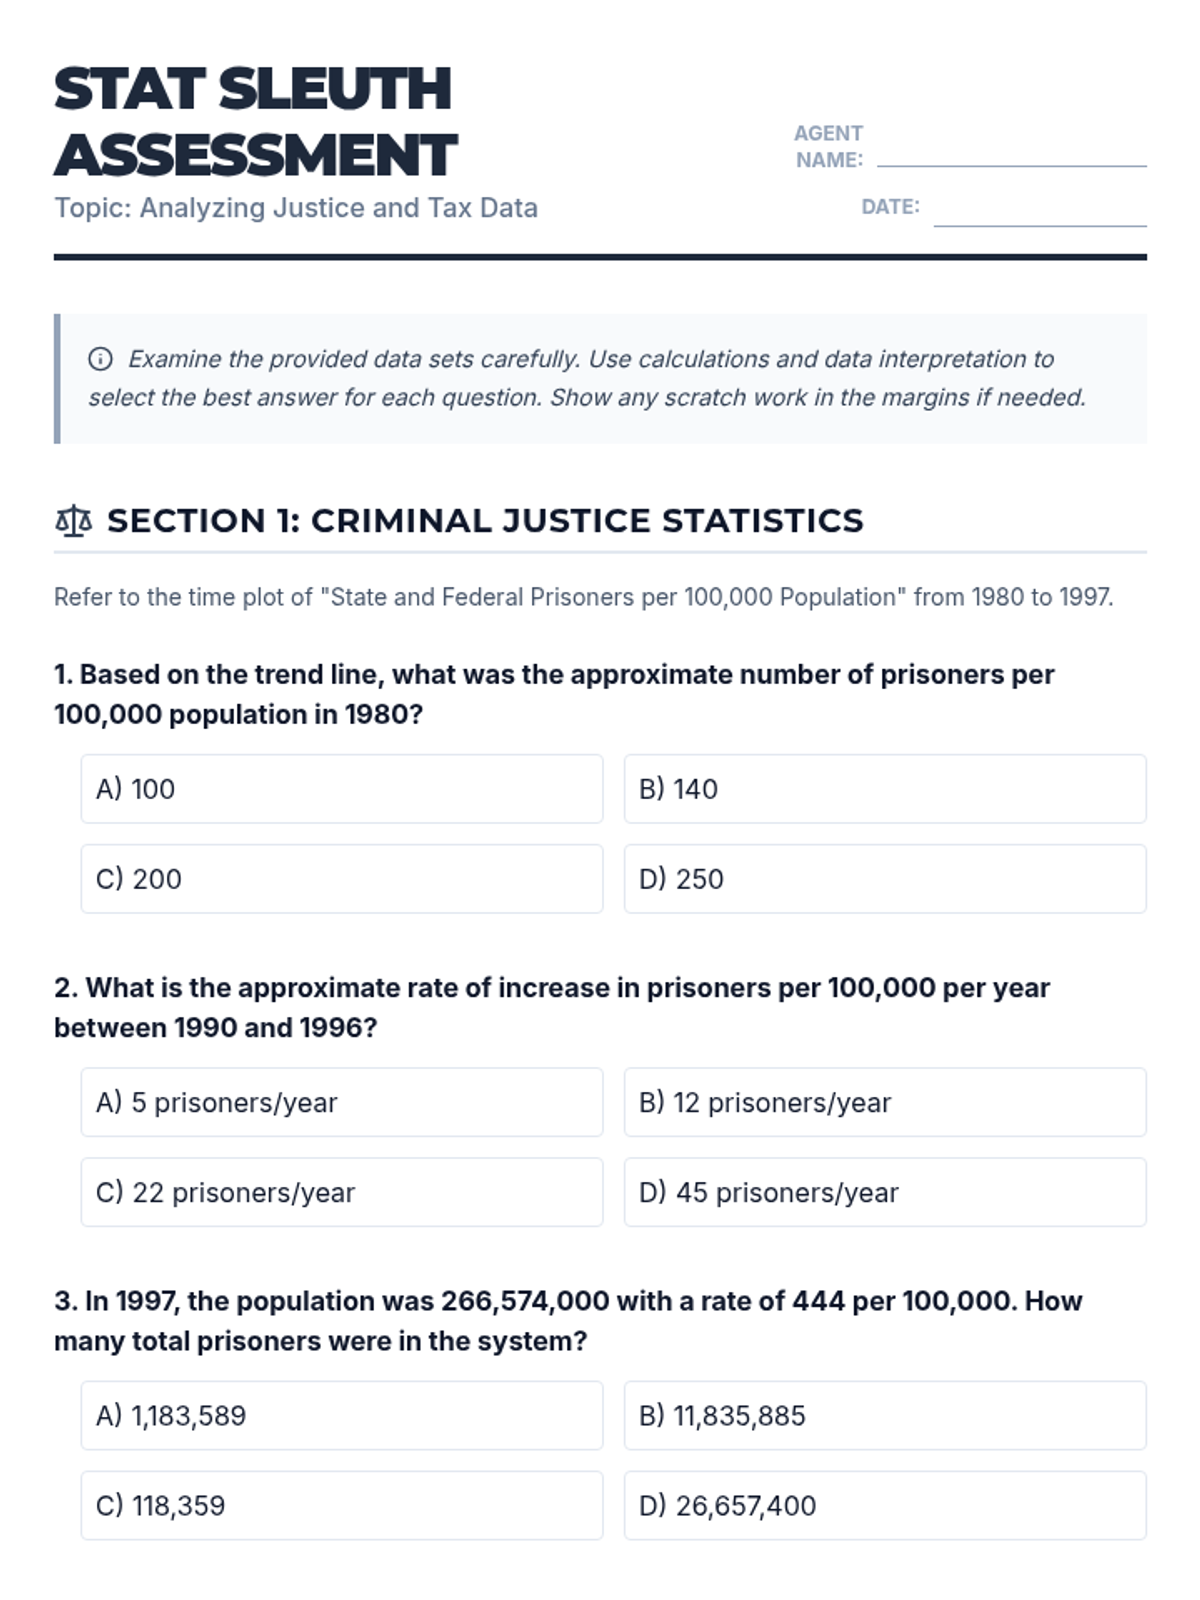
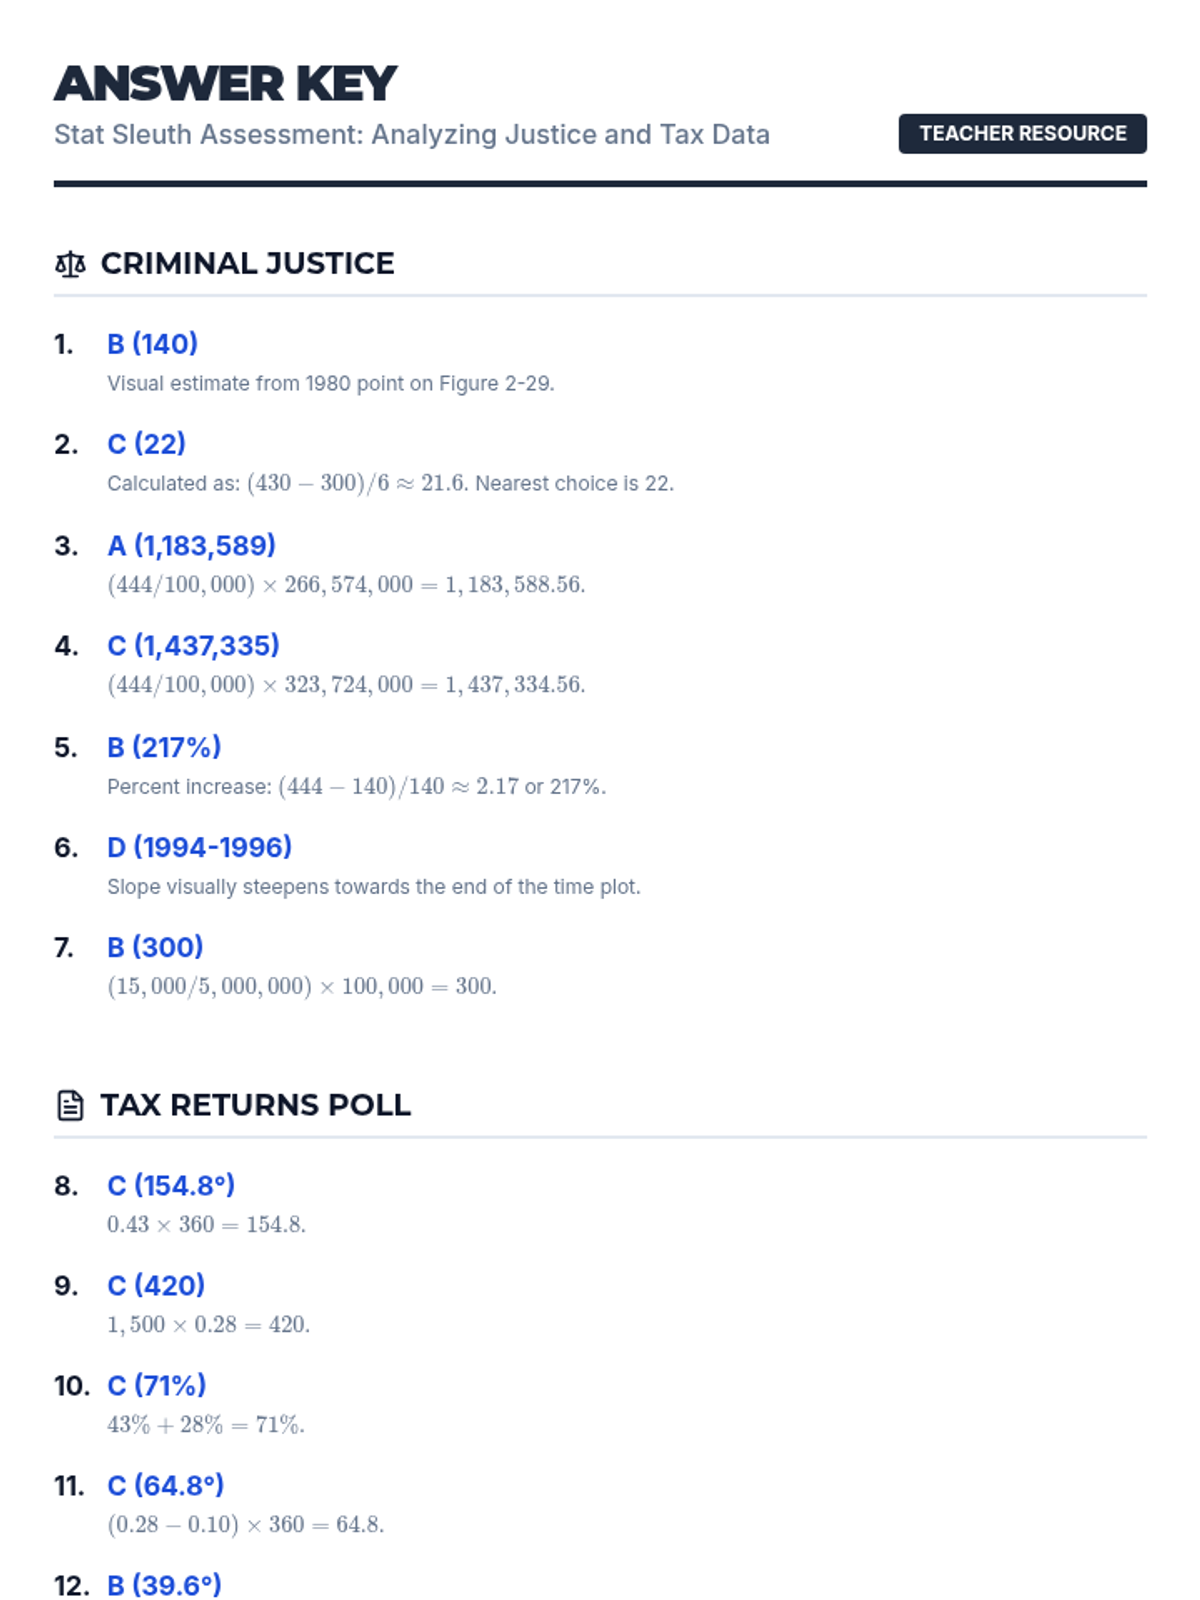
A comprehensive 3rd-quarter statistics assessment combining data interpretation, central tendency, variation, probability, and counting techniques. Students analyze real-world scenarios including justice system data, tax polls, and probability models.
A comprehensive 40-question review covering descriptive statistics, elementary probability, and counting techniques based on Algebra 1 and Statistics curriculum.
A lesson focused on interpreting and analyzing real-world data from criminal justice, tax returns, and law enforcement statistics using calculations like rates of change, percentages, and frequency distributions.
A comprehensive practice session for the TSIA2 Math exam, focusing on quantitative reasoning, algebraic reasoning, geometry, and statistics.
A comprehensive lesson focused on performing and interpreting linear regression analysis using real-world UN population and surface area data. Students will learn to identify variables, evaluate the impact of outliers, and draw conclusions based on correlation coefficients.
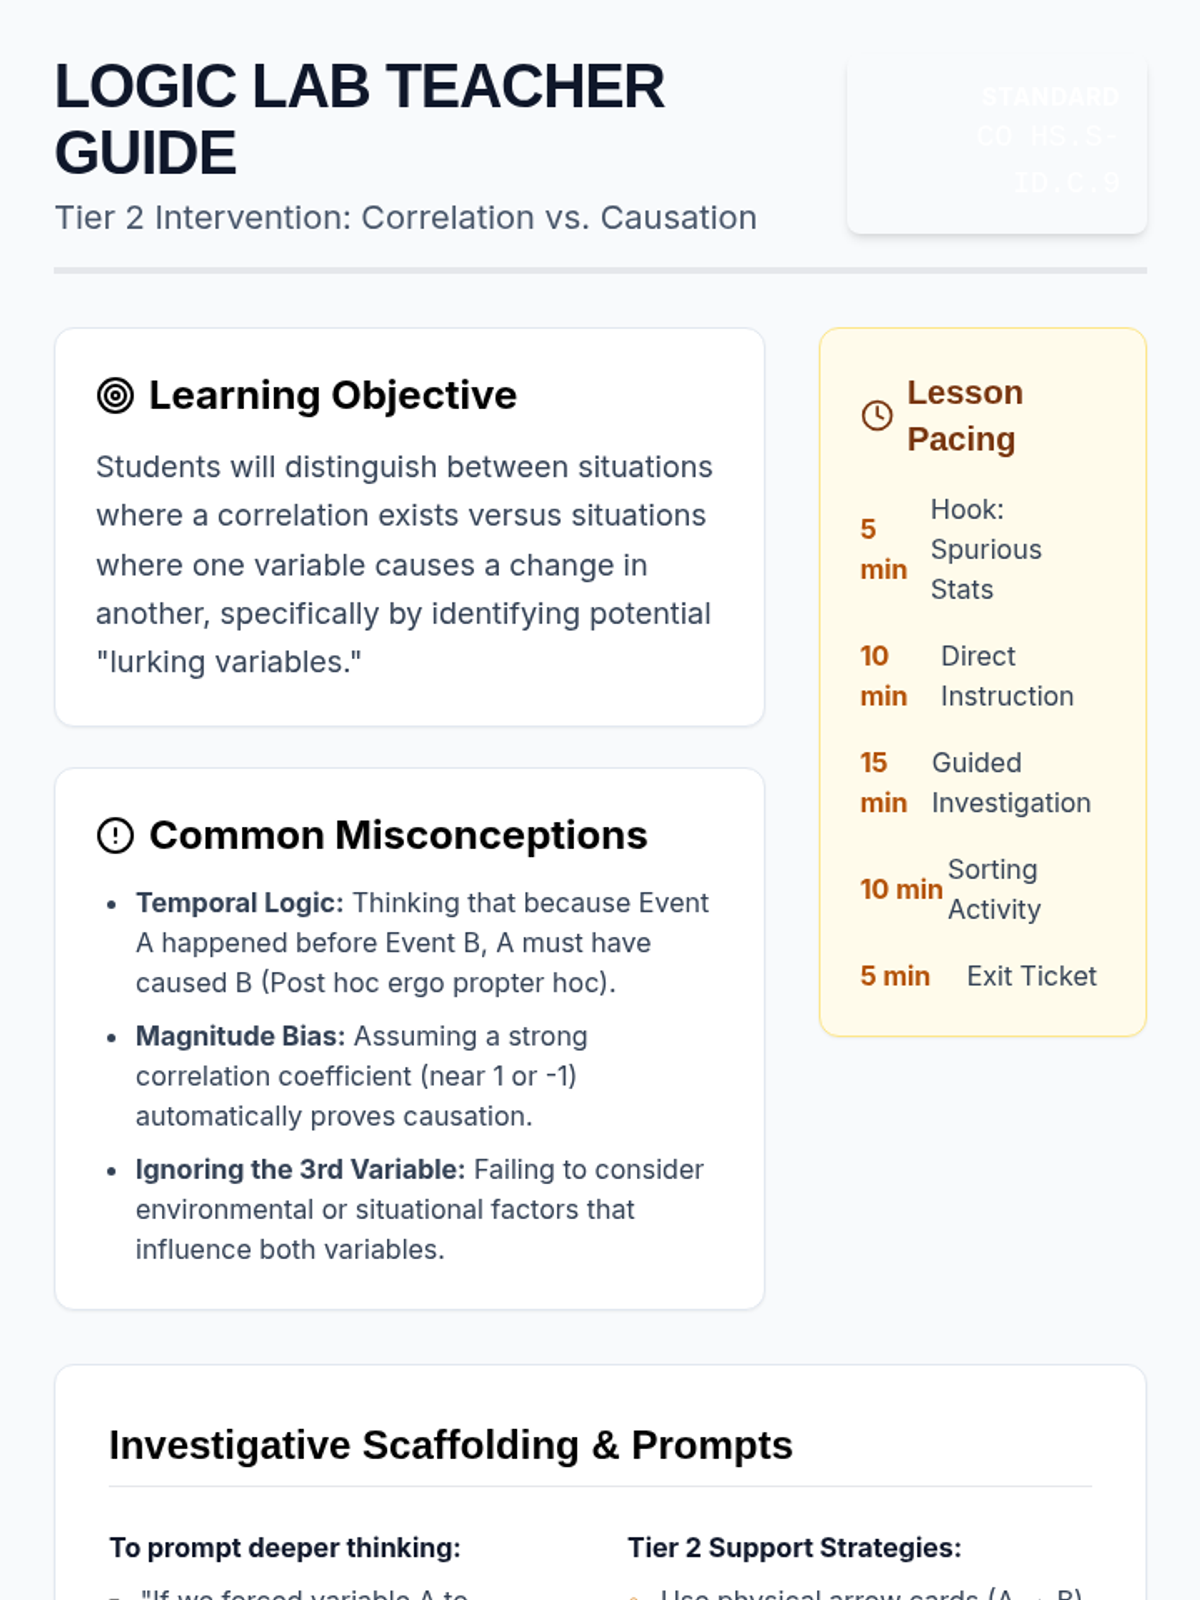
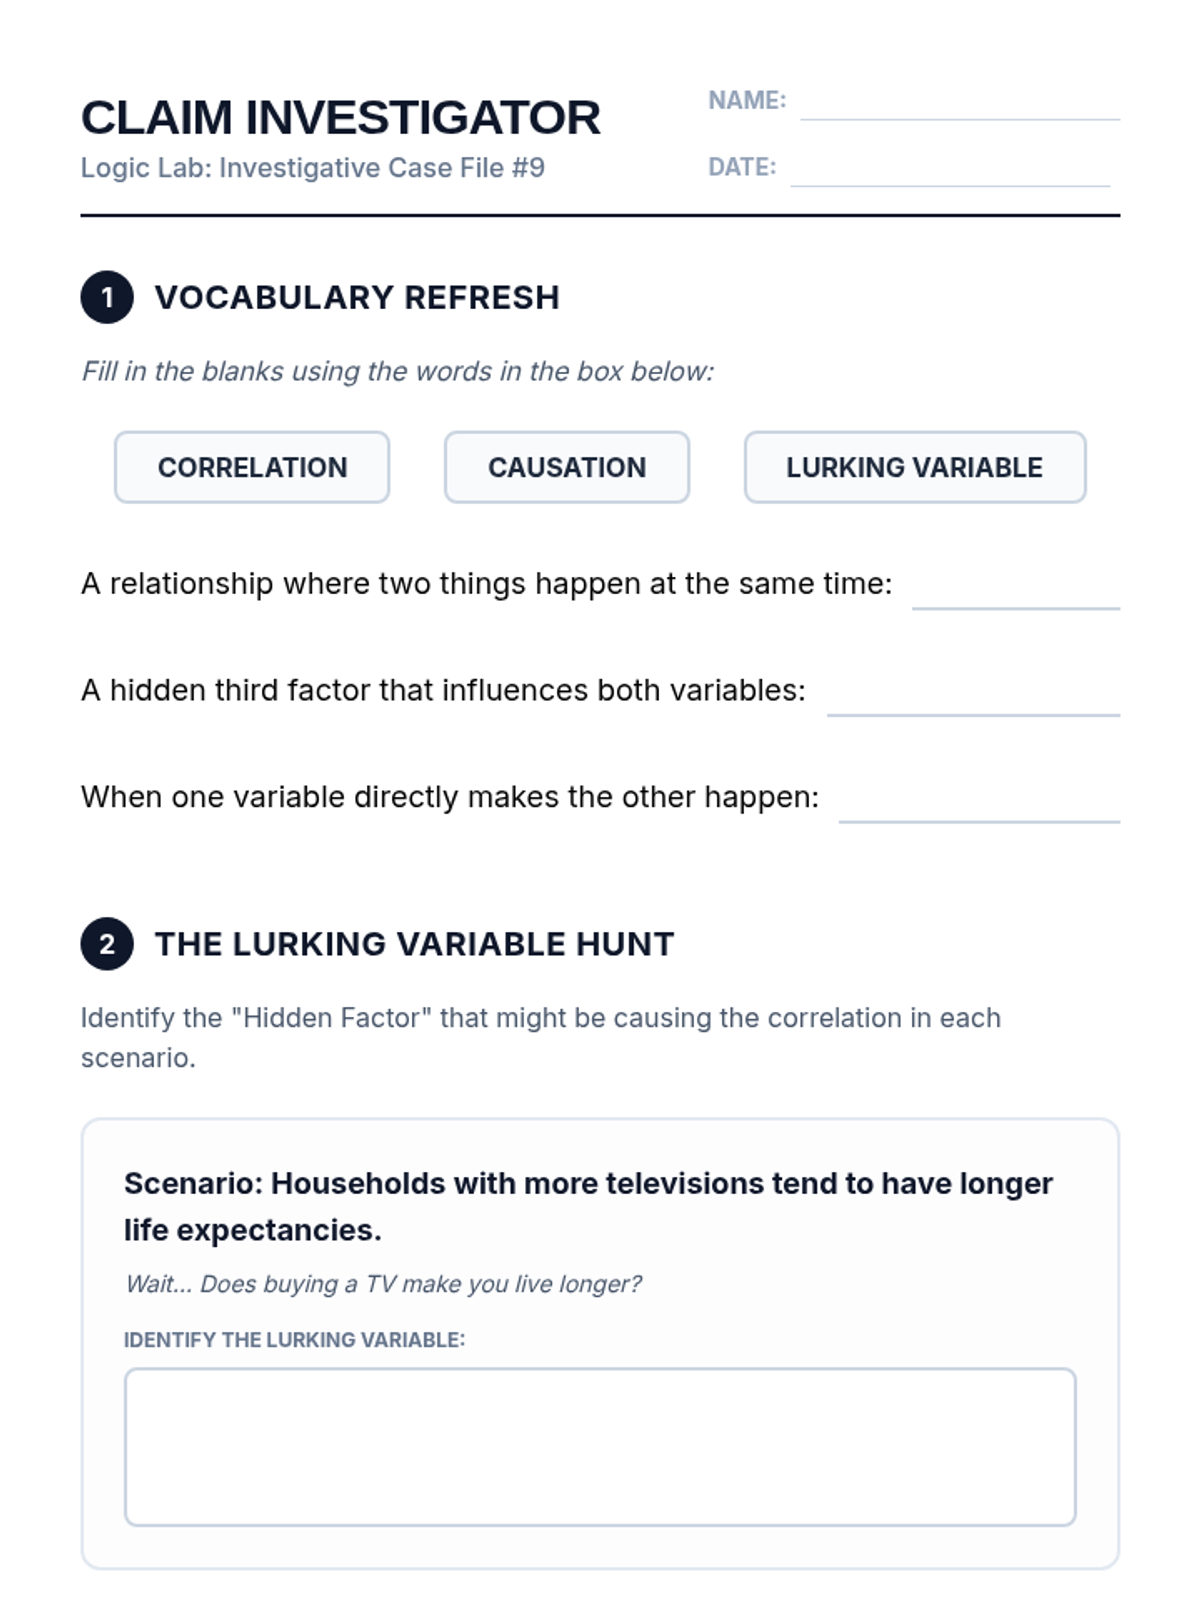
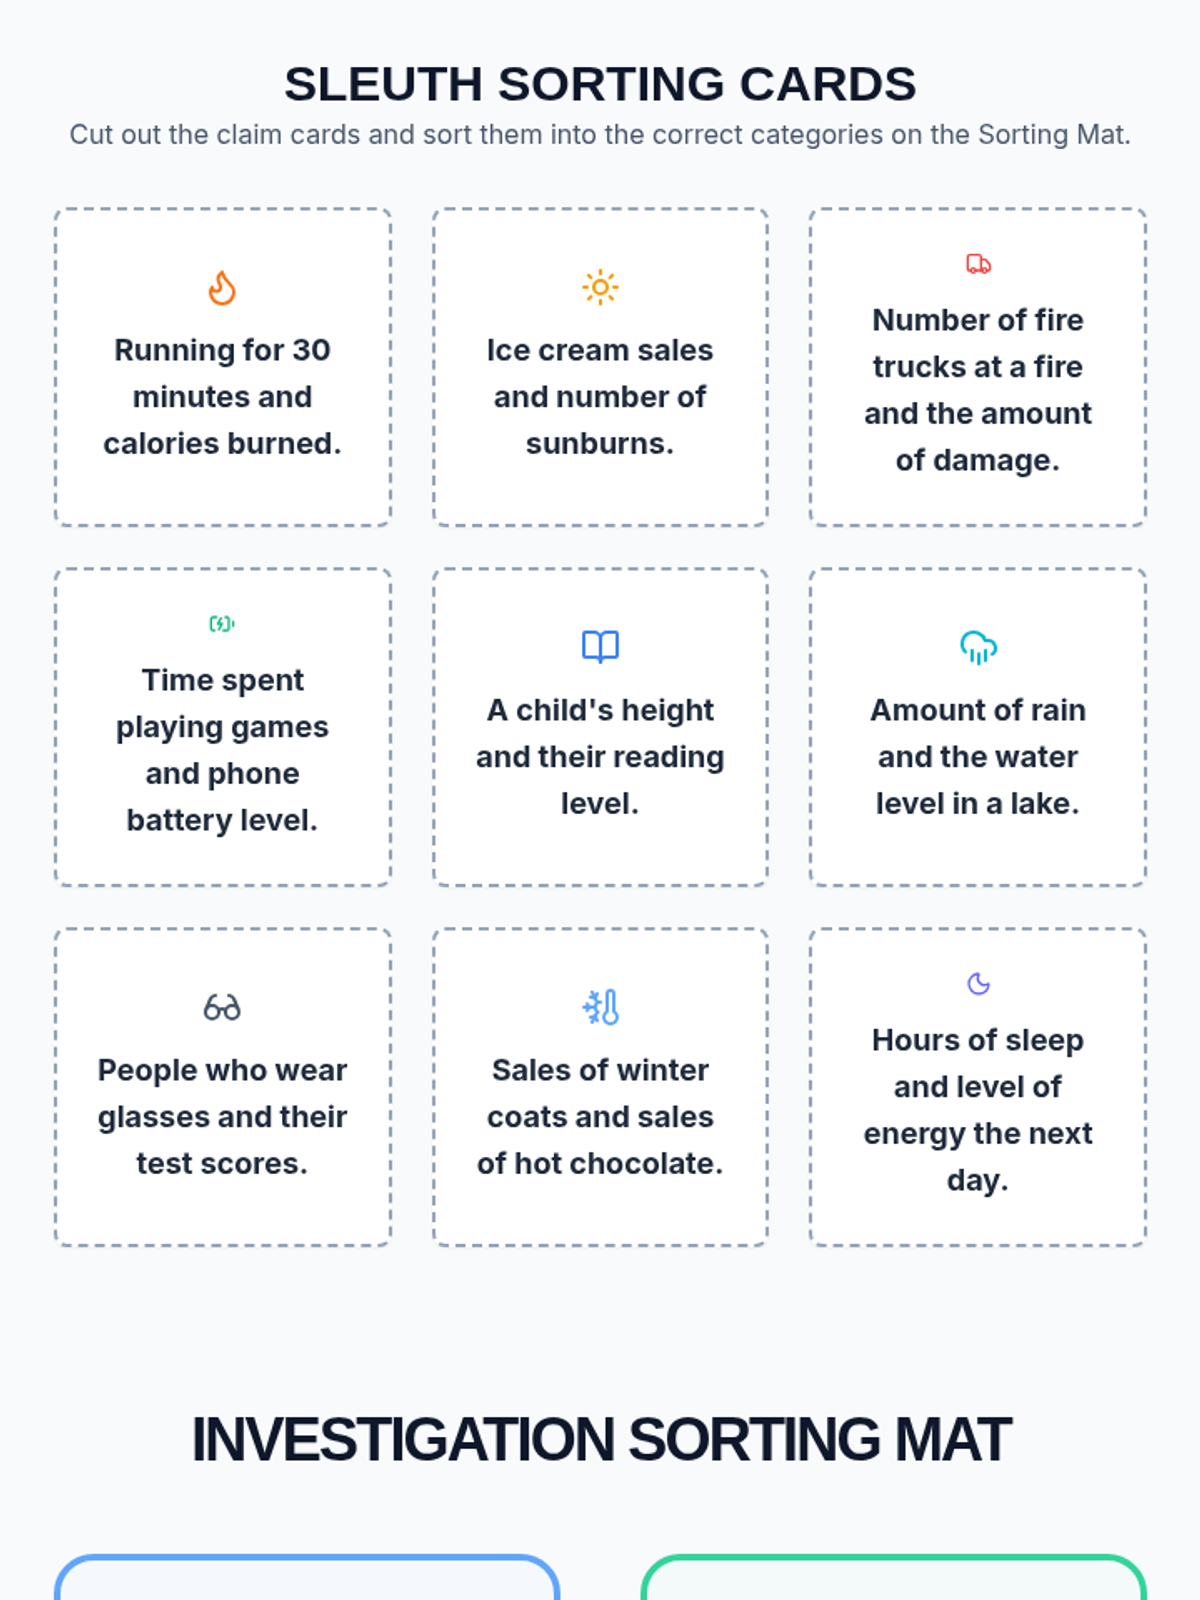
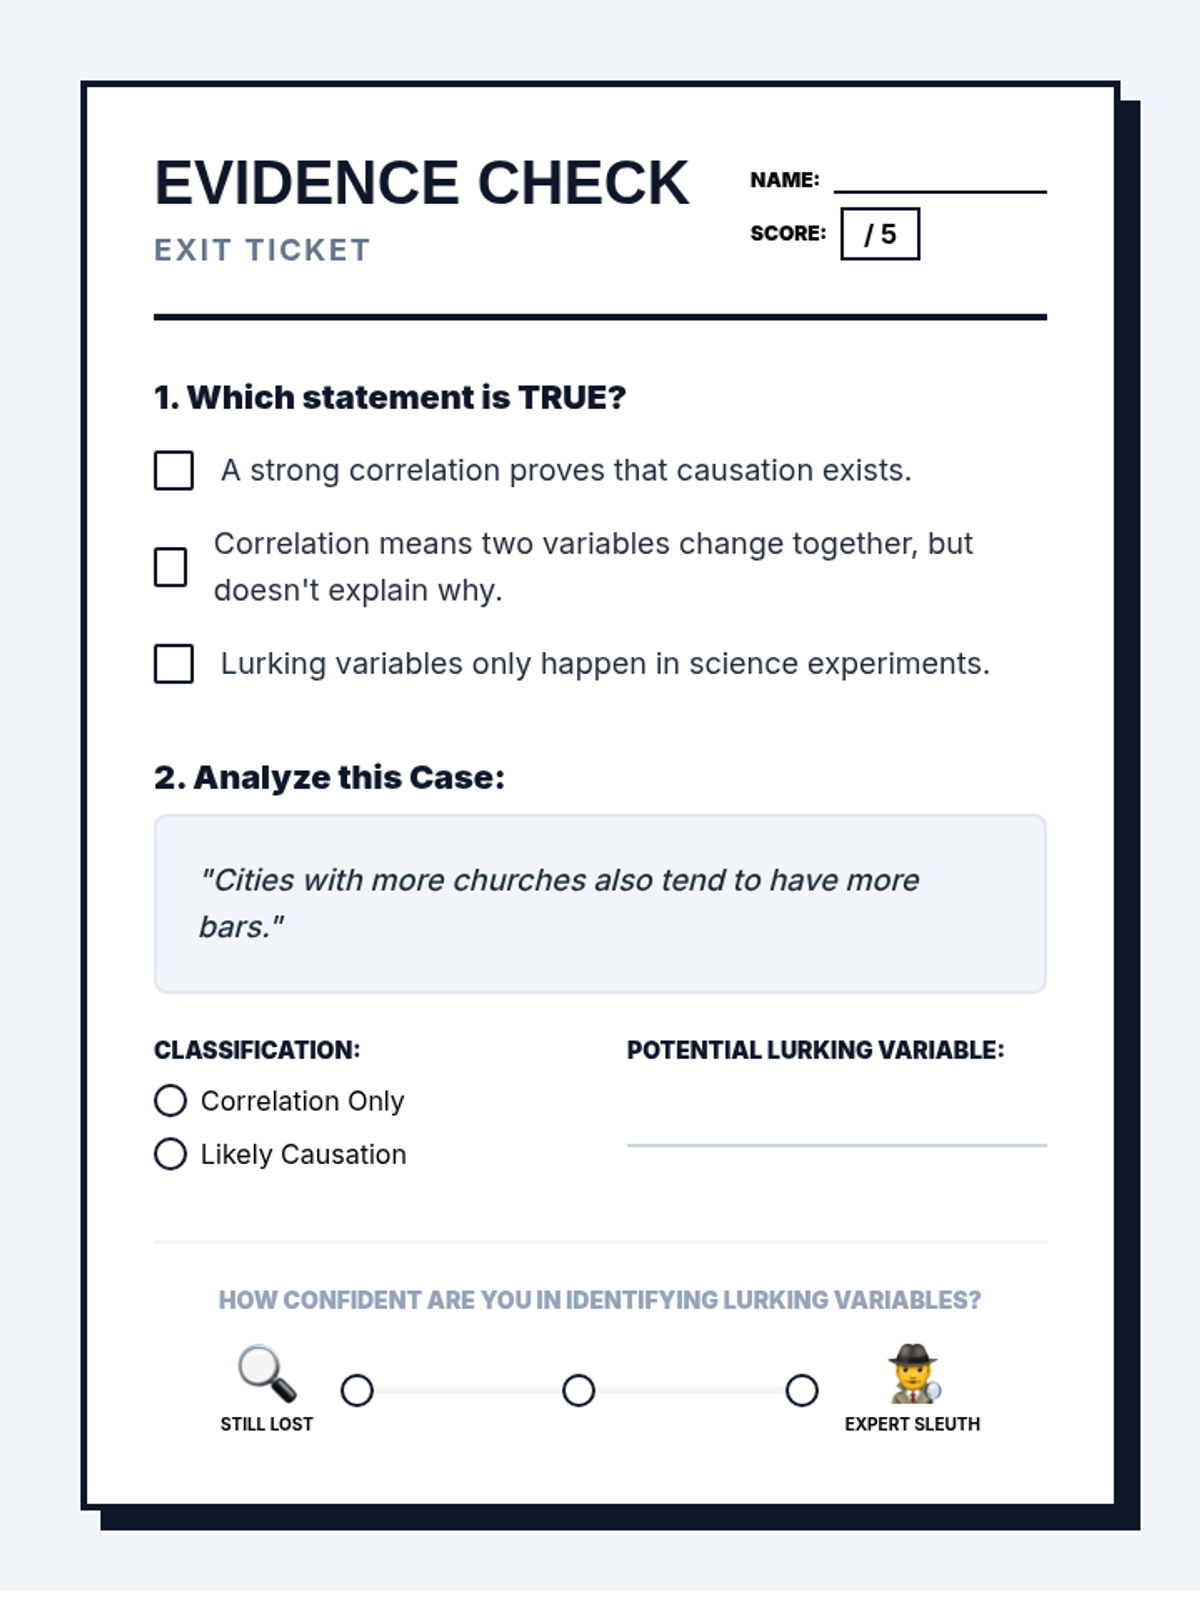
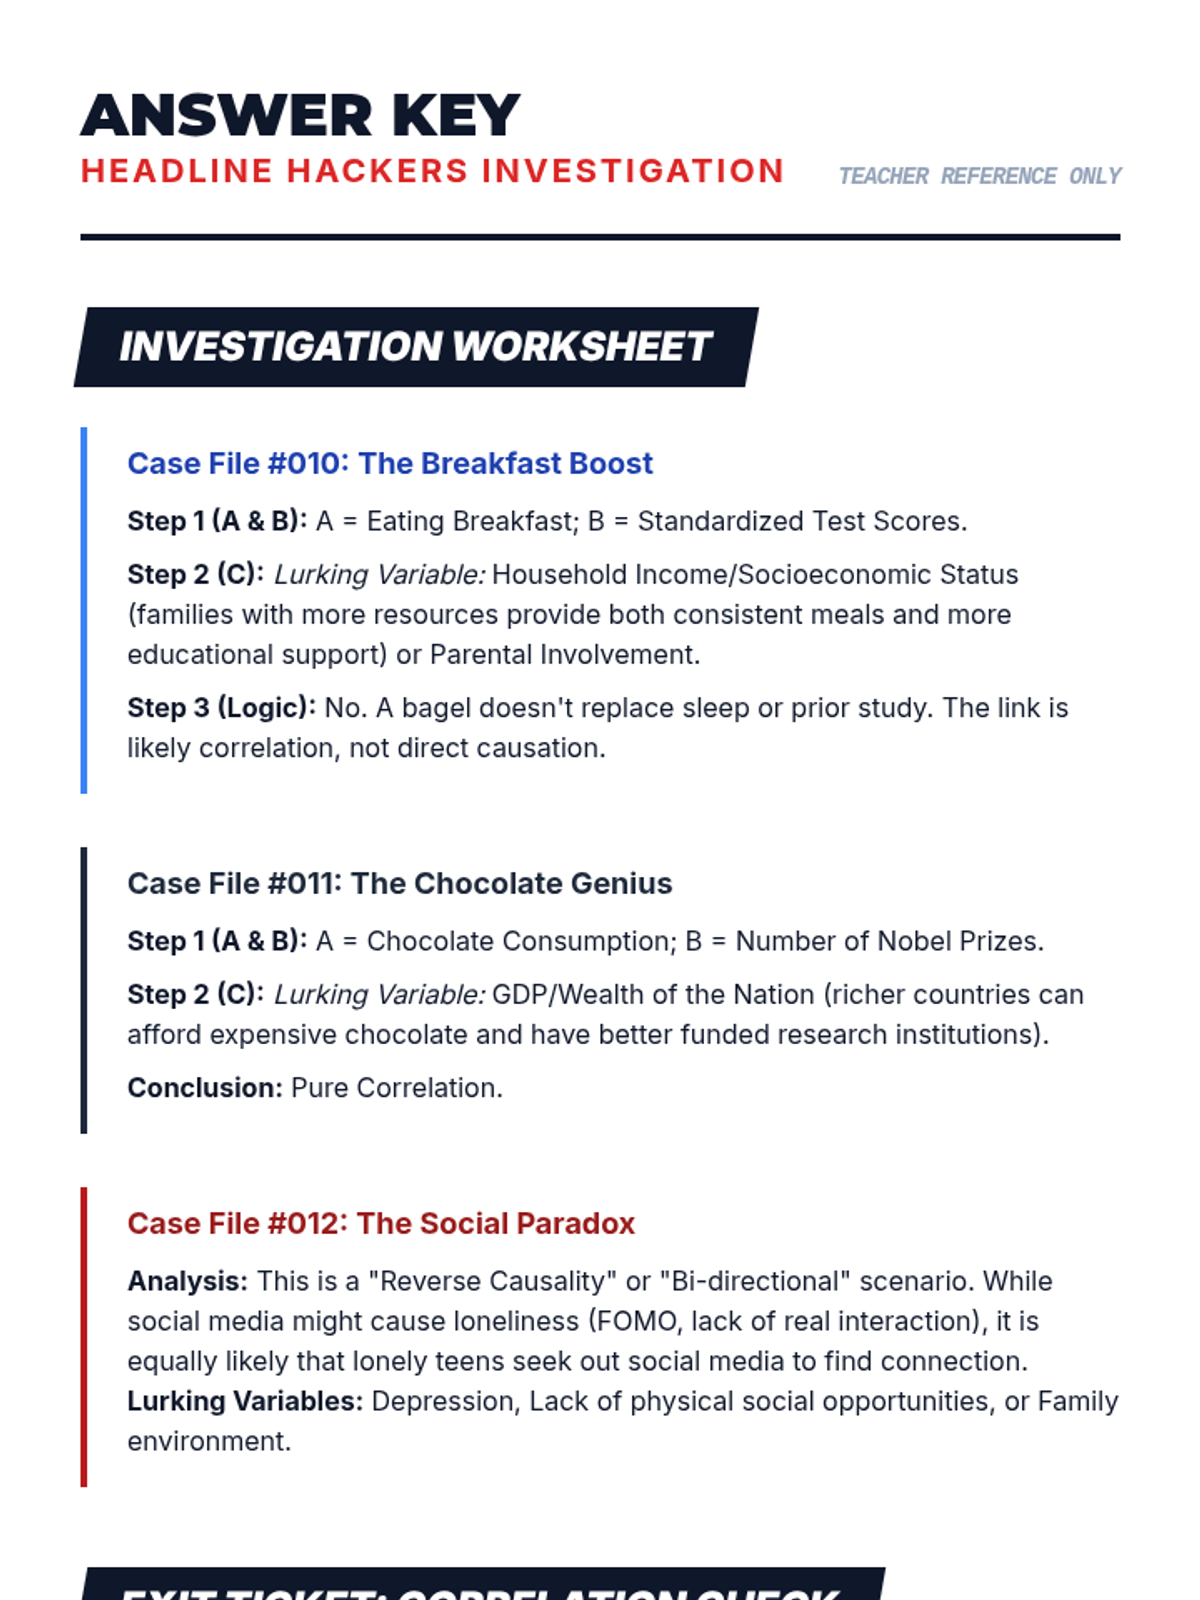
A targeted Tier 2 intervention lesson focused on distinguishing between correlation and causation through investigative scenarios, lurking variable identification, and sorting activities.
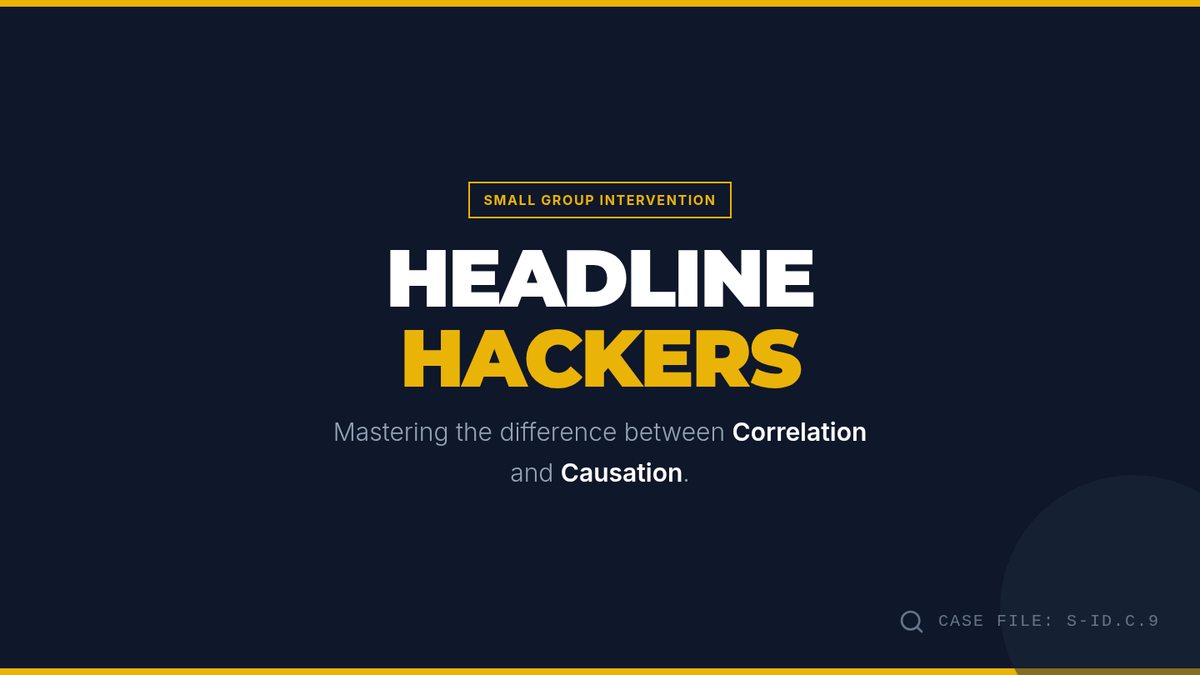
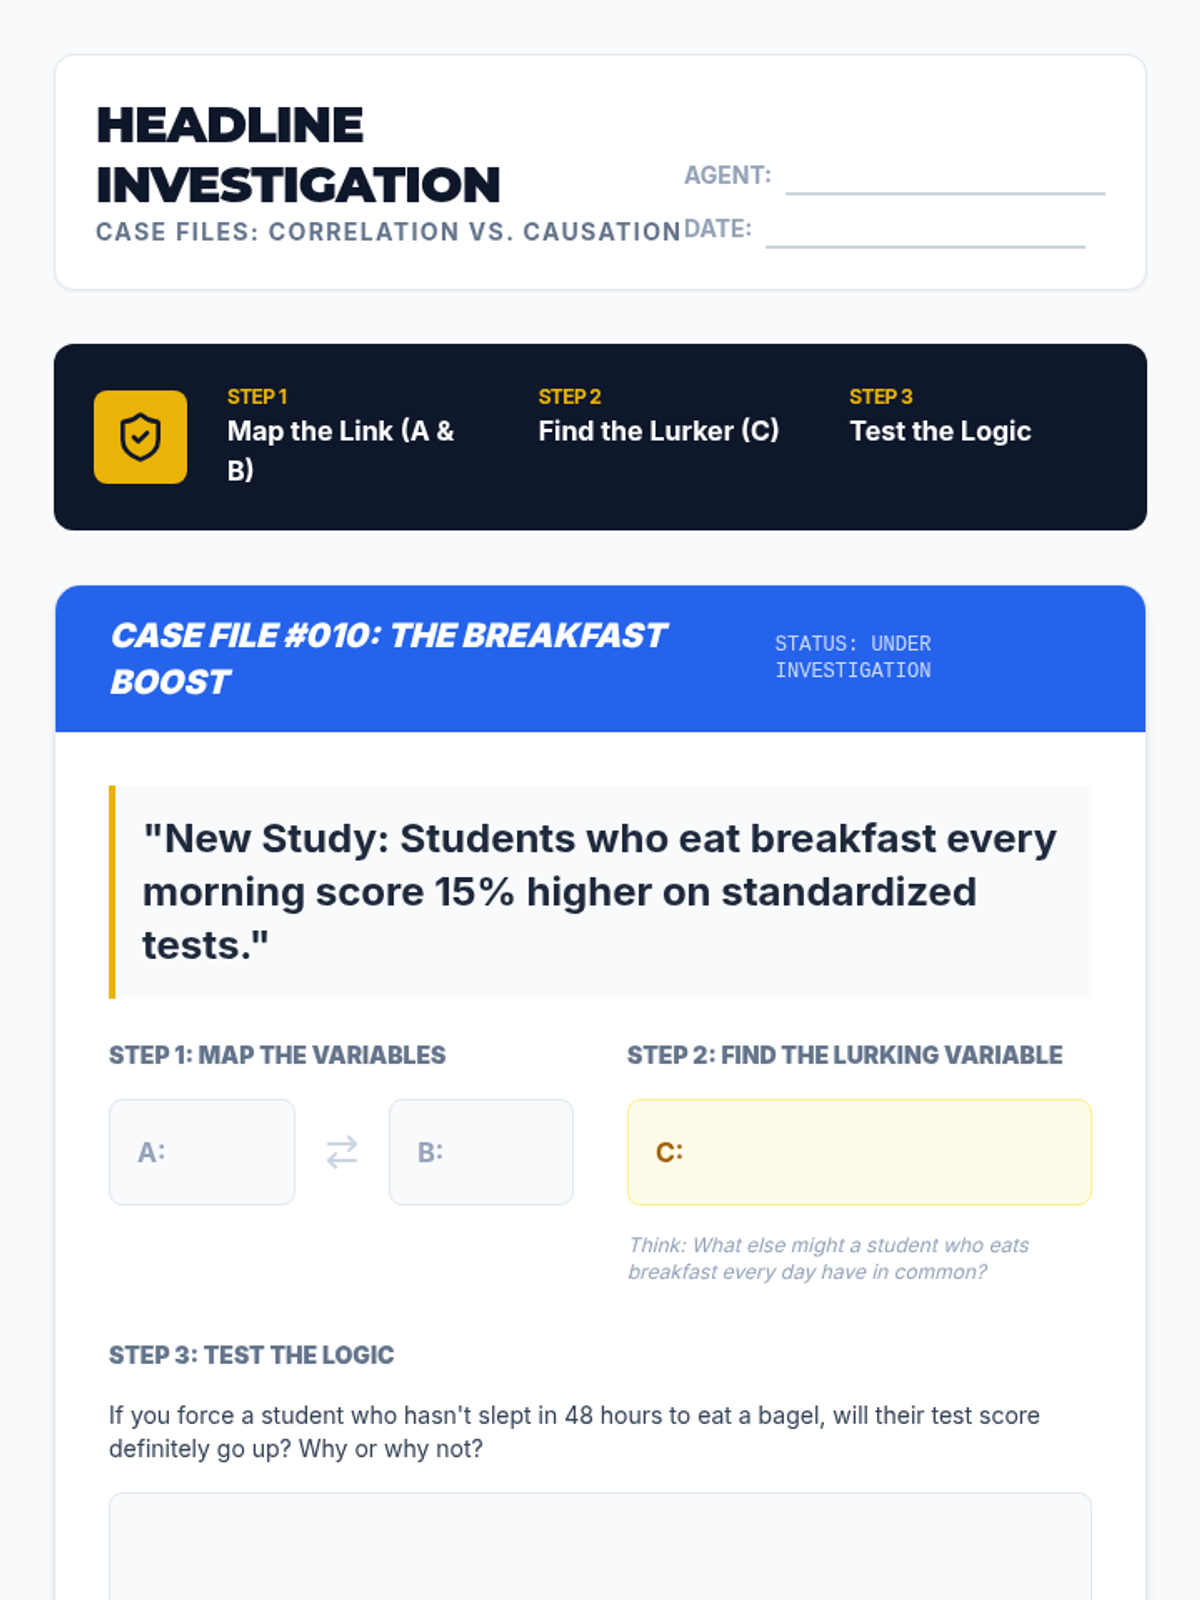
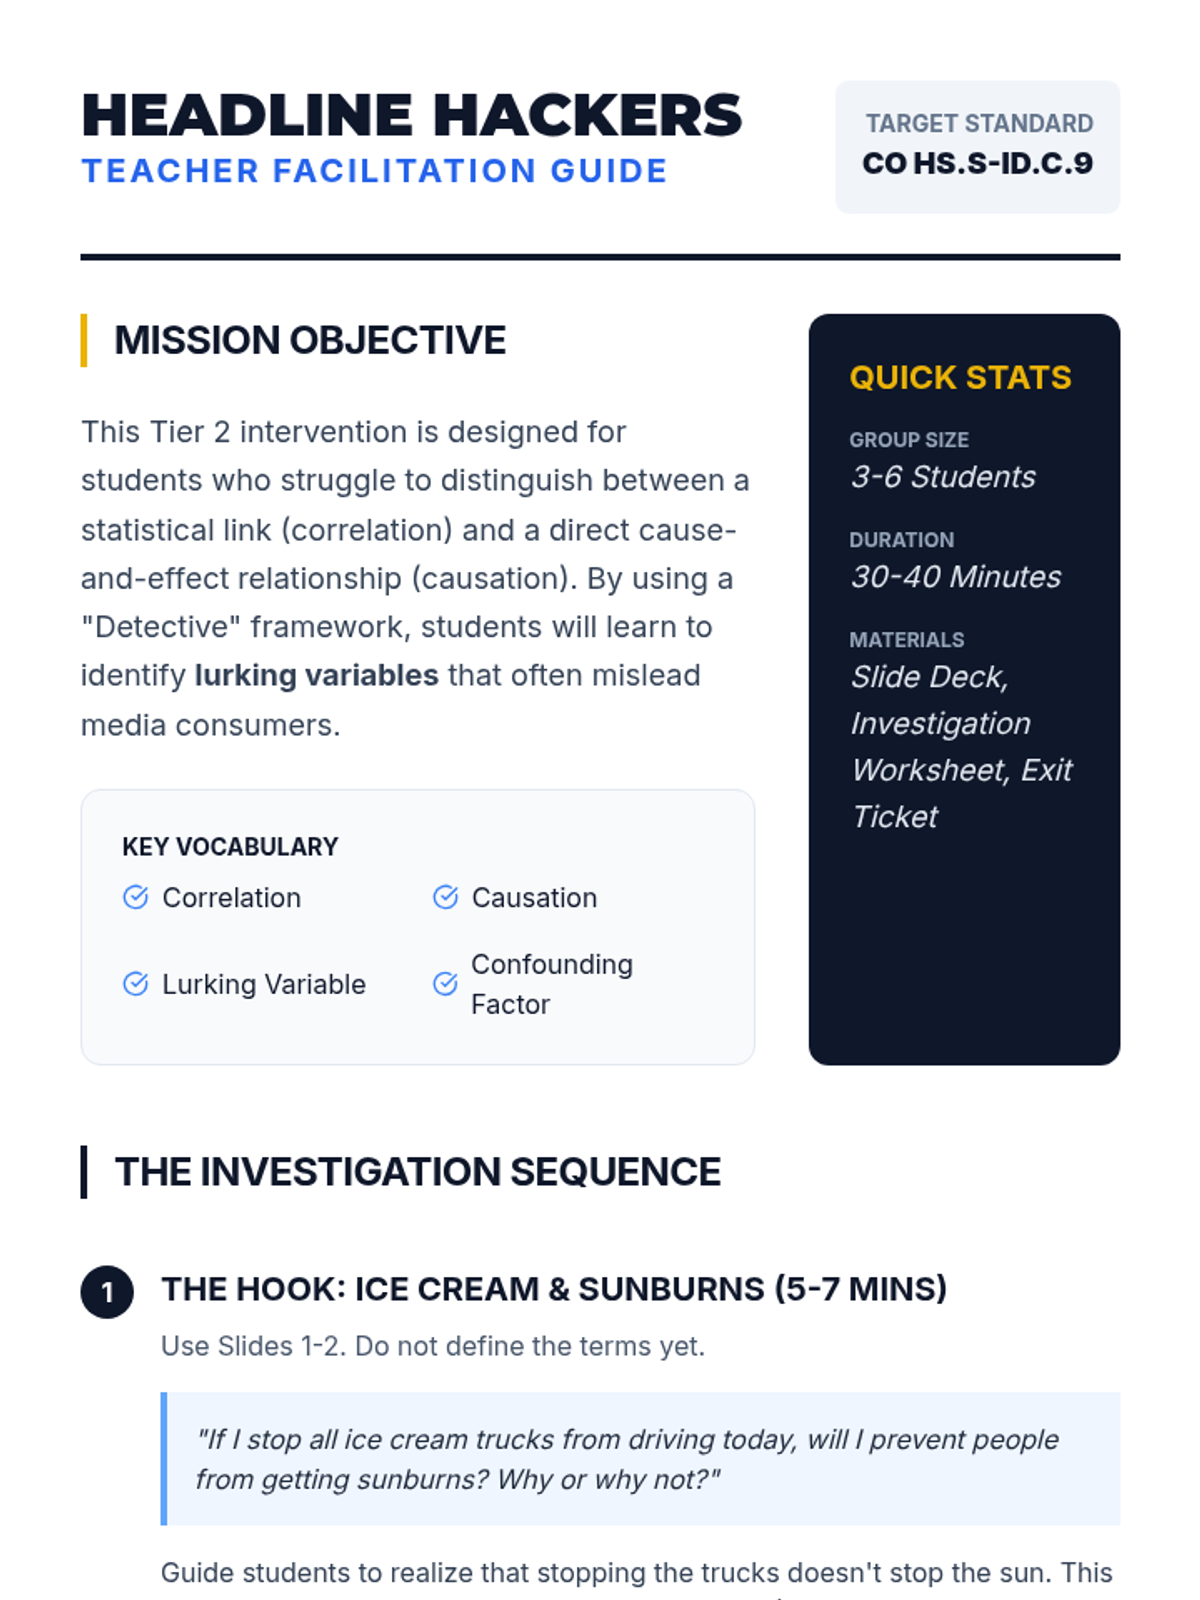
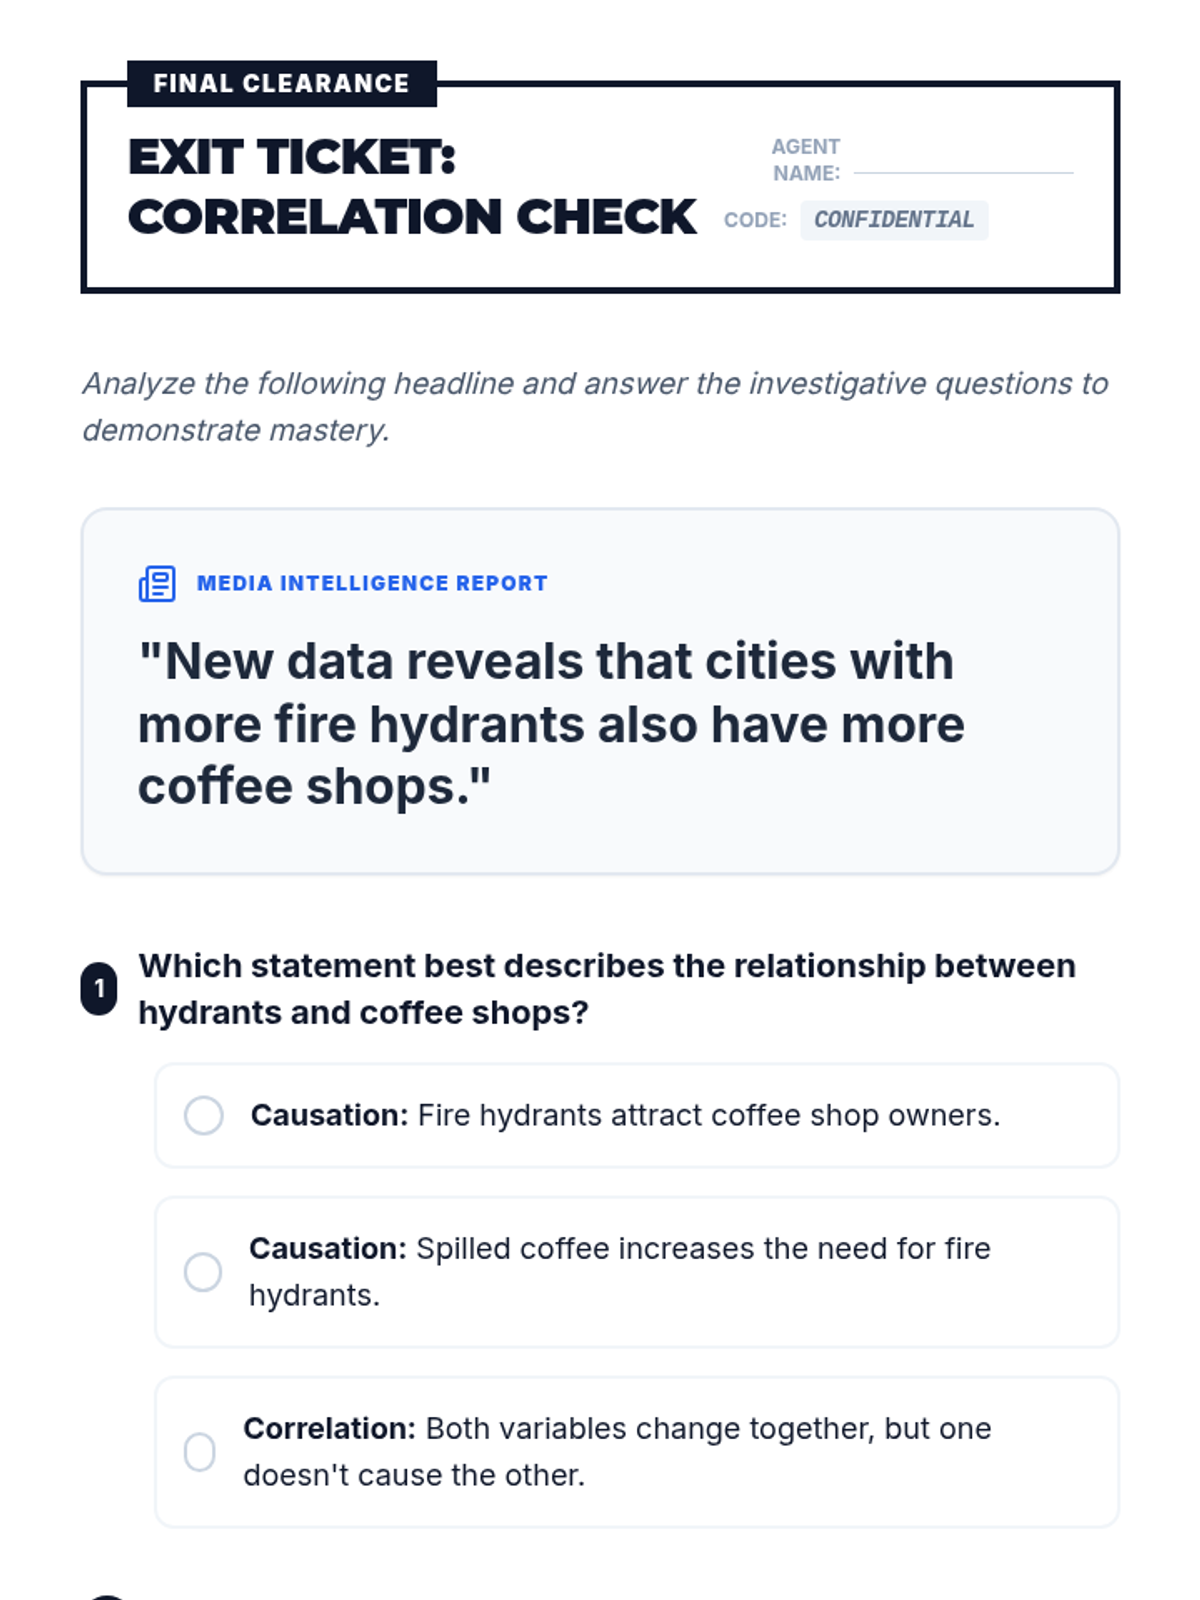
A Tier 2 small group intervention lesson focused on distinguishing correlation from causation through the lens of media headline analysis. Students use a 'detective' framework to identify lurking variables and evaluate claims.
A comprehensive 20-question practice test and answer key designed to prepare students for the TSIA2 Mathematics assessment, focusing on algebraic, geometric, and statistical reasoning.
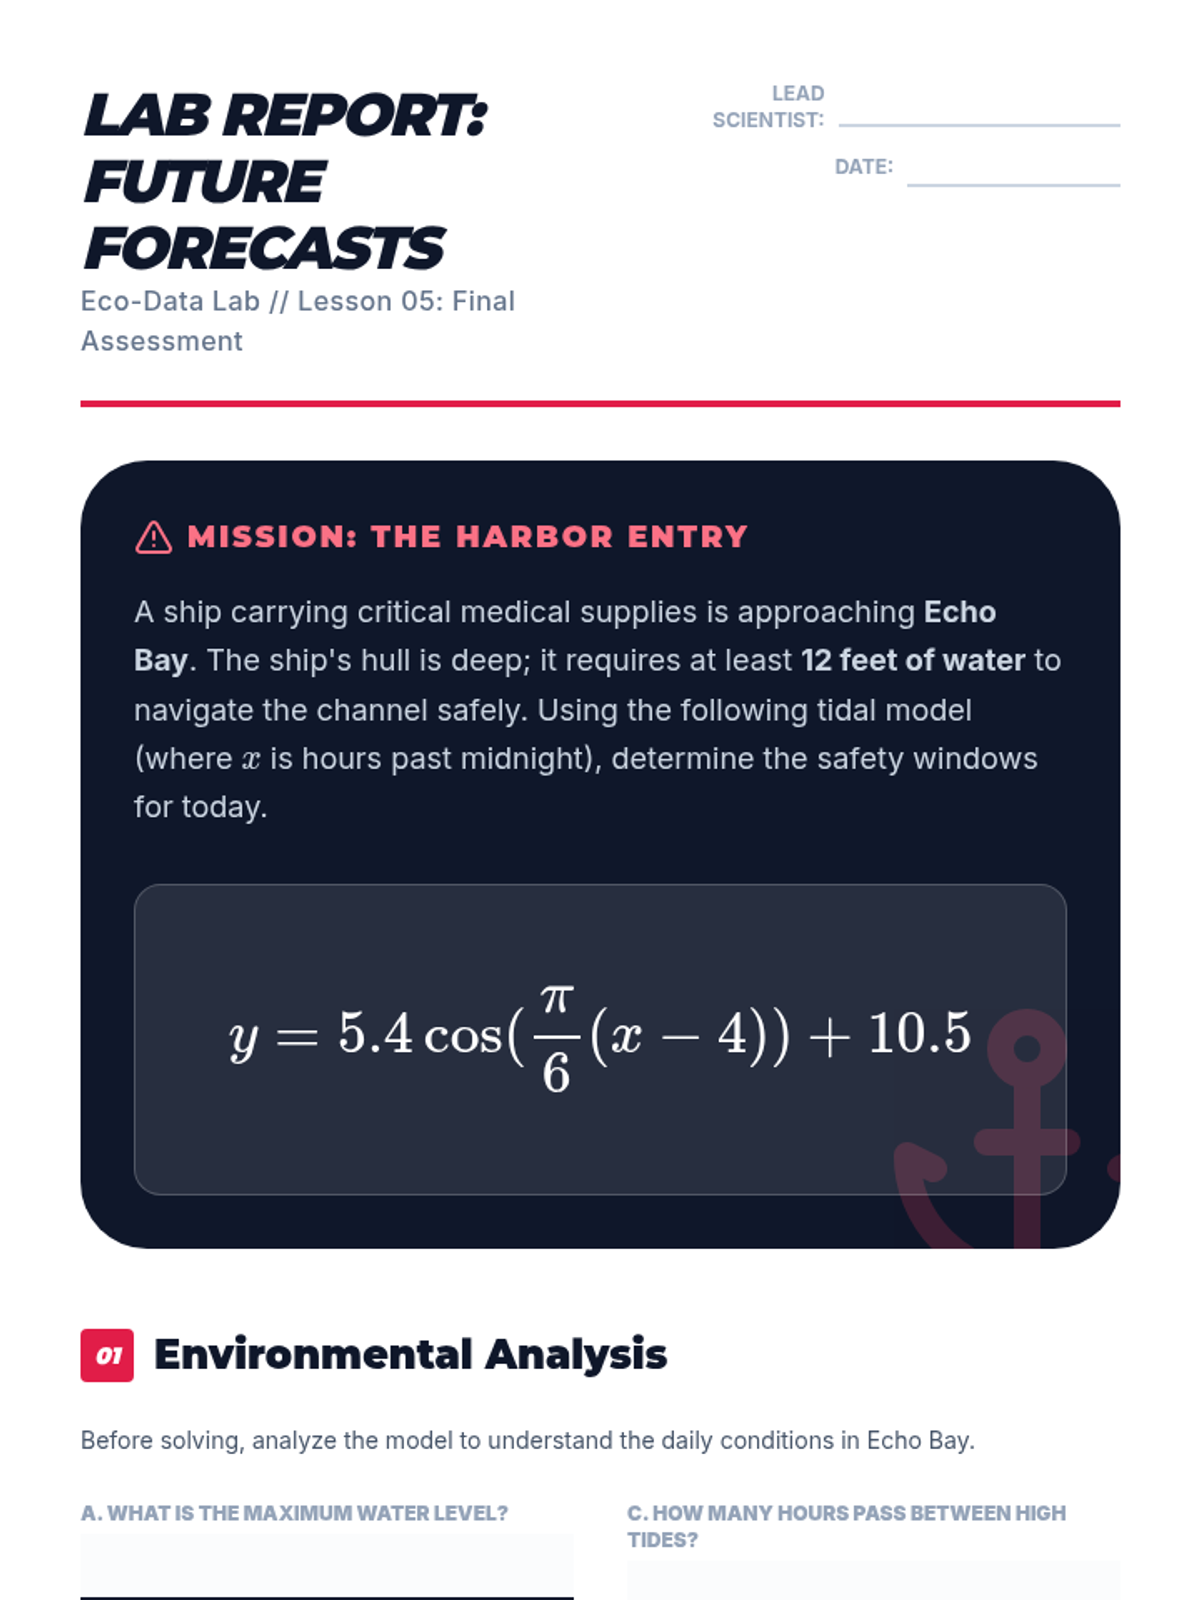
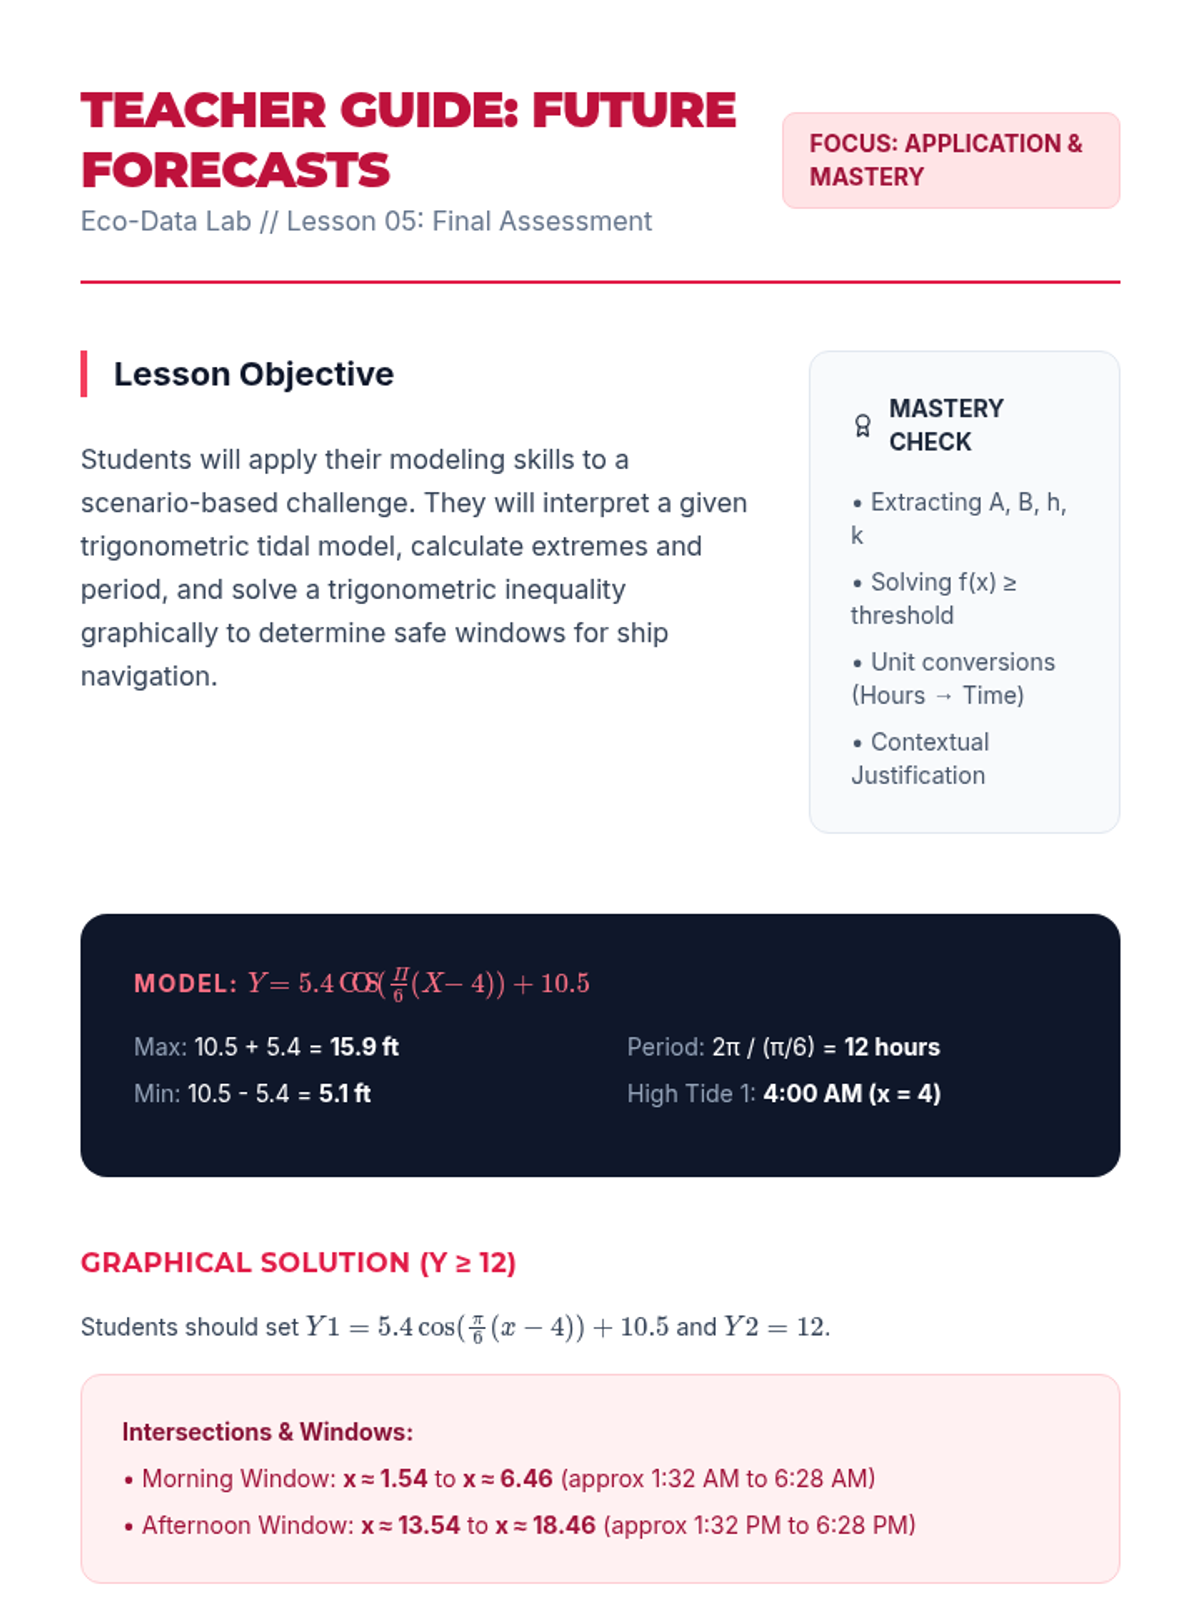
Students use their constructed models to extrapolate and answer questions about future events, solving trigonometric inequalities graphically.
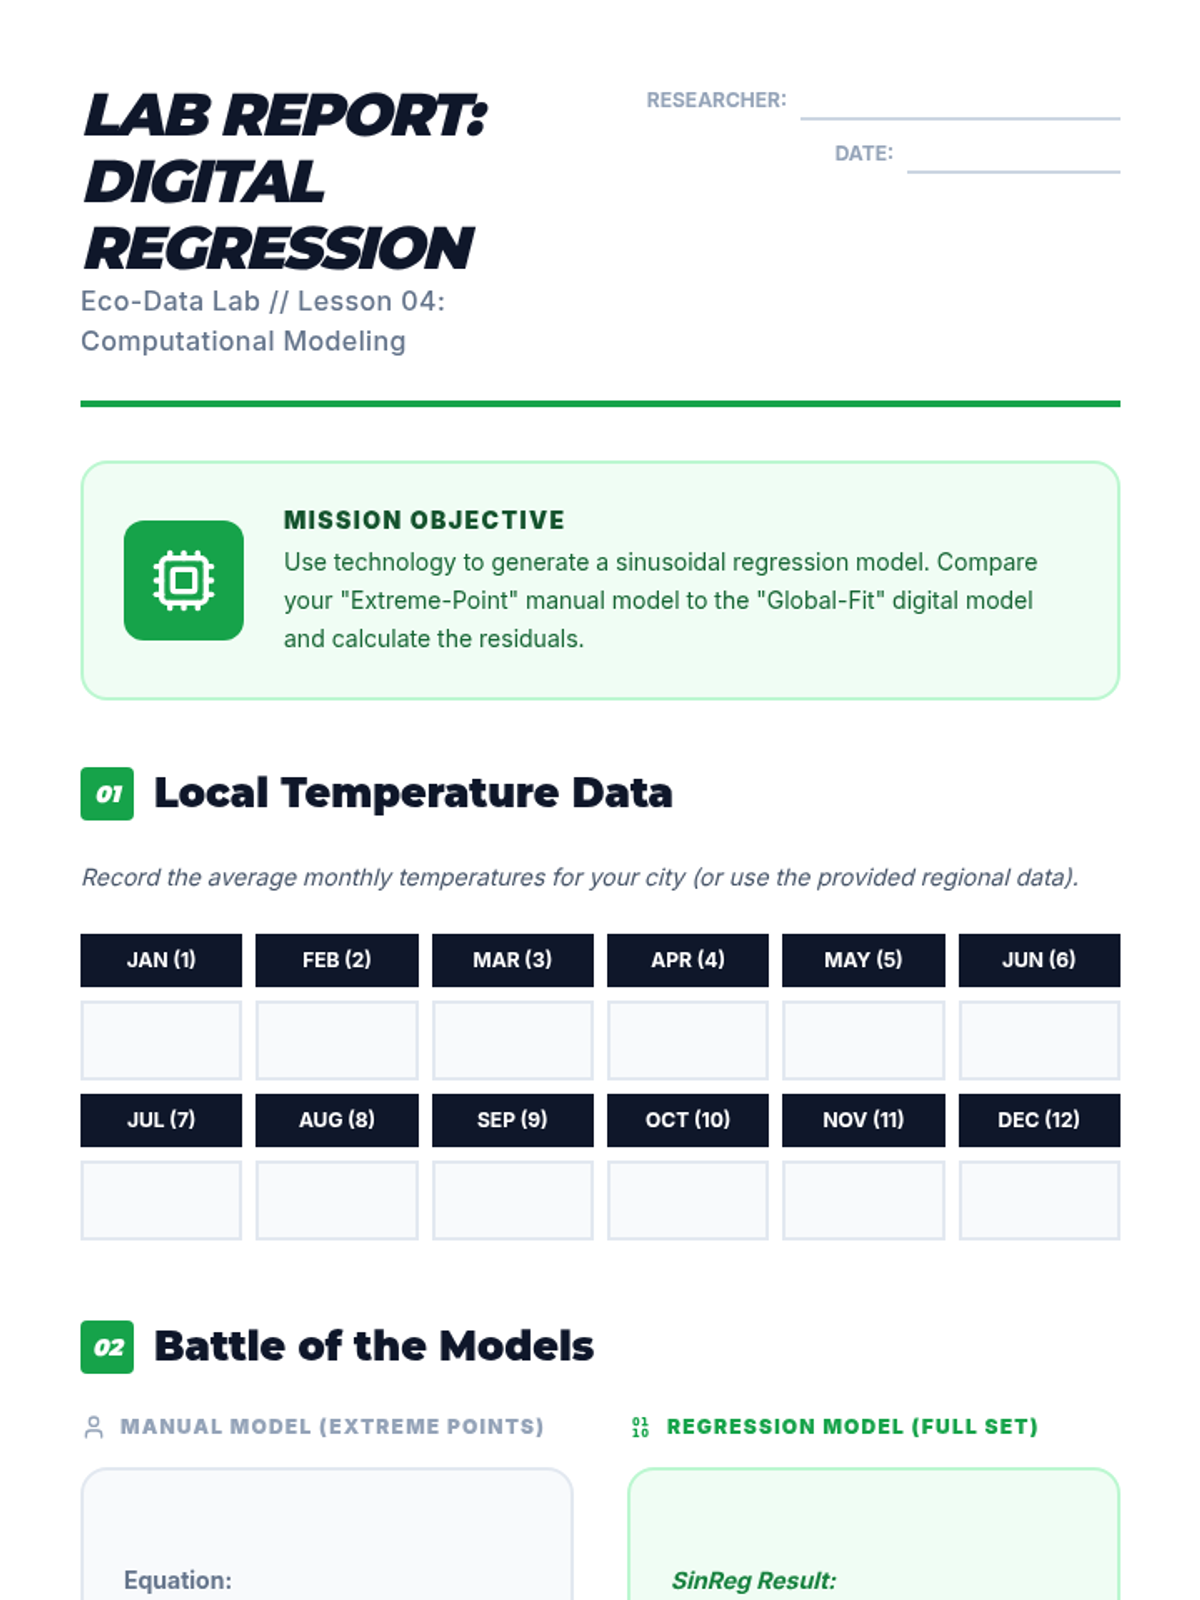
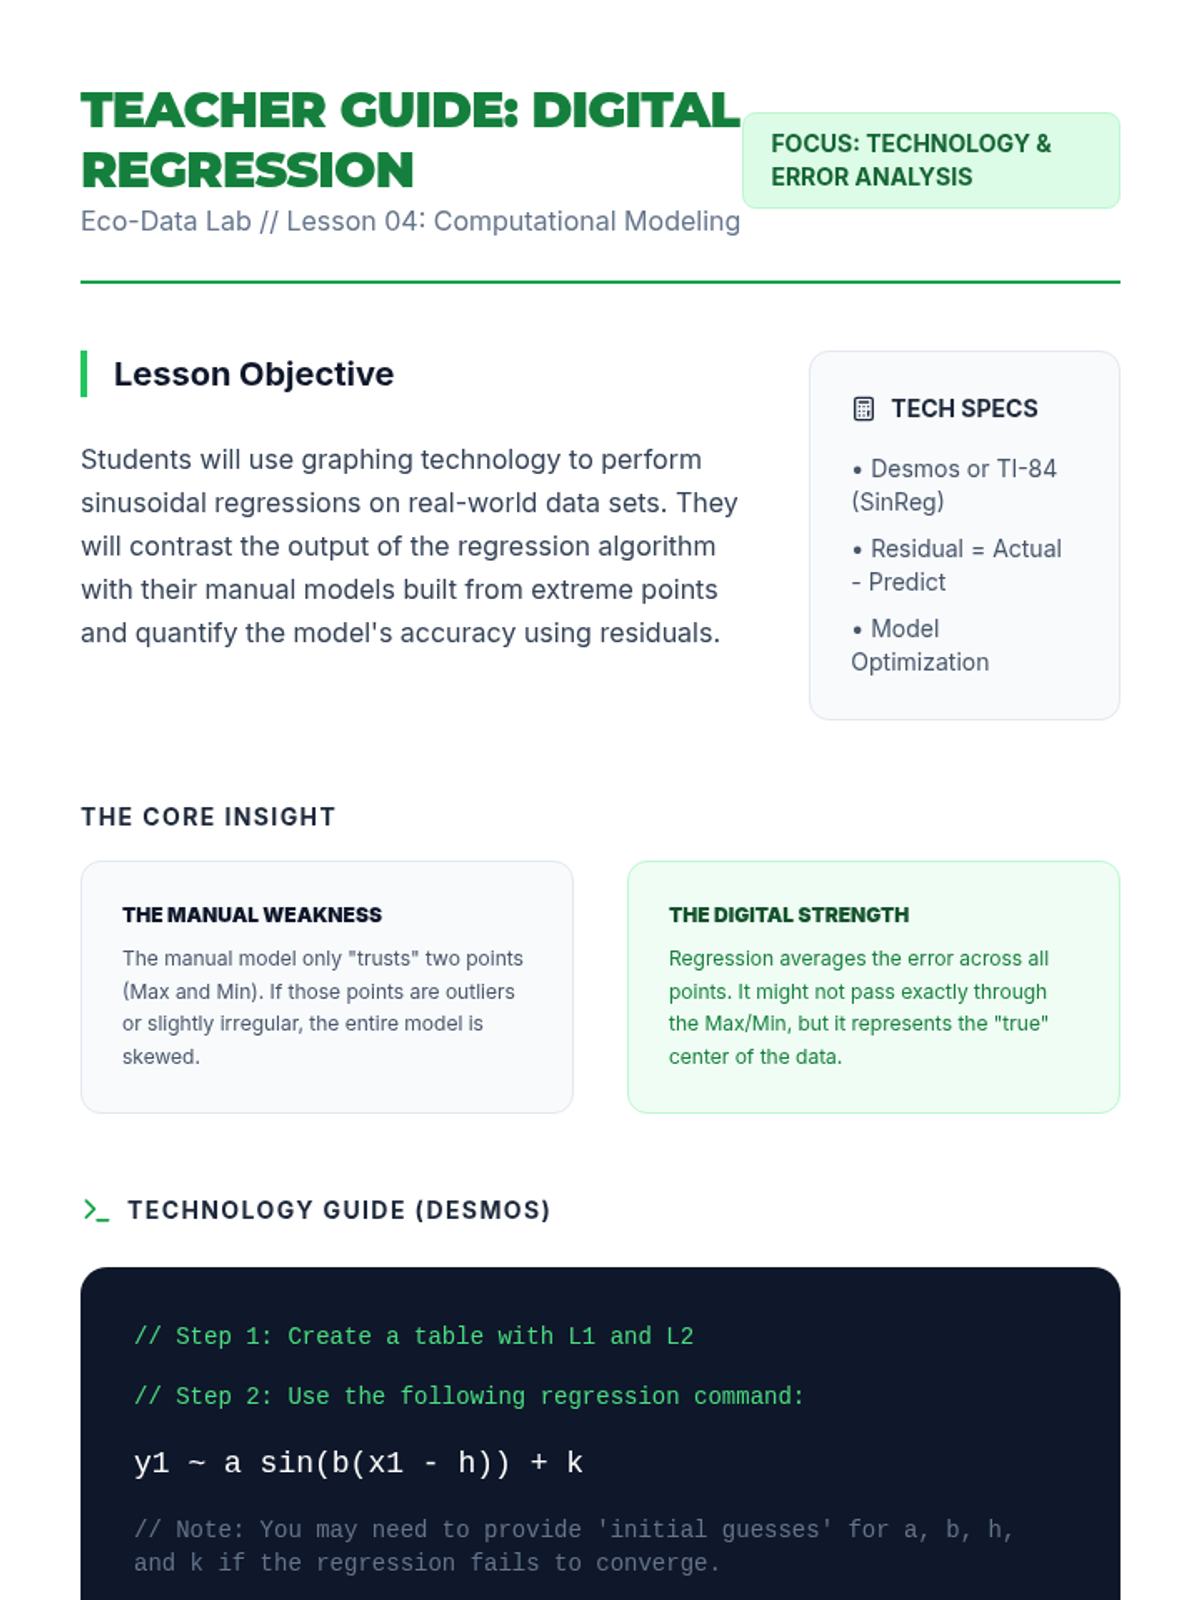
Students use graphing calculators or regression software to fit trigonometric equations to data sets. They compare their hand-calculated models to the regression models.
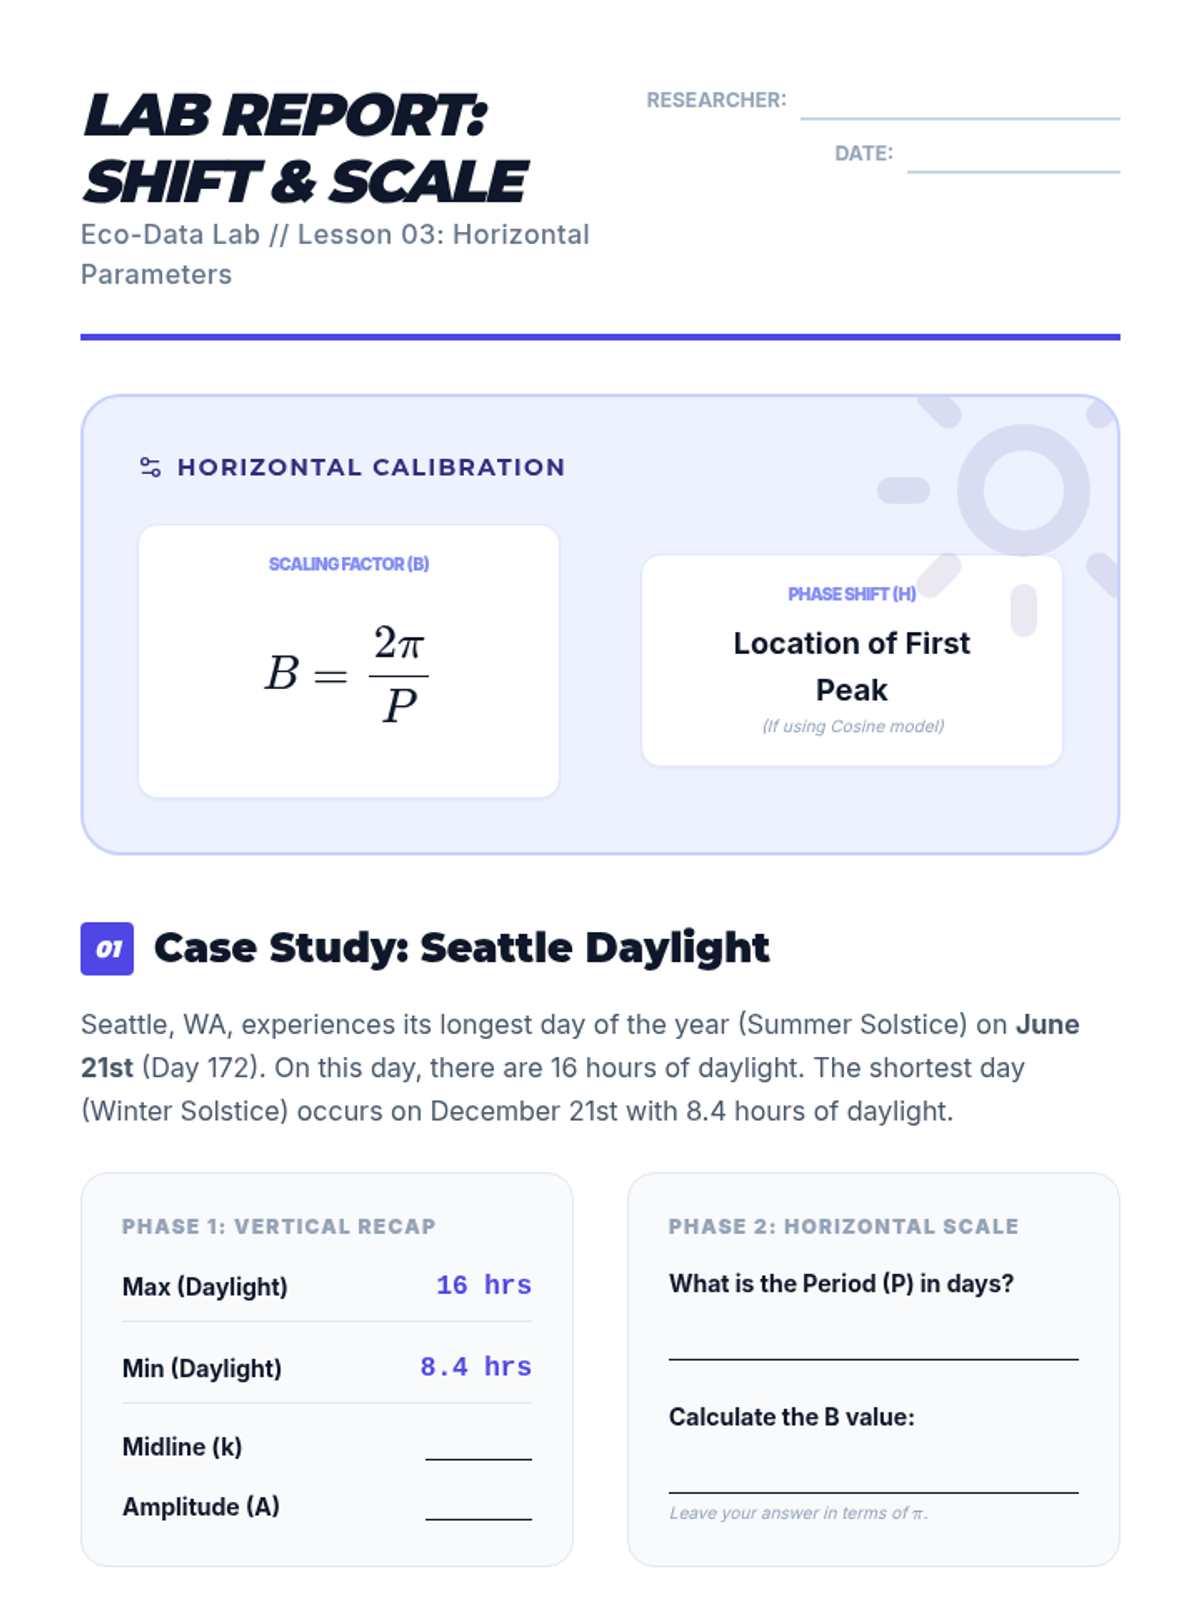
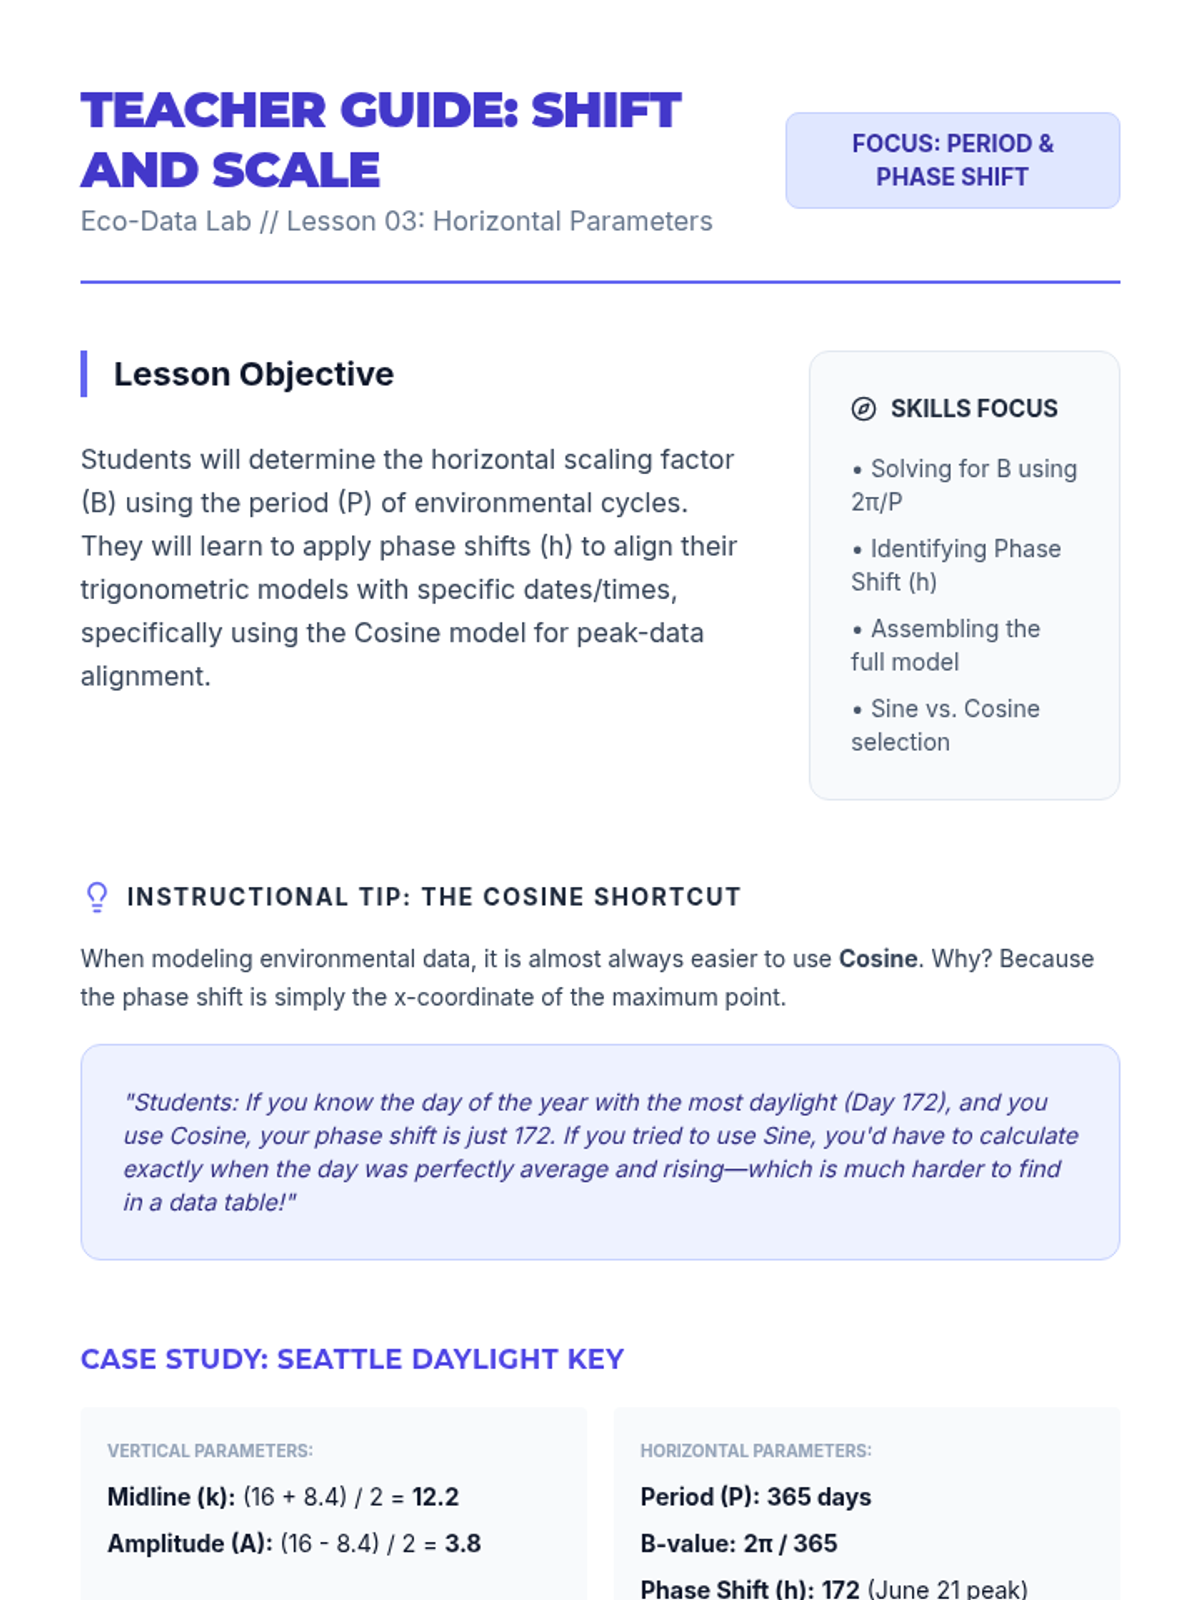
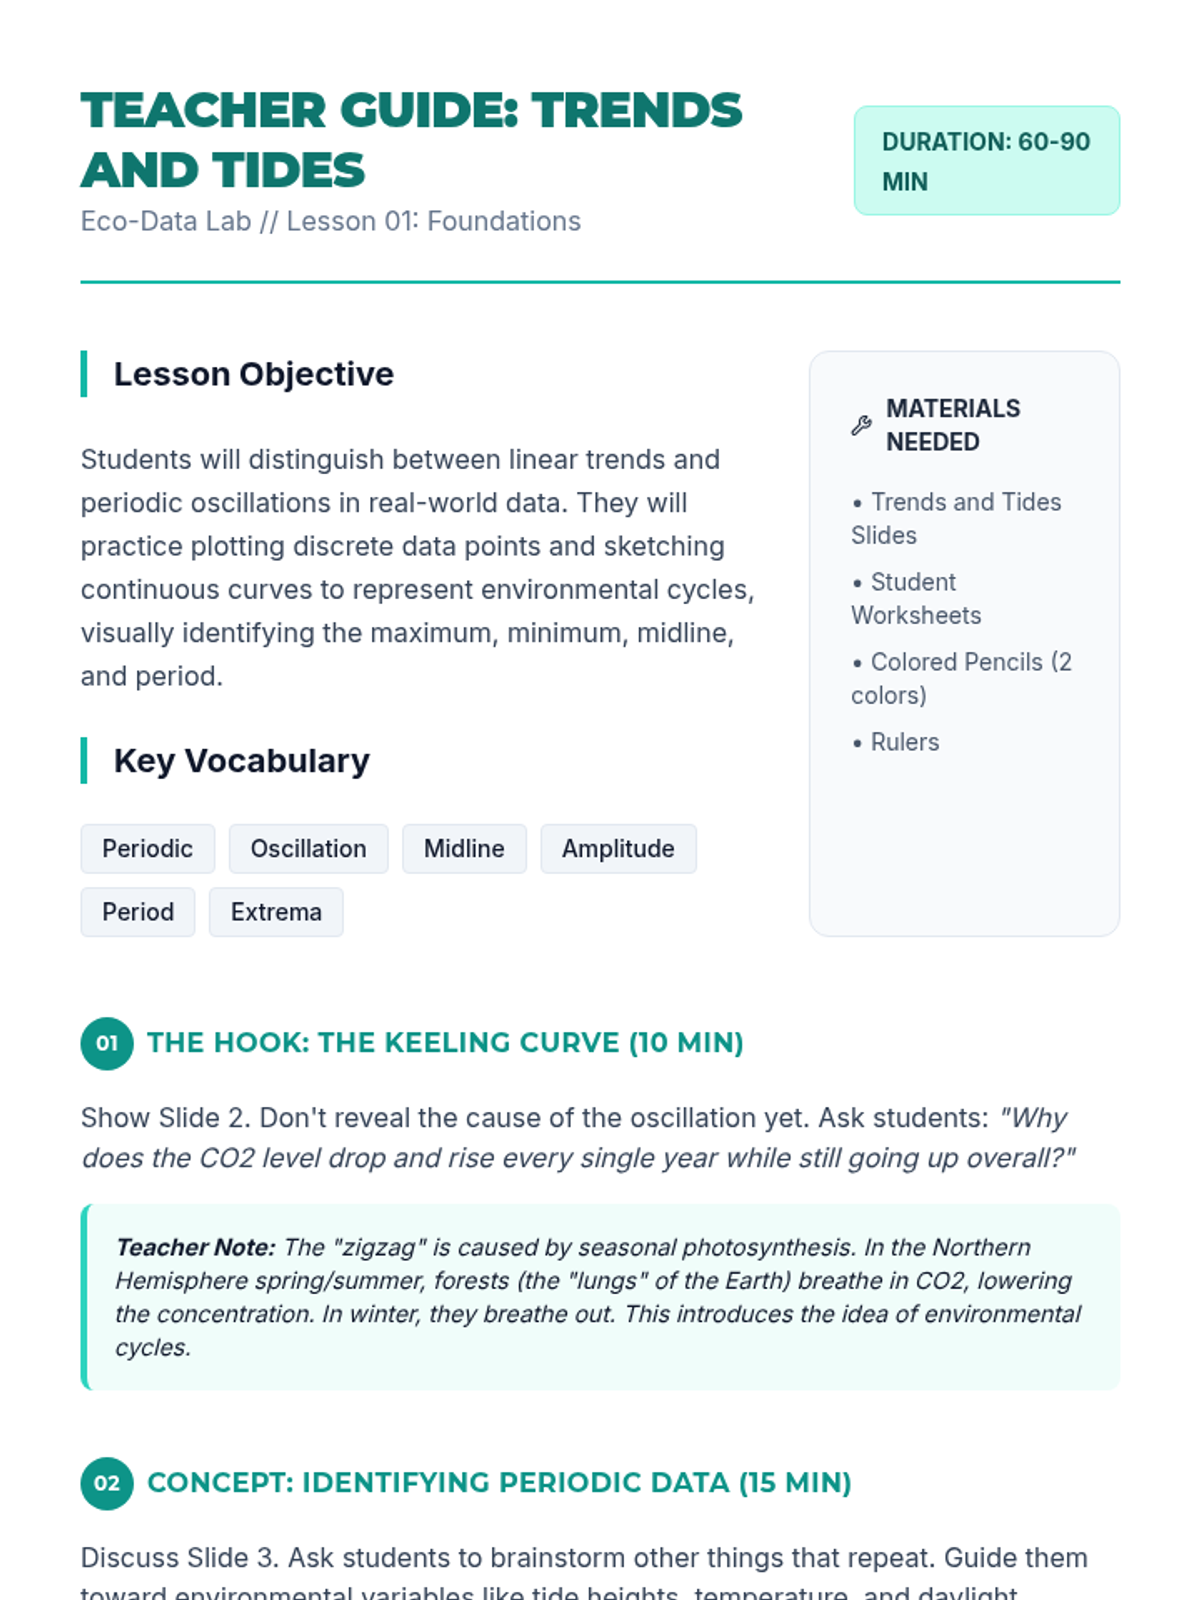
Focusing on the x-axis, students determine the period of real-world cycles. They calculate the horizontal scaling factor and determine appropriate horizontal shifts.
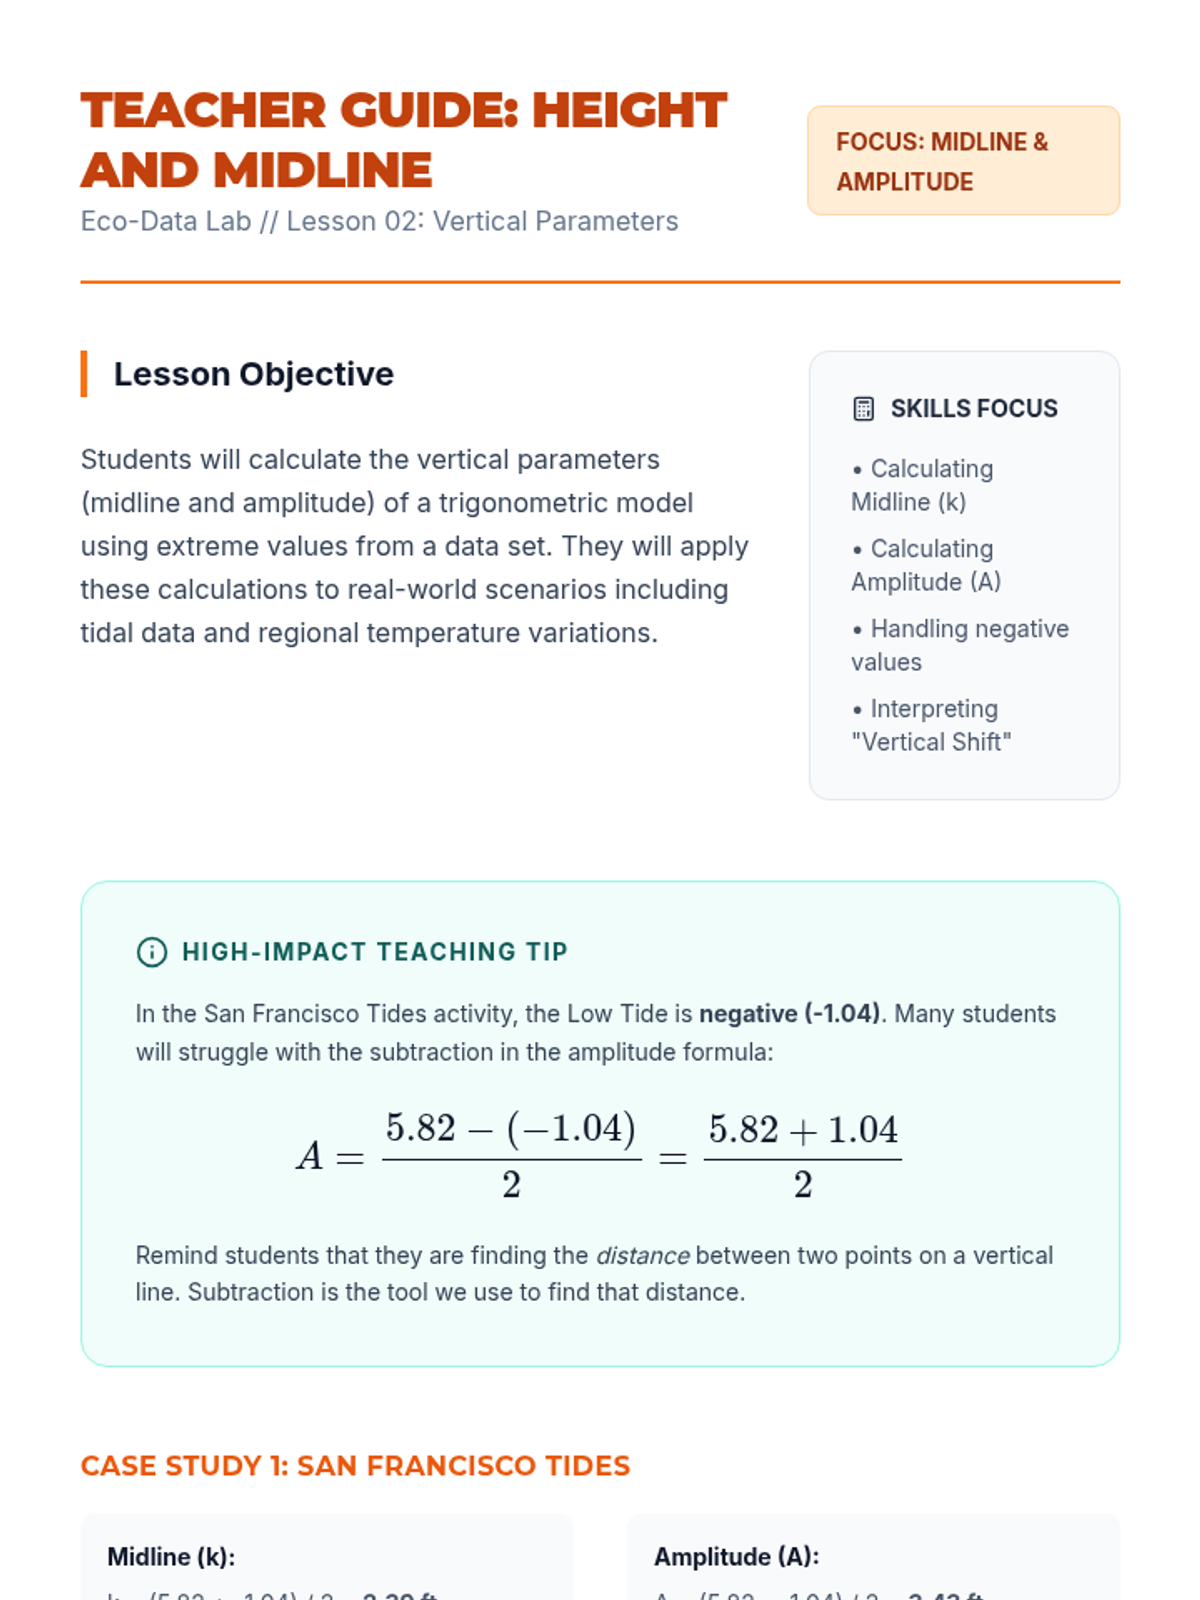
Students learn the algebraic techniques to extract the midline and amplitude from a data table. They practice these calculations on various environmental data sets.
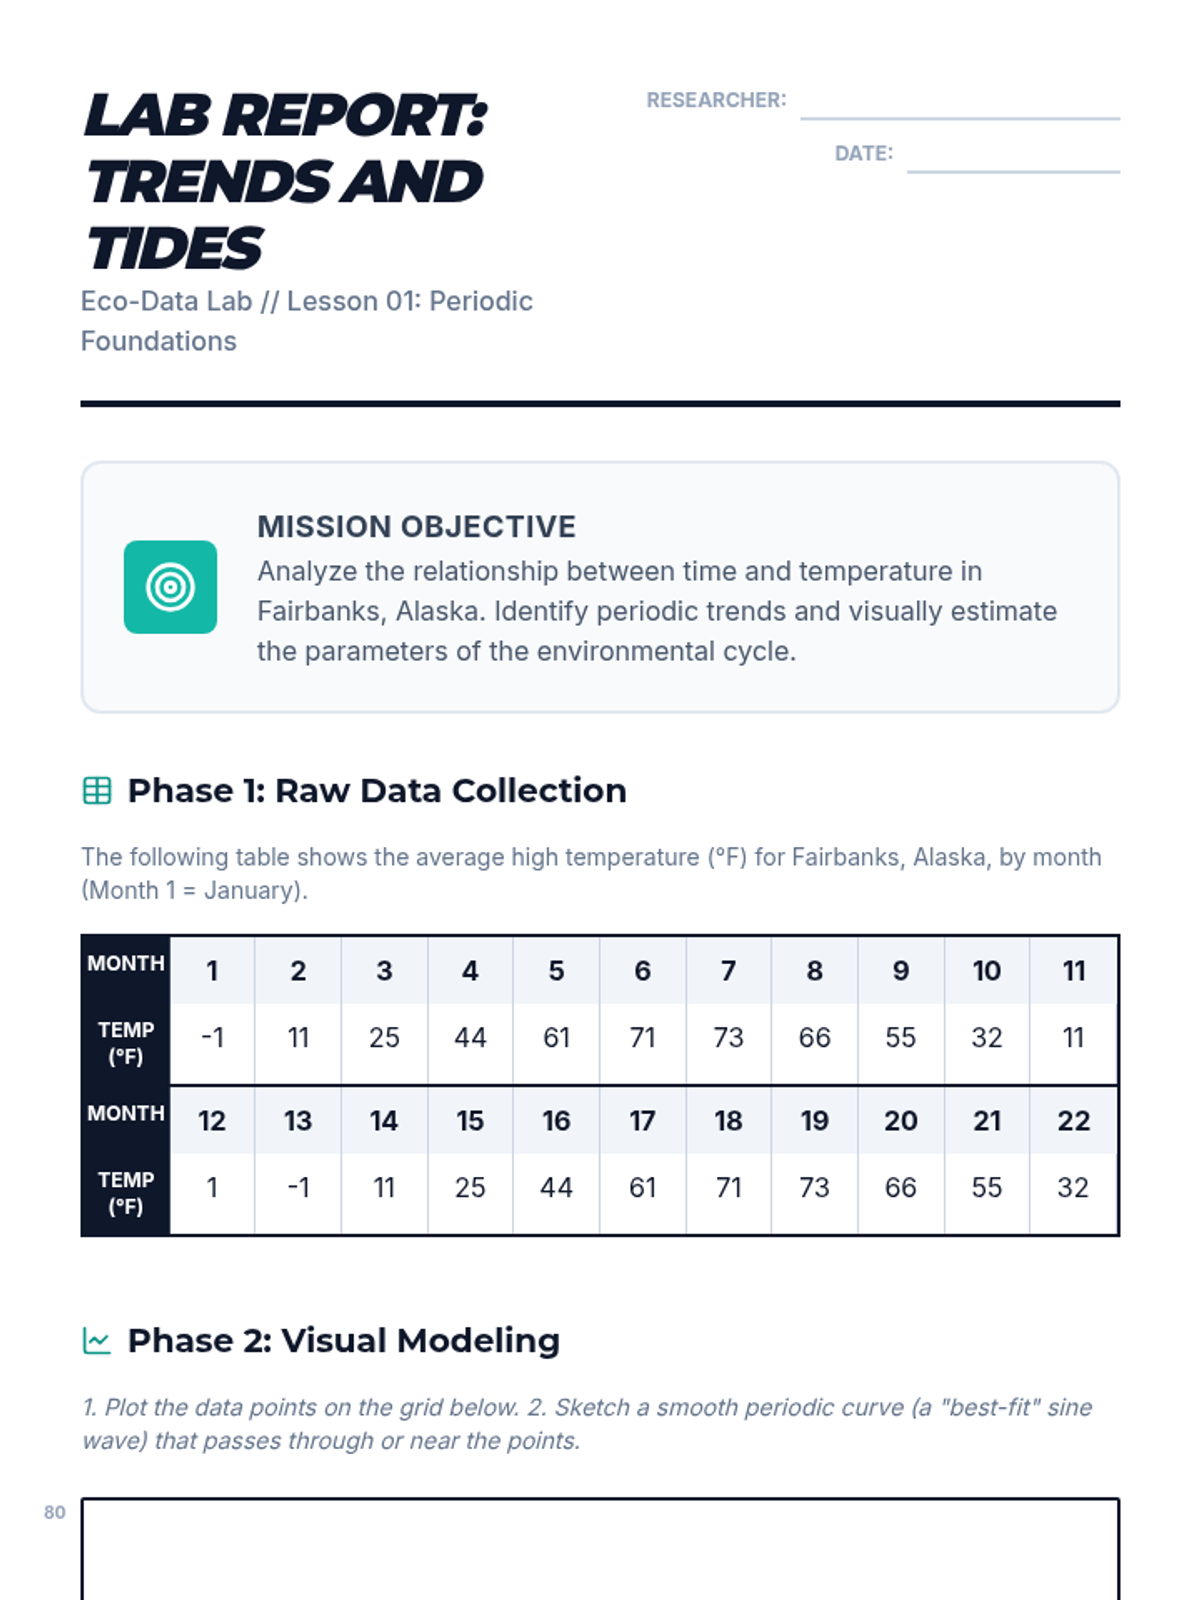
Students plot given data sets and identify the periodic nature of the data. They sketch a 'best fit' curve by hand to estimate the maximums, minimums, and cycle length.
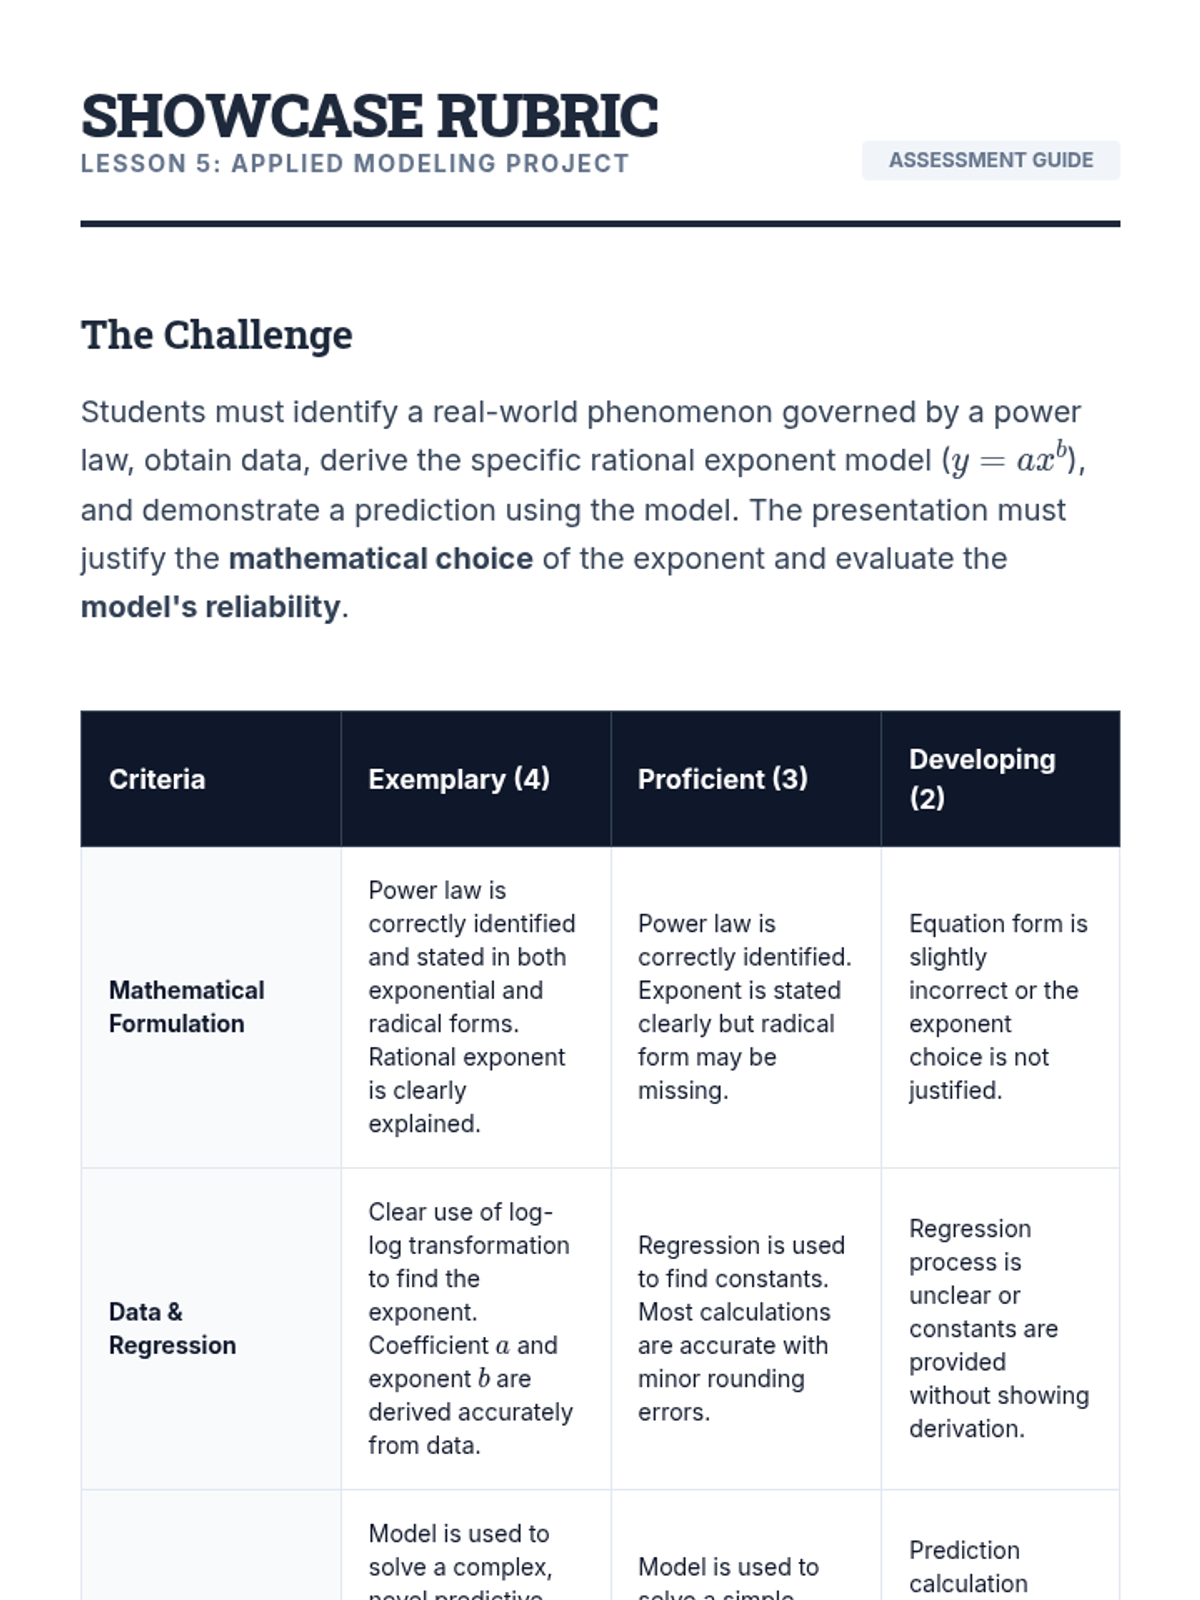
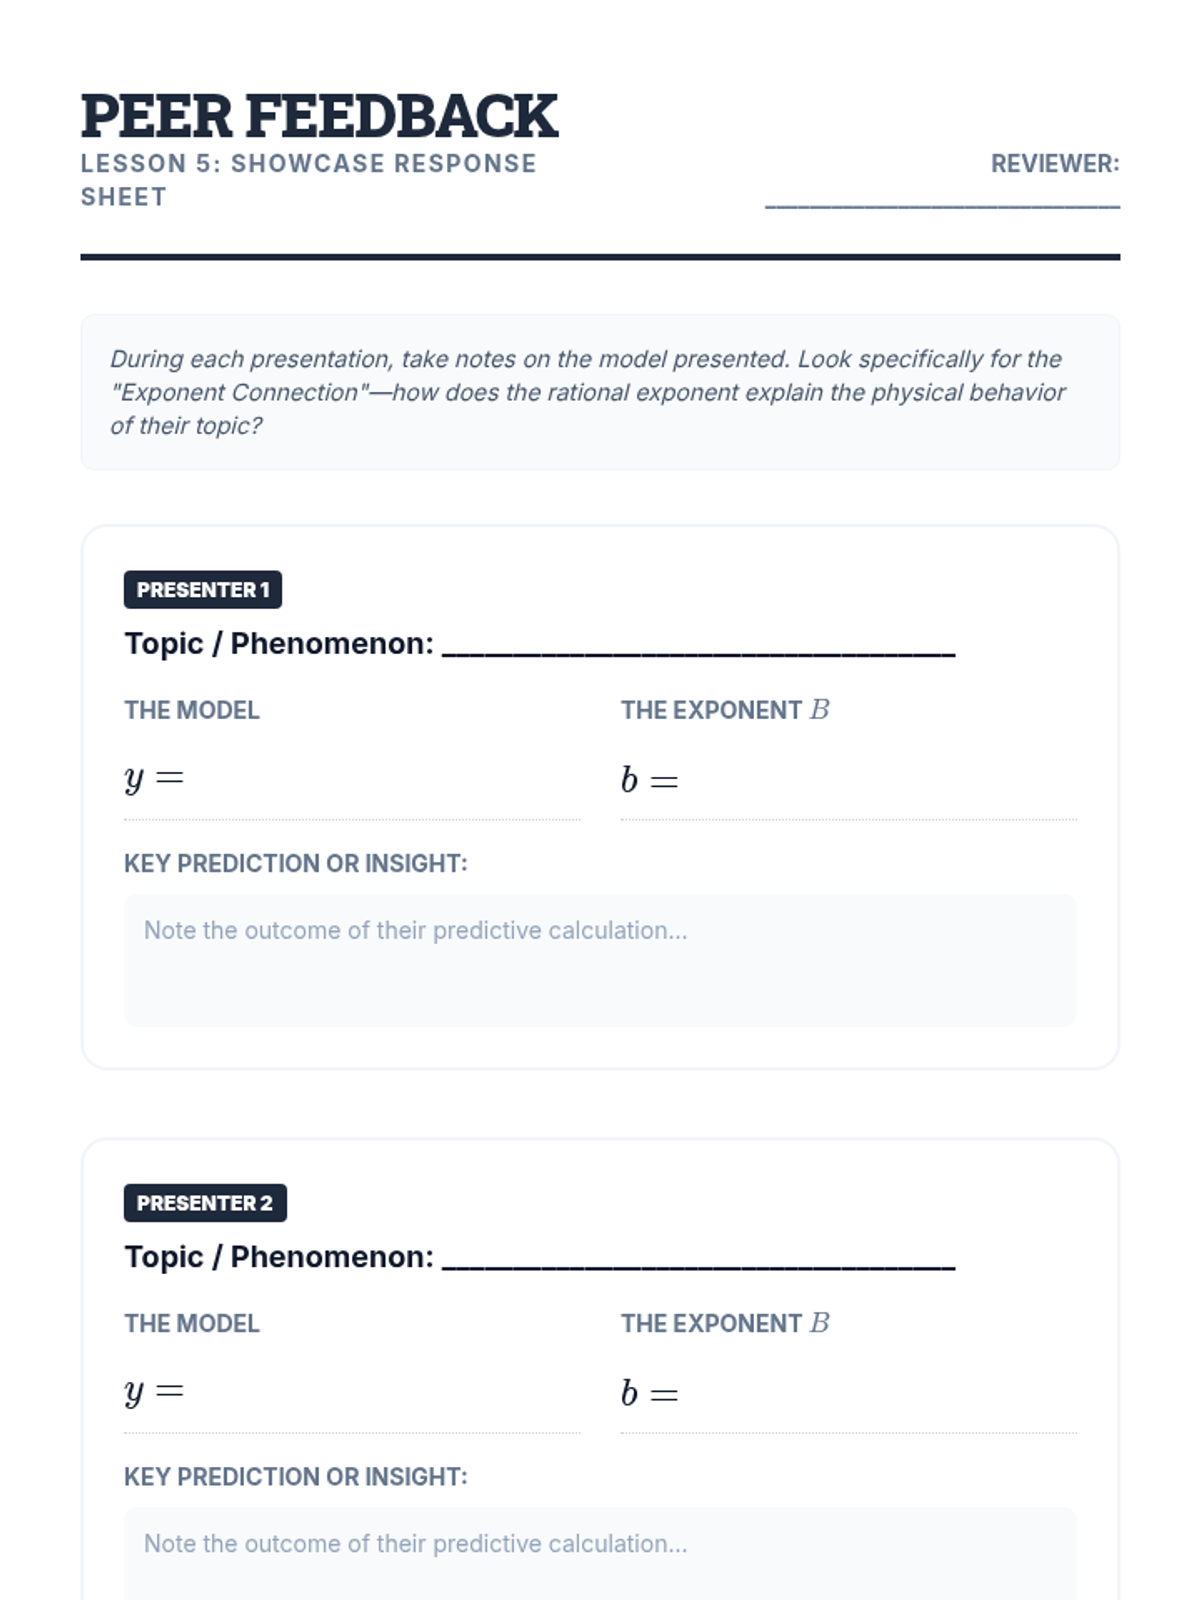
A culminating presentation where students share a power function model derived from real-world data, justifying their choice of rational exponent.
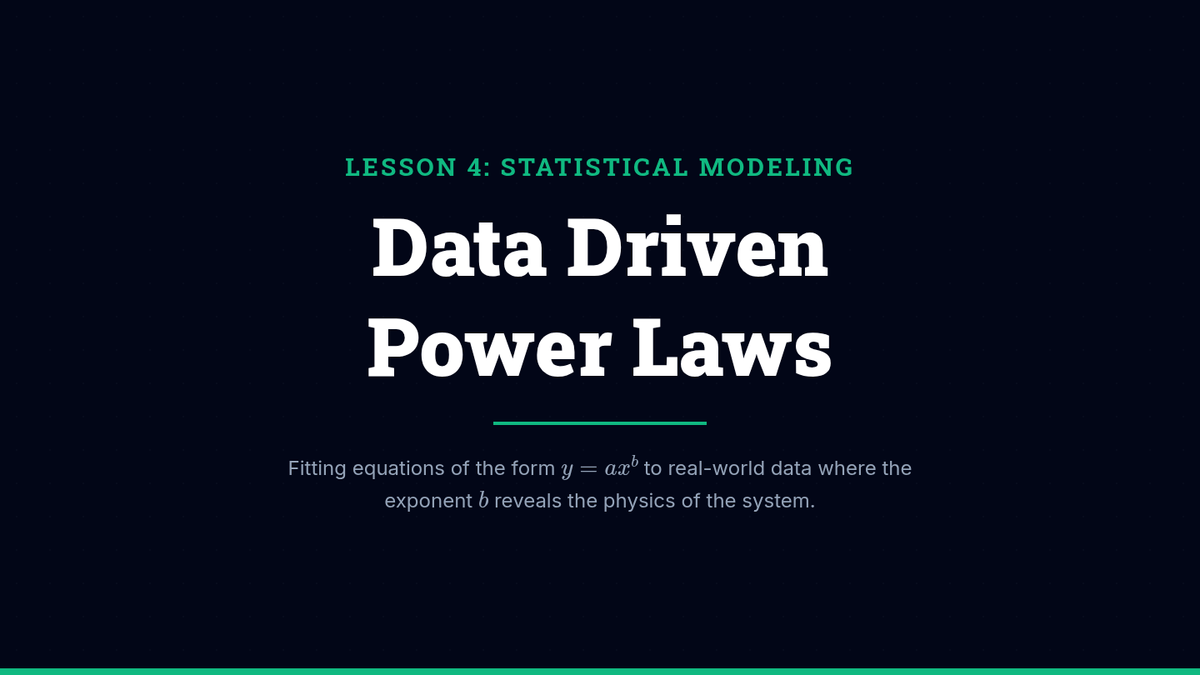
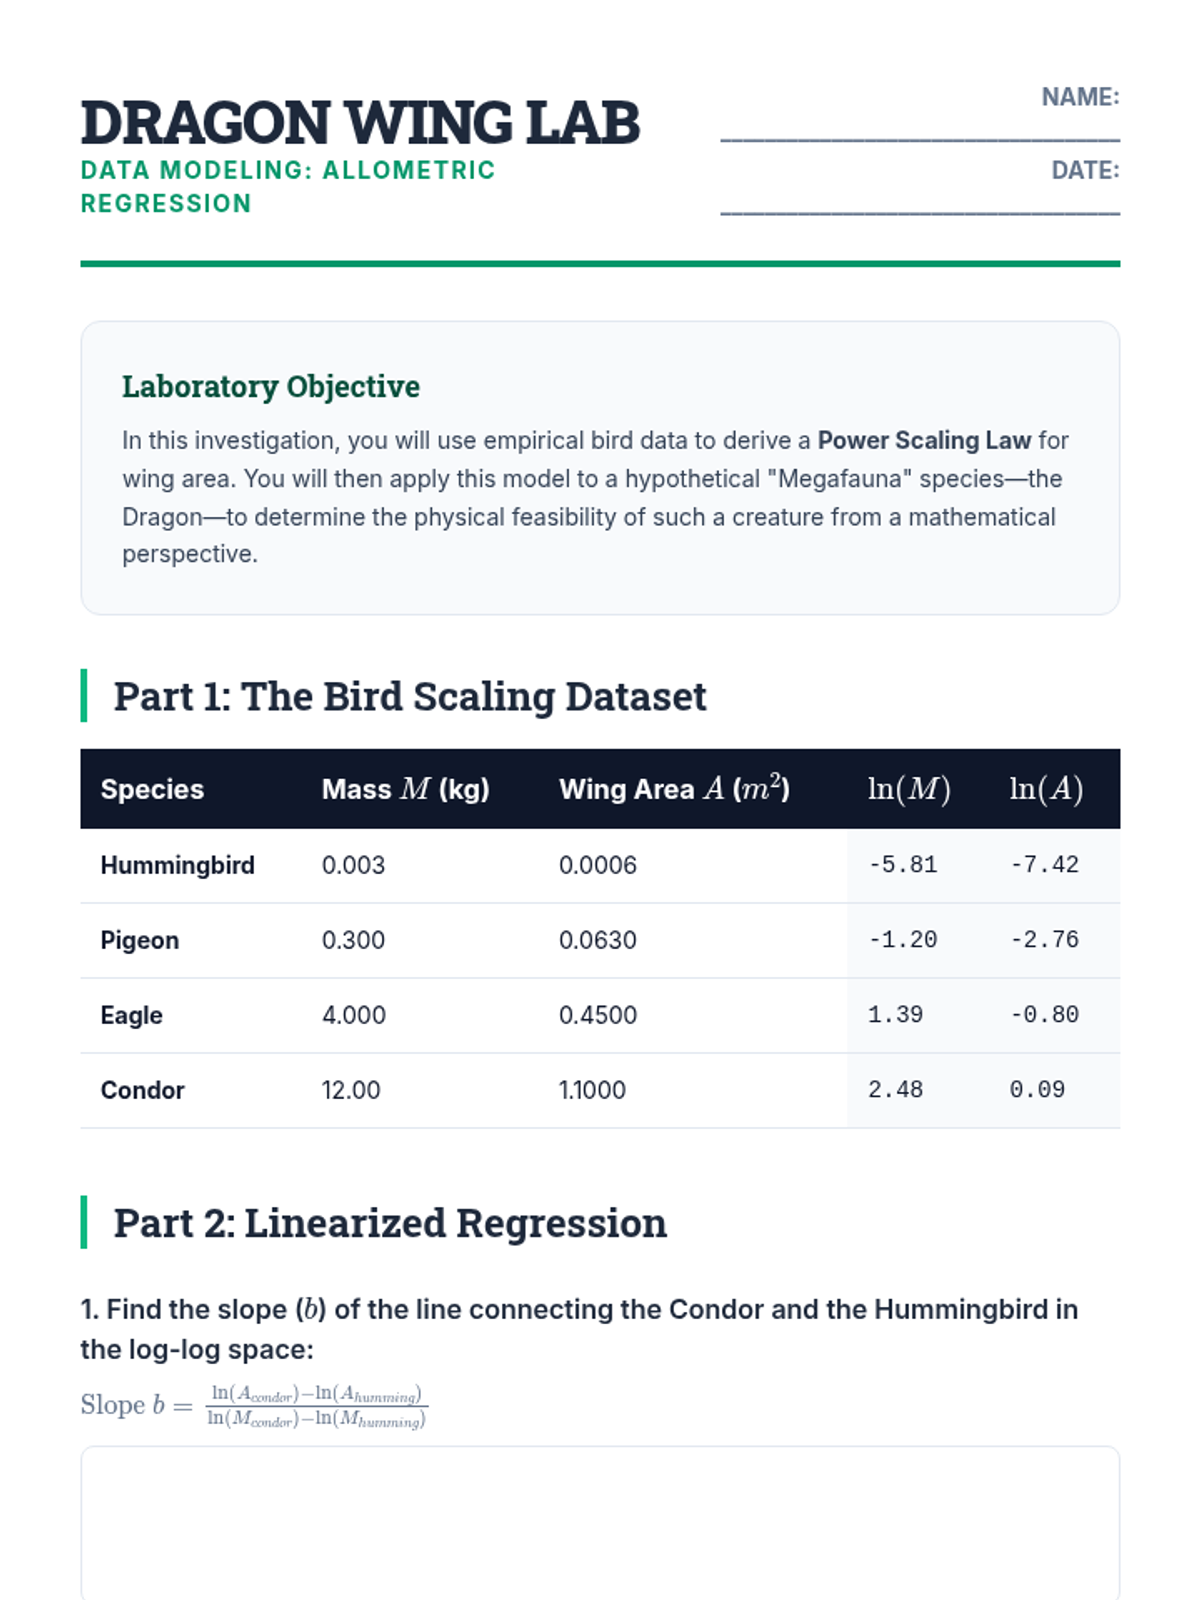
Students learn the fundamentals of power regression and use data sets to fit functions of the form y = ax^b, where b is a rational number.
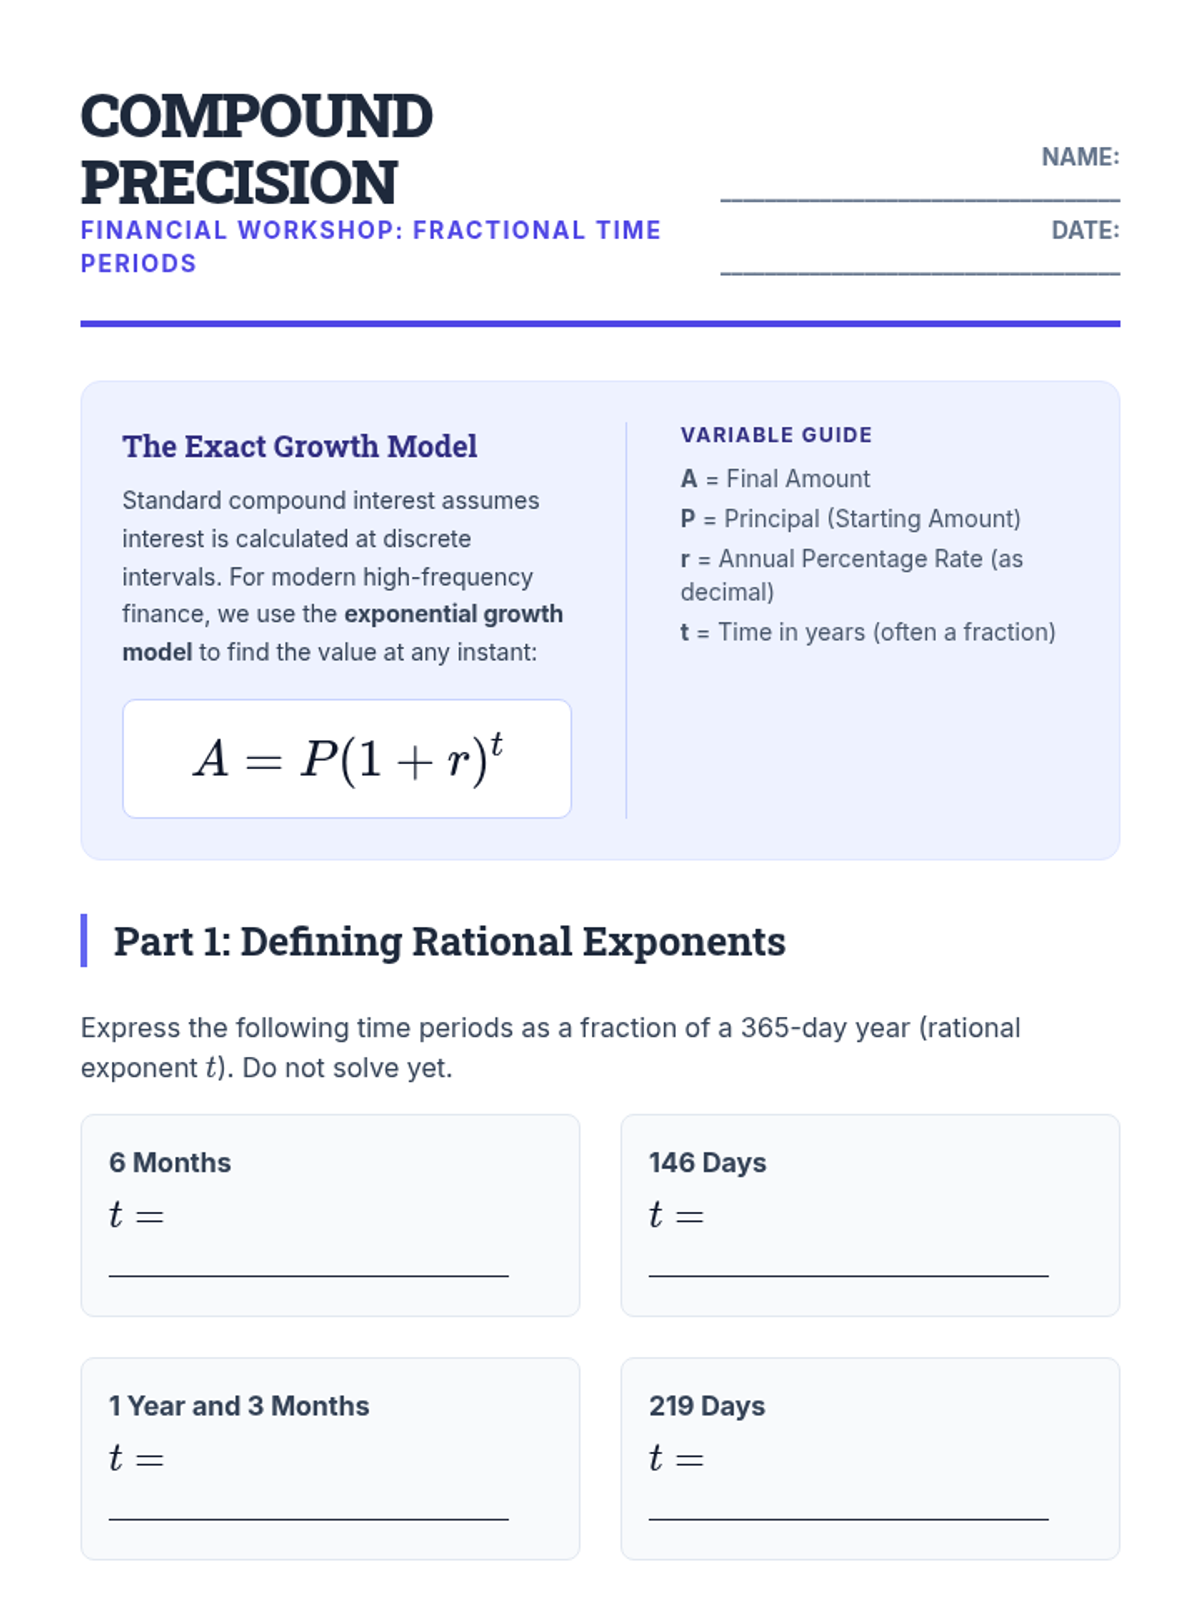
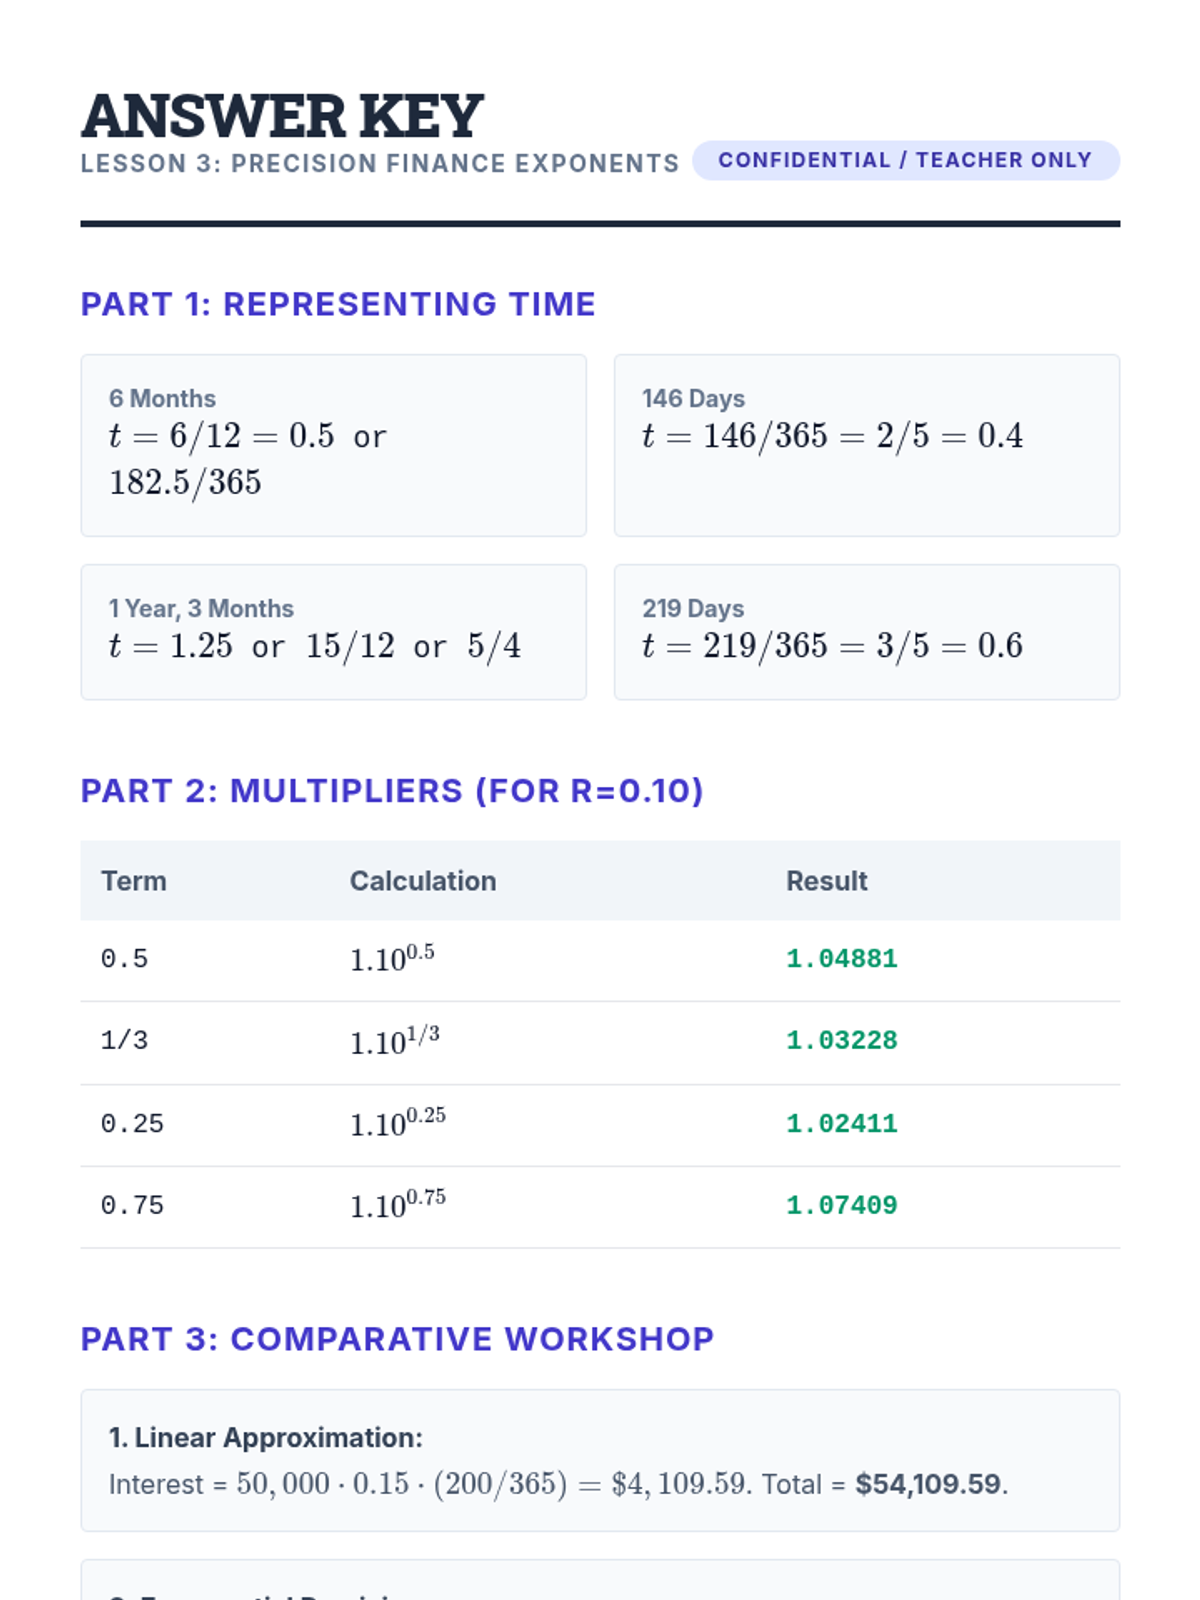
This lesson focuses on the precision of financial modeling when using rational exponents to calculate interest for partial compound periods.
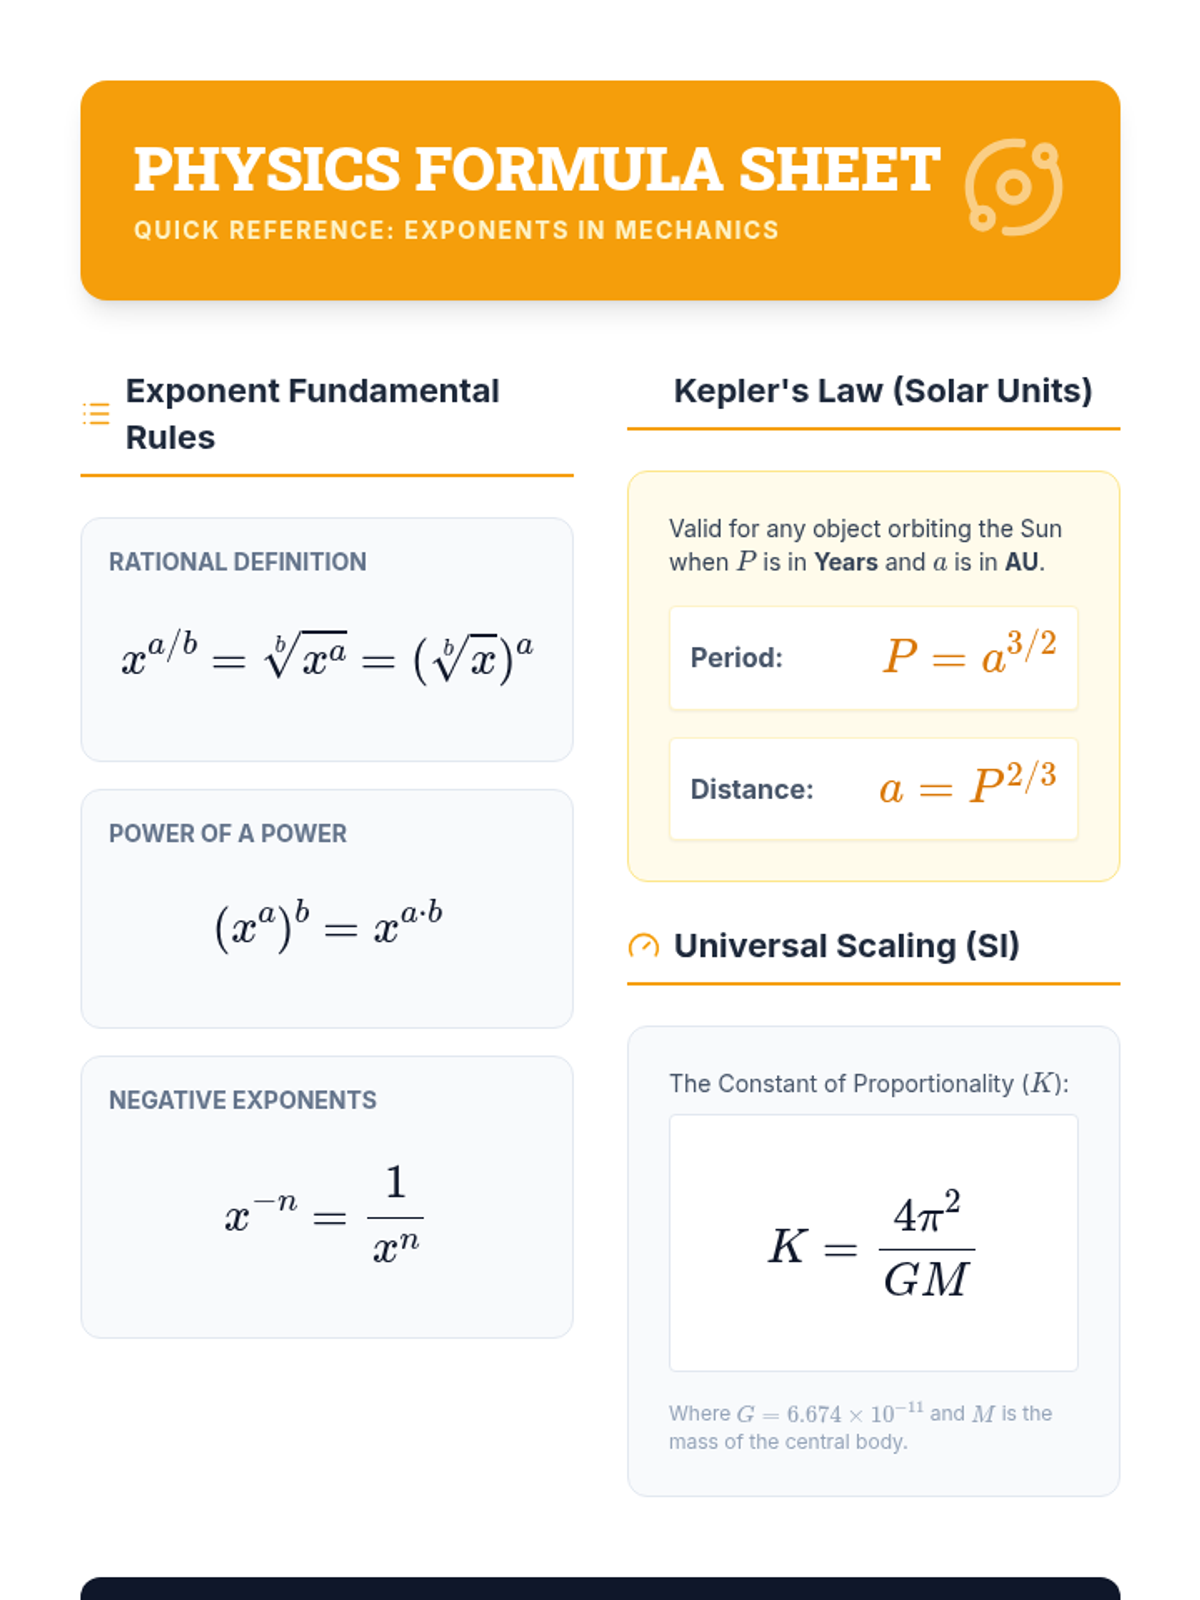
Applying rational exponents to orbital mechanics, students use Kepler's Third Law to calculate planetary distances and periods.
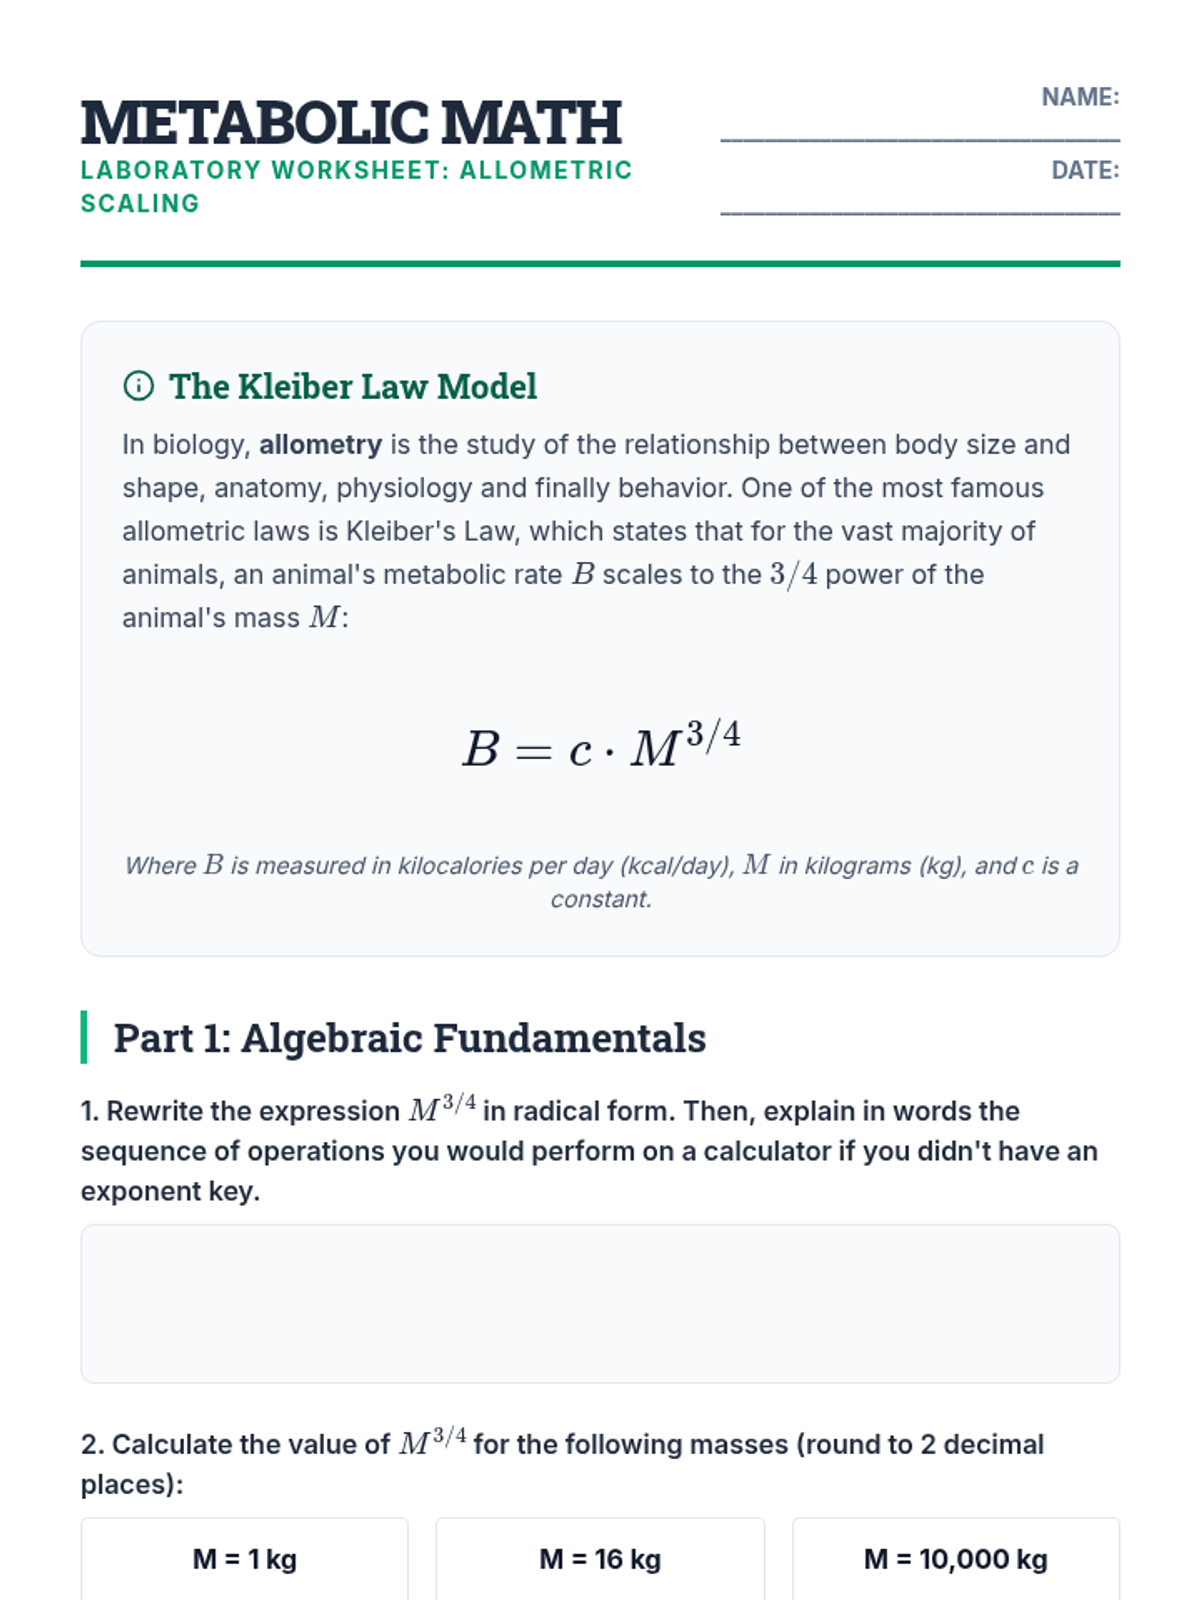
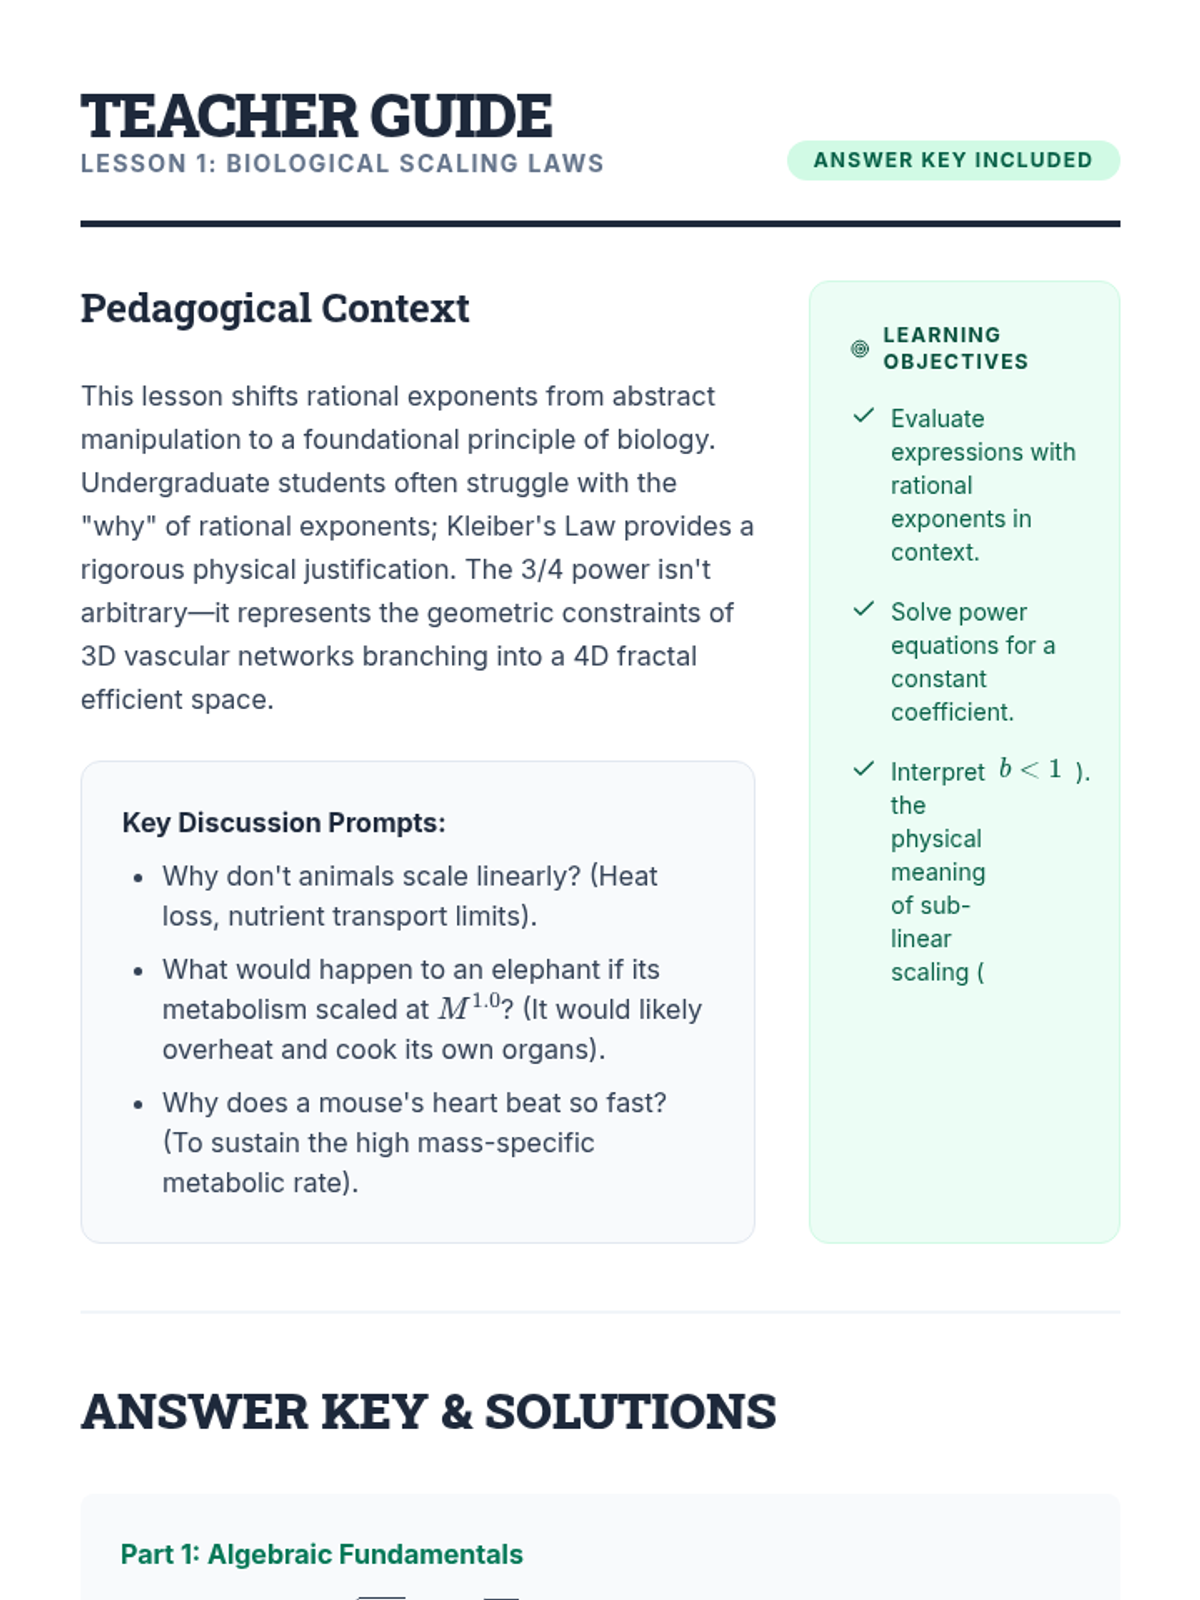
Students investigate the non-linear relationship between animal mass and metabolic rate, evaluating Kleiber's Law (B = M^(3/4)) to understand biological scaling.
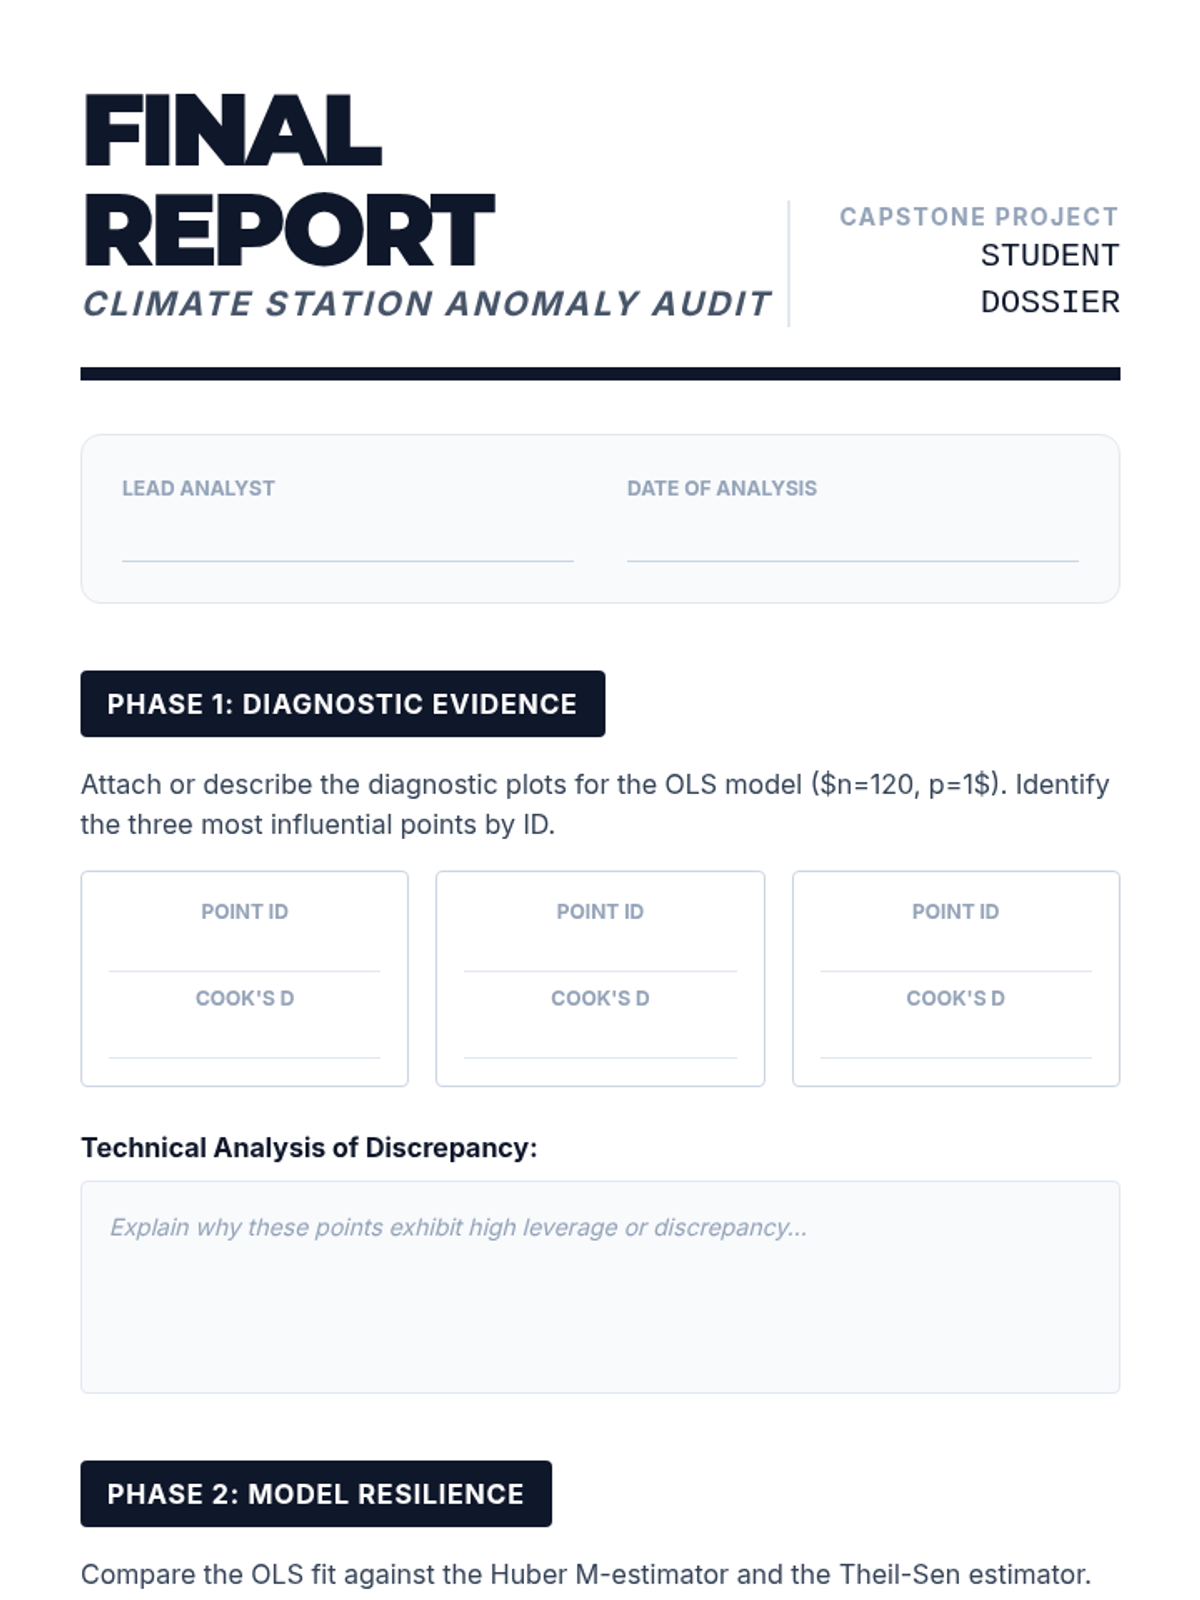
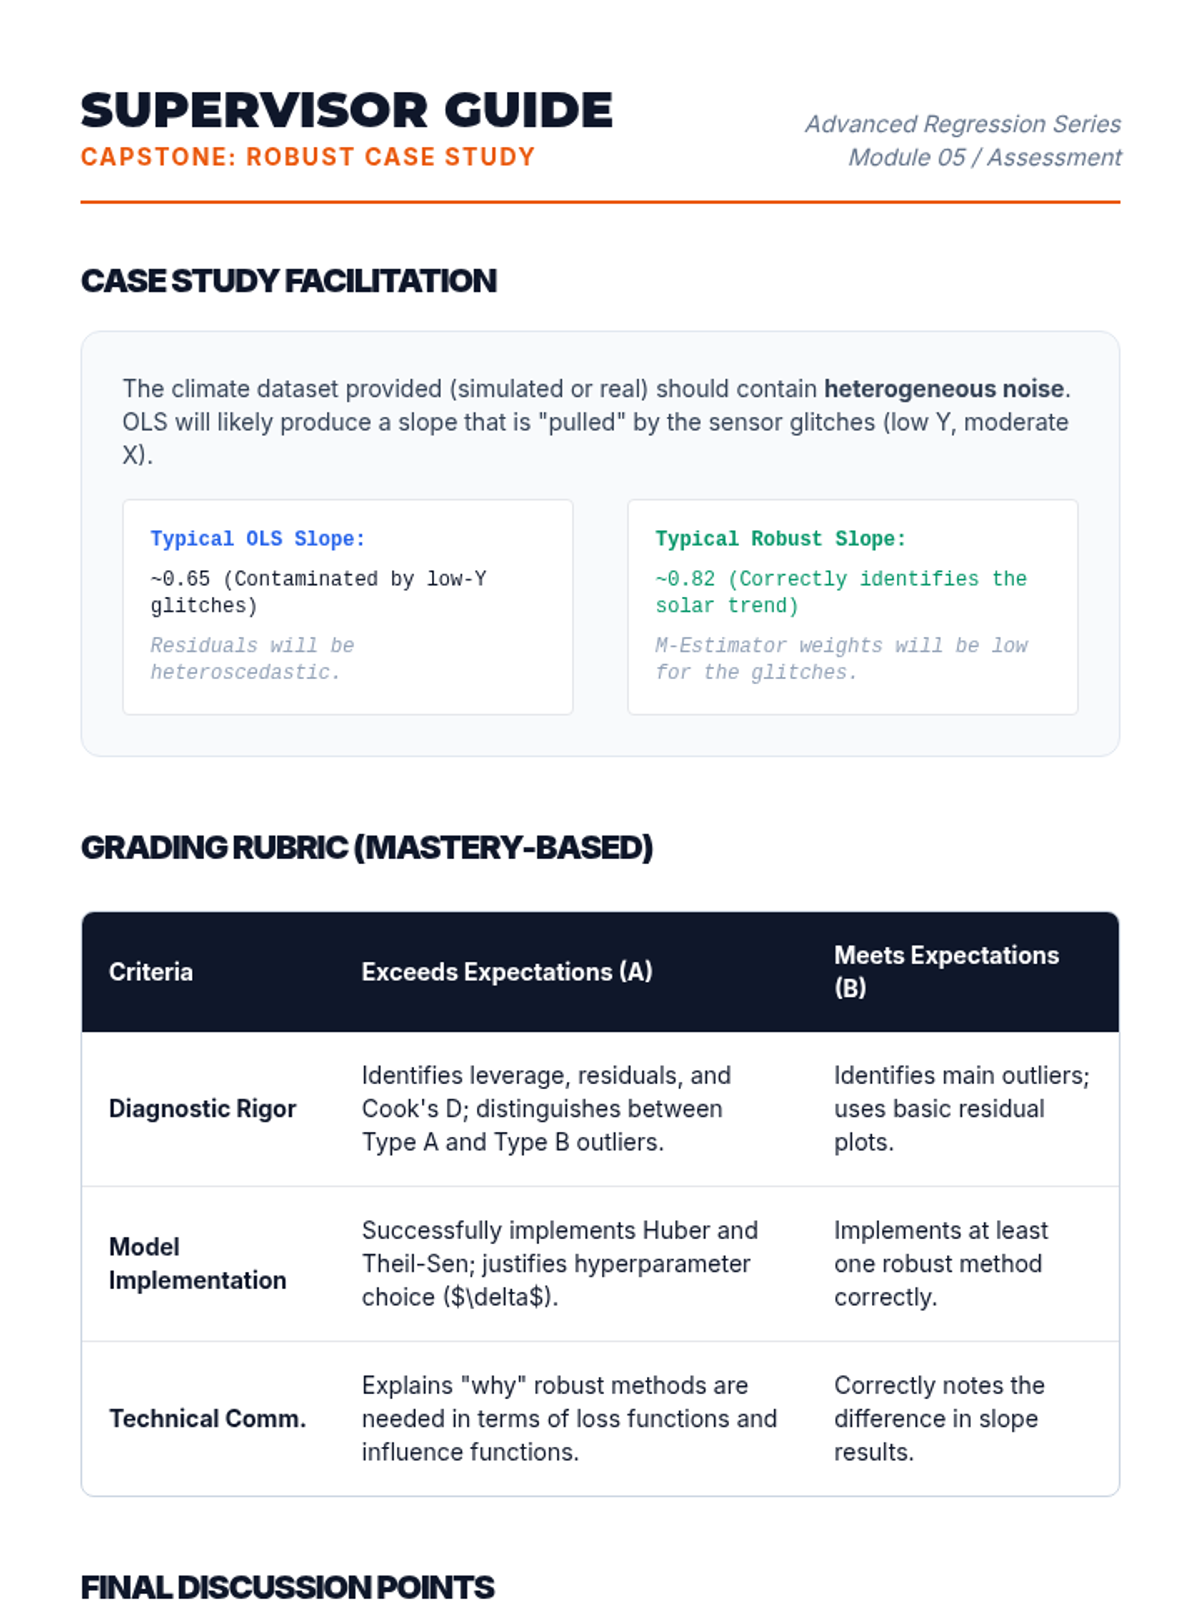
Students analyze a contaminated dataset (e.g., historical climate data with sensor errors) using both OLS and robust methods. They must justify their choice of model and explain the nature of the identified outliers.
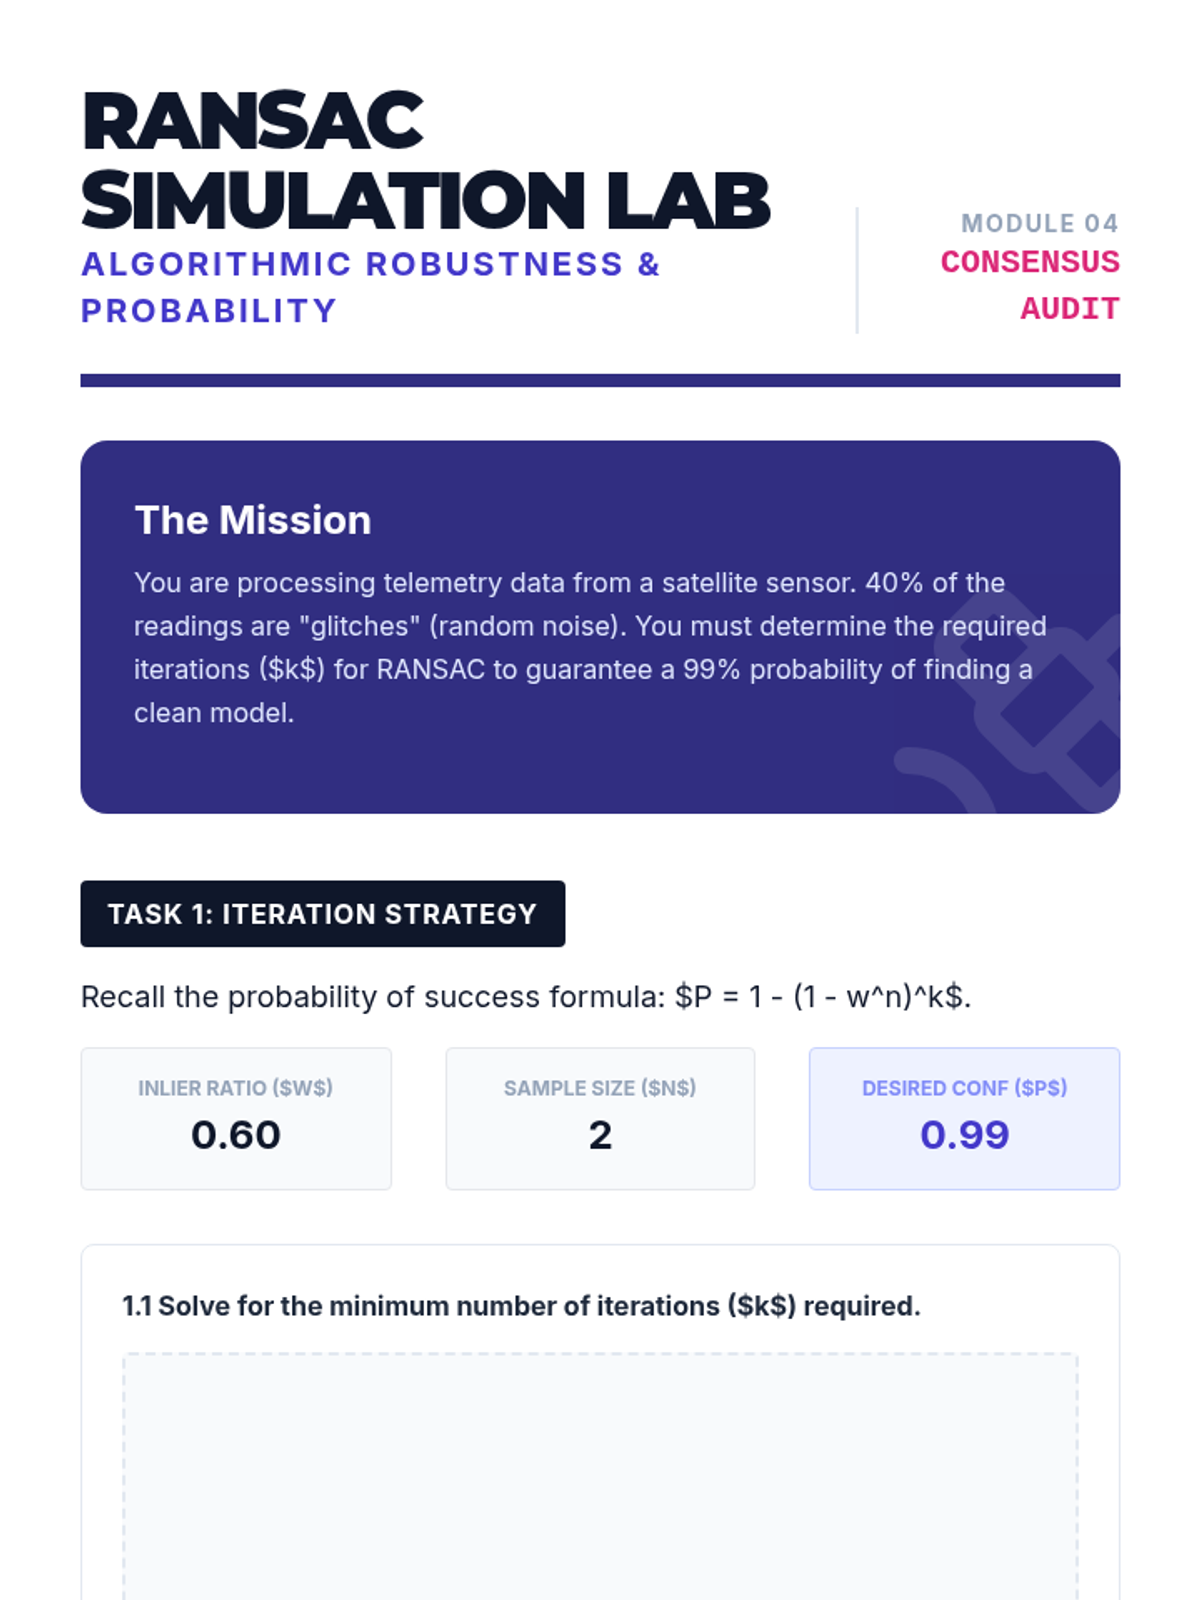
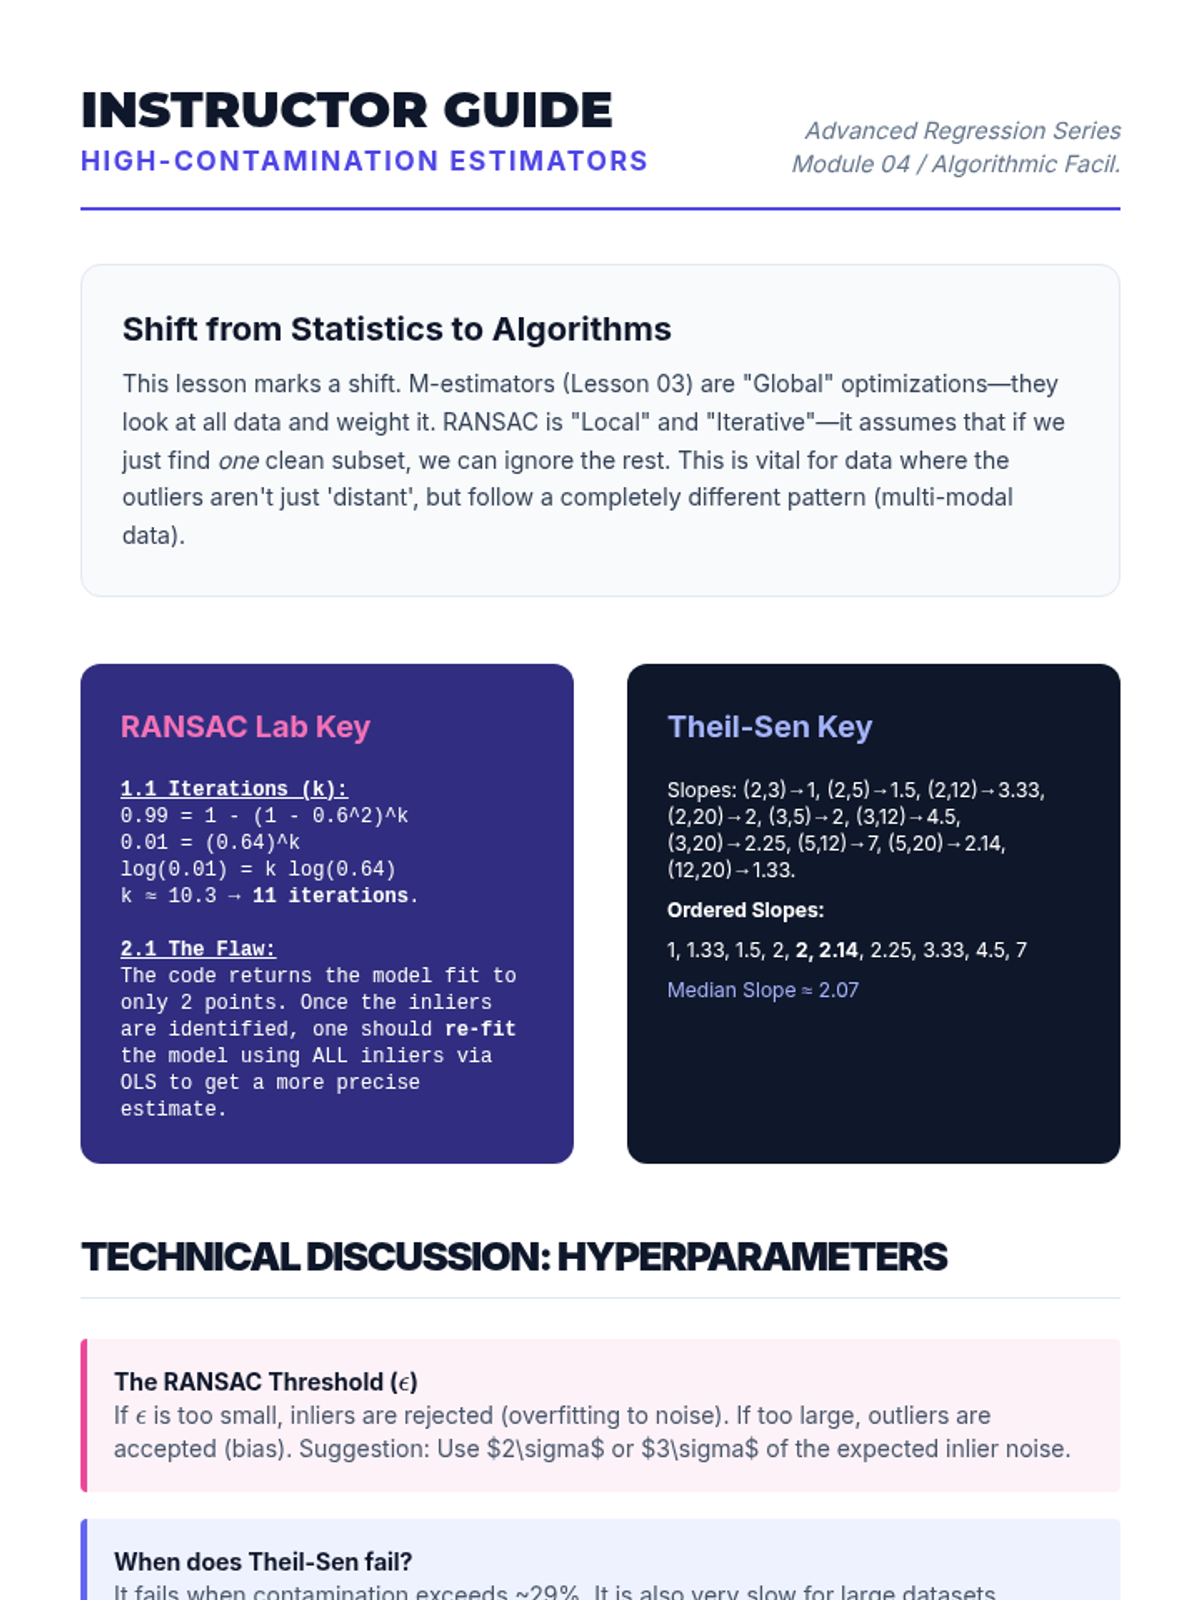
This lesson covers iterative robust methods used frequently in computer vision and engineering. Students implement RANSAC (Random Sample Consensus) to fit models to data with high contamination rates (up to 50% outliers).
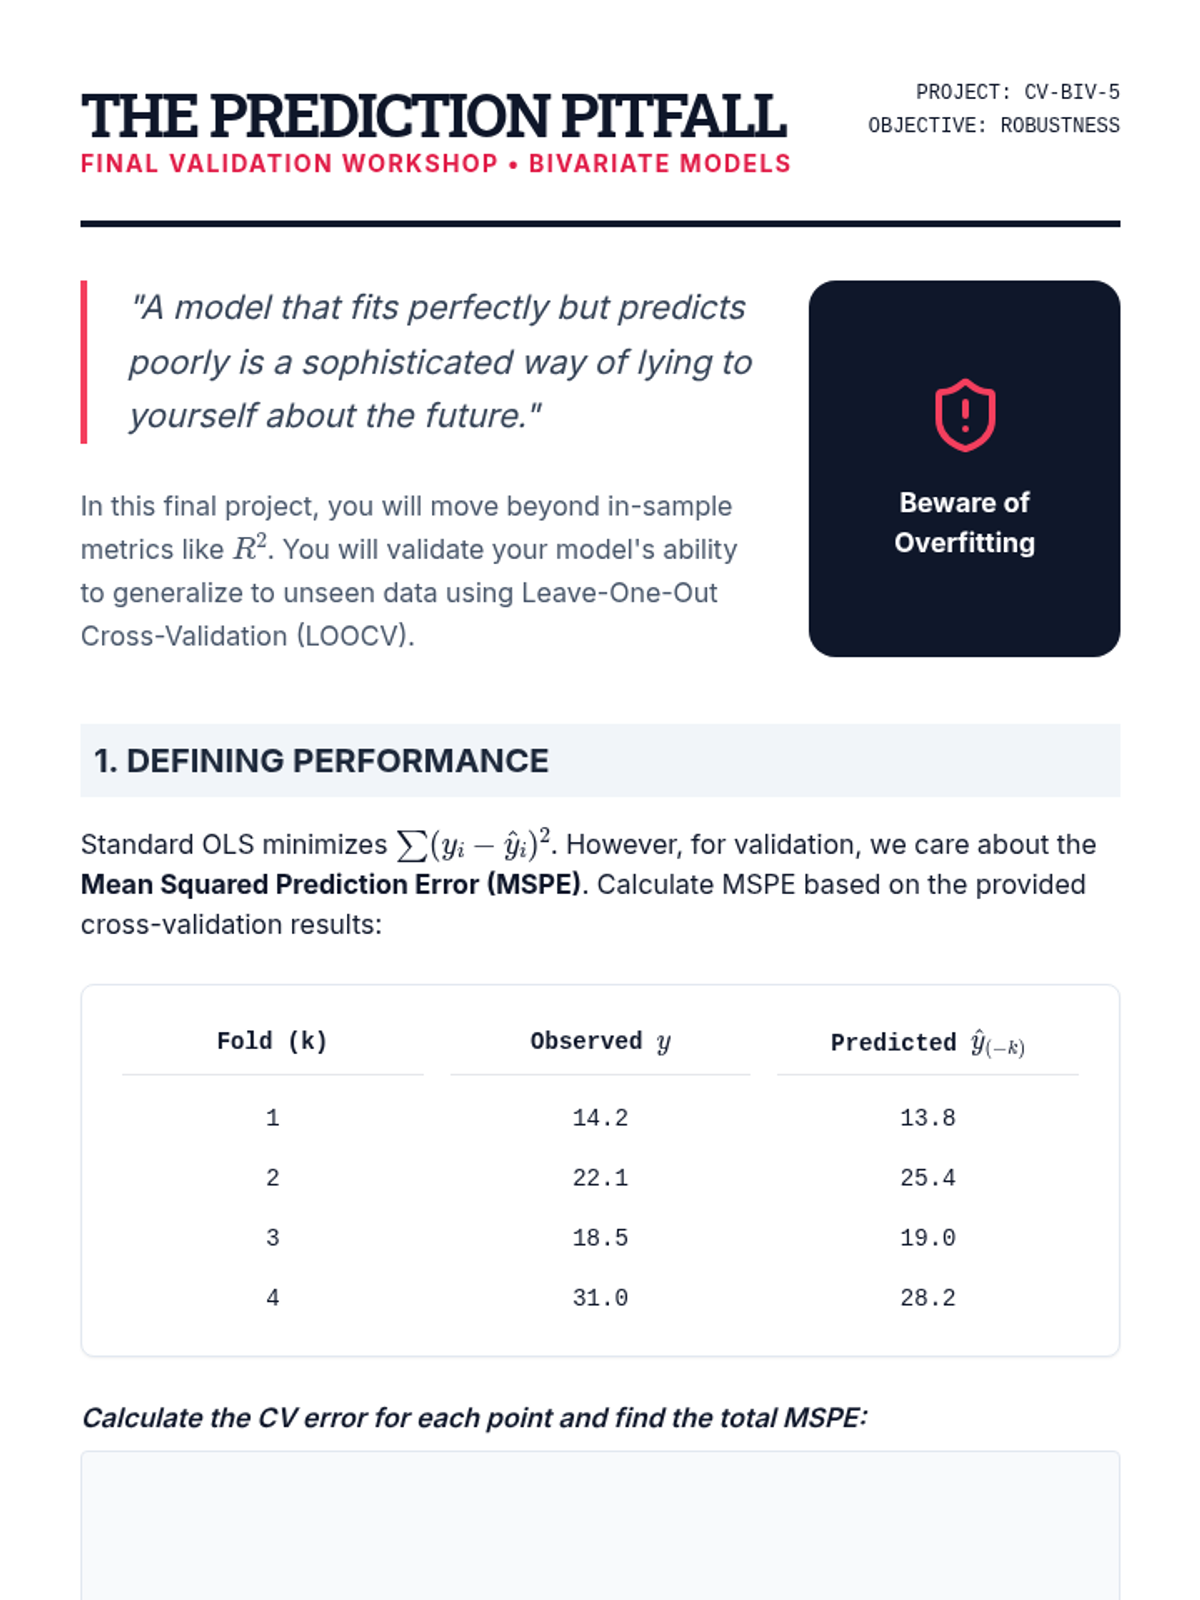
Students synthesize their diagnostic skills by implementing cross-validation frameworks to assess model generalizability and prevent overfitting.
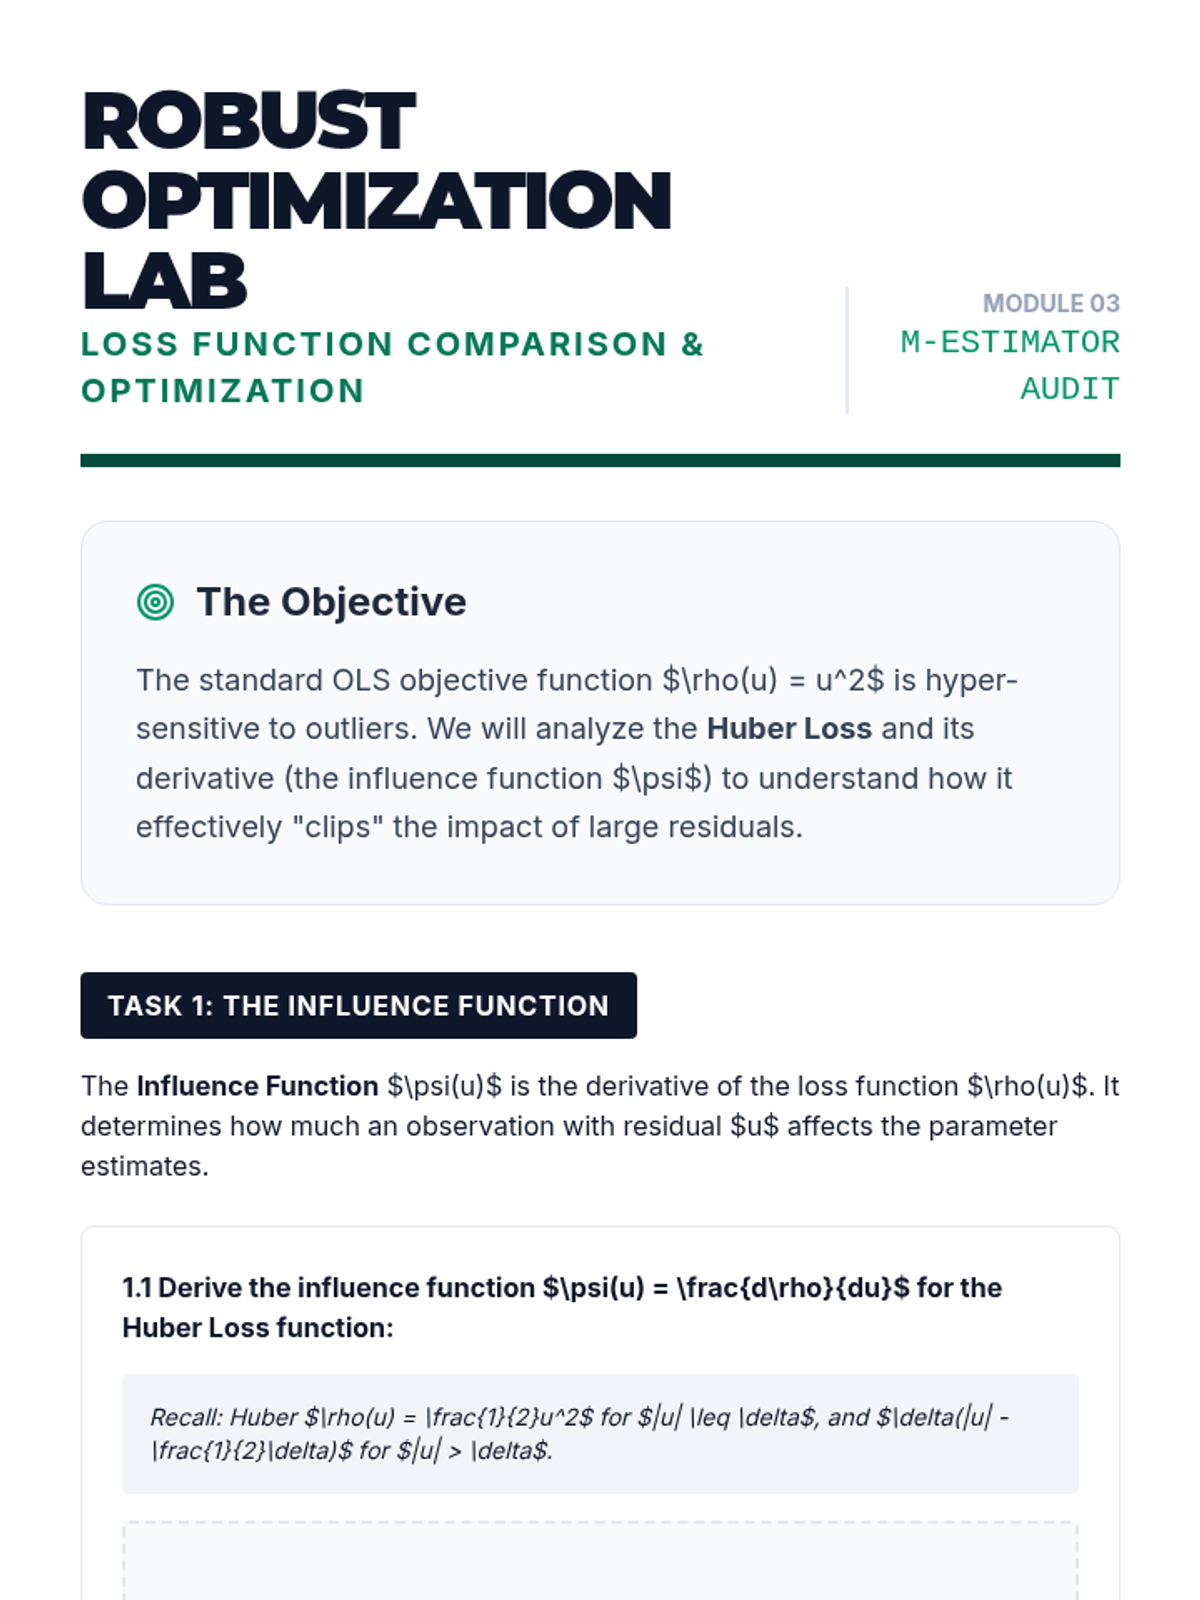
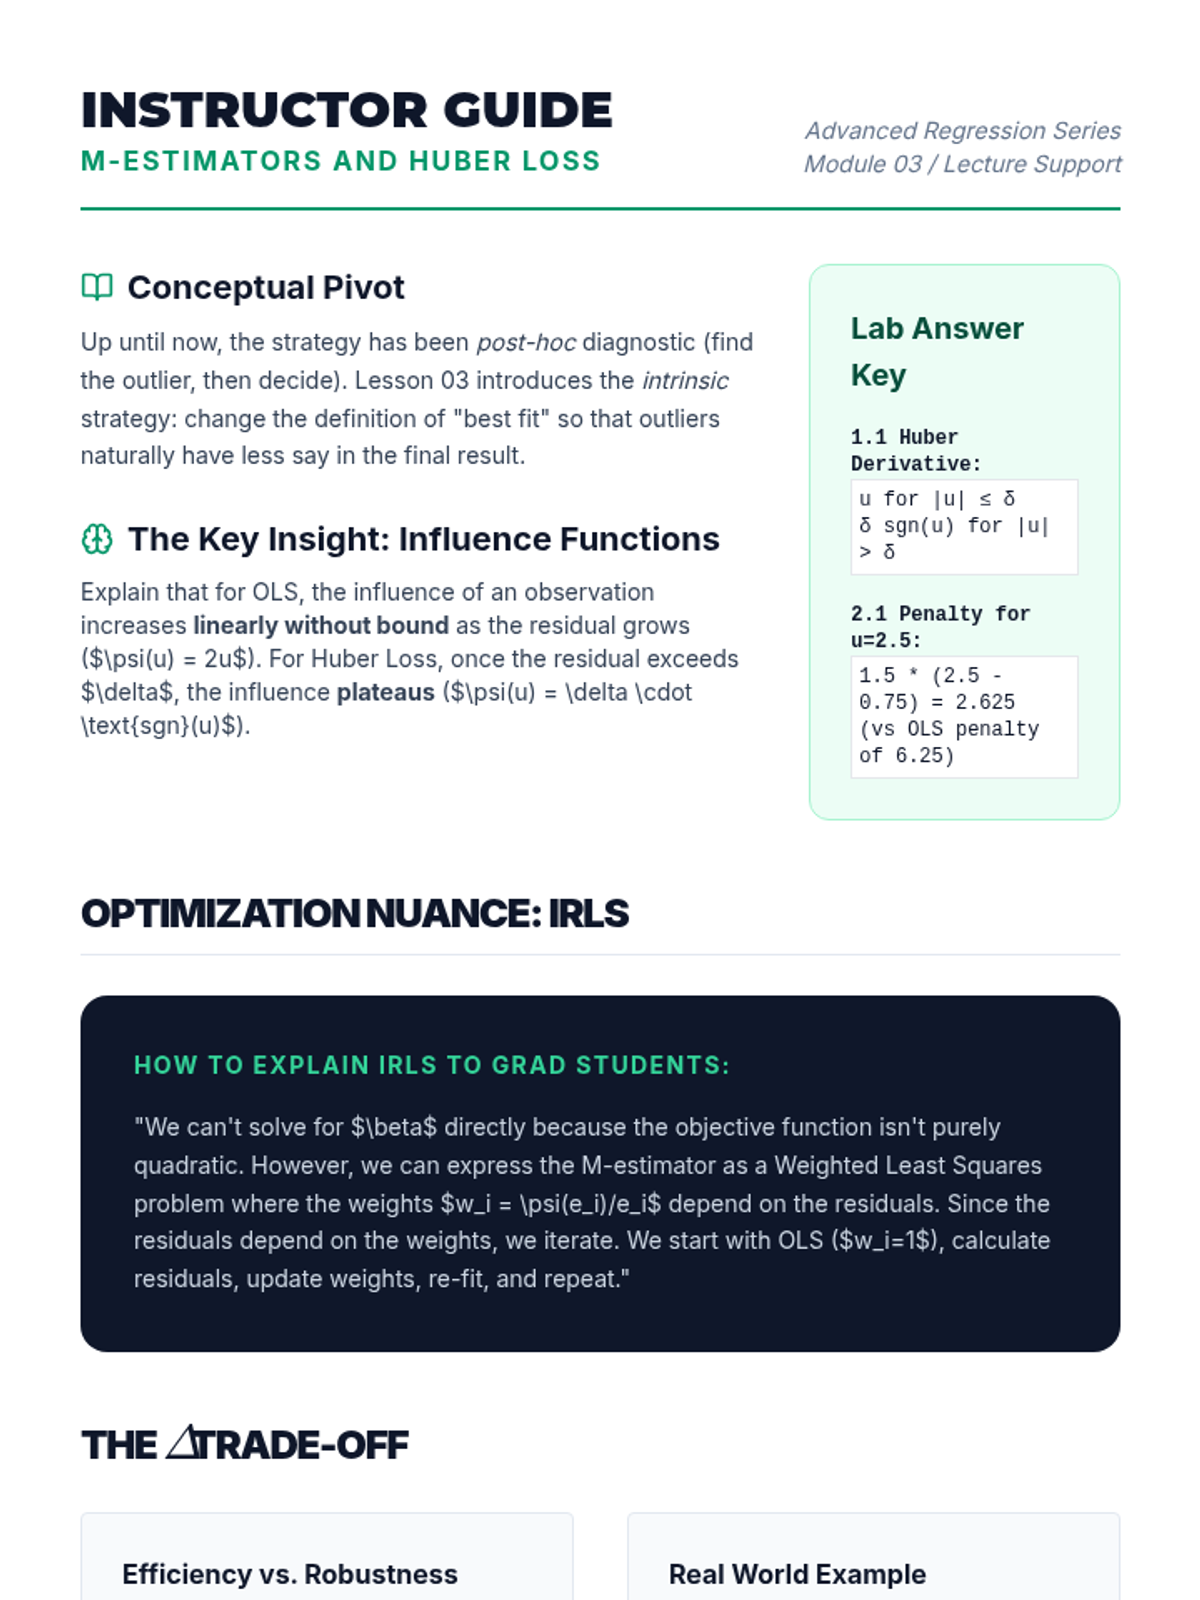
Students are introduced to robust regression techniques that modify the loss function. The lesson contrasts squared error loss (L2) with absolute error (L1) and Huber loss to reduce the impact of outliers.
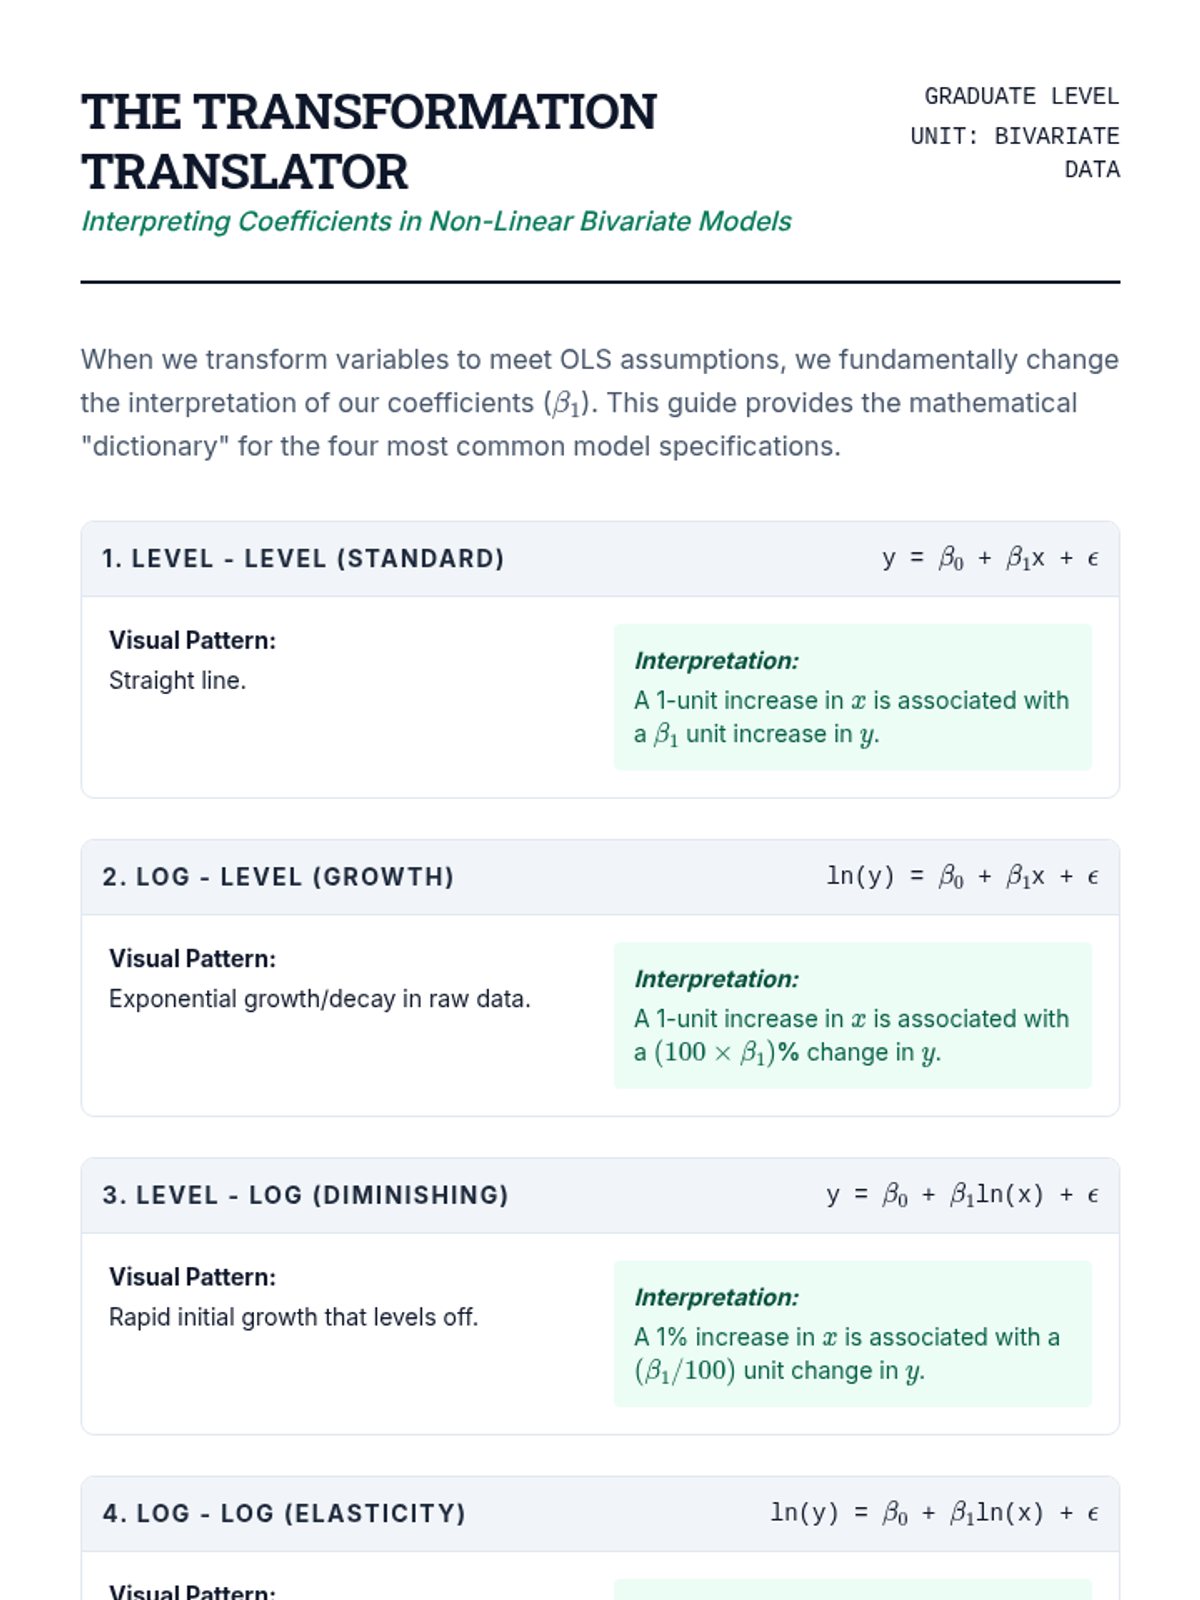
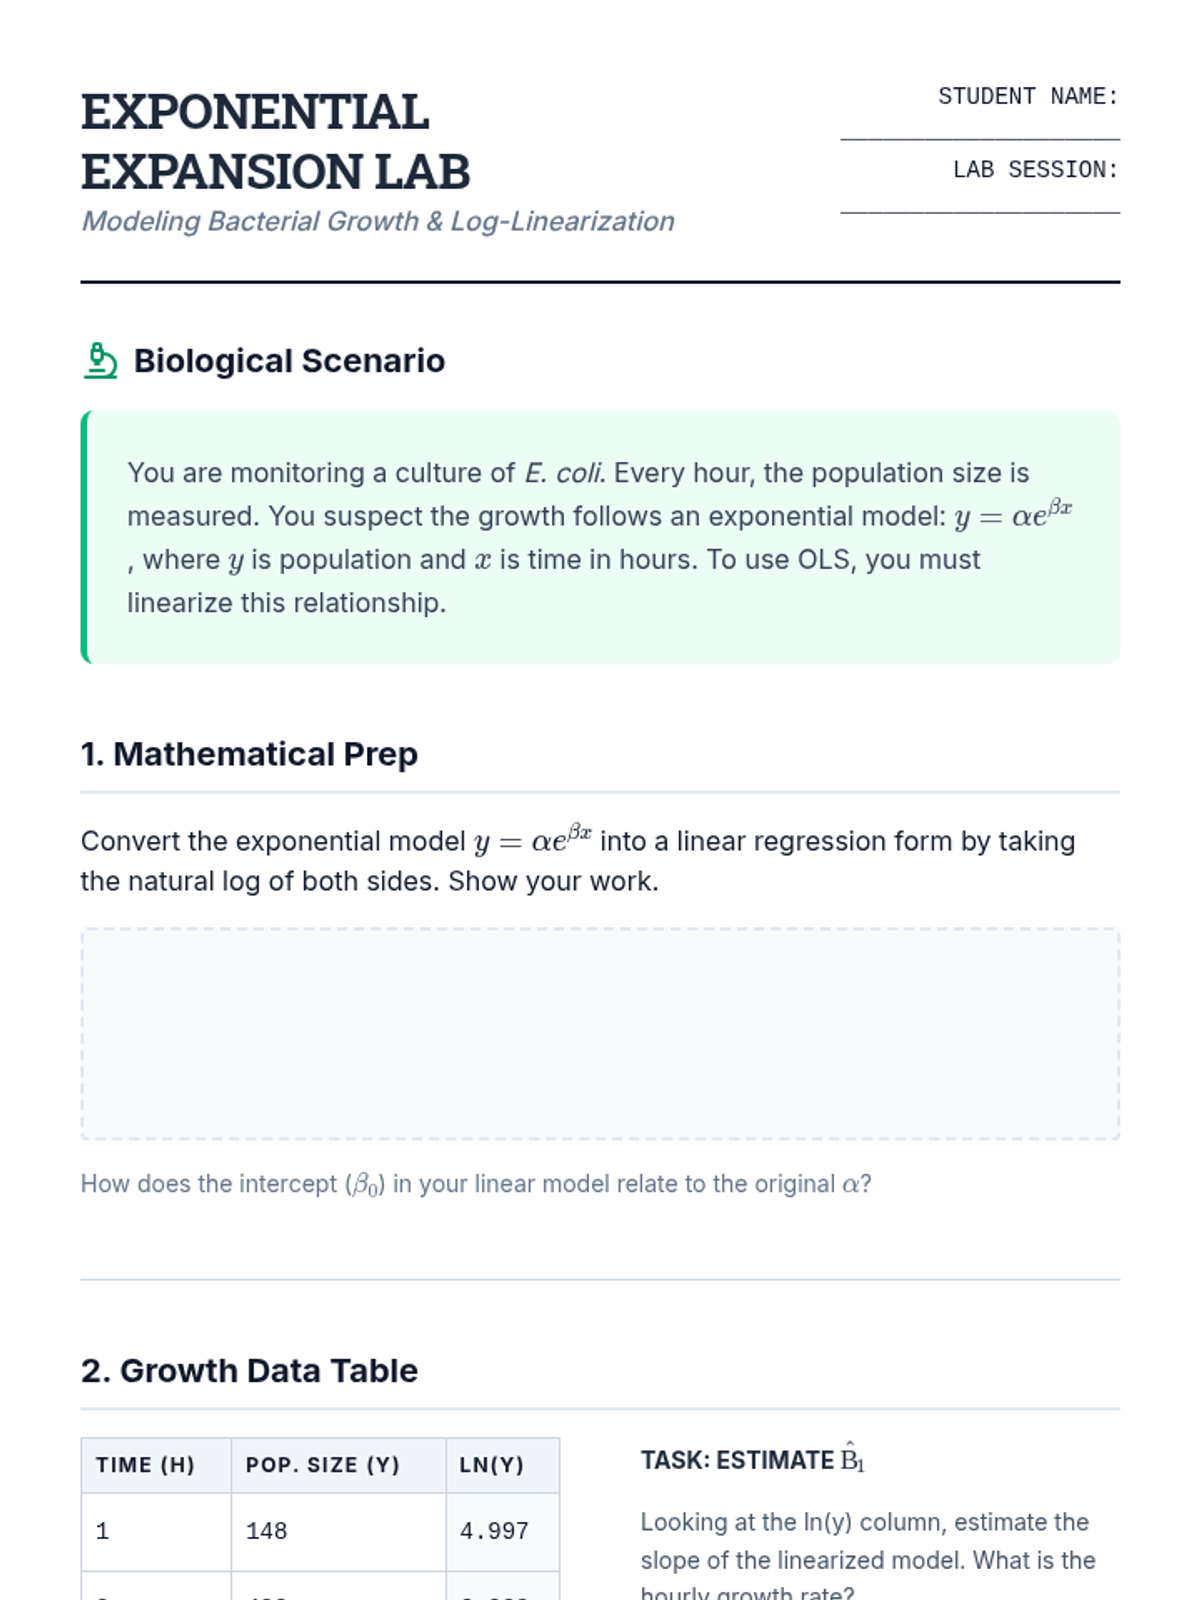
Students master data transformations to linearize relationships and stabilize variance, focusing on the interpretative shifts required for log-based models.
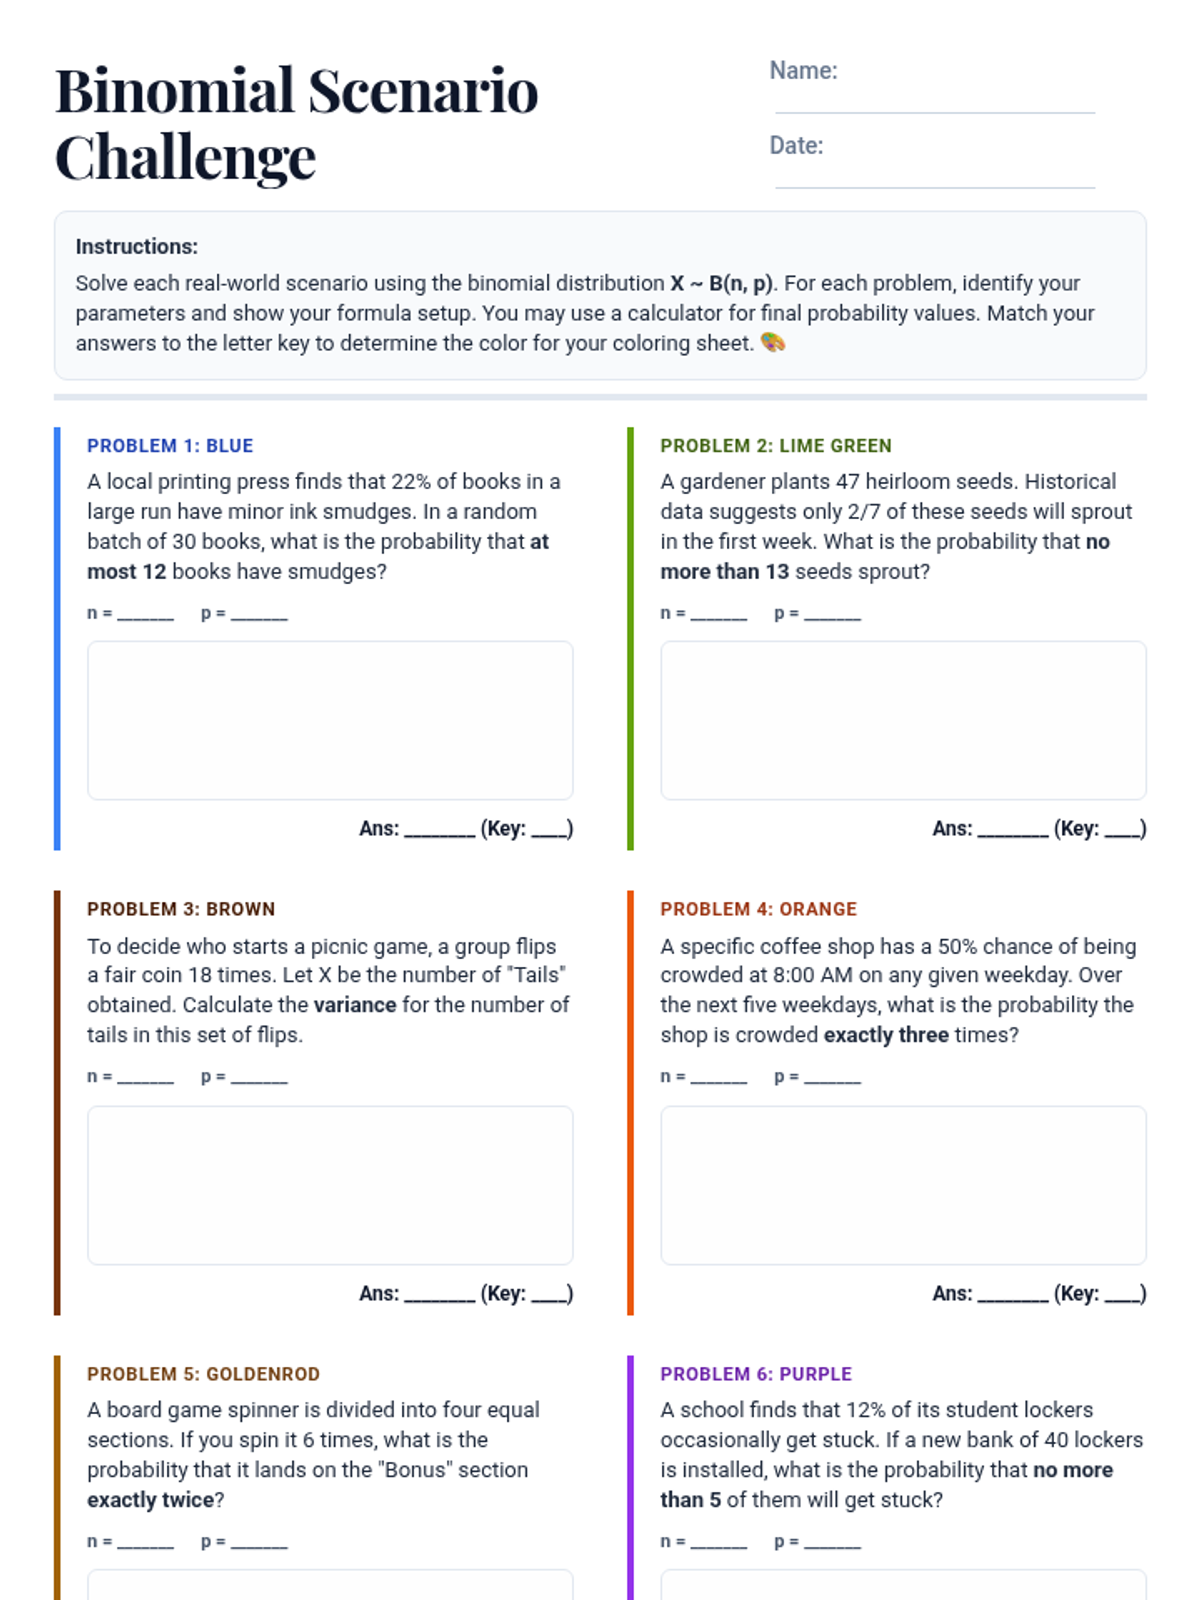
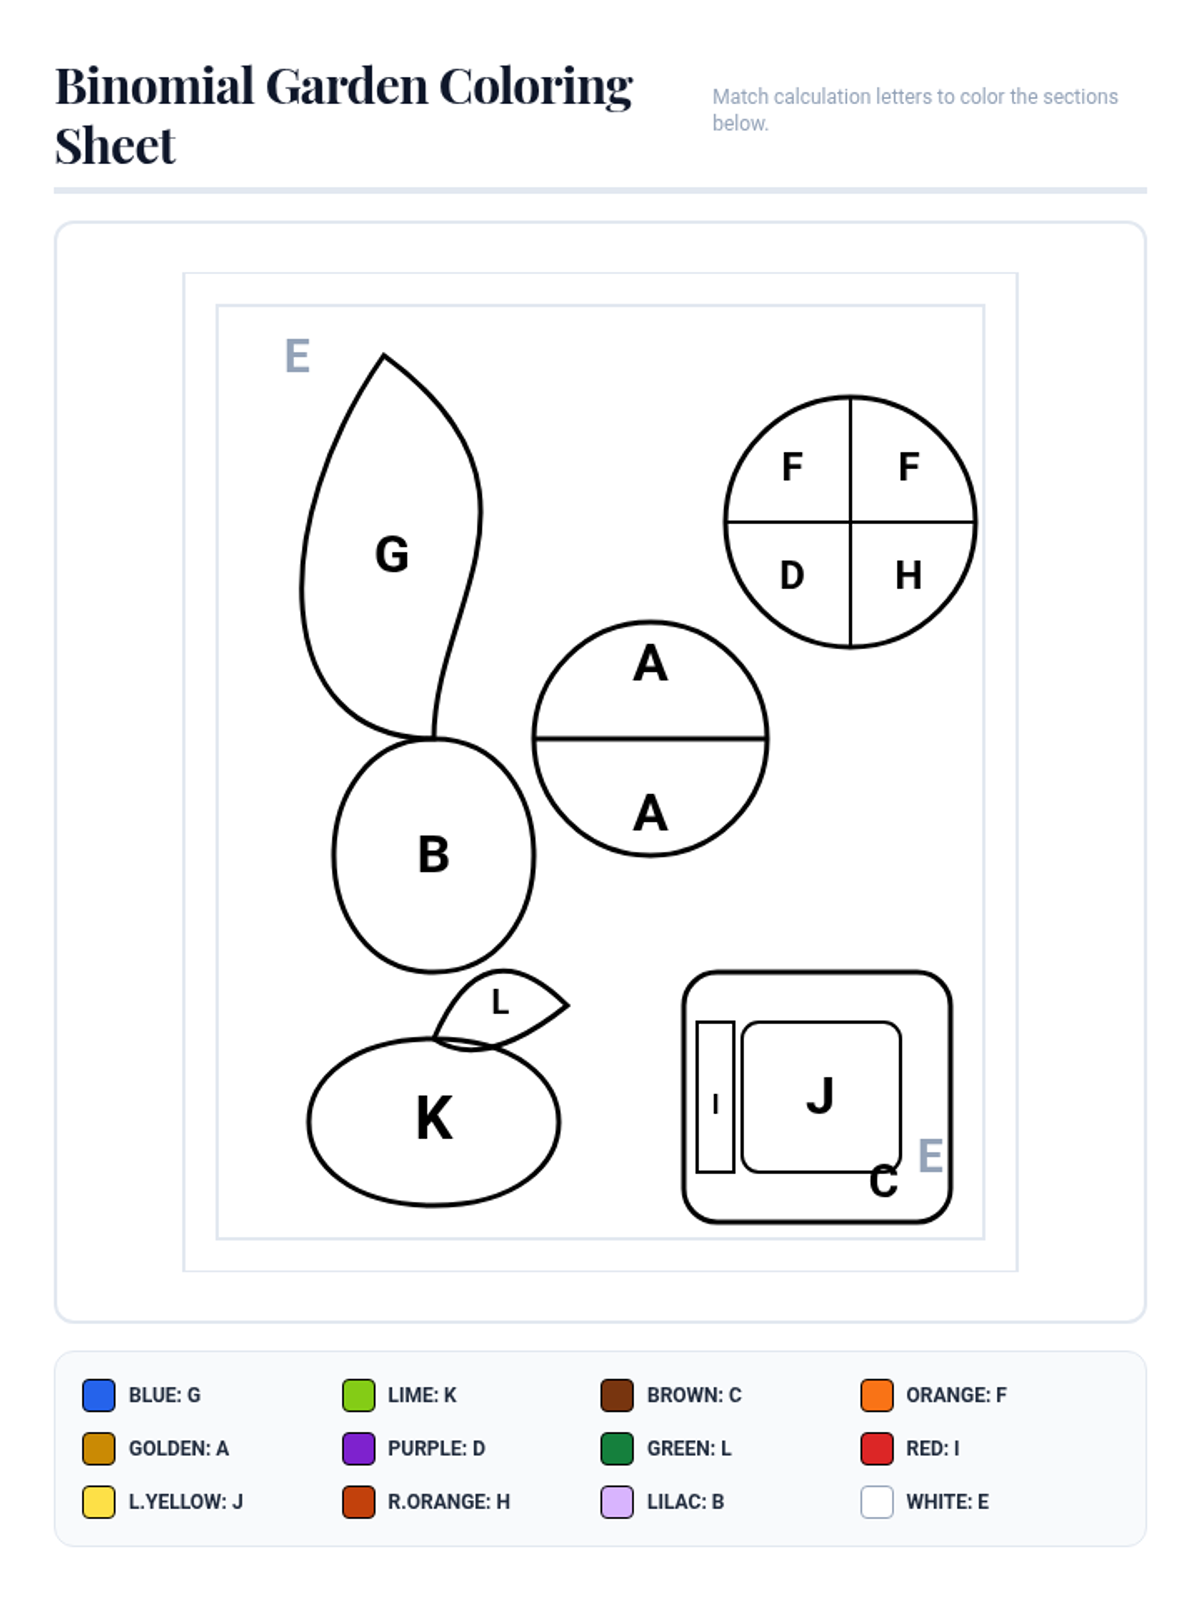
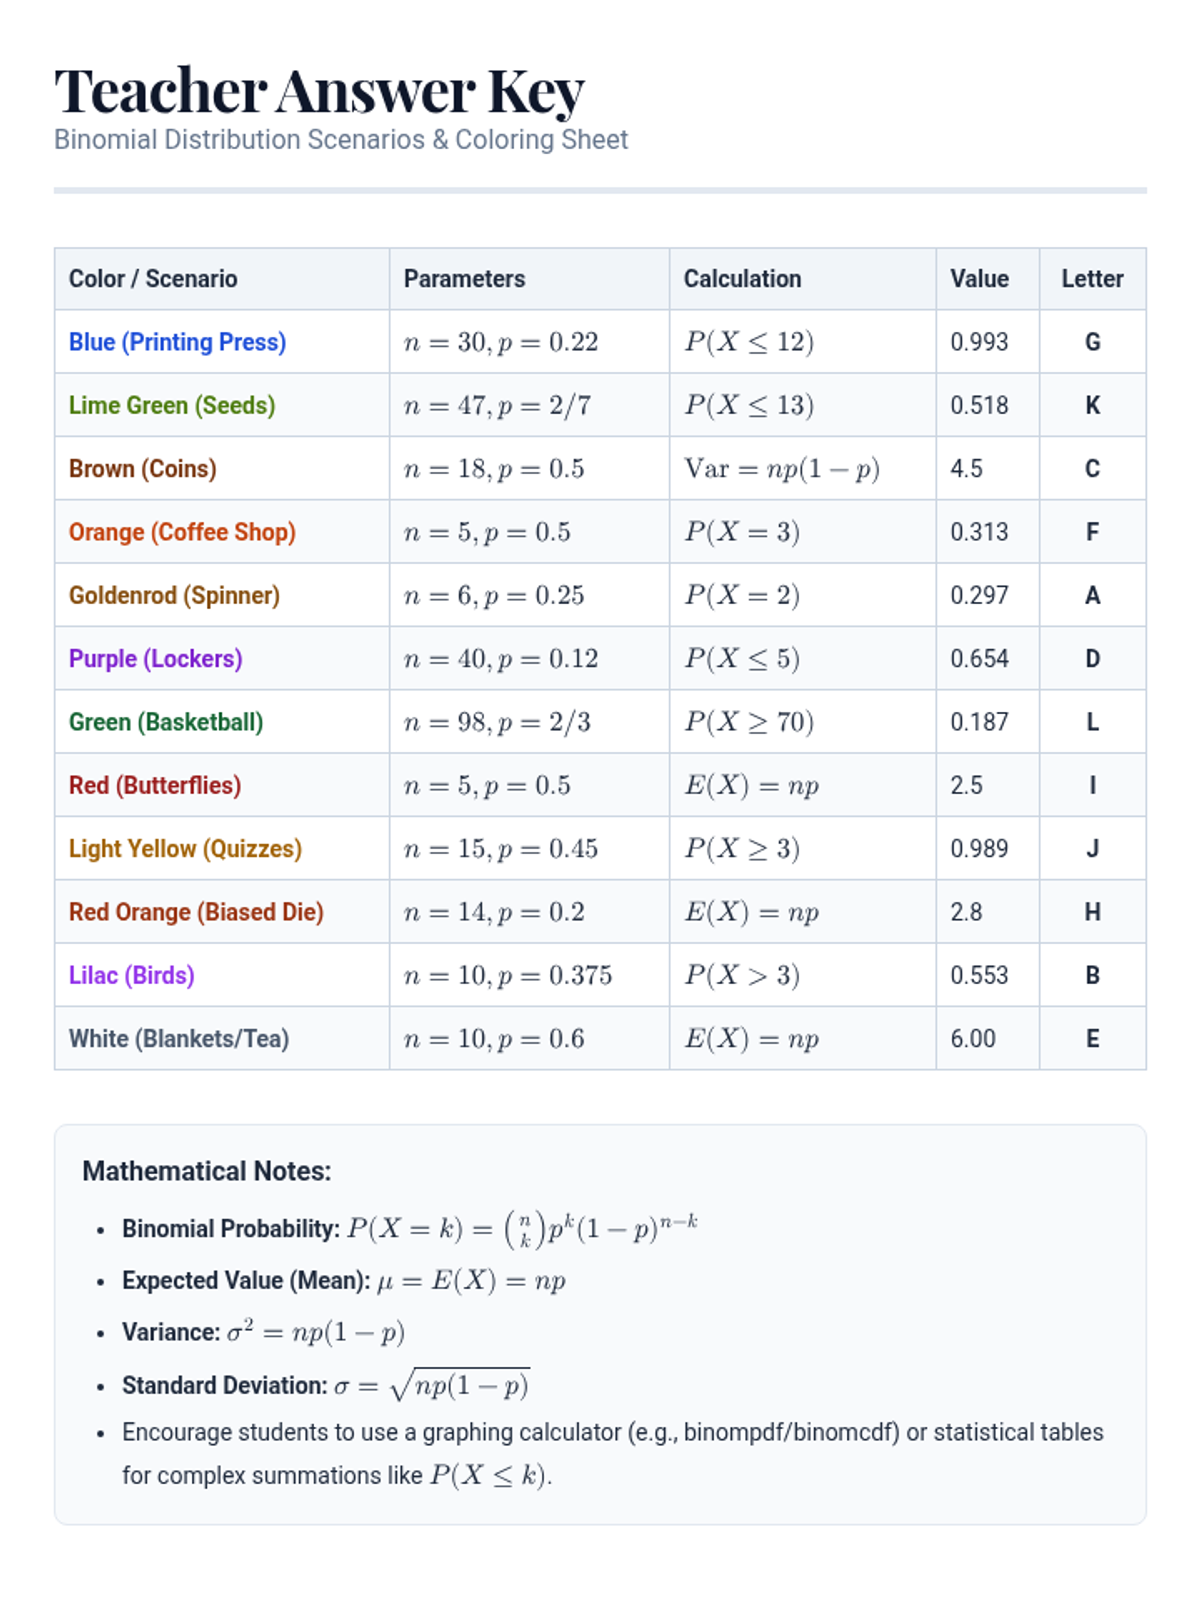
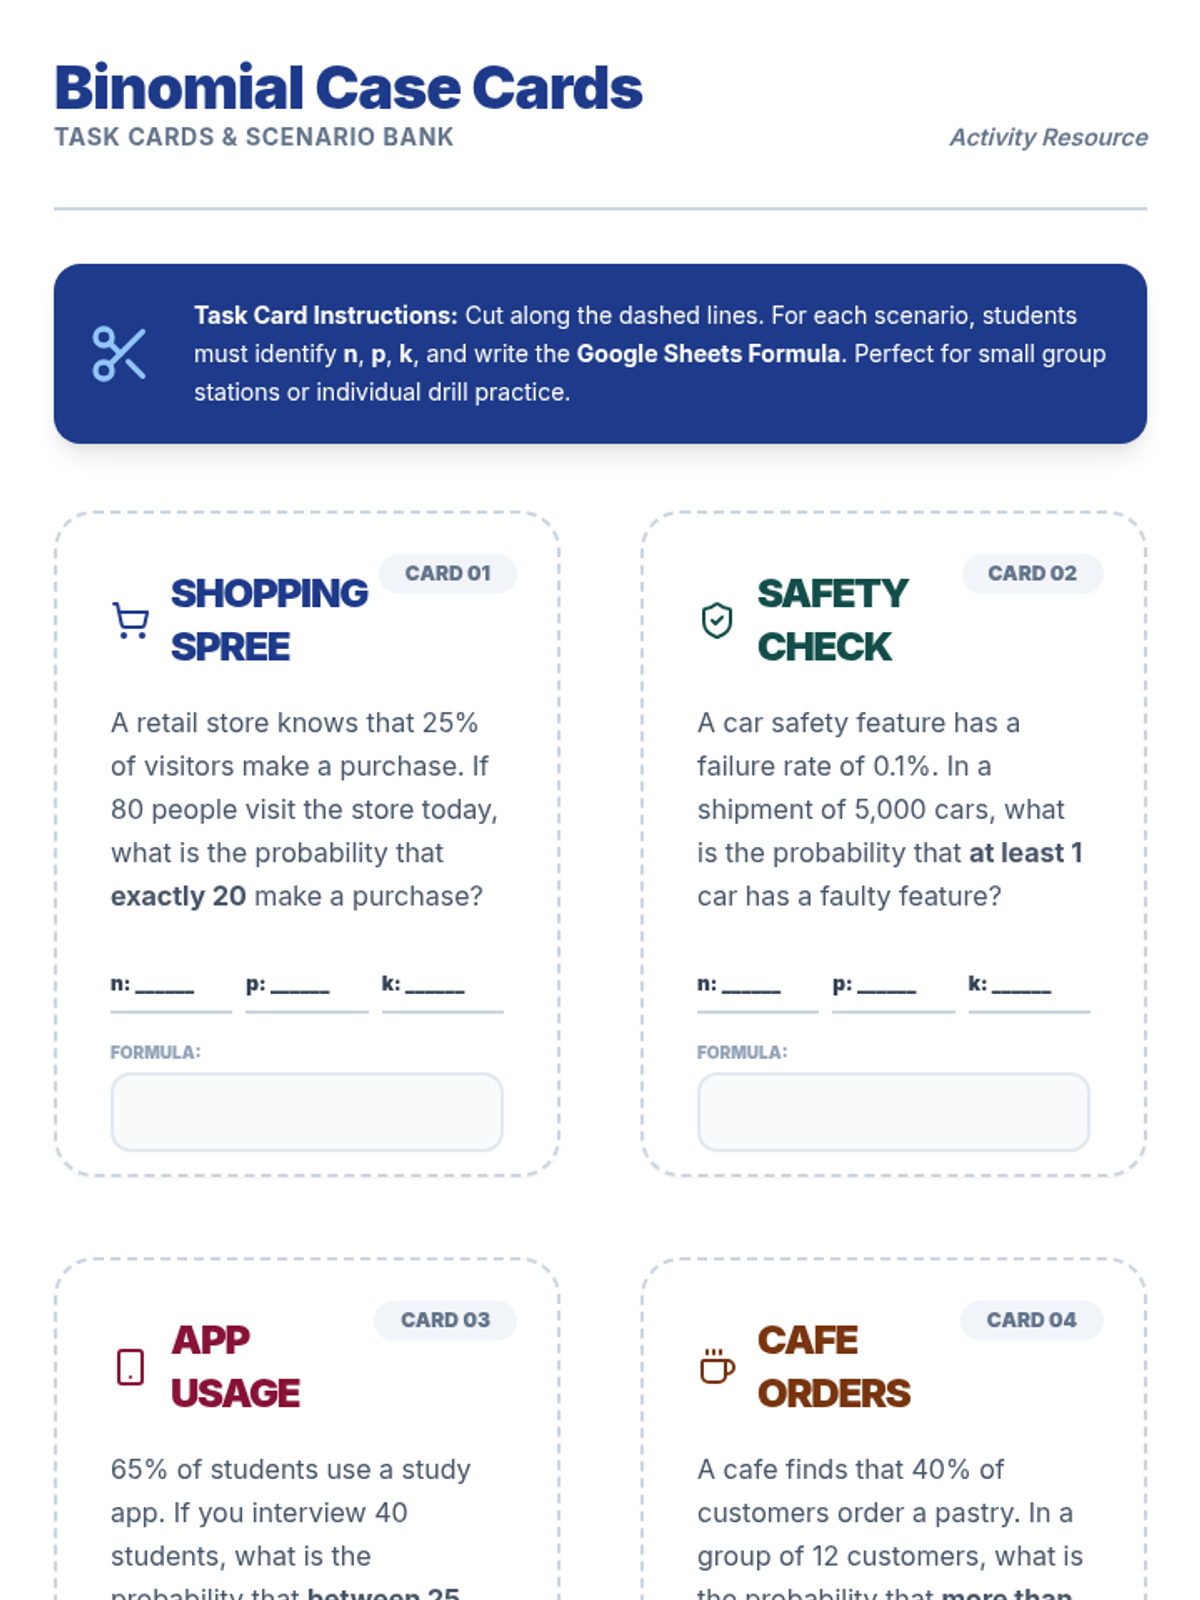
A lesson focused on applying binomial distribution concepts to real-world scenarios through a creative coloring activity. Students translate narrative word problems into mathematical models to calculate probabilities, means, and variances.
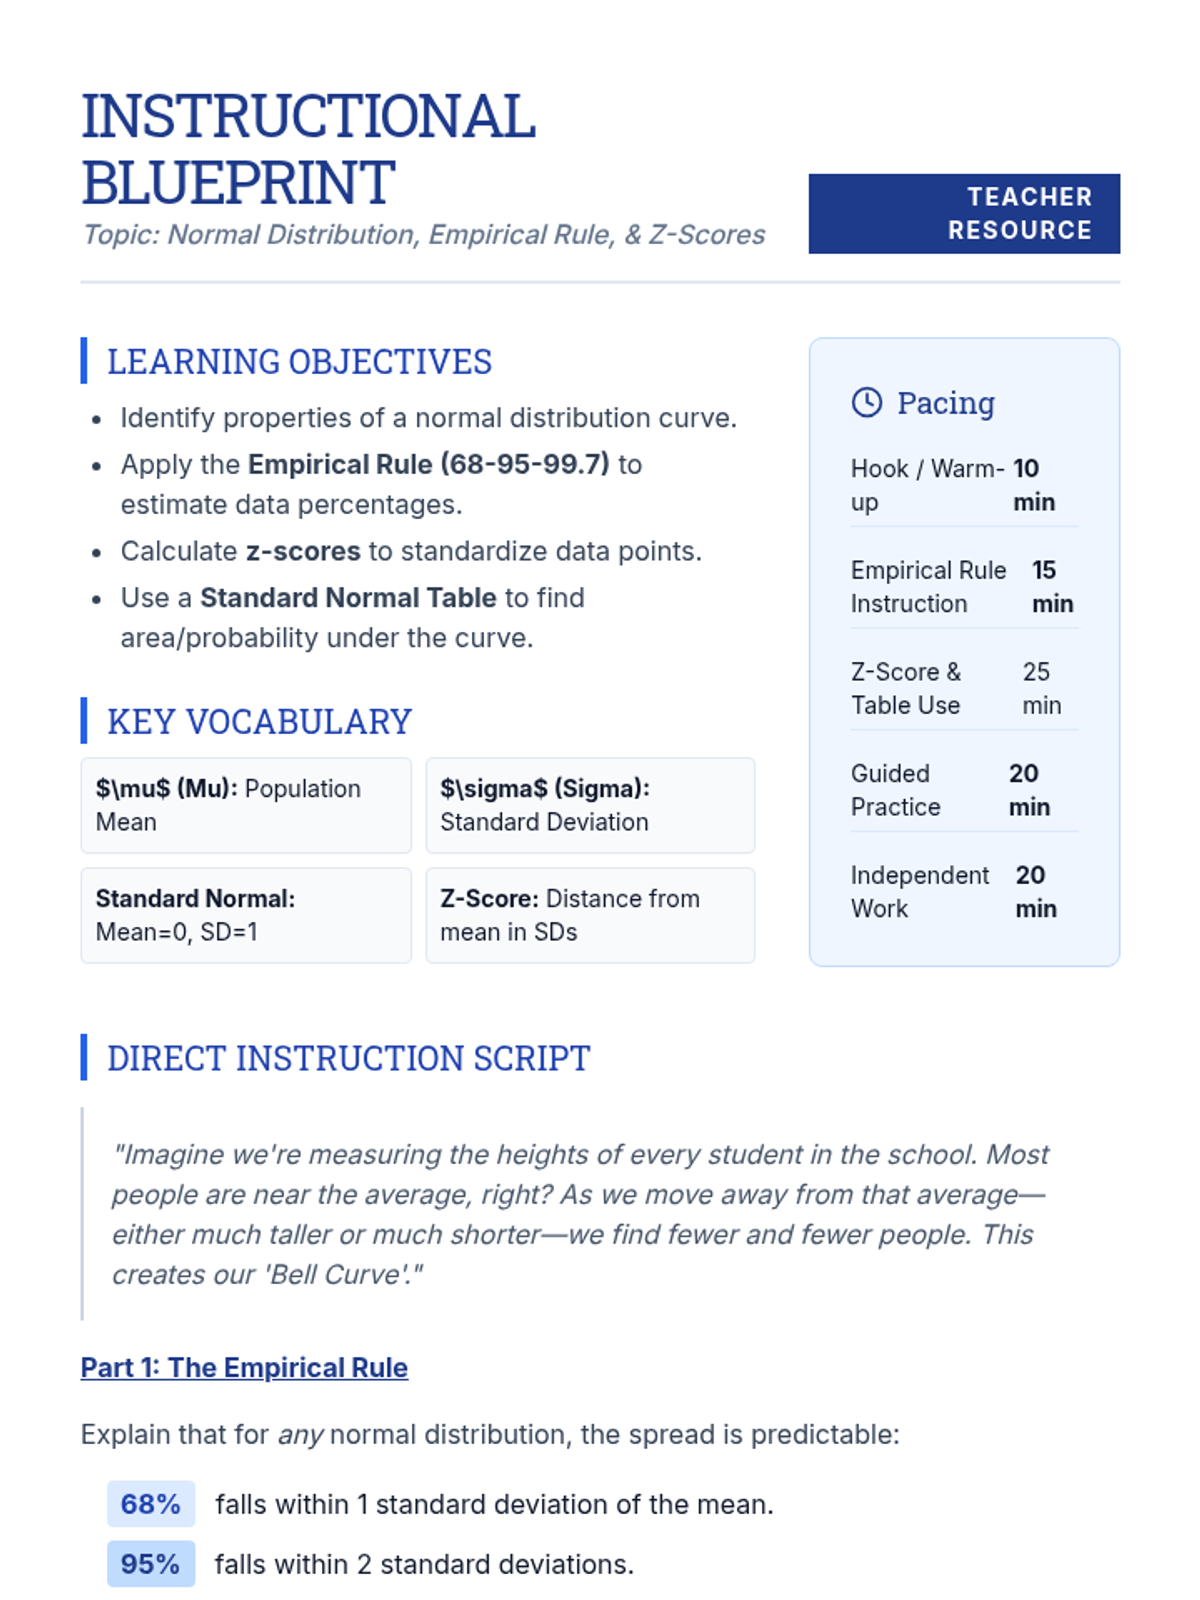
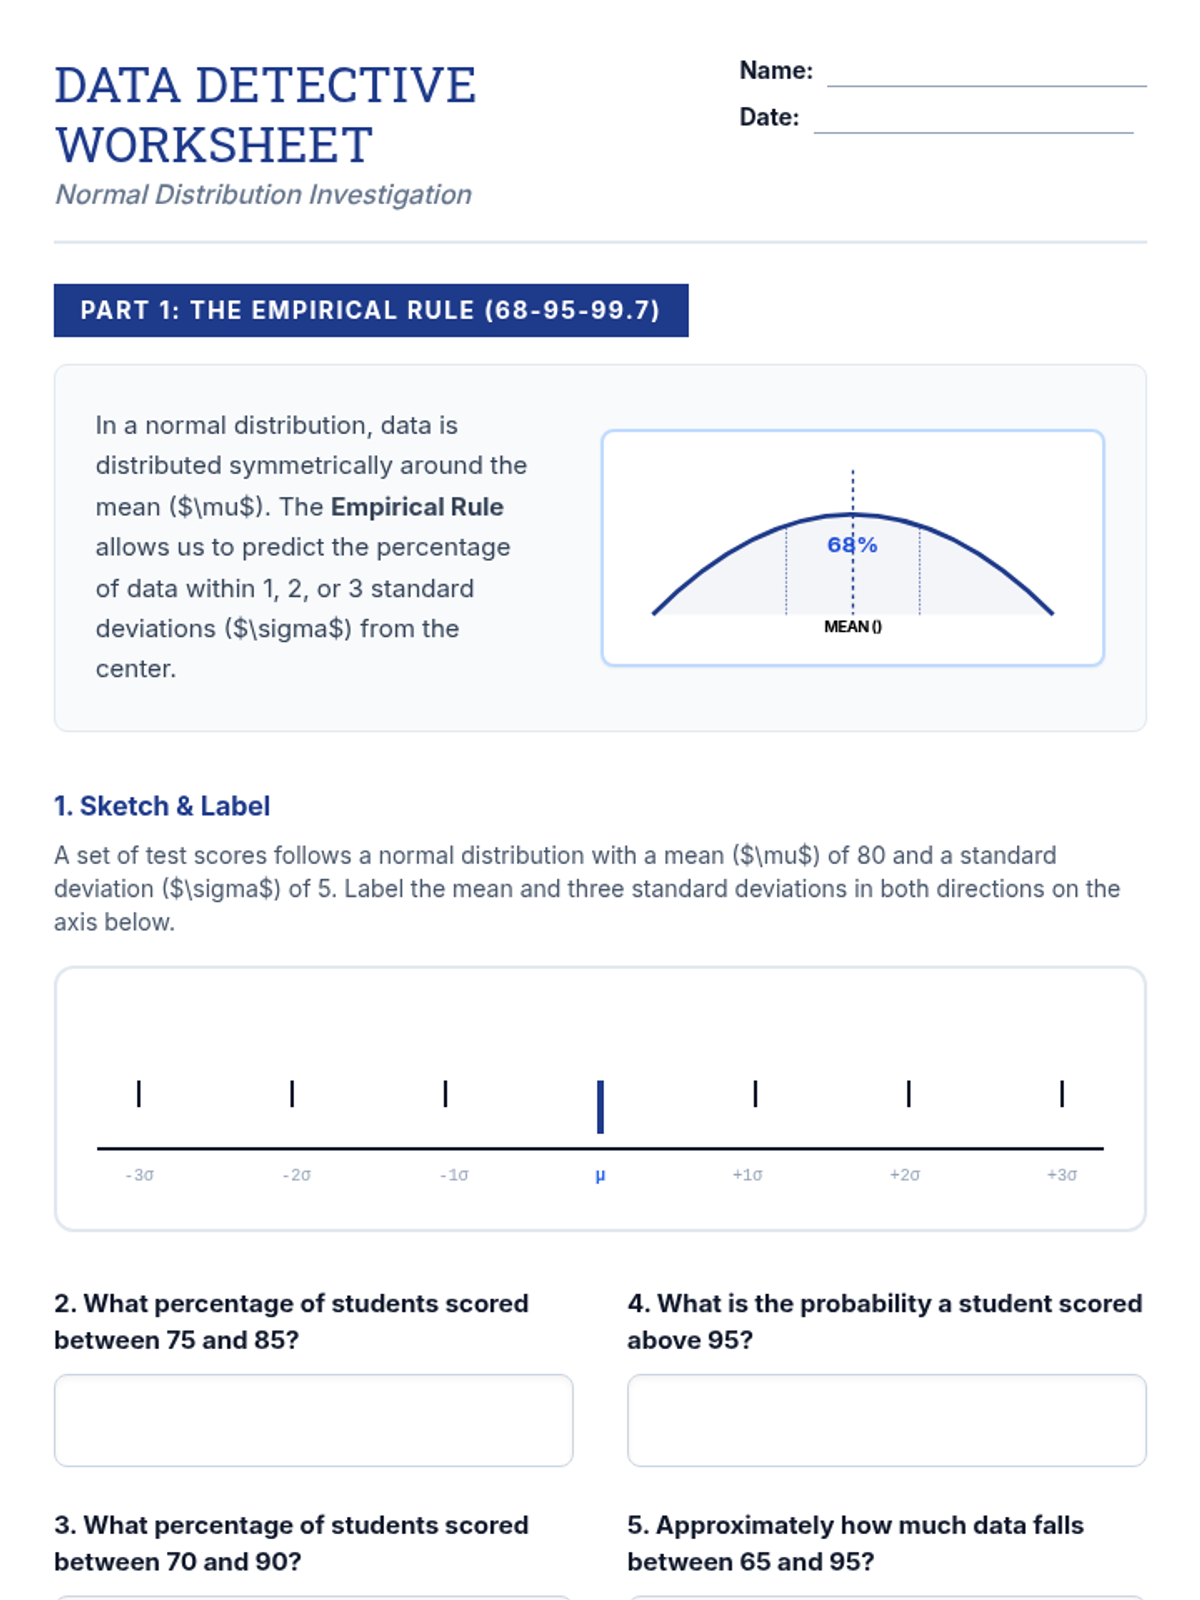
A comprehensive introduction to the normal distribution, focusing on the empirical rule and calculating probabilities using z-score tables. Students will learn to visualize data distributions and find areas under the curve.
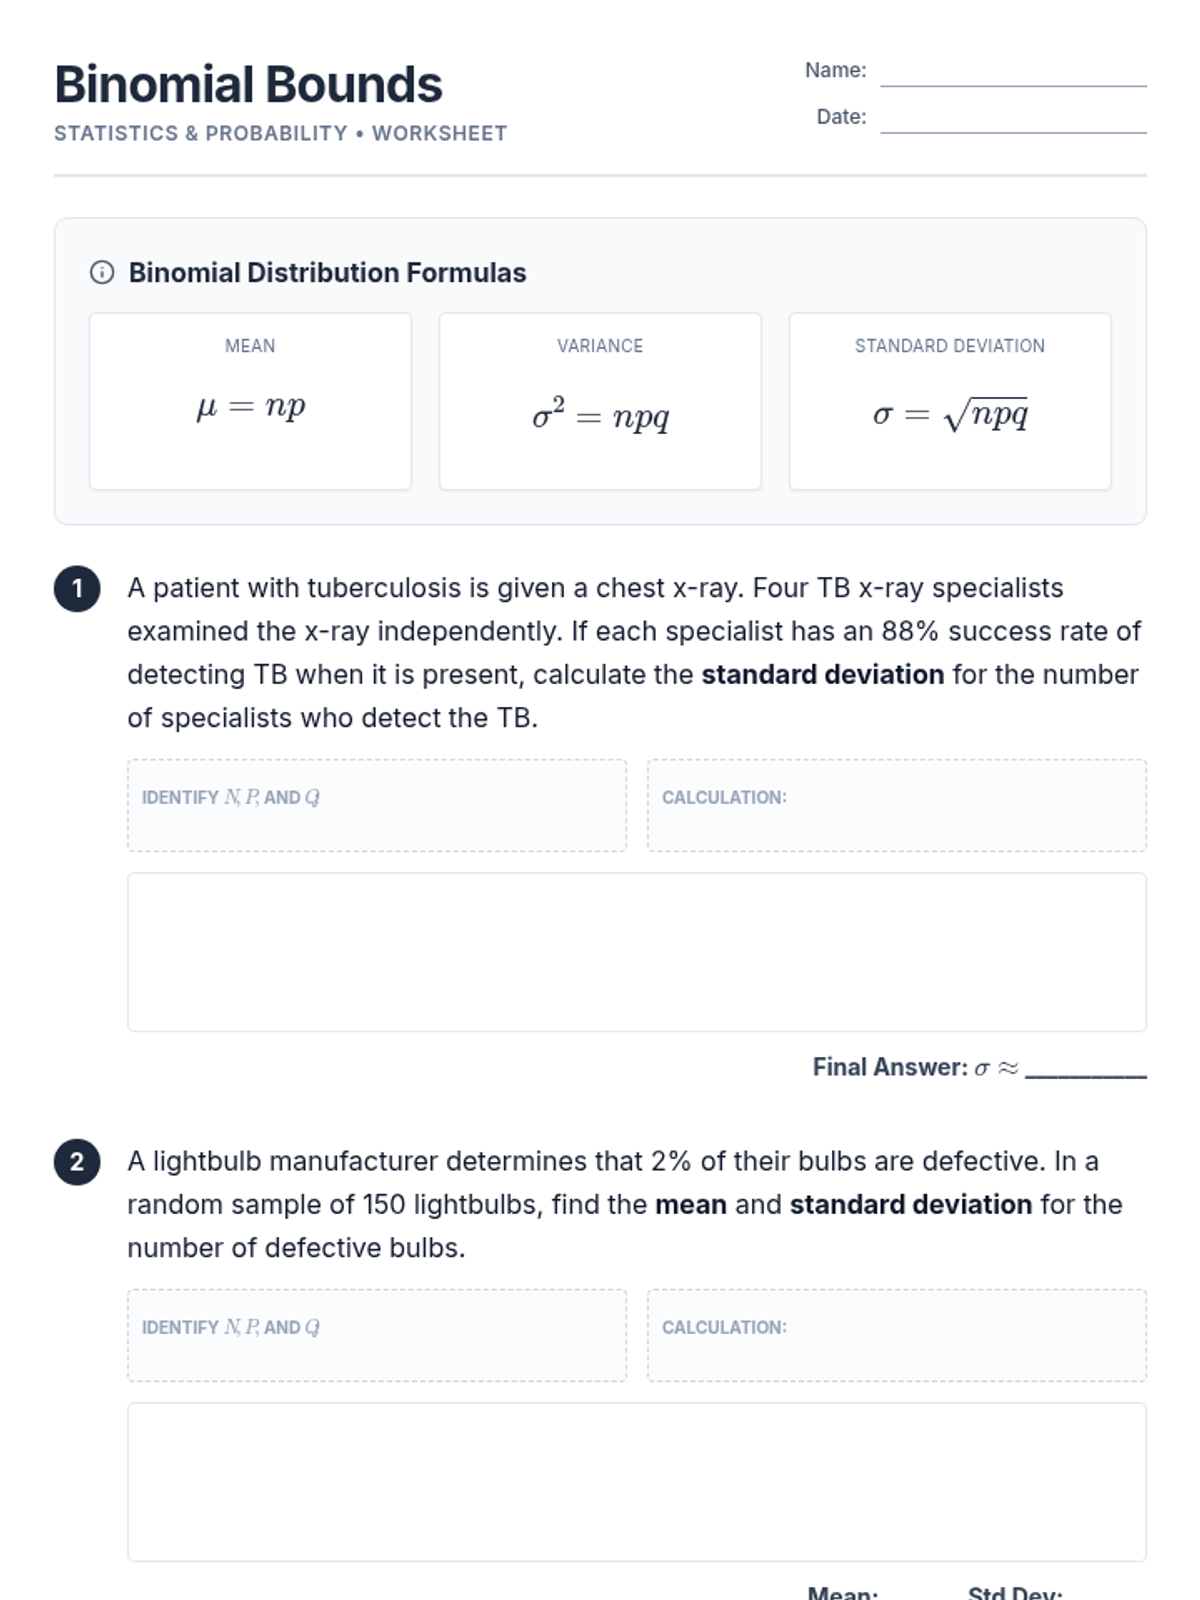
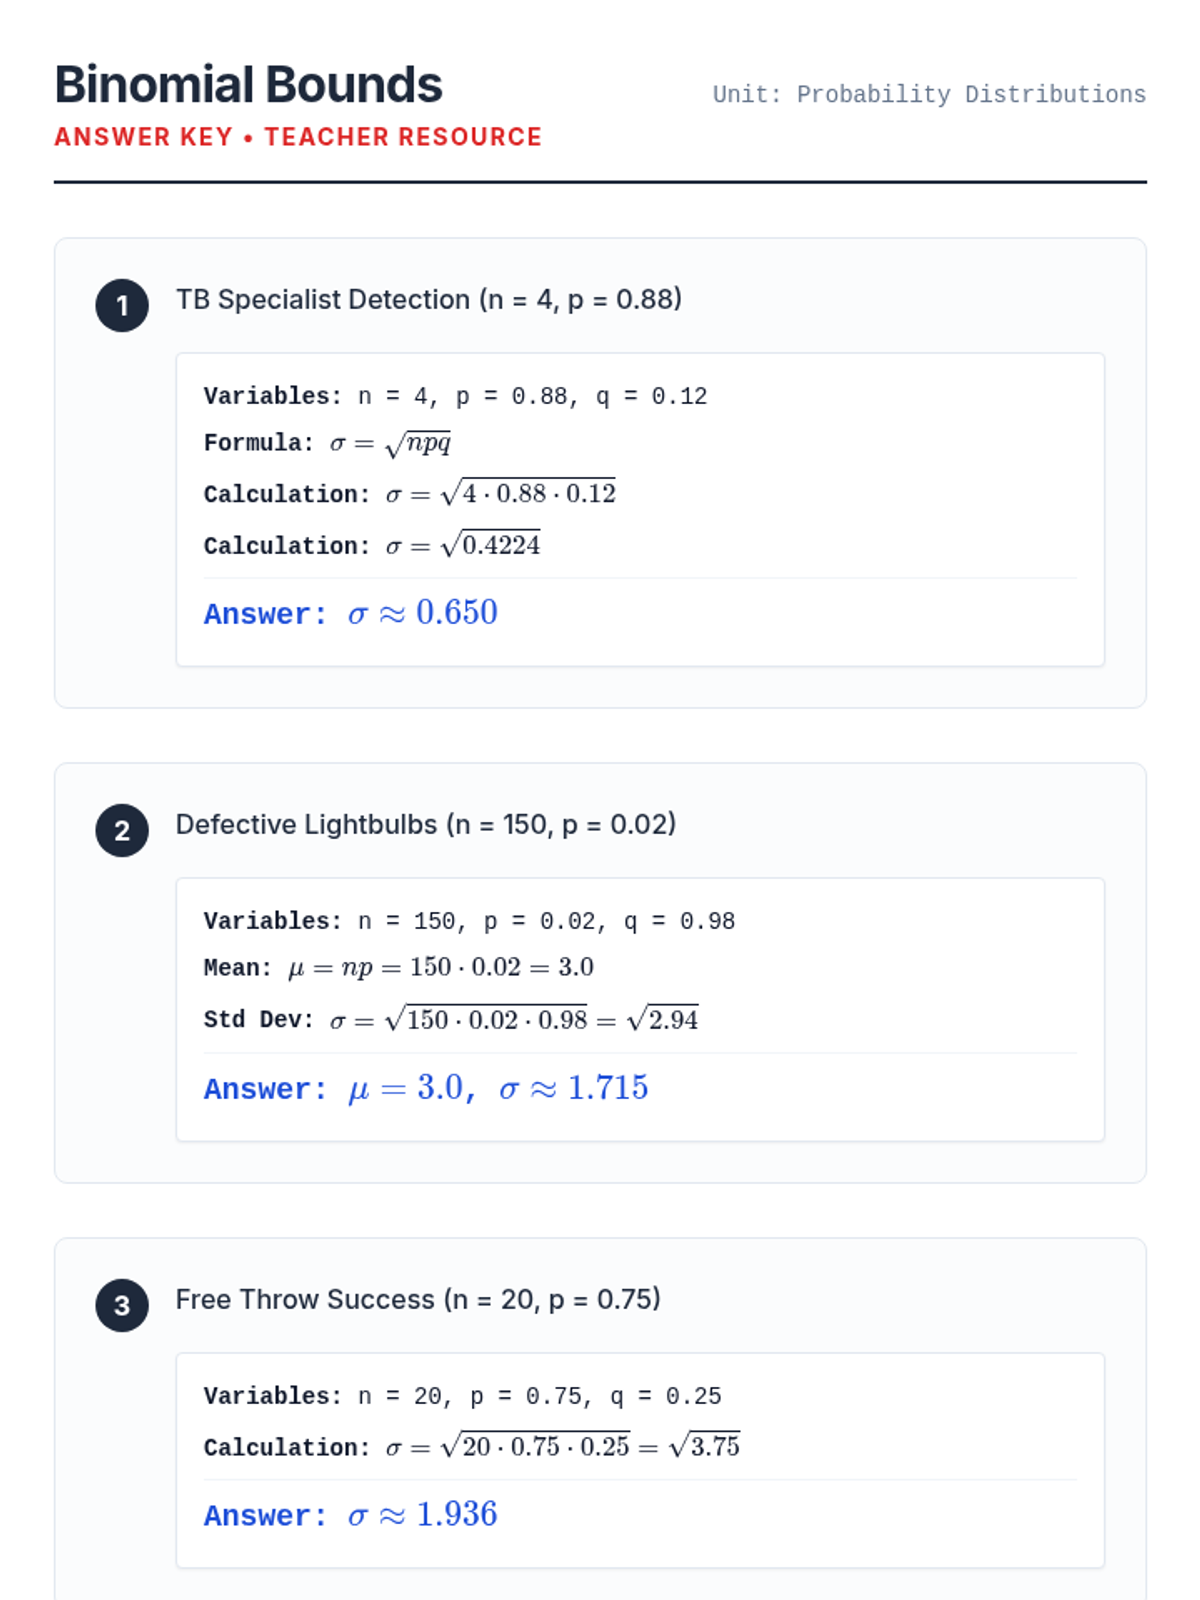
A lesson focused on calculating the mean, variance, and standard deviation of binomial probability distributions in real-world contexts.
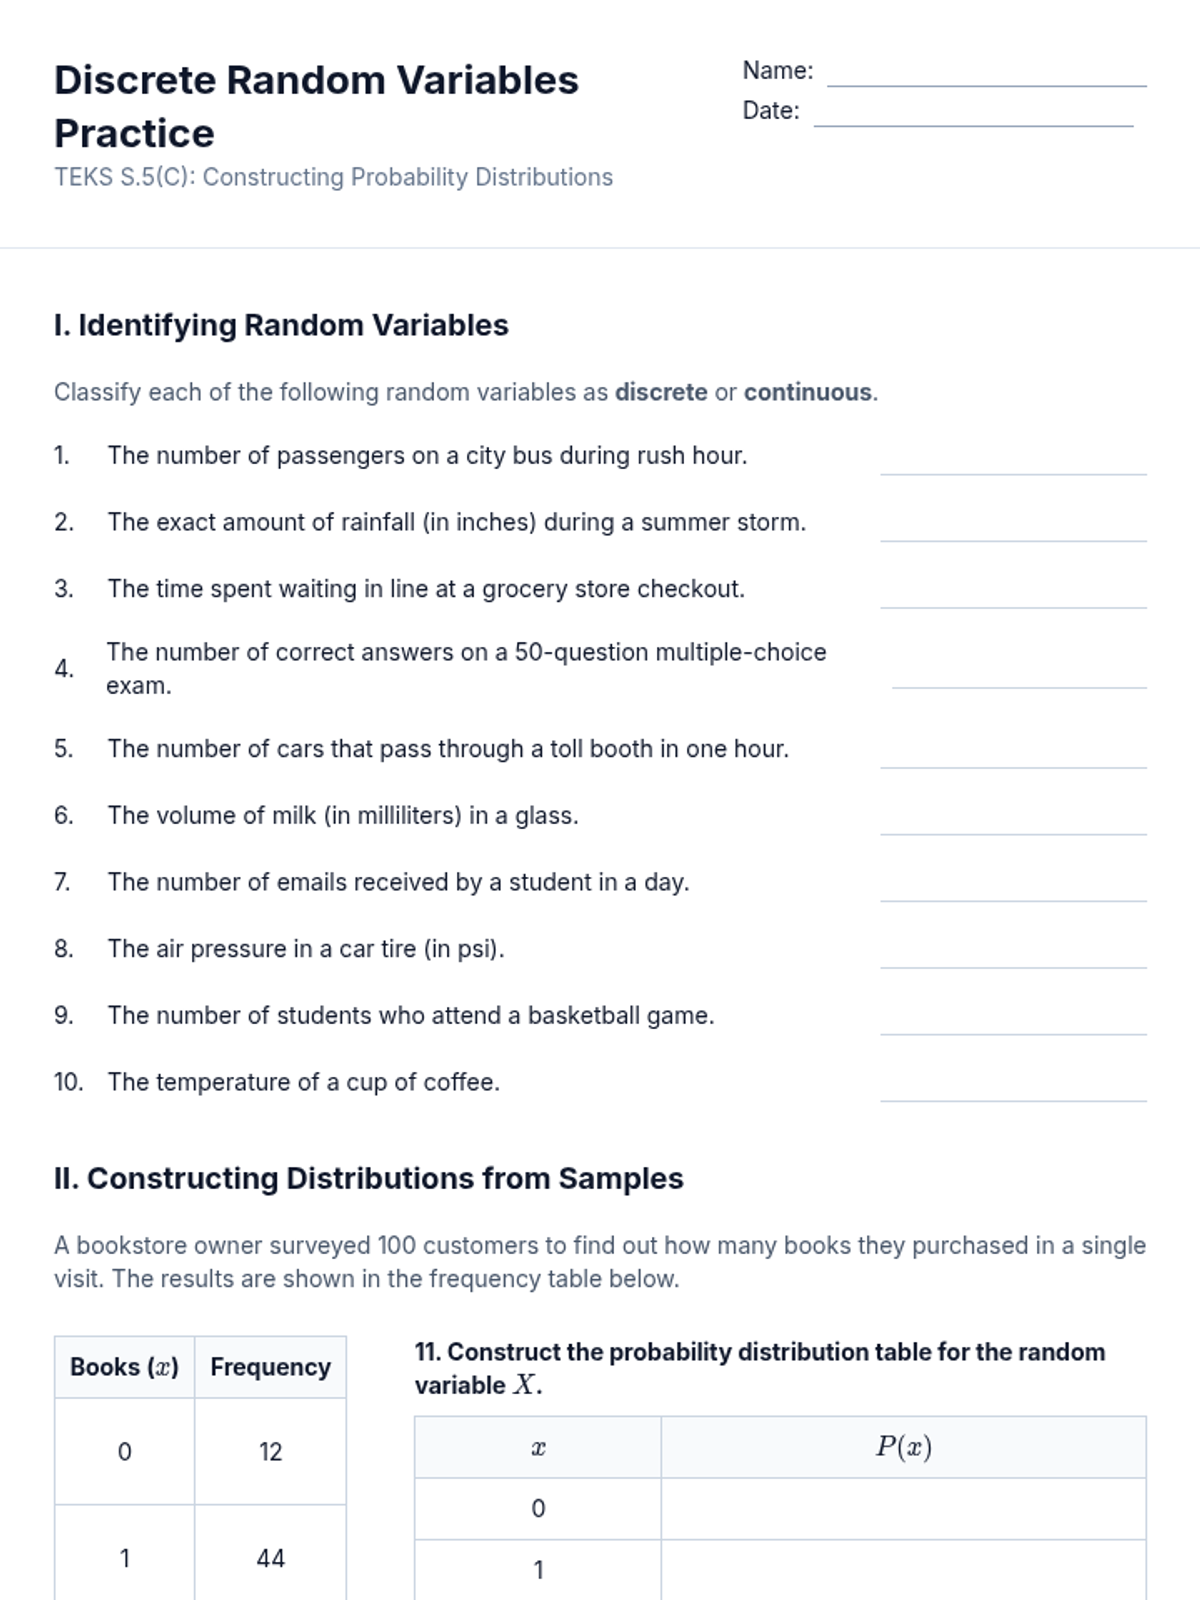
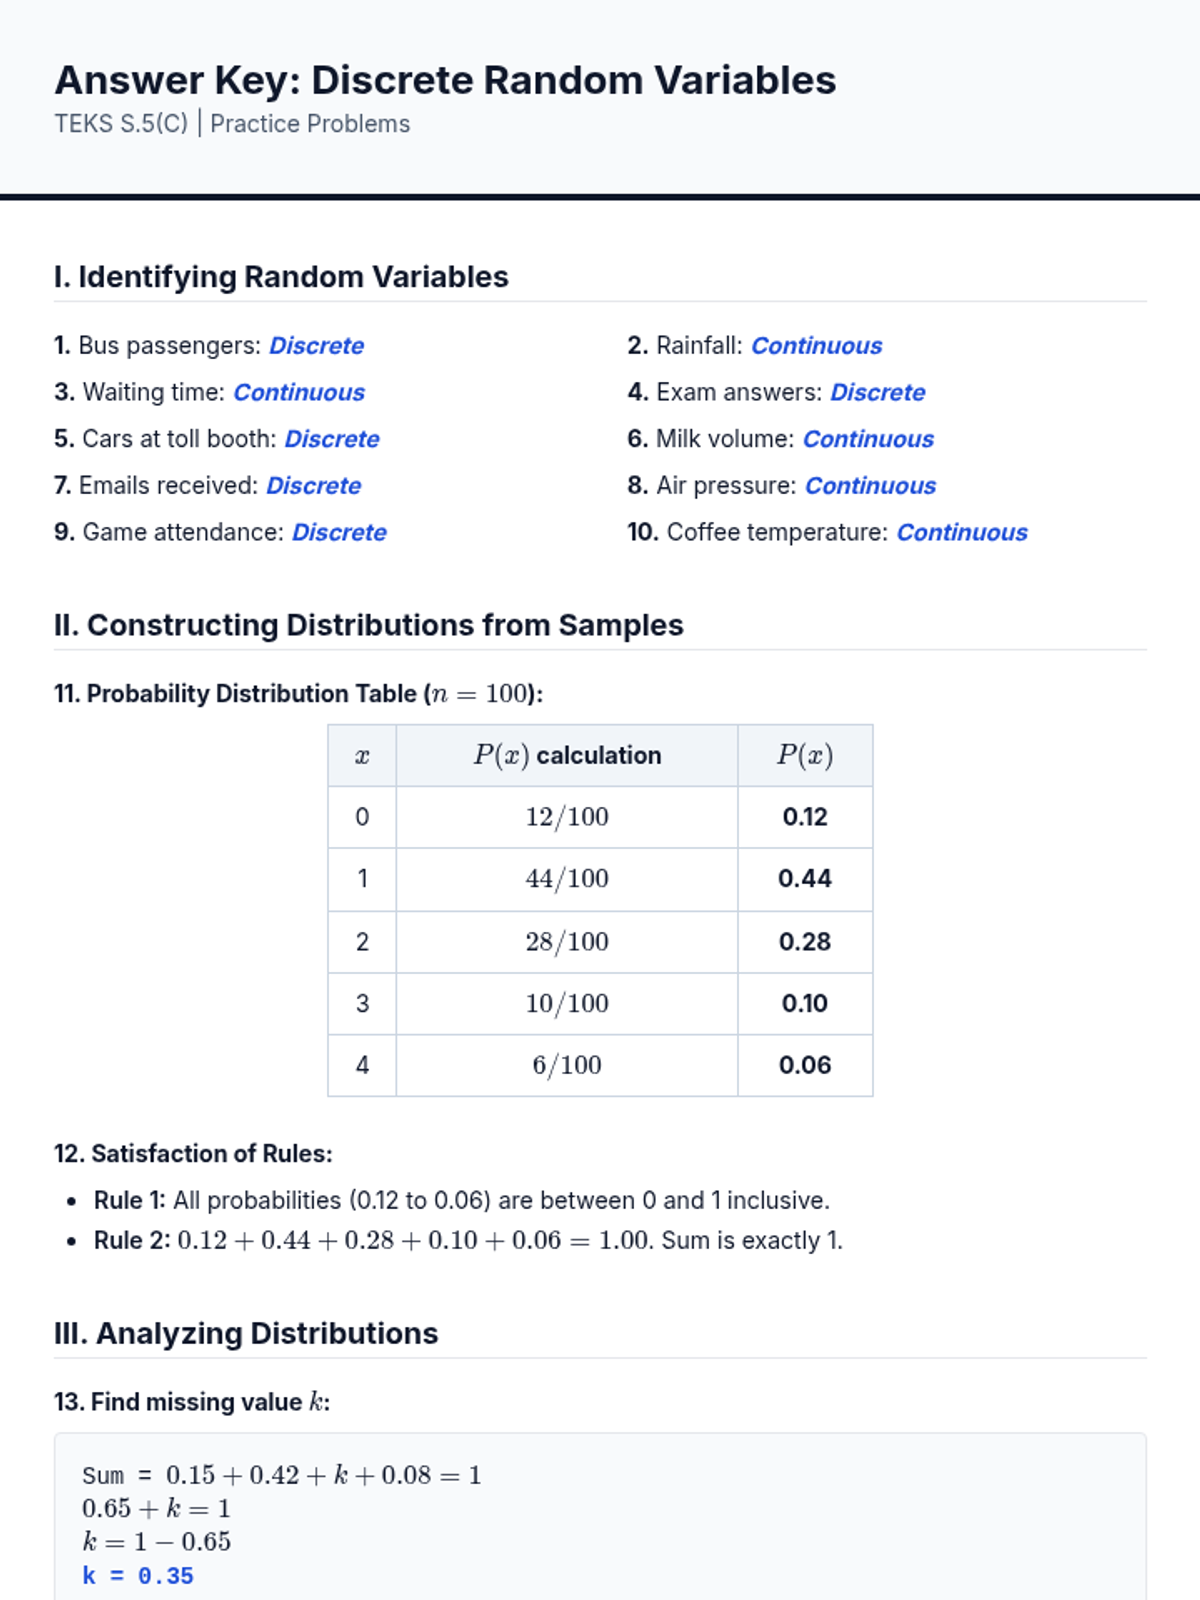
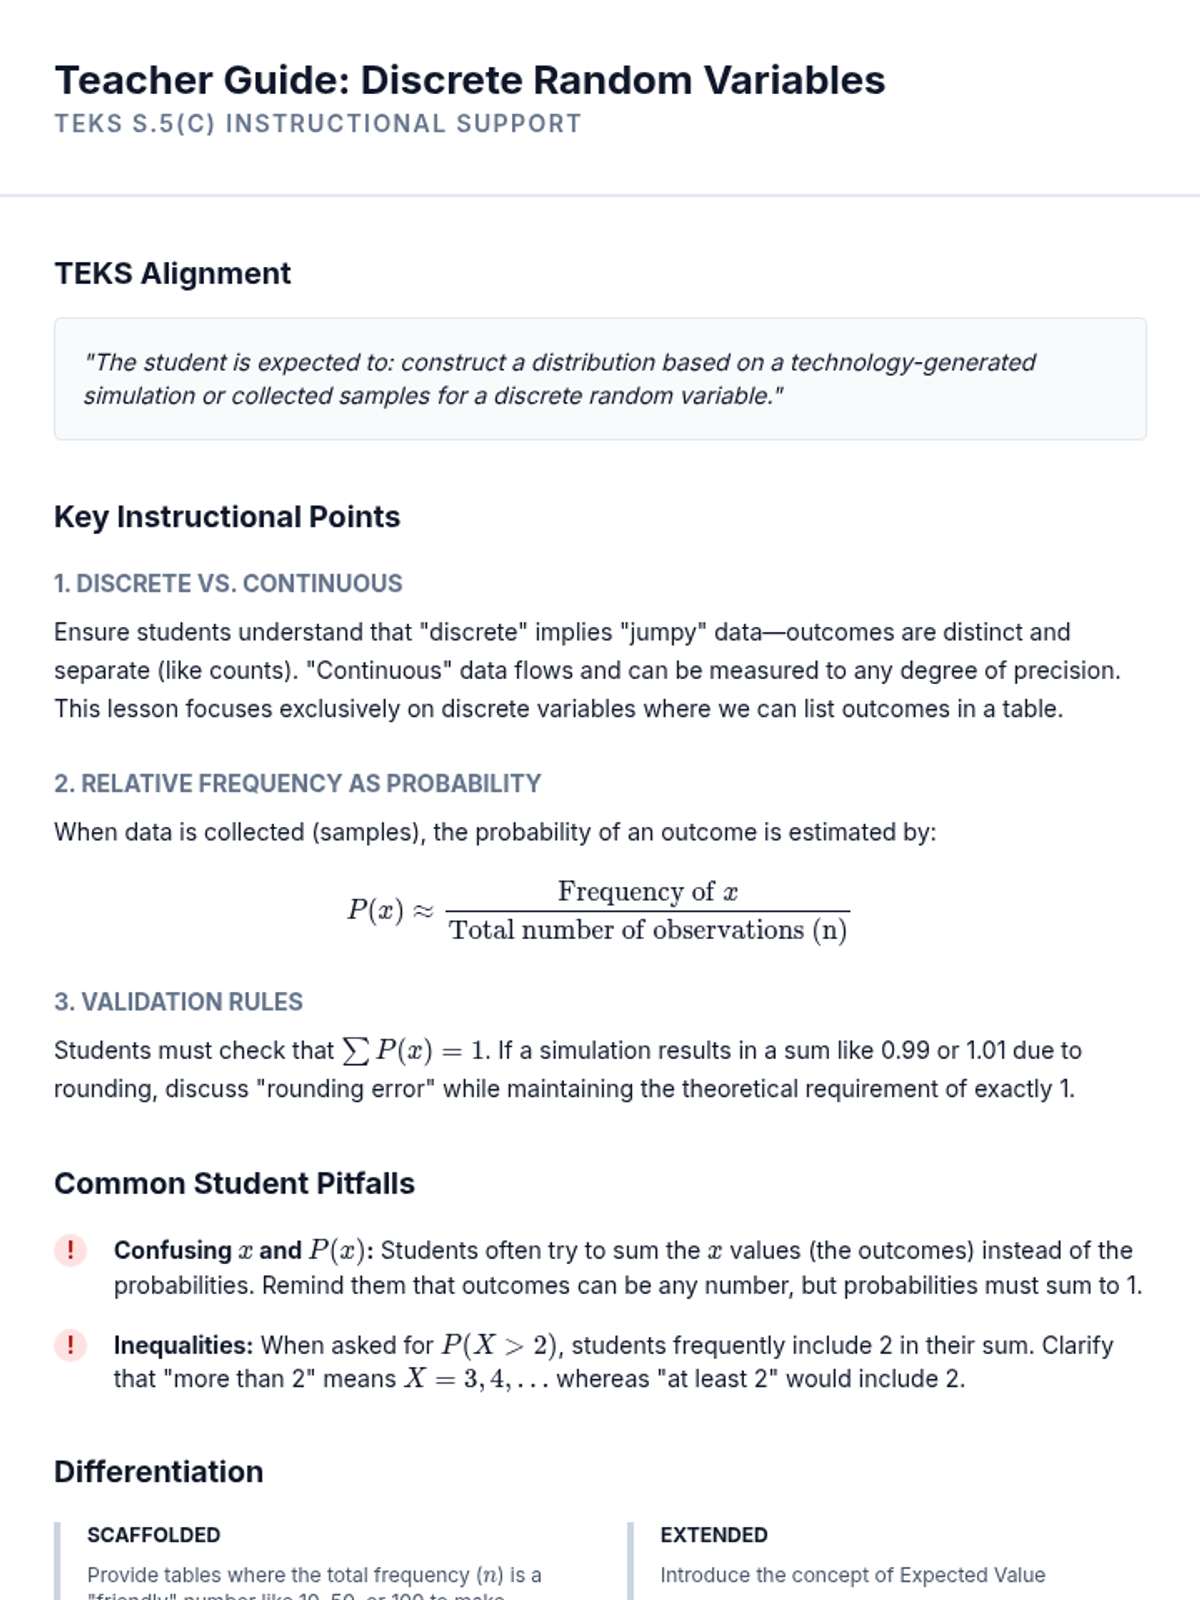
A lesson on constructing and analyzing probability distributions for discrete random variables based on collected samples or simulations, aligned with TEKS S.5(C).
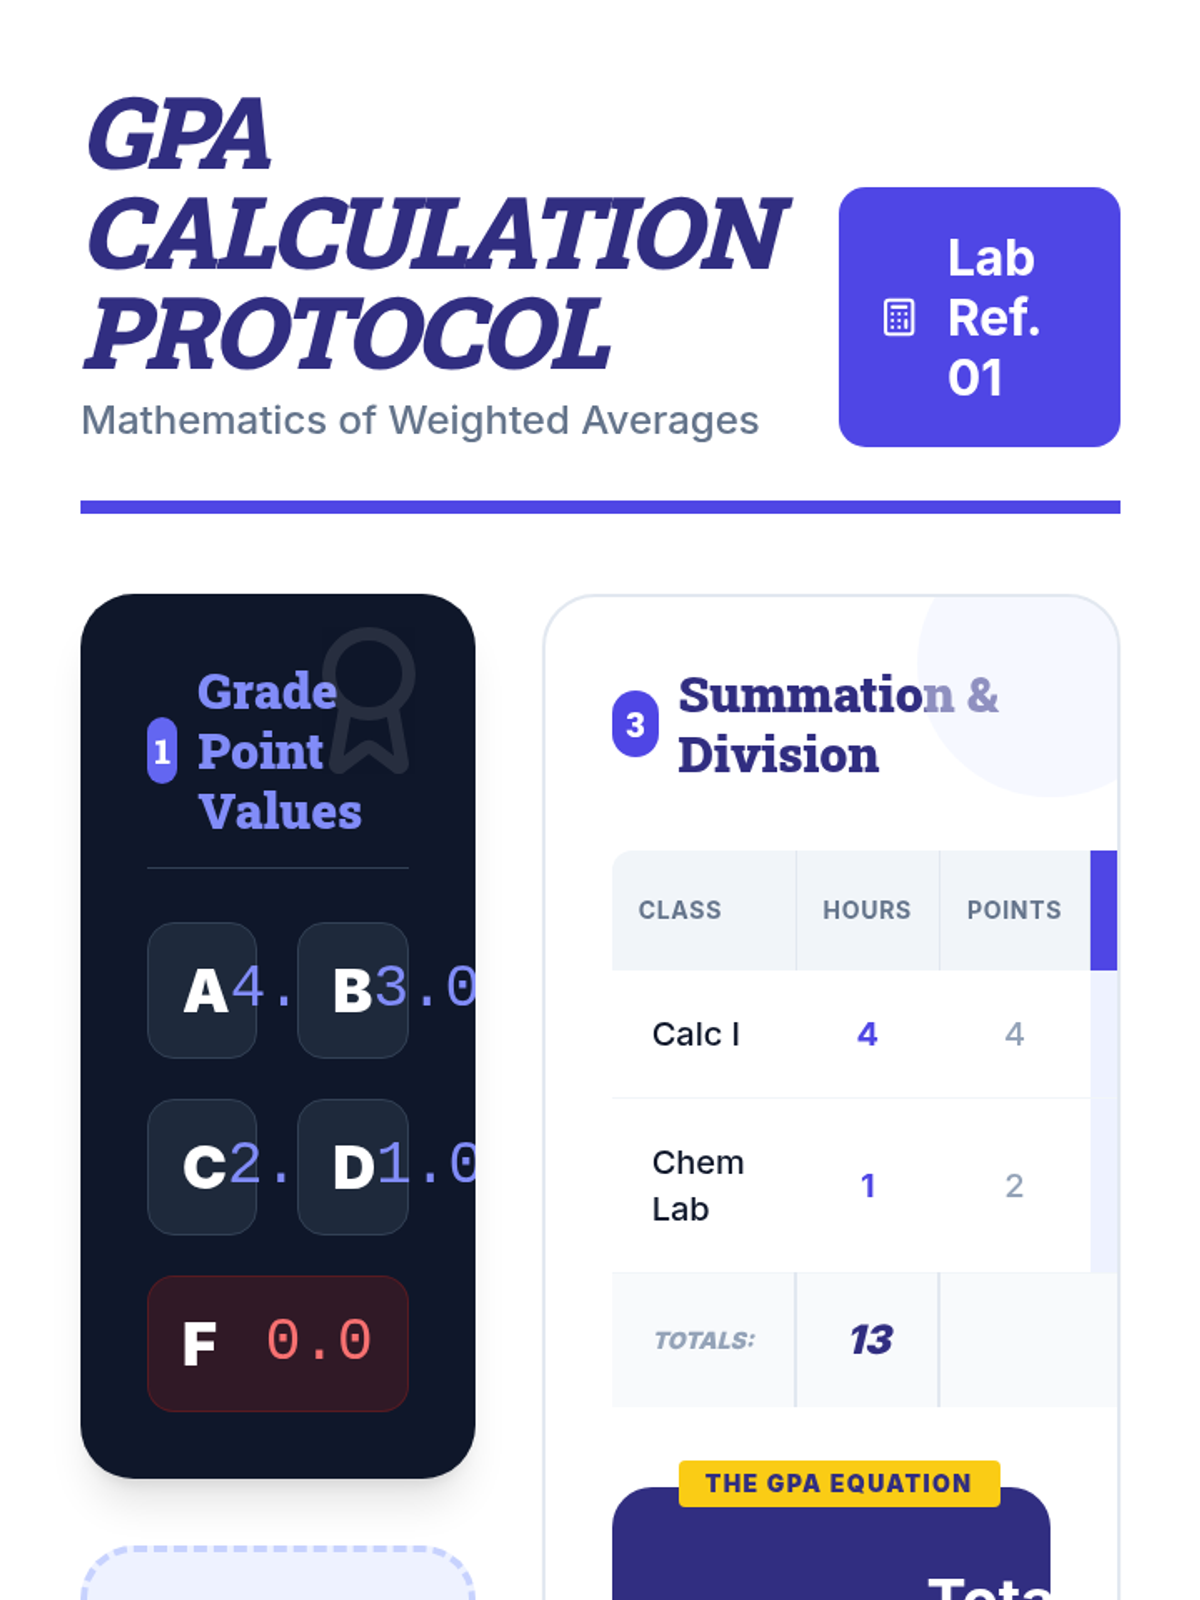
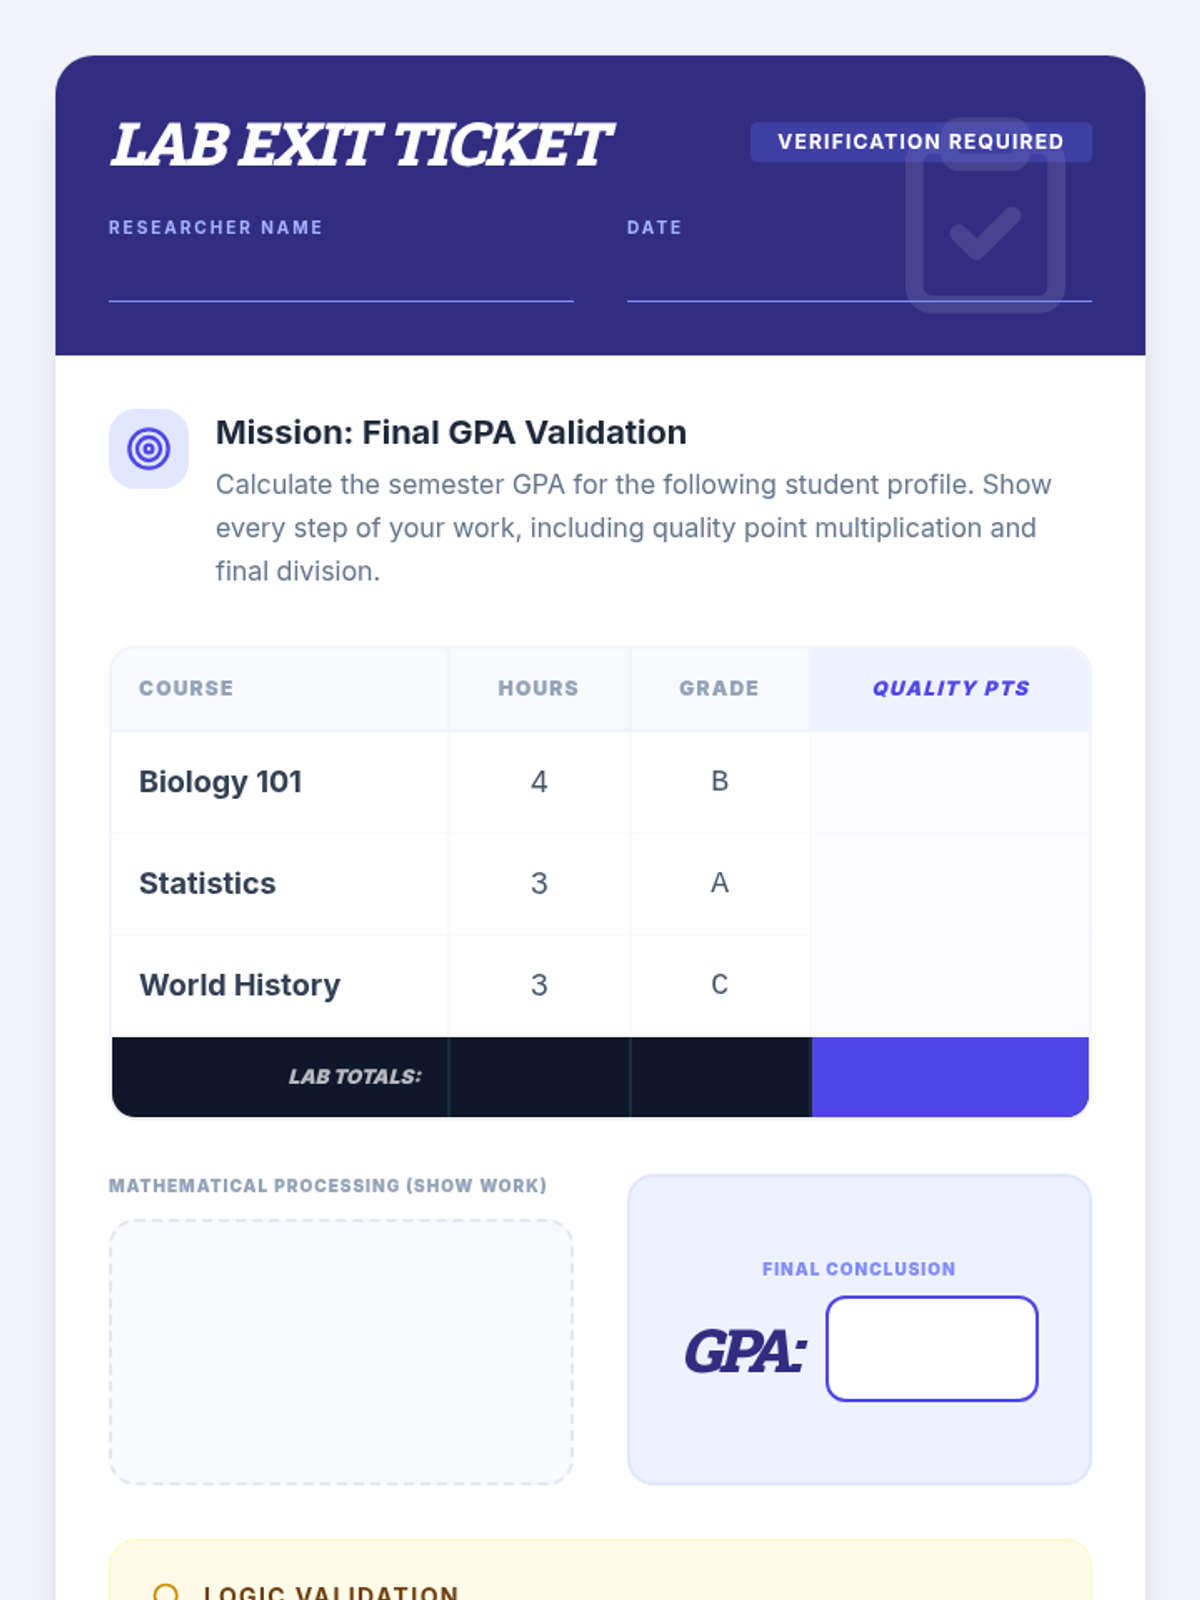
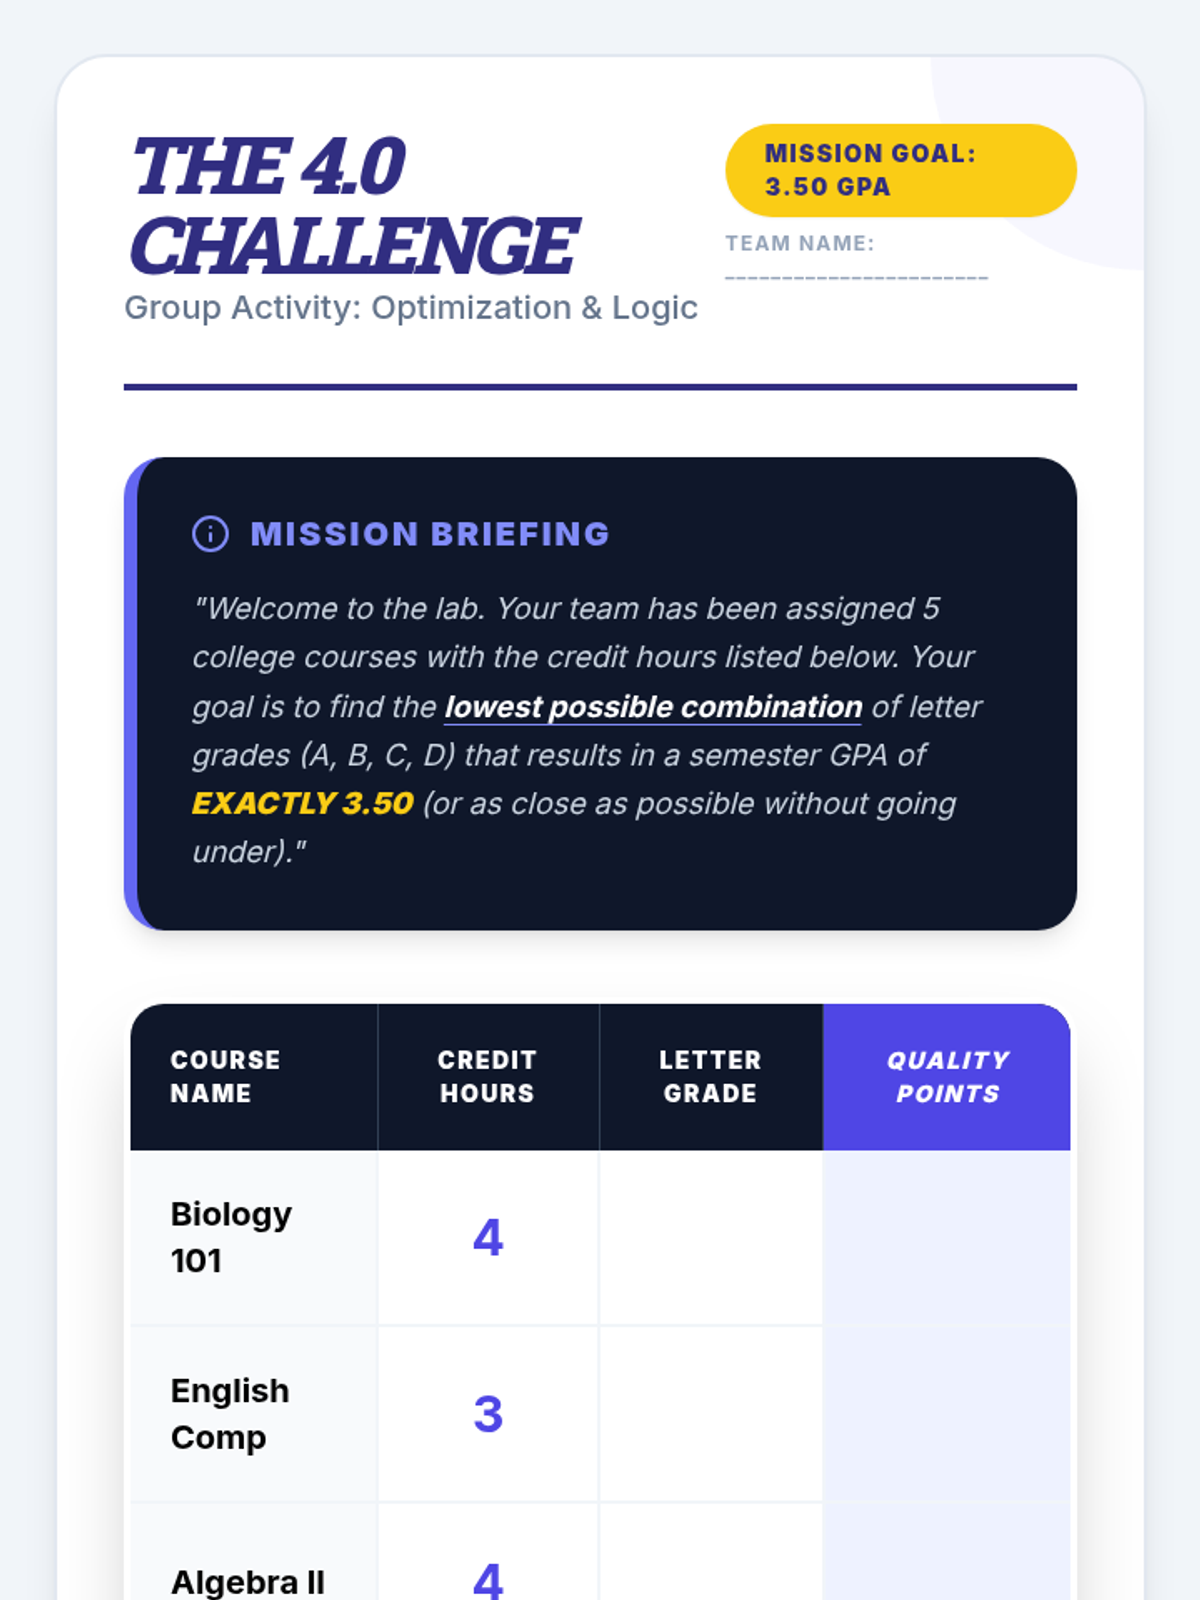
Students will apply arithmetic operations like multiplication, addition, and division to calculate Grade Point Averages (GPA), exploring the concept of weighted averages through a real-world academic lens.
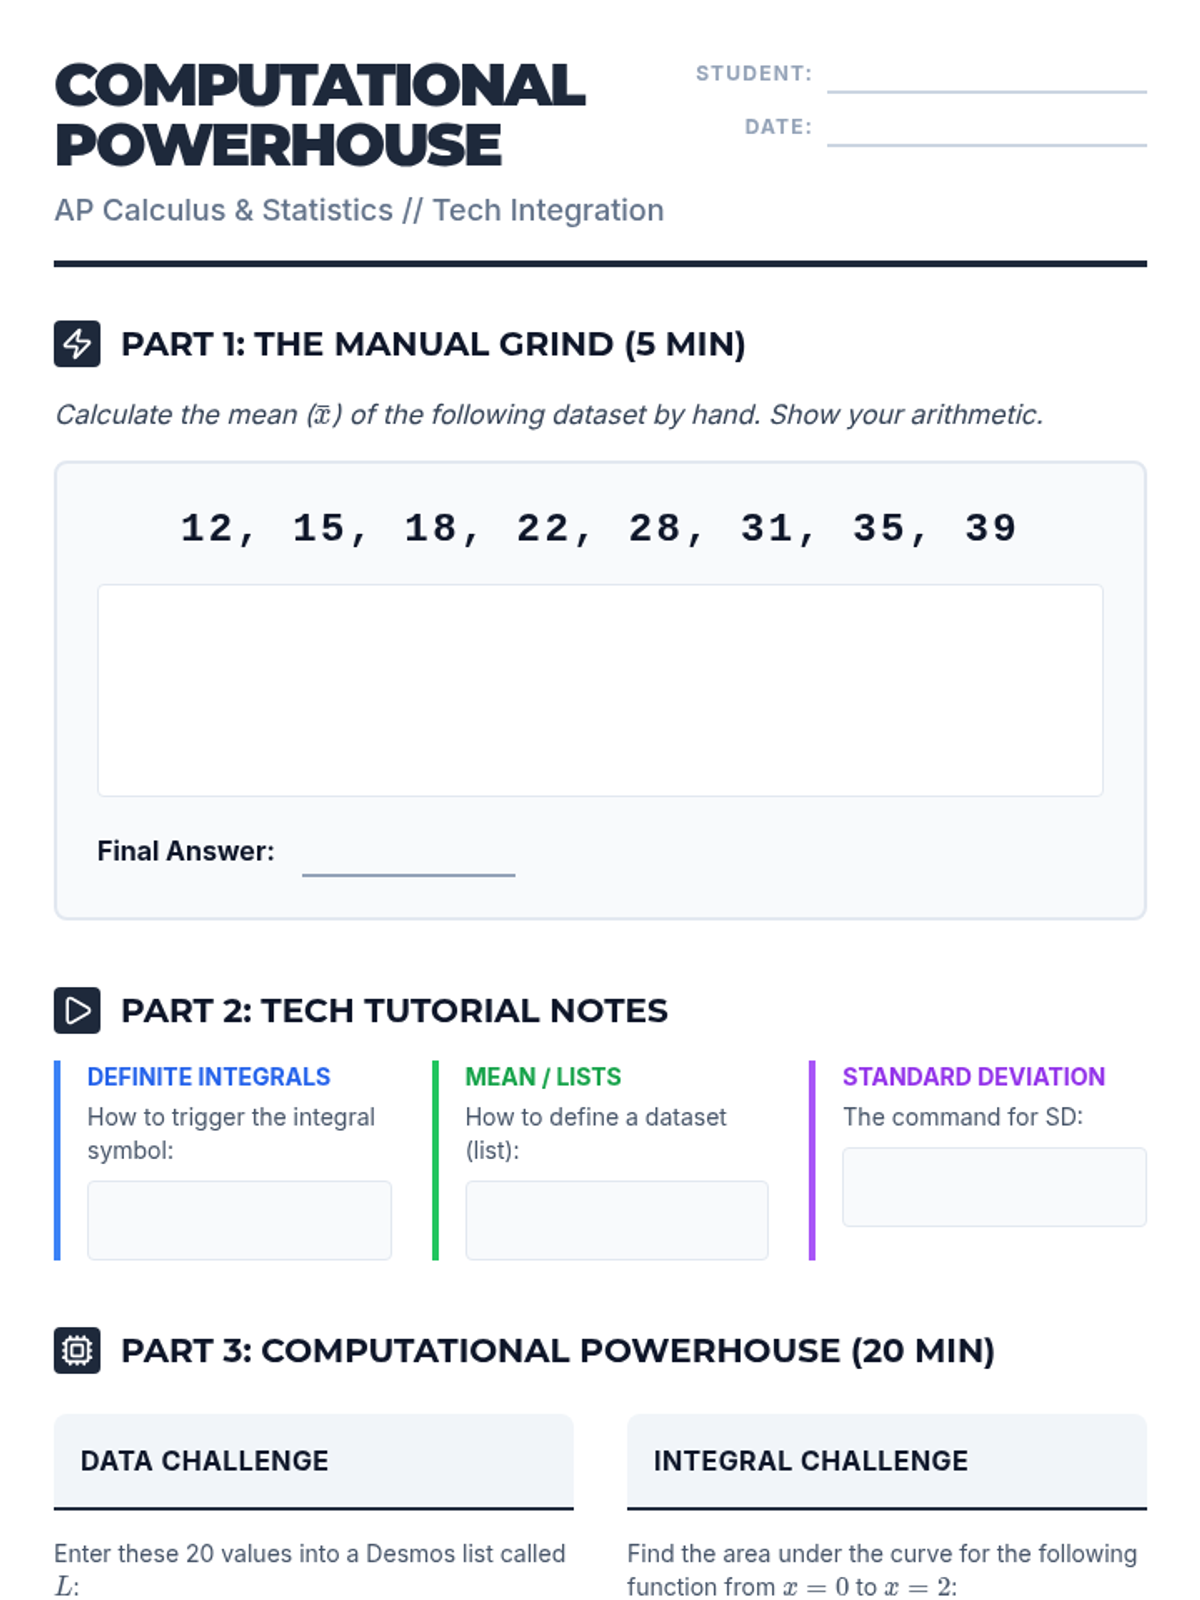
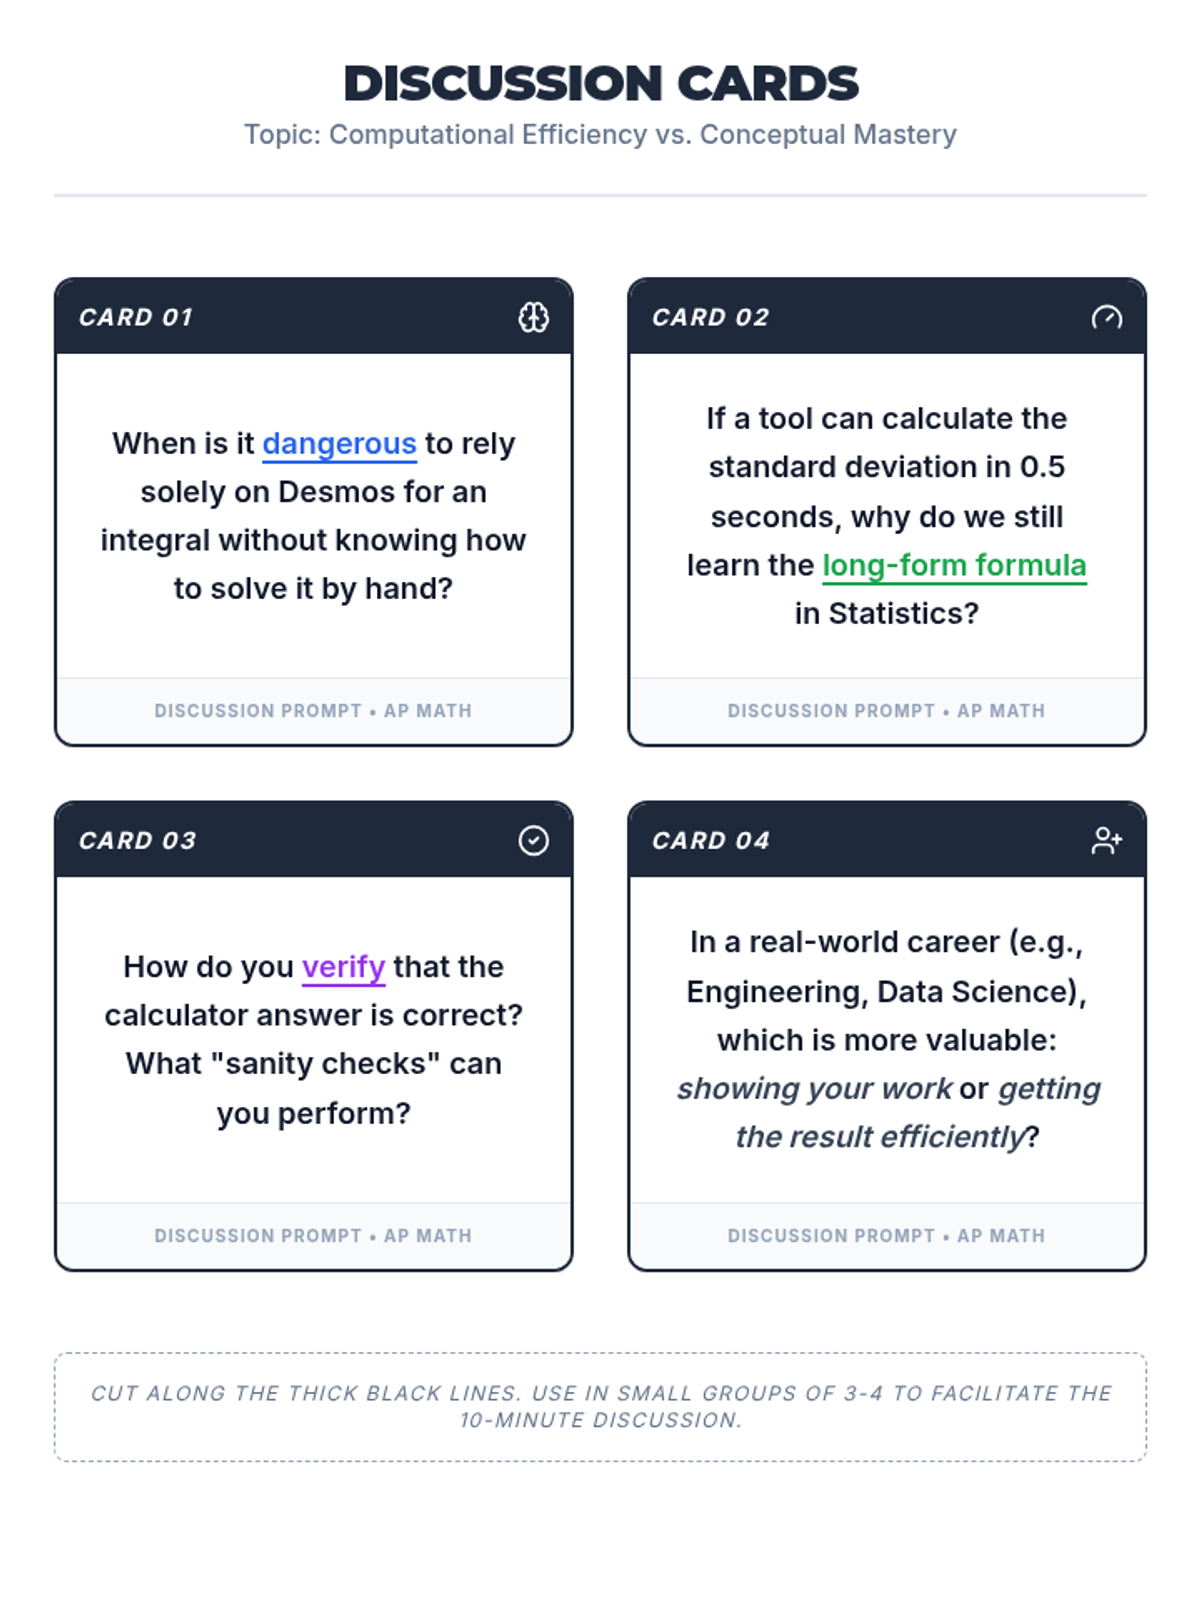
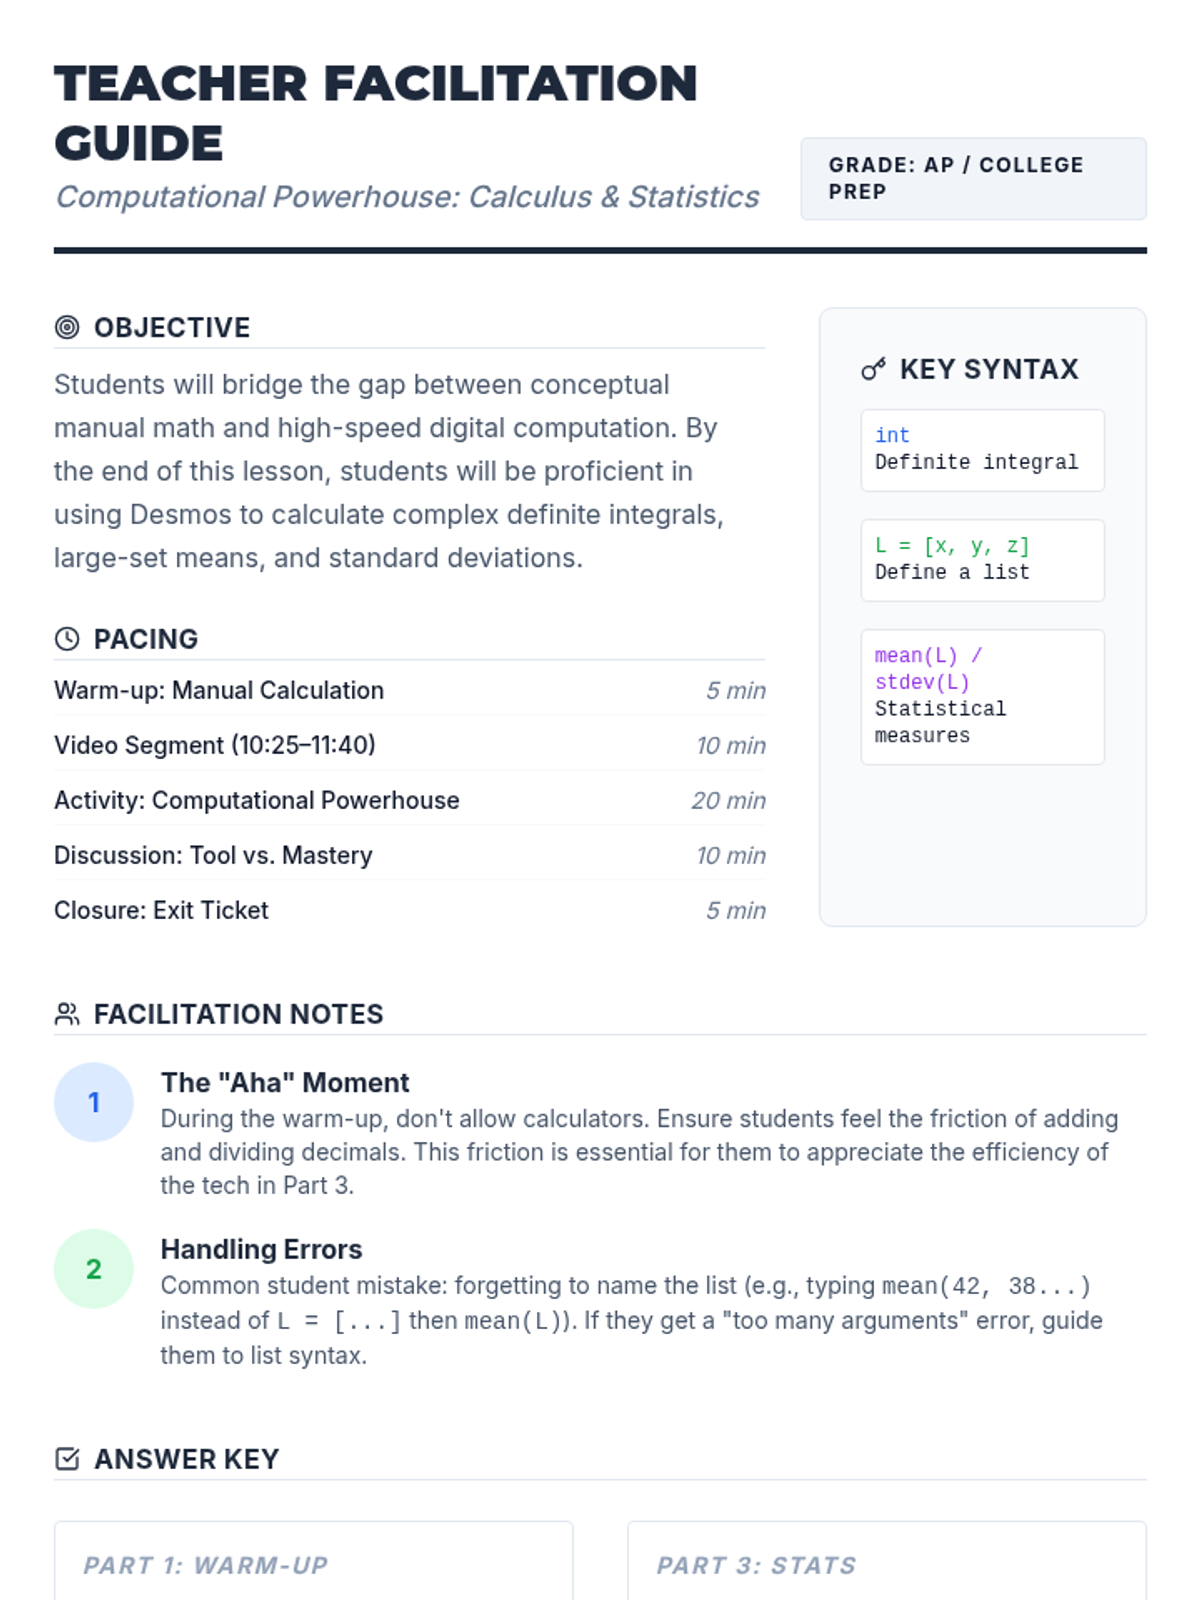
A high-school level lesson for AP Calculus and Statistics students focusing on using Desmos for complex integrals and statistical calculations, emphasizing the balance between manual understanding and technological efficiency.
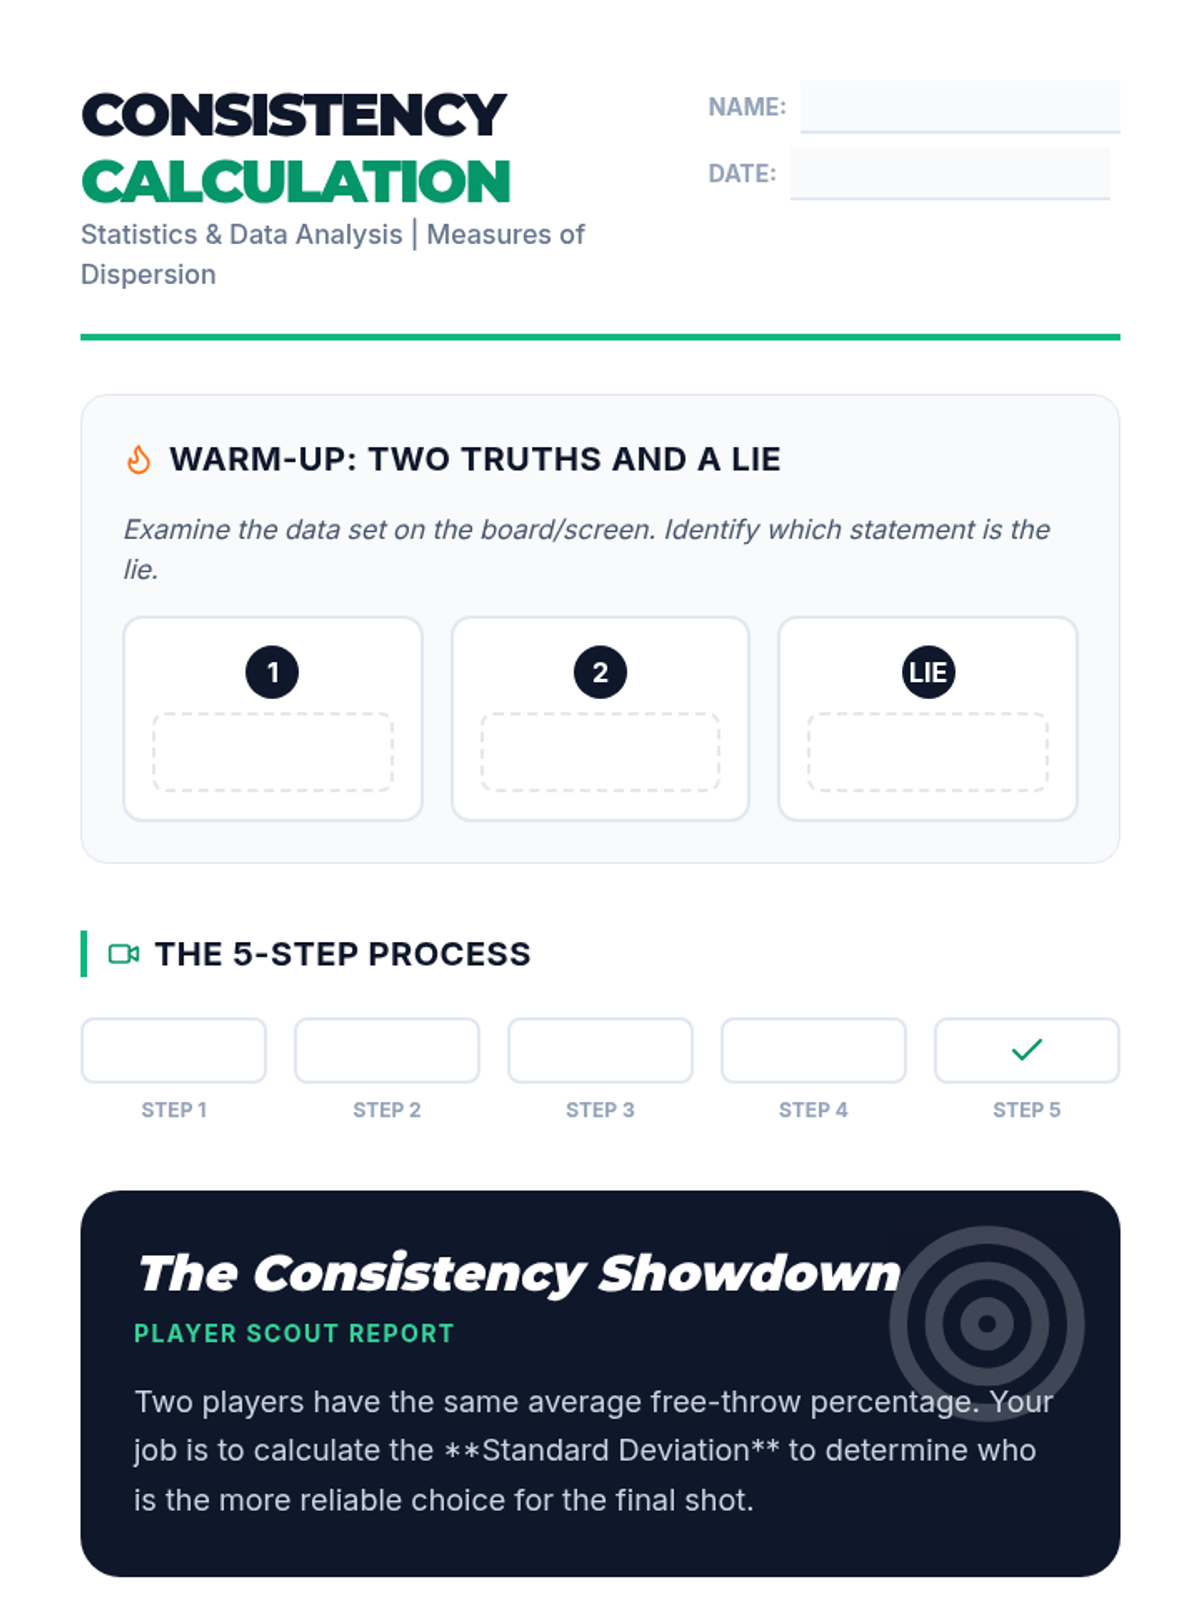
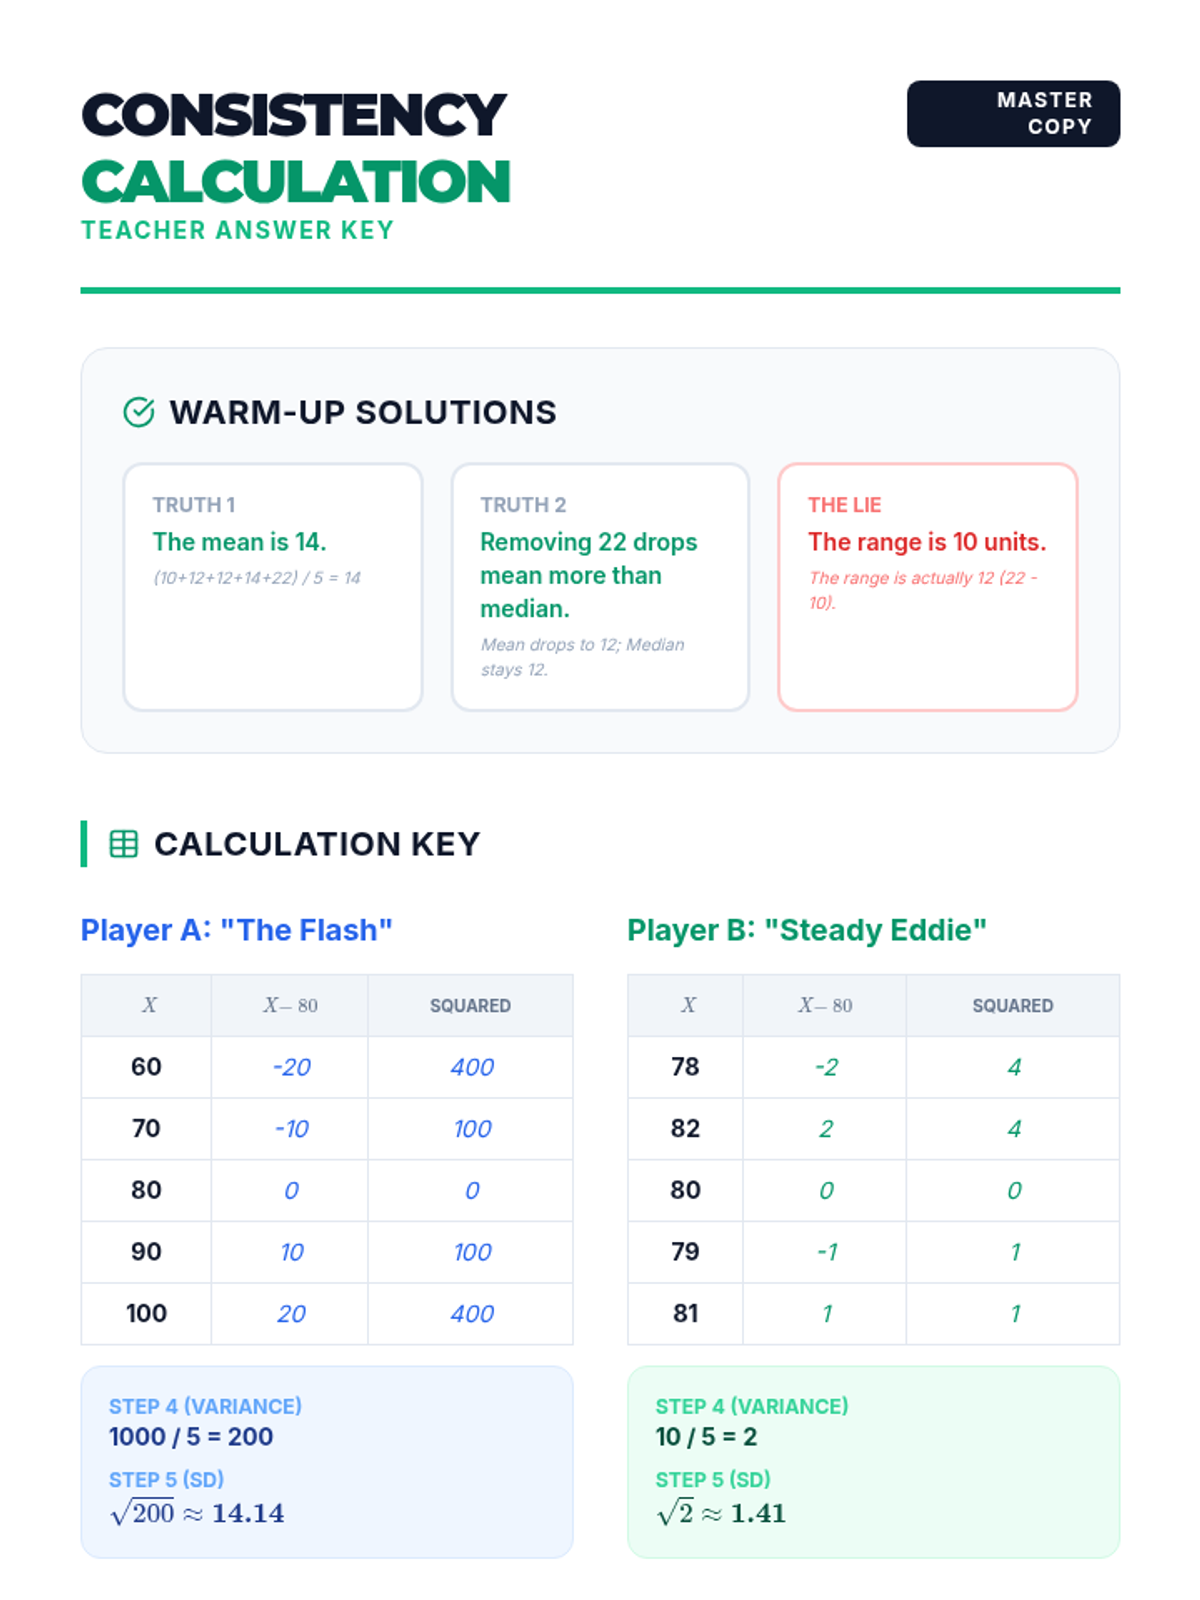
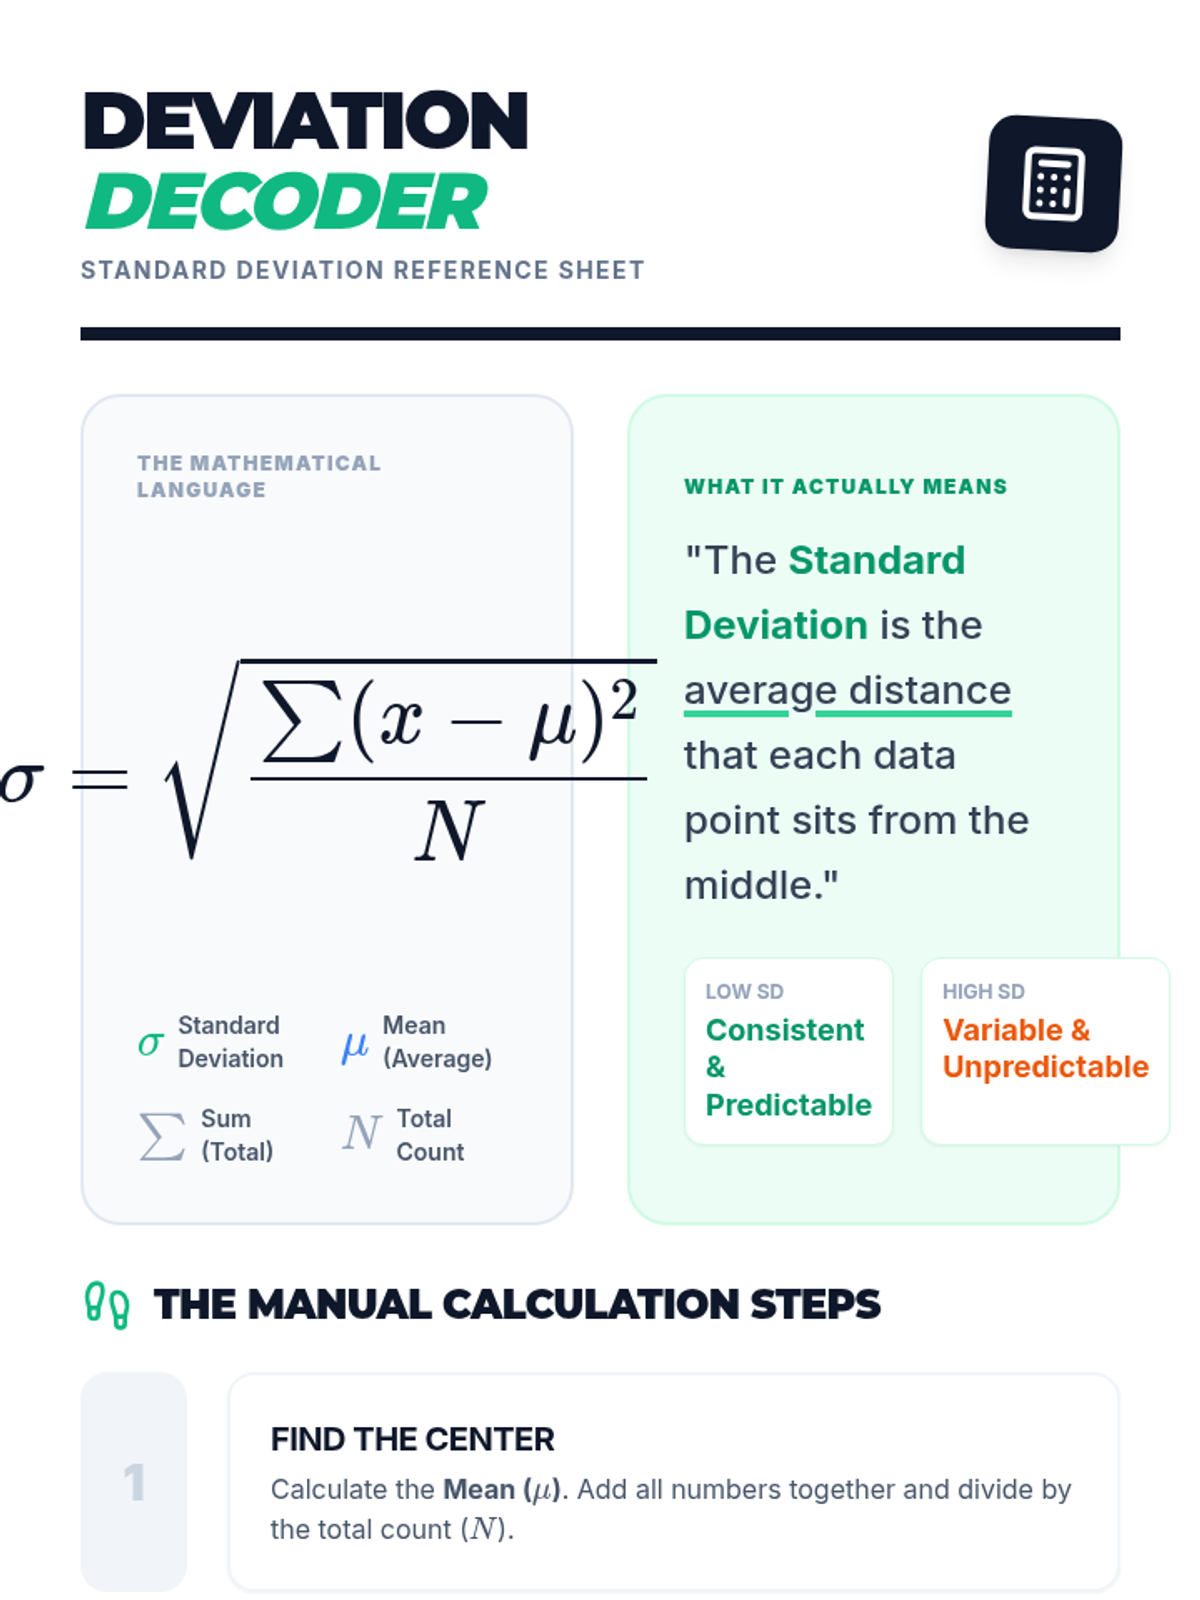
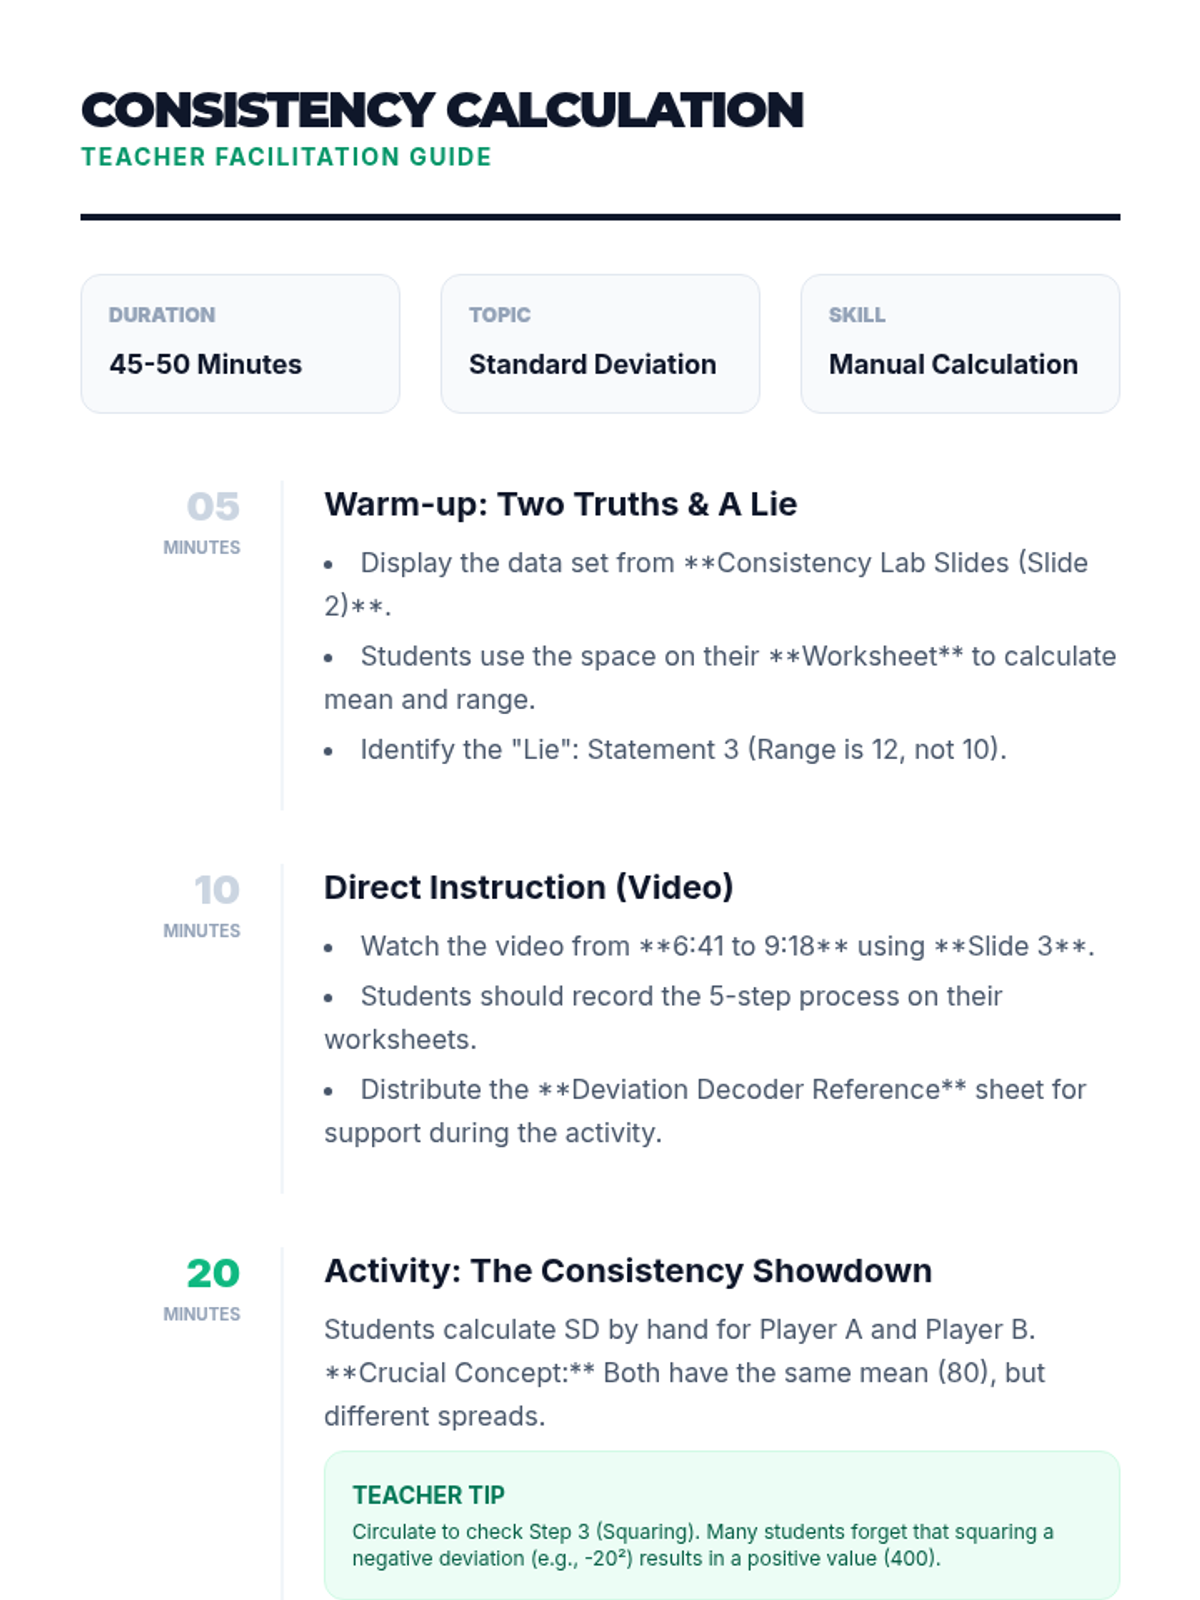
Students will learn to calculate and interpret standard deviation as a measure of consistency. This lesson uses a sports-themed scenario to compare data sets with identical means but different spreads.
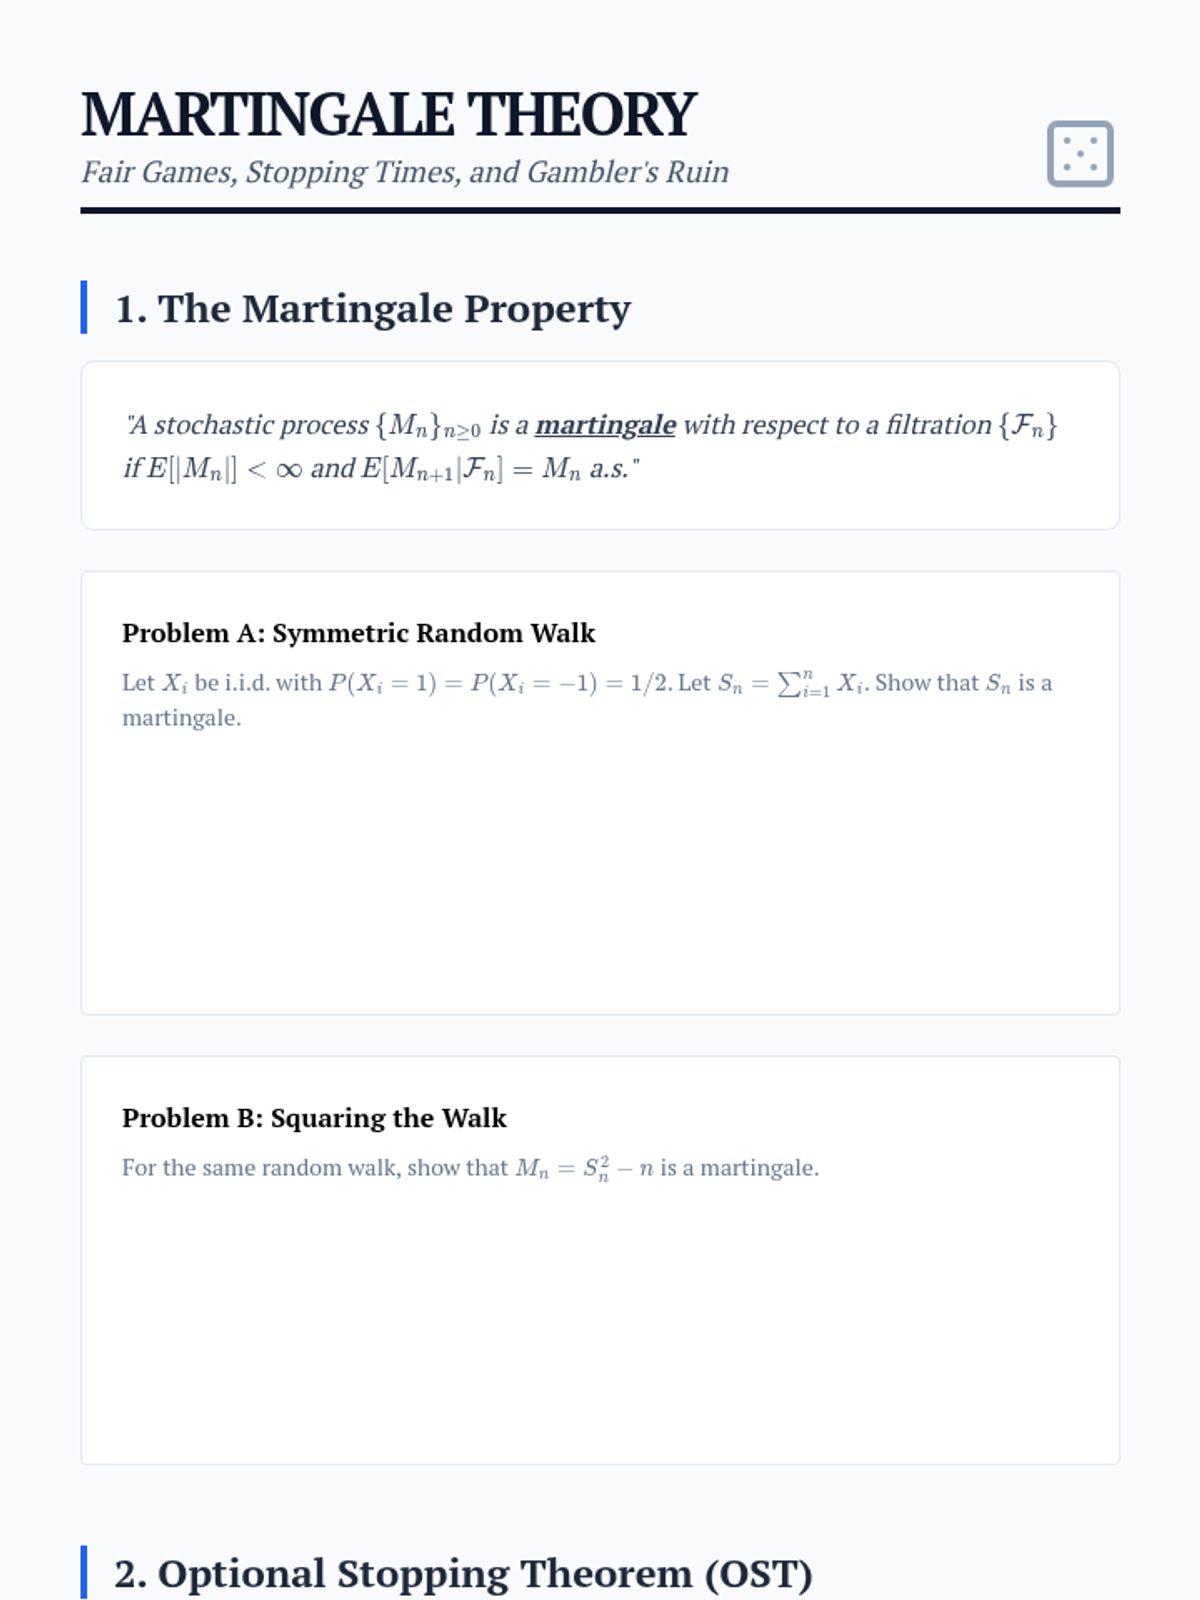
Introduction to Martingales and the Optional Stopping Theorem, applying these concepts to fair games and boundary crossing probabilities.
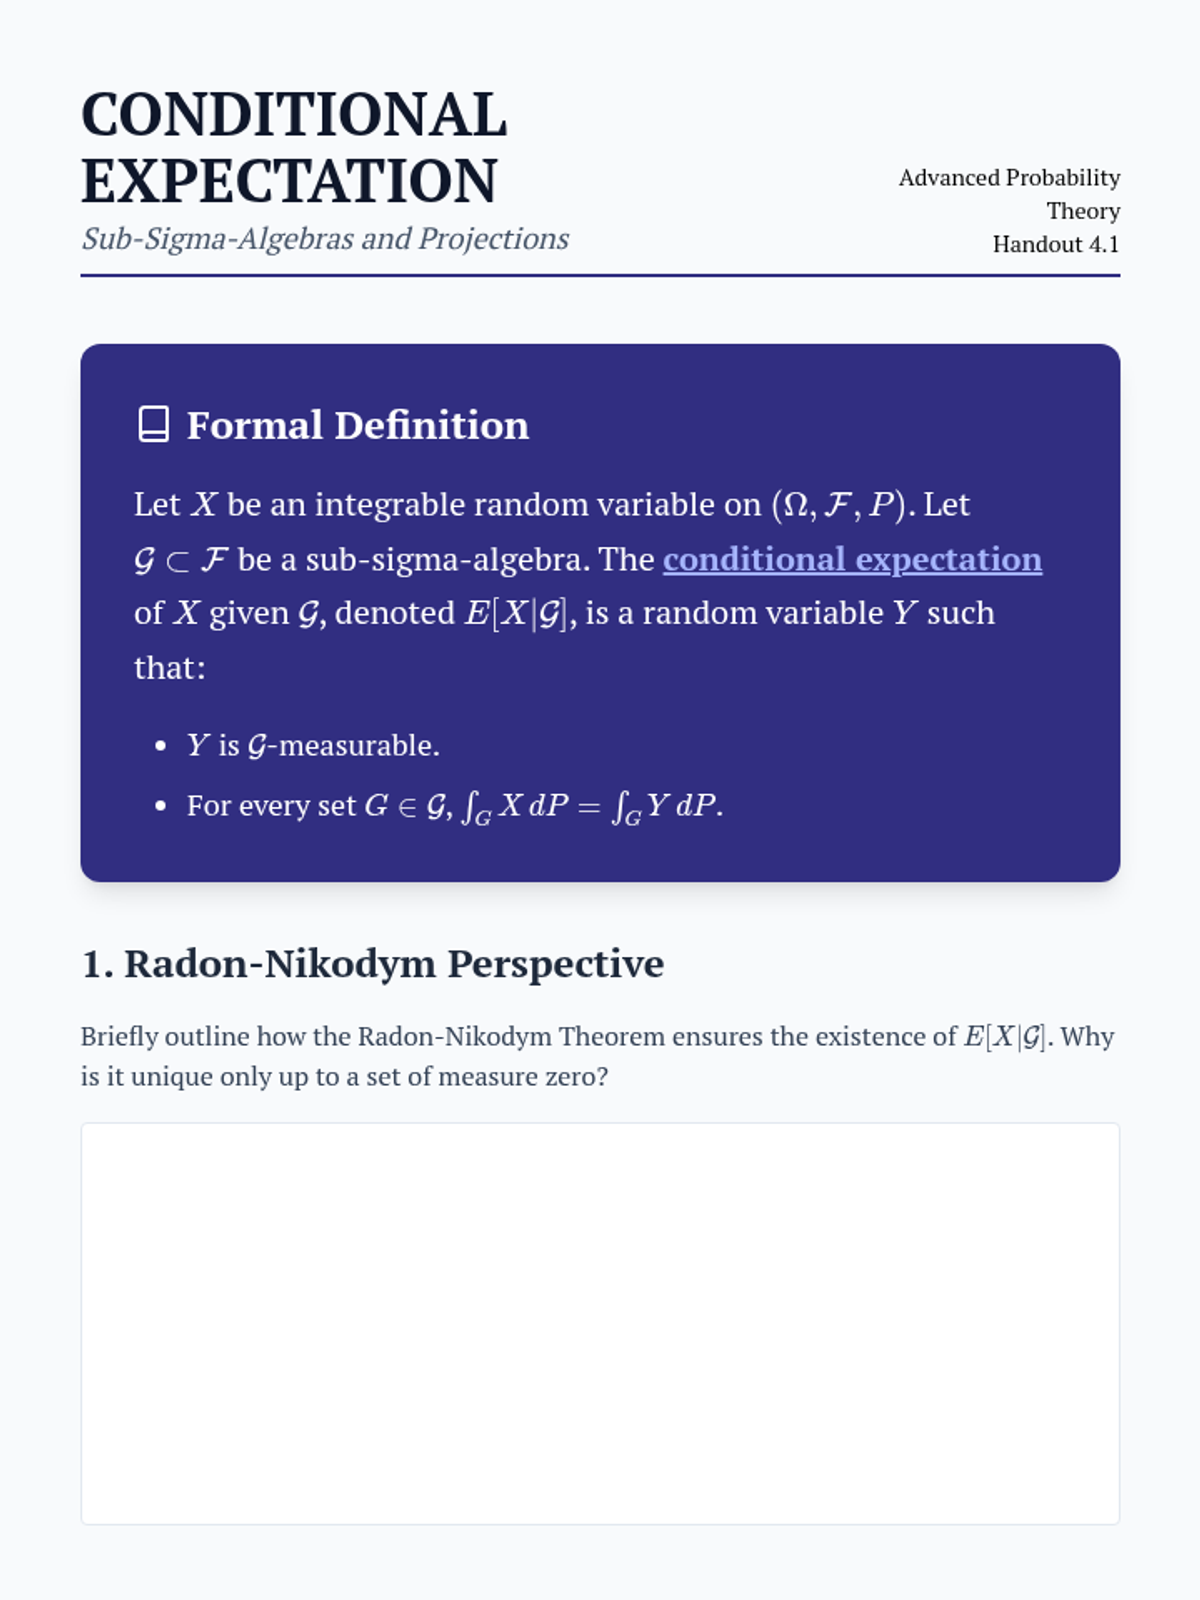
Defines conditional expectation as a random variable measurable with respect to a sub-sigma-algebra, utilizing the Radon-Nikodym theorem.
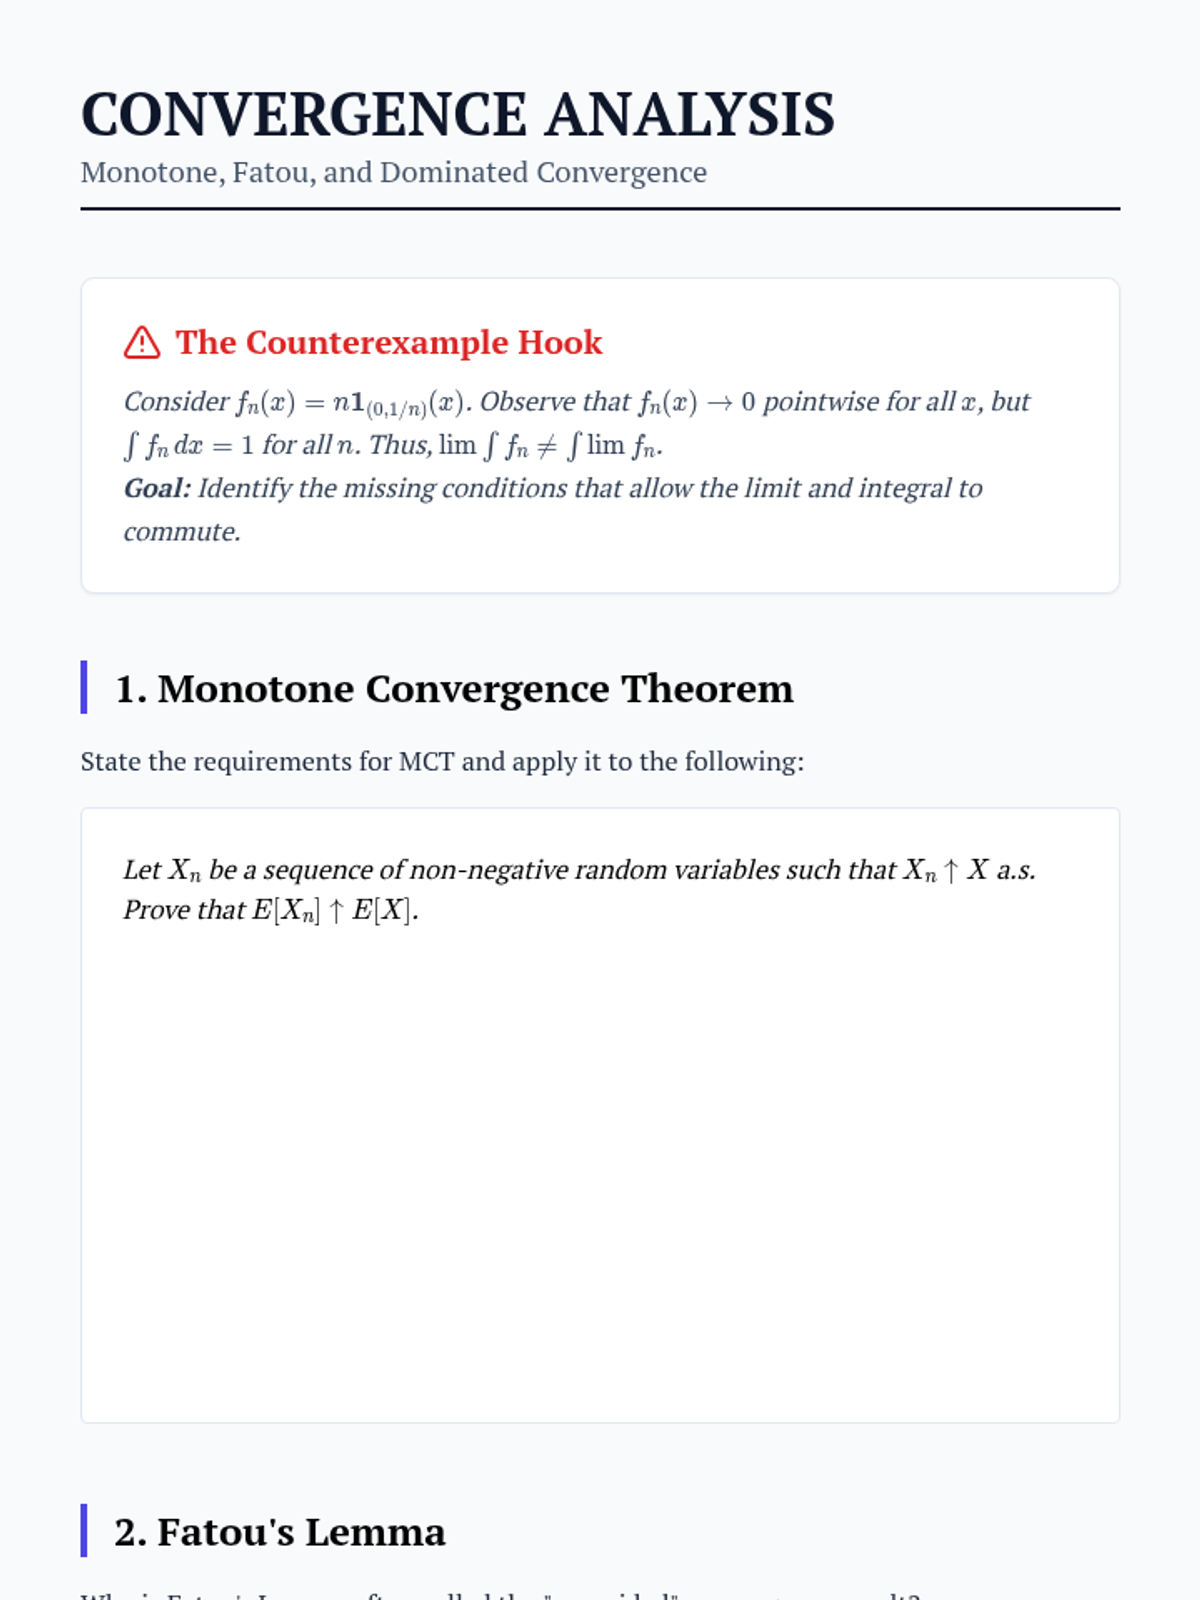
Analysis of Monotone Convergence, Fatou's Lemma, and Dominated Convergence Theorems to determine when limits and expectations commute.
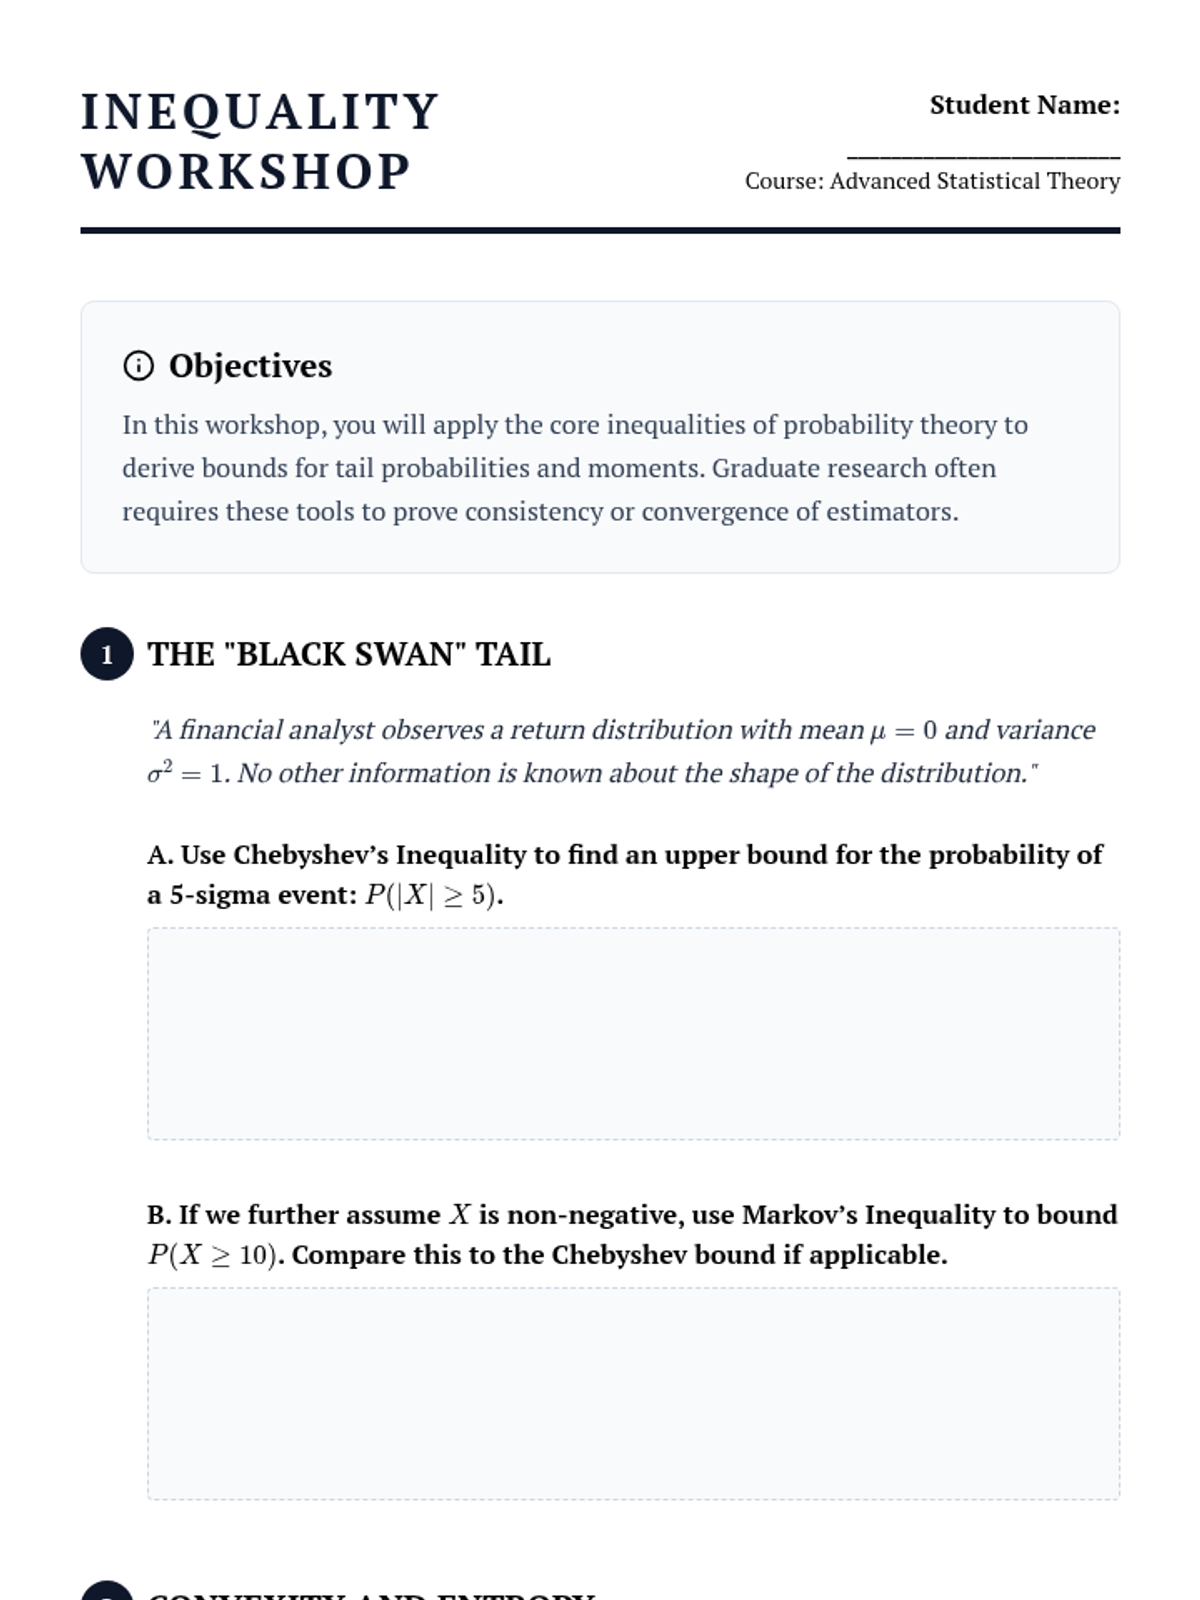
Focuses on the derivation and application of Markov, Chebyshev, Jensen, Hölder, and Minkowski inequalities to bound expected values.
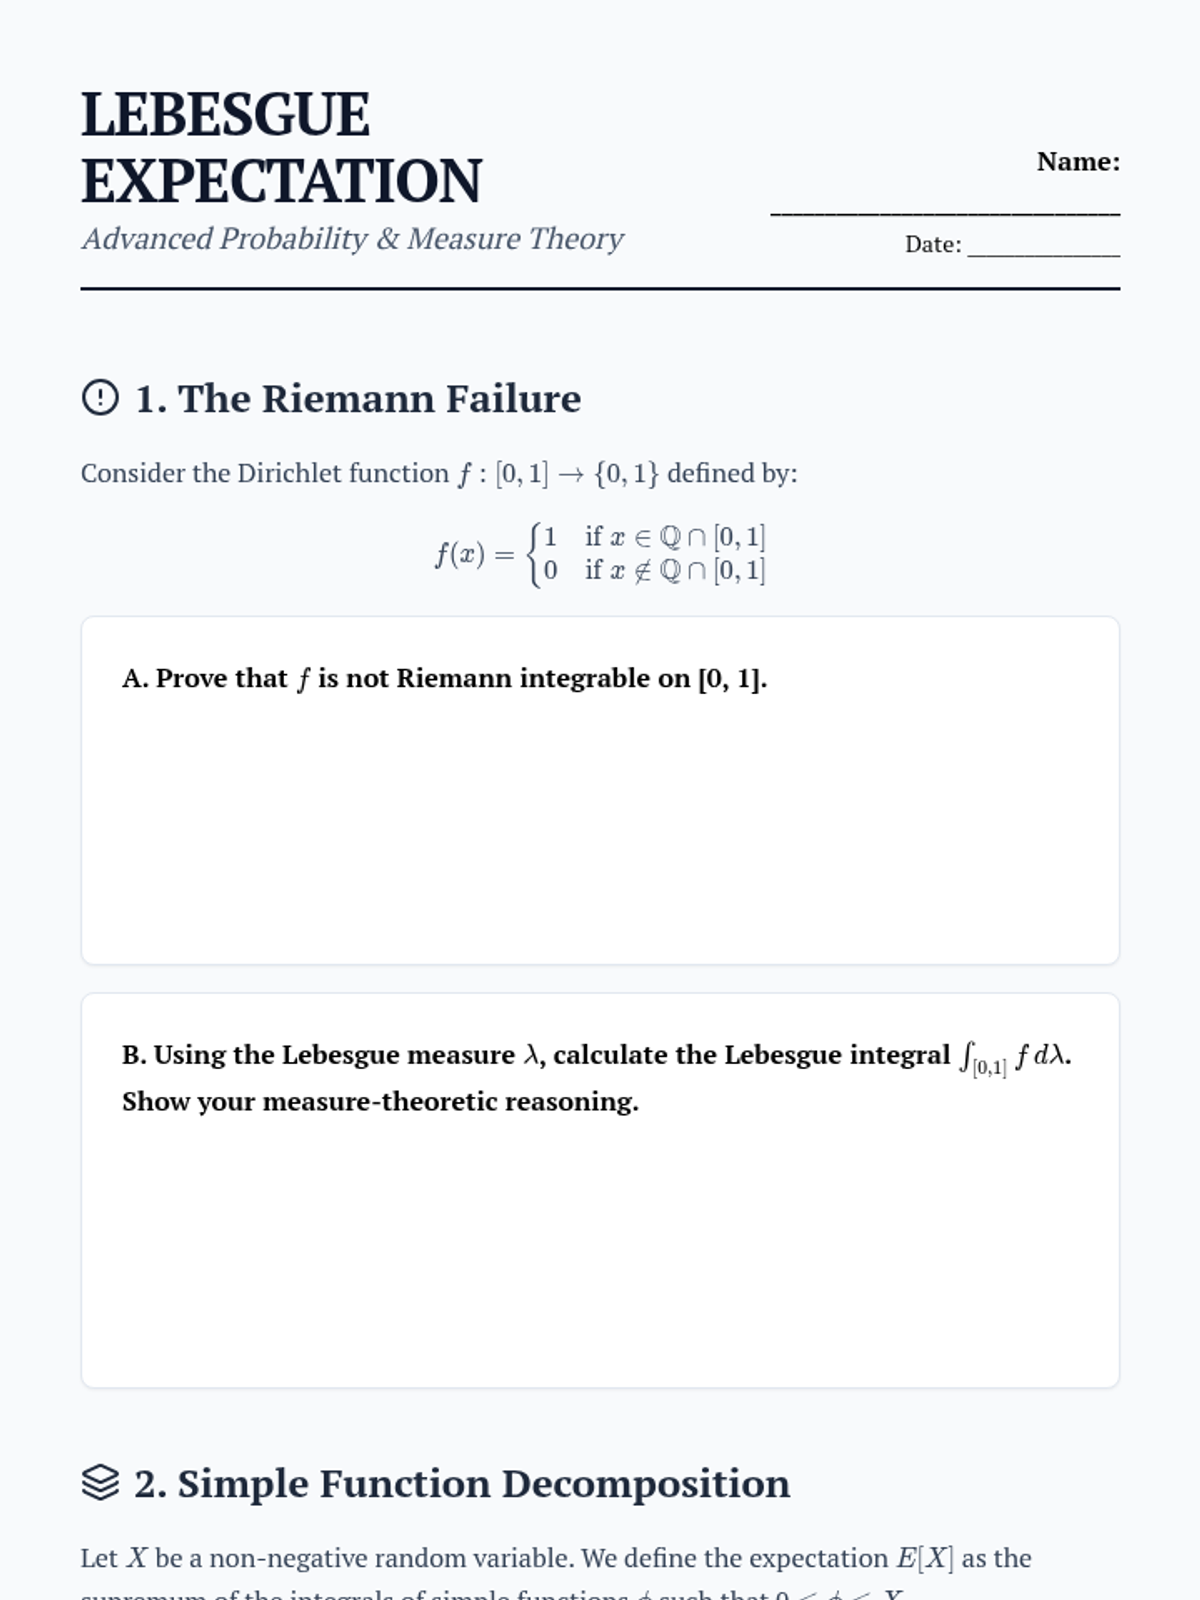
Students define expectation using the Lebesgue integral, moving from simple functions to non-negative random variables and addressing the limitations of Riemann integration.
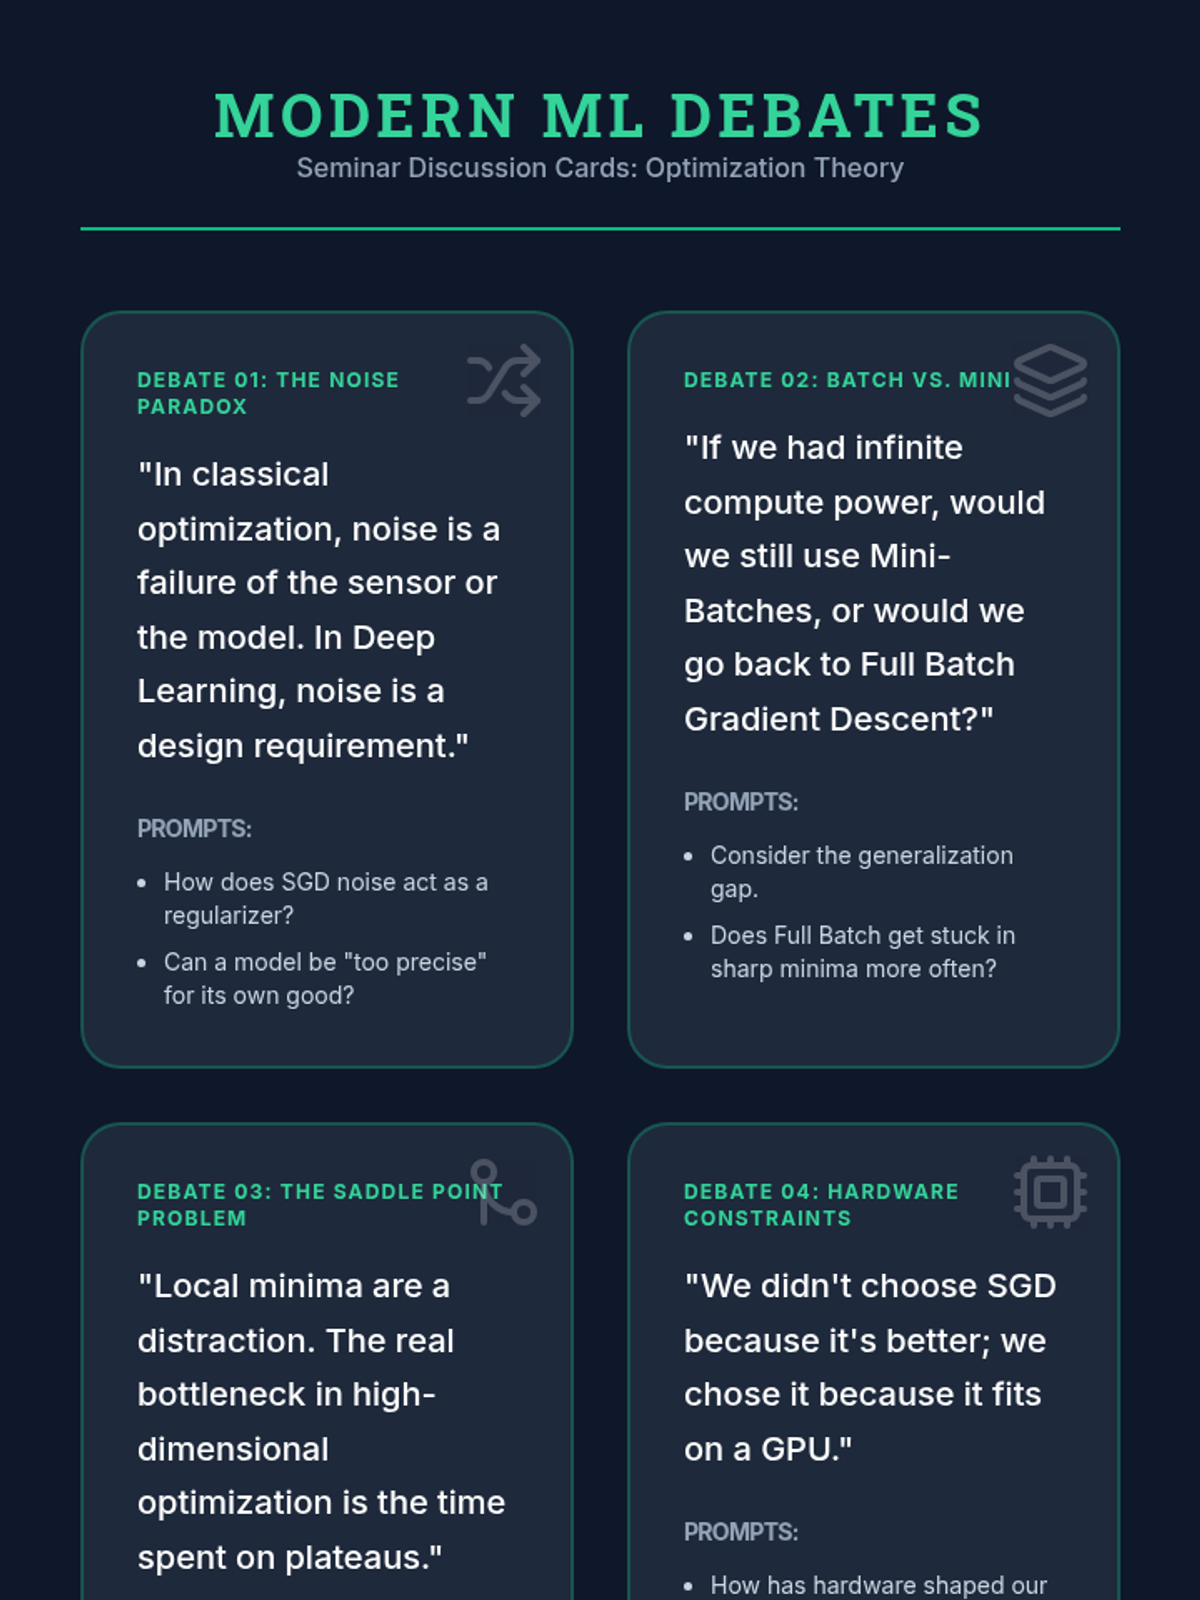
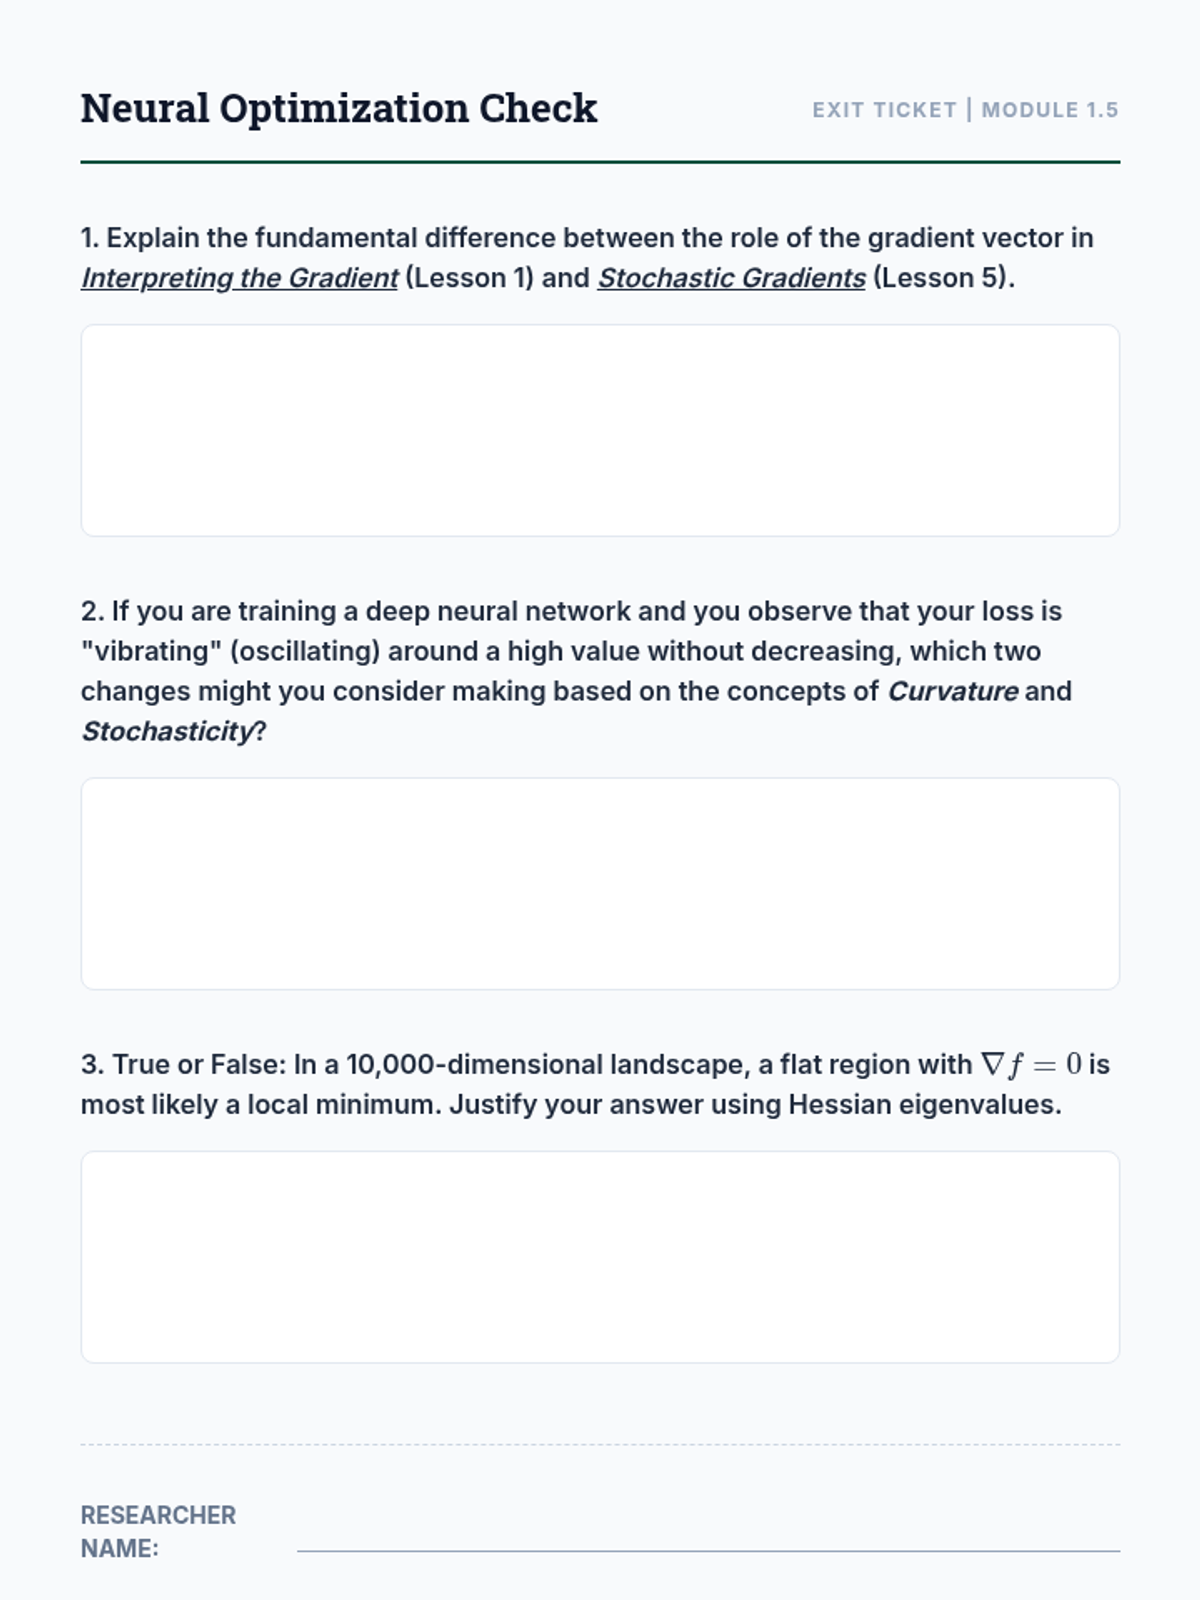
Exploring Stochastic Gradient Descent (SGD) and its role in navigating high-dimensional, non-convex landscapes in machine learning.
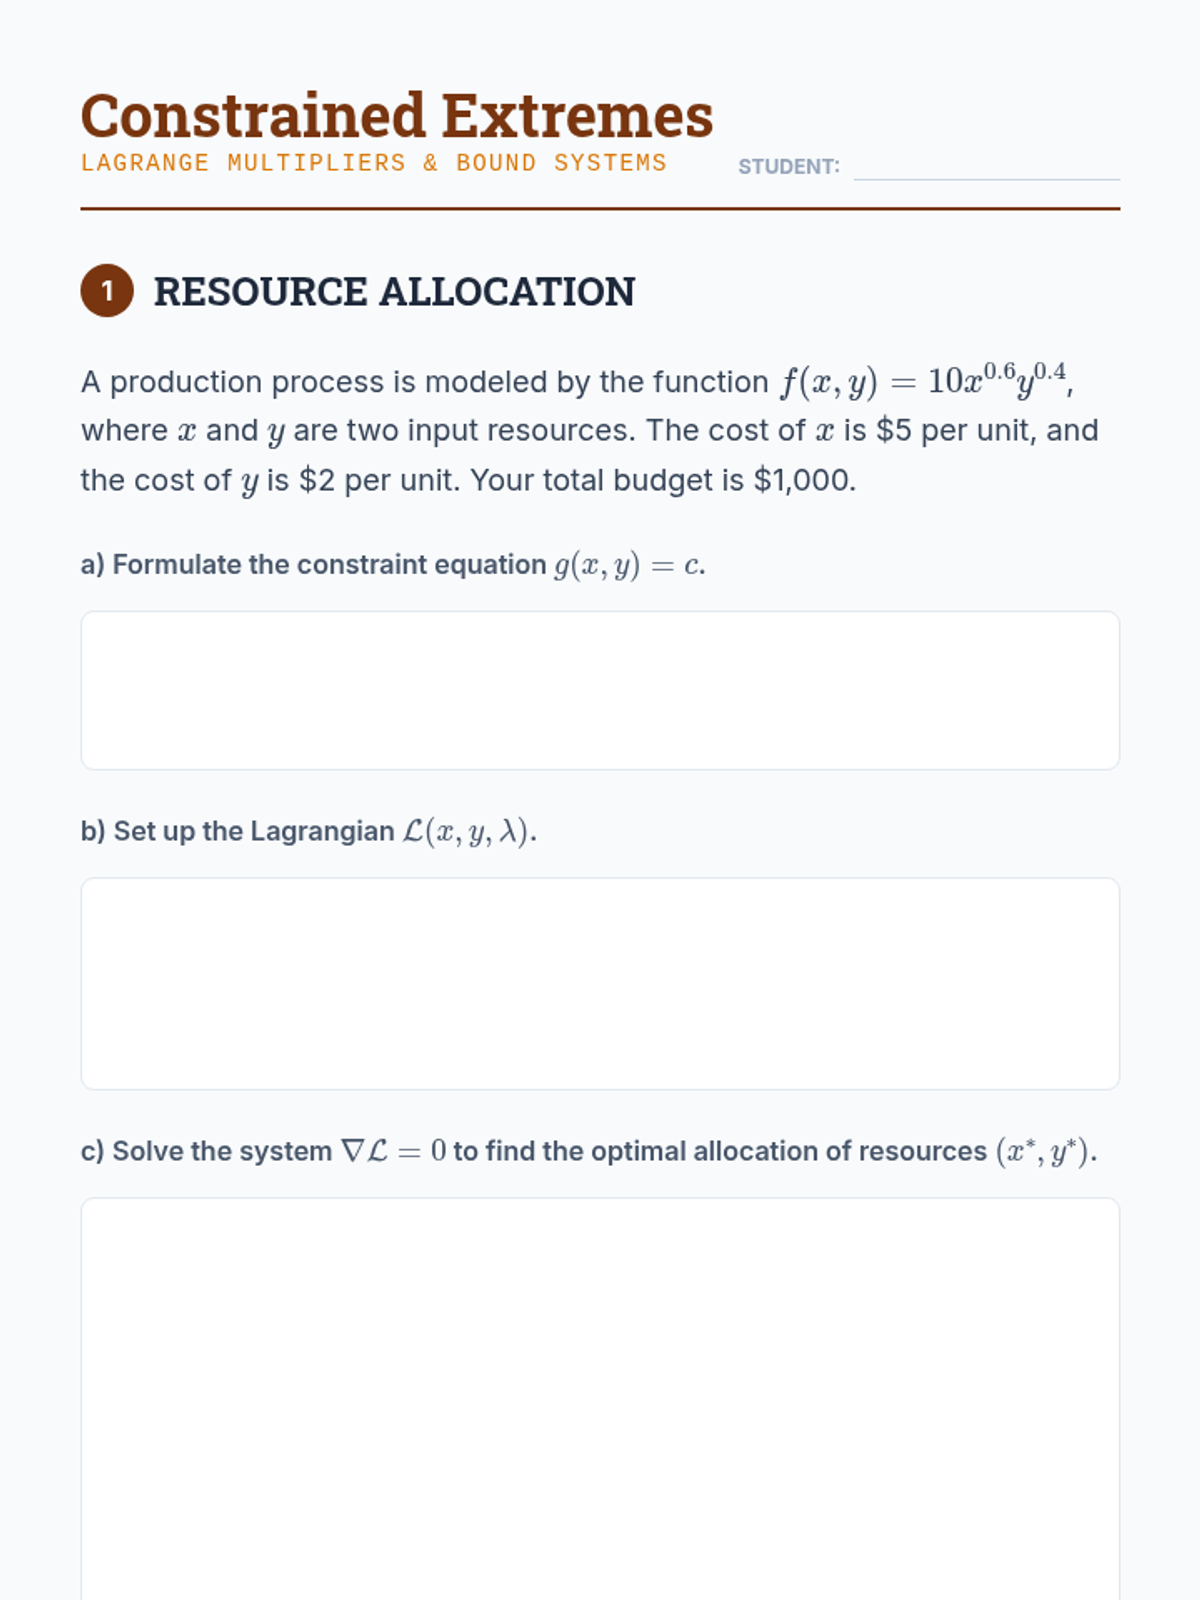
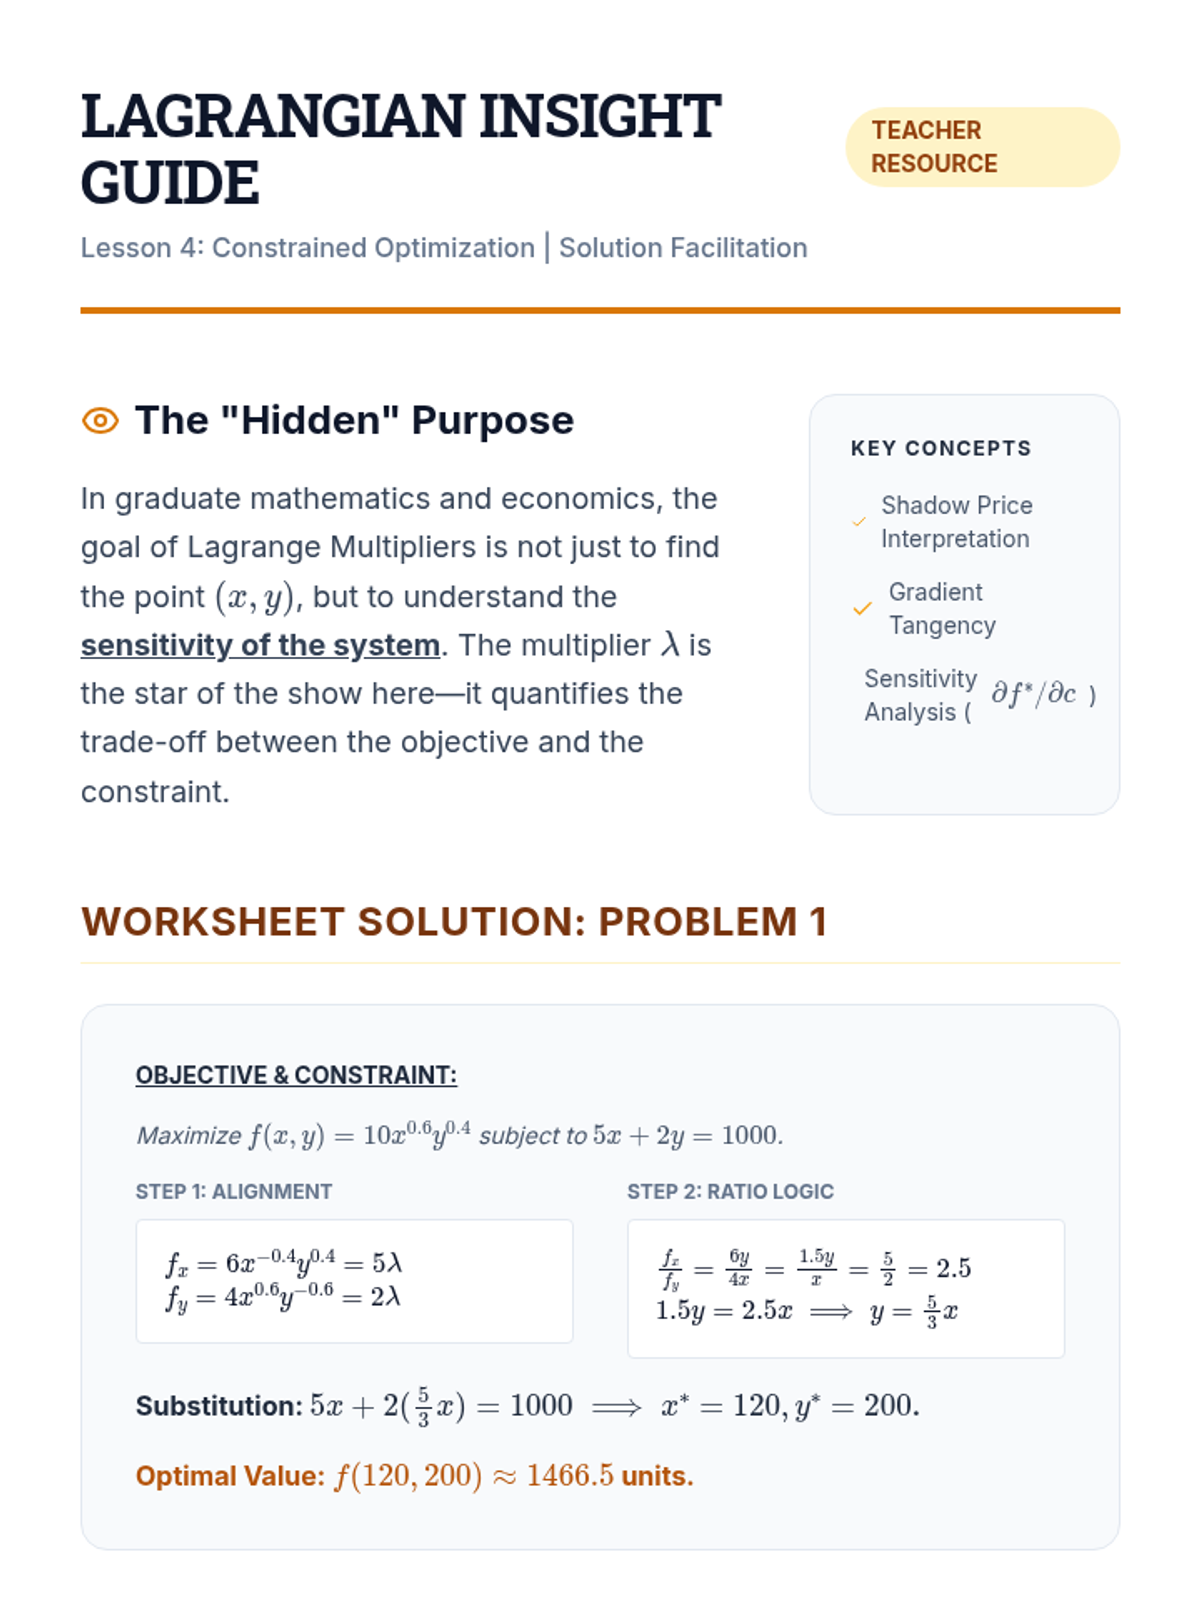
Solving optimization problems under constraints using the method of Lagrange multipliers, focusing on the alignment of gradient vectors.
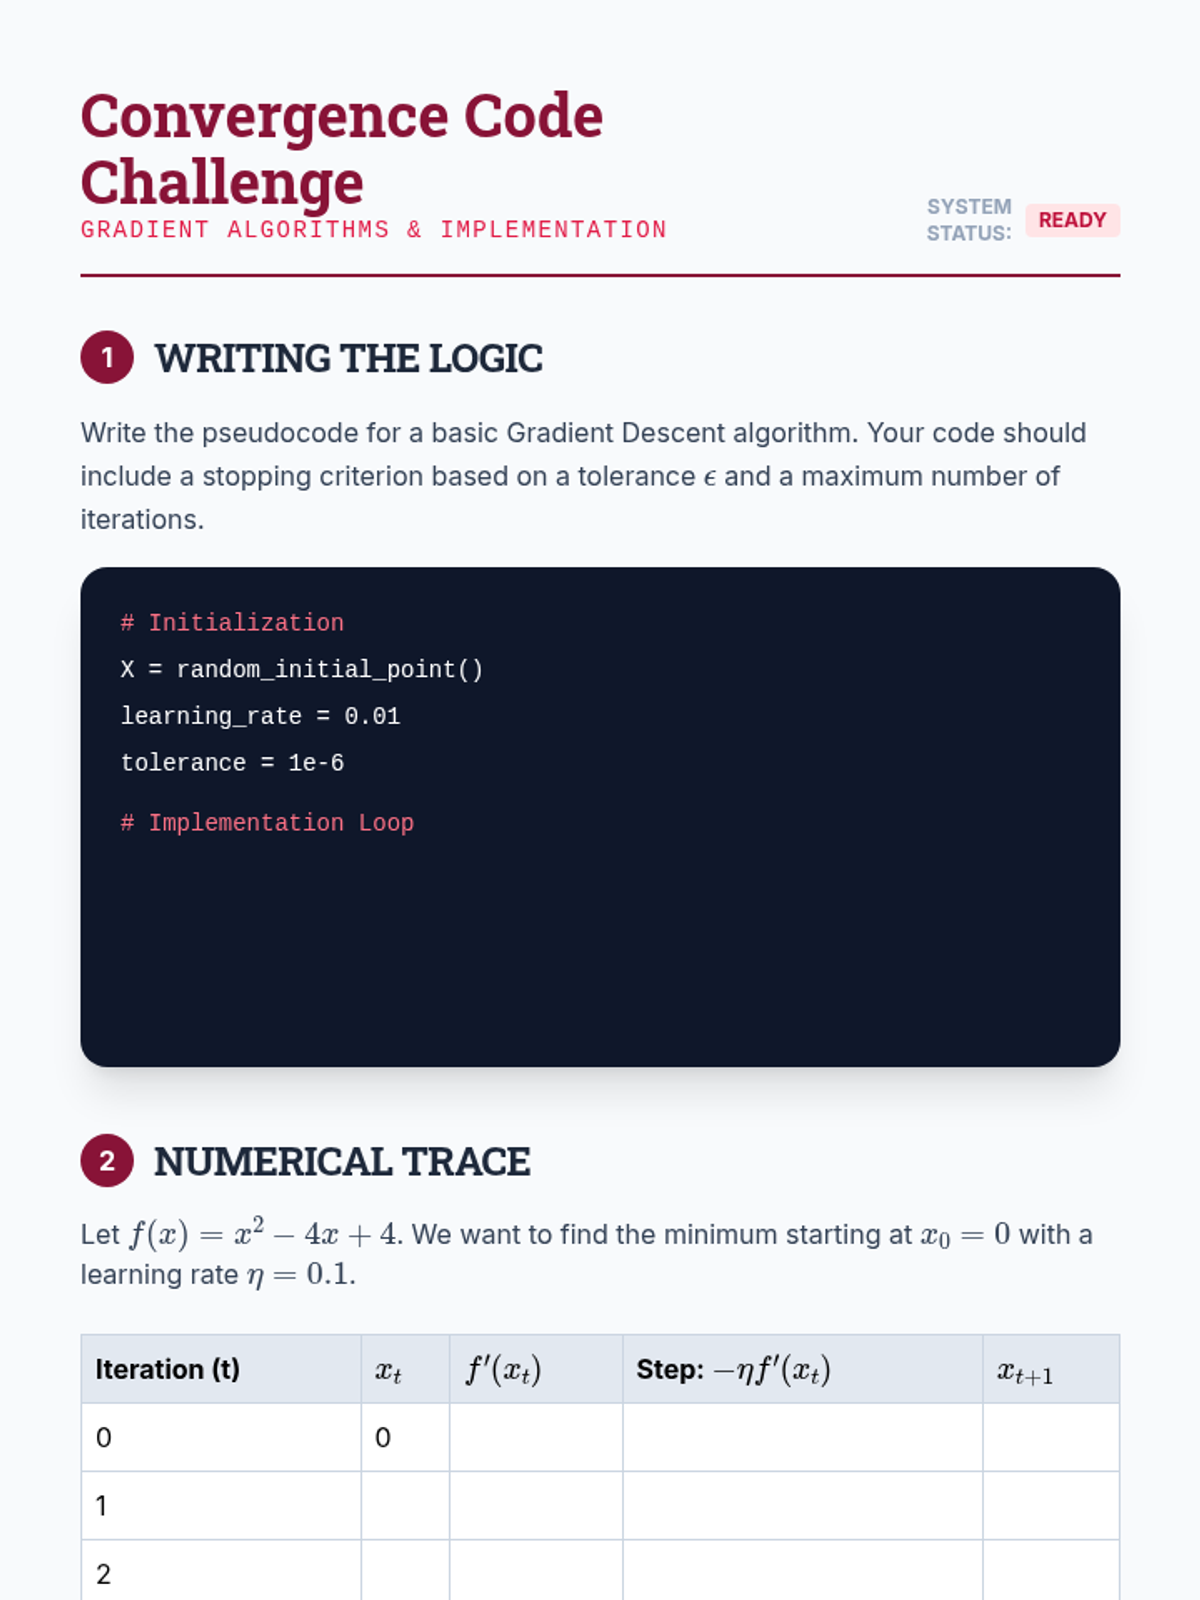
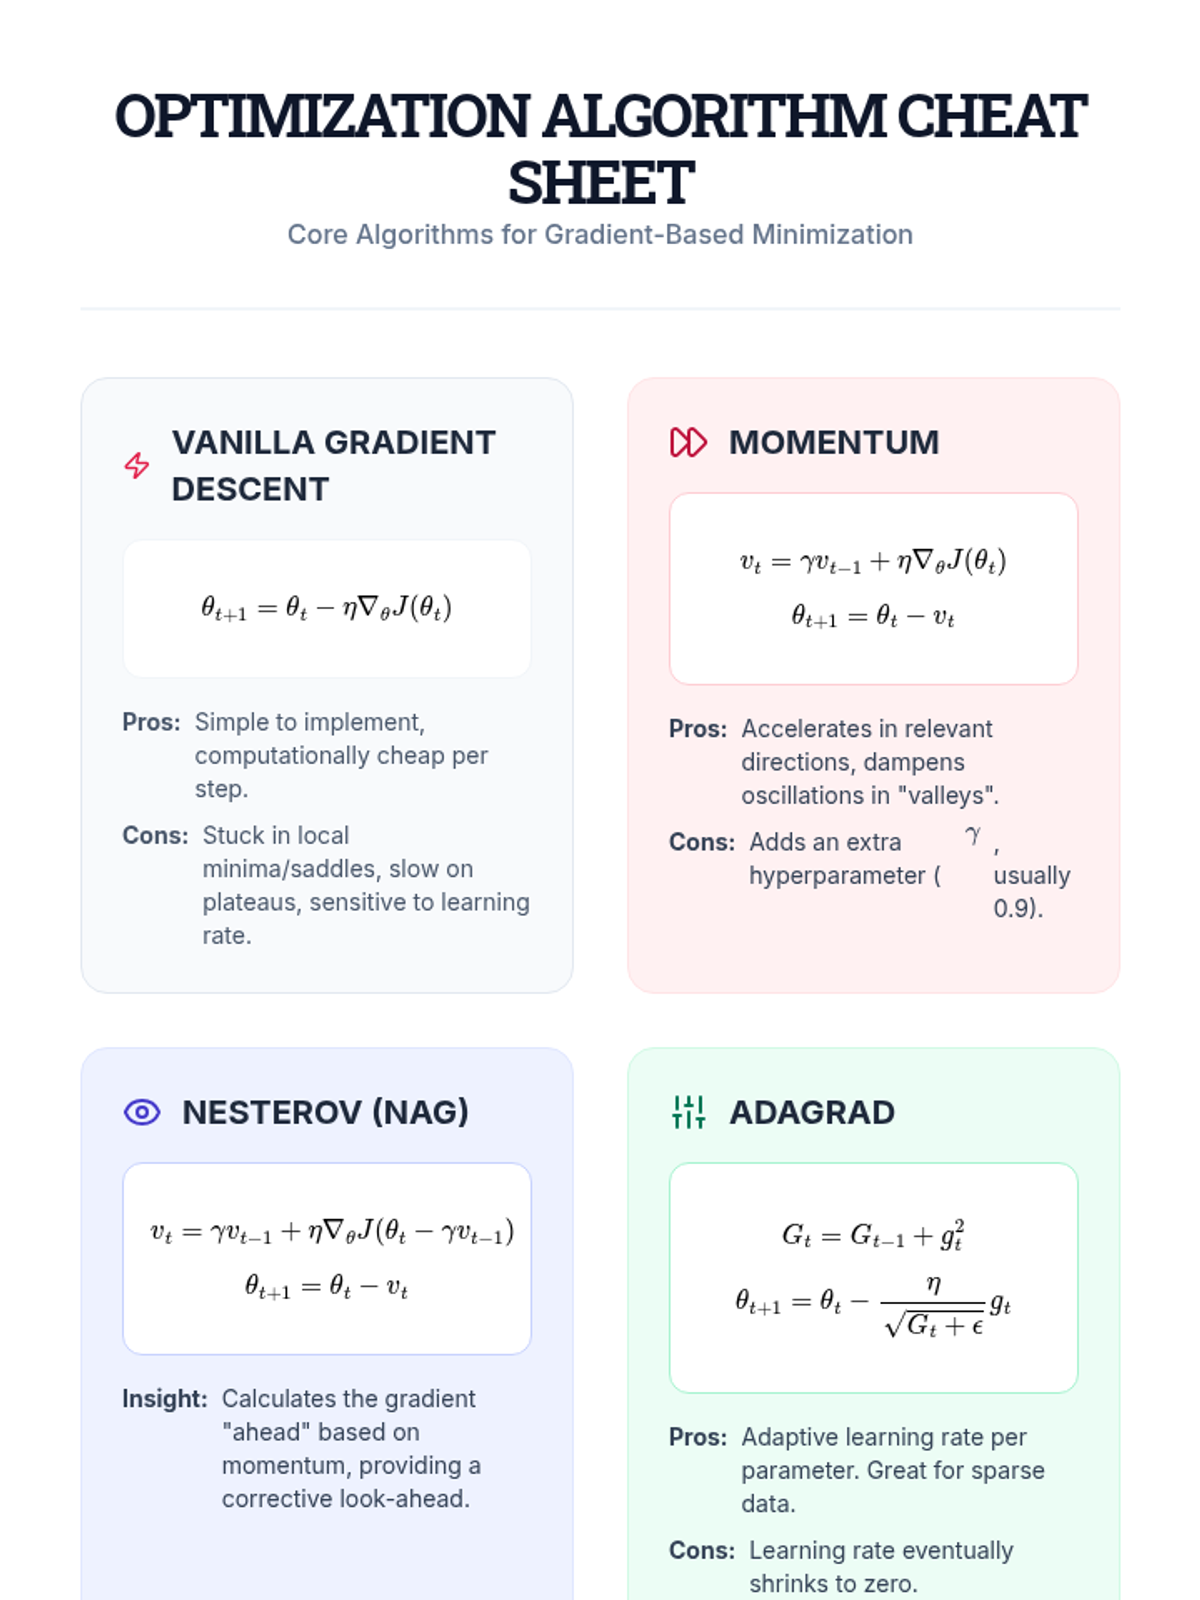
Implementation of iterative numerical methods, focusing on the geometry of convergence, learning rates, and momentum in gradient descent.
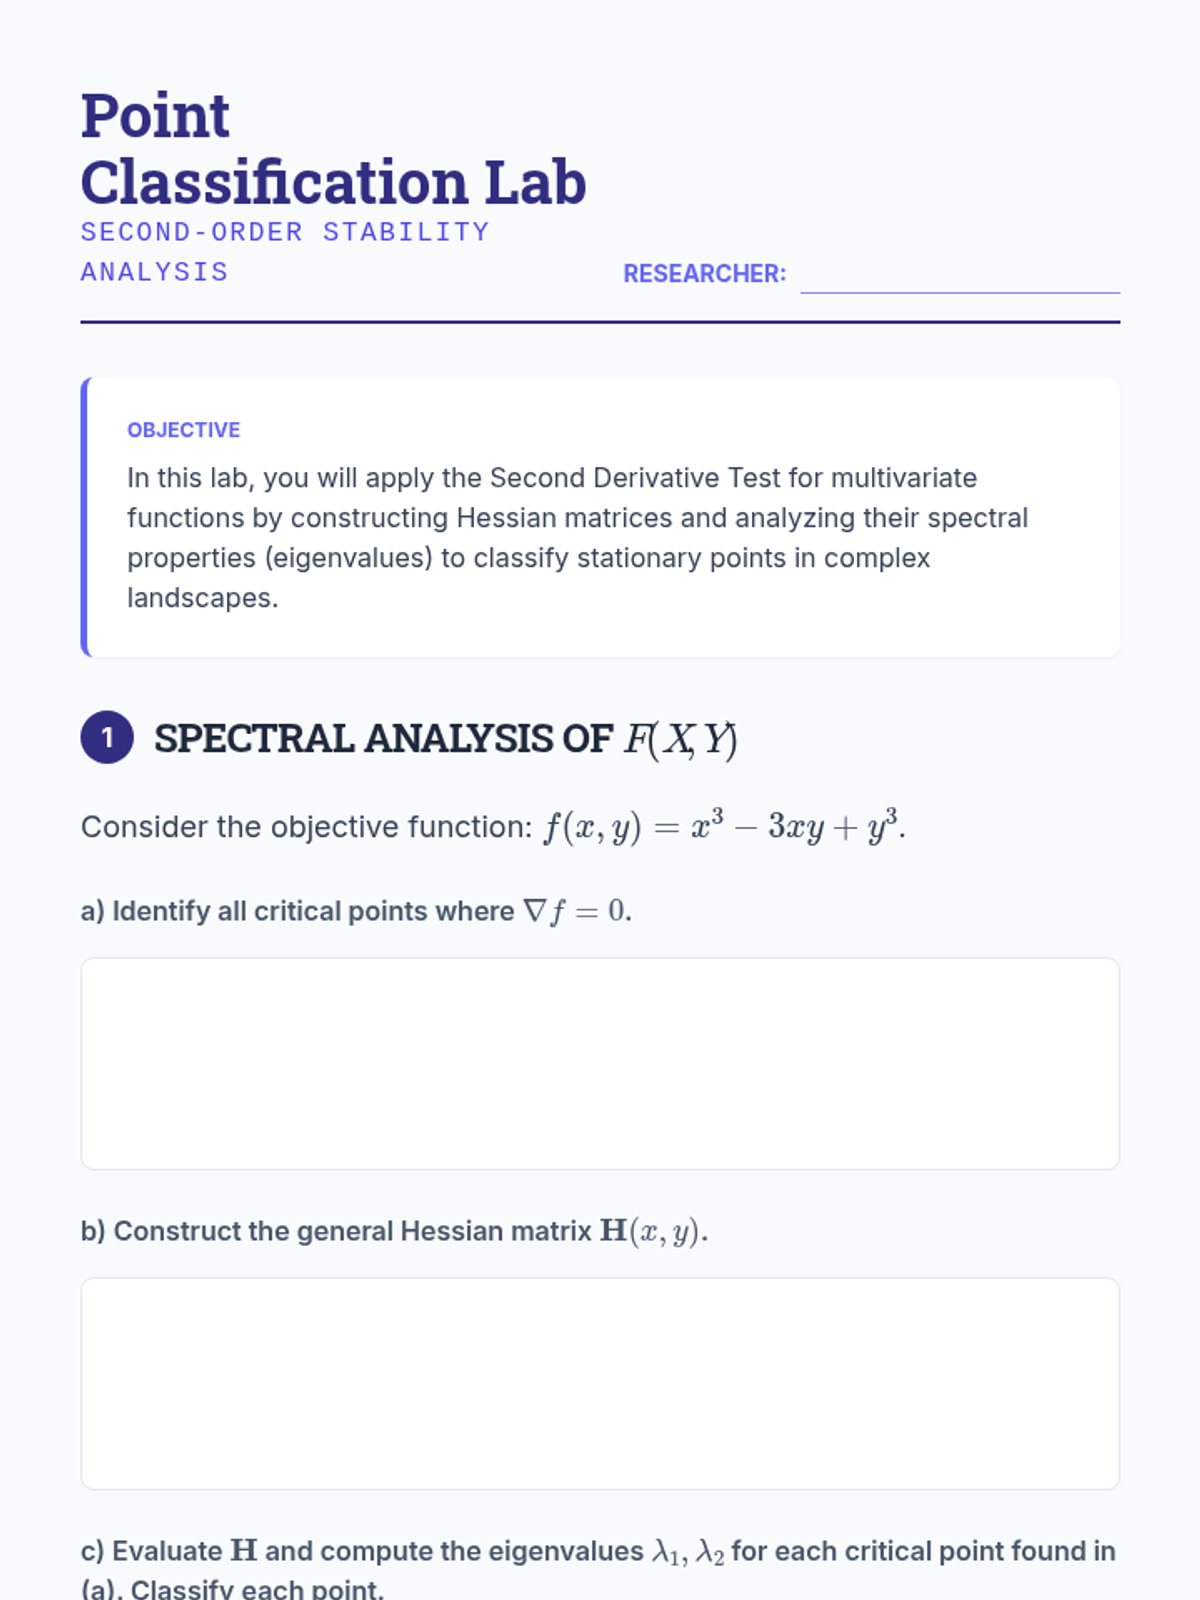
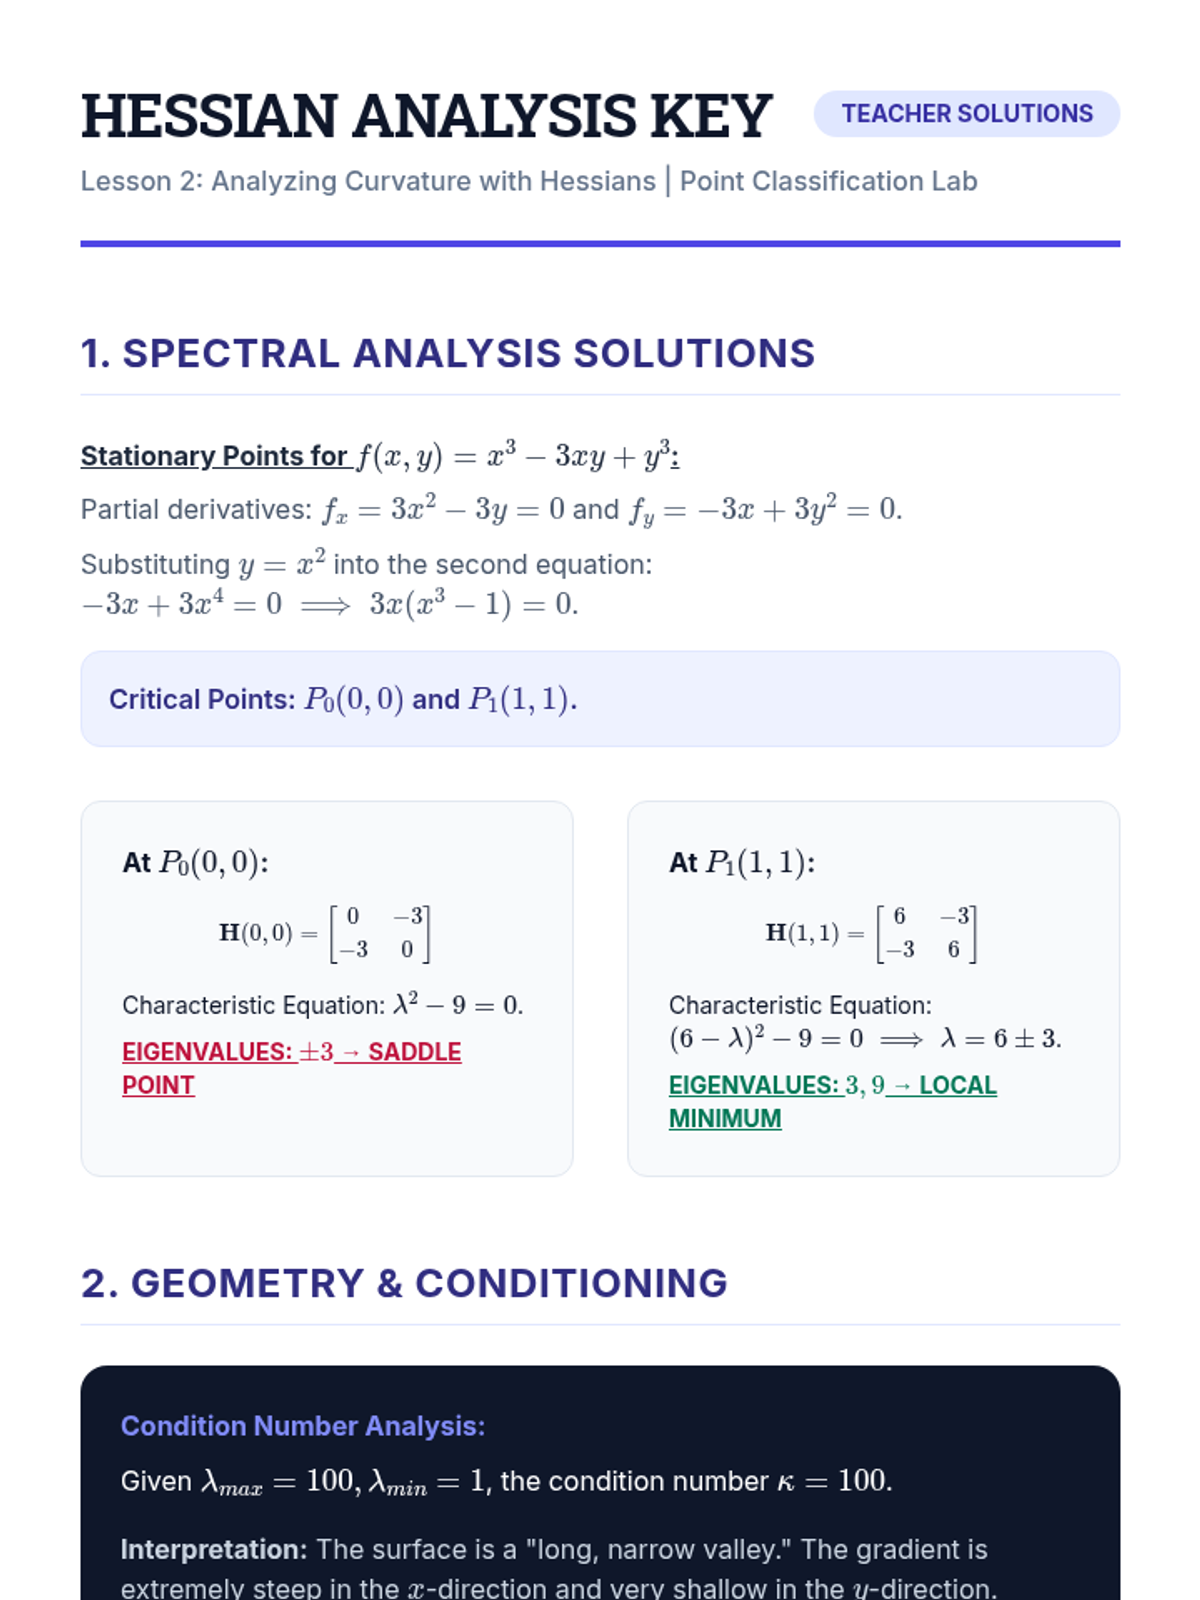
An examination of second-order derivatives via the Hessian matrix to understand surface curvature and classify critical points using eigenvalues.
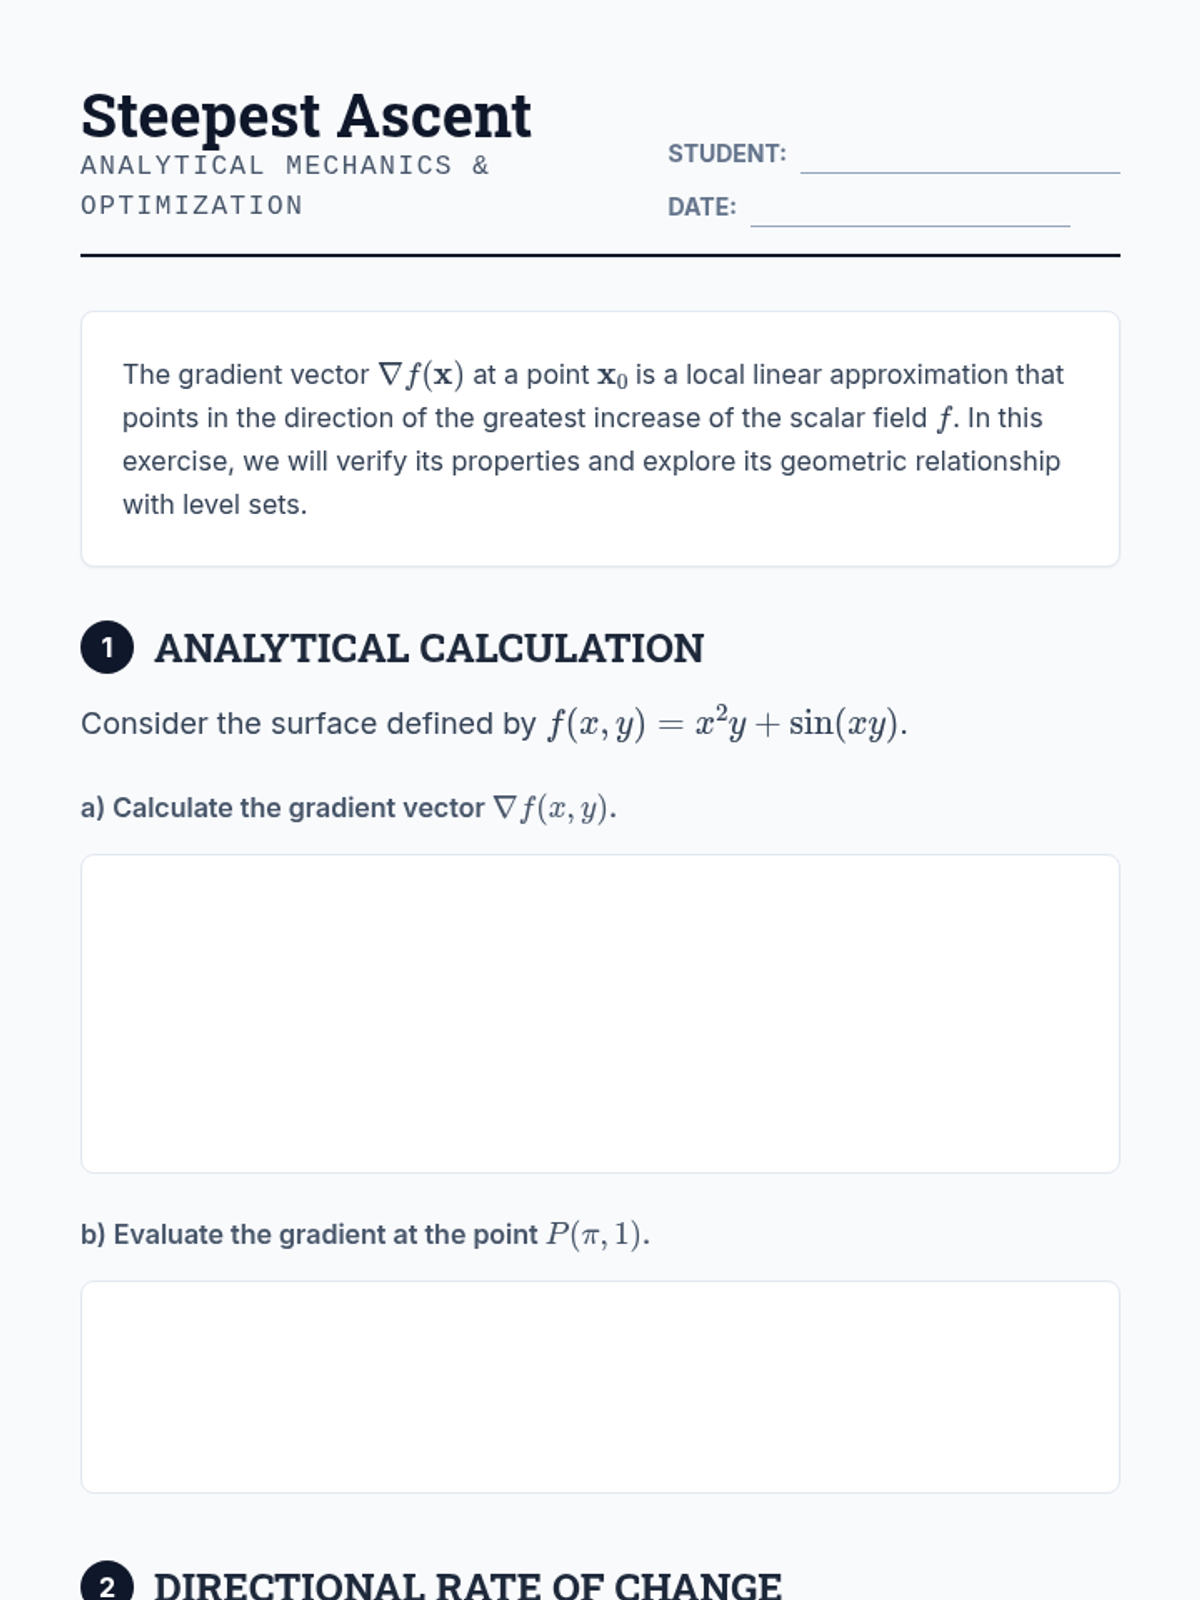
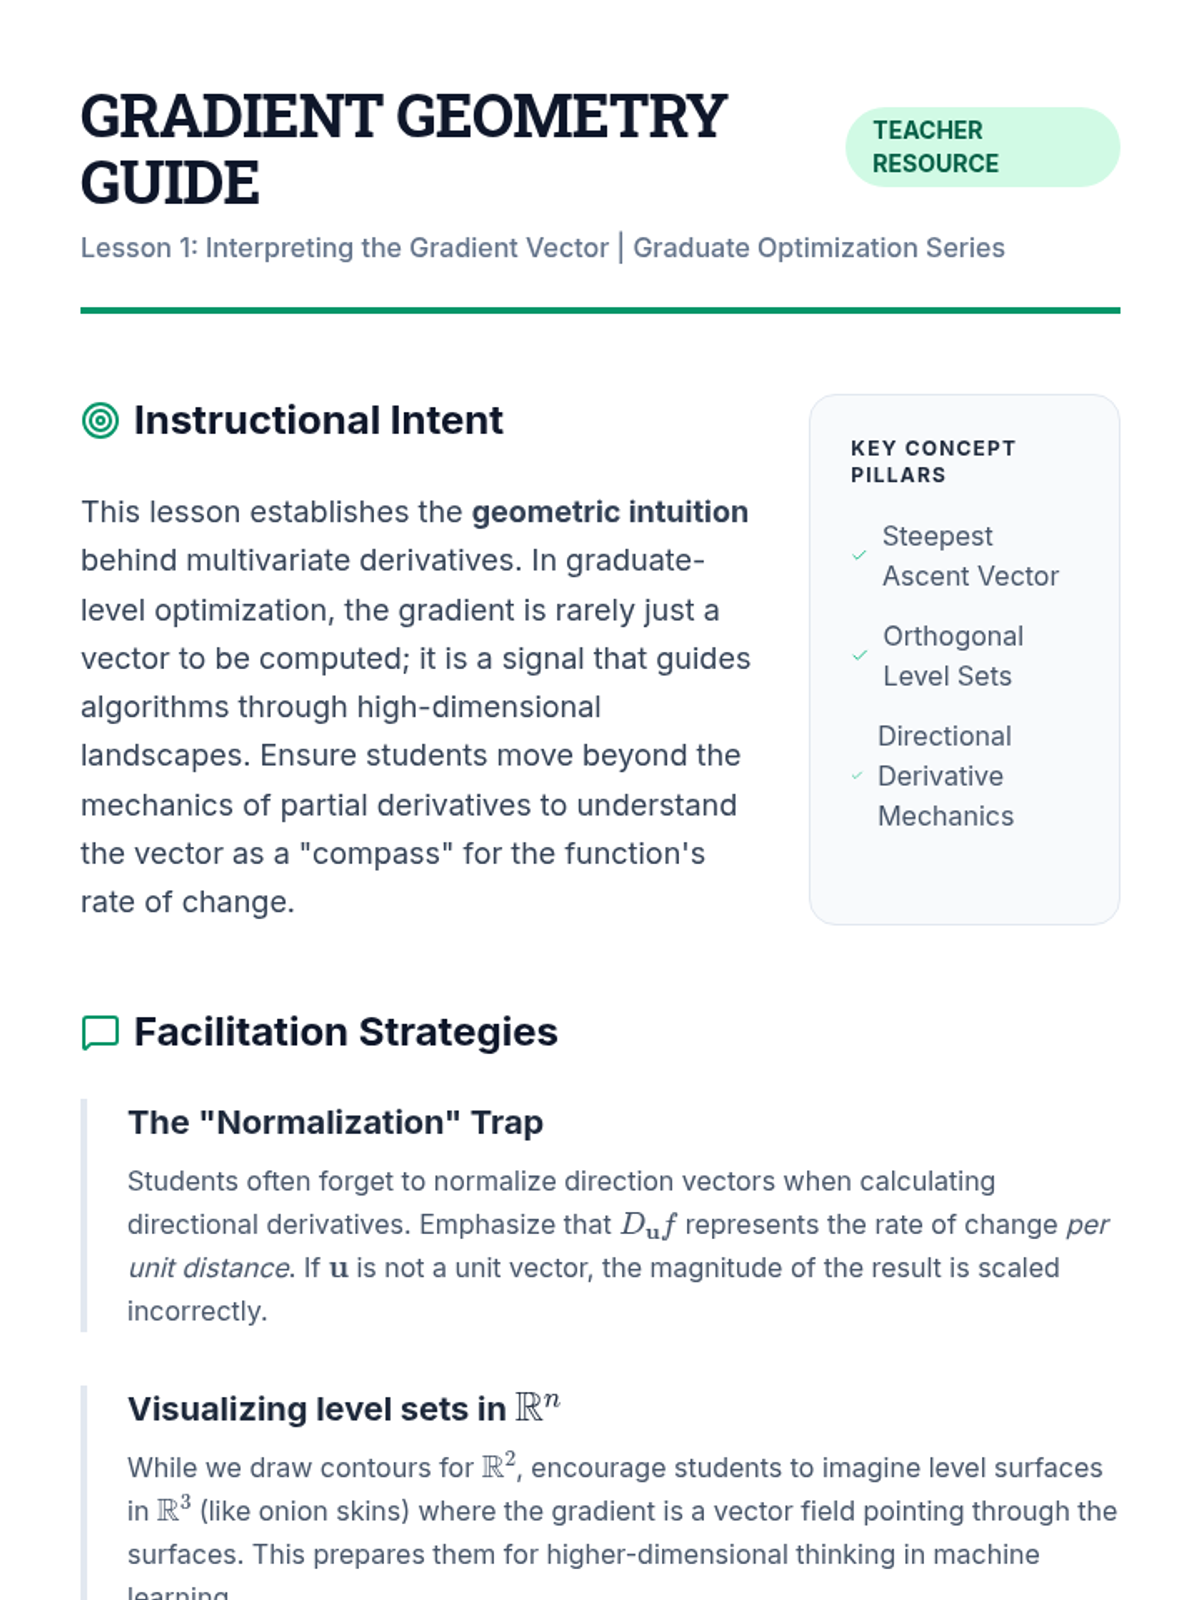
Students analyze the gradient vector as a directional quantity, establishing its geometric relationship with level sets and proving it indicates the steepest ascent.
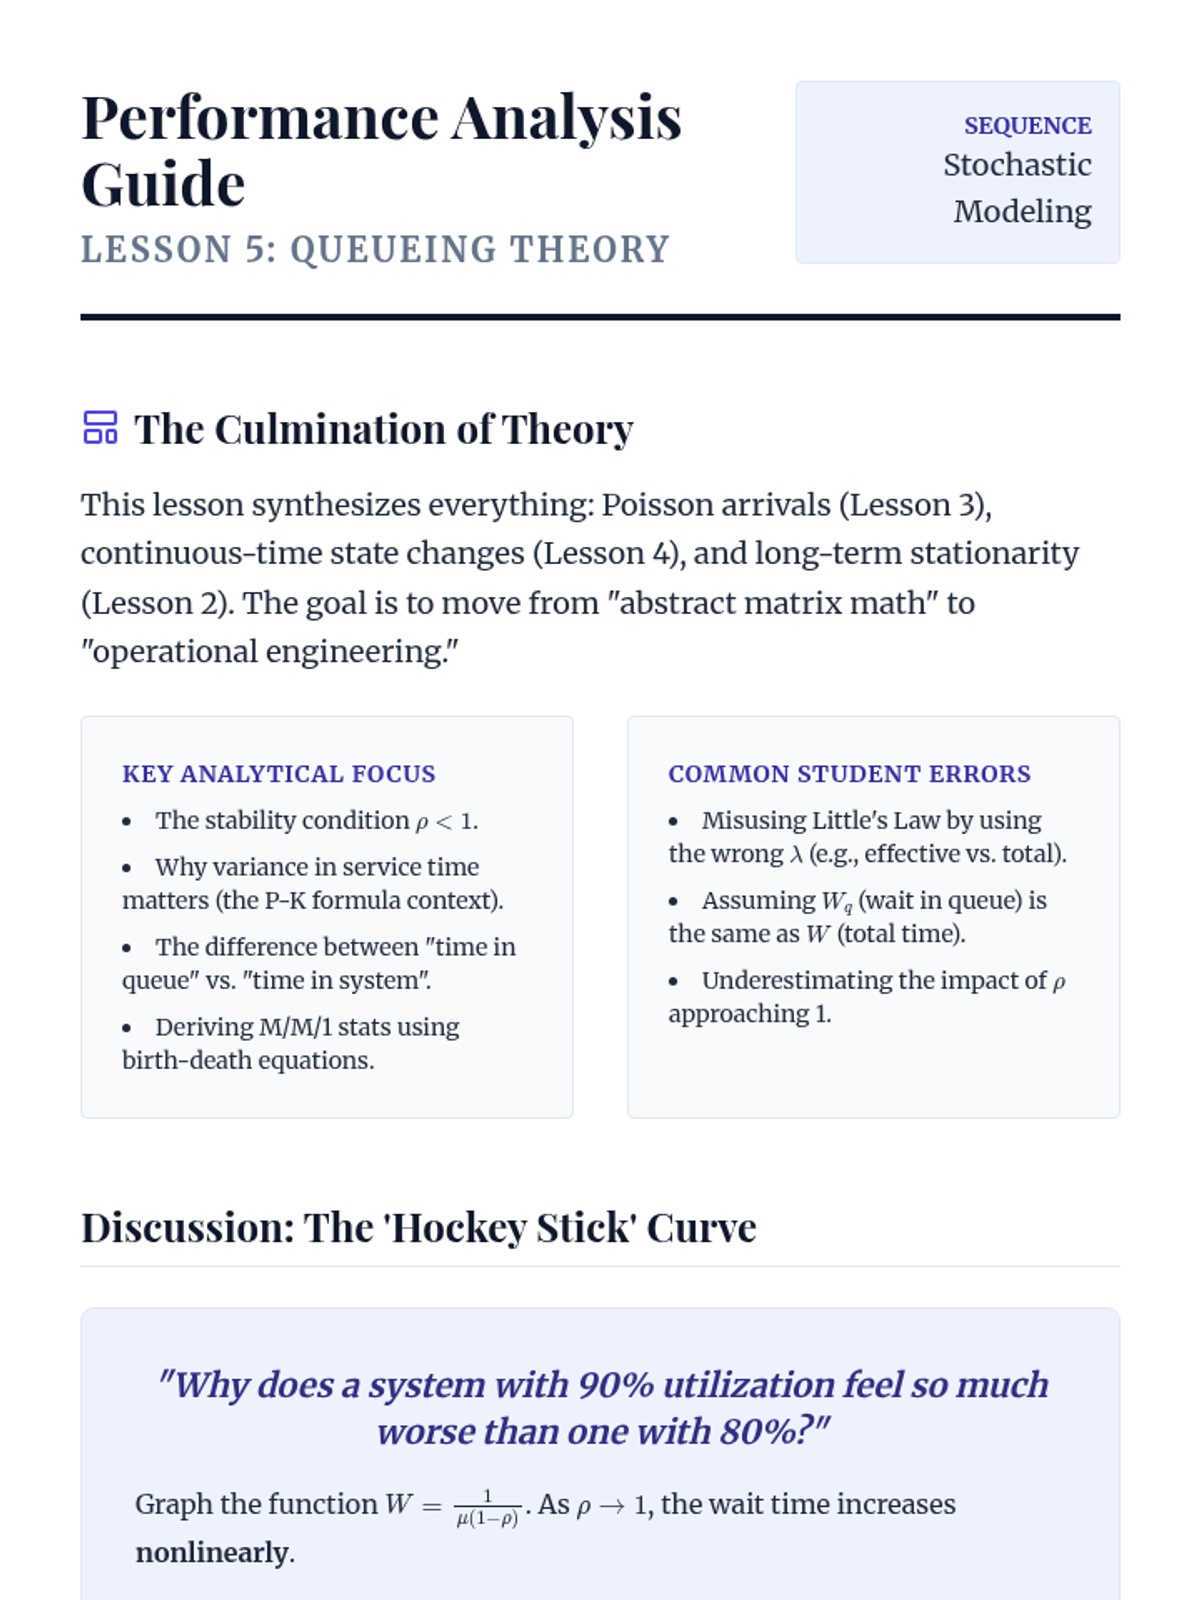
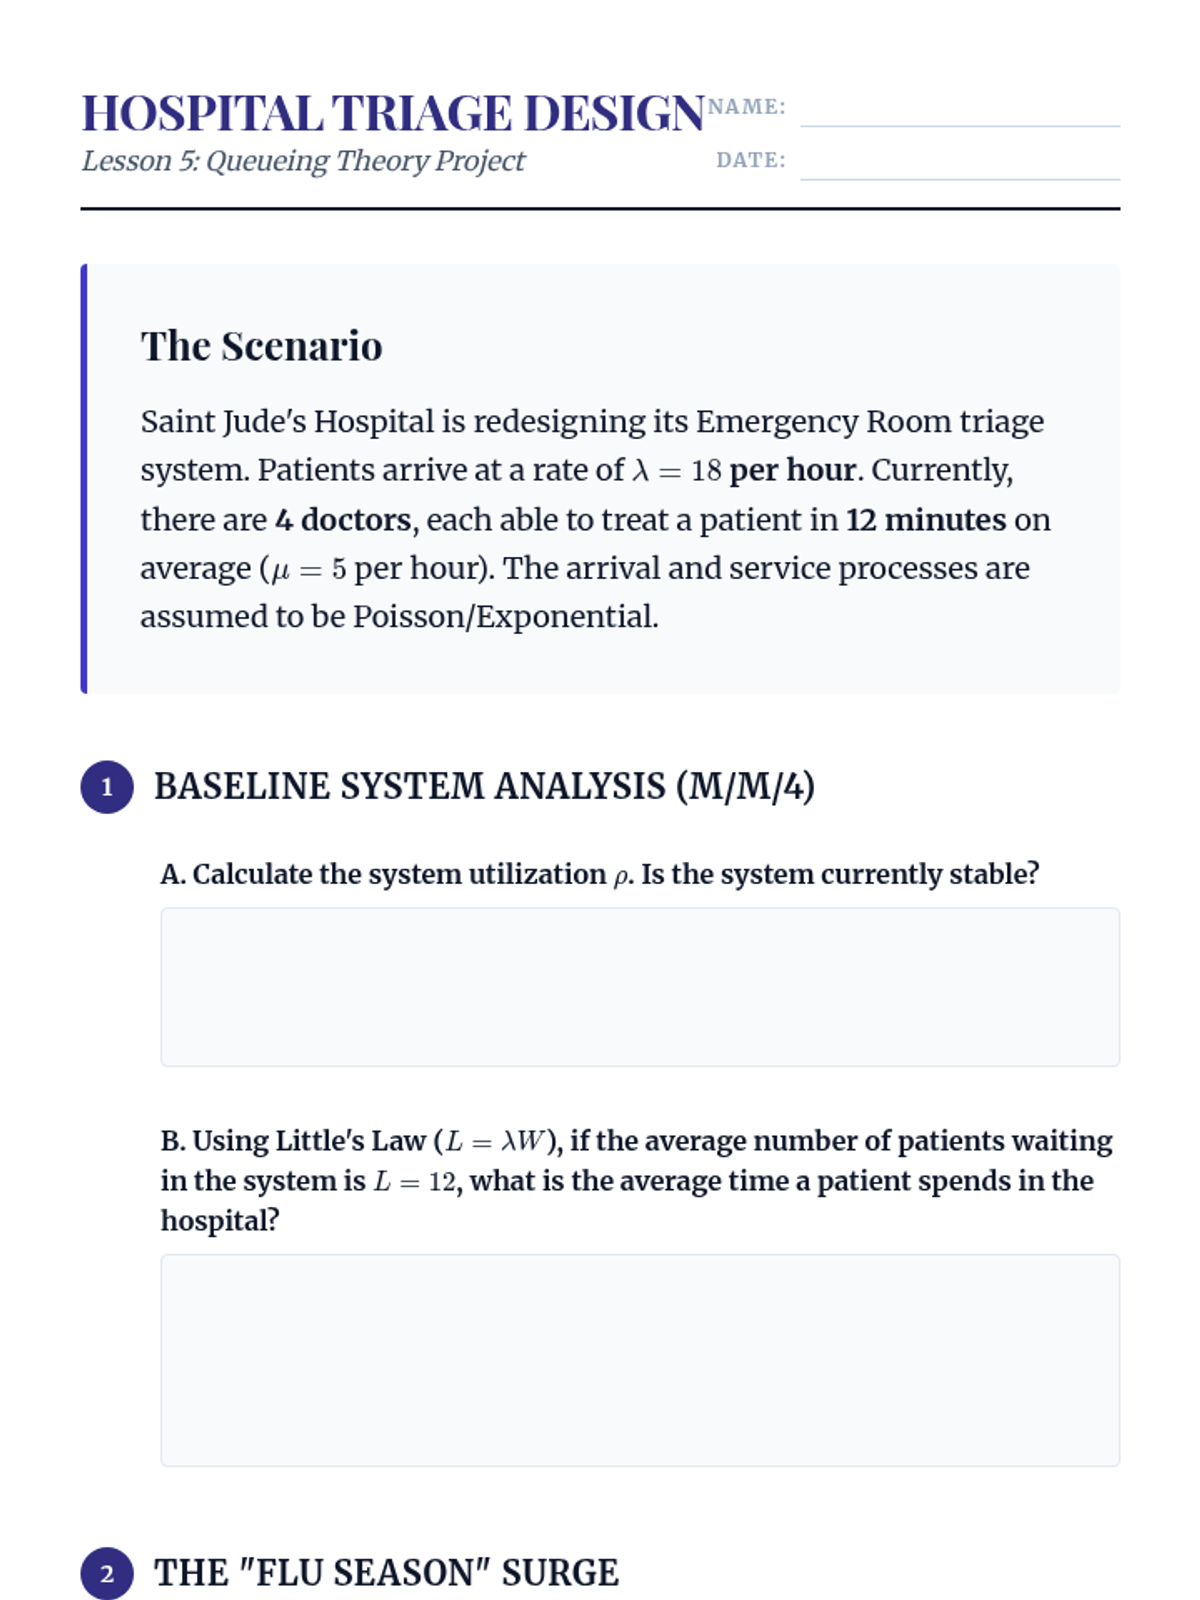
Application of stochastic modeling to queueing systems, using Little's Law and steady-state analysis to optimize performance in complex environments.
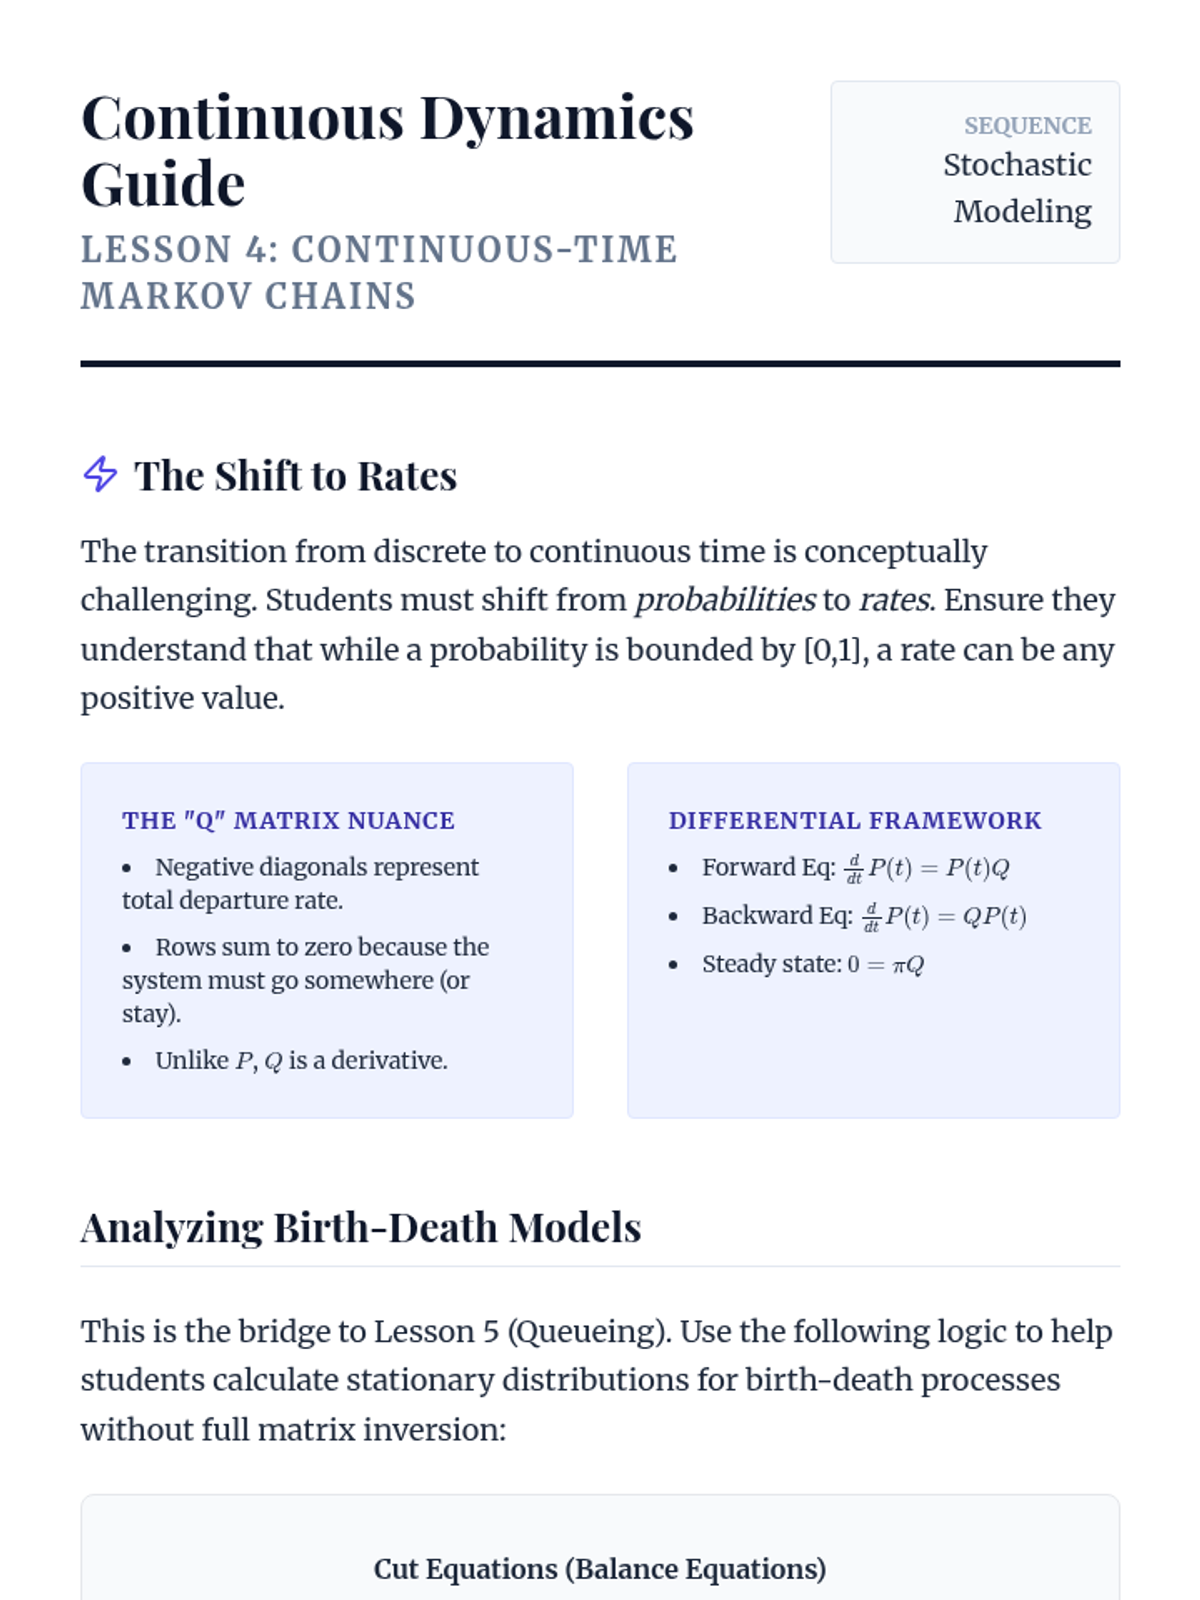
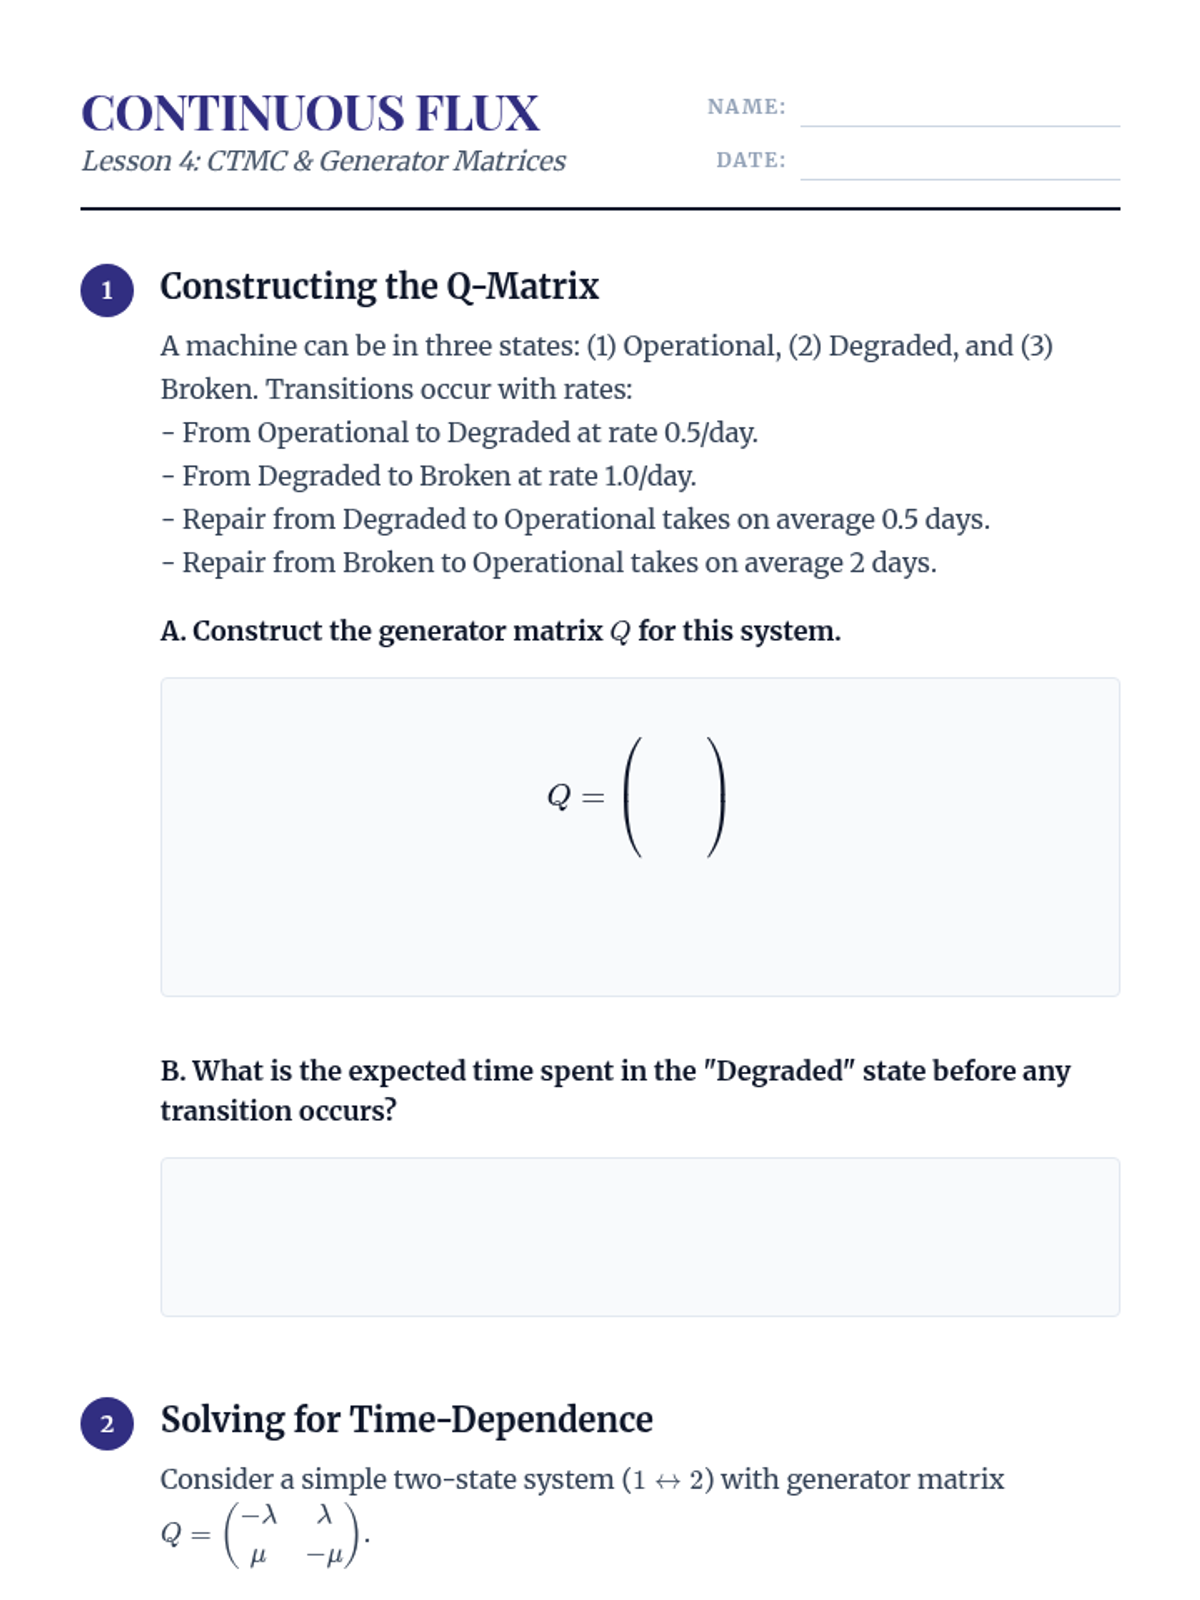
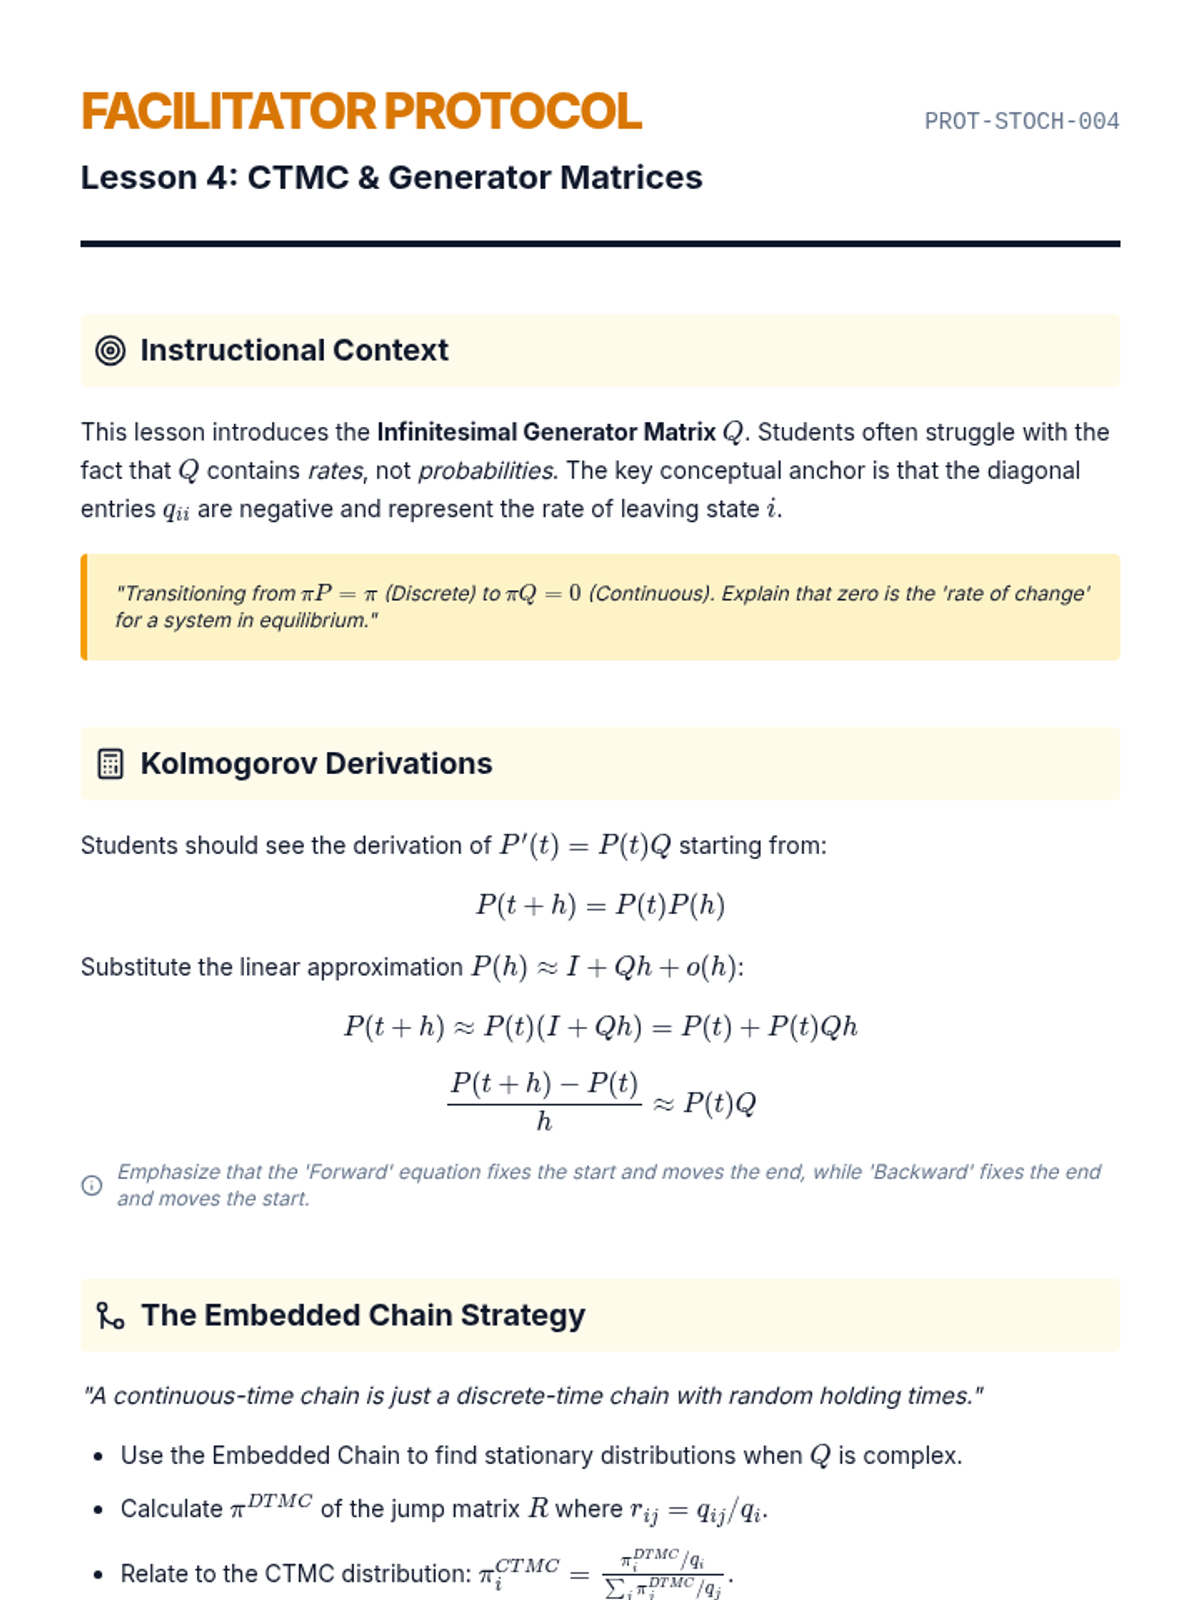
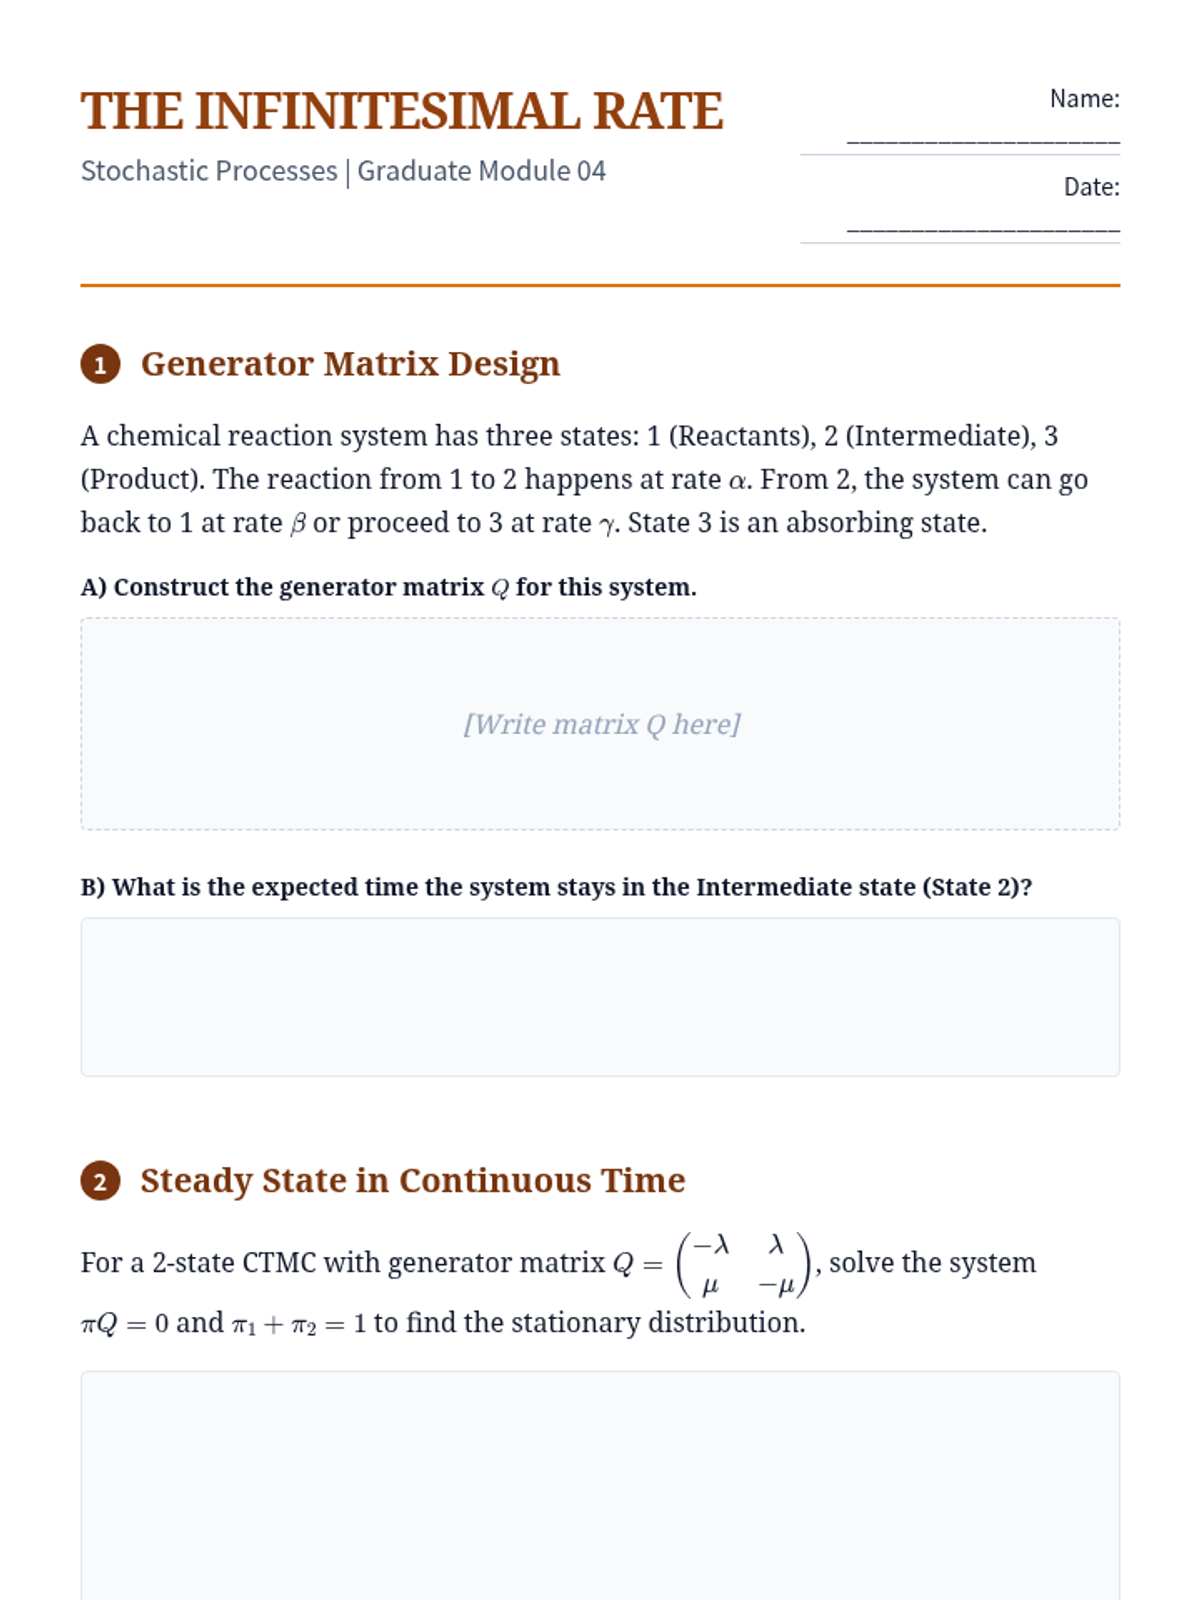
Transitioning to continuous-time Markov chains using generator matrices and solving Kolmogorov's differential equations for birth-death processes.
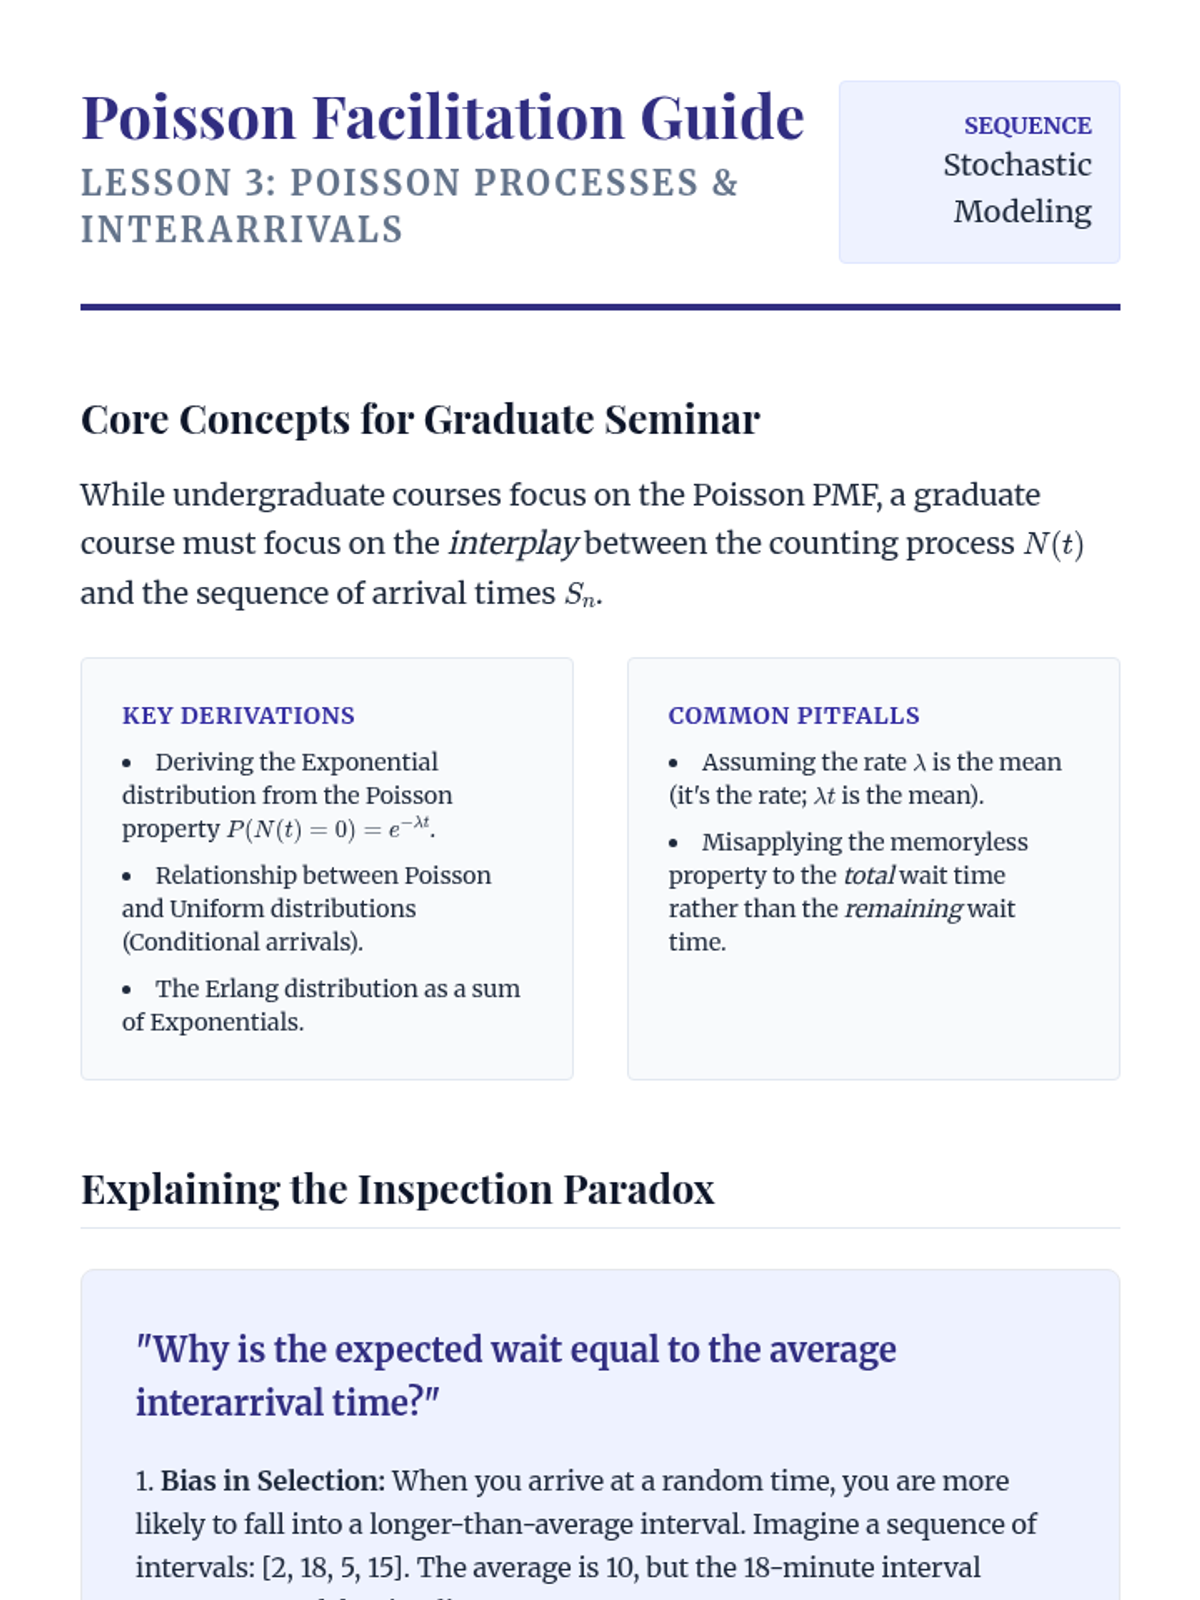
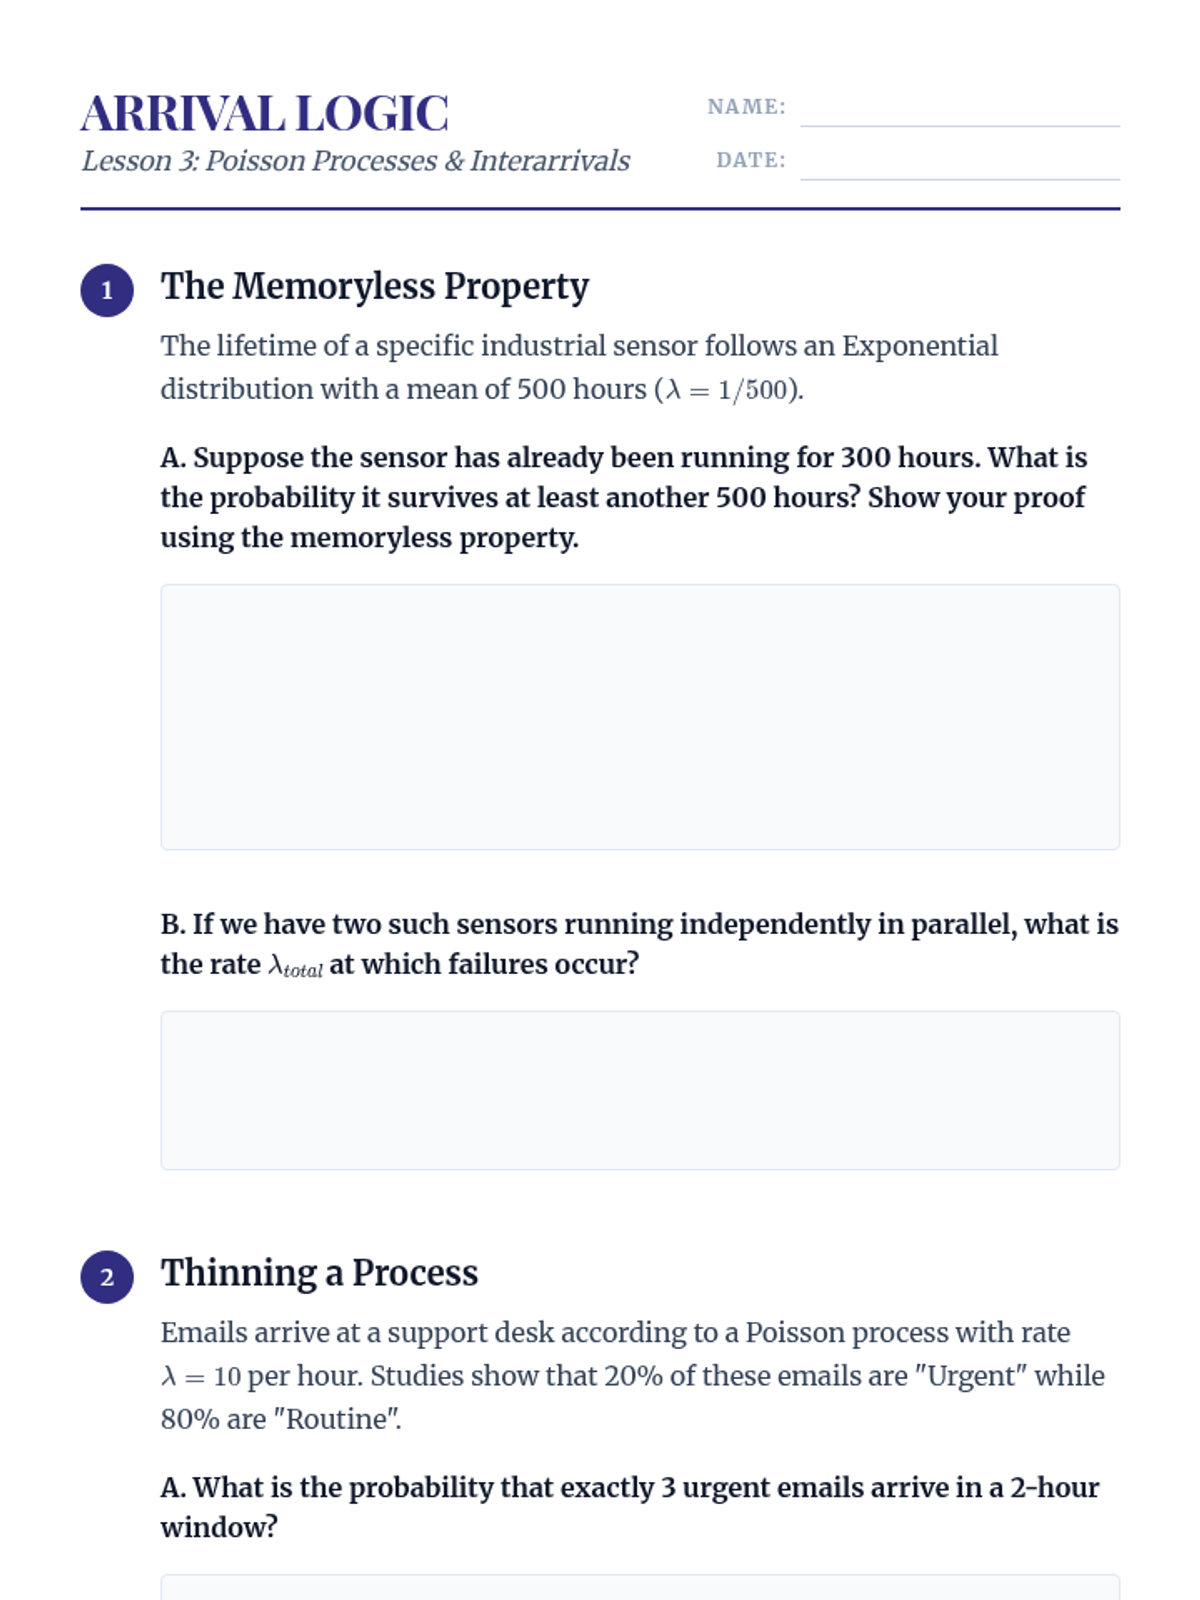
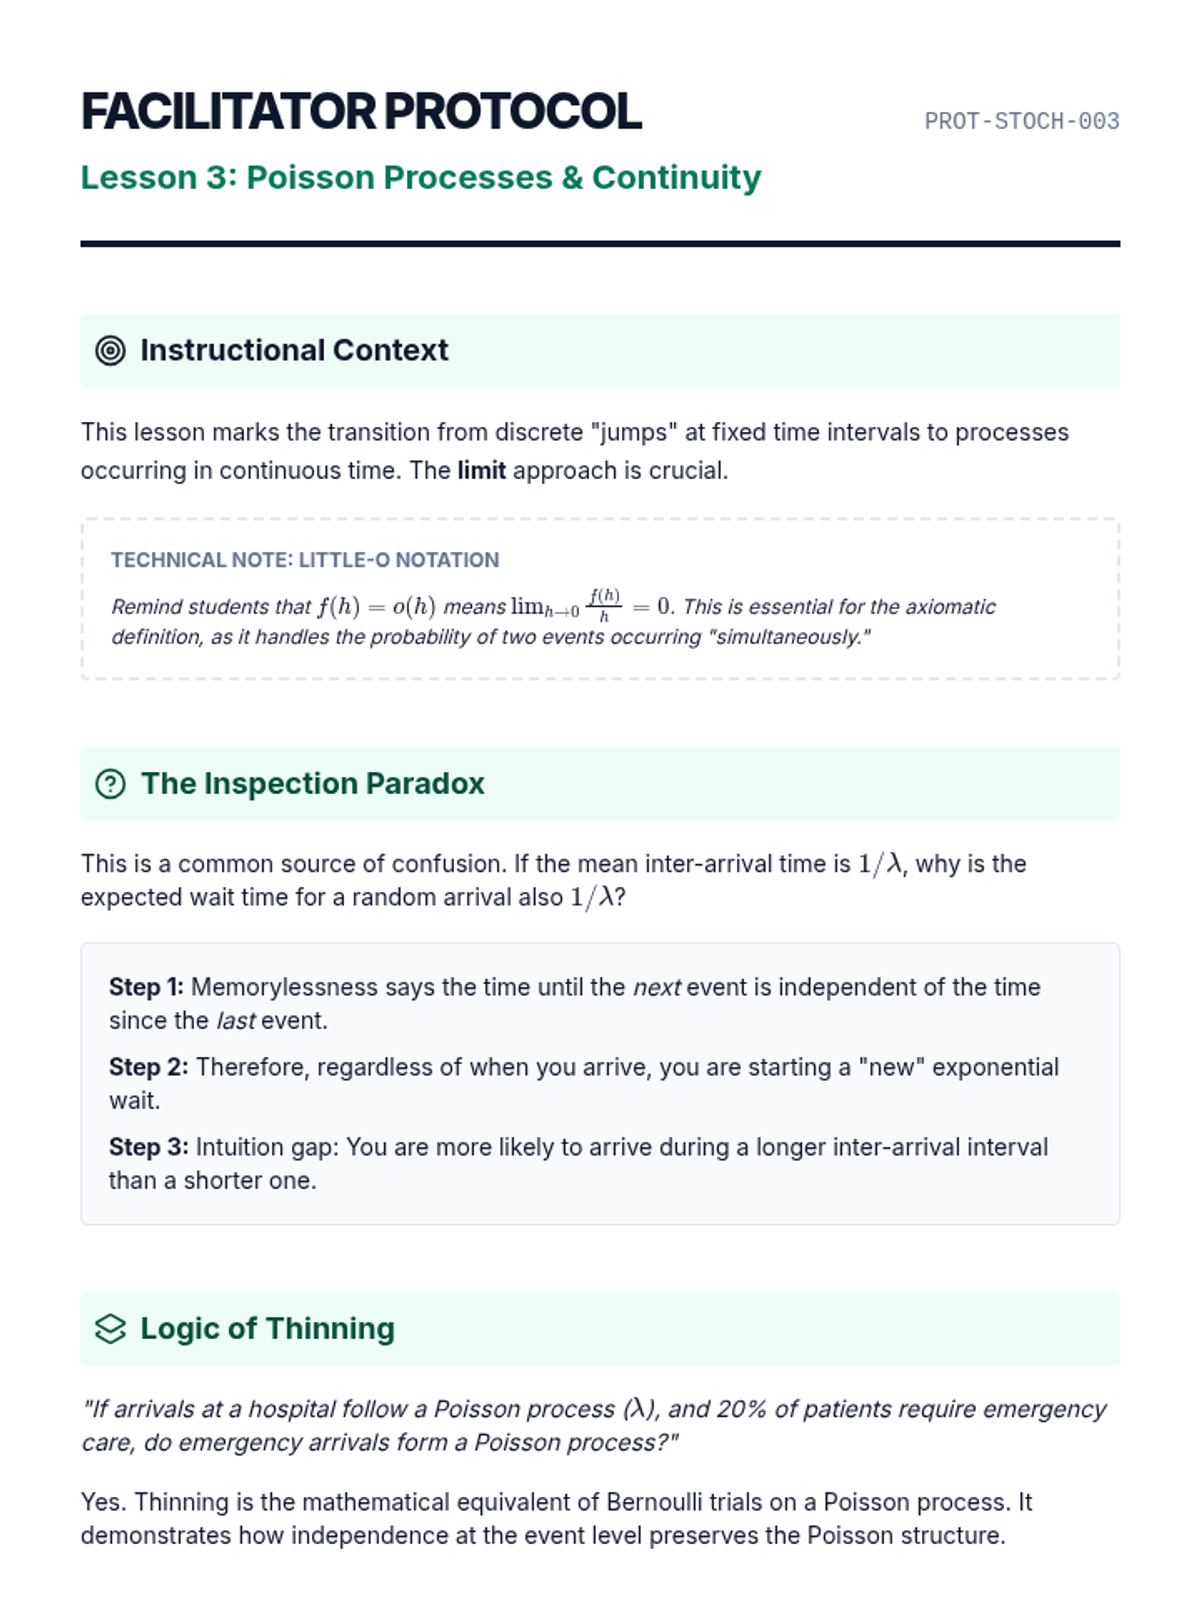
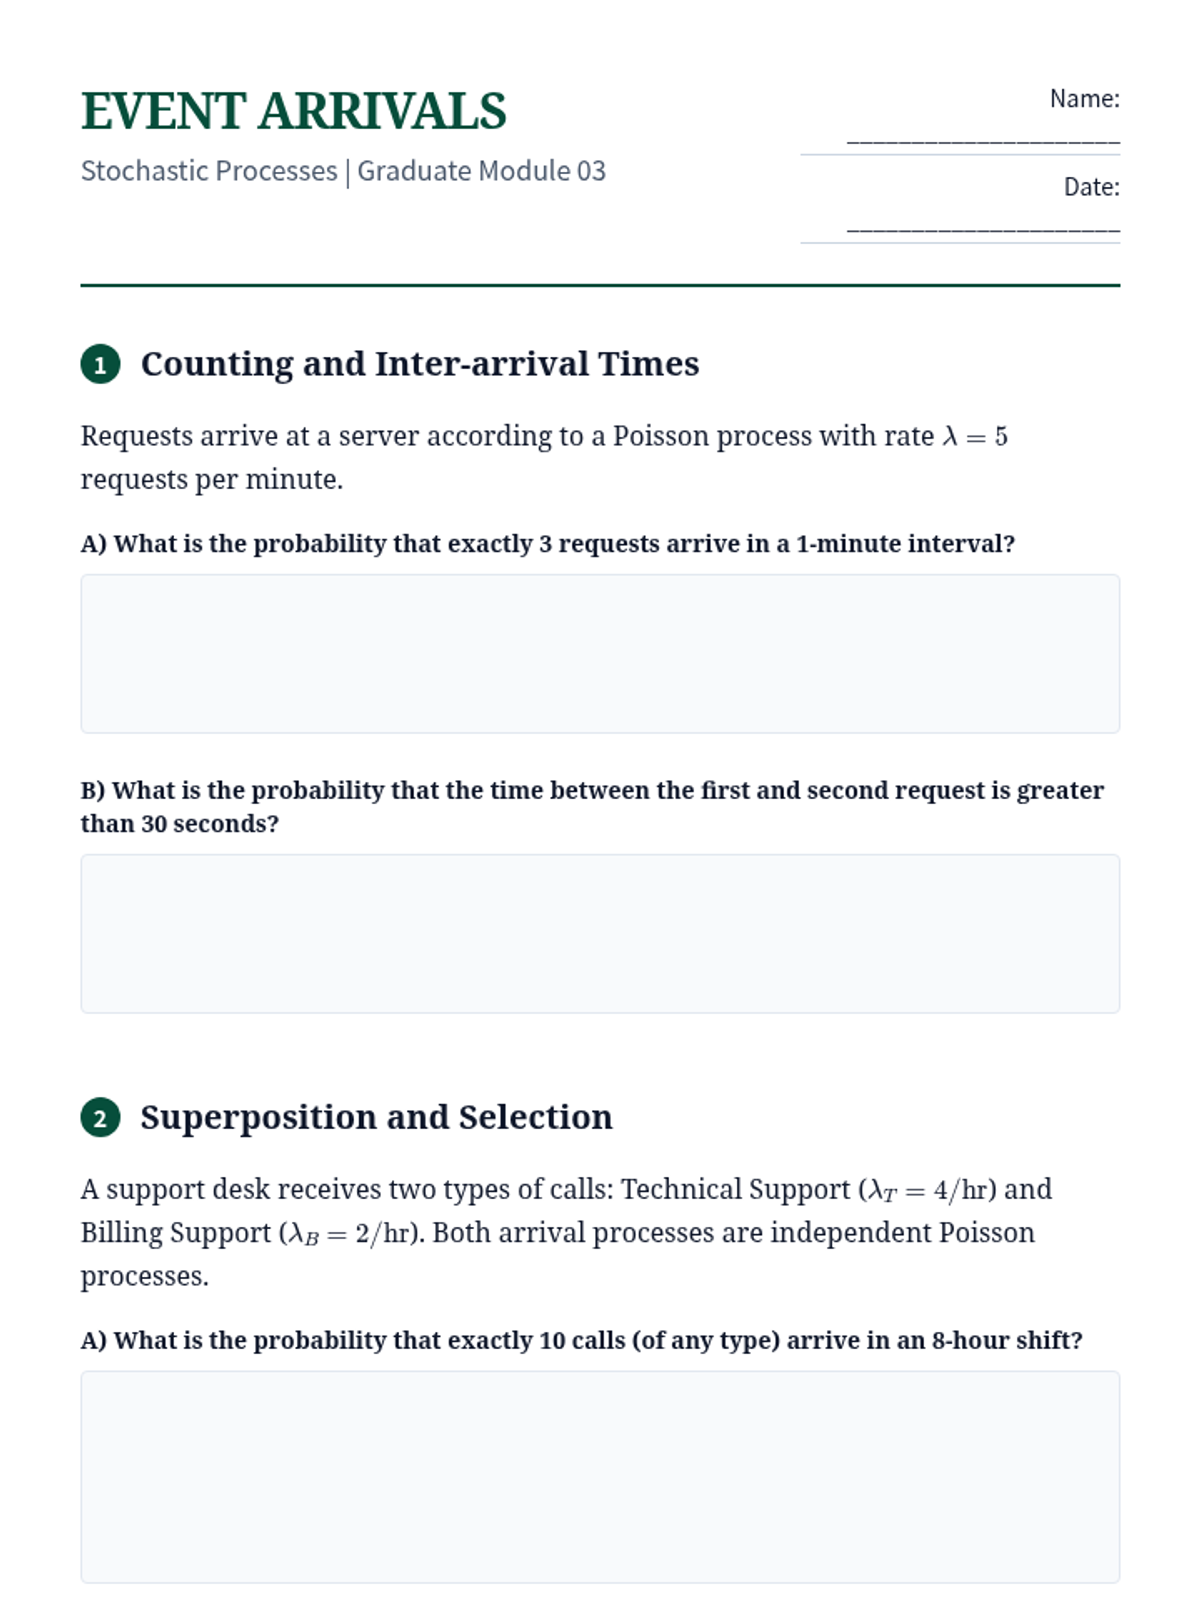
Investigation of the Poisson process, its relationship to the exponential distribution, and the implications of the memoryless property in continuous-time modeling.
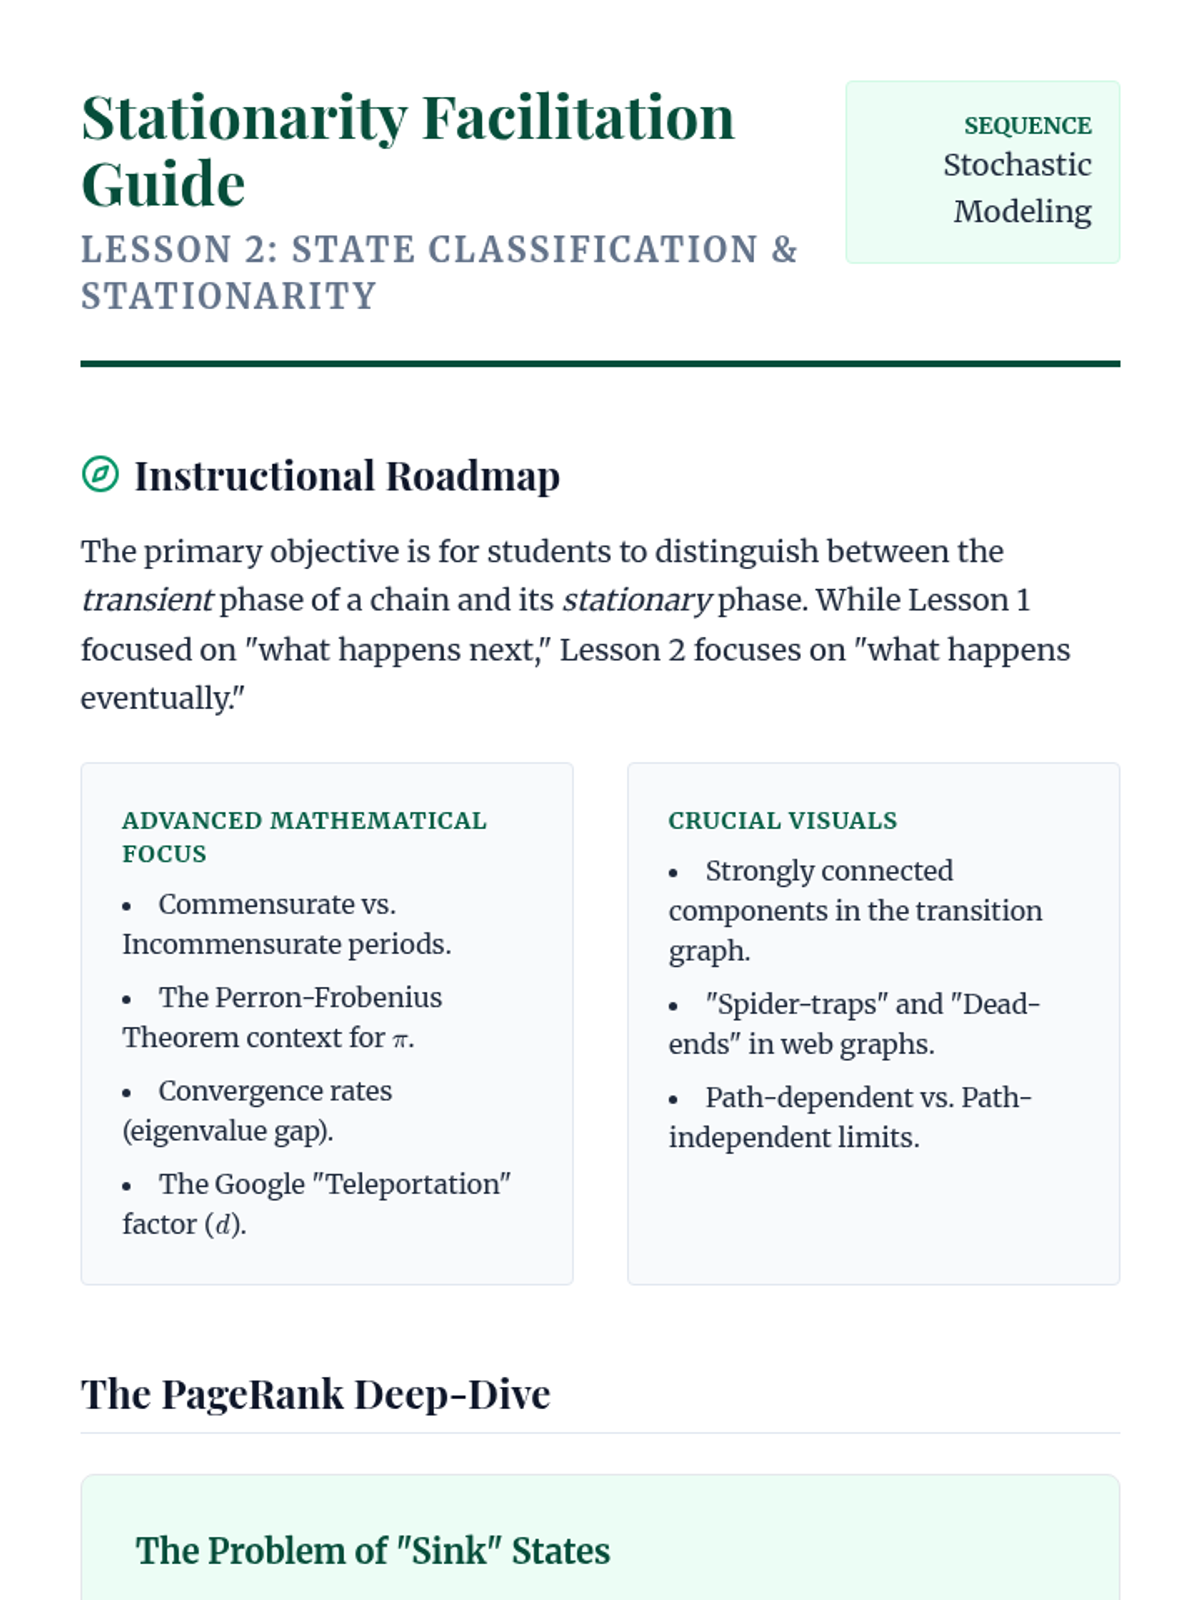
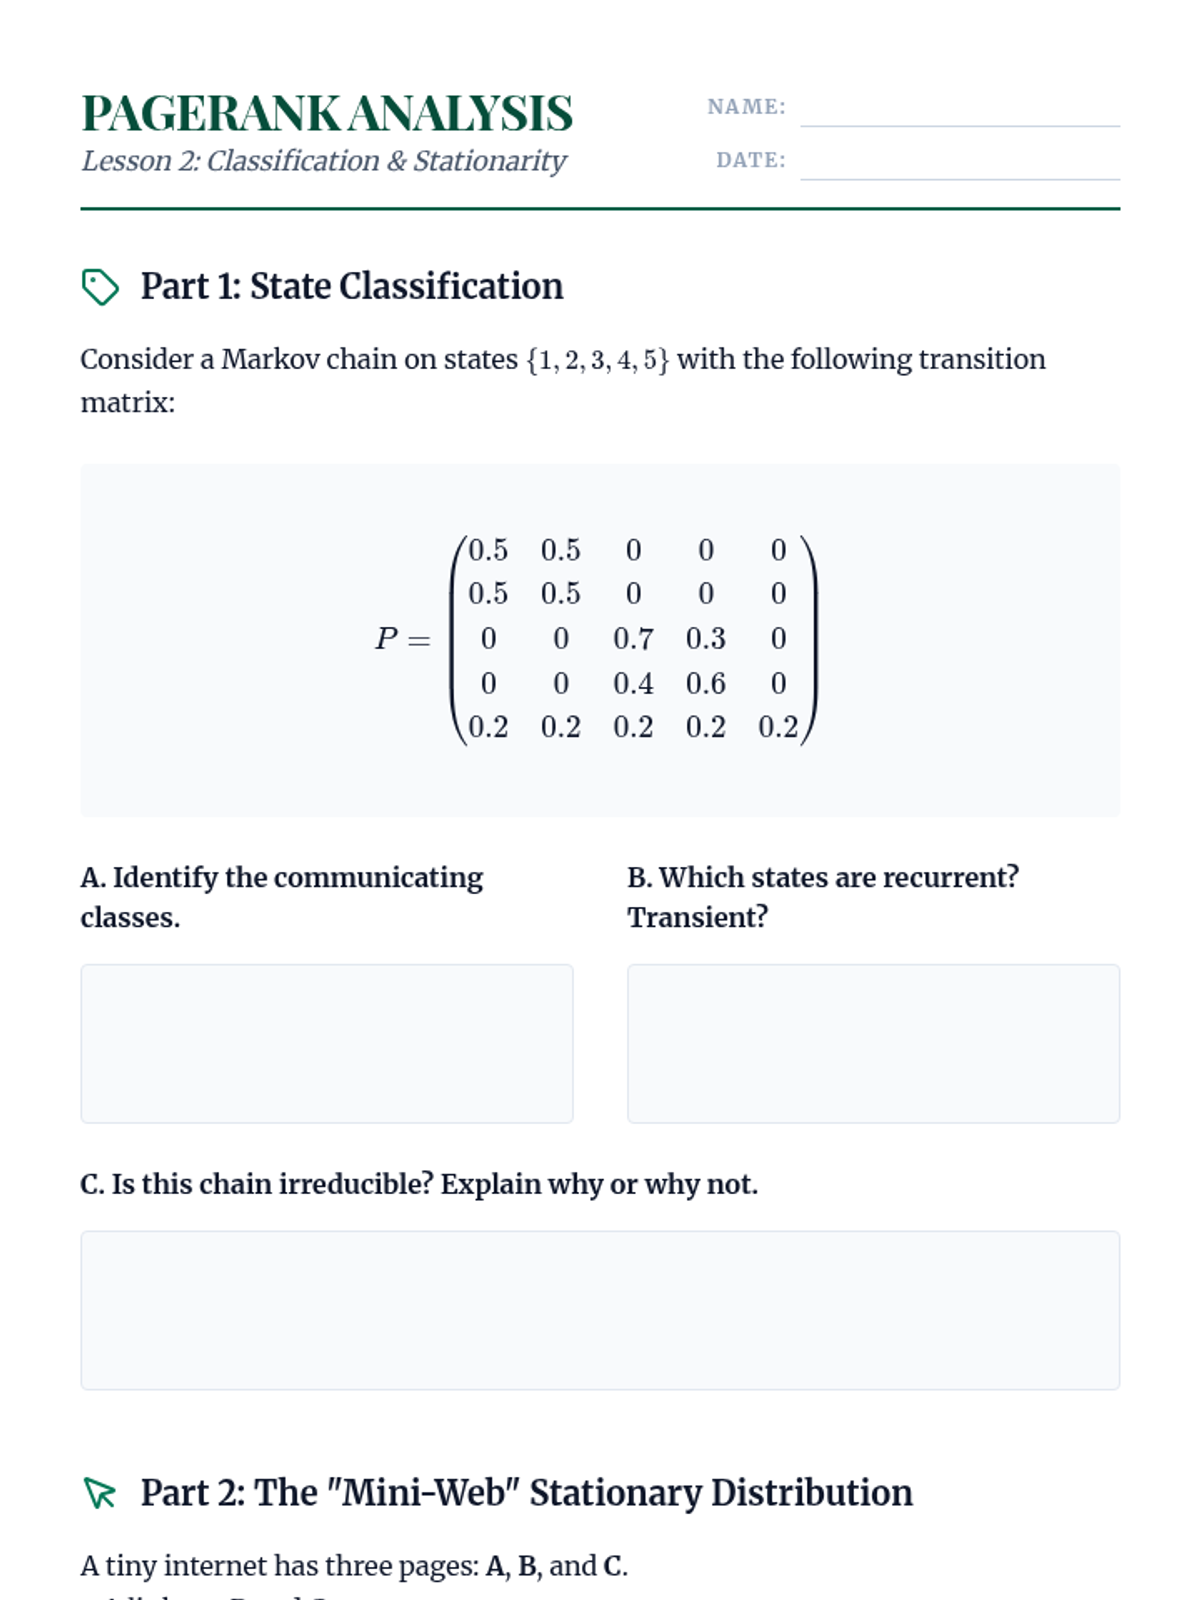
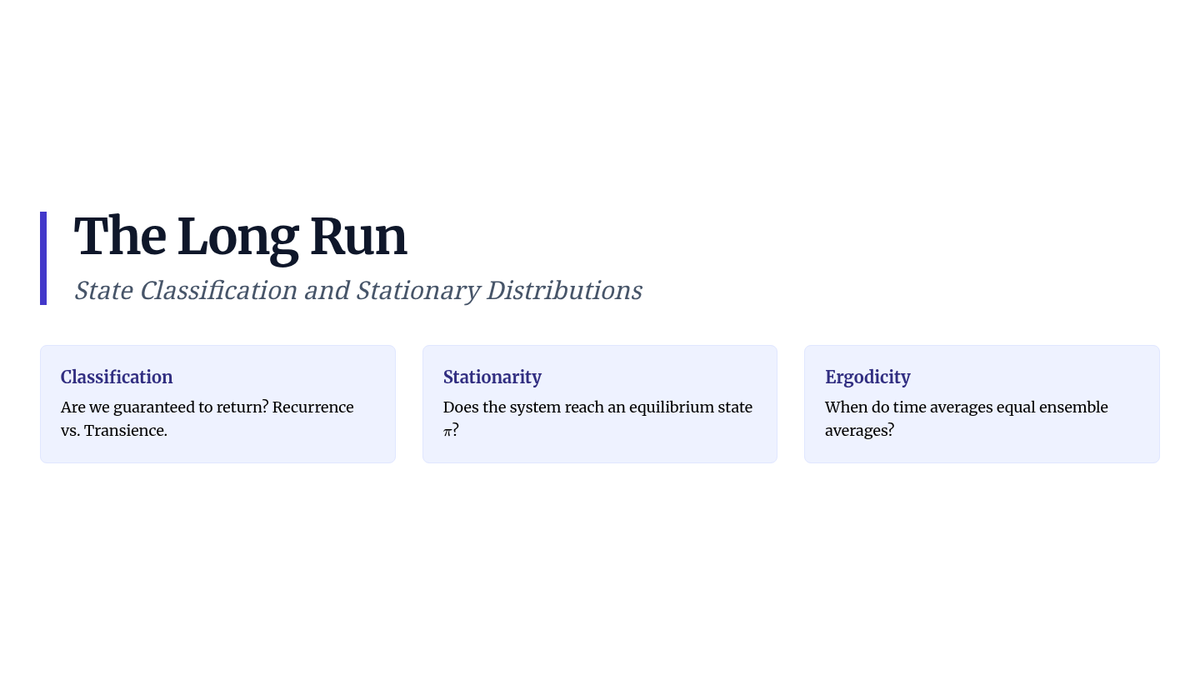
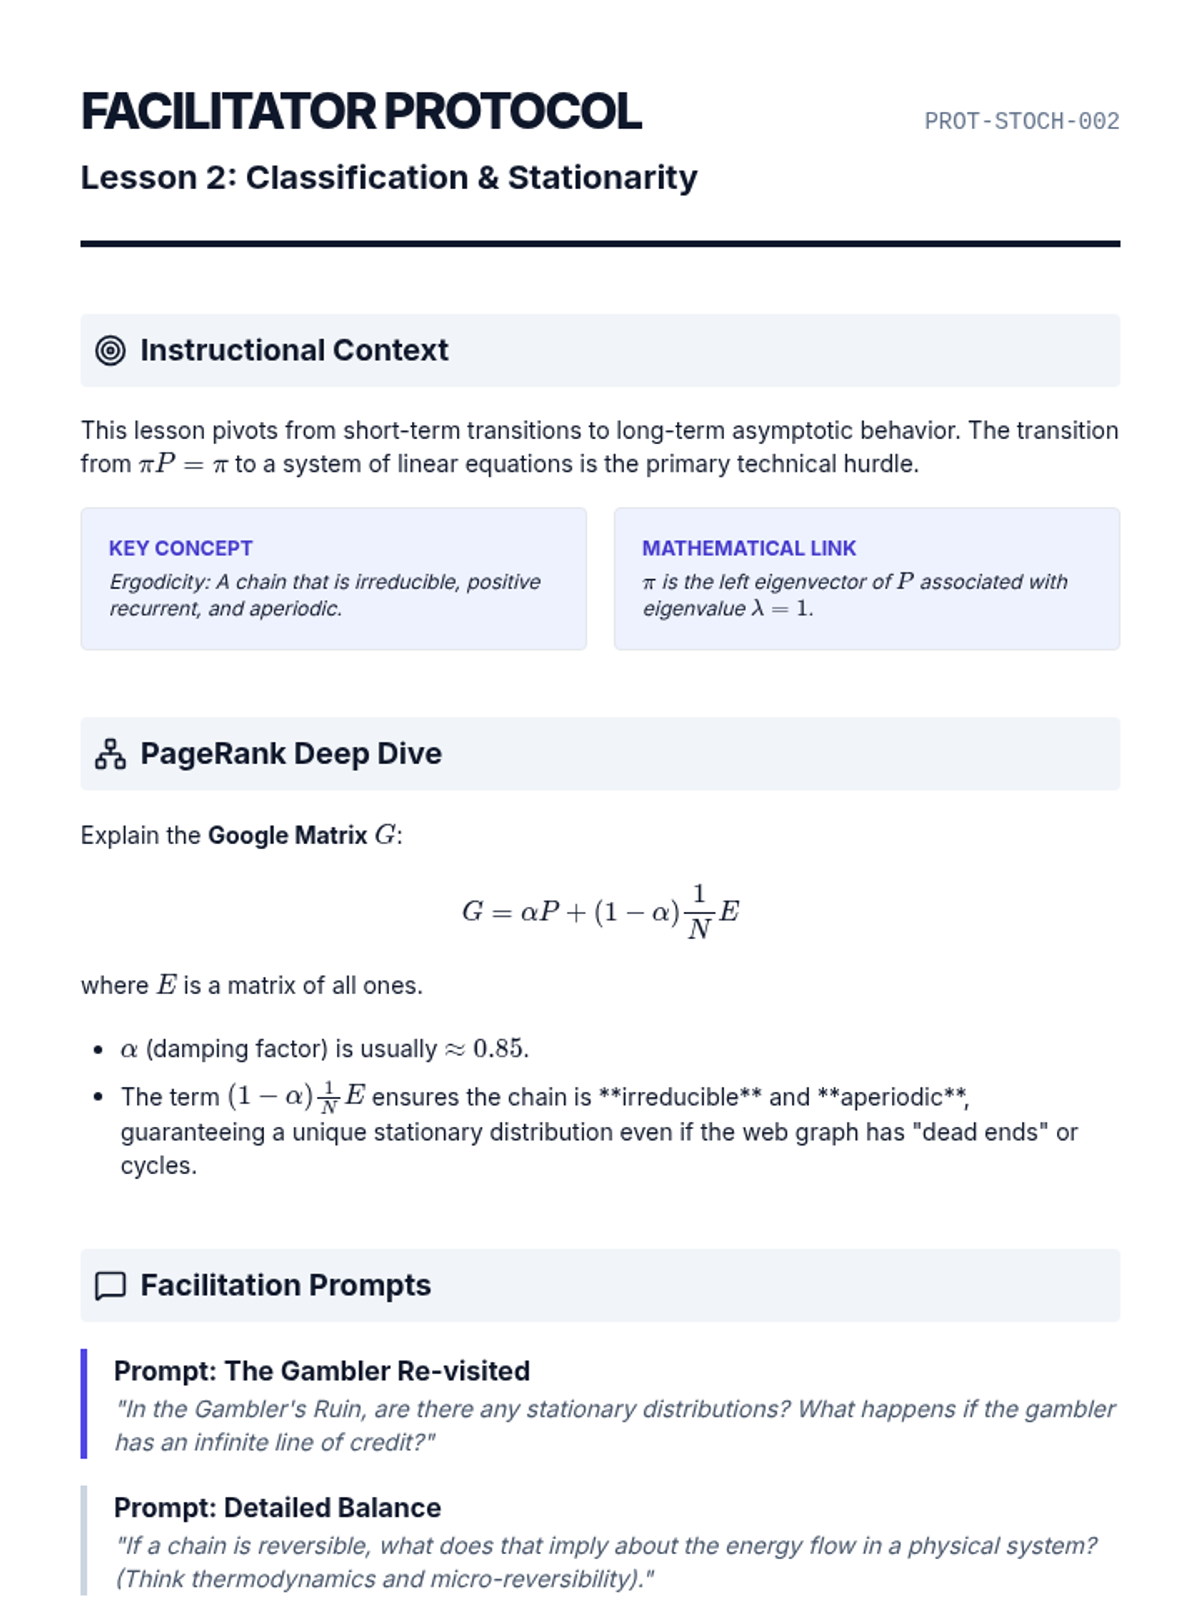
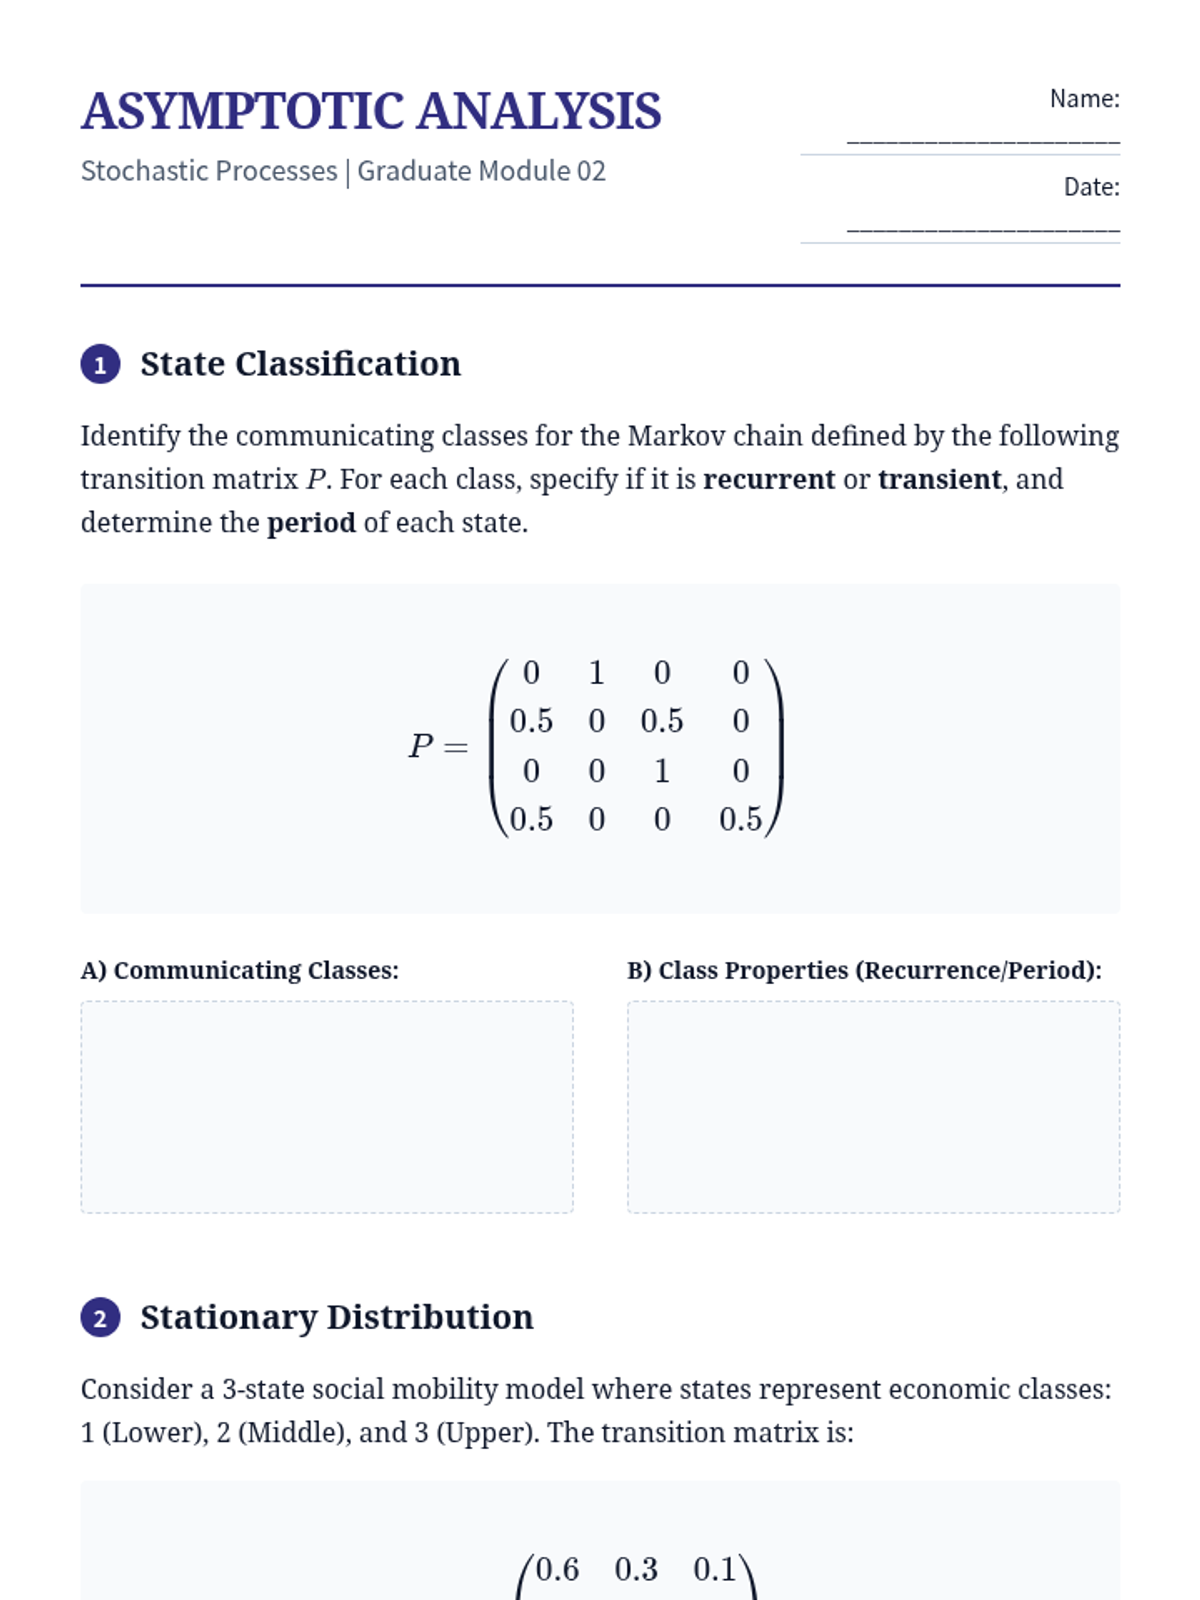
Analysis of the long-term behavior of Markov chains, focusing on state classification (recurrence, transience) and the computation of stationary distributions.
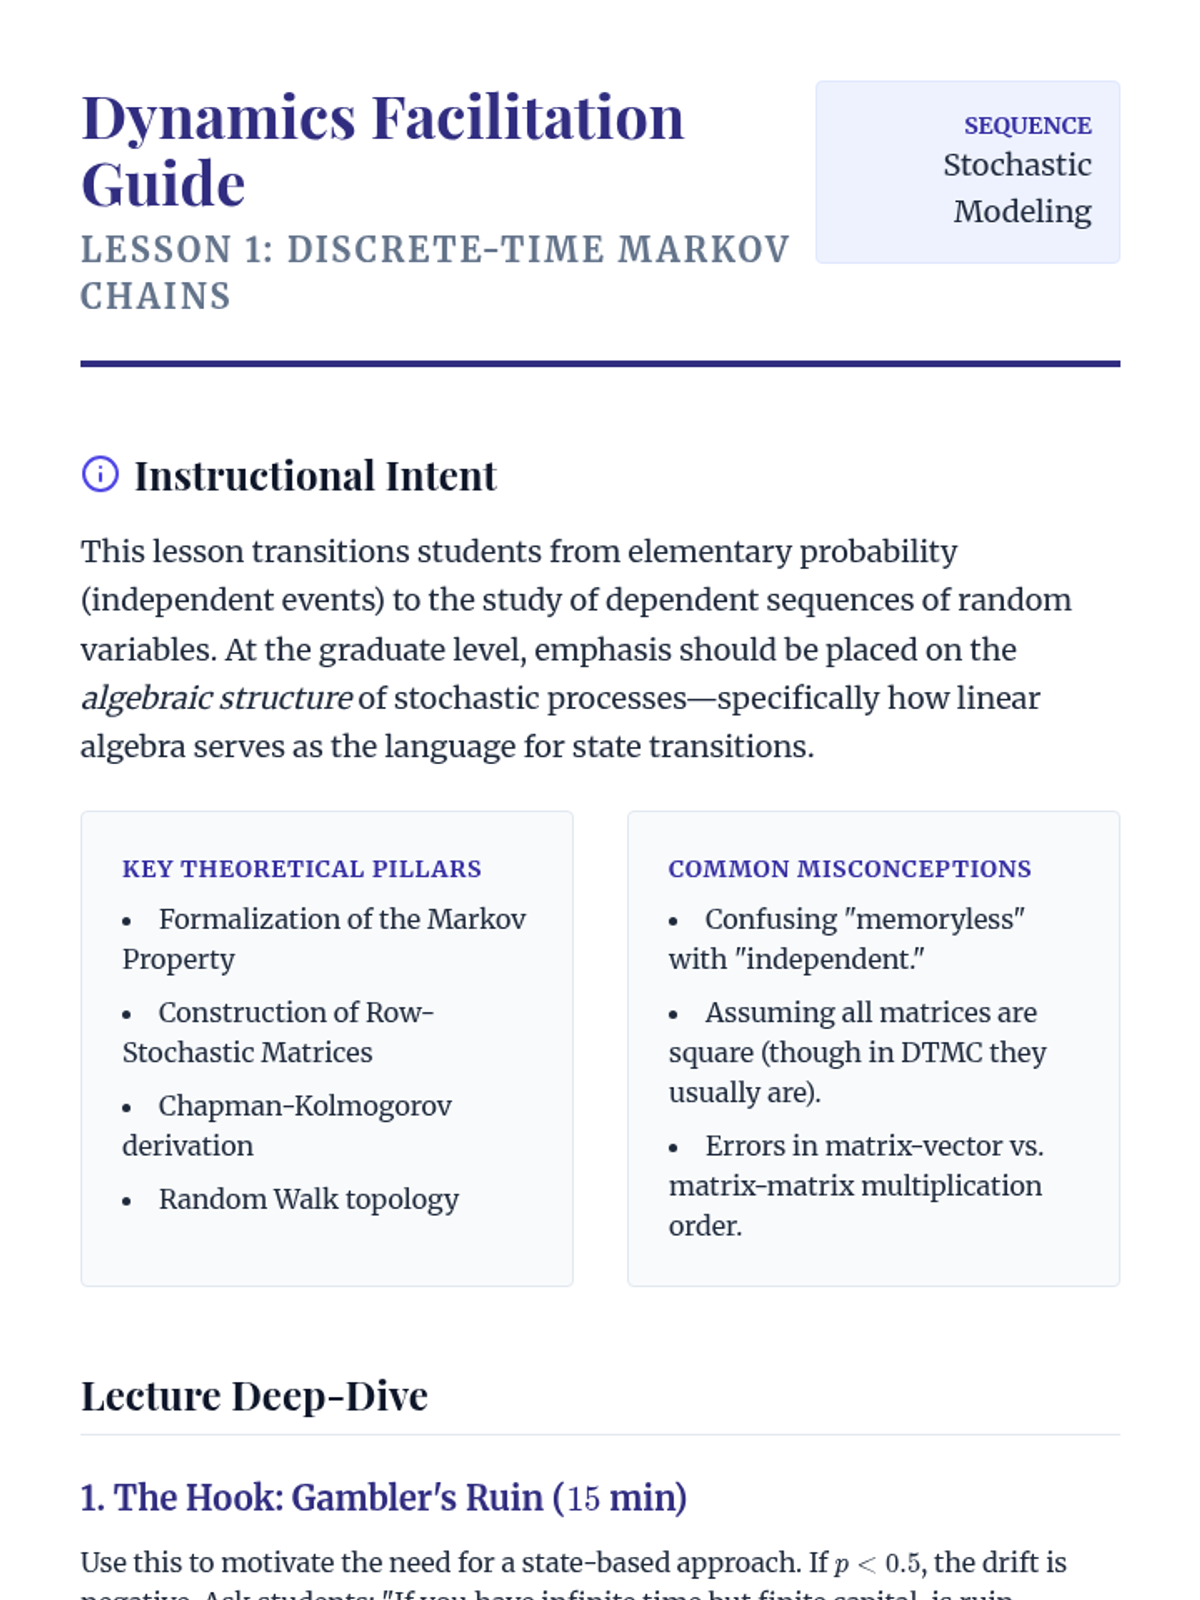
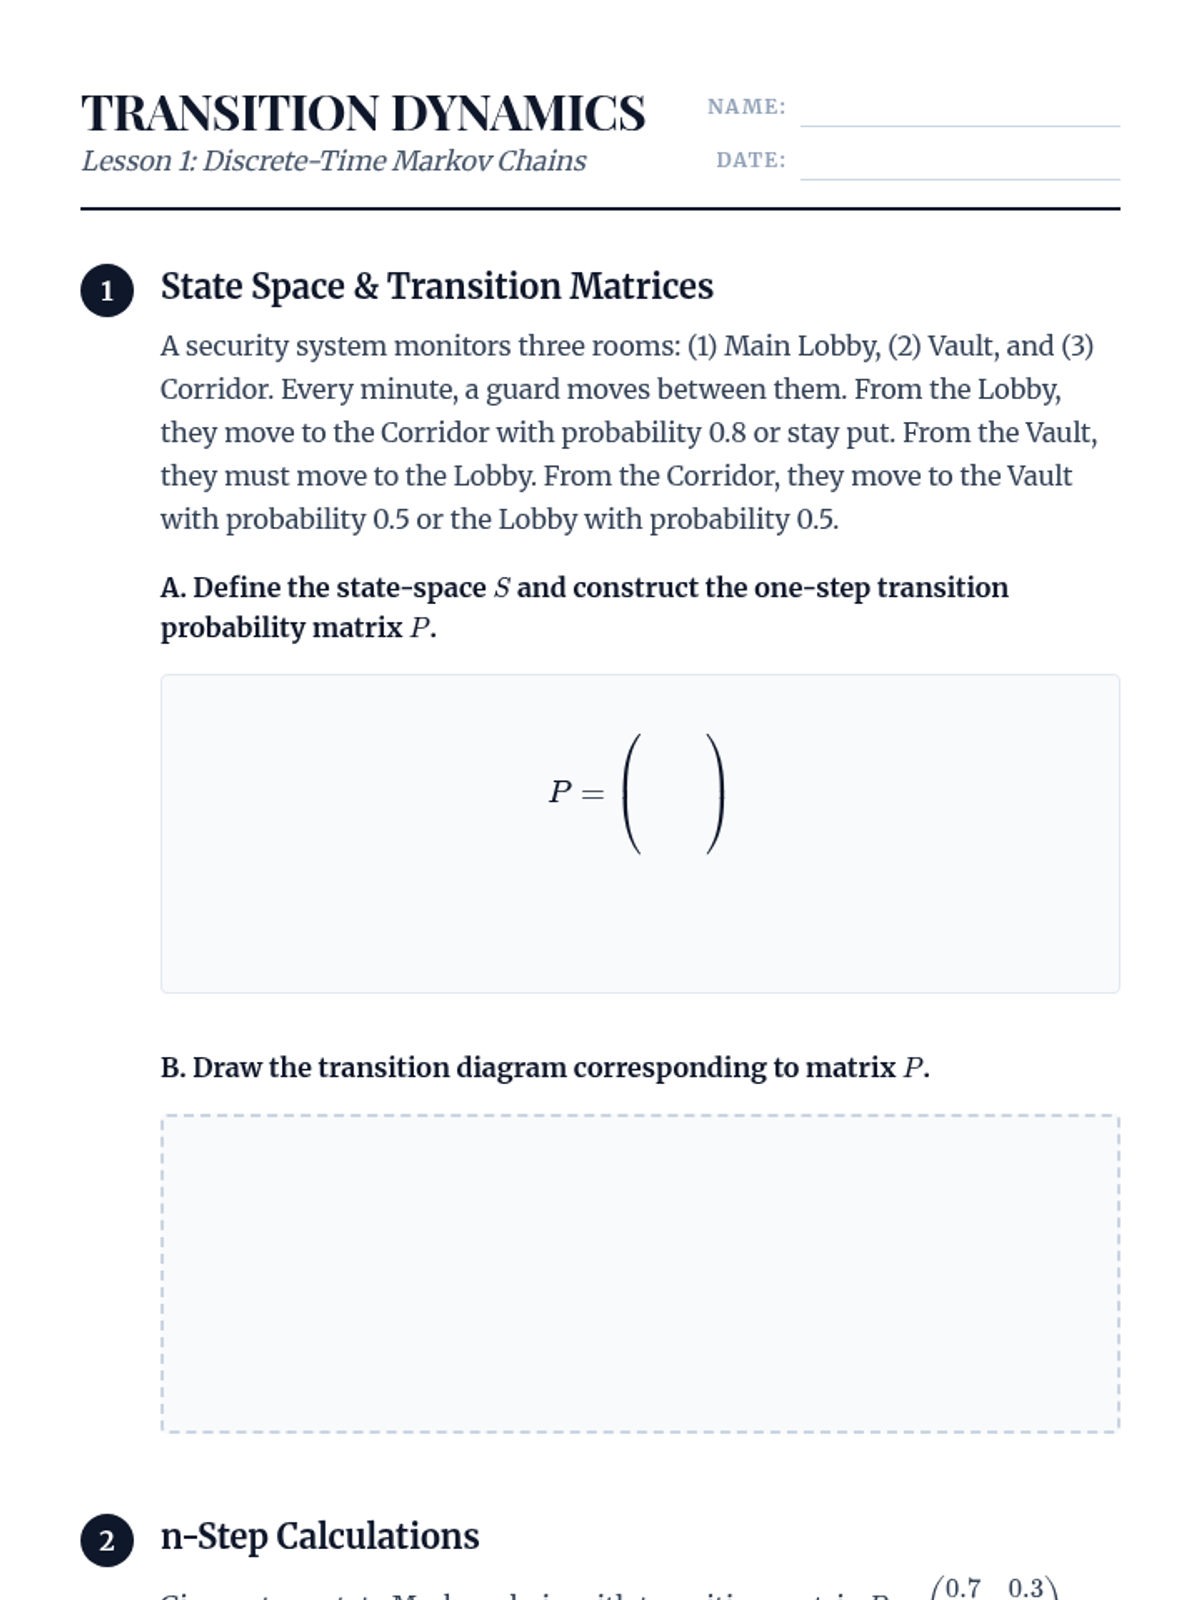
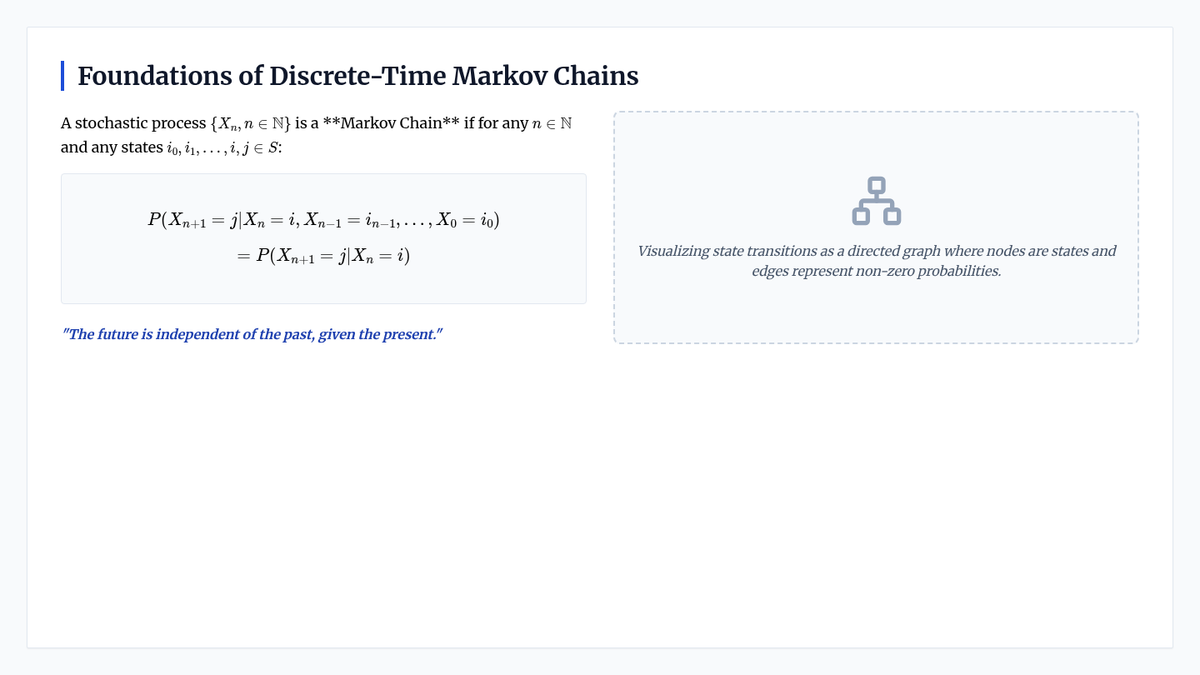
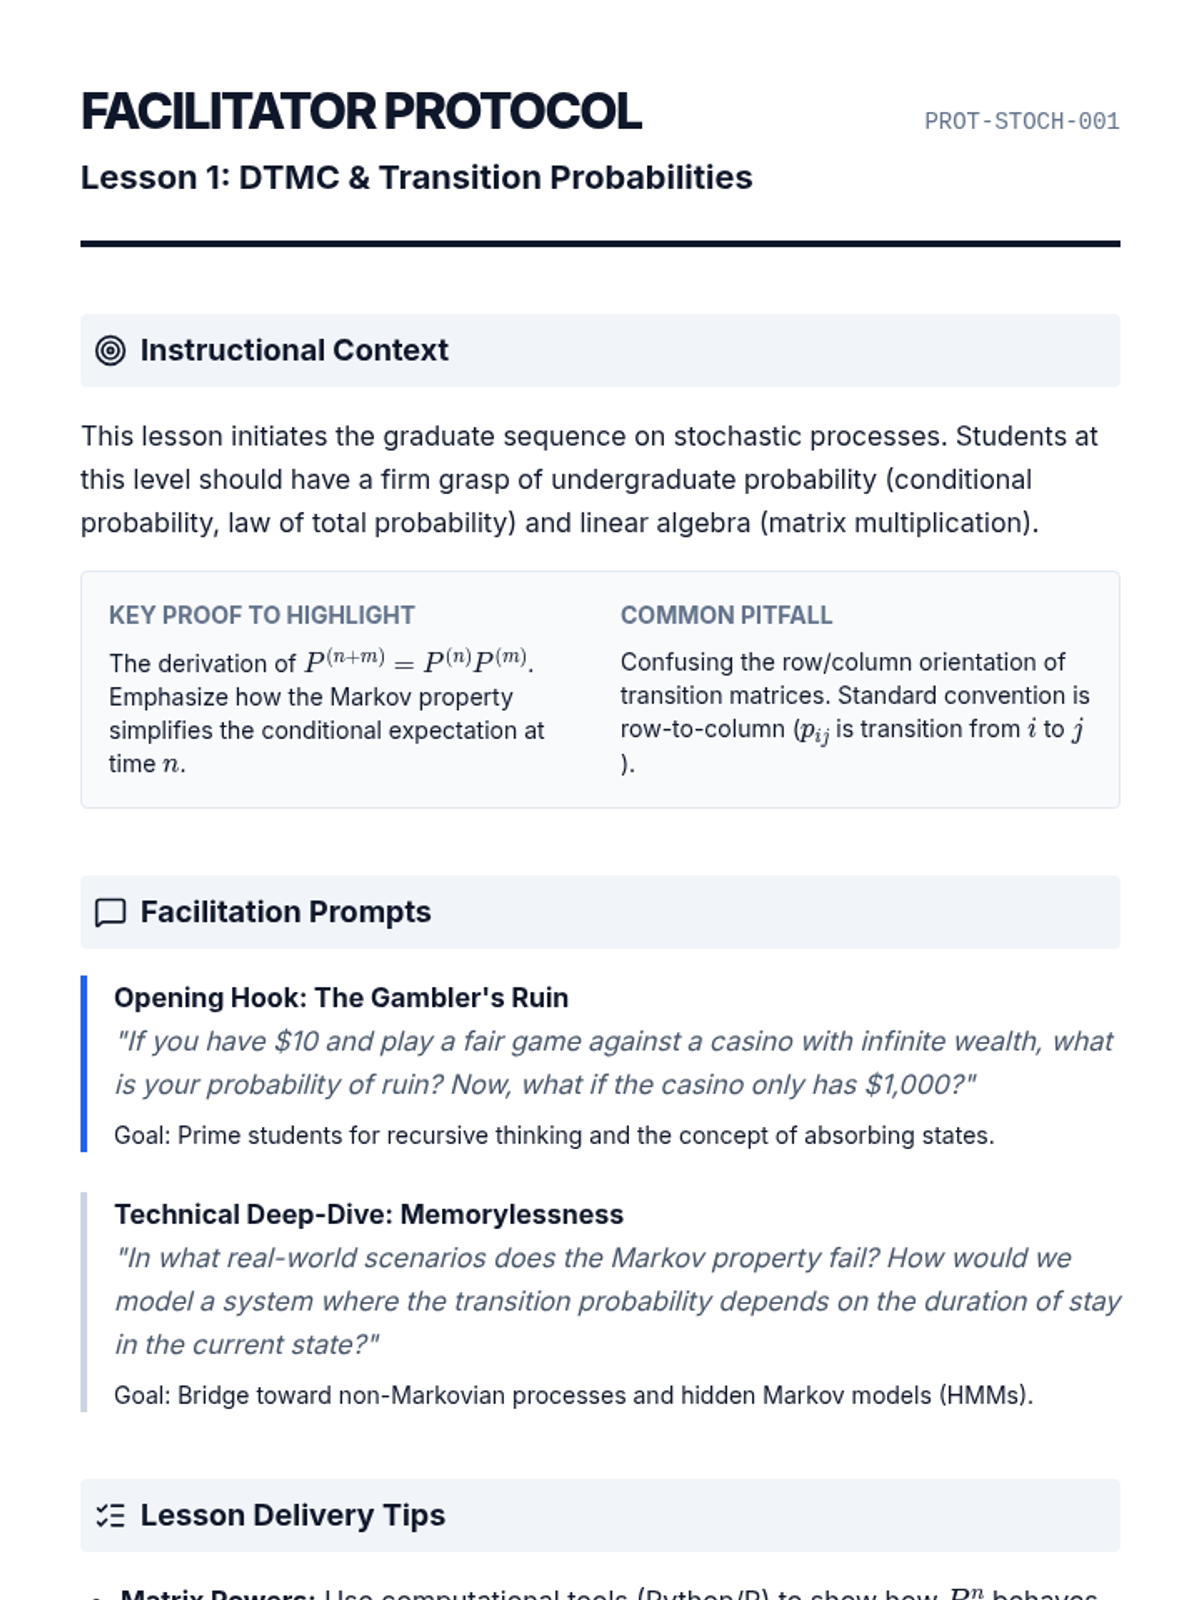
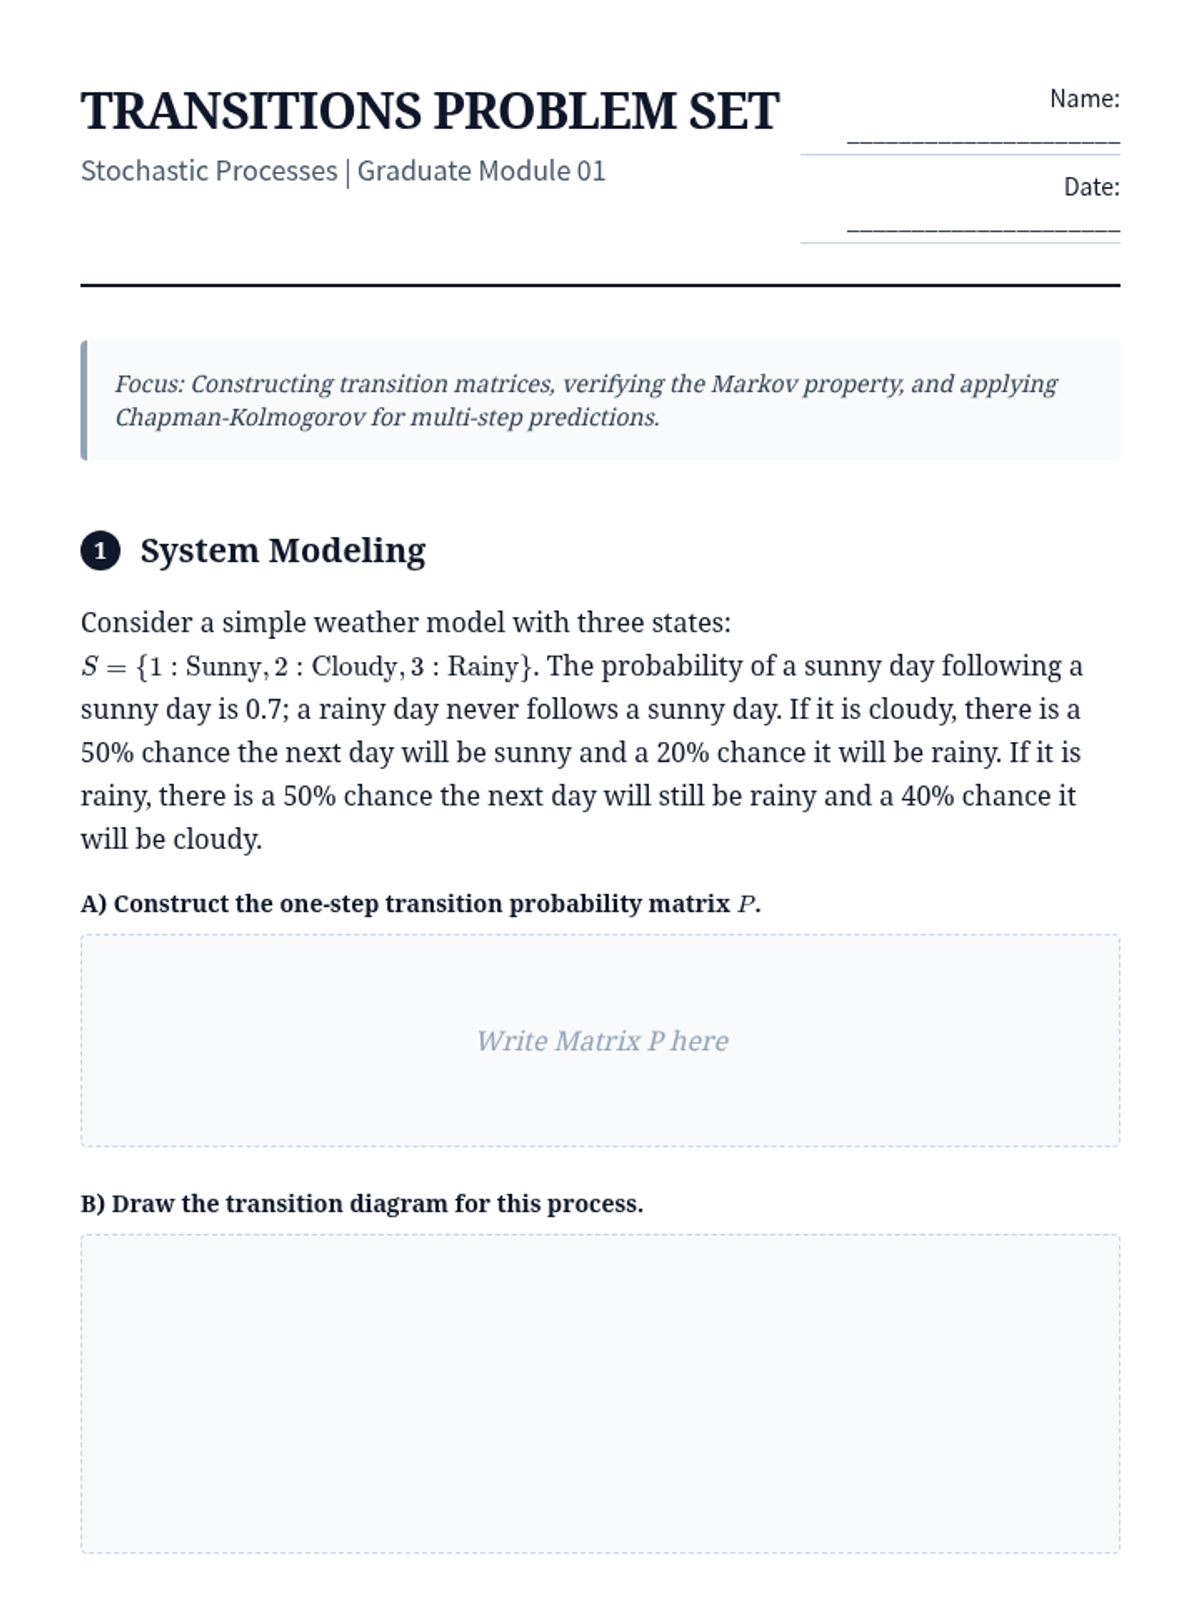
Foundational concepts of Markov processes, the Markov property, and the mathematical framework of transition matrices and Chapman-Kolmogorov equations.
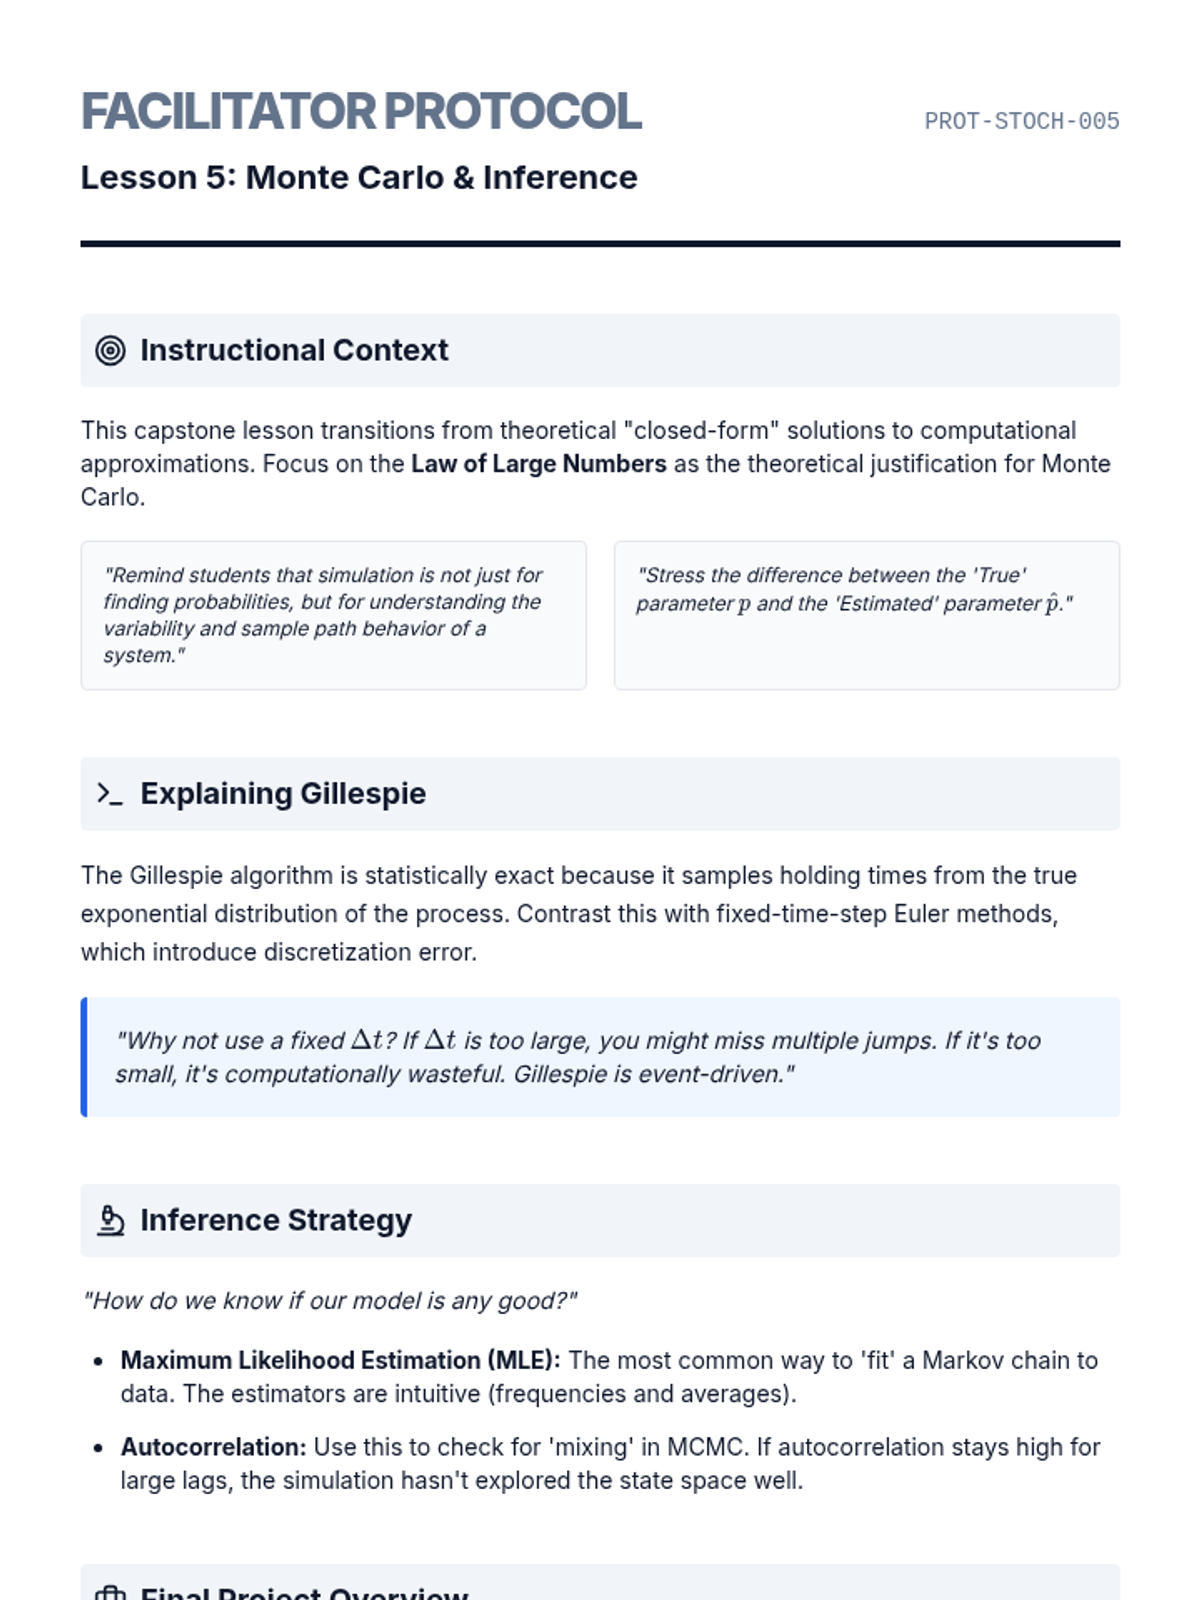
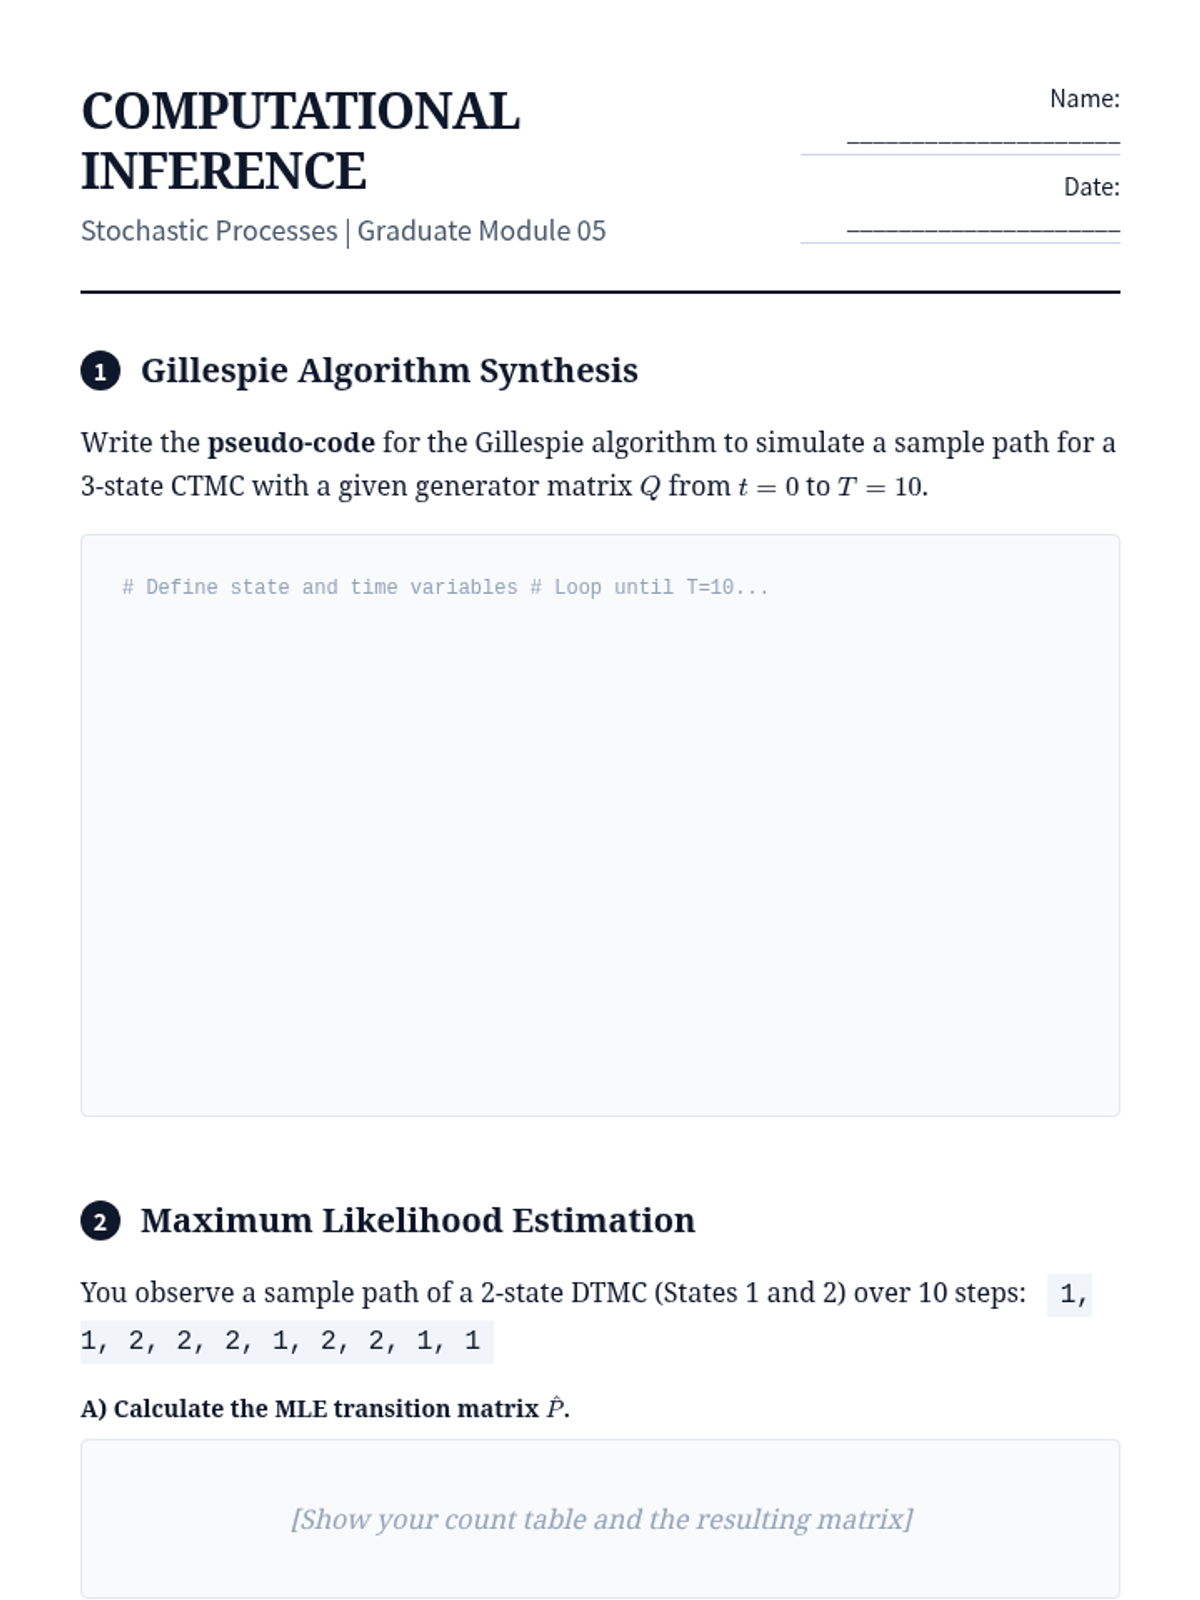
Computational synthesis of stochastic theory using Monte Carlo simulations, the Gillespie algorithm, and statistical inference of transition parameters.
Defining continuous-time Markov chains through infinitesimal generator matrices and deriving the Kolmogorov Forward and Backward equations.
Transitioning to continuous time with Poisson processes, exploring axiomatic definitions, the memoryless property, and inter-arrival time distributions.
Analyzing the long-term behavior of Markov chains through state classification, ergodicity, and stationary distribution calculations using linear algebra.
Introduction to discrete-time Markov chains, transition probability matrices, and the proof and application of Chapman-Kolmogorov equations.
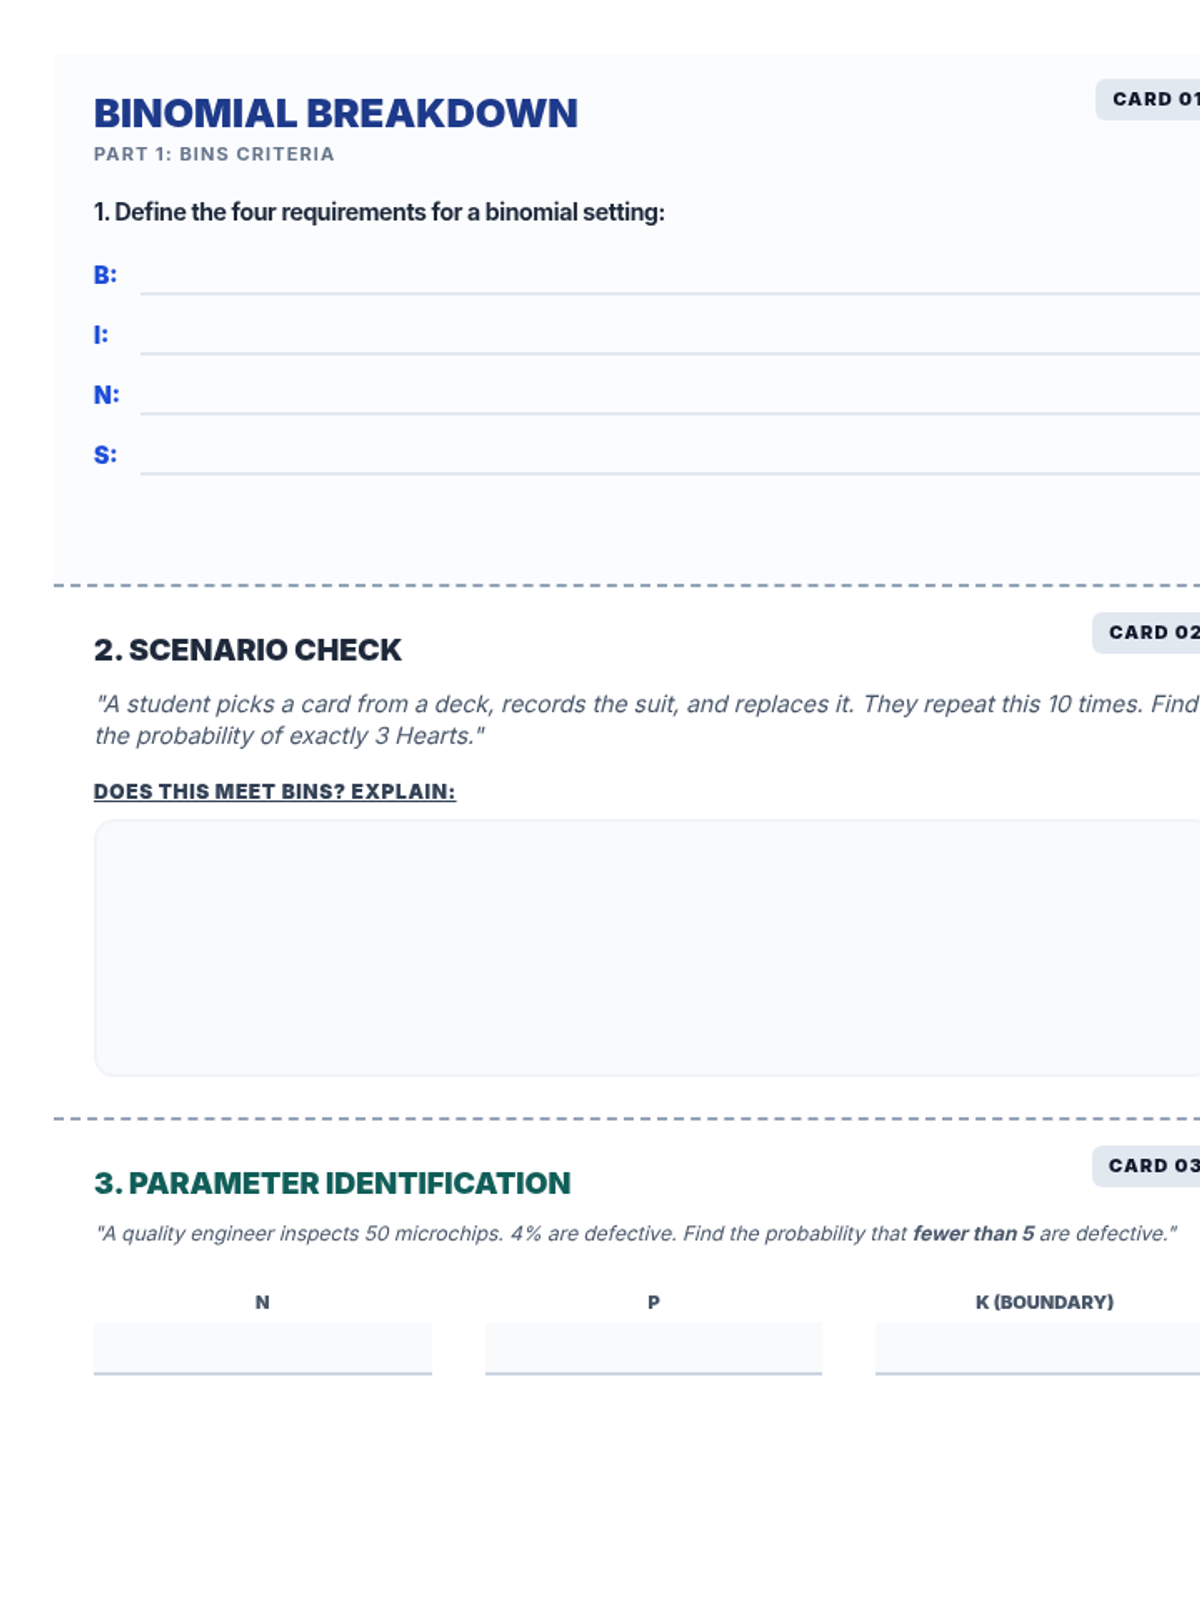
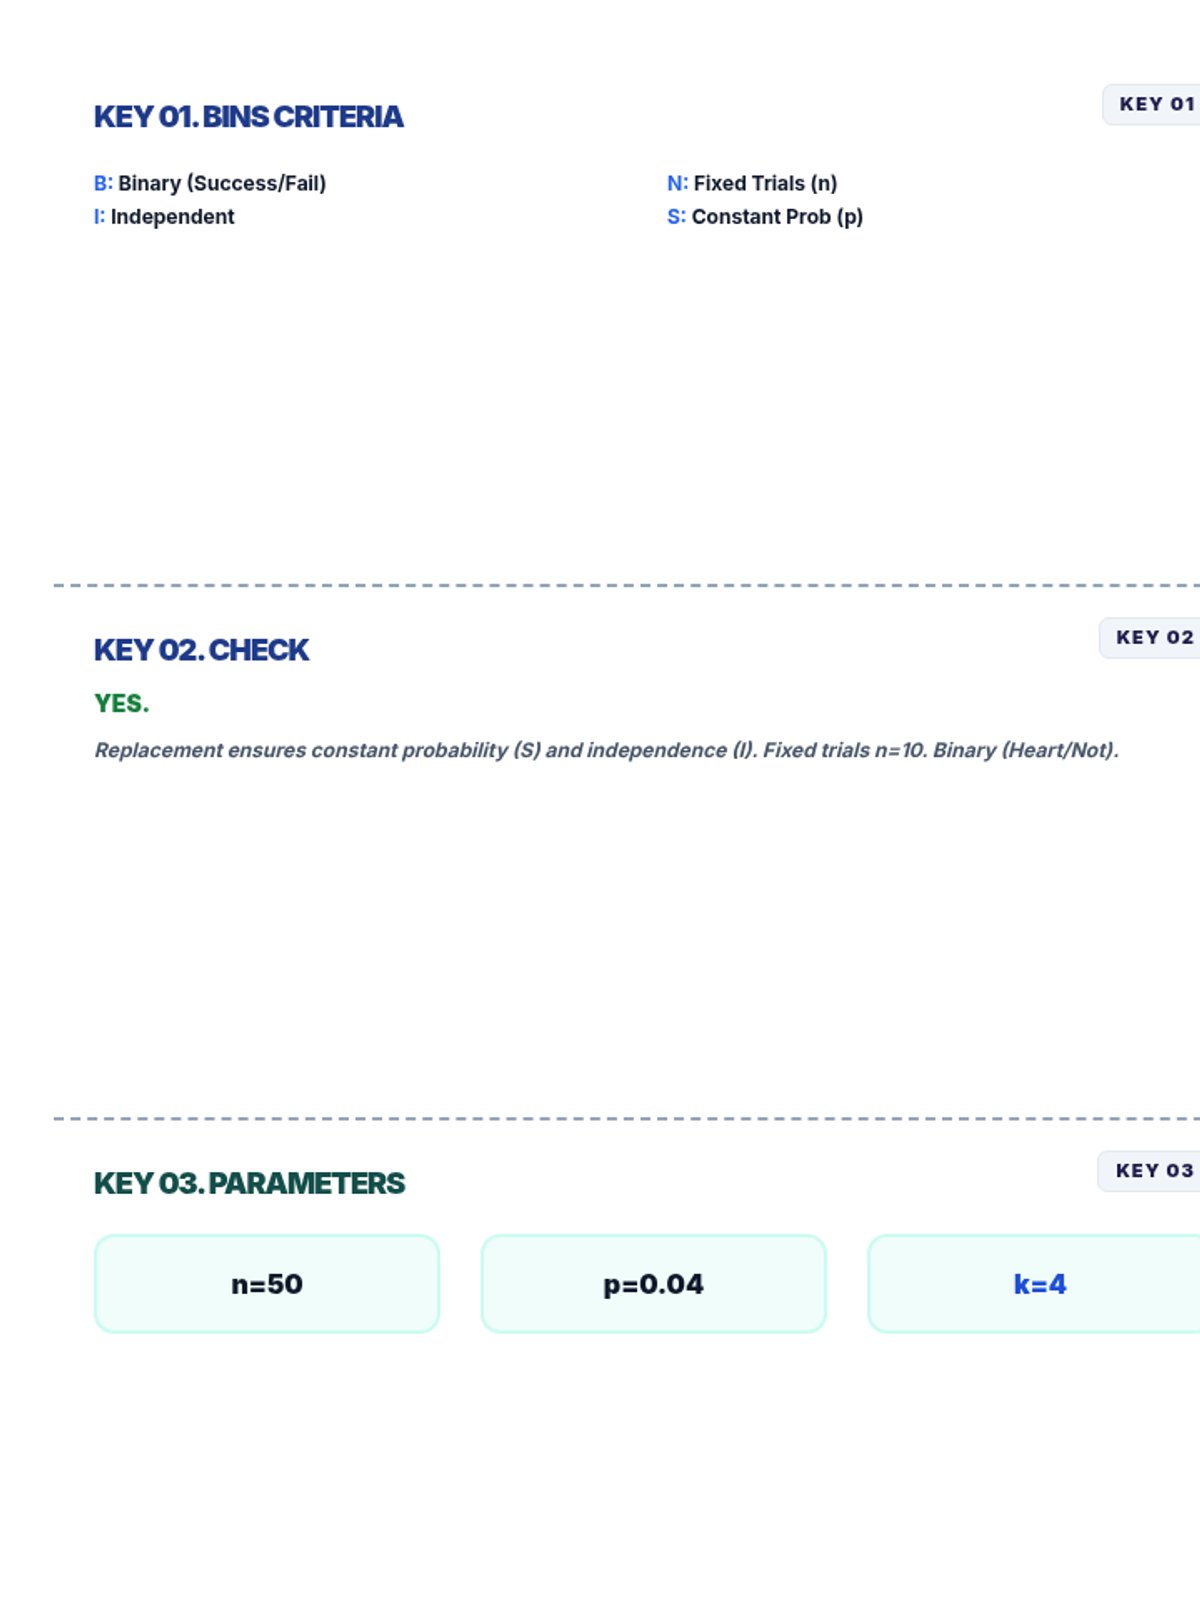
A focused lesson on the binomial distribution, covering the BINS criteria, identifying parameters, and calculating probabilities using digital spreadsheet tools.
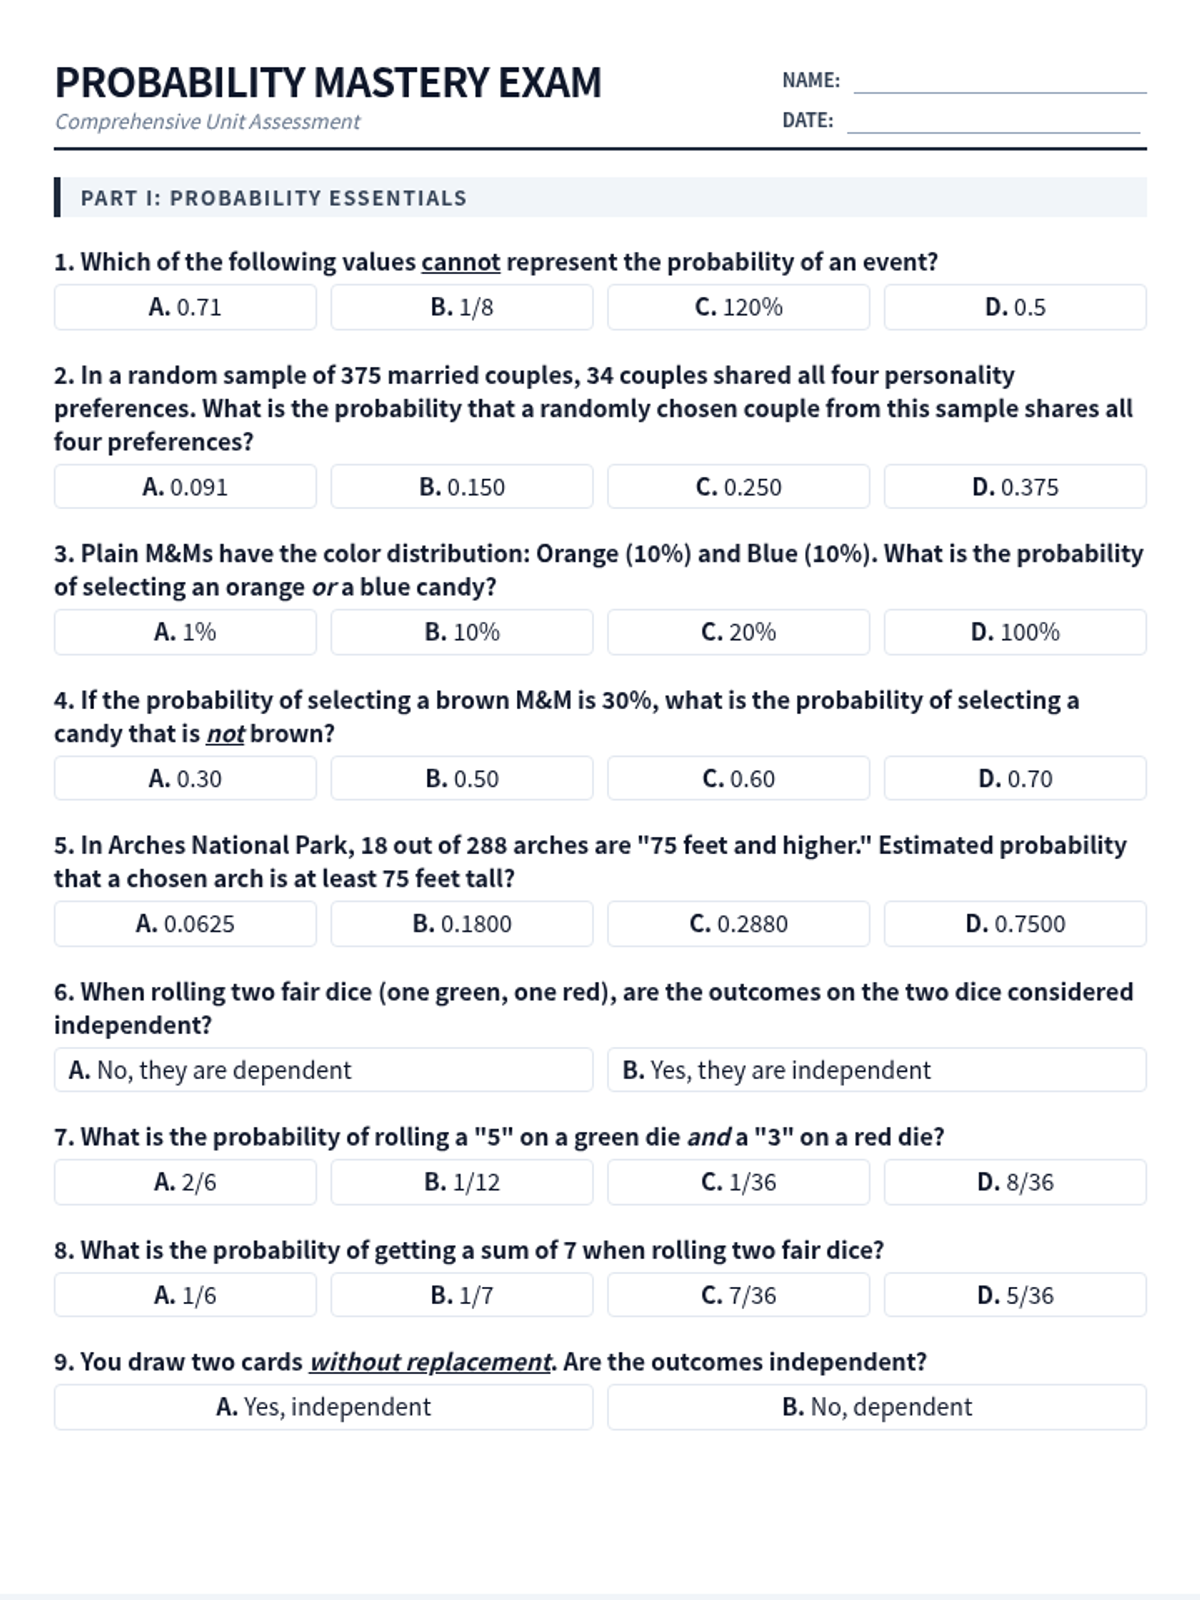
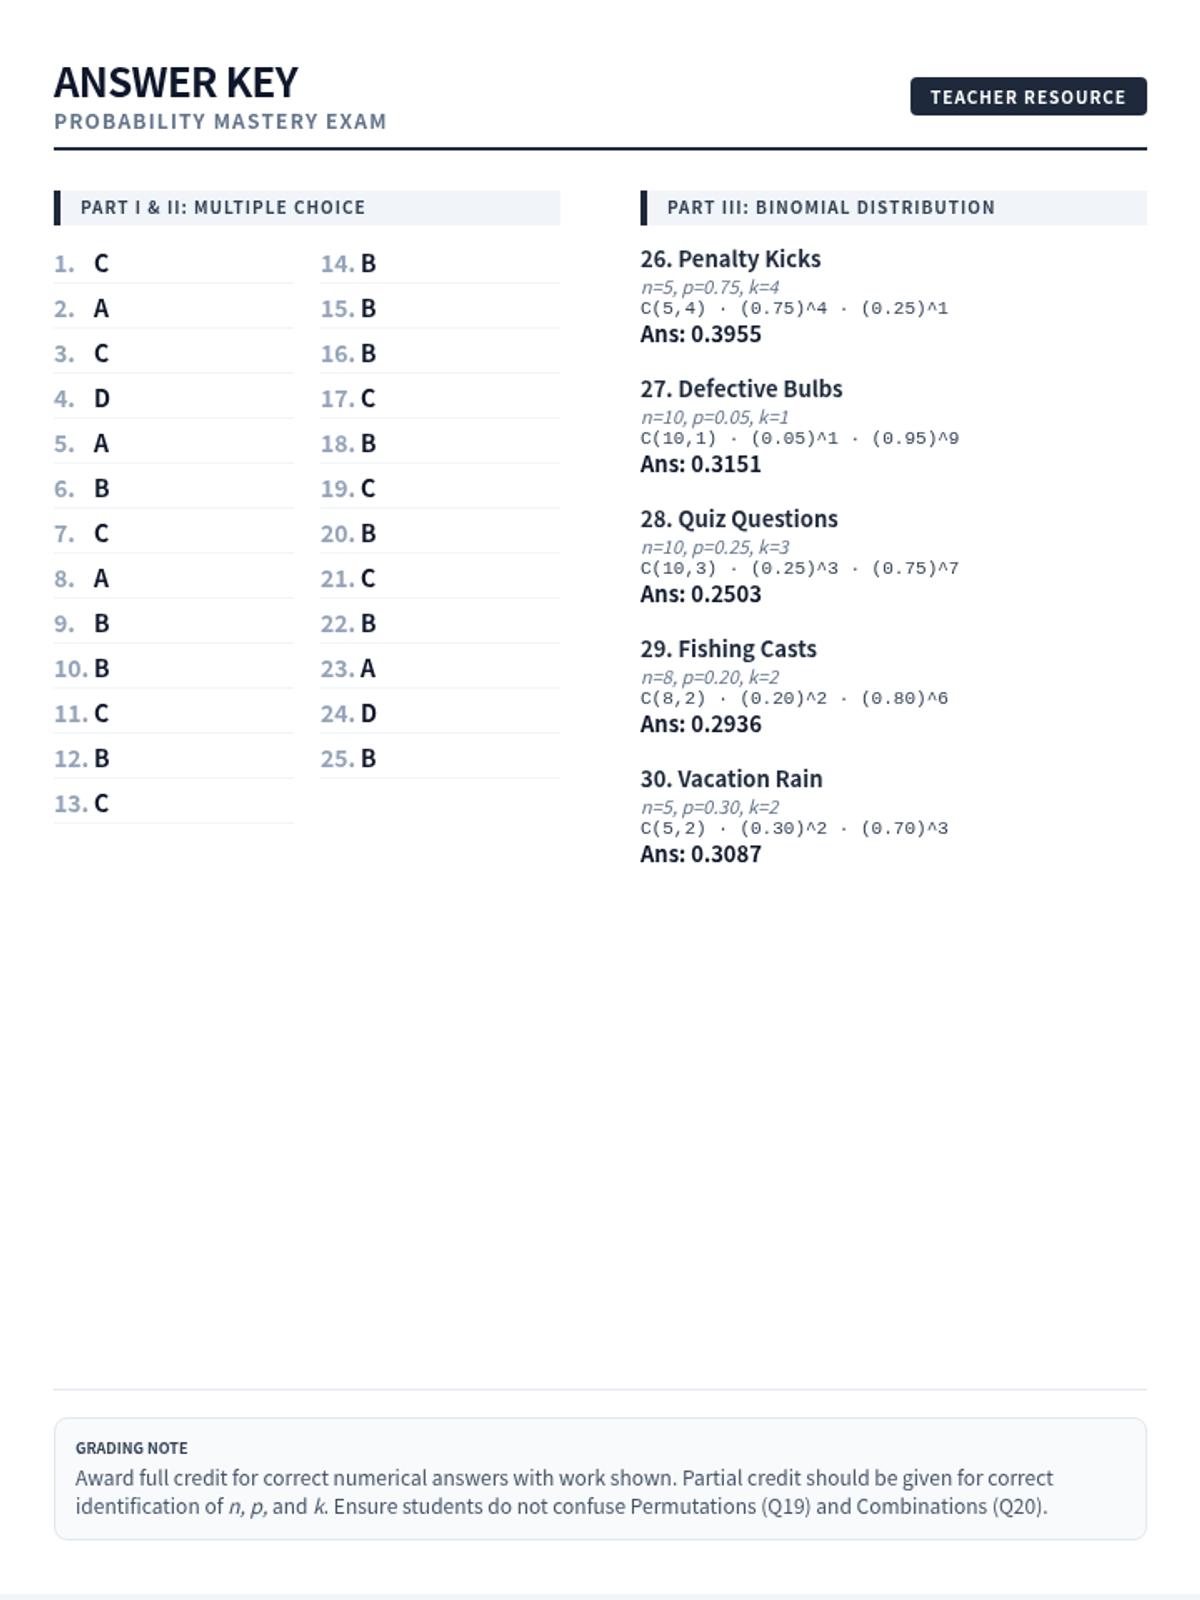
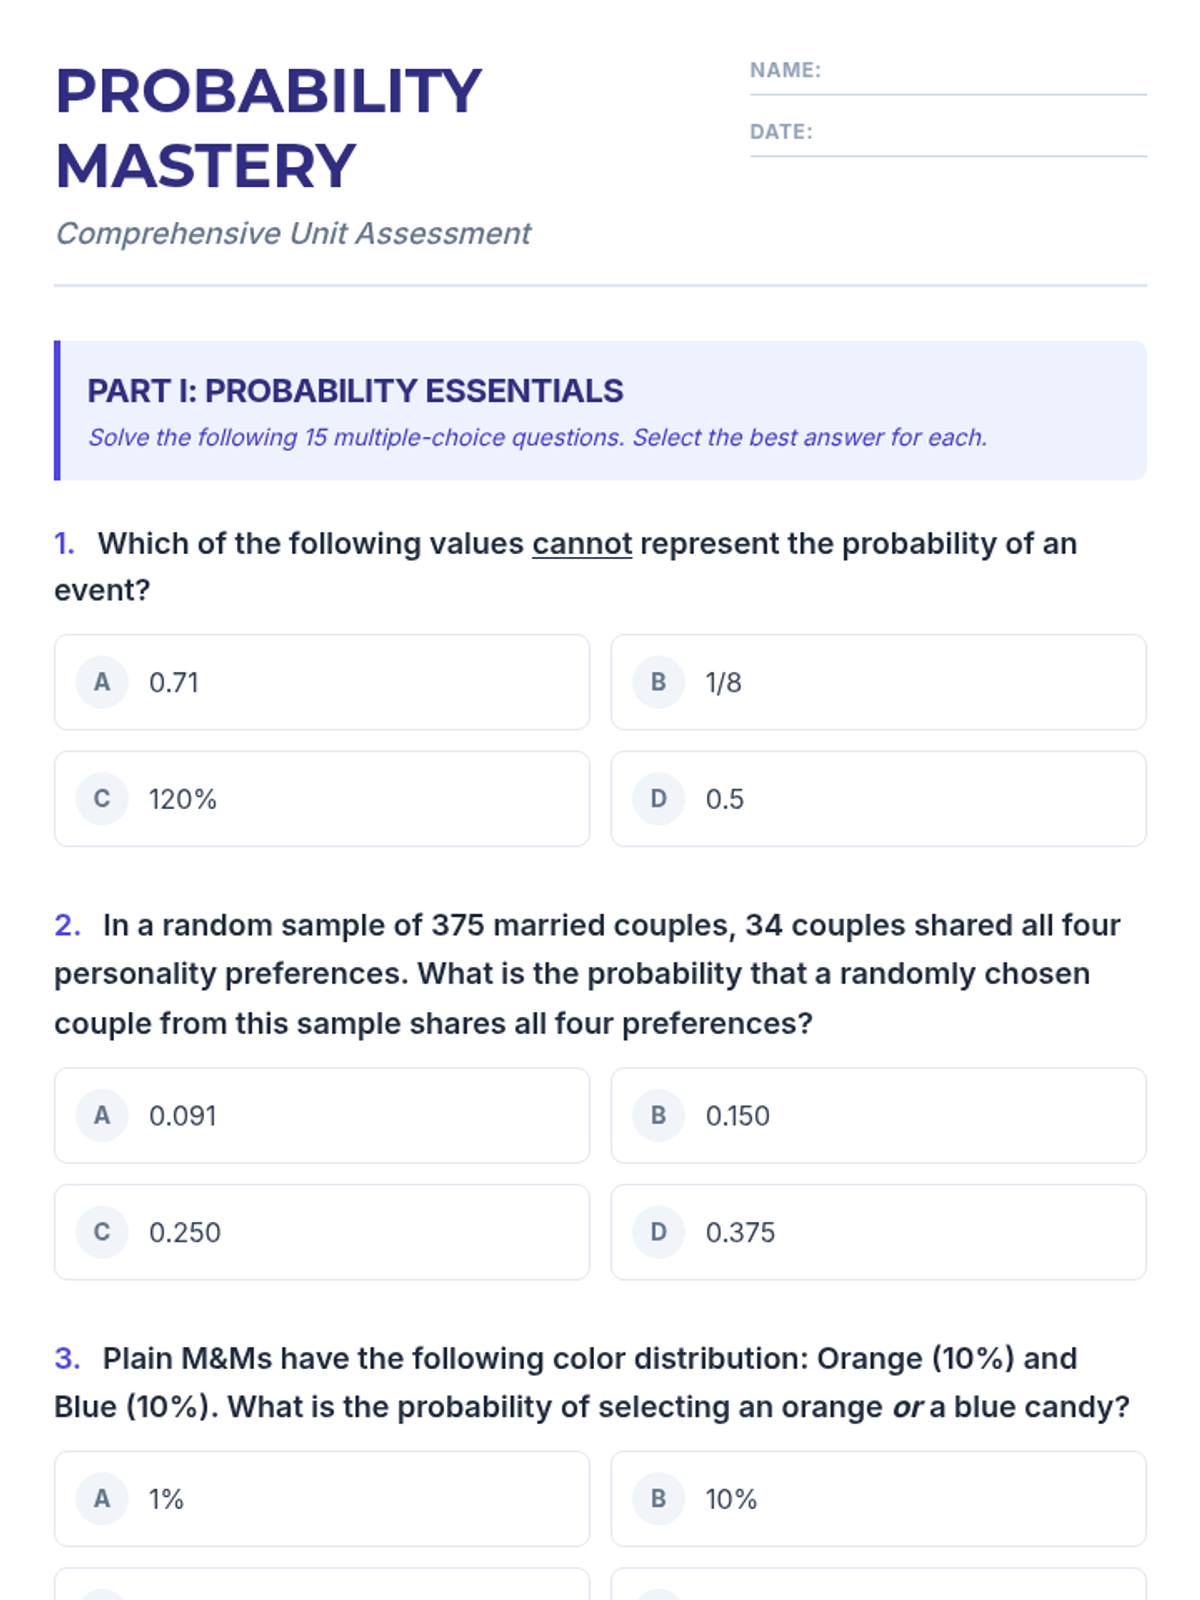
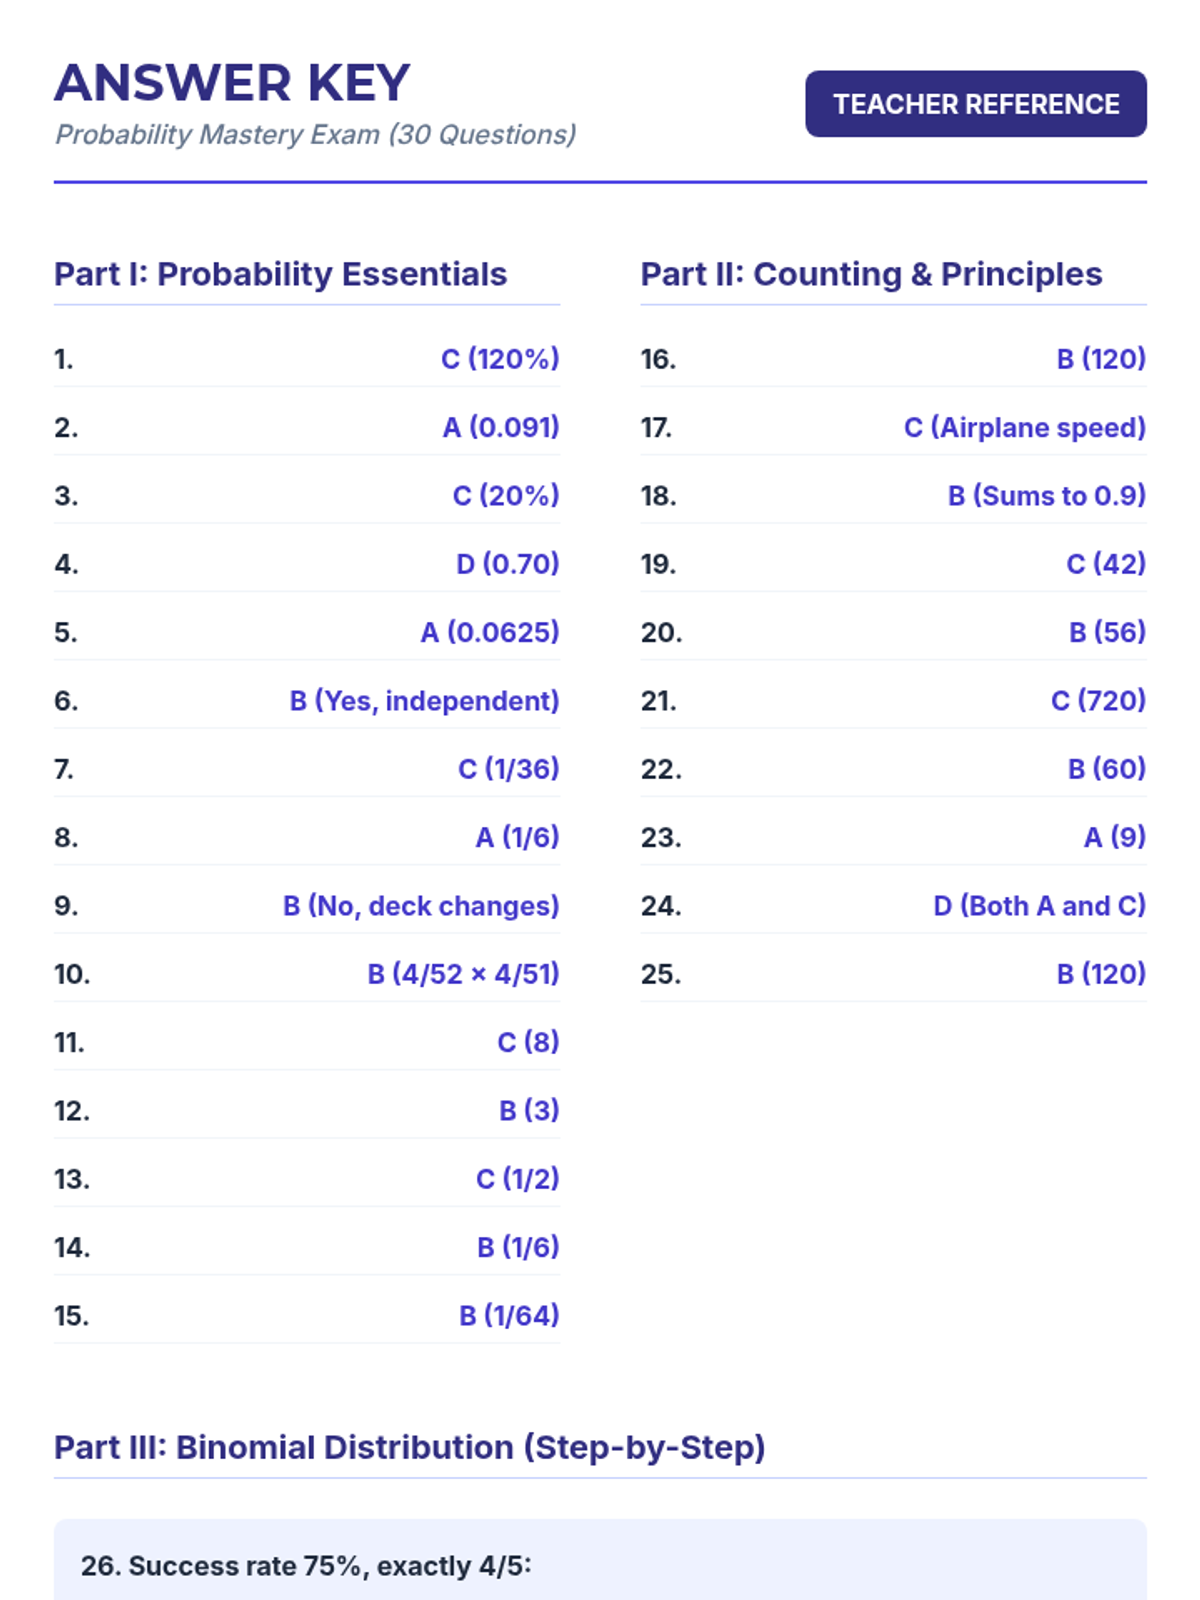
A comprehensive lesson covering probability basics, counting principles, and the binomial distribution, concluding with a summative 30-question mastery exam.
A comprehensive examination combining elementary probability theory, counting principles, and binomial distribution problems into a single rigorous assessment.
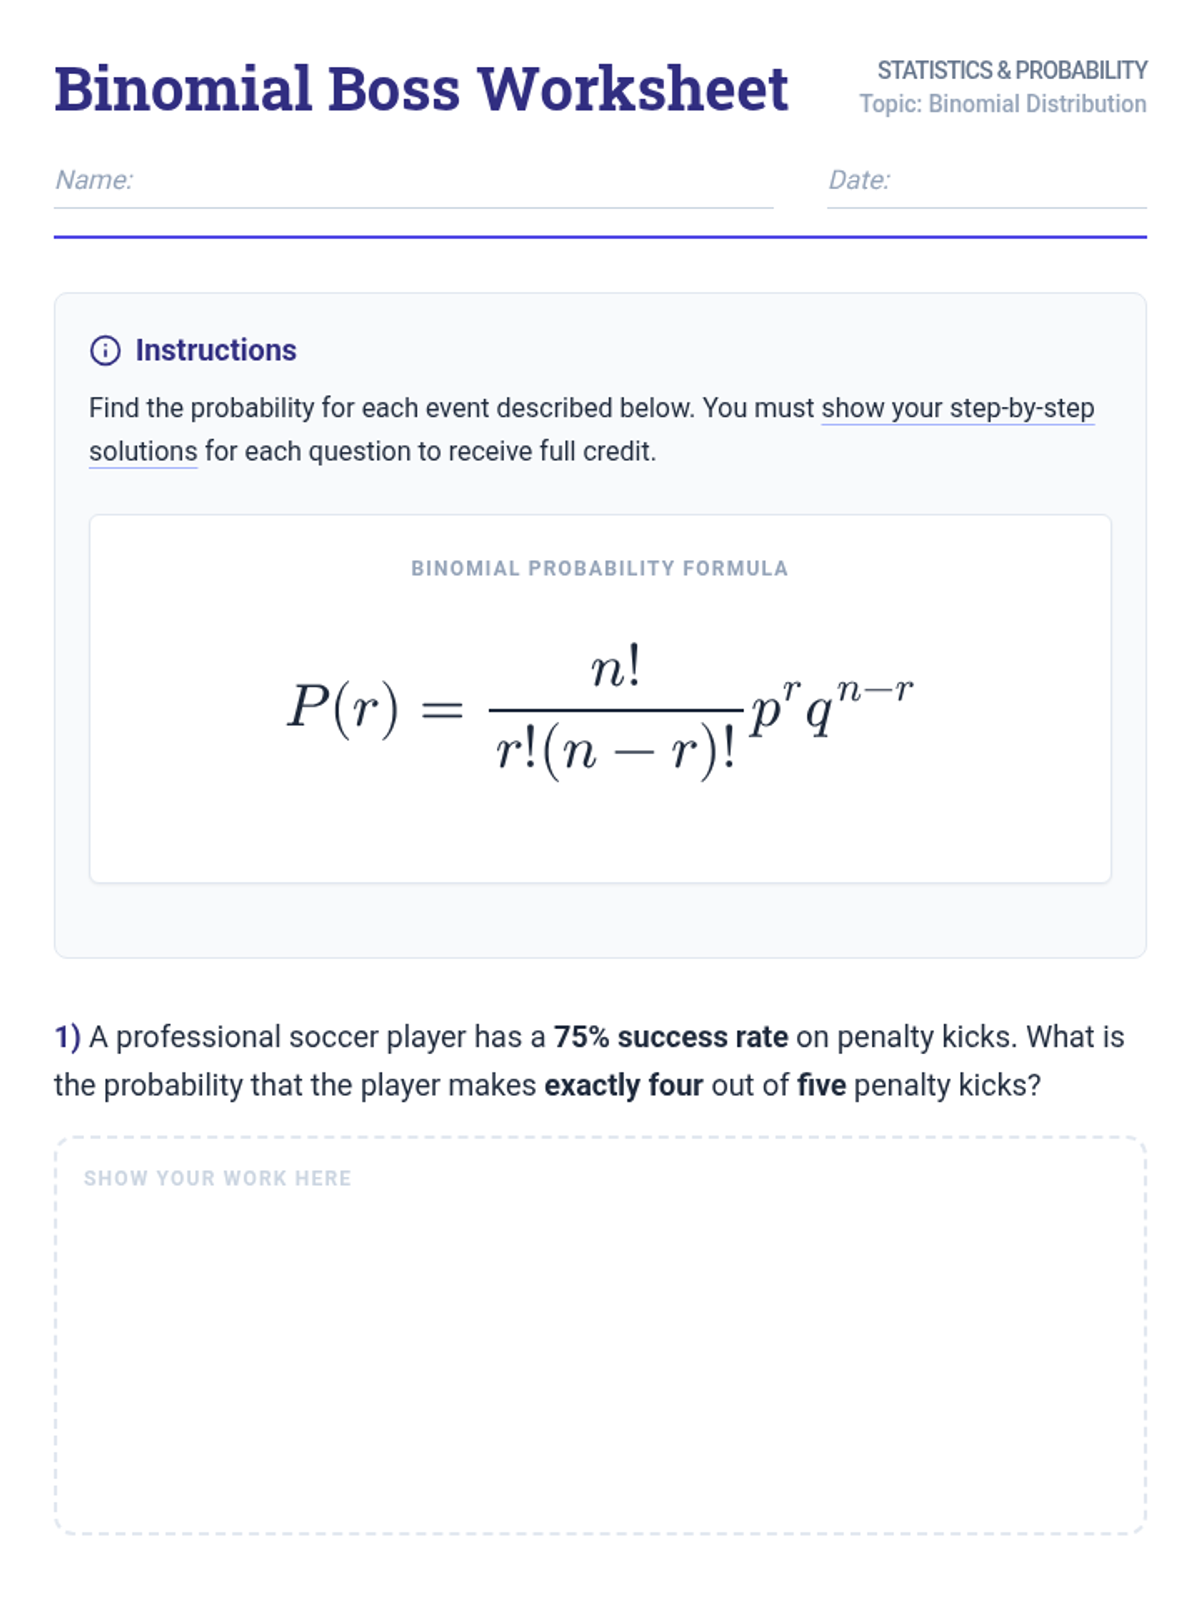
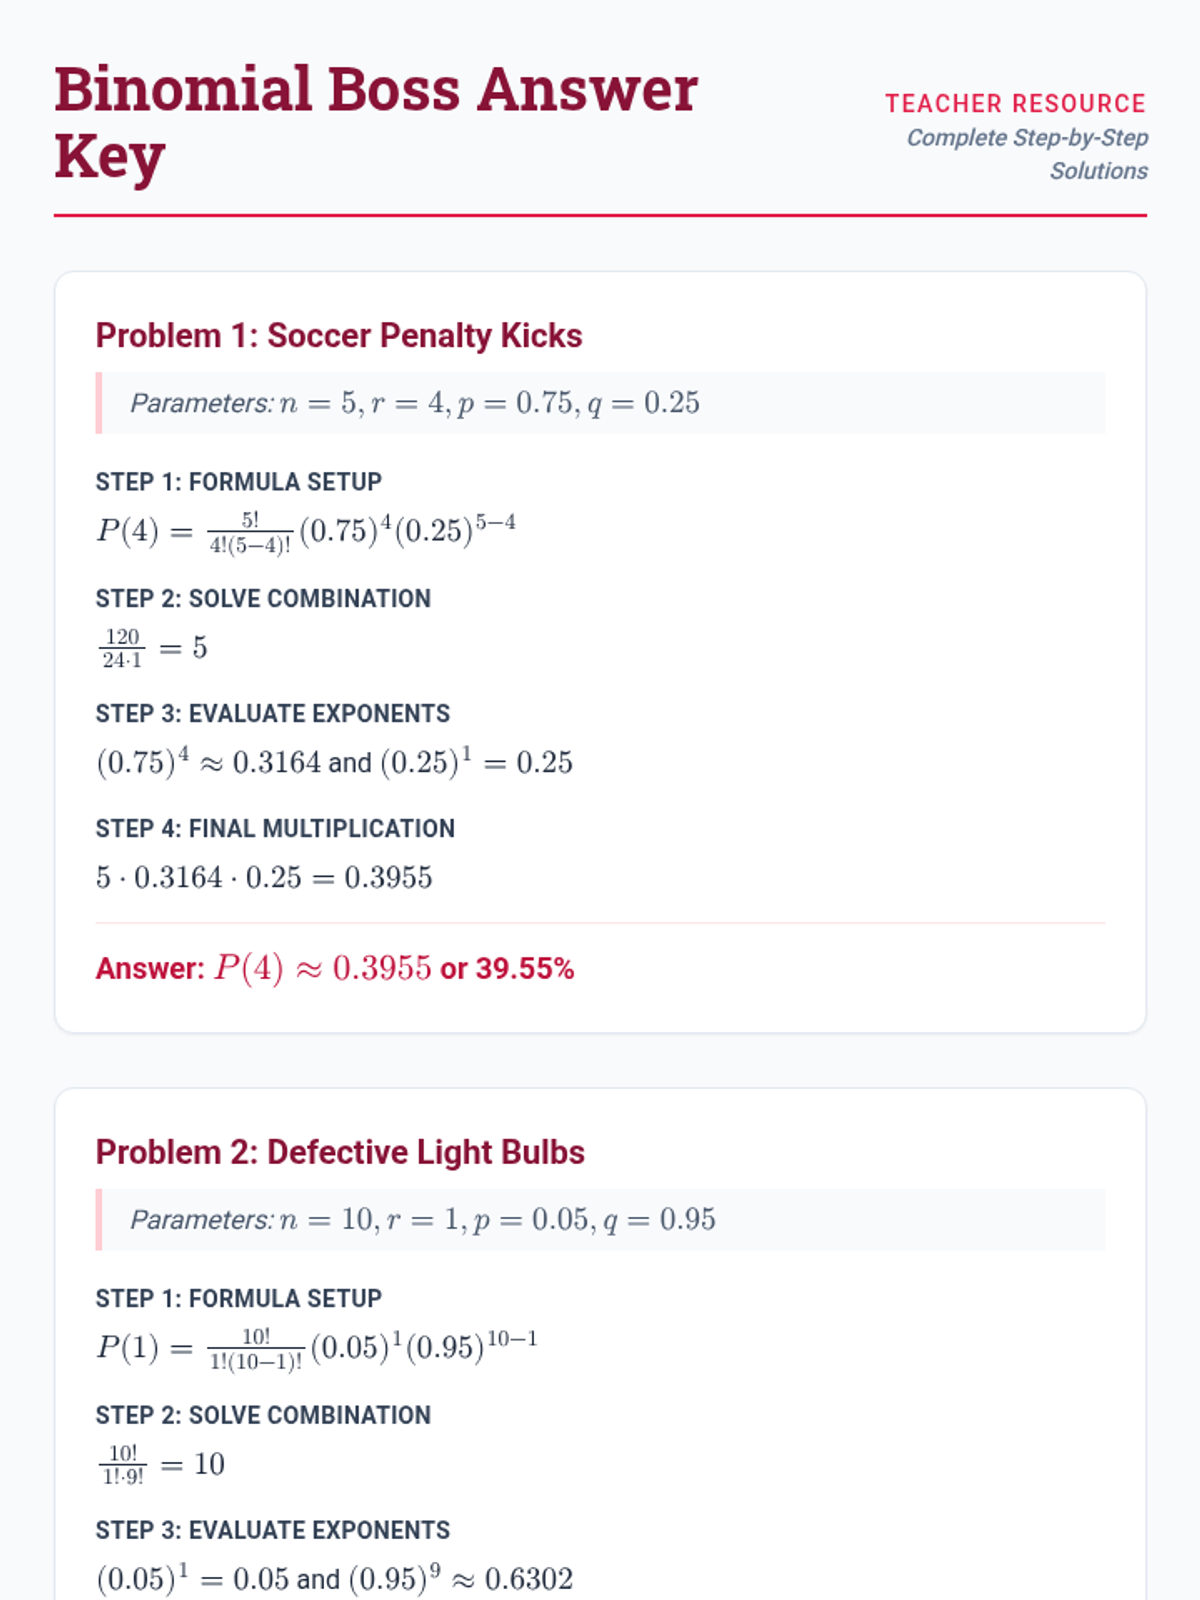
A lesson focused on solving word problems using the binomial probability distribution formula, featuring real-world scenarios and step-by-step calculations.
A lesson covering fundamental counting techniques, random variable classification, and probability distributions based on statistical principles.
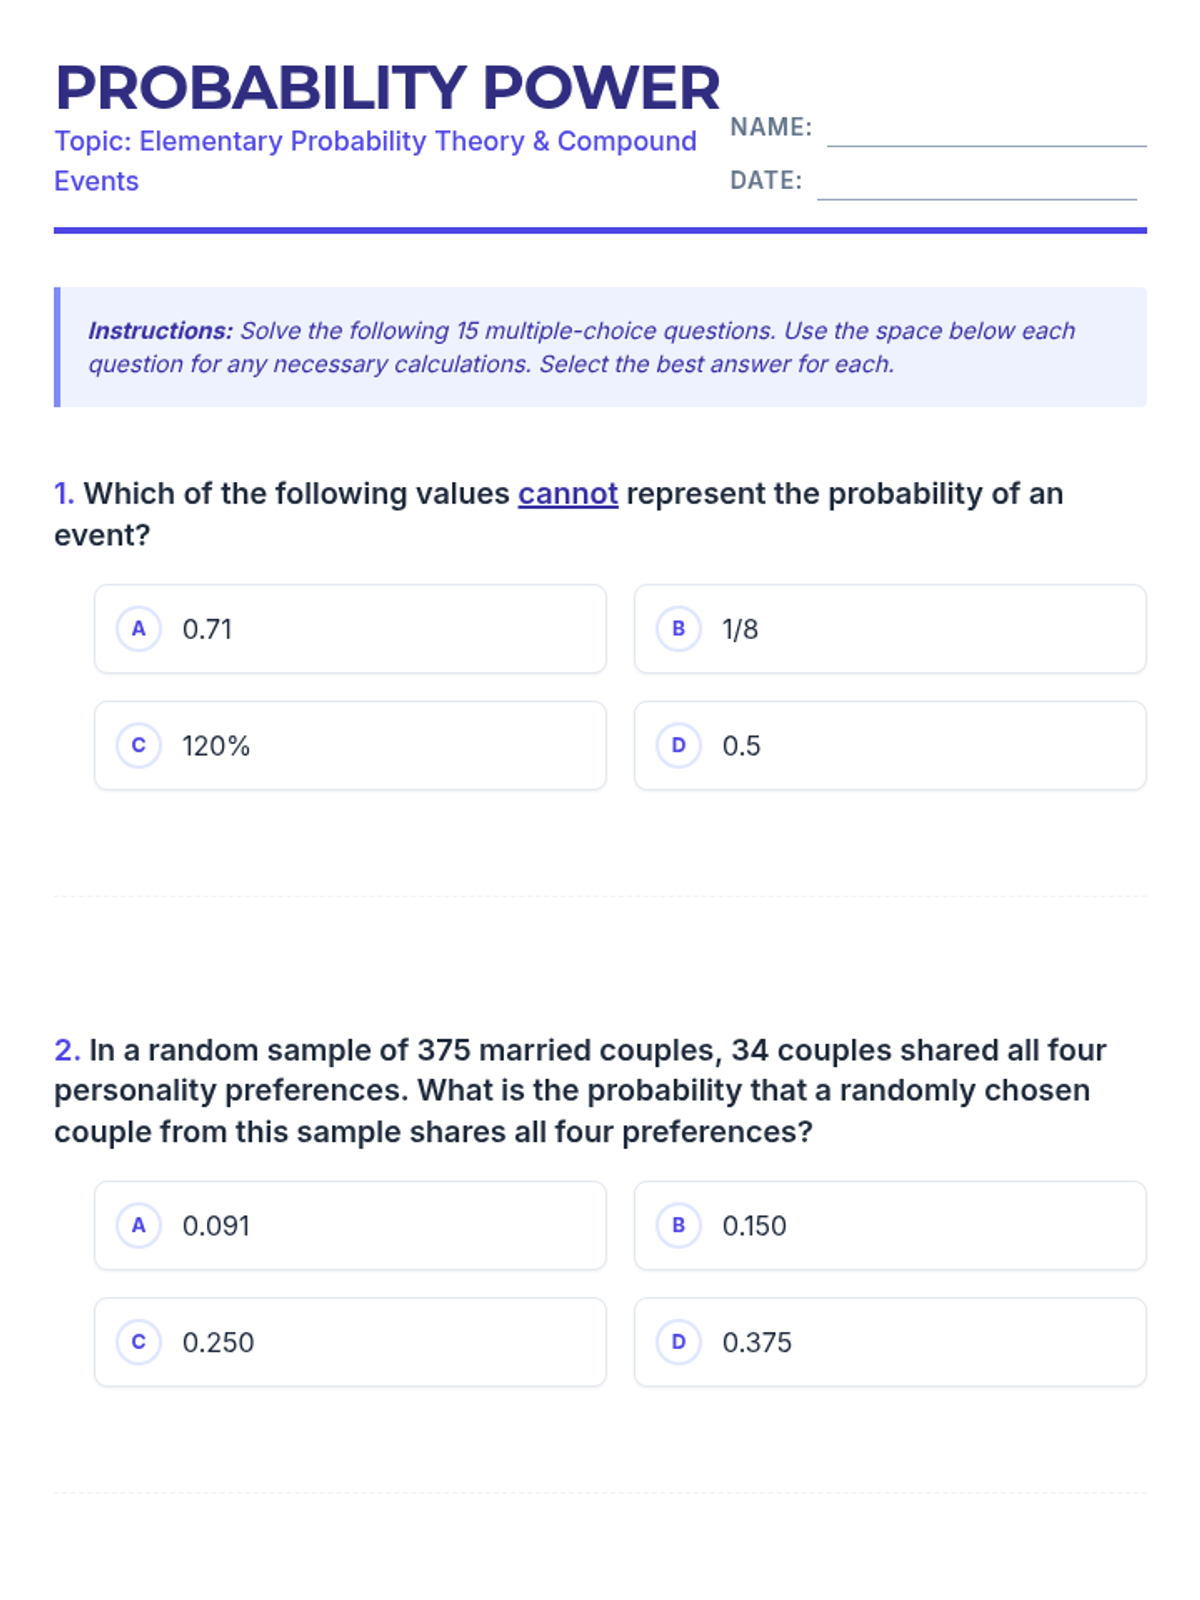
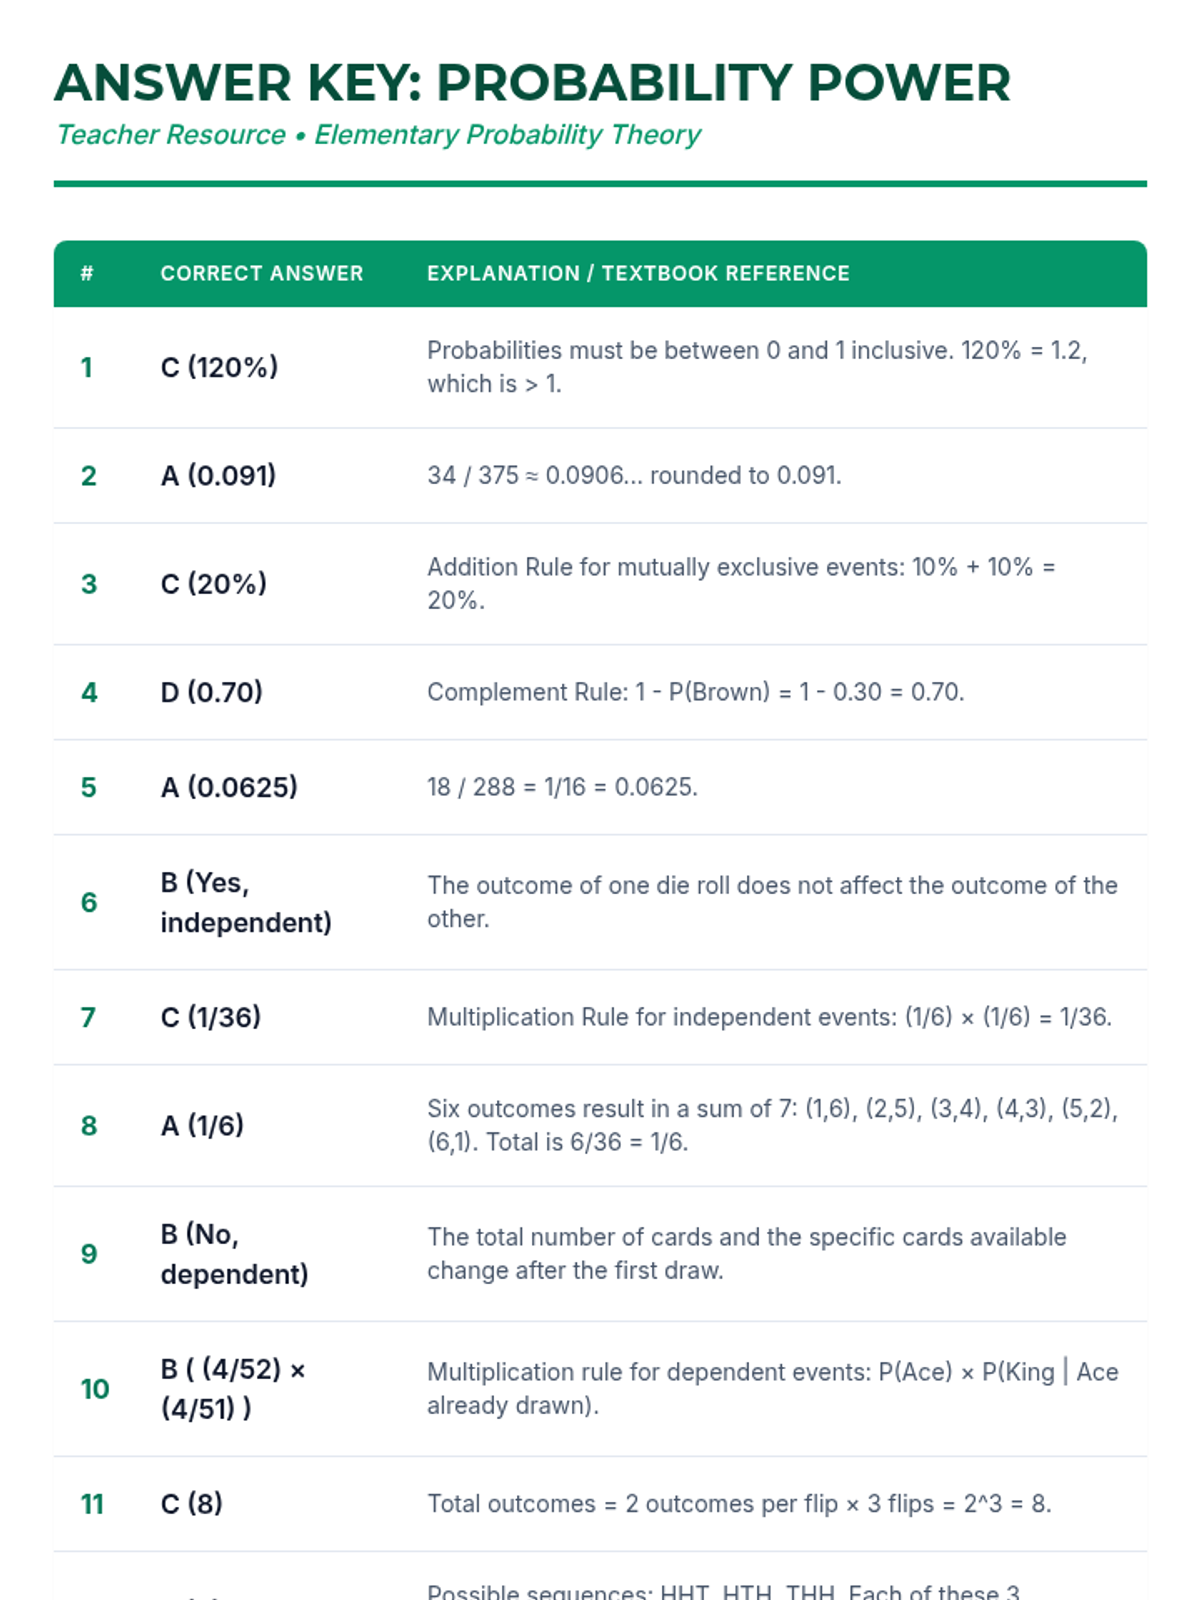
A comprehensive lesson on elementary probability theory covering valid probability ranges, compound events, independent and dependent outcomes, and tree diagrams based on textbook problems.
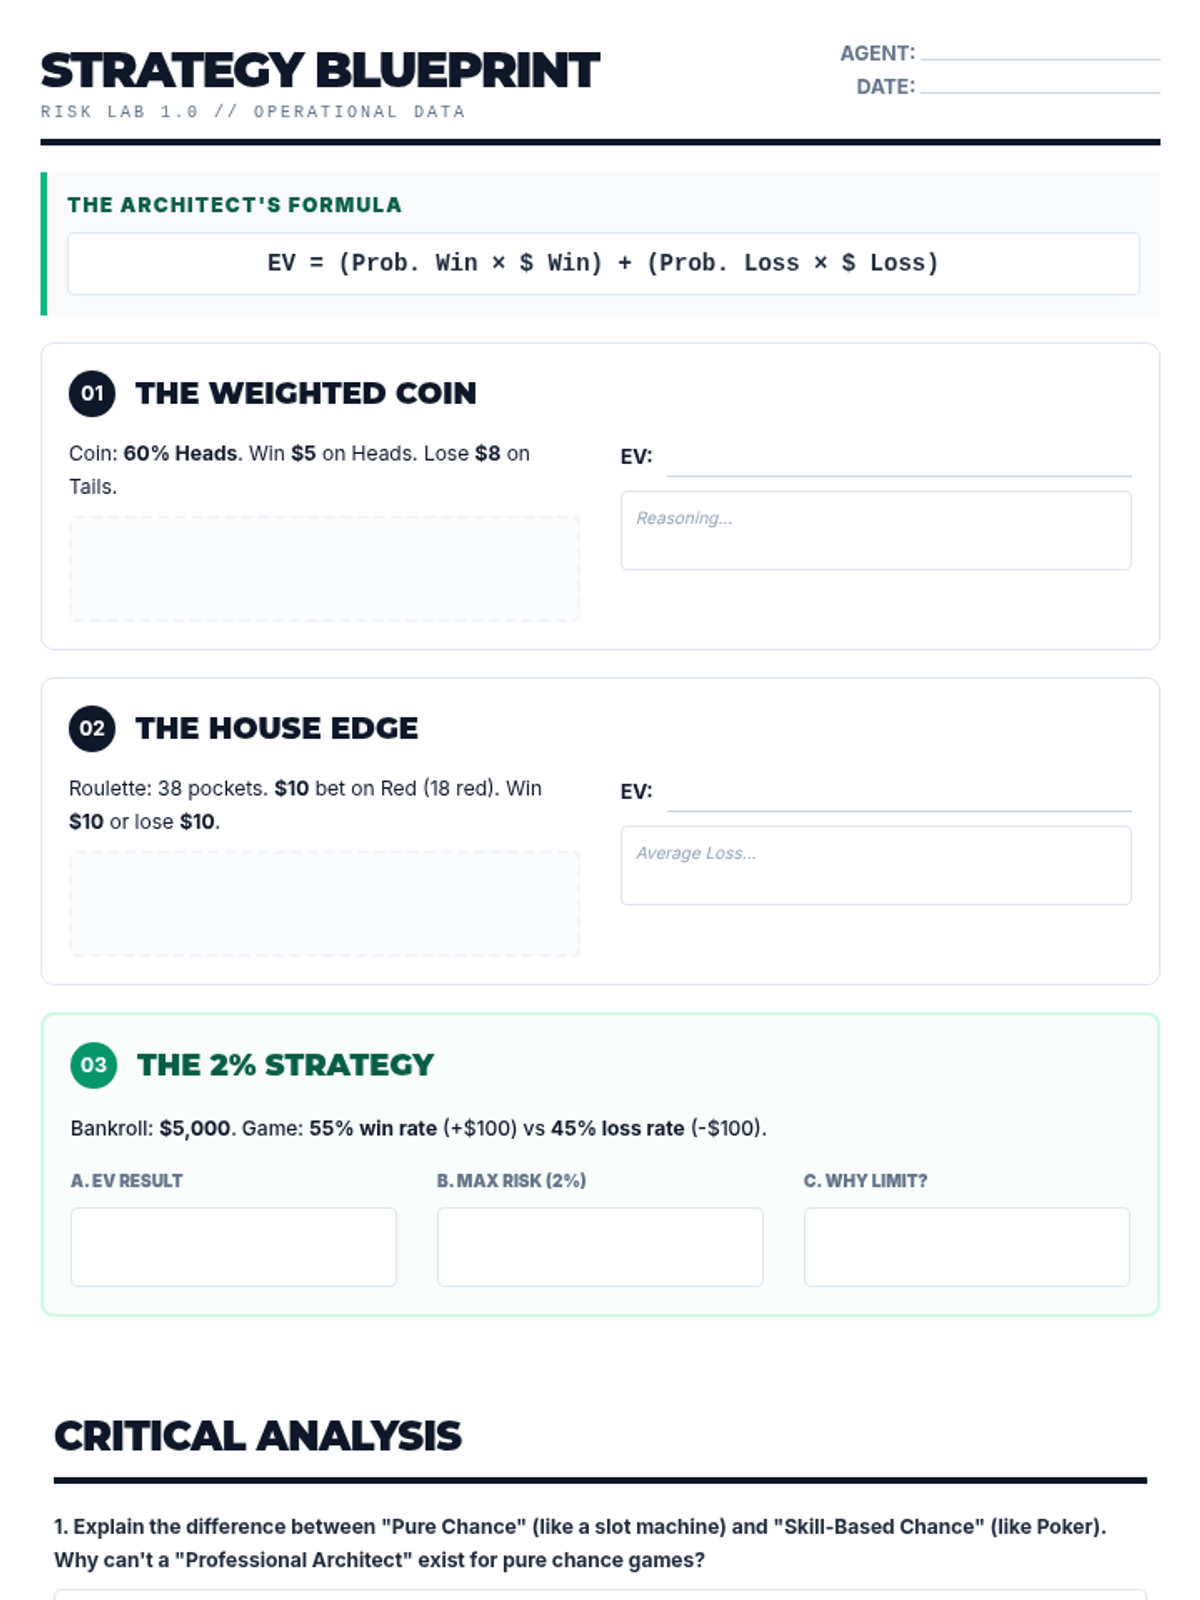
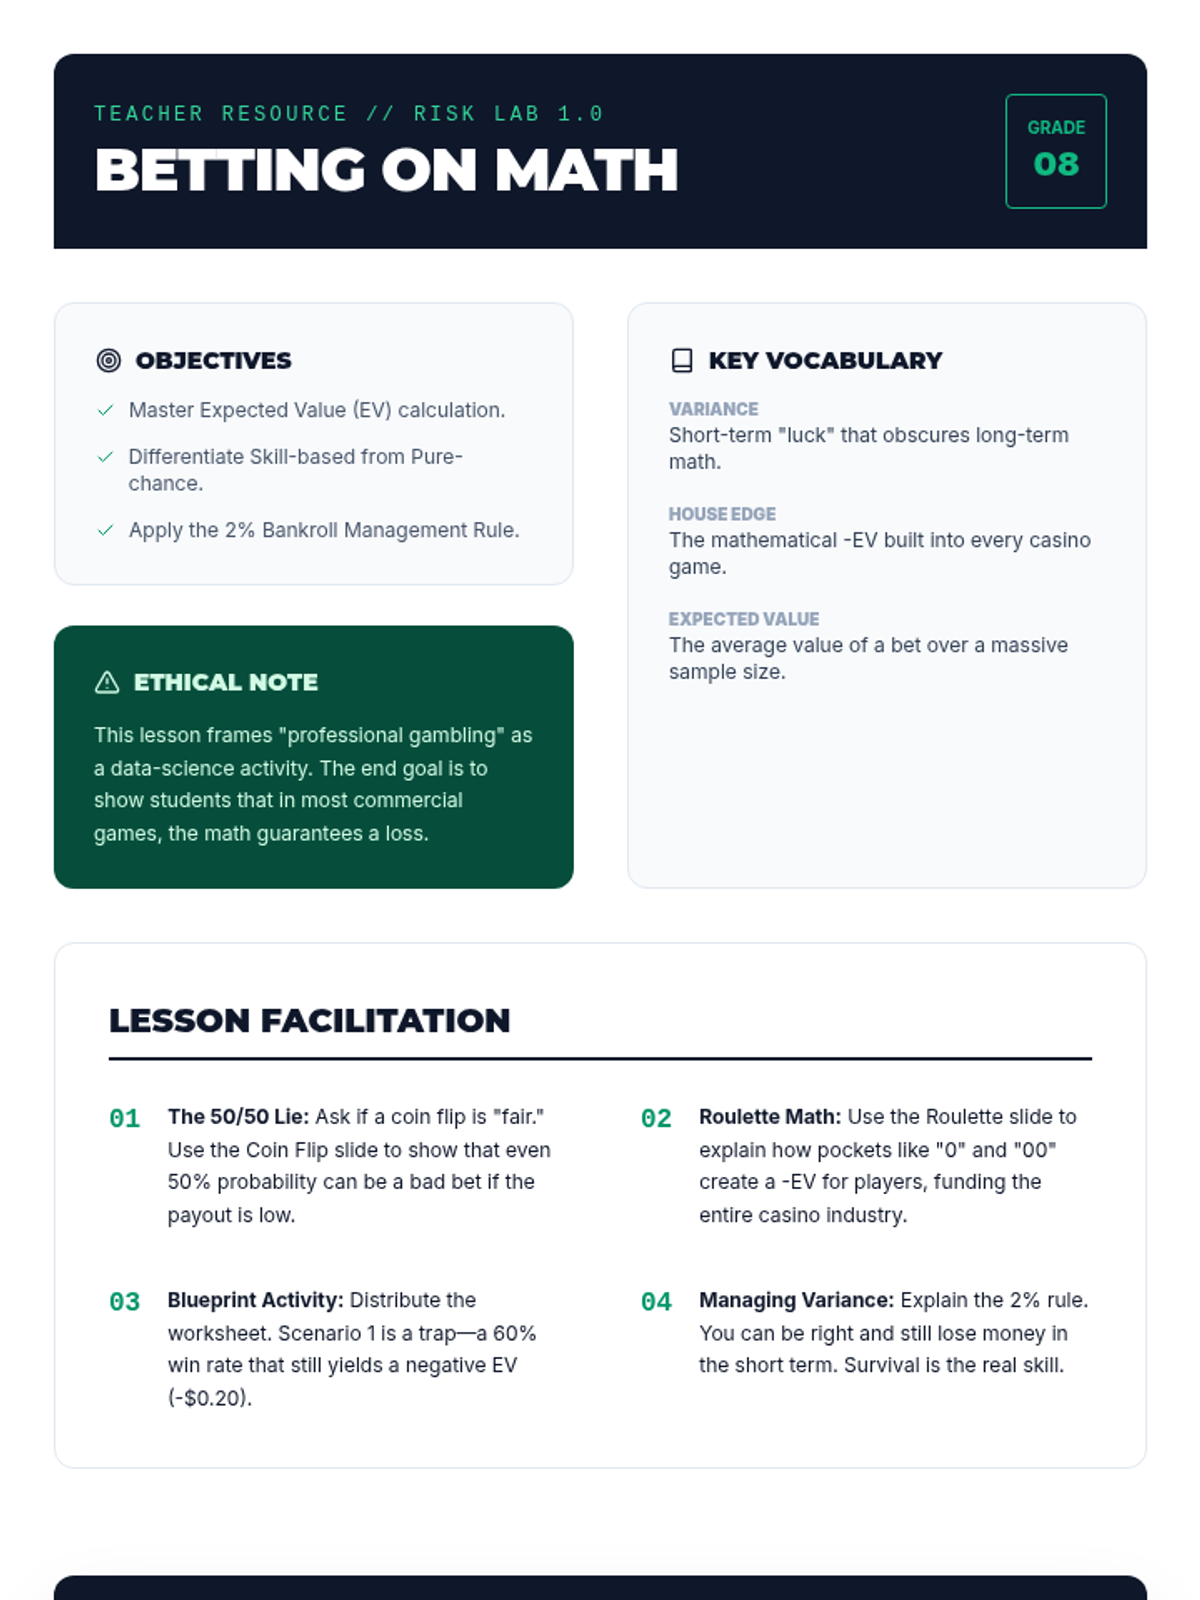
Students explore the concept of expected value and house edge to understand why certain strategies succeed while others are designed to fail.
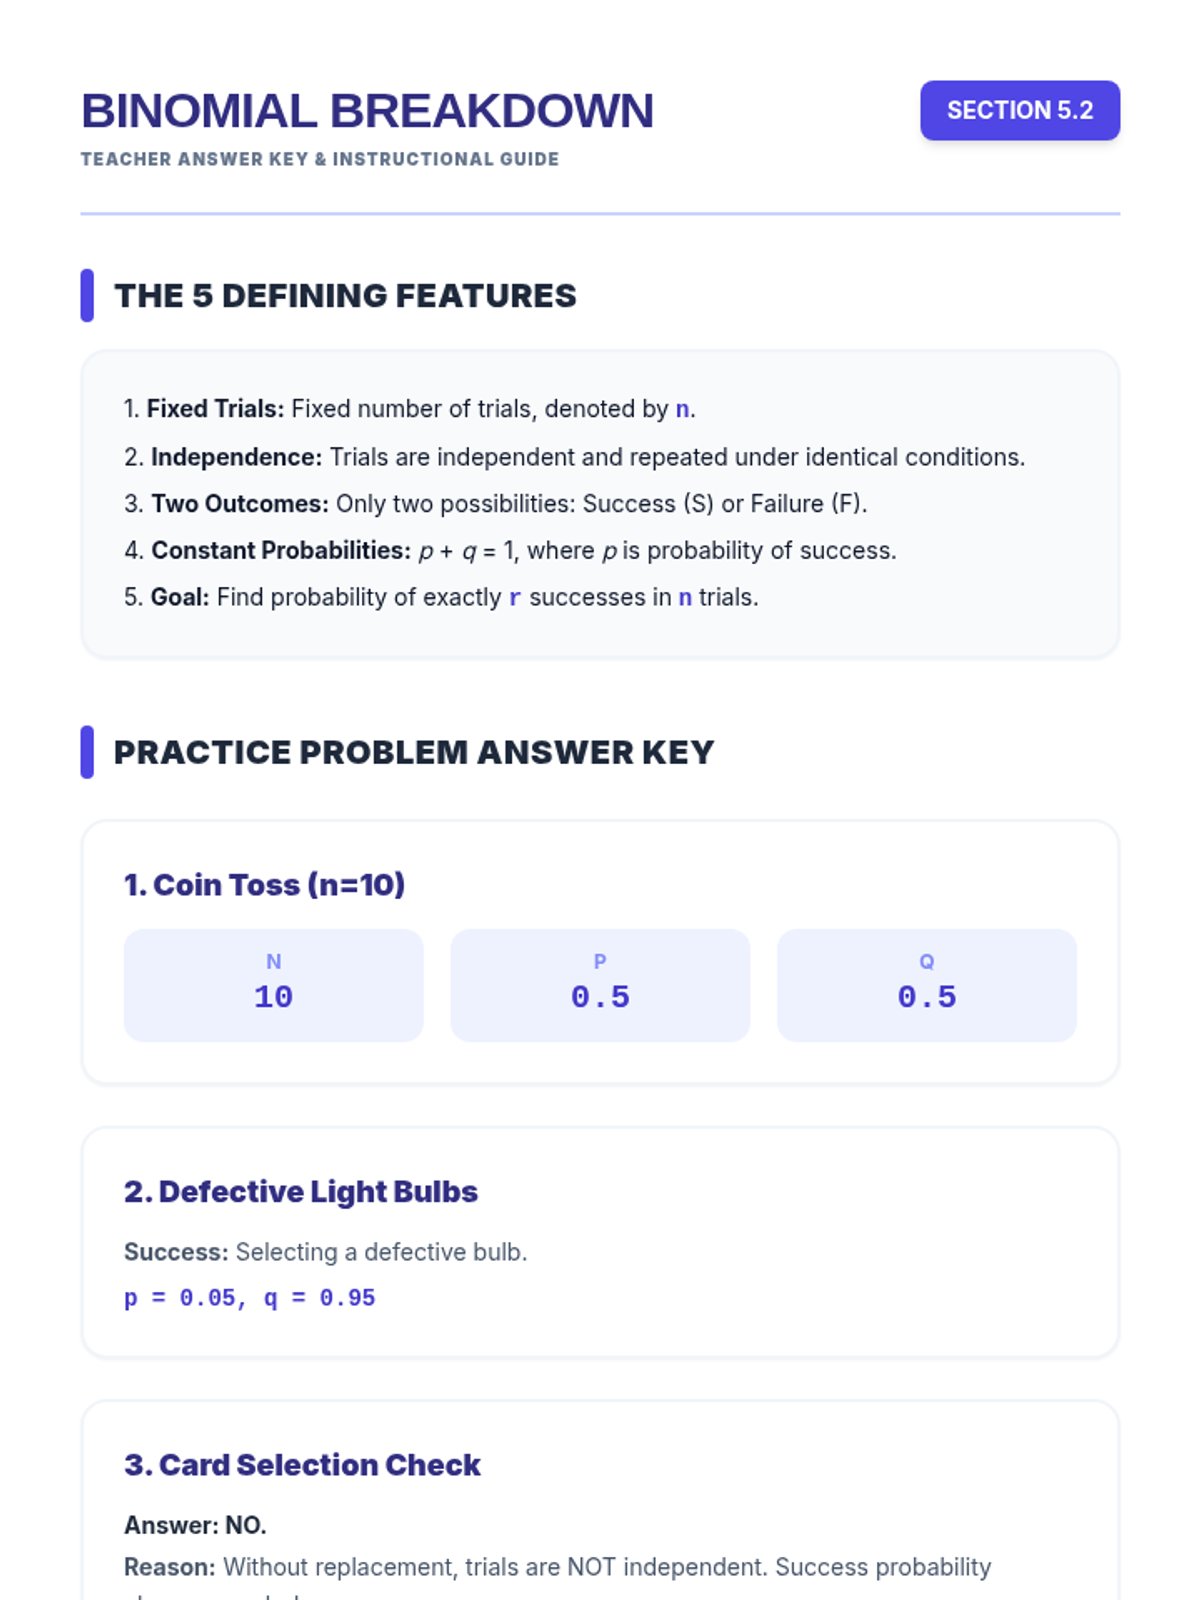
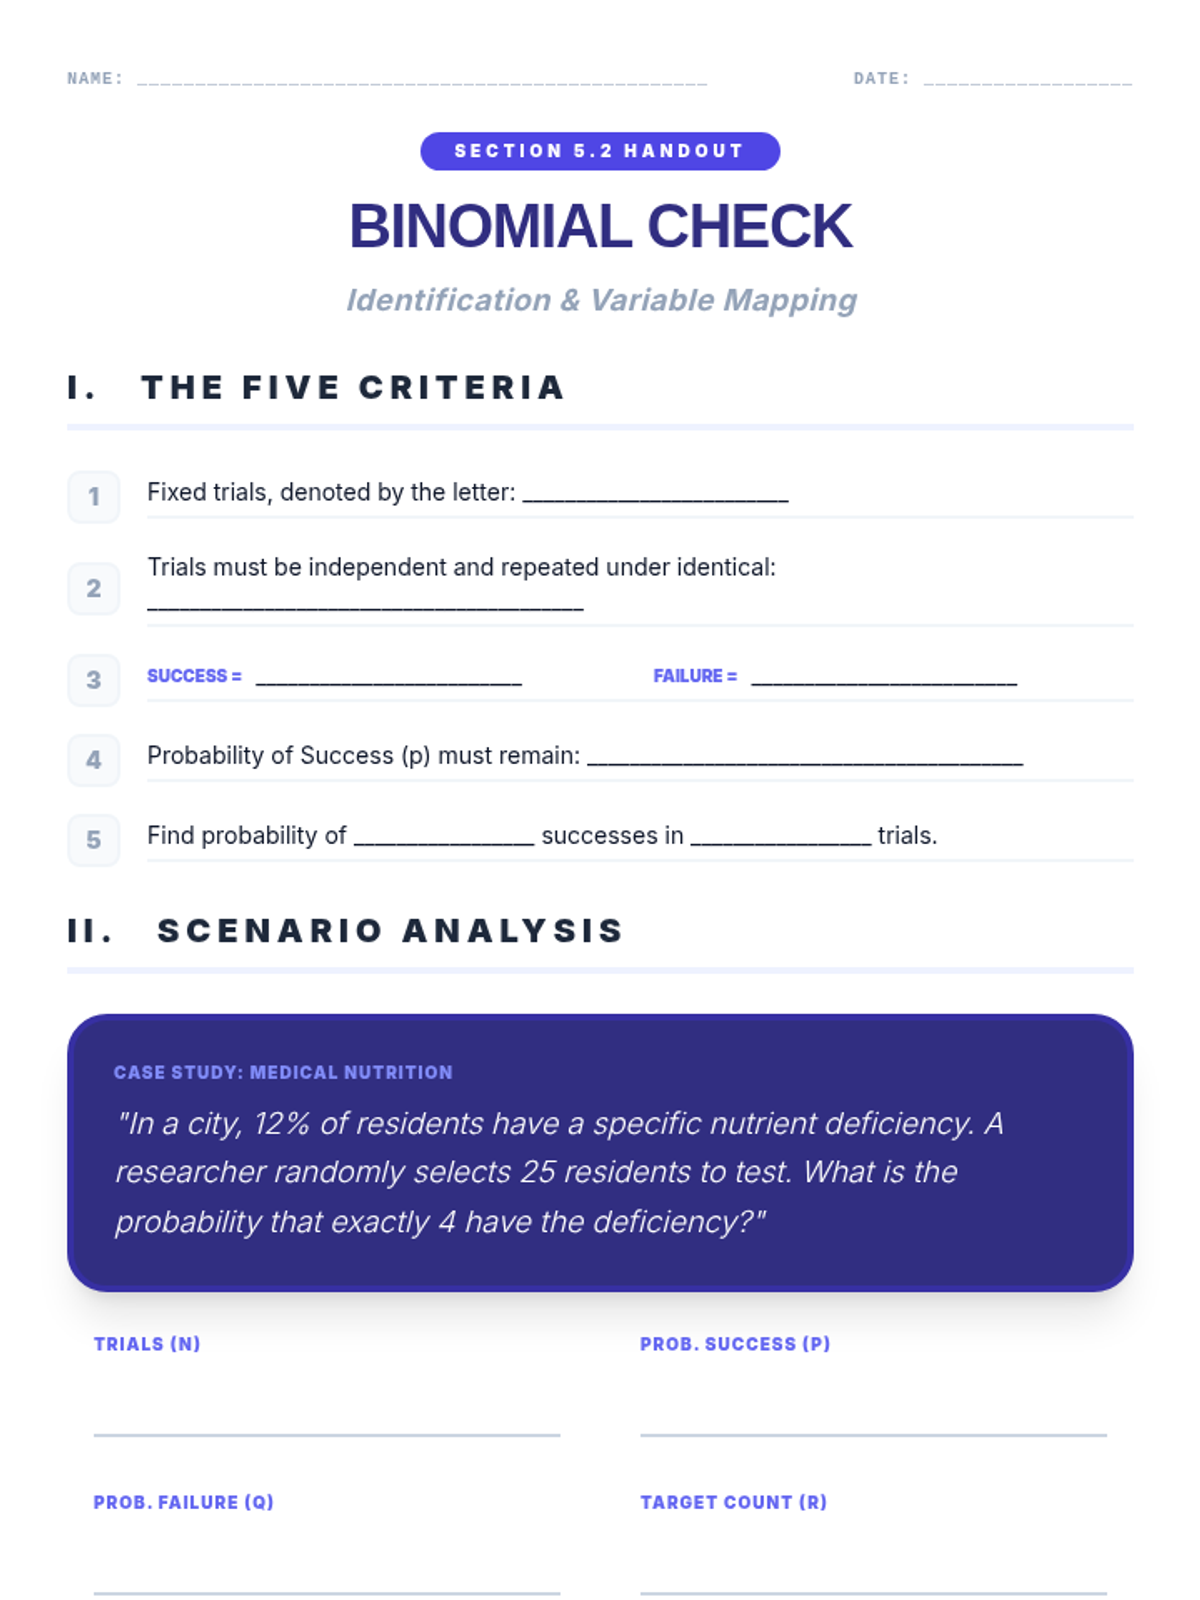
A comprehensive introduction to binomial experiments, covering the five core criteria, Bernoulli trials, and practical probability examples.
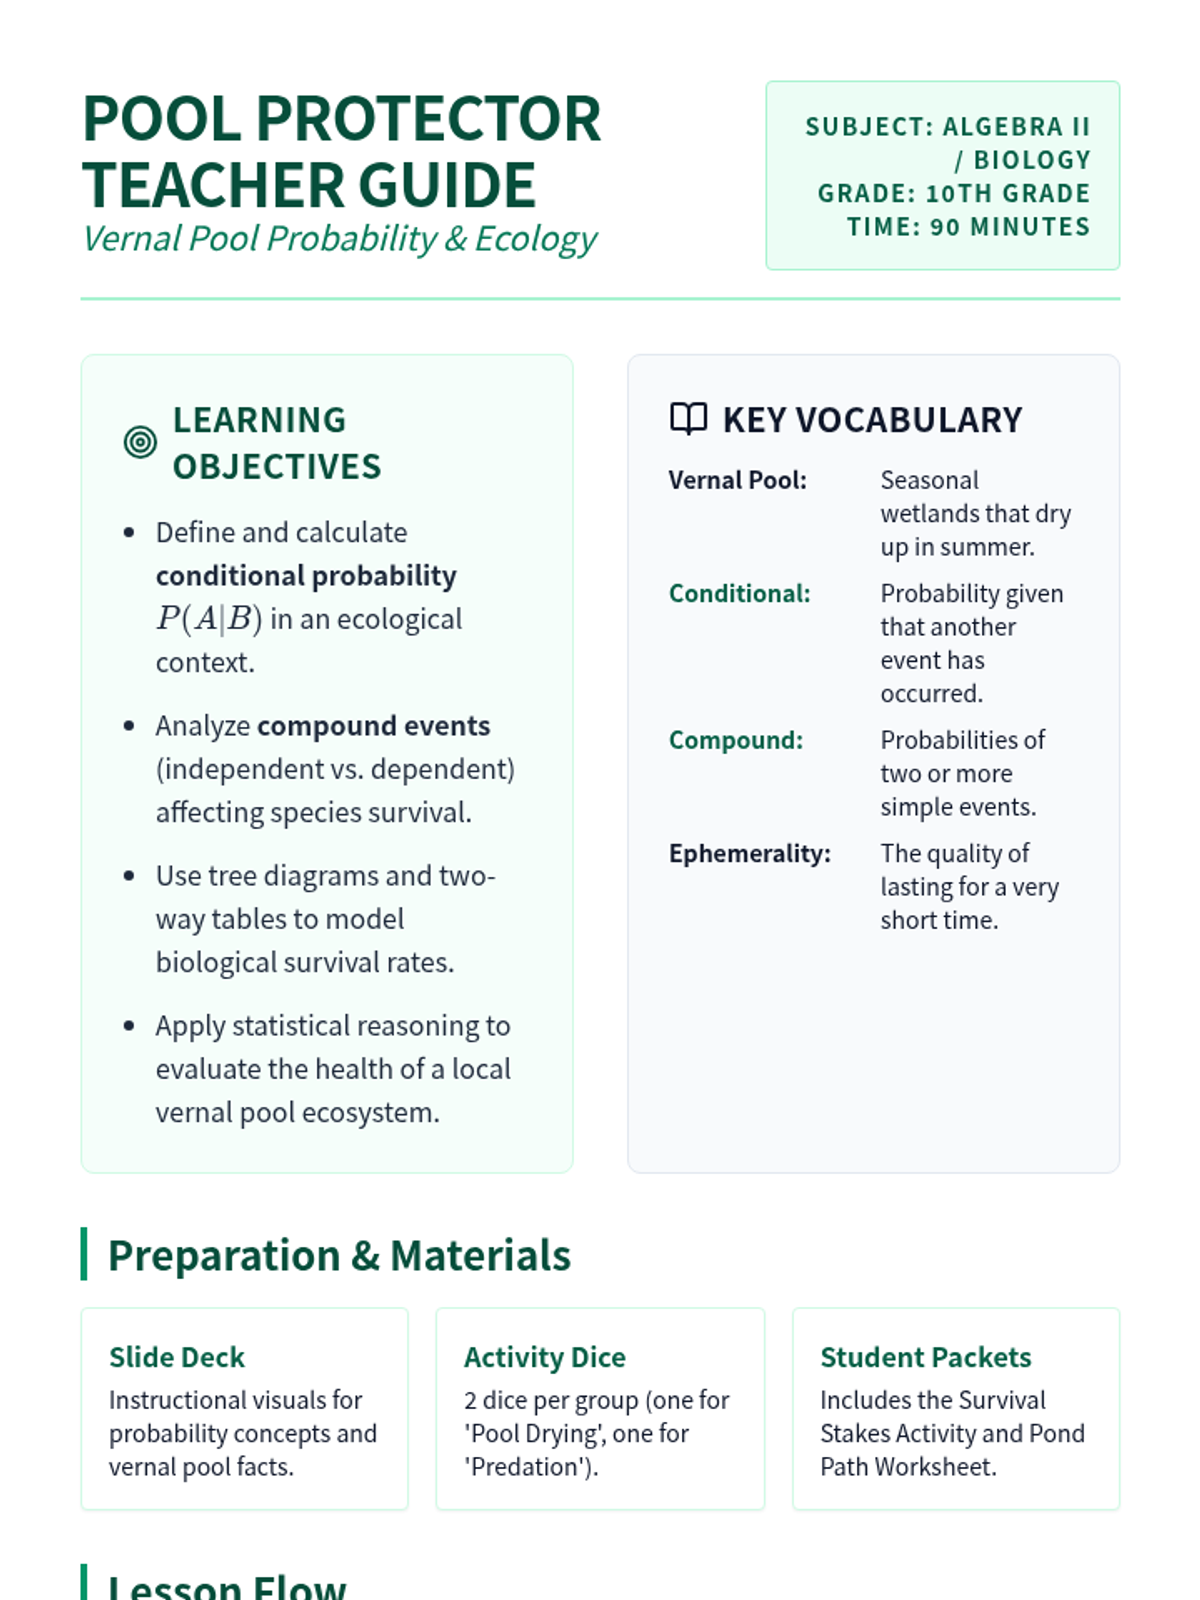
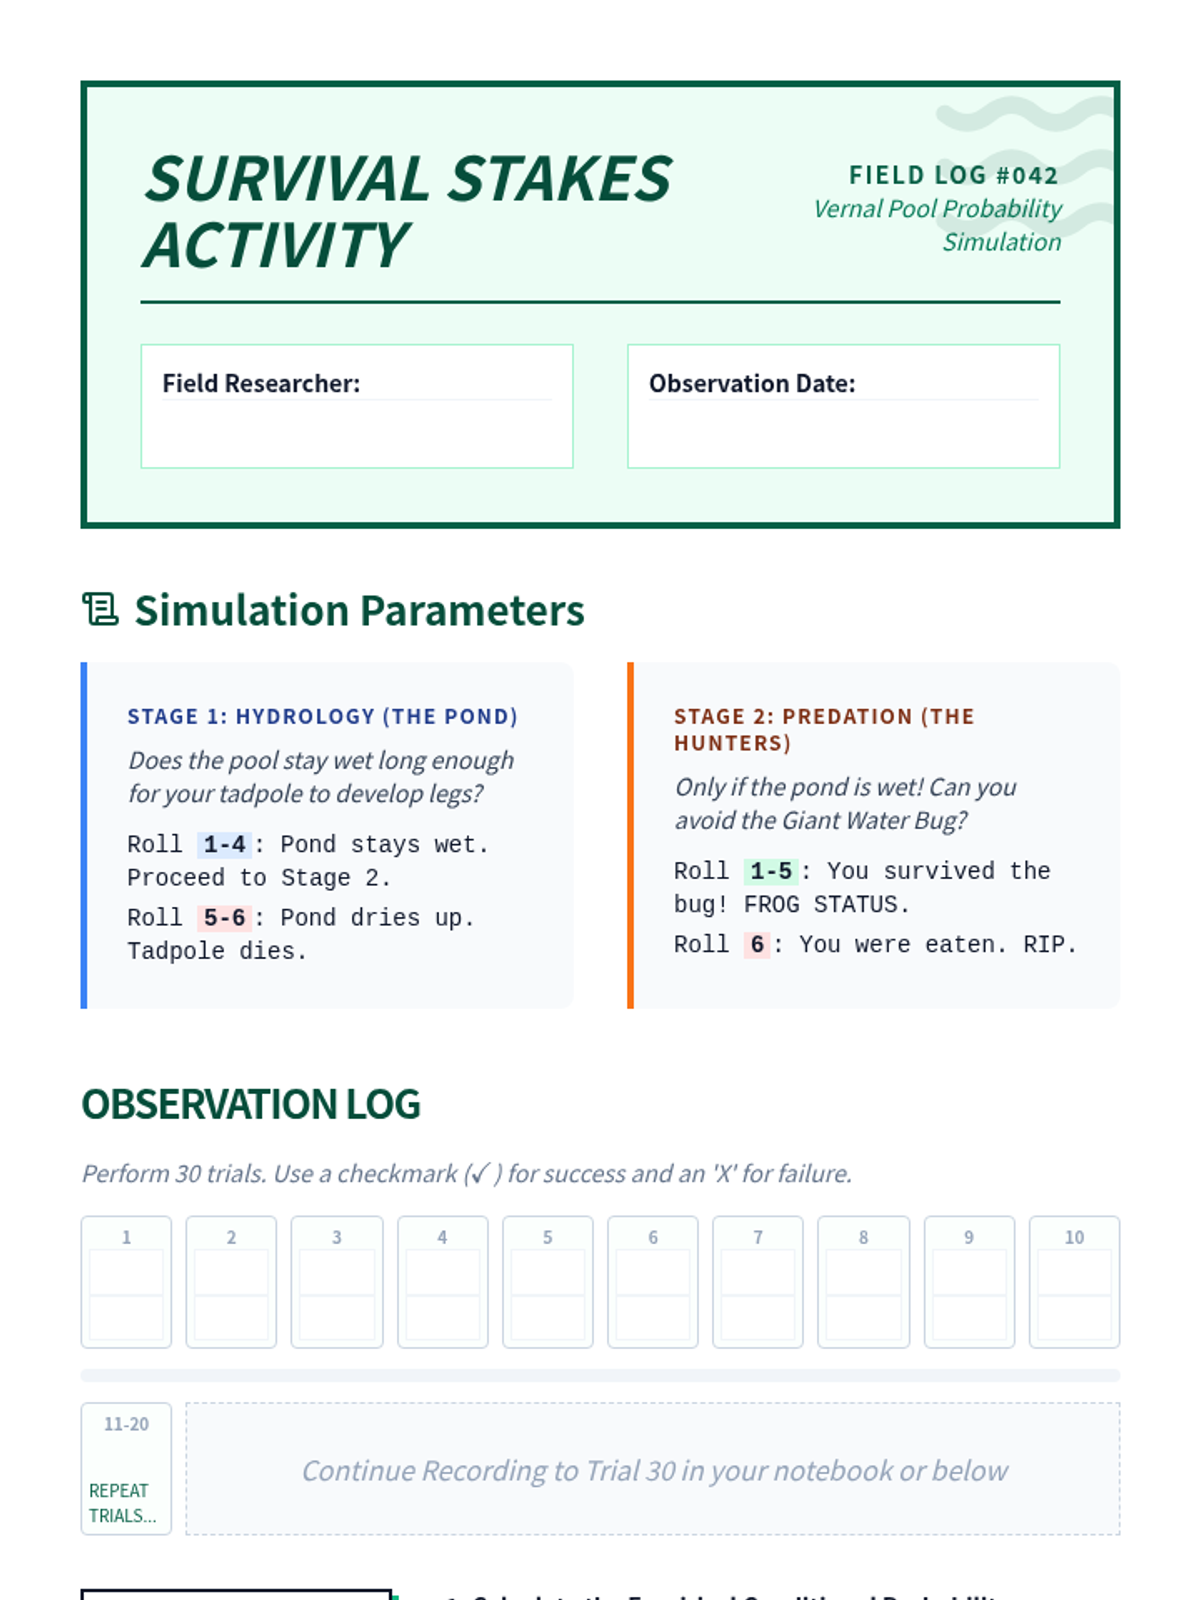
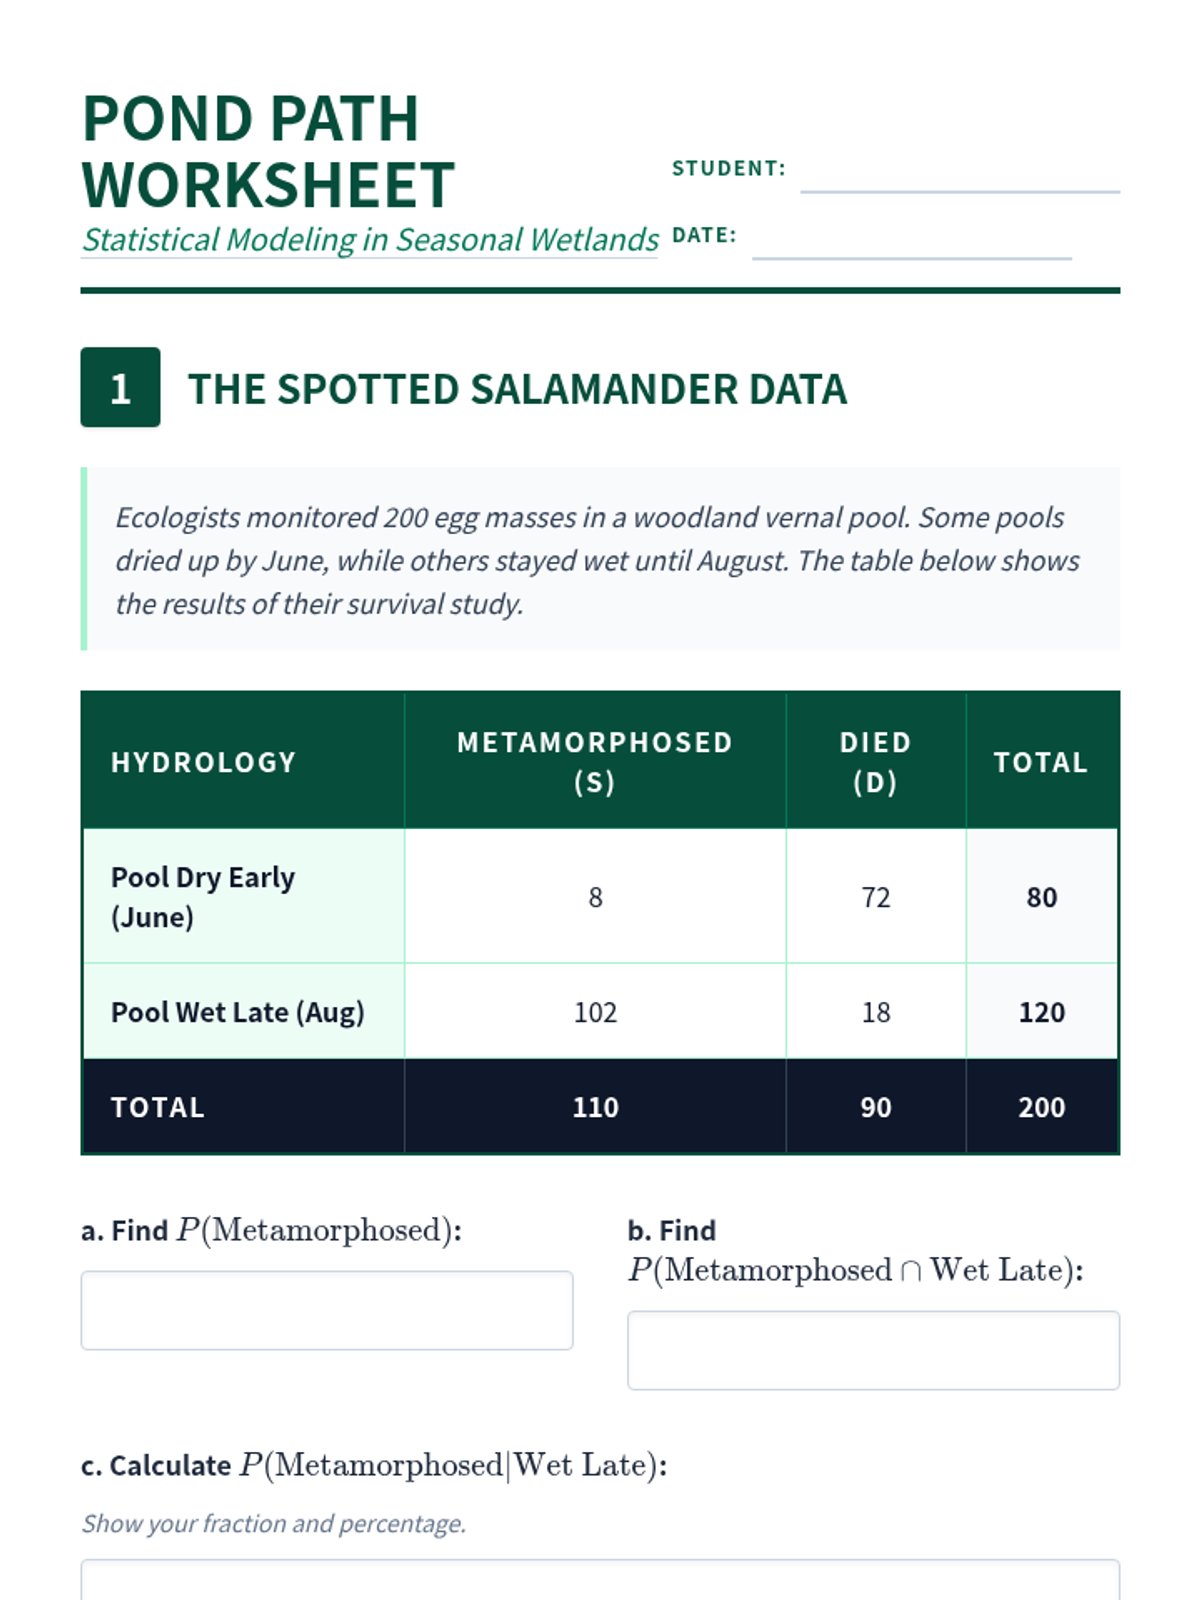
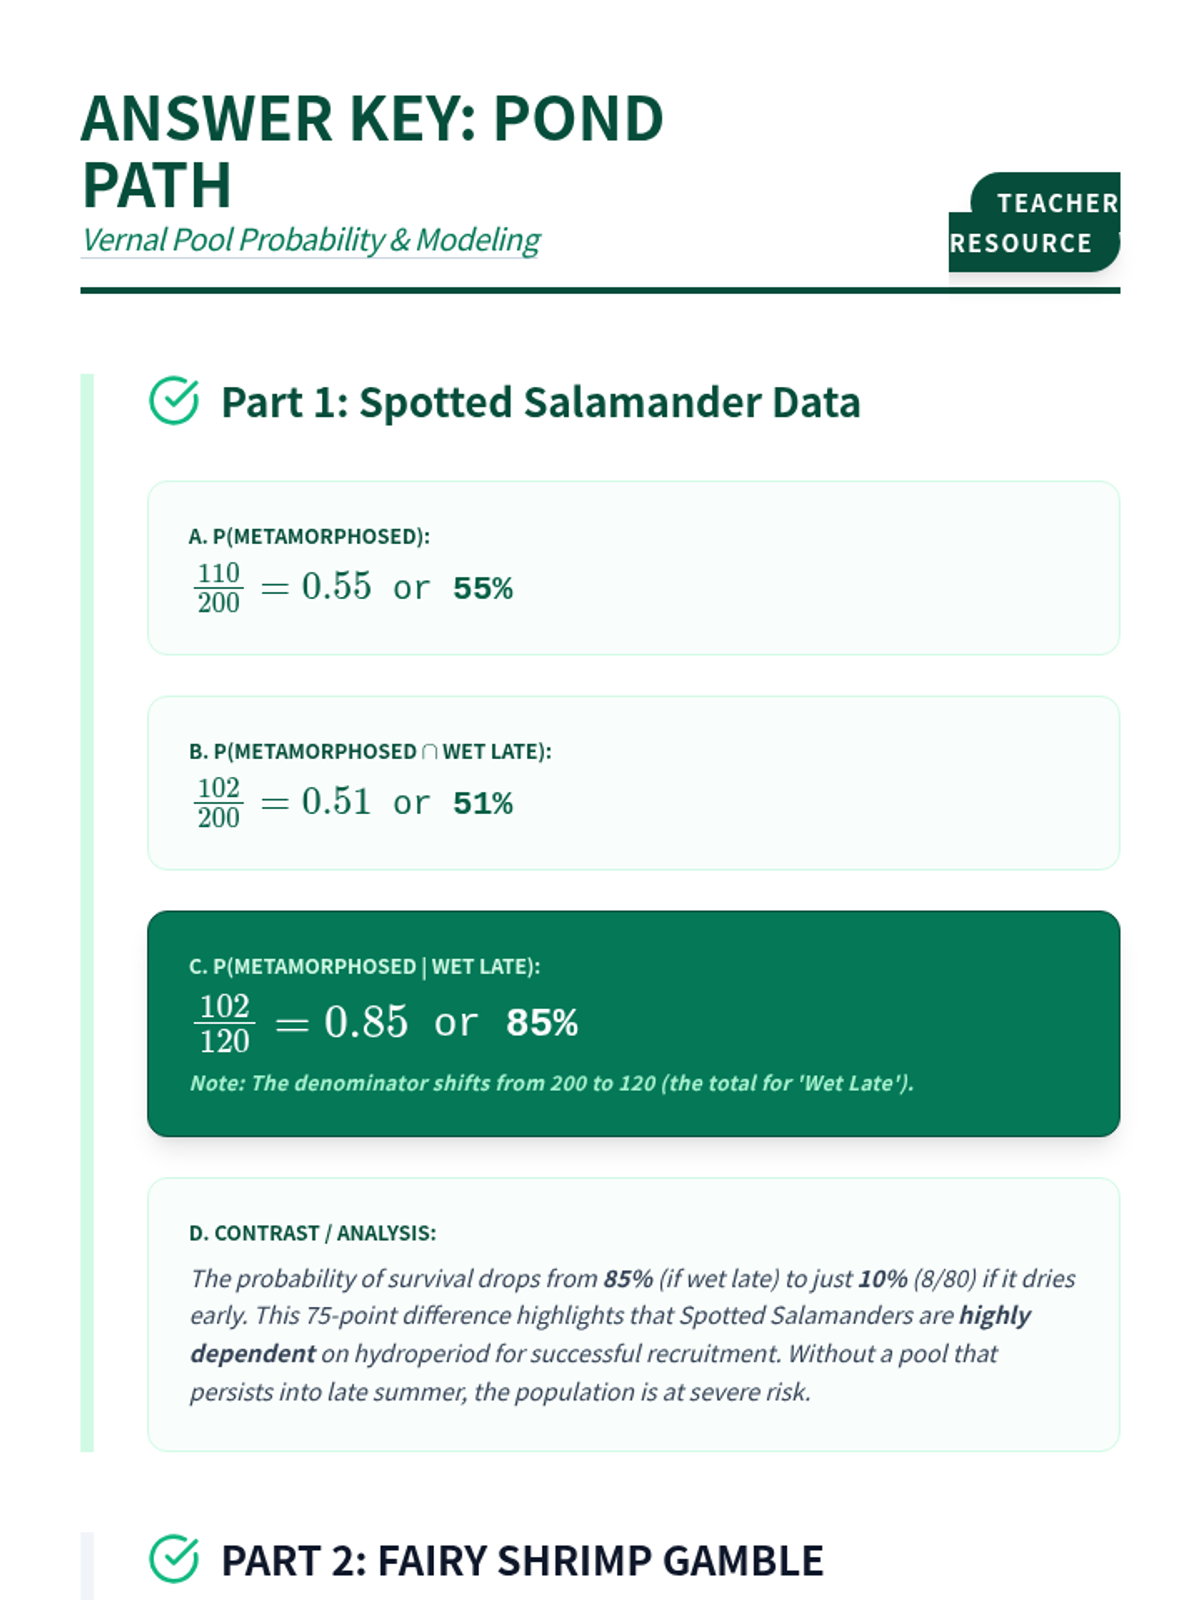
Students apply conditional probability and compound event analysis to understand the survival dynamics of species in vernal pools, bridging biology and statistical reasoning.
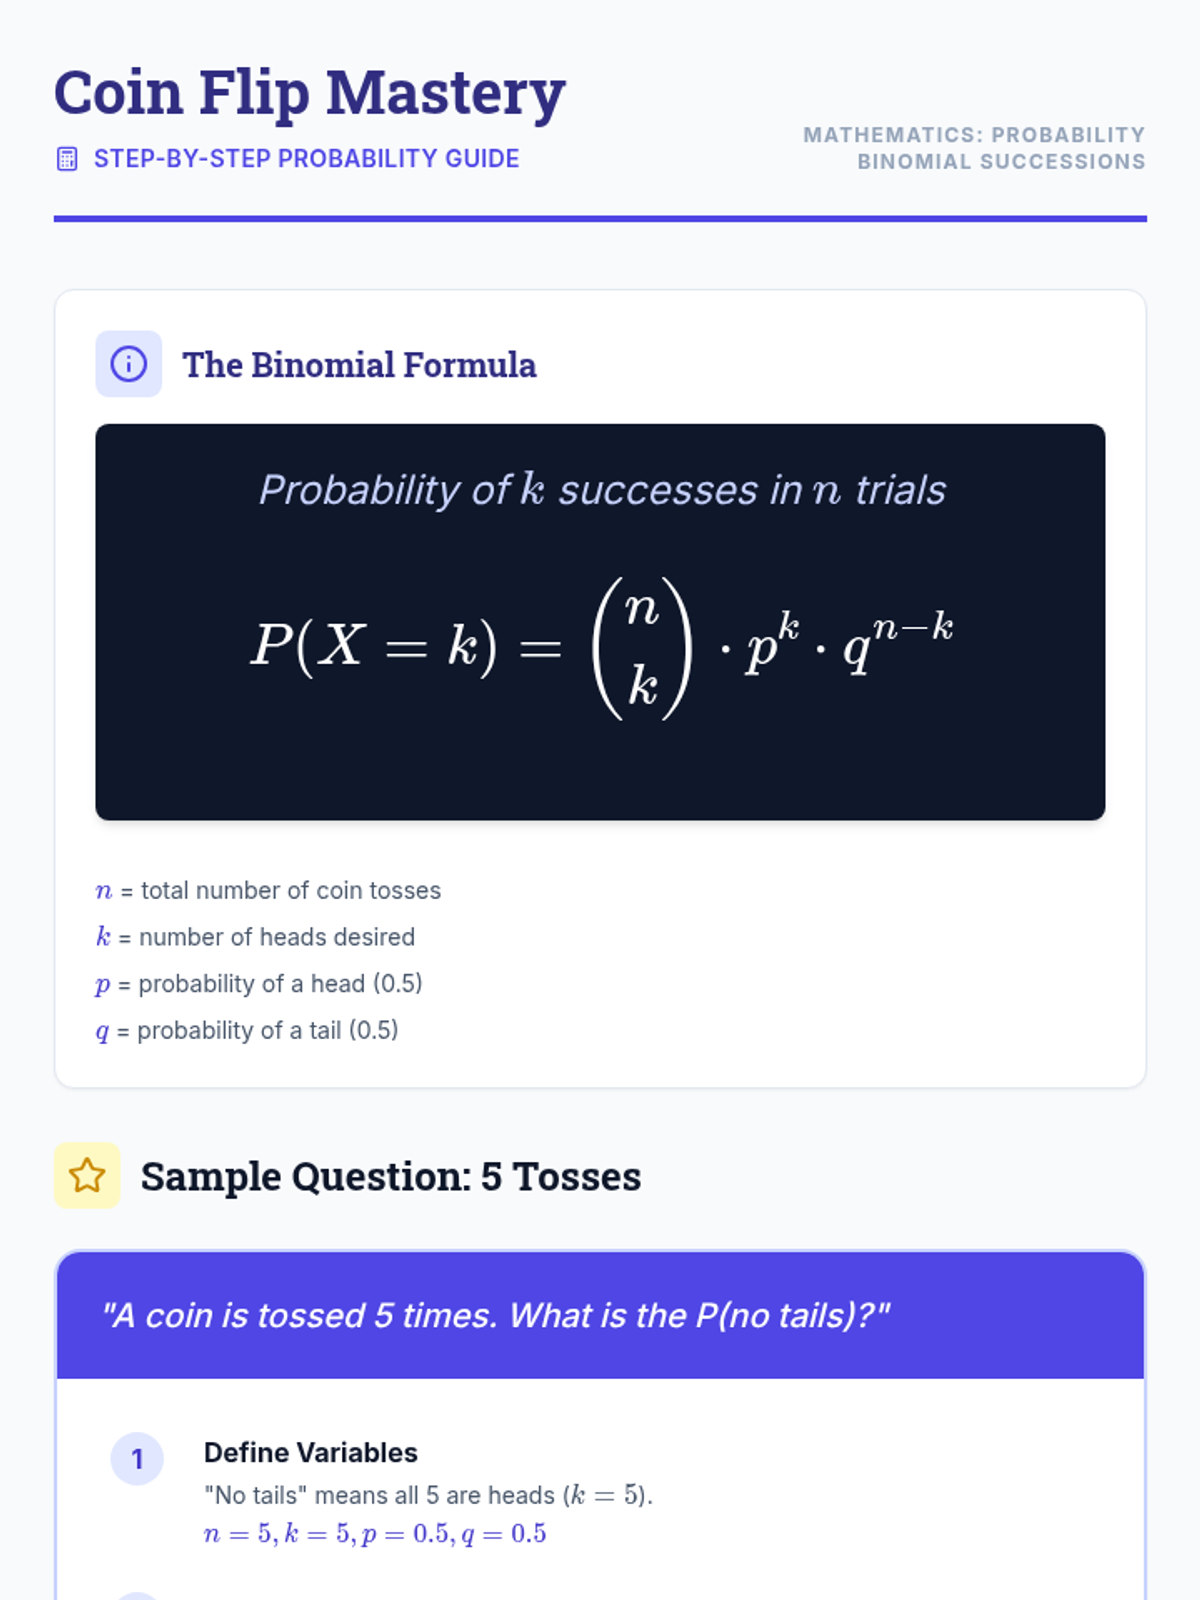
A focused lesson on calculating binomial probabilities for independent coin toss events, specifically focusing on 'all-or-nothing' outcomes.
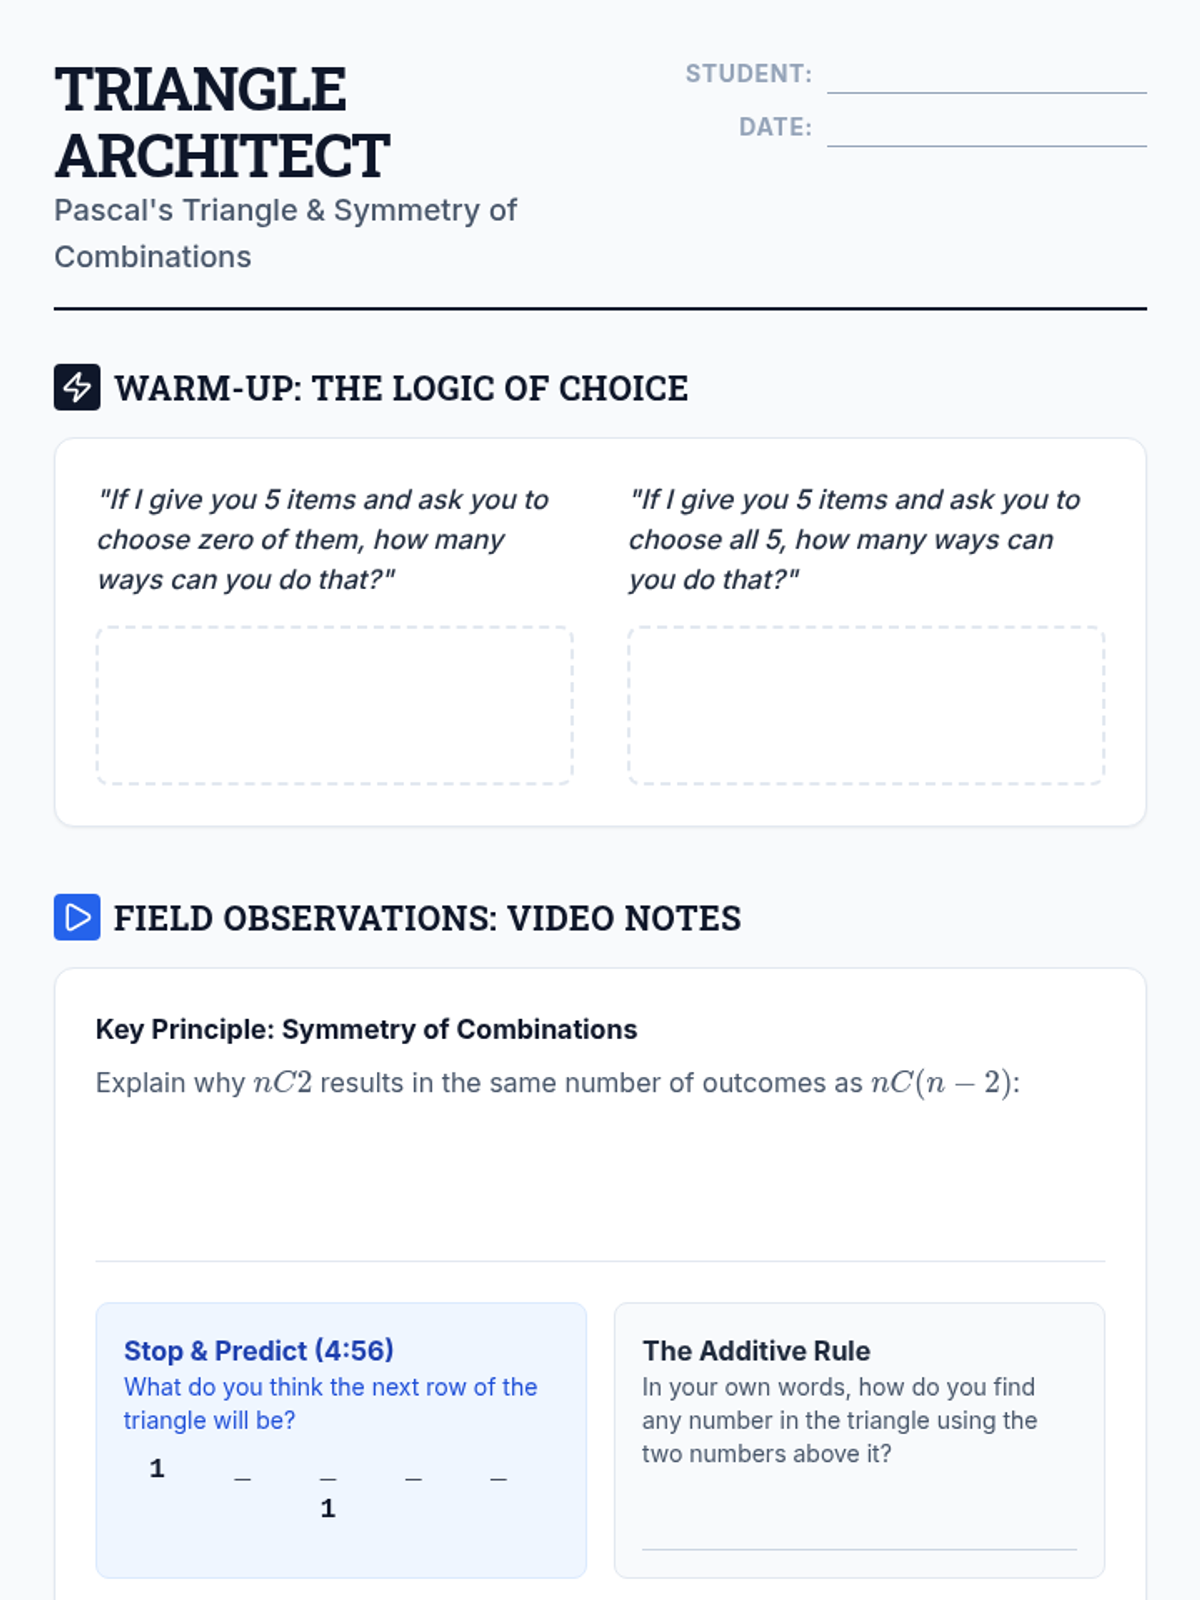
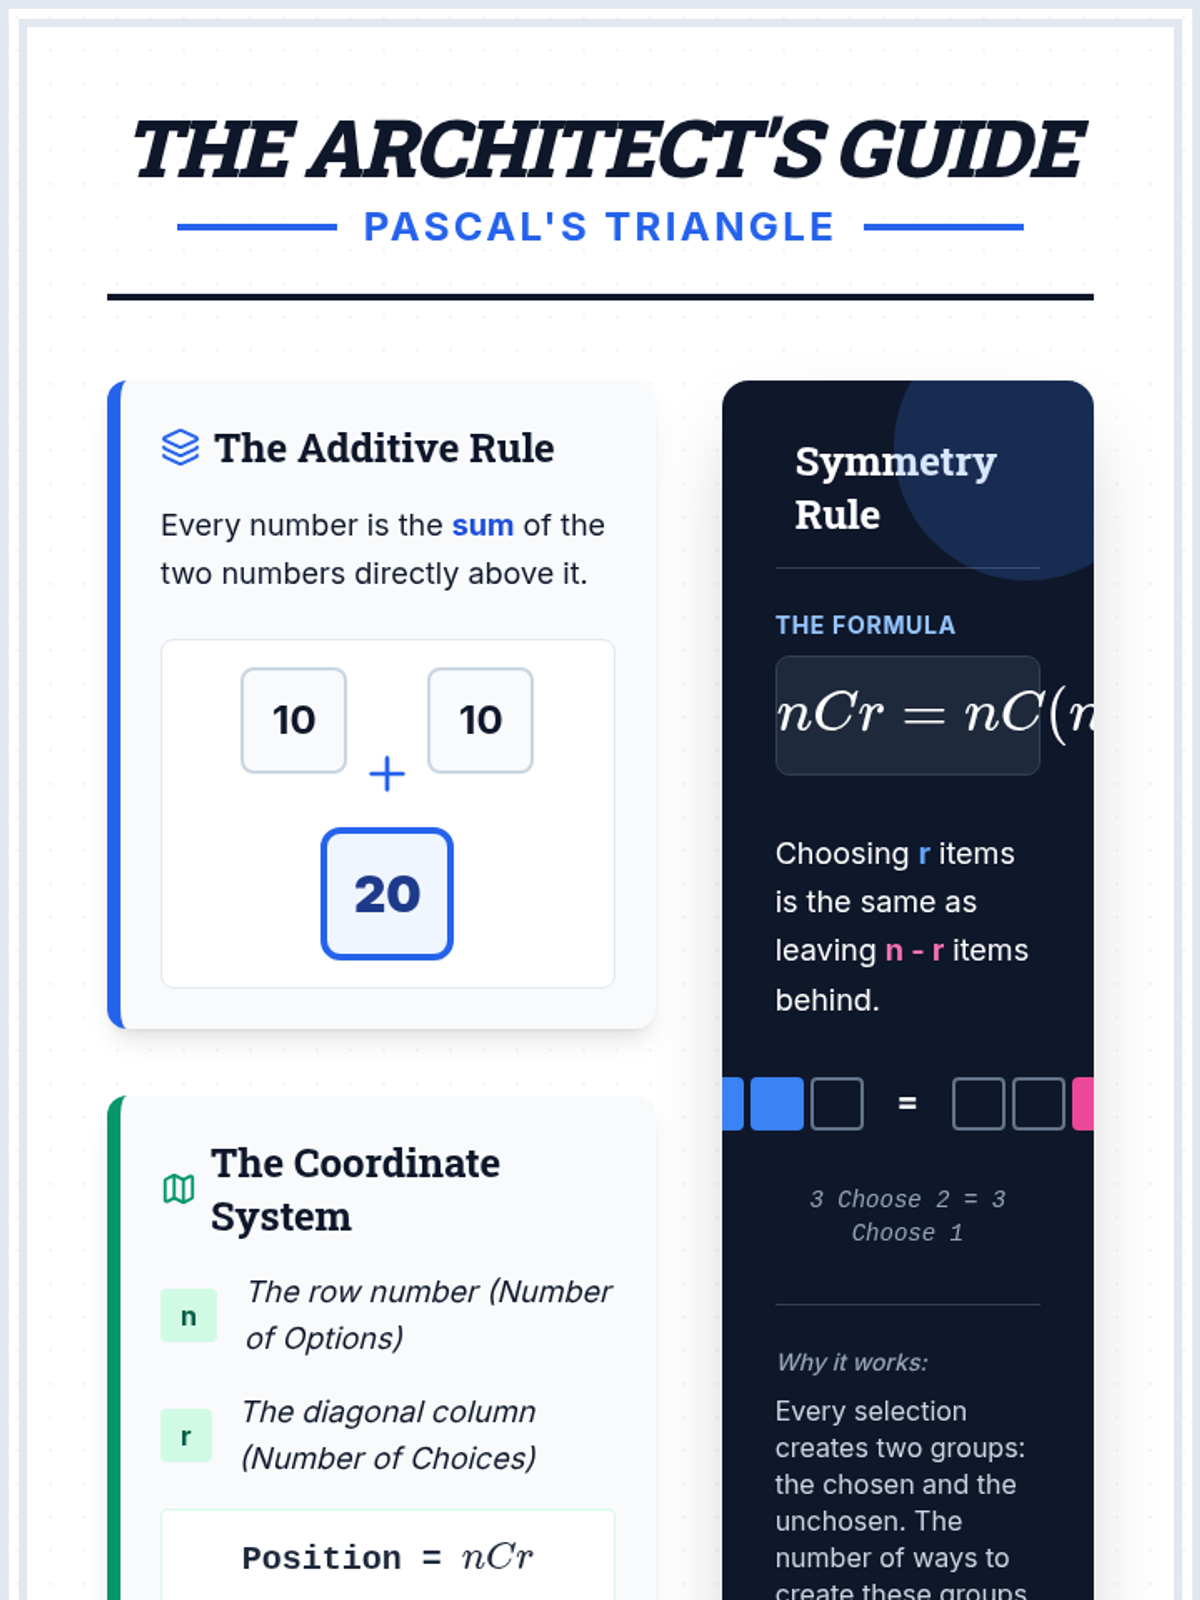
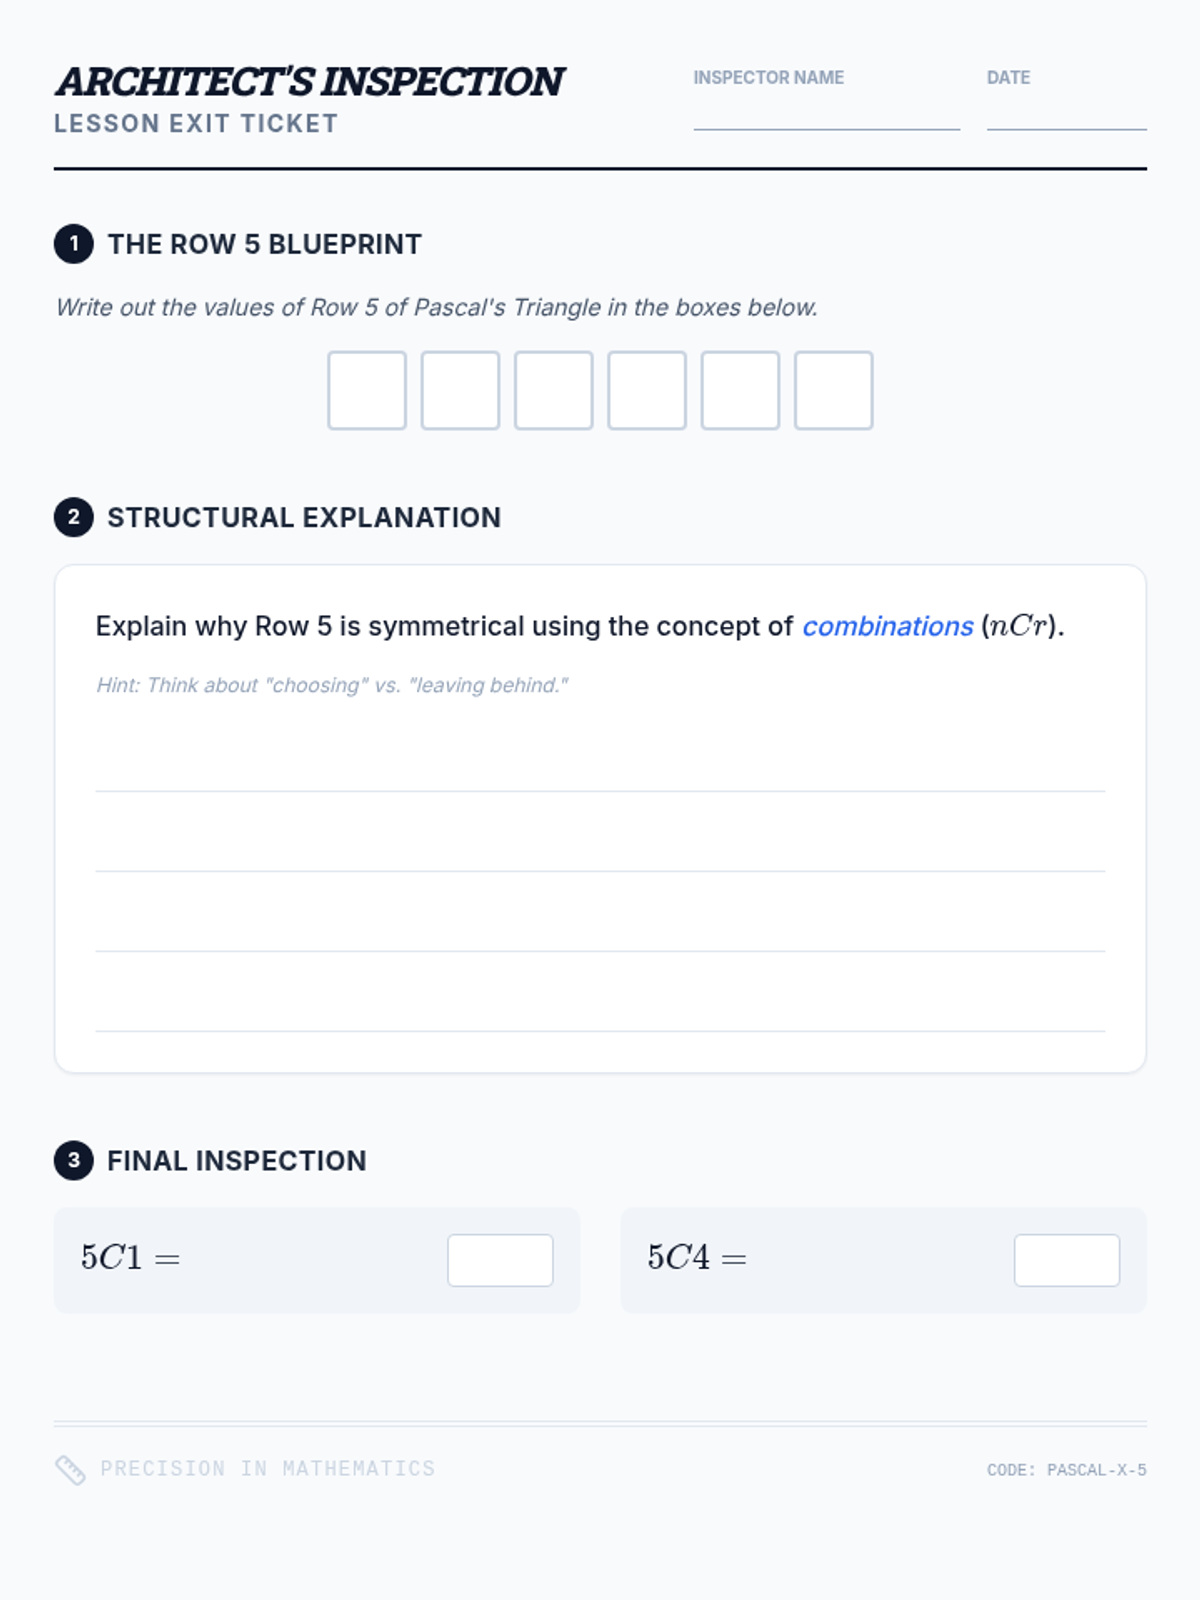
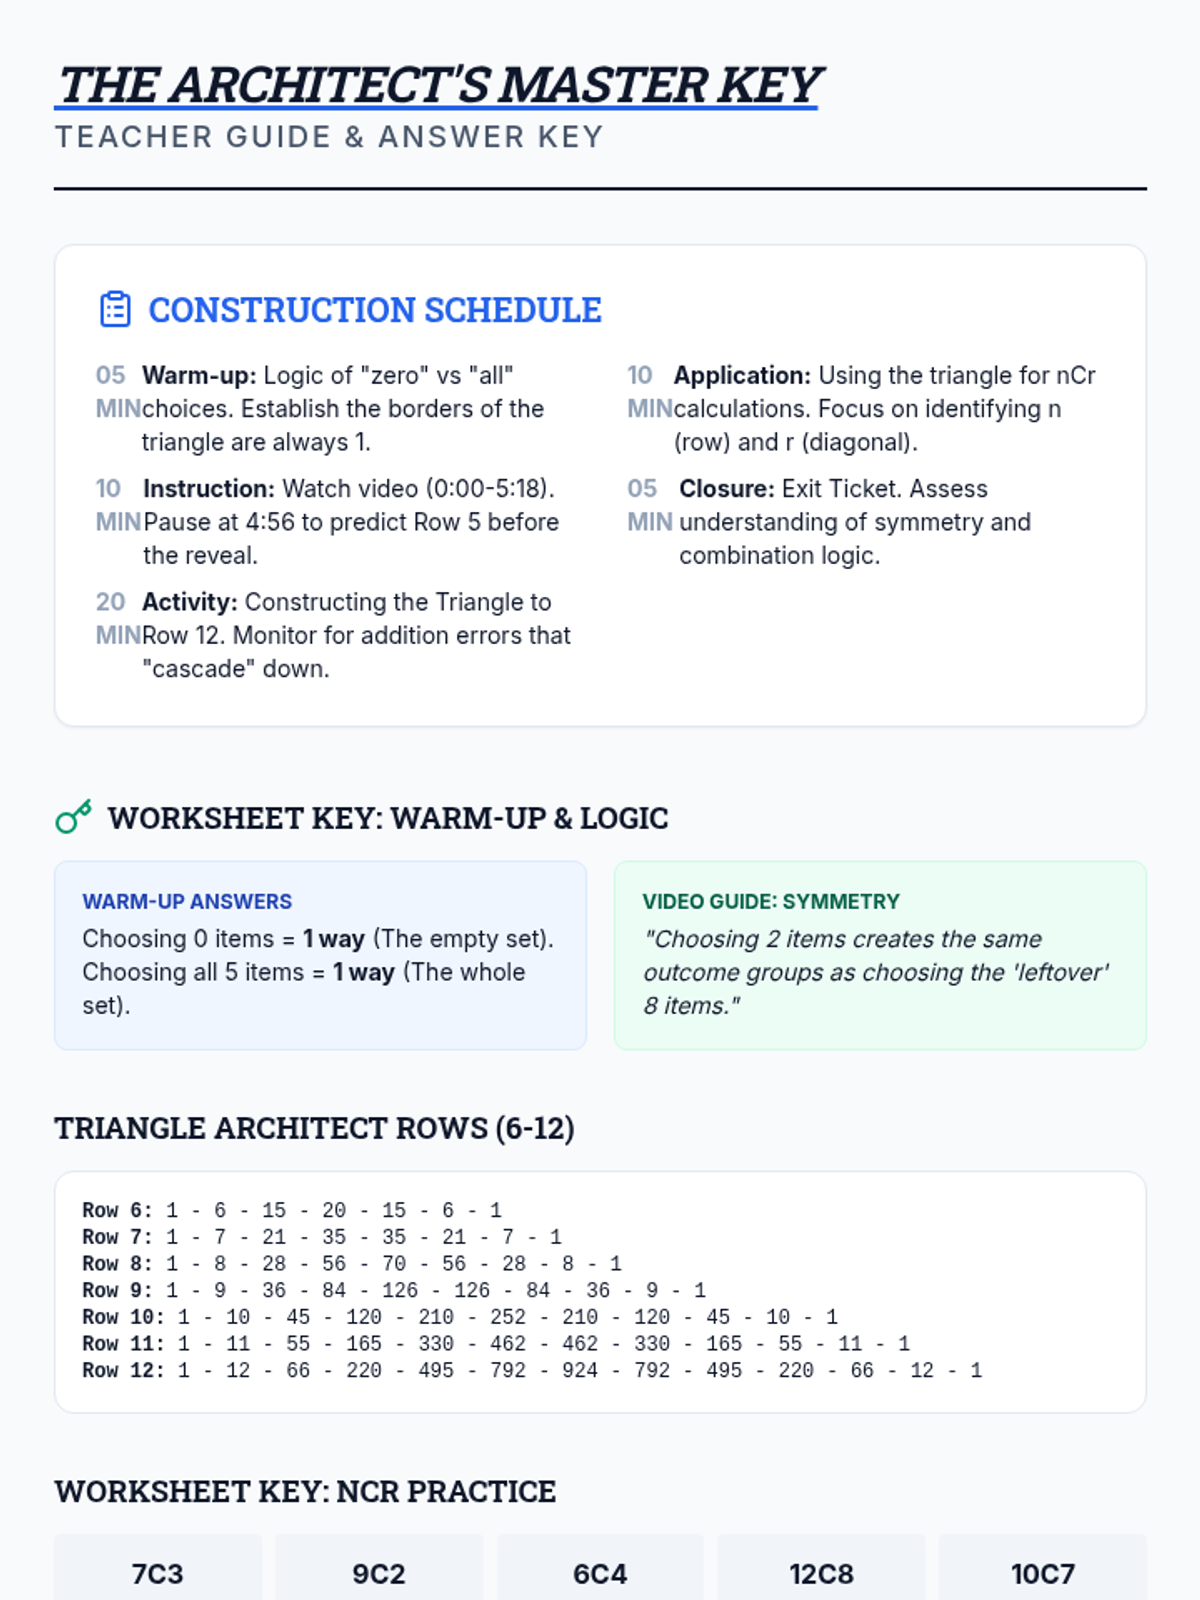
Students will construct Pascal's Triangle and explore the mathematical logic of the symmetry of combinations ($nCr = nC(n-r)$) through visual patterns and algebraic reasoning.
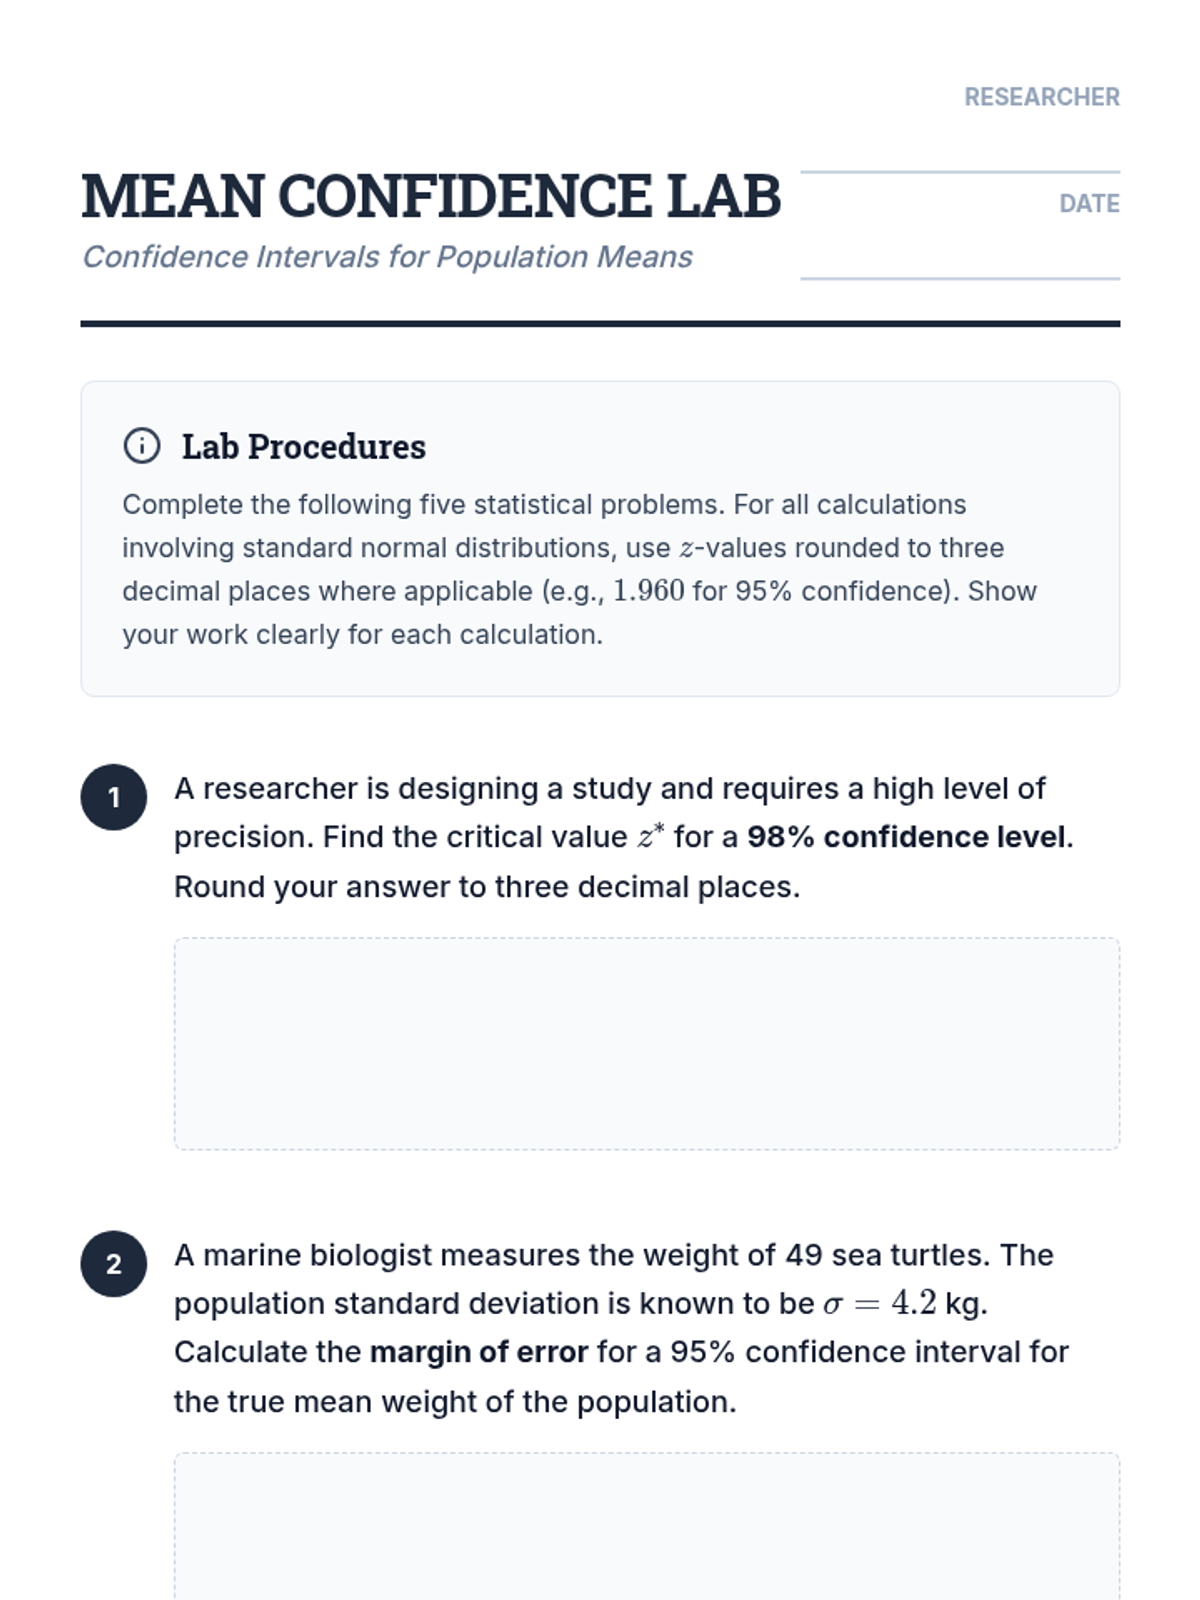
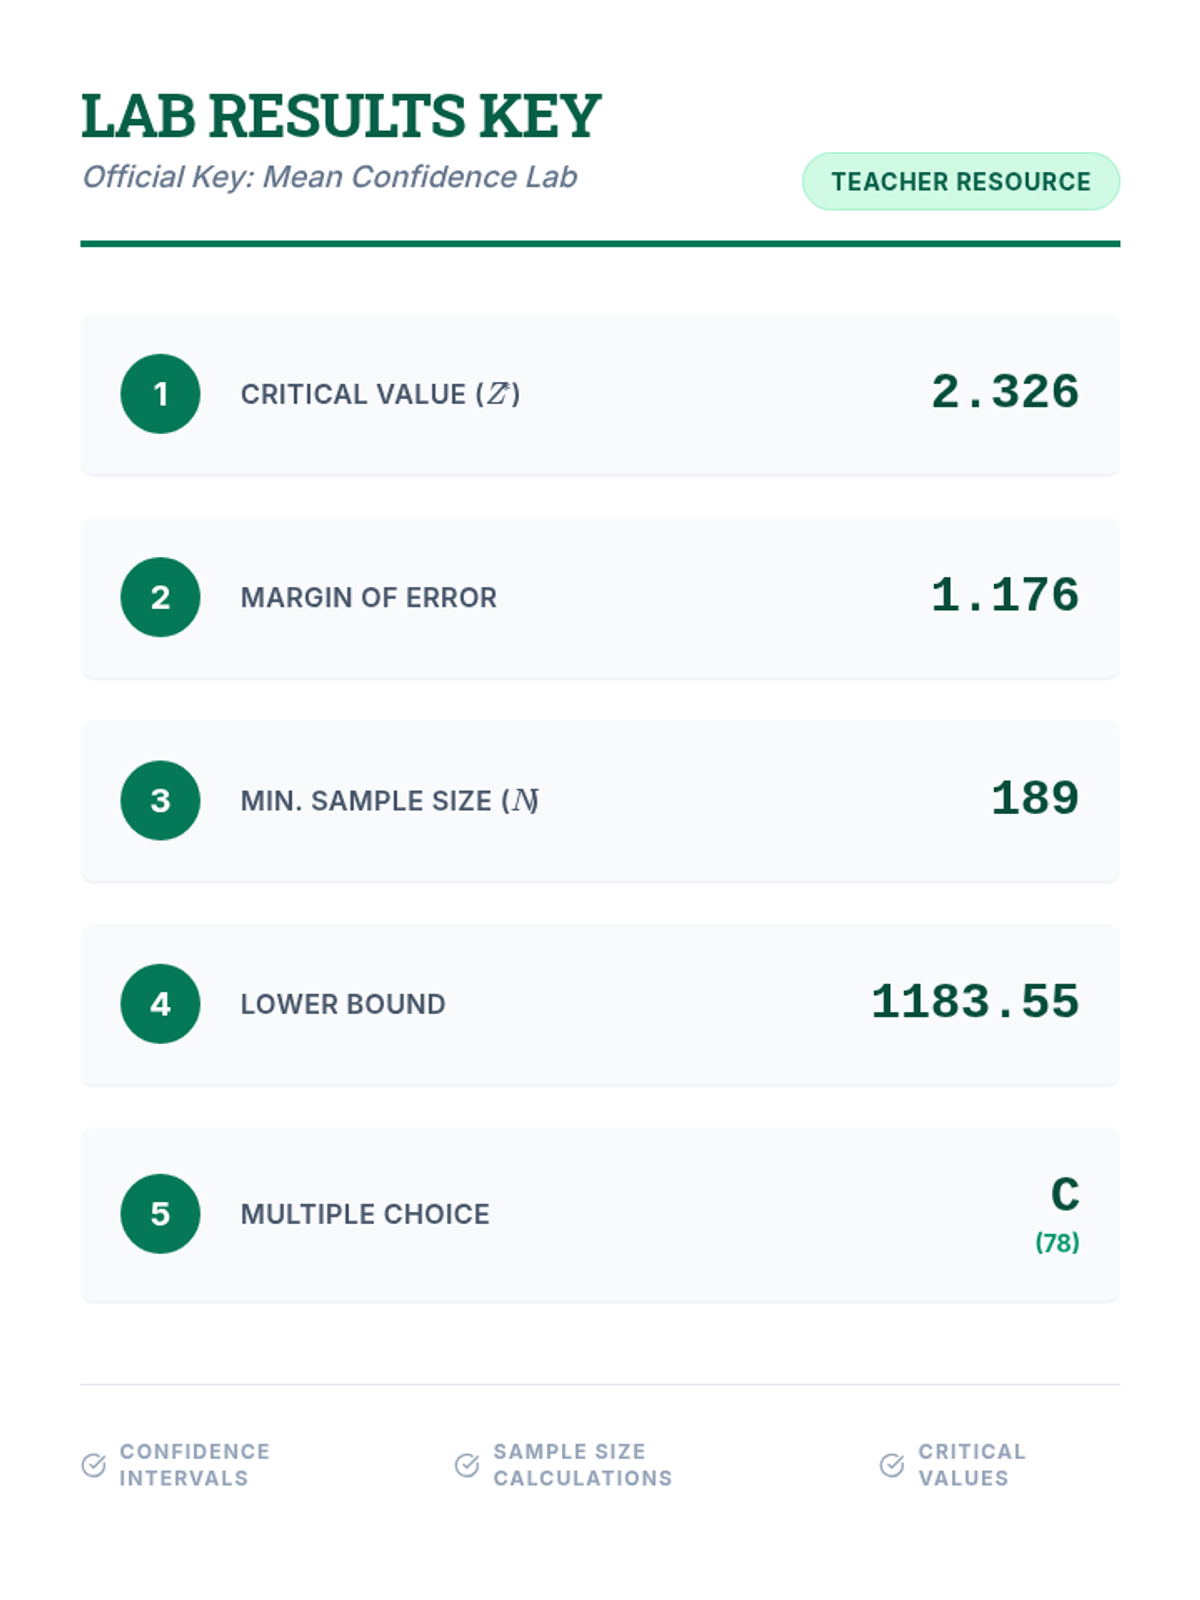
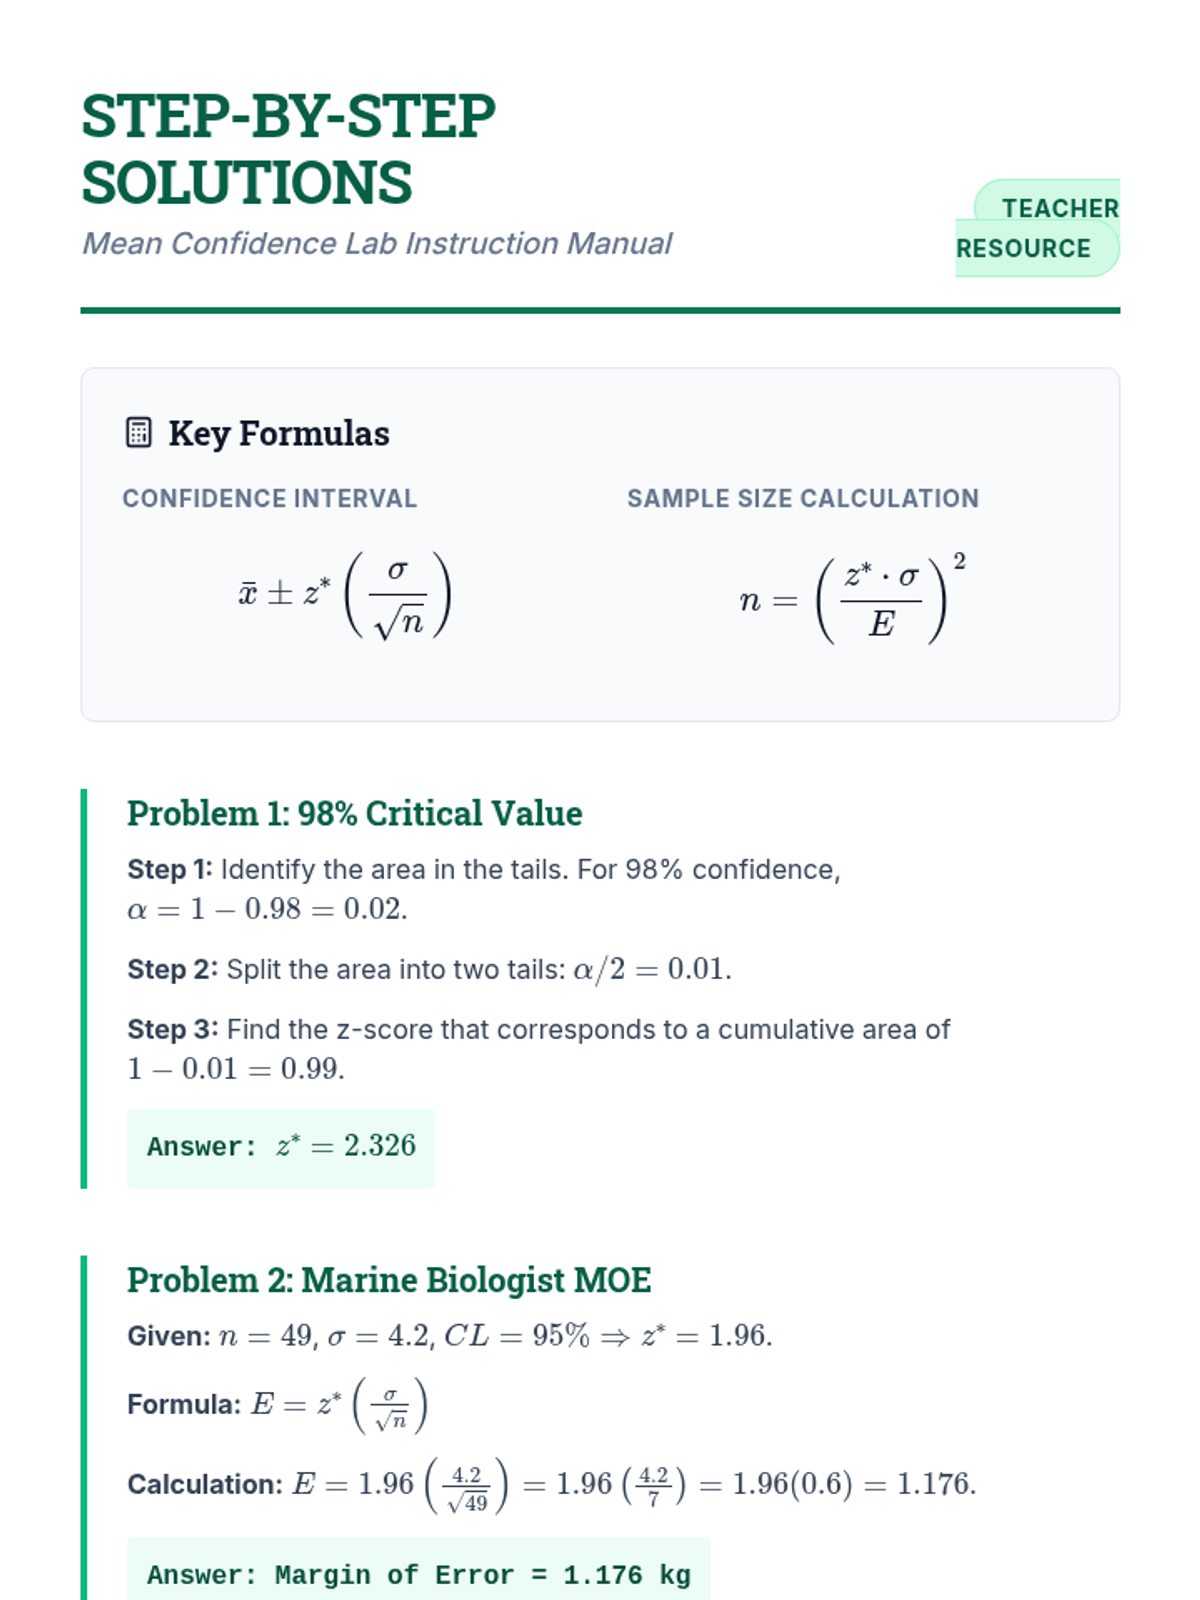
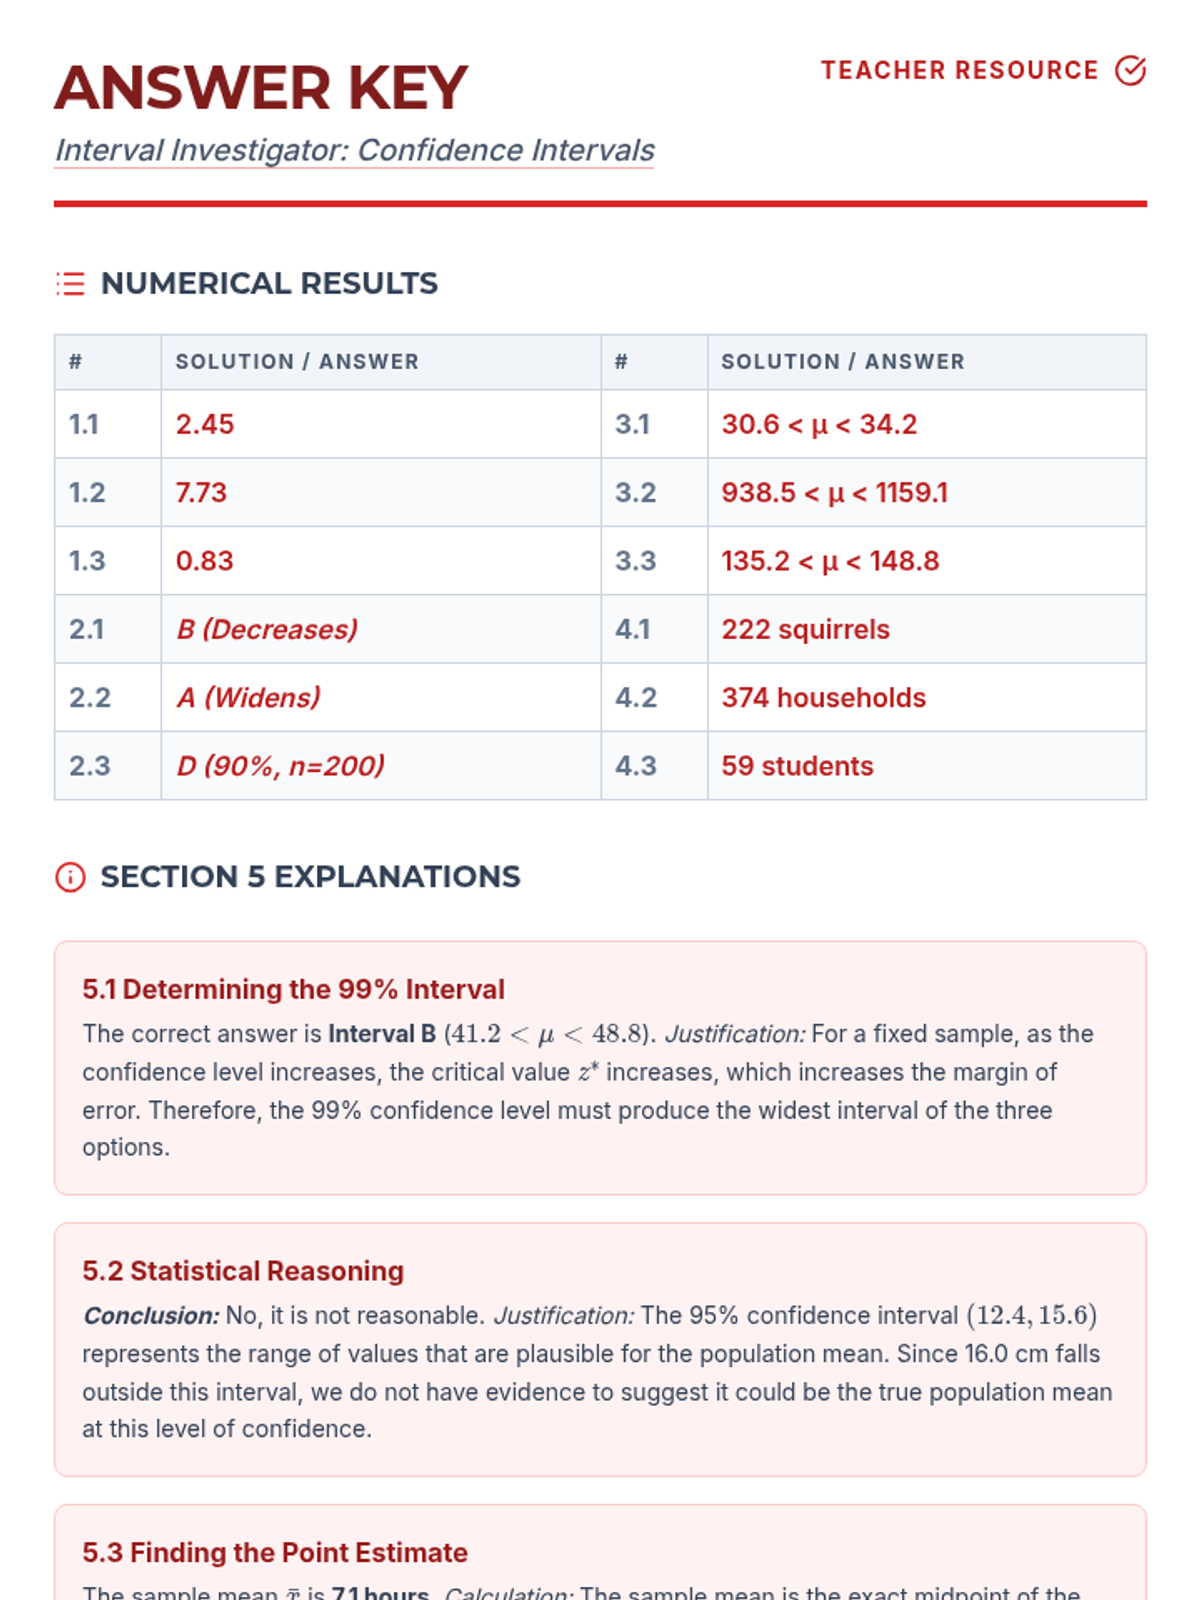
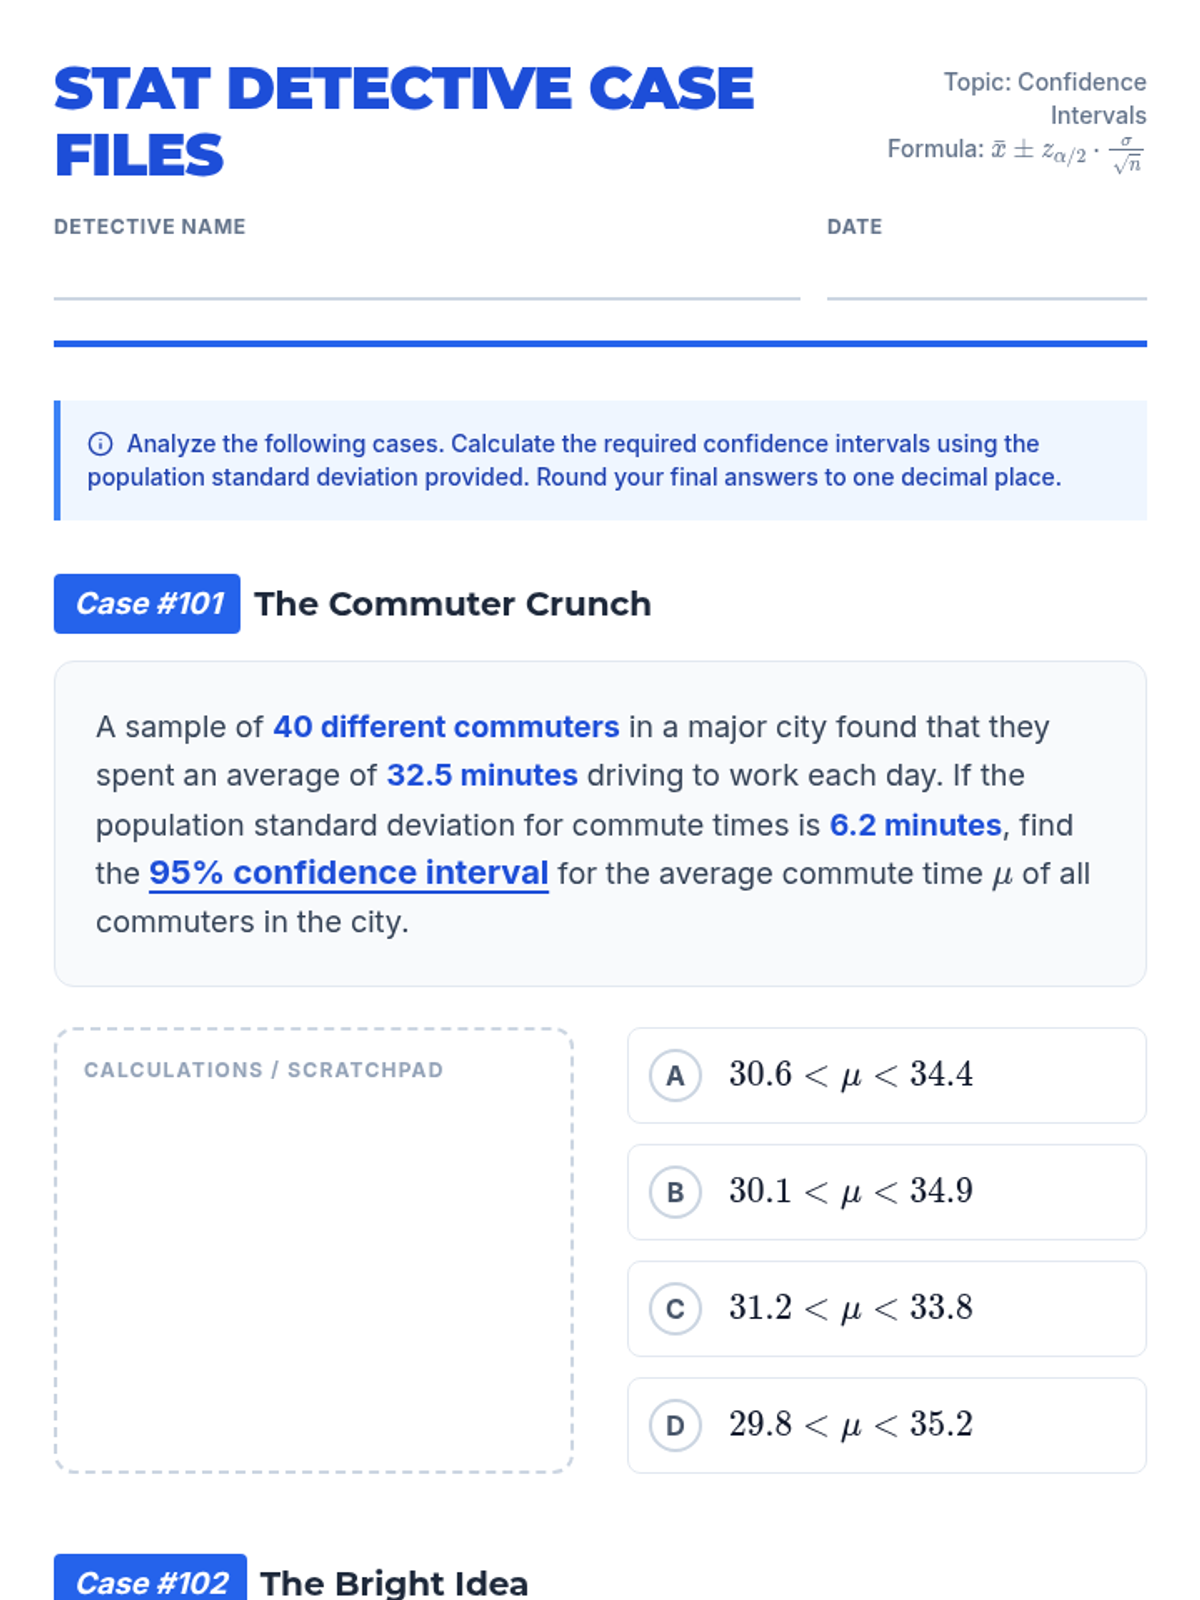
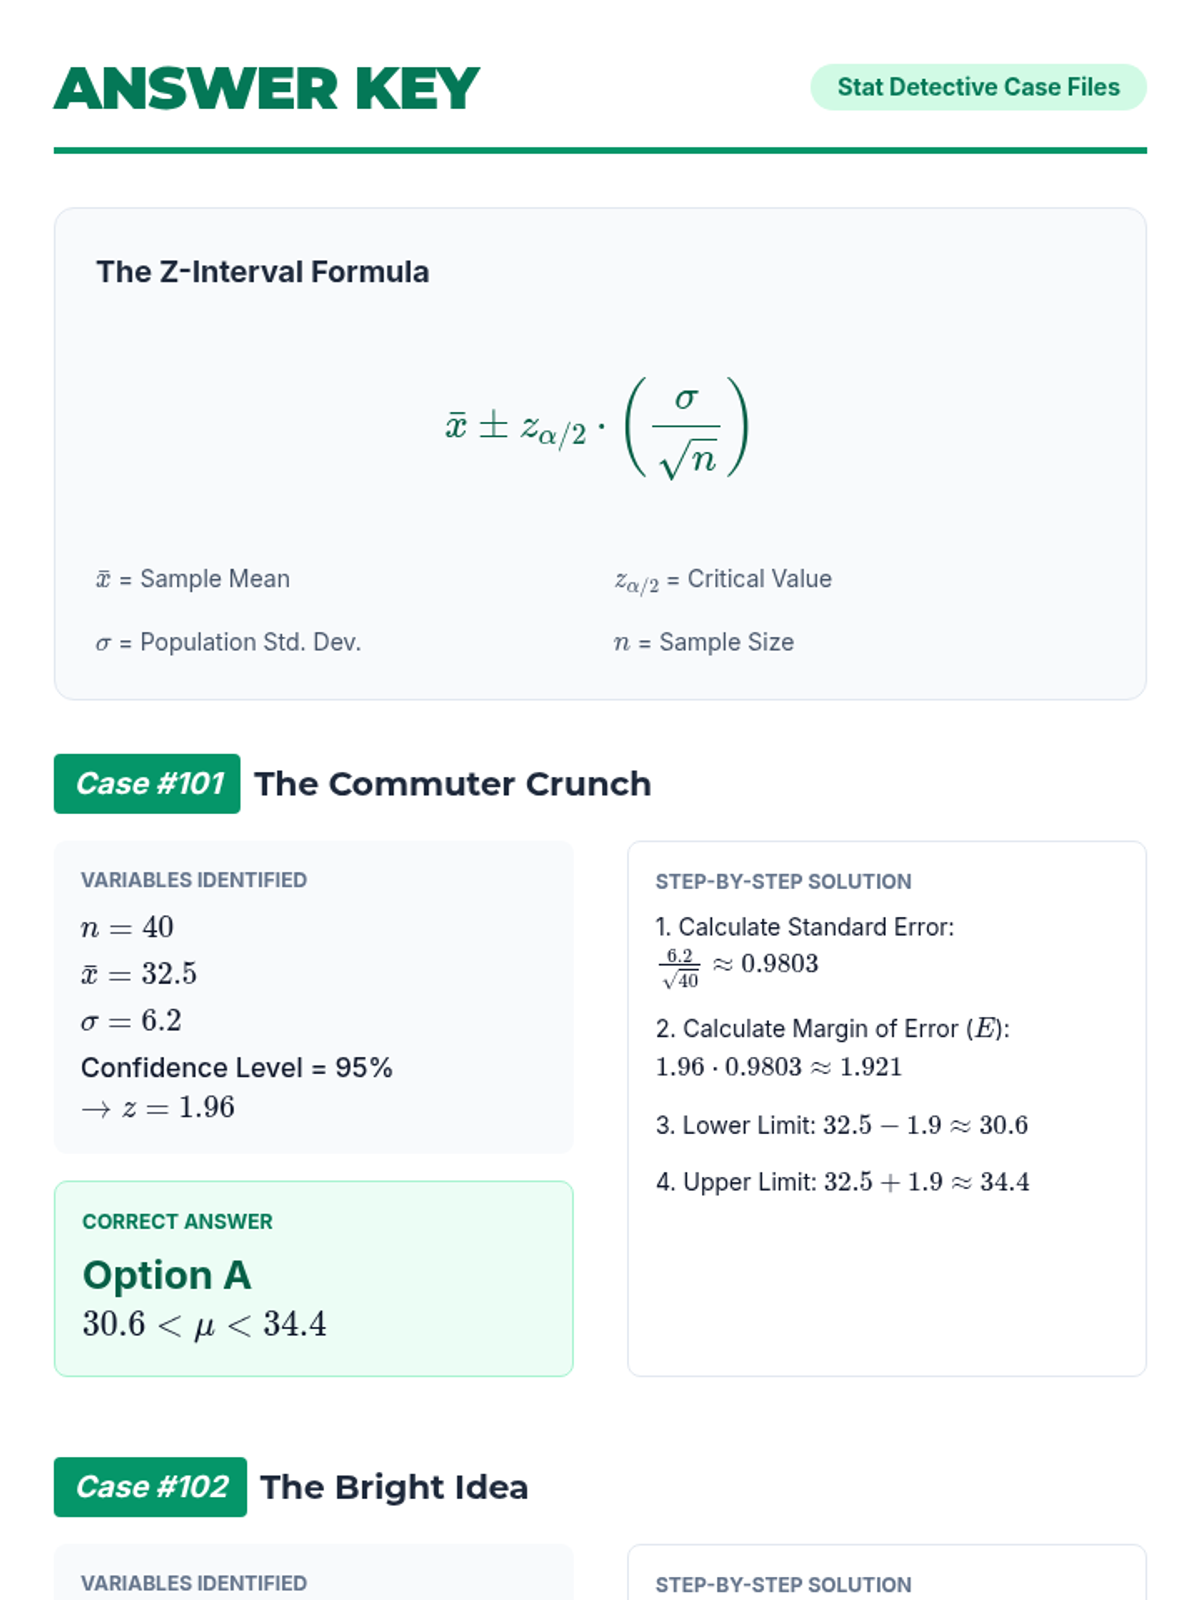
A focused practice set on calculating confidence intervals for means, finding critical values, and determining minimum sample sizes for specific margins of error.
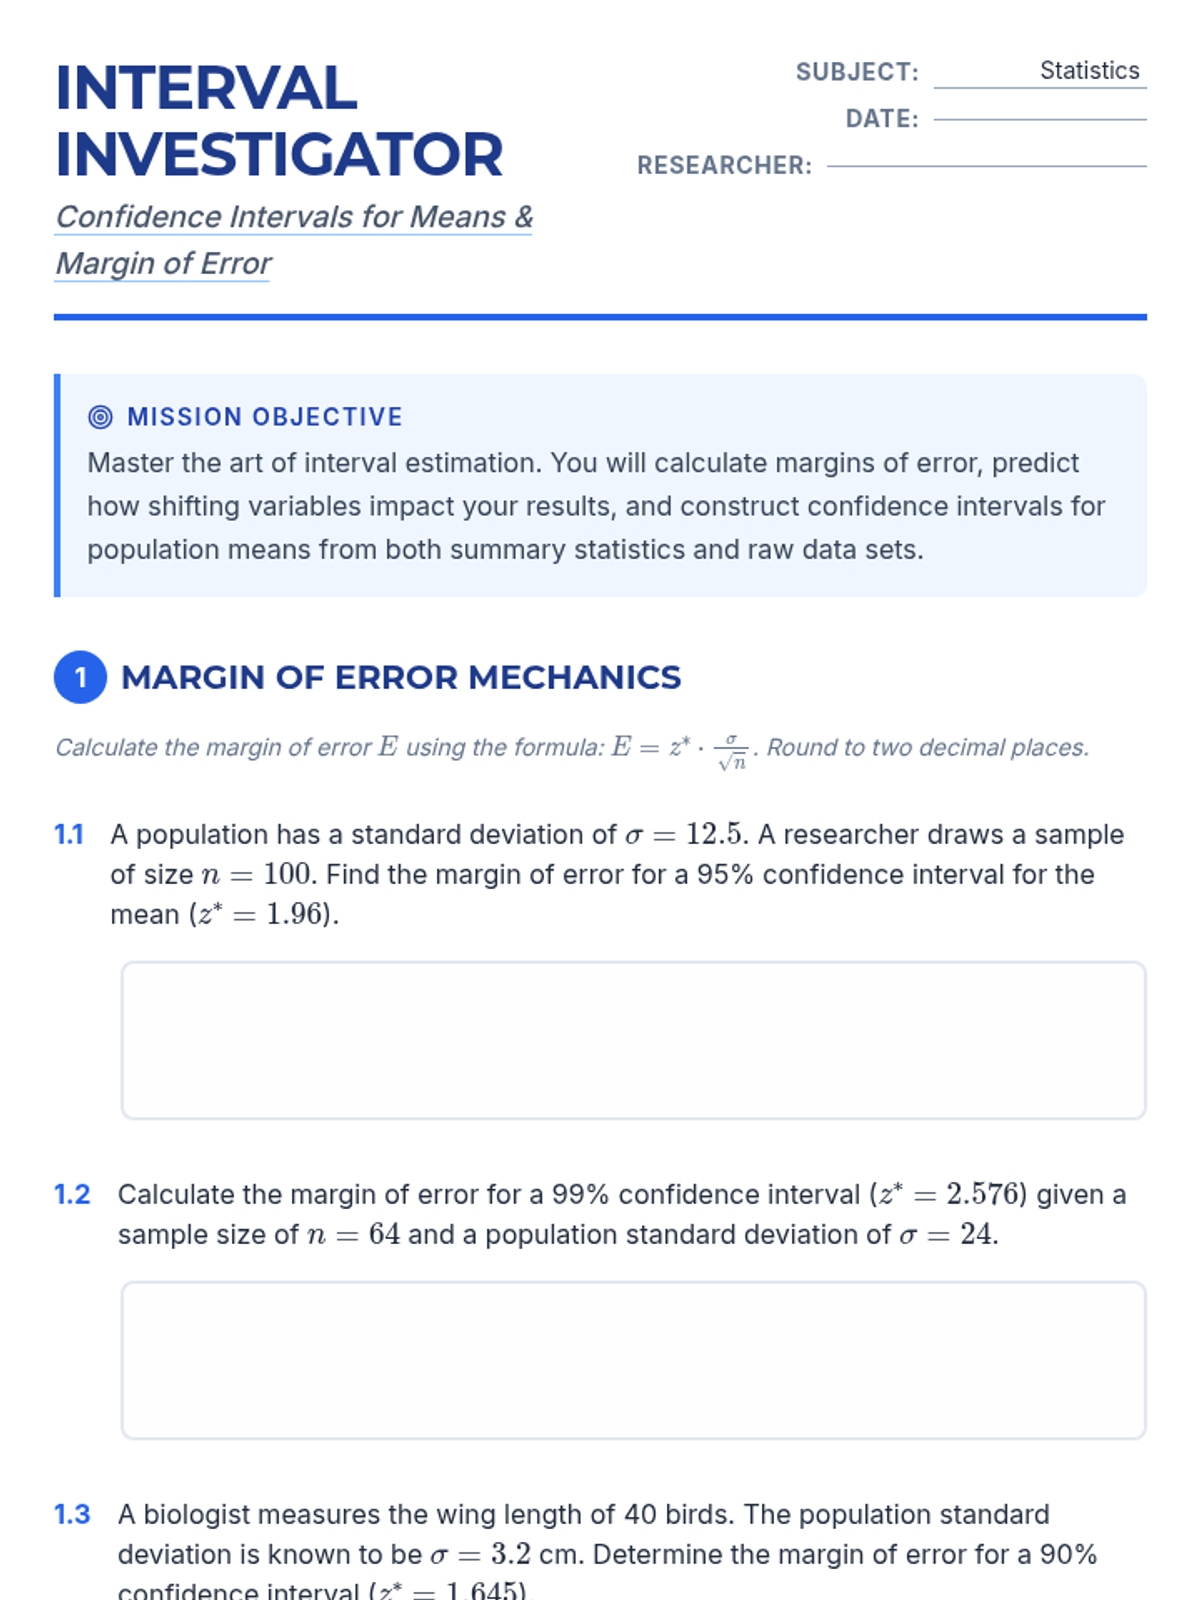
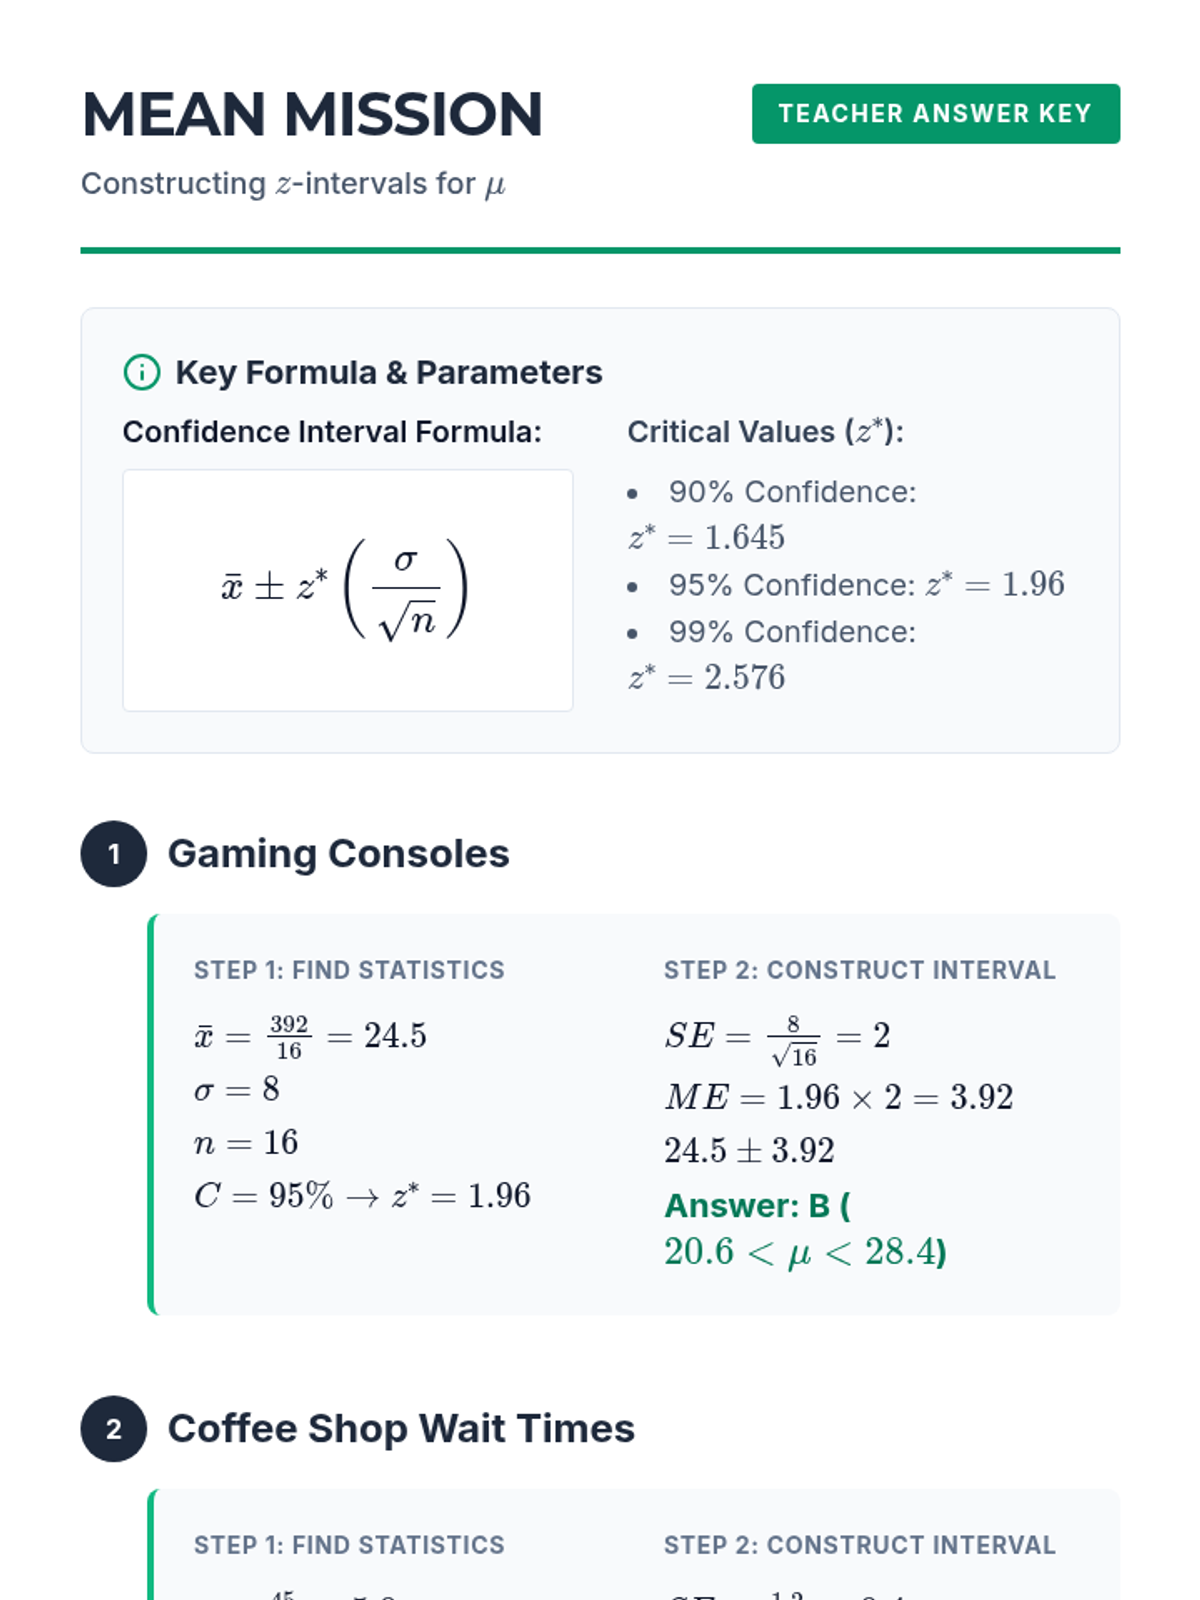
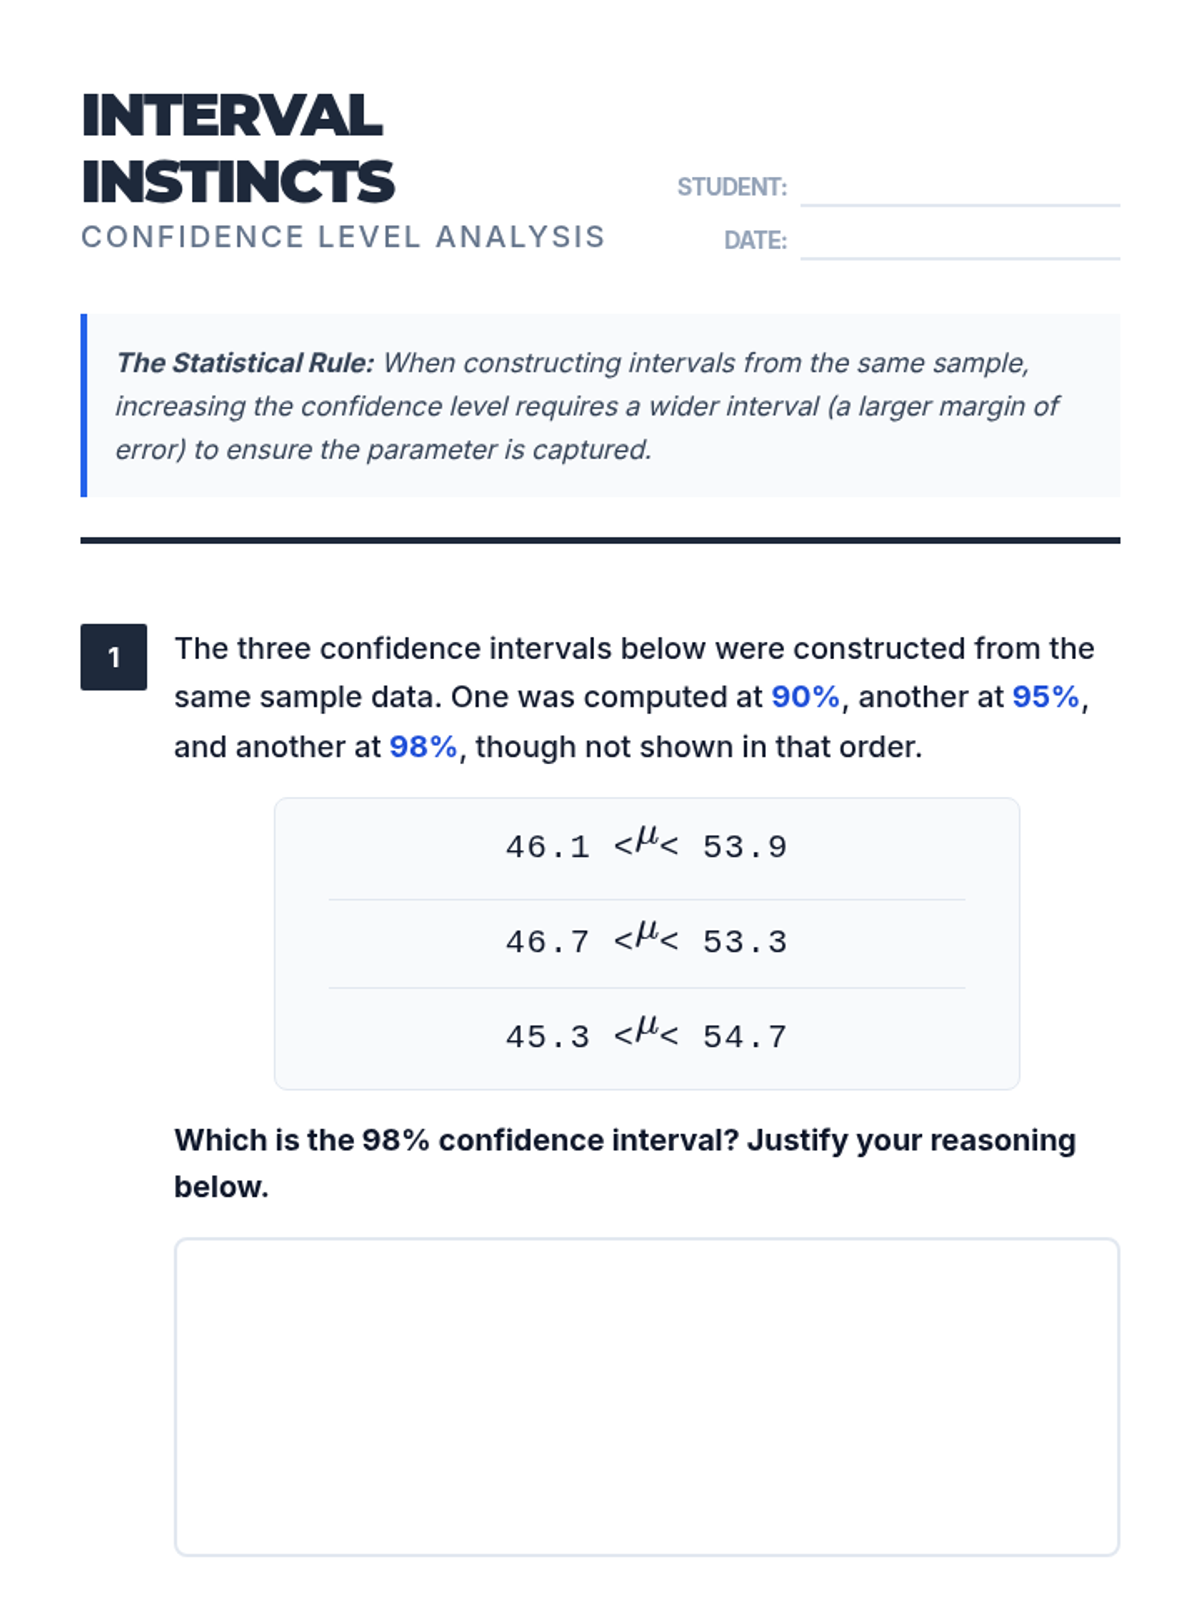
A comprehensive lesson focusing on constructing and interpreting confidence intervals for population means, specifically targeting how various factors like sample size and confidence level influence the margin of error.
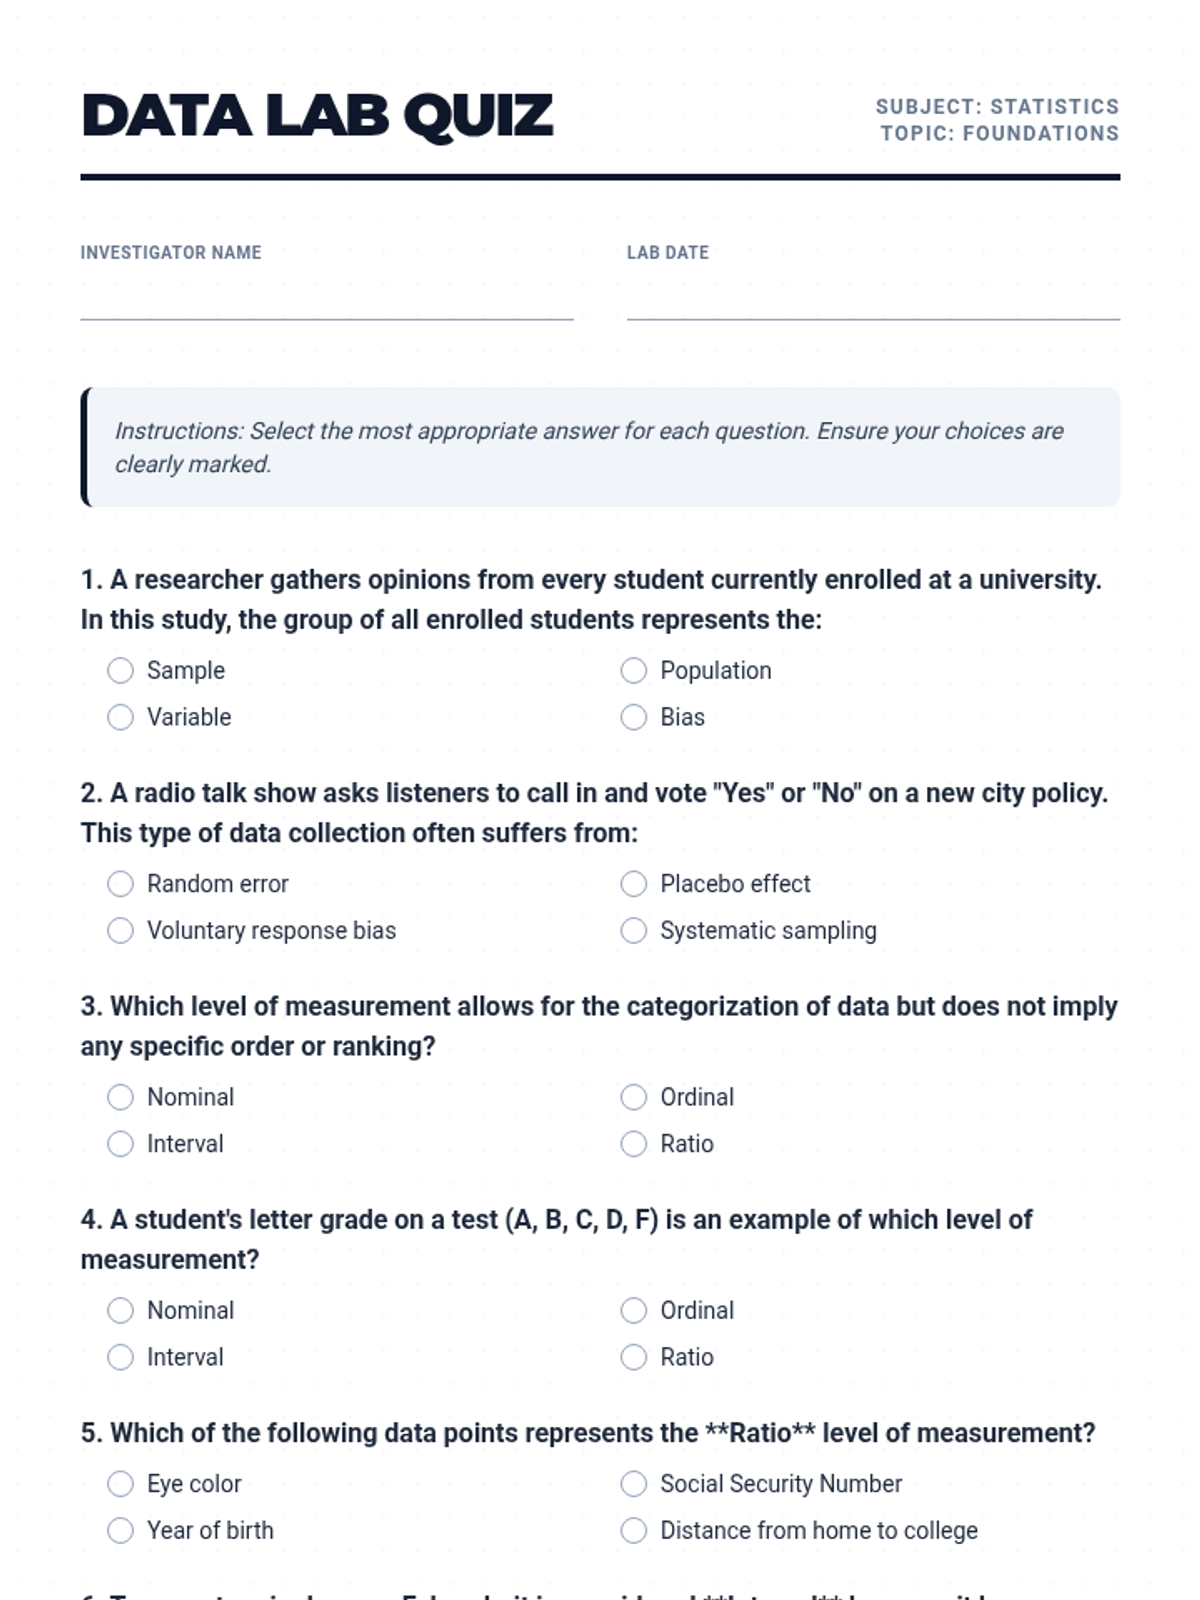
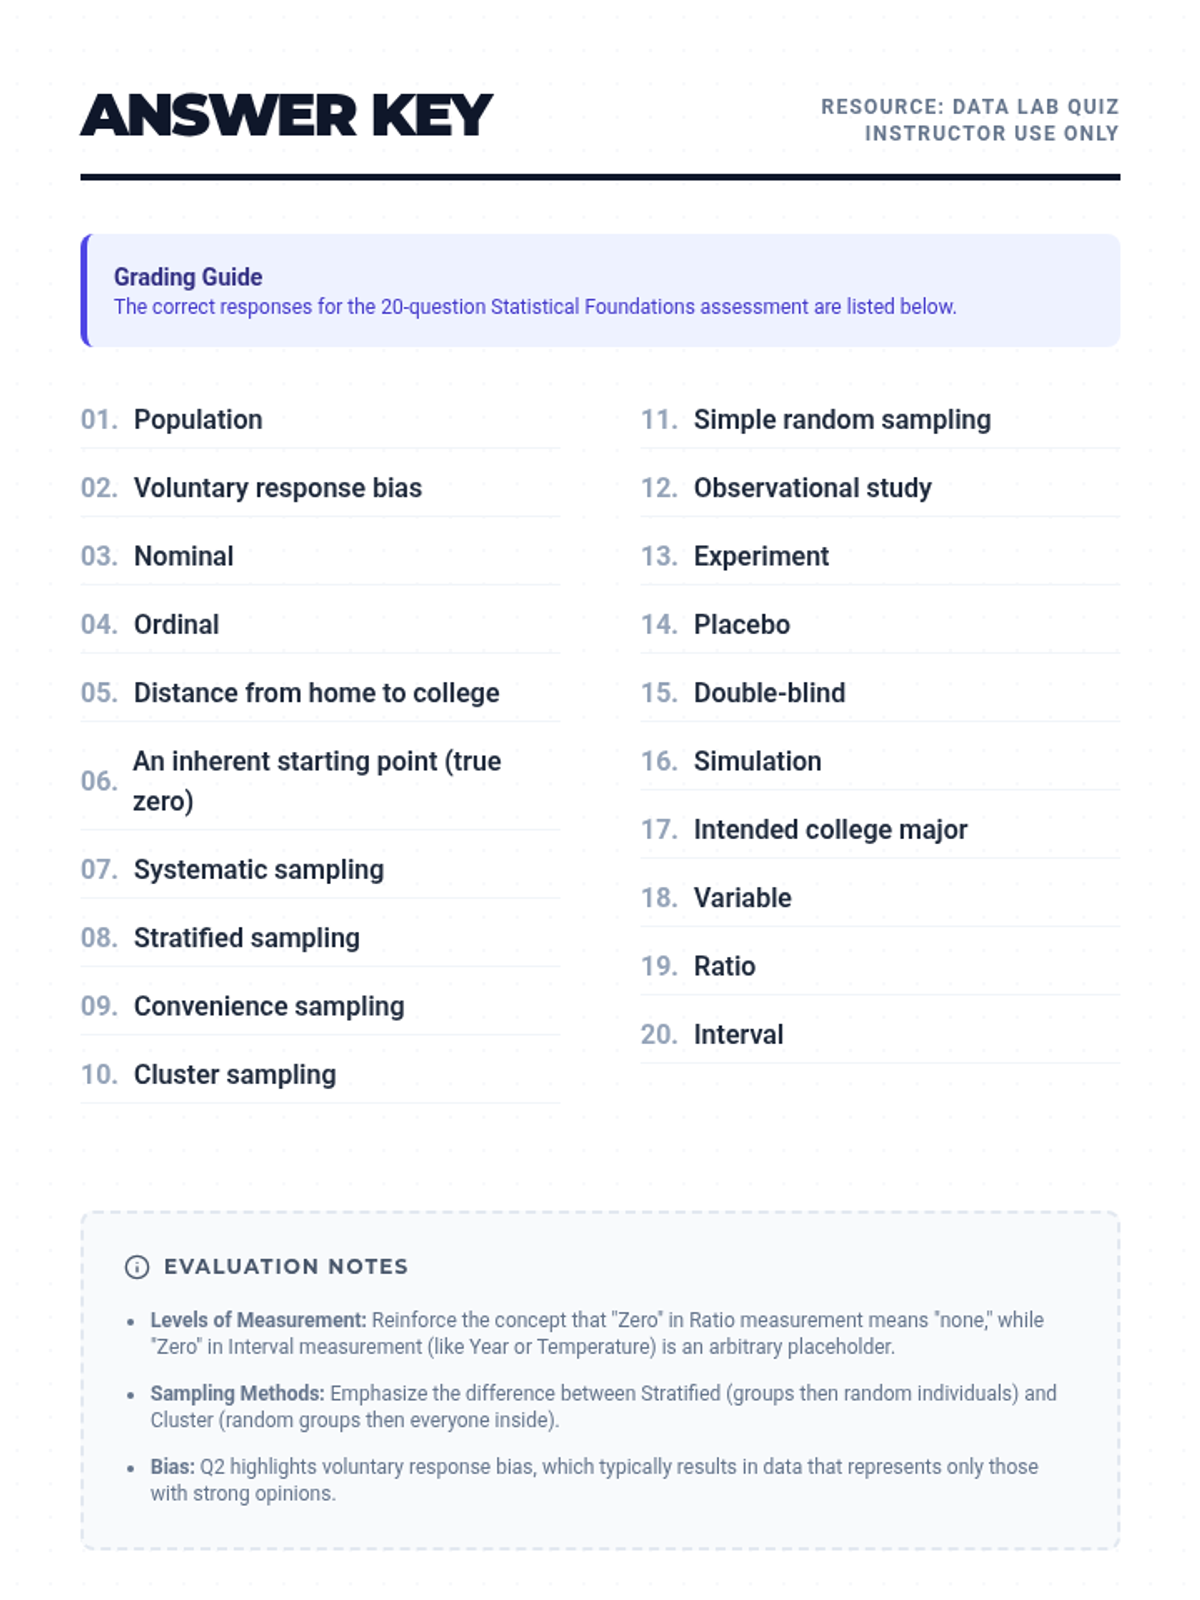
A comprehensive introduction to the fundamental concepts of statistics, including data classification, sampling methods, and experimental design.
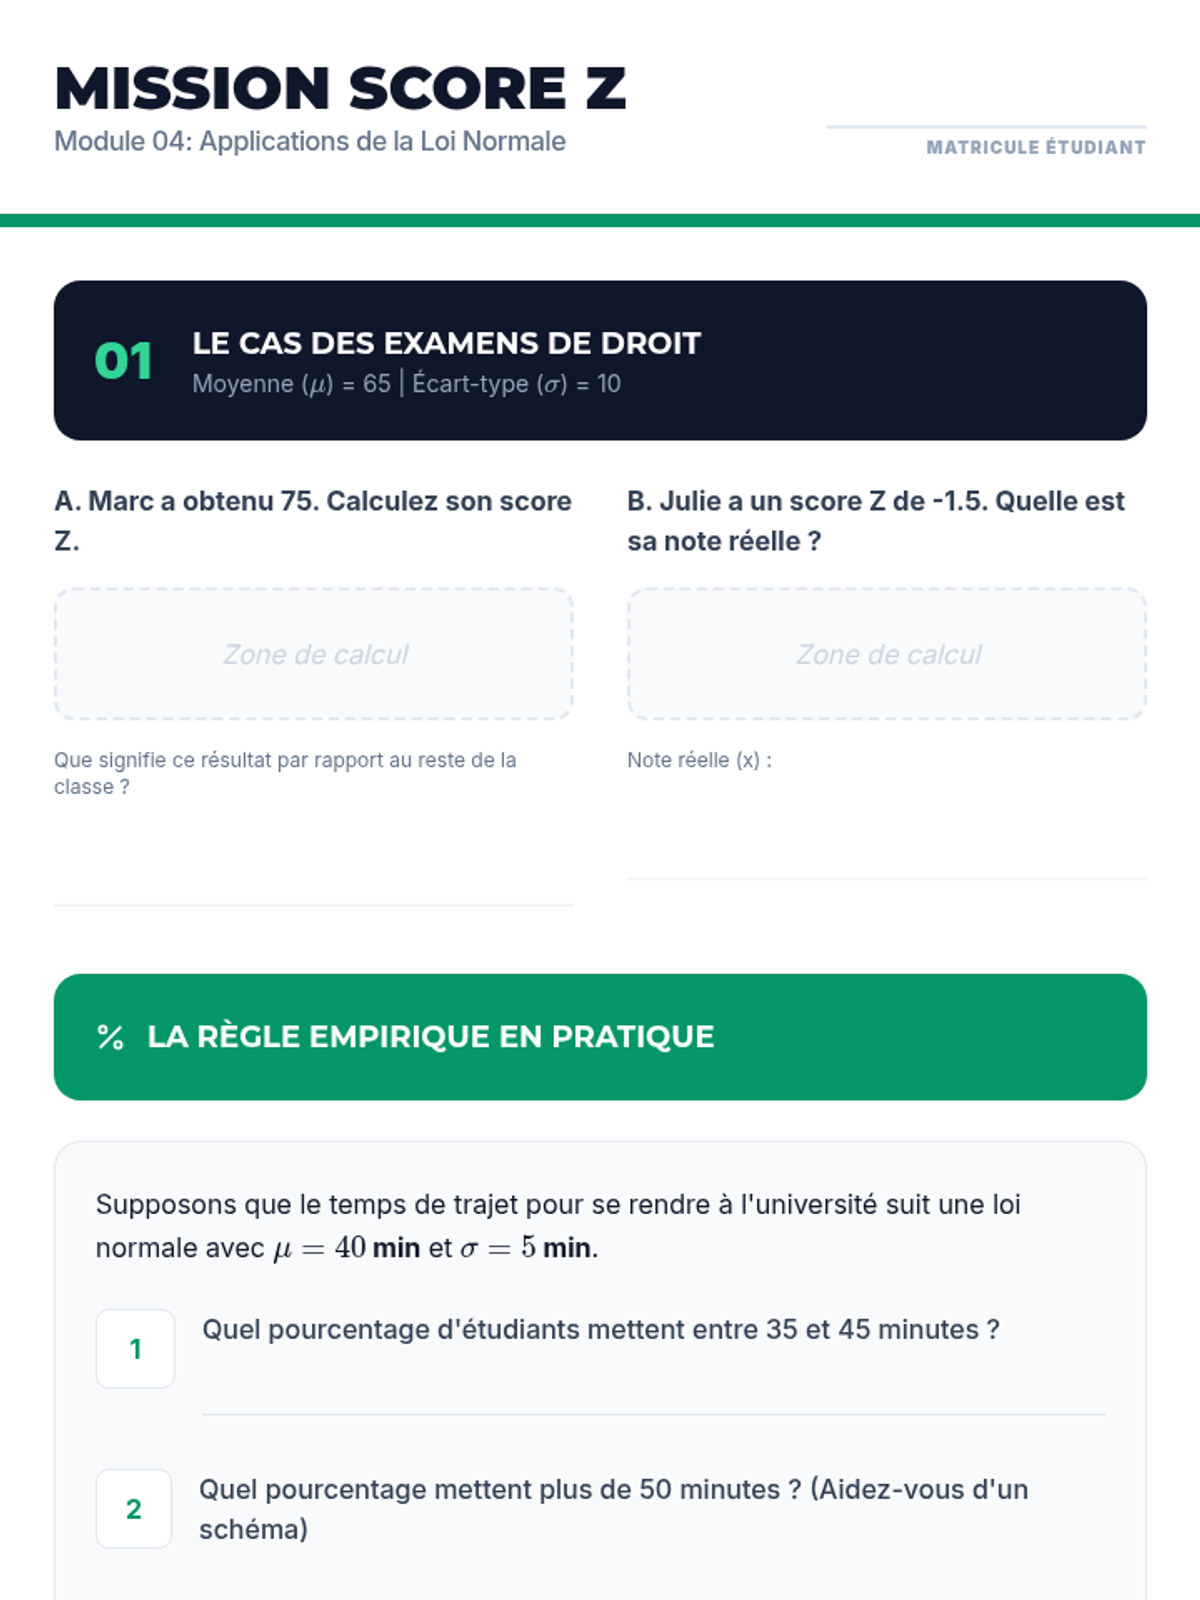
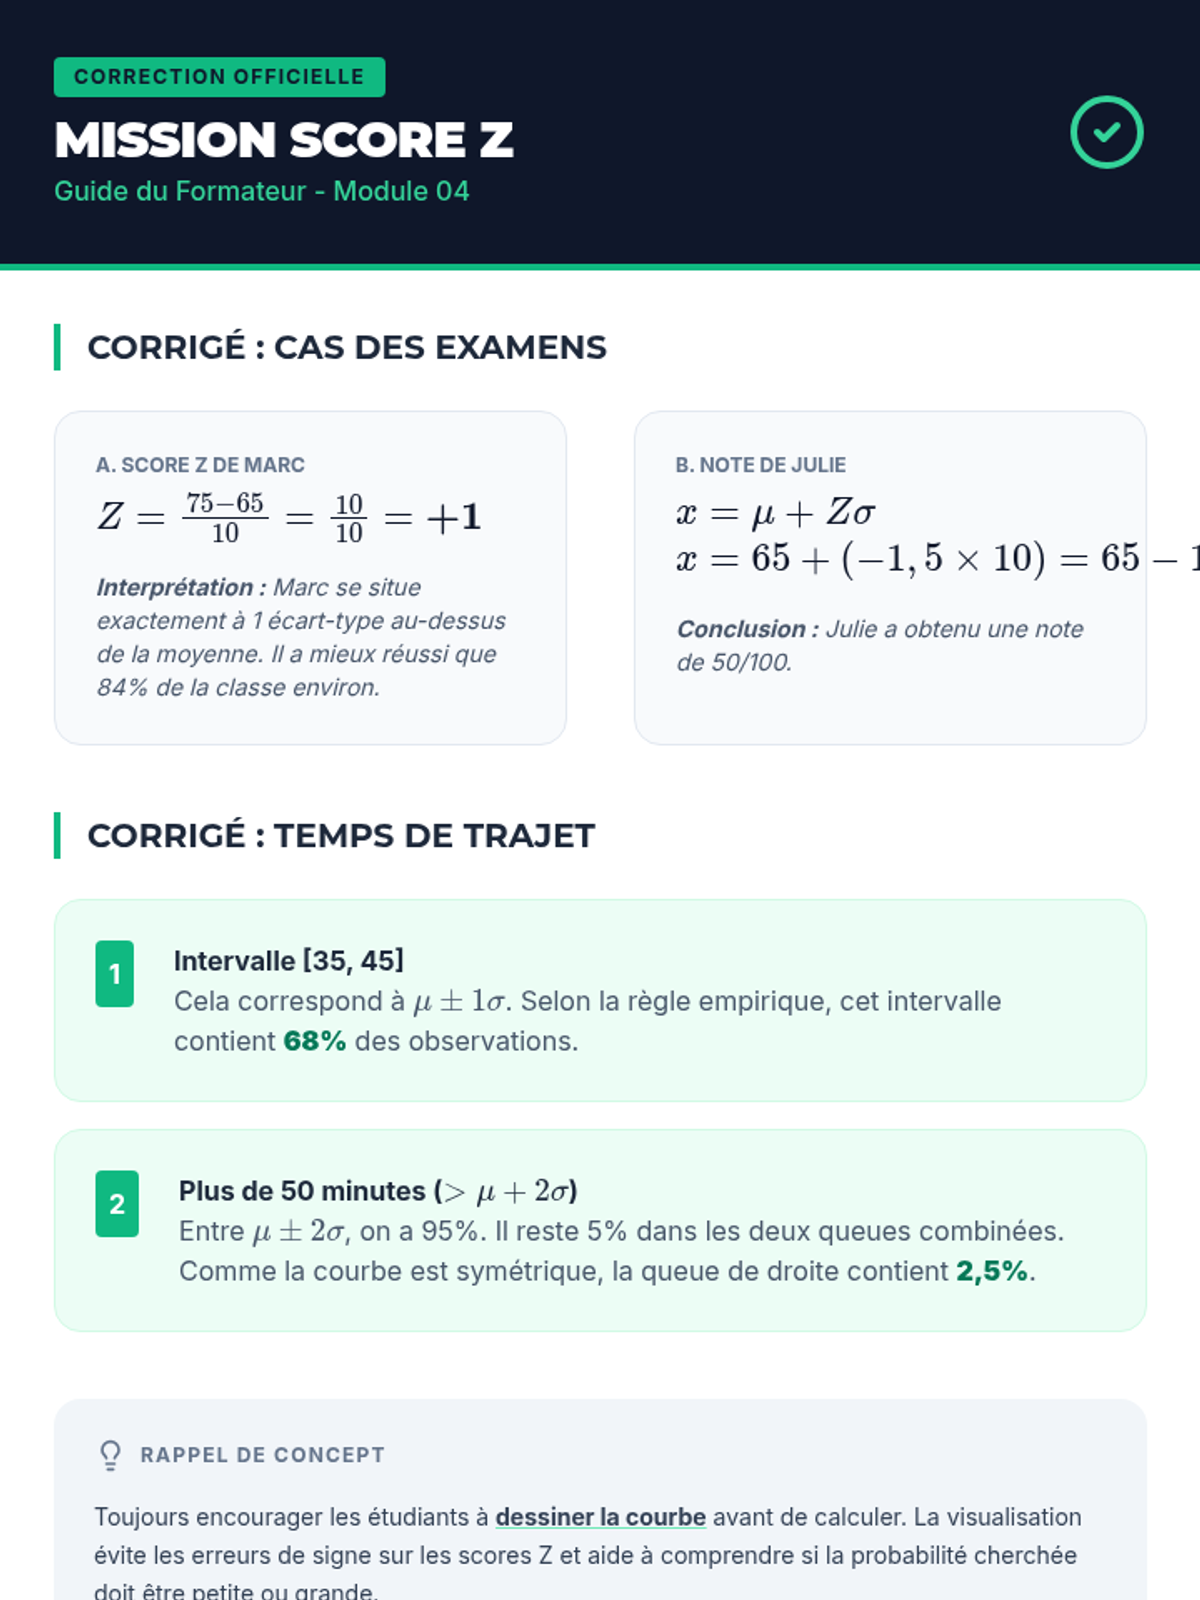
Introduction à la distribution normale, au calcul des scores Z et à l'utilisation de la table de probabilités pour l'inférence.
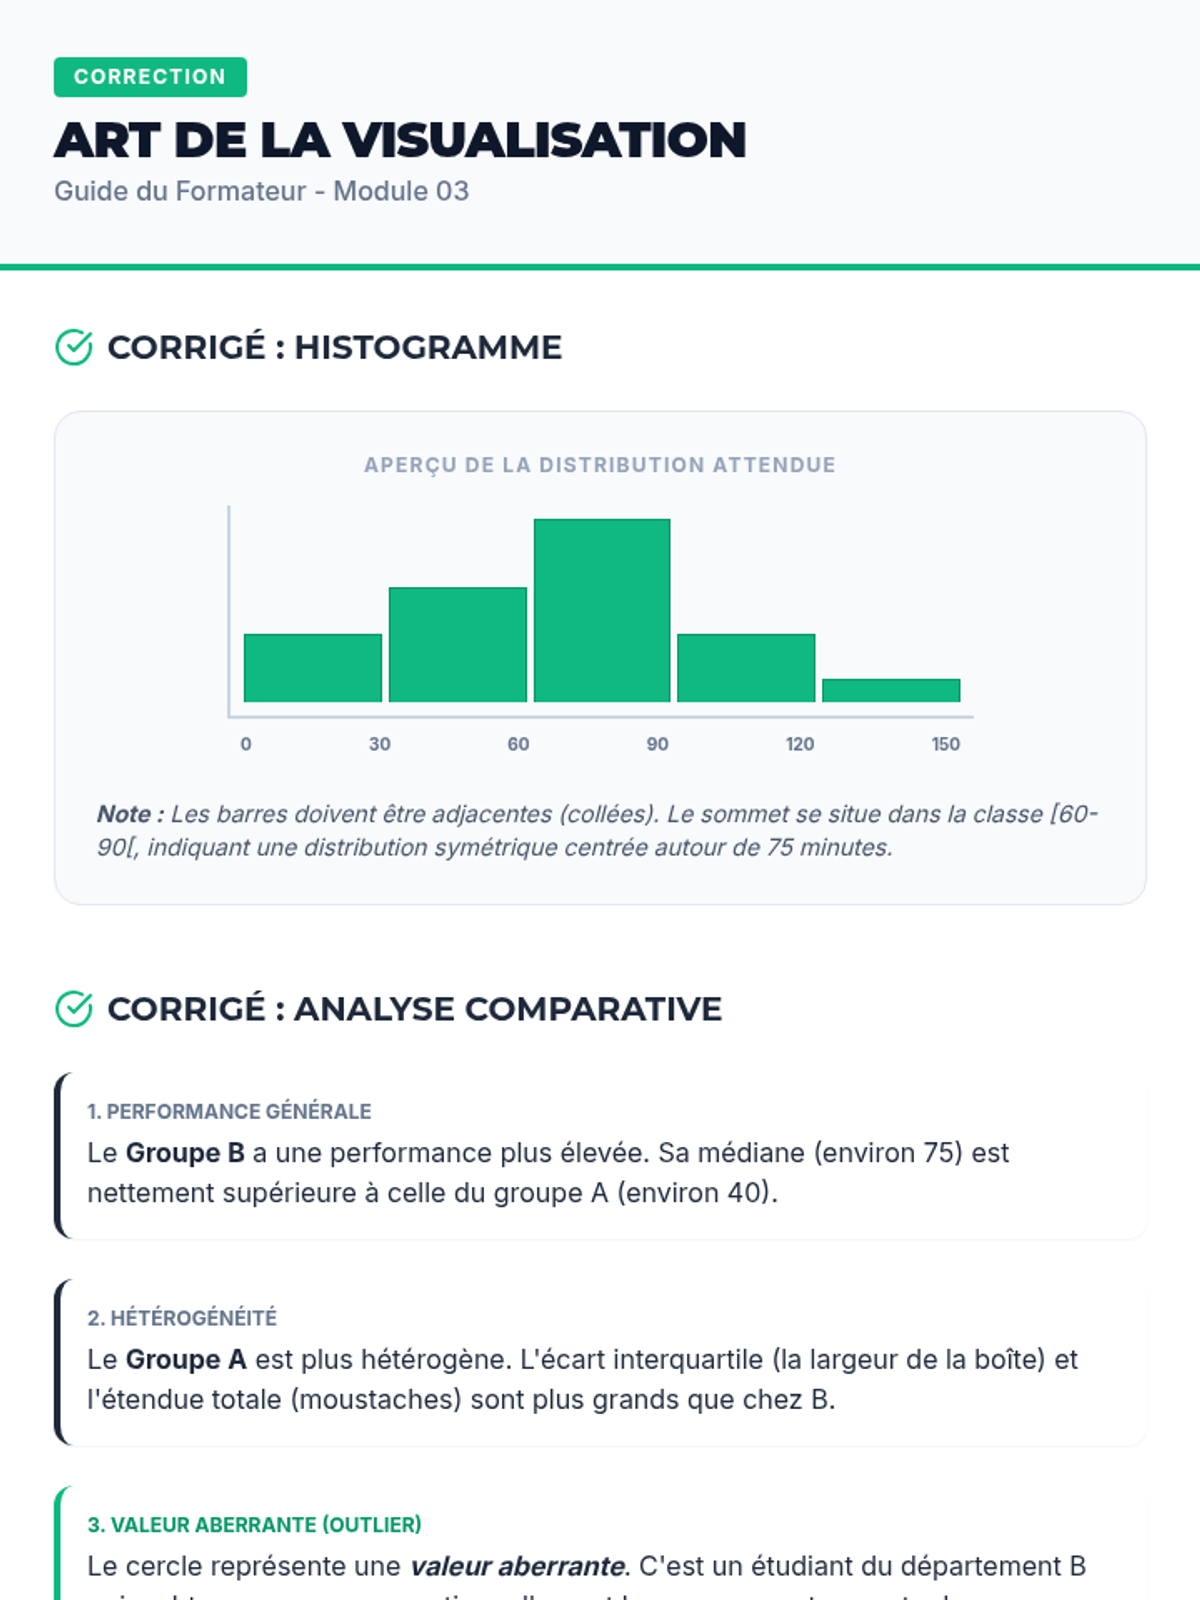
Apprendre à choisir le bon graphique pour le bon type de données : histogrammes, boîtes à moustaches et diagrammes de dispersion.
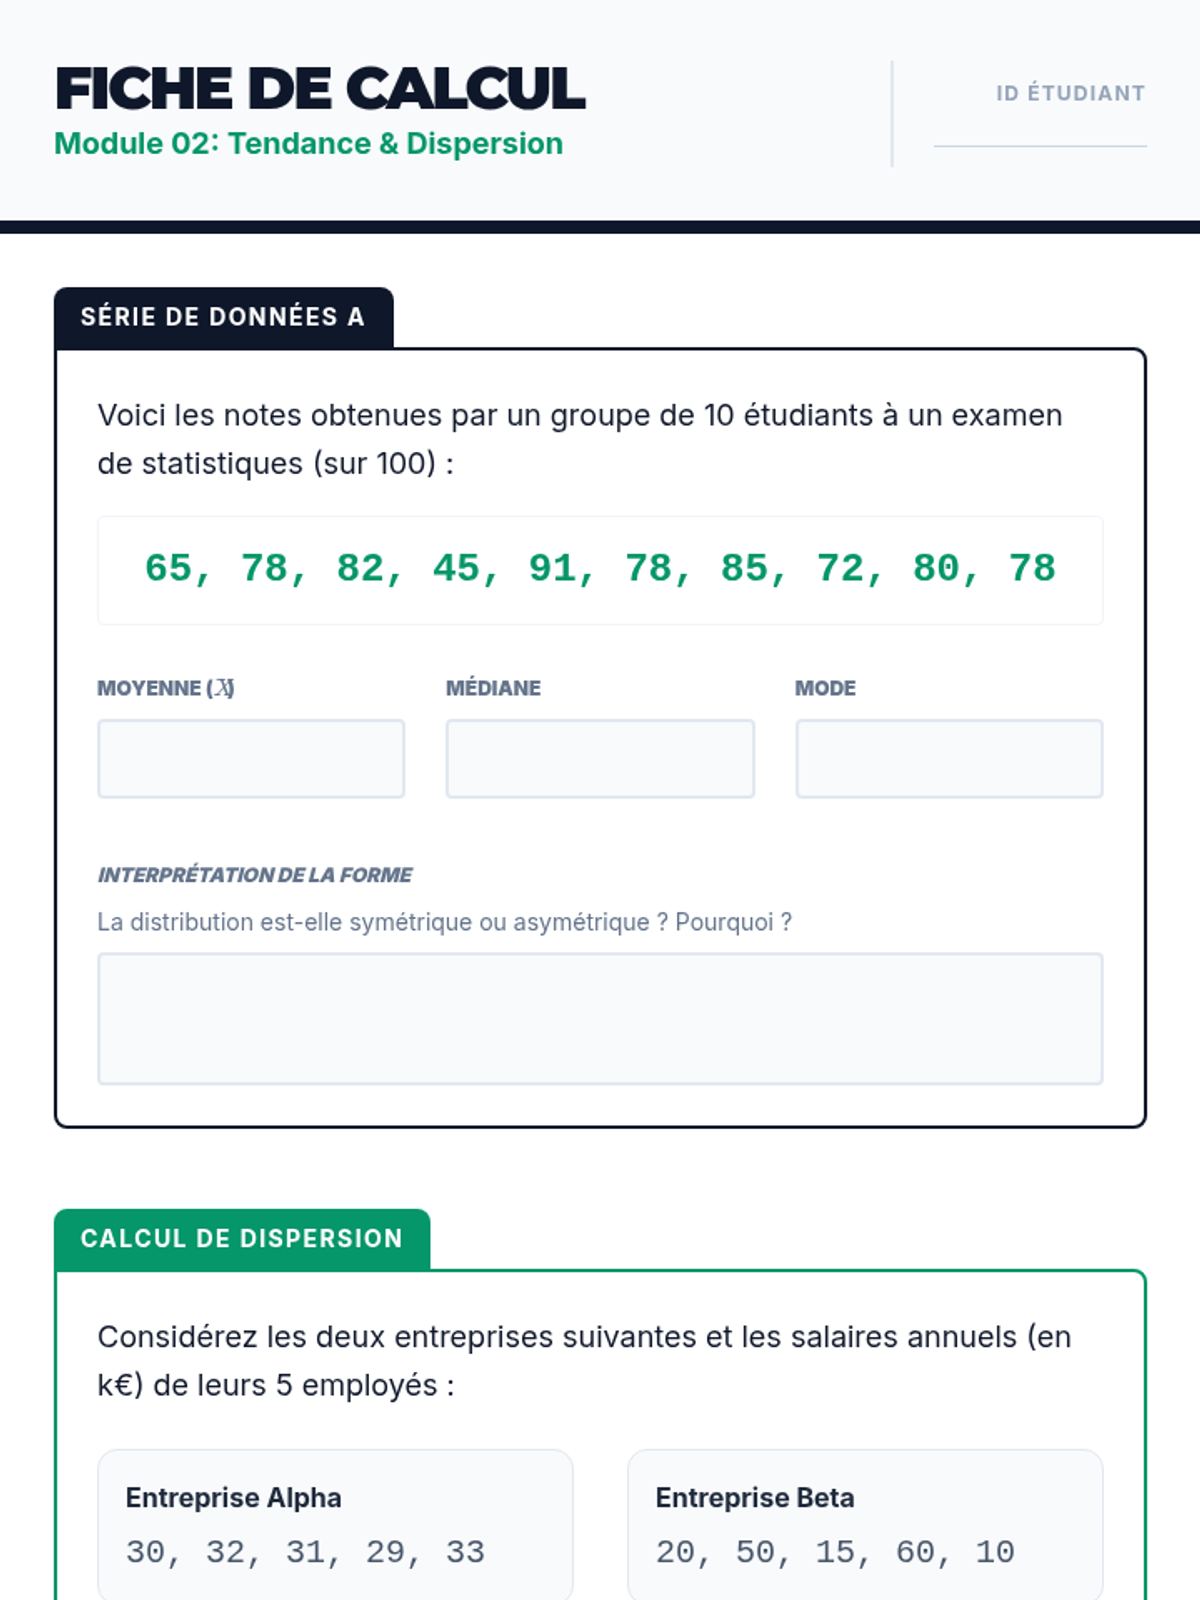
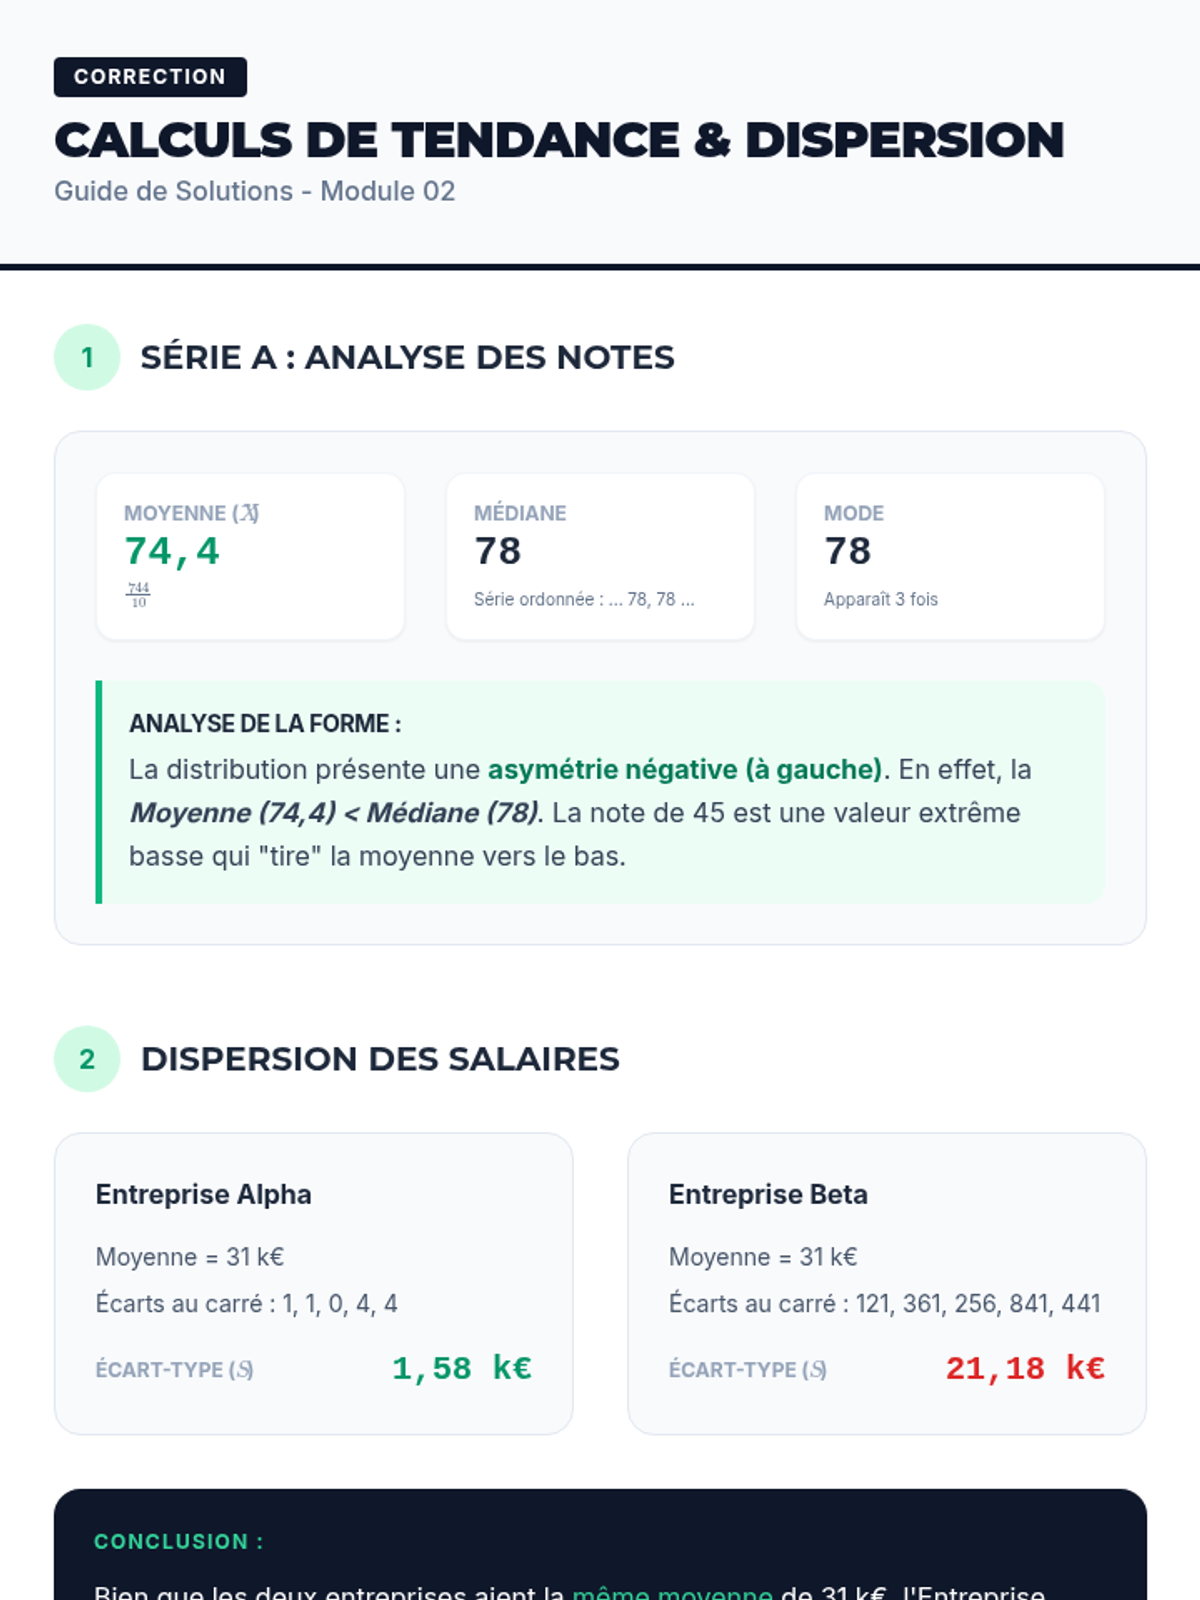
Calculer et interpréter la moyenne, la médiane et le mode, ainsi que la variance et l'écart-type pour décrire la forme d'une distribution.
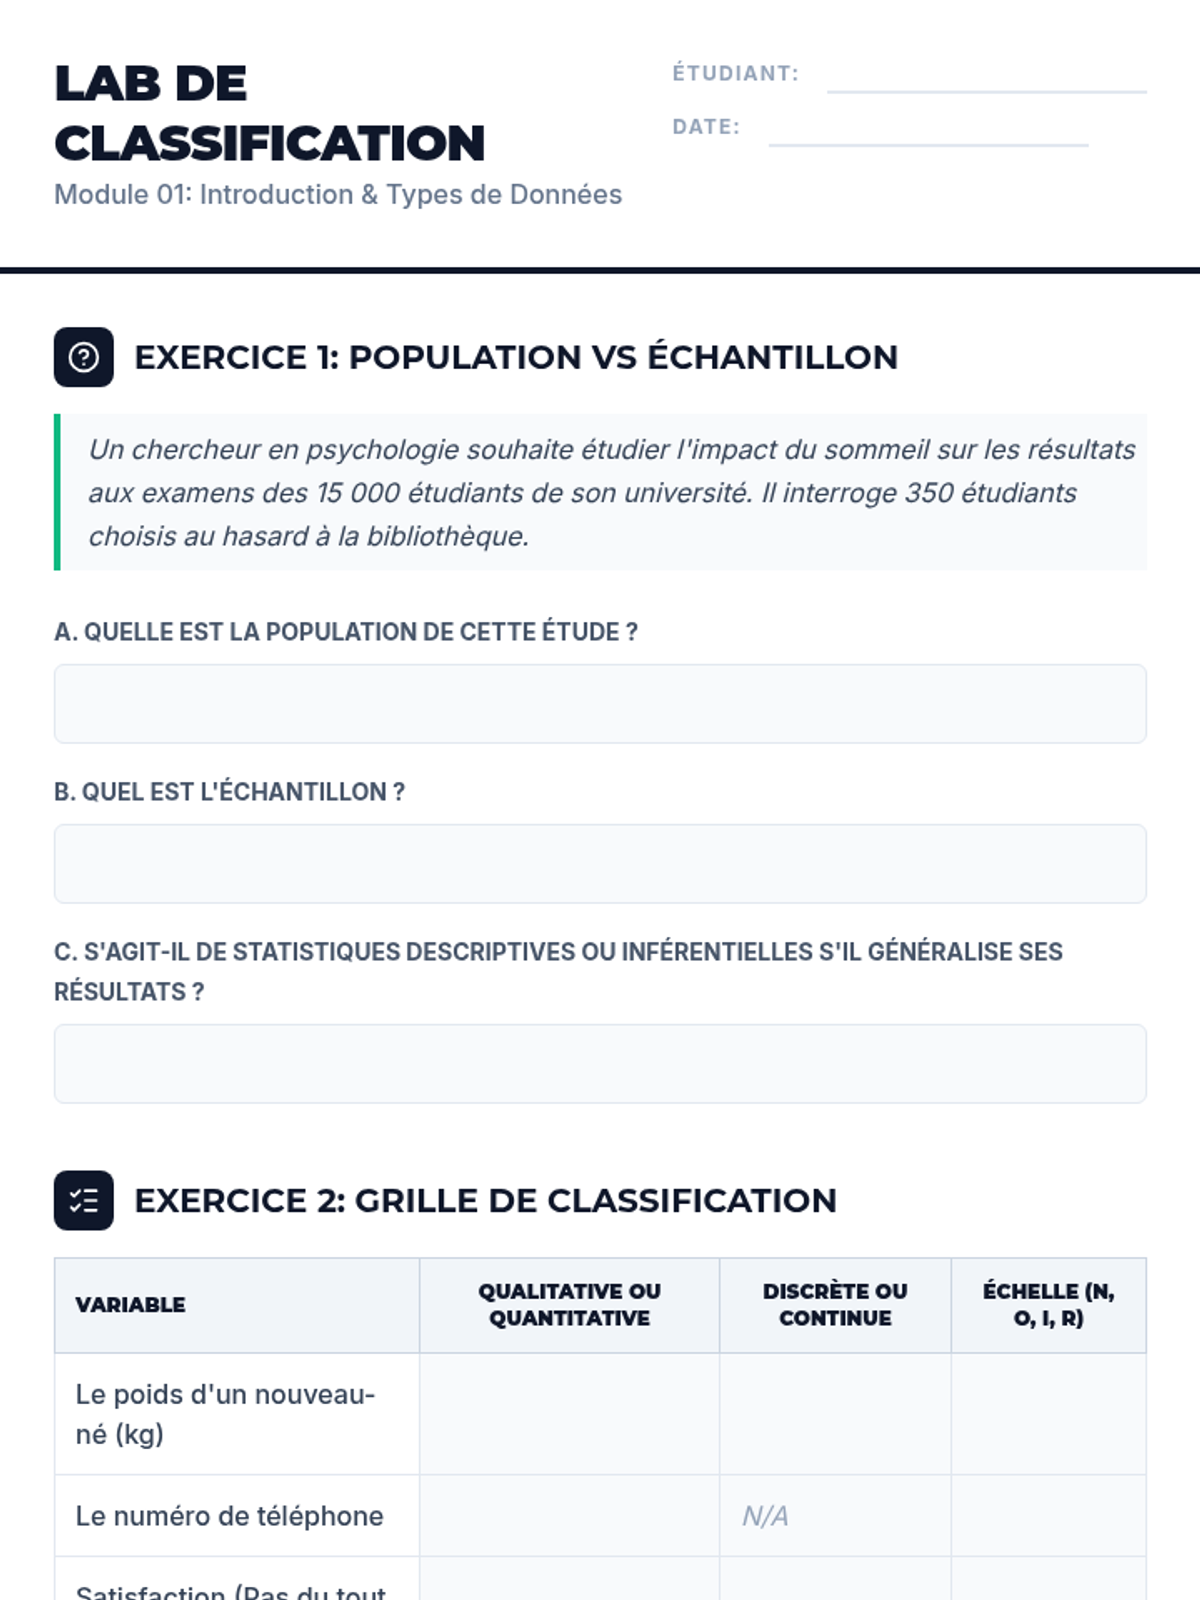
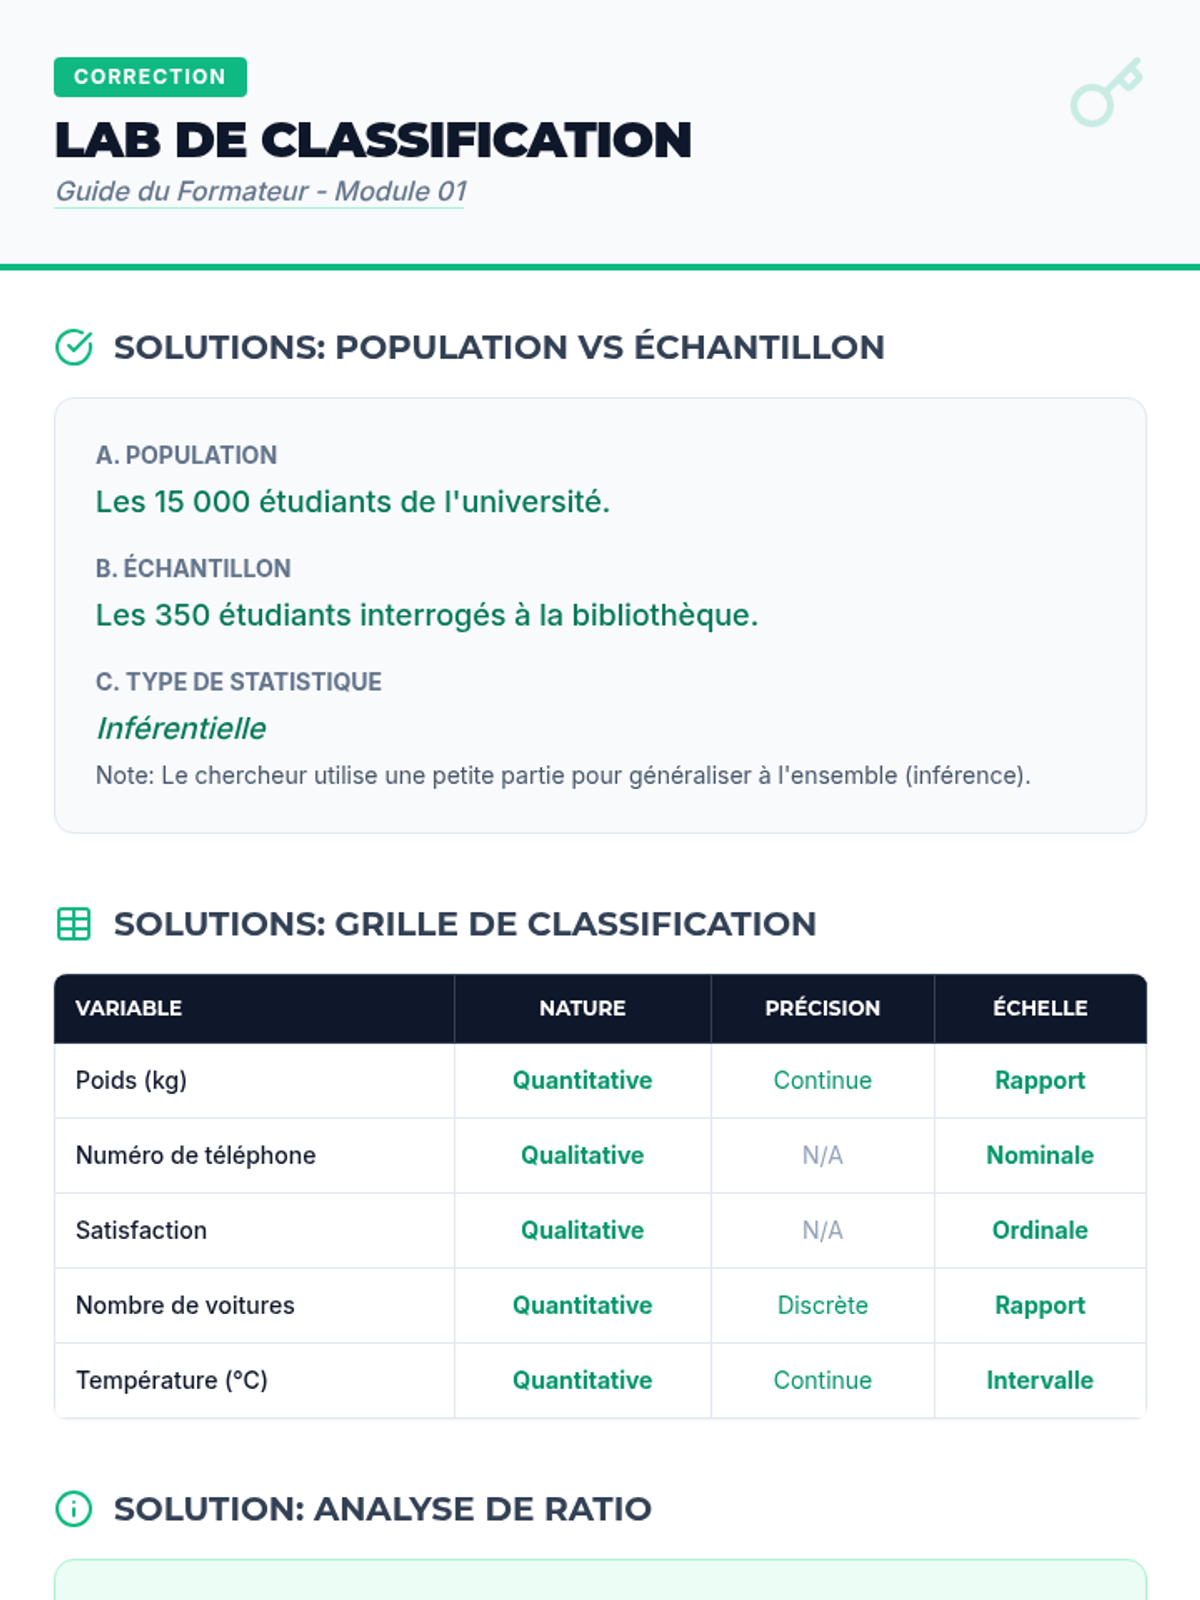
Comprendre la nature des données : variables qualitatives vs quantitatives, échelles de mesure (nominale, ordinale, intervalle, rapport) et introduction à l'échantillonnage.
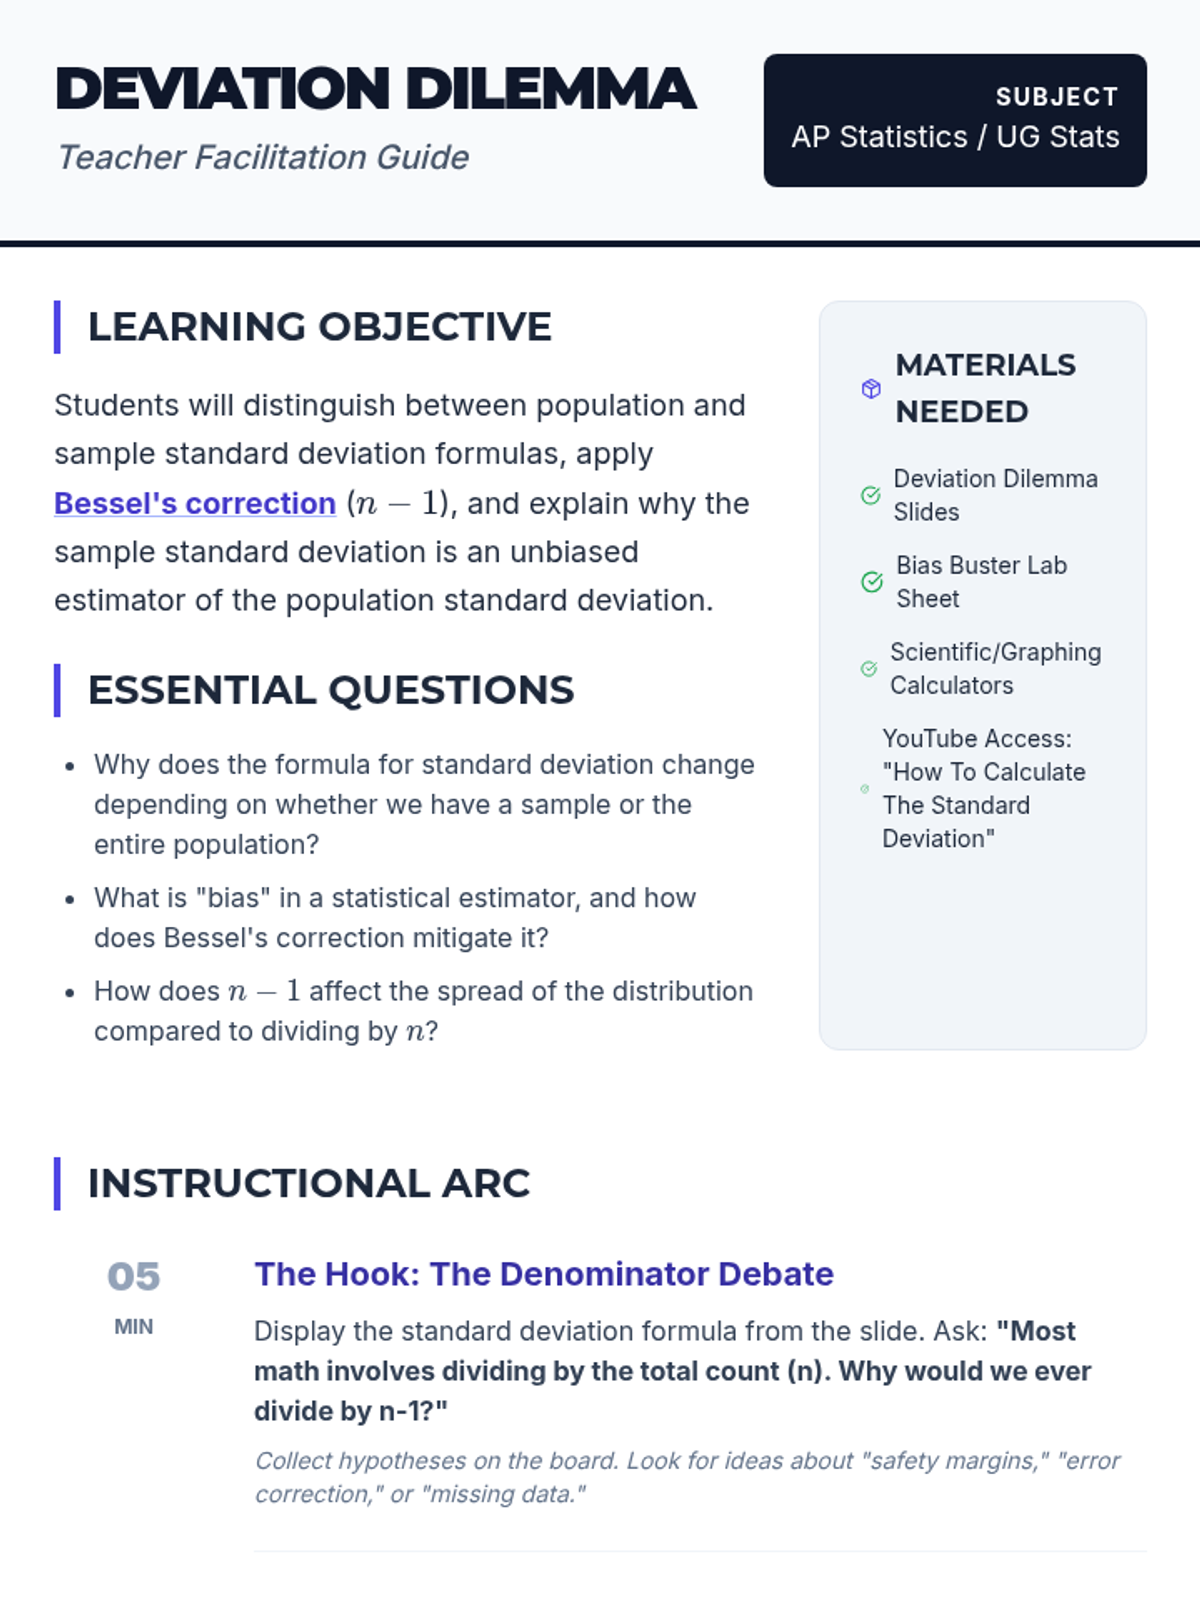
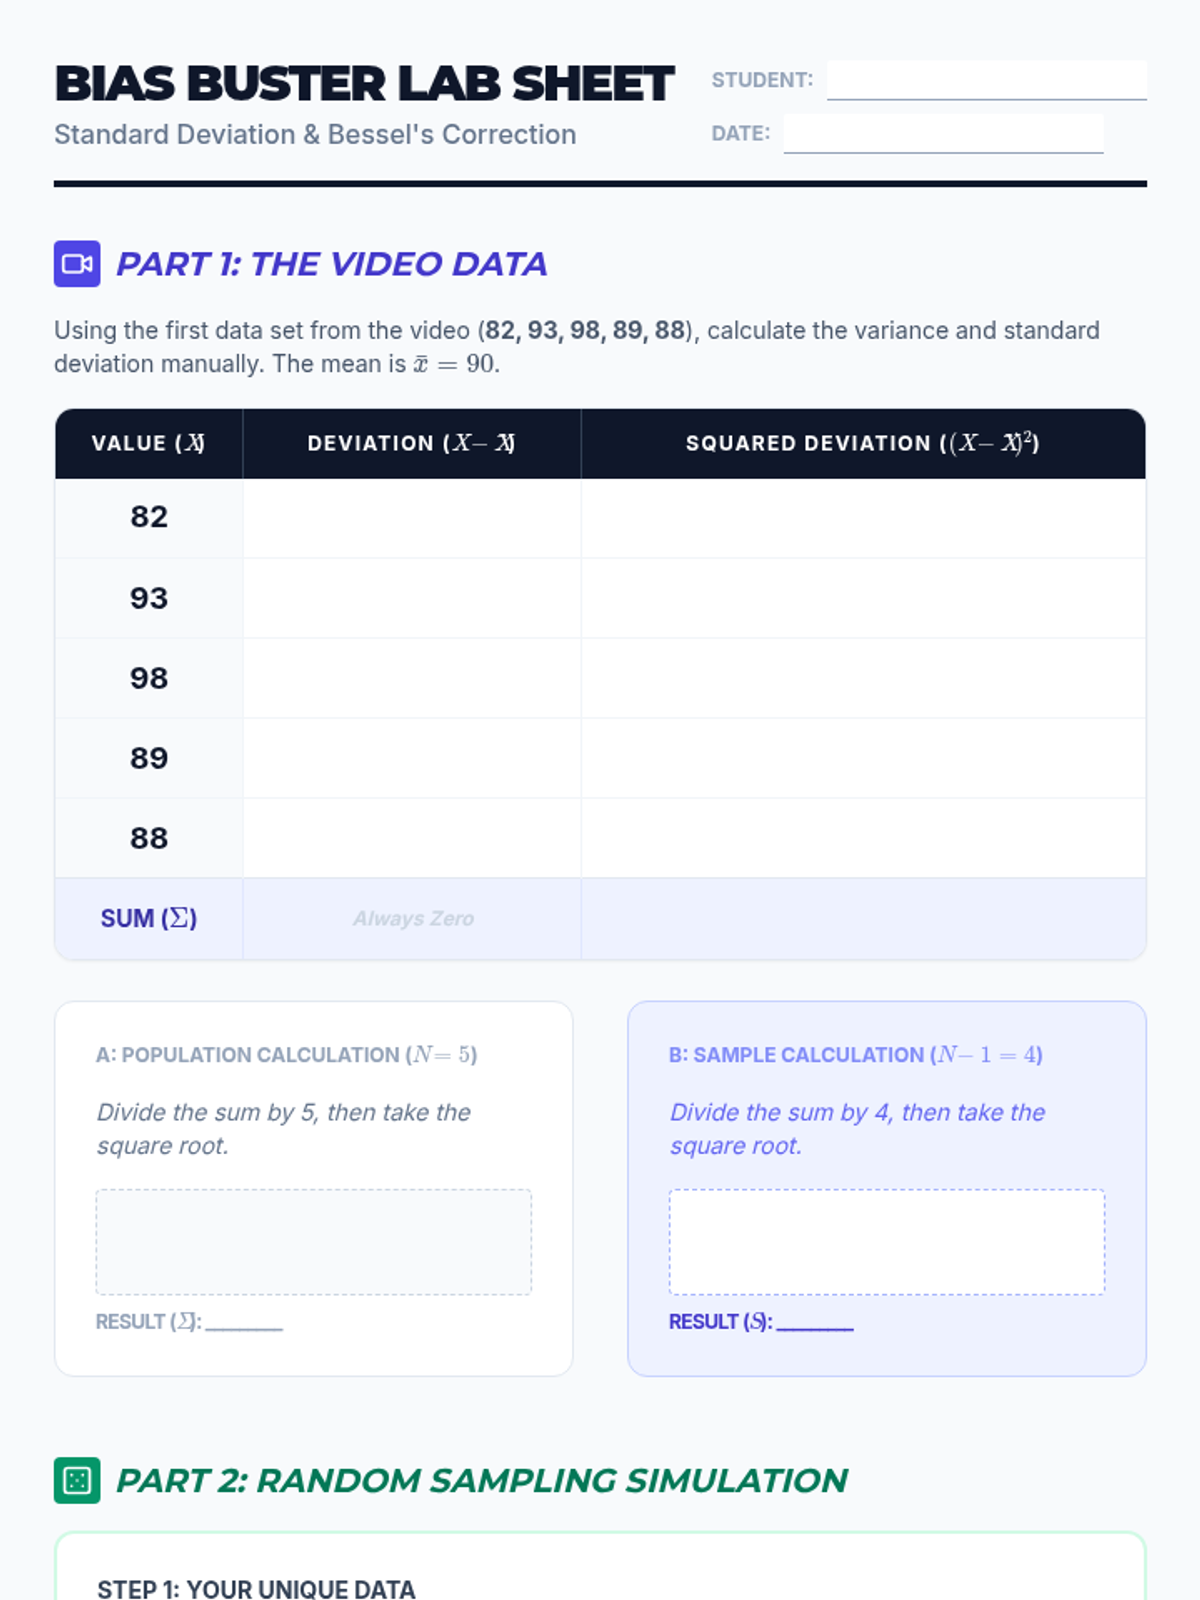
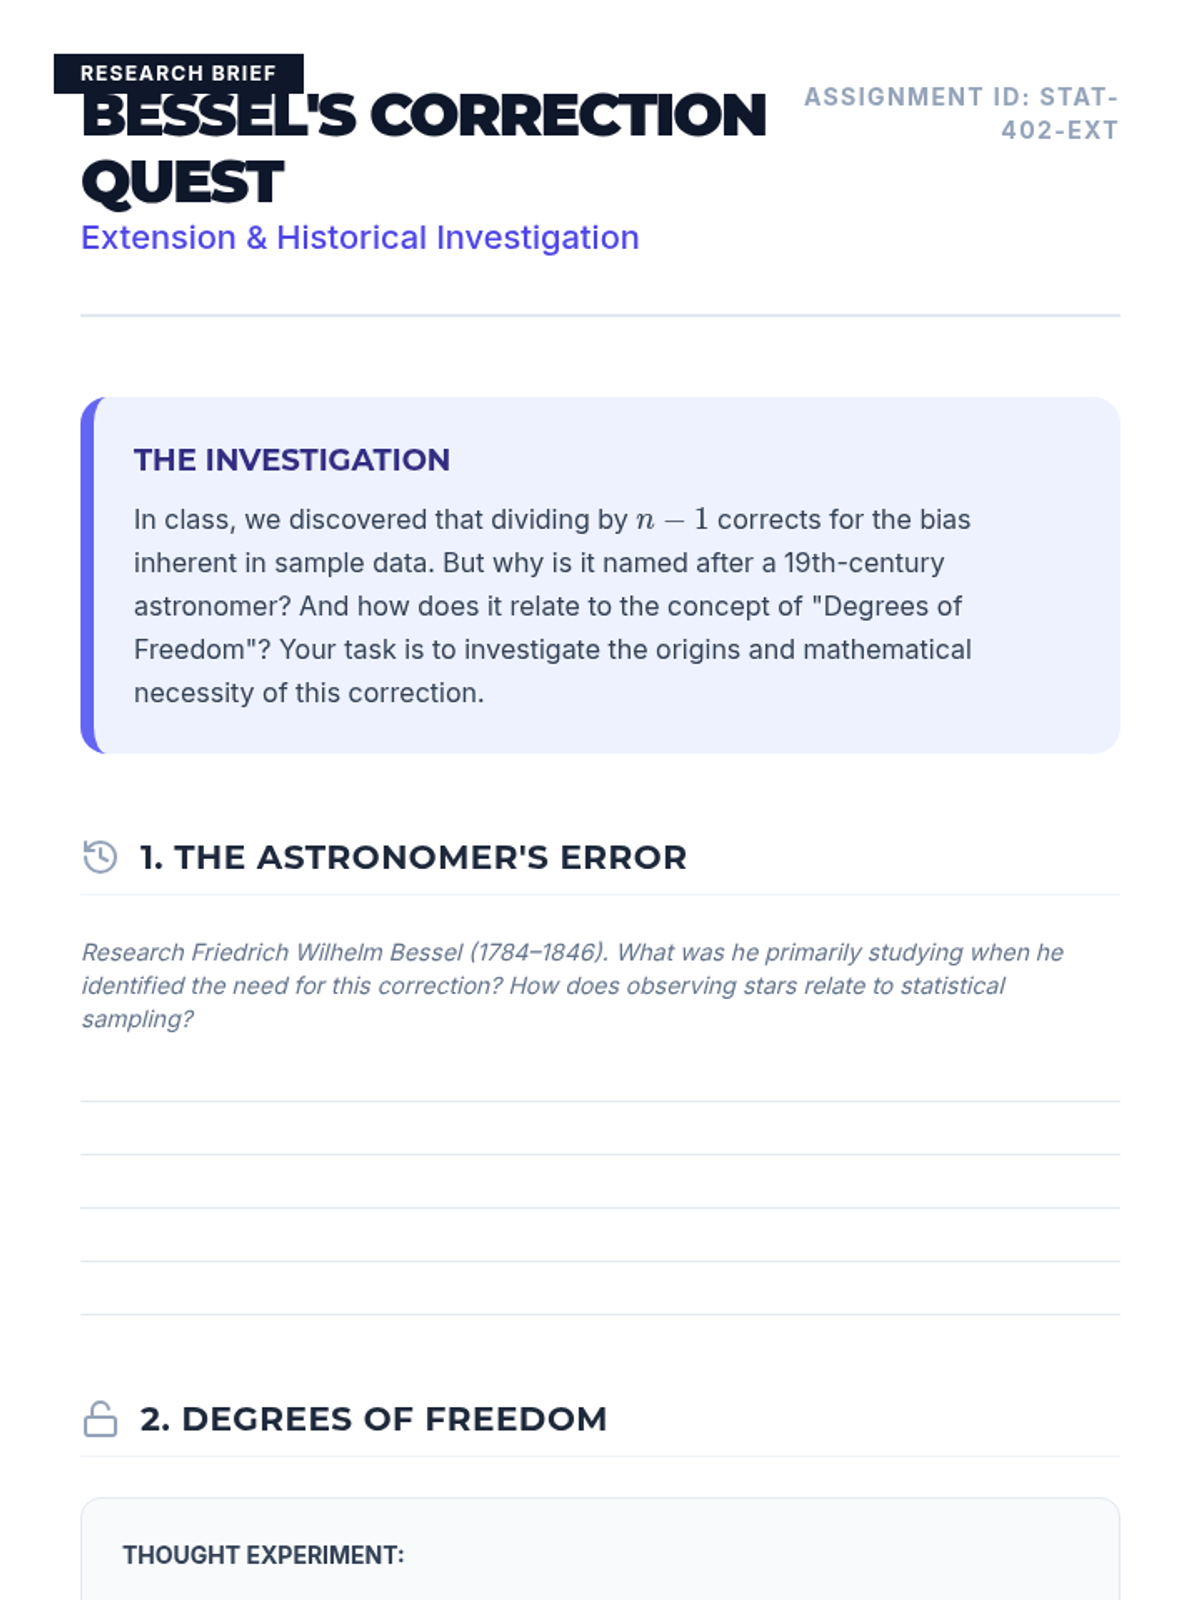
This lesson explores the conceptual and mathematical differences between population and sample standard deviation, focusing on the derivation and application of Bessel's correction (n-1) to ensure unbiased estimation. Students will analyze video demonstrations, perform comparative calculations, and conduct a sampling simulation to witness bias in action.
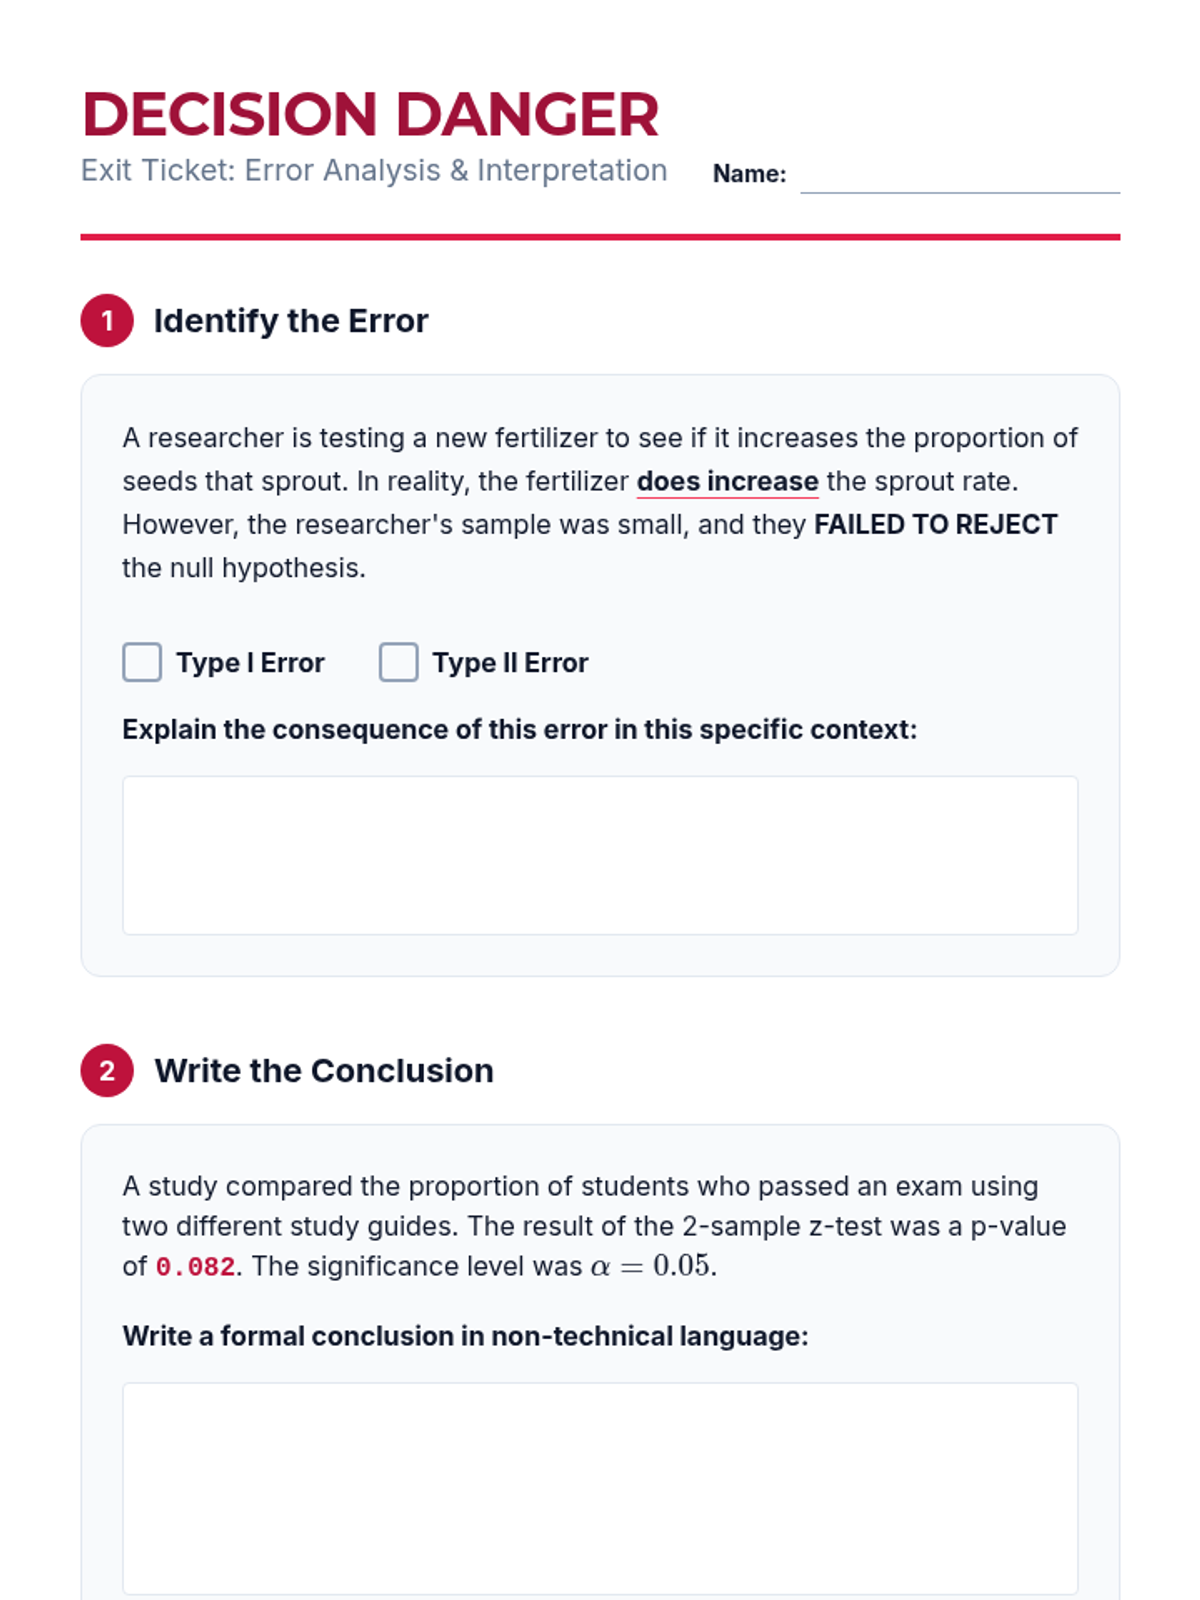
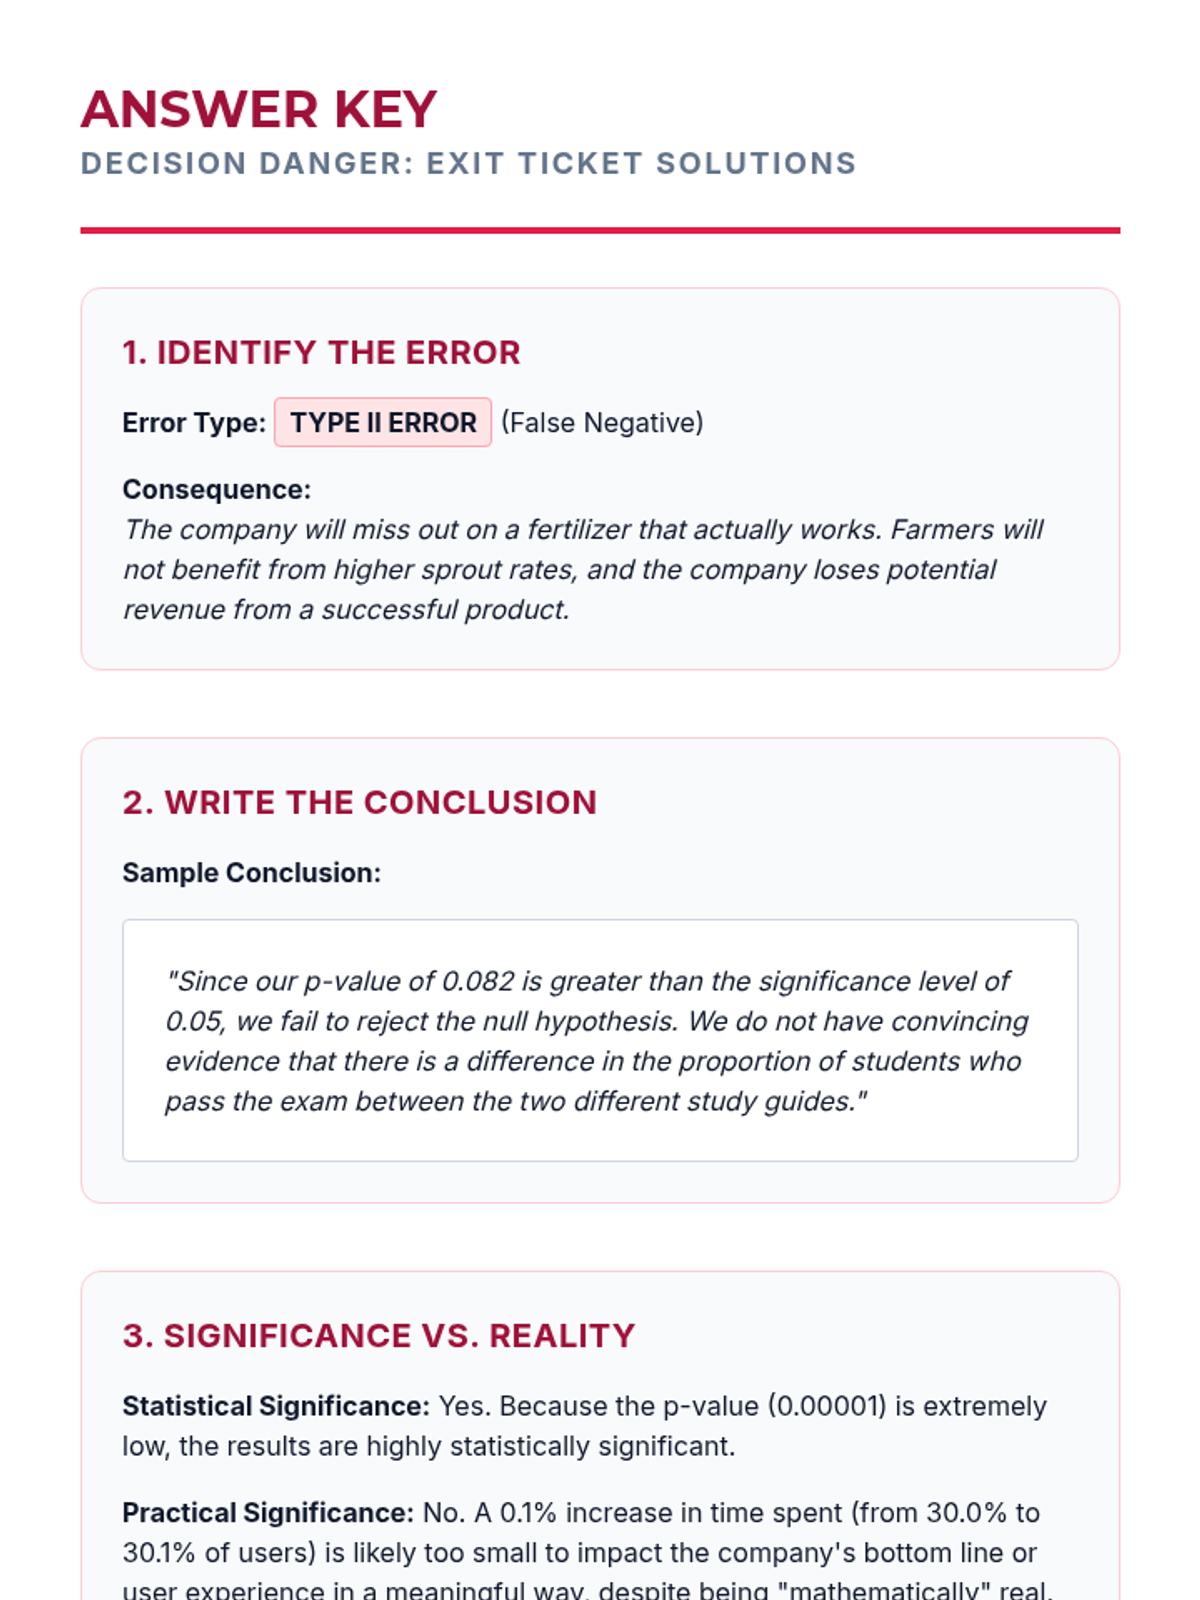
Focus on articulating conclusions in non-technical language and discussing Type I and Type II errors. Students differentiate between statistical and practical significance.
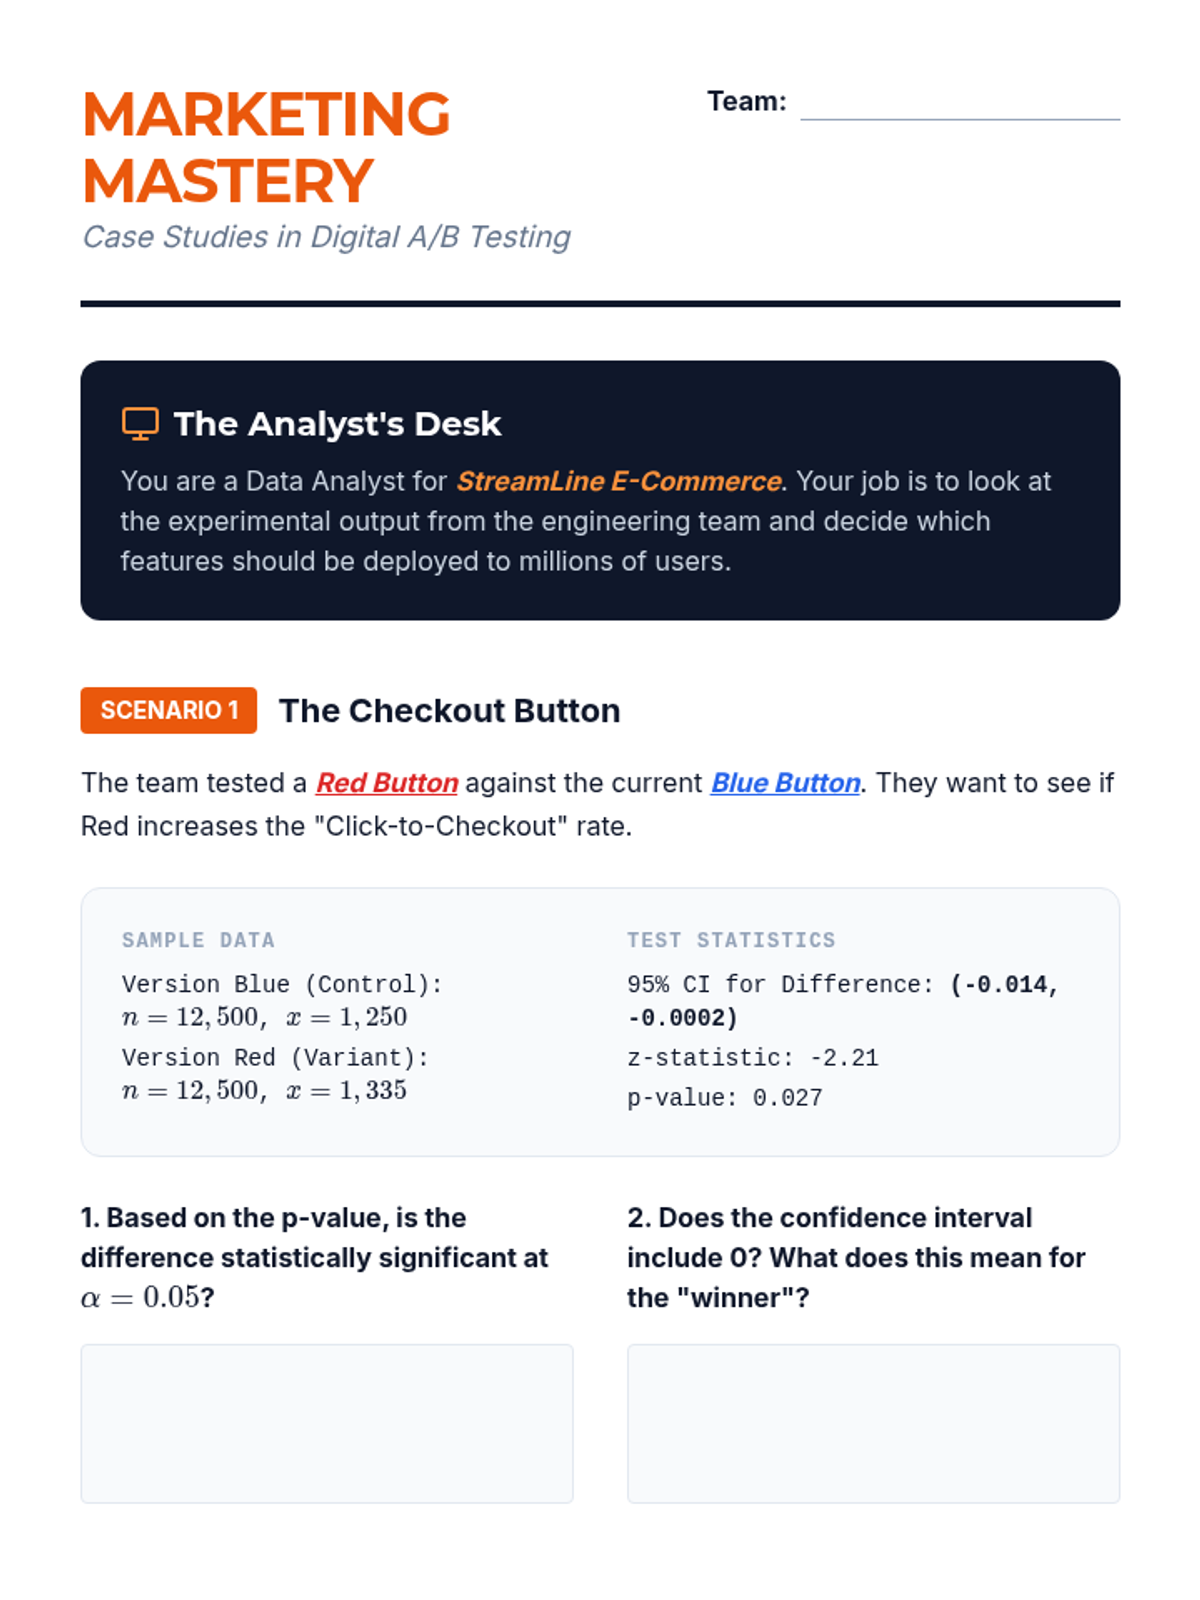
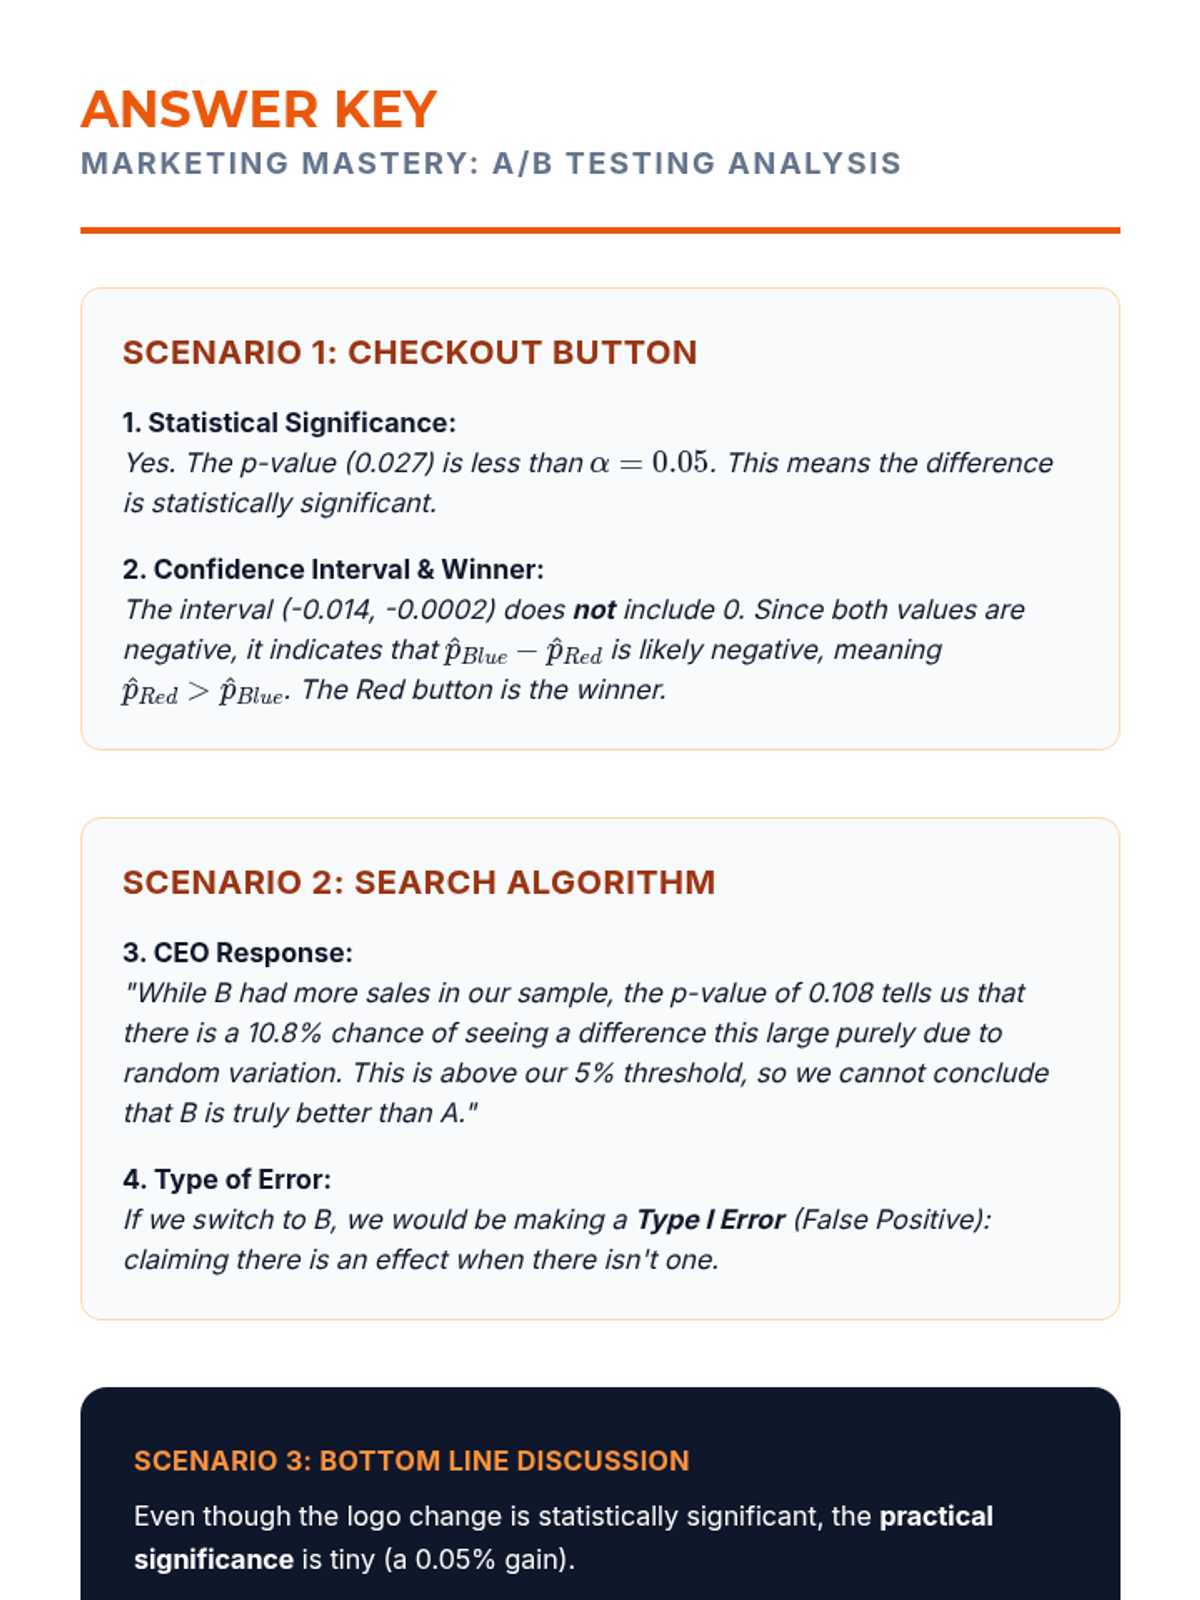
Students apply their skills to A/B testing data from digital marketing scenarios. They interpret computer output and determine if design changes resulted in statistically significant differences.
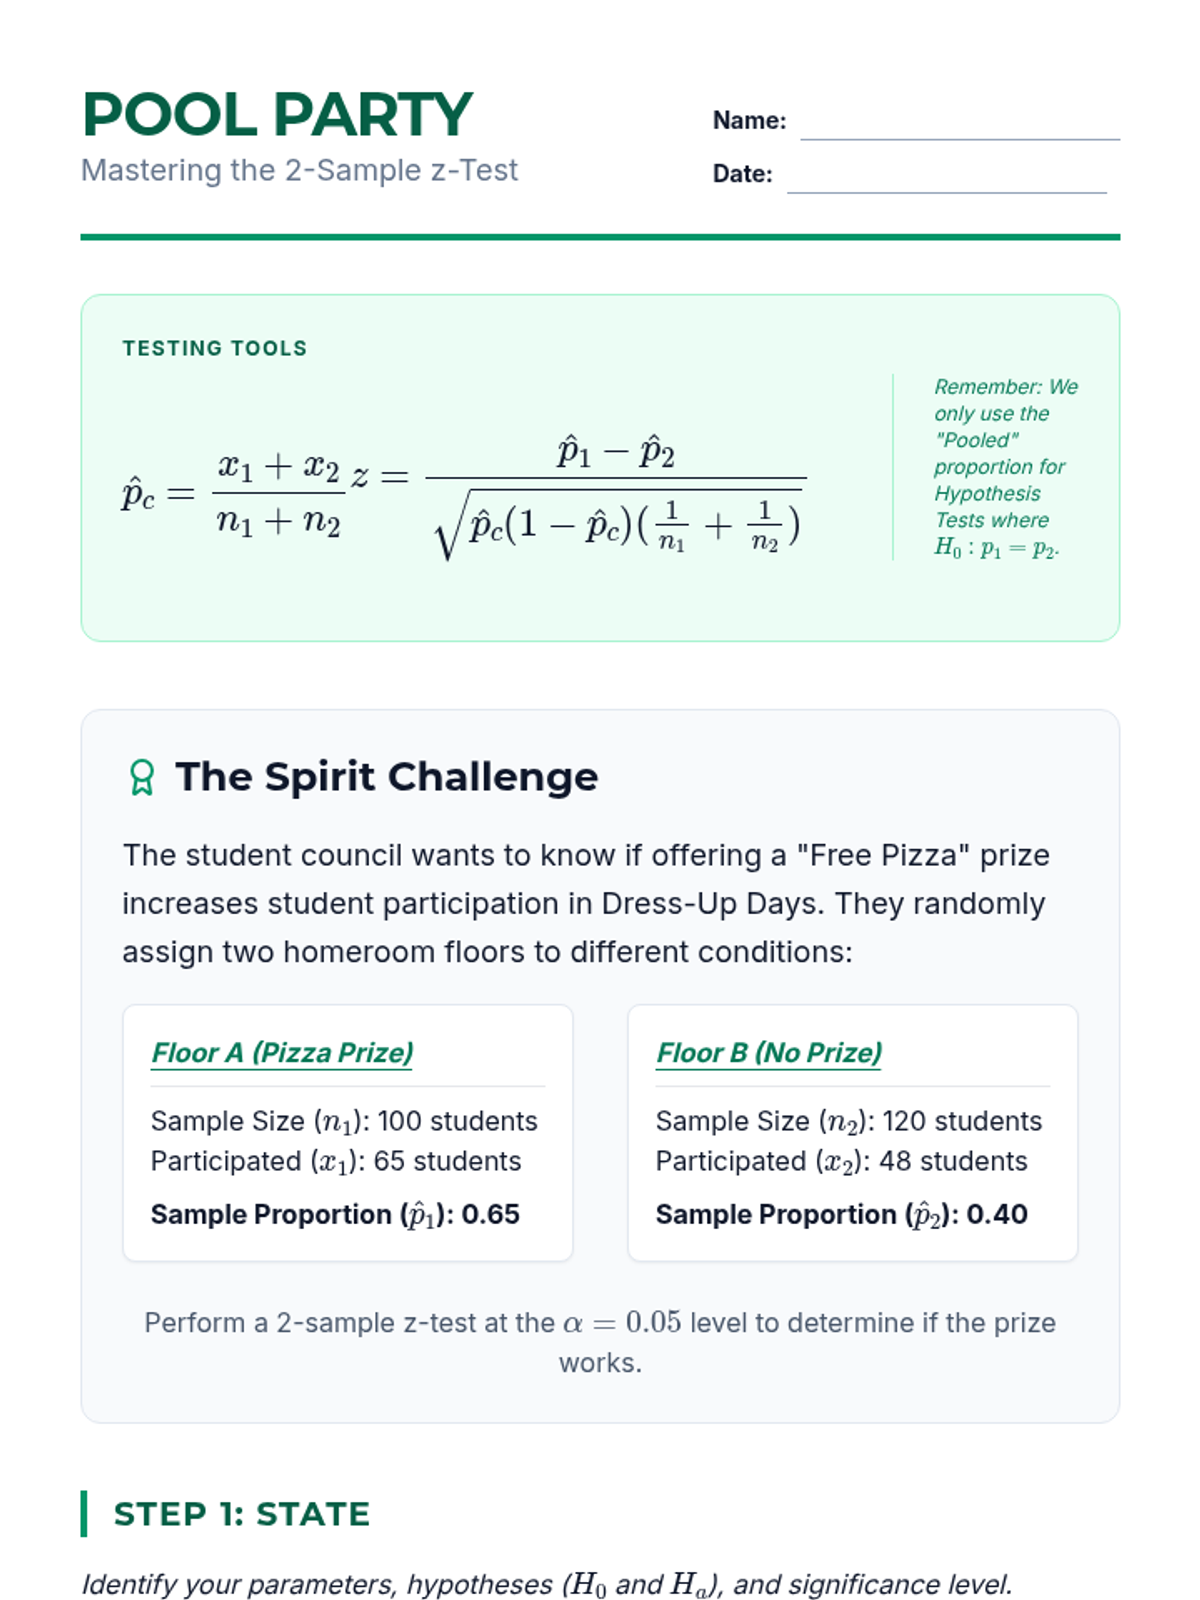
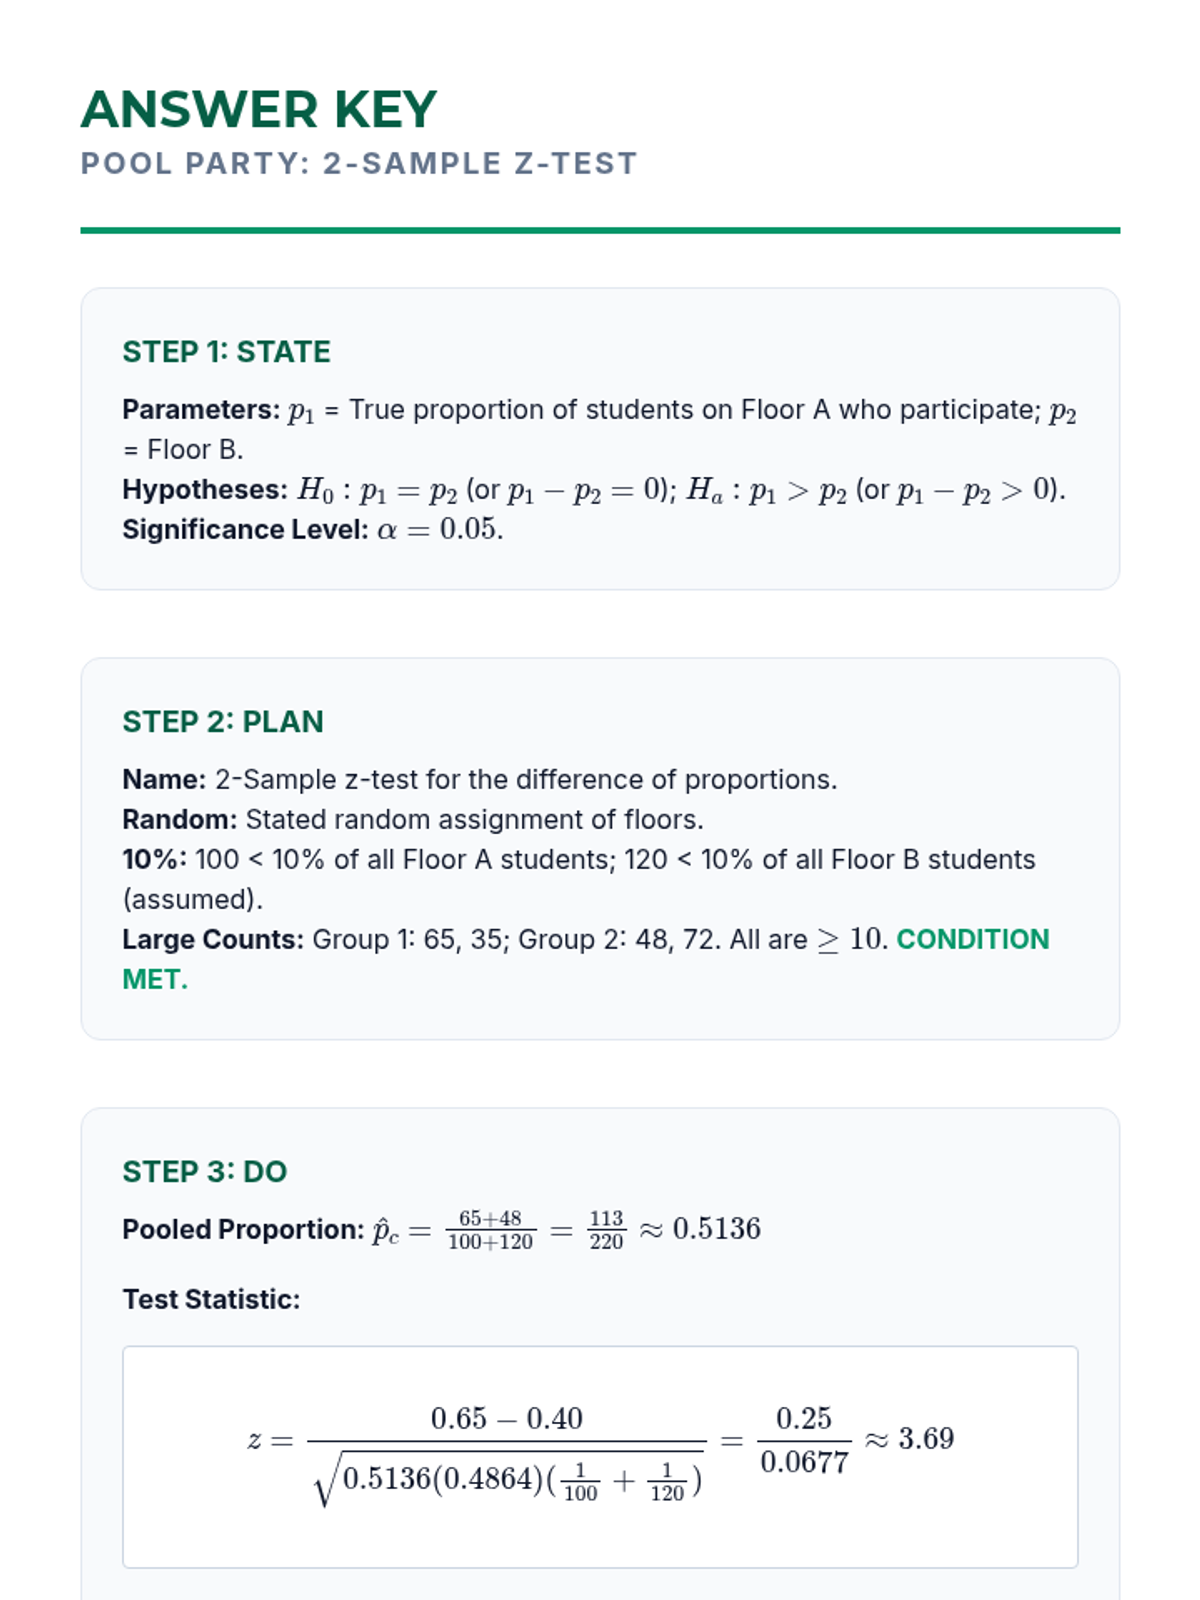
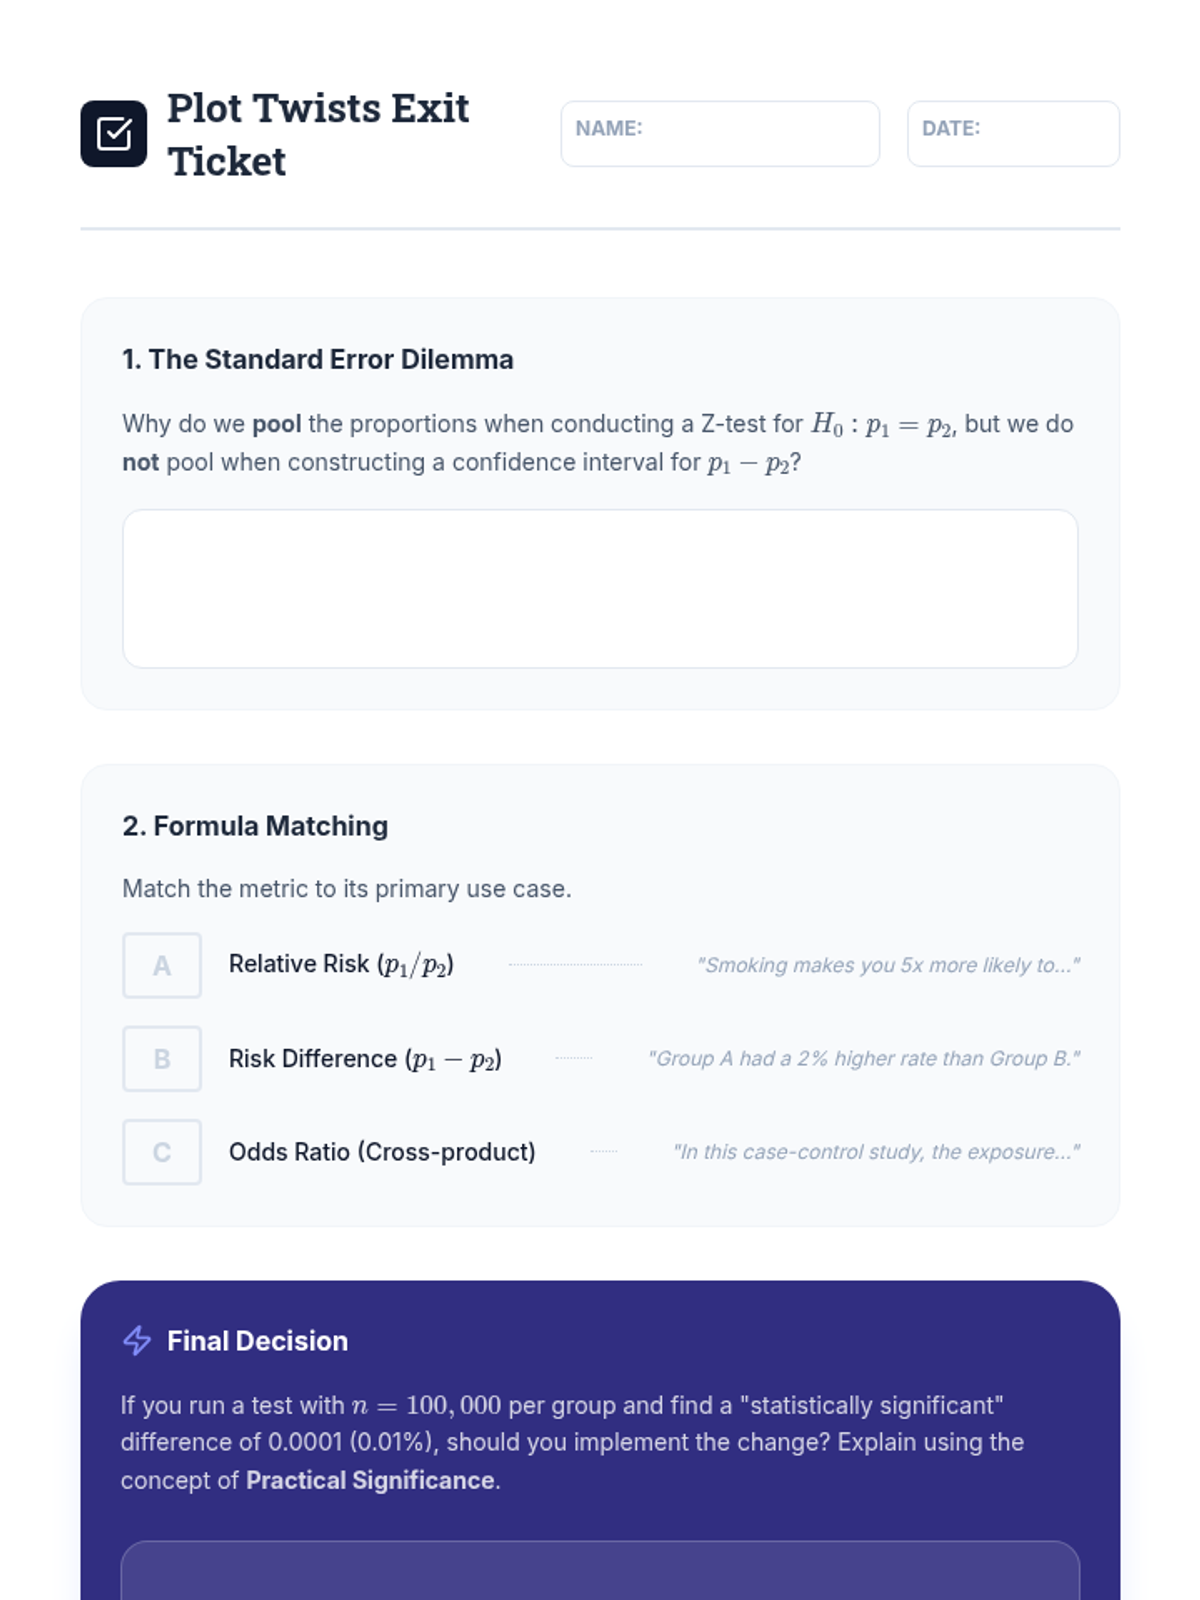
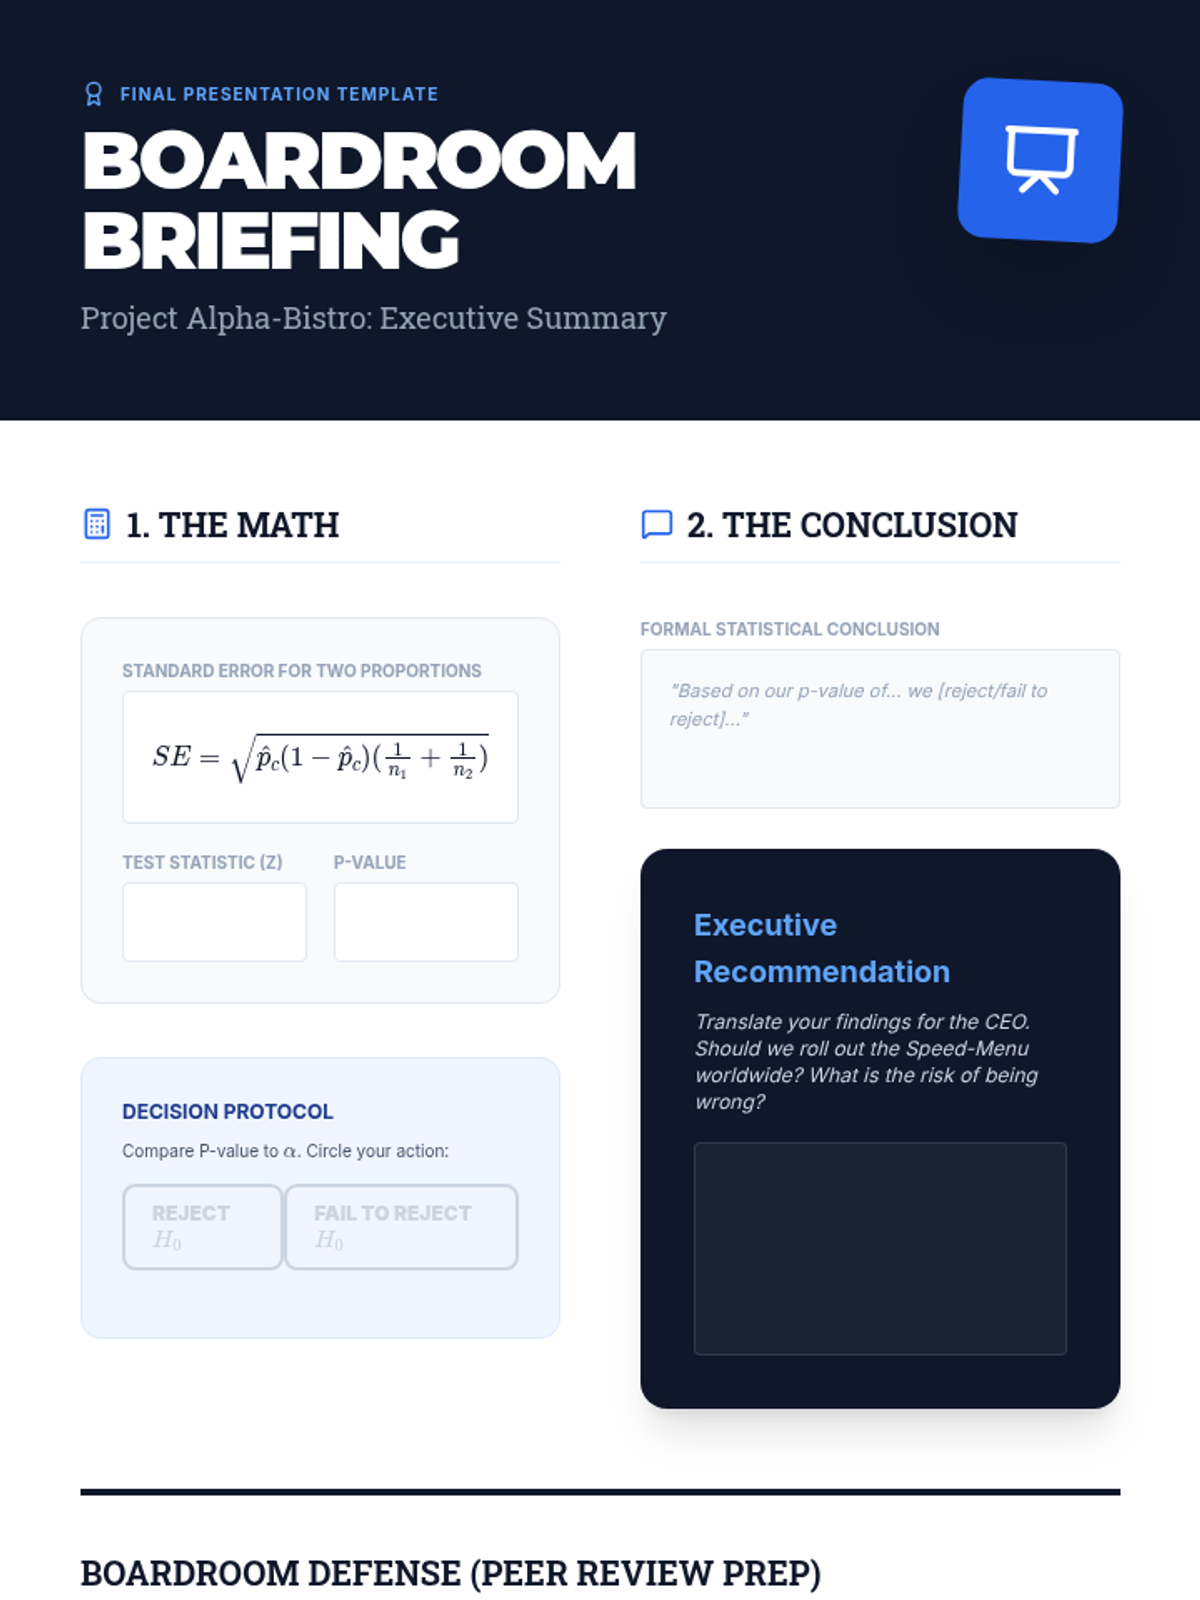
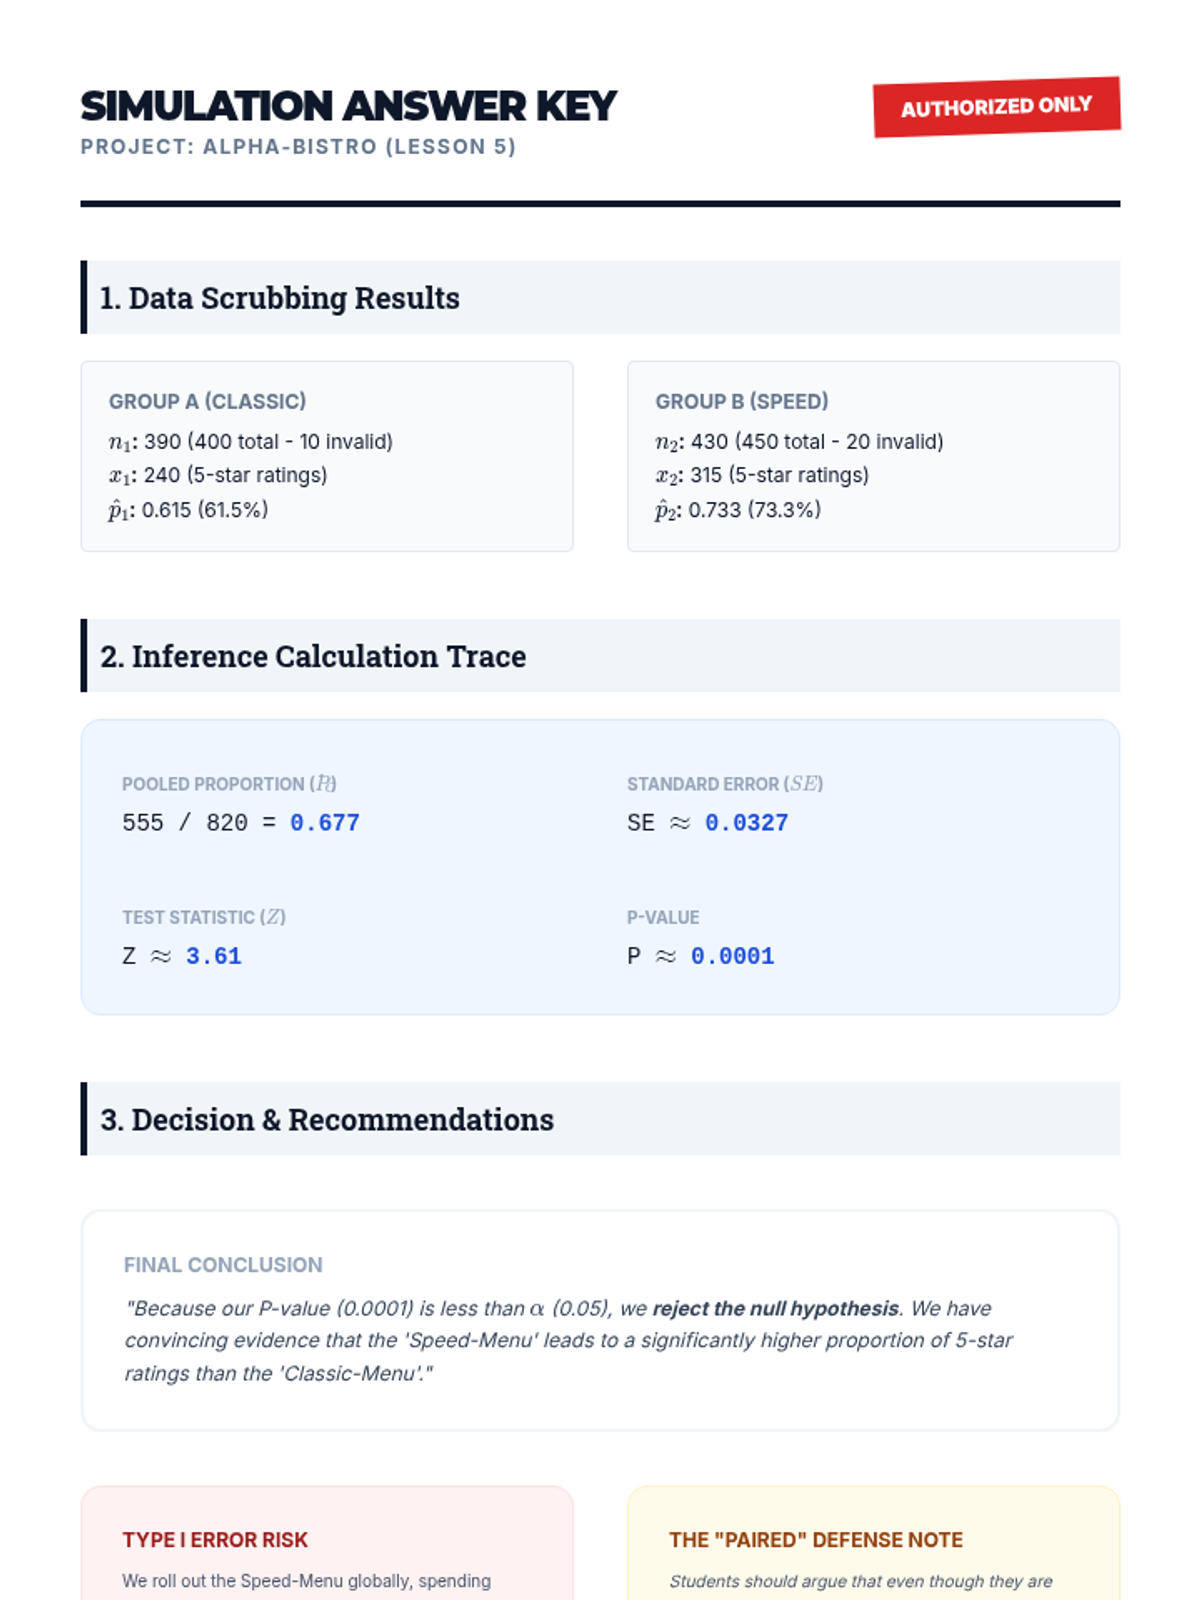
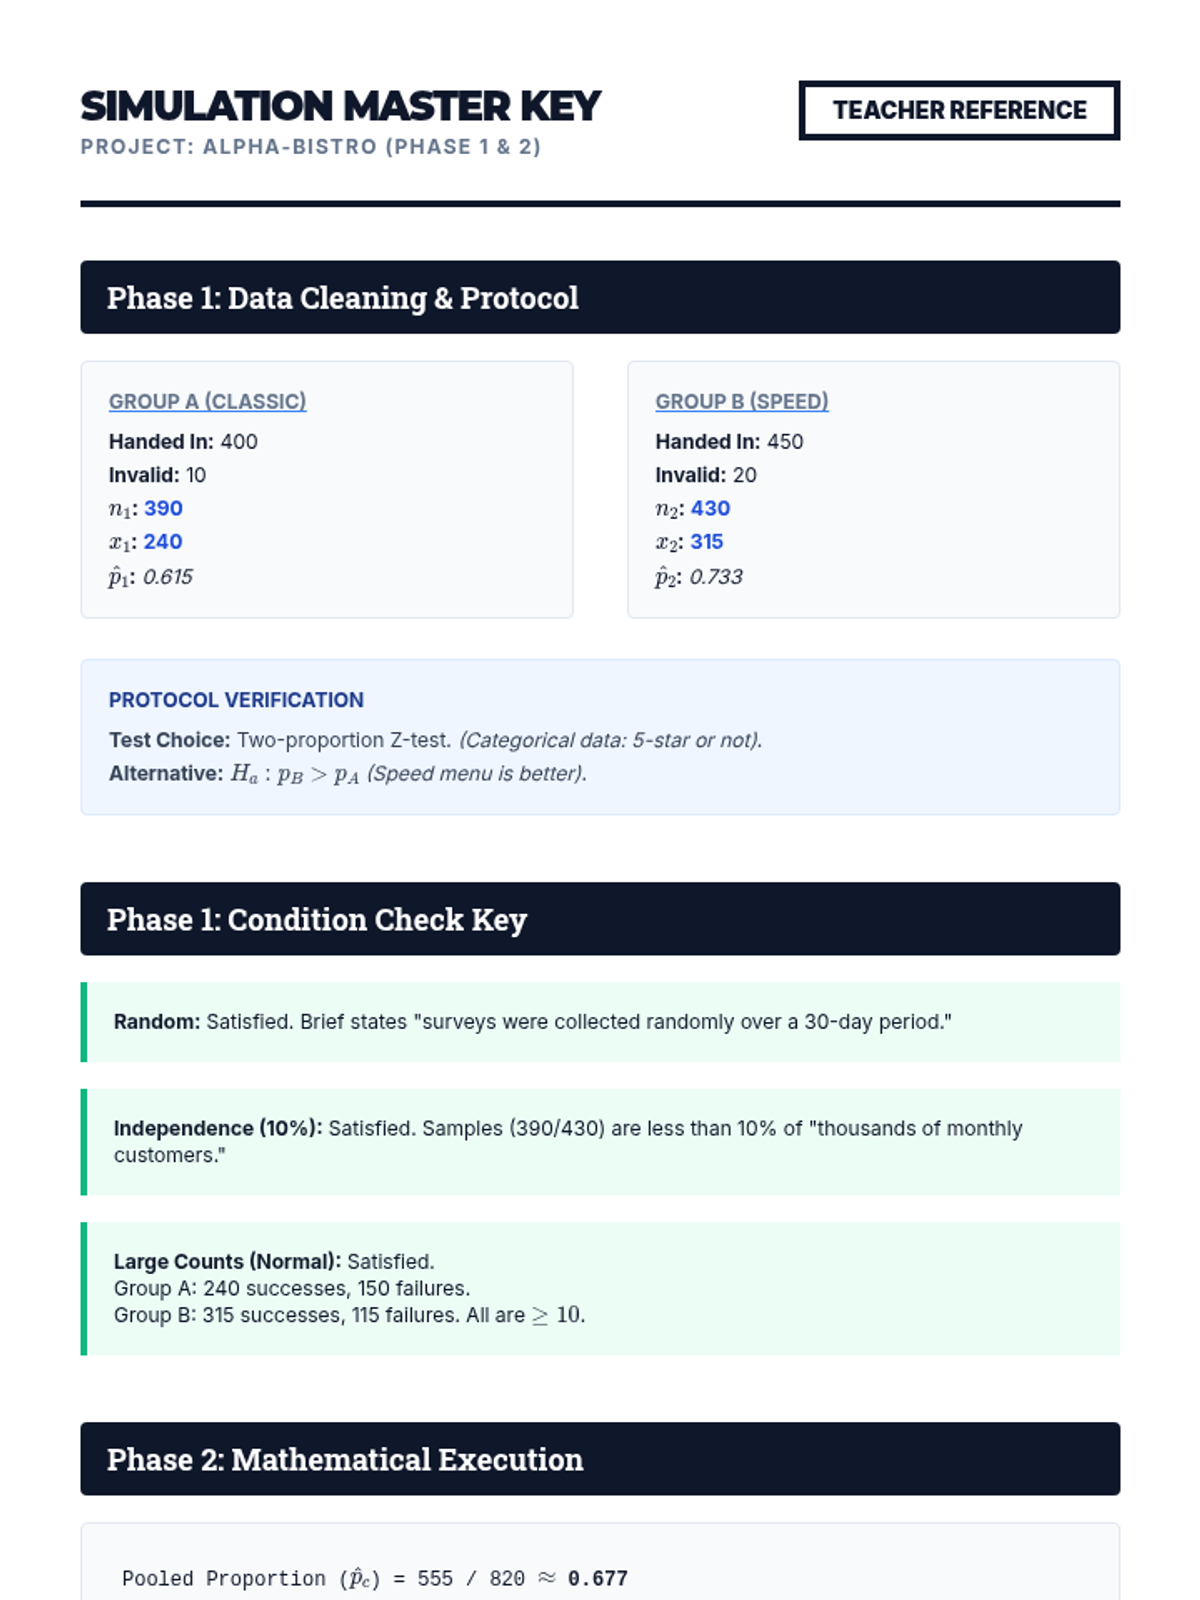
This lesson formalizes the 2-sample z-test, introducing the pooled proportion. Students calculate z-statistics and p-values to make decisions about the null hypothesis.
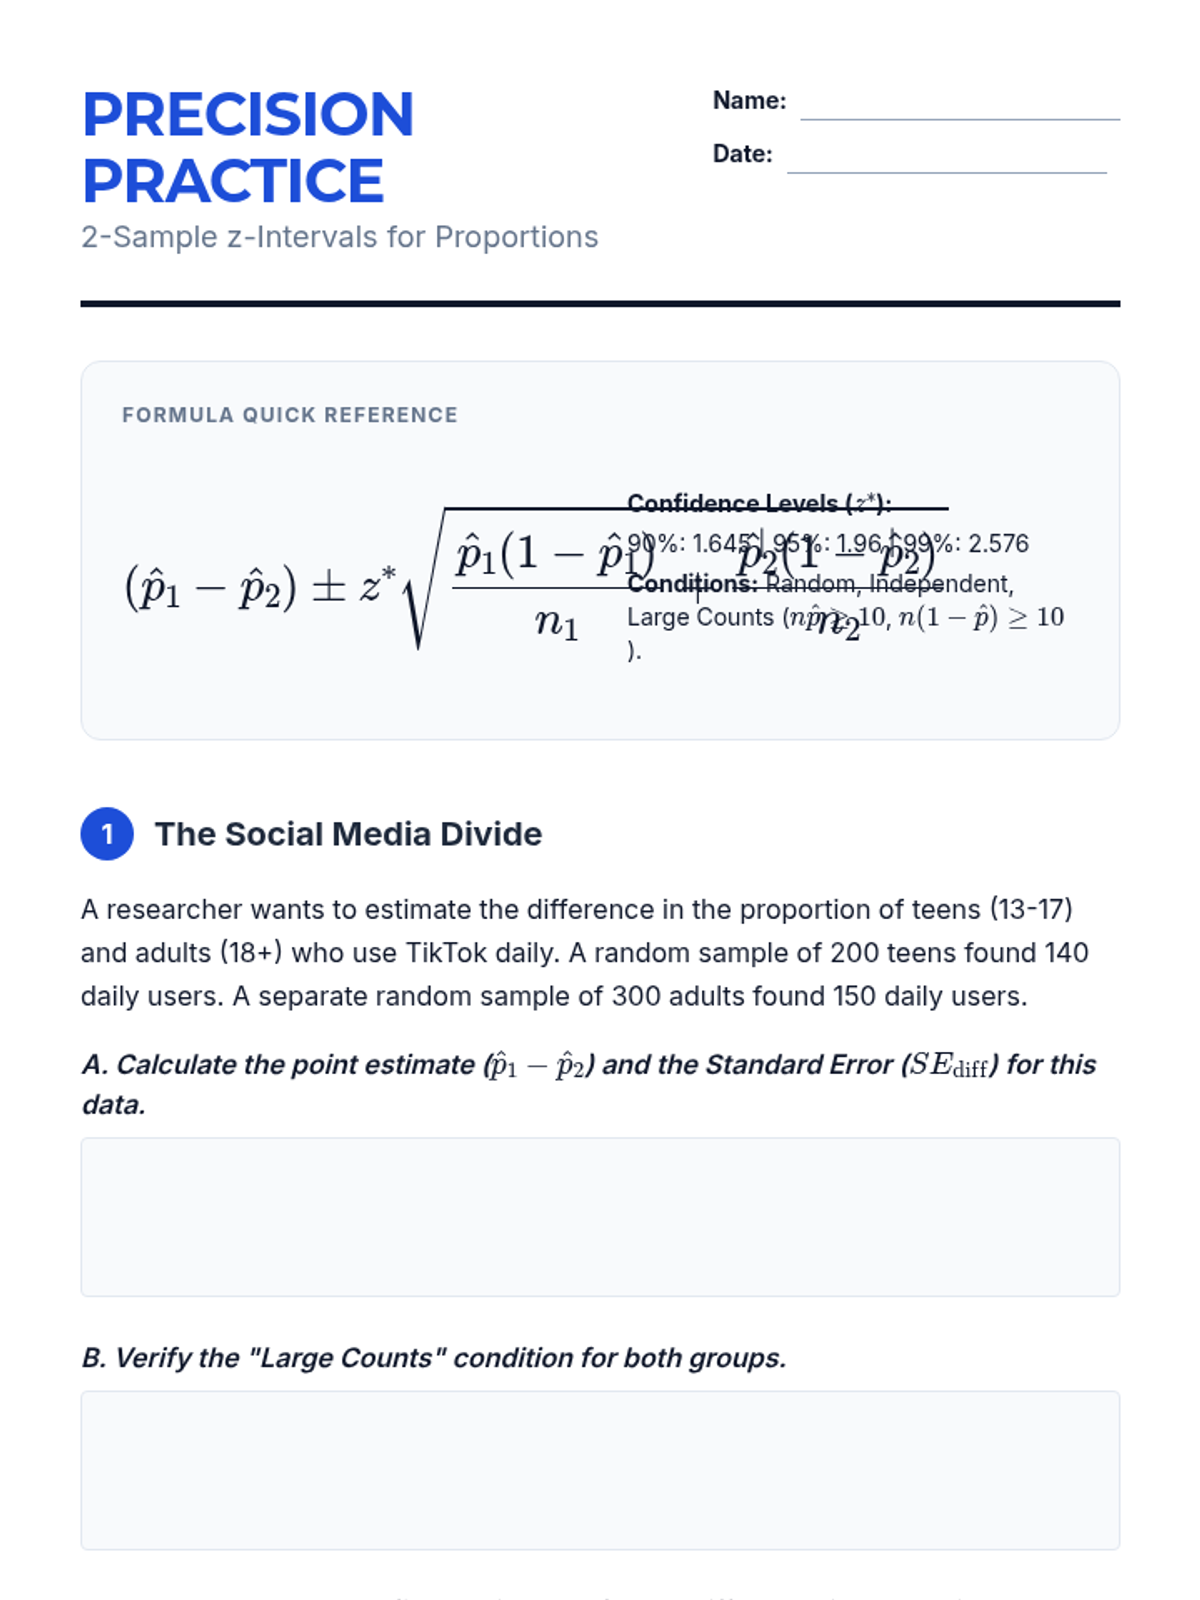
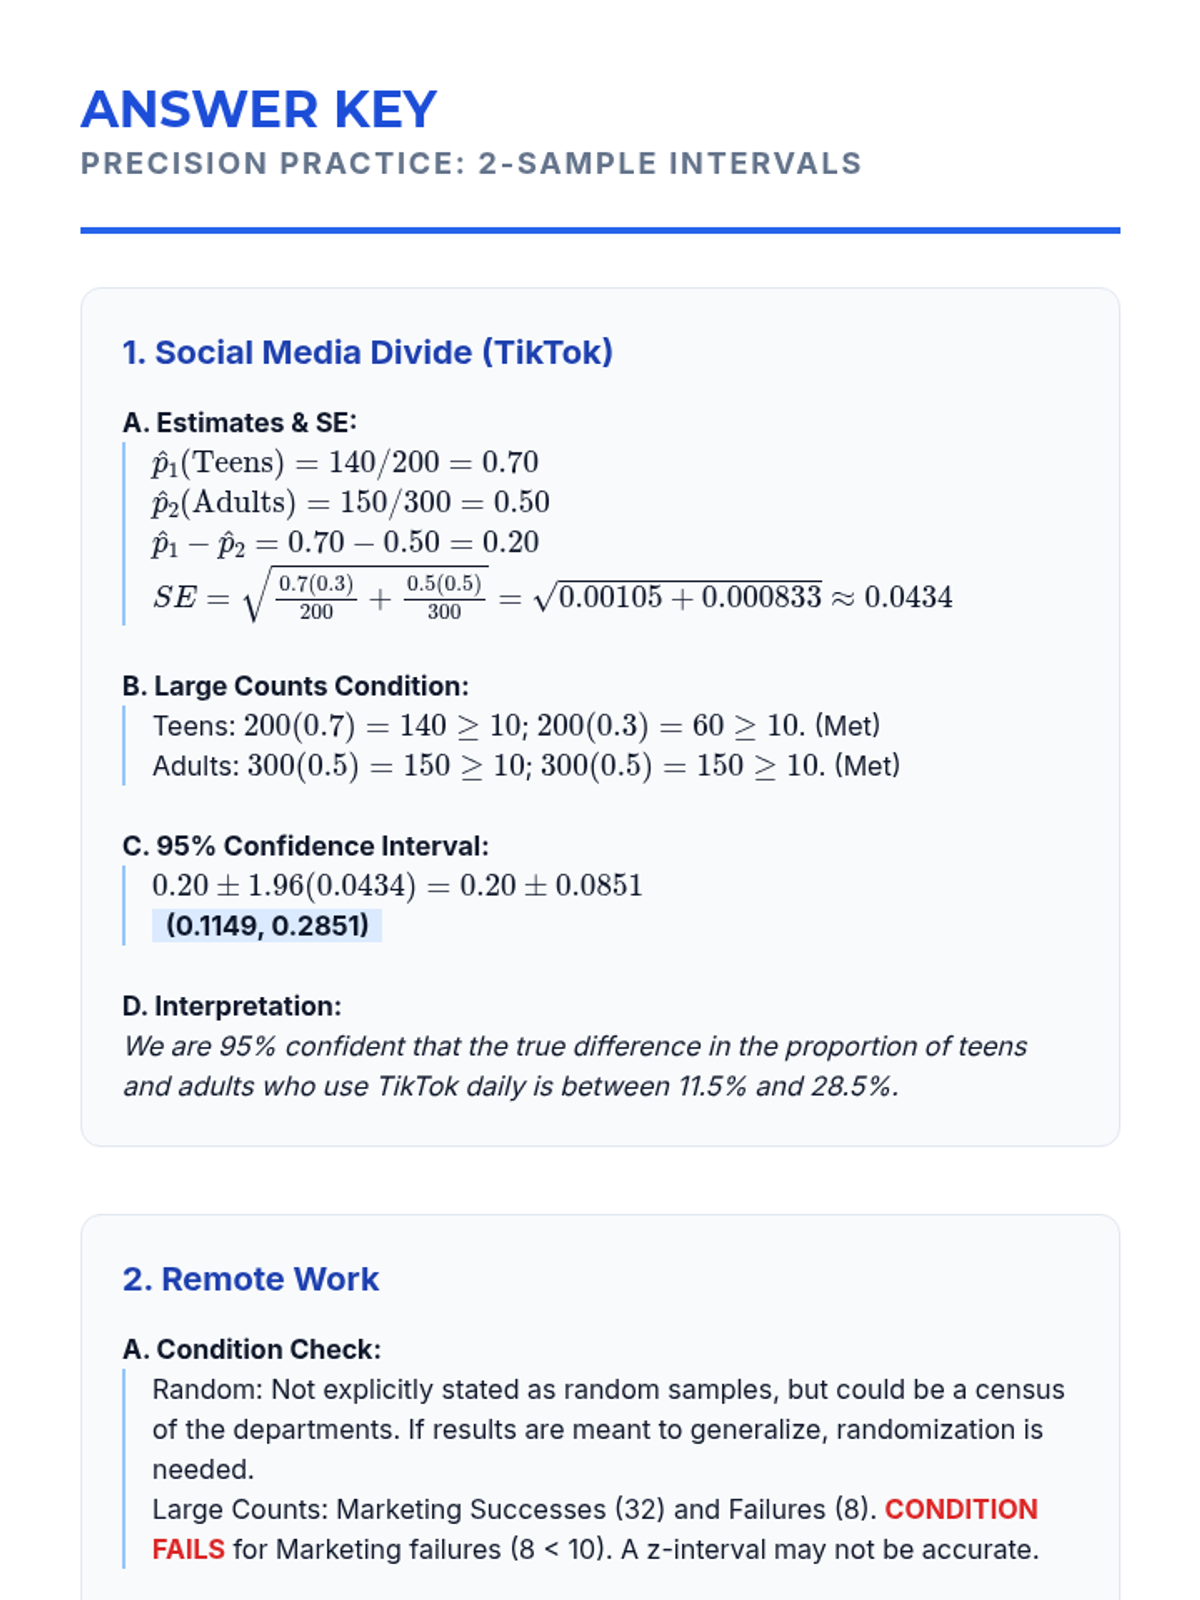
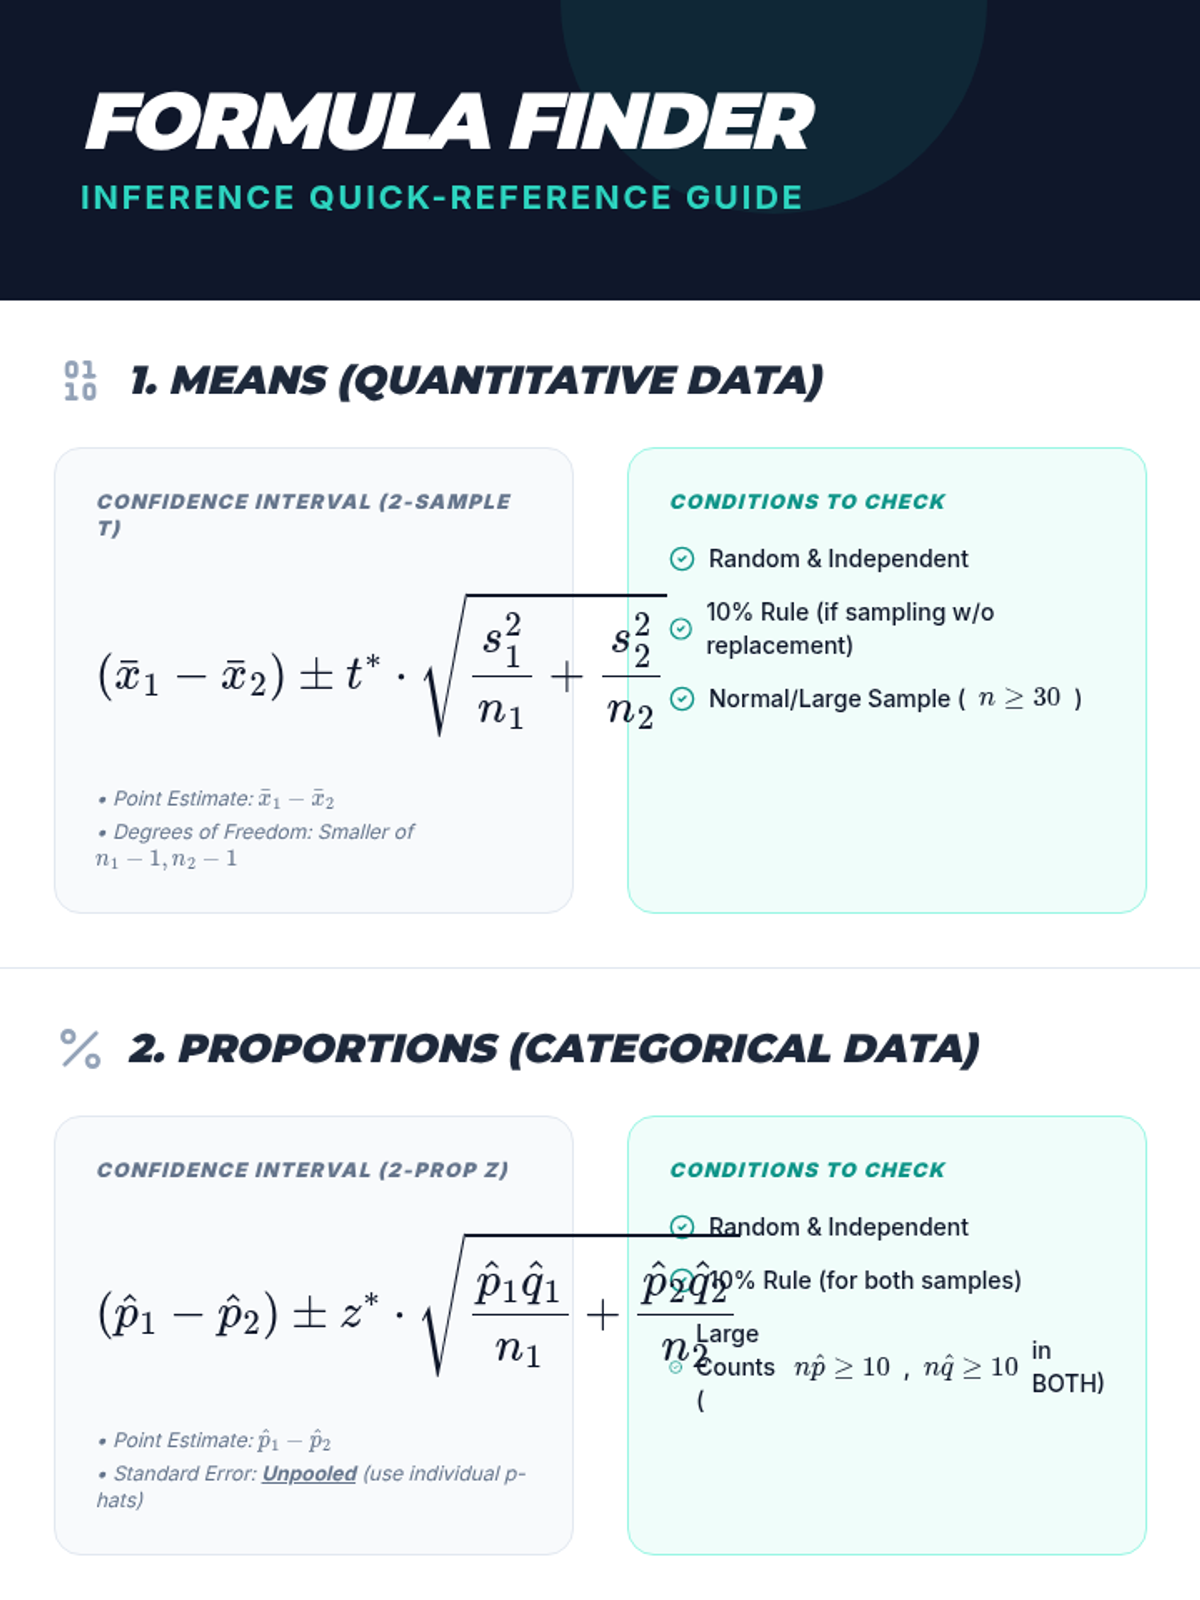
Students learn the formula for the standard error of the difference between two proportions and construct 2-sample z-intervals. Emphasis is placed on checking the Random, Independent, and Large Counts conditions.
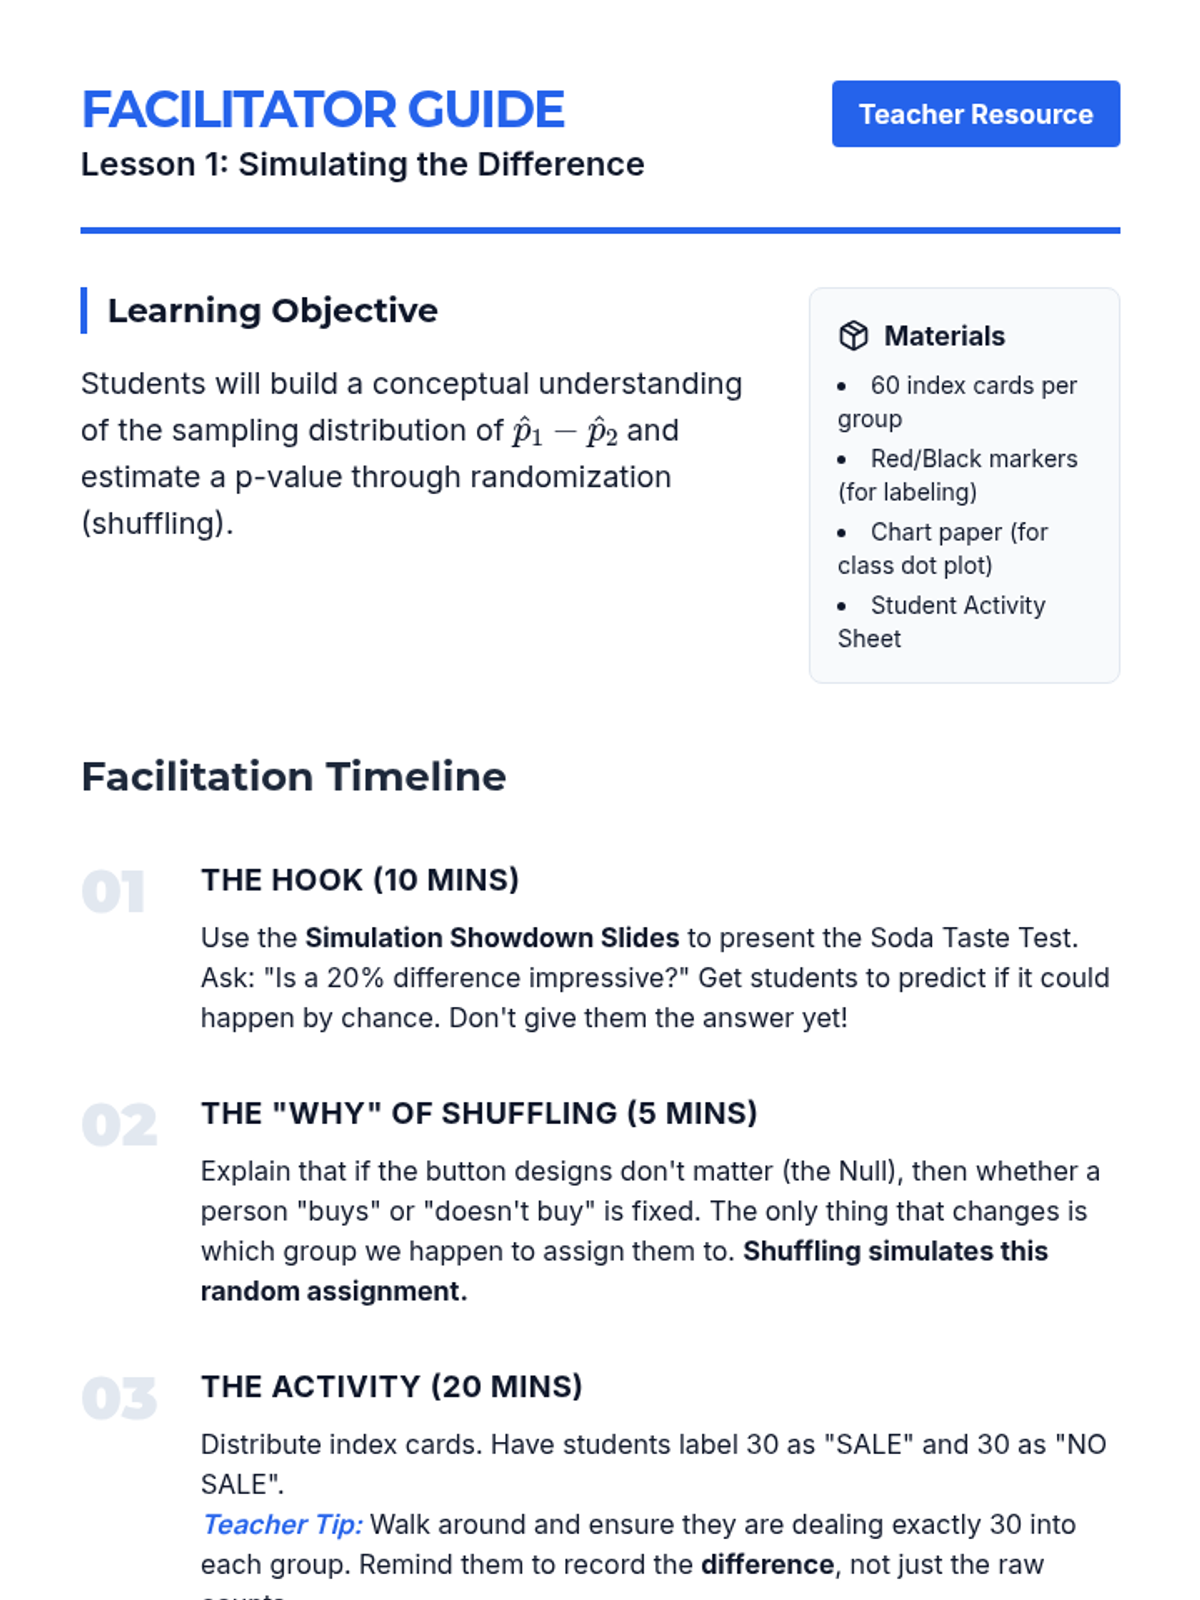
Students use randomization techniques to simulate the sampling distribution of the difference between two proportions. This builds intuition for p-values and sampling variability before introducing formal formulas.
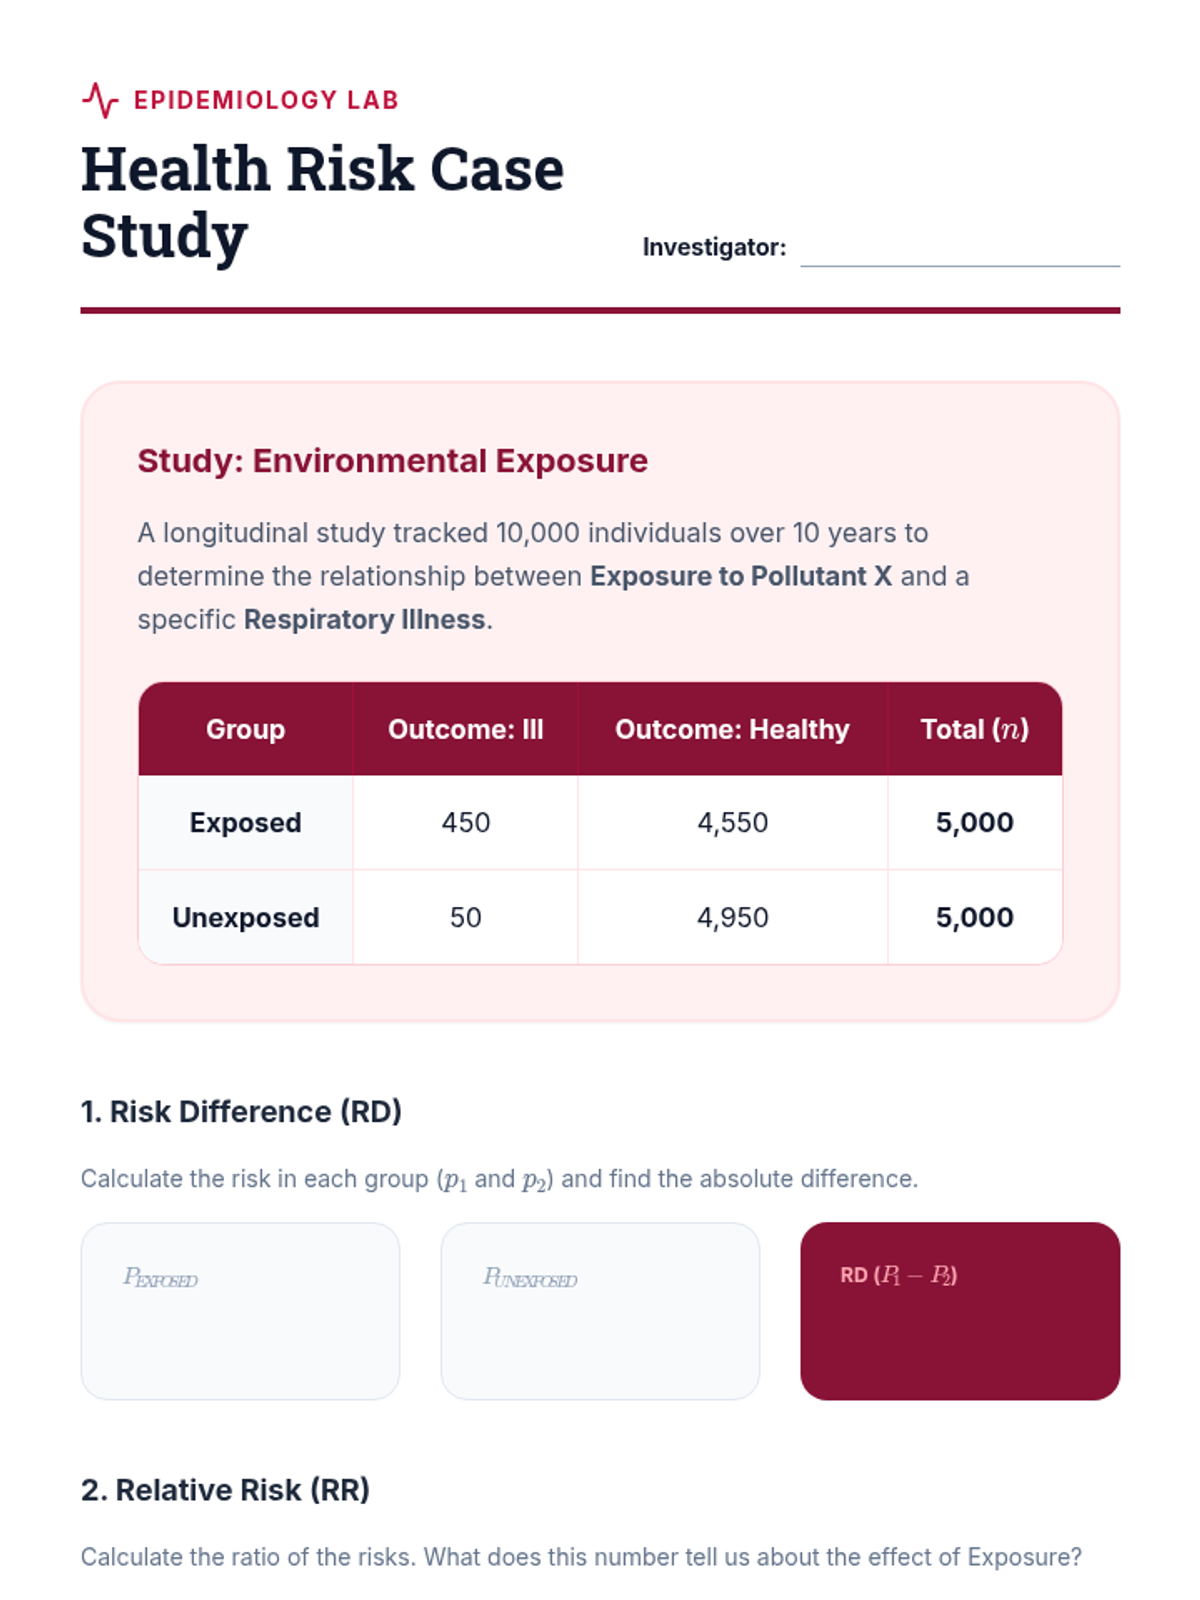
Introduces relative risk and odds ratios as alternative ways to compare rates, with a focus on applications in public health and epidemiology.
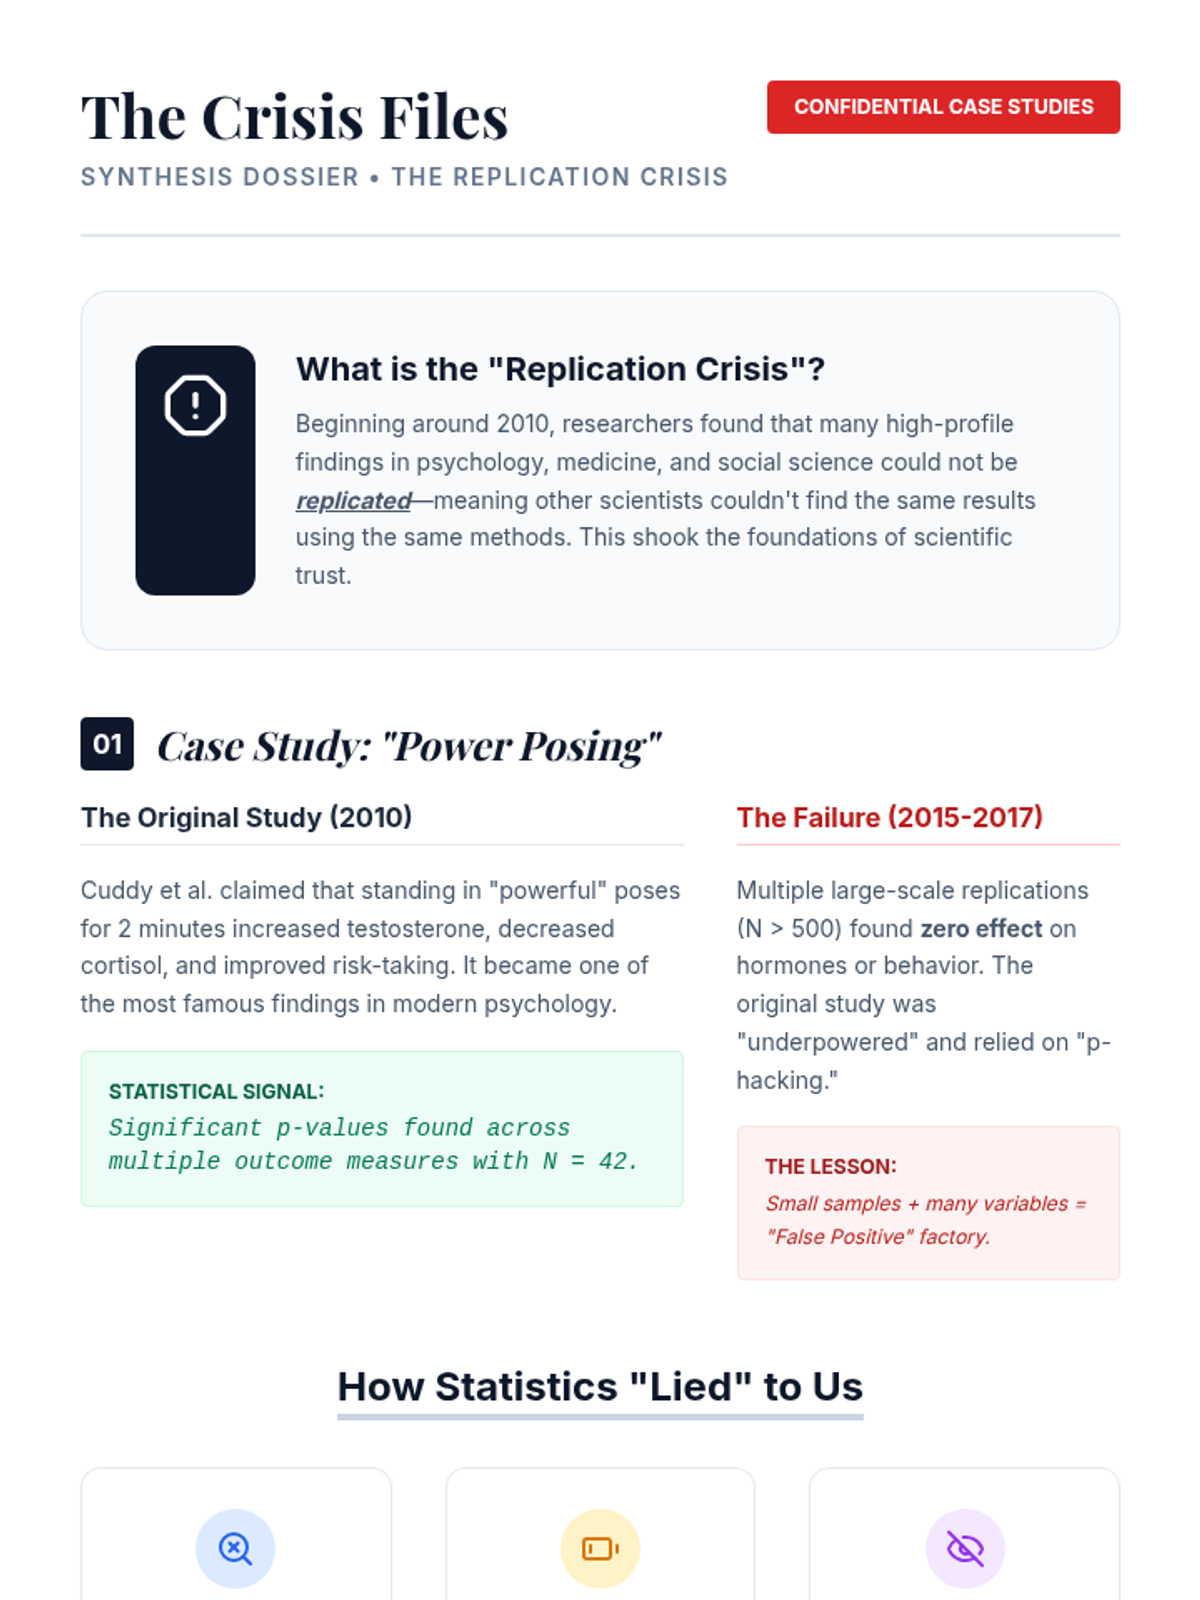
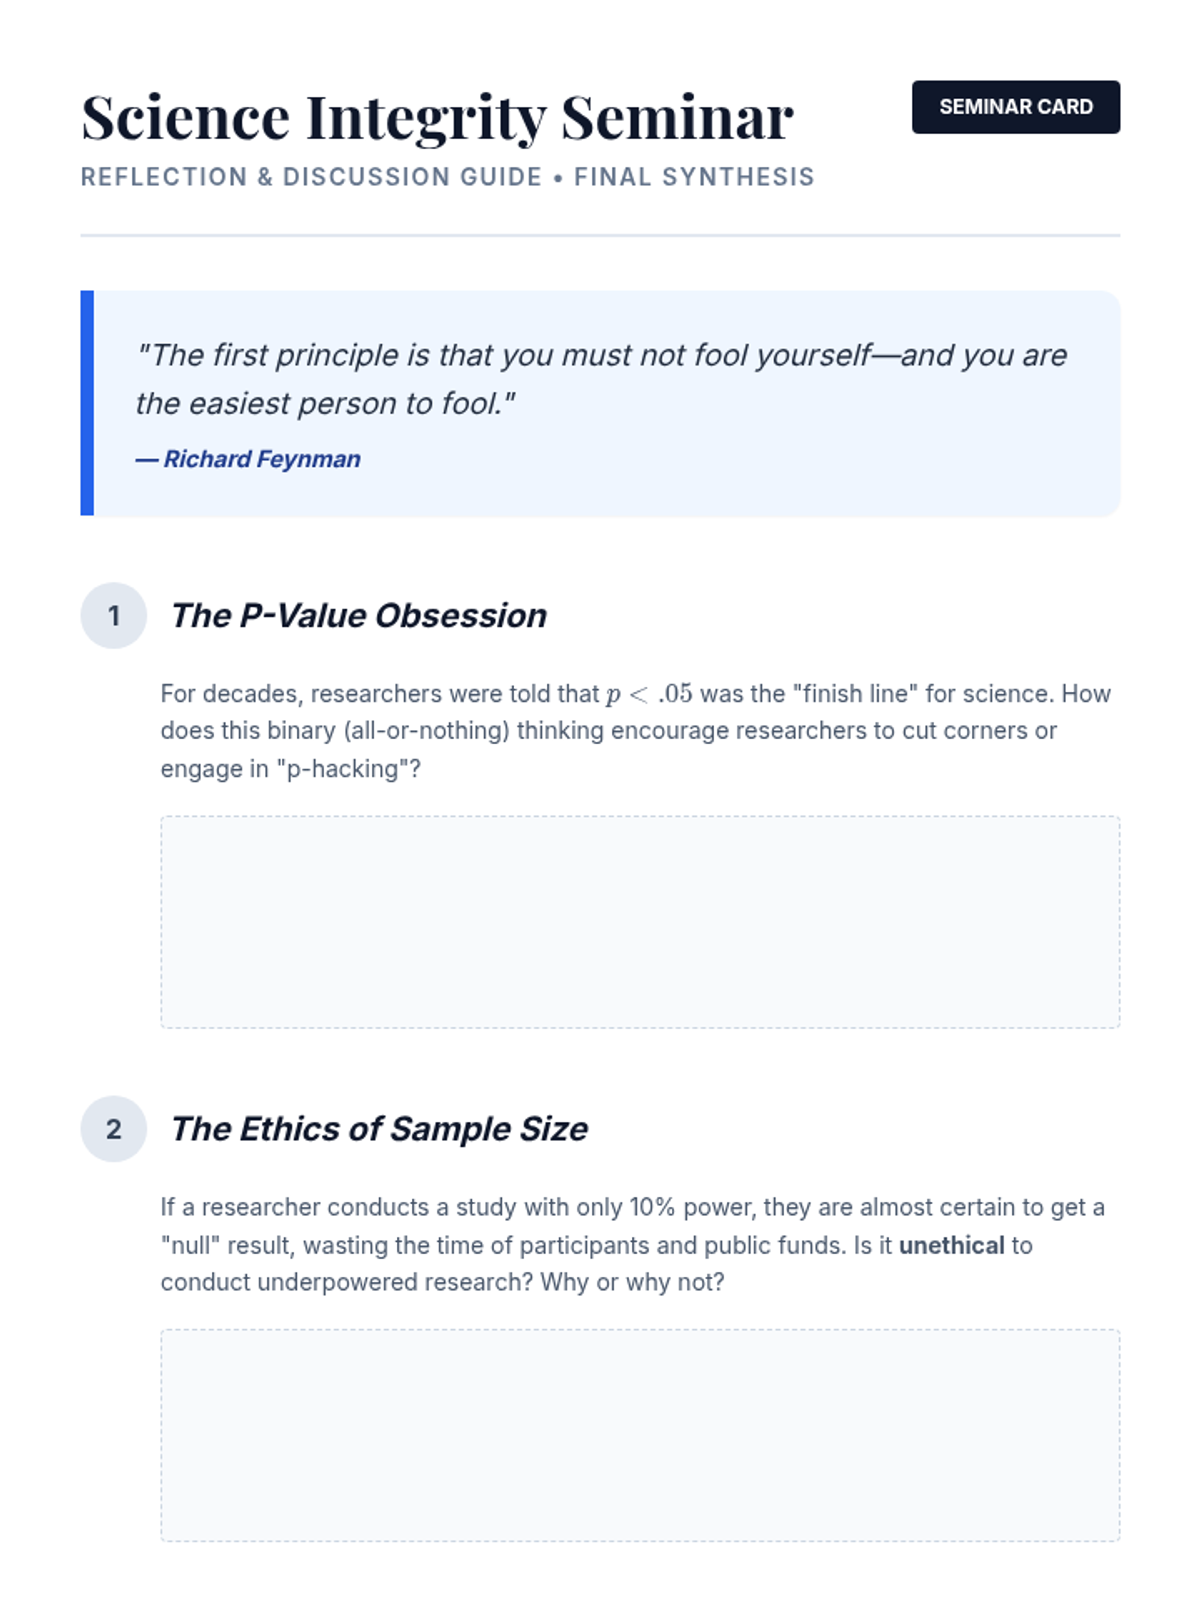
A culminating discussion on the replication crisis in science. Students synthesize their knowledge of power, effect size, and p-hacking to evaluate the credibility of published research and the importance of open science practices.
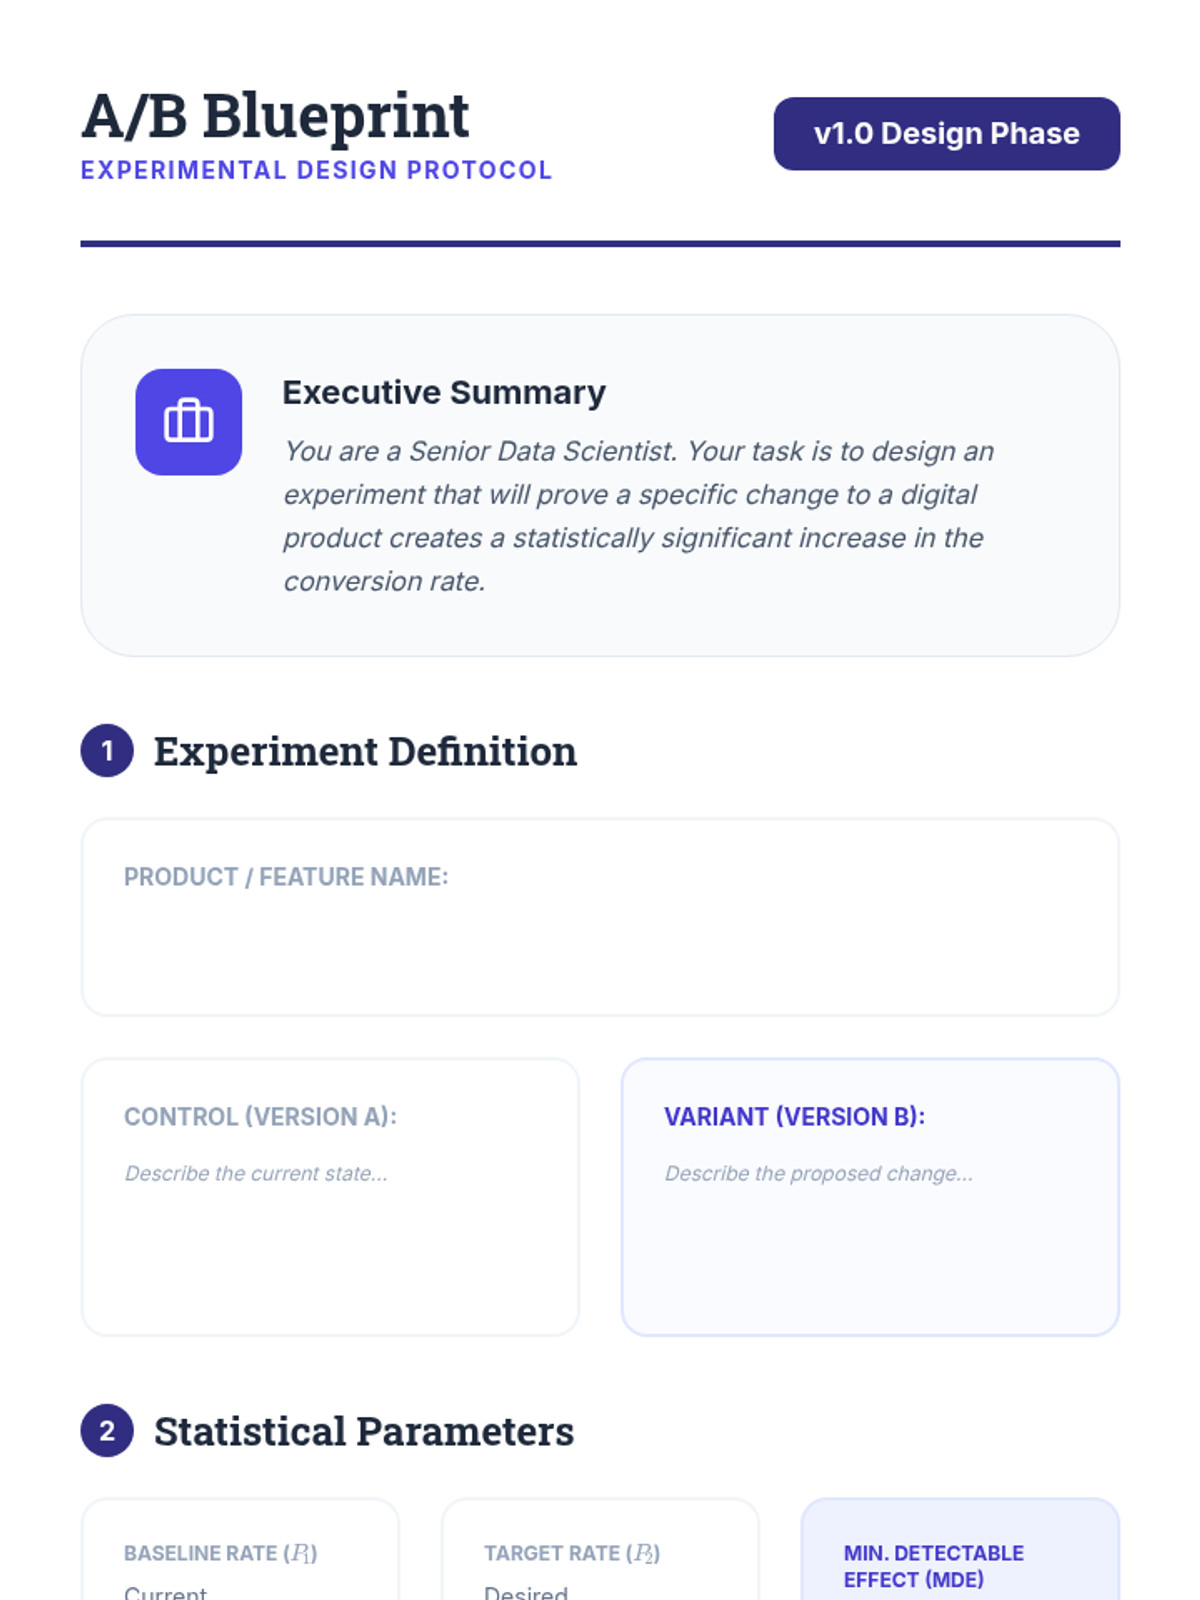
A project-based lesson where students design a theoretical A/B test, determining sample sizes and minimum detectable effects for digital products.
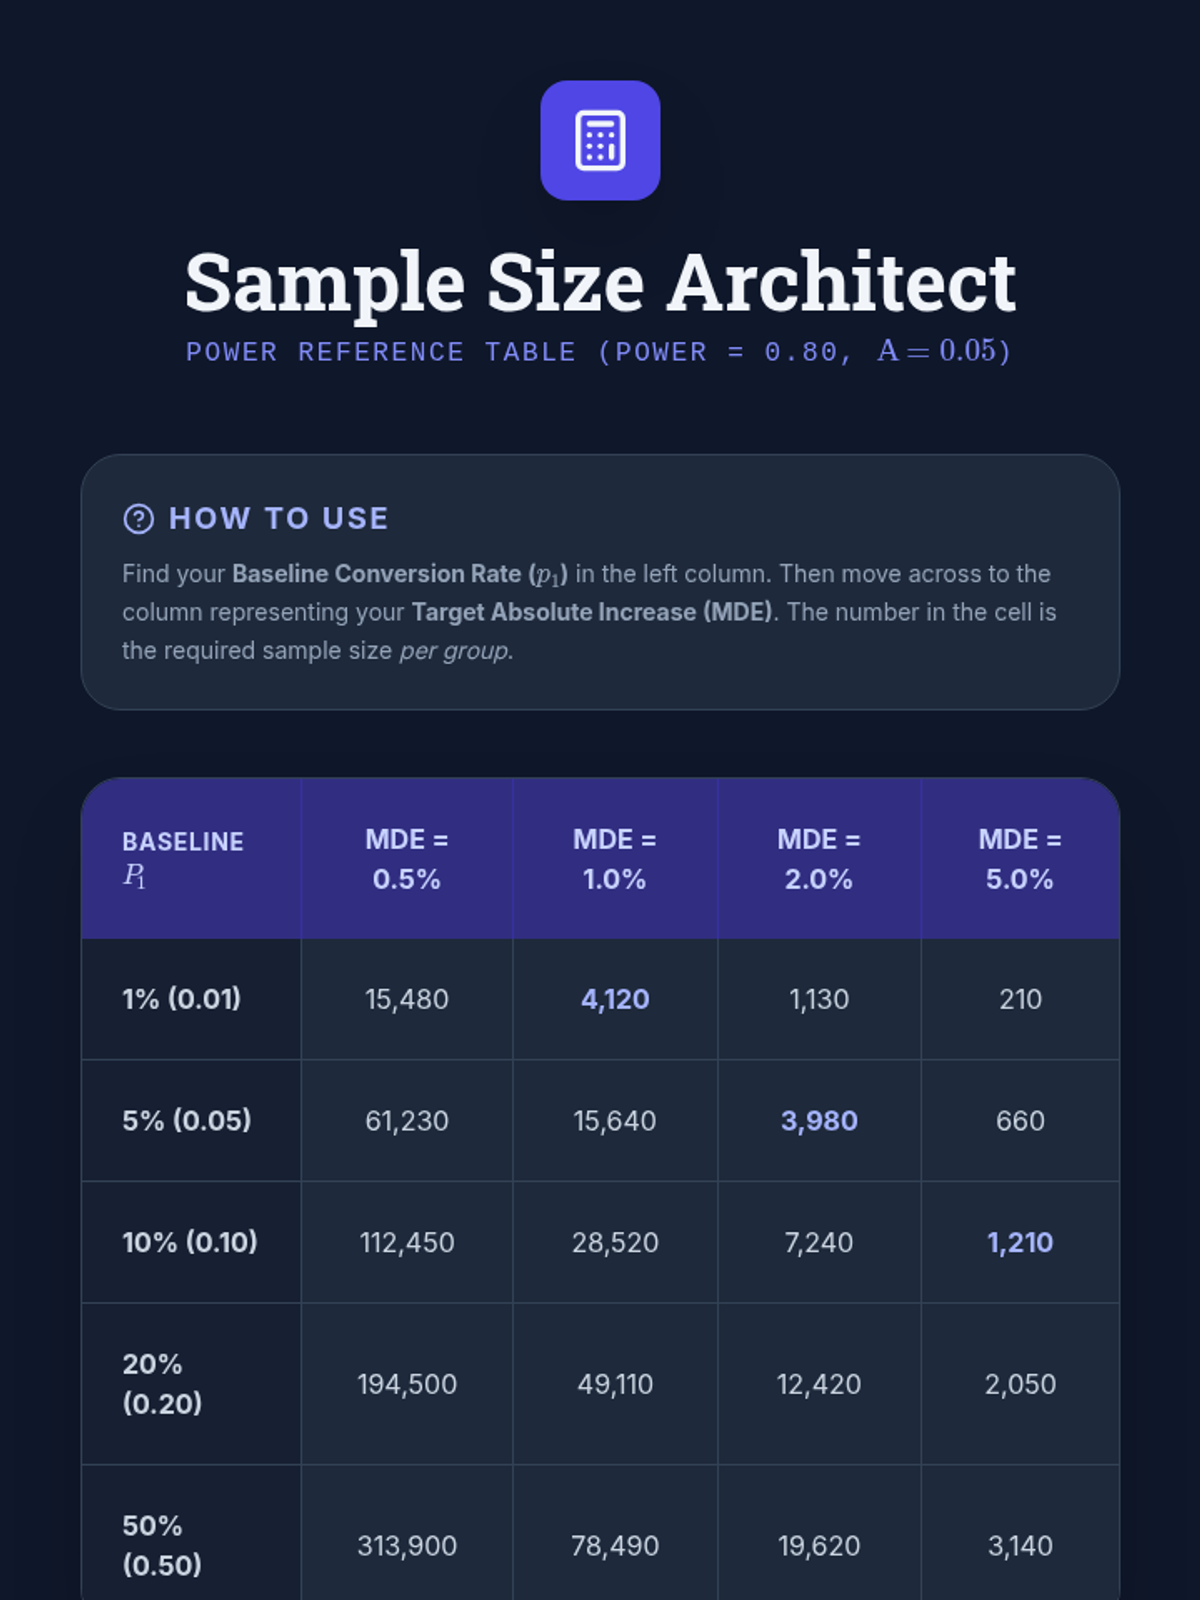
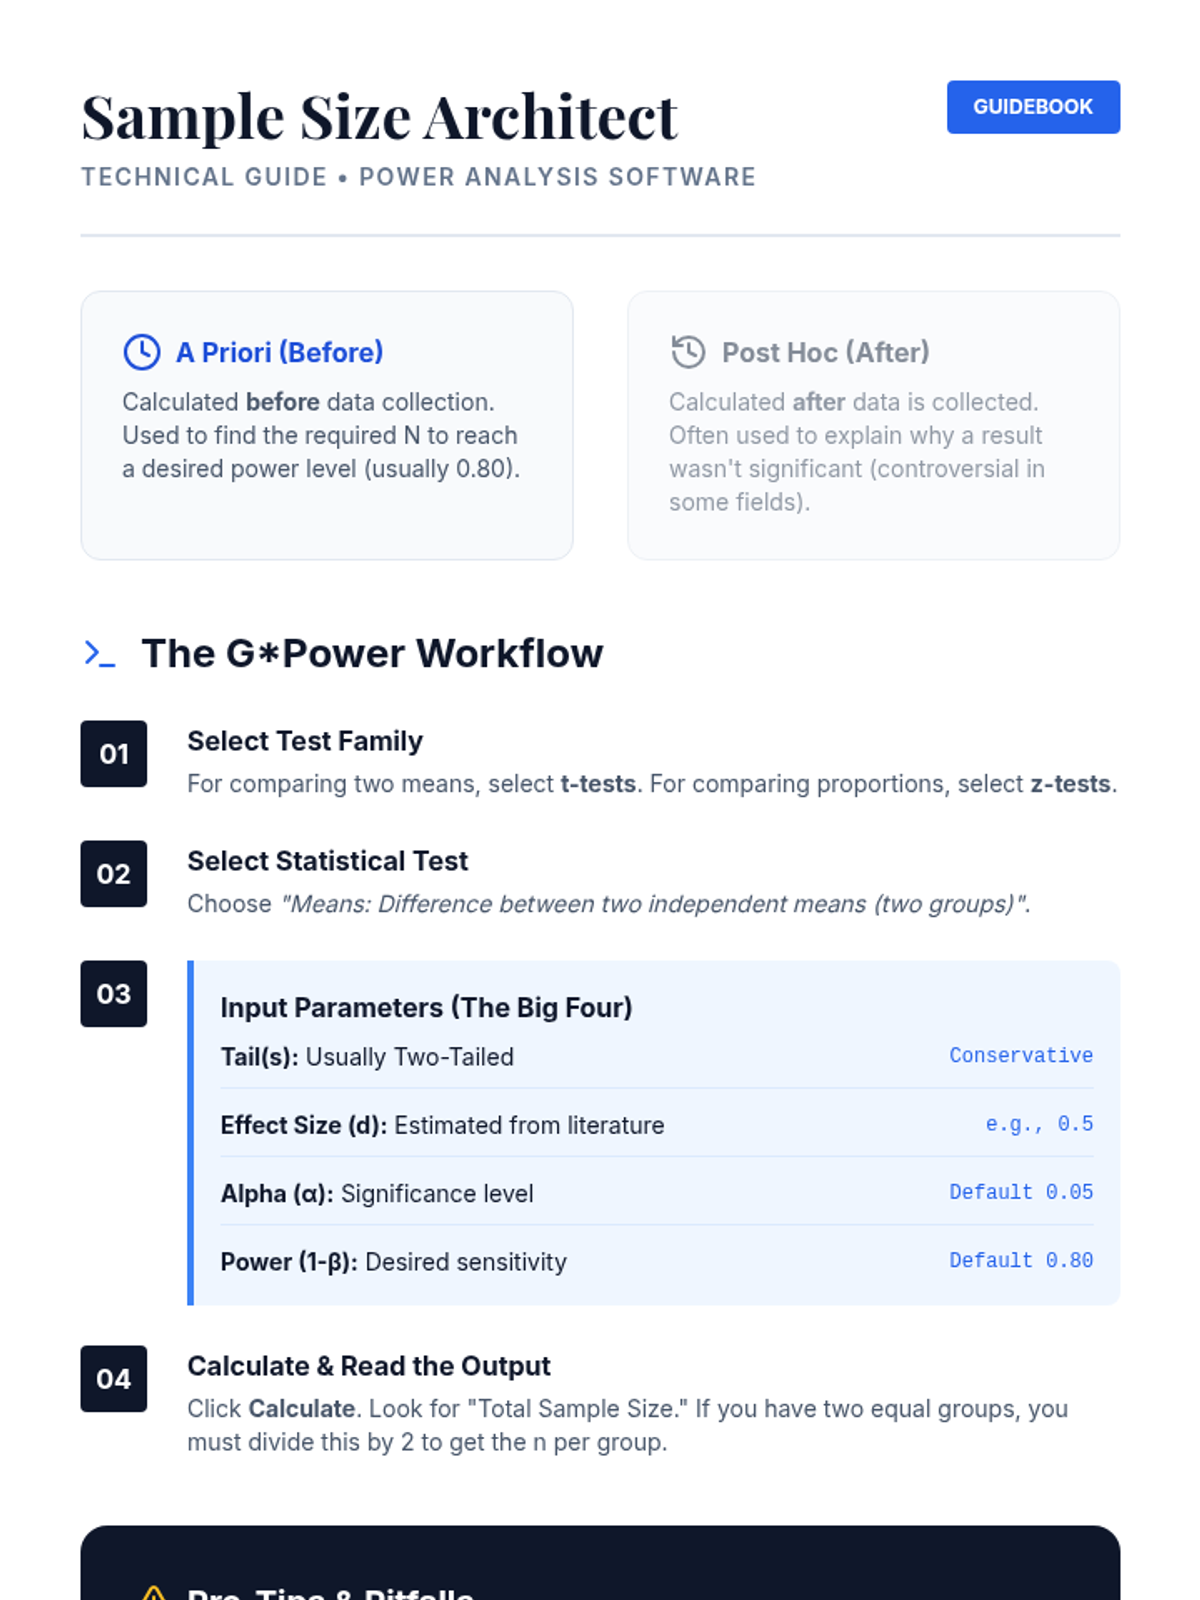
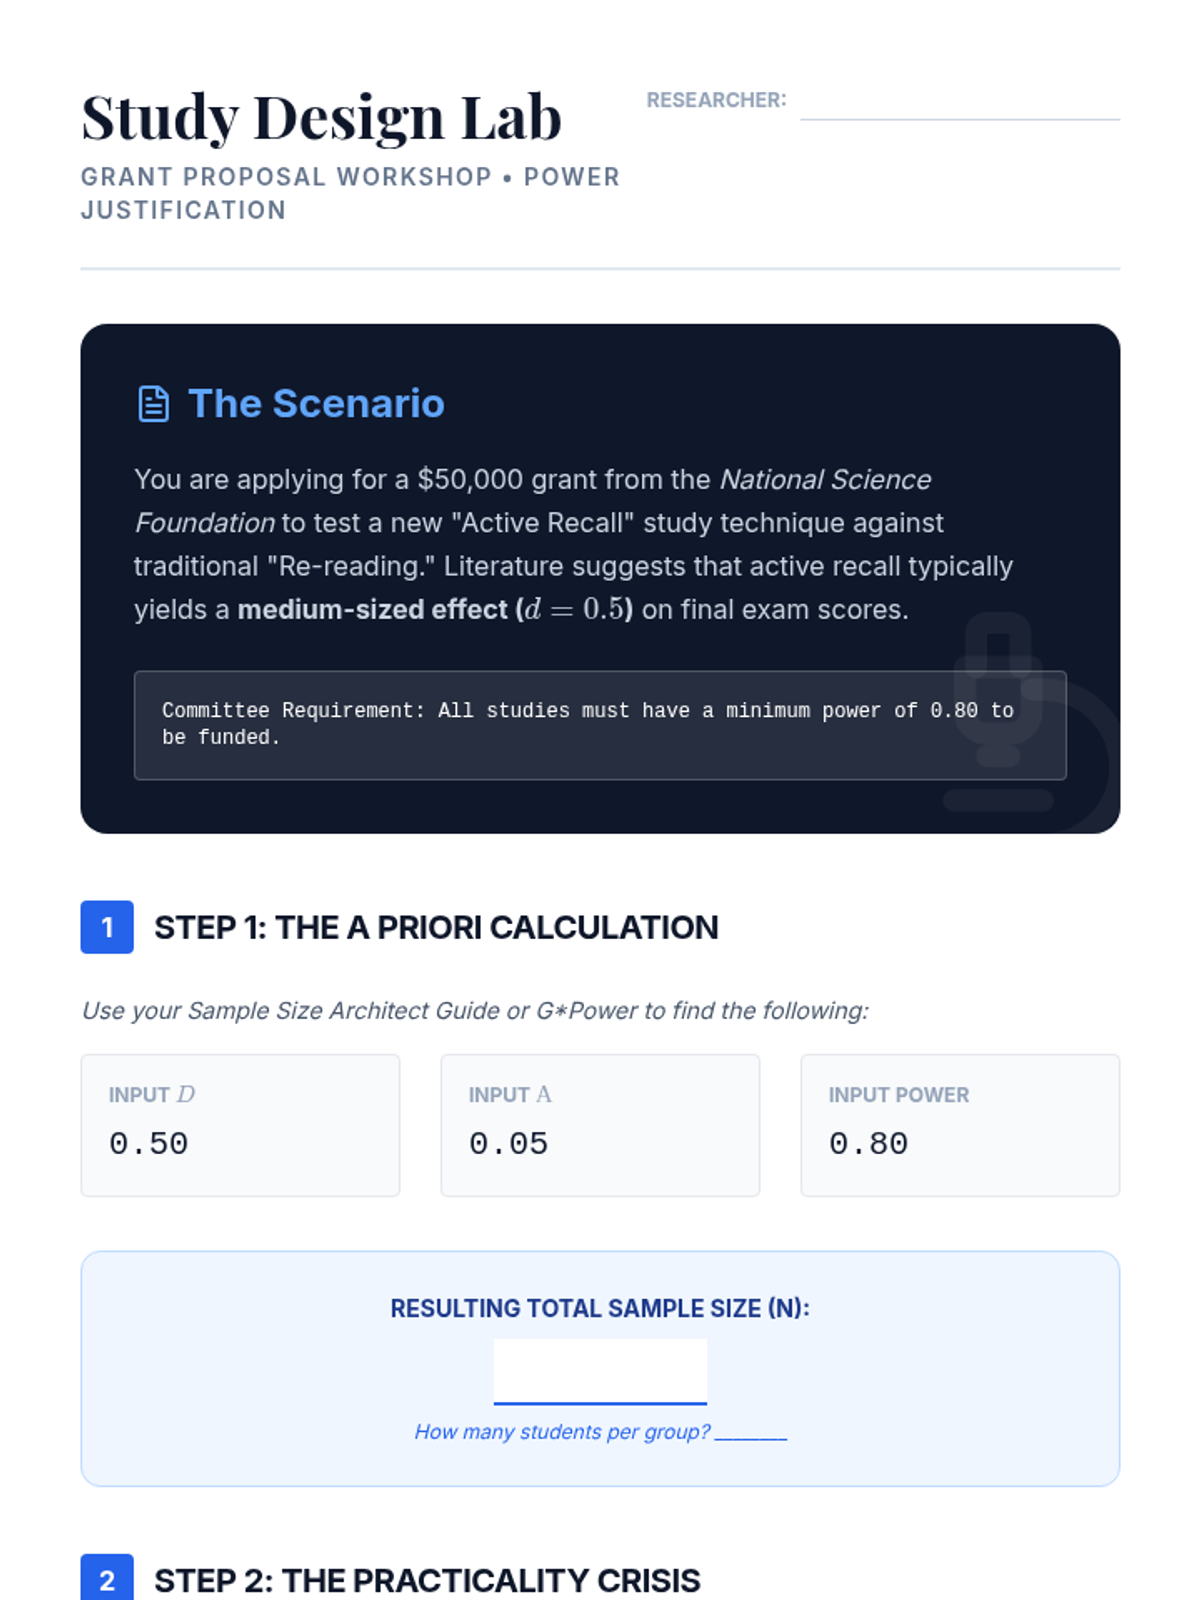
Applying power analysis to study design, students learn to determine required sample sizes before data collection. This lesson focuses on the practical use of power analysis software to justify research parameters in grant and project proposals.
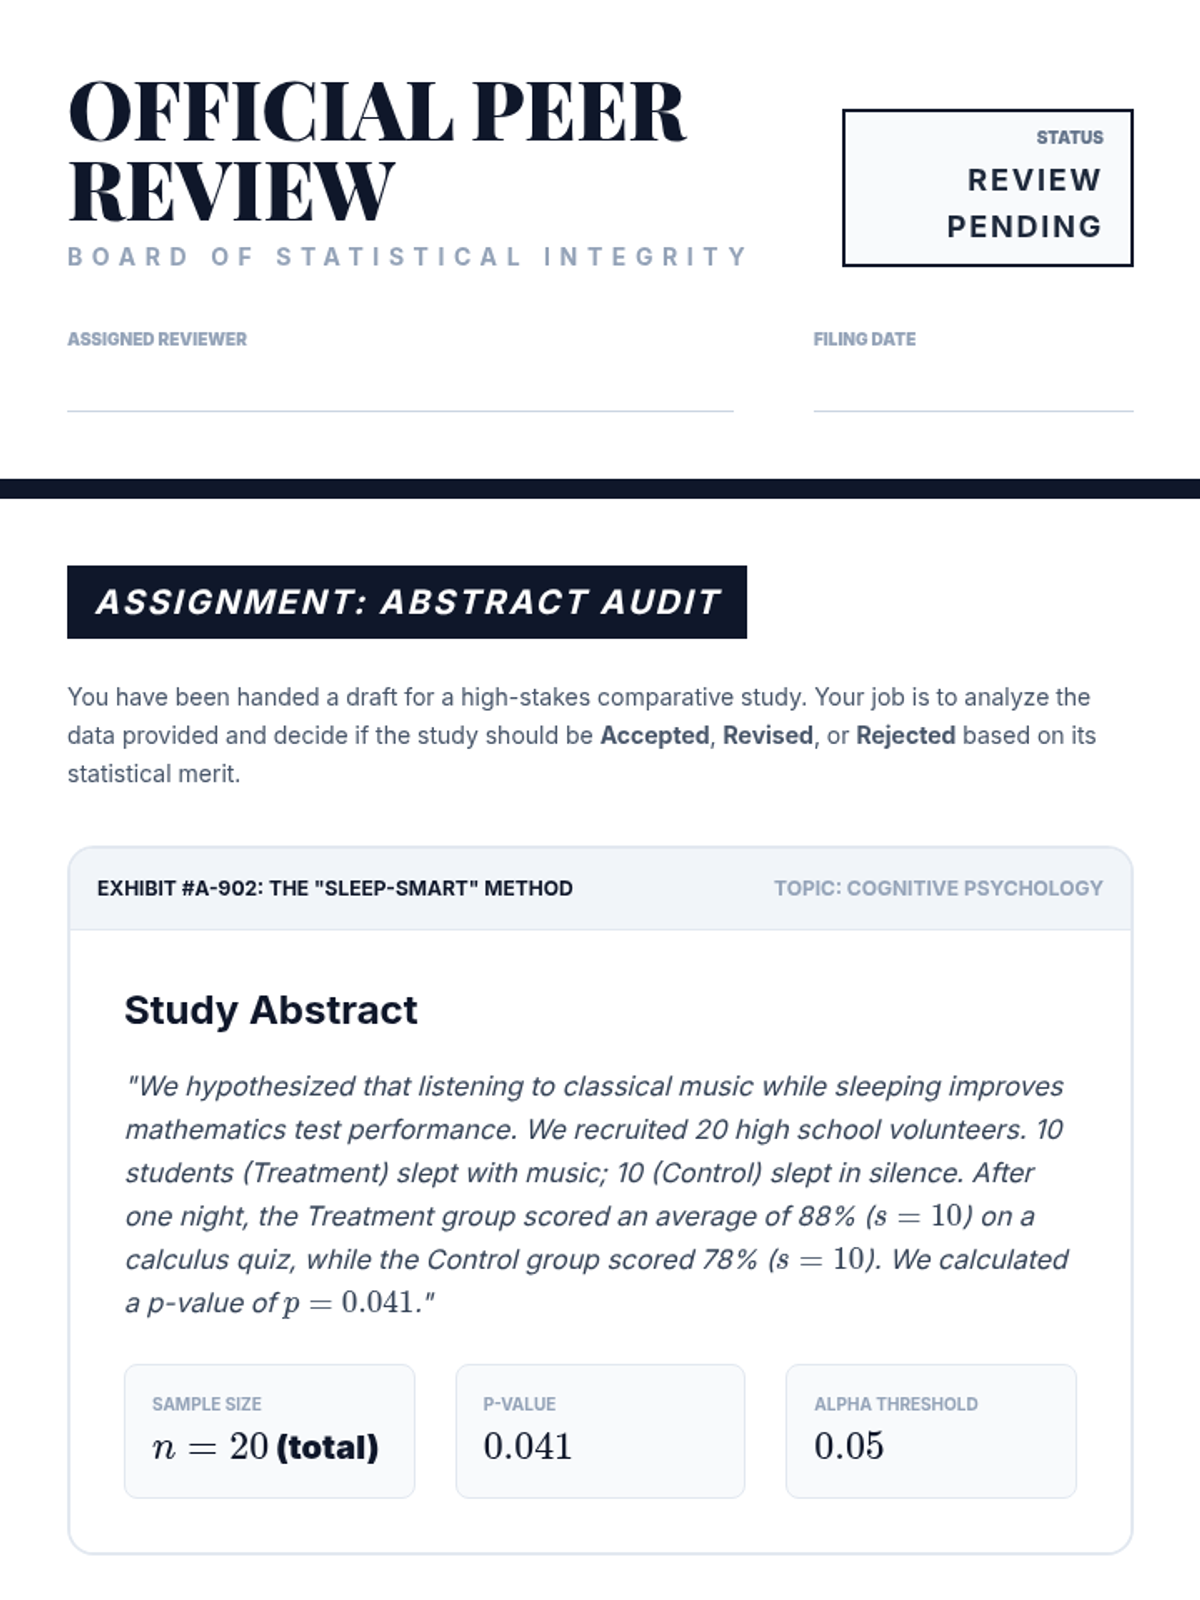
A capstone workshop where students apply their knowledge to critique actual research abstracts, acting as peer reviewers to evaluate the validity of comparative claims.
An investigation into the replication crisis and unethical practices like p-hacking, emphasizing the ethical responsibility of statisticians in reporting findings.
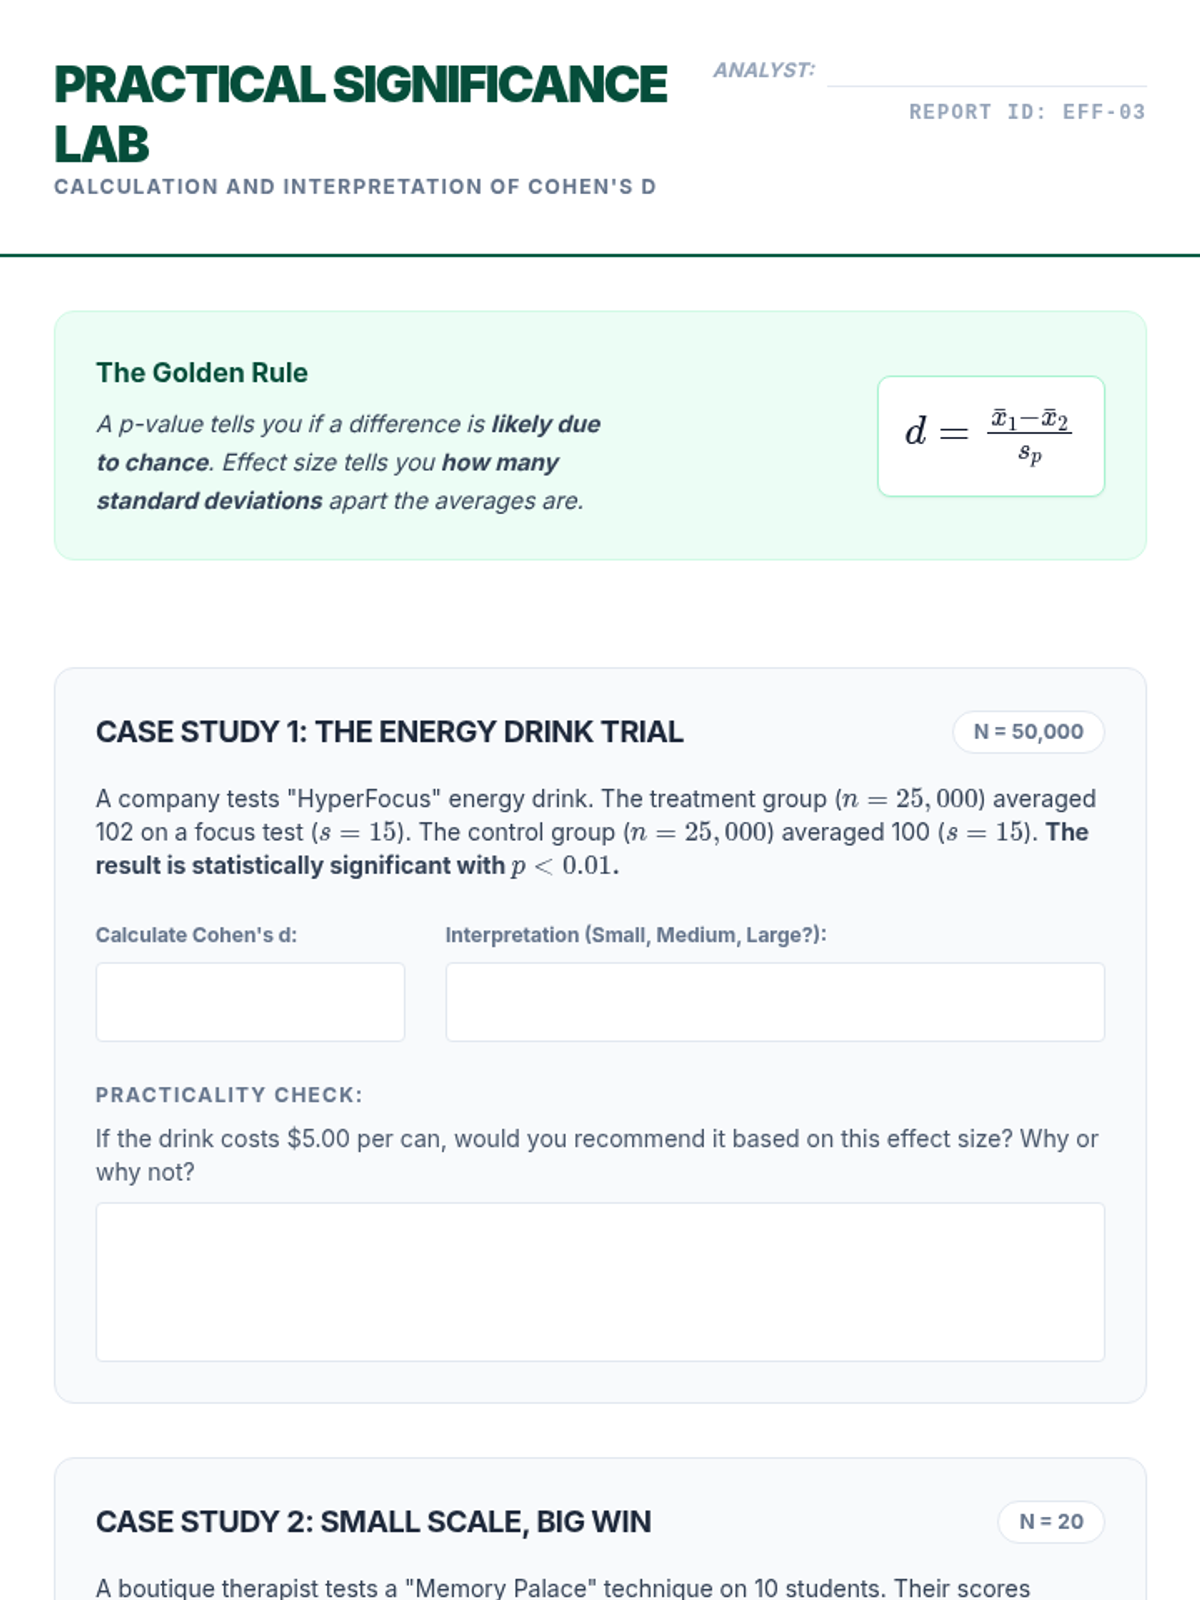
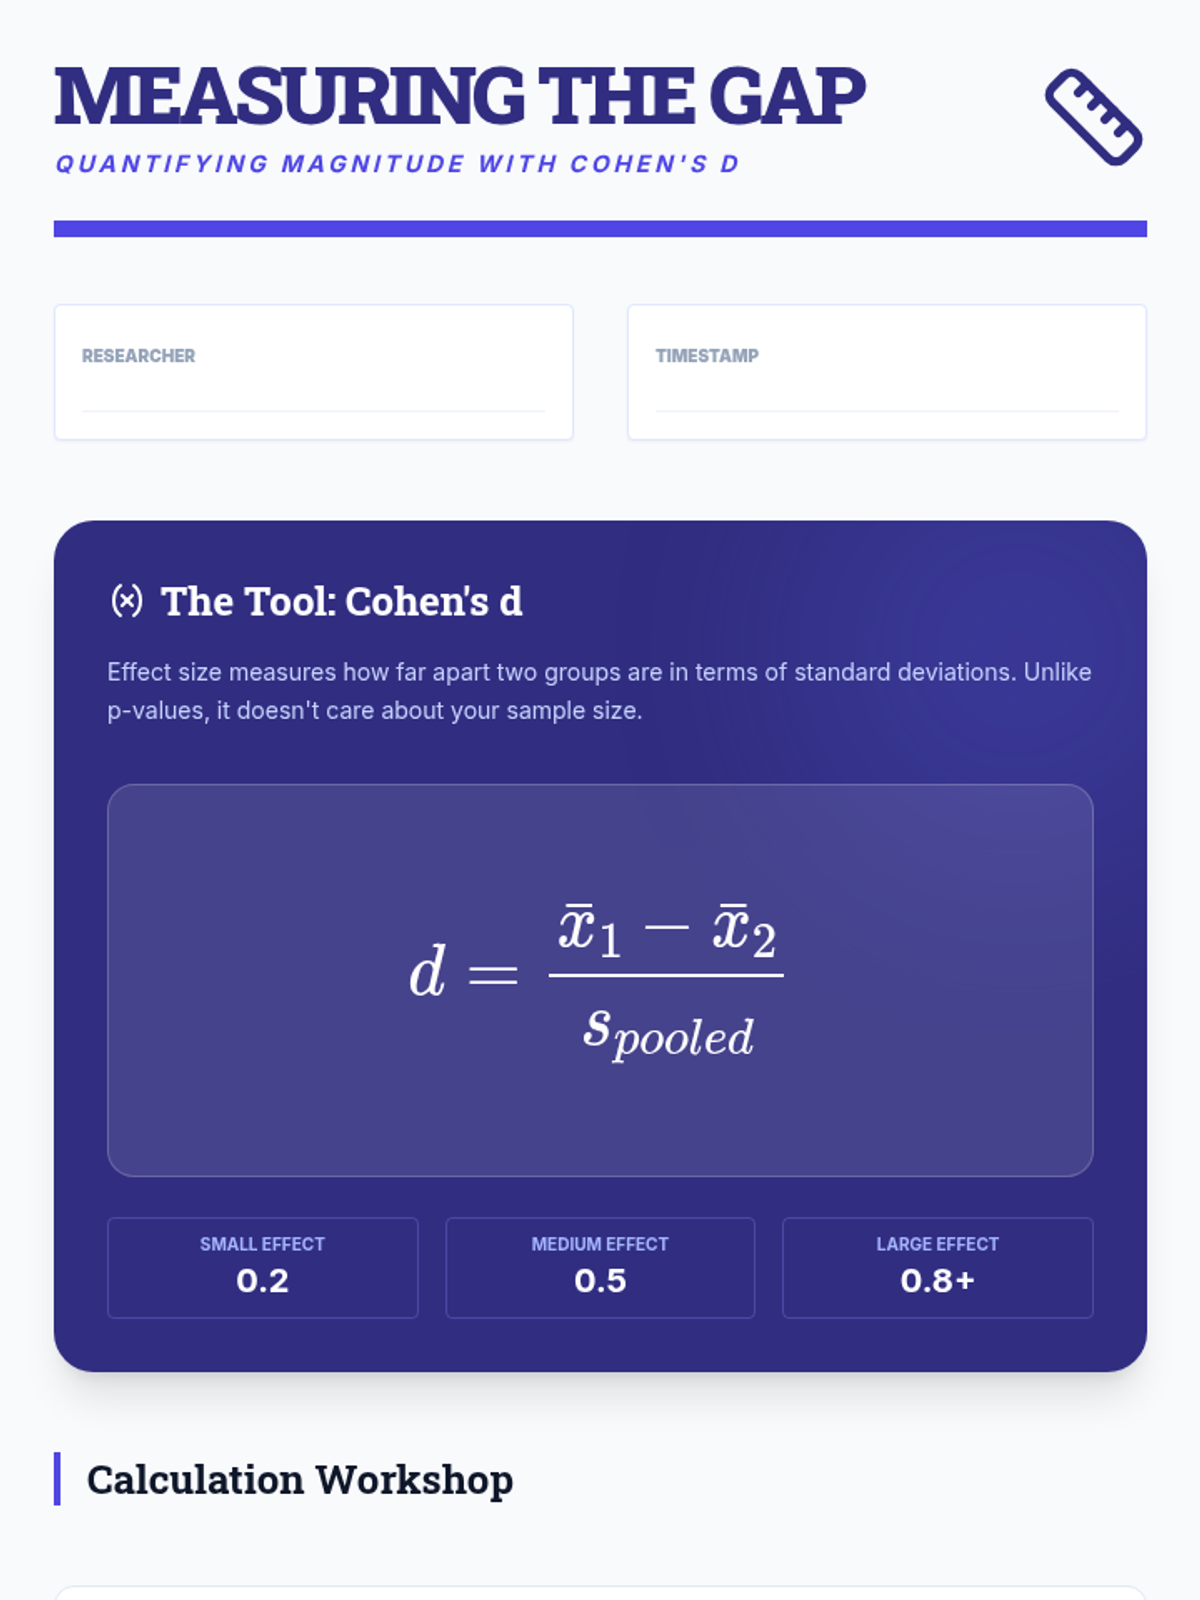
Students learn to calculate and interpret Cohen's d, distinguishing between statistical significance (is there an effect?) and practical importance (how big is the effect?).
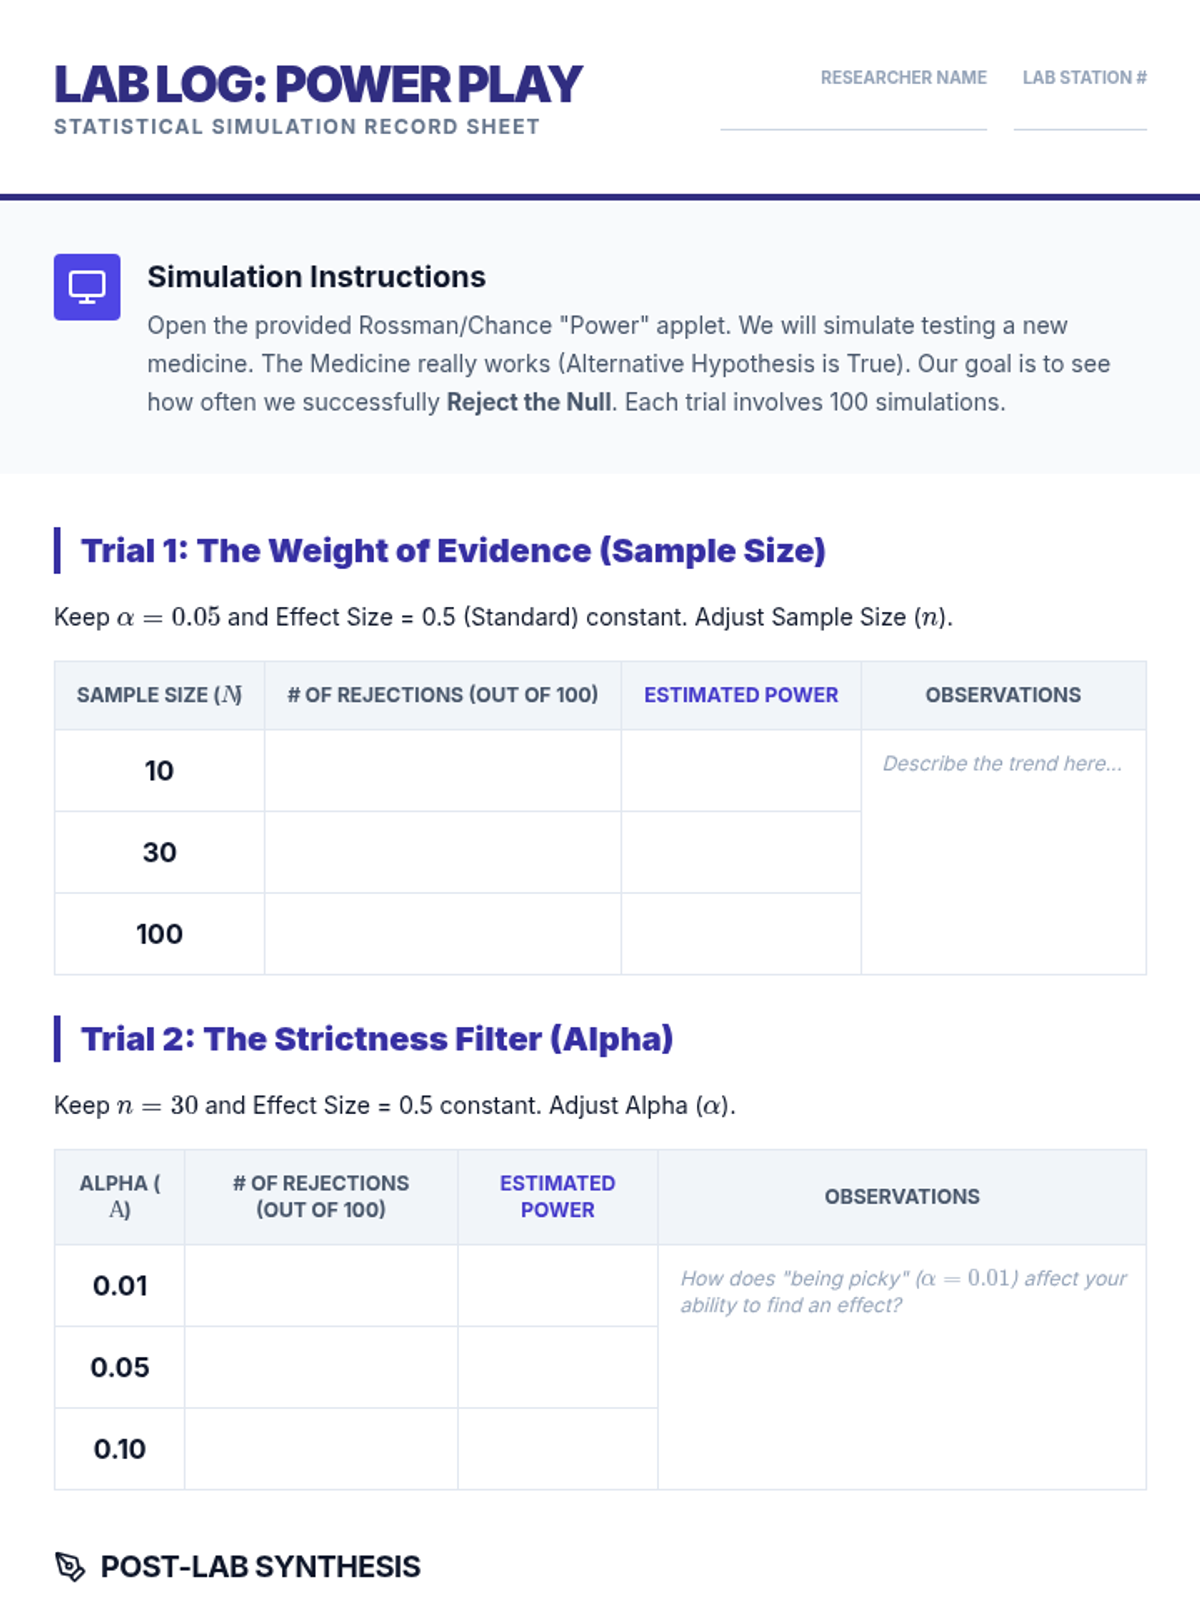
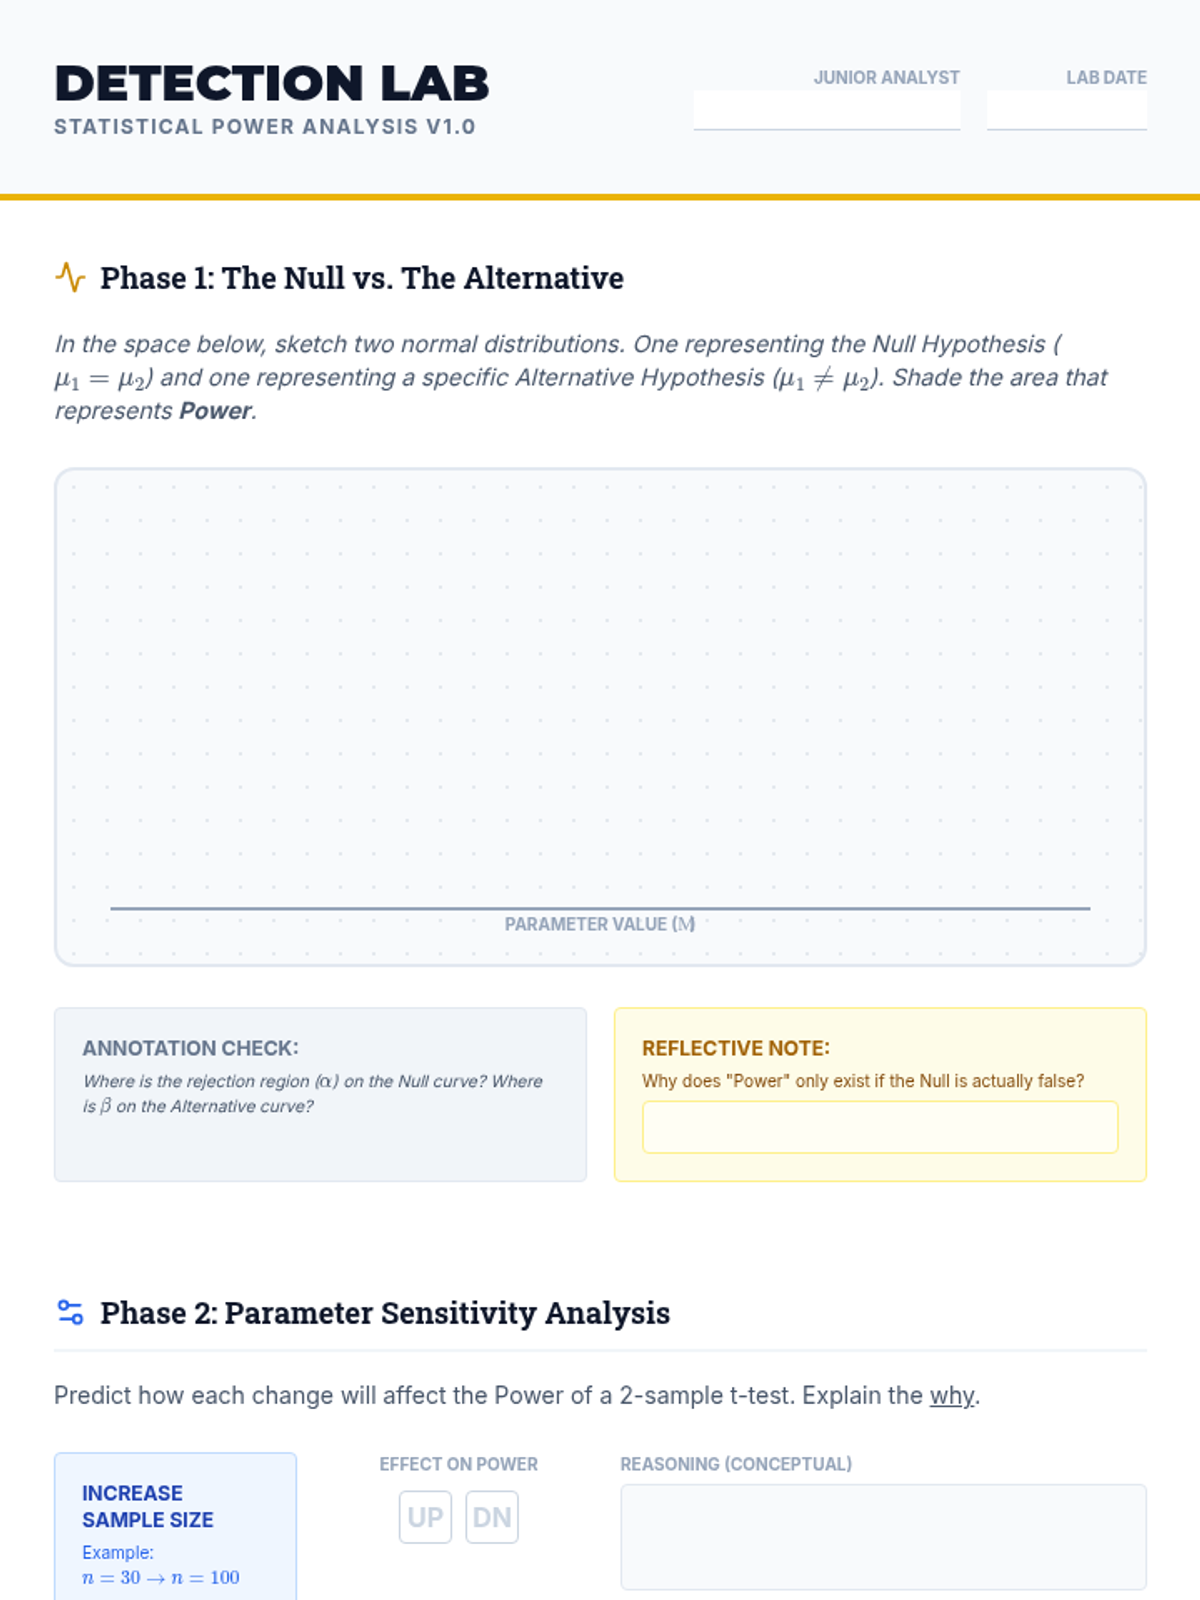
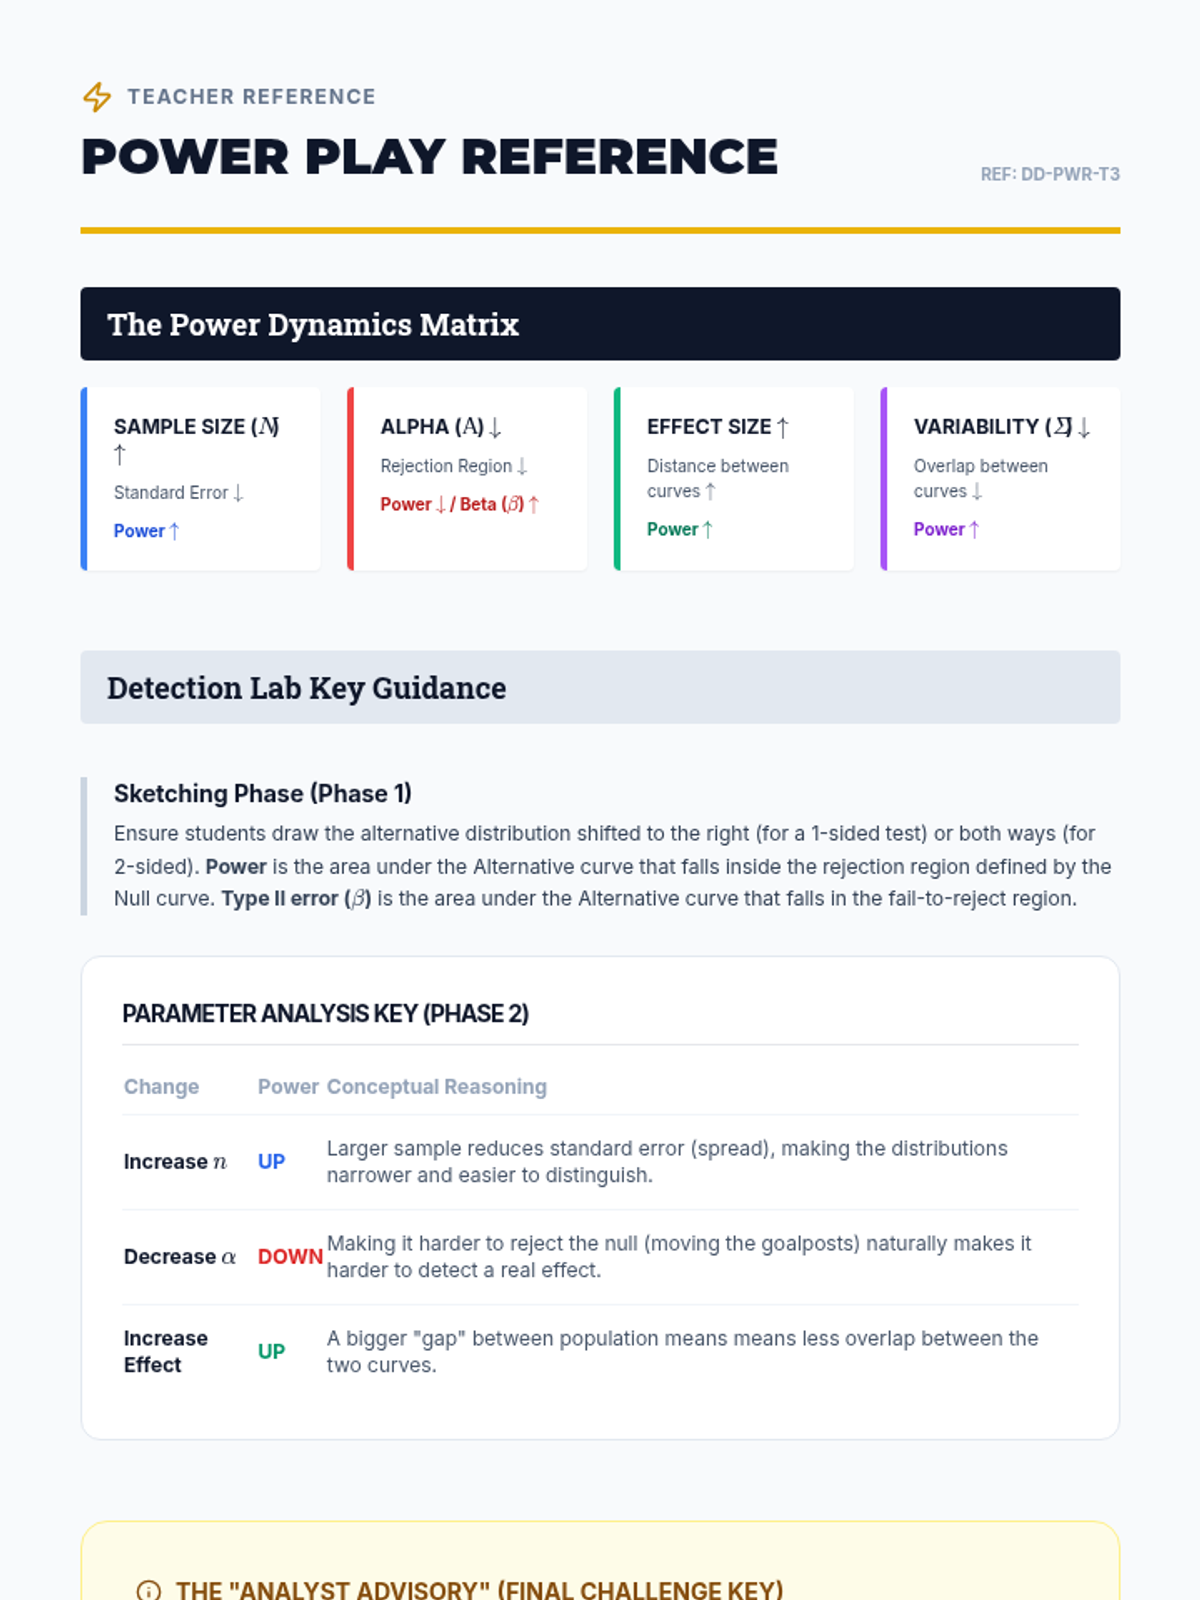
A simulation-based lesson where students manipulate sample size, alpha levels, and effect size to see how they influence a test's ability to detect a true difference between populations.
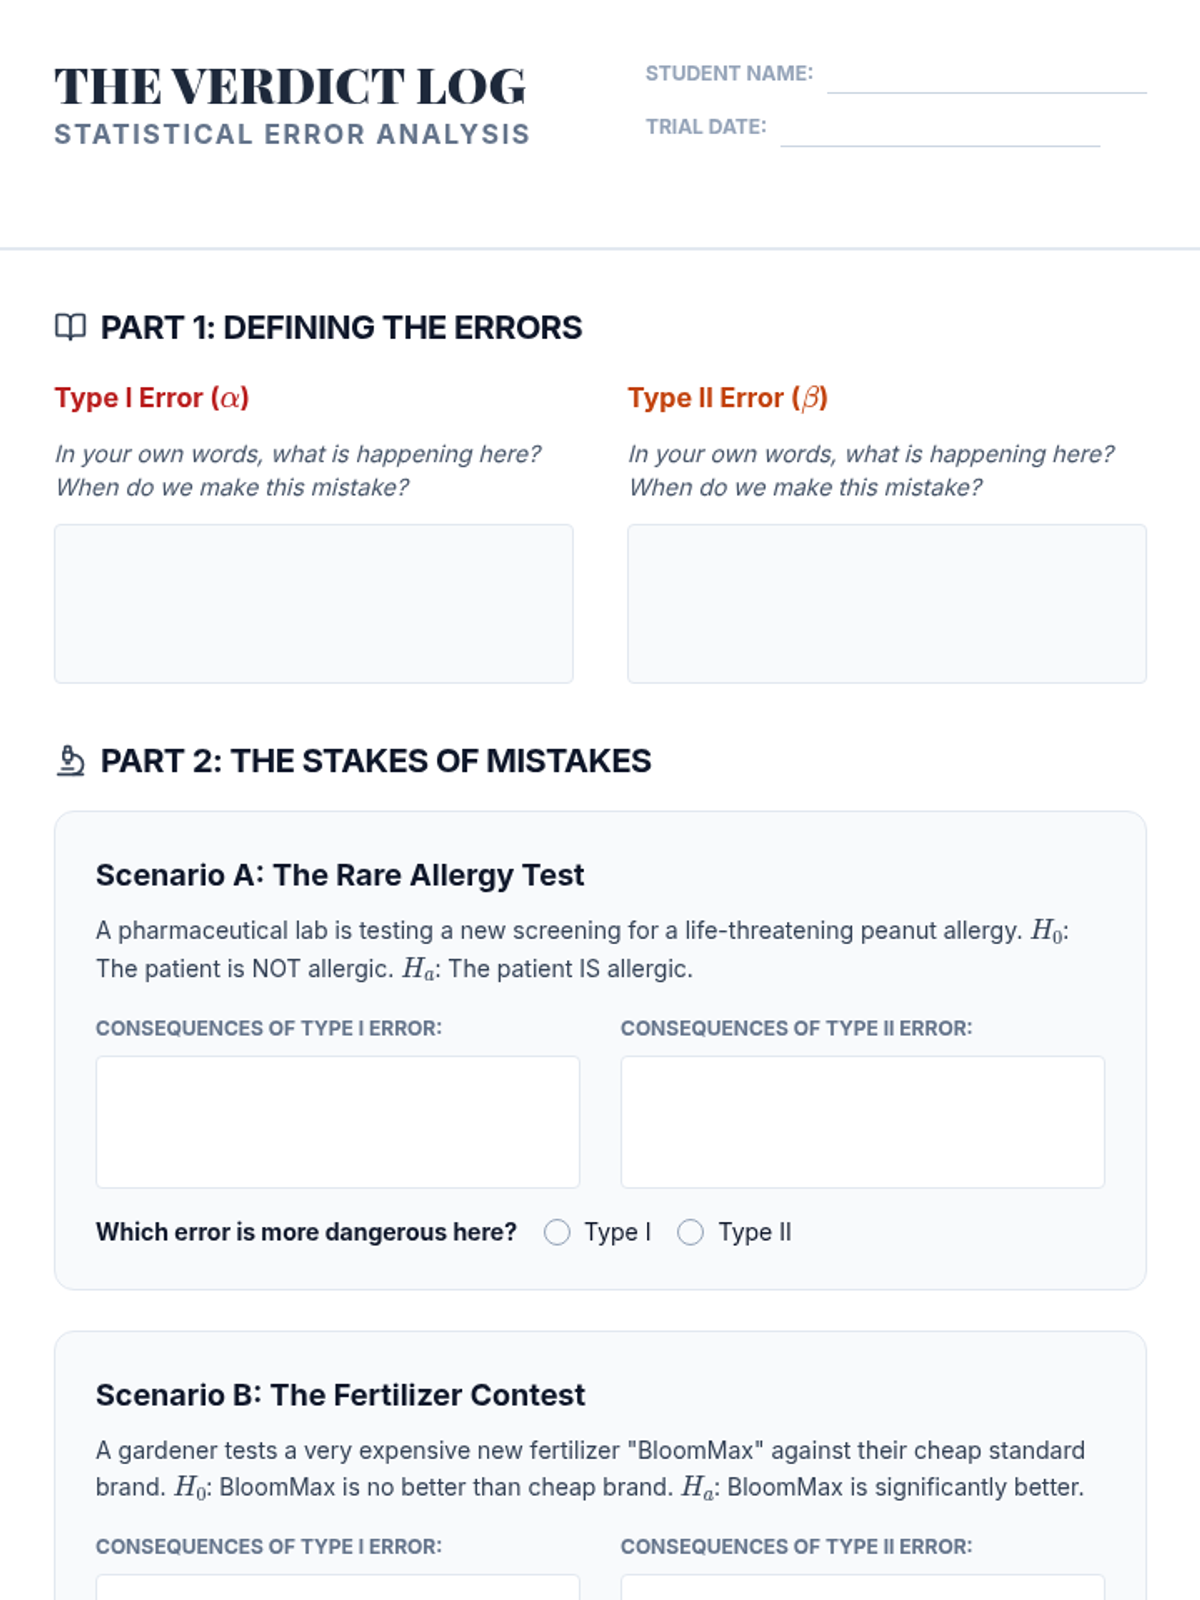
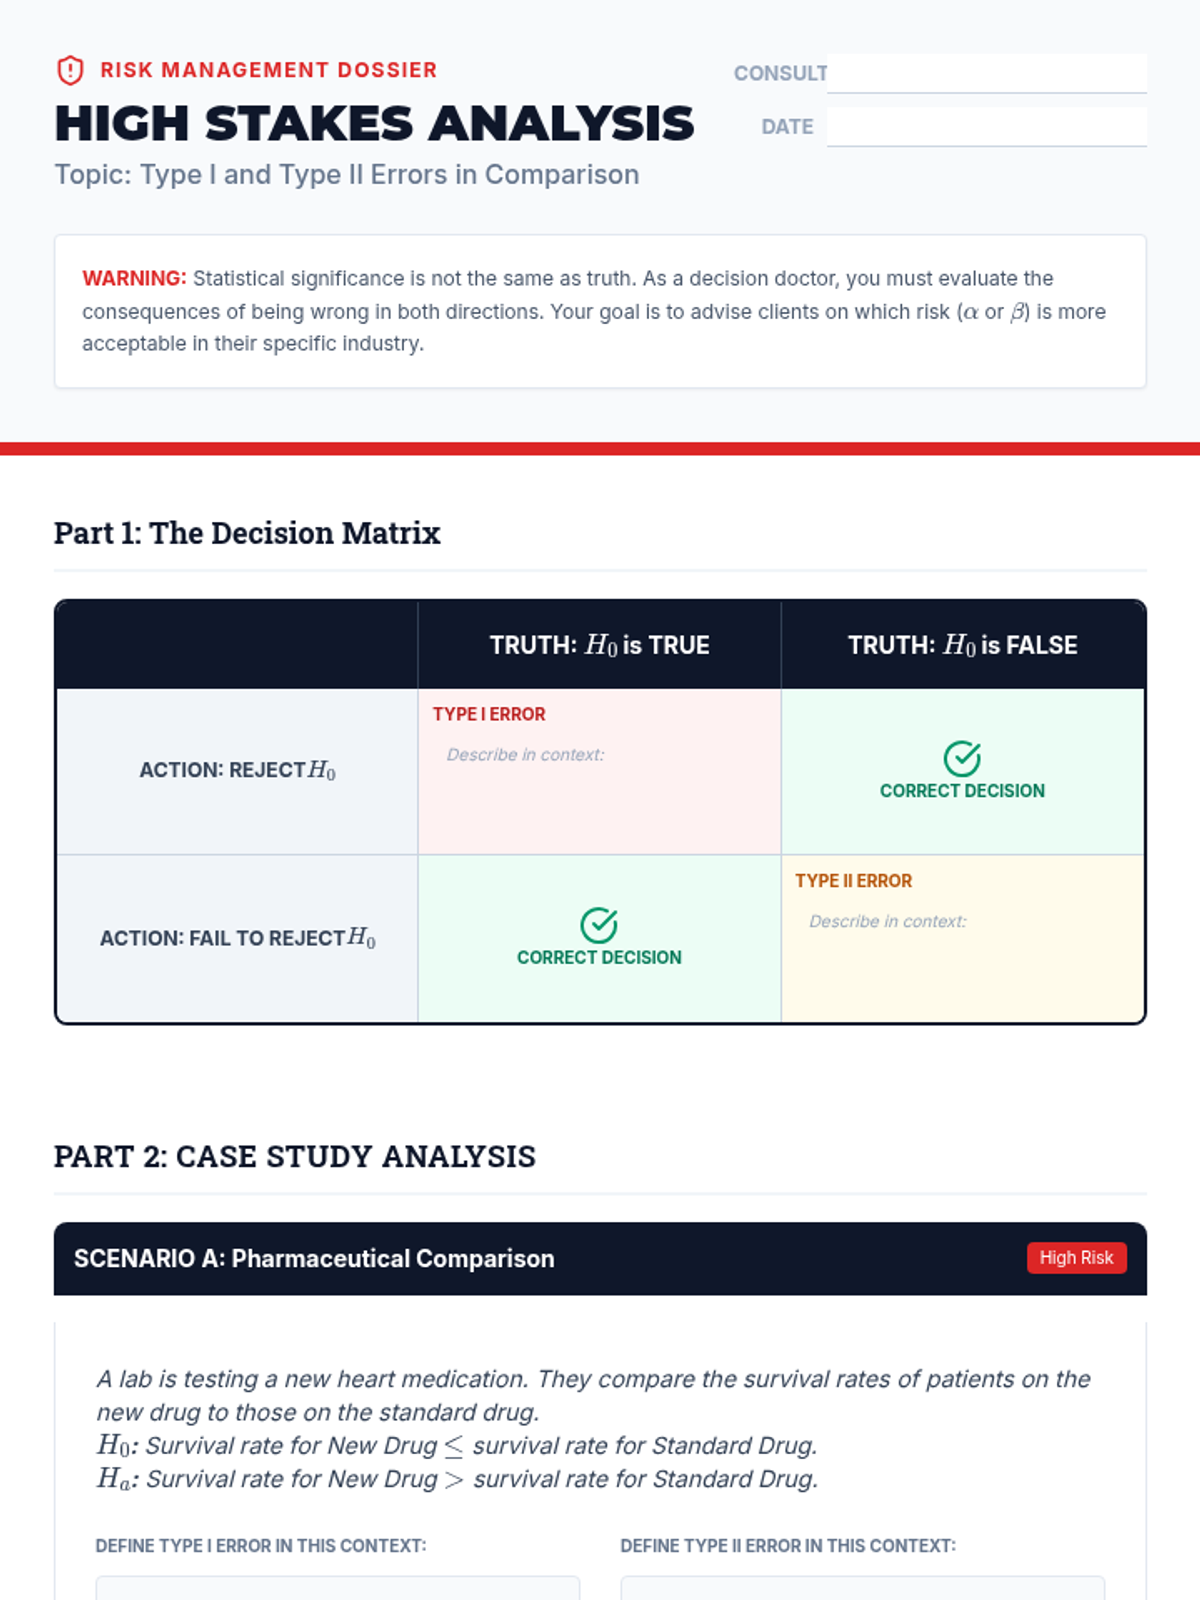
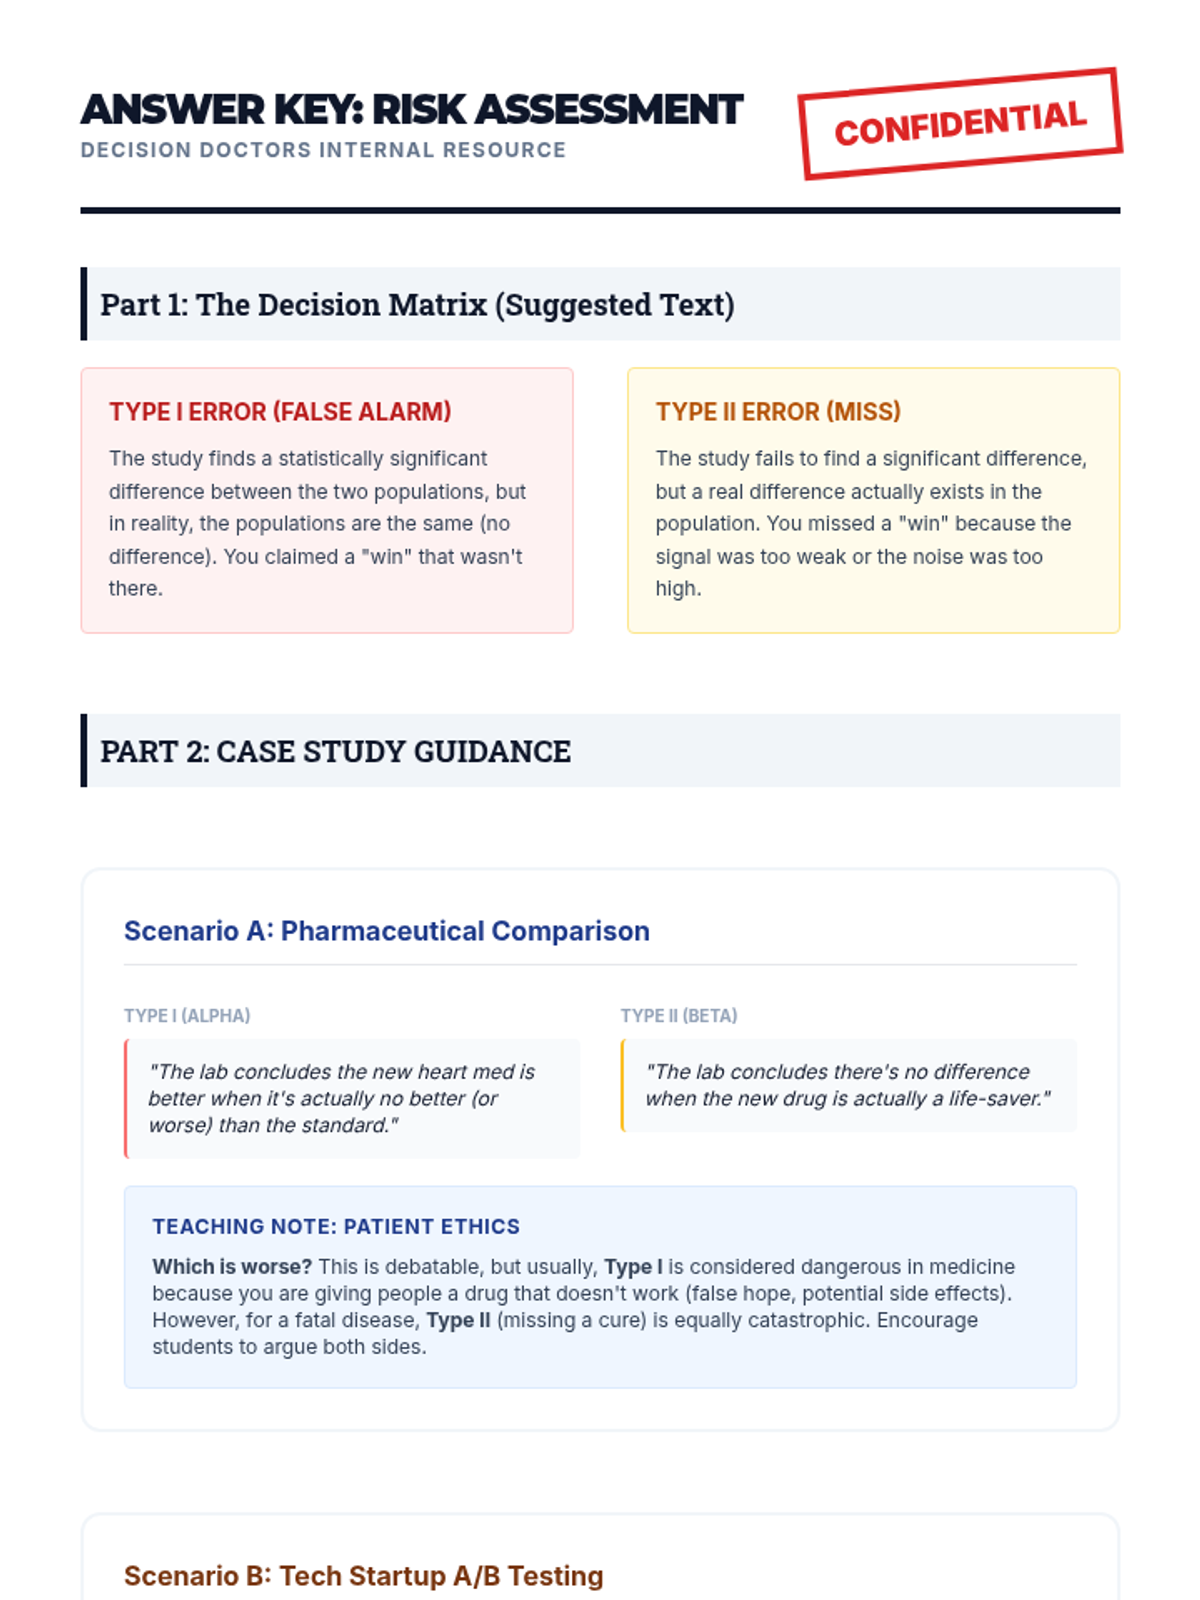
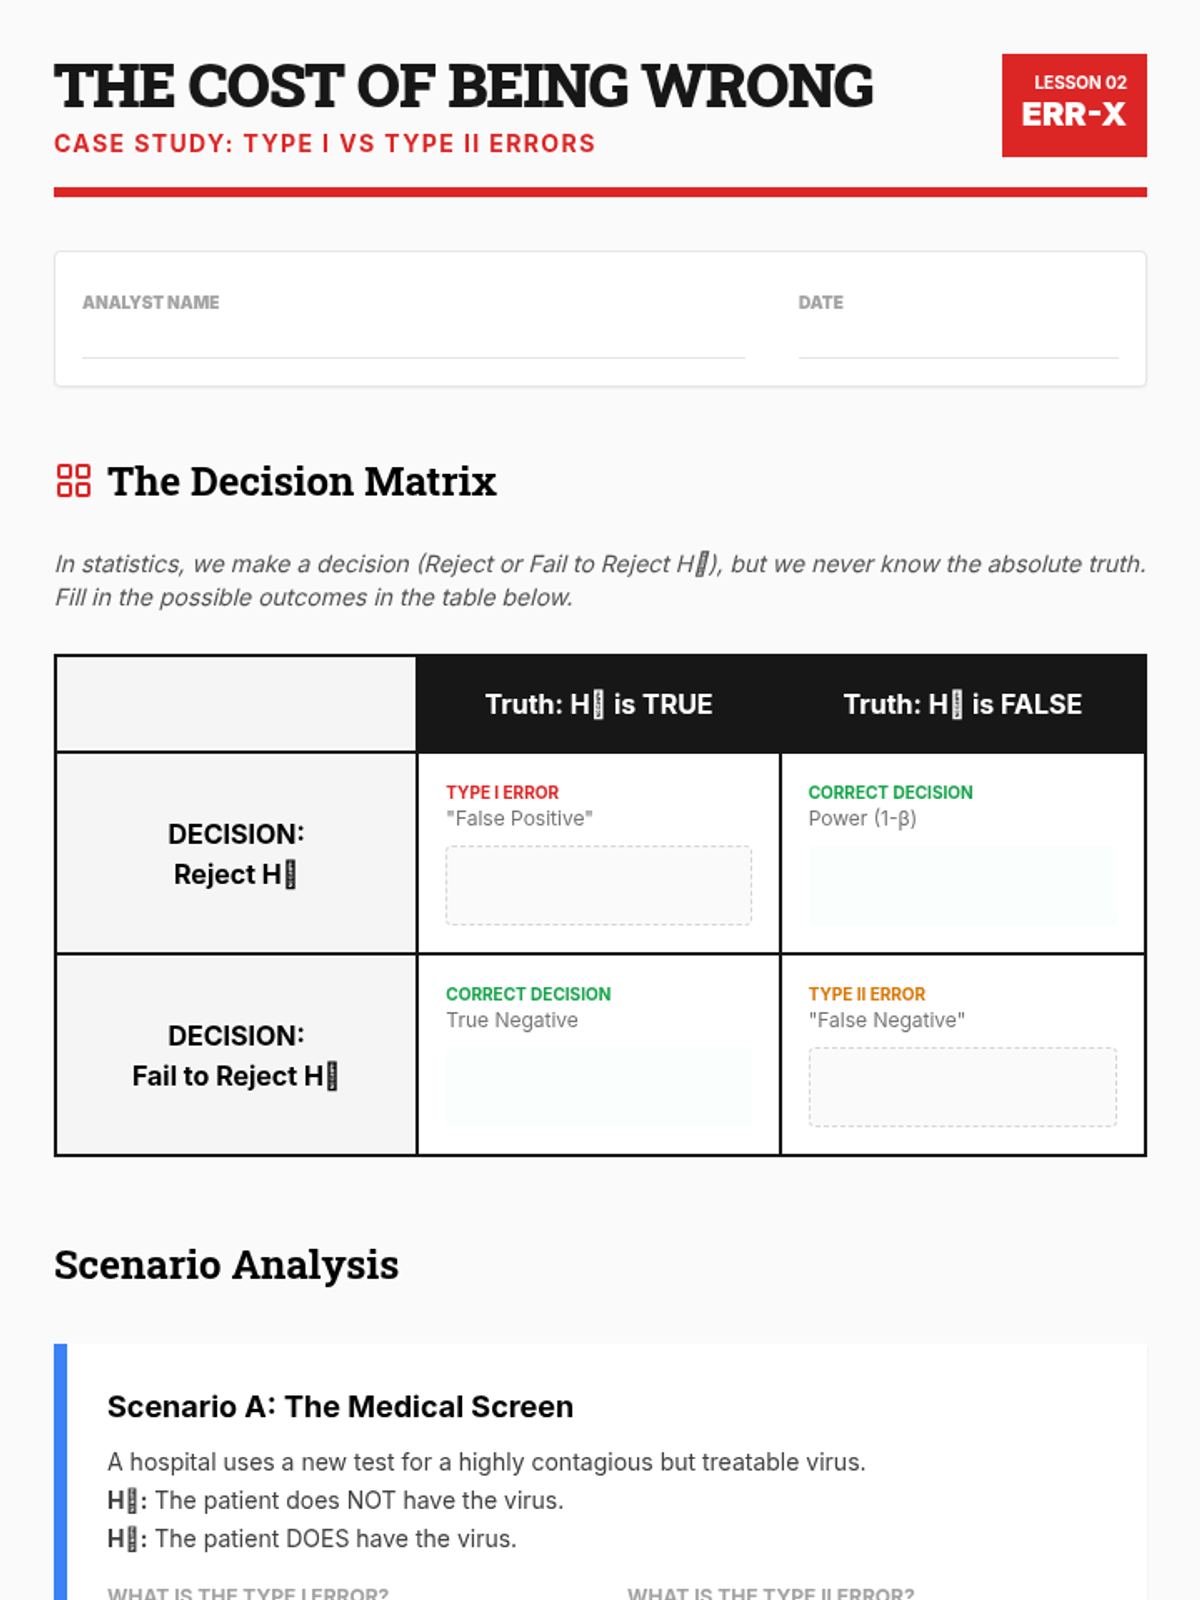
Students explore the trade-offs between Type I and Type II errors through a courtroom analogy and medical scenarios, understanding the real-world consequences of statistical decision-making.
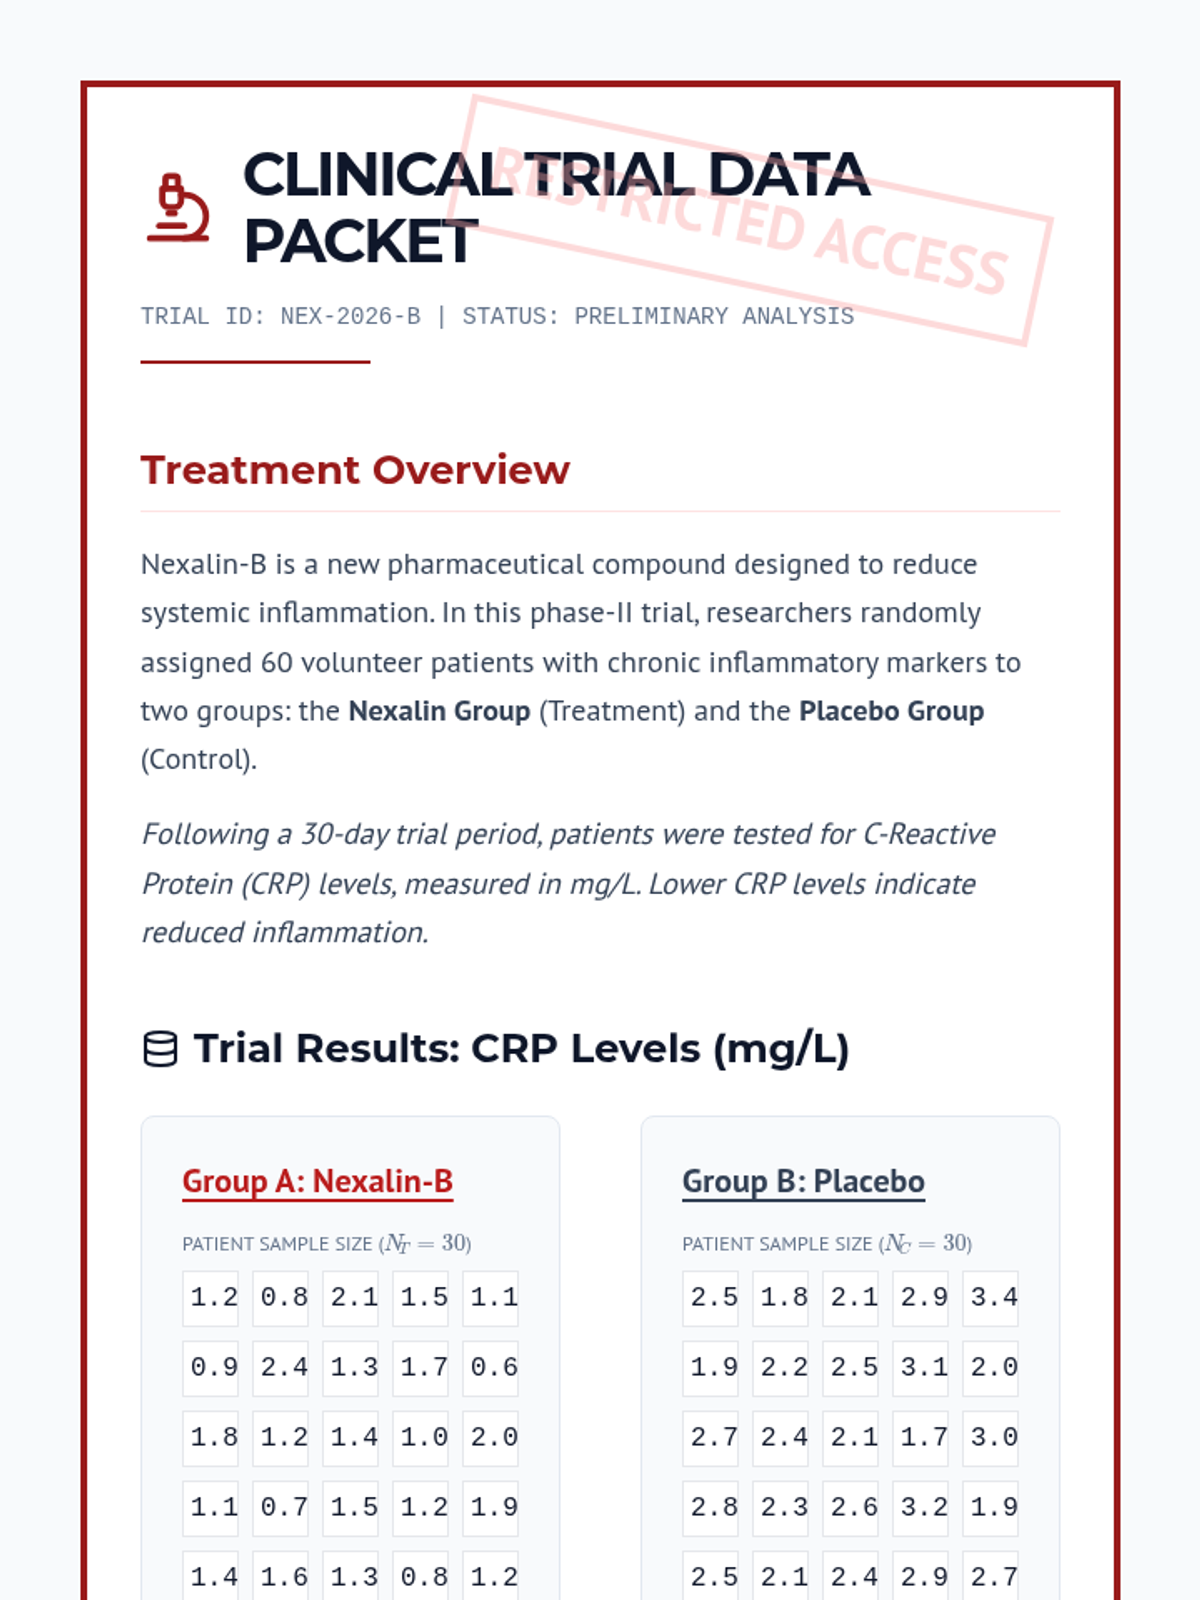
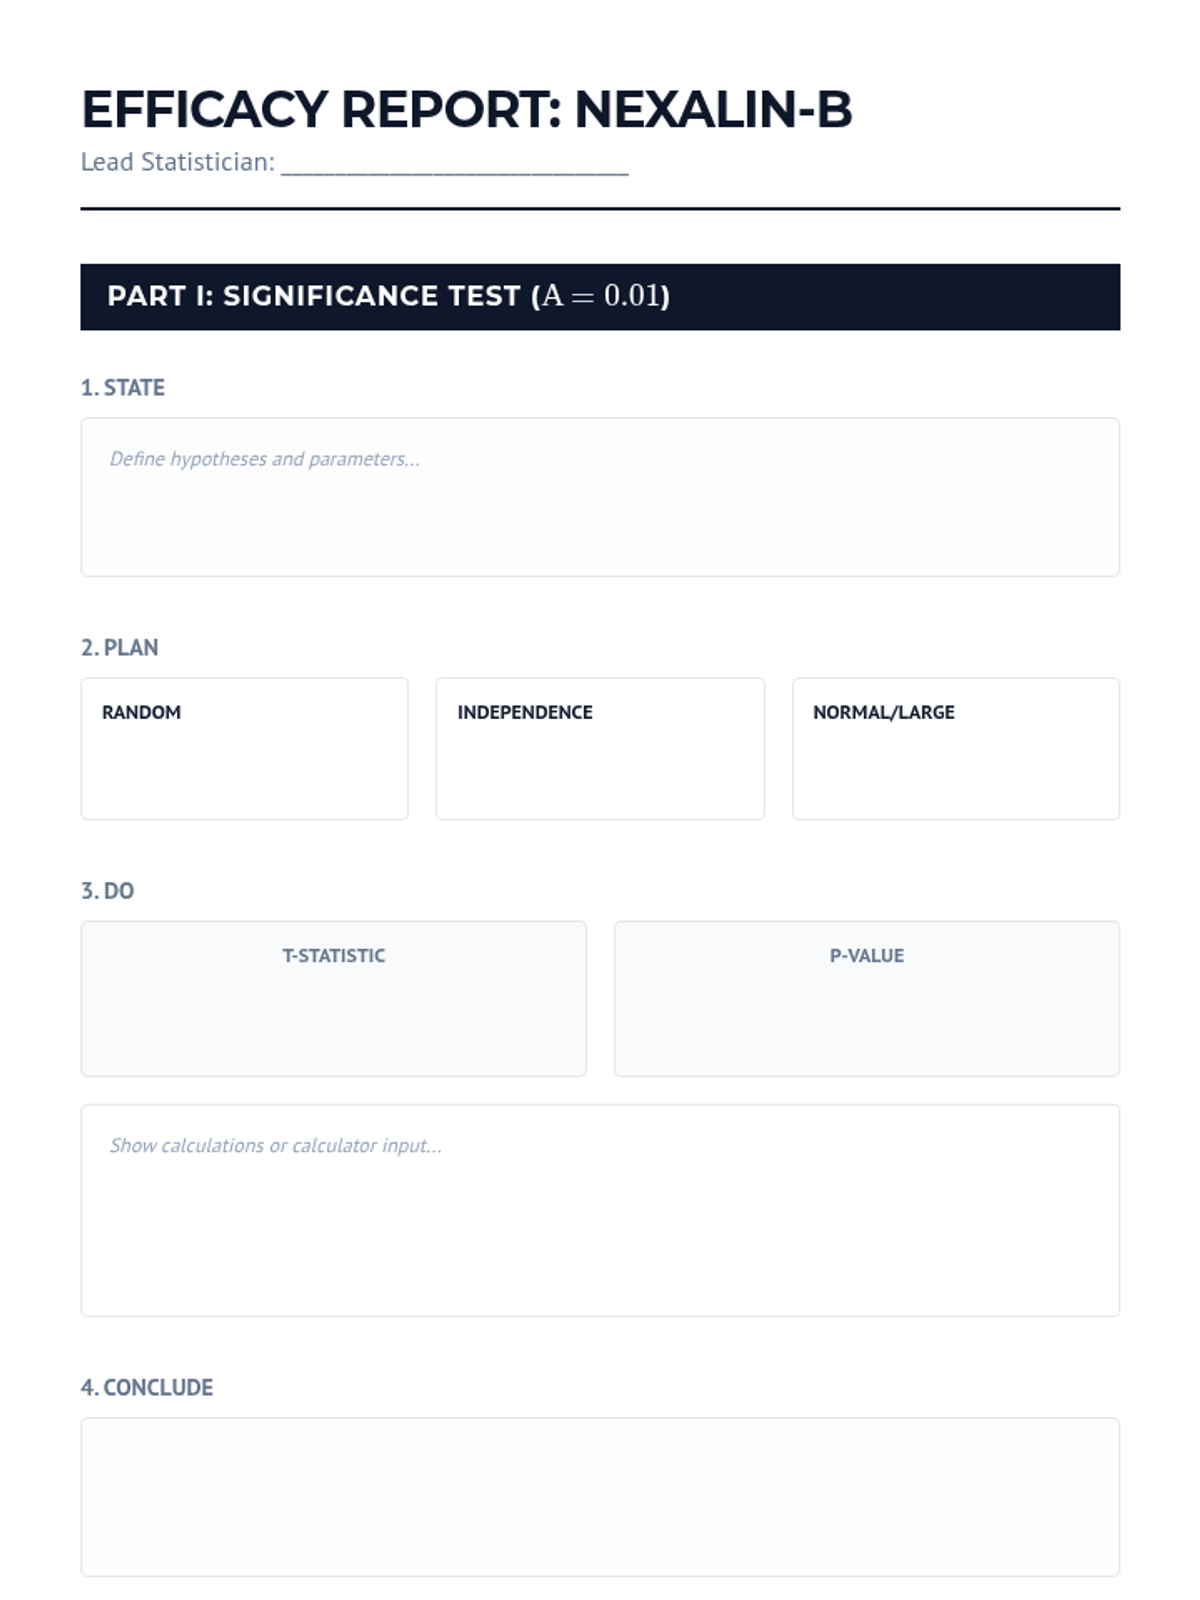
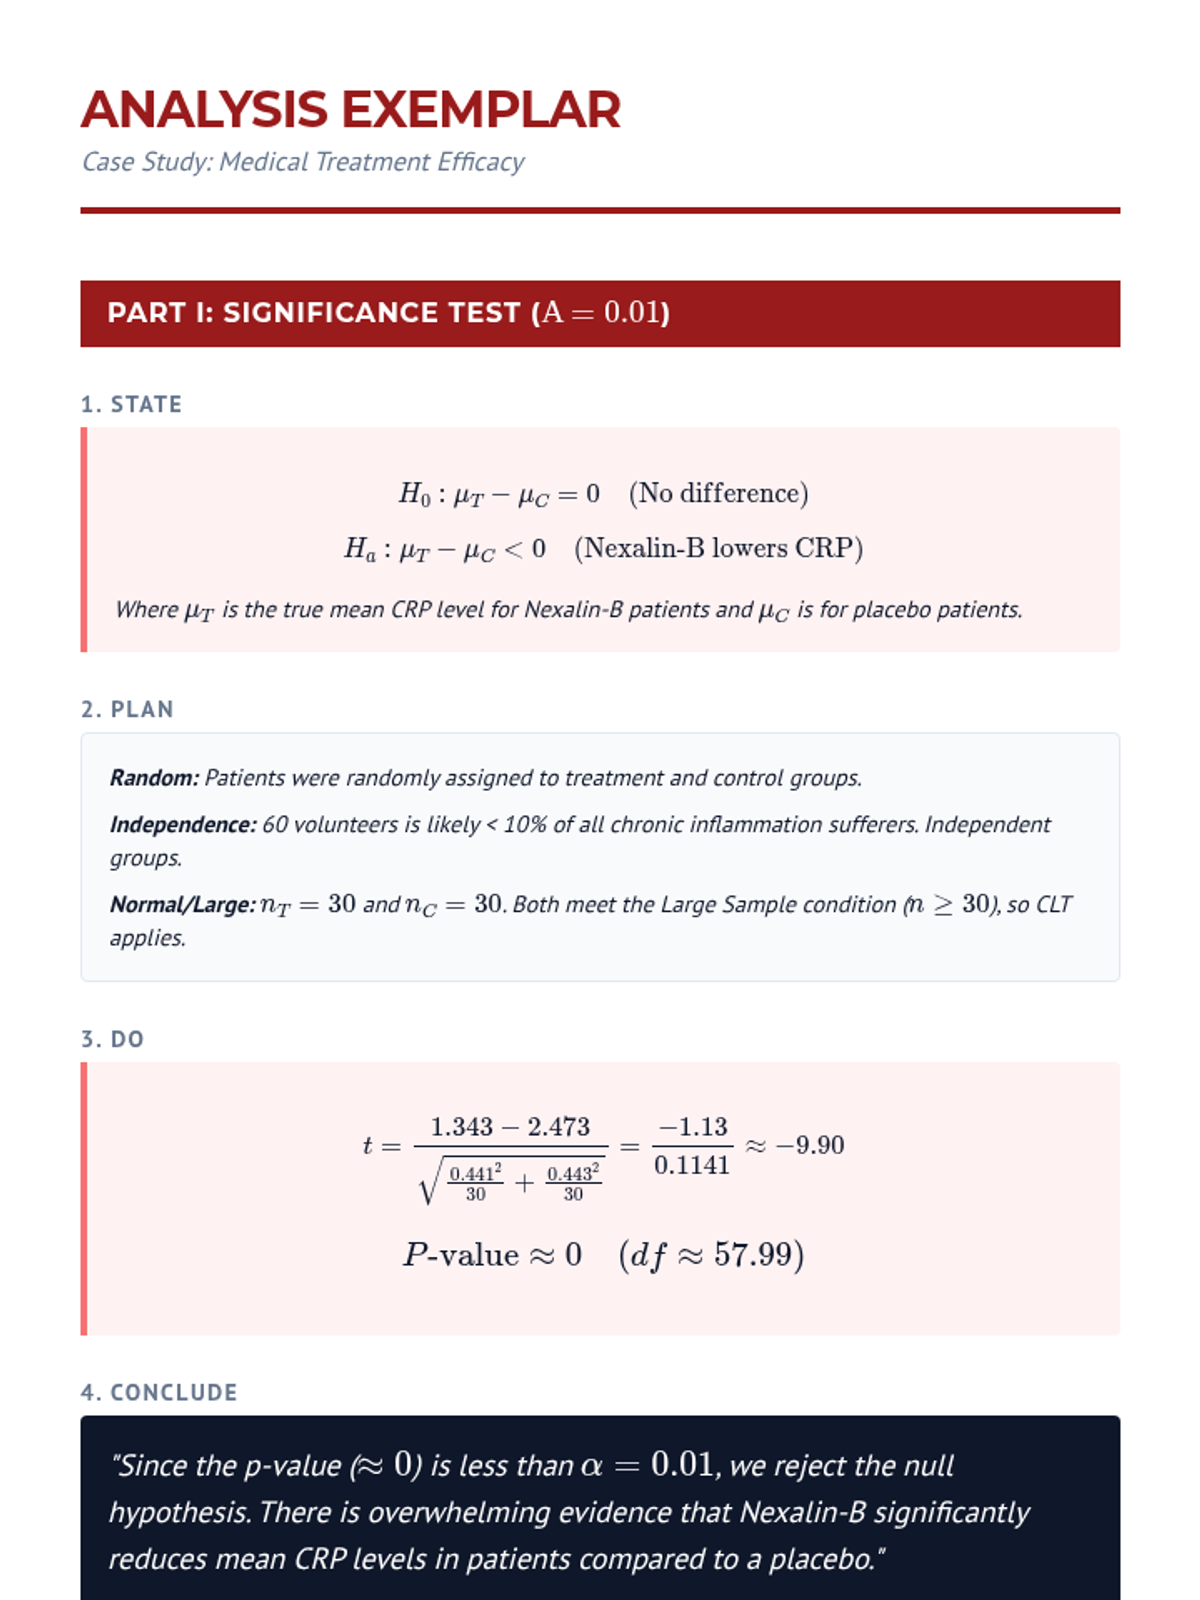
A culminating case study where students analyze clinical trial data to determine treatment efficacy and write a formal statistical report.
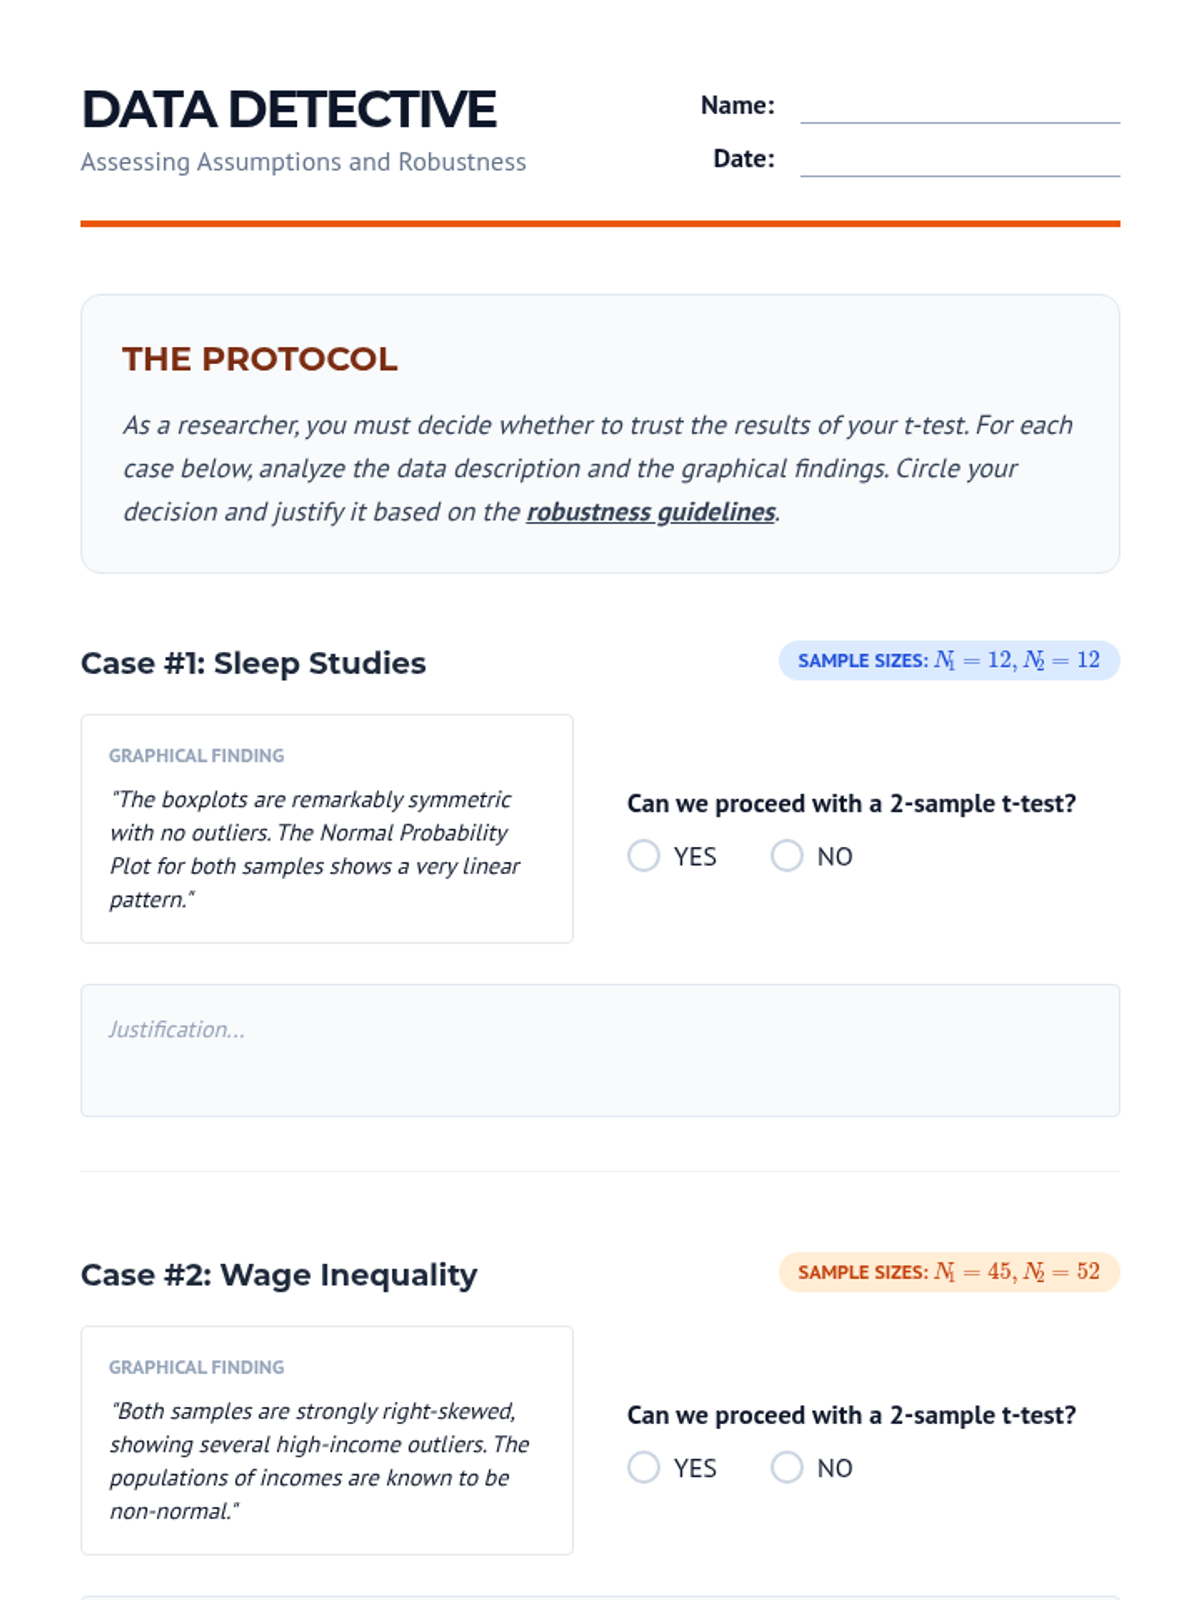
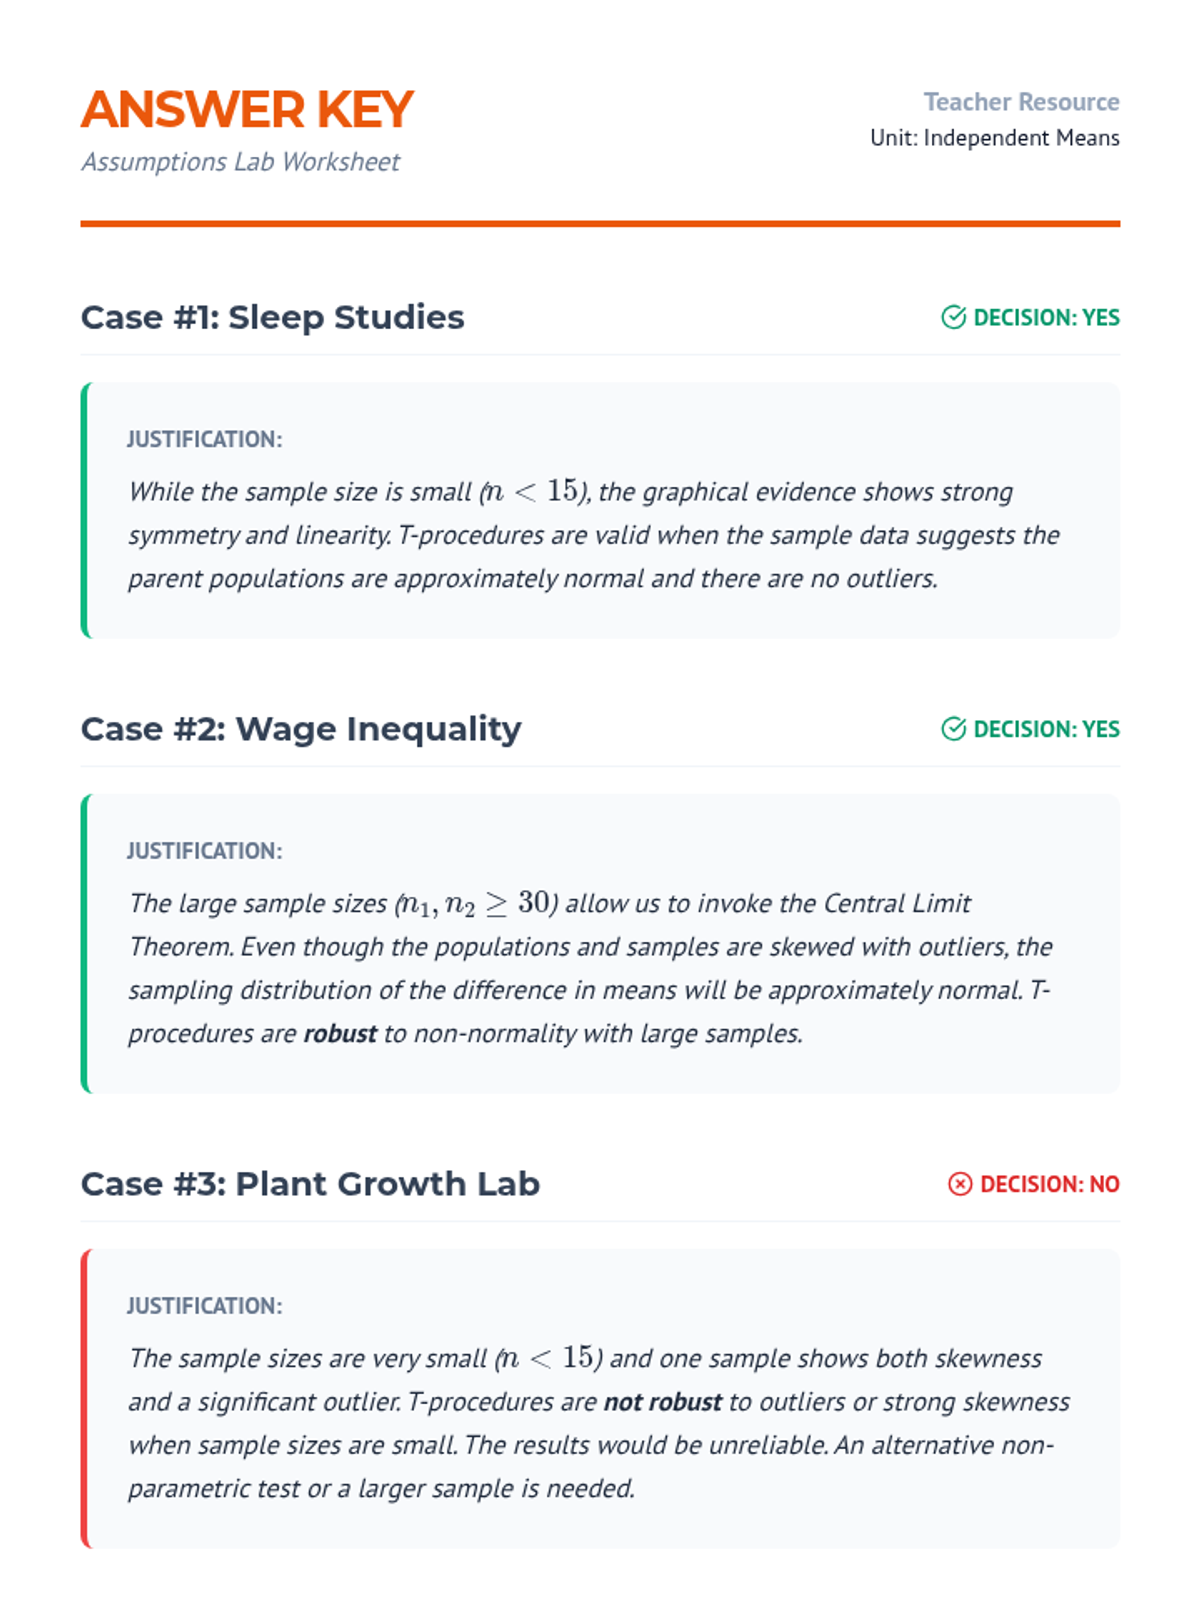
An analysis of the validity conditions and robustness of t-procedures, specifically for small sample sizes and non-normal data.
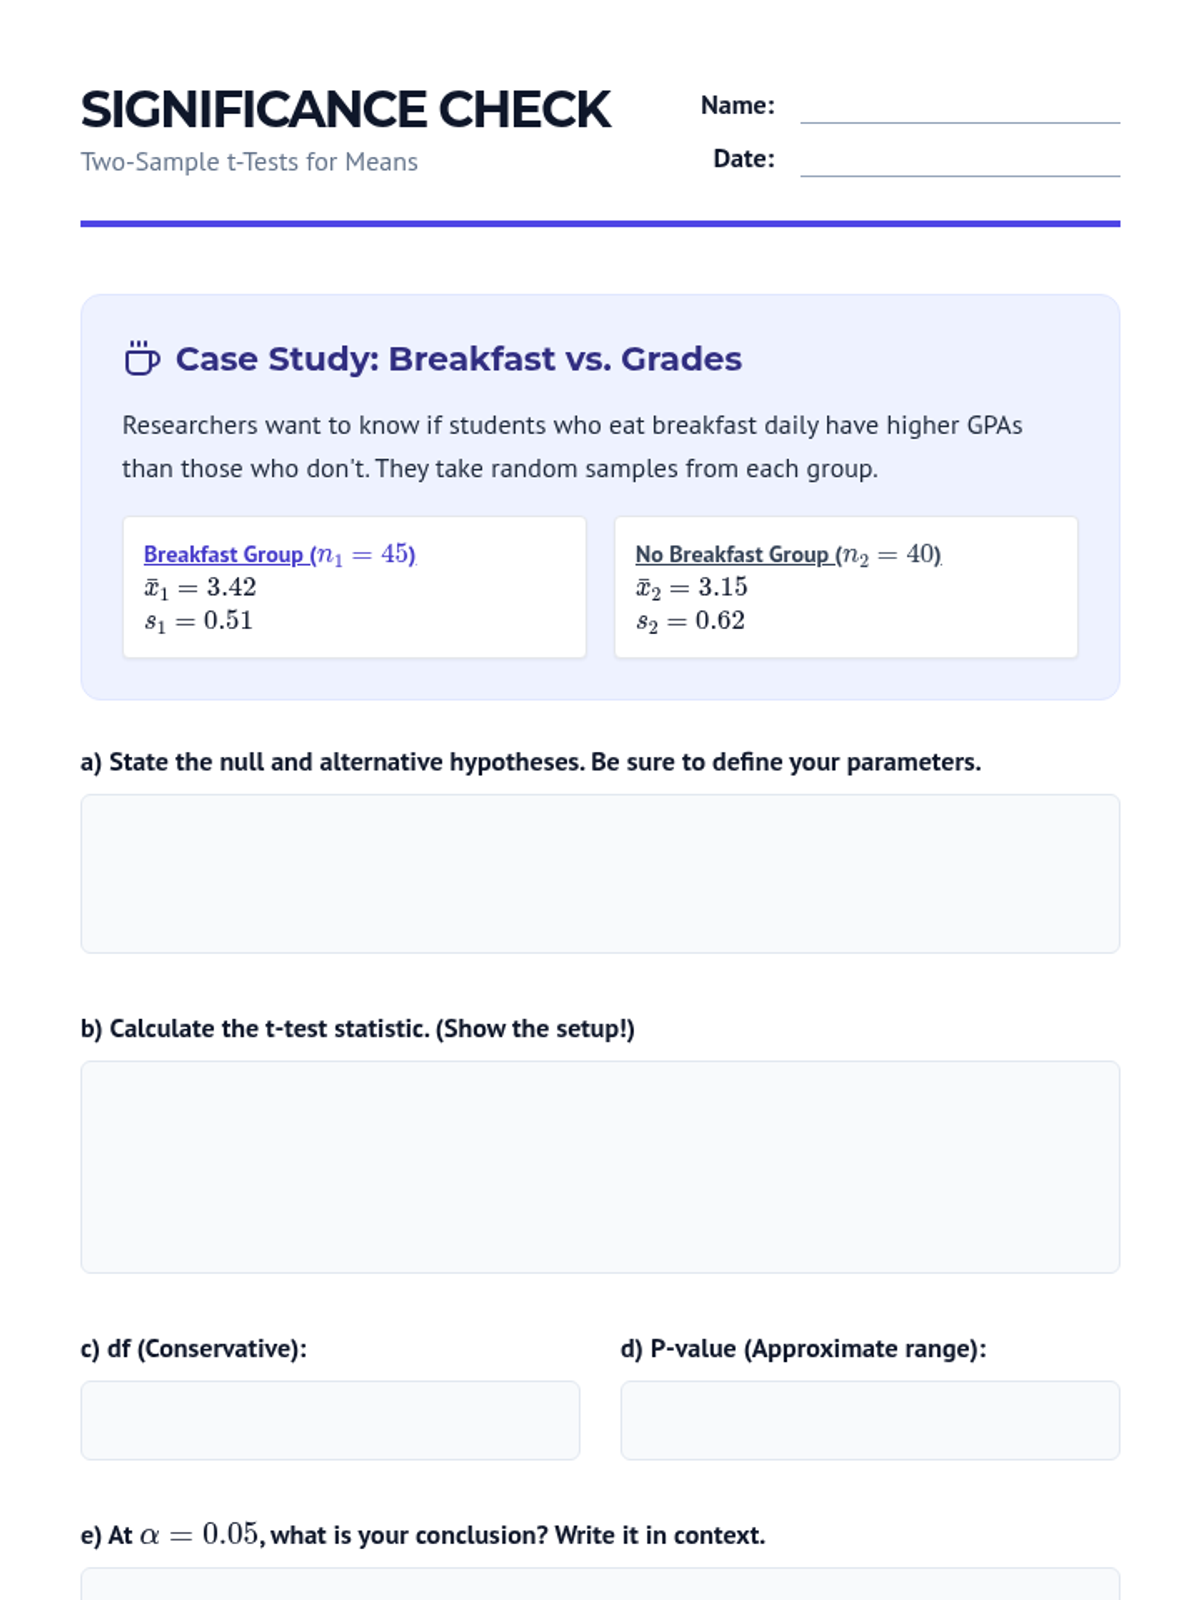
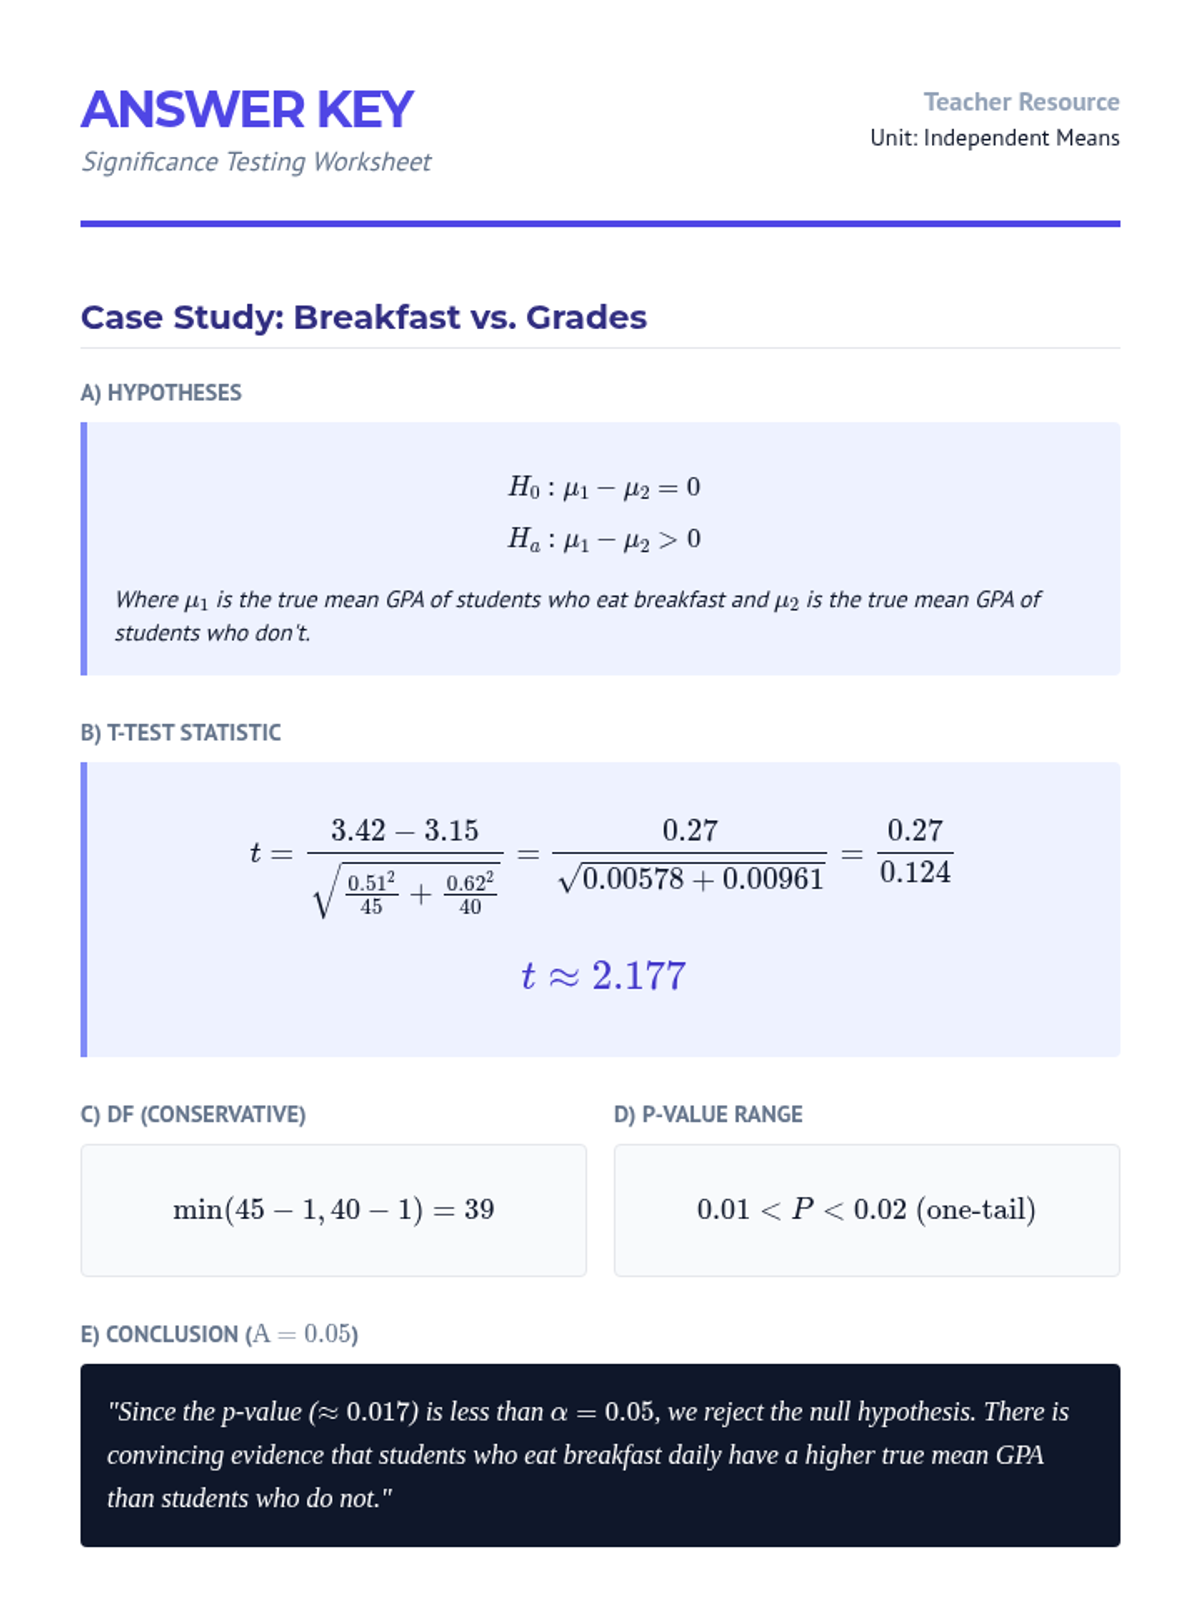
Students perform hypothesis tests to determine if two population means differ, focusing on t-statistics and p-values.
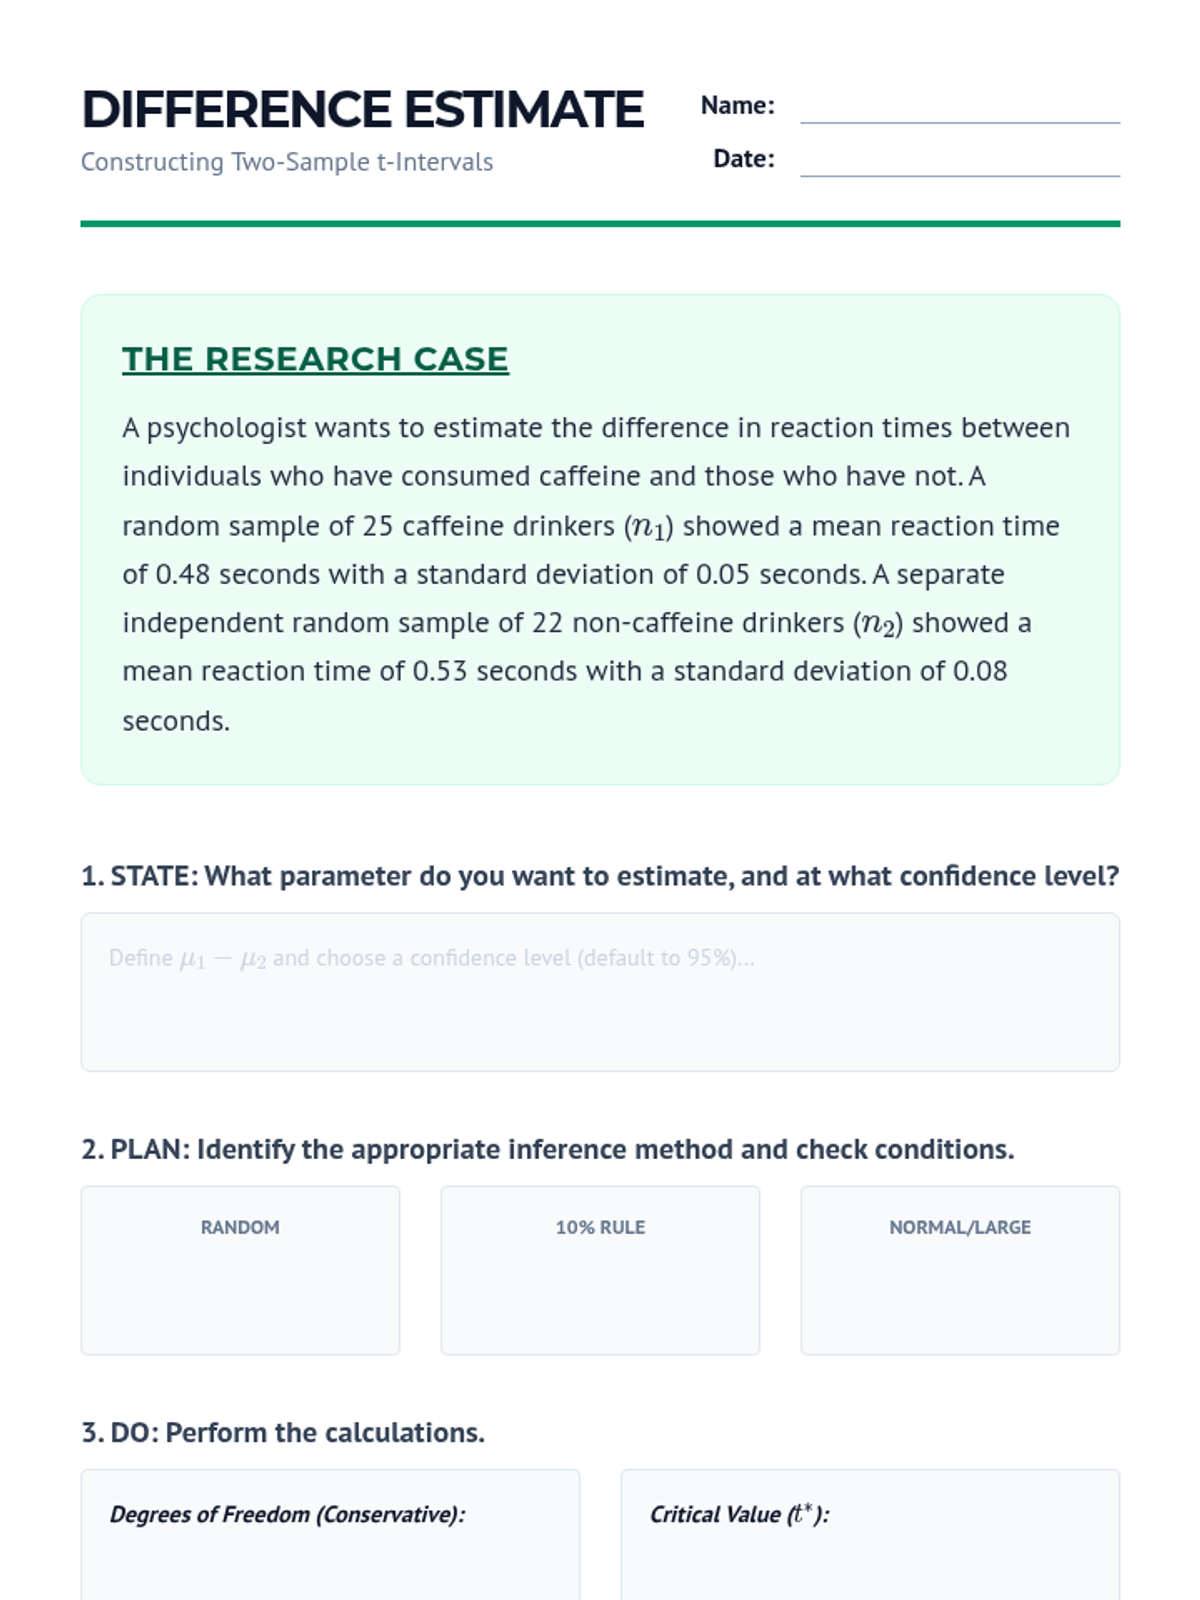
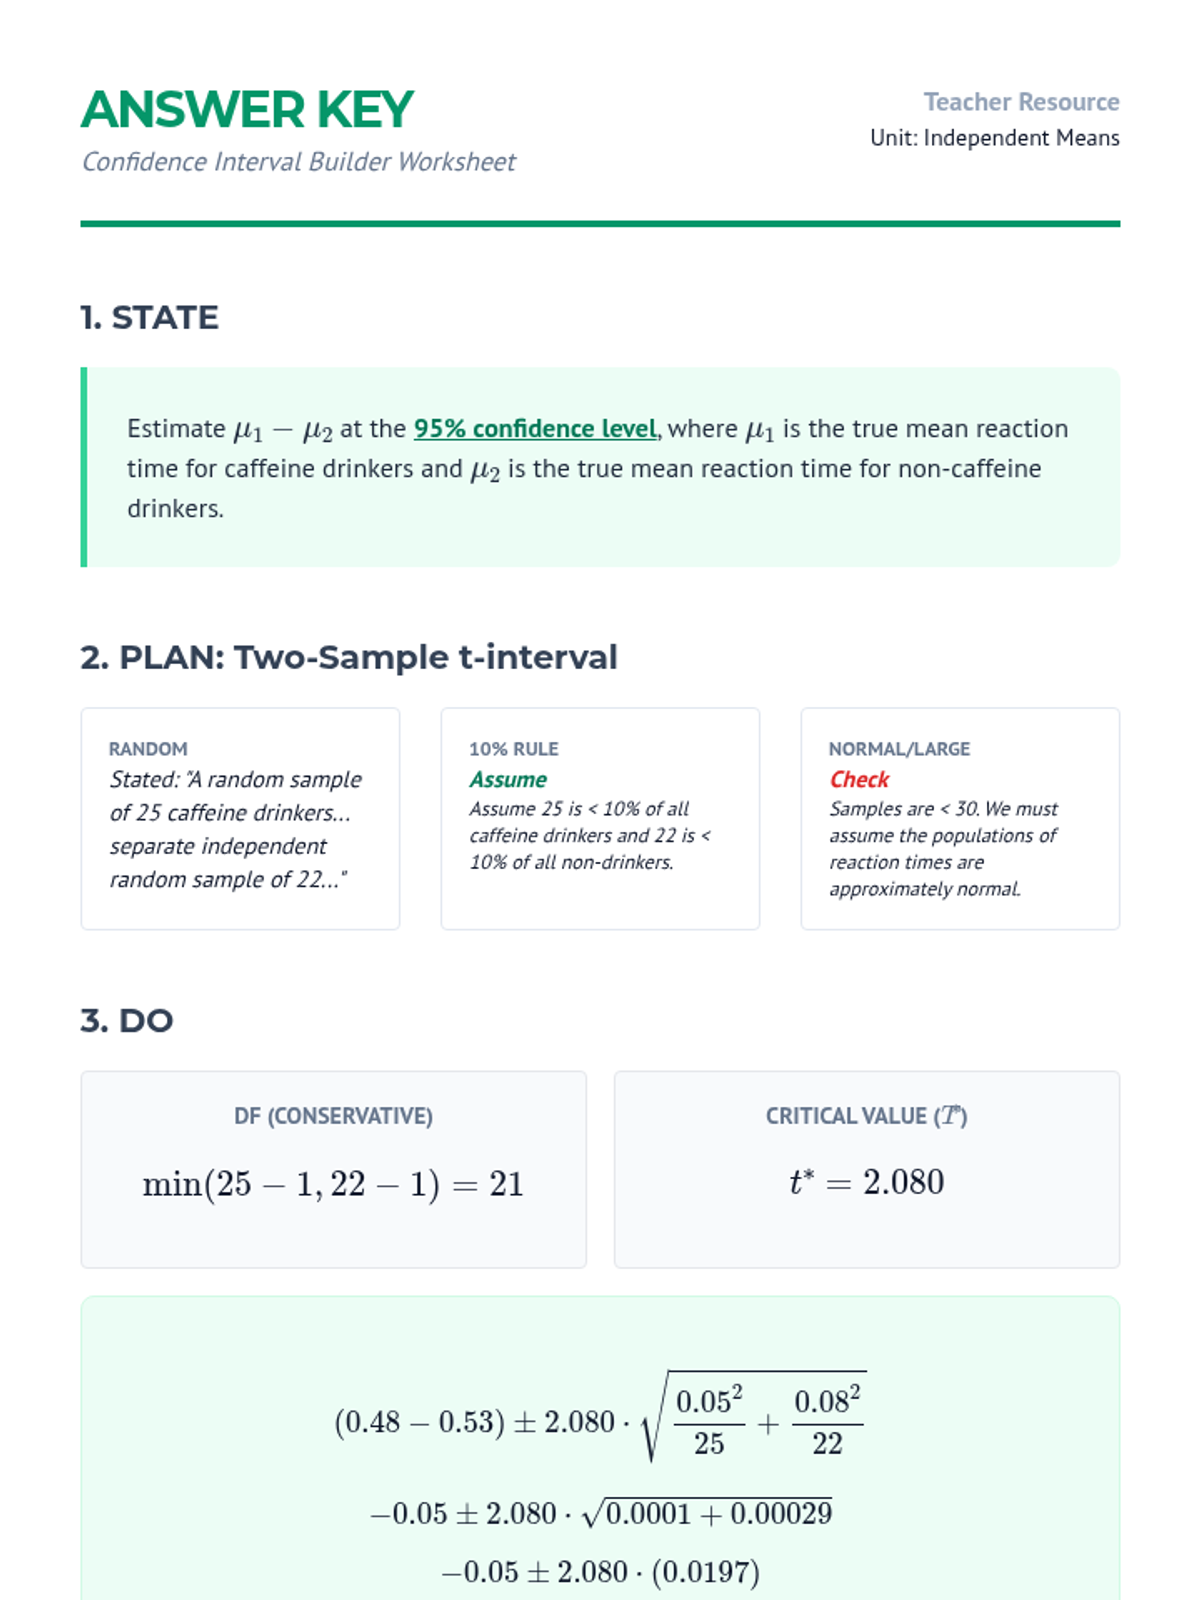
Focuses on constructing and interpreting confidence intervals for the difference of two population means, including checking necessary conditions.
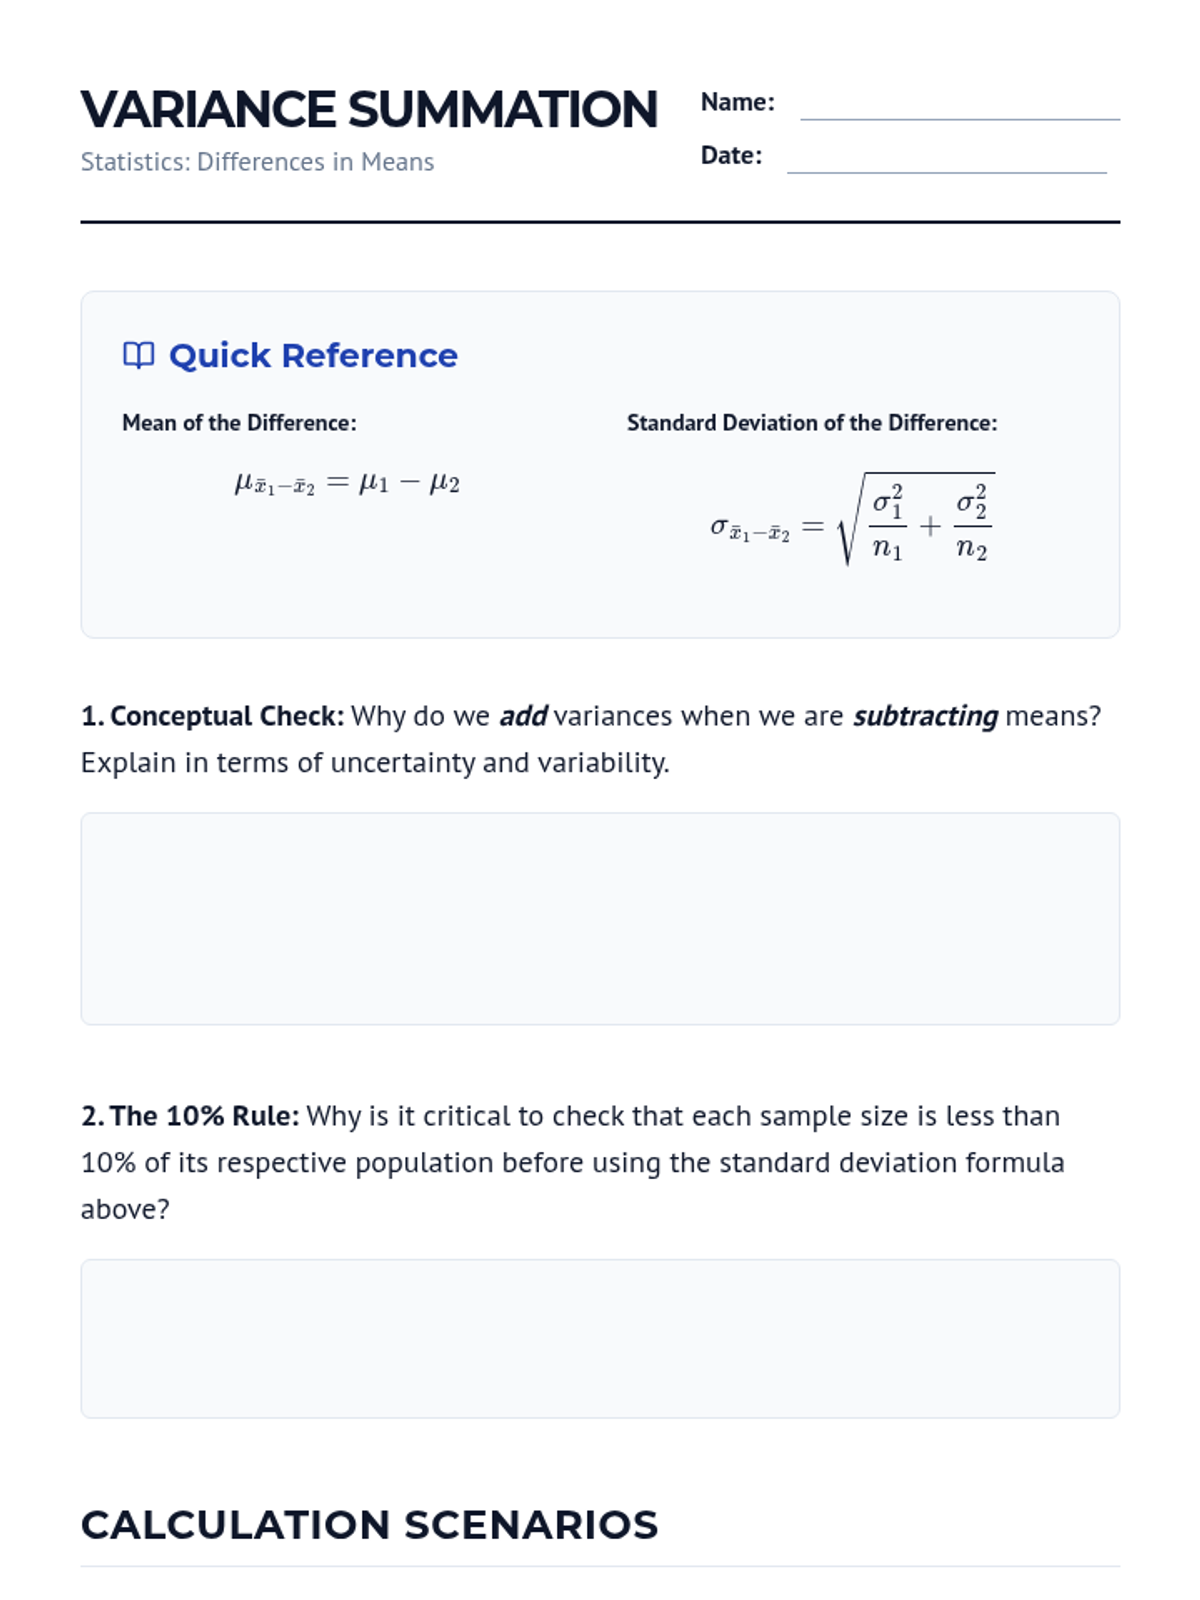
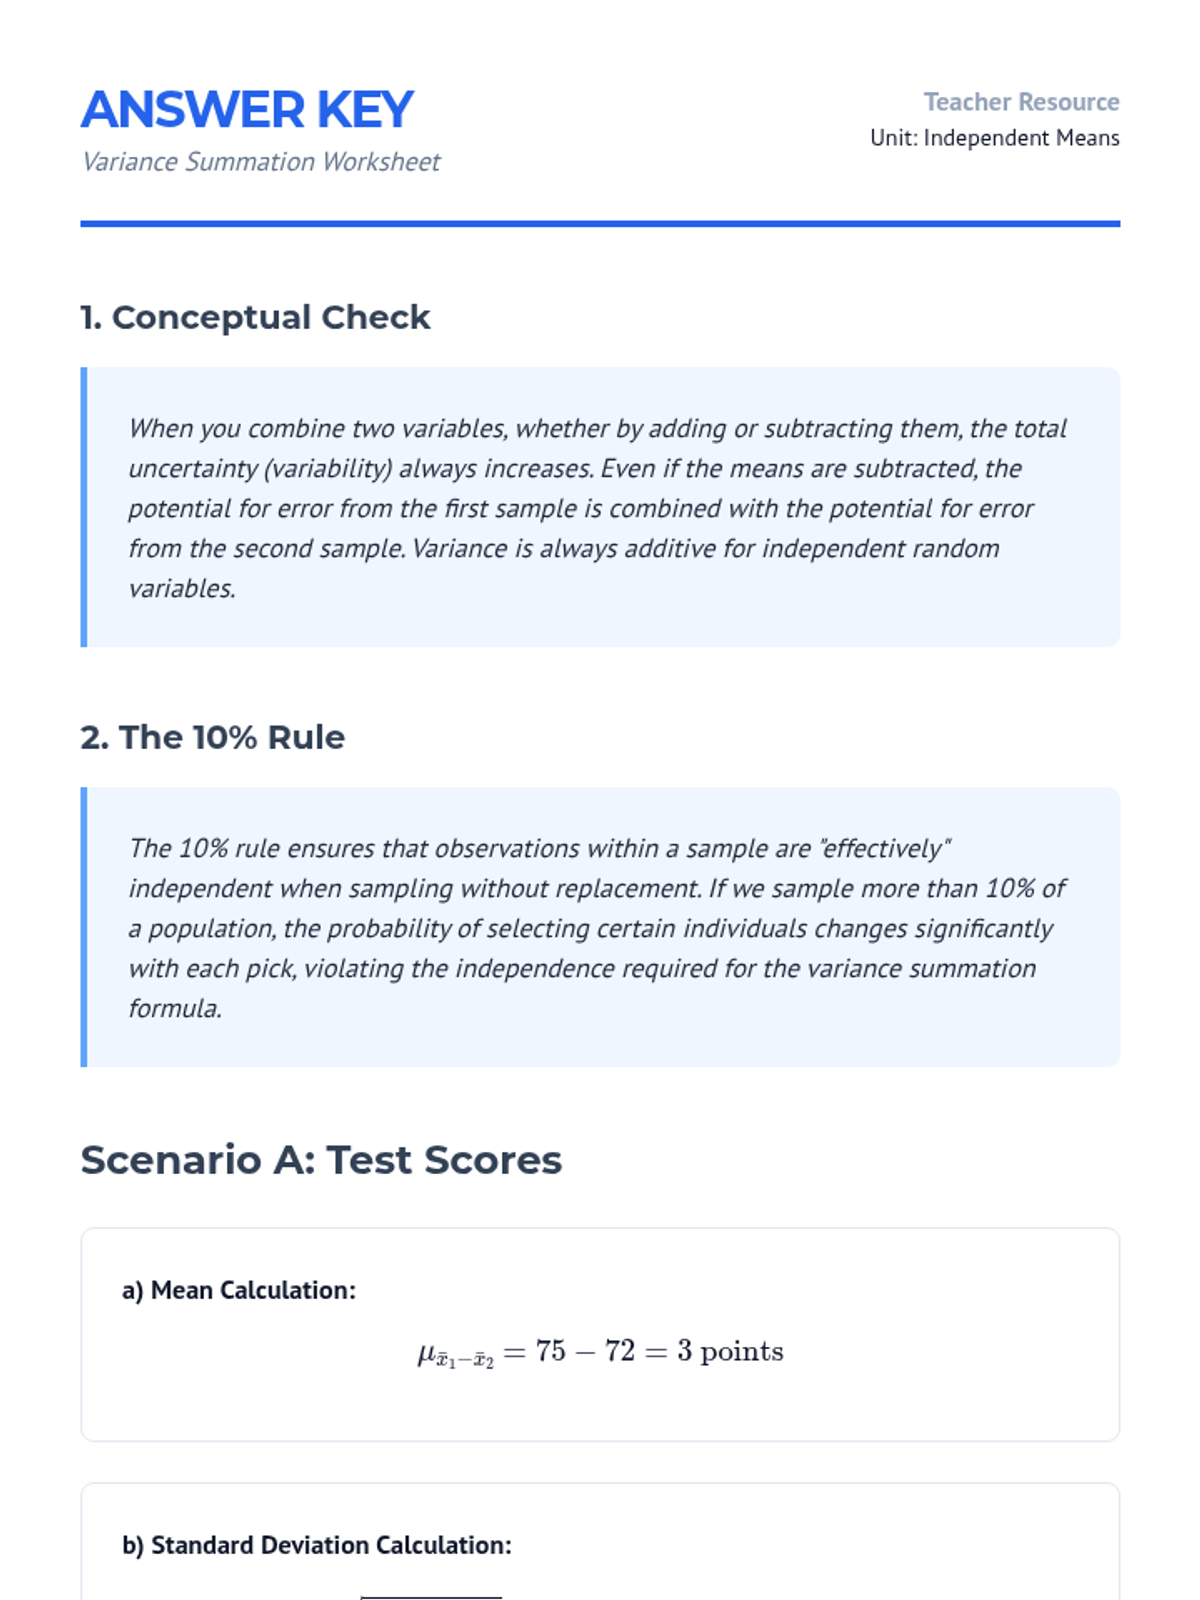
Students explore the sampling distribution of the difference between two sample means and learn the variance summation rules for independent samples.
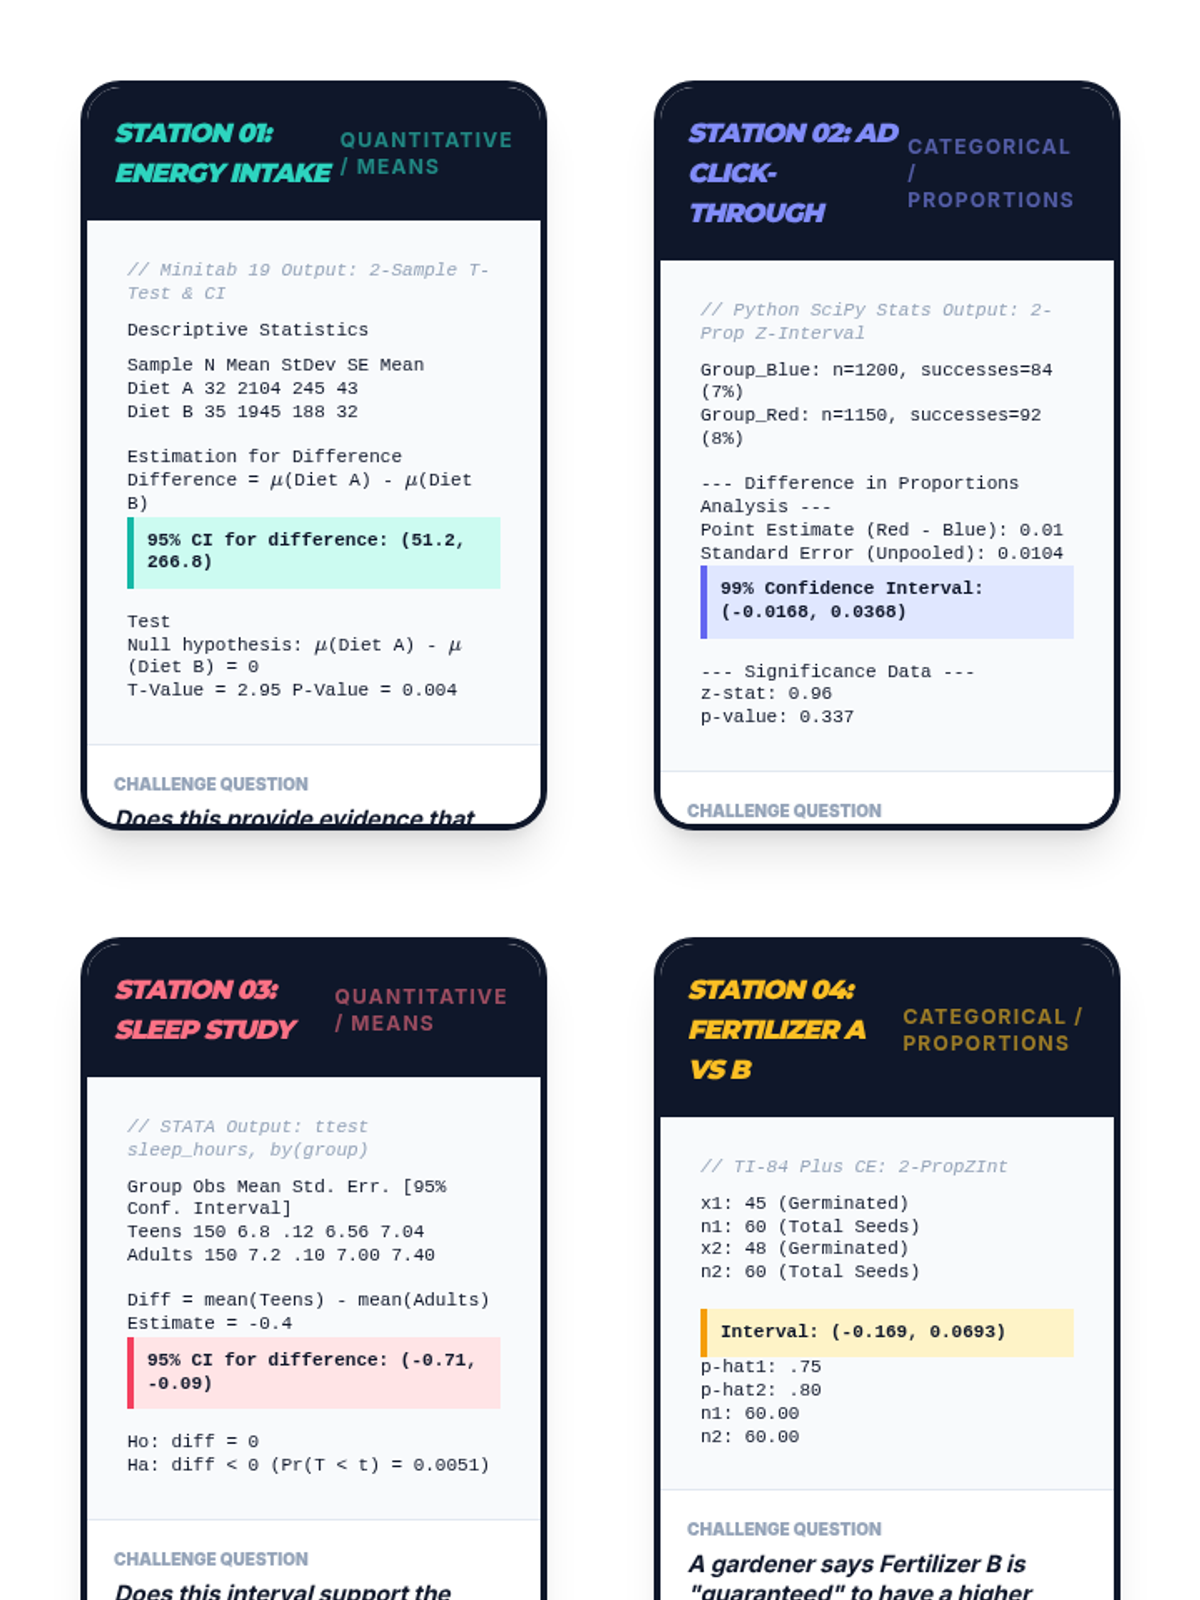
A station-based lab where students analyze computer output from various statistical packages. They identify procedures, interpret confidence intervals and p-values, and synthesize their learning.
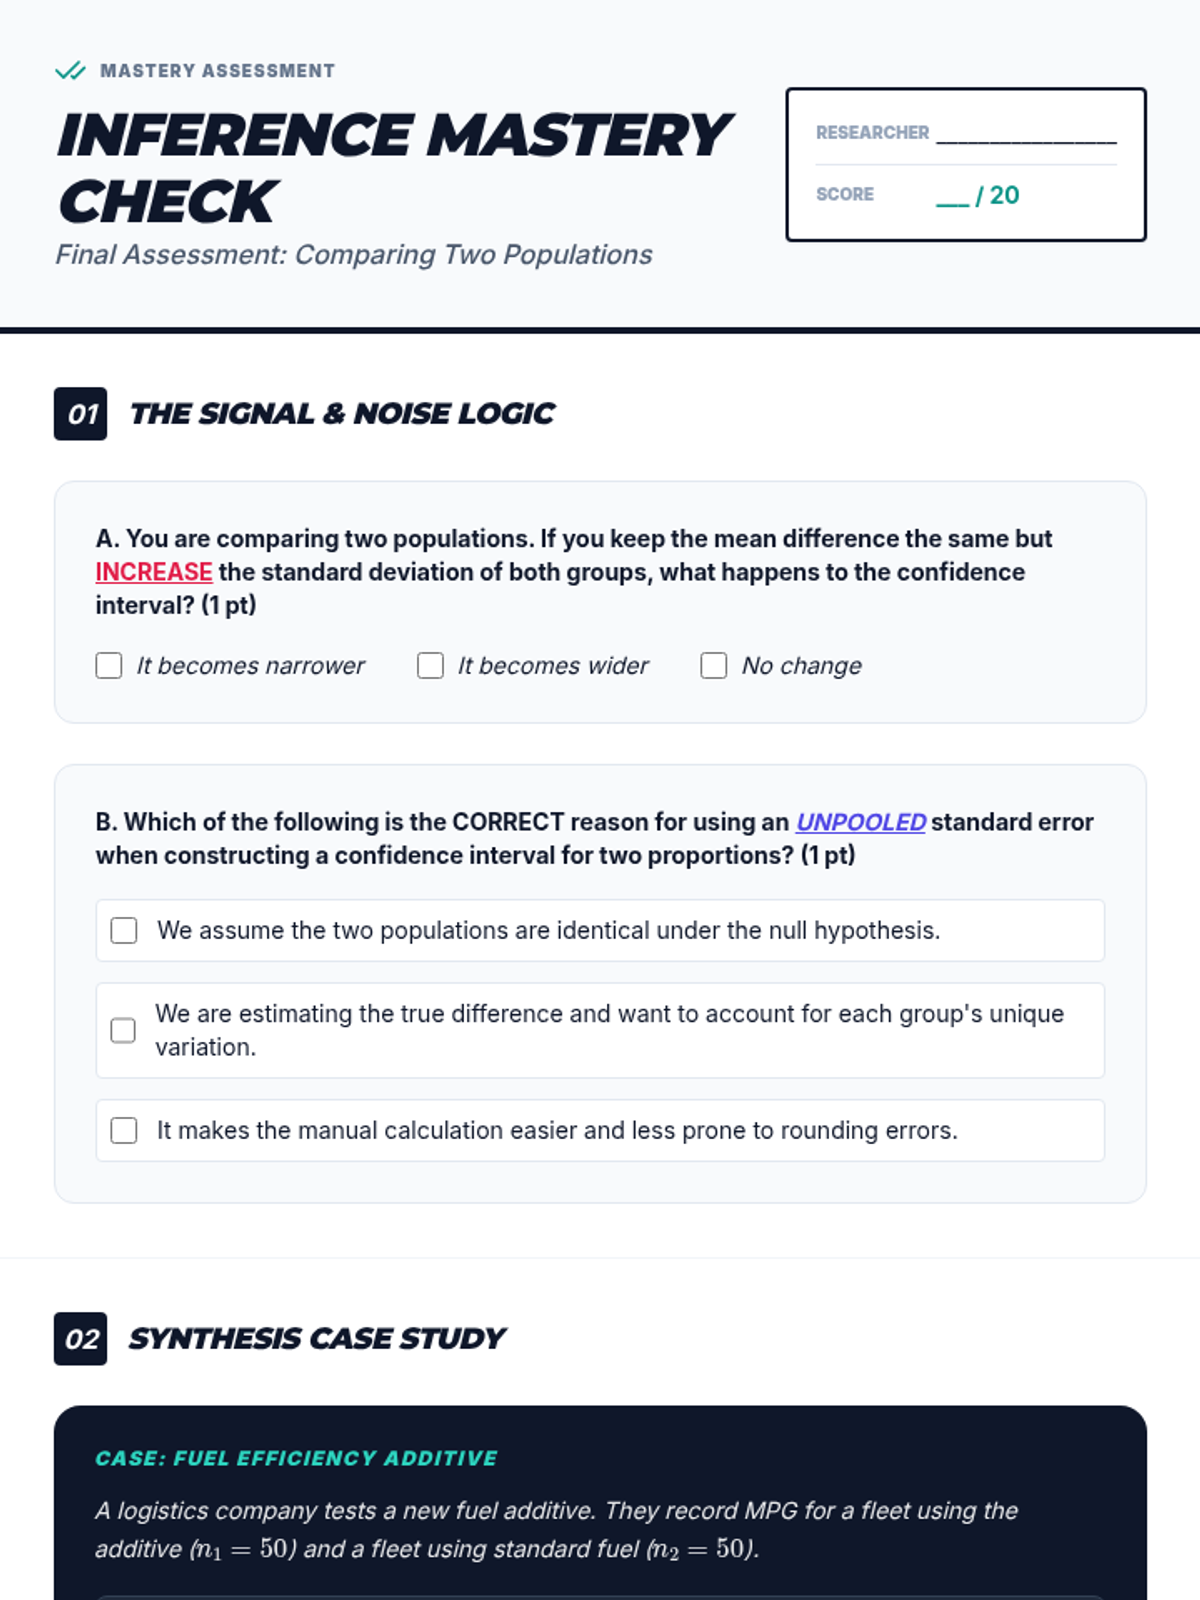
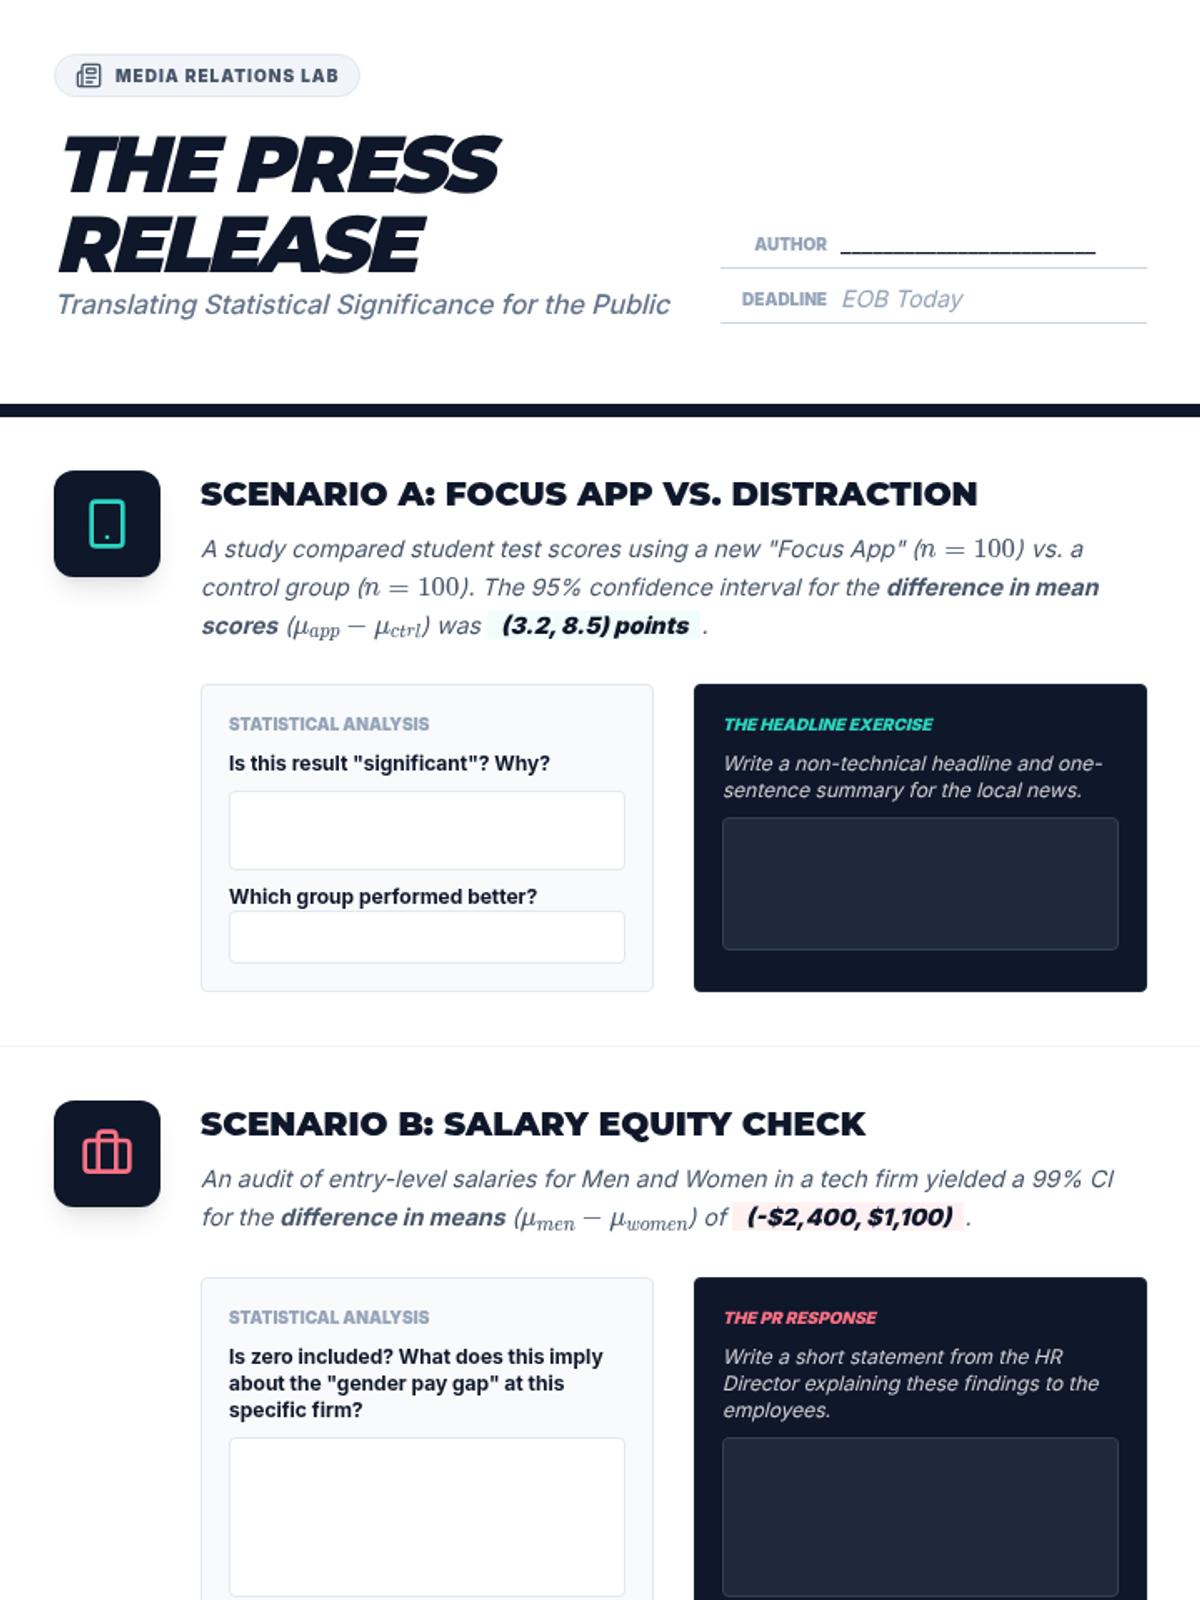
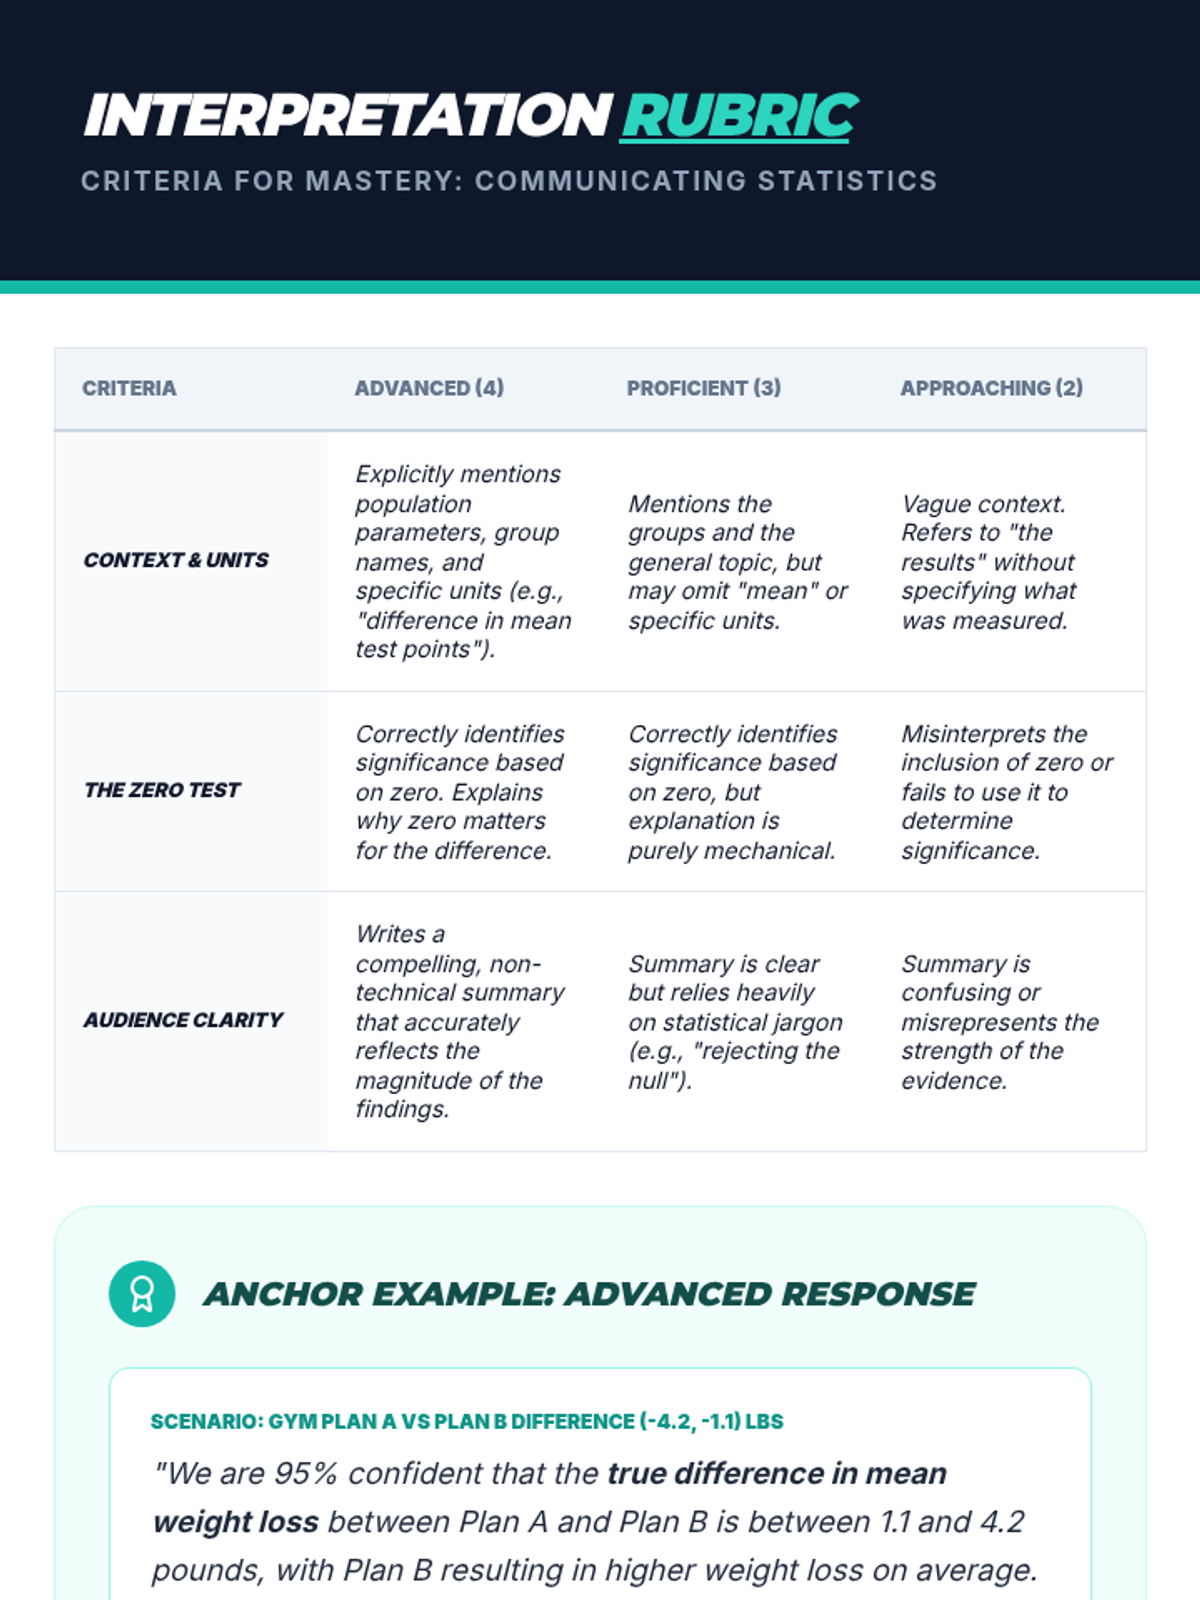
Interpretation is the focus as students determine statistical significance based on whether an interval includes zero. They practice translating complex data into clear, non-technical reports.
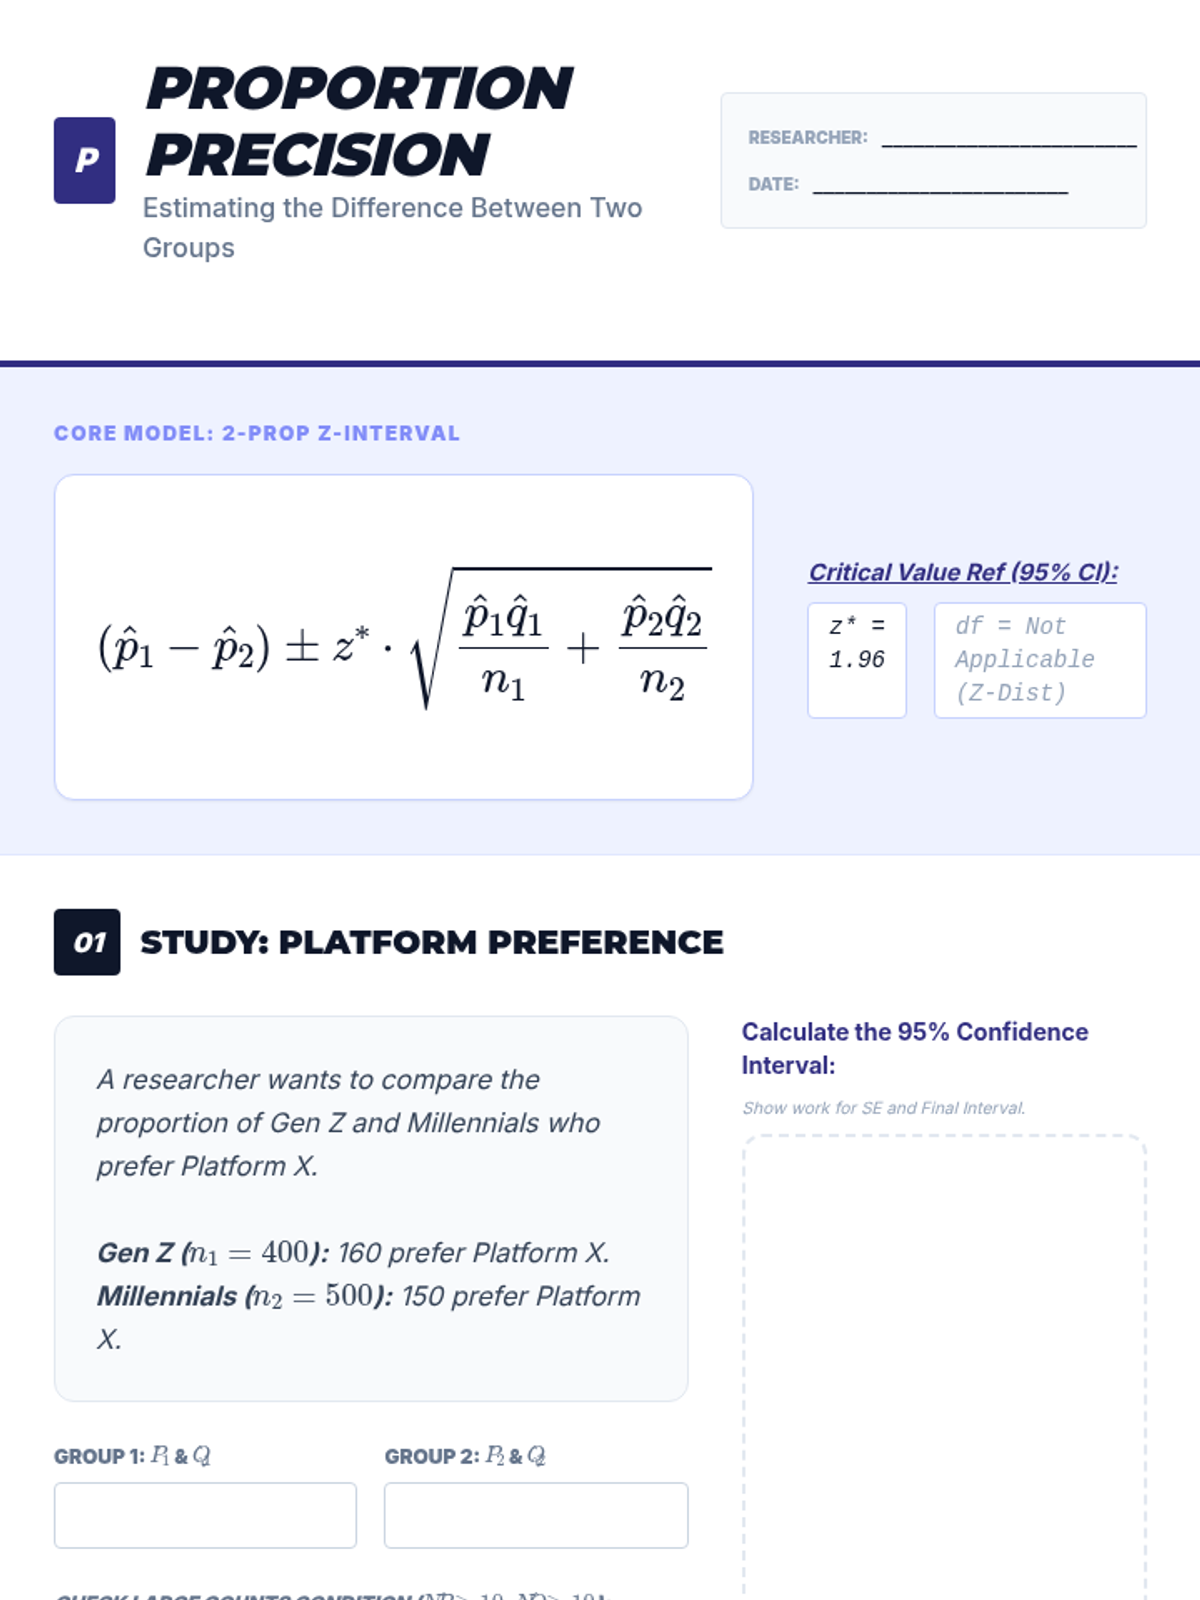
Students master the 2-proportion z-interval, focusing on the specific standard error formulas required. The lesson clarifies the distinction between unpooled and pooled standard errors.
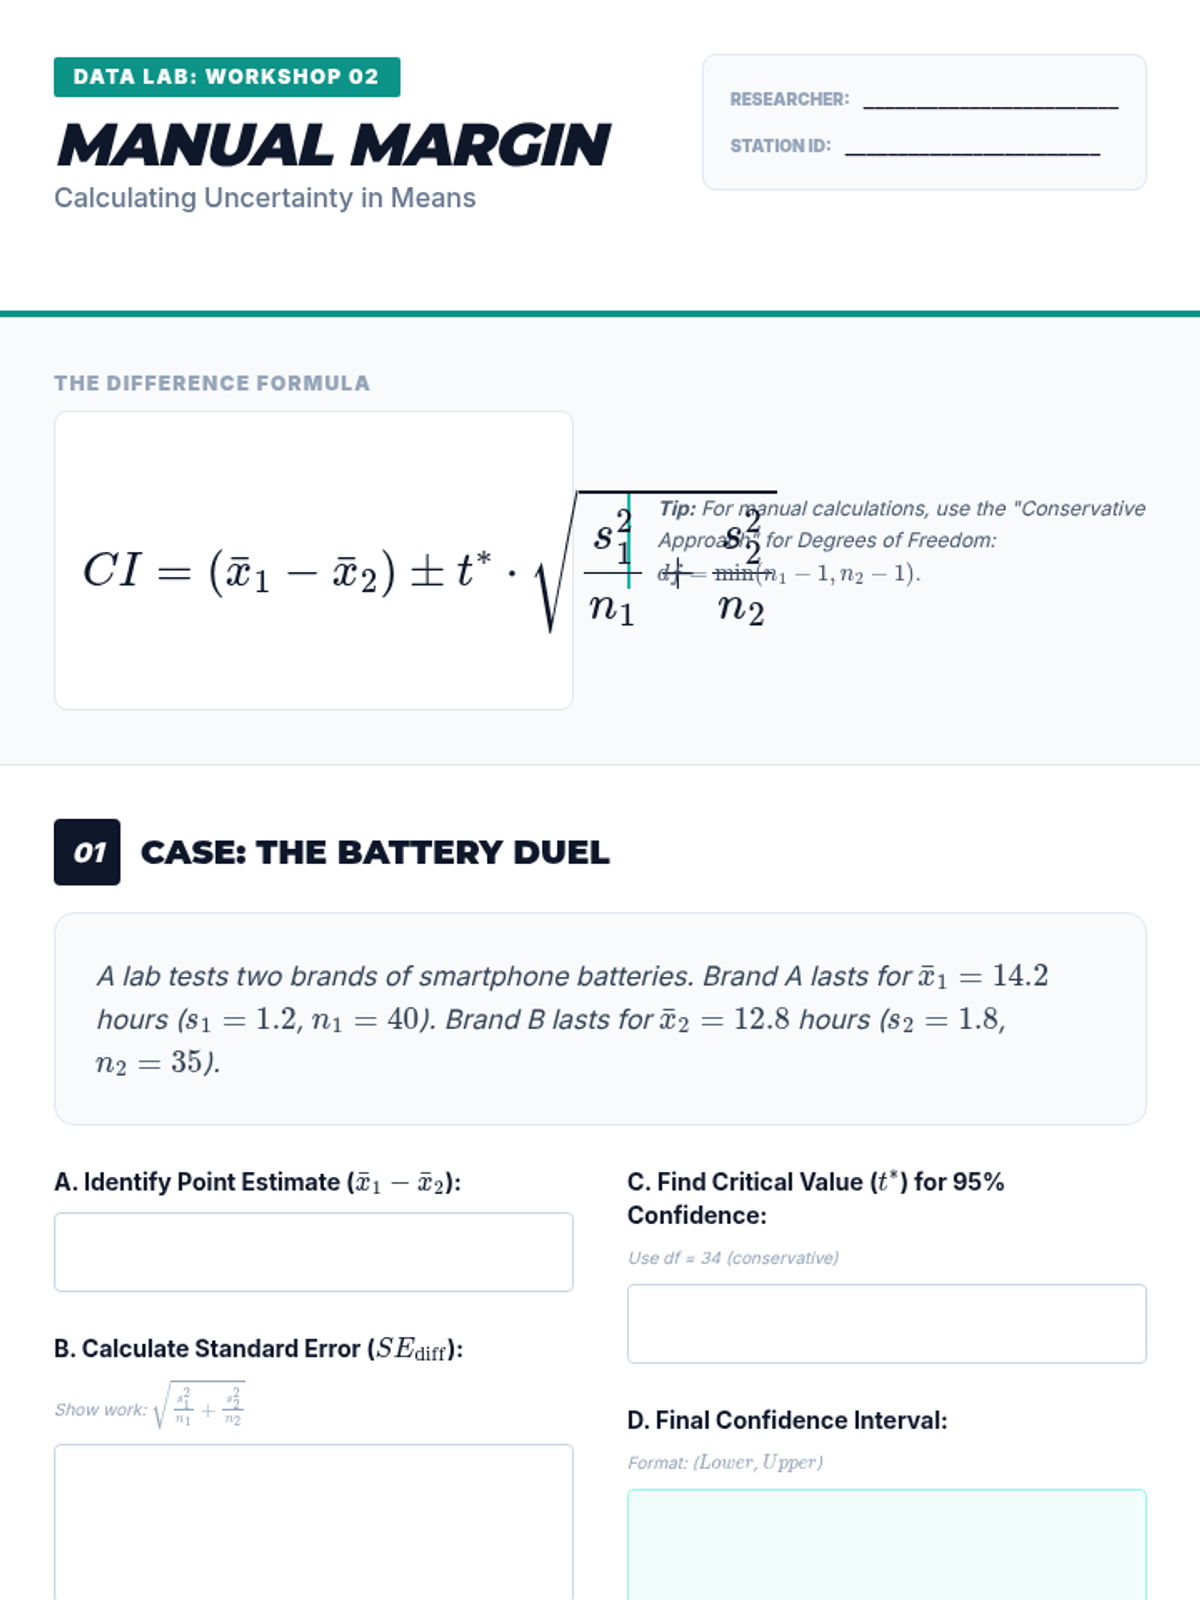
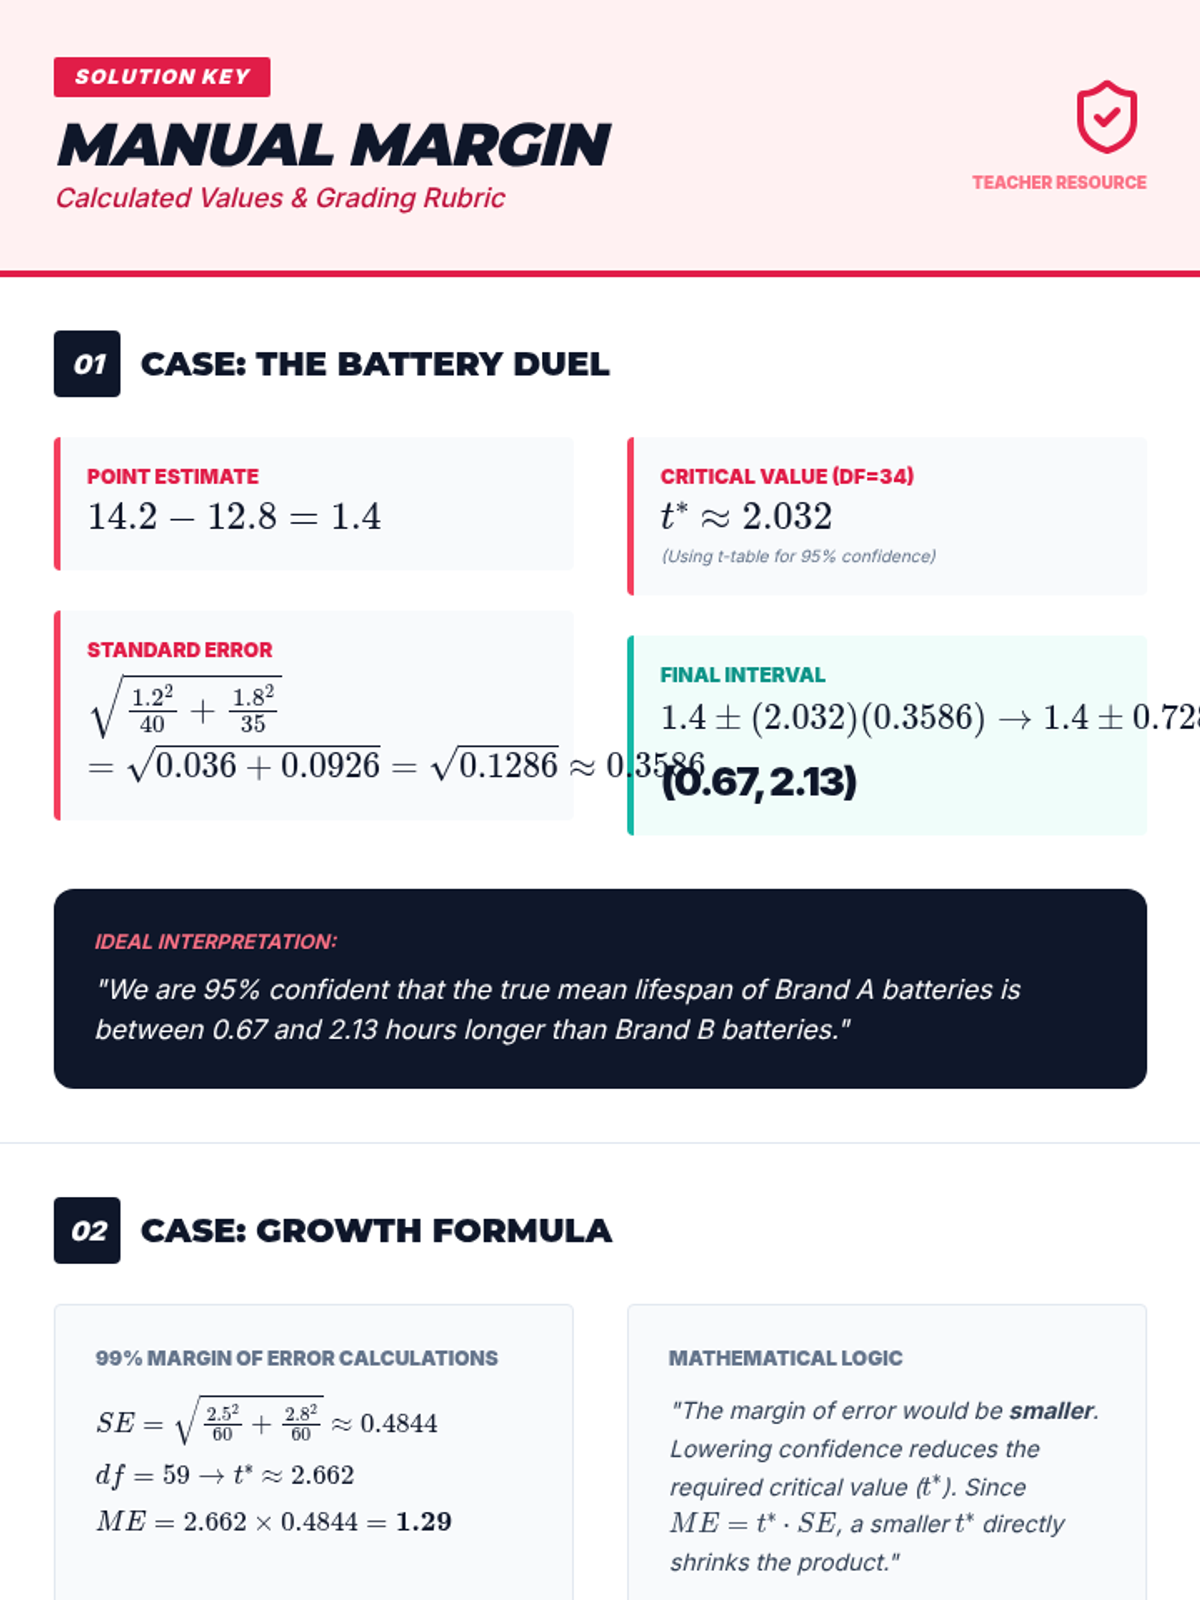
A technical workshop focused on the construction of 2-sample t-intervals for means. Students calculate margins of error manually to understand how sample size and standard deviation impact interval width.
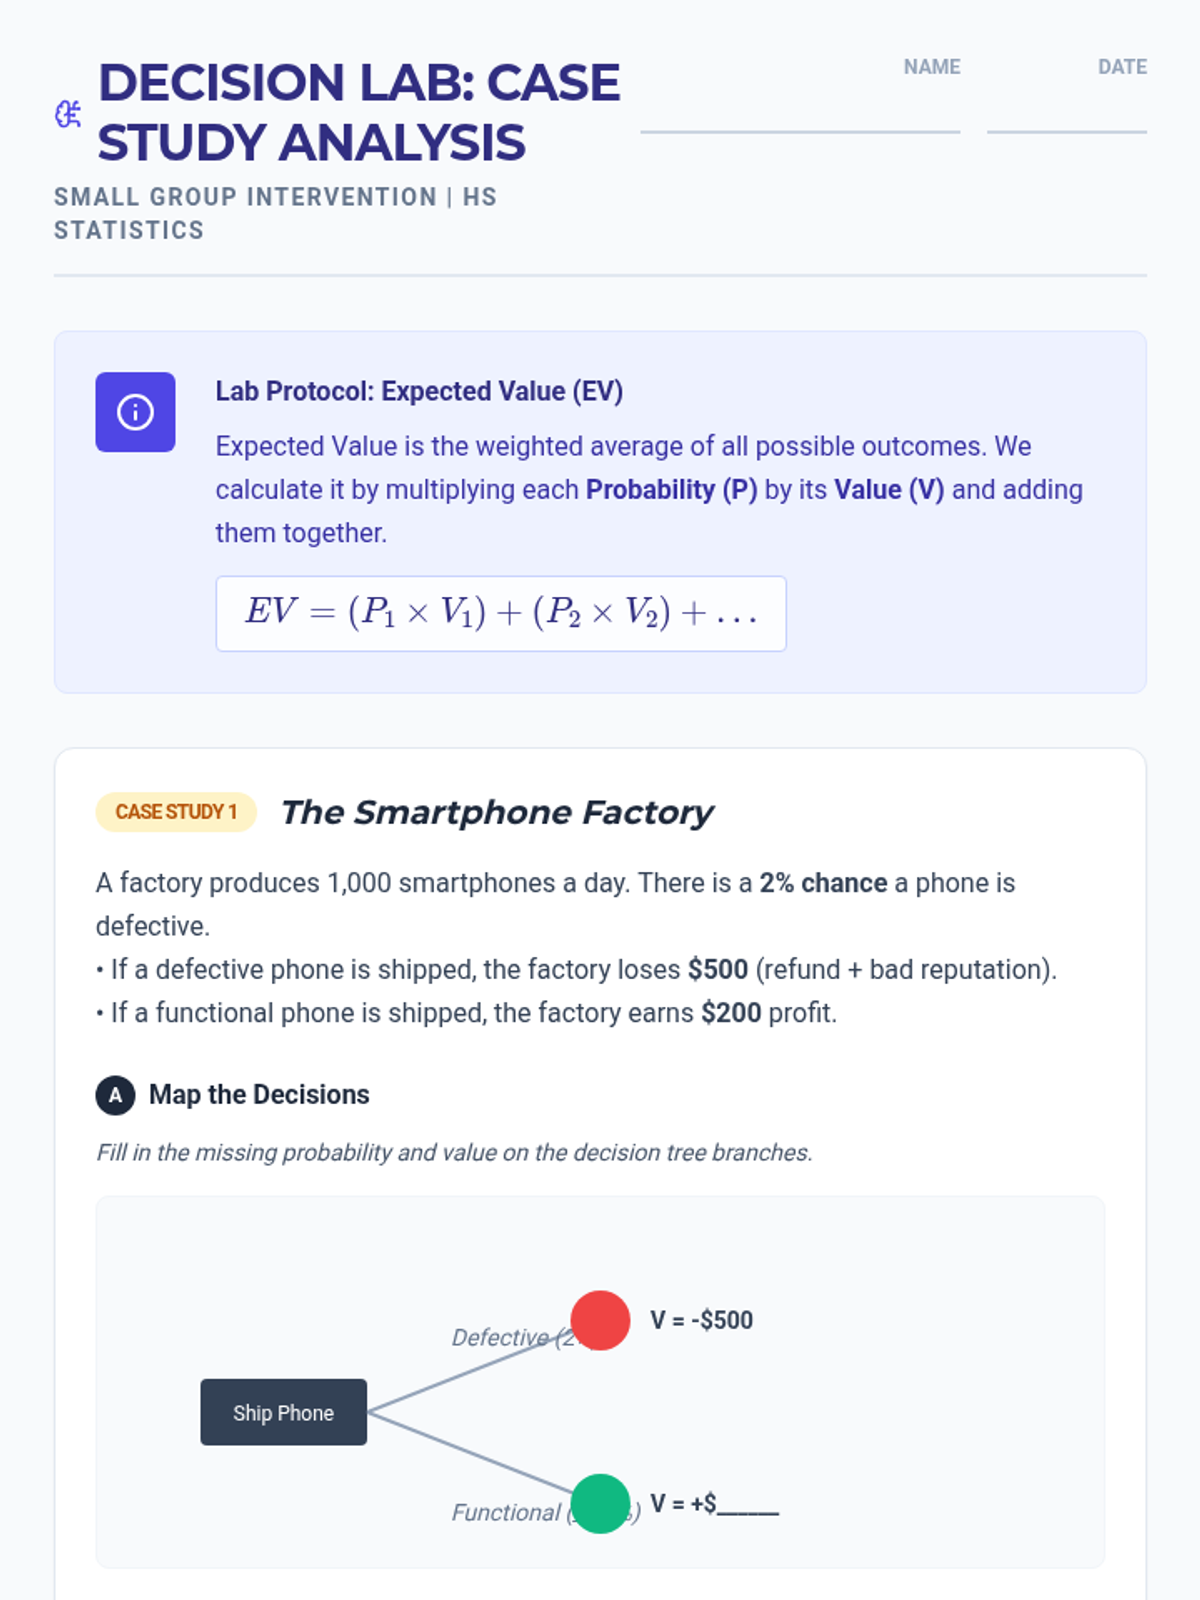
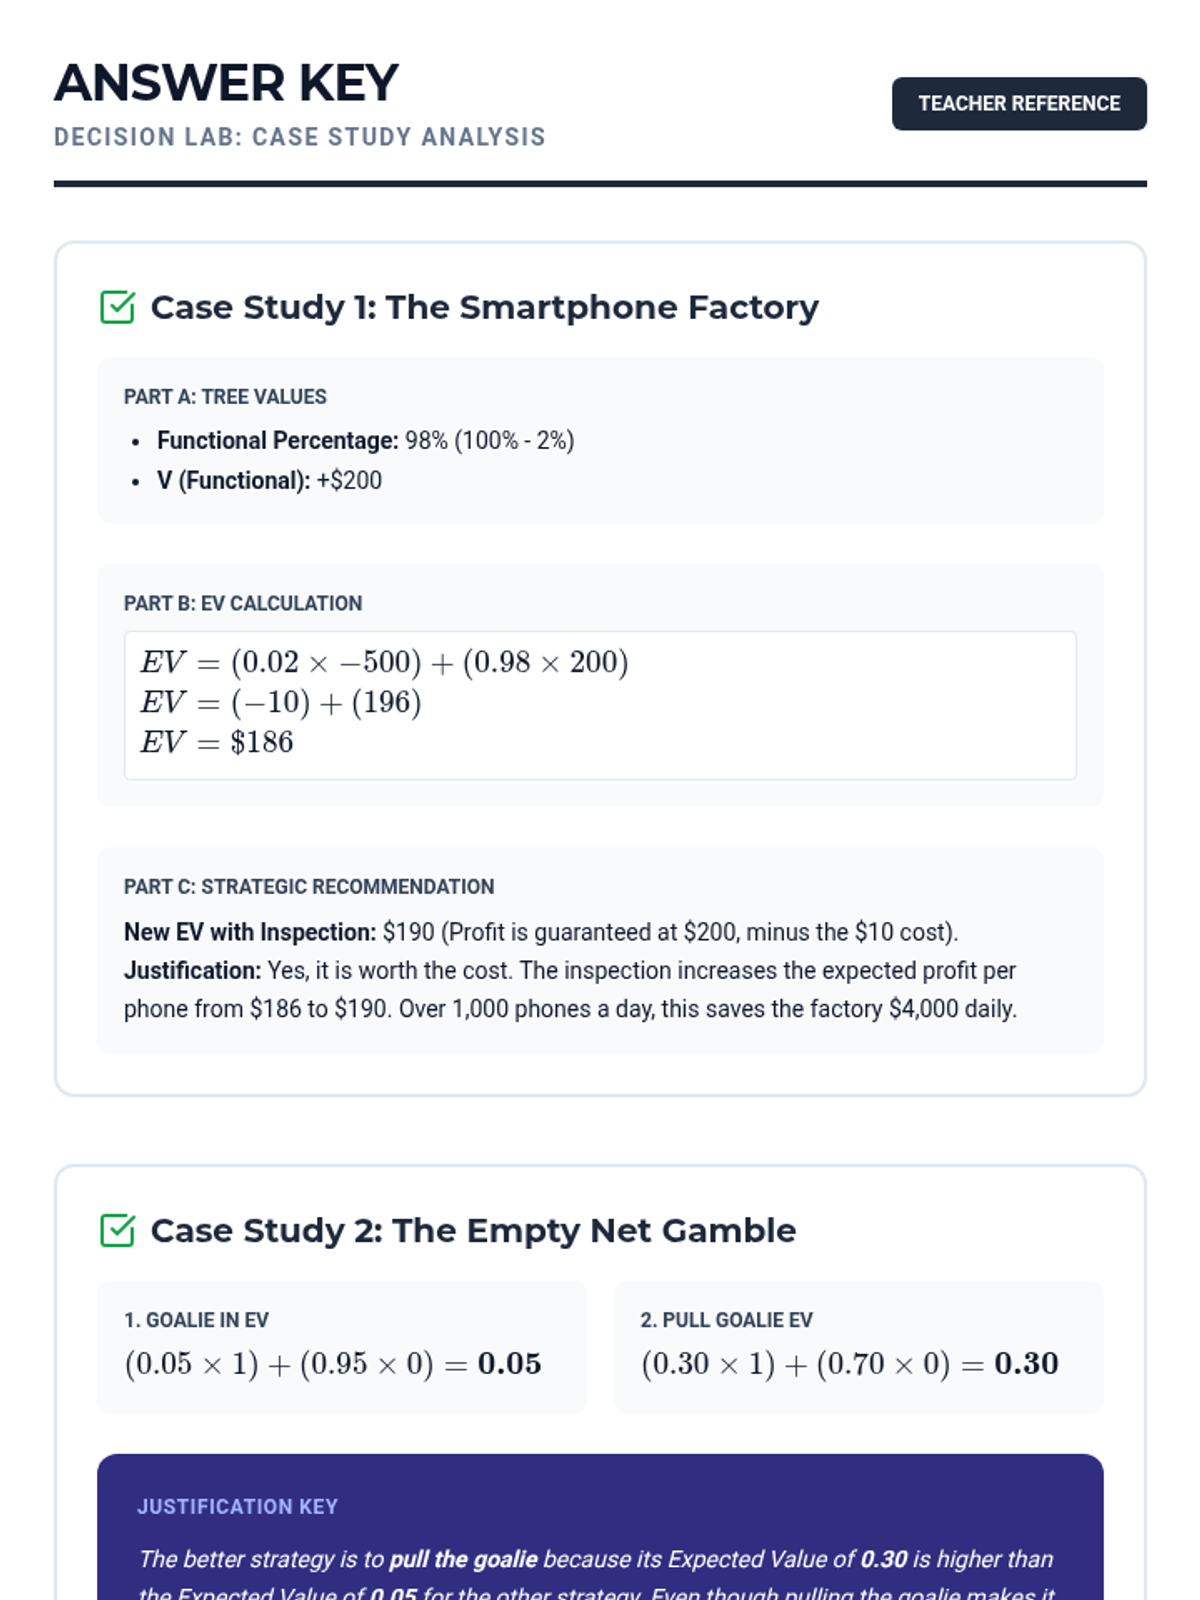
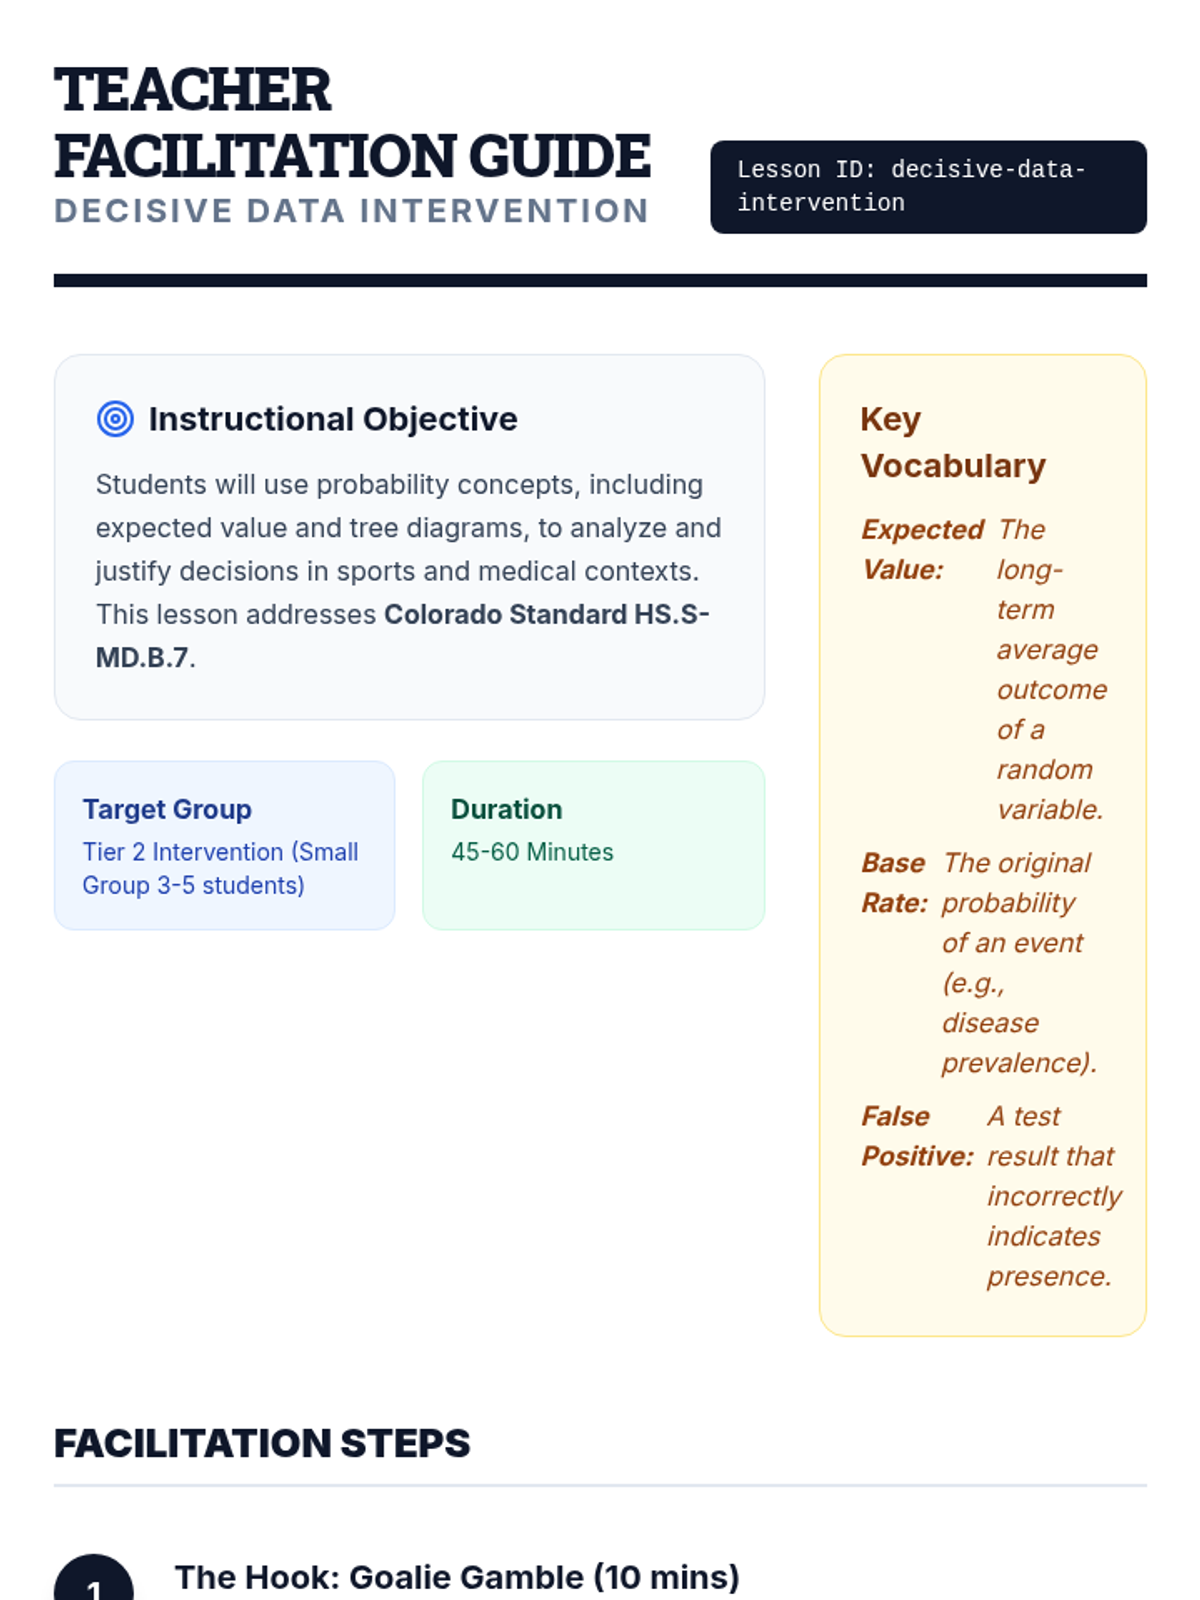
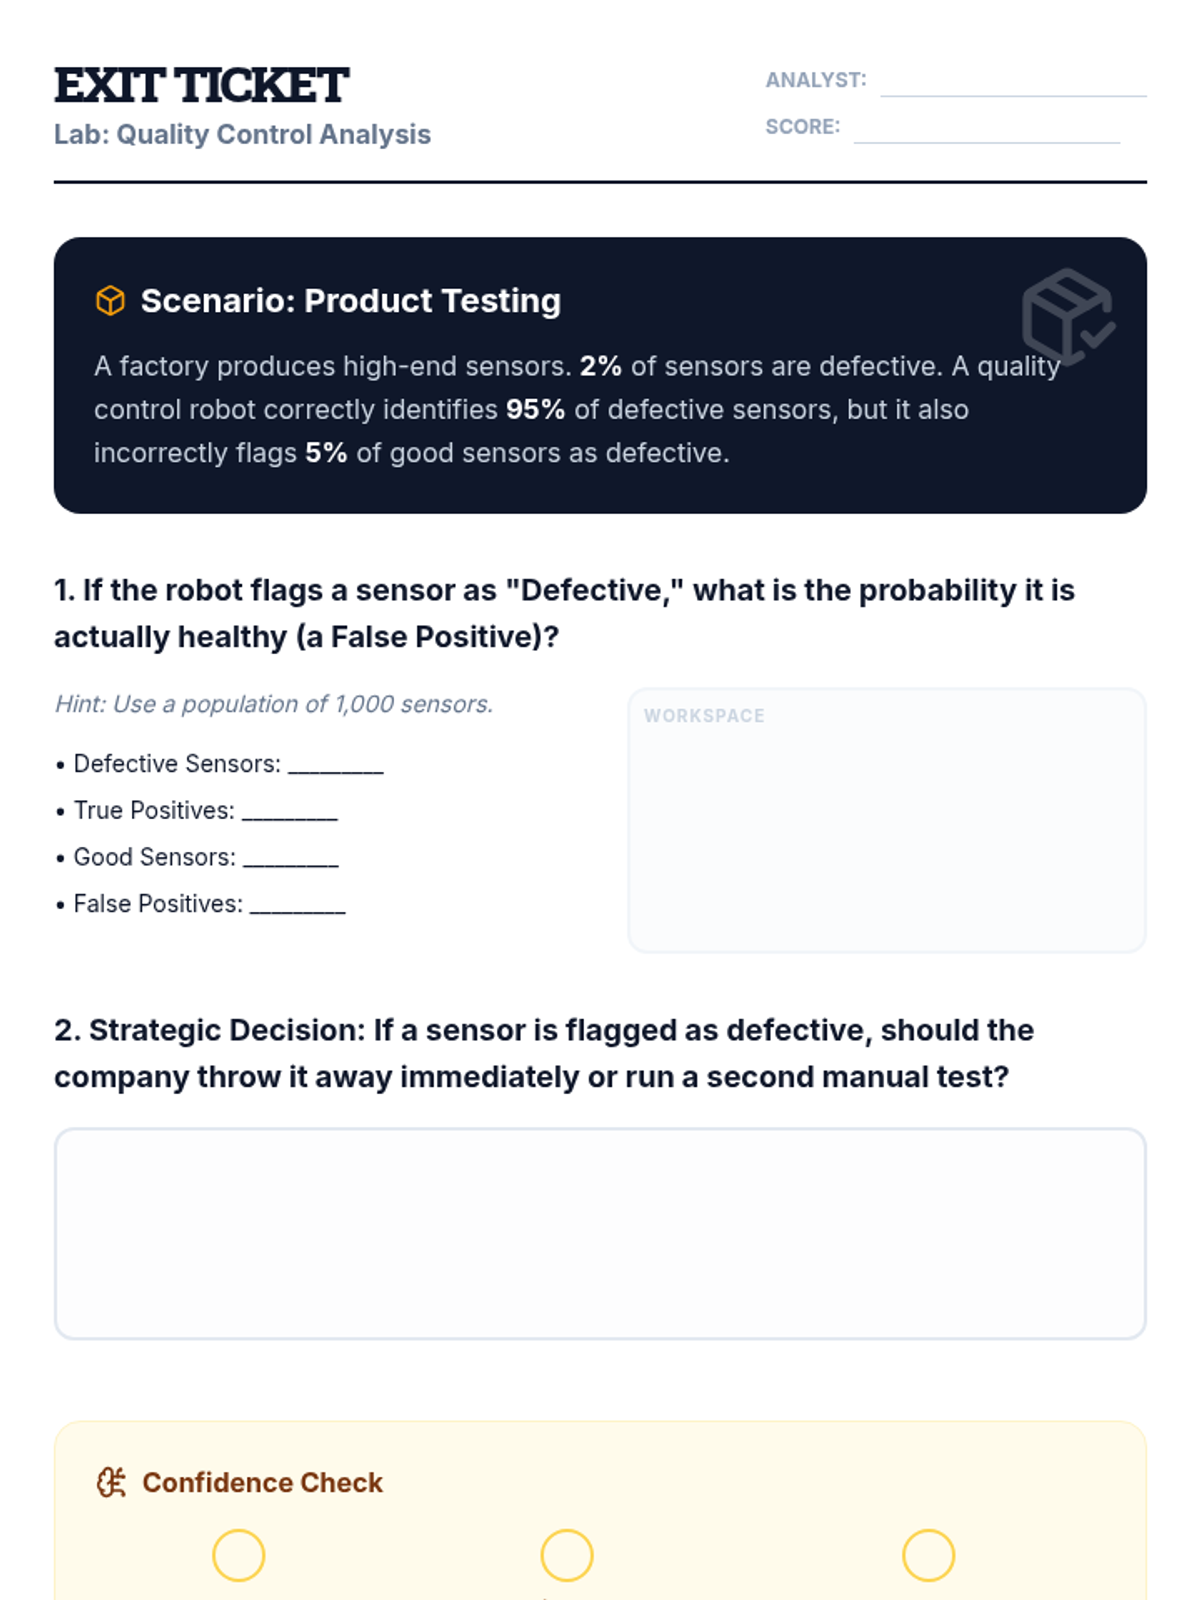
A Tier 2 intervention lesson focusing on using probability and expected value to analyze real-world decisions in medical testing, product quality, and sports strategy. Students use decision trees and justification templates to move from calculations to reasoned arguments.
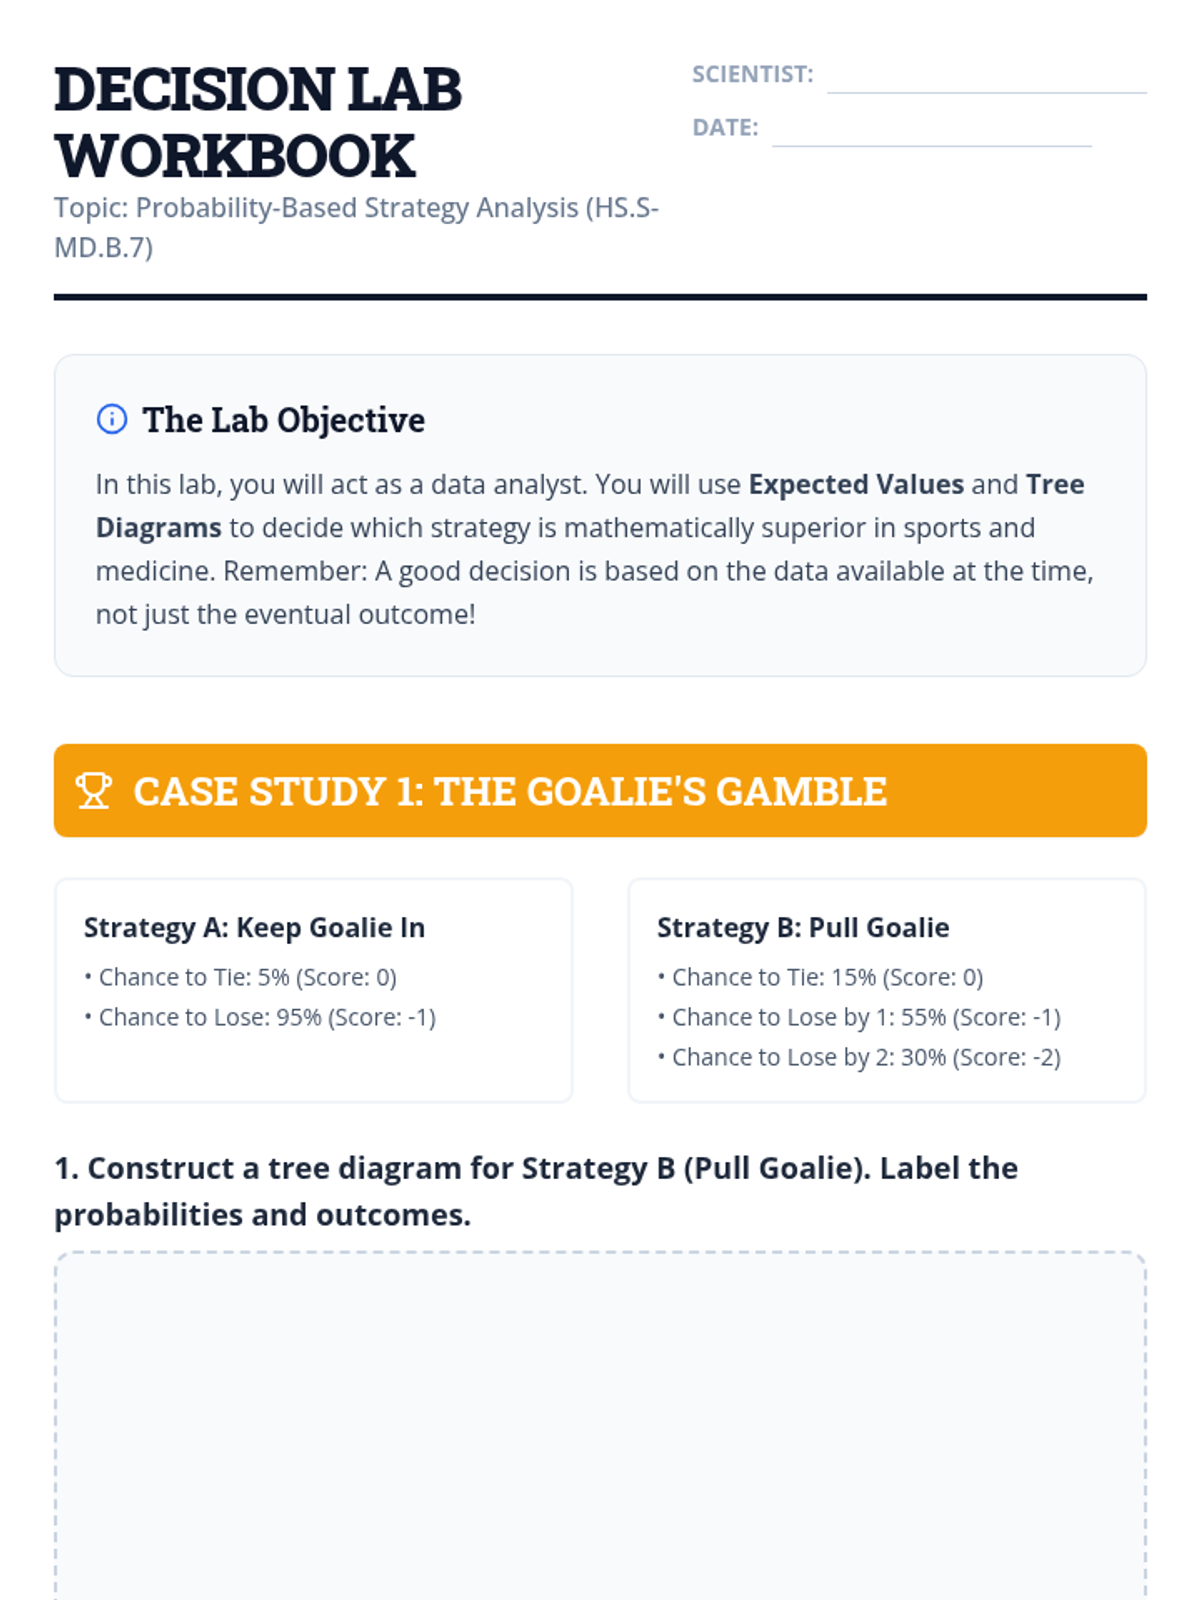
A targeted small group intervention lesson focused on using probability to make and analyze real-world decisions in sports and medicine. Students will use expected value and tree diagrams to justify strategies like pulling a hockey goalie or interpreting medical tests.
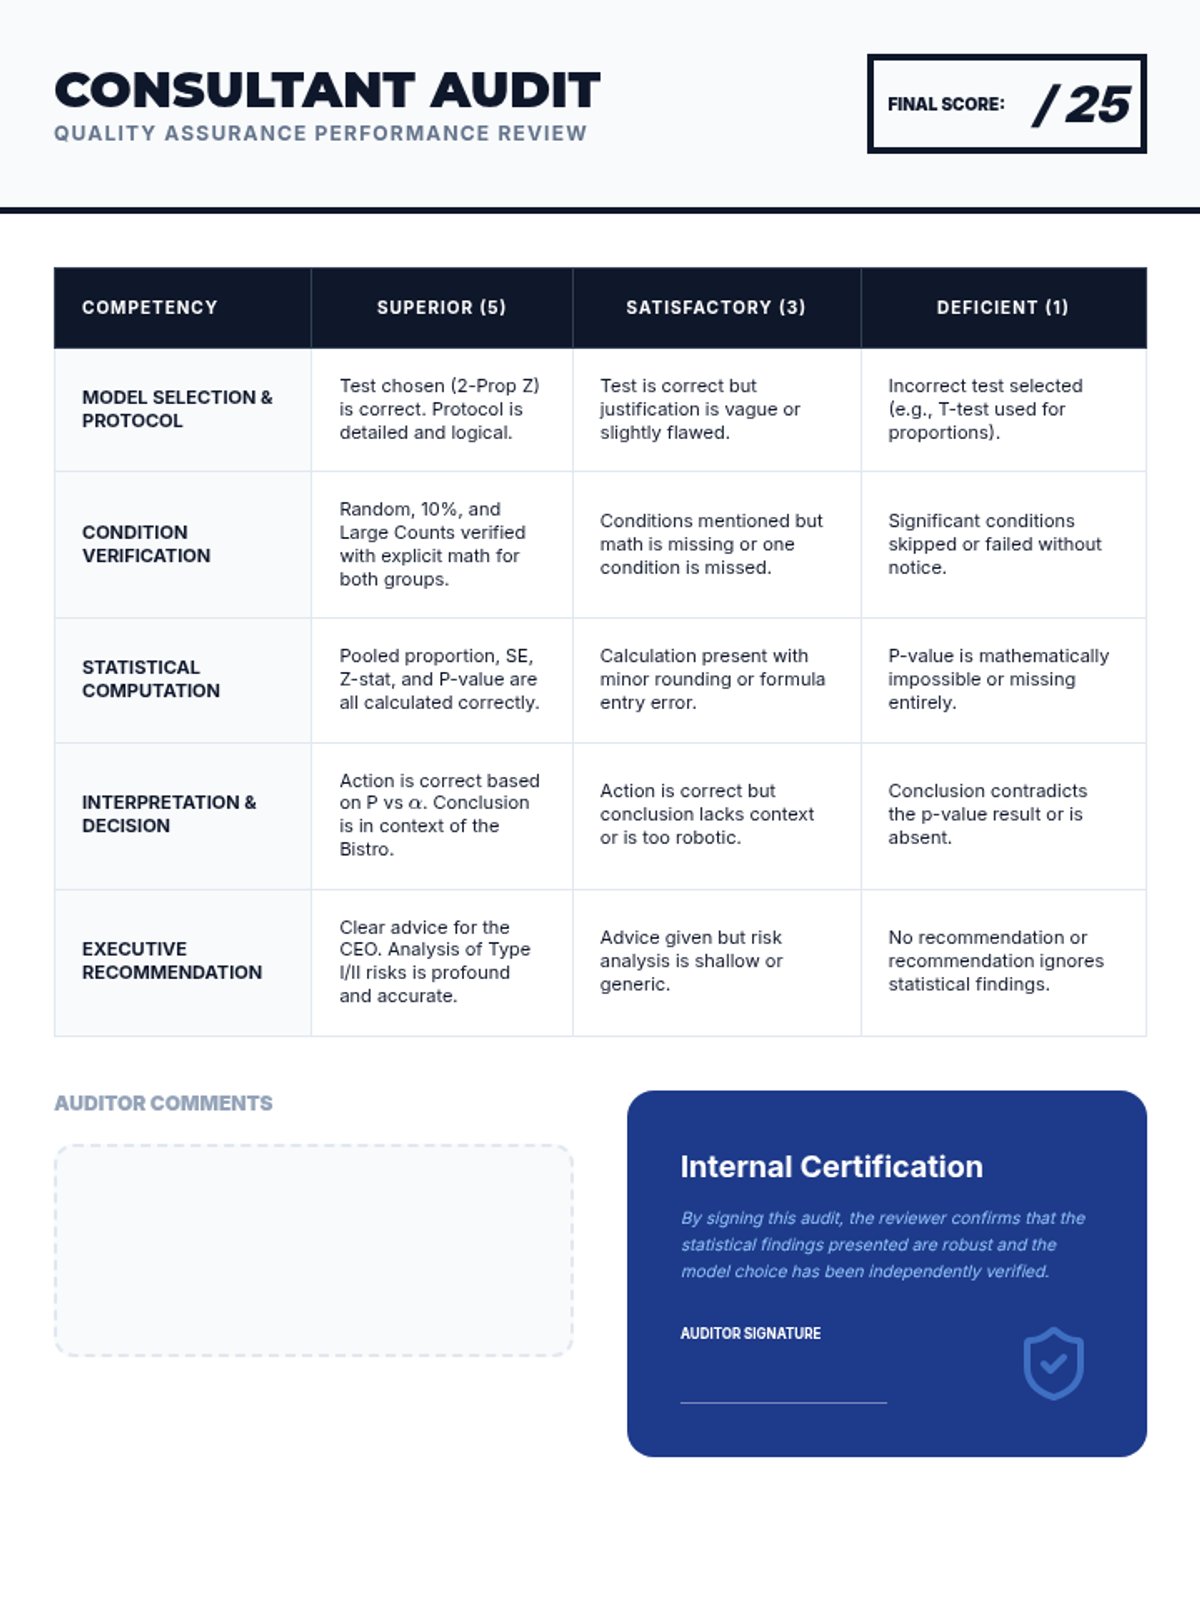
Part 2 of the simulation focusing on analysis, interpretation, and presenting findings to a simulated 'board of directors'.
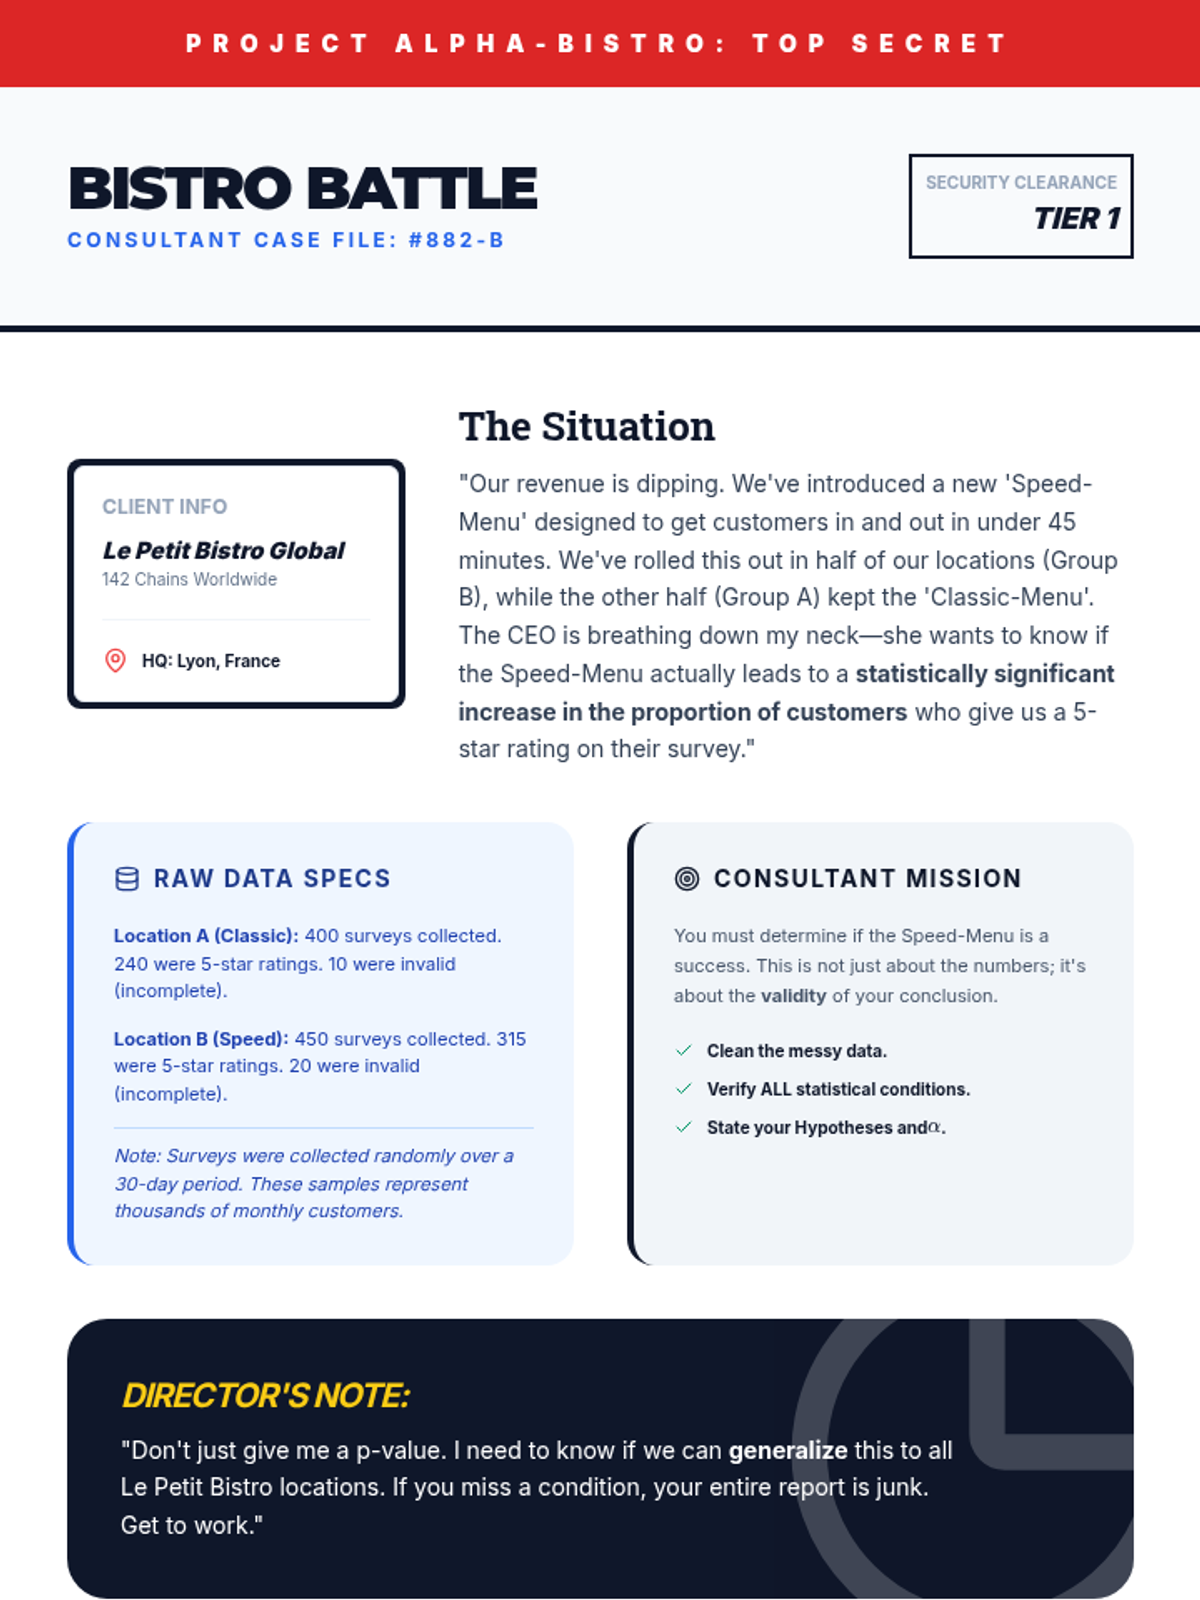
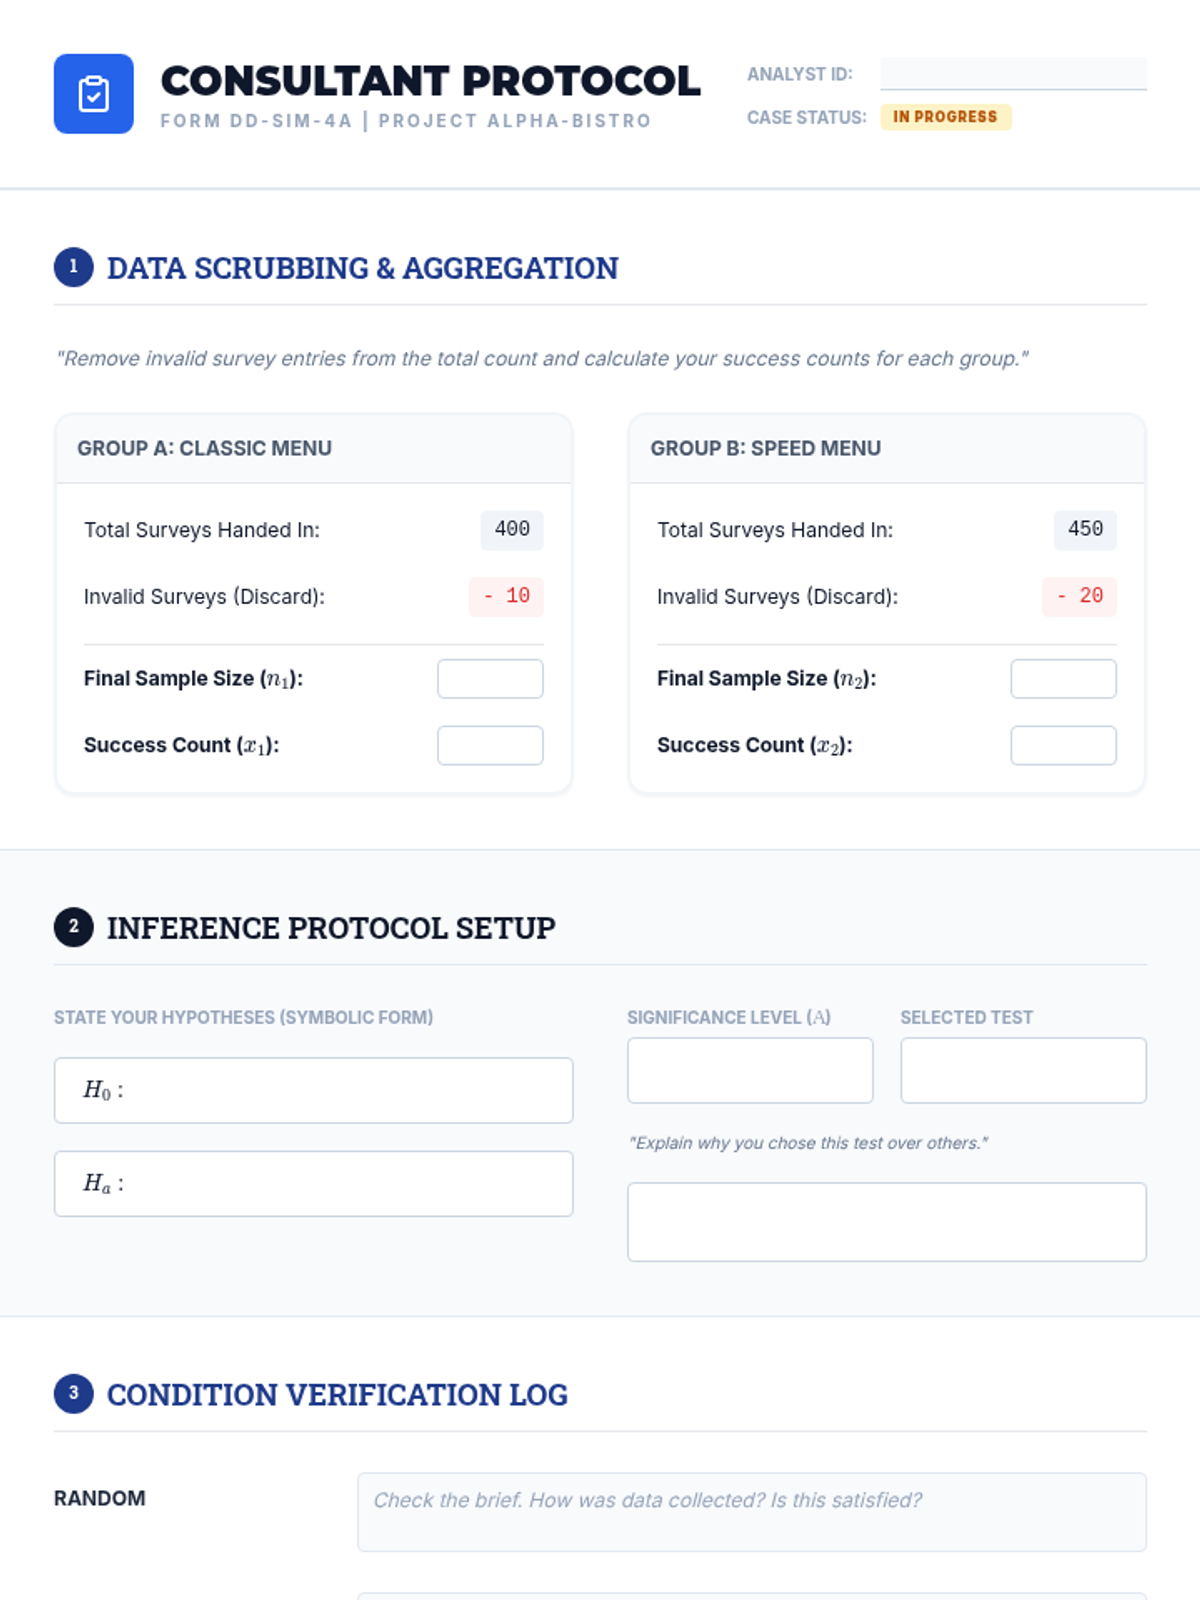
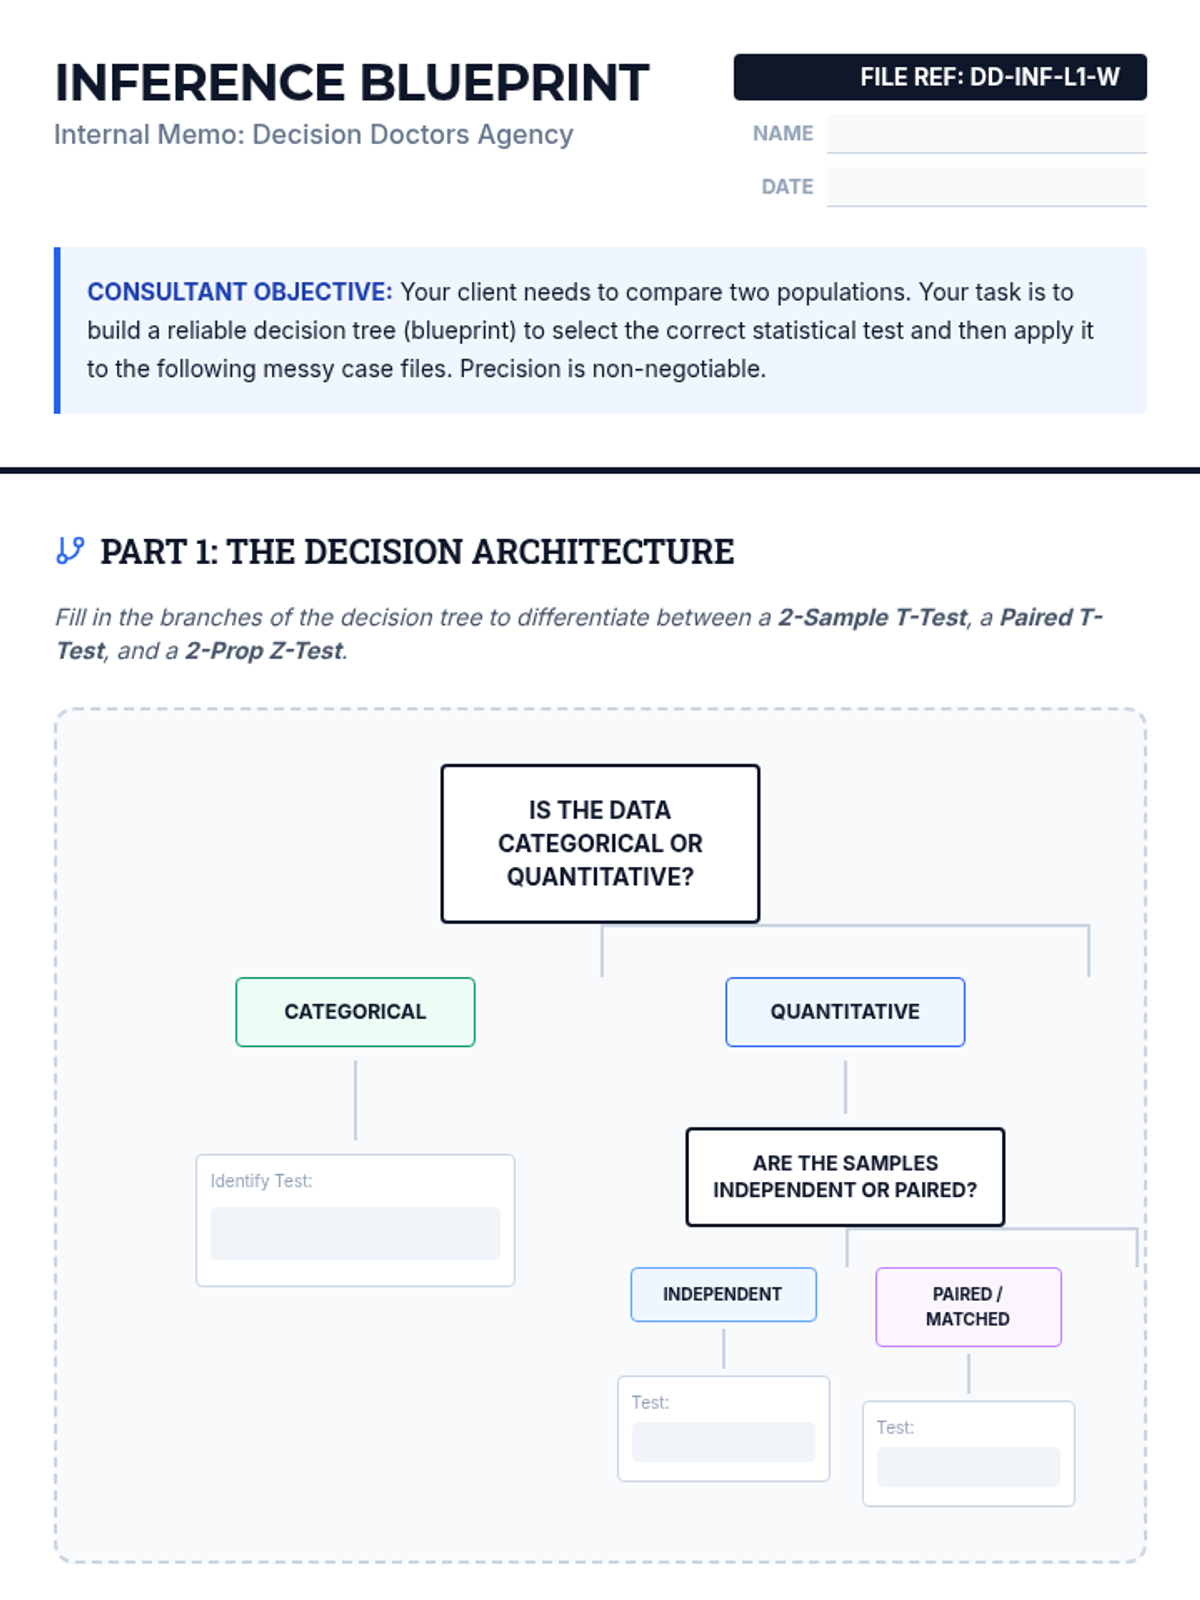
Part 1 of a simulation where students act as consultants to clean, organize, and select the correct test for a messy real-world dataset.
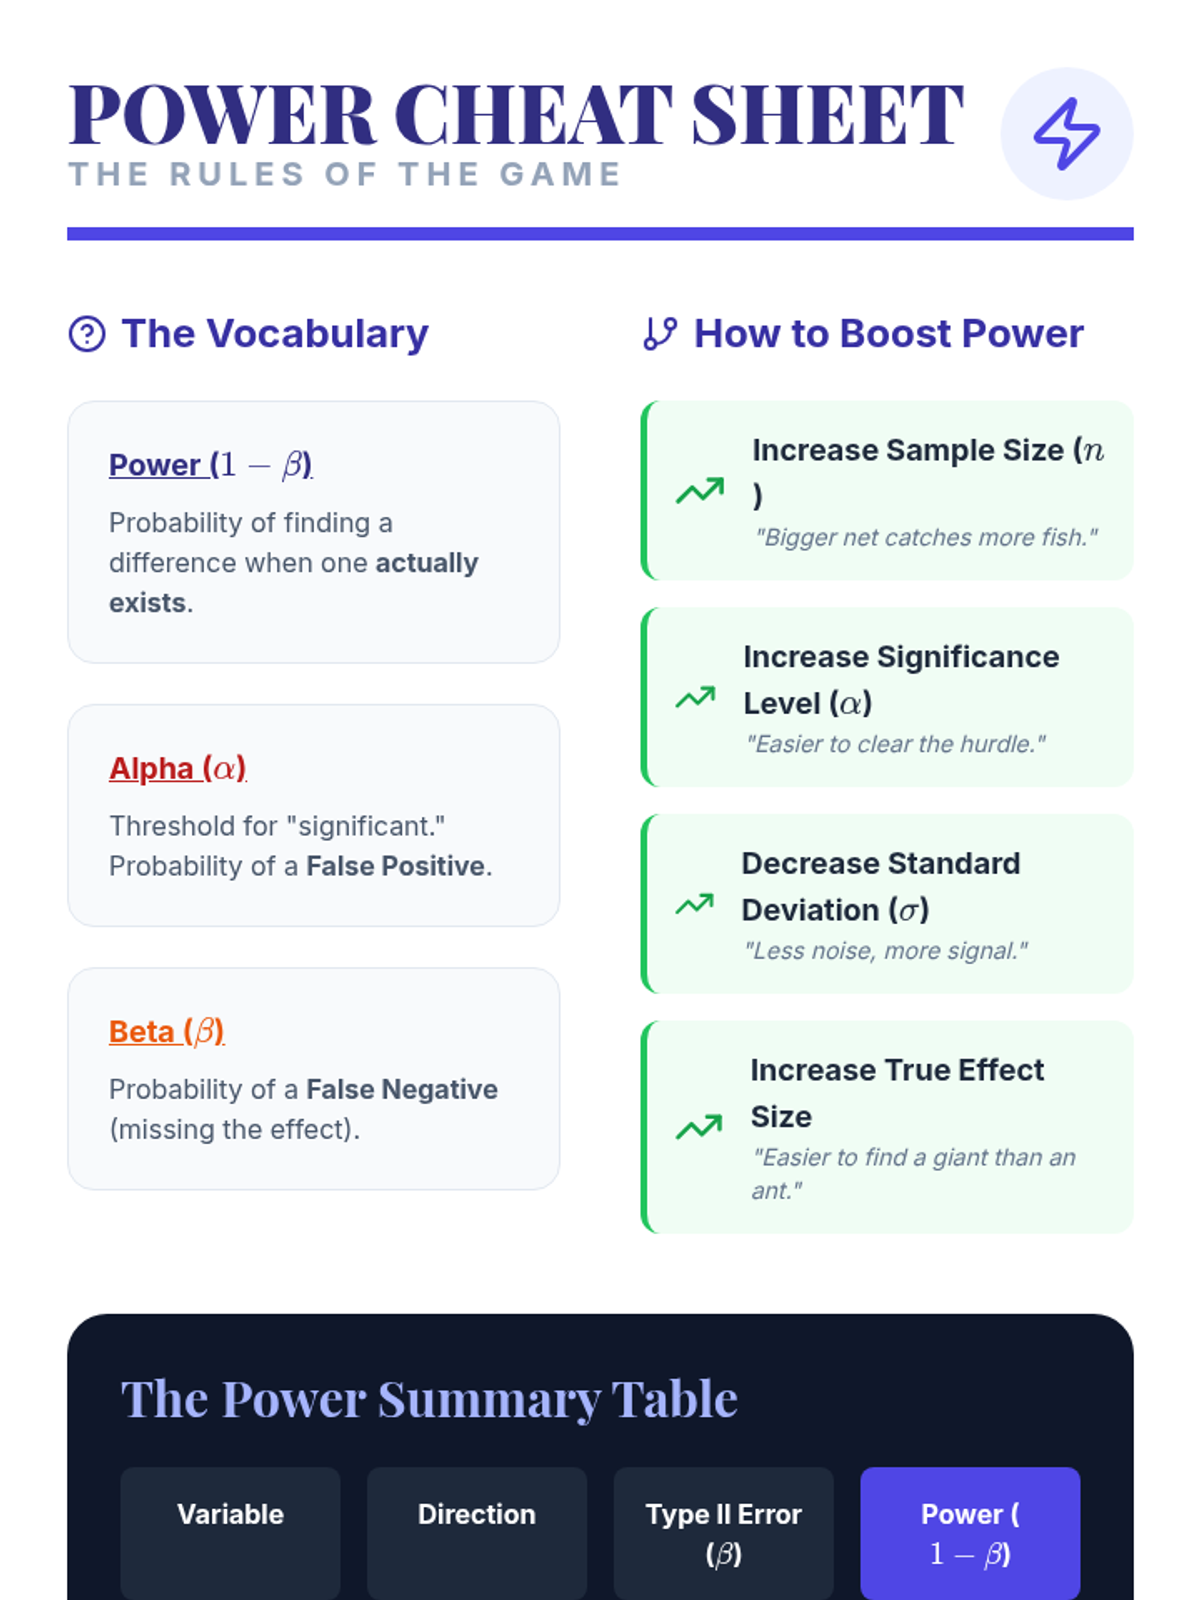
A conceptual exploration of statistical power, investigating how sample size and effect size influence the ability to detect differences.
Explores the real-world impact and definitions of Type I and Type II errors within the context of comparative studies.
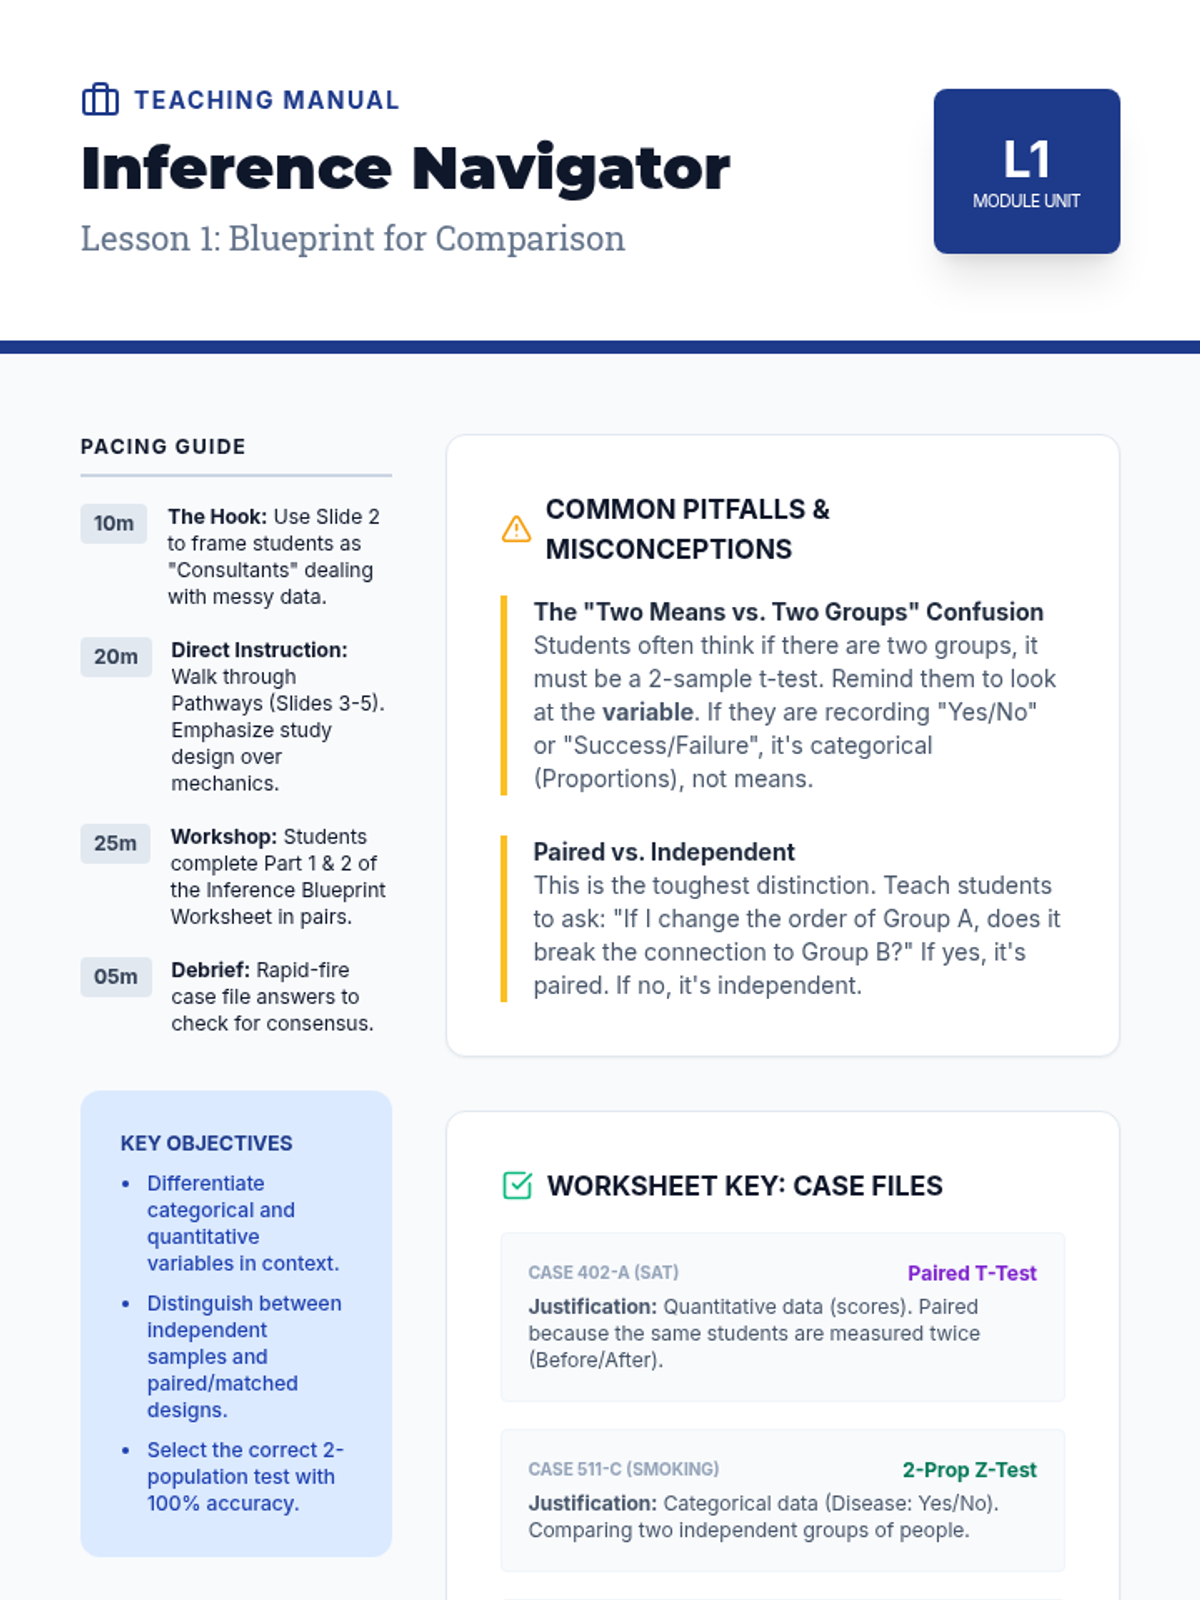
Students master the logic of selecting between 2-sample t, paired t, and 2-prop z tests based on data structure and study design.
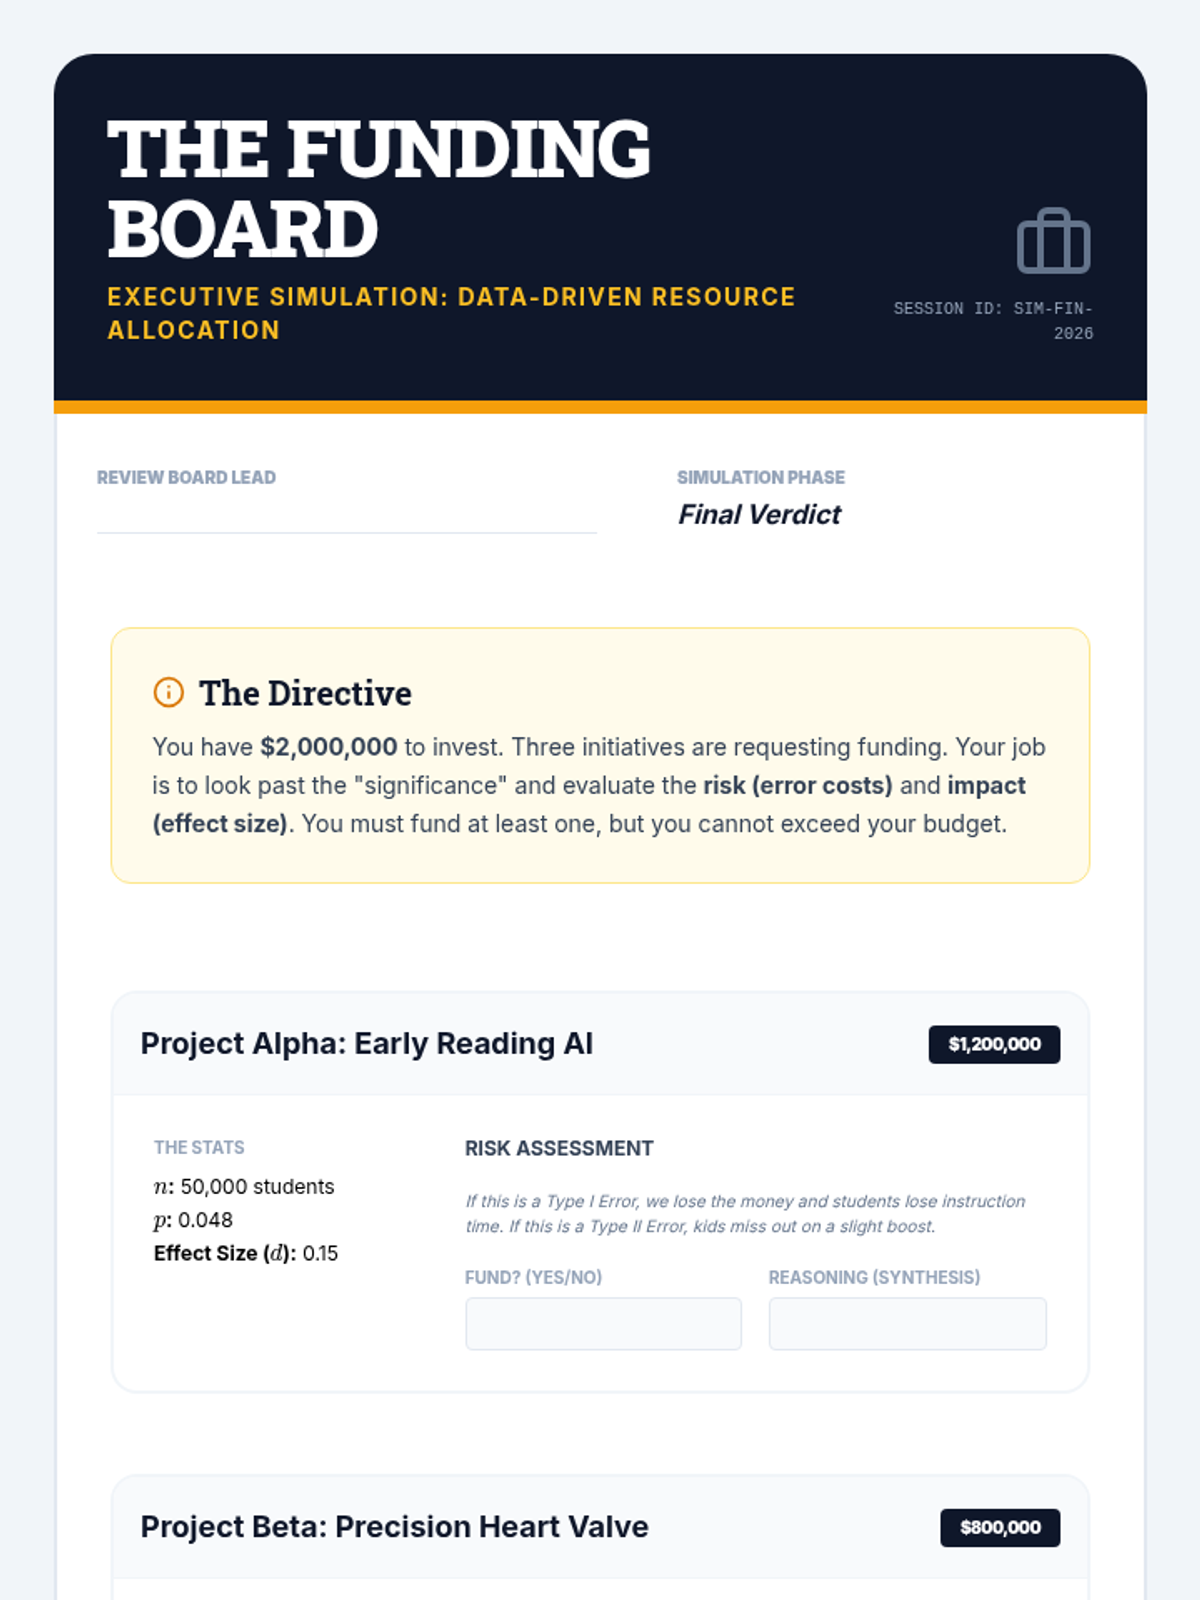
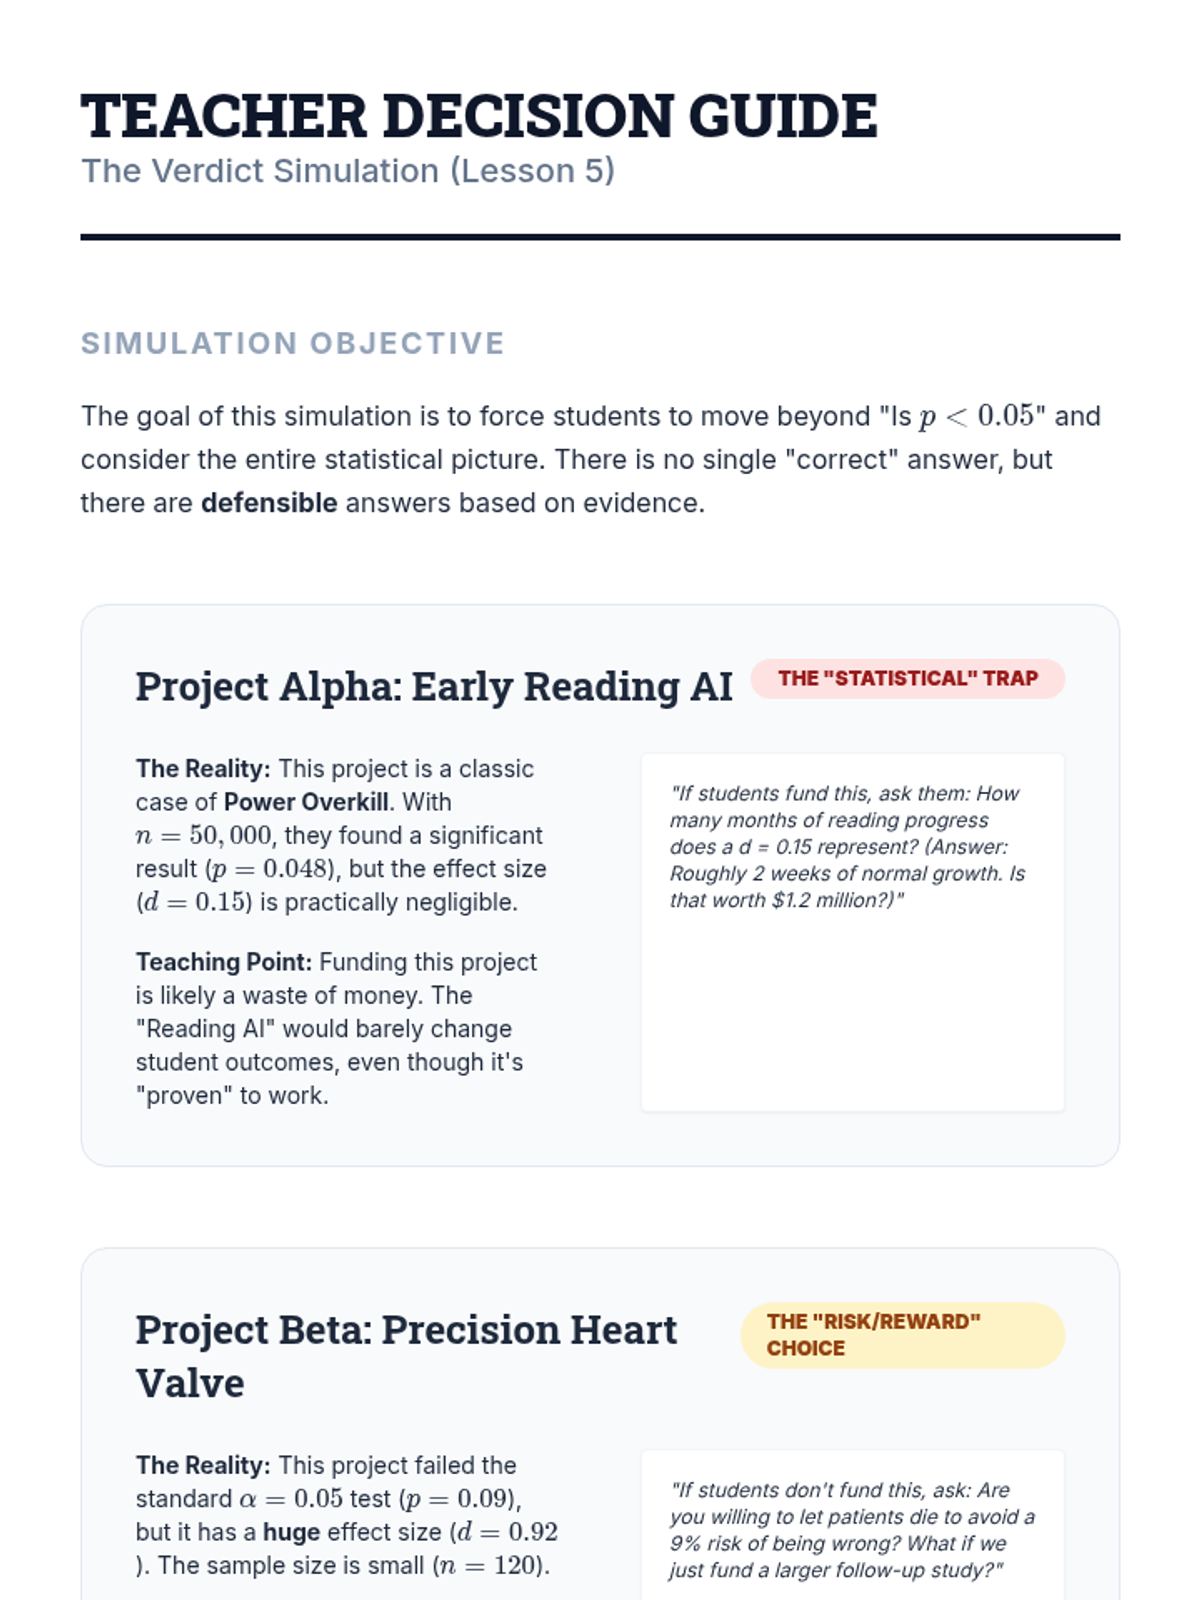
A culminating simulation where students act as a review board, synthesizing p-values, errors, and effect sizes to make evidence-based funding recommendations.
An introduction to quantifying the magnitude of differences using Cohen's d and other effect size measures to provide context to statistical findings.
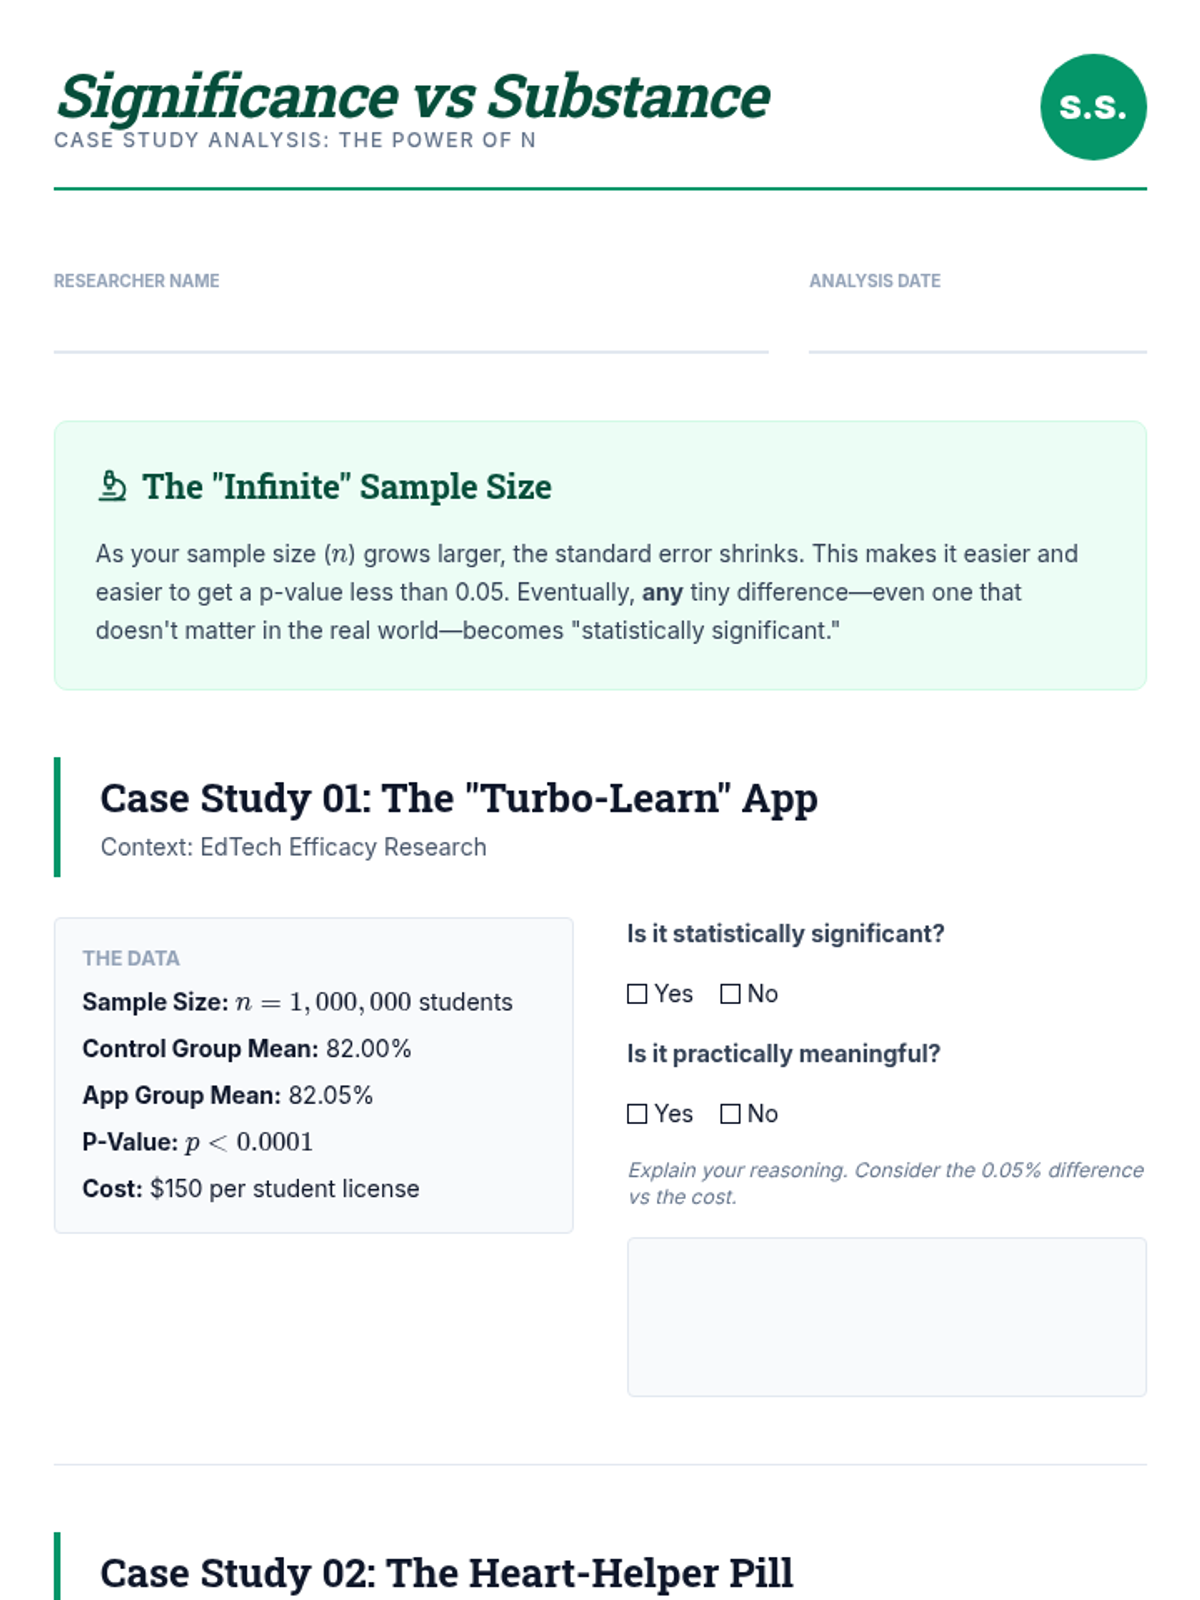
Students distinguish between statistical results and real-world impact by analyzing how massive sample sizes can produce significant results for negligible differences.
An exploration of Type I and Type II errors, their consequences in fields like medicine and technology, and the use of truth tables to visualize statistical outcomes.
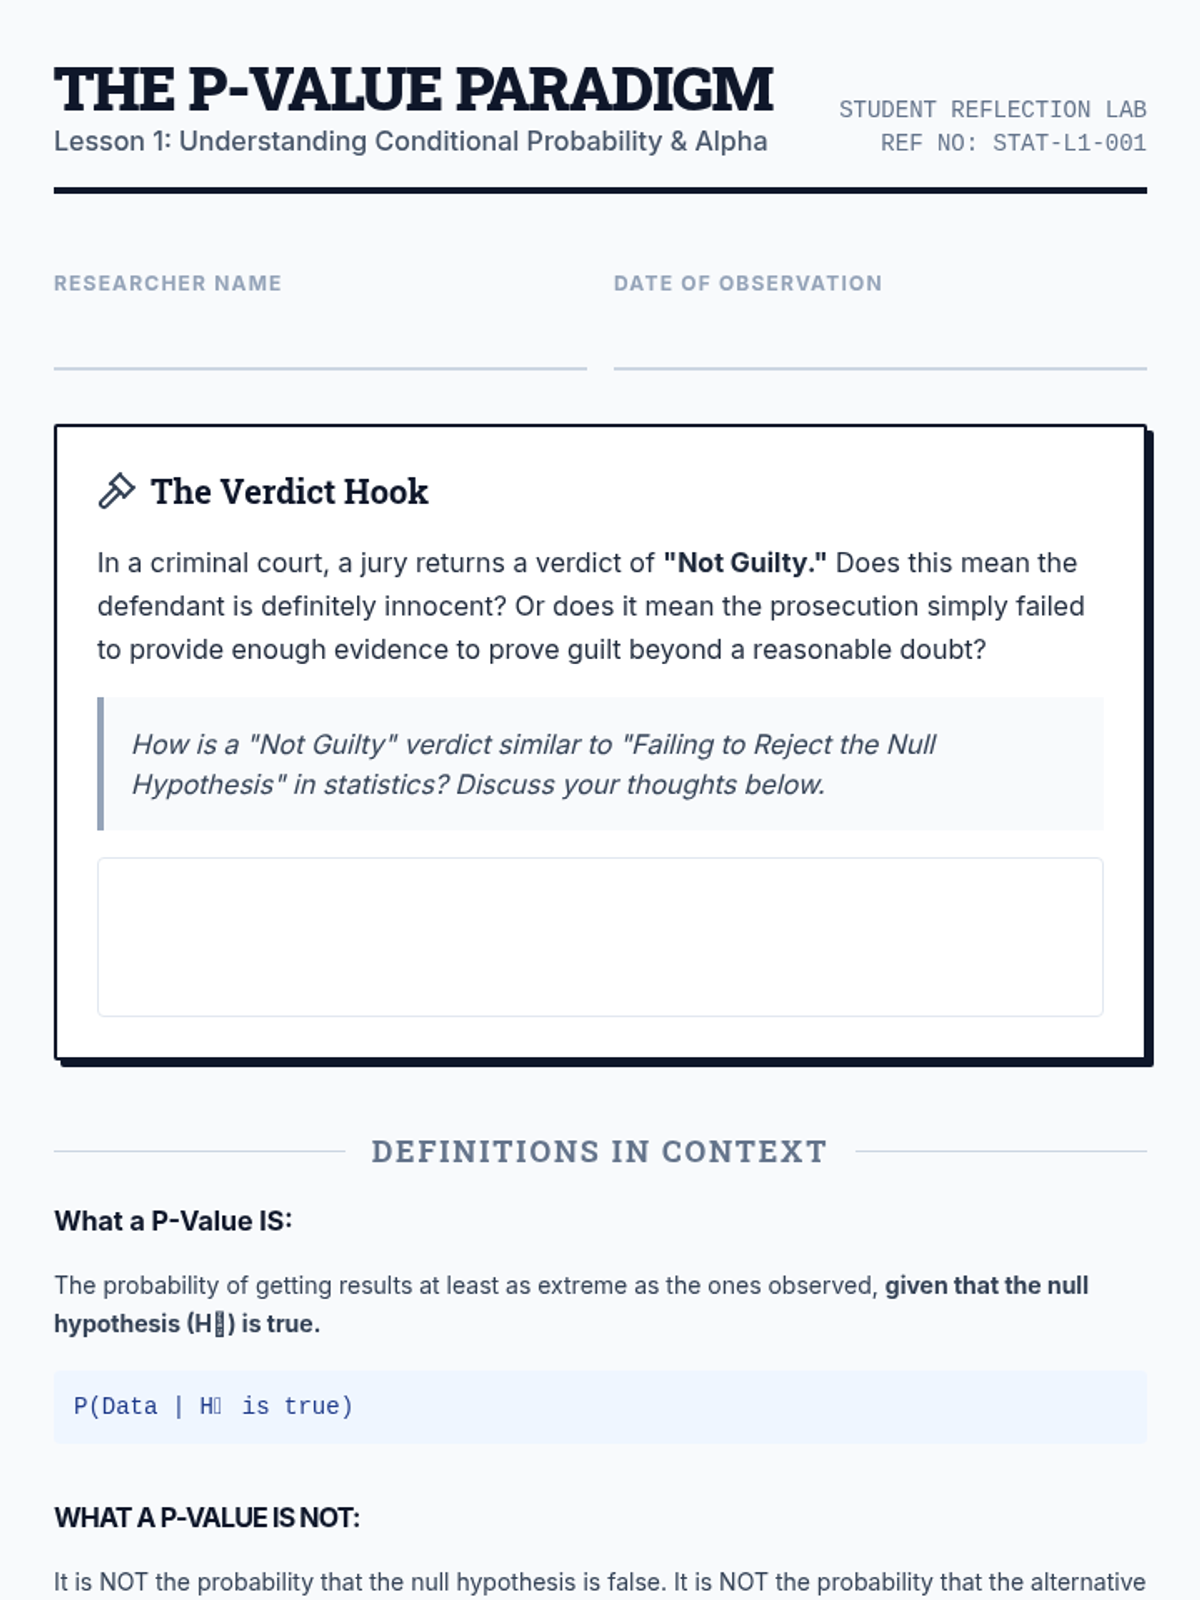
Students explore the conceptual meaning of P-values as conditional probabilities and debate the selection of significance levels (alpha) in different contexts.
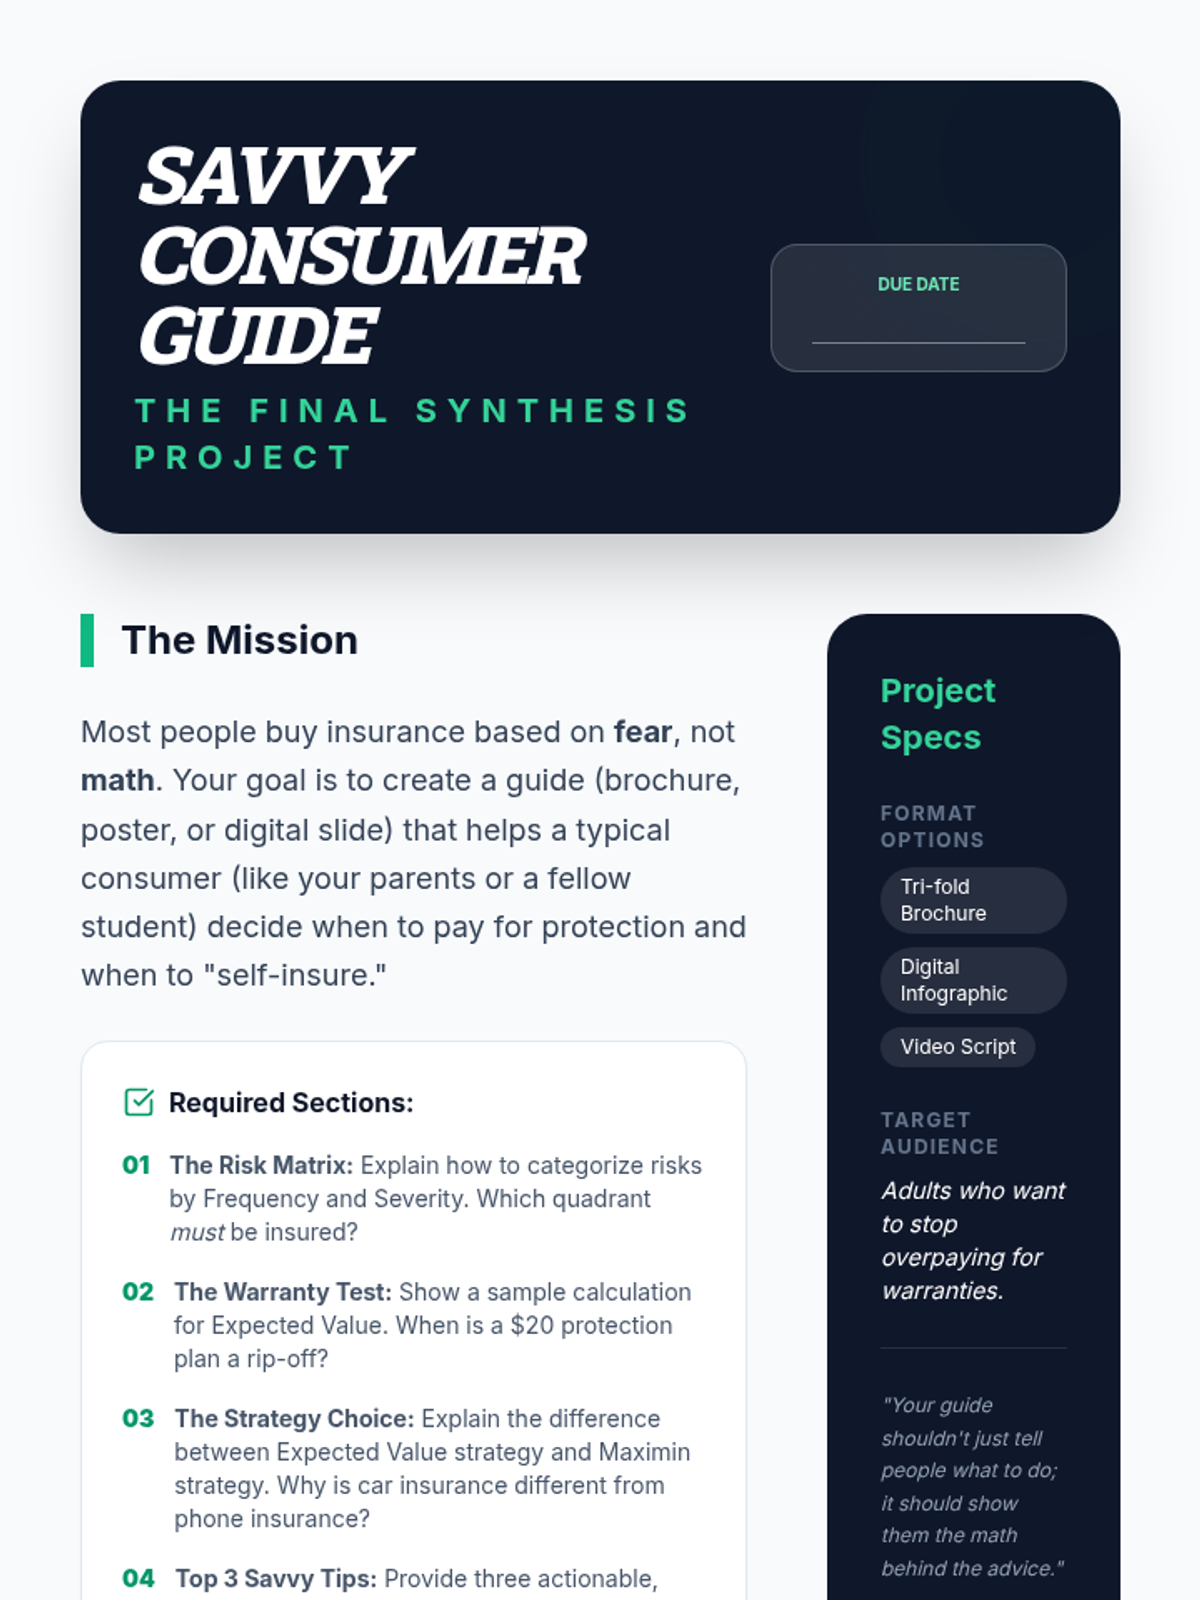
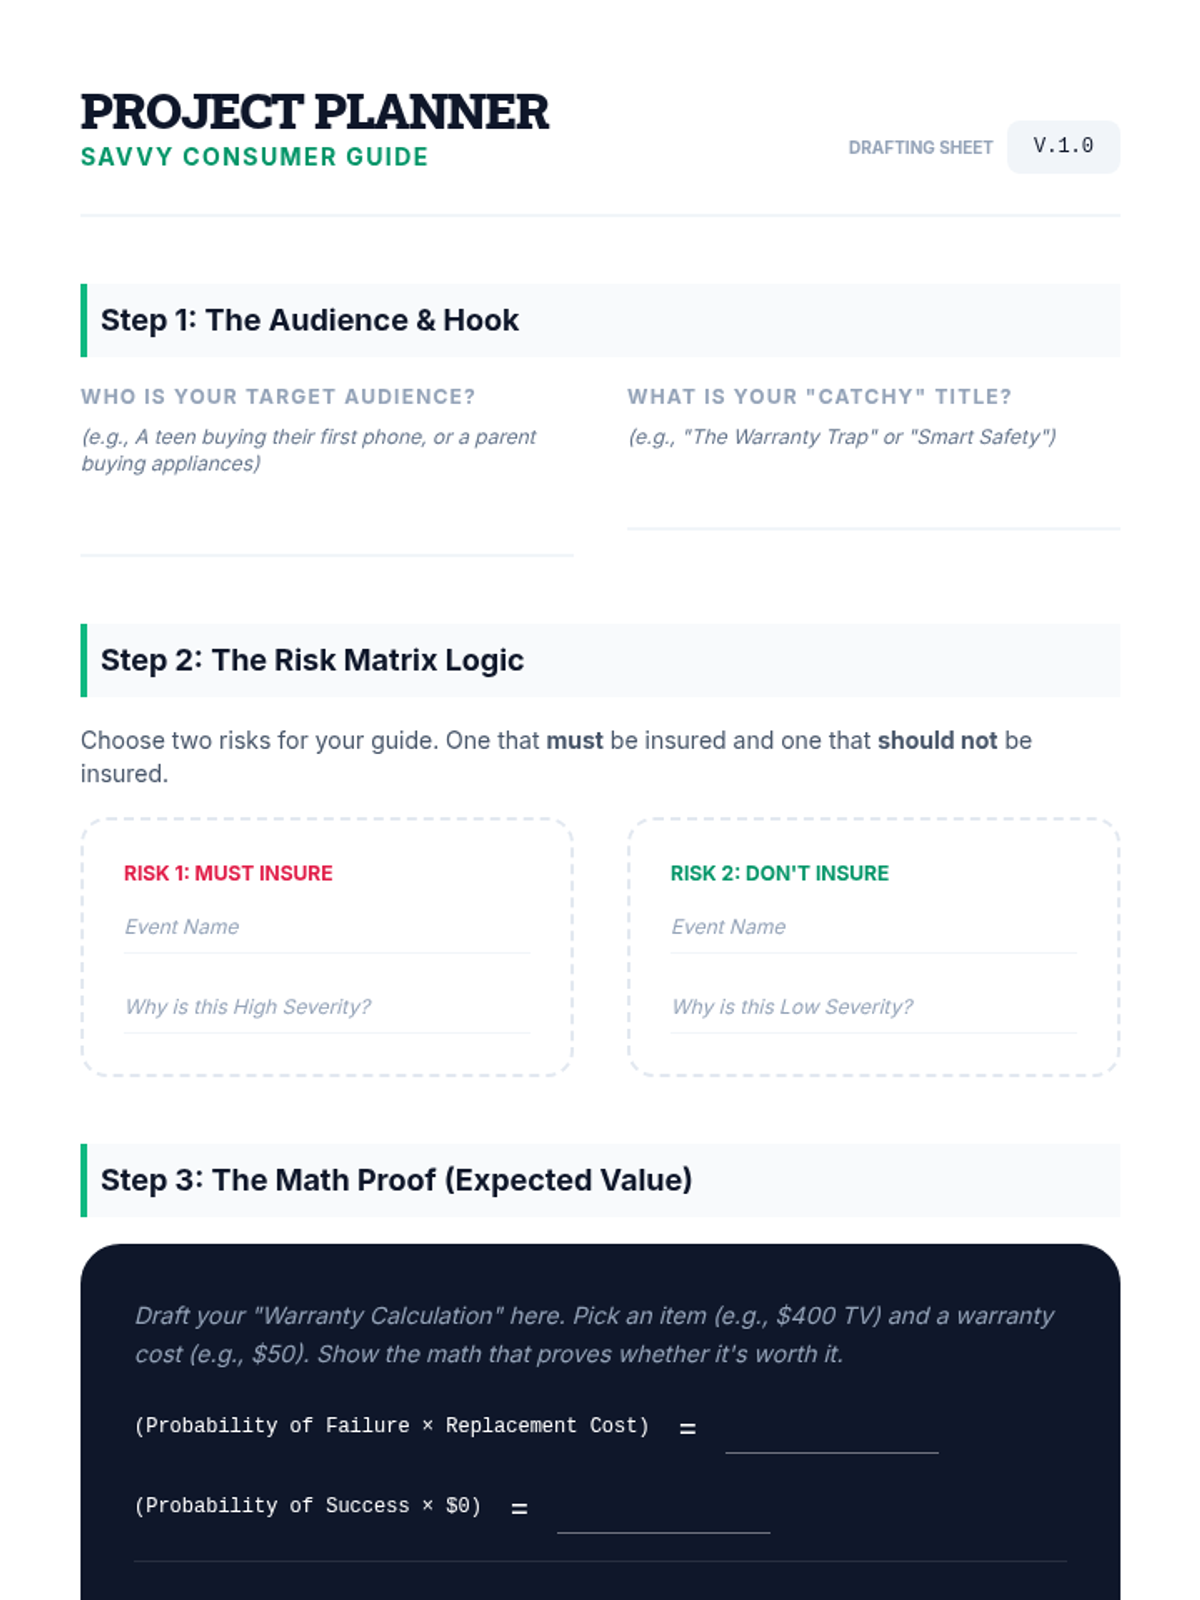
Students synthesize their learning by creating a consumer guide that provides mathematically-backed advice on when to purchase insurance versus when to self-insure.
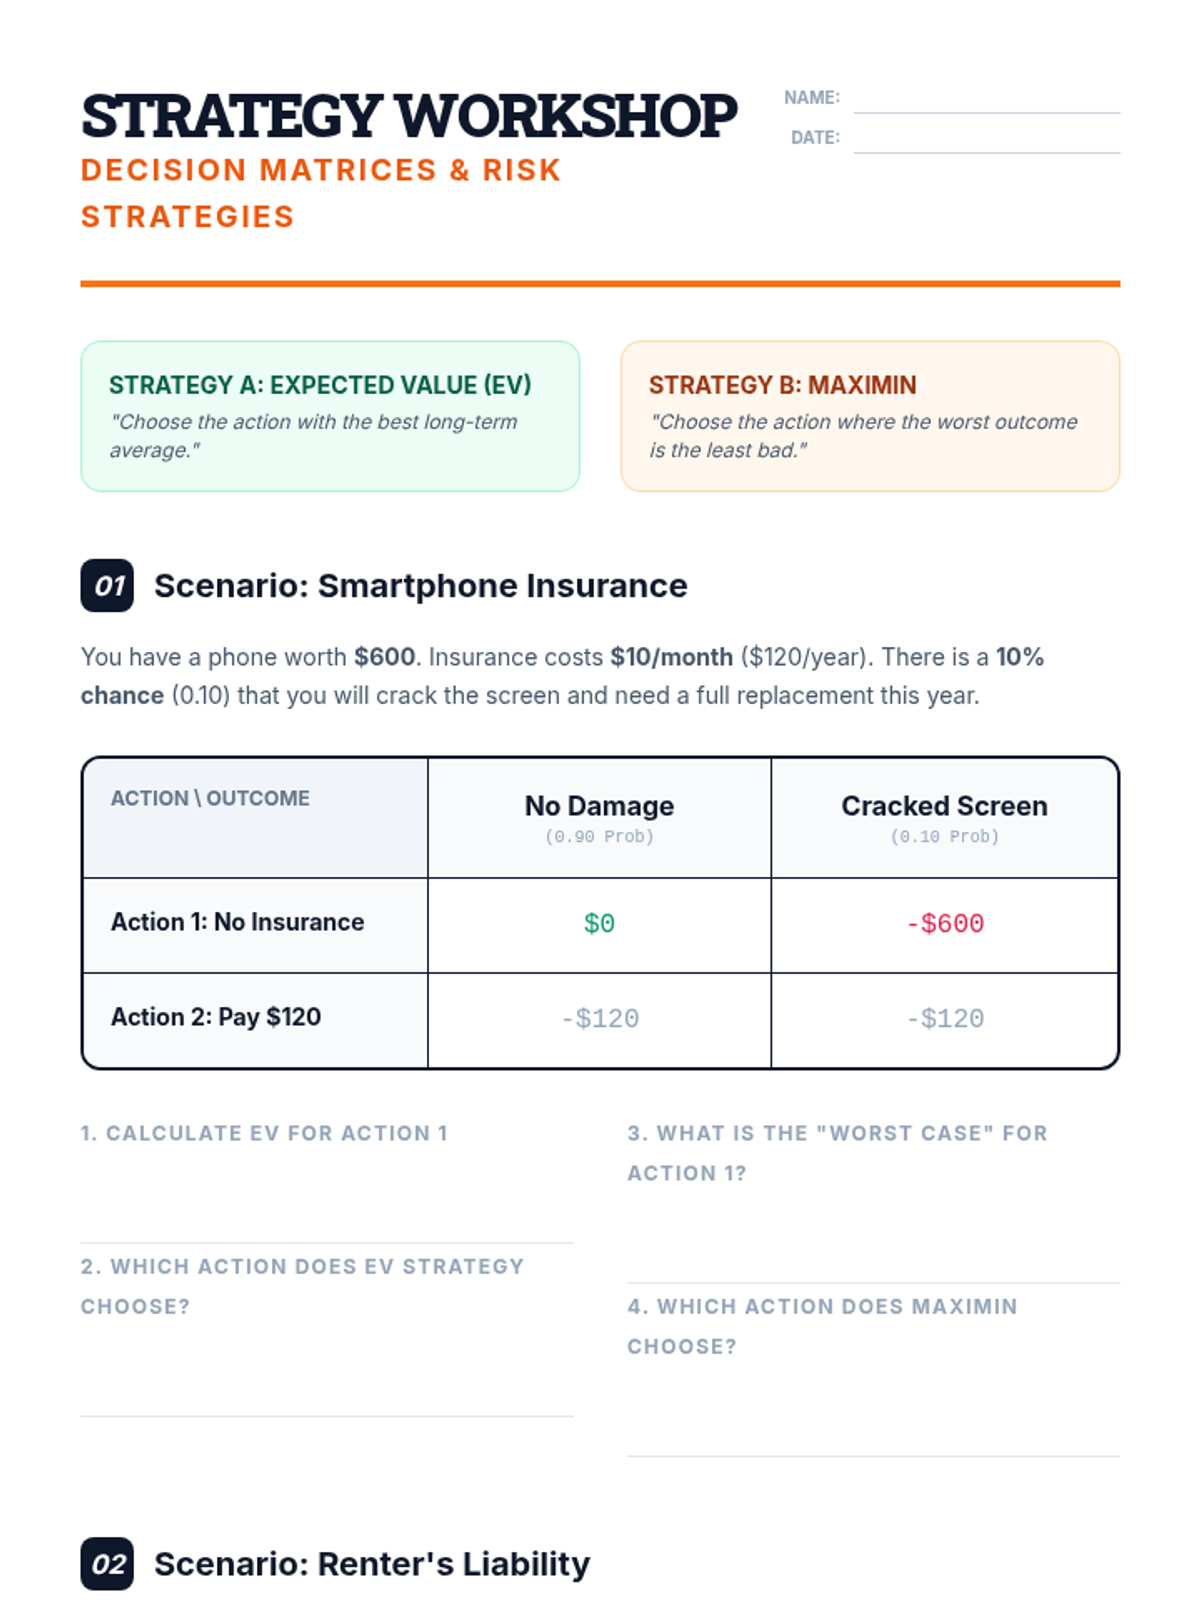
Students compare different decision-making strategies, such as Maximin and Expected Value, to evaluate complex financial scenarios like car and travel insurance.
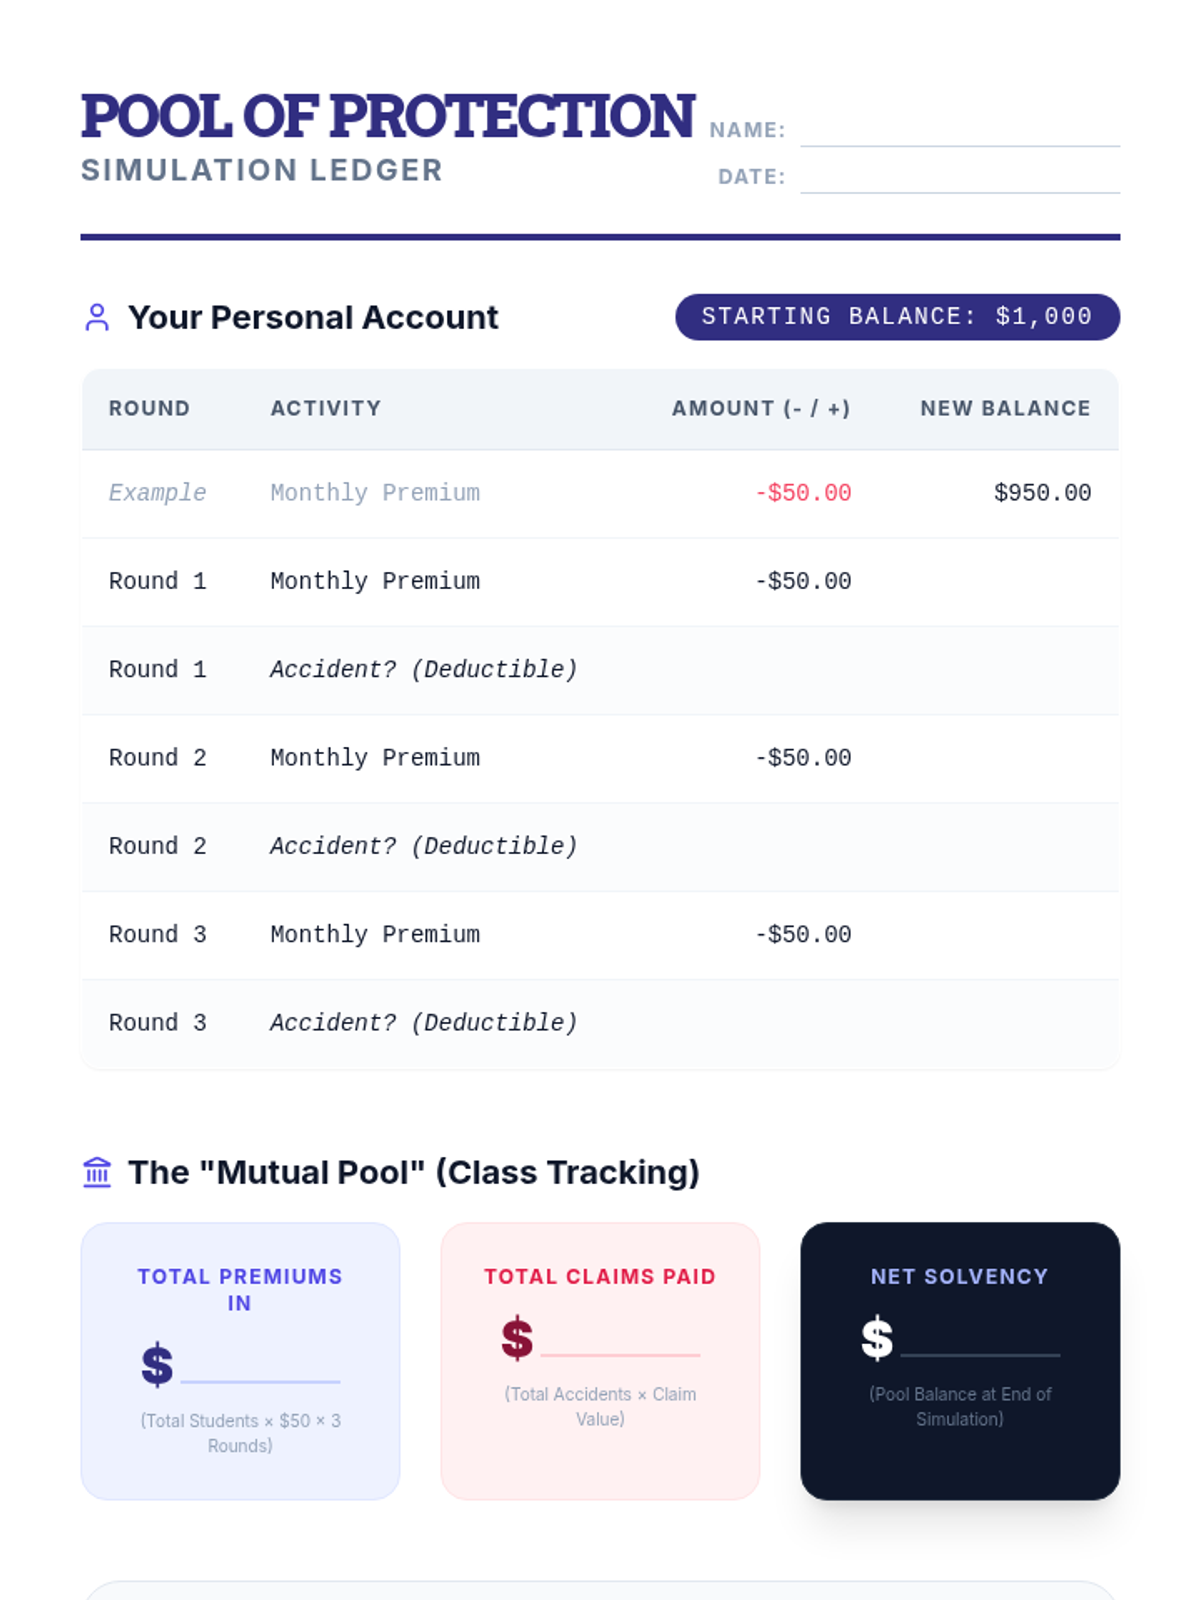
A simulation-based lesson where students act as an insurance company to understand risk pooling, premiums, and the impact of deductibles on solvency.
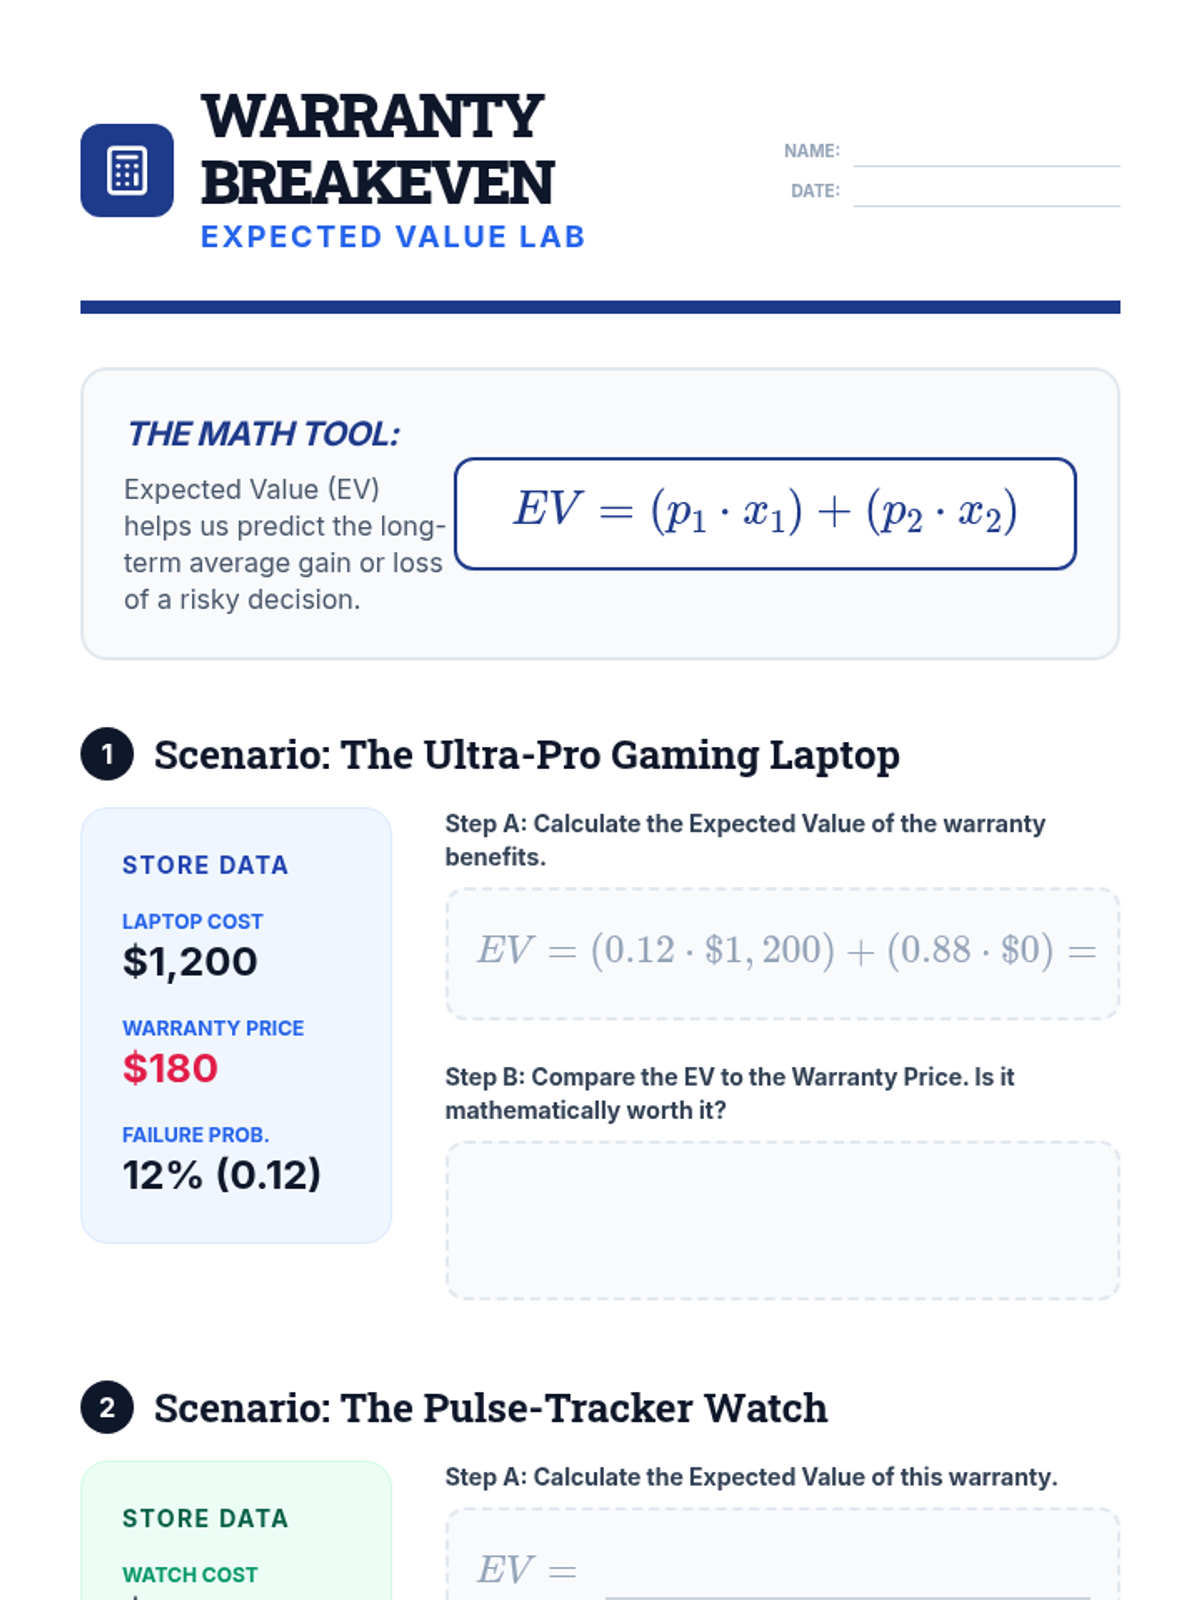
Students use expected value to analyze the financial viability of extended warranties on consumer electronics, determining when protection plans are mathematically sound.
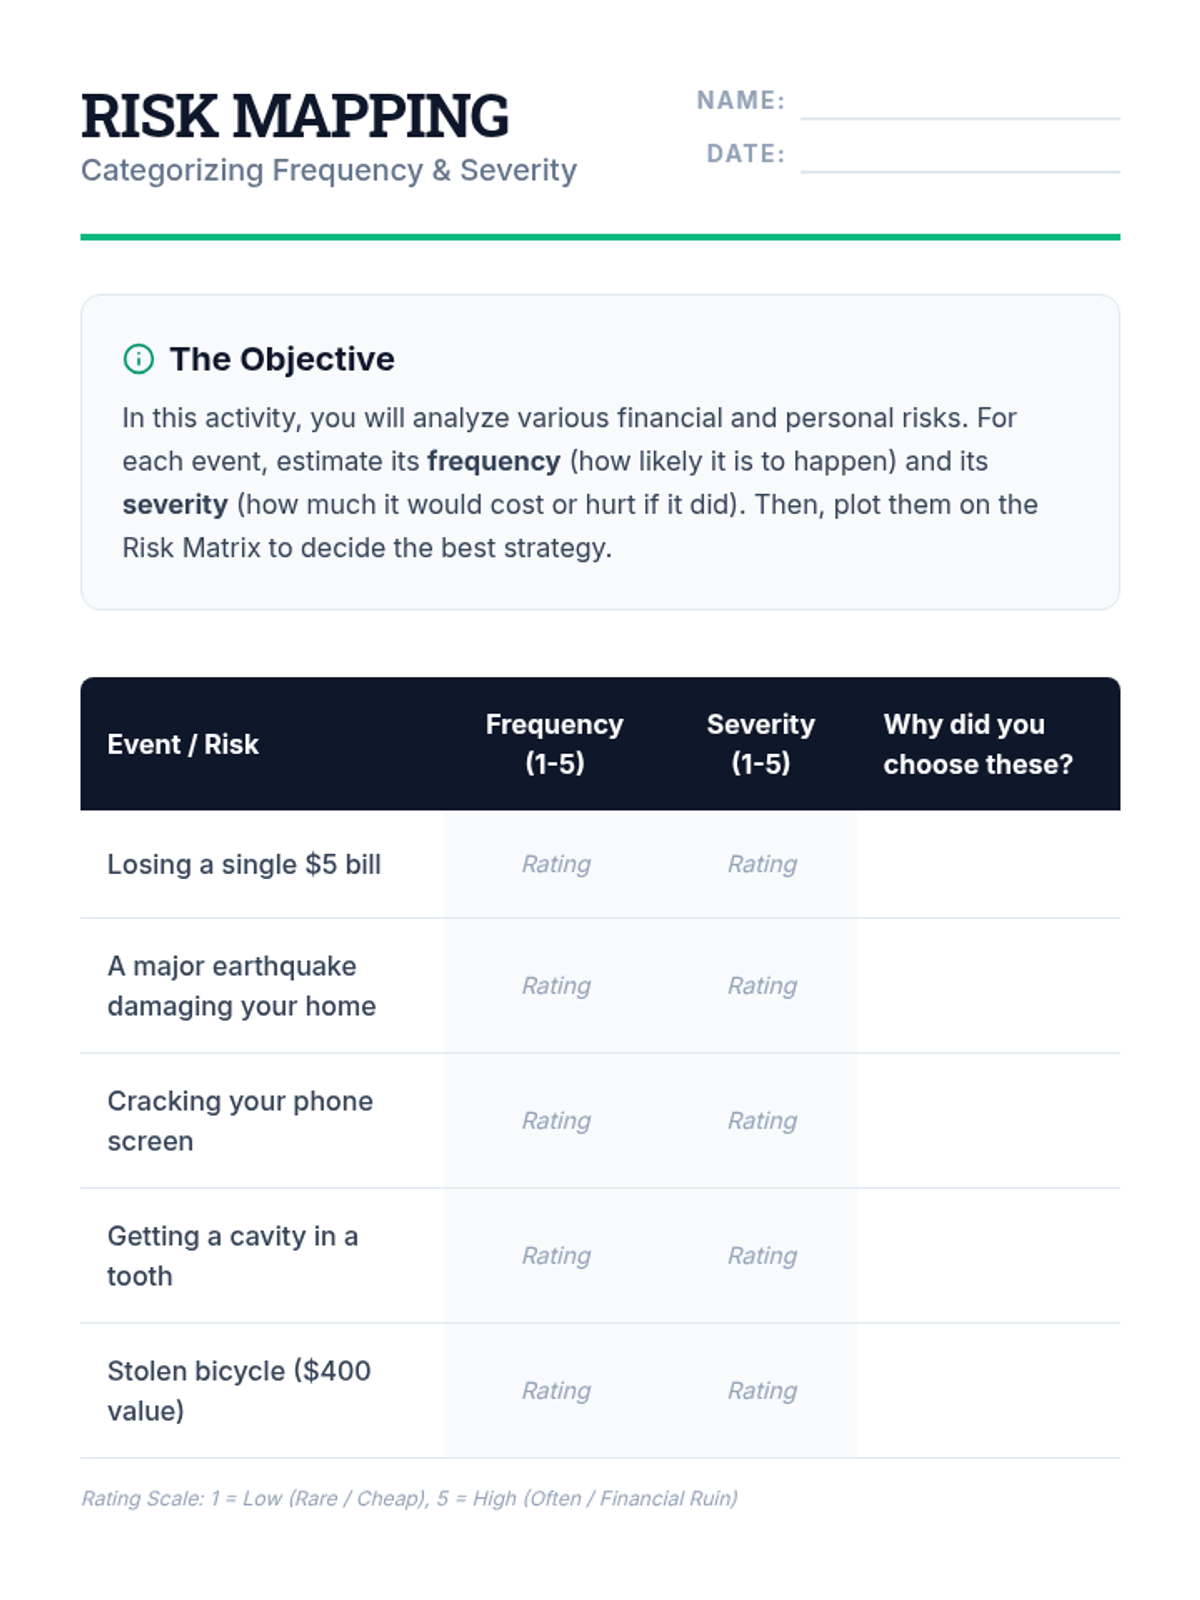
Students categorize risks by frequency and severity, analyzing data to understand the difference between high-probability/low-impact events and low-probability/high-impact catastrophes.
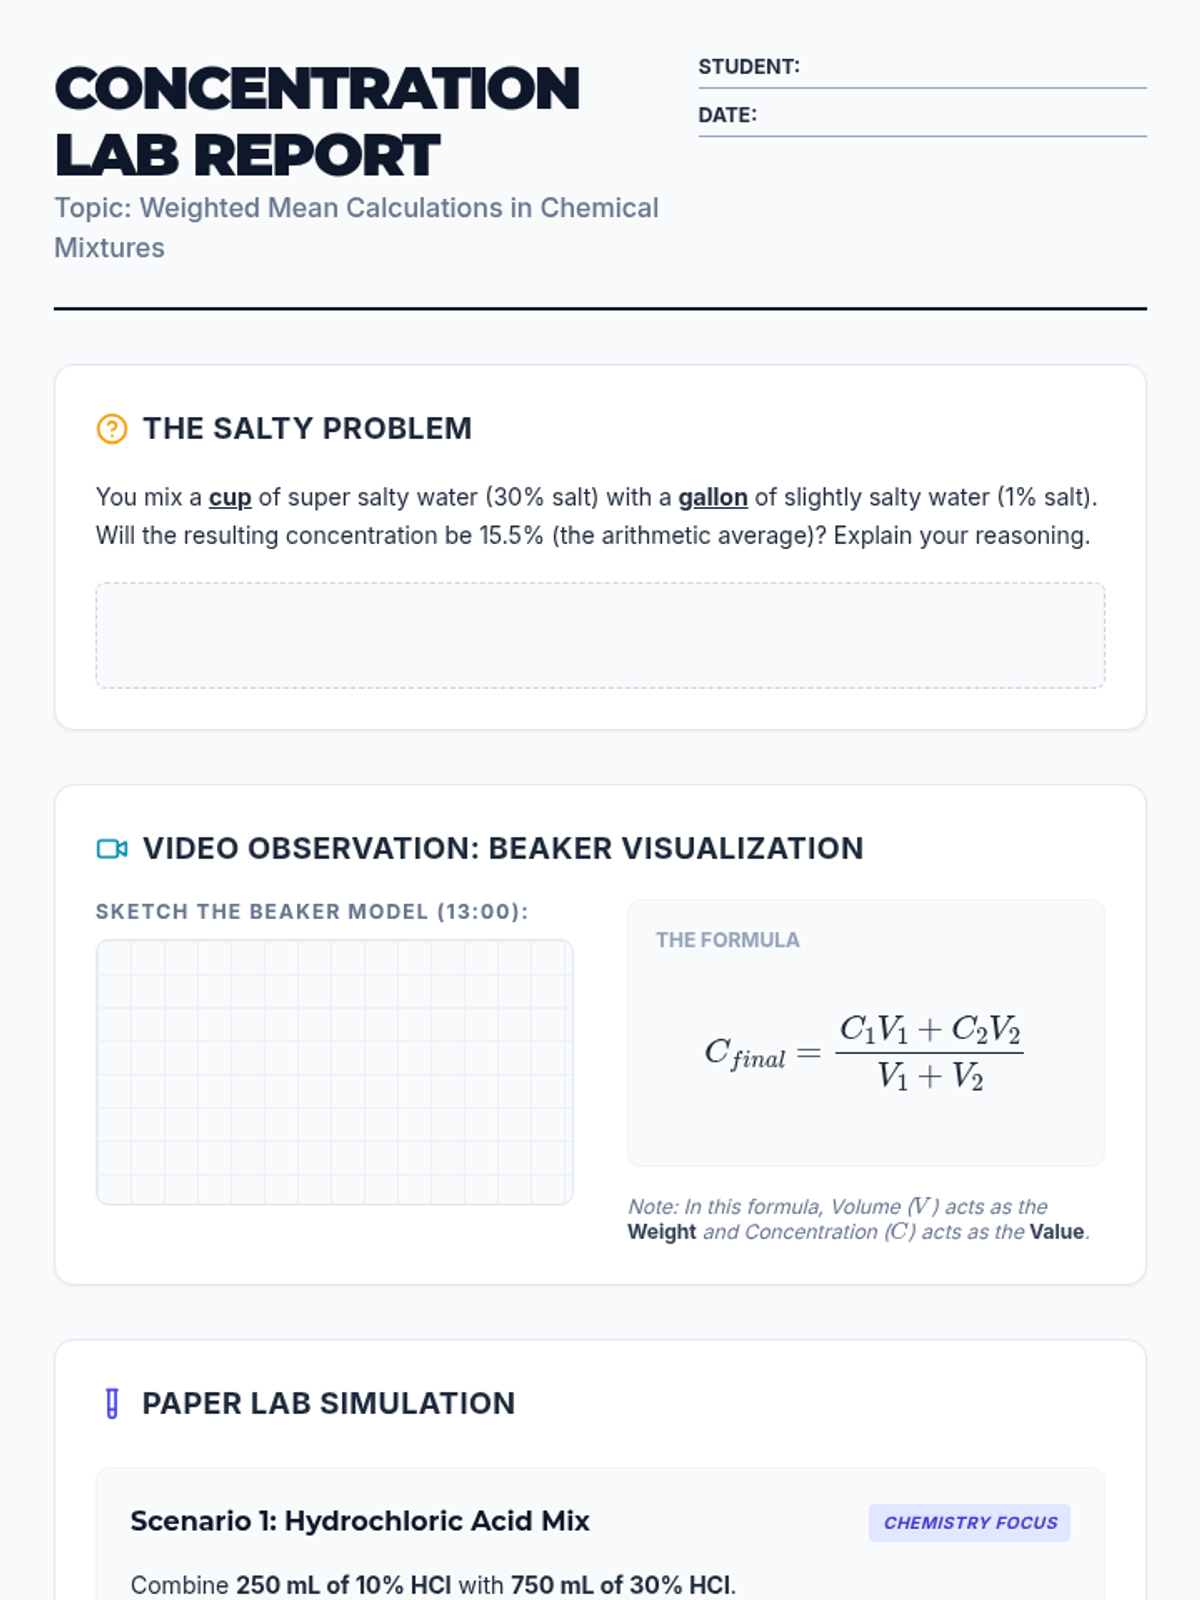
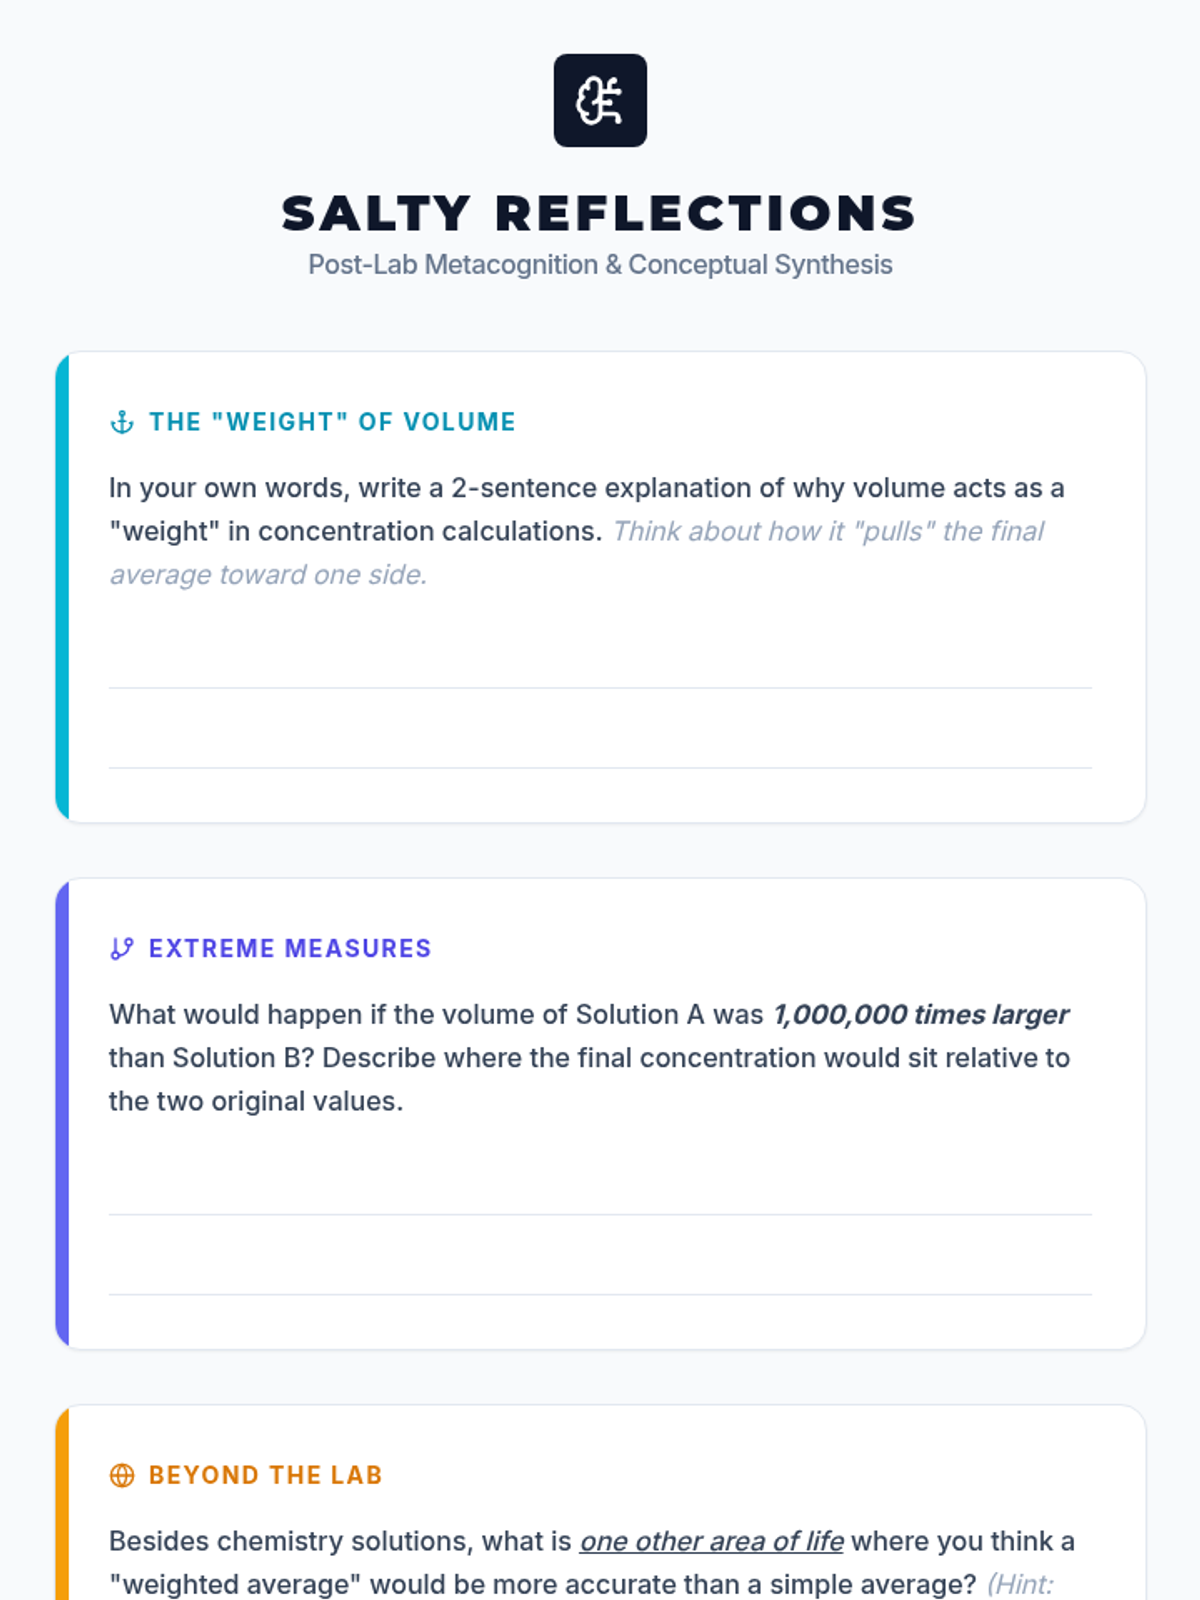
This lesson guides students through the application of the weighted mean formula to determine solution concentrations. It combines visual learning from video demonstrations with a paper-based lab simulation to reinforce the relationship between volume and concentration 'weight'.
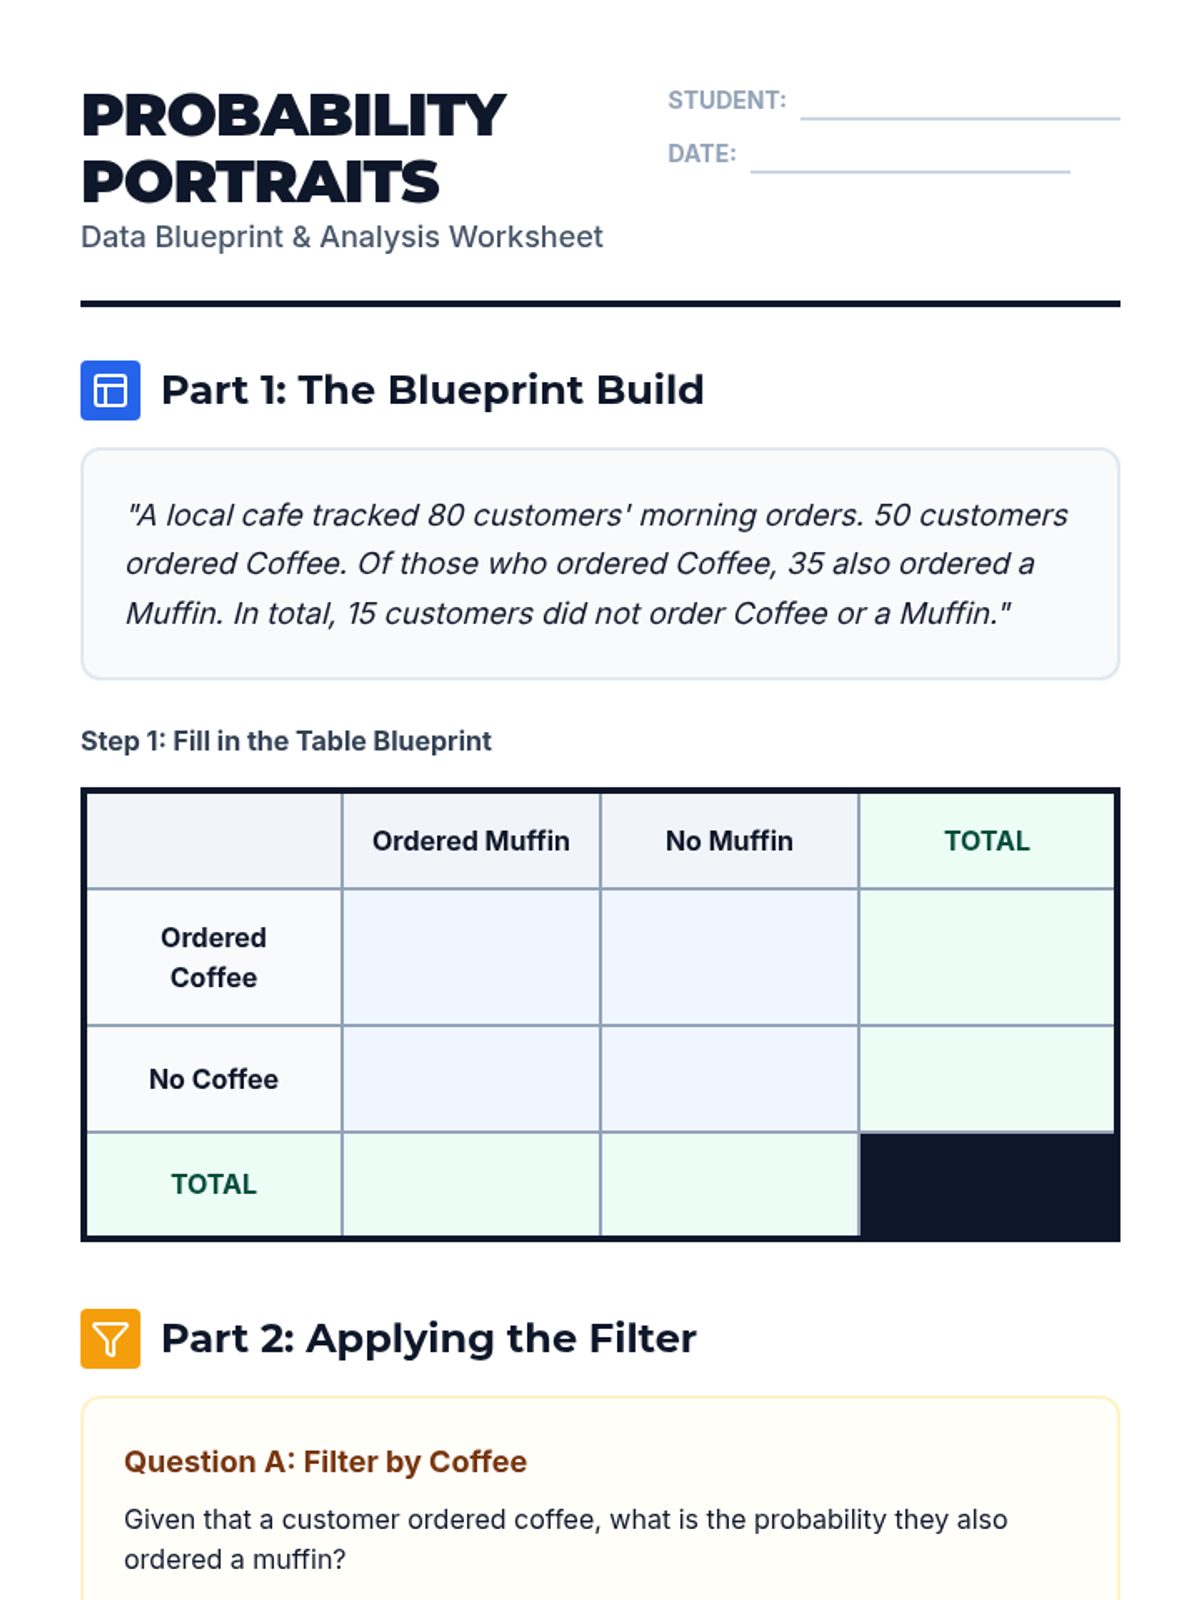
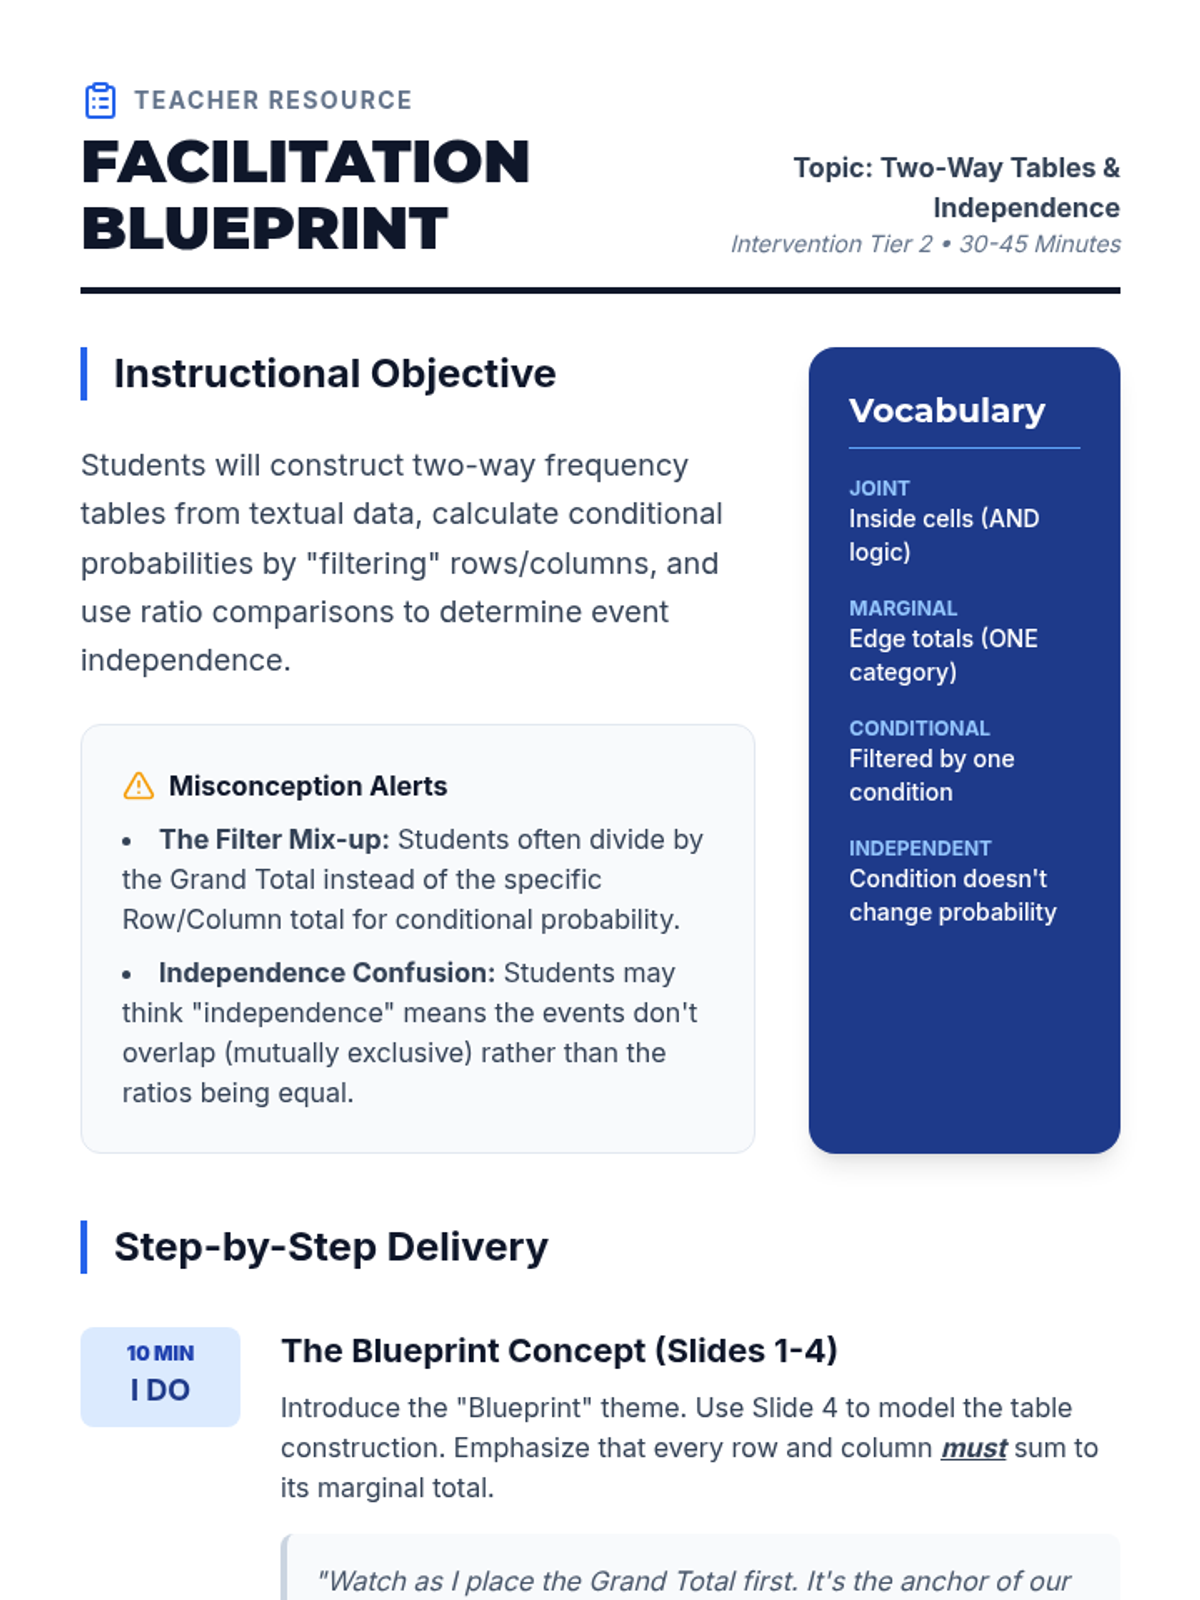
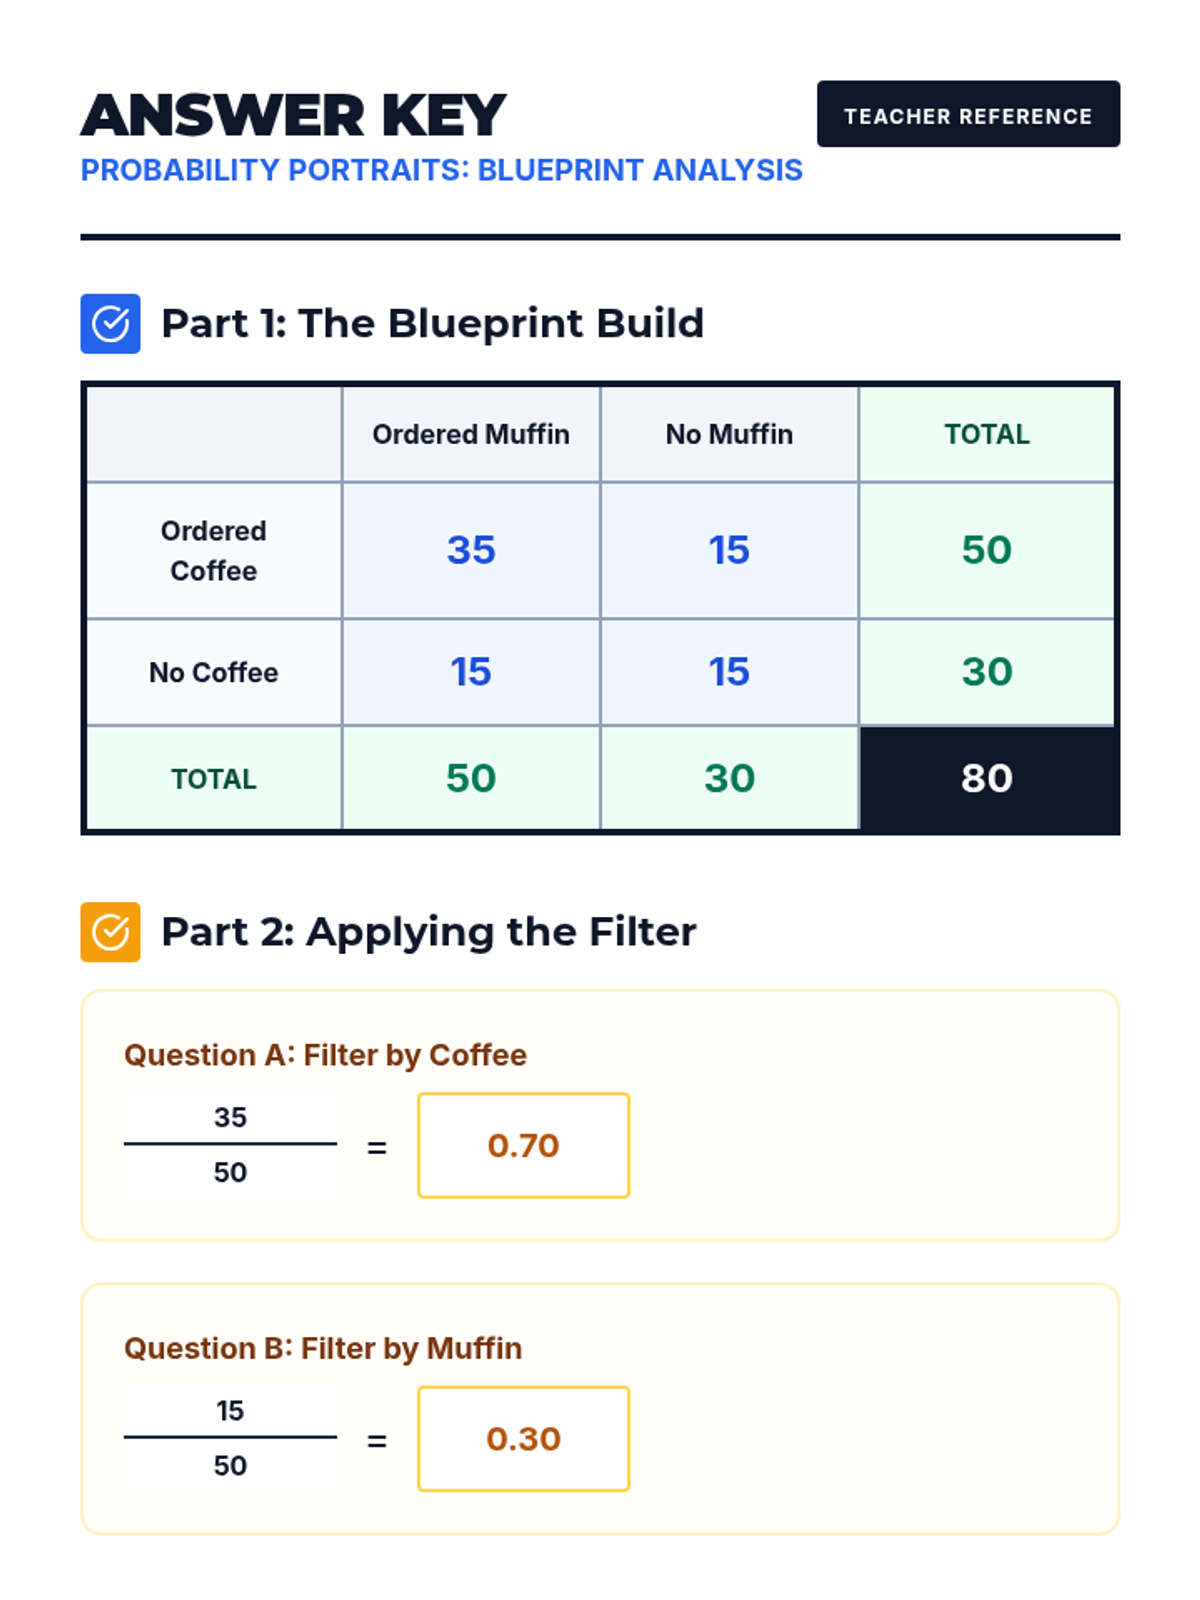
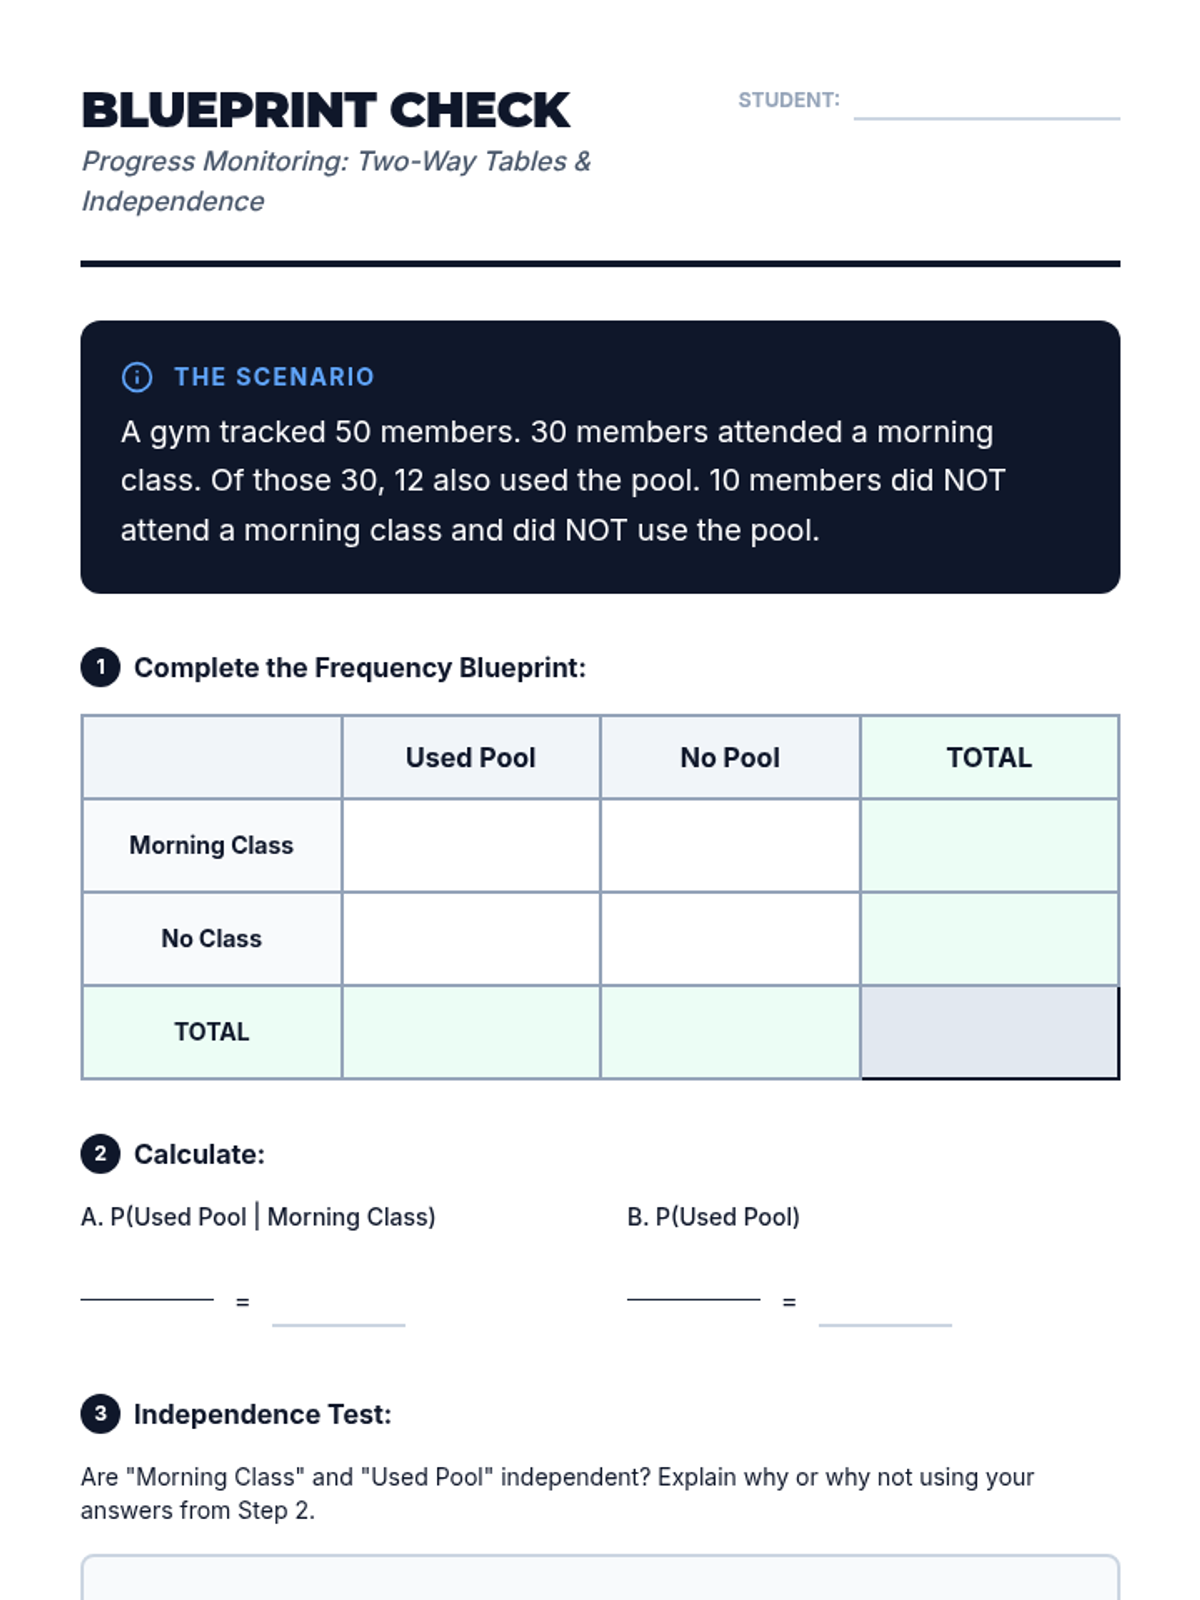
A targeted Tier 2 intervention lesson focusing on constructing two-way frequency tables, calculating conditional probabilities, and testing for independence using a color-coded blueprint approach.
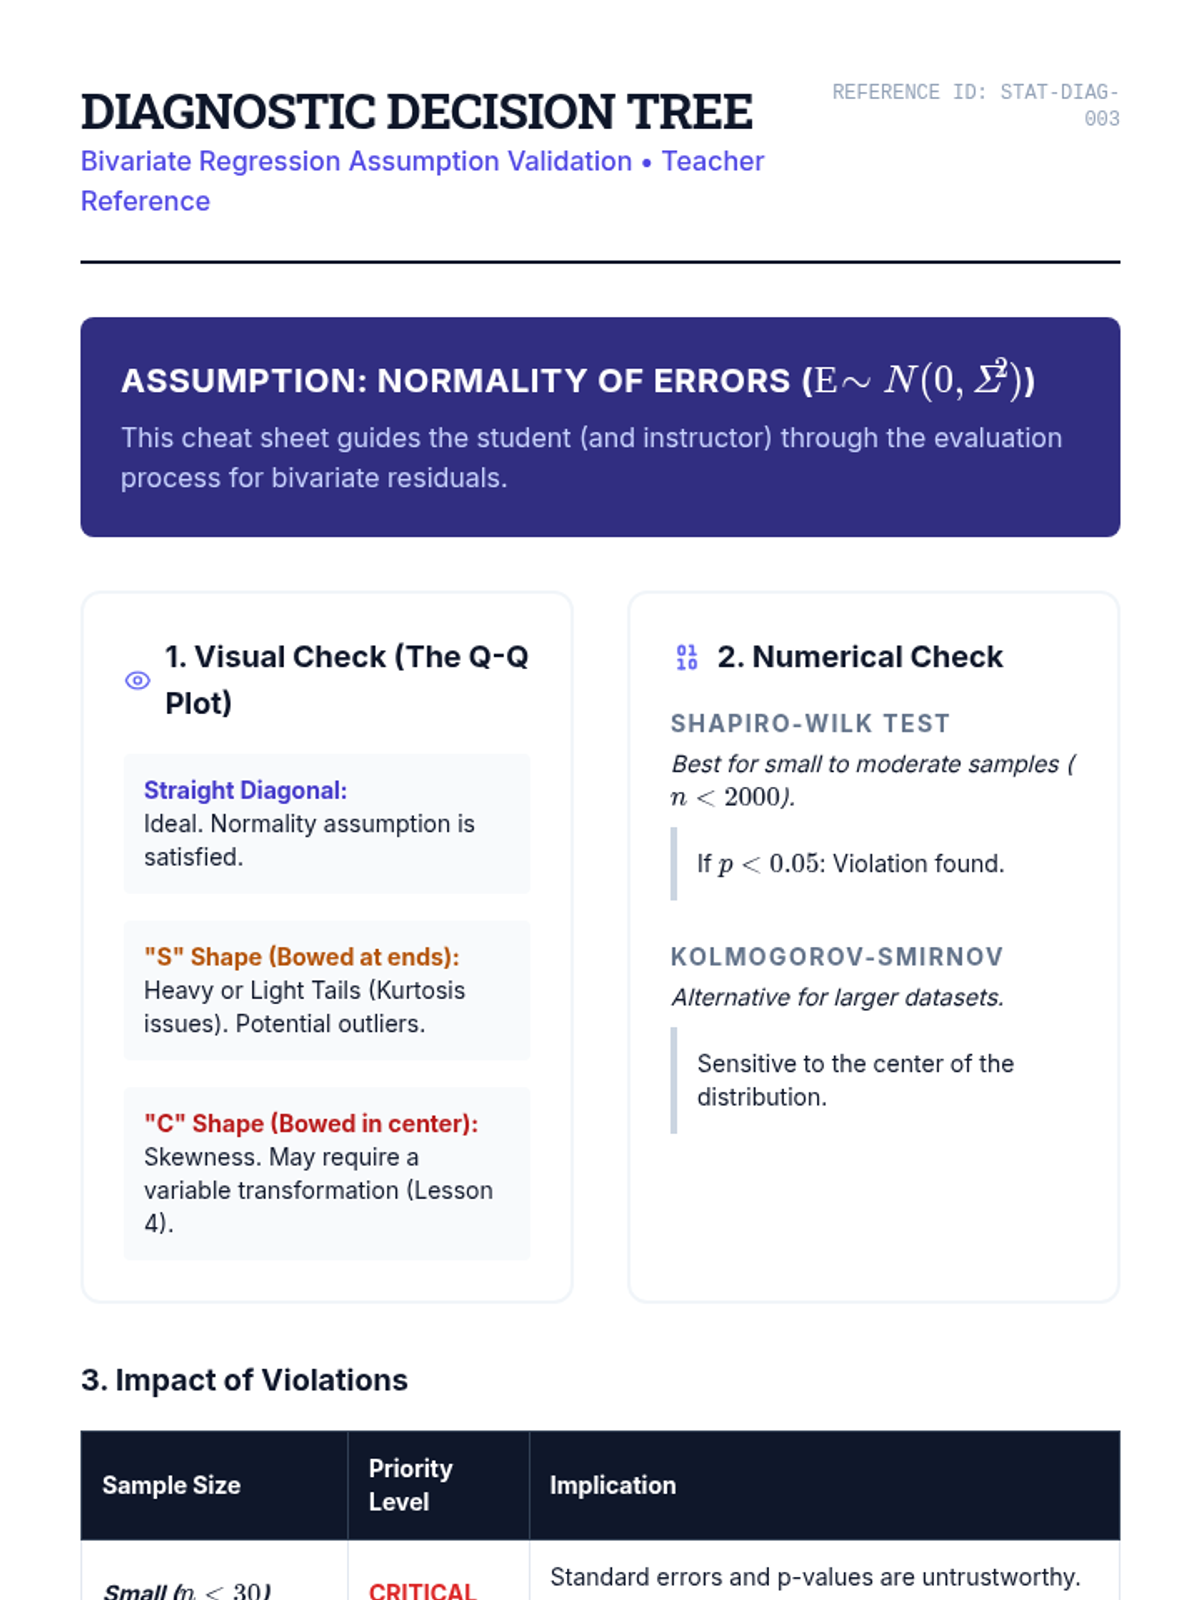
Students investigate the normality assumption of errors using Q-Q plots and statistical tests, understanding how departures from normality impact inference in small vs. large samples.
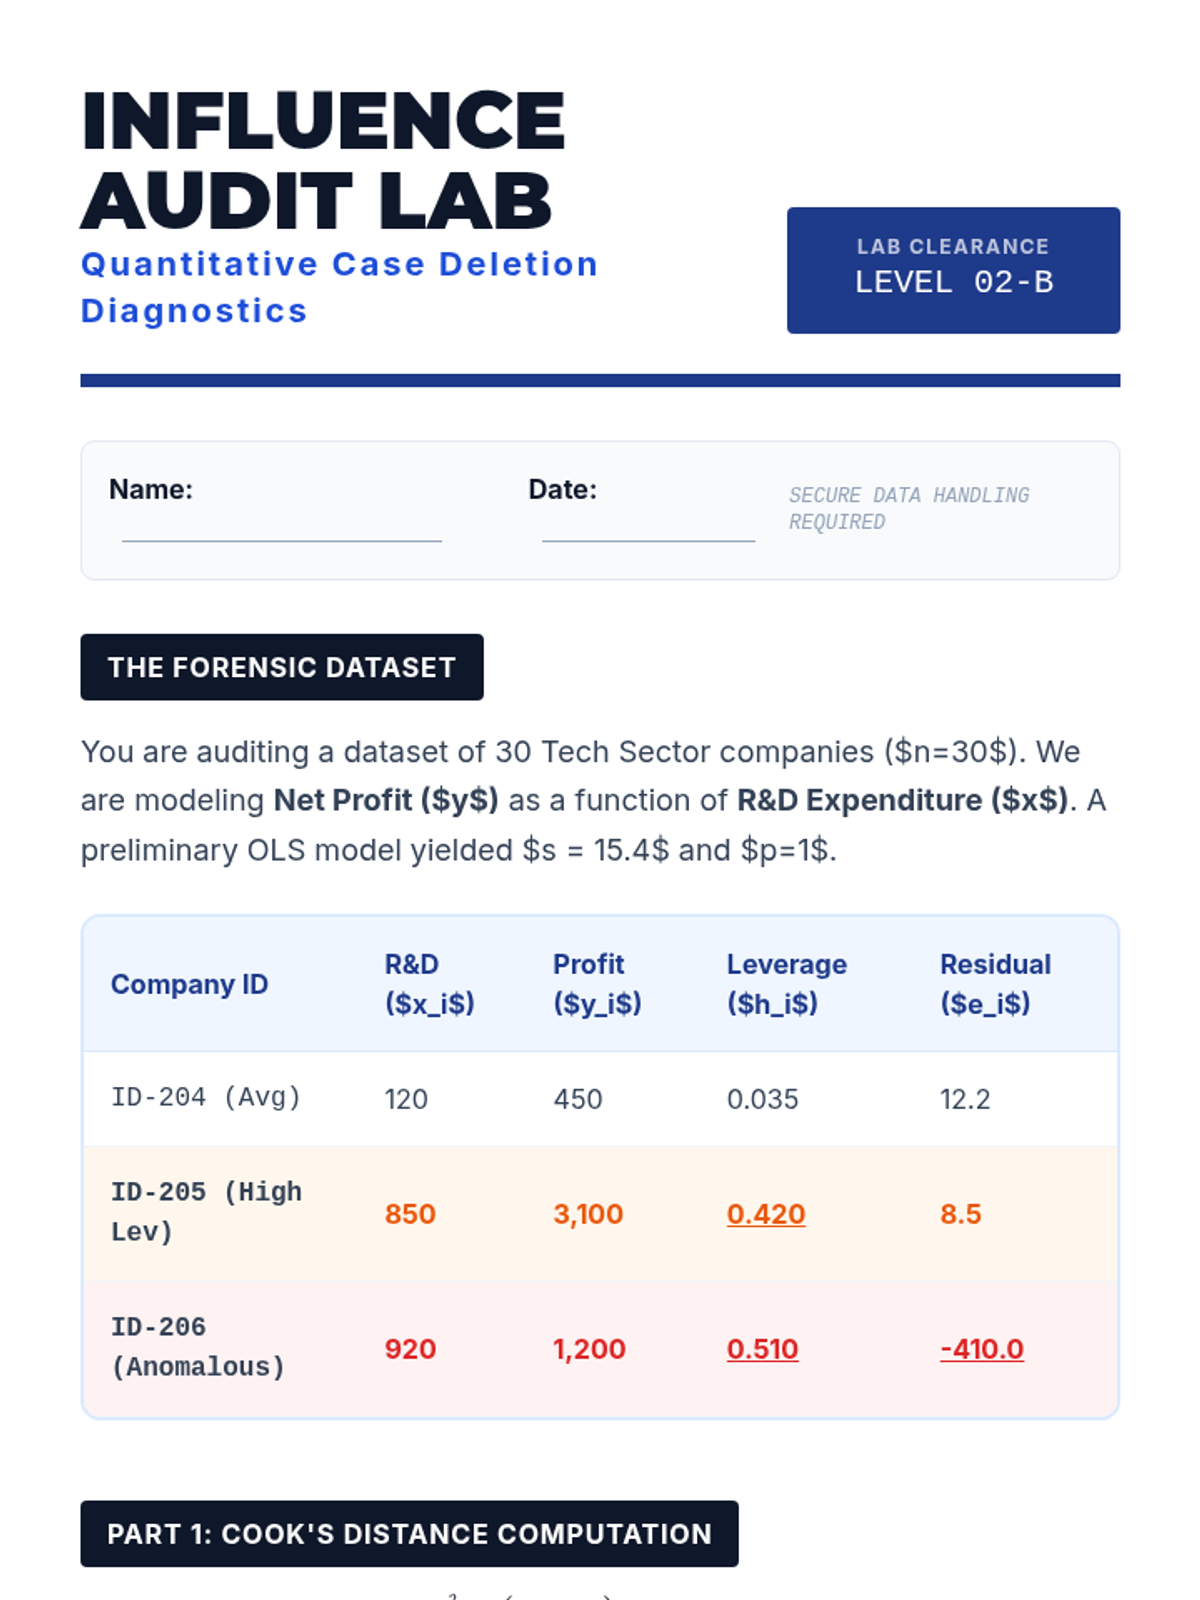
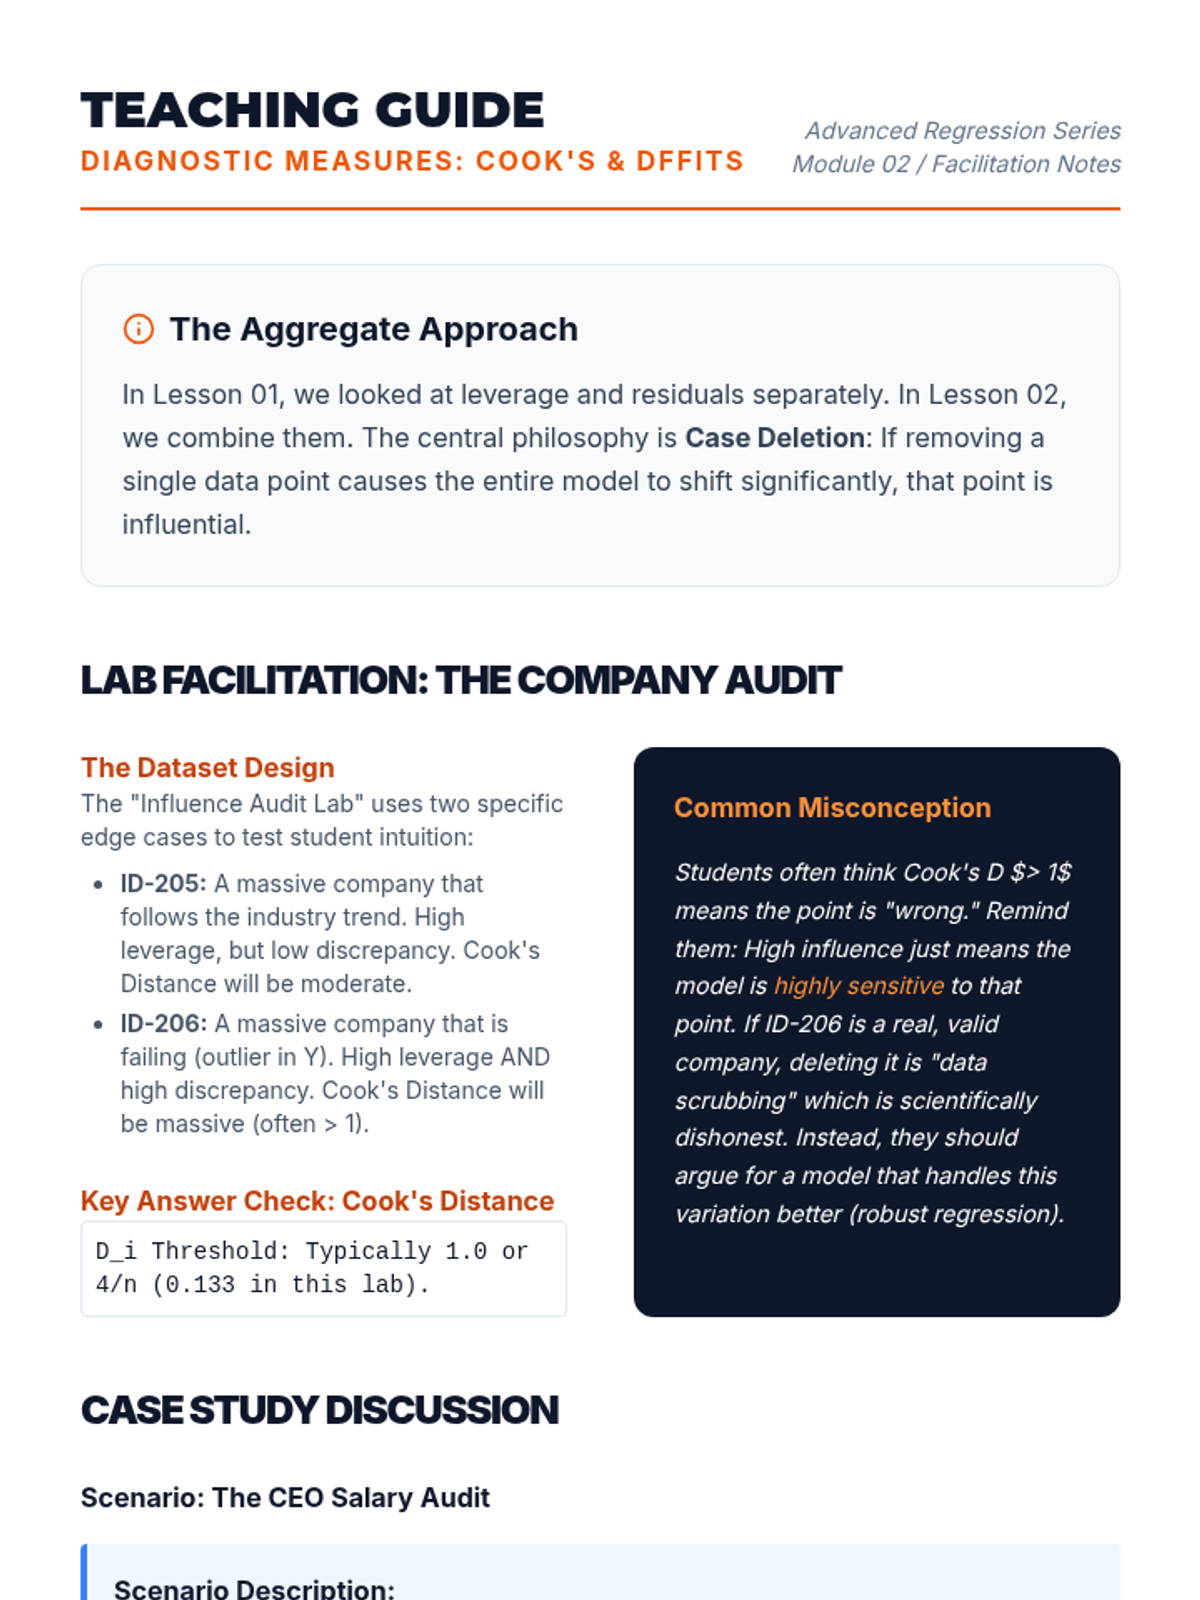
This lesson details specific aggregate measures of influence. Students calculate Cook's Distance and DFFITS to quantitatively identify points that justify exclusion or special handling in regression analysis.
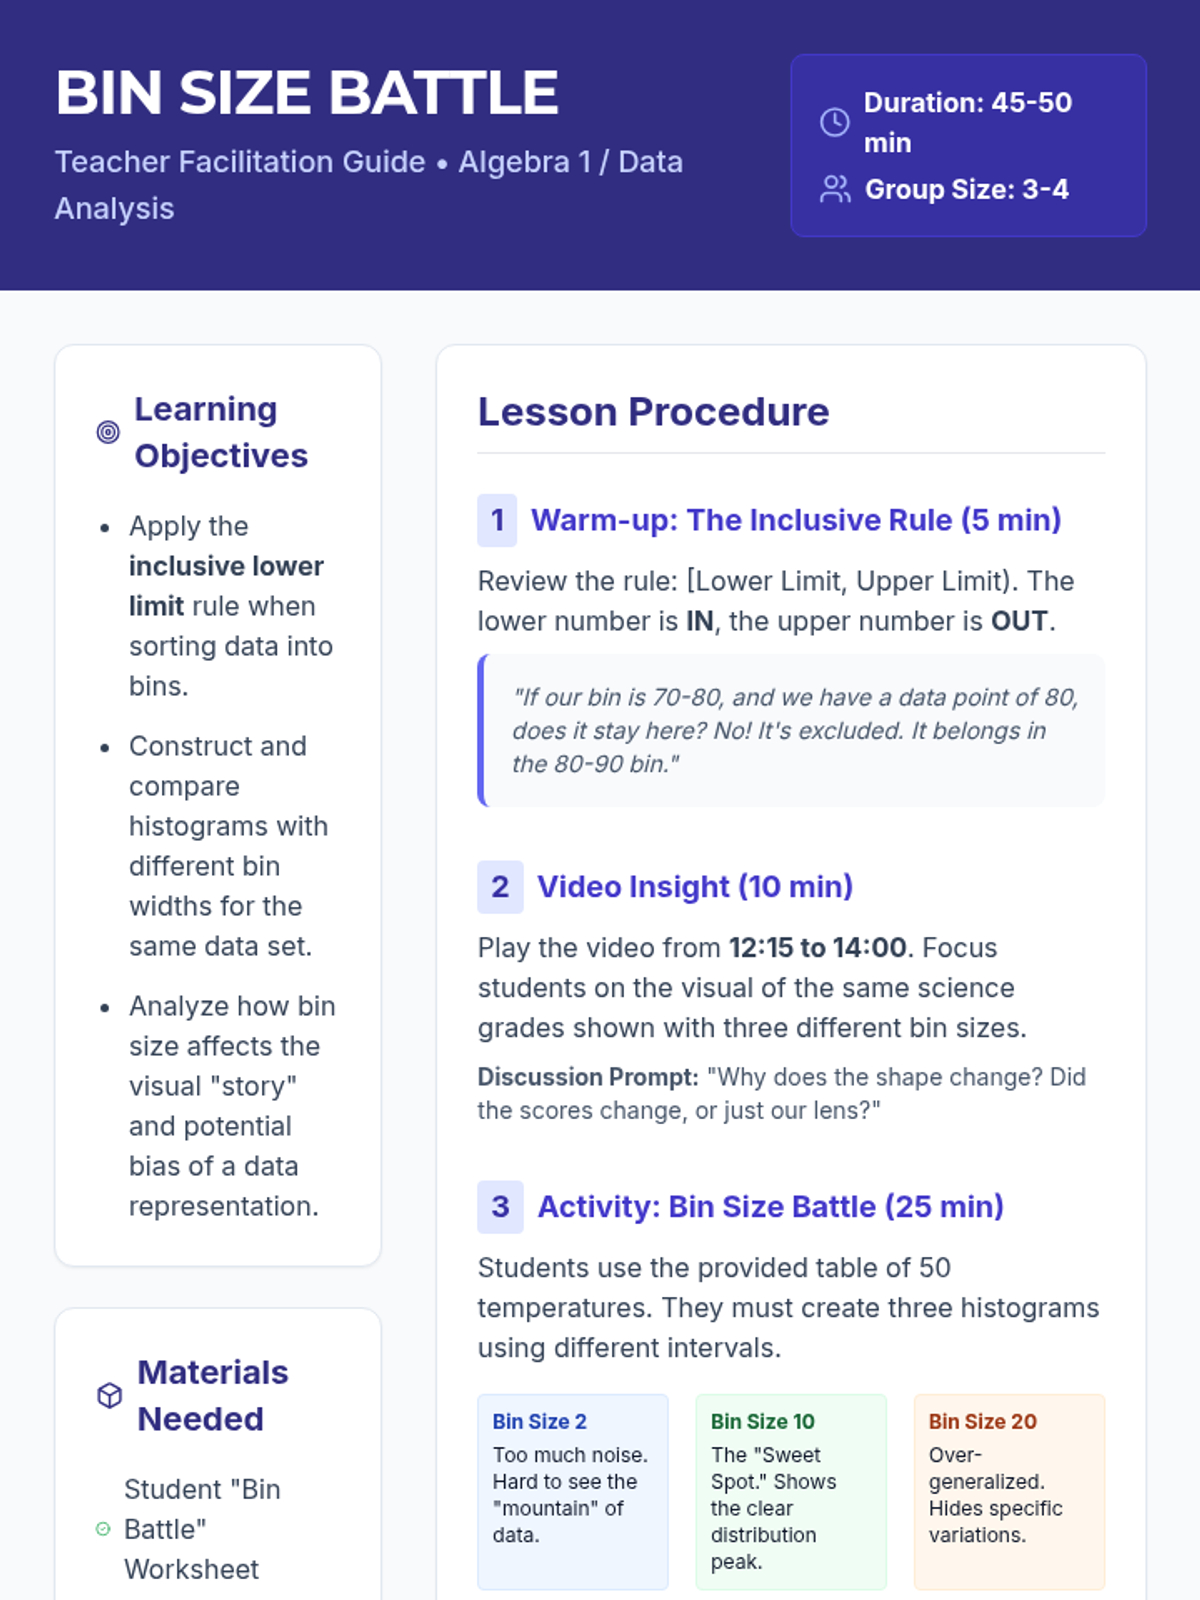
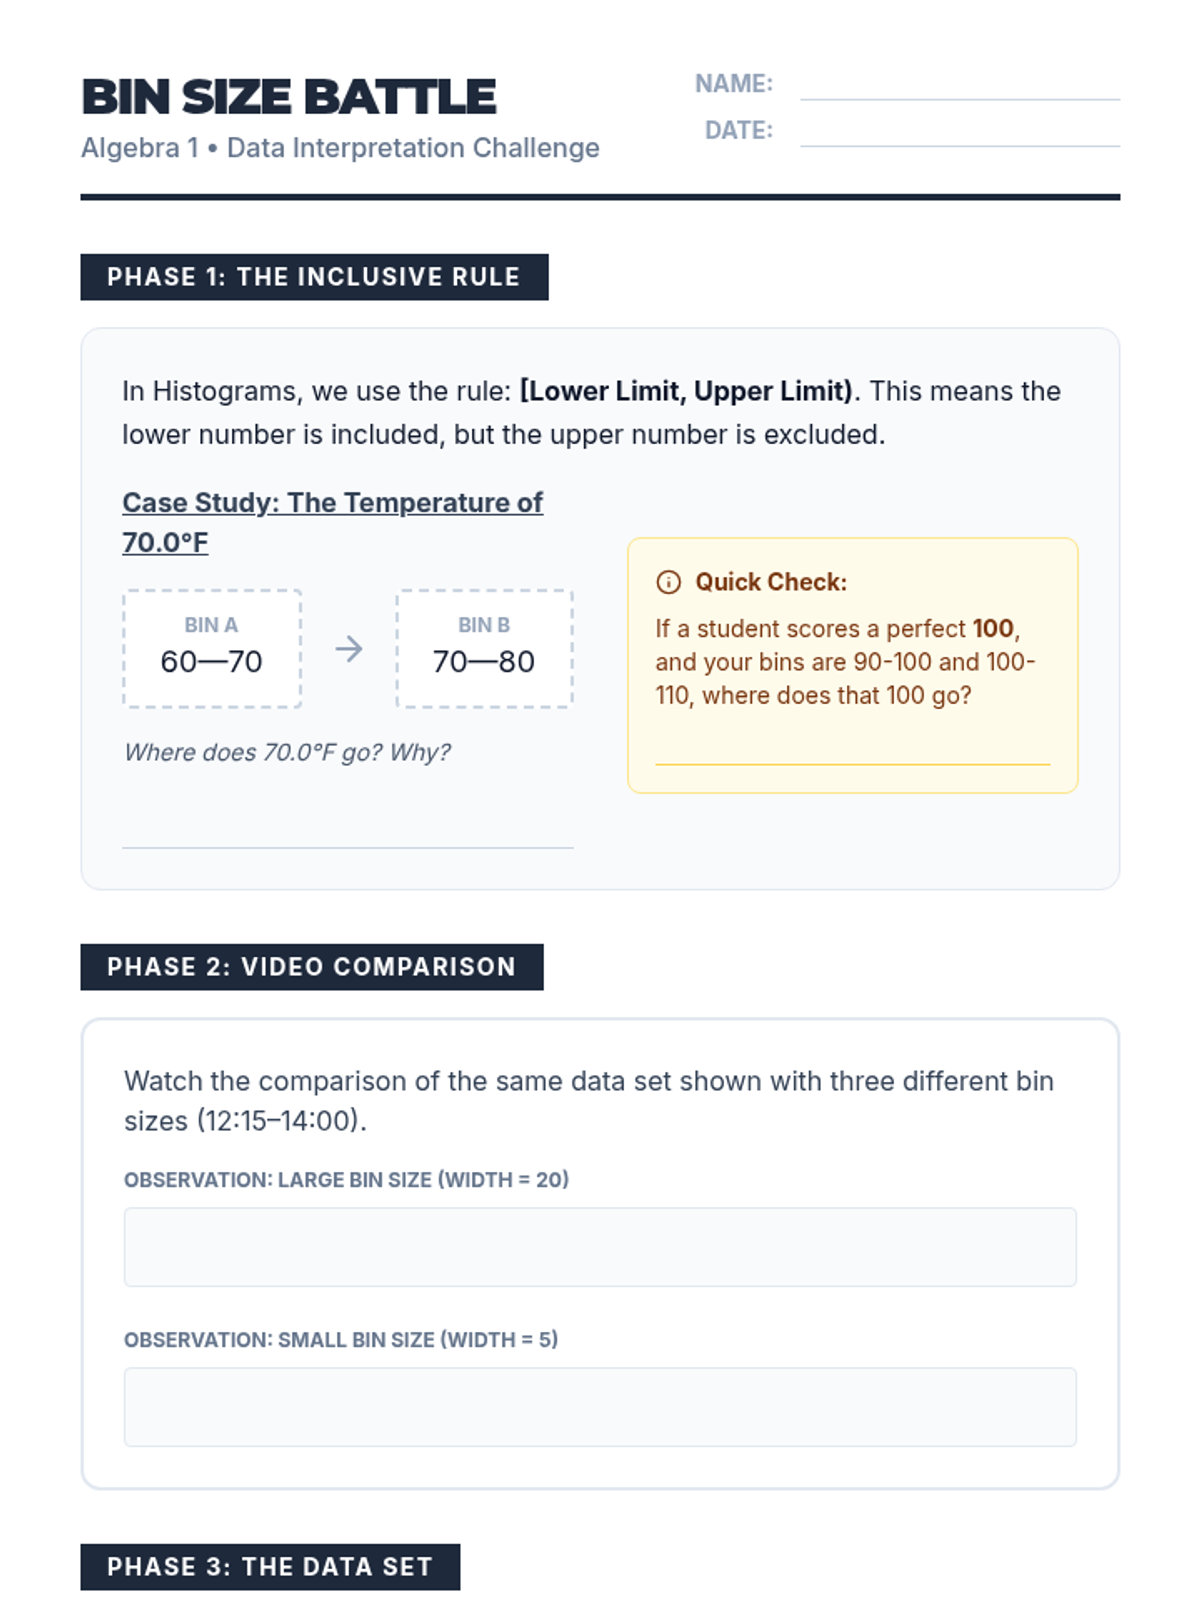
Students will investigate how changing bin sizes in a histogram can drastically alter the interpretation of a single data set of 50 temperatures. They will practice the 'inclusive lower limit' rule, watch a video demonstration, and engage in a 'Bin Size Battle' to determine which interval size provides the most honest representation of the data.
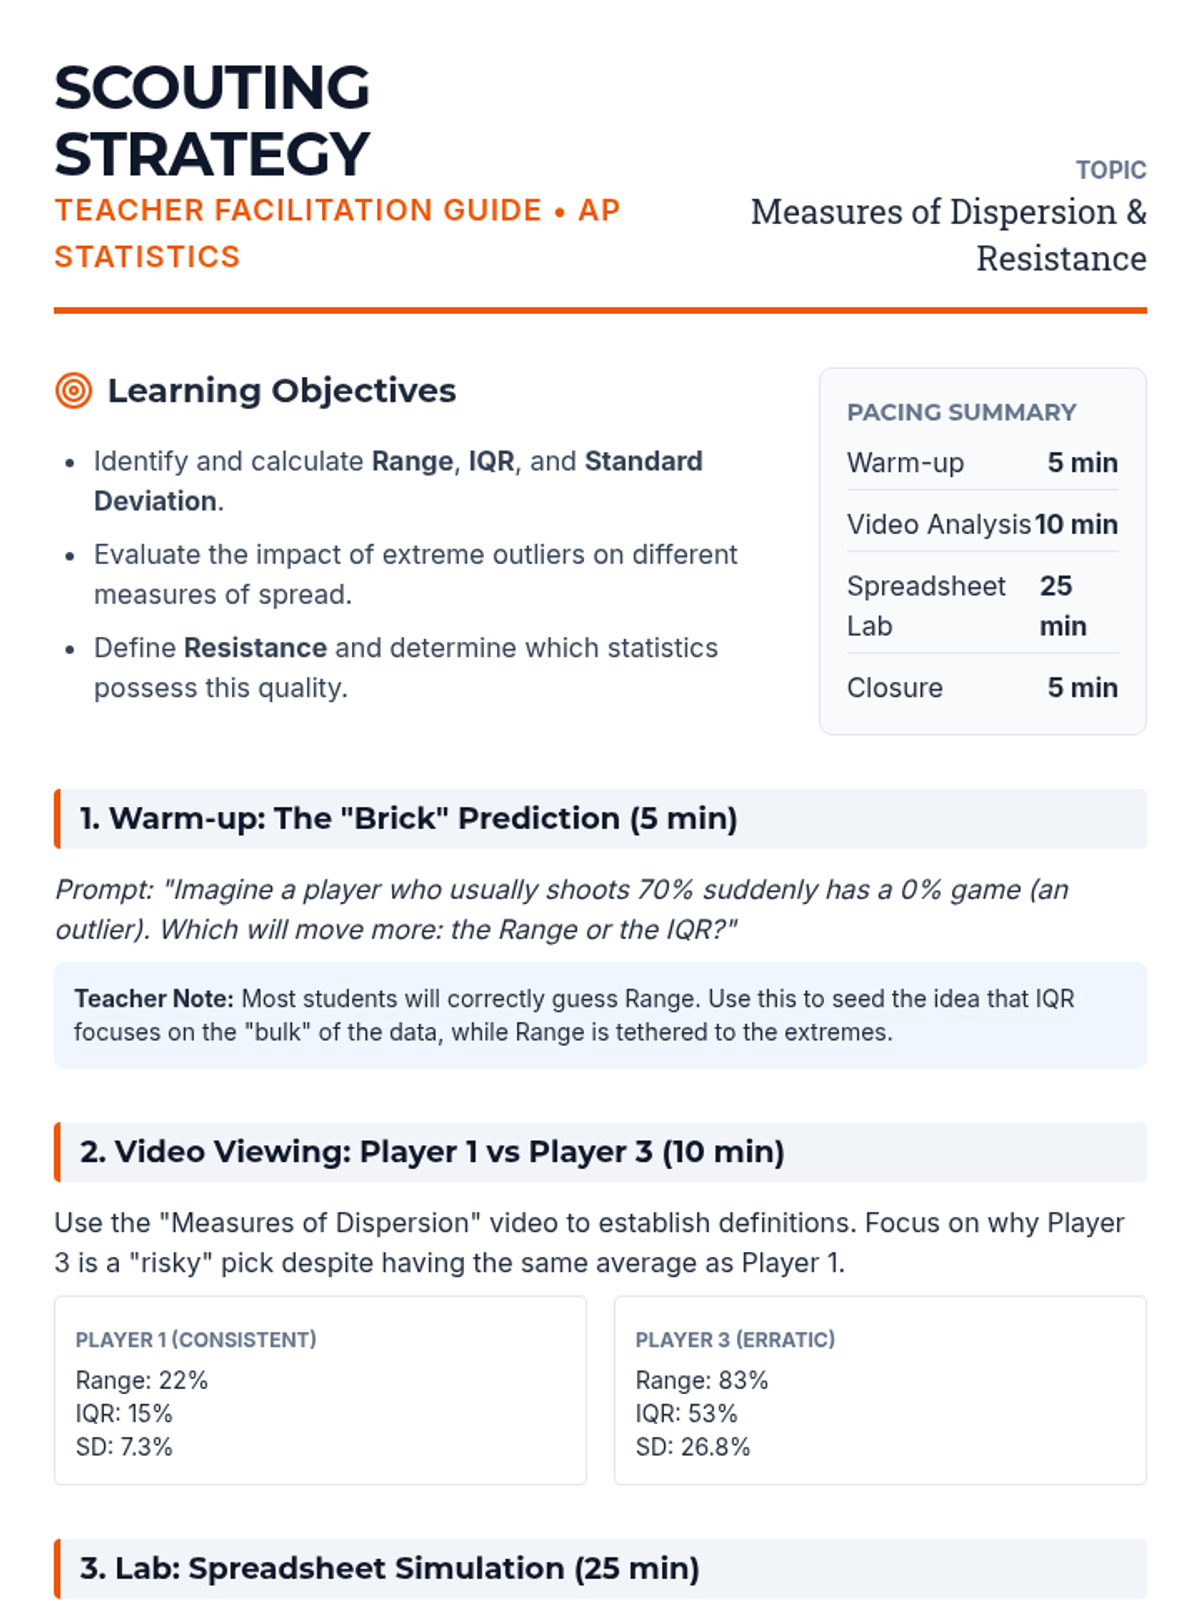
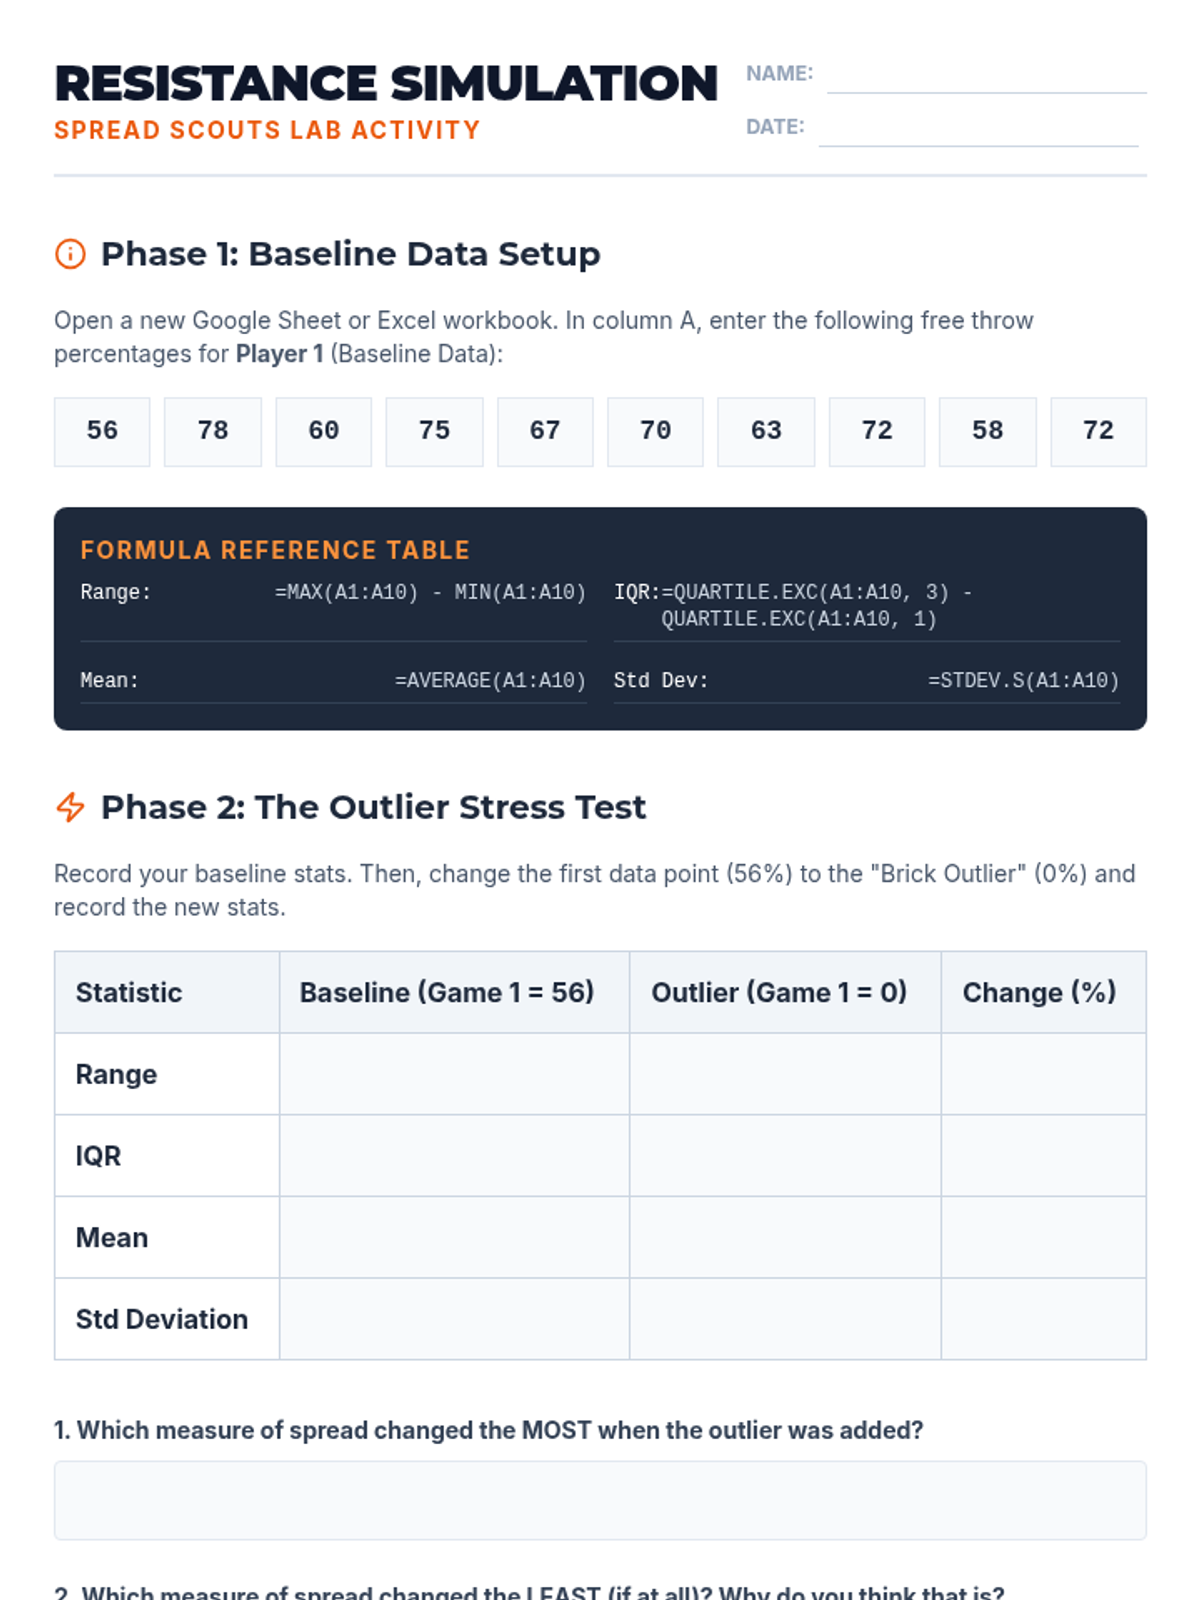
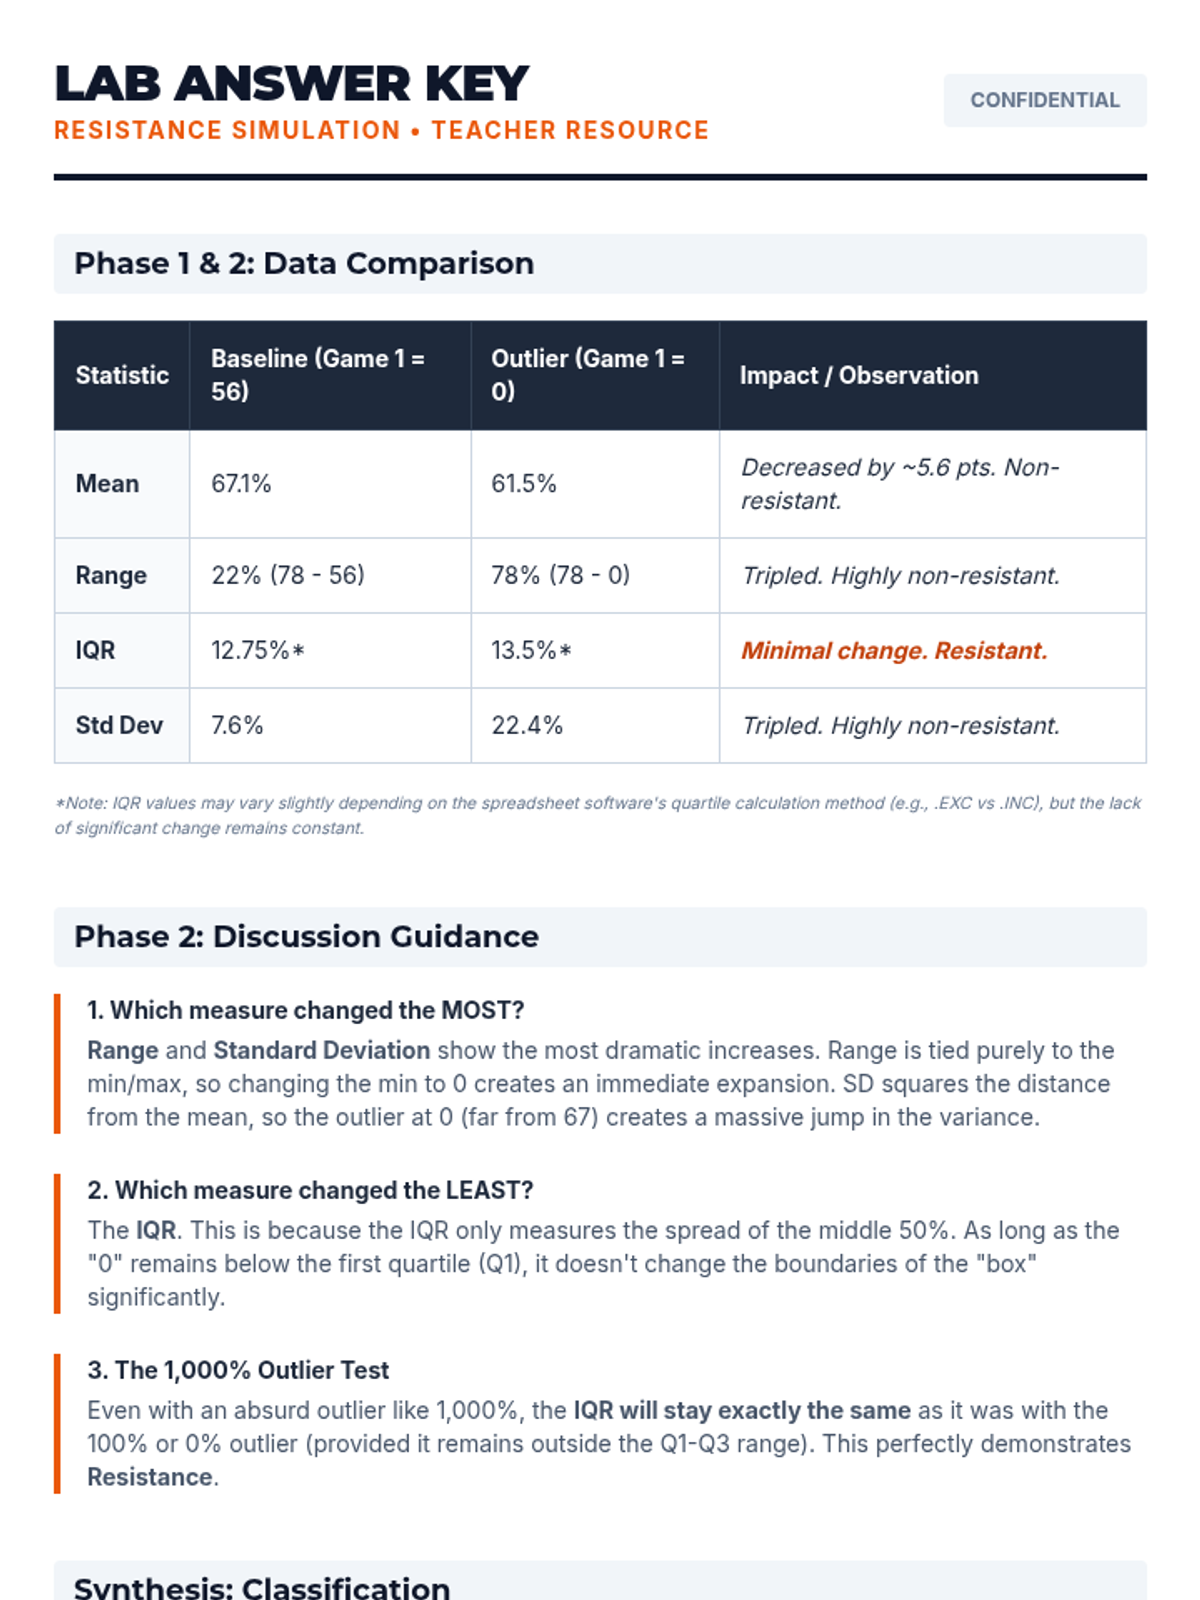
An AP Statistics lesson exploring how outliers impact measures of dispersion (Range, IQR, and Standard Deviation), featuring a video-based case study and a spreadsheet simulation to determine which statistics are 'resistant'.
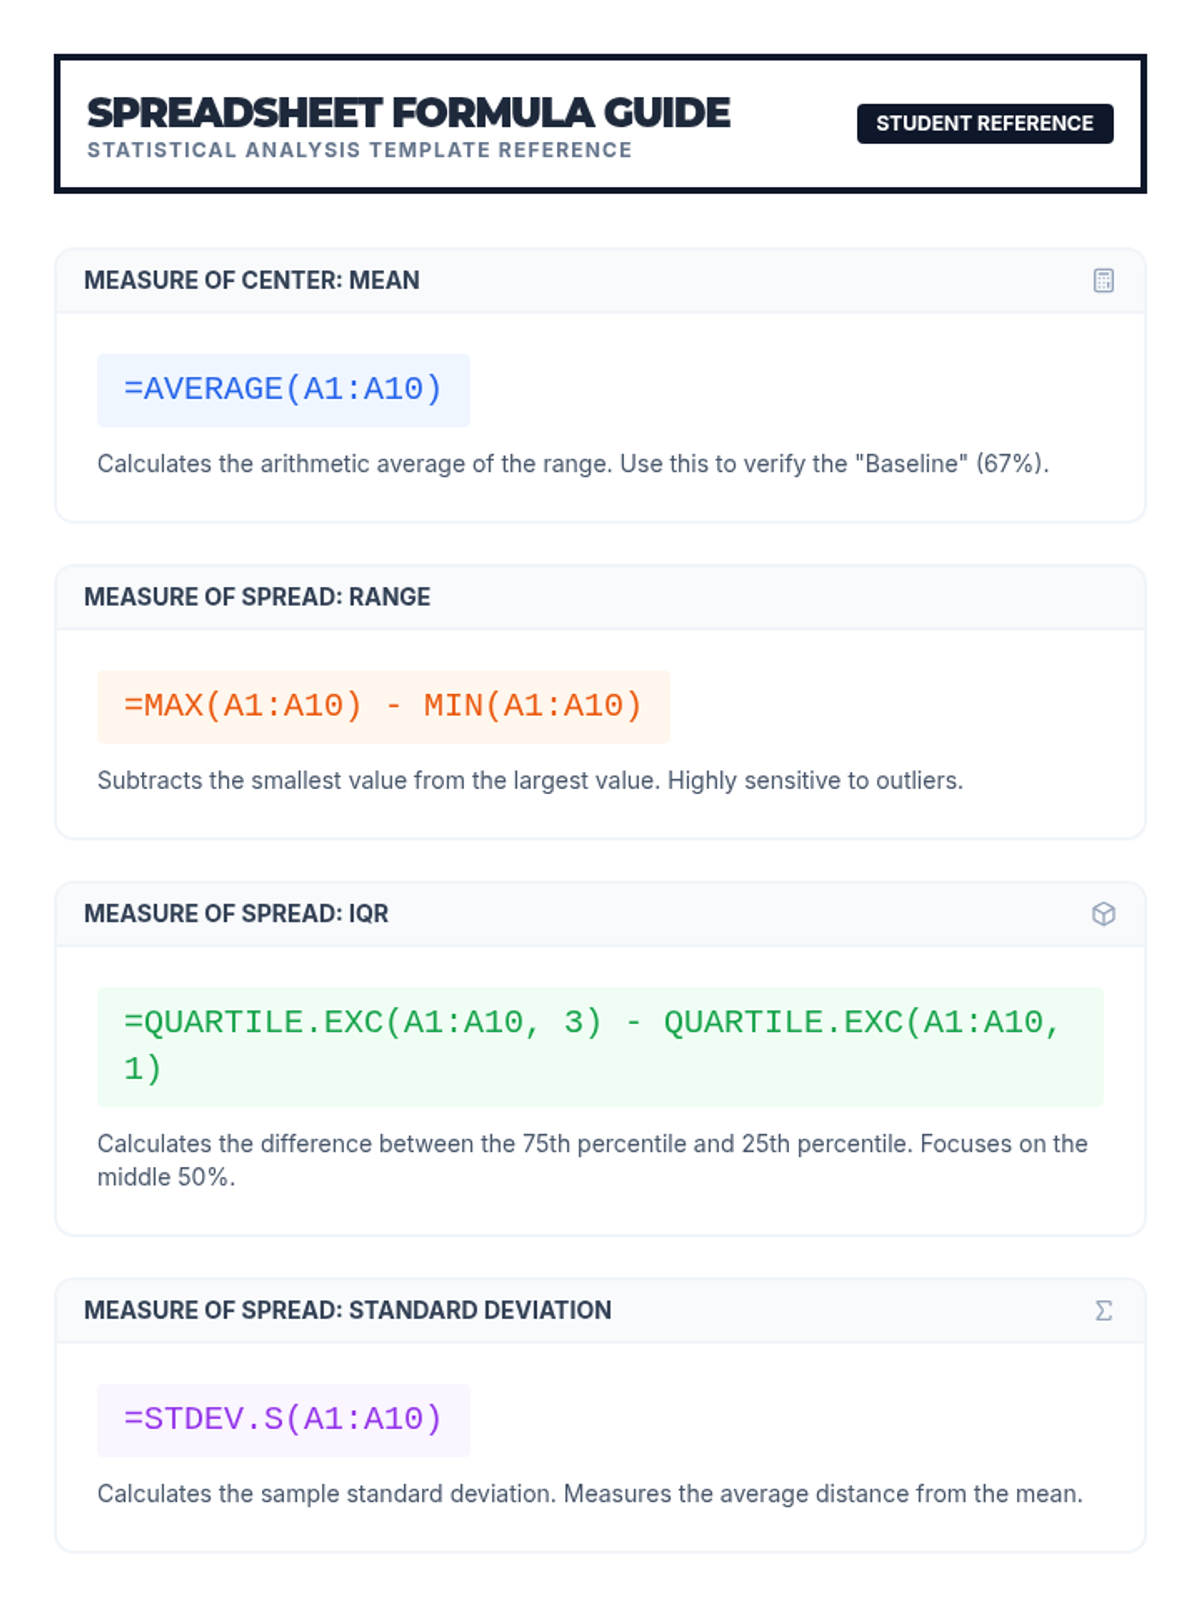
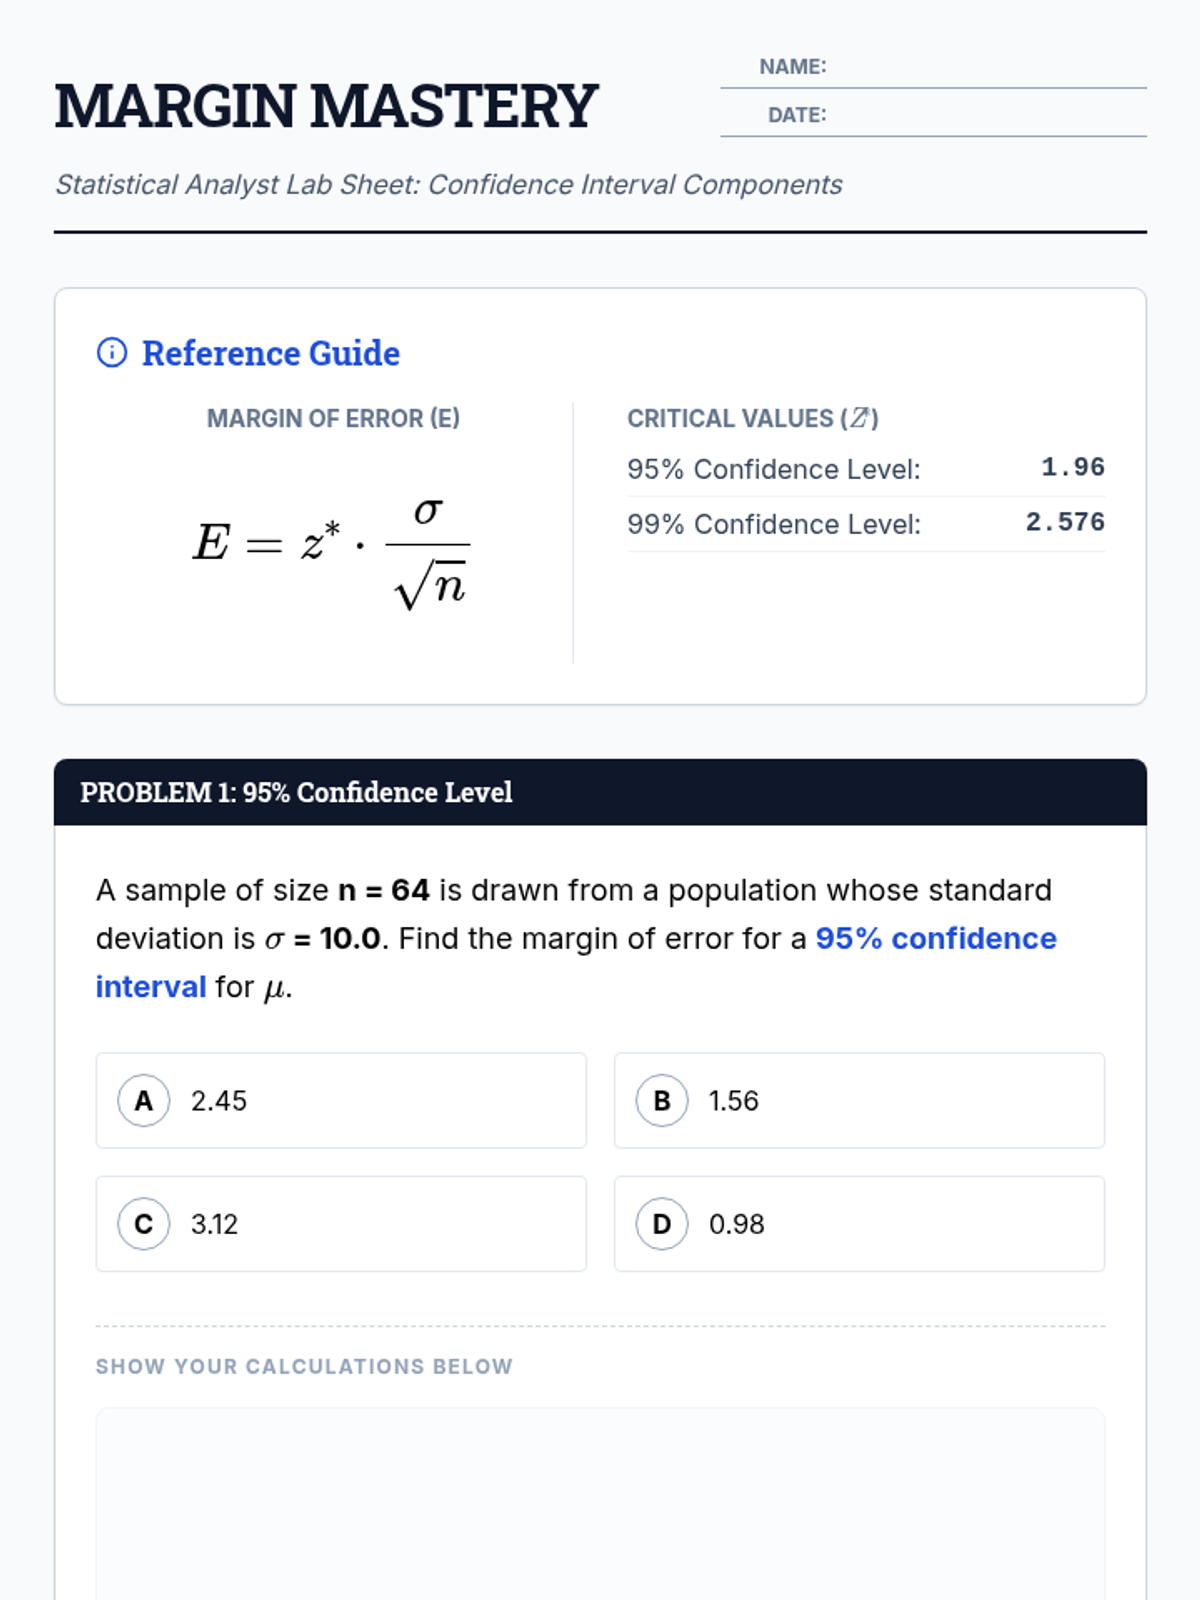
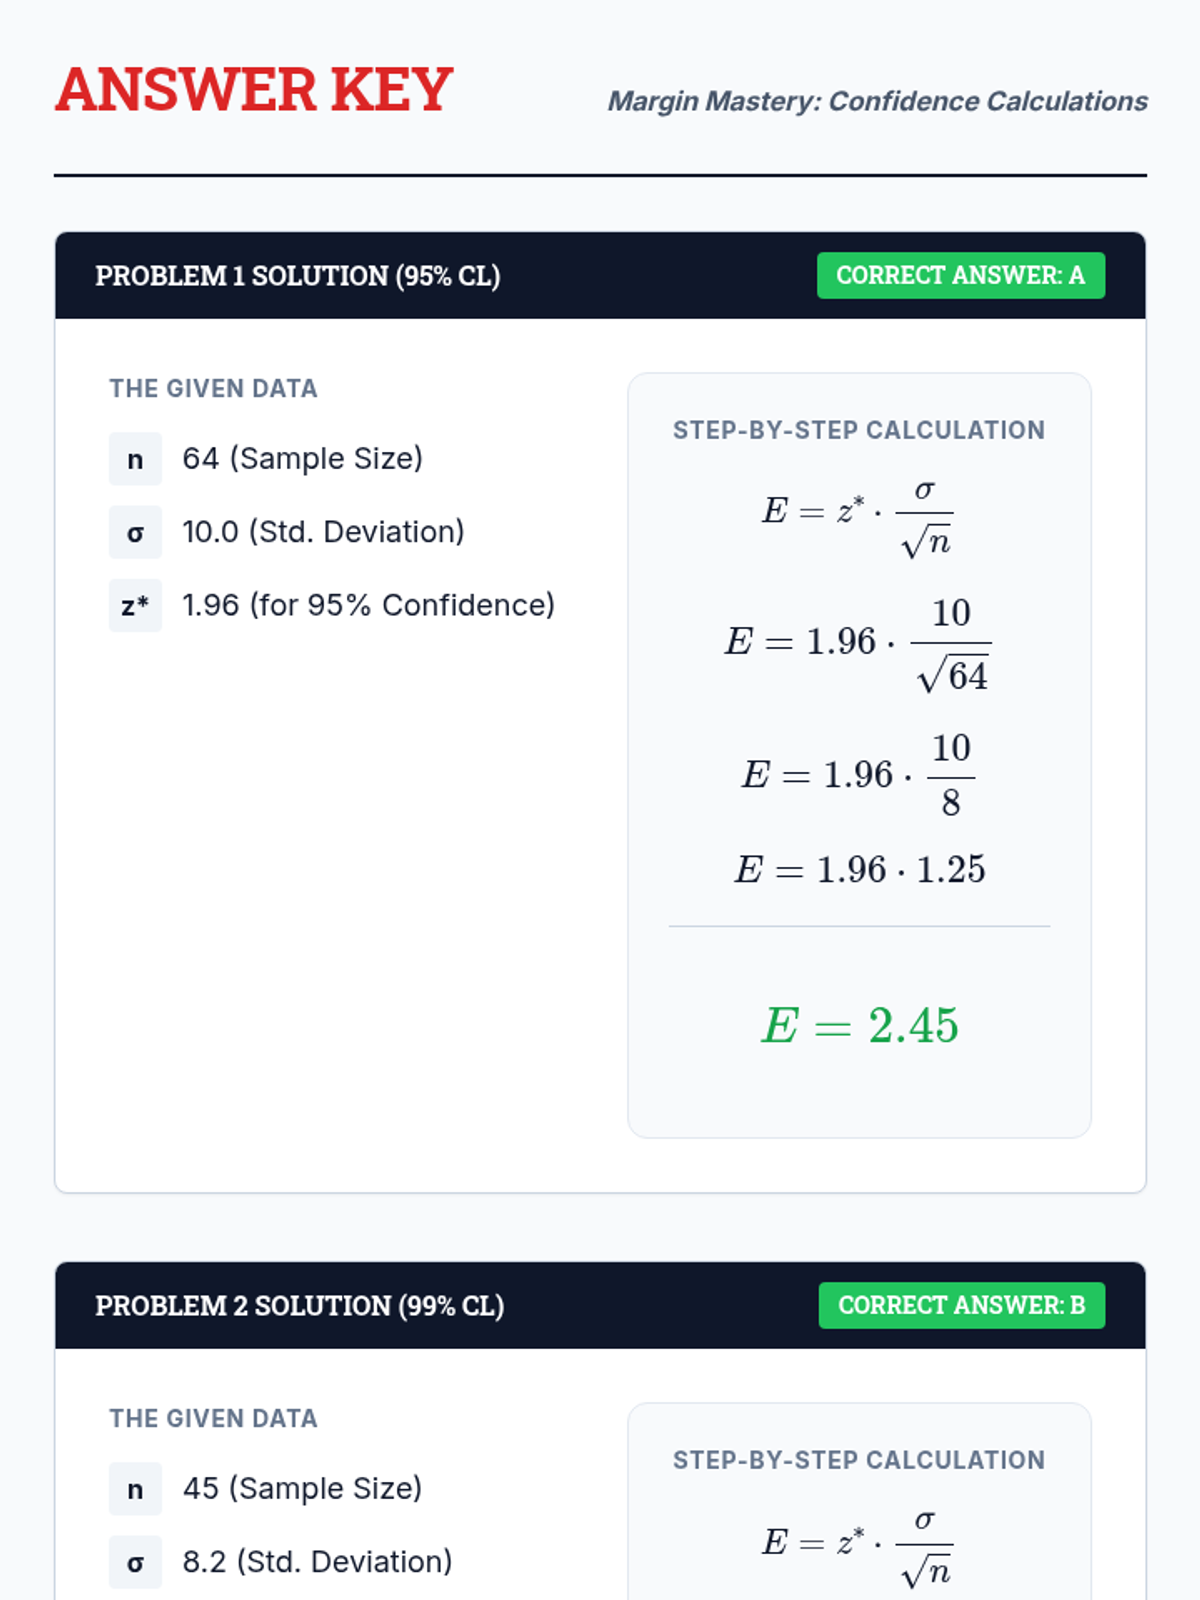
A lesson focused on calculating the margin of error for population means when the population standard deviation is known. Students practice using z-scores for different confidence levels.
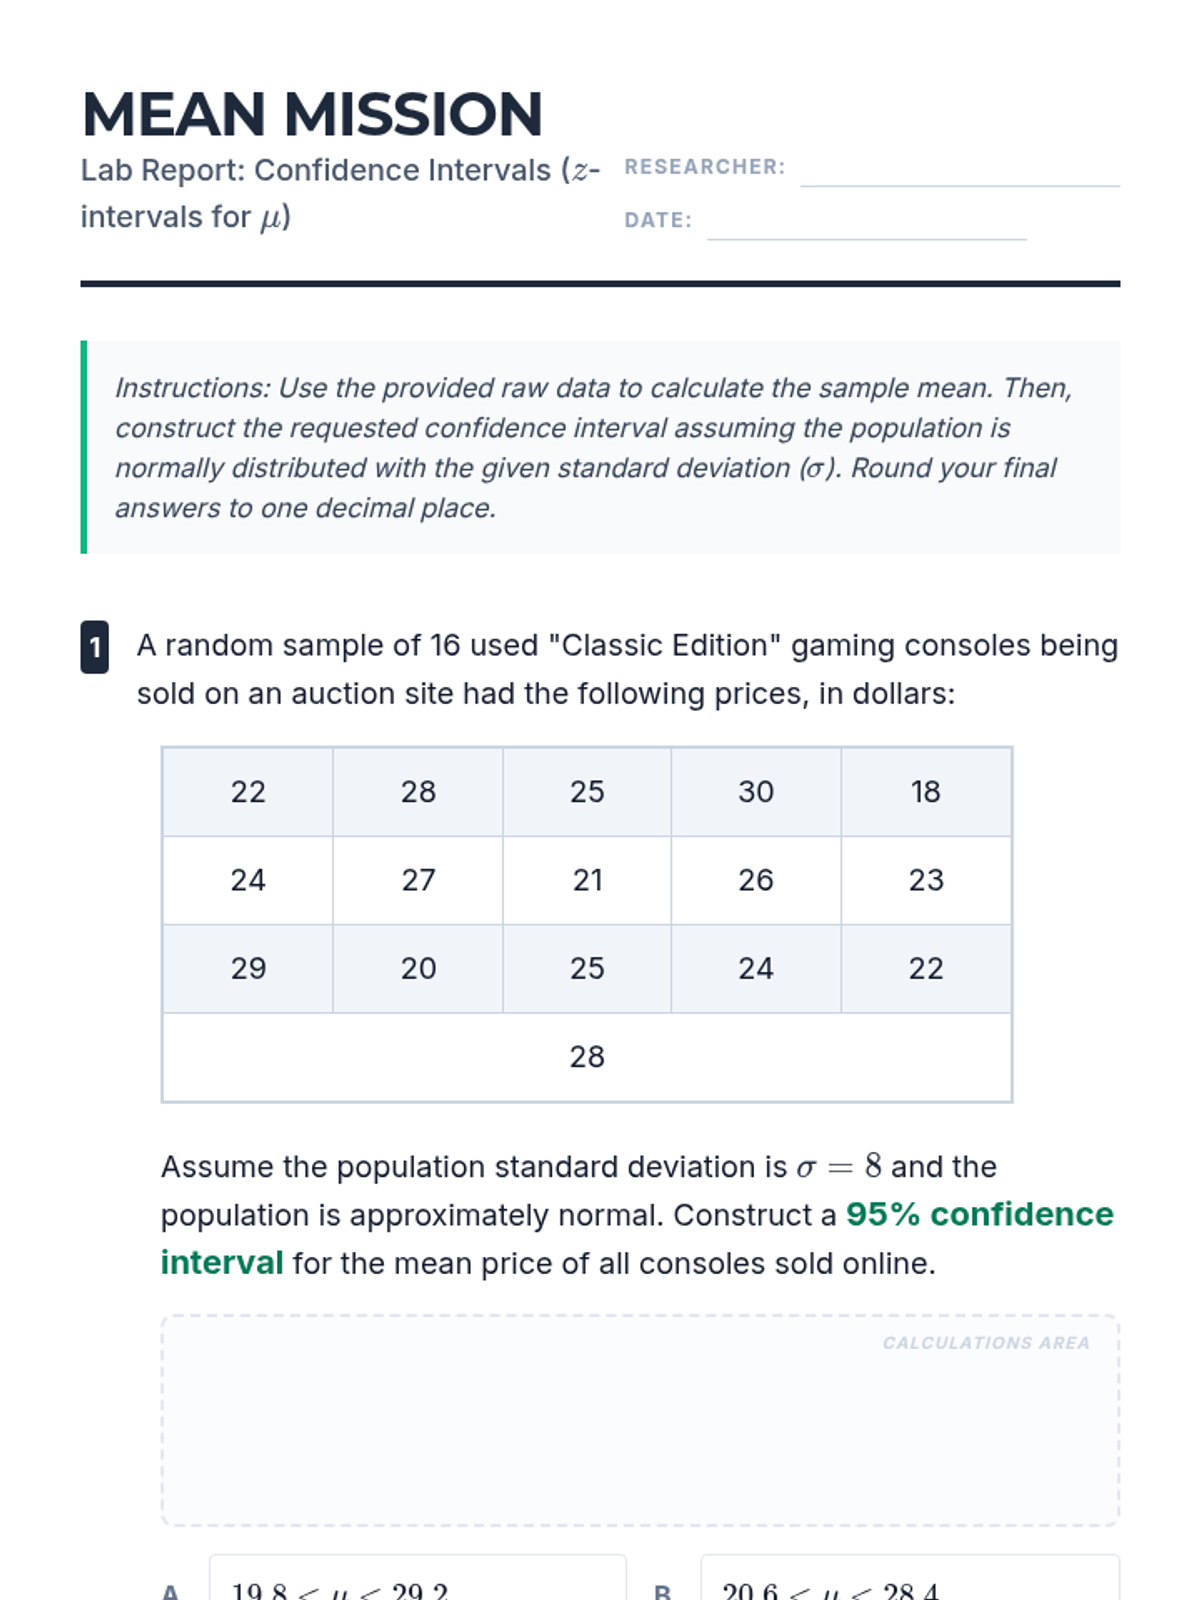
A focused practice session on constructing z-confidence intervals for the mean using raw data and known population standard deviations.
A lesson focused on calculating and interpreting confidence intervals for population means when the population standard deviation is known. Students practice identifying key statistics and applying the Z-interval formula to real-world scenarios.
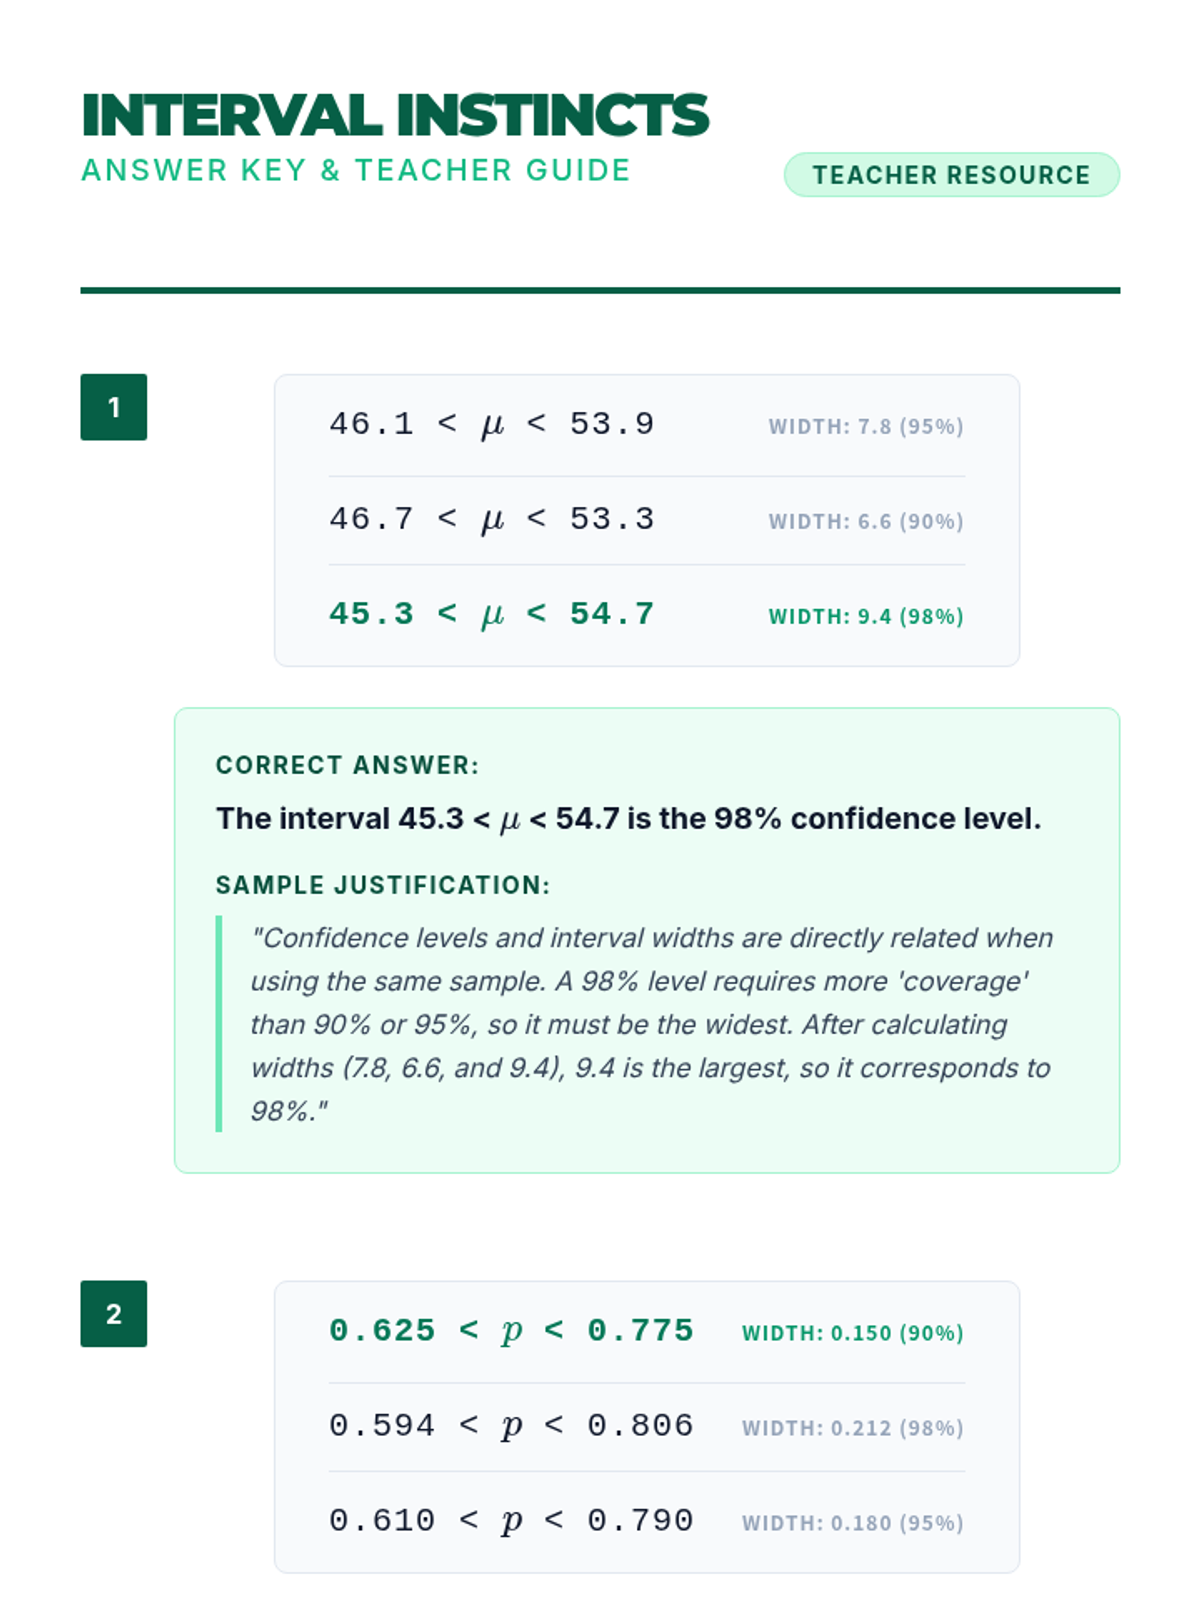
A practice lesson focusing on the relationship between confidence levels and interval width. Students analyze sets of intervals to identify specific confidence levels based on their precision.
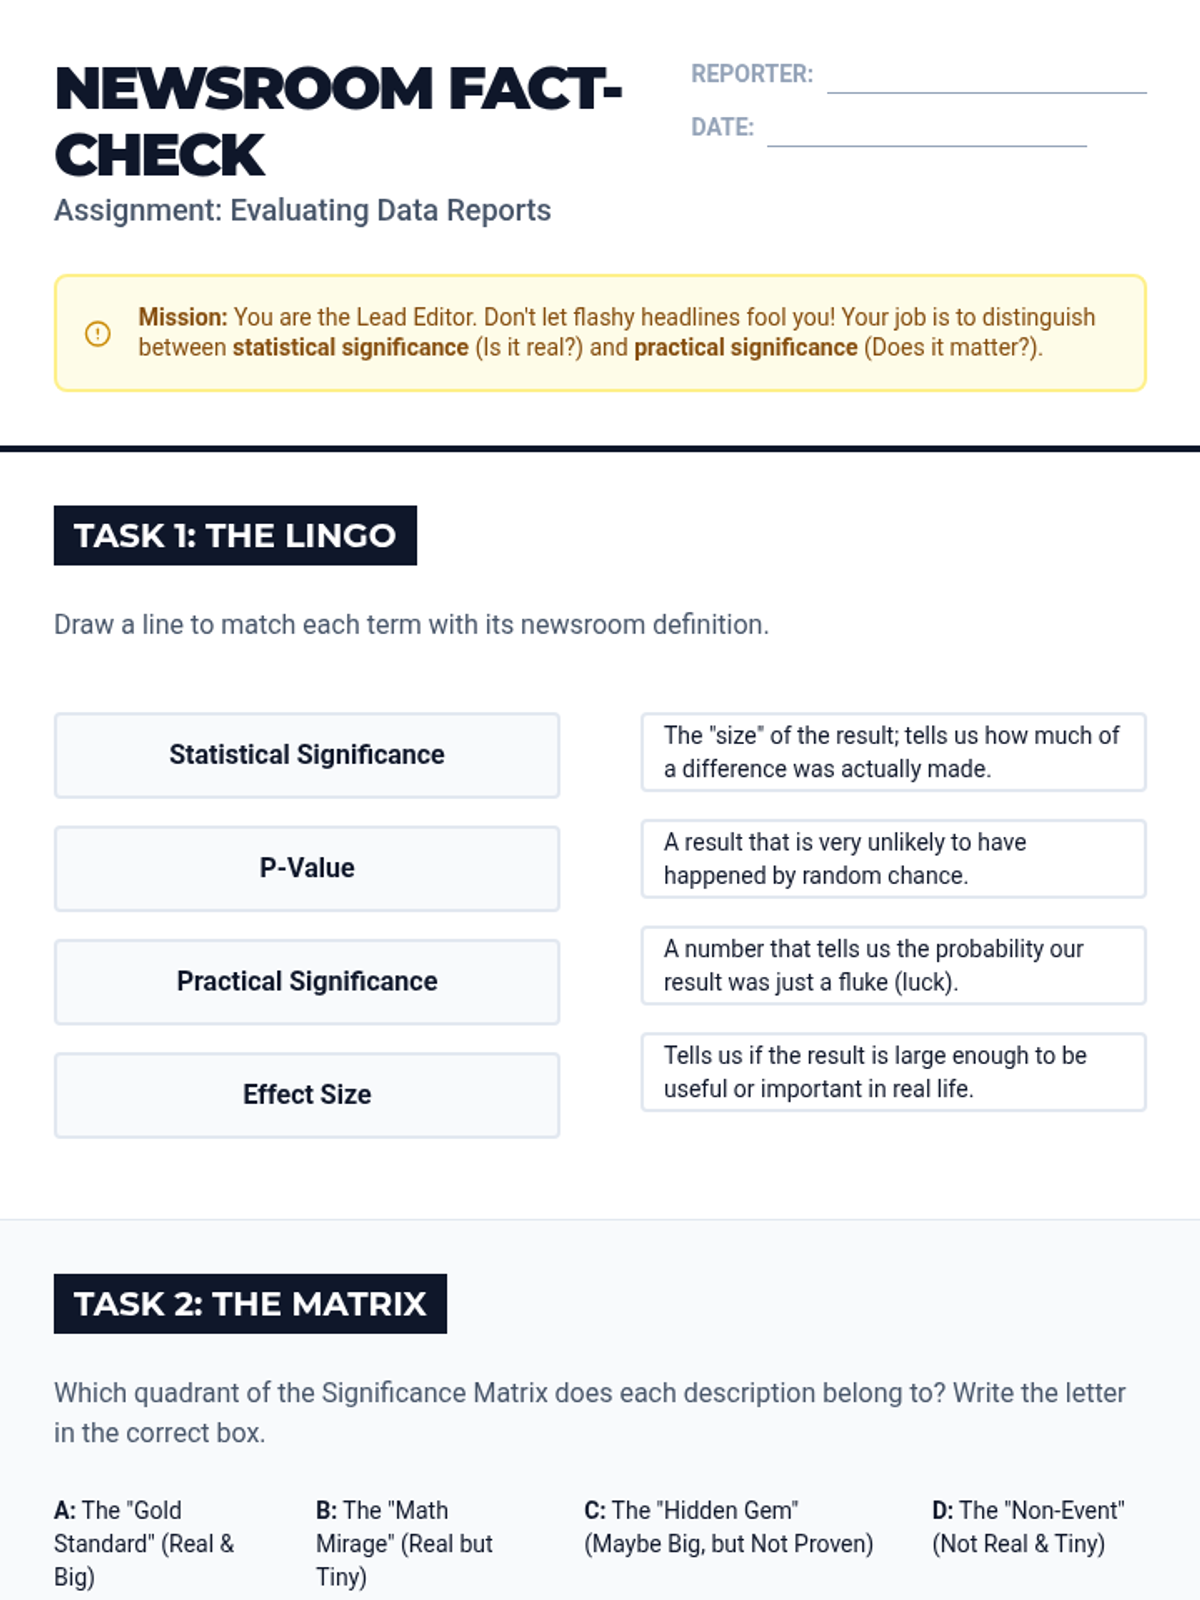
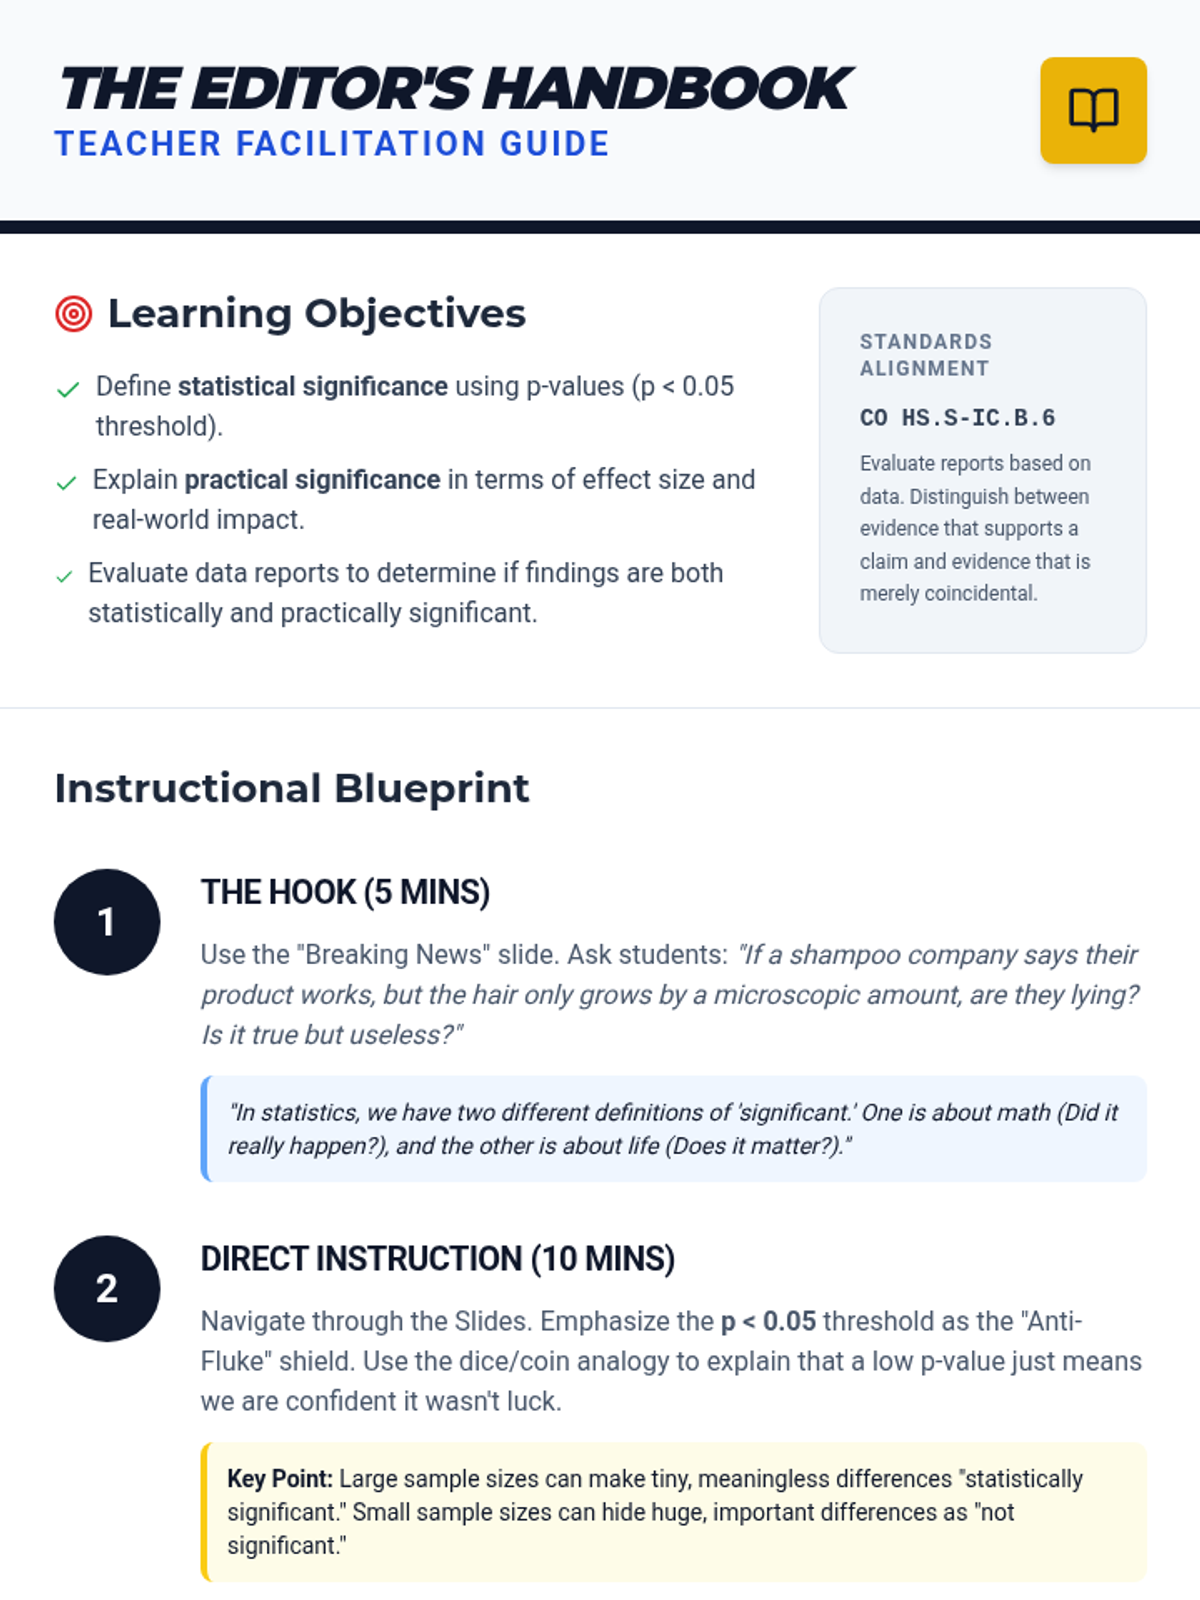
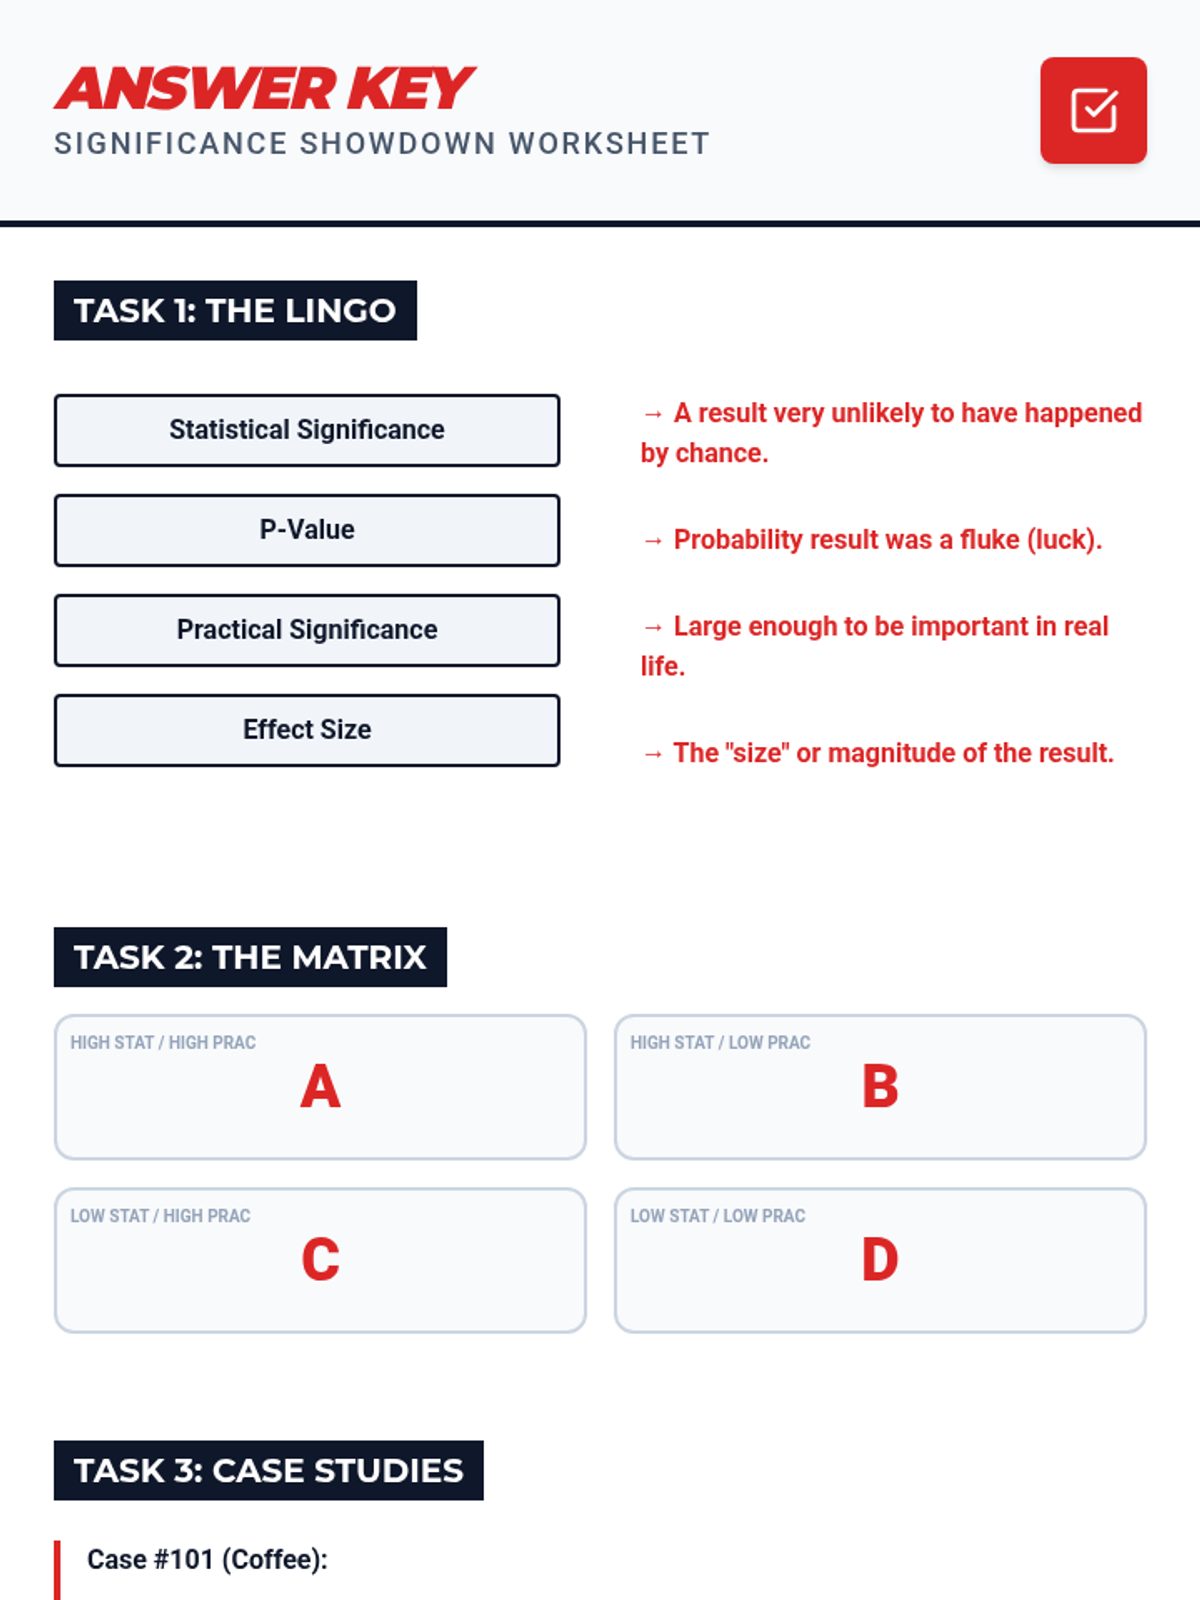
A Tier 2 intervention lesson focused on distinguishing statistical significance (p-values) from practical significance (effect size) when evaluating data reports. Students learn to critically analyze headlines and data claims through scaffolded examples and structured comparison activities.
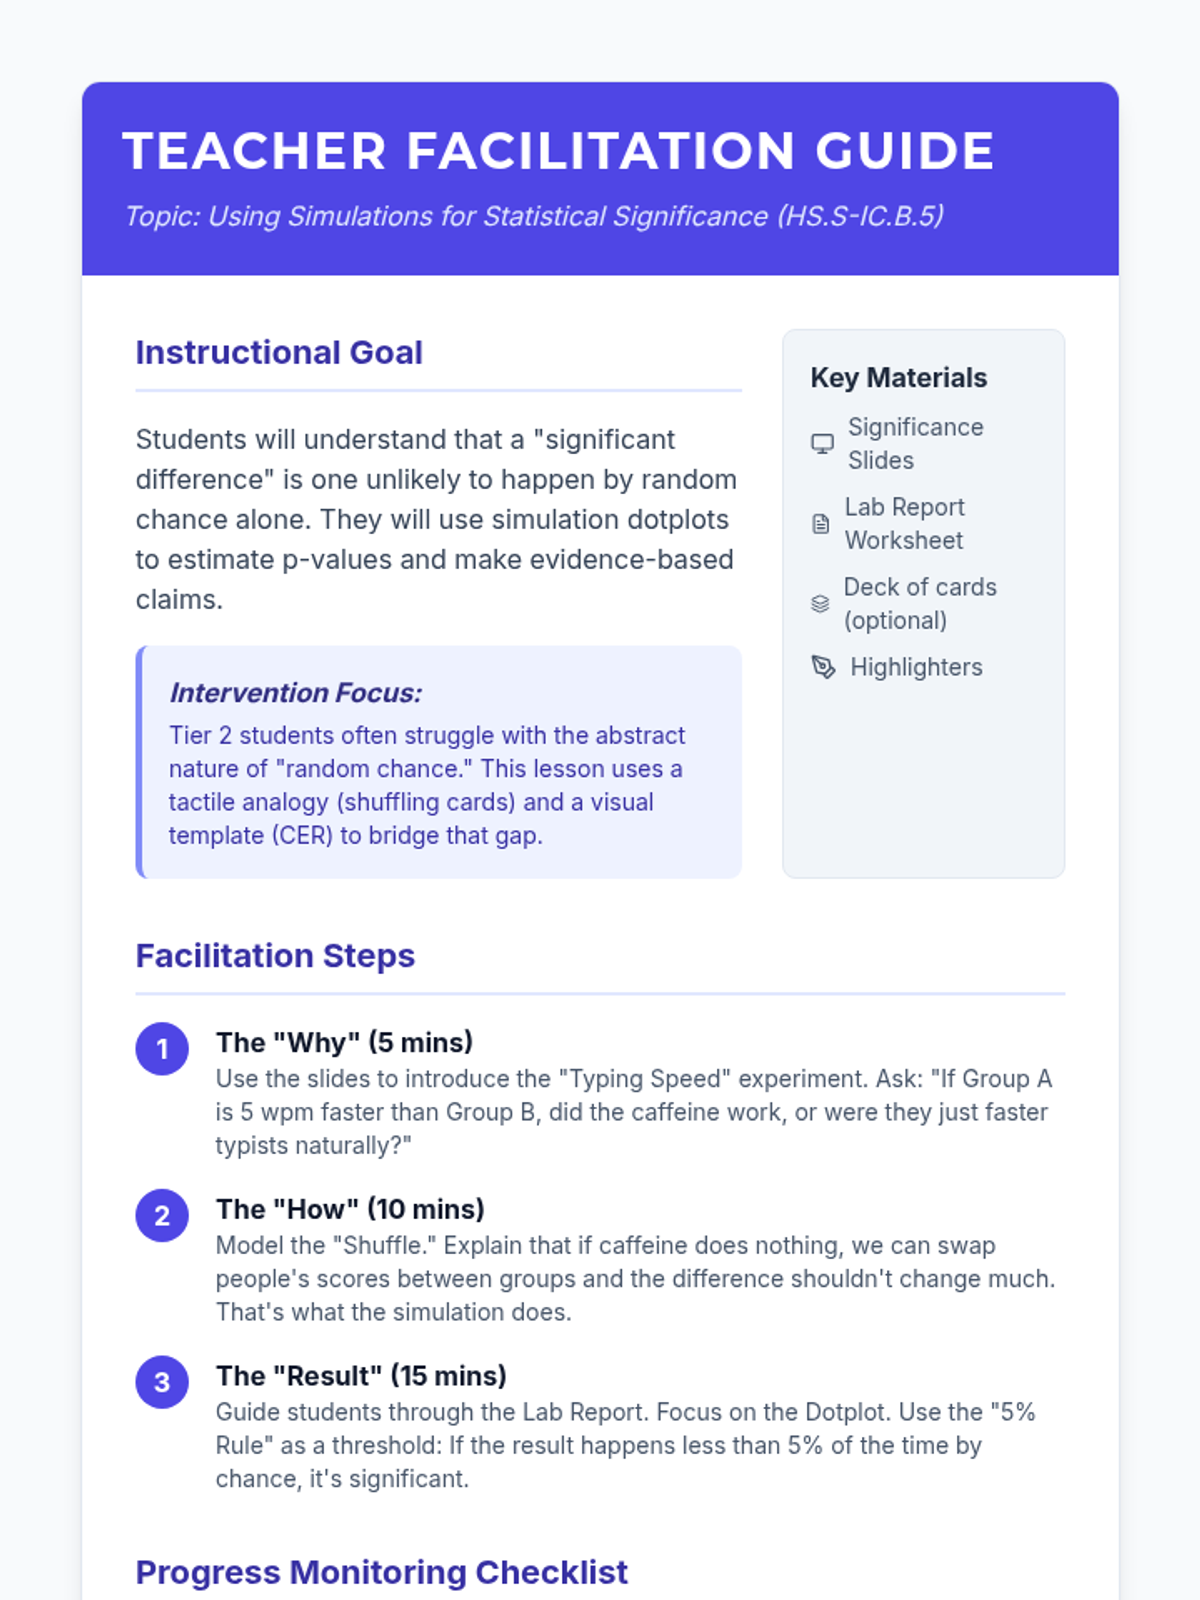
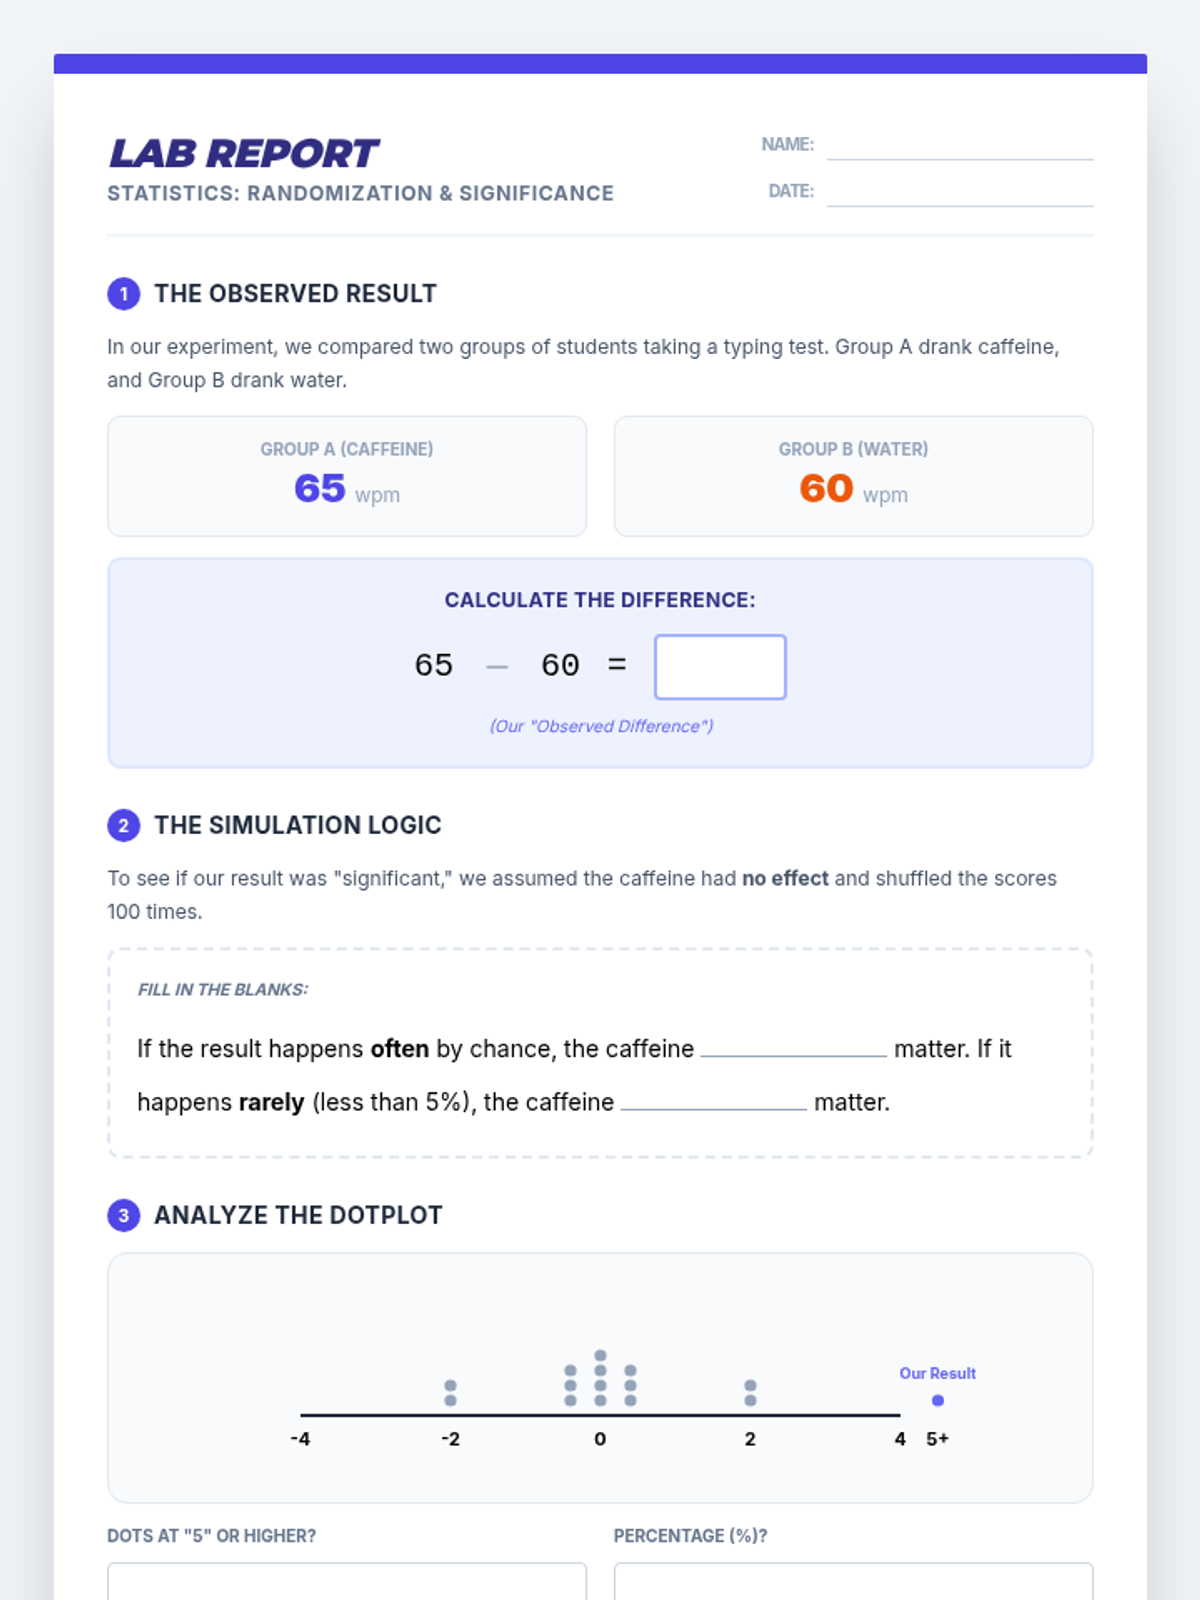
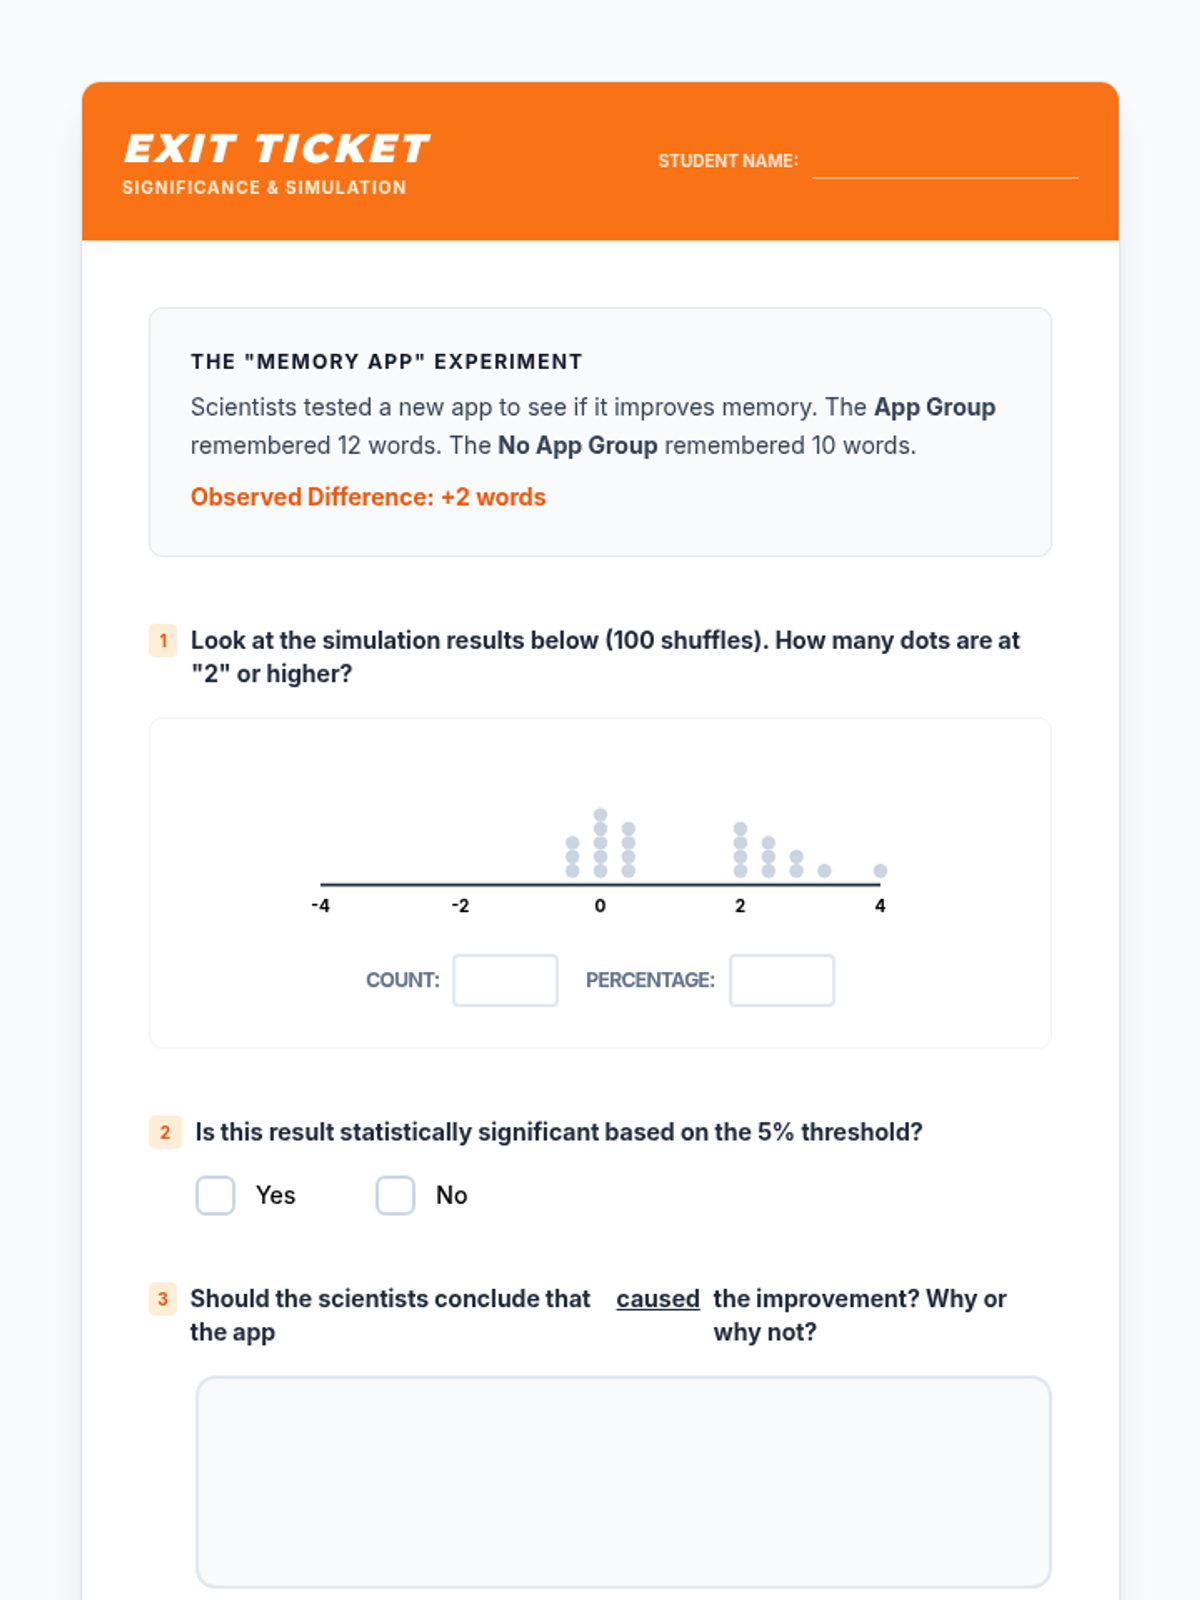
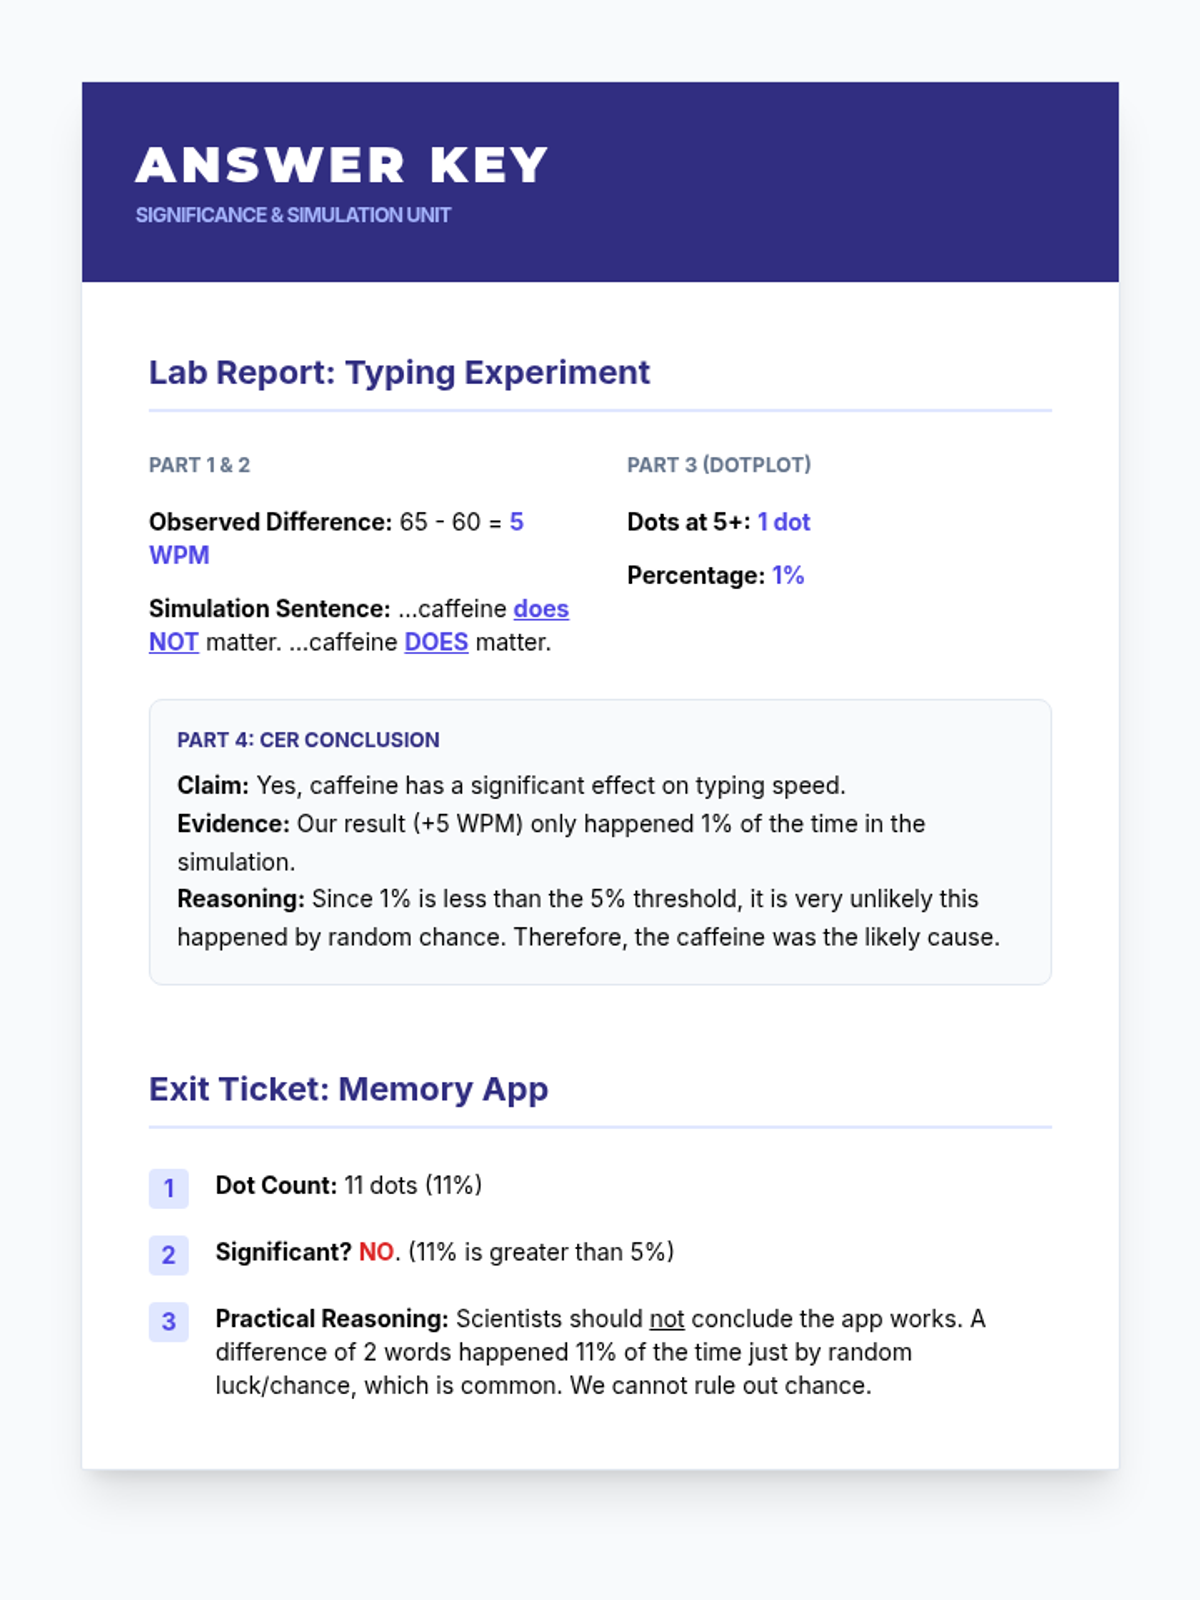
A targeted small group intervention lesson focused on using simulations to determine statistical significance in randomized experiments. Students will analyze experimental data and use guided reasoning templates to connect simulation results to practical conclusions.