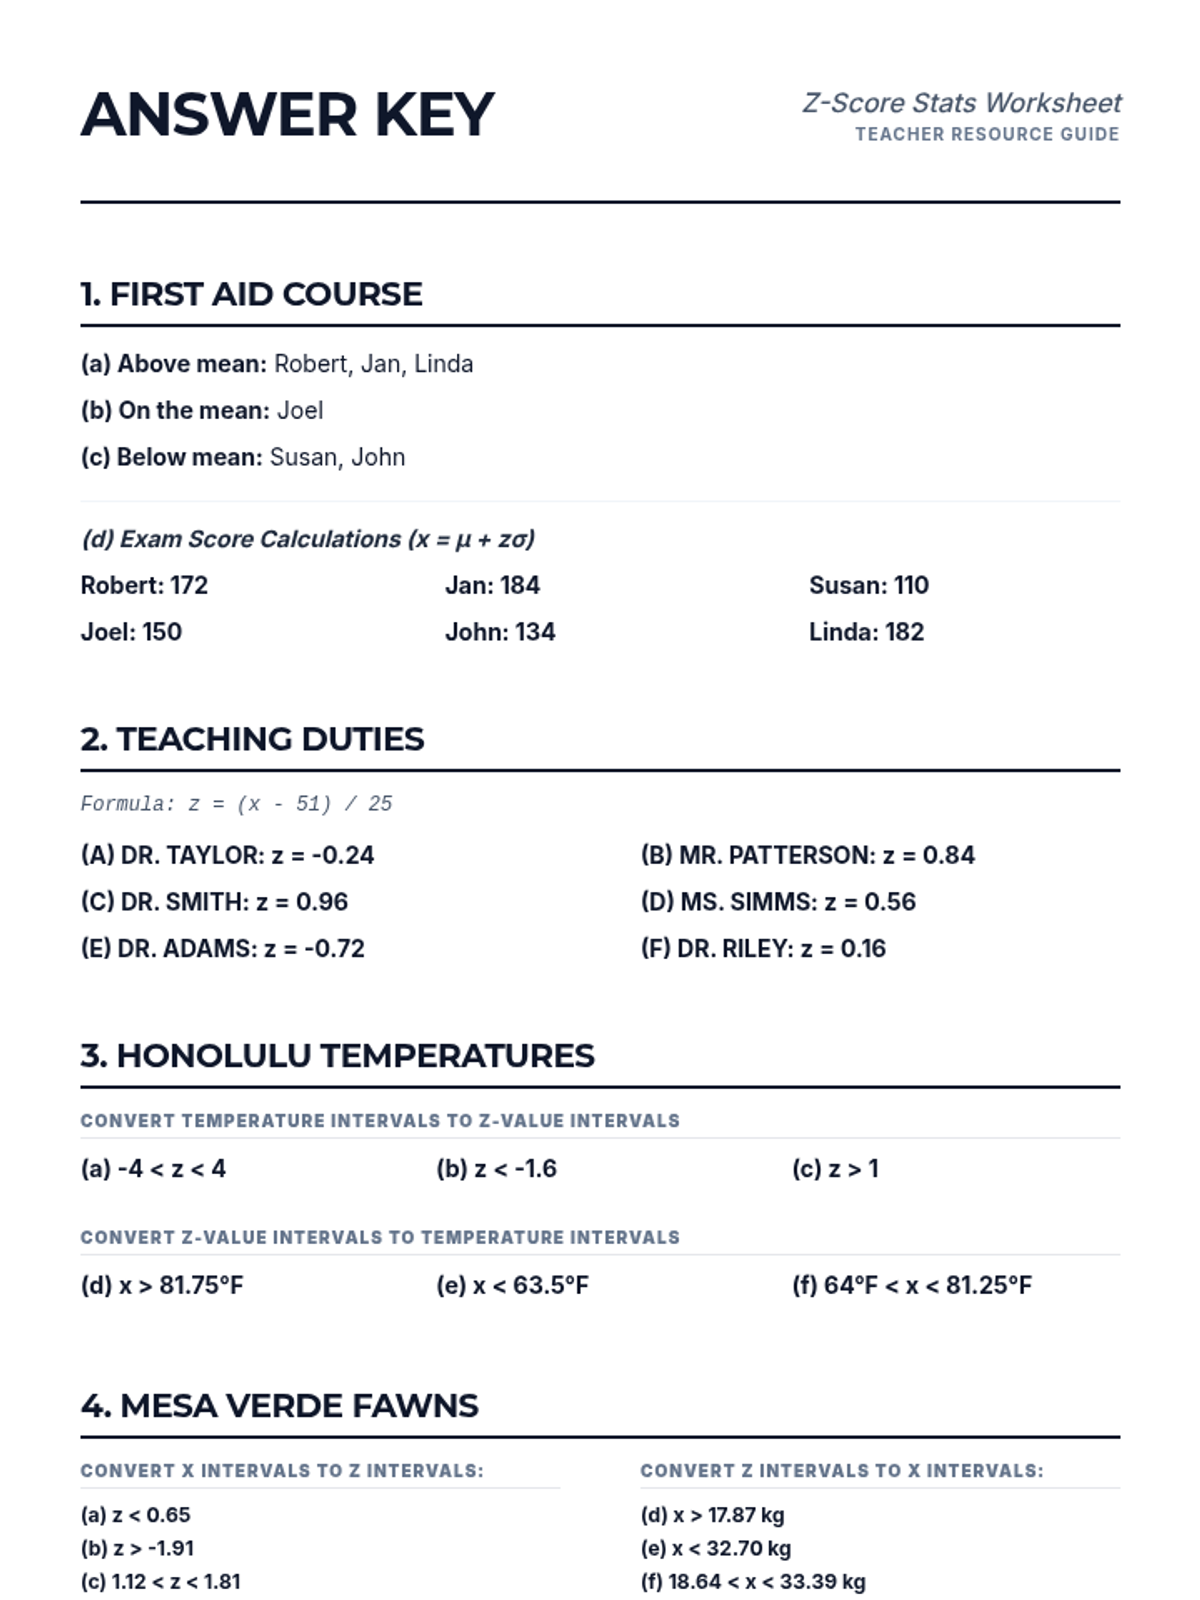
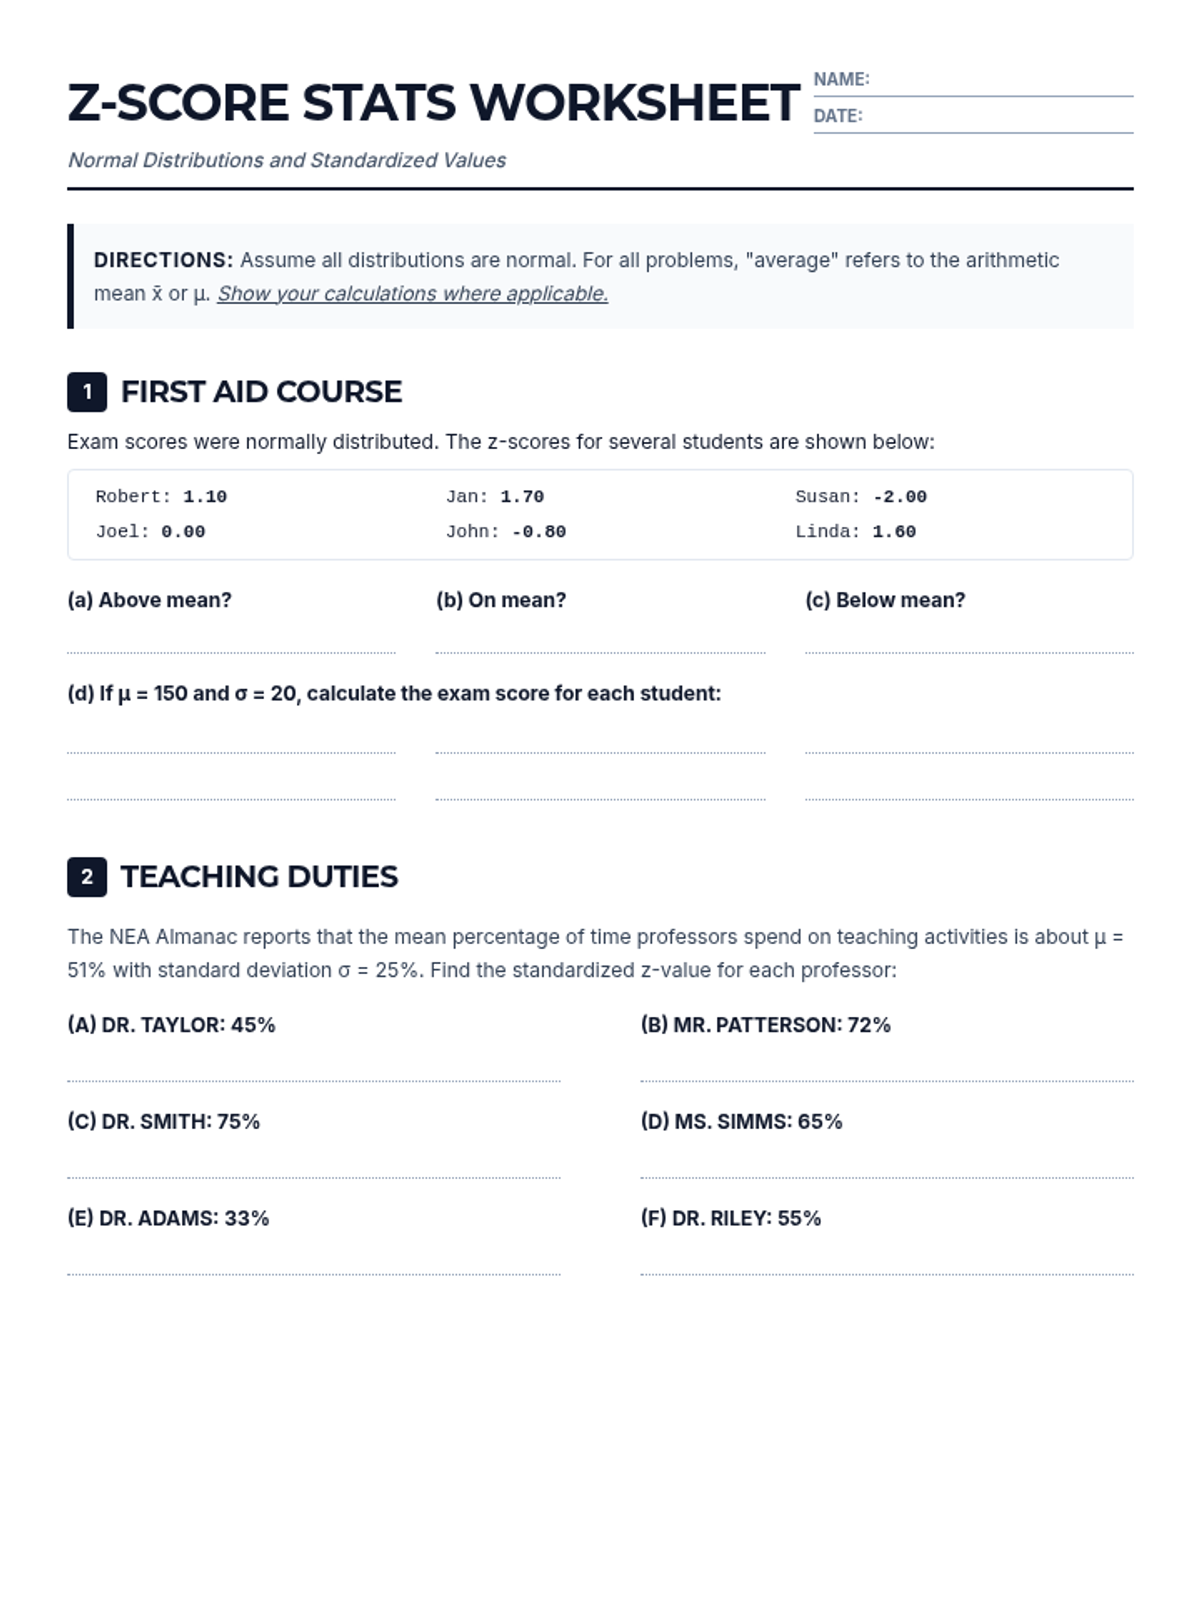
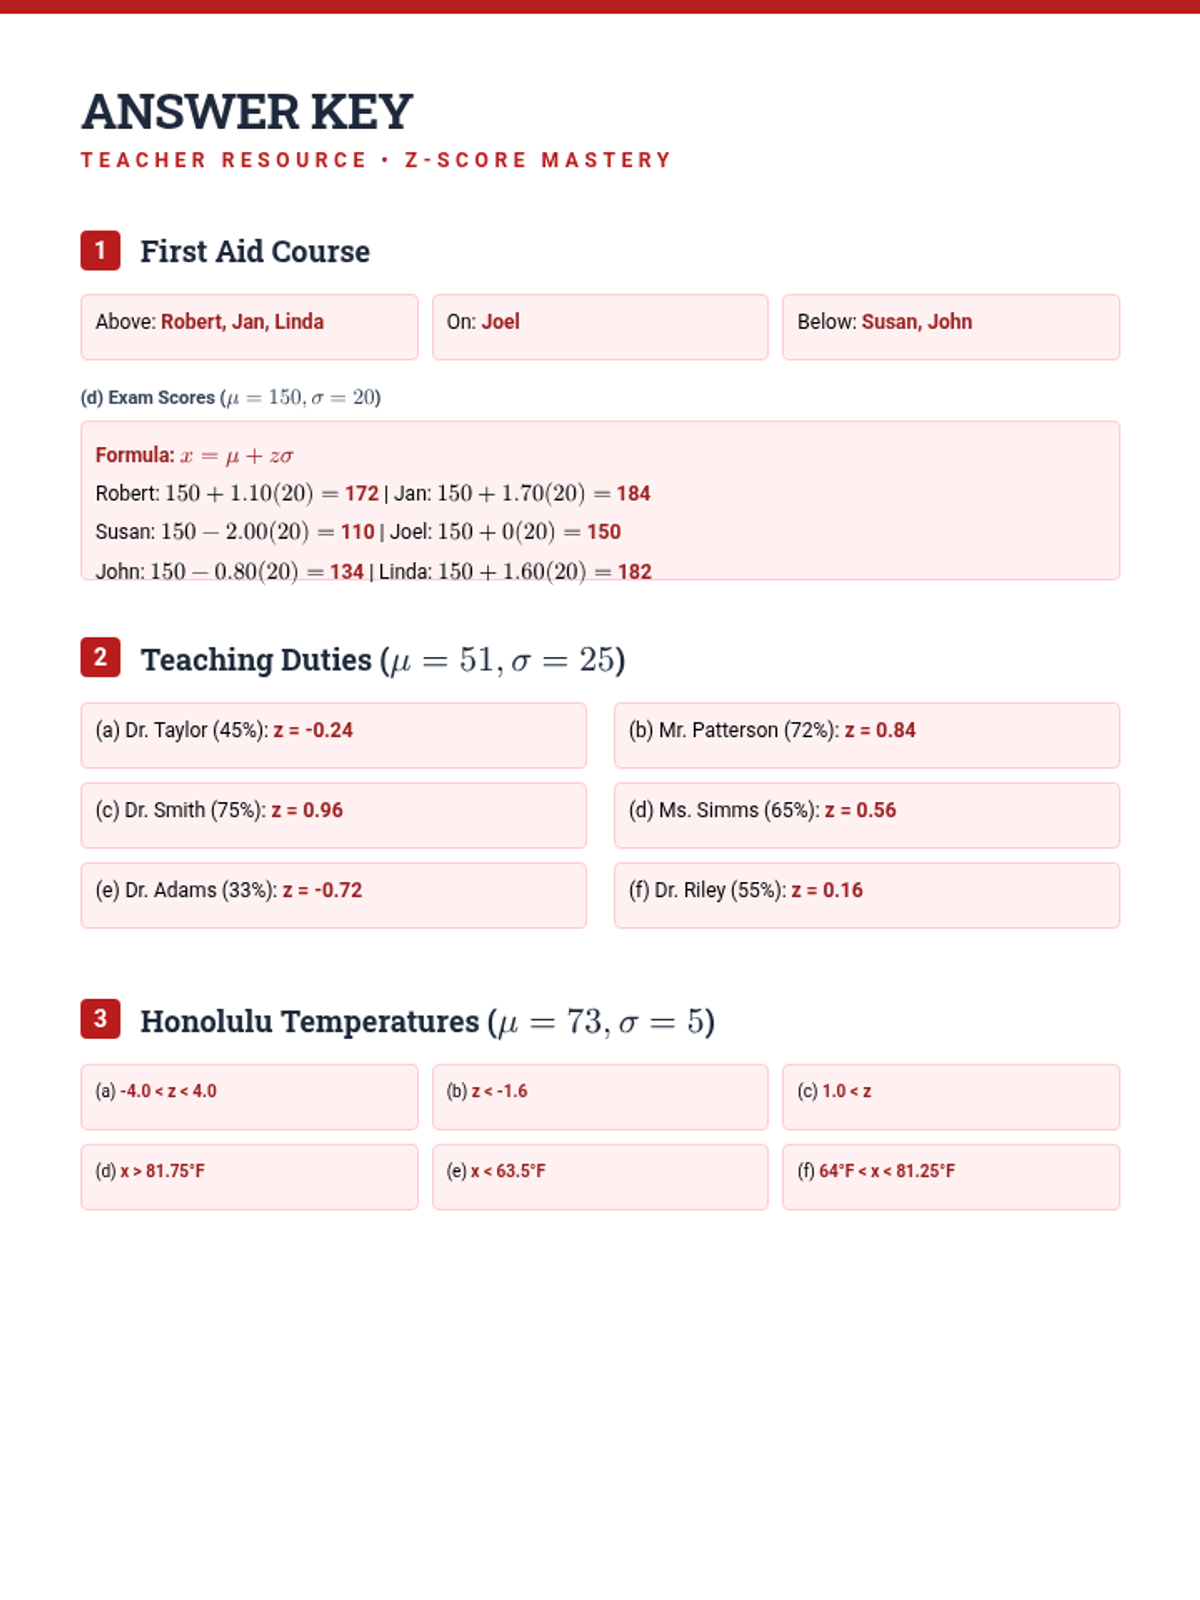
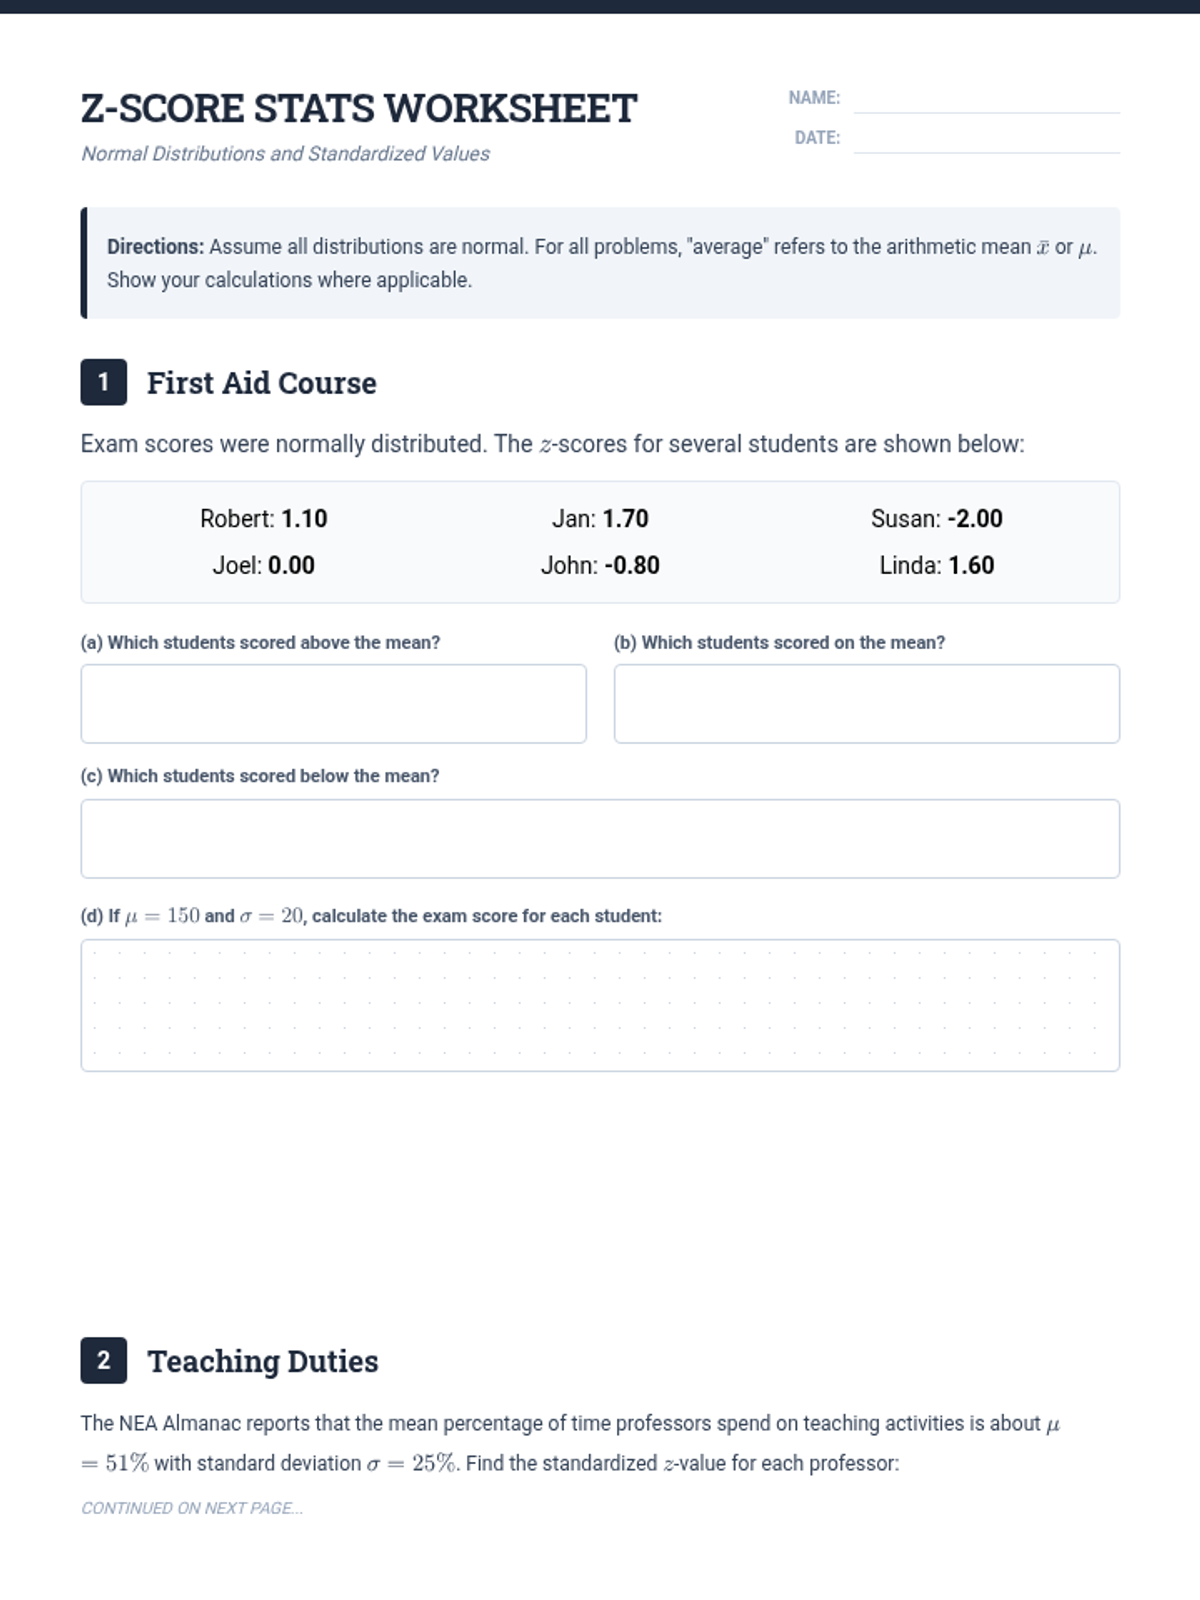
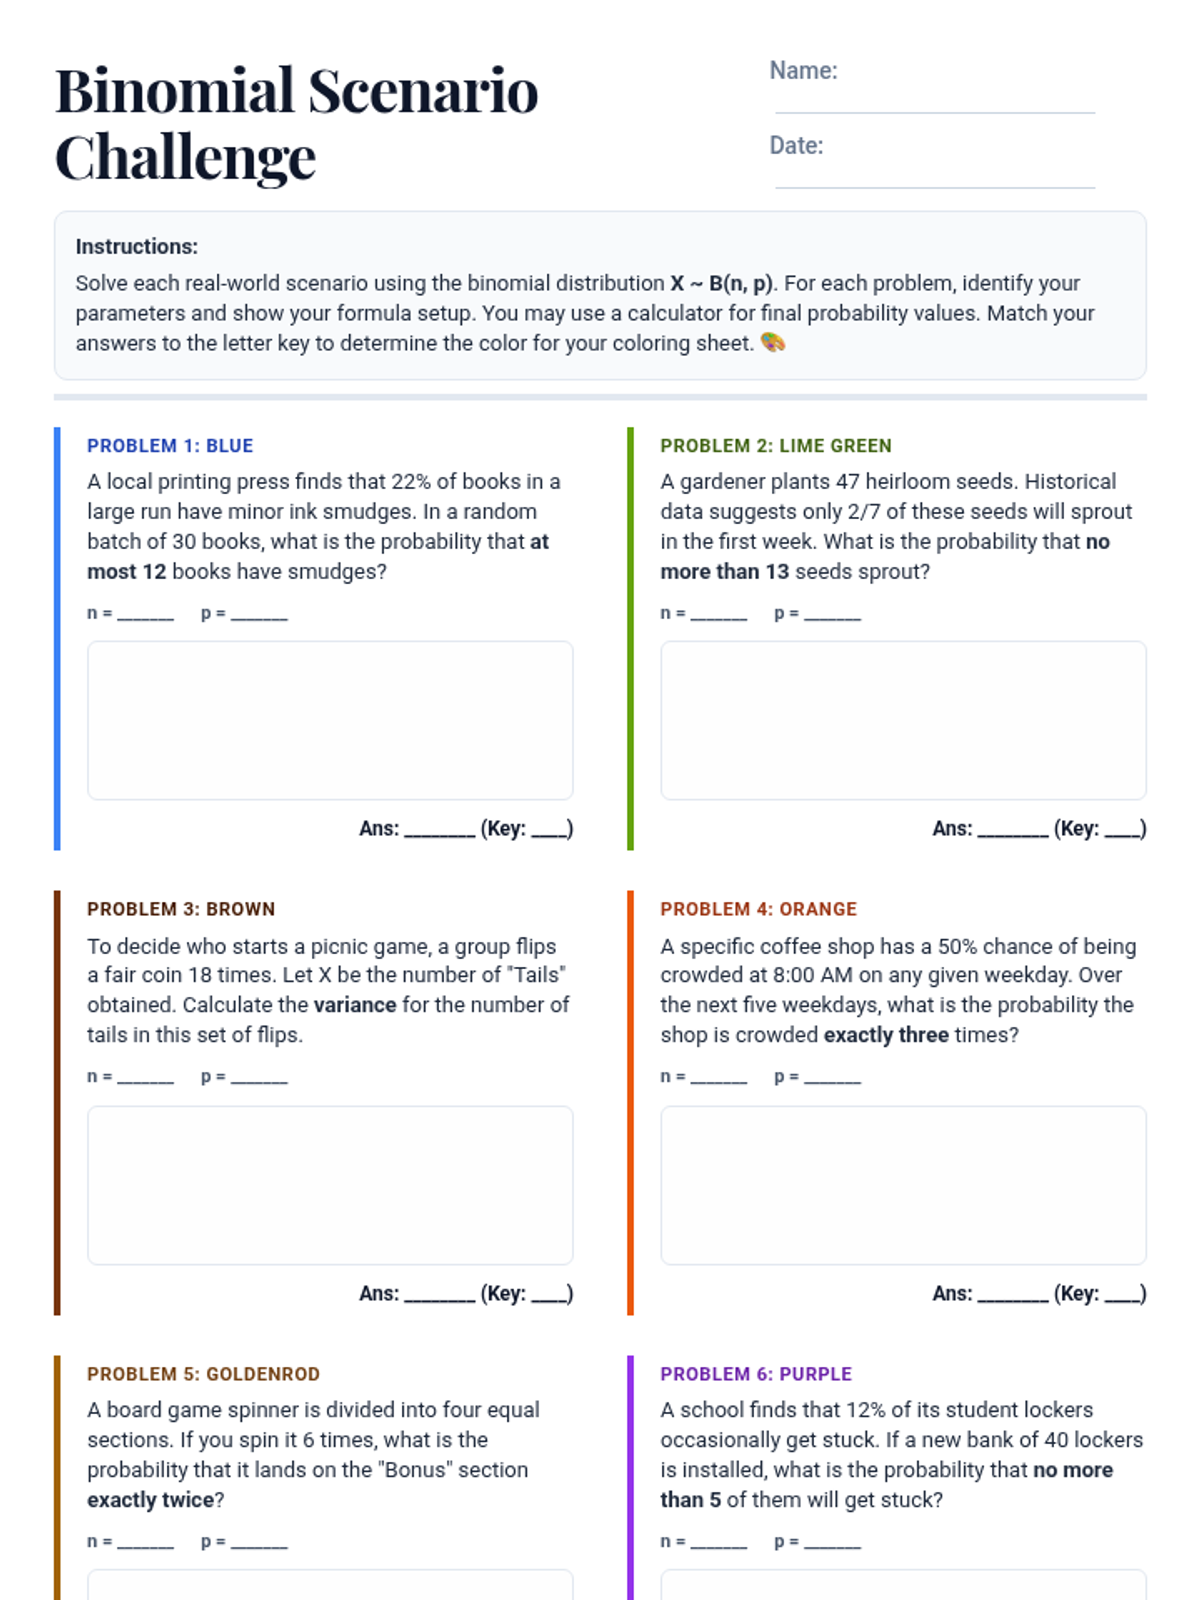
Binomial Breakdown Worksheet slice edition
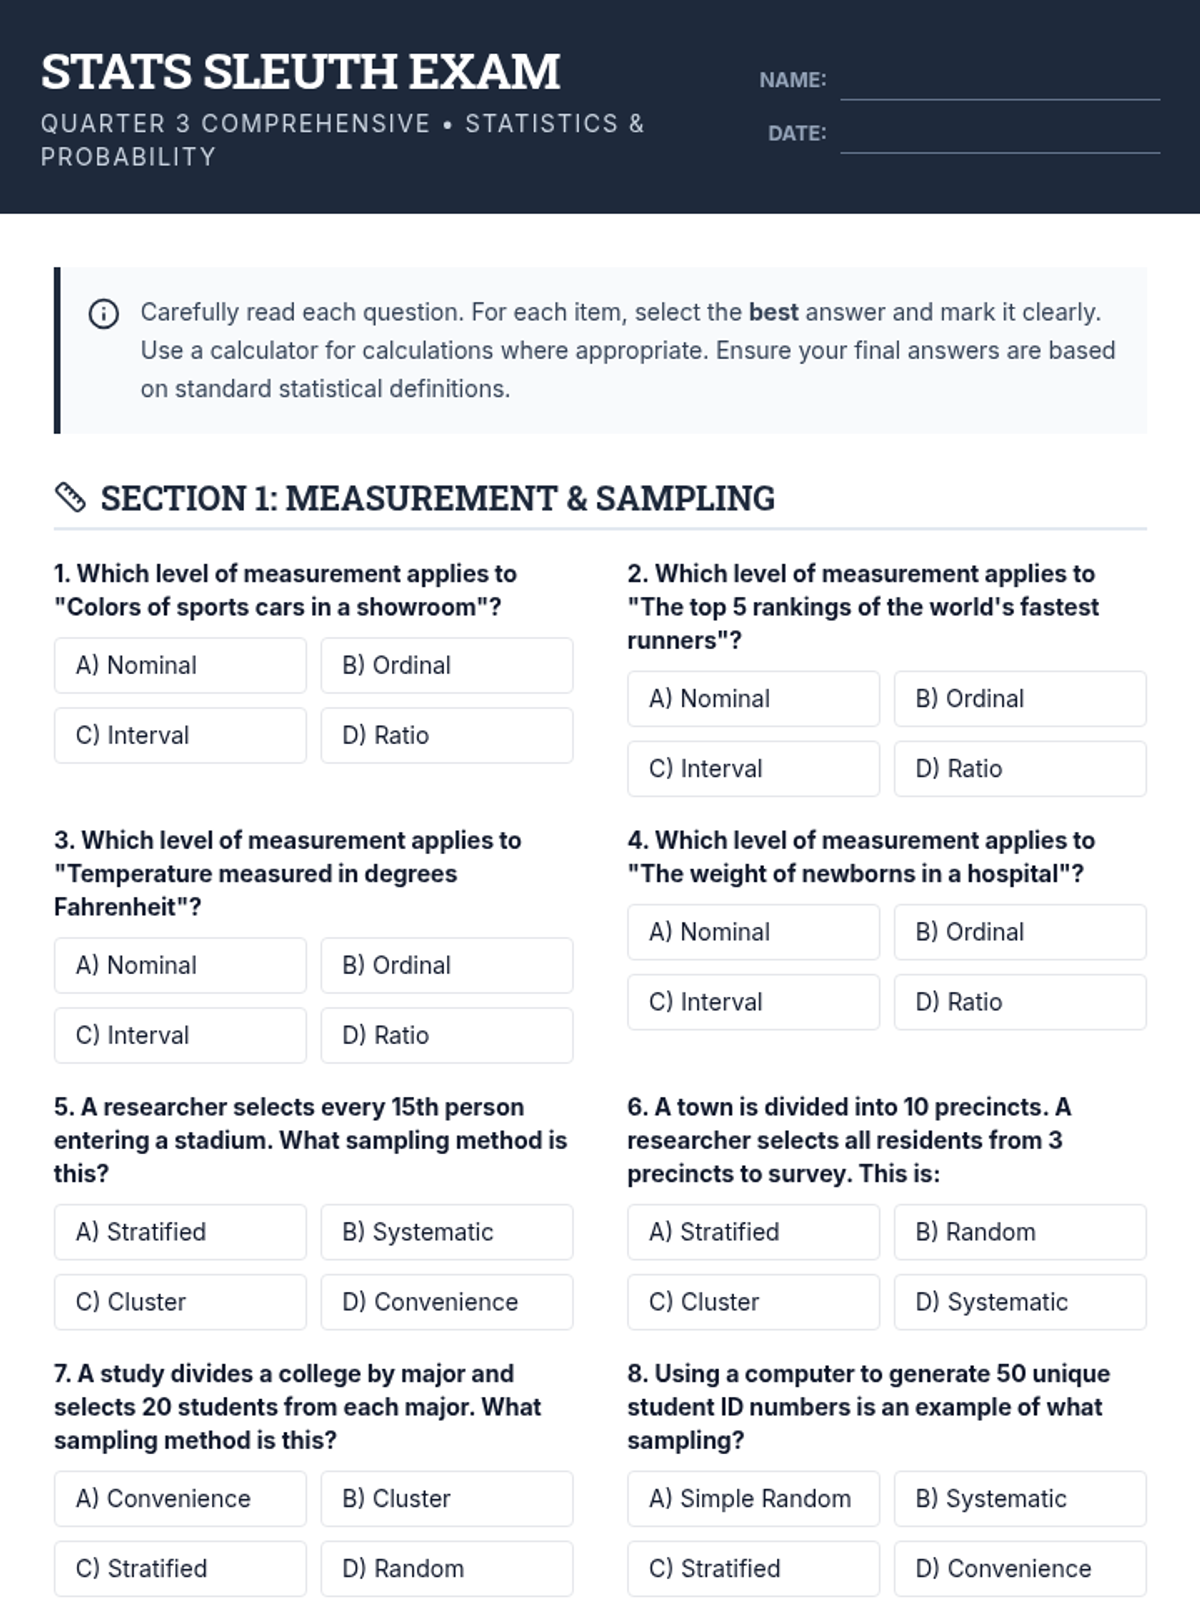
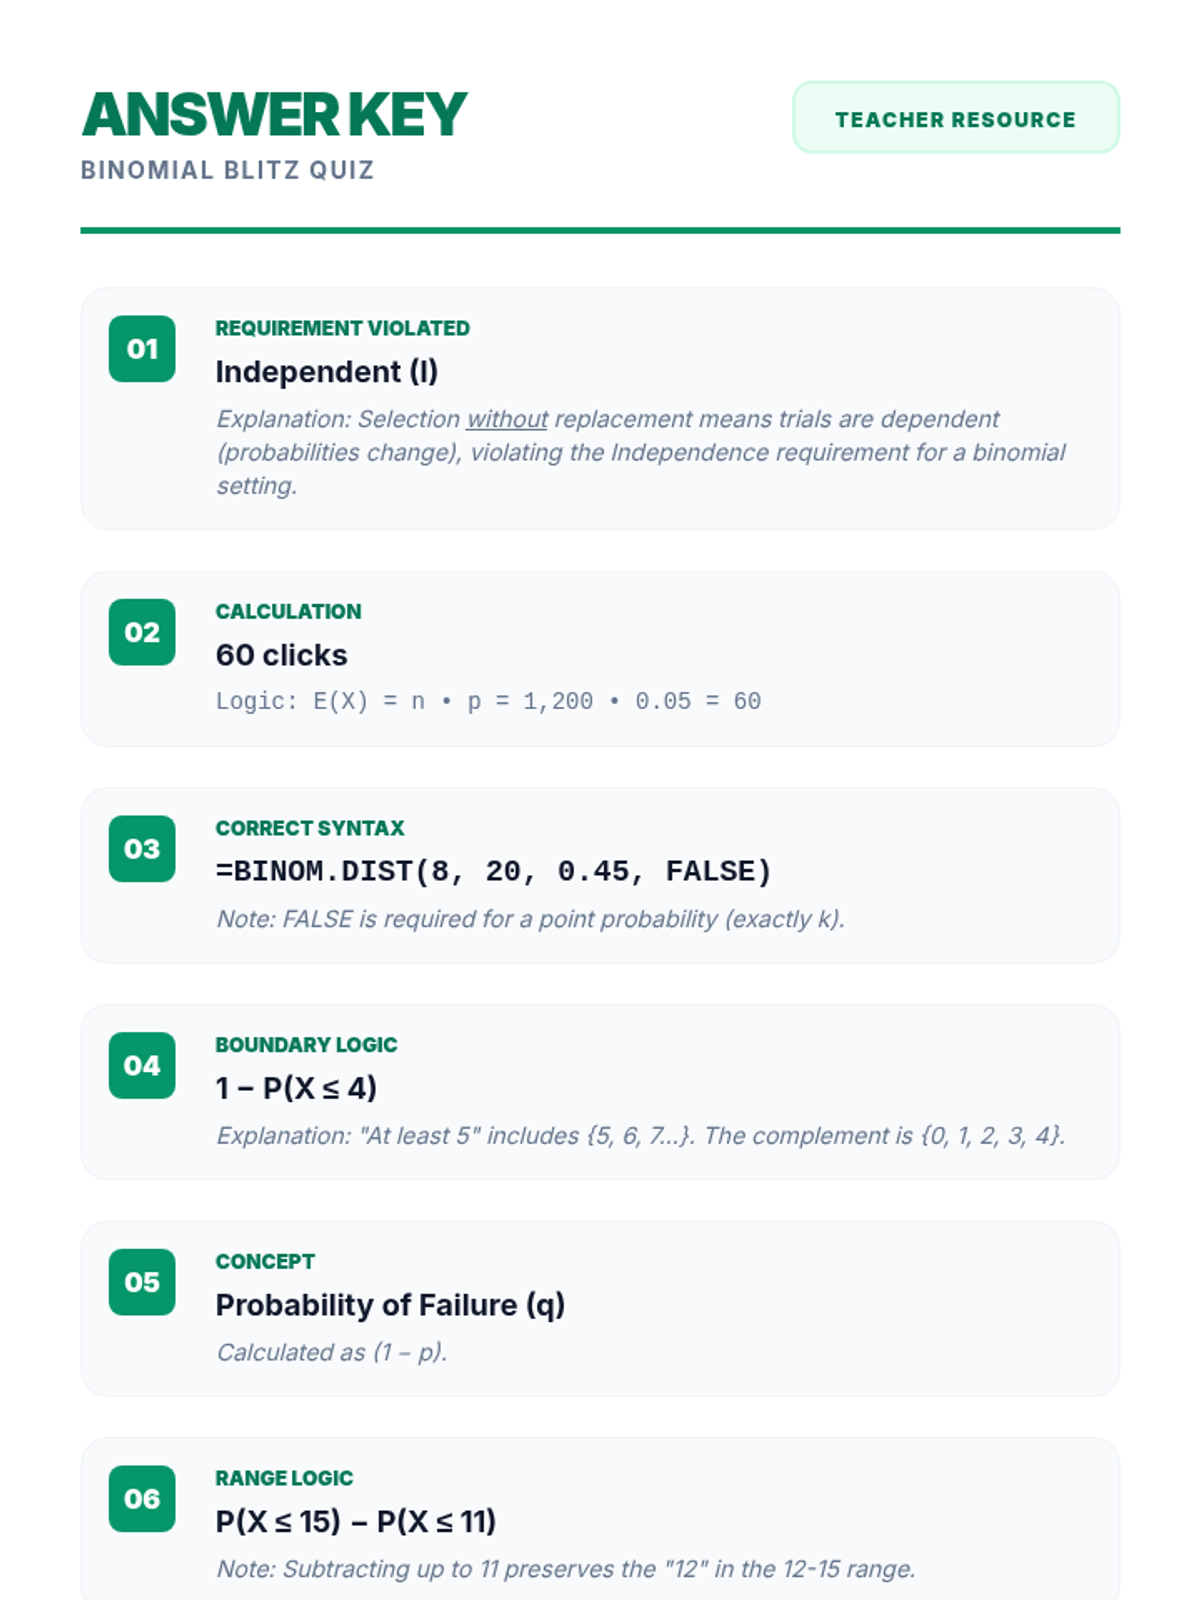
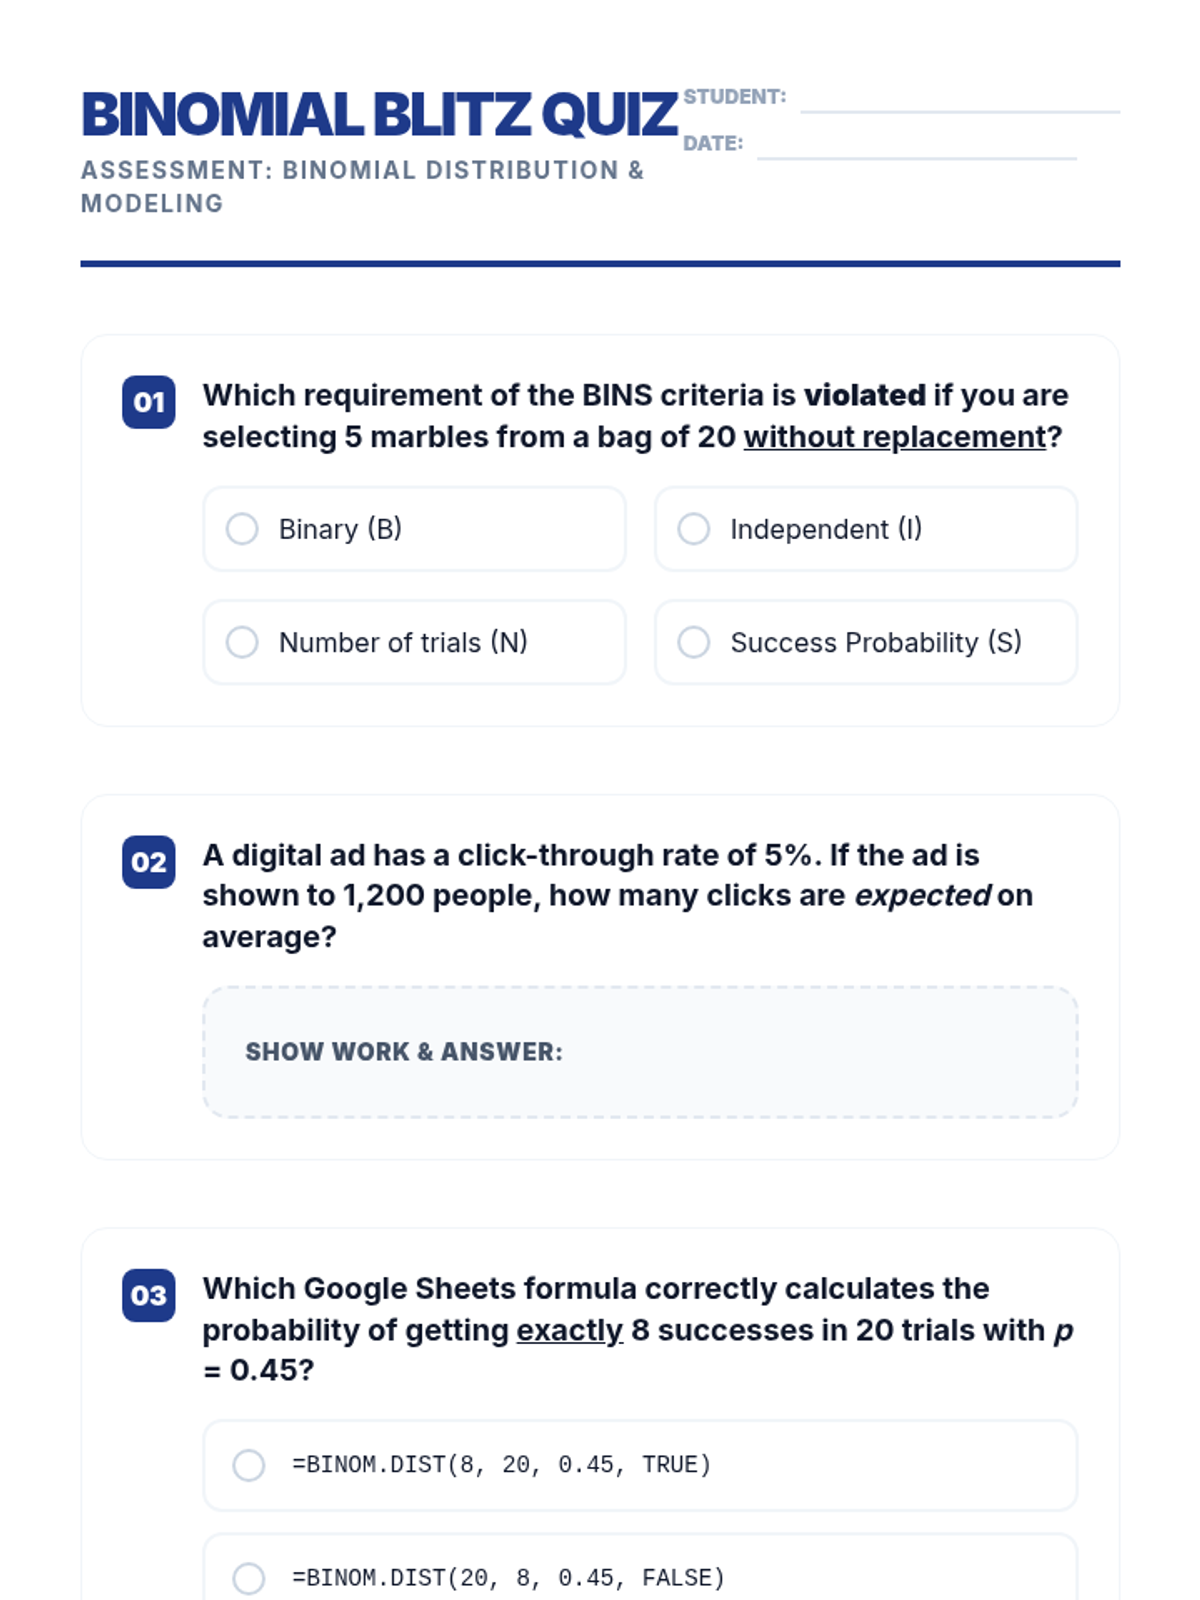
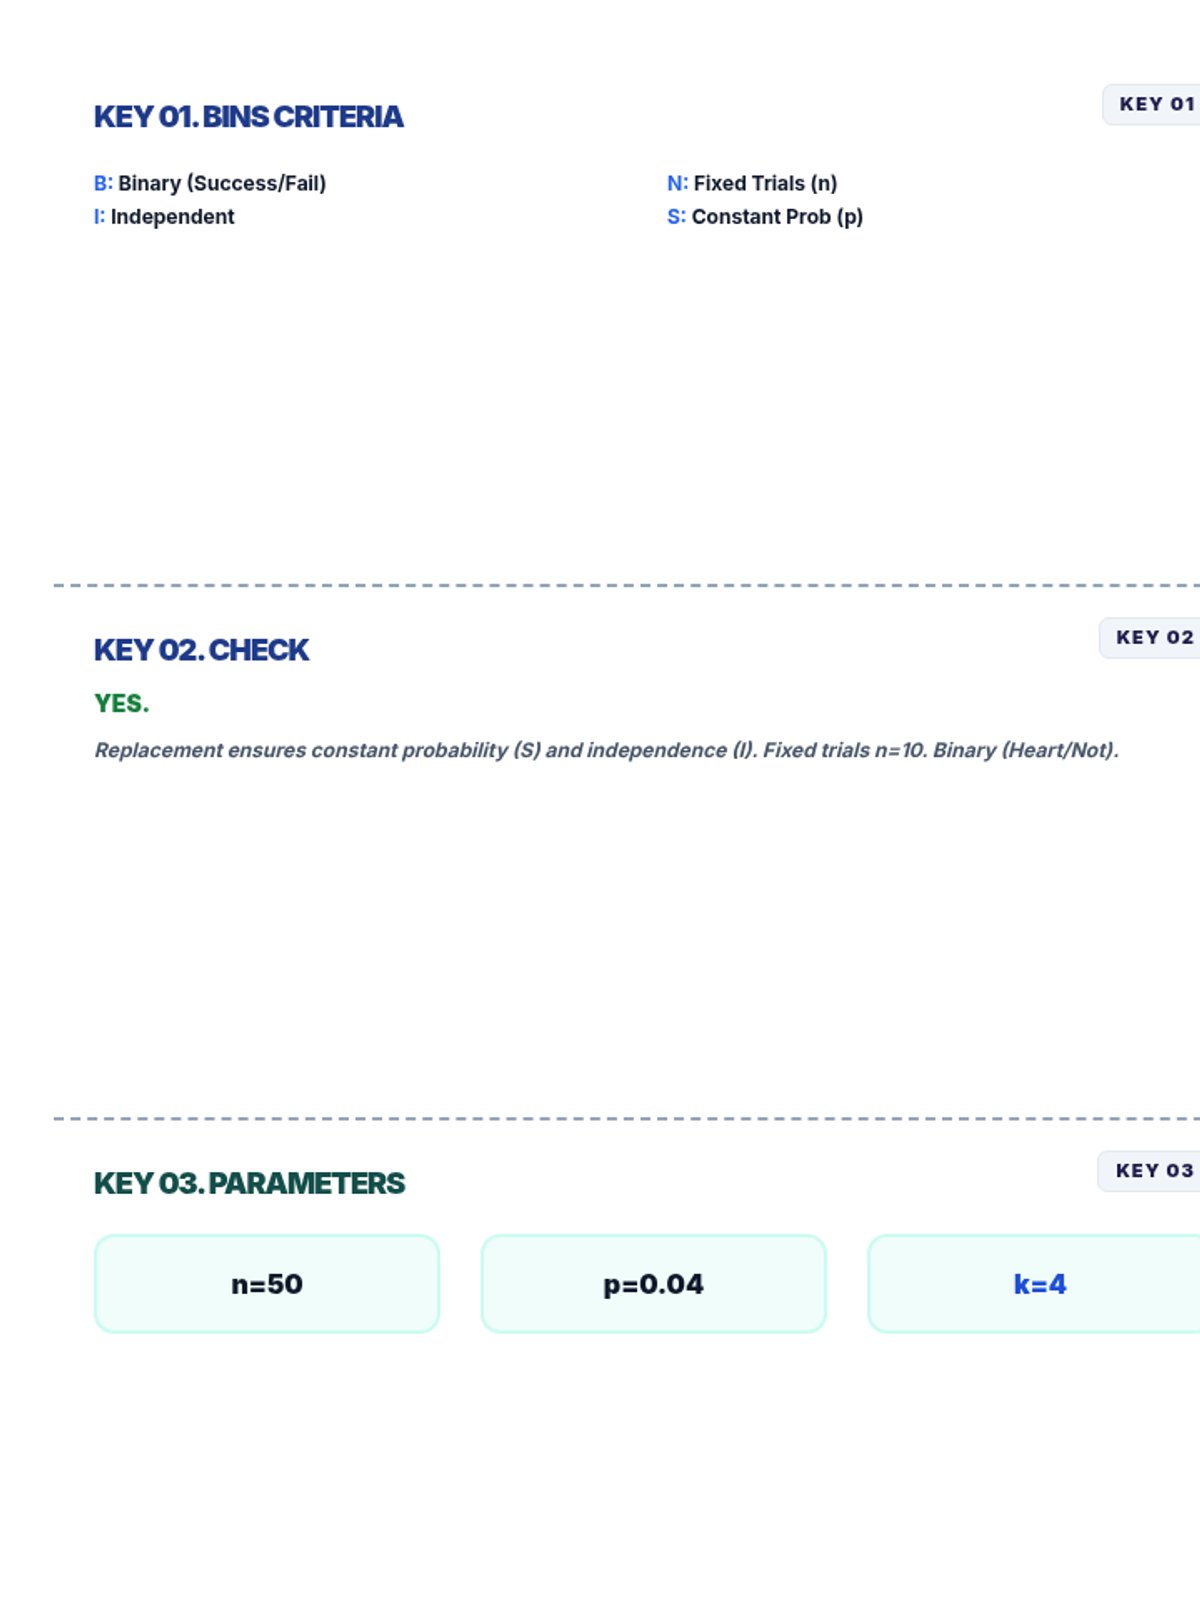
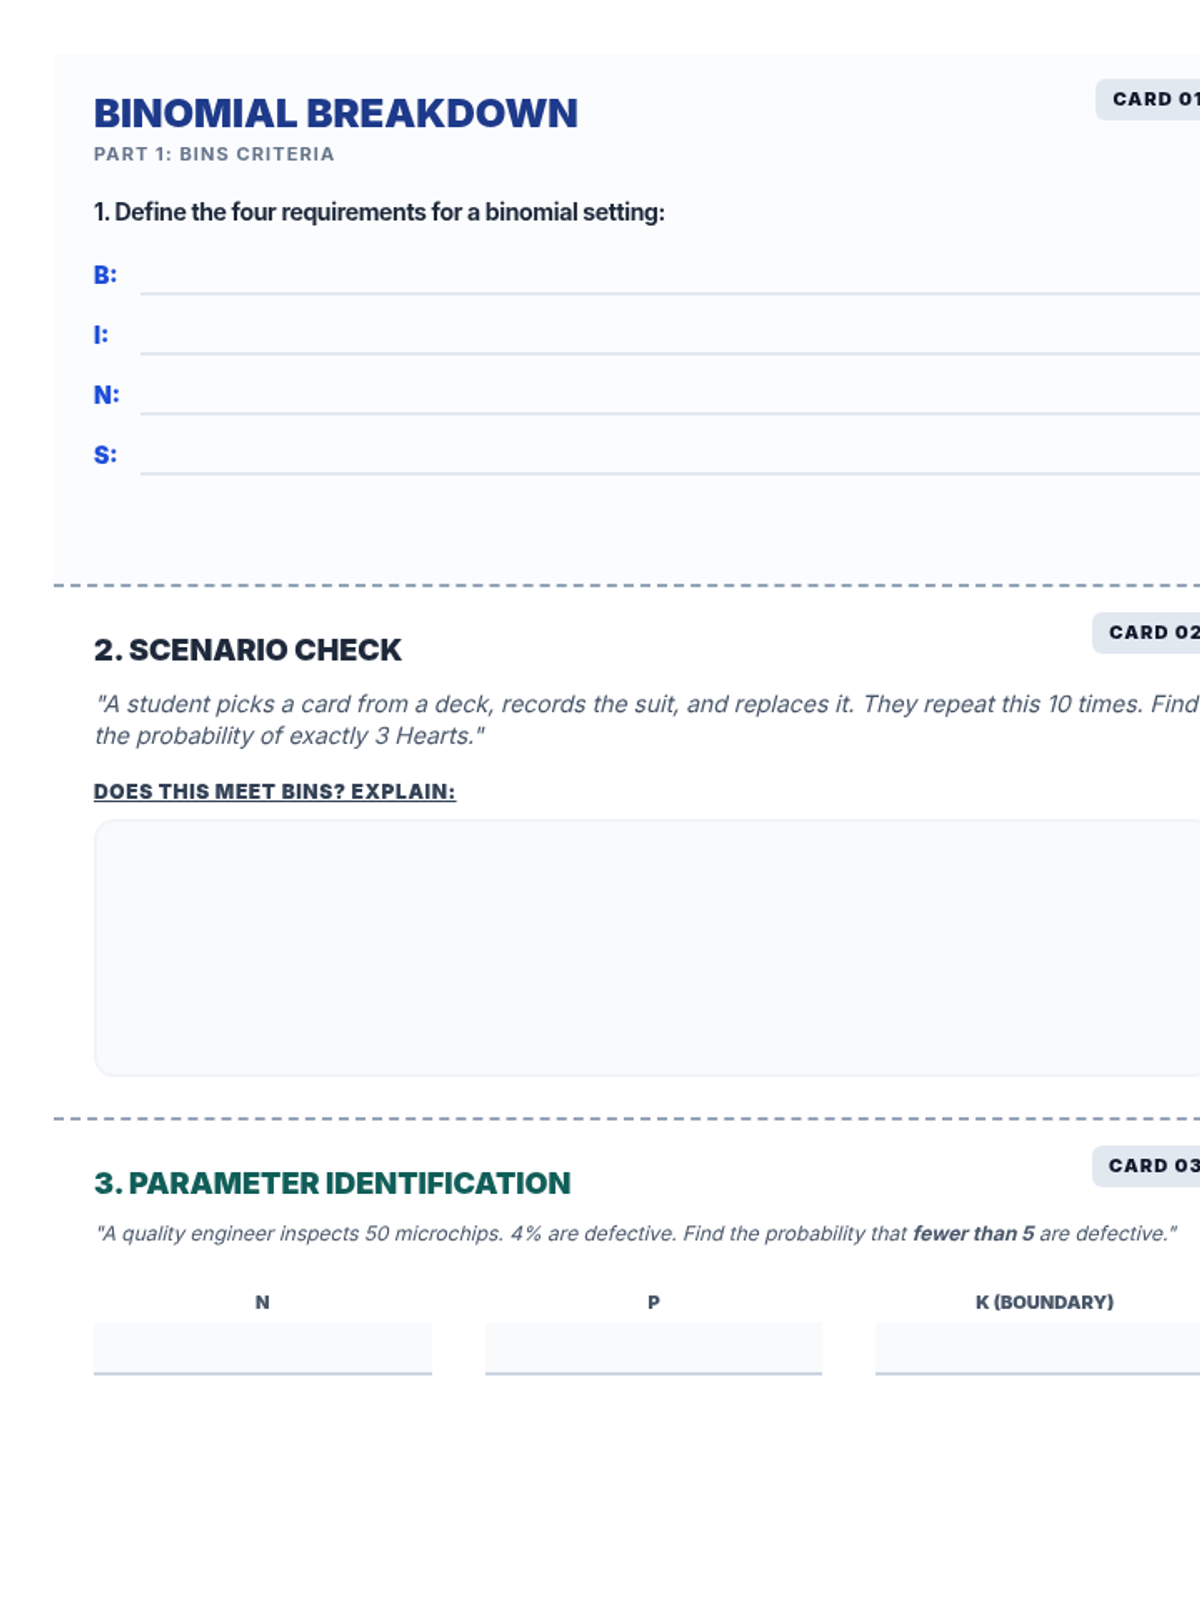
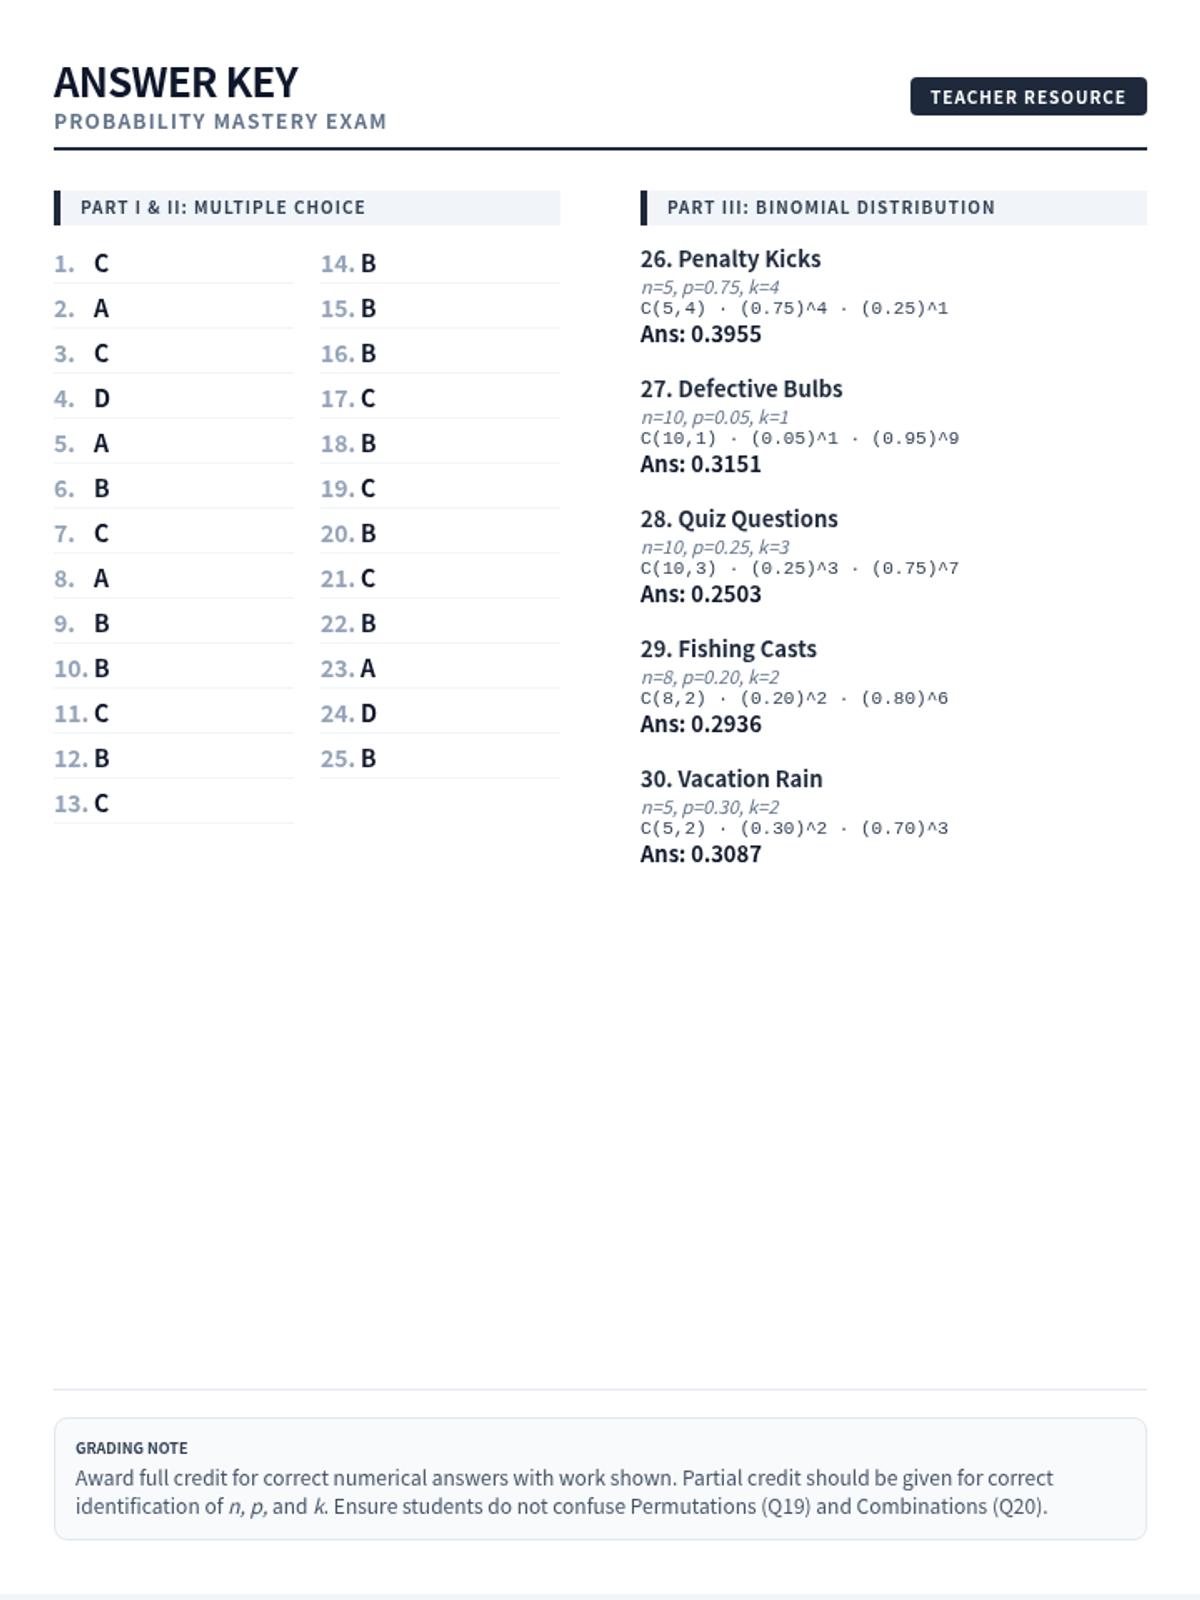
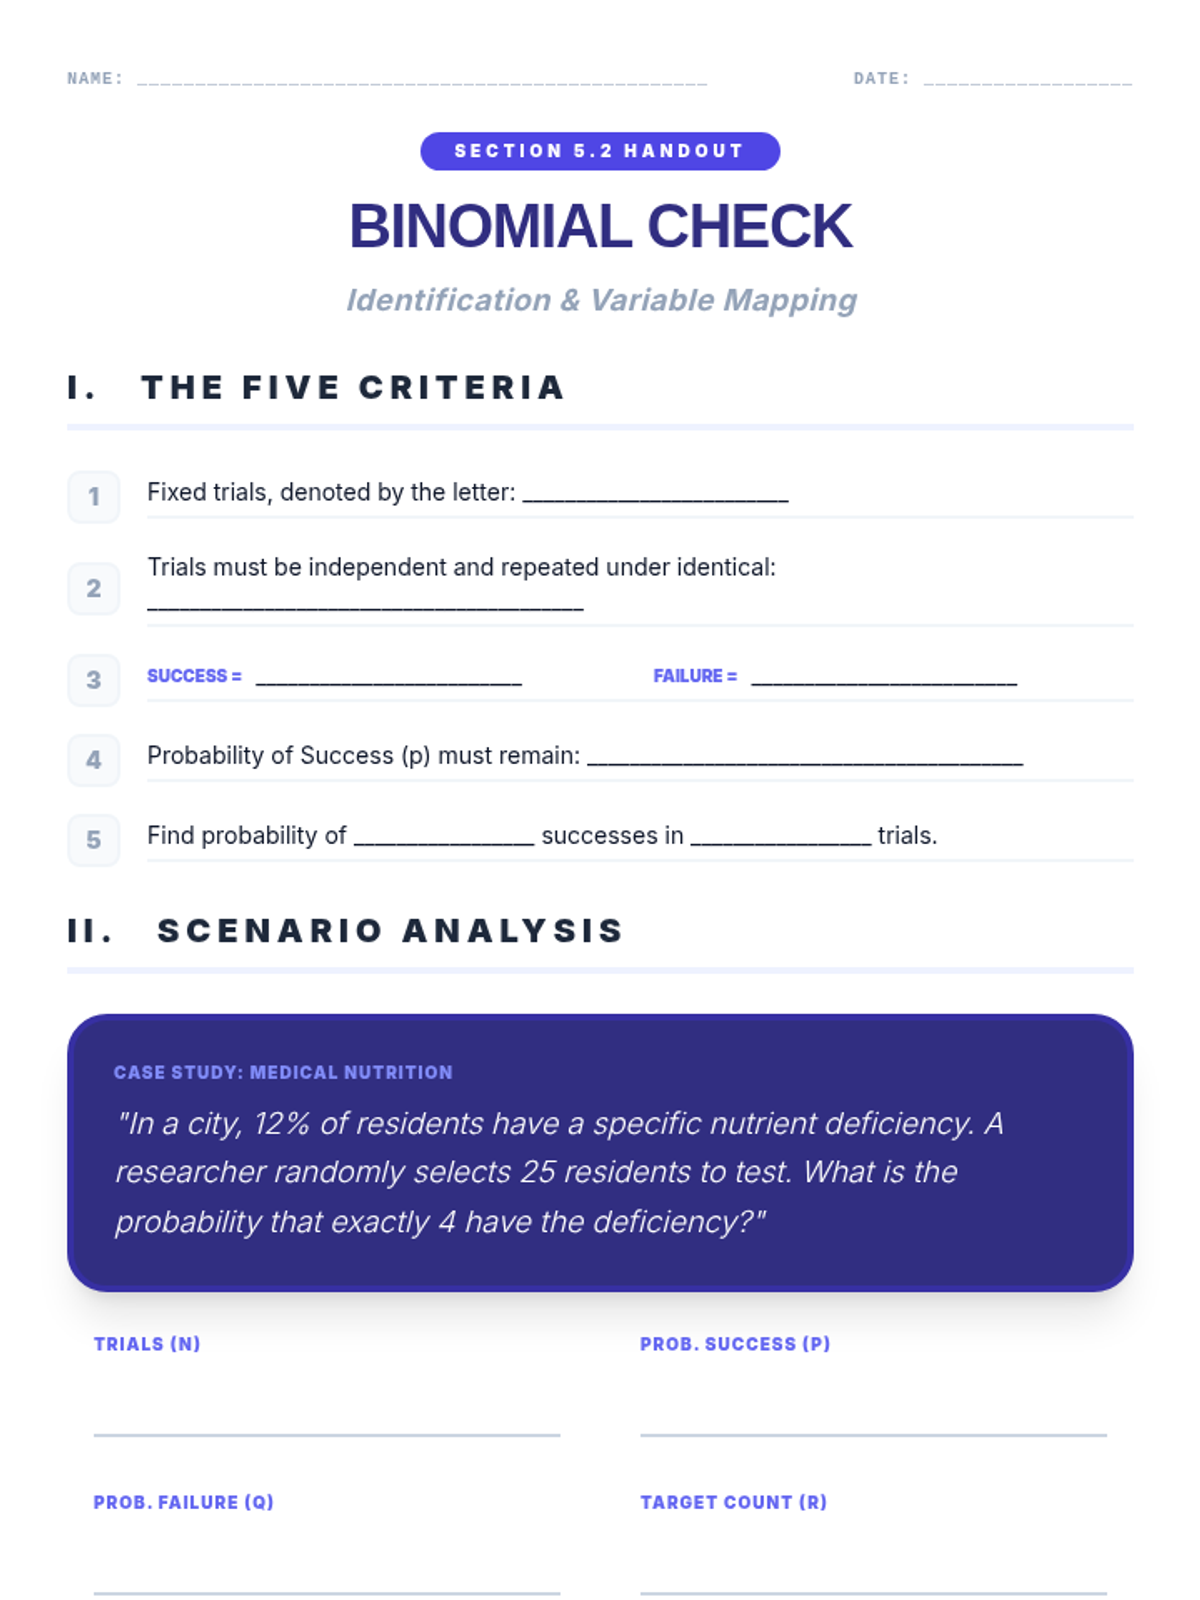
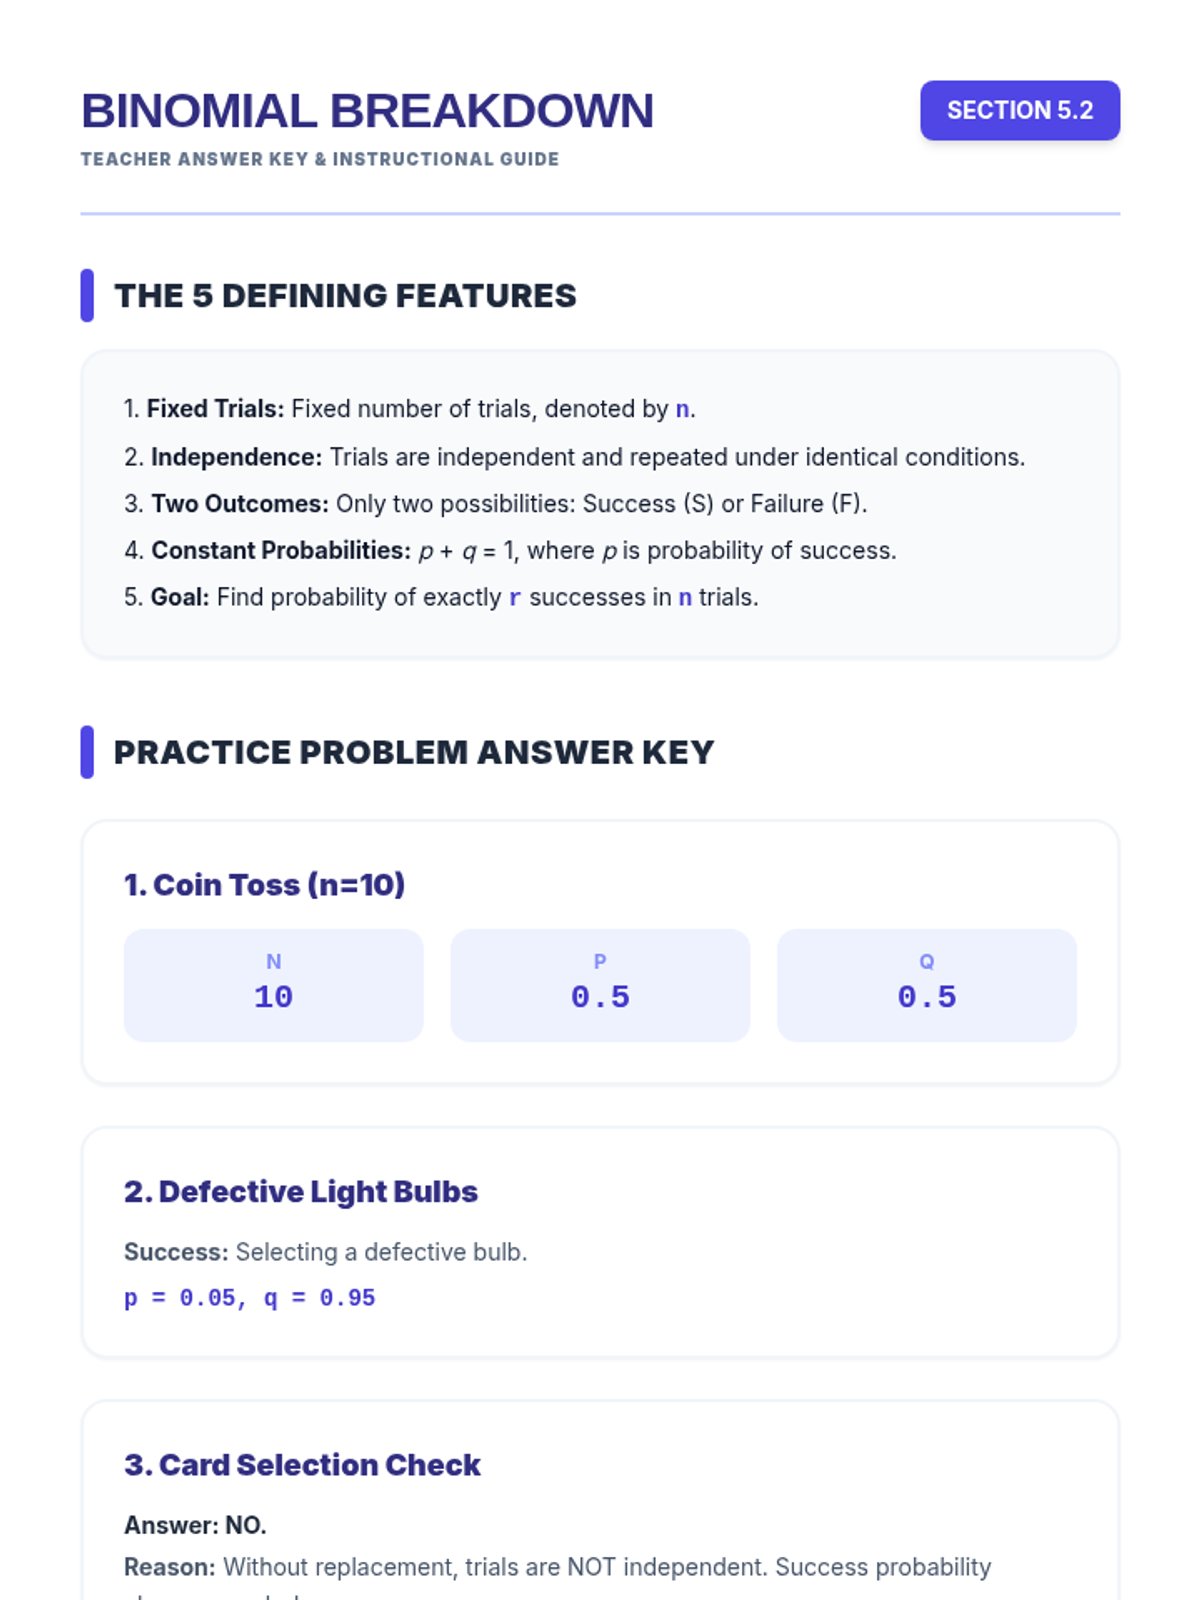
A 17-question practice worksheet for 12th-grade statistics, reformatted as a modular task-card bank. Designed with three horizontal cut-lines per page for easy physical division. Covers BINS criteria, spreadsheet formulas (BINOM.DIST), and hand-calculation theory with fill-in-the-blank formula components. Updated with improved structured identification grids, reliable math rendering syntax, and integrated cuttable answer key. Card IDs and questions are now aligned 1:1.
KCKatelyn Coleman
Math Teacher 4/27