Students use quantitative data to graph temperature changes over time, visualizing the rate of energy transfer.
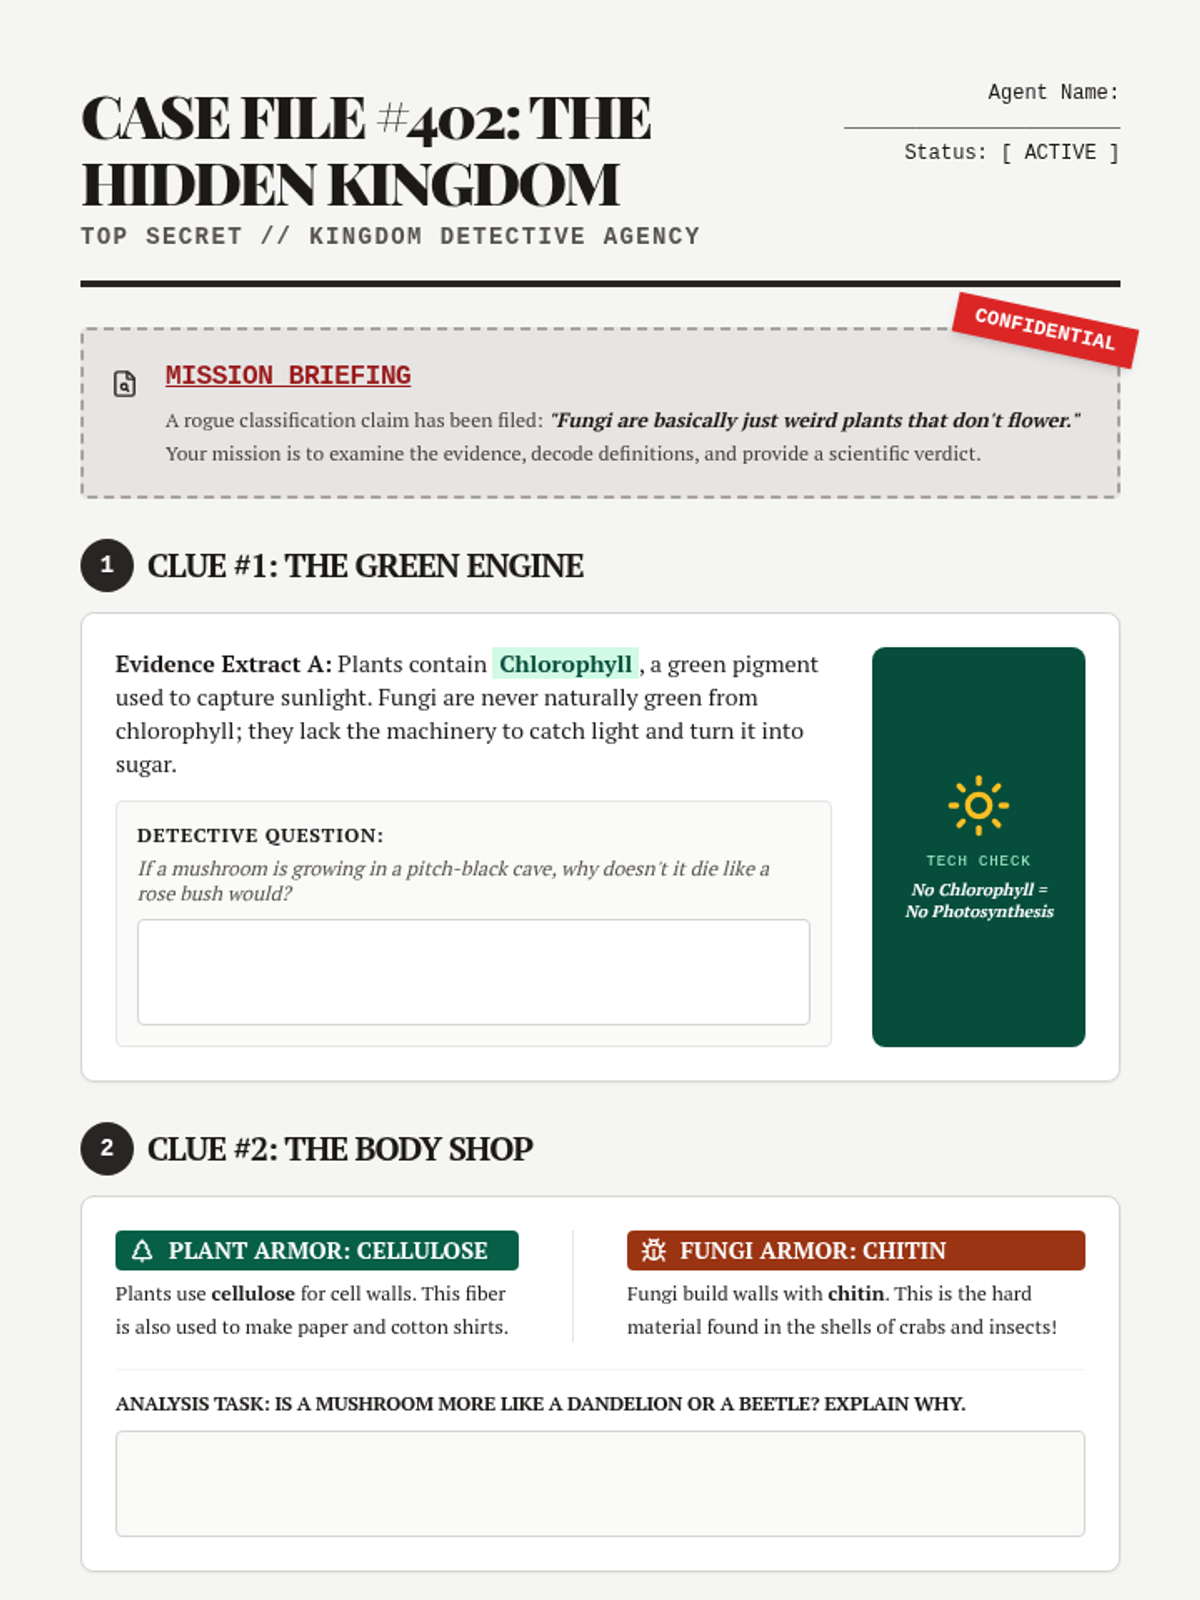
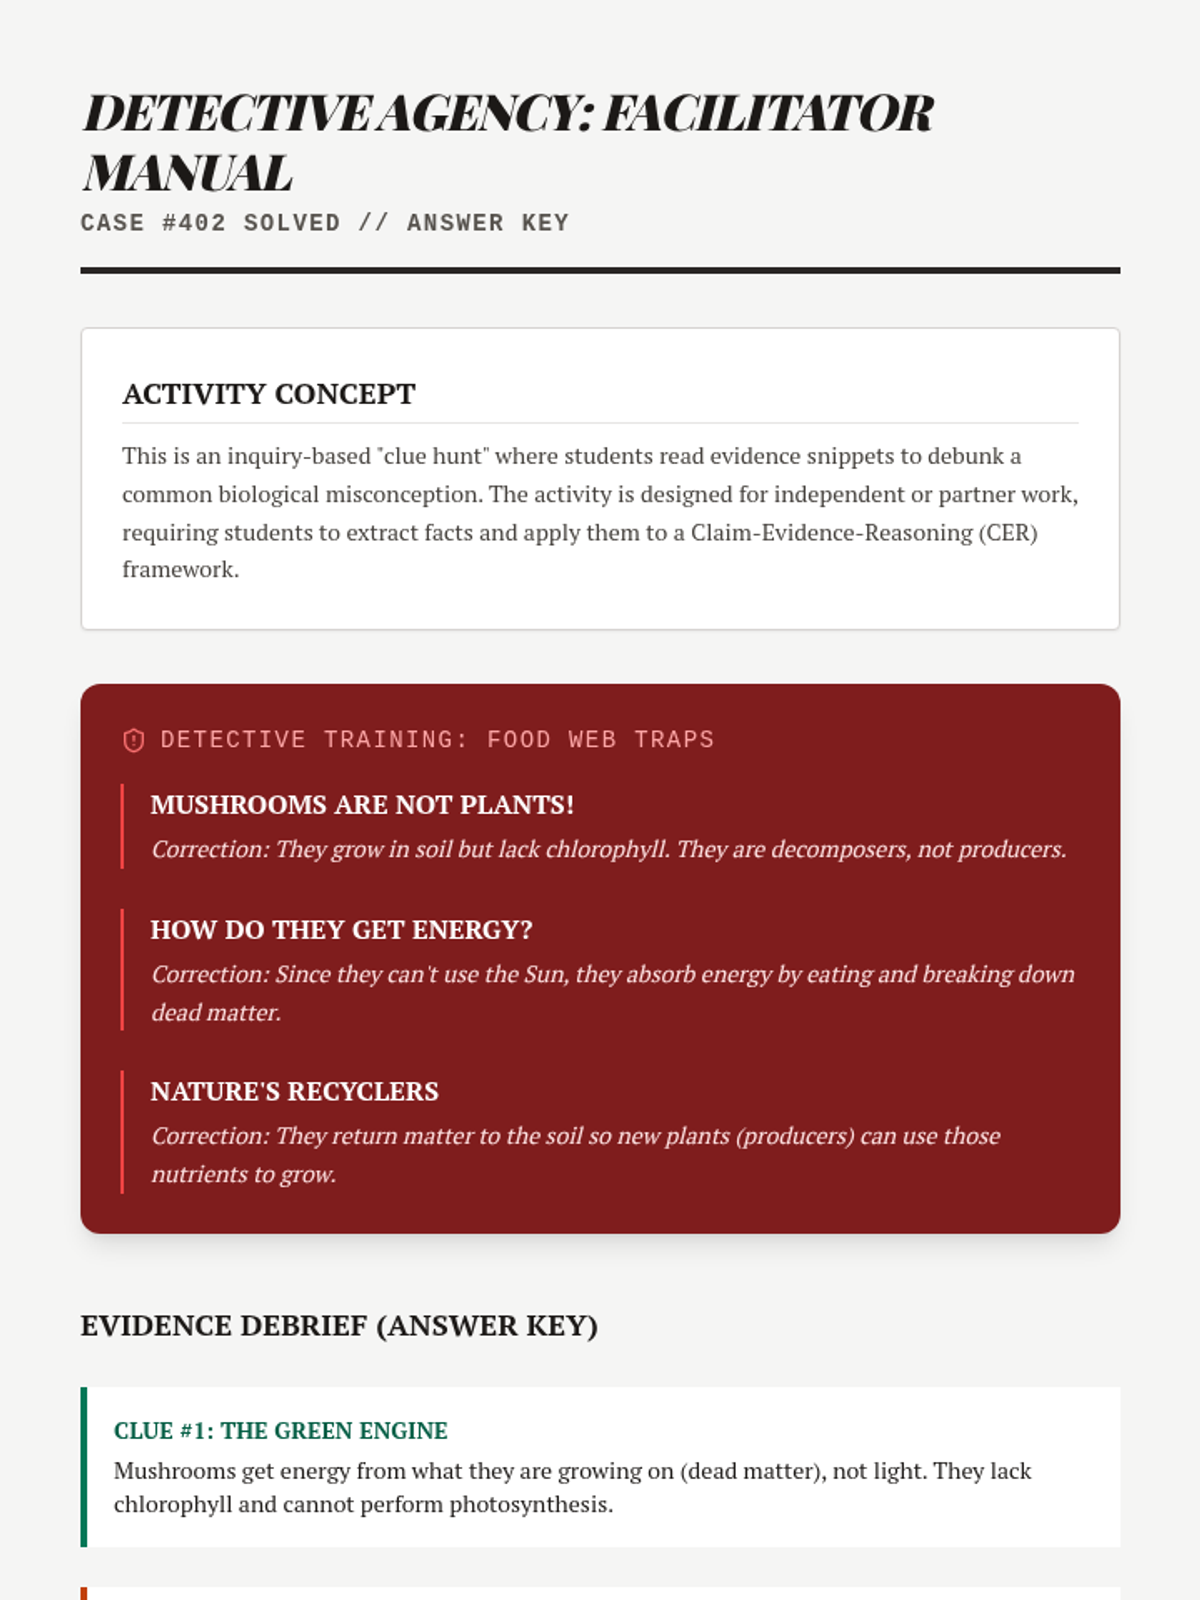
An independent, mystery-themed activity where students act as "Kingdom Detectives." They analyze a series of clues, definitions, and evidence files to determine why fungi are not plants and clarify the role of the sun in ecosystems.
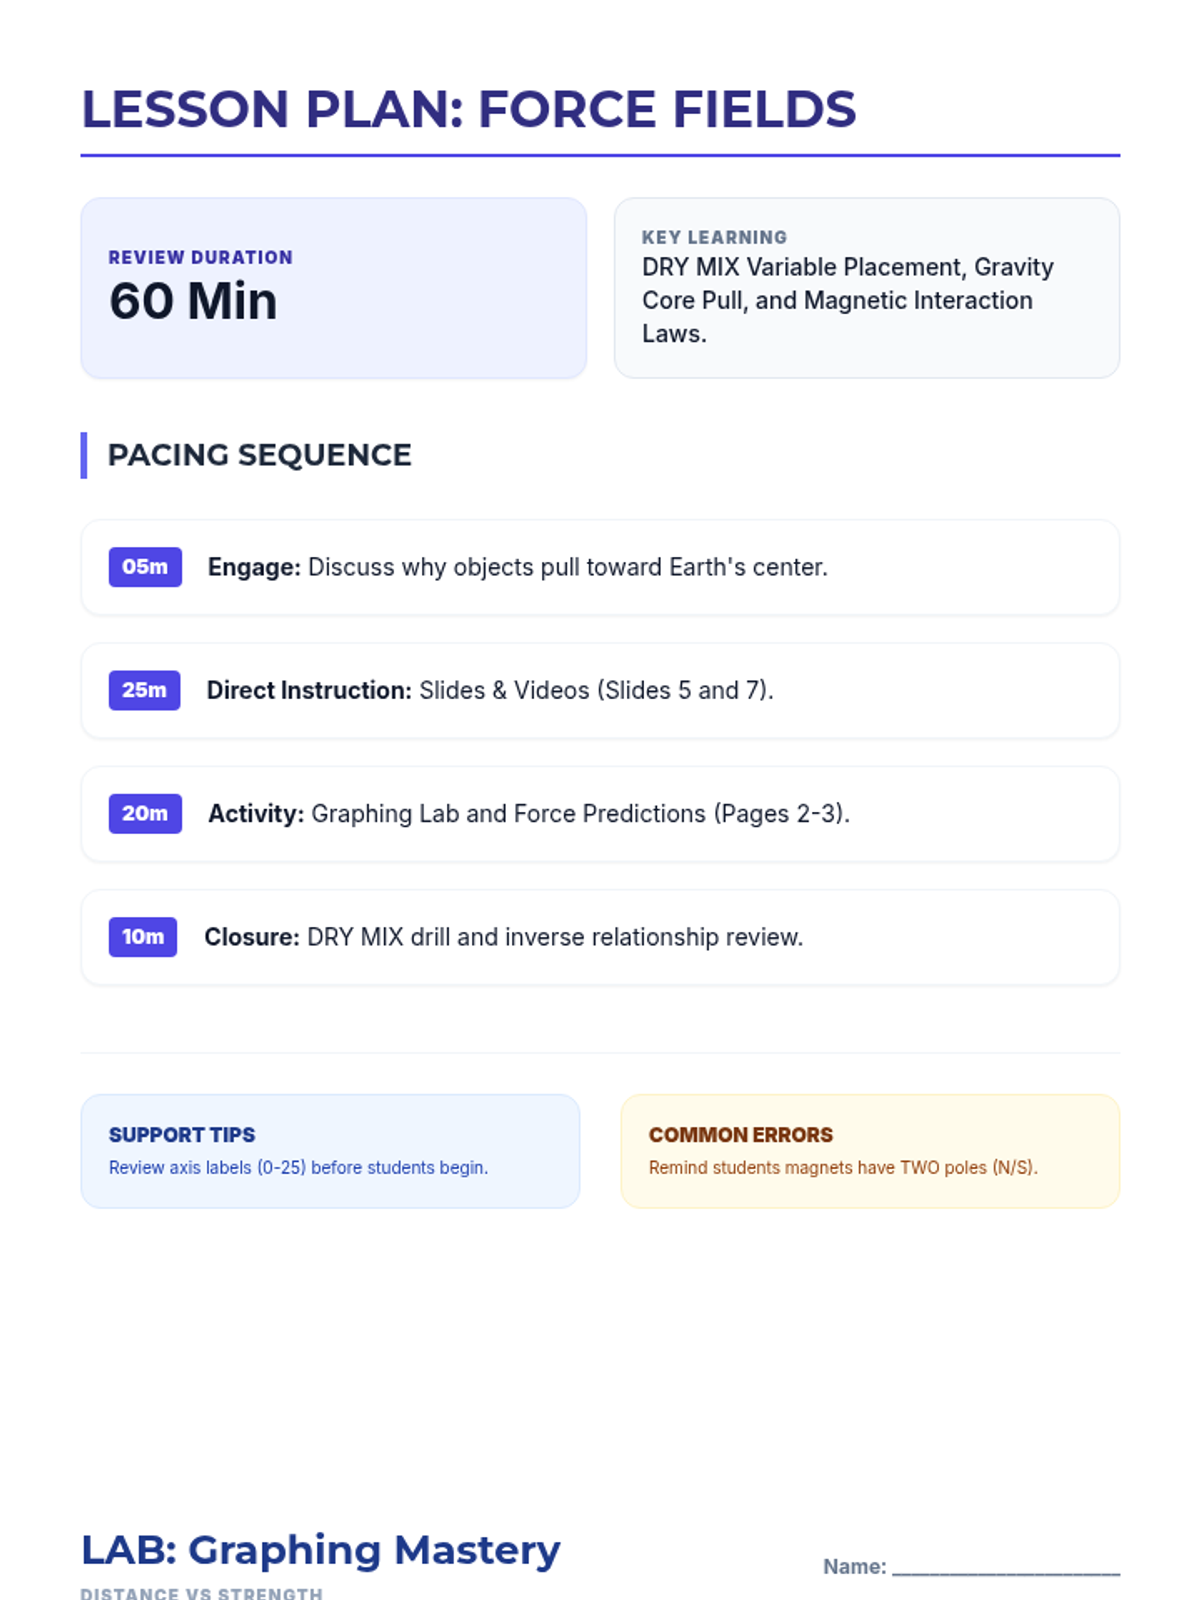
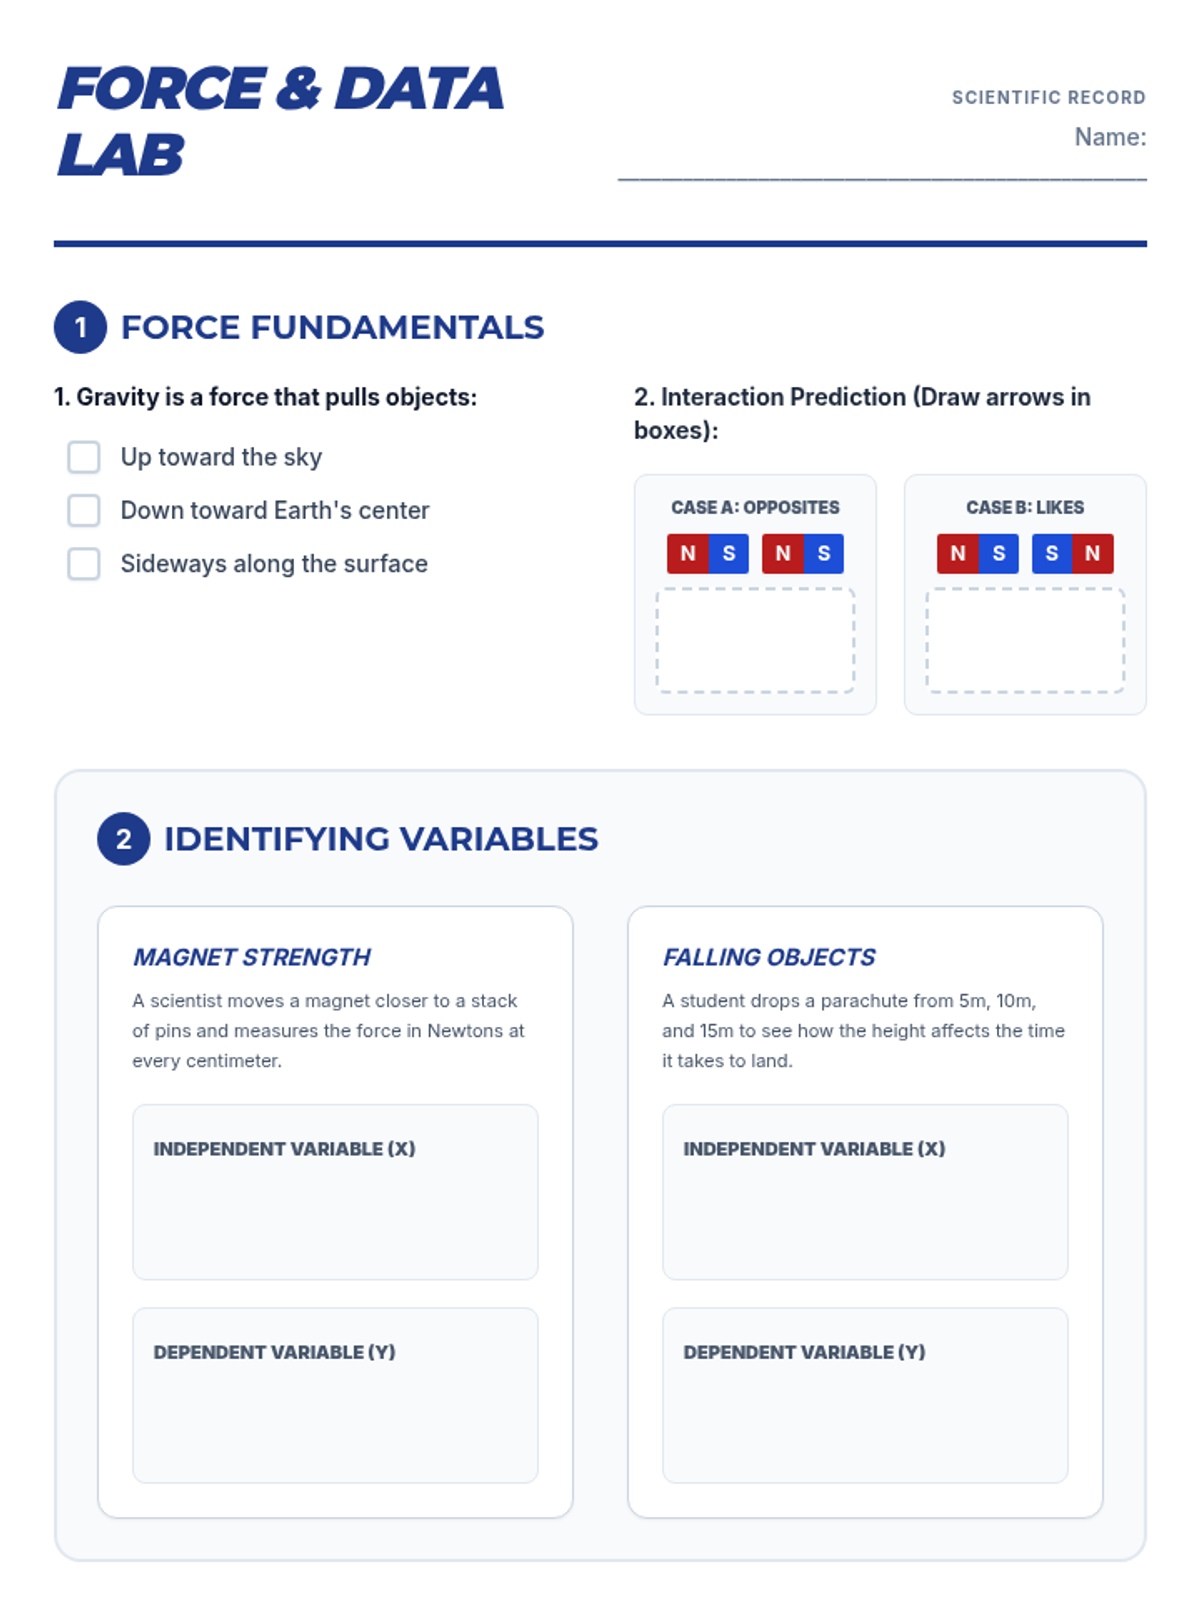
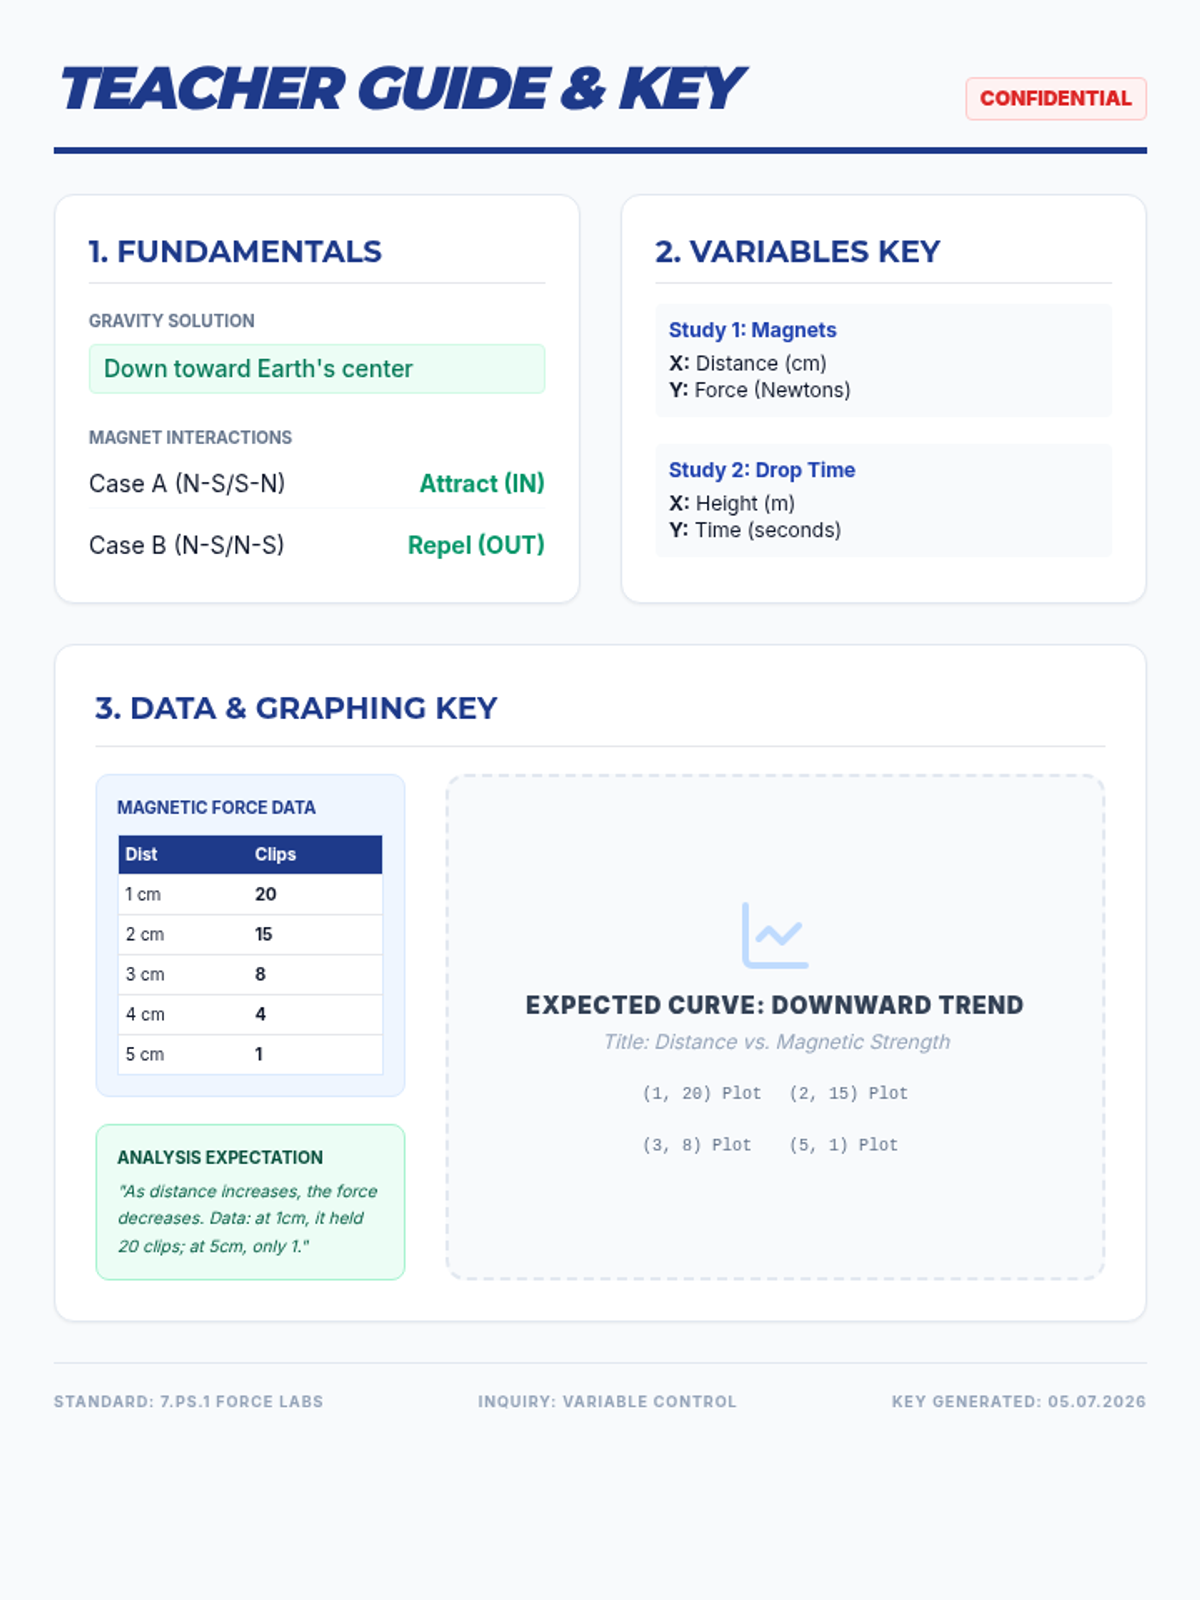
A focused review lesson on graphing independent and dependent variables, the constant pull of gravity, and the fundamental laws of magnetism.
This lesson explores the invisible forces of gravity and magnetism, while teaching students how to organize and visualize scientific observations through graphing. Students will learn to identify variables and create accurate line graphs from experimental data.
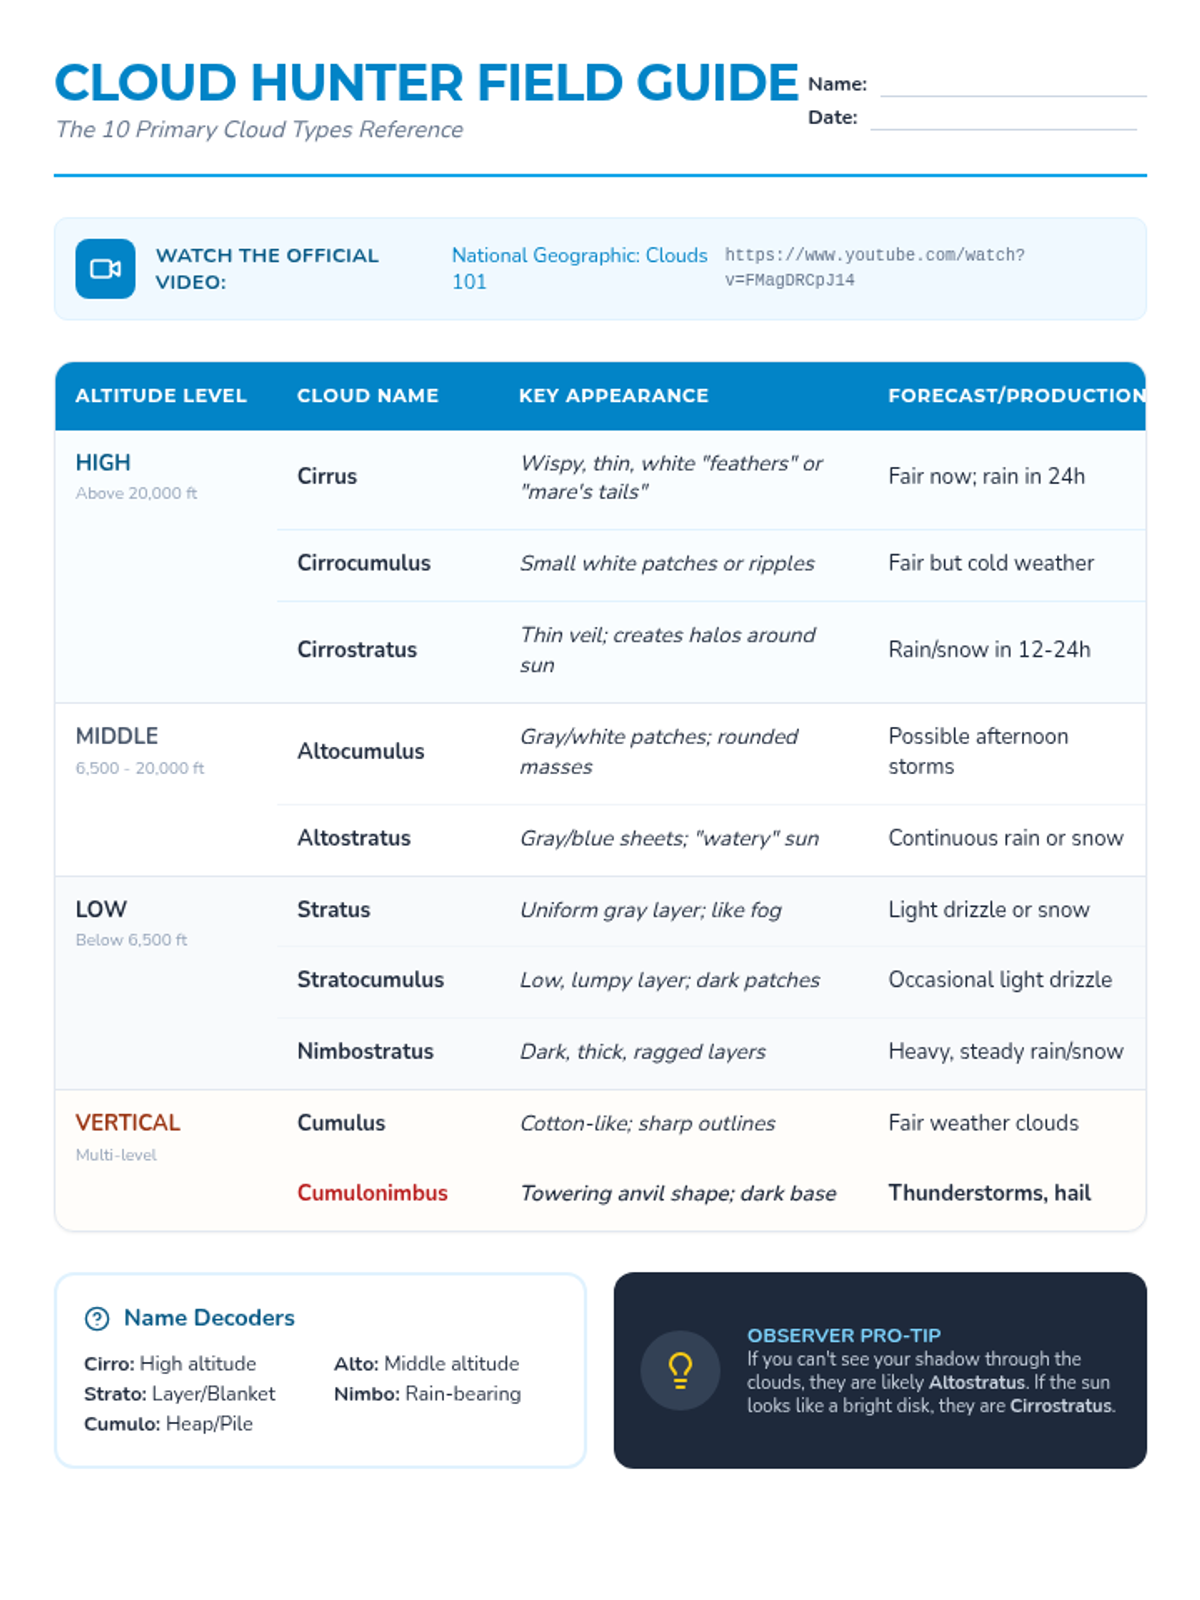
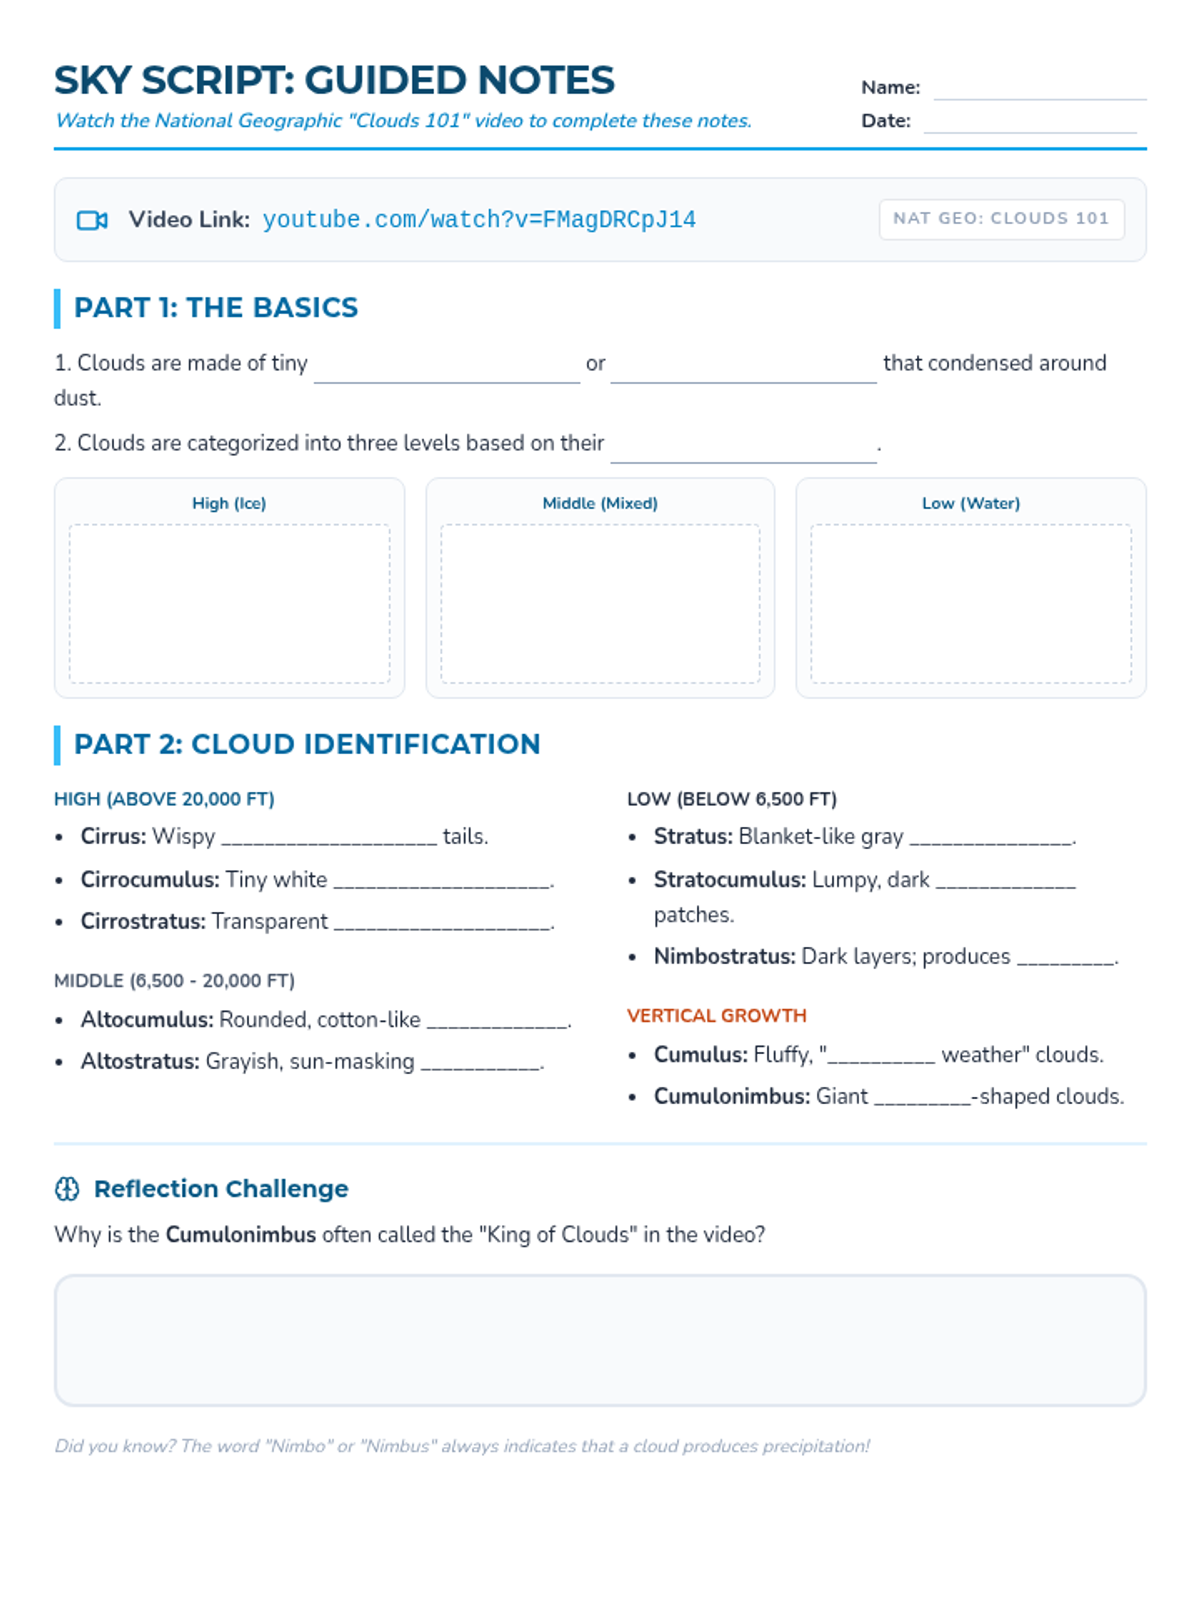
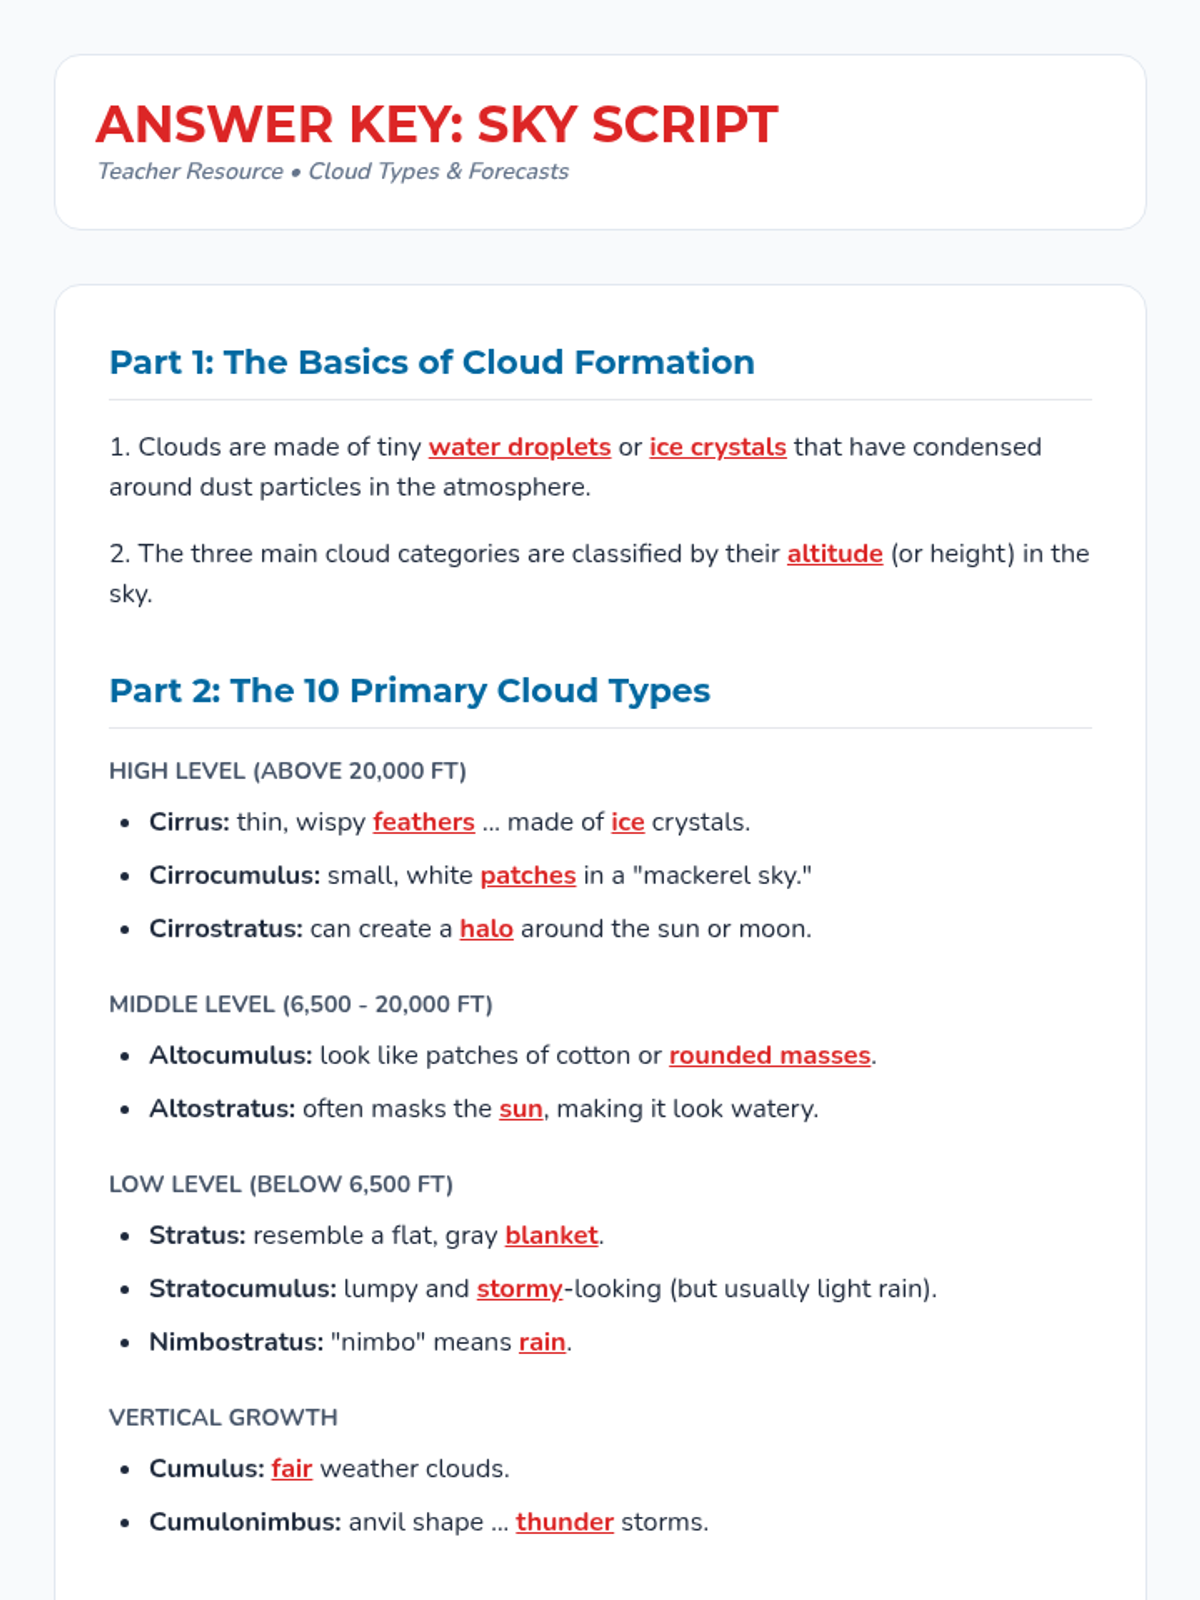
Students will learn to identify the ten primary cloud types, categorize them by altitude, and predict weather outcomes based on cloud formations.
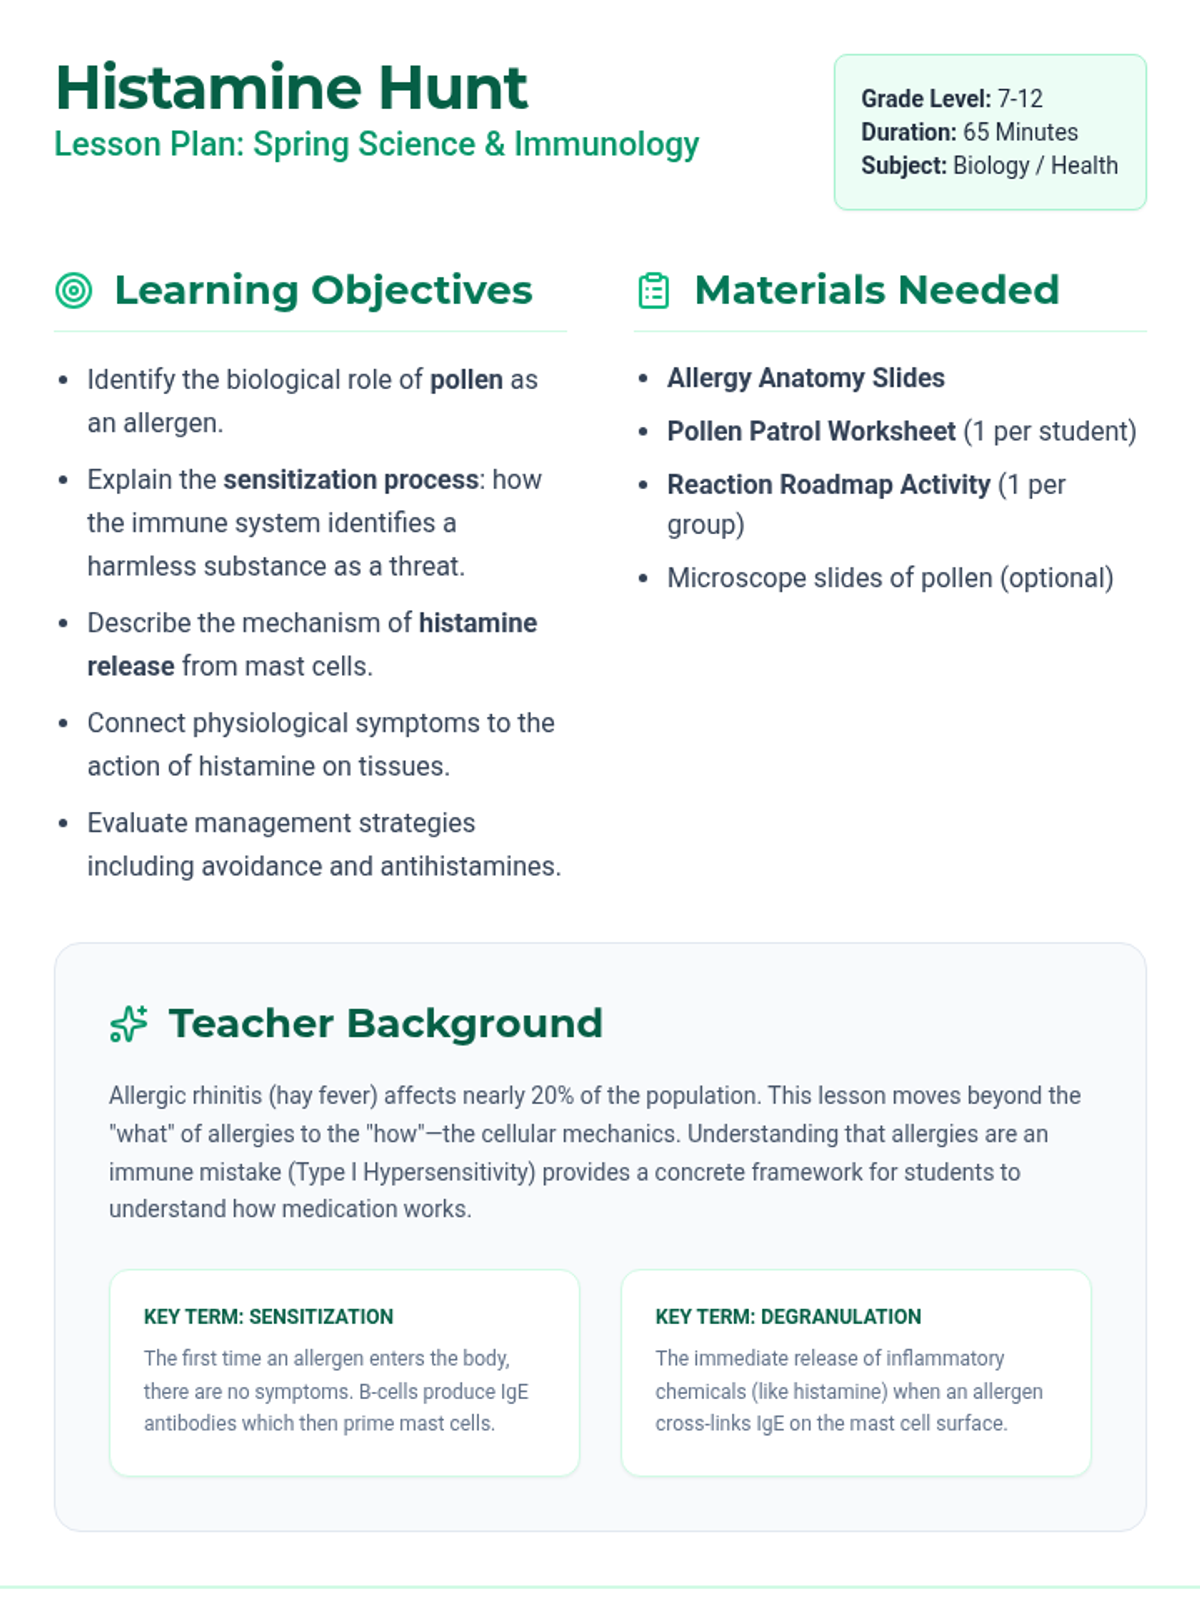
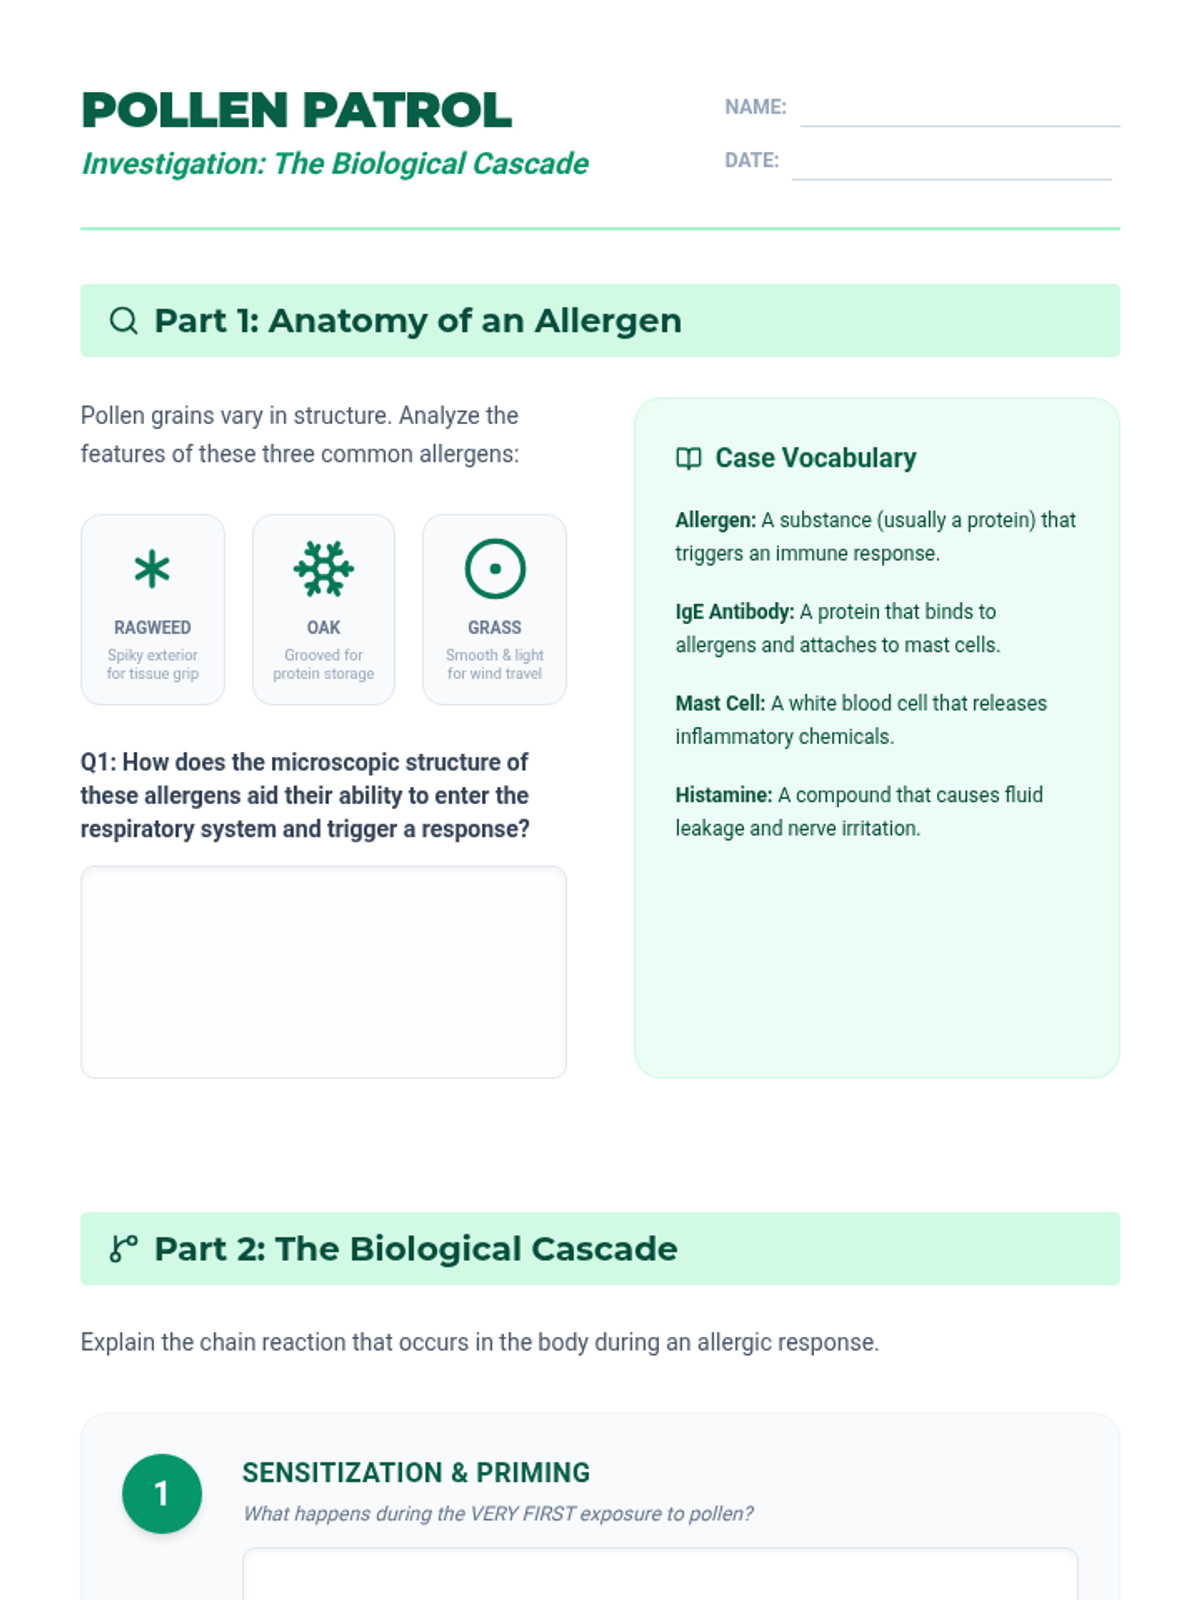
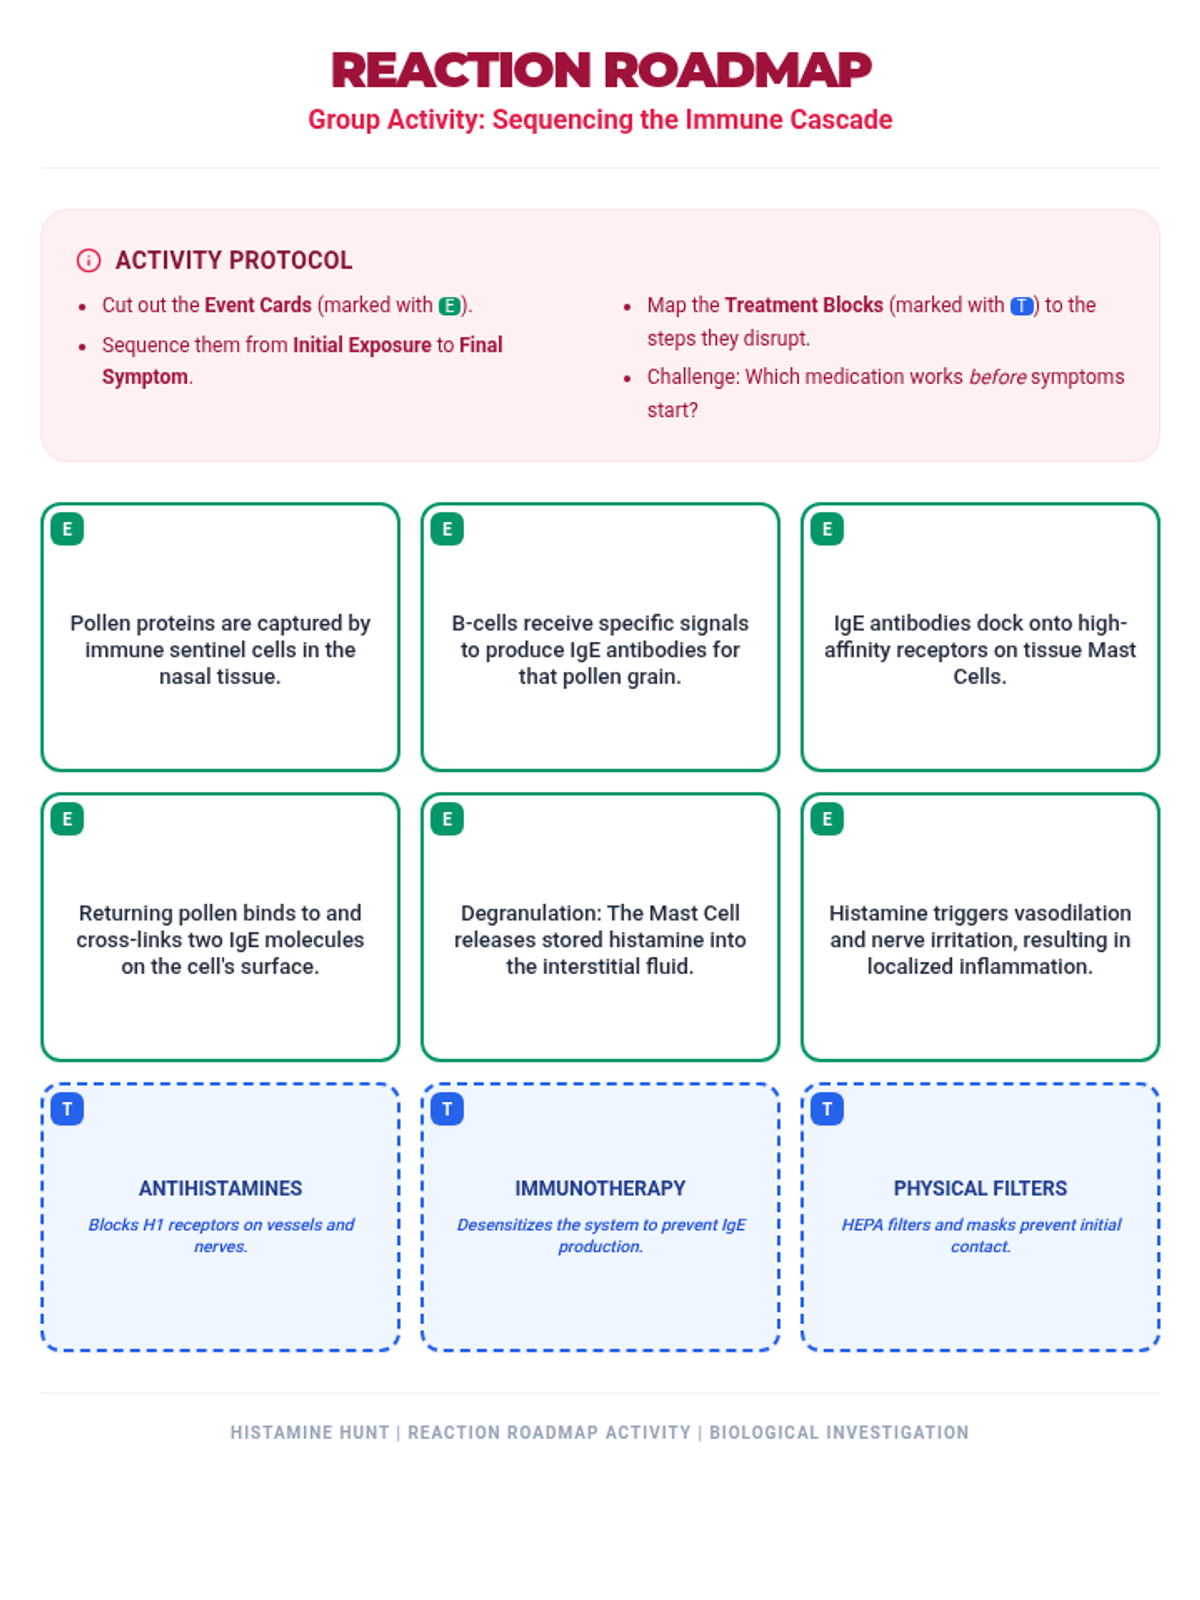
A comprehensive investigation into the biological mechanisms of seasonal allergies, focusing on the immune system's overreaction to pollen and the role of histamine. Students will explore hypersensitivity, physical symptoms, and evidence-based management strategies.
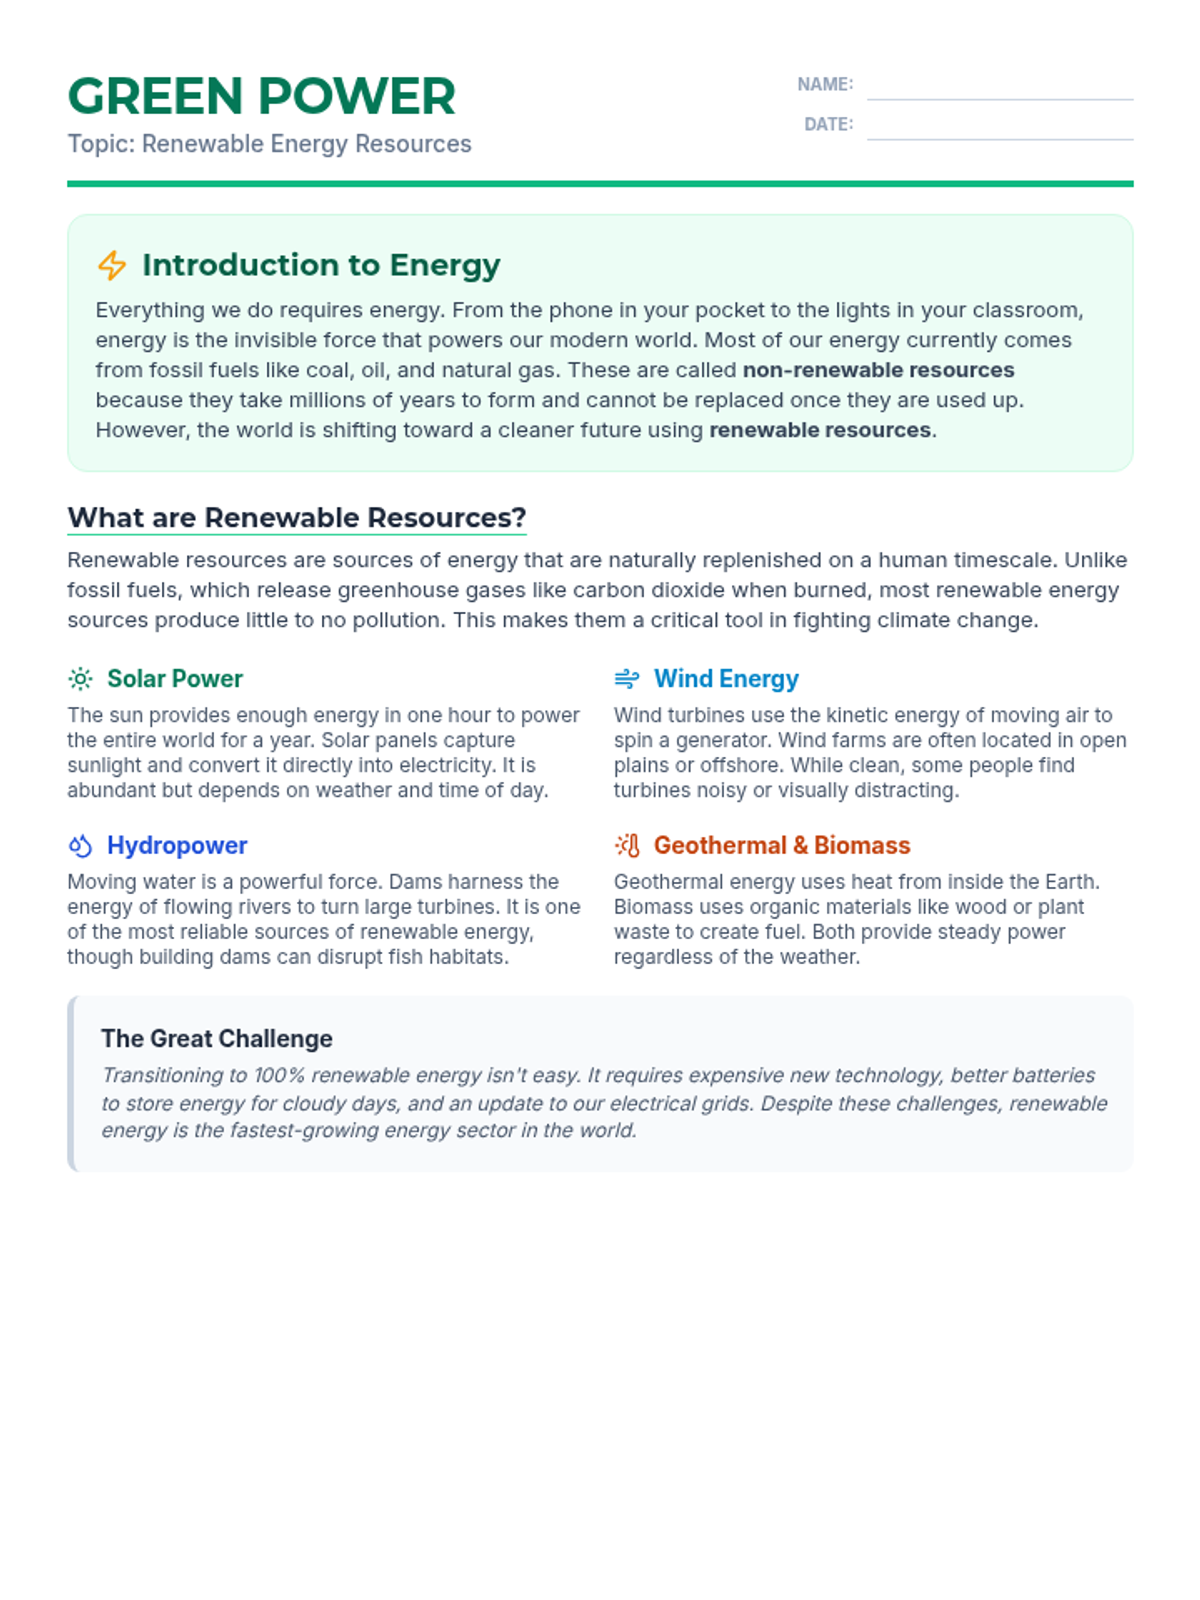
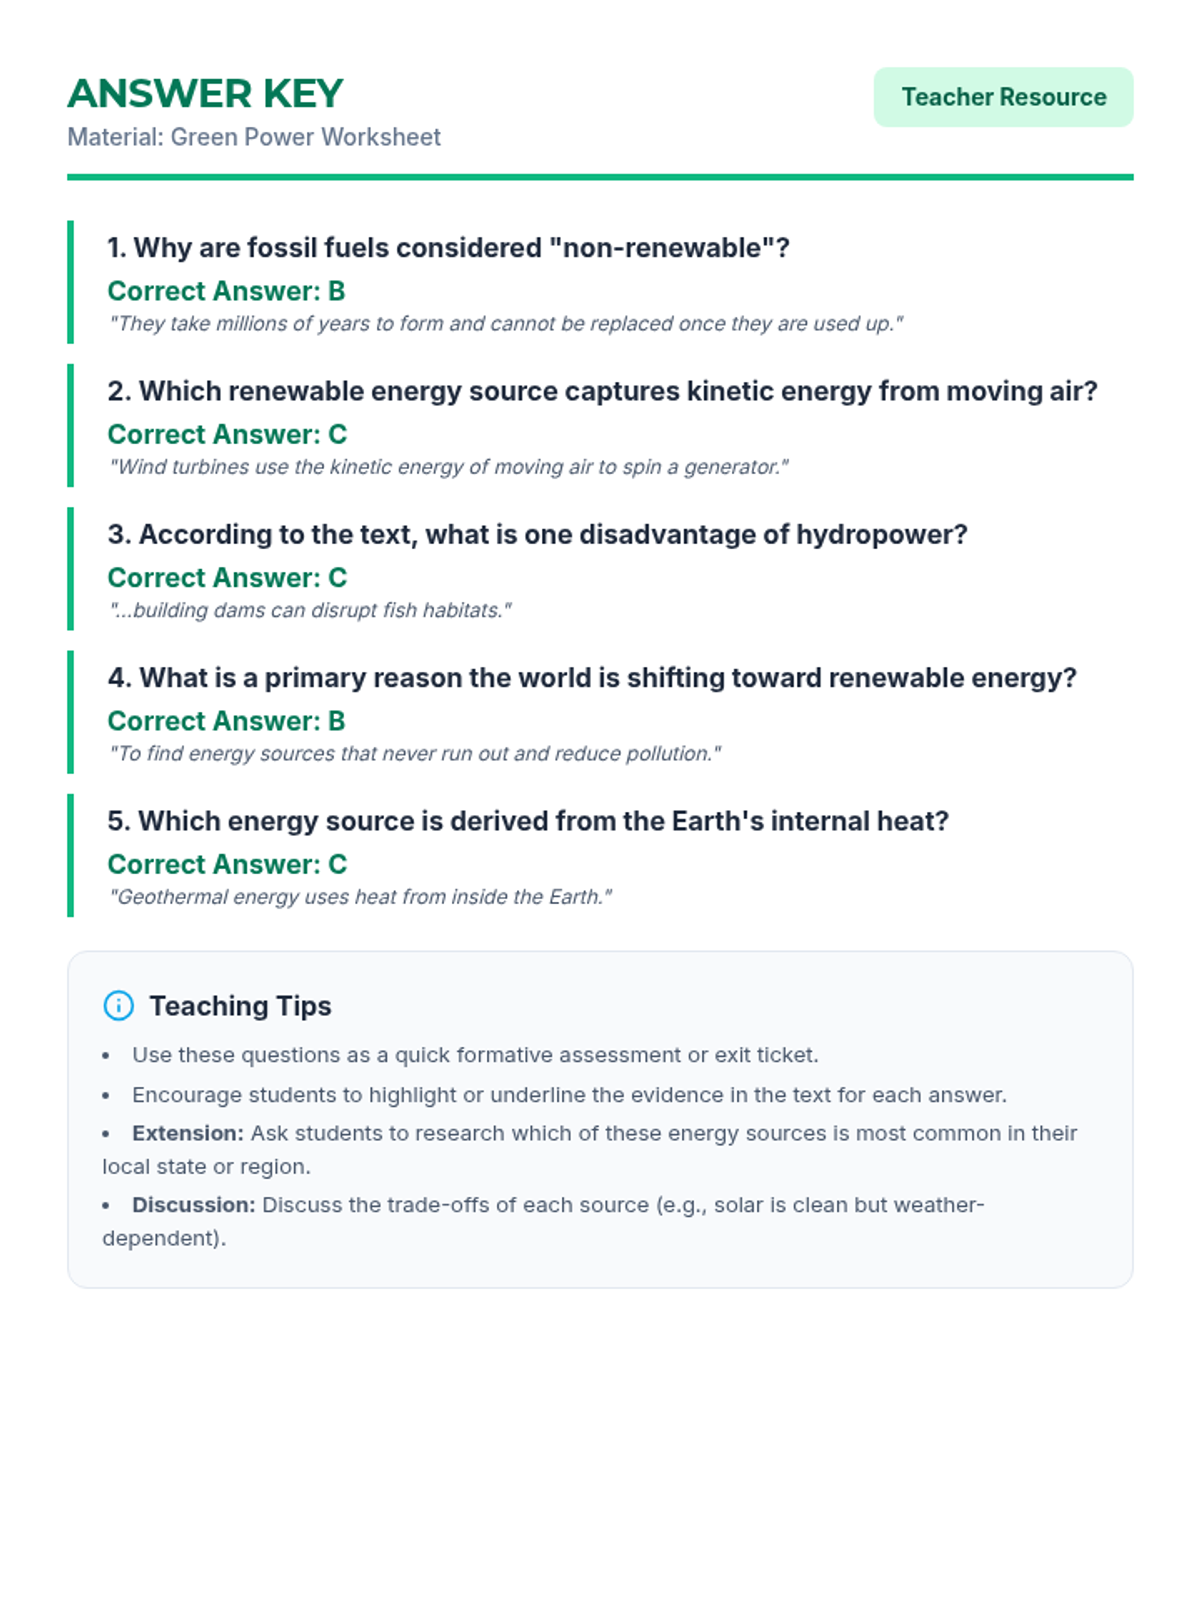
An introductory lesson on renewable and non-renewable energy resources, focusing on the science behind solar, wind, and hydroelectric power. Students will explore how these energy sources work and their impact on the environment.
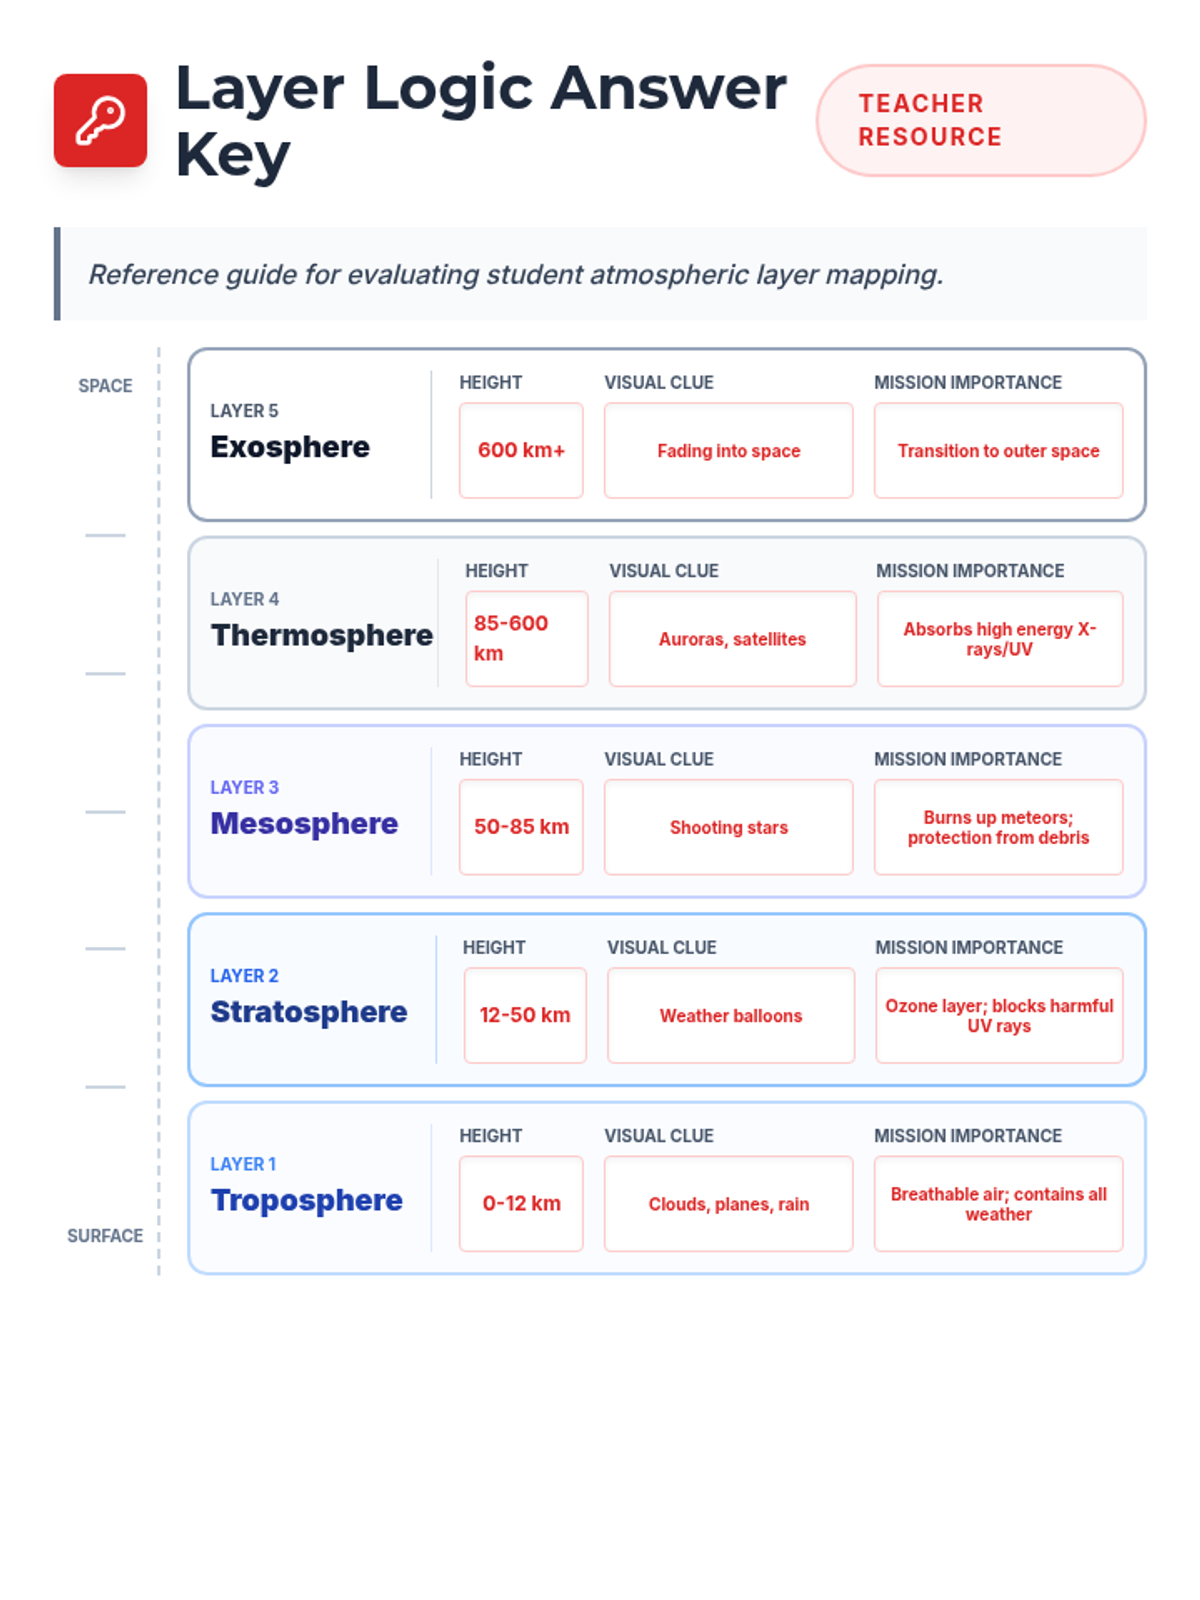
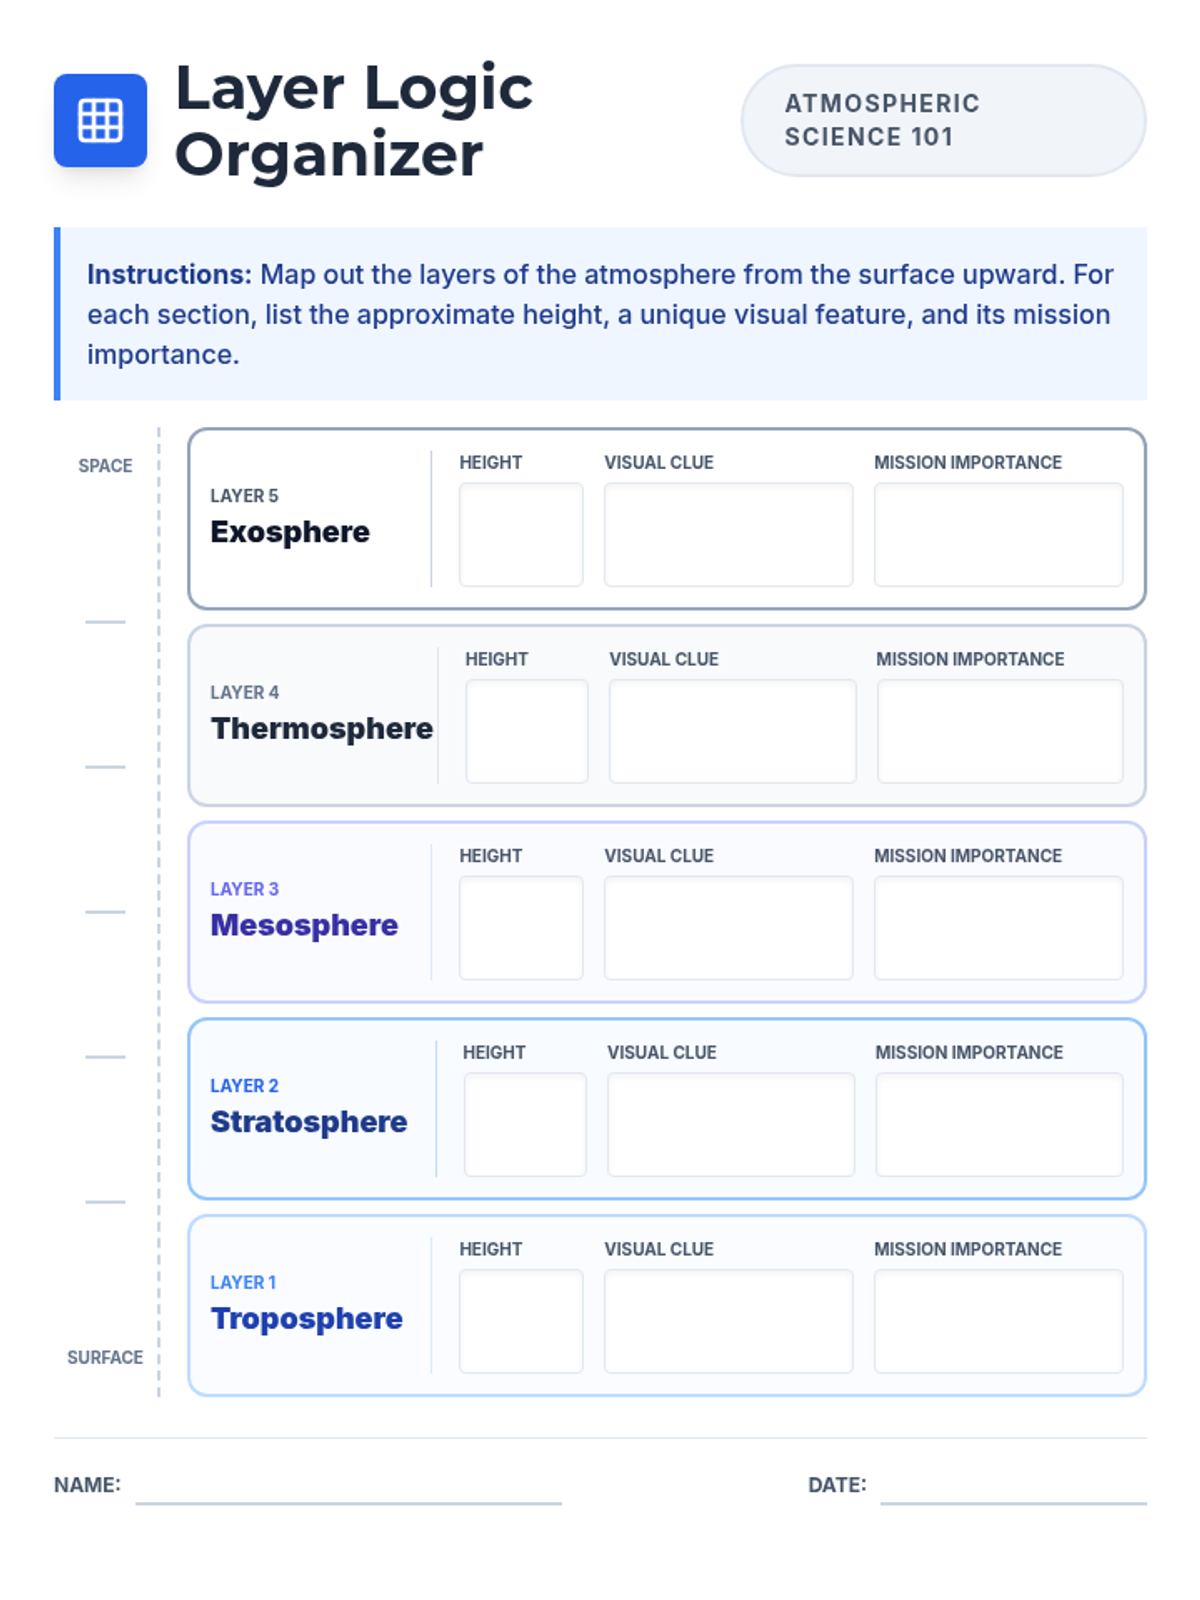
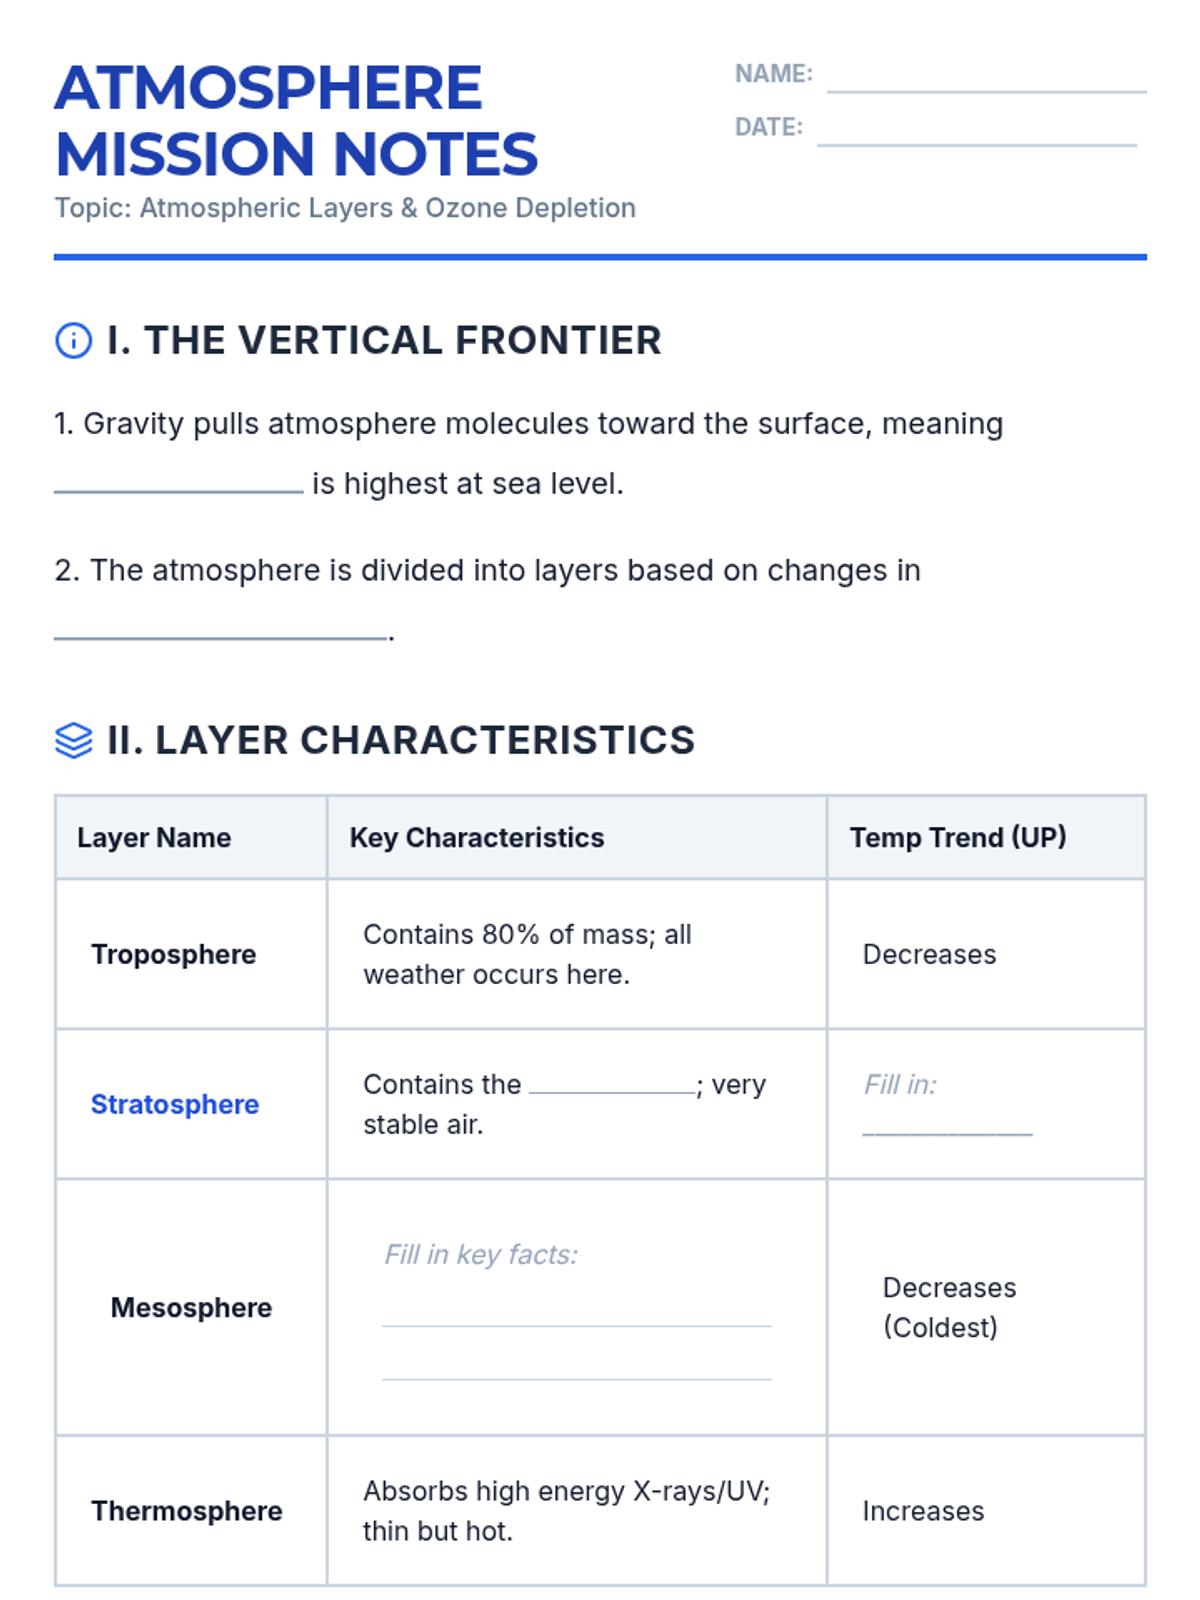
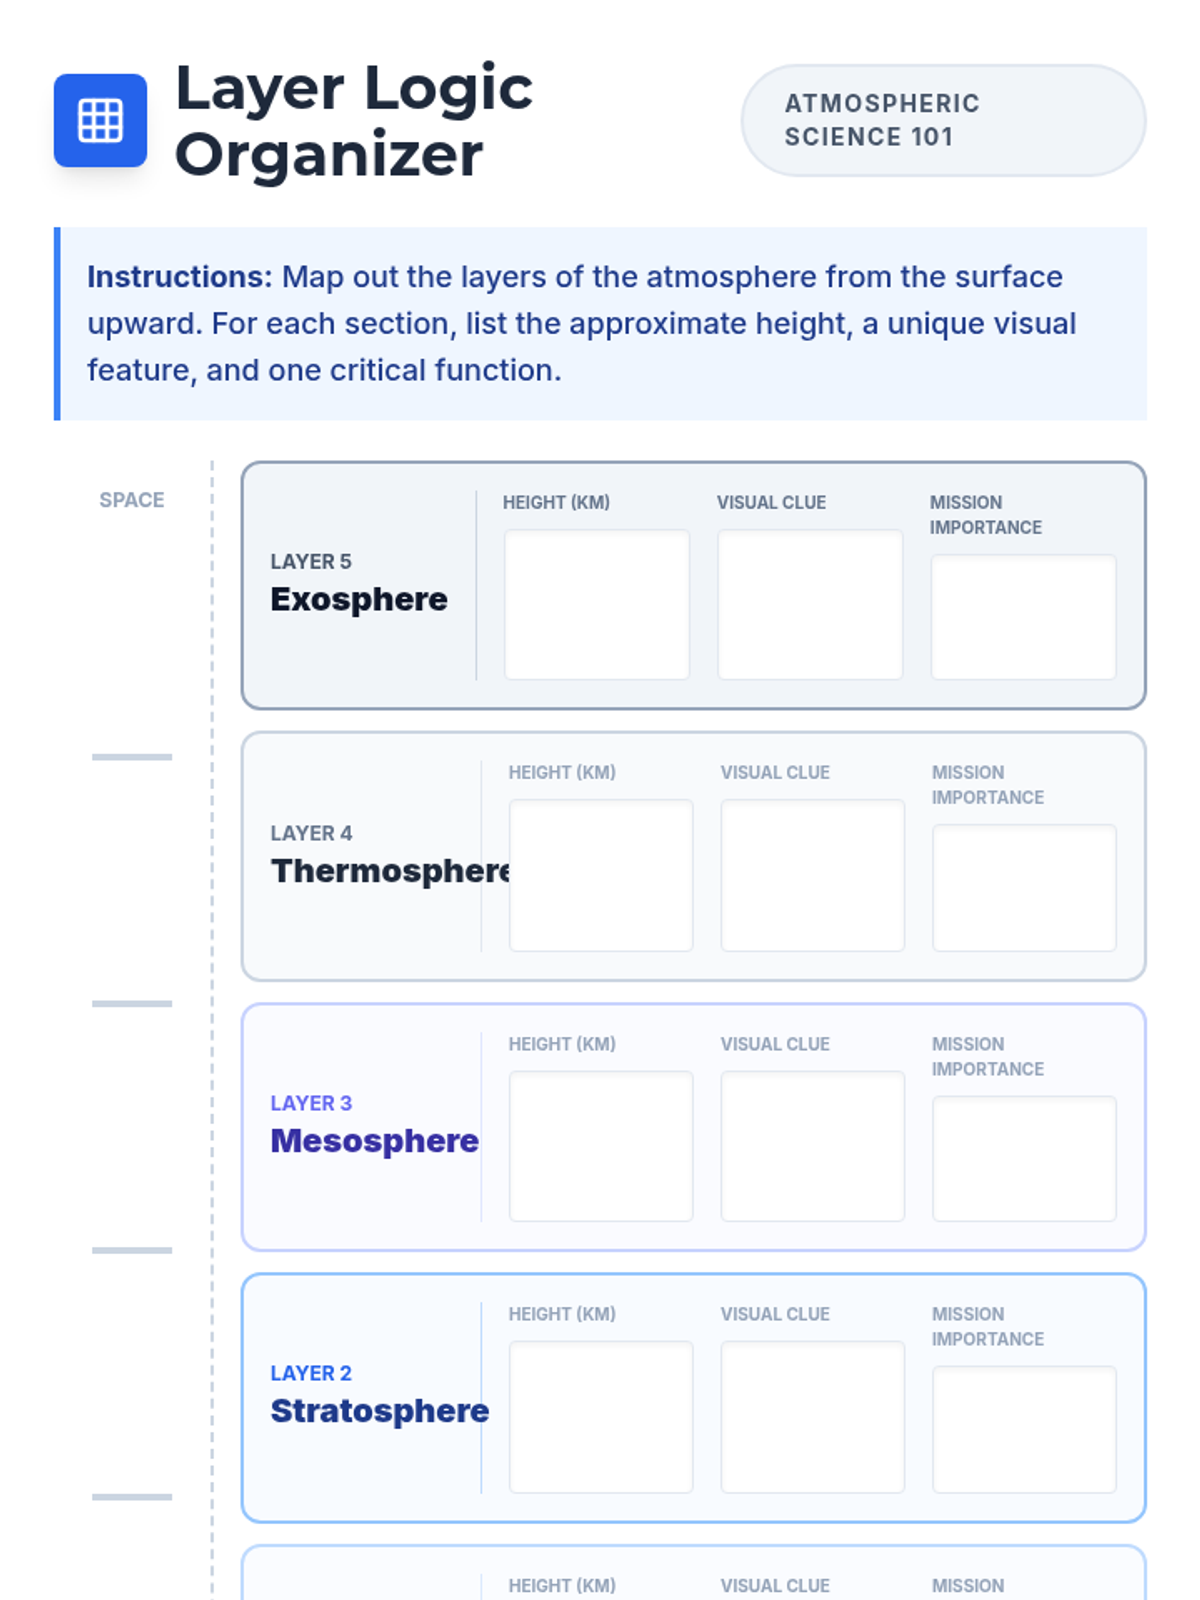
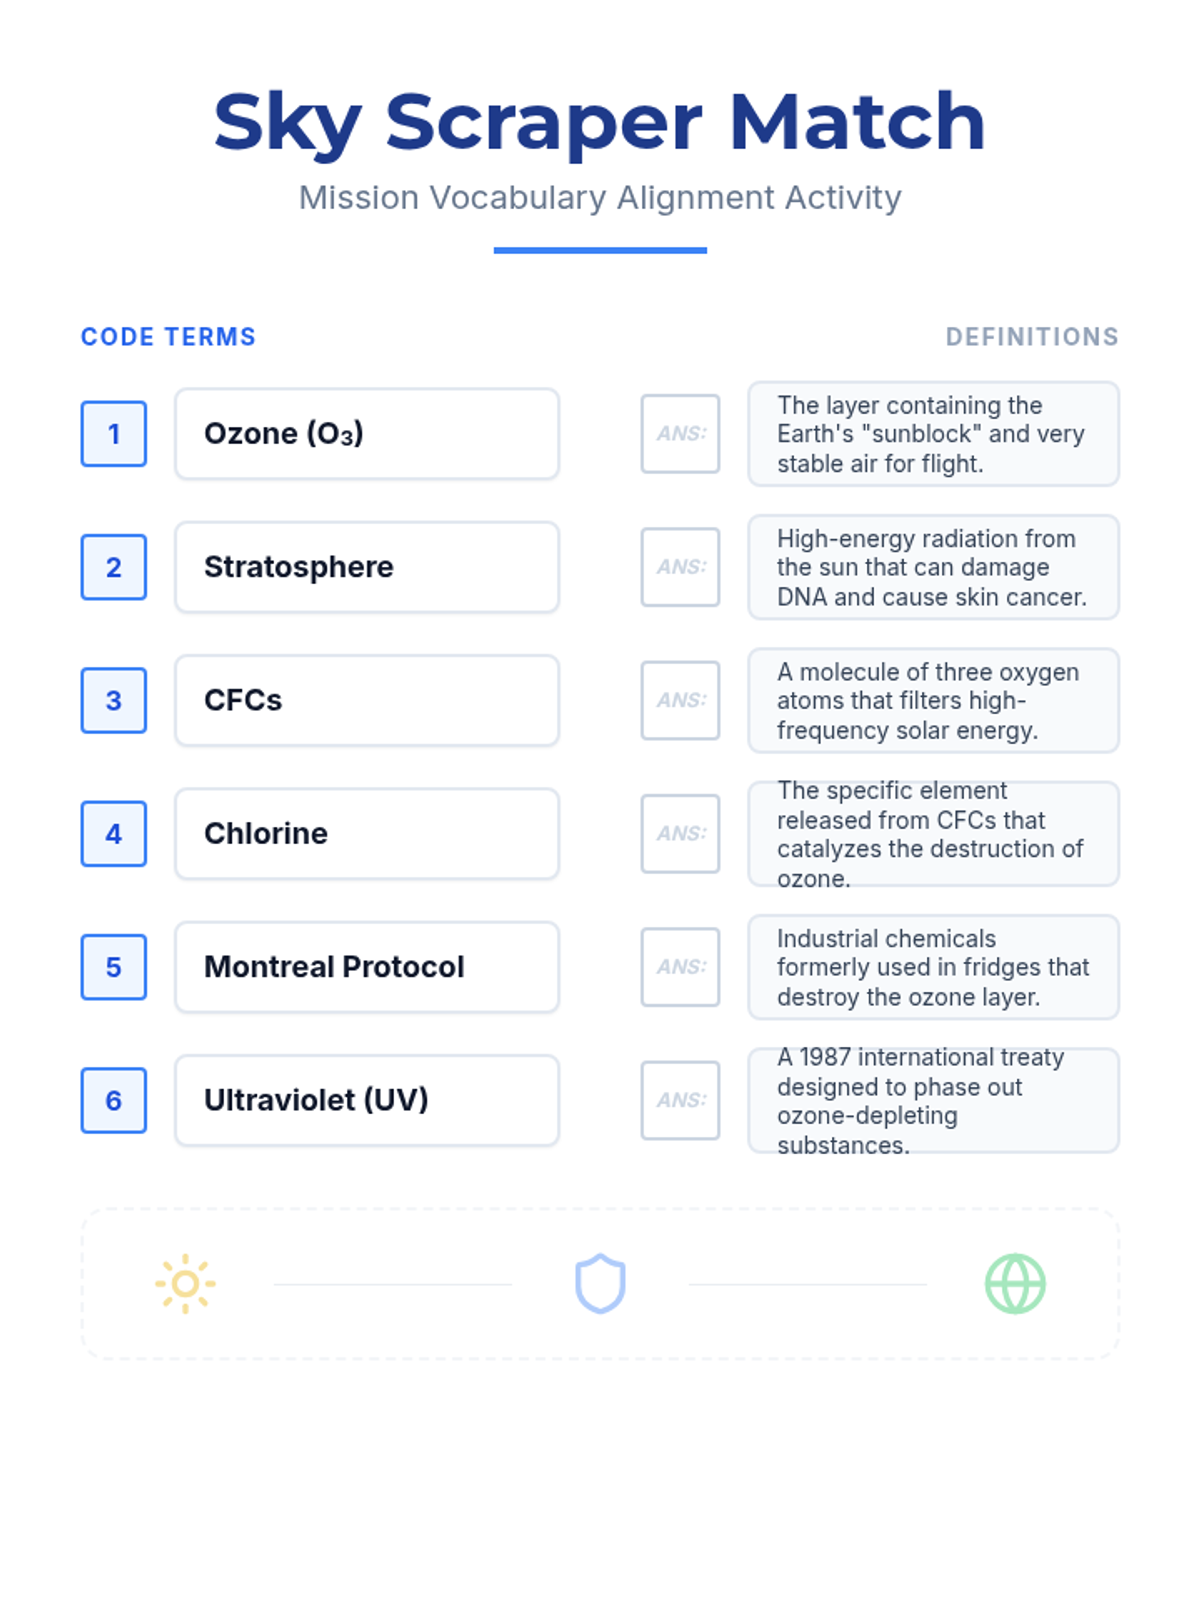
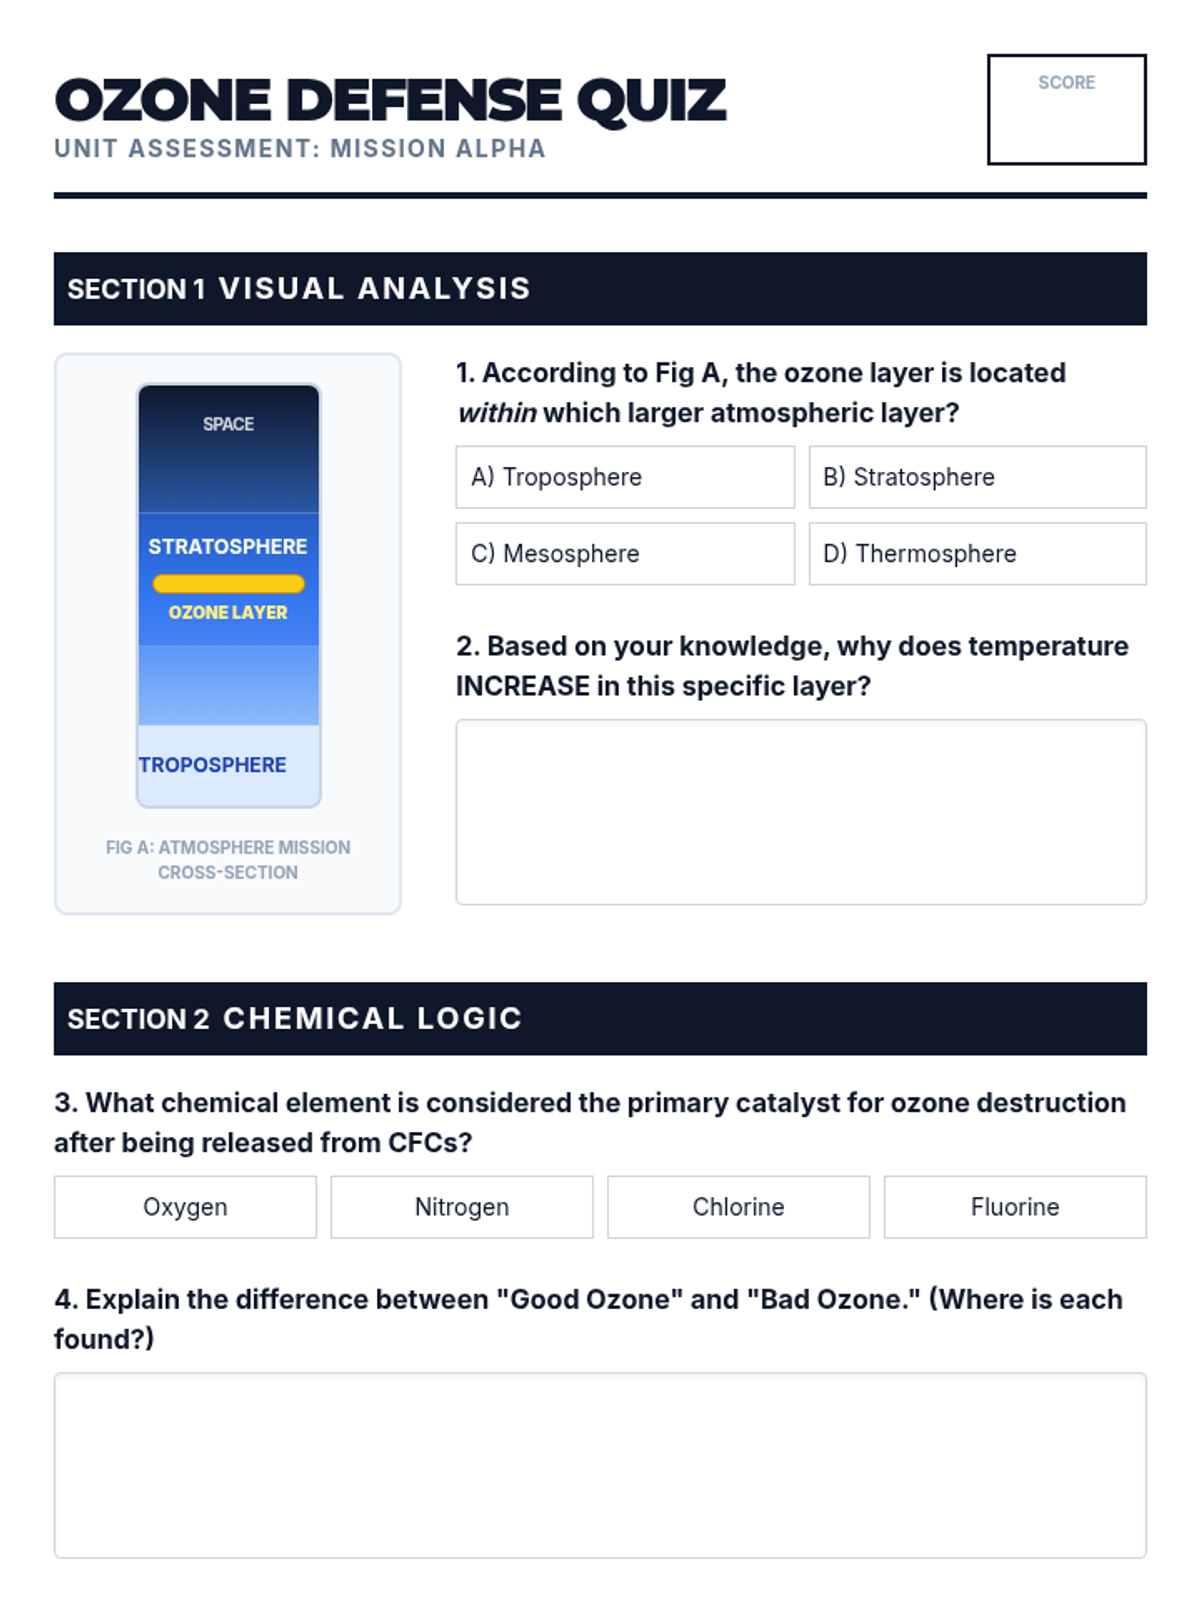
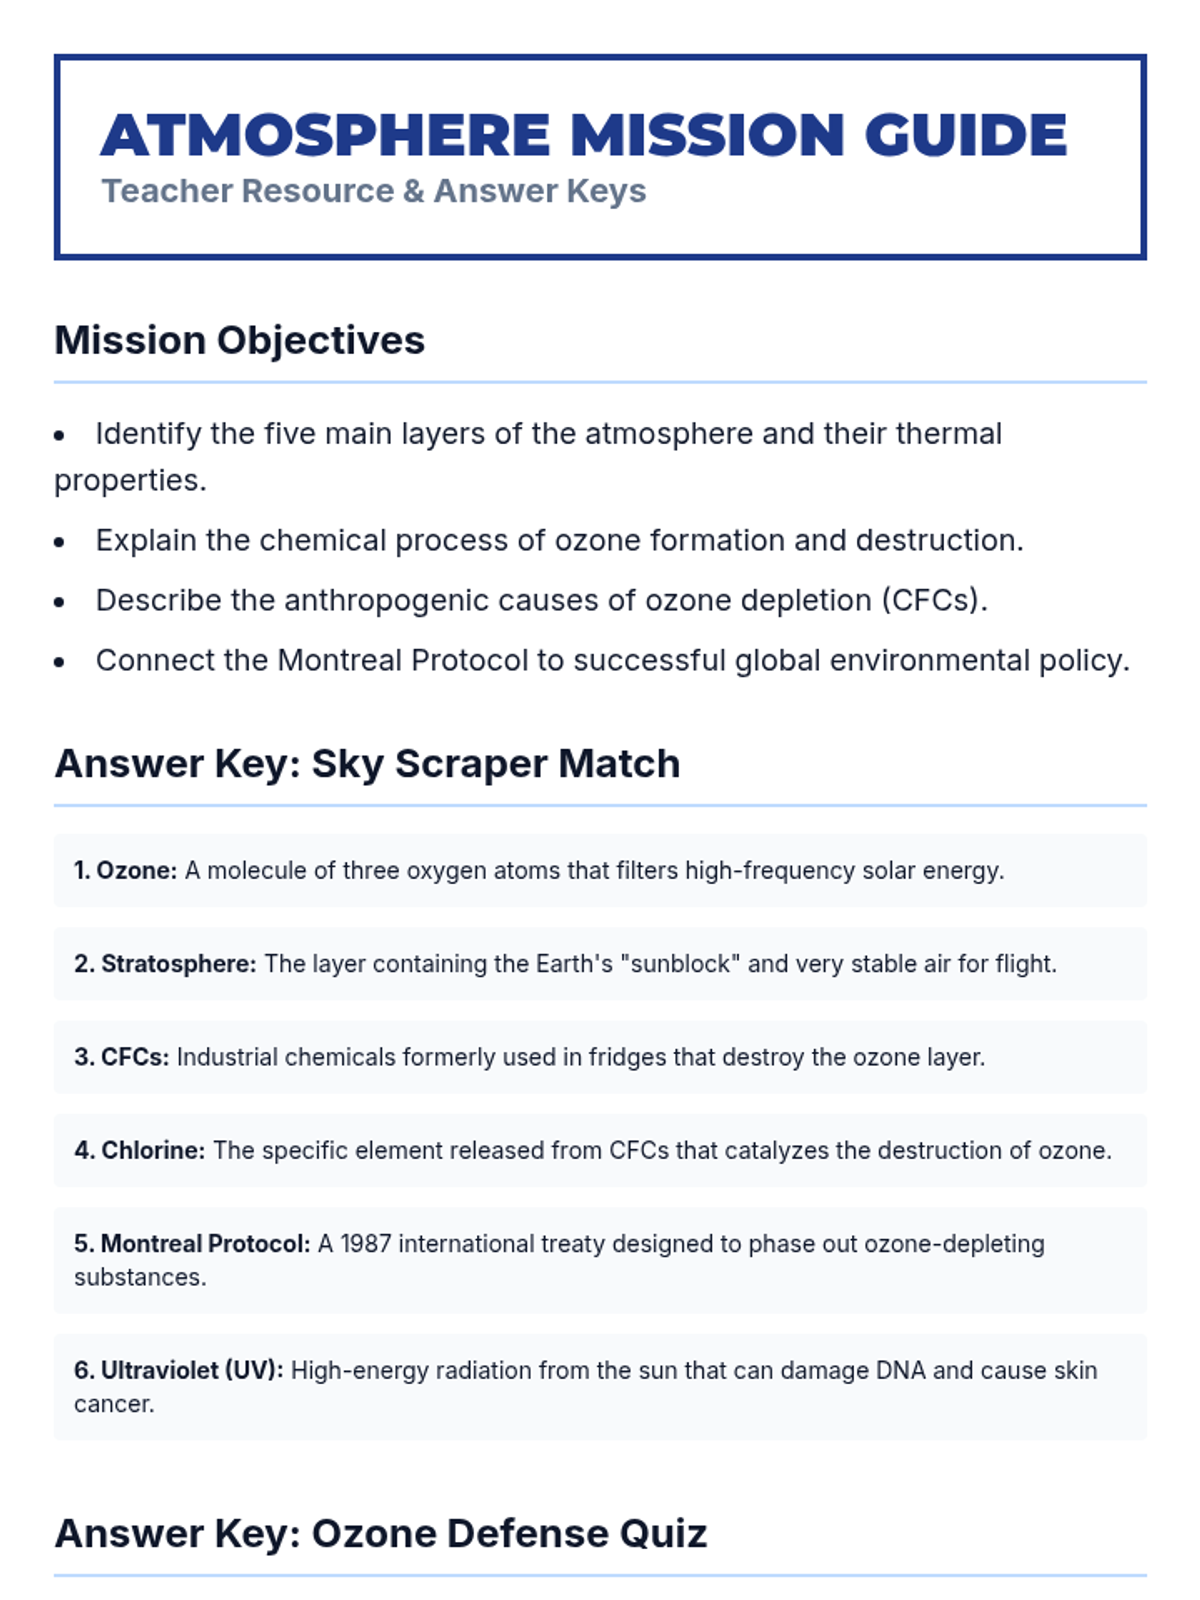
A comprehensive review of Earth's atmospheric layers, the crucial role of the ozone layer, and the chemical impact of CFCs on our planetary shield.
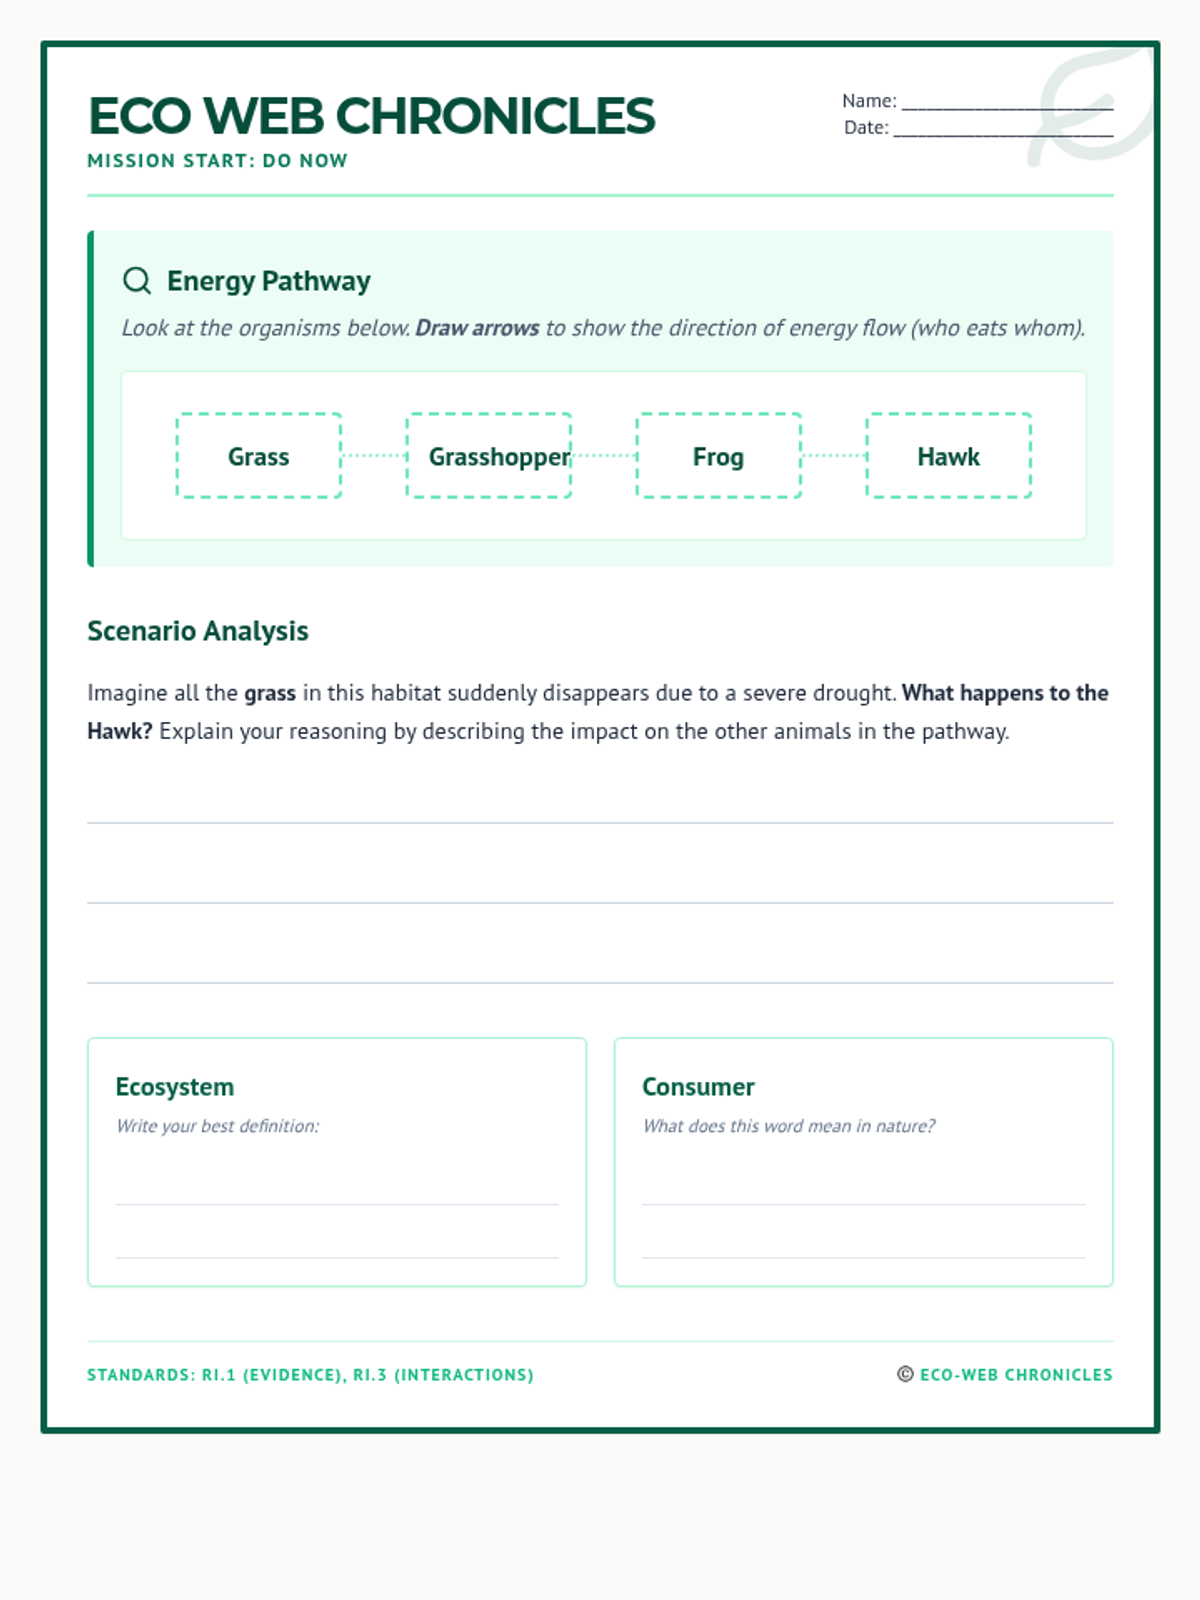
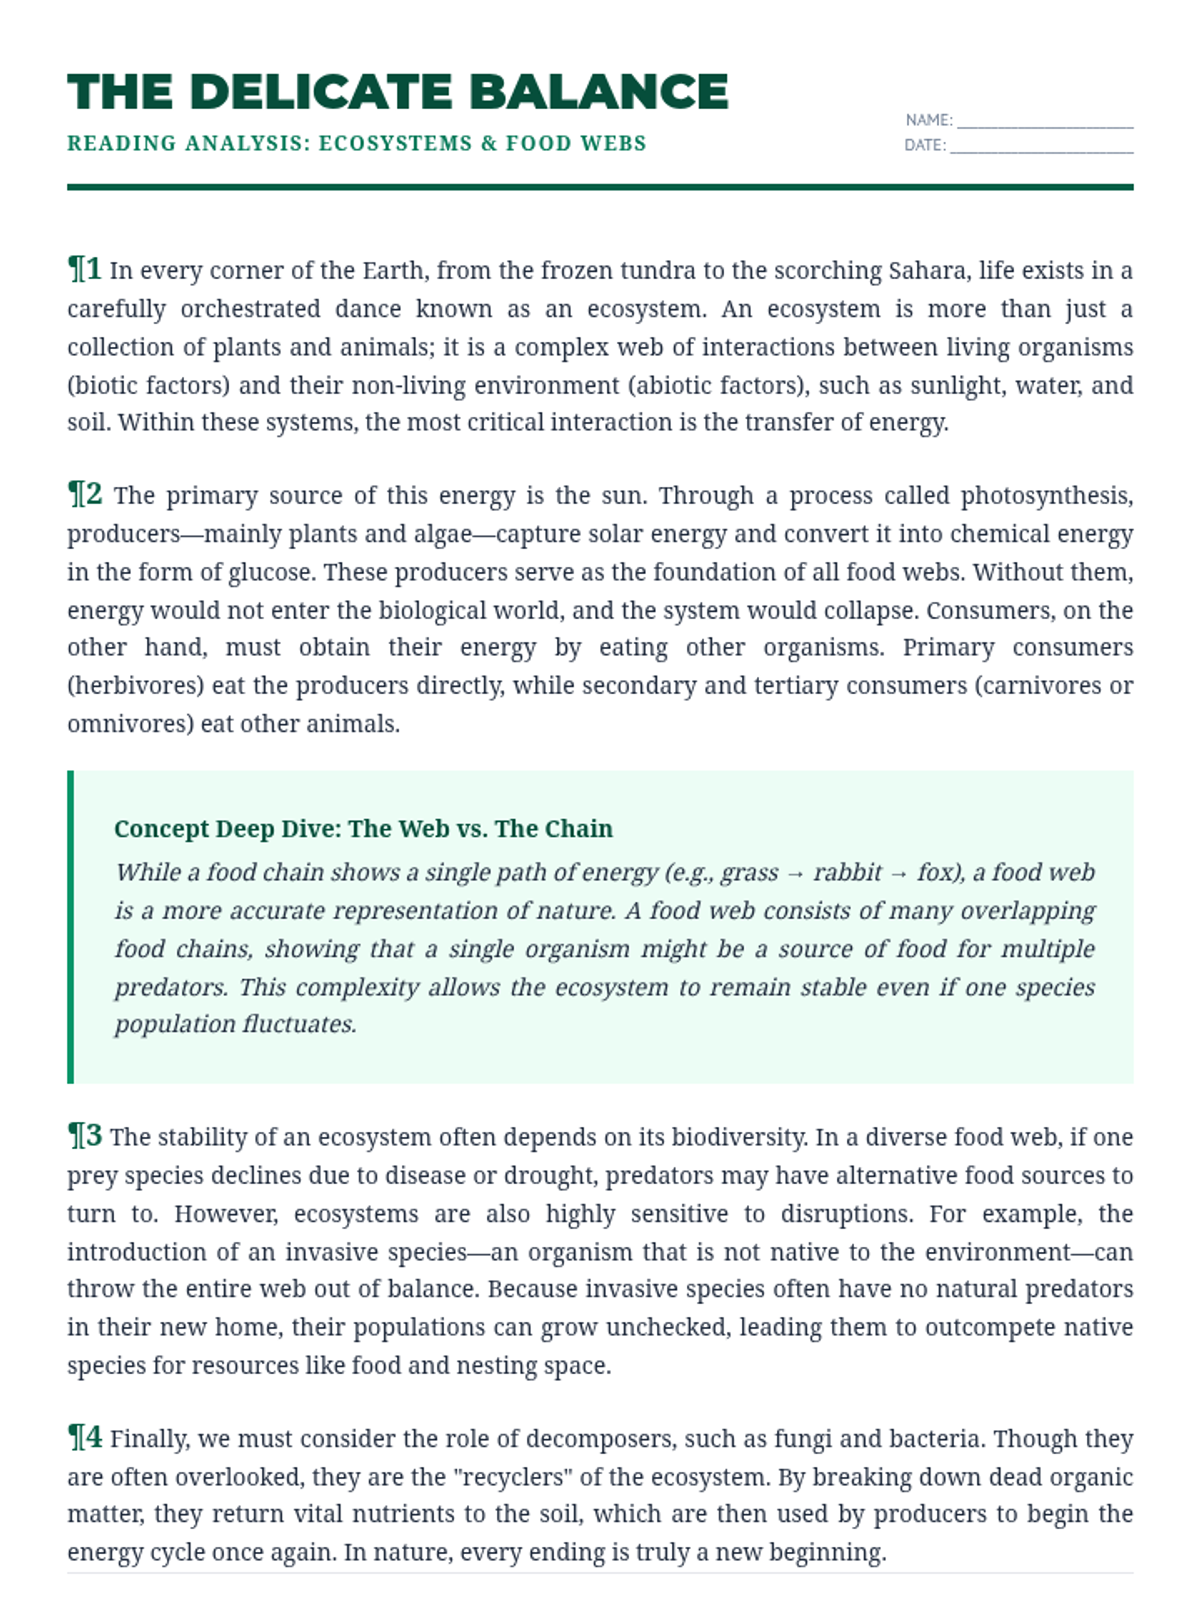
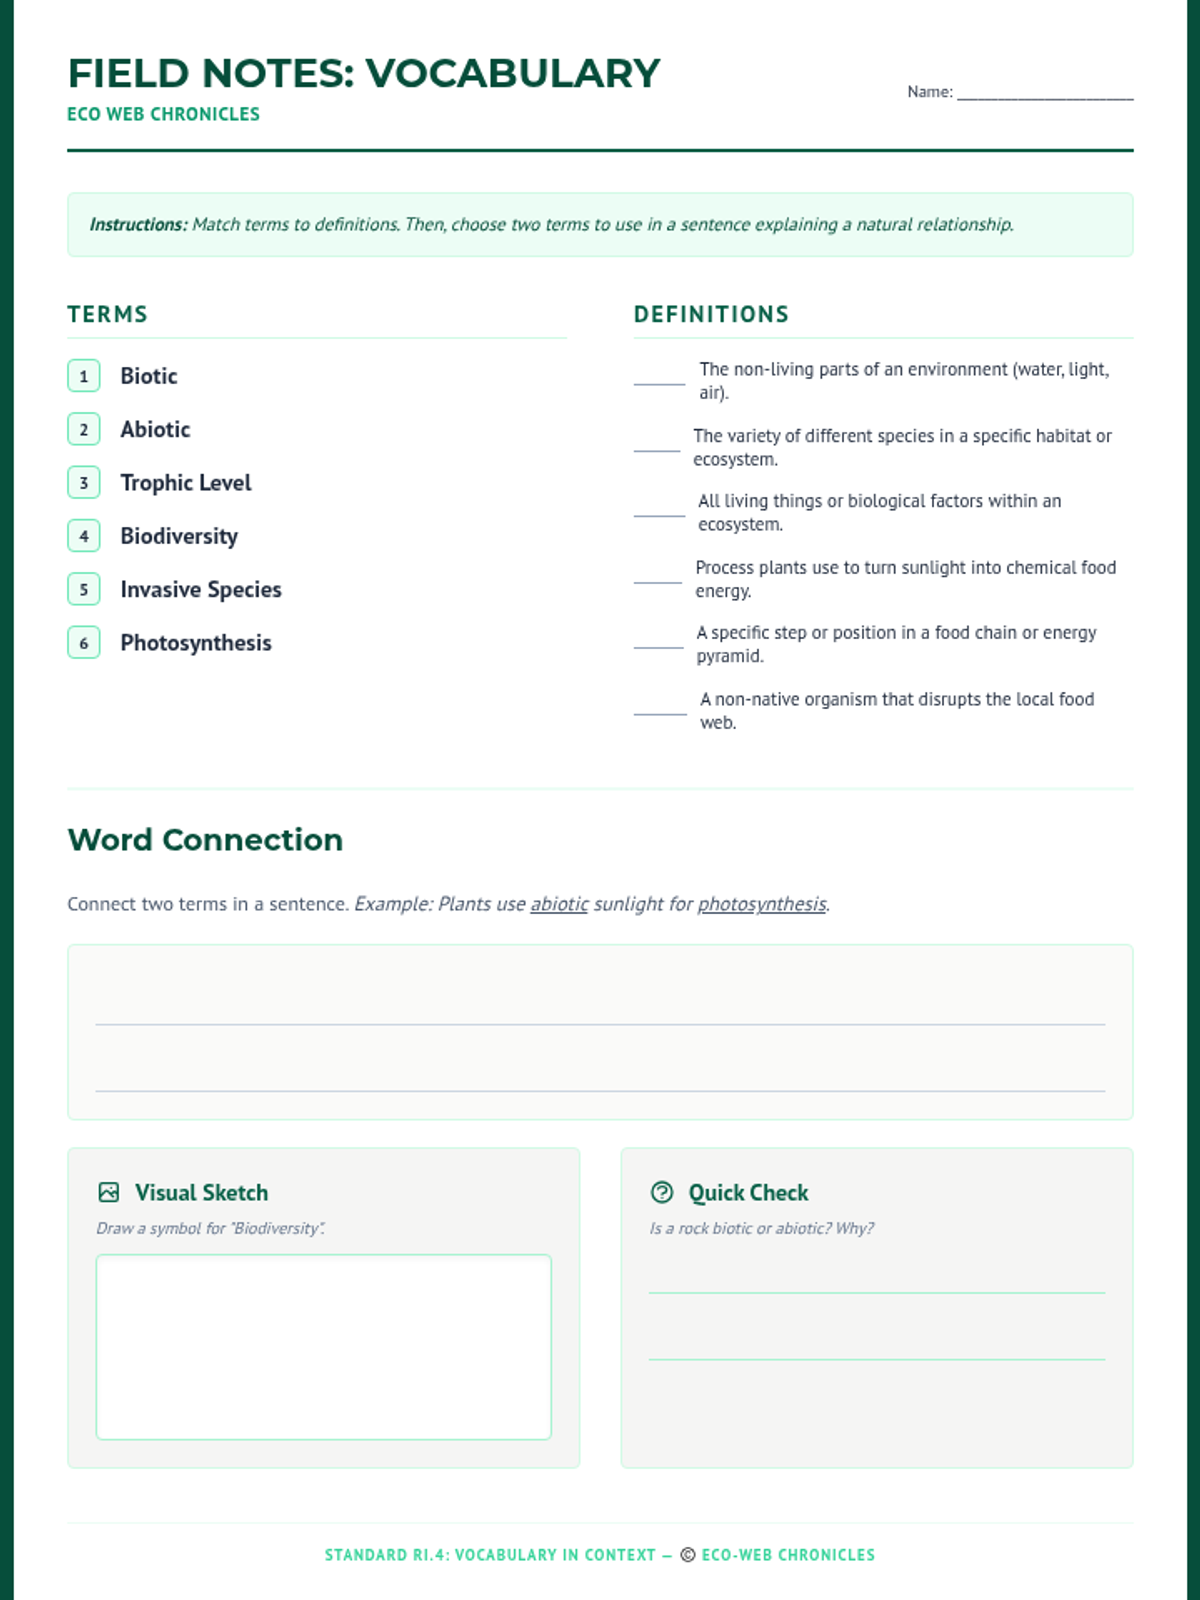
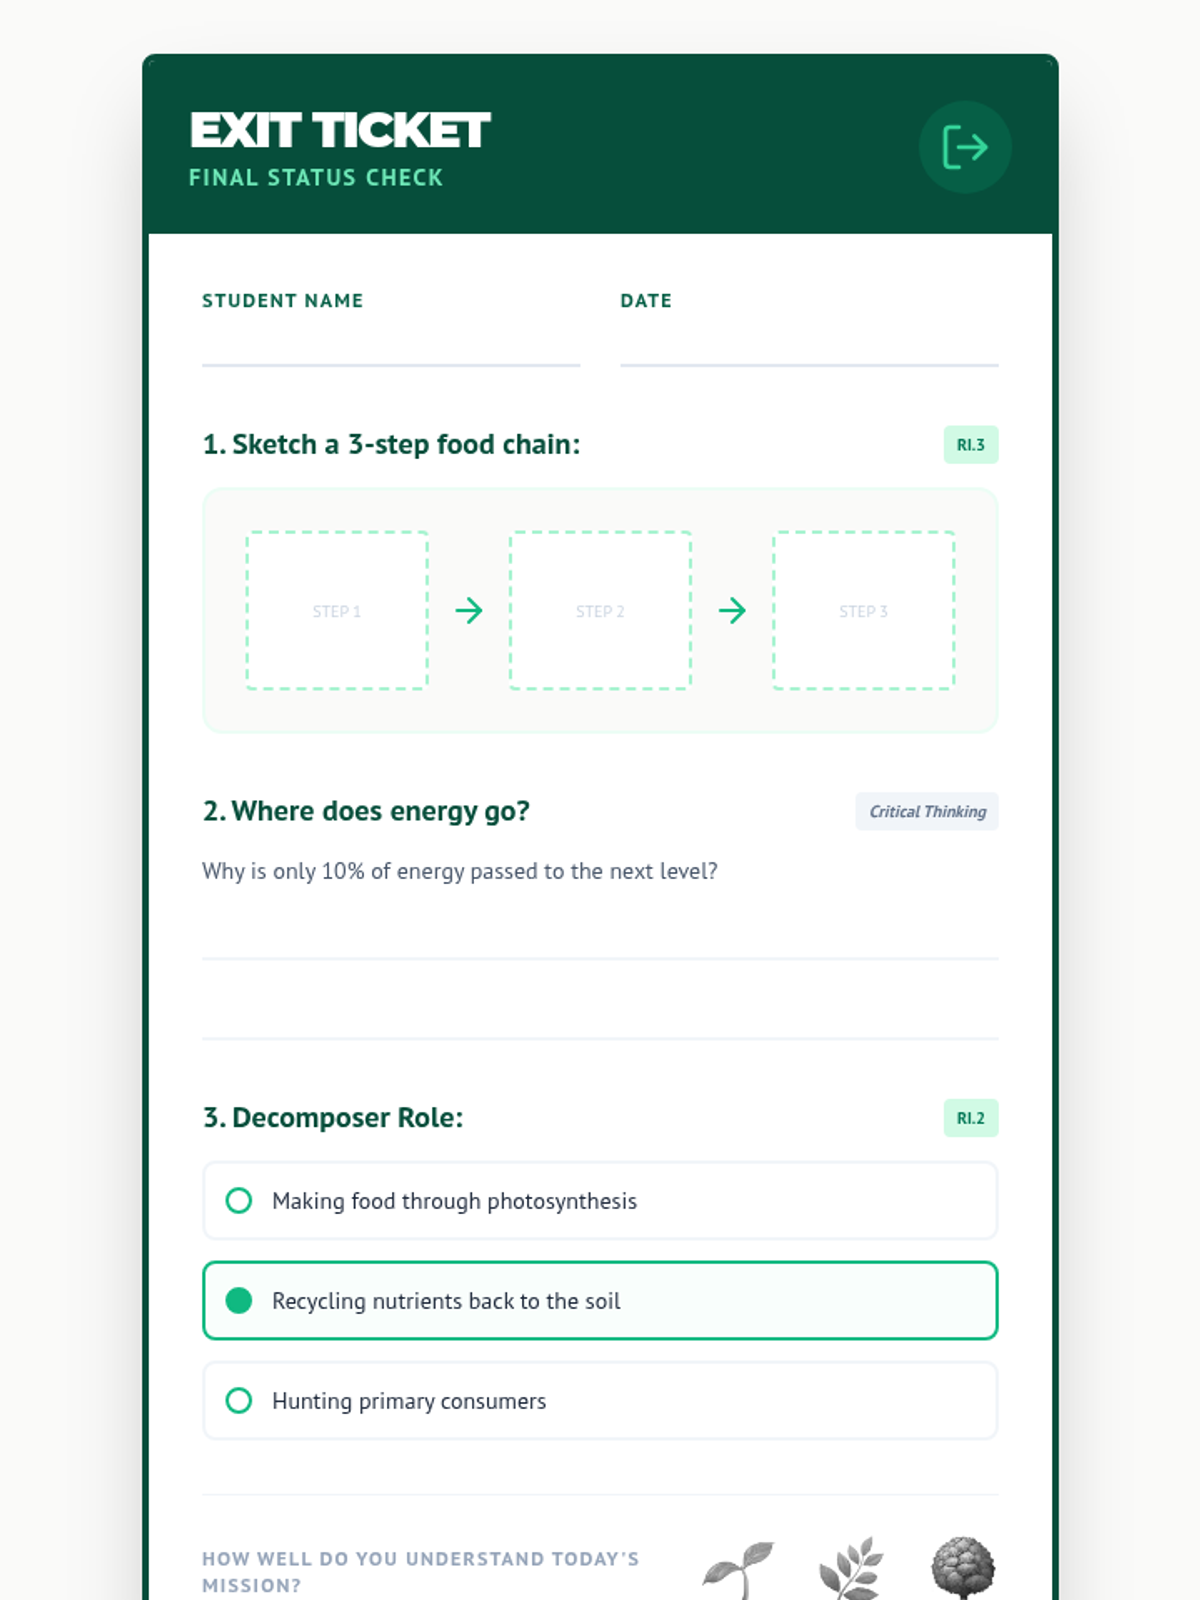
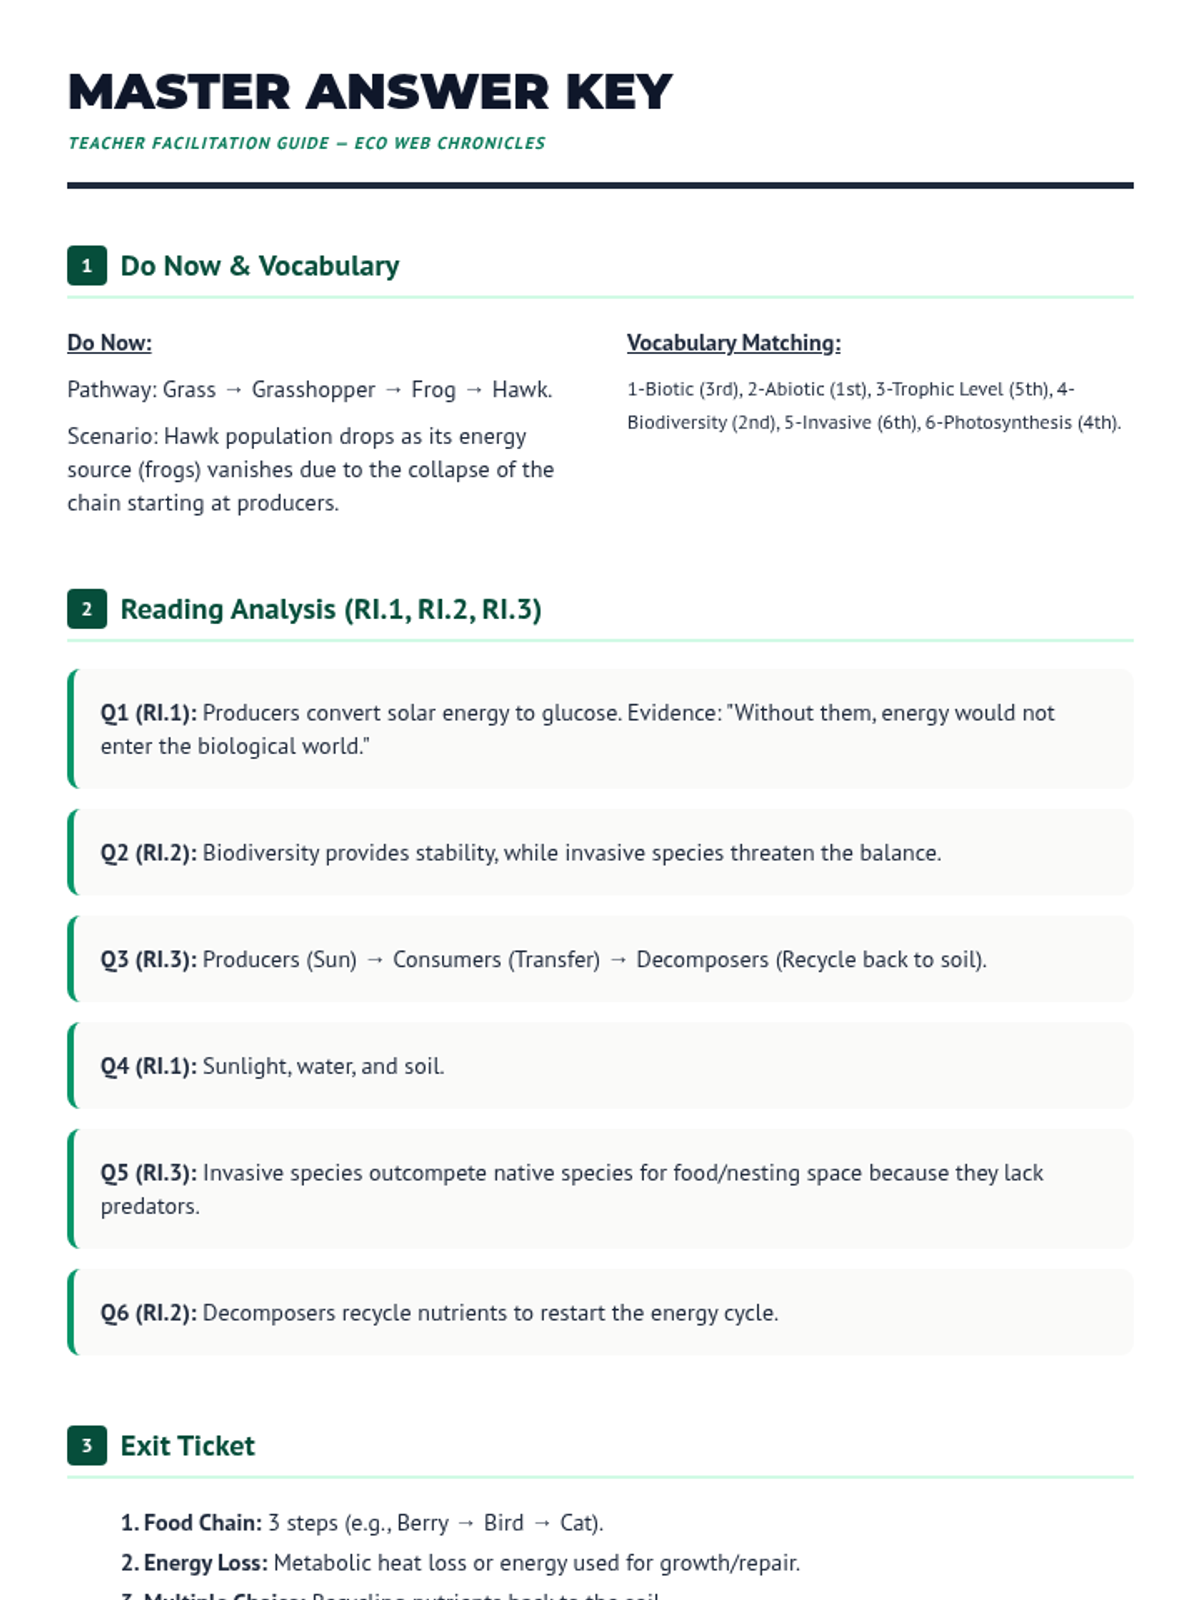
A comprehensive science lesson exploring the complex interactions within ecosystems and the flow of energy through food webs. Includes instruction, reading comprehension, and assessment materials.
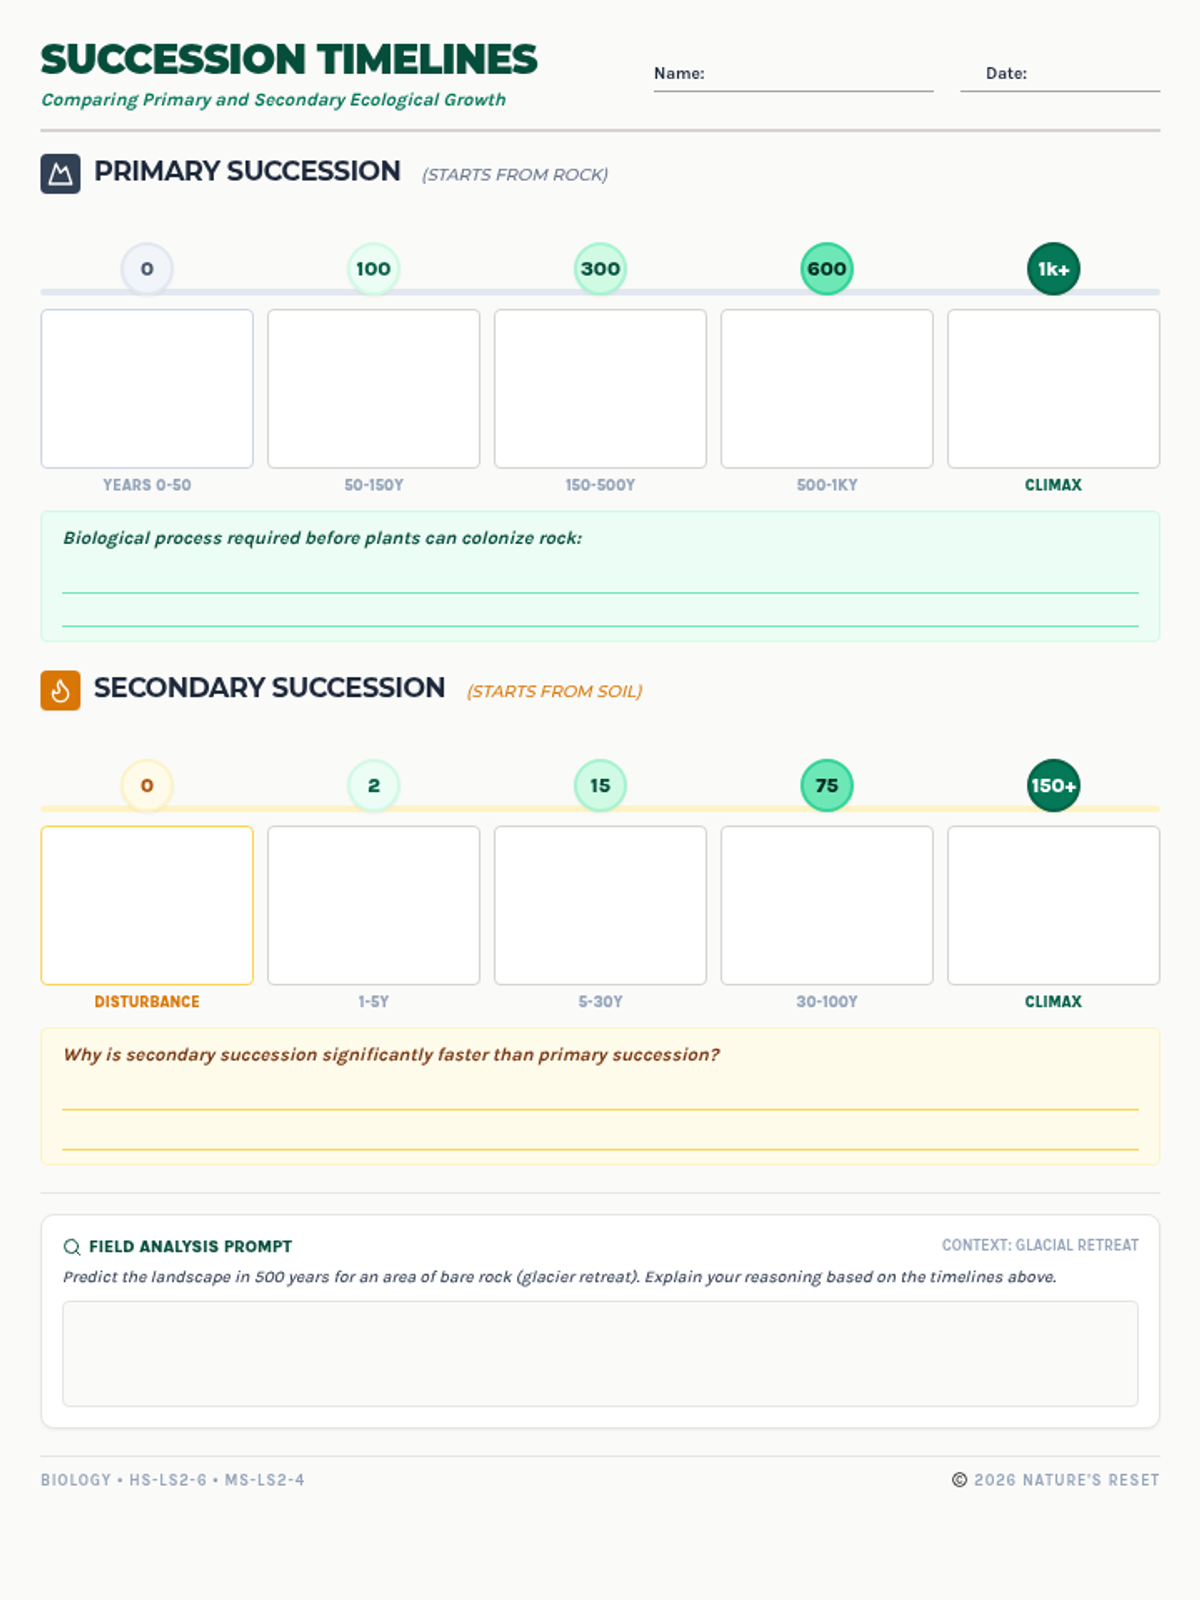
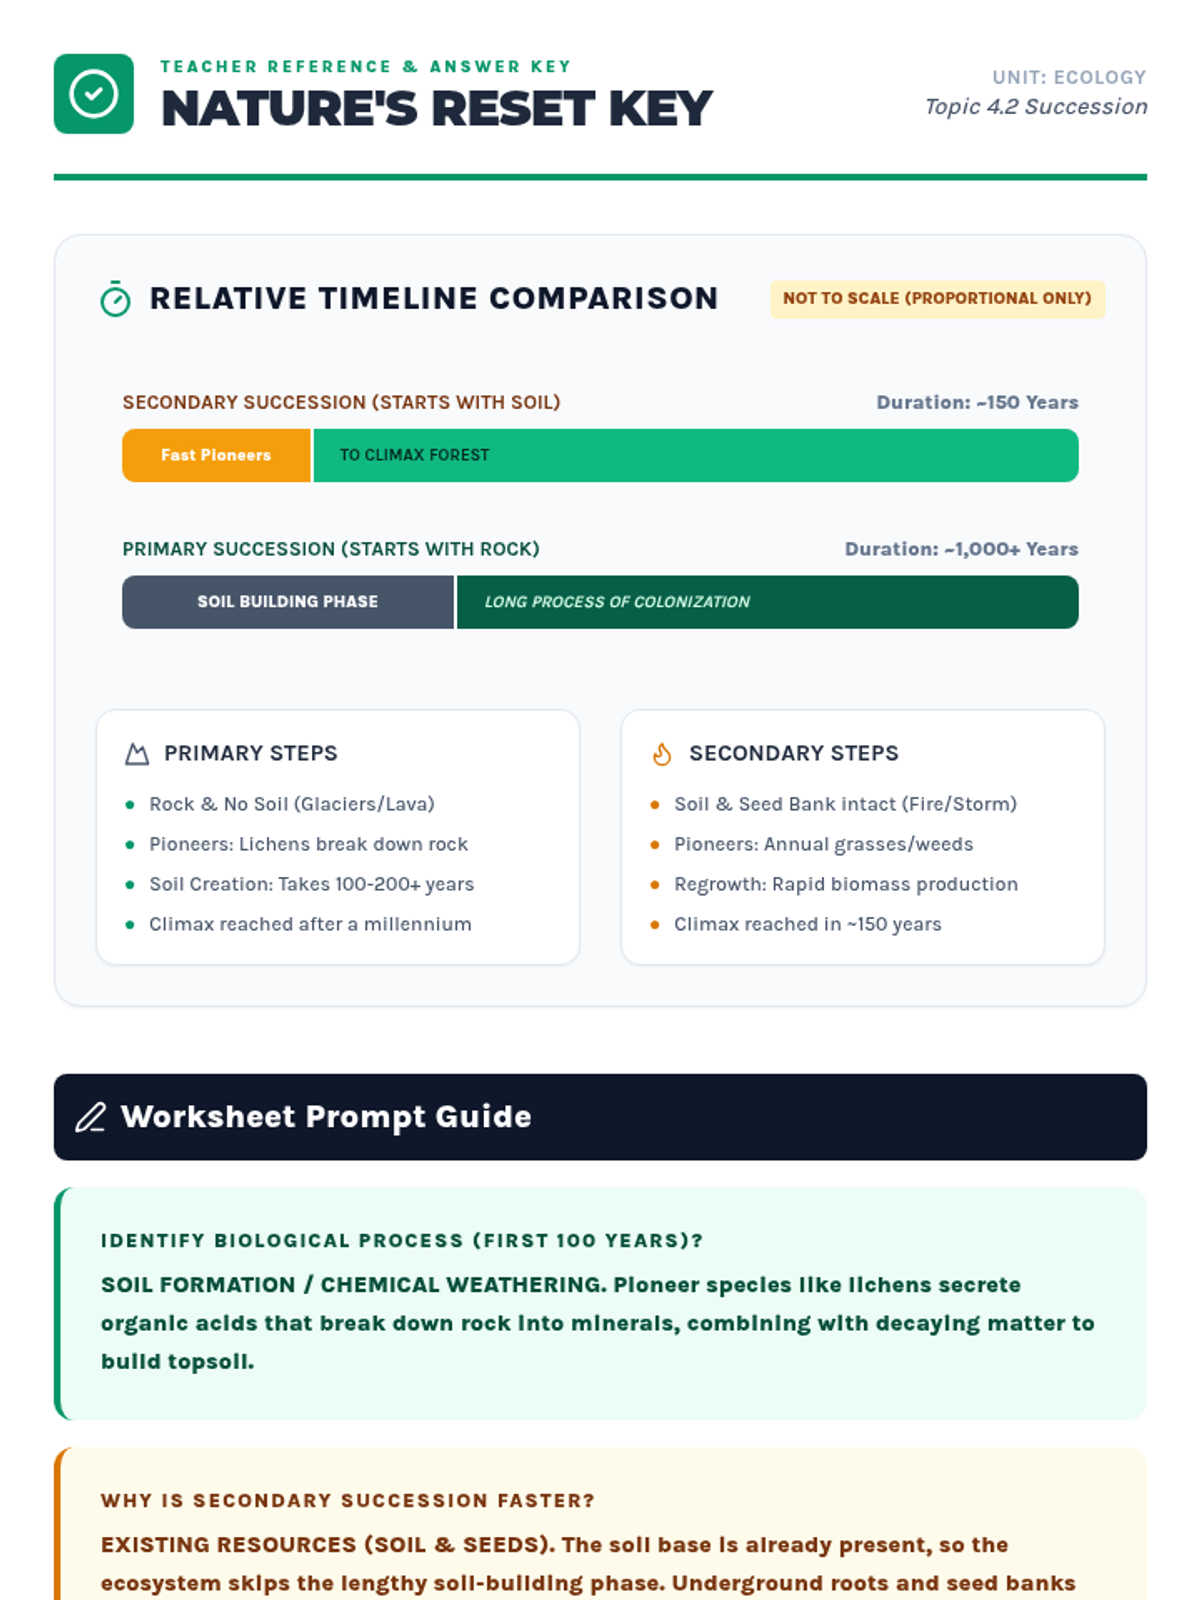
A visual exploration of how ecosystems recover and develop over time, comparing the long-term process of primary succession with the faster recovery of secondary succession. Students will analyze timeframes, pioneer species, and climax communities.
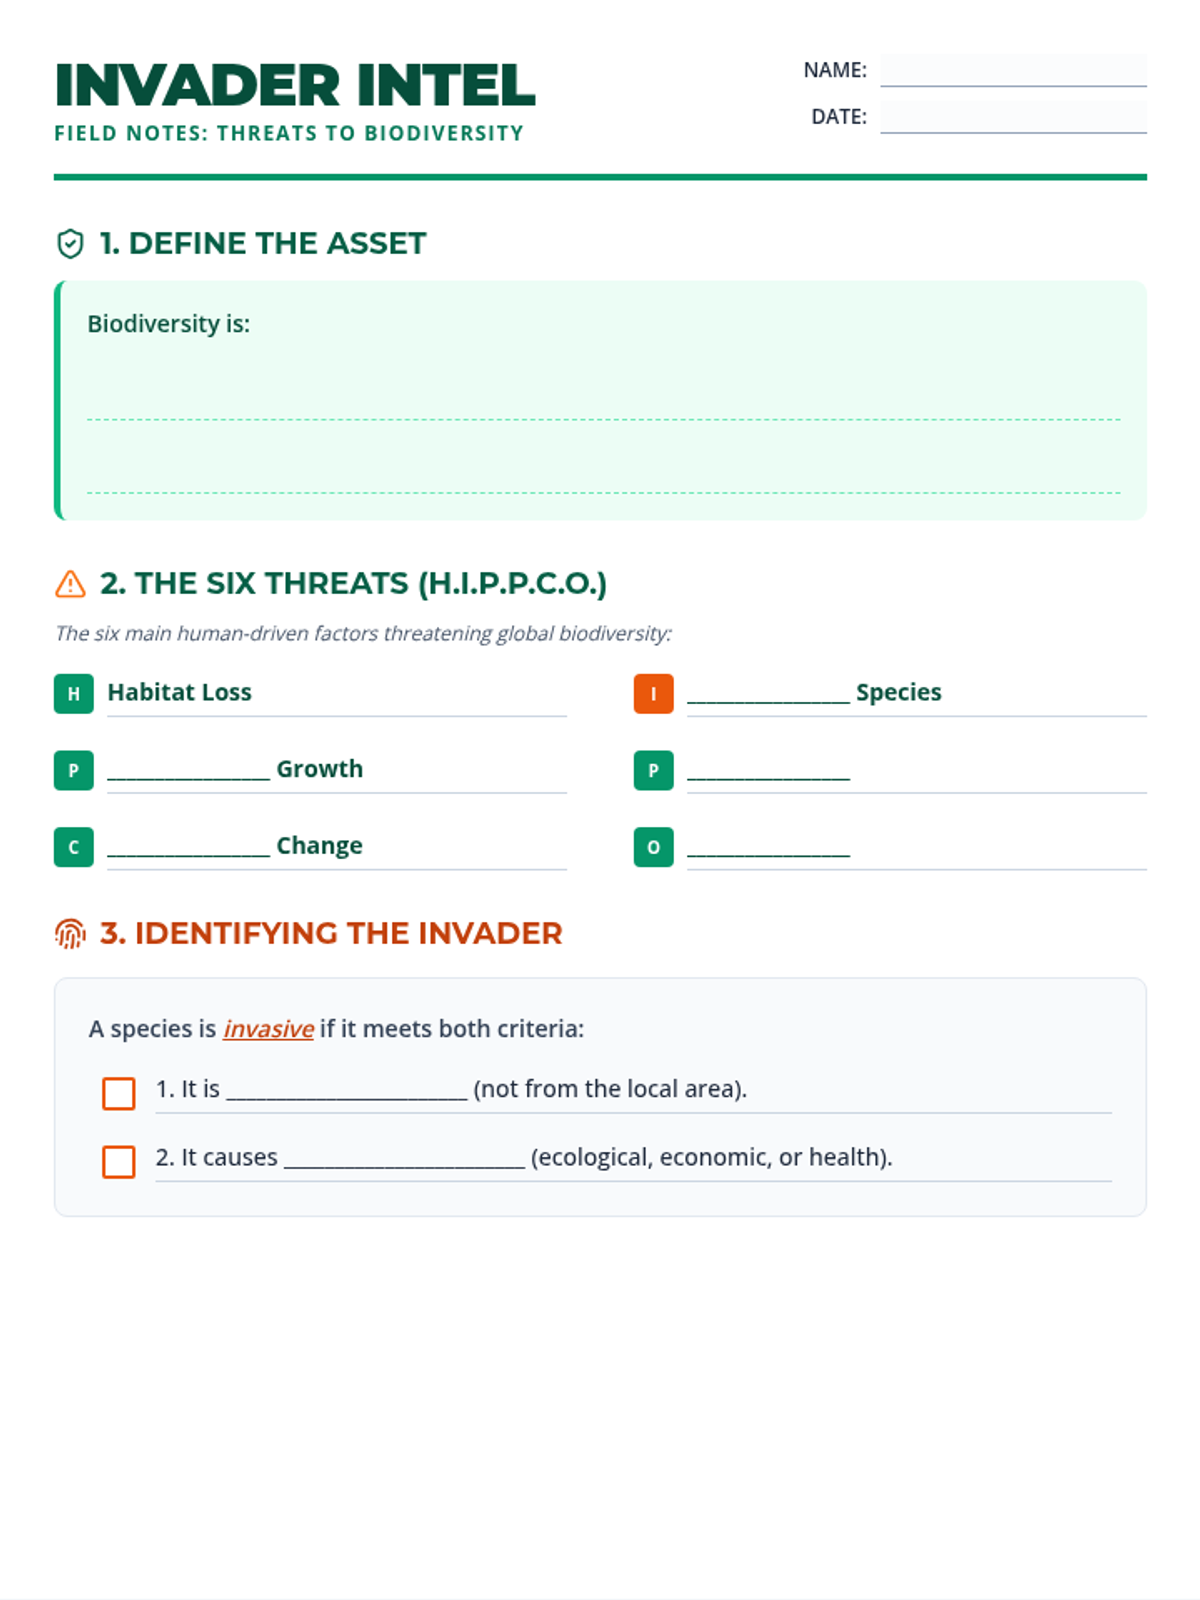
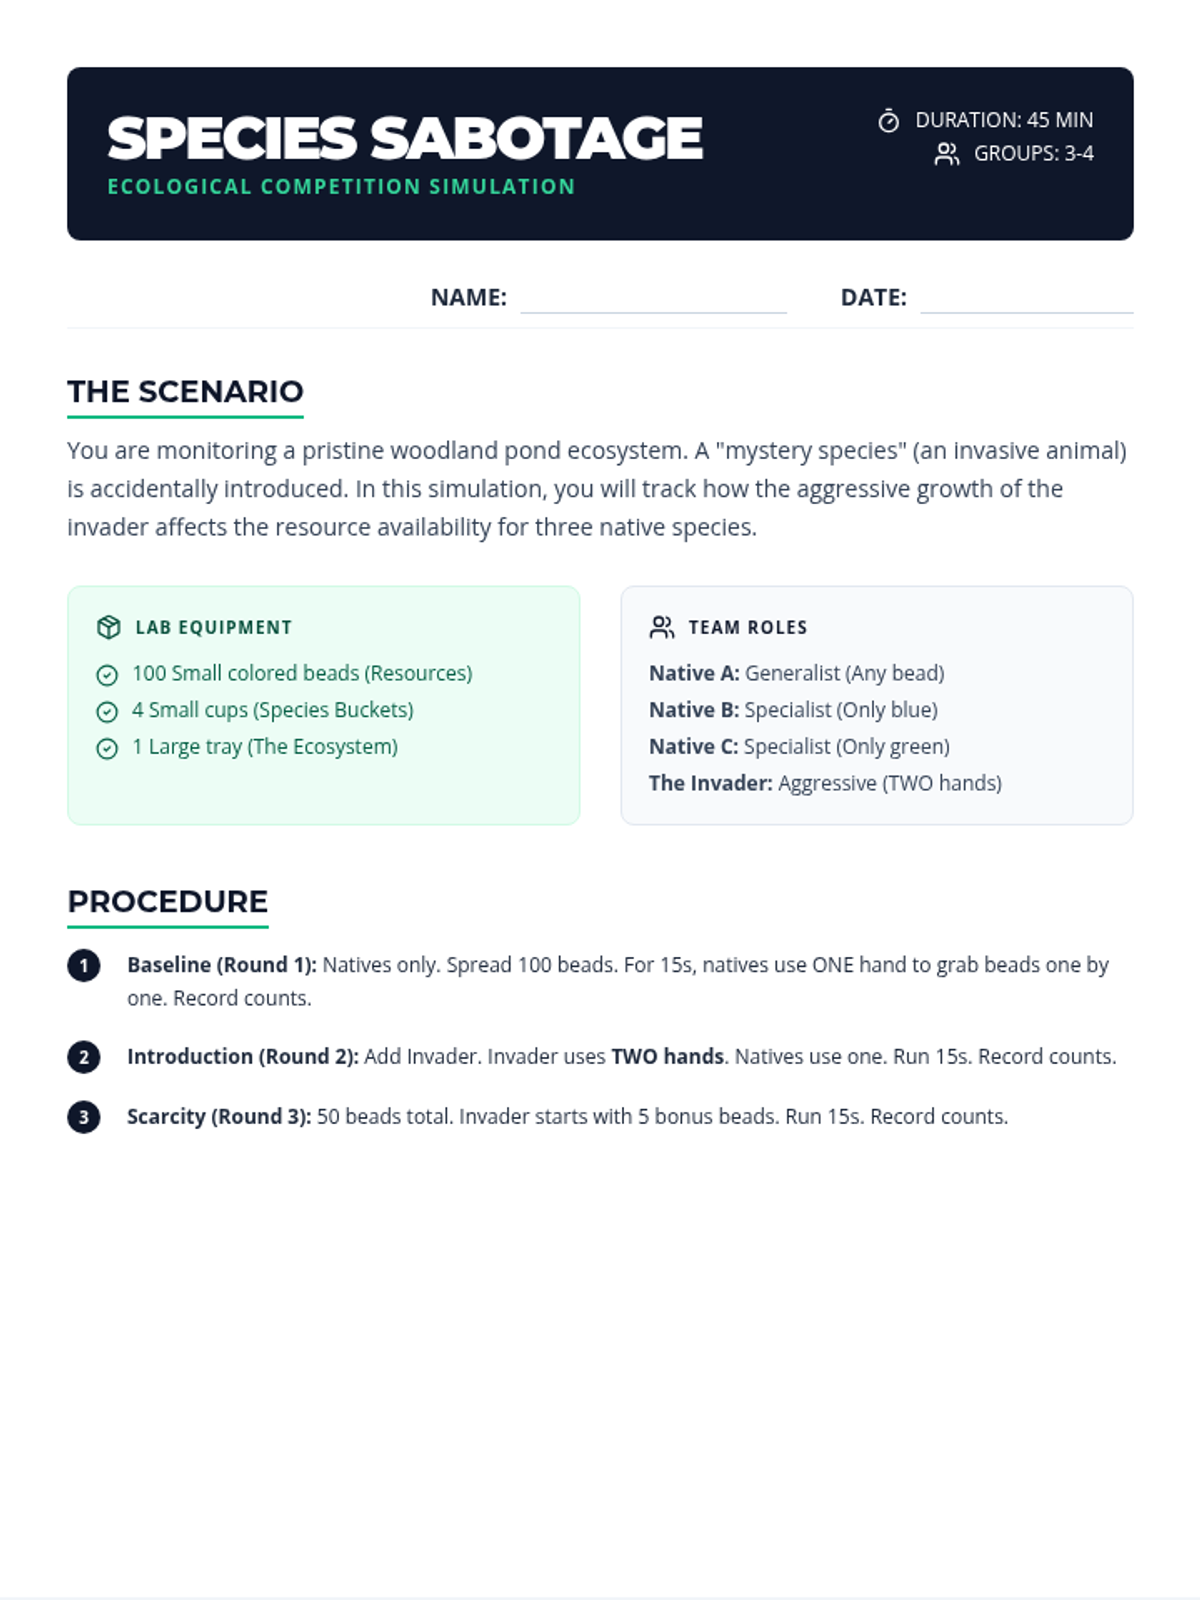
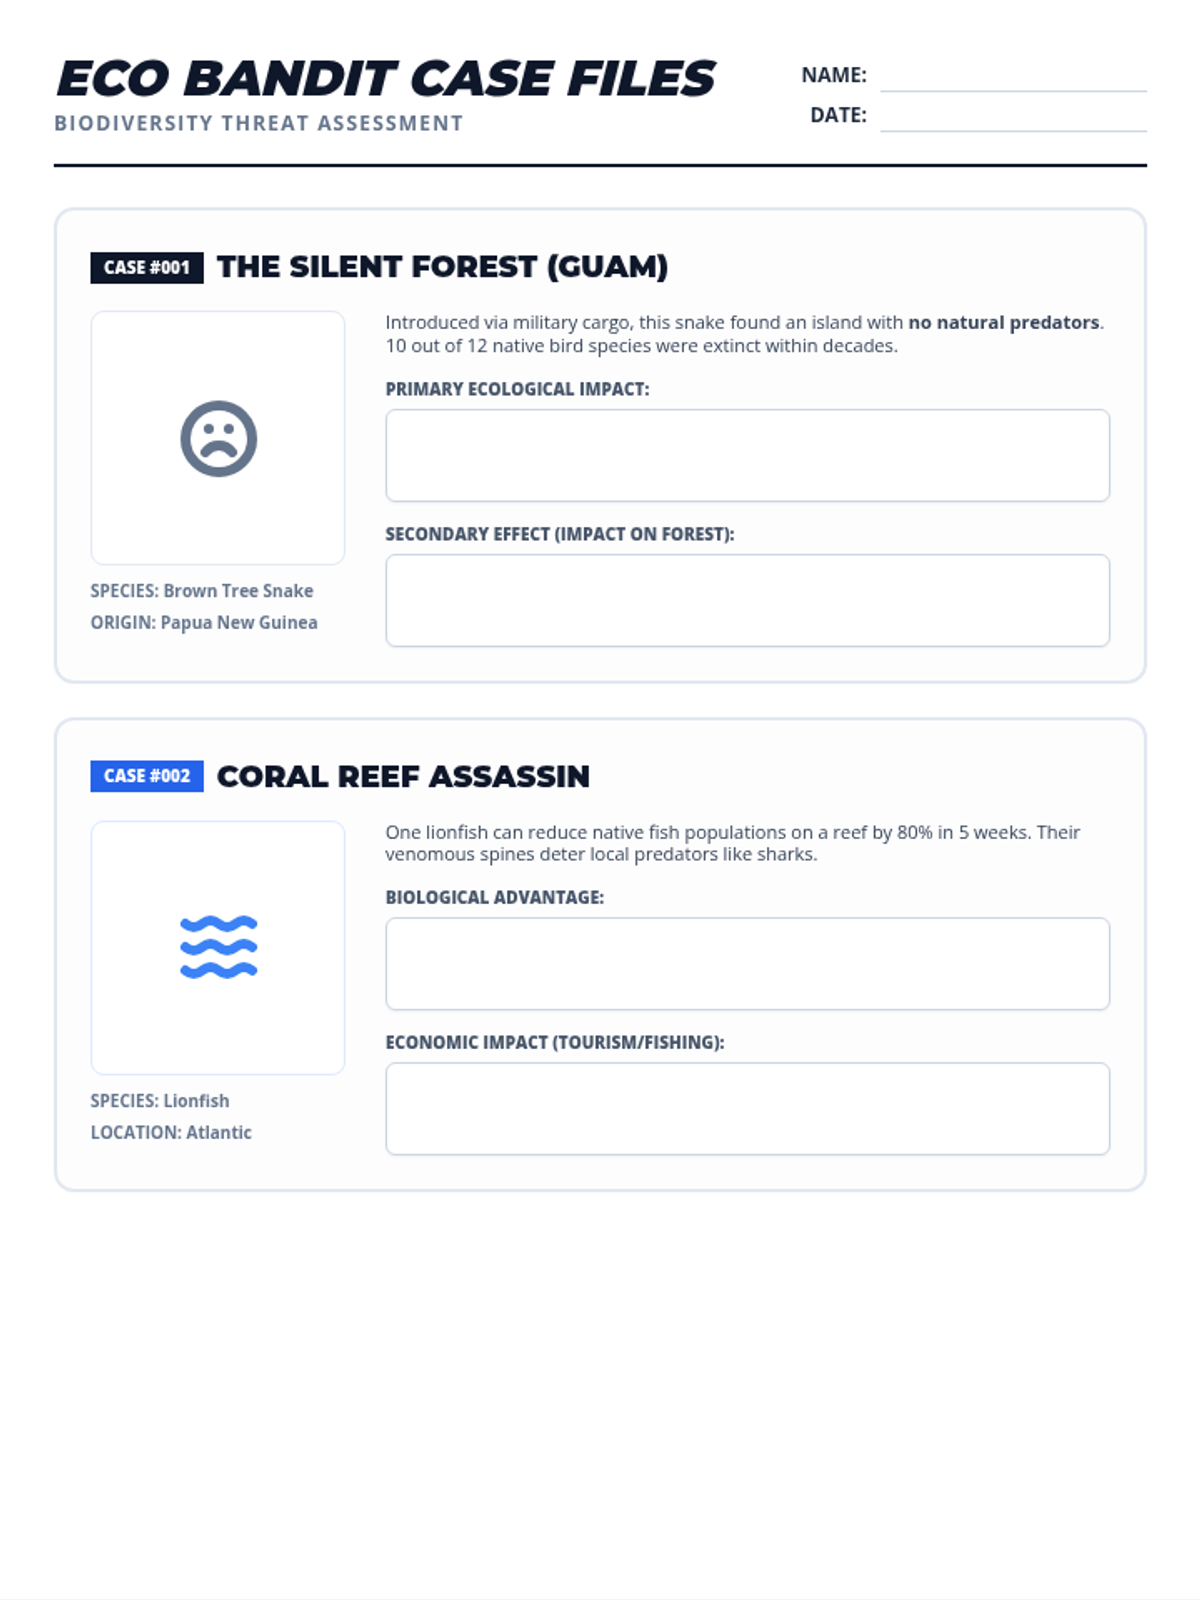
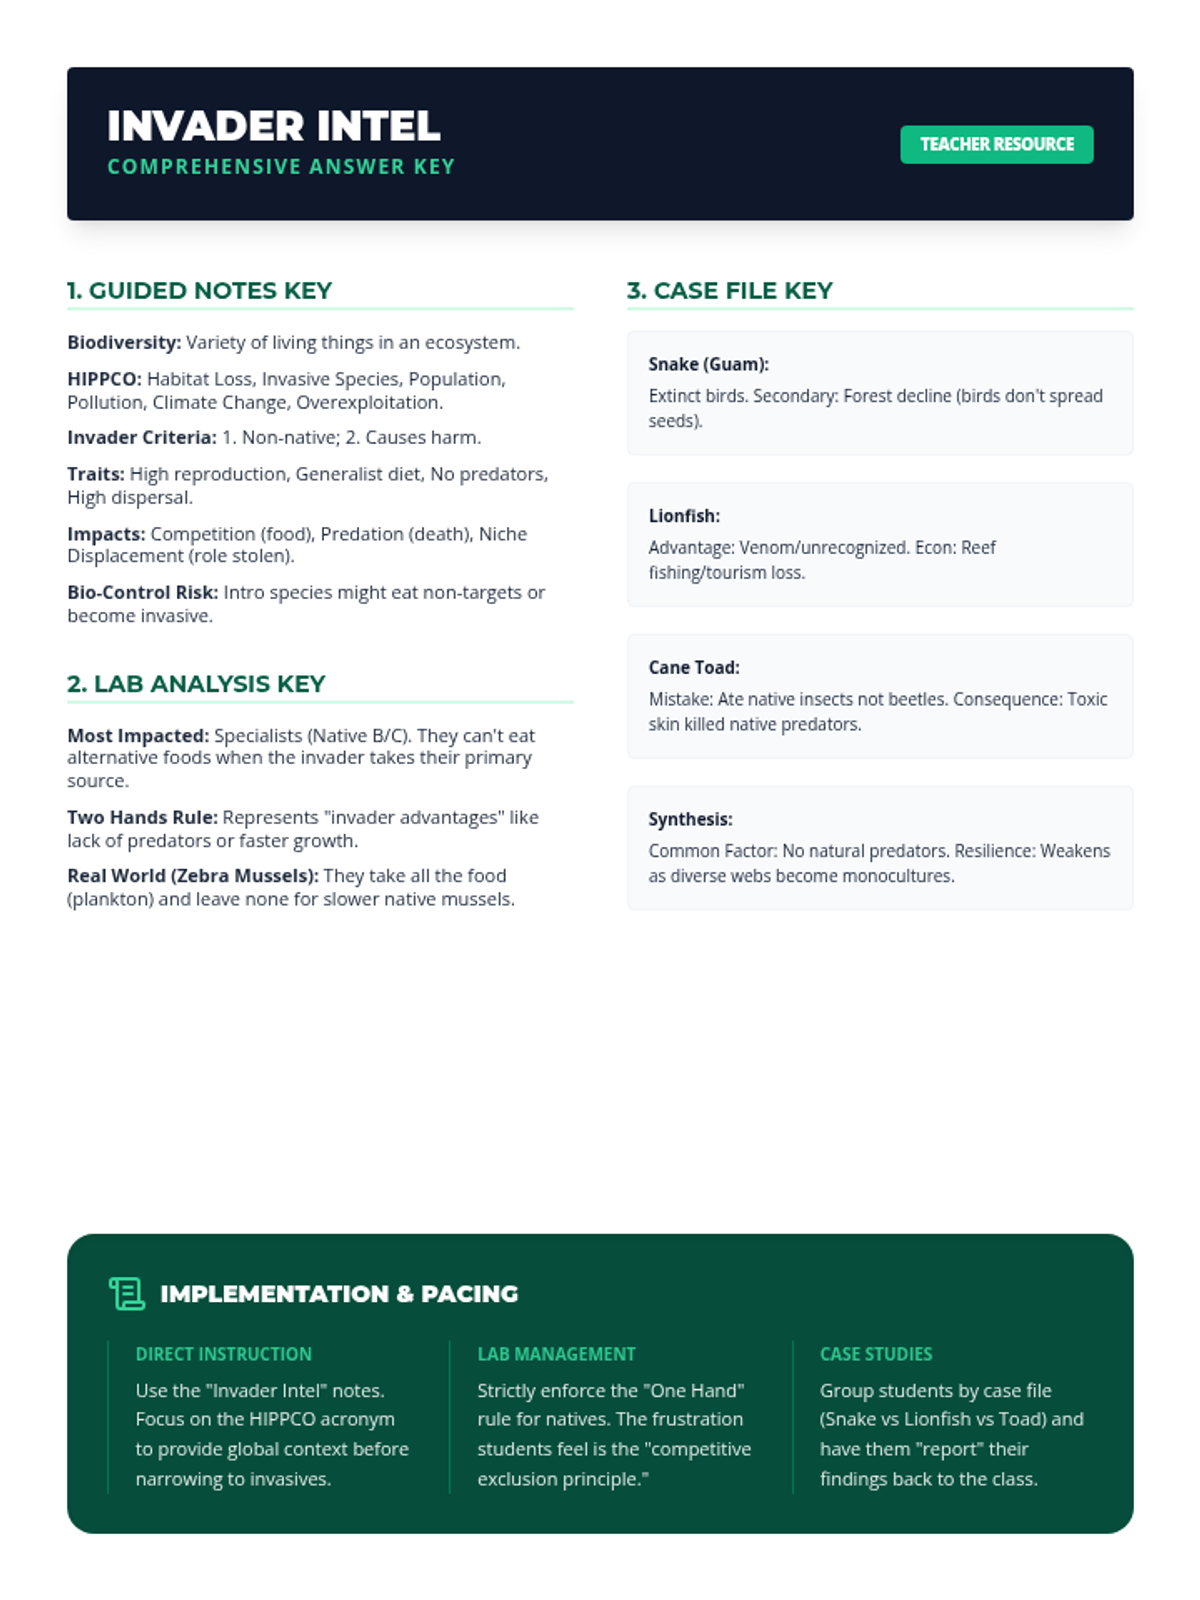
This lesson explores the impact of invasive species on global biodiversity through hands-on simulation and detailed case studies. Students will identify key characteristics of successful invaders and analyze the ecological and economic consequences of their introduction.
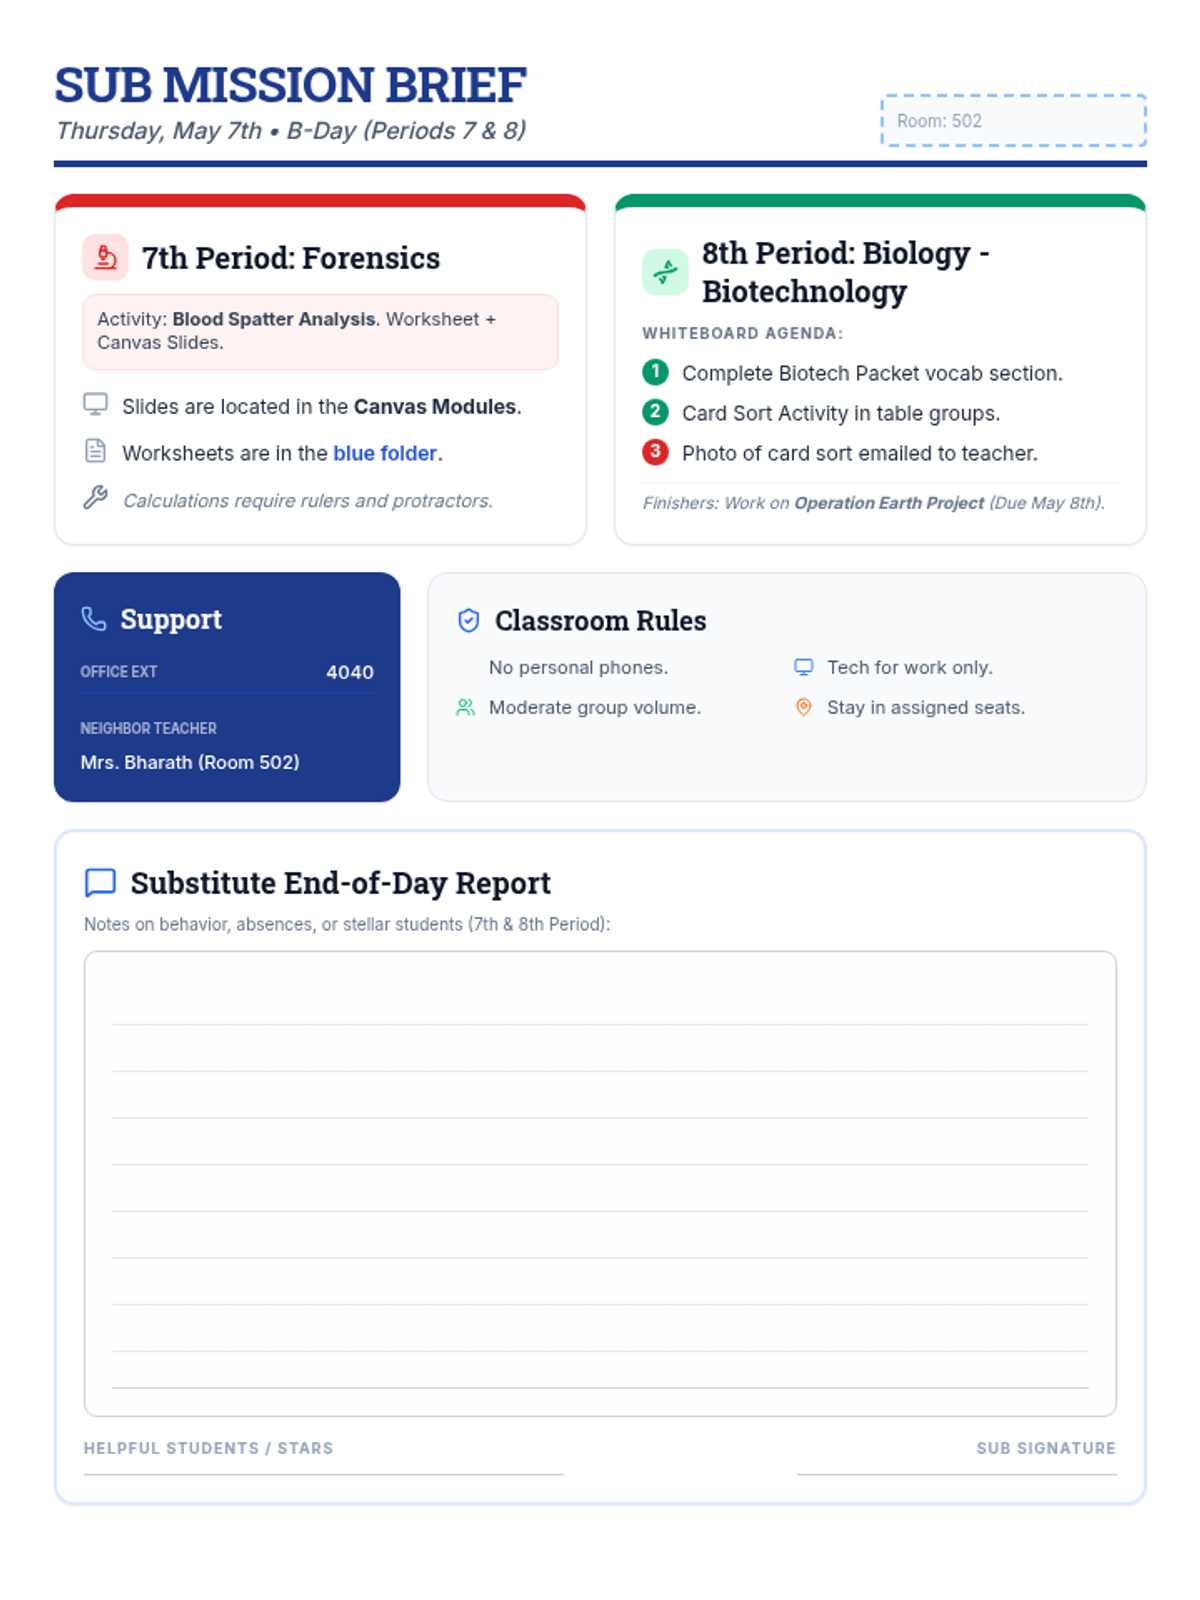
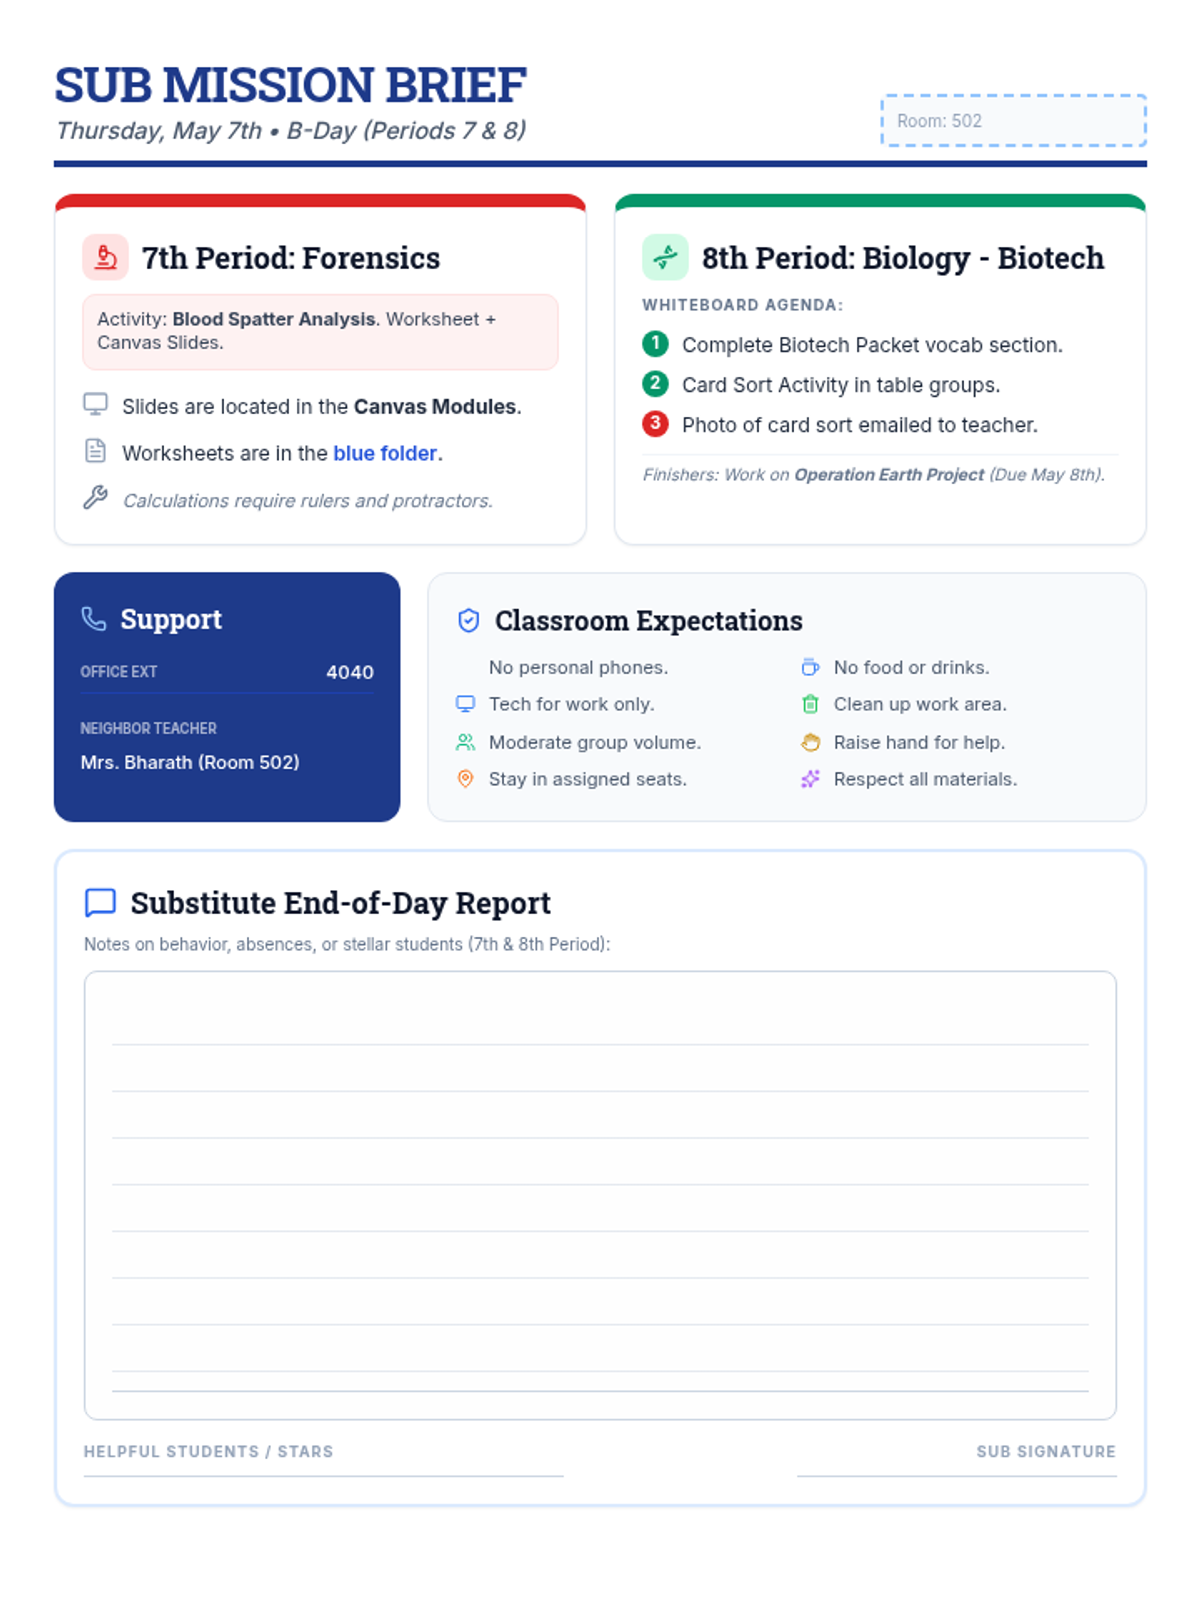
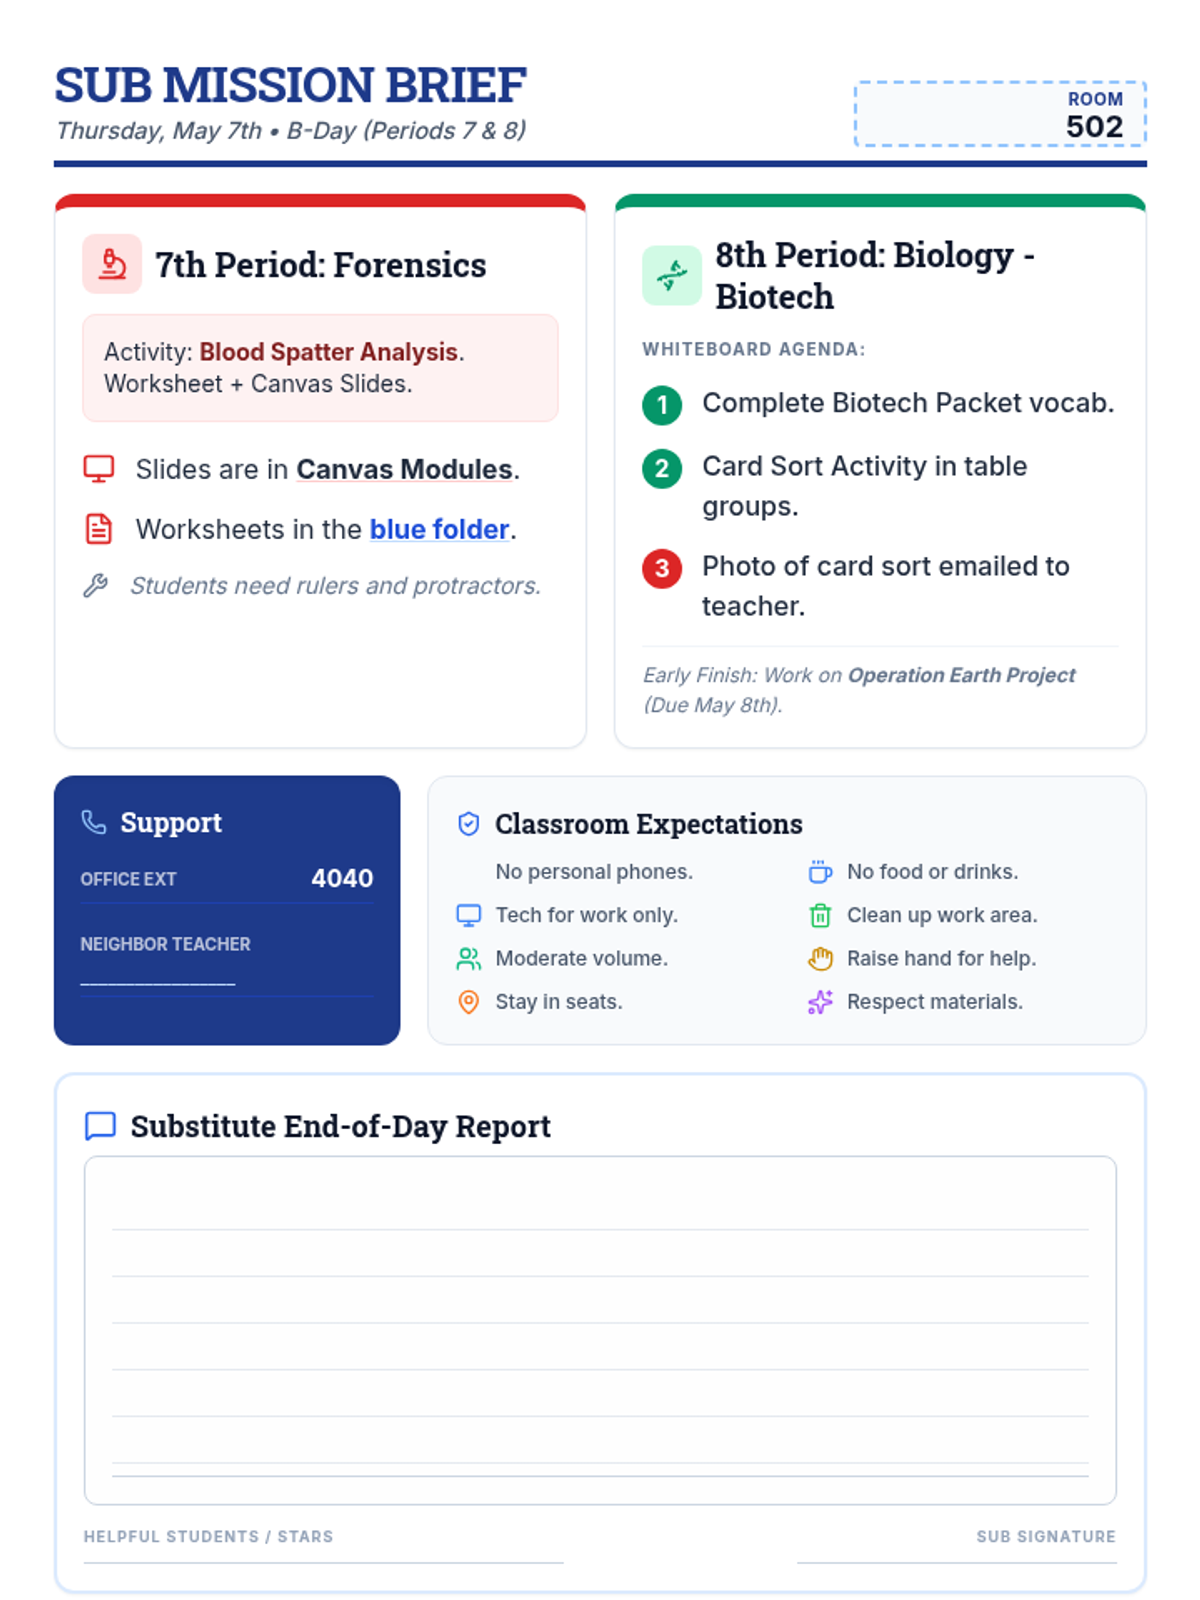
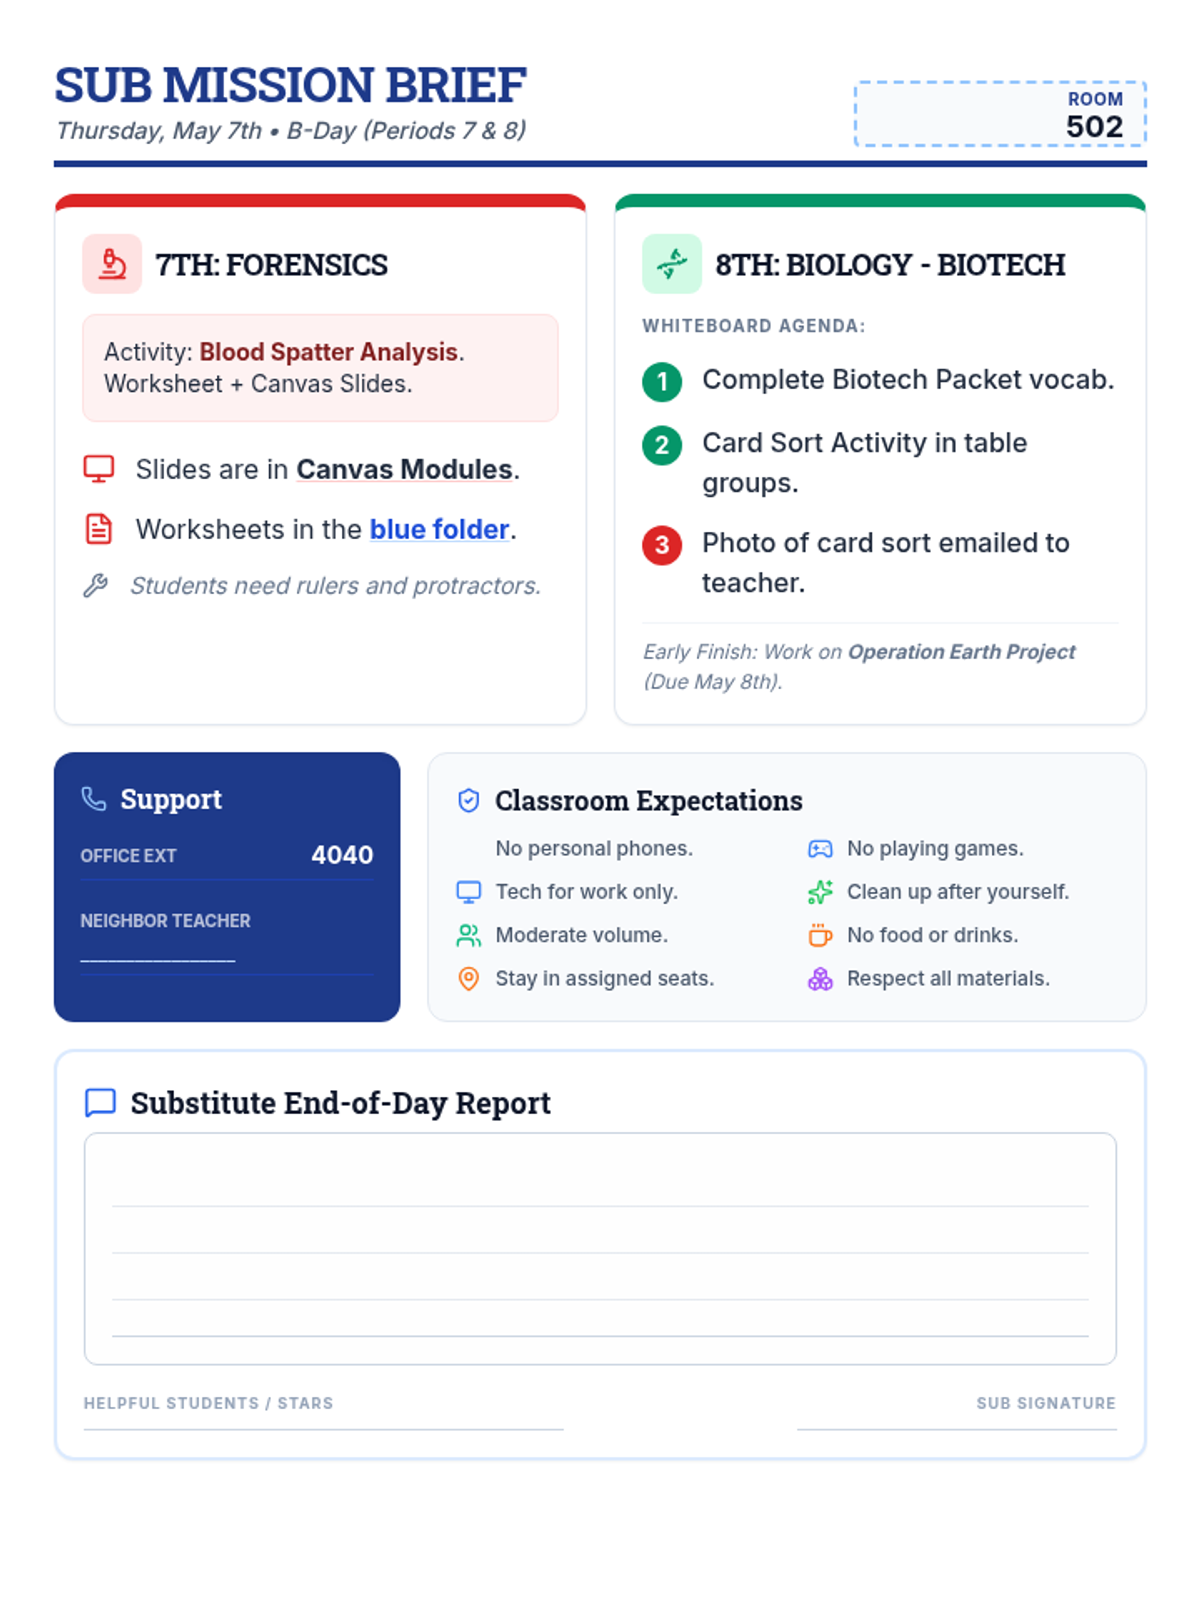
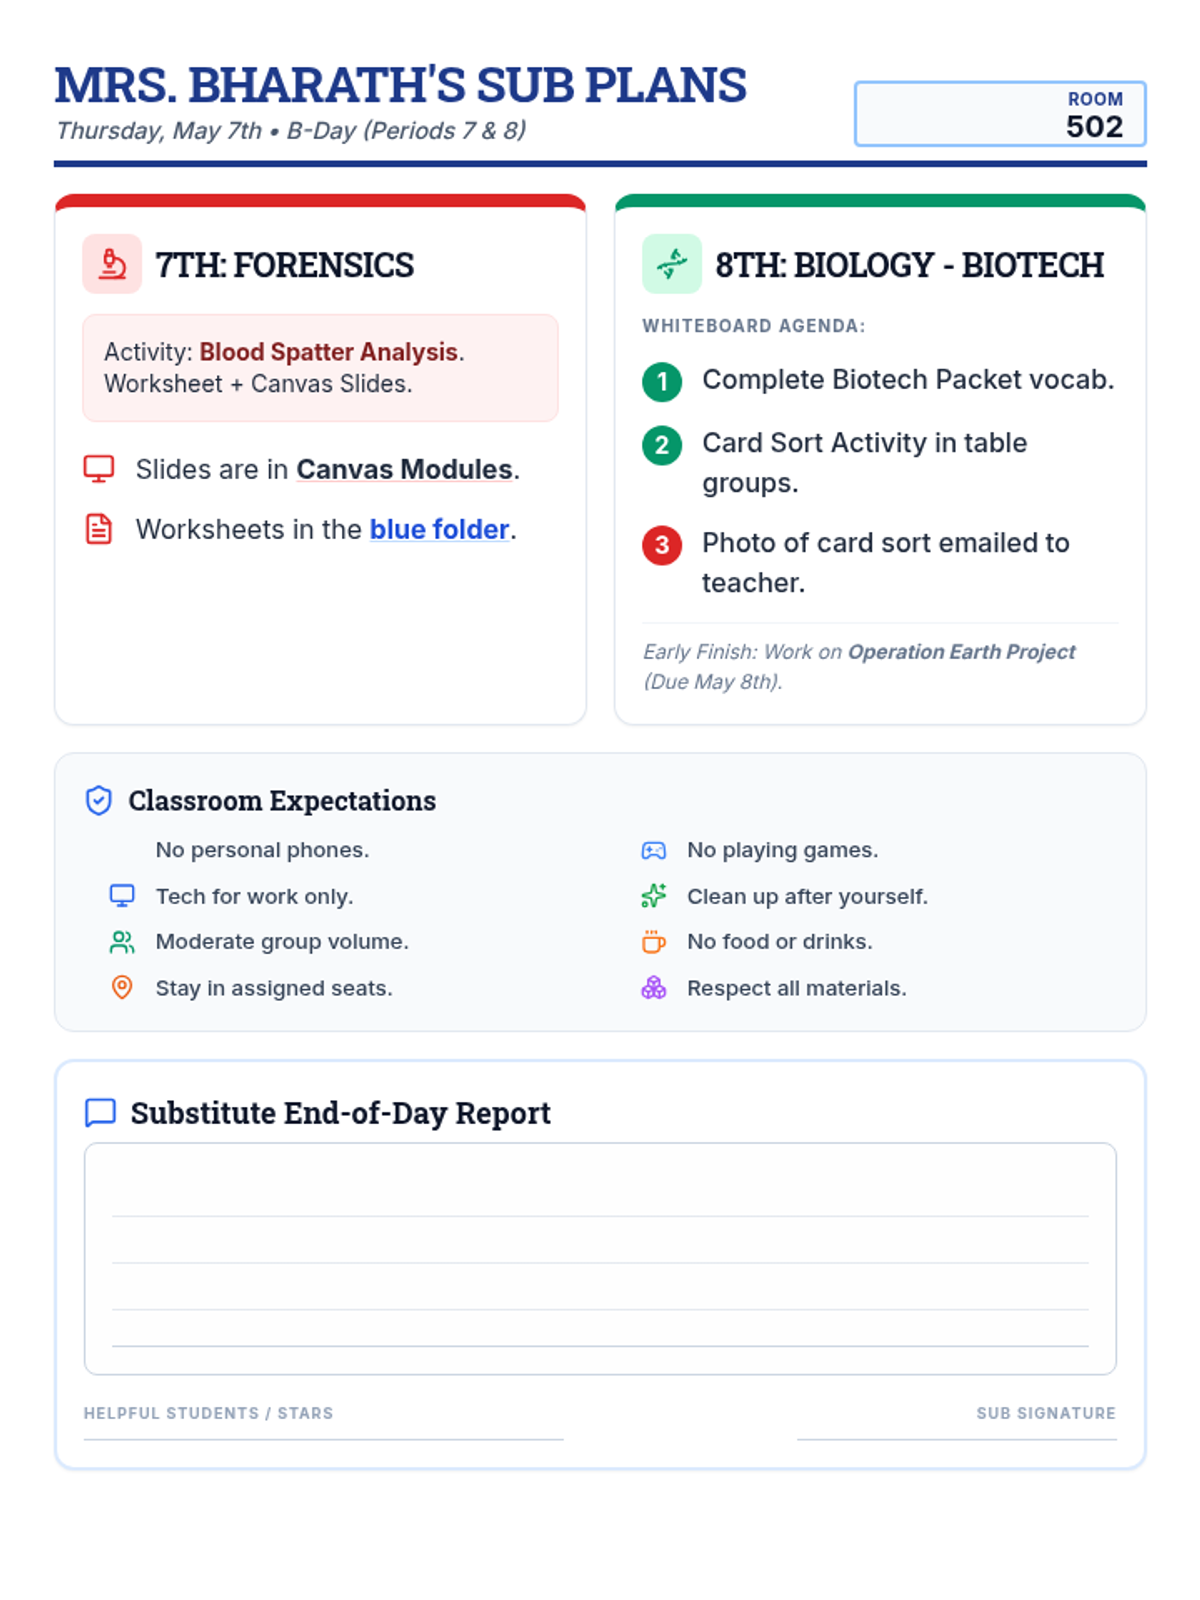
A concise and clear guide for a substitute teacher covering 7th and 8th period classes on May 7th, featuring forensics and biotechnology activities.
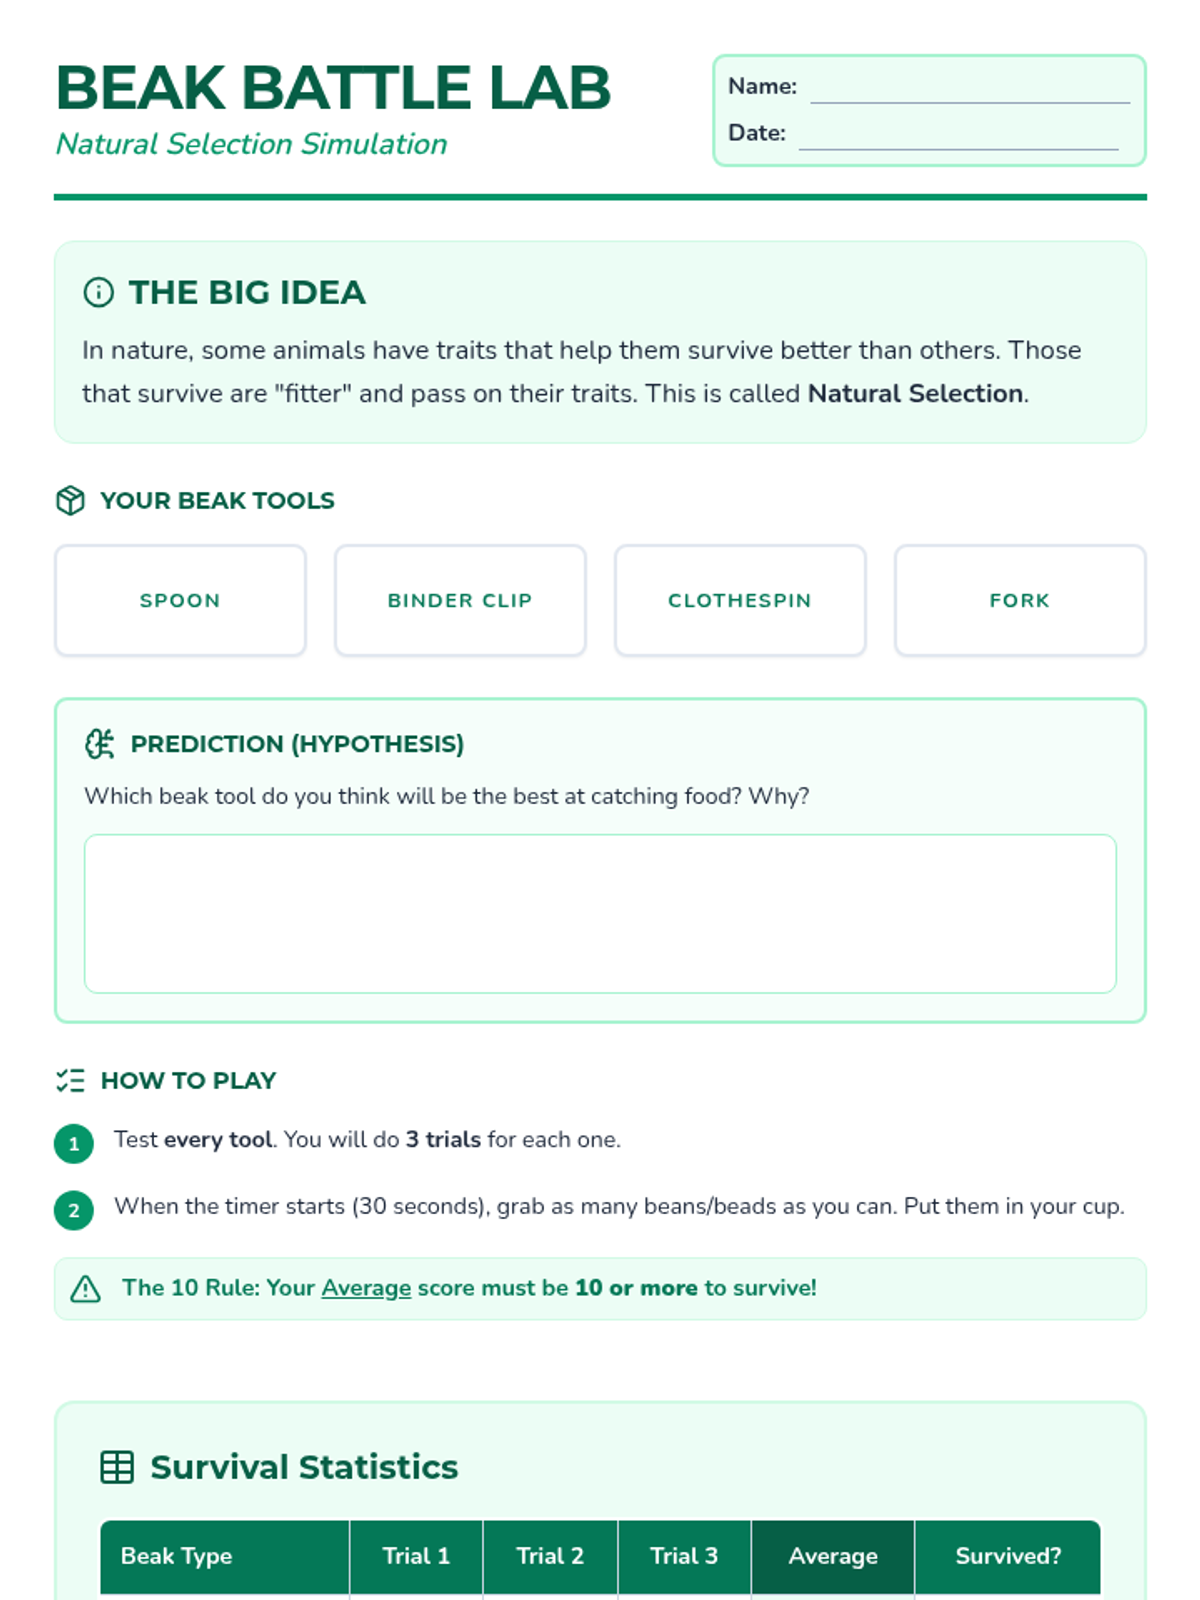
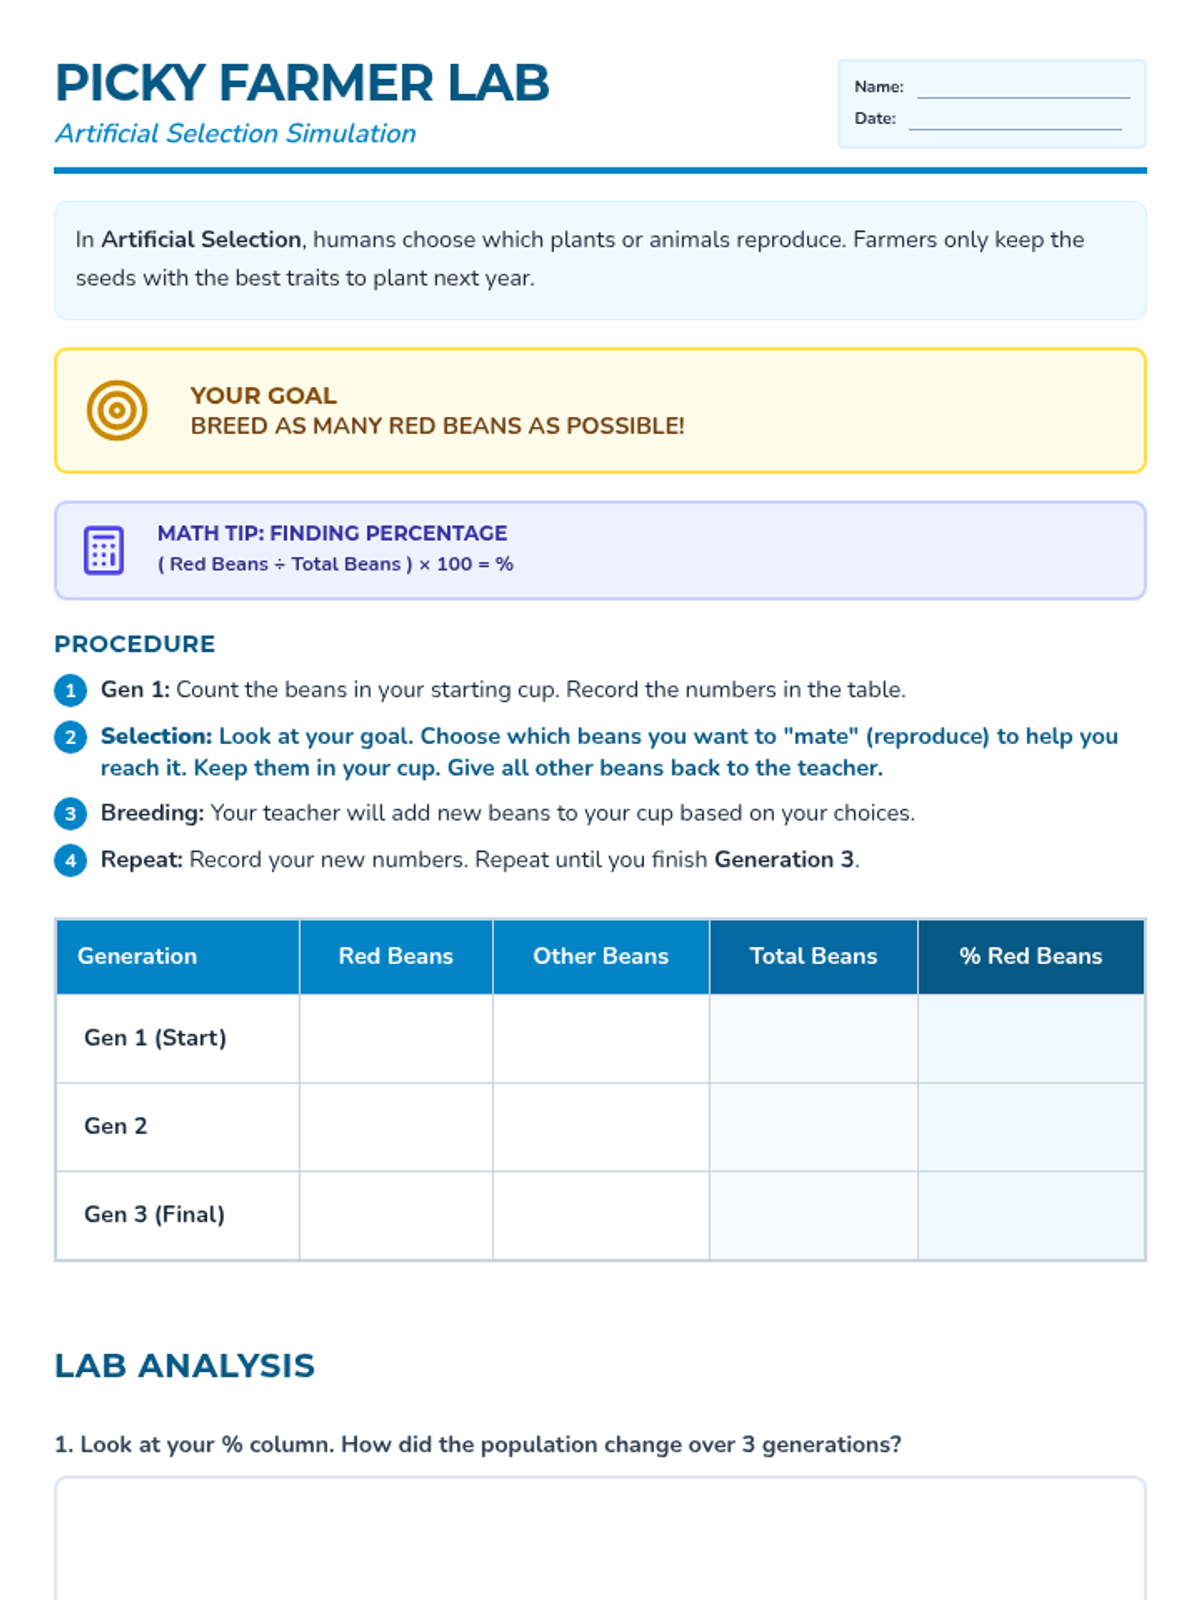
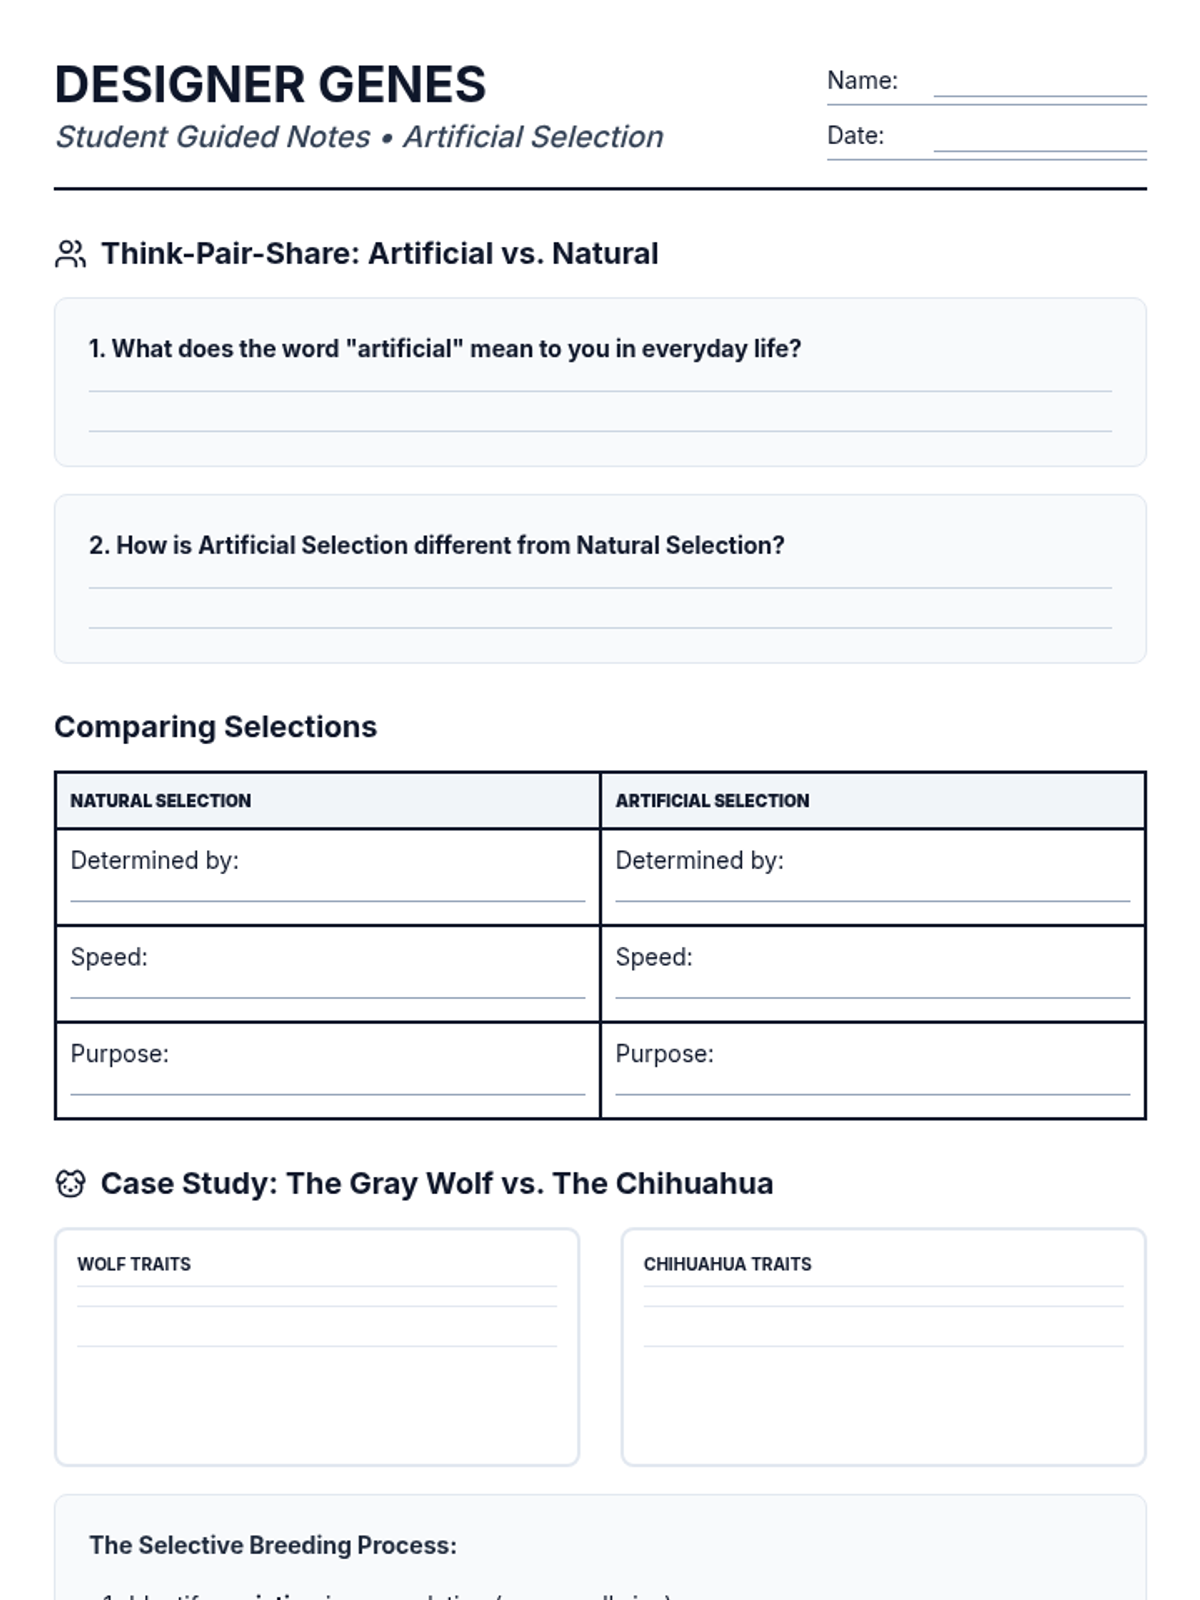
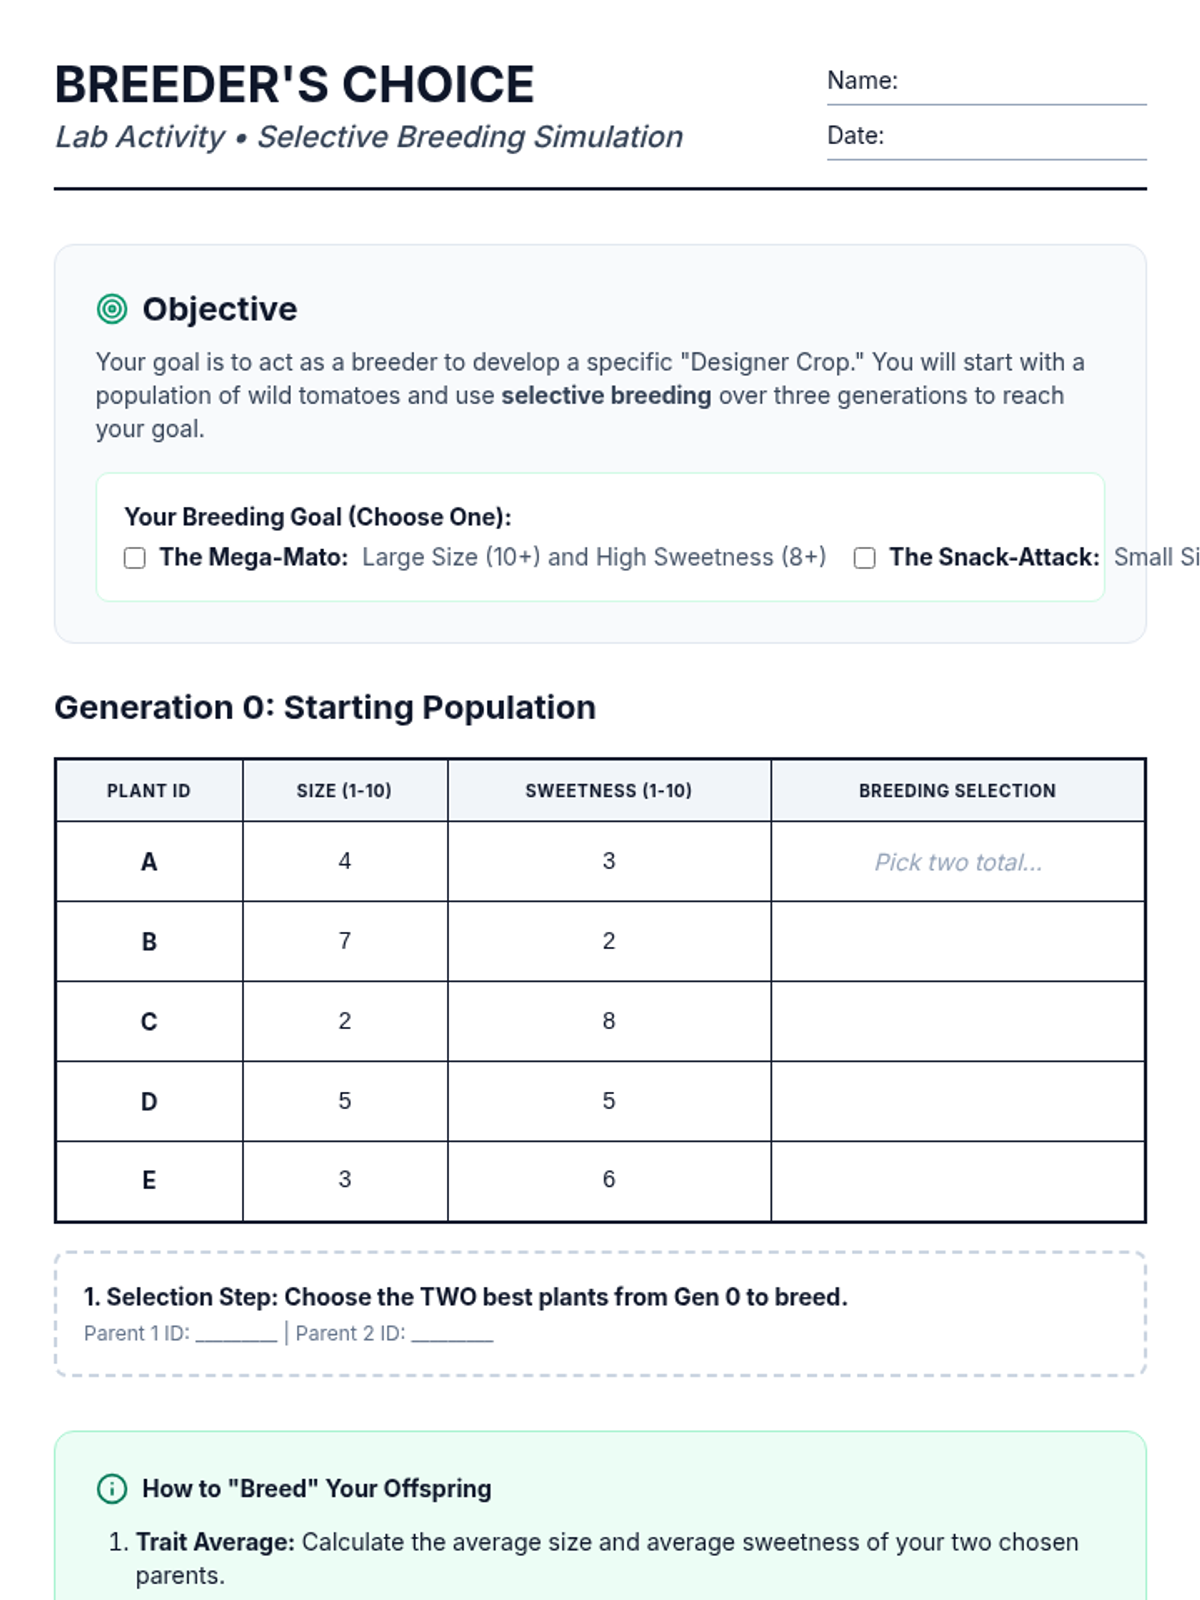
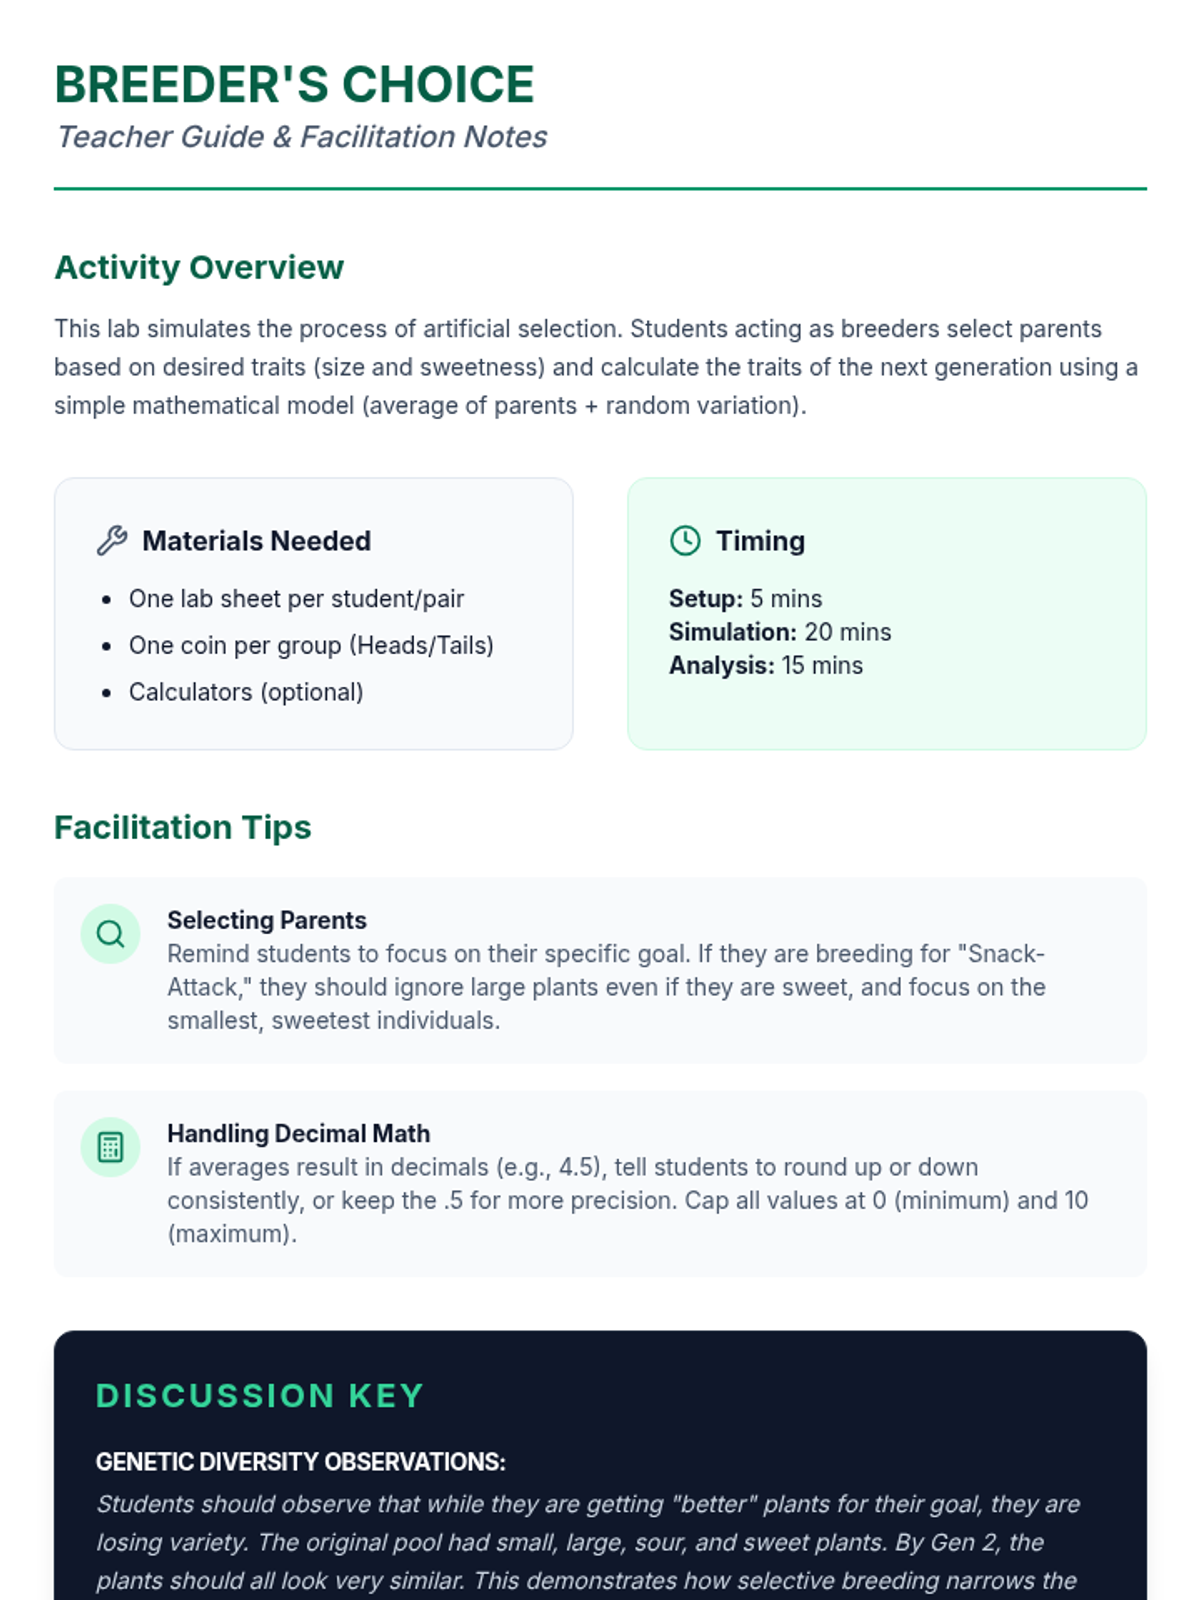
A hands-on lesson featuring two labs where students simulate natural selection through 'beak' adaptations and artificial selection through selective crop breeding.
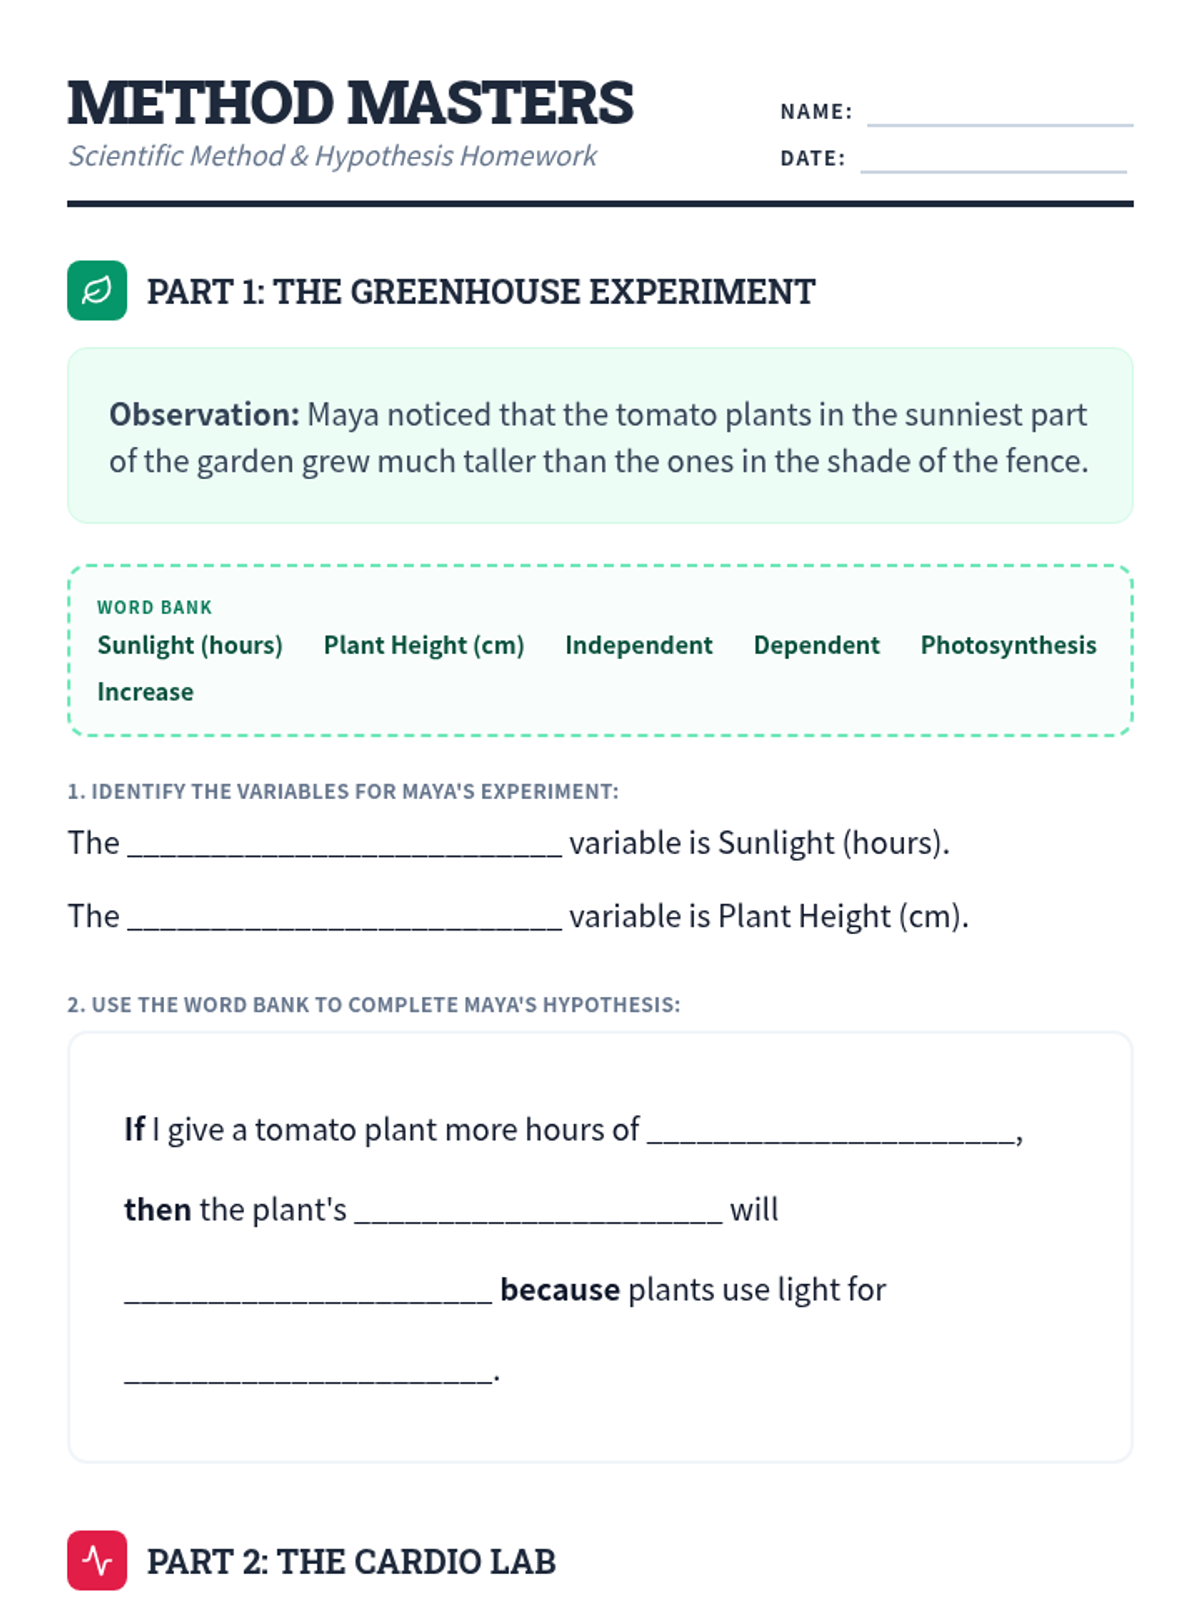
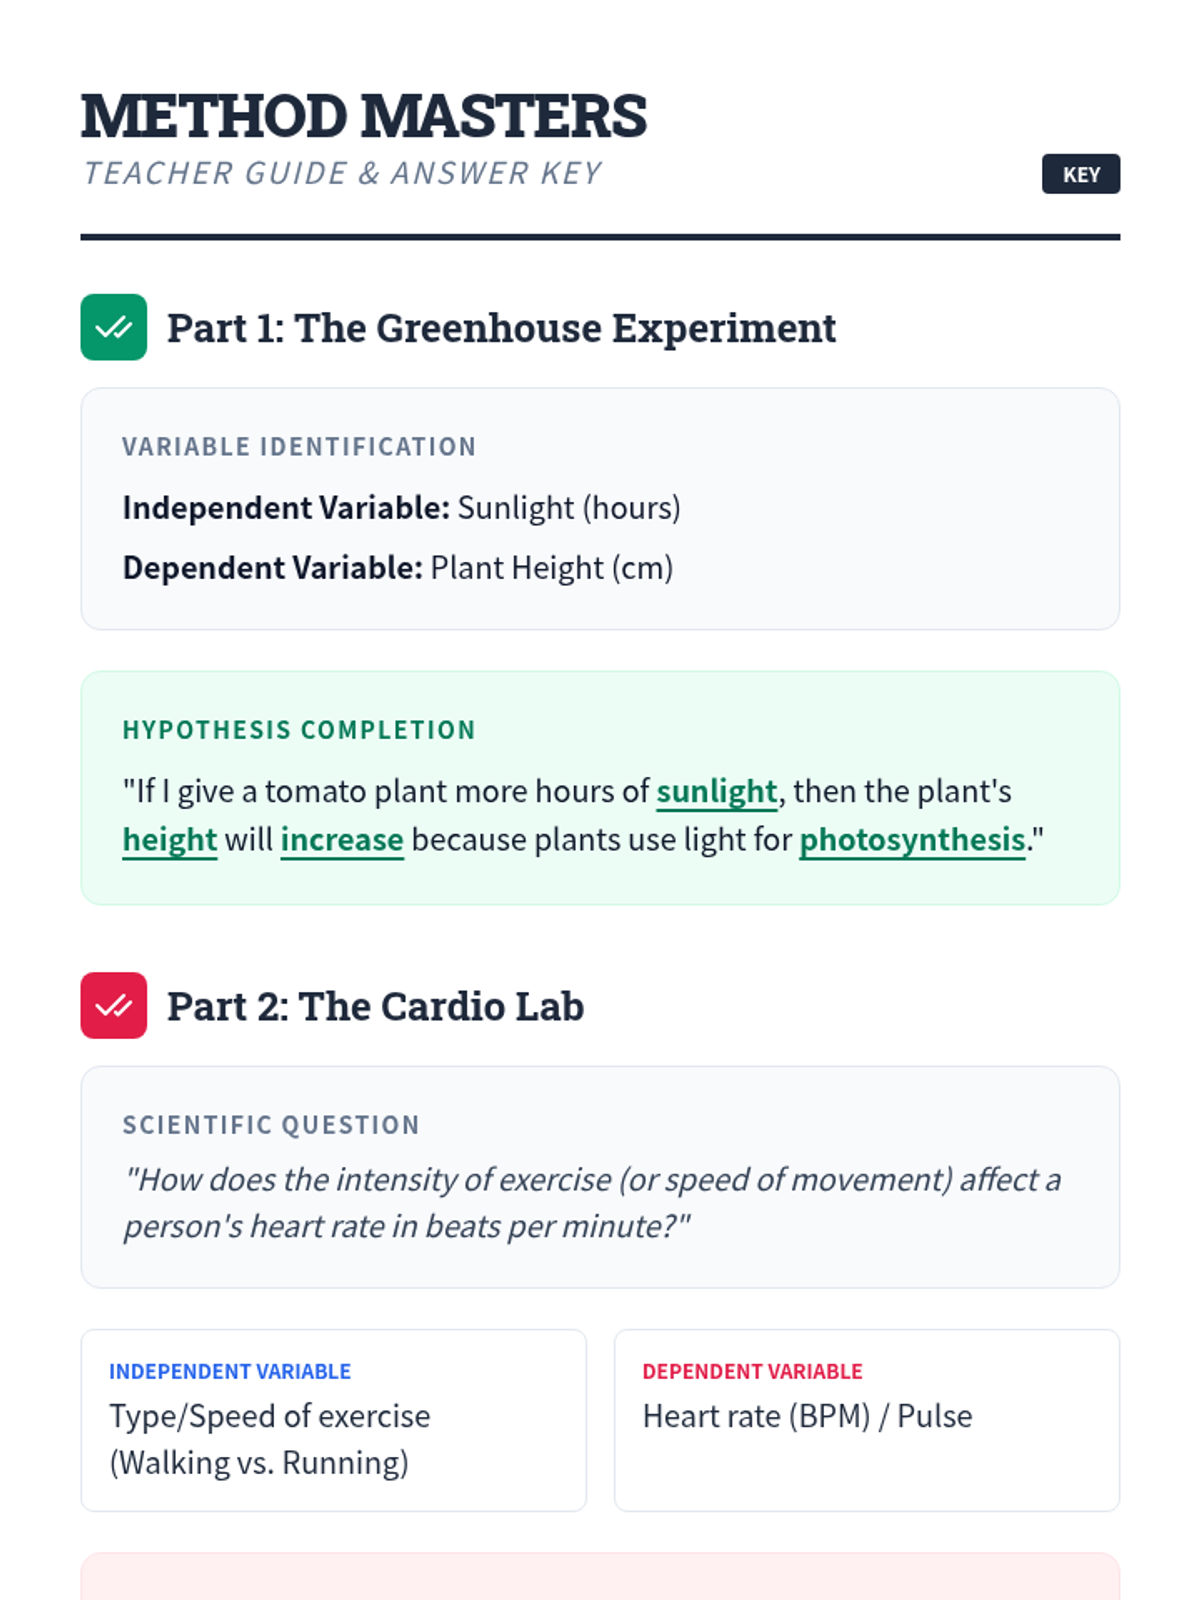
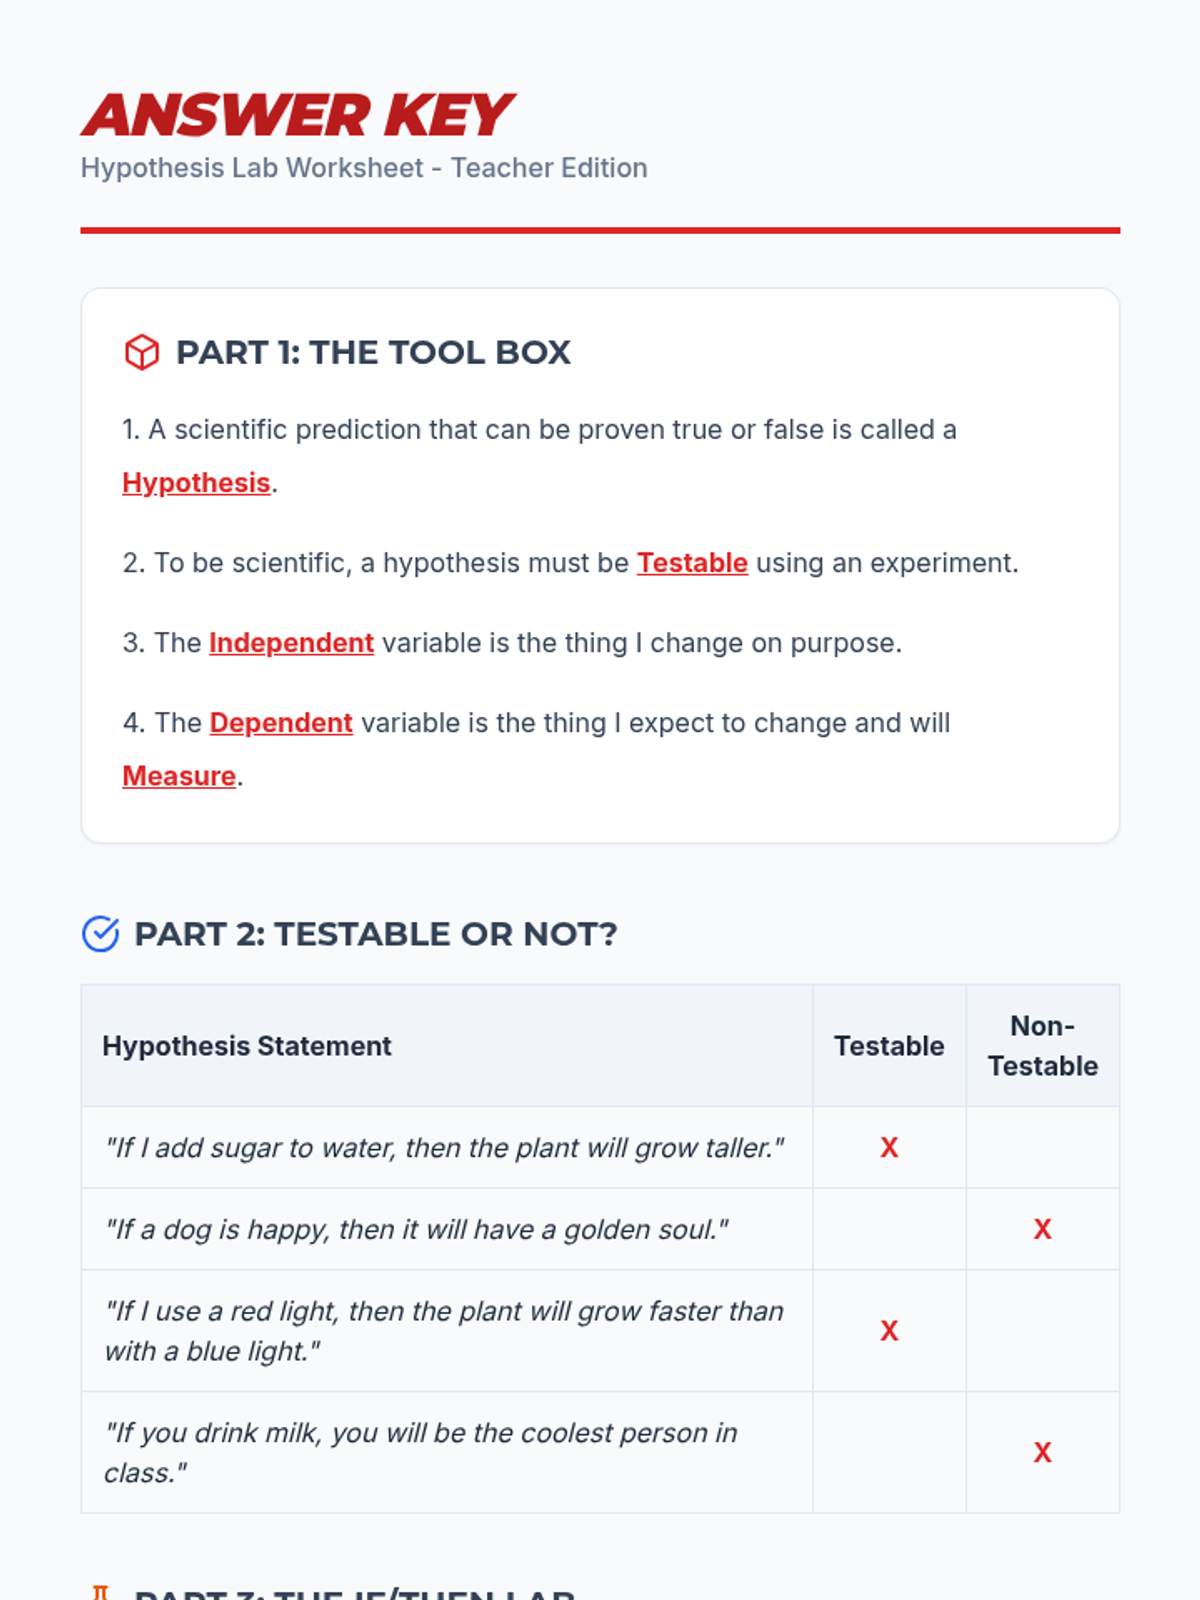
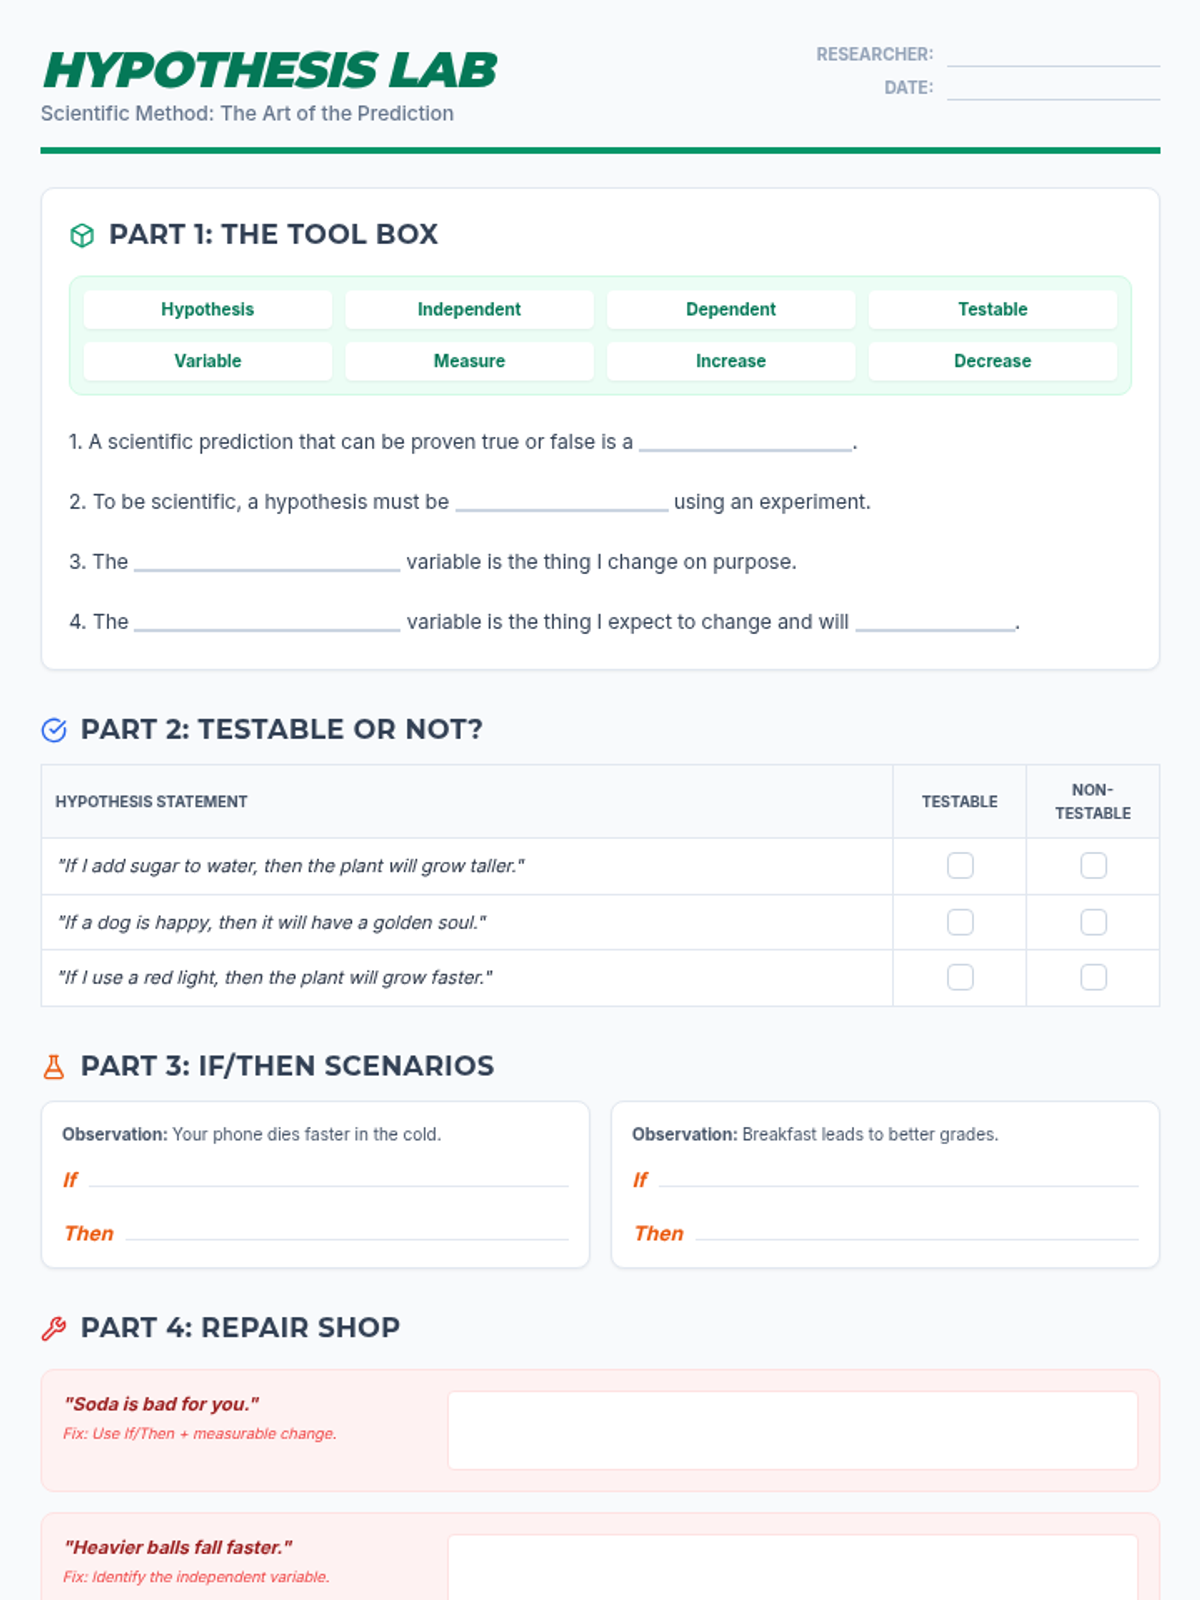
A foundational lesson on the scientific method and hypothesis formation, using real-world biological examples to practice variable identification and structured prediction.
A focused lesson on crafting and refining scientific hypotheses using the If/Then format and distinguishing between testable and non-testable questions.
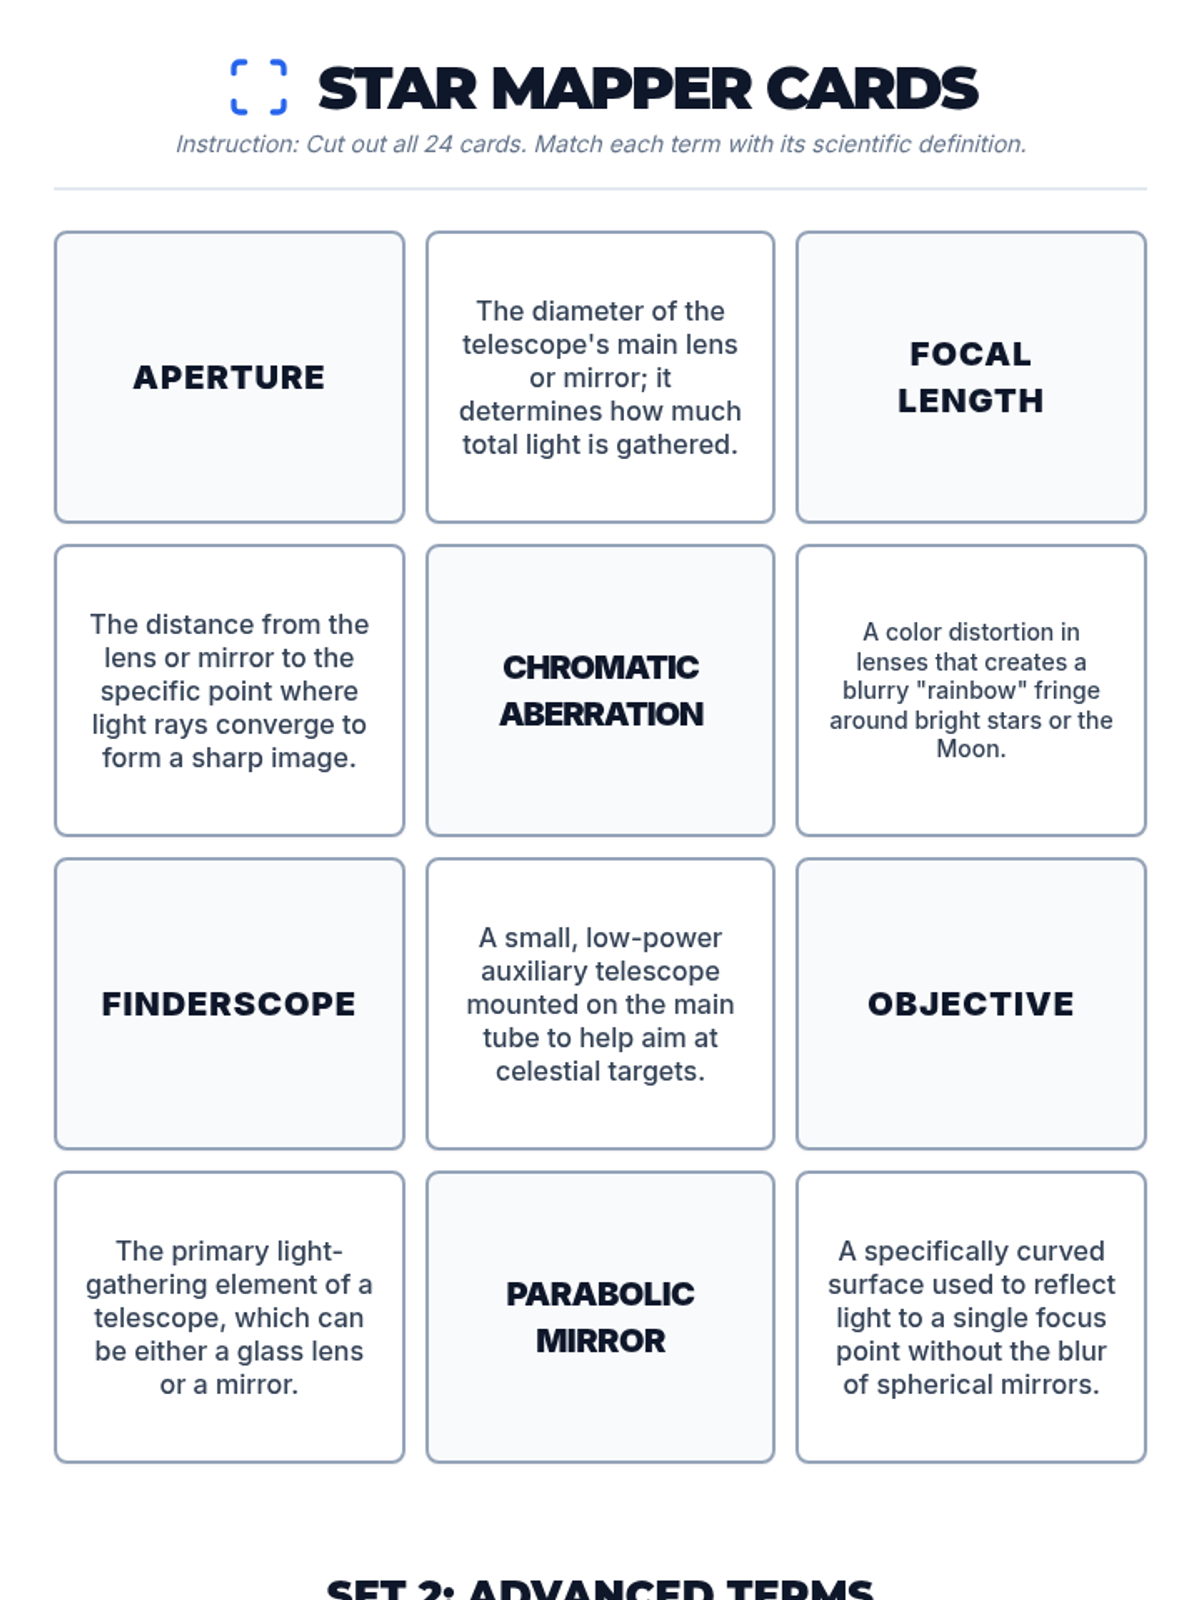
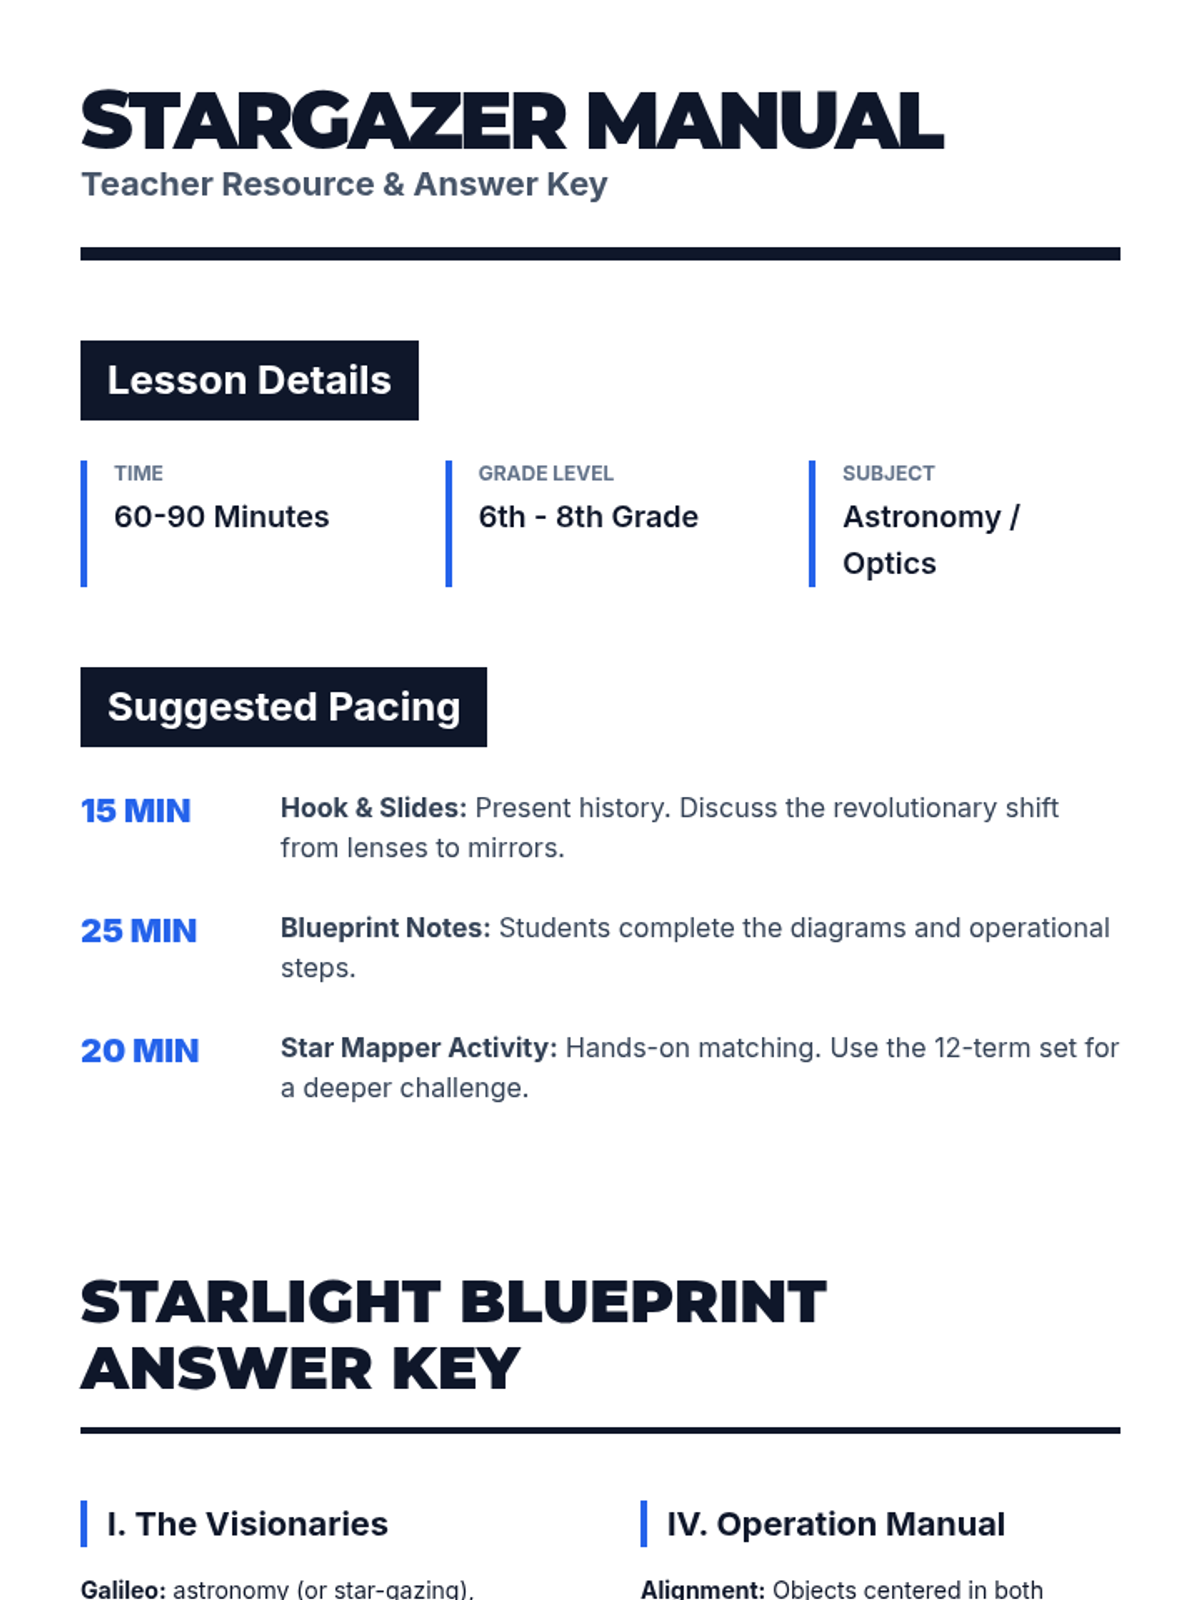
An introductory exploration into how telescopes work, the history of their invention by Galileo and Newton, and the practical steps for observing the night sky.
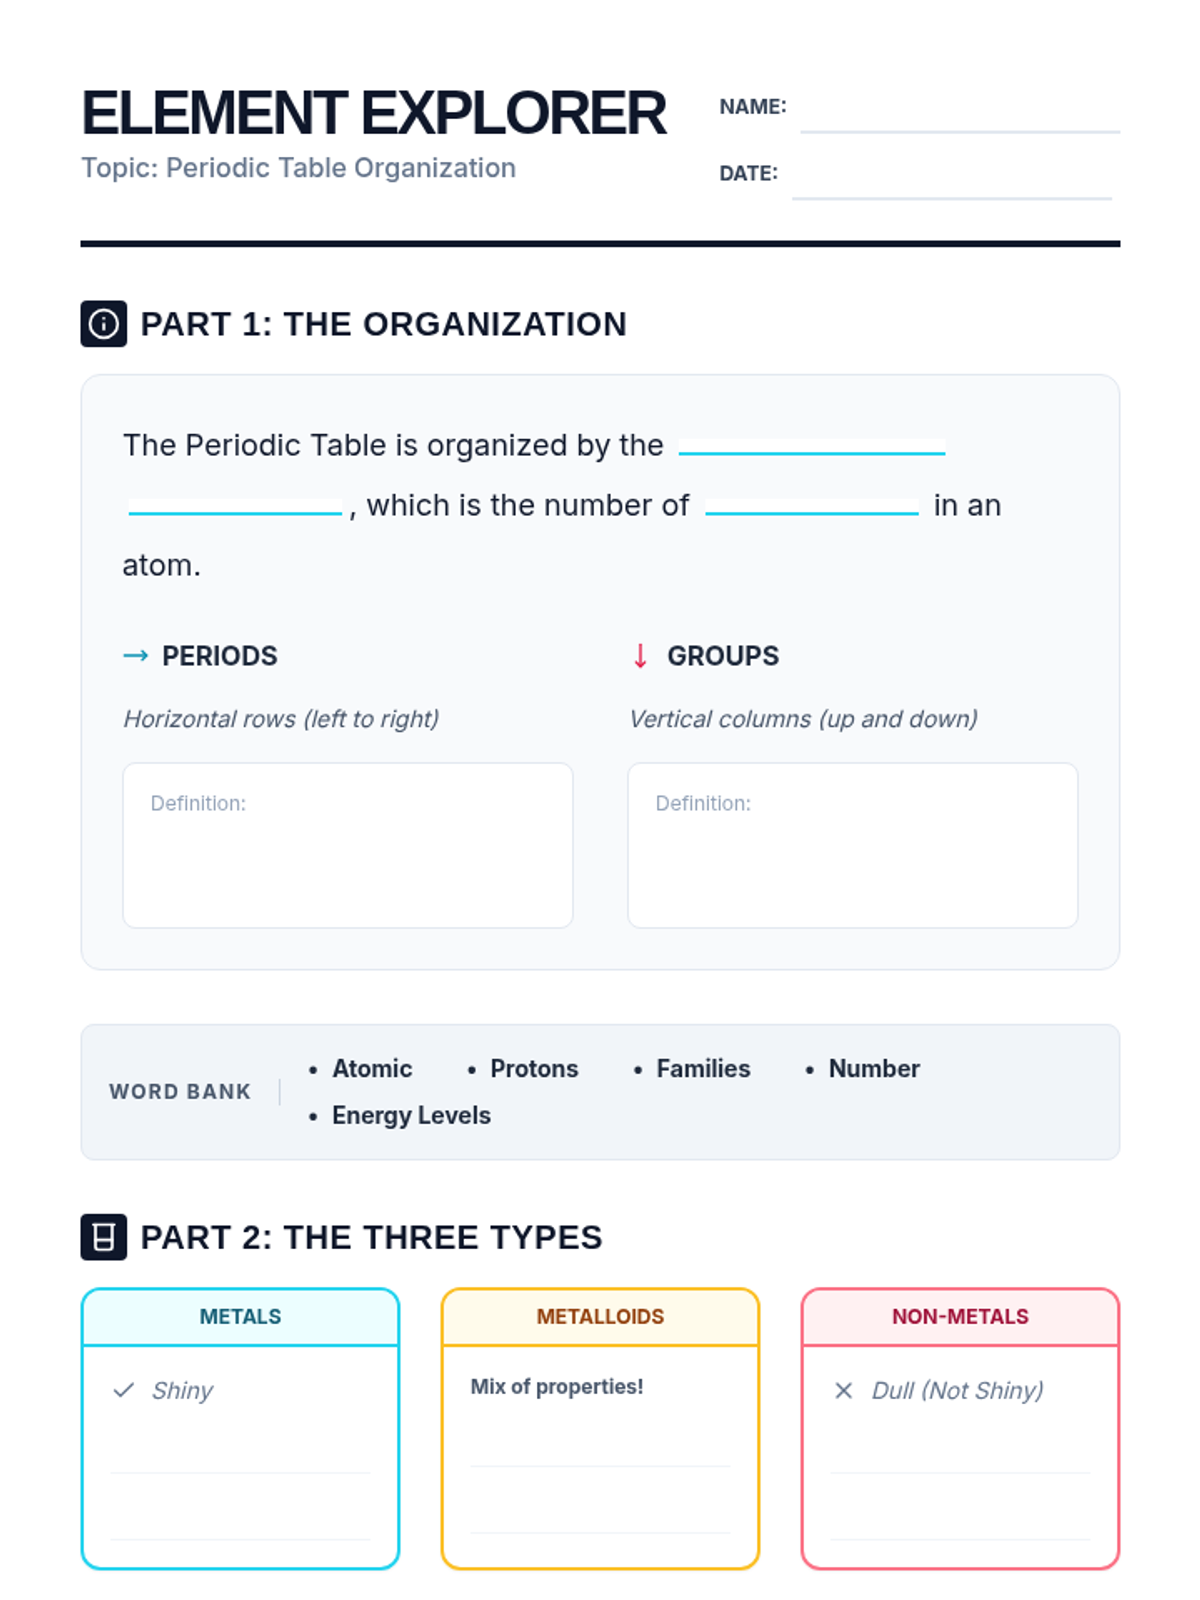
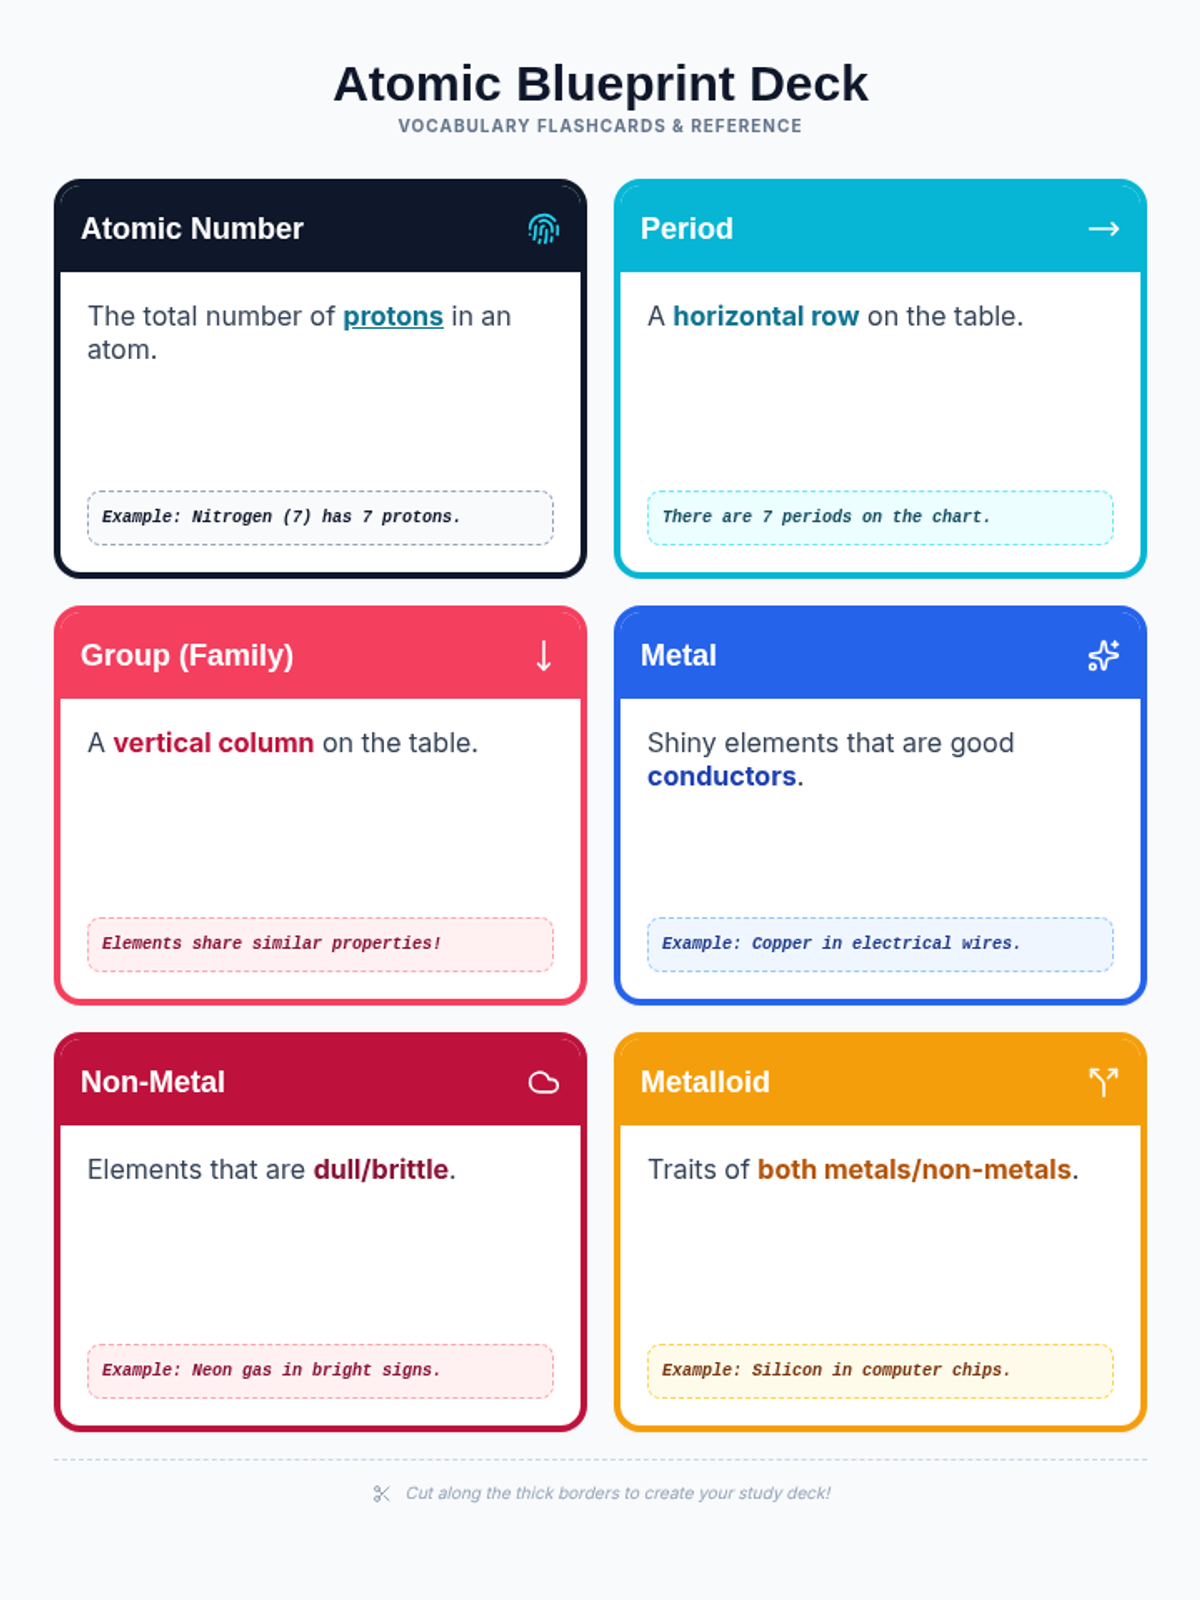
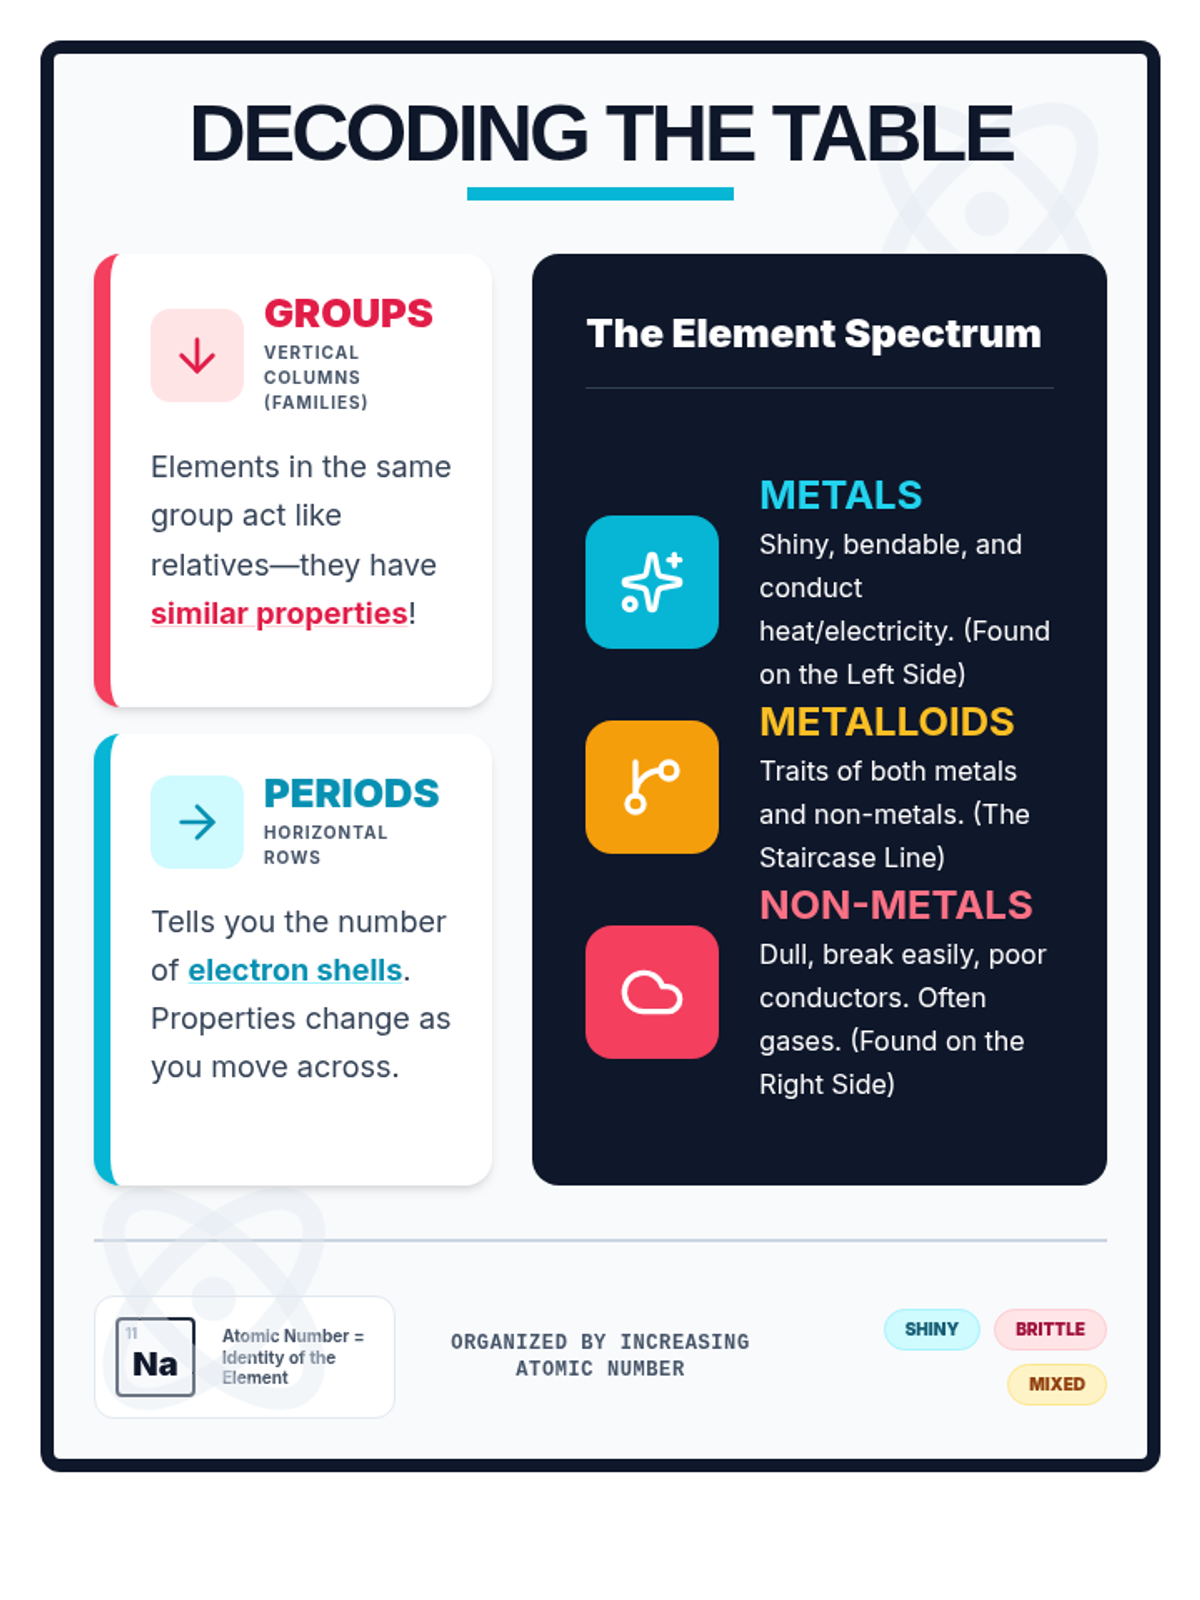
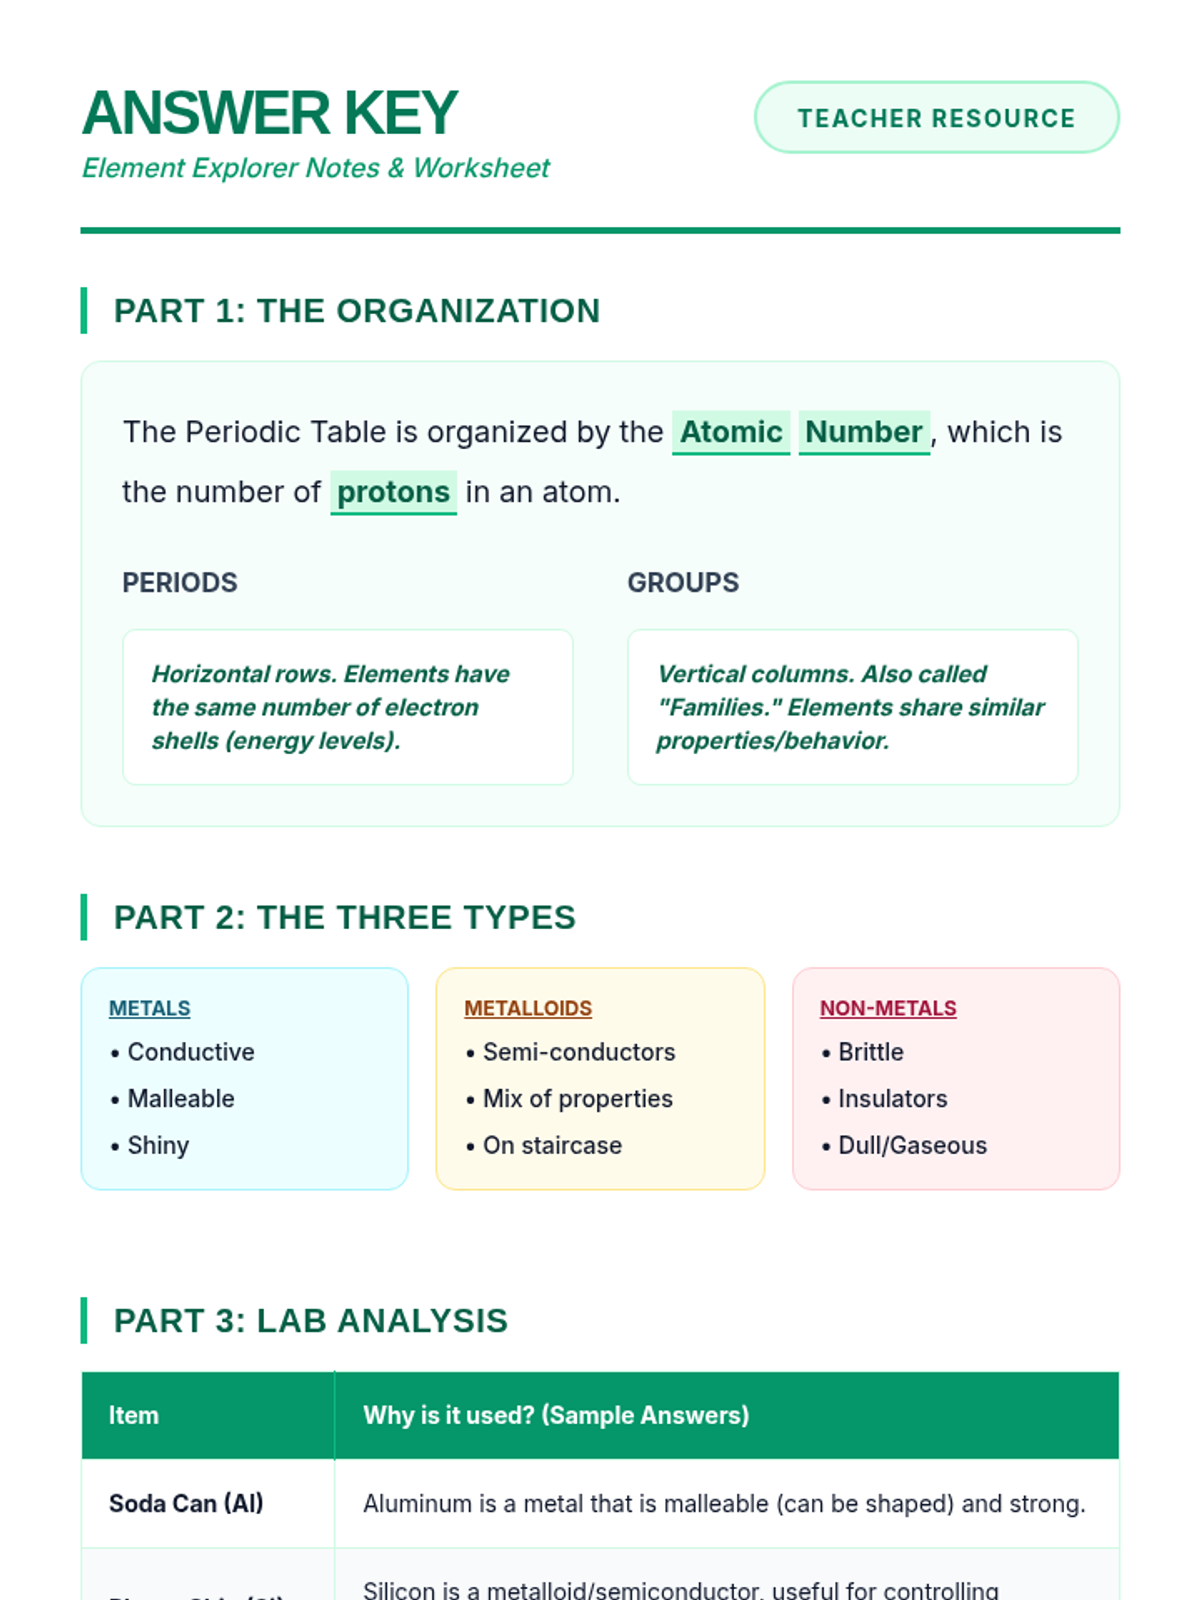
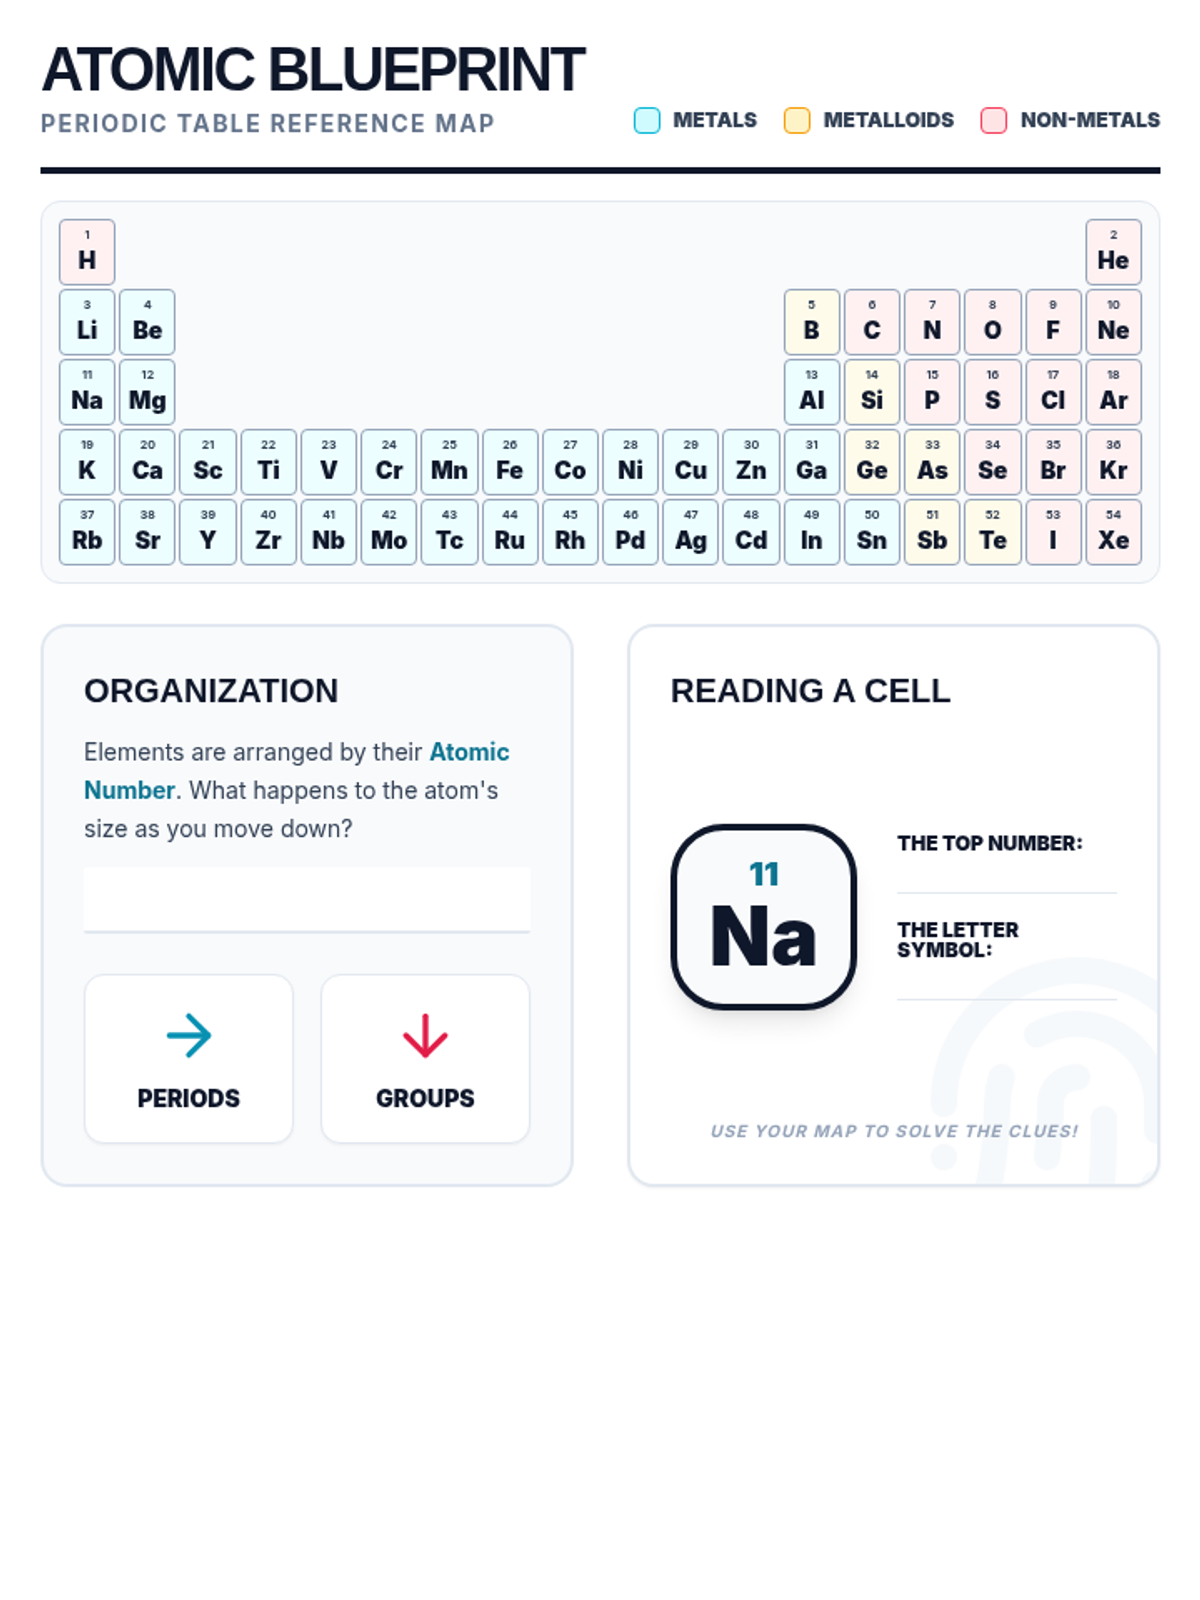
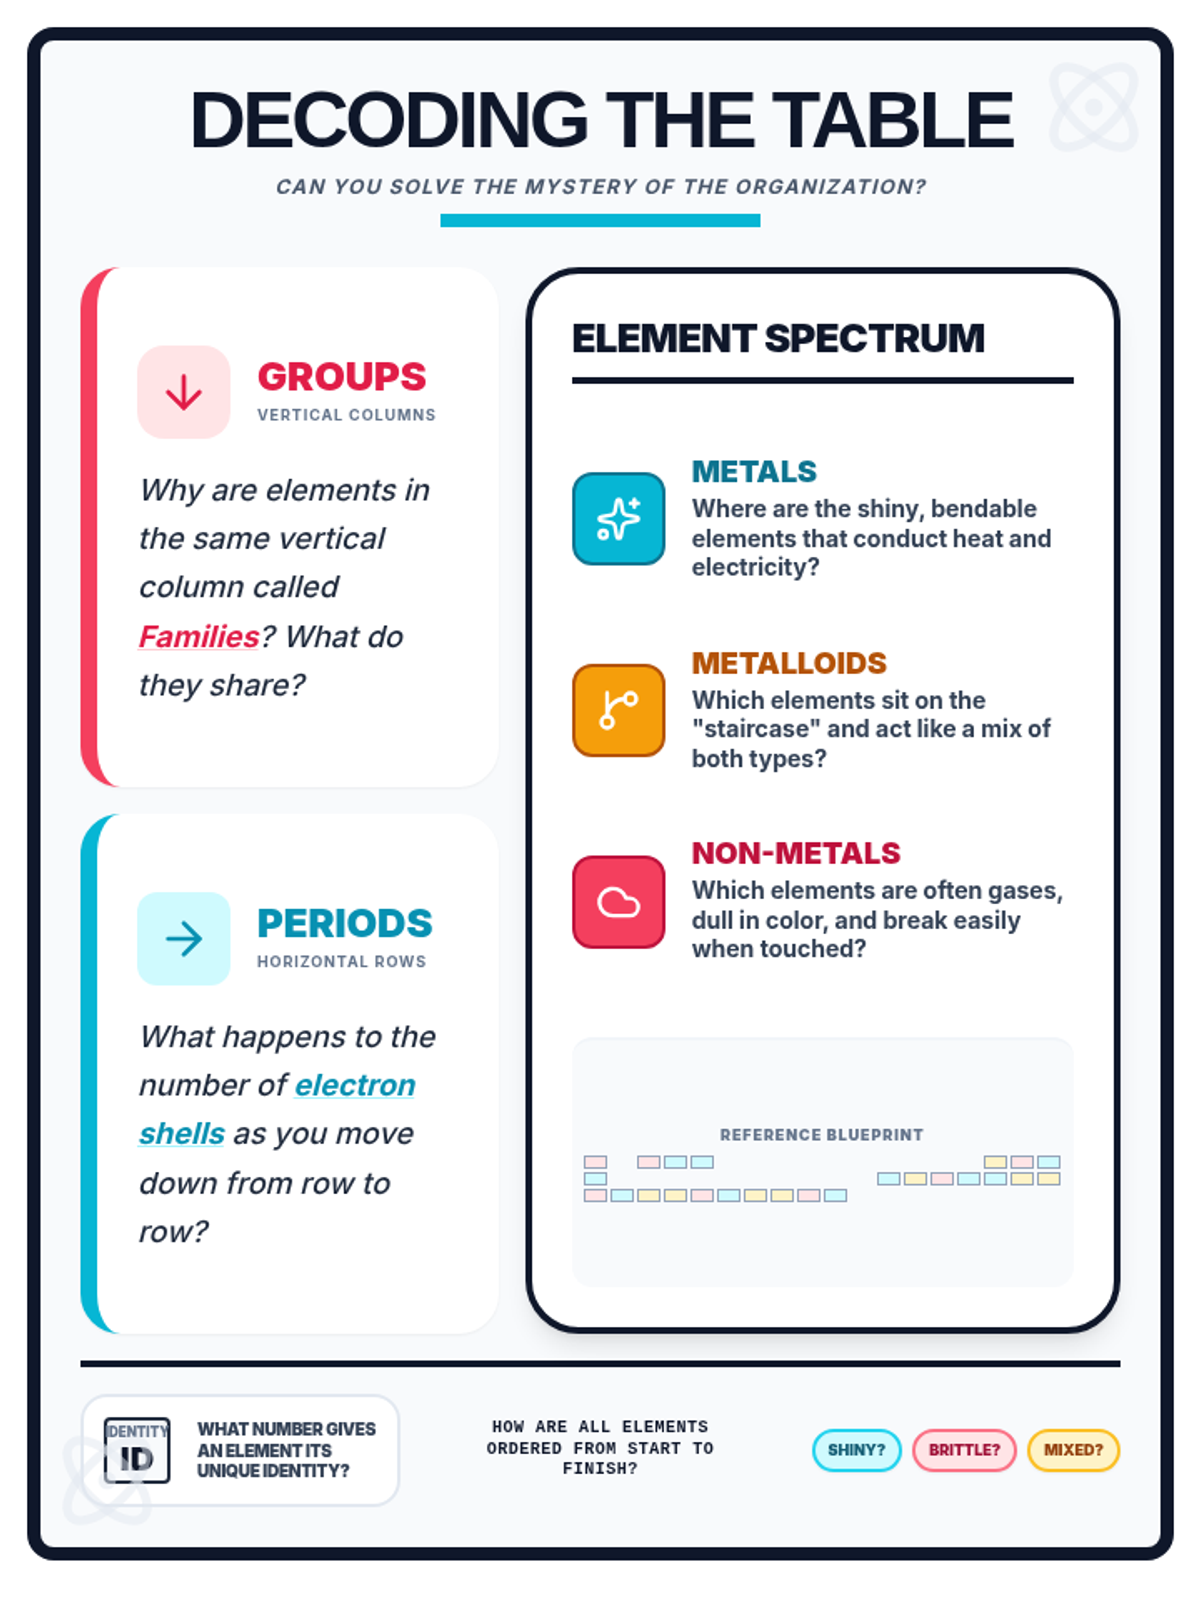
A comprehensive introduction to the Periodic Table, exploring how elements are organized by atomic number, the significance of groups and periods, and the distinct properties of metals, non-metals, and metalloids through real-world examples.
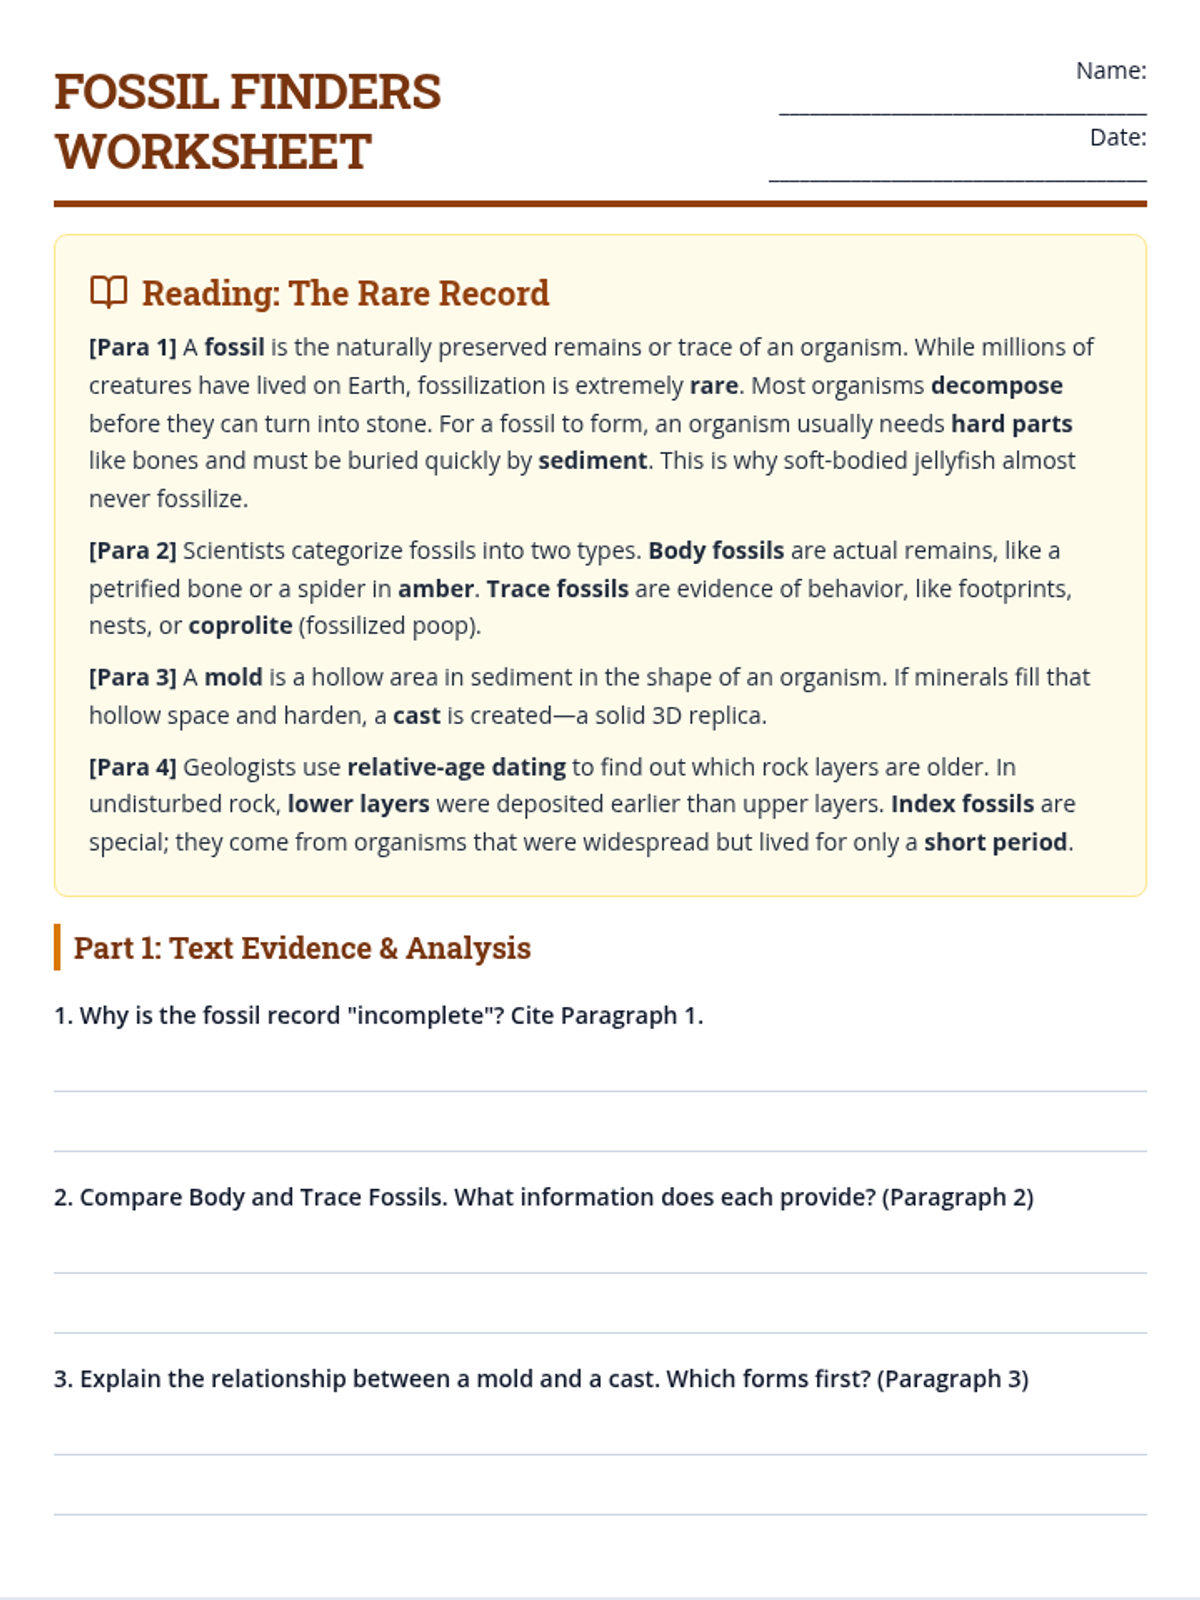
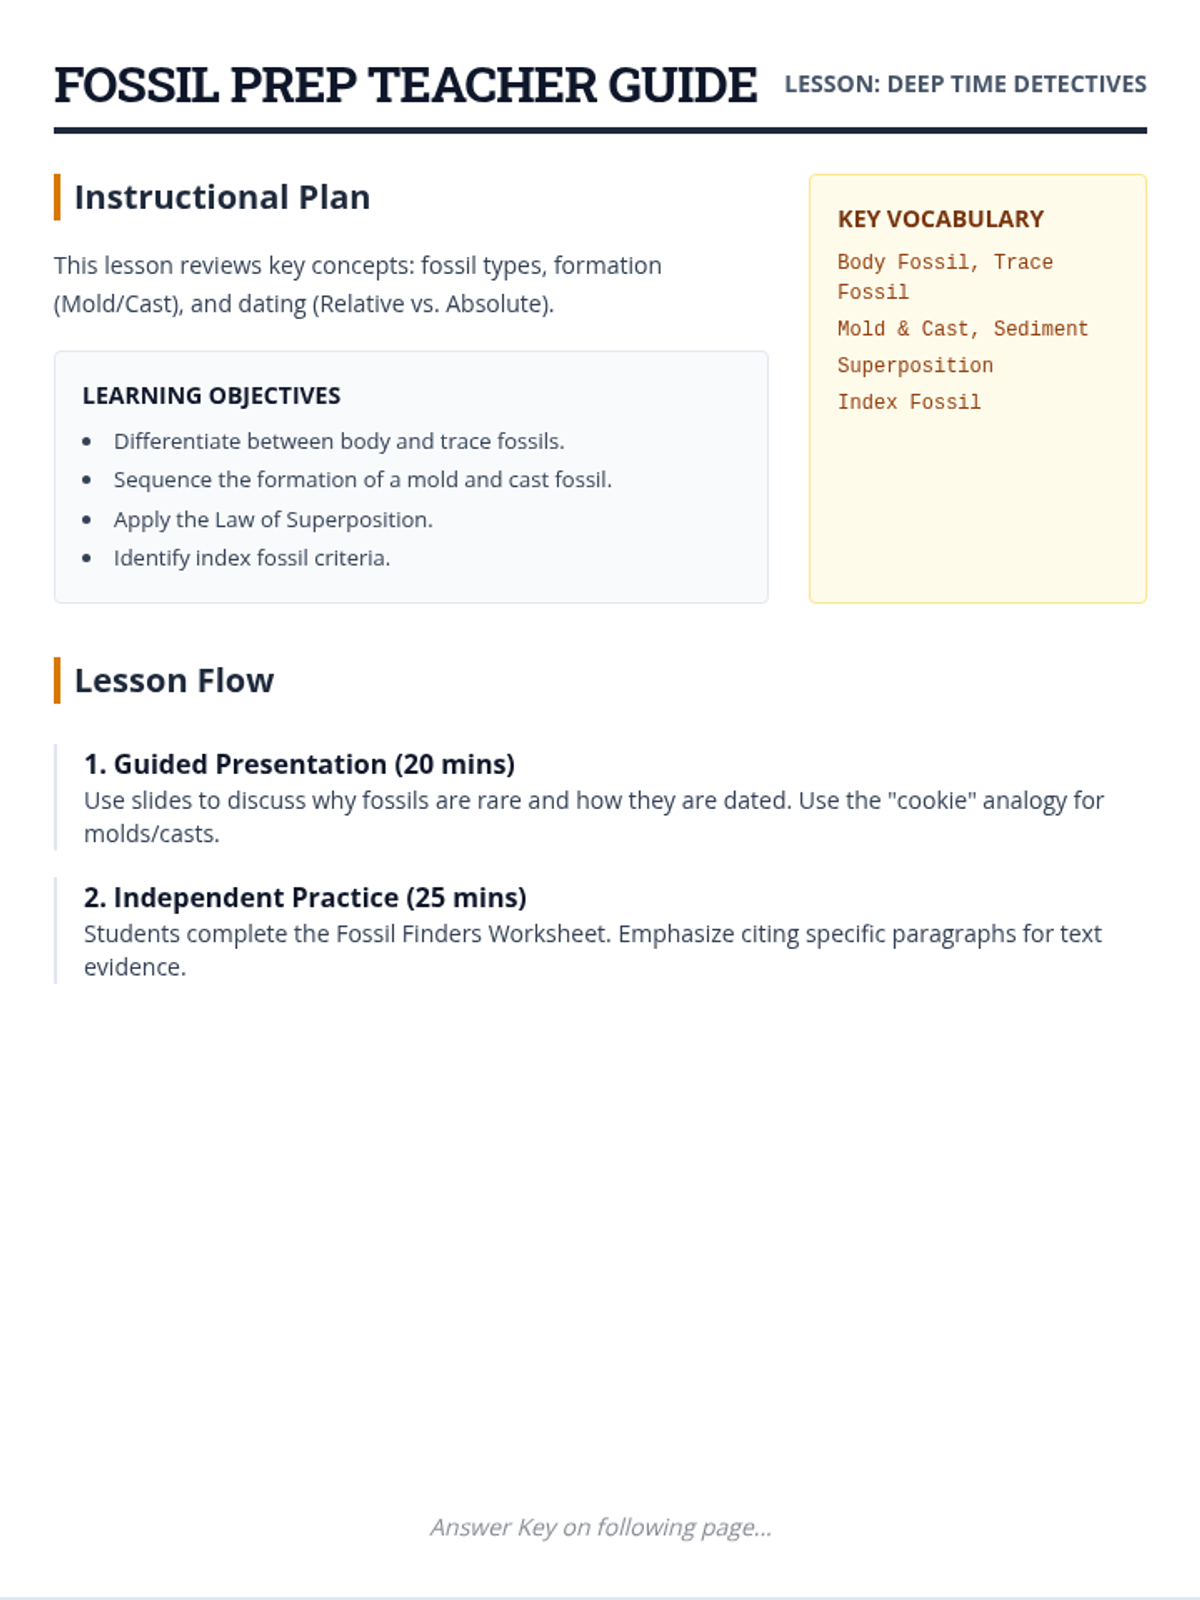
A guided lesson preparing students for a fossils assessment through reading comprehension, visual analysis of rock layers, and vocabulary reinforcement.
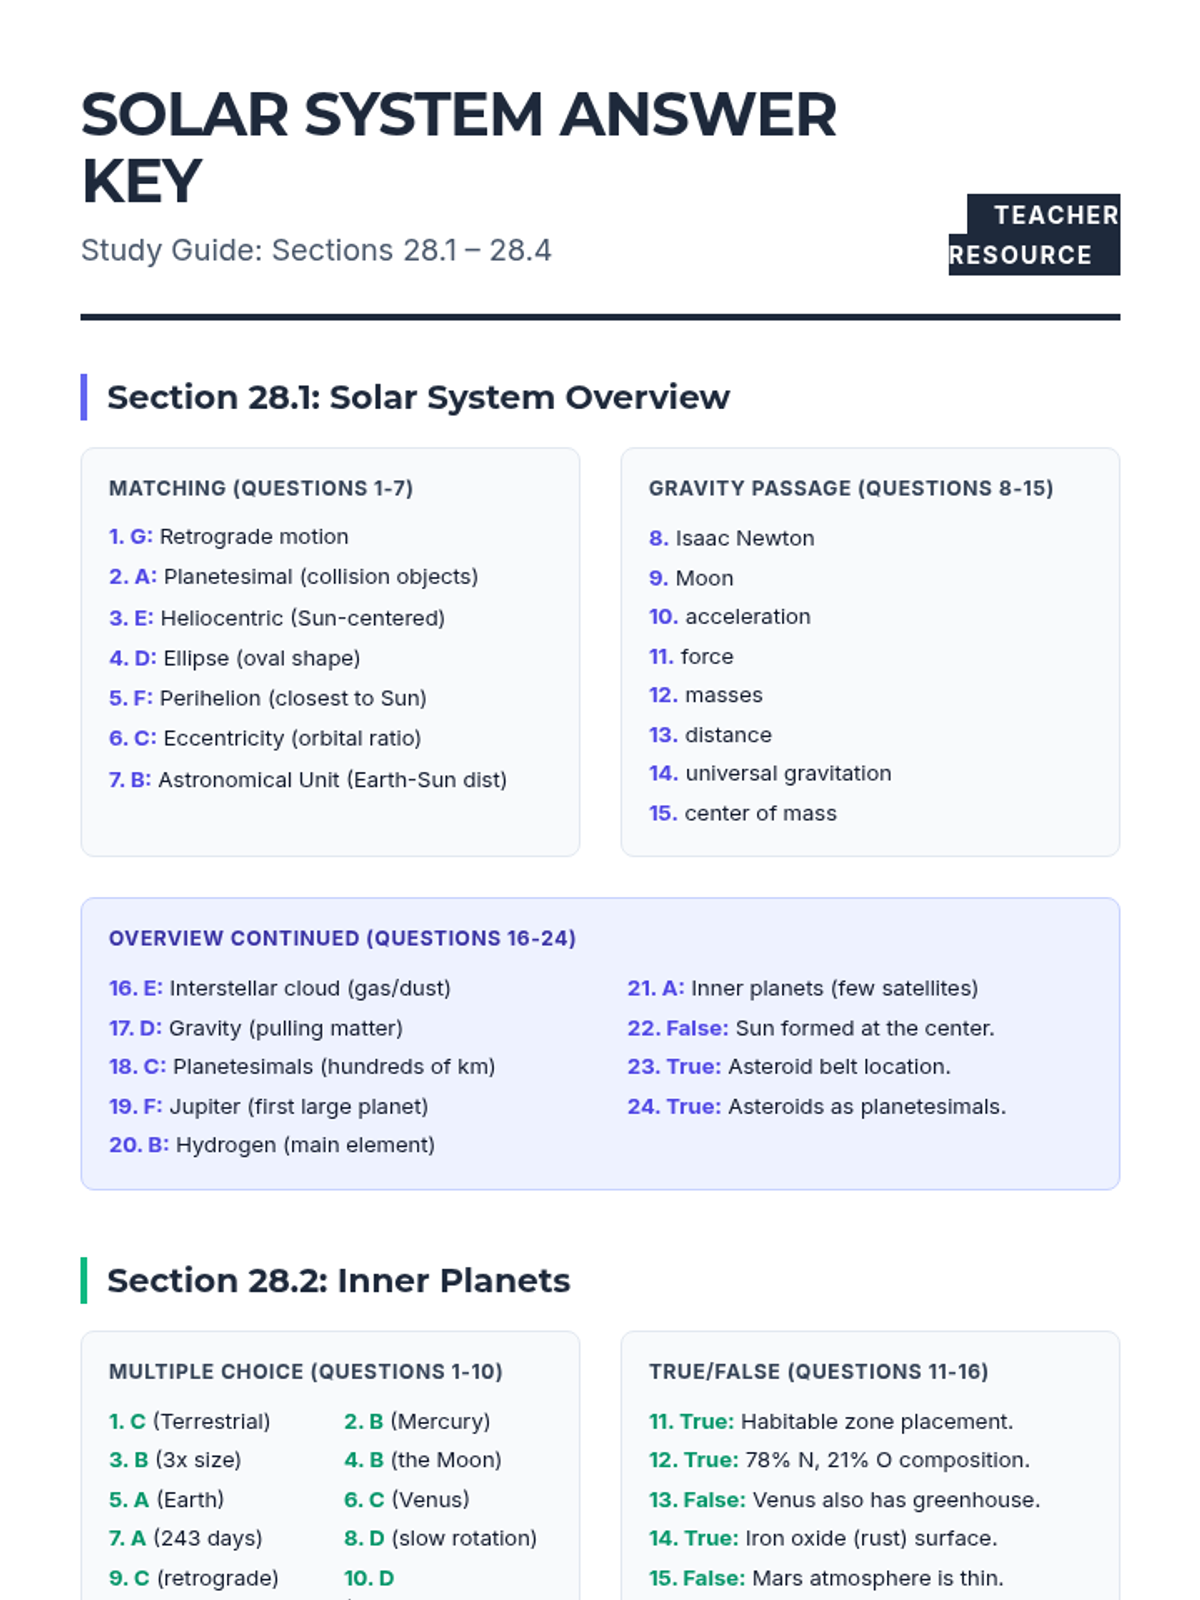
A comprehensive study of planetary characteristics, orbital mechanics, and the formation of our solar system based on the Unit 8 Study Guide.
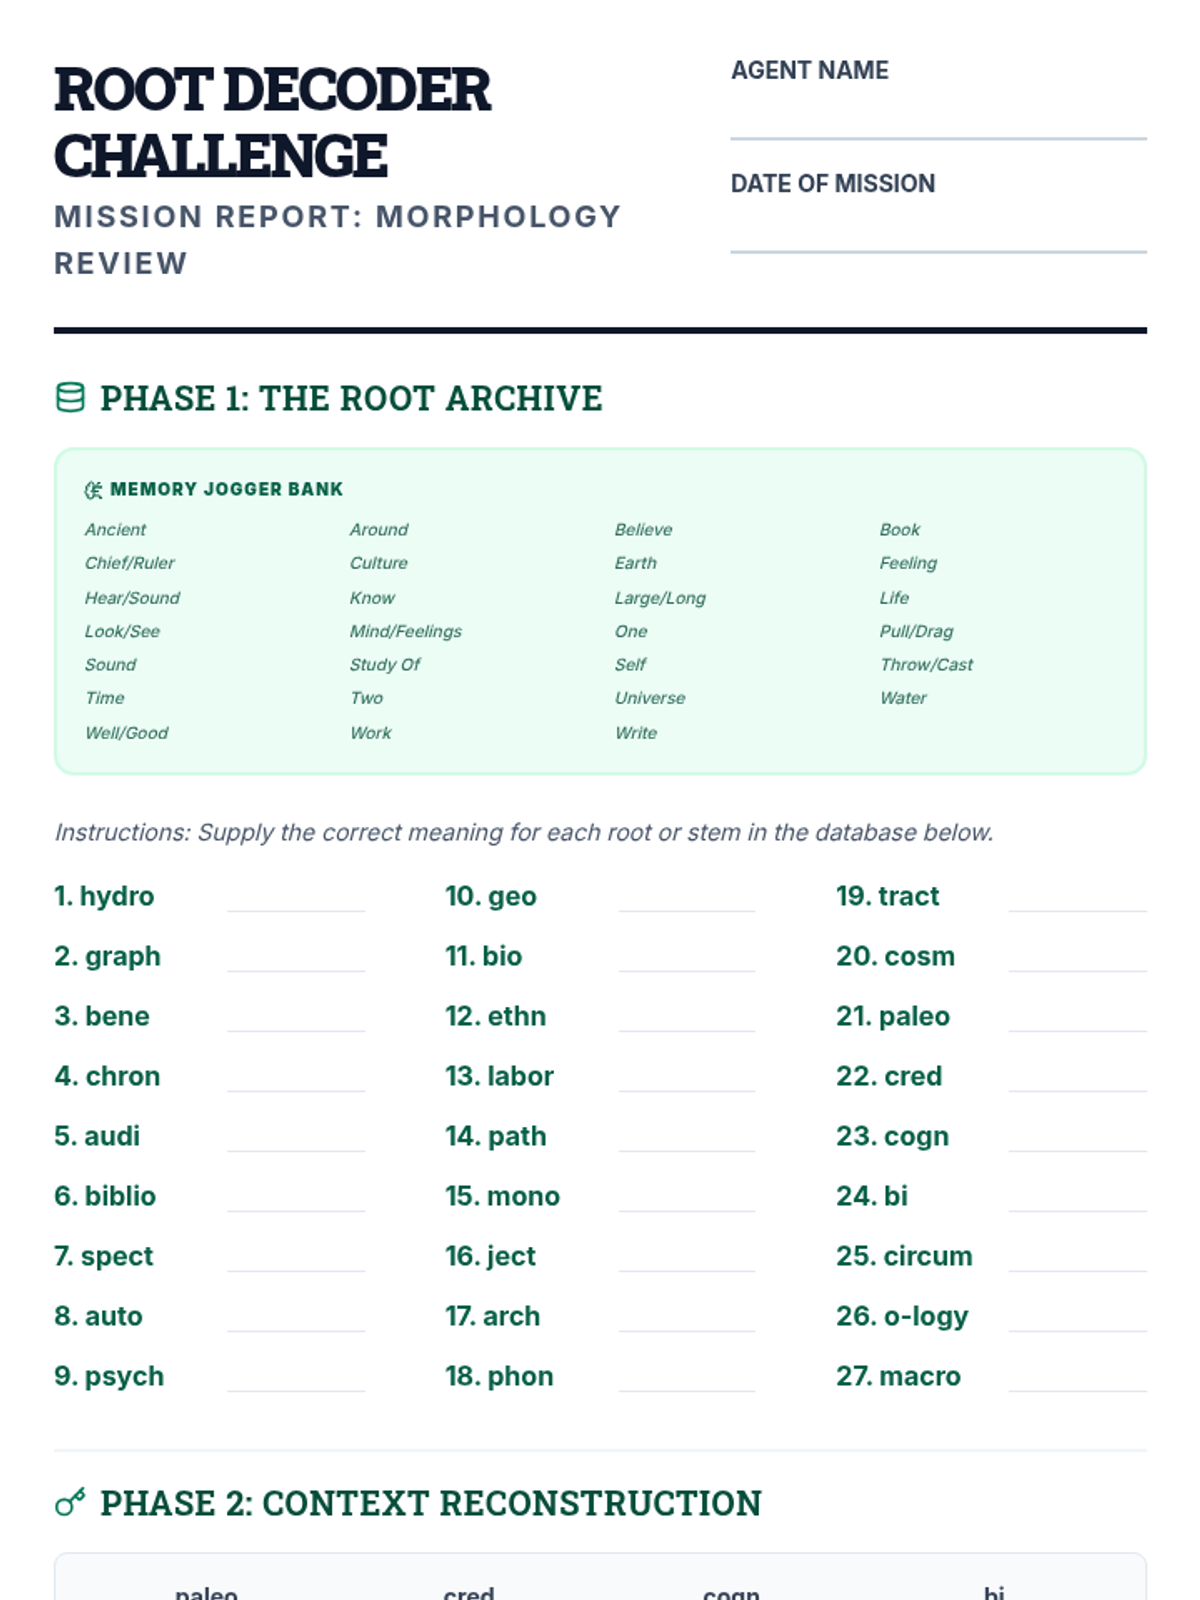
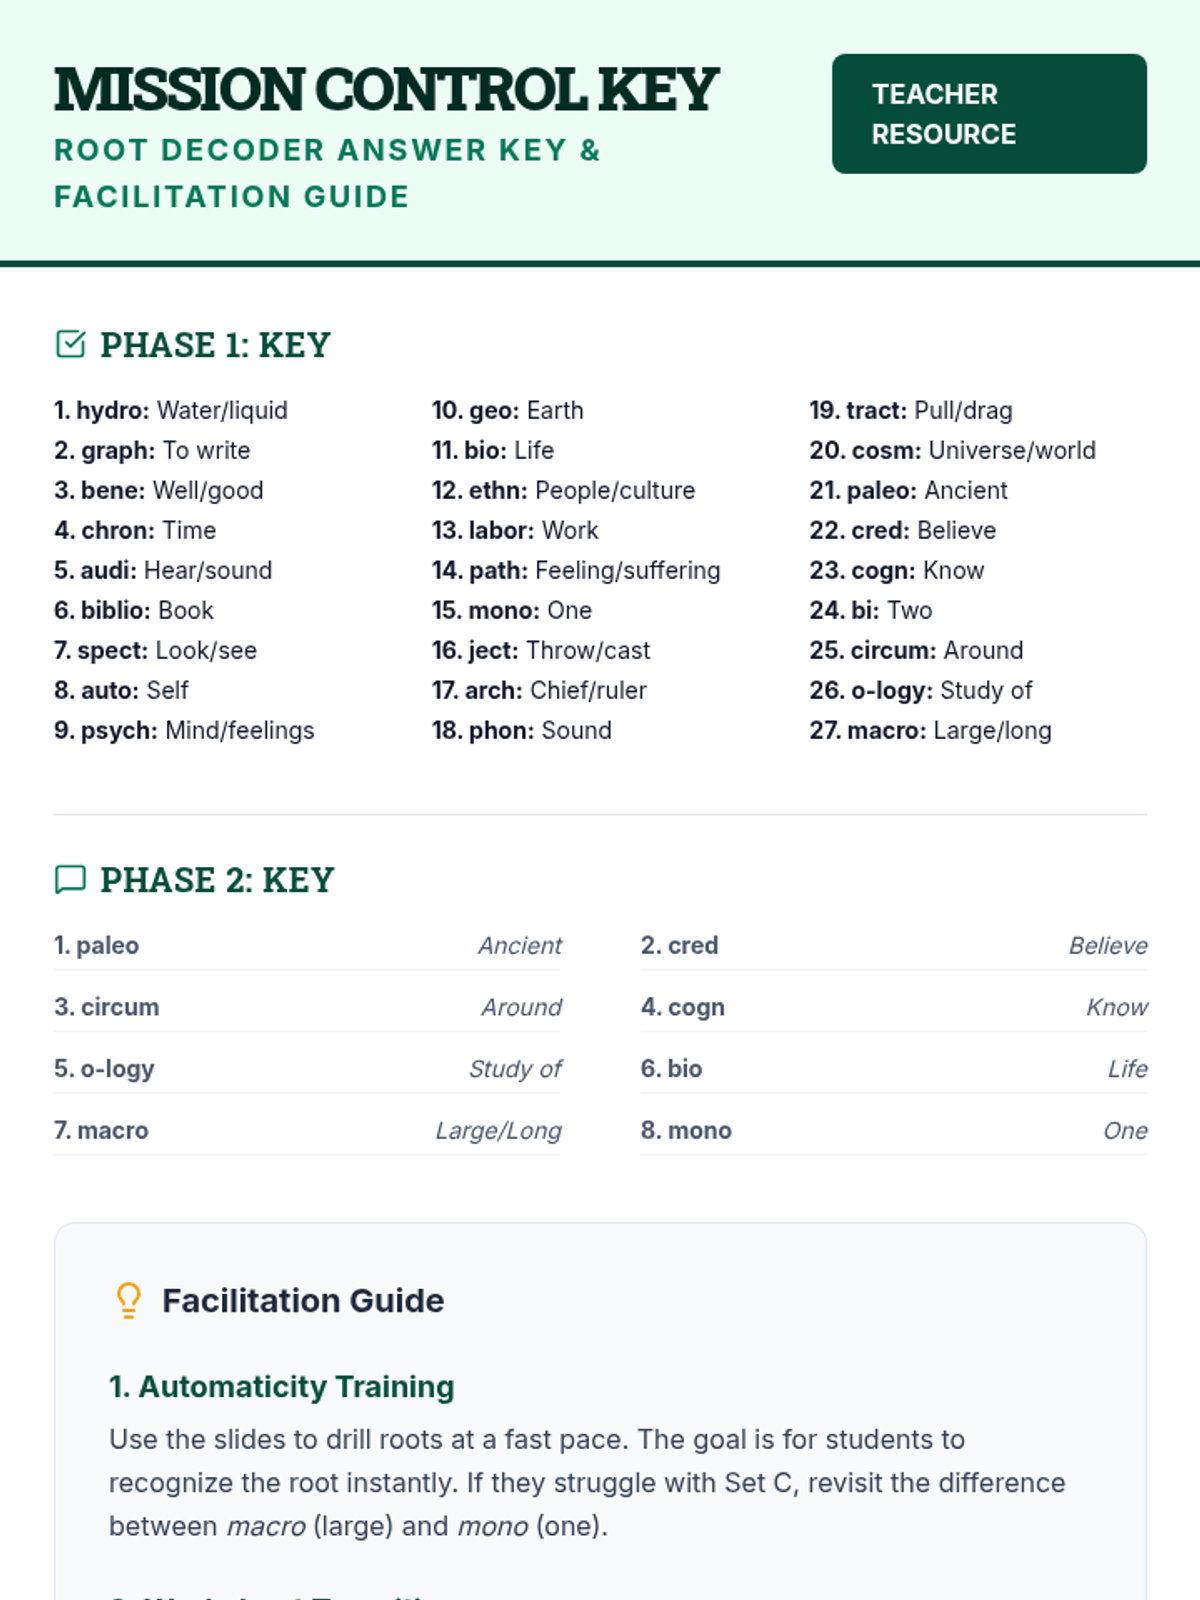
A comprehensive review lesson covering 27 Greek and Latin roots to help developmental reading students prepare for their morphology assessment through gamified slides and a decoding worksheet.
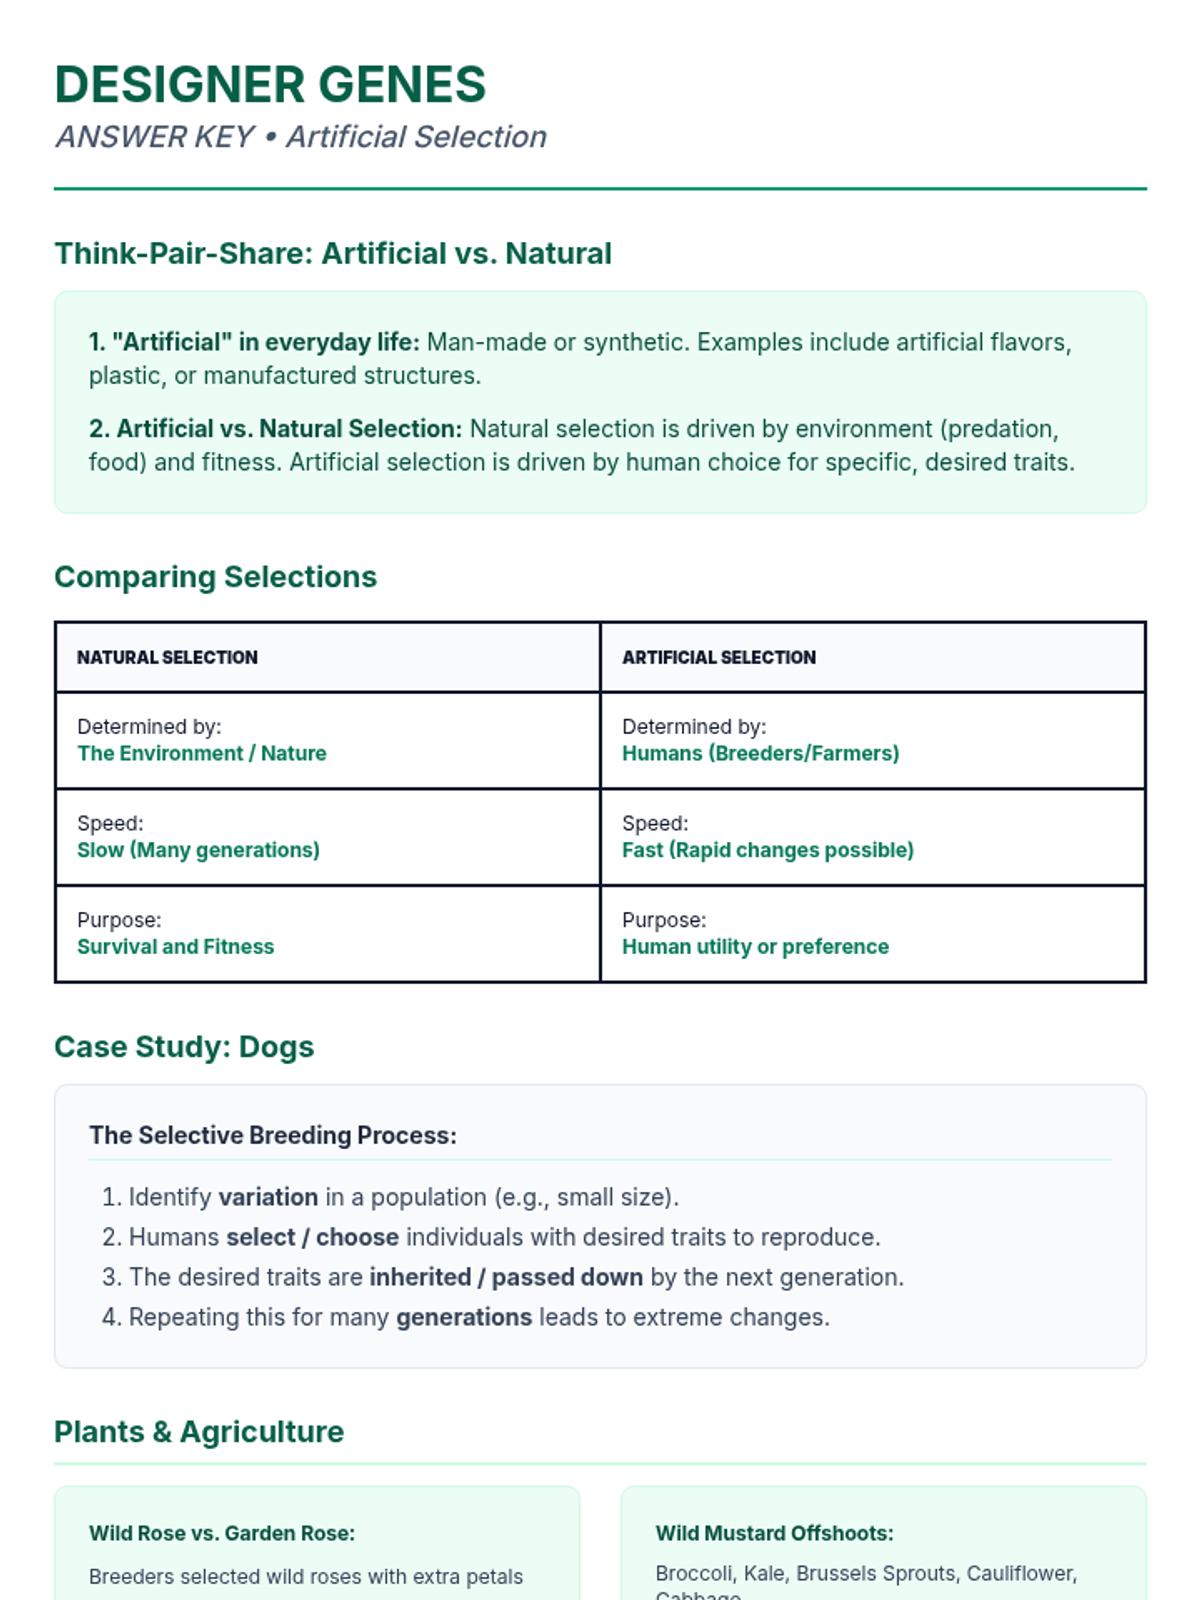
A lesson exploring artificial selection and selective breeding through familiar examples like dogs, roses, and vegetables, highlighting the differences from natural selection and the impact on genetic diversity.
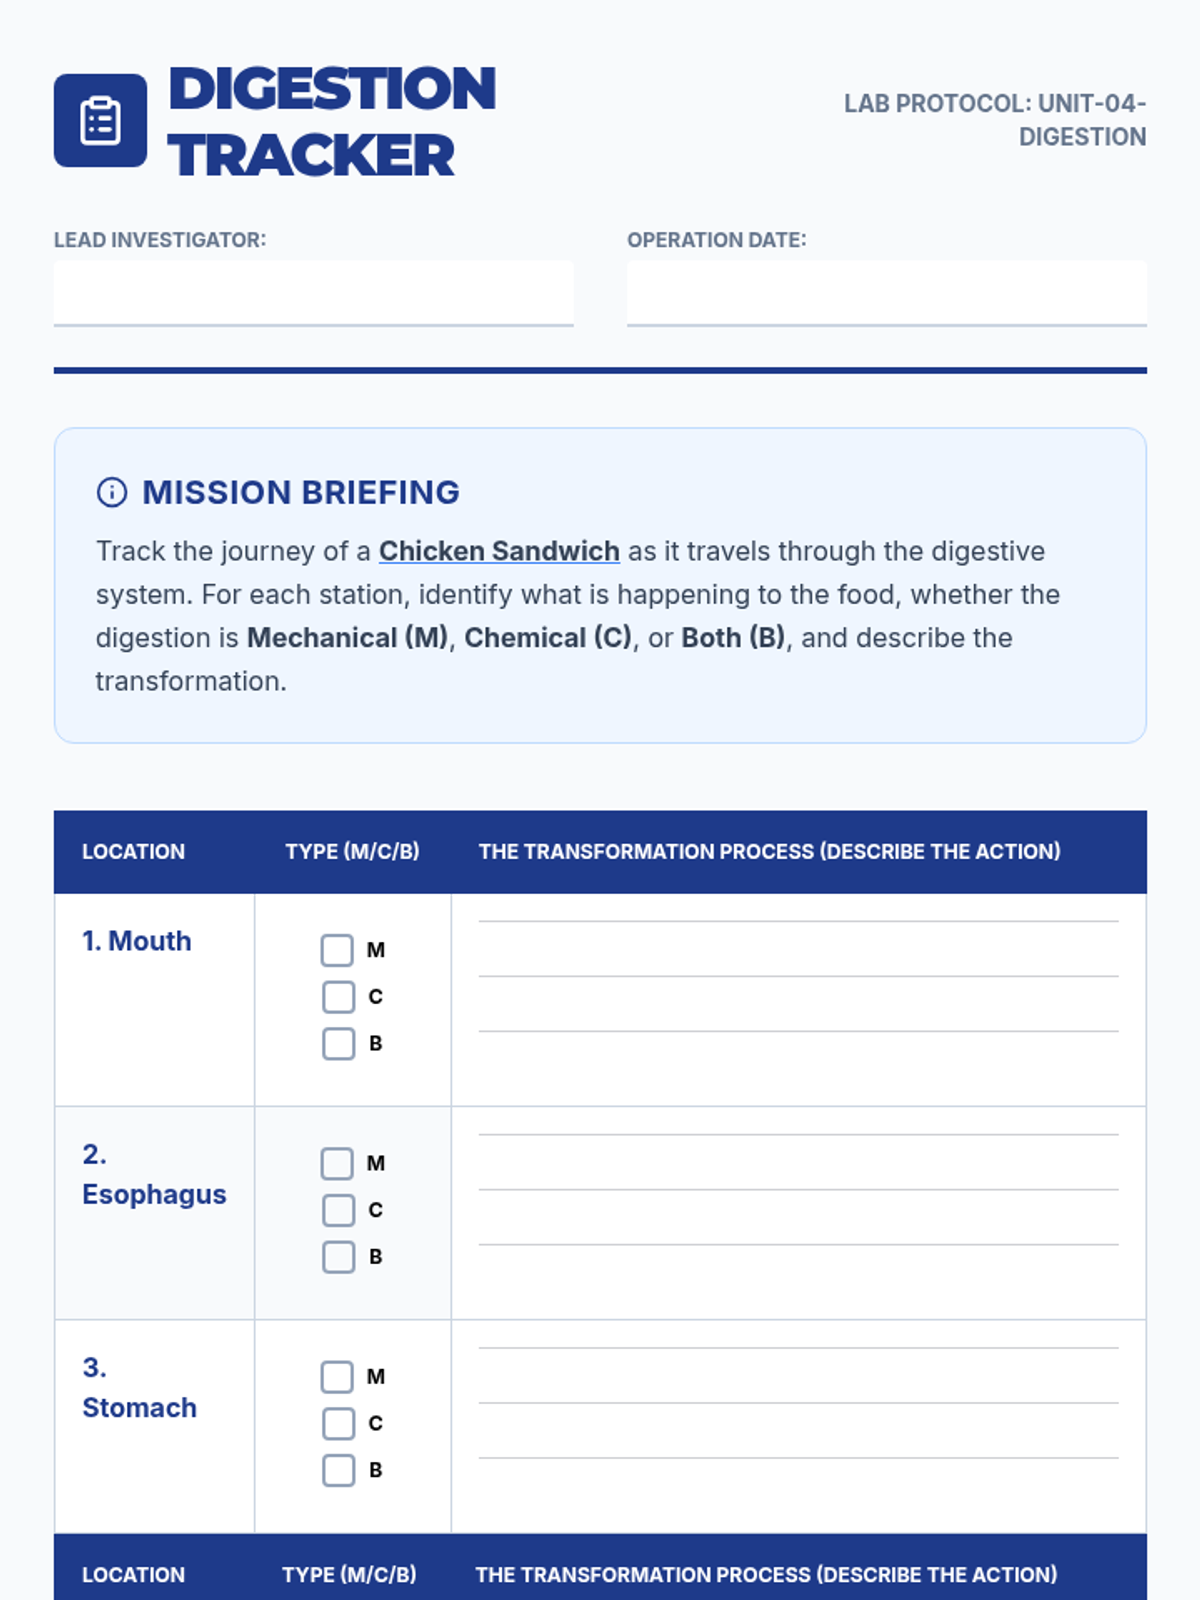
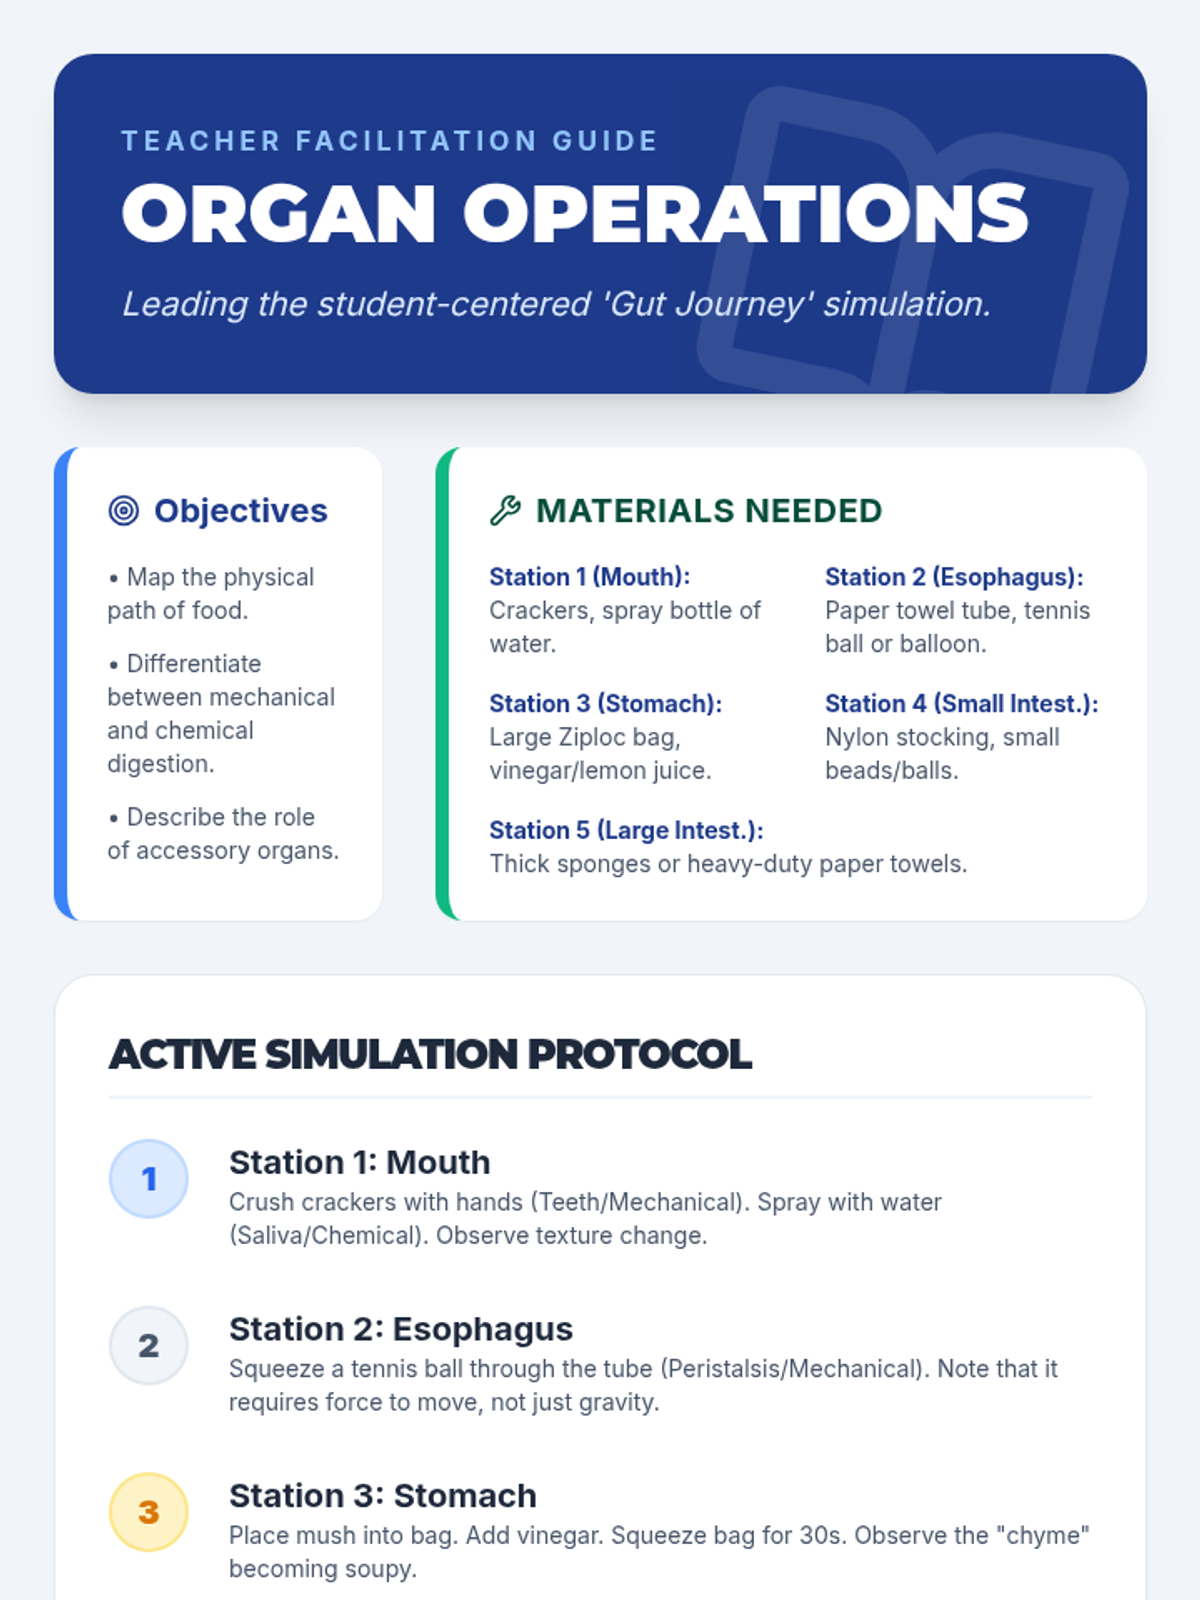
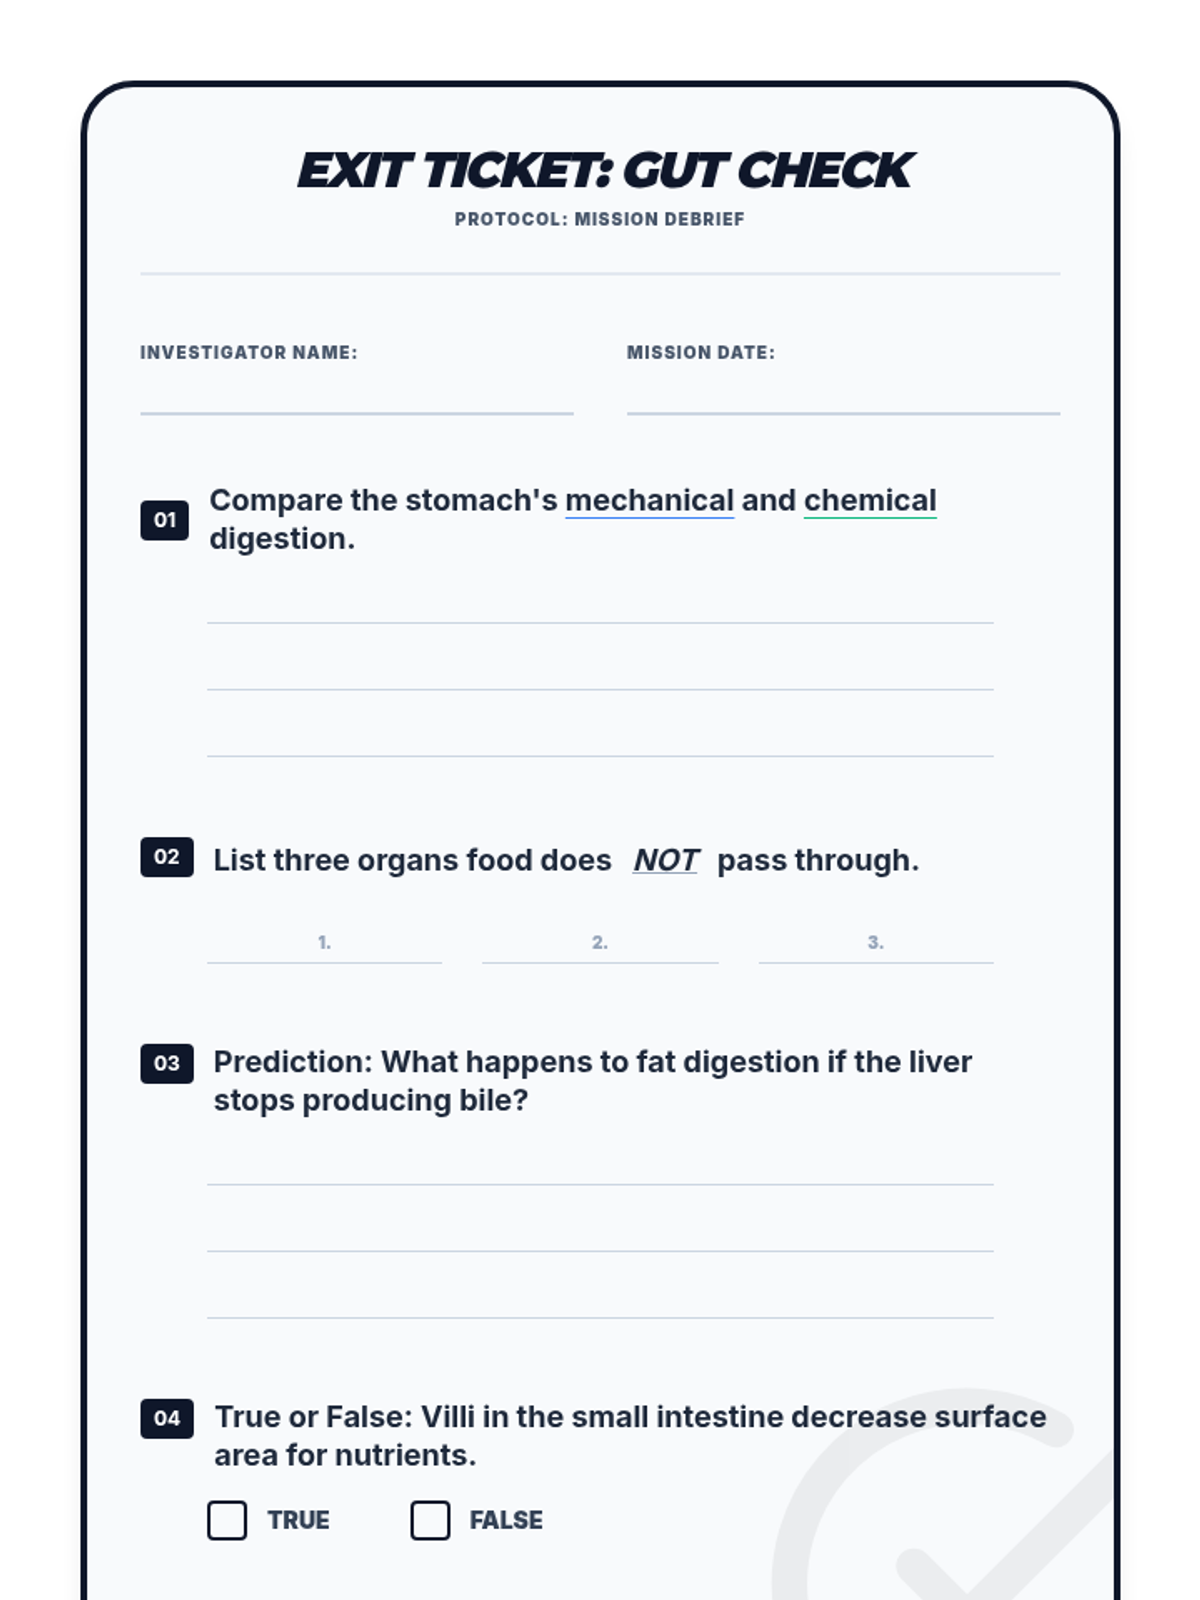
A student-centered exploration of the human digestive system, following the path of food from ingestion to elimination through mechanical and chemical processes.
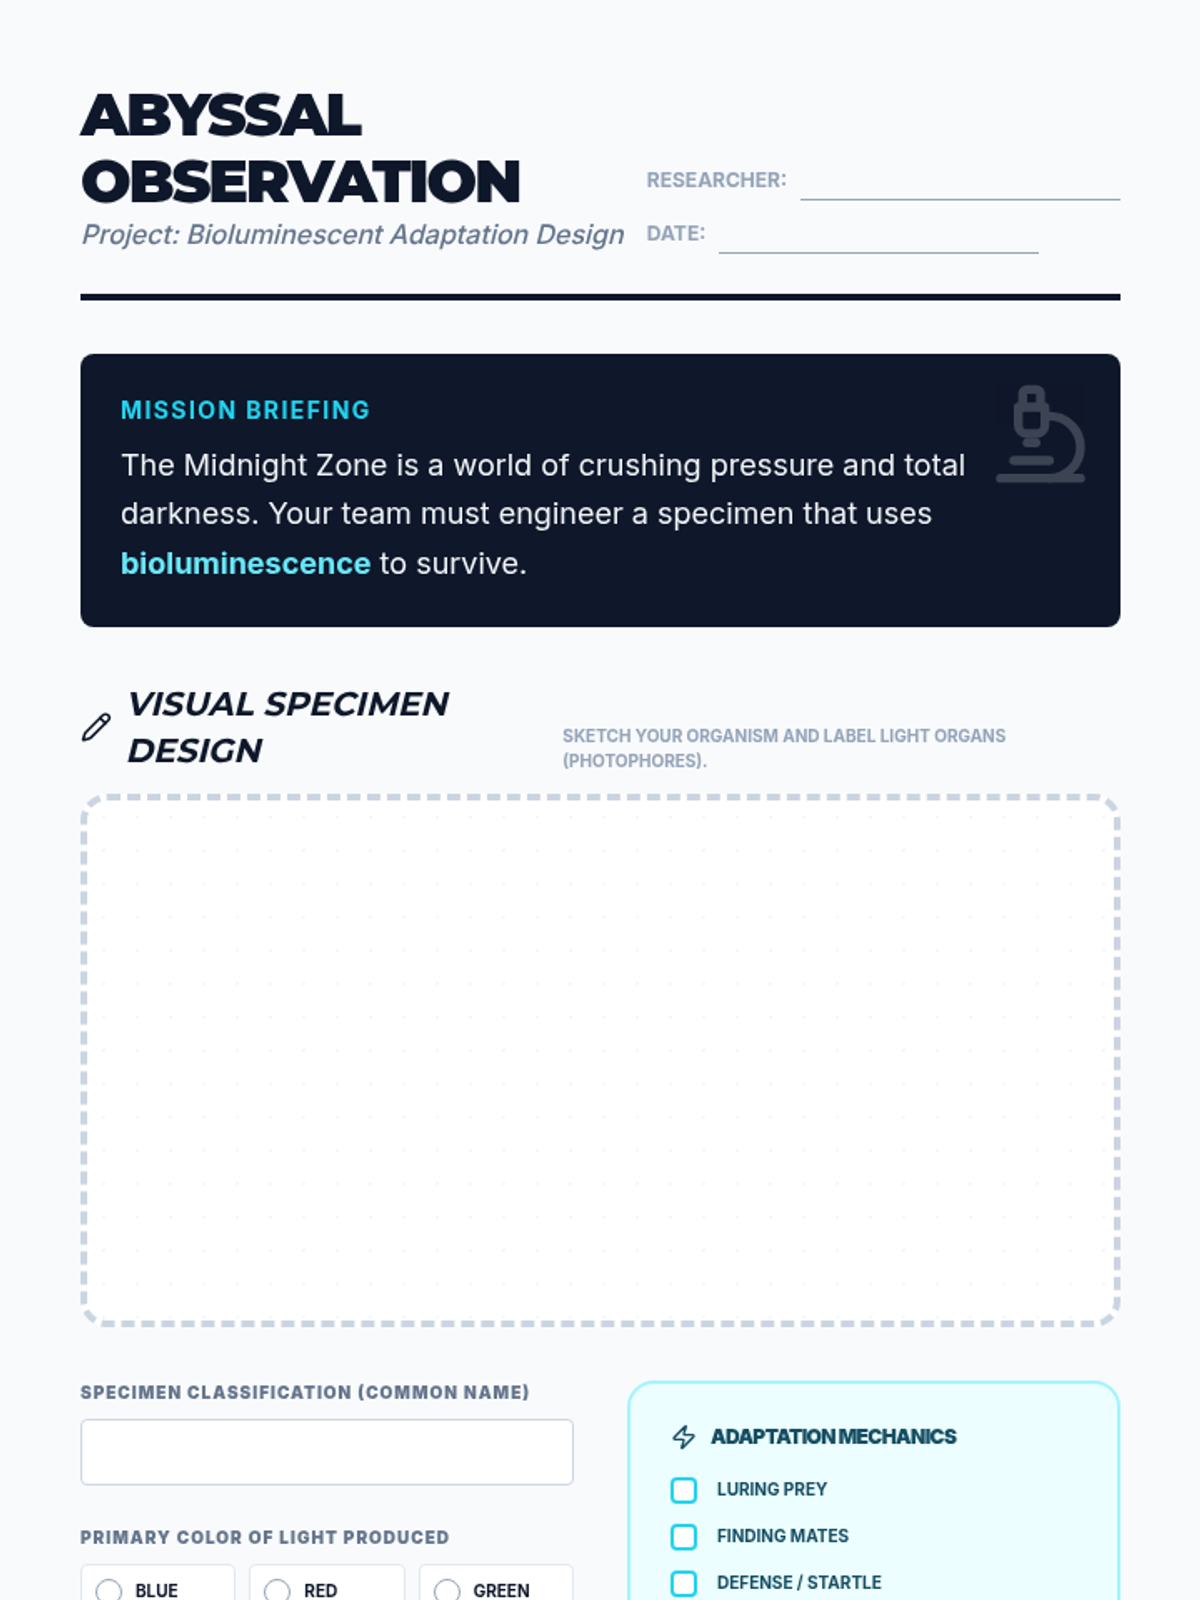
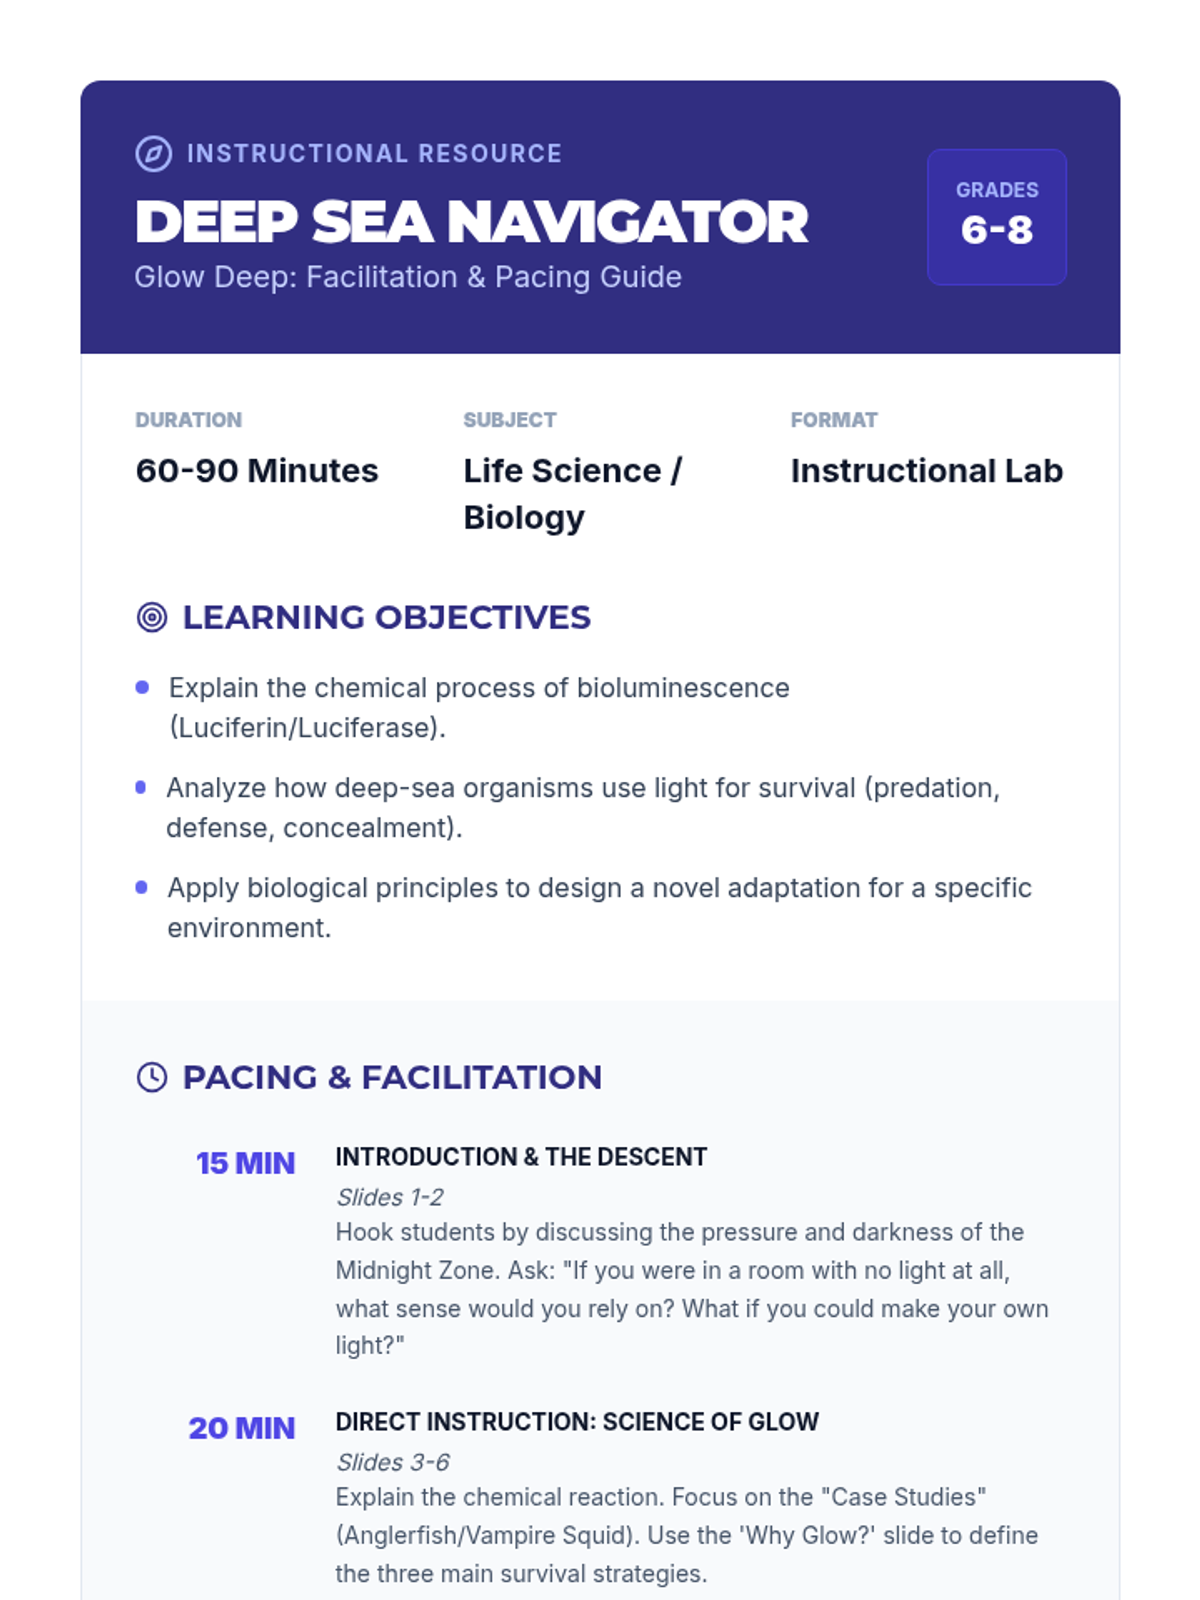
An immersive exploration of deep-sea bioluminescence, where students investigate how creatures adapt to the midnight zone through chemical light. Students will design their own abyssal organism based on scientific adaptation principles.
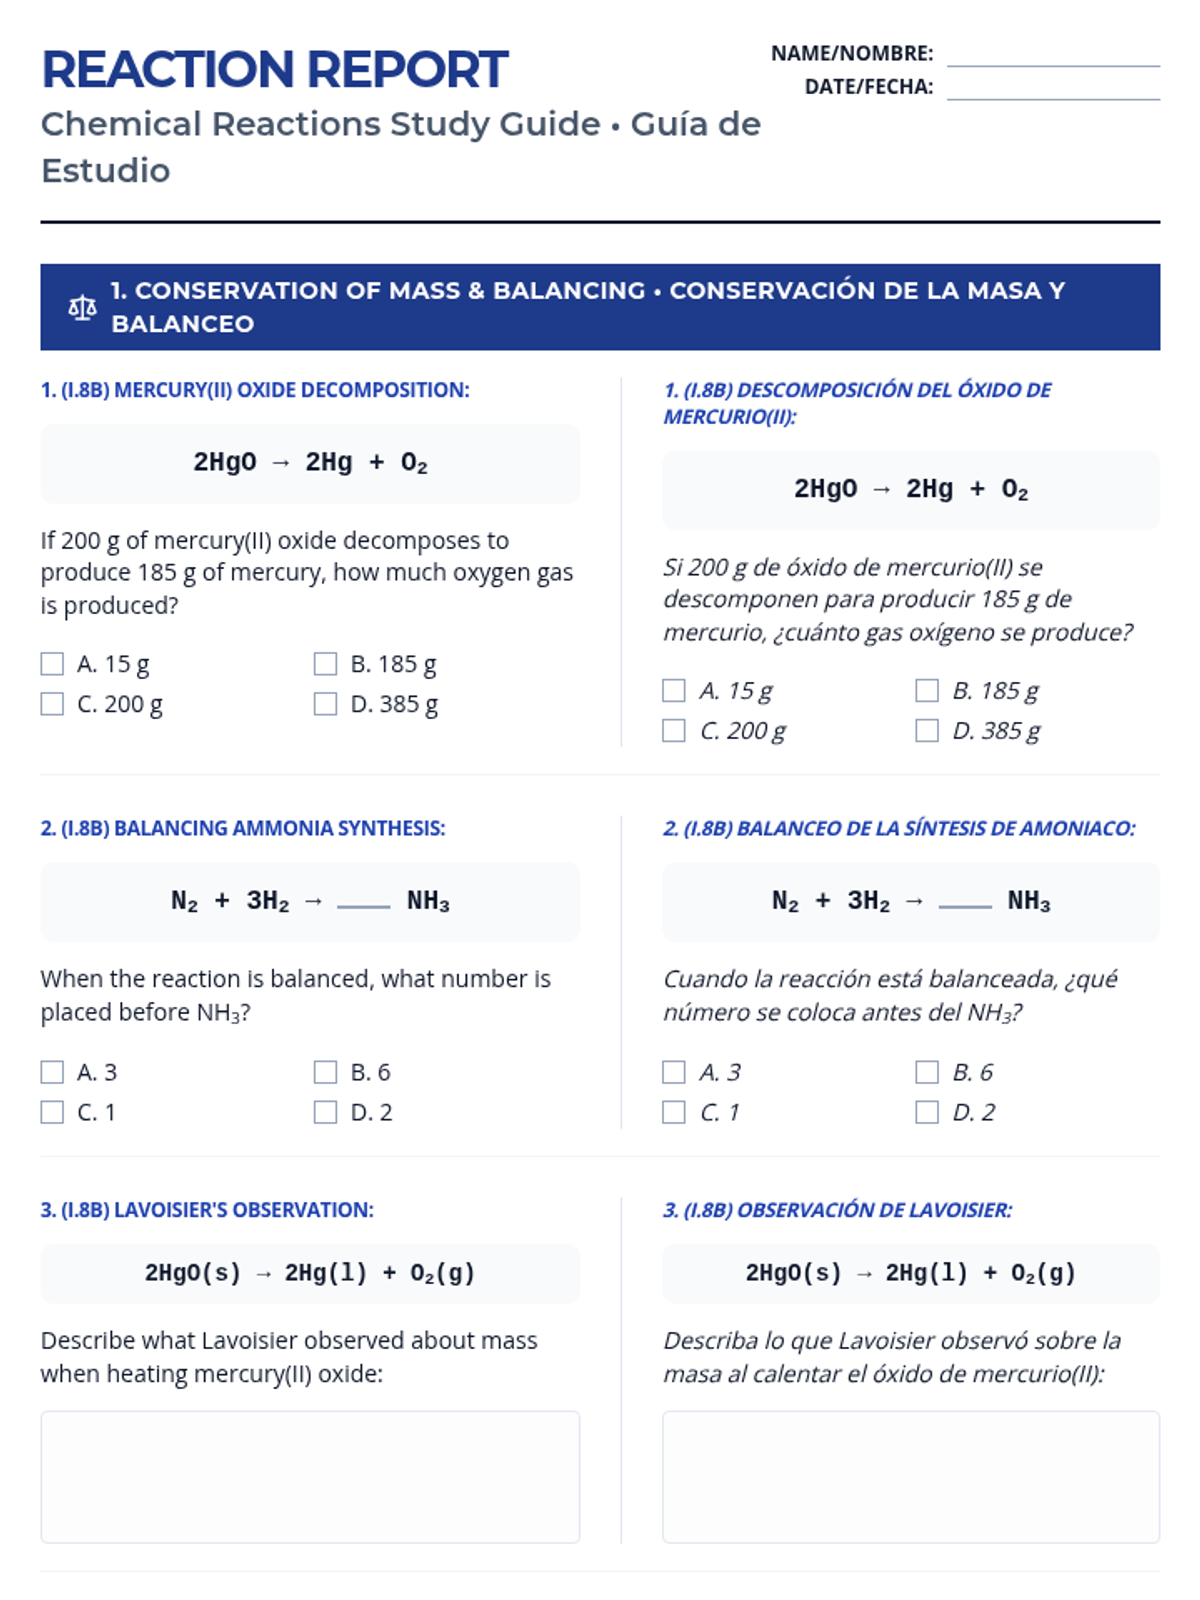
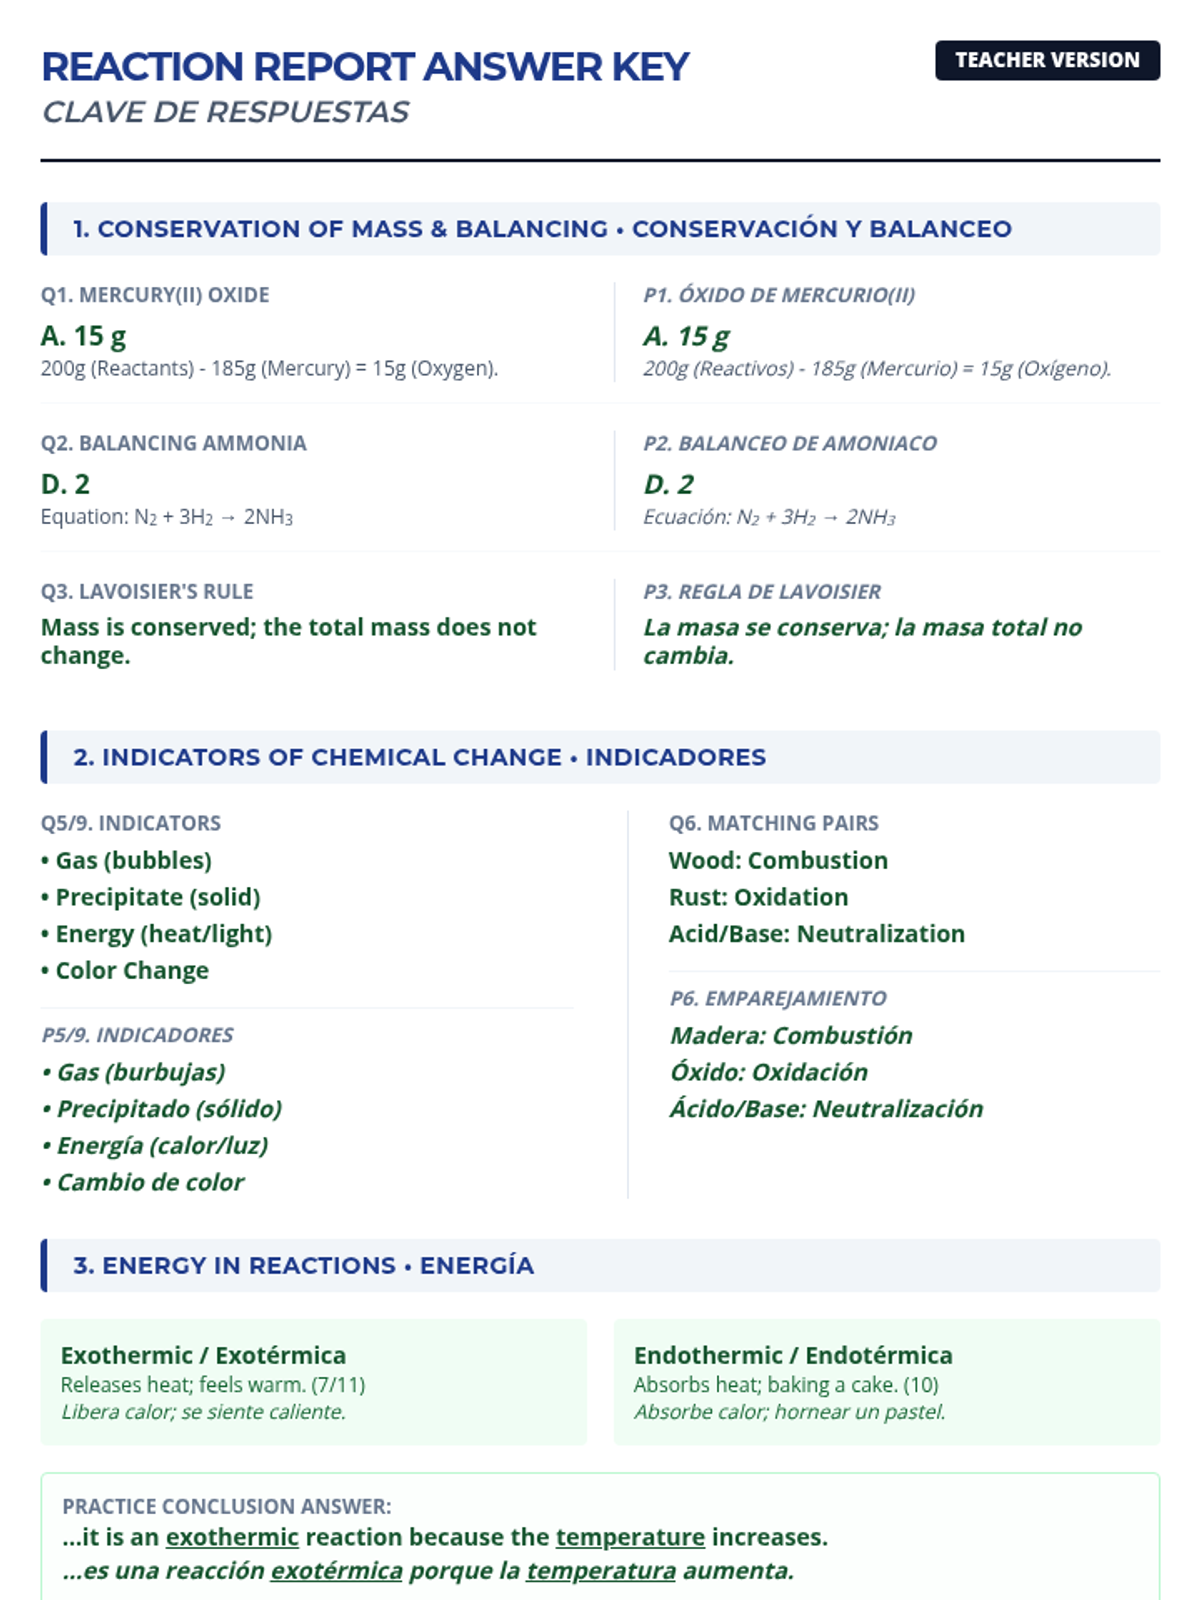
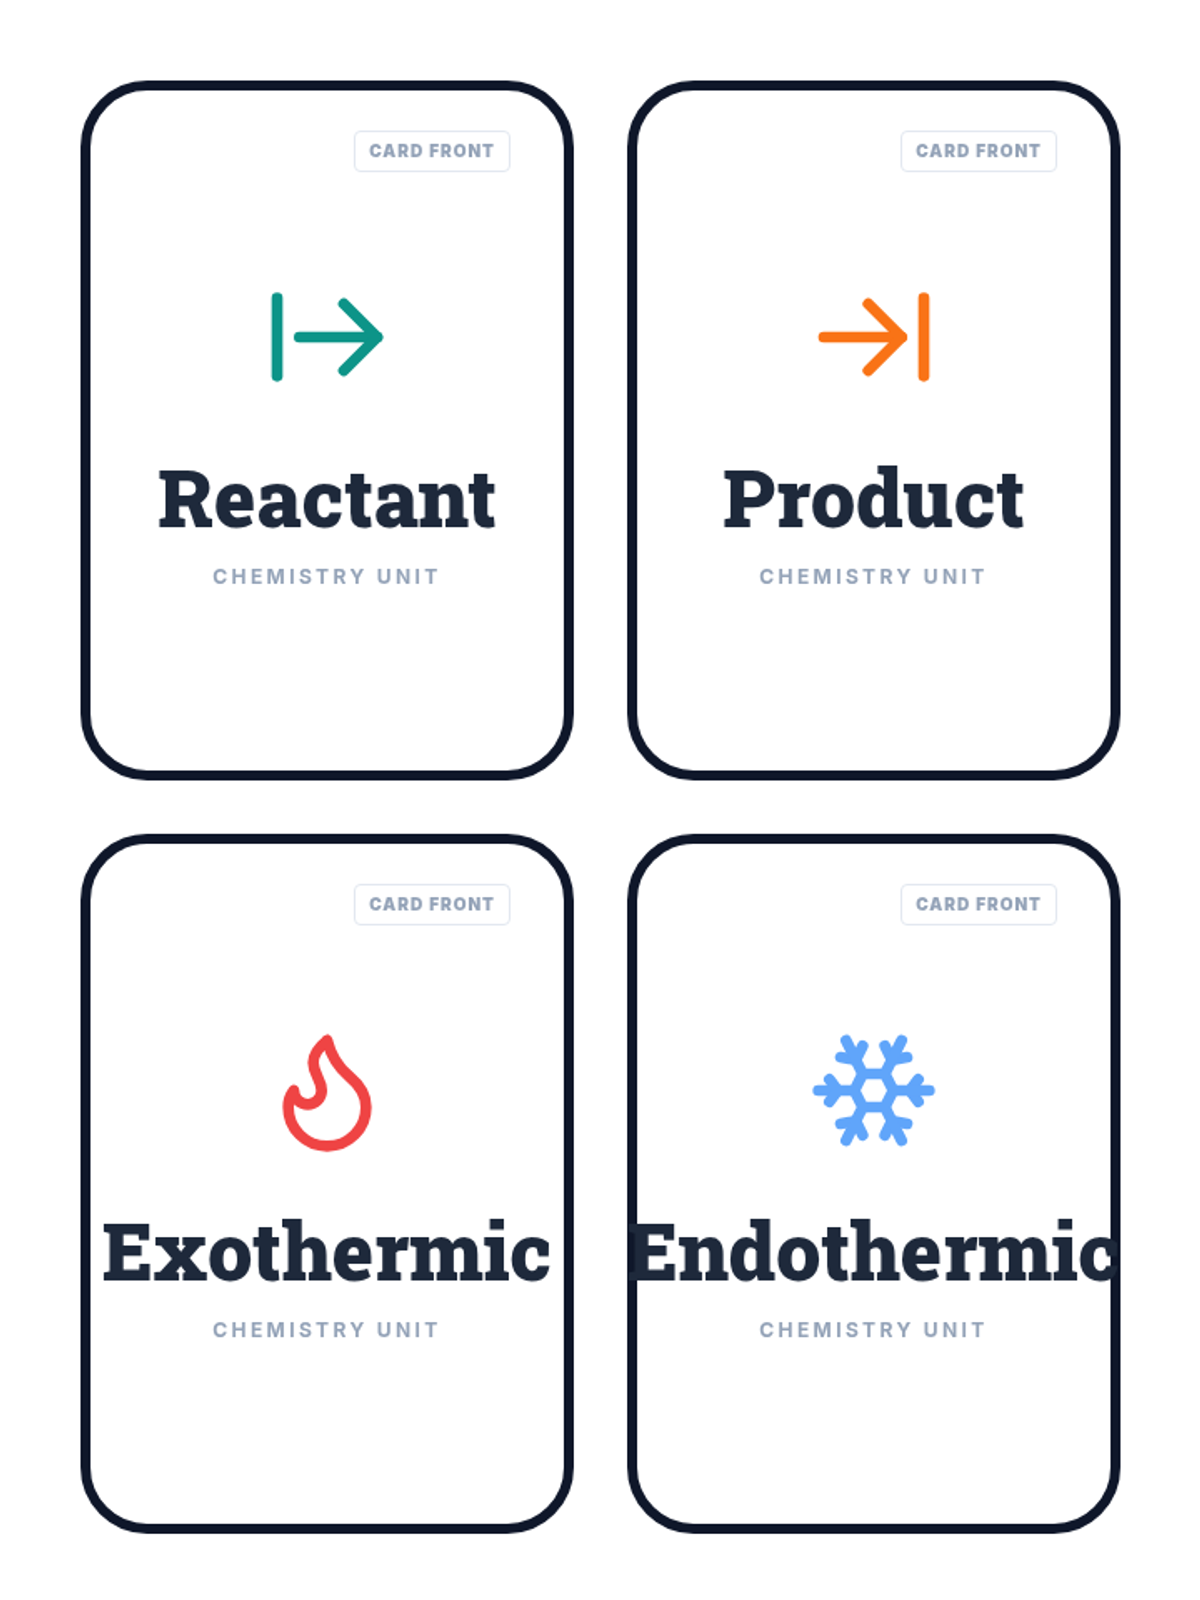
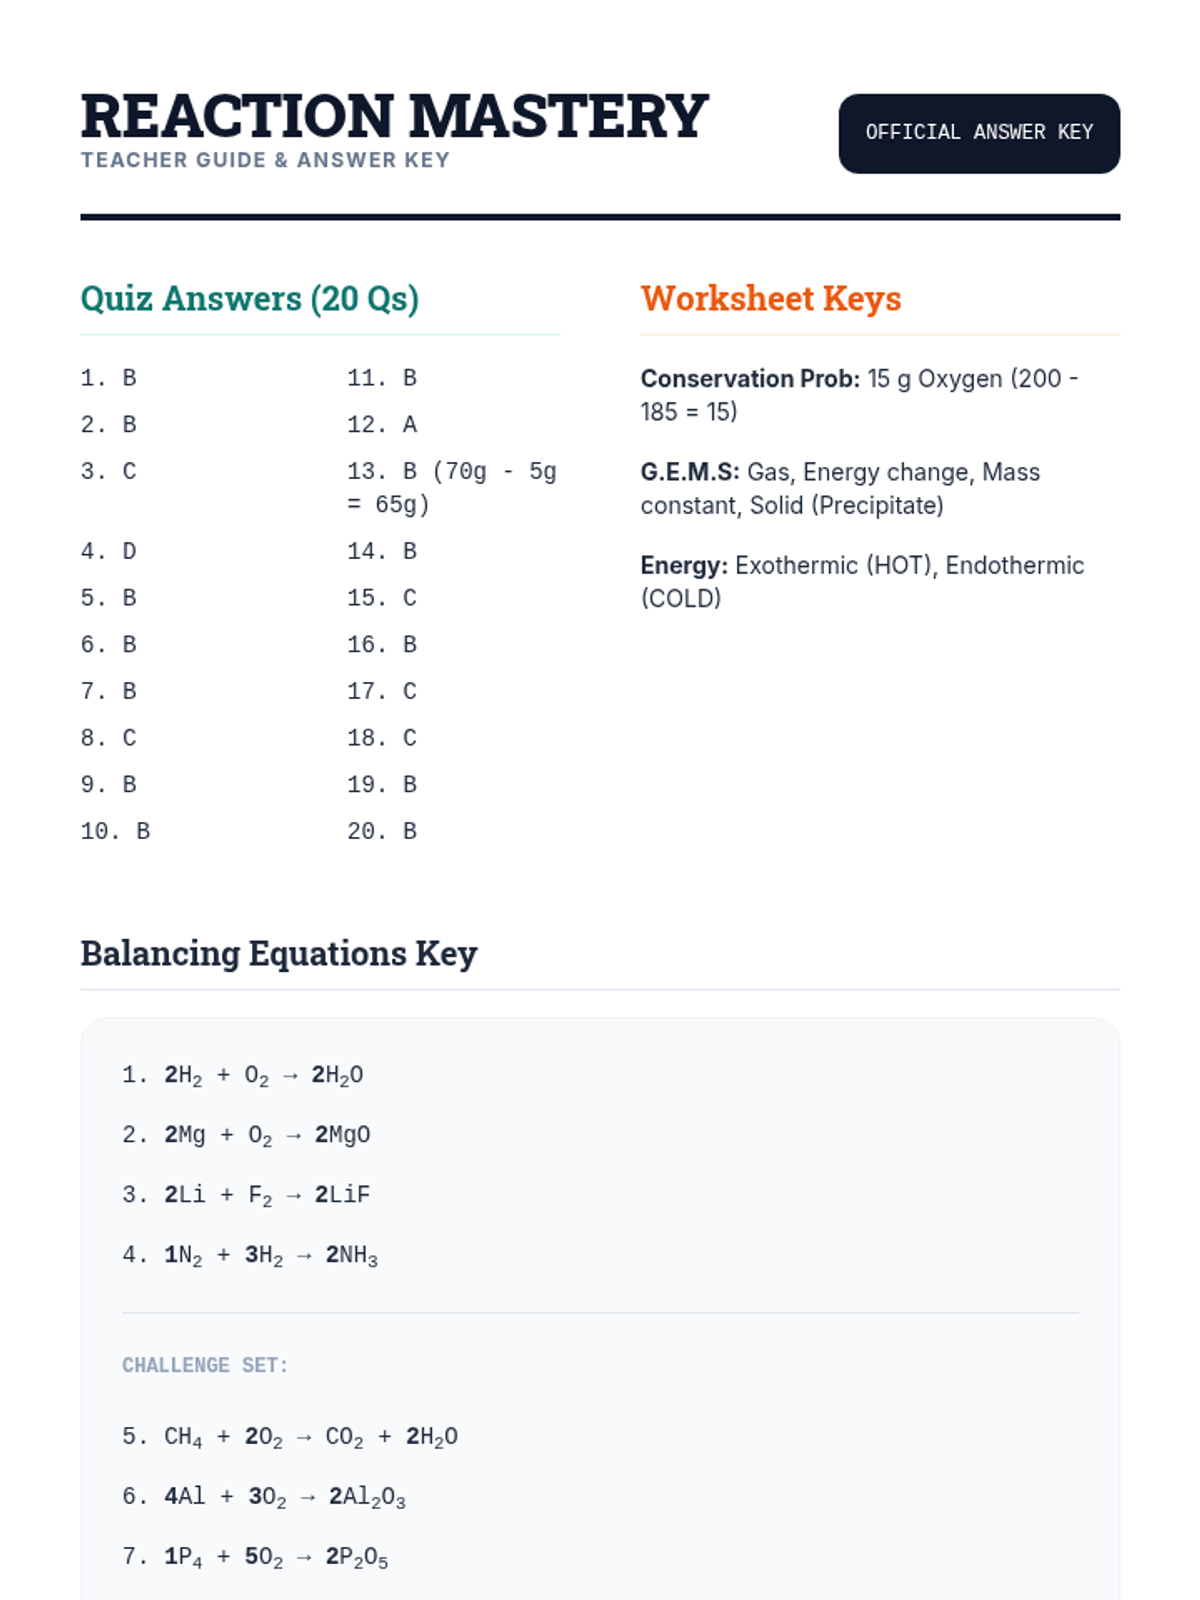
A comprehensive study guide covering chemical reactions, balancing equations, conservation of mass, and energy changes, provided in a bilingual English-Spanish format.
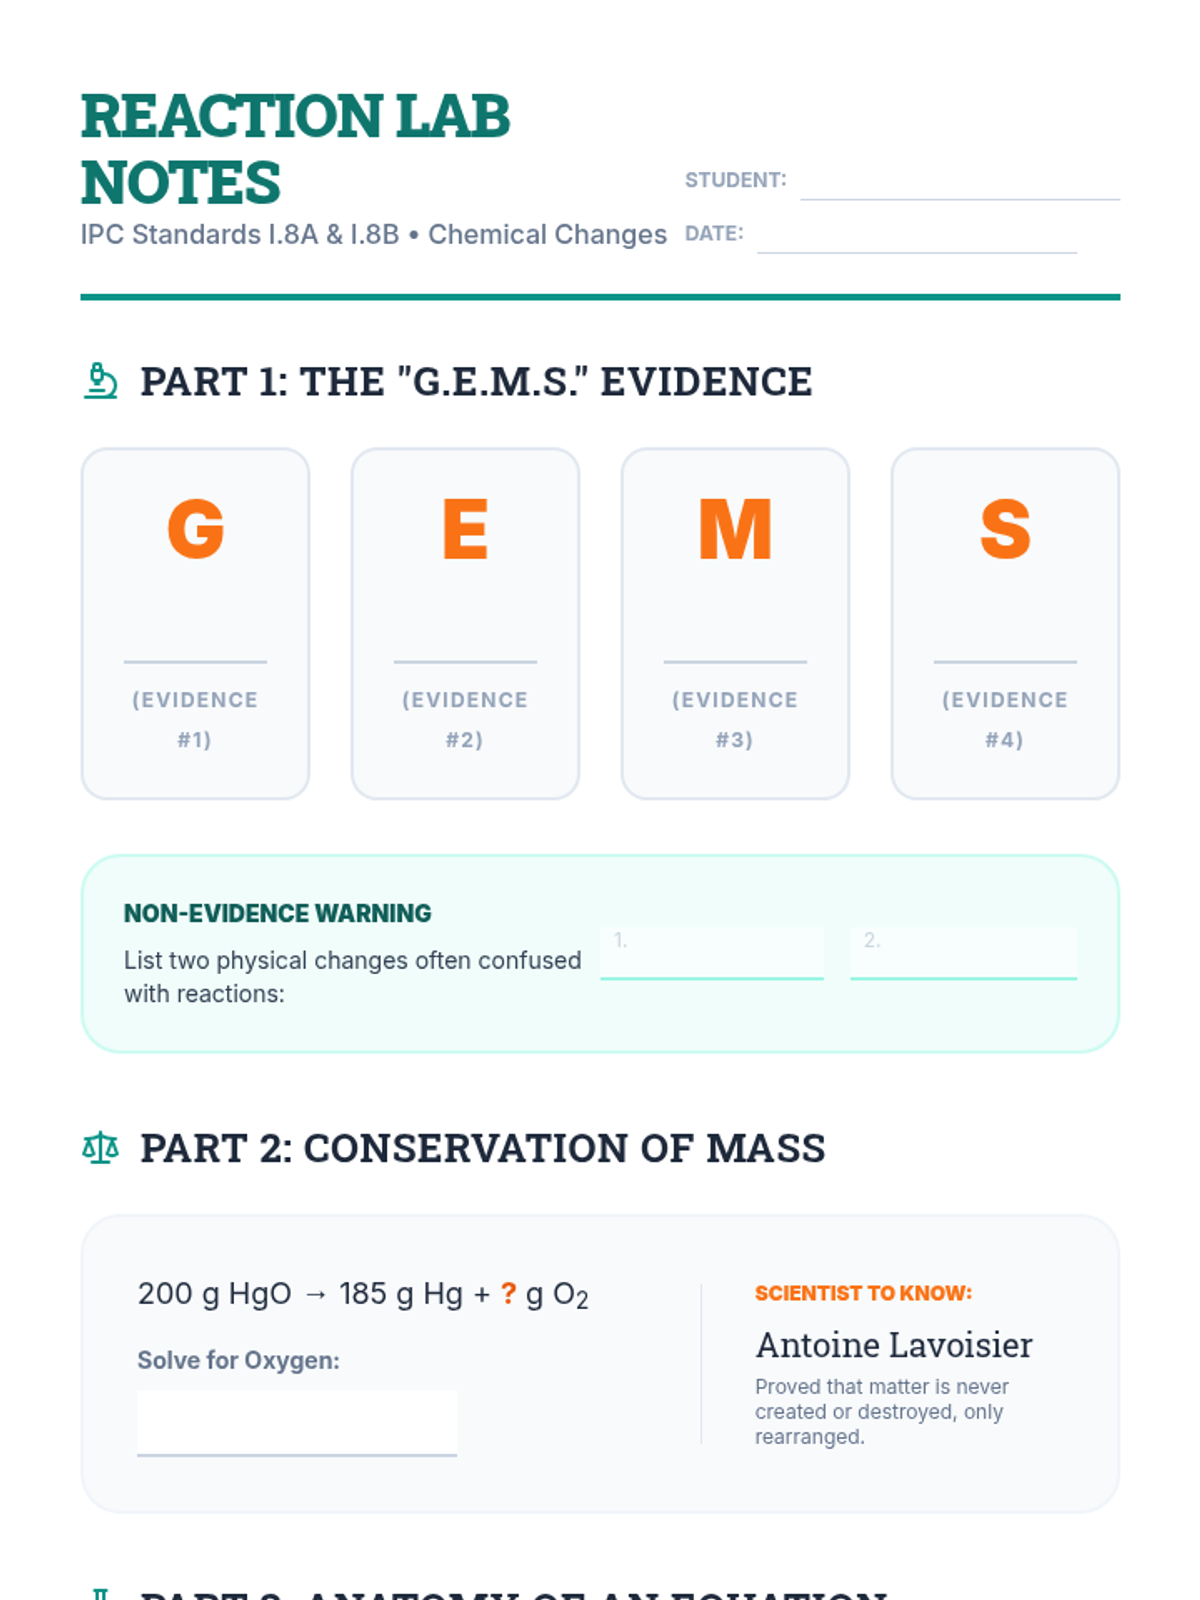
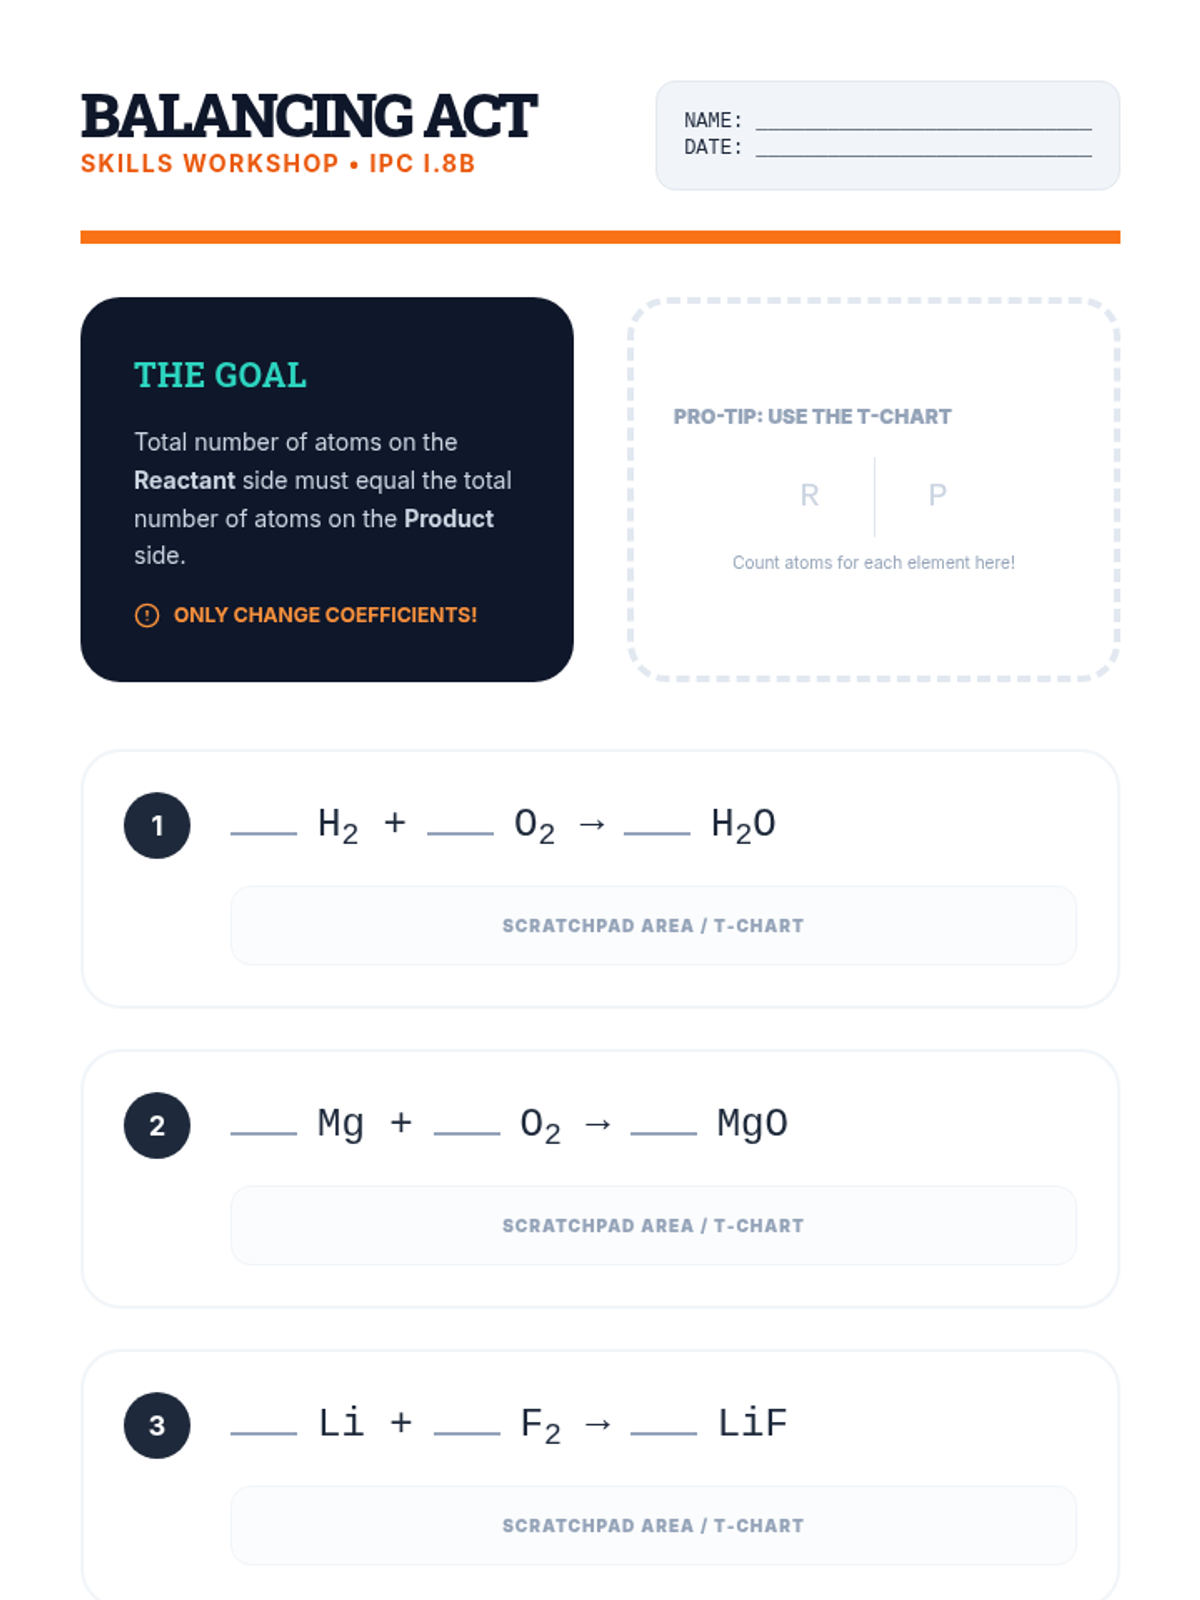
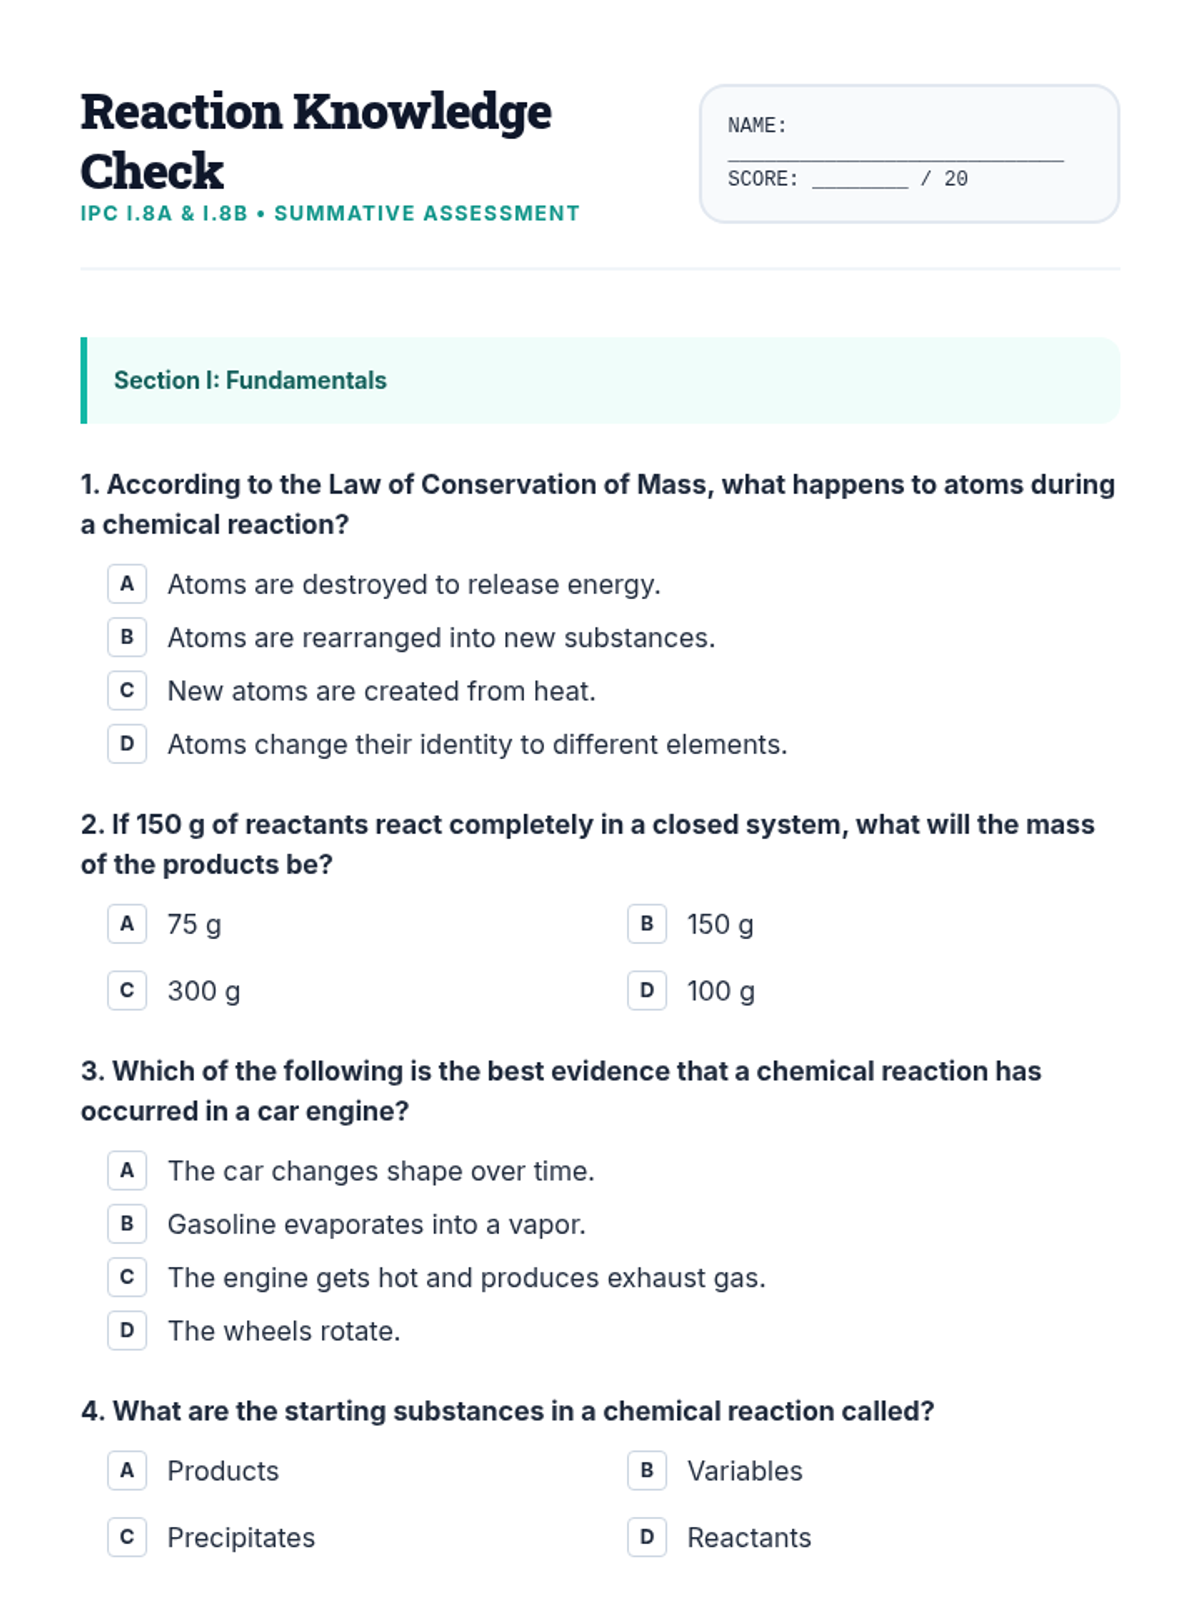
A comprehensive lesson on chemical reactions covering conservation of mass, balancing equations, evidence of reactions, and energy changes. Students will engage with visual slides, practice worksheets, and a summative assessment.
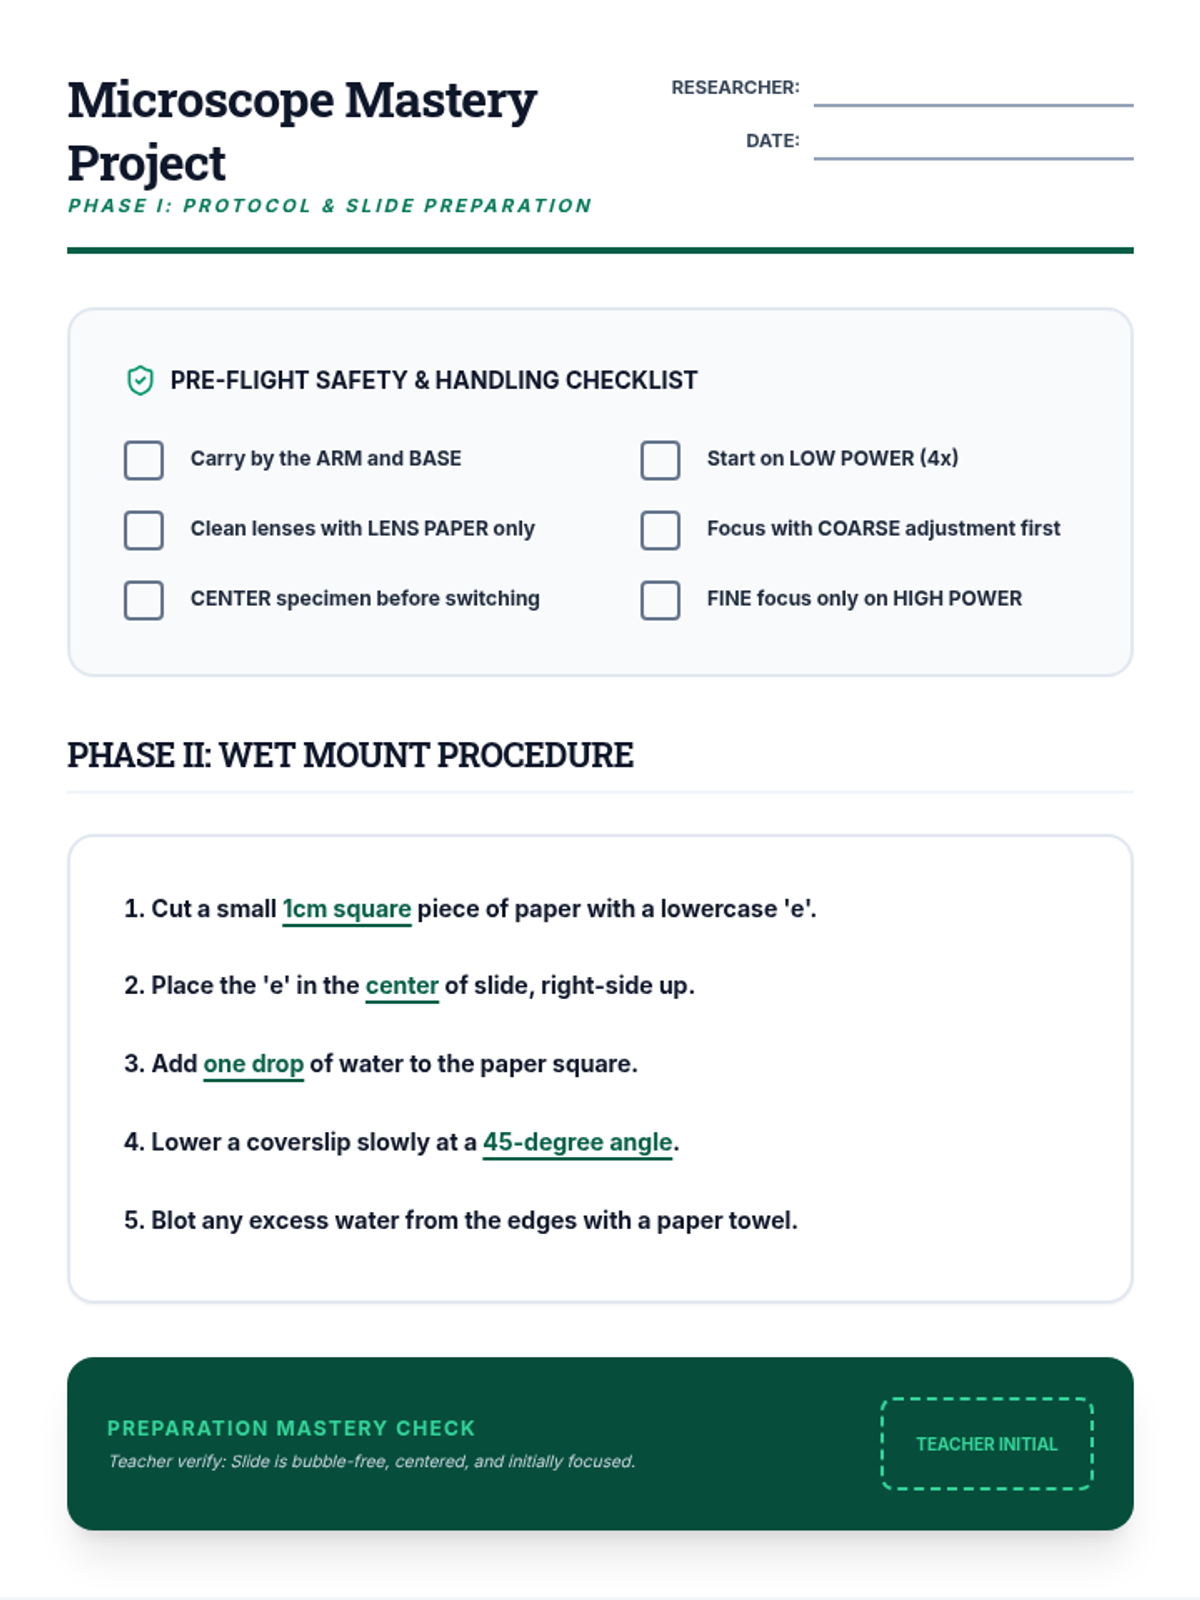
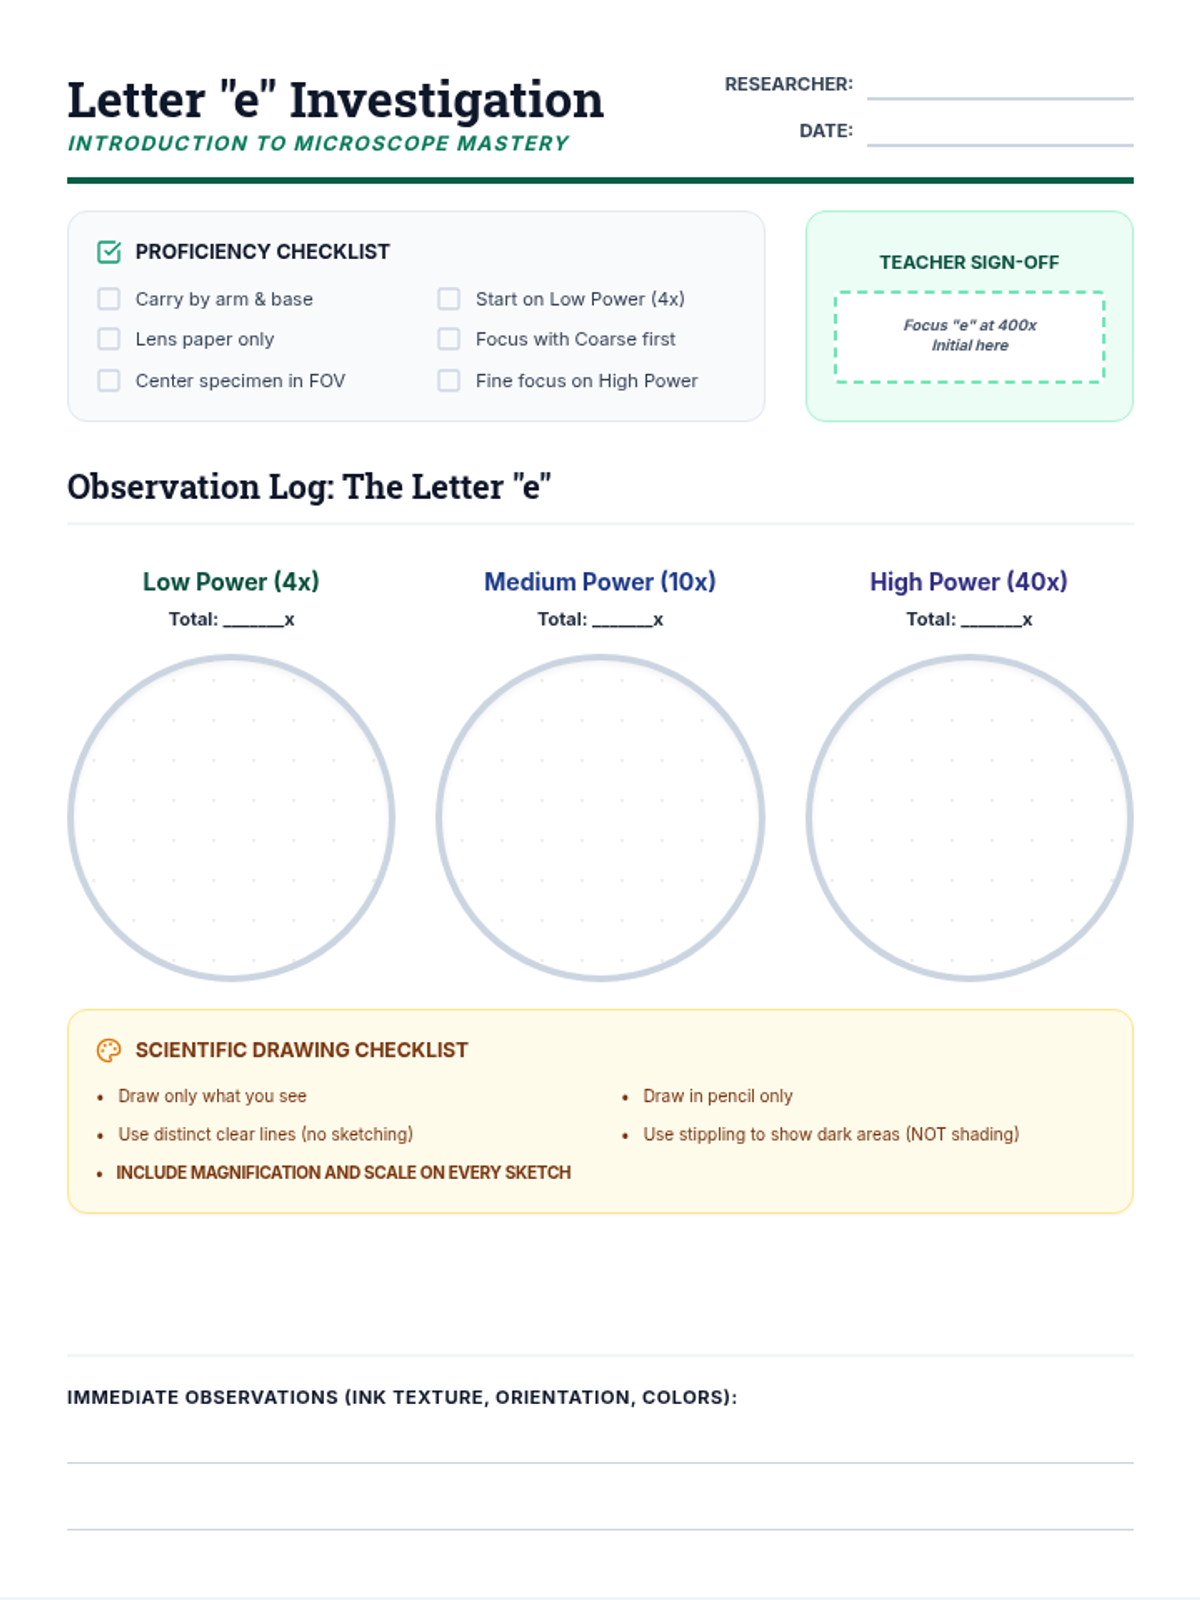
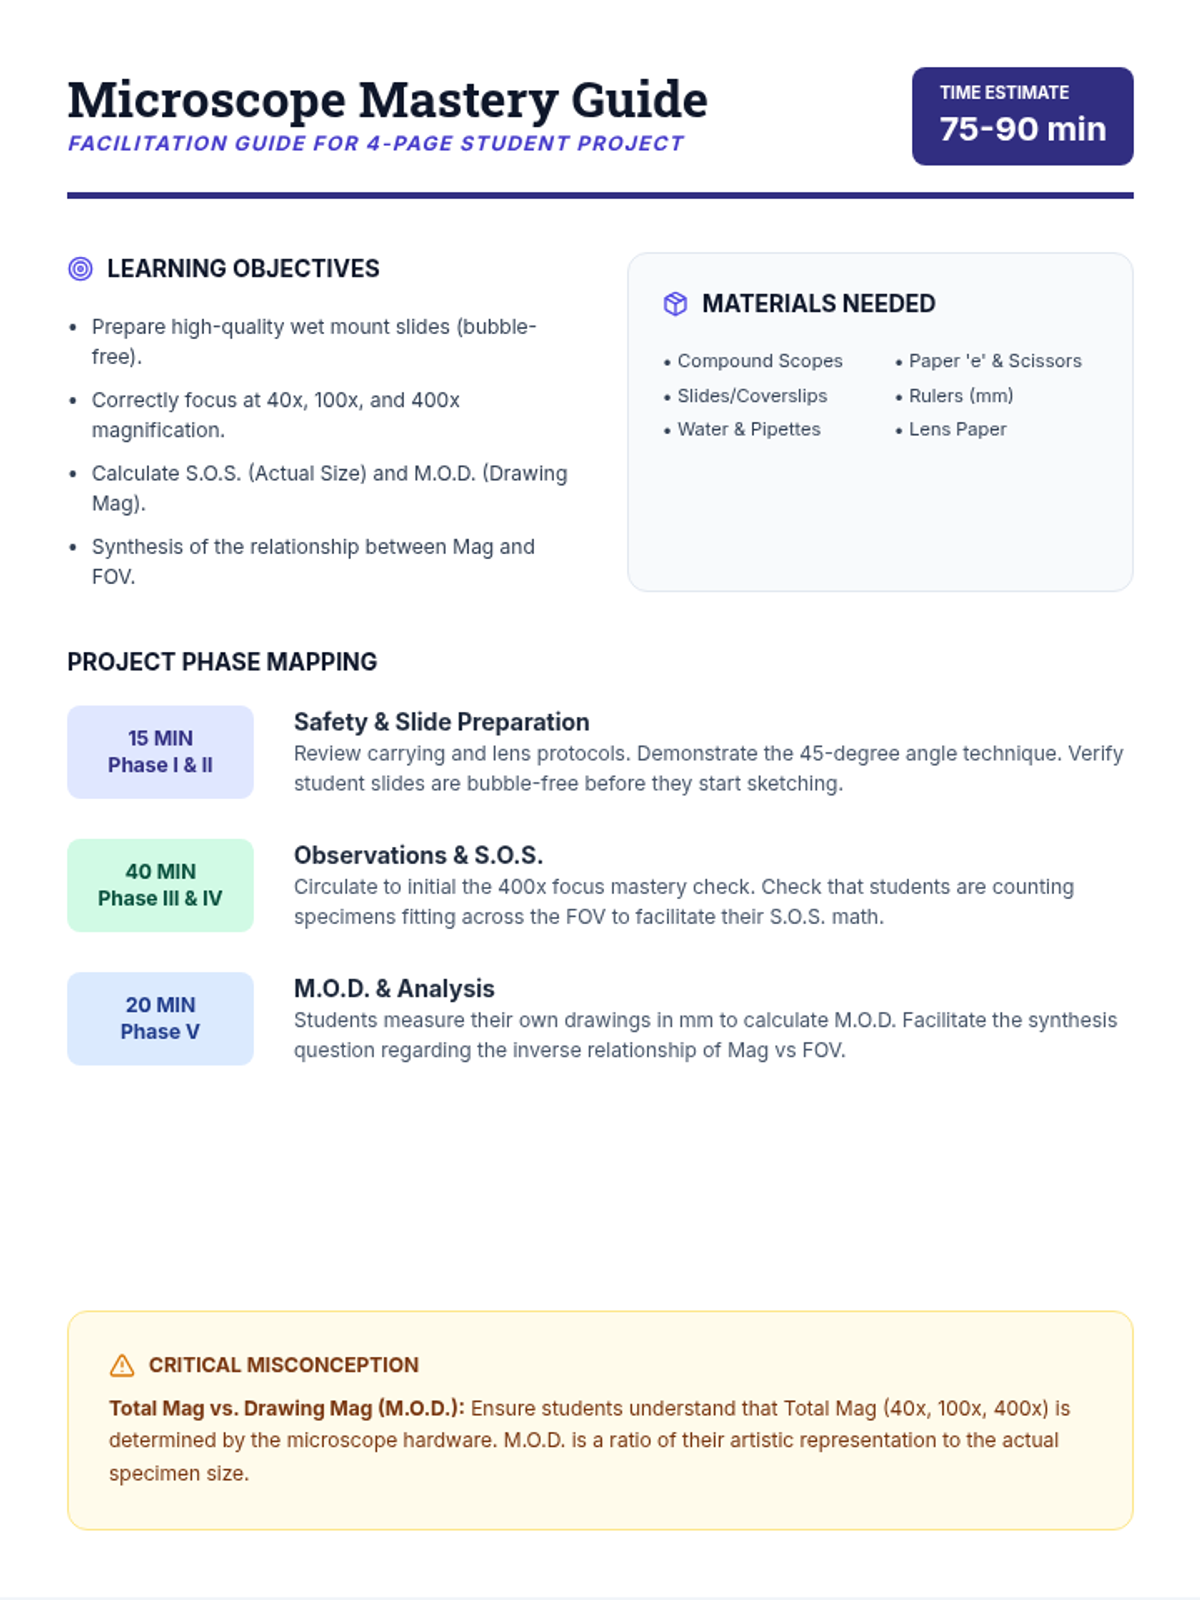
Students learn the fundamentals of microscopy by investigating the letter 'e', practicing slide preparation, and mastering magnification calculations. This lesson covers microscope parts, safety, wet mount preparation, and scientific drawing.
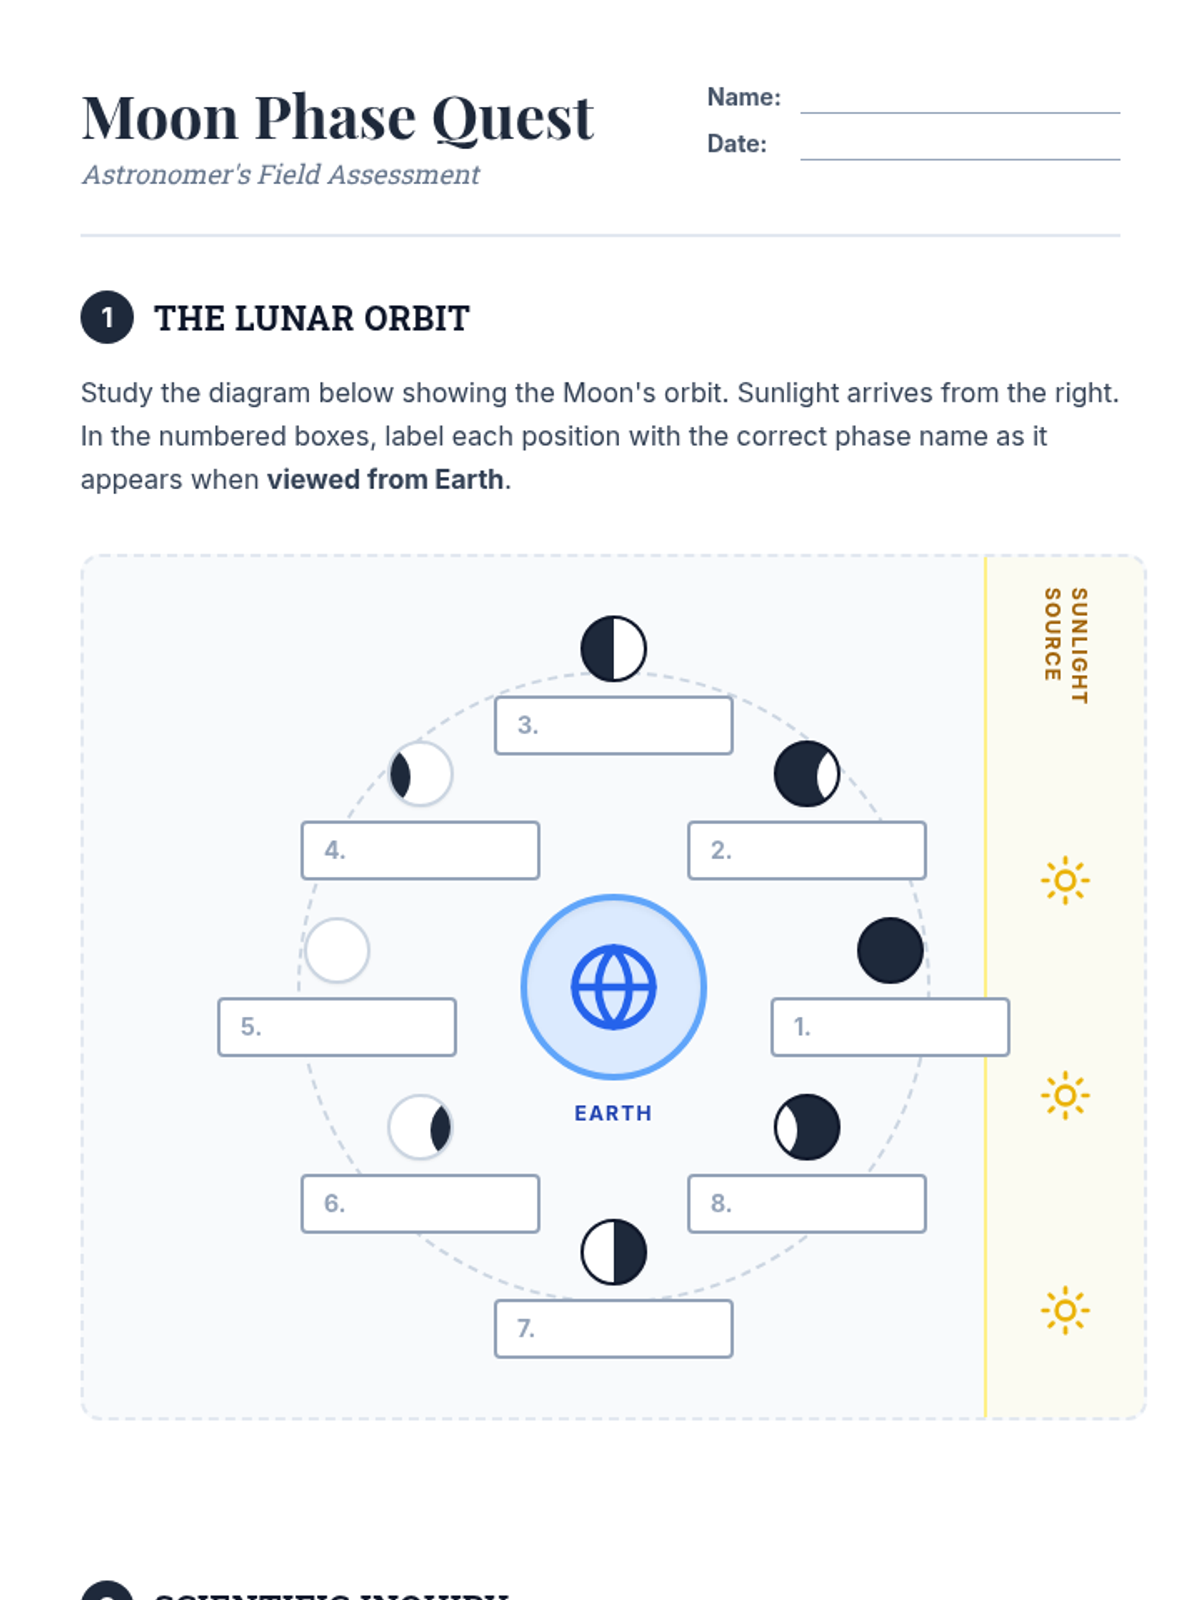
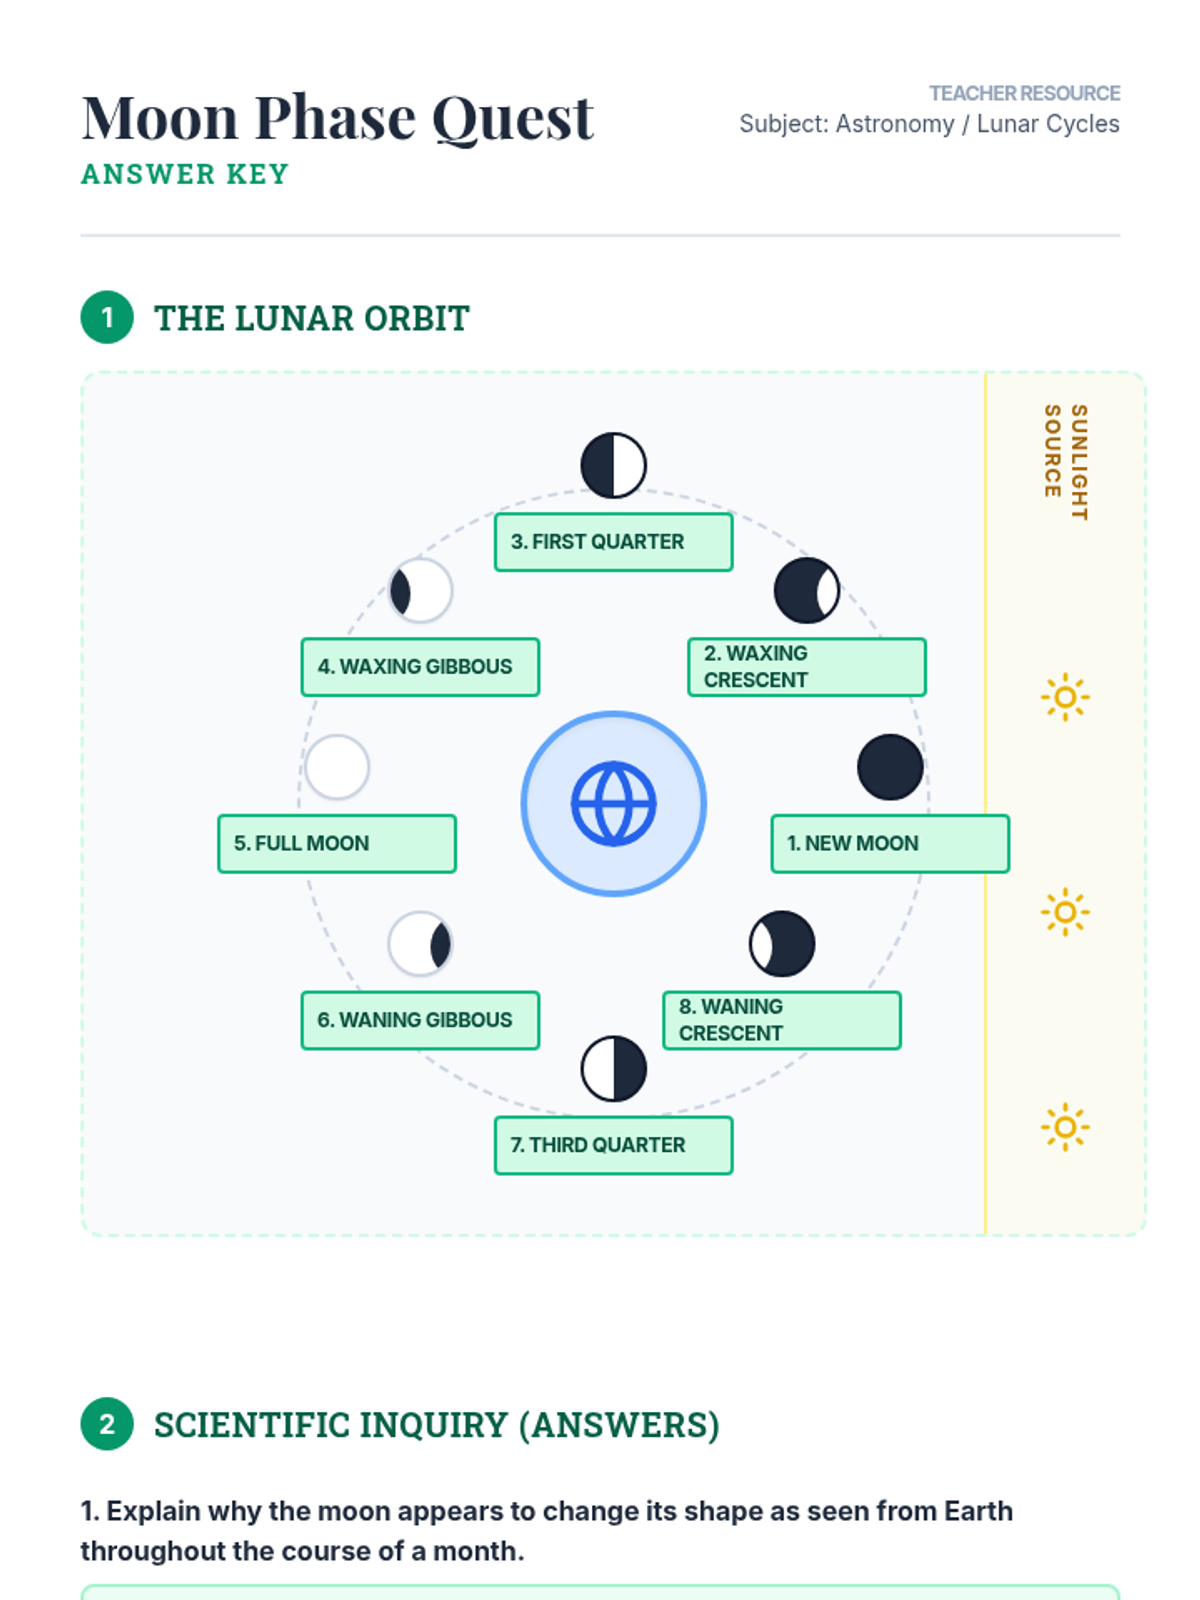
A comprehensive assessment on the lunar cycle, featuring diagram labeling of all eight phases and conceptual short-answer questions.
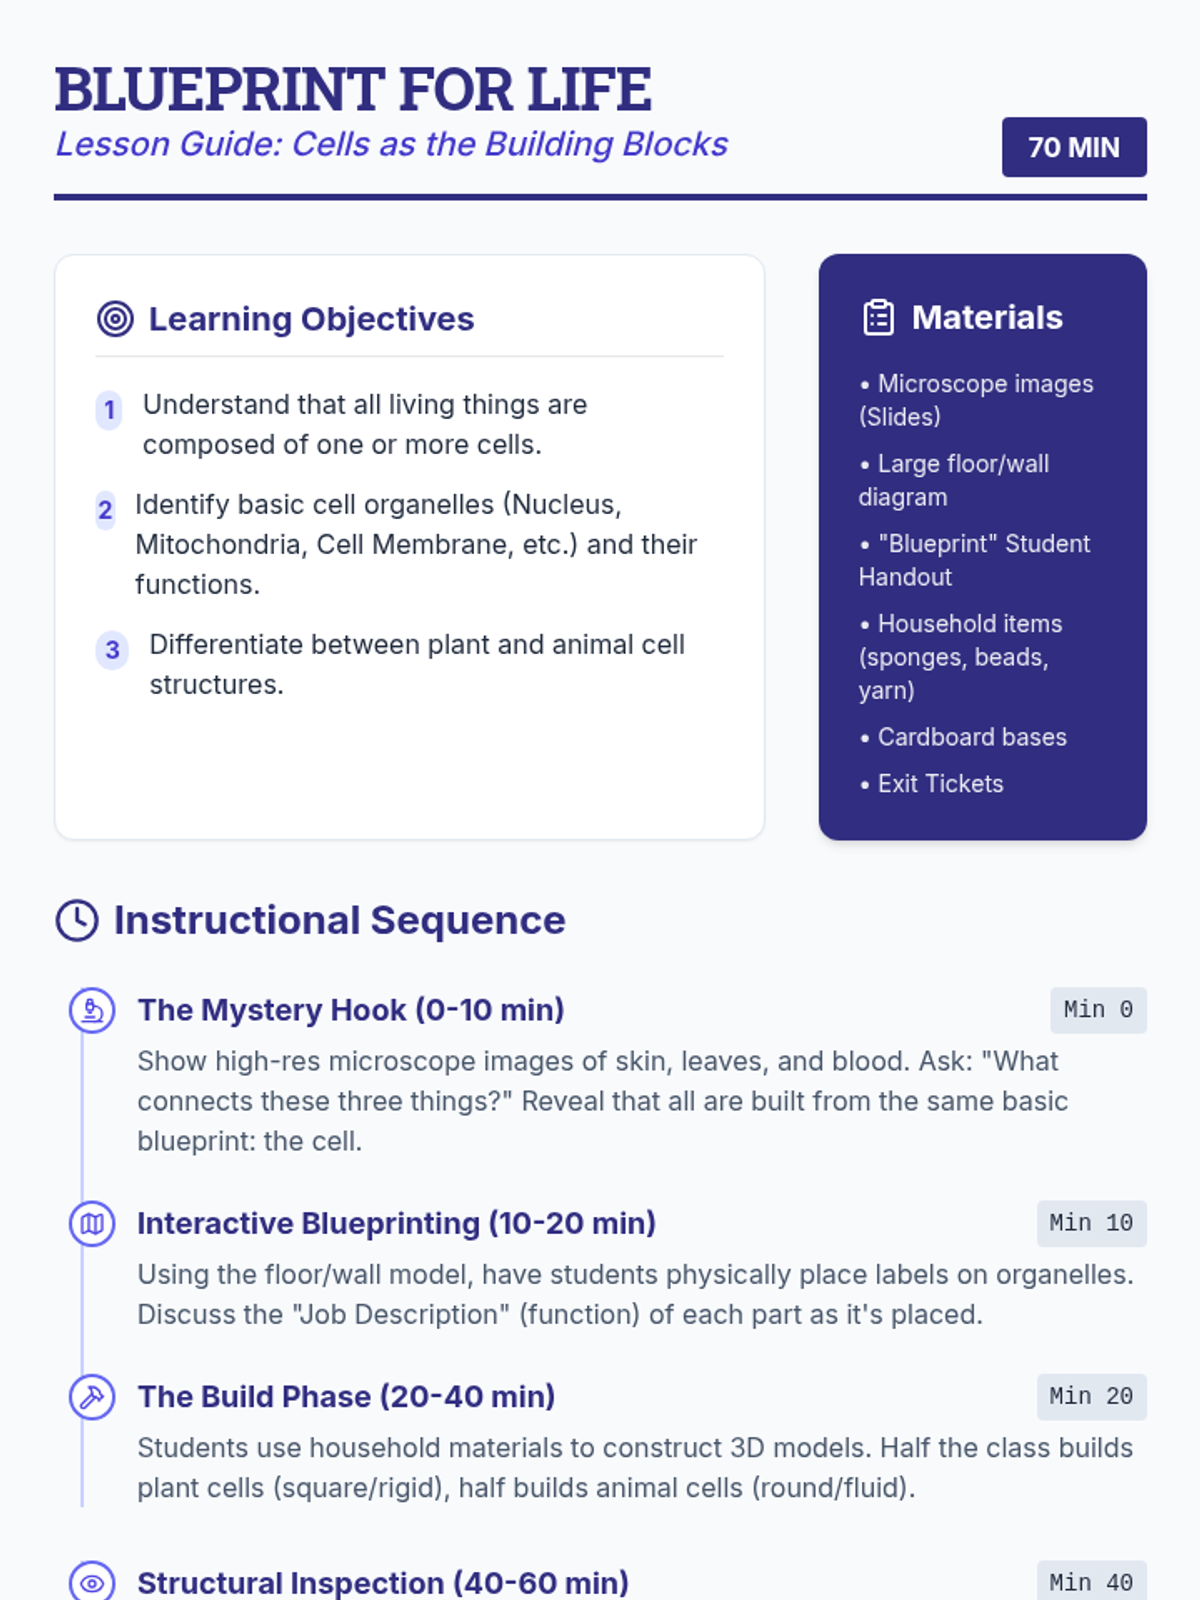
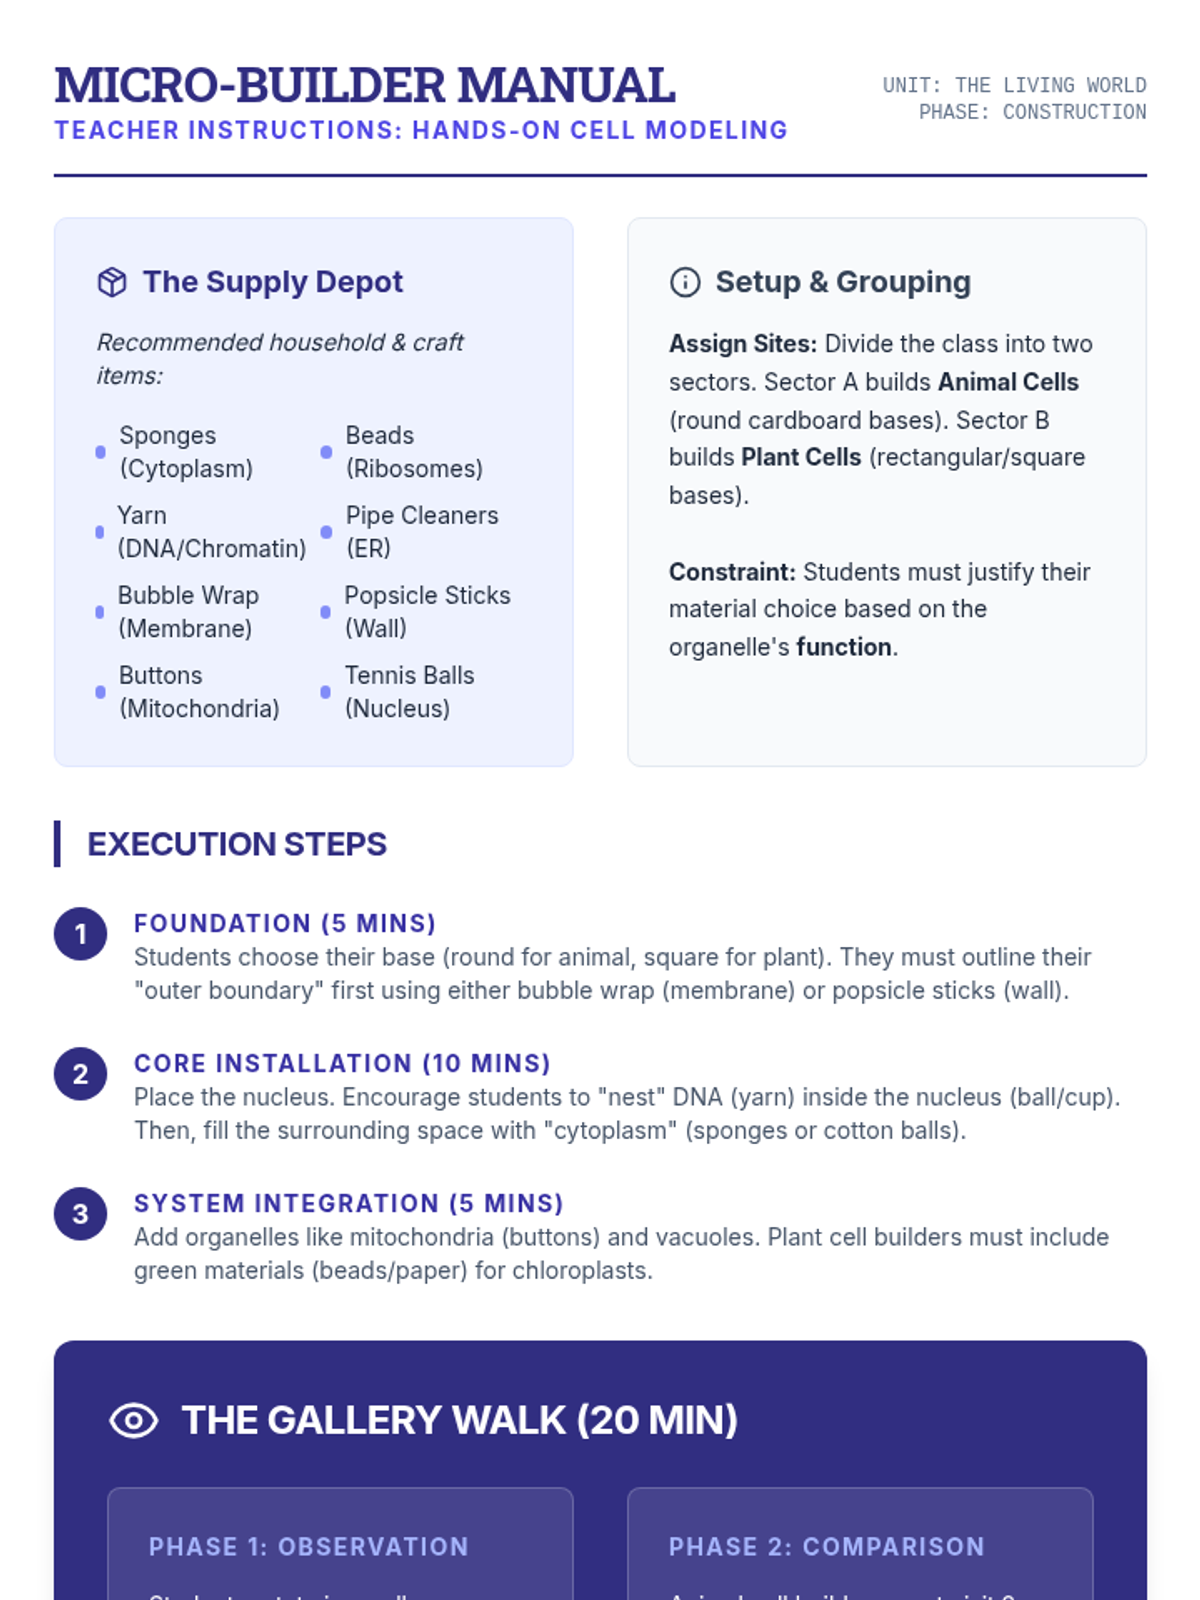
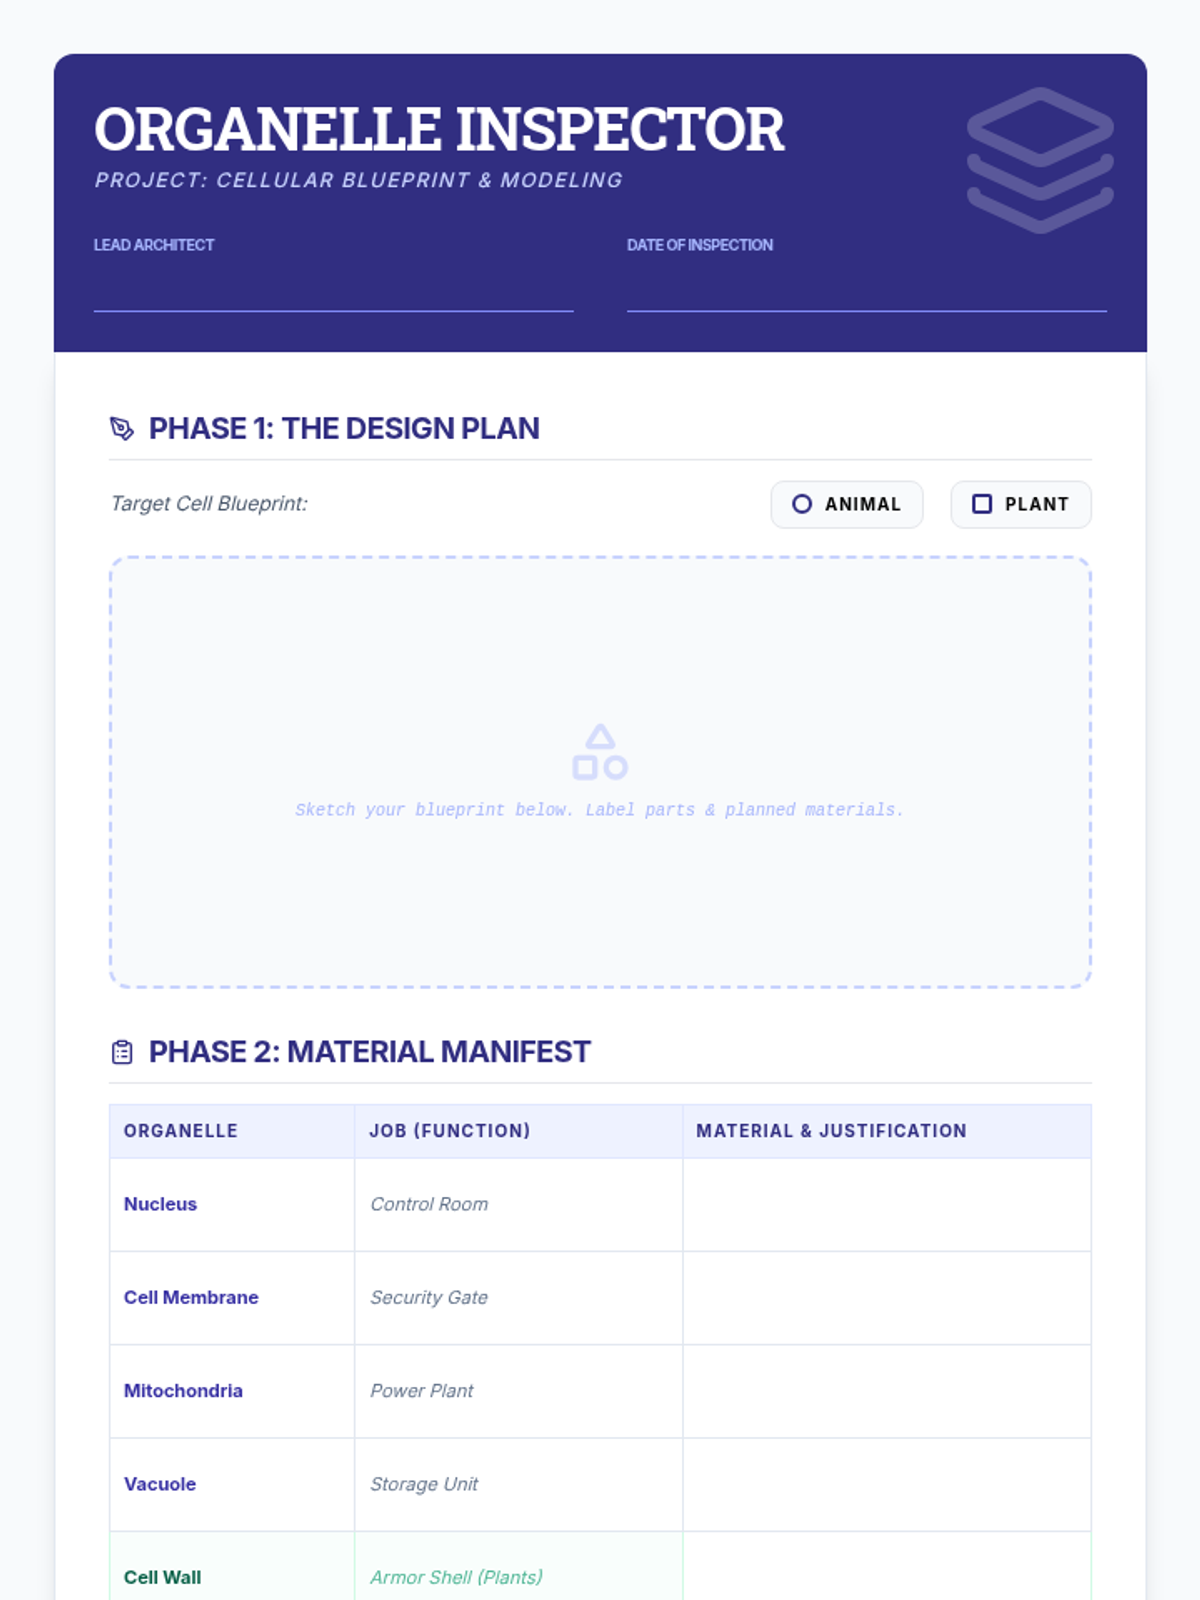
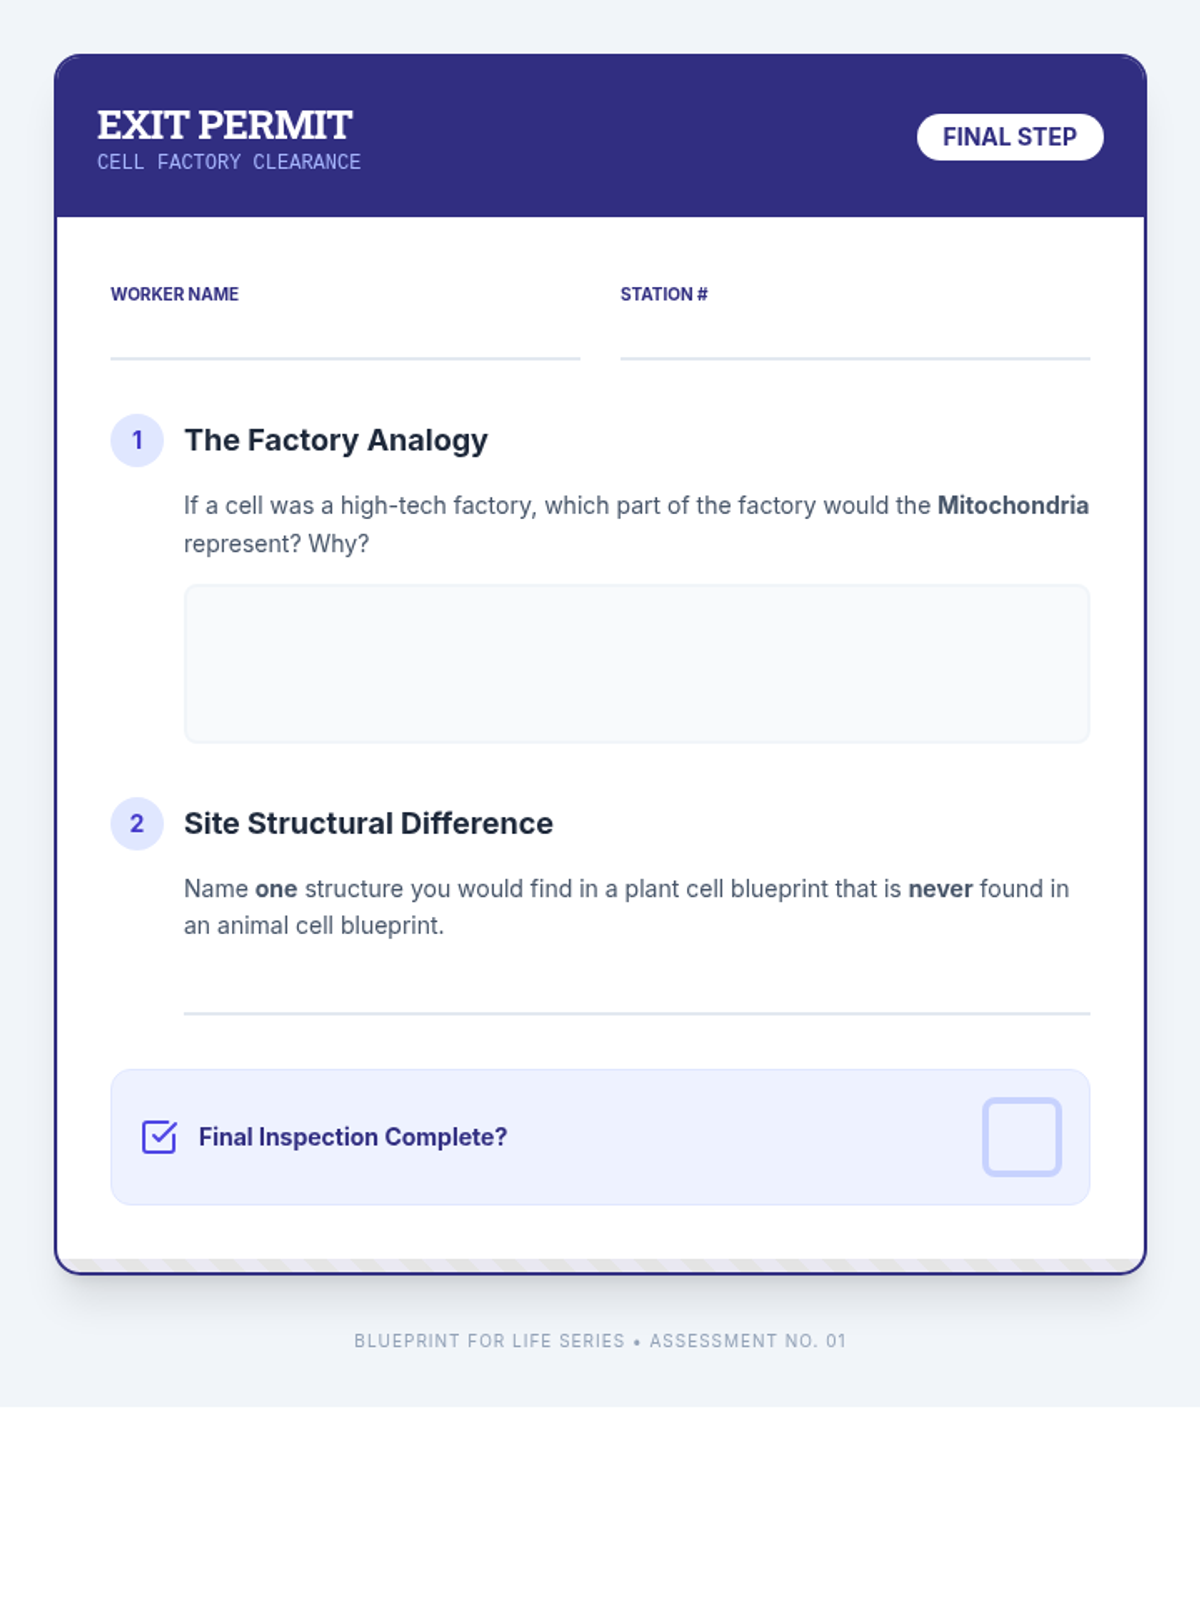
An introductory biology lesson exploring the fundamental unit of life through the lens of architectural design. Students compare plant and animal cells, identify organelles, and construct physical models using everyday materials.
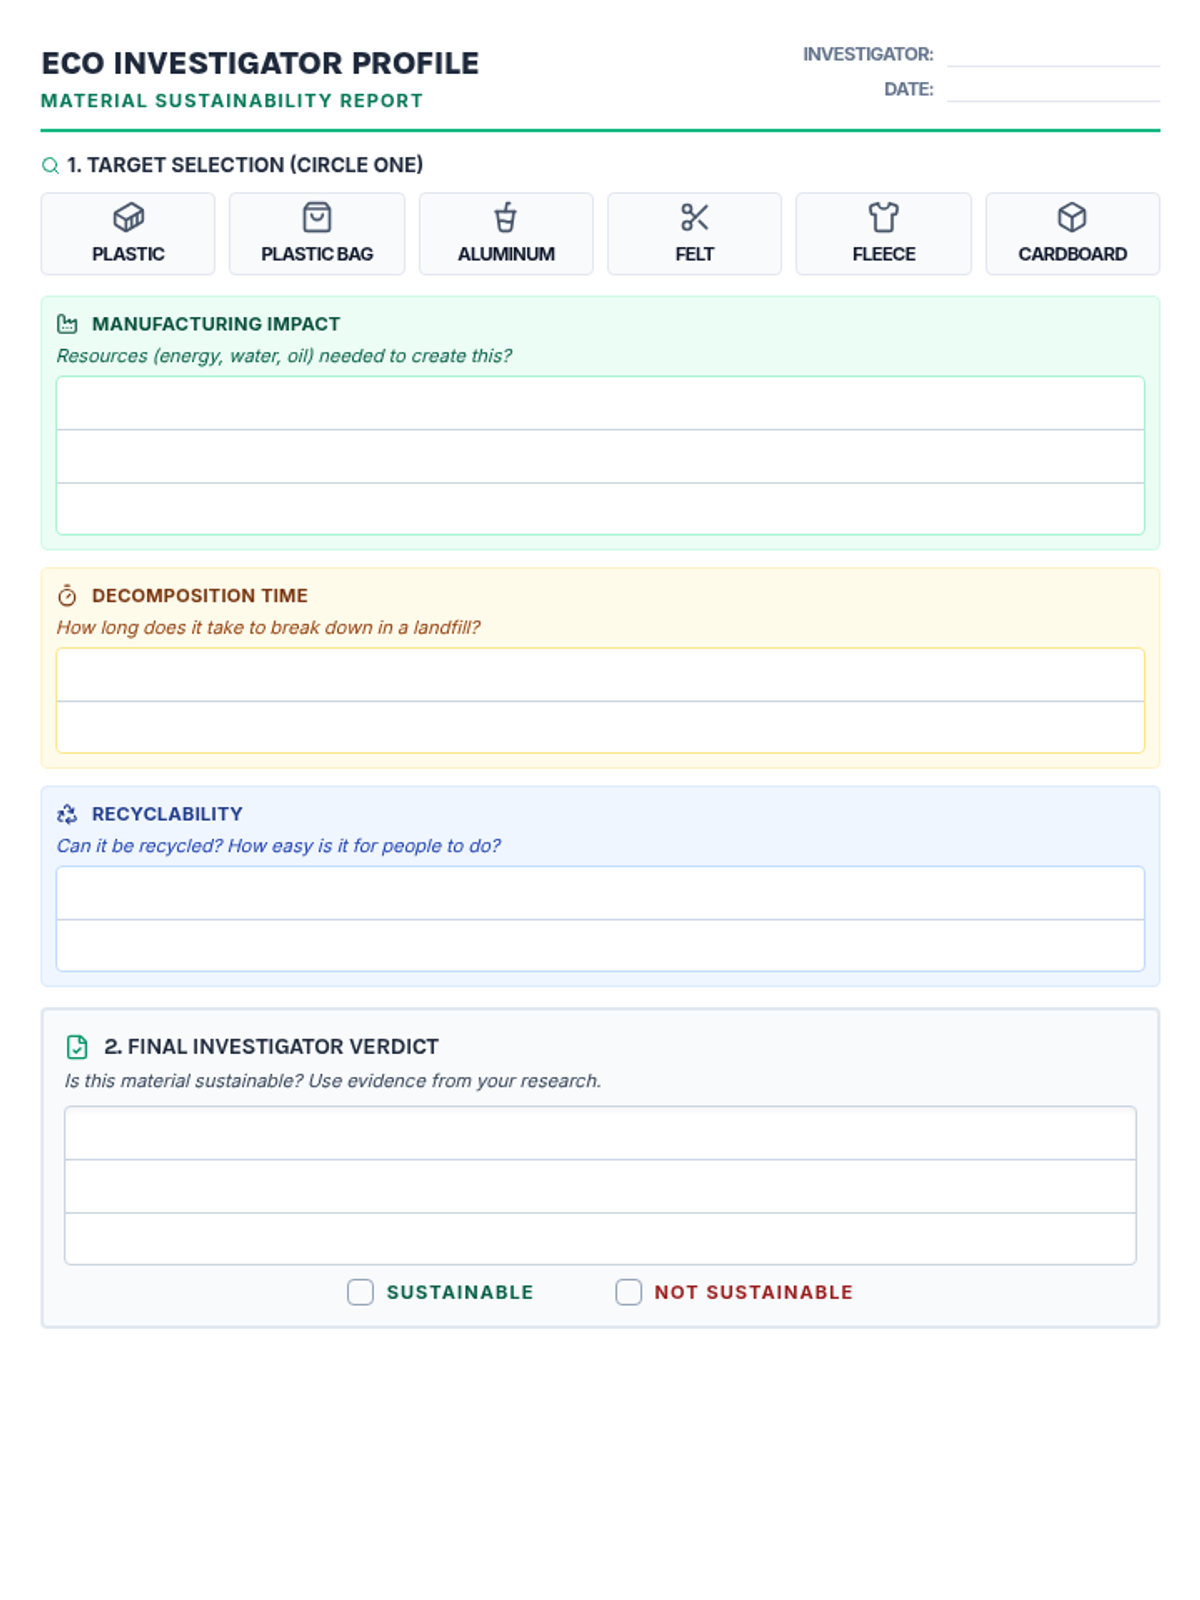
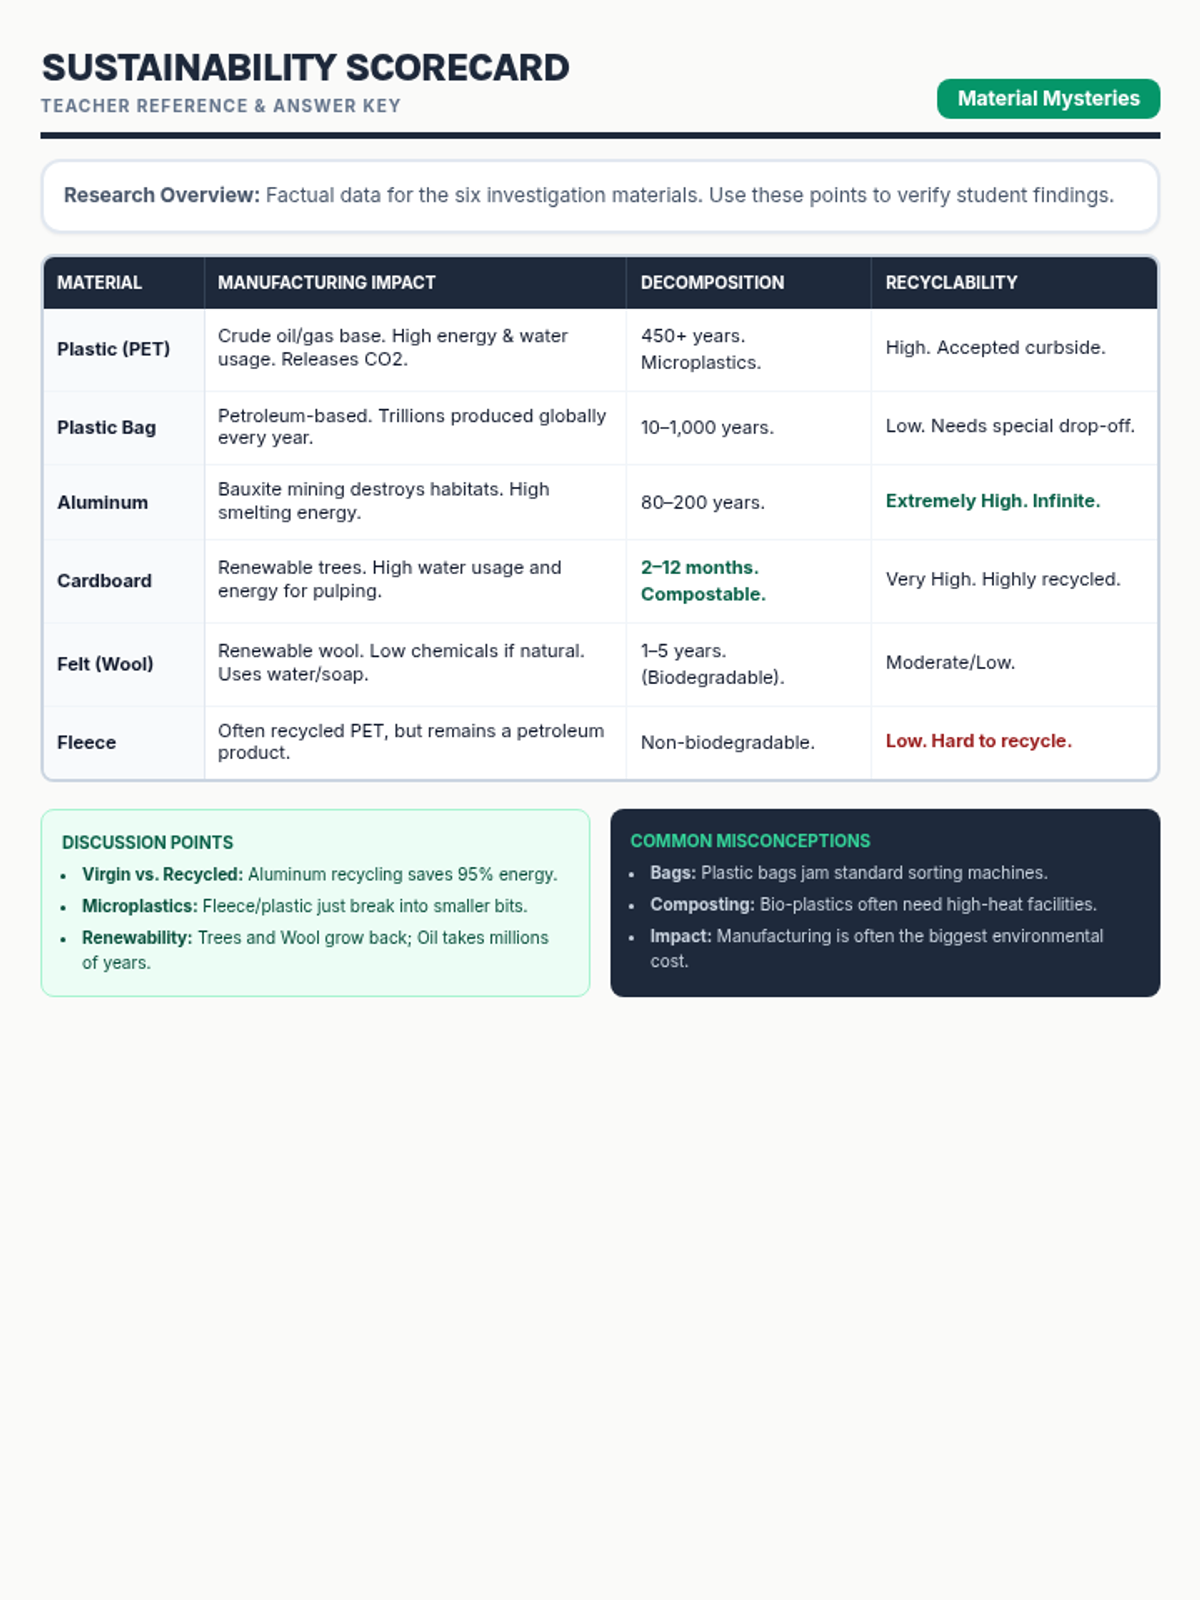
A research-based science lesson where students investigate the environmental impact of common materials like plastic, aluminum, and fleece. Students act as eco-detectives to evaluate recyclability, decomposition, and manufacturing footprints.