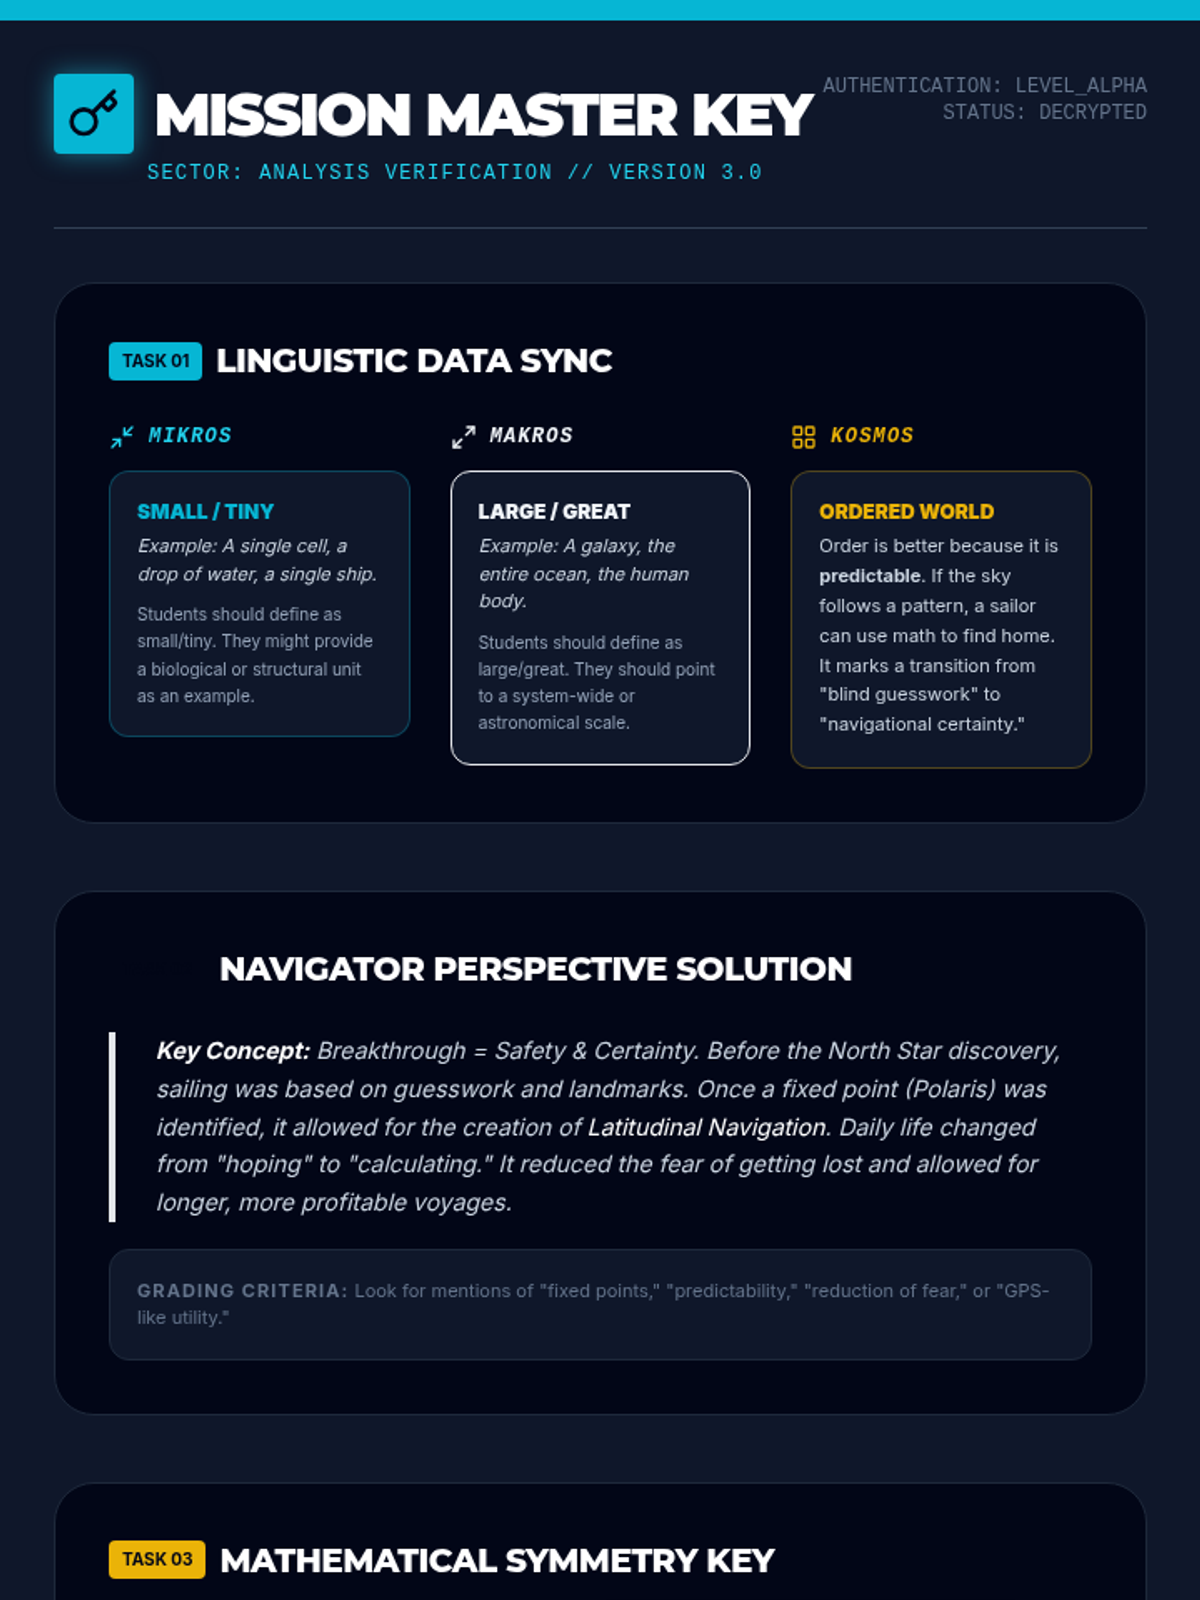
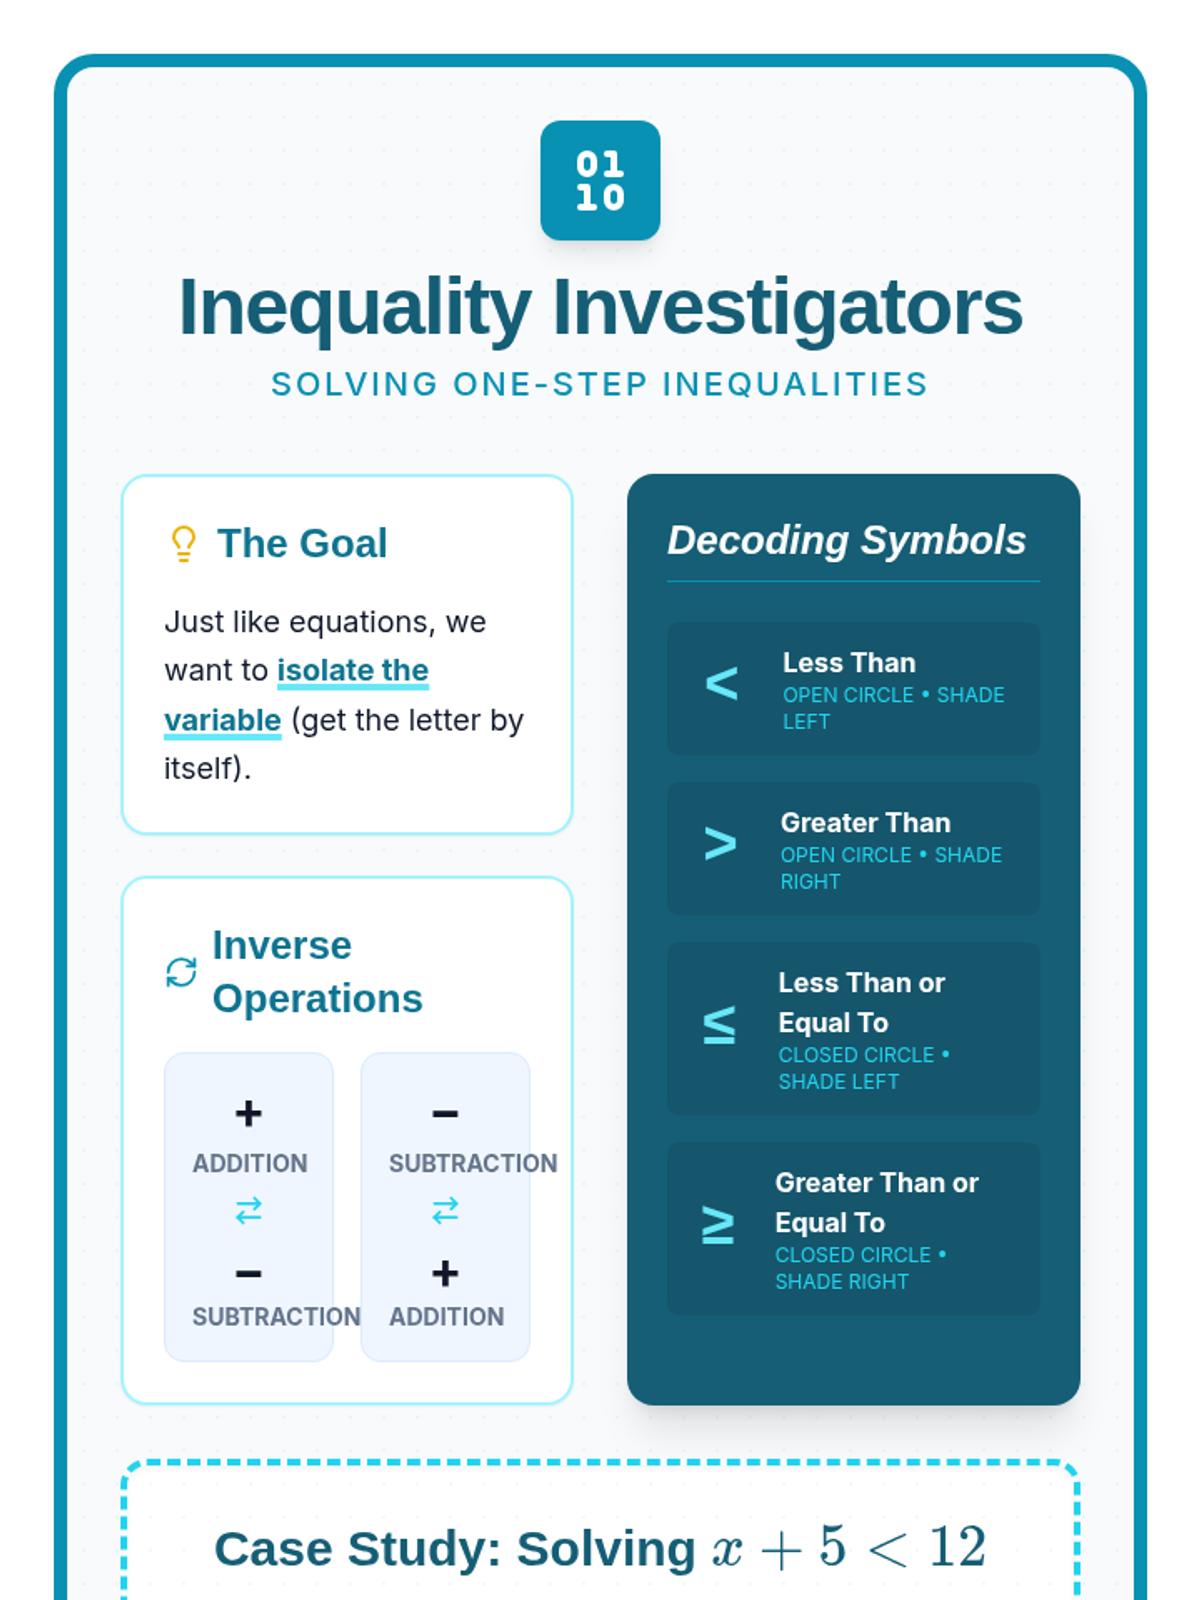
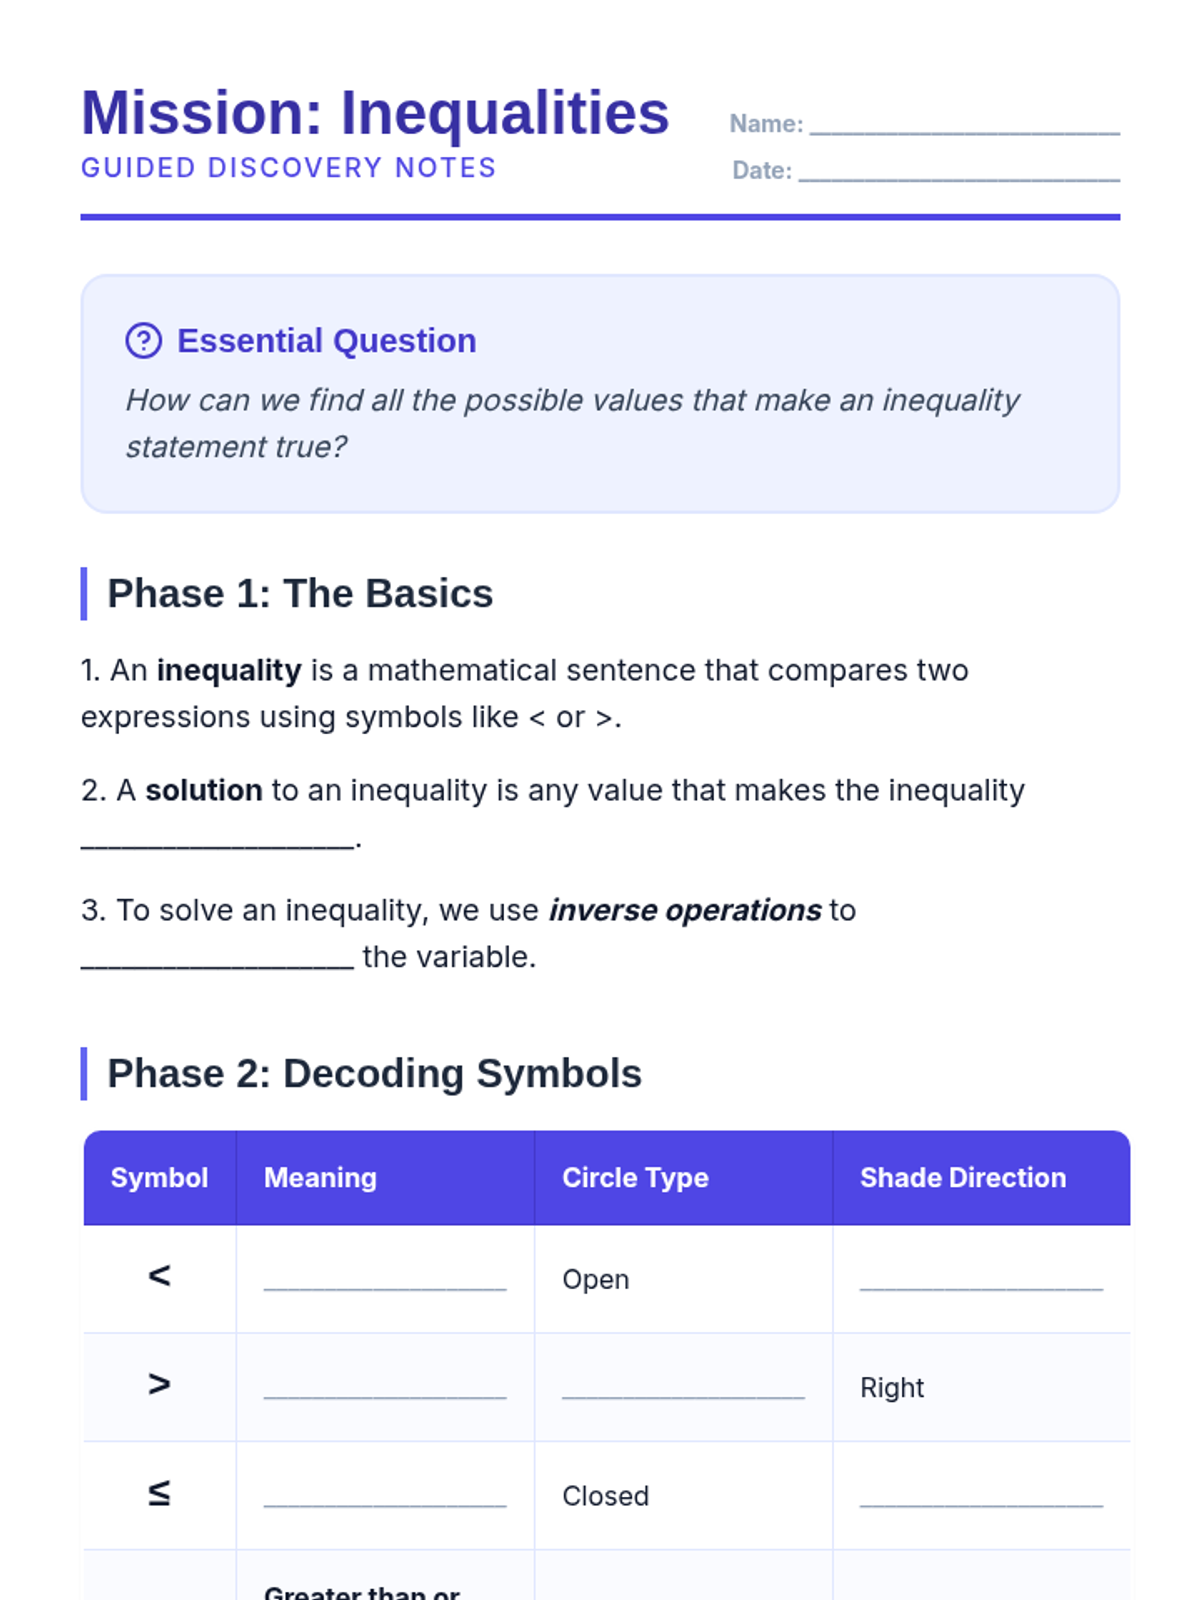
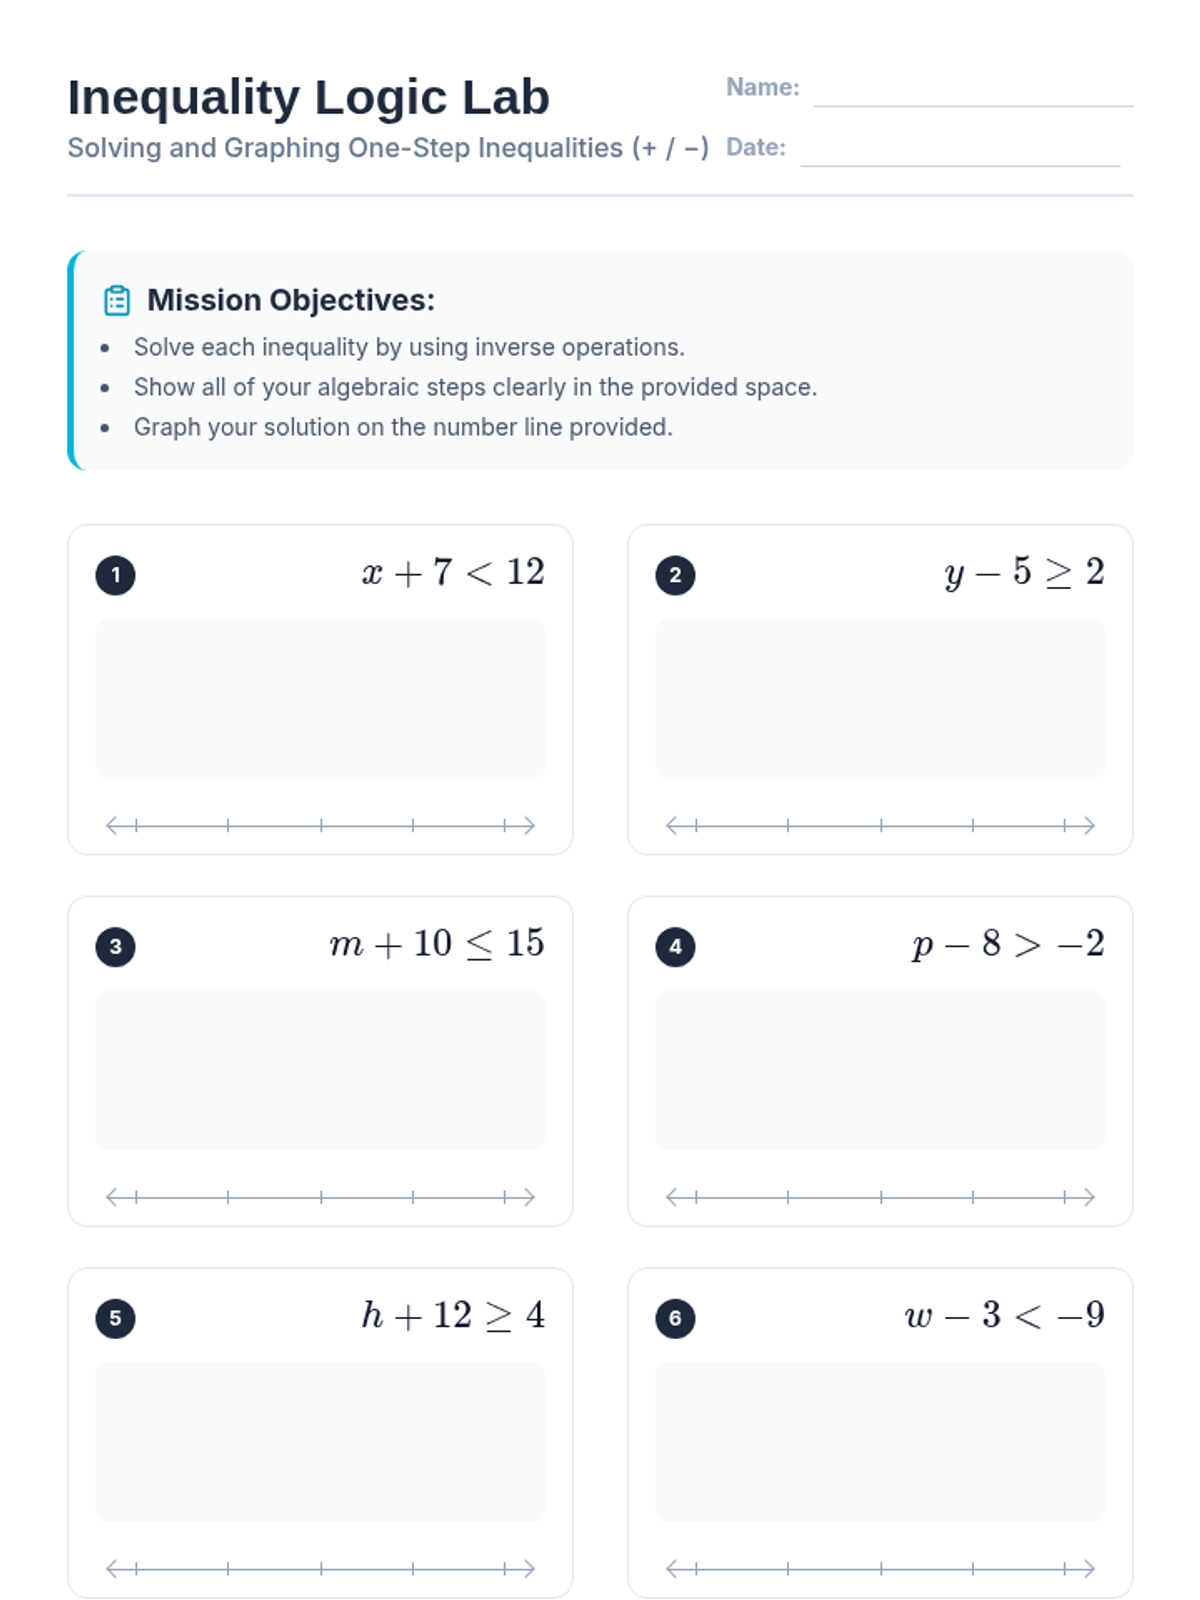
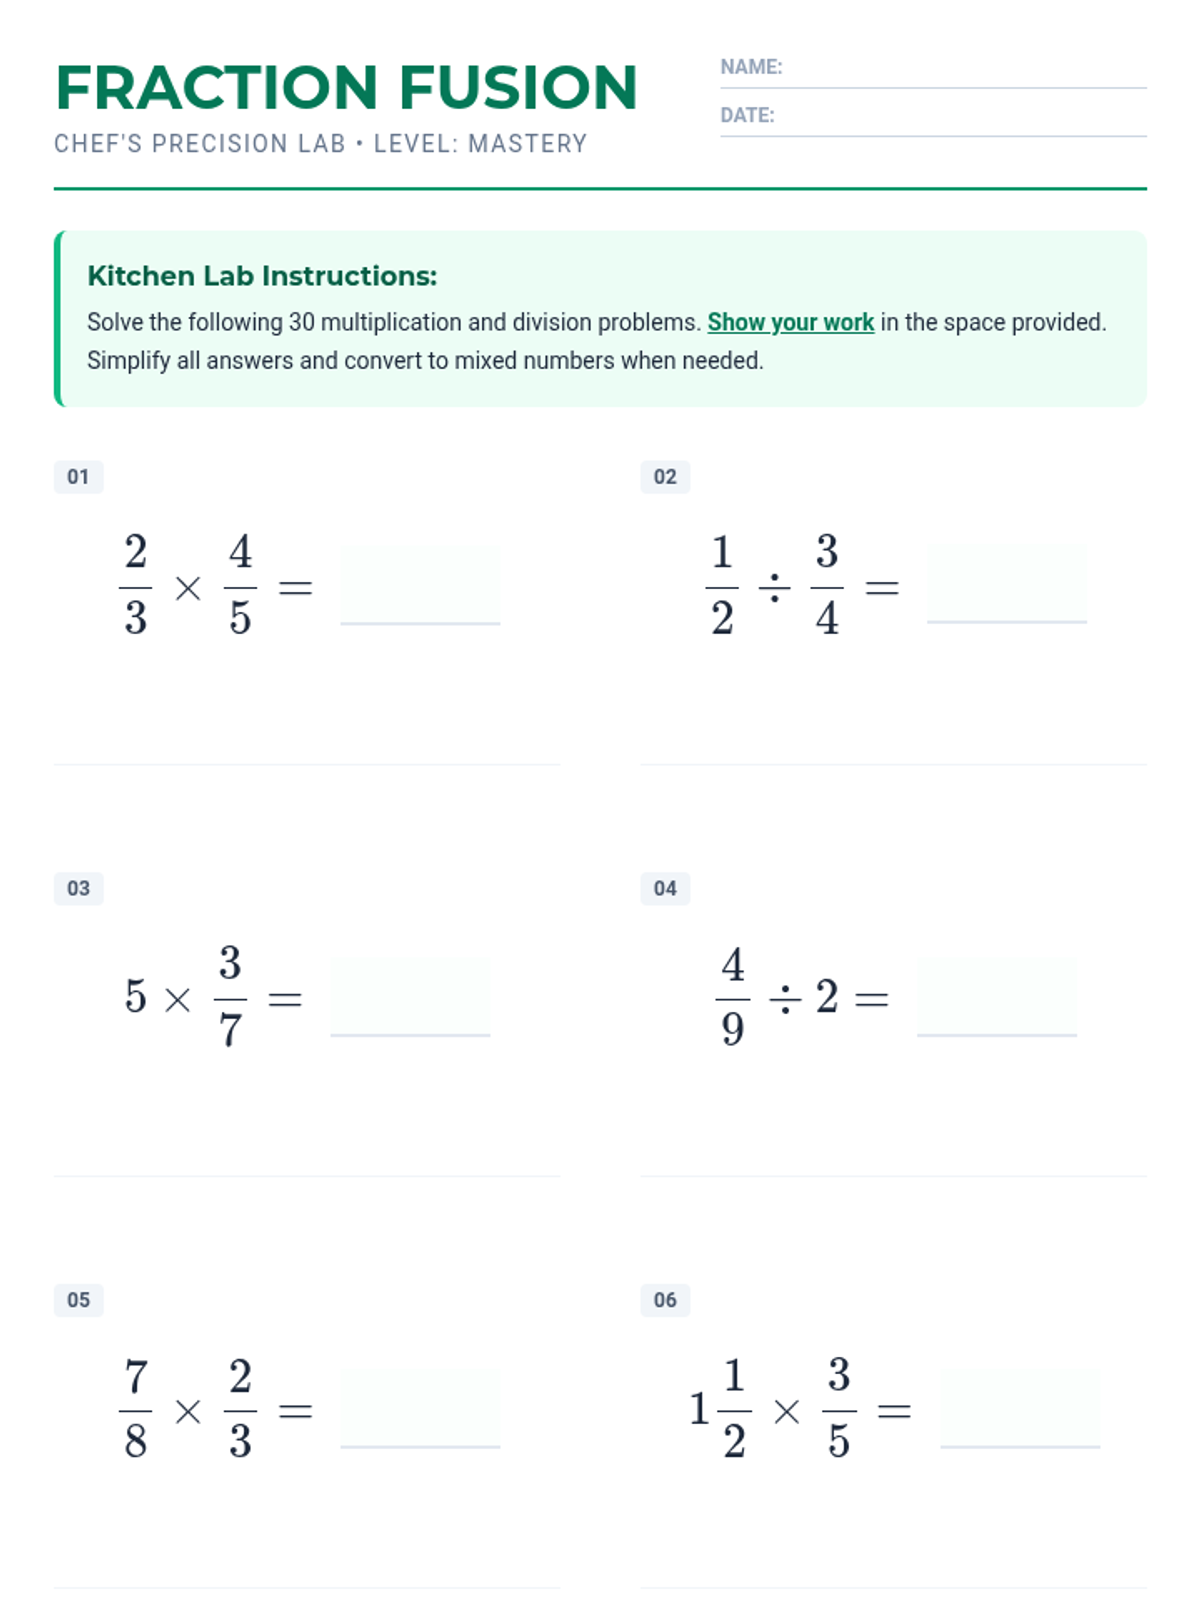
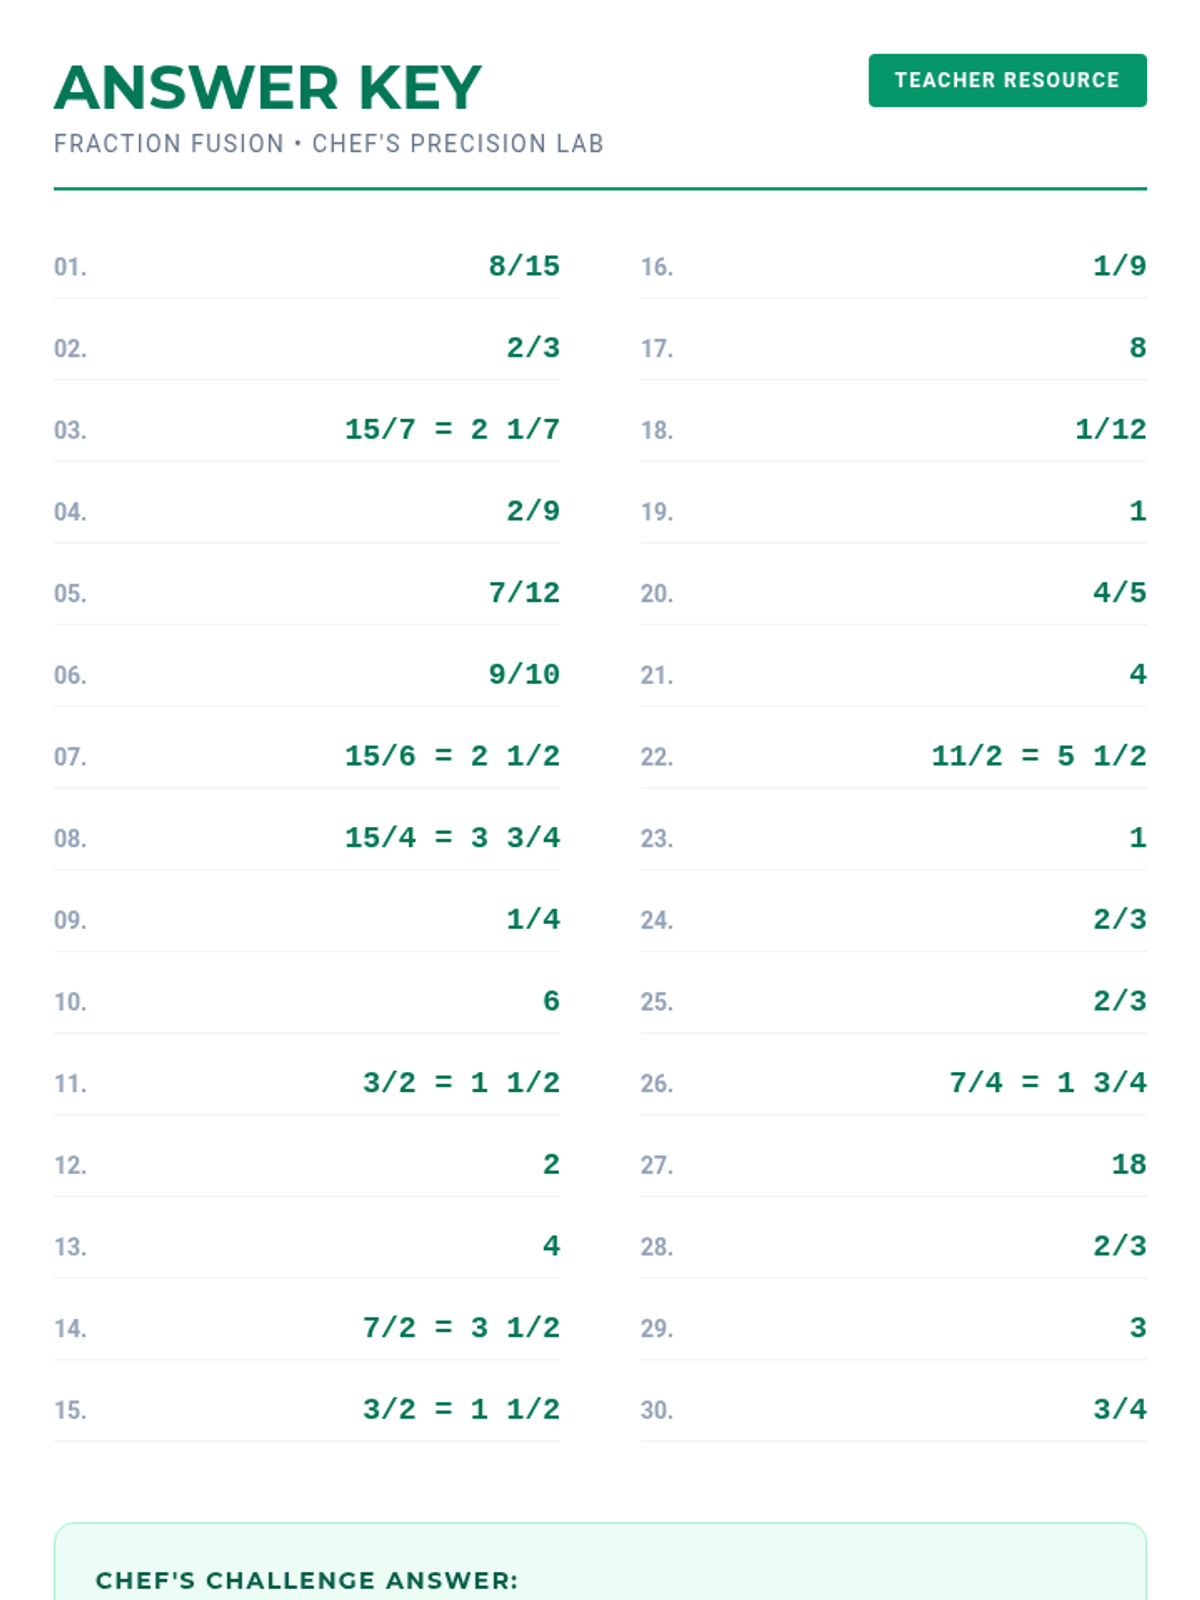
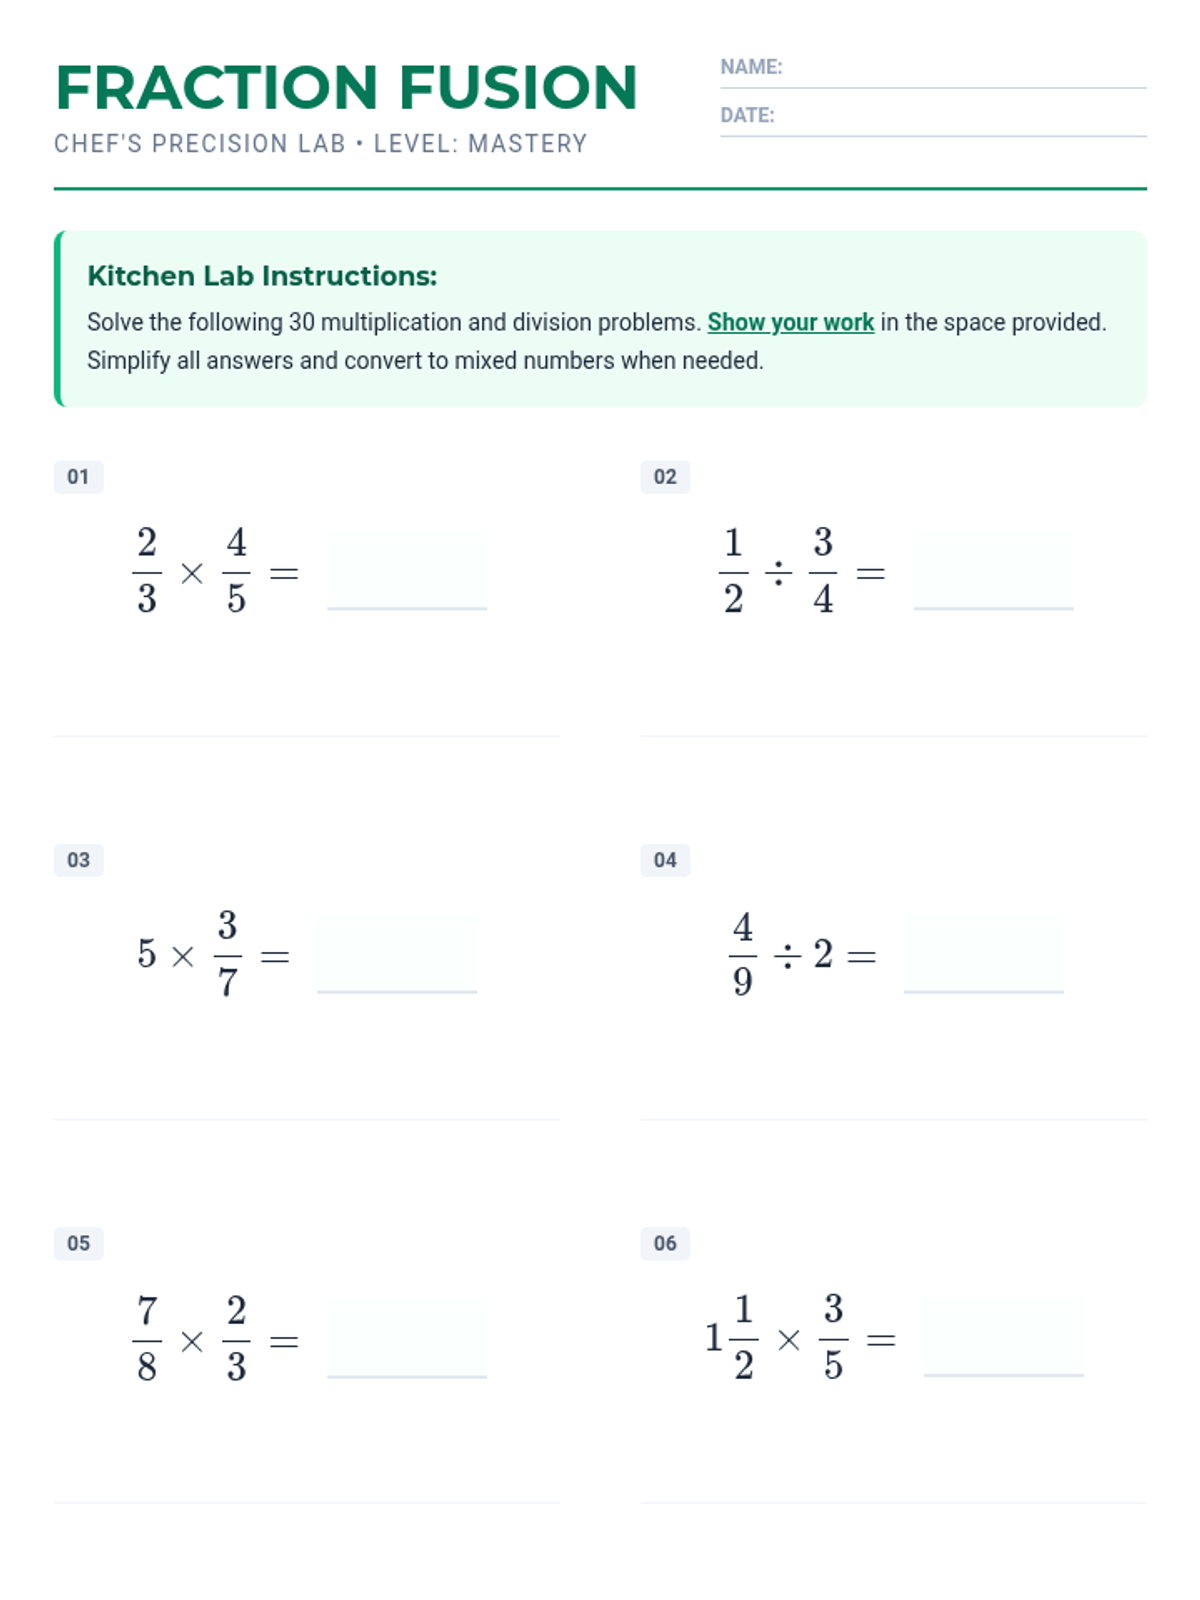
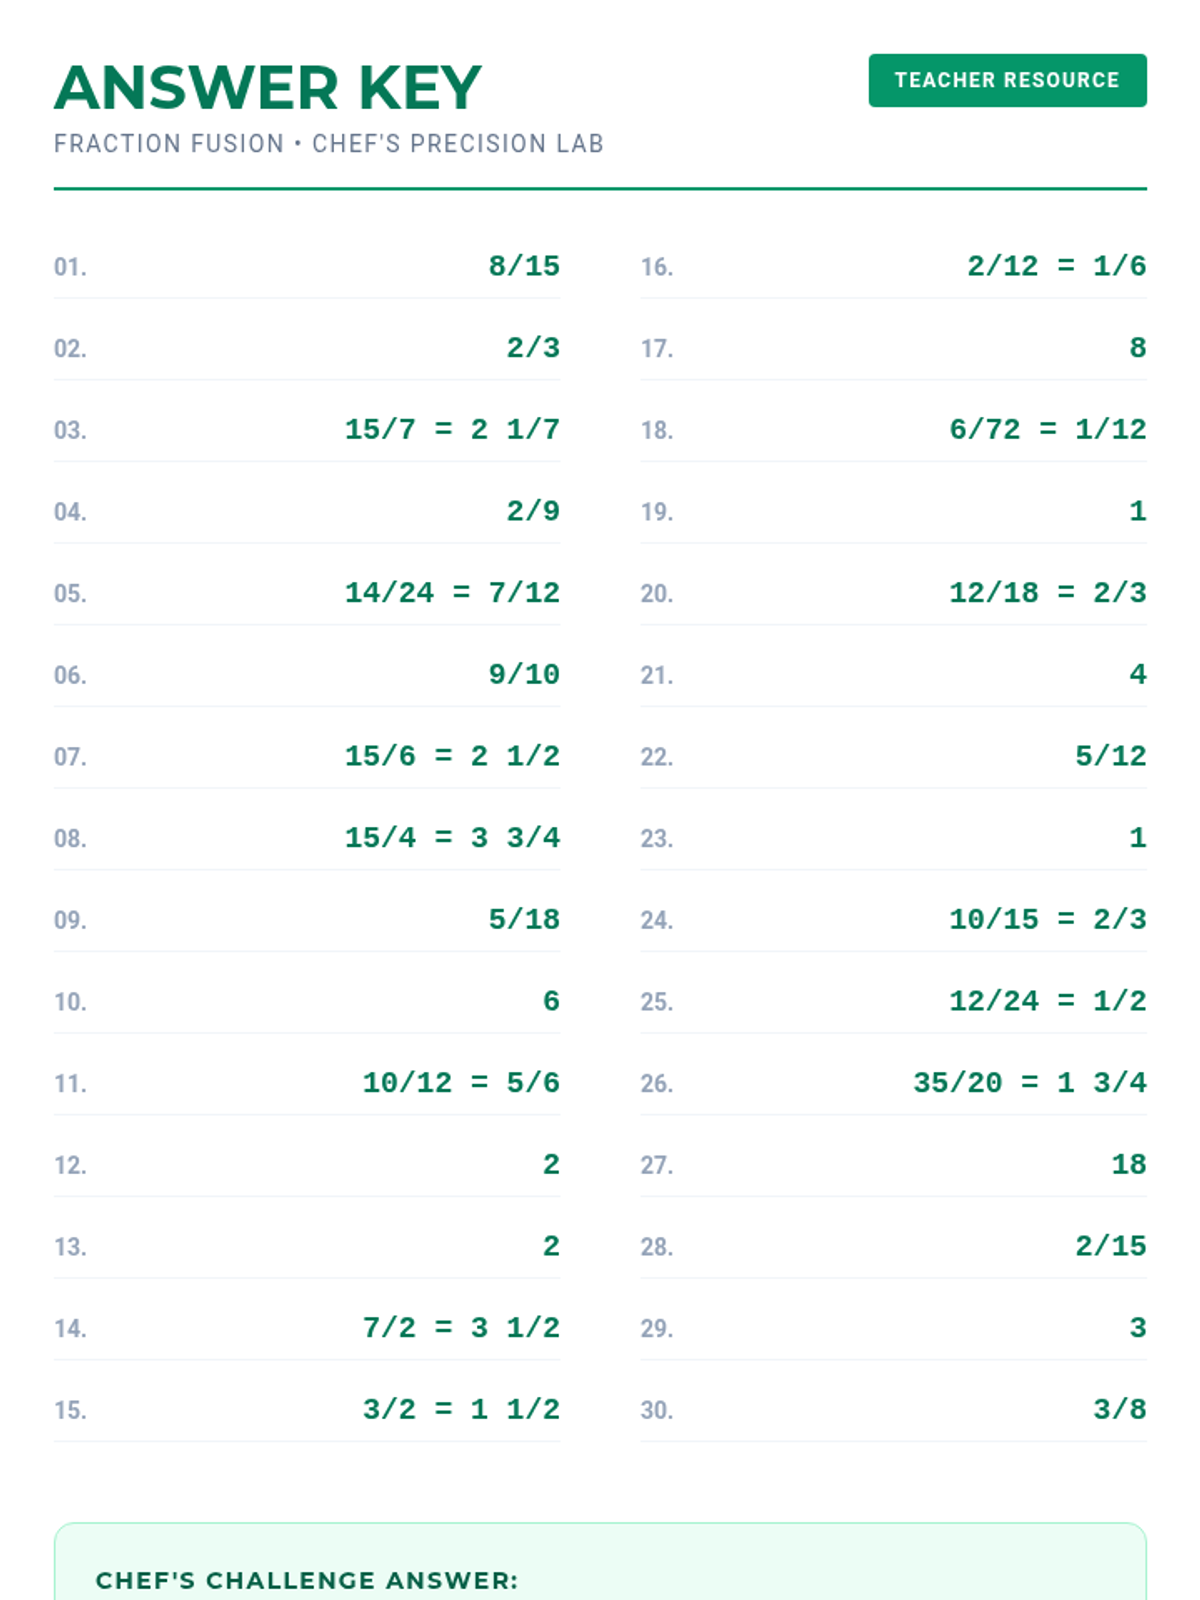
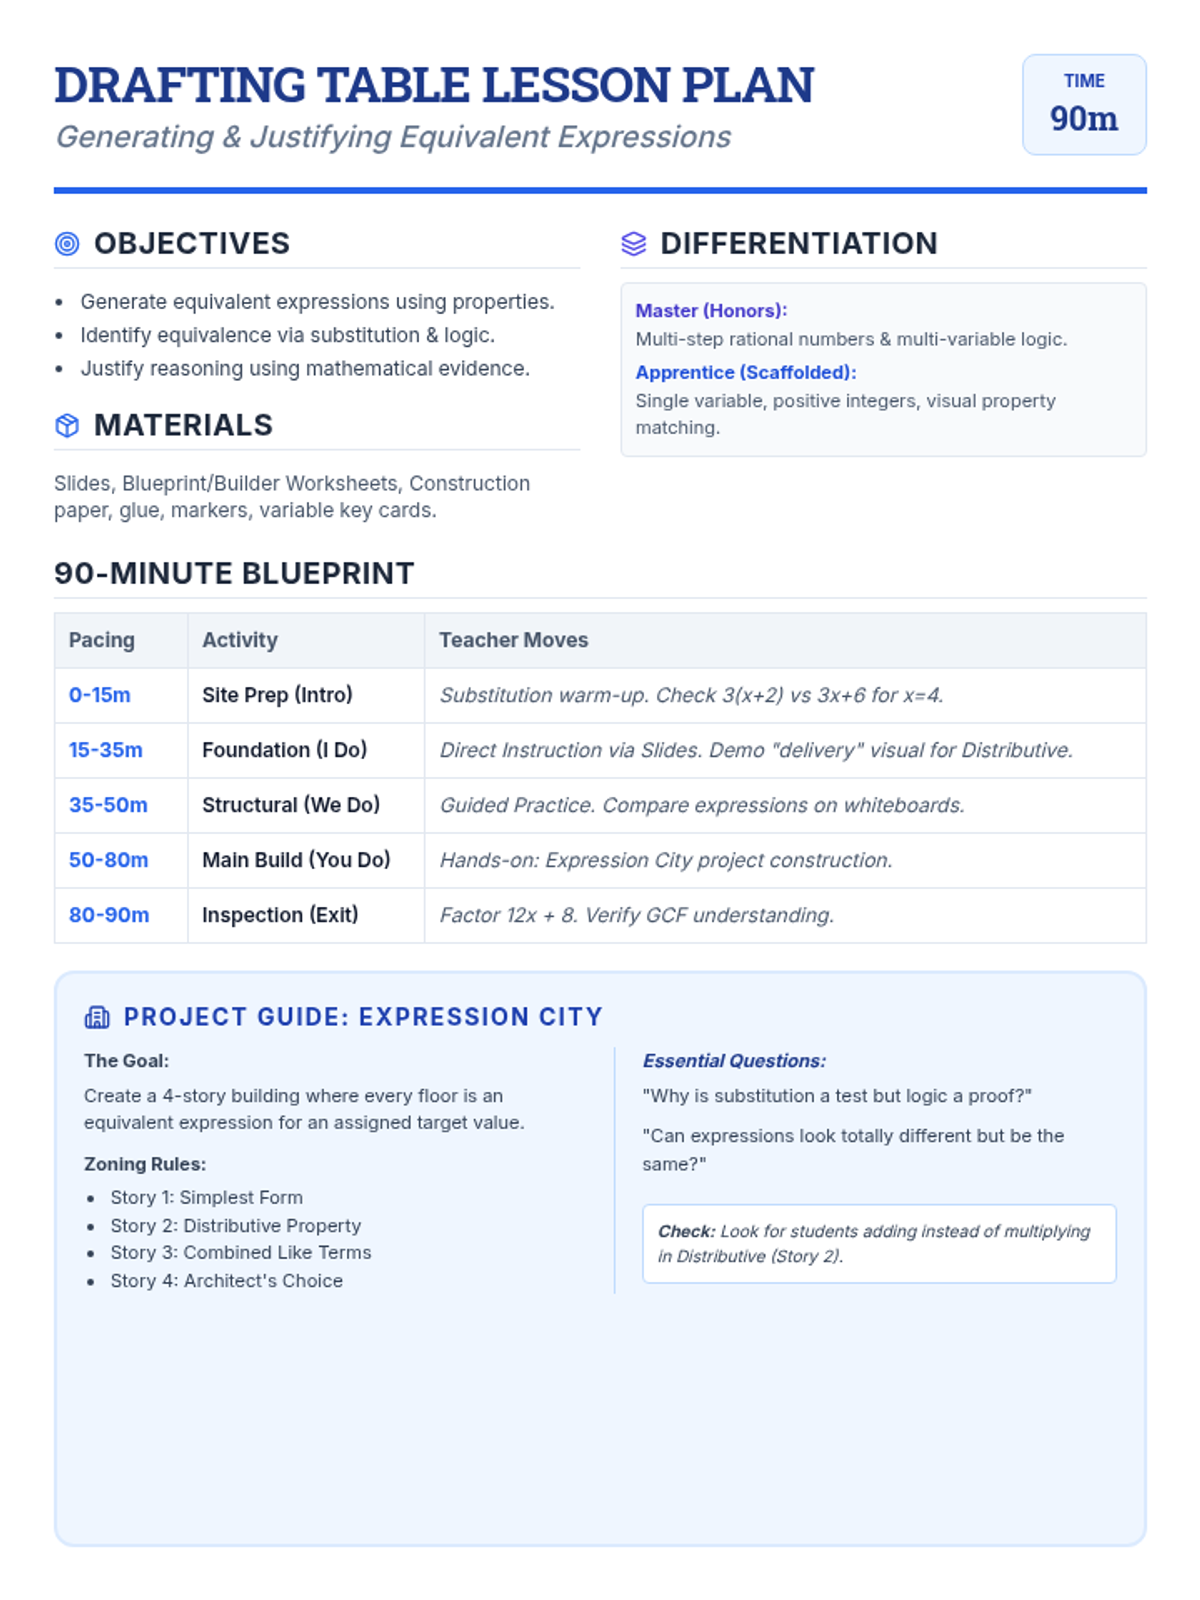
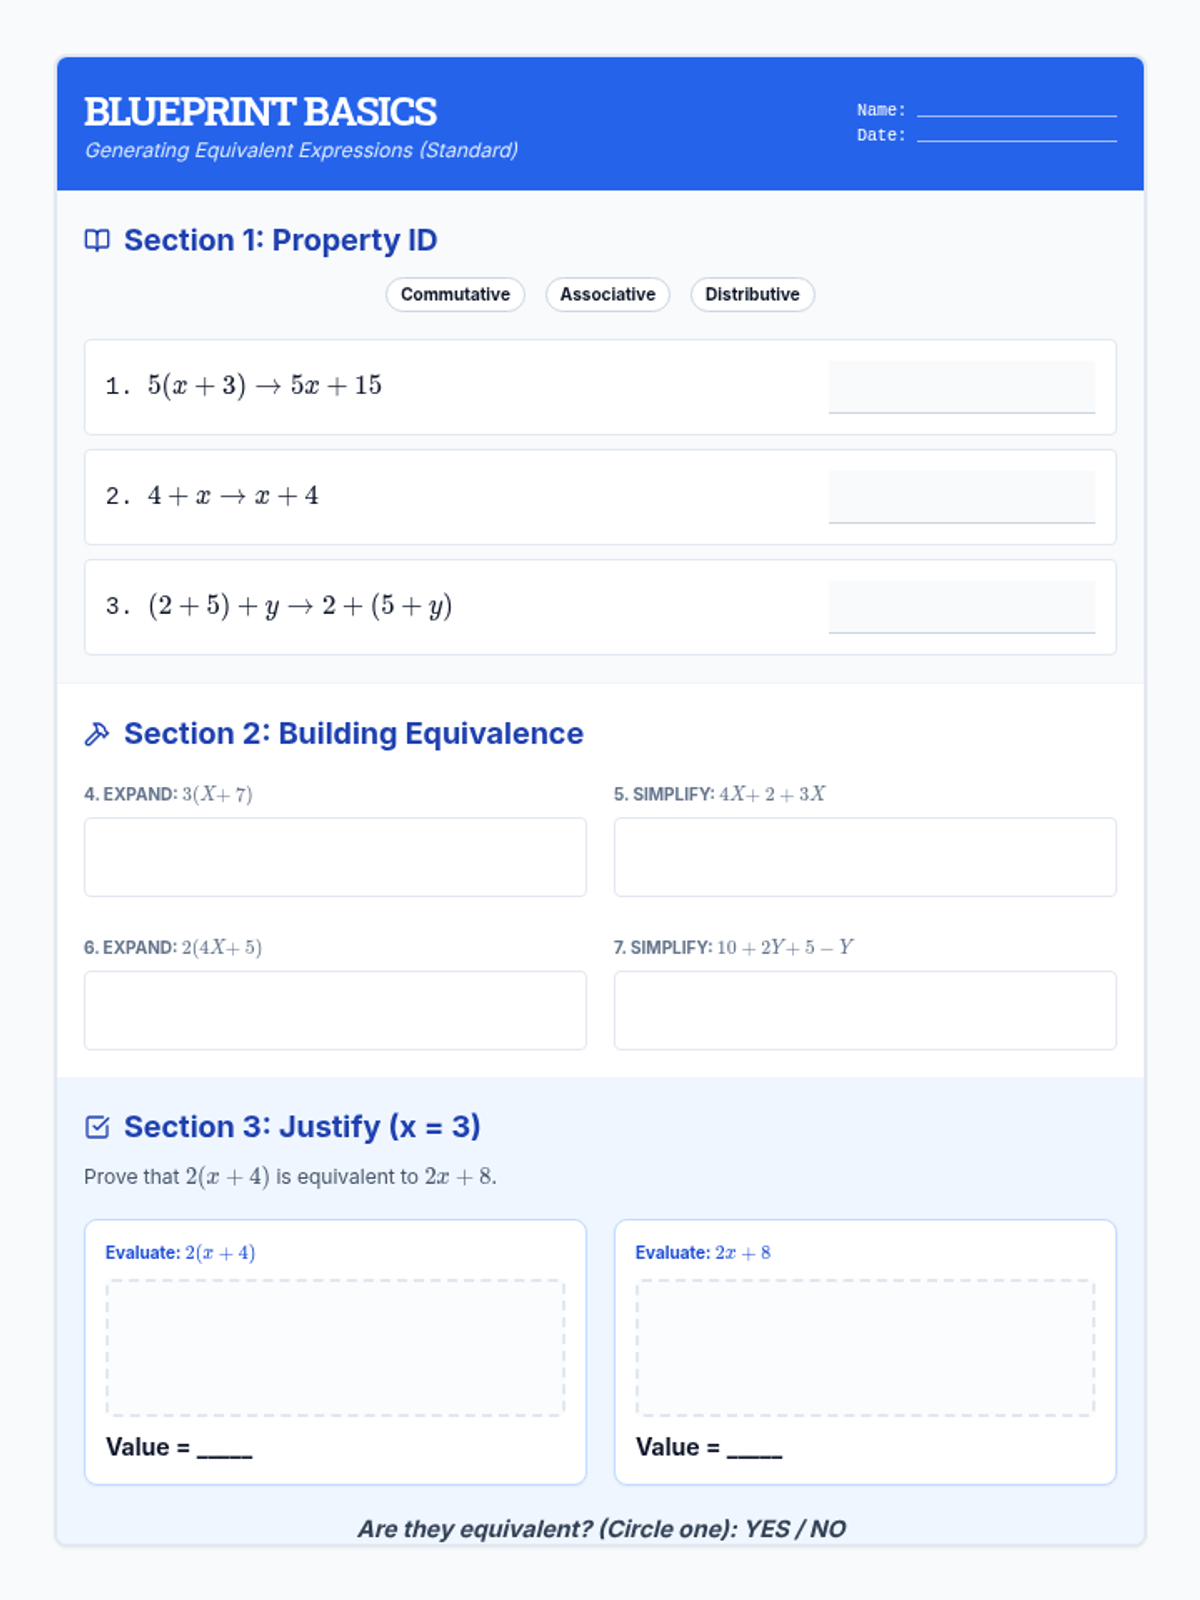
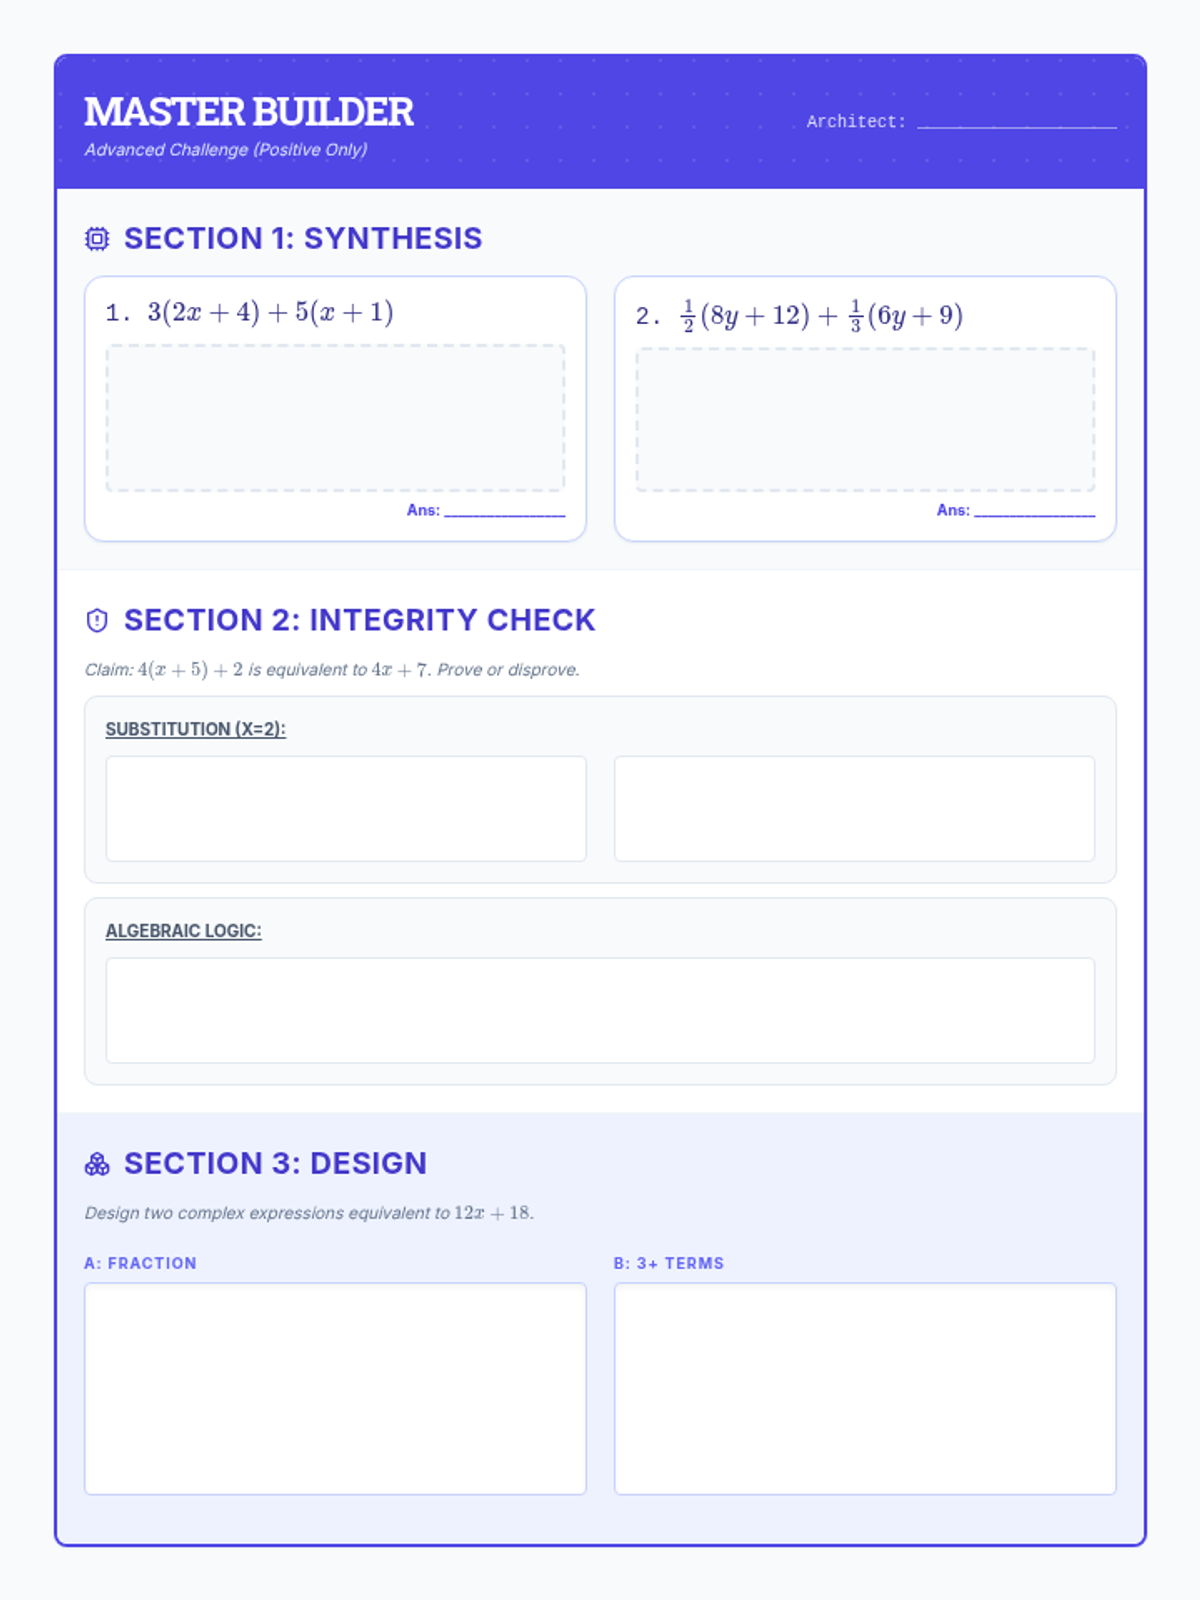
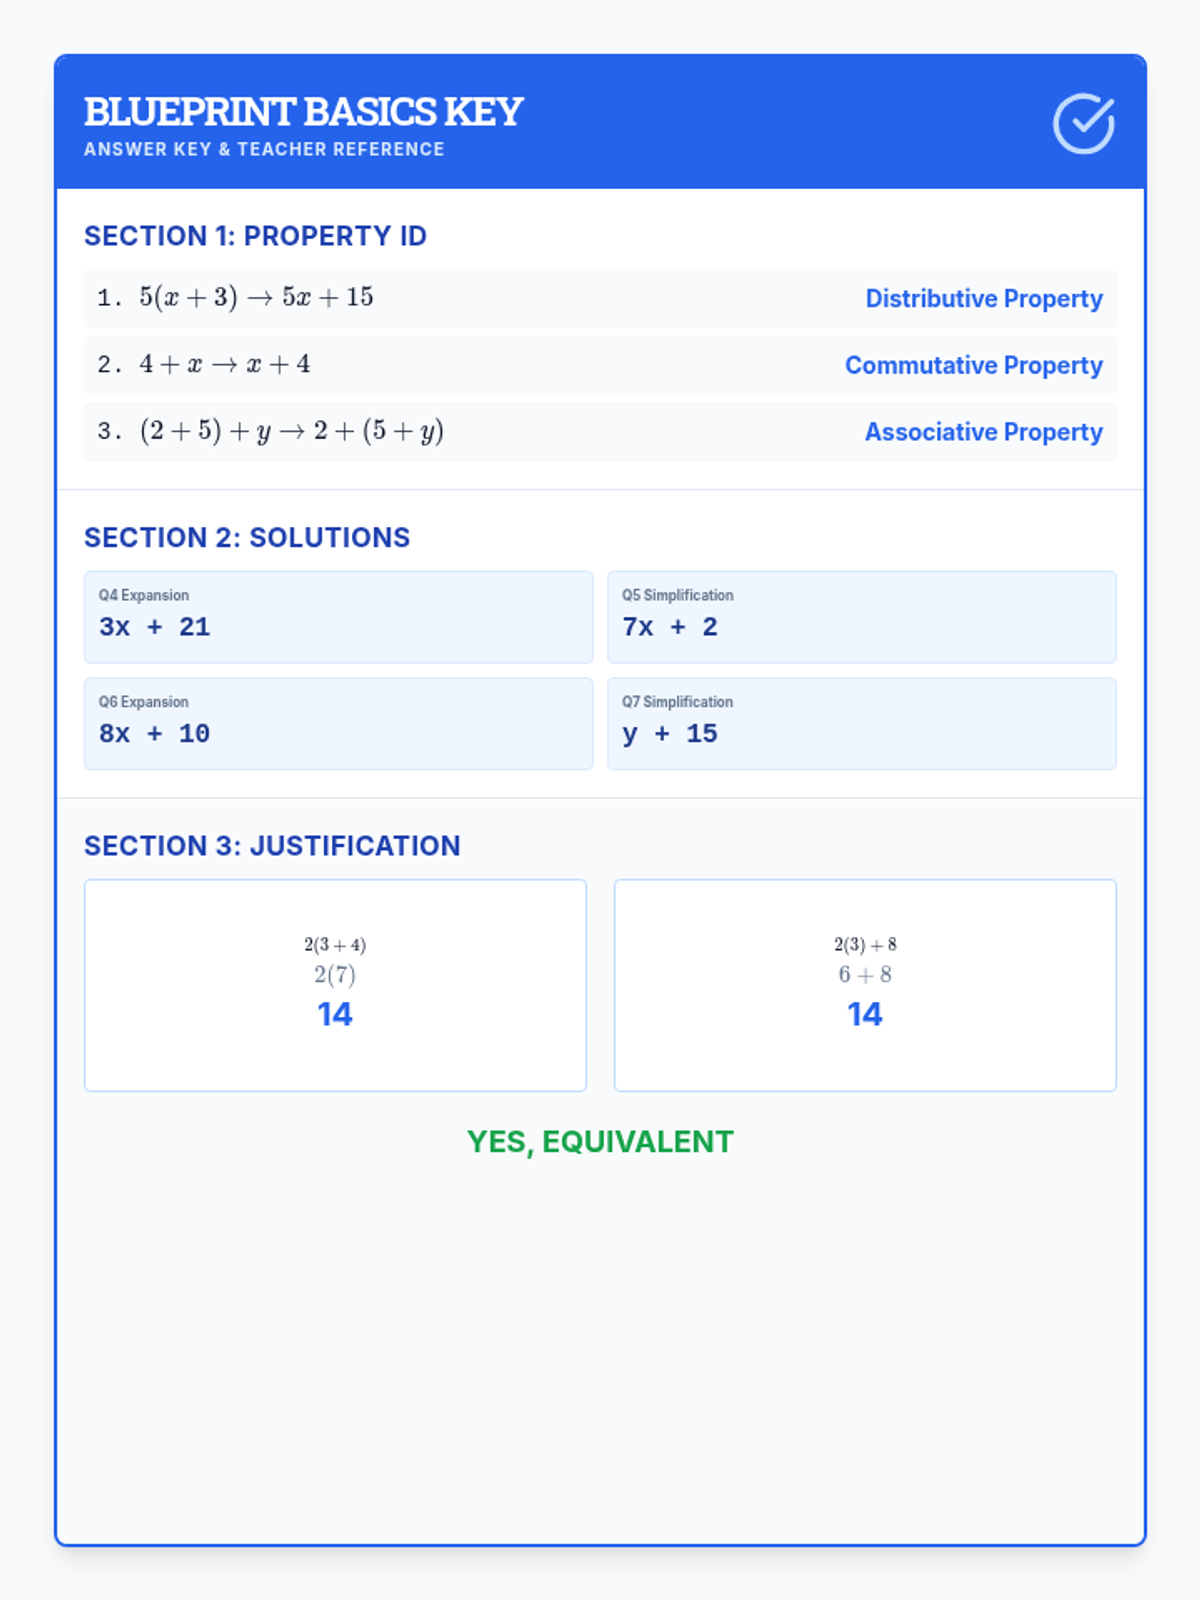
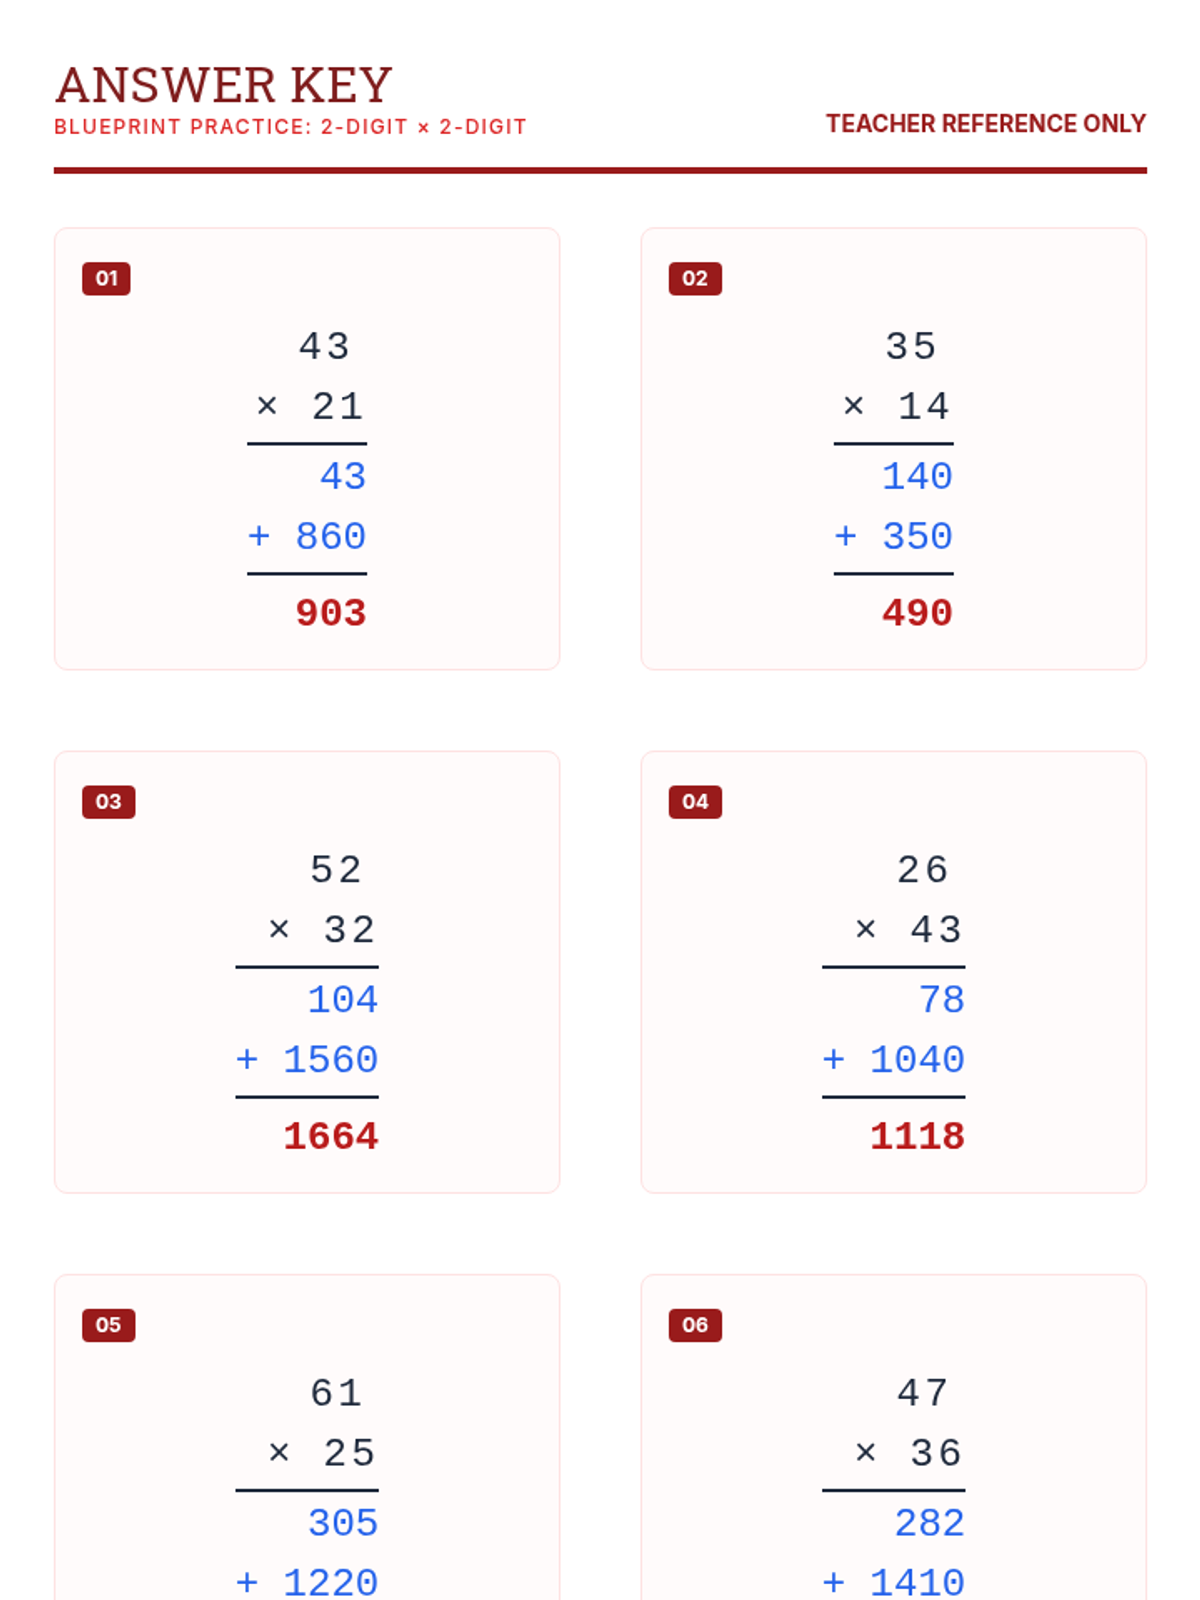
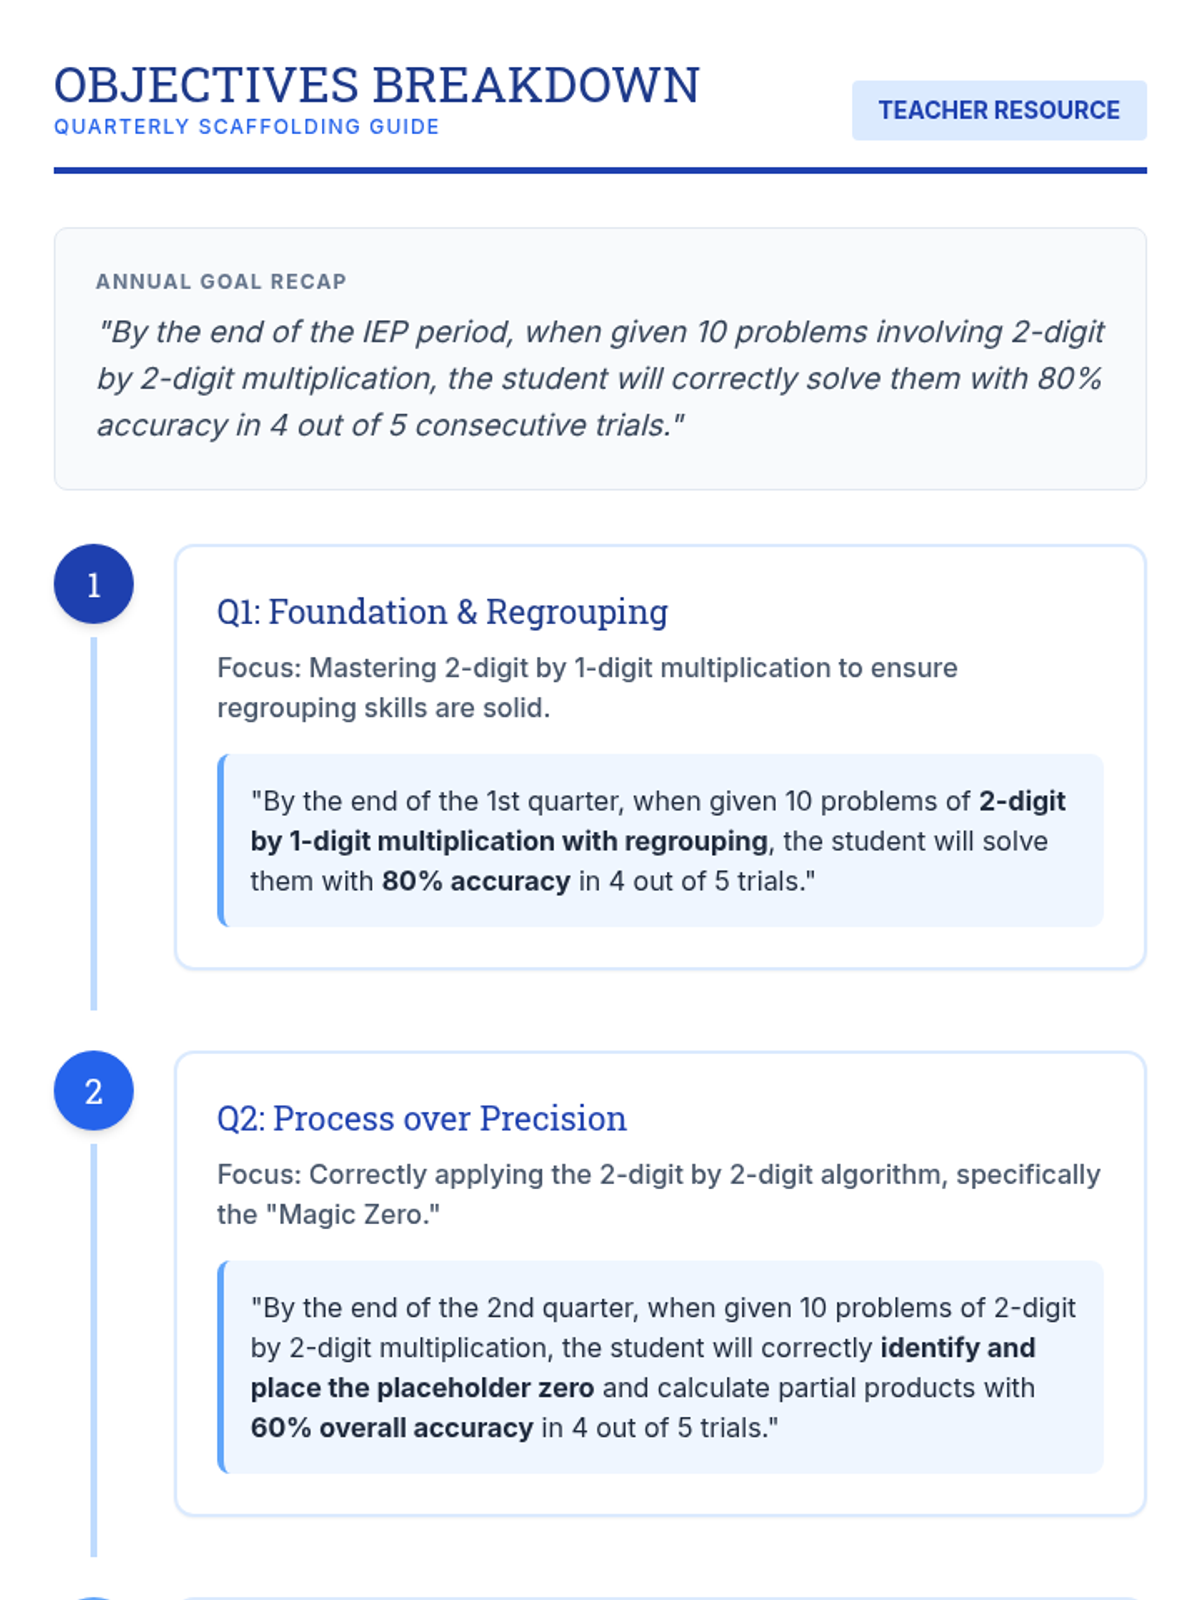
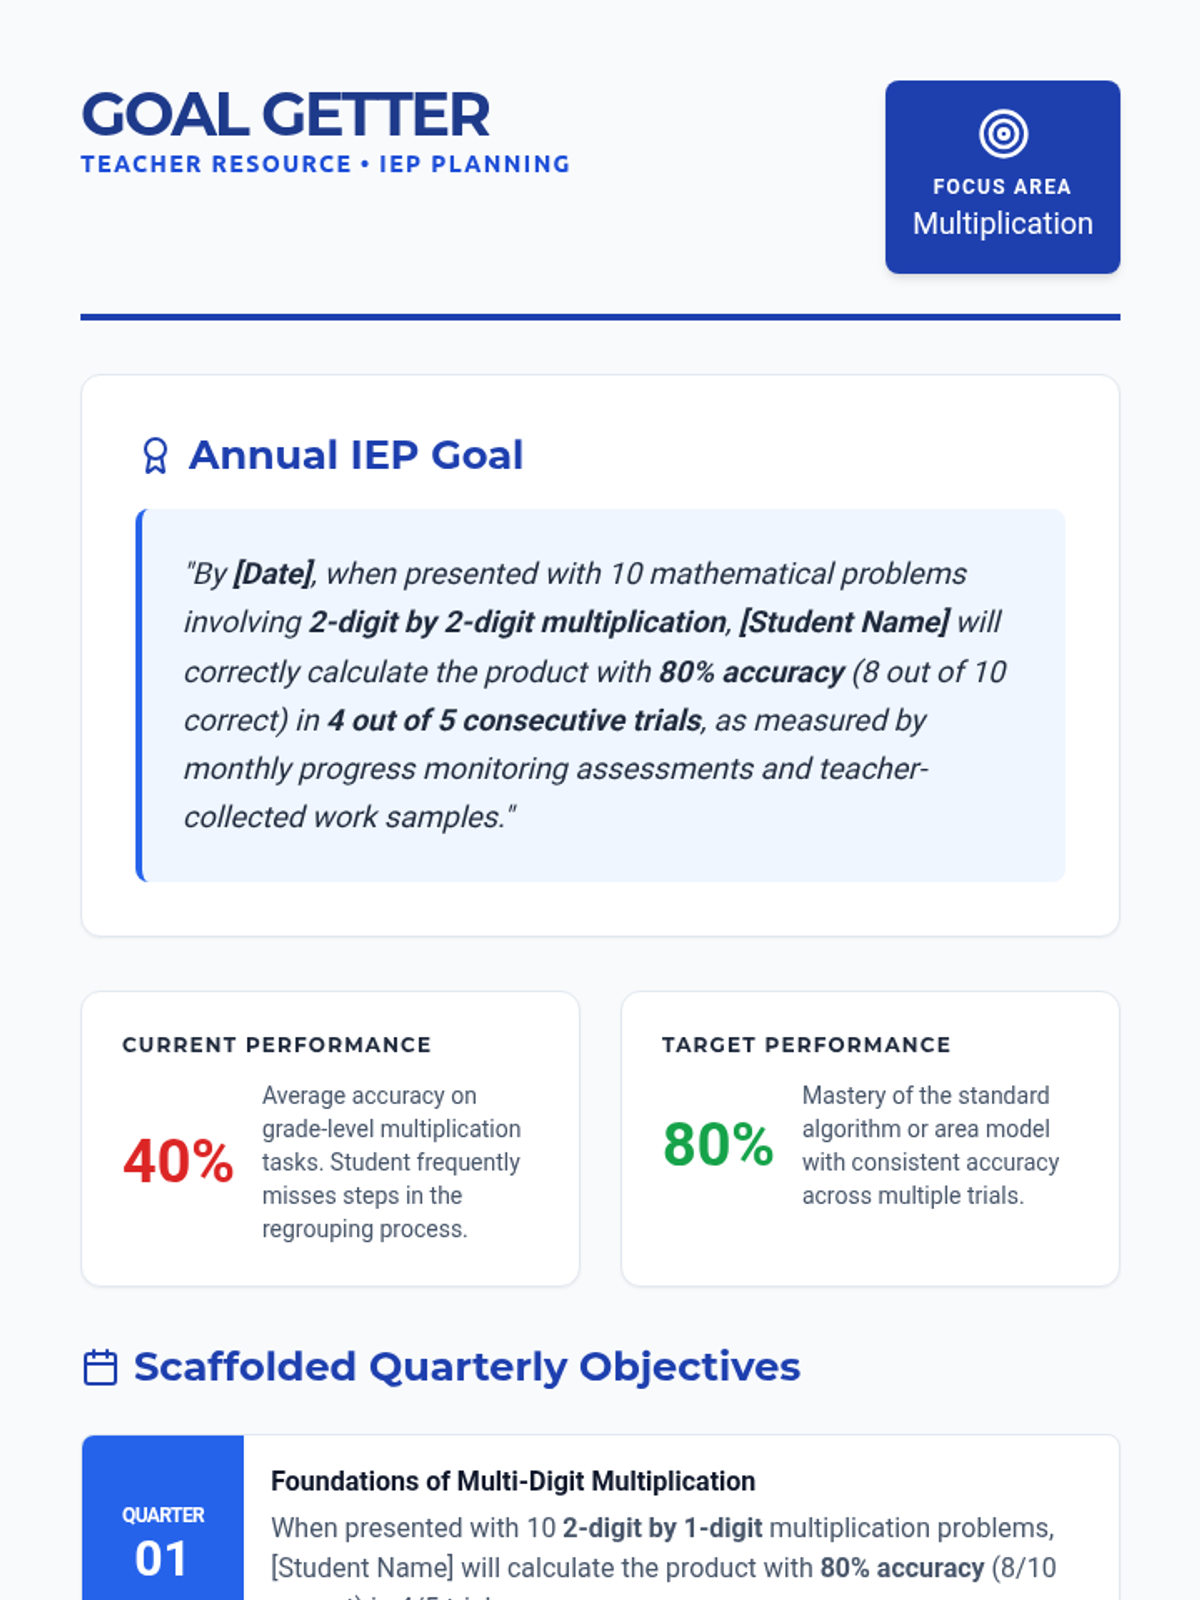
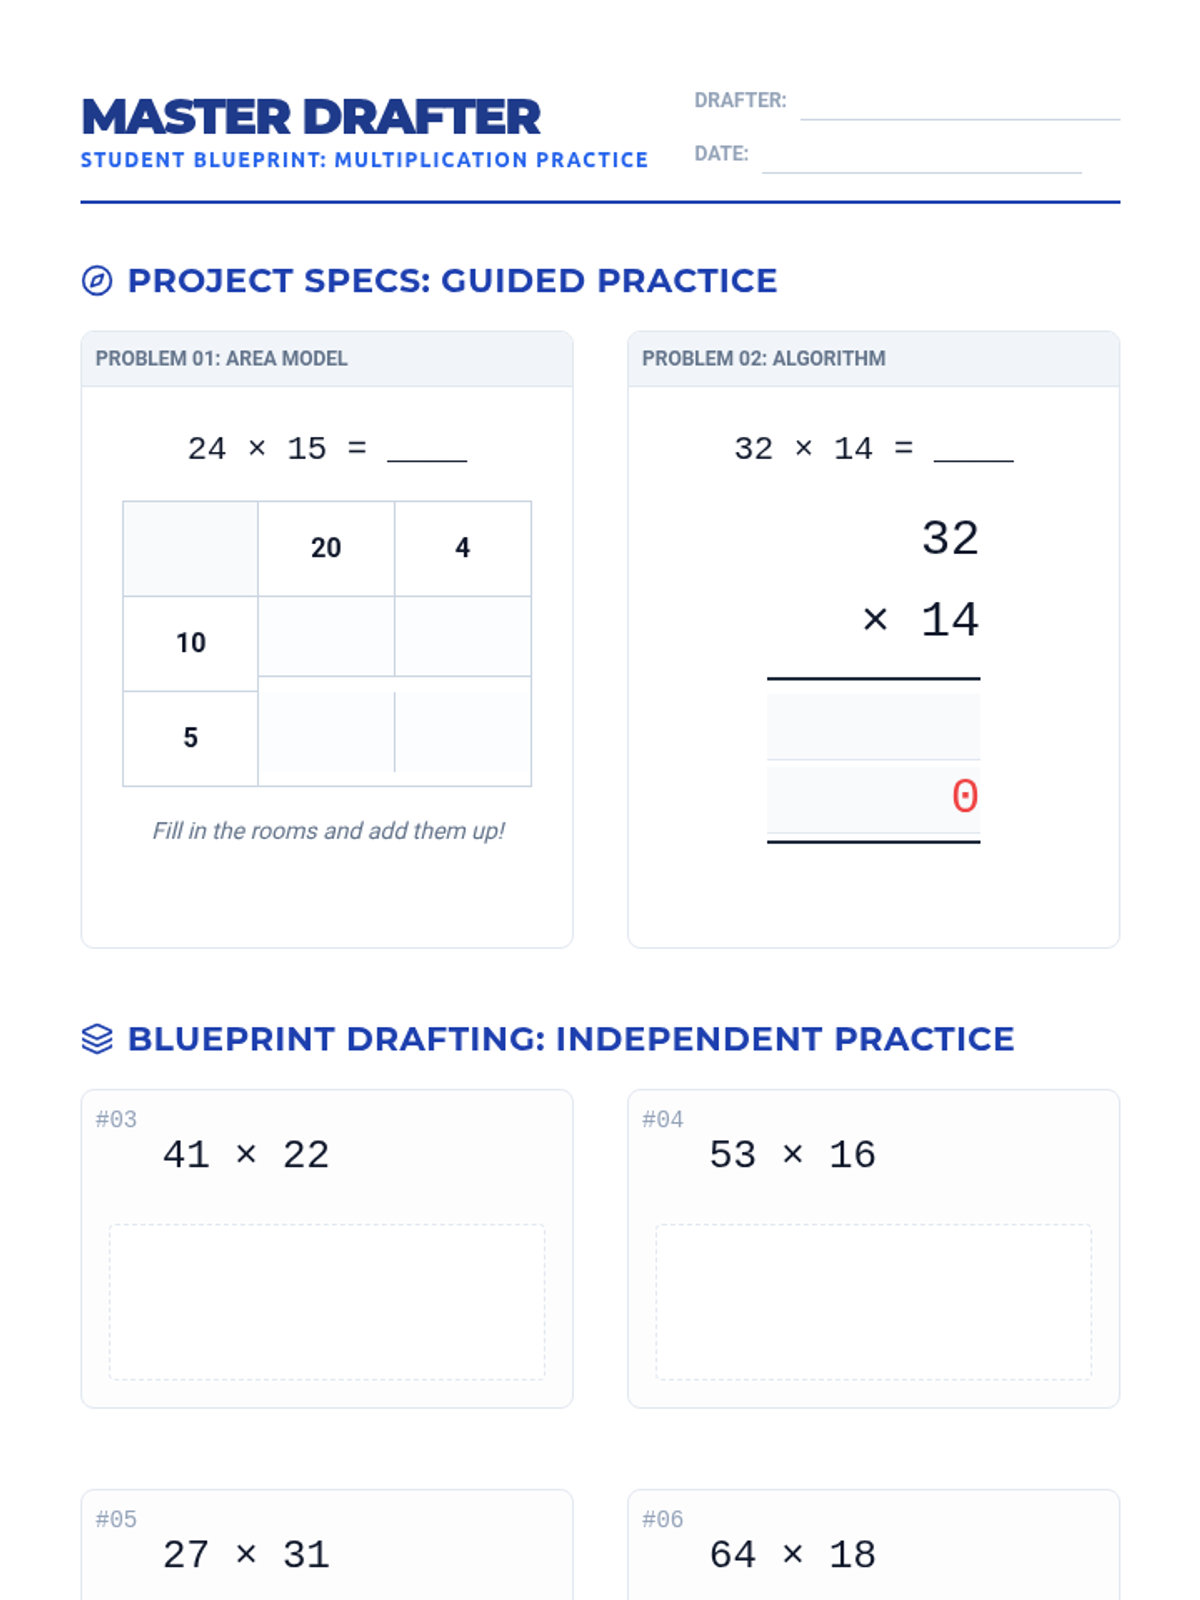
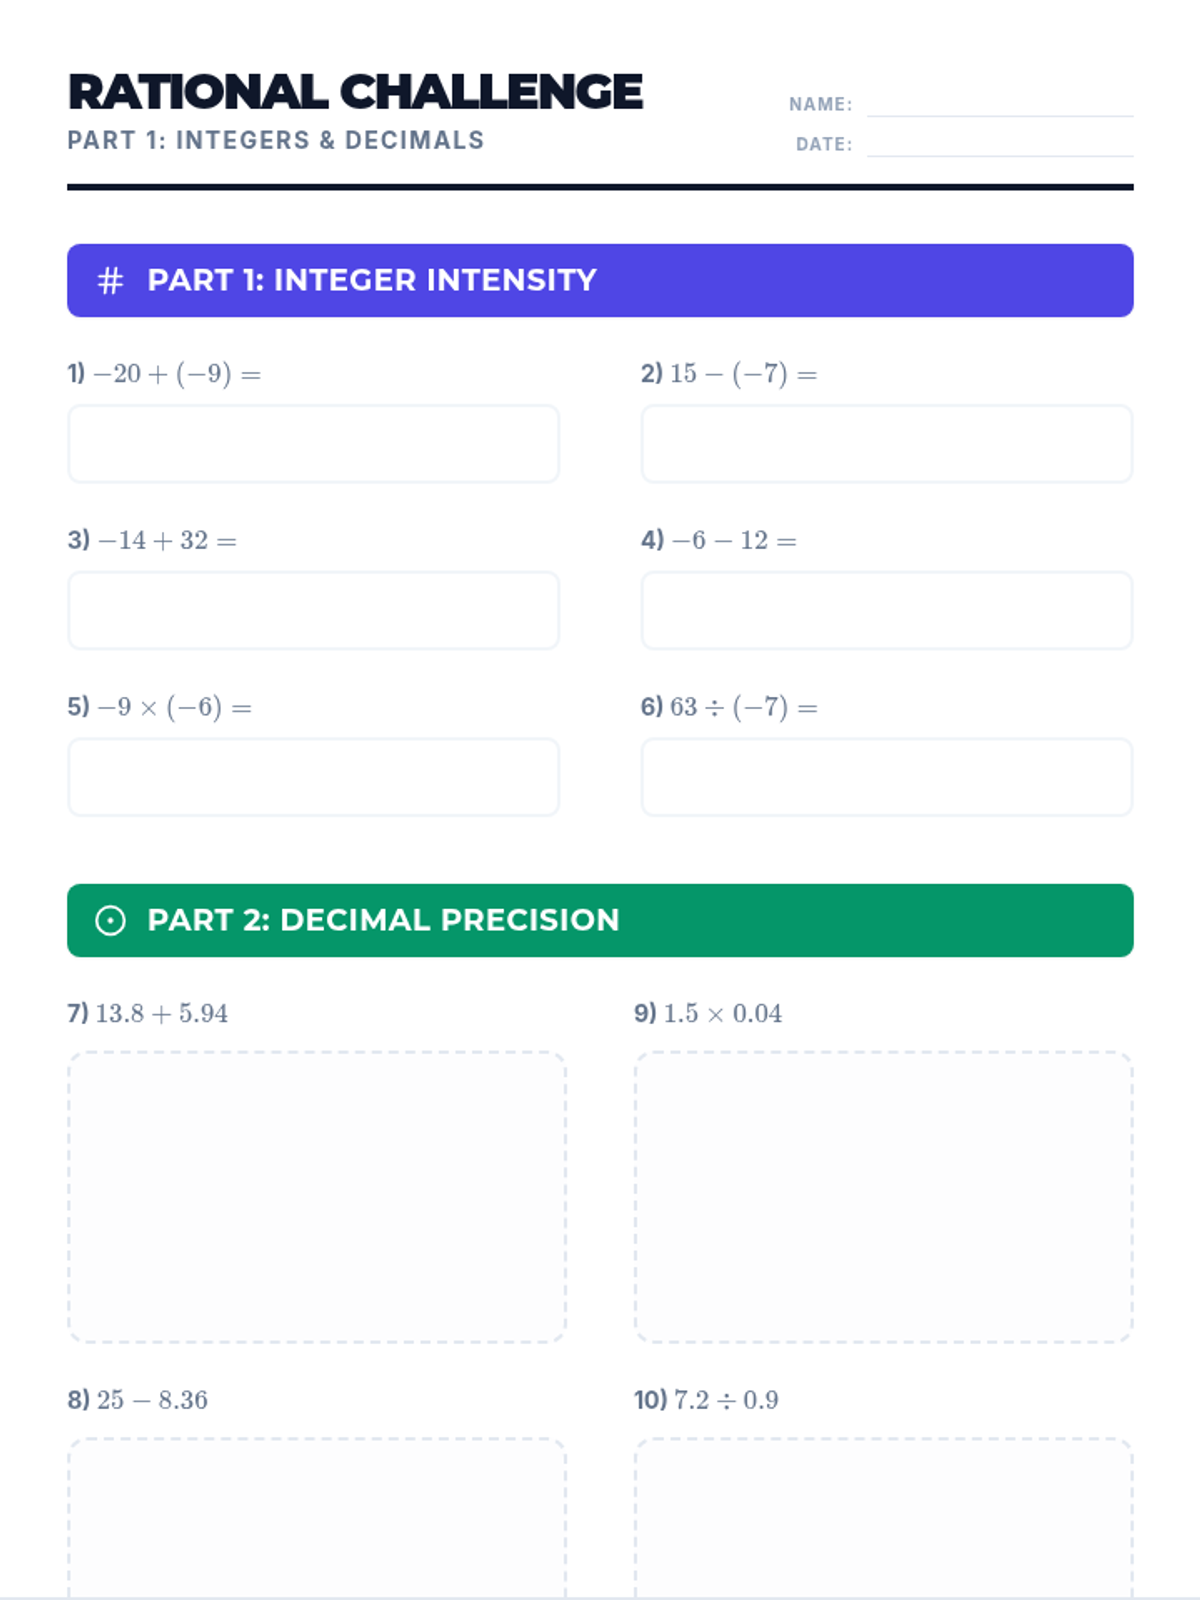
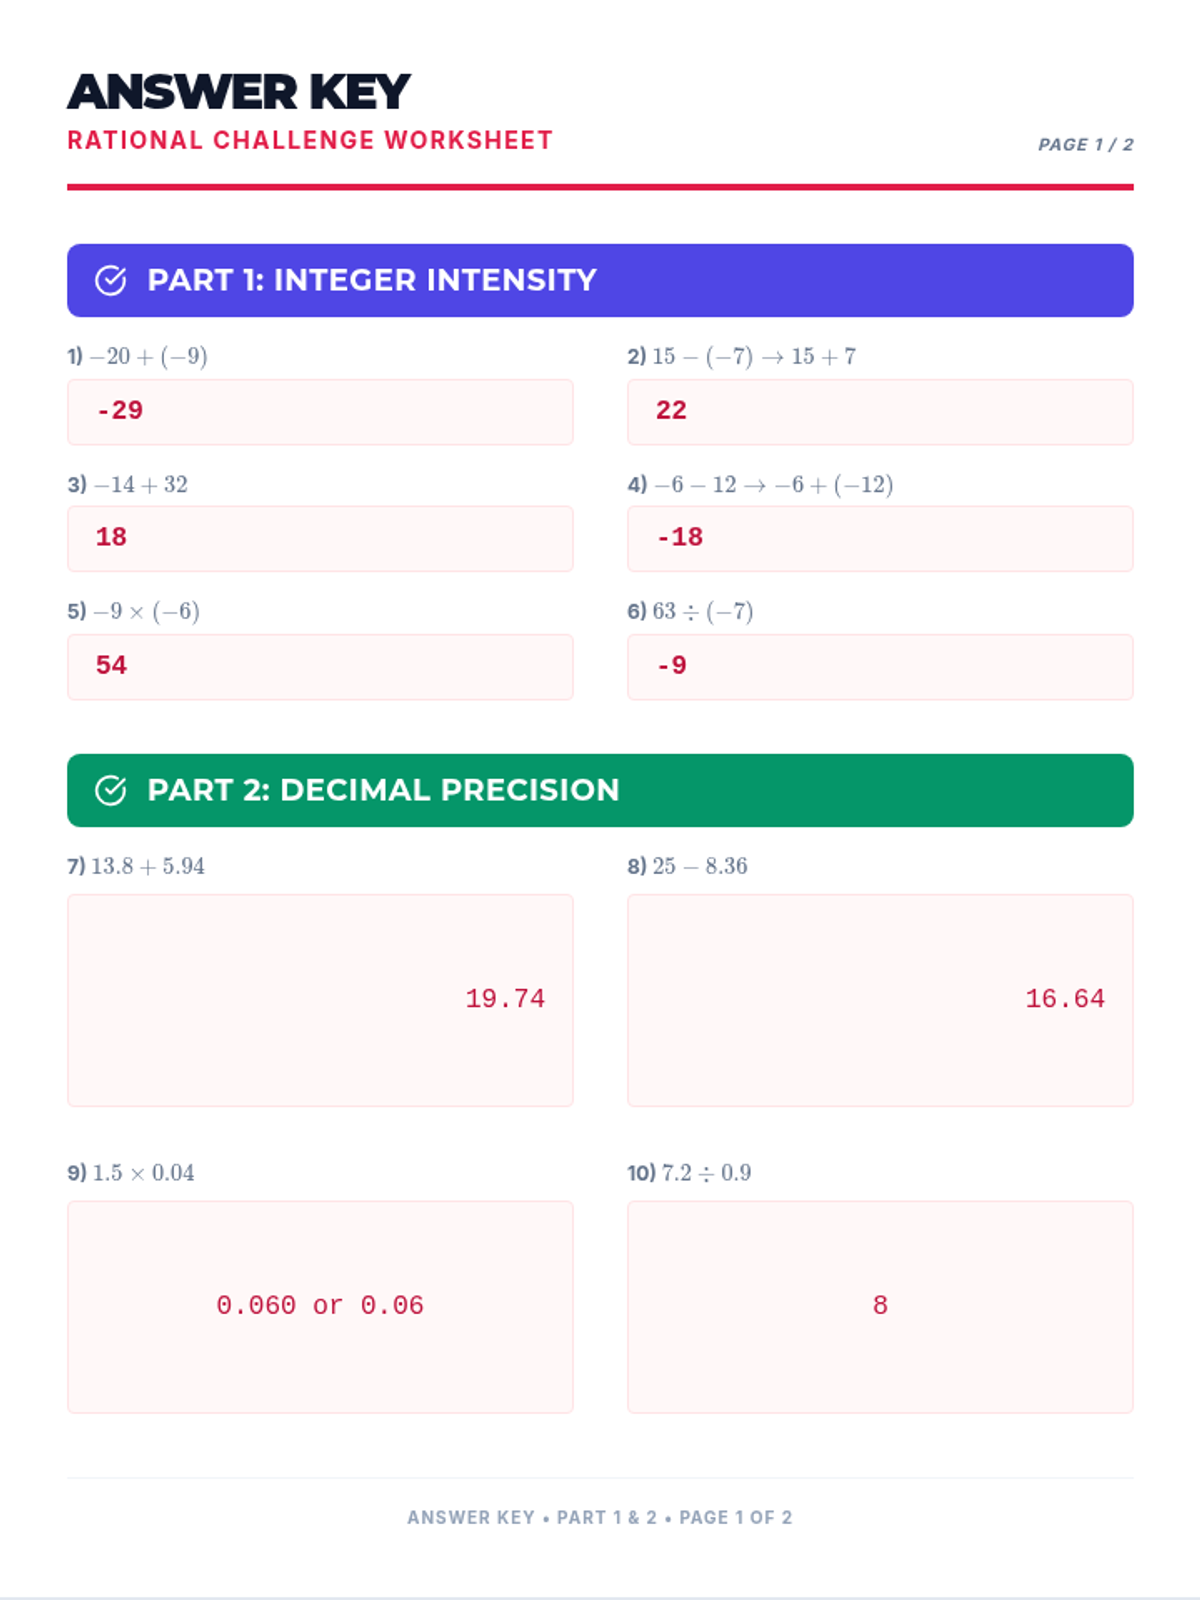
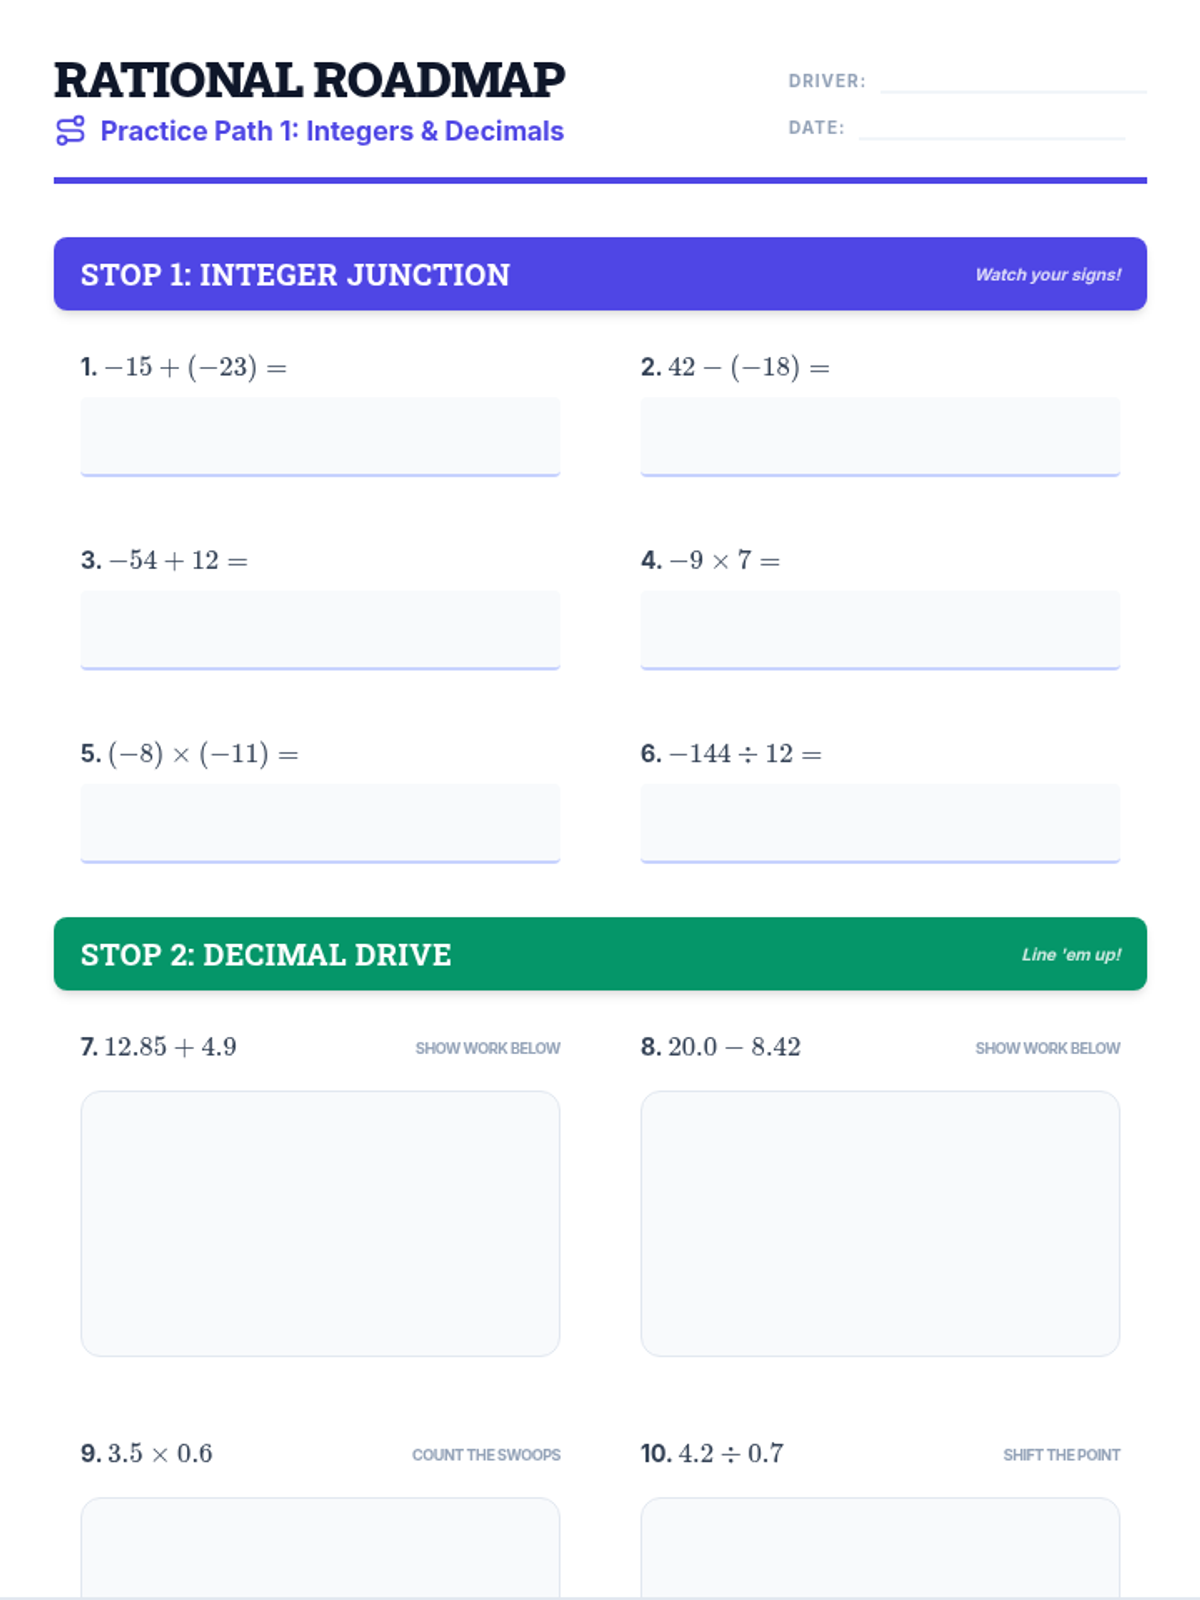
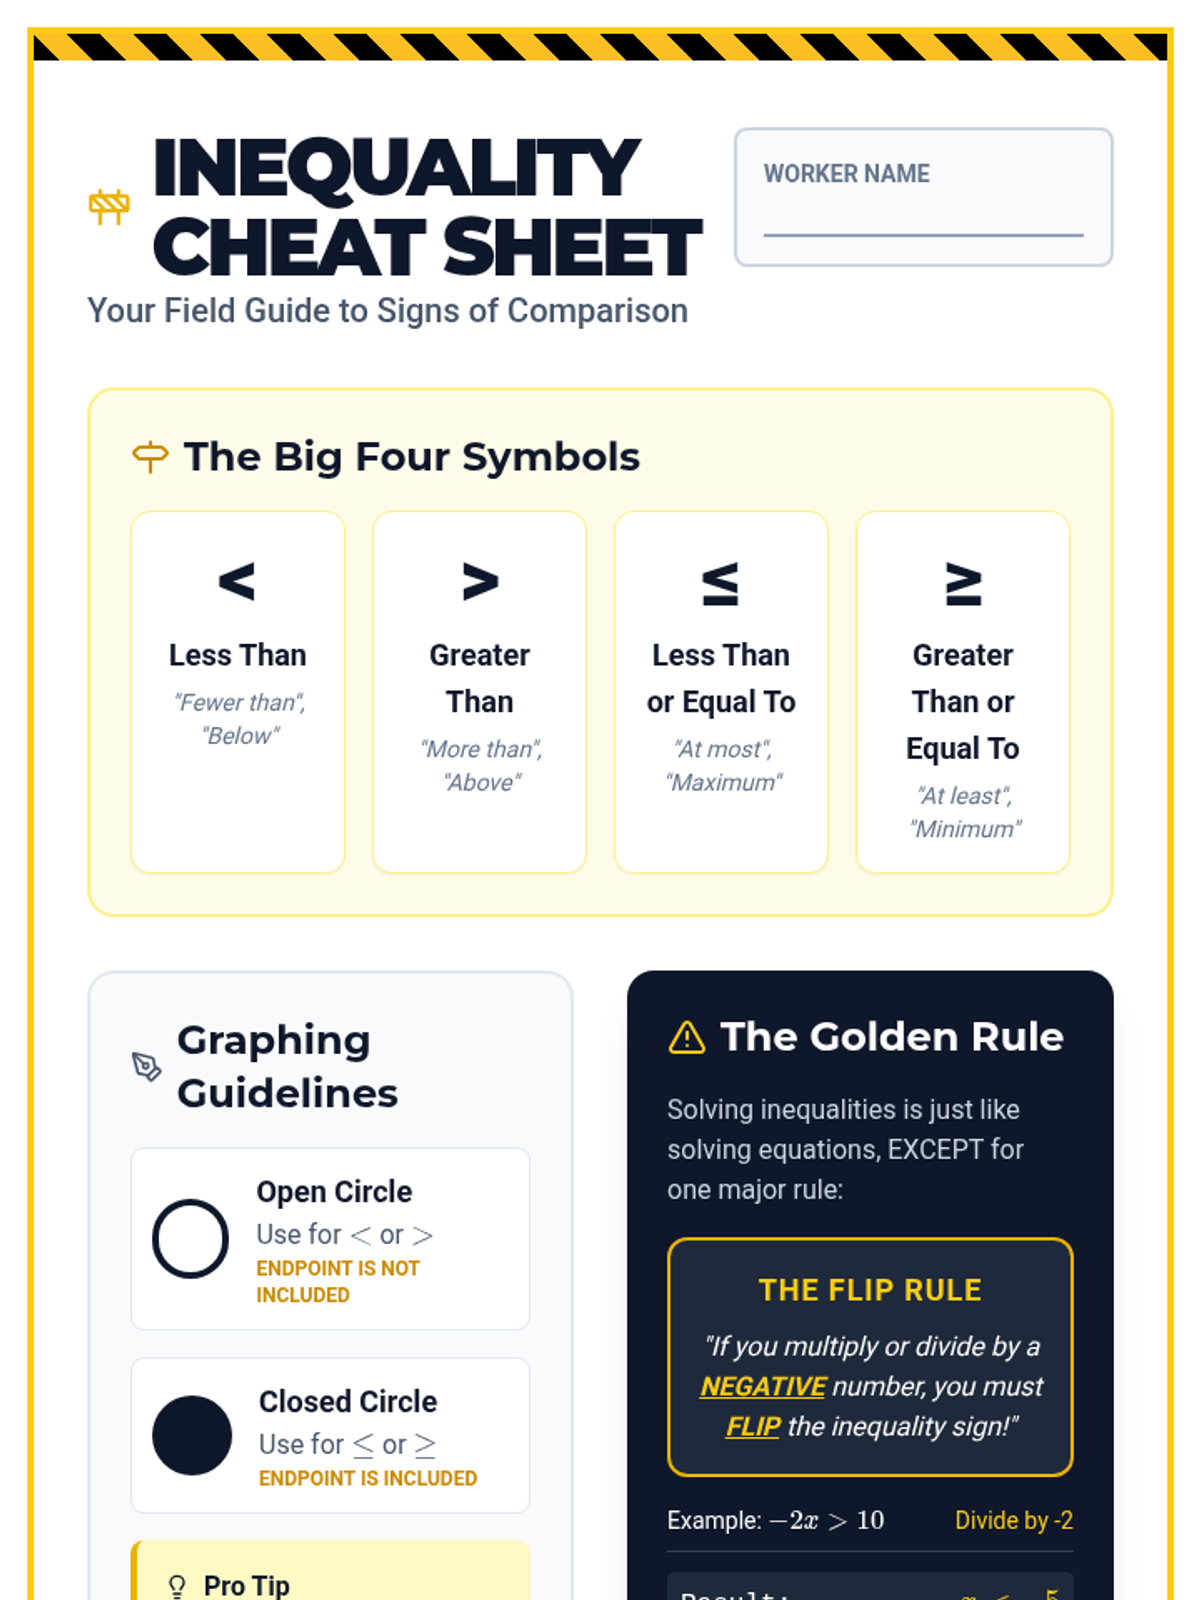
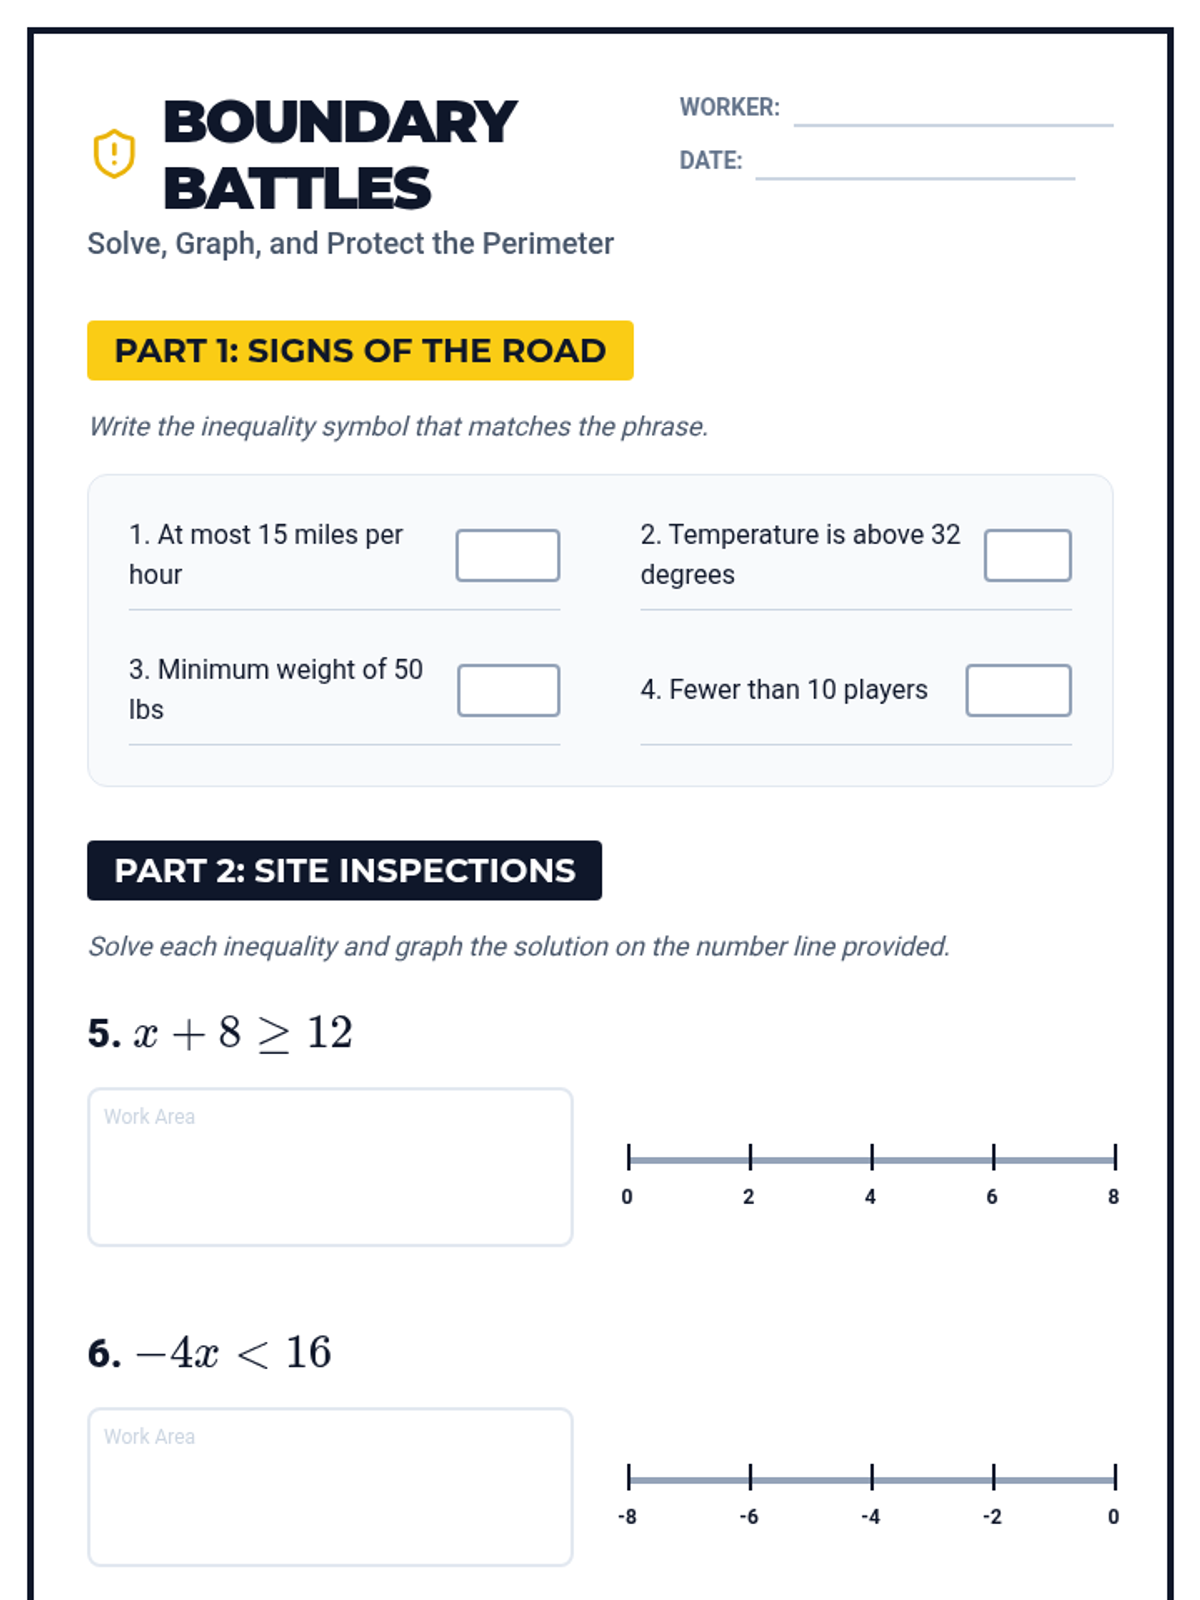
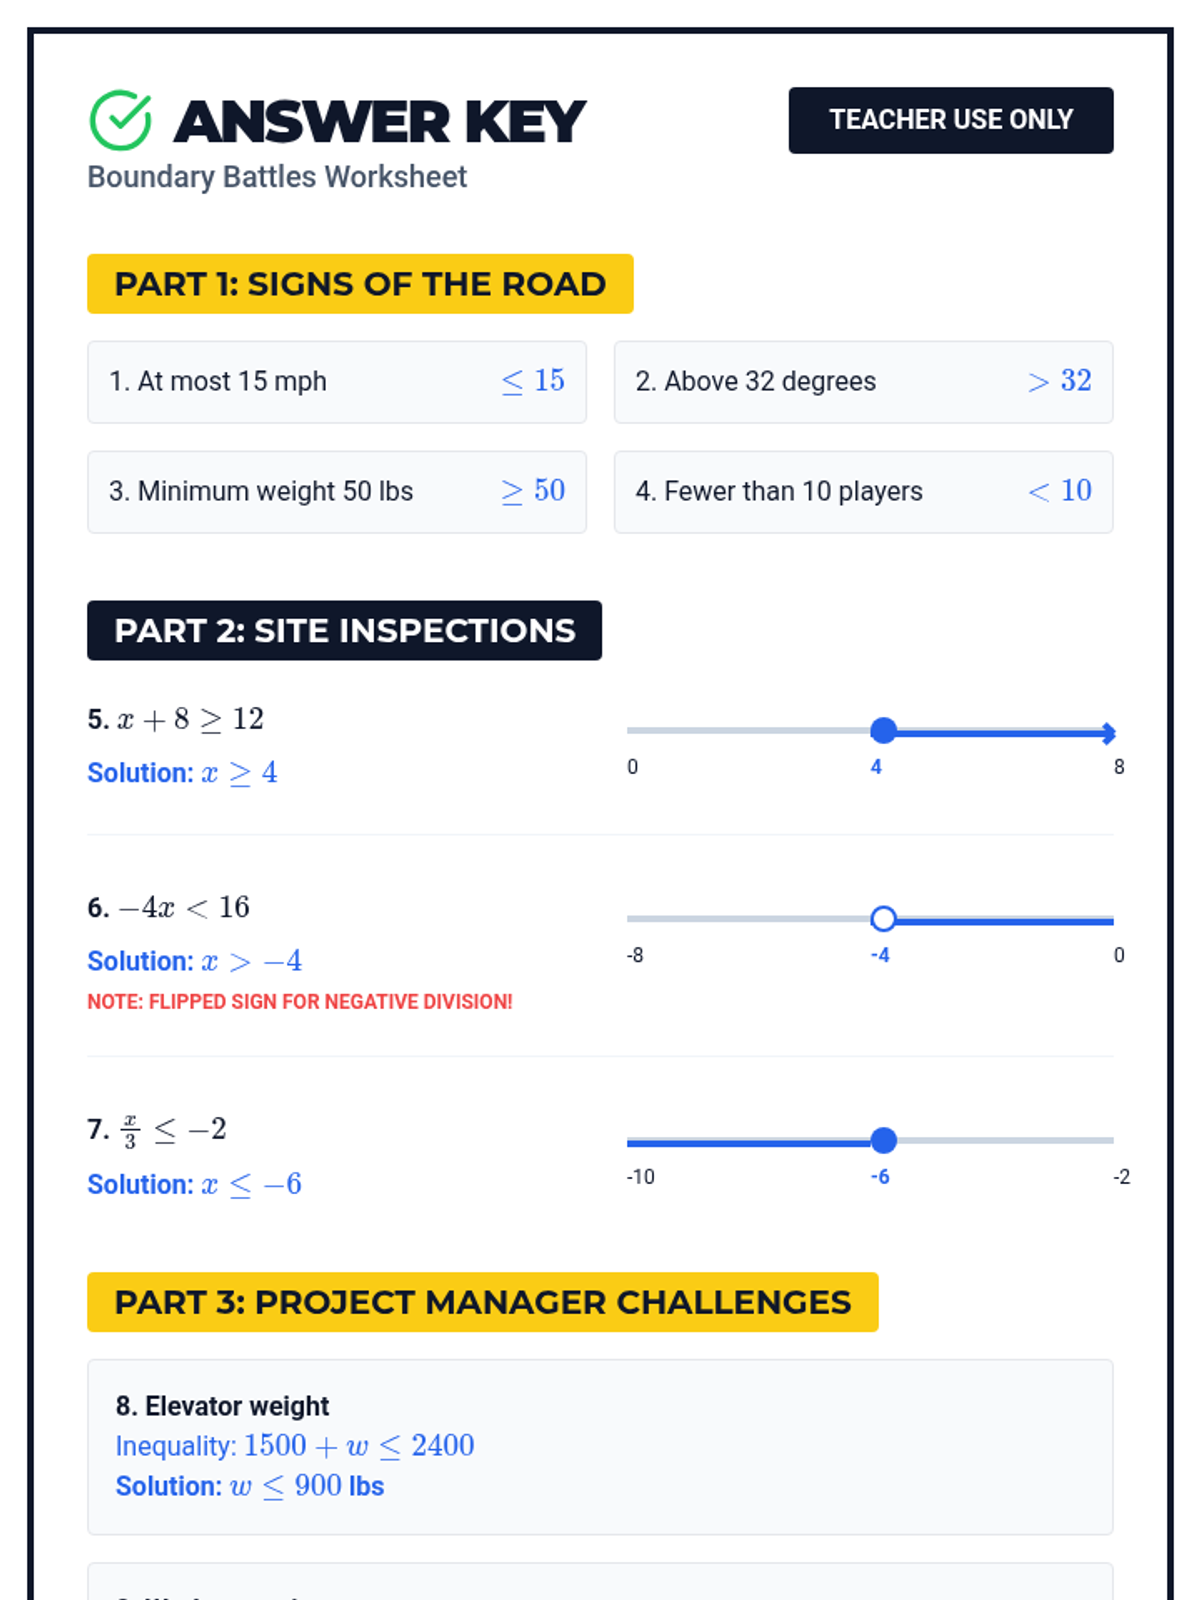
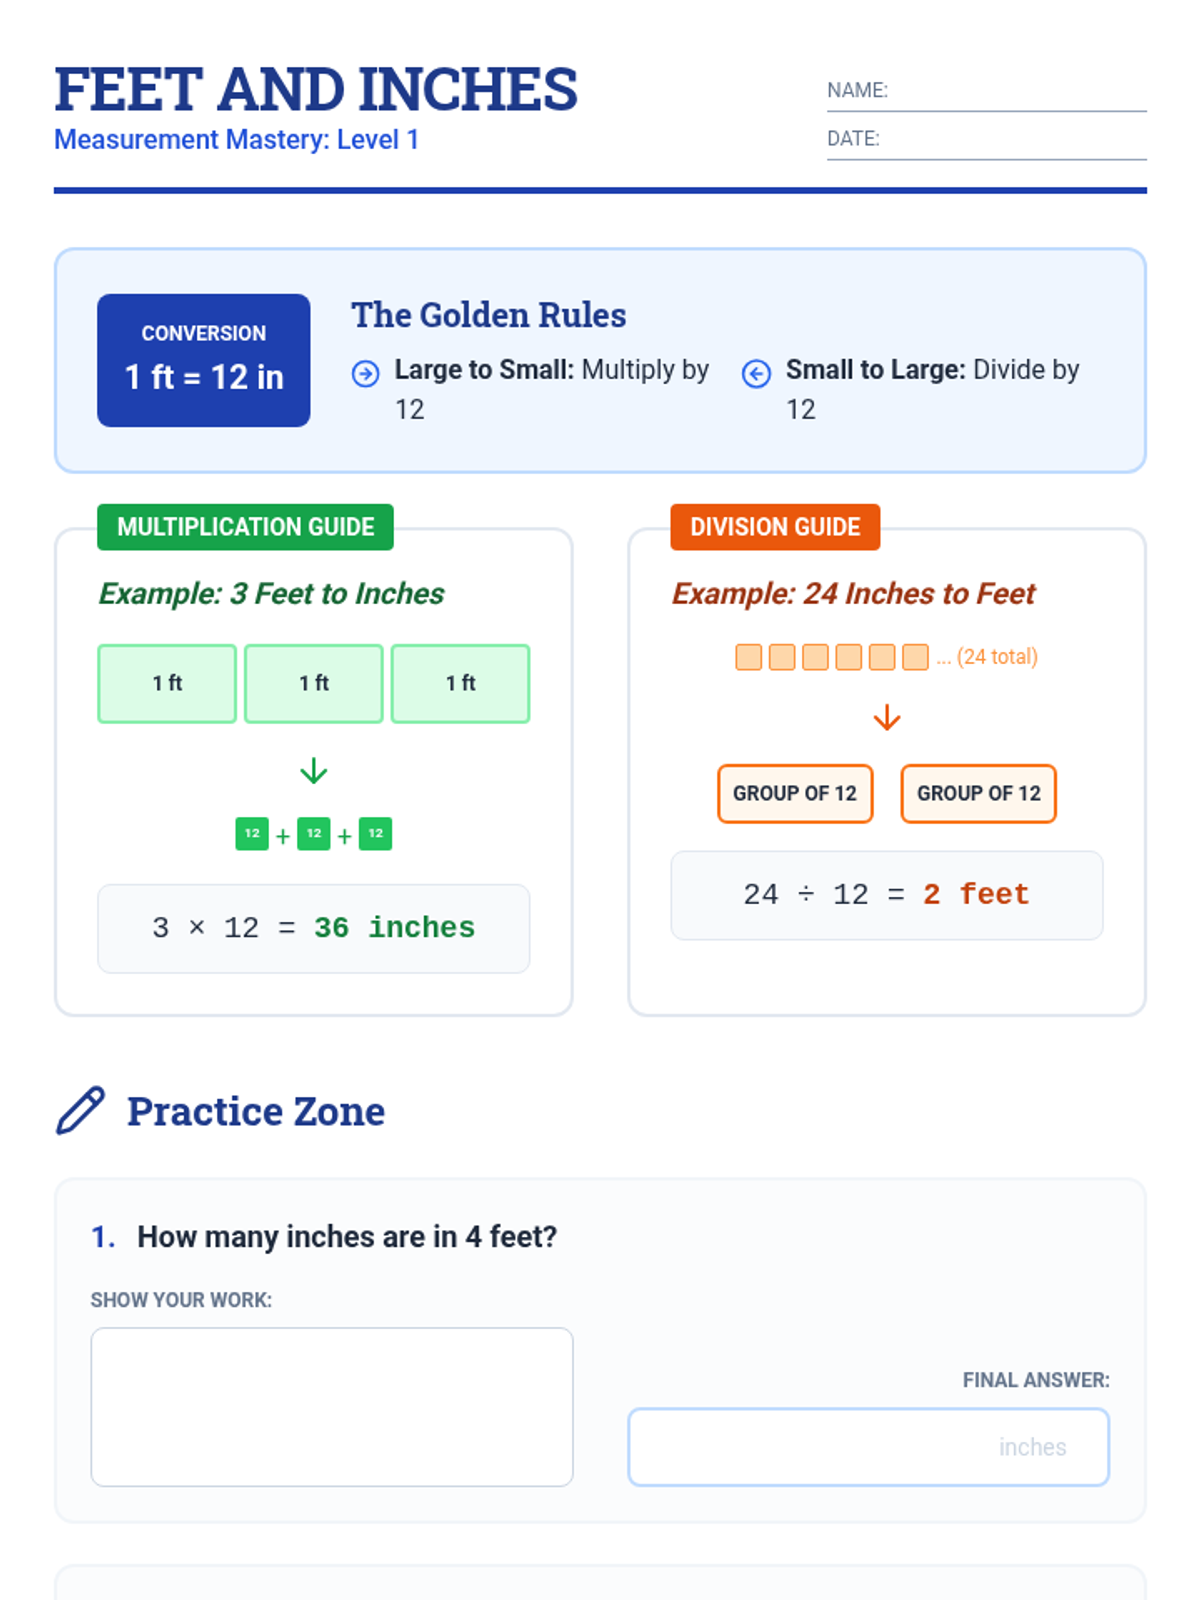
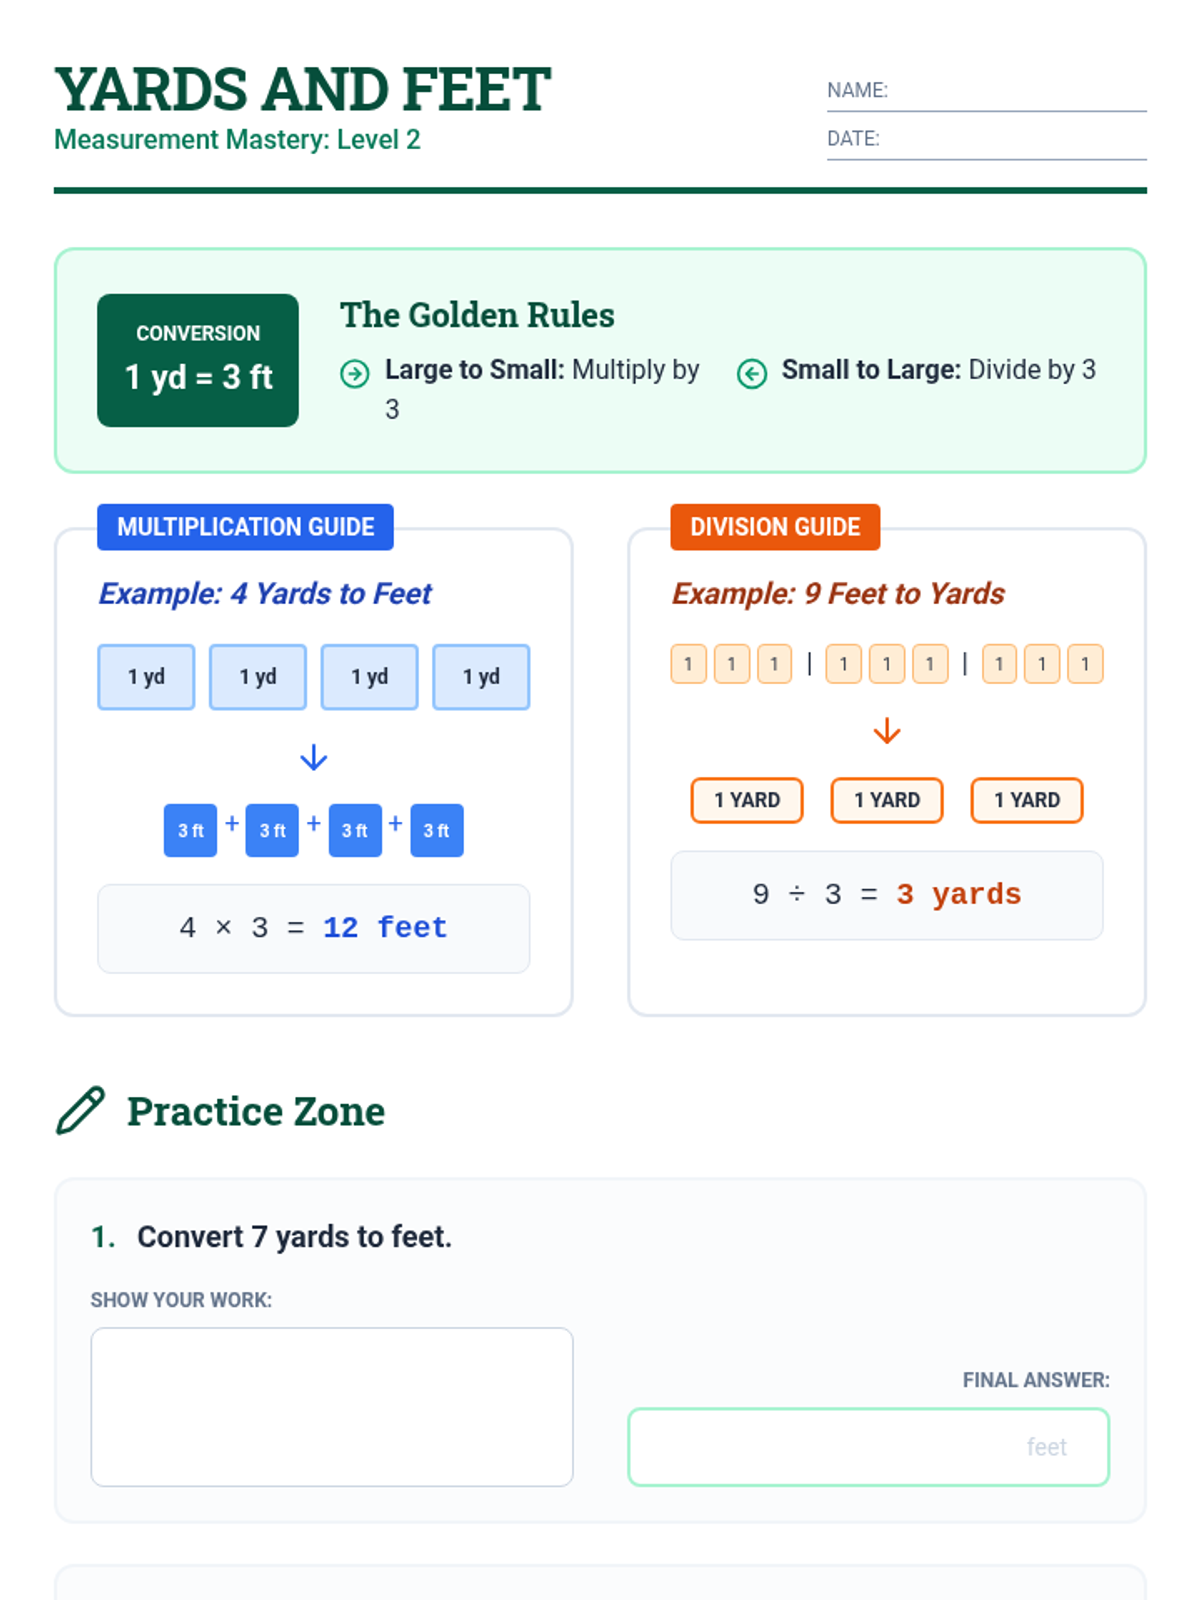
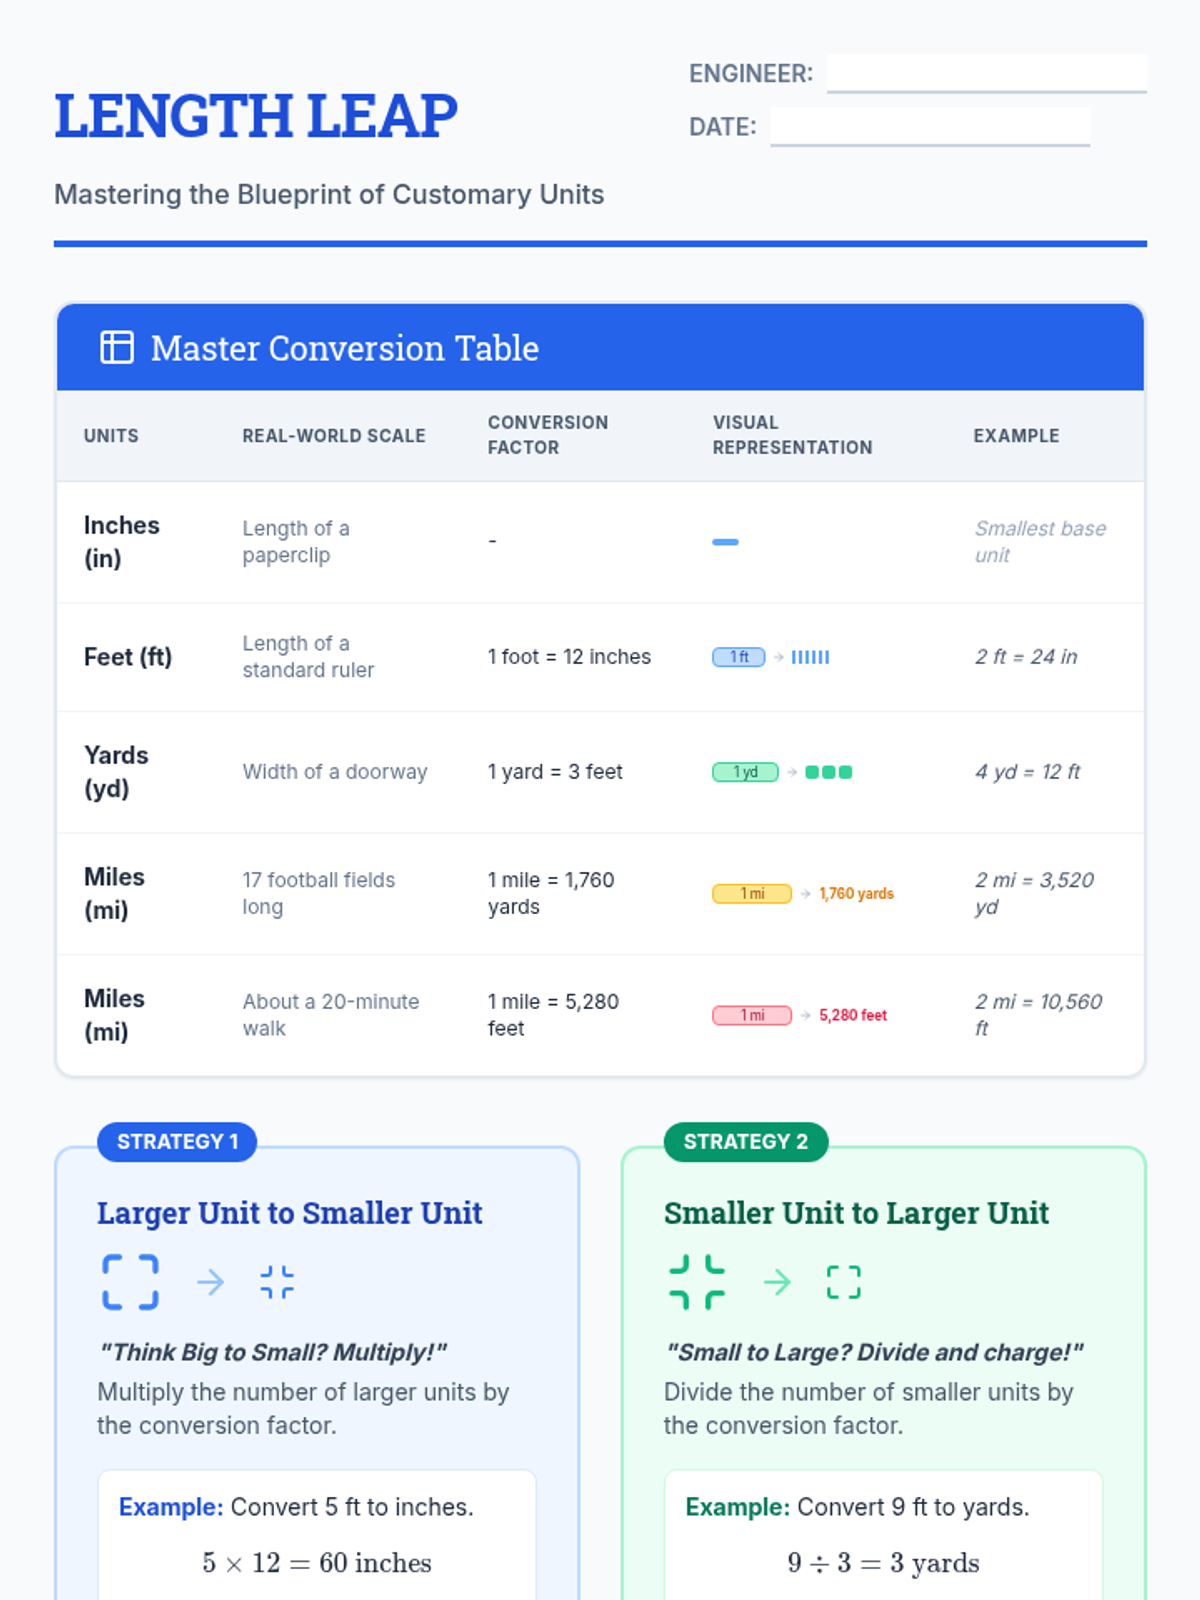
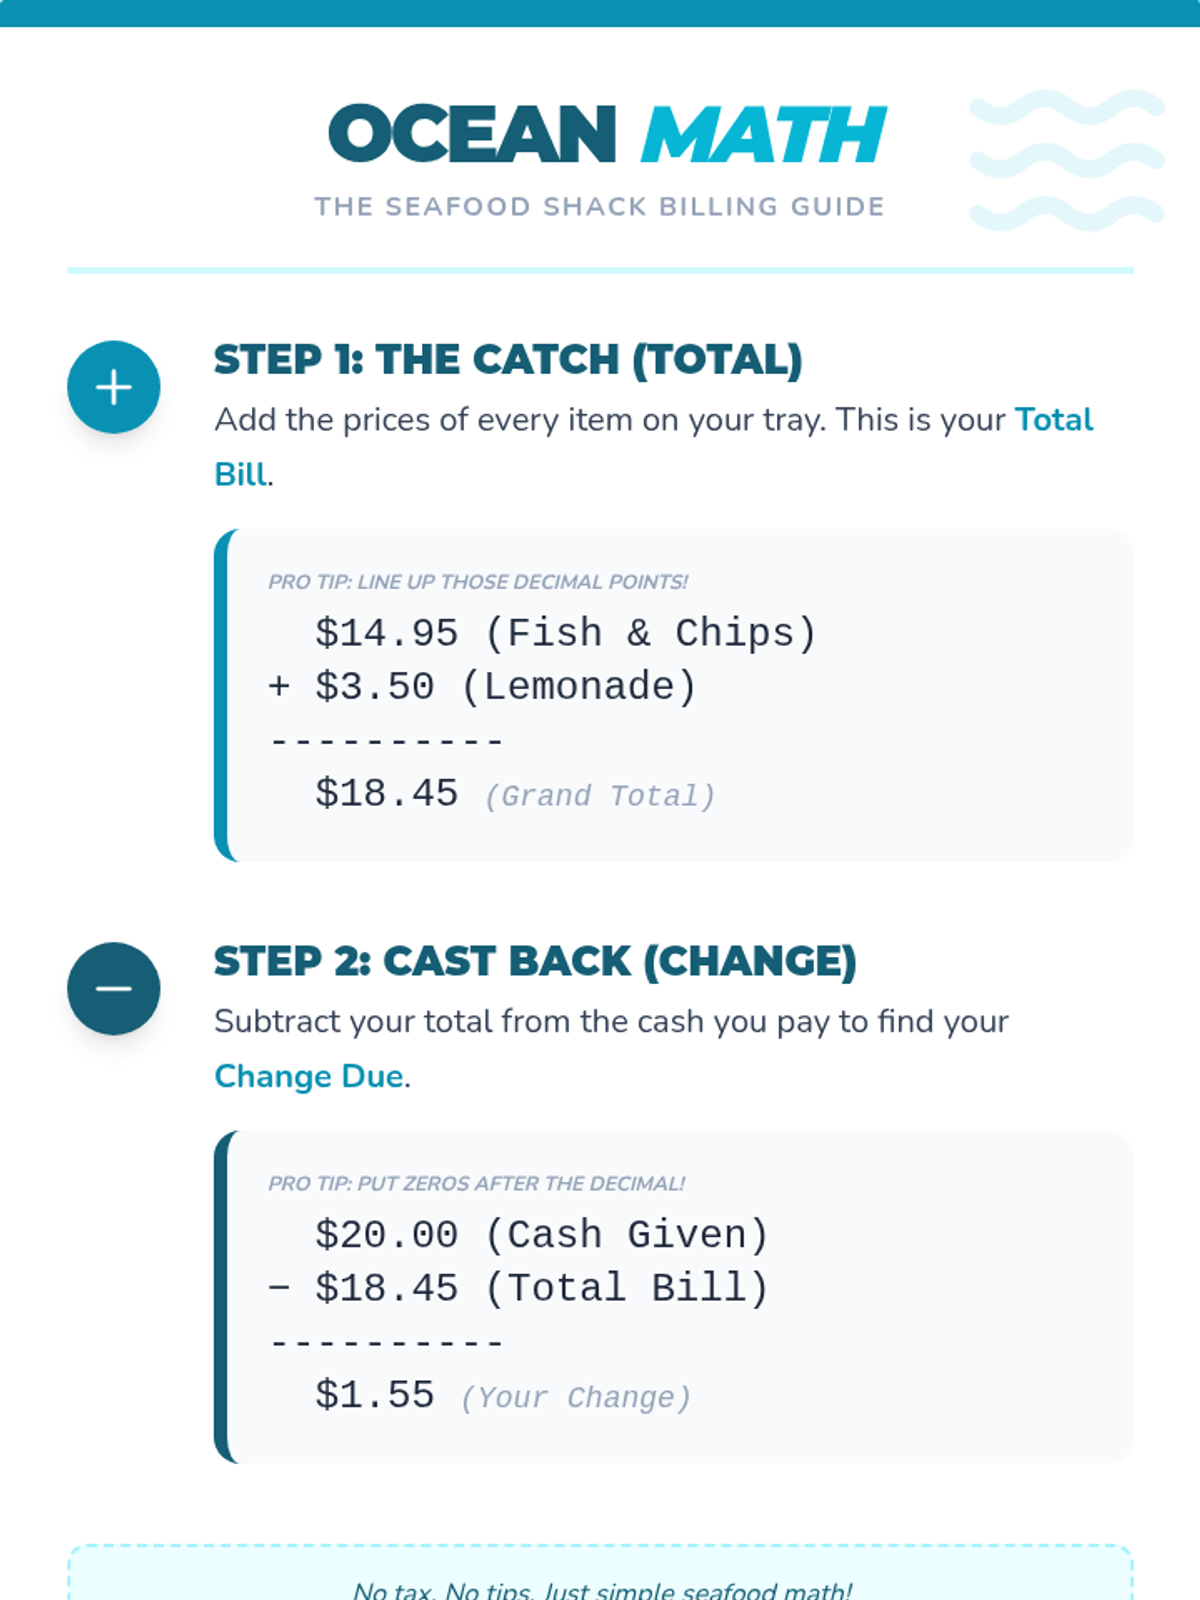
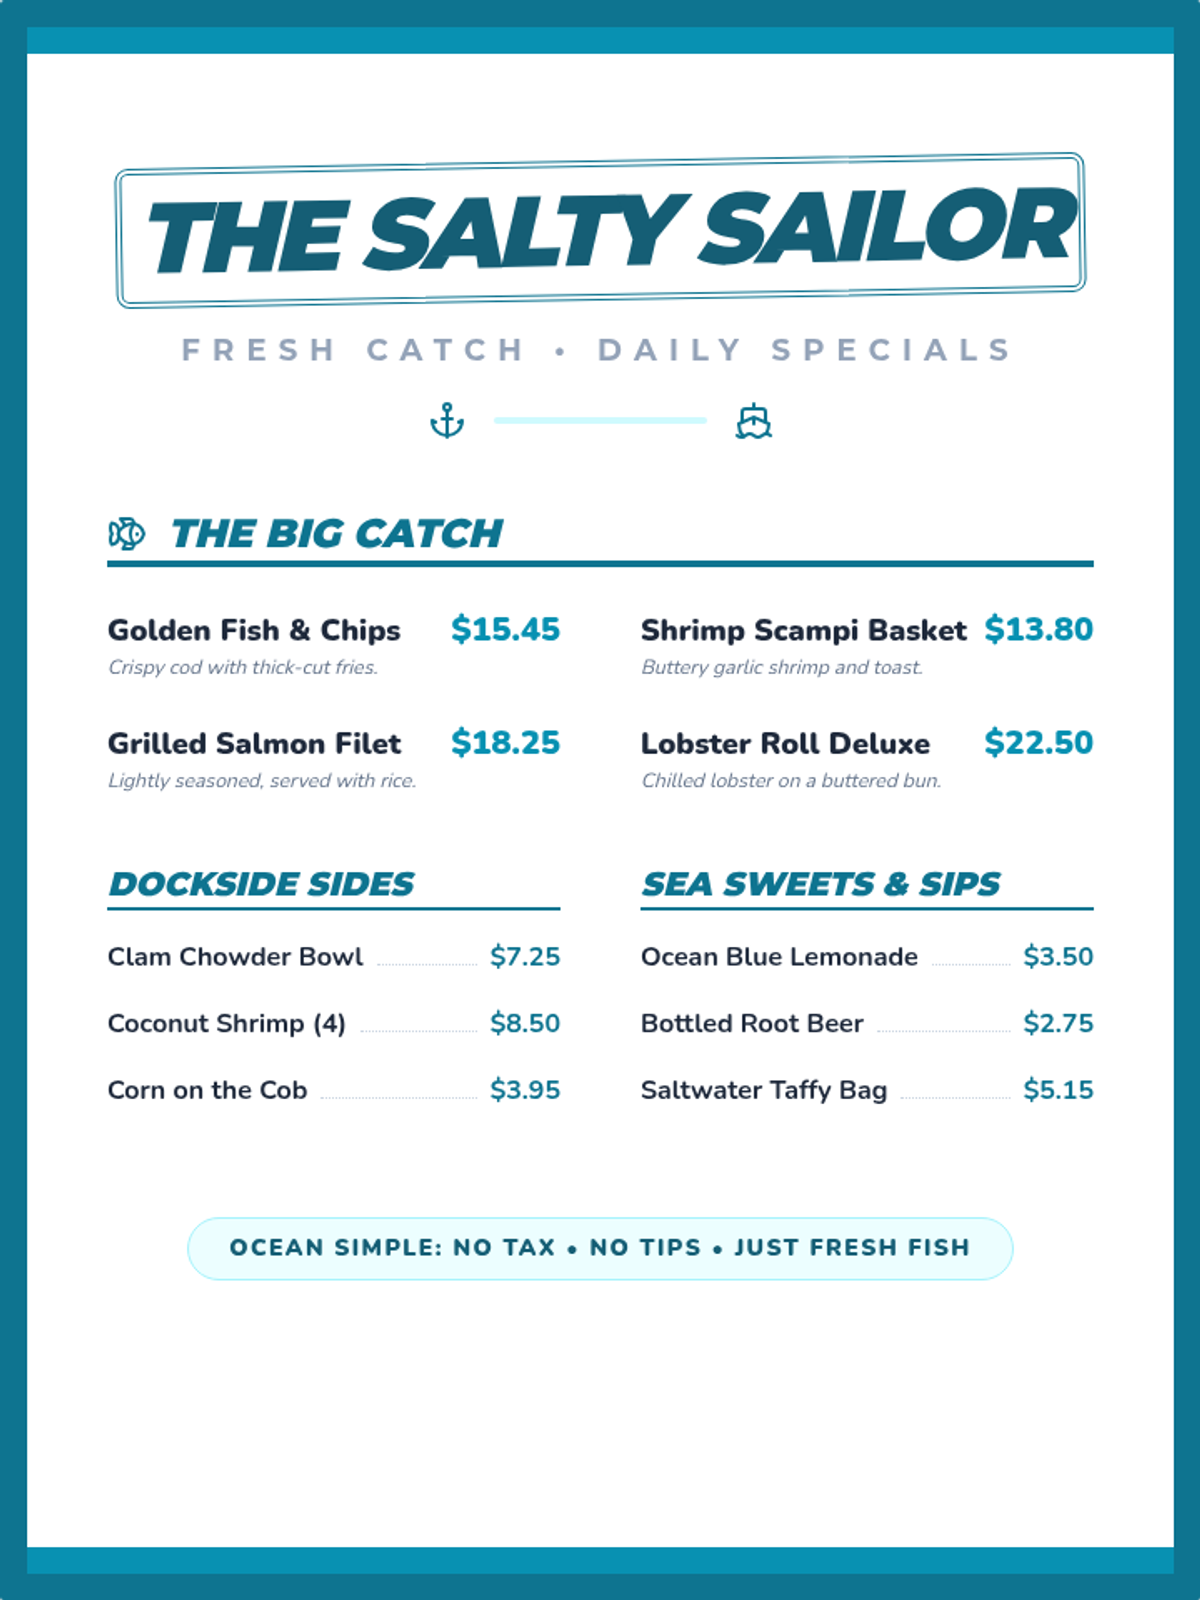
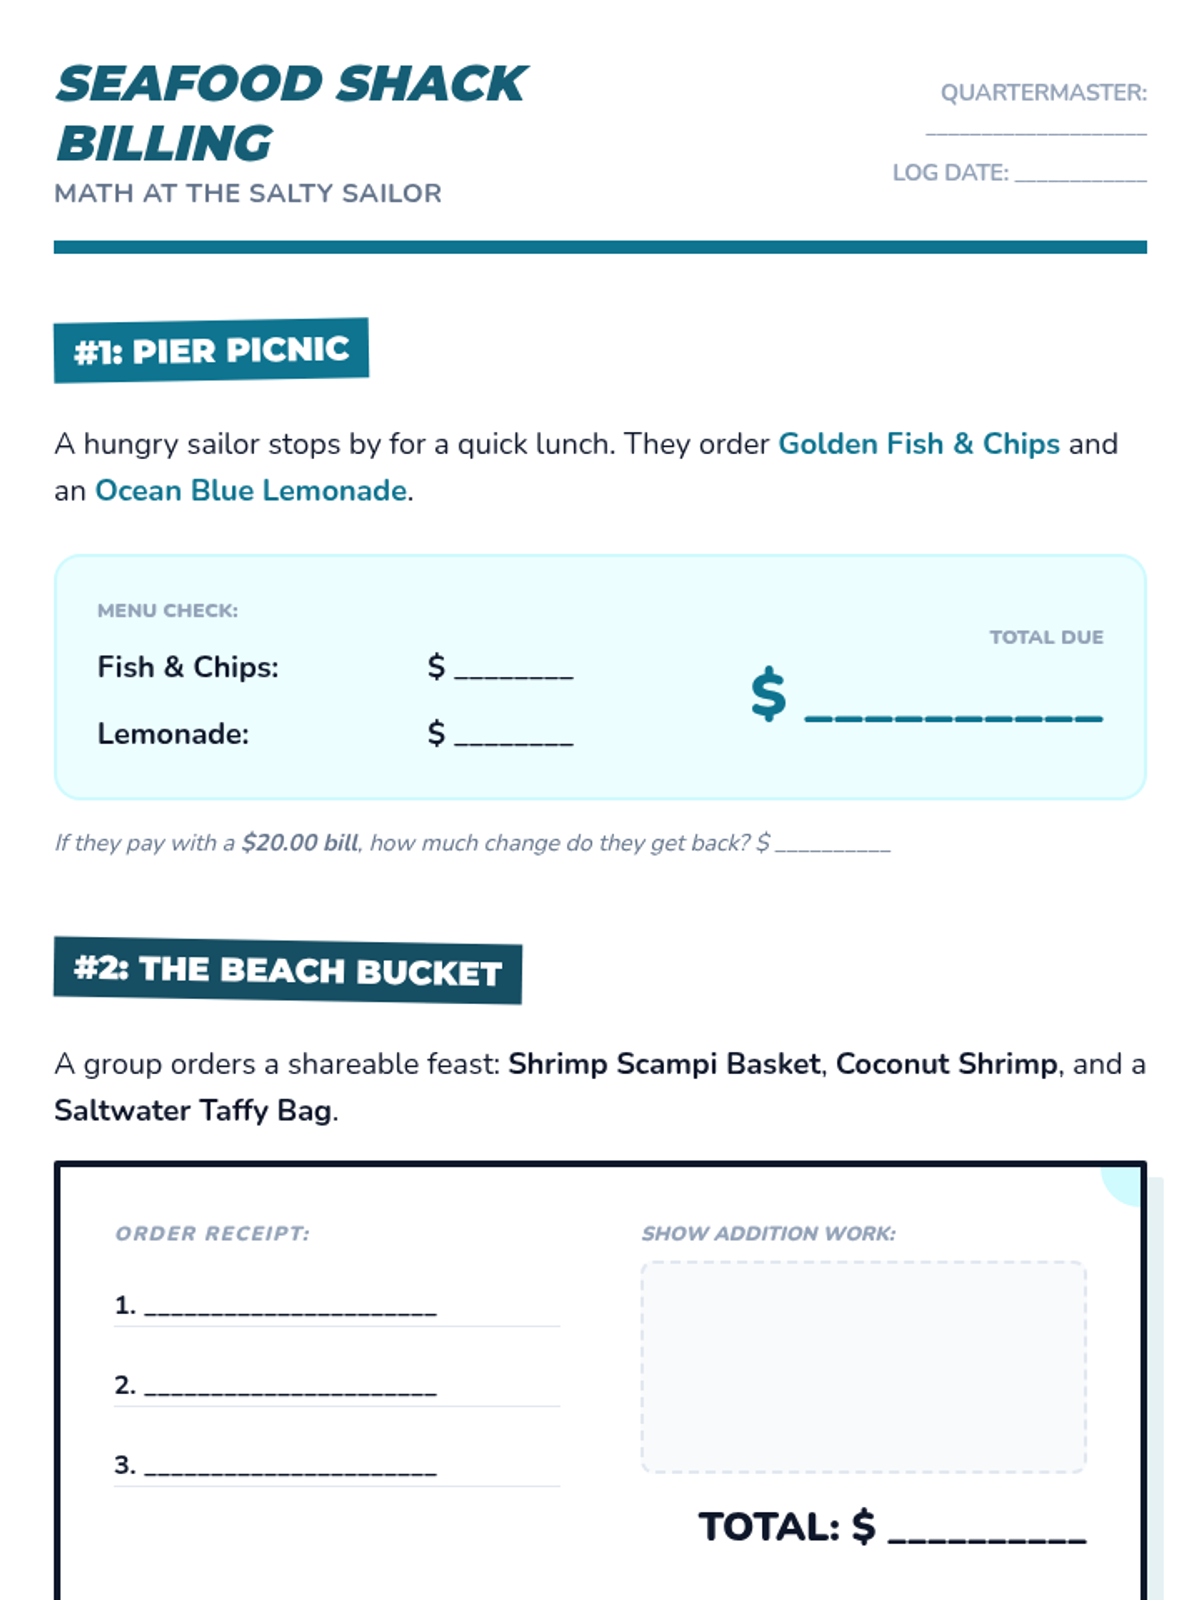
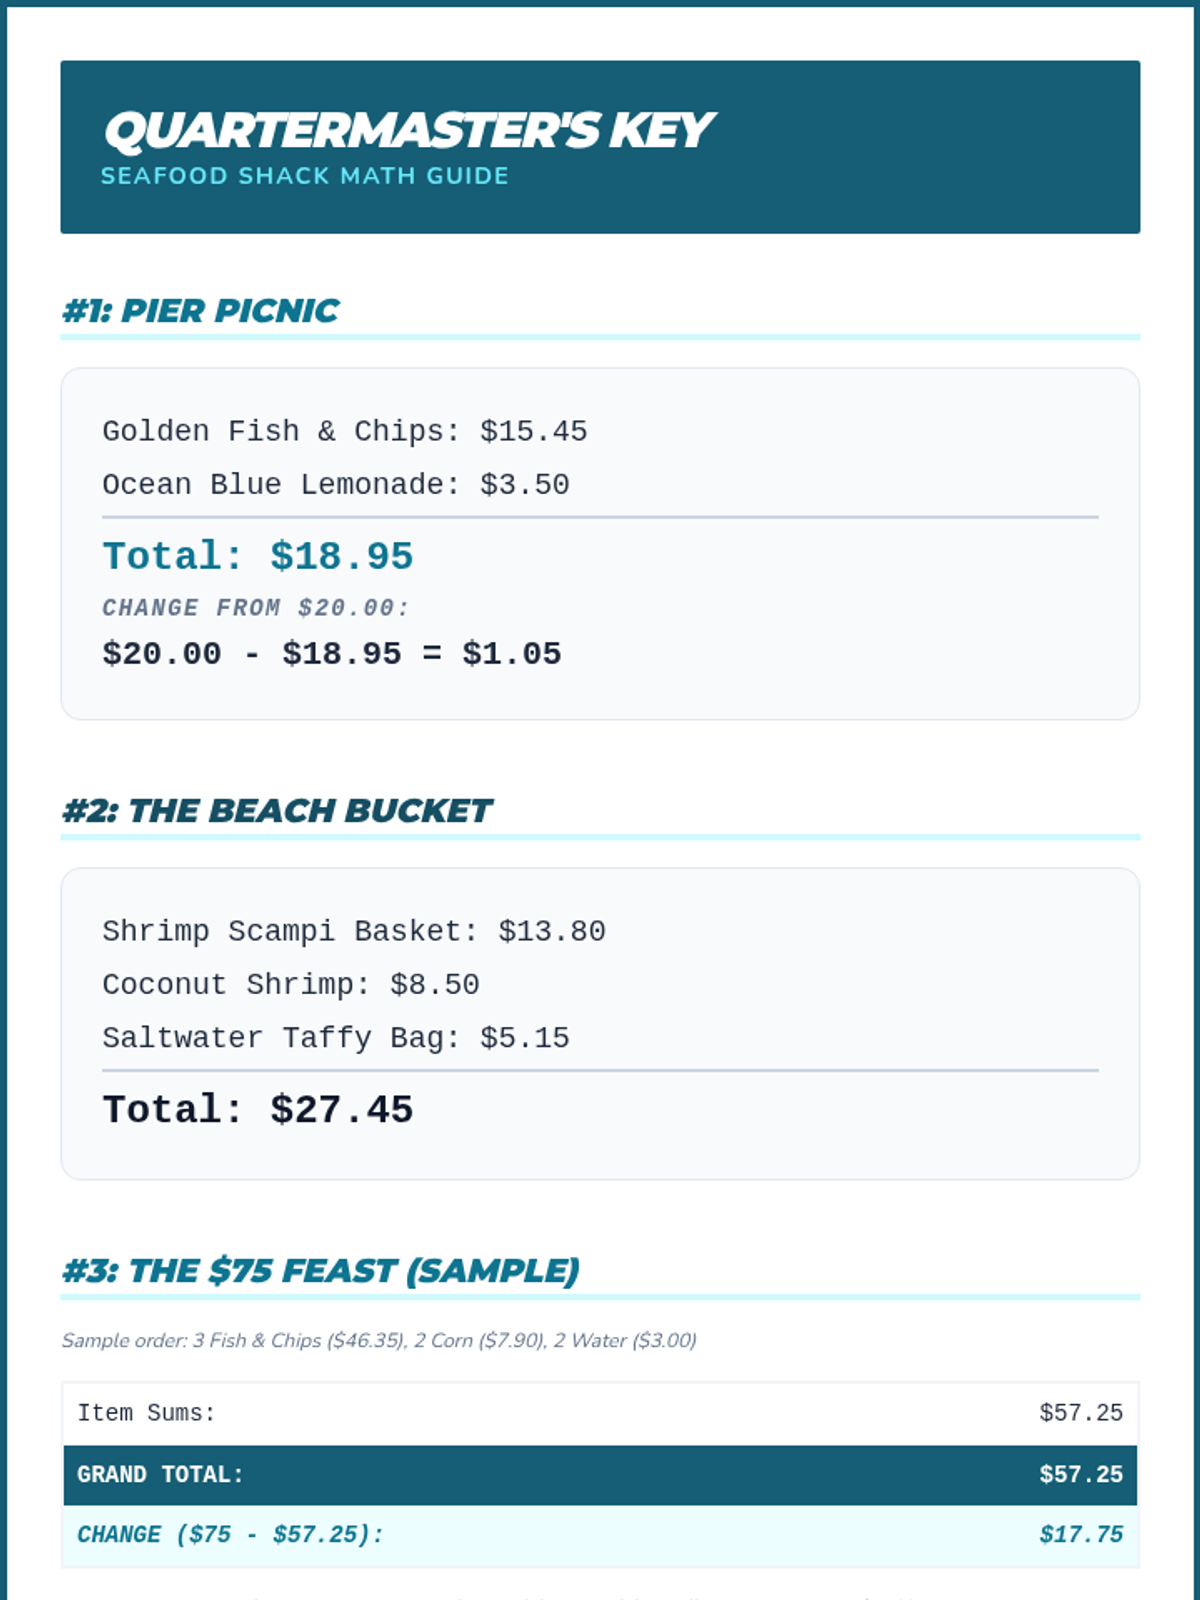
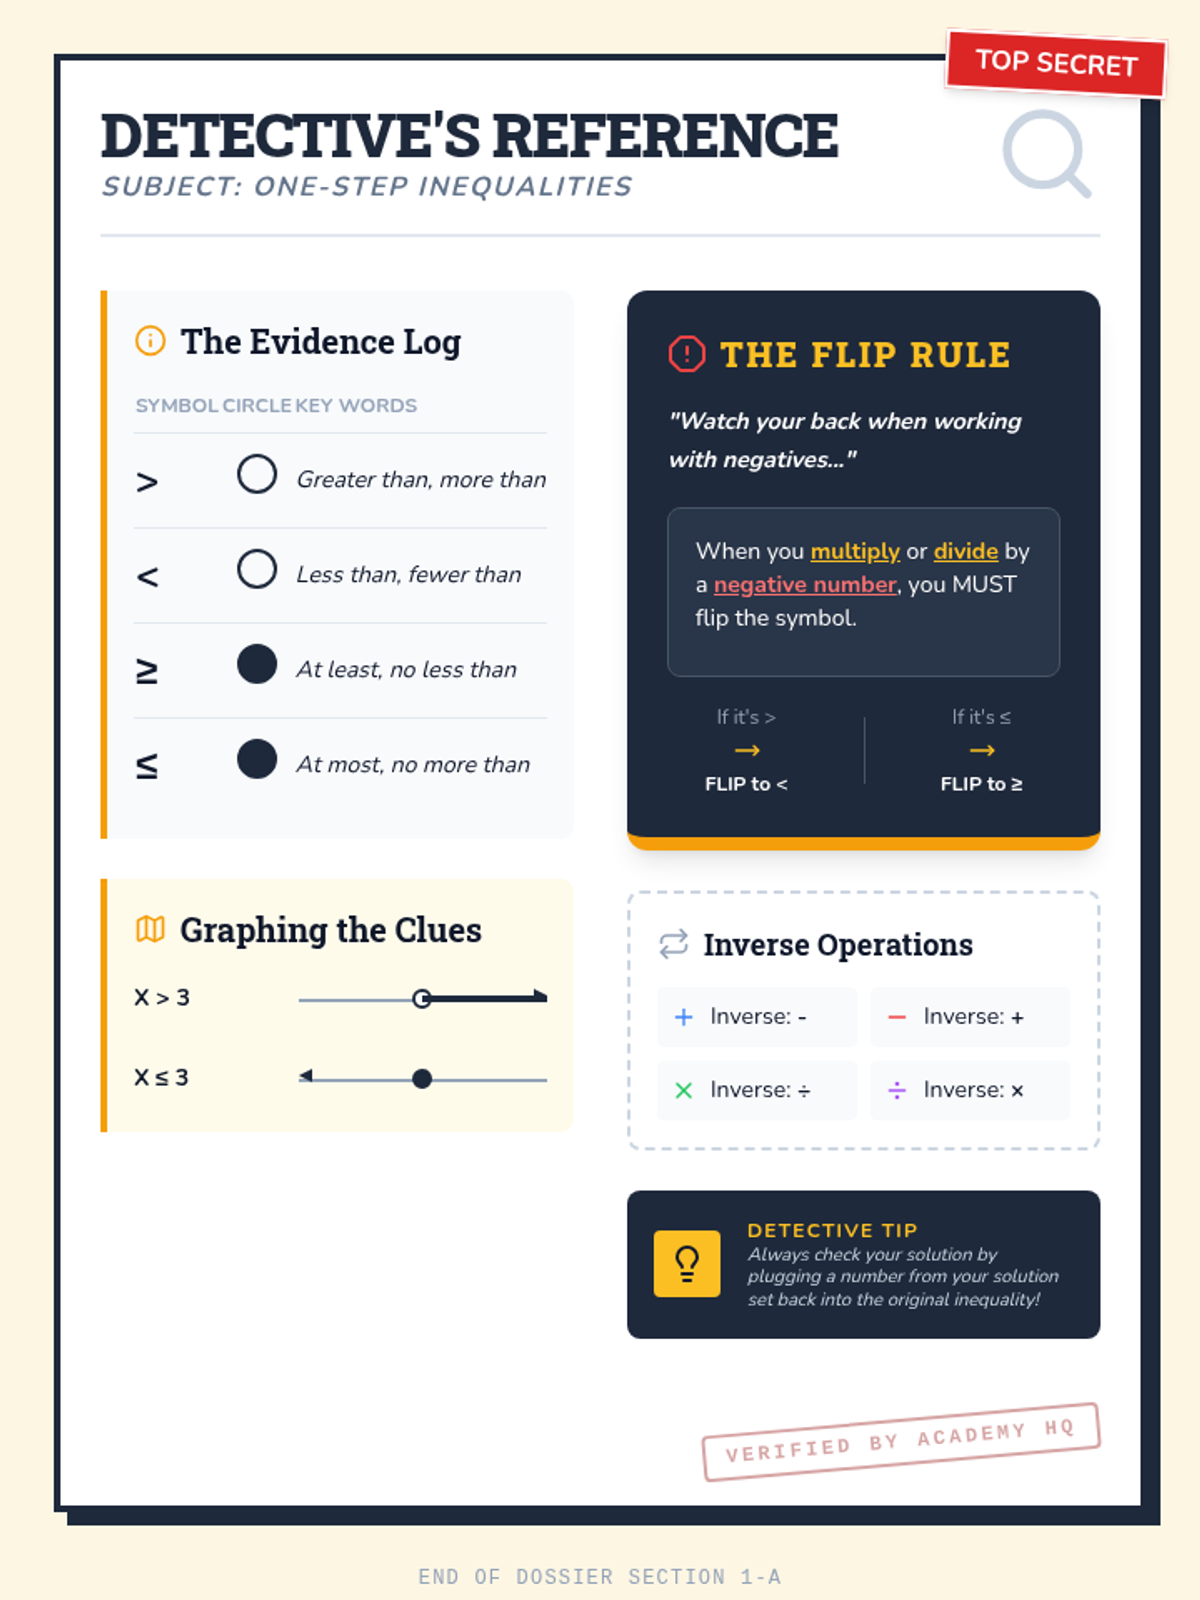
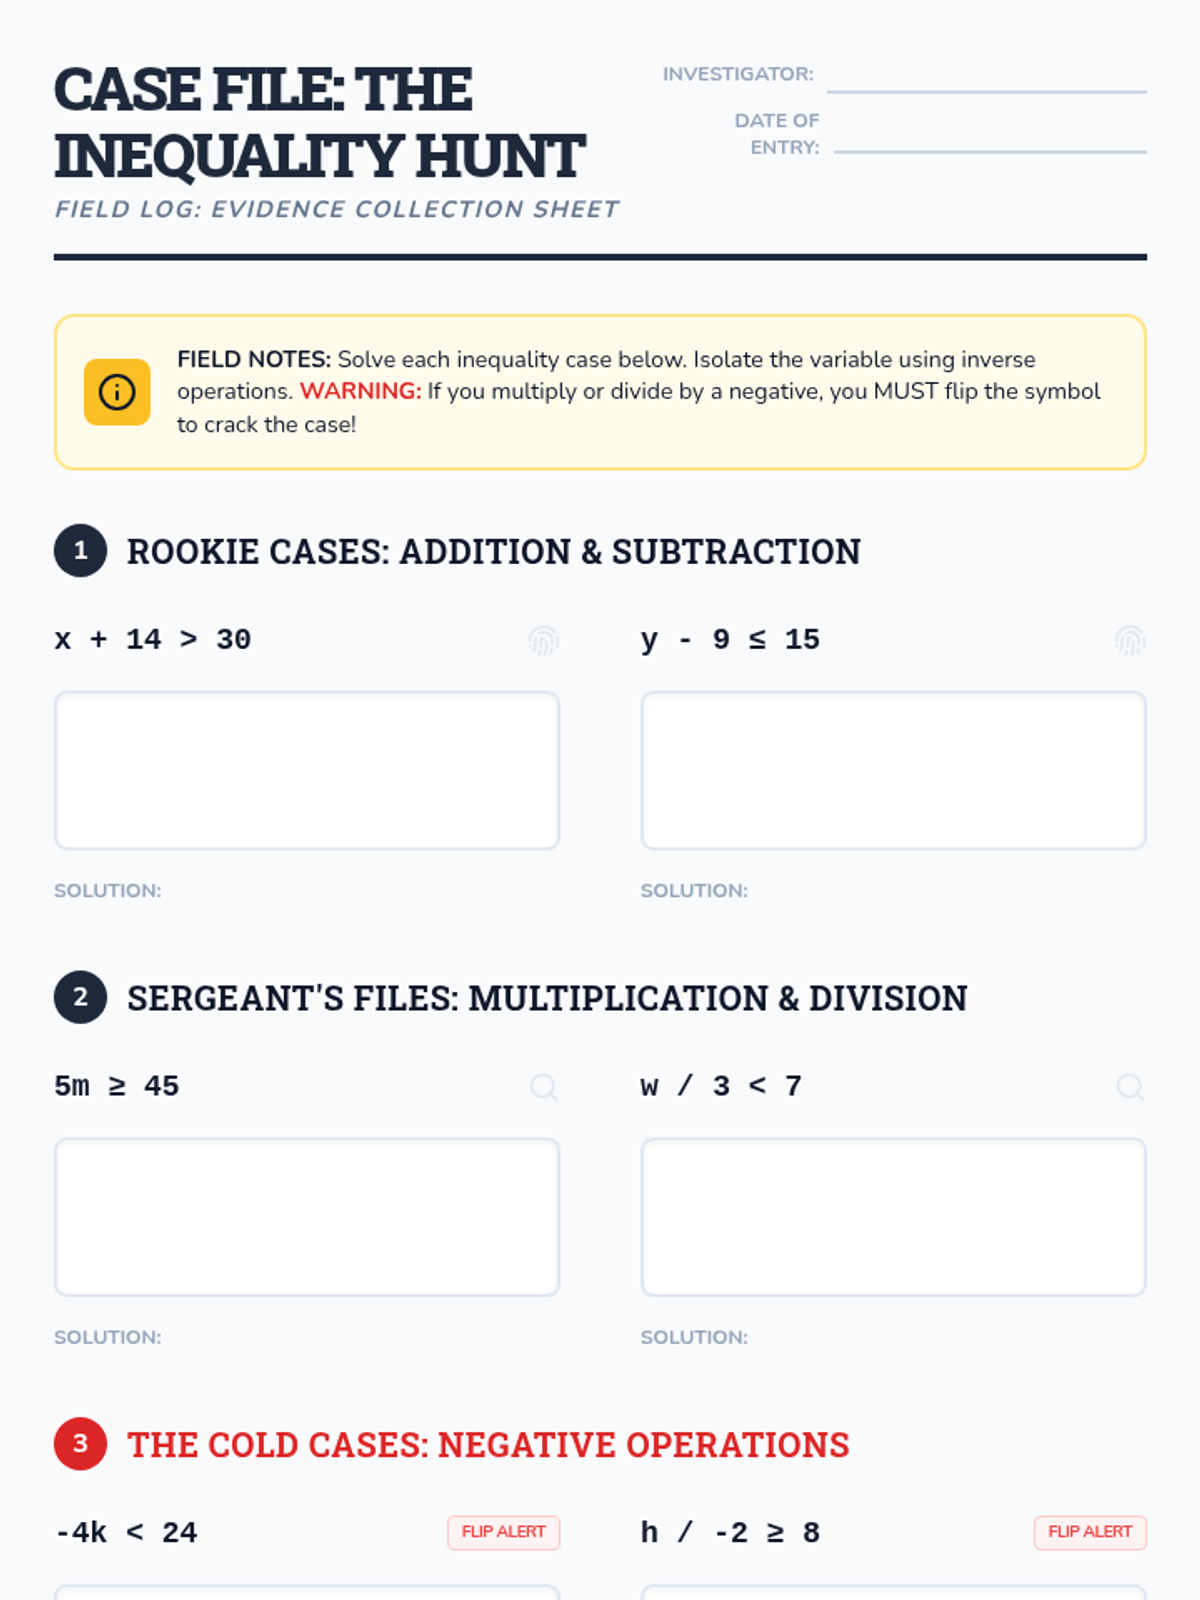
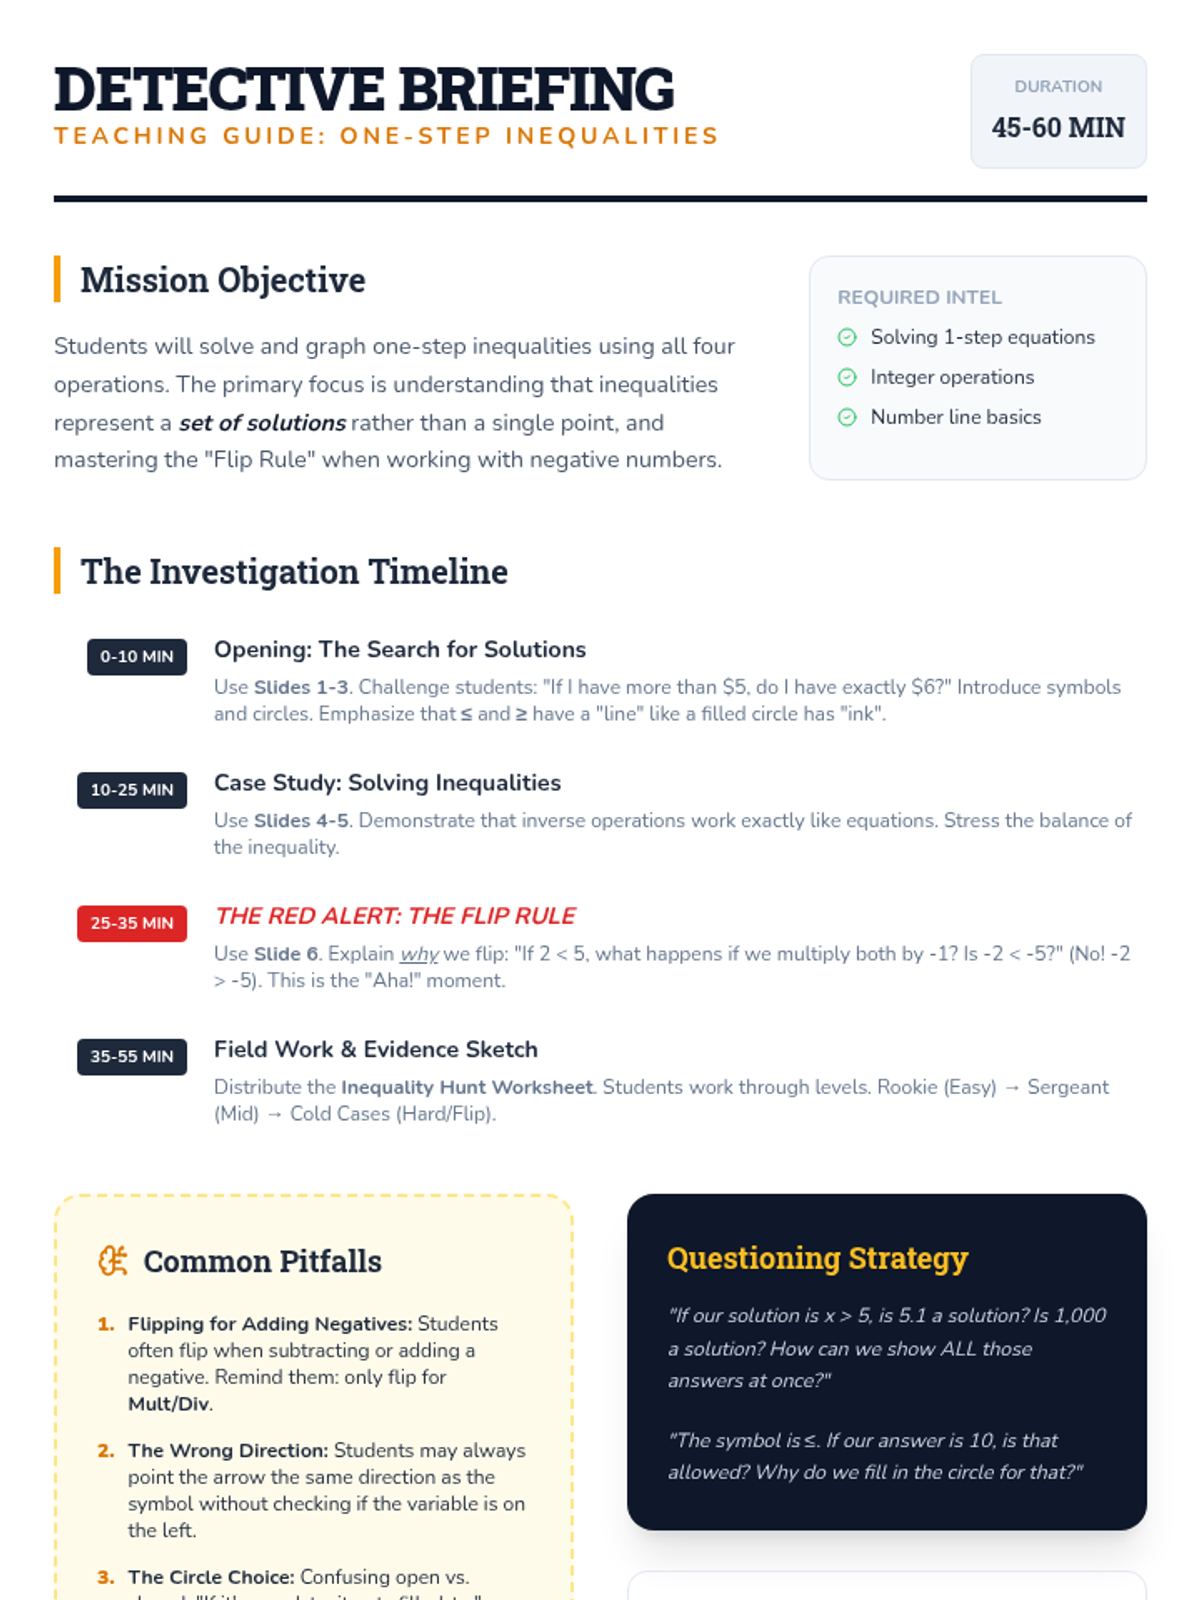
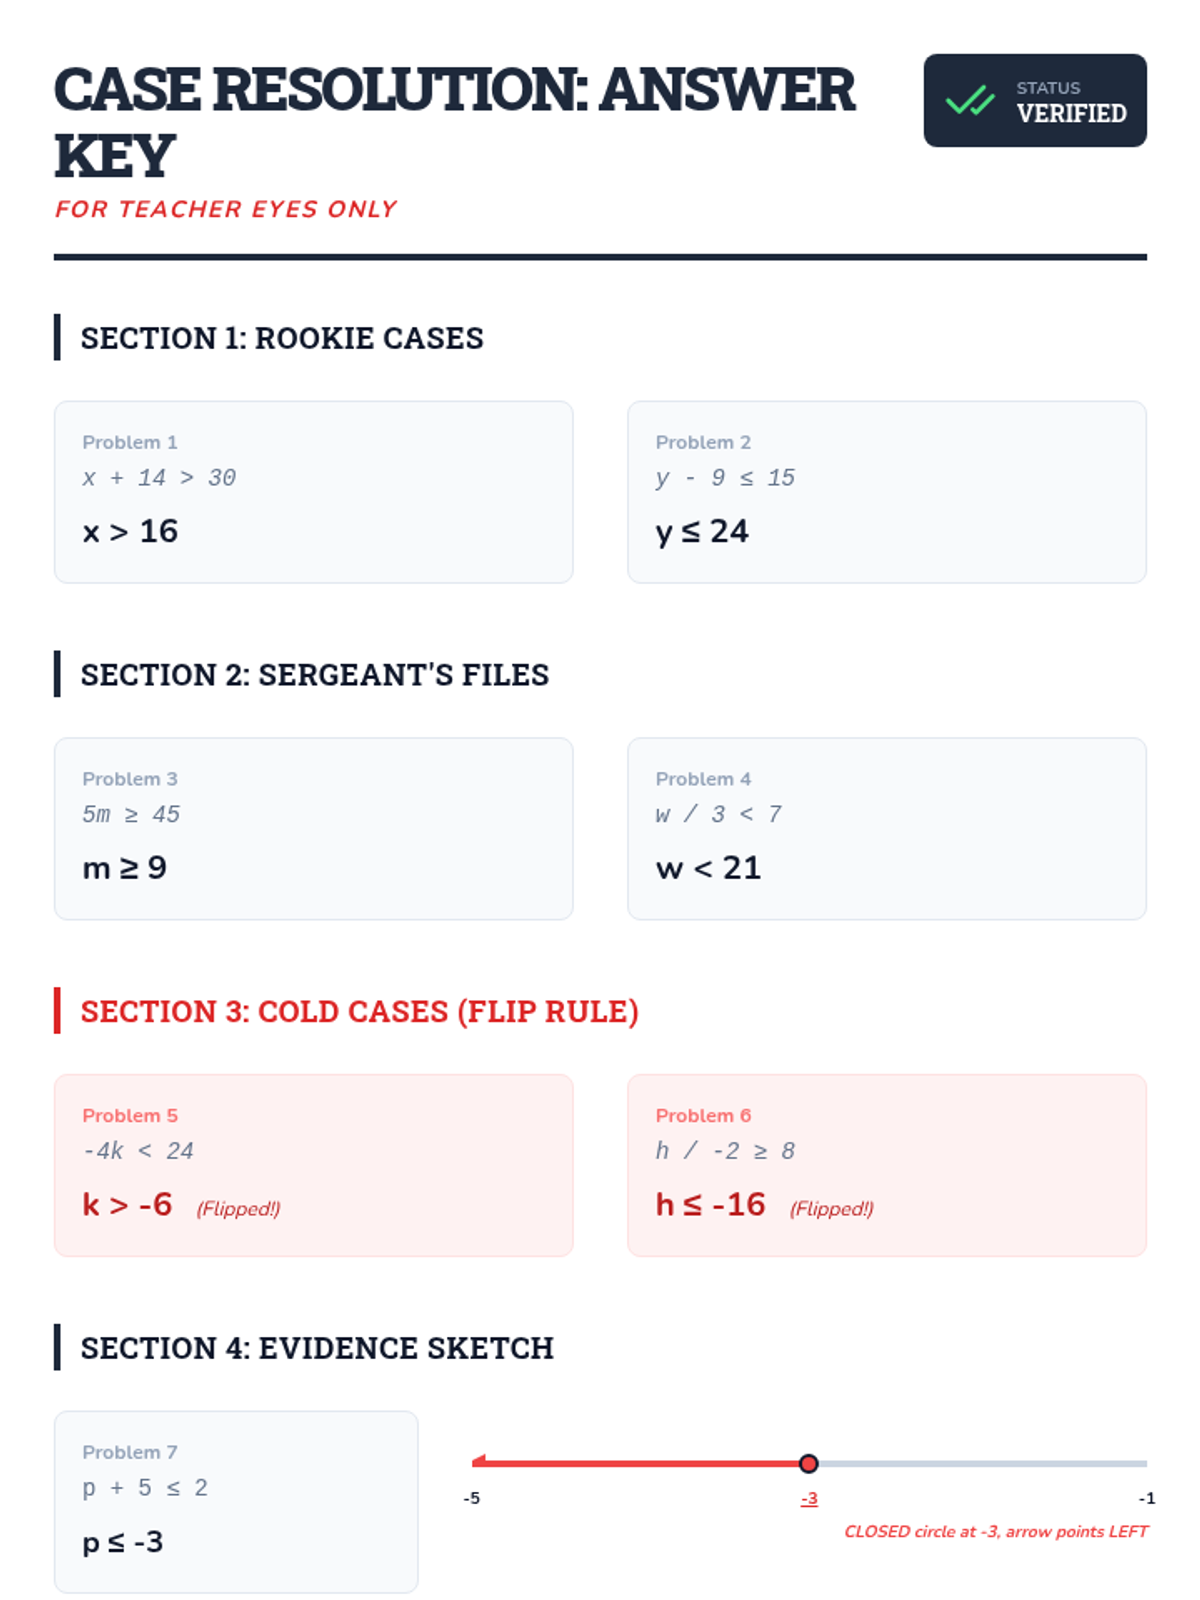
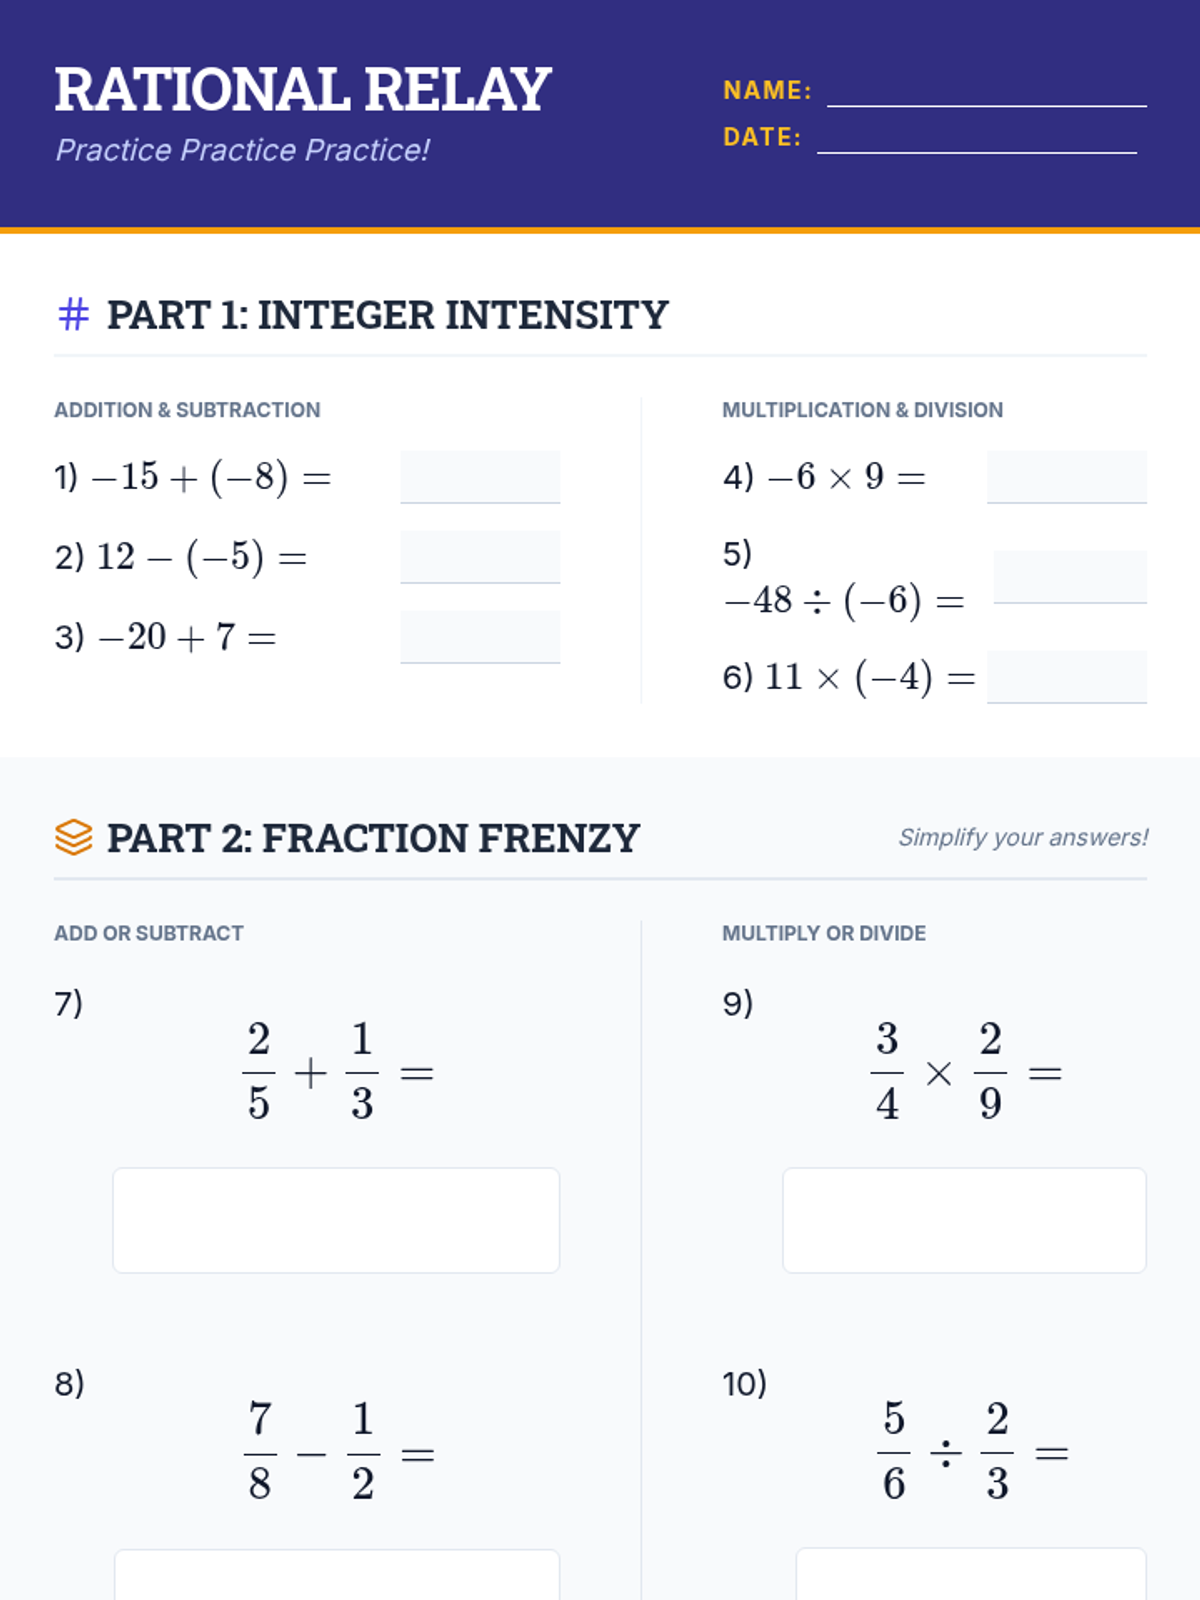
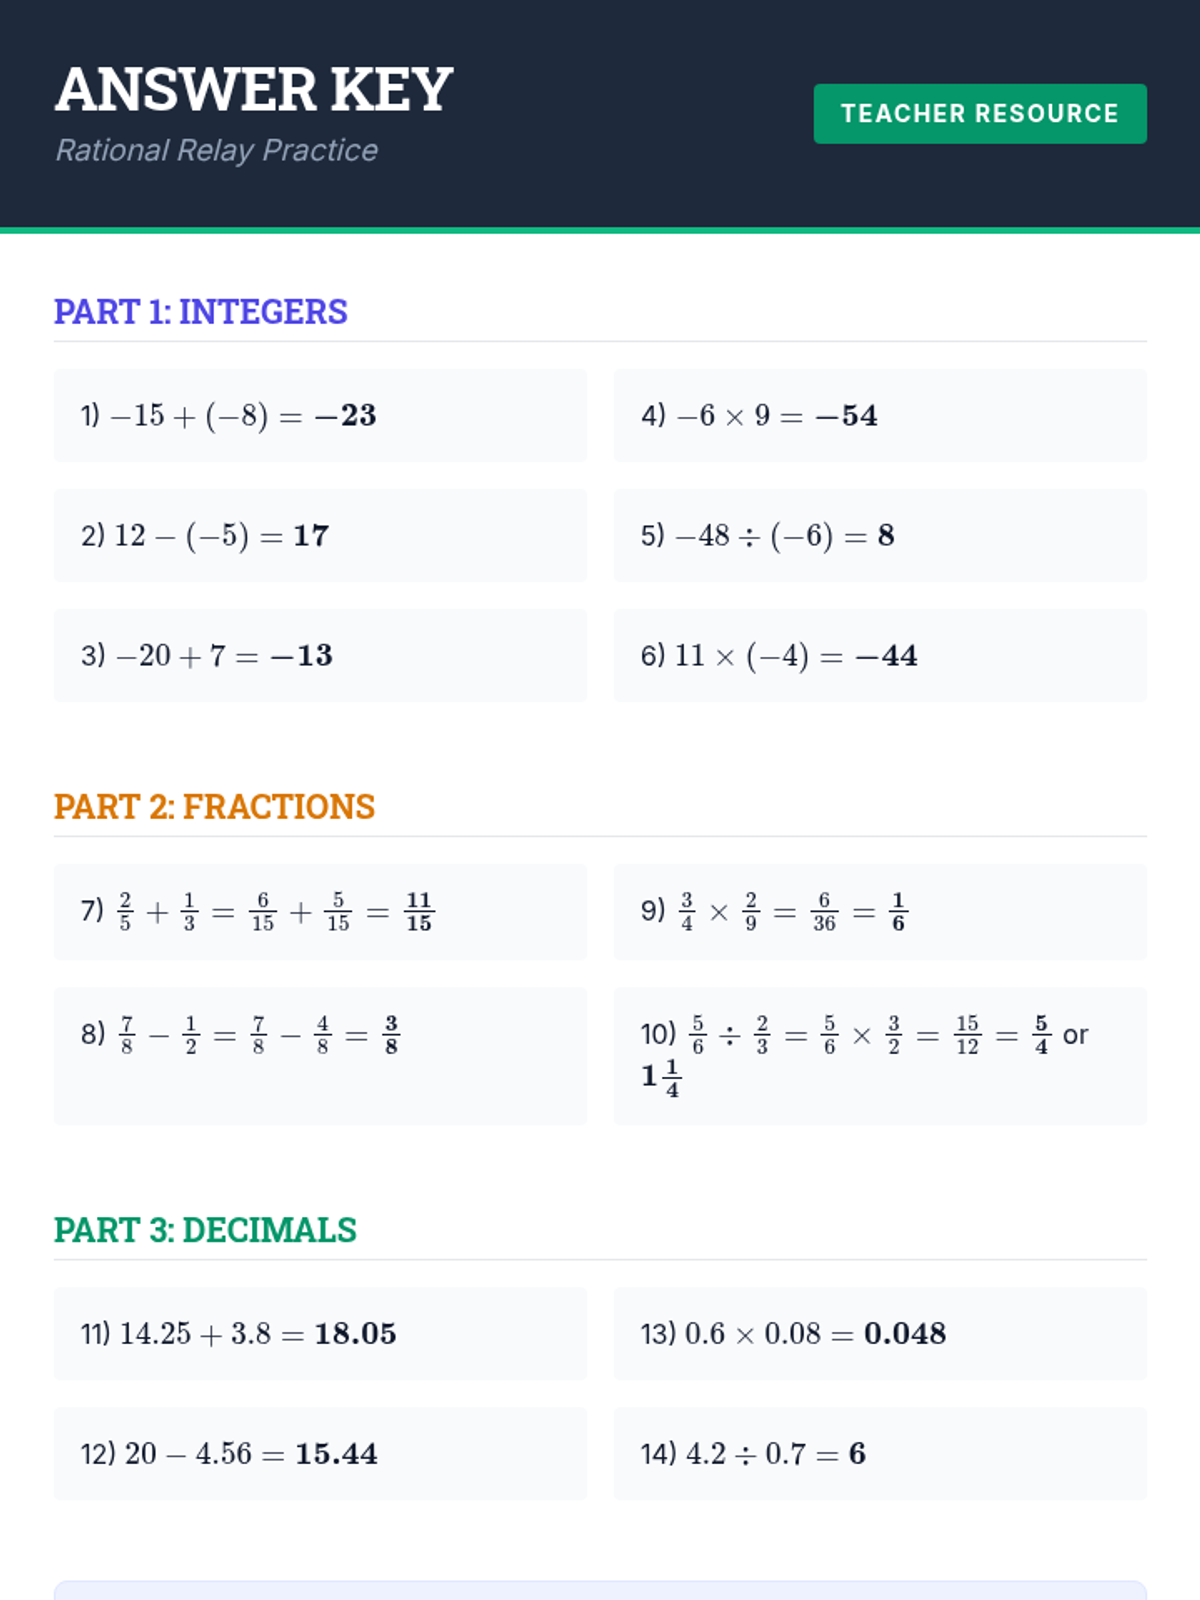
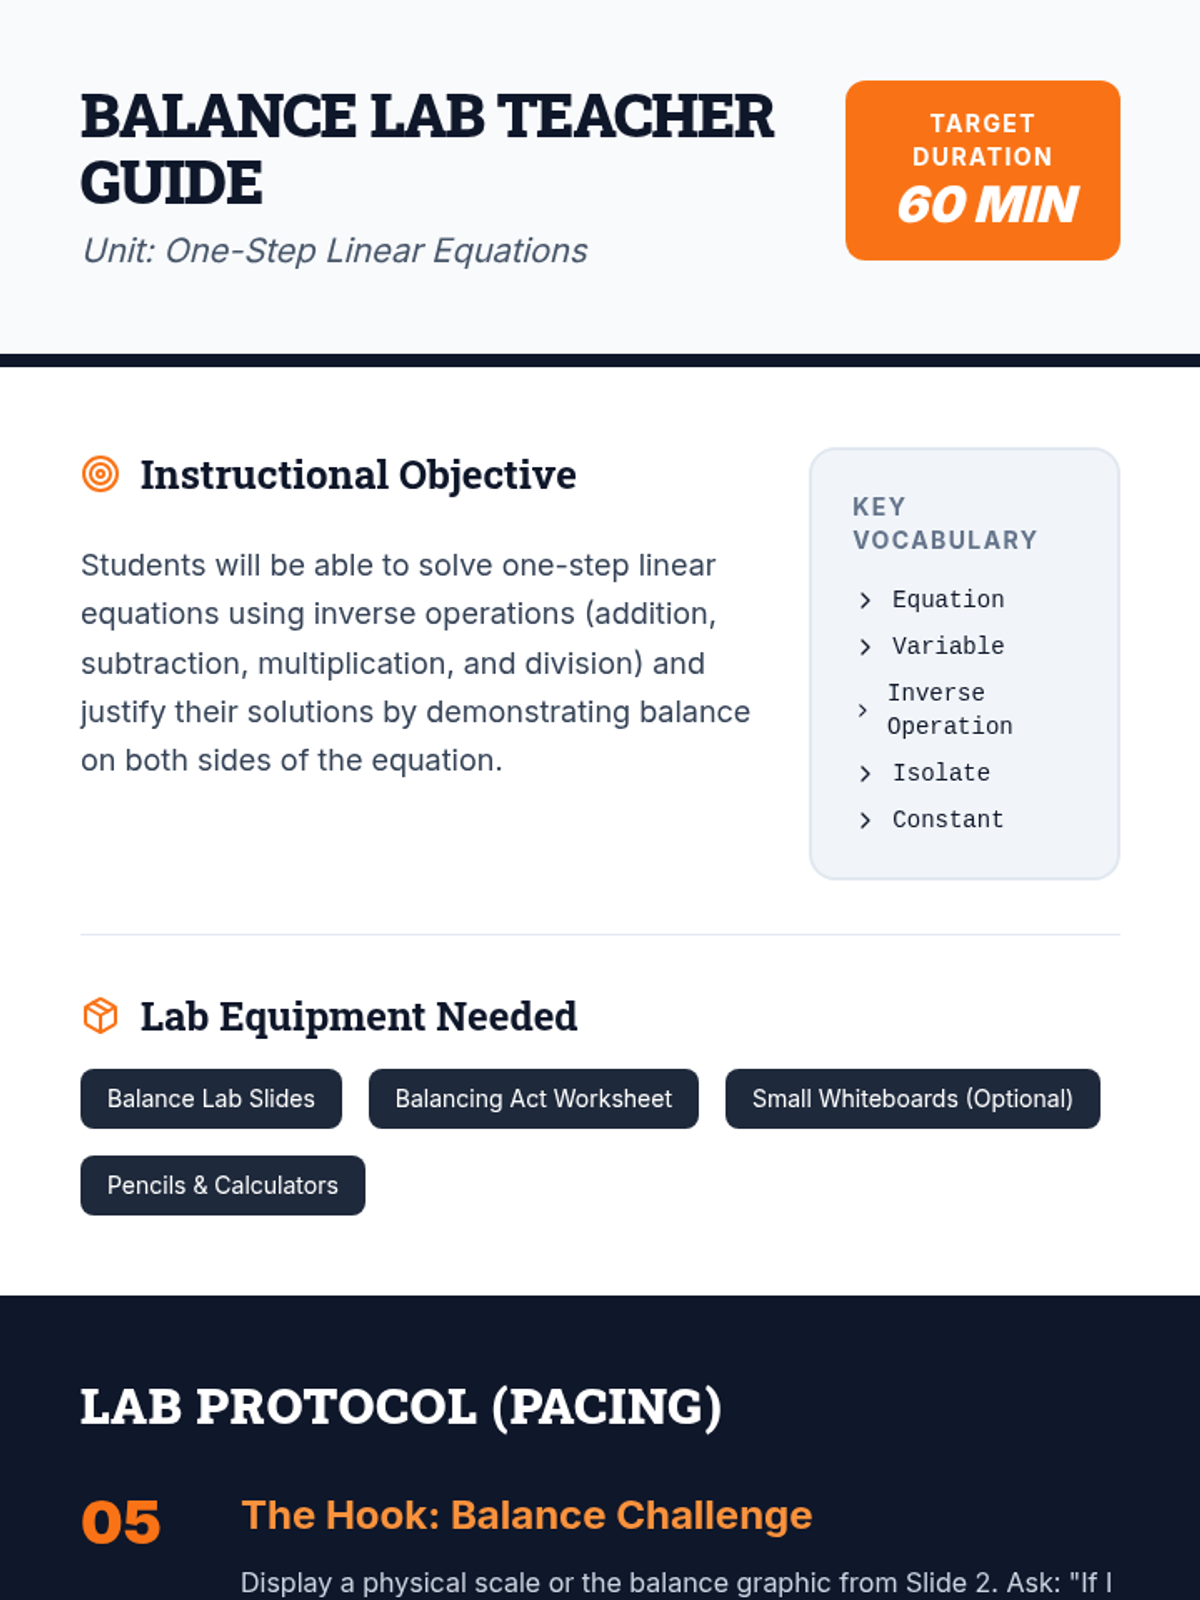
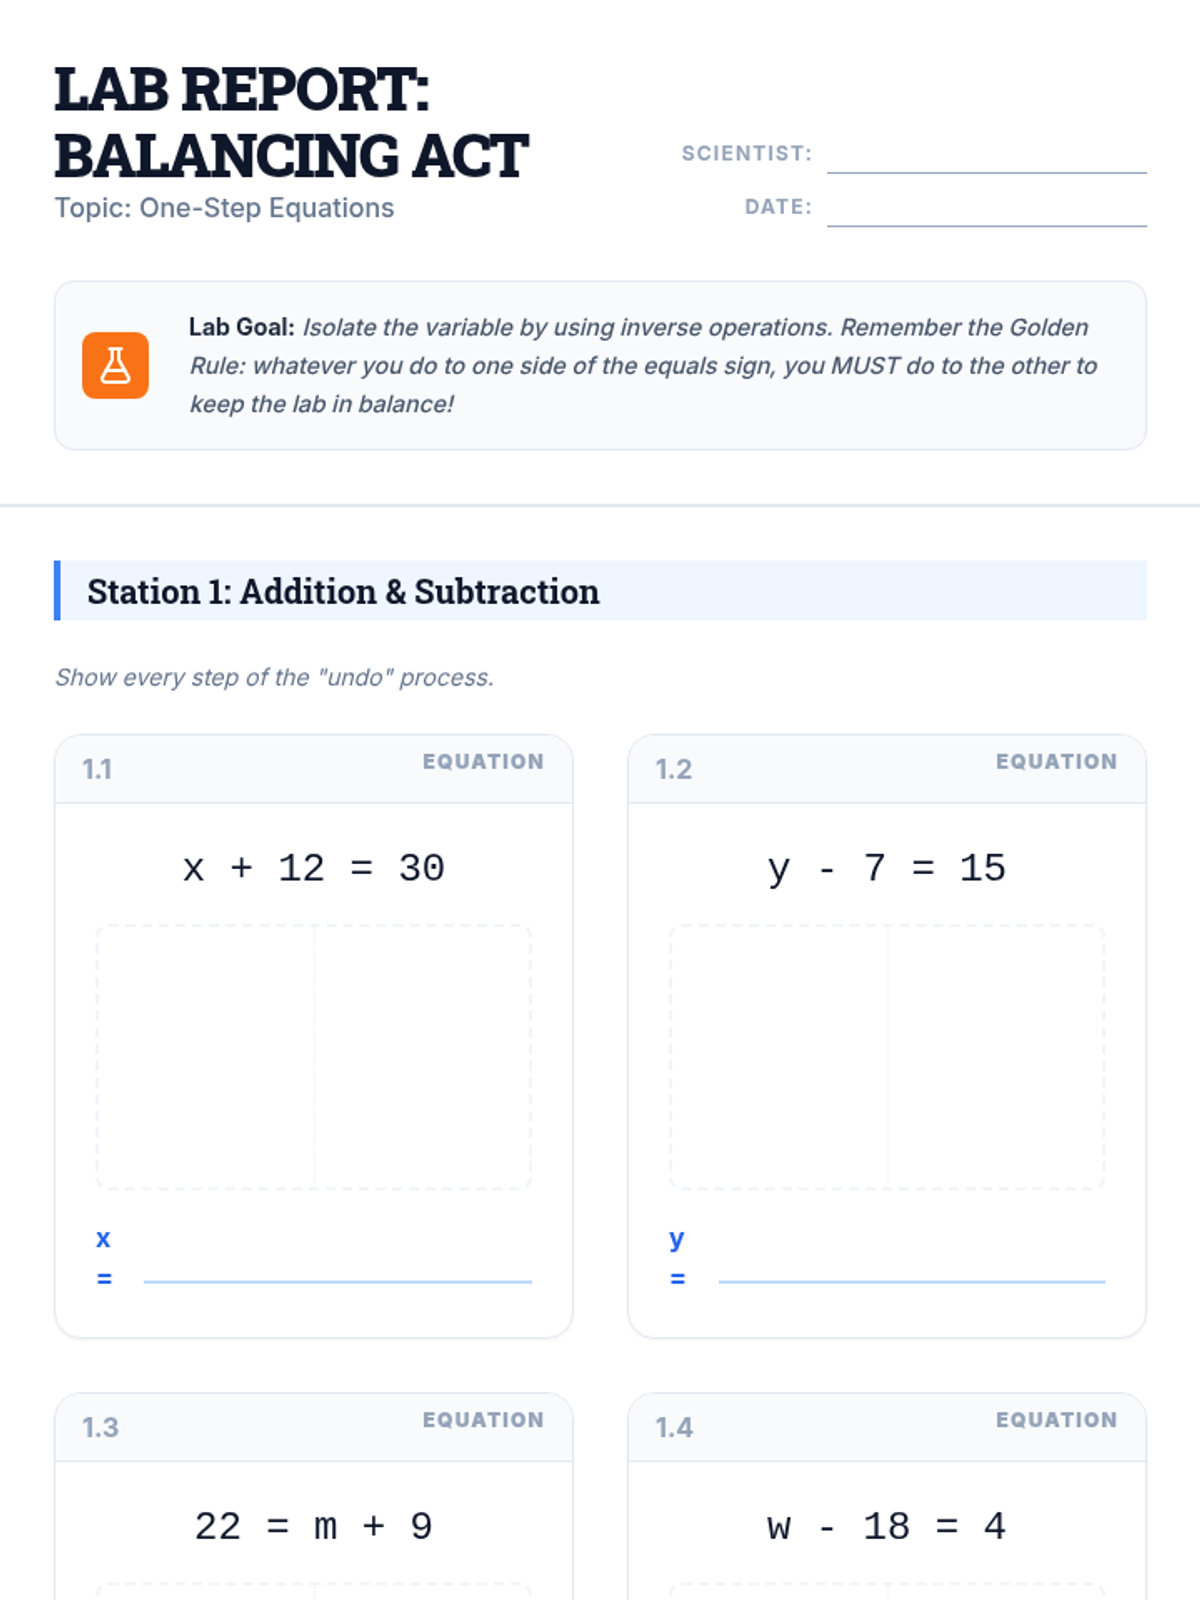
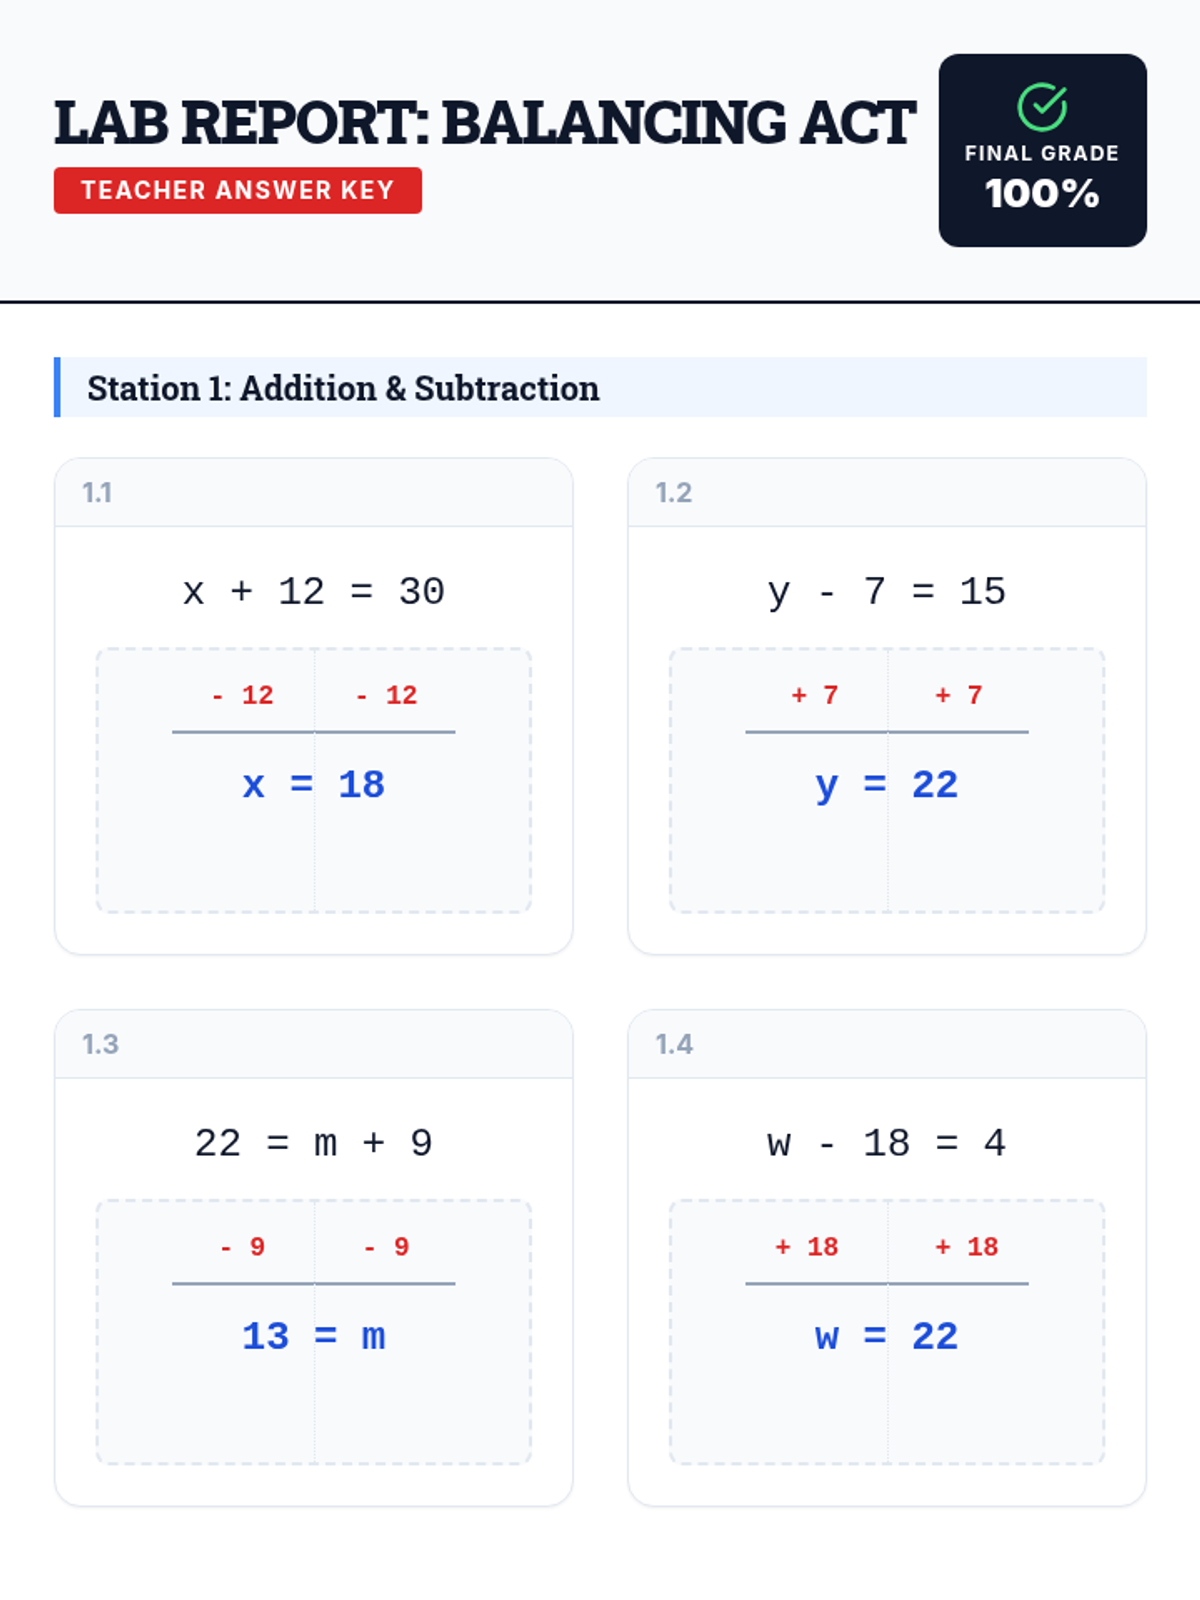
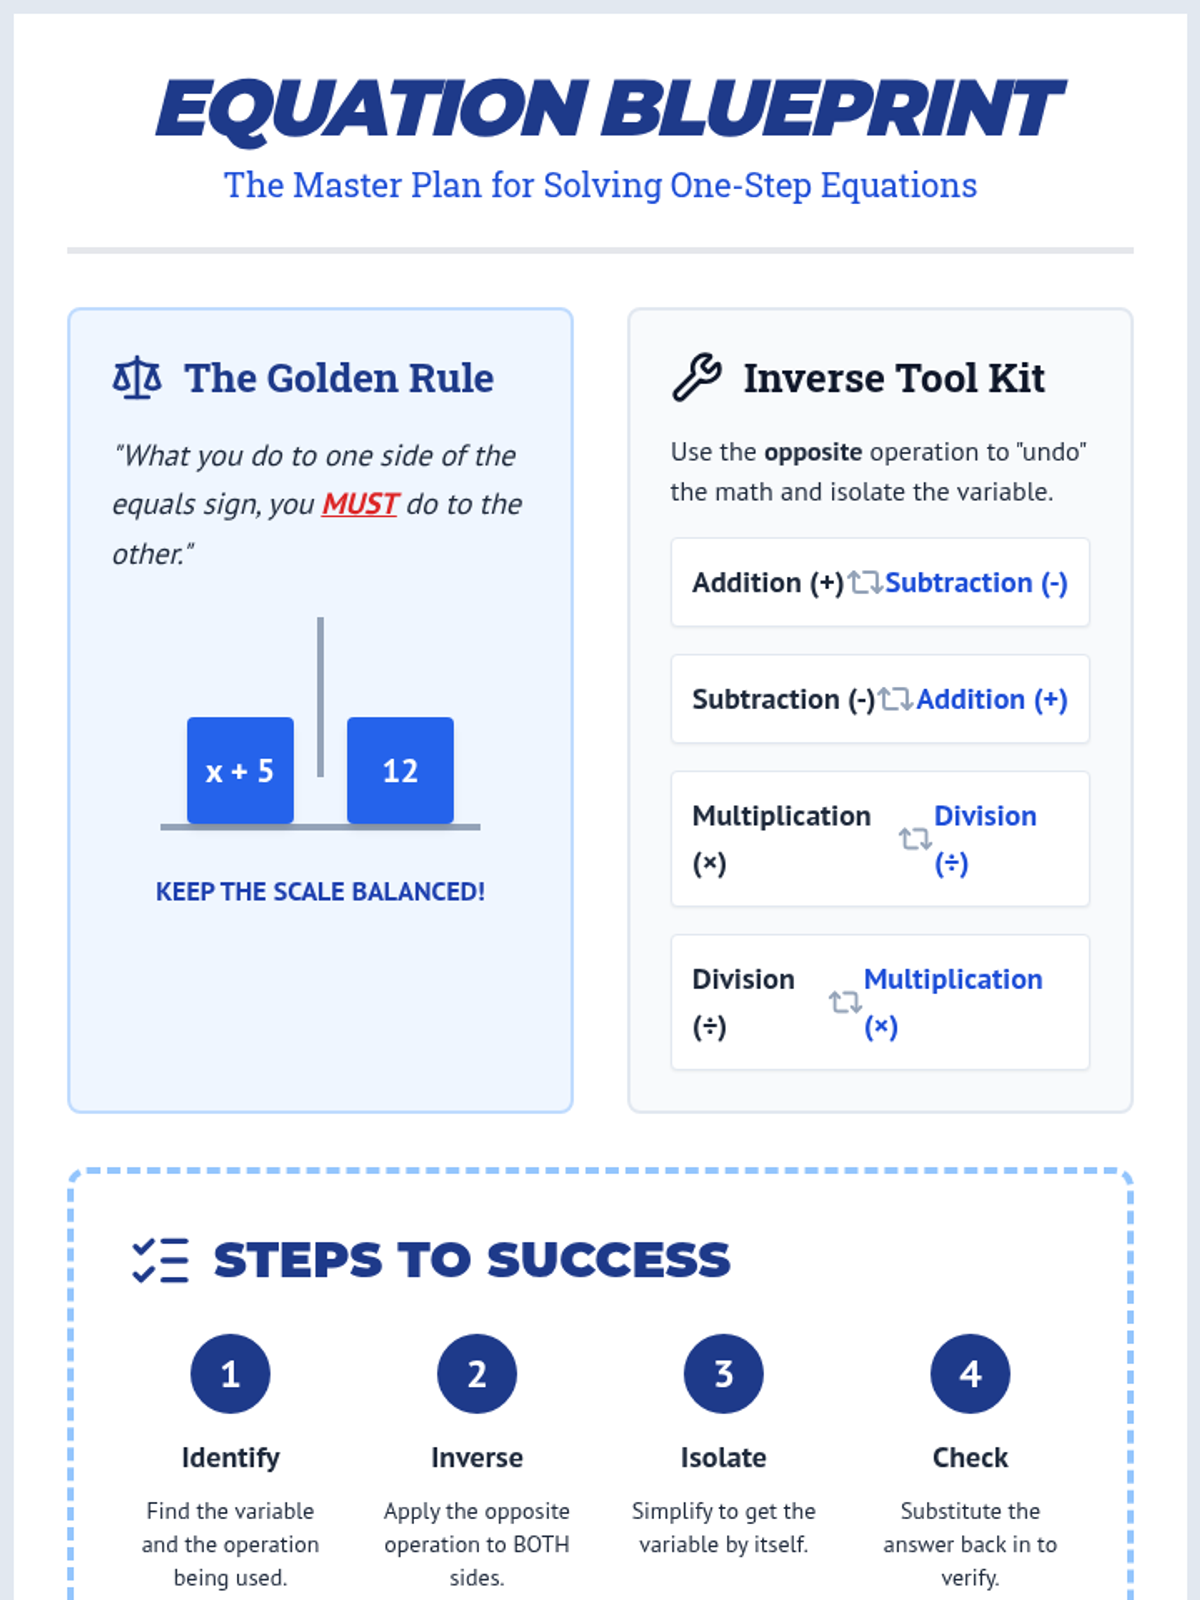
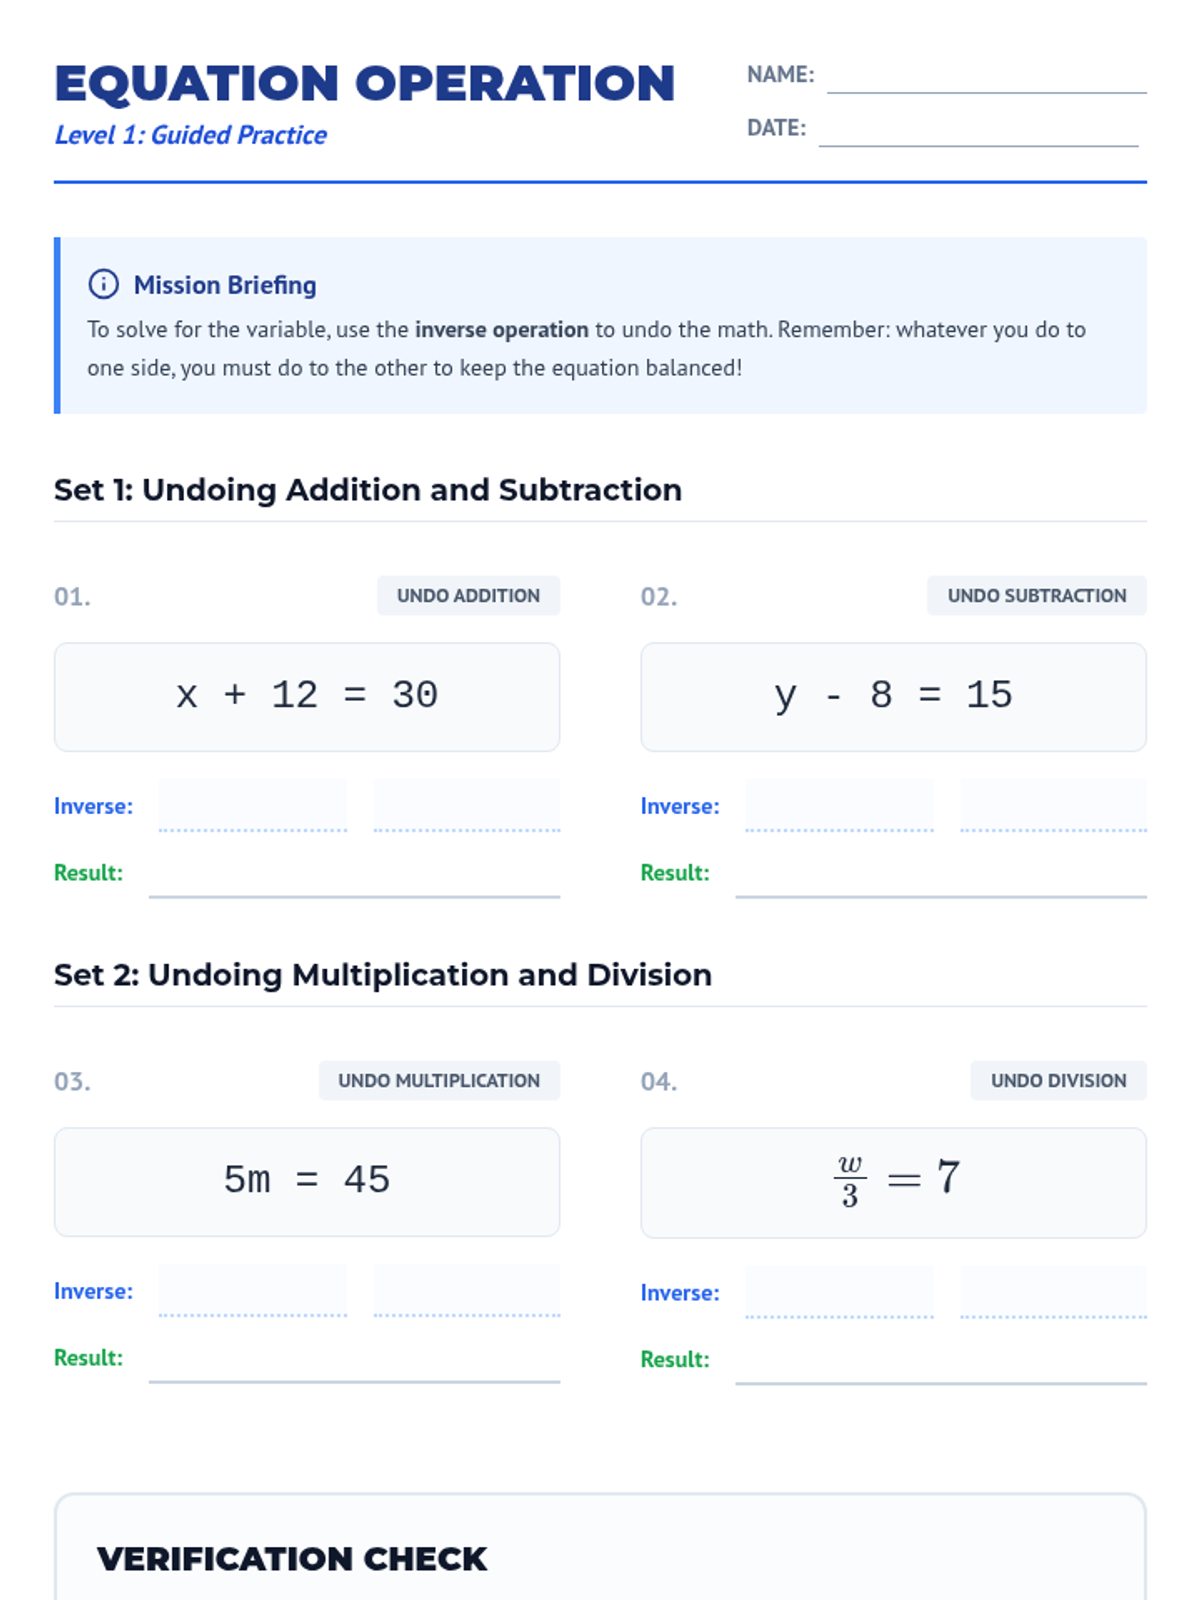
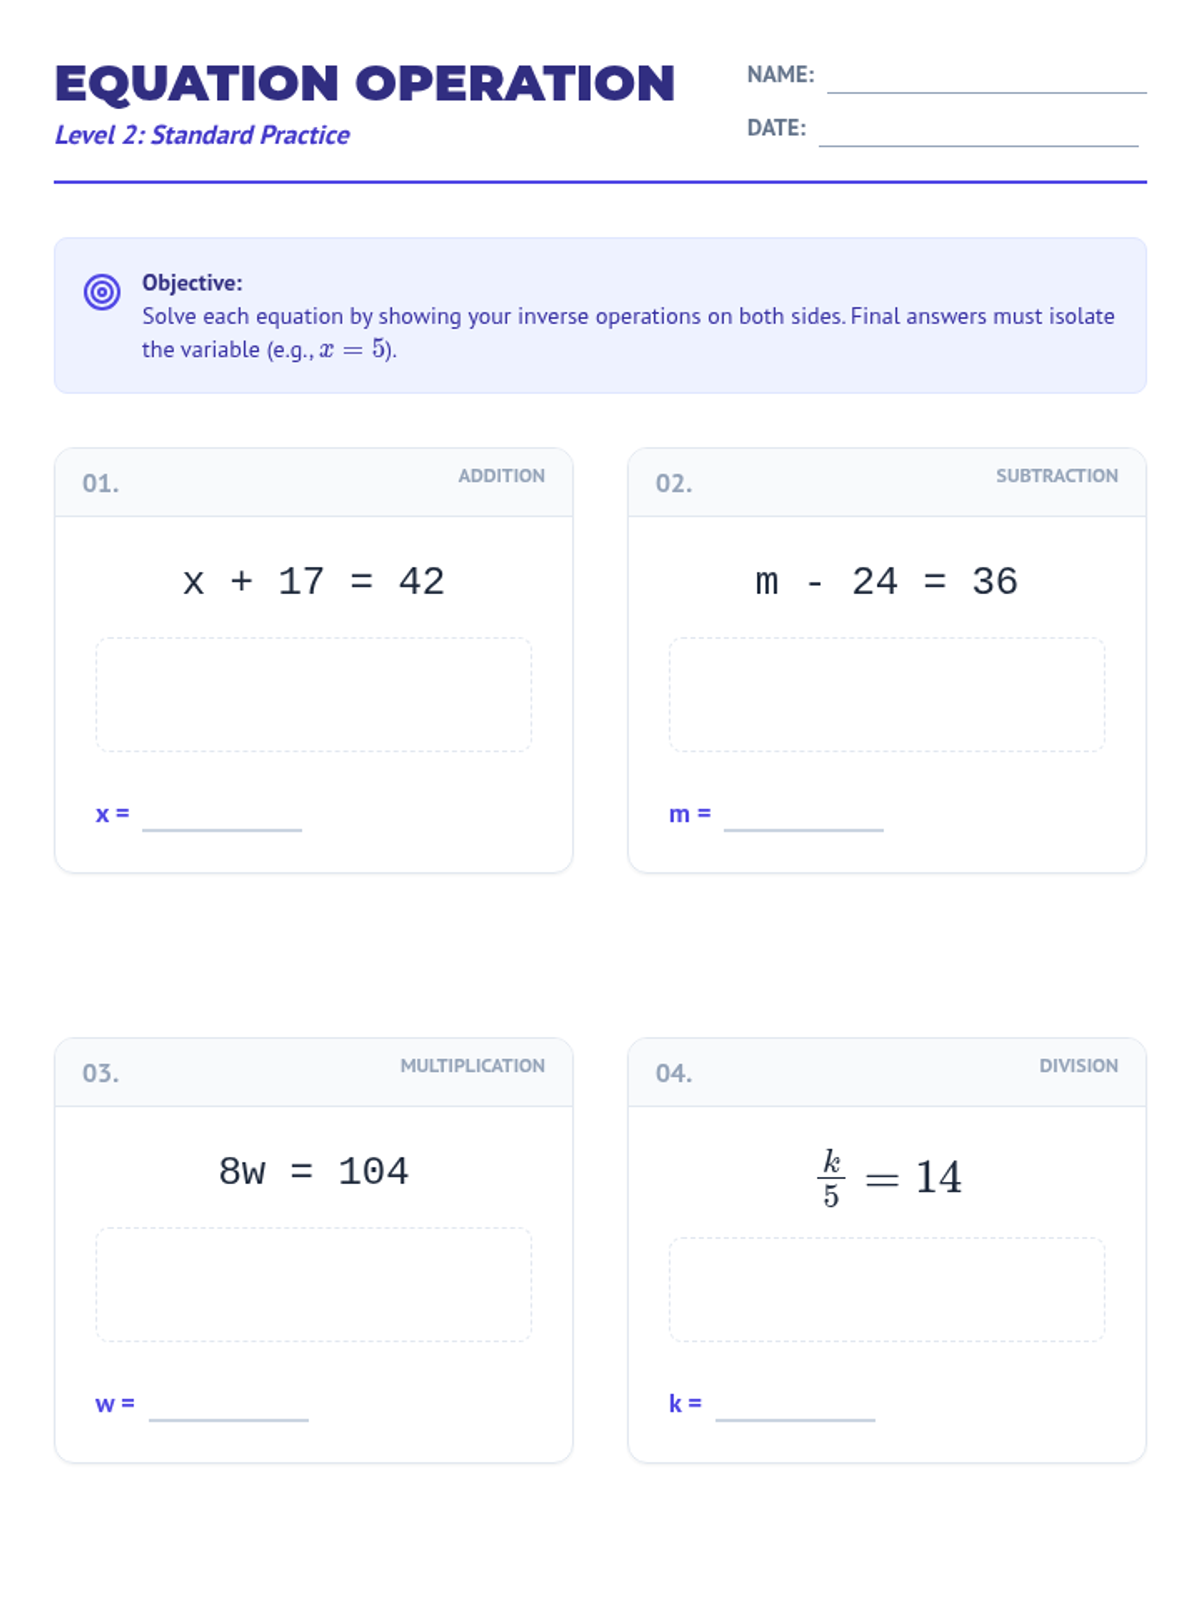
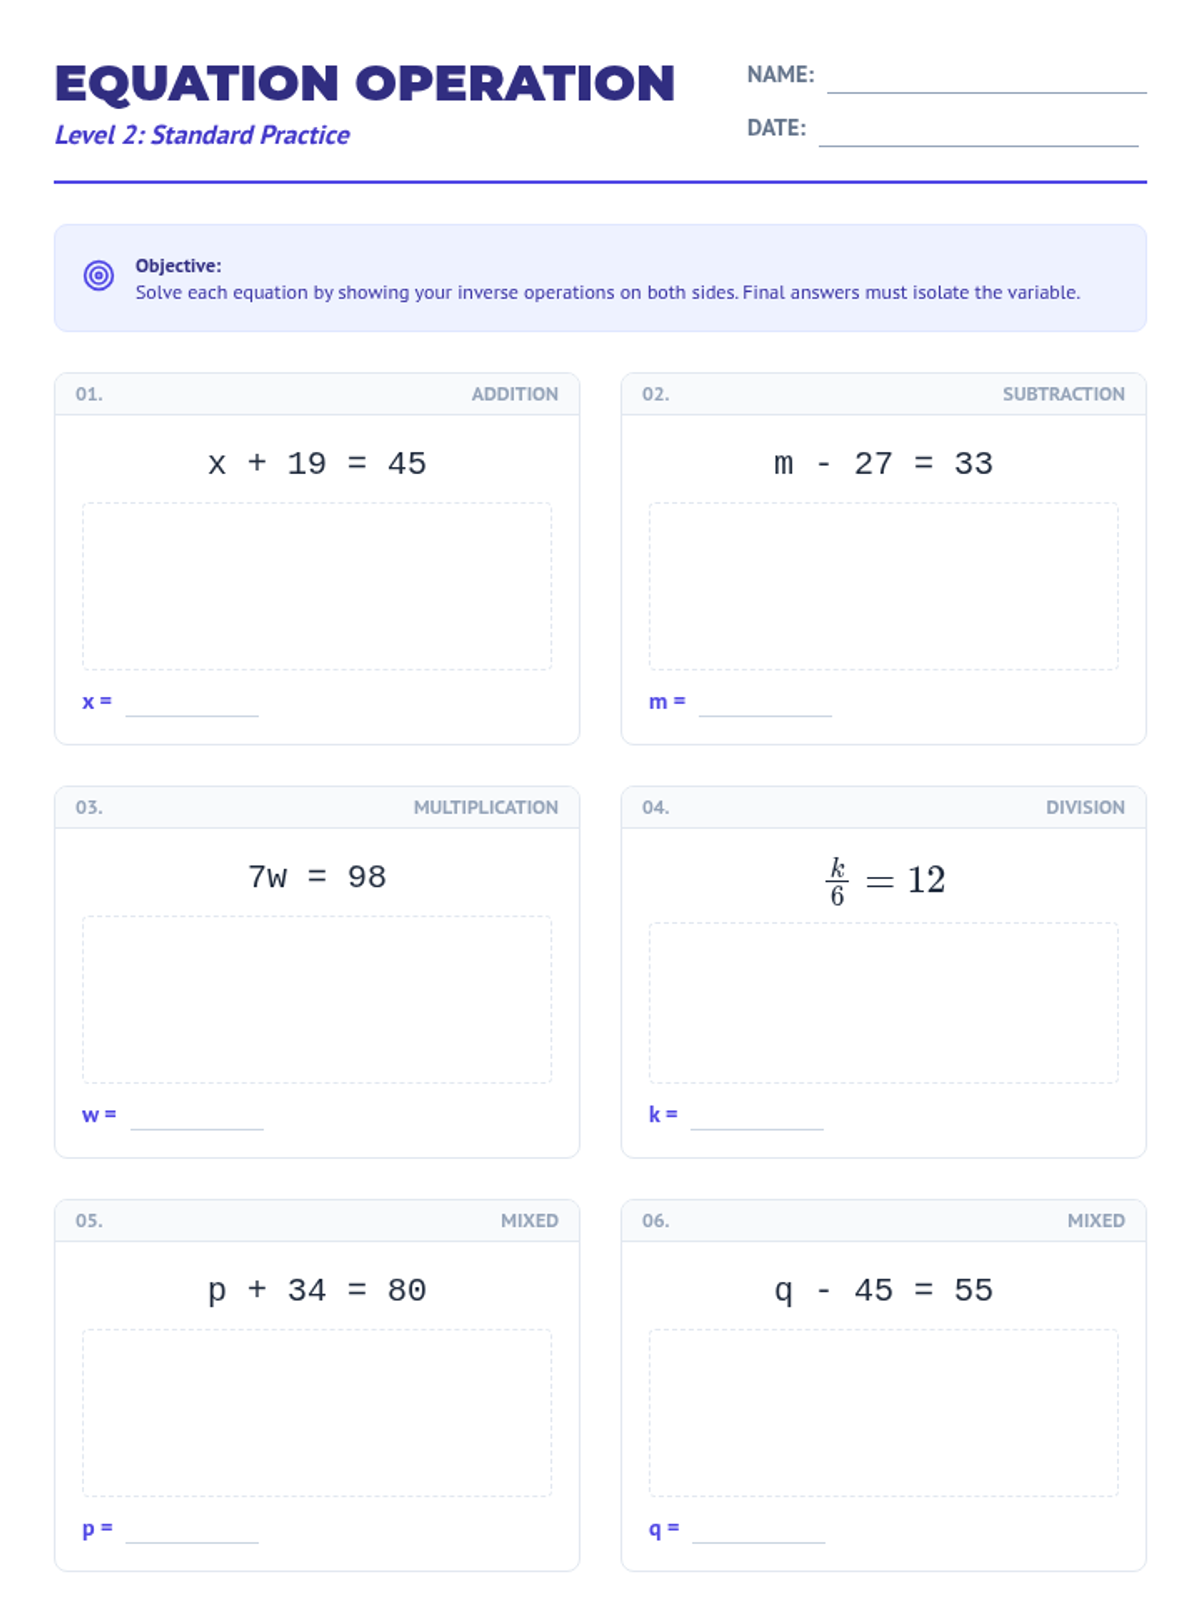
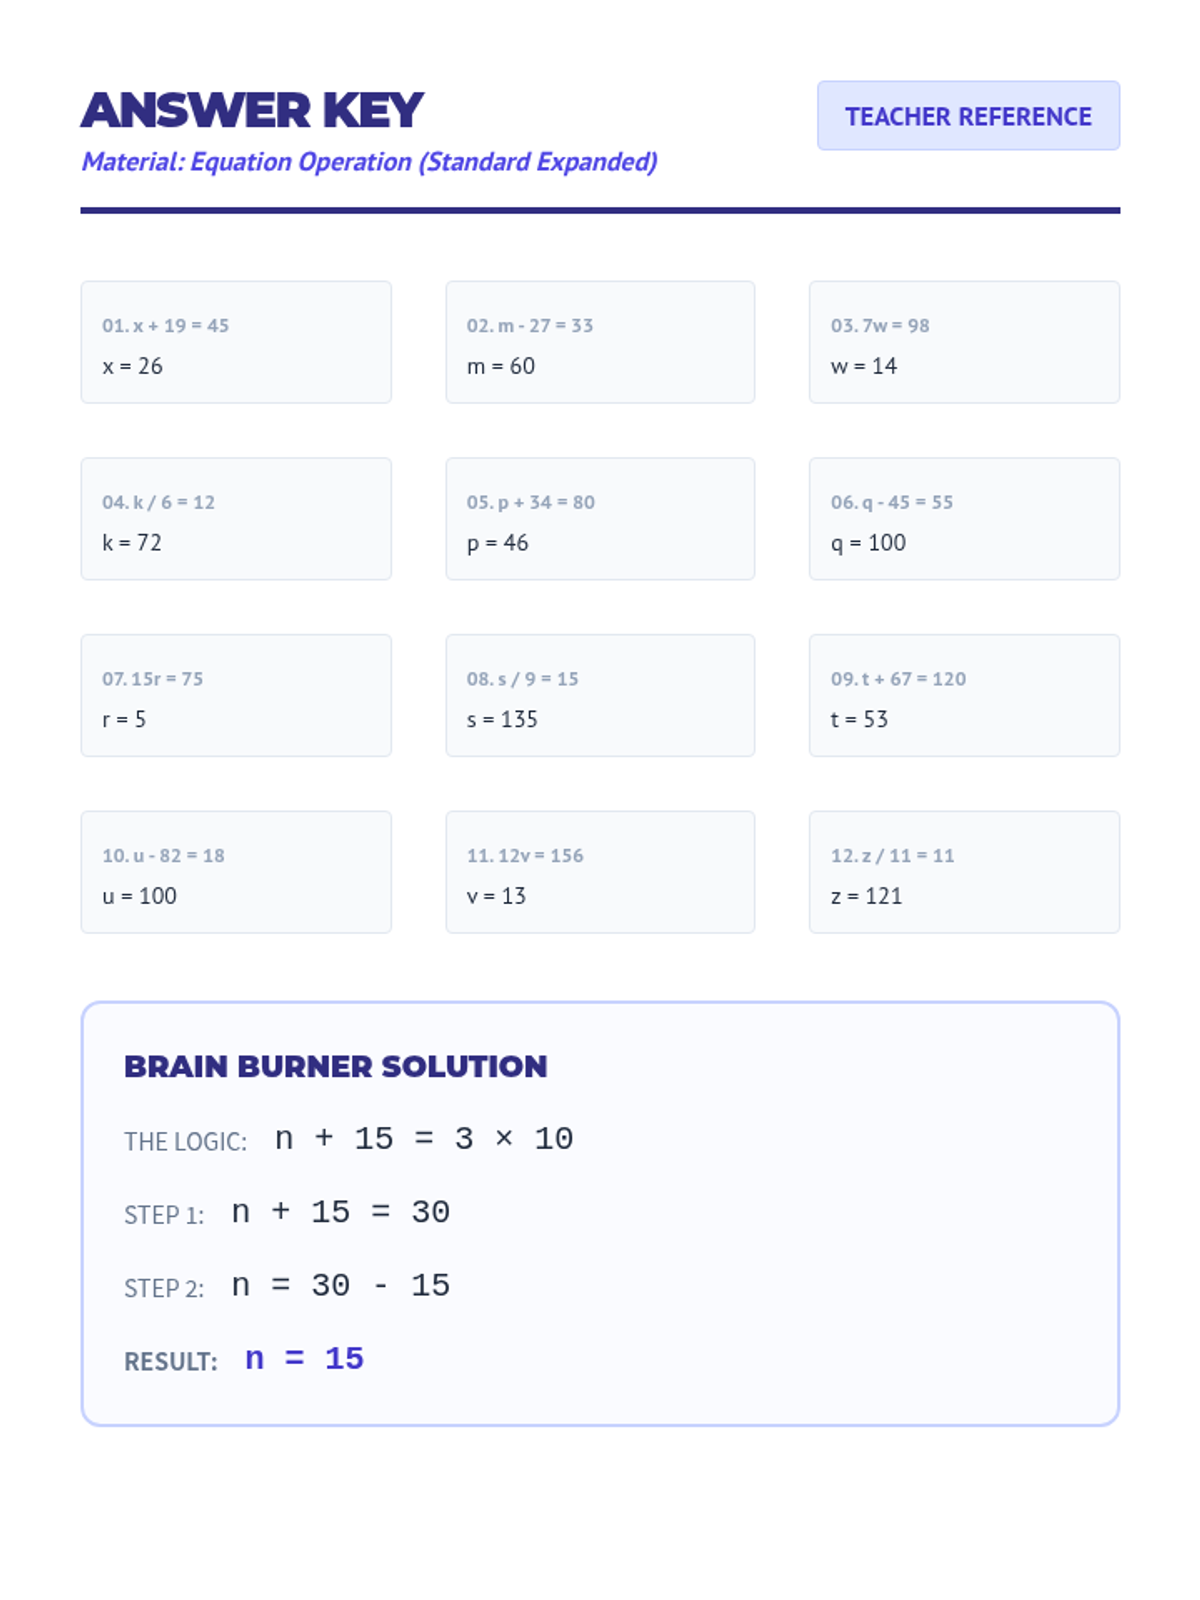
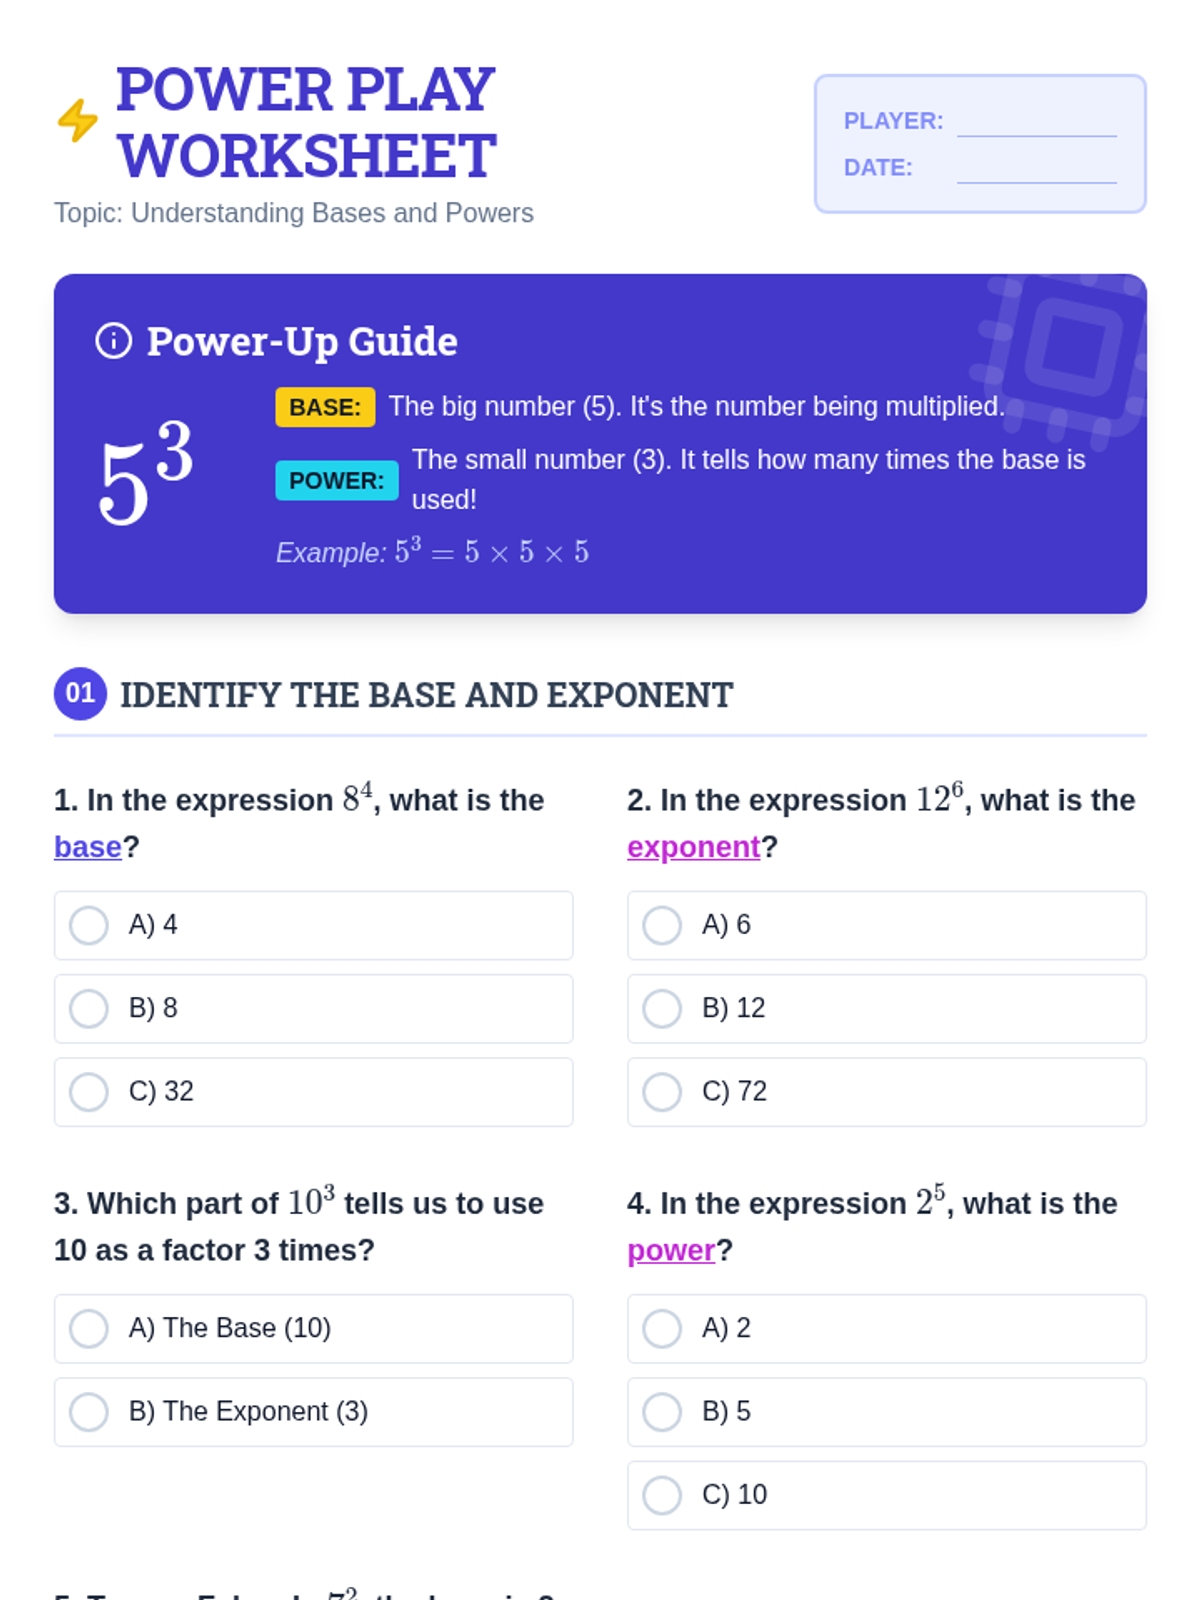
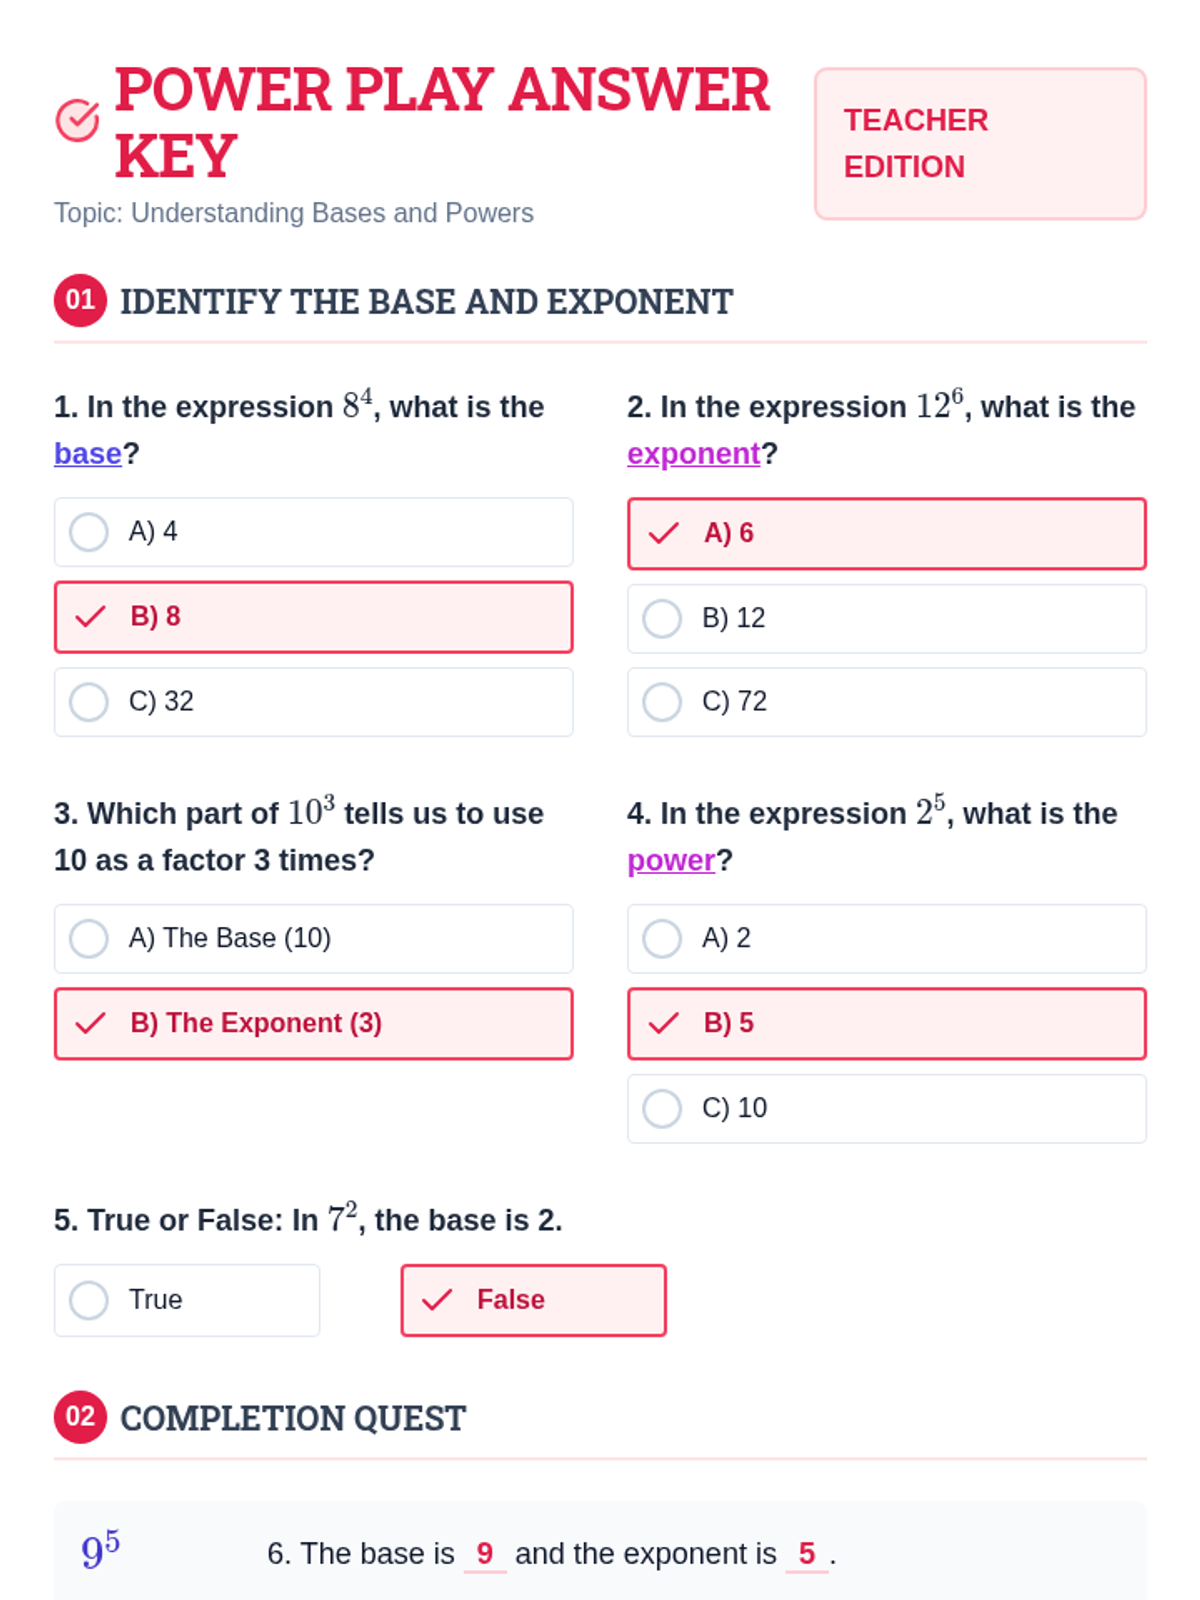
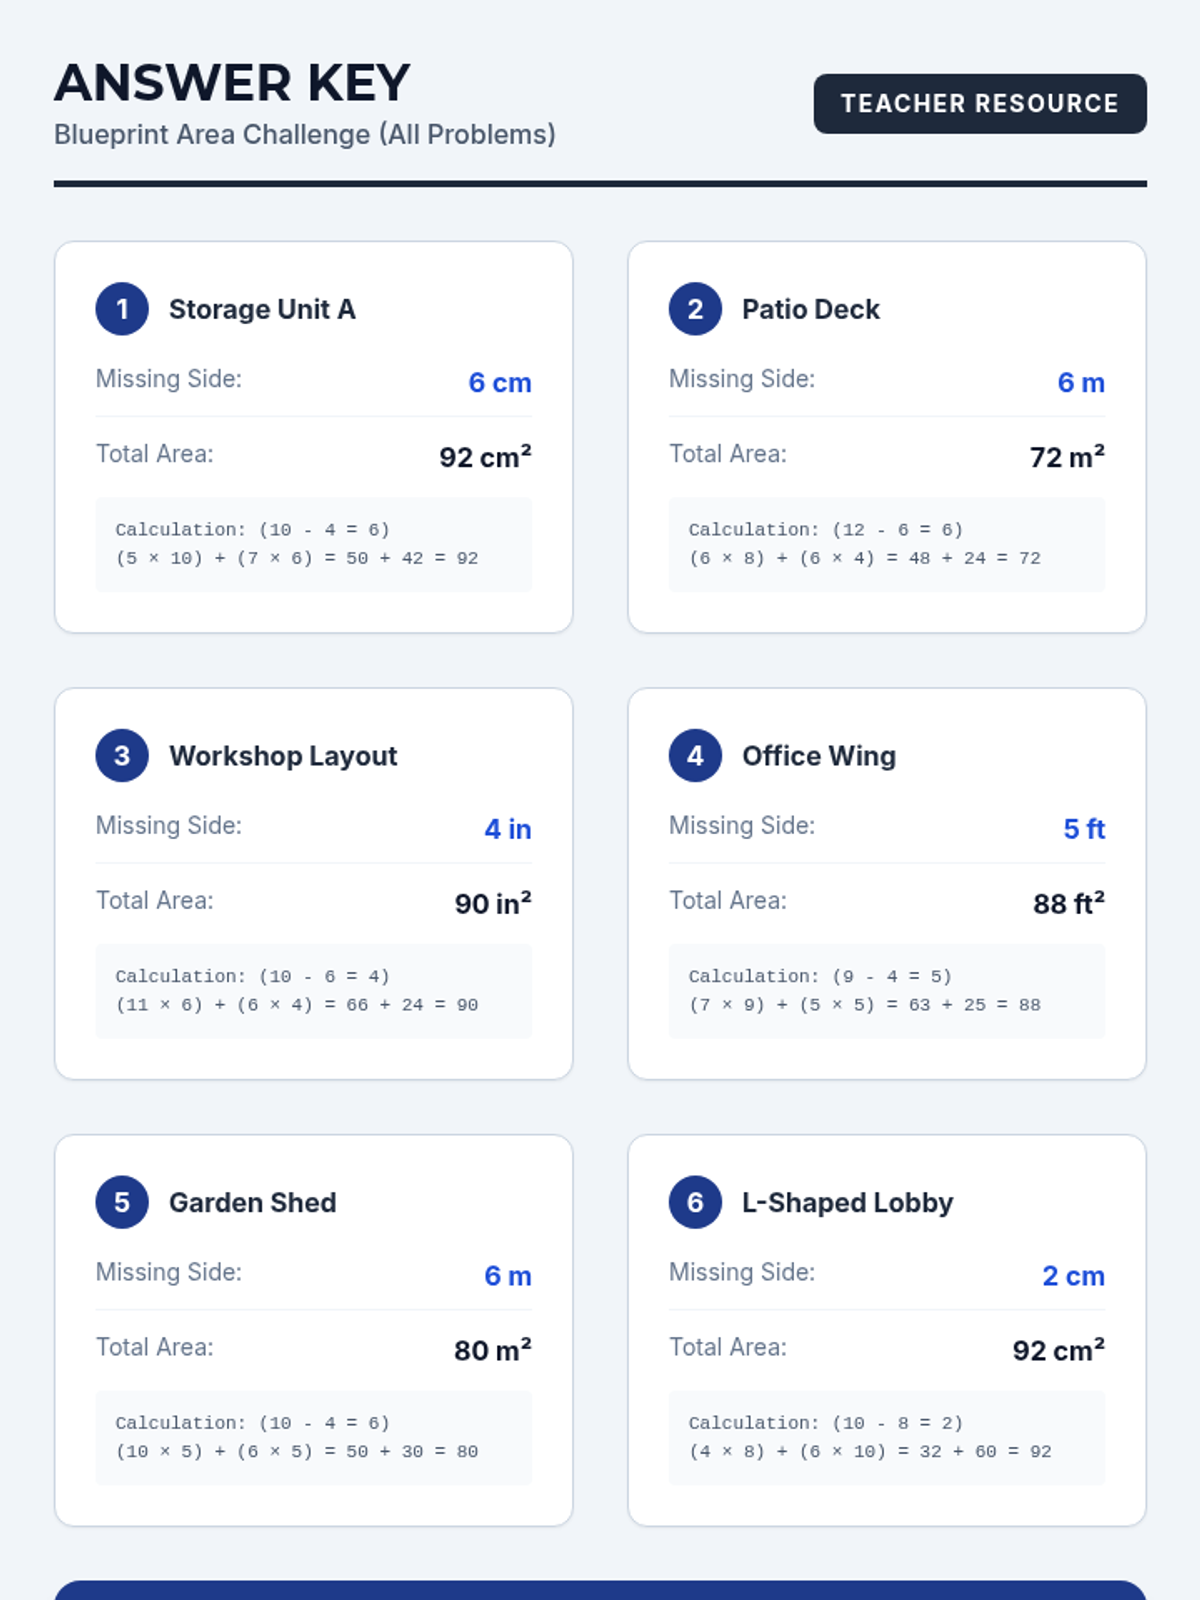
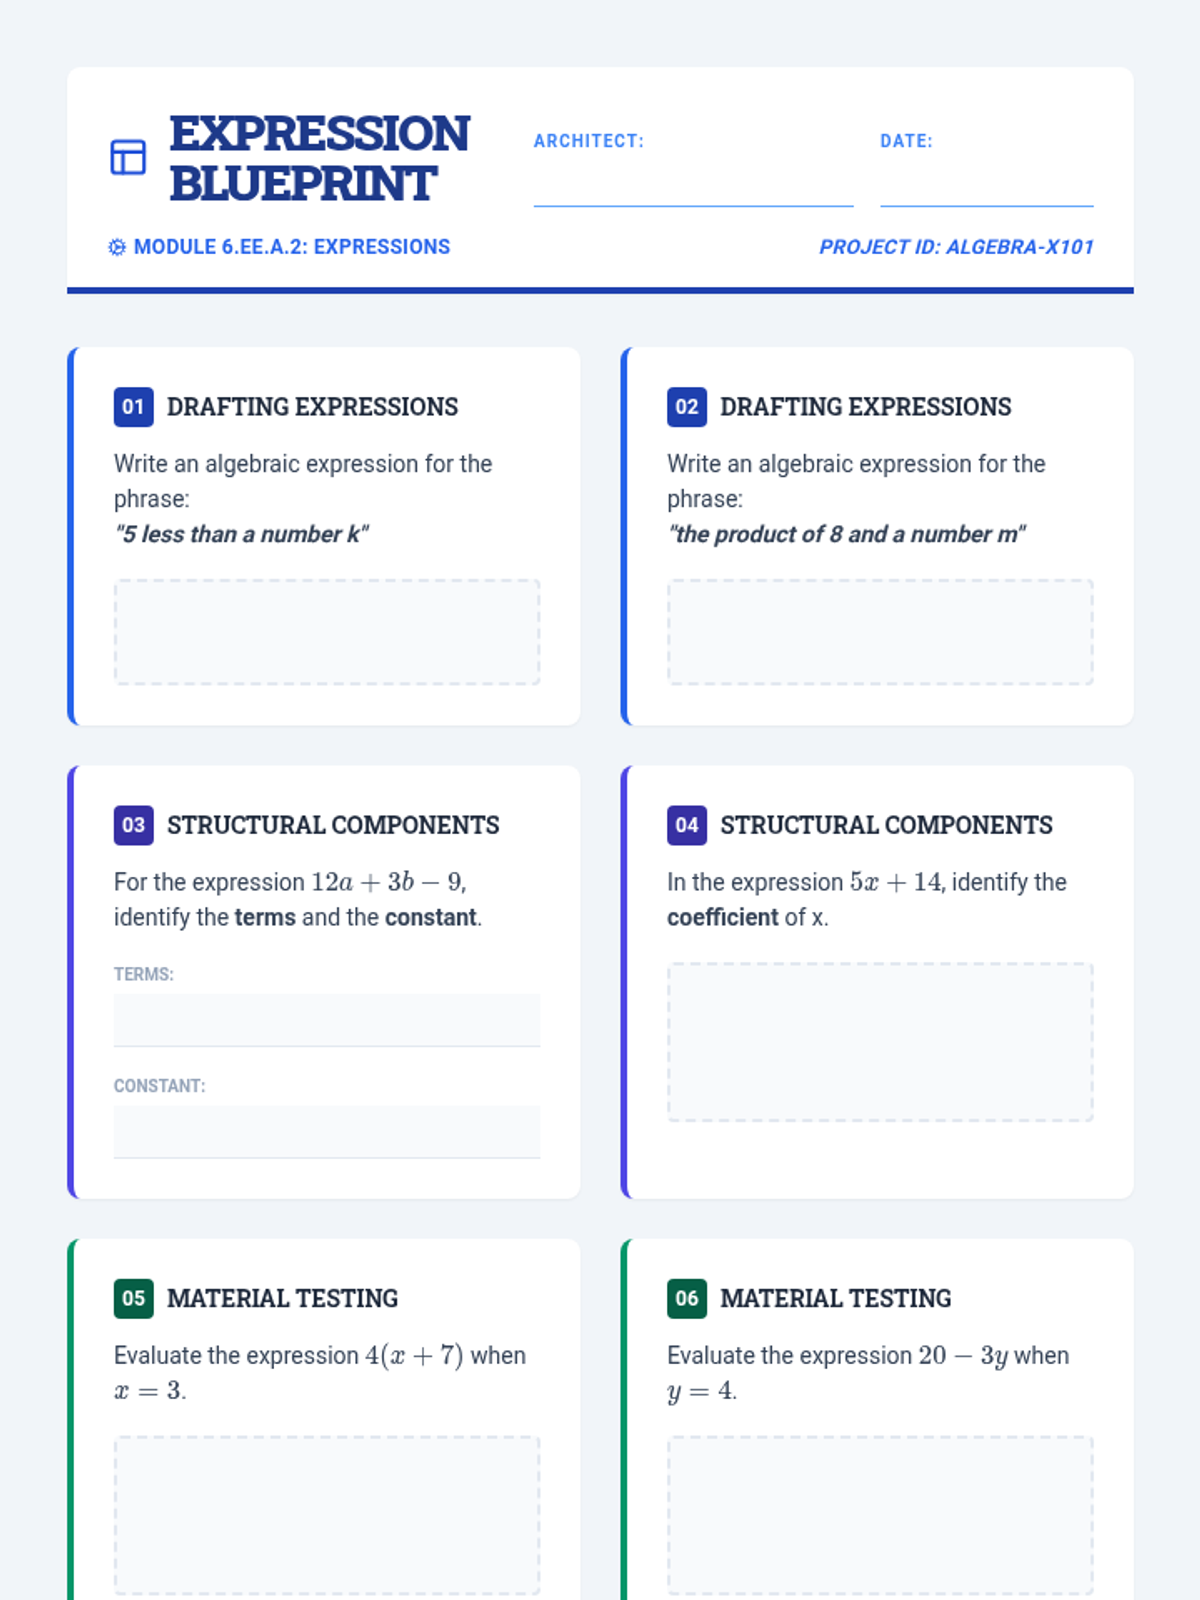
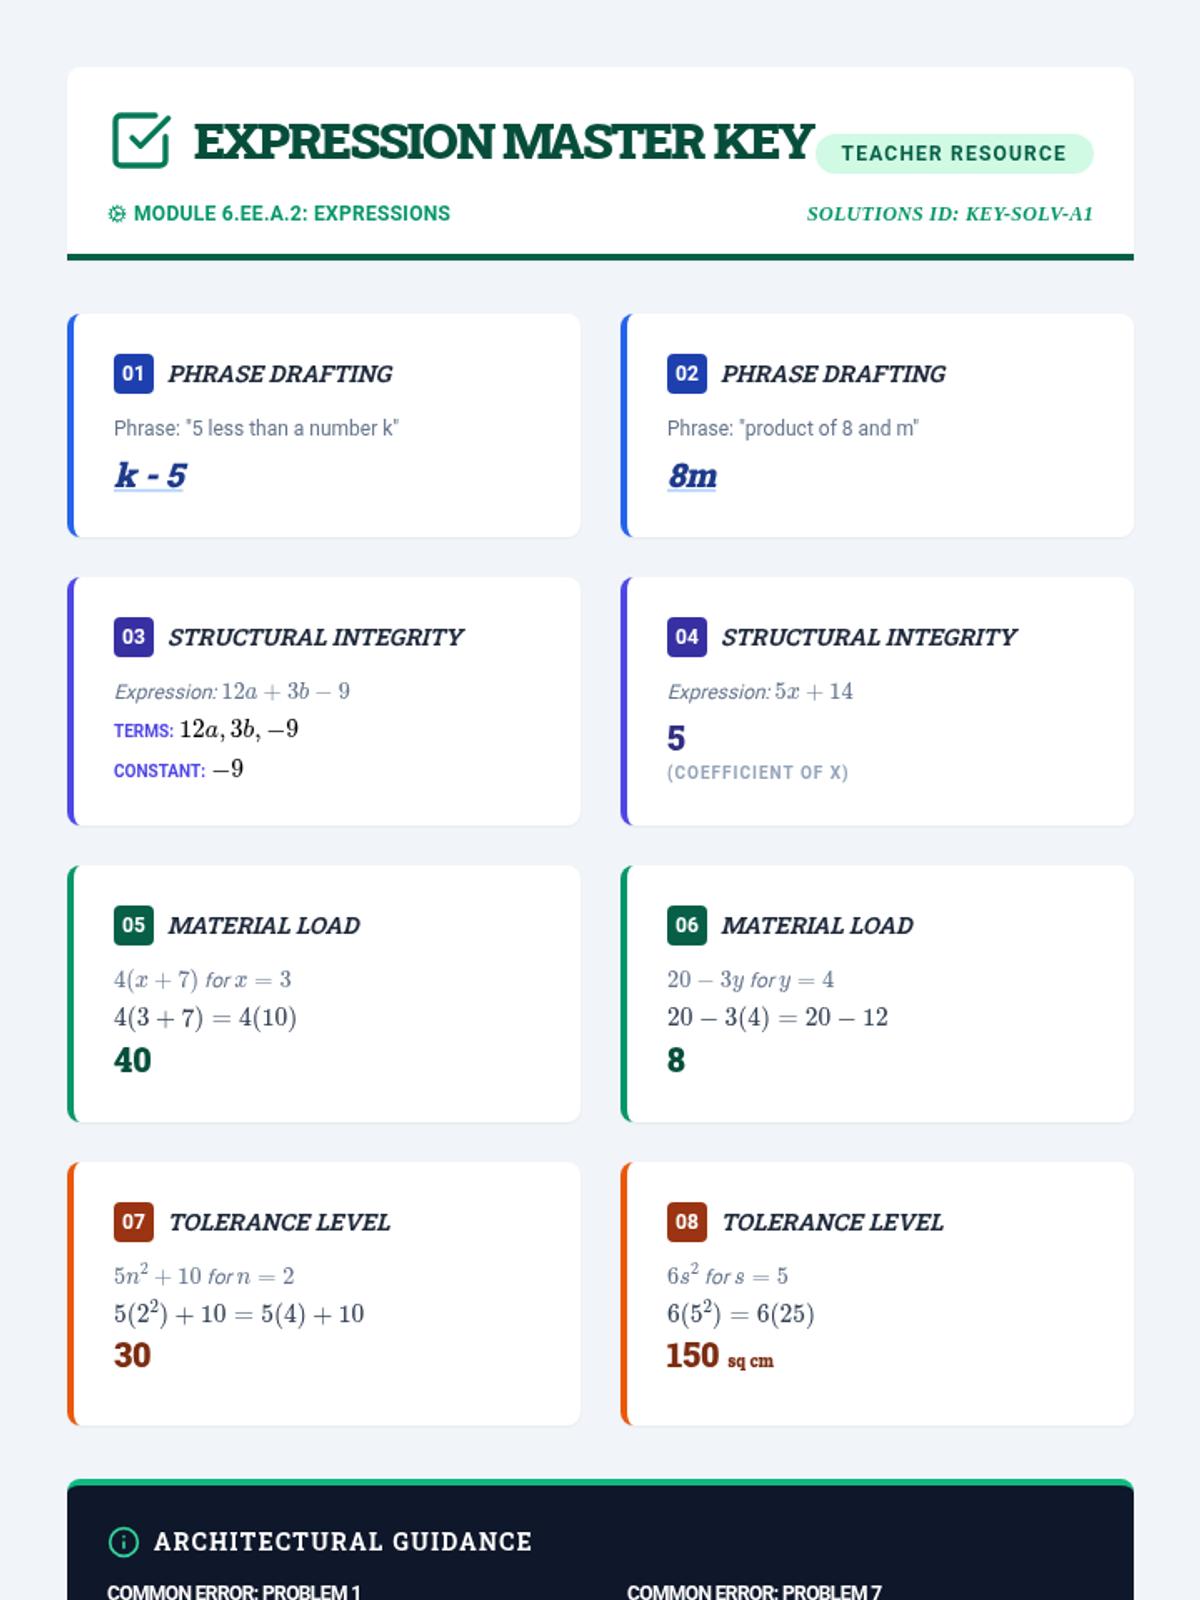
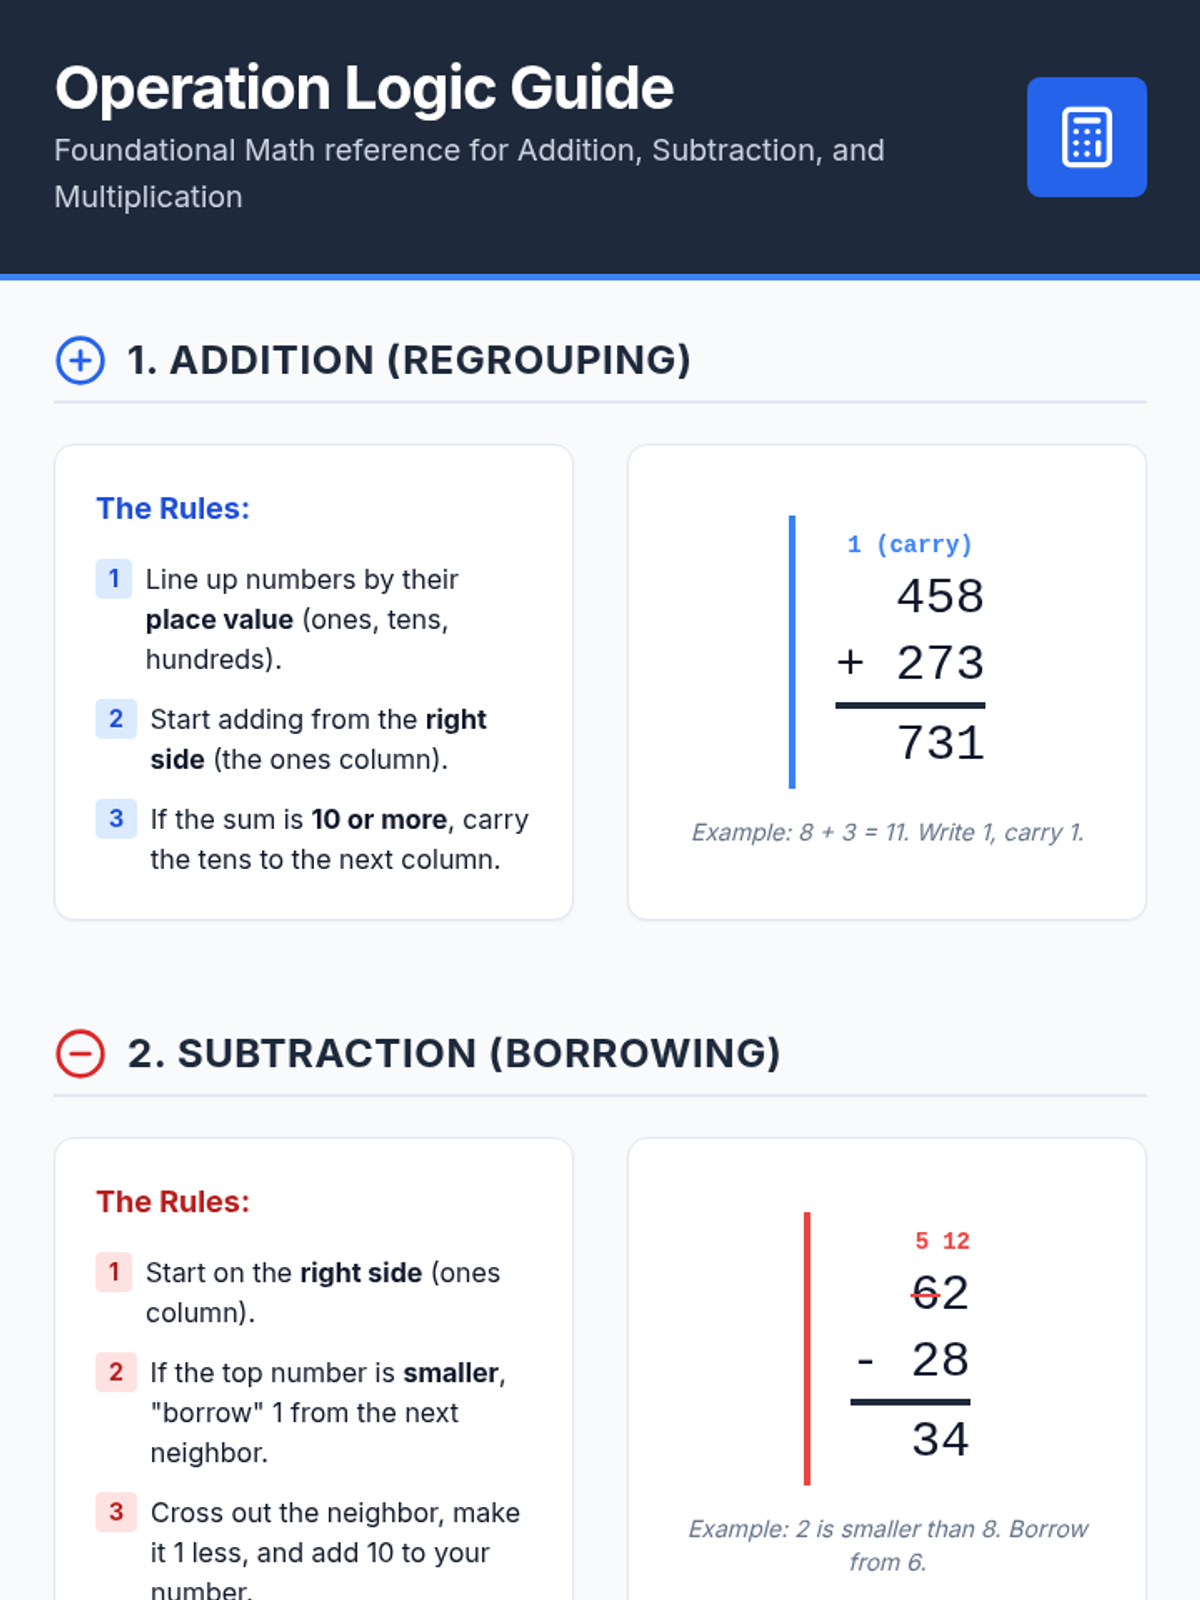
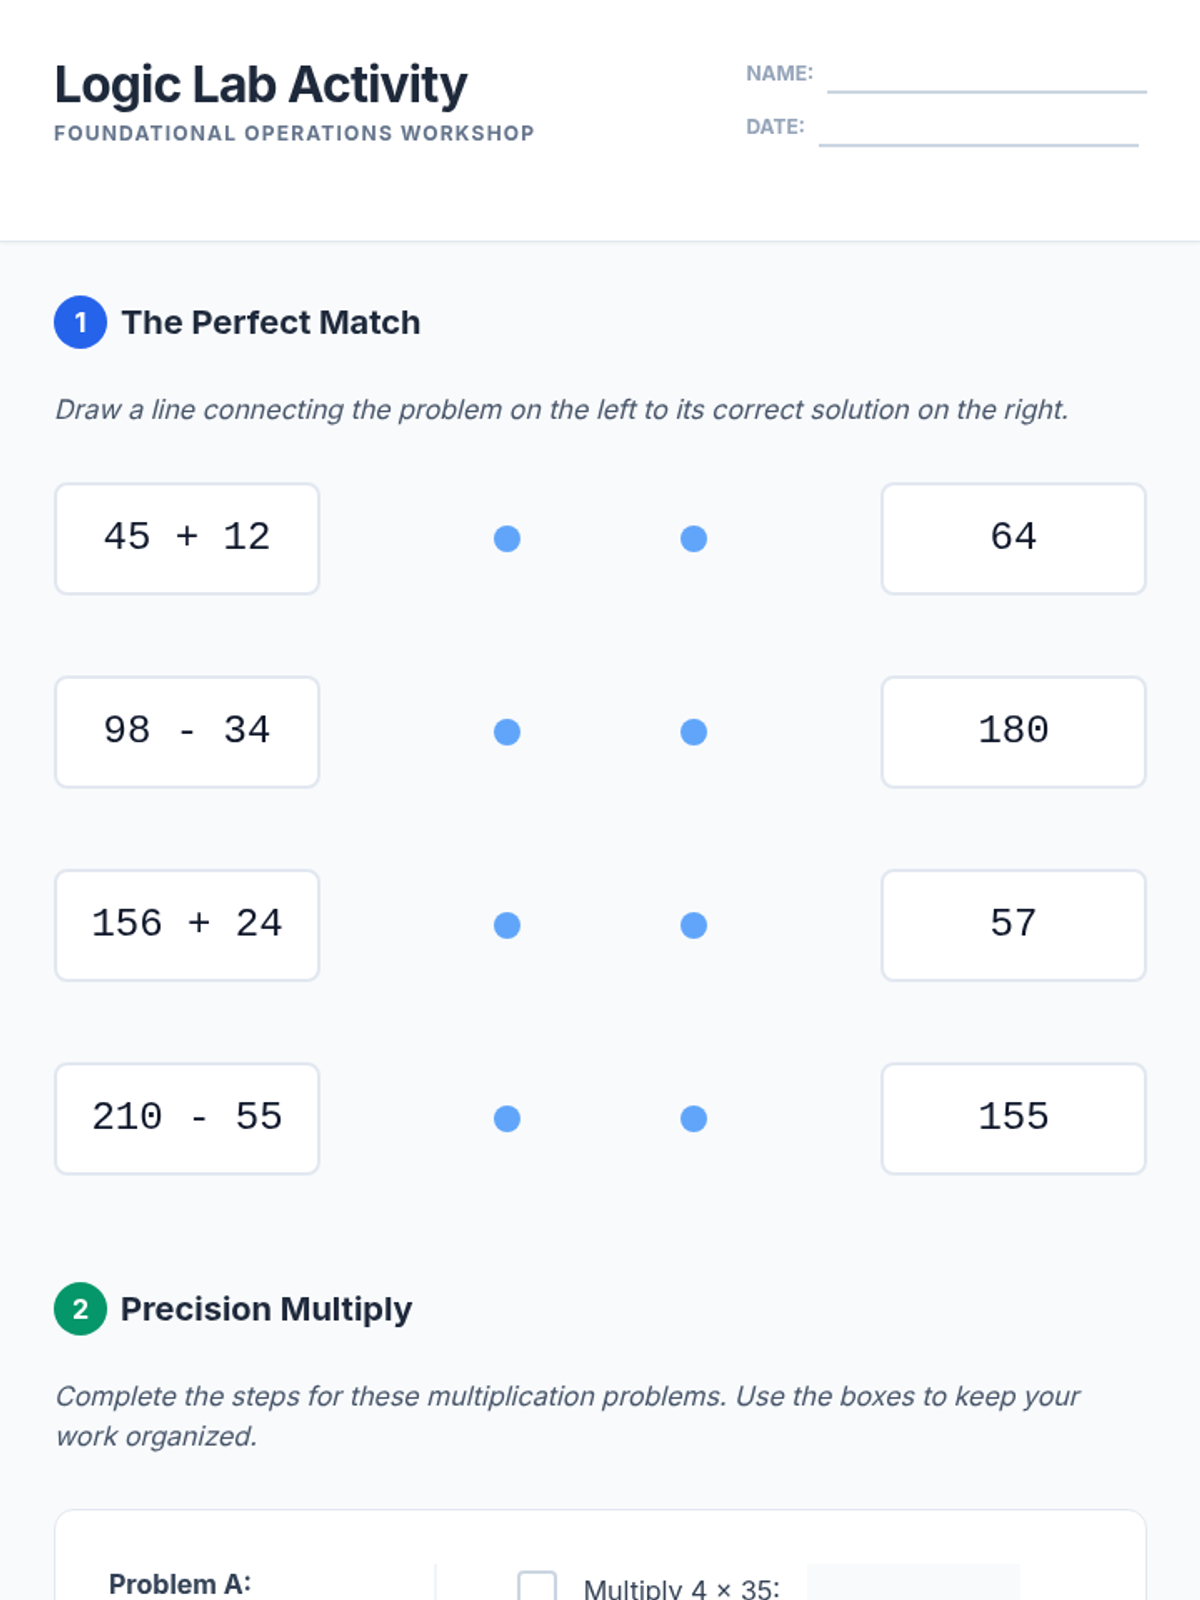
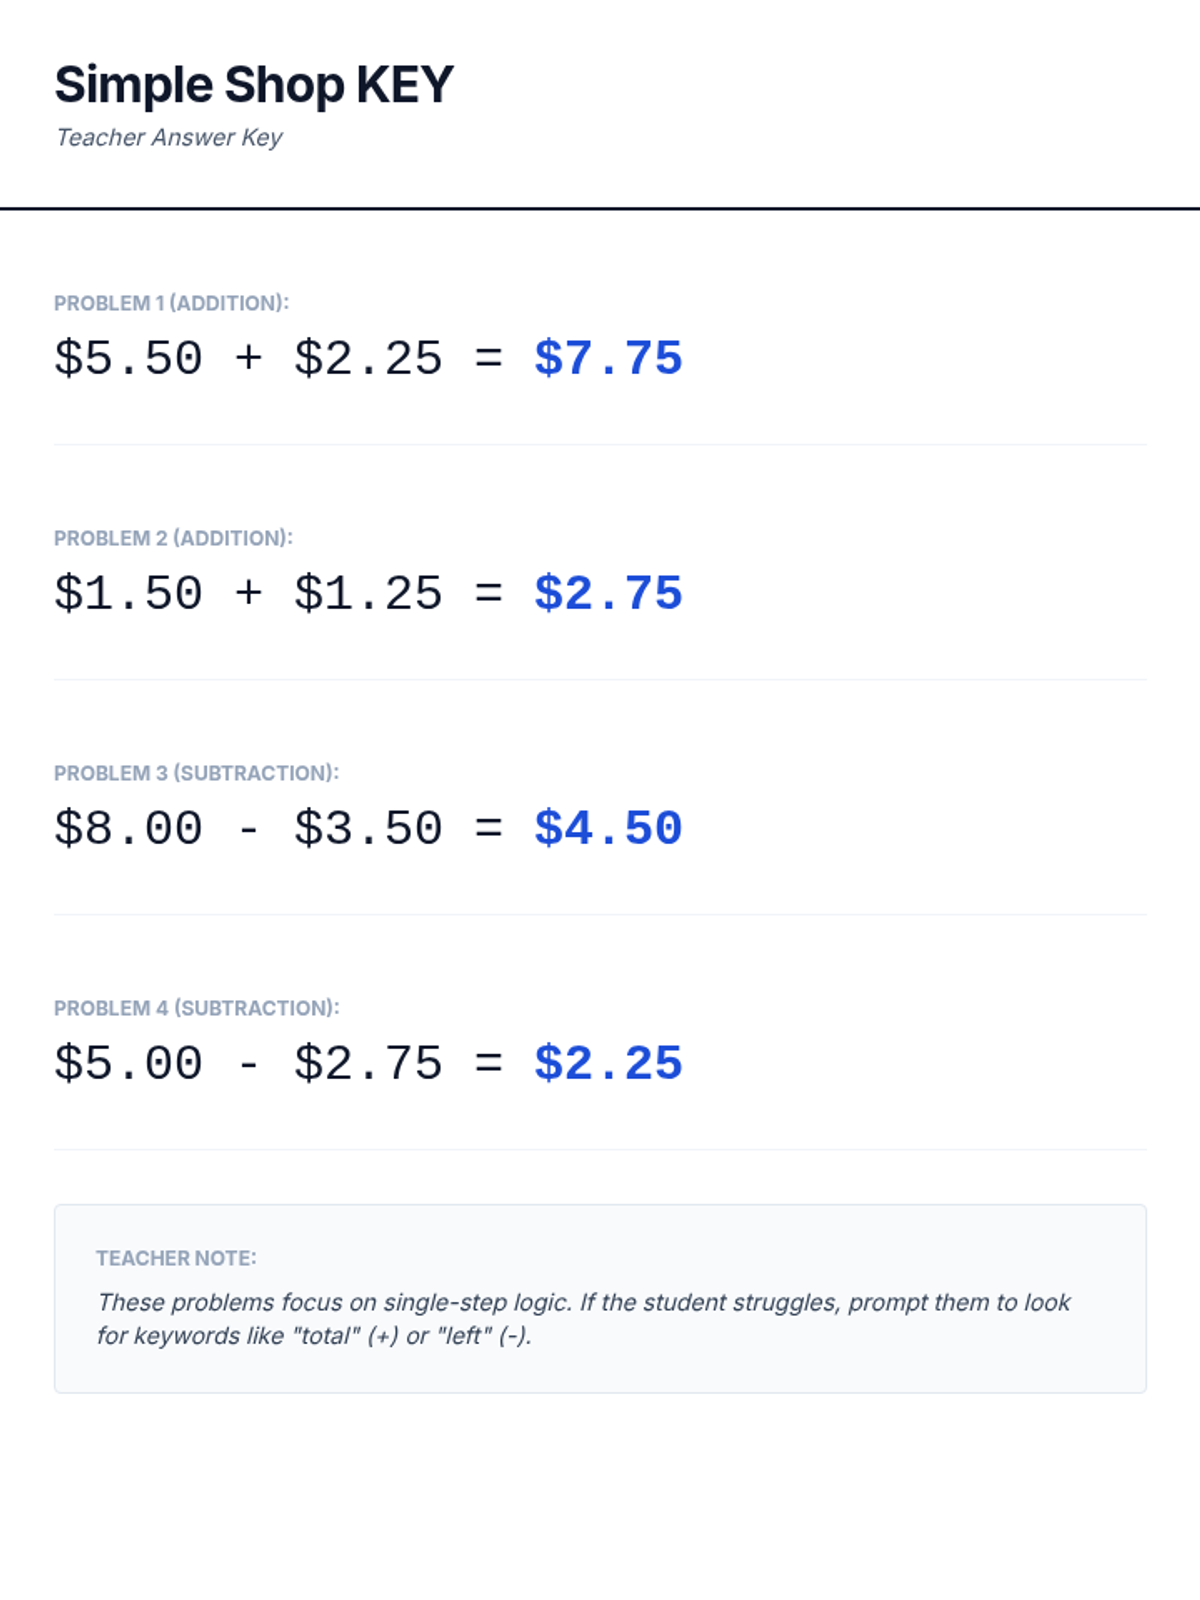
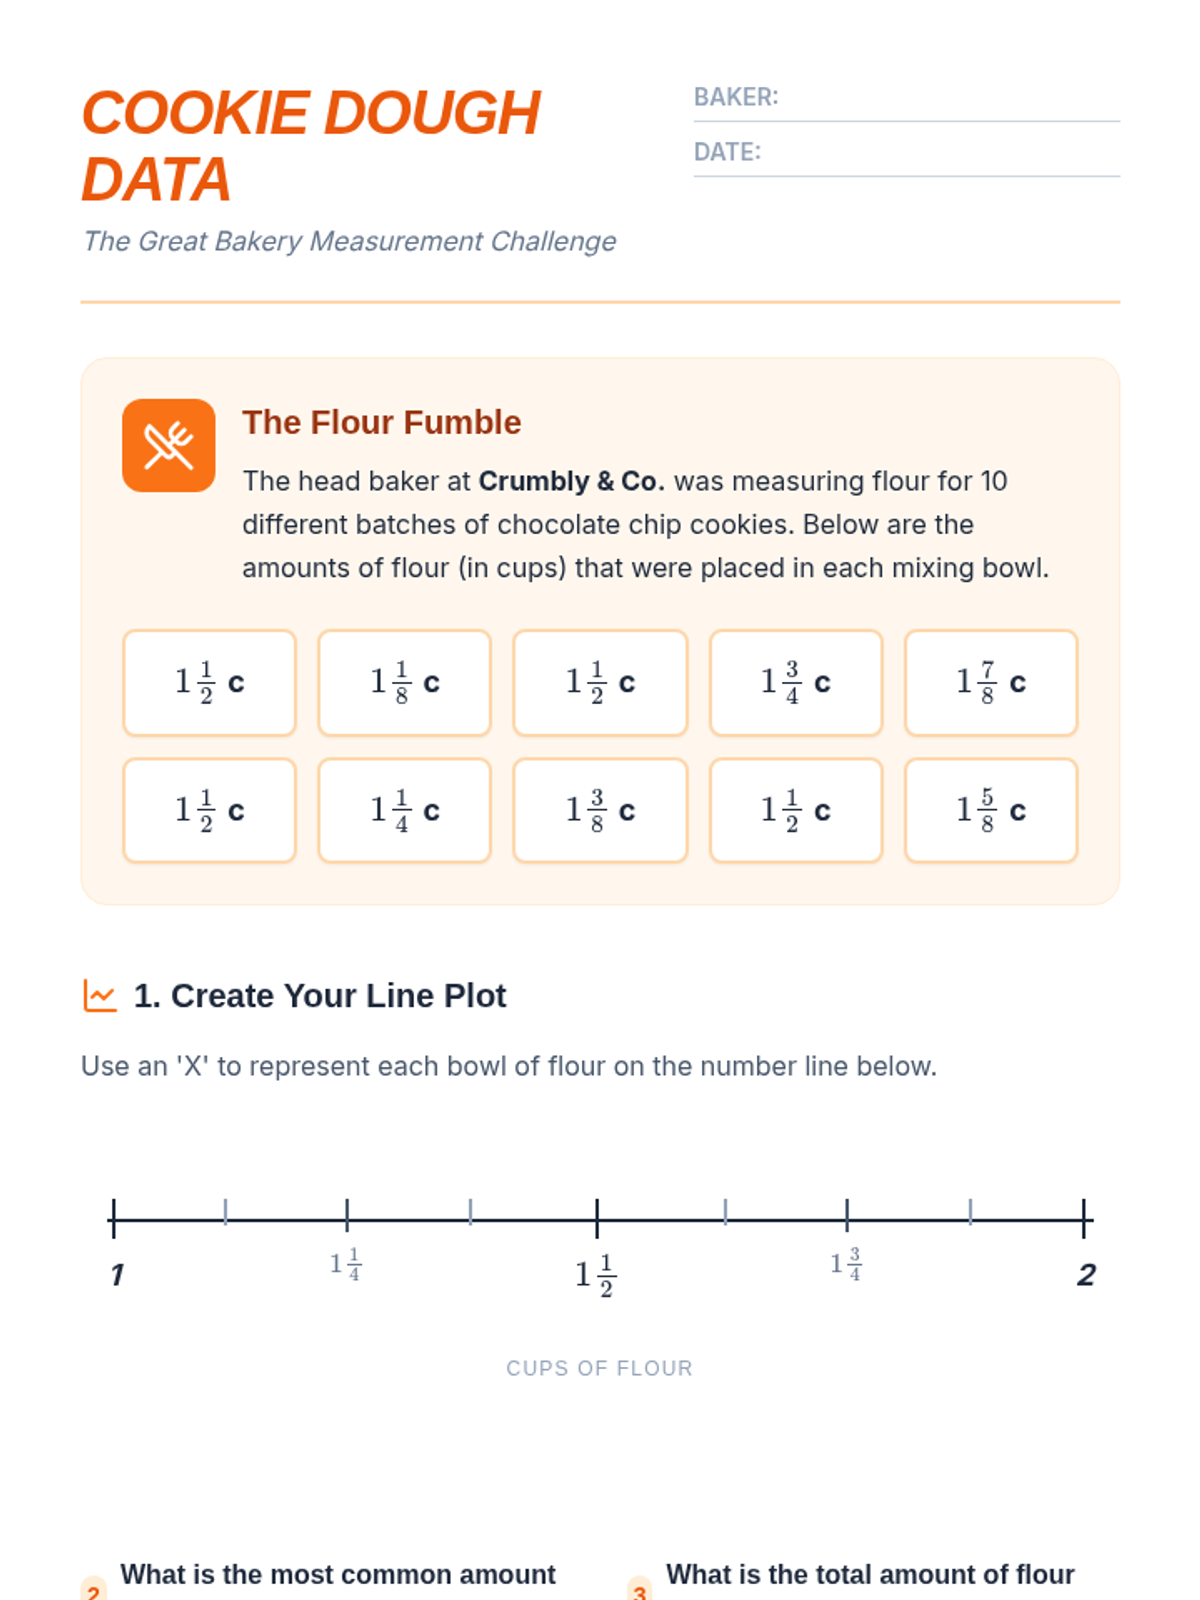
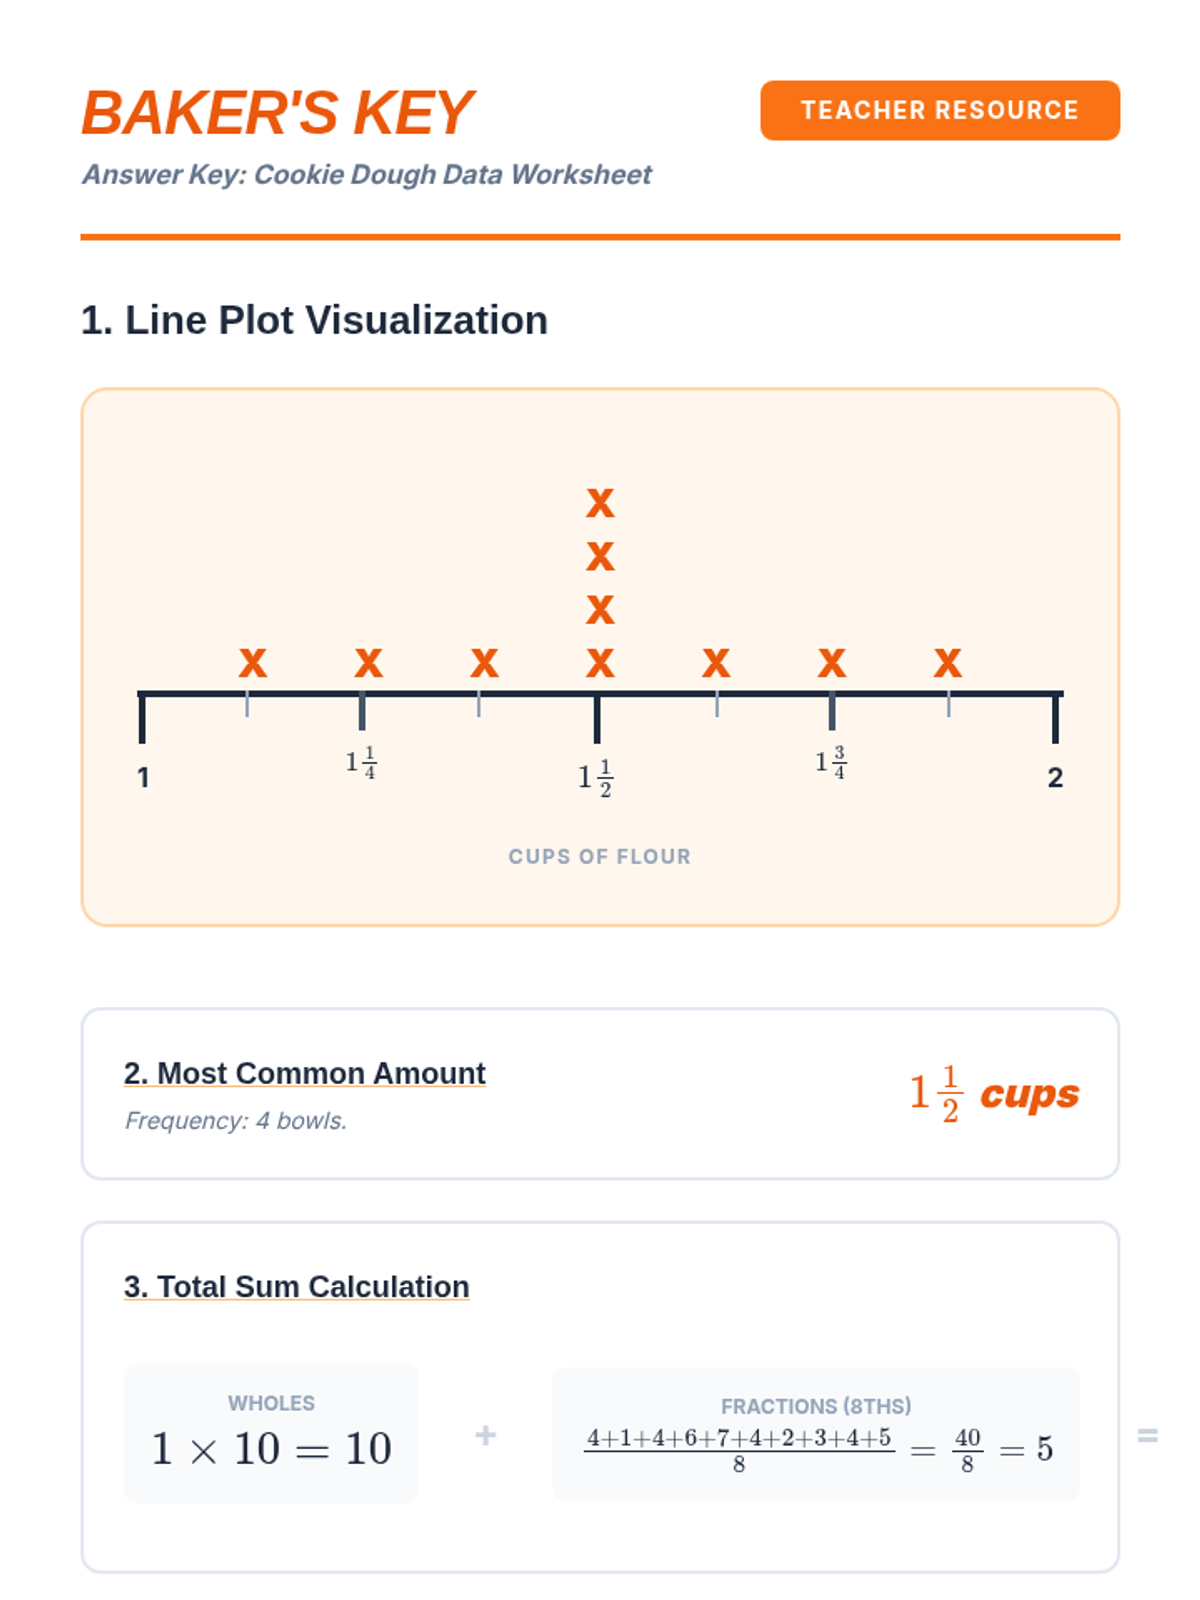
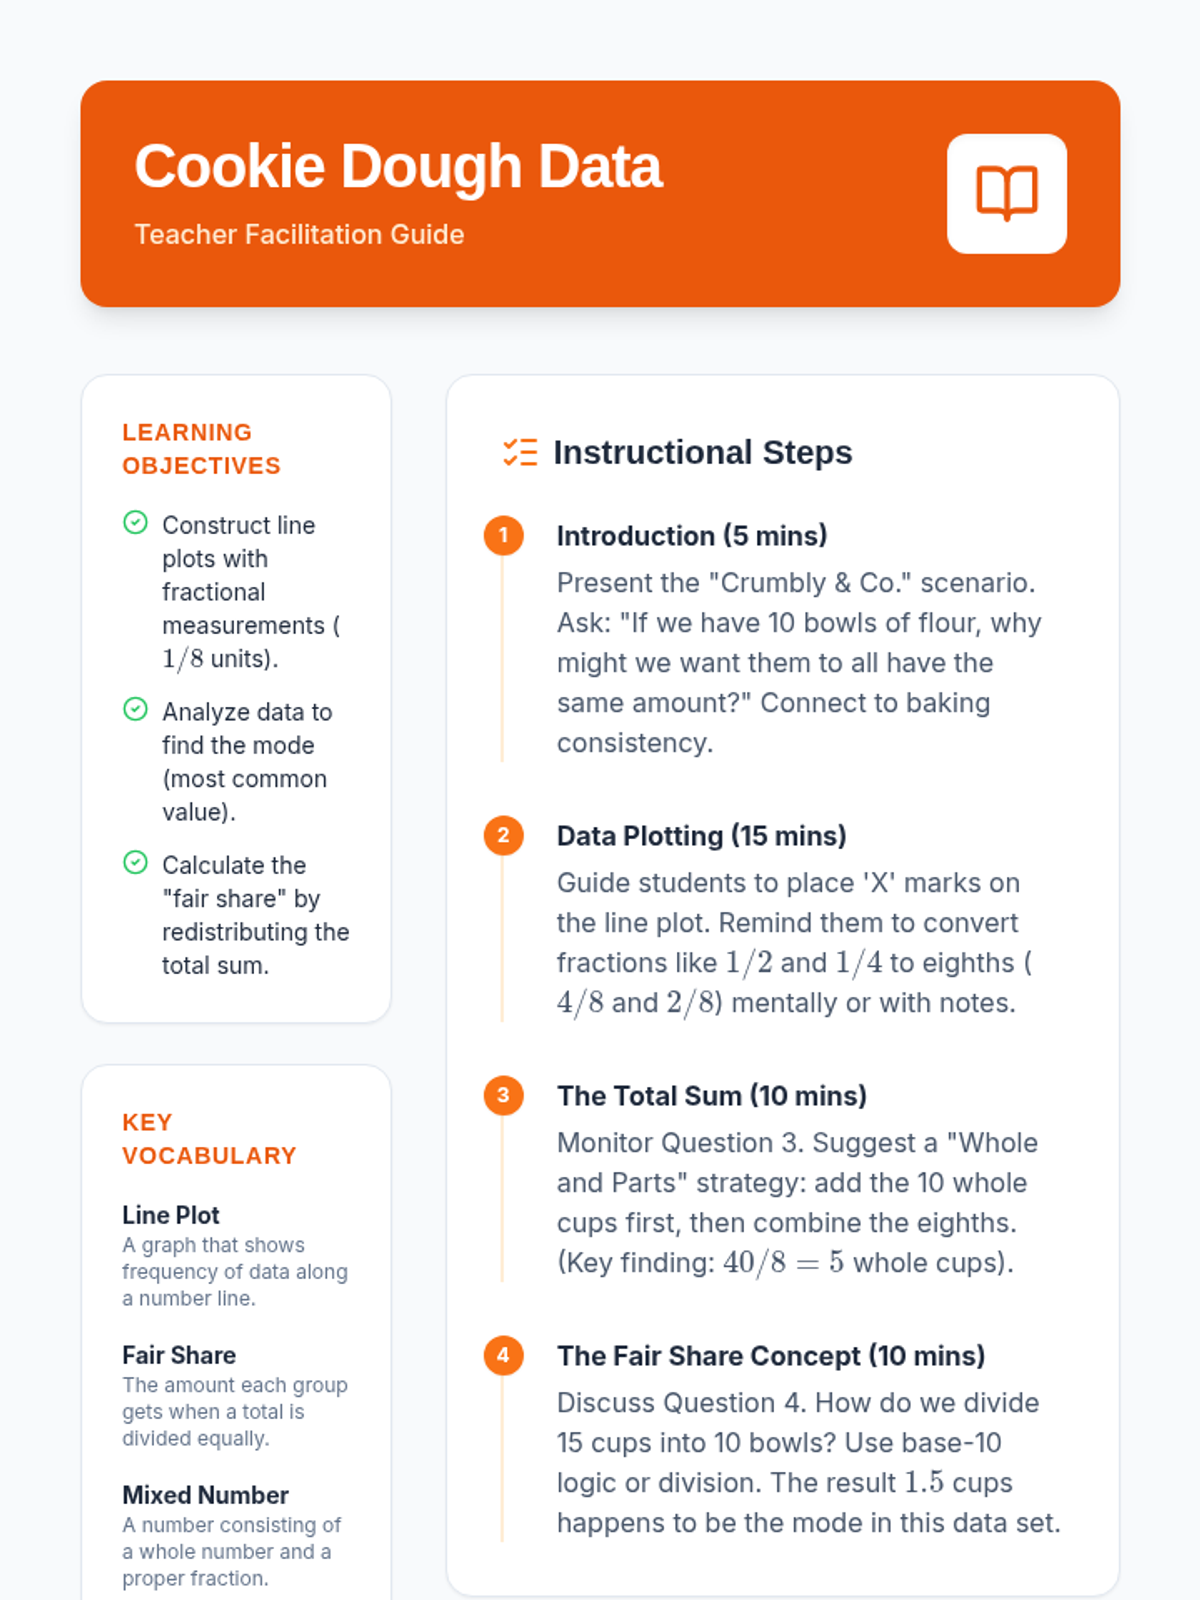
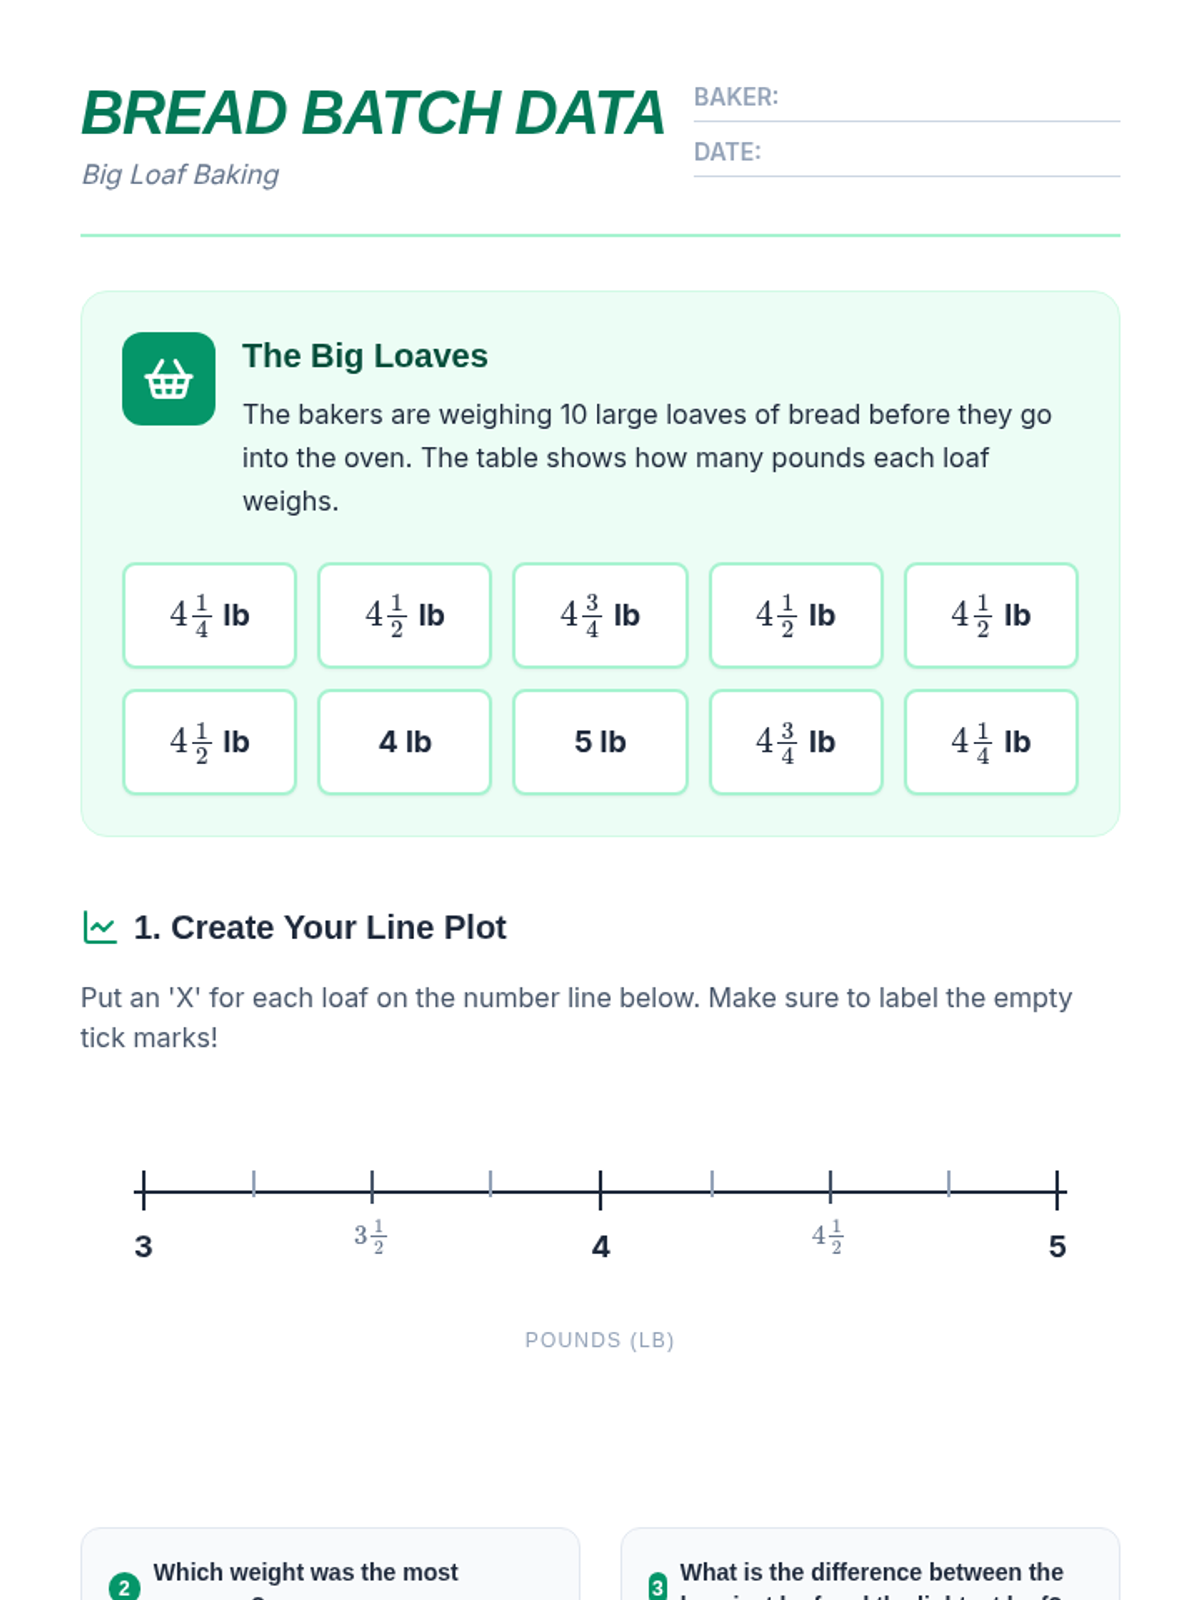
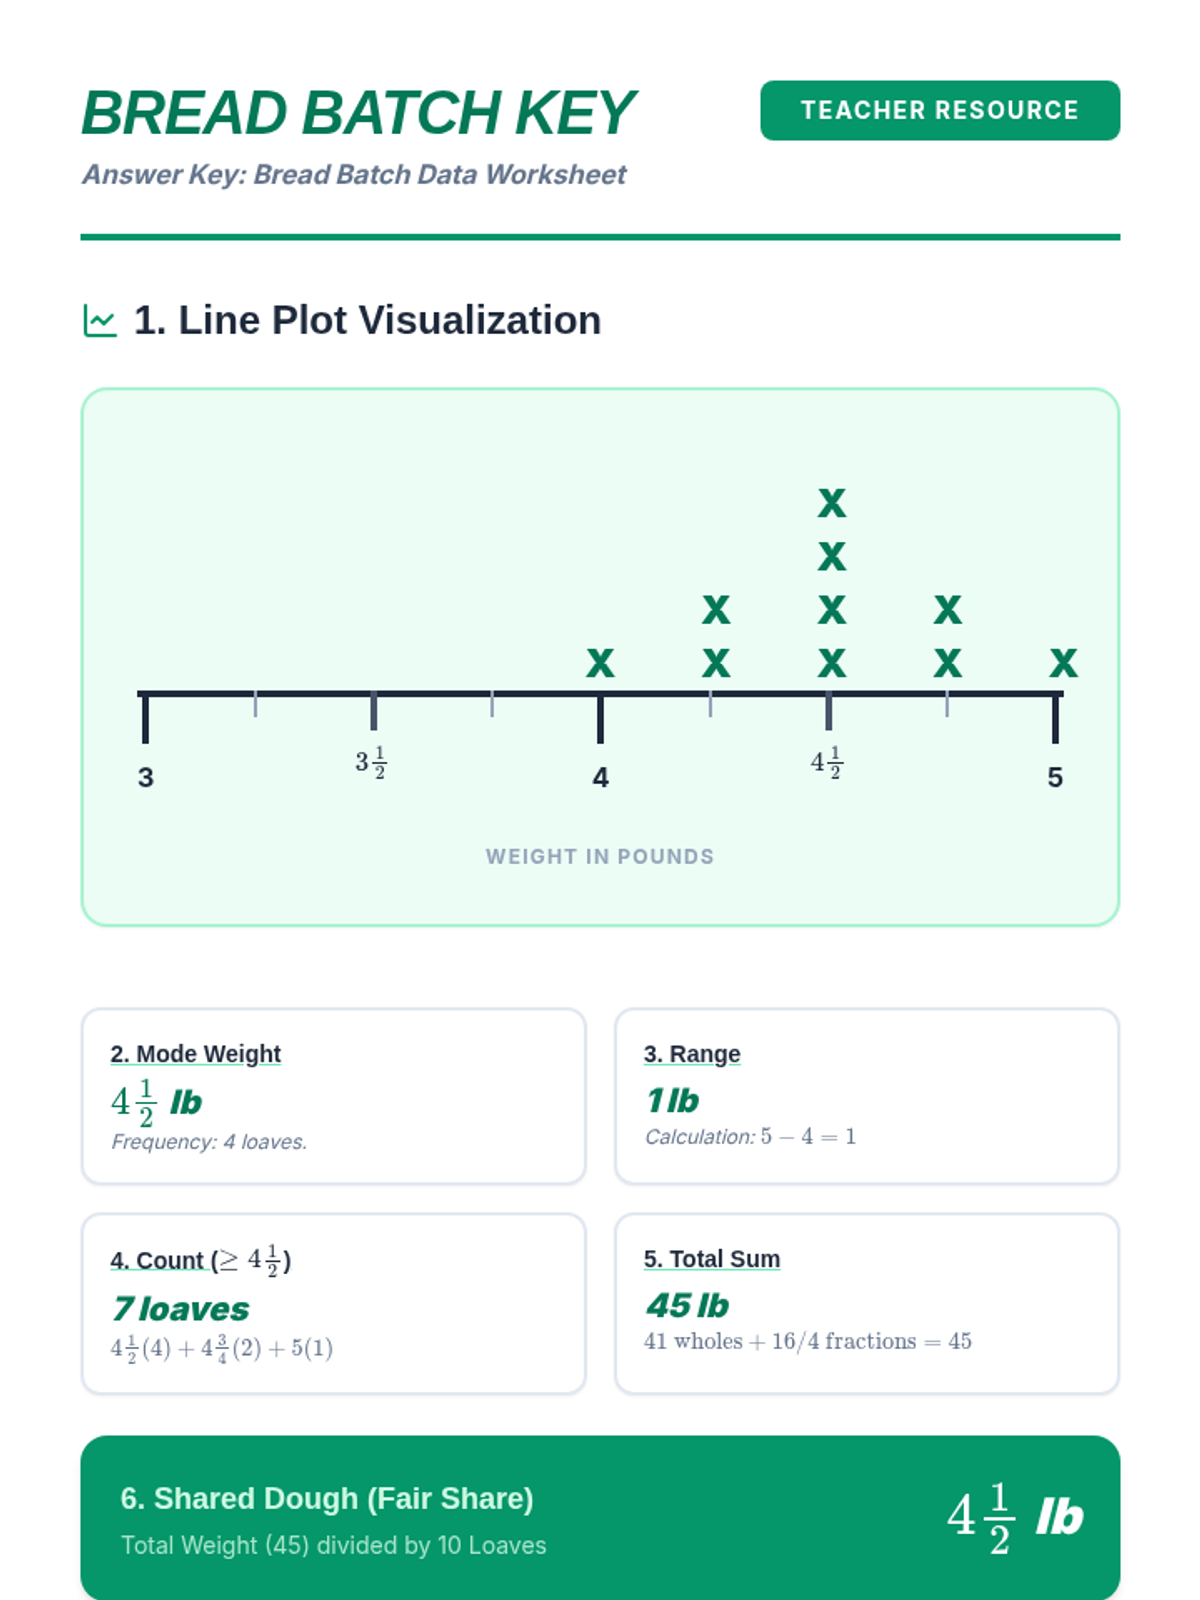
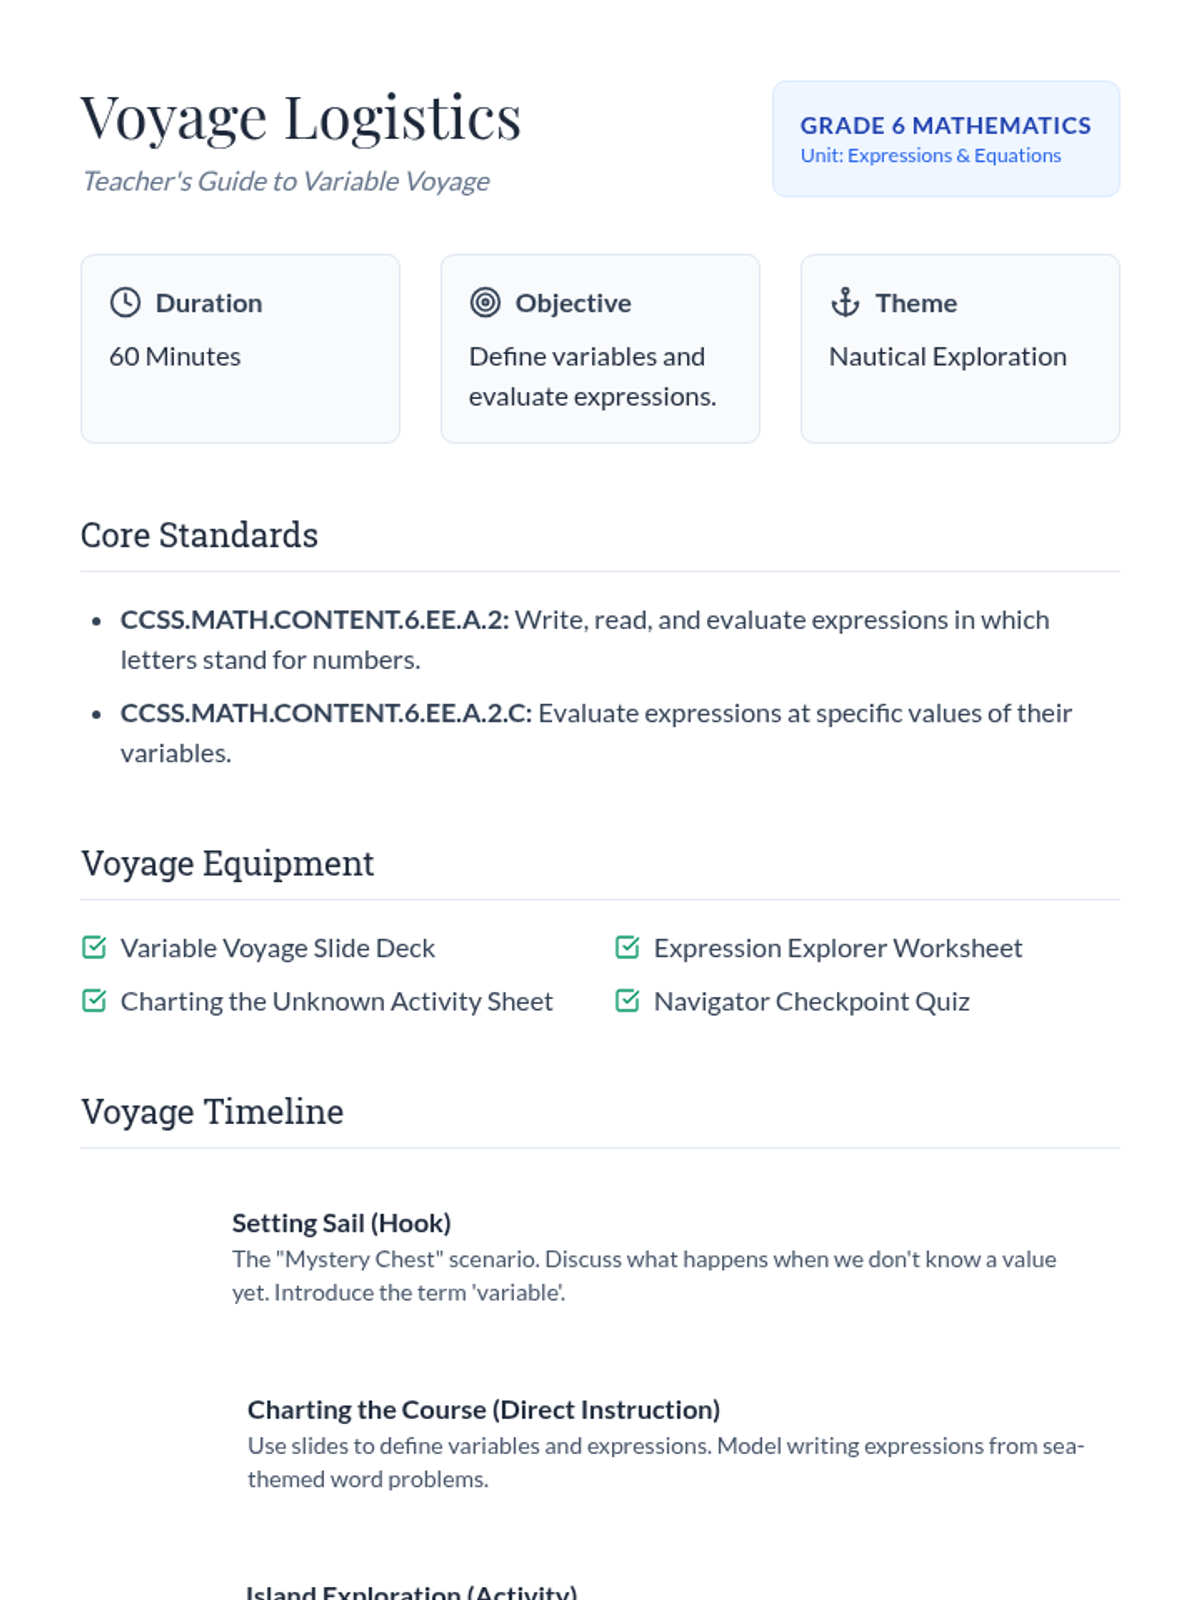
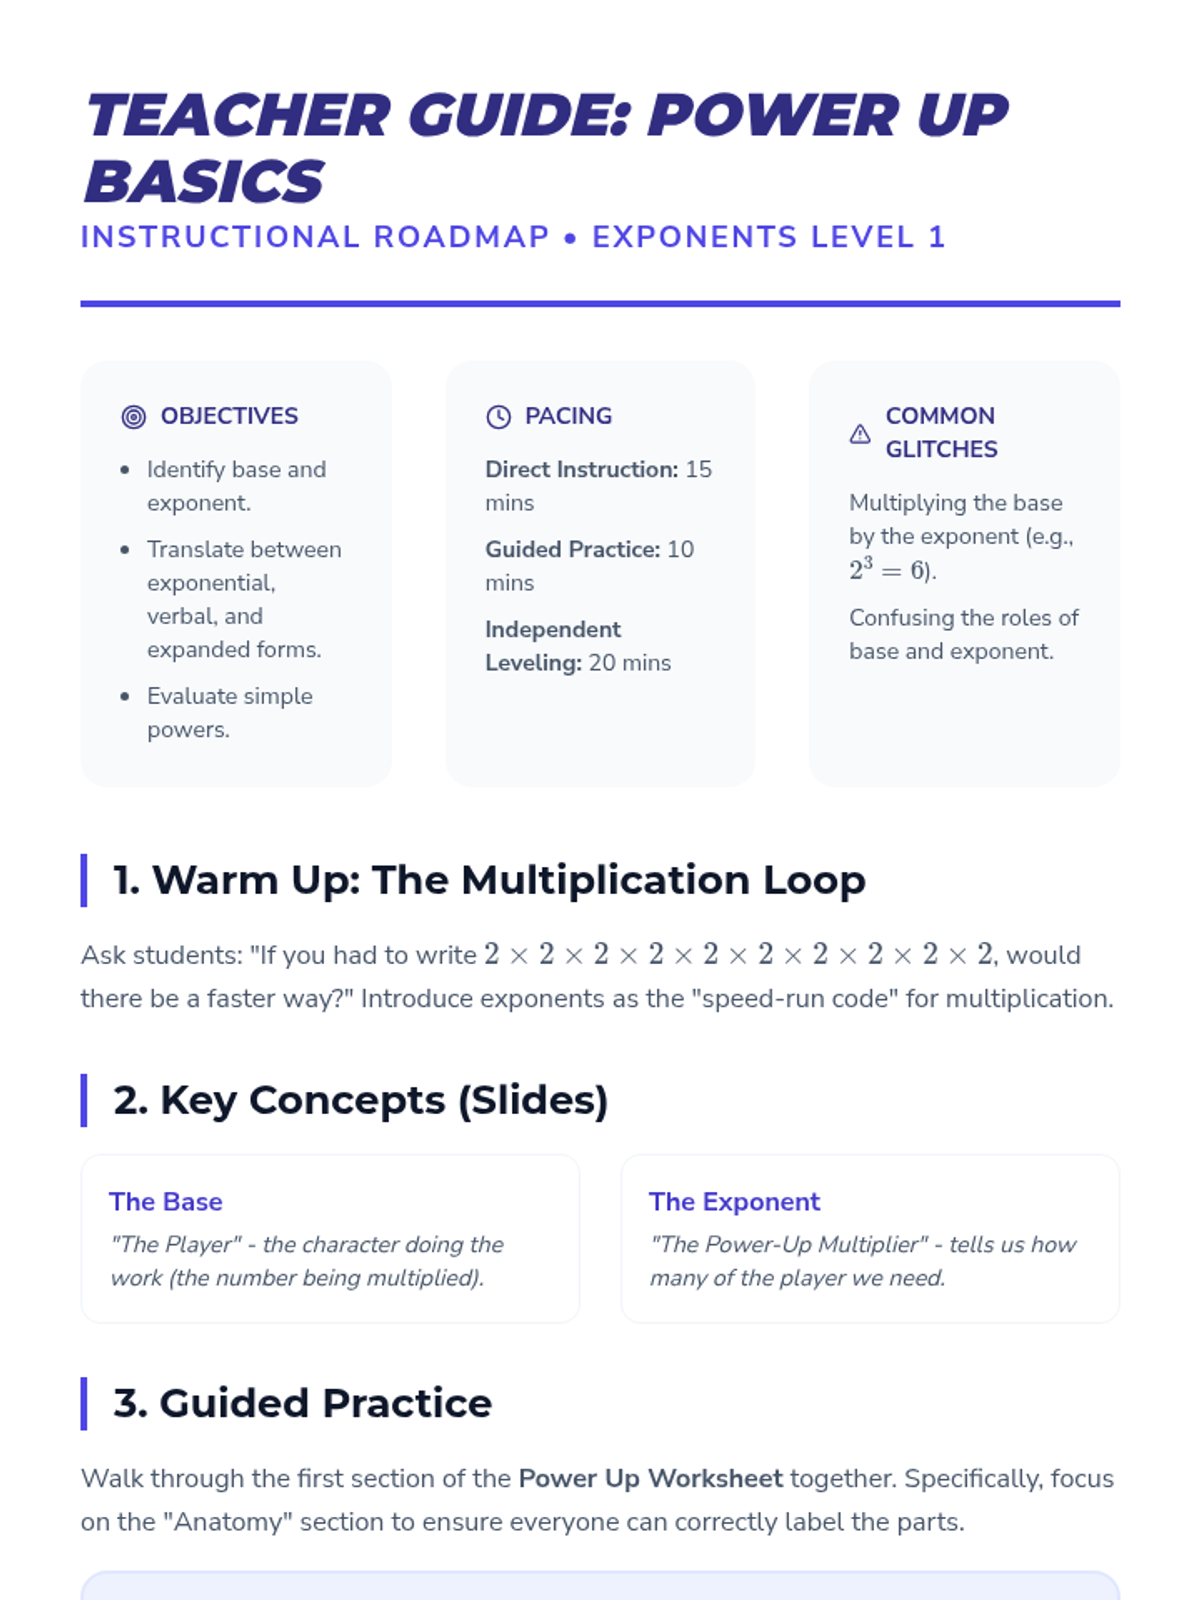
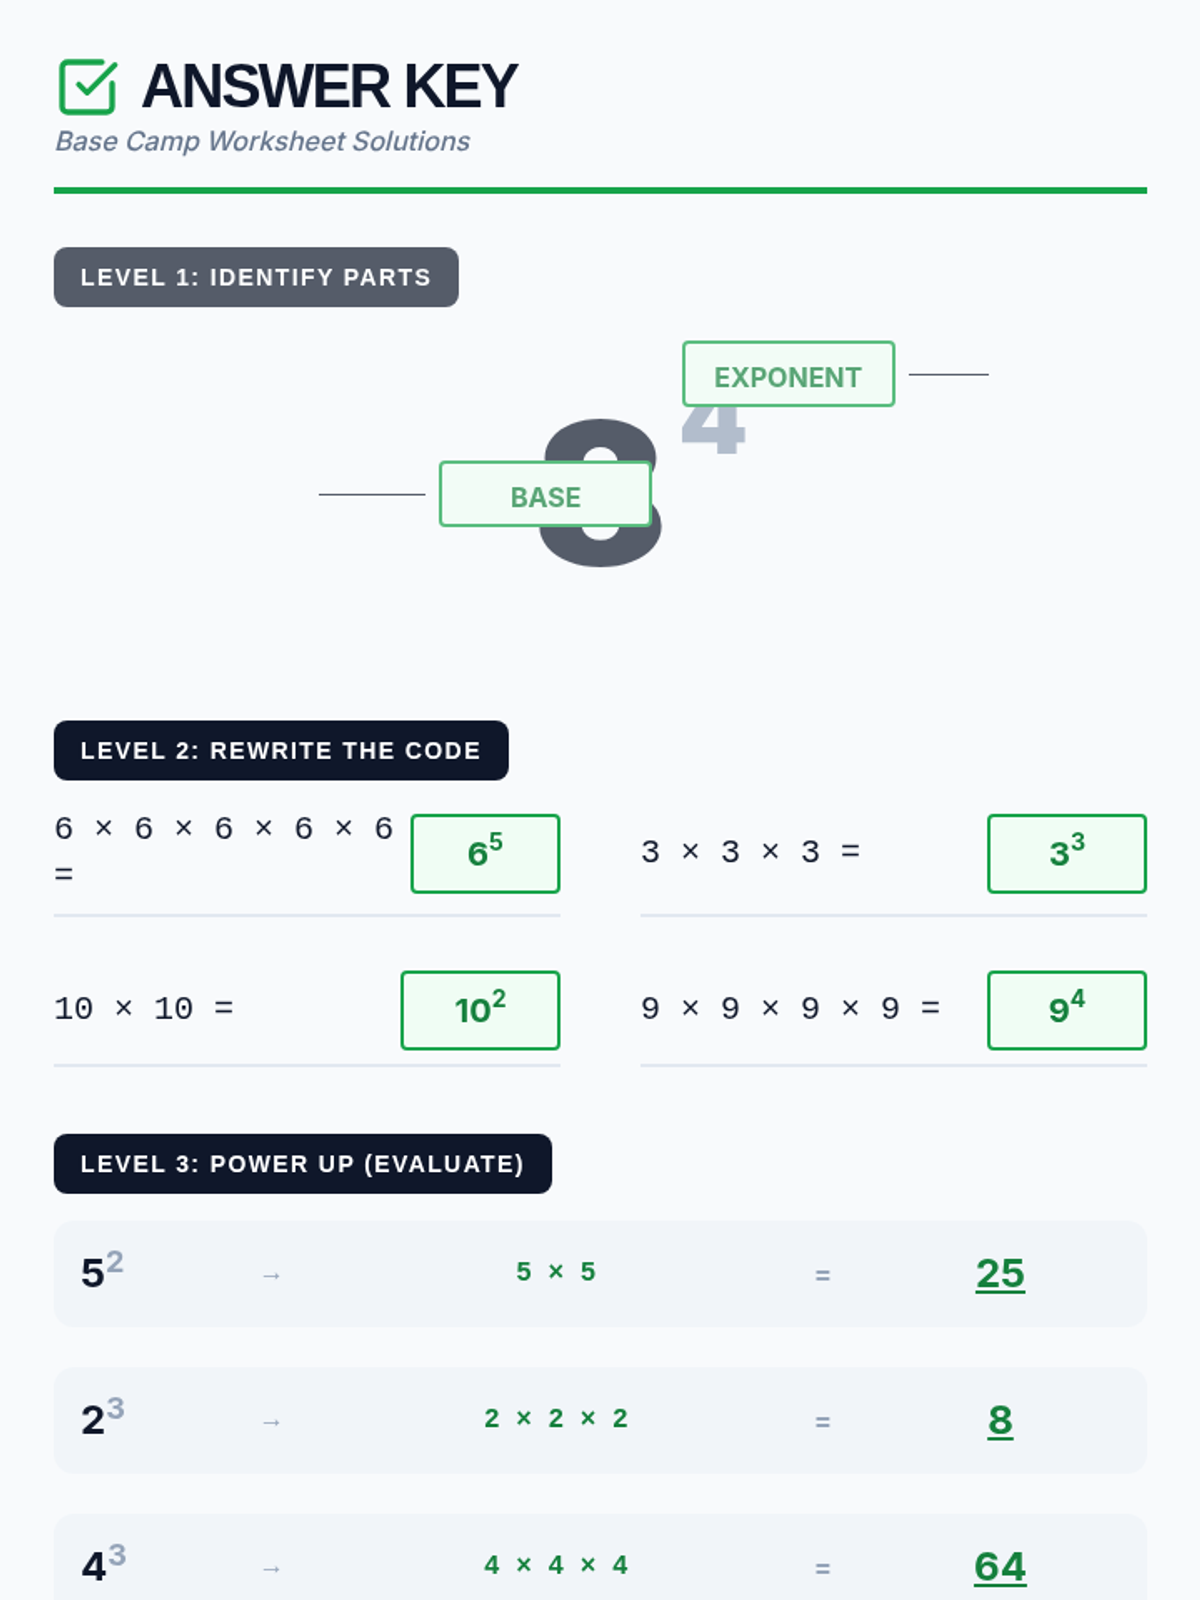
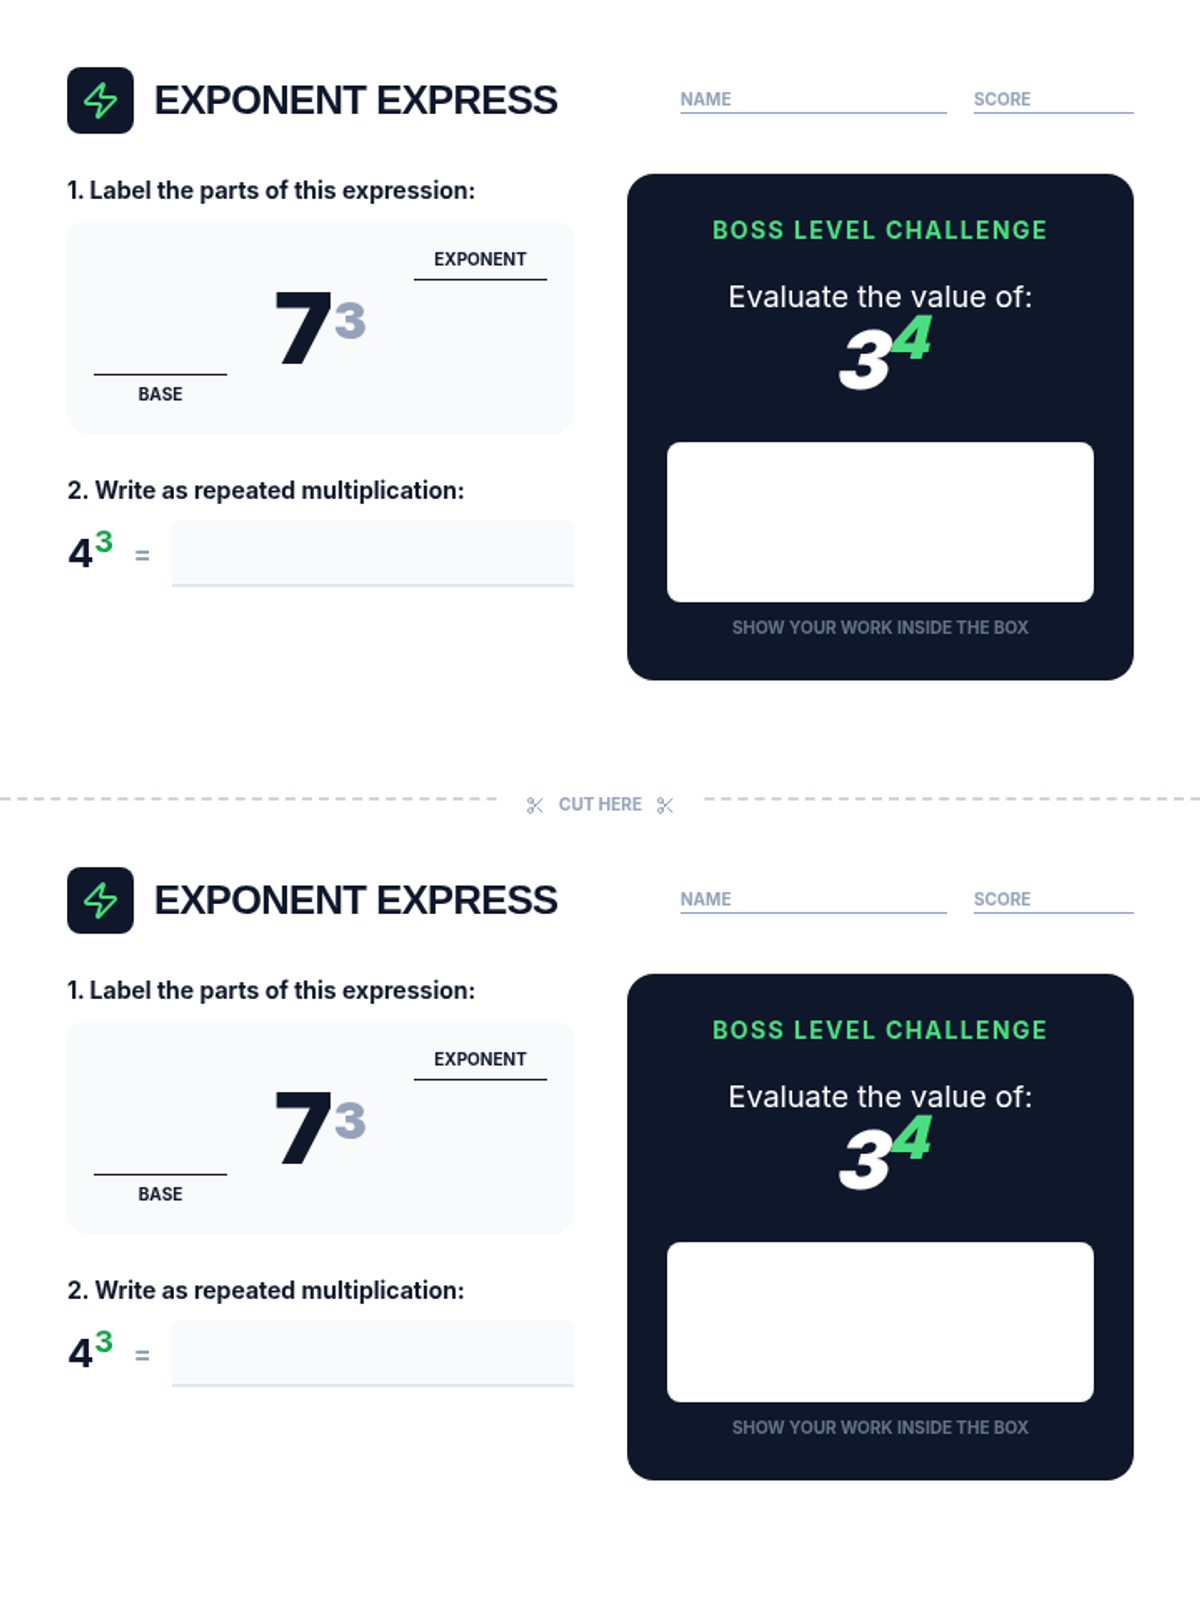
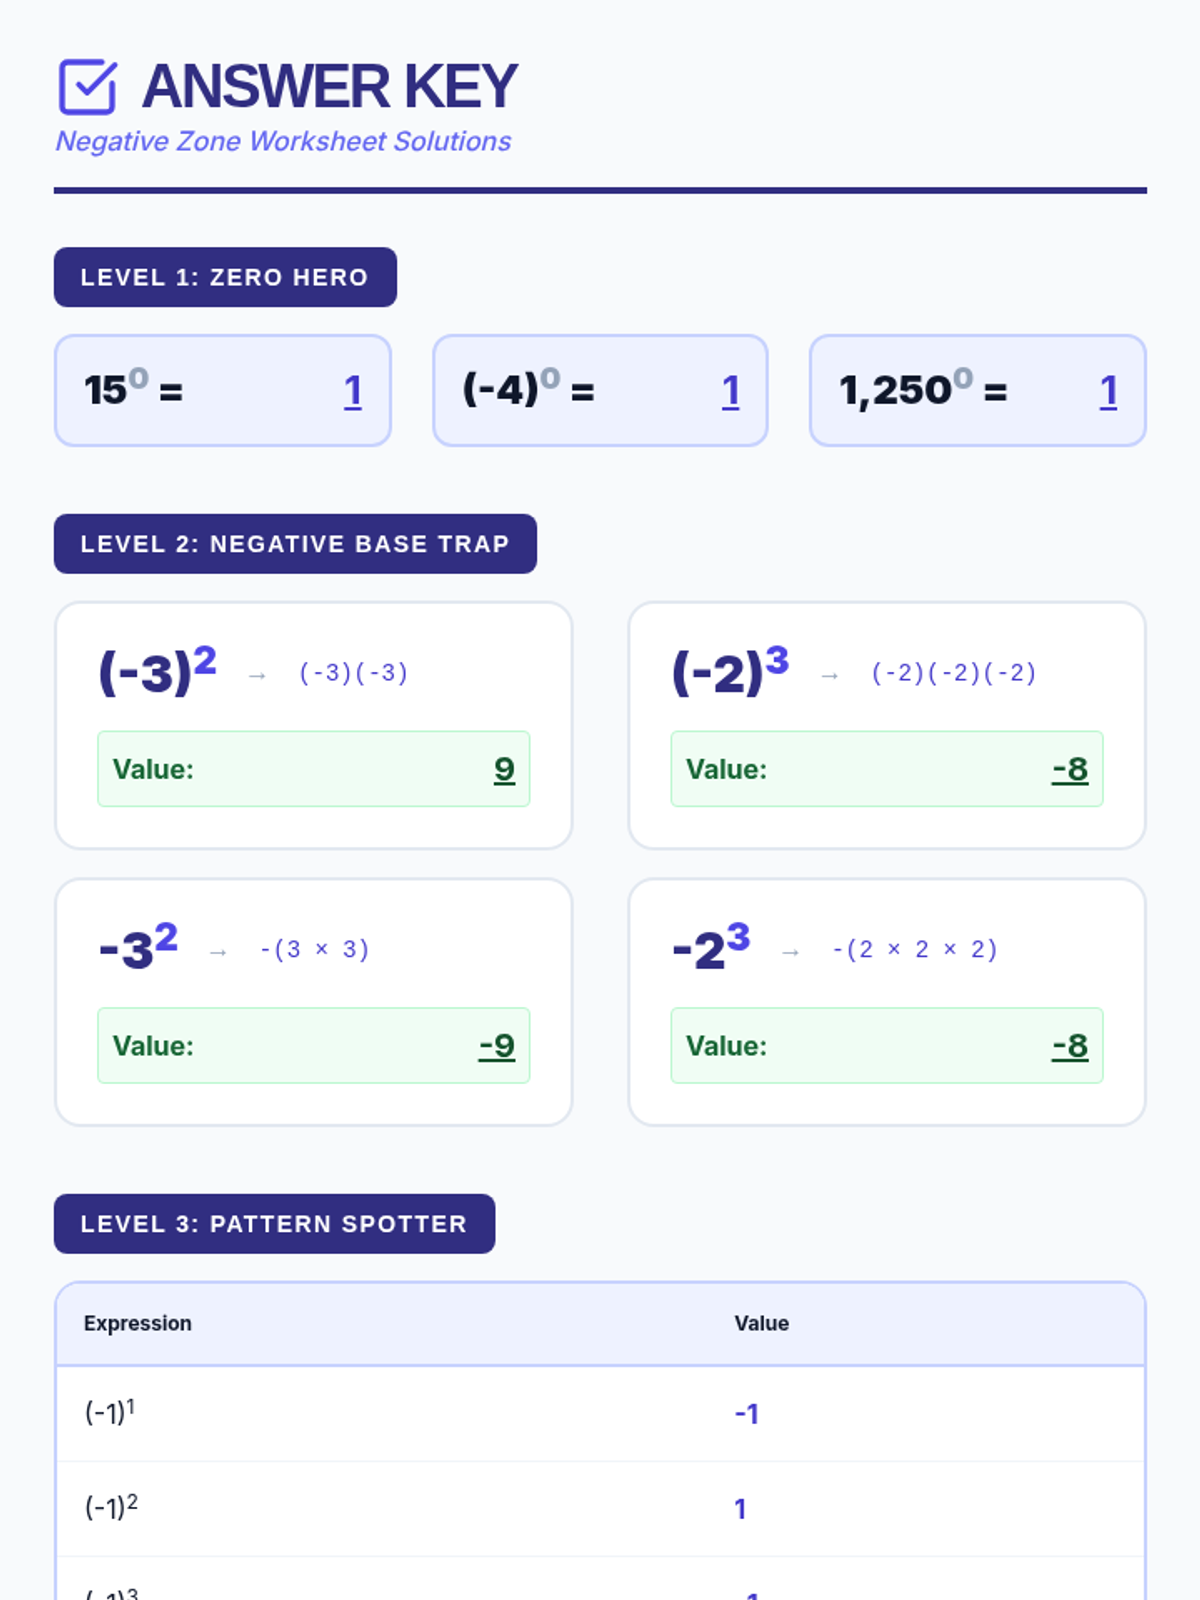
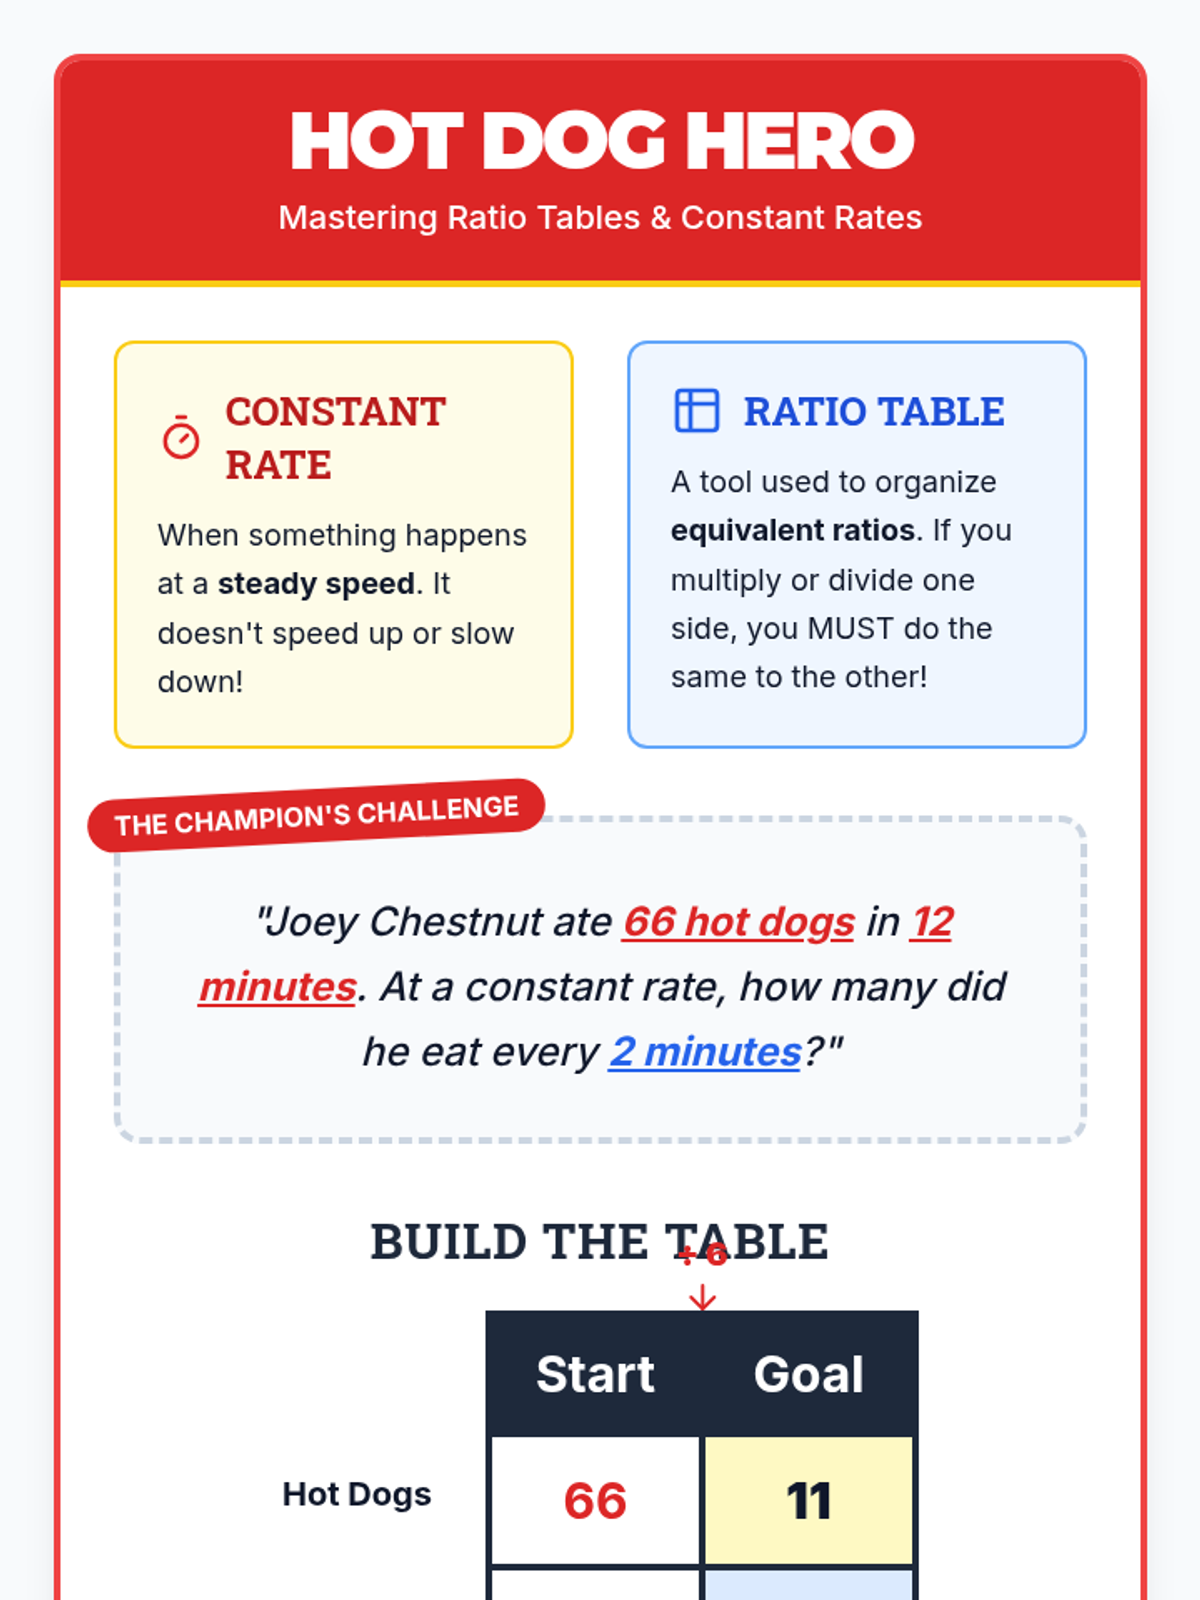
A targeted intervention lesson for Grade 6 students to master creating dot plots, histograms, and box plots through hands-on activities and scaffolded practice. This lesson focuses on the procedural steps and conceptual understanding of data organization and visualization.