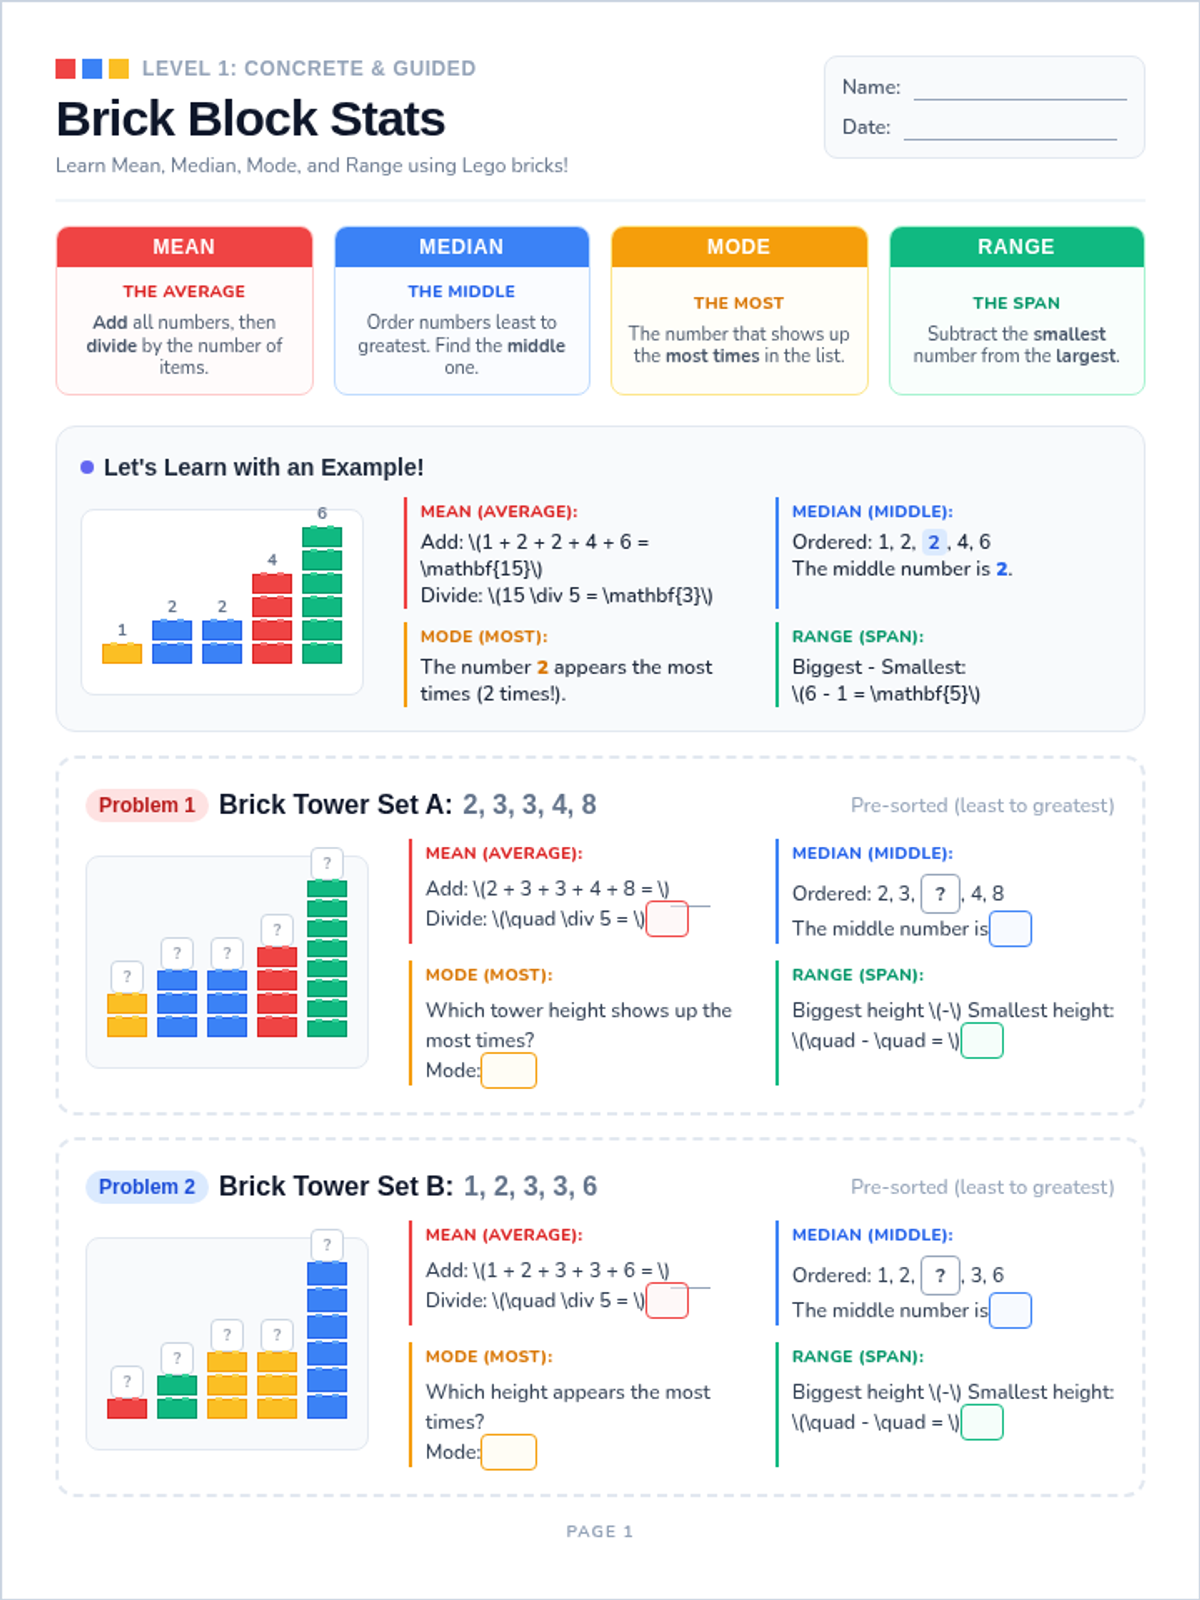
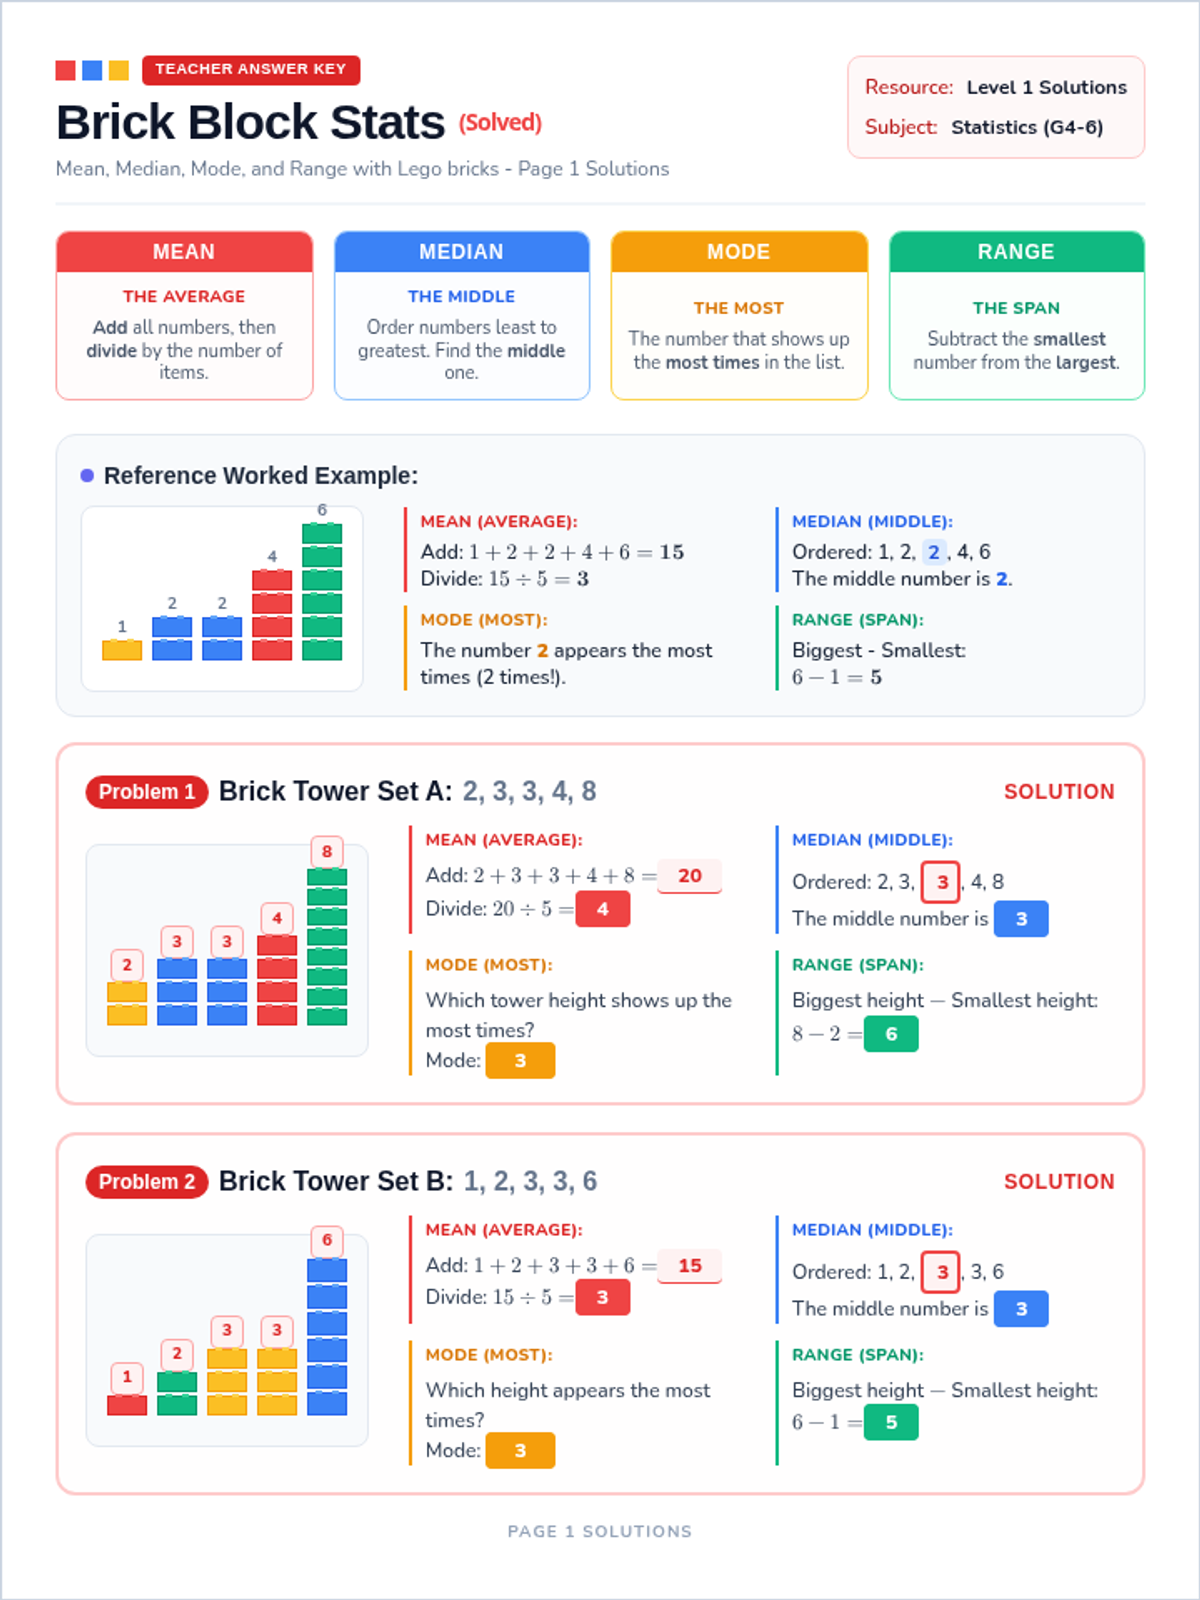
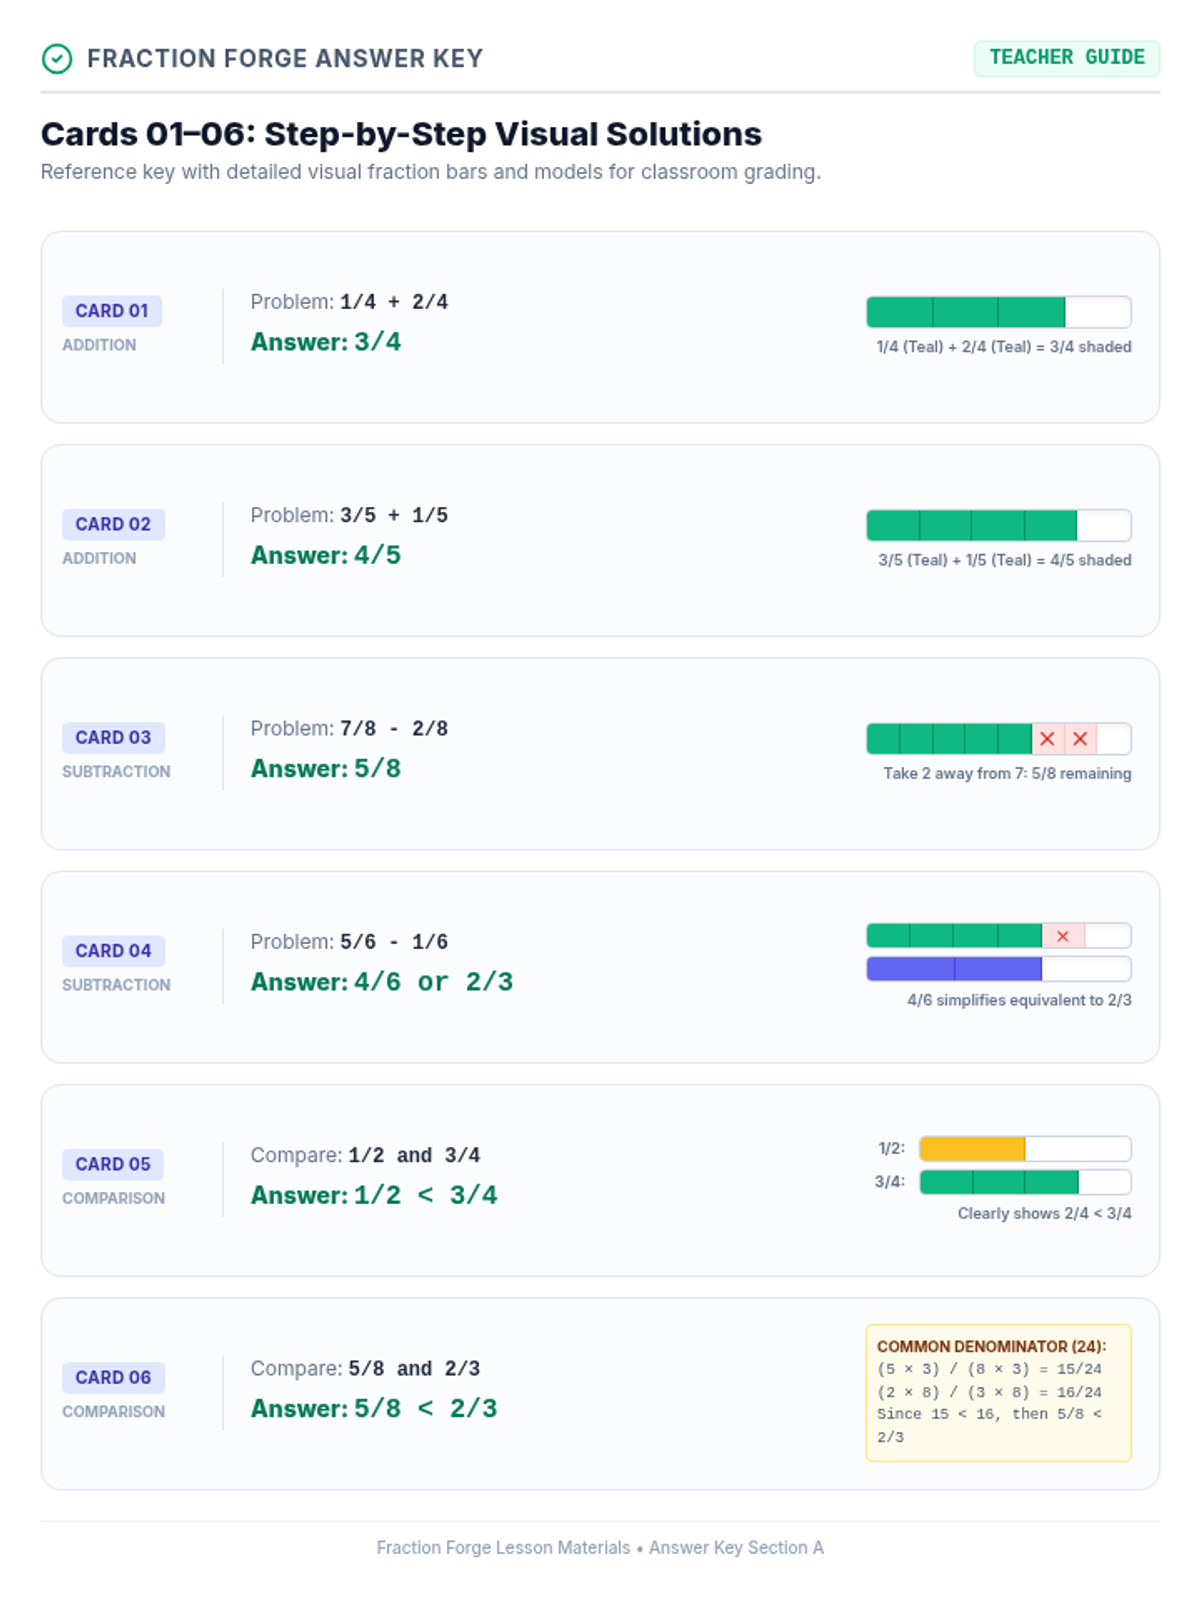
This lesson challenges students to translate data from one format to another, such as turning a tally chart into a bar graph or a bar graph into a pictograph. This reinforces the connection between the underlying numbers and their visual counterparts.
No materials in this lesson yet.