A visual anchor chart for Week 9, summarizing data center/spread, box plot components, and correlation strength.
A visual presentation to introduce integer rules and average calculation methods with a polar exploration theme.
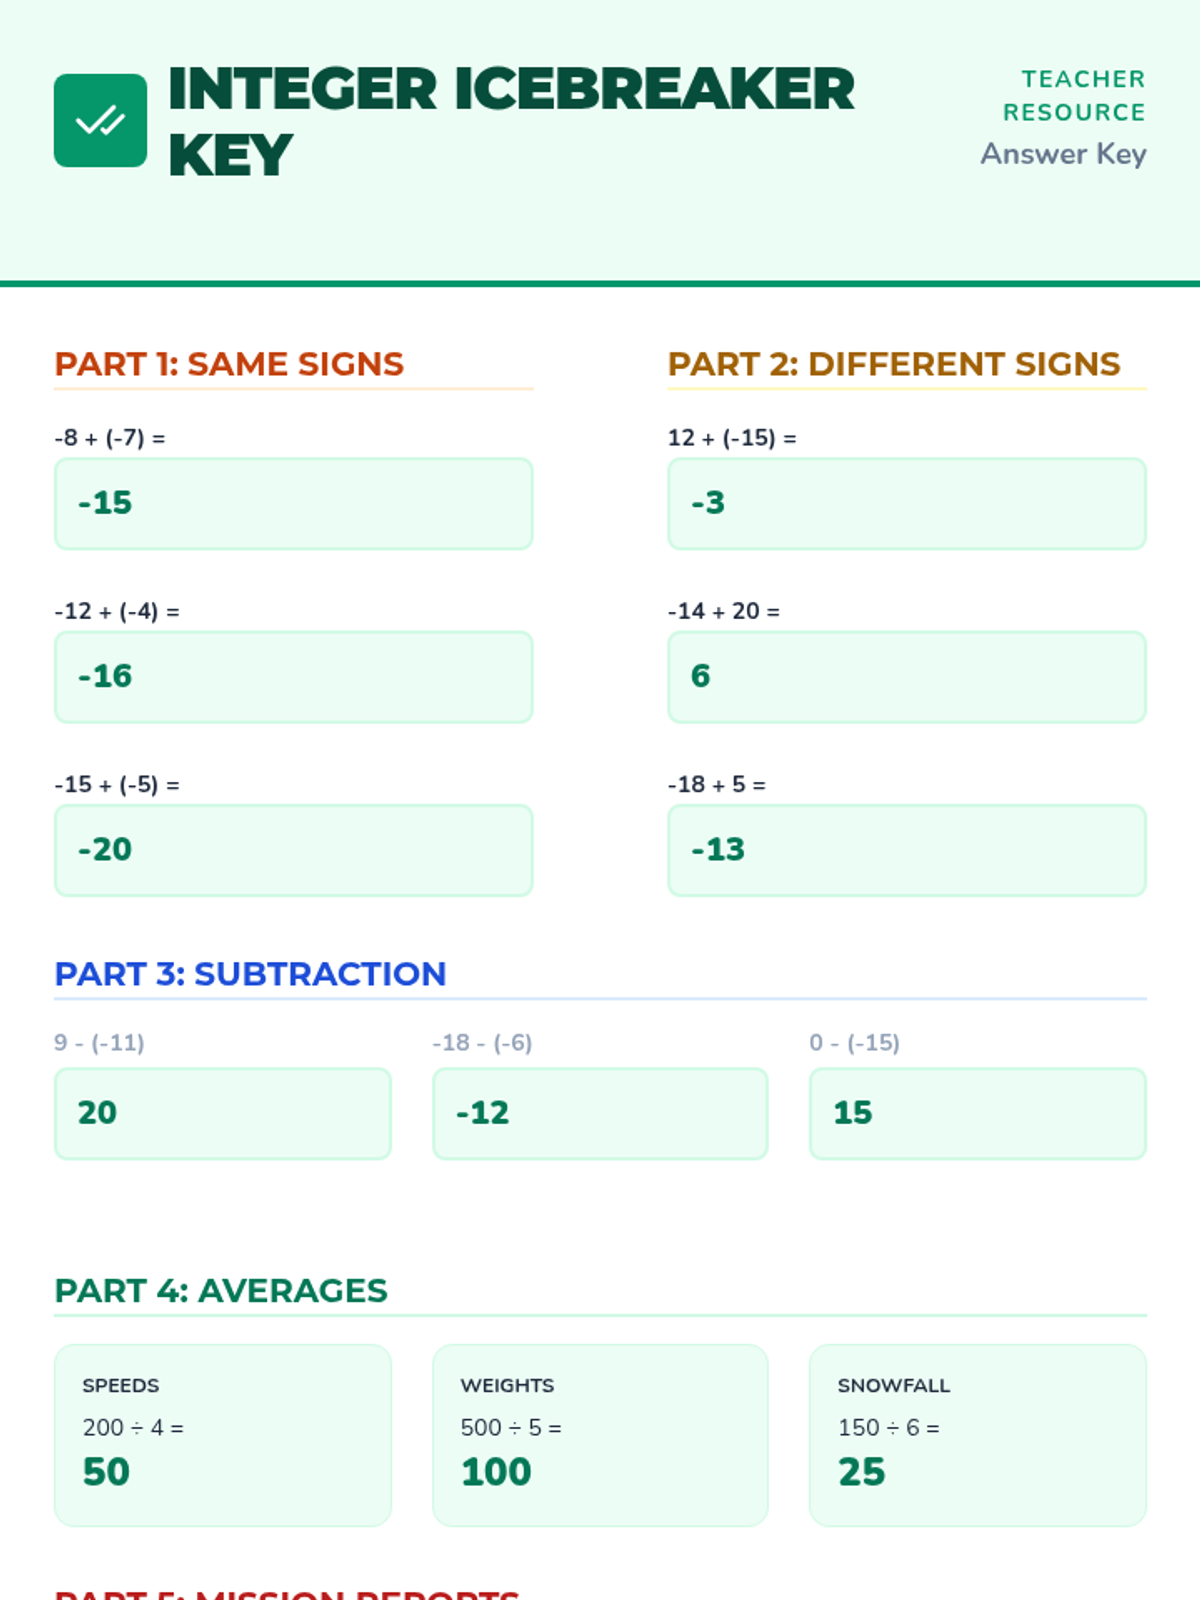
Detailed teacher answer key for the Integer Icebreaker worksheet, now updated to match the three-of-each-type structure.
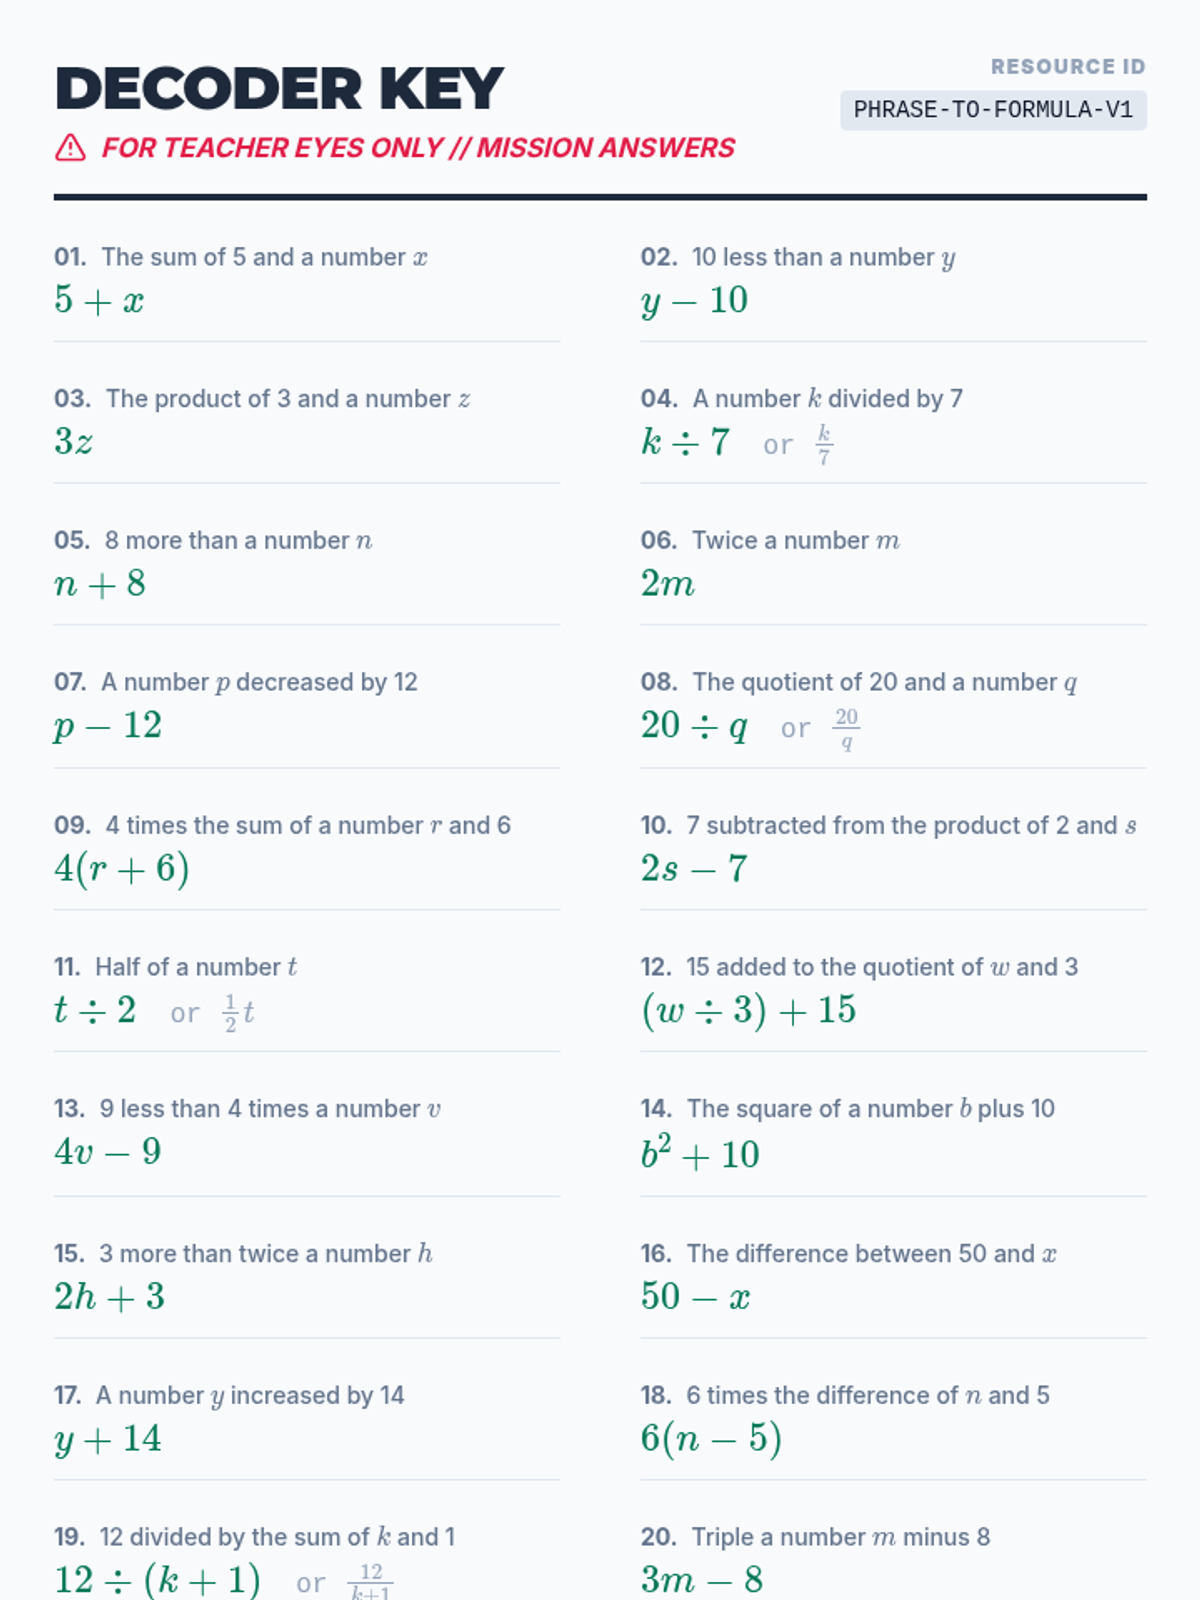
The teacher's answer key for the Expression Decoder Worksheet, featuring clear mathematical expressions for all 20 problems. Improved LaTeX formatting.
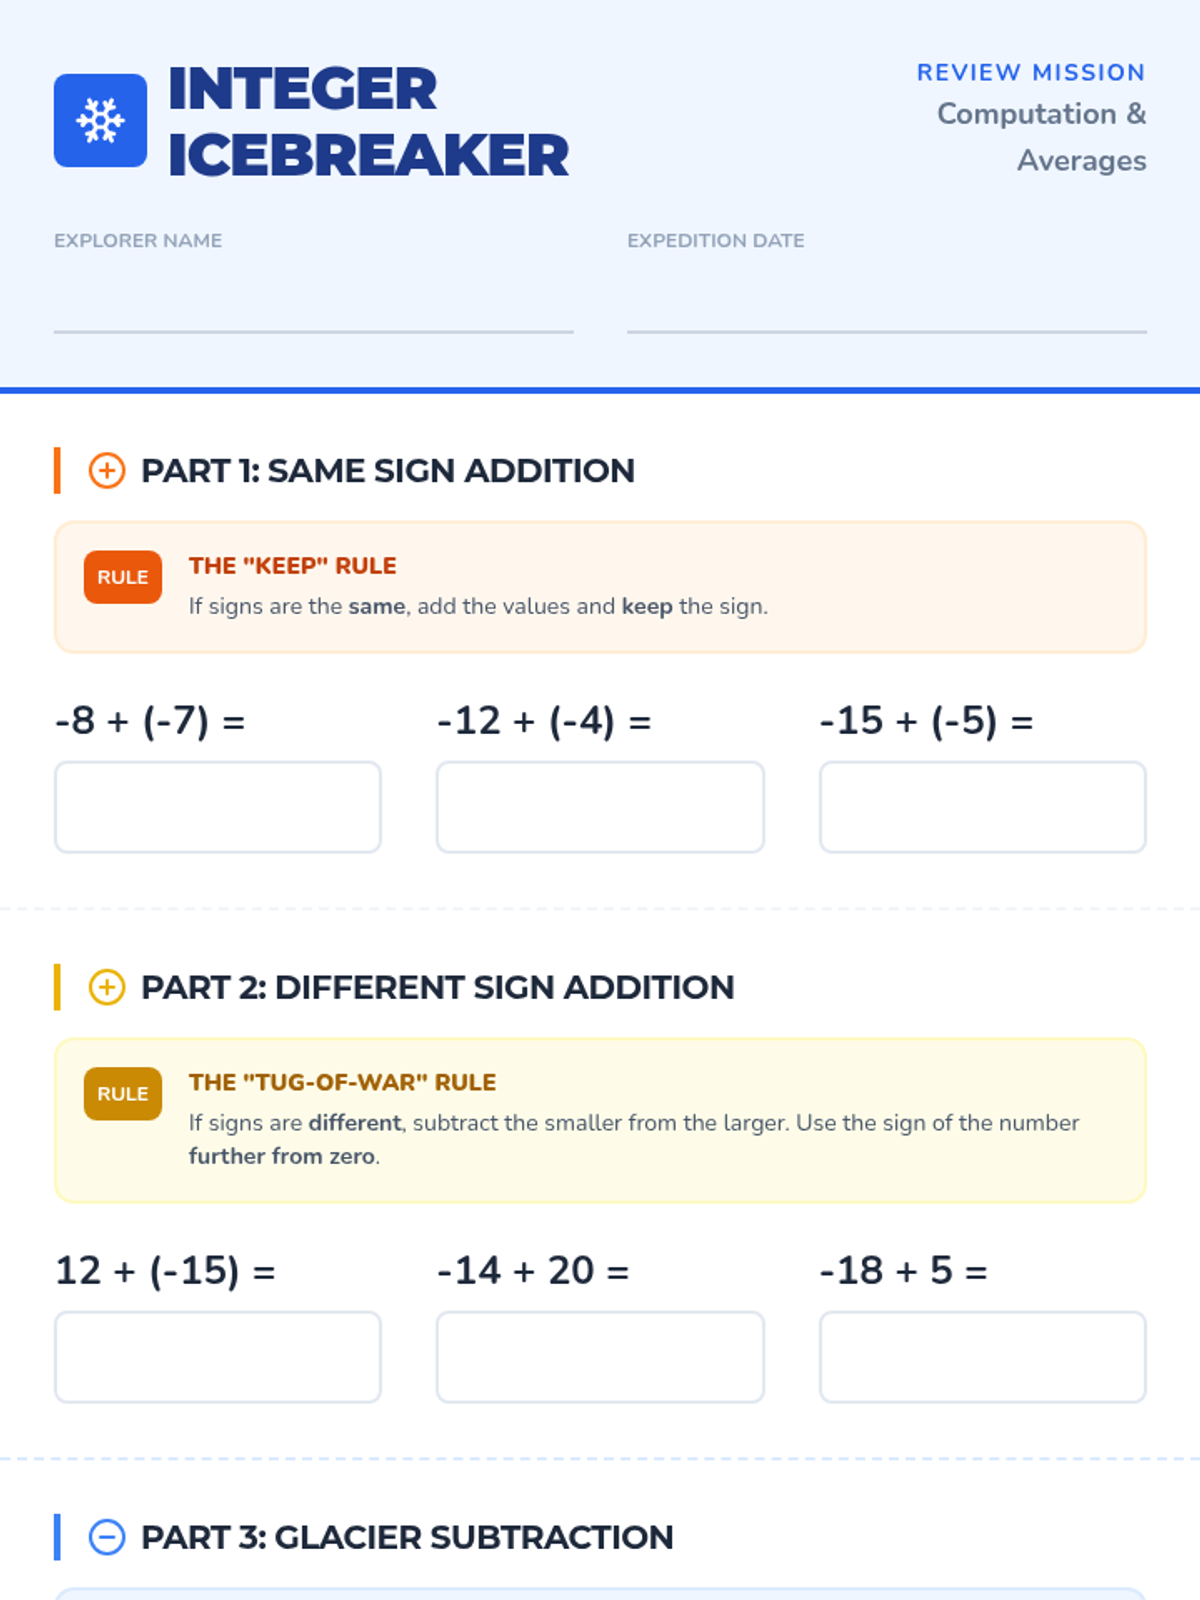
A two-page mixed practice worksheet for adding and subtracting integers and calculating averages, now balanced with exactly three problems per section.
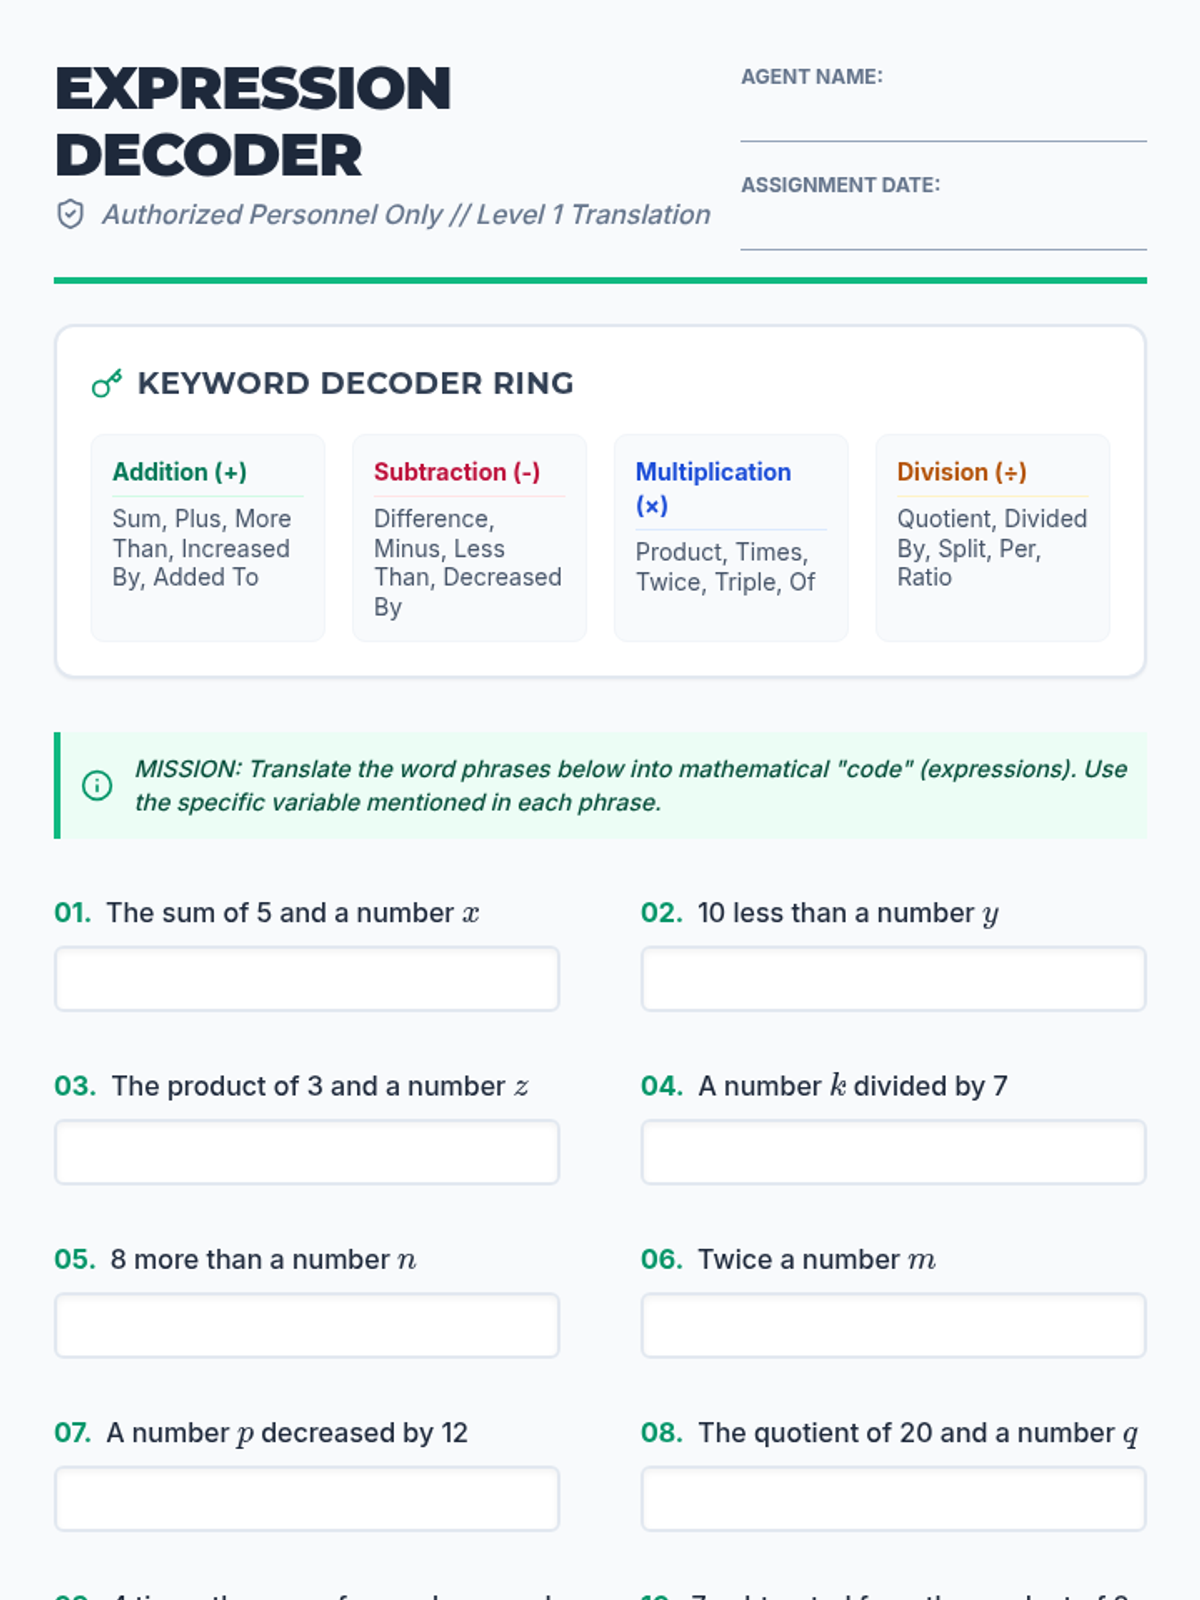
A 20-problem practice worksheet where students translate word phrases into algebraic expressions, themed as an "Expression Decoder" mission. Improved spacing and visual hierarchy.
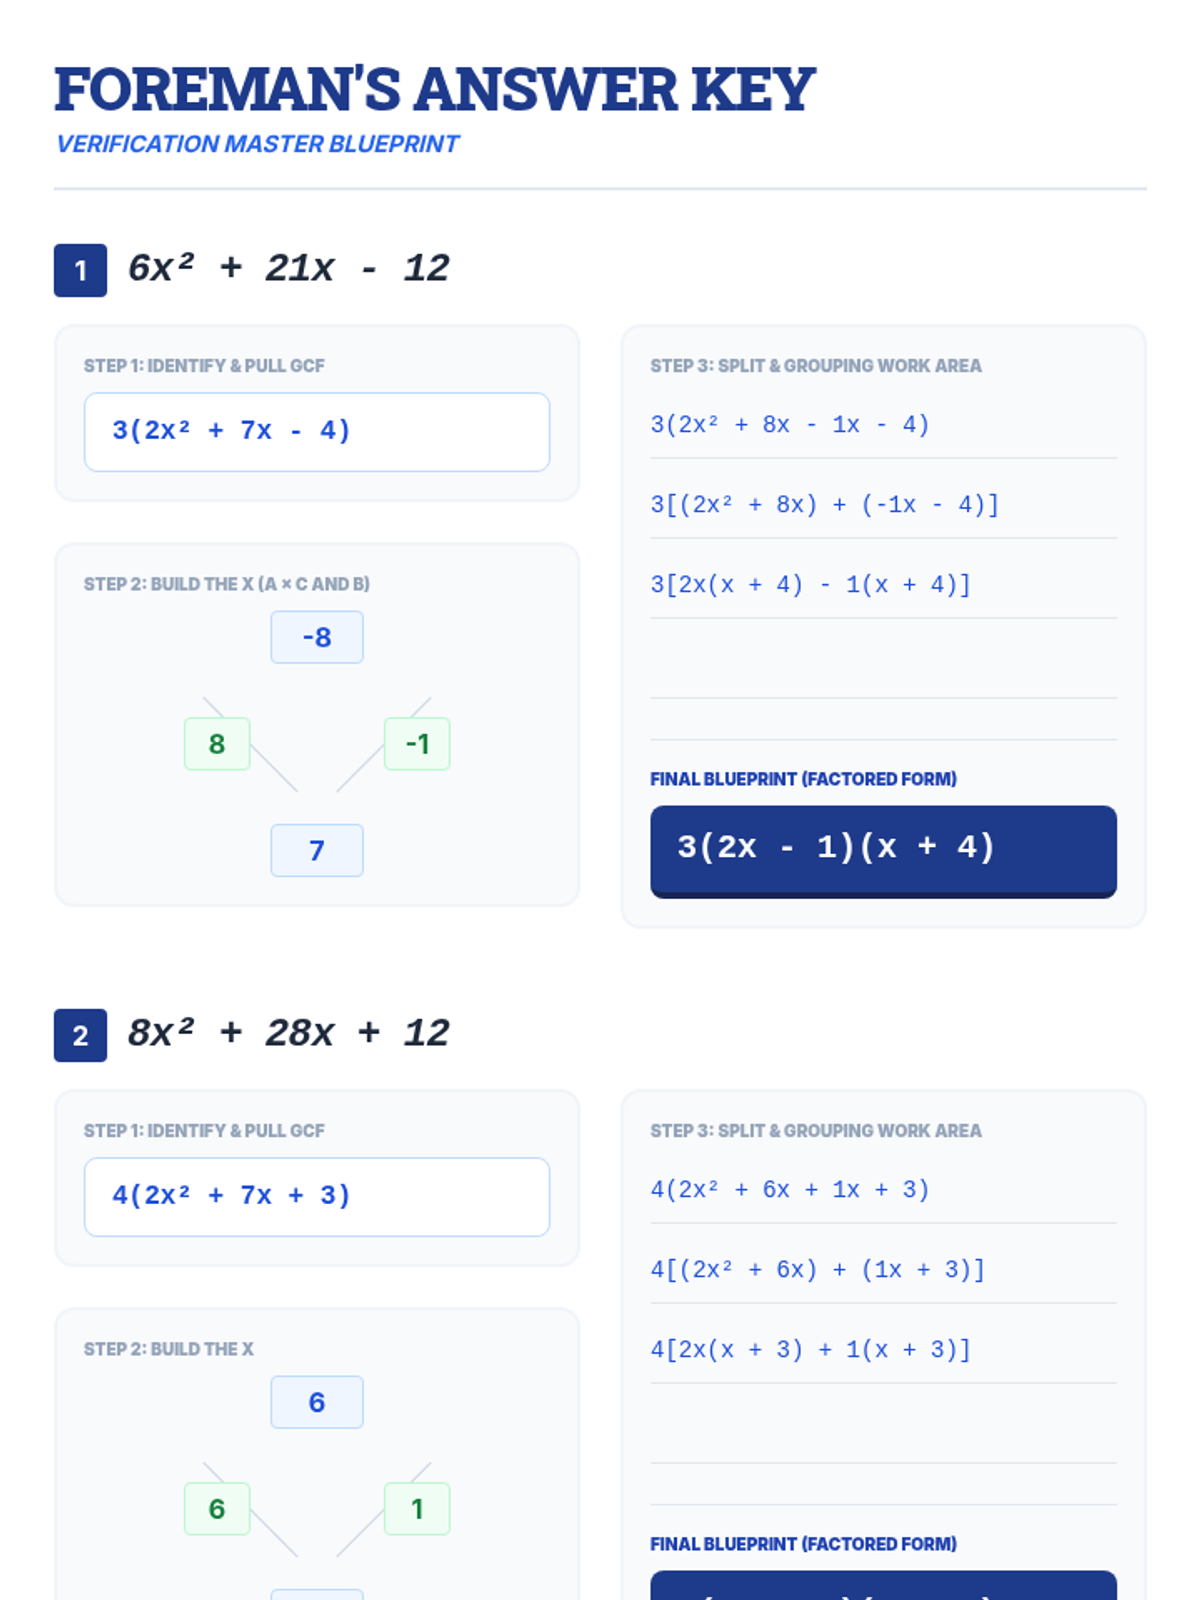
An answer key for the Construction Site Practice worksheet, providing step-by-step solutions for factoring quadratic expressions using GCF, X-Method, and grouping.
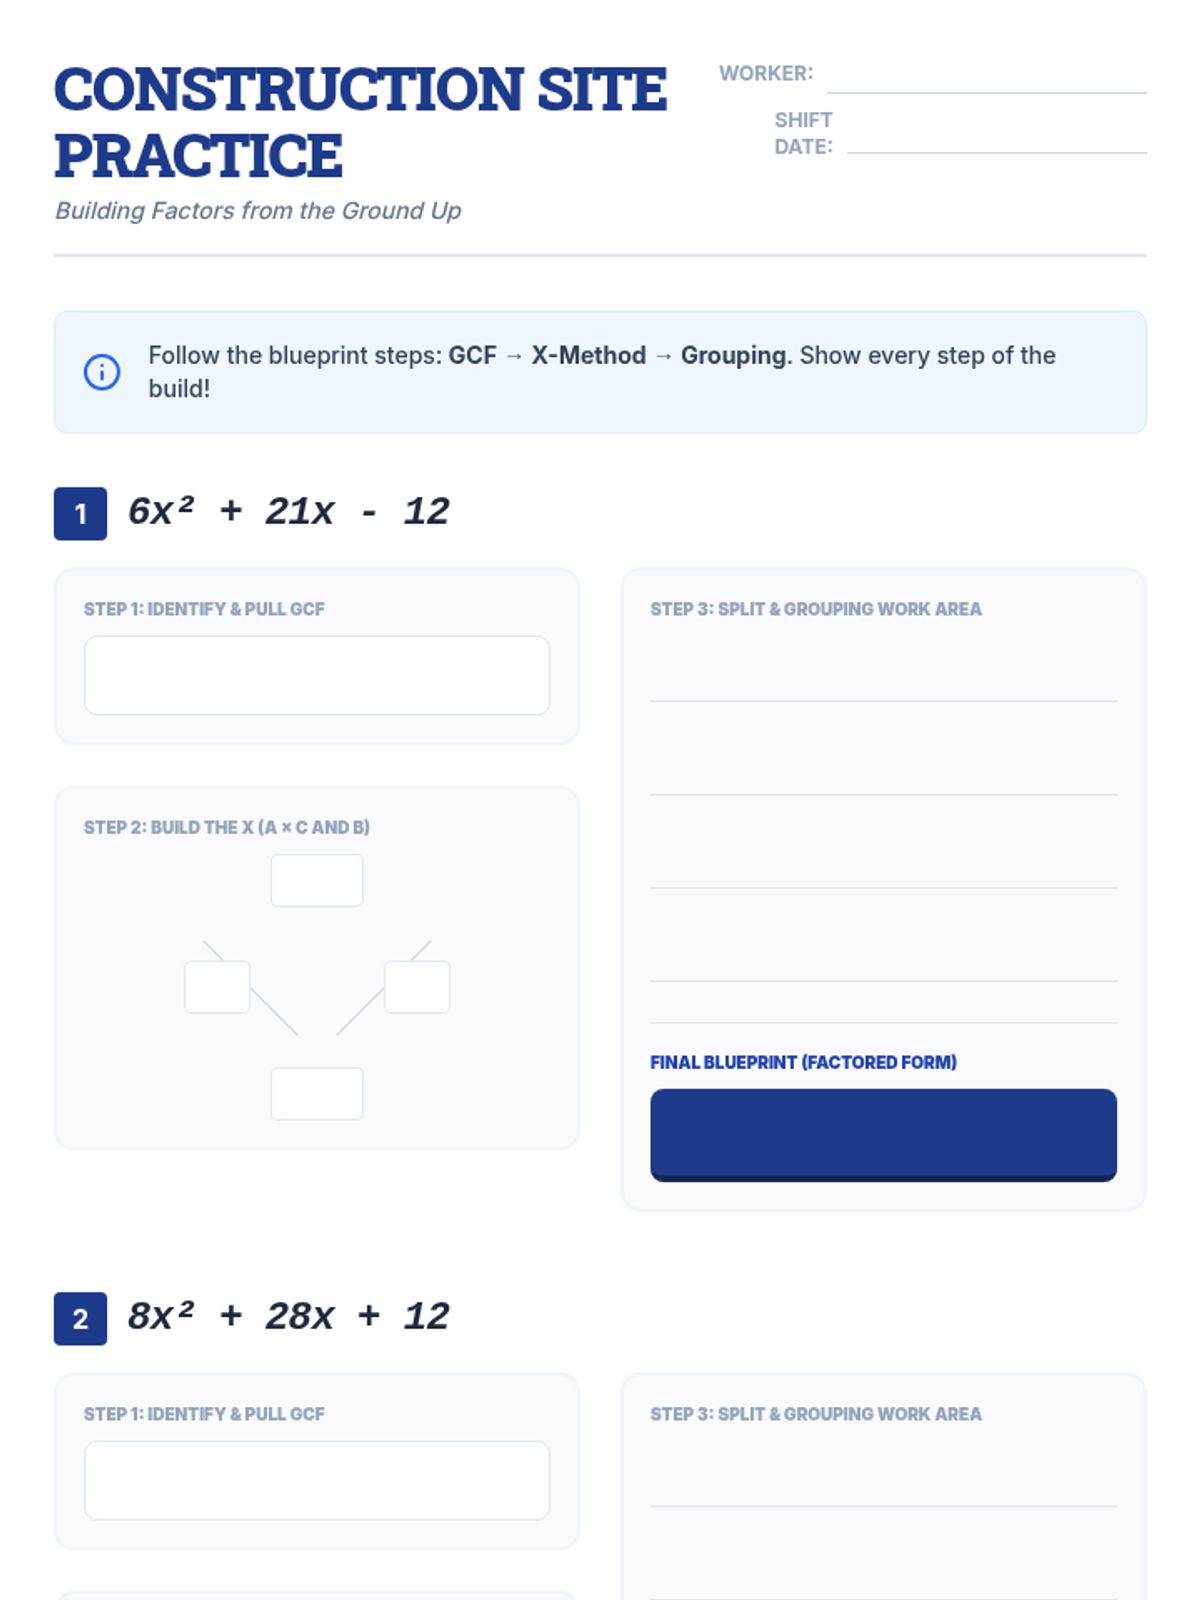
A construction-themed practice worksheet for students to apply the Factor Fortress steps. It features structured work areas for pulling the GCF, setting up the X-Method, and factoring by grouping.
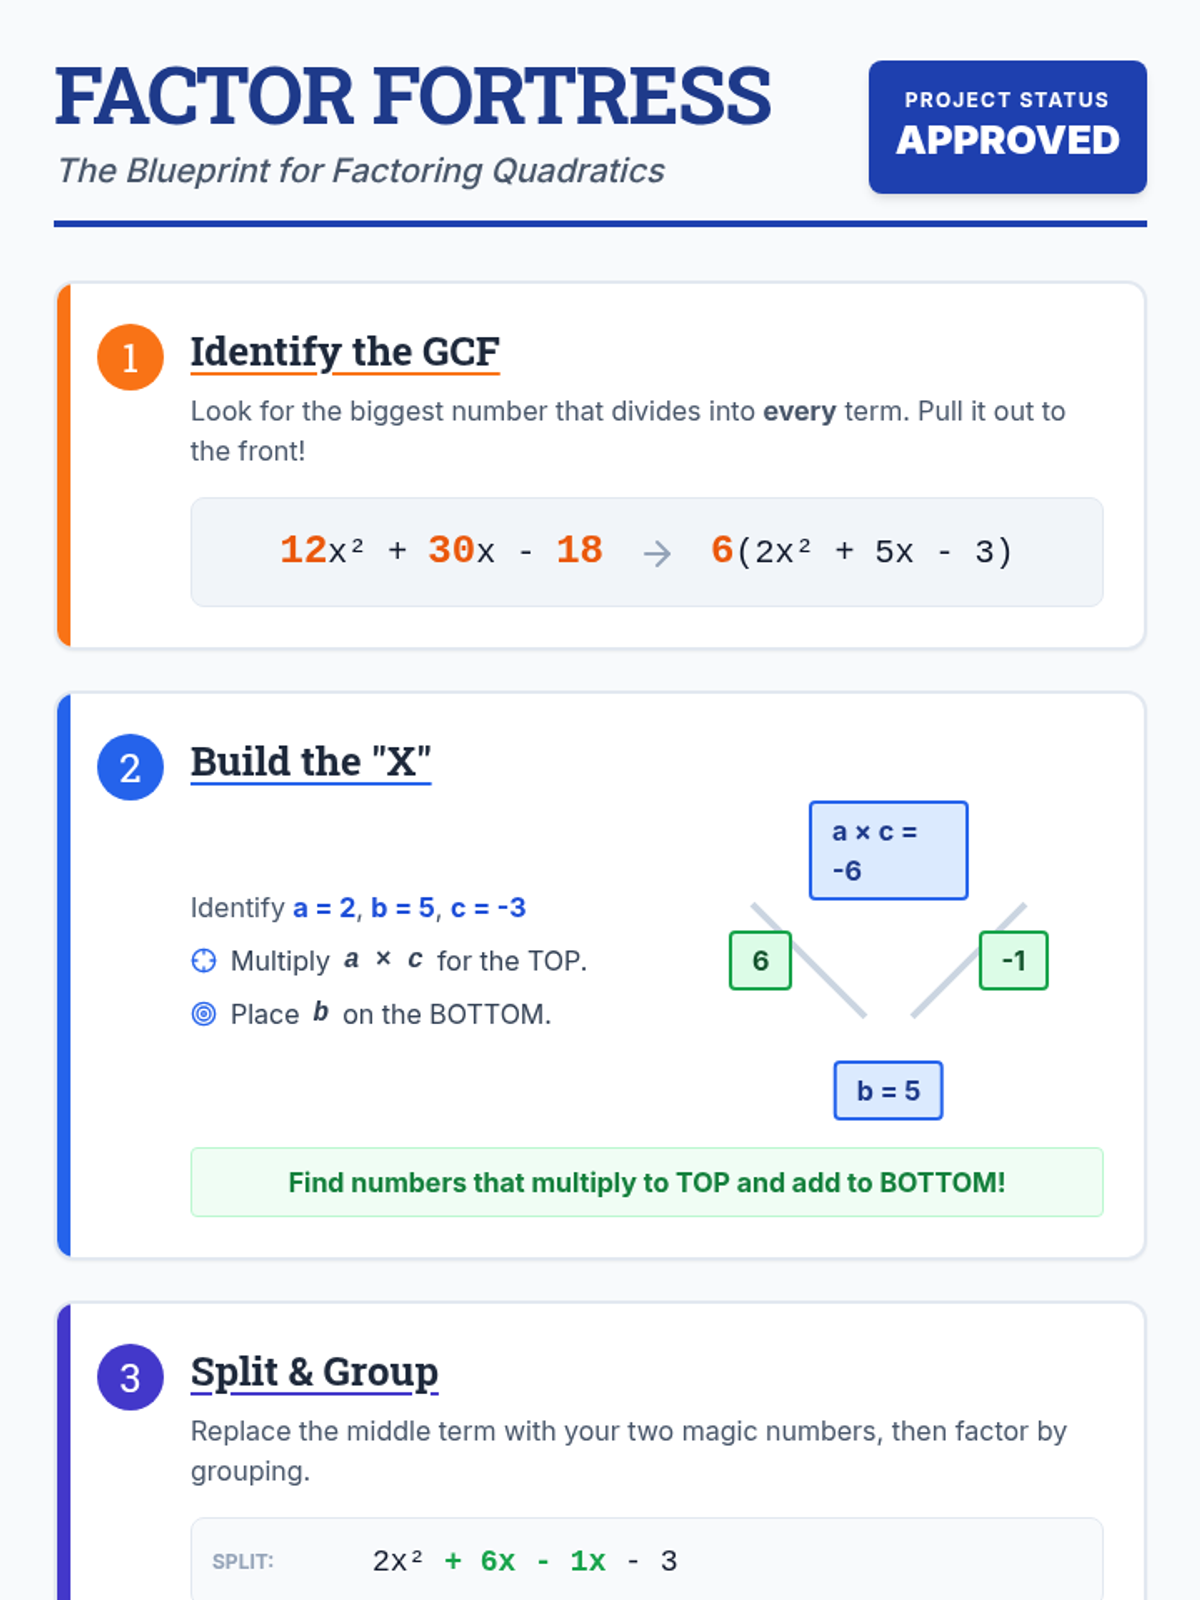
A step-by-step presentation that walks through the "Factor Fortress" process using a construction theme. It features large, high-contrast visuals for finding the GCF, setting up the X, and final assembly via grouping.
A high-contrast, construction-themed anchor chart that breaks down quadratic factoring into four visual steps: GCF identification, X-Method setup, factor by grouping, and final assembly.