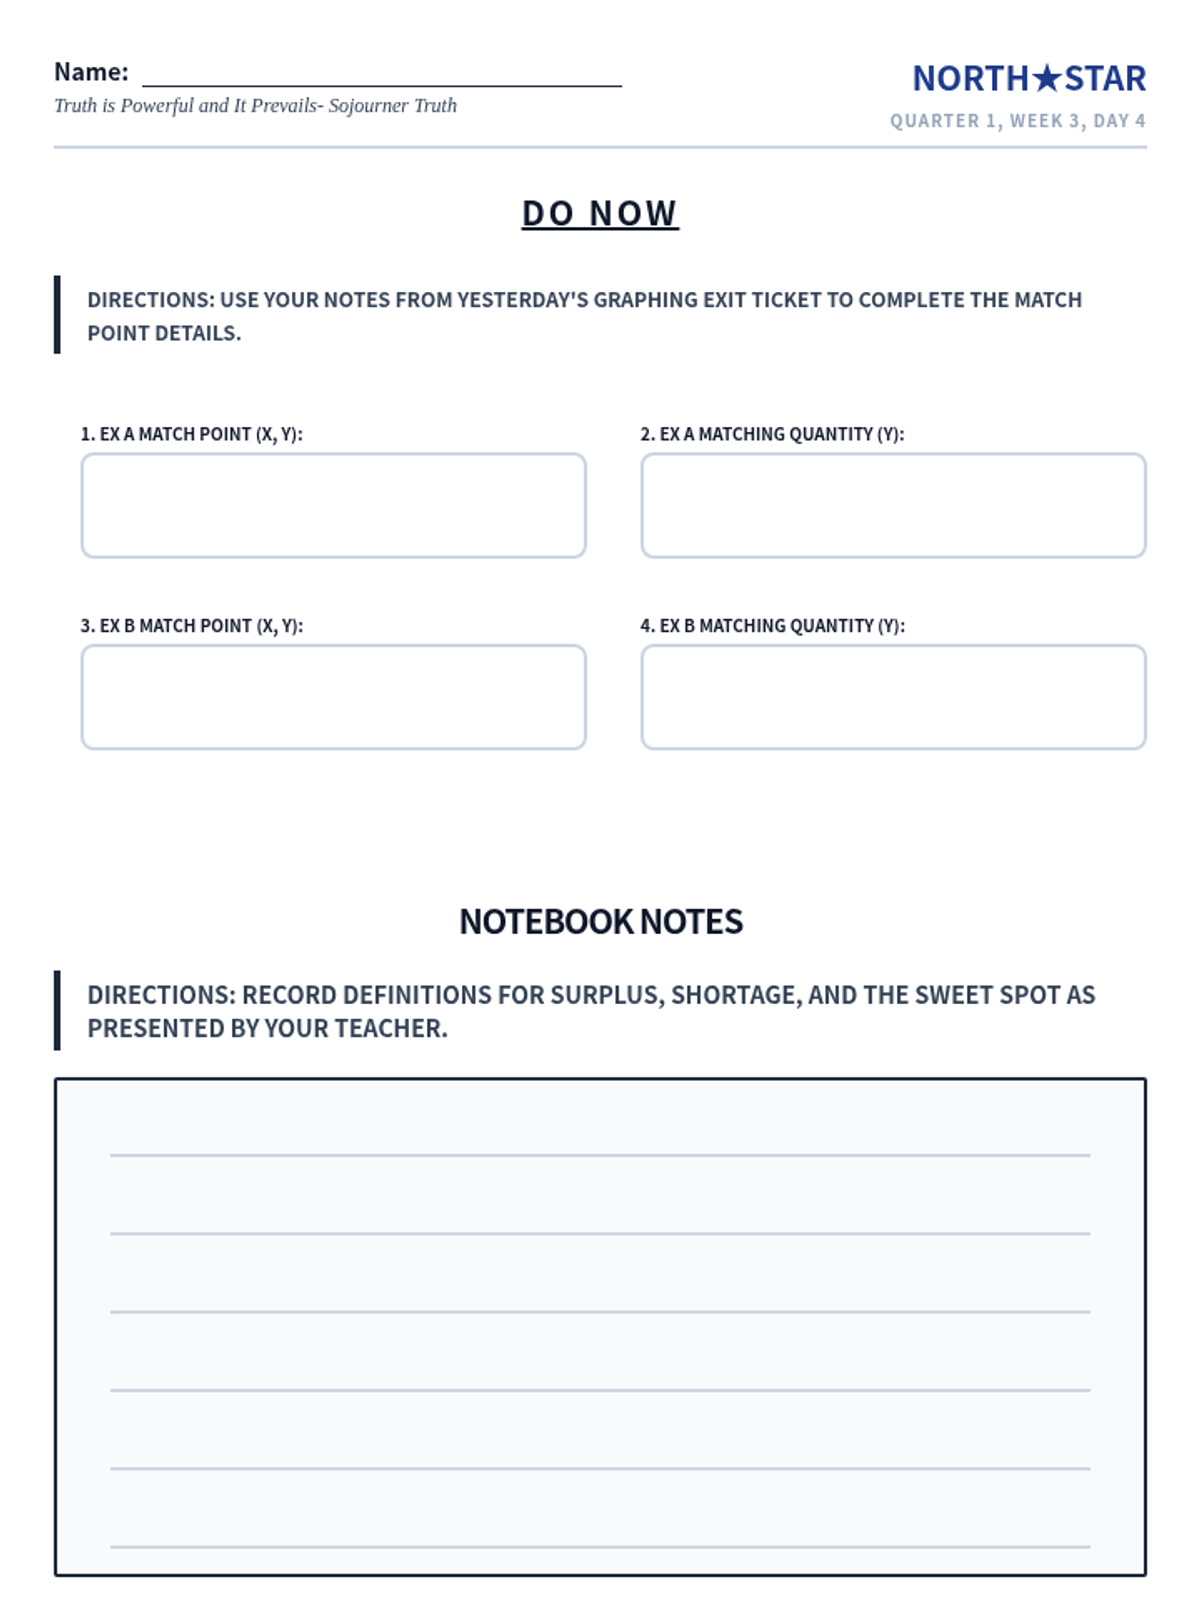
A 60-minute lesson plan for Unit 8.5 (Interpreting Systems) for 9th-grade Algebra SPED students. Features discovery-based modeling, teacher prompts, and the requested instructional sequence.
Revised Lesson Plan for 'Market Meaning'. Updated to align with the new student handout featuring 6 IP logic scenarios and a blended mastery Exit Ticket. Includes comprehensive teacher answers for algebraic solving and conceptual scenarios.
Revised Lesson 4 Handout. Improved vertical spacing and increased student work box heights to 'h-8' for better handwriting legibility. Repositioned 'P' and 'Q' axis labels for clarity and increased coordinate plane grid contrast. Corrected all footer numbering to ensure a precise two-page document.
Revised Lesson Plan for 'Table Trends'. Updated to reflect the student handout change where students calculate all Demand and Supply values from equations. Includes full numerical teacher keys for all 4 IP scenarios and the Exit Ticket.
Revised Lesson 2 Handout. Adjusted section heights to match the 960px virtual viewport constraint, ensuring all content fits comfortably on exactly two pages. Fixed footer numbering and increased row heights in the Exit Ticket for student completion. Corrected table header alignment and text contrast.
A comprehensive teacher resource containing answer keys for the worksheet and guided notes, plus instructional strategies, common student misconceptions, and tips for effective lesson delivery.
A practice worksheet for calculating area and circumference from a given radius. Includes computational problems and a real-world word problem, all within a clean architectural blueprint aesthetic.
Student guided notes handout that mirrors the Circle Secrets slide deck. Includes fill-in-the-blank definitions, formula boxes, and a structured example problem area.
Instructional slide deck for teaching area and circumference of circles using radius. Features a professional blueprint theme with clear formula breakdowns and example problems.
An answer key for the Data Patterns Worksheet, providing formal definitions for sampling distributions and histograms, along with scoring considerations for teachers.
A worksheet containing two definition-based questions focused on sampling distributions and histograms, with lined spaces for student responses.
The answer key for the Normal Curve Analysis worksheet, providing correct multiple-choice selections and step-by-step mathematical solutions for each problem.
A 4-question multiple-choice worksheet on normal distribution and z-scores, including space for students to show their work. Inspired by textbook problems on abstract variables and medical blood data. Optimized for 2-page printing.
Revised Student Handout for Market Meaning. Fixed ID brace issue. Corrected directions kerning, fixed logical axes on the graph (Price on X), and ensured all 8 IP tasks and 4 Exit Ticket questions fit on Page 2 without overflow using break-inside-avoid. Darkened Notebook Notes lines and optimized for SPED students.