A visual presentation for teaching reverse engineering of polynomial multiplication, featuring hook slides, video integration points, guided practice, and unit connections. Content updated to ensure font sizes are slide-appropriate (24px+).
An answer key for the Data Lab lesson. Consolidated to one page with corrected visuals, centered box plots, and accurate scales.
A scientific laboratory results worksheet. Updated with vertical scales, improved graph visibility, and clear analysis prompts.
A scientist's log for students to record findings and practice data visualizations. Updated with y-axis scales and improved grid visibility.
An instructional slide deck for the Data Lab lesson, featuring scientific research visuals and concepts. Updated with better alignment and spacing.
A teacher facilitation guide for the Data Lab lesson, themed around scientific research and experimentation. Consolidated to one page.
A comprehensive teacher guide providing lesson flow, ML/ELL scaffolding strategies, common misconceptions, and a detailed answer key for the Number Navigator lesson. Updated with an expanded answer key for the new worksheet problems and full terms for place values. Content layout is optimized for clarity and professional delivery.
A matching card activity spread across three pages to maximize card size. Includes 8 pairs of cards covering place value identification and rounding, a reference guide, and a match log for student recording. Cards are uniformly styled with increased text contrast for better accessibility. Layout optimized to prevent page overflow.
A two-page student worksheet featuring a visual place value organizer and a step-by-step rounding guide with explicit linguistic scaffolding for multilingual learners. Updated with 6 rounding problems in Part 3 and optimized layout to fit two pages perfectly. Includes white backgrounds for work areas as requested.
A visual and engaging slide deck introducing place value (millions to hundredths) and rounding rules with specific scaffolding for multilingual learners. Includes a corrected place value lineup and higher contrast practice slide.
A comprehensive one-page reference guide for middle school algebra students, featuring a blueprint-inspired design. It includes specific note-taking frameworks, practice protocols, a daily maintenance checklist, and an error analysis guide to help students master algebraic concepts and study habits.
Detailed answer key and teacher facilitation guide for the jellybean geometric modeling activity.
A student worksheet for calculating volume and performing geometric modeling to estimate the number of jellybeans in a cylinder.
A slide presentation exploring geometric modeling through the estimation of jellybeans in a cylindrical jar, covering volume calculations and packing efficiency.
Detailed teacher answer key providing the step-by-step volume calculations and final counts (adjusting for packing density) for the Estimation Station activity.
A structured recording sheet for students to document their mathematical thinking and final estimates for each of the three containers.
Three large, colorful station cards providing dimensions and item information for a 3D estimation game featuring a cylinder, rectangular prism, and triangular prism, now including detailed SVG illustrations of the containers filled with their respective items and a built-in teacher cheat sheet.
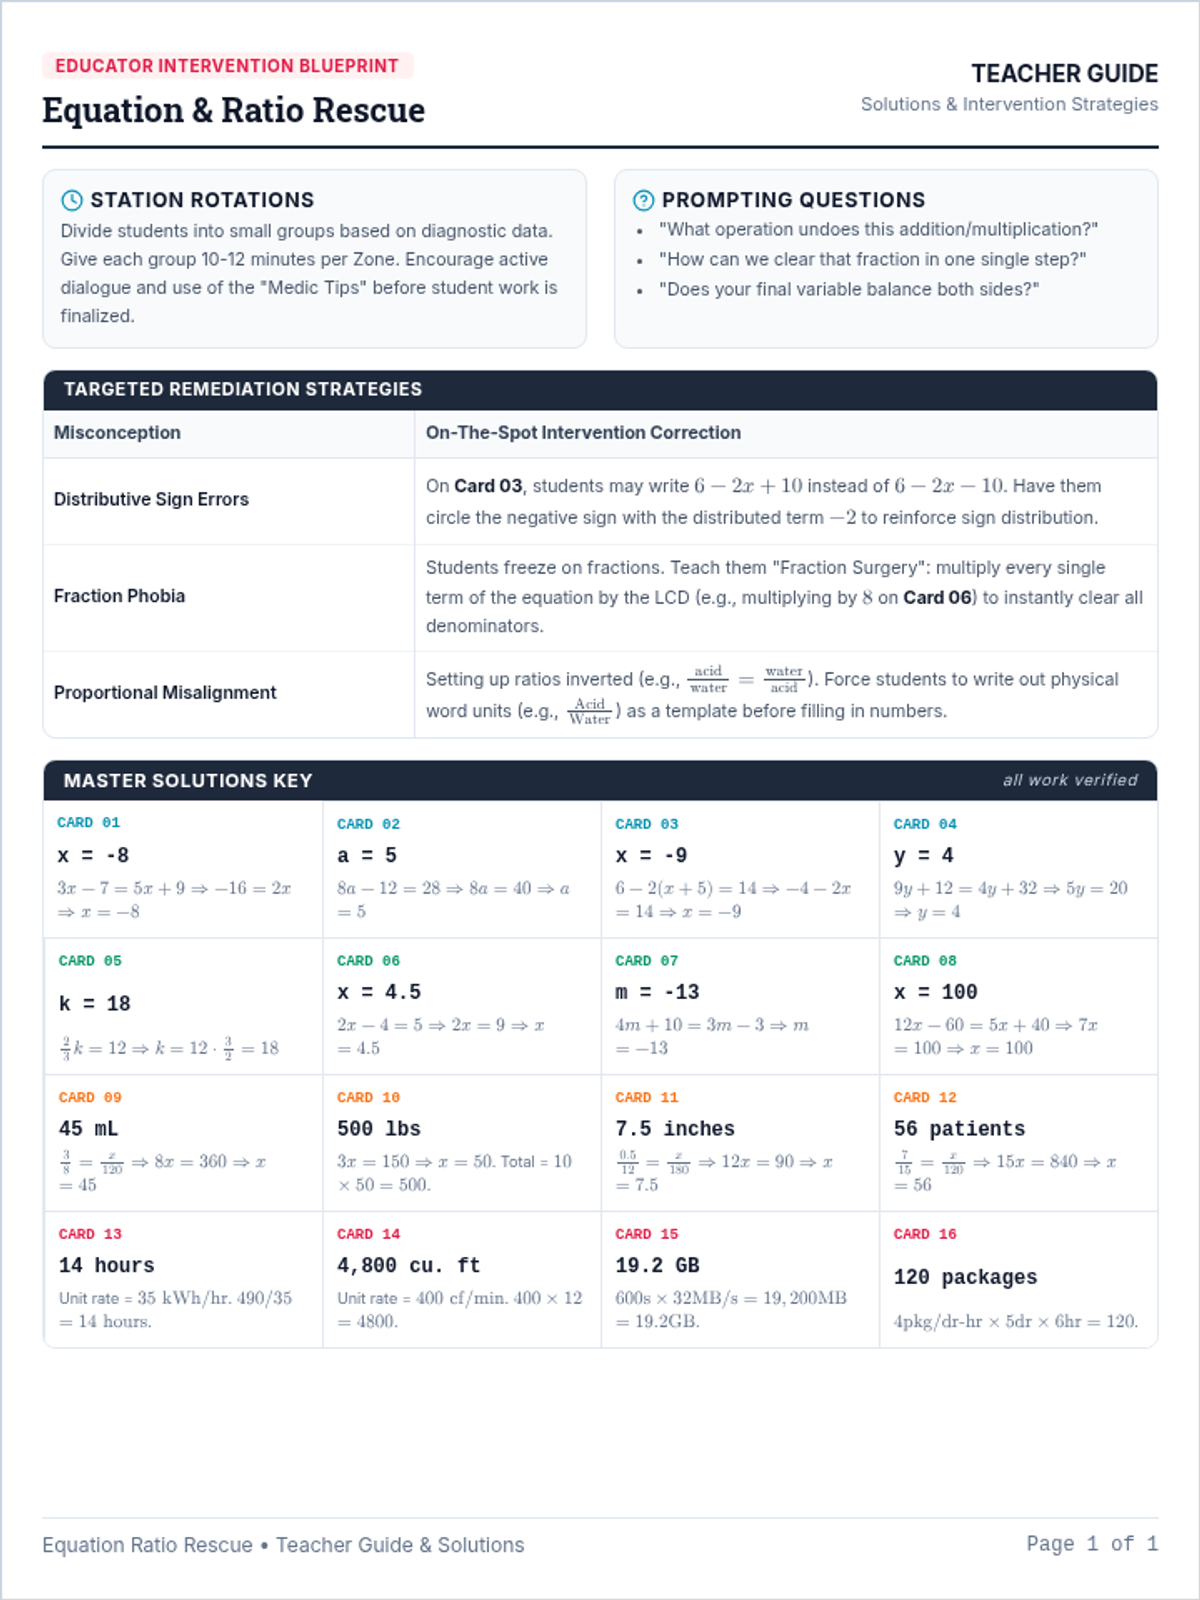
A detailed answer key for the Equation Architect worksheet. It features a quick-reveal table for all 10 equations, step-by-step structural analysis of each problem, and a brief pedagogical note on the logic behind the distractor choices.
A master answer key for all worksheets and the final review packet in the Canterlot Data Quest sequence. Updated to include Day 5 answers and revised book totals. Highly formatted for clarity and professional presentation.
A comprehensive 5-page review packet covering central tendency, data visualization (bar and pie charts), and probability outcomes in an Equestria Girls theme. Includes a new section on identifying misleading graphs. Highly formatted for high-quality printing with strictly defined page boundaries.
A single-page printable worksheet for mastering simple probability outcomes. Features a likelihood scale with dedicated answer boxes and a logical reasoning scenario based on school event drawing.
A high-quality printable worksheet for teaching pie charts and percentages. Features a perfectly circular graphing area with guides, a clean data table, and dedicated space for proportional reasoning.
A single-page printable worksheet focusing on frequency tables and bar graph creation with cafeteria data. Features a polished layout with clear labeling and defined graphing space.
An answer key for the Canterlot Stats Worksheet, providing clear solutions, mathematical breakdowns, and a grading guide for teachers.
A 3-page high school statistics worksheet featuring data collection, central tendency calculations, and visual data analysis themed around Equestria Girls. Formatted for high-quality printing with distinct section boundaries and clear student work areas.
A visual slide deck for teaching statistics concepts (mean, median, mode, range, bar graphs, and probability) themed around the Equestria Girls universe. Includes clear definitions and simplified visual representations for instructional delivery.
A summative exit ticket assessing understanding of 10-year wealth projections, correlation interpretation, and the purpose of forecasting. Fixed layout for single-page print.
A predictive math worksheet exploring linear forecasts, negative correlation impacts from expenditures, and outlier analysis within the class economy context. integrate student-specific data for personal trend analysis.
A 2-page activity worksheet for calculating 10-year wealth projections and plotting them on a class-wide scatter plot to identify economic trends.