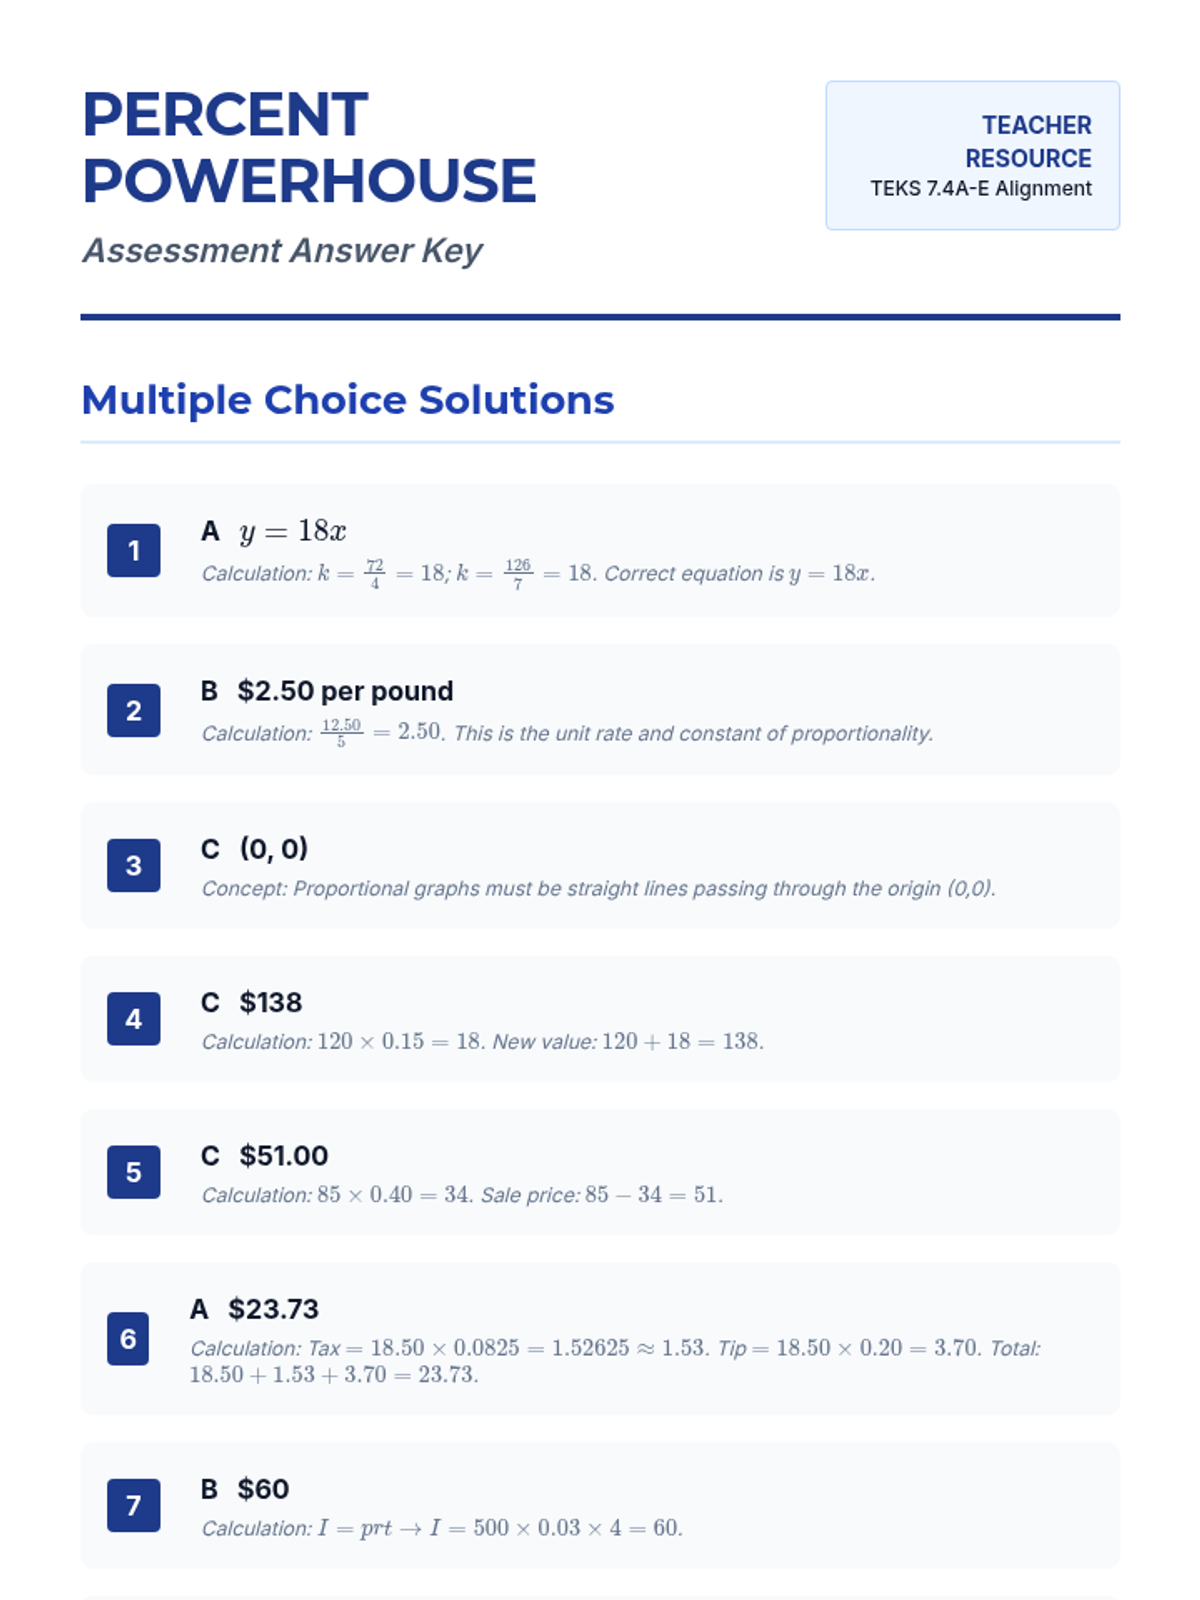
A 10-question STAAR-formatted assessment for 7th-grade math, covering proportional relationships, constant of proportionality, percent increase/decrease, financial applications, and simple interest.
An engaging instructional slide deck for Grade 7 probability and statistics, featuring visual explanations of theoretical vs. experimental probability, prediction math, and data display anatomy. Revised for improved readability with larger font sizes.
A comprehensive answer key for the Odds Lab worksheets and STAAR Quiz, including step-by-step rationales for probability and data analysis questions.
Detailed answer key for the Percent Powerhouse Assessment, providing step-by-step solutions and pedagogical grading notes for Texas teachers.
A detailed answer key for the Blueprint Final Inspection assessment, including calculation steps and a TEKS-alignment matrix for progress monitoring.
An 8-question STAAR-aligned assessment for Grade 7 probability and statistics, featuring multiple-choice questions on predictions, data displays, and probability theory. Visuals updated for mathematical accuracy.
A 10-question multiple-choice assessment modeled after the STAAR Grade 7 Mathematics test, focusing on circles, composite figures, and 3D geometry problems.
A student worksheet for creating and analyzing box plots and histograms from provided data sets, including proportional reasoning questions for predictions.
Student worksheet featuring the 3-act sneaker sale task, proportional relationship table and graph analysis, and financial literacy practice problems with Texas tax rates.
A student worksheet focused on the surface area and volume of 3D prisms and pyramids. Includes net visualization, lateral vs. total surface area distinction, and real-world capacity problems.
A hands-on student activity worksheet for recording and comparing experimental results with theoretical probability using dice, cards, and spinners.
A student worksheet focusing on the area and circumference of circles and the analysis of composite figures using partitioning strategies. Includes clear visual diagrams and dedicated work areas for step-by-step problem solving.
Visual slides for teaching percent applications and proportional relationships, including the sneaker sale 3-act task and STAAR-prep strategy tips.
A visual slide deck teaching Grade 7 geometry concepts, including circumference/area of circles, composite figure strategies, and 3D surface area/volume visualization using architectural themes.
A comprehensive three-page printable STAAR Prep study guide for Grades 6-7, covering essential Math and RLA concepts with clear visual organization and student-friendly strategies.