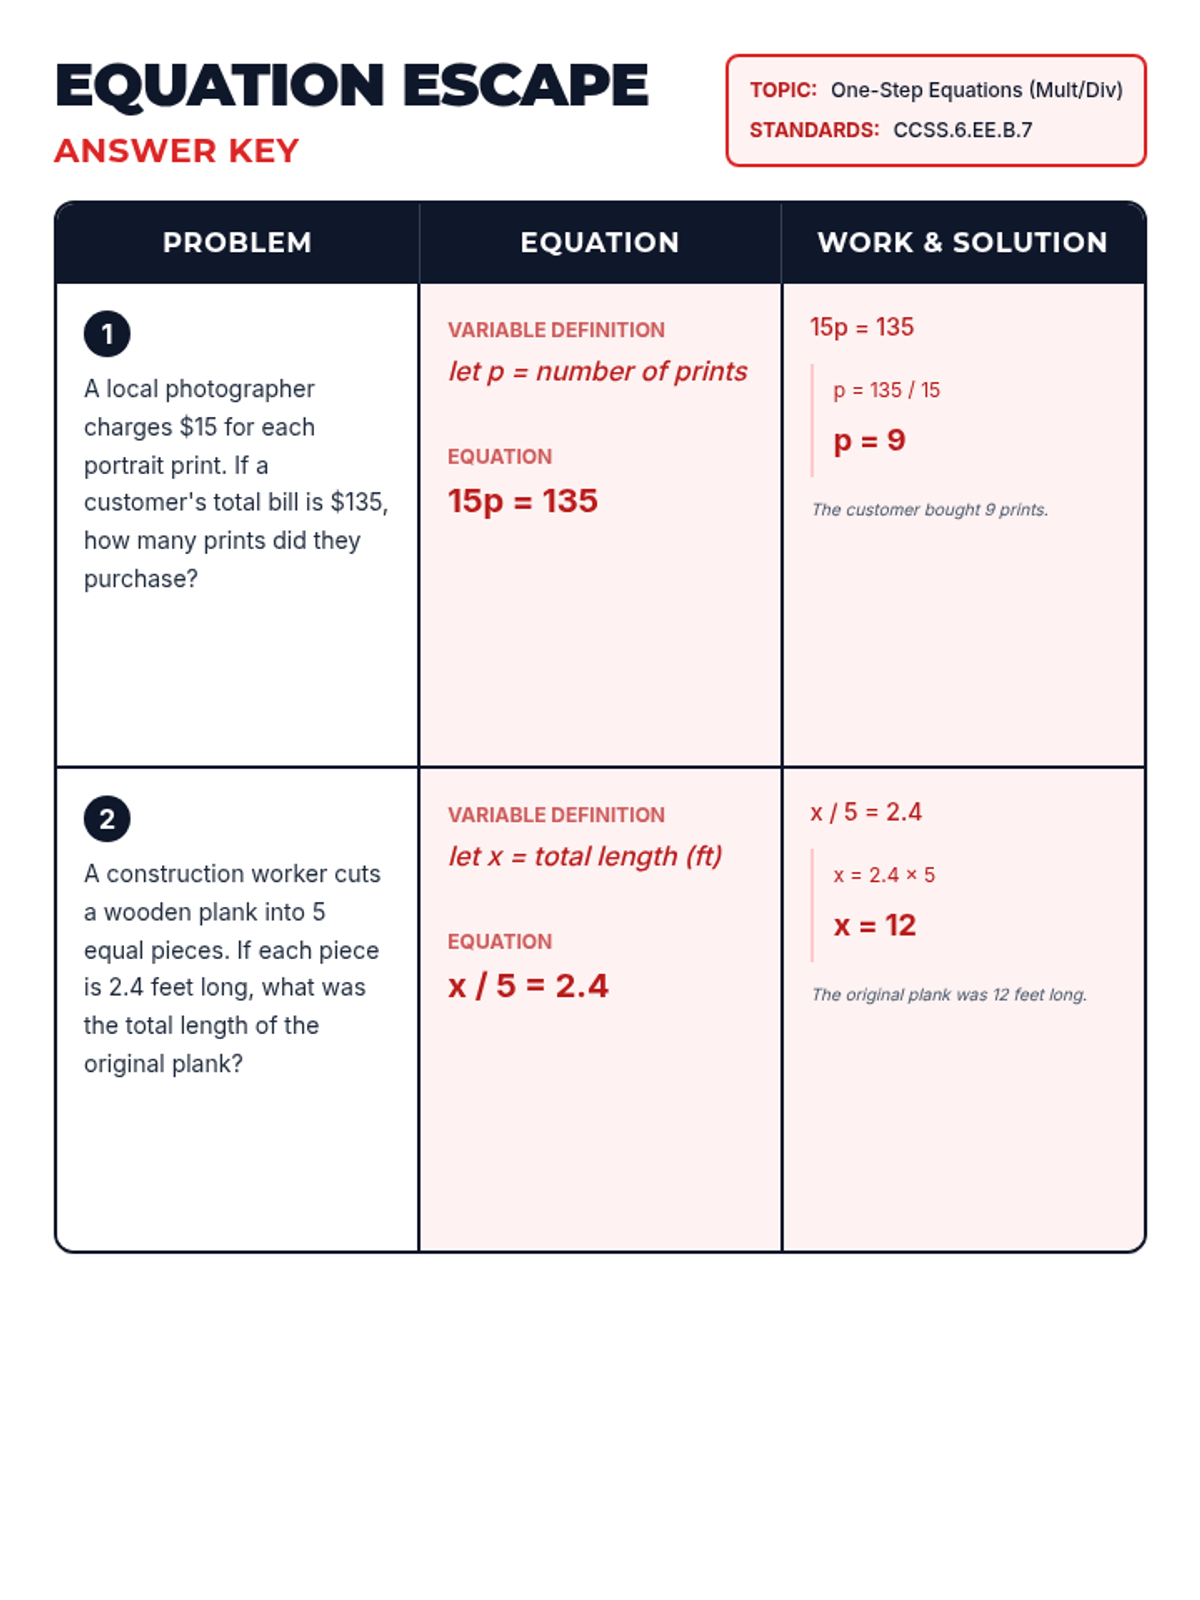
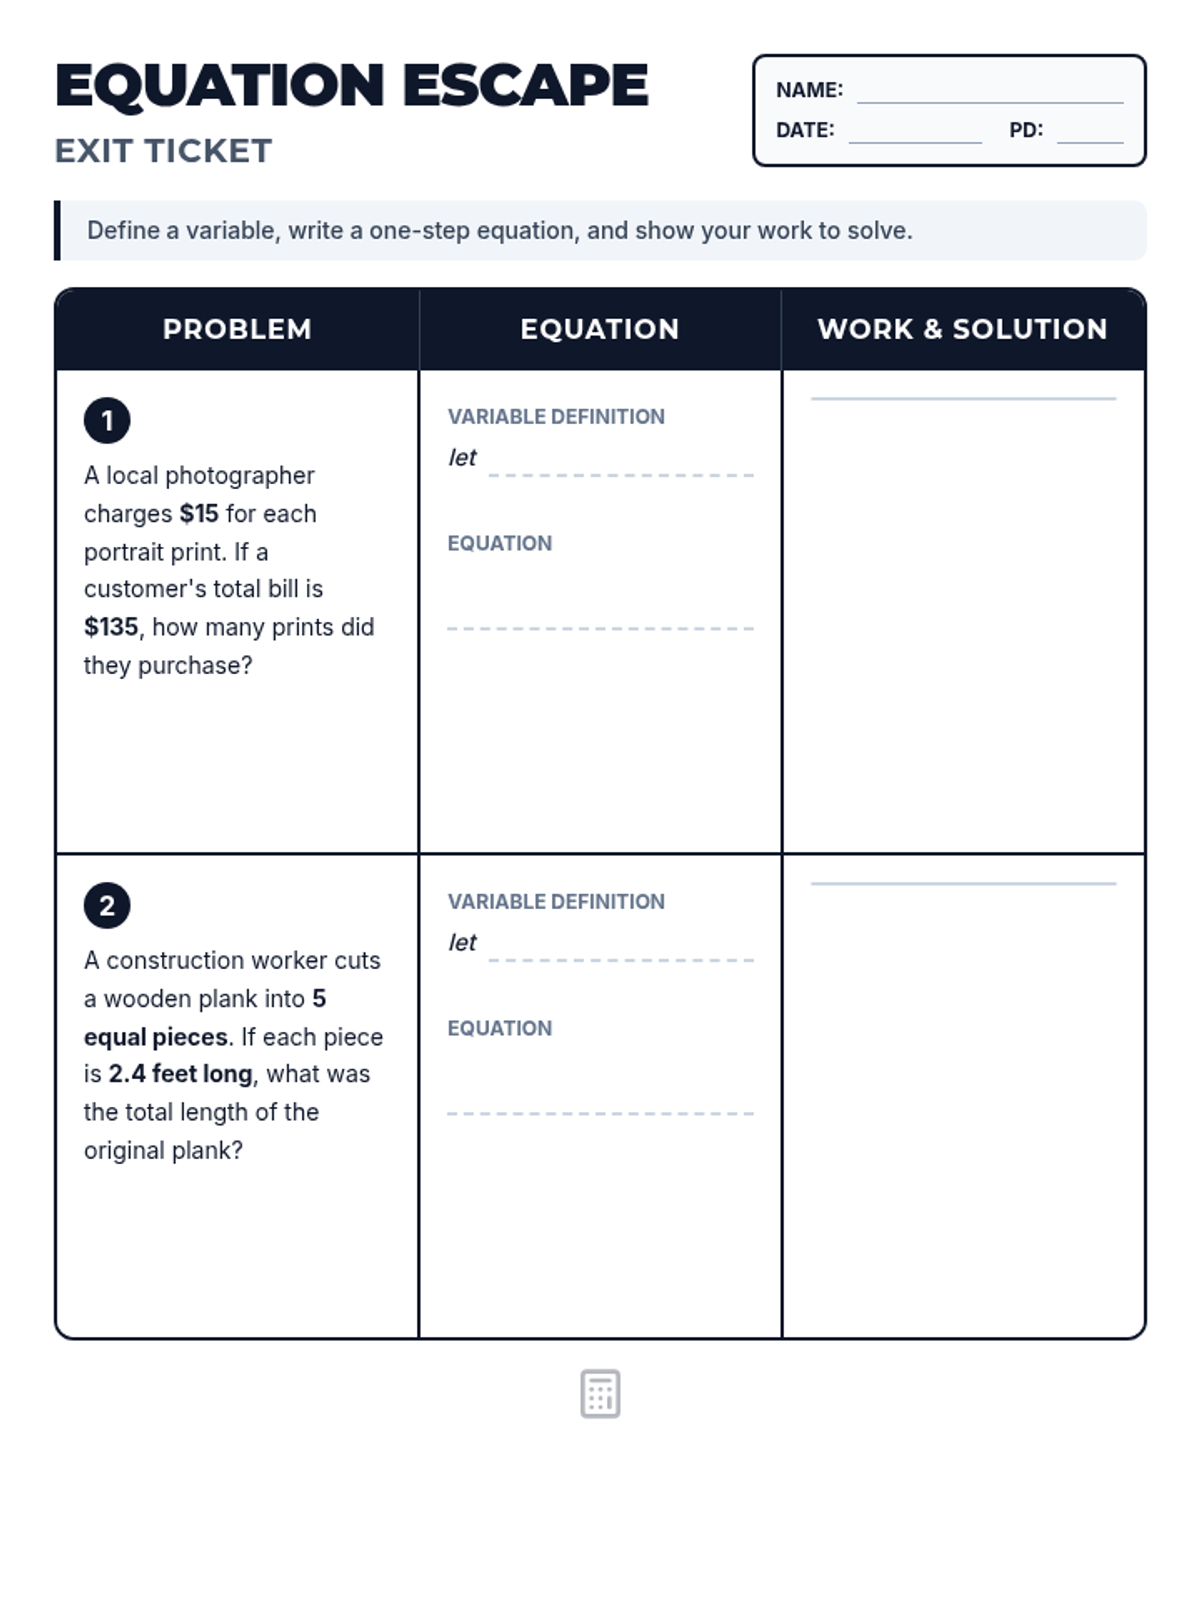
A skills-practice worksheet featuring real-world business word problems that require multiplication, subtraction, and multi-step logic to solve.
Teacher answer key and discussion guide for the Shape Basics lesson. Provides definitions, notation examples, and common misconceptions to address.
A guided note-taking worksheet where students define and sketch basic geometry terms based on the lesson slides. Includes sections for definition, notation, and a sketching grid.
A visual presentation introducing fundamental geometry terms using a blueprint theme. Covers points, lines, planes, rays, segments, angles, parallel, and perpendicular lines.
An optimized math anchor chart for adding and subtracting fractions. It features a high-legibility 2x2 grid for step instructions with increased font size and bolded keywords, along with dual addition and subtraction work areas for each major strategy.
An answer key for the Detective Log worksheet, providing the correct calculations and reasoning for each beam trial and reflection question.
A comprehensive teacher facilitation guide providing hands-on setup options, scavenger hunt instructions, and pedagogical tips for the Triangle Inequality lesson.
A recording sheet for students to track their findings from the task card scavenger hunt, featuring calculation spaces and reflection questions.
Large-format sorting mats for categorizing task cards into "Stable Support" (Possible Triangles) or "Structural Failure" (Impossible Triangles).
A set of 8 scavenger hunt task cards featuring visual representations and integer lengths for students to analyze using the Triangle Inequality Theorem.
Teacher answer key for the Prize Wheel Worksheet including sample space and probability calculations.
Visual presentation introducing the Triangle Inequality Theorem through a bridge-building architectural theme, featuring clear diagrams and structural engineering analogies.
A printable worksheet where students practice identifying sample space, likelihood, calculating theoretical probability, and analyzing experimental data.
A 6-slide presentation introducing sample space, theoretical vs. experimental probability, and likelihood using simple language and carnival-themed visuals.
A teacher-facing answer key for the Triangle Architect Exit Ticket. It uses a red blueprint theme and provides worked-out solutions for each problem, including numeric justifications for the Triangle Inequality Theorem.
A blueprint-themed 5-question exit ticket for students to practice the Triangle Inequality Theorem. It includes numeric checks, a visual aid with checkboxes, and word problems with scaffolding. Final version optimized for a single-page layout.
Teacher answer key for the Nowhere News statistics worksheet.
A statistics graphic organizer and reference sheet for students, featuring key formulas and a data table for organizing calculations.
A guided statistics worksheet themed around Courage the Cowardly Dog, covering mean, median, mode, range, dot plots, and probability.
A detailed answer key for the Equation Escape Exit Ticket, providing variable definitions, correct one-step equations, step-by-step solution work, and final answers with units.
A two-question exit ticket focused on writing and solving one-step multiplication and division equations based on word problems. Includes dedicated space for variable definition, equation writing, and solution steps.
The answer key for the Roof Pitch Problems worksheet, including slope calculations and rational/irrational number classification. Now with improved layout and single-page optimization where possible.
An 8th-grade worksheet exploring slope (rise over run) through roof pitch problems and the classification of rational and irrational numbers. Includes a real-world ramp design challenge. Now with generous work areas and improved LaTeX rendering.
A presentation for 8th-grade math covering slope as a fraction (rise over run) and the difference between rational and irrational numbers in structural engineering contexts.