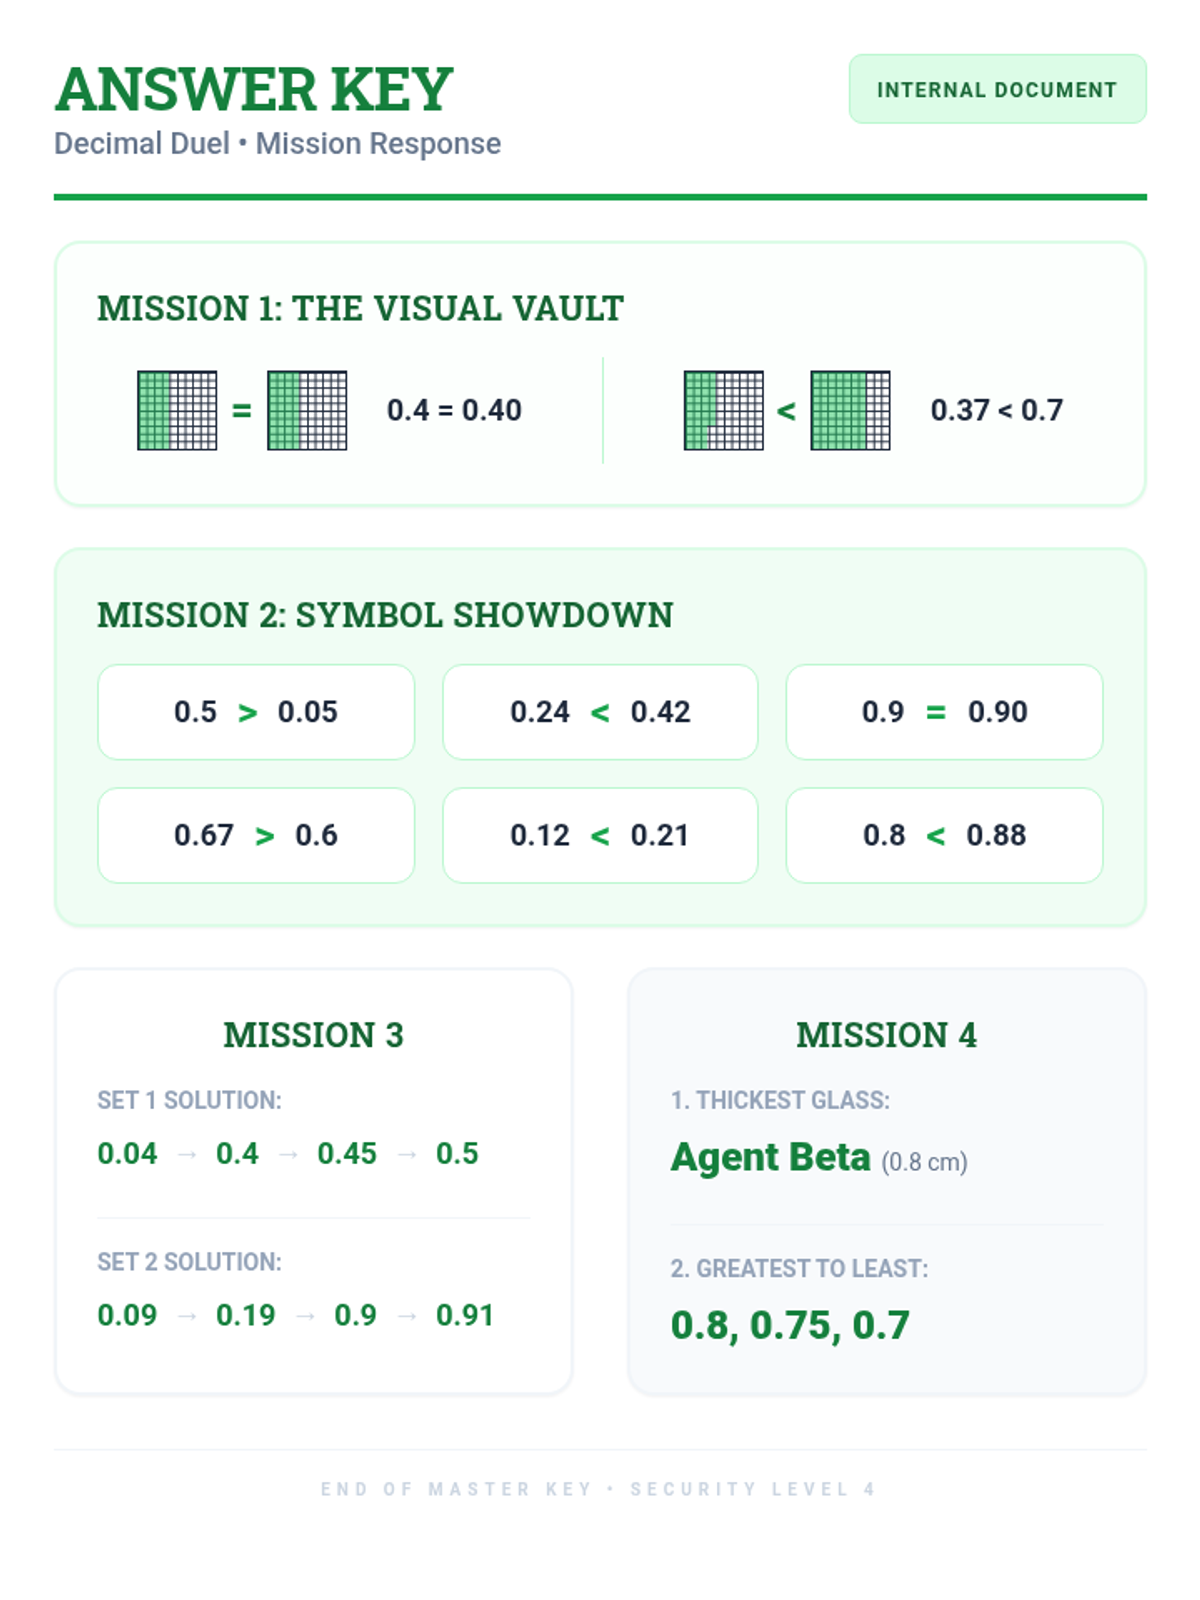
A 4th-grade math worksheet on comparing and ordering decimals to the hundredths place, structured as a two-page "Agent" mission with visual grids, symbol practice, and word problems.
An answer key for the Blueprint Division Worksheet, providing the full long division steps and final quotient/remainder for all 10 problems with color-coded instruction.
A color-coded blueprint themed worksheet for practicing long division with remainders. It includes a clear step-by-step legend and ample workspace for 10 division problems.
Answer key for the Site Inspection exit ticket, featuring clear regrouping steps for both addition and subtraction problems.
A 2-question exit ticket for 3-digit regrouping, featuring base-ten block visual scaffolds and space for vertical calculation.
Answer key for the Blueprint Math Worksheet, showing full regrouping steps and final solutions in an easy-to-grade format.
A 3-digit addition and subtraction worksheet featuring a graph paper background for alignment and specific regrouping spaces.
A visual slide deck introducing 3-digit regrouping concepts, base-ten block visual aids, and 'Next Door Rule' subtraction strategies with a construction theme.
A comprehensive teacher's guide for the 'Blueprint Builders' lesson, featuring instructional steps, vocabulary, and differentiation strategies for teaching 3-digit regrouping.
Teacher answer key for the Decimal Duel worksheet, condensed onto a single page with visual and symbolic solutions.
An answer key and teacher facilitation guide providing solutions to the math problems and strategic scenarios presented in the student materials. It includes step-by-step calculations and expected responses for critical thinking questions.
A strategic planning activity where students take on the role of an Indy 500 Crew Chief. They must calculate and plan fuel stops across the 200-lap race based on fuel tank capacity and historical pit data, balancing safety and speed.
A math-focused student worksheet that requires students to calculate average speeds from historical Indy 500 data and track section statistics. It includes a critical thinking reflection on technological and social changes over time.
A high-energy visual presentation introducing the history, culture, and mathematics of the Indianapolis 500. Slides cover 'The Brickyard' origin, iconic traditions like drinking milk, and the fundamental Speed = Distance / Time formula.
A comprehensive teacher guide for the Indy Speedsters lesson, including learning objectives, a detailed instructional sequence, and differentiation strategies. It bridges mathematical speed calculations with the cultural history of the Indianapolis 500.
An engaging student activity that guides them through branding their lemonade business, analyzing location demand, and designing their physical stand. Reorganized layout to provide more drawing space and fixed page break issues. Drawing area background set to white for student work.
A student worksheet that provides hands-on practice with multiplication and subtraction through real-world business scenarios. Students calculate supply costs, revenue from sales, and final profit using two different pricing strategies. Lightened student work area for better legibility.
A high-impact, 16:9 visual presentation that introduces students to business concepts, economics vocabulary (Cost, Revenue, Profit), and the fundamental math formula. Scaled and adjusted elements to prevent visual clipping.
A concise teacher guide for 'The Lemonade Stand Moguls' lesson, featuring learning objectives, a lesson flow, essential vocabulary, and a clear answer key. Optimized for single-page guide layout with a separate answer key.
A detailed answer key for the 'Line and Angle Lab' and 'Quadrilateral Quest' worksheets, providing teacher guidance and correct responses.
A visually engaging slide deck covering points, lines, rays, angles, and quadrilateral properties with an architectural theme.