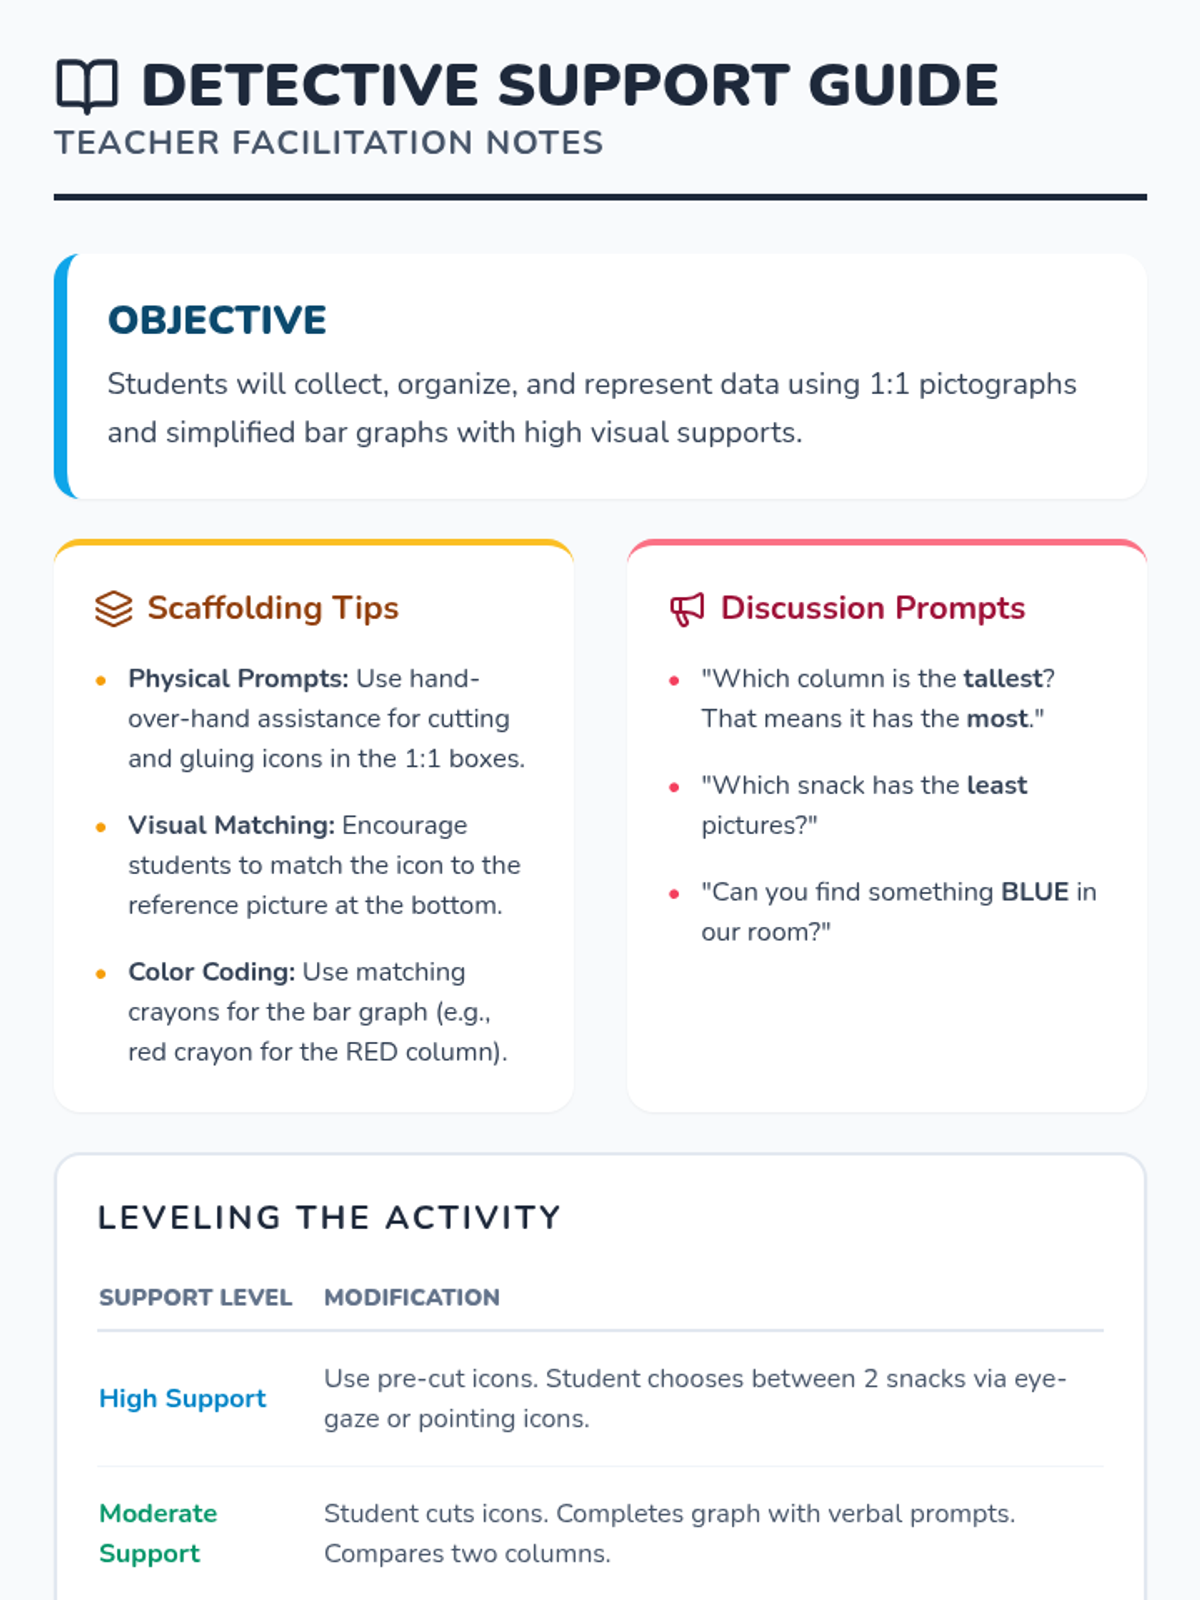
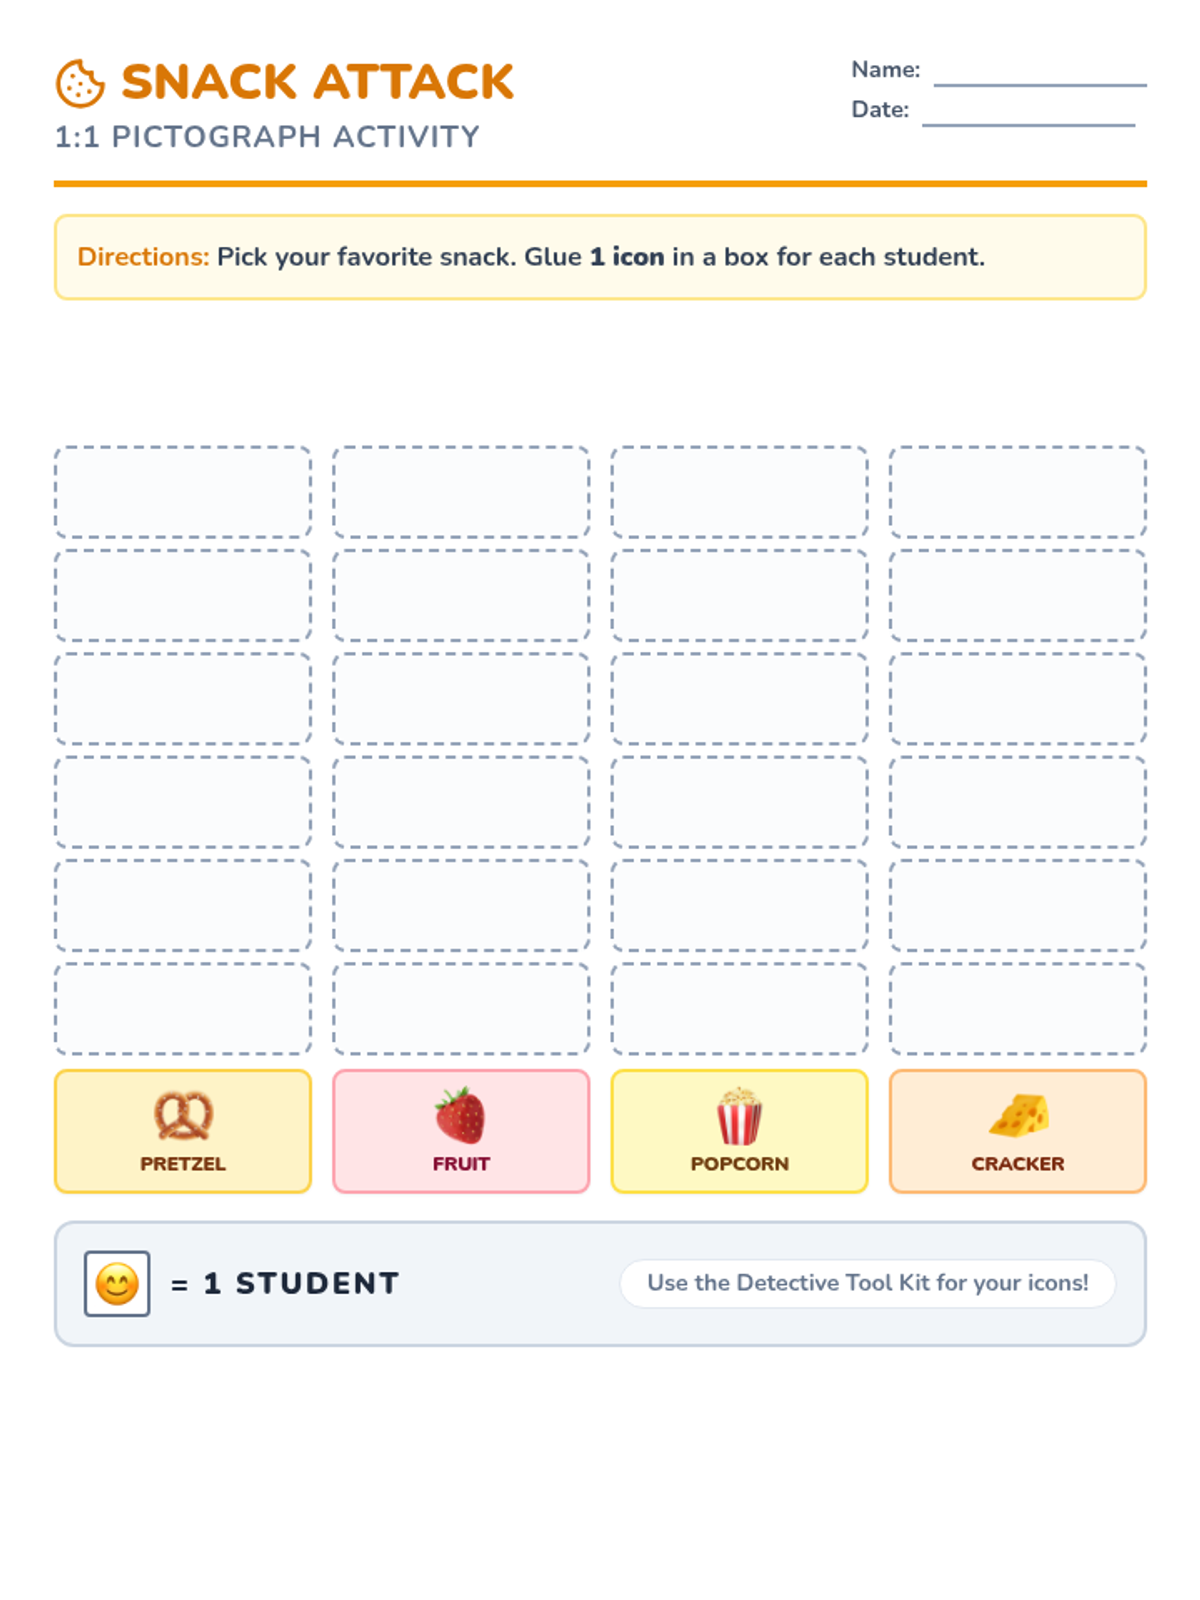
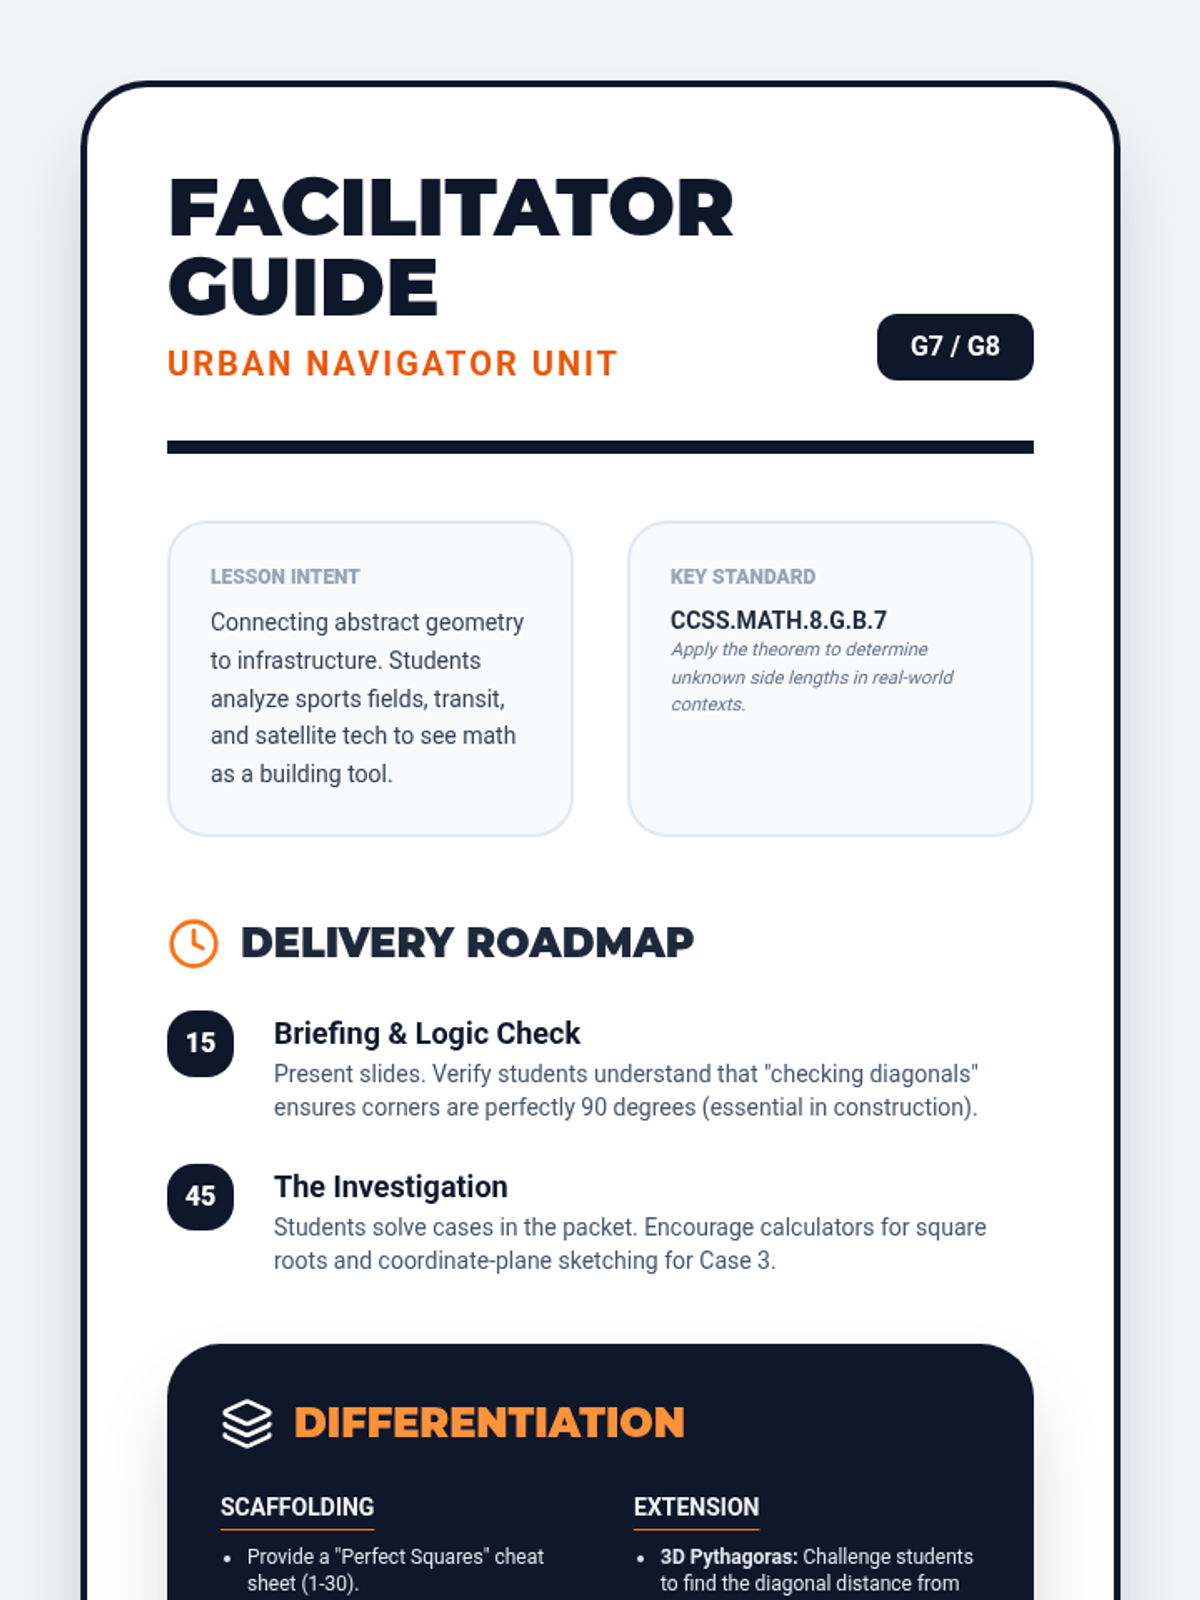
A comprehensive teacher facilitation guide for the Data Workshop intervention, detailing the concrete-to-pictorial-to-abstract progression, key questions, and common student misconceptions for Grade 1 data interpretation.
A professional teacher guide for the "Decimal Multipliers" lesson, including instructional strategies, standard alignment, common student misconceptions, and a quick-reference answer key for the practice sheet.
A student practice worksheet containing three sections: a "Warm Up" for counting decimal places, a "Calculation Station" for procedural practice with workspace, and a "Real World Drill" word problem.
A visual anchor chart illustrating the three-step process for multiplying decimals by decimals. It features a clean blueprint aesthetic with clear examples and a special section on using placeholder zeros.
A comprehensive teacher's answer key for the Stat Sense Worksheet, including step-by-step calculation formulas and final results for z-scores, raw values, and distribution interpretations.
A 4-page statistics worksheet featuring five detailed word problems on z-scores and normal distributions. Includes sections on first aid exams, teaching hours, regional temperatures, and wildlife population data with ample space for calculations.
A teacher support guide providing scaffolding strategies, discussion prompts, and level-based modifications for the graphing activities. Includes tips for IEP alignment and physical accessibility.
A collection of cut-out icons (snacks, pets, and colors) to be used with the pictograph activities. Designed with large dotted borders and high contrast to assist students with developing fine motor and visual skills.
A two-part student activity sheet for pet preferences. Includes a survey section for peer interaction and a corresponding graphing area with visual supports for dogs, cats, and fish.
A bar graph worksheet for identifying and counting classroom colors (Red, Blue, Green, Yellow). Includes large grid boxes for coloring and visual color-swatch labels to support non-readers.
A 1:1 pictograph worksheet for student snack preferences. Features large, high-contrast columns with designated spaces for glue-on icons and clear emoji supports for pretzels, fruit, popcorn, and crackers.
A 5-slide visual presentation introducing graphing concepts with 1:1 pictographs and bar graphs using snack, color, and pet themes. Includes large icons and clear, simplified explanations for Essential Skills students.
A complete teacher's answer key for the Gig Guru project, providing exact numerical solutions for all three job scenarios, model graphs, and detailed algebraic solving steps for the financial goals.
A comprehensive guide for teachers to facilitate the Gig Guru project, including standards alignment, pacing suggestions, answer keys, and a grading rubric.
An extension worksheet focusing on budget management, calculating goal-based targets using algebraic solving, and reflecting on the impact of expenses on linear models.
A project worksheet where students select a summer job scenario and build a linear function model. It includes identifying parameters, writing the equation, calculating values in a table, and graphing the results.
A visual presentation introducing students to the Gig Guru project. It covers the core mathematical concepts of linear functions (slope and y-intercept) within the context of a summer job and starting savings.
A teacher's answer key providing step-by-step calculations and final answers for all tasks in the Pythagoras Project Packet.
A professional facilitator guide for teachers, providing instructional strategies, common misconceptions, and differentiation tips for the Urban Navigator project.
A comprehensive student investigation packet that applies the Pythagorean Theorem to sports fields, city planning shortcuts, and coordinate-based GPS navigation.
A vibrant slide deck introducing the Urban Navigator project, connecting the Pythagorean Theorem to sports, city planning, and GPS navigation.
A set of 10 printable task cards featuring diverse binomial distribution scenarios. Perfect for station activities, group work, or extra practice bank. Includes integrated answer key. Now updated to include Expected Value (E[X]) calculations for every case.
A comprehensive answer key for the task-card edition of the Binomial Breakdown Worksheet, reformatted into individual 1/3-page cards to facilitate separate distribution or physical cutting. Each card provides detailed logic, modern BINOM.DIST syntax, and correctly rendered manual formulas. Updated for density and usability.
A 21-question practice worksheet for 12th-grade statistics, reformatted as a modular task-card bank. Designed with three horizontal cut-lines per page for easy physical division. Covers BINS criteria, spreadsheet formulas (BINOM.DIST), hand-calculation theory, and now includes questions on Expected Value (n*p). Card IDs and questions are aligned 1:1.
A visual presentation accompanying the Binomial Breakdown lesson. Covers BINS criteria, expected value (mean), spreadsheet formula syntax (BINOM.DIST), and the hand-calculation formula connection. Updated with a new slide for expected value (n*p) and improved summary visuals.
A teacher-facing guide for the Green Thumb Architects lesson, including TEKS alignment, grading rubric, project answer keys, and task card solutions. Updated with light backgrounds for easy printing.