Data representation, distributions, and statistical variability using sampling and inference techniques. Integrates probability models, compound events, bivariate patterns, and linear models to guide data-driven decision making.
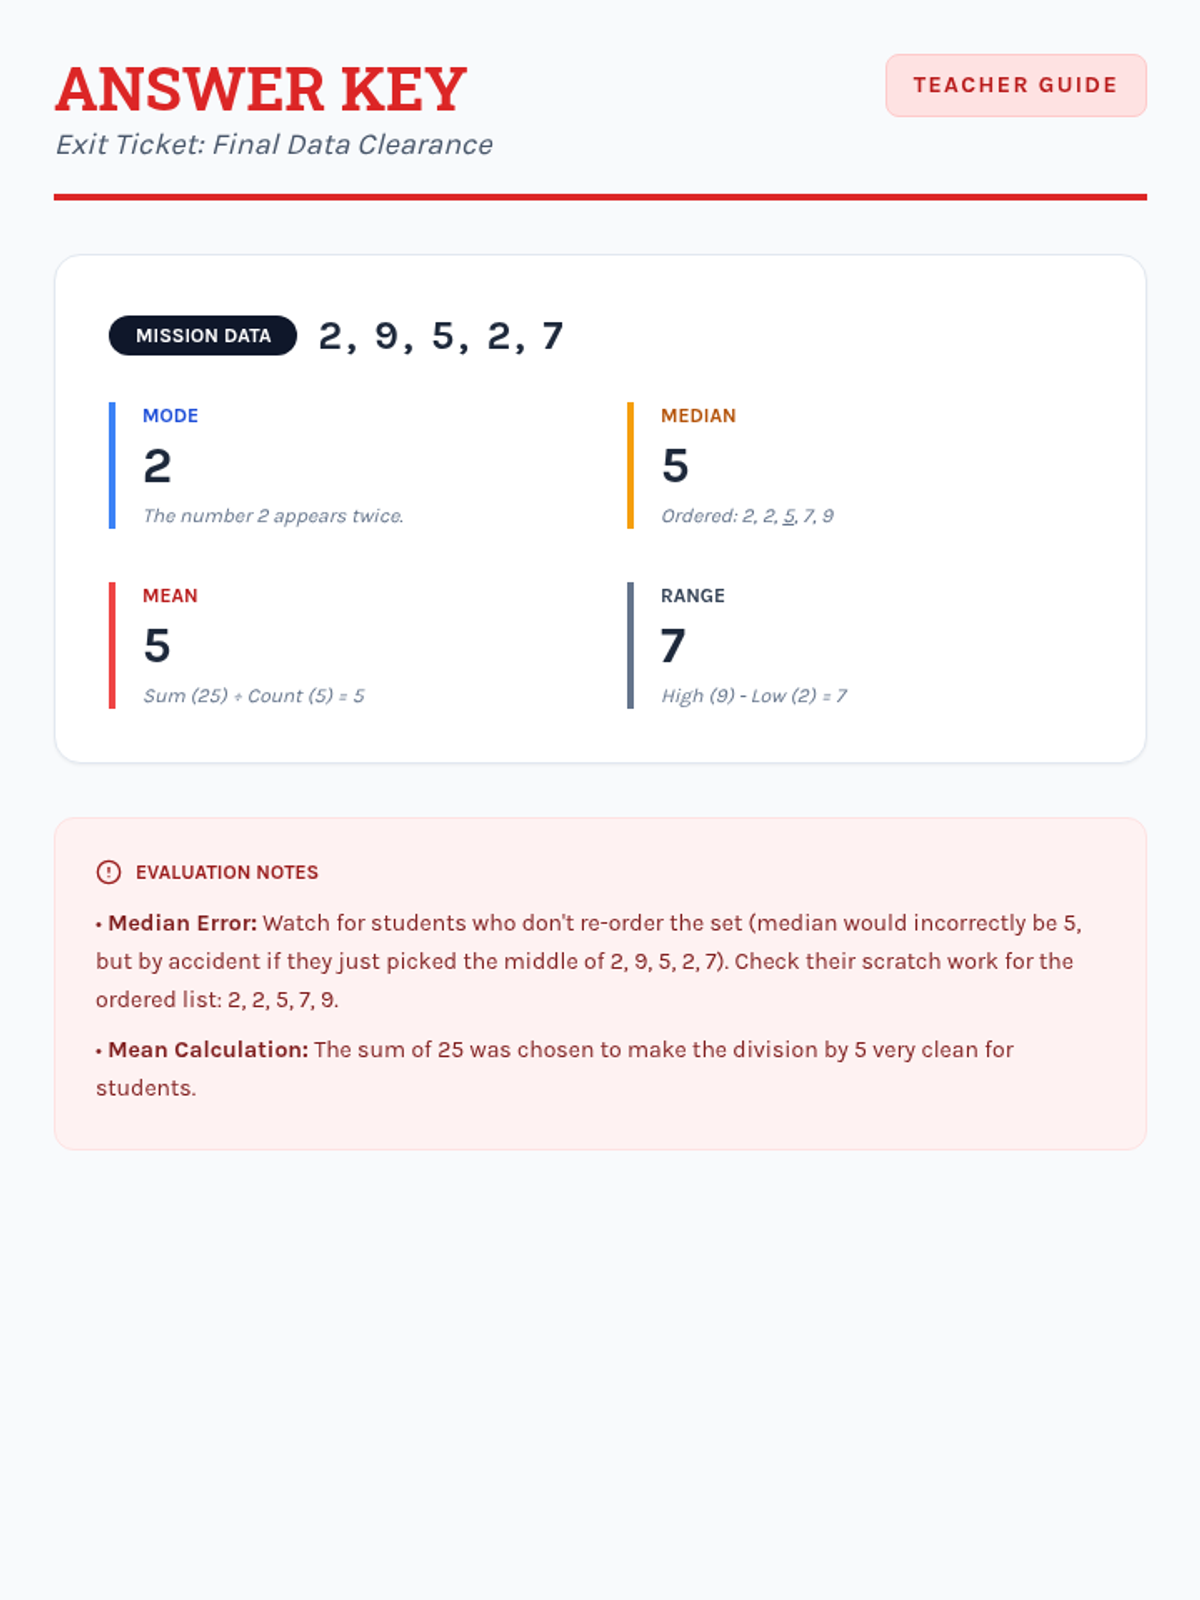
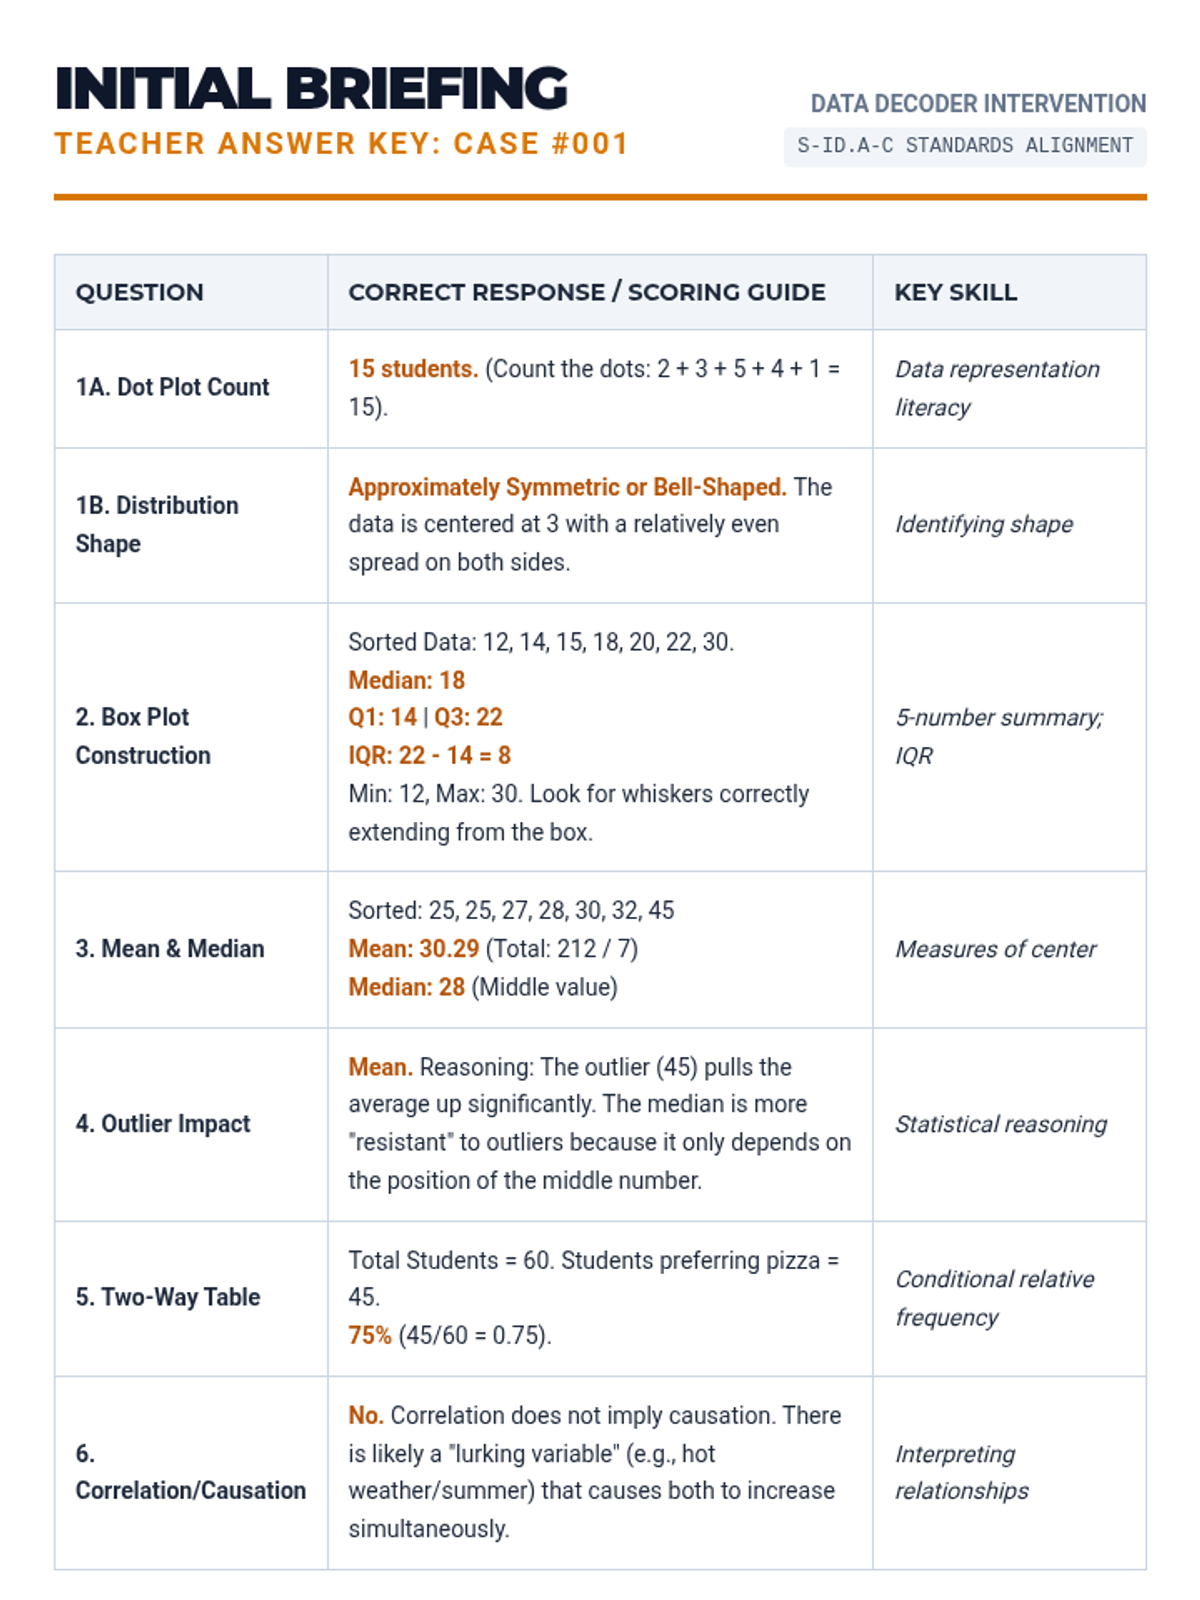
A comprehensive progression through descriptive statistics, from foundational calculations to high-school level analytical applications, including outlier effects and algebraic problem-solving.
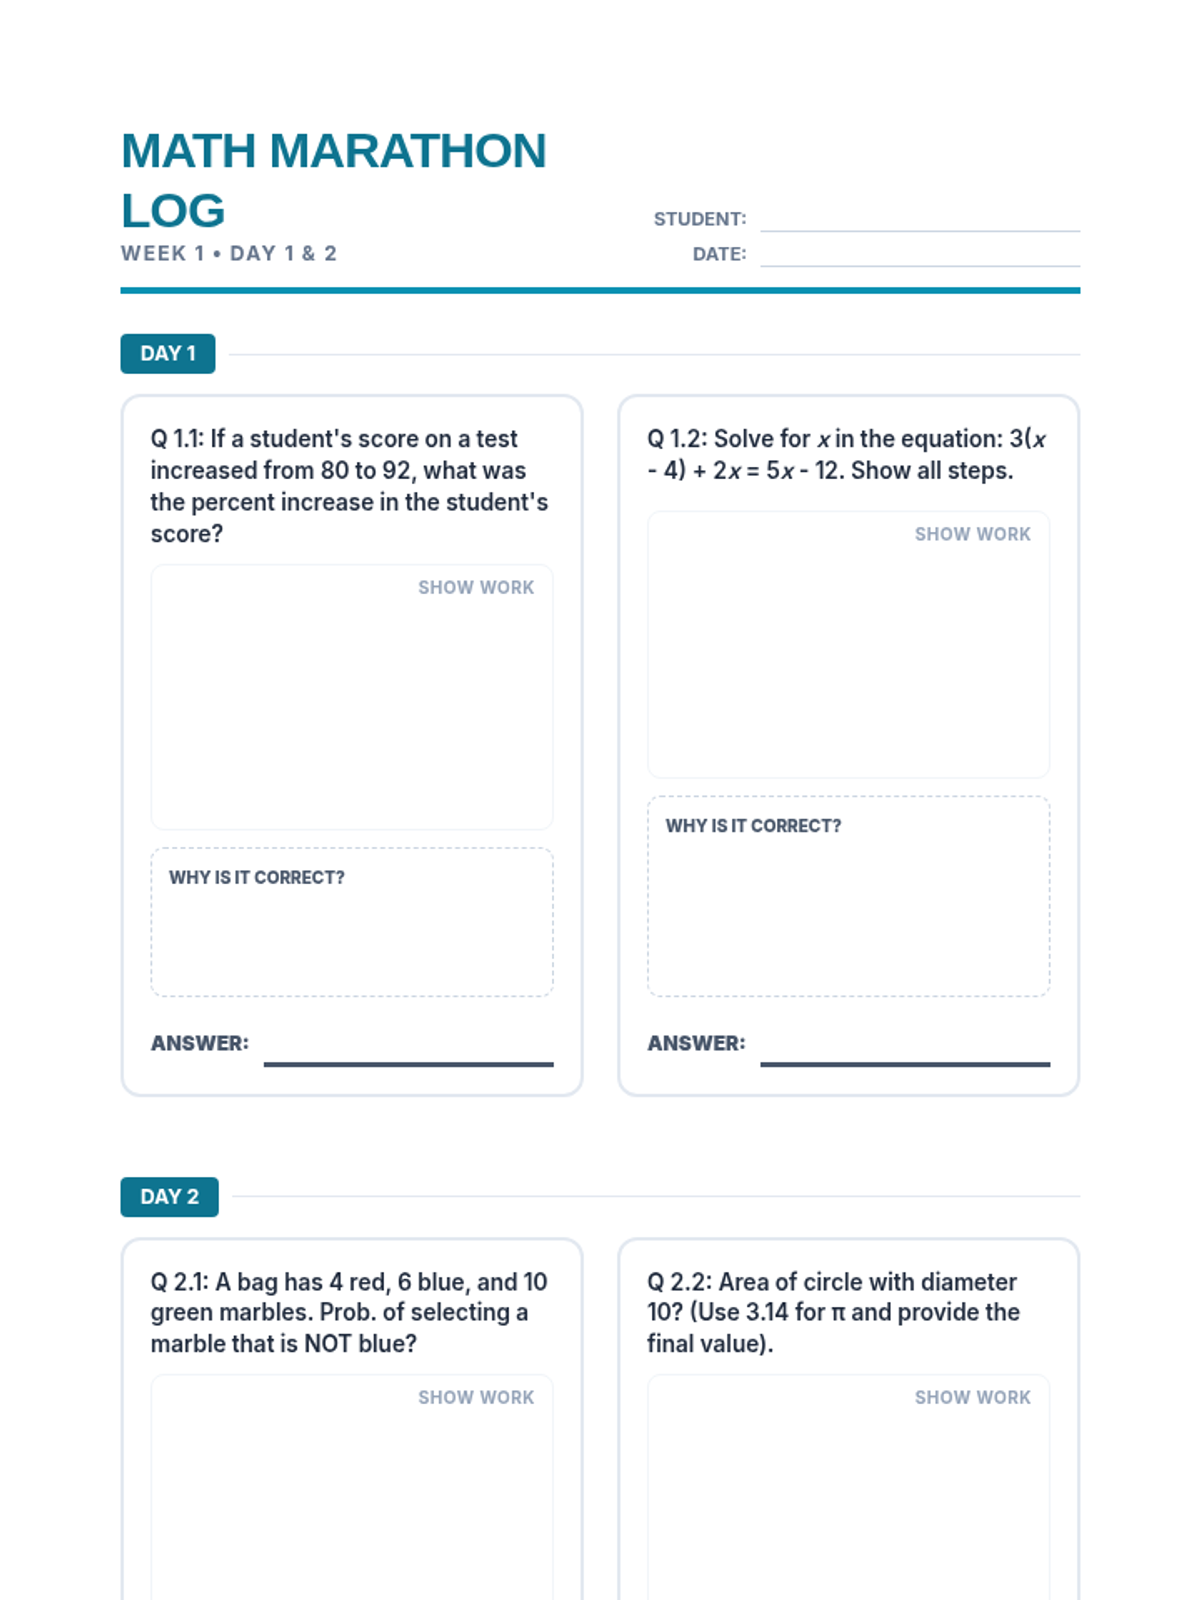
A comprehensive 15-day TSIA2 math review sequence featuring daily warm-up questions and weekly progress logs for students. The program covers all four TSIA2 domains through a "Math Marathon" theme.
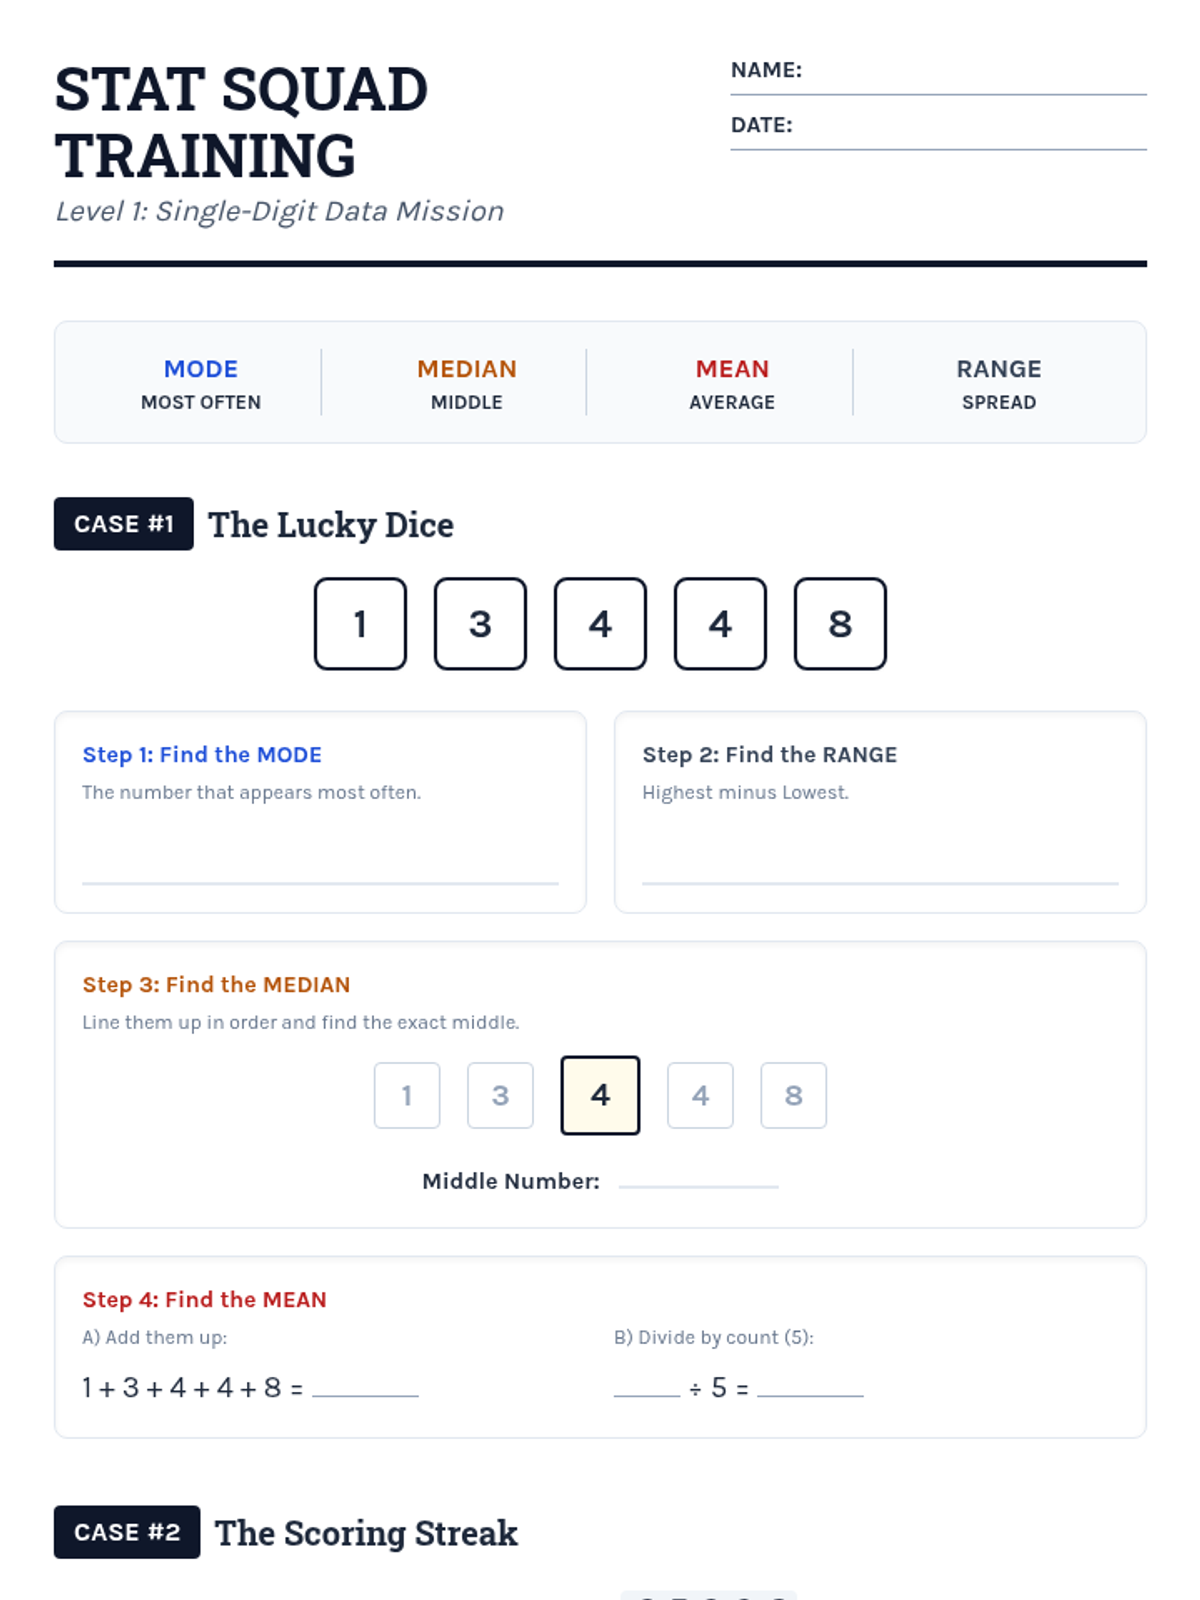
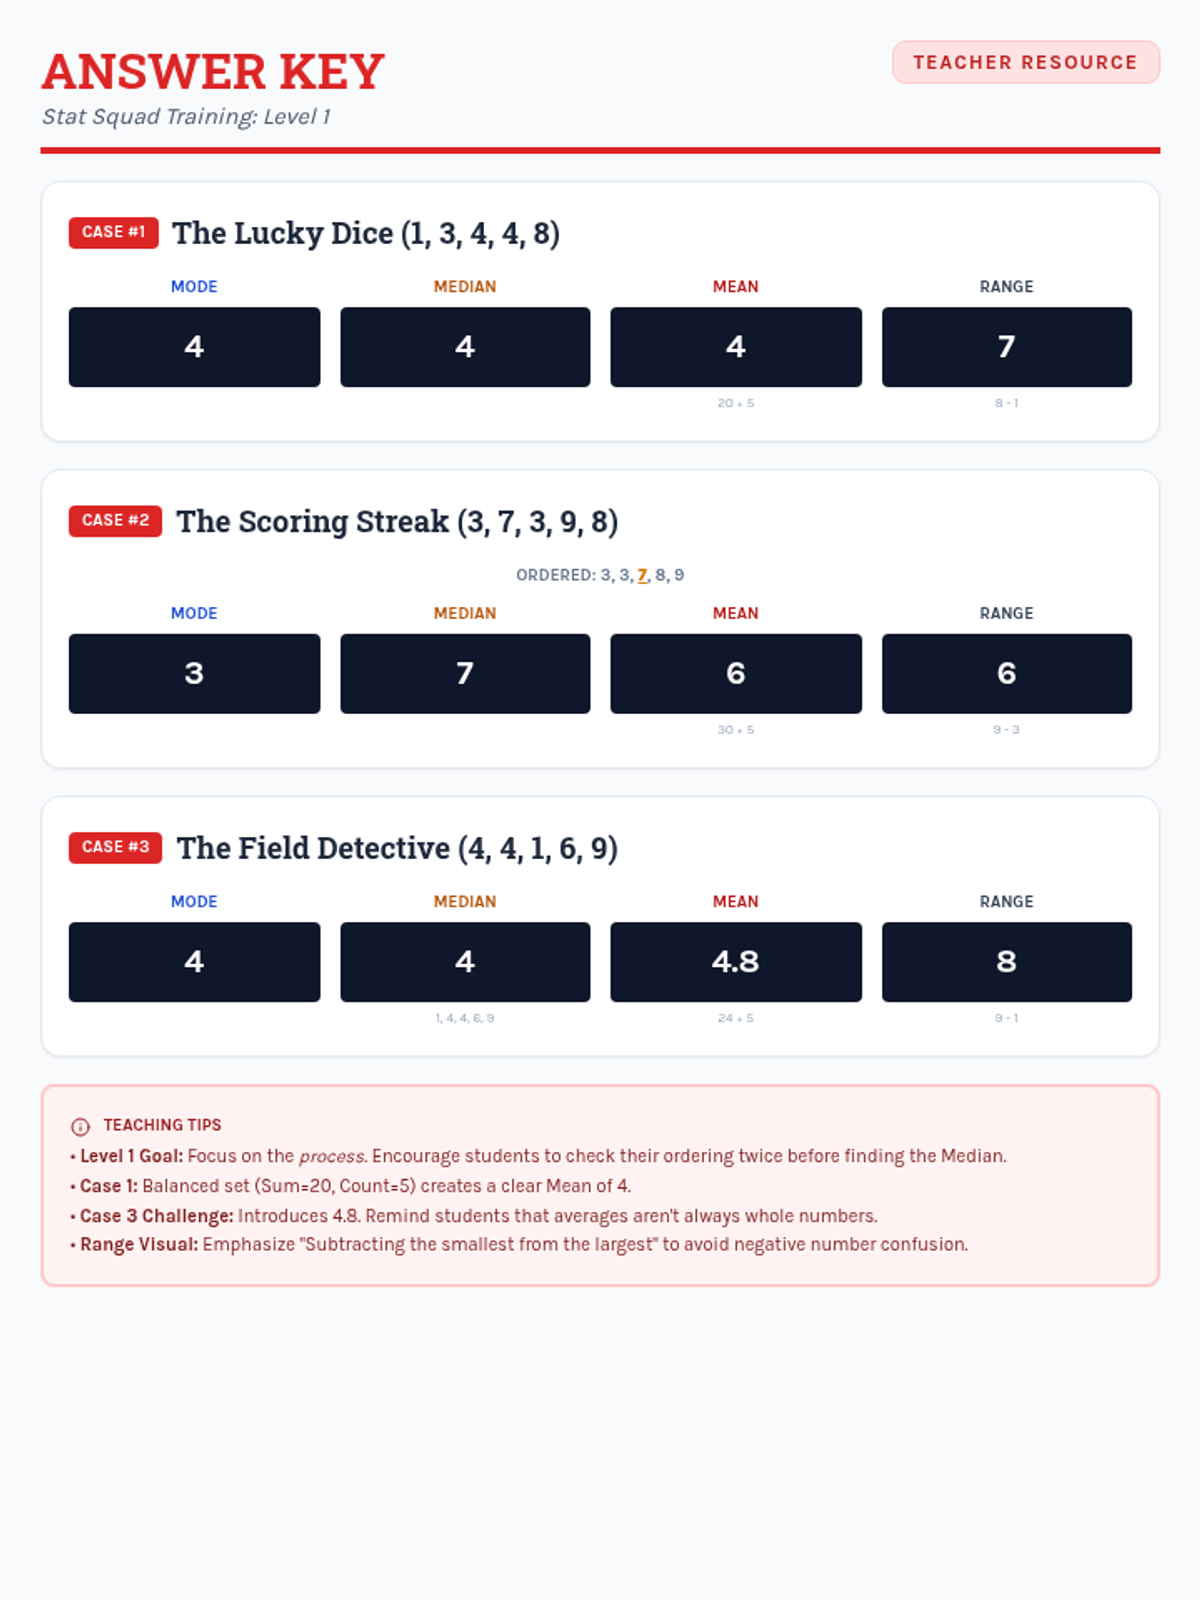
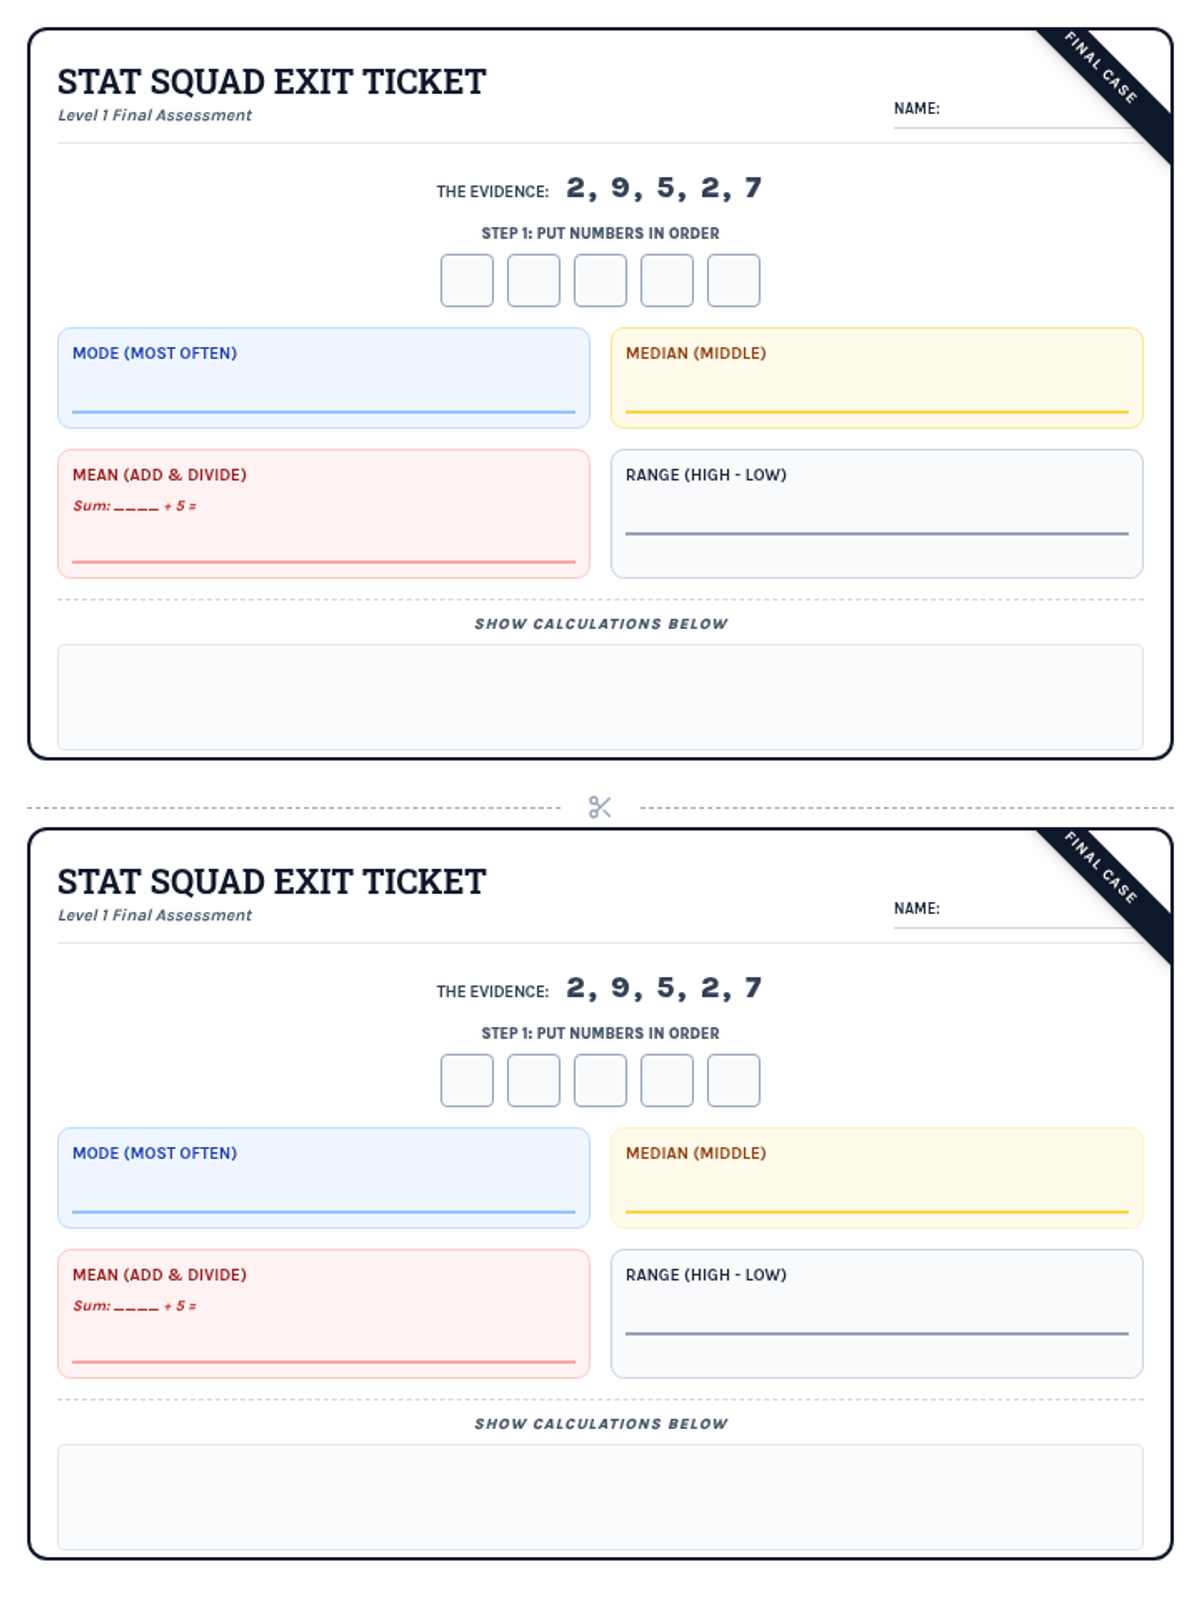
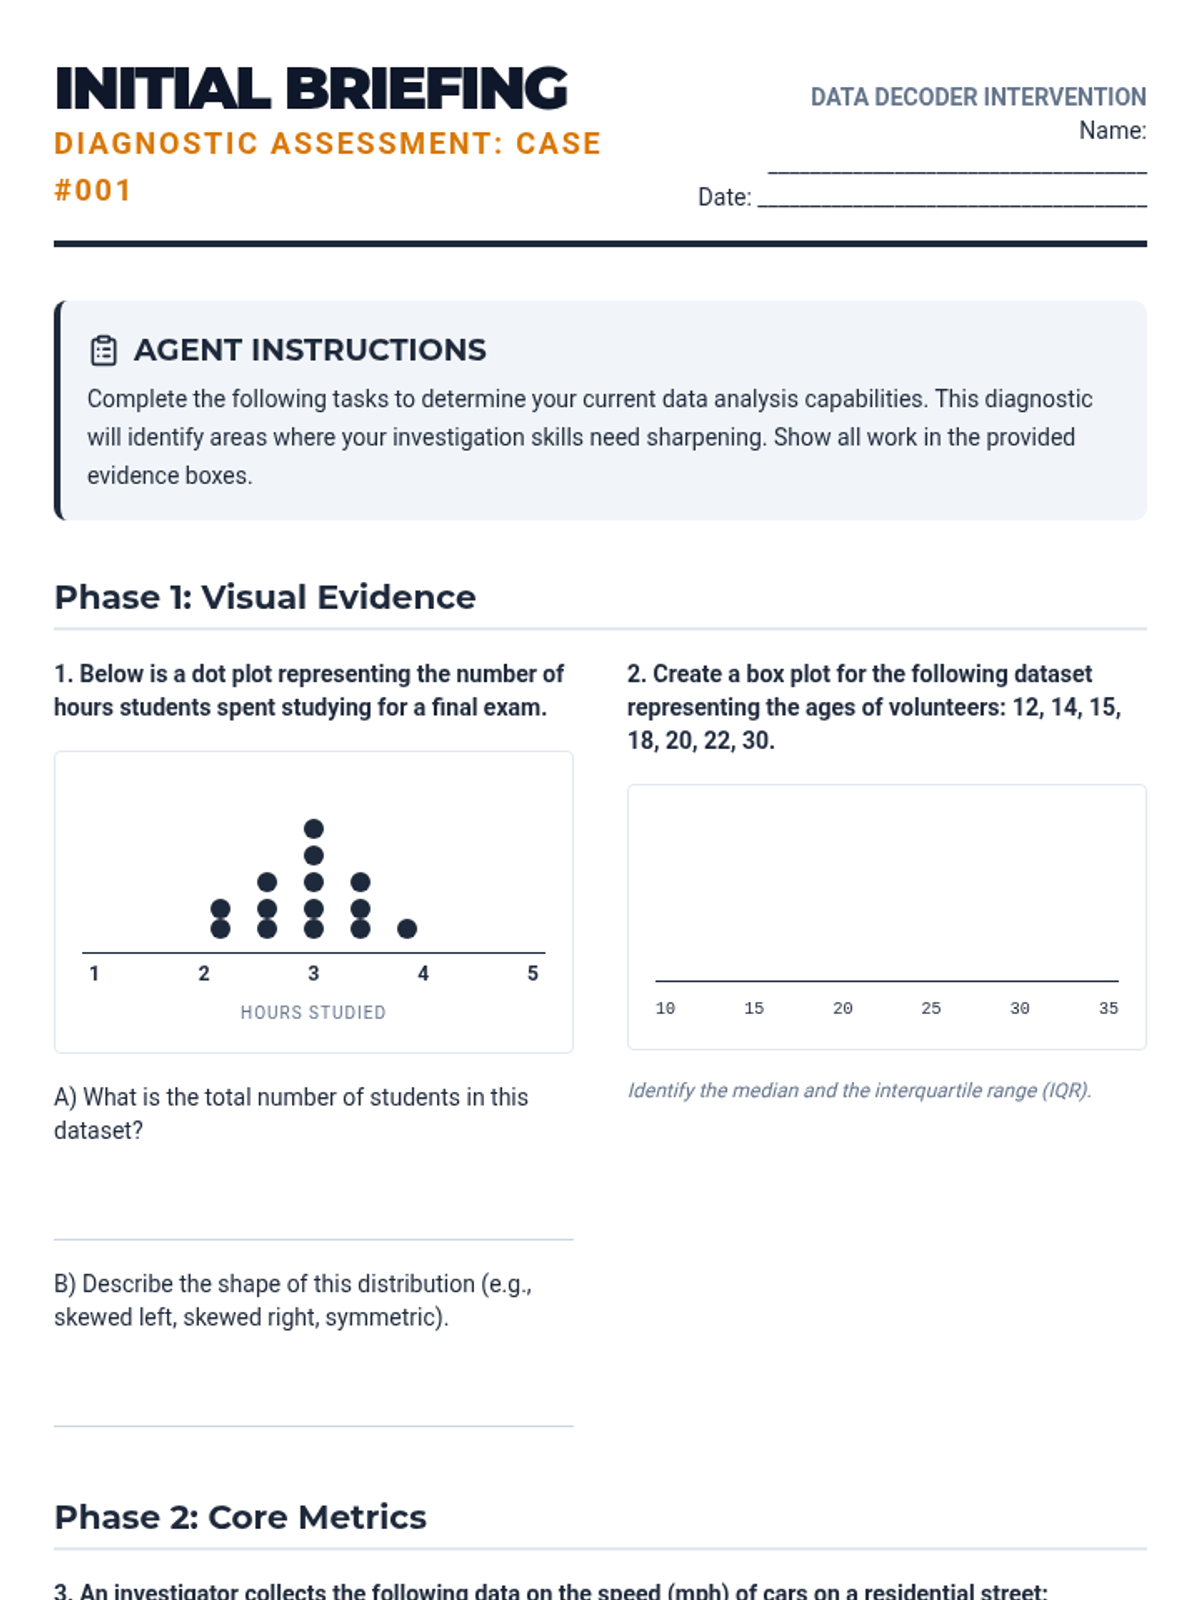
A comprehensive Tier 2 intervention sequence for high school students focused on summarizing, representing, and interpreting data, aligned with Colorado Standard 3. The program uses a 'Data Forensics' theme to engage students in uncovering insights from real-world datasets through scaffolded analysis and visual interpretation.
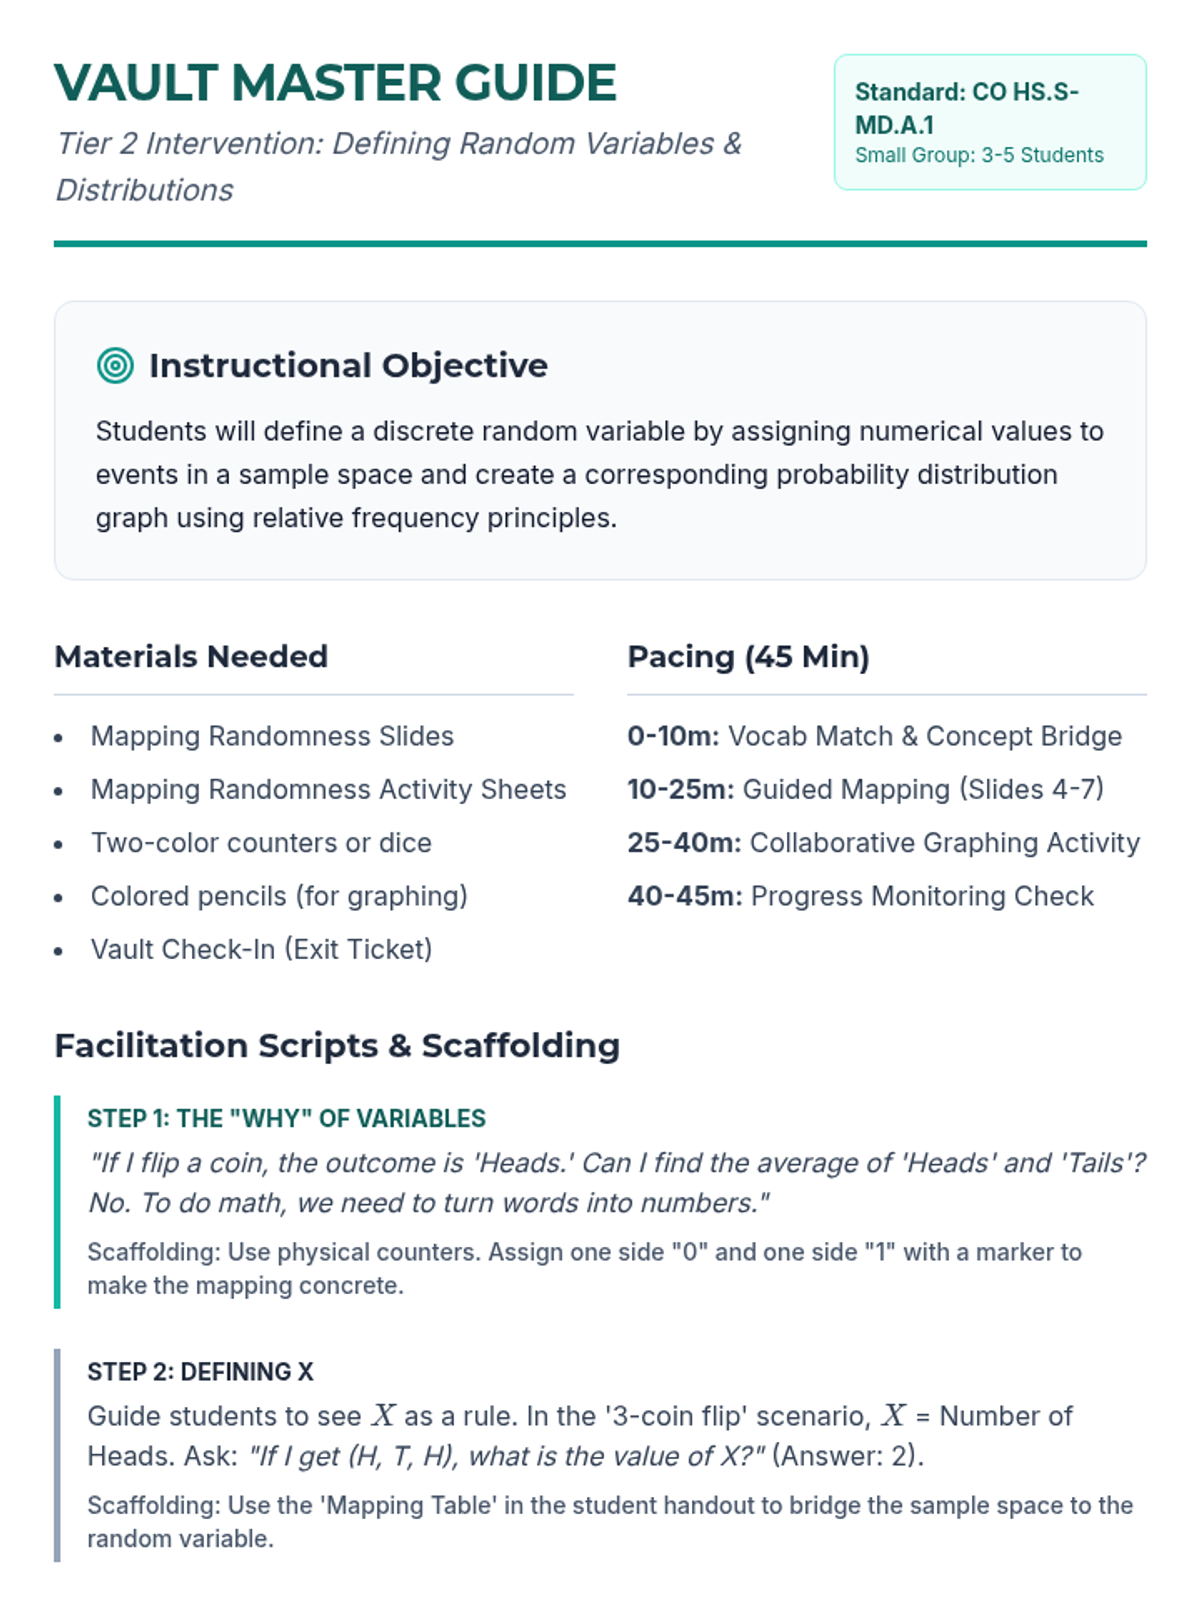
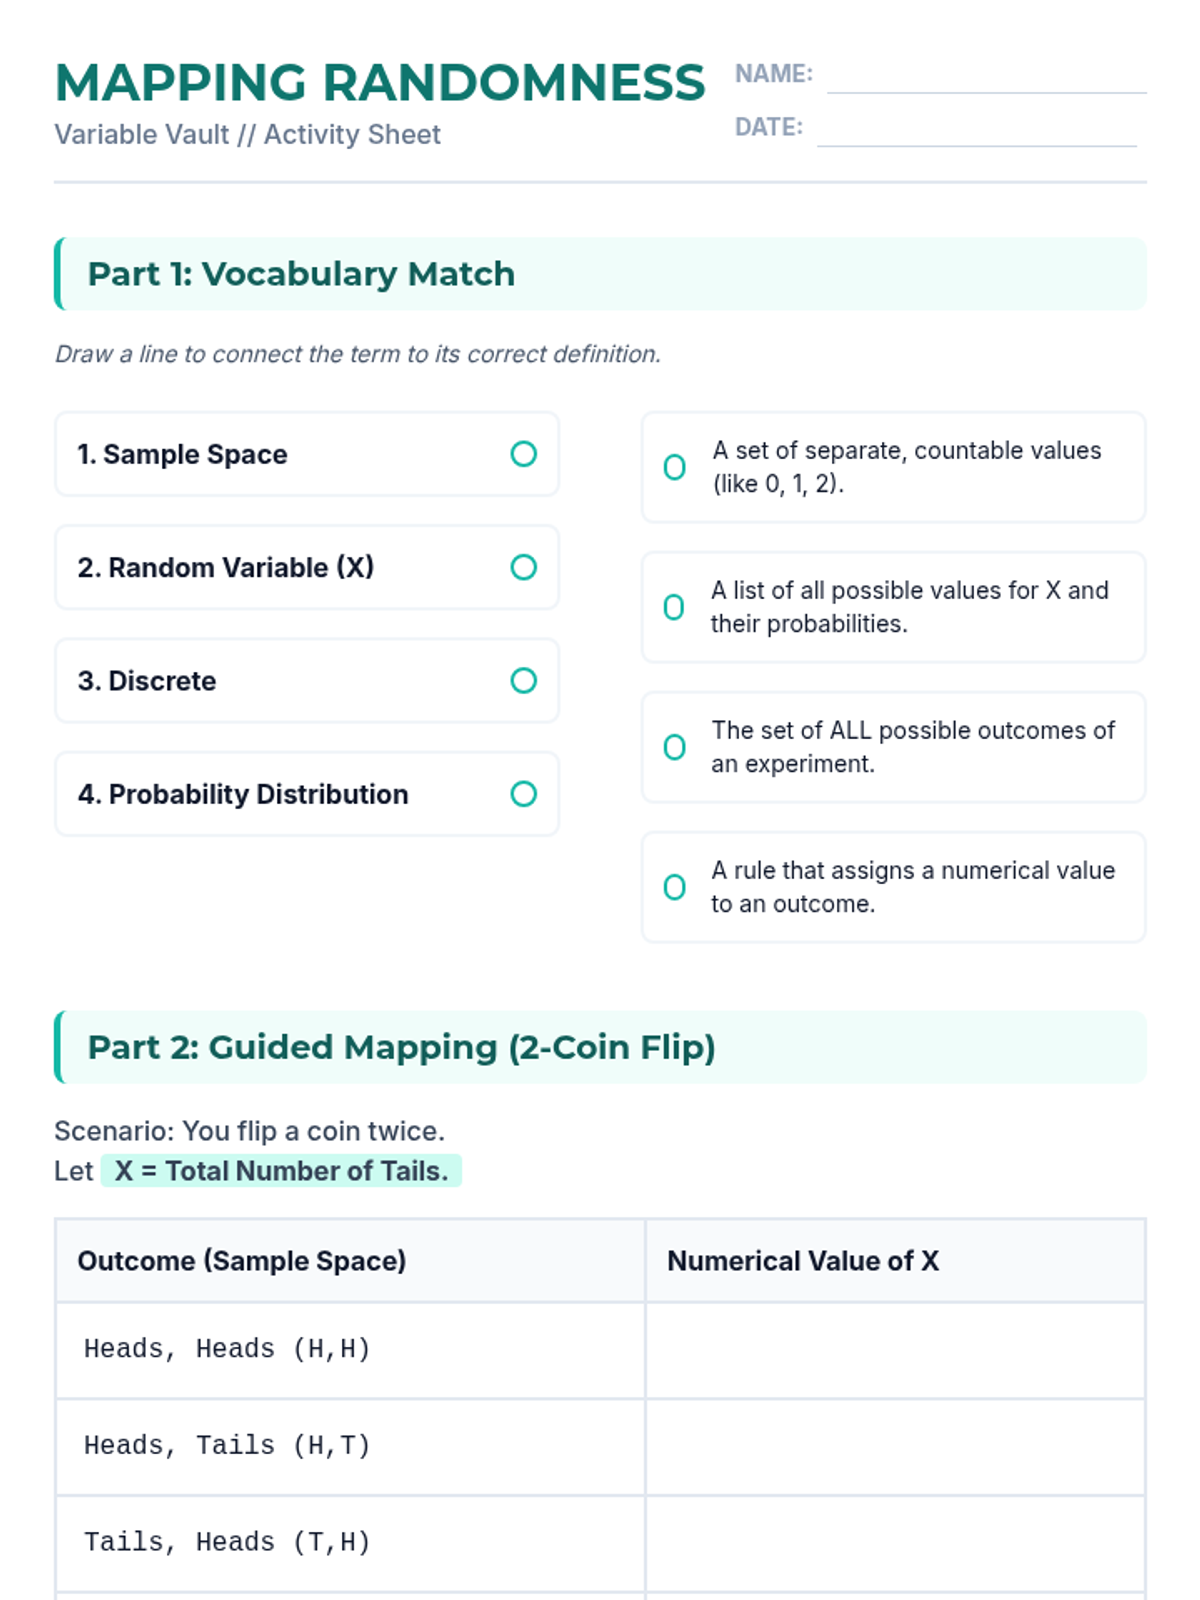
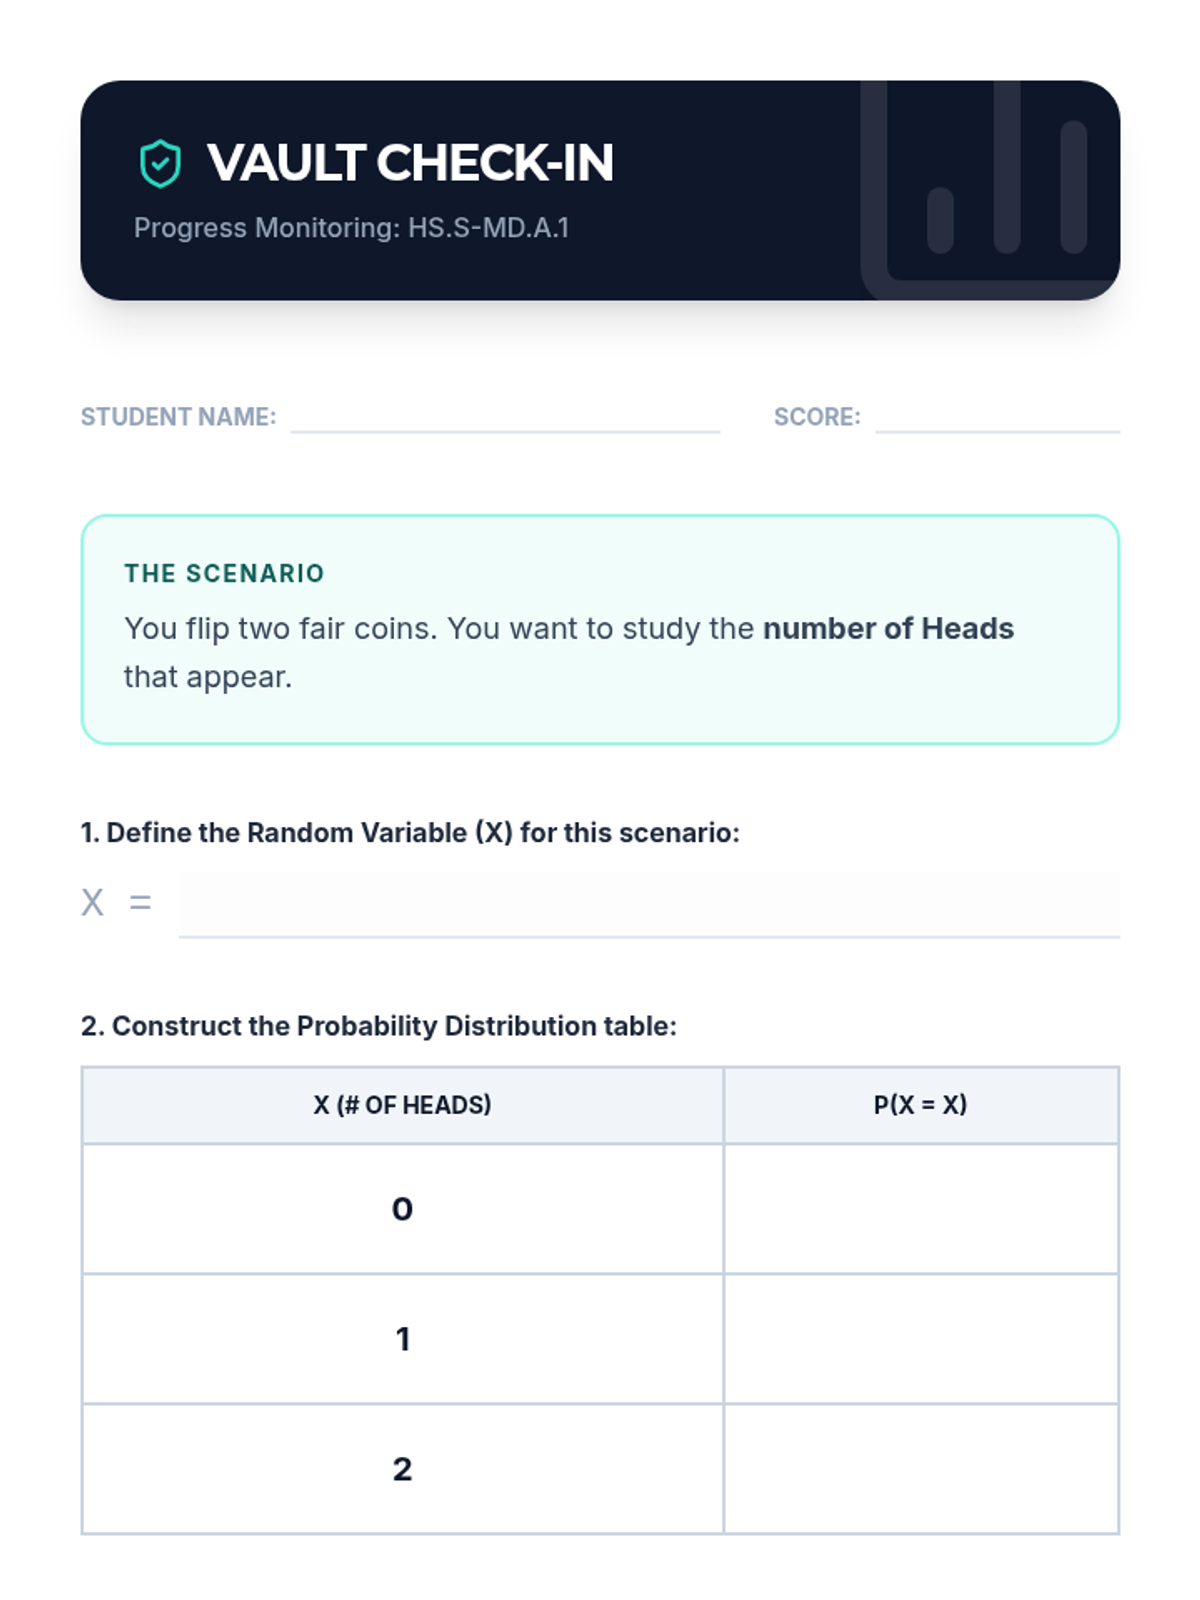
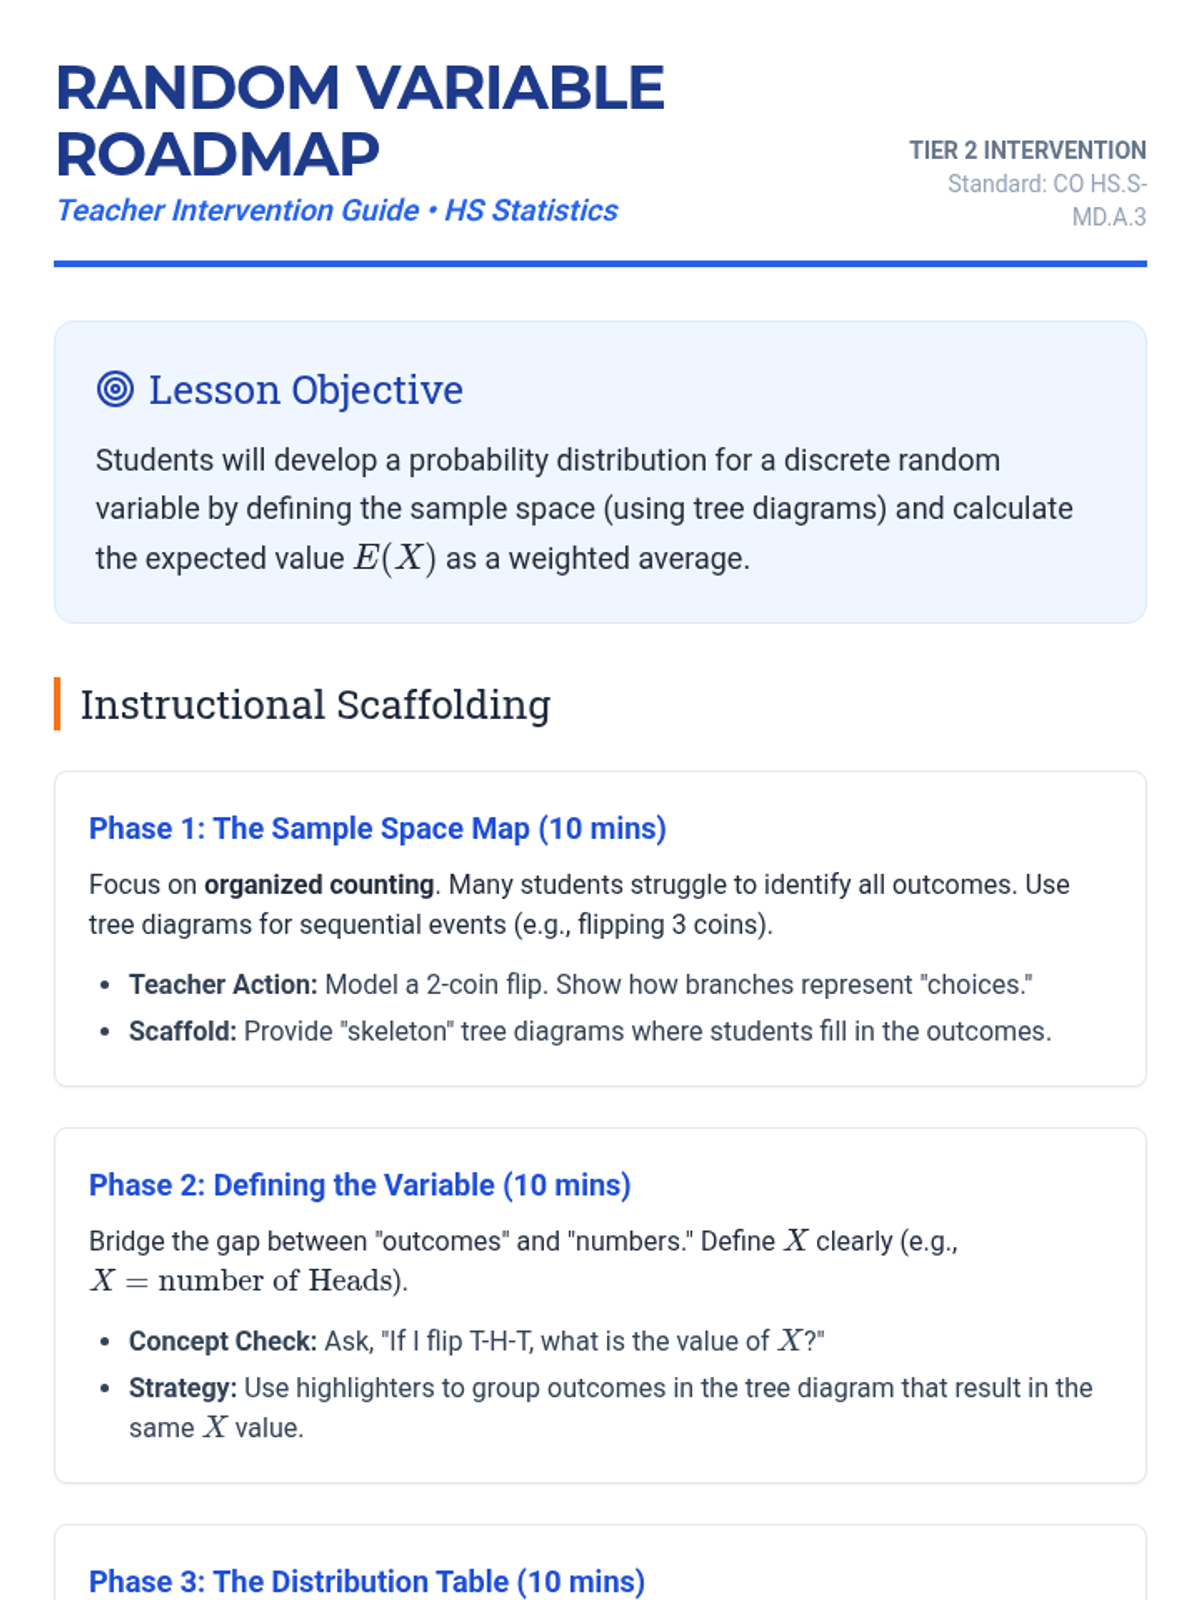
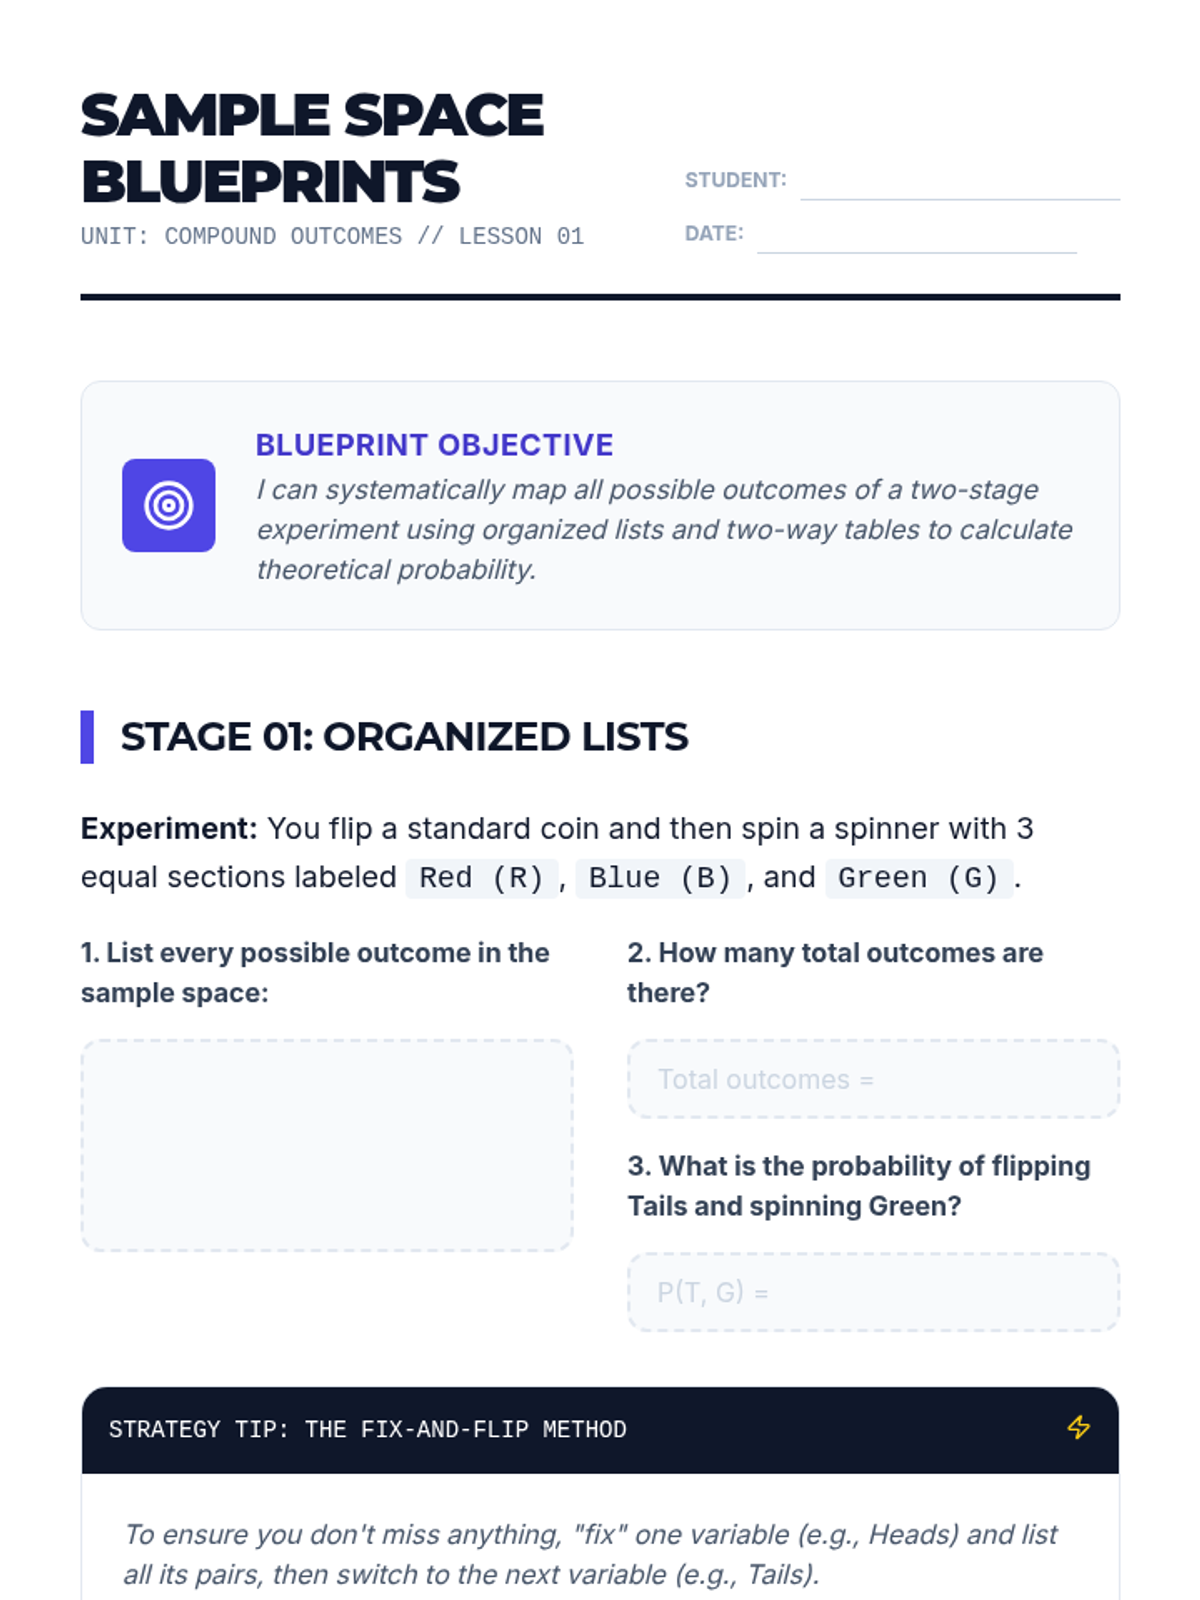
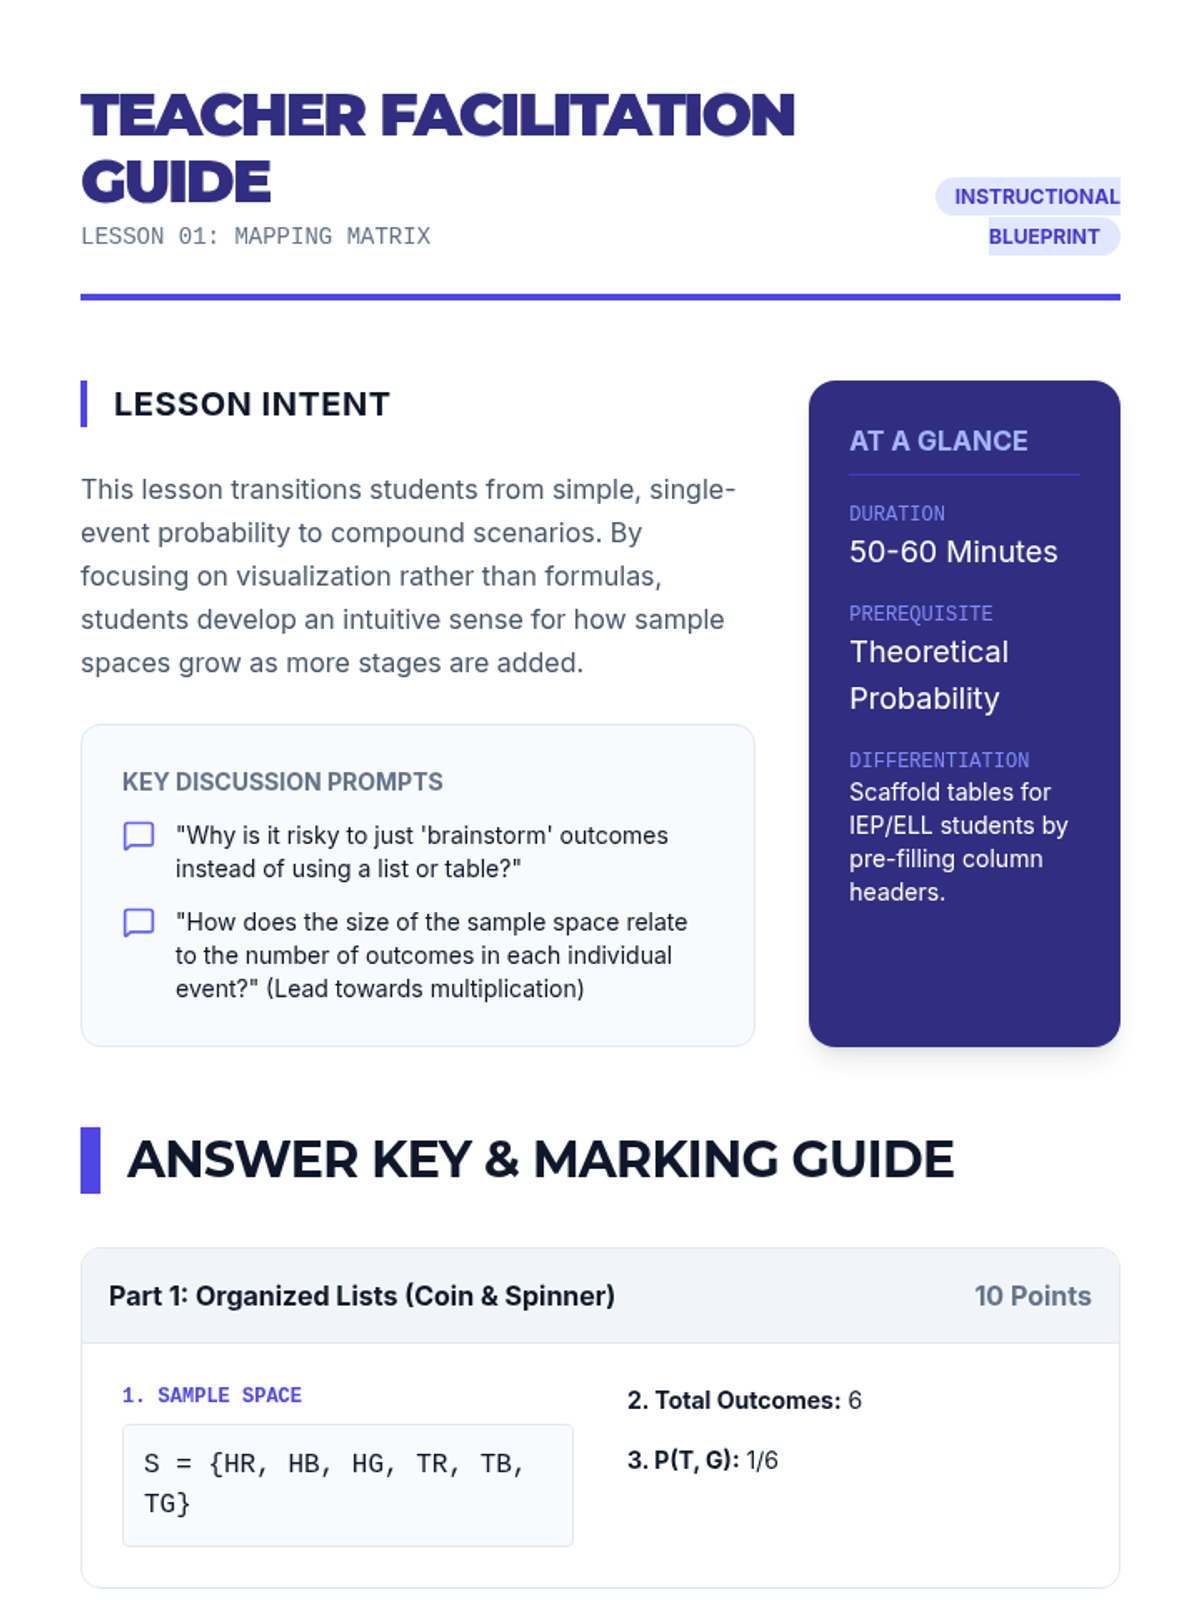
A targeted intervention sequence focused on foundational probability concepts, specifically defining random variables and constructing probability distributions for high school statistics students.
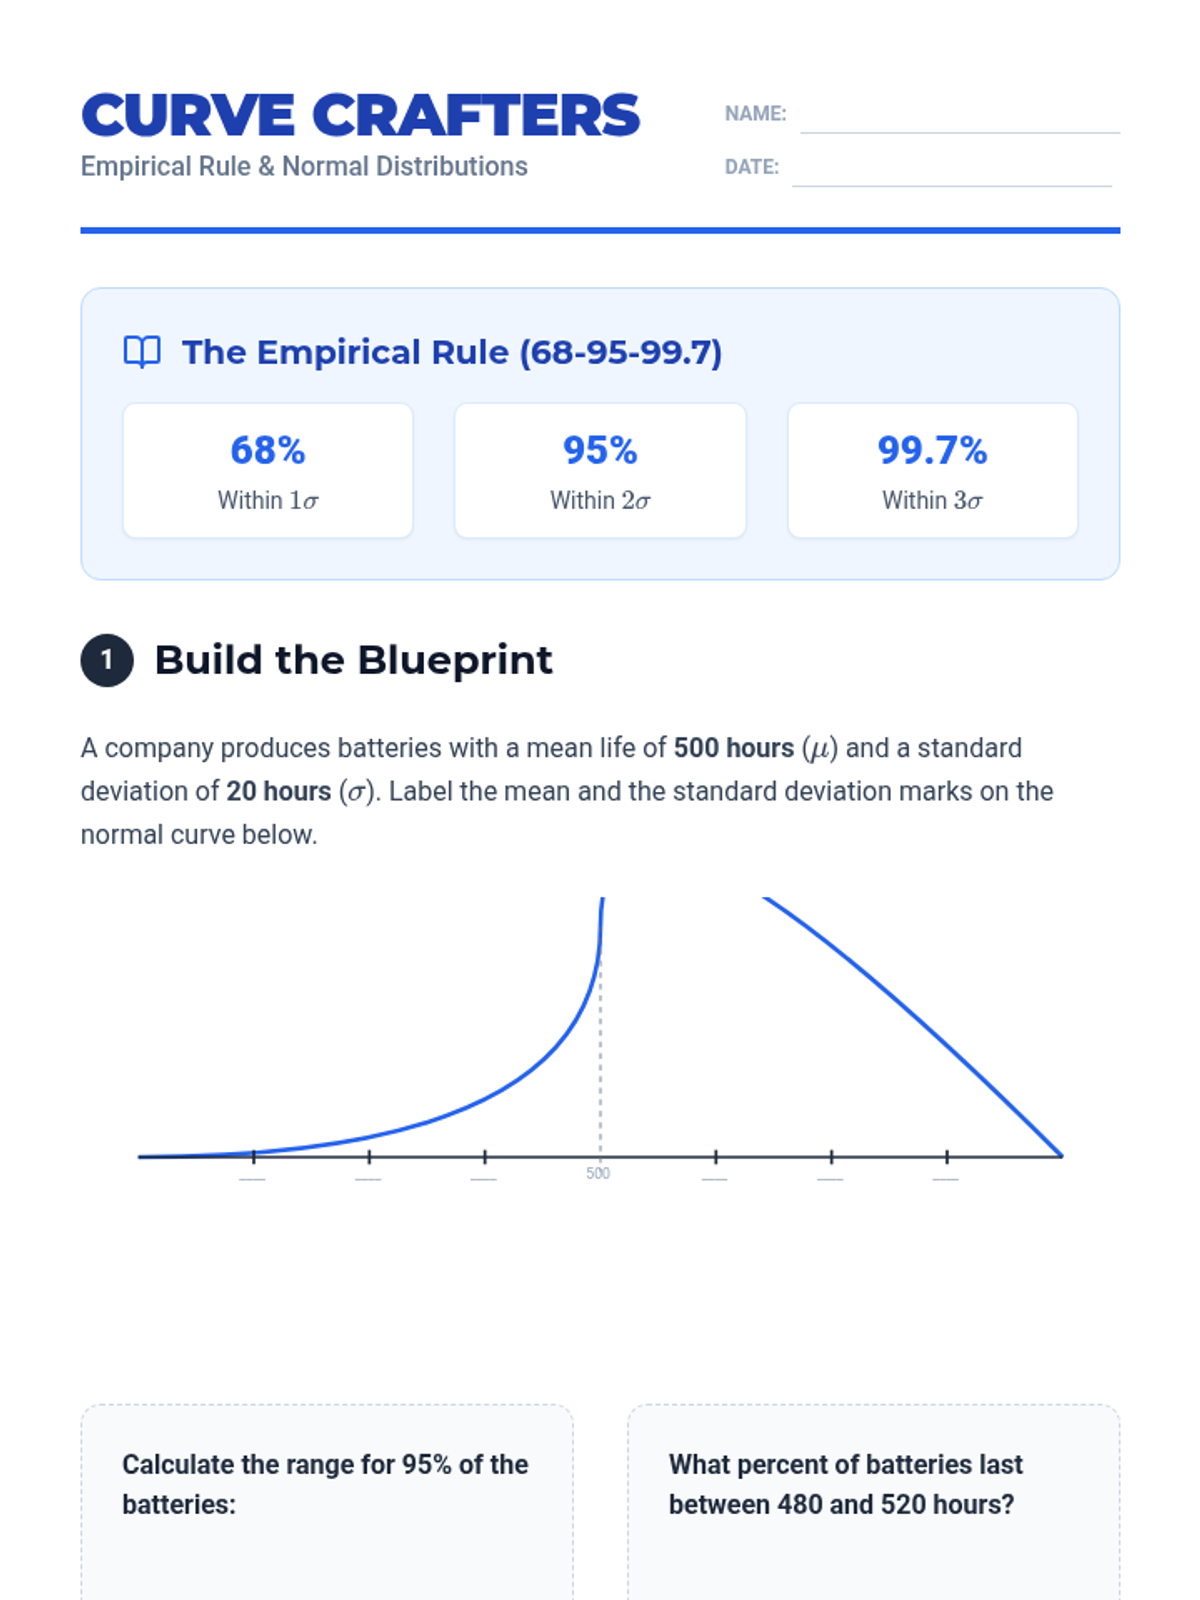
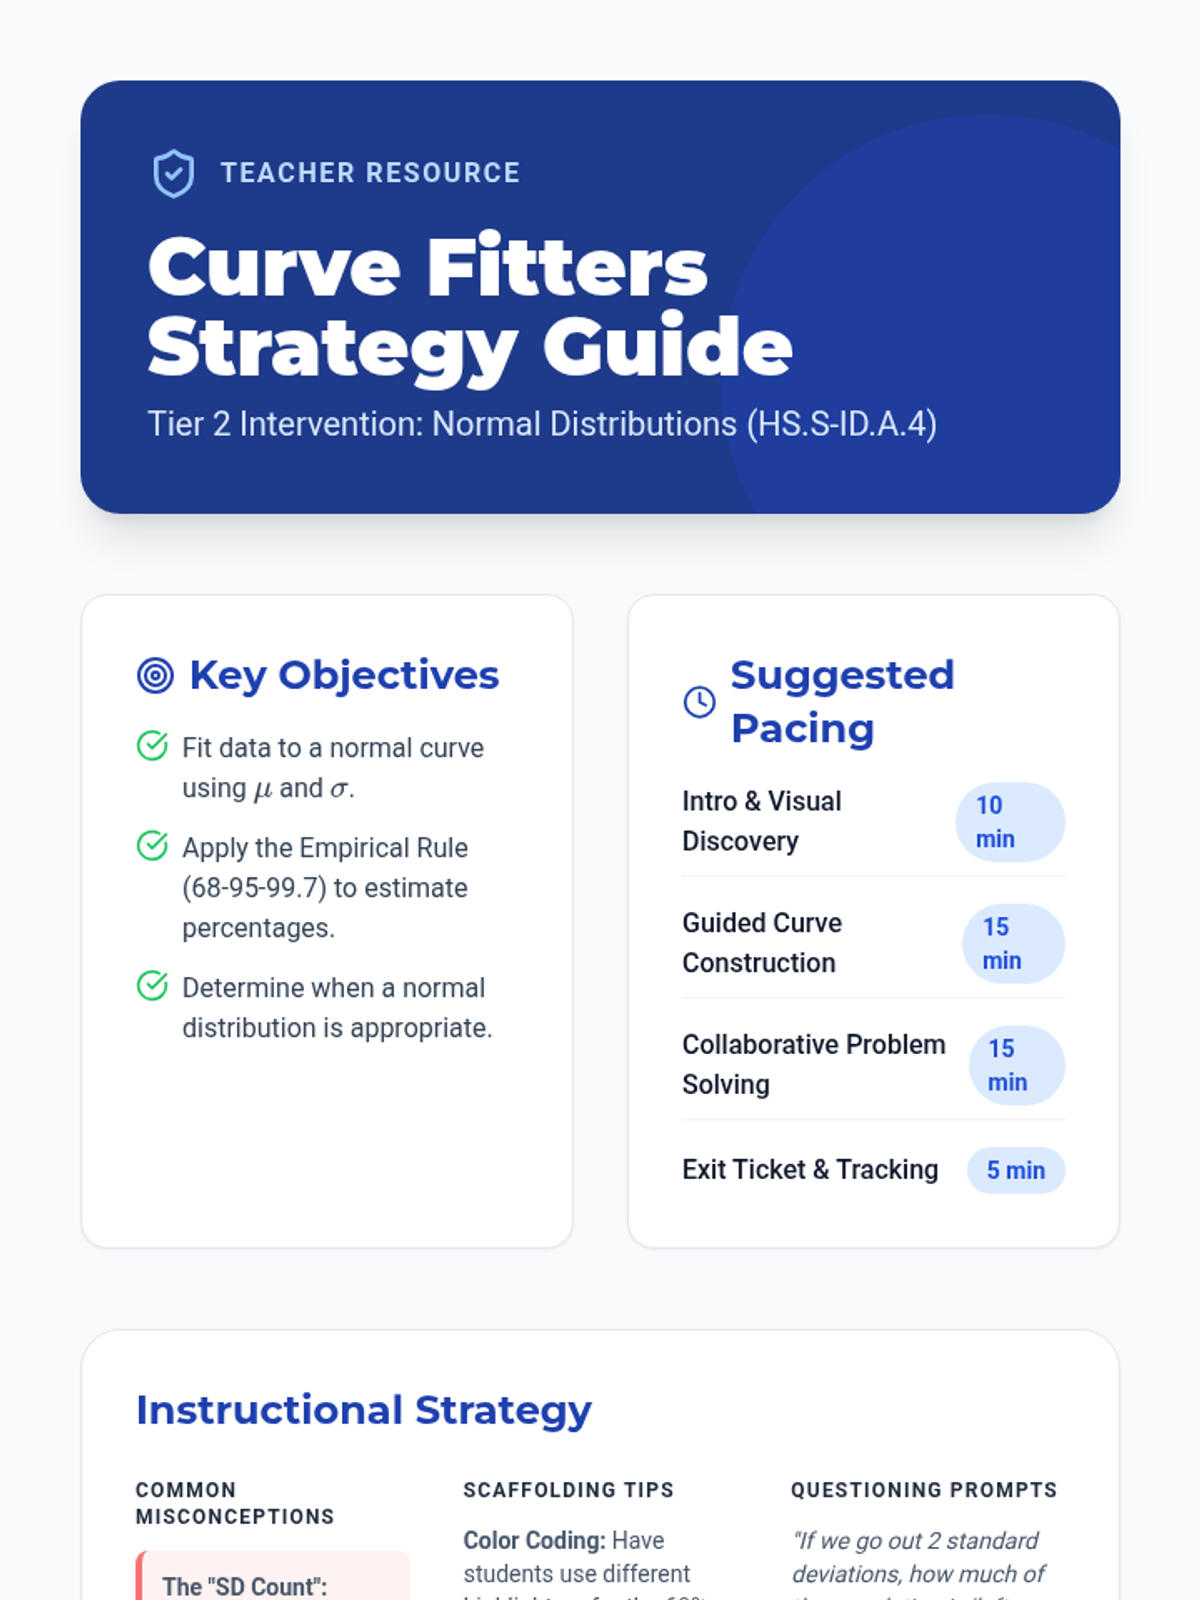
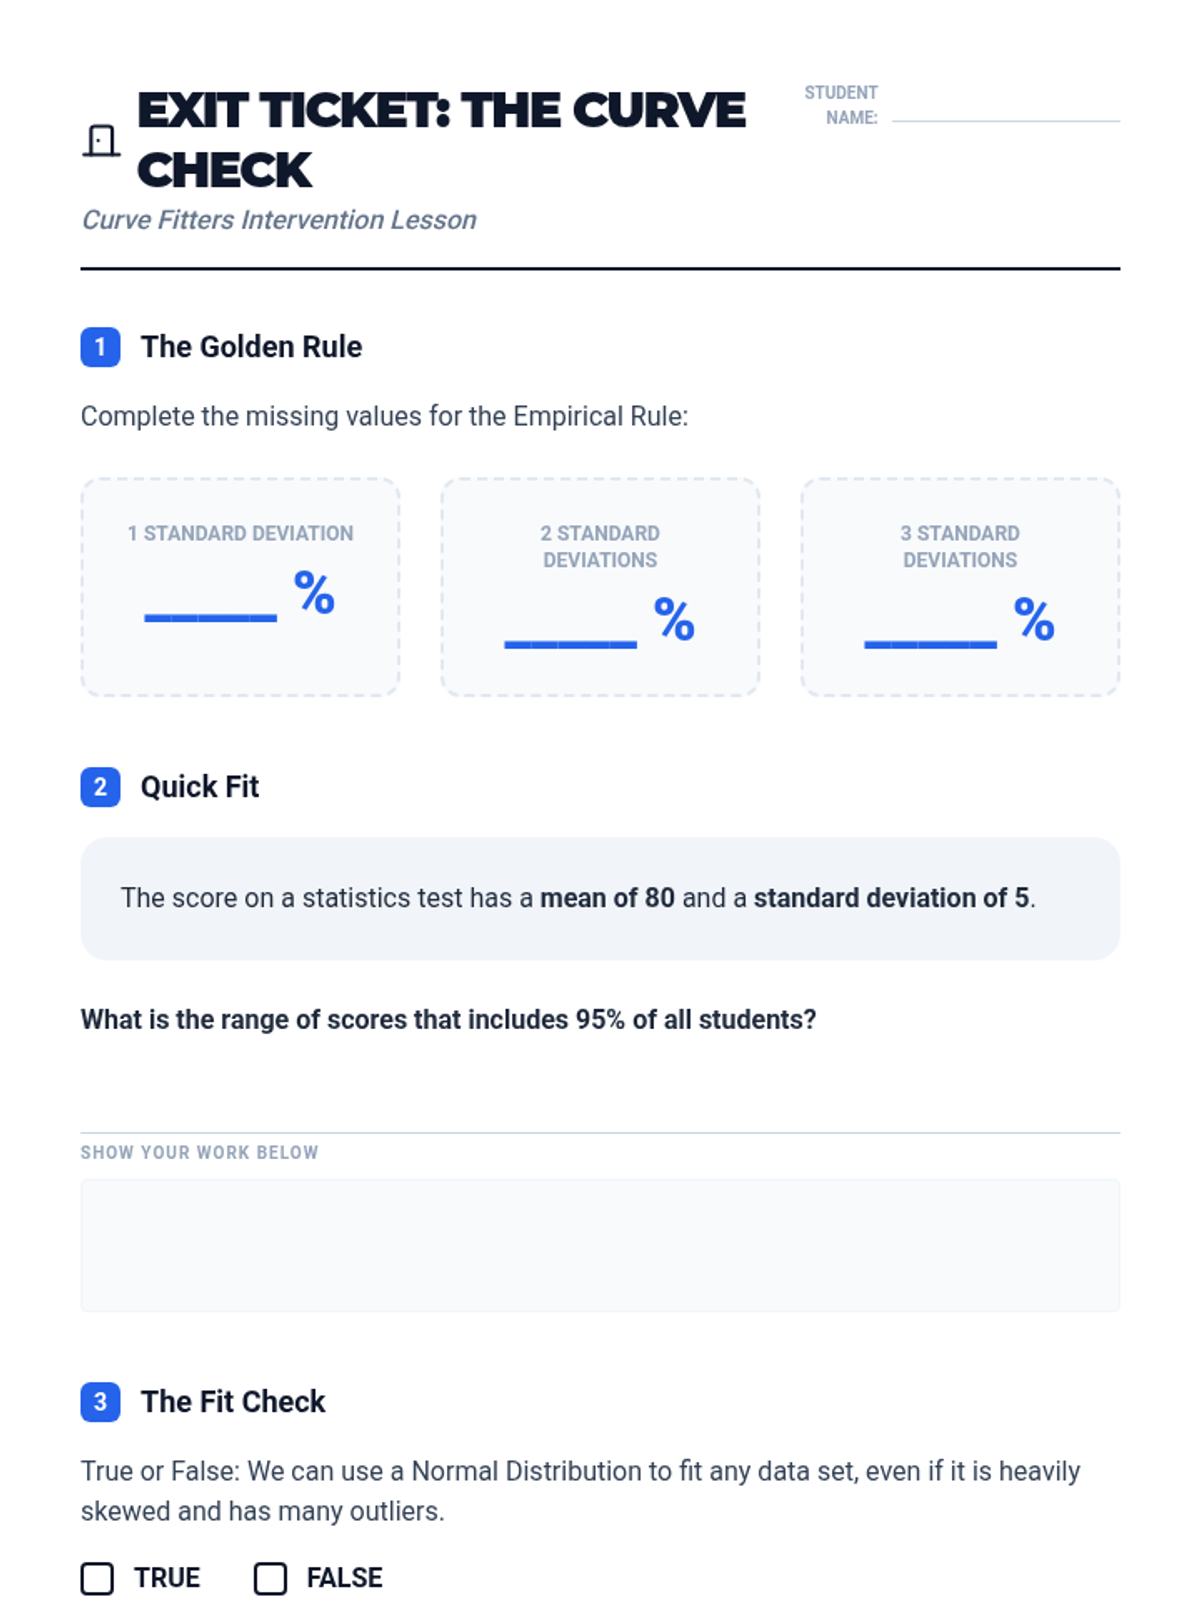
A Tier 2 intervention sequence focused on helping students master the Normal Distribution and the Empirical Rule through real-world applications and scaffolded practice.
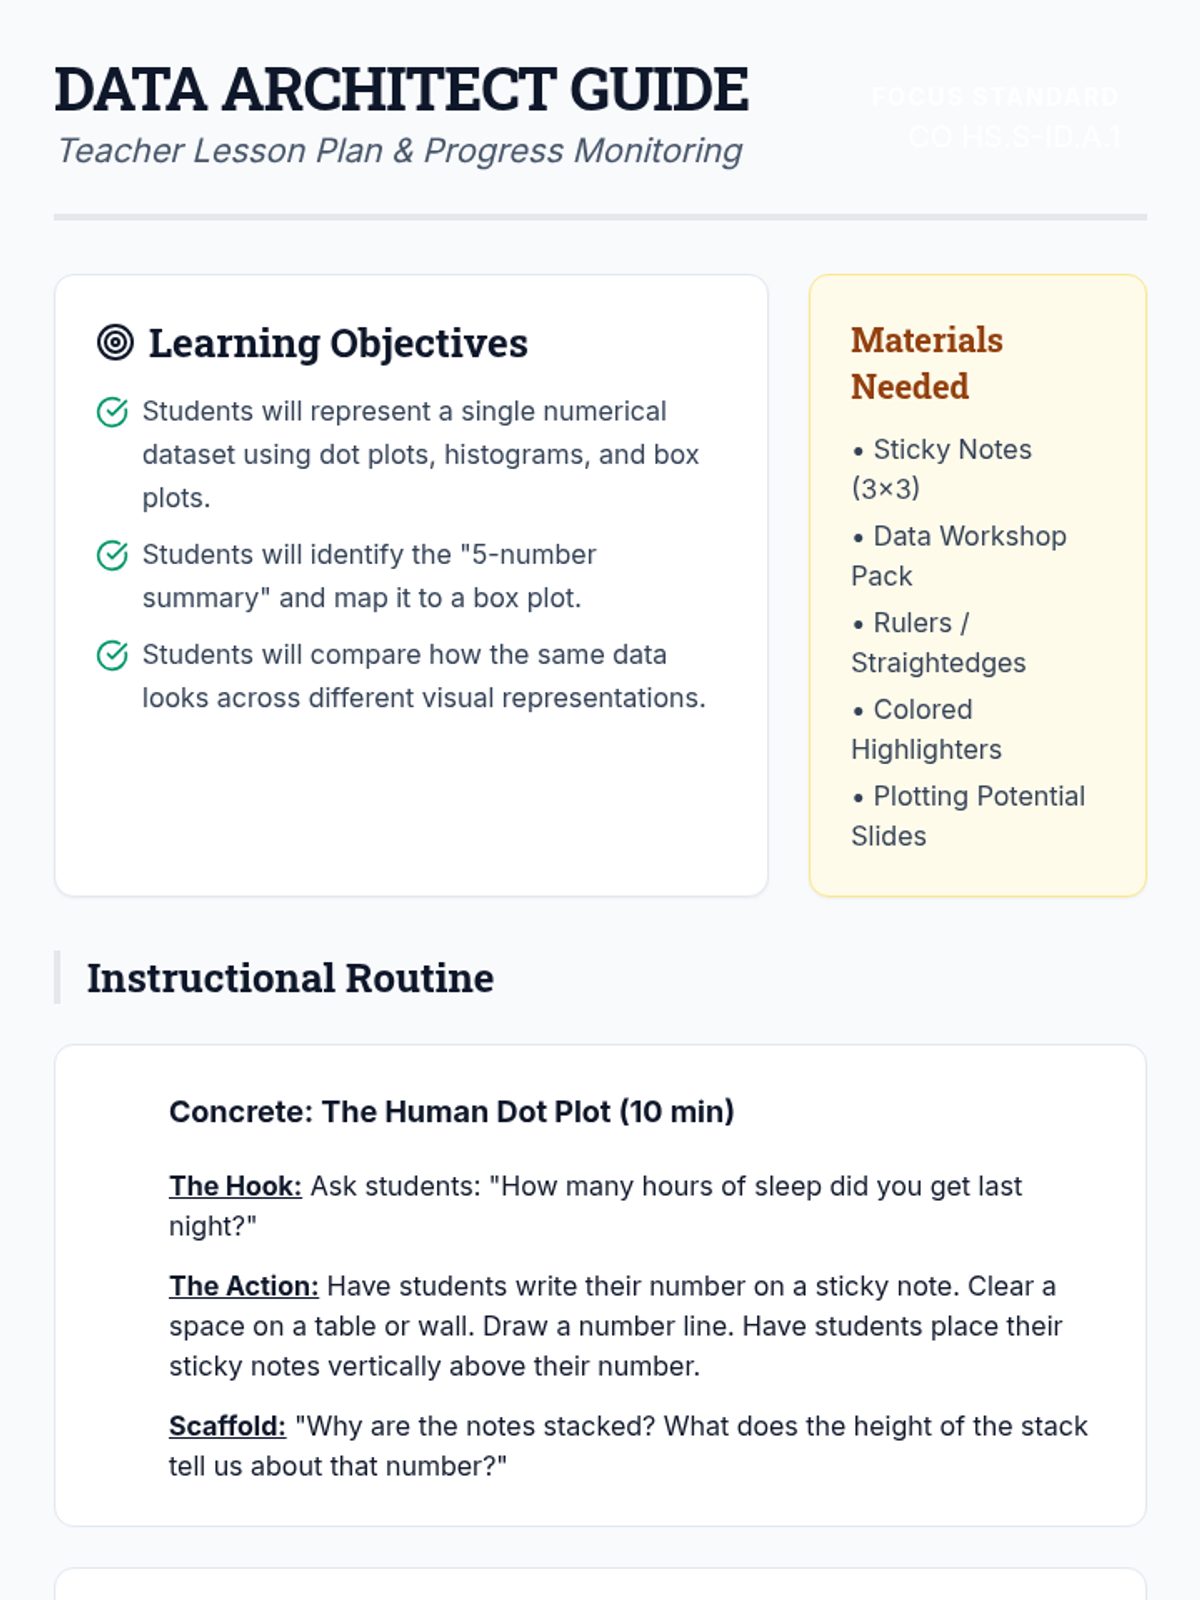
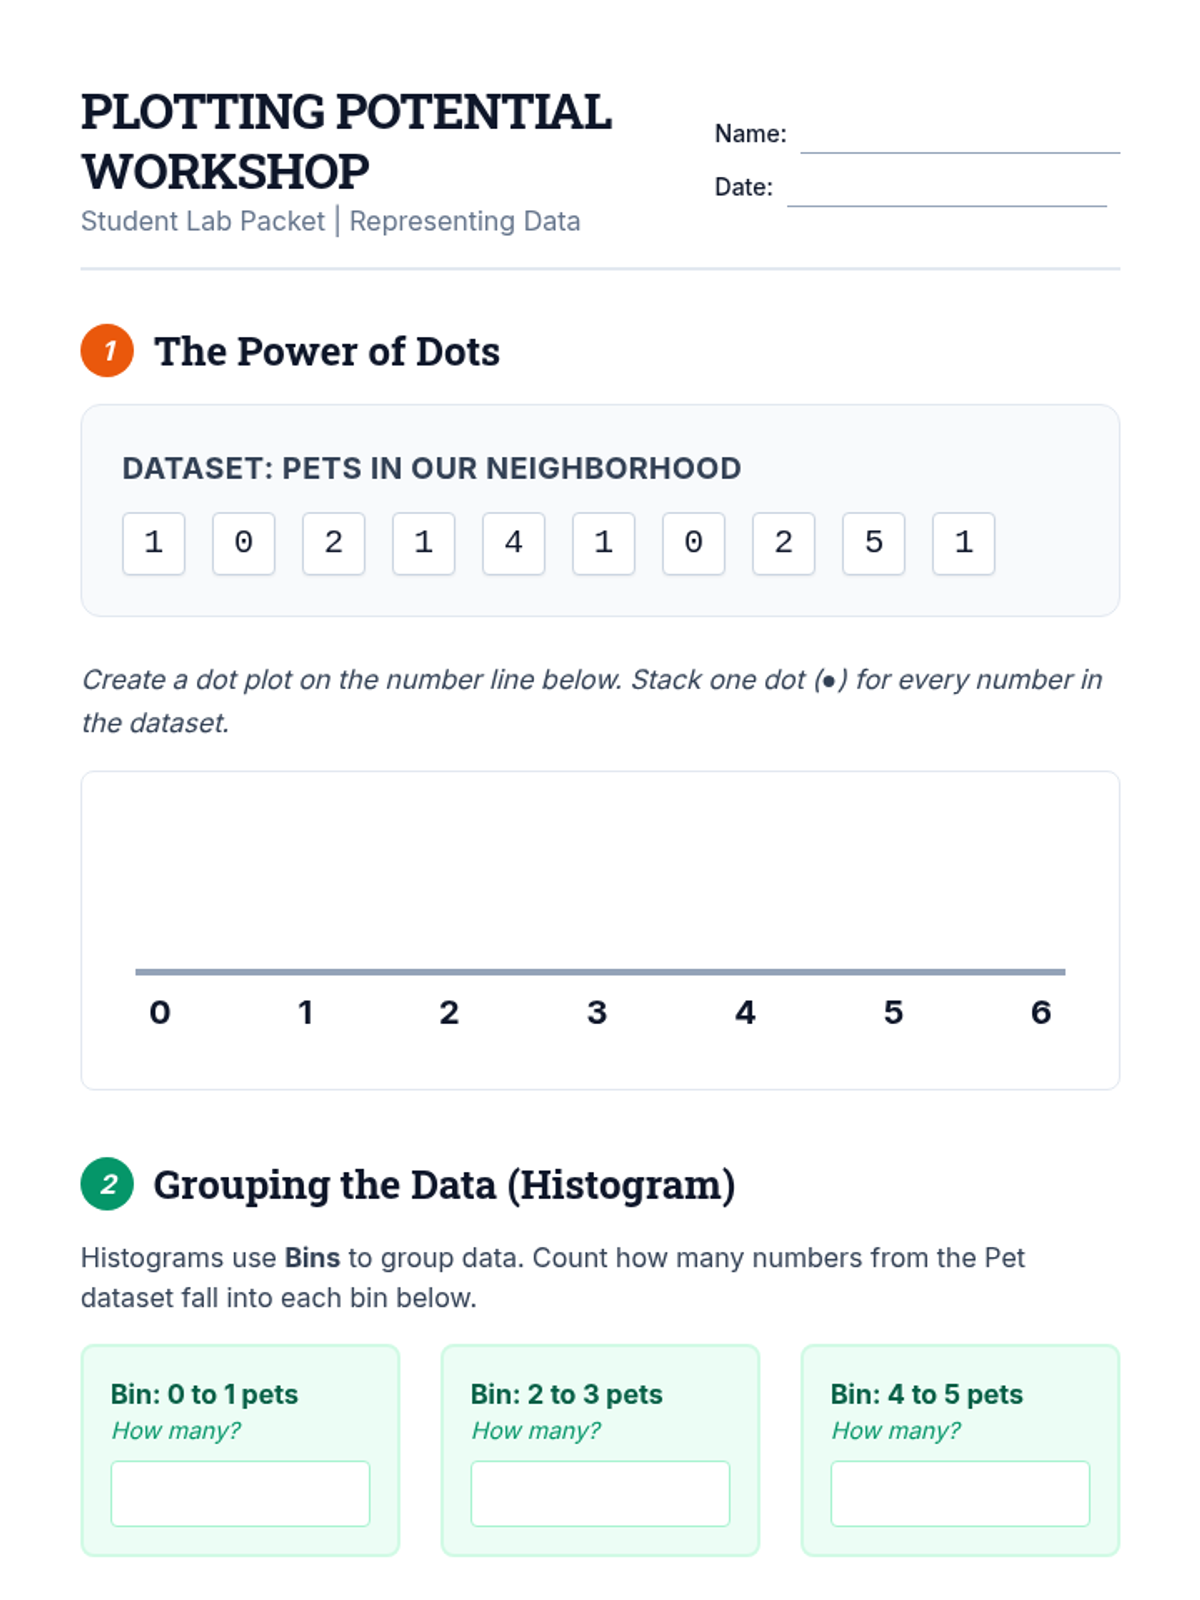
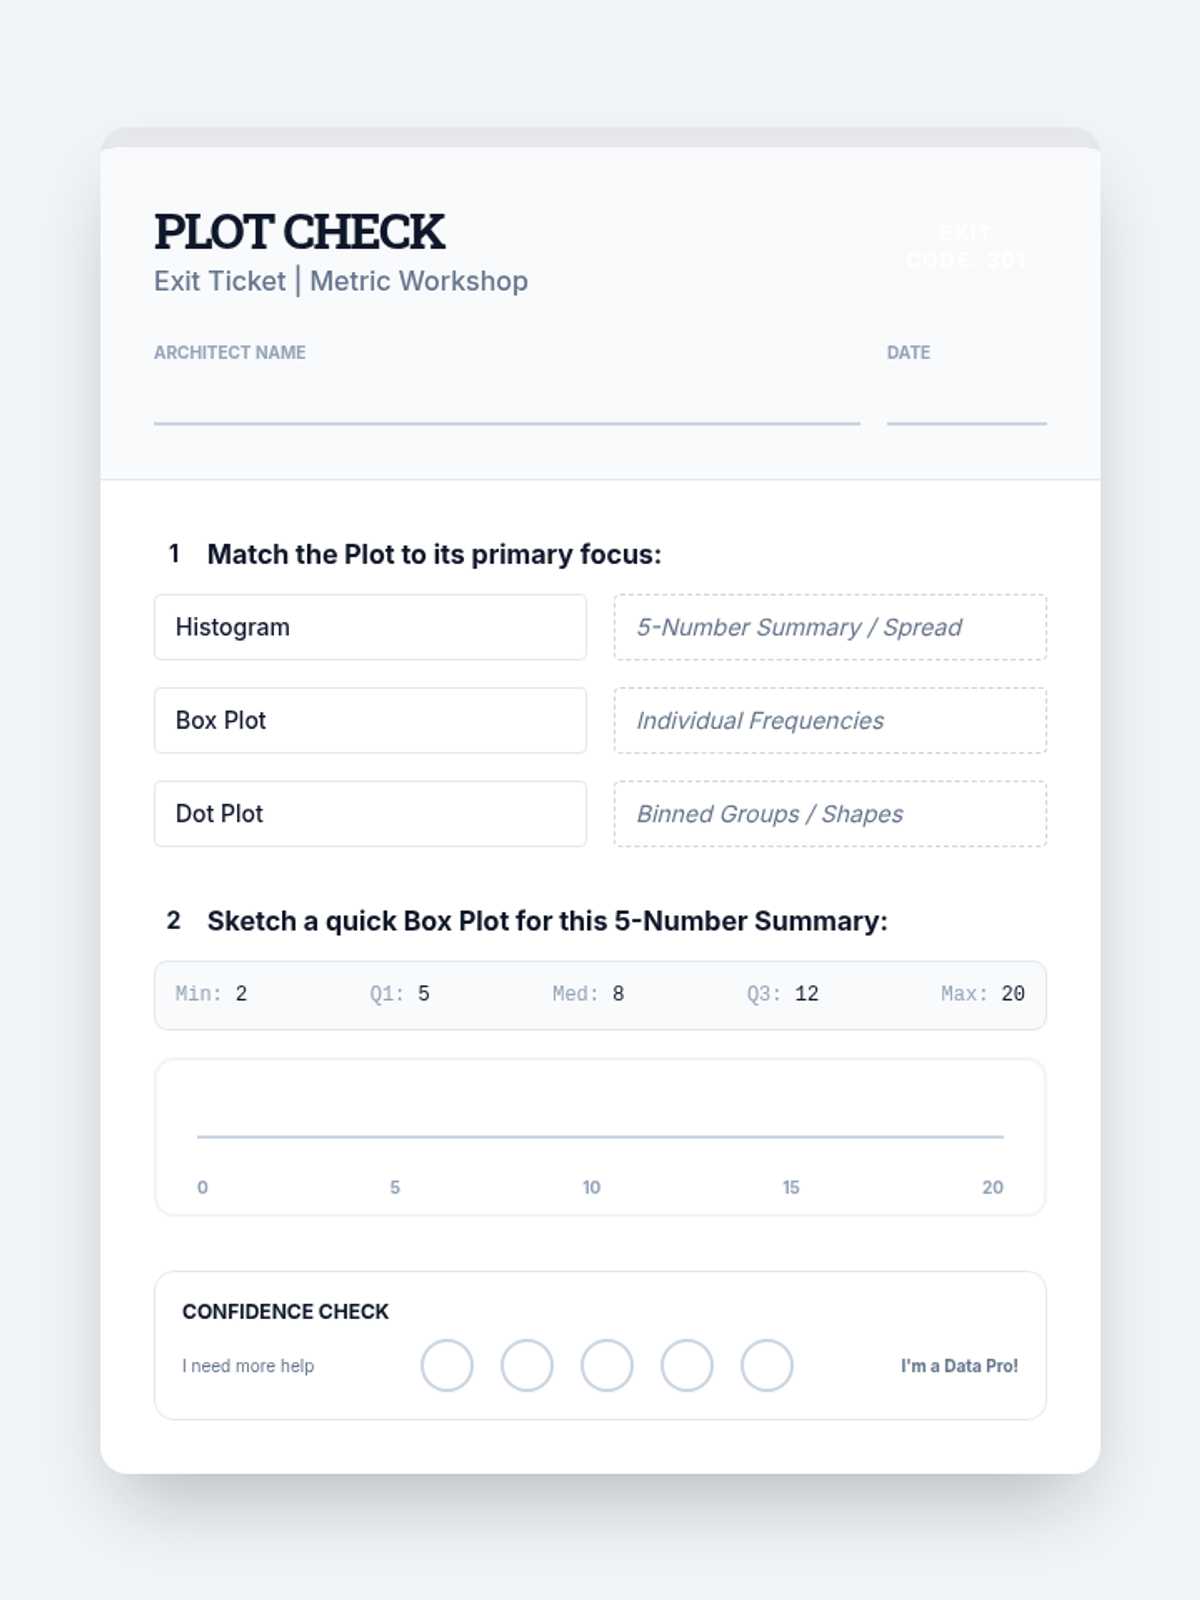
A Tier 2 intervention sequence focused on building concrete understanding of data representations including dot plots, histograms, and box plots for high school statistics students.
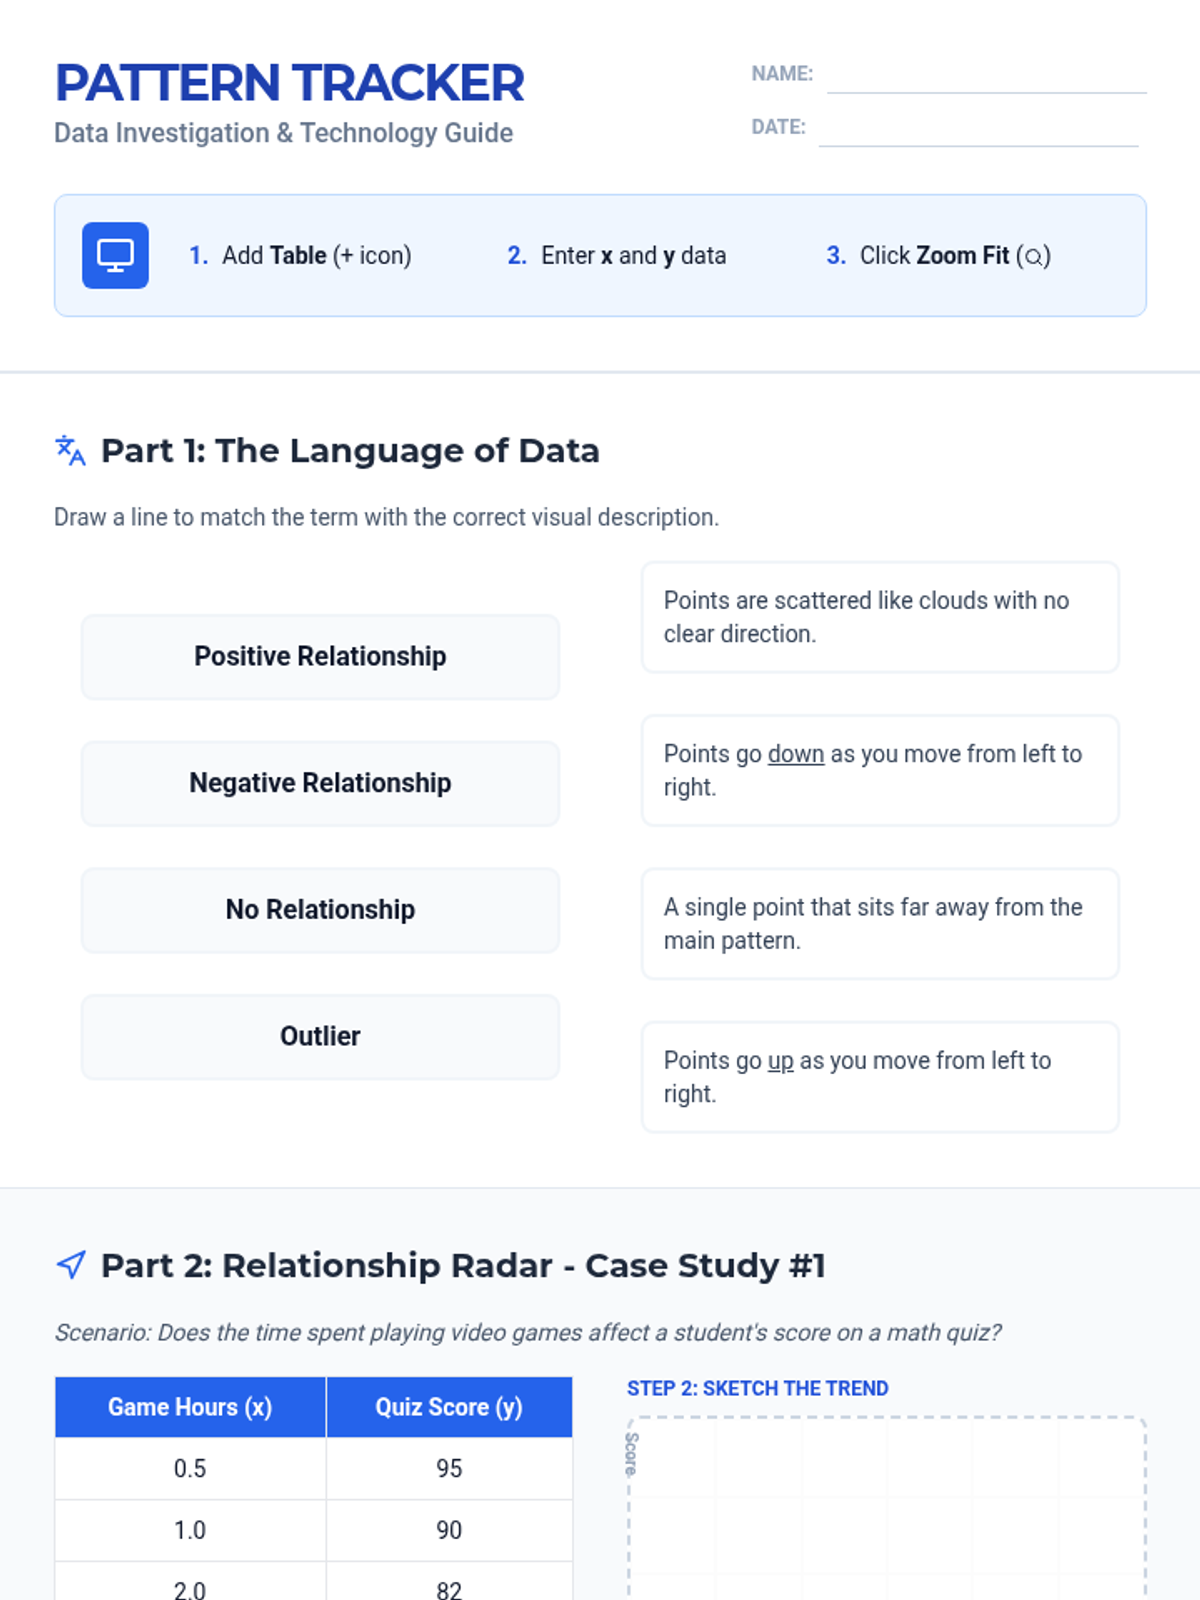
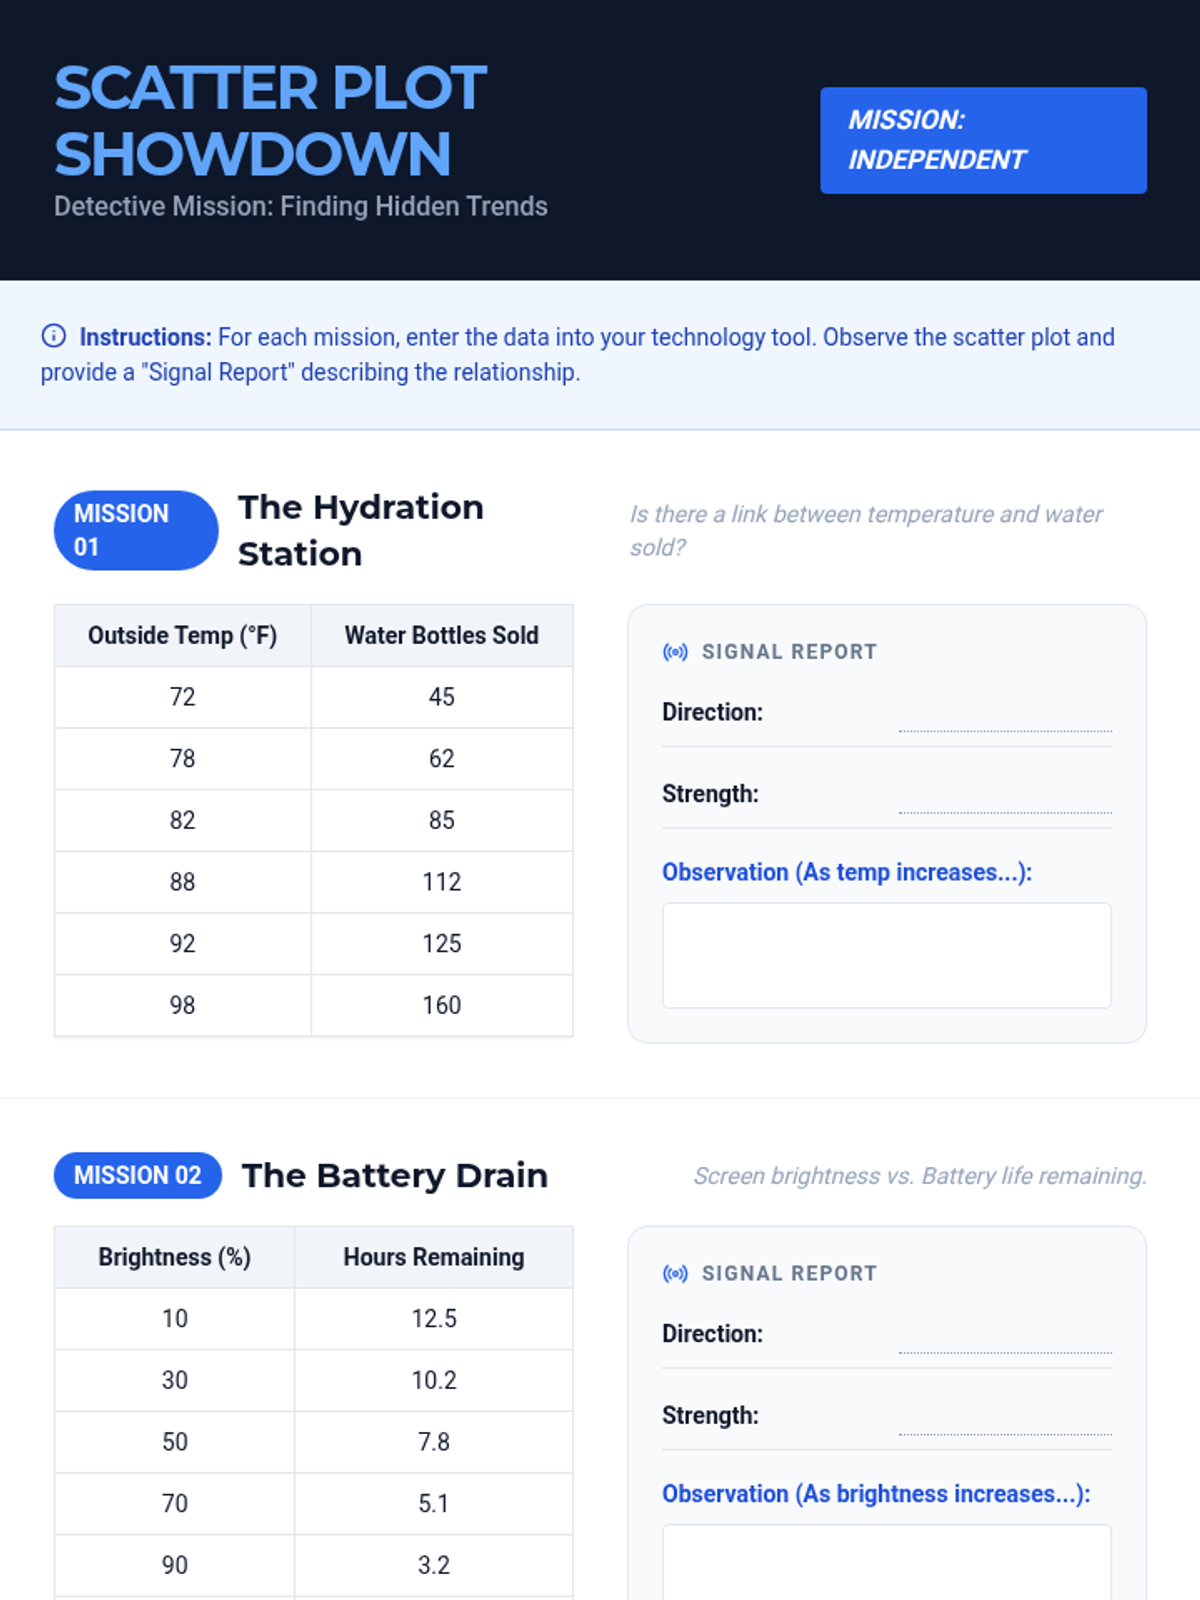
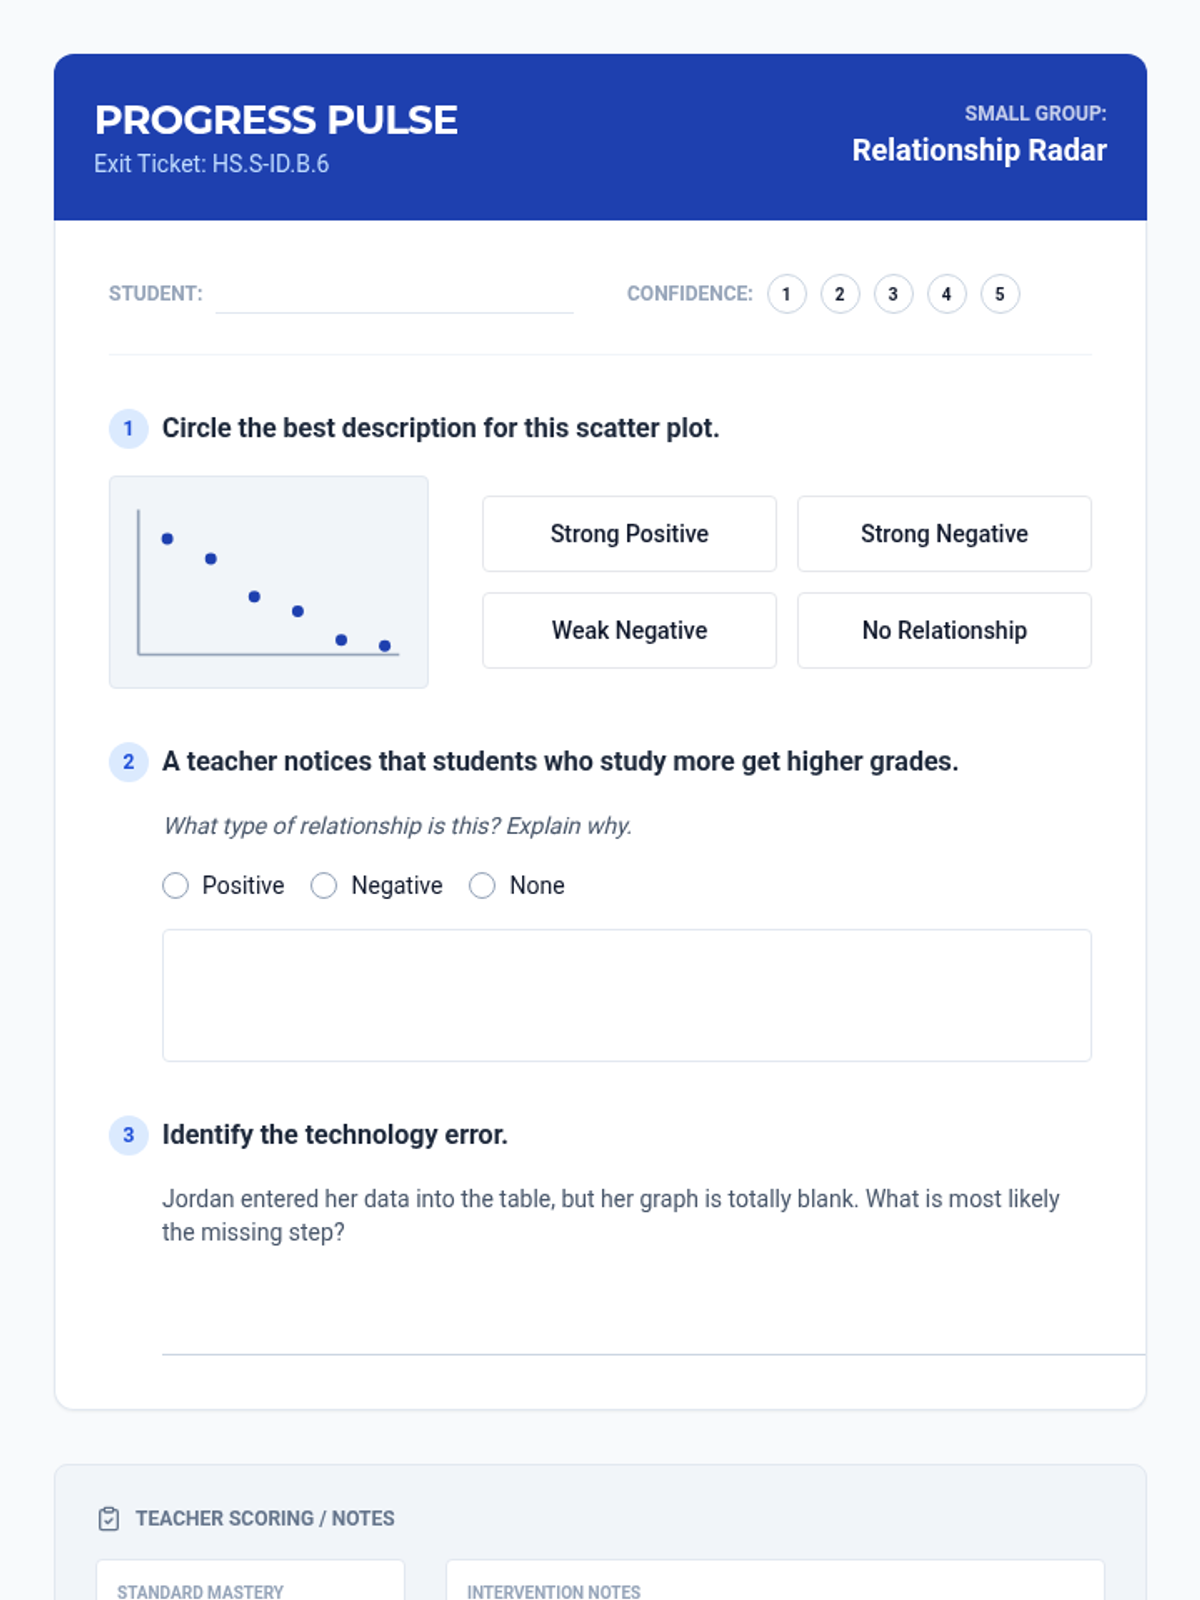
A Tier 2 intervention sequence focused on analyzing bivariate data. Students learn to use technology to create scatter plots and develop a precise vocabulary for describing relationships between quantitative variables.
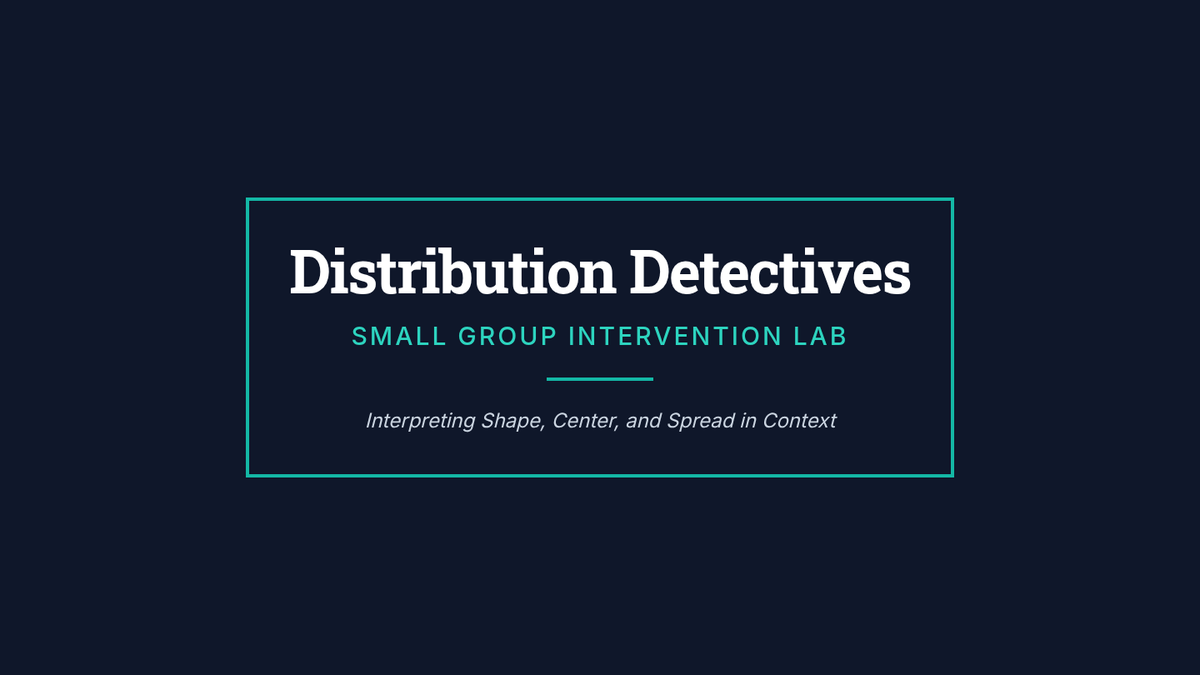
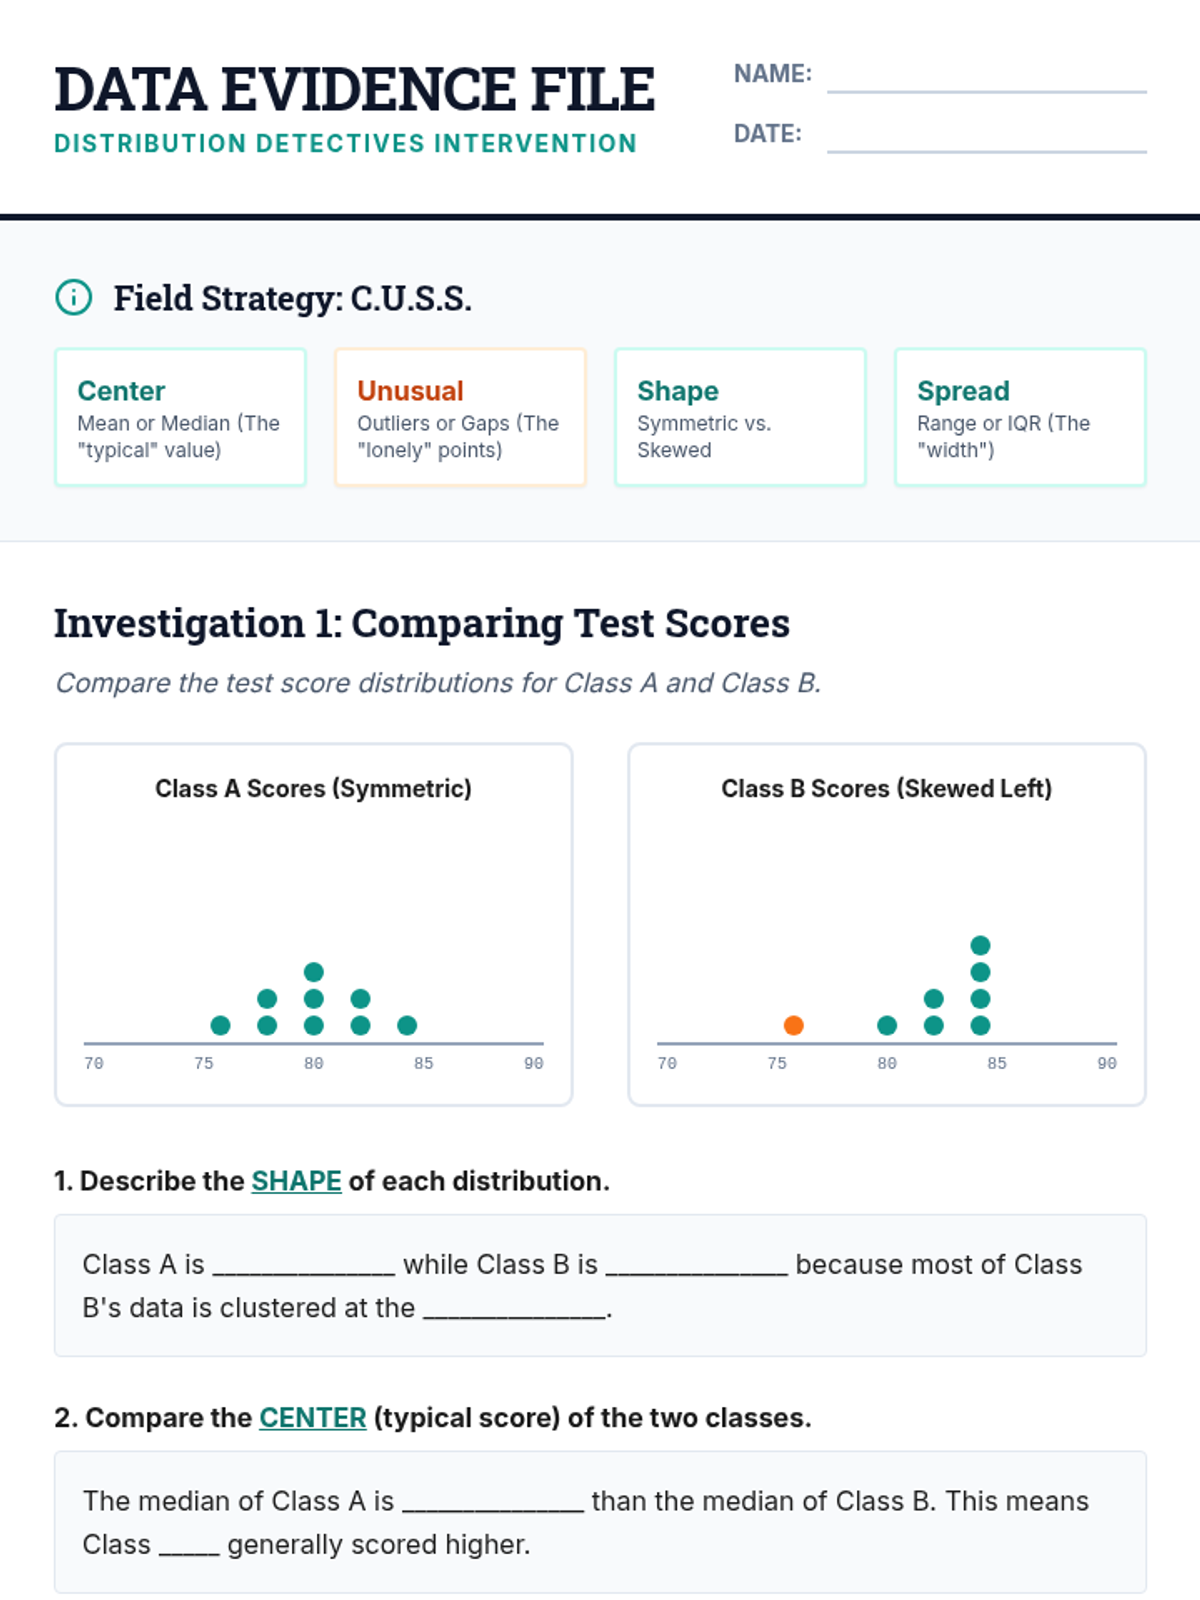
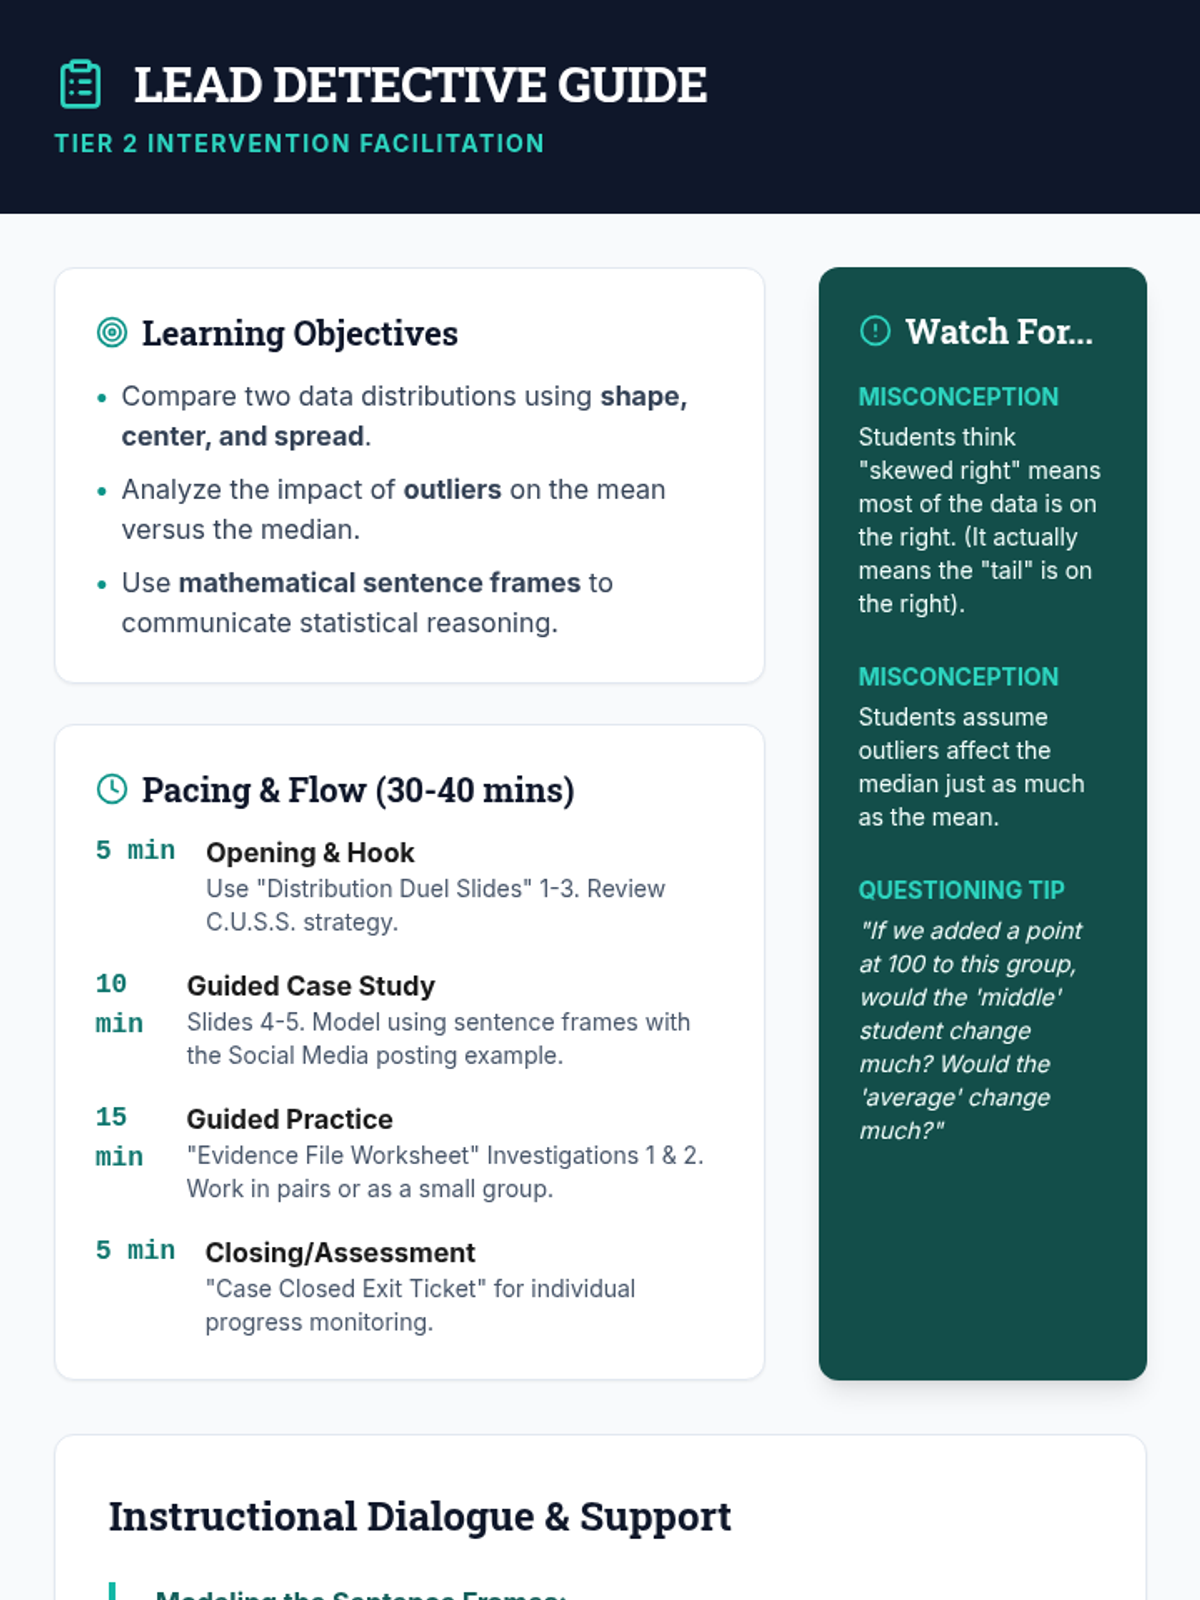
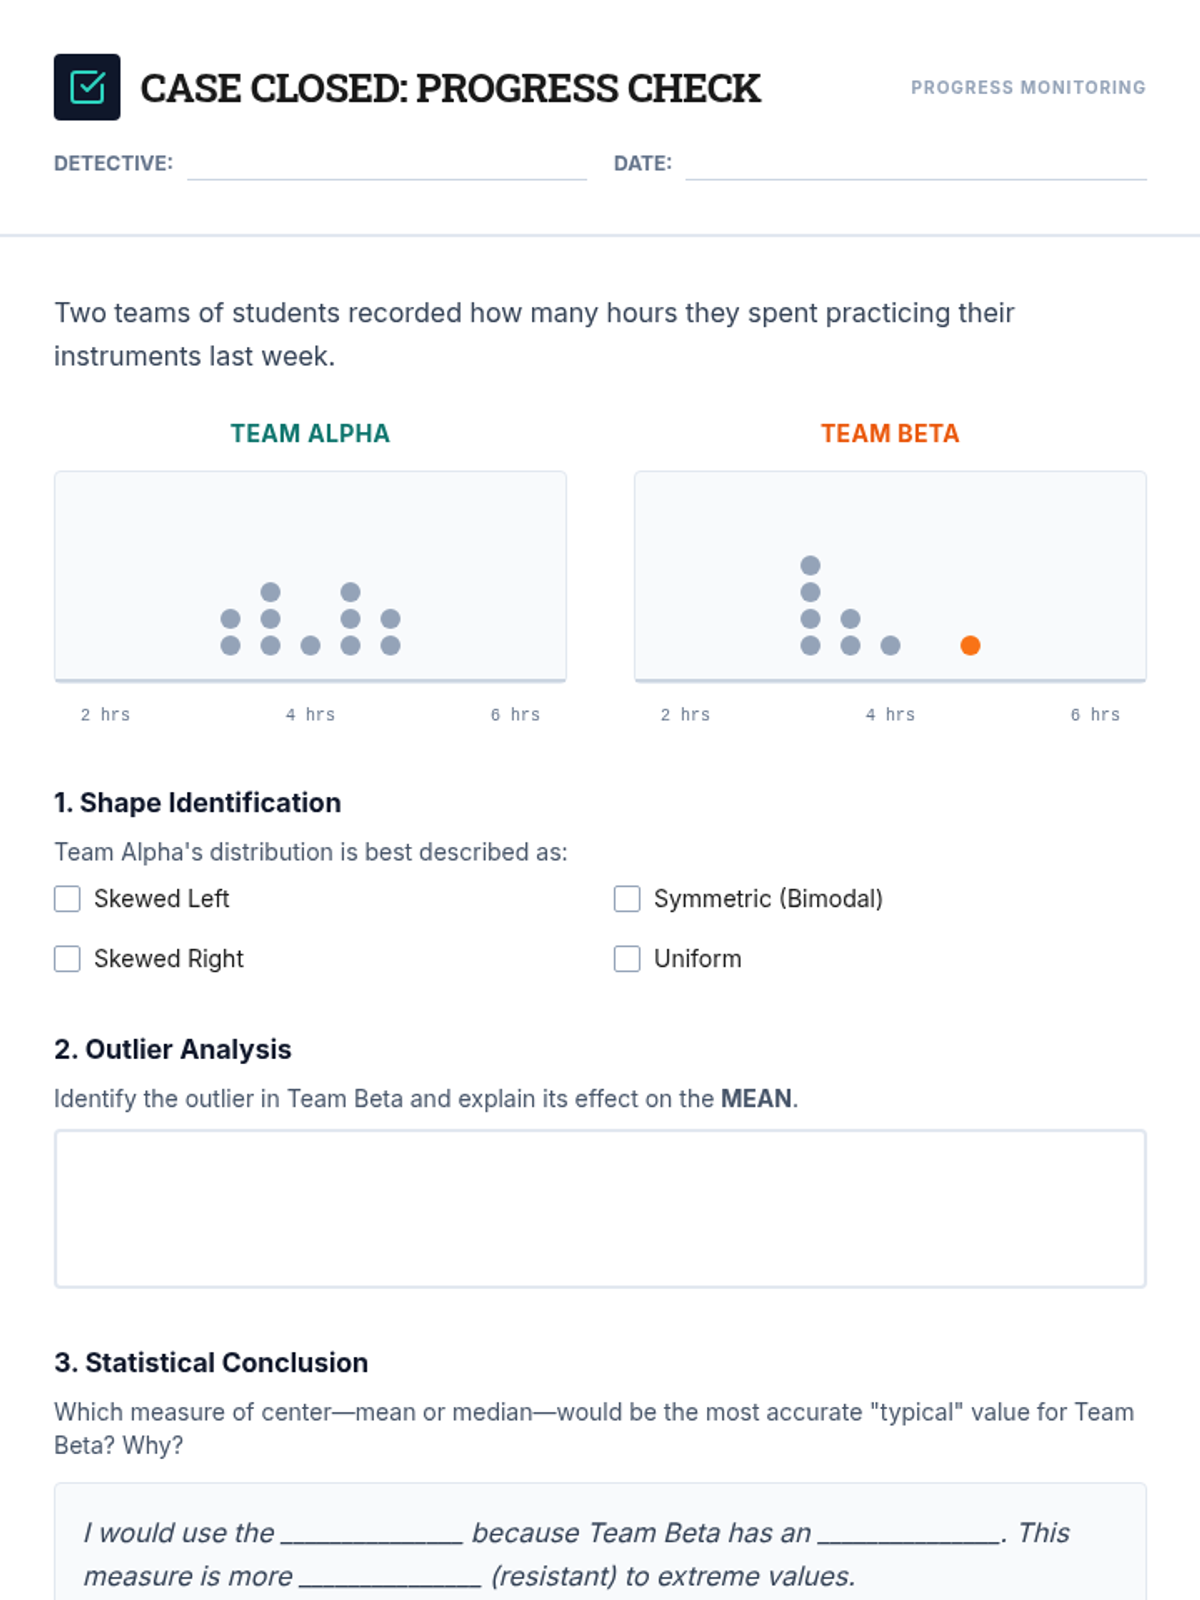
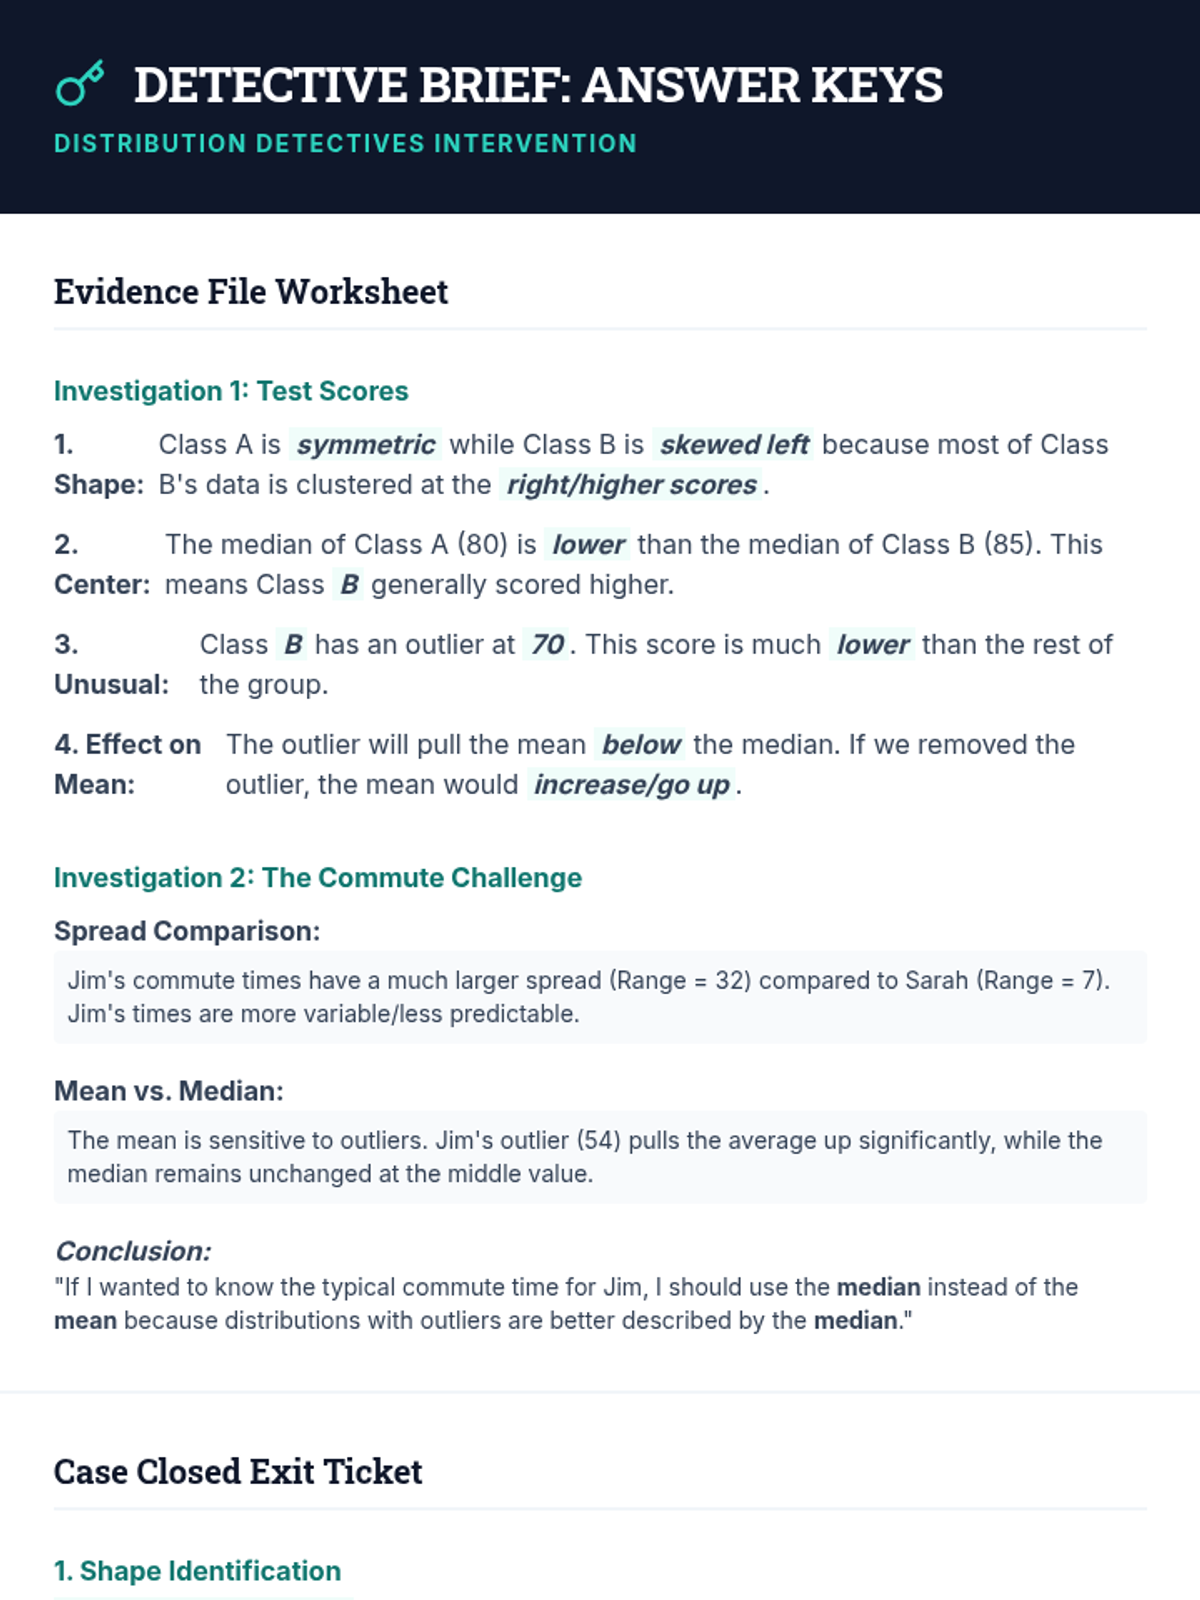
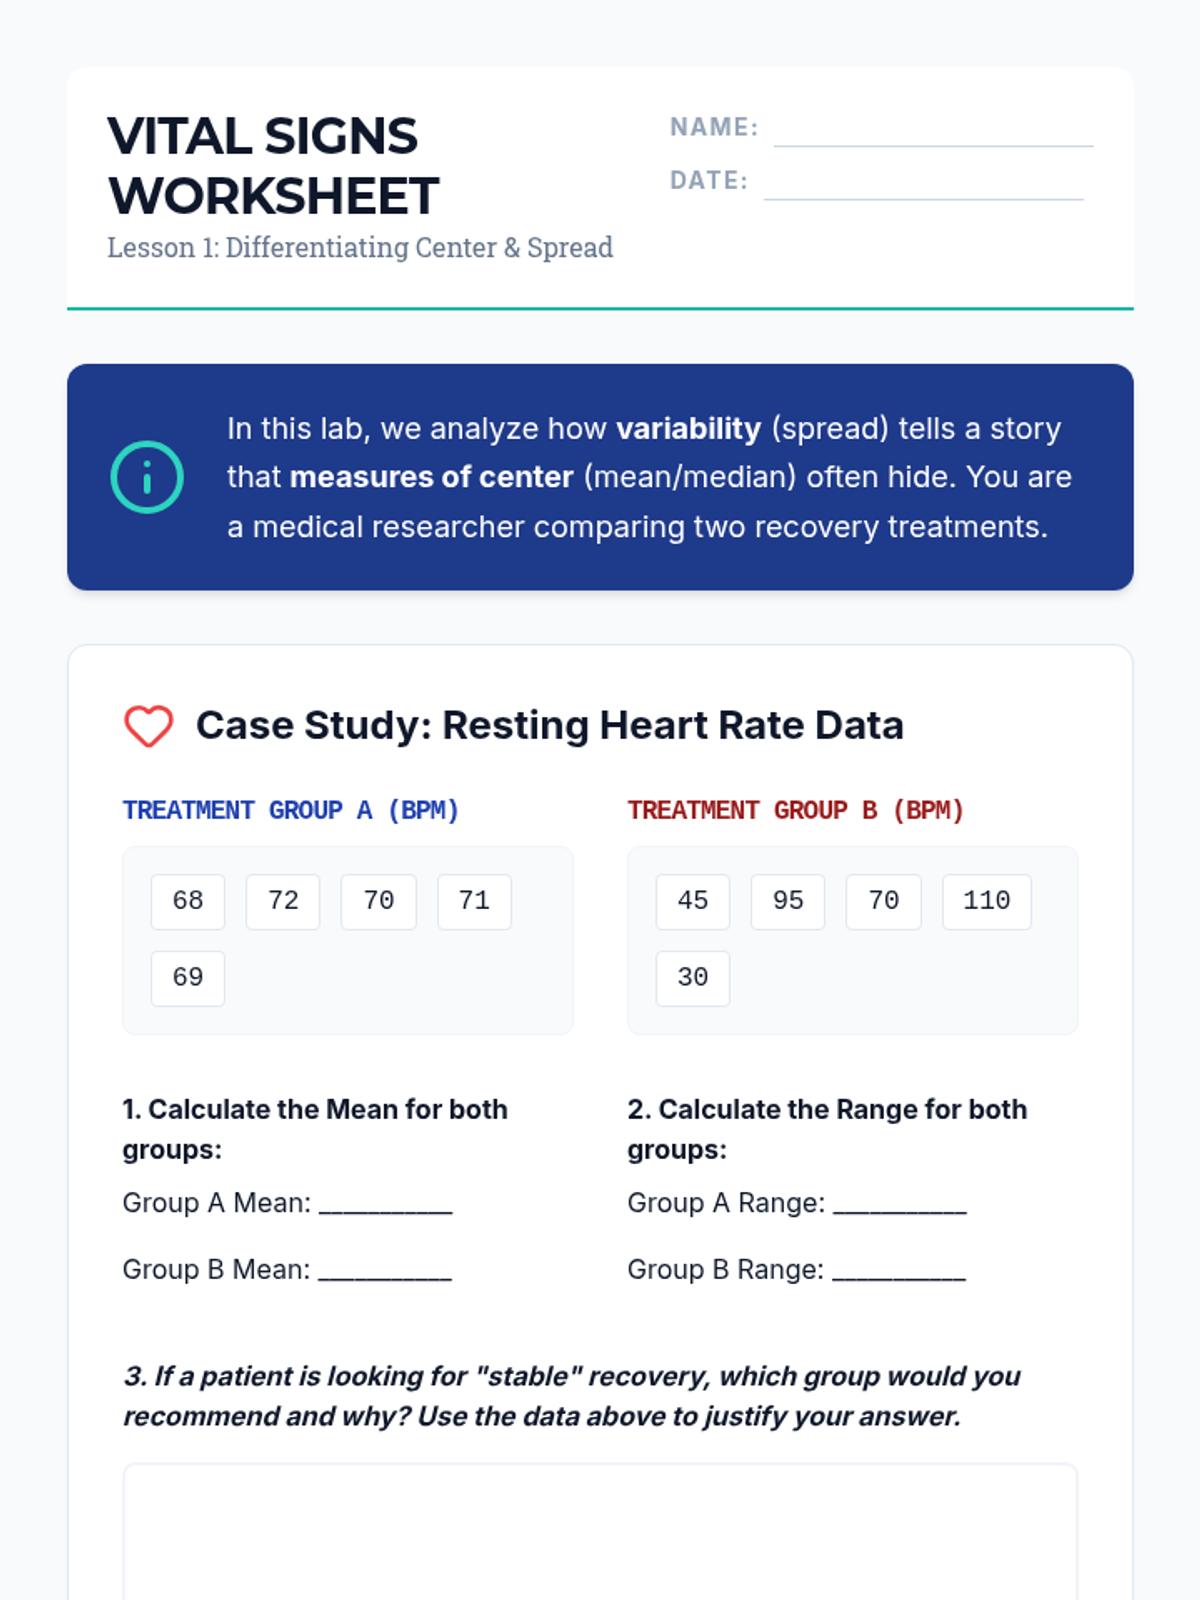
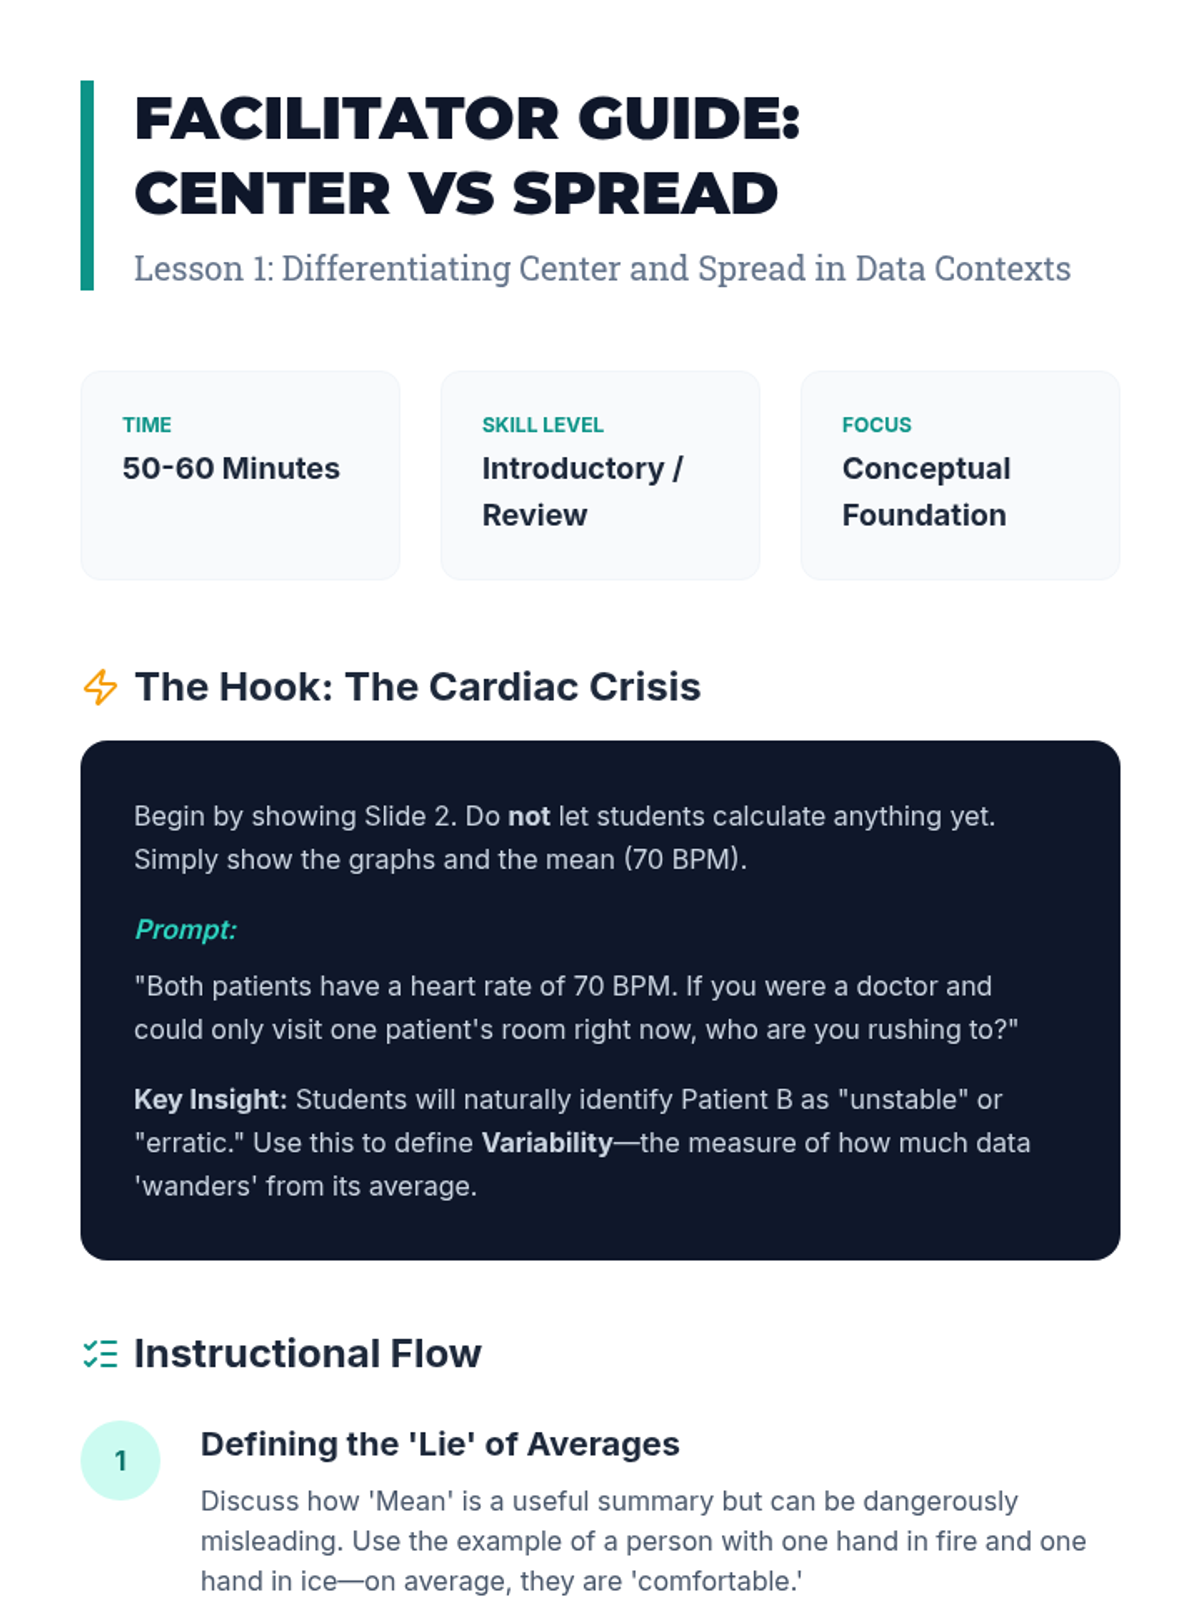
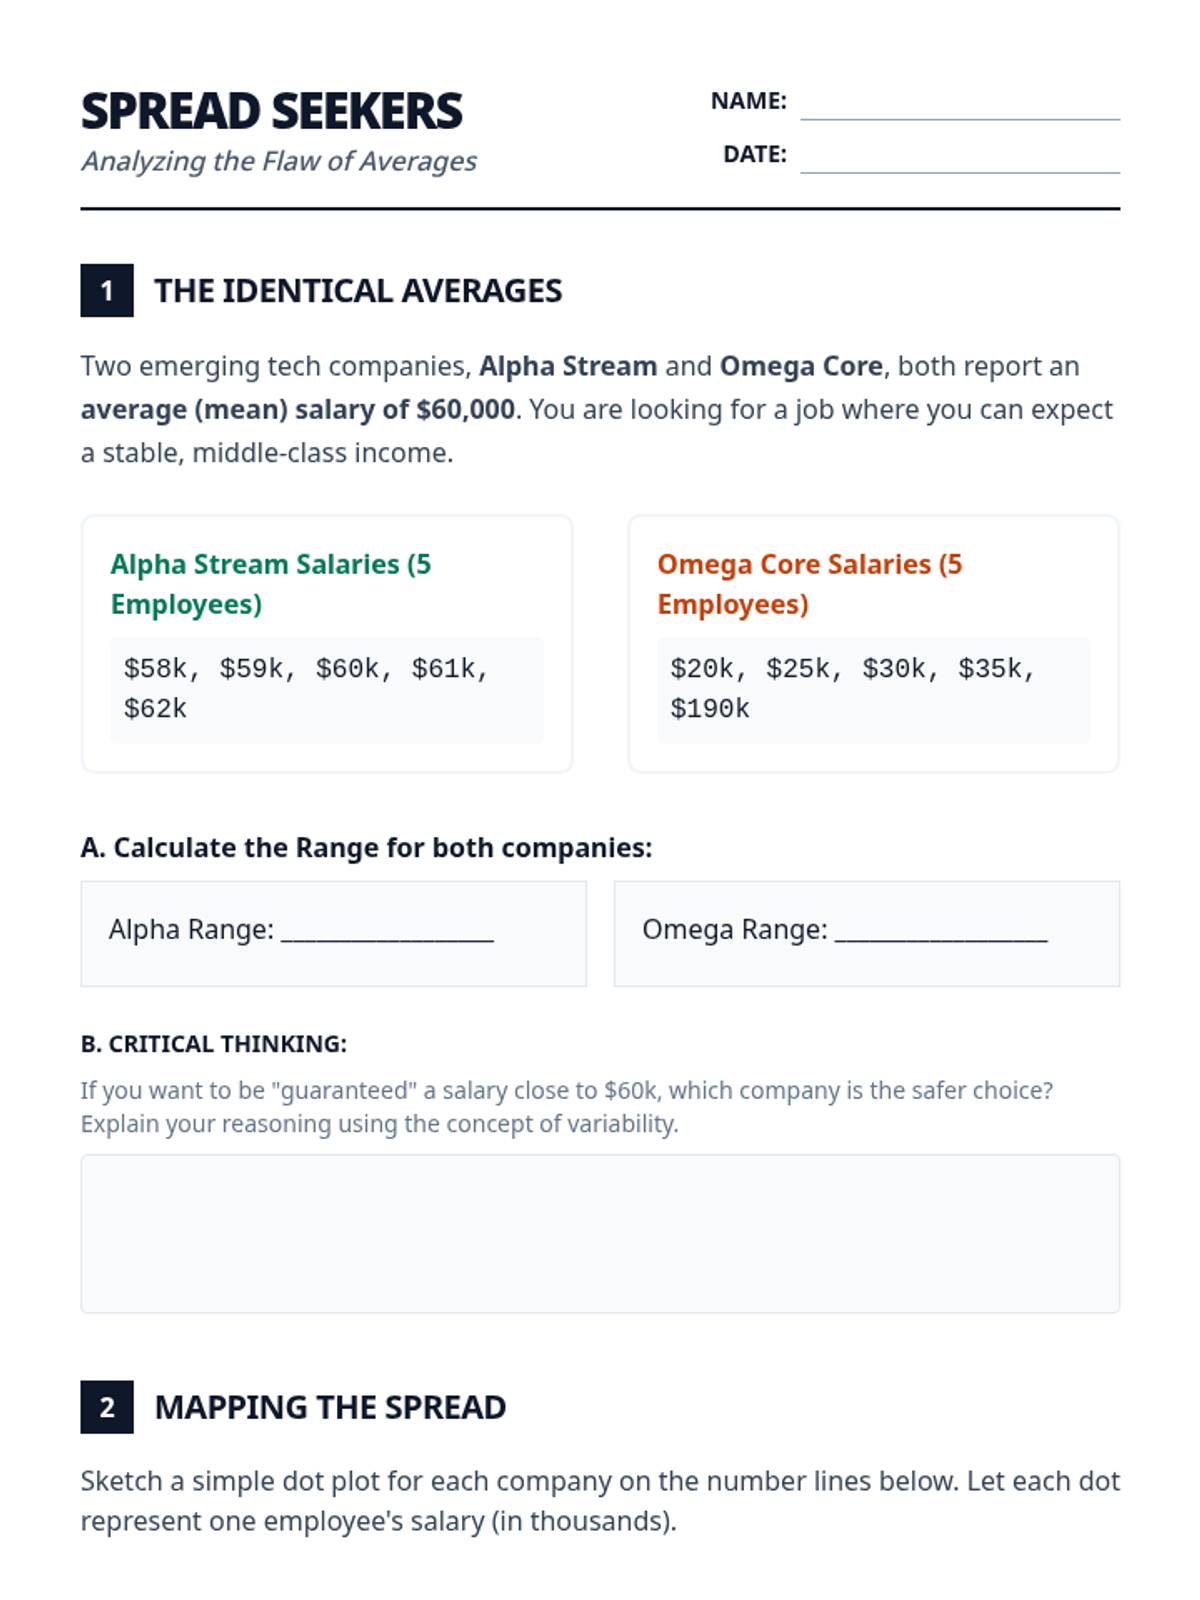
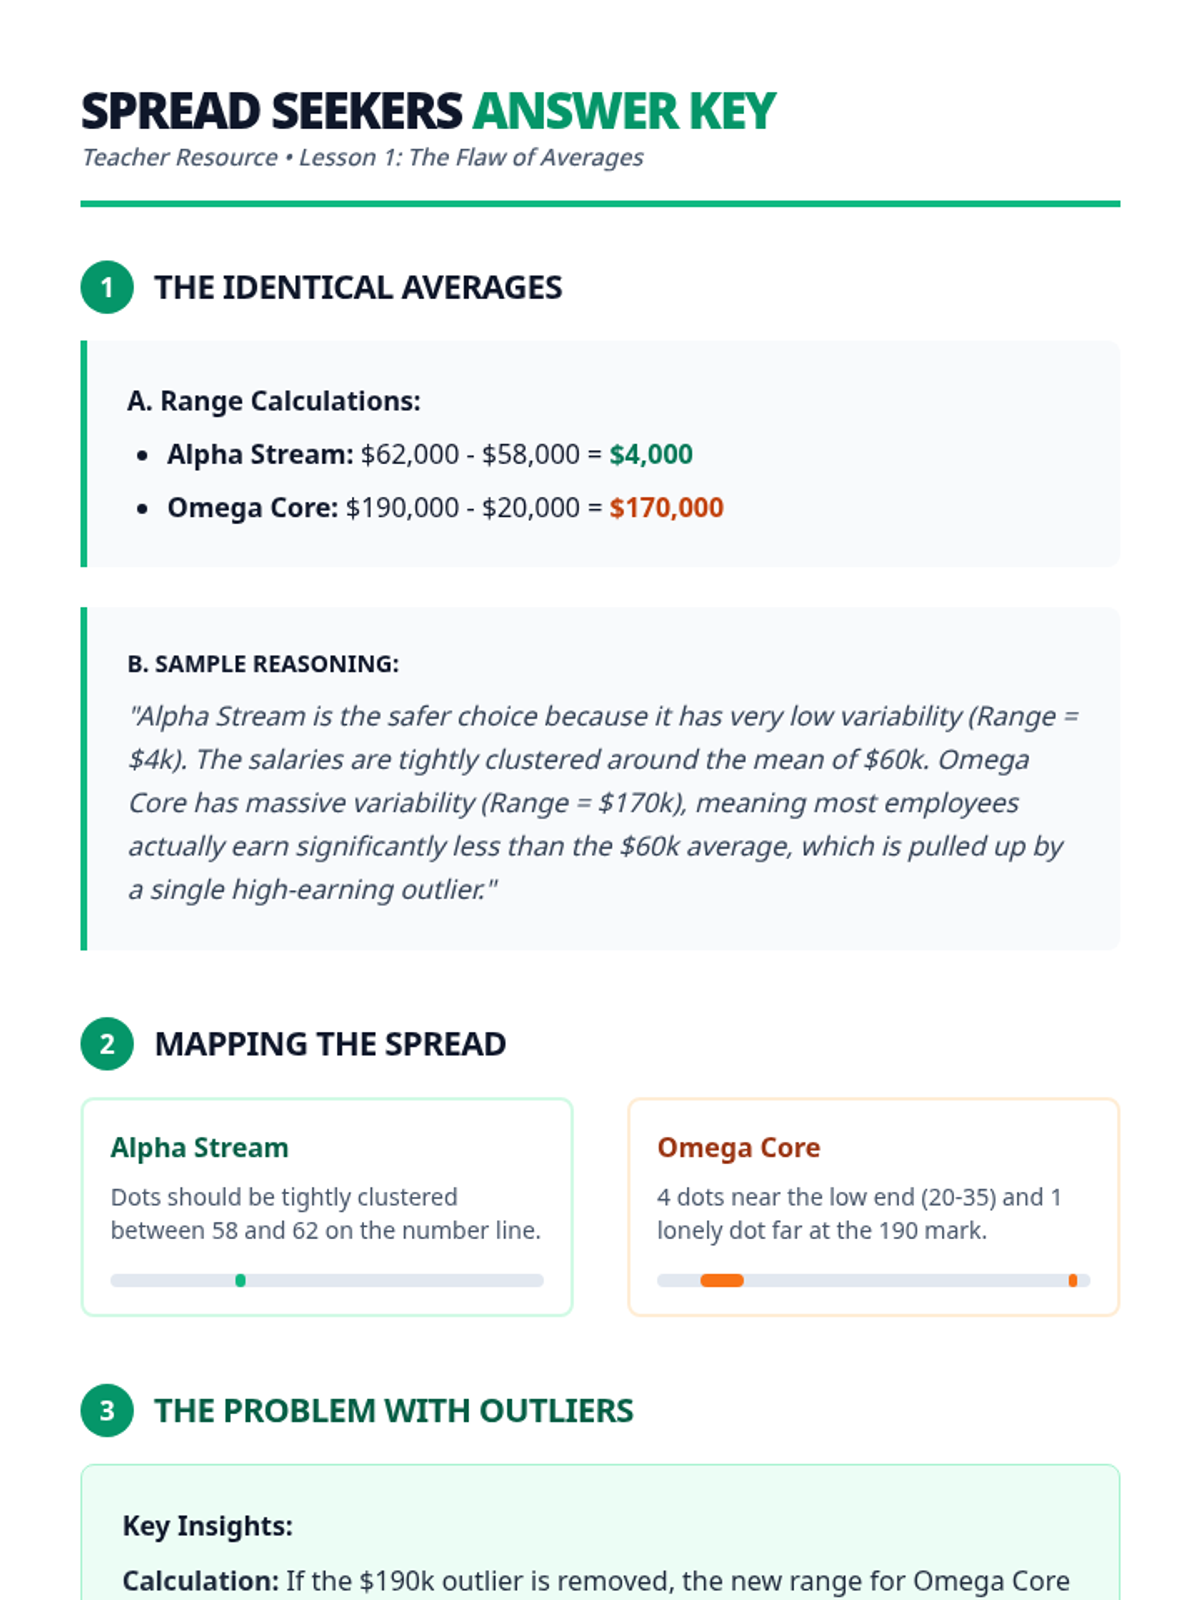
A targeted Tier 2 intervention for High School Statistics focusing on comparing data distributions (shape, center, spread) and understanding the impact of outliers. Includes scaffolded instruction, guided practice with sentence frames, and progress monitoring tools.
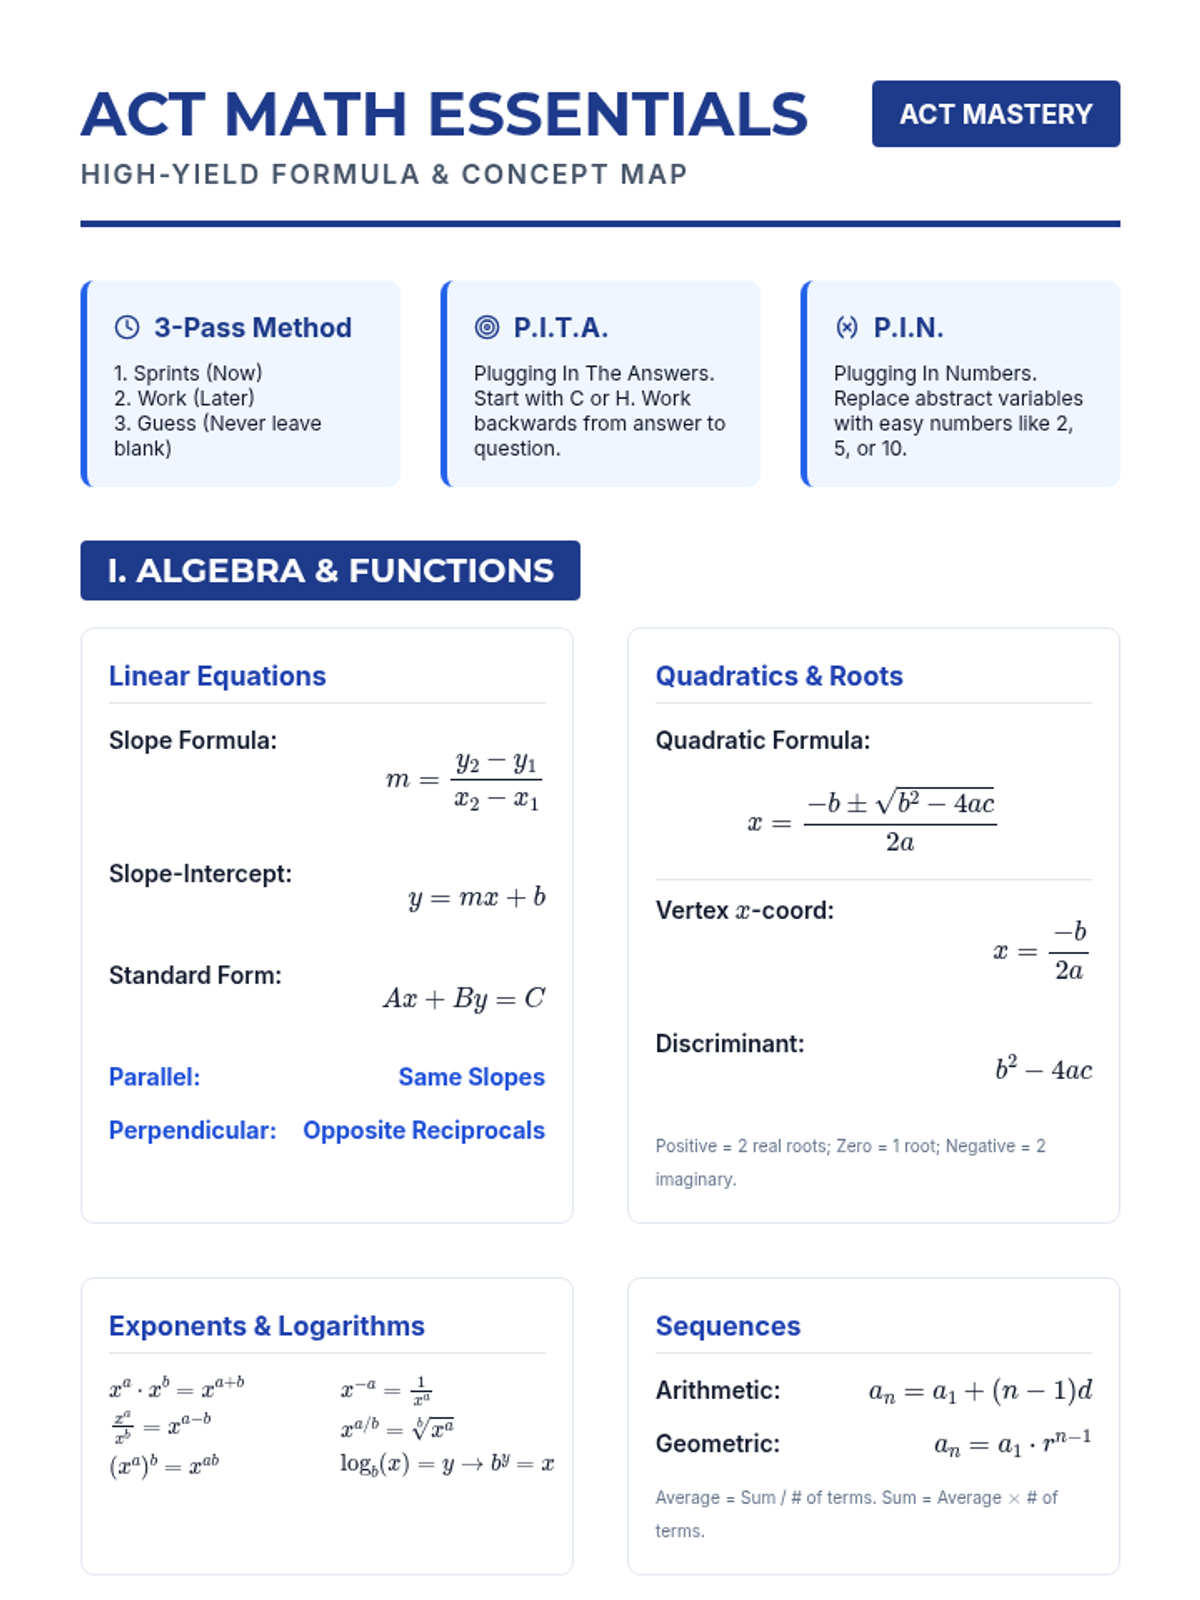
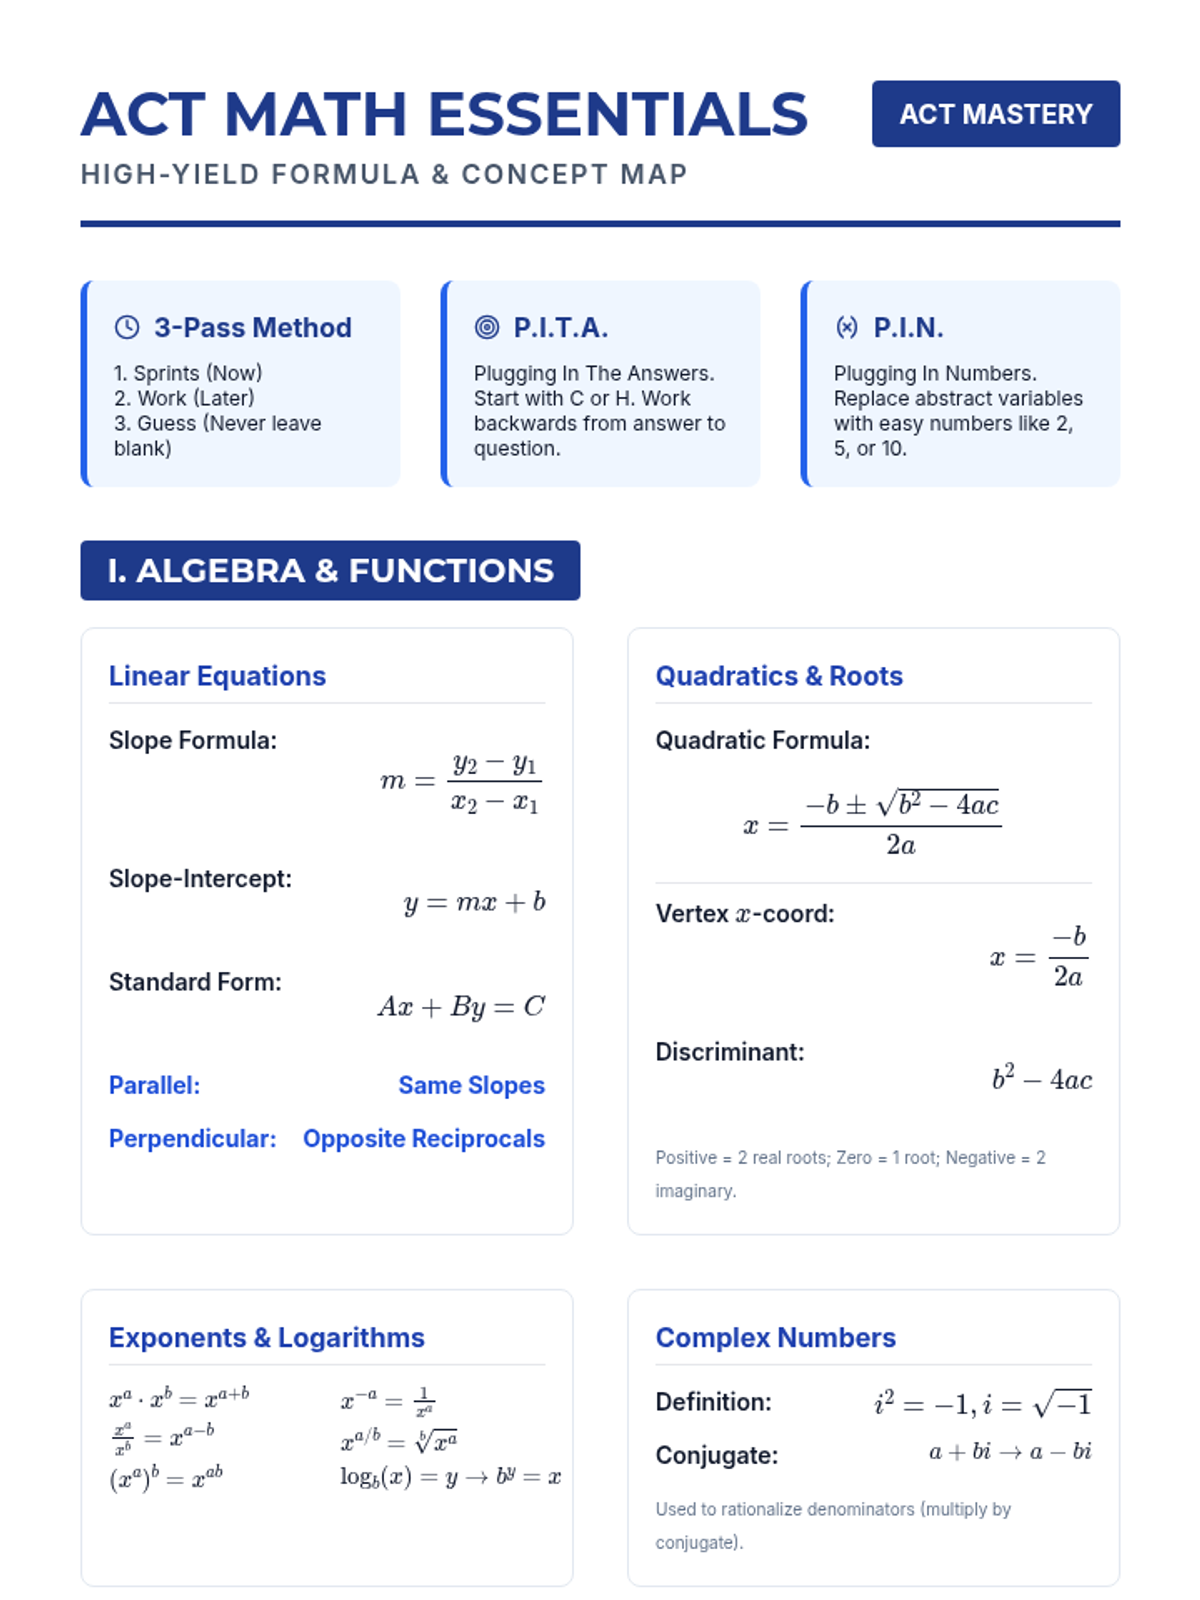
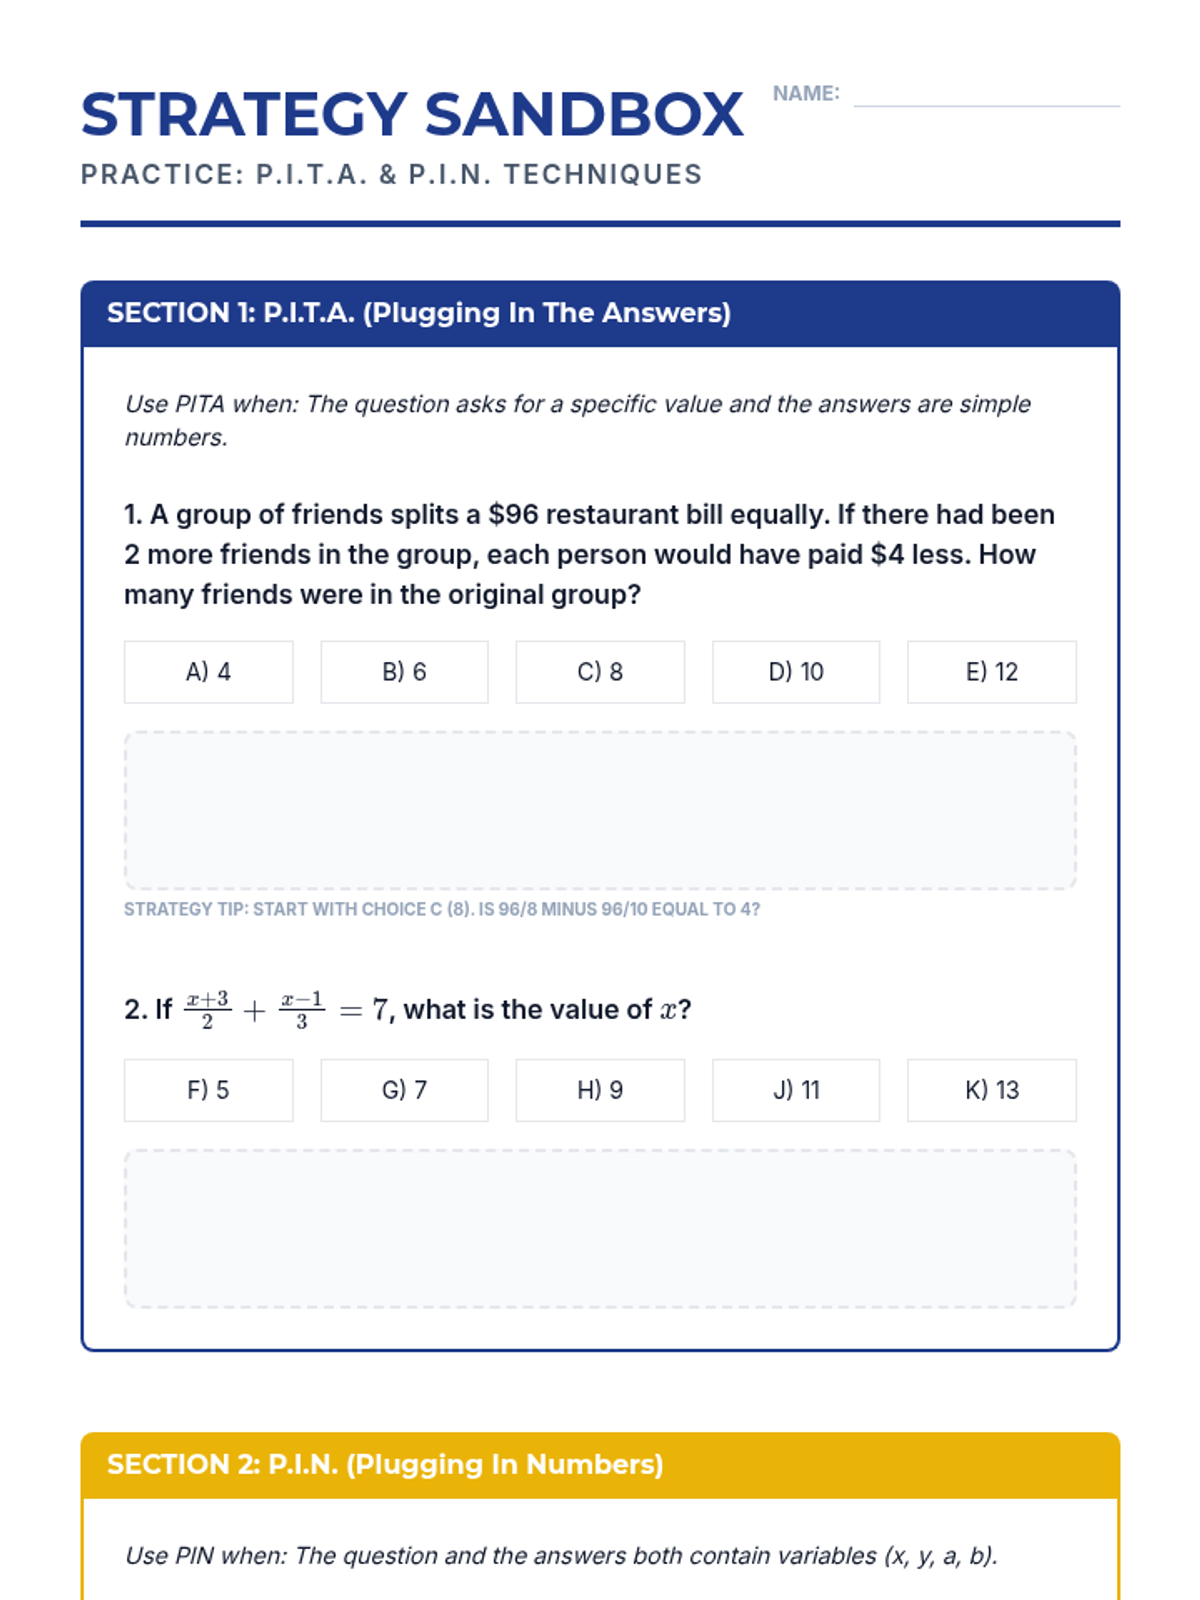
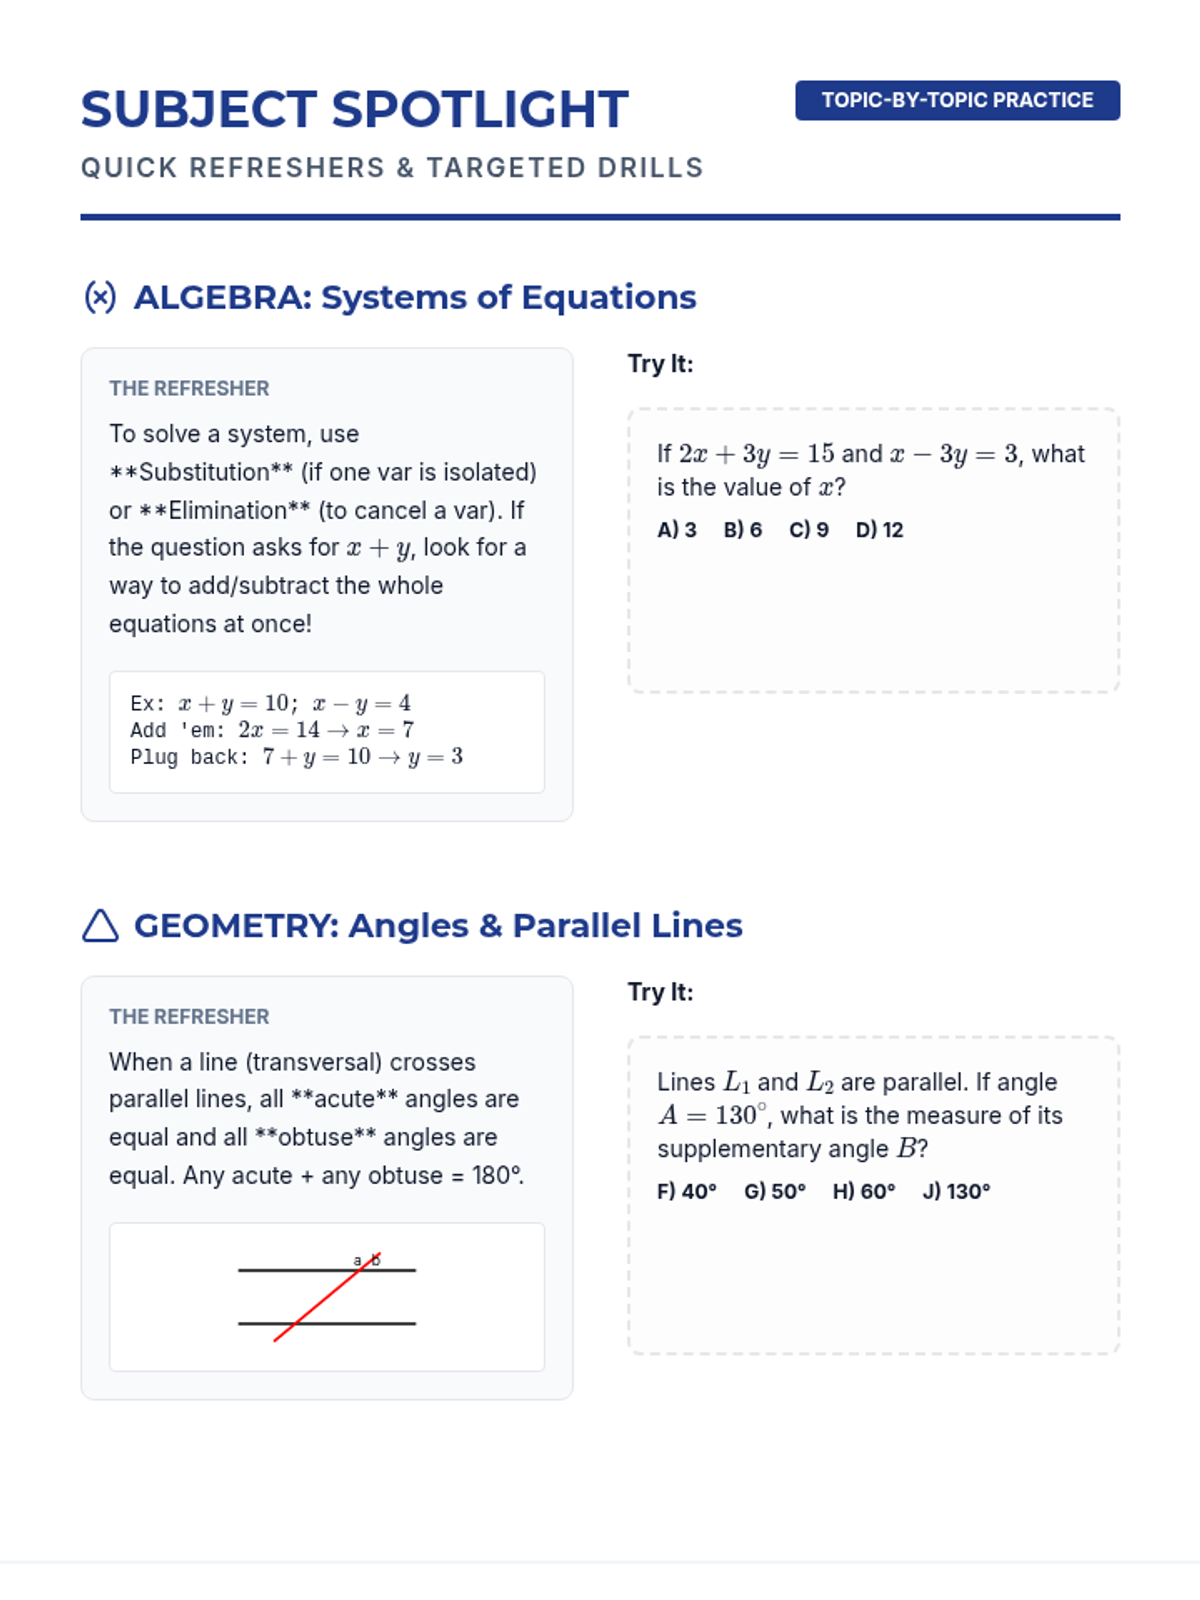
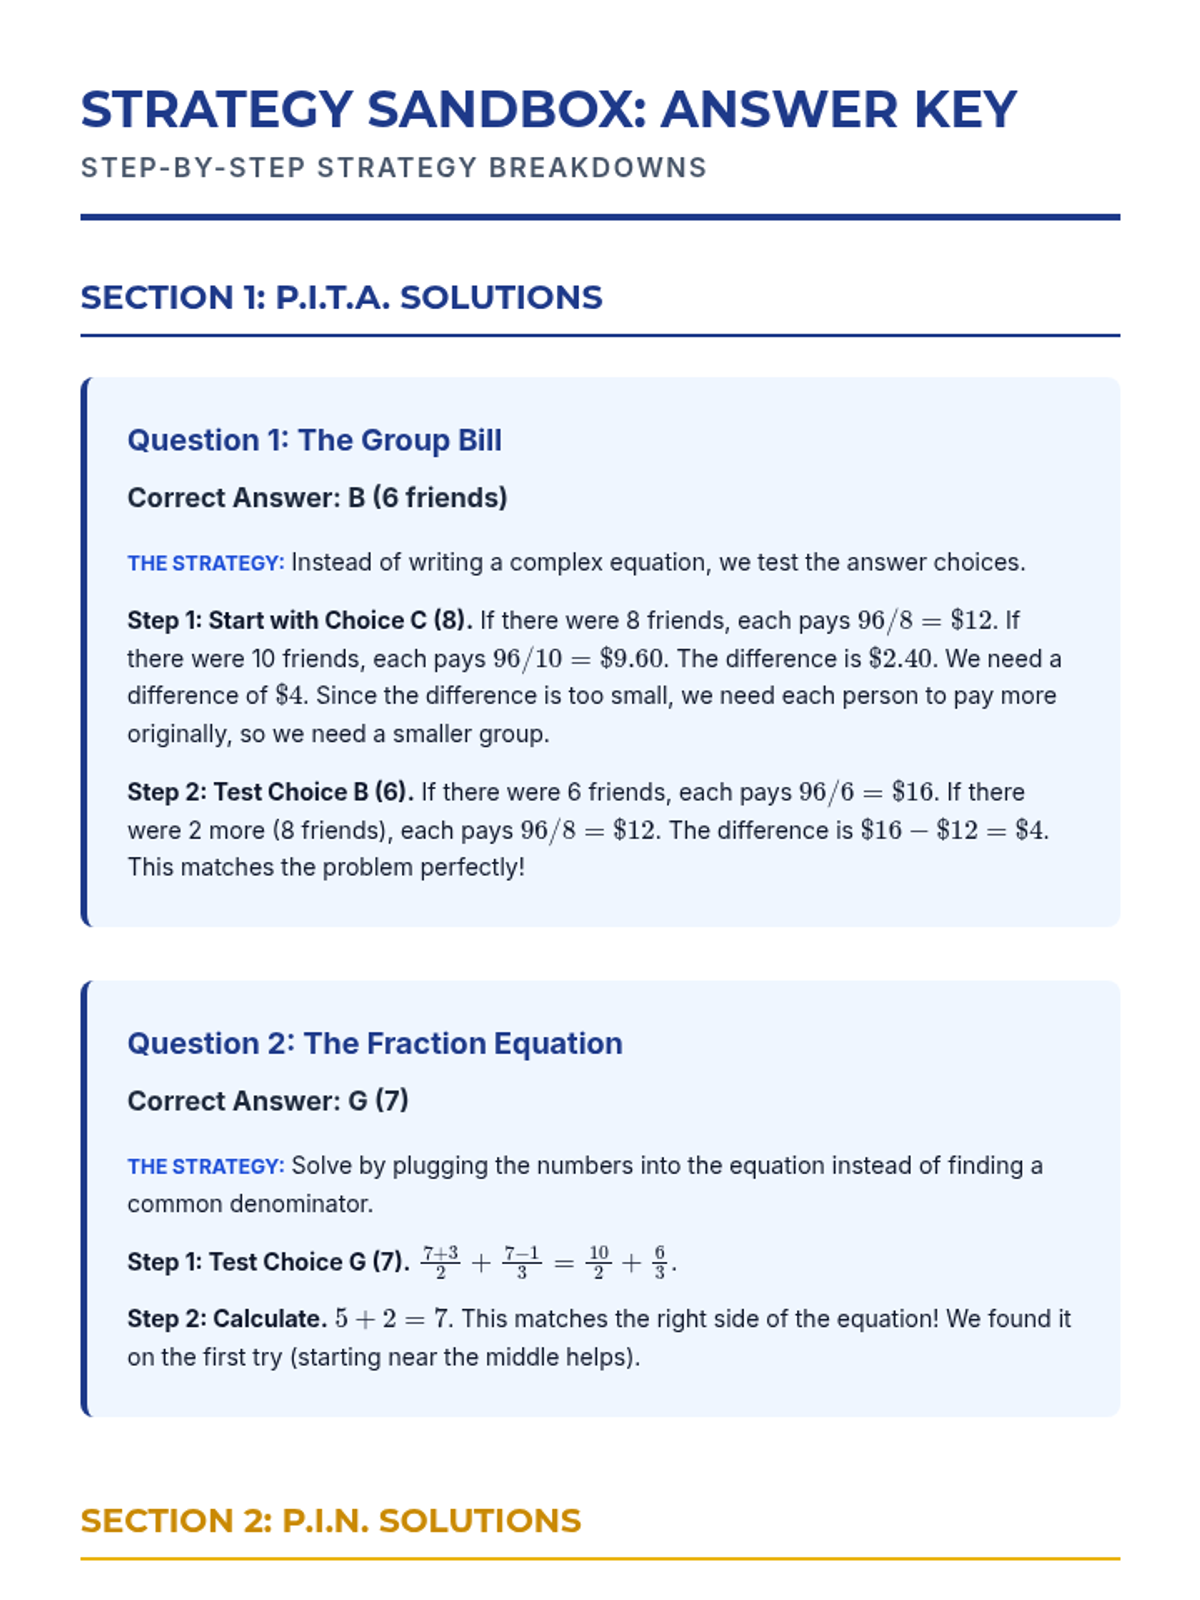
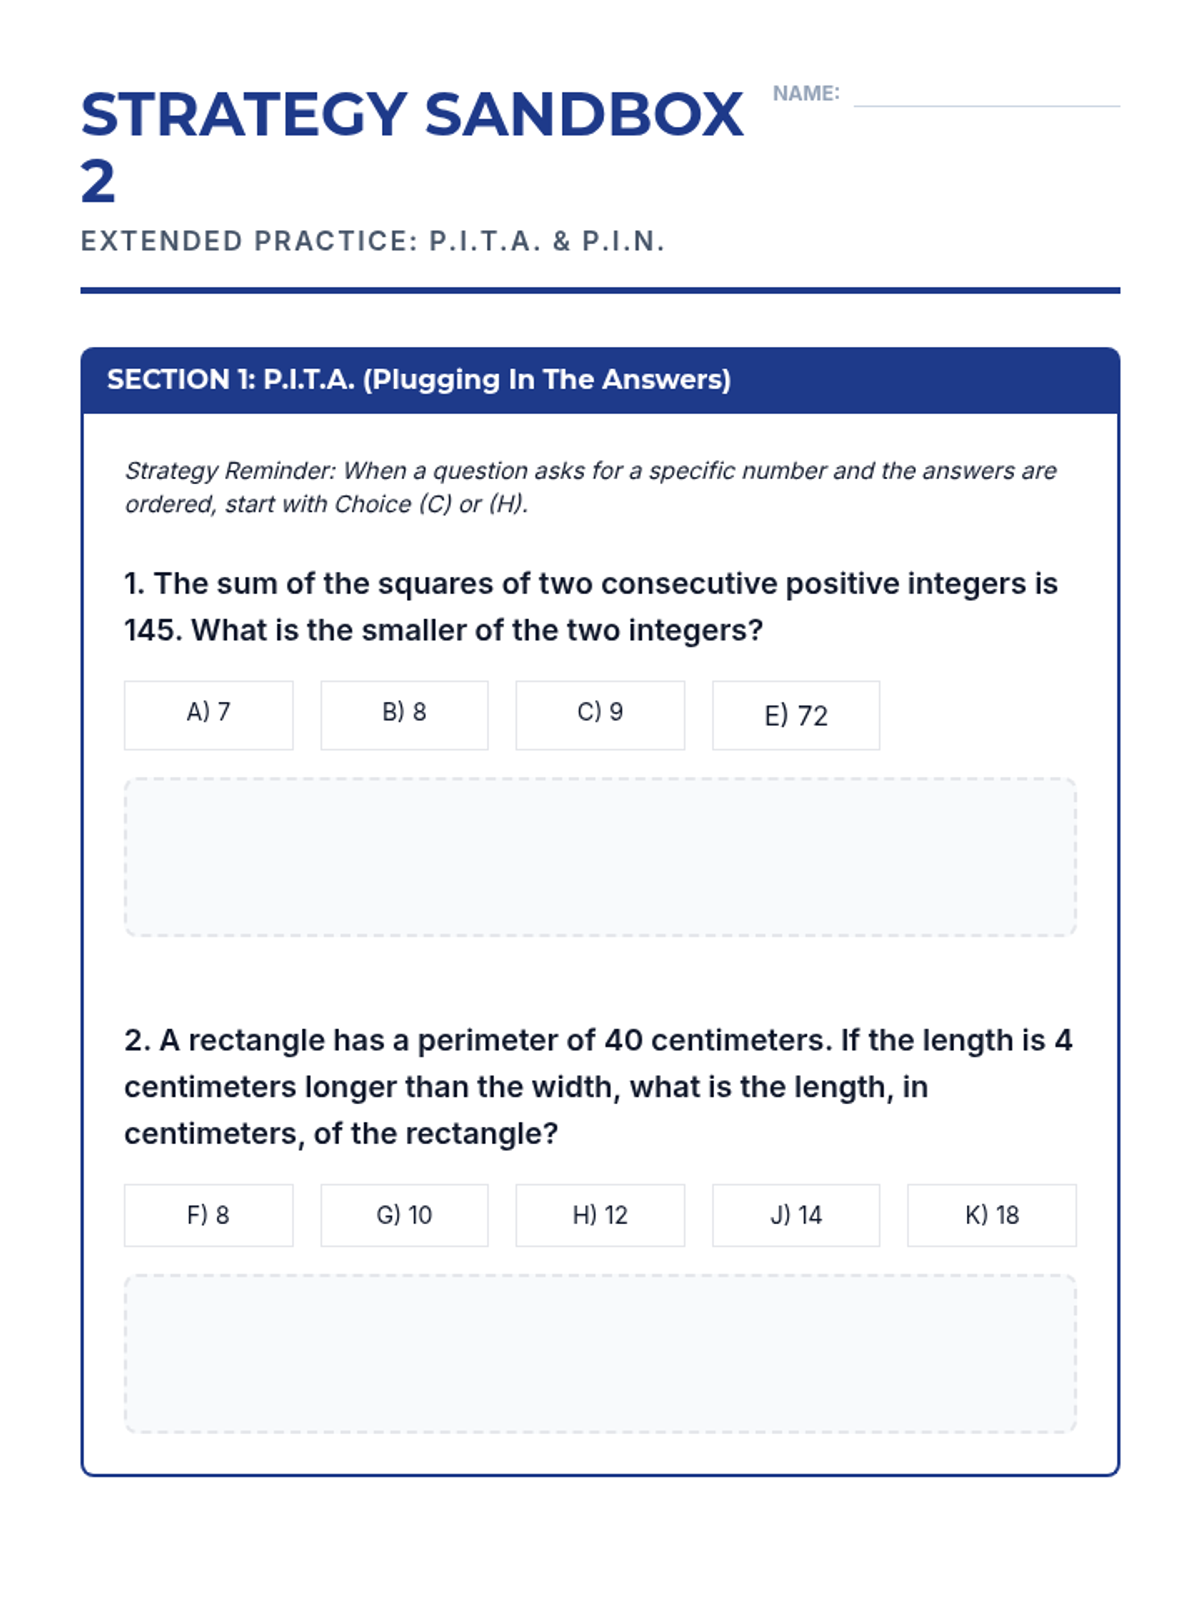
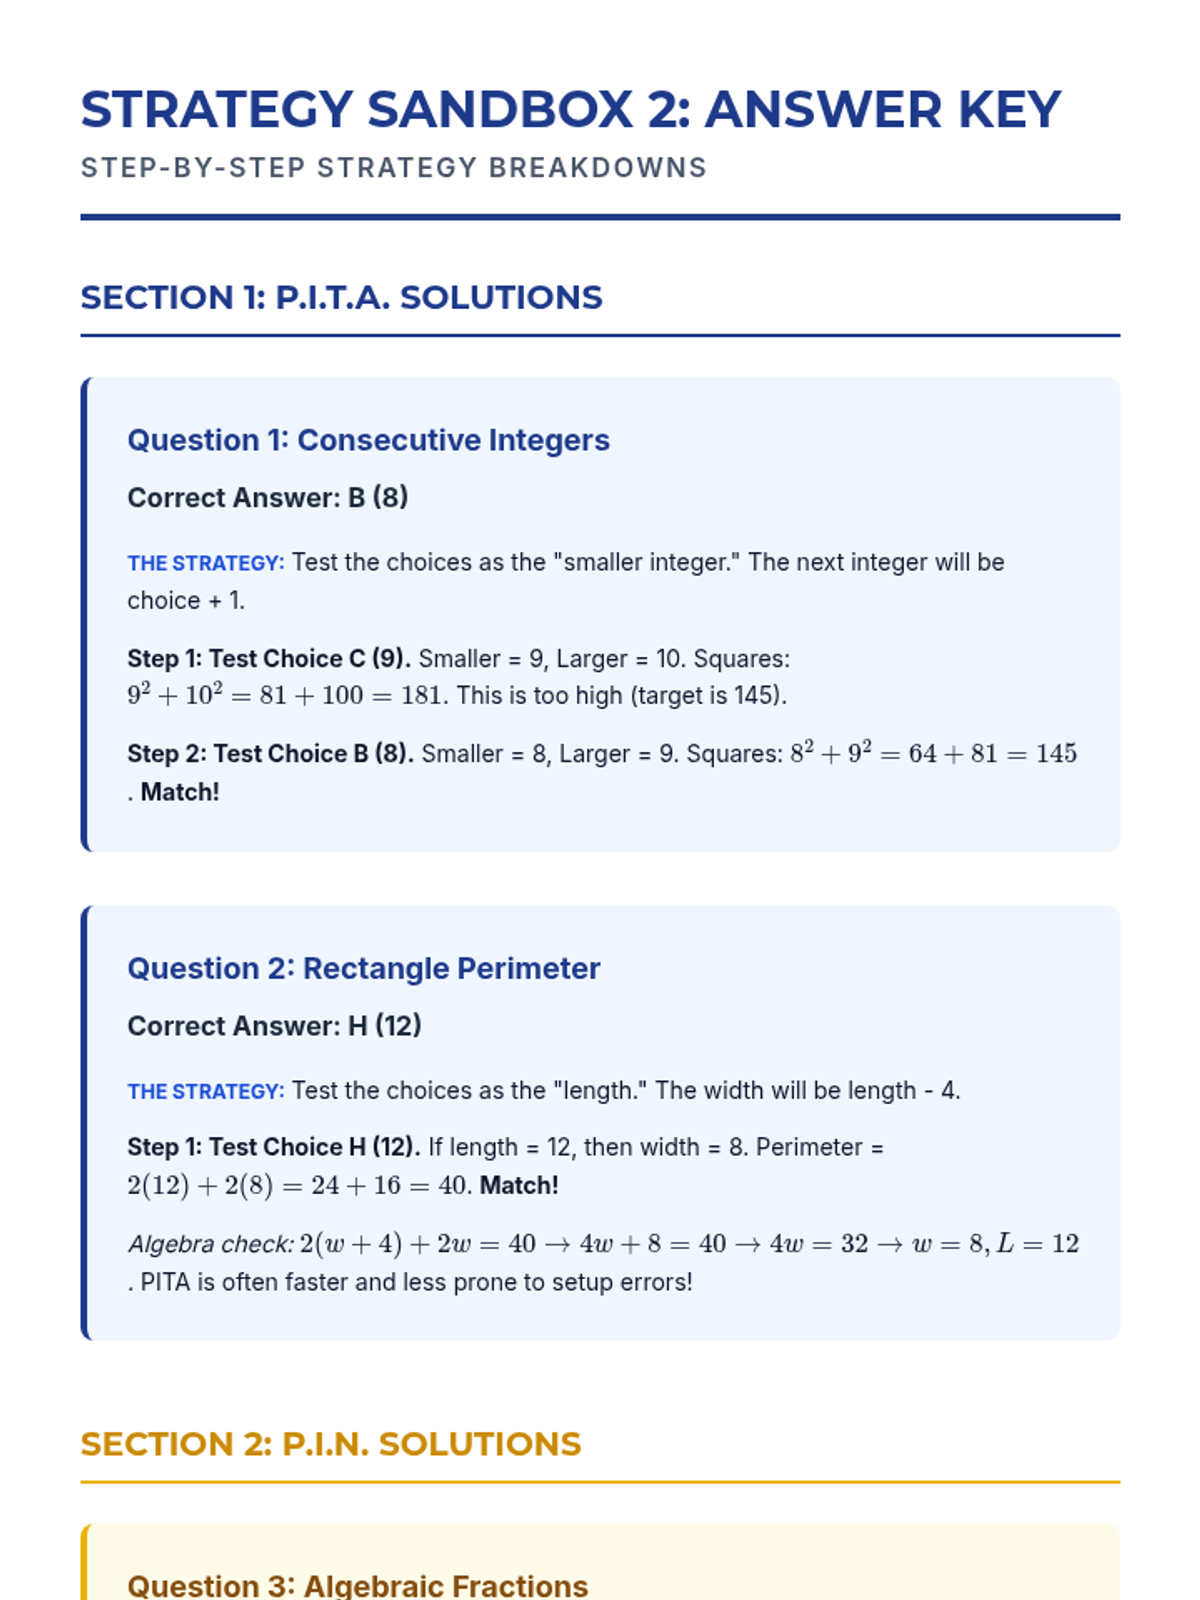
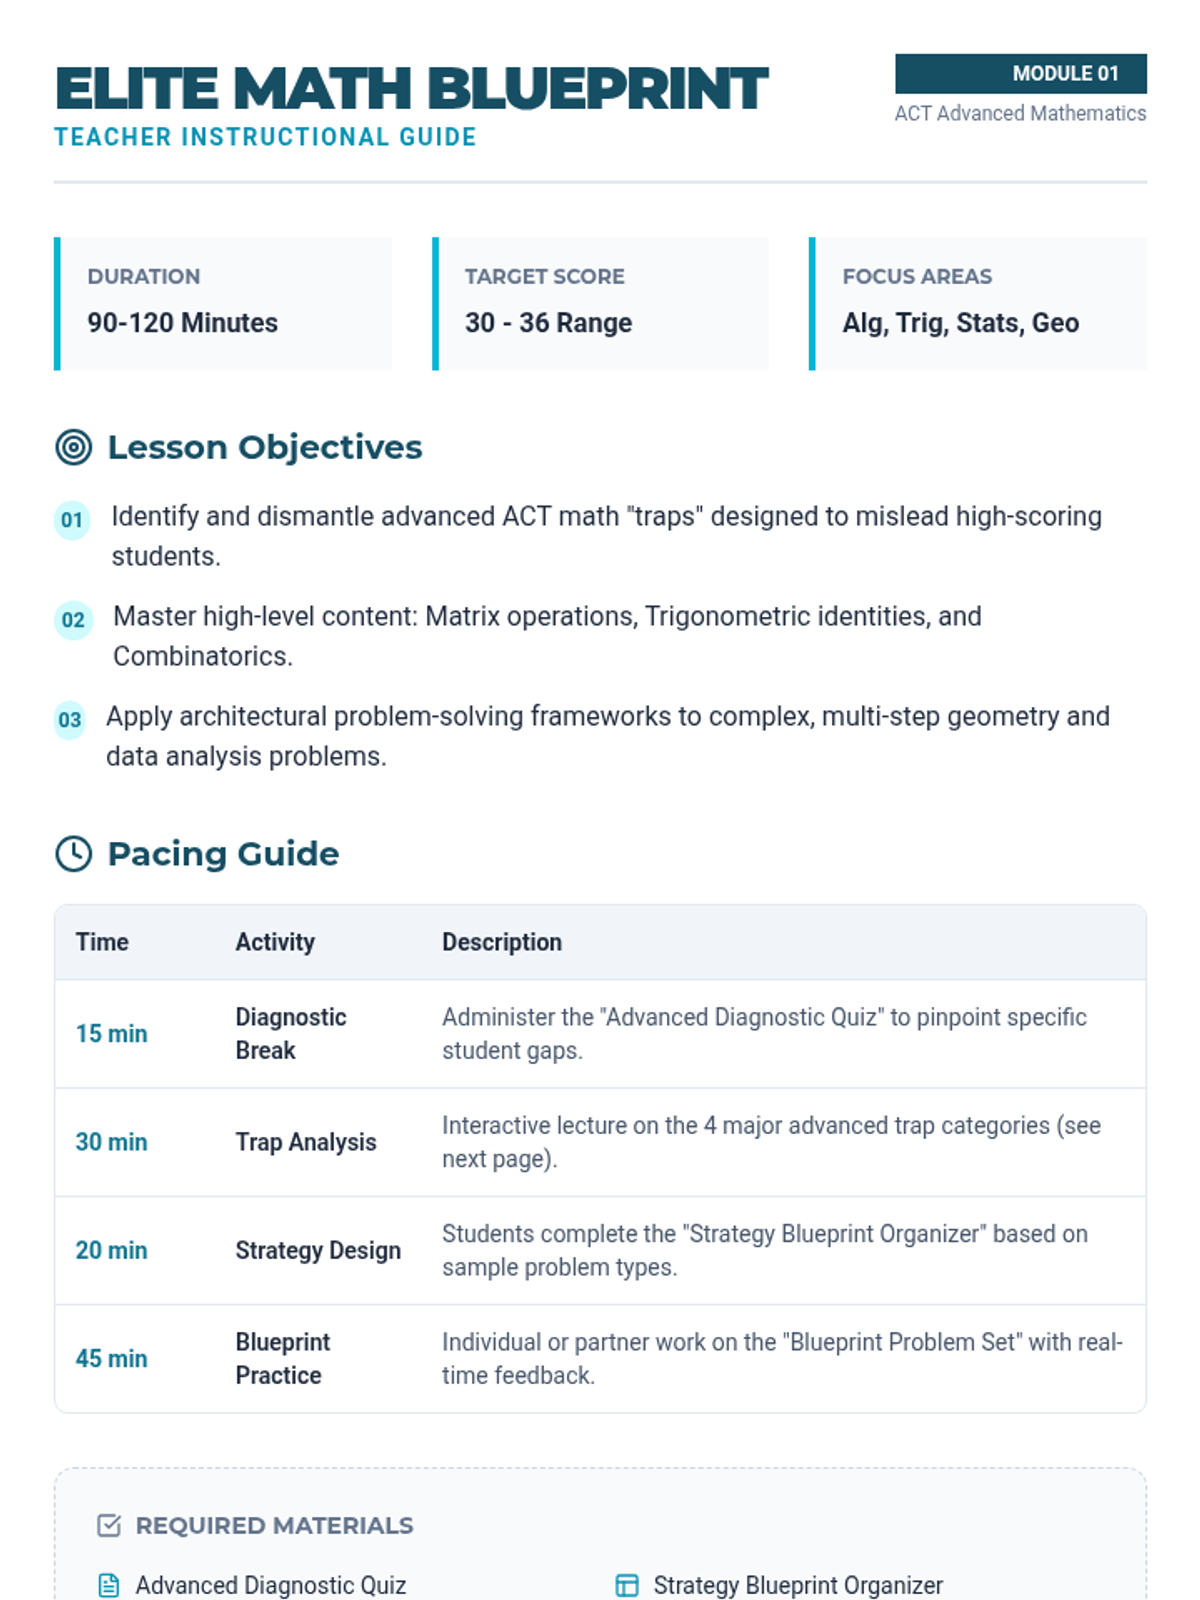
A comprehensive ACT Math preparation program focusing on essential strategies, high-yield Algebra and Geometry concepts, and realistic practice to boost scores.
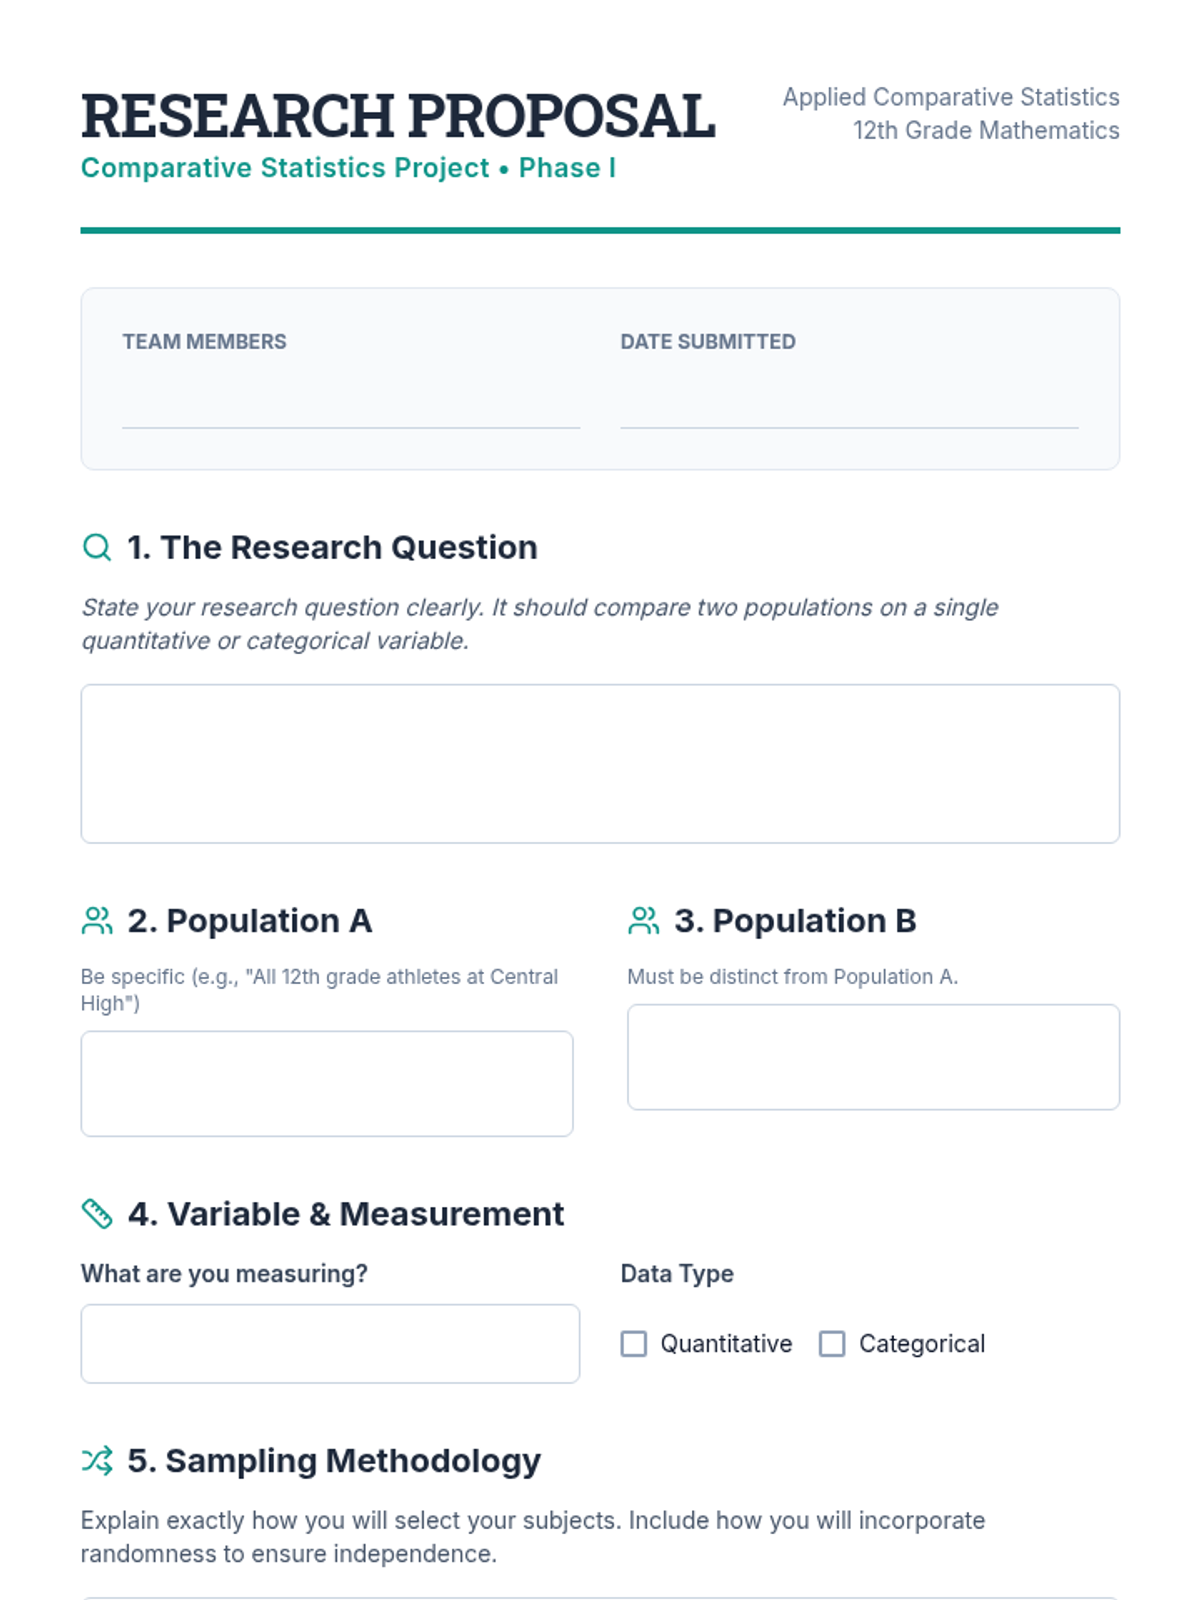
A project-based unit where 12th-grade students design and execute an original statistical study comparing two populations. Students move from research design and ethical data collection to exploratory data analysis and formal inferential testing, culminating in a professional research presentation.
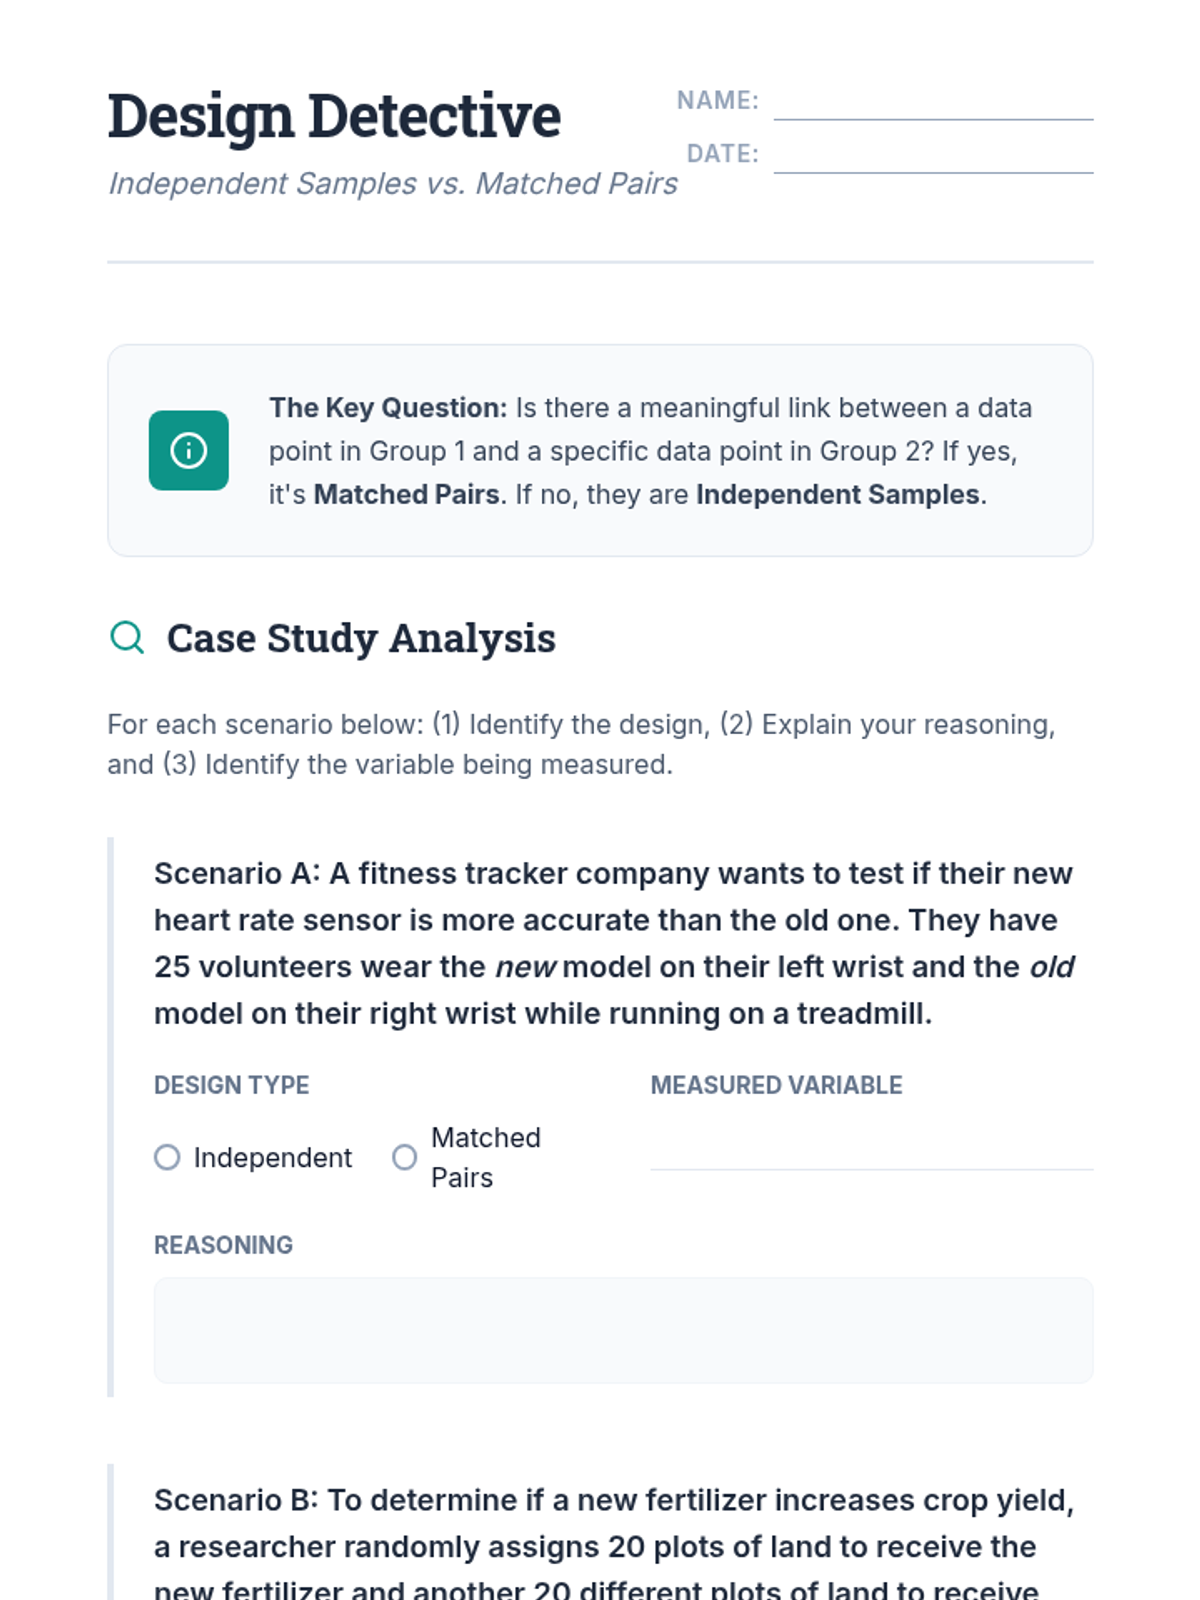
A comprehensive 12th-grade statistics sequence focused on identifying, analyzing, and performing inference on paired data designs to reduce variability and compare population means.
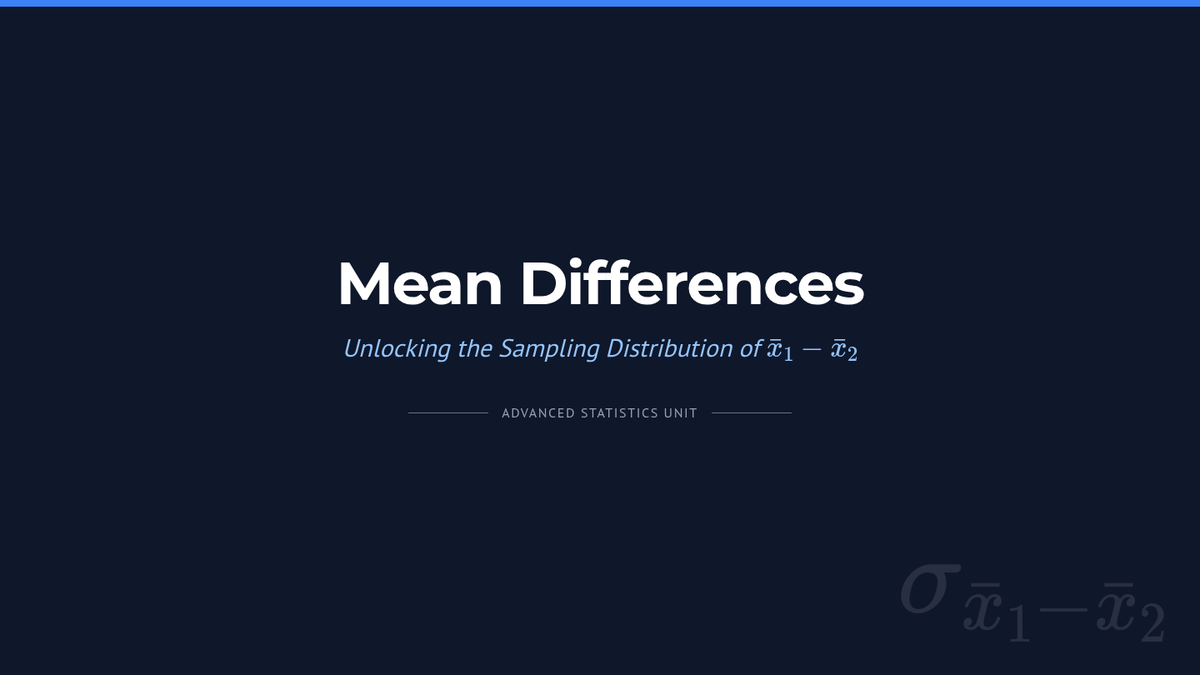
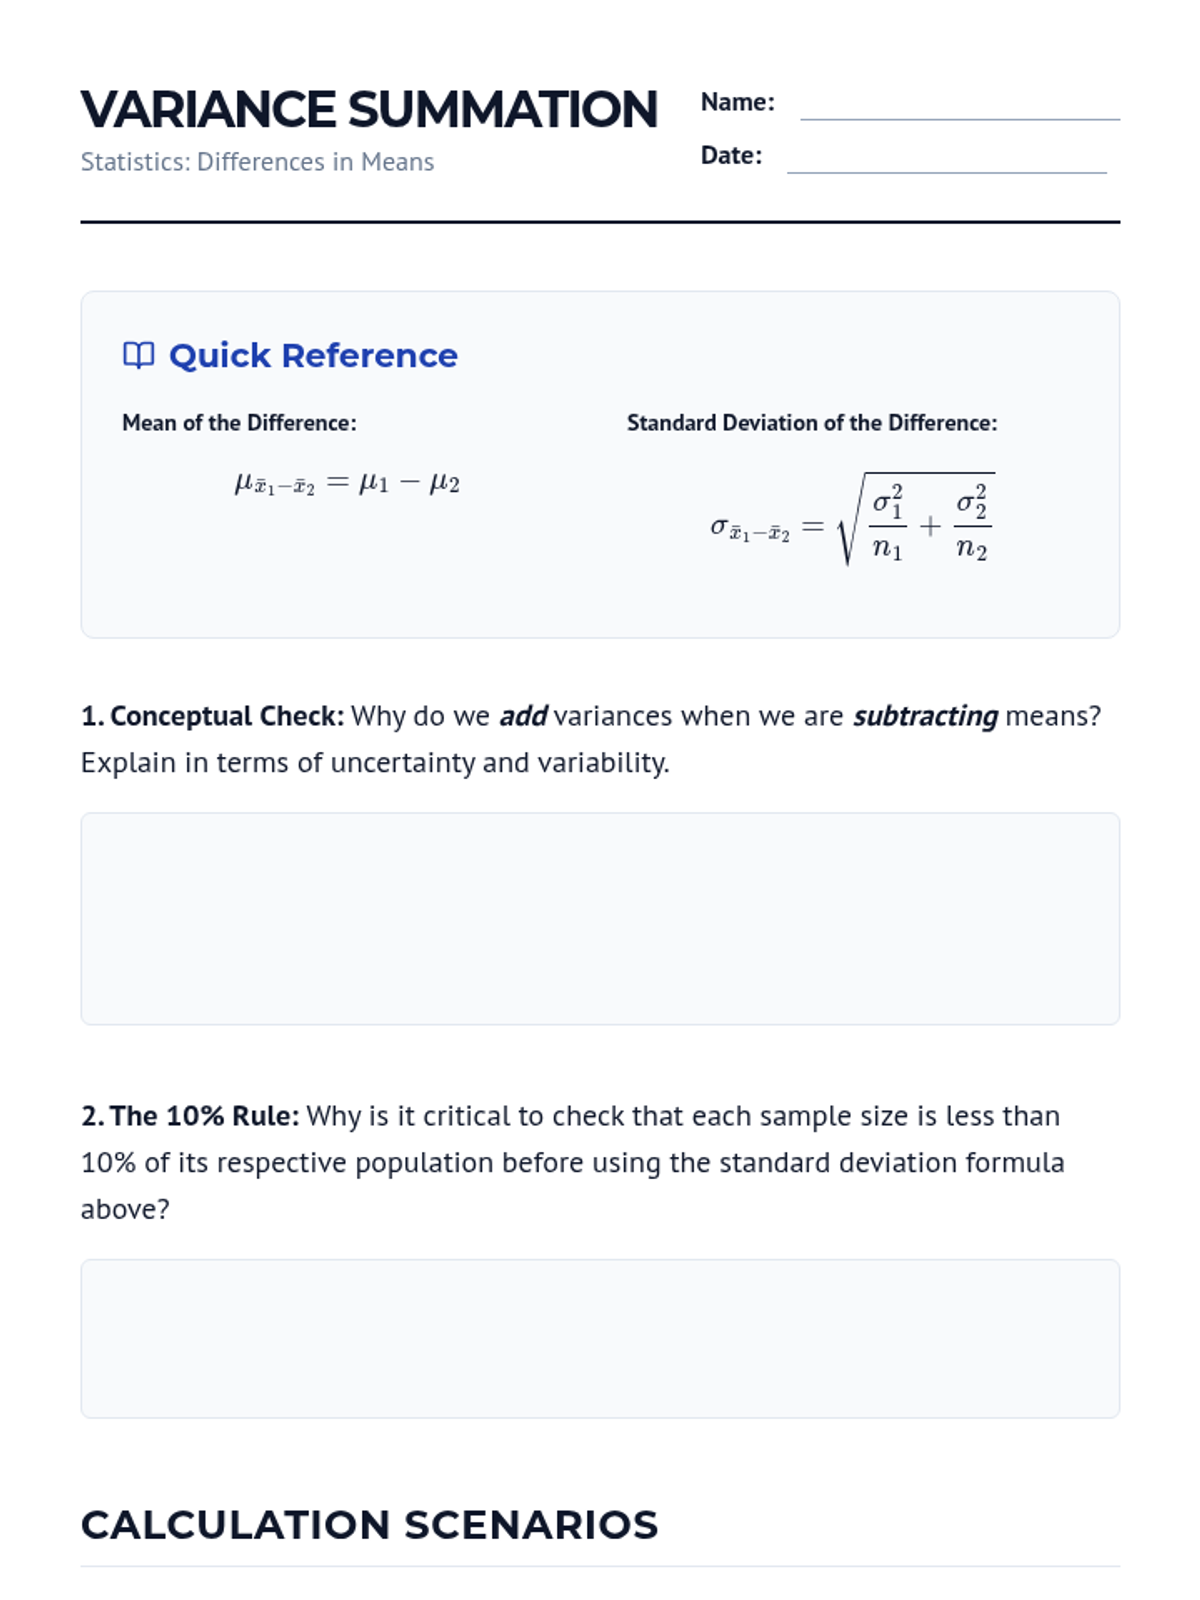
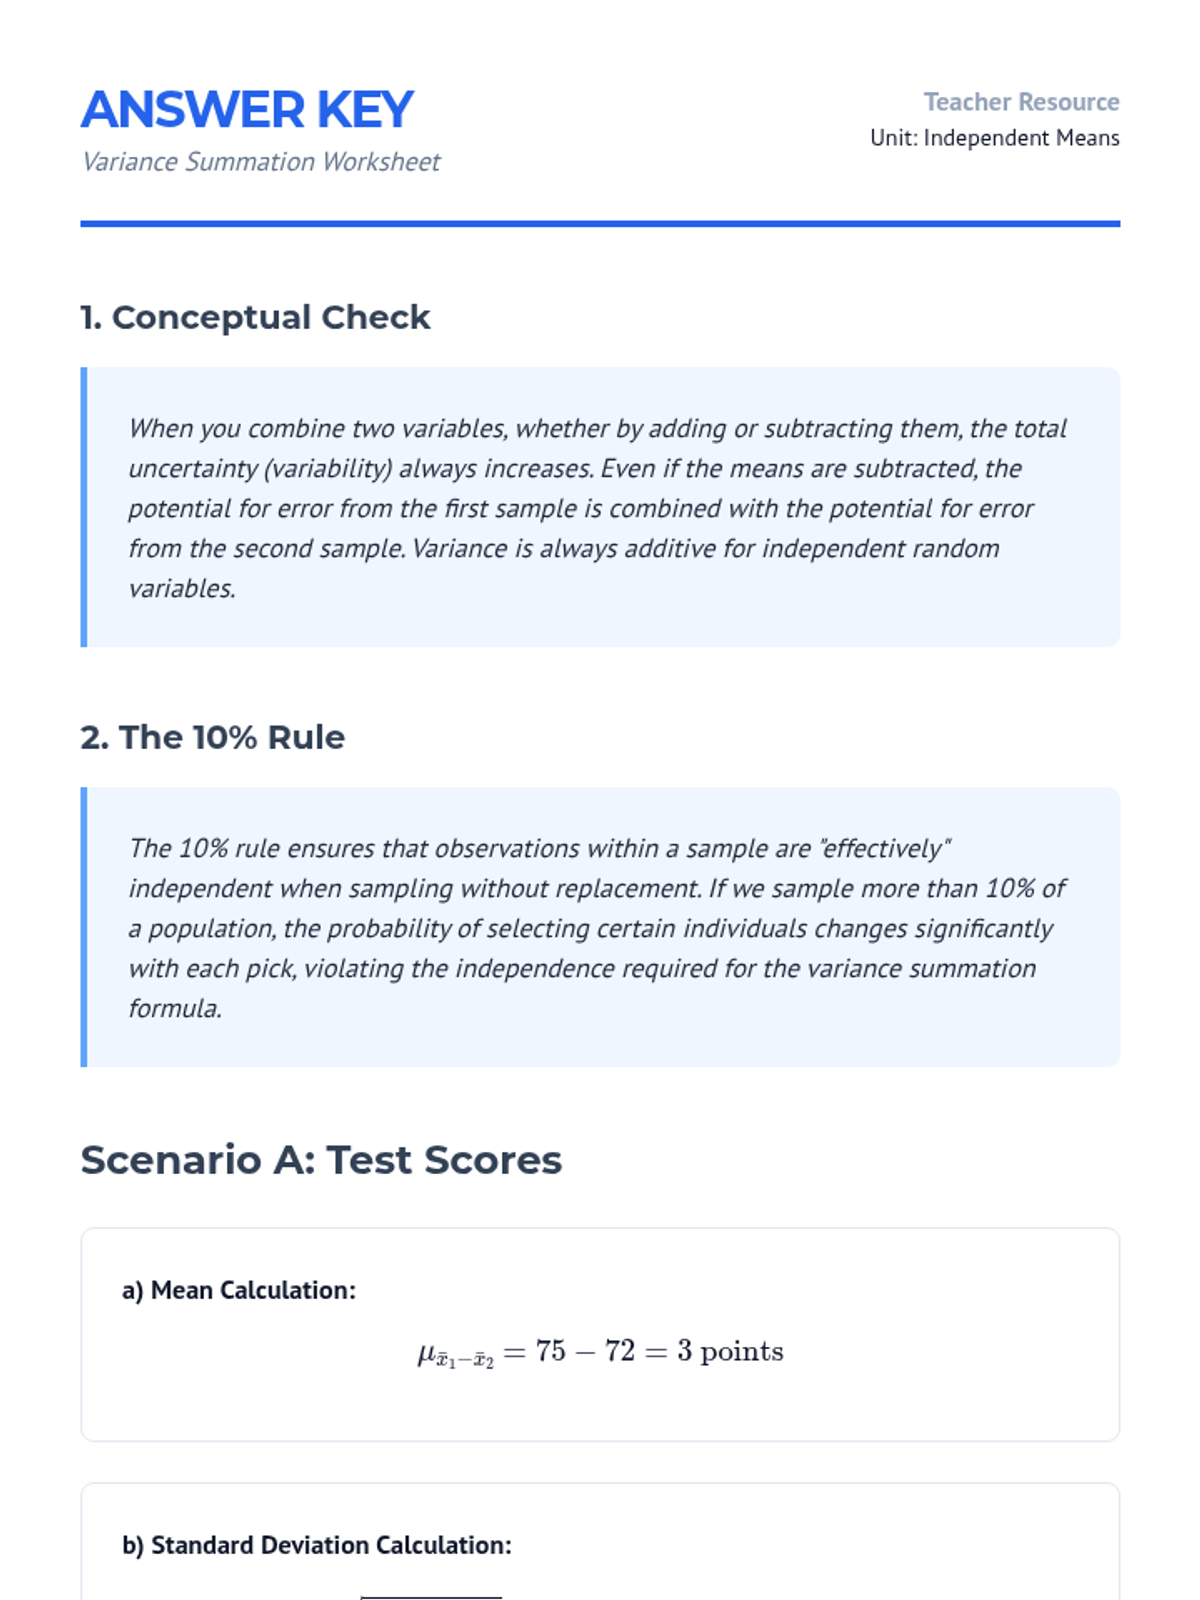
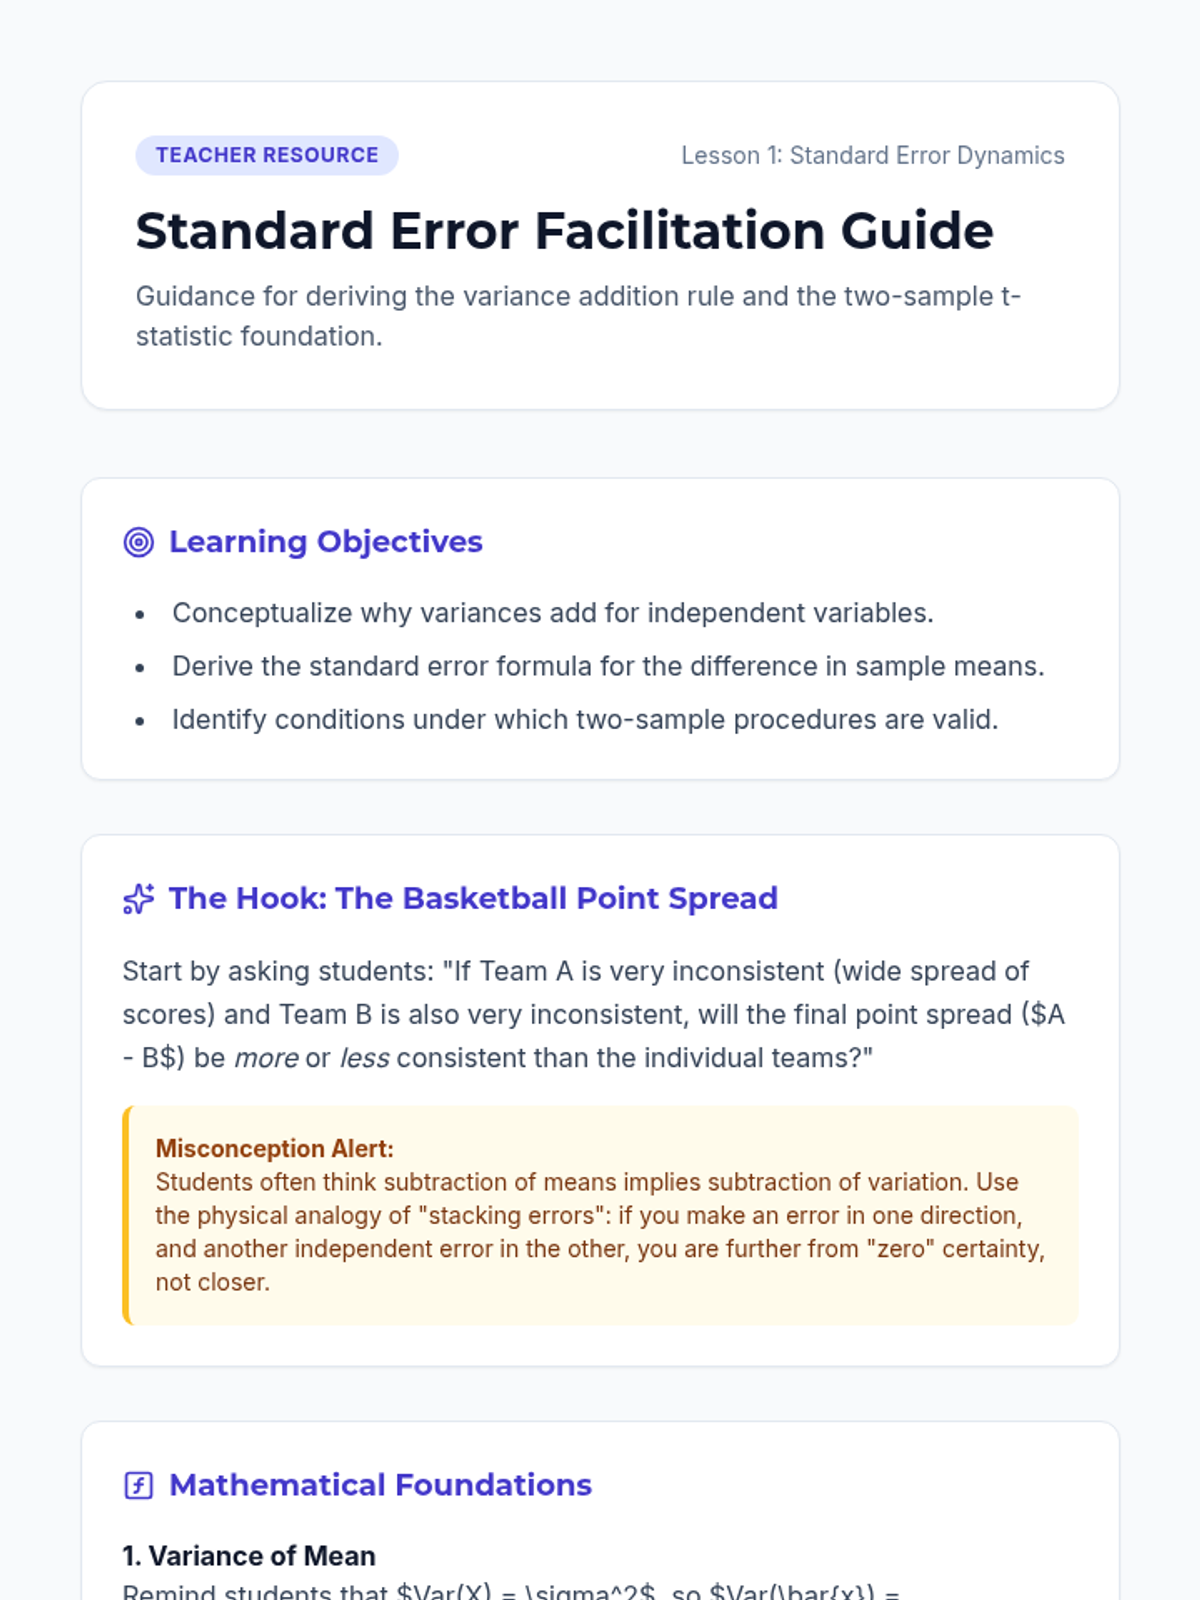
A comprehensive unit on comparing means from two independent populations. Students move from the theoretical foundations of sampling distributions to practical applications in clinical trials, mastering two-sample t-procedures, degrees of freedom, and robustness analysis.
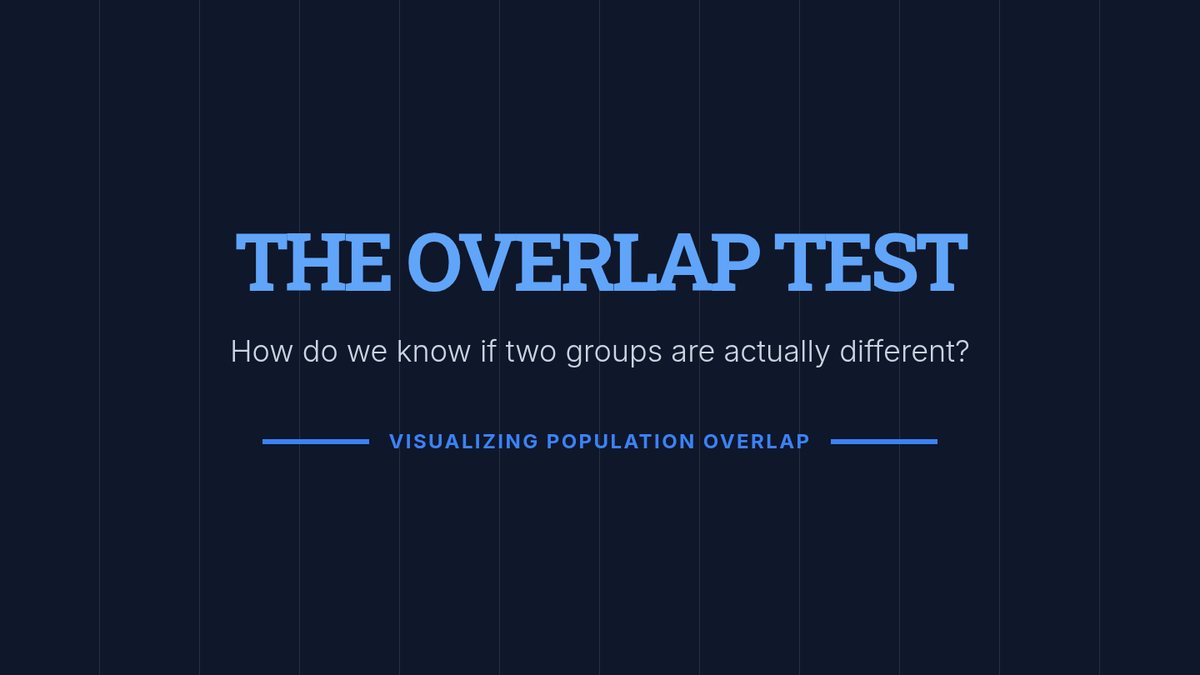
This sequence moves beyond binary decisions to quantify relationships using confidence intervals and effect sizes. Students explore population overlap, calculate margins of error for means and proportions, and learn to communicate statistical findings to non-technical audiences.
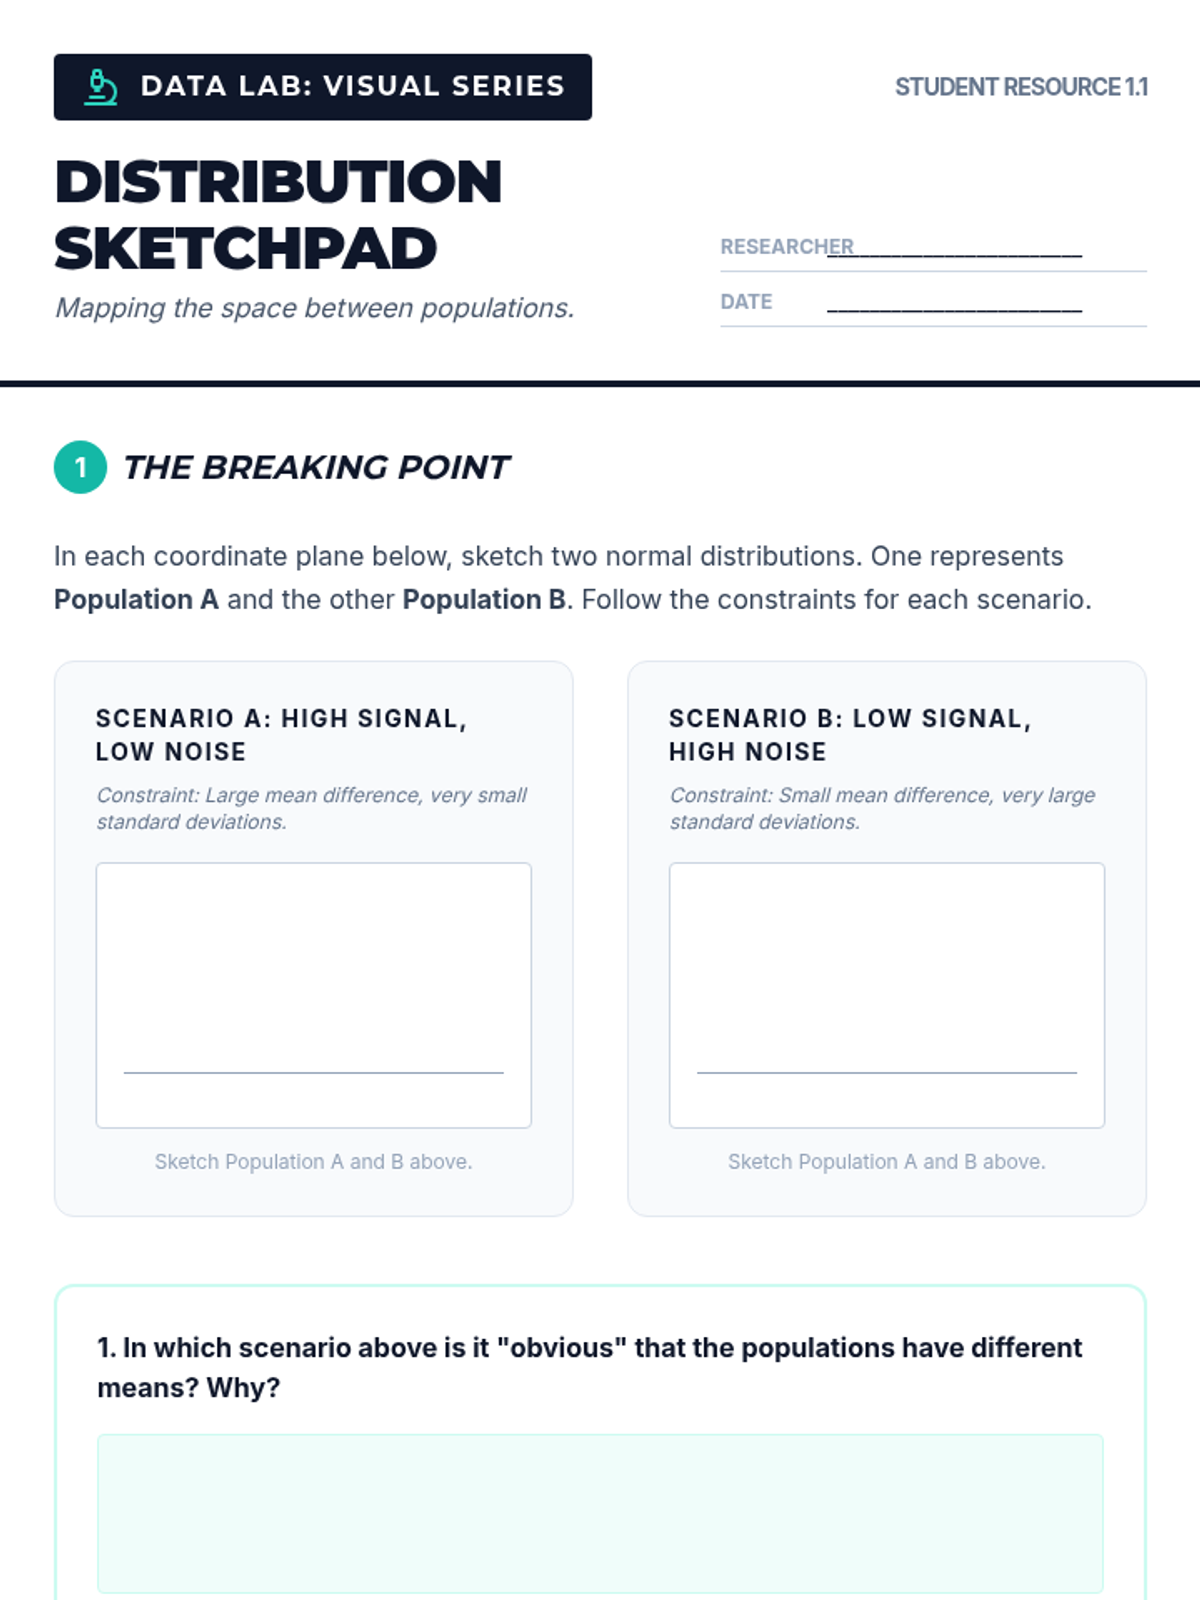
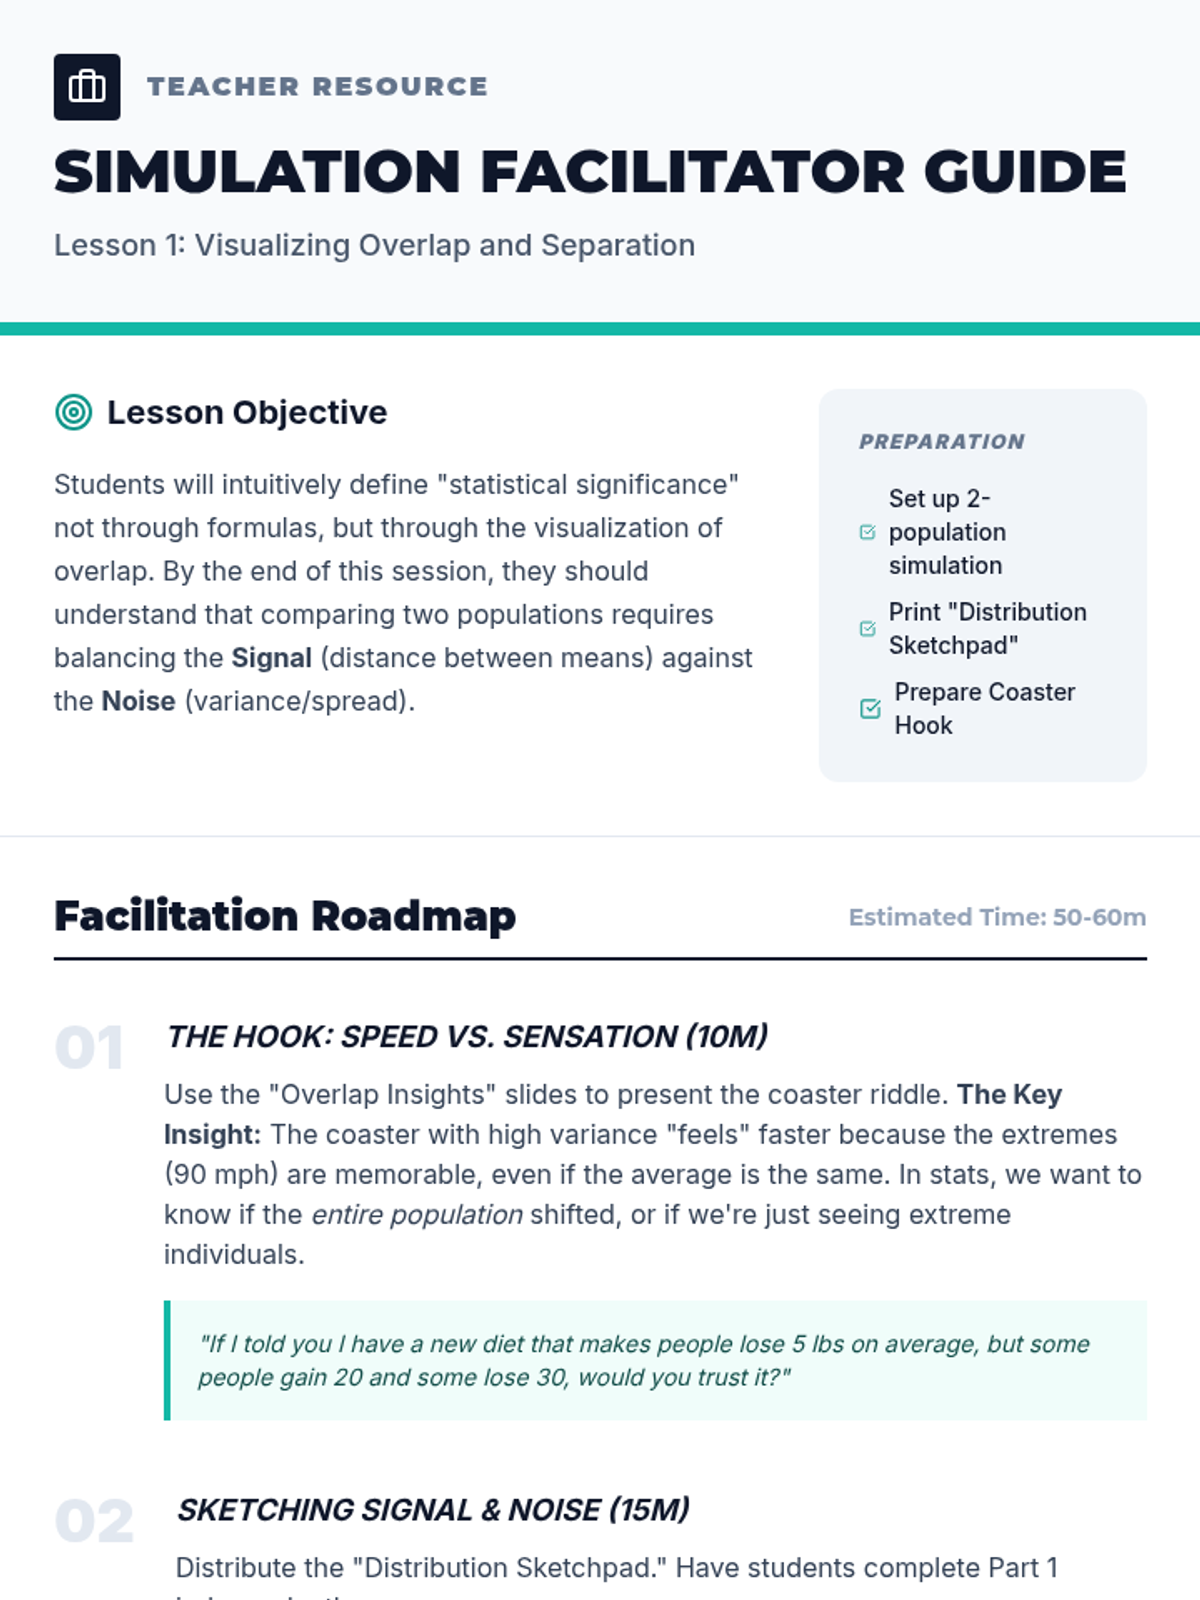
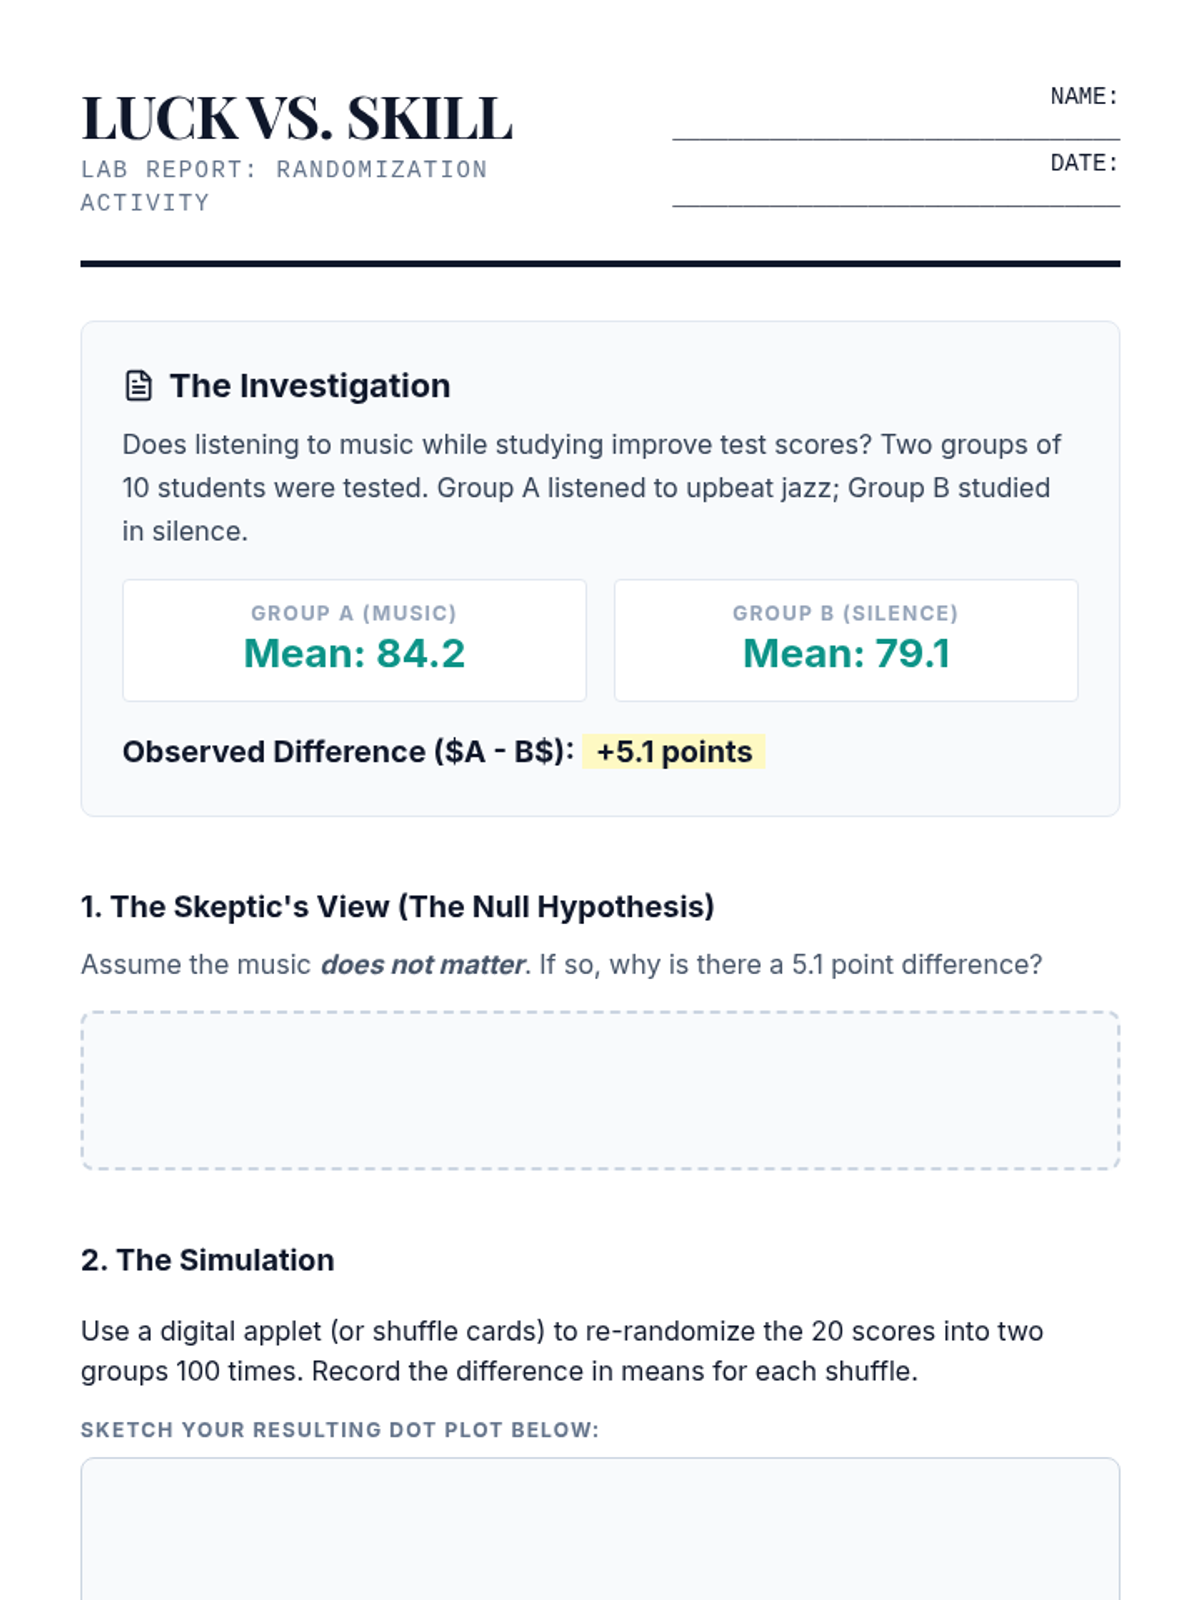
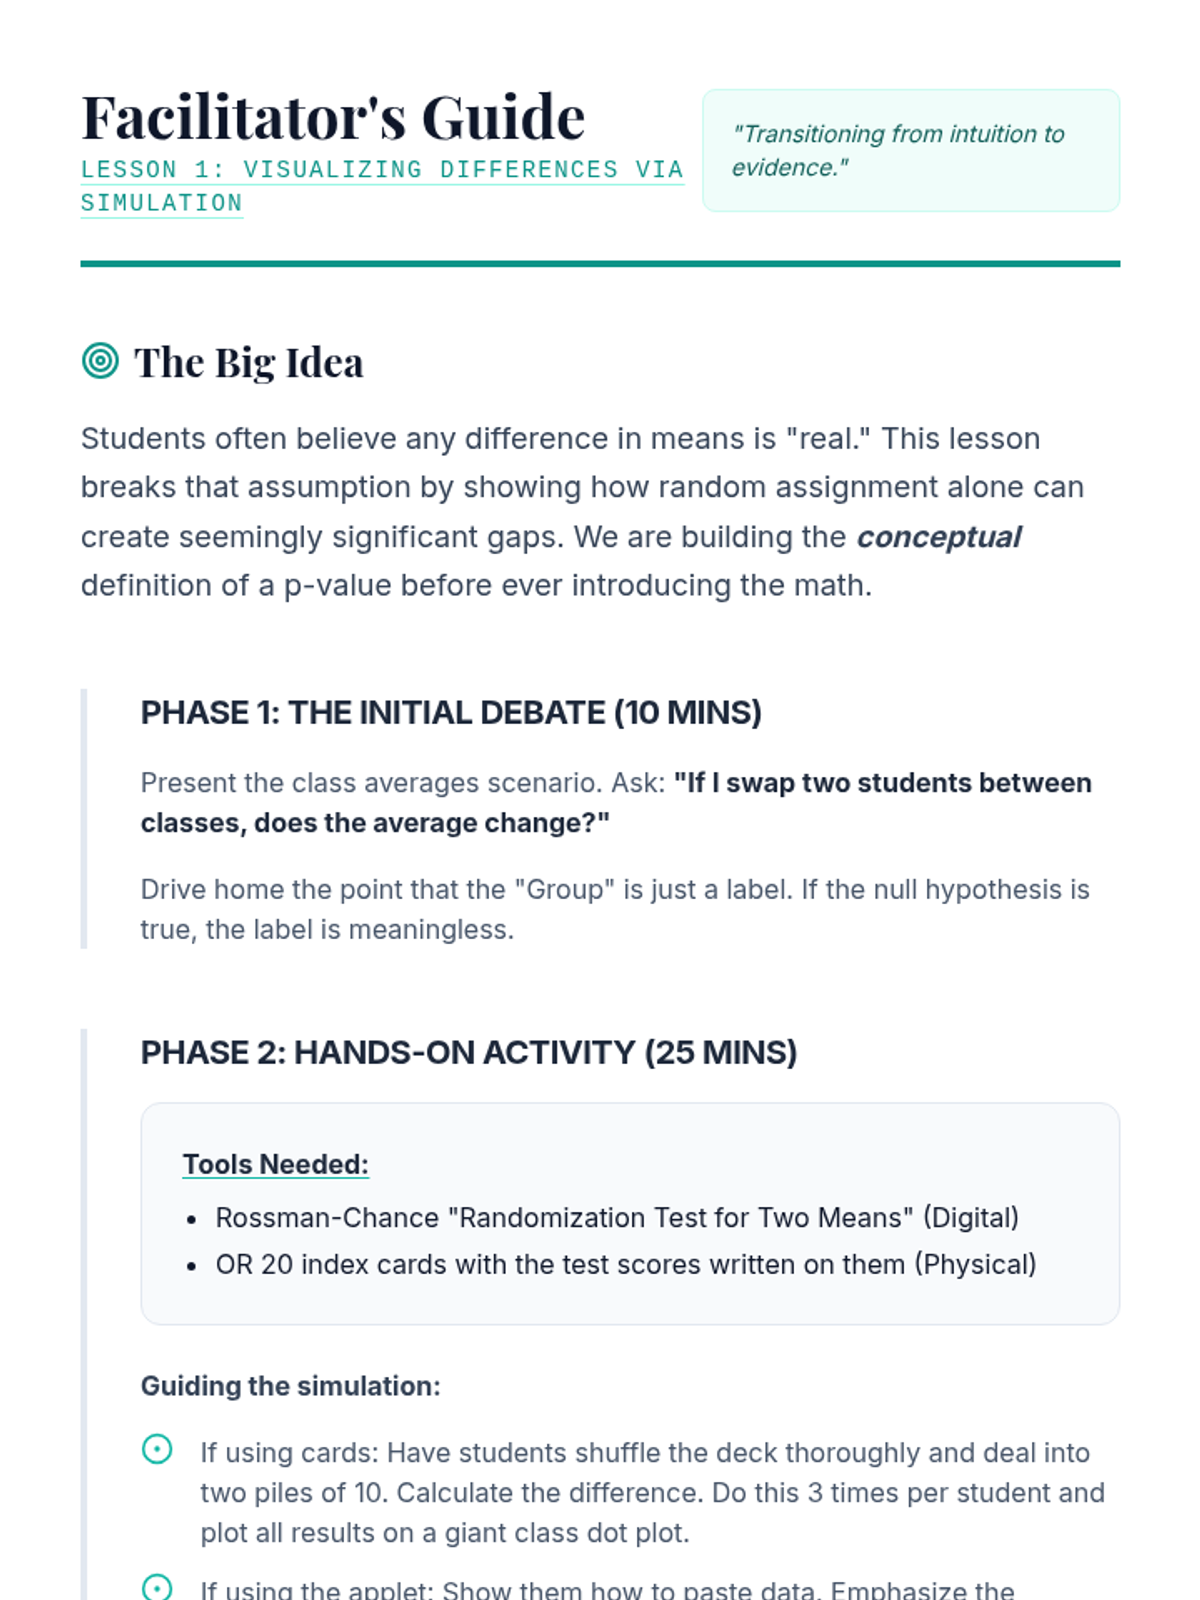
A comprehensive unit for 10th-grade students on comparing two independent population means. Students move from intuitive simulation-based reasoning to formal hypothesis testing and confidence intervals, focusing on variability and statistical significance.
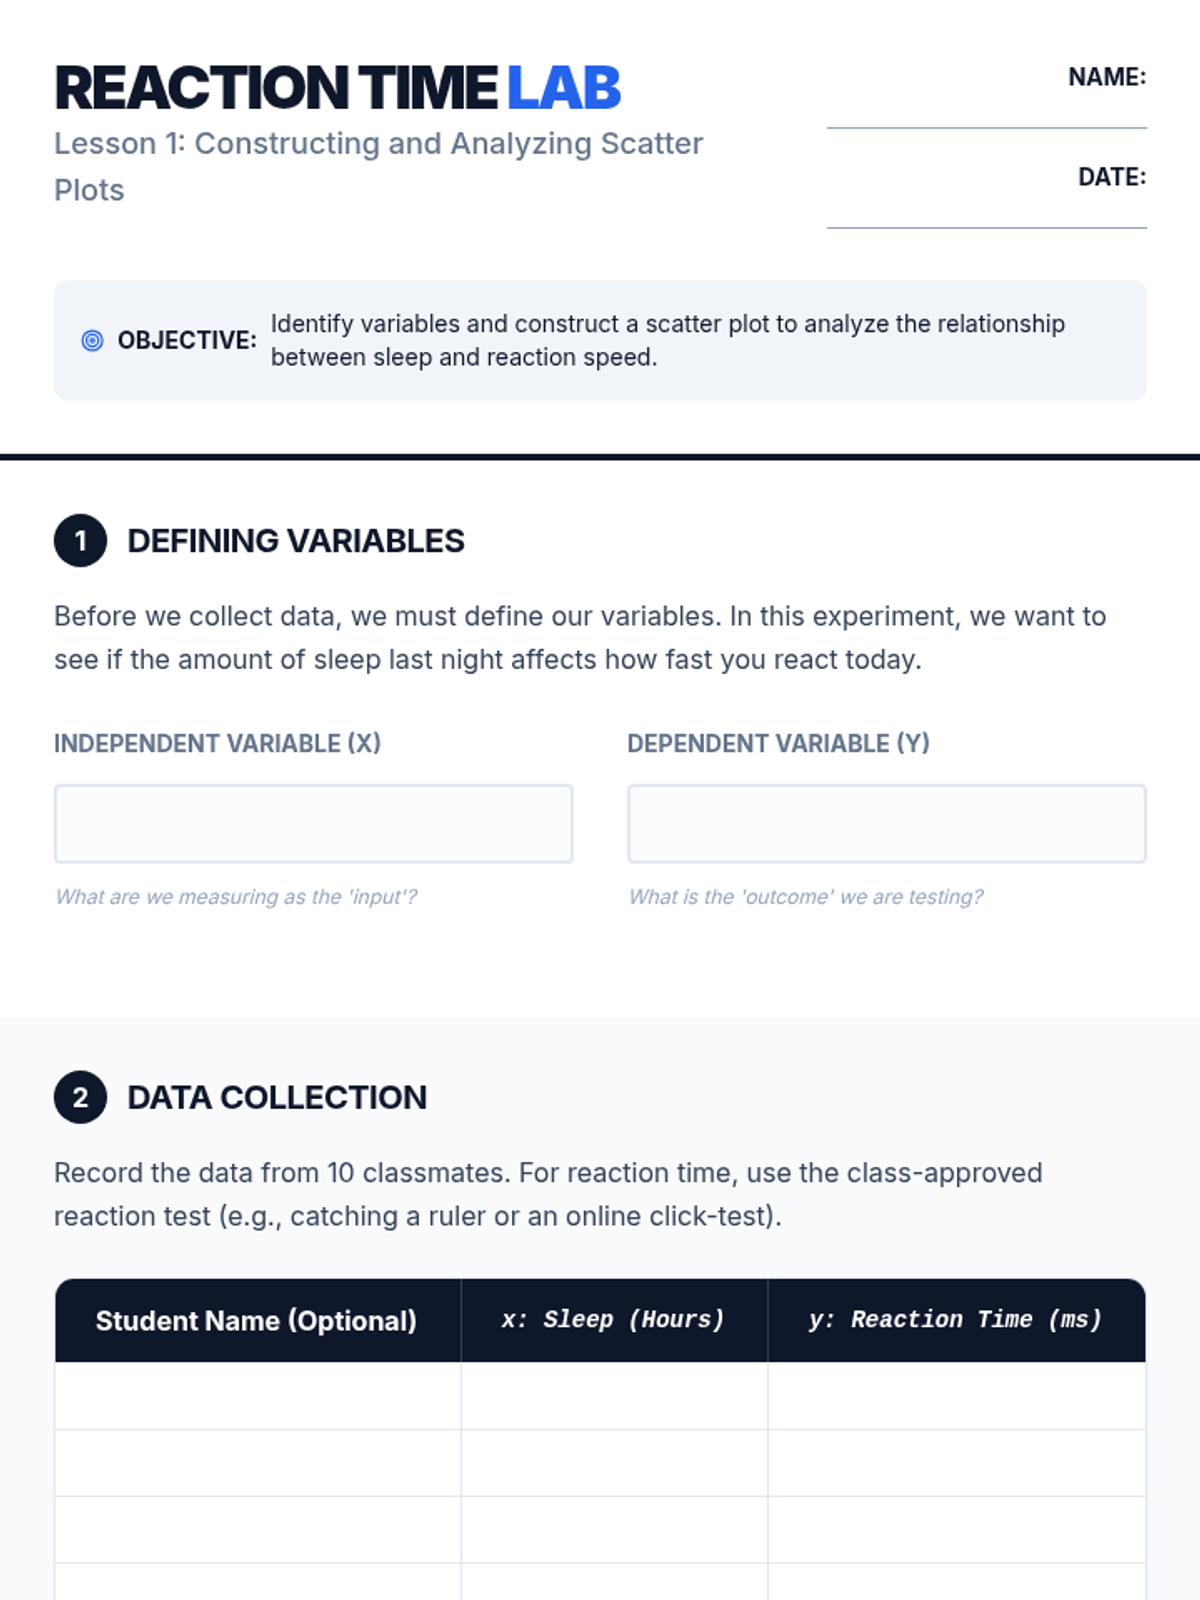
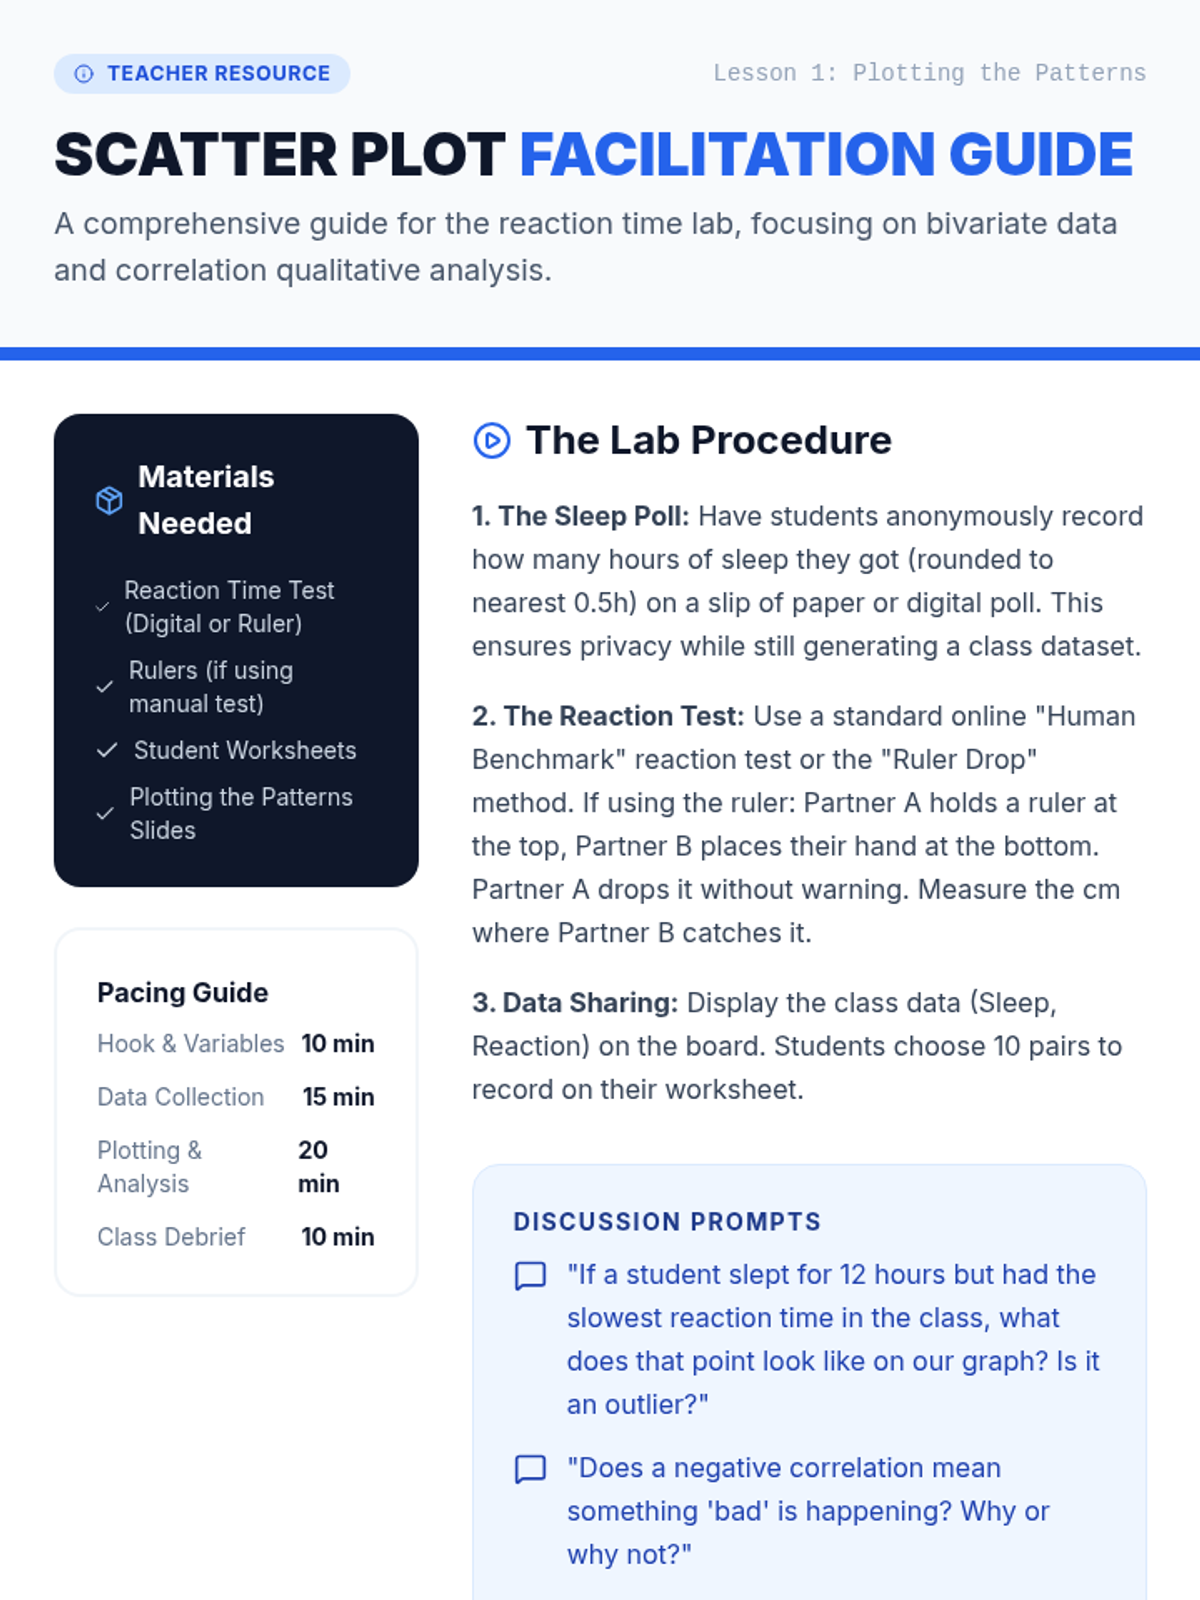
Students act as data analysts to investigate relationships between variables in fields like sports, economics, and environmental science. The learning arc progresses from constructing scatter plots and generating lines of best fit to deeply interpreting the specific meaning of slope and y-intercept in context, concluding with a capstone project on predictive modeling.
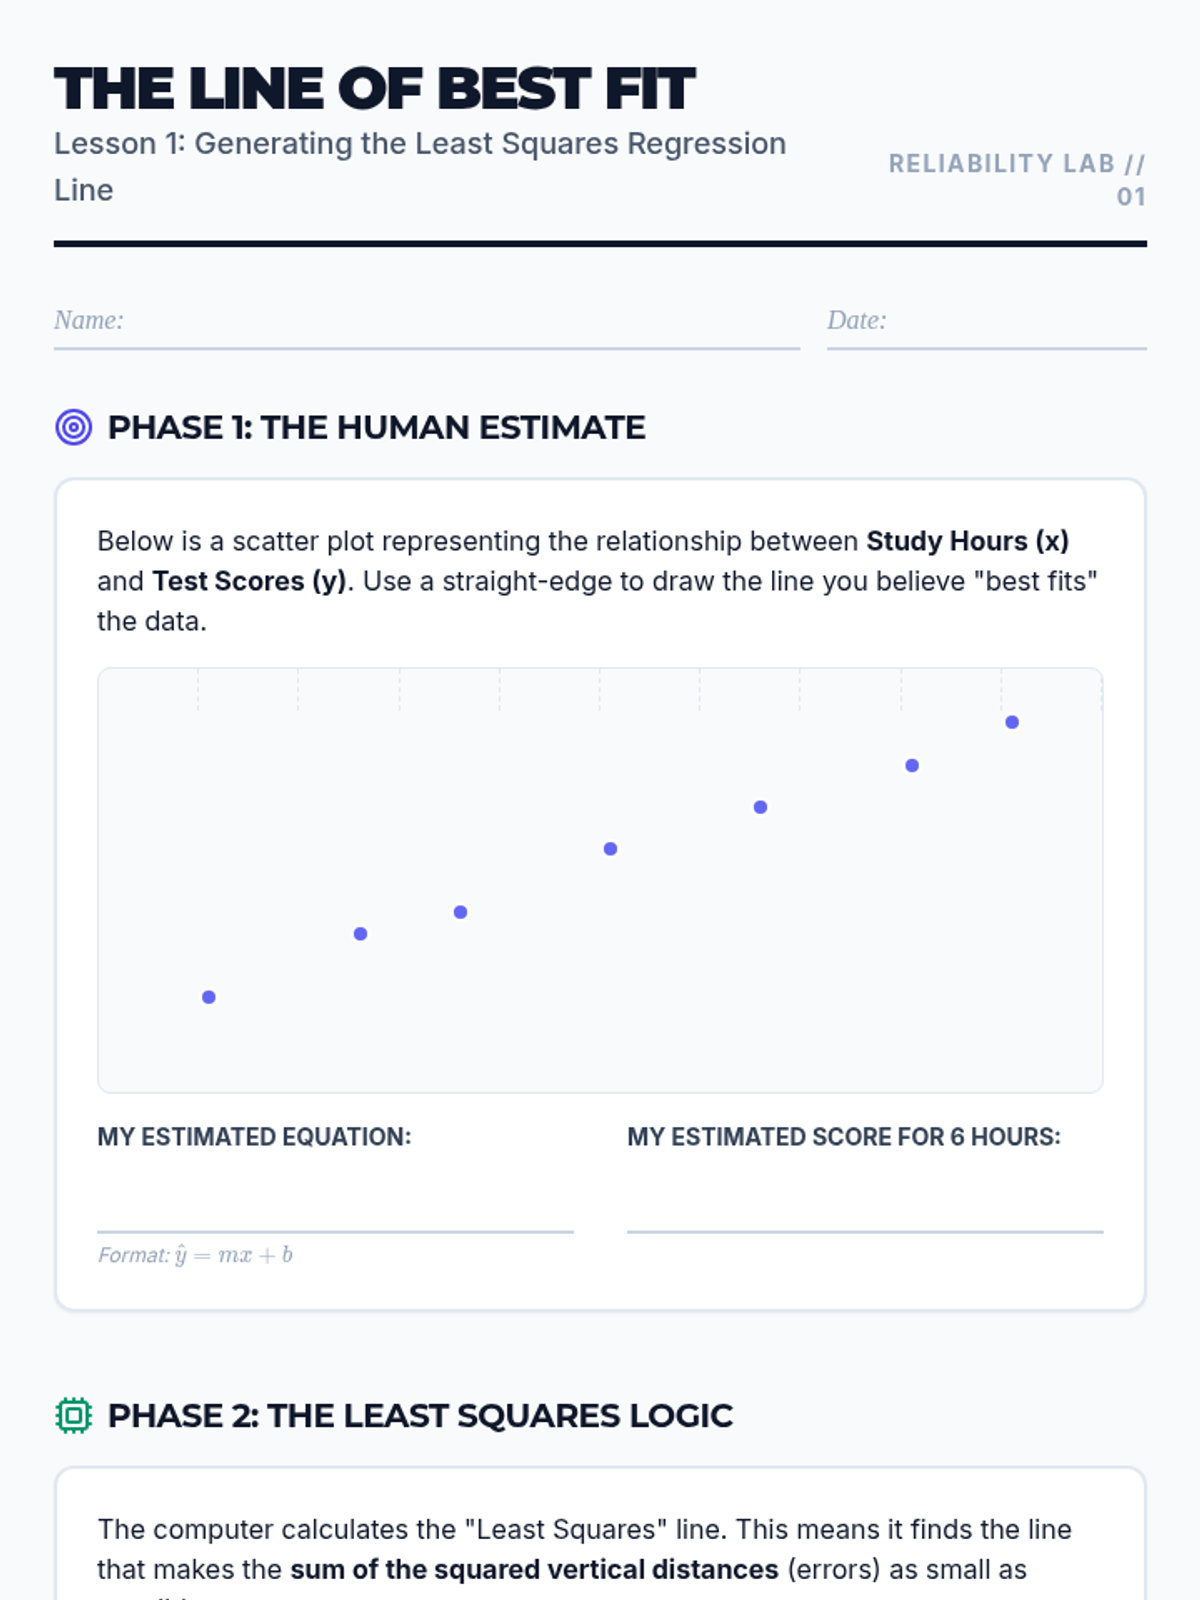
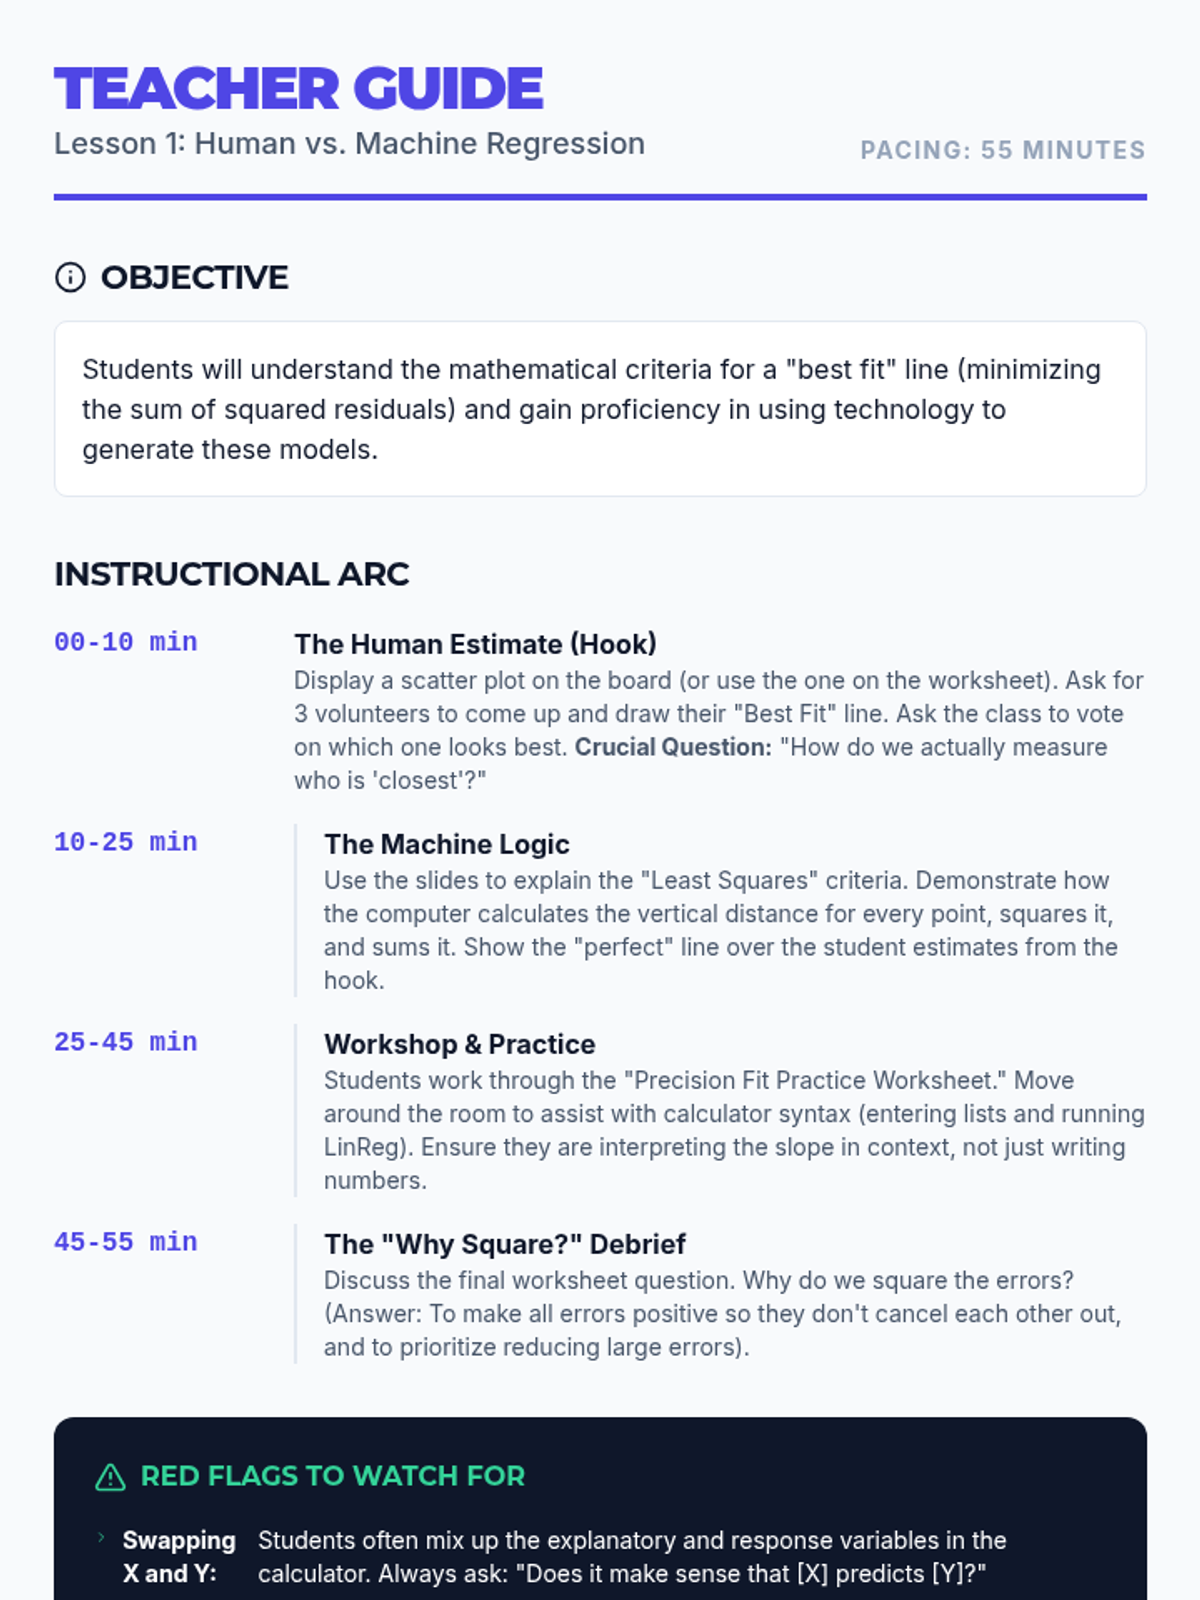
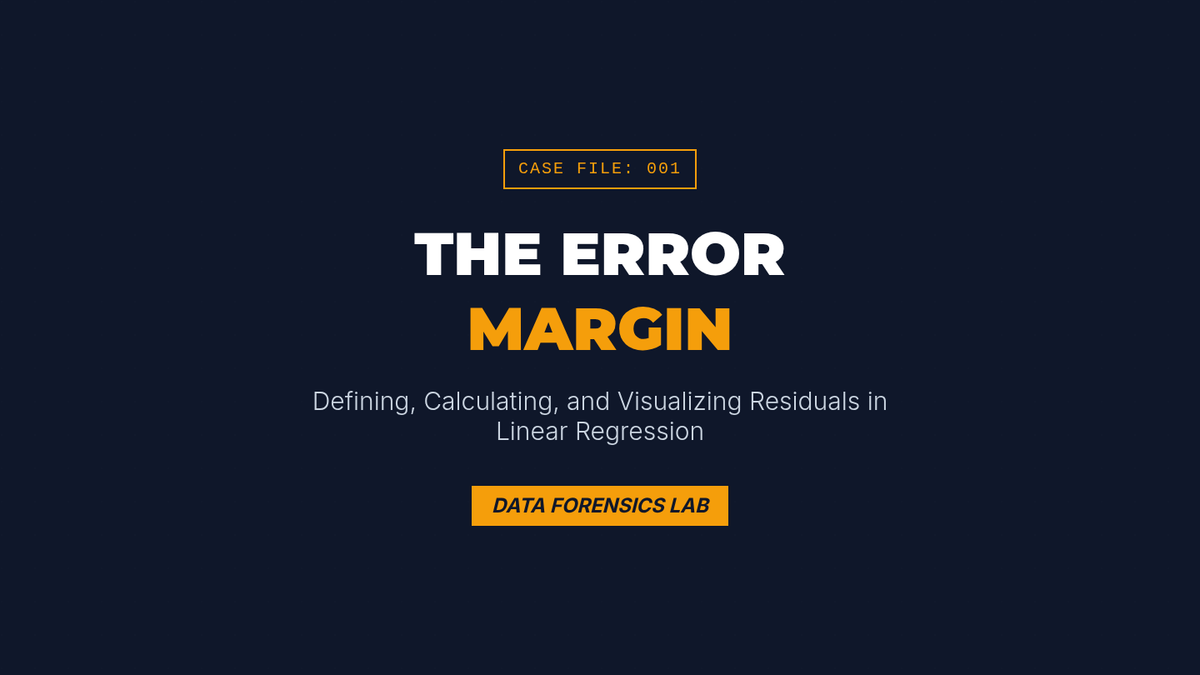
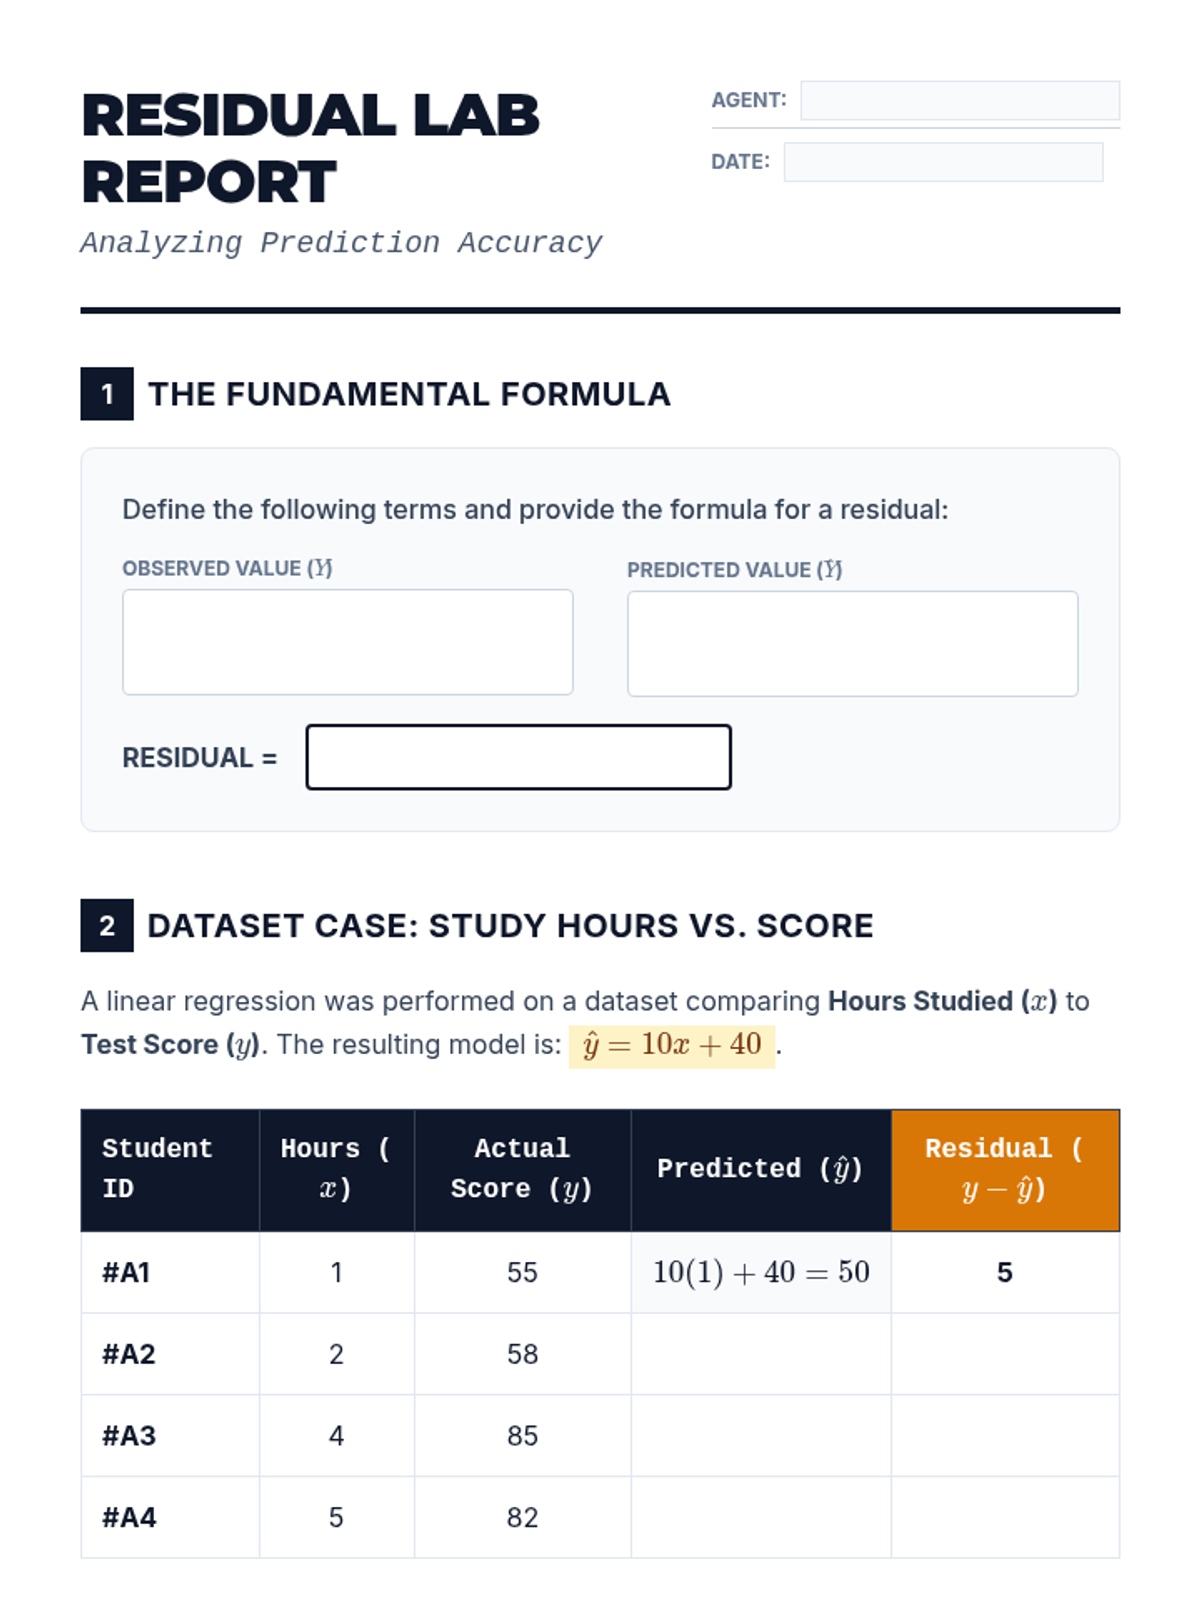
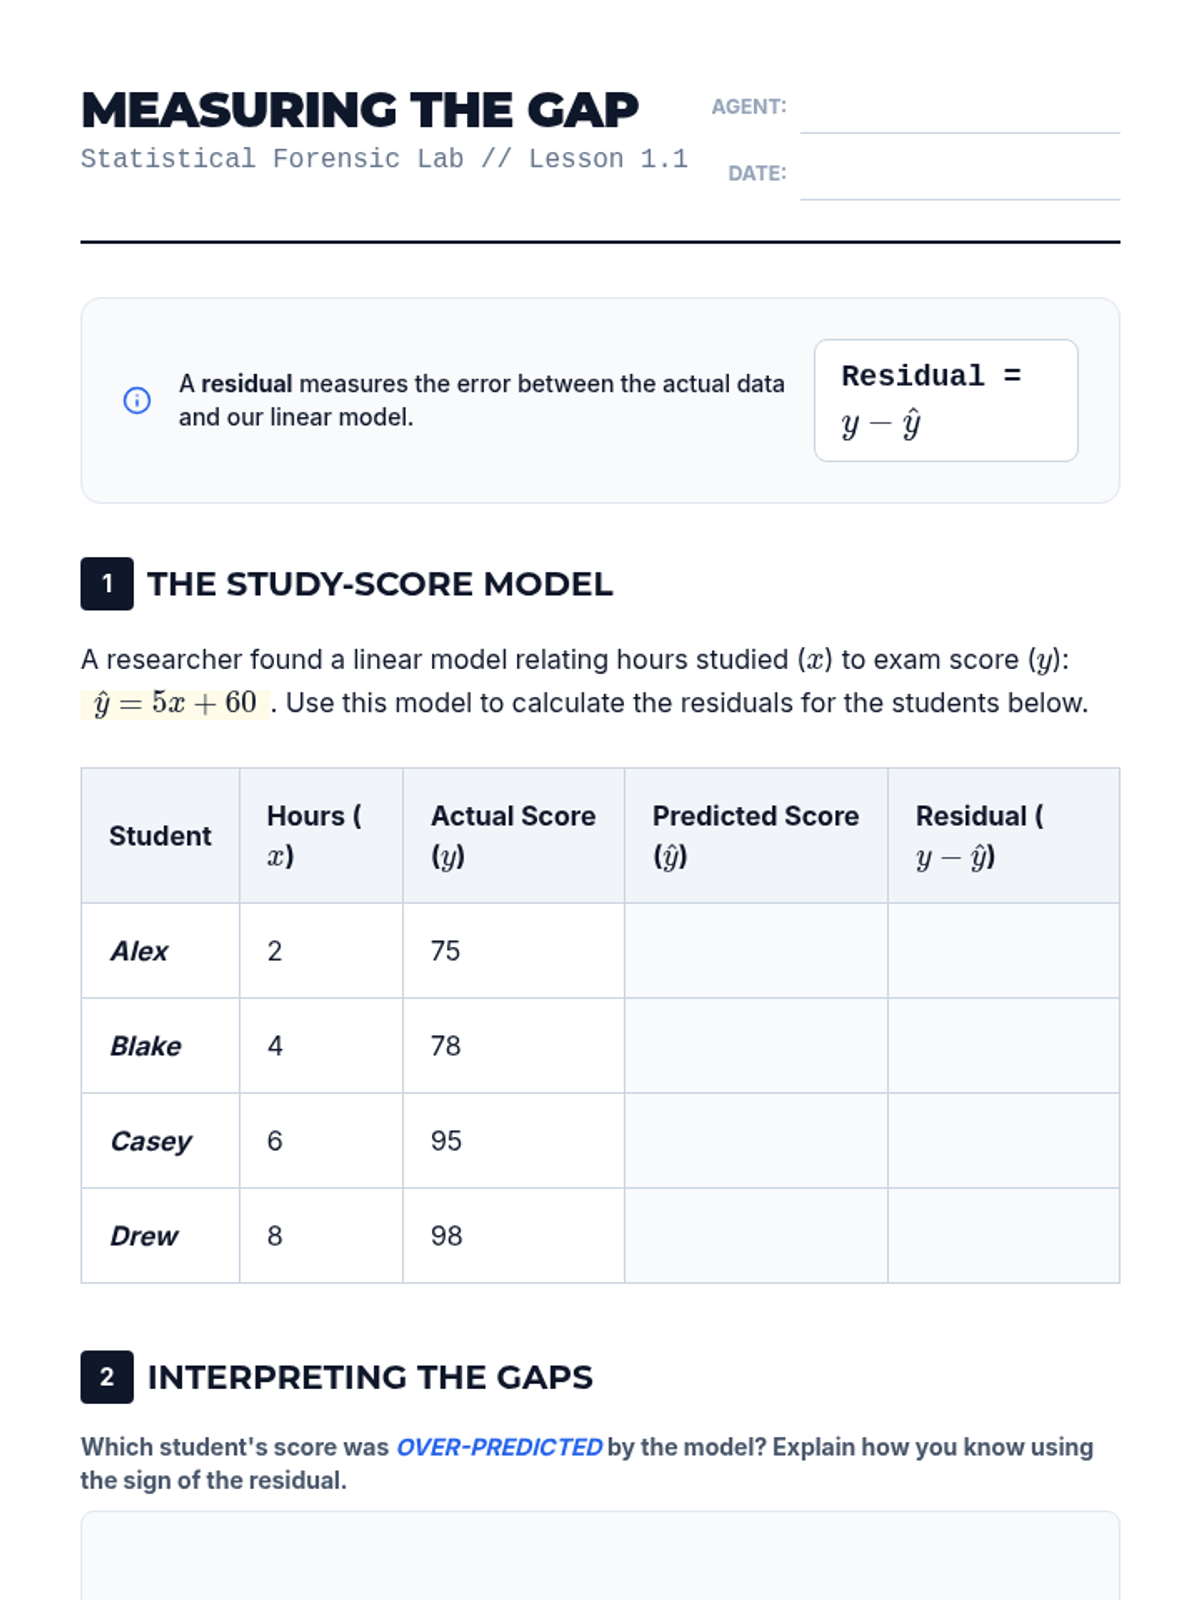
This 11th-grade statistics sequence focuses on evaluating the reliability of linear models. Students progress from generating least squares regression lines to performing advanced residual analysis, identifying non-linear patterns, and assessing the impact of influential outliers through a forensic data analysis lens.
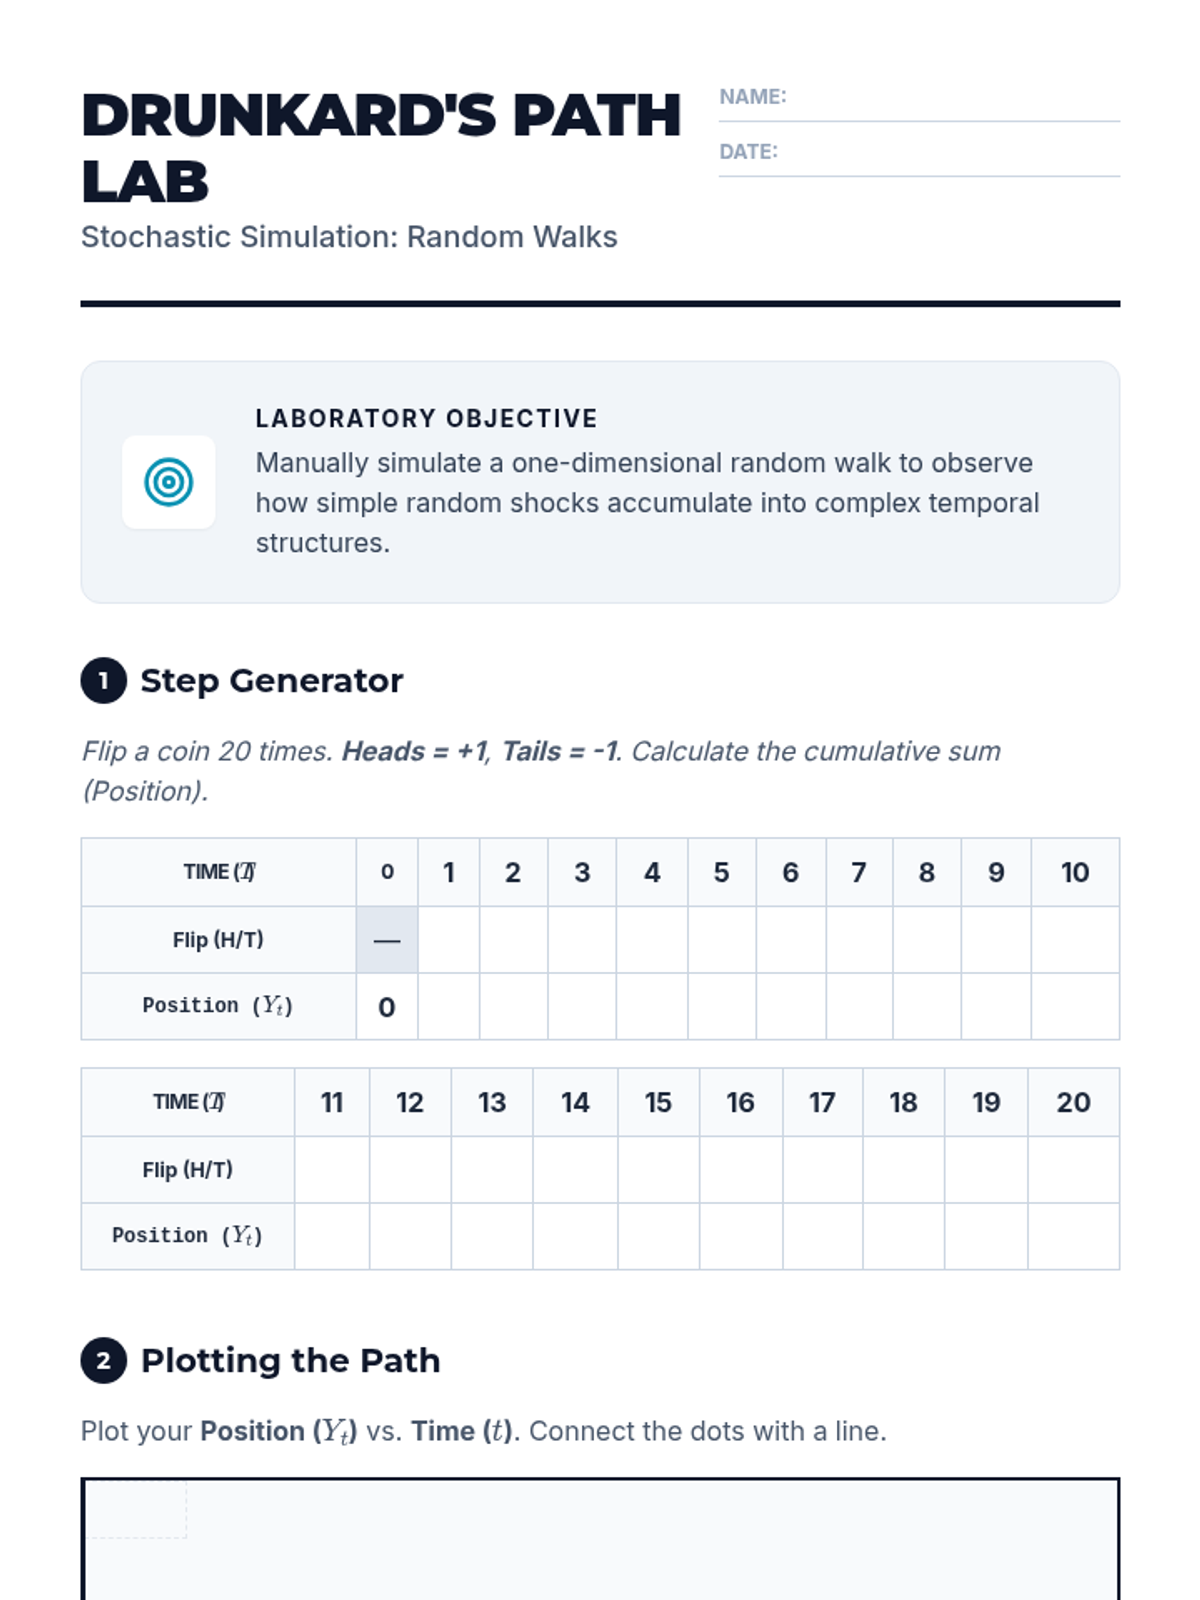
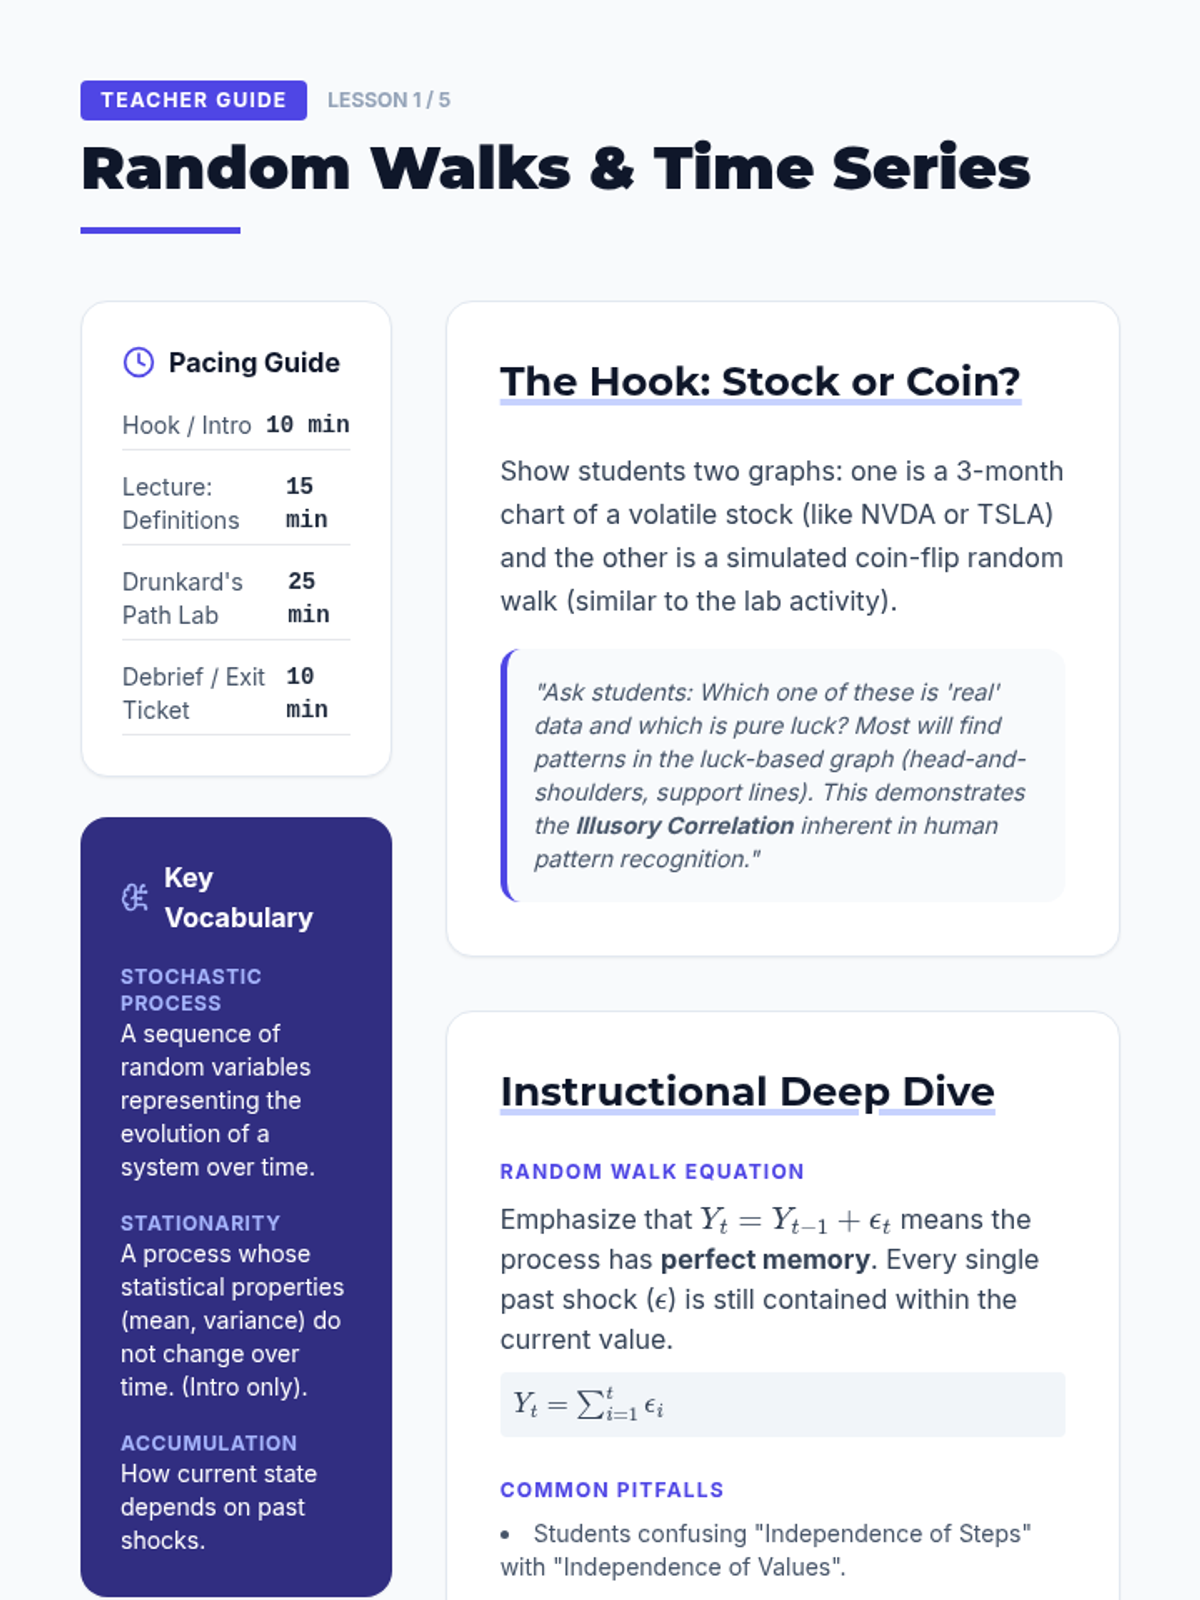
A comprehensive introduction to Time Series Analysis for 12th-grade students, focusing on random processes, autocorrelation, stationarity, and smoothing techniques. Students move from basic random walks to understanding complex dependencies in temporal data.
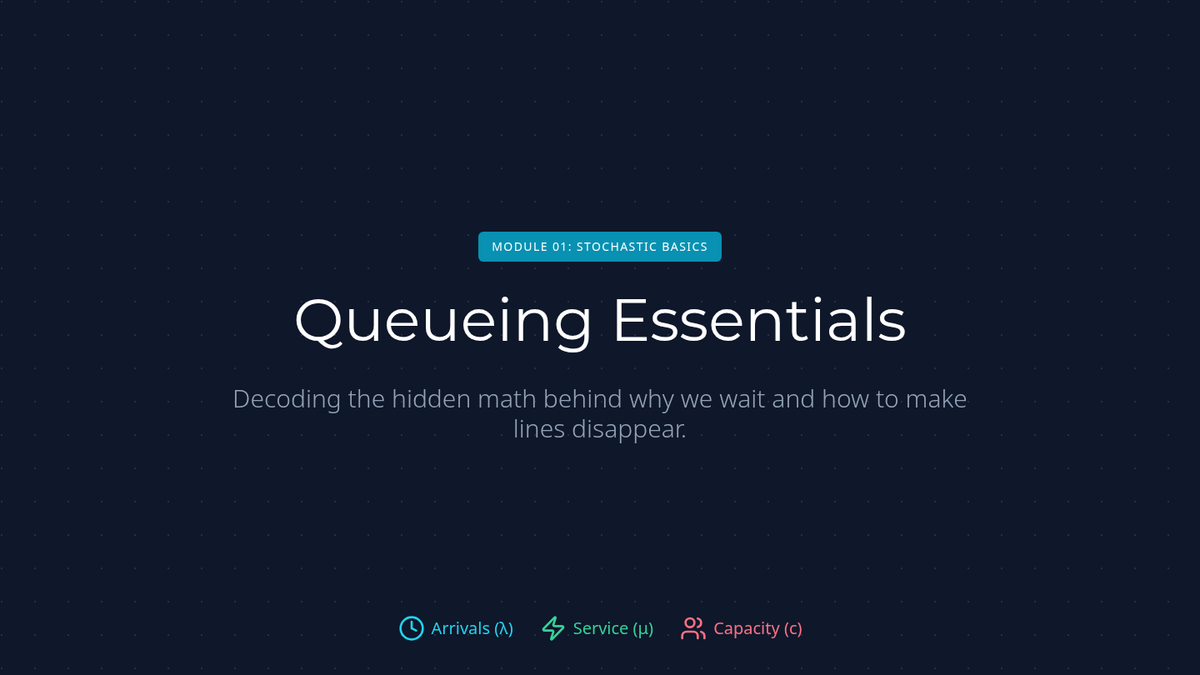
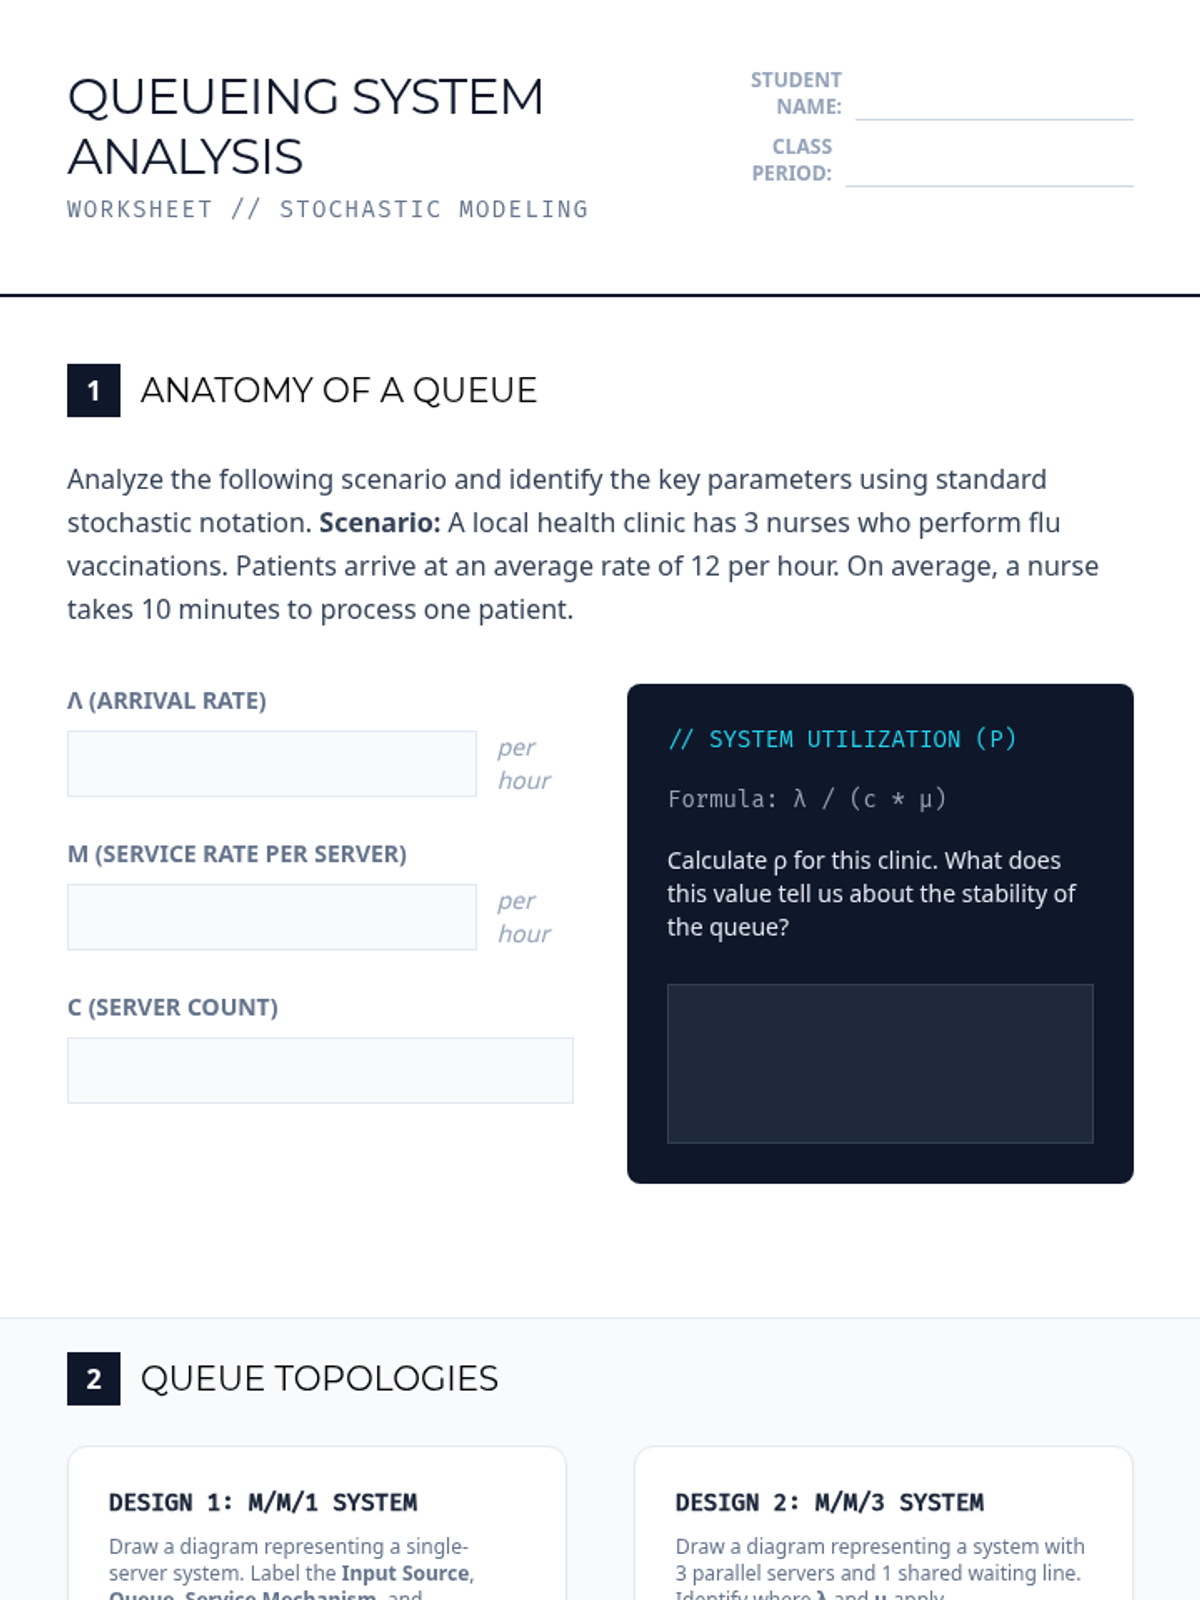
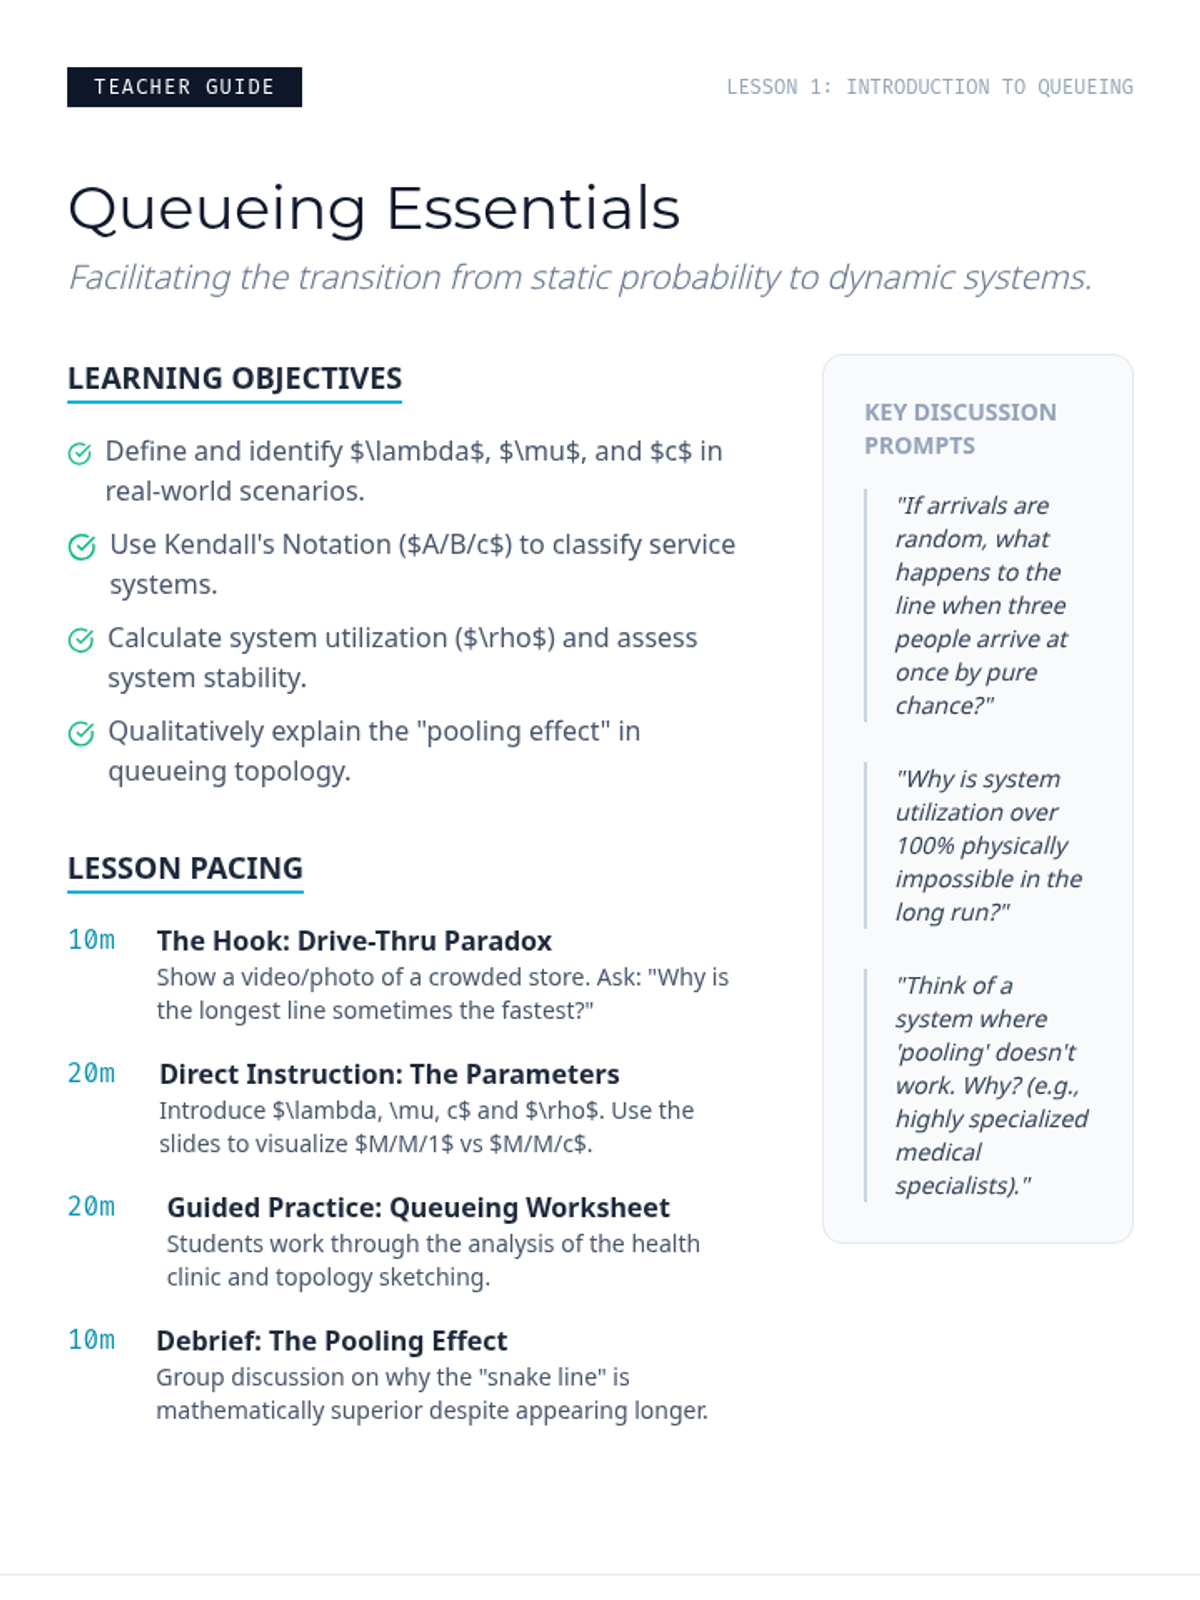
A project-based exploration of stochastic modeling, focusing on Queueing Theory and Monte Carlo simulations. Students design and build computational models to optimize real-world systems like traffic flow and service lines.
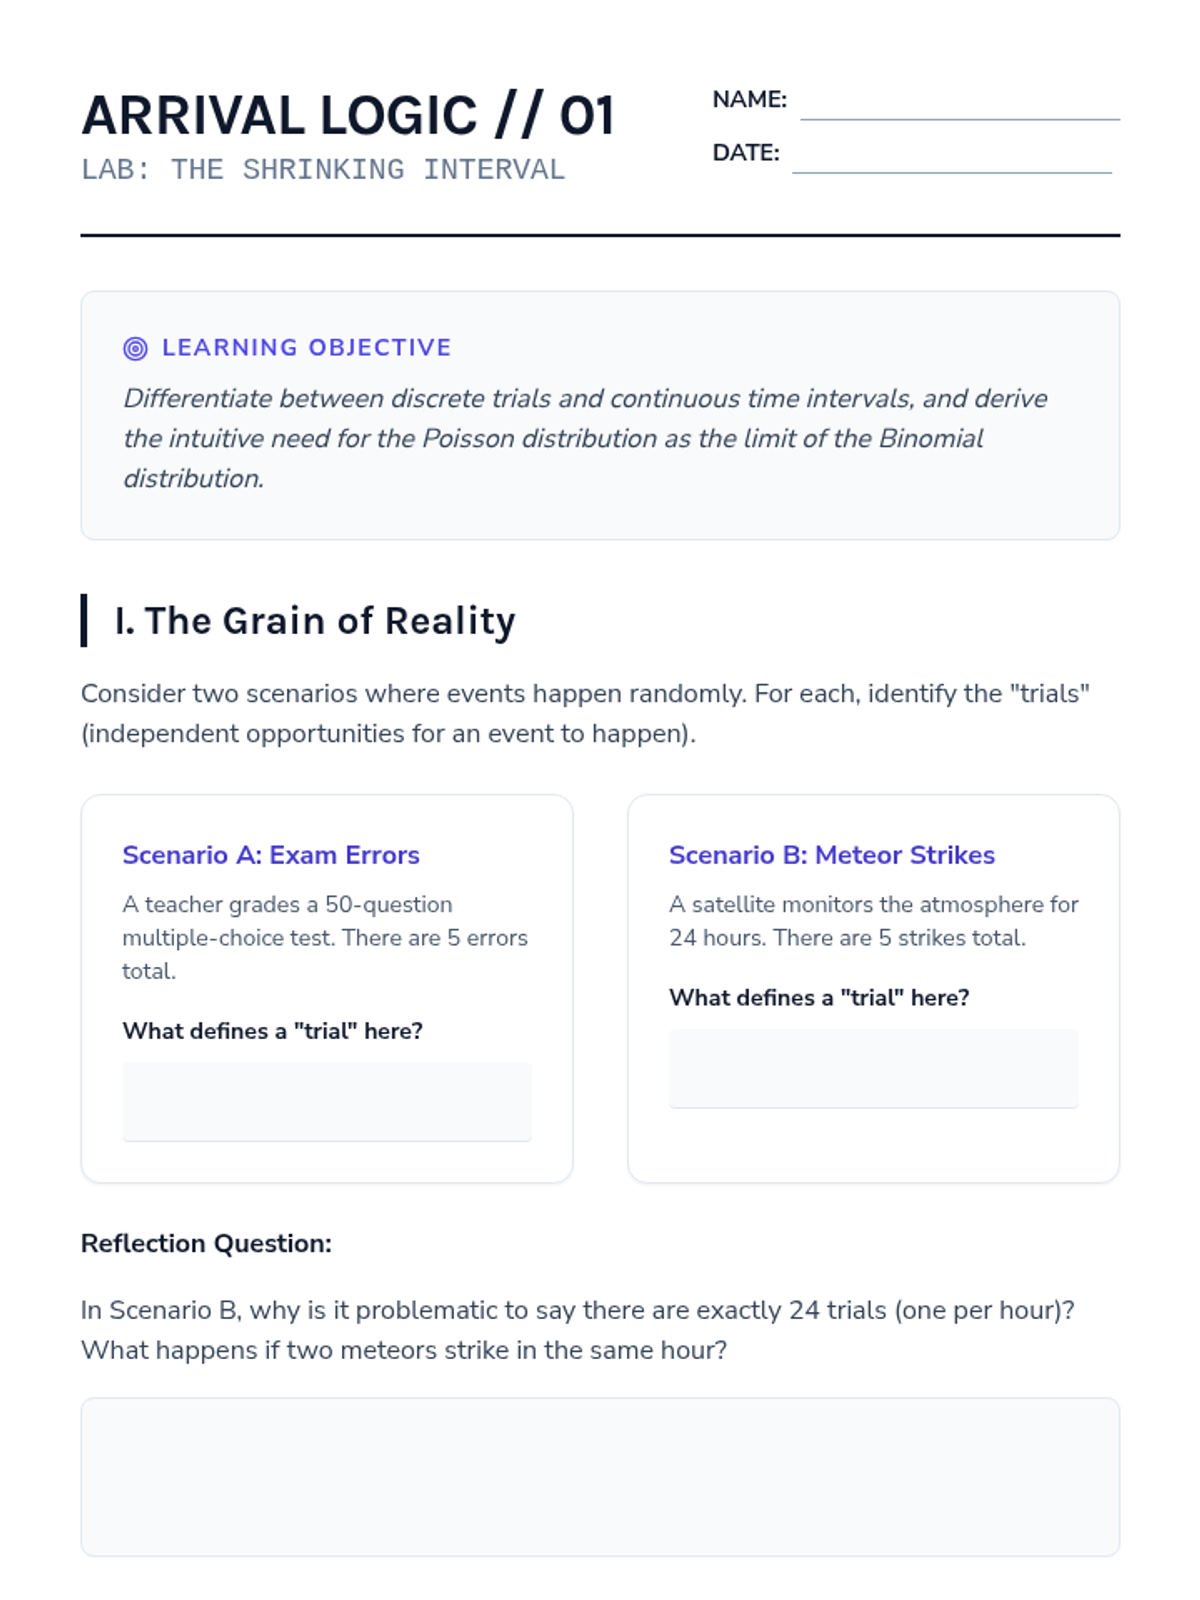
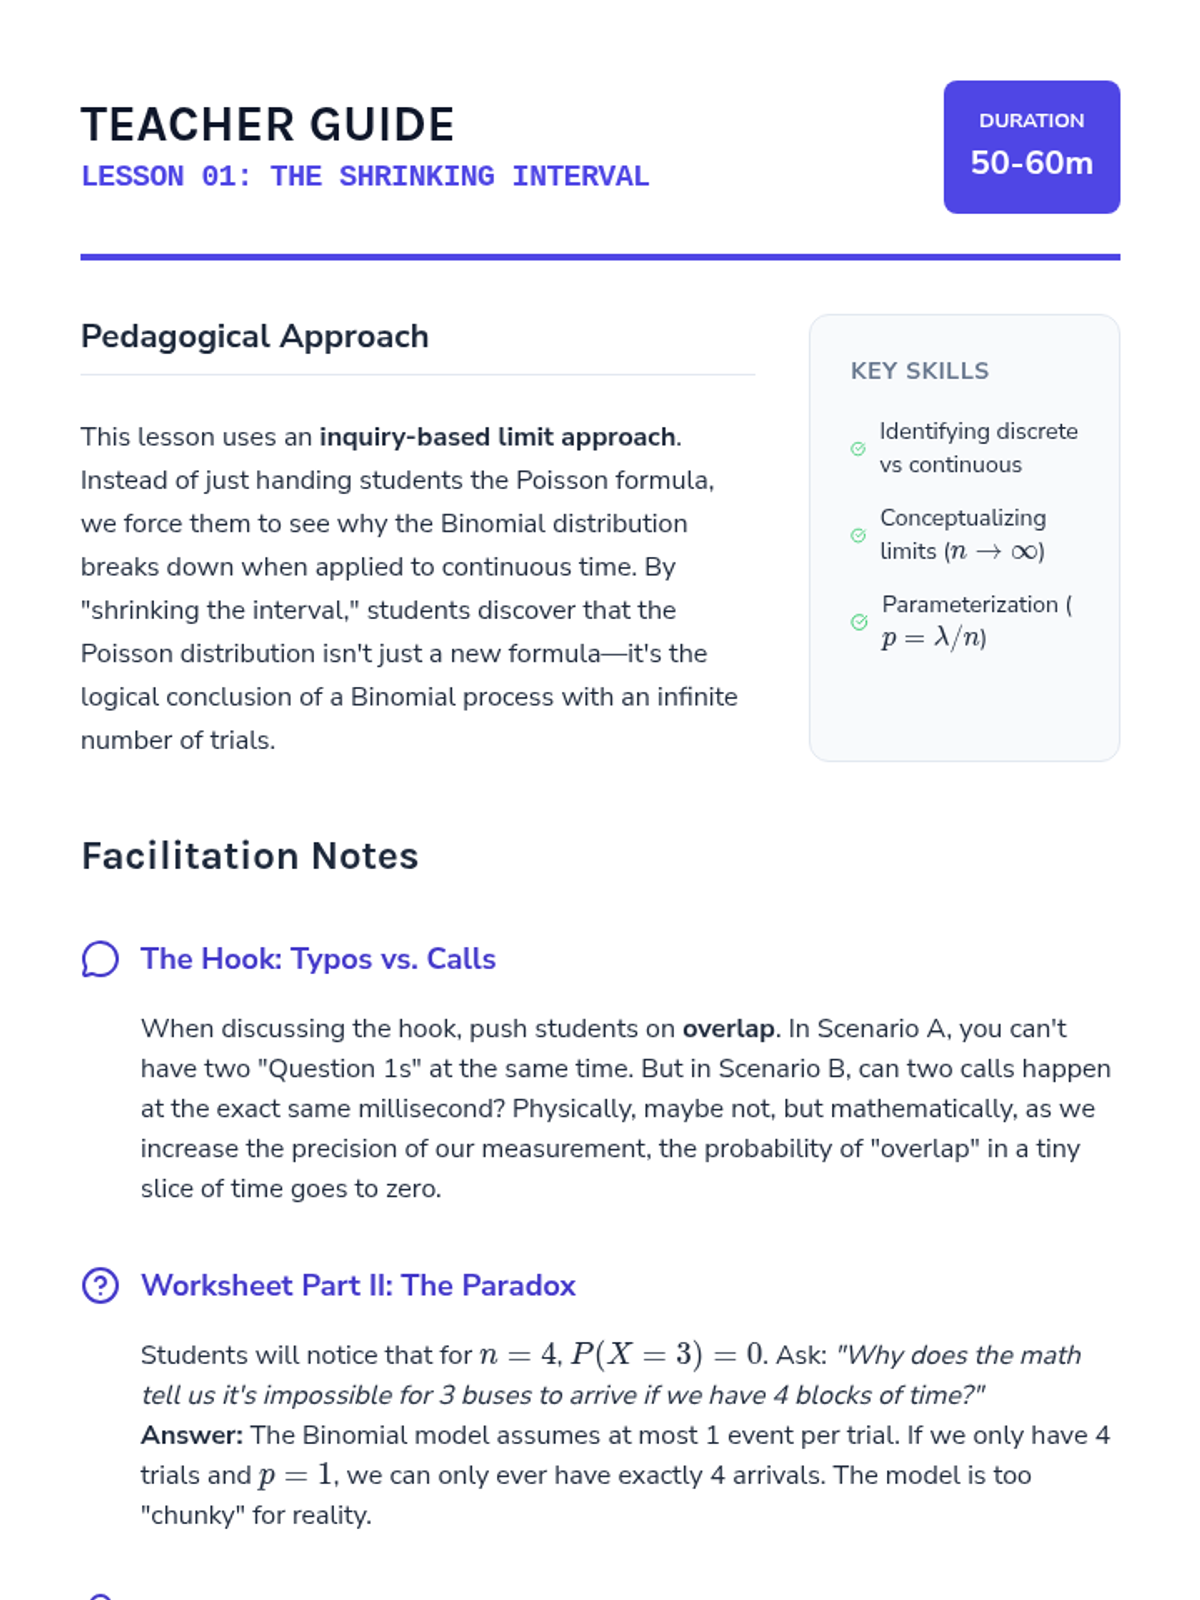
A 12th-grade statistics sequence exploring Poisson processes, transitioning from discrete counts to continuous time intervals and waiting times. Students will investigate arrival rates, the exponential distribution, and the unique memoryless property through inquiry and simulation.
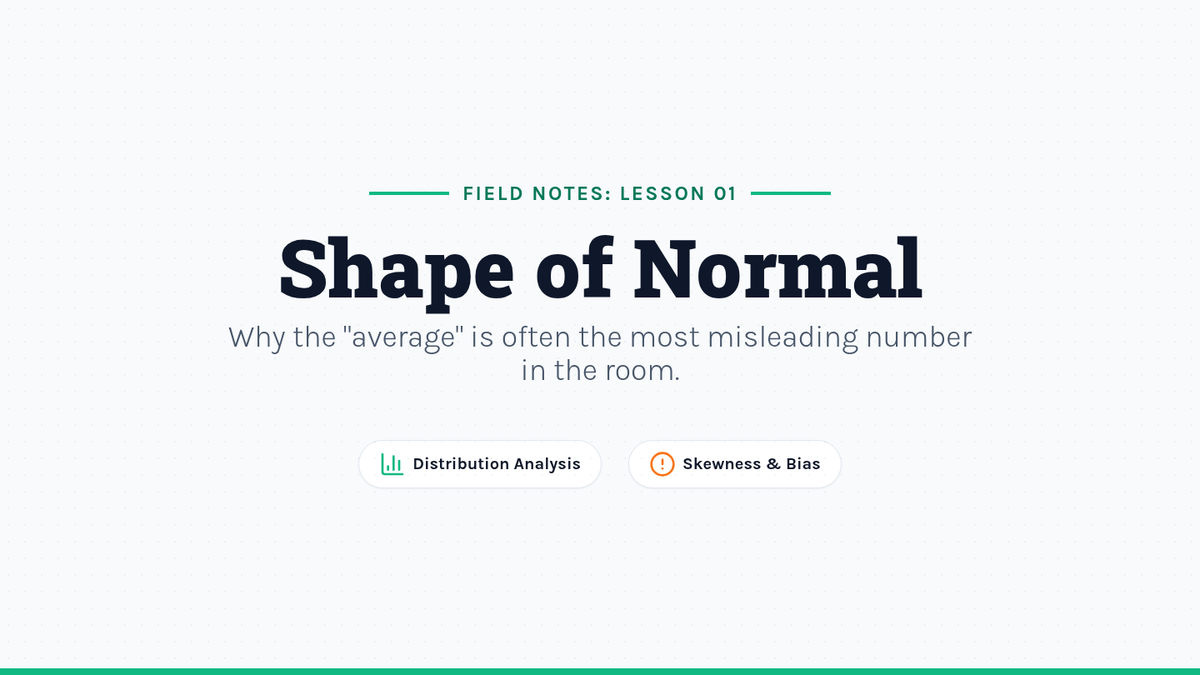
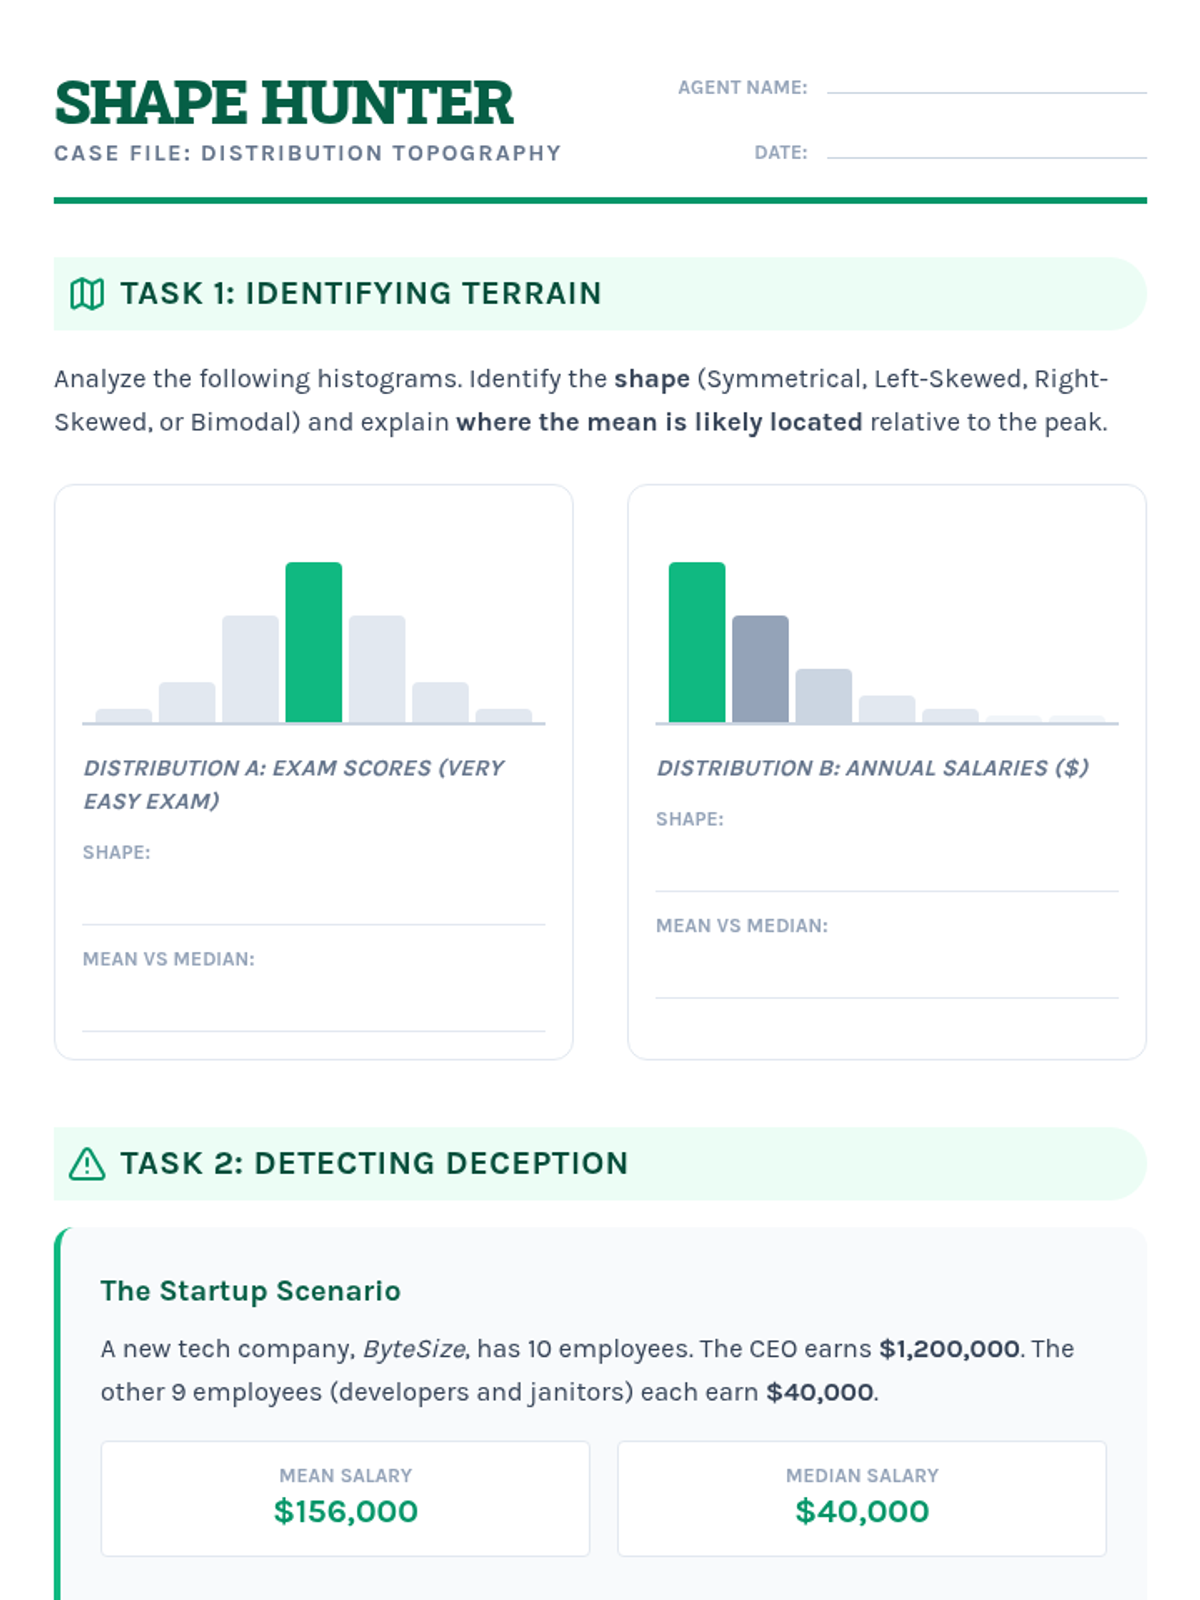
An inquiry-based exploration of statistical variability, focusing on how data spread reveals truths about inequality, climate instability, and diversity that averages often hide. Students transition from visual distribution analysis to quantifying disparity using IQR and MAD, culminating in an independent investigation.
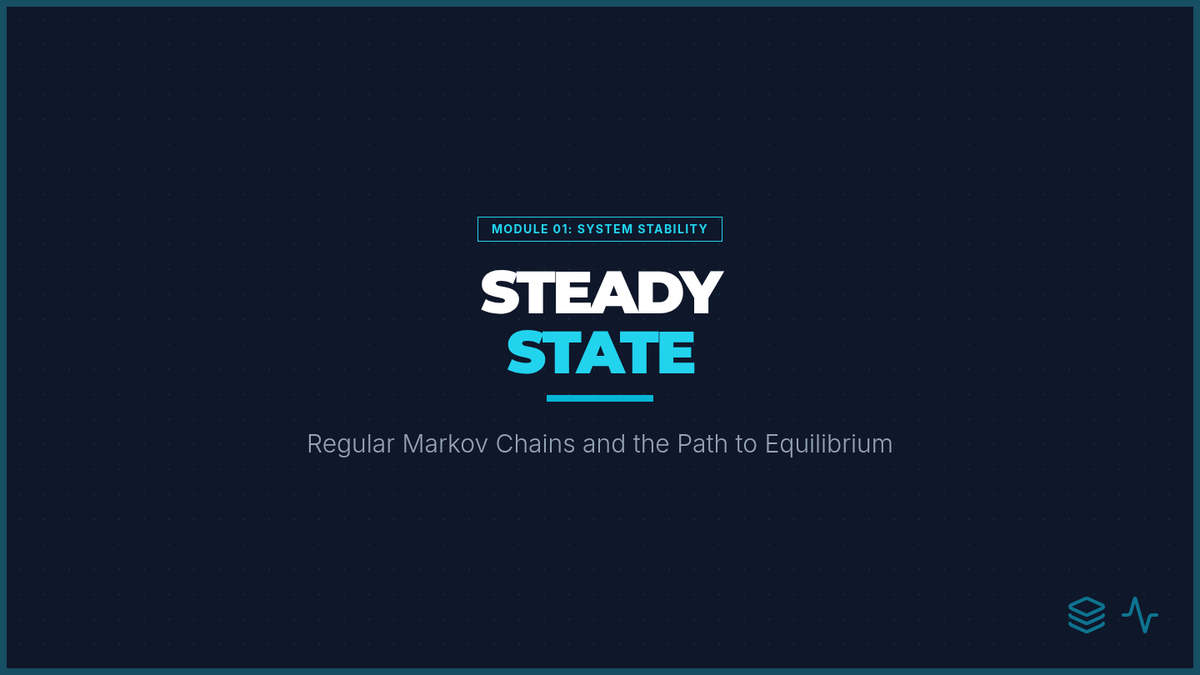
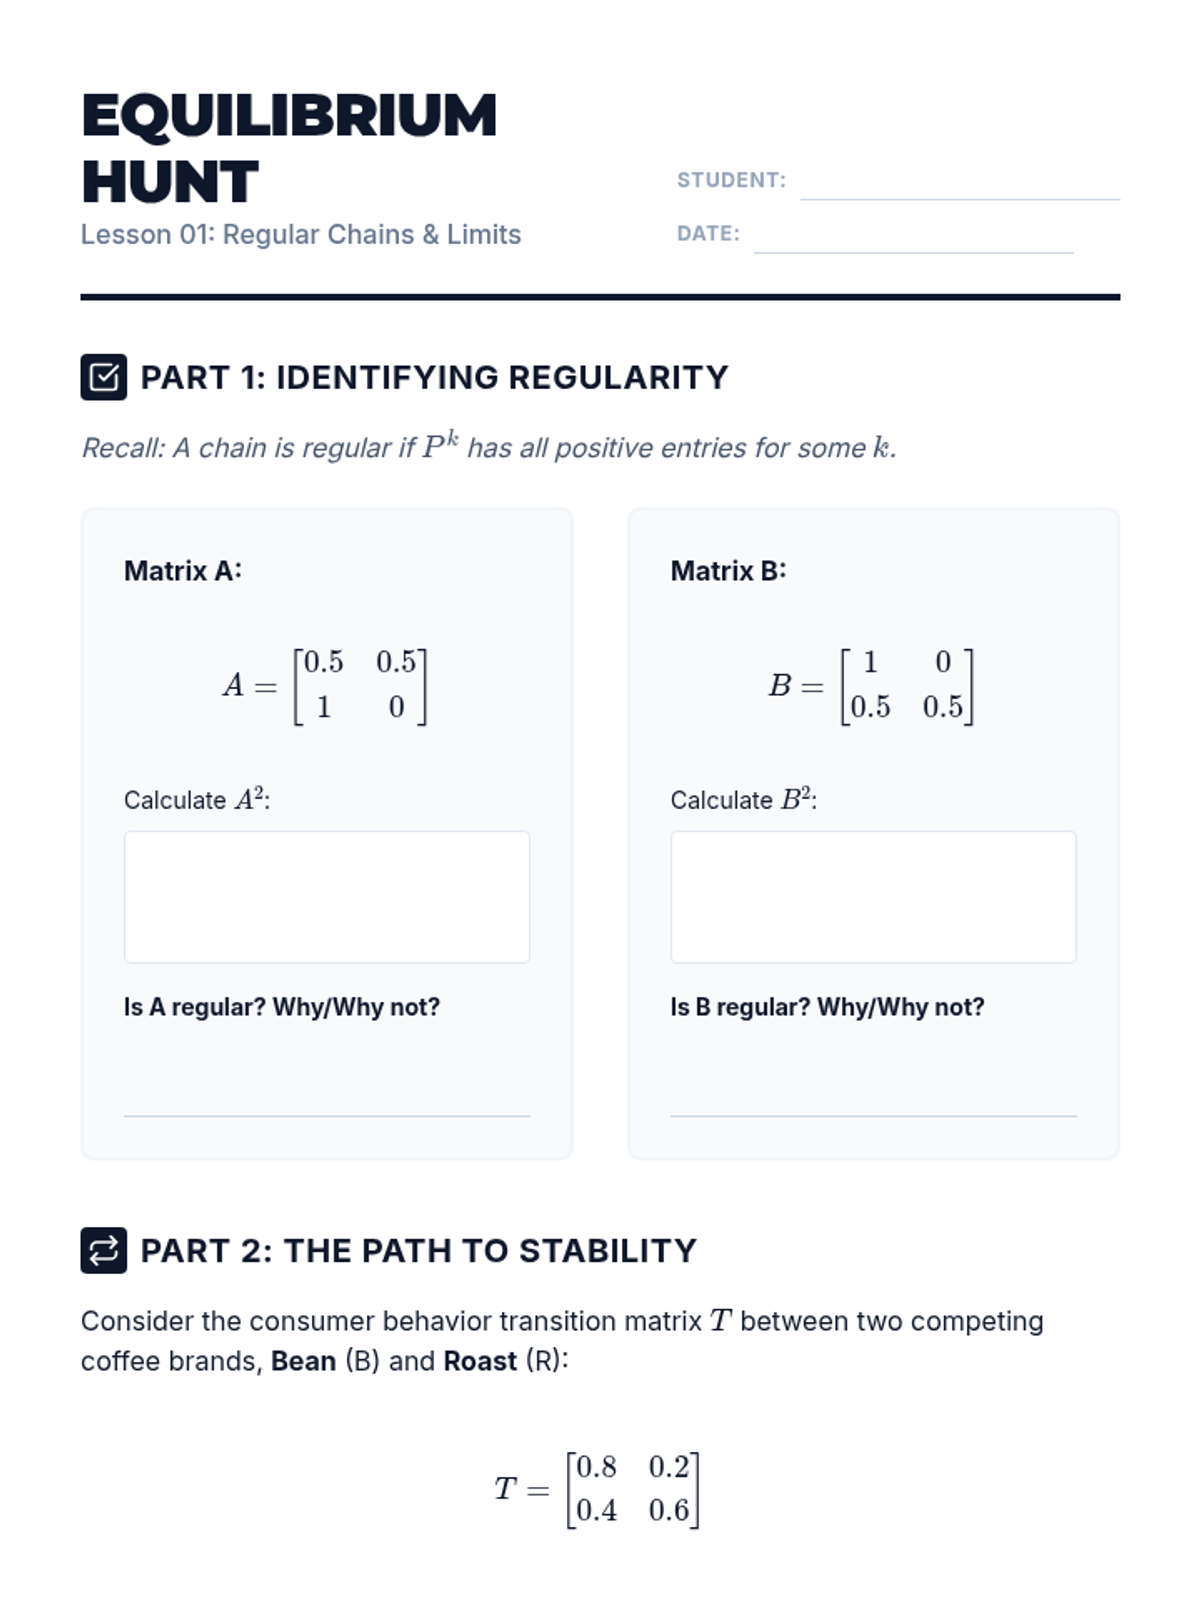
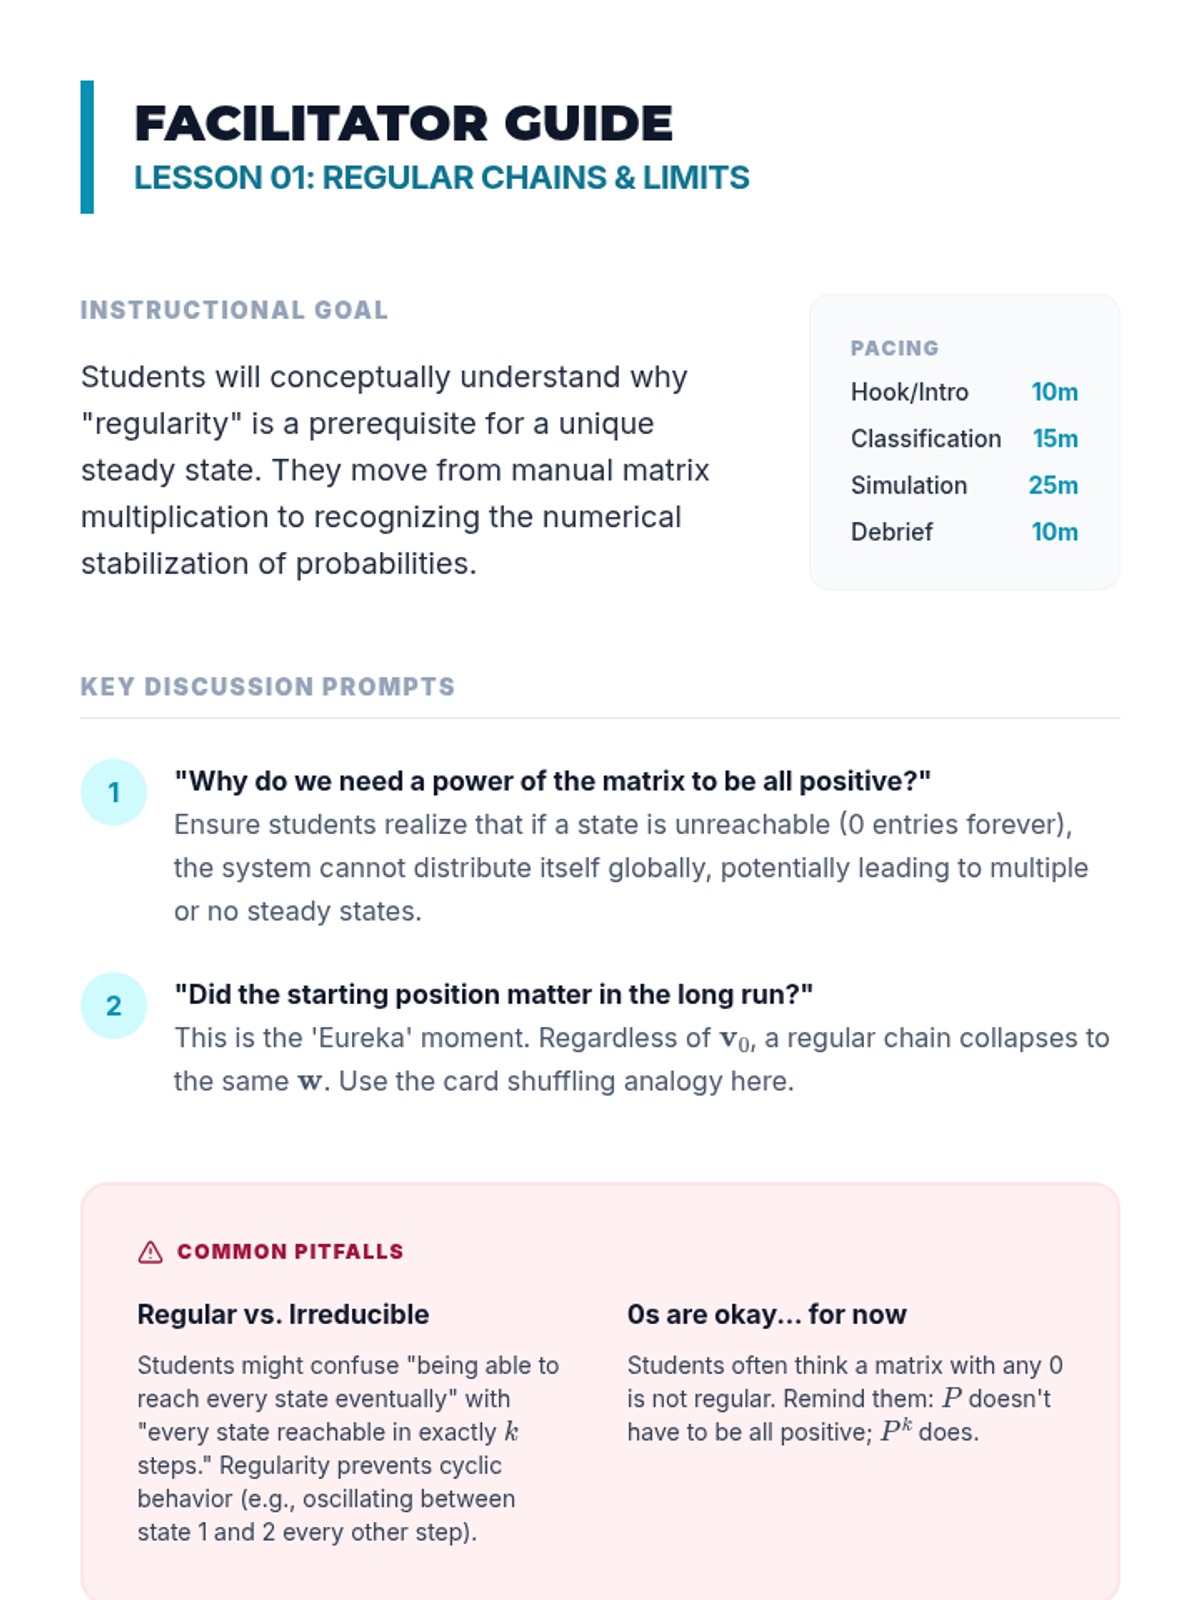
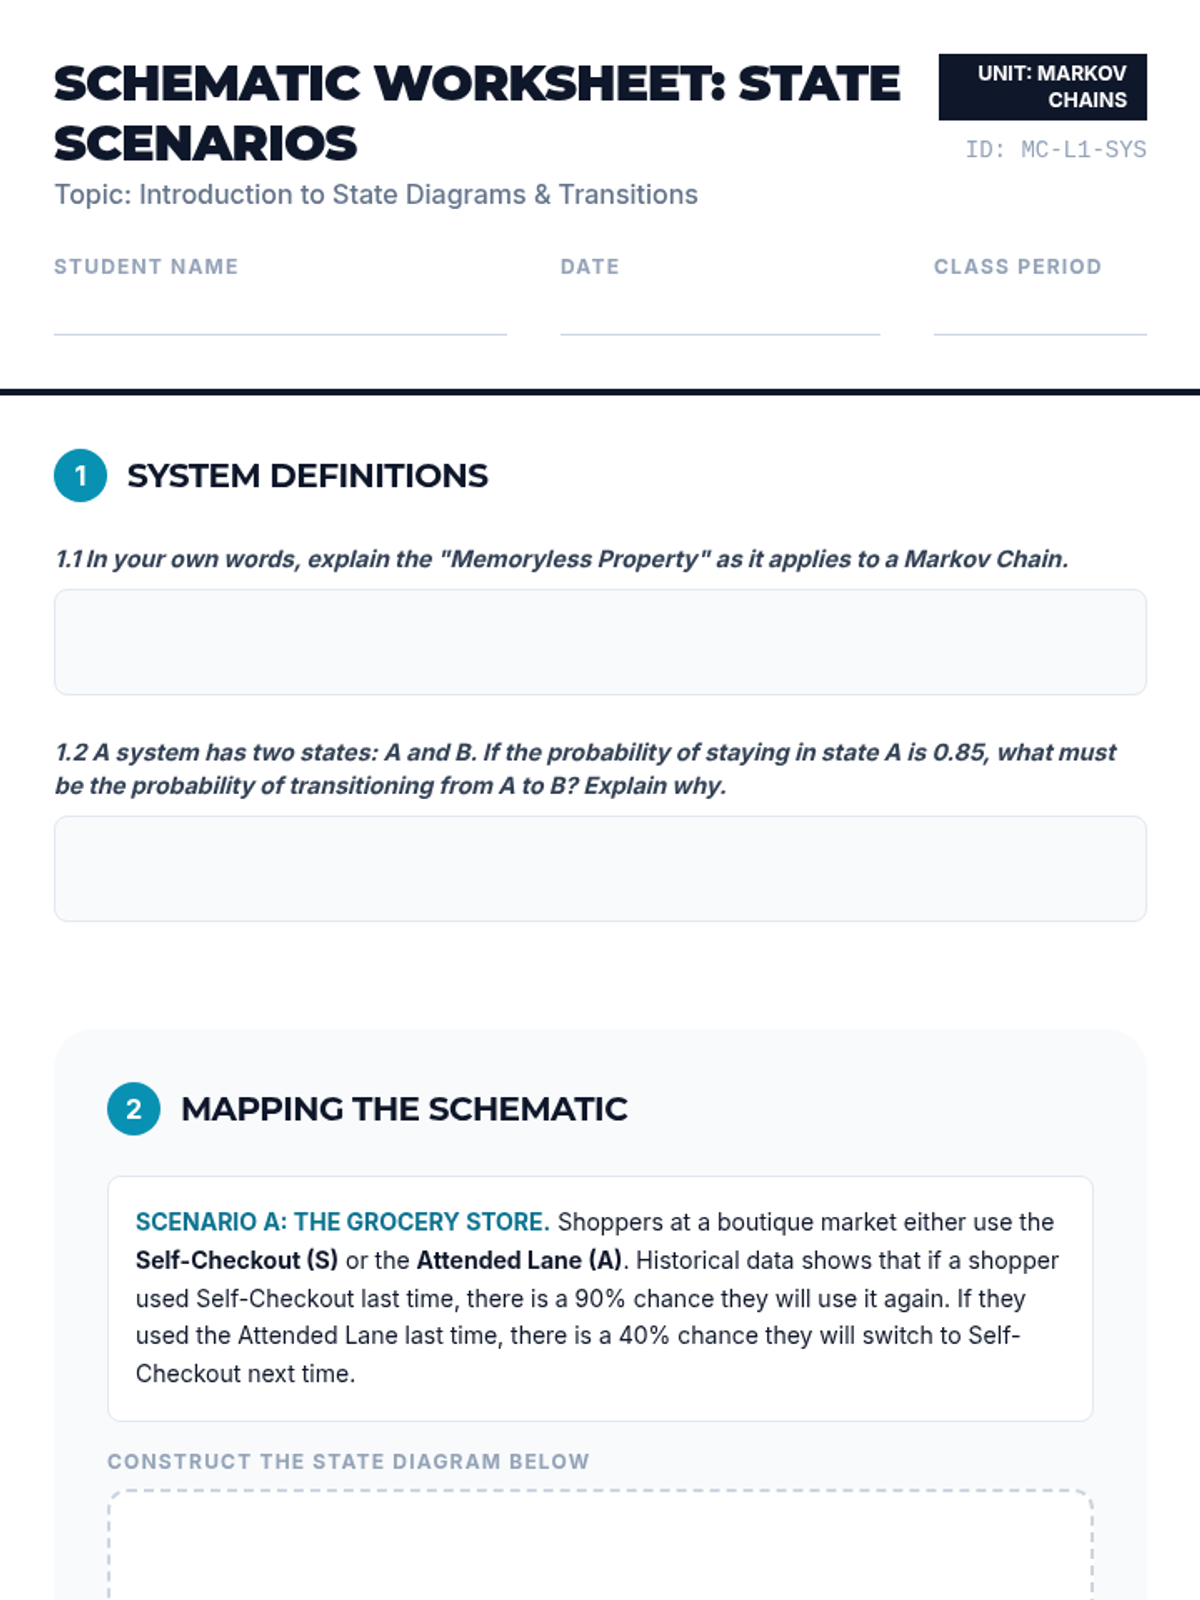
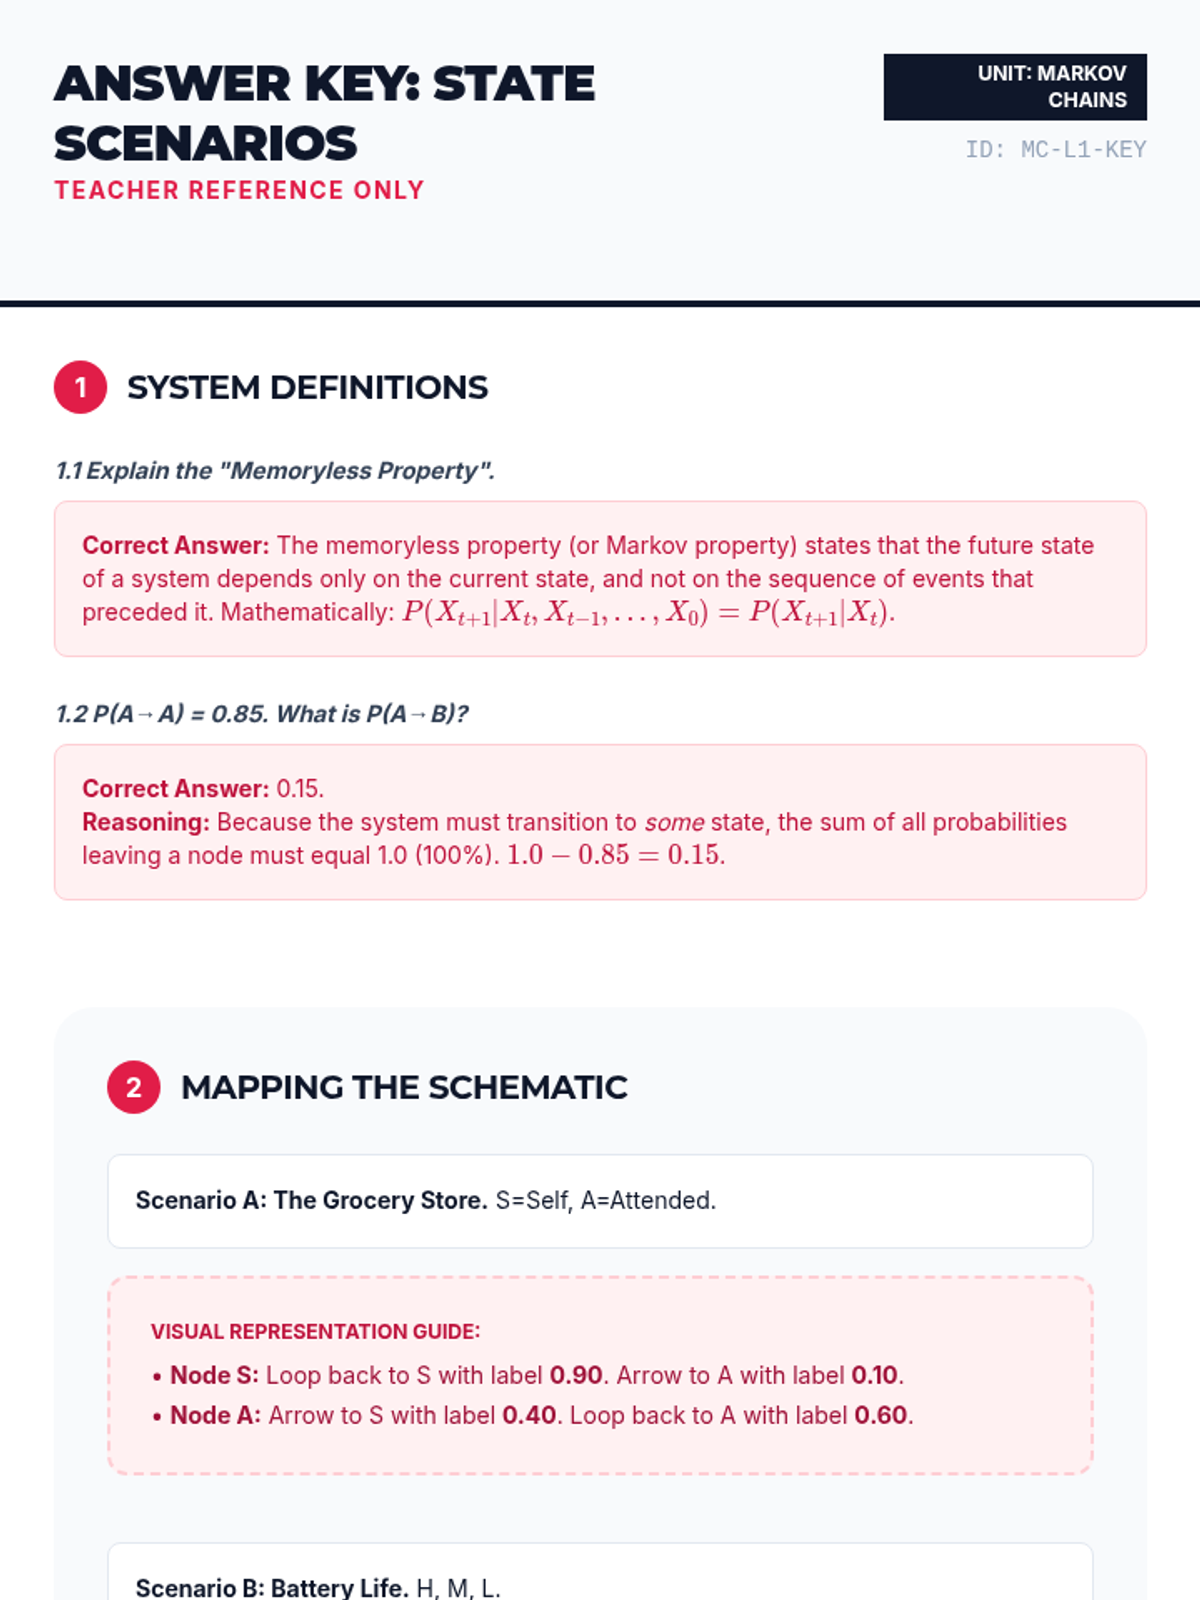
A high-level exploration of stochastic processes, focusing on how random systems reach equilibrium. Students will master Markov chains, steady-state algebra, and real-world applications like Google's PageRank algorithm.
A comprehensive sequence for 12th-grade students on discrete-time Markov chains, covering state diagrams, transition matrices, and n-step probability calculations using matrix algebra.
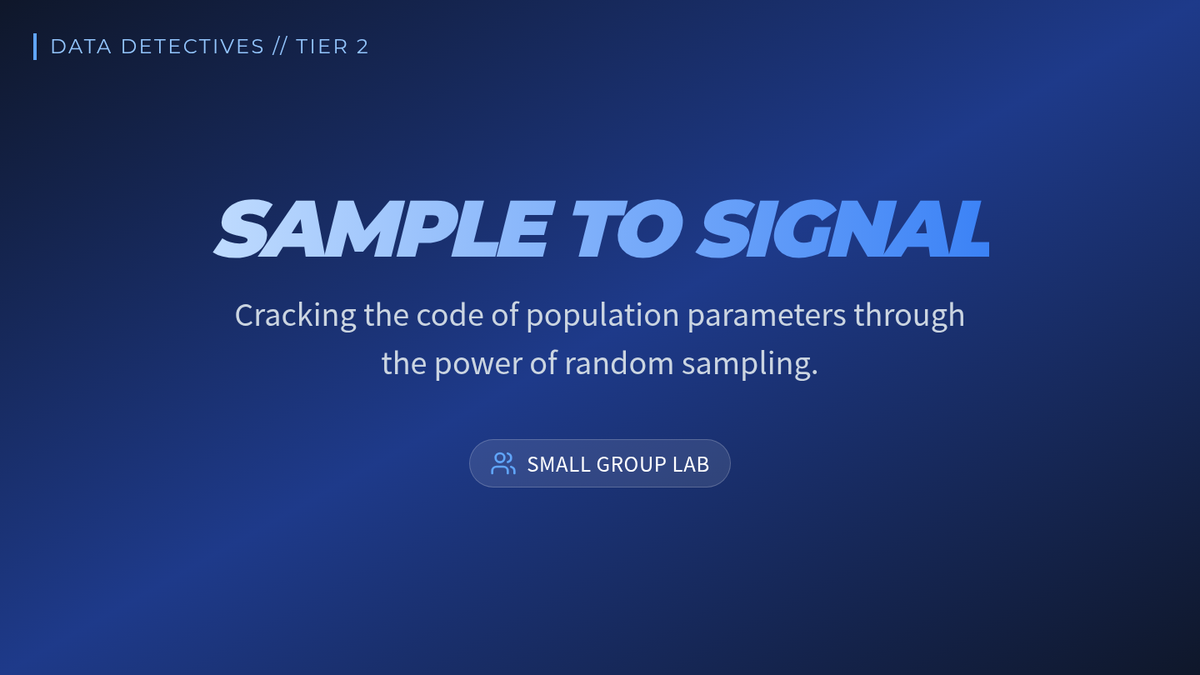
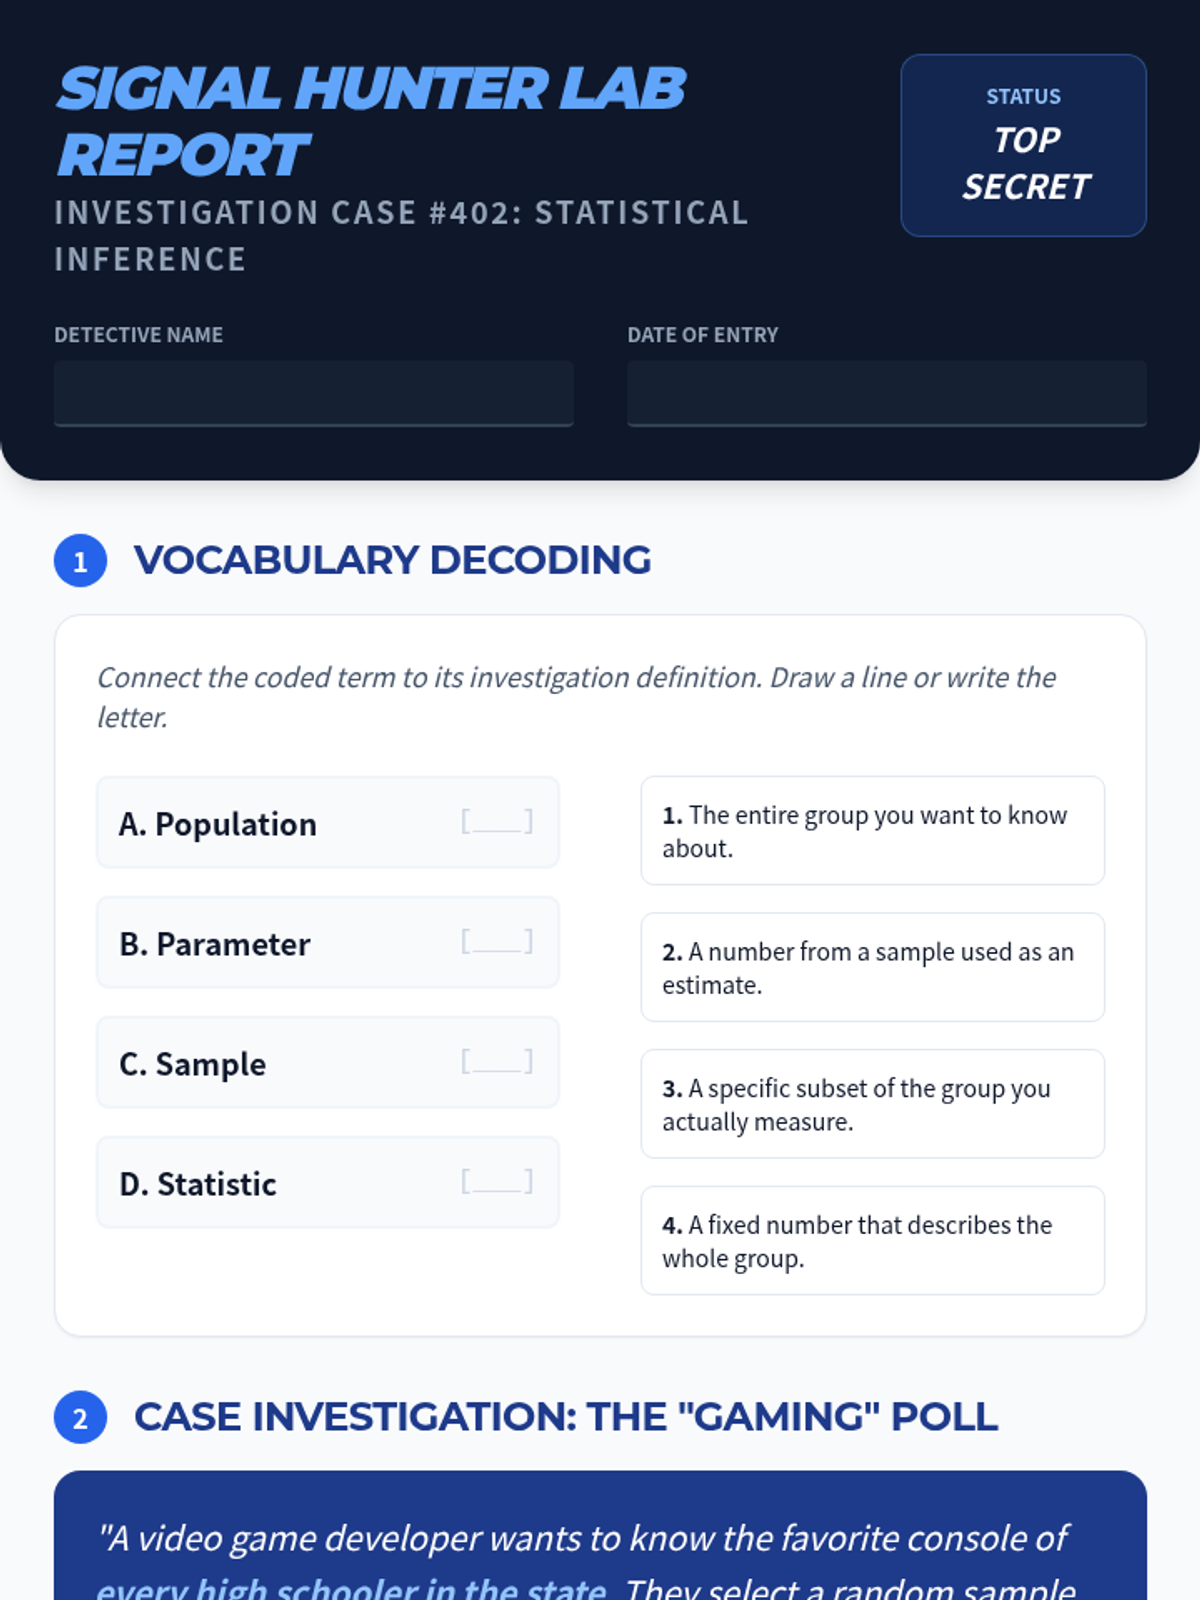
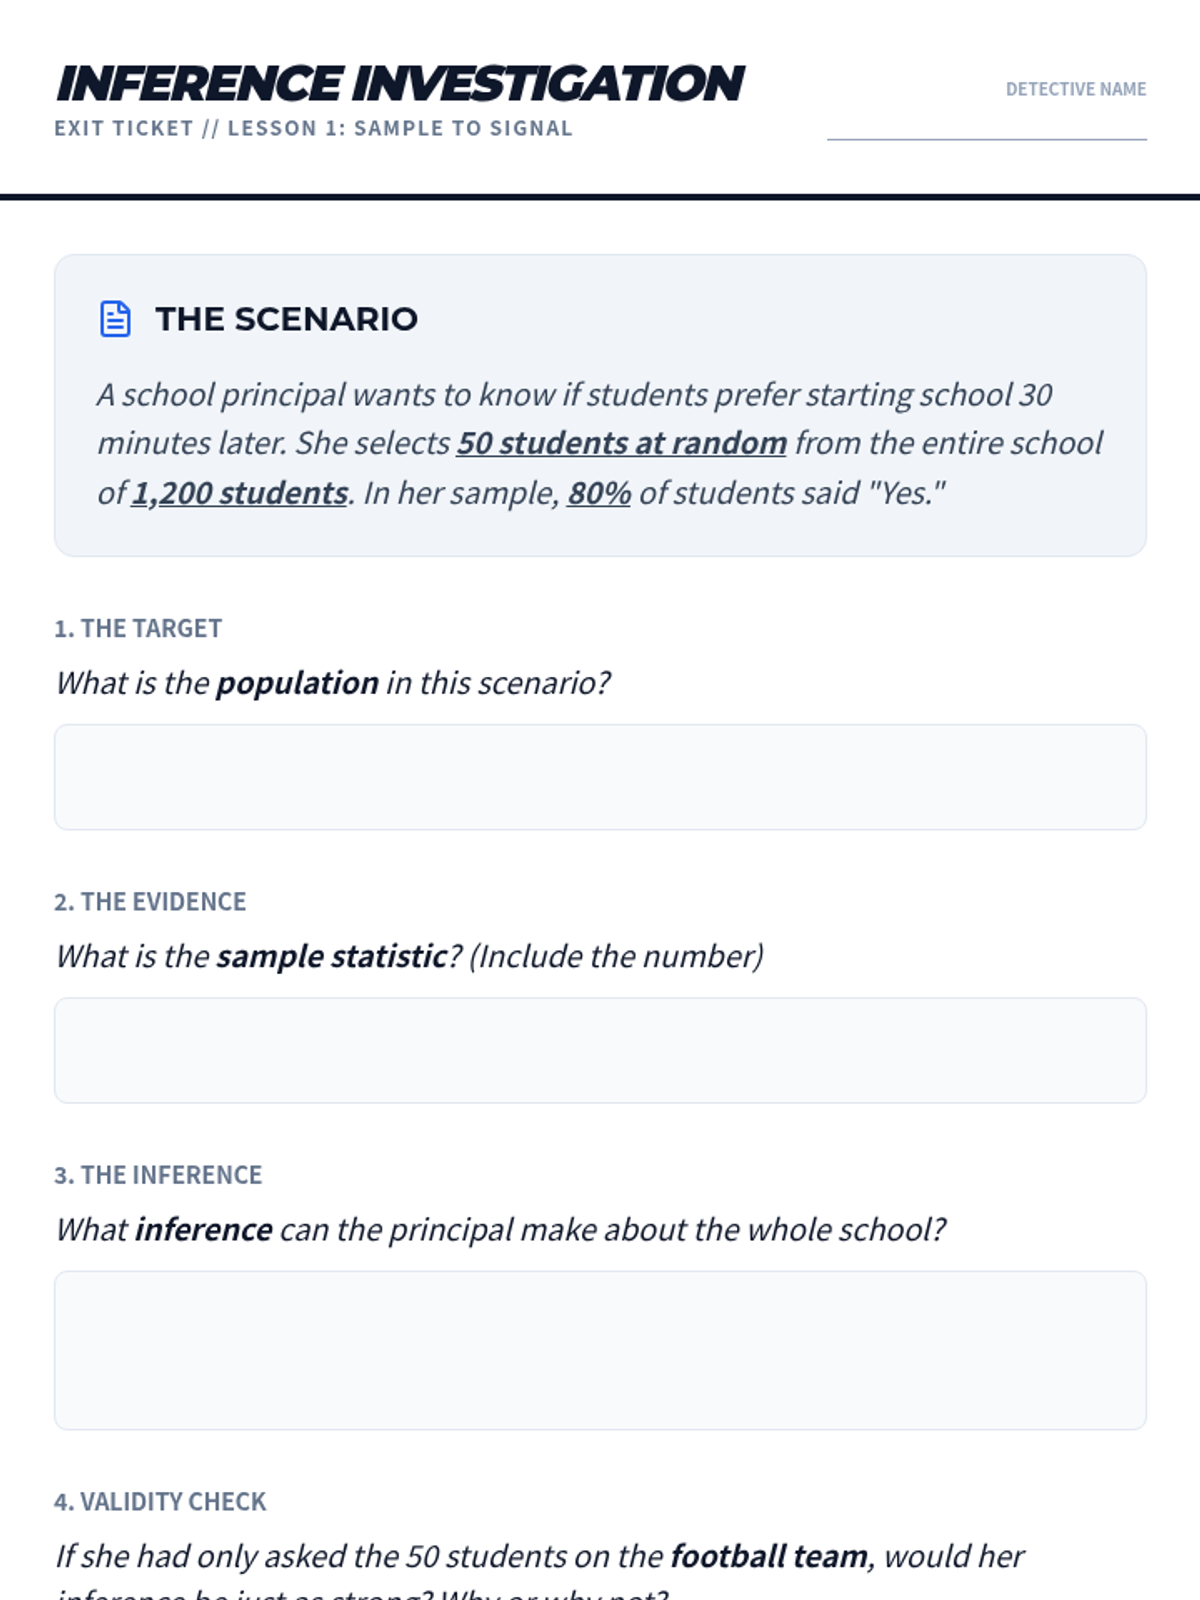
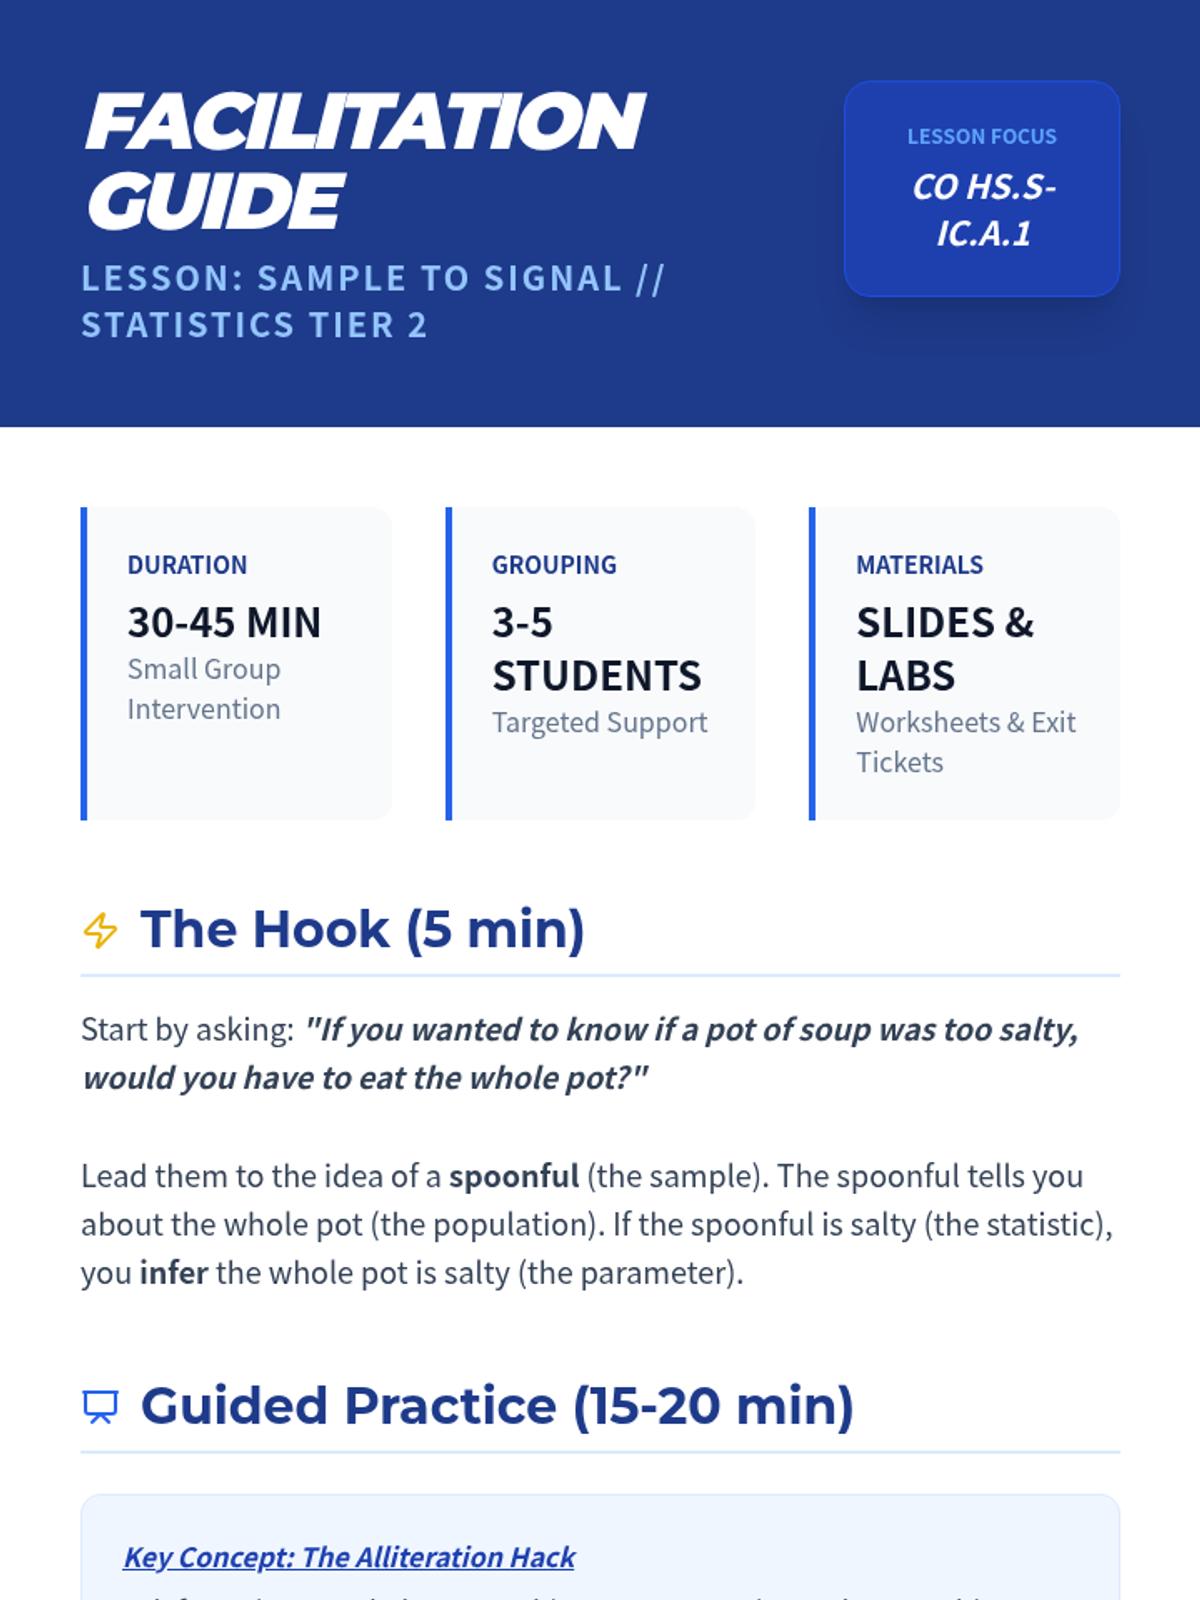
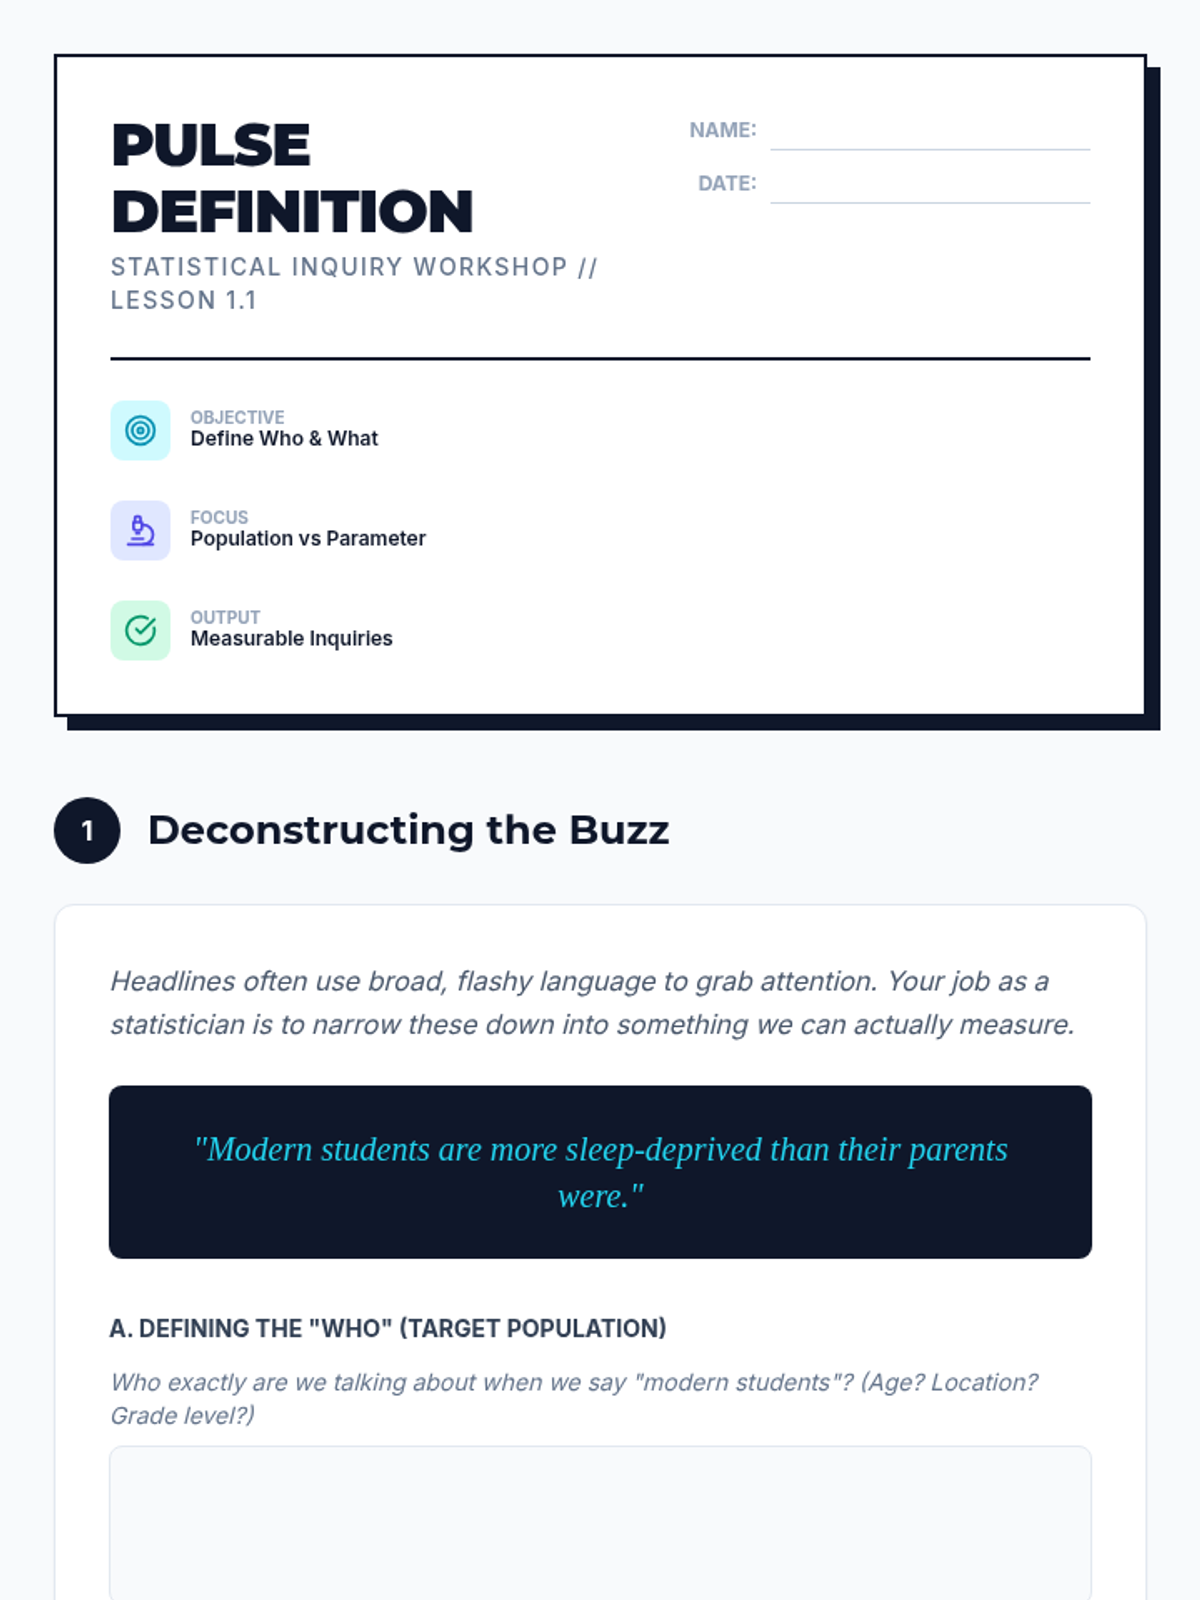
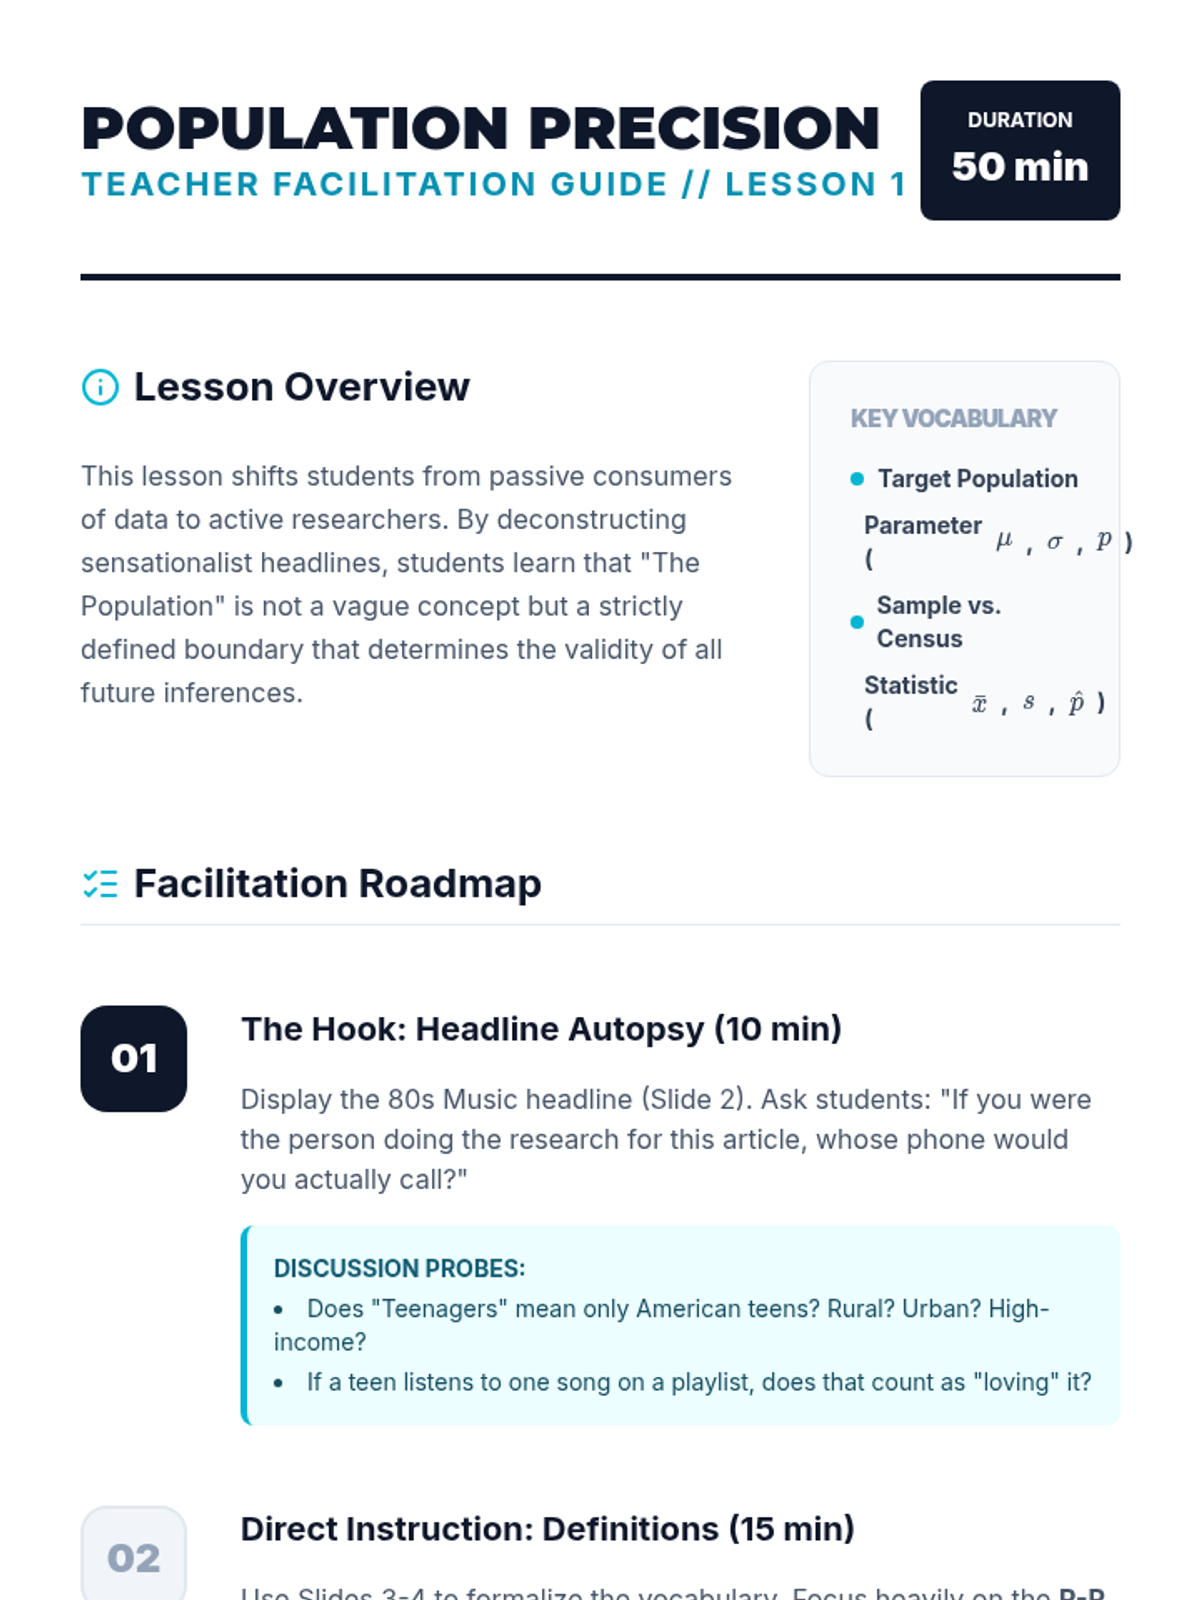
A targeted Tier 2 intervention sequence designed to help high school students master the fundamental concepts of statistical inference, moving from population parameters to sample statistics and back again through real-world applications.
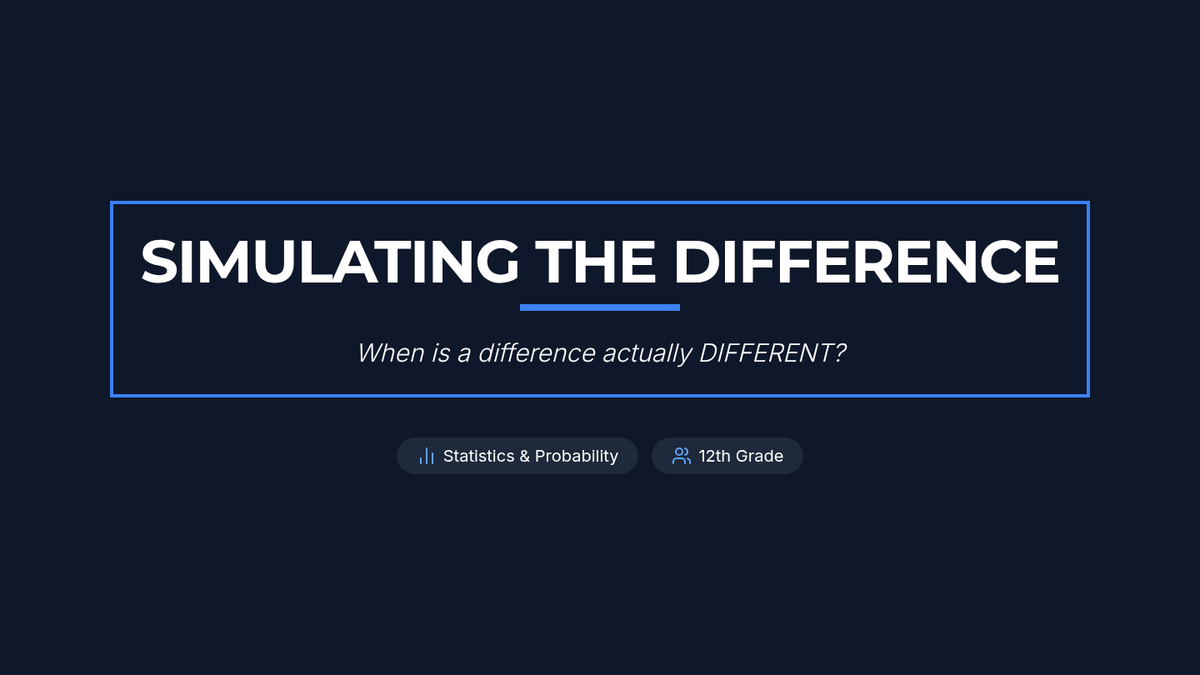
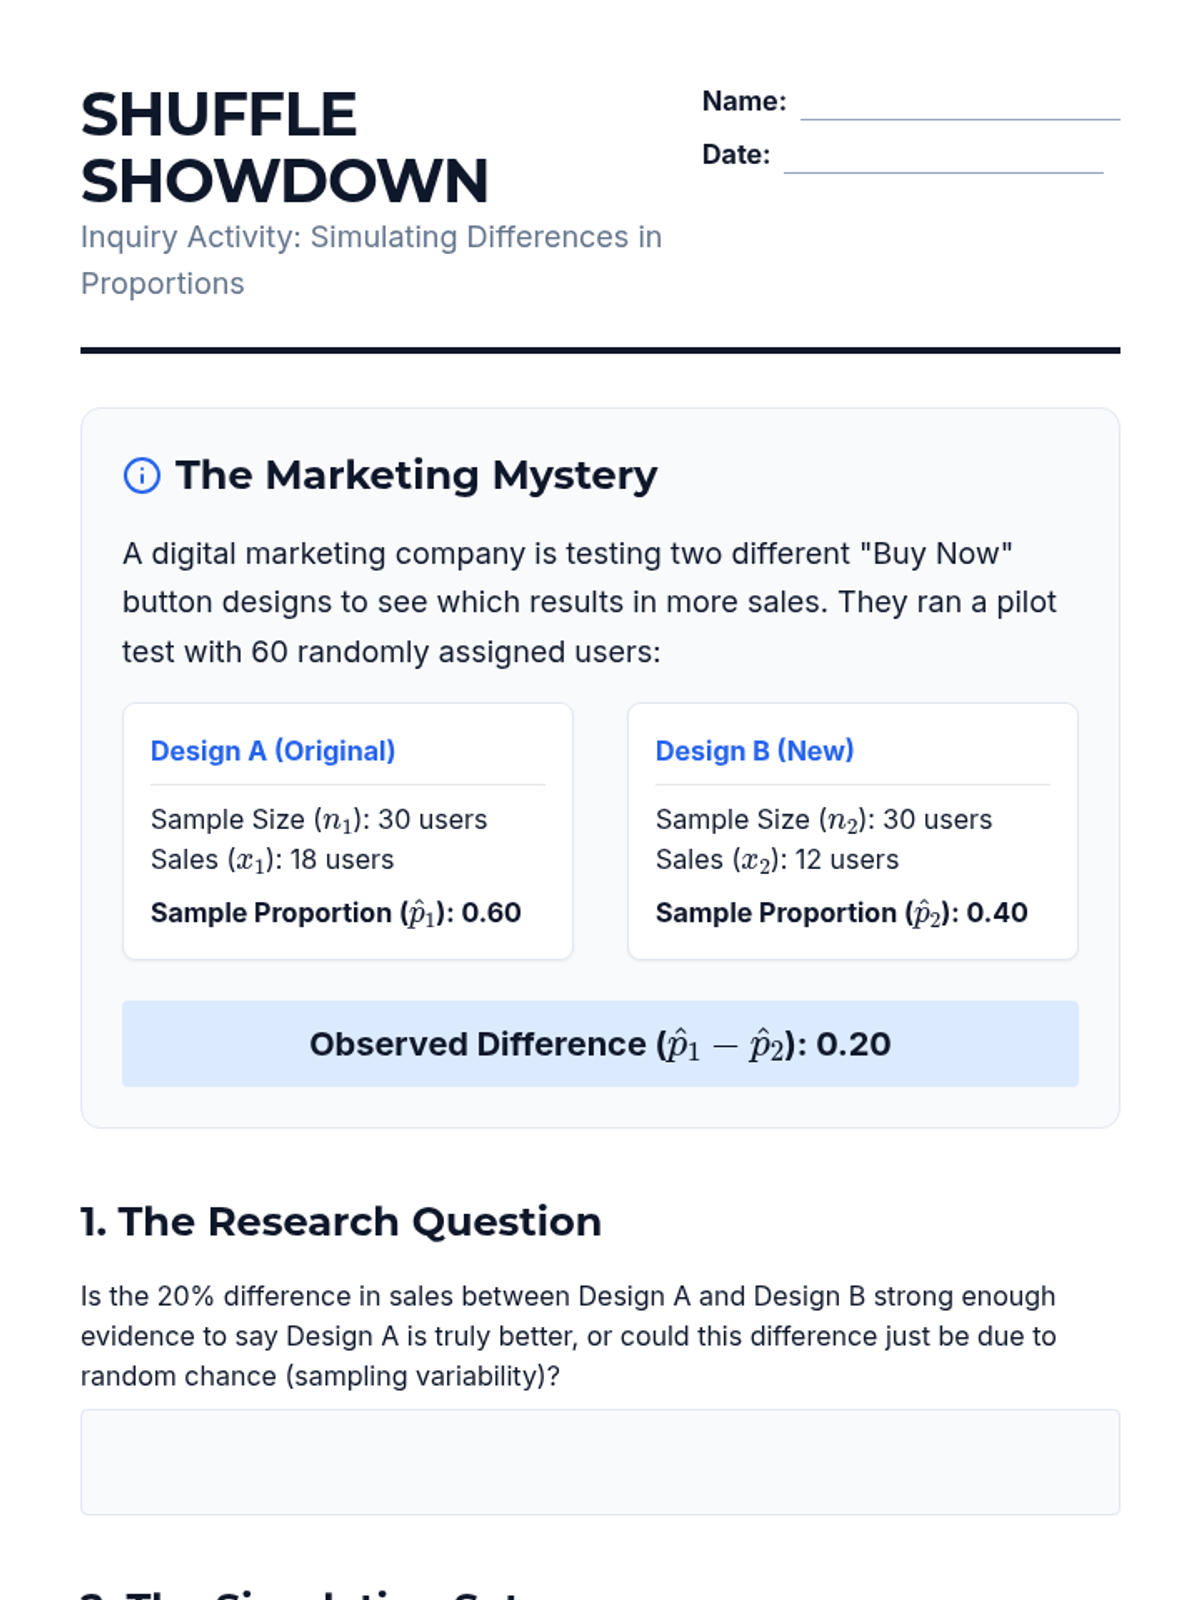
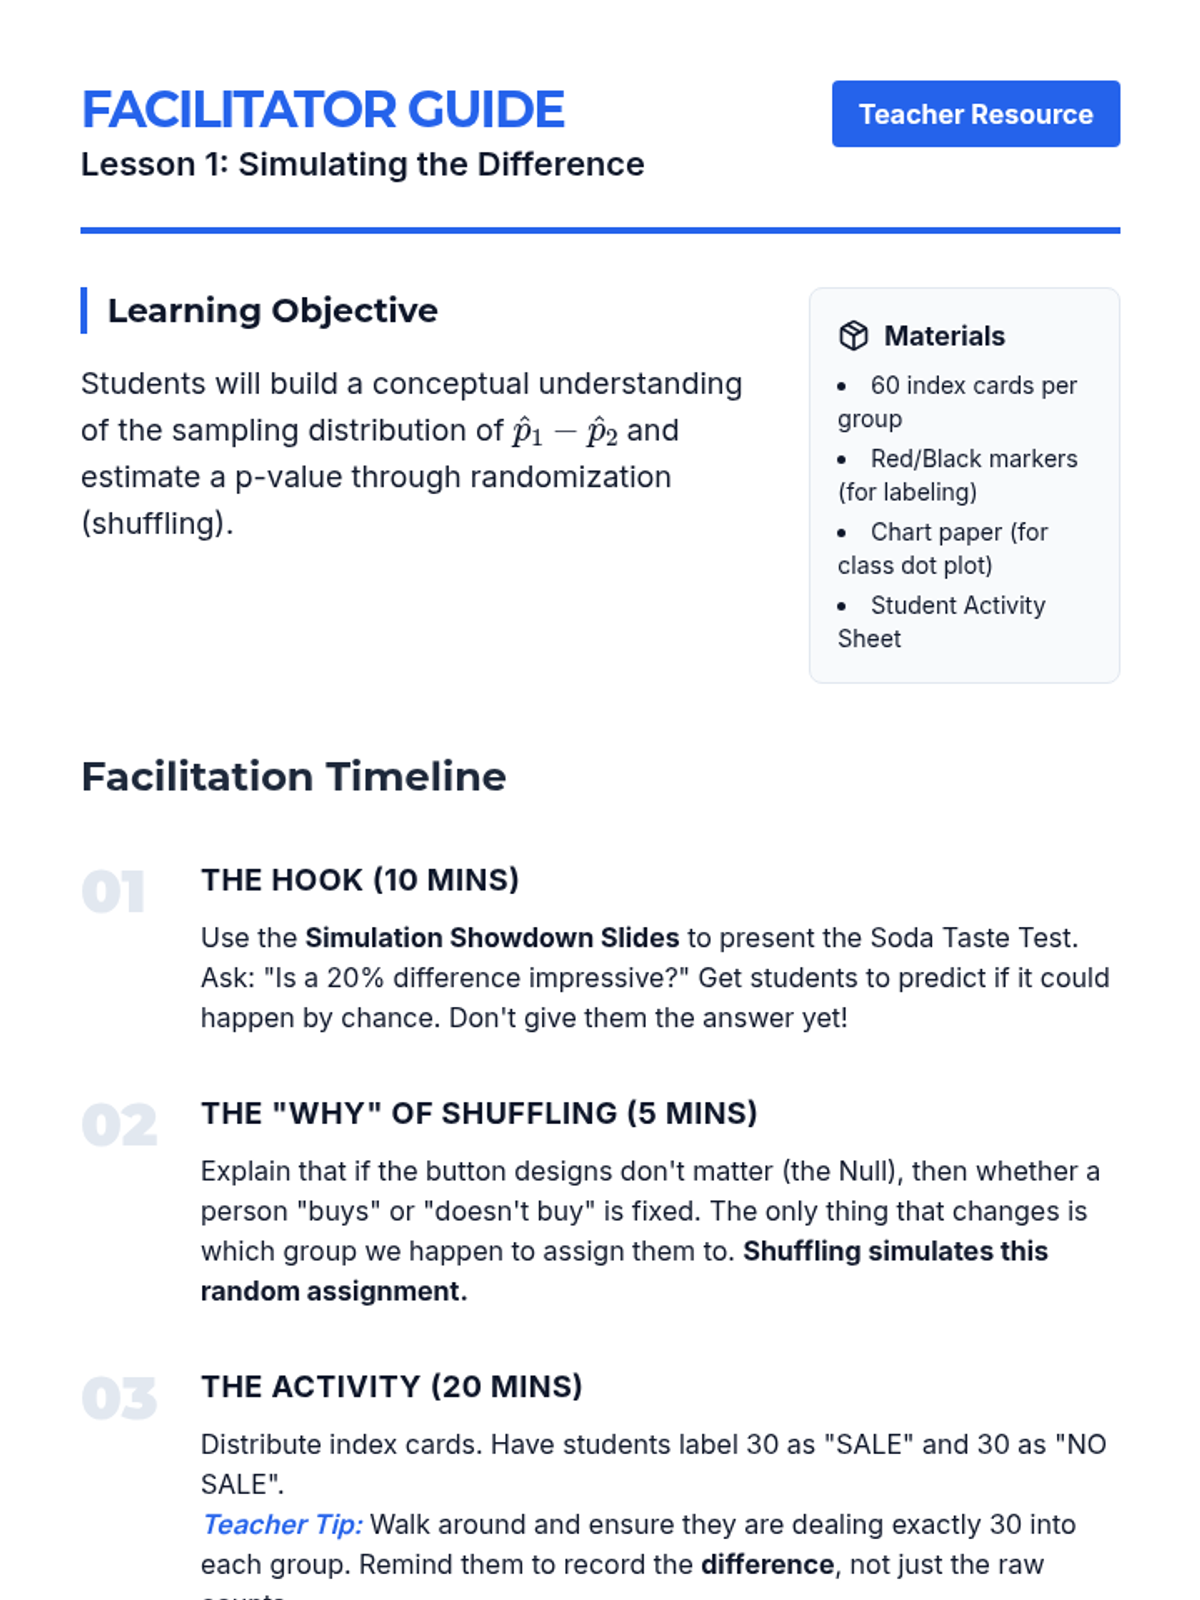
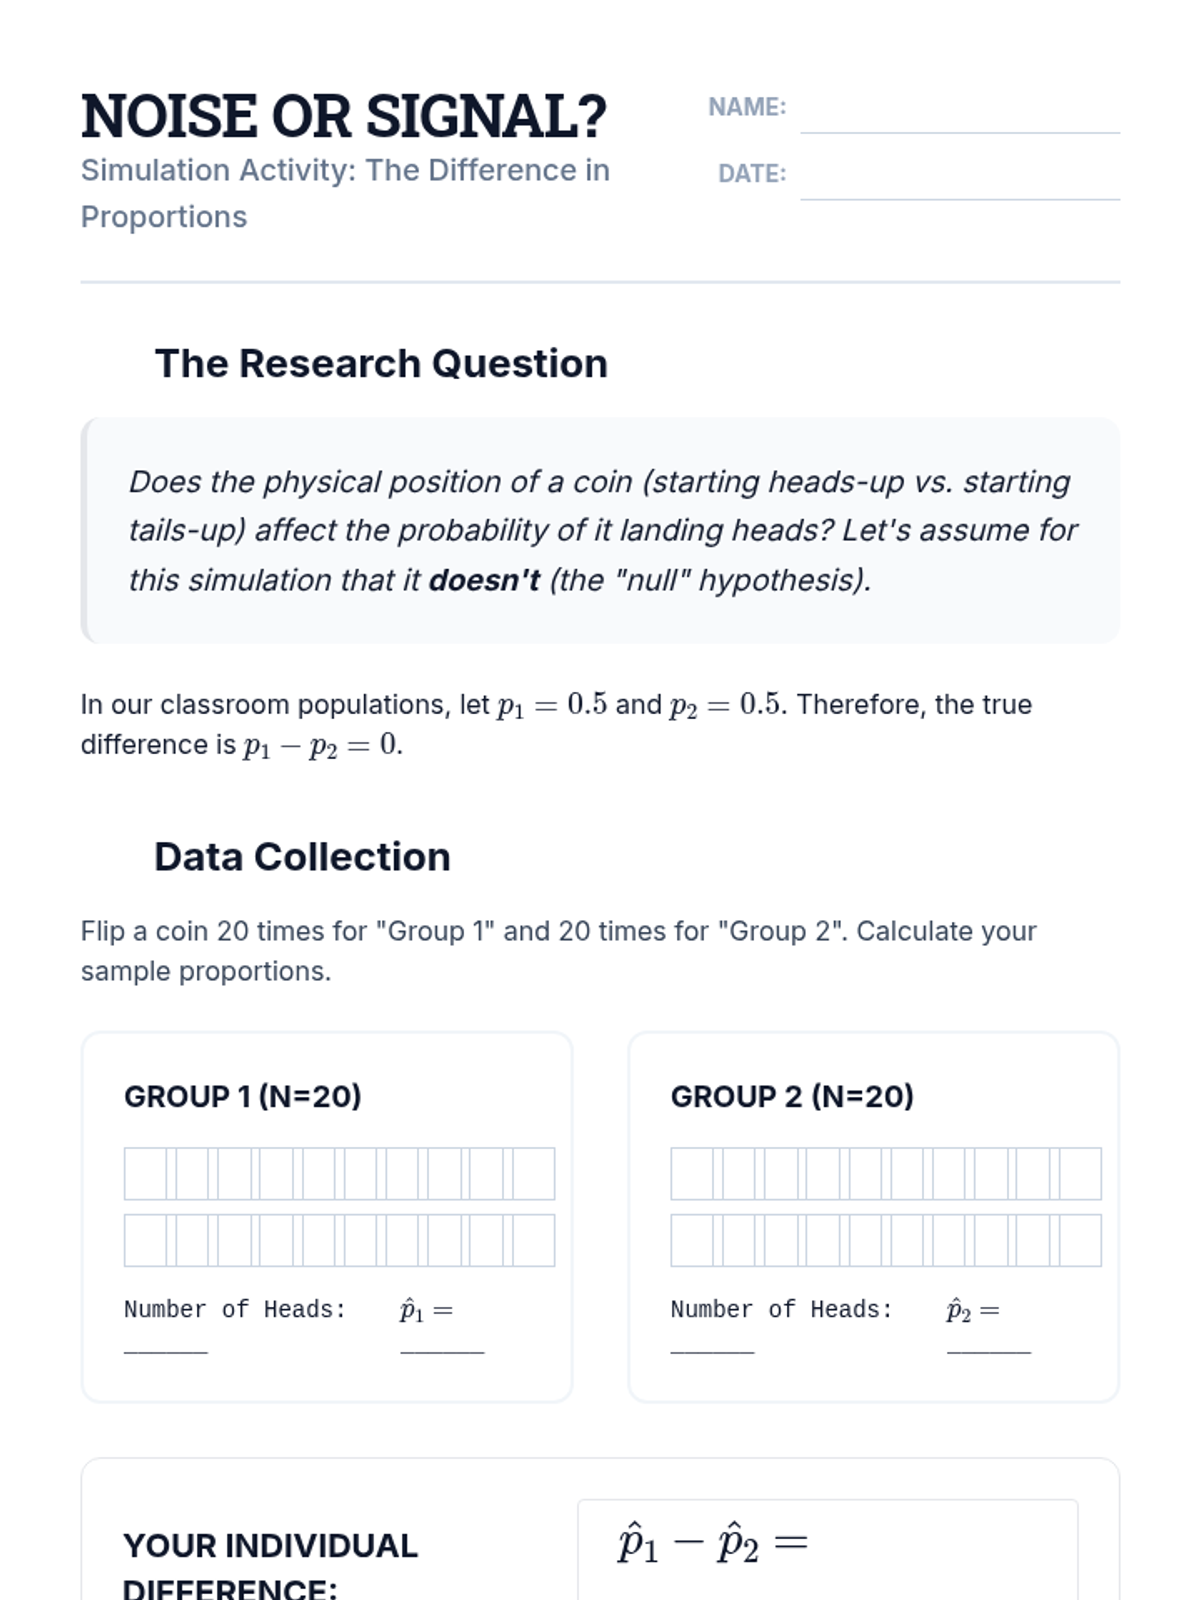
Students build a conceptual understanding of comparing two proportions through simulation before formalizing the math. They learn to conduct and interpret 2-sample z-tests and confidence intervals for differences in proportions in real-world contexts like marketing and public opinion.
A comprehensive unit for 11th-grade statistics focusing on the comparison of proportions between two independent populations. Students transition from simulation-based inquiry to formal z-tests and confidence intervals, culminating in a real-world sociological data analysis project.
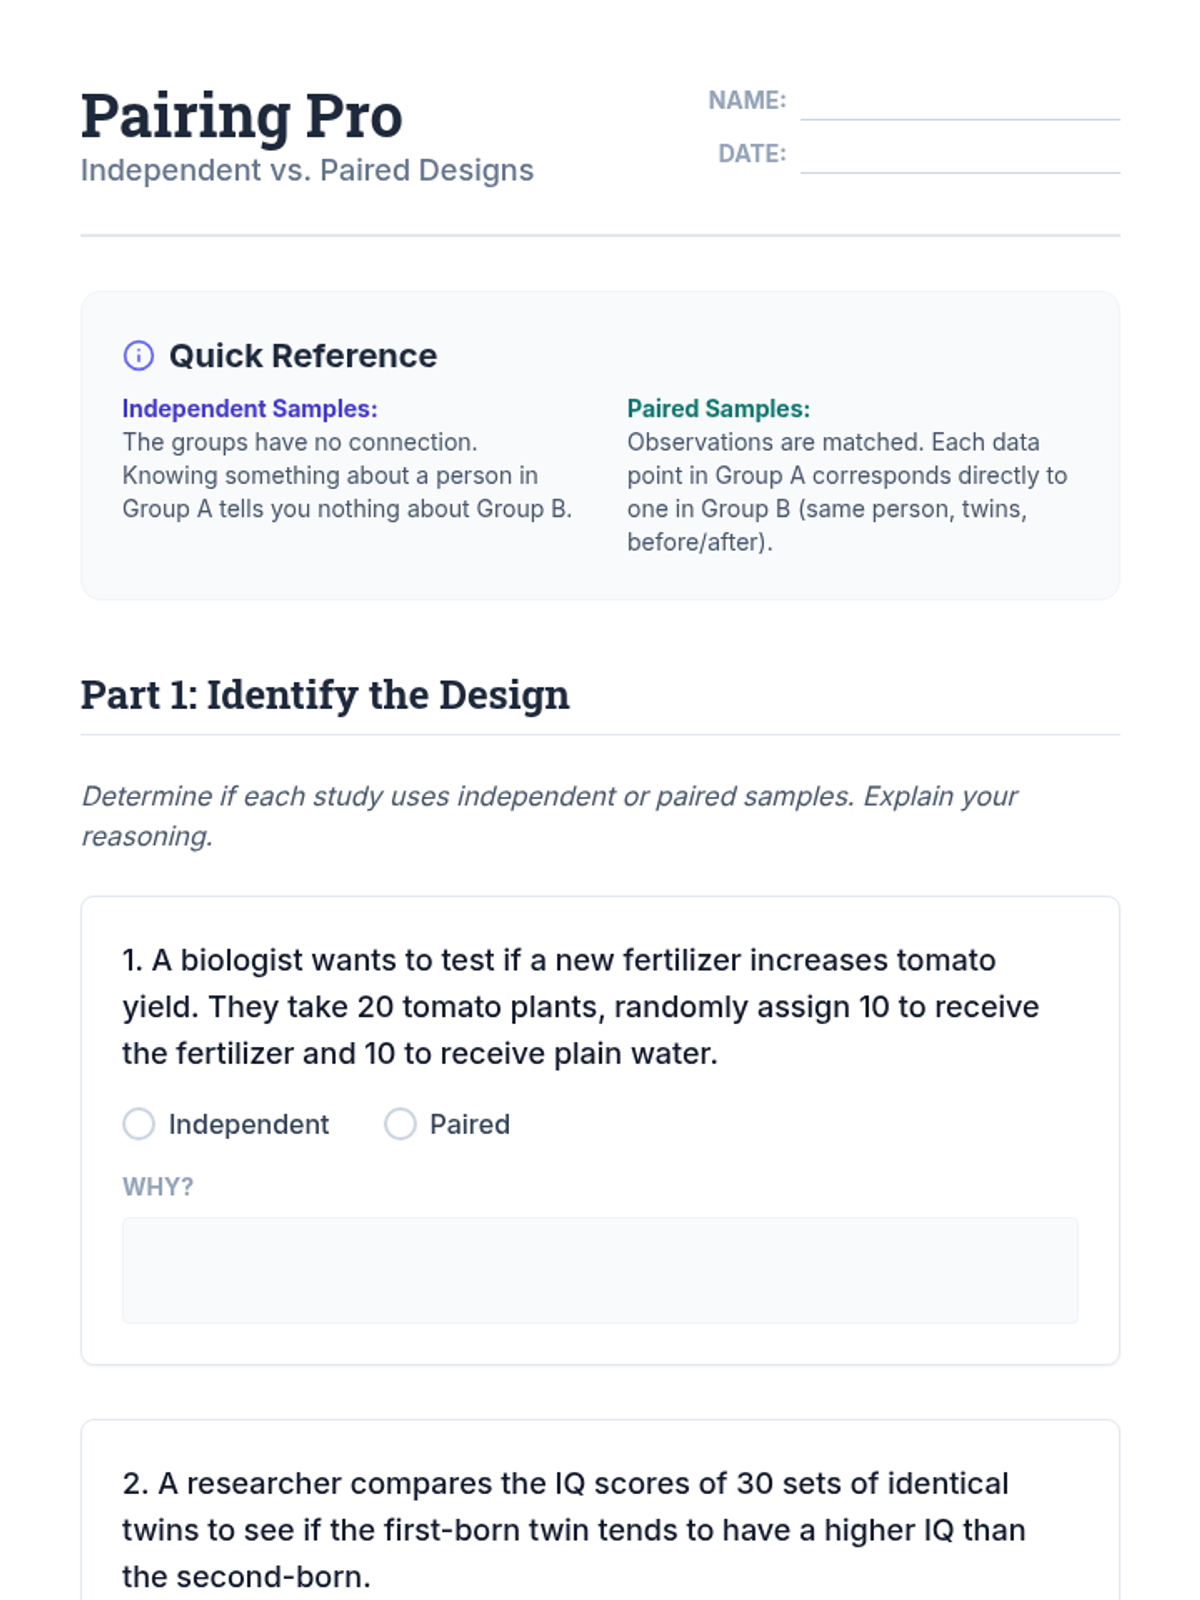
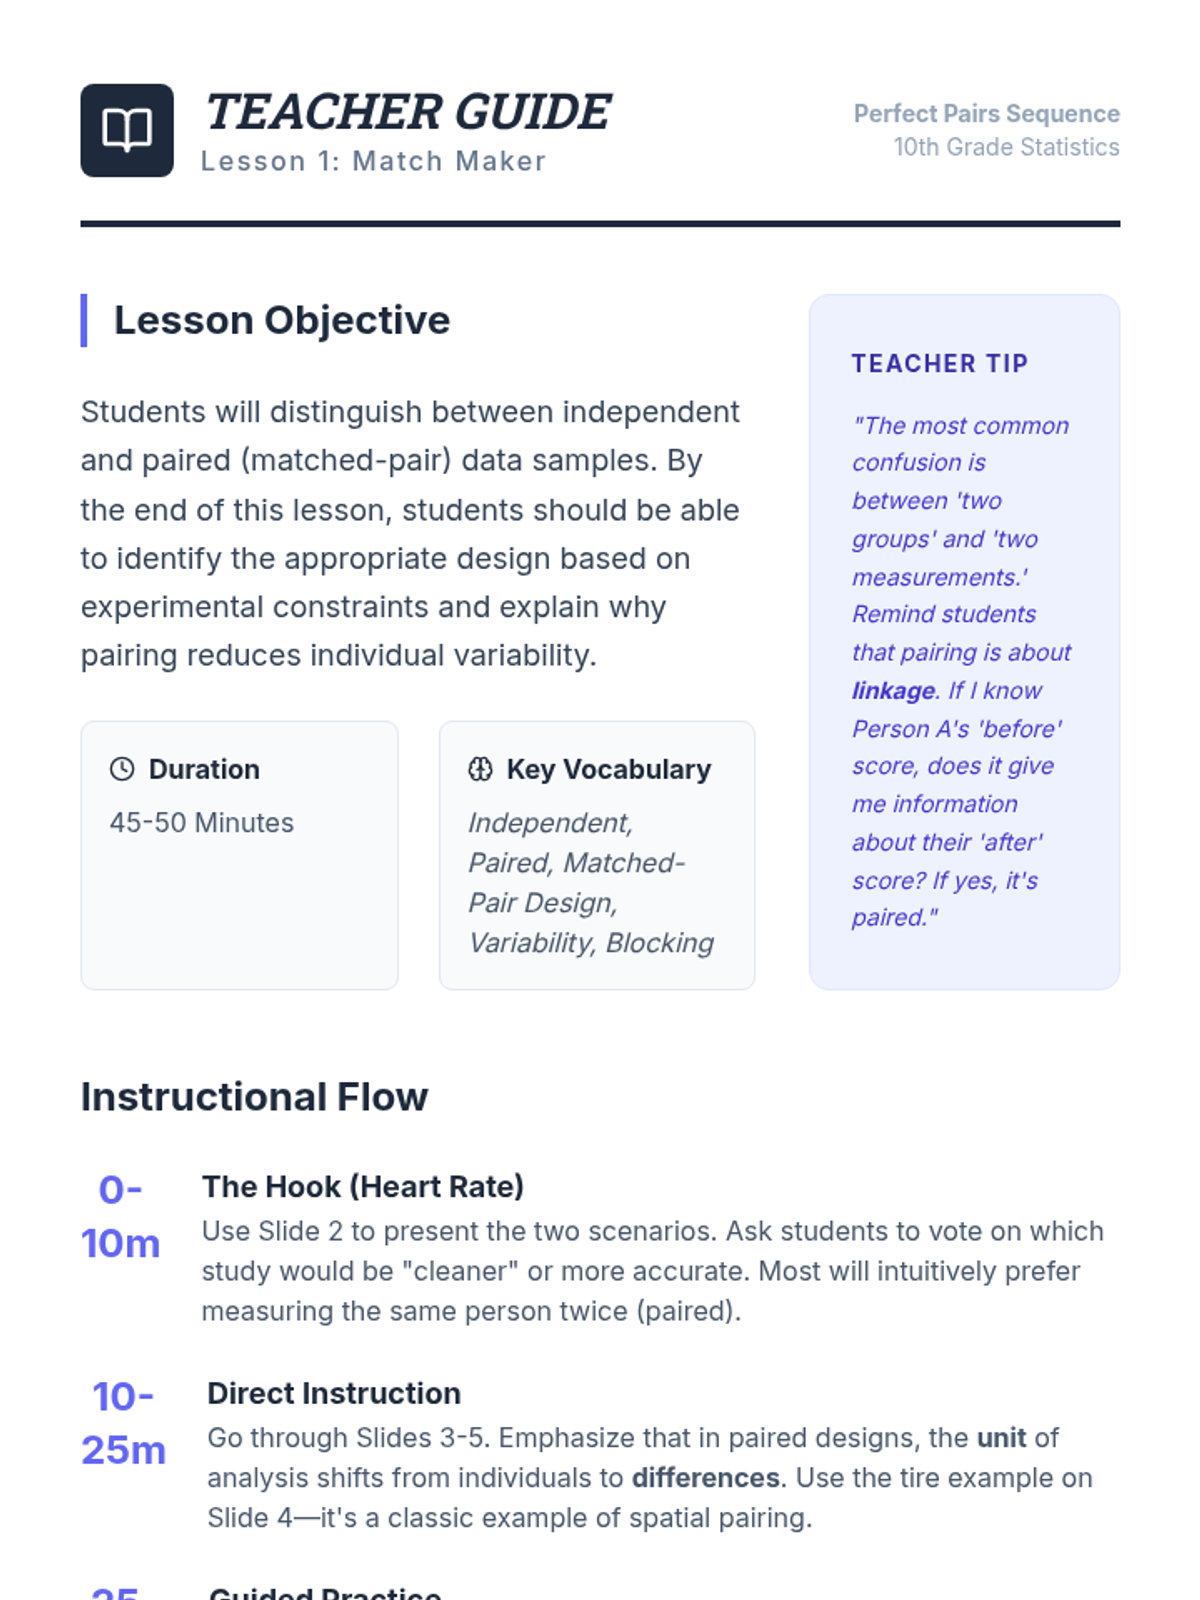
This sequence explores the distinction between independent and paired samples in statistics. Students learn to identify matched-pair designs, calculate paired differences, conduct hypothesis tests for means of differences, and understand how pairing increases statistical power by reducing variability.
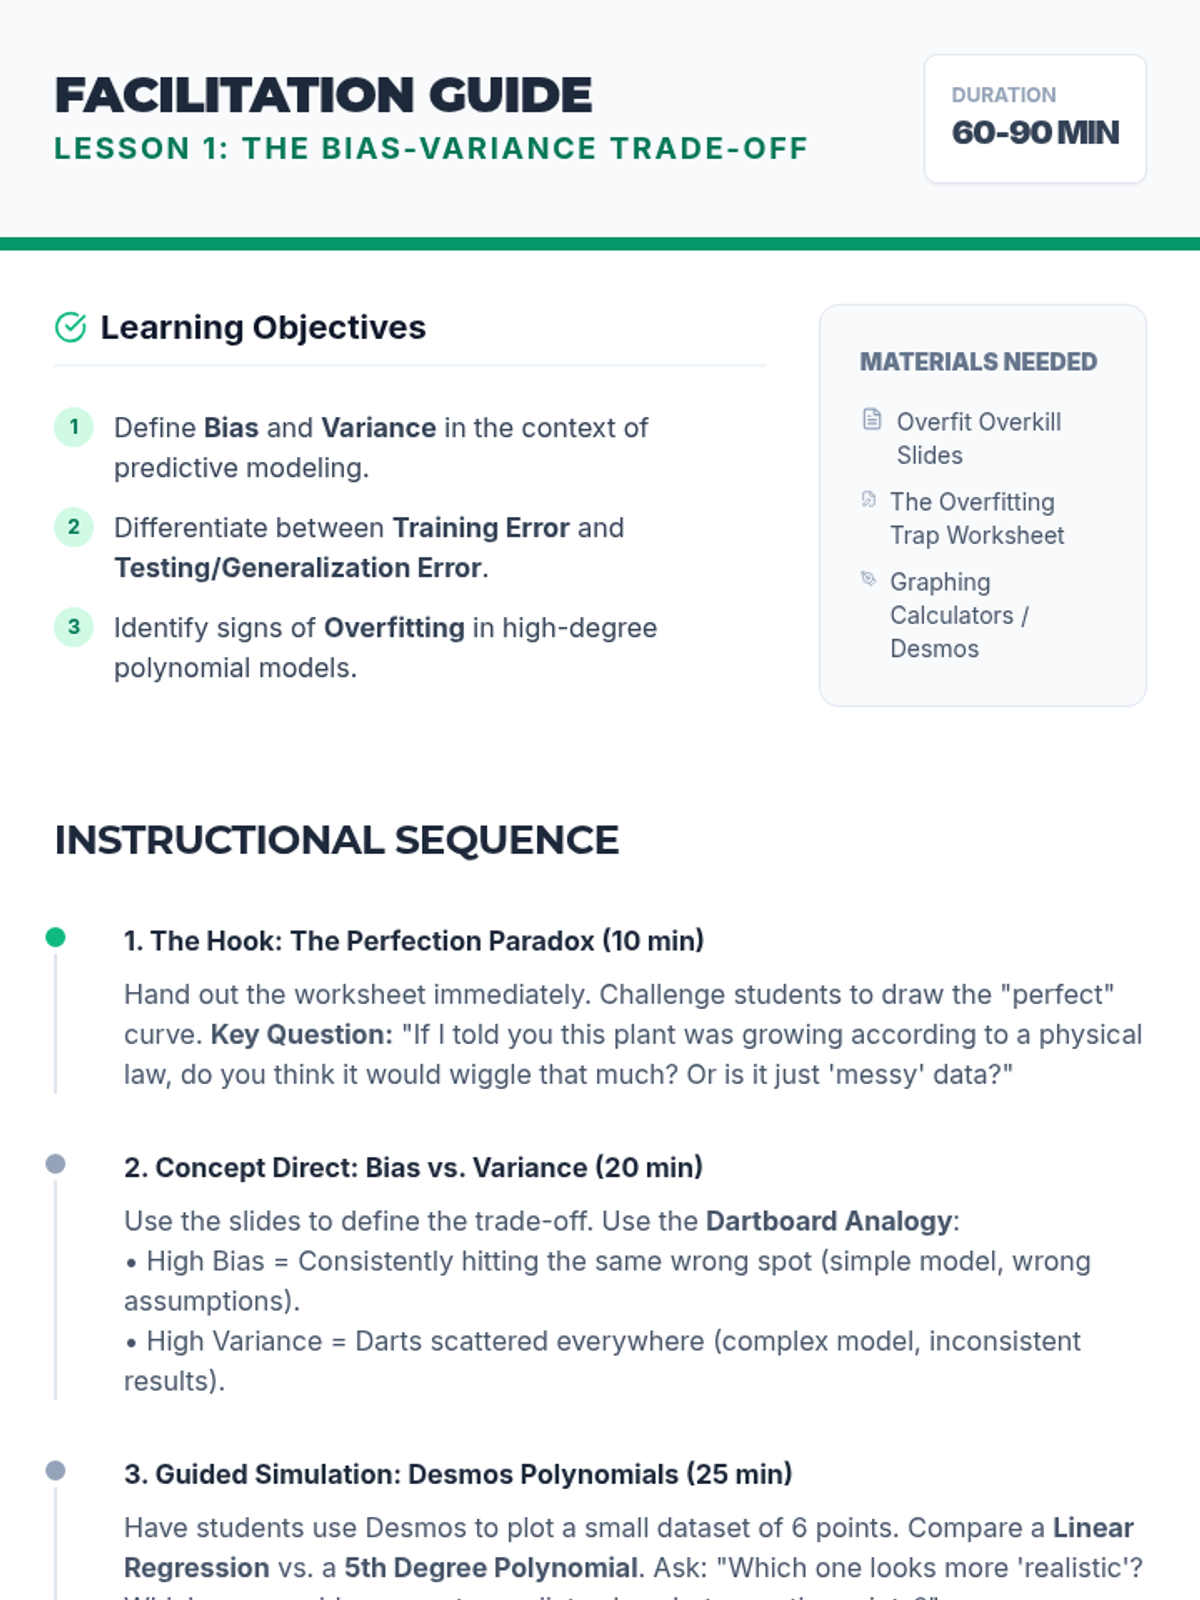
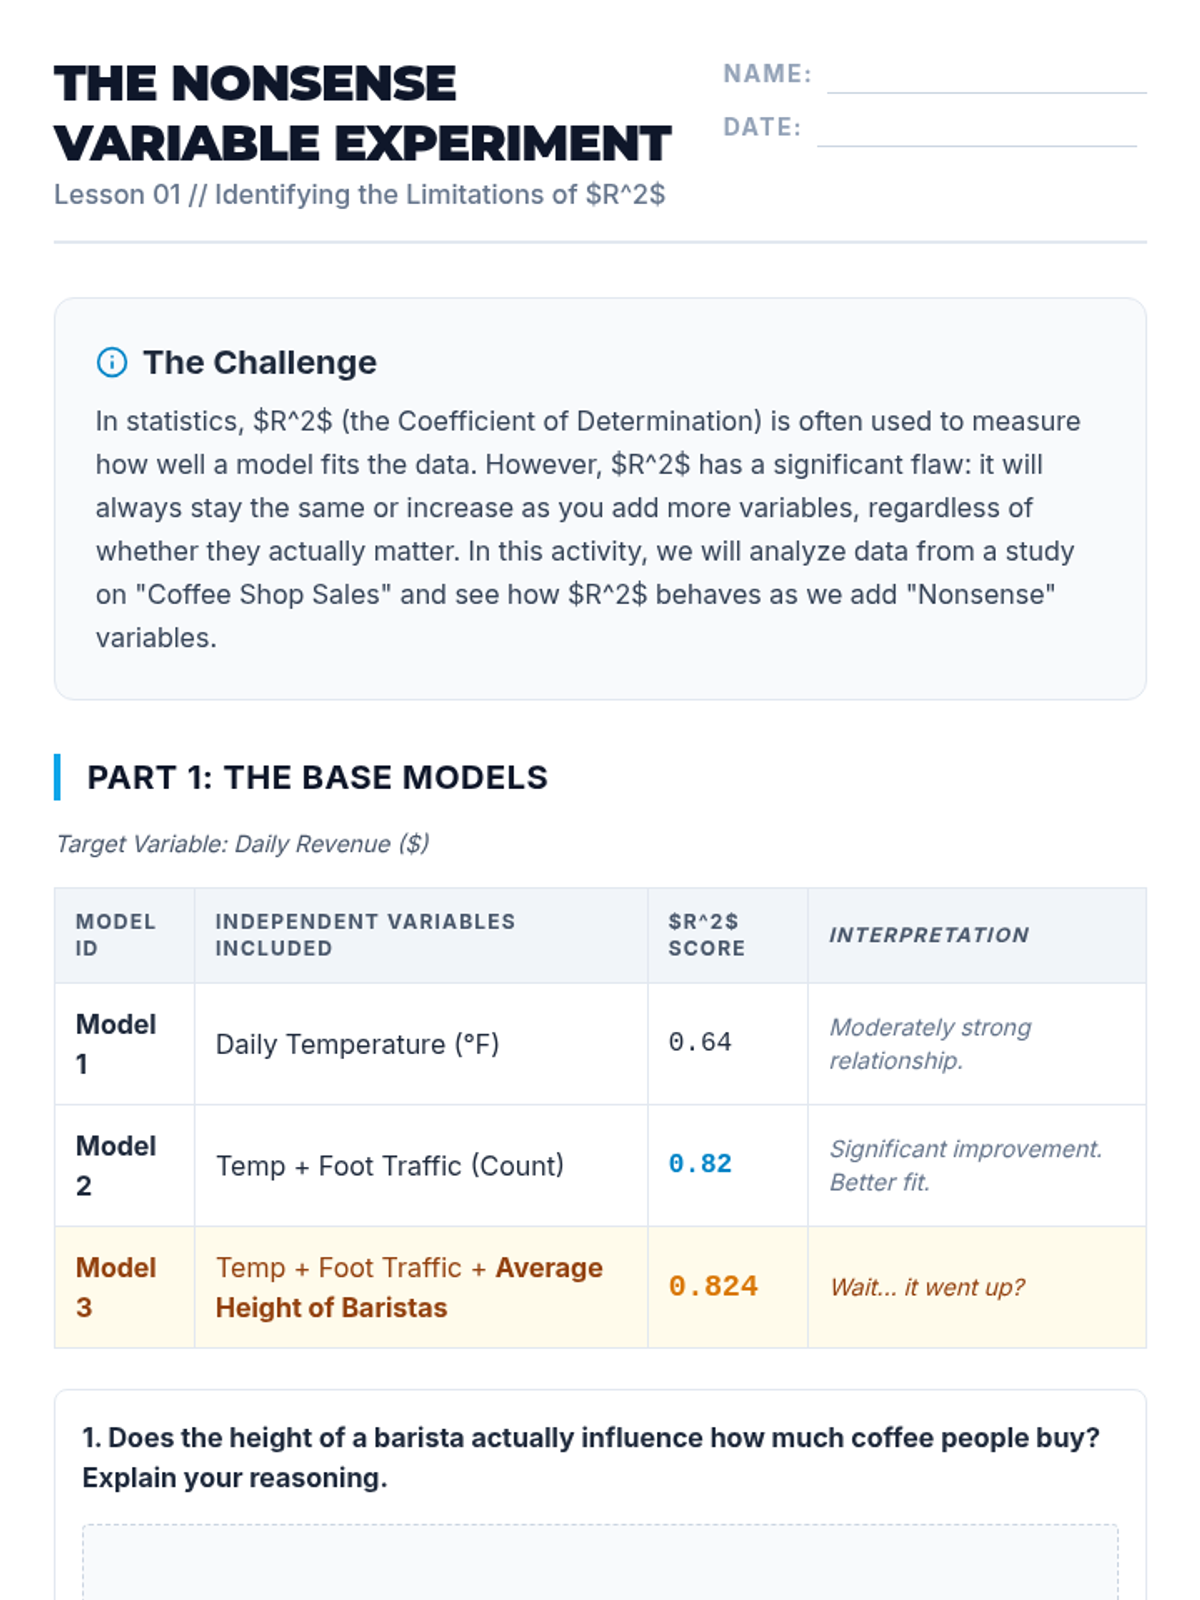
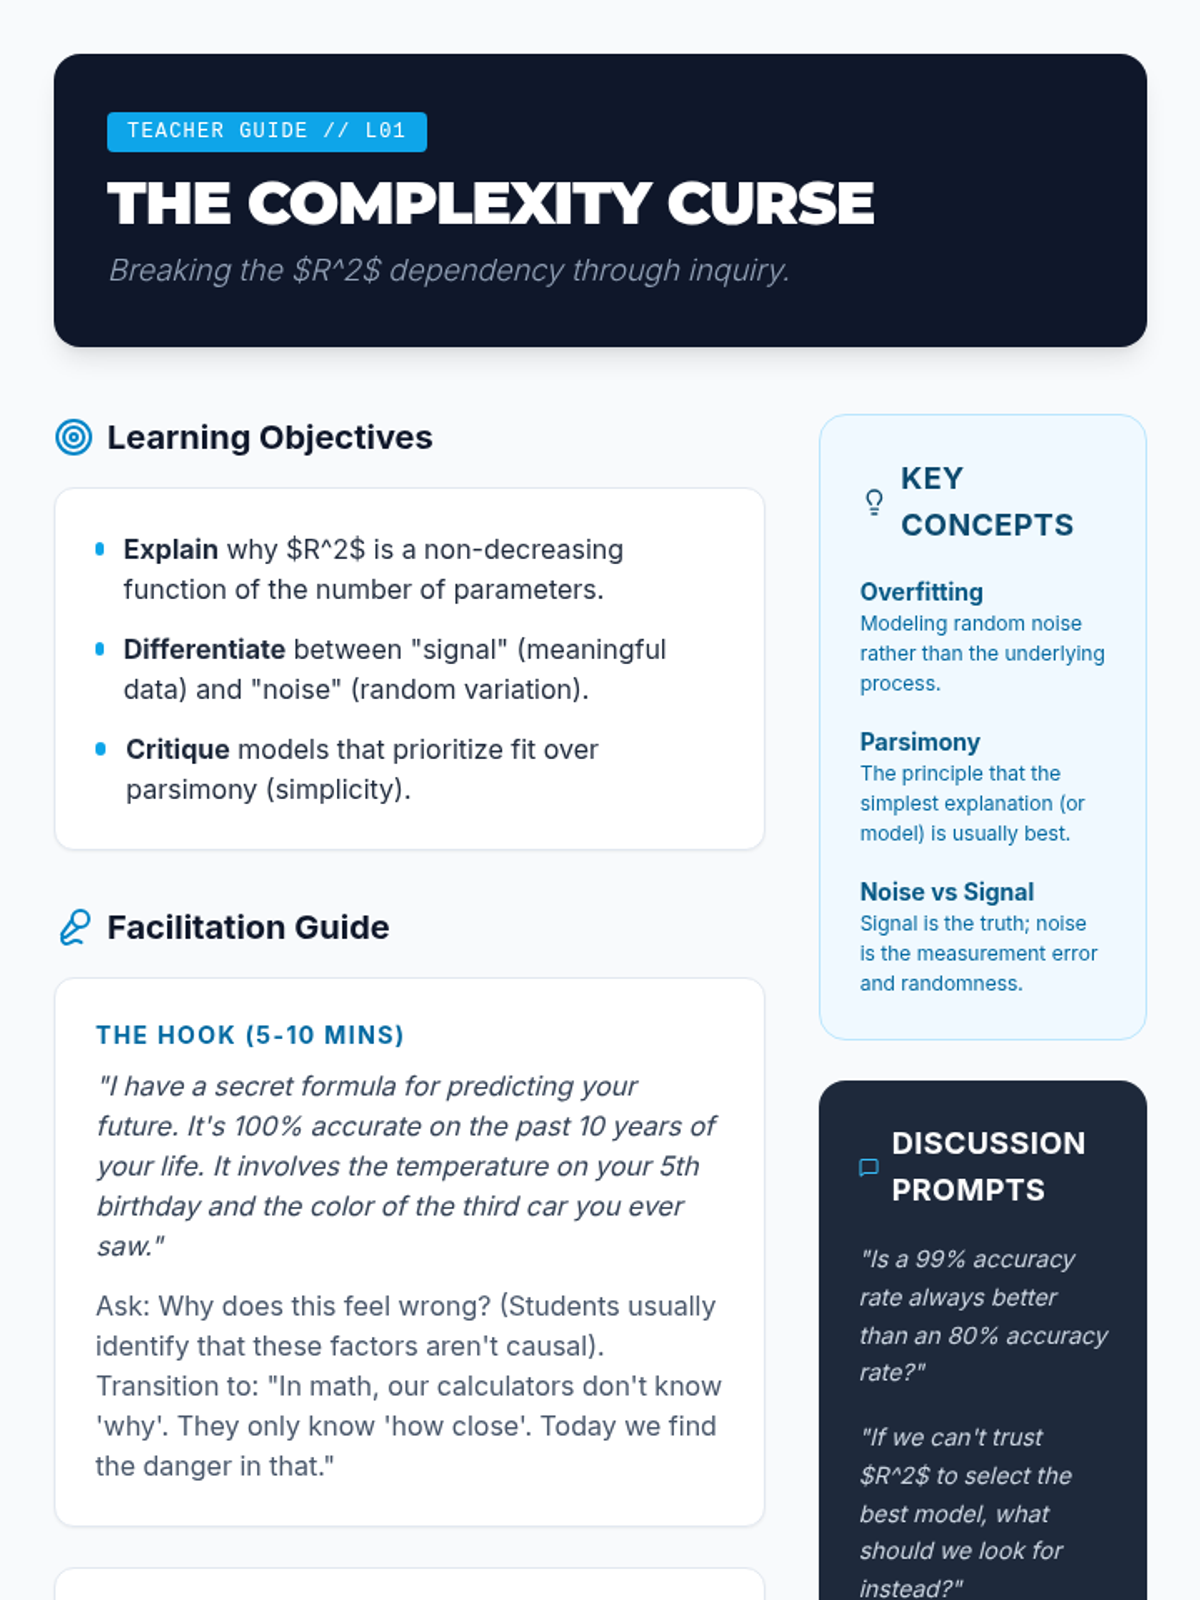
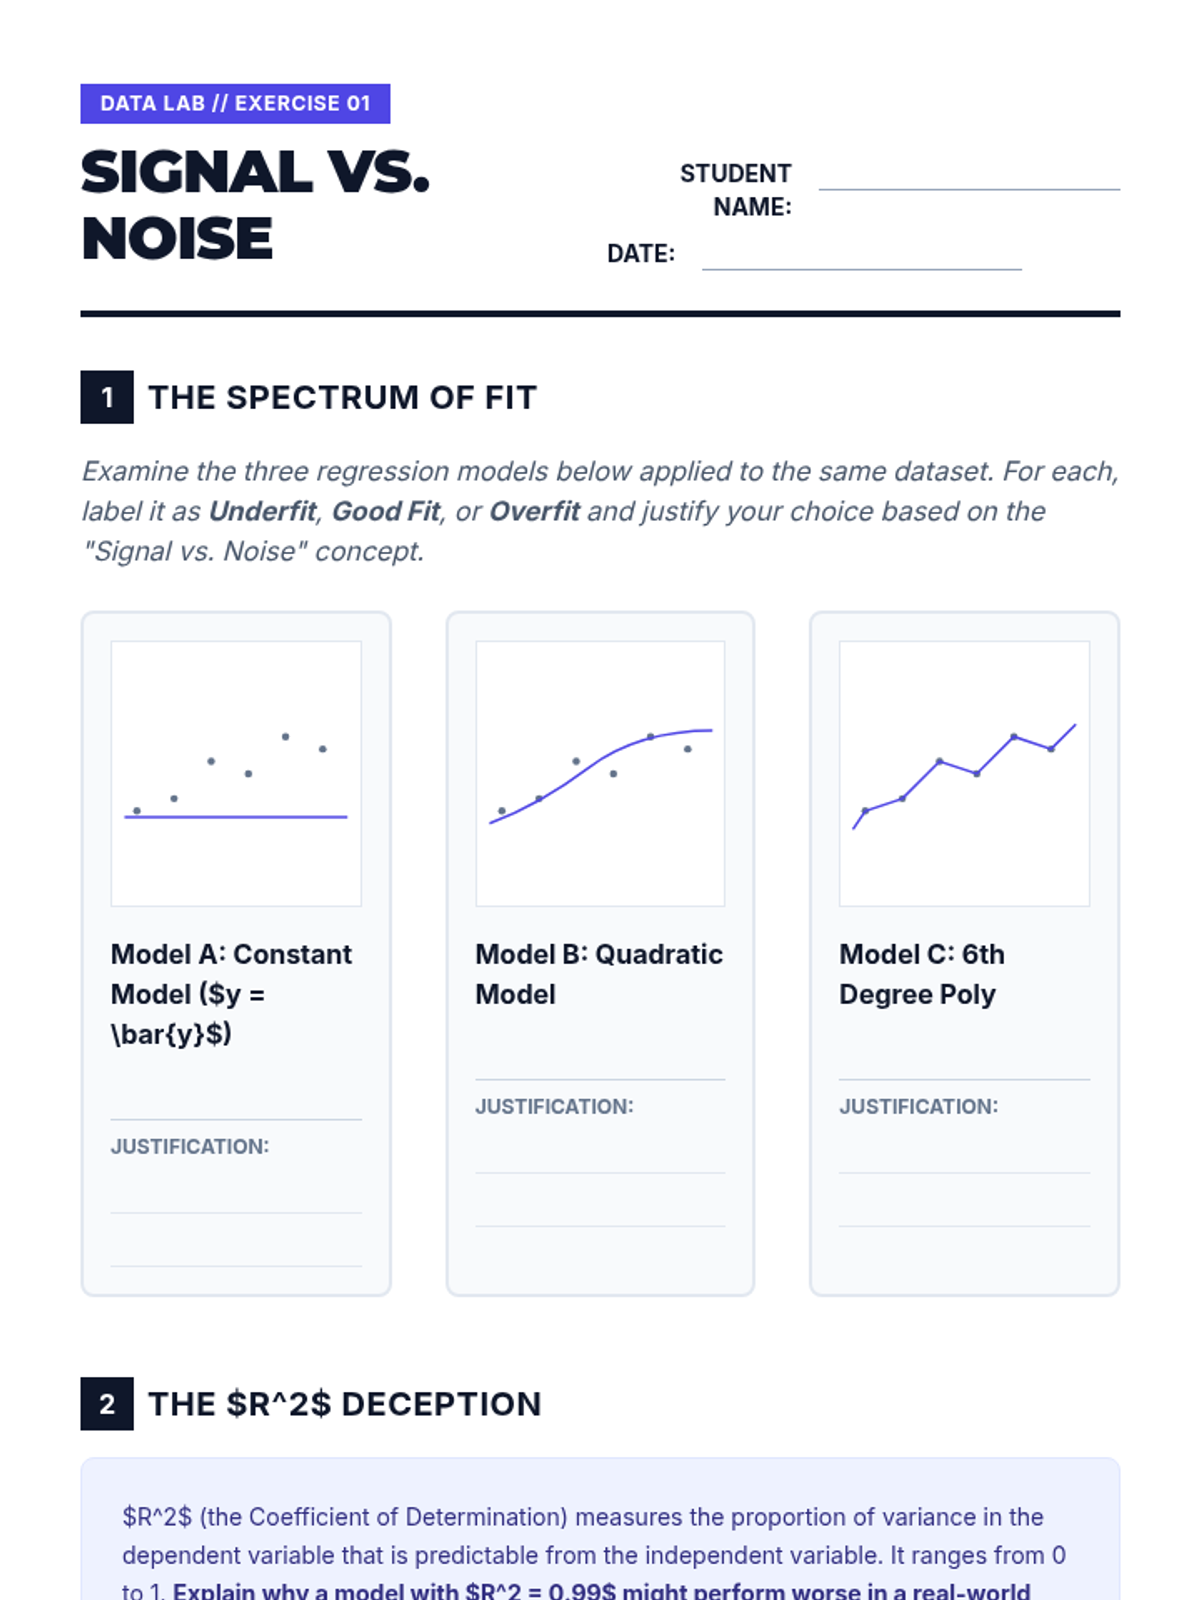
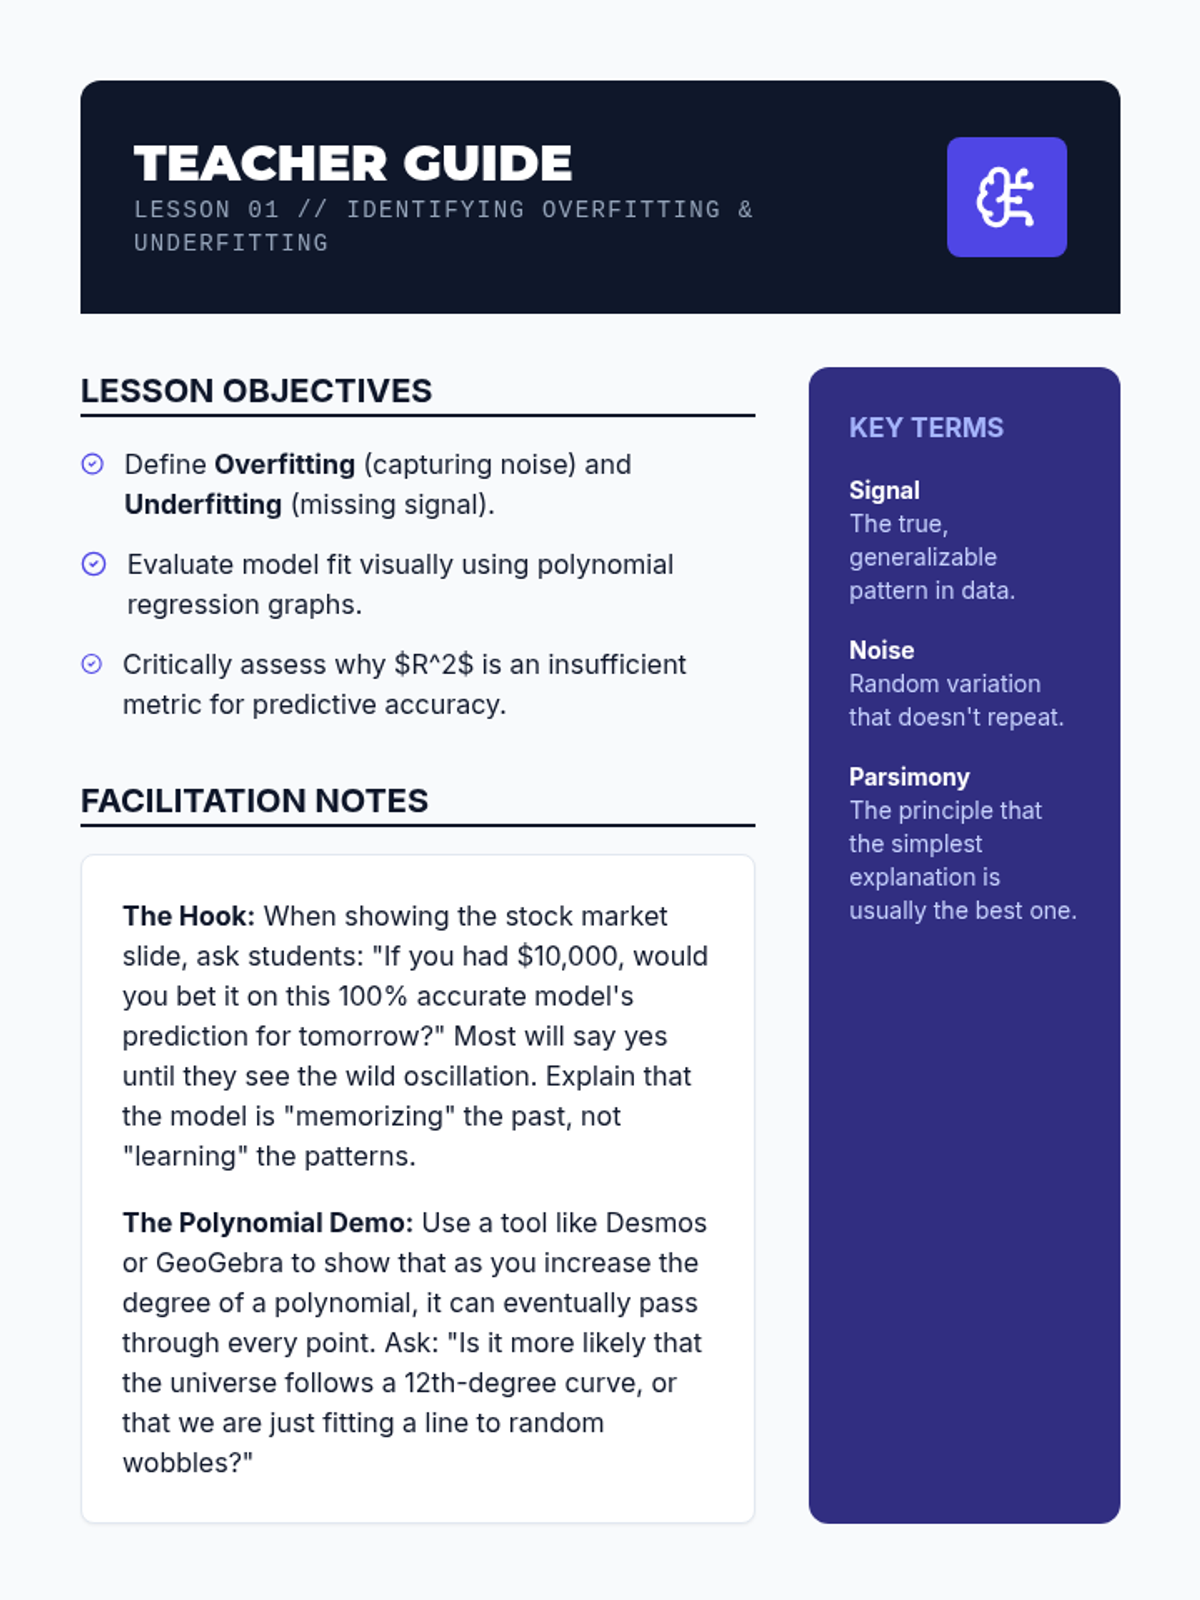
An advanced 12th-grade mathematics sequence focusing on model evaluation and selection. Students explore the bias-variance trade-off, information criteria (AIC/BIC), and cross-validation to select optimal predictive models.
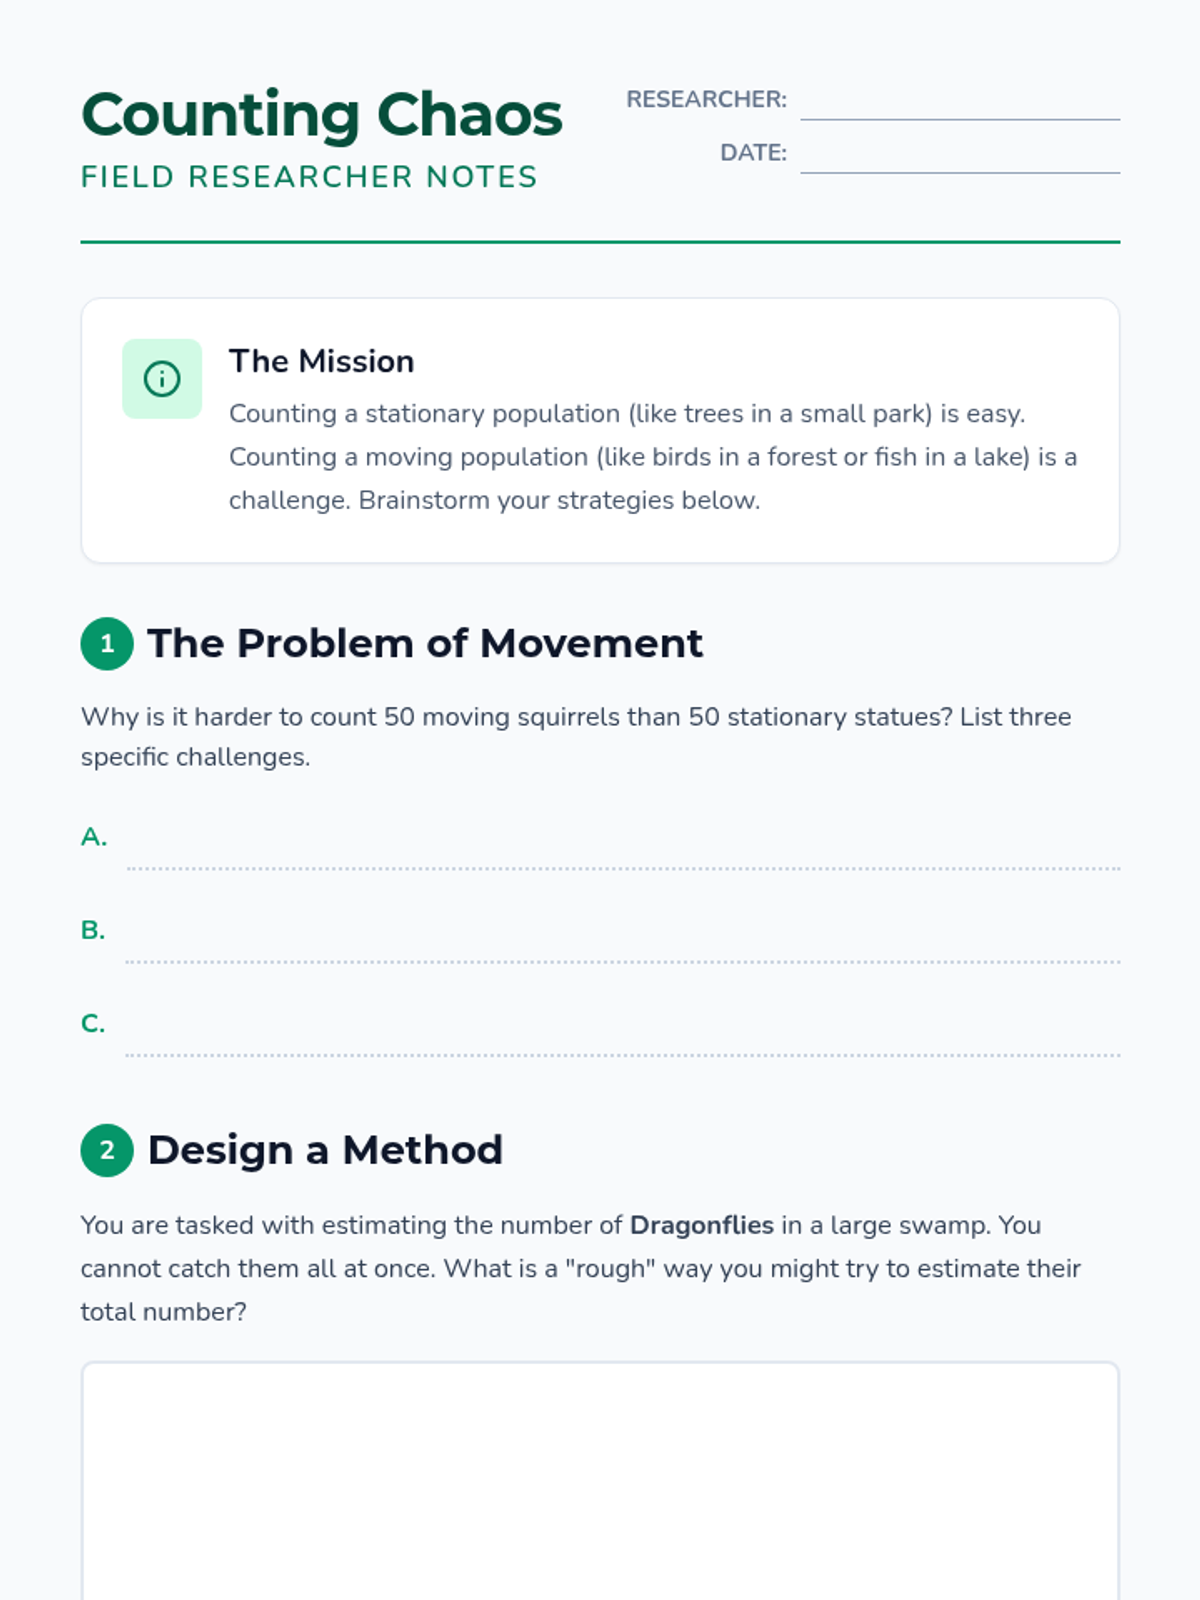
A game-based sequence where students use the Capture-Recapture method to estimate population sizes, progressing from physical simulations to proportional reasoning and real-world ecological analysis.
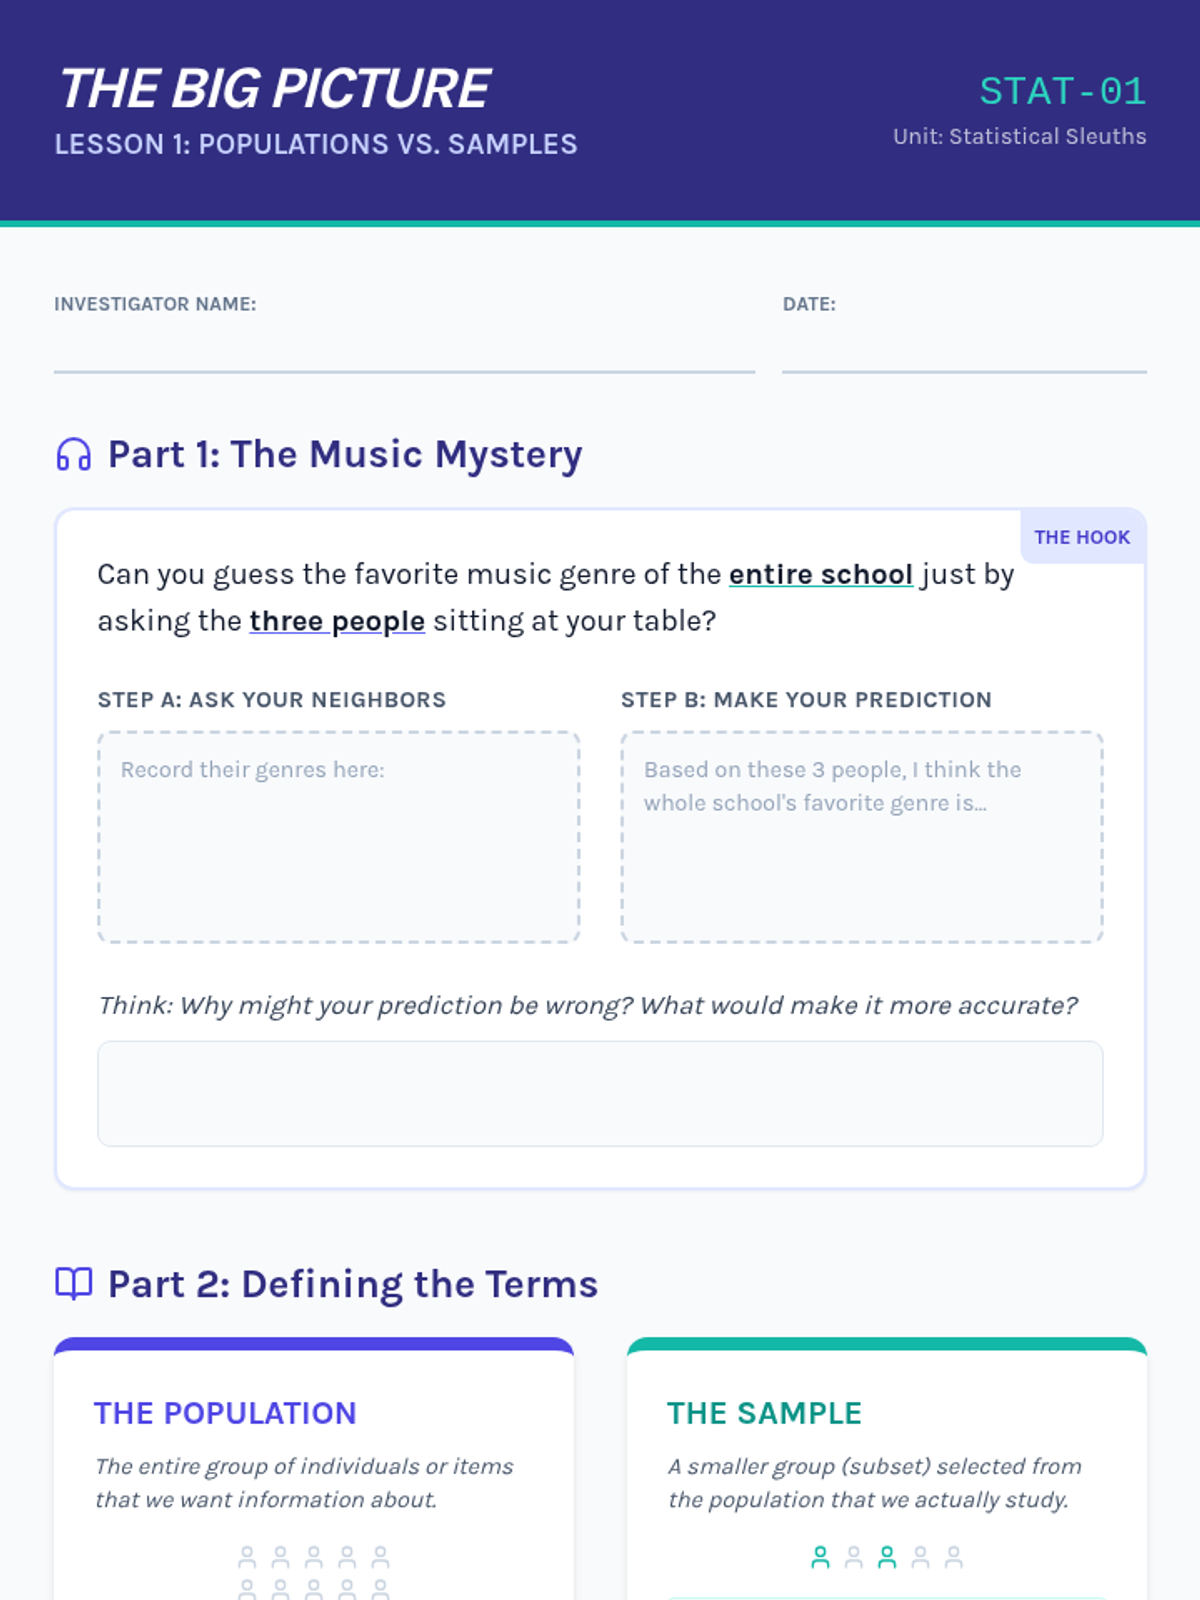
This sequence explores the critical world of statistical sampling, teaching students to identify bias, understand the importance of randomness, and evaluate the validity of data-driven claims in media and history.
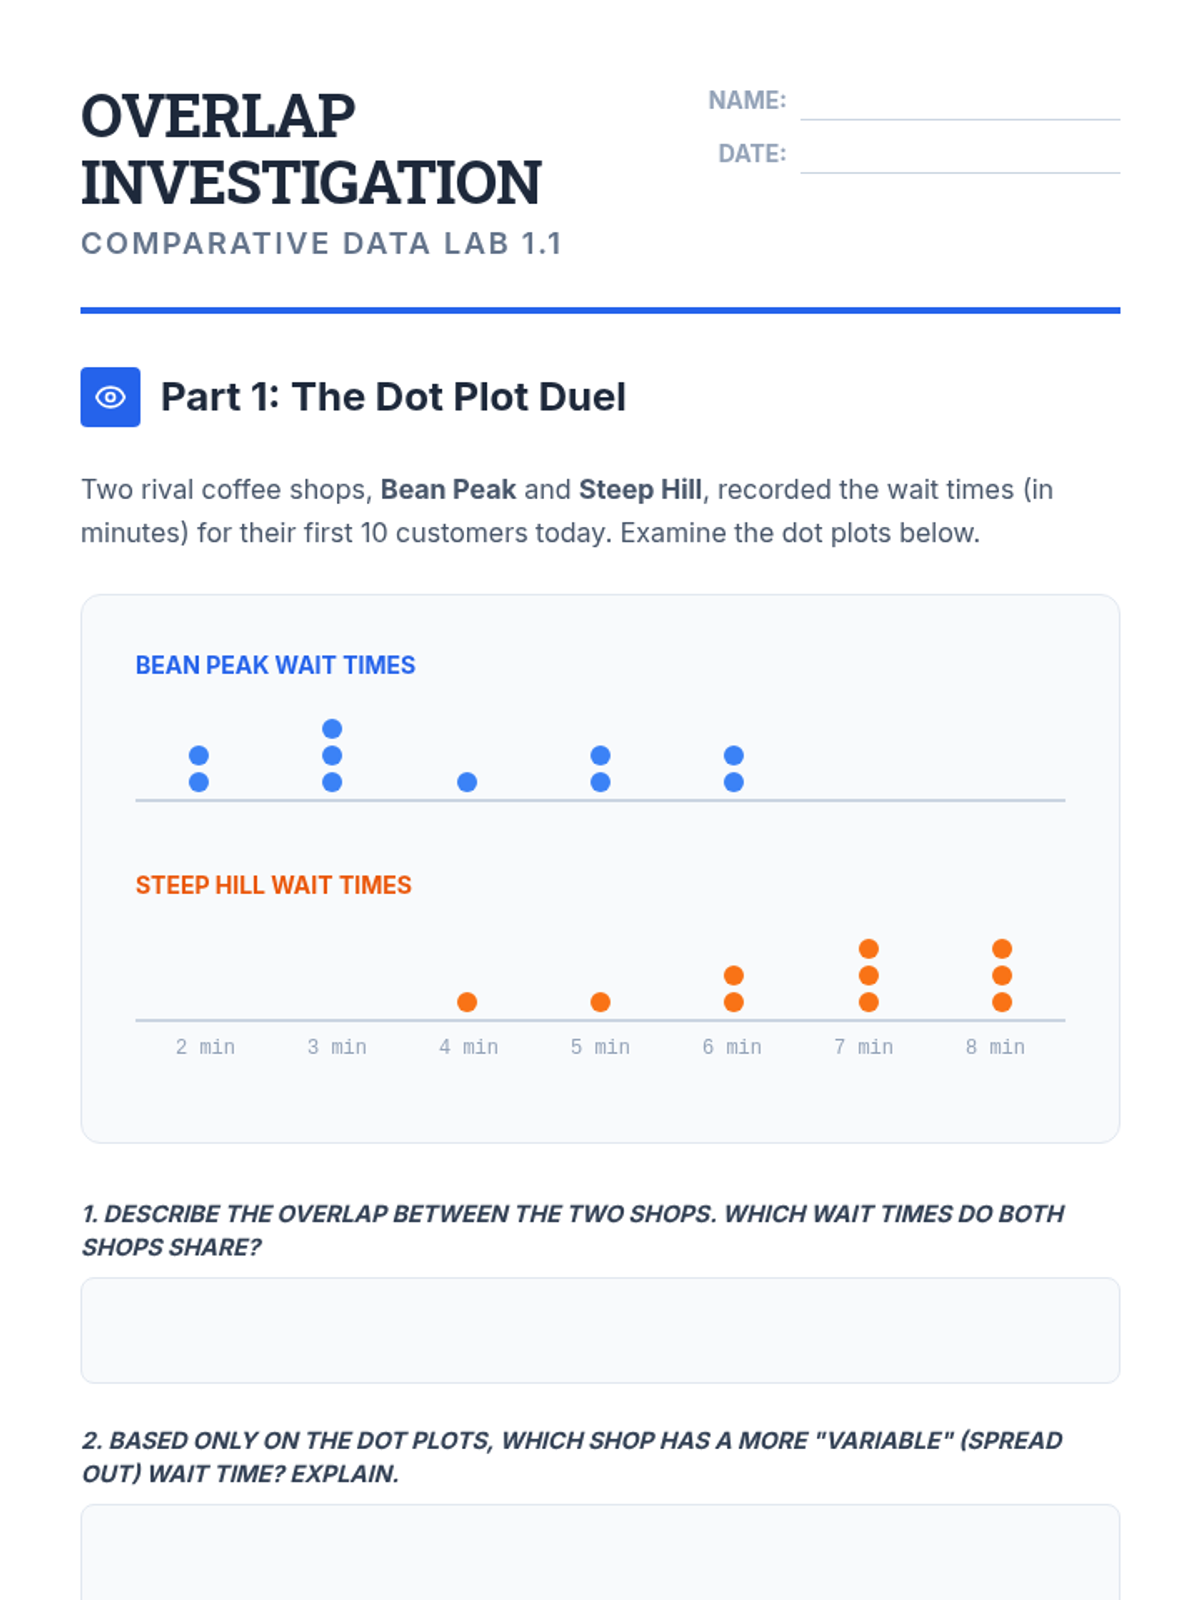
A 9th-grade statistics sequence focused on comparing populations through measures of center and variability. Students learn to interpret overlap, select appropriate metrics, and express differences in terms of spread to make informal inferences.
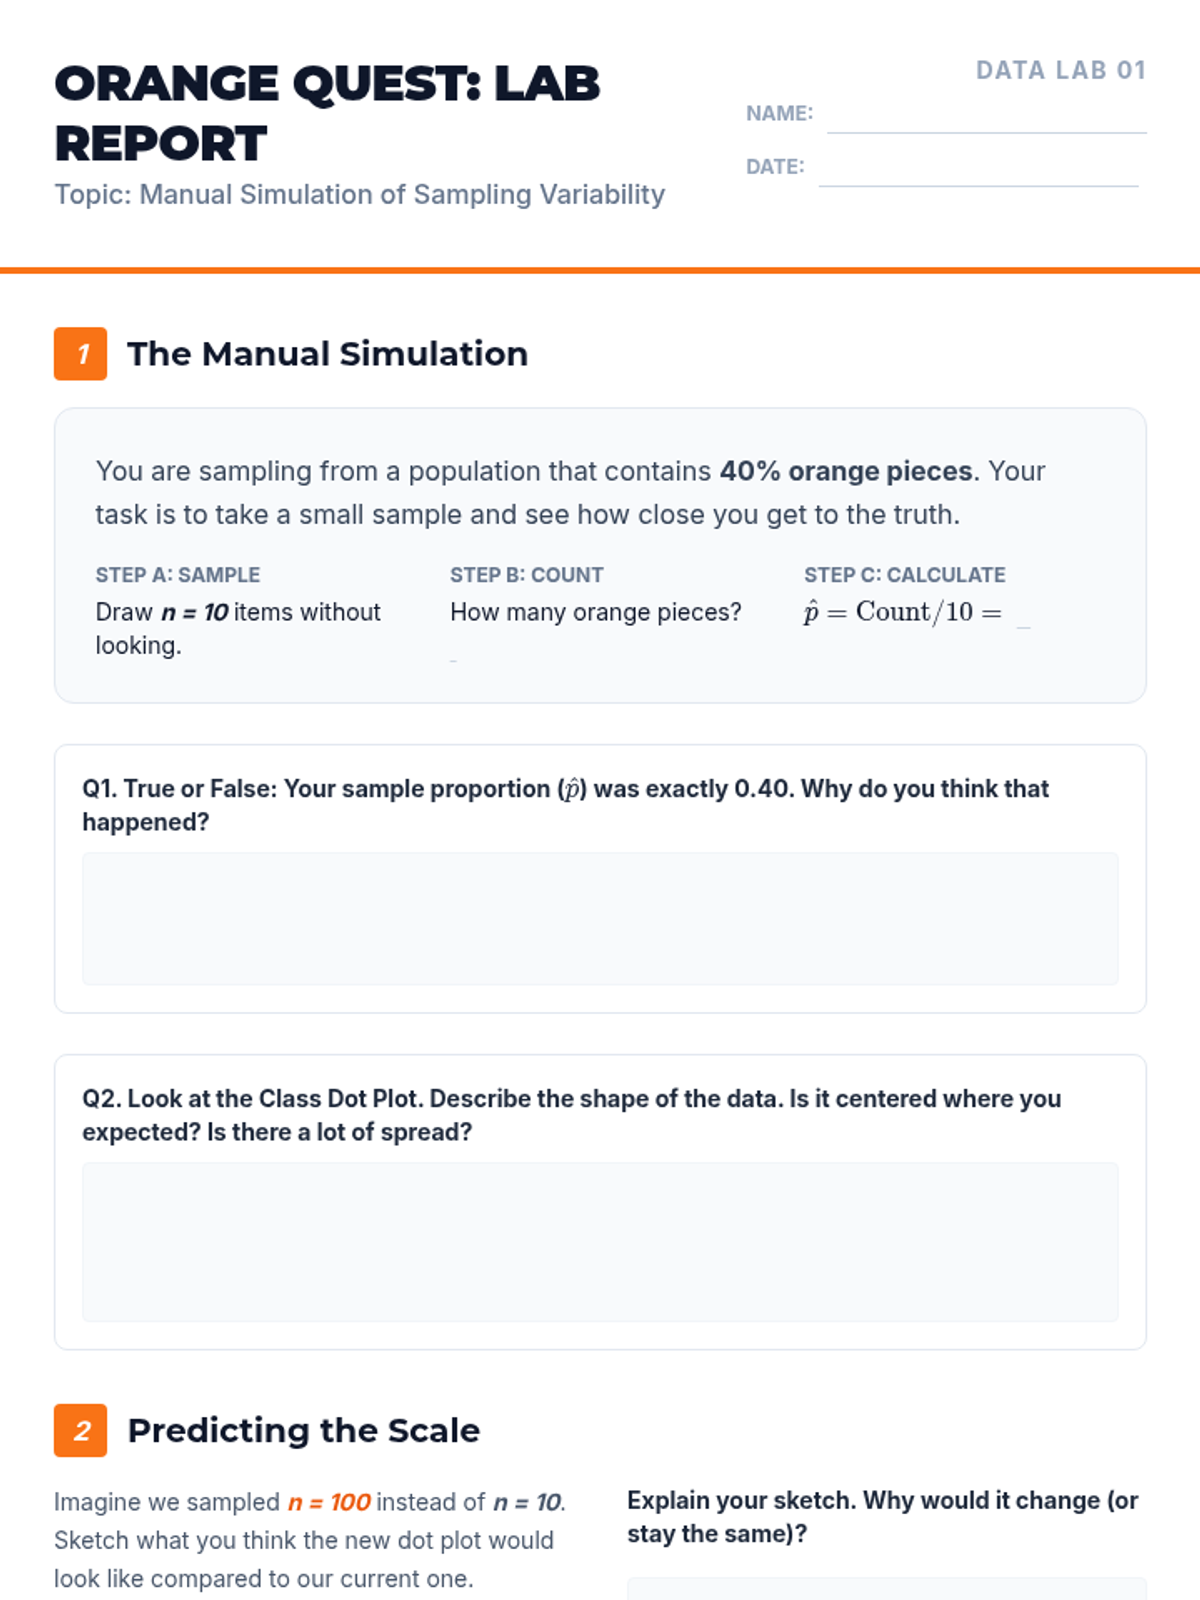
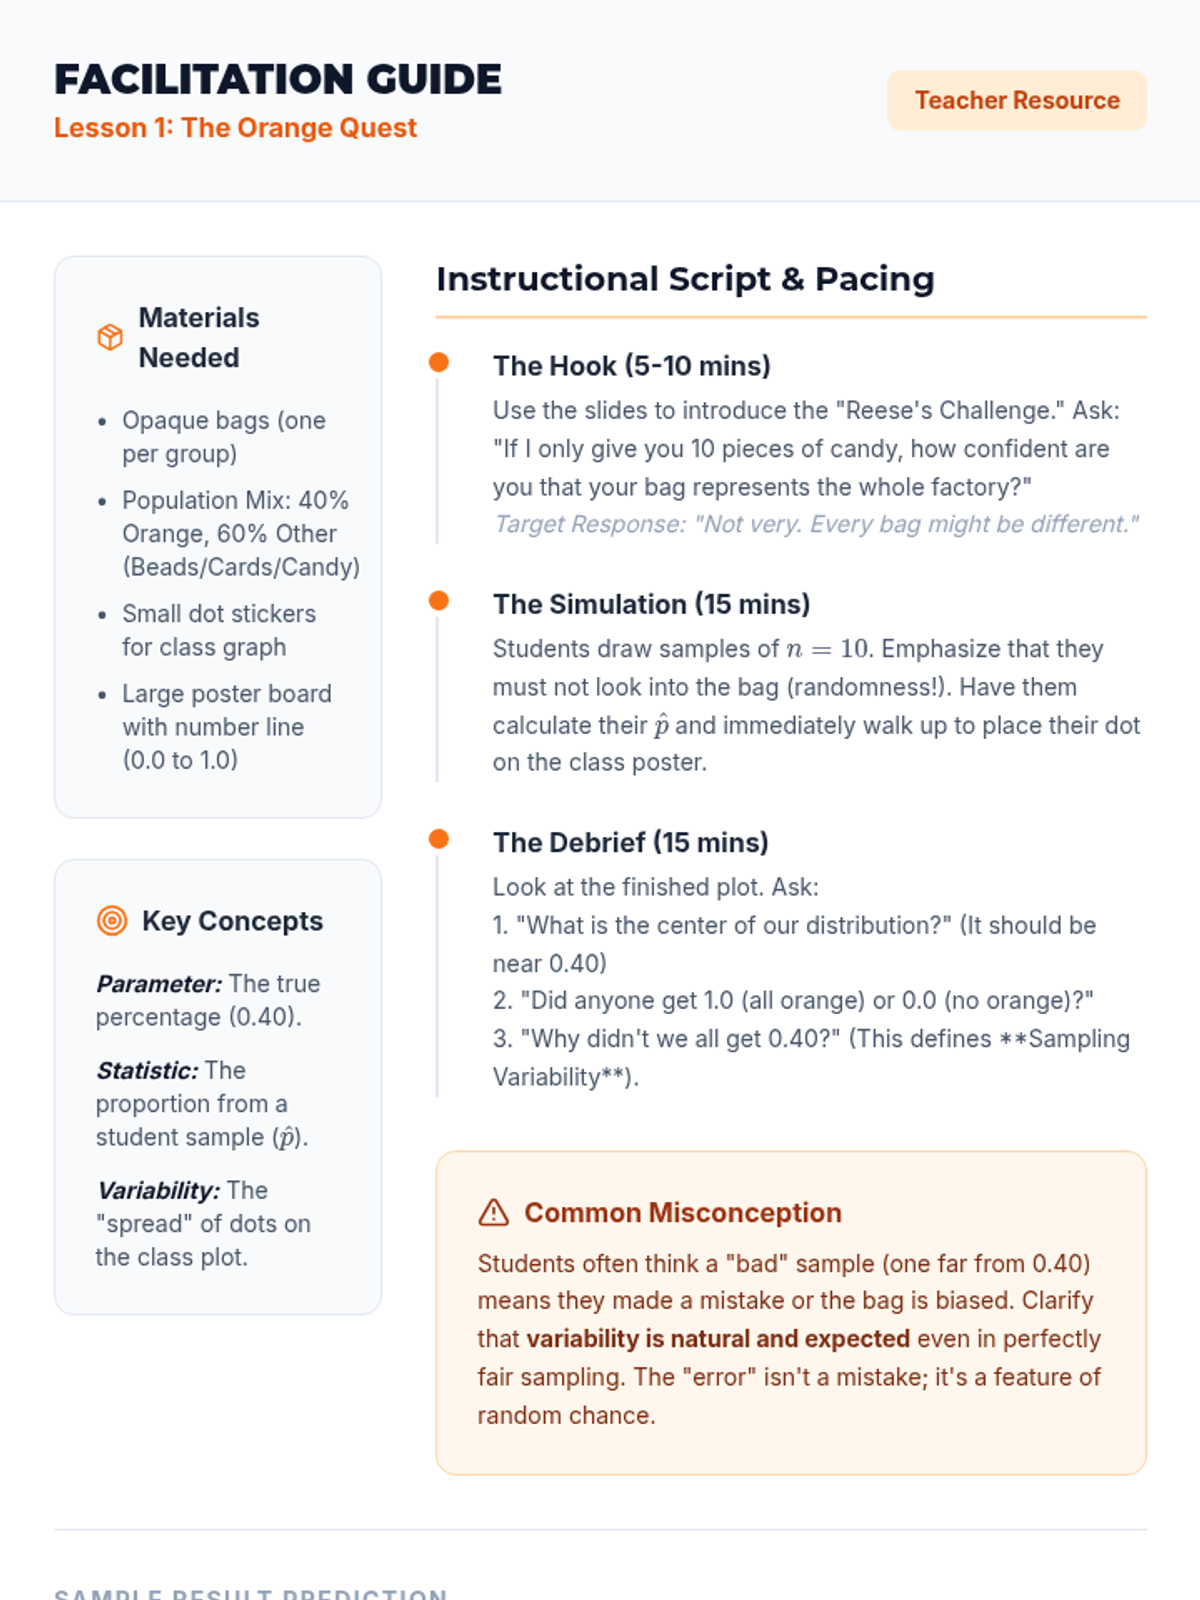
A simulation-based journey through statistical sampling, focusing on the Law of Large Numbers, variability, and the distinction between bias and precision. Students move from manual experiments to digital simulations to build intuition for statistical inference.
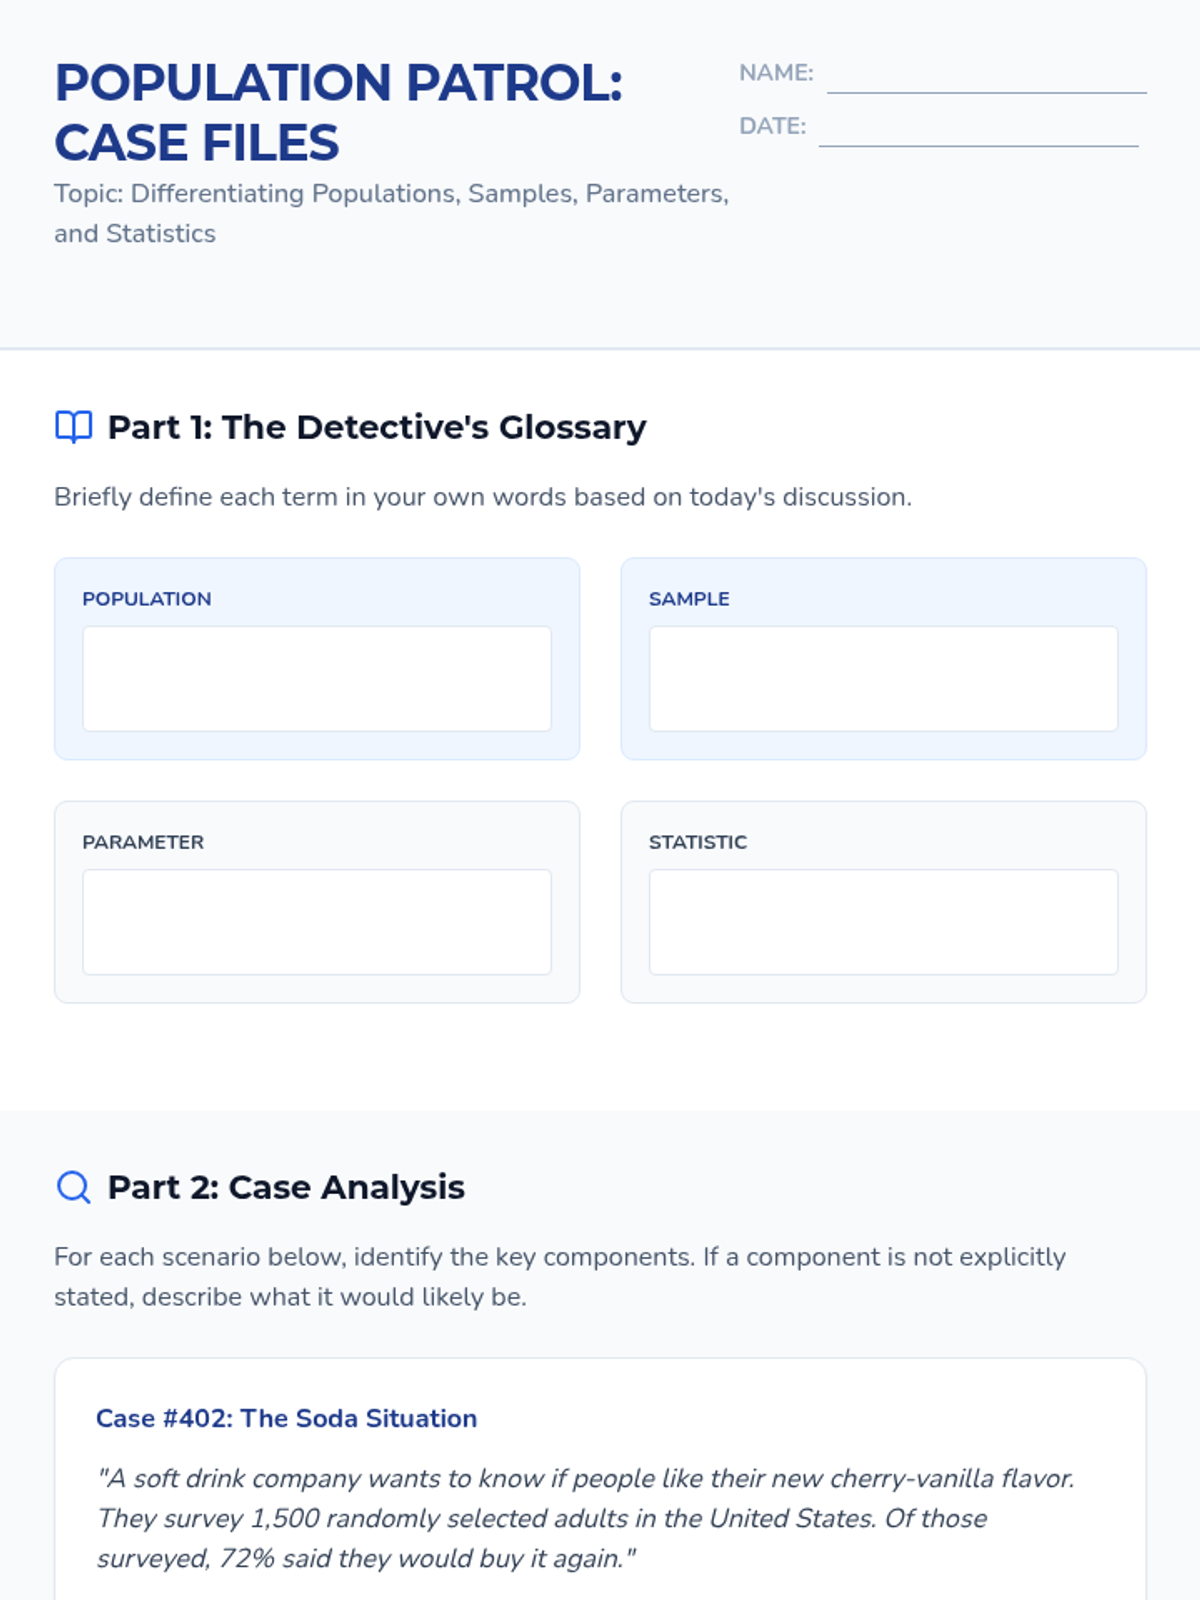
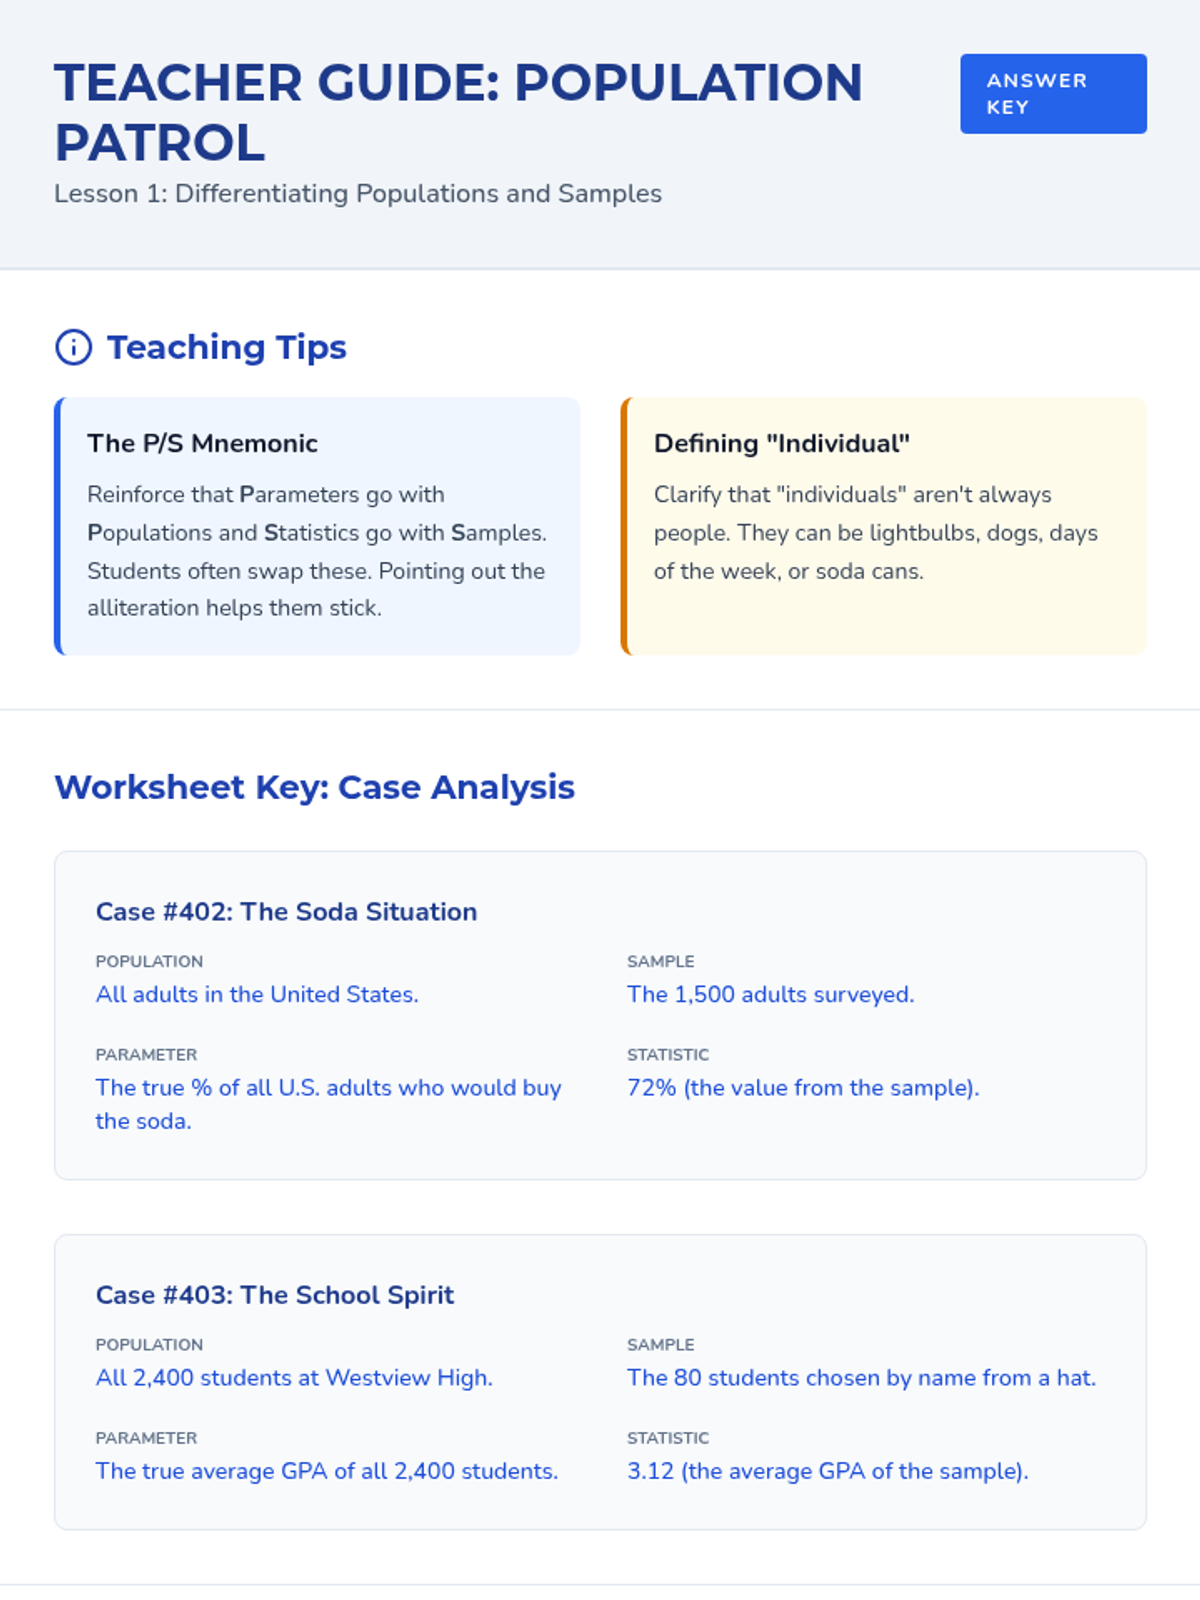
A comprehensive 9th-grade statistics sequence exploring populations, sampling methods (SRS, stratified, cluster, systematic), and the identification of bias in data collection. Students progress from foundational definitions to critiquing the validity of real-world statistical claims.
A project-based exploration of statistical sampling where students learn to define populations, determine sample sizes, design protocols, and make valid inferences. Students act as data consultants, moving from theoretical understanding to simulated data collection and analysis.
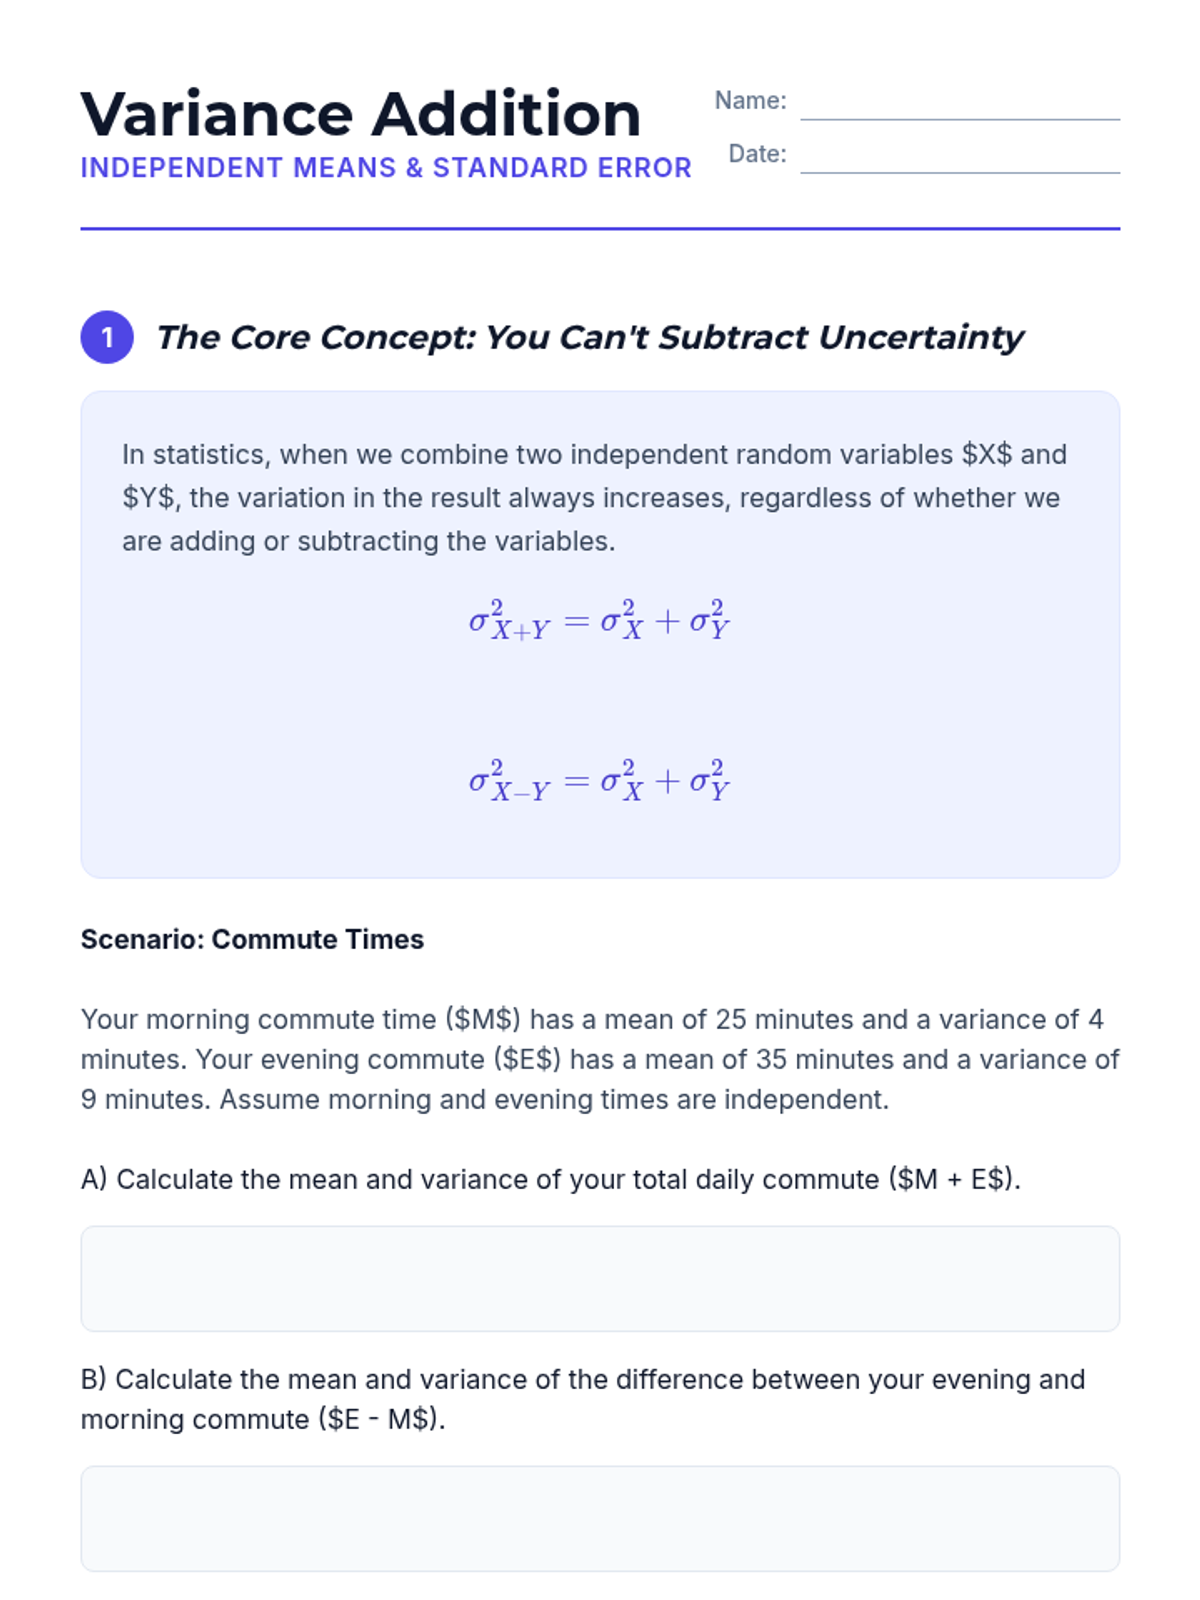
This sequence covers the comparison of means from two independent groups in quantitative data. Students explore the standard error of the difference, degrees of freedom complexities, hypothesis testing through clinical trials, confidence intervals, and the distinction between statistical and practical significance.
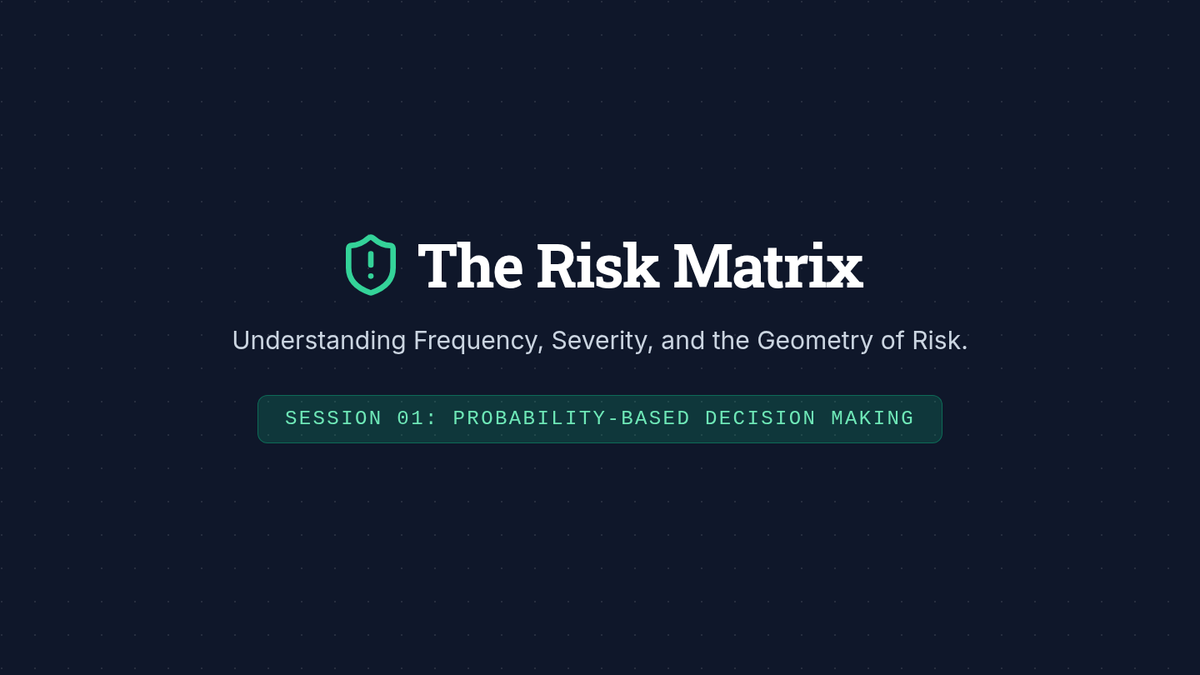
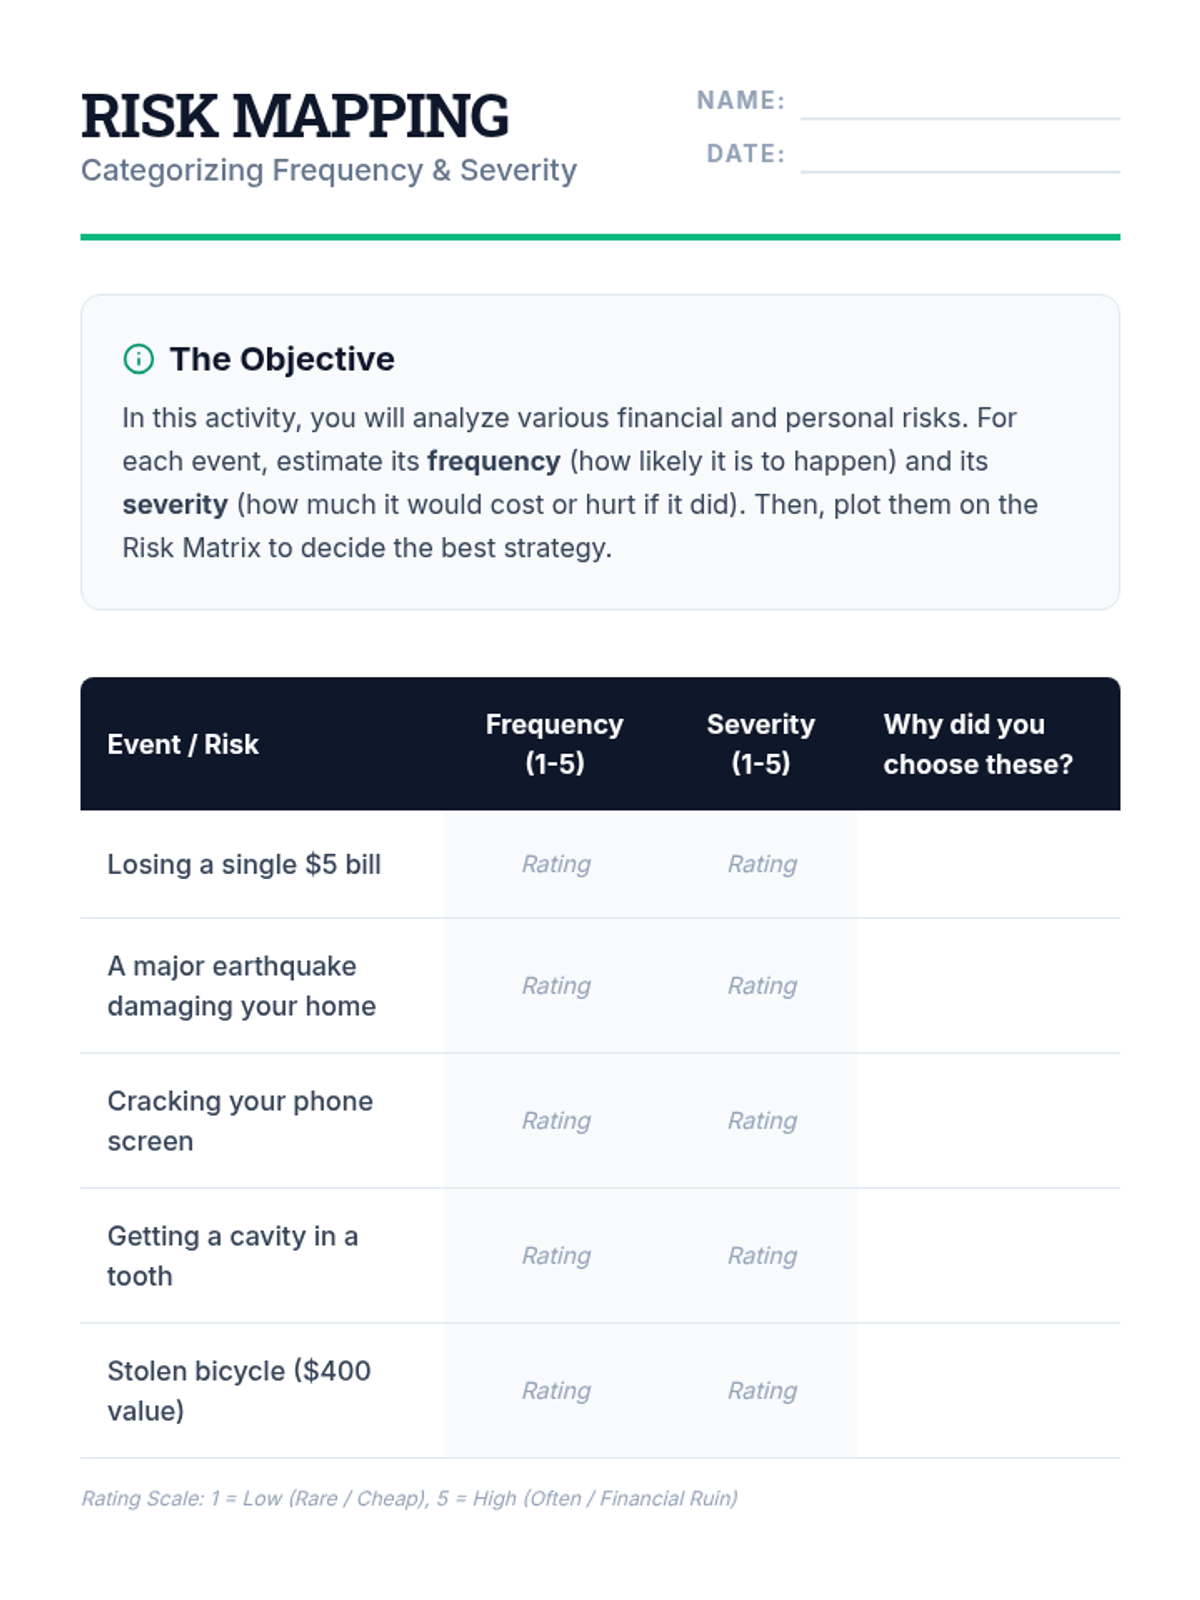
A high school statistics sequence focused on quantifying risk and consistency through measures of variability. Students move from basic spread concepts to complex financial and industrial case studies, culminating in a data-driven risk assessment report.
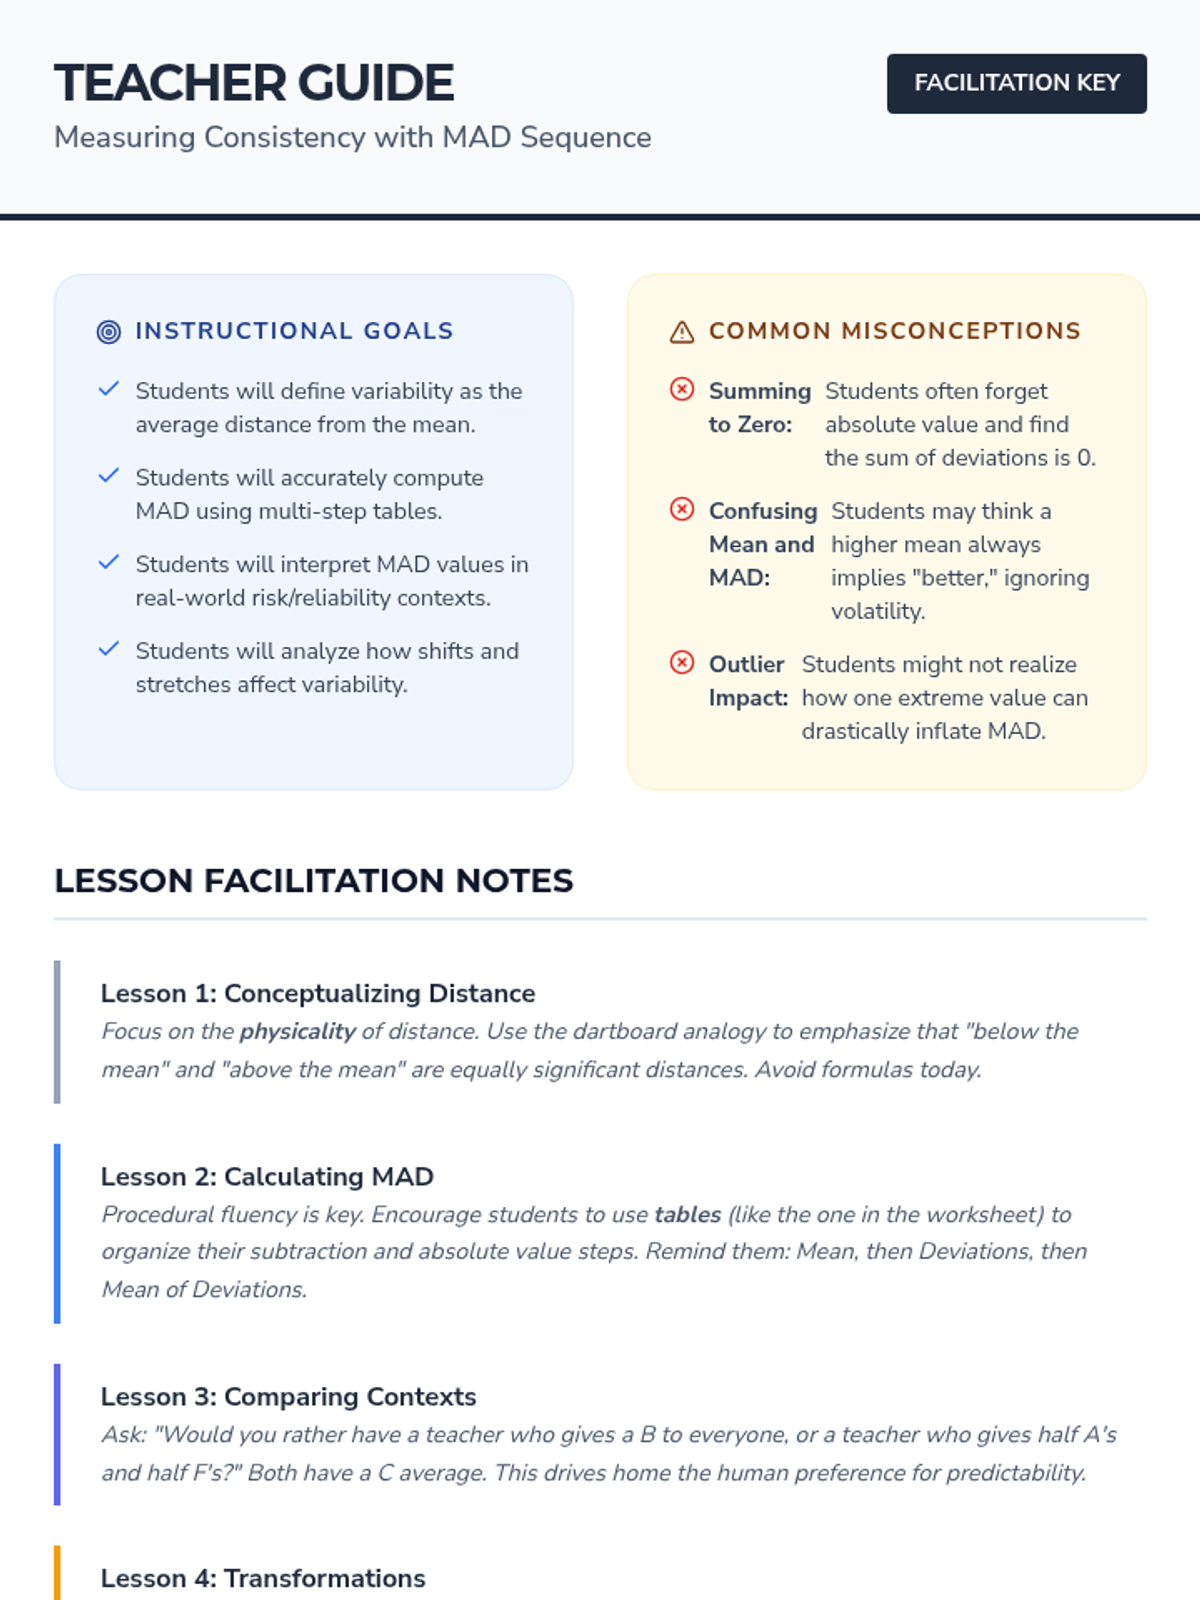
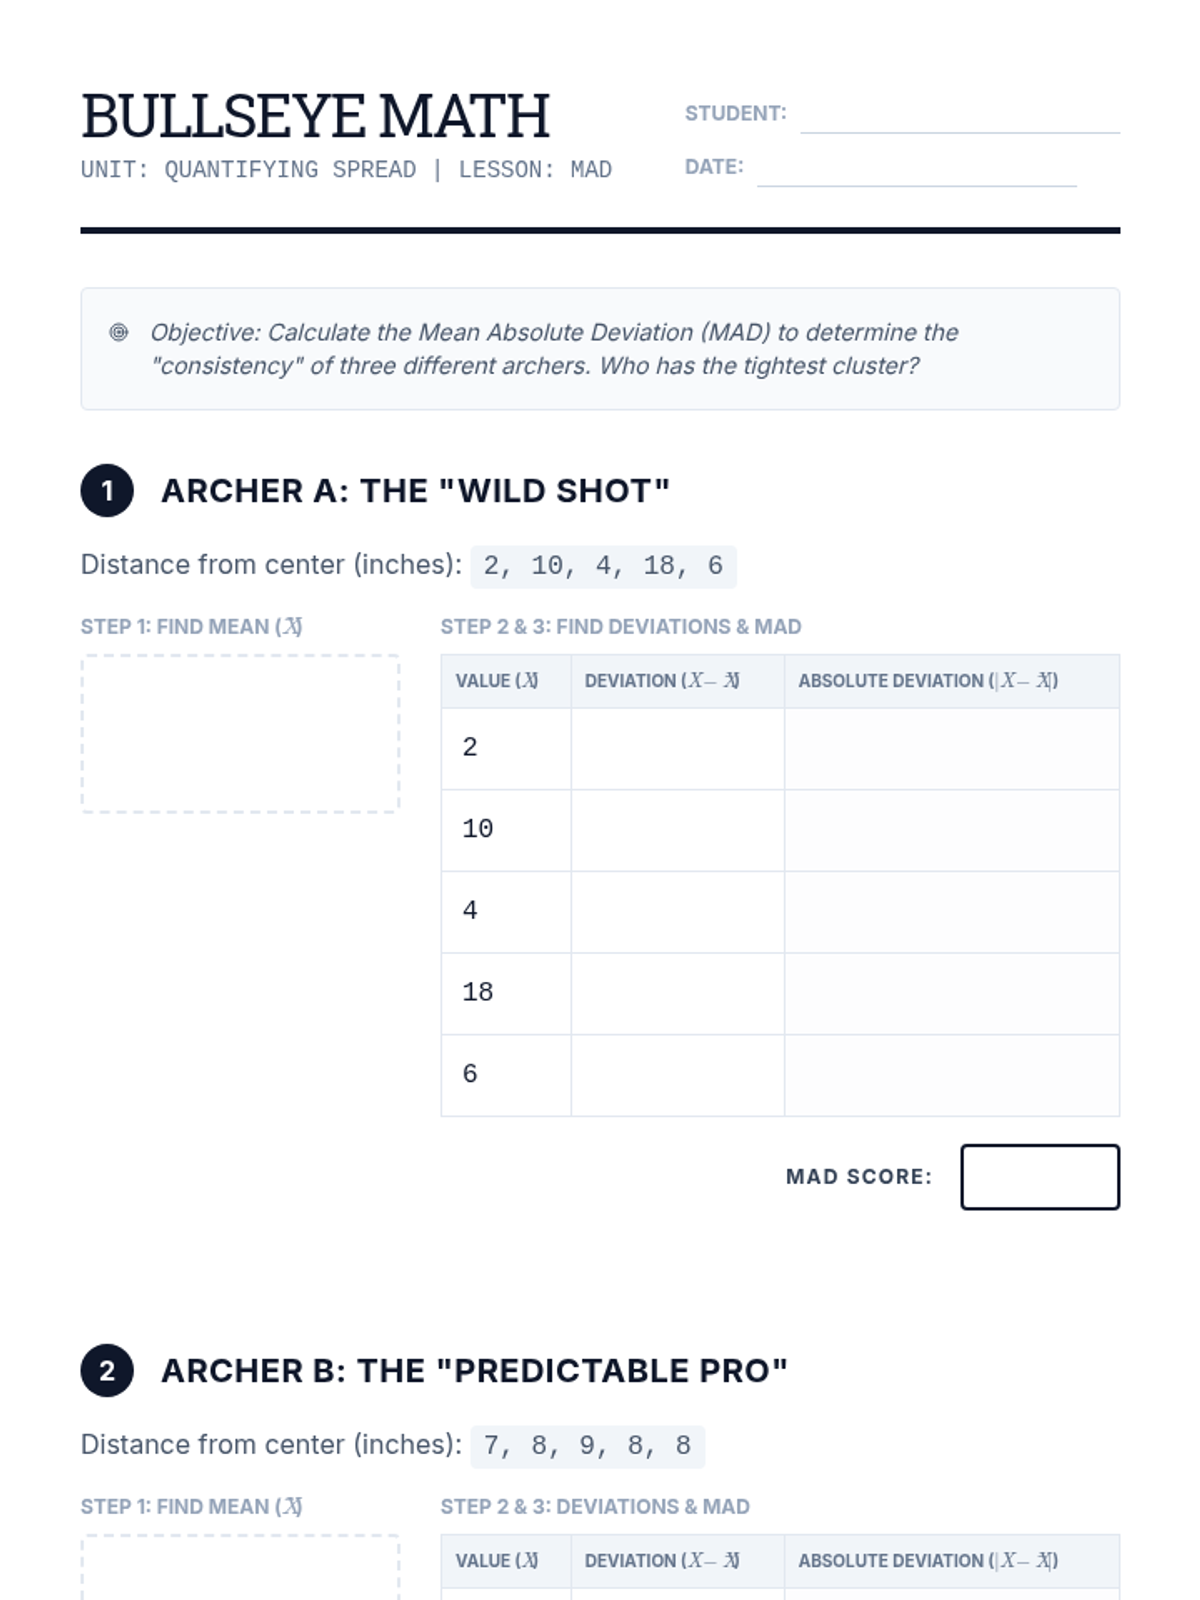
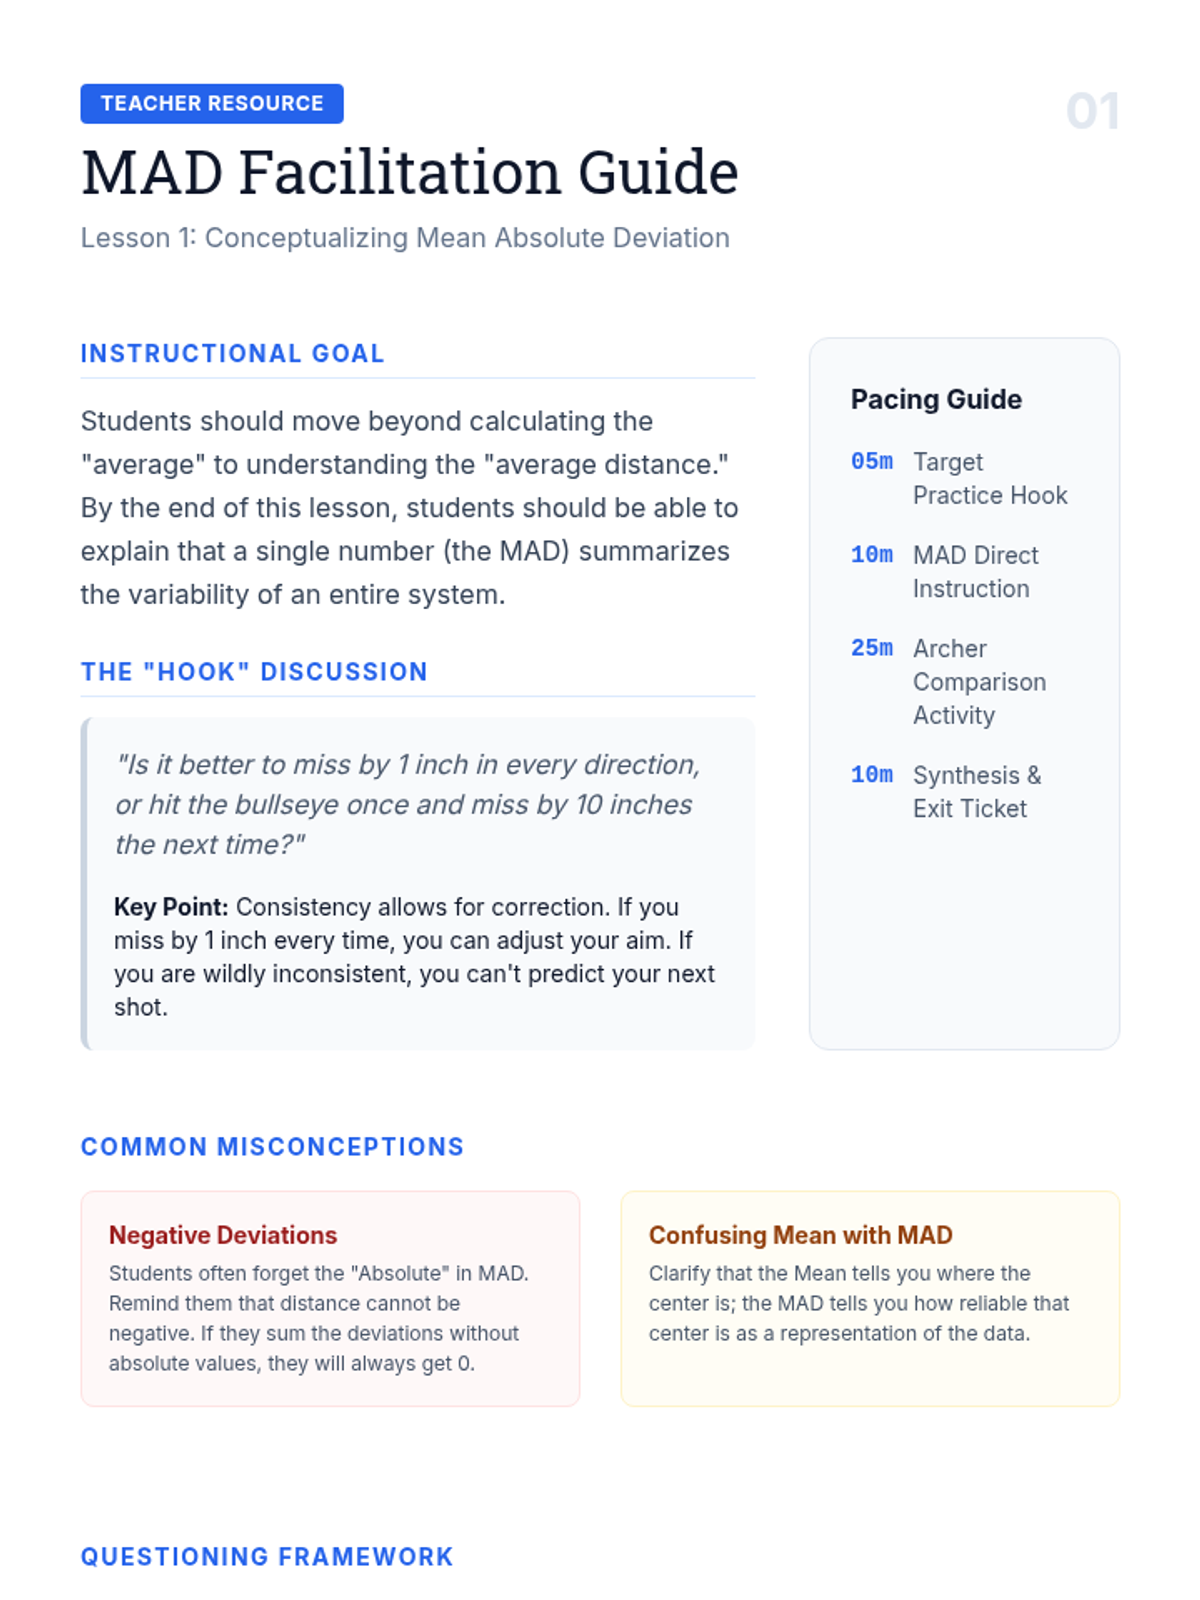
This project-based sequence explores consistency and volatility through the lens of Mean Absolute Deviation (MAD). Students analyze real-world datasets to understand how variability quantifies 'reliability' beyond simple averages.
A 10th-grade statistics workshop exploring the mathematical transition from Mean Absolute Deviation to Standard Deviation. Students analyze data spread, the logic of variance, and the application of the Empirical Rule and Z-scores to real-world datasets.
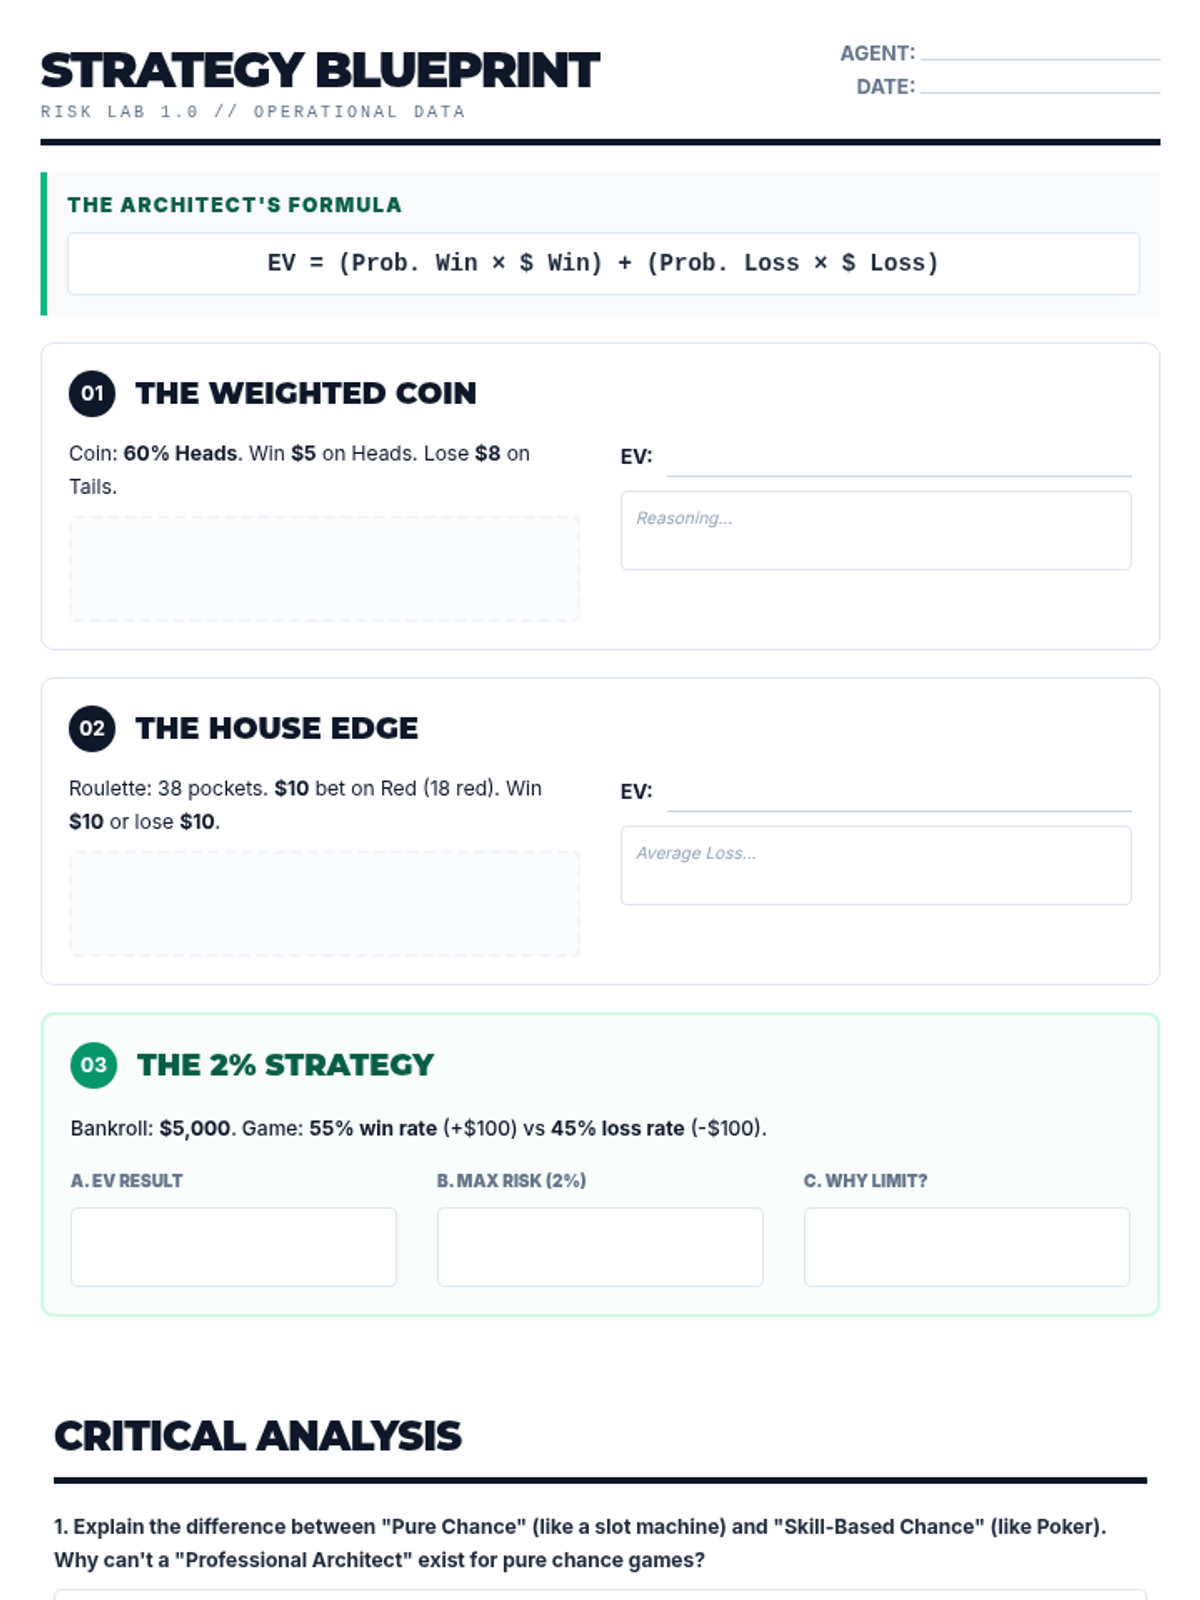
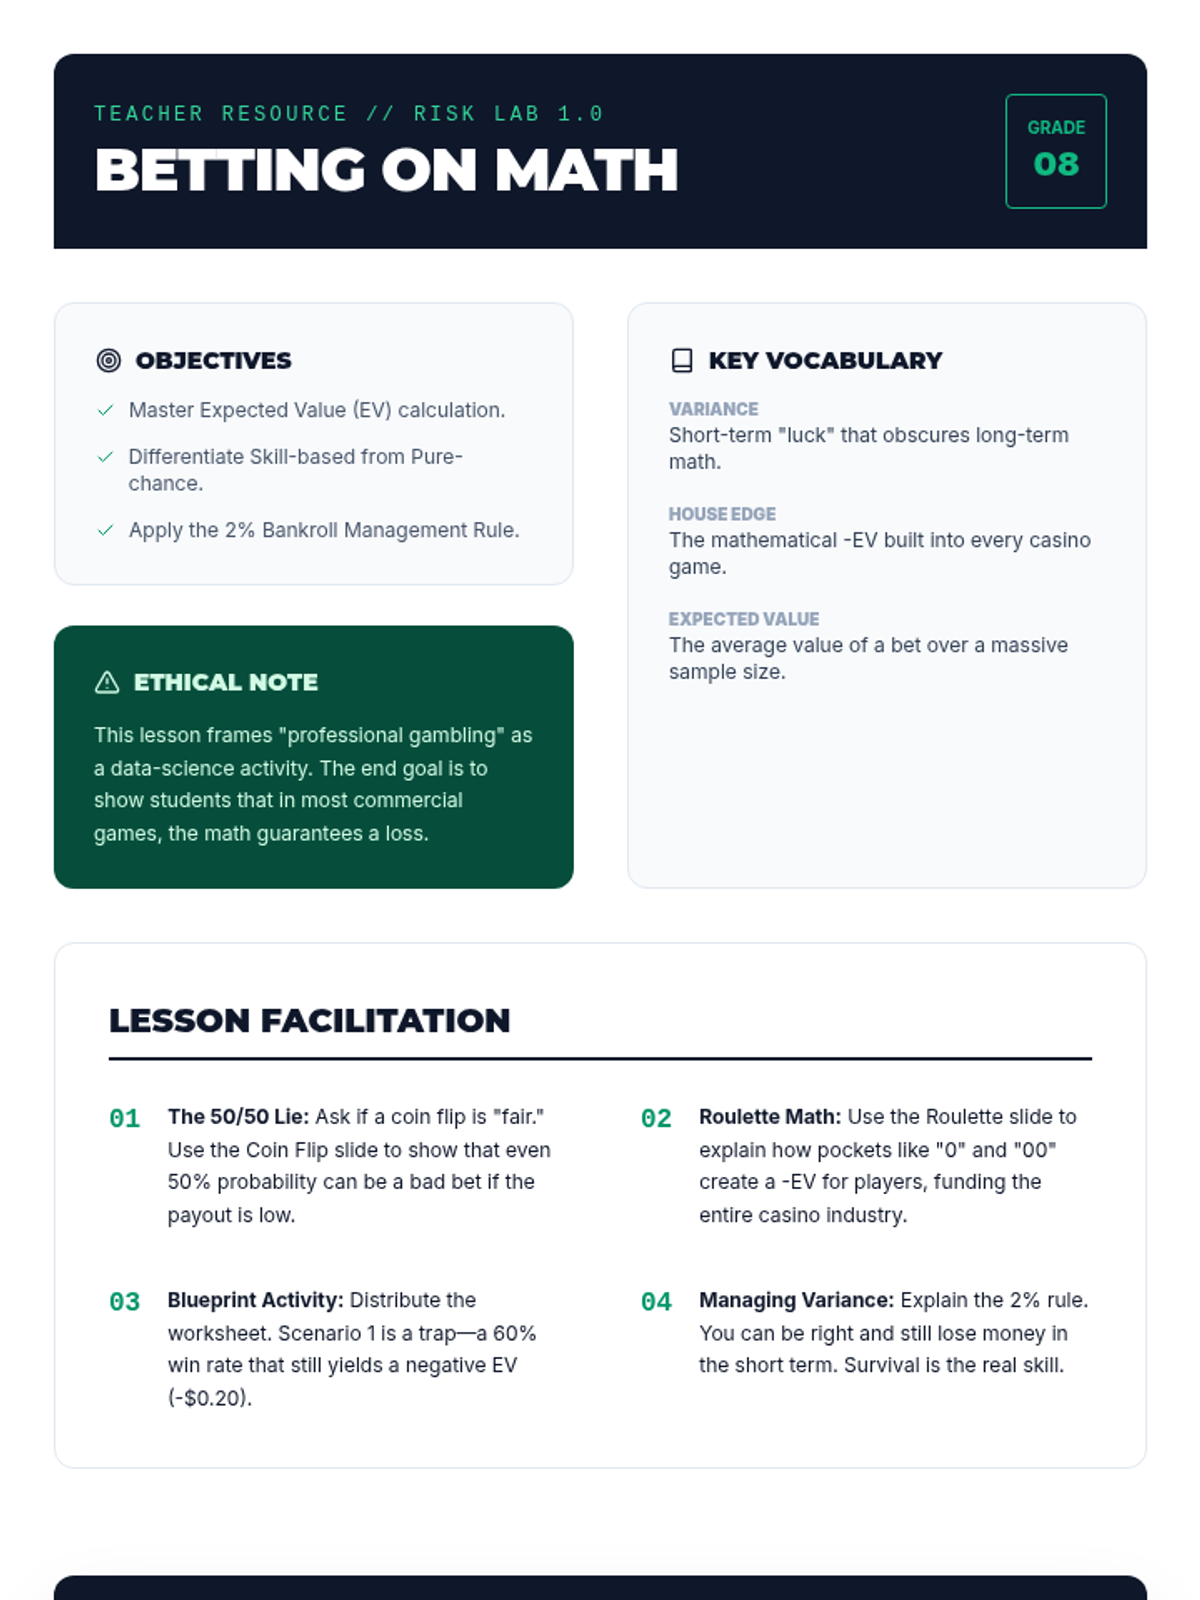
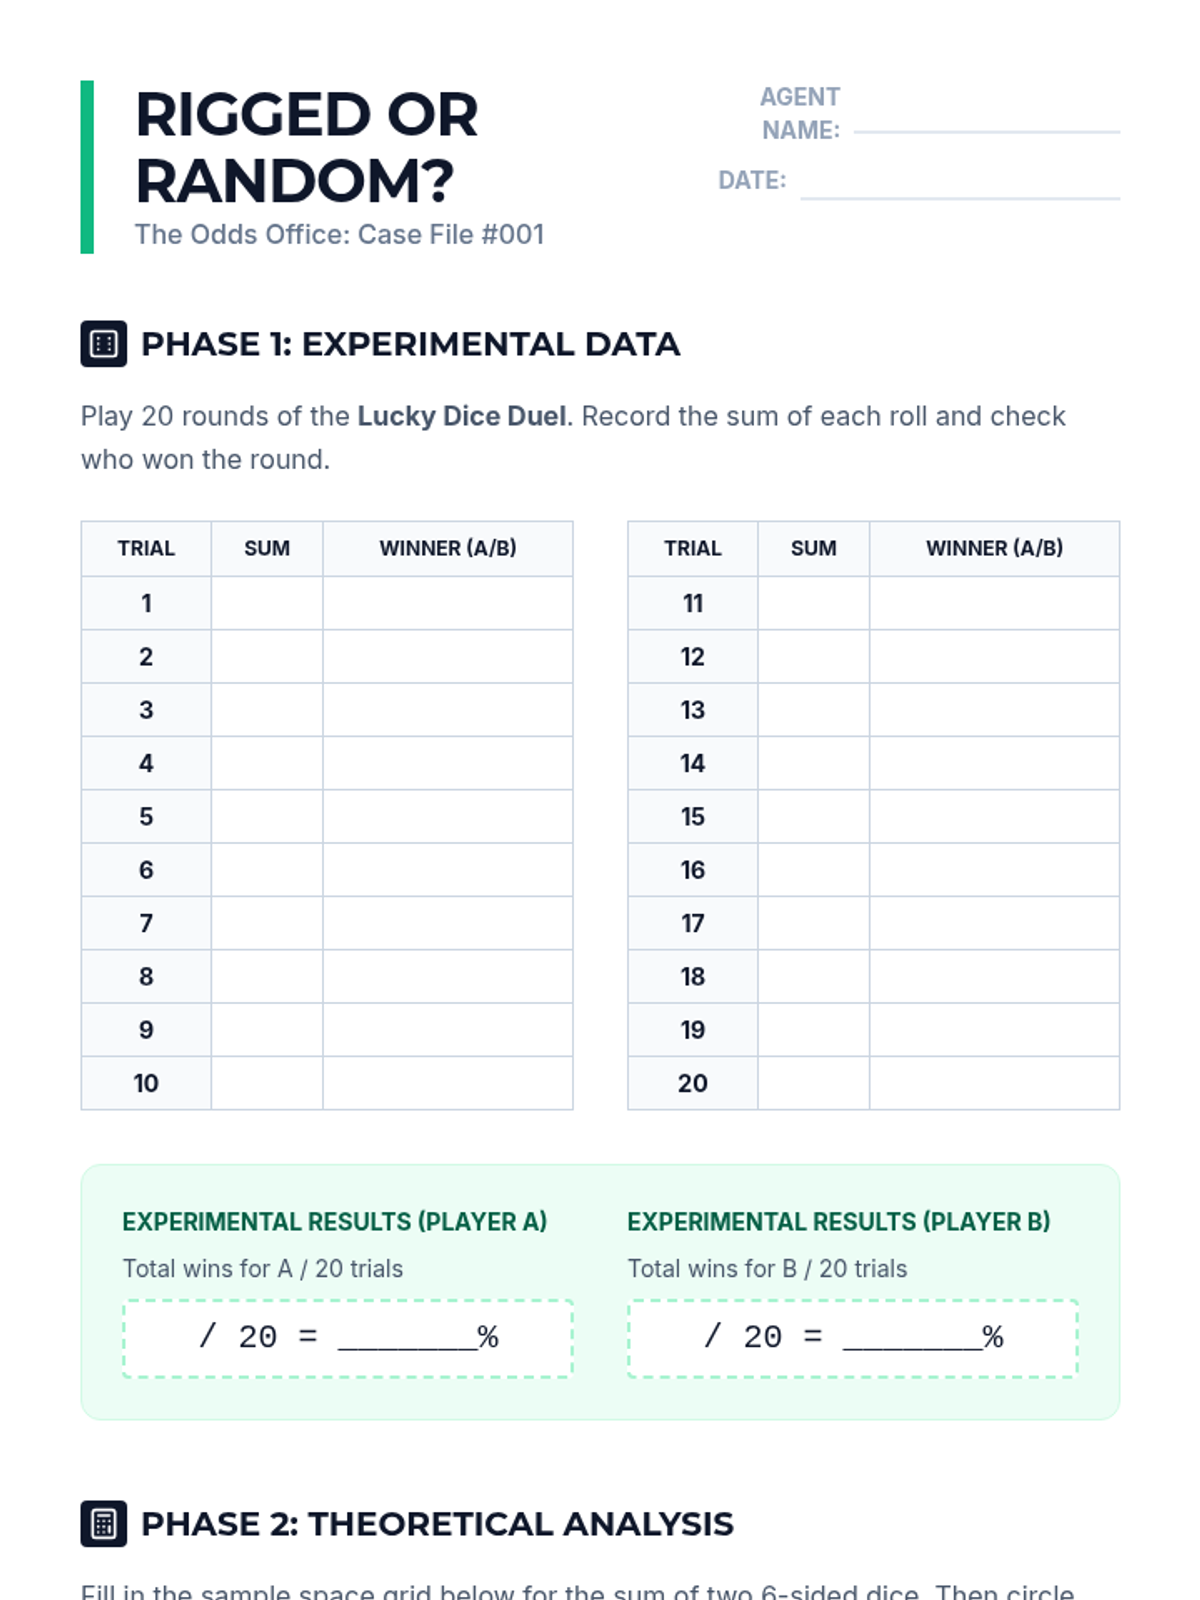
A high-stakes dive into the mathematics of probability, risk assessment, and expected value, teaching students how to analyze games of chance and skill through a professional lens.
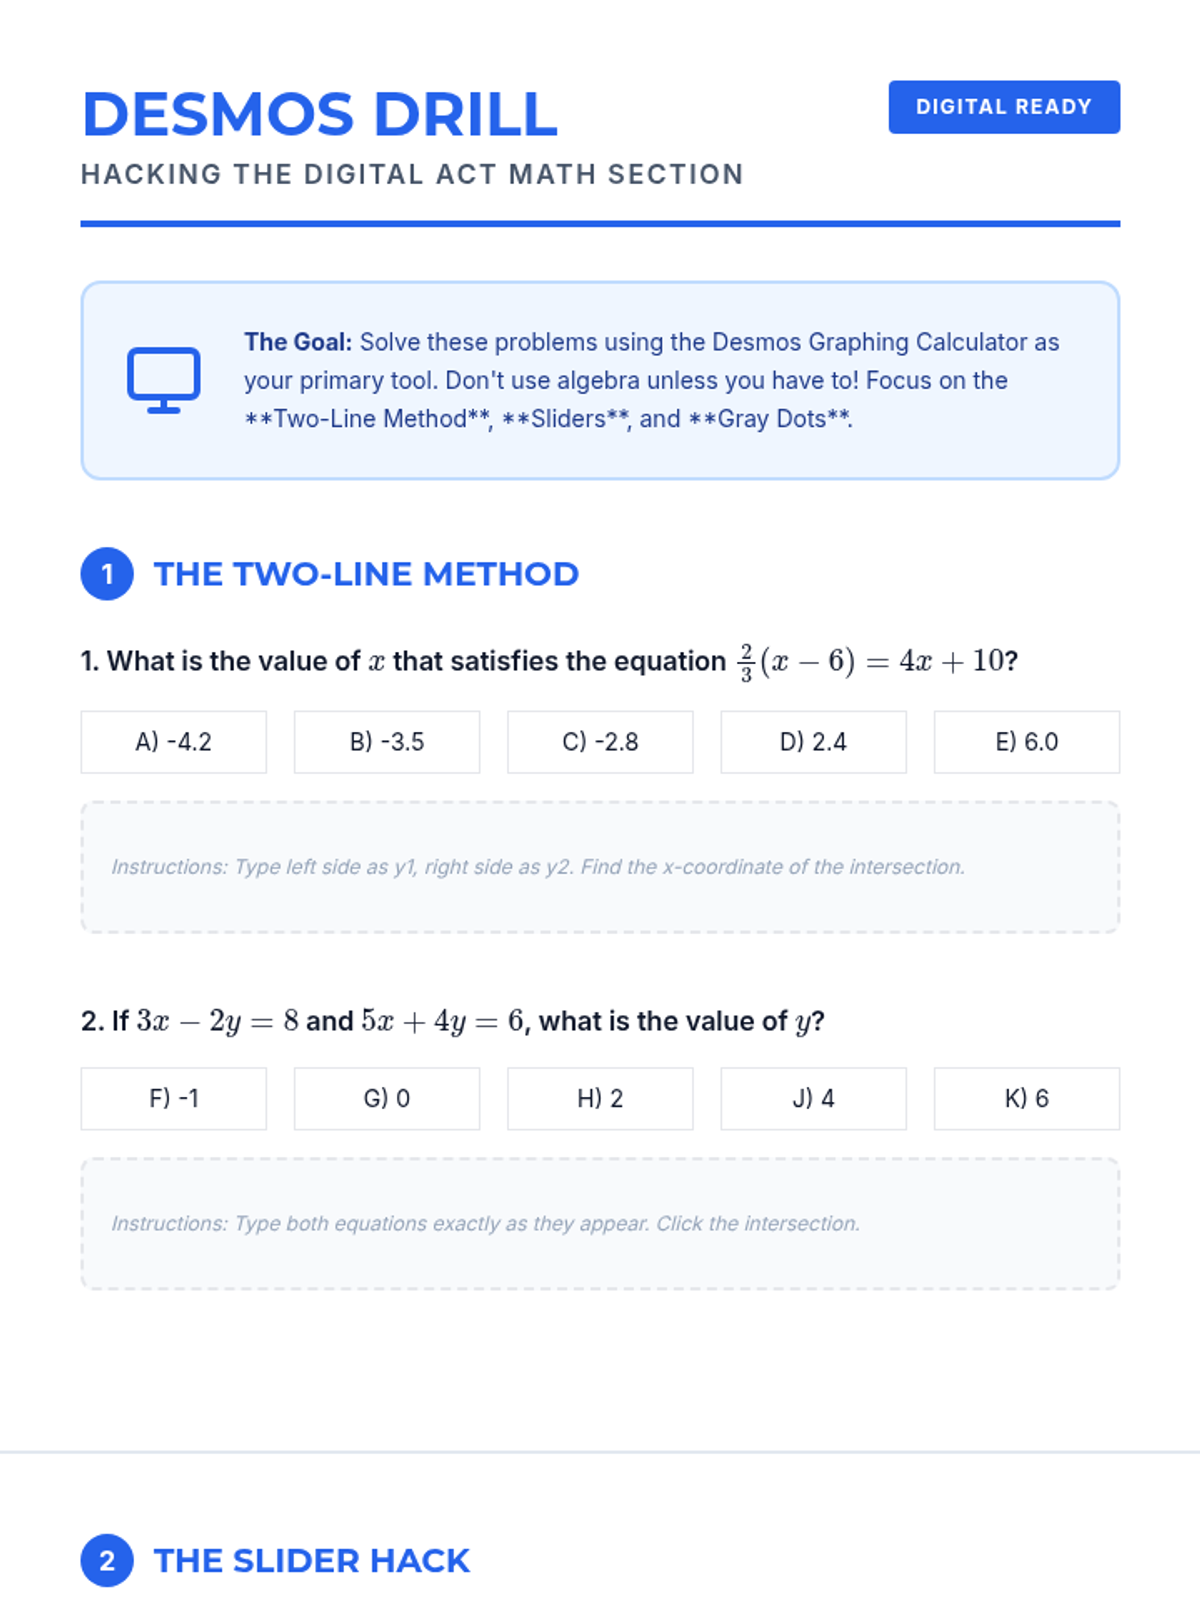
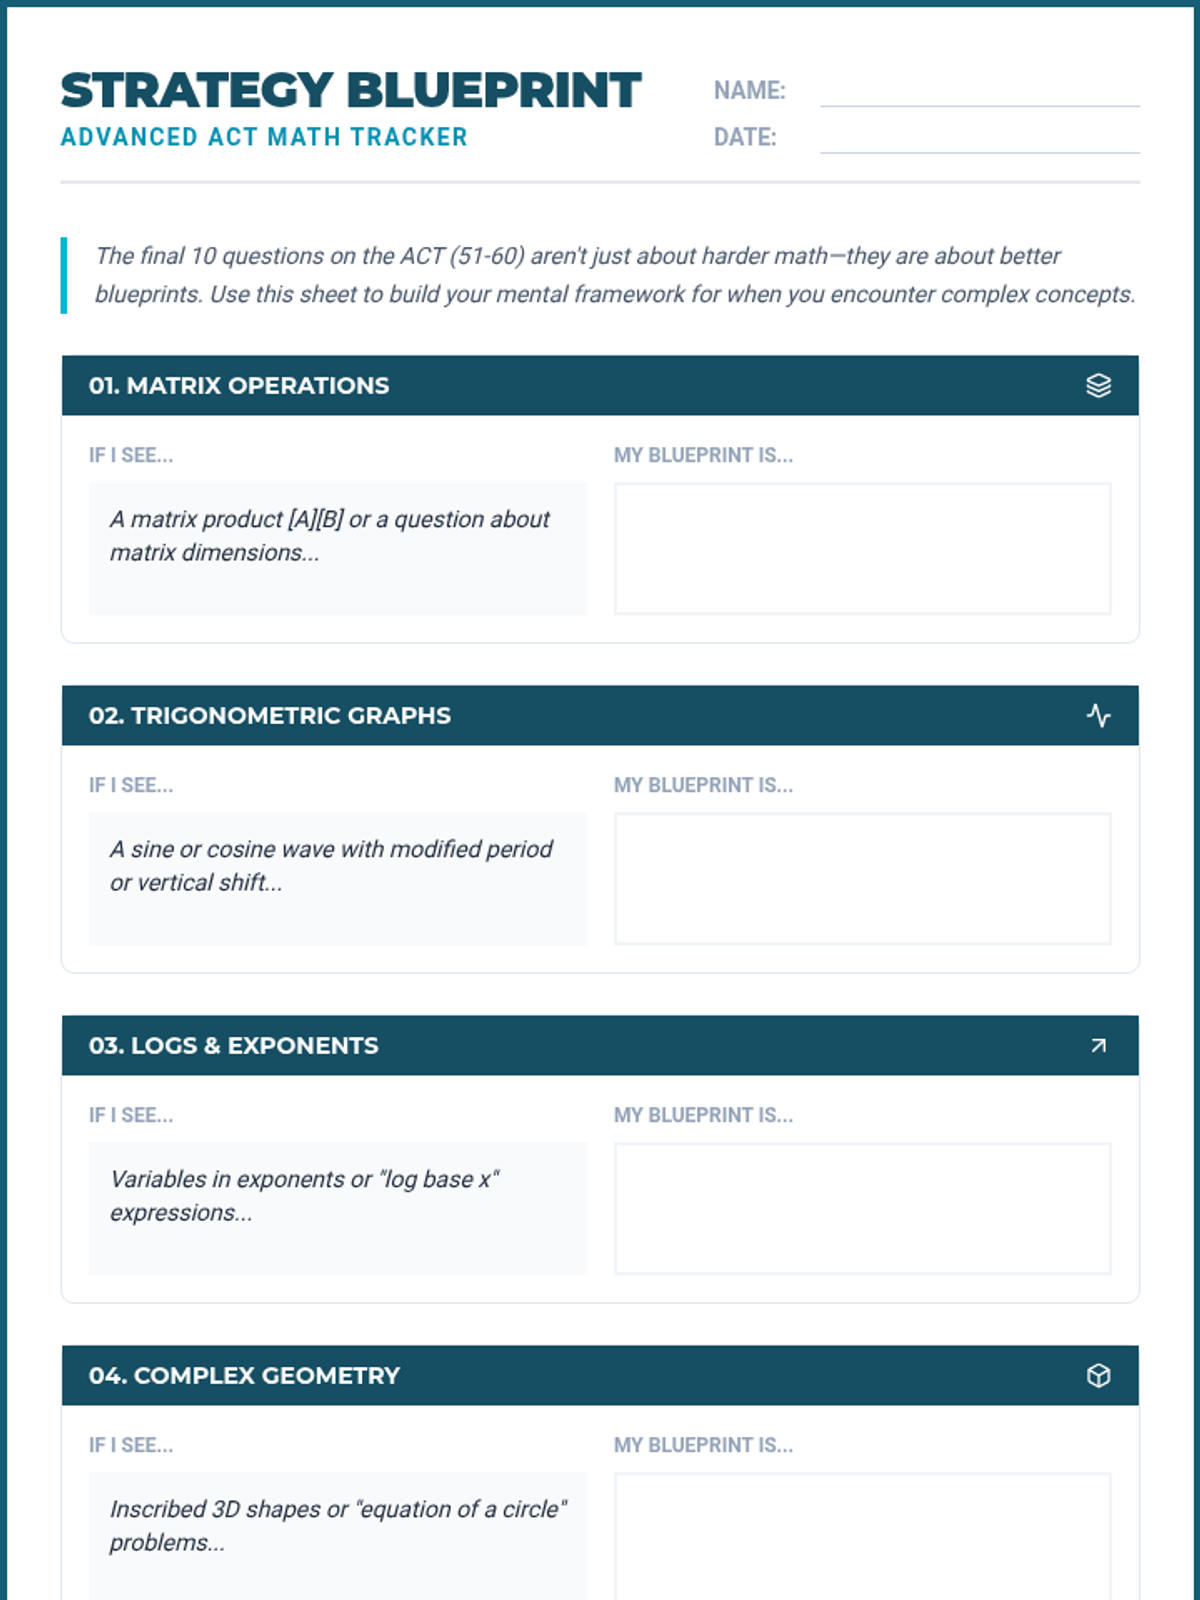
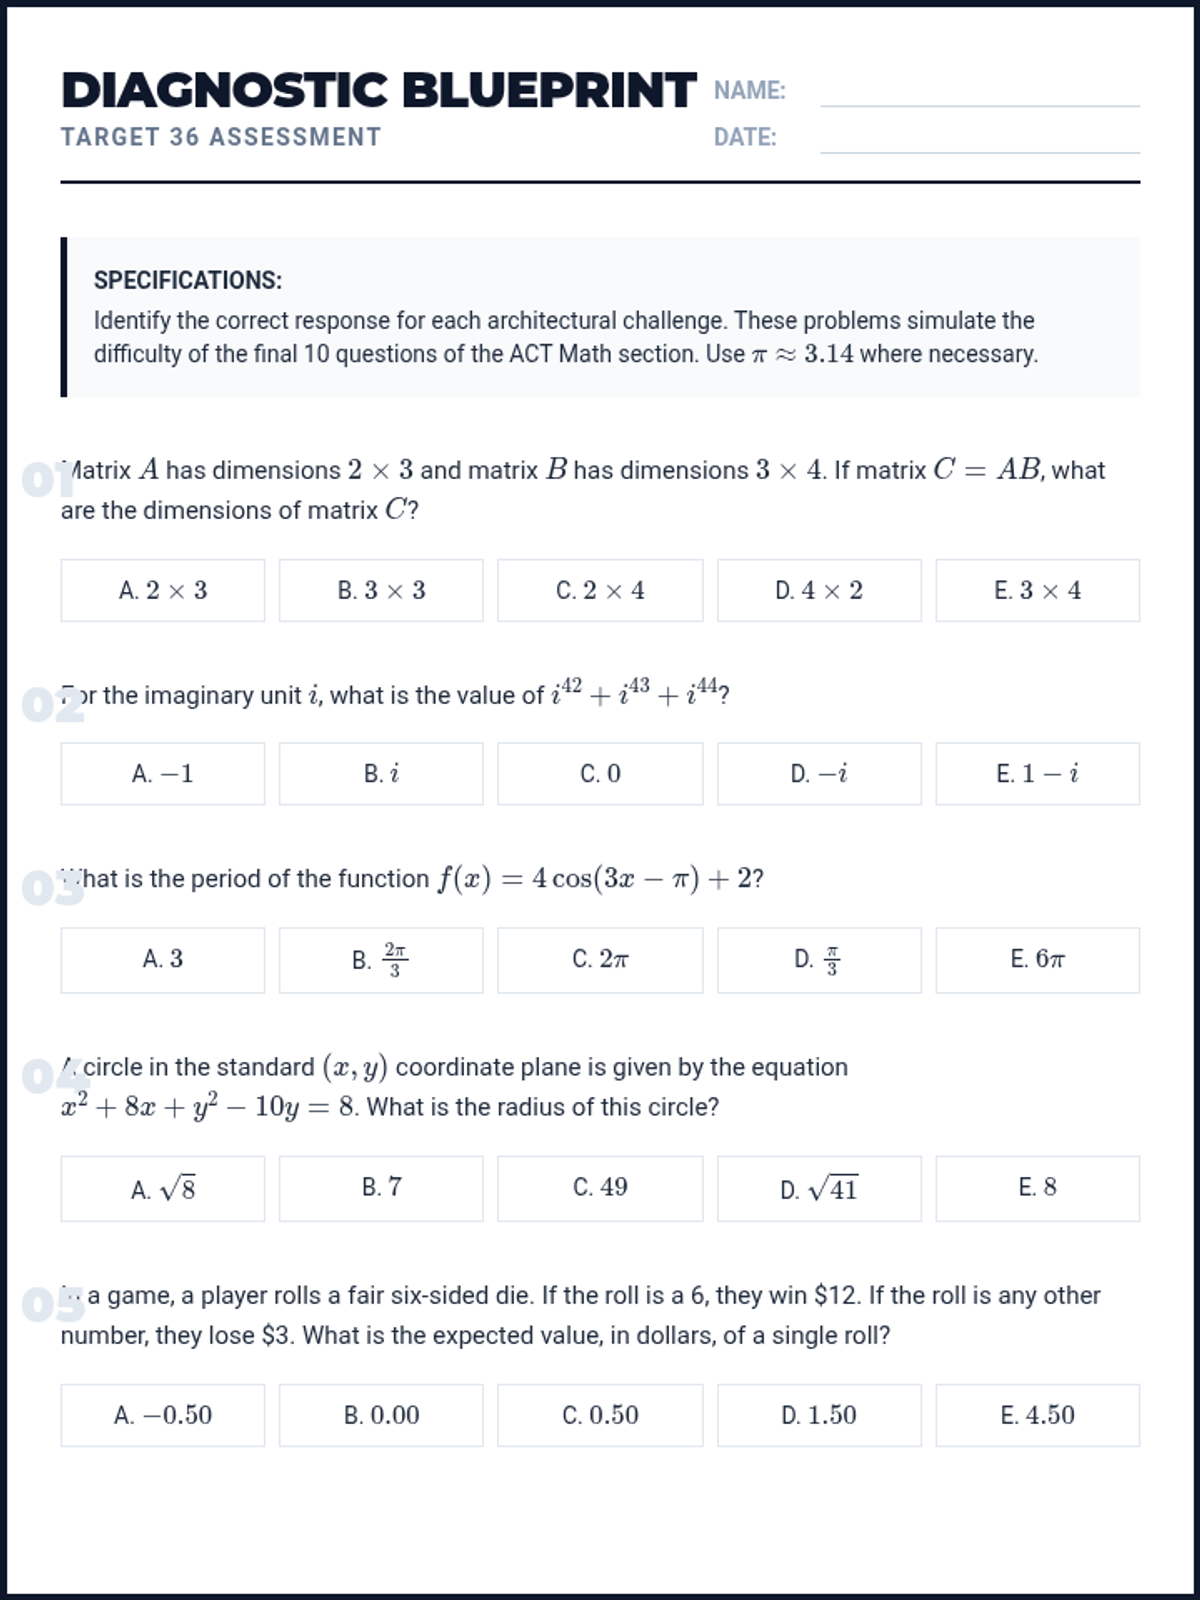
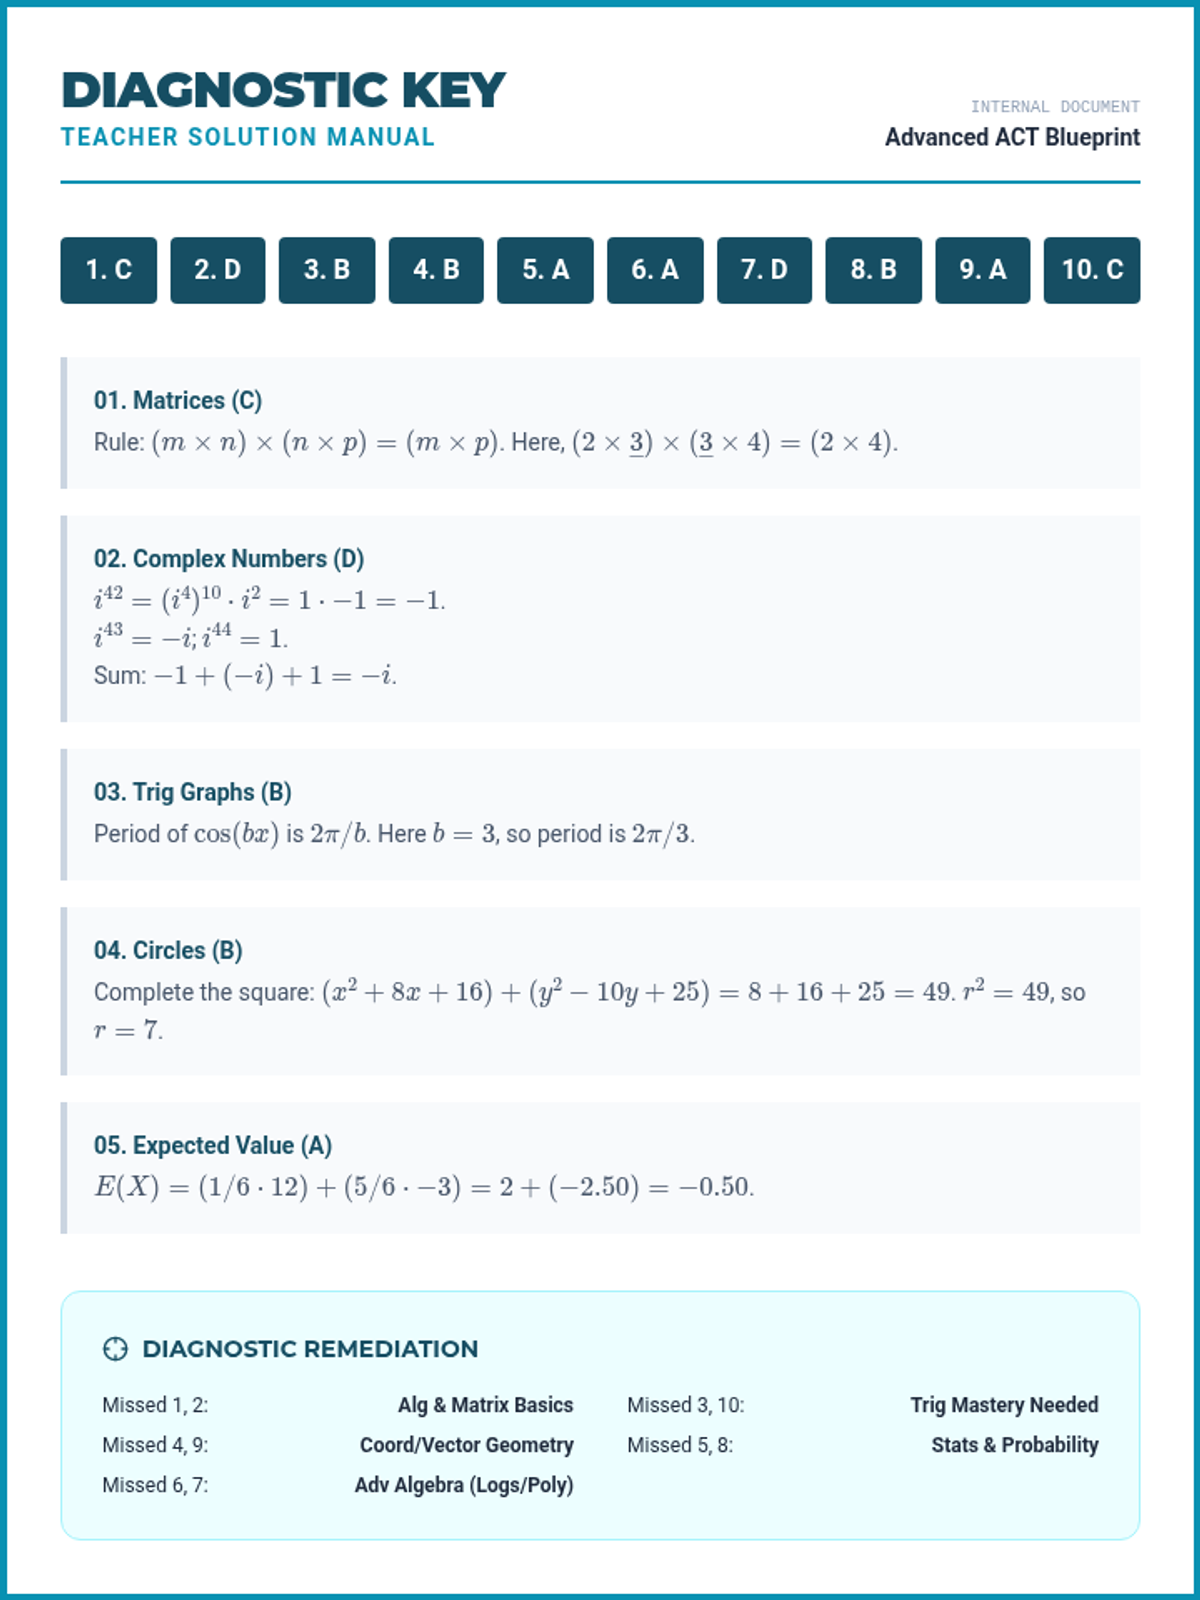
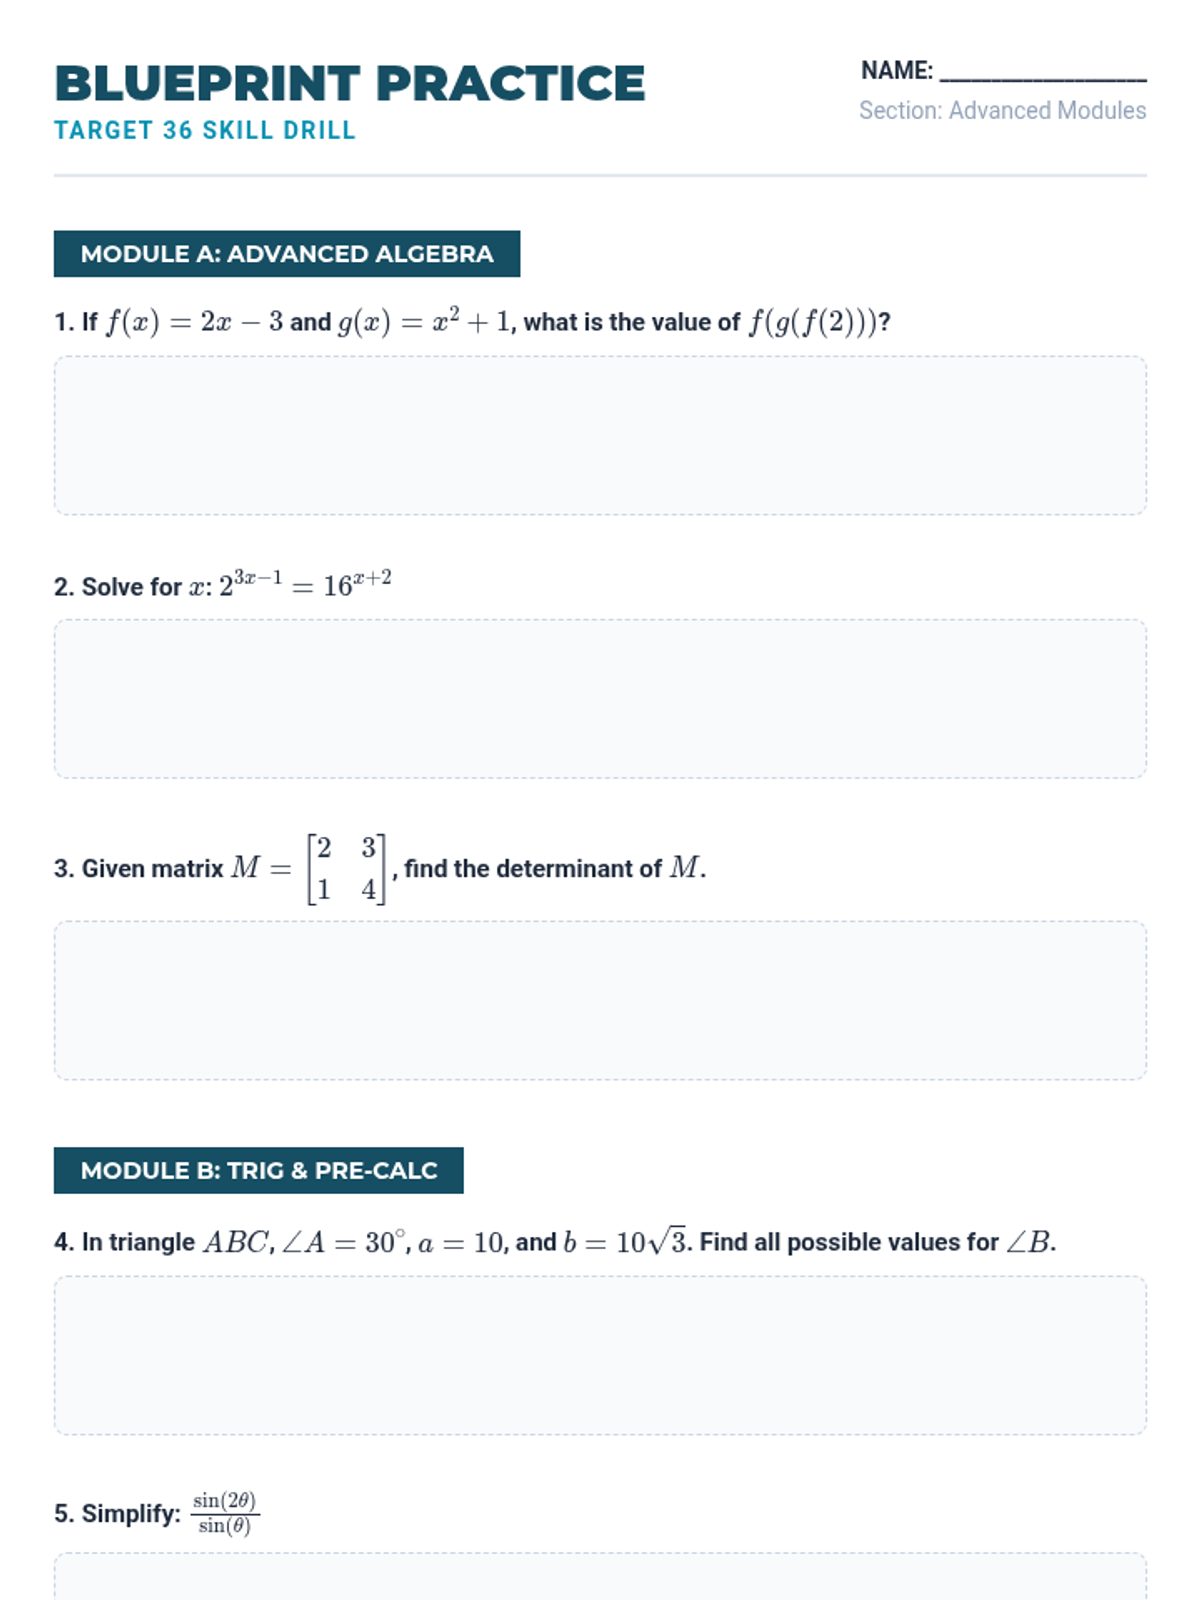
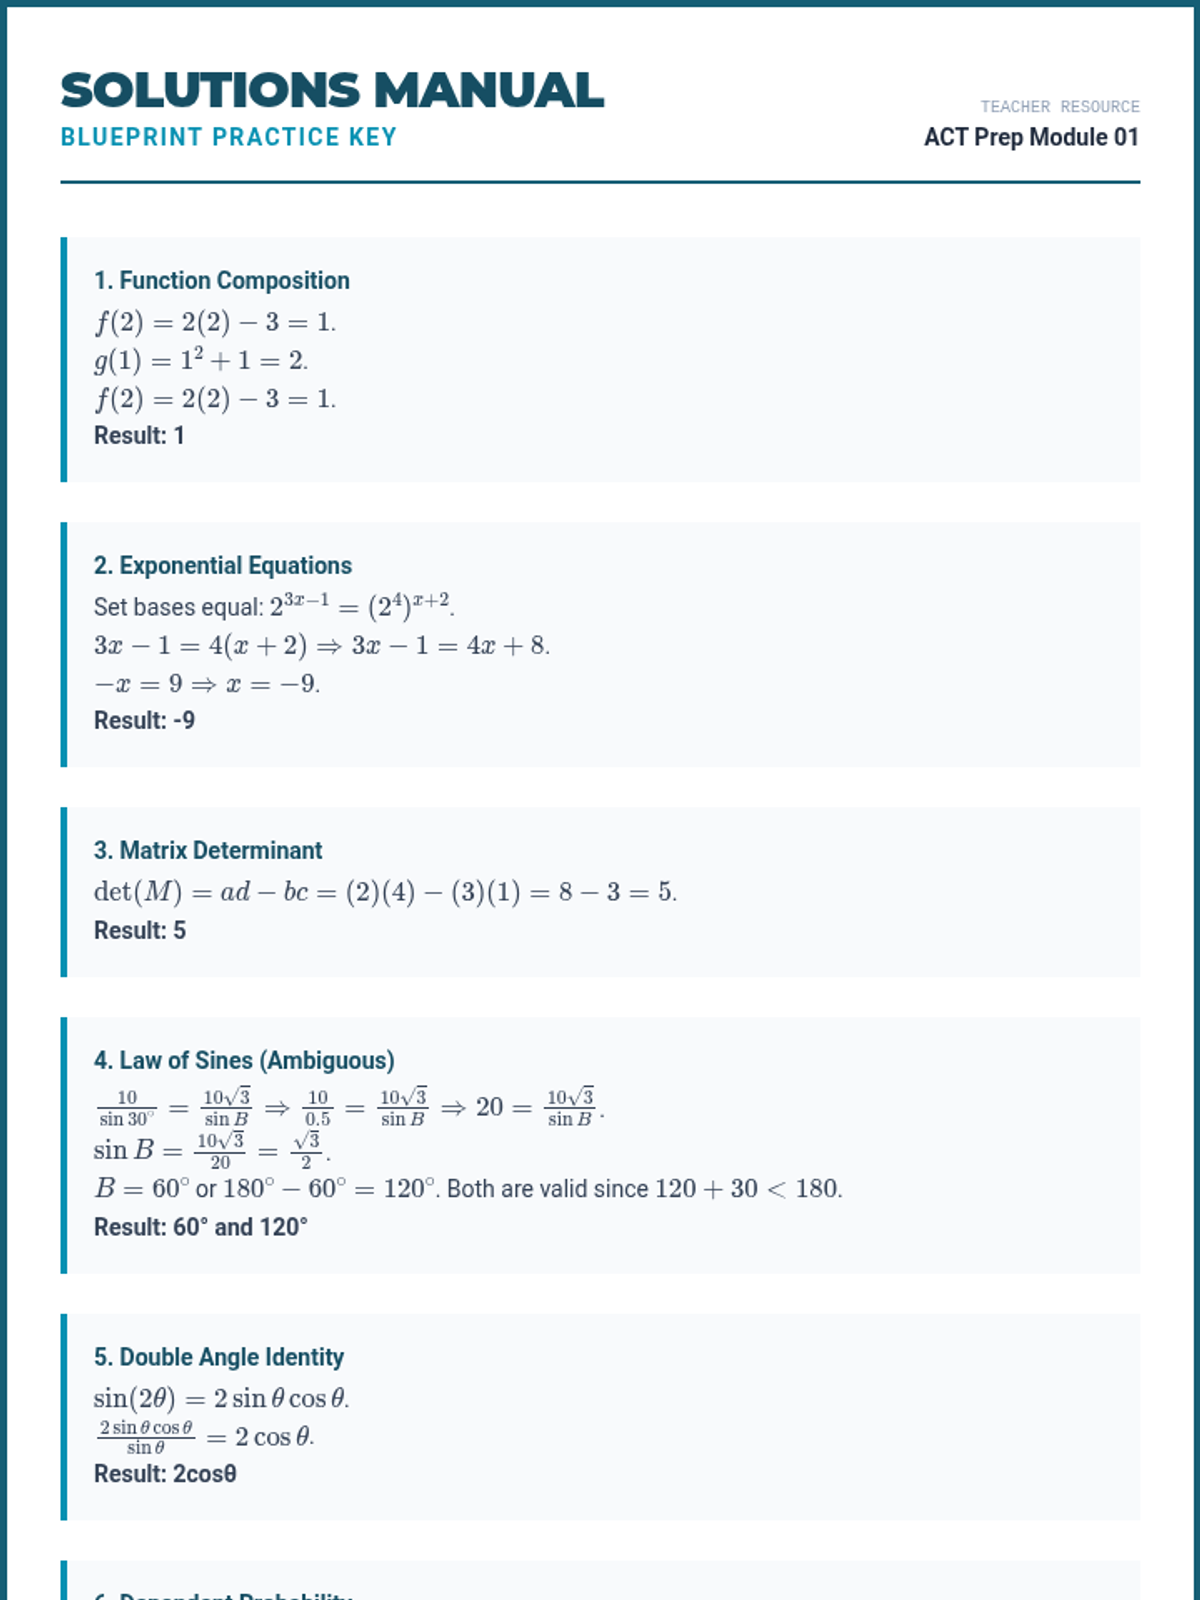
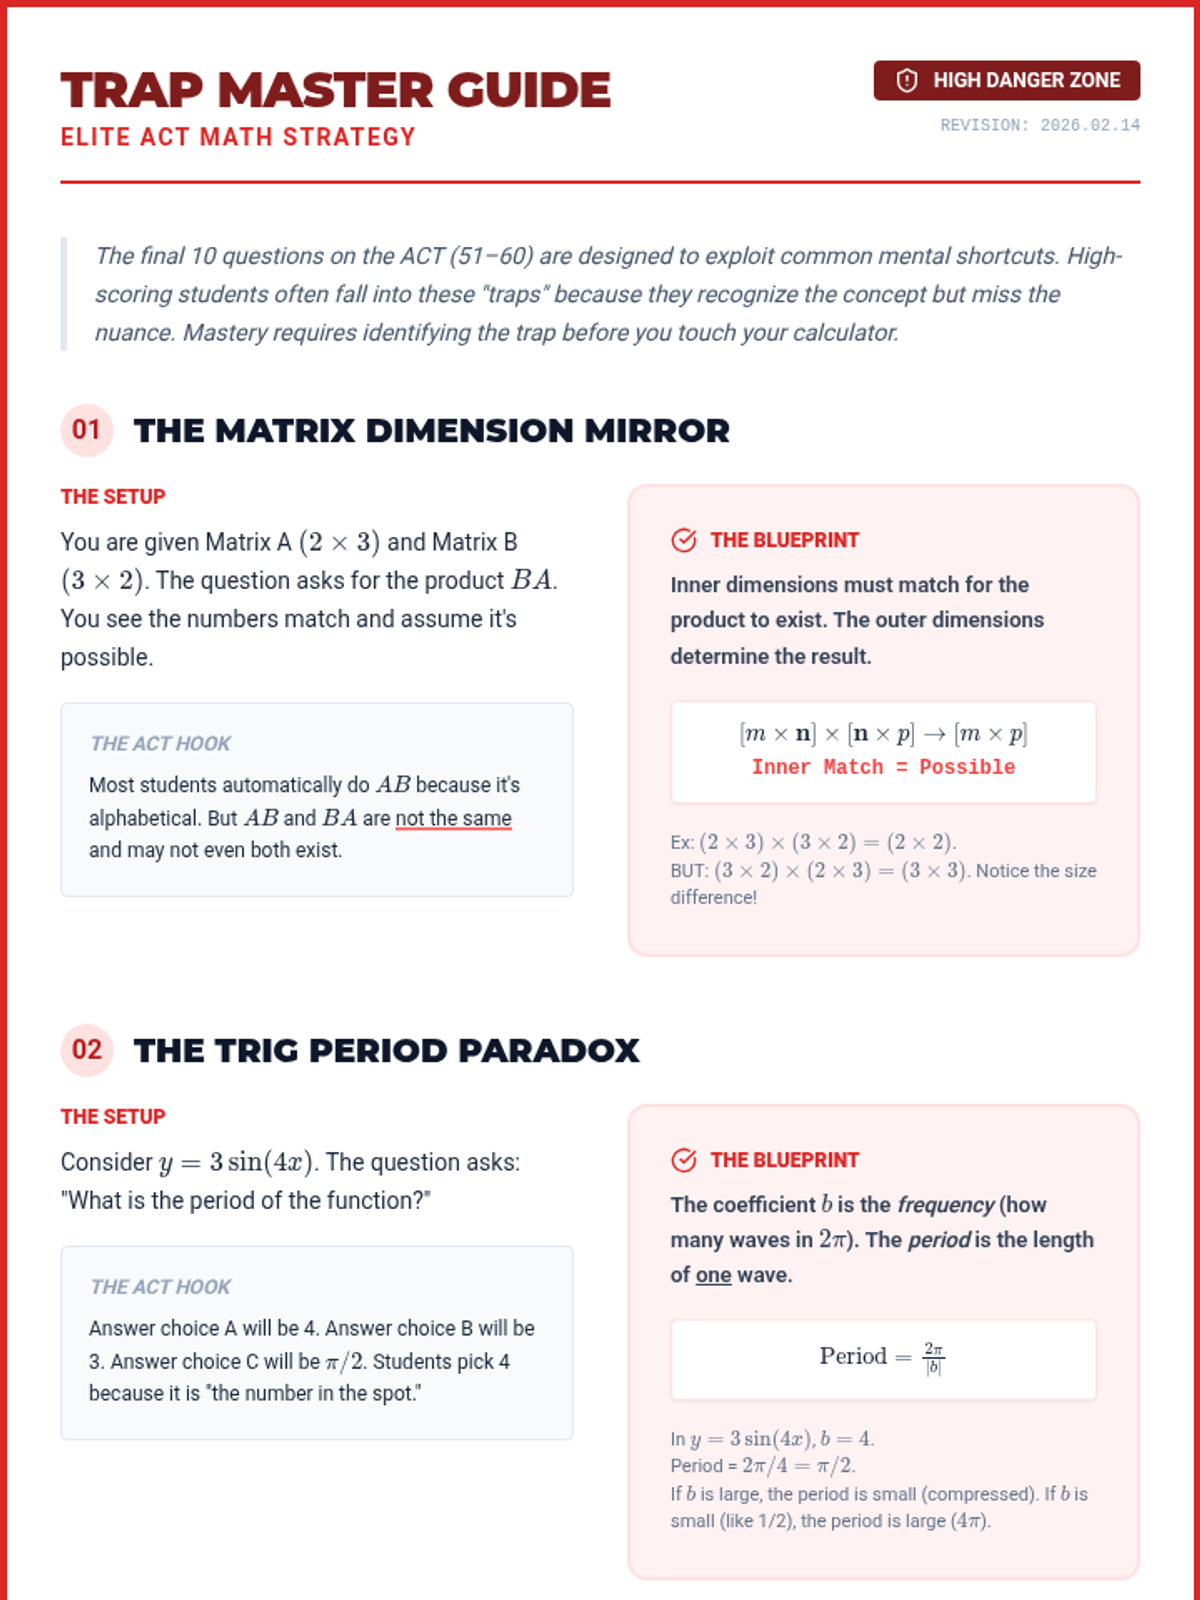
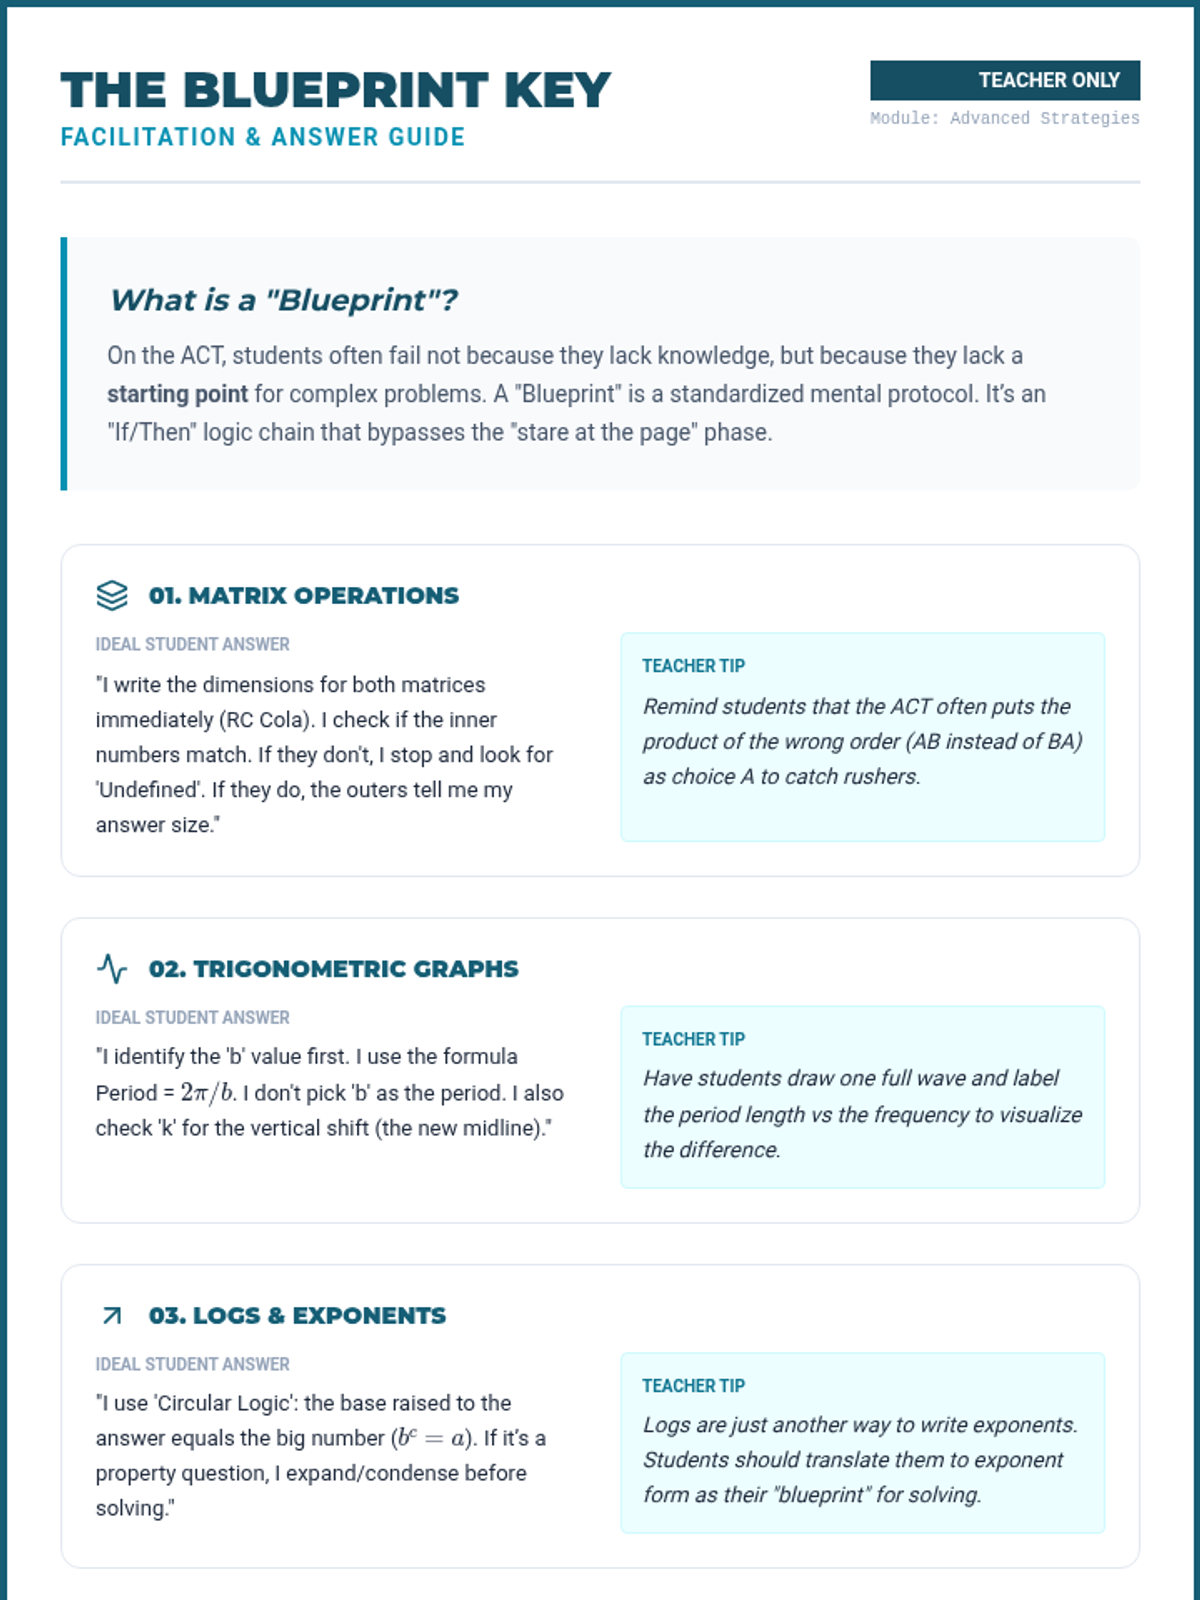
A comprehensive prep sequence for the most challenging questions on the ACT Math and Science sections. It focuses on high-level conceptual blueprints for math topics like complex numbers and matrices, alongside speed-reading and data-interpretation strategies for the Science section.
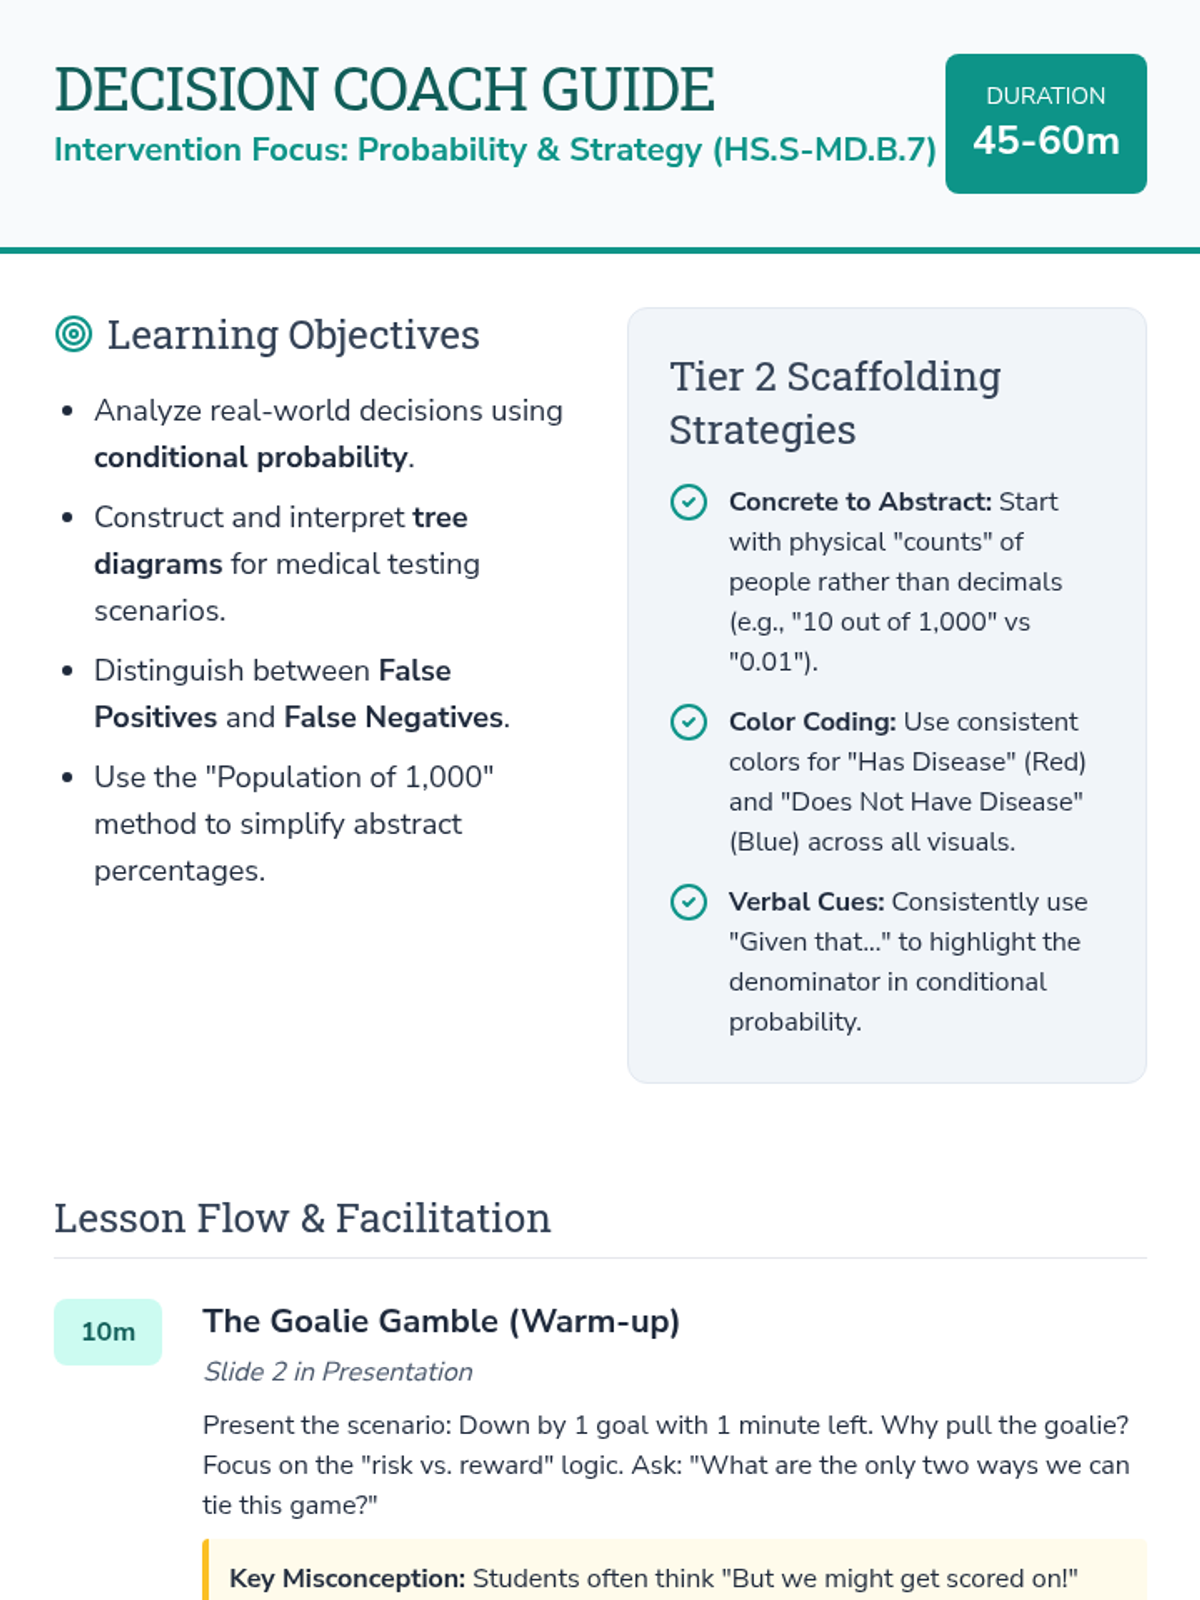
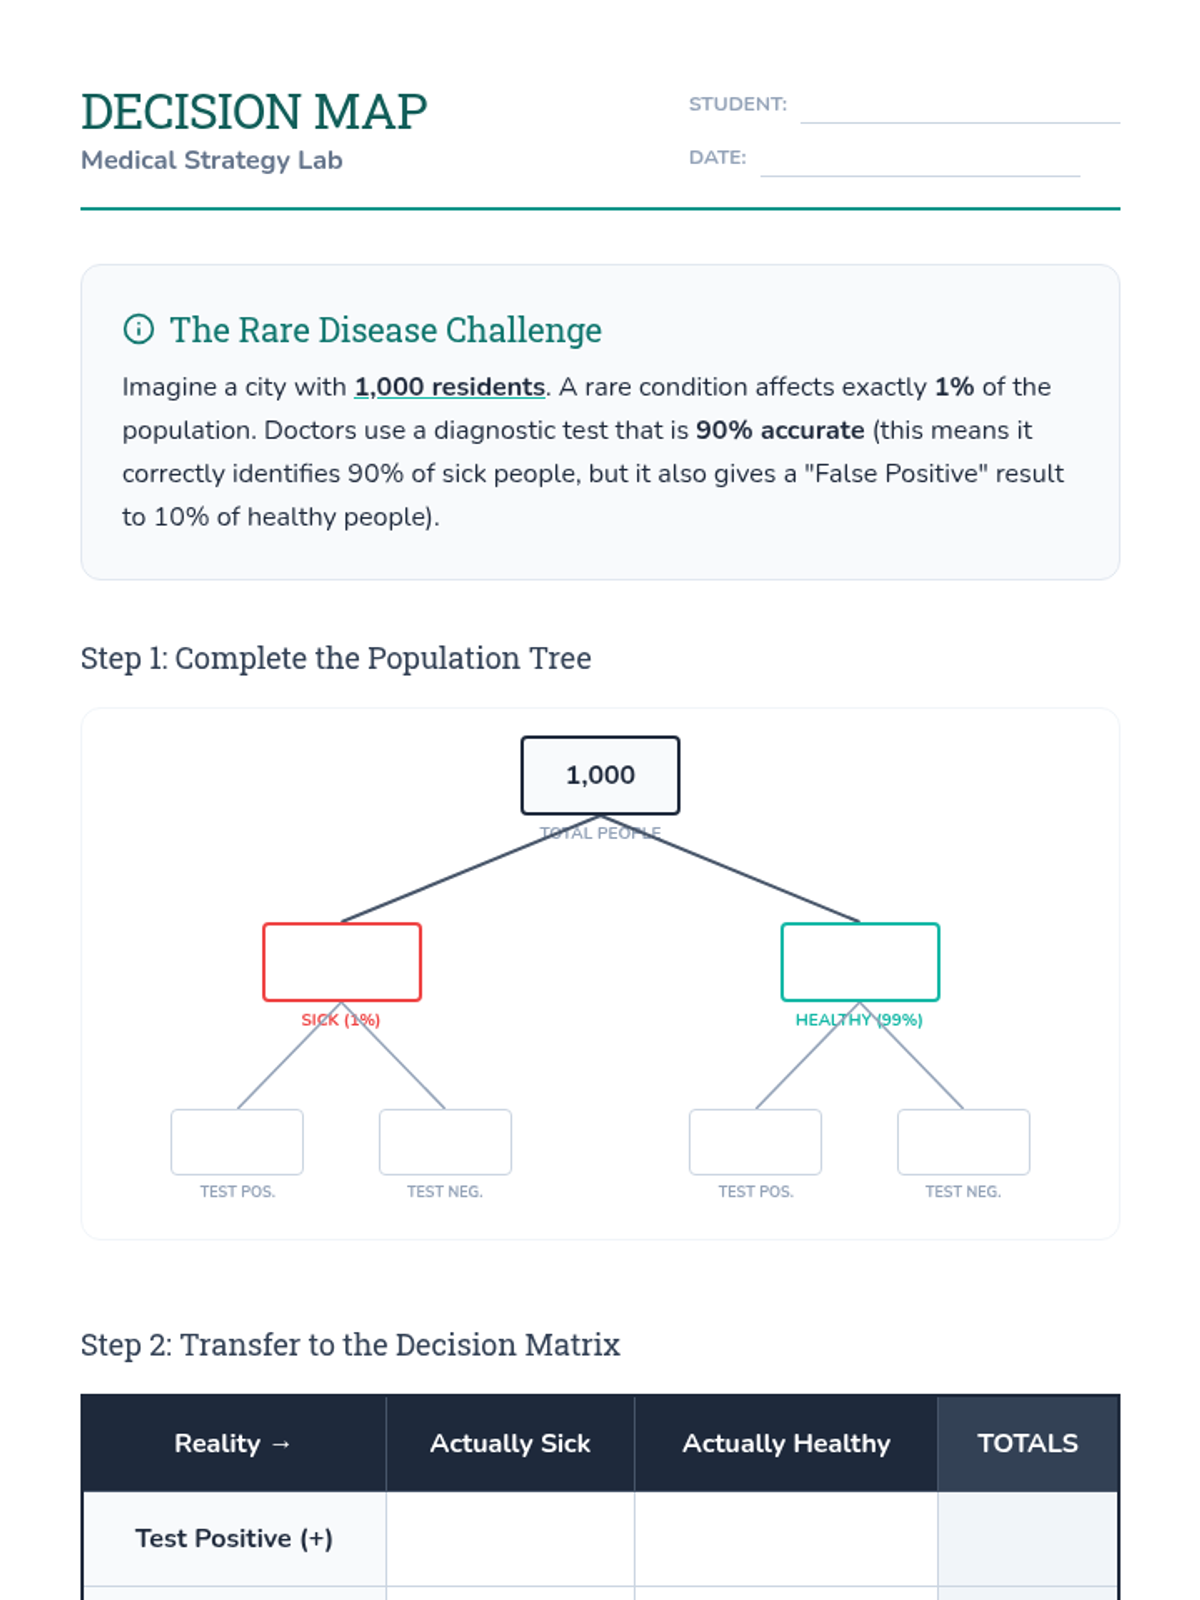
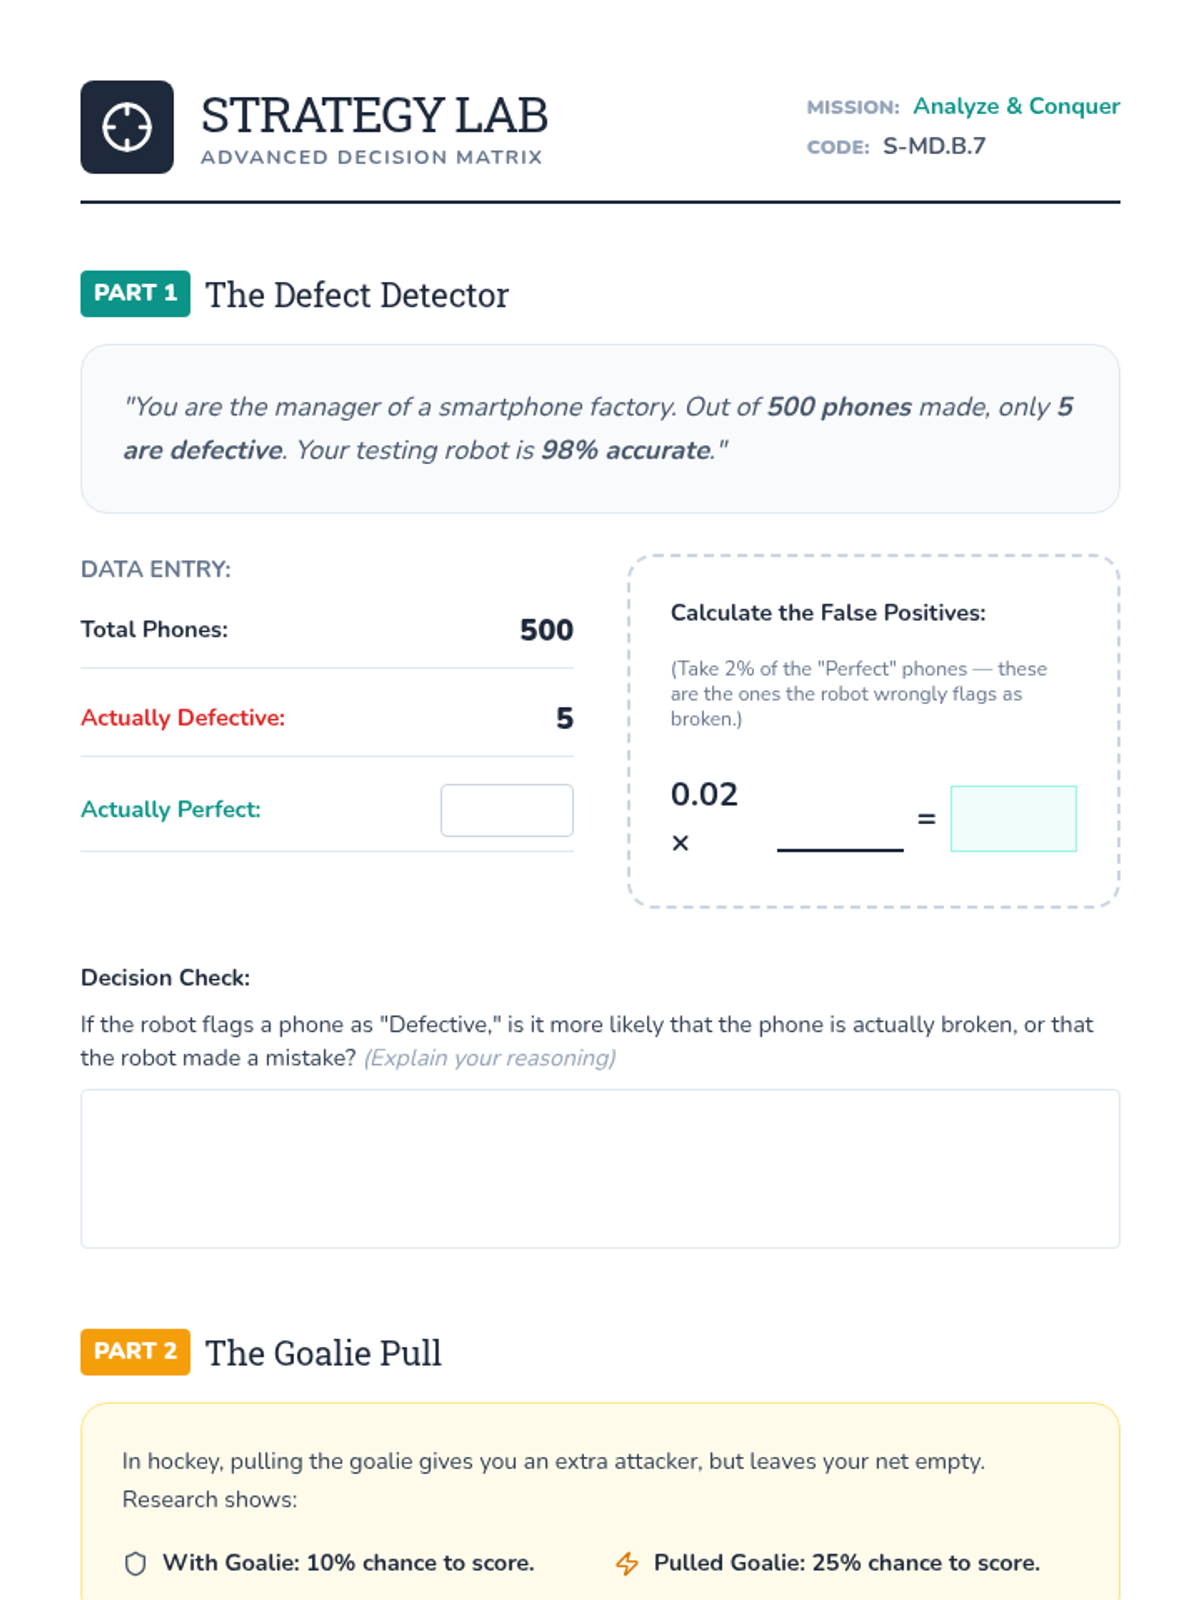
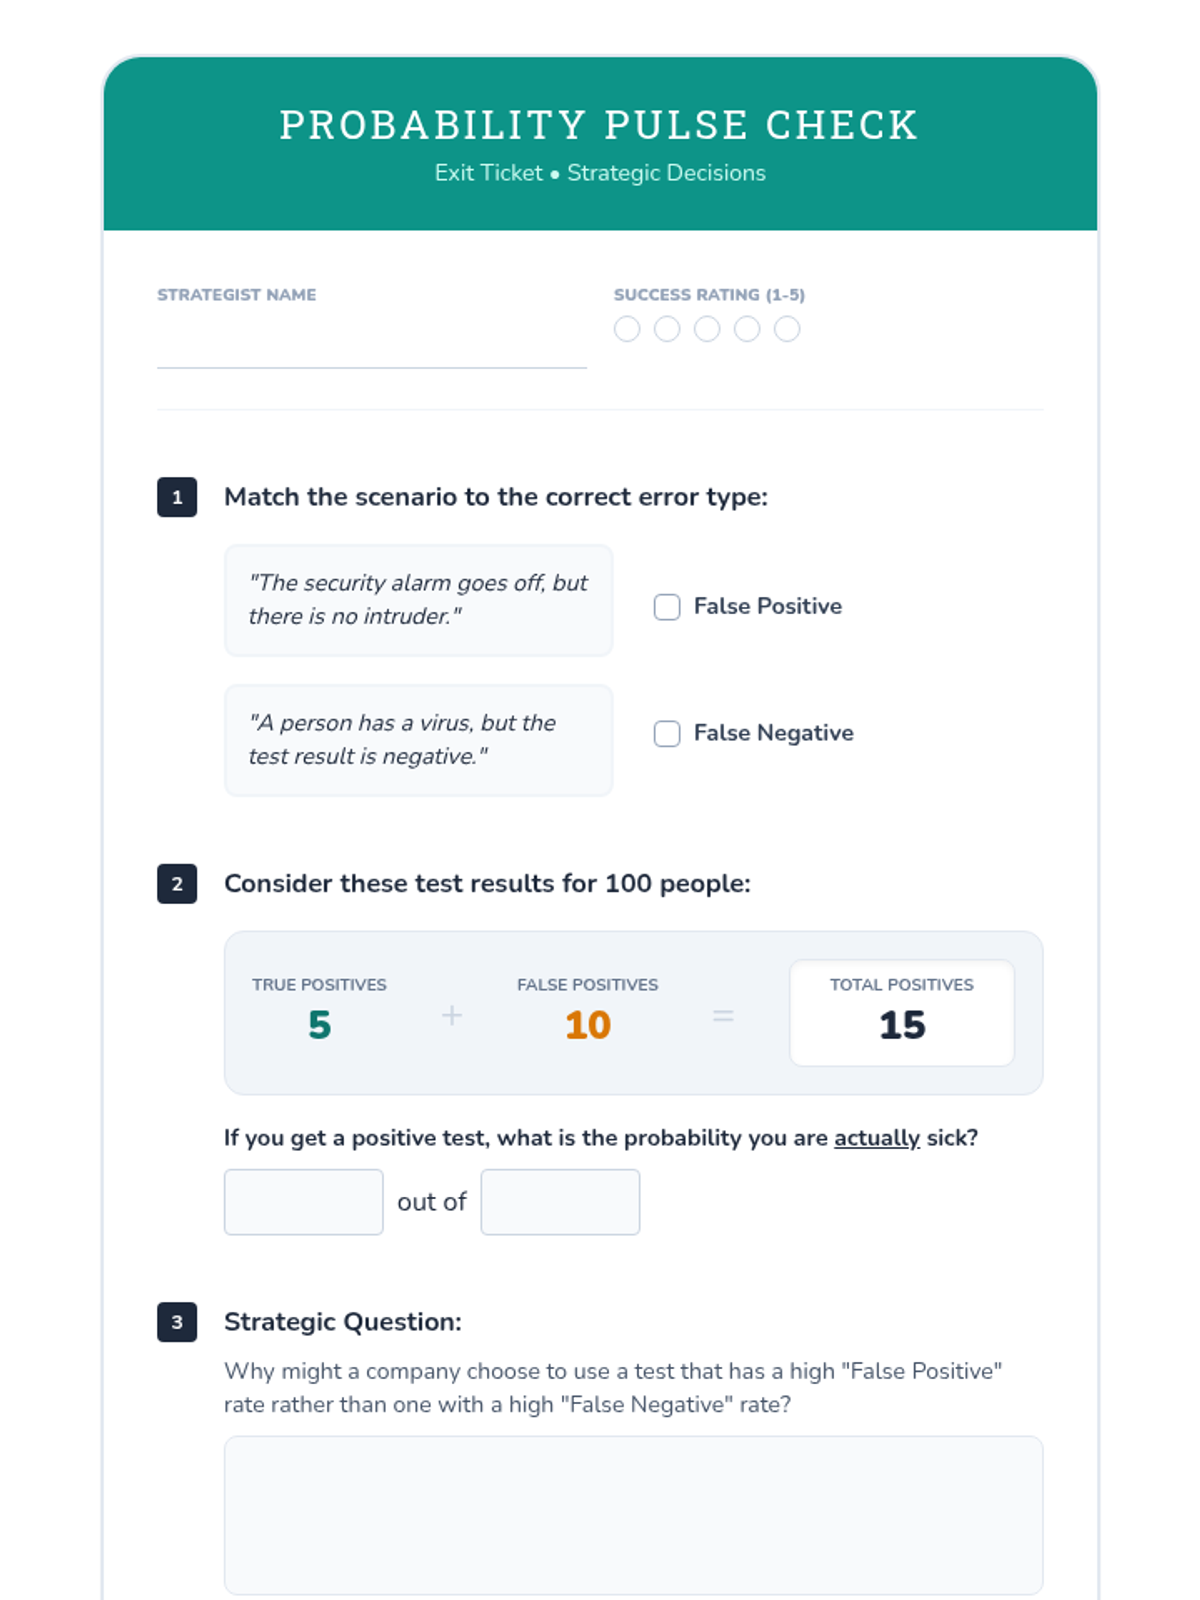
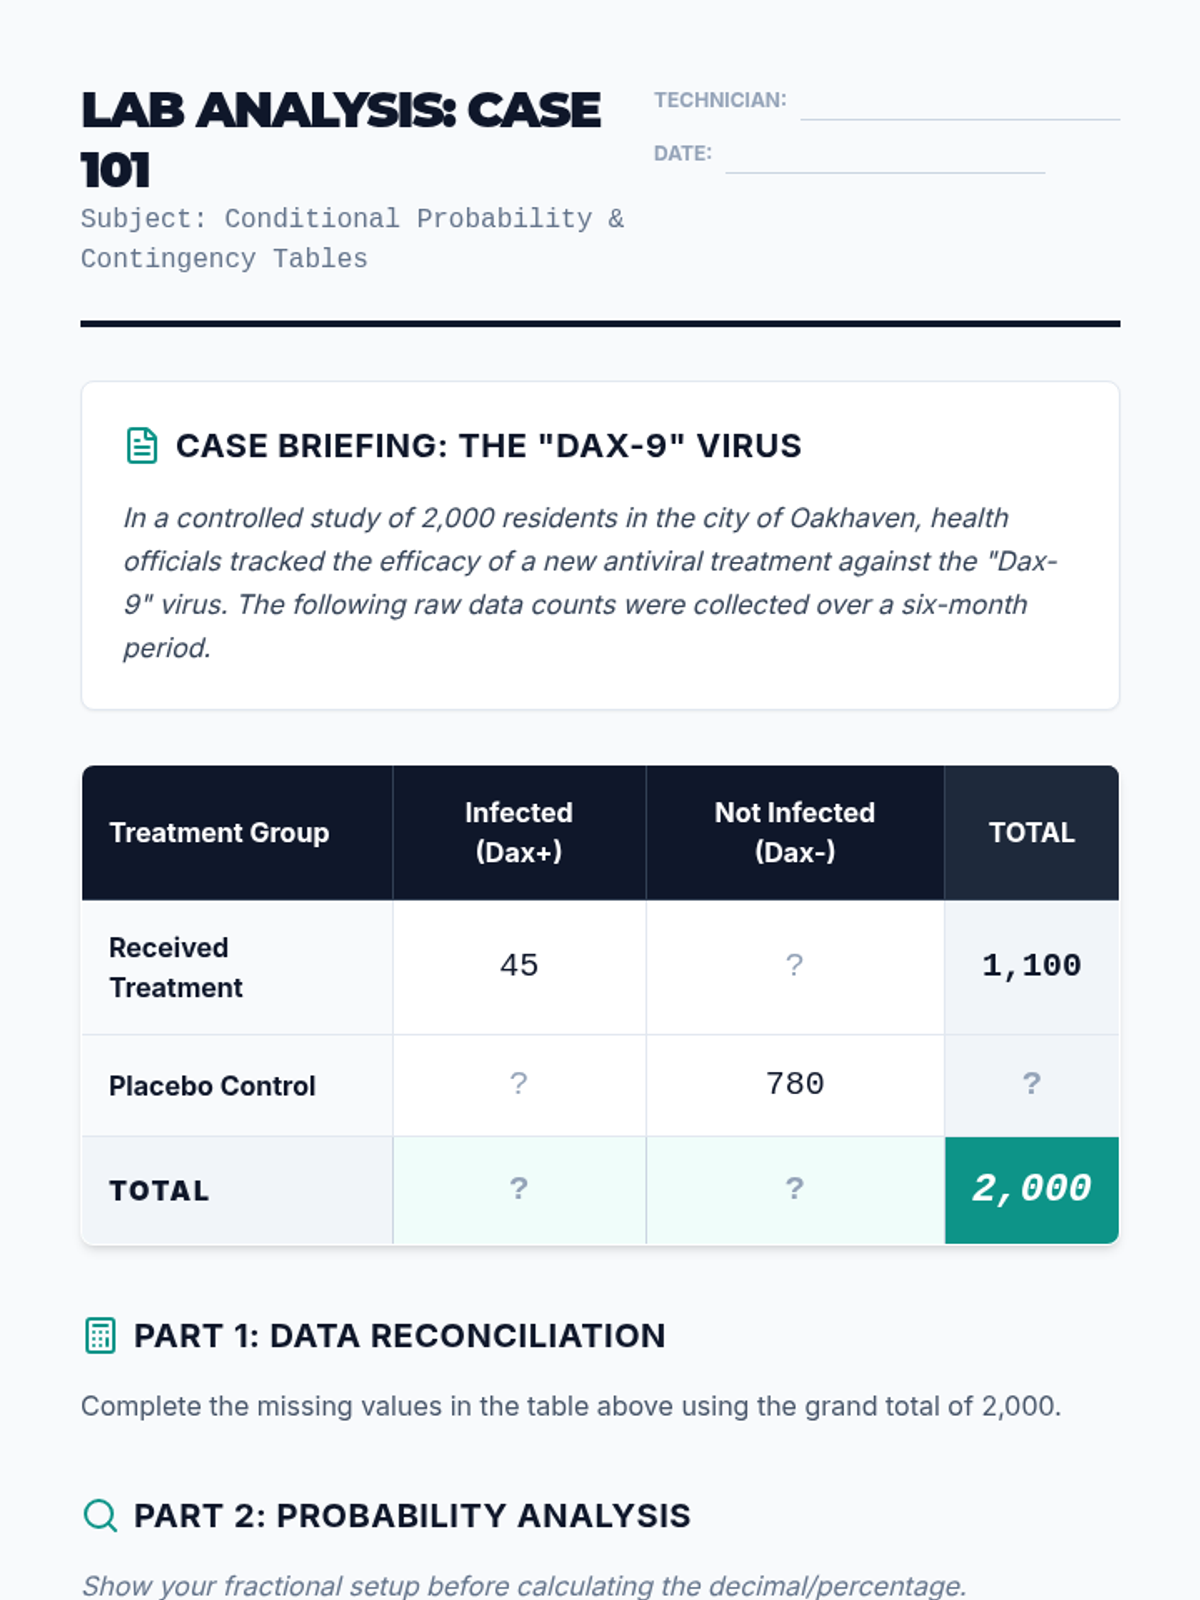
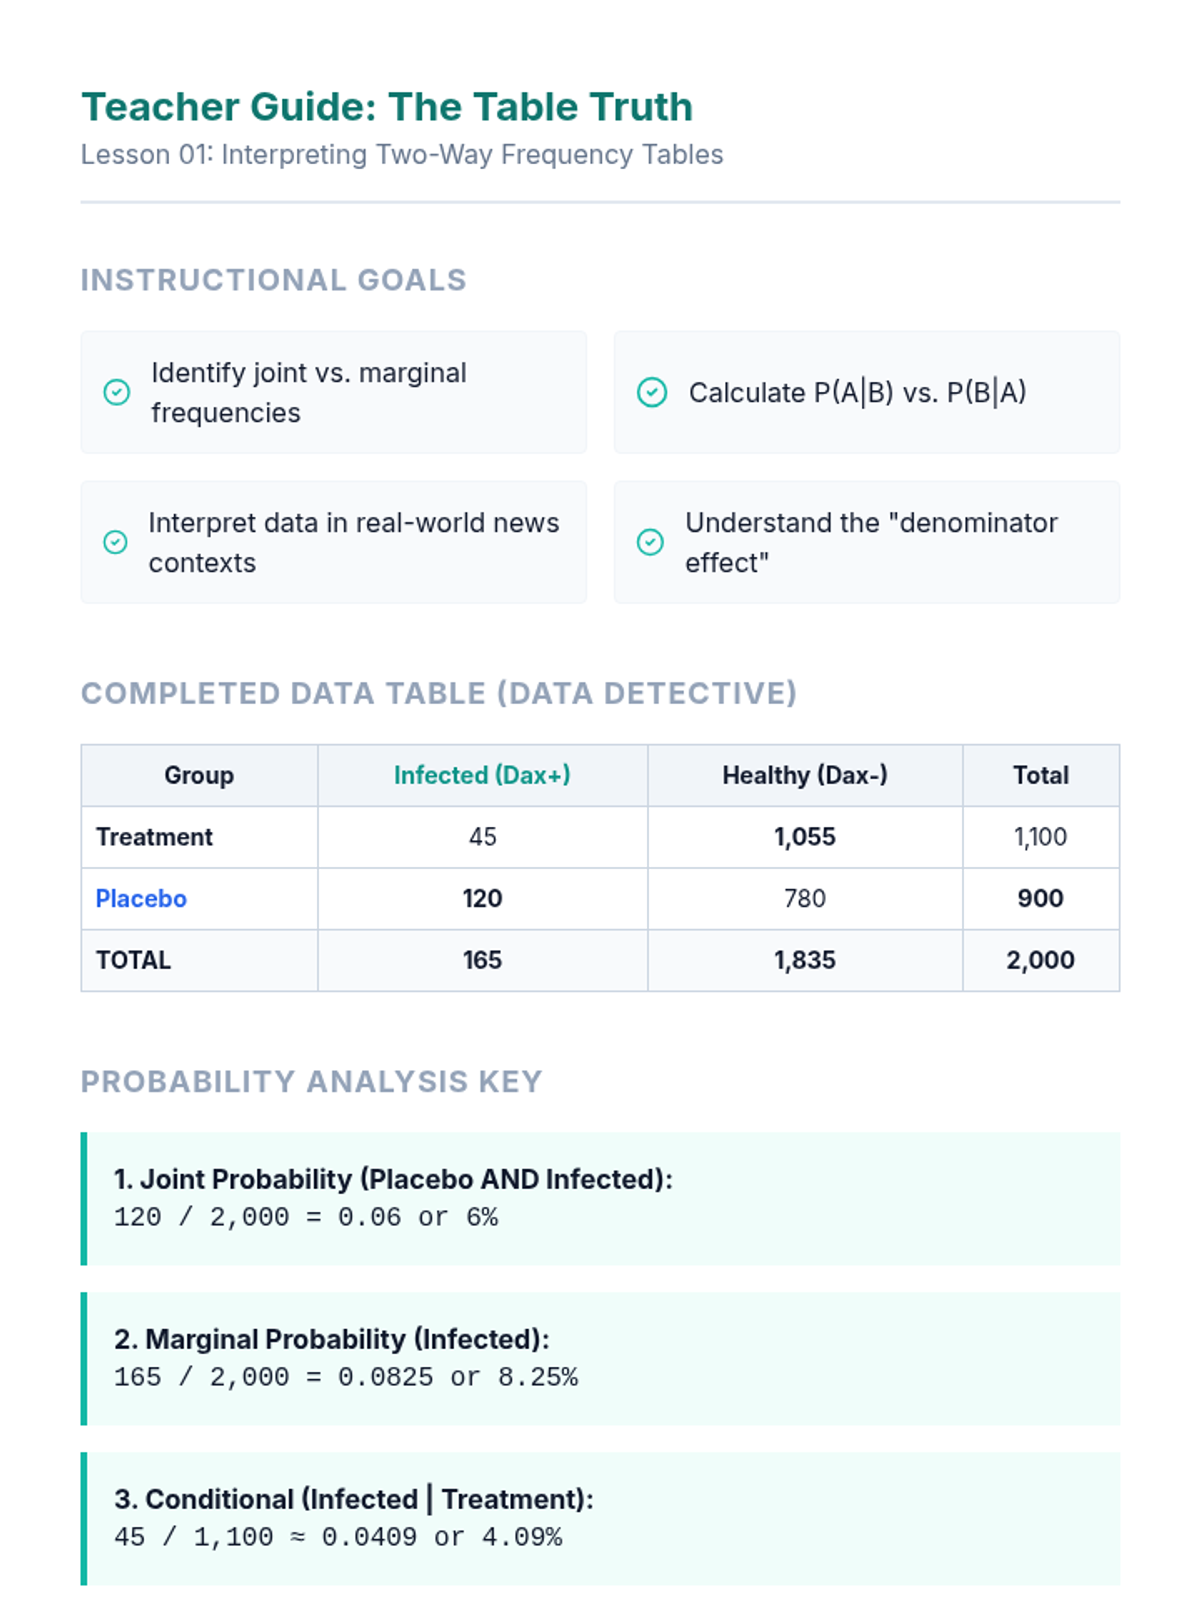
A Tier 2 intervention sequence focused on using probability to analyze decisions, specifically targeting medical testing (false positives/negatives) and game-time strategies. Students learn to use tree diagrams and contingency tables to navigate complex conditional probability scenarios.
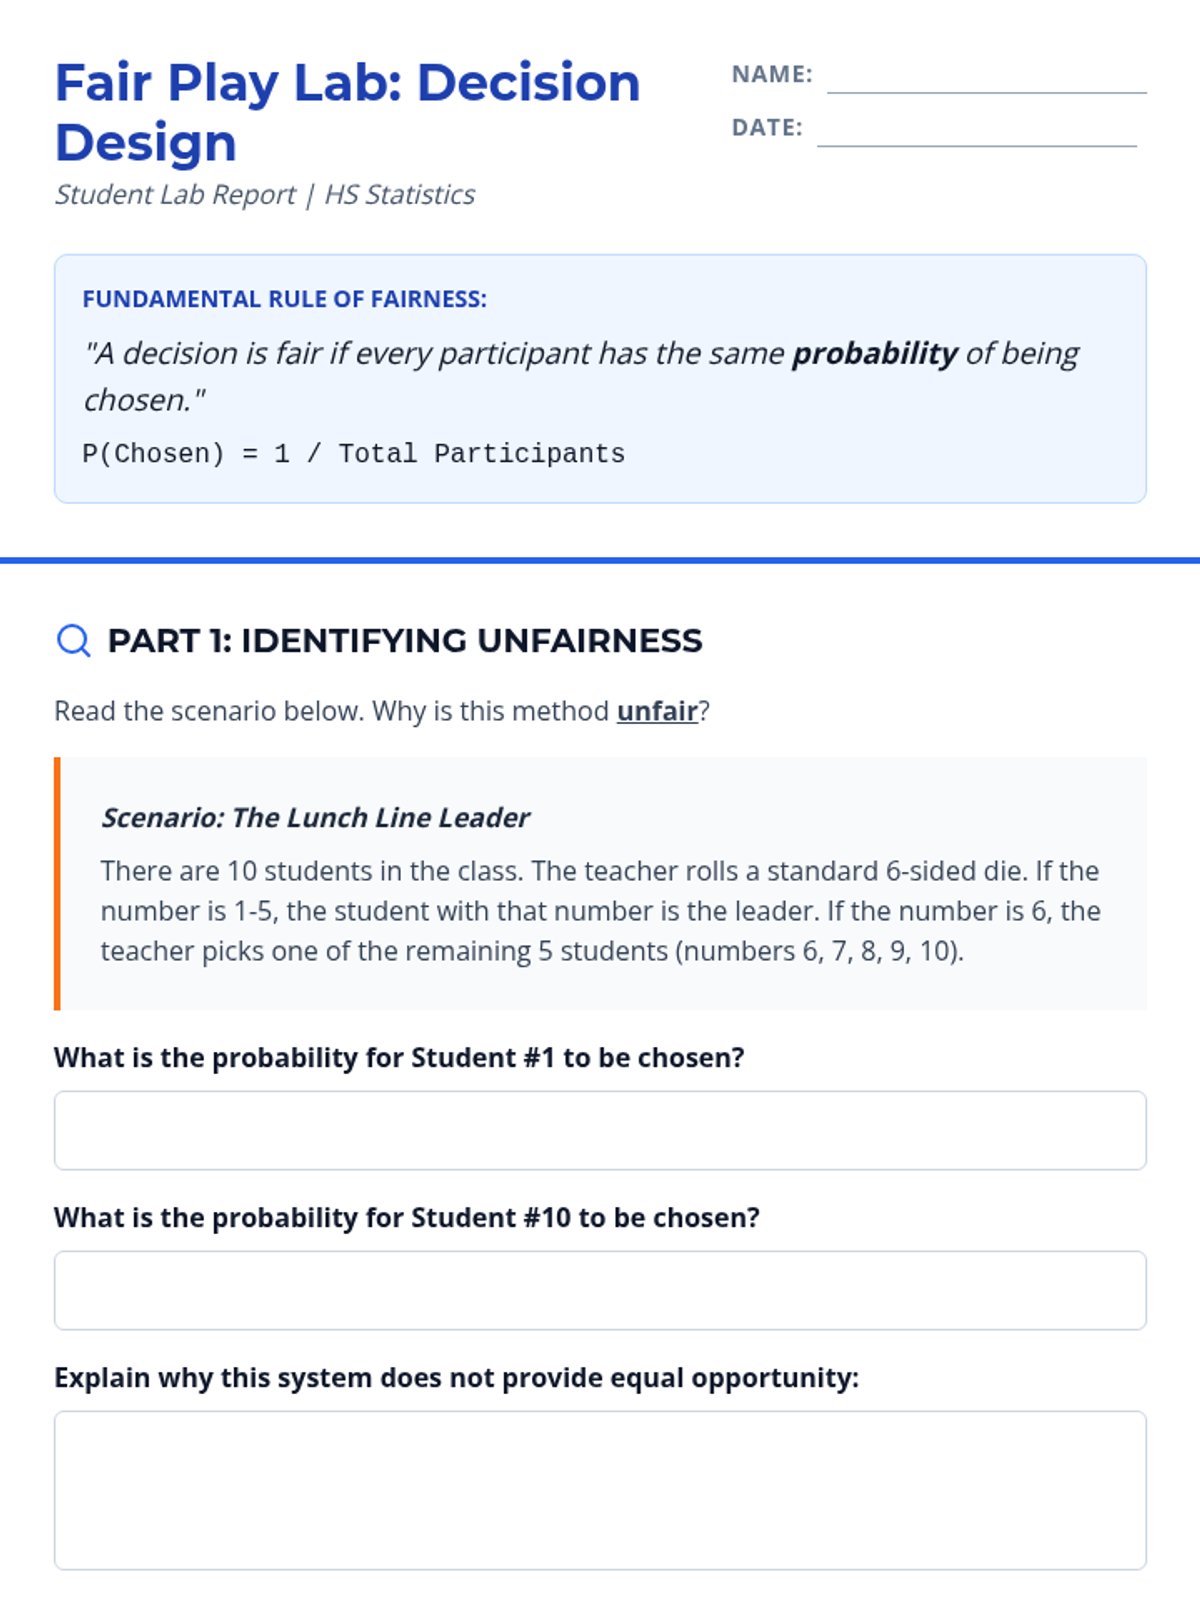
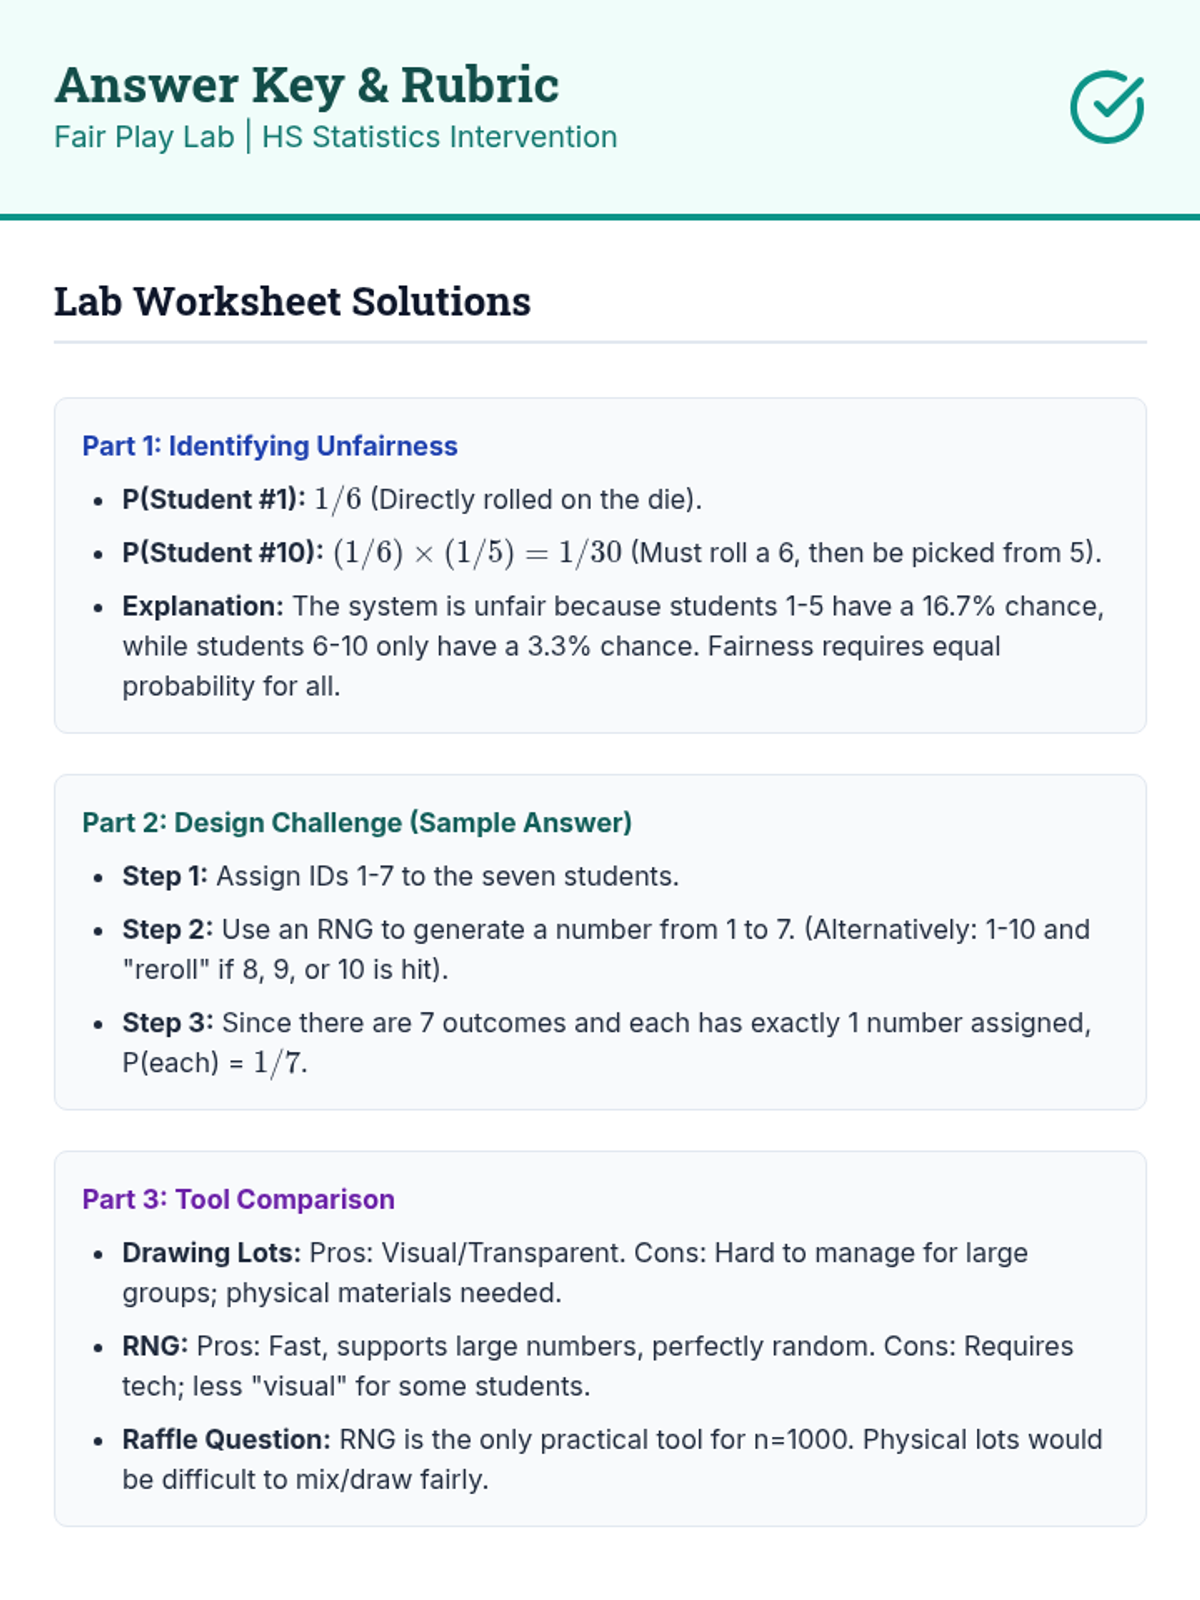
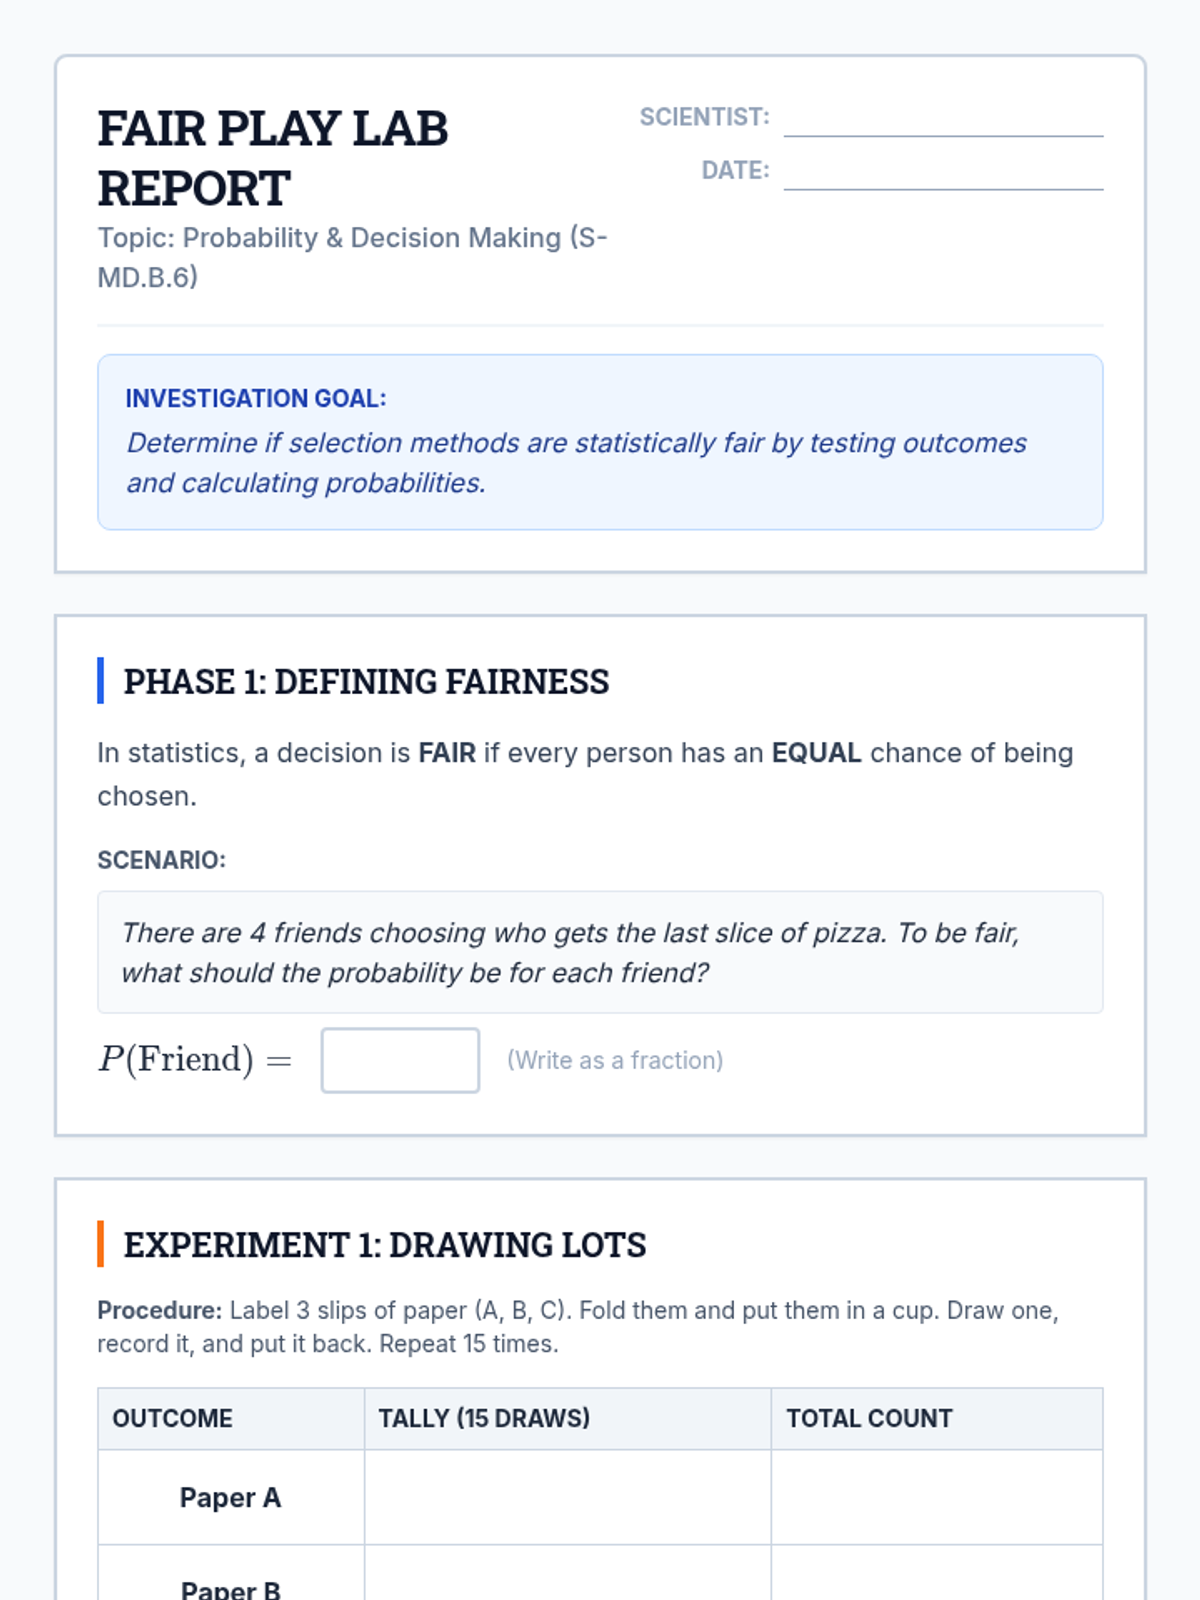
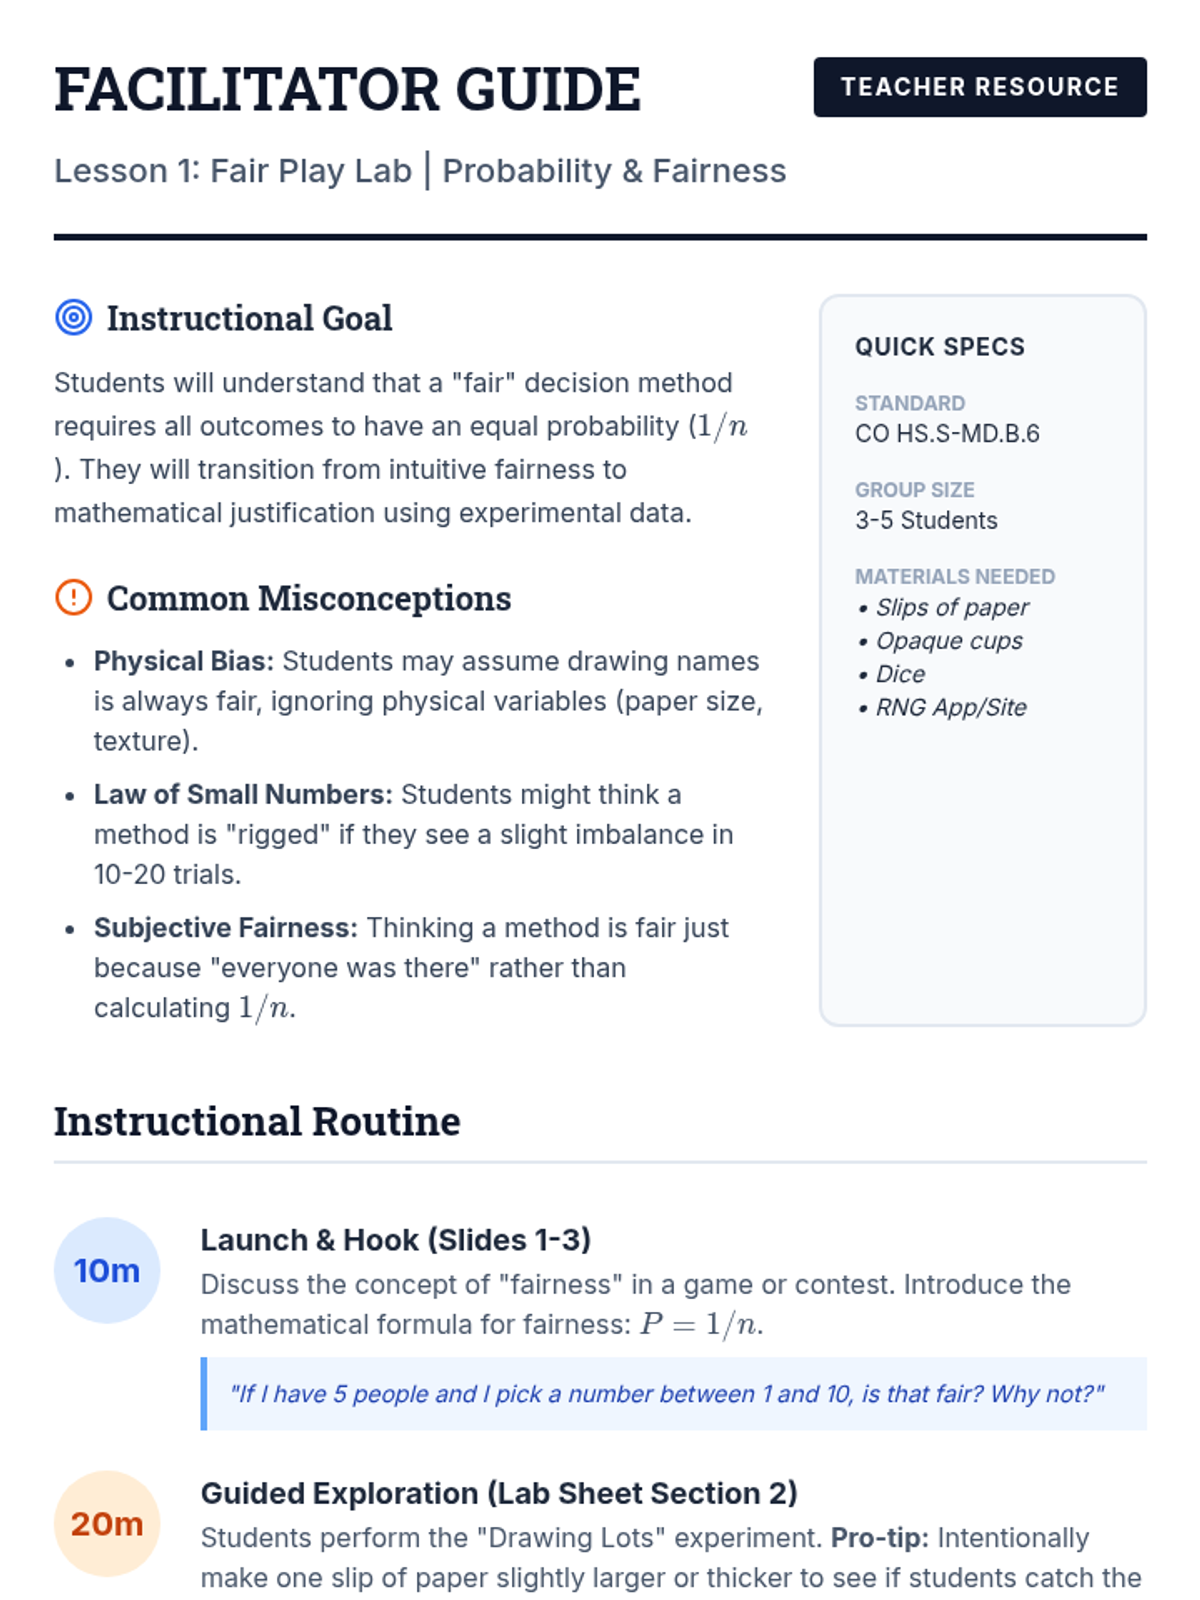
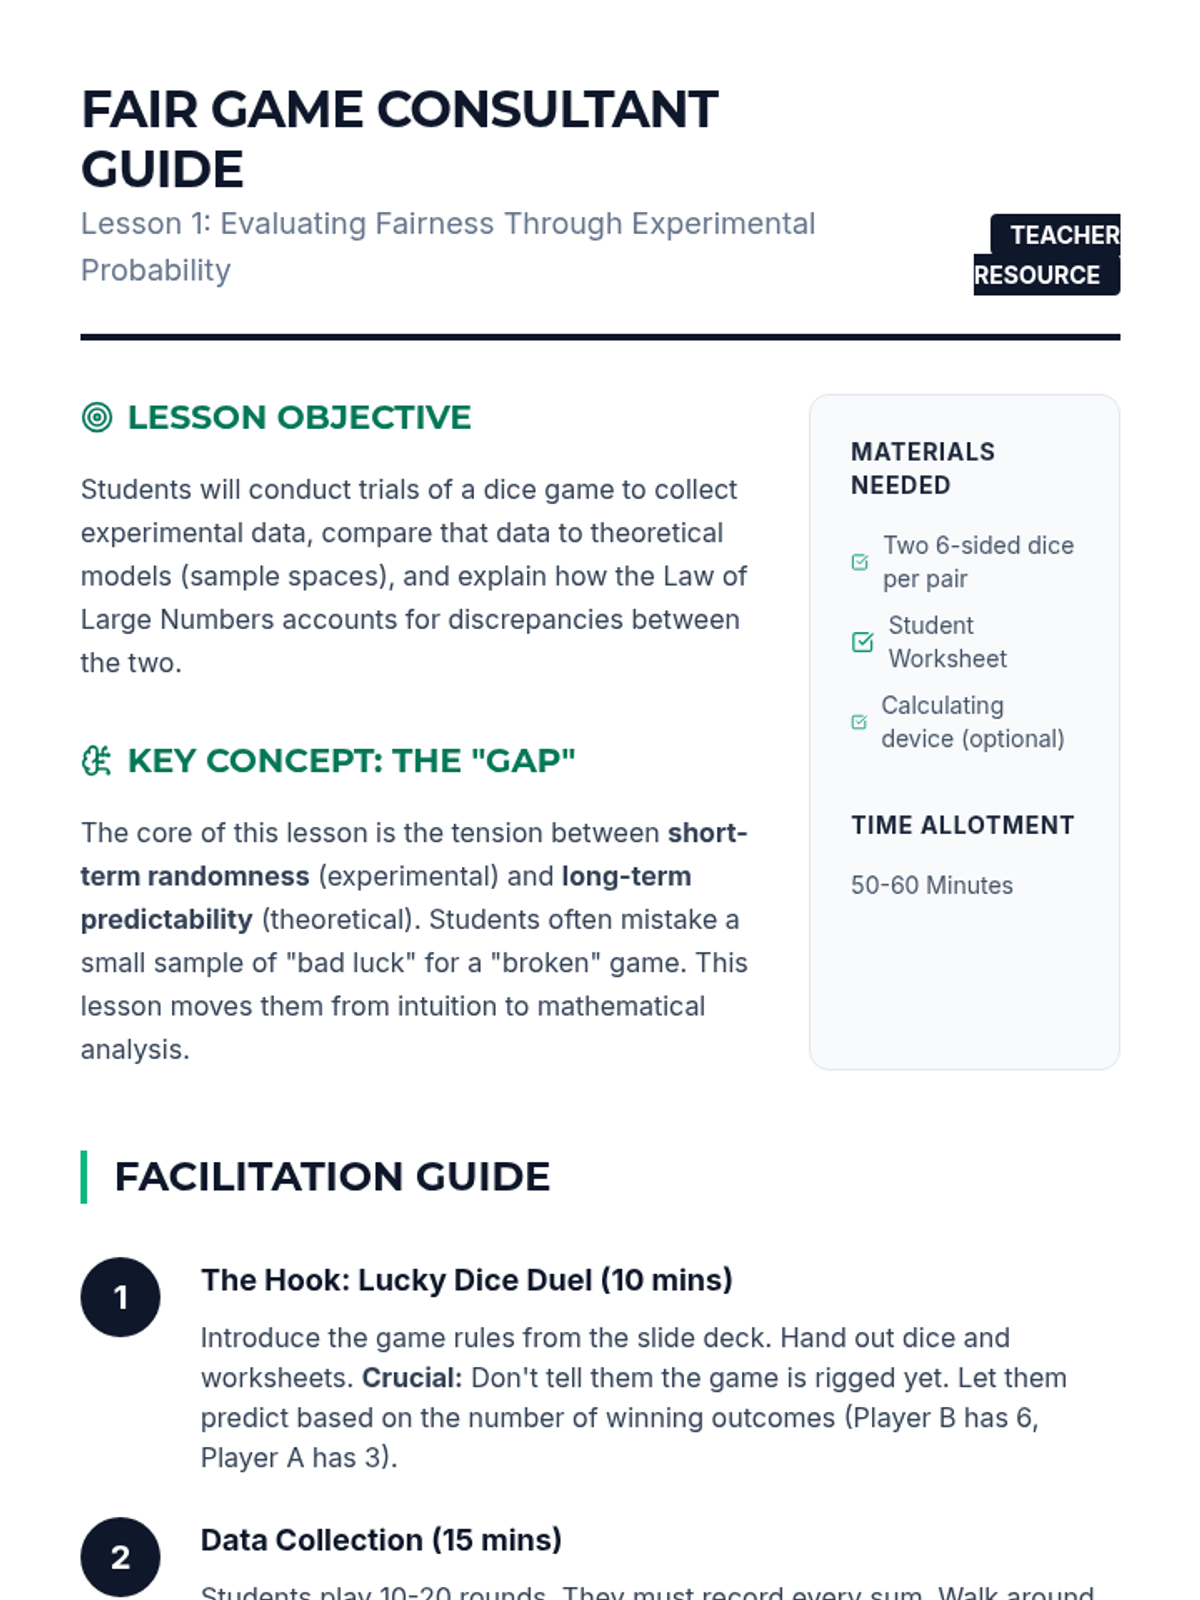
A comprehensive unit focused on practical applications of probability for high school students, emphasizing decision-making, fairness, and risk assessment.
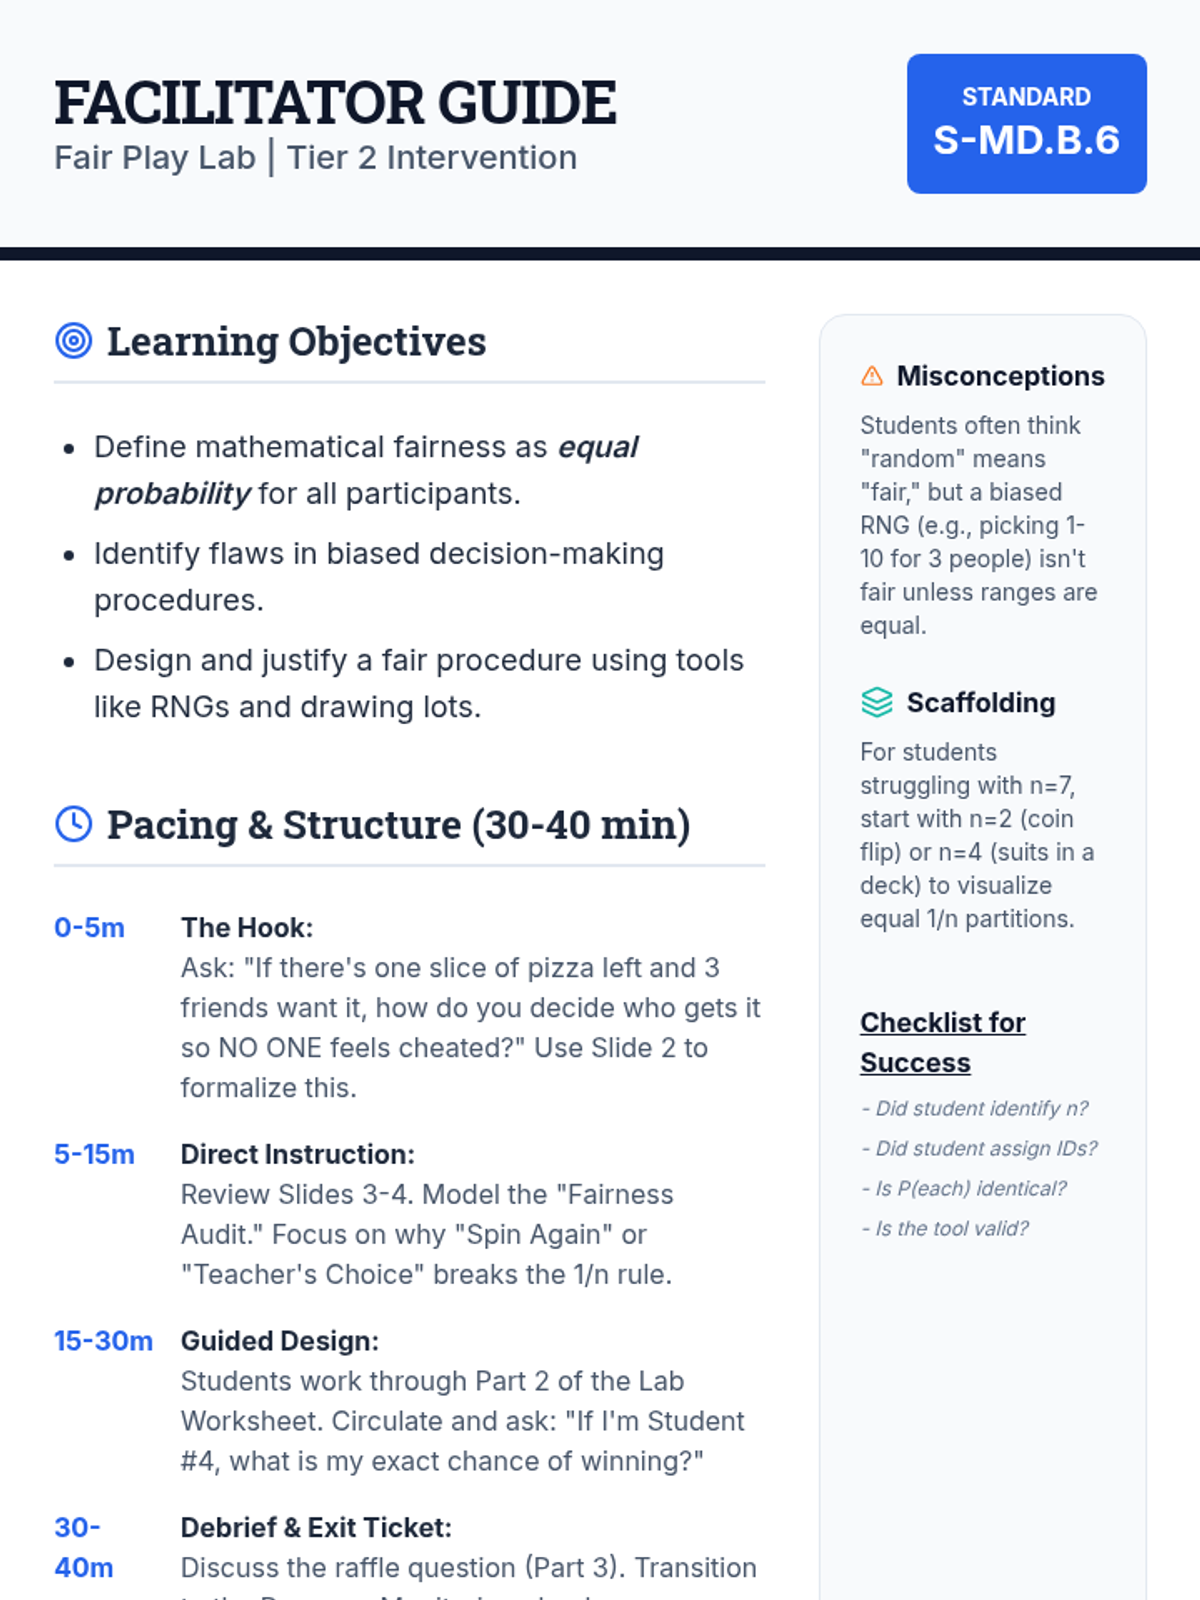
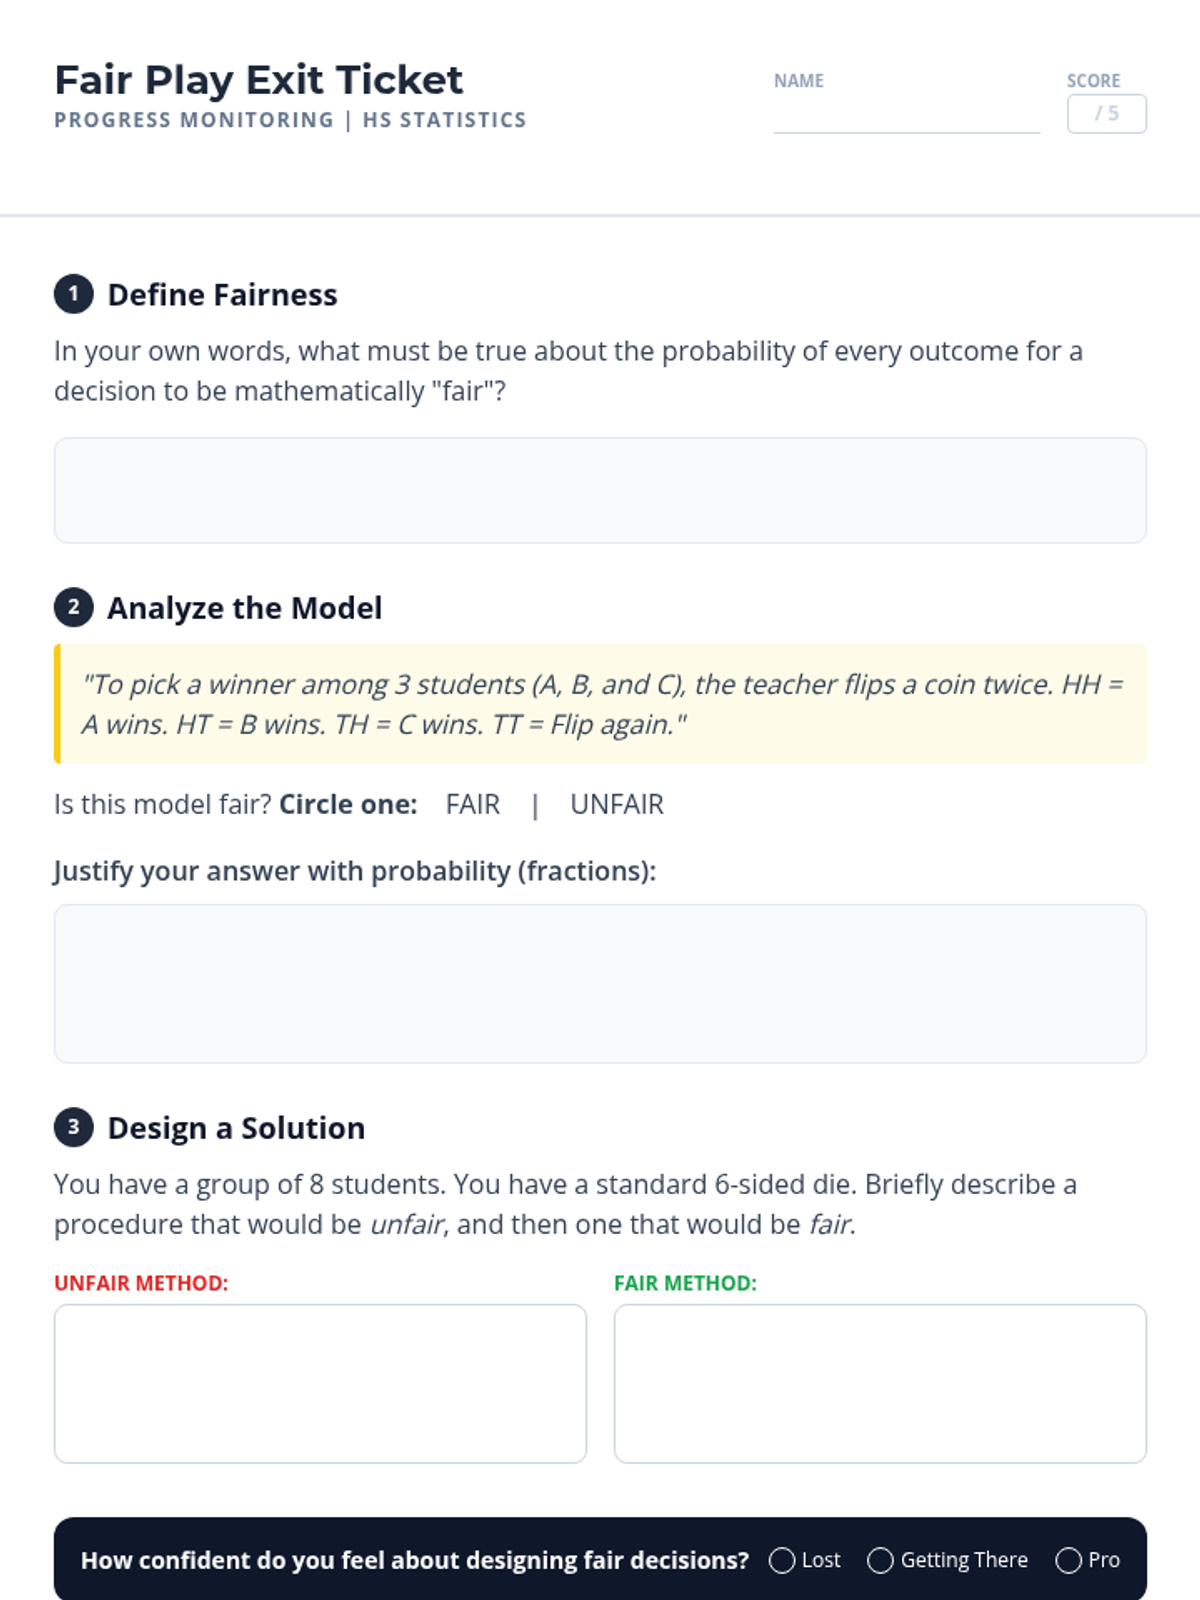
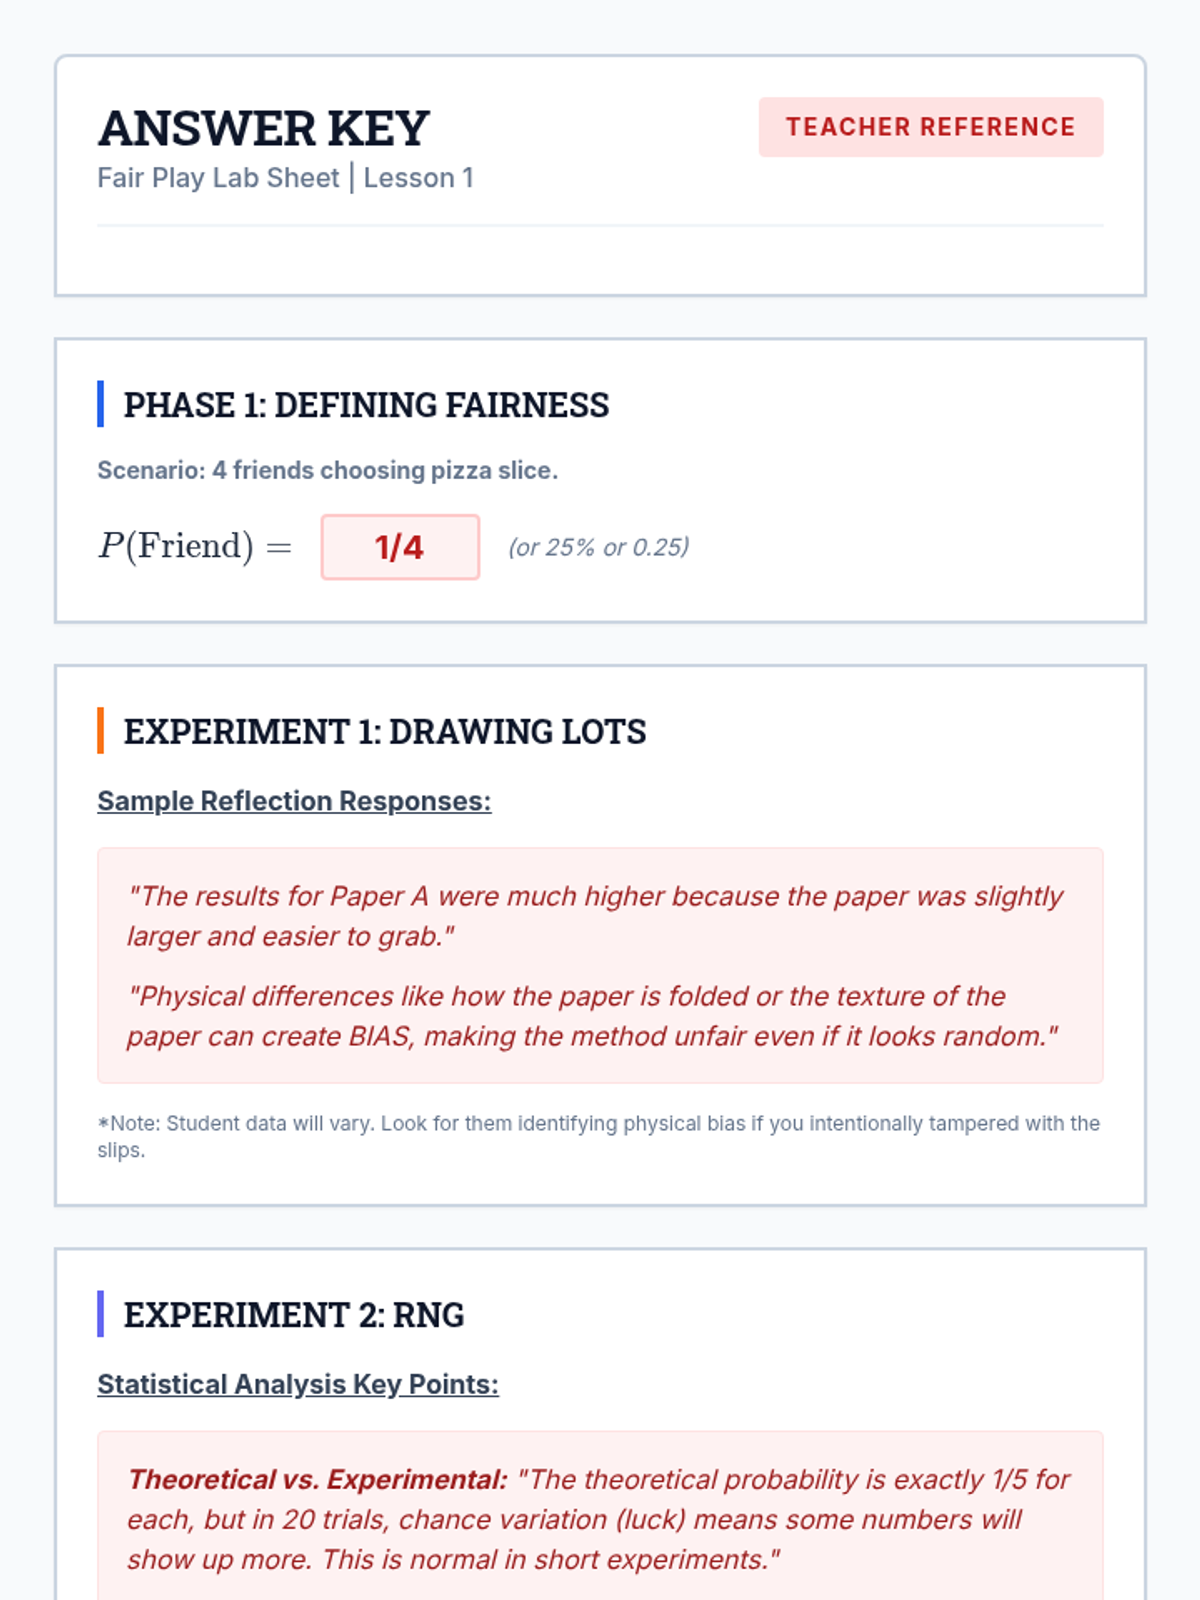
A small group intervention sequence focused on understanding and applying probability to ensure fair decision-making, specifically designed for students needing extra support in High School Statistics.
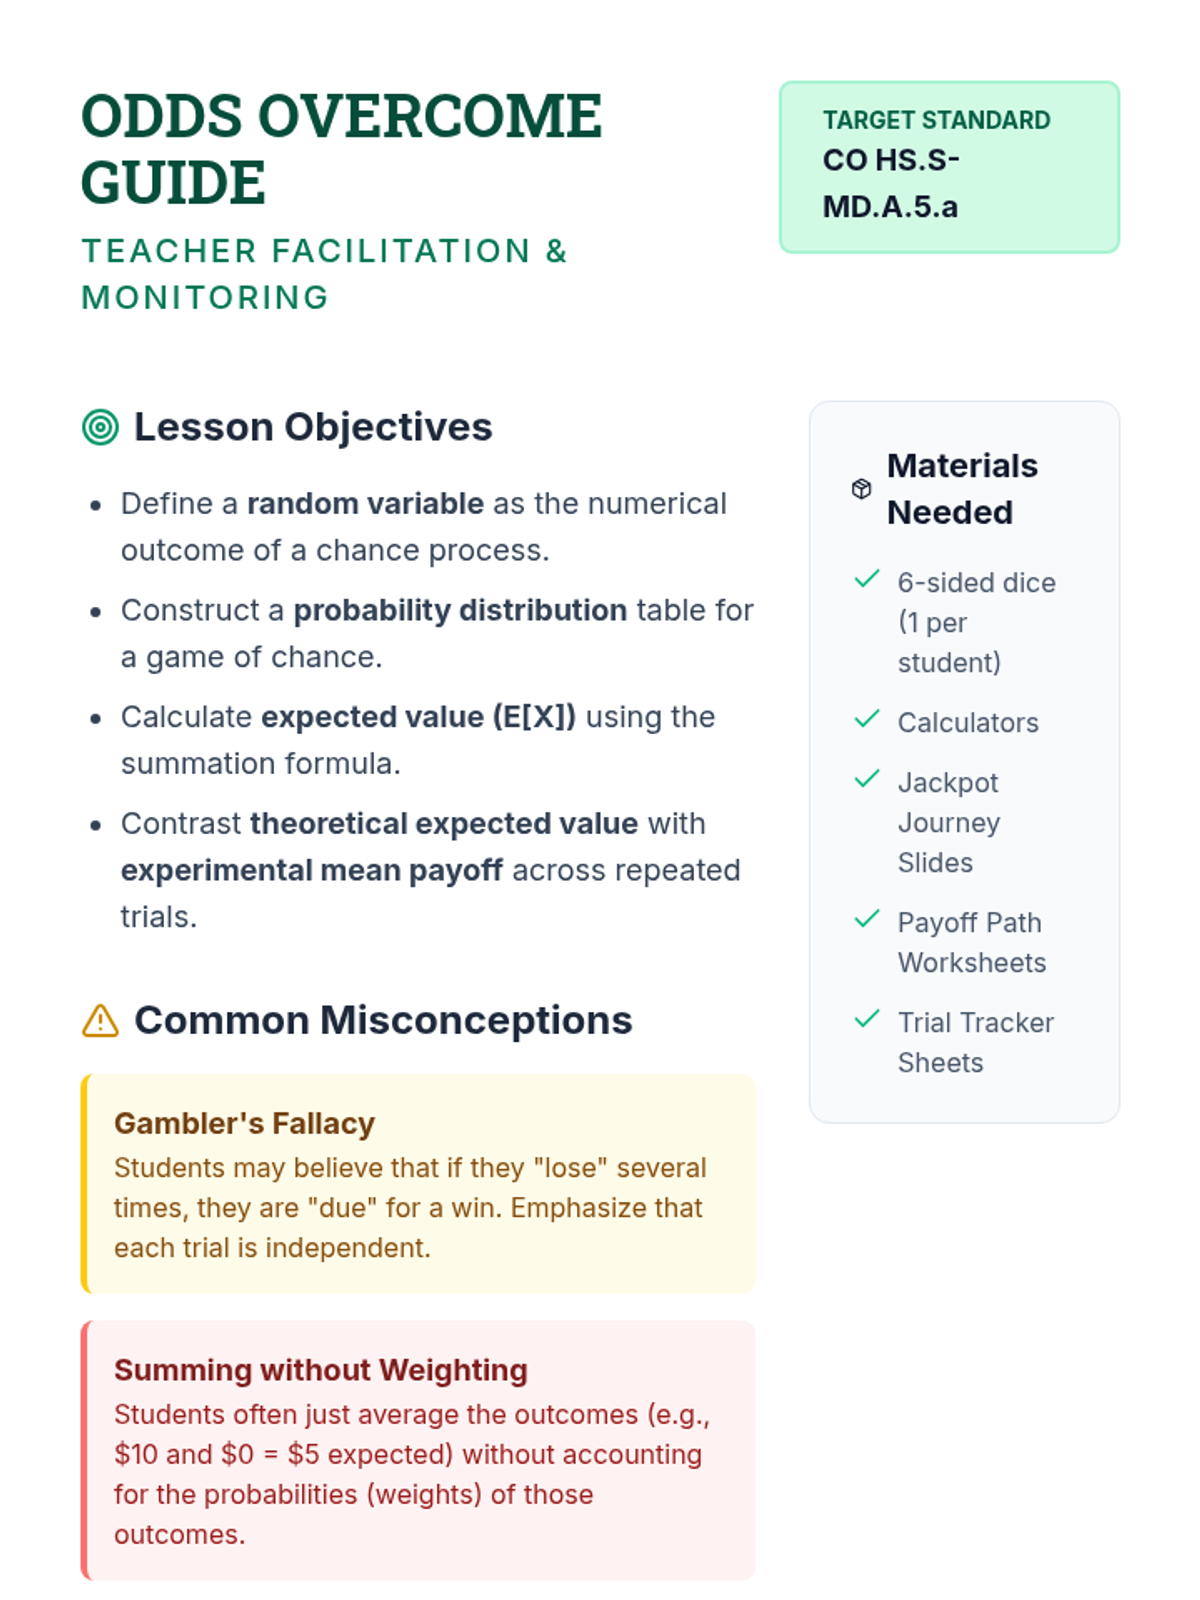
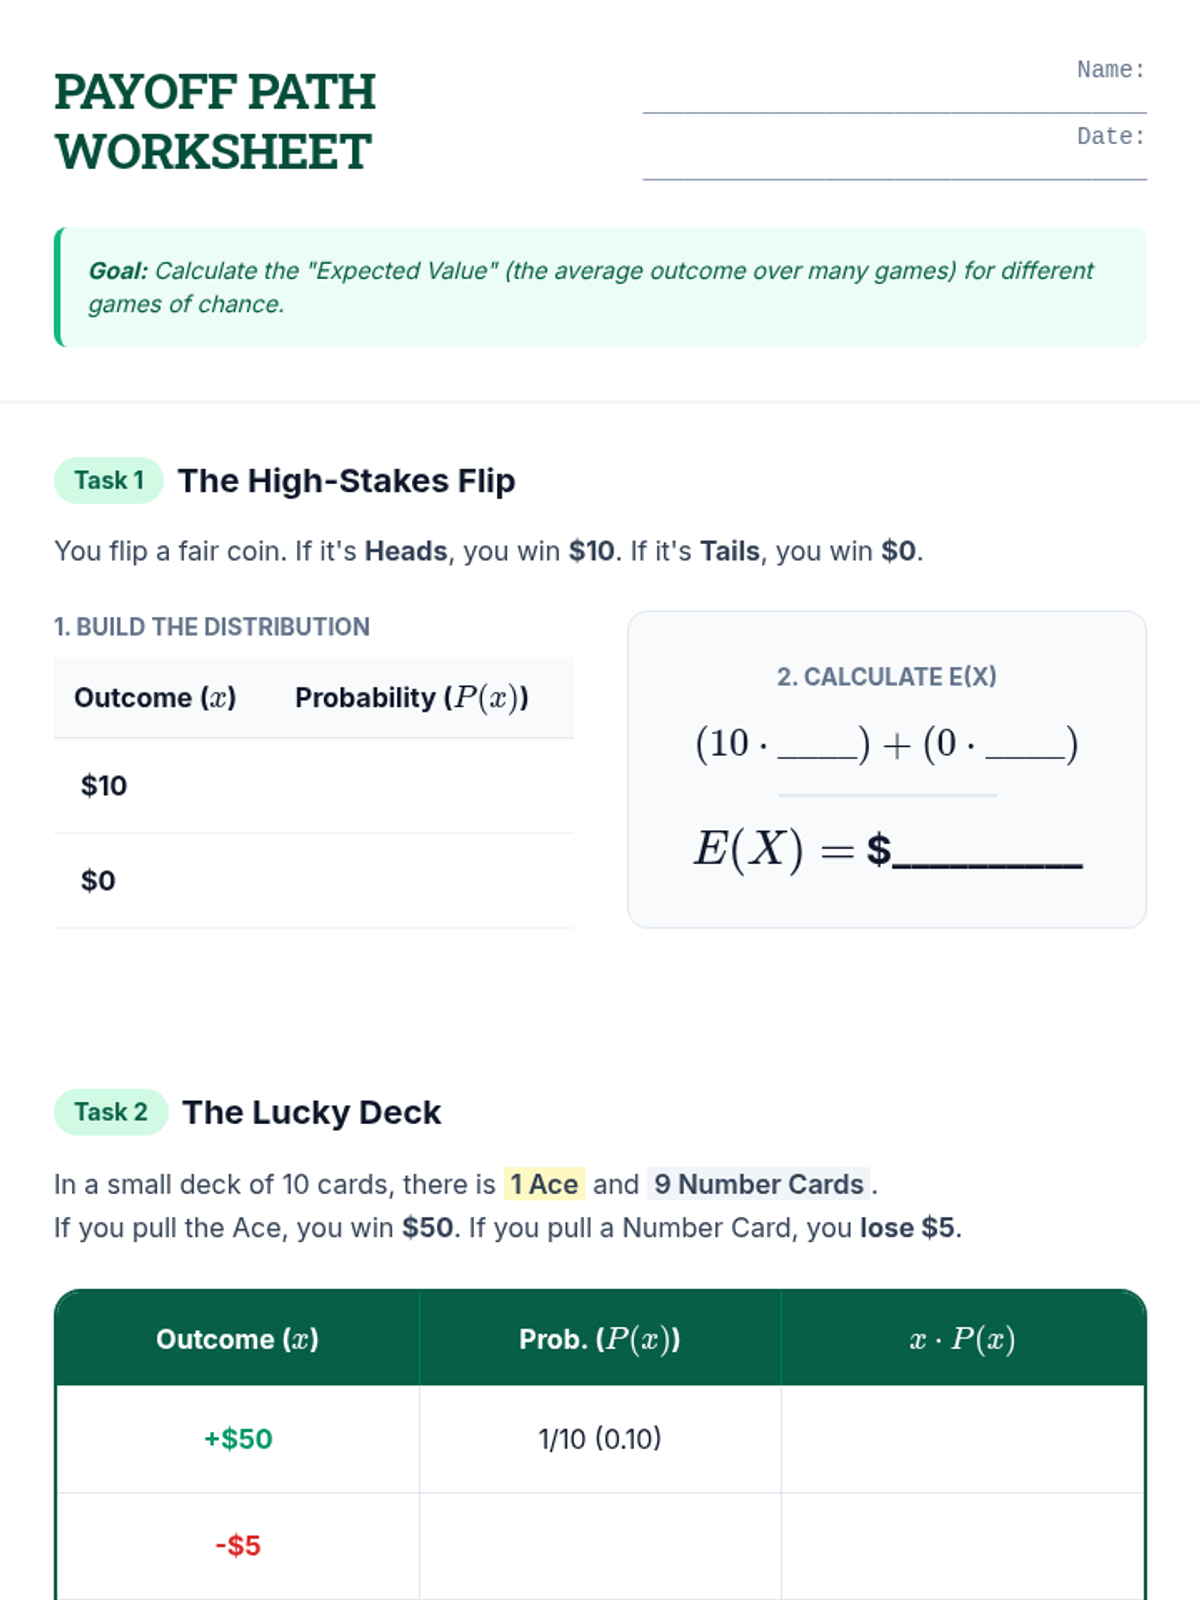
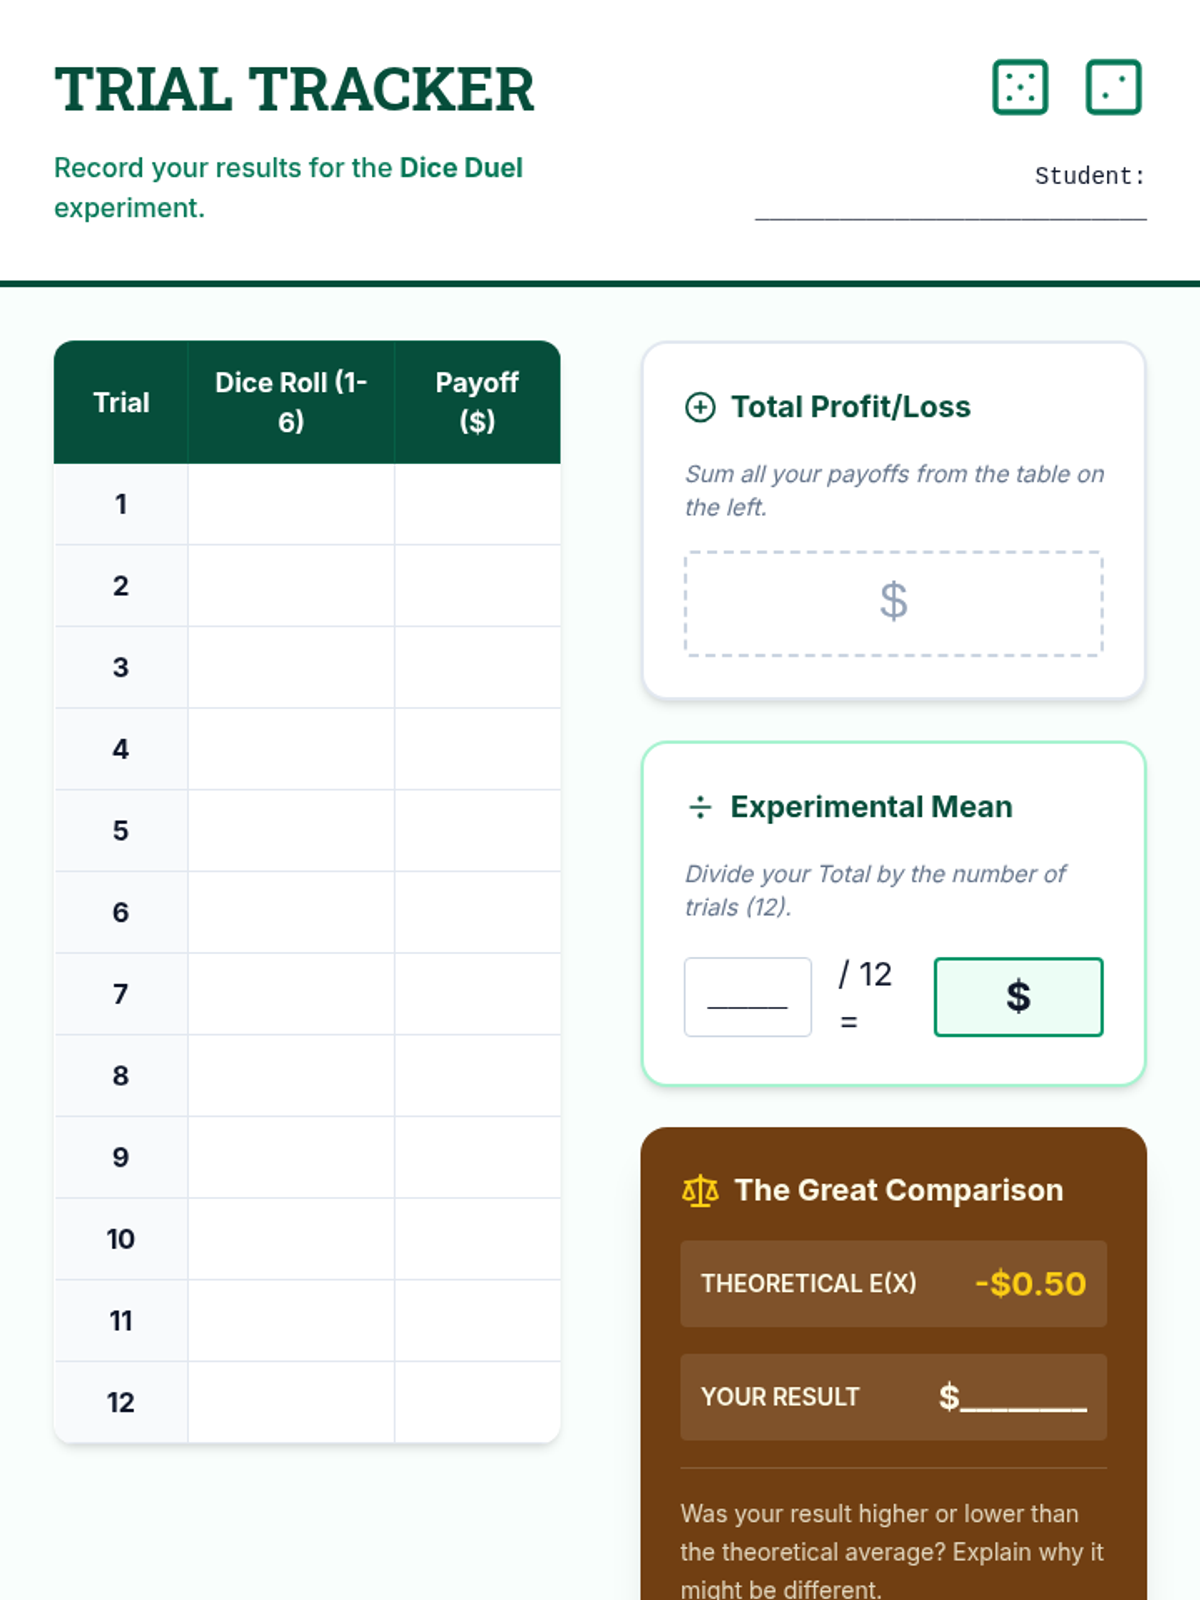
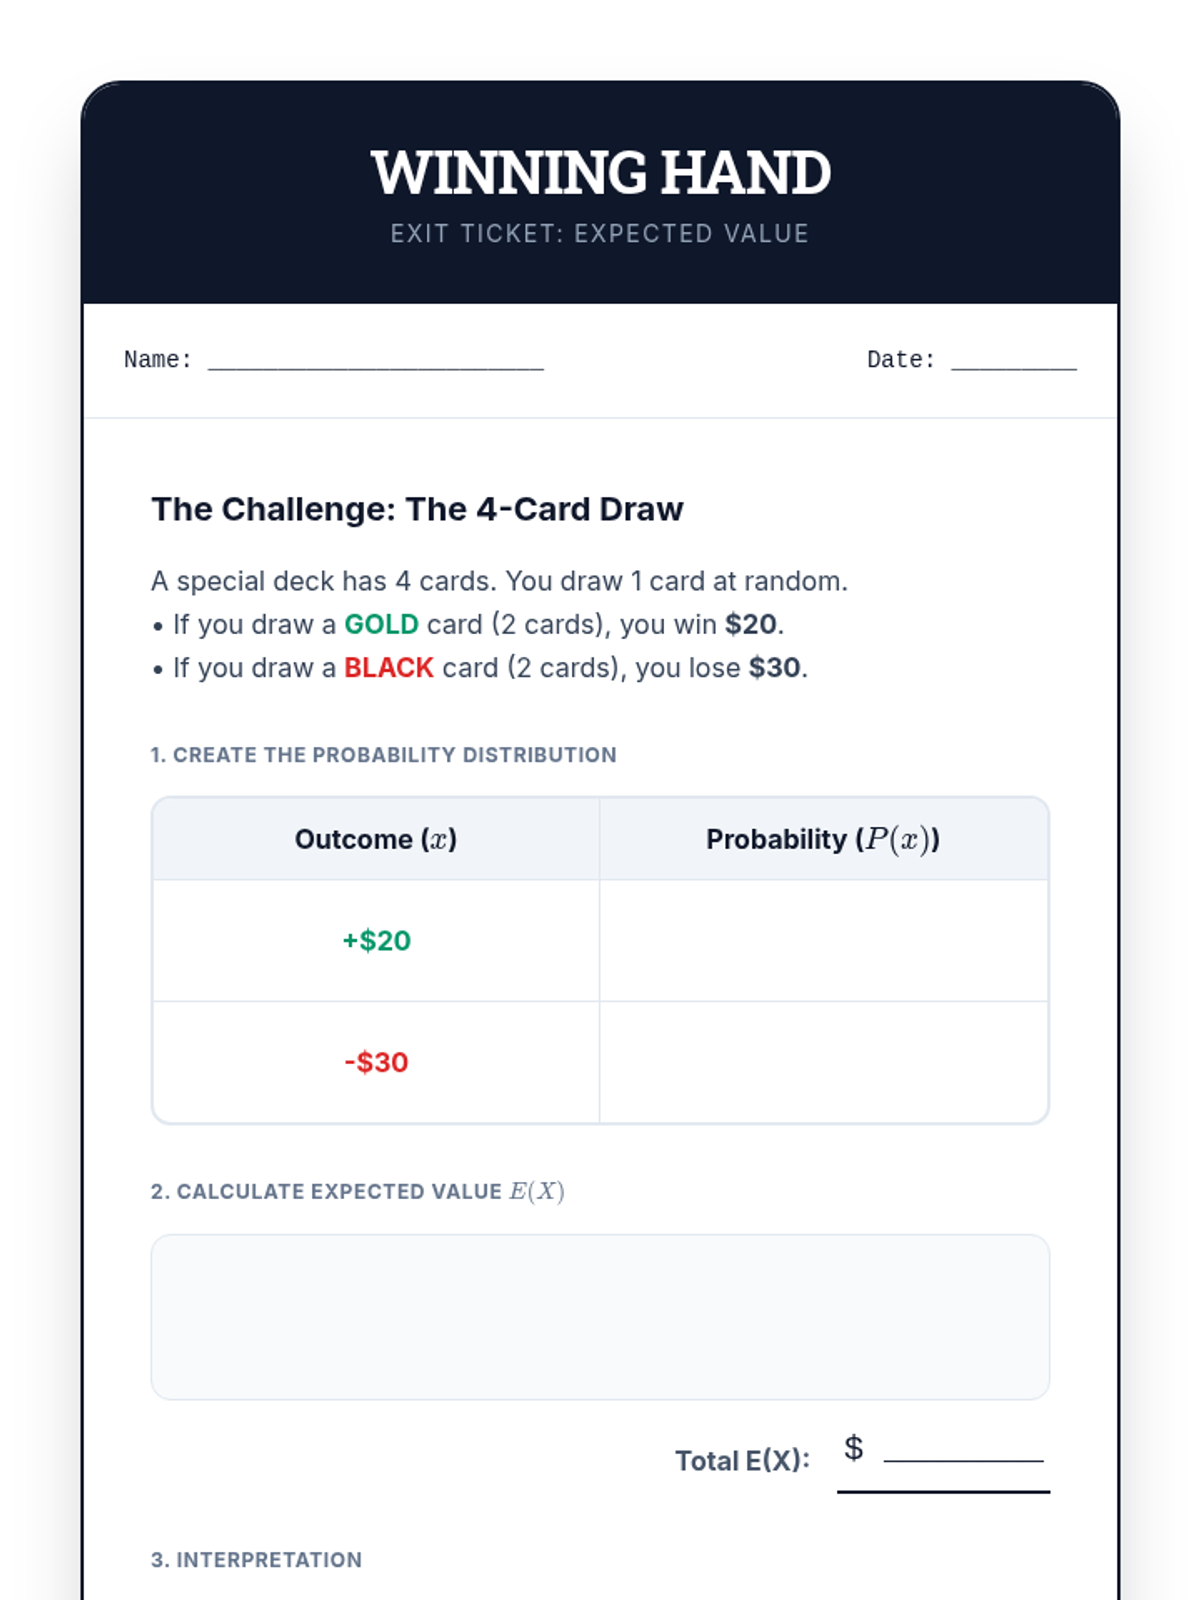
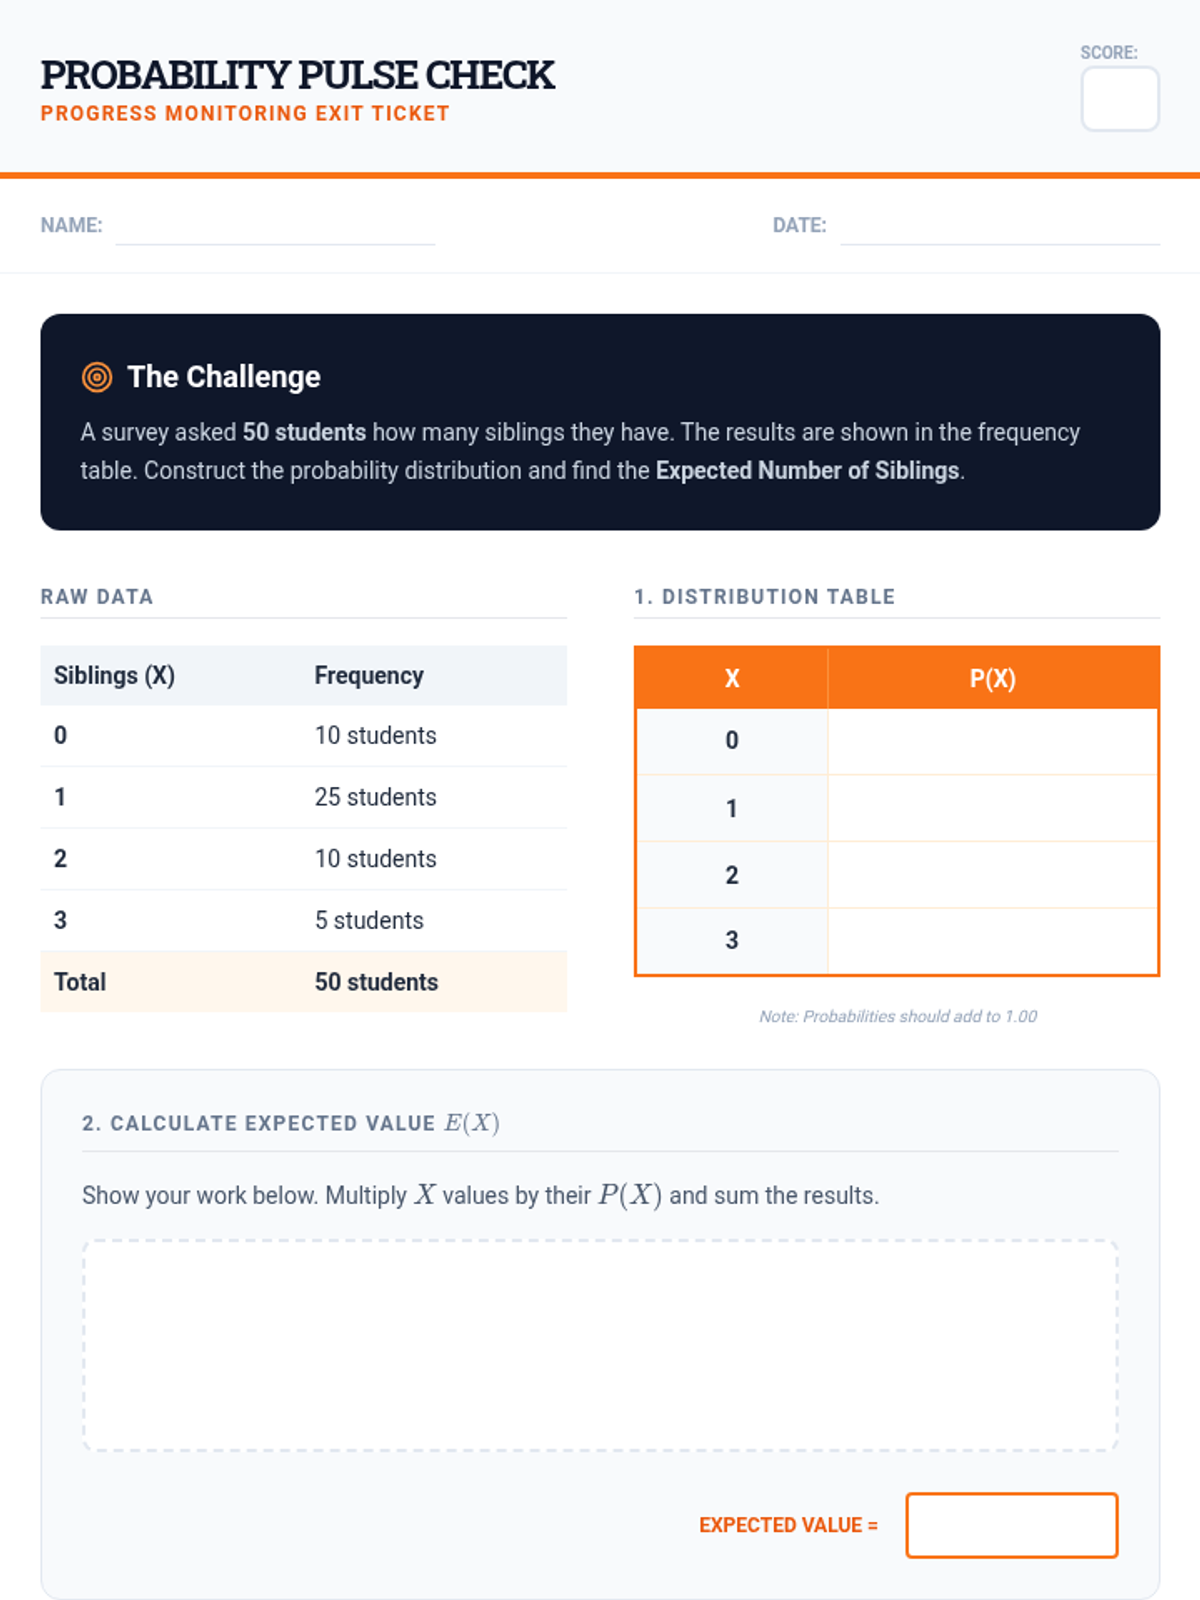
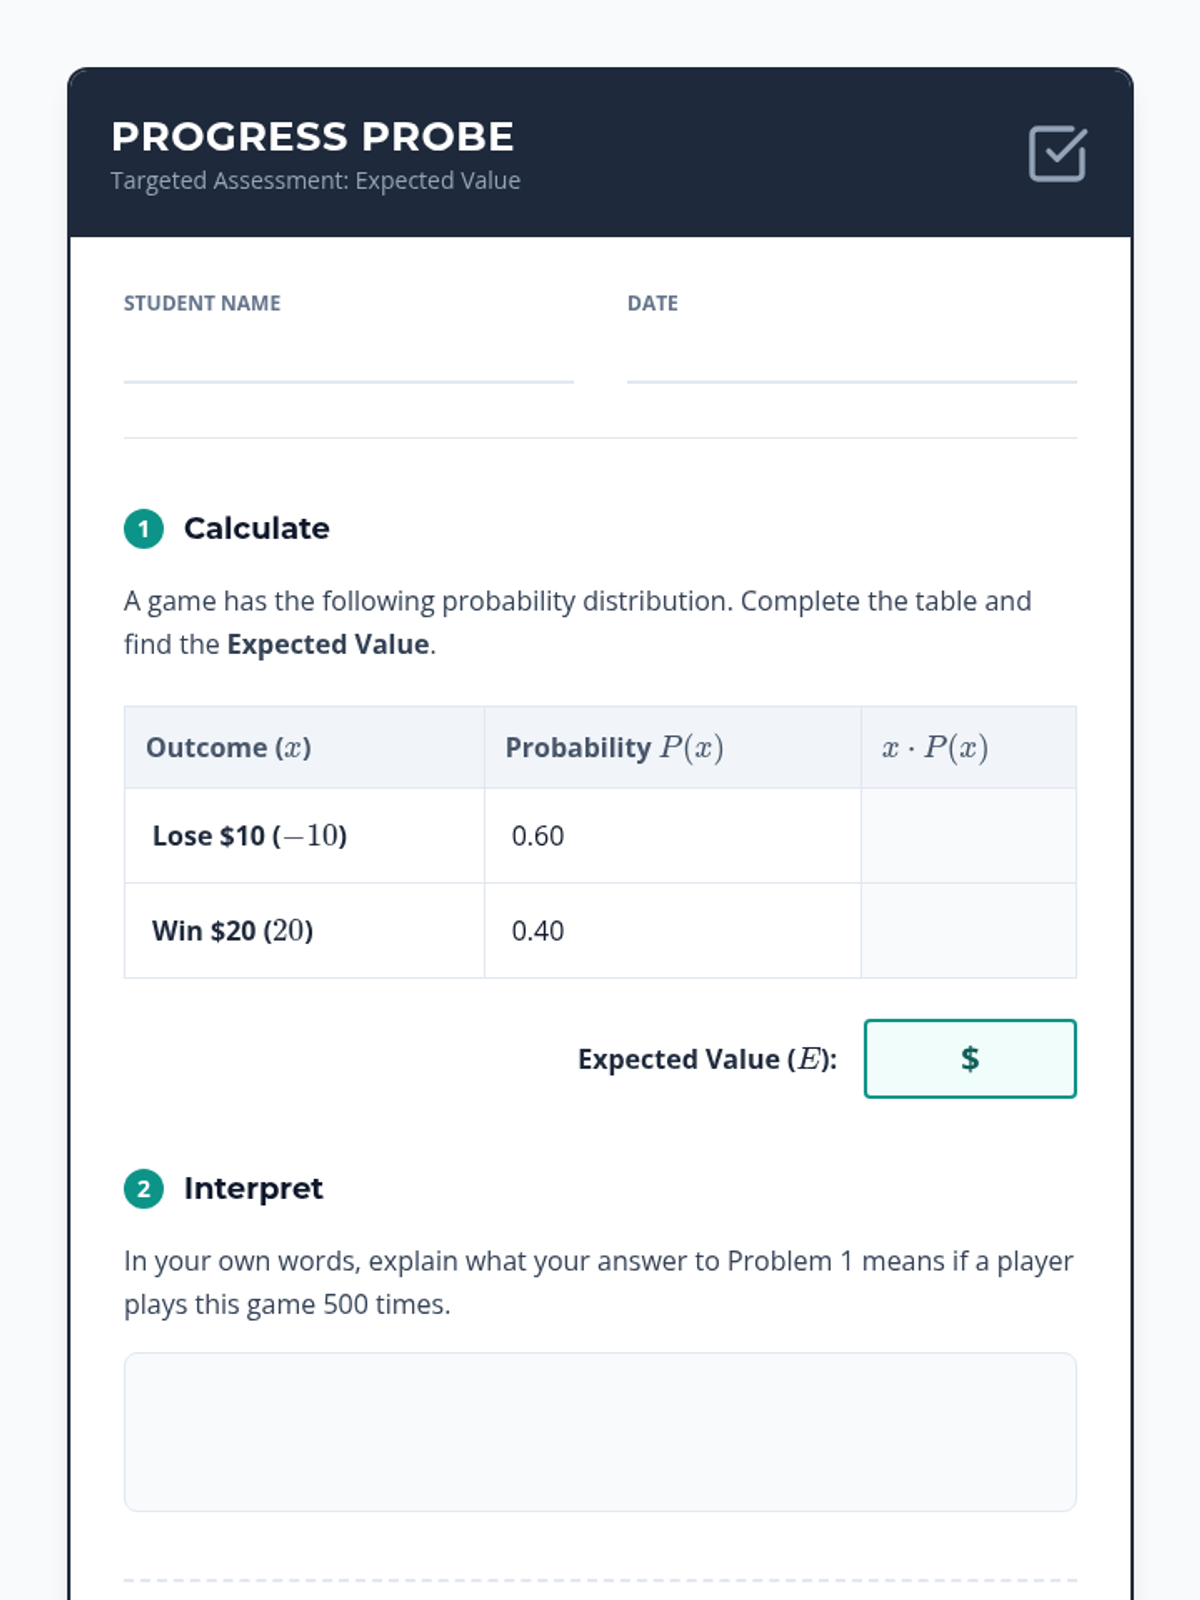
A Tier 2 statistics intervention focusing on calculating and interpreting expected values in games of chance. Students transition from intuitive guesses to formal probability distributions and compare experimental data to theoretical outcomes.
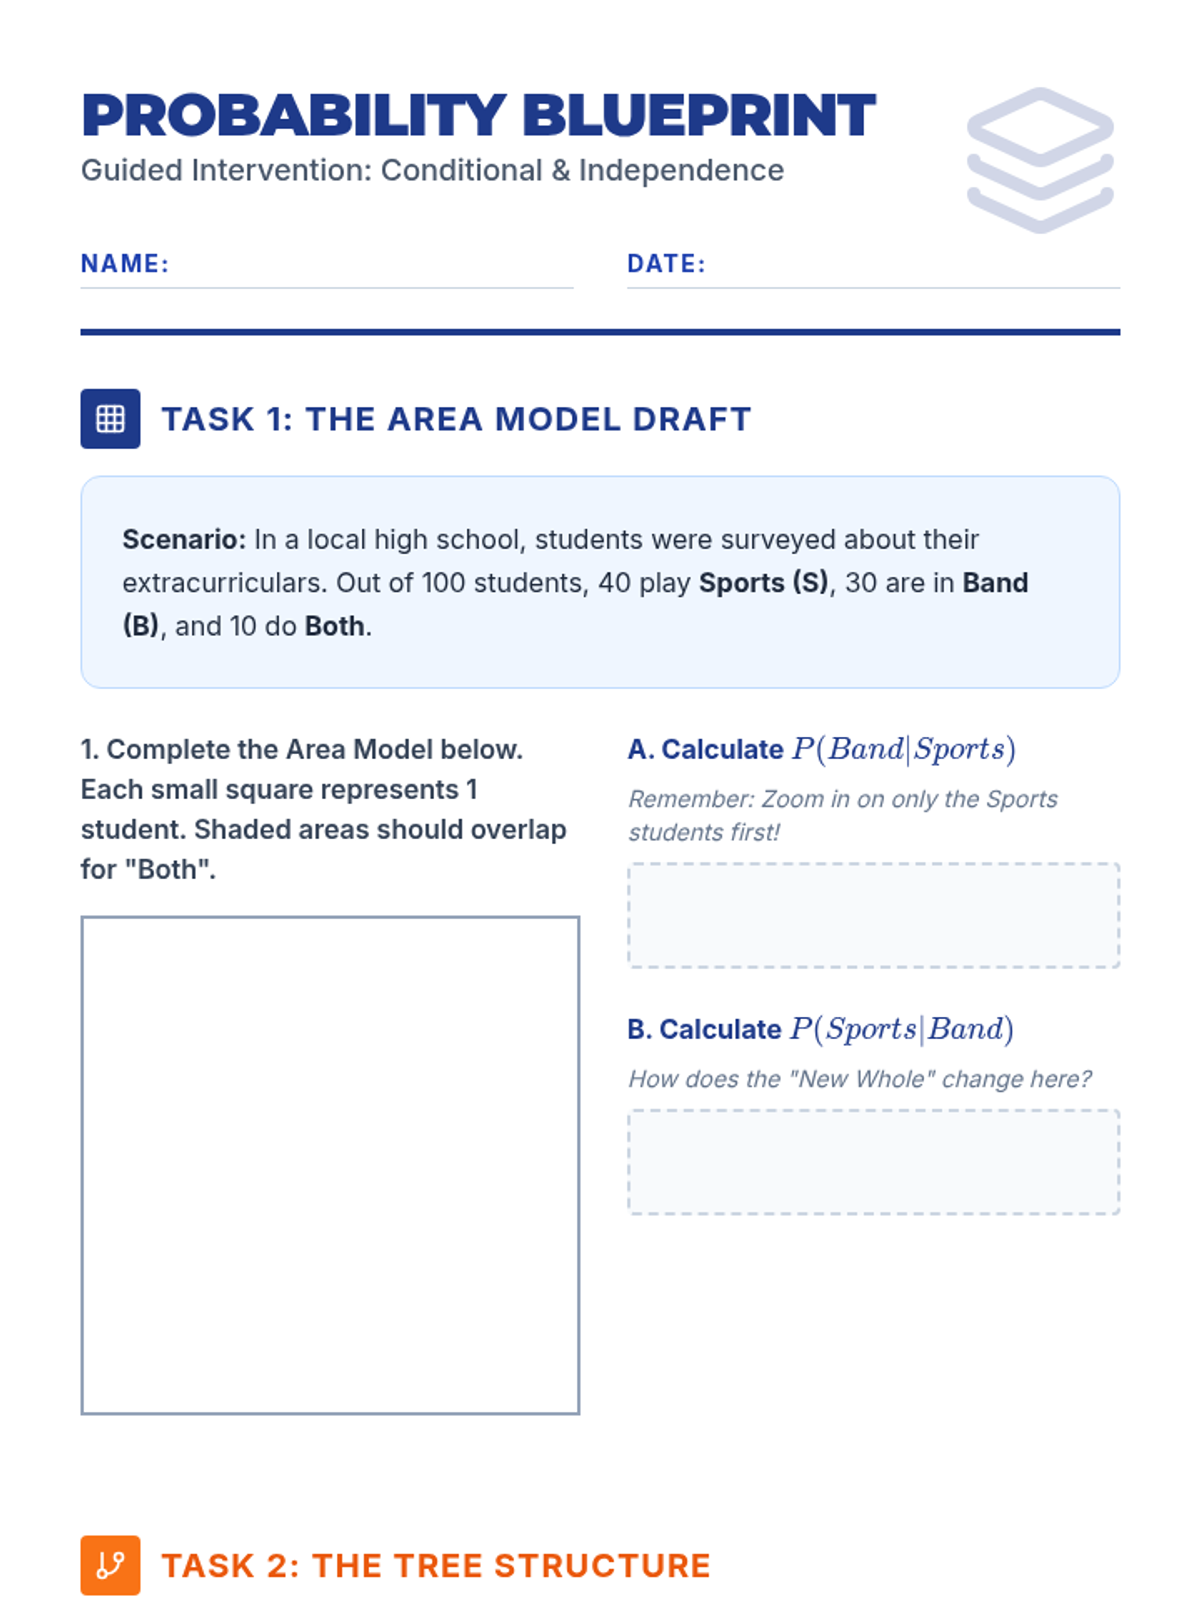
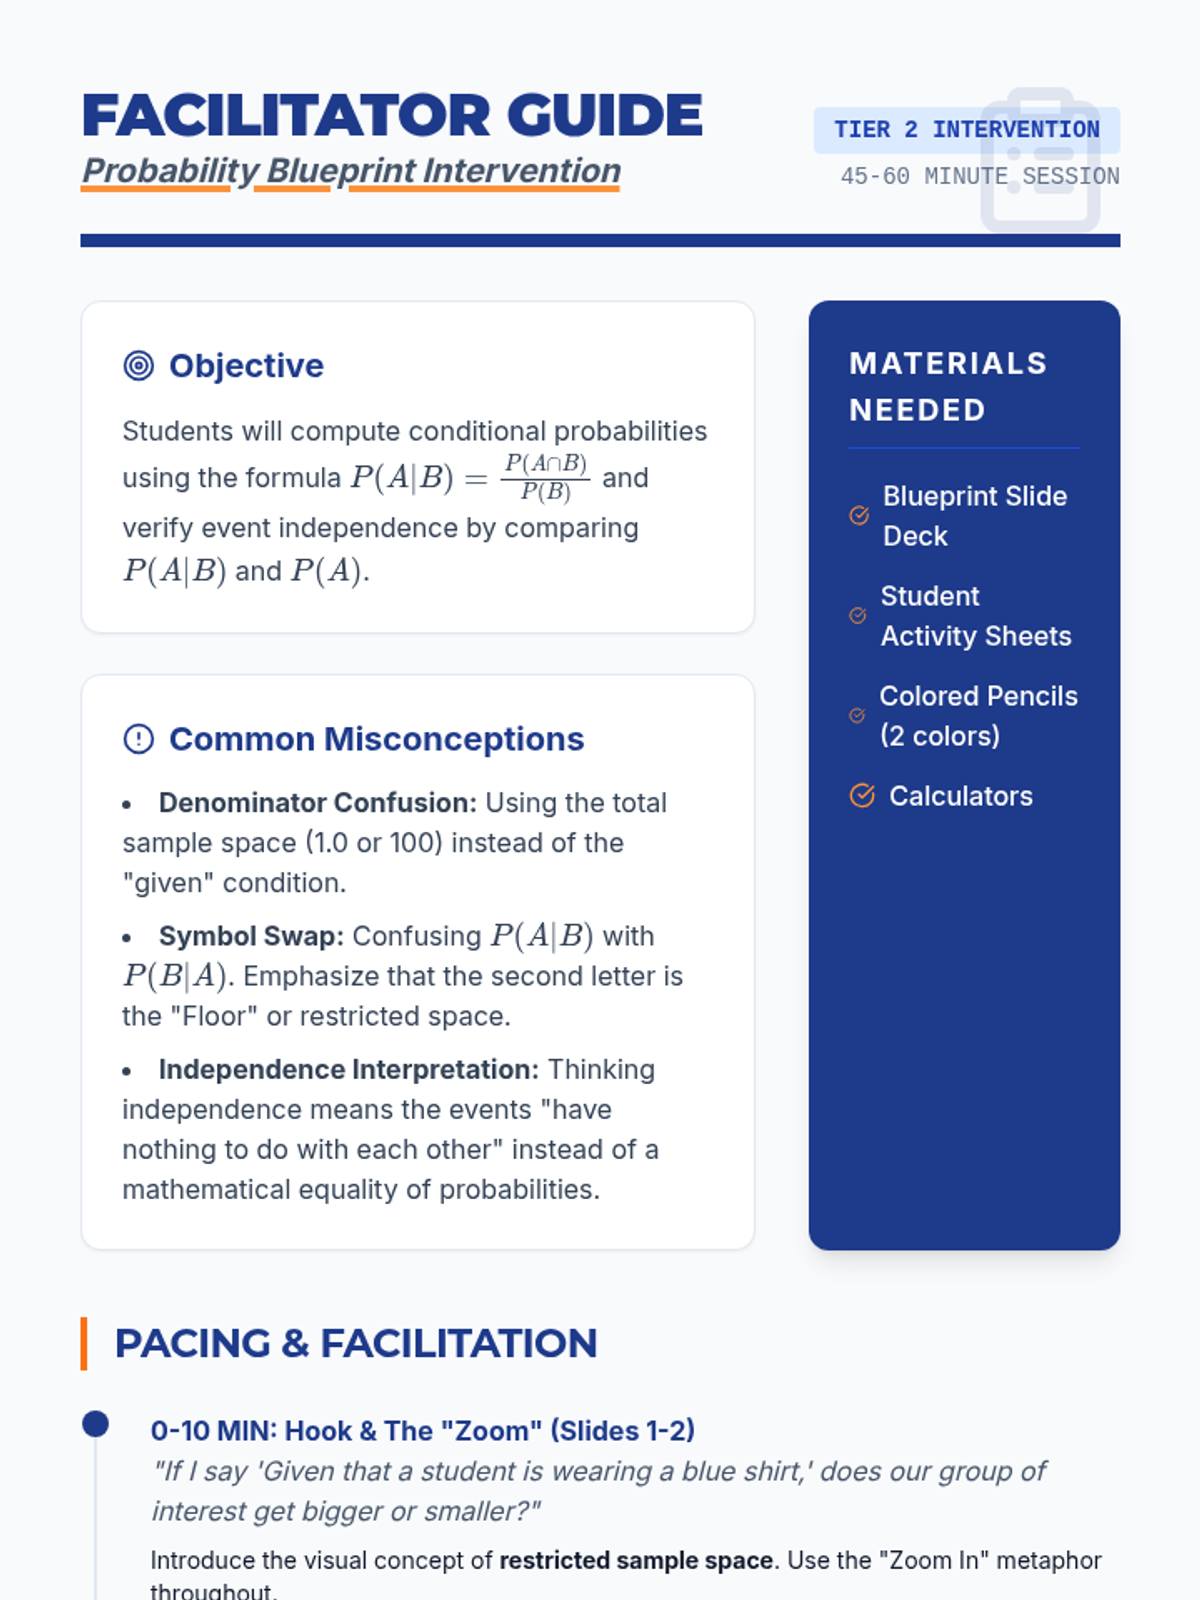
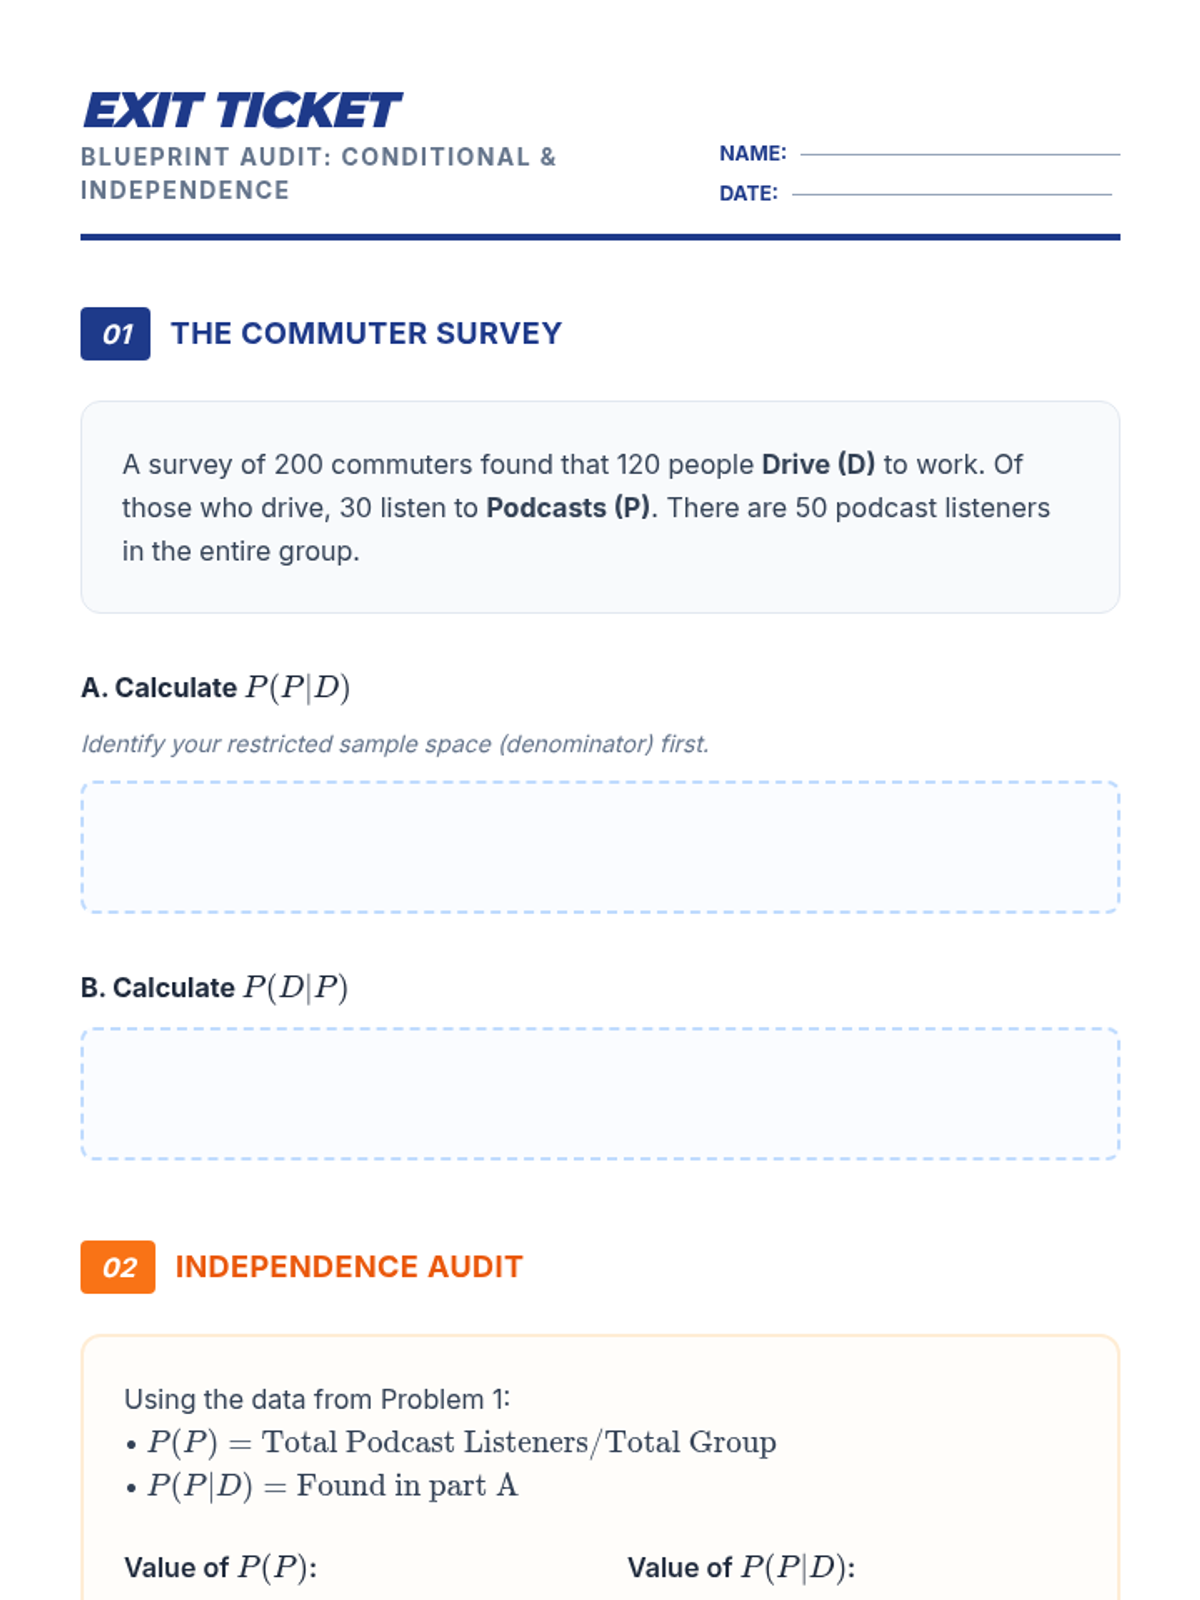
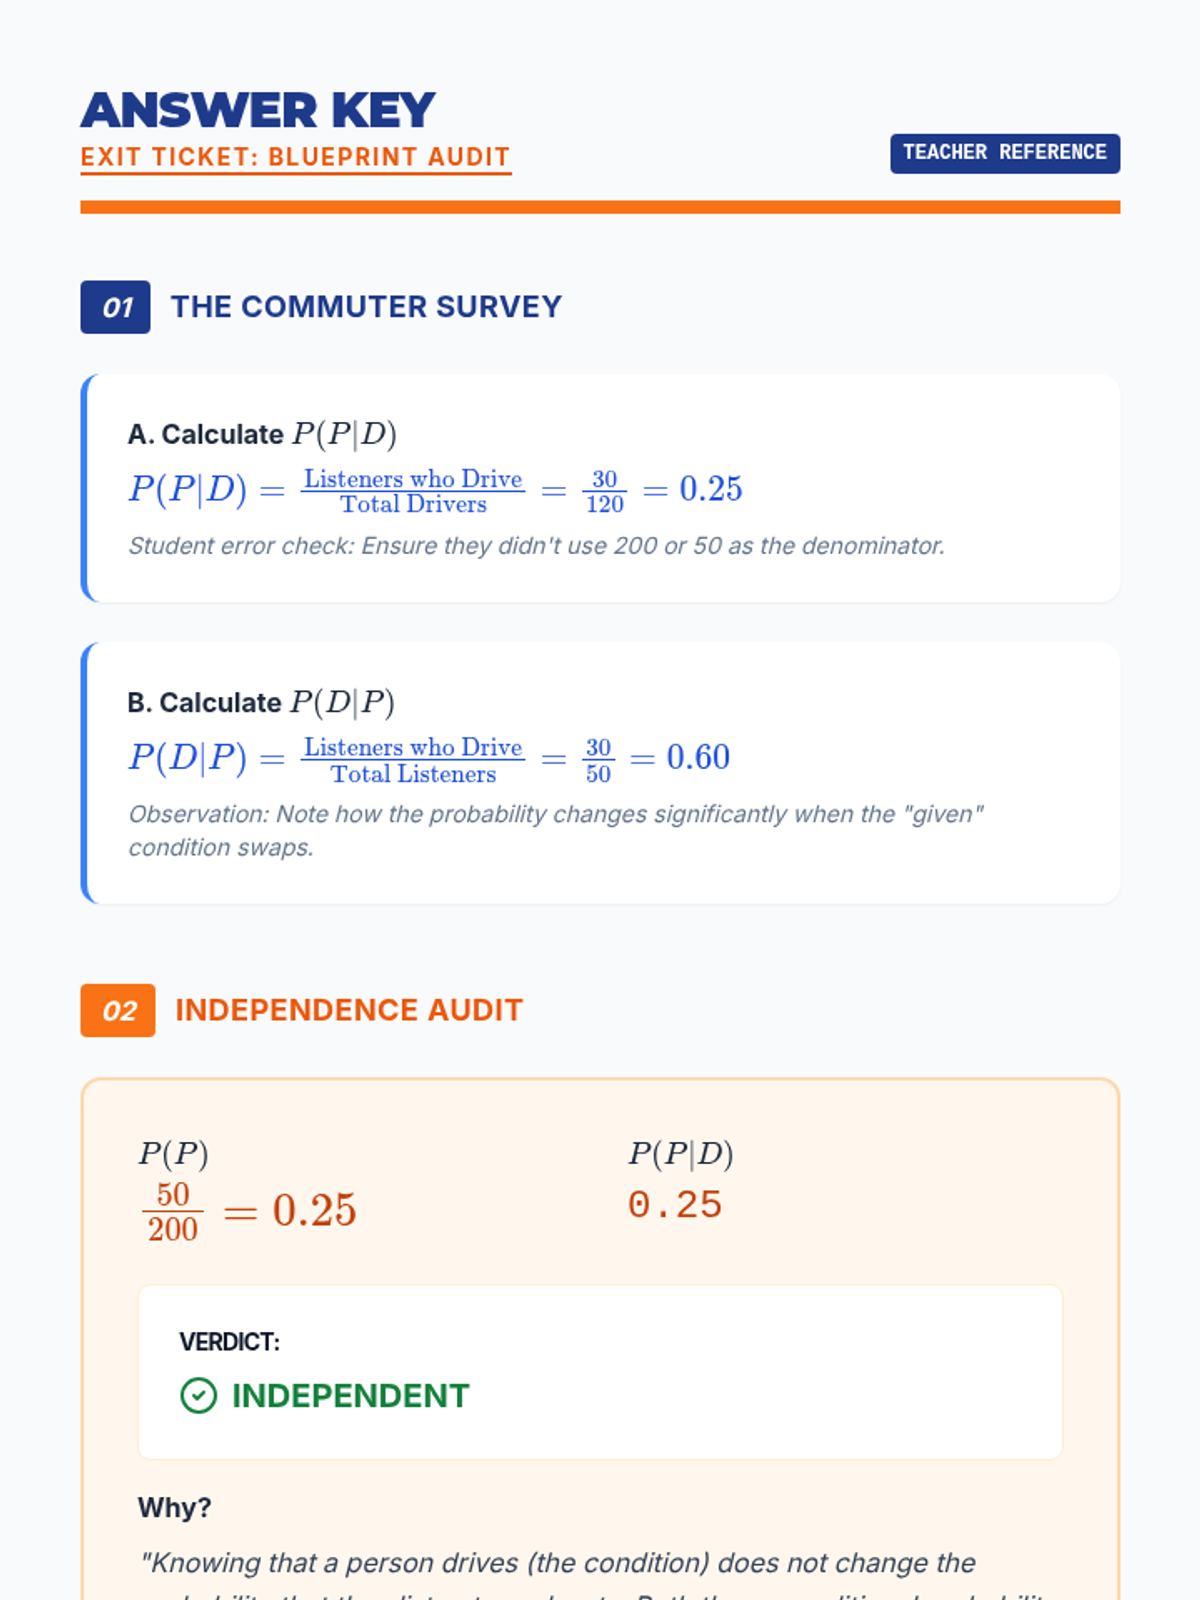
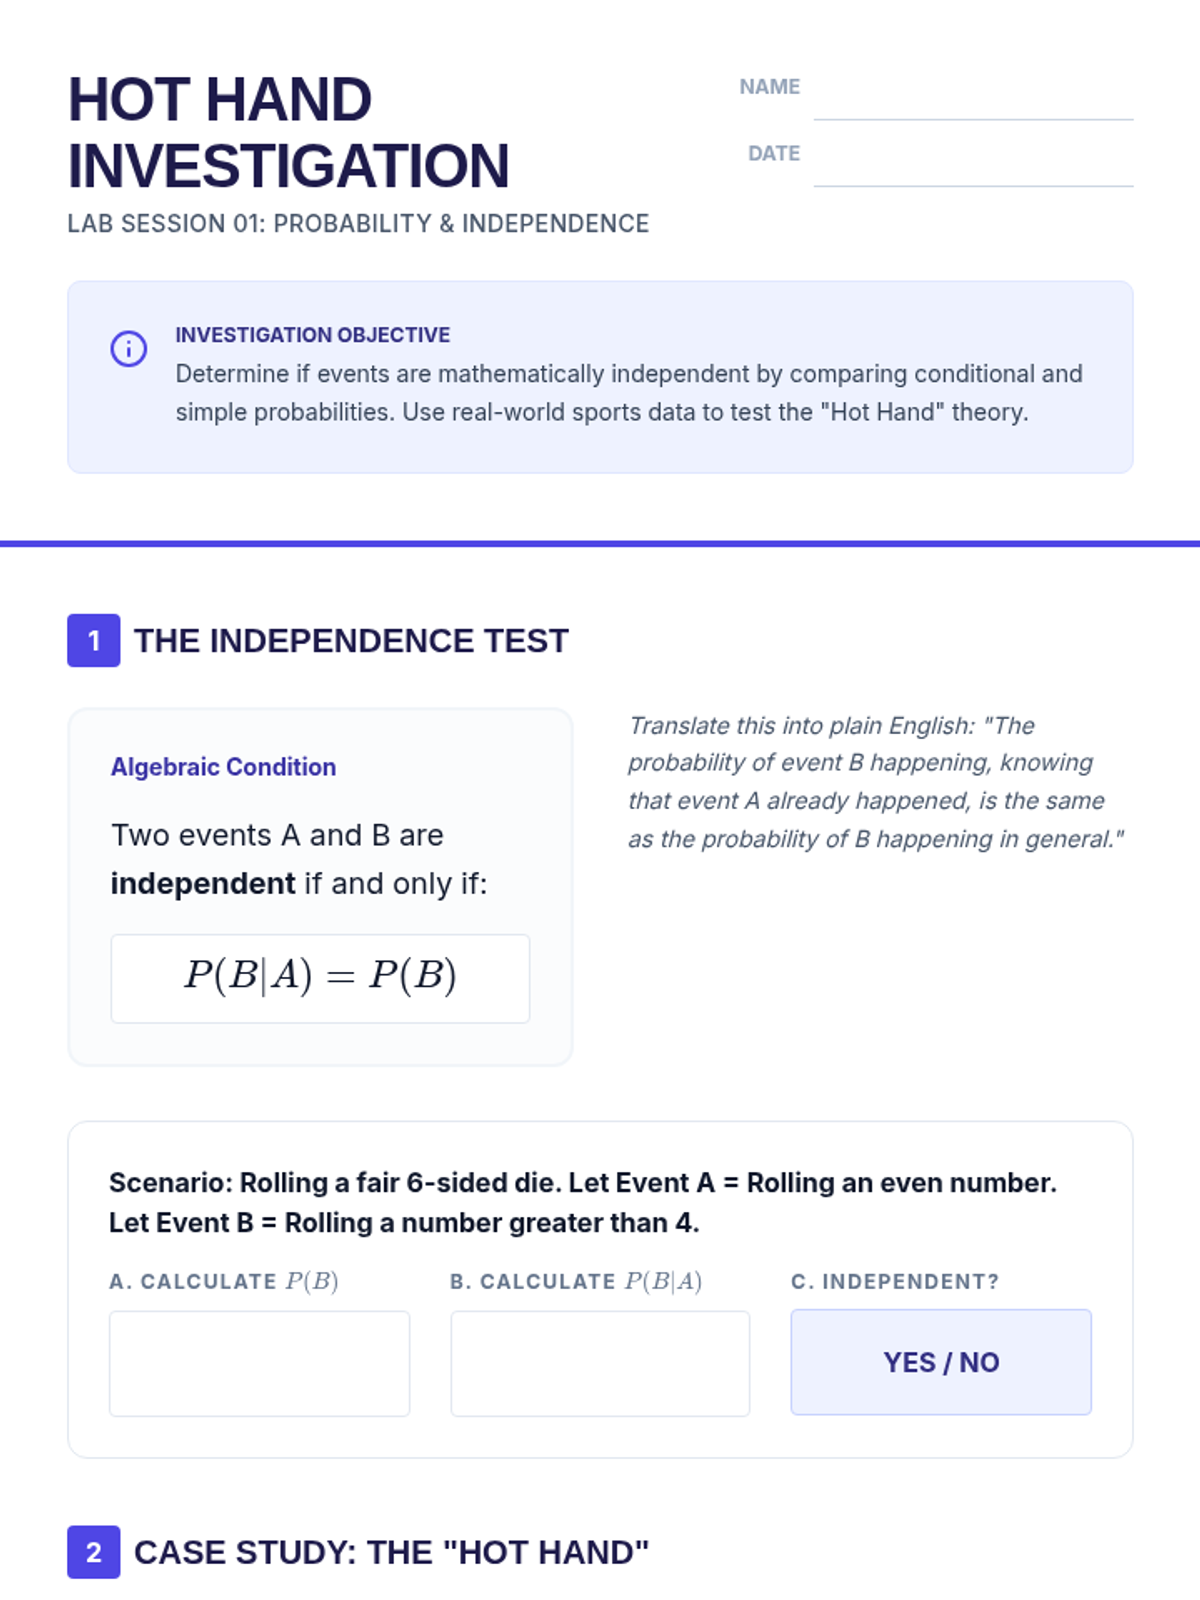
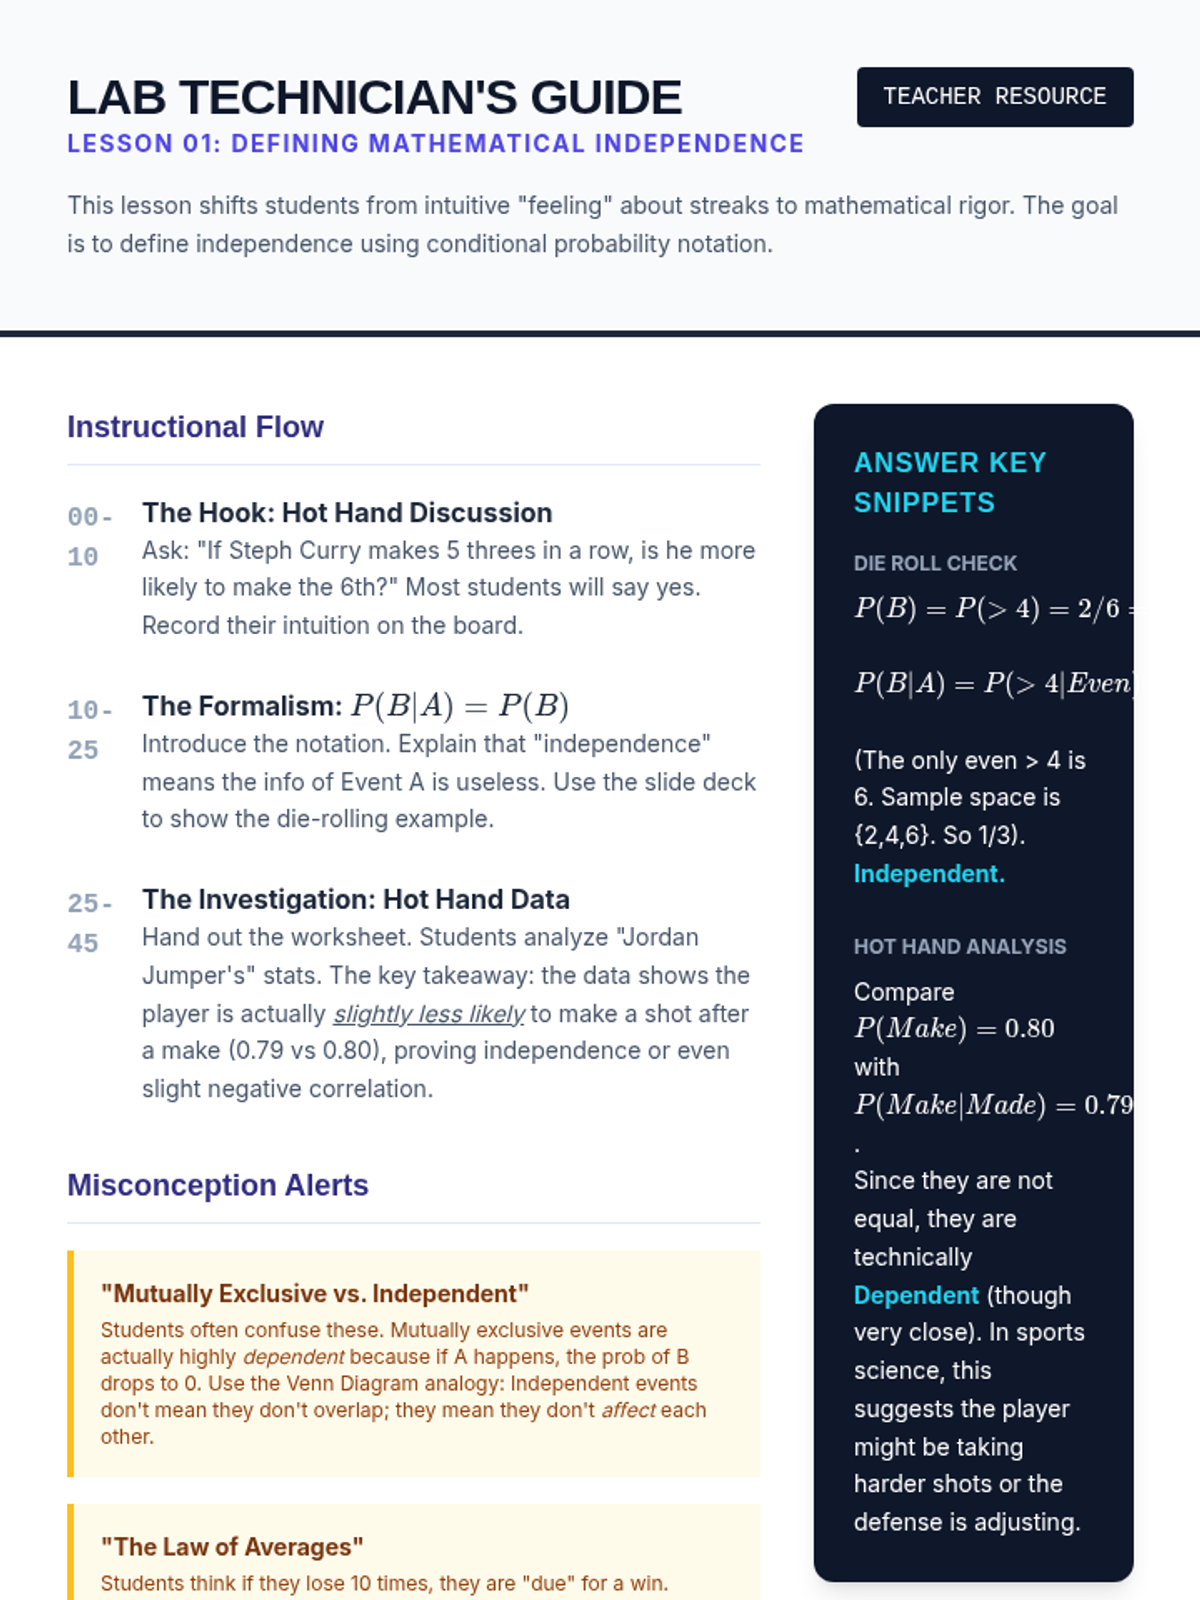
A targeted Tier 2 intervention sequence focused on conditional probability and independence for high school students. This sequence emphasizes visual models like tree diagrams and area models to bridge conceptual understanding to formal notation.
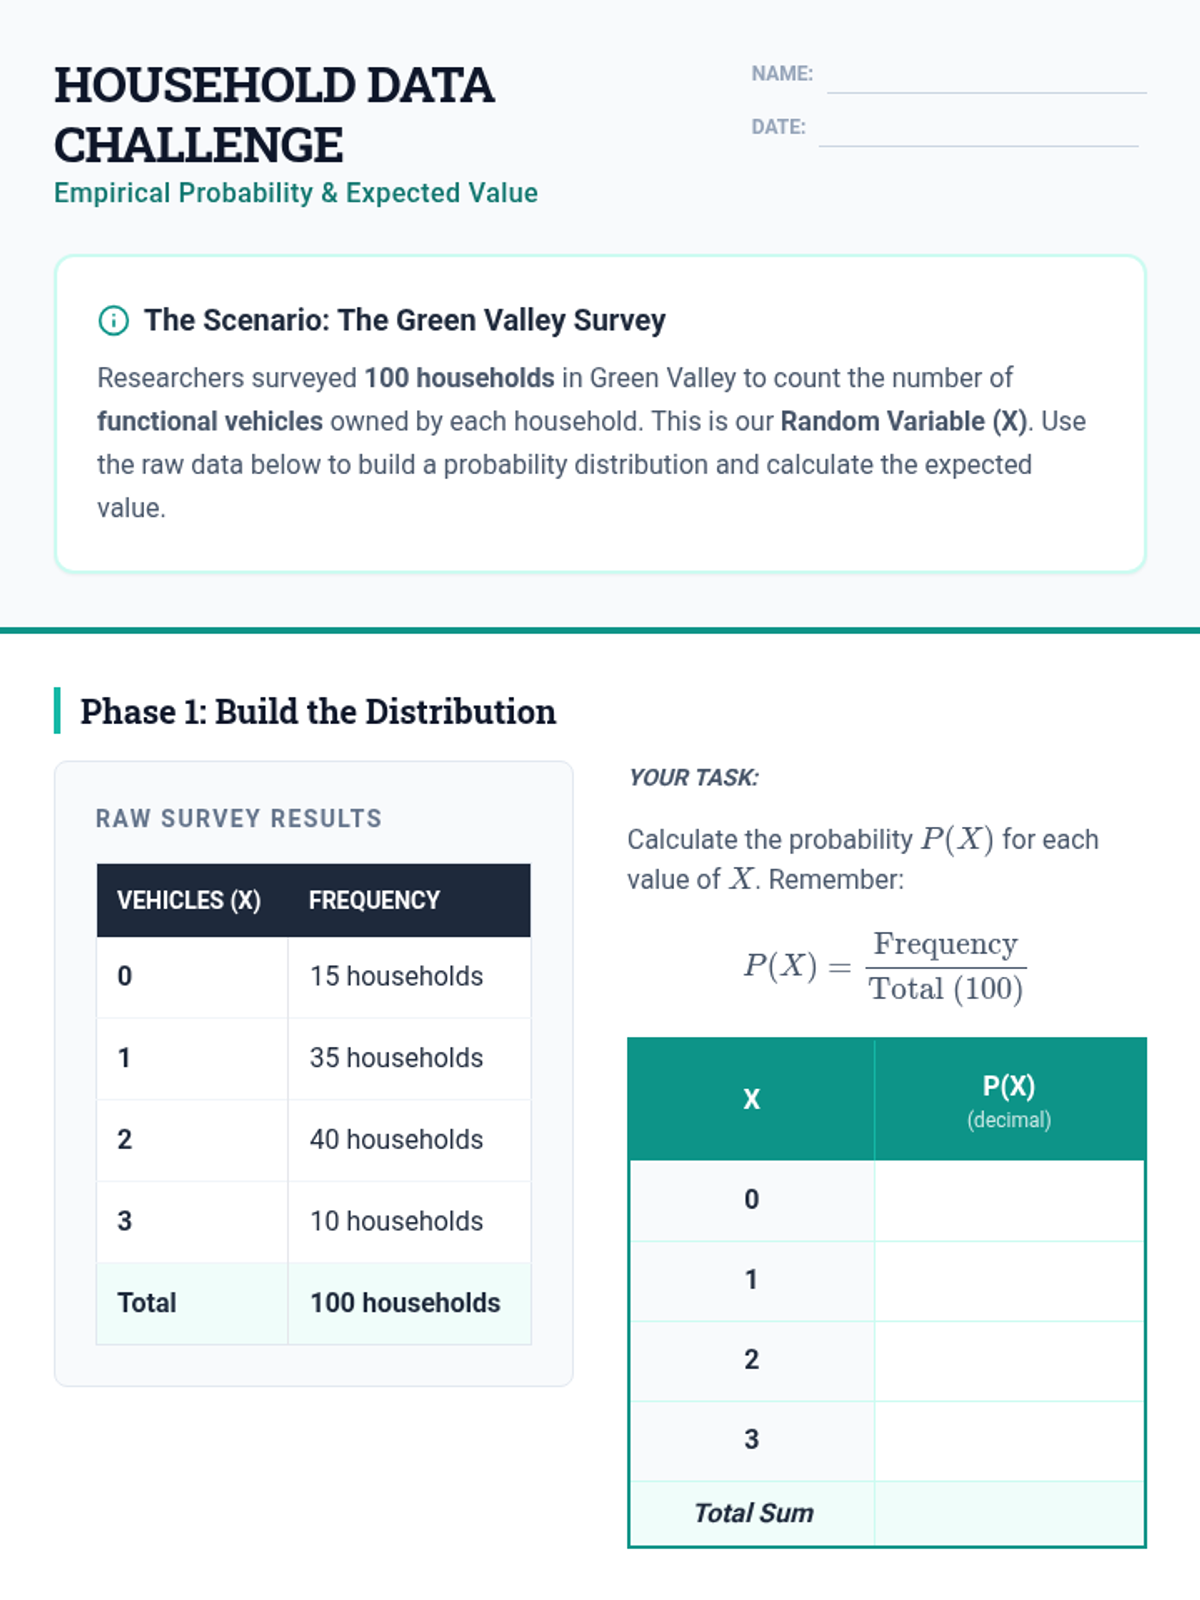
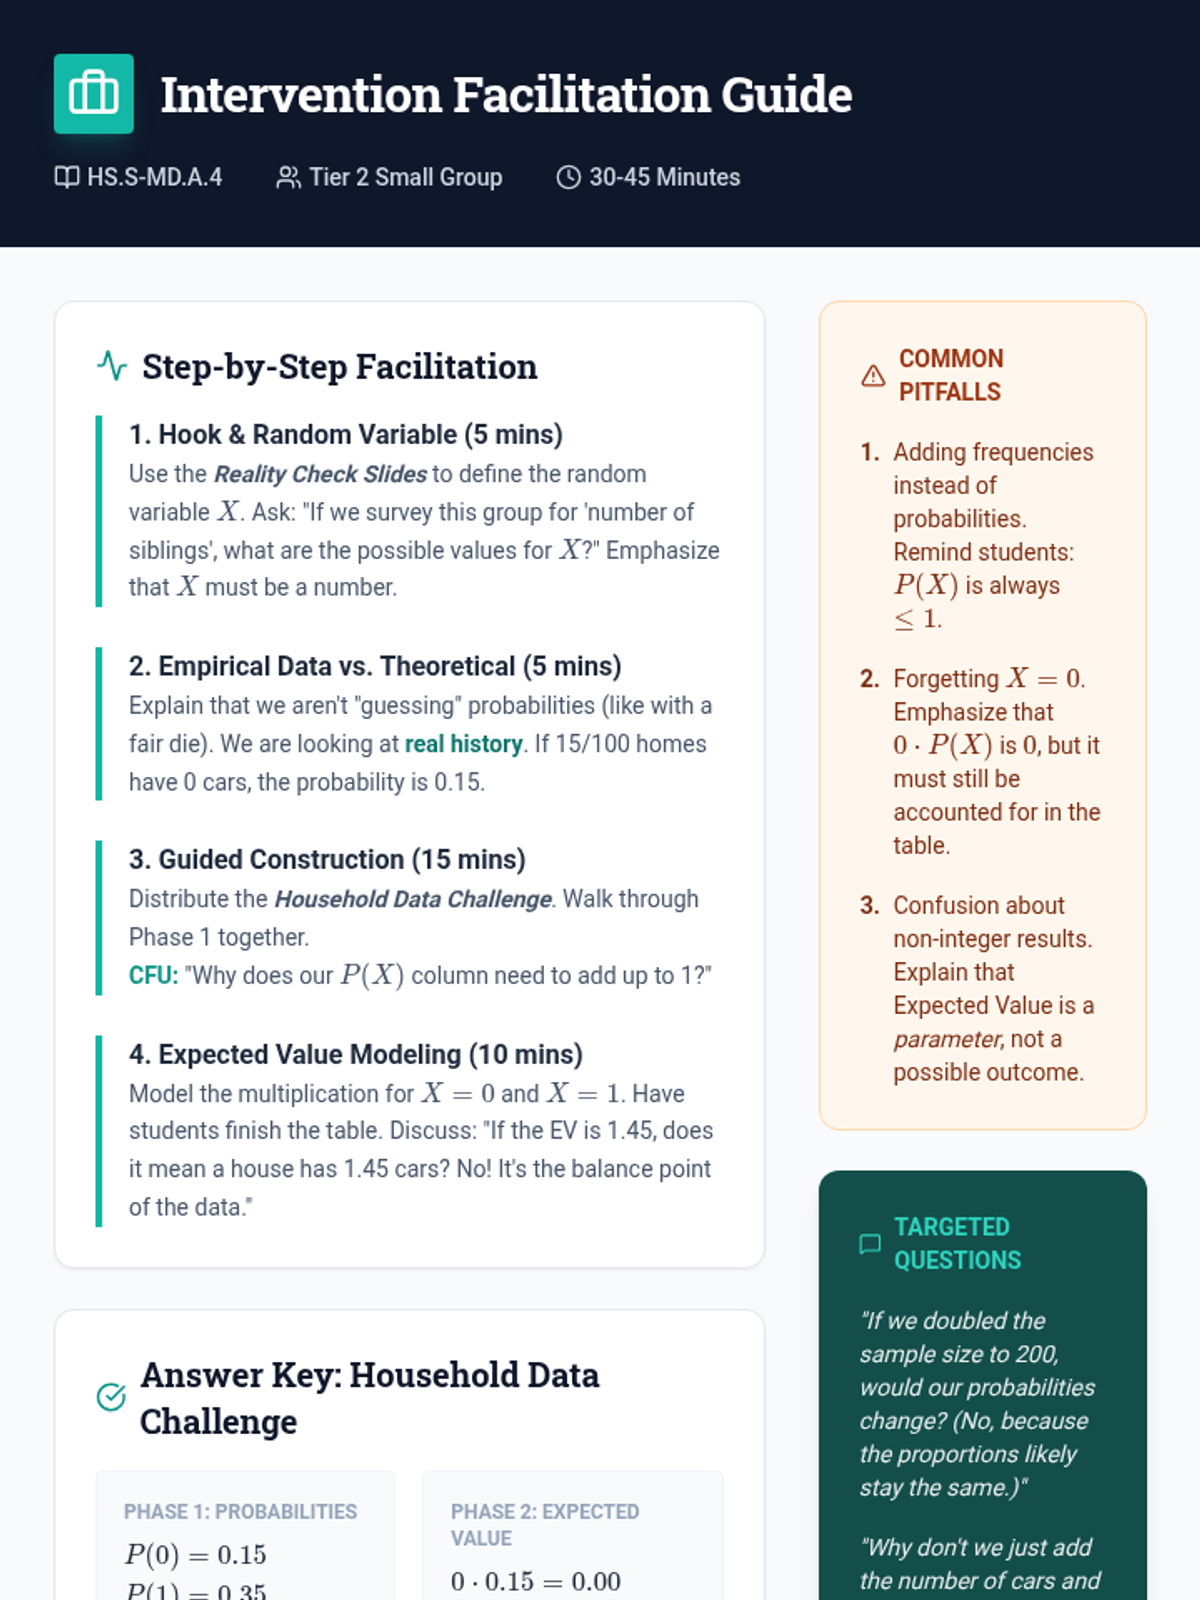
A Tier 2 intervention sequence focused on helping students develop empirical probability distributions and calculate expected values using real-world household data. This sequence provides high-scaffolding and structured practice for small group instruction.
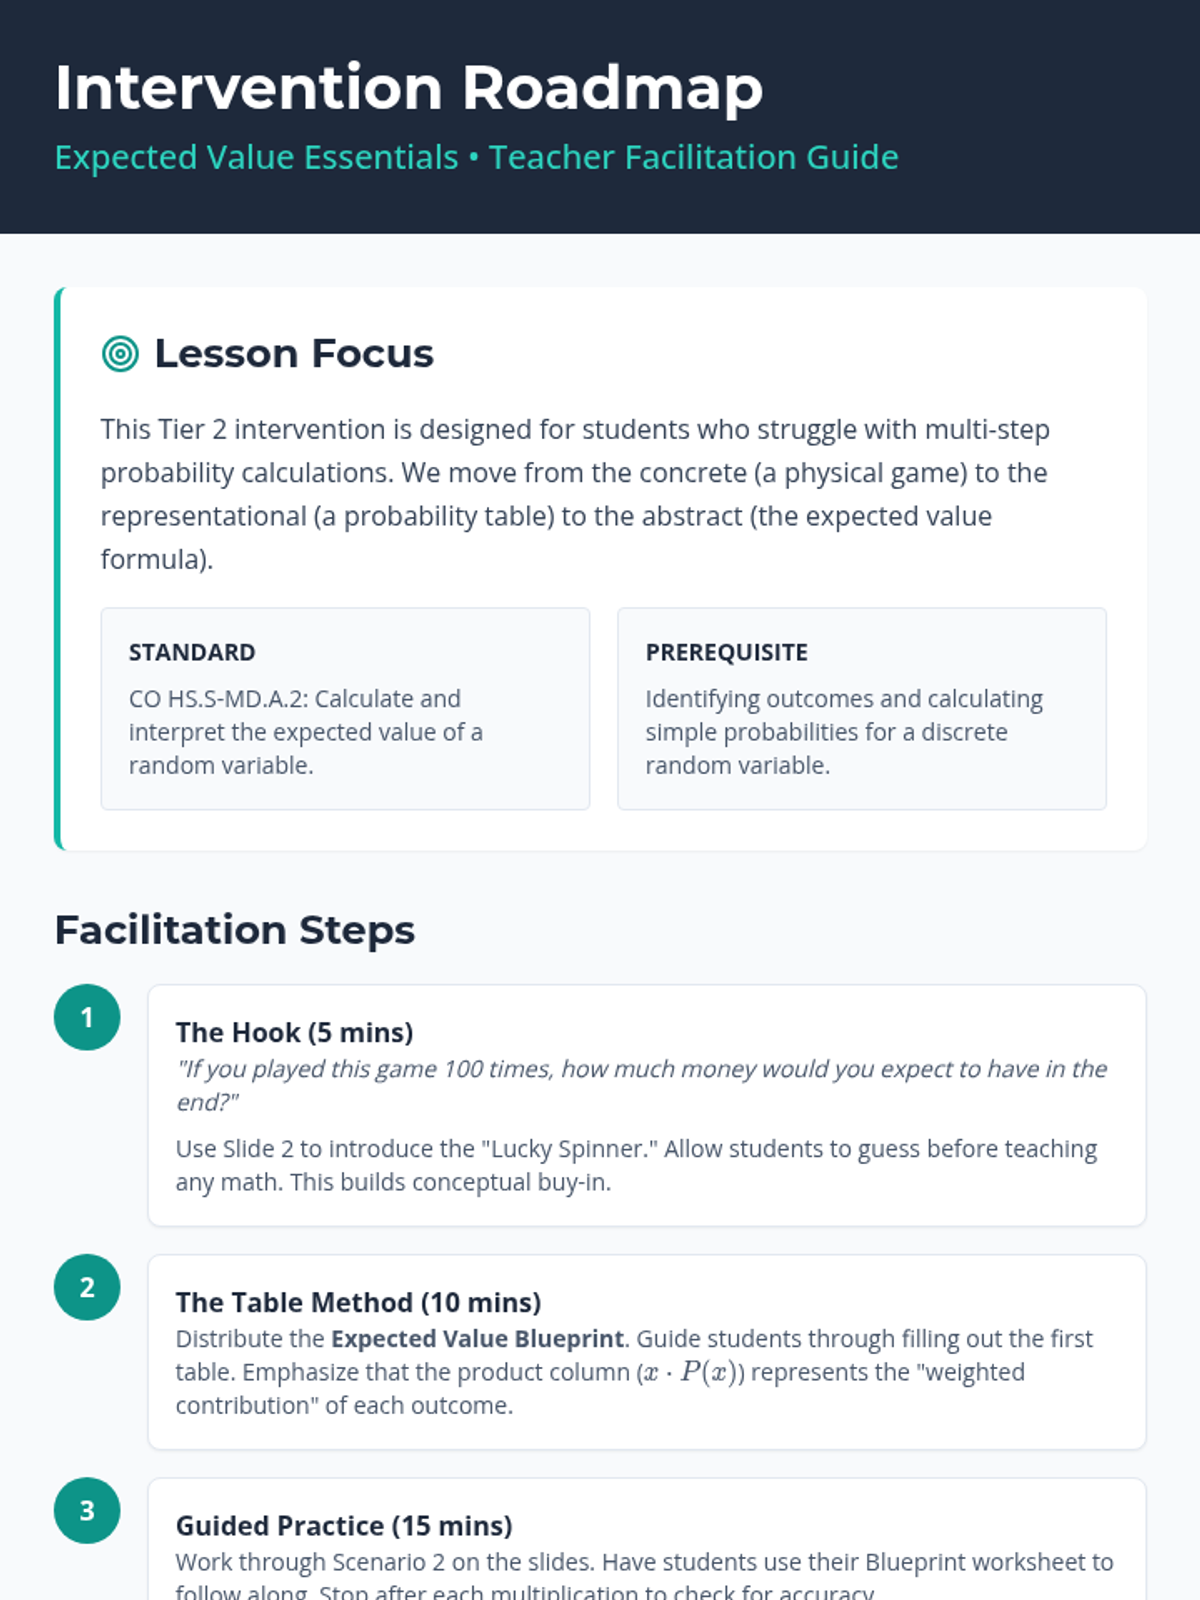
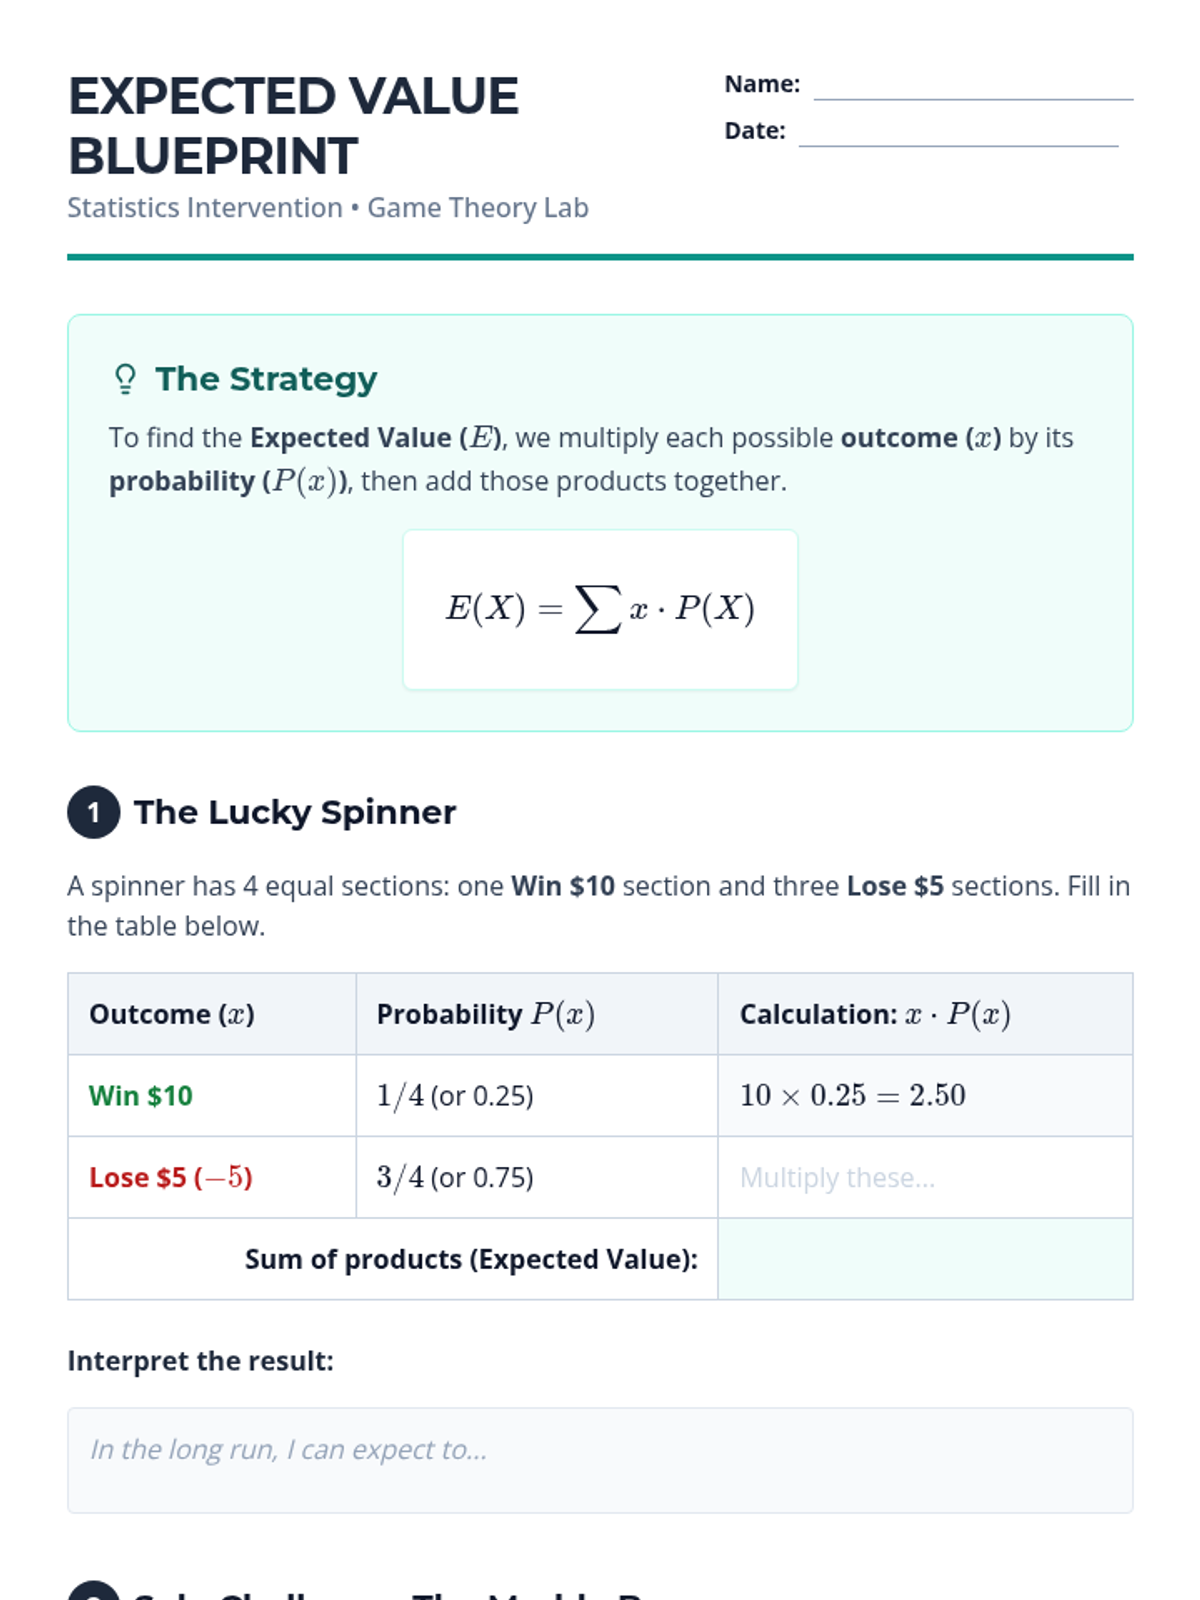
A targeted intervention sequence focused on helping High School students master the calculation and interpretation of expected value using concrete game scenarios and scaffolded table methods.
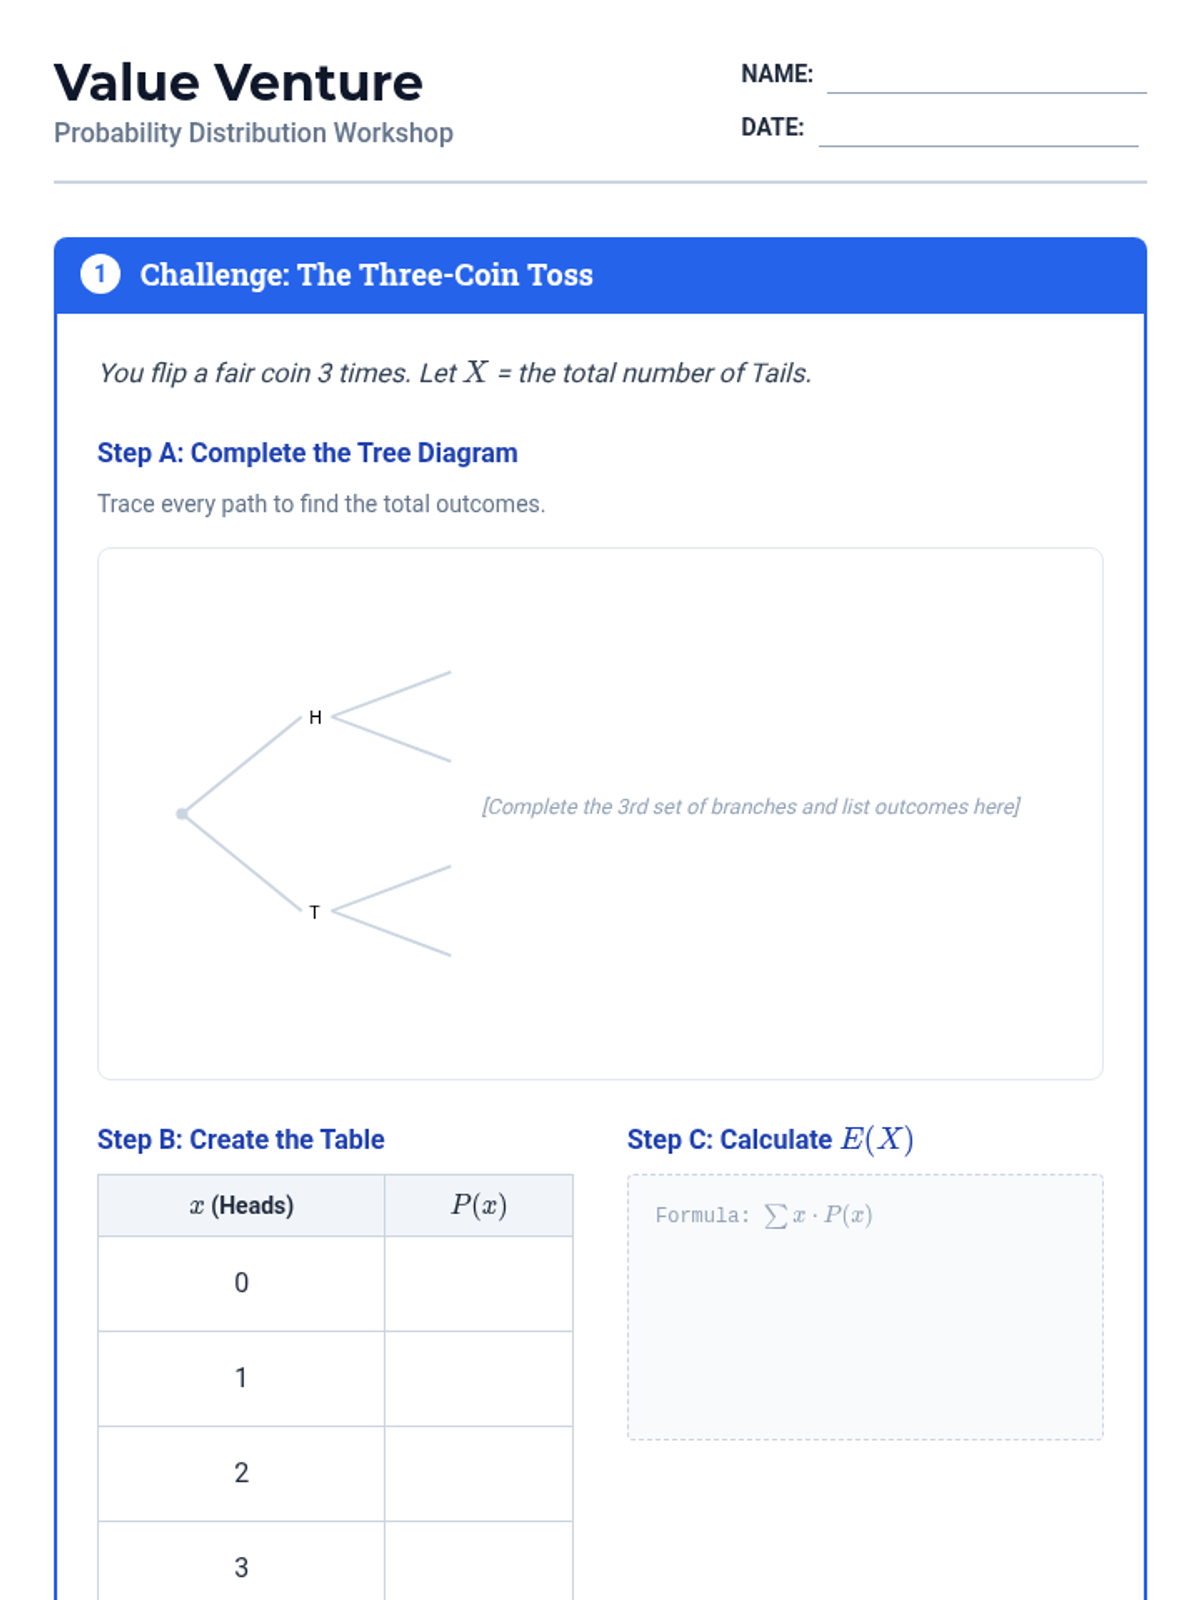
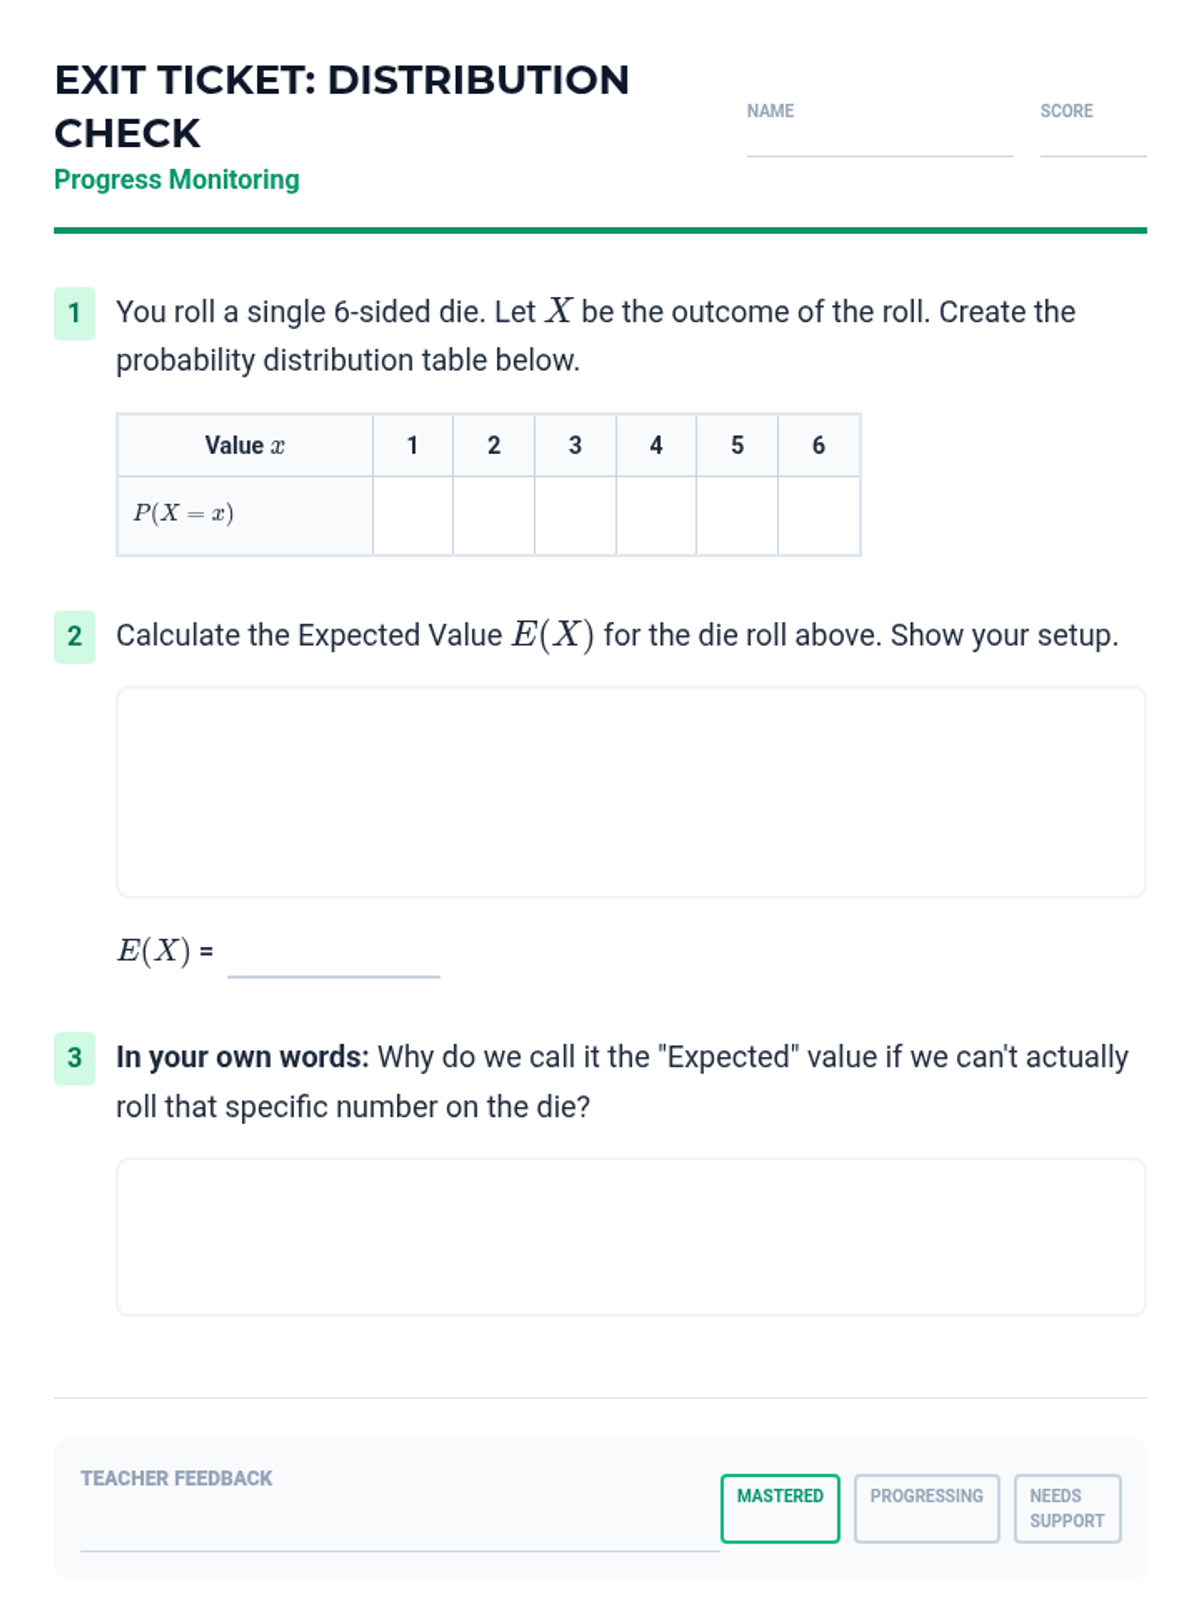
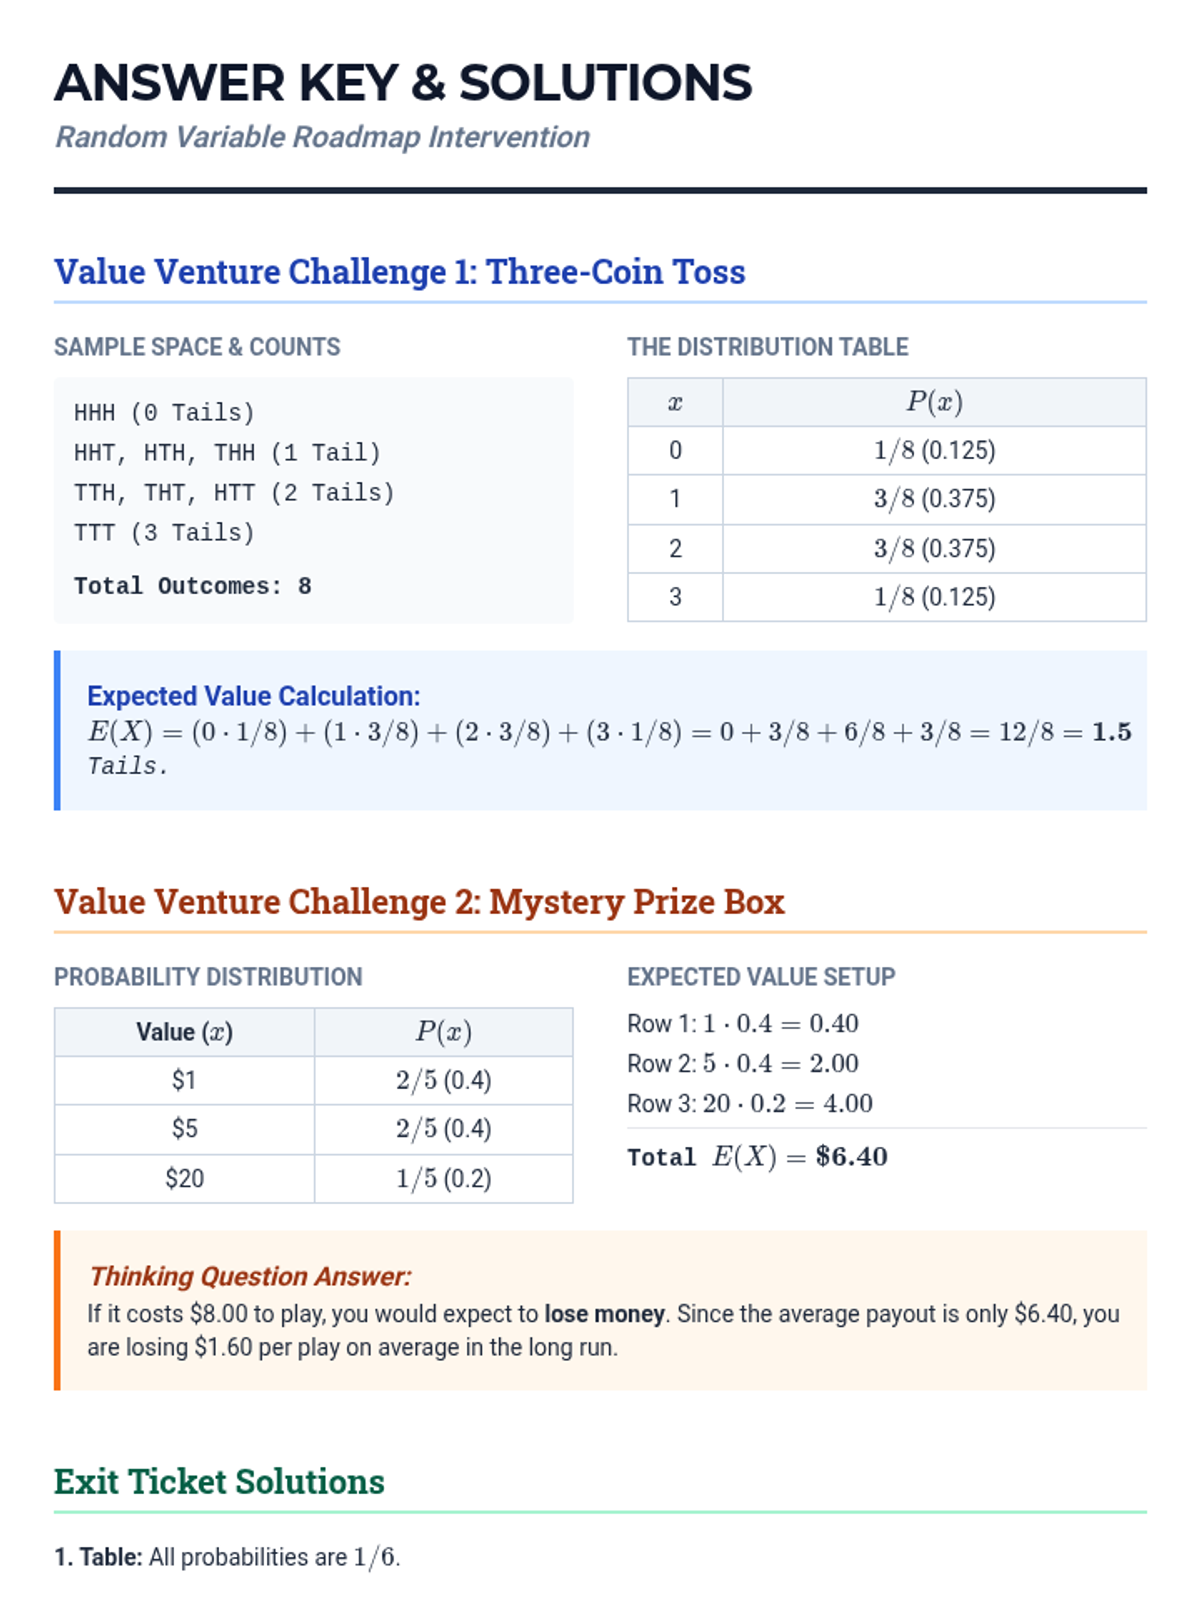
A targeted intervention sequence focused on foundational probability concepts, specifically developing discrete probability distributions and calculating expected values through visual scaffolds like tree diagrams and organized counting.
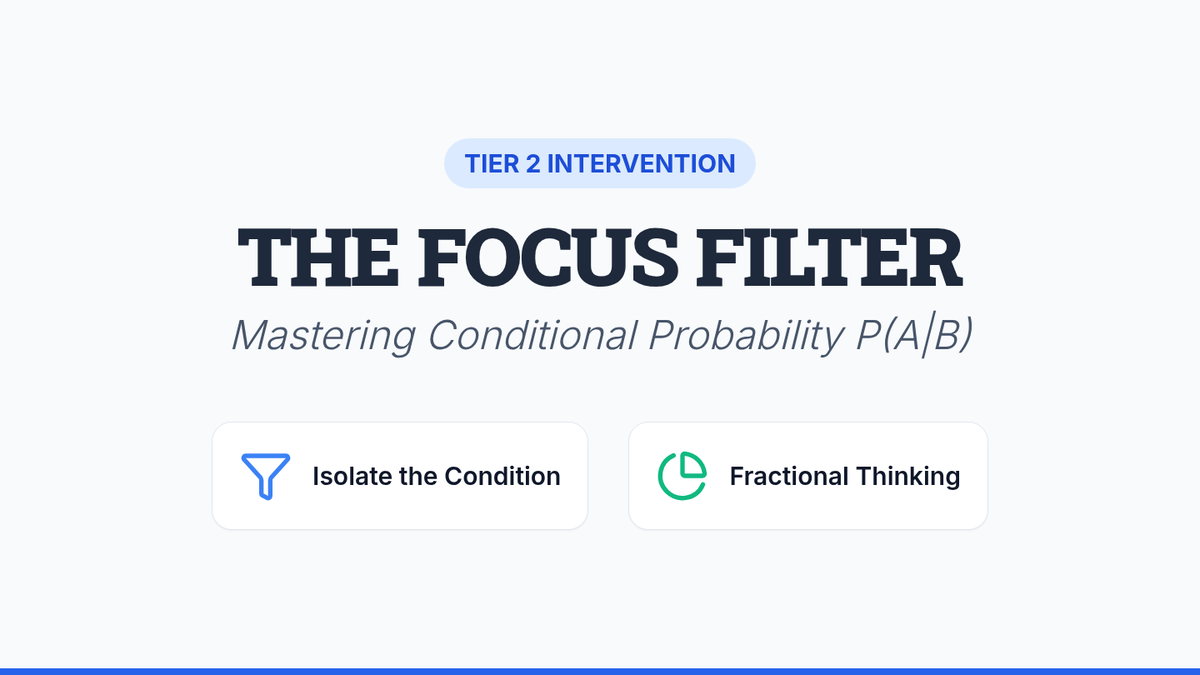
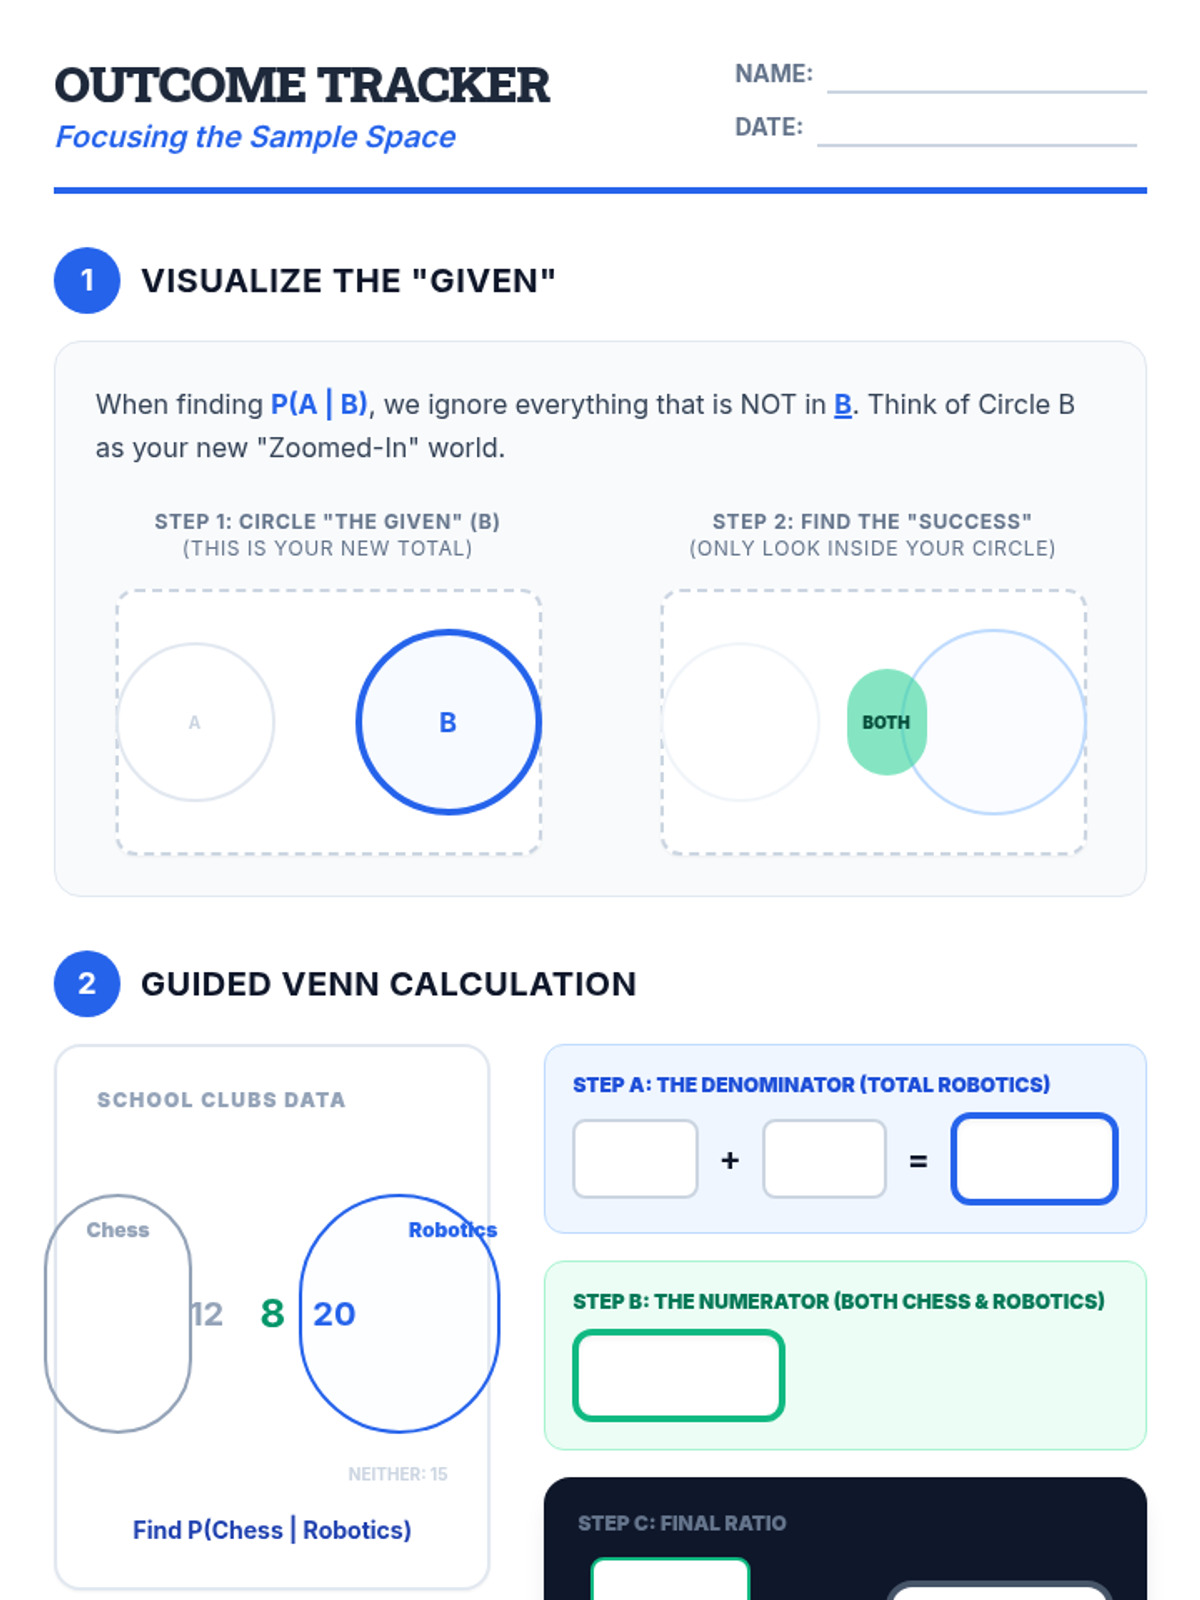
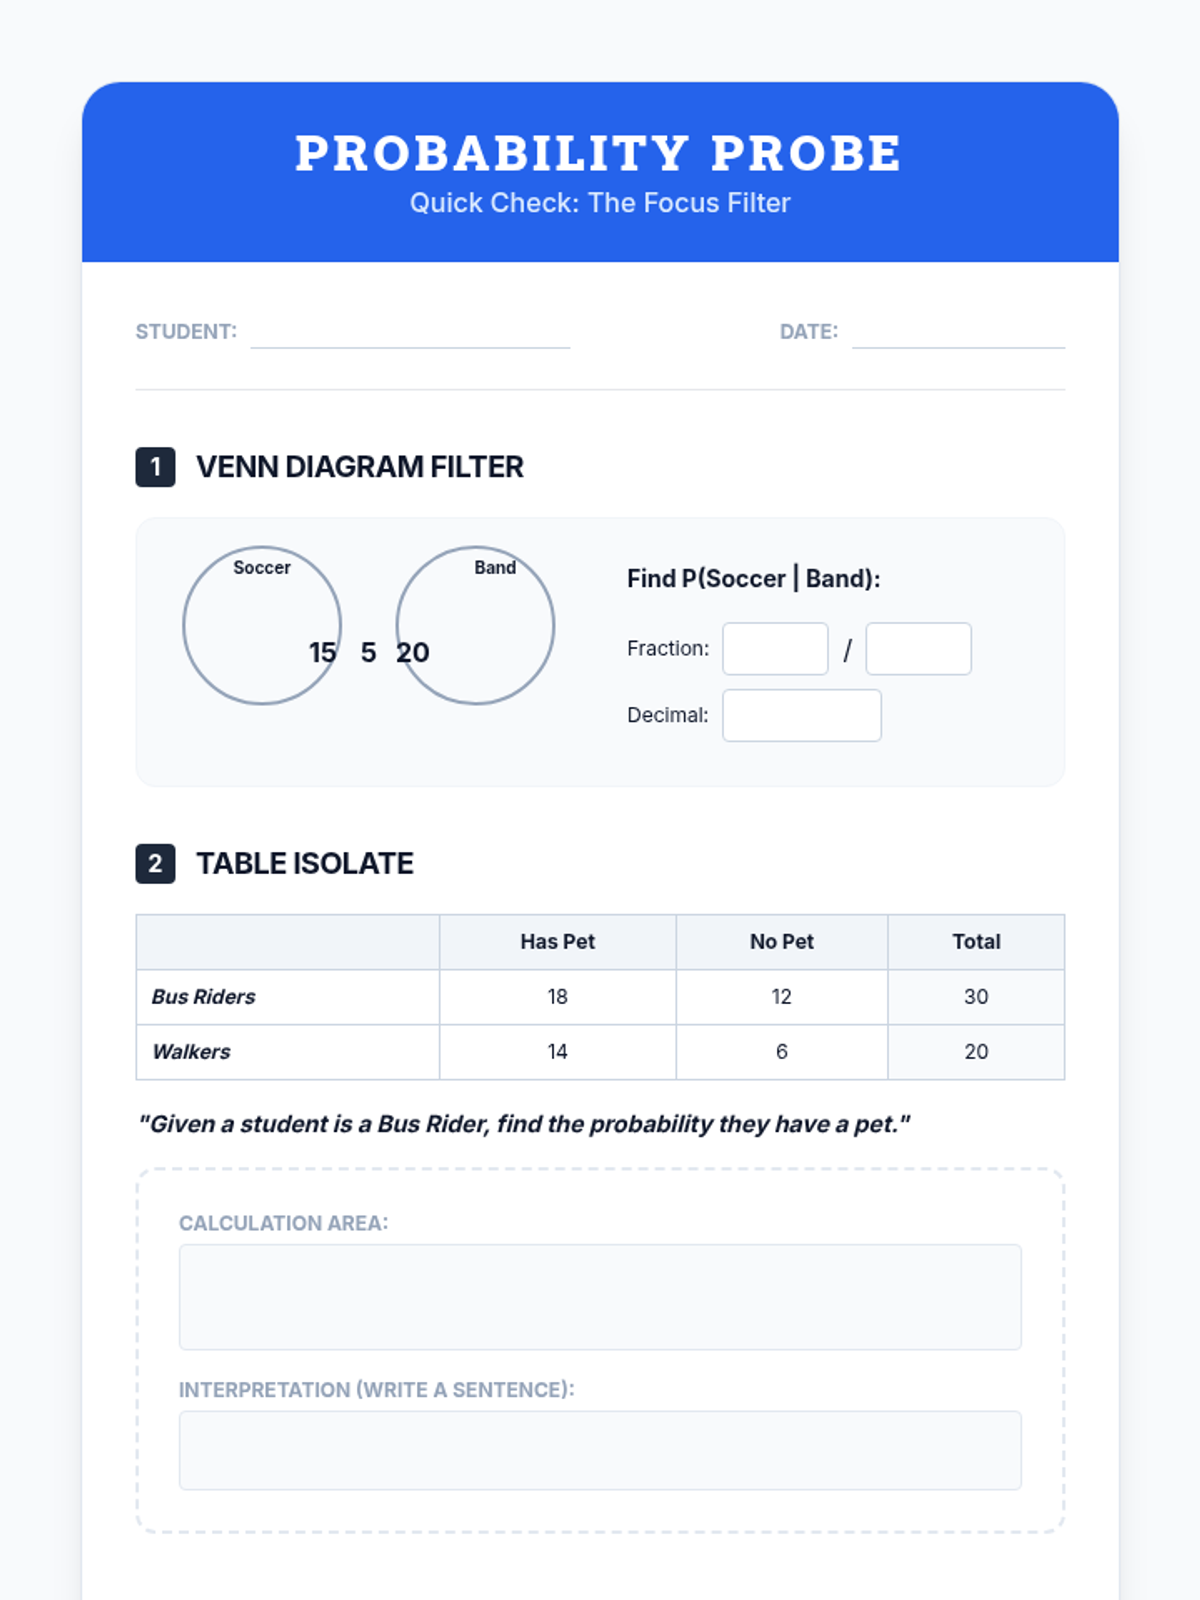
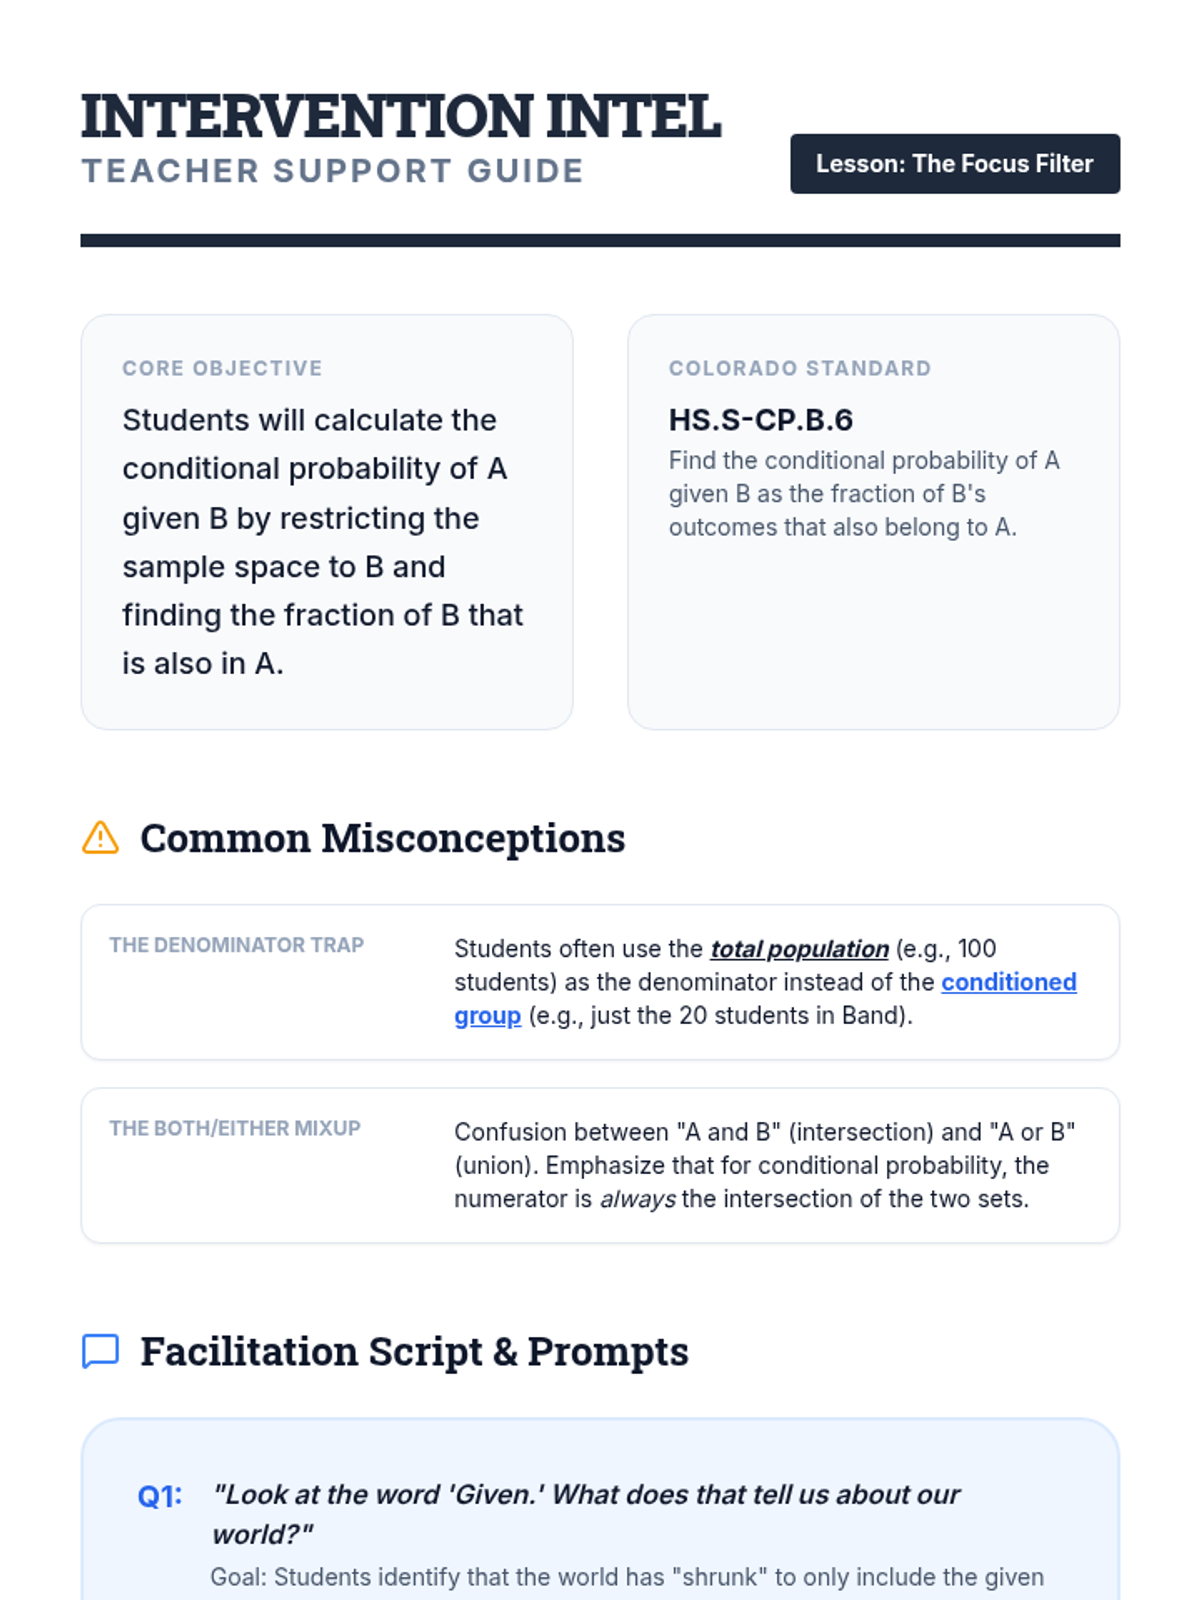
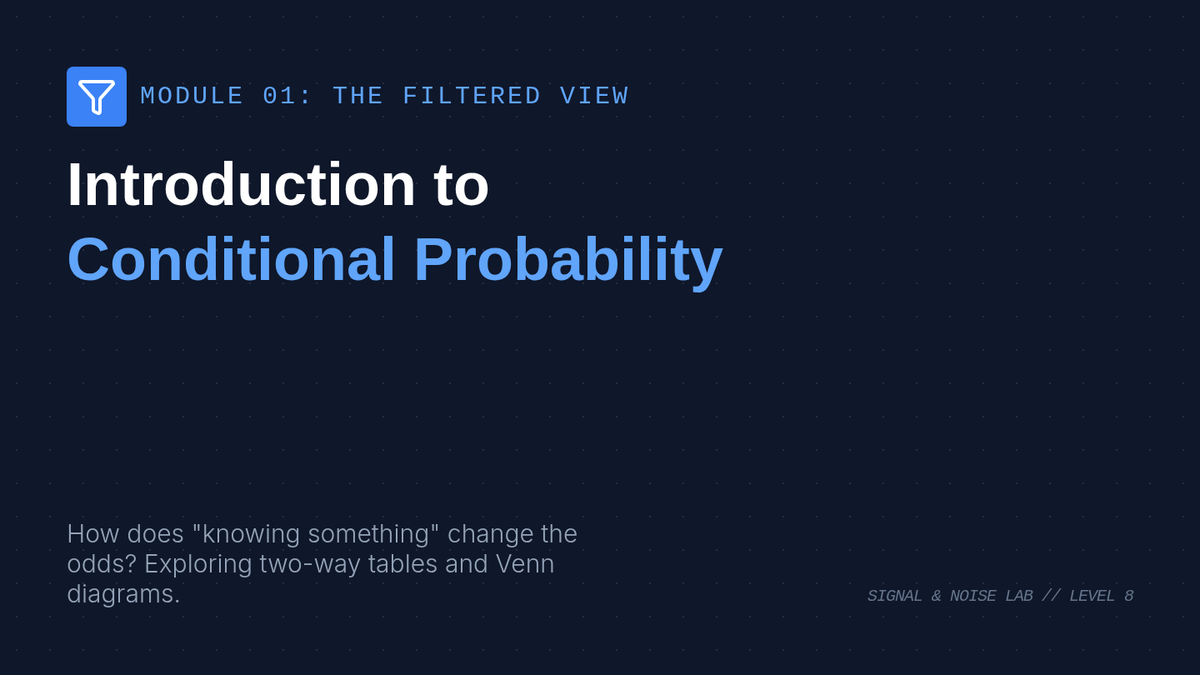
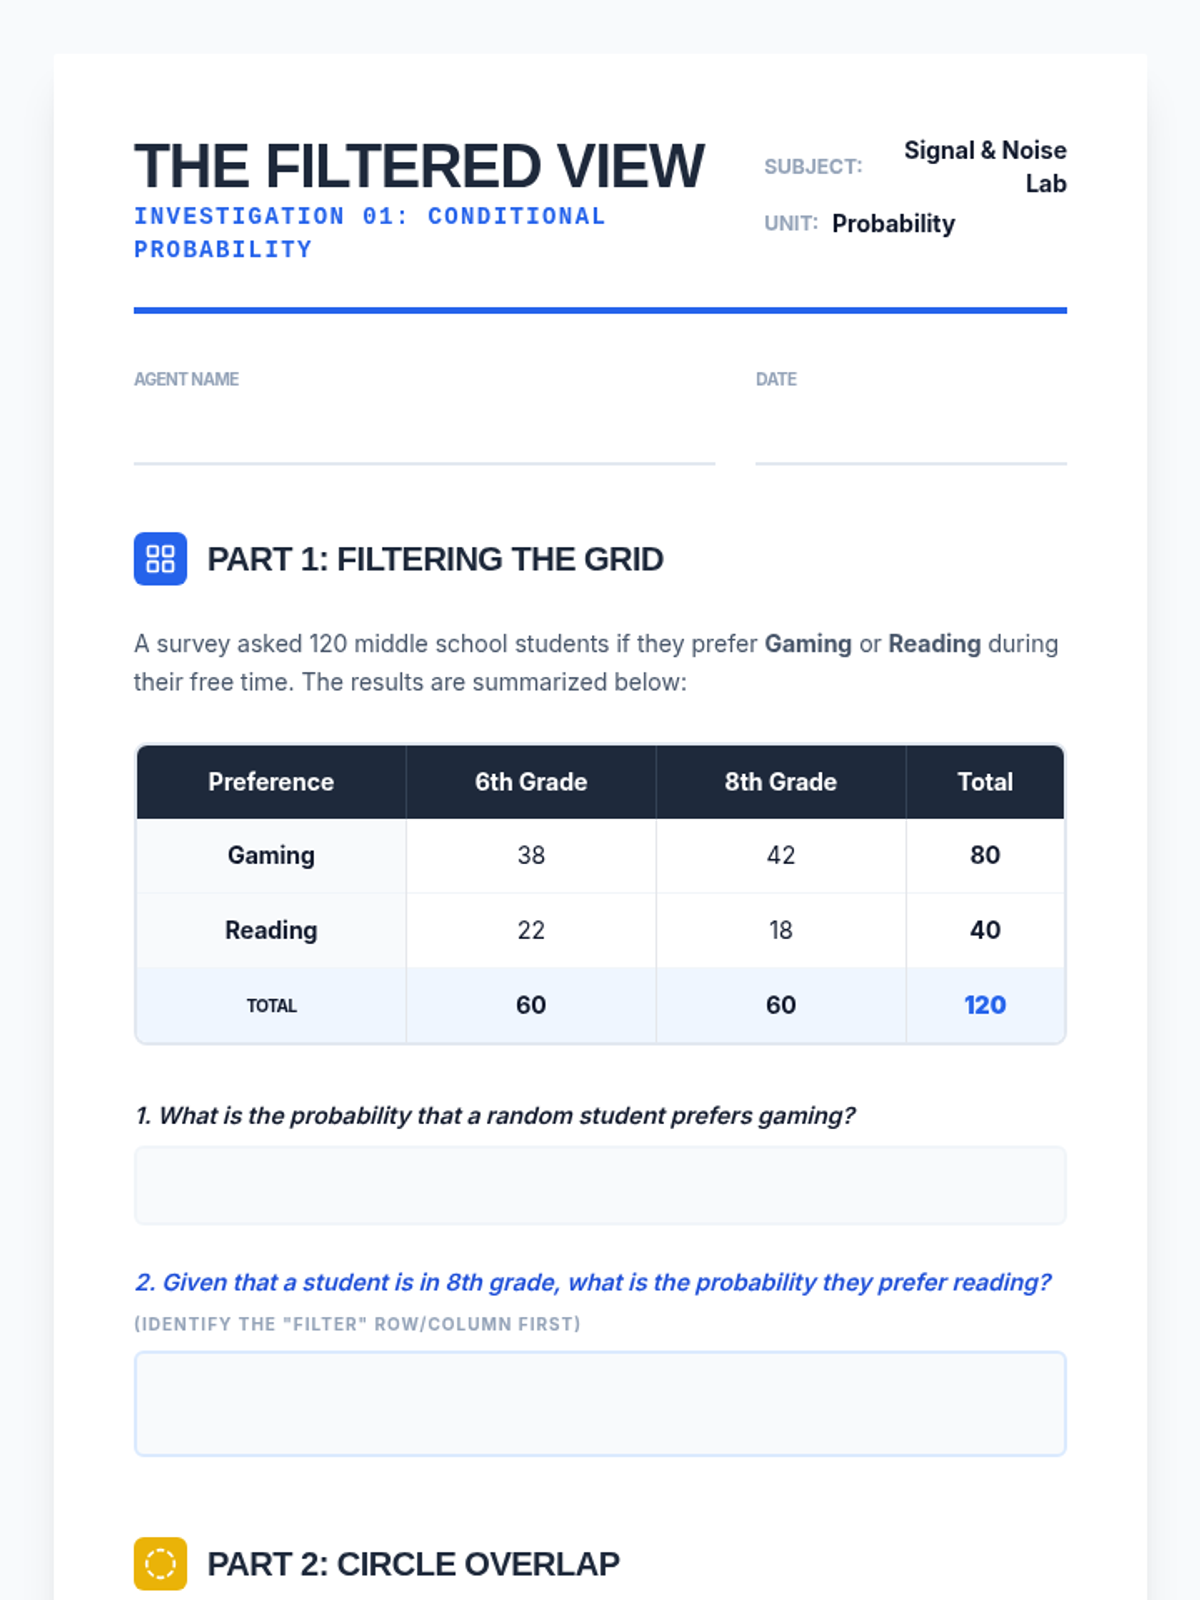
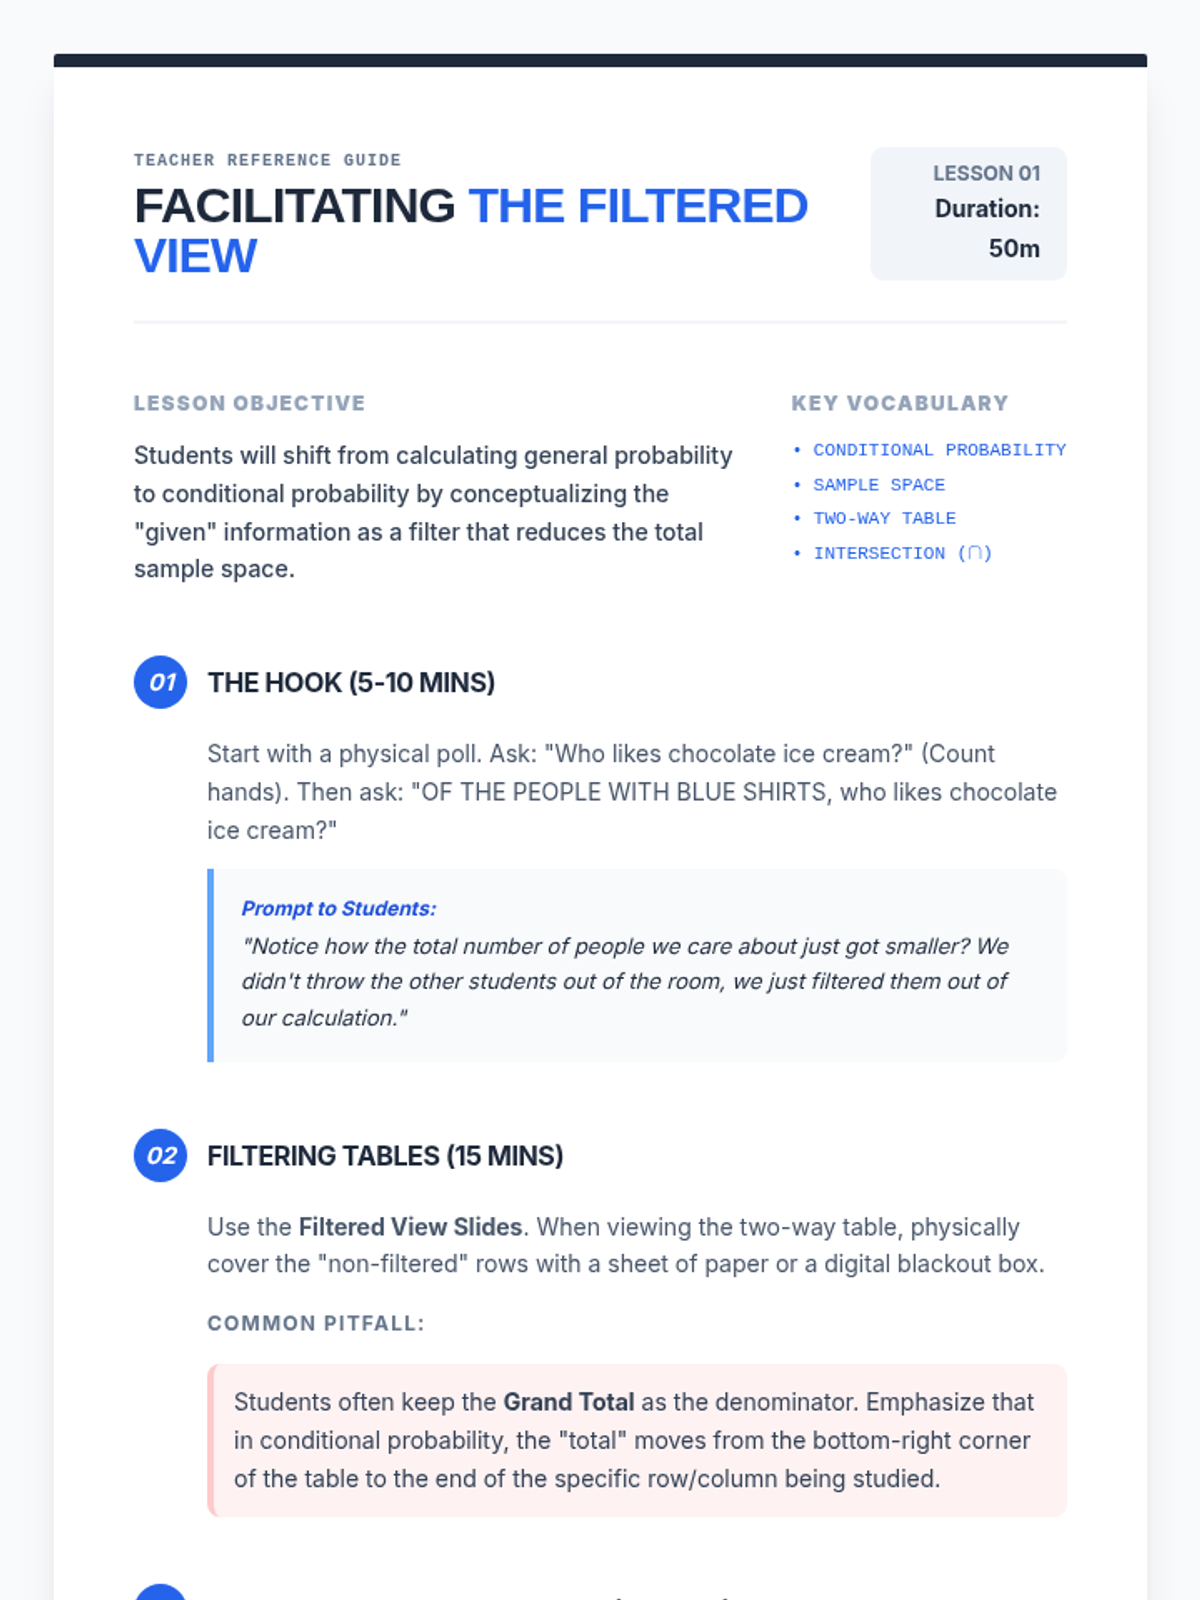
A Tier 2 intervention sequence focused on mastering conditional probability through visual filters and fractional reasoning. Students learn to restrict their sample space to the 'given' condition using Venn diagrams and tables.
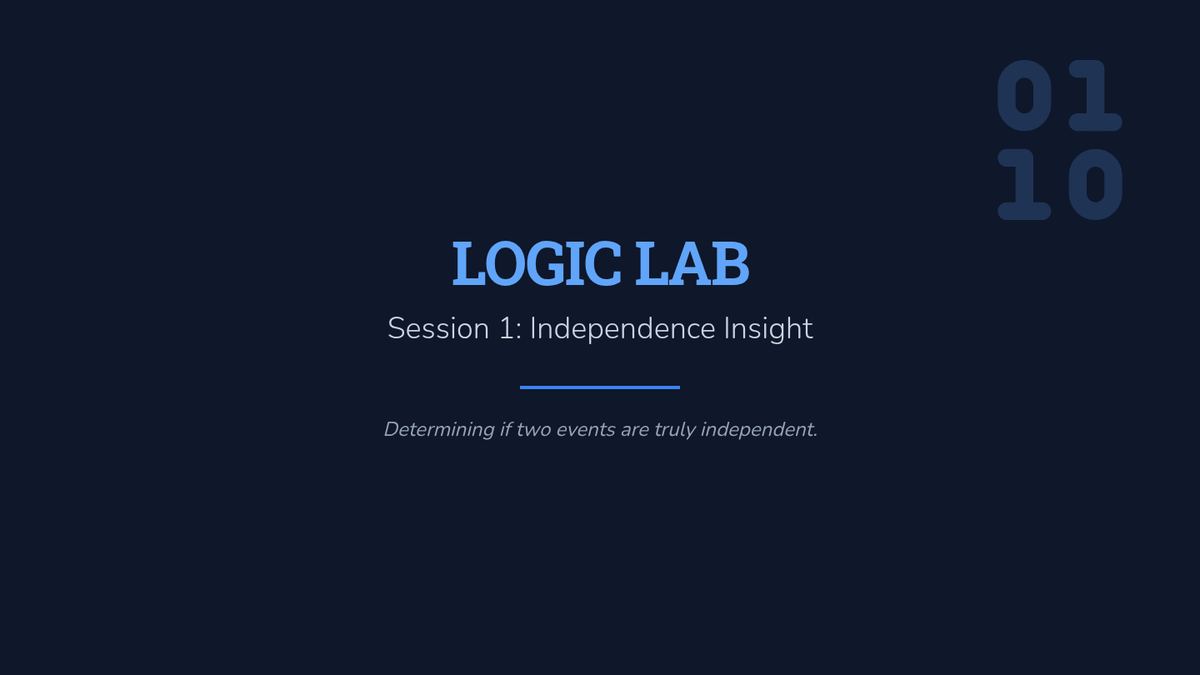
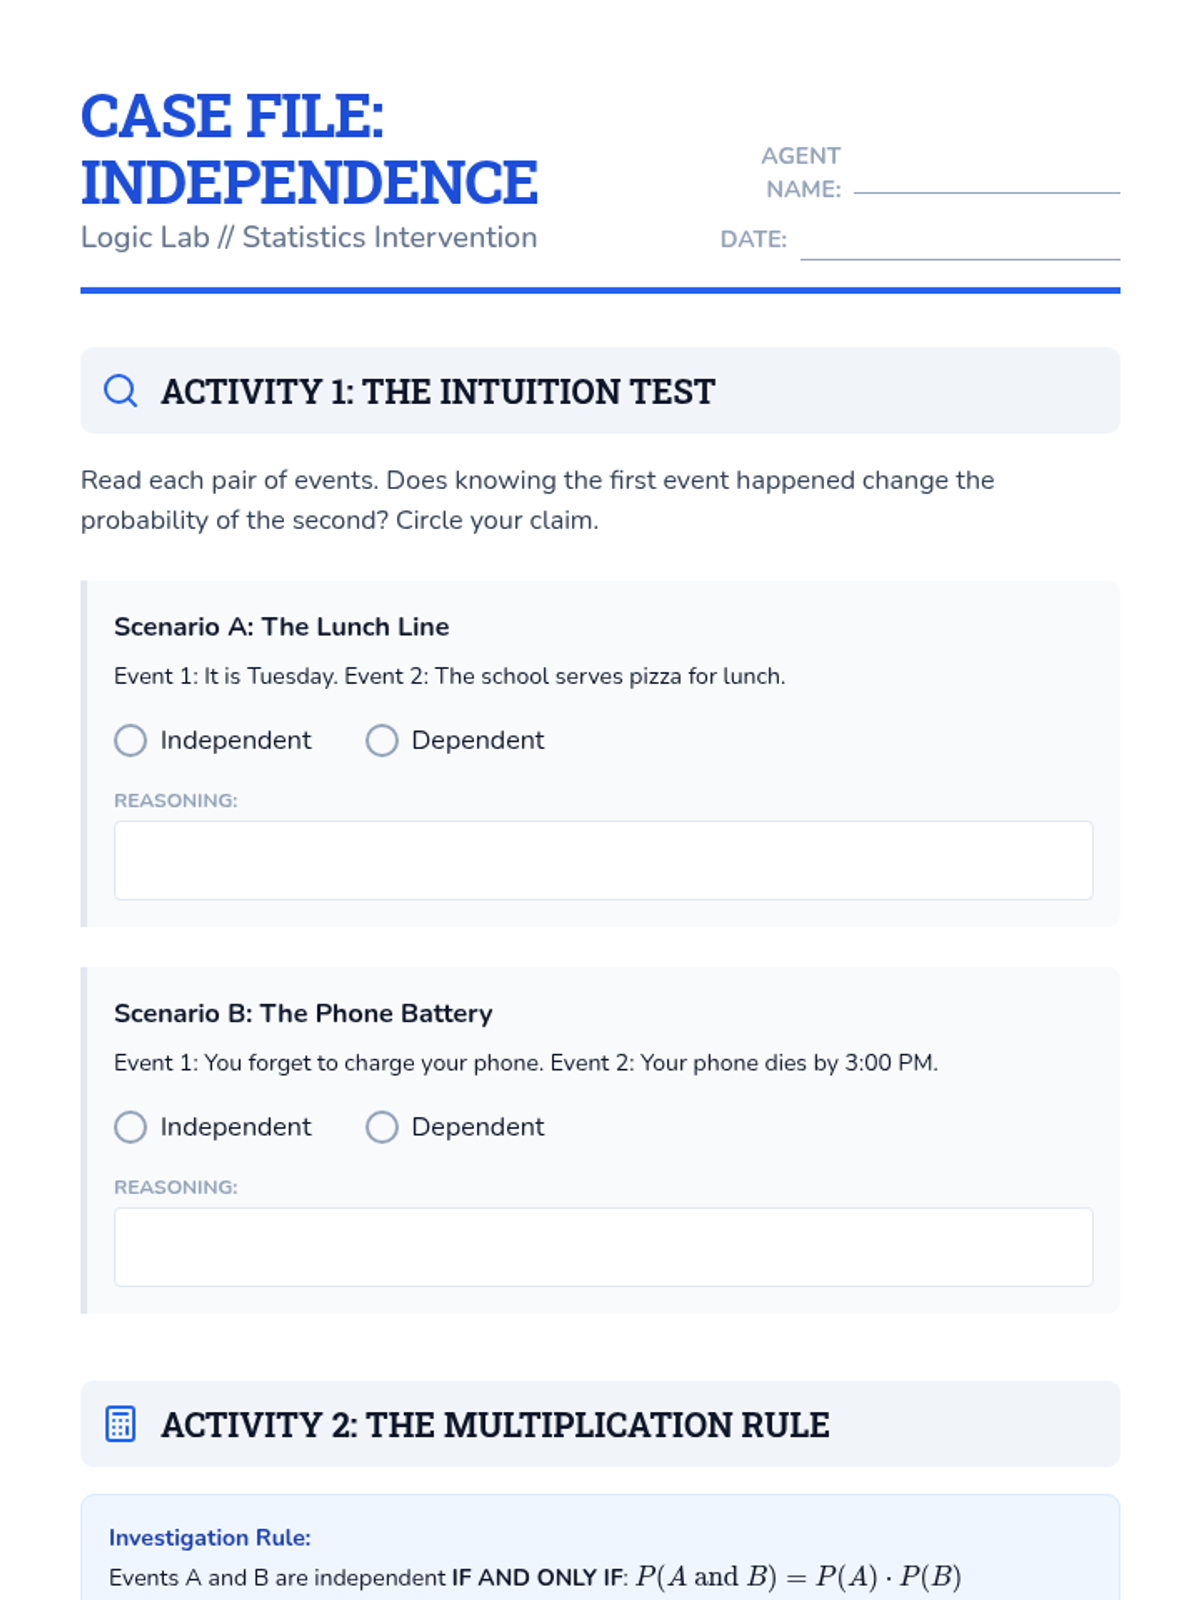
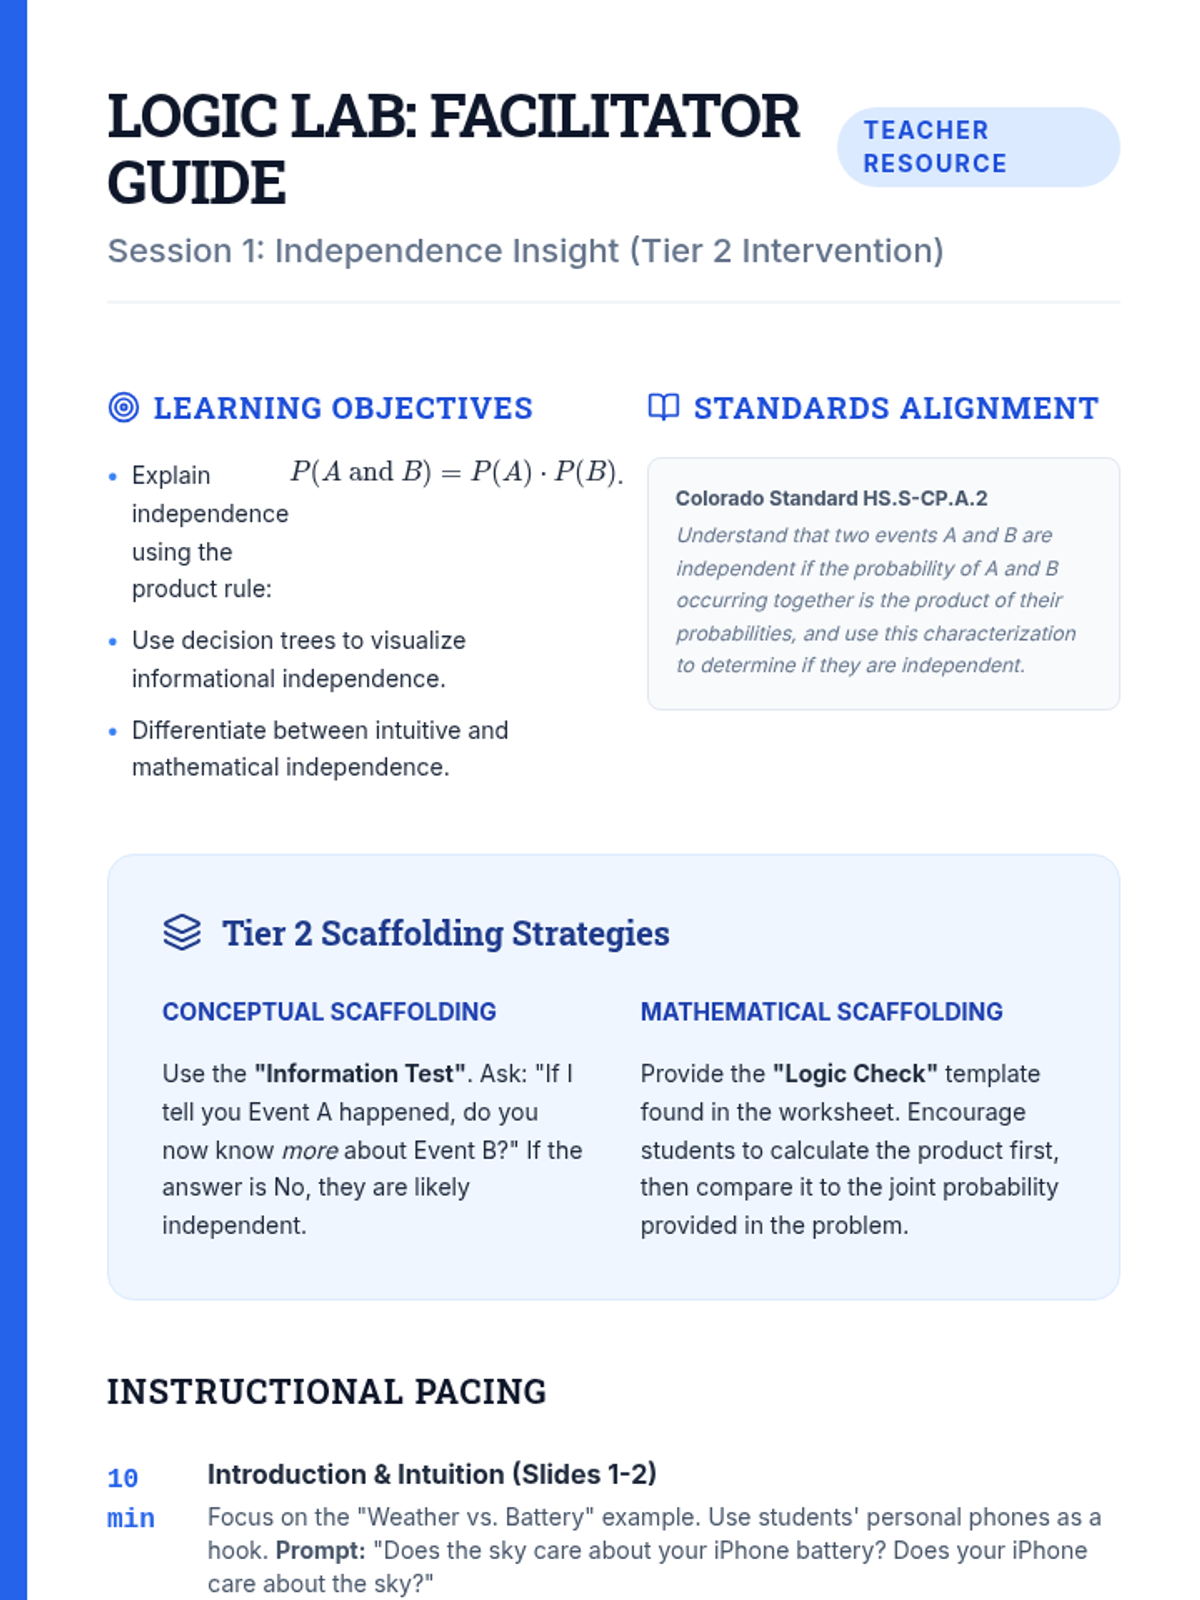
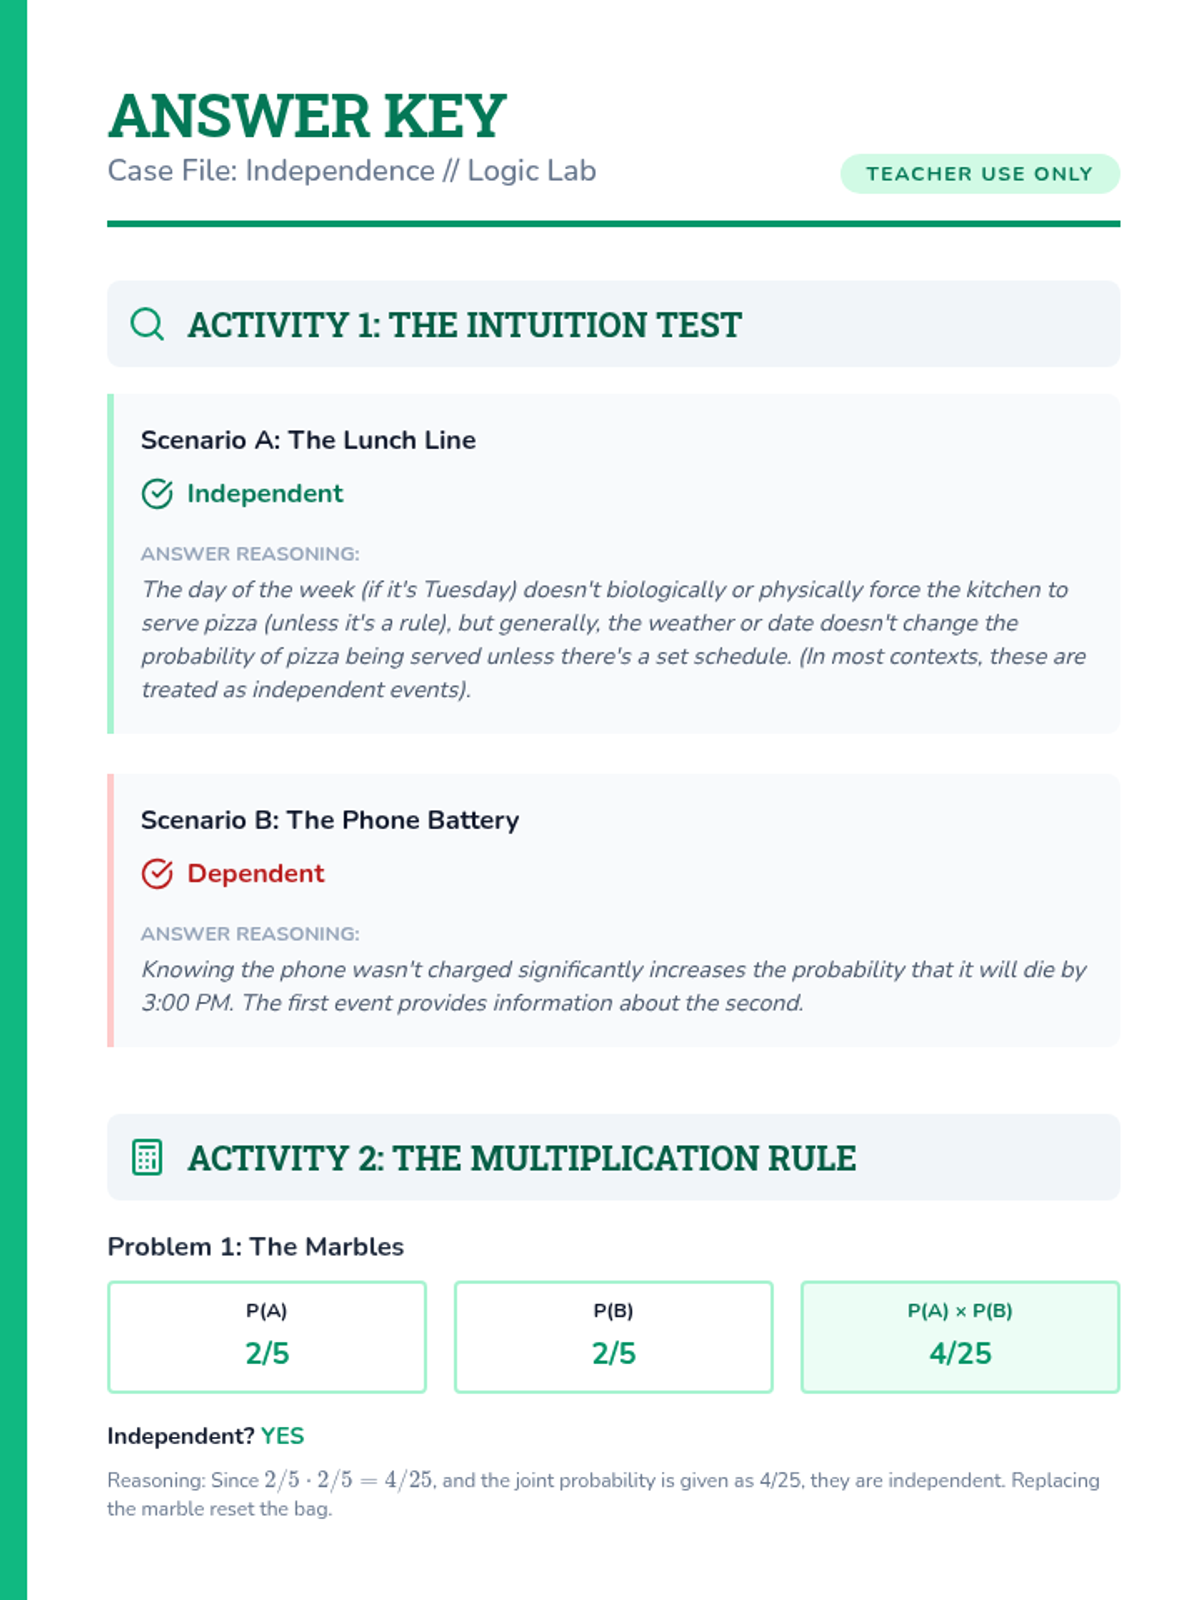
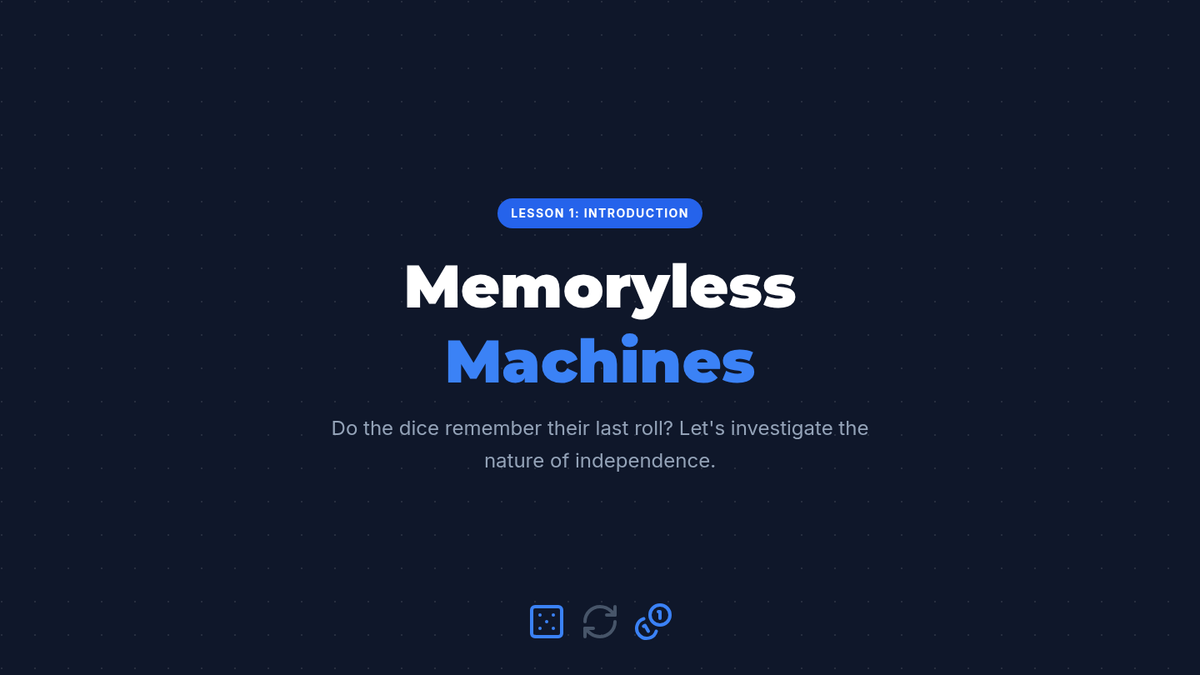
A targeted intervention sequence focused on understanding and calculating the independence of events through structured reasoning and decision trees.
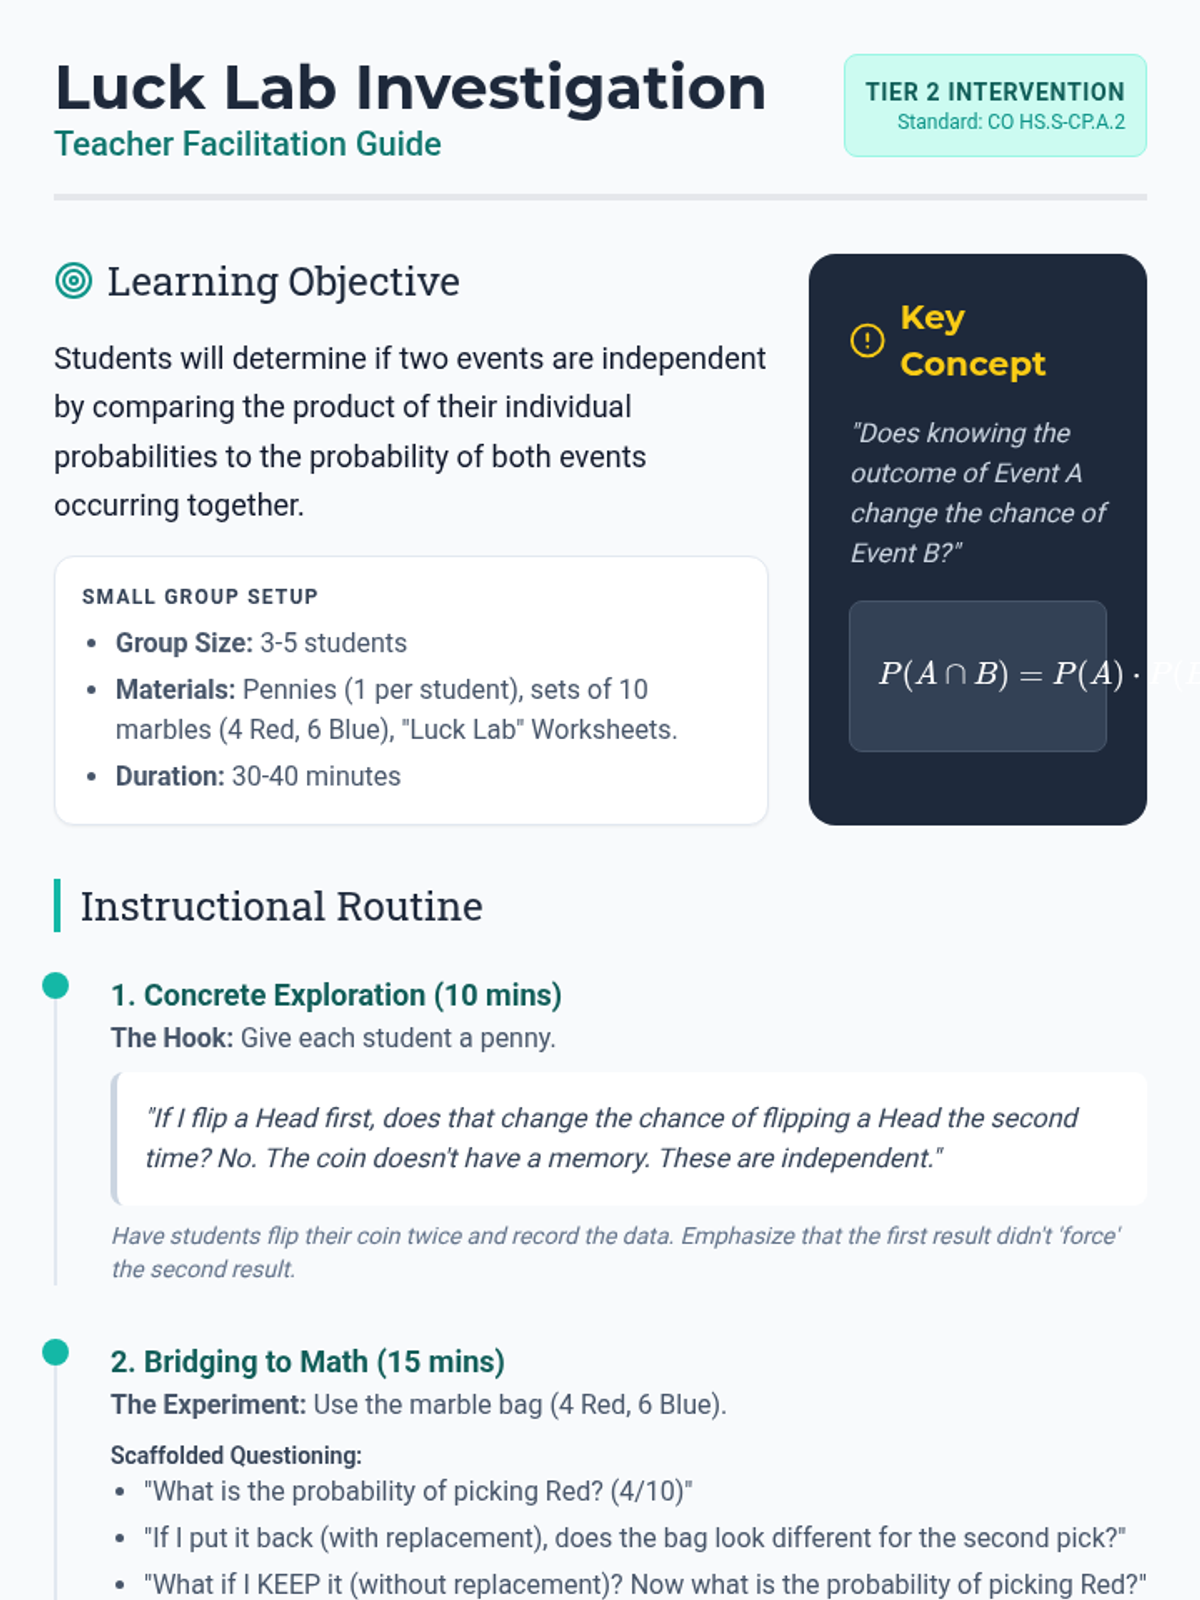
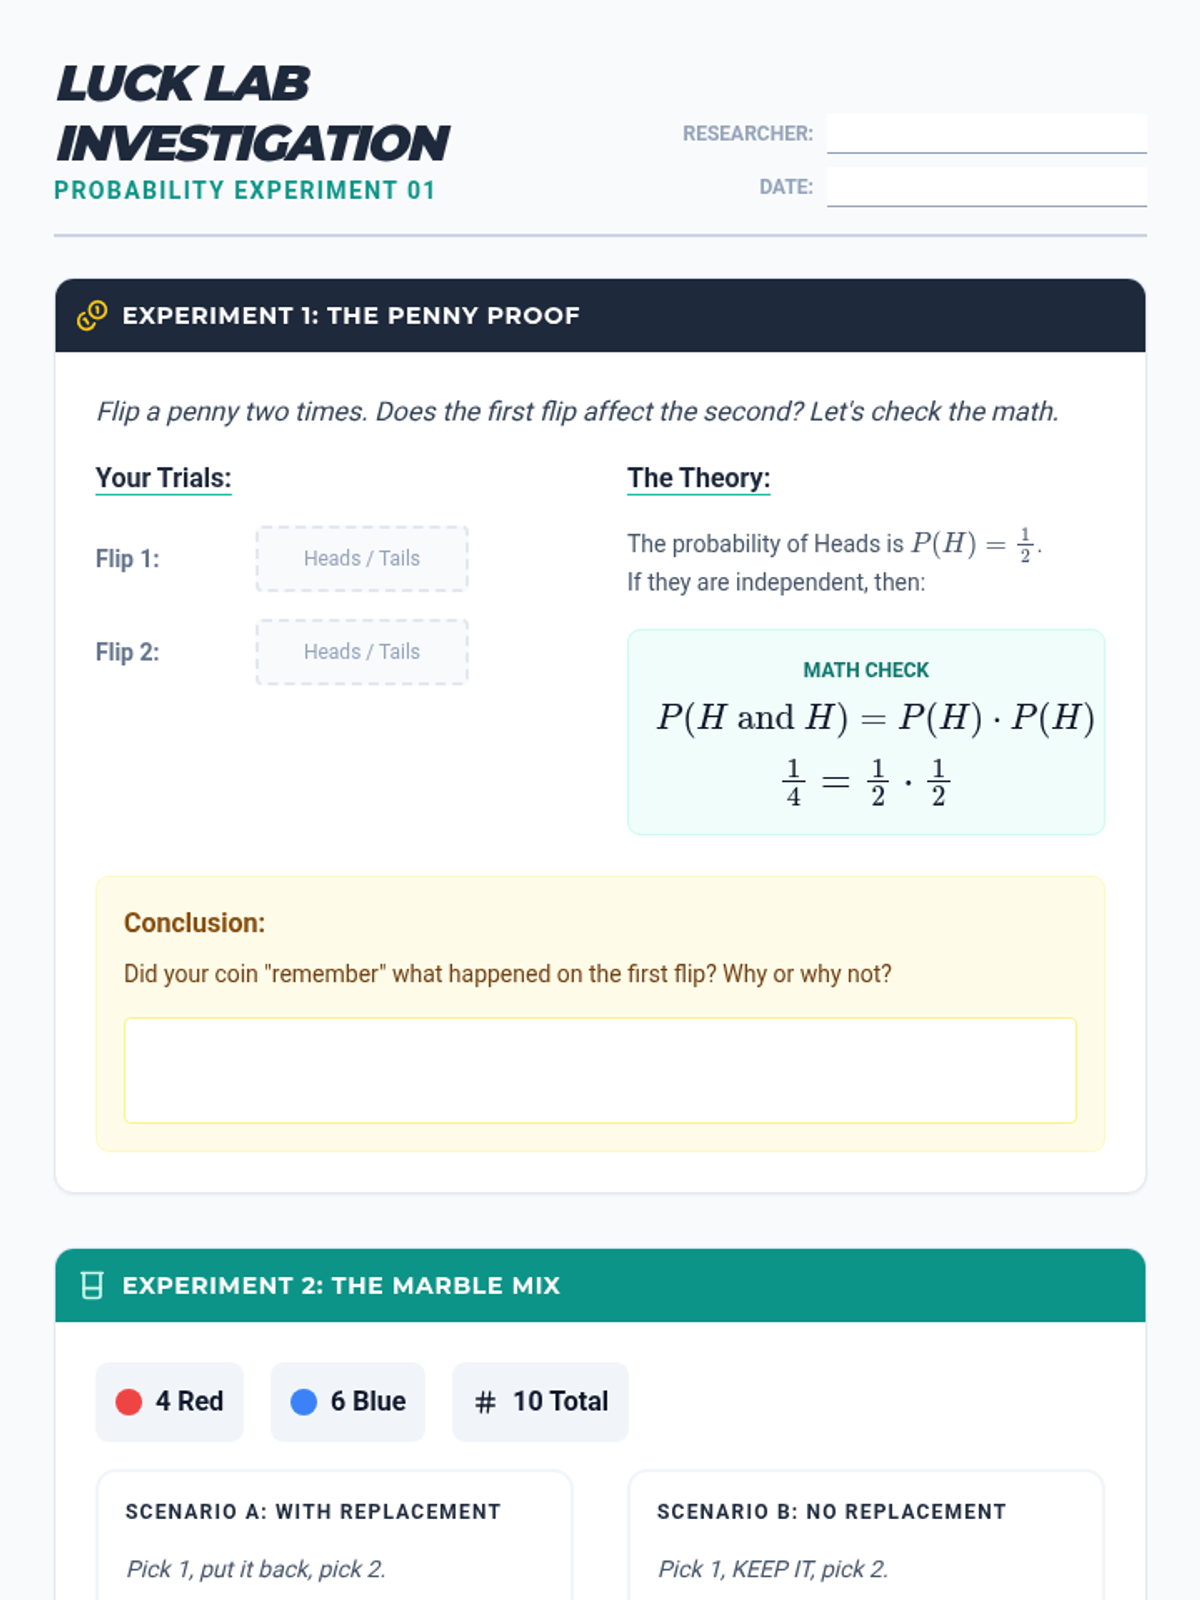
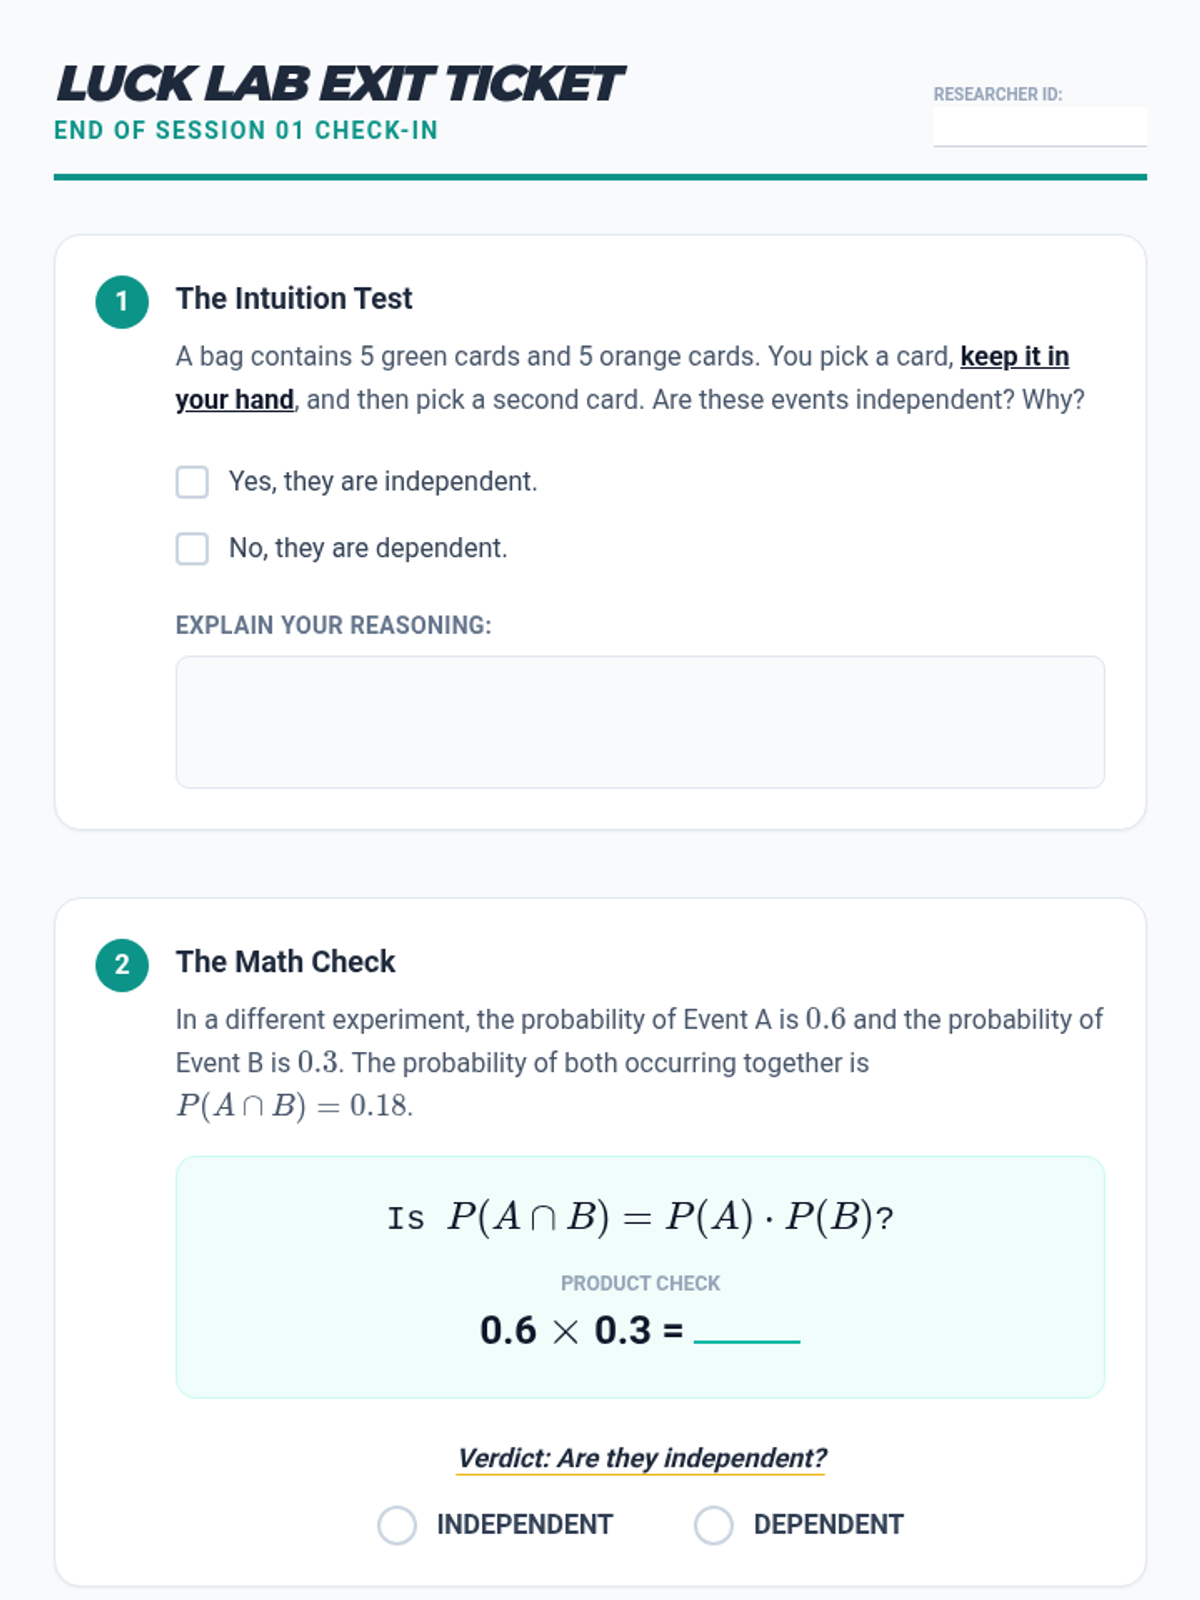
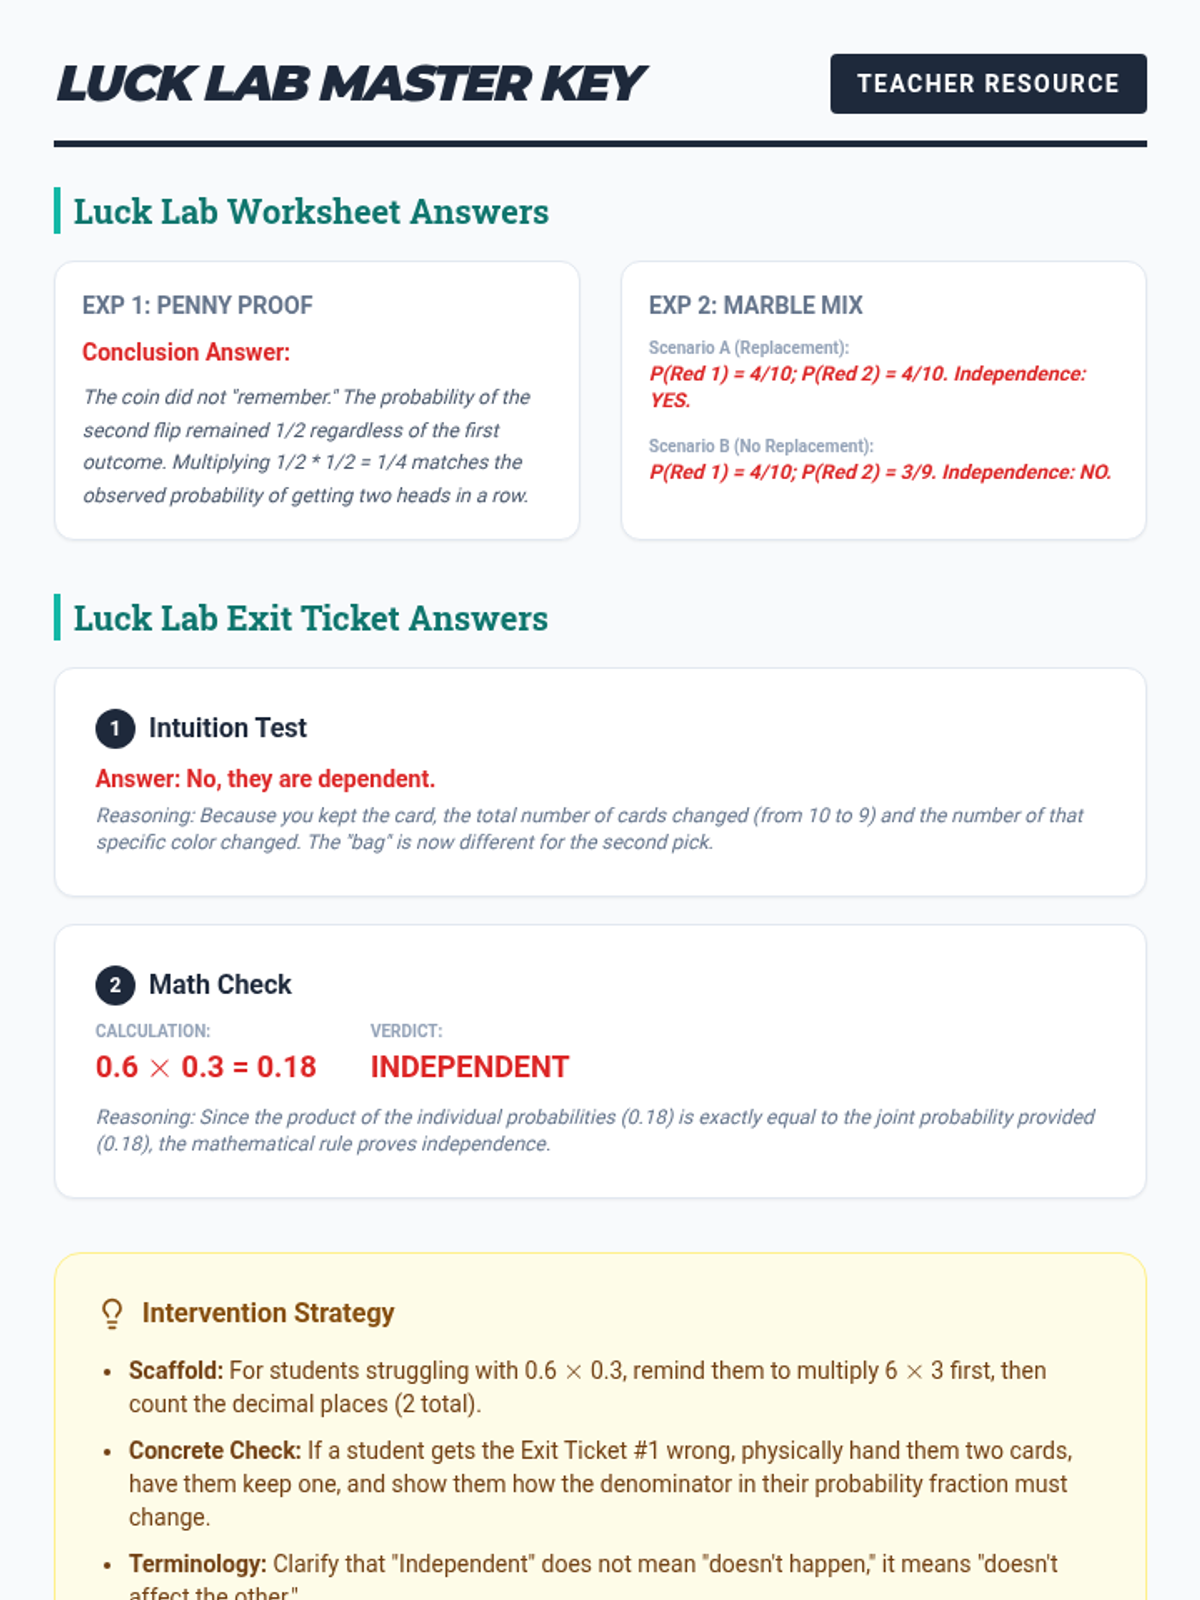
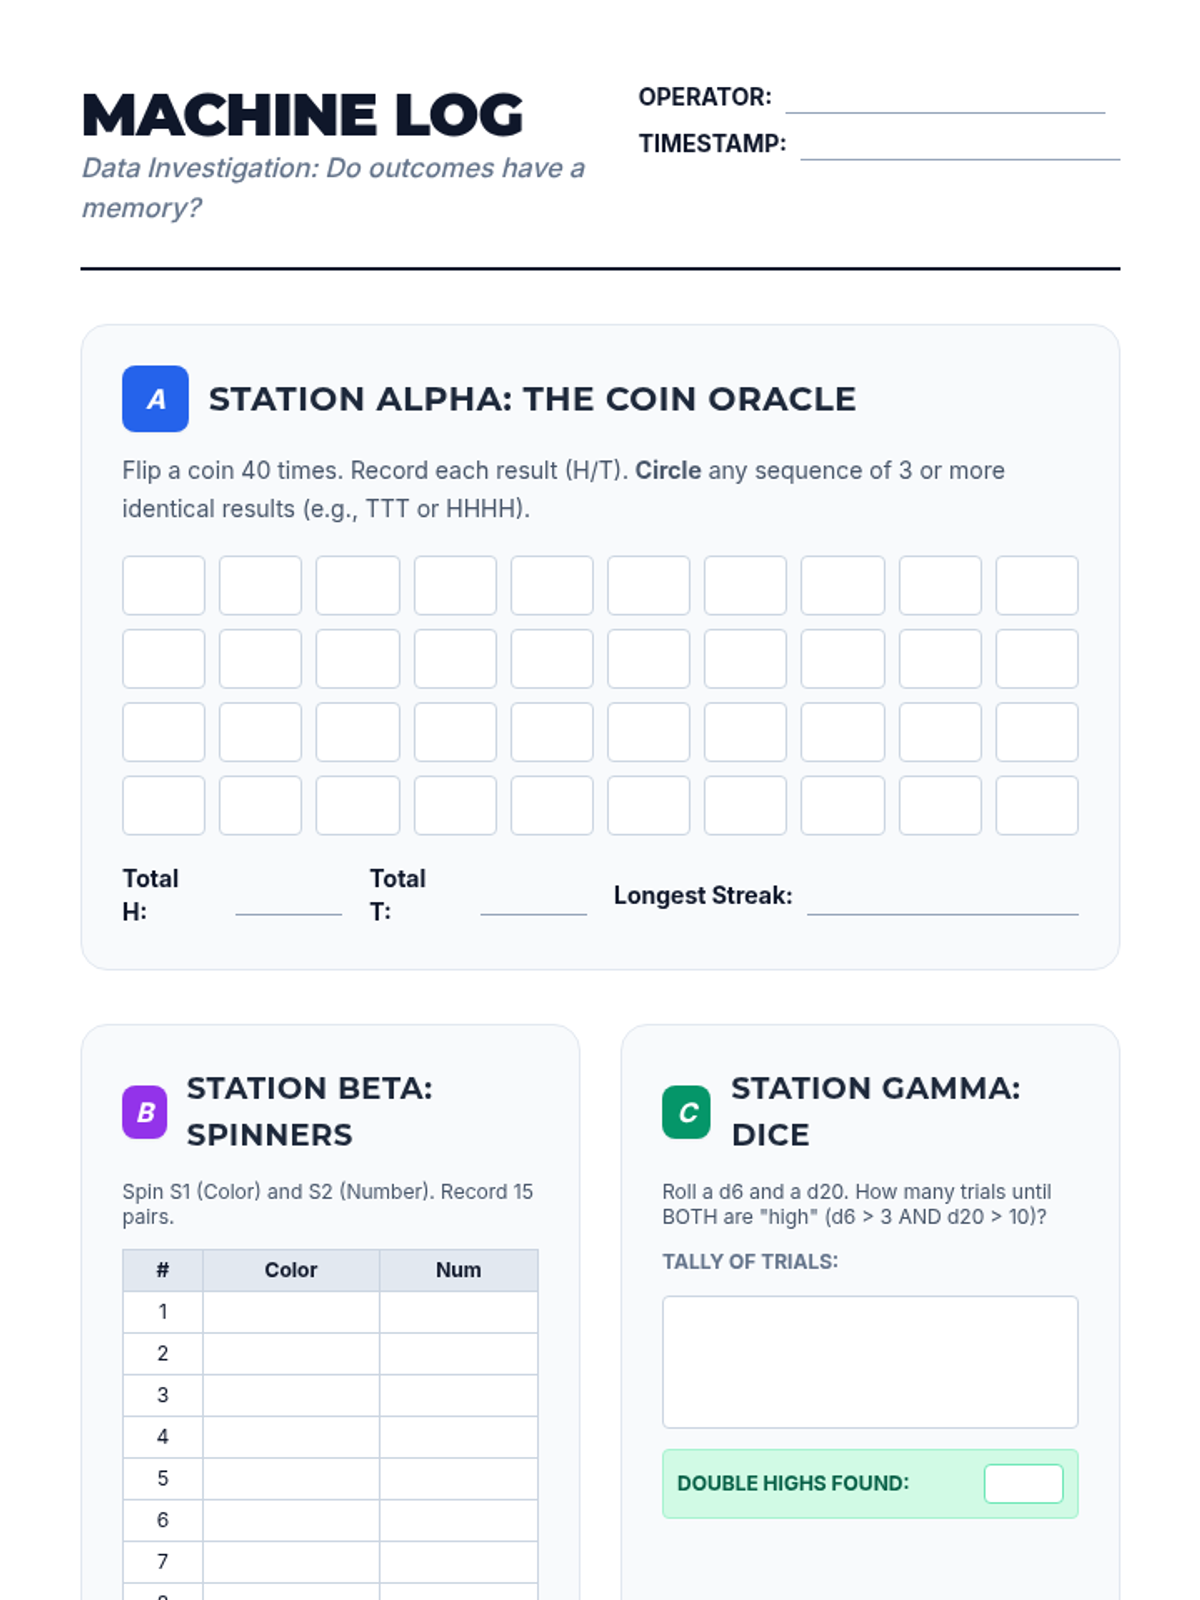
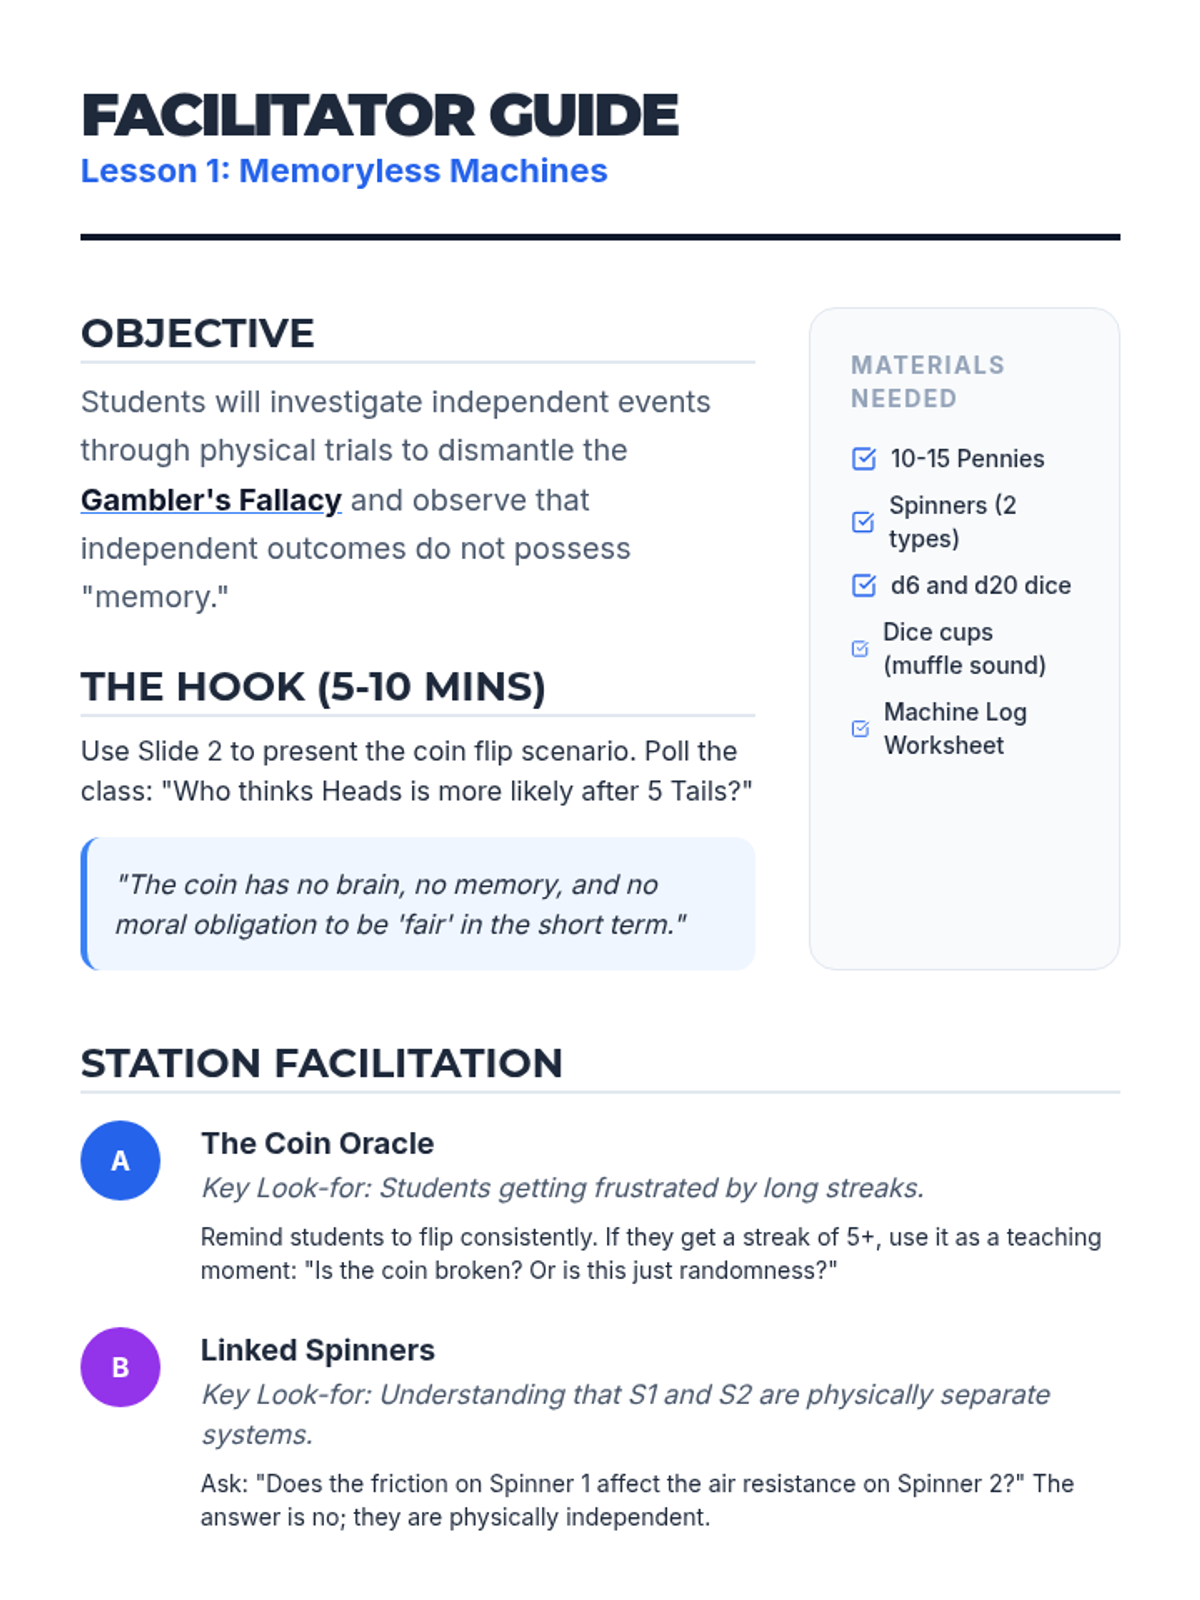
A targeted Tier 2 intervention unit focused on understanding and calculating the independence of two events using the multiplication rule. This sequence uses concrete manipulative-based experiments to bridge the gap between intuition and formal probability notation.
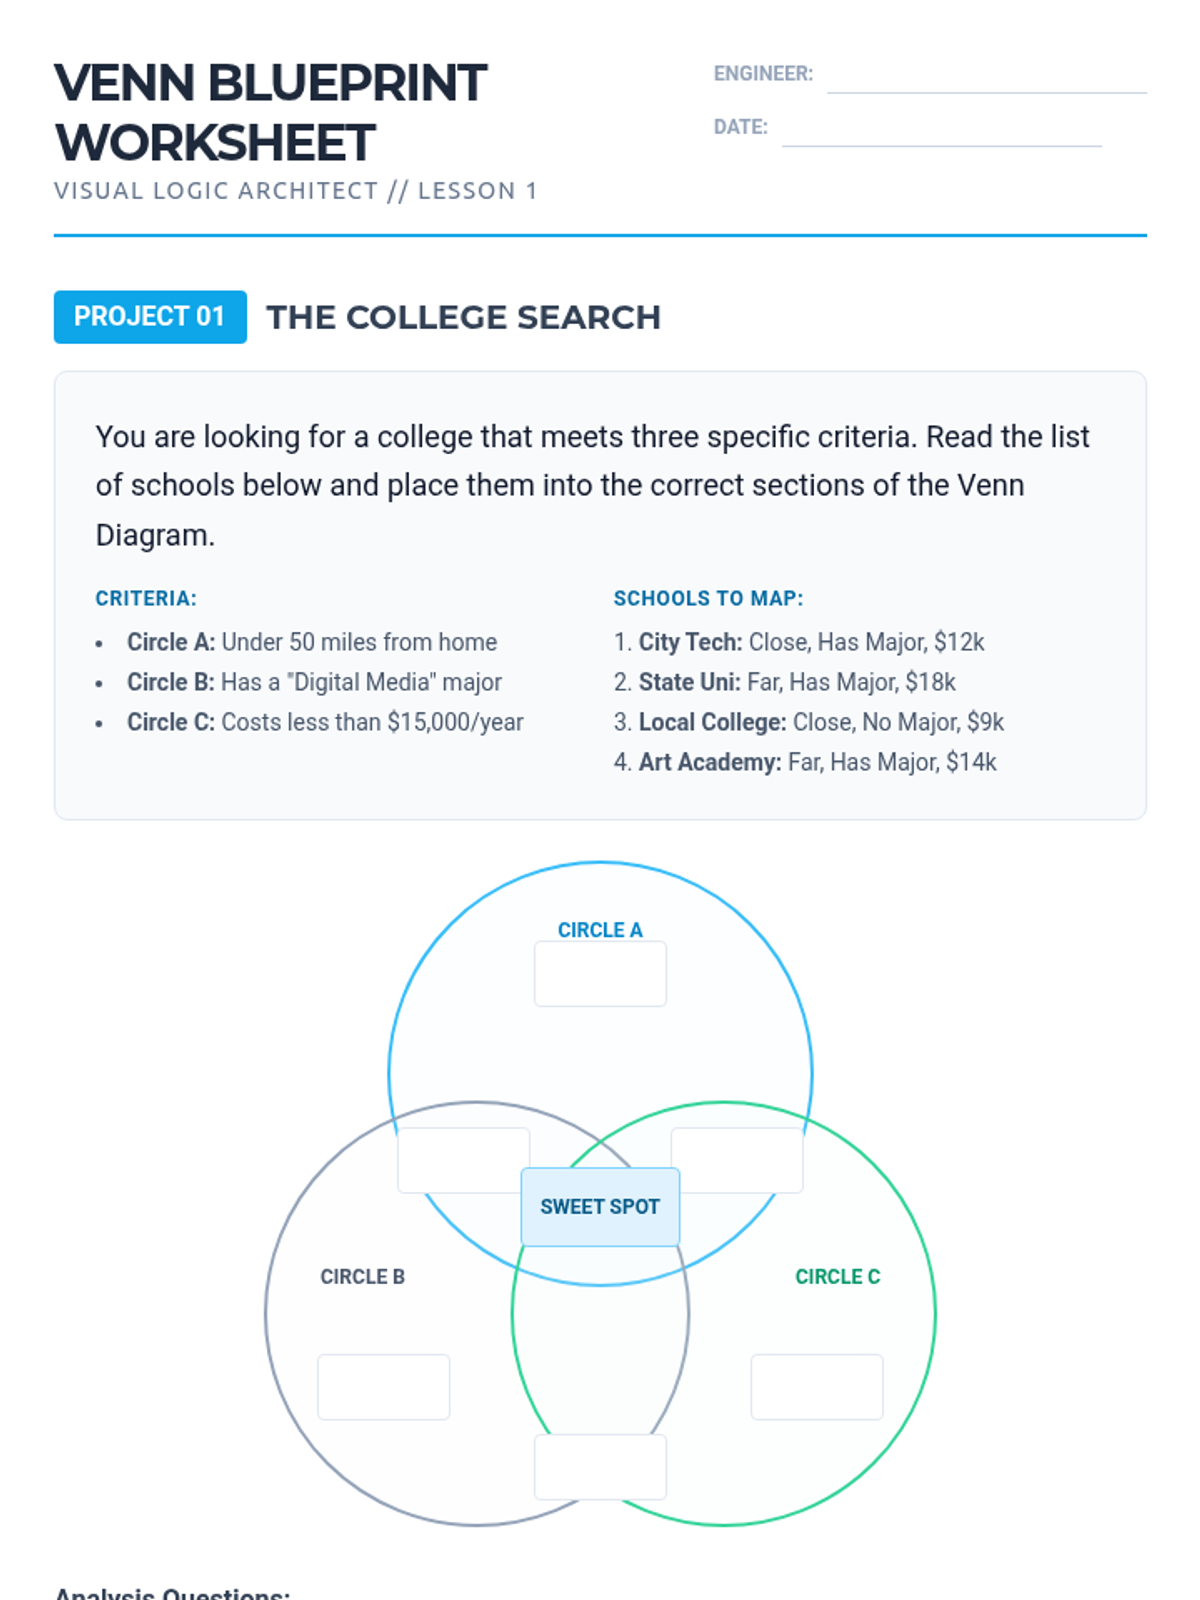
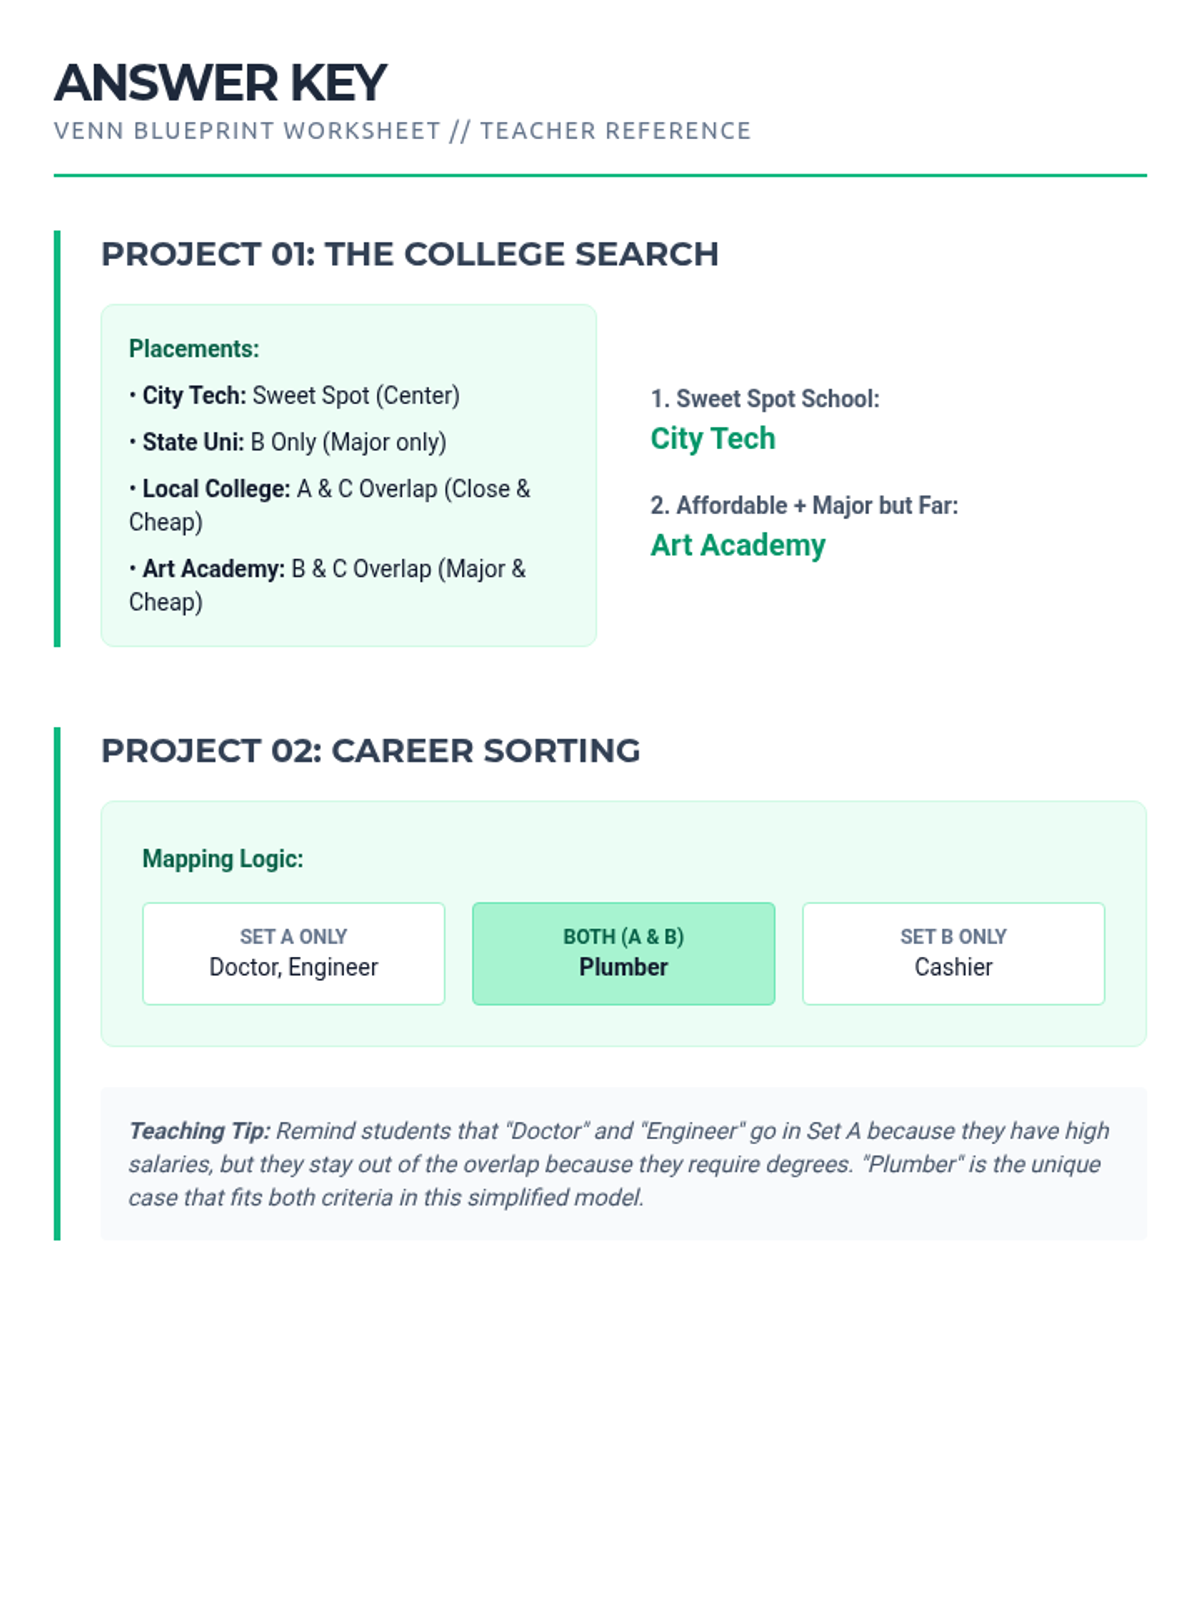
A sequence for 12th-grade students focusing on selecting and using visual organizers like Venn diagrams, tree diagrams, flowcharts, and logic grids to solve complex logic and probability problems. Students move from guided practice to independent metacognitive selection of the best tool for the job.
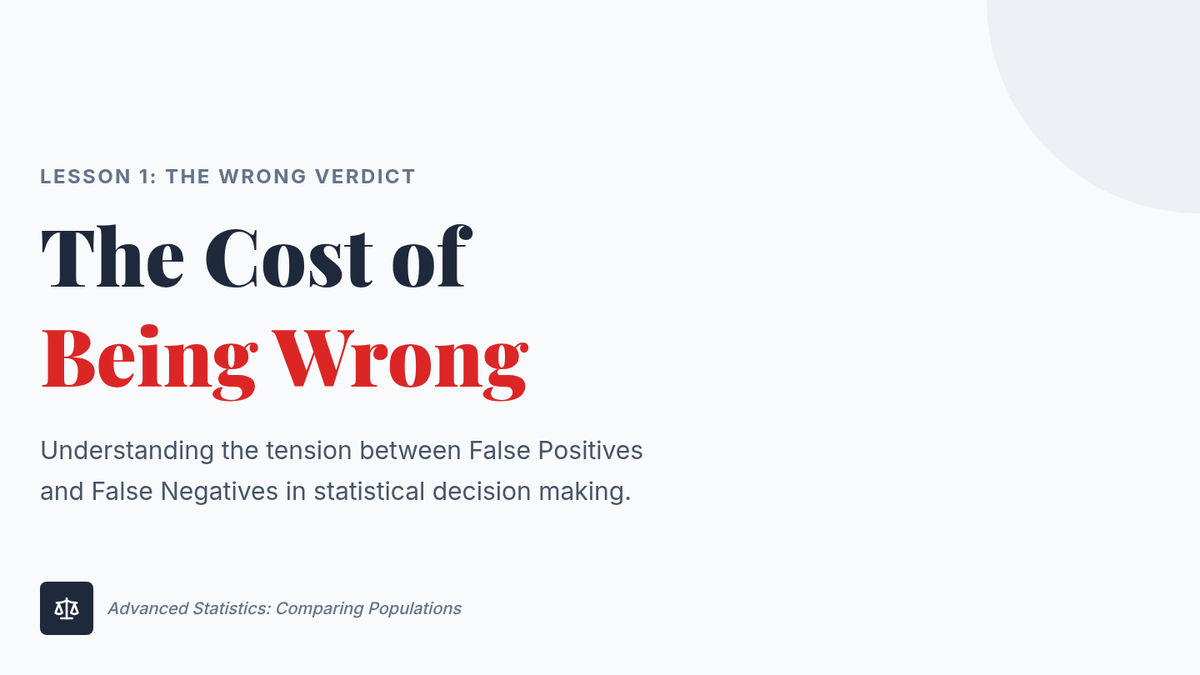
This sequence explores conditional probability and the reliability of tests using frequency trees and area models. Students investigate 'false positives' and 'false negatives' in real-world contexts like medical testing and spam filters, ultimately debating the ethical implications of screening policies.
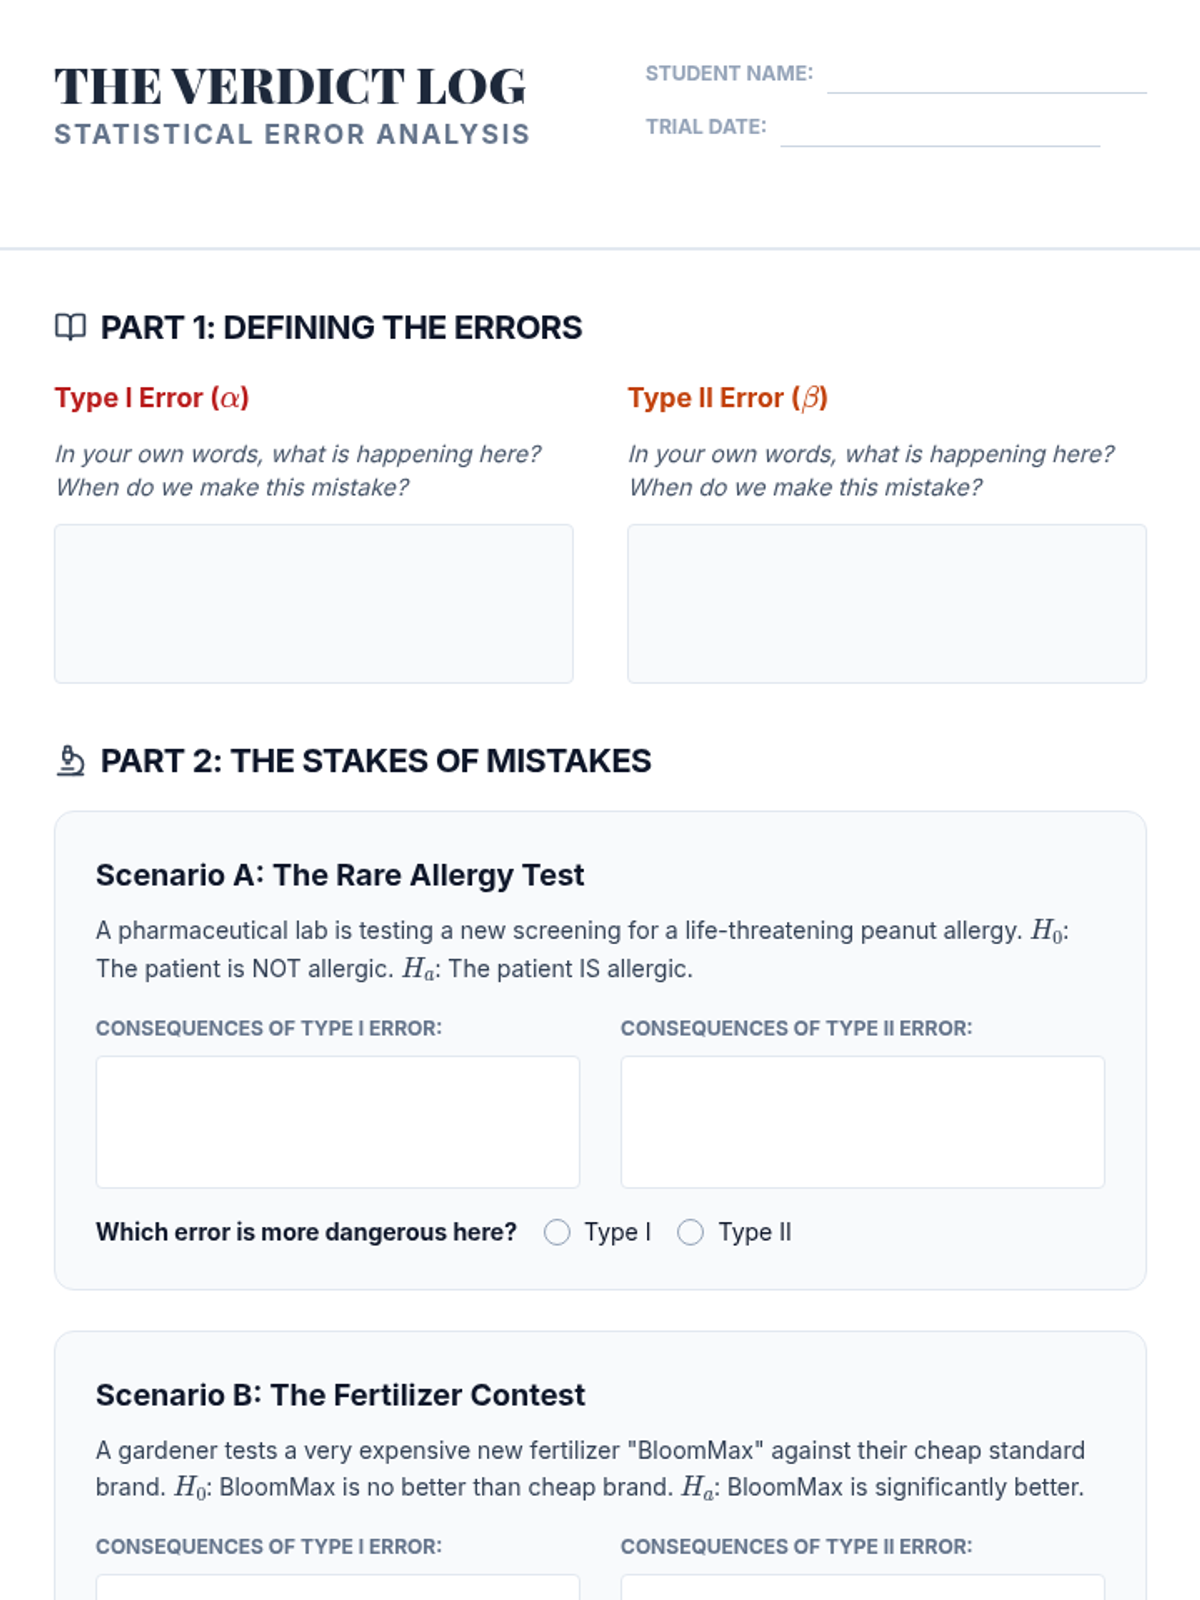
An advanced exploration of statistical power, error types, and effect sizes in the context of comparing two populations, teaching students to look beyond p-values to evaluate the practical importance and reliability of scientific findings.
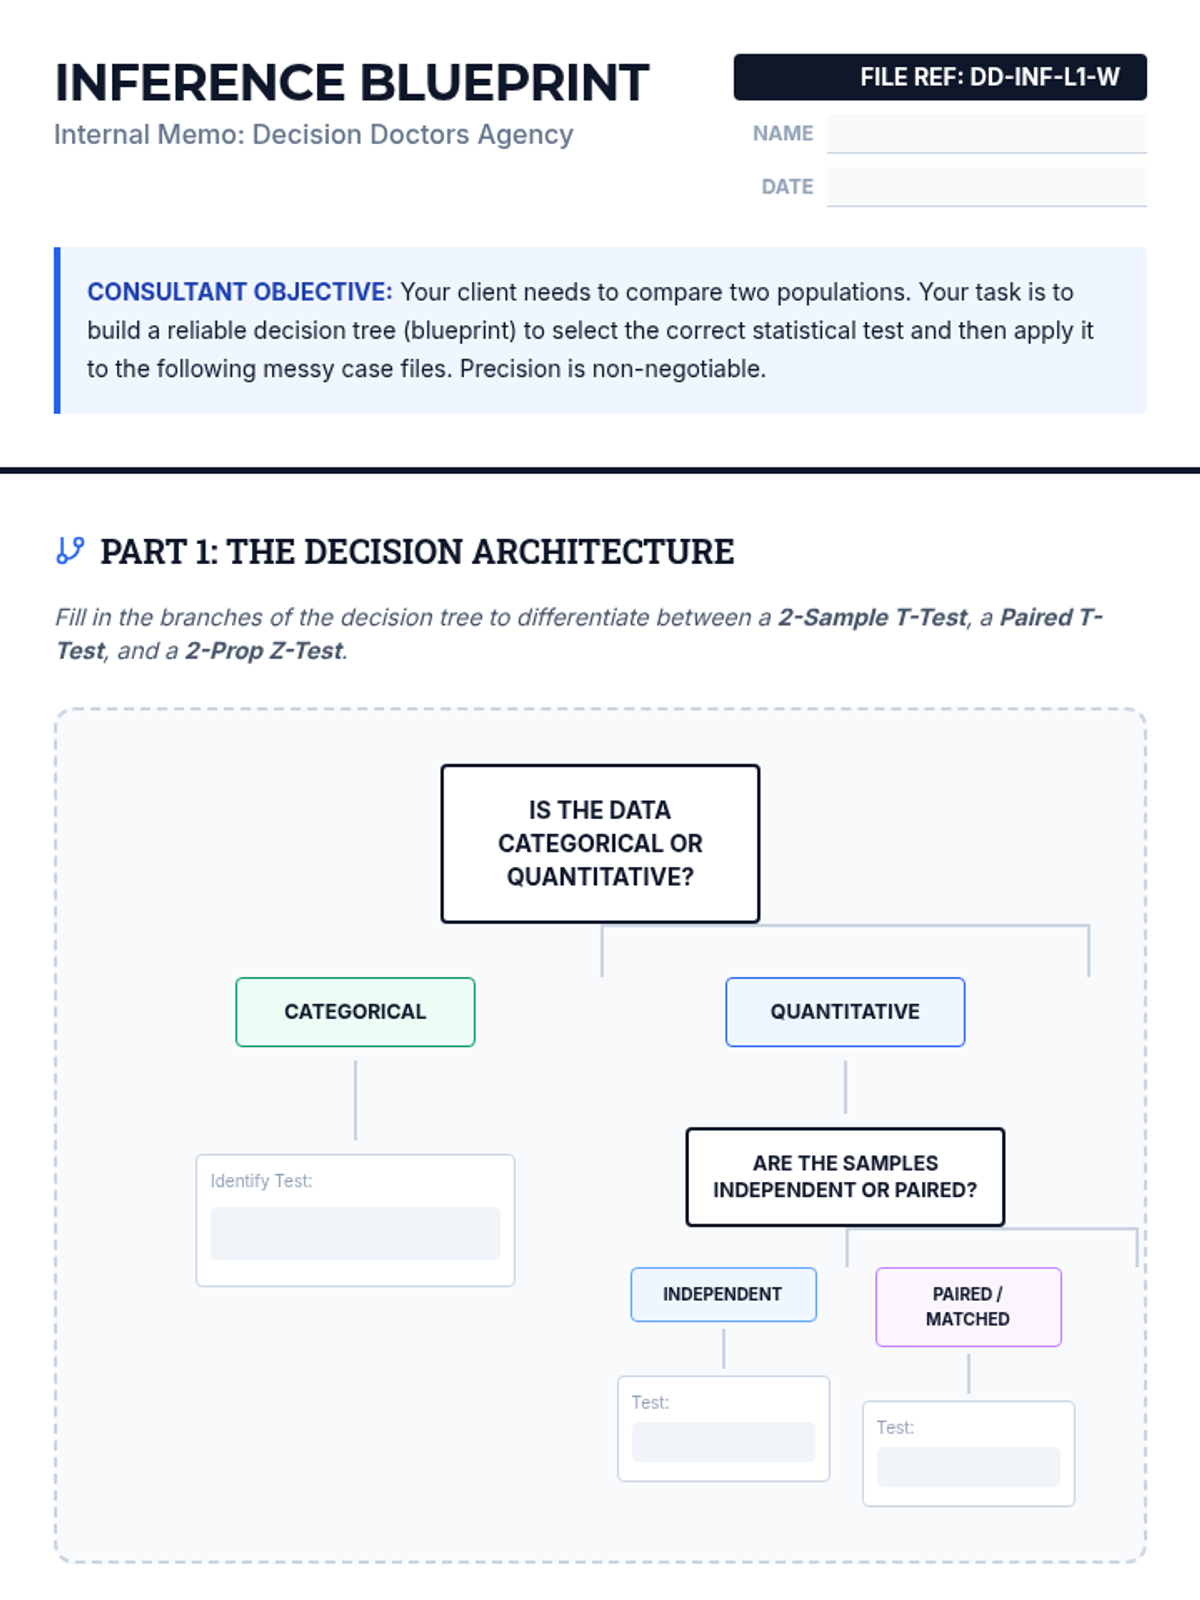
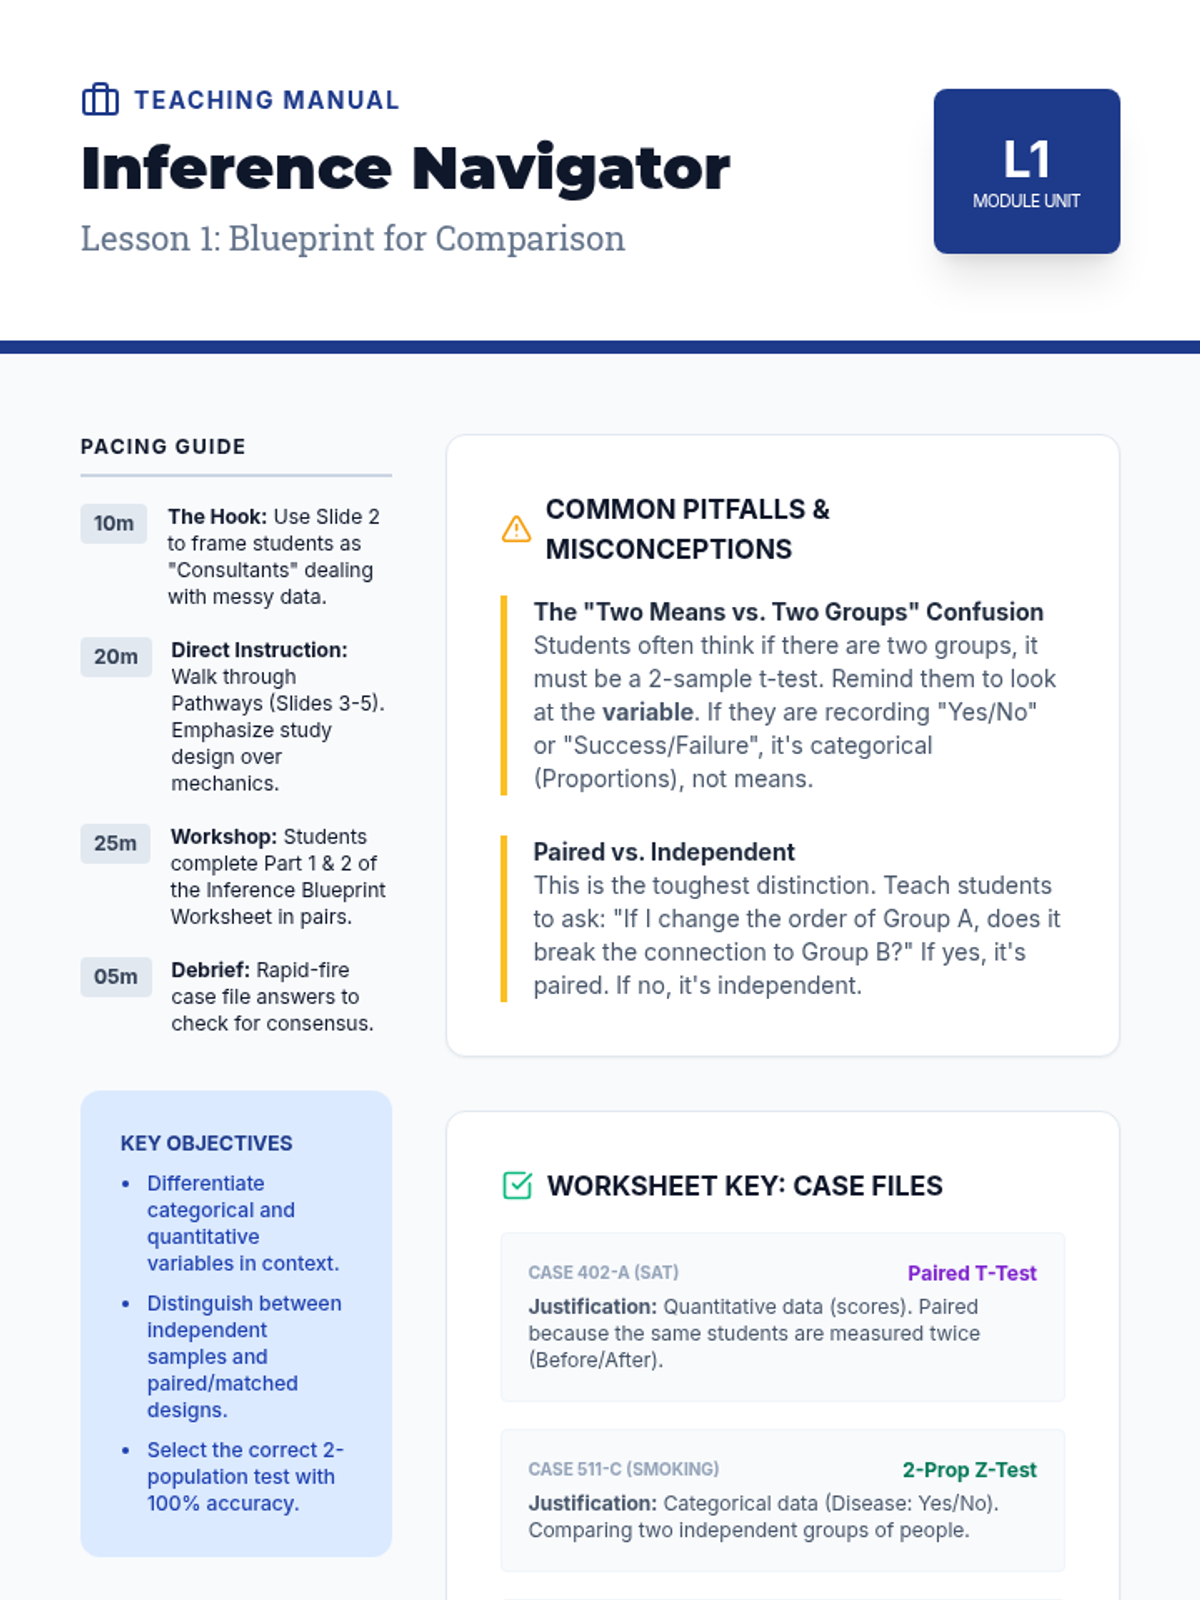
An advanced 11th-grade statistics sequence focusing on the selection, application, and ethical implications of two-population inference tests through a professional consultant simulation.
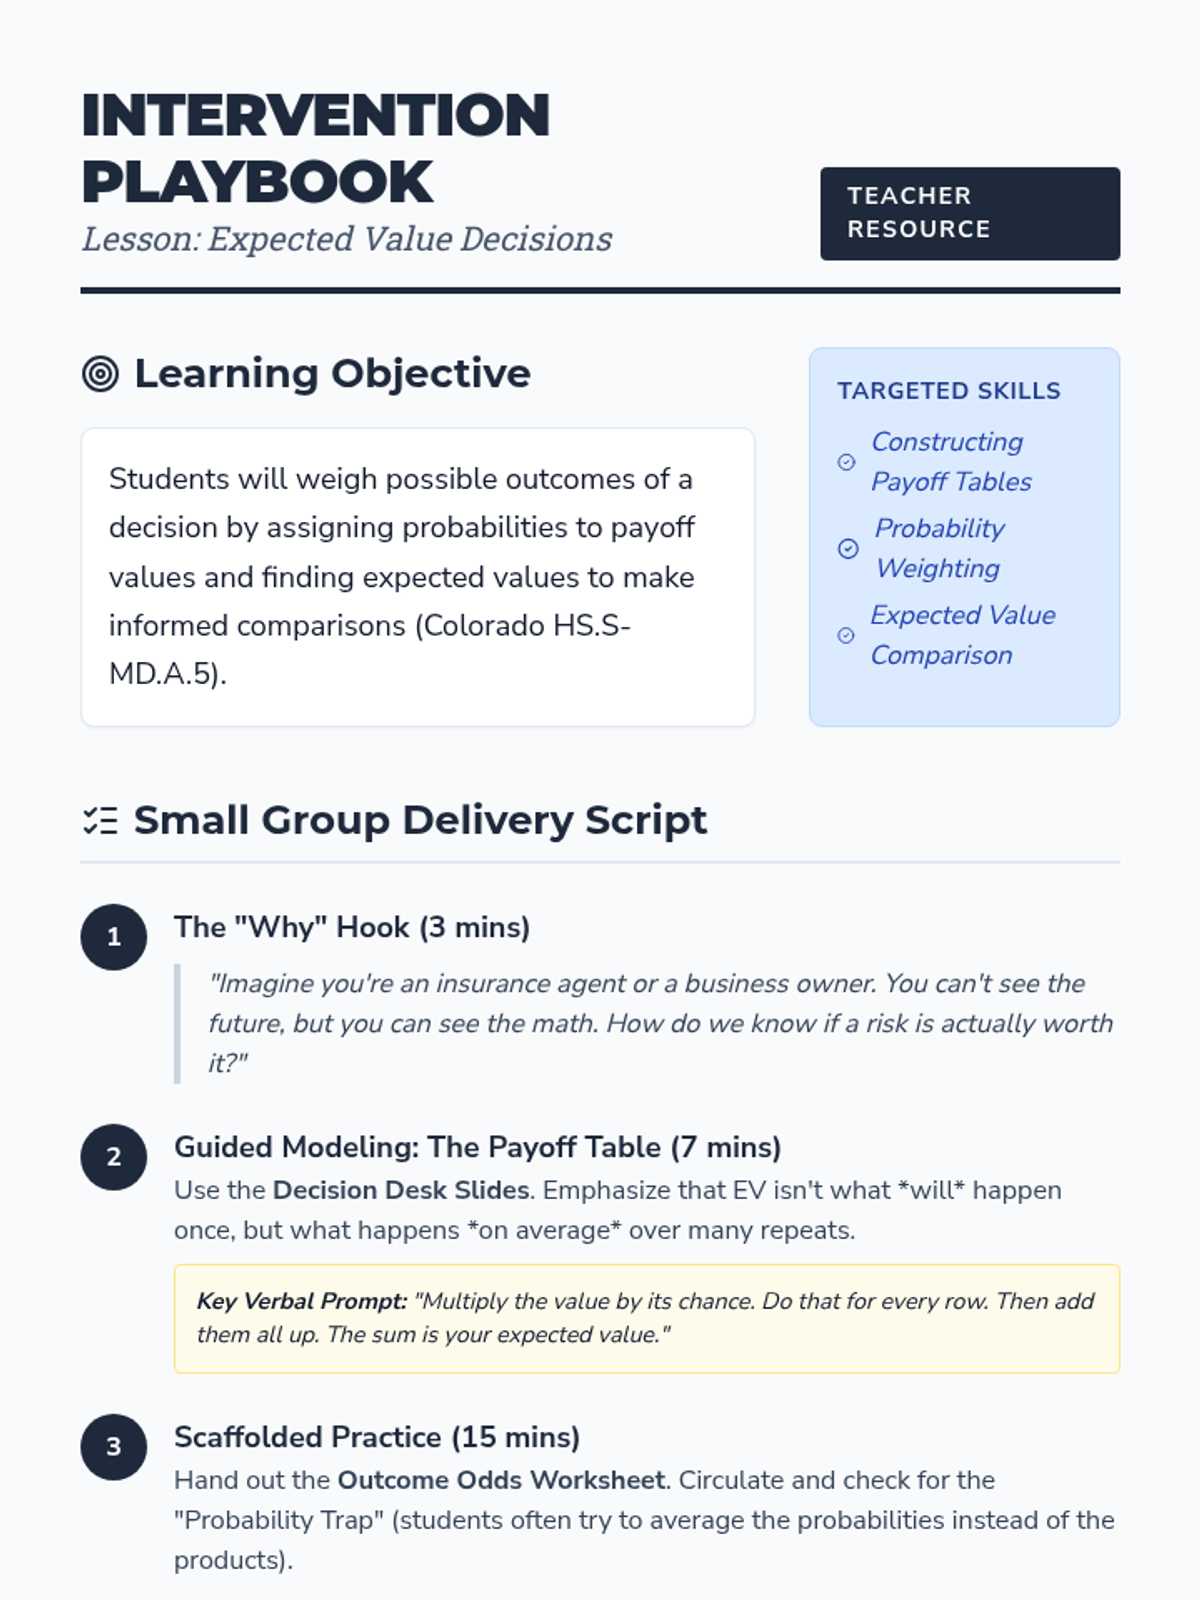
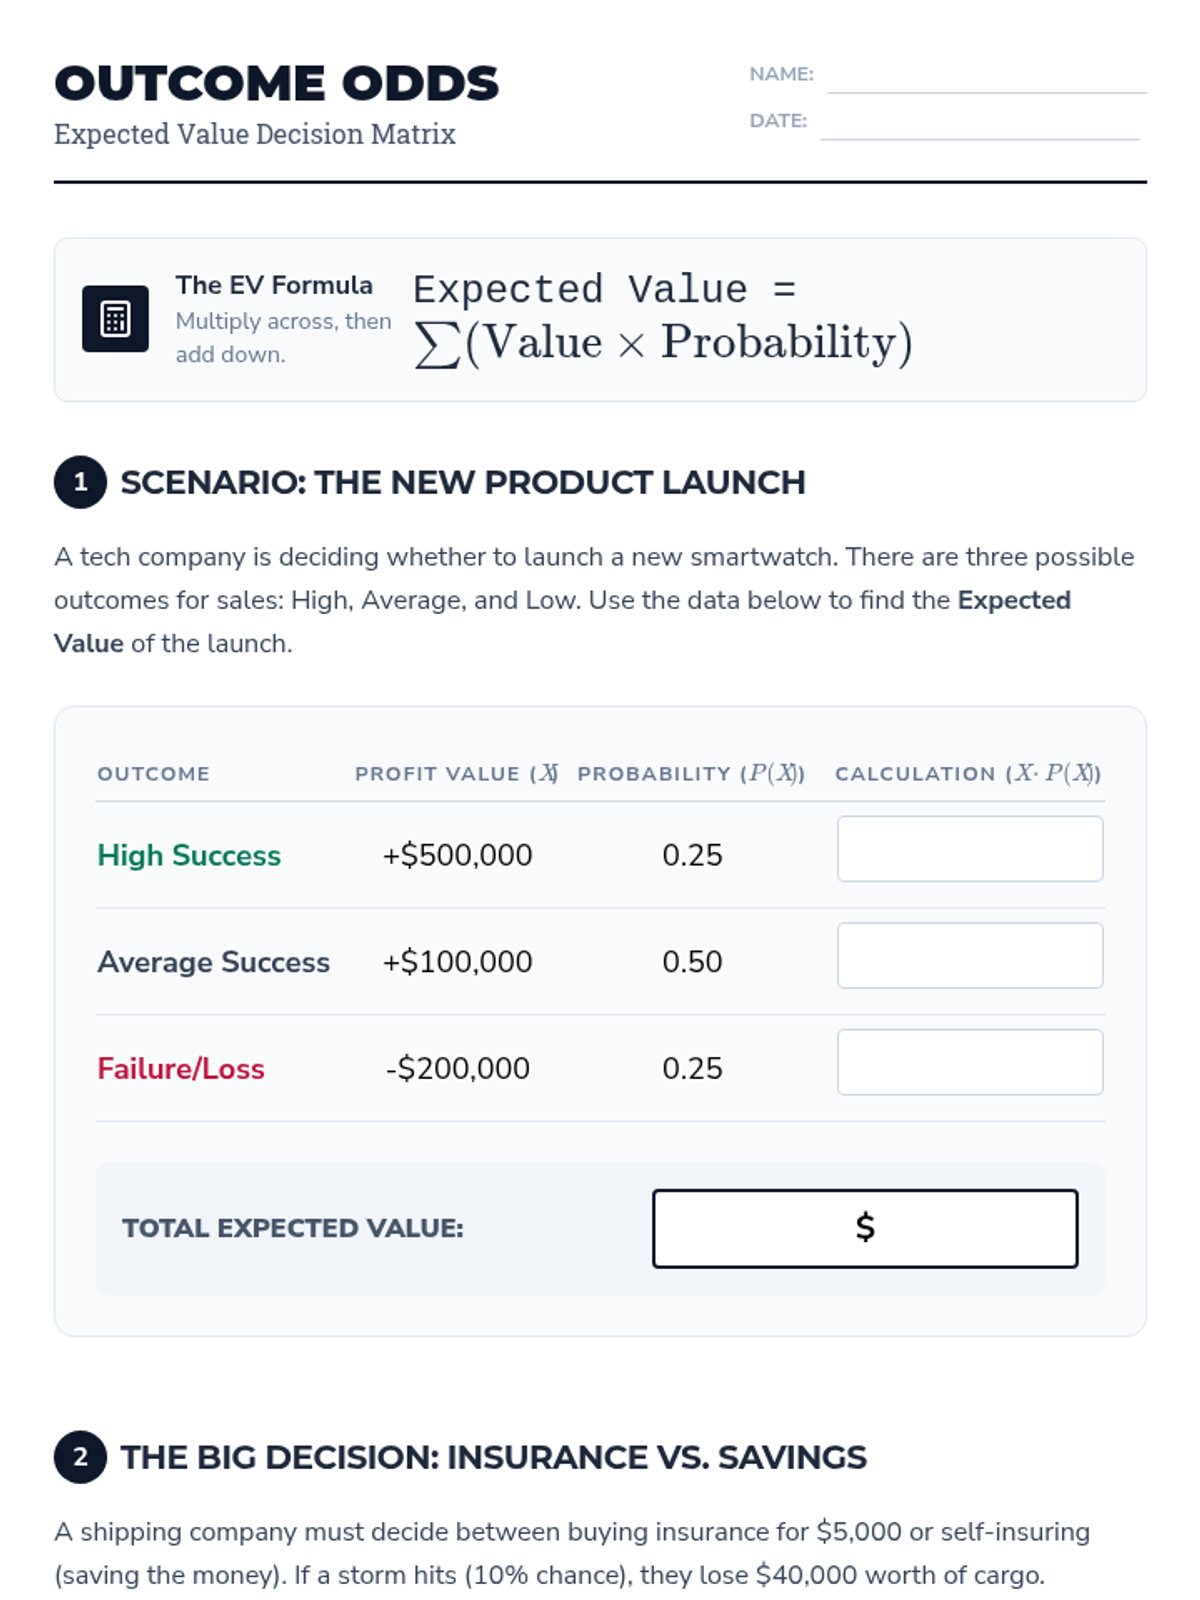
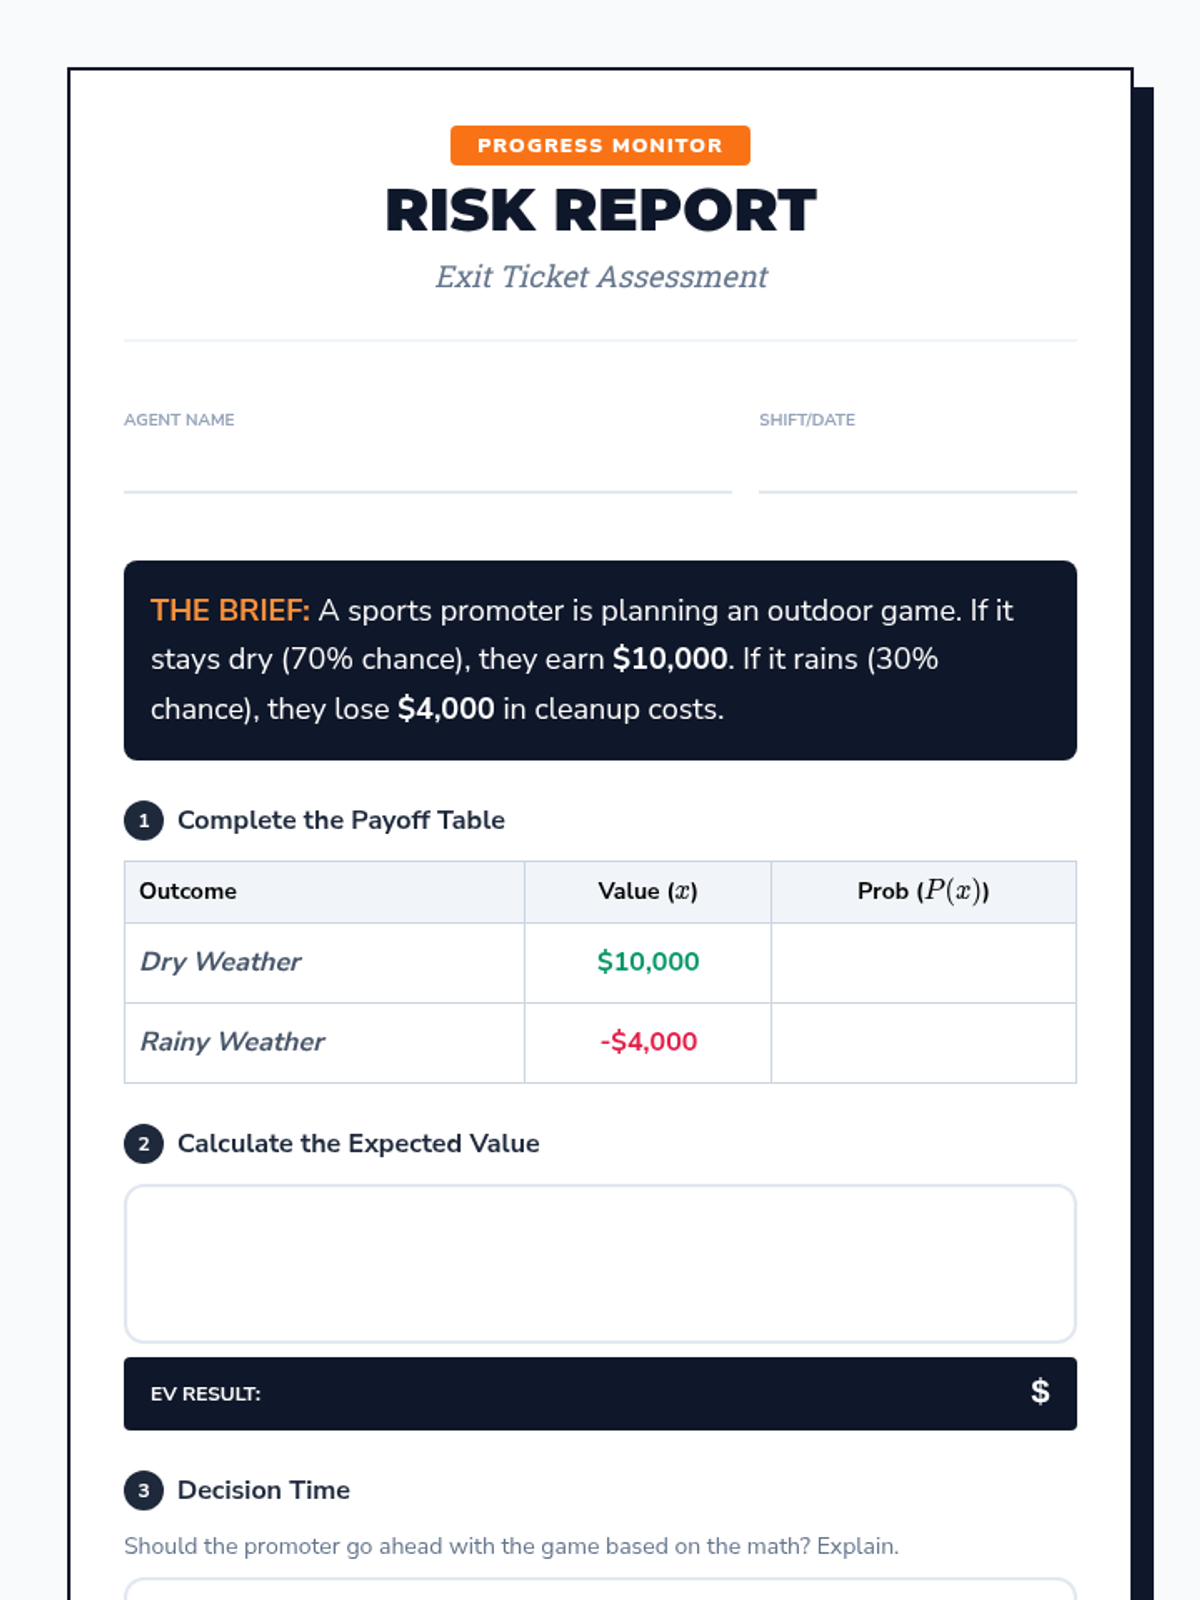
A high school statistics intervention sequence focused on decision-making through expected value calculations. Students learn to construct payoff tables, assign probabilities, and compare outcomes in real-world scenarios.
This sequence explores probability-based decision making through the lens of financial literacy. Students apply expected value and risk assessment to evaluate insurance, extended warranties, and the mathematical trade-off between known costs and unknown risks.
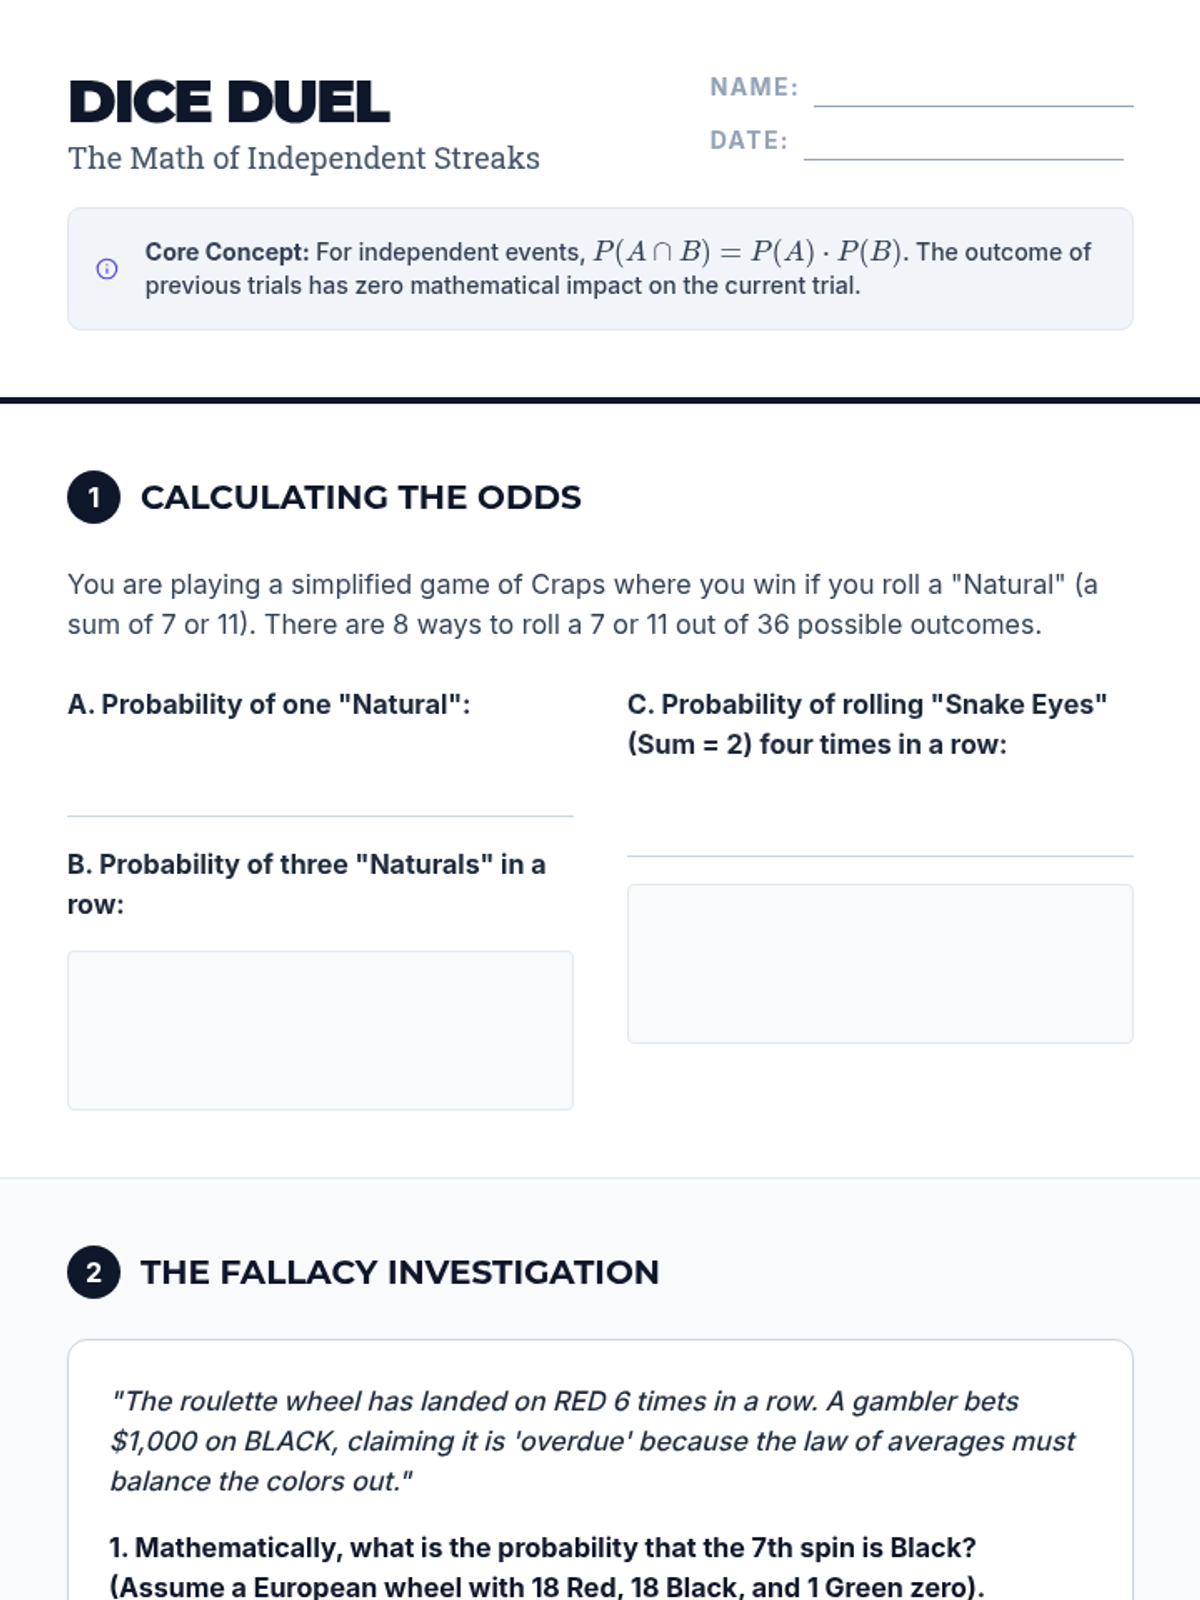
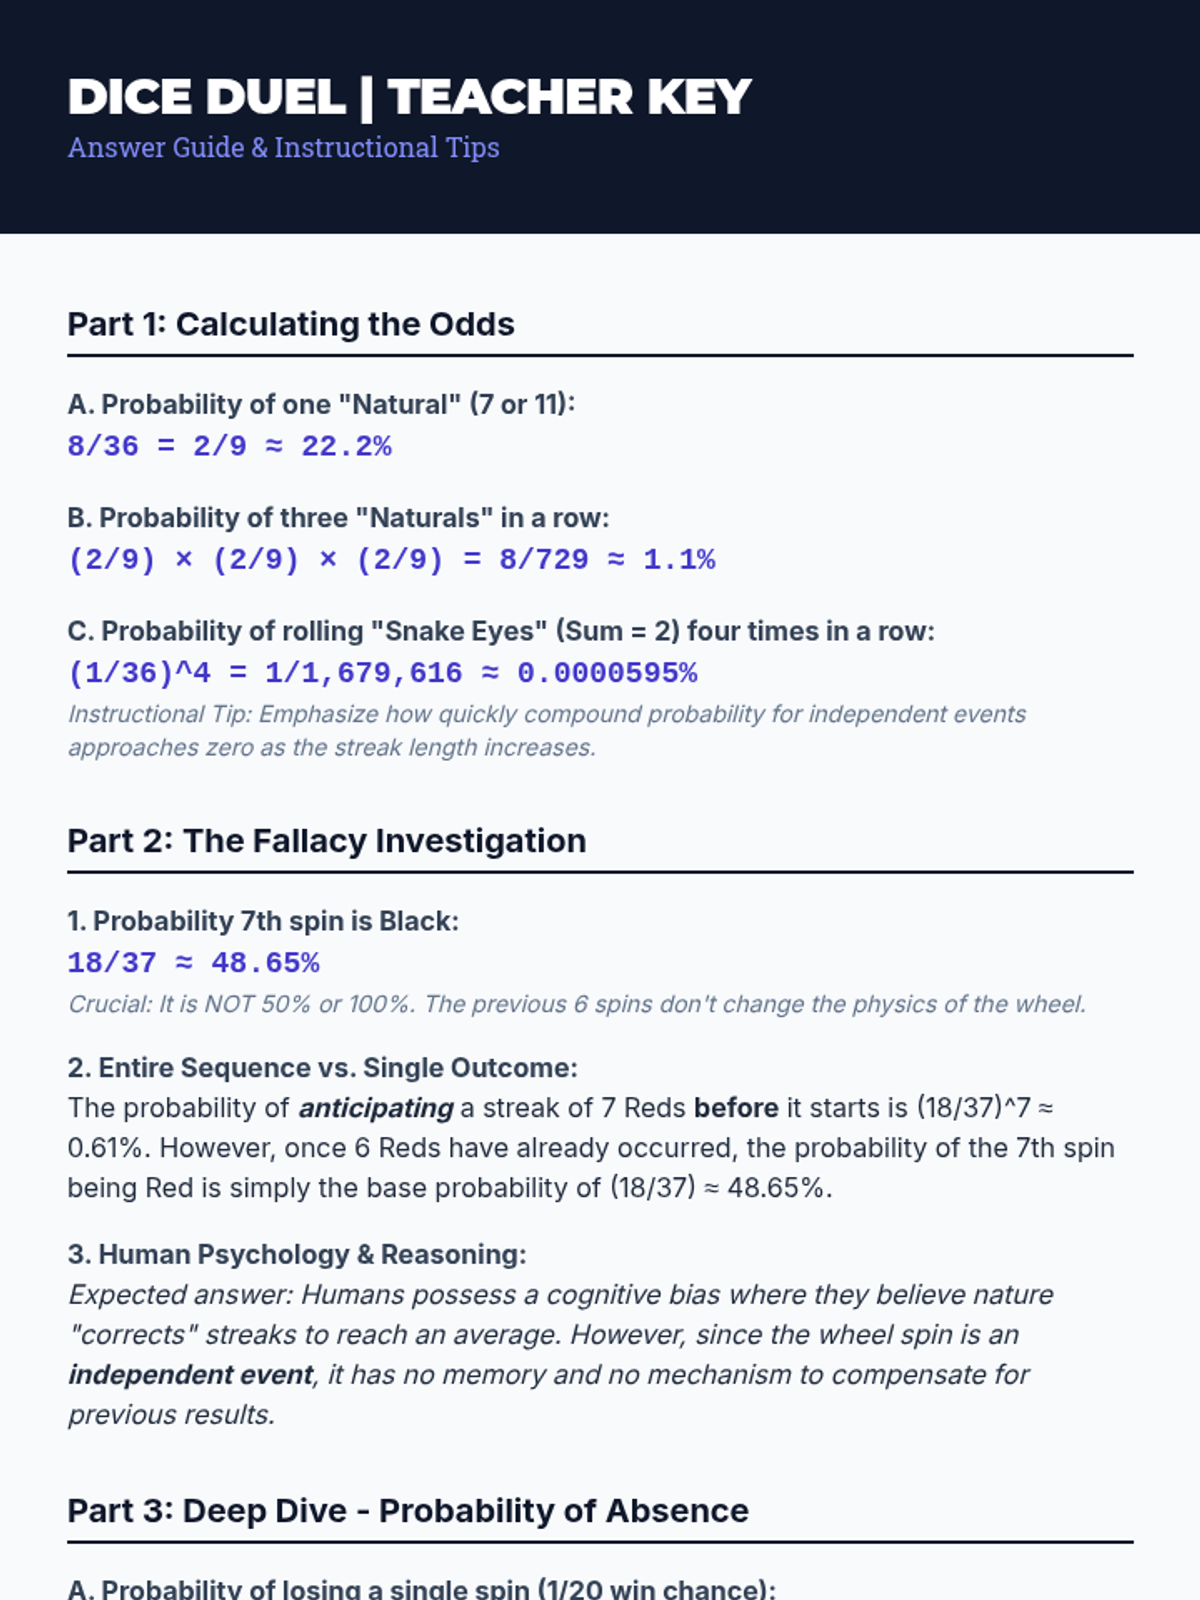
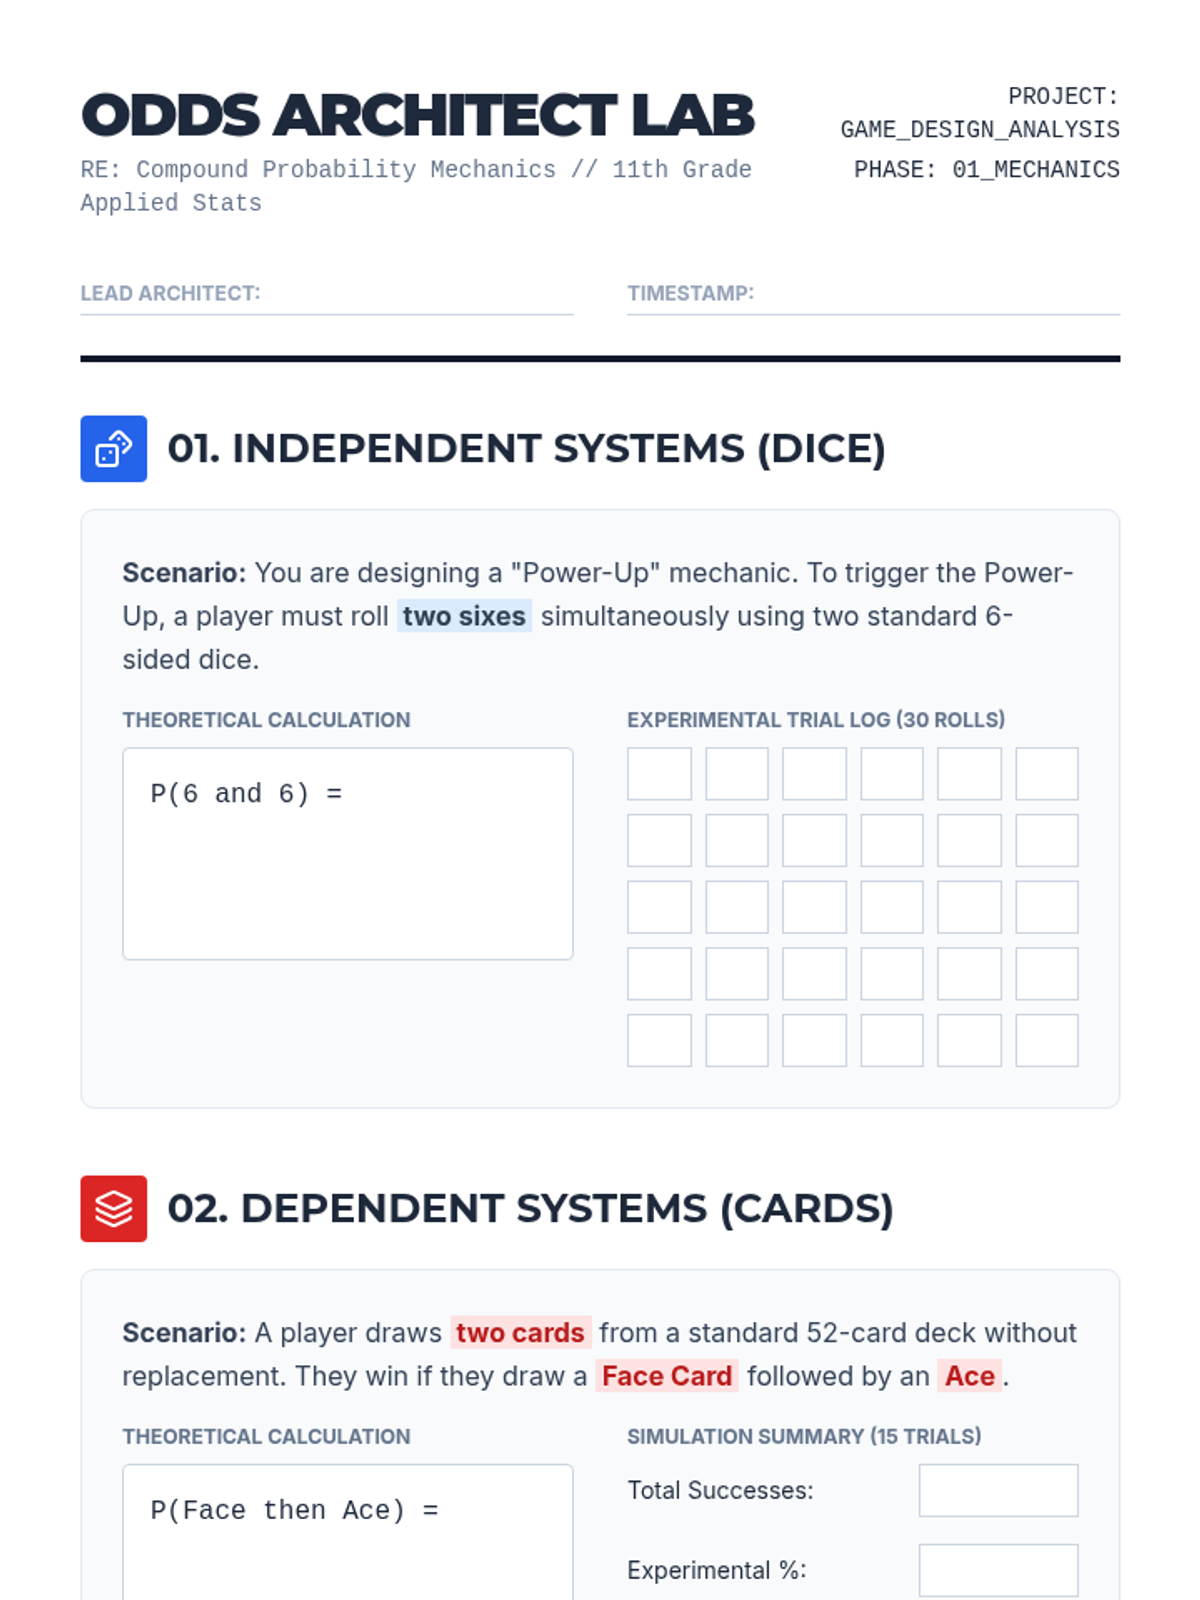
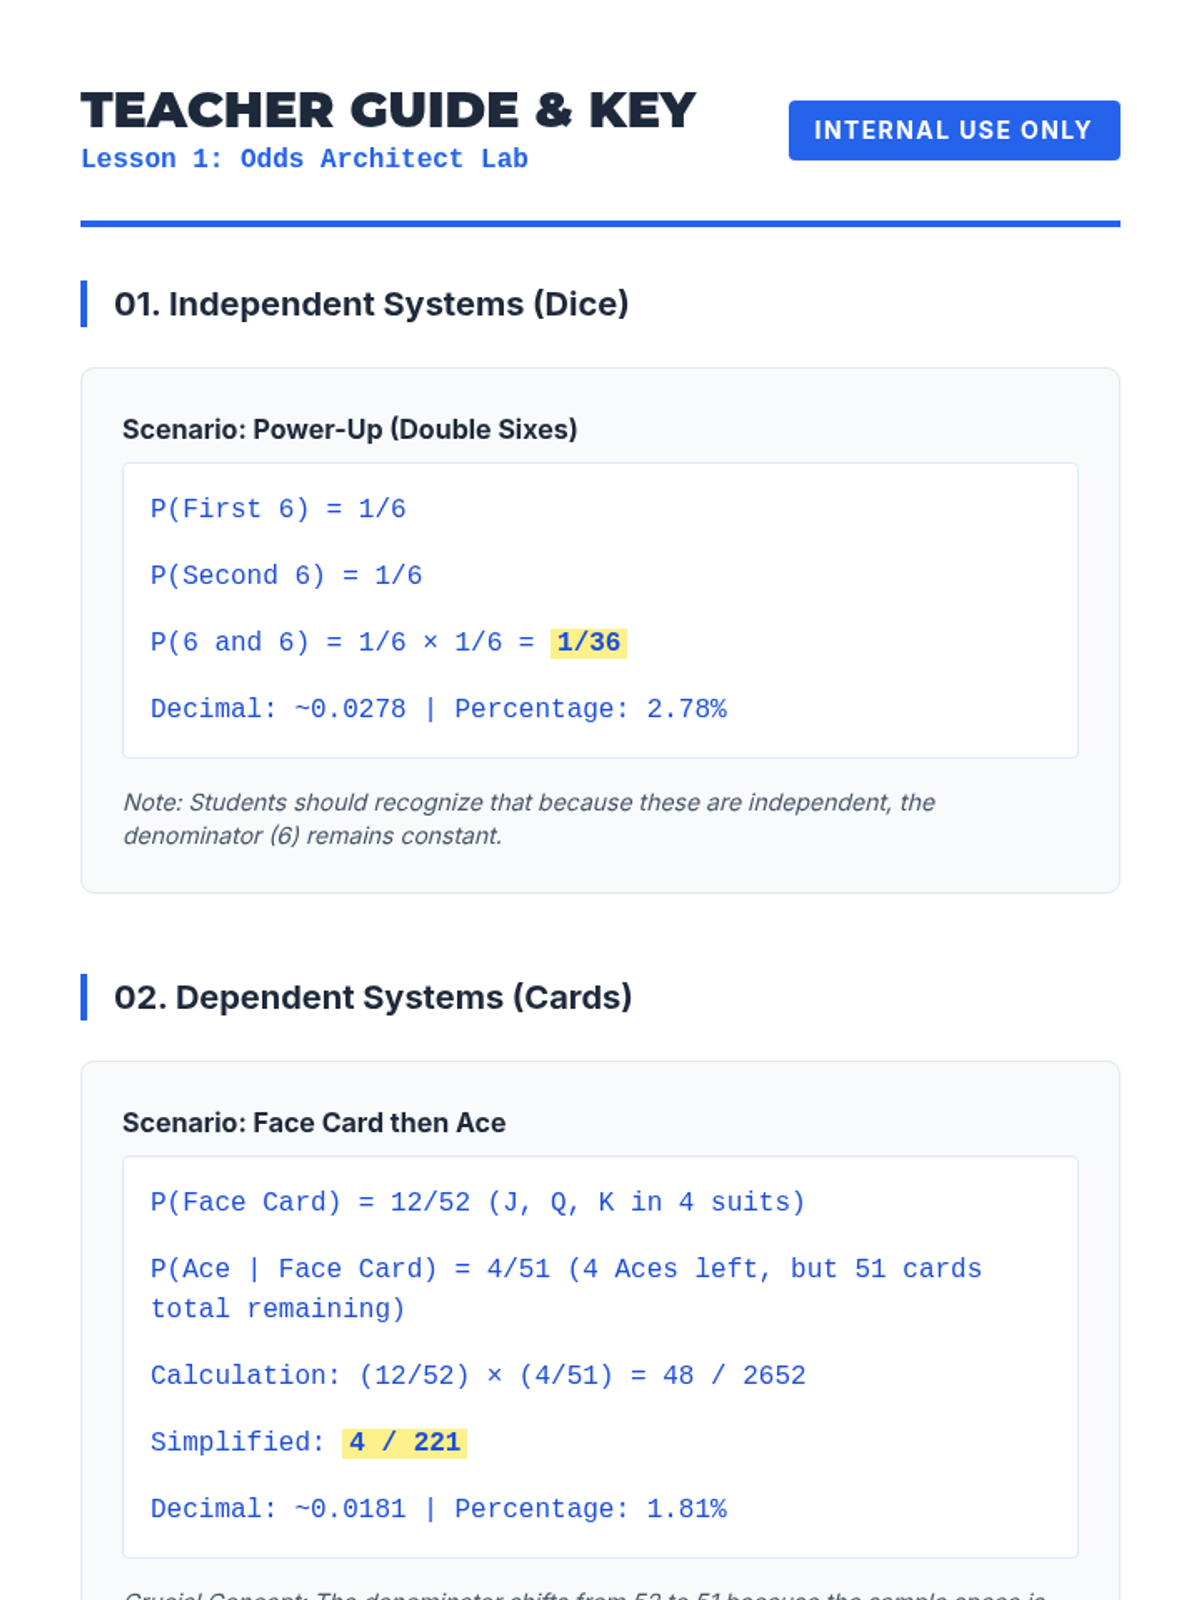
A 12th-grade mathematics unit exploring compound probability through the lens of casino games, lotteries, and game design, focusing on the distinction between independent and dependent events.
This 11th-grade sequence explores compound probability through the lens of game design and analysis. Students move from analyzing existing games of chance to engineering their own balanced systems using the multiplication rule, expected value, and area models.
This sequence explores how compound probability and risk assessment are used in professional fields like engineering, medicine, insurance, and law. Students apply the multiplication rule and conditional probability to high-stakes real-world scenarios.
In this sequence, students explore how mathematical probability guides rational decision-making in uncertain situations. Learners progress from simple compound events to constructing decision trees and calculating expected values to evaluate the fairness and potential payoff of various choices.
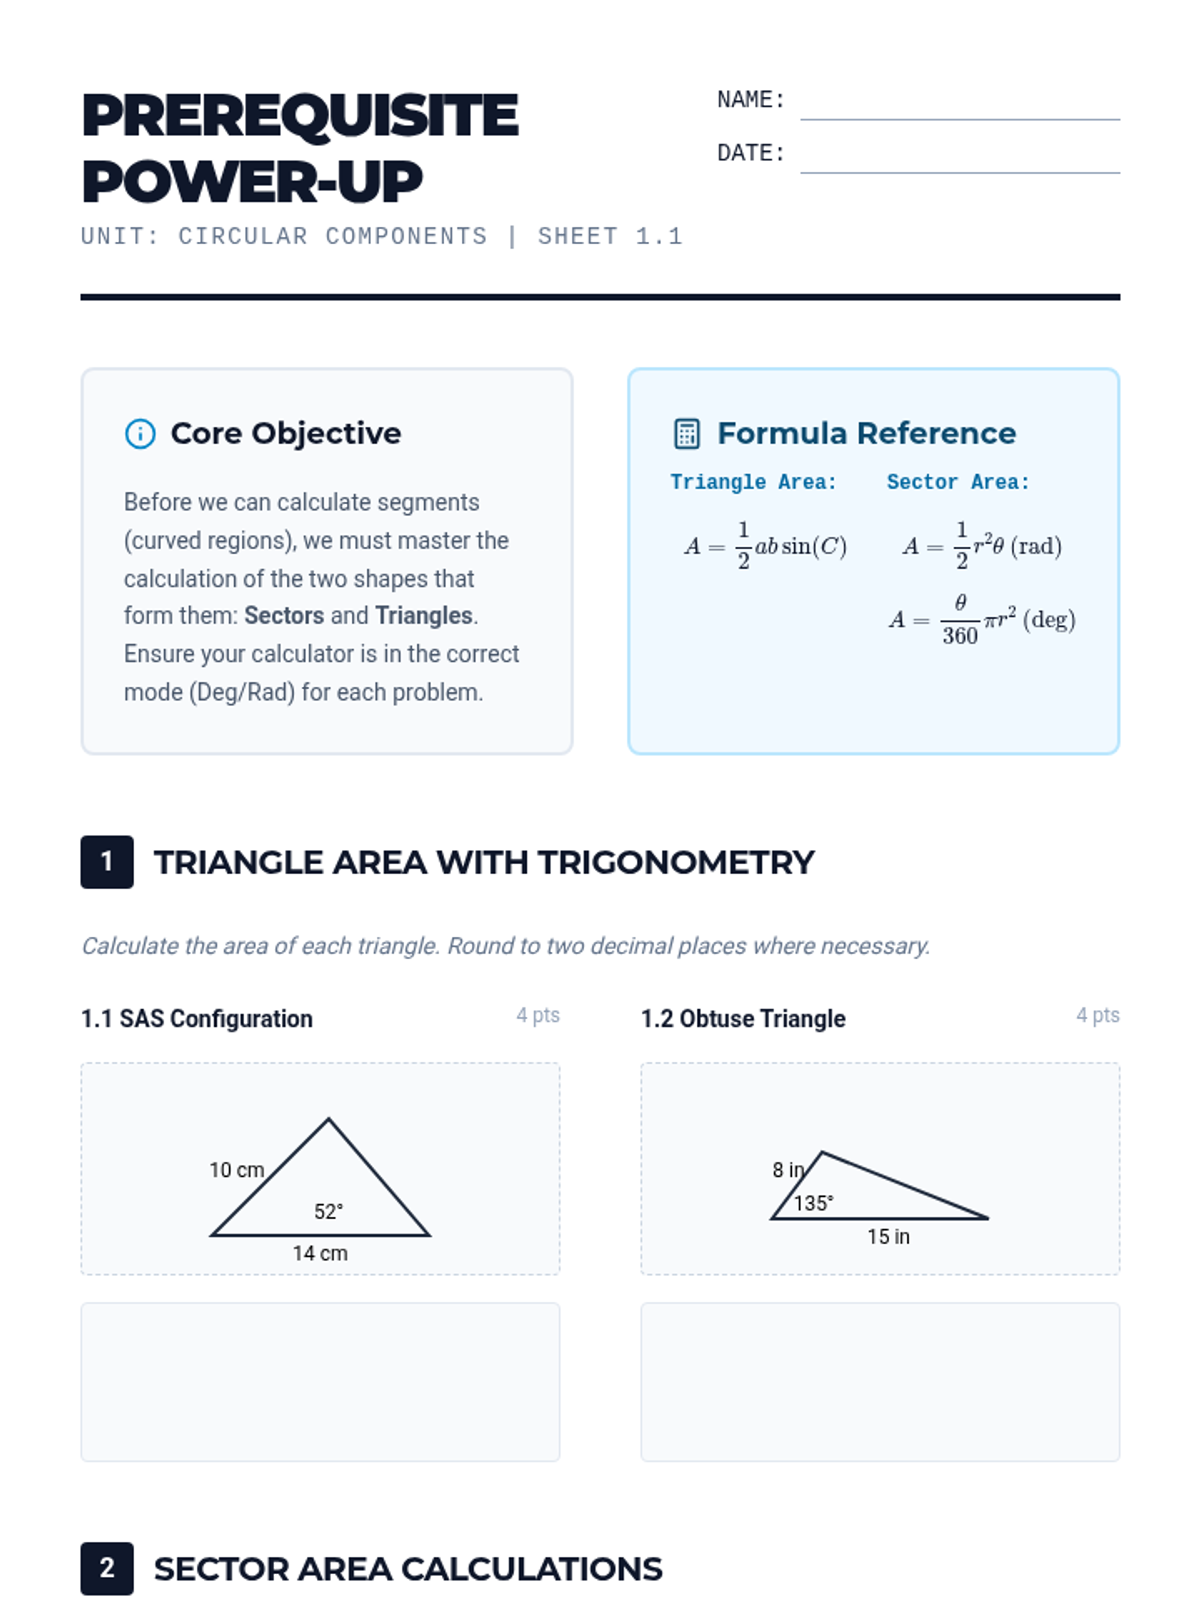
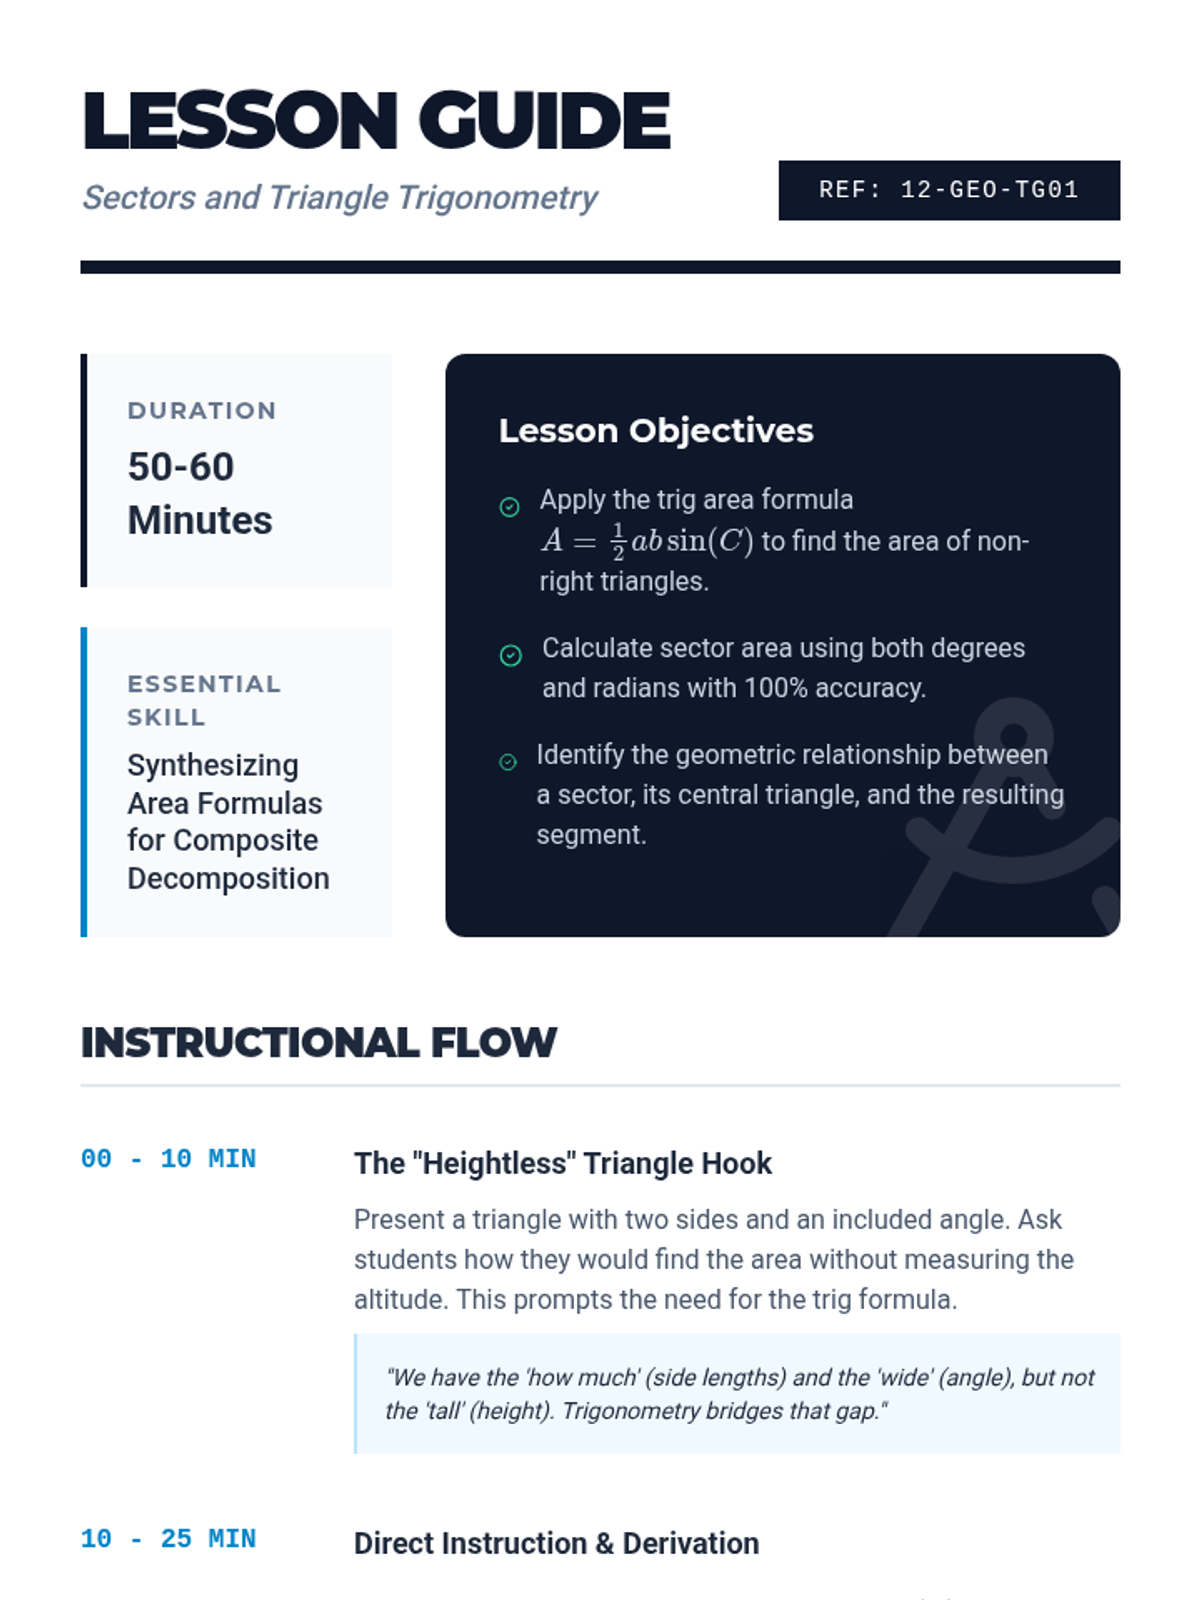
A high-level geometry sequence for 12th-grade students focusing on circular segments, composite regions, and their applications in engineering and architecture. Students progress from foundational sector calculations to complex decomposition of architectural forms.
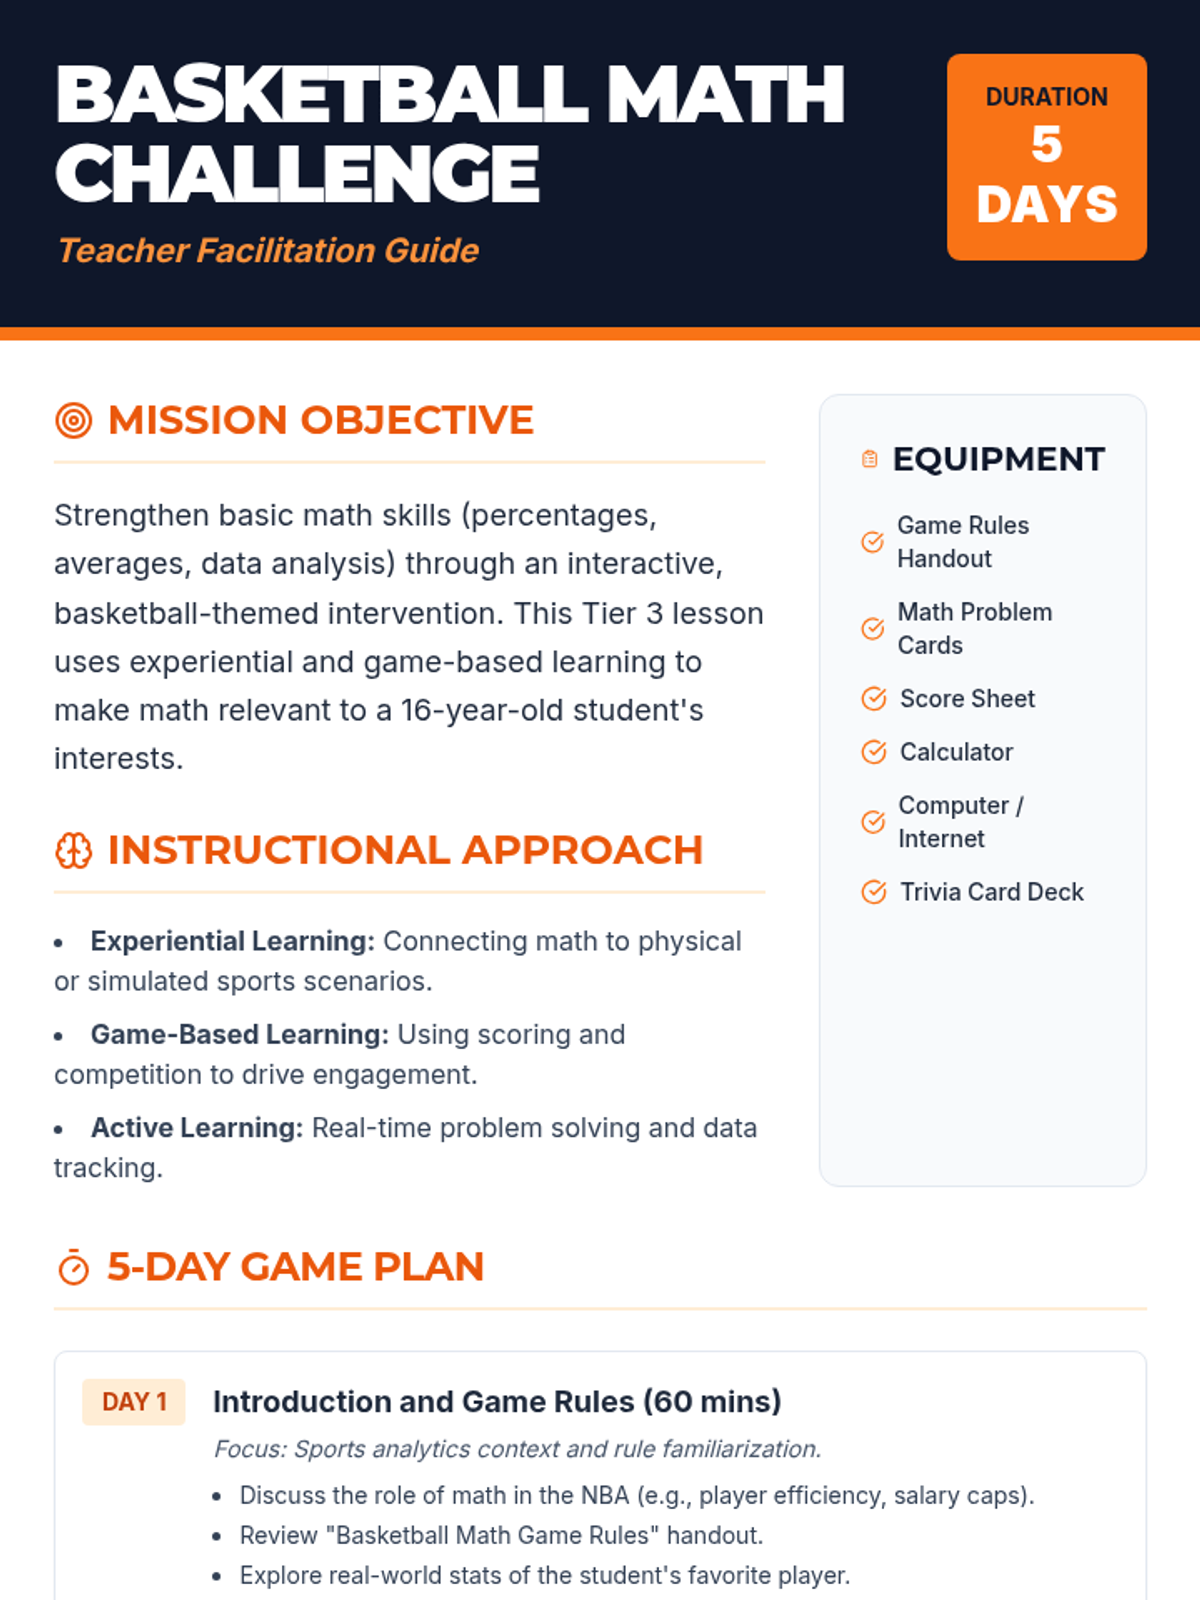
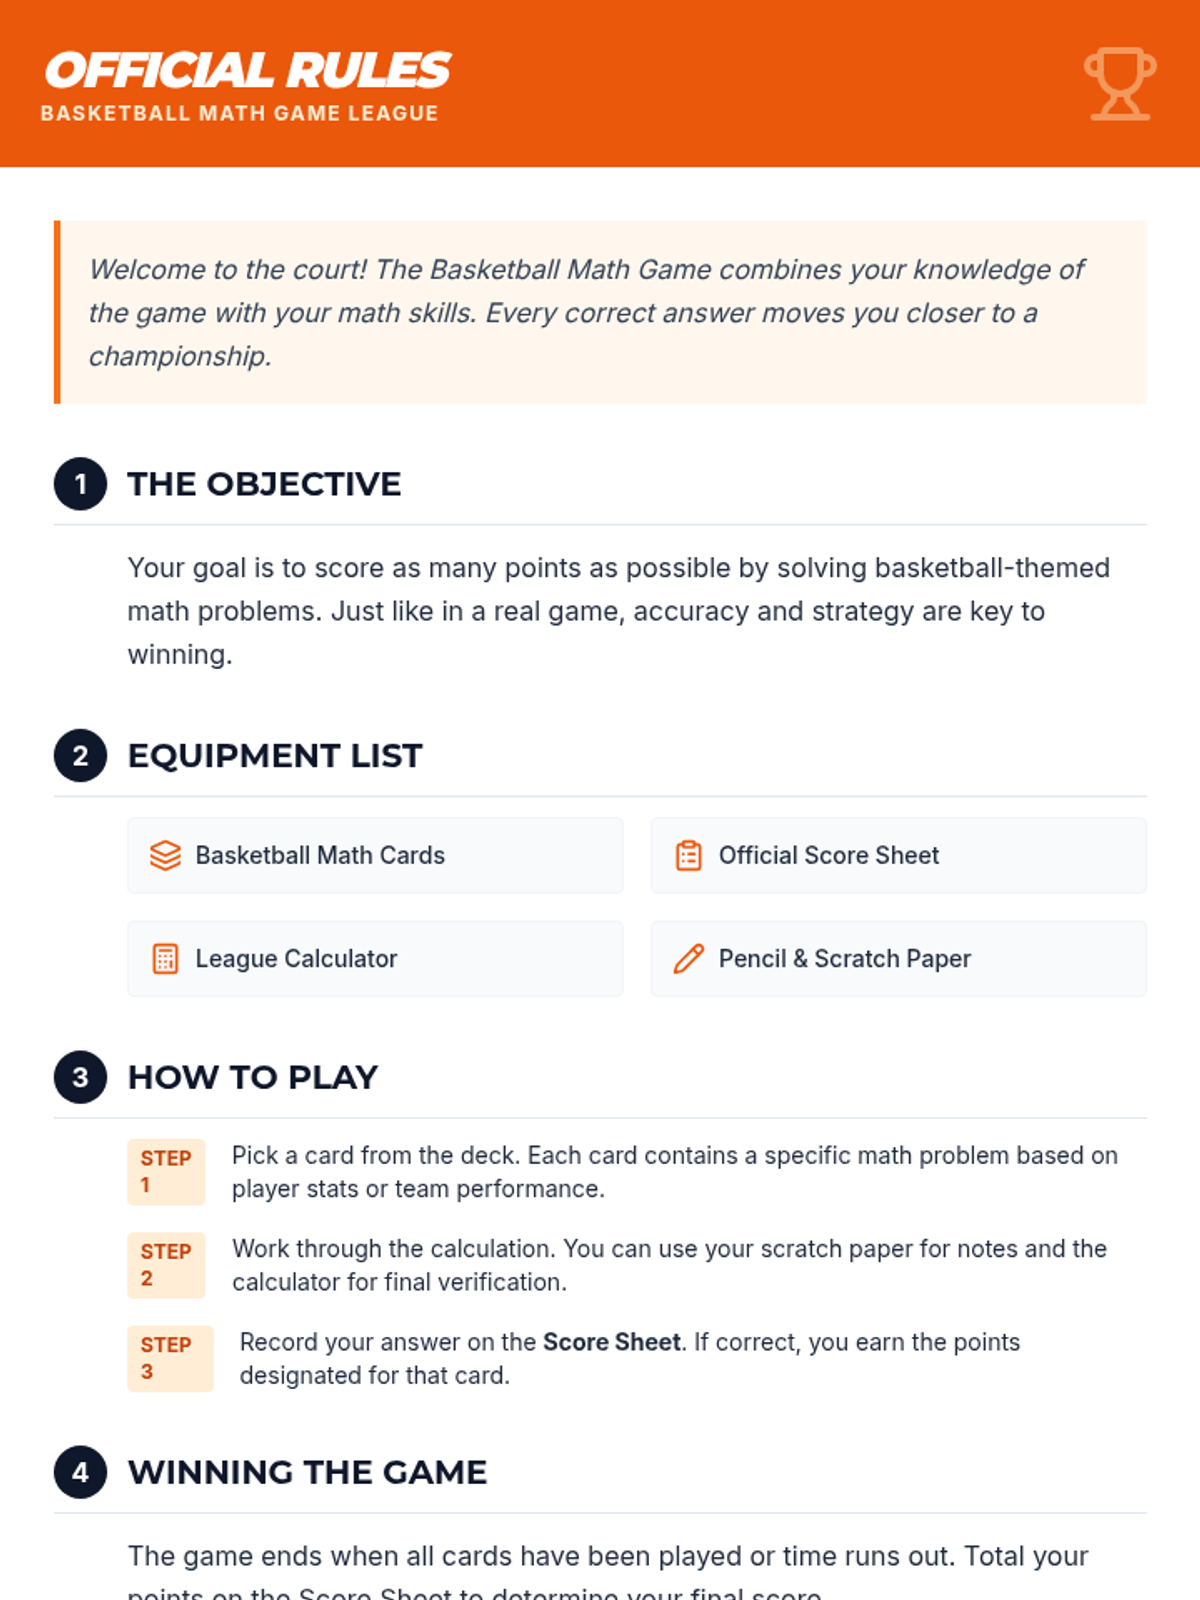
A 5-day math intervention for a high school student that uses basketball statistics and simulation to teach percentages, averages, and data analysis.
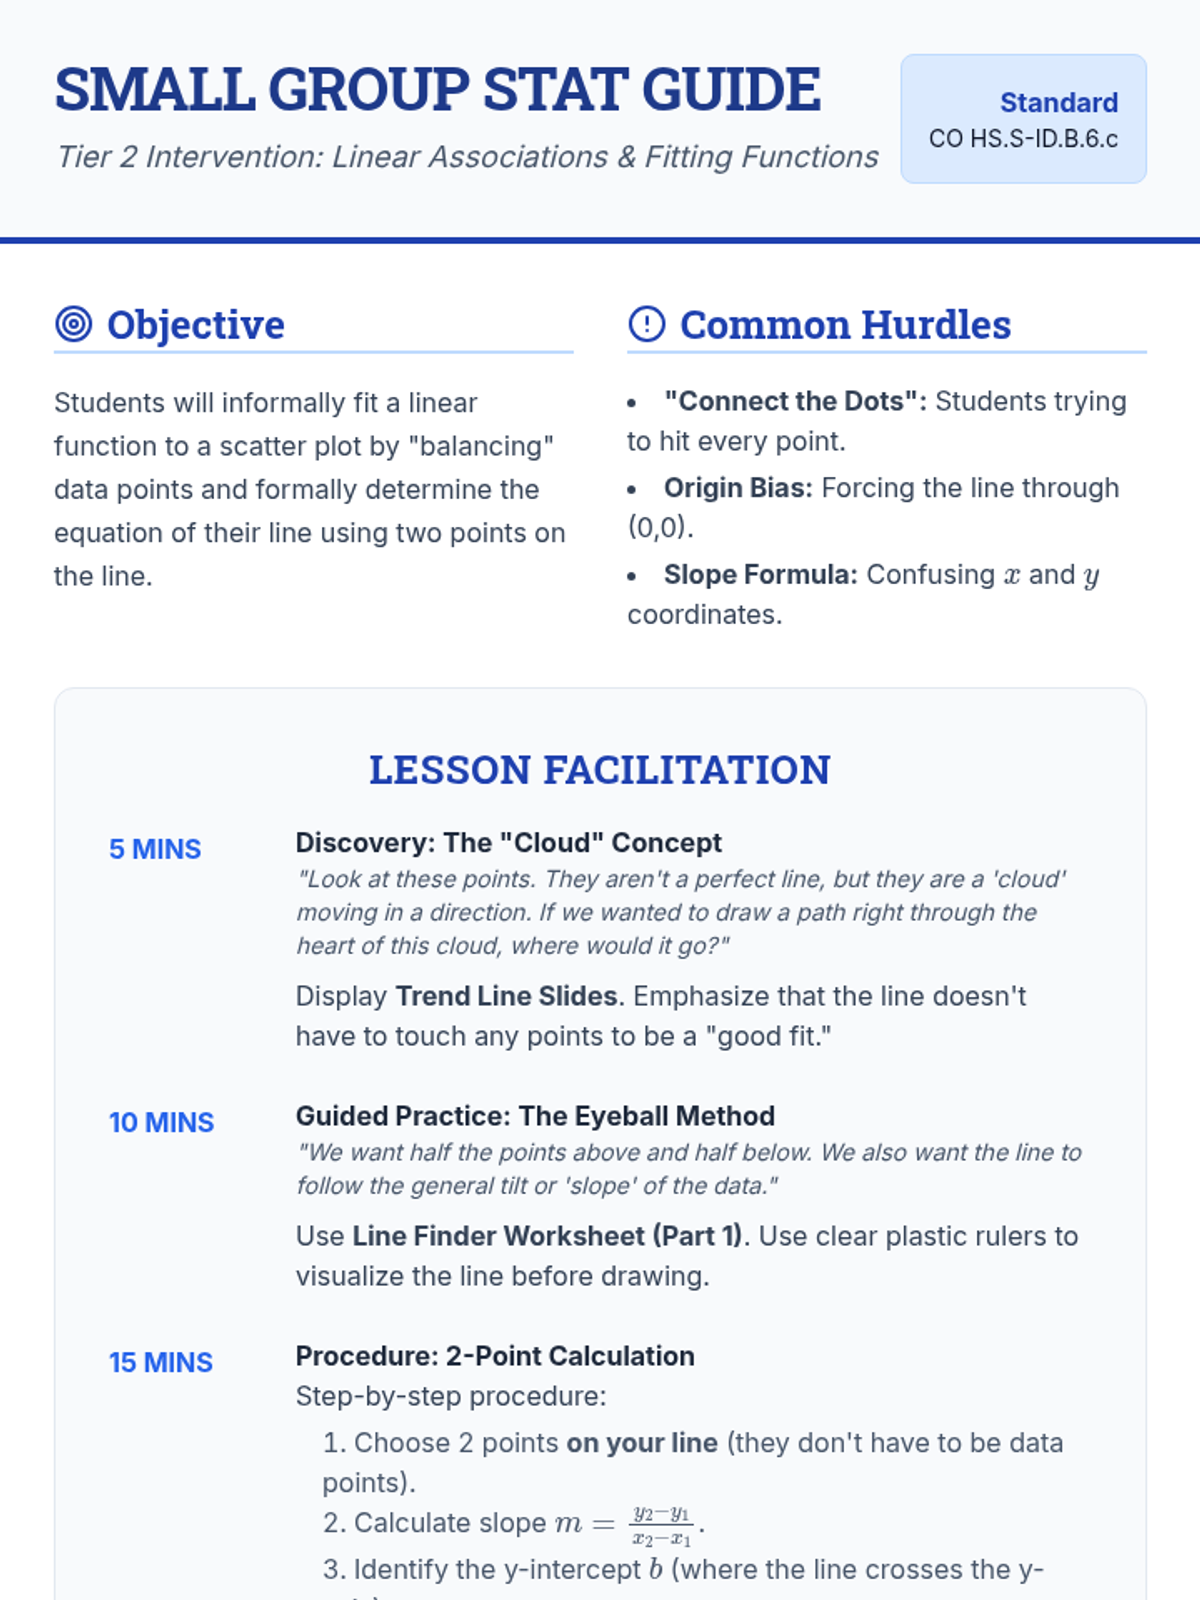
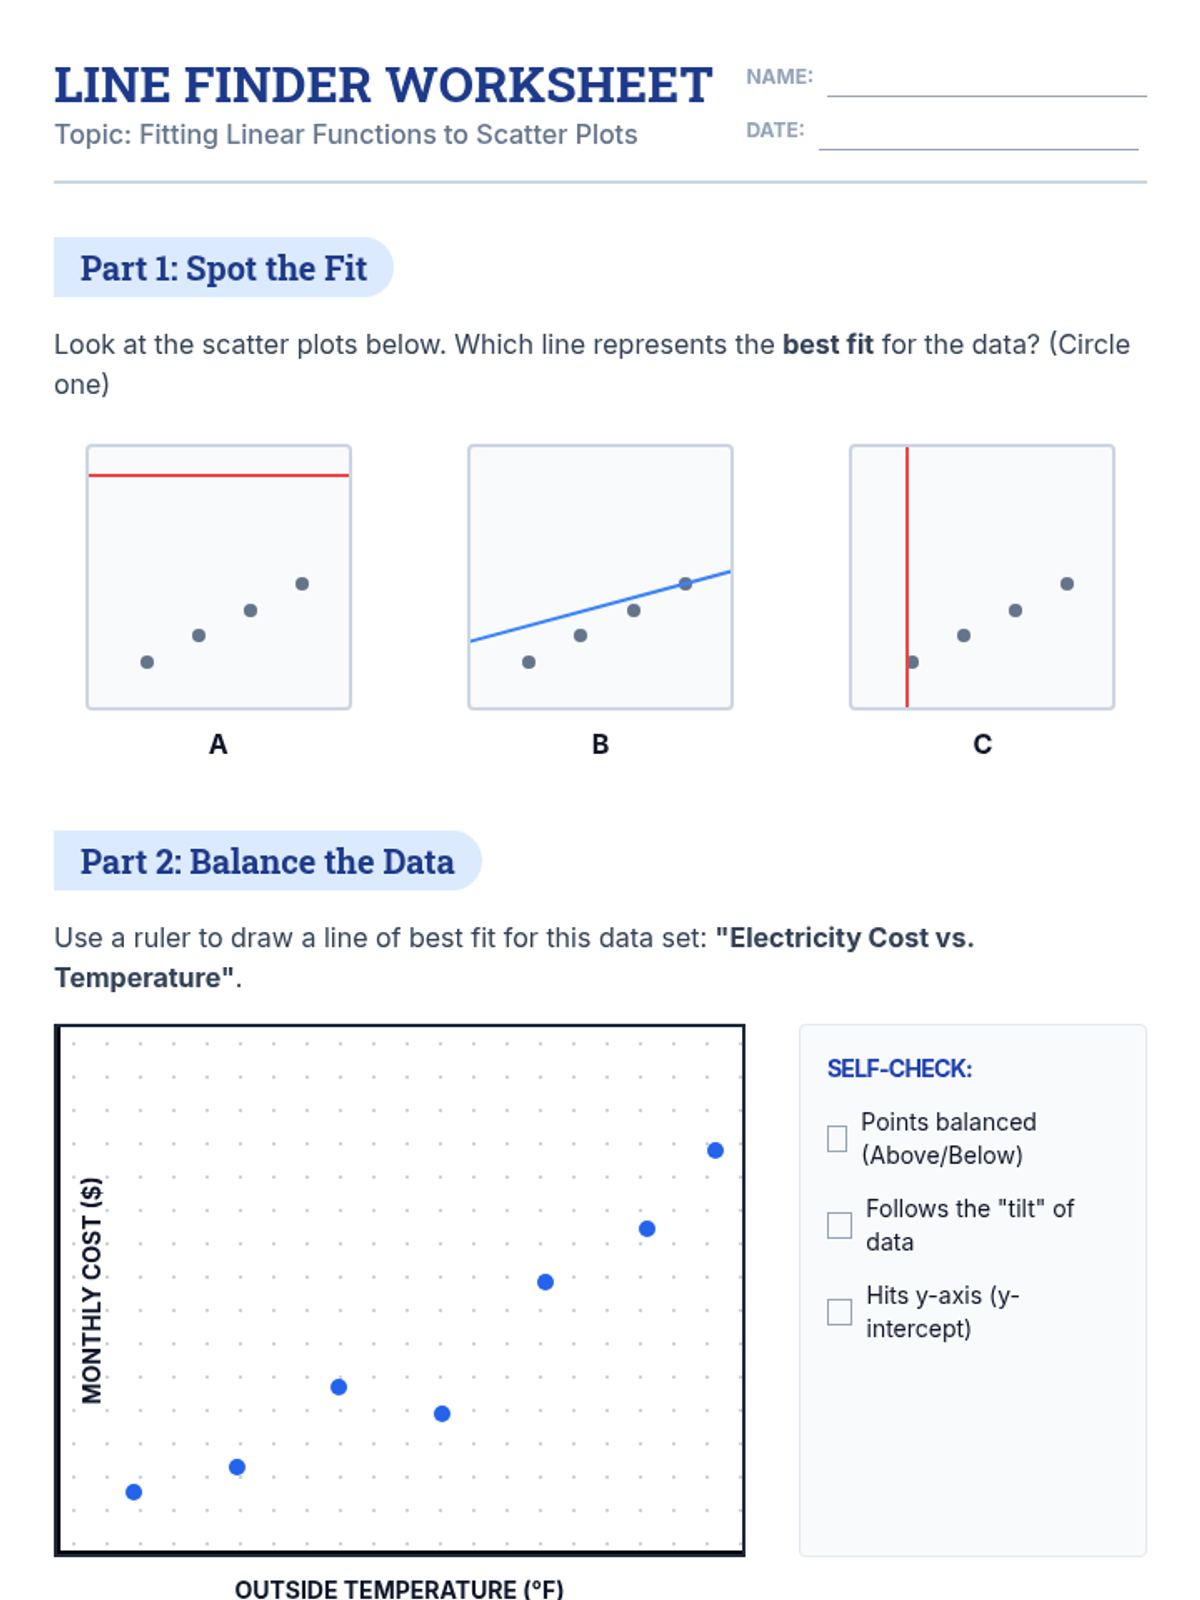
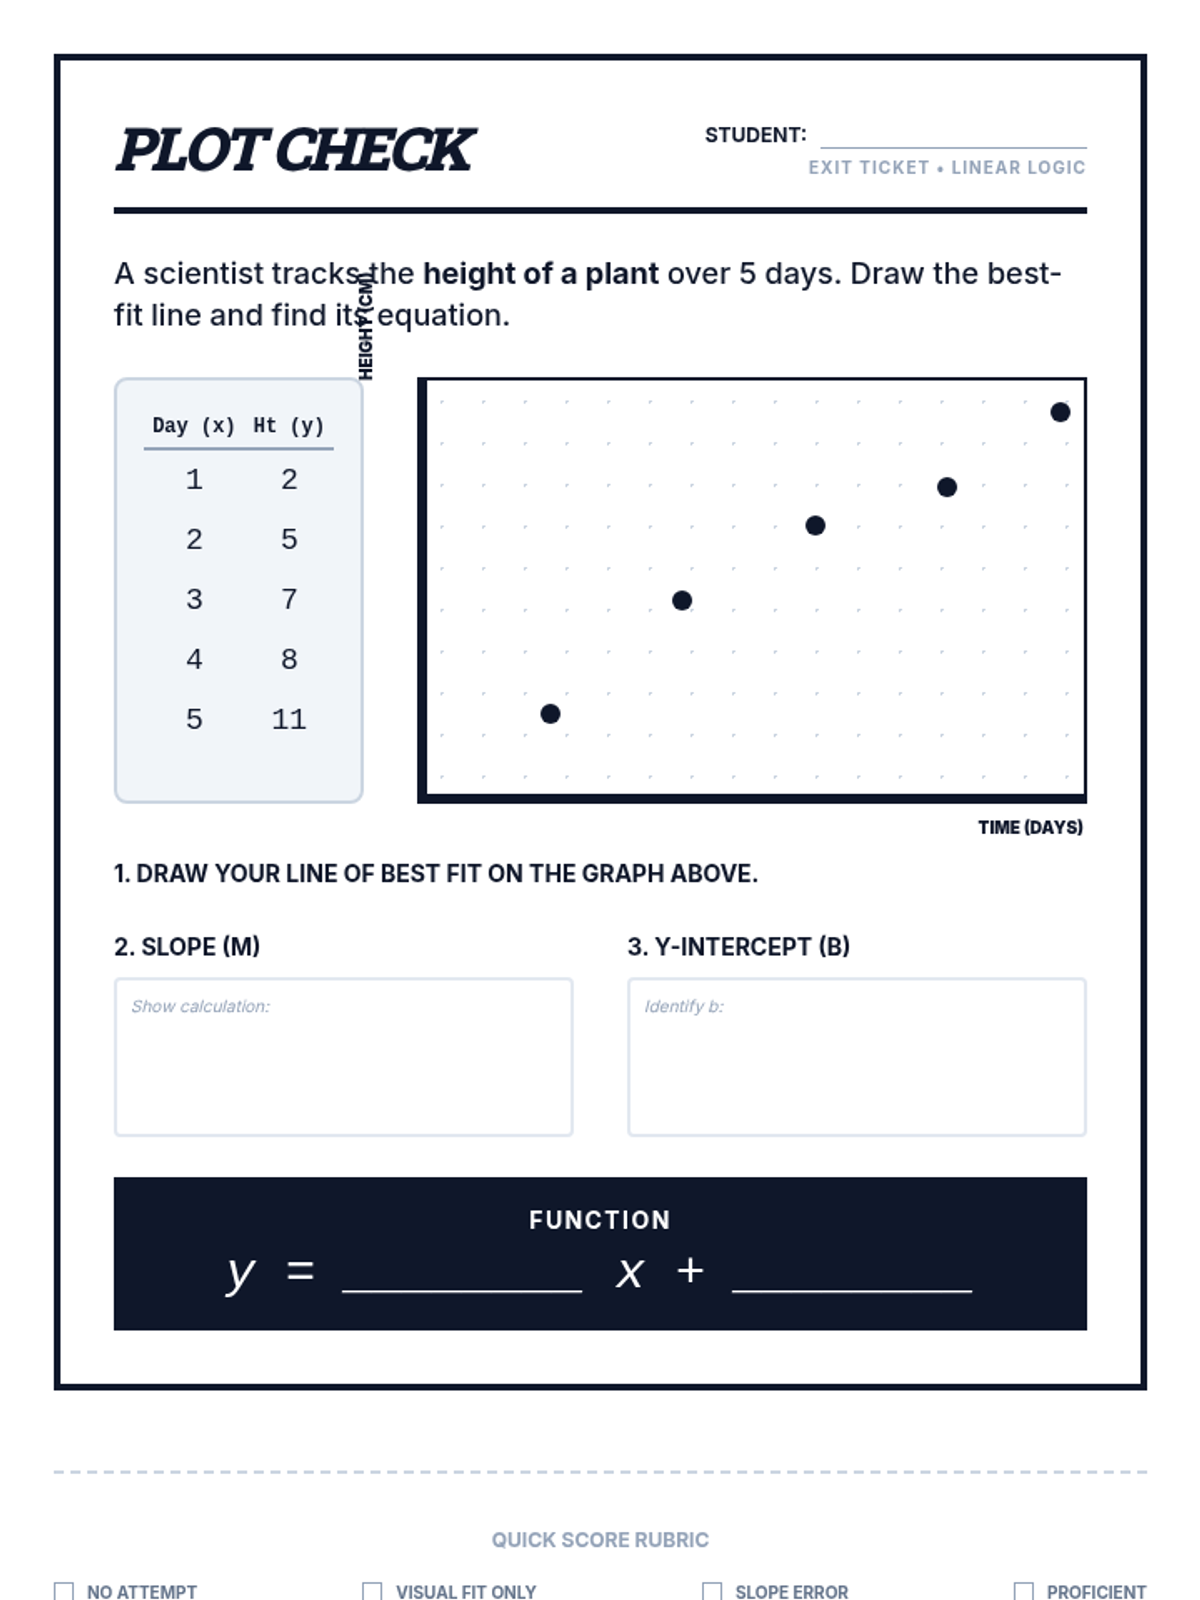
A targeted intervention sequence for high school statistics students focusing on fitting linear functions to scatter plots. It moves from conceptual understanding of 'balance' in data to the procedural steps of calculating lines of best fit.
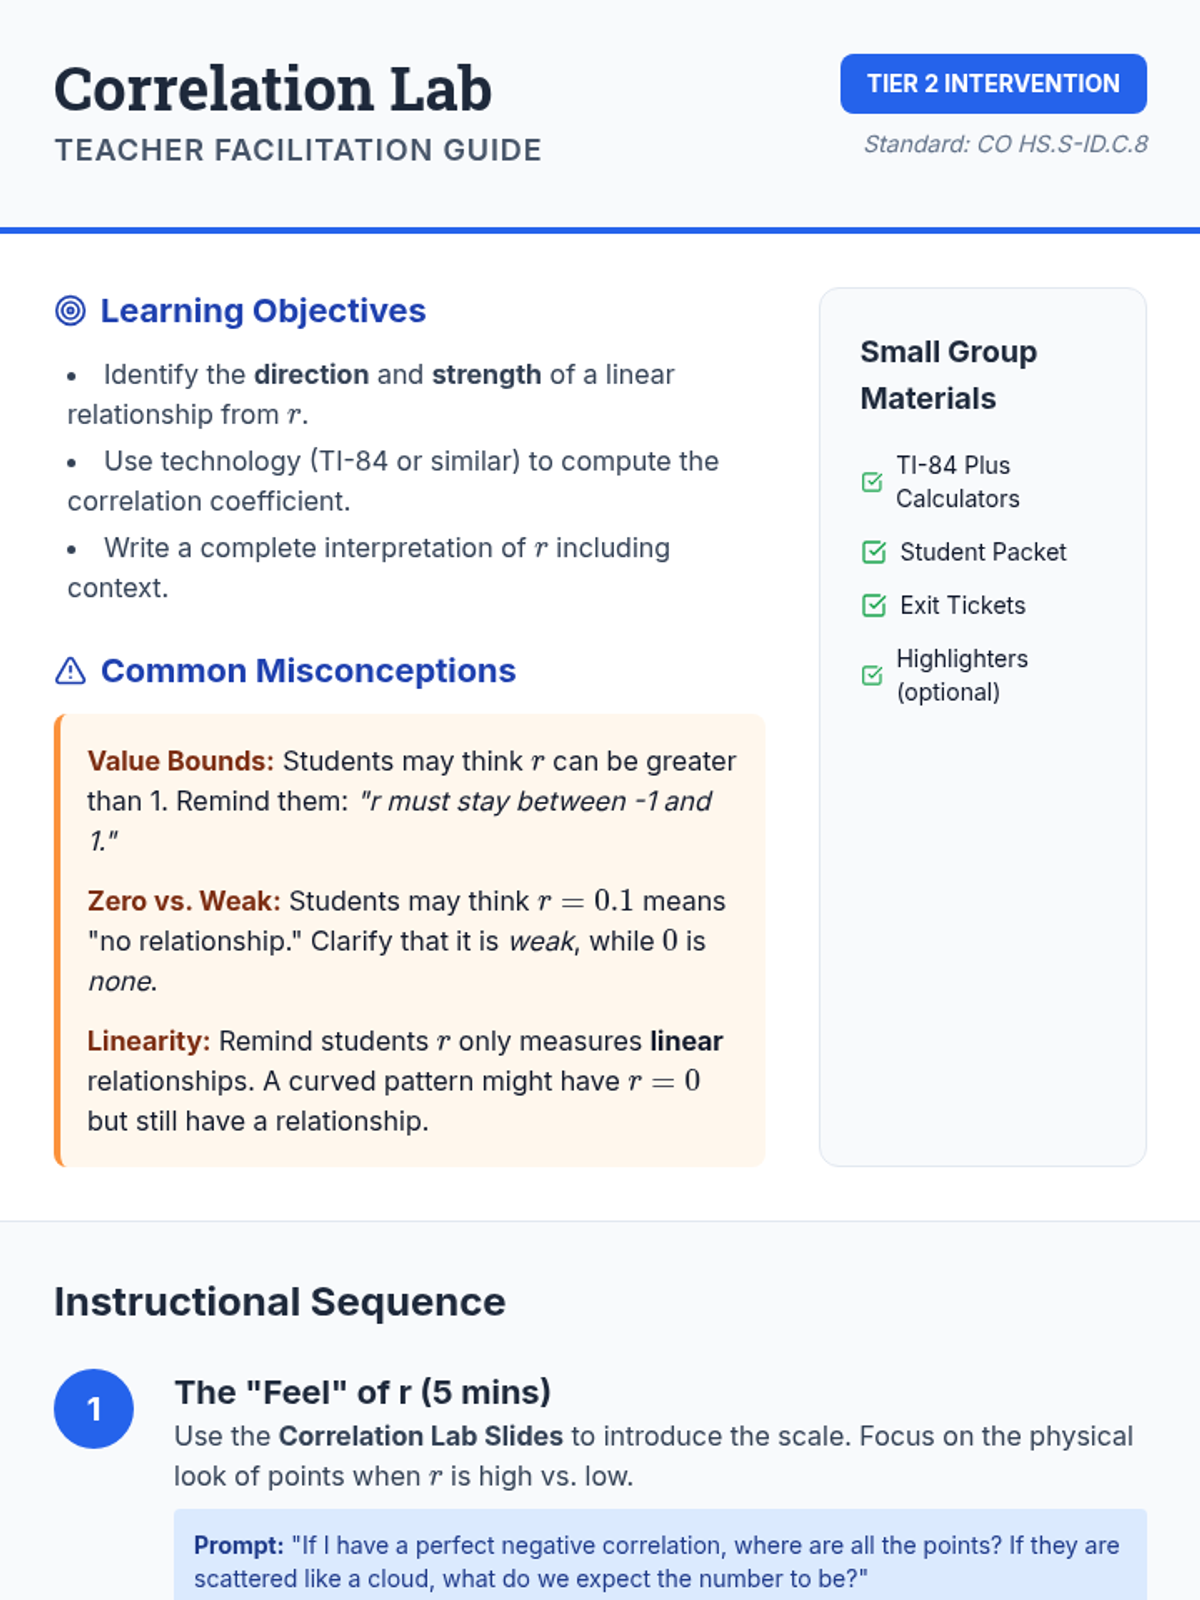
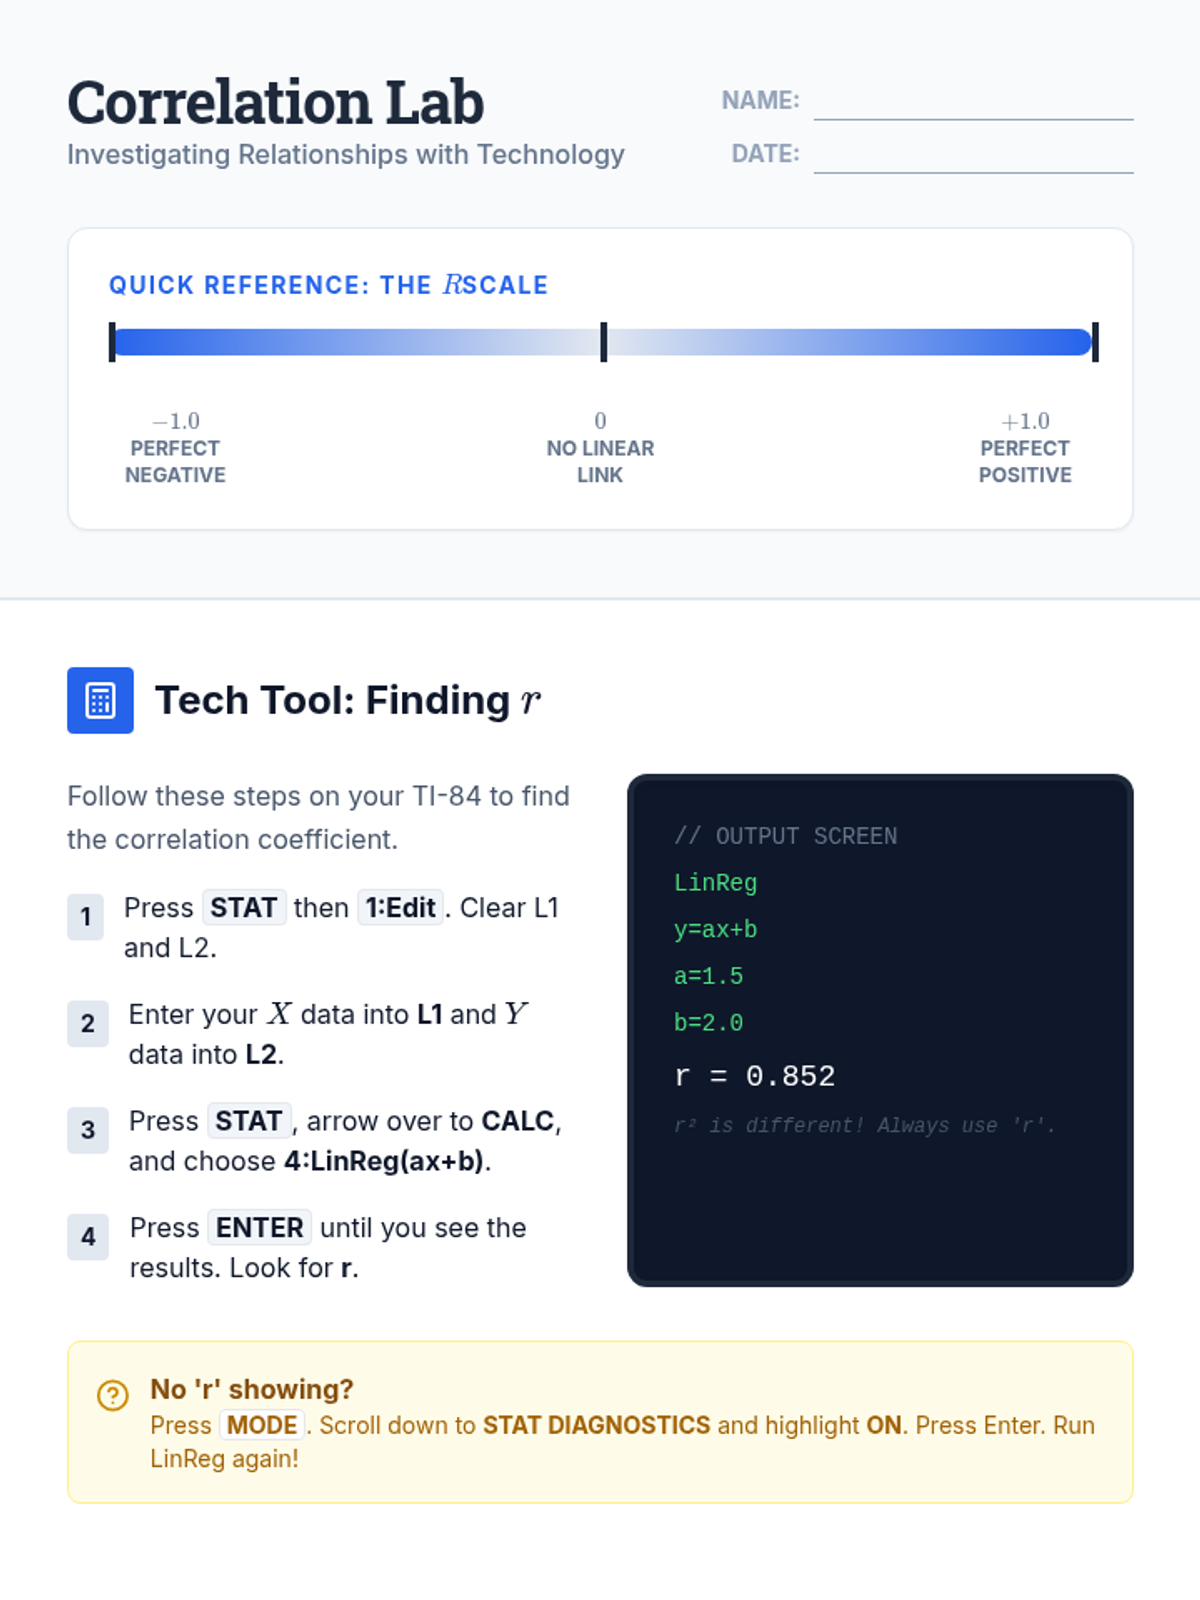
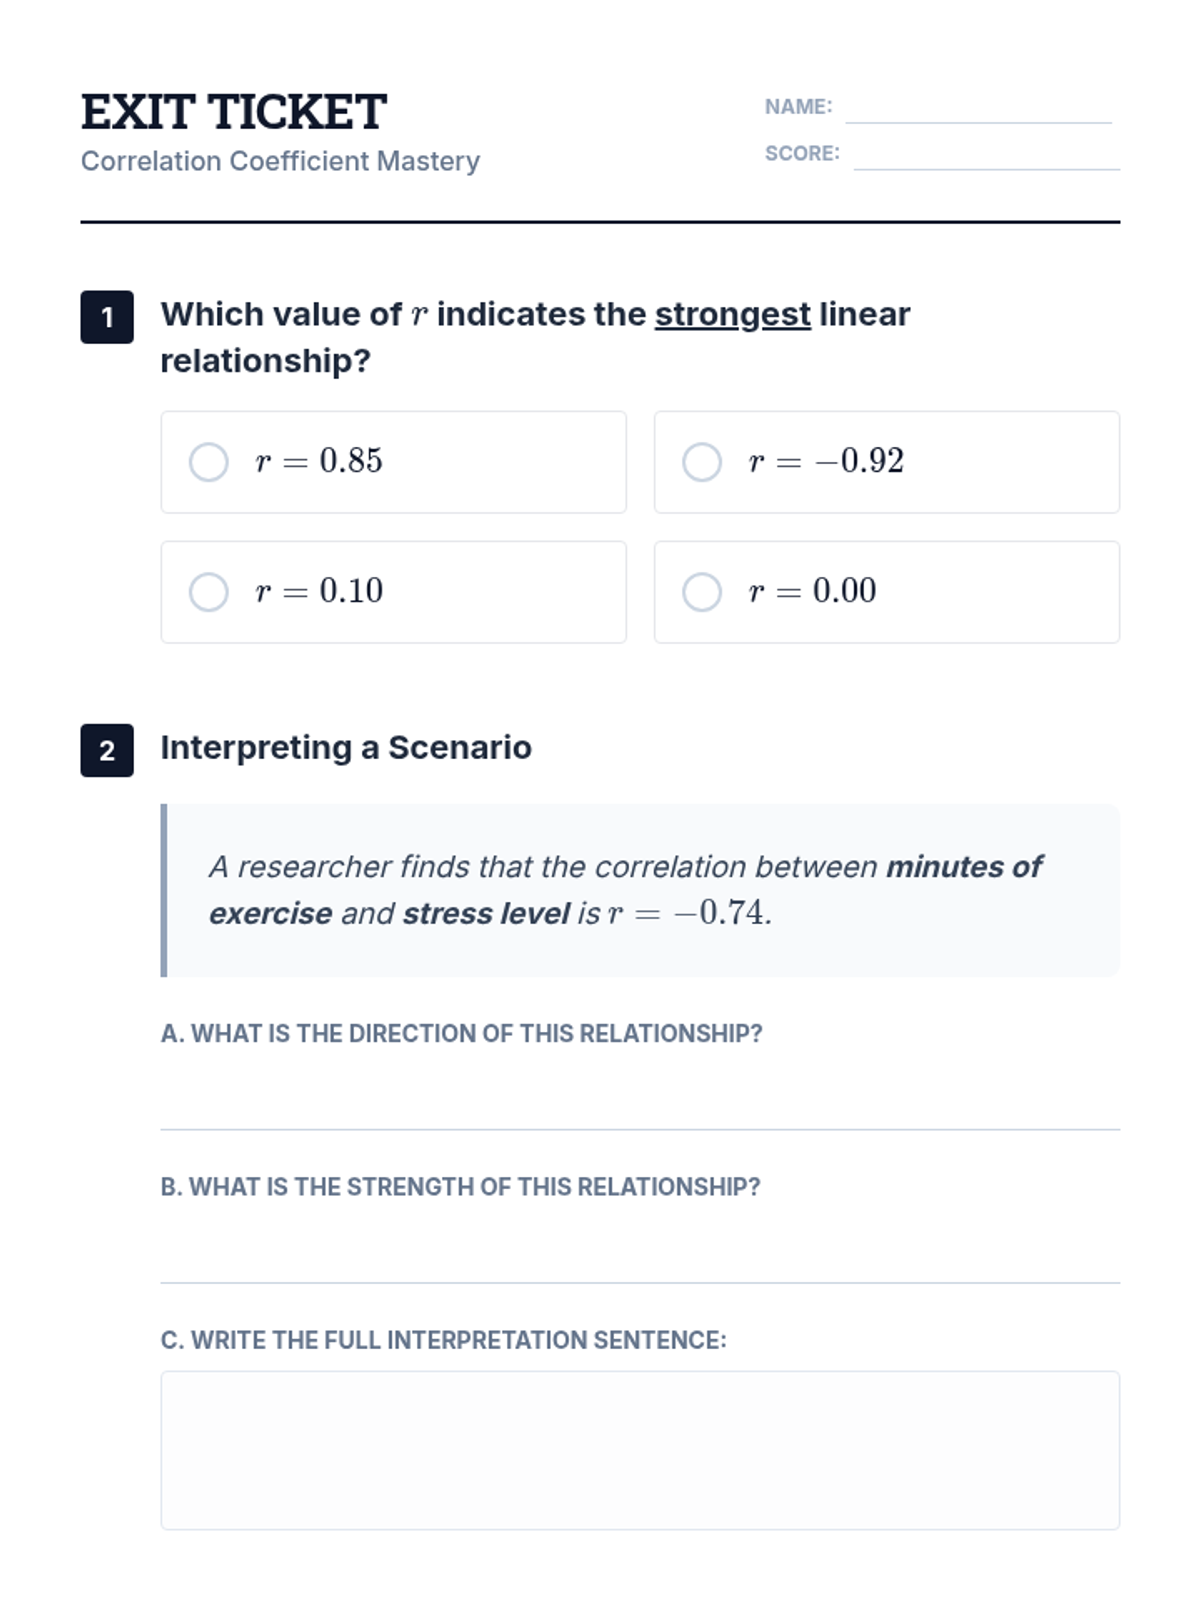
A Tier 2 intervention sequence focused on computing and interpreting the correlation coefficient (r) using technology, designed for high school statistics students needing targeted support.
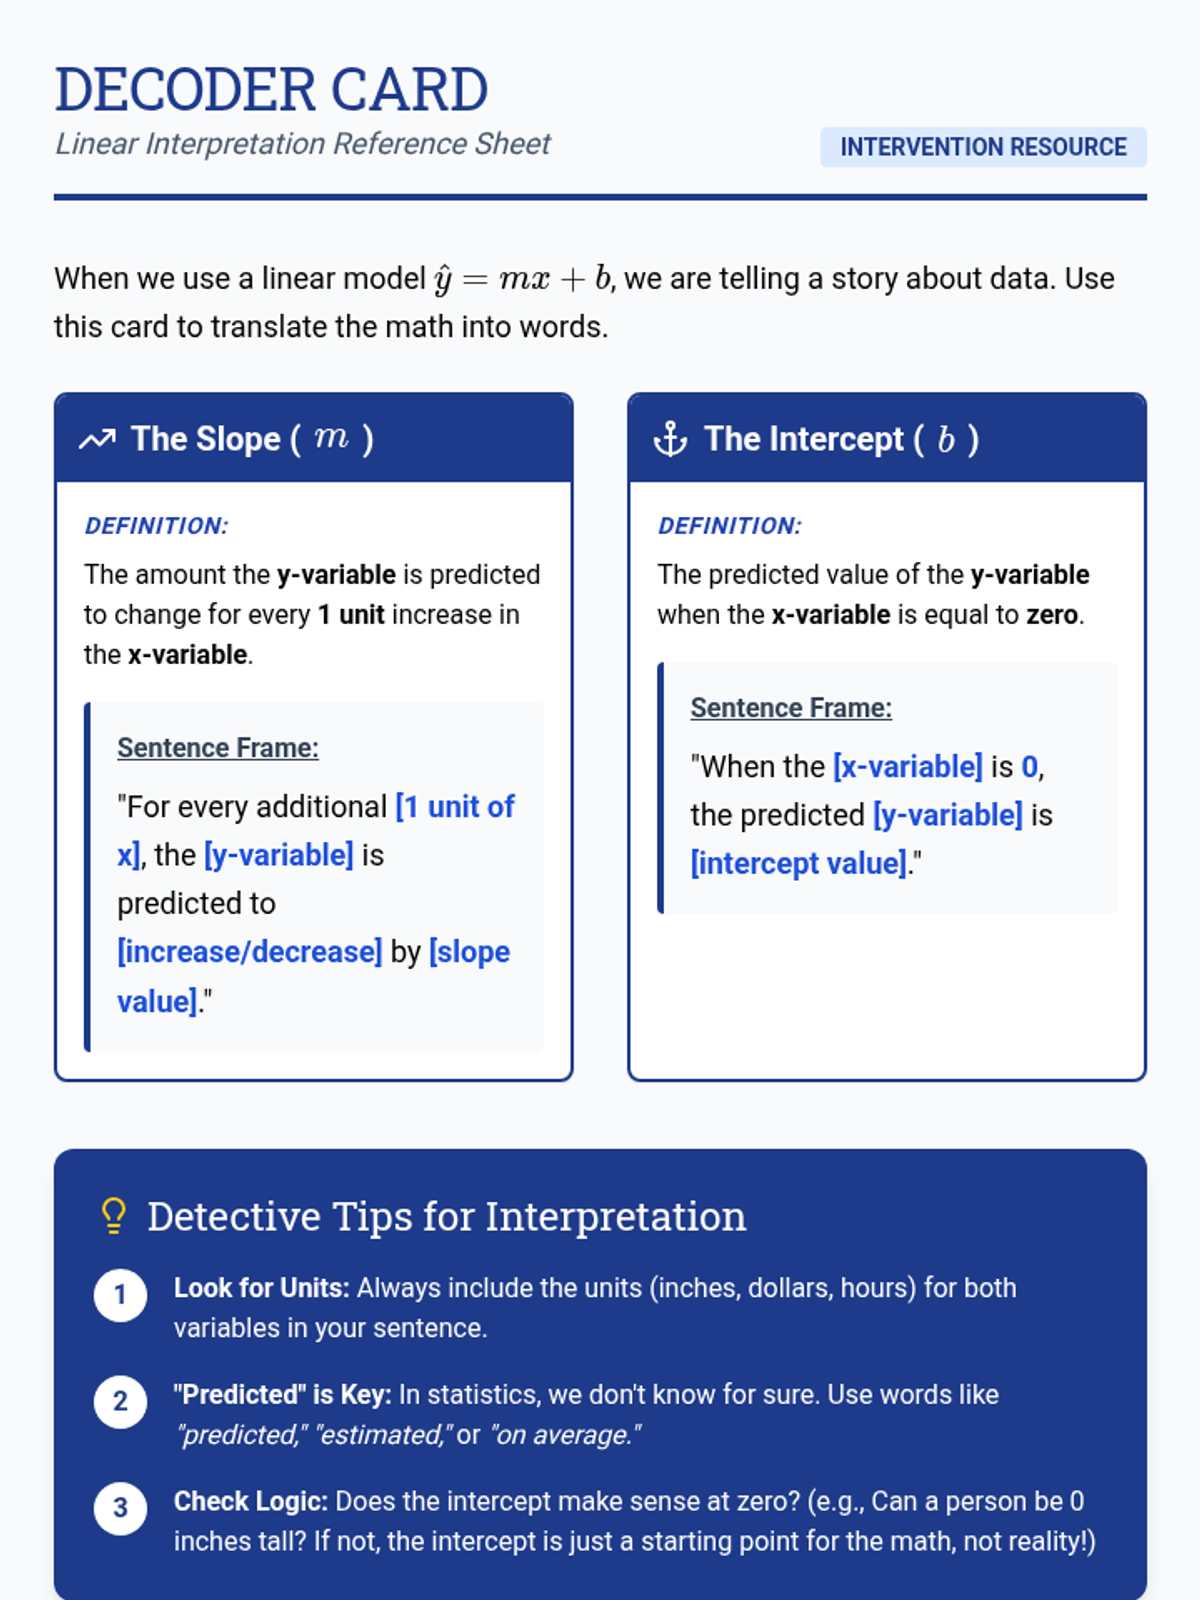
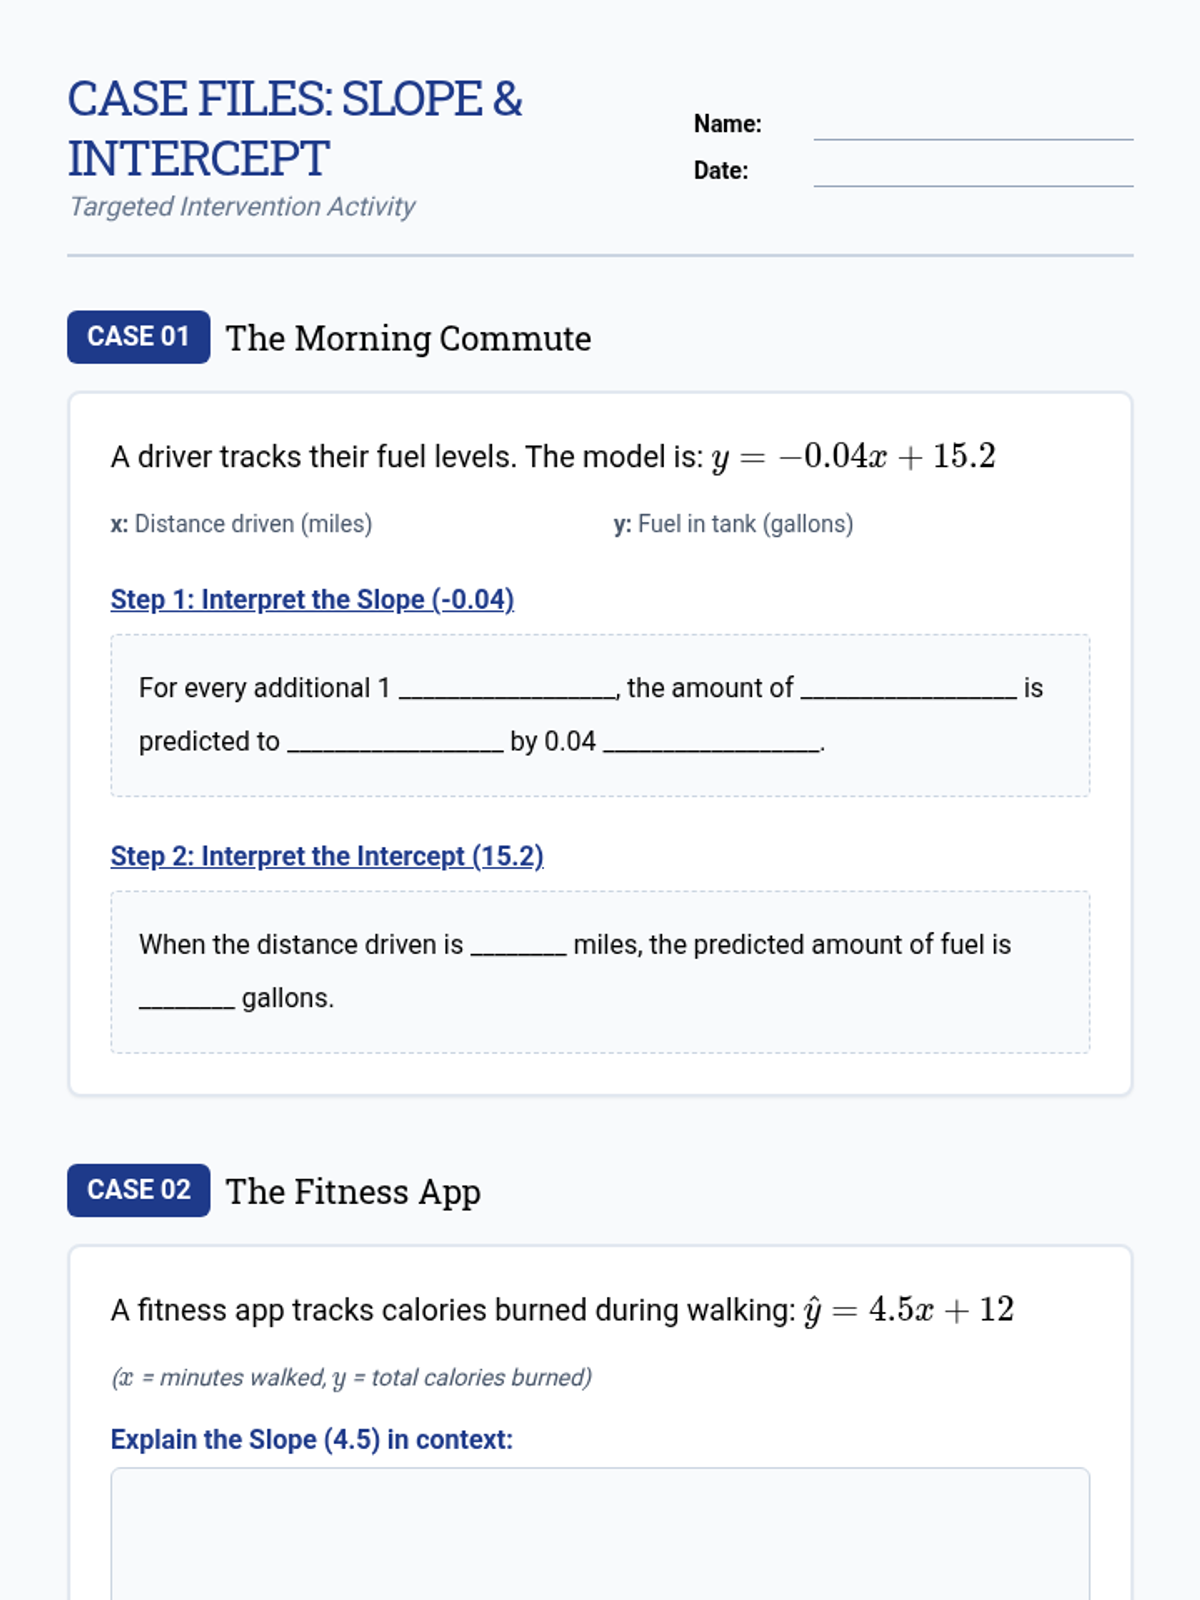
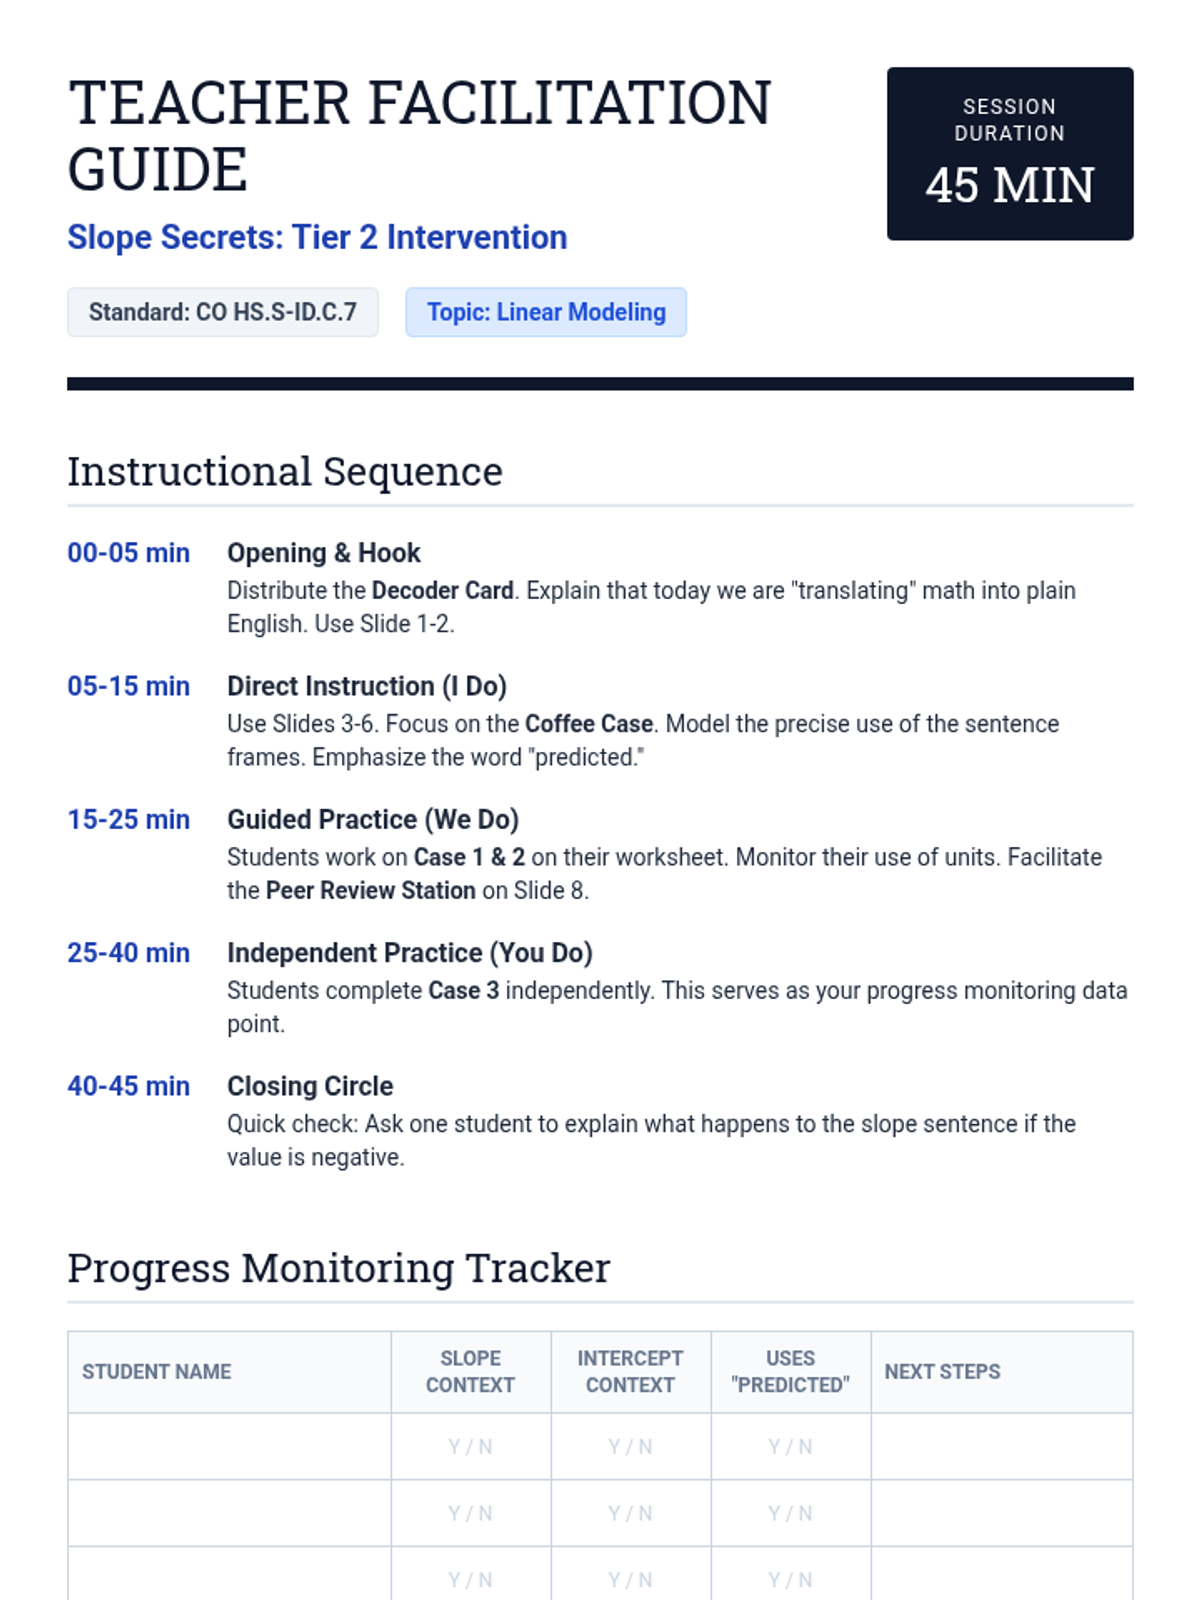
A specialized intervention sequence focusing on the foundational skills of linear modeling in statistics, specifically interpreting slope and intercept in real-world contexts. Designed for small groups requiring Tier 2 support.
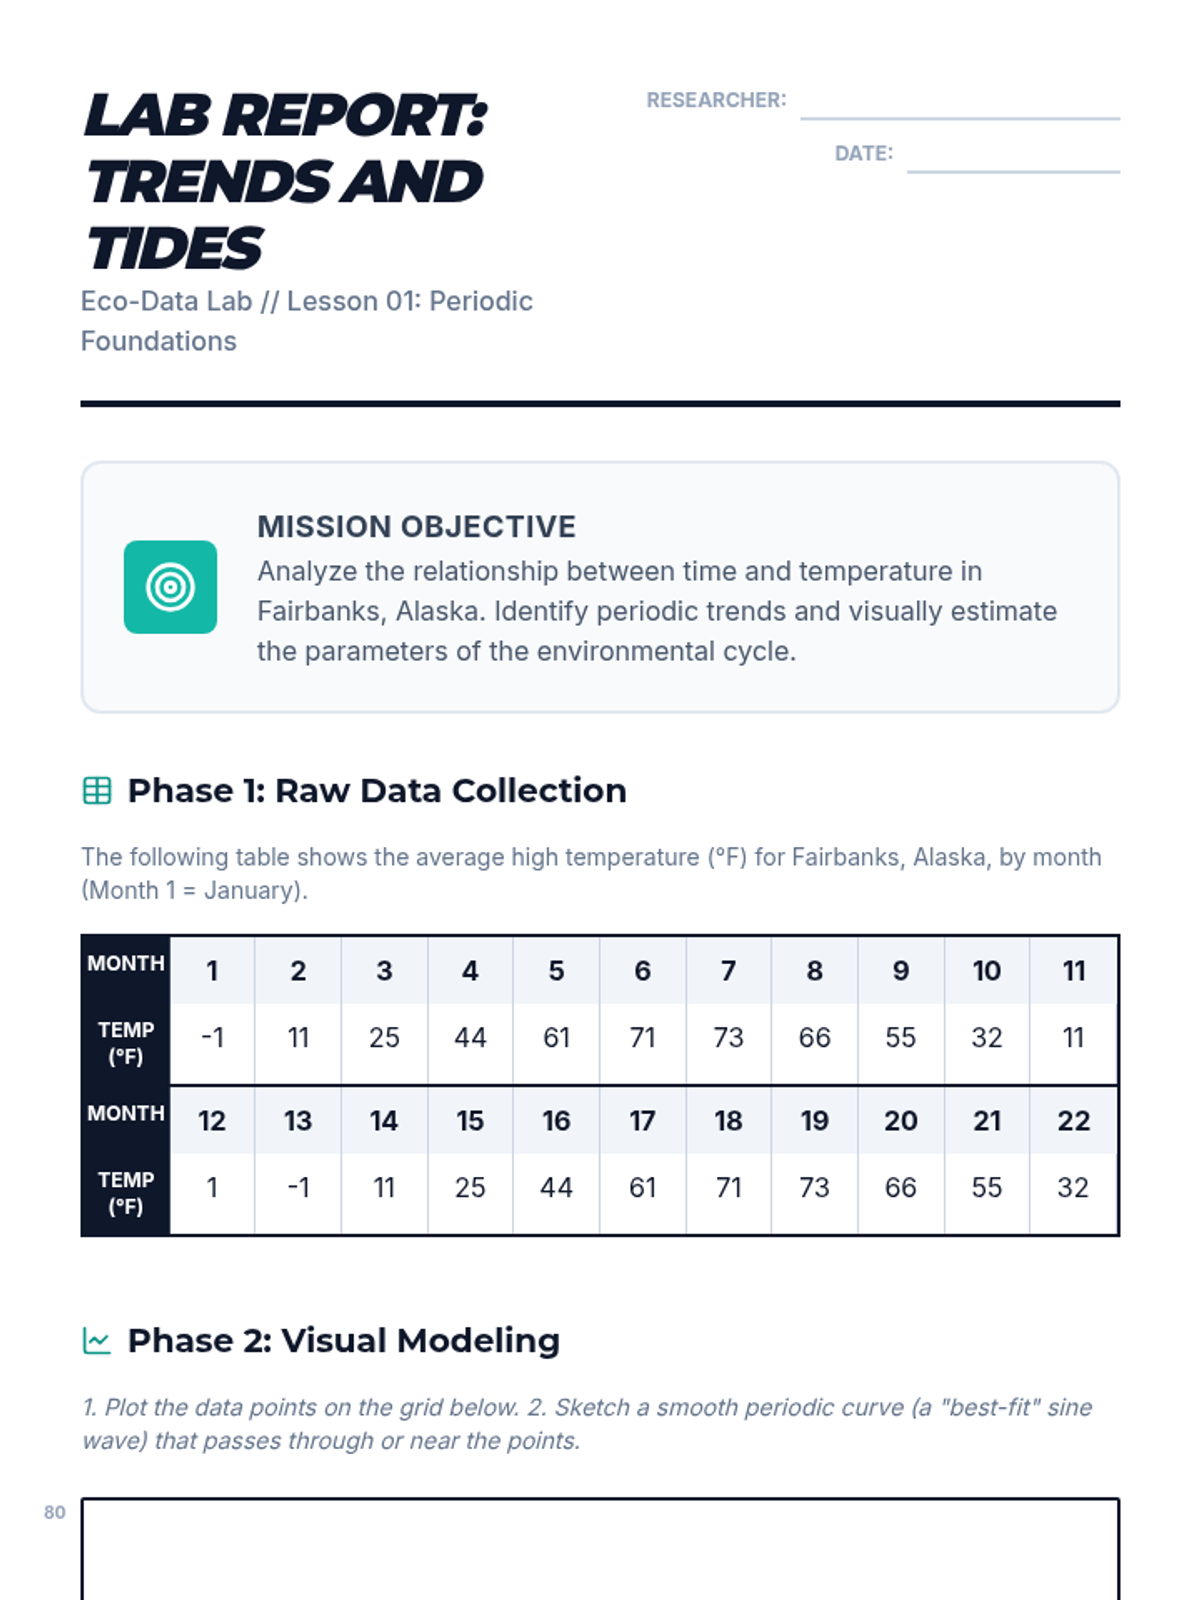
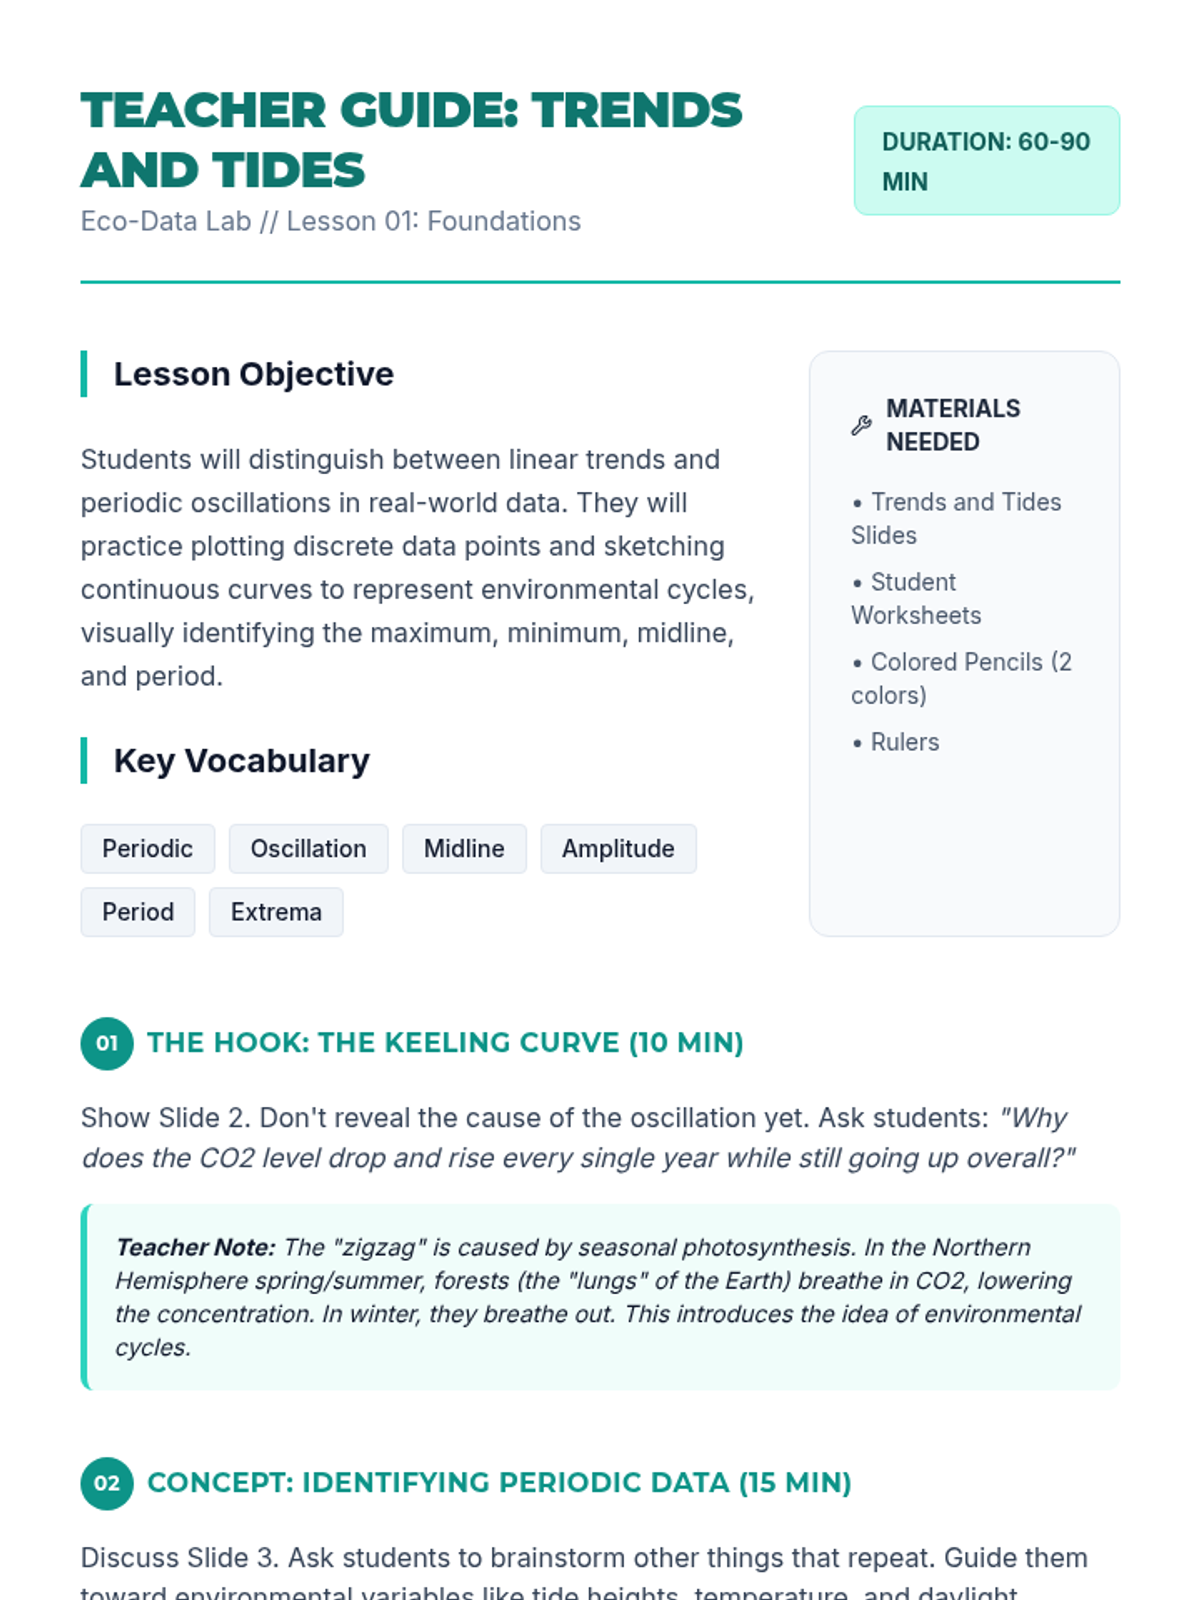
A comprehensive unit where students act as data scientists to model real-world environmental phenomena using trigonometric functions. They progress from visual estimation to precise algebraic modeling and technological regression to predict future environmental conditions.
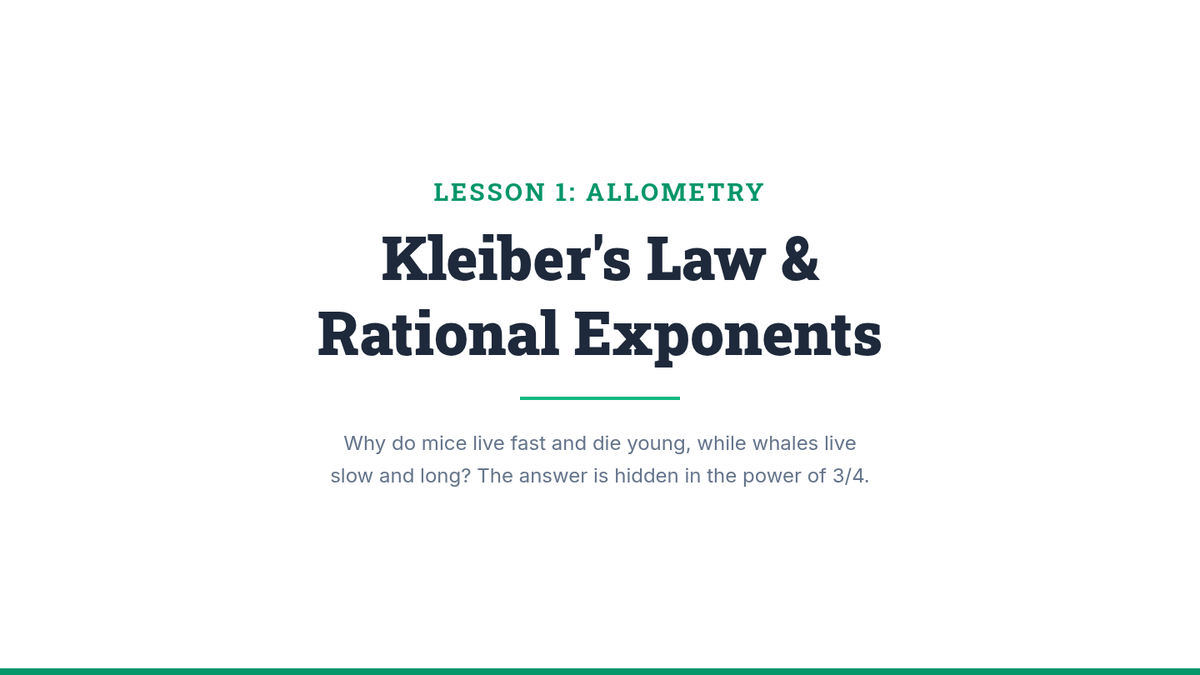
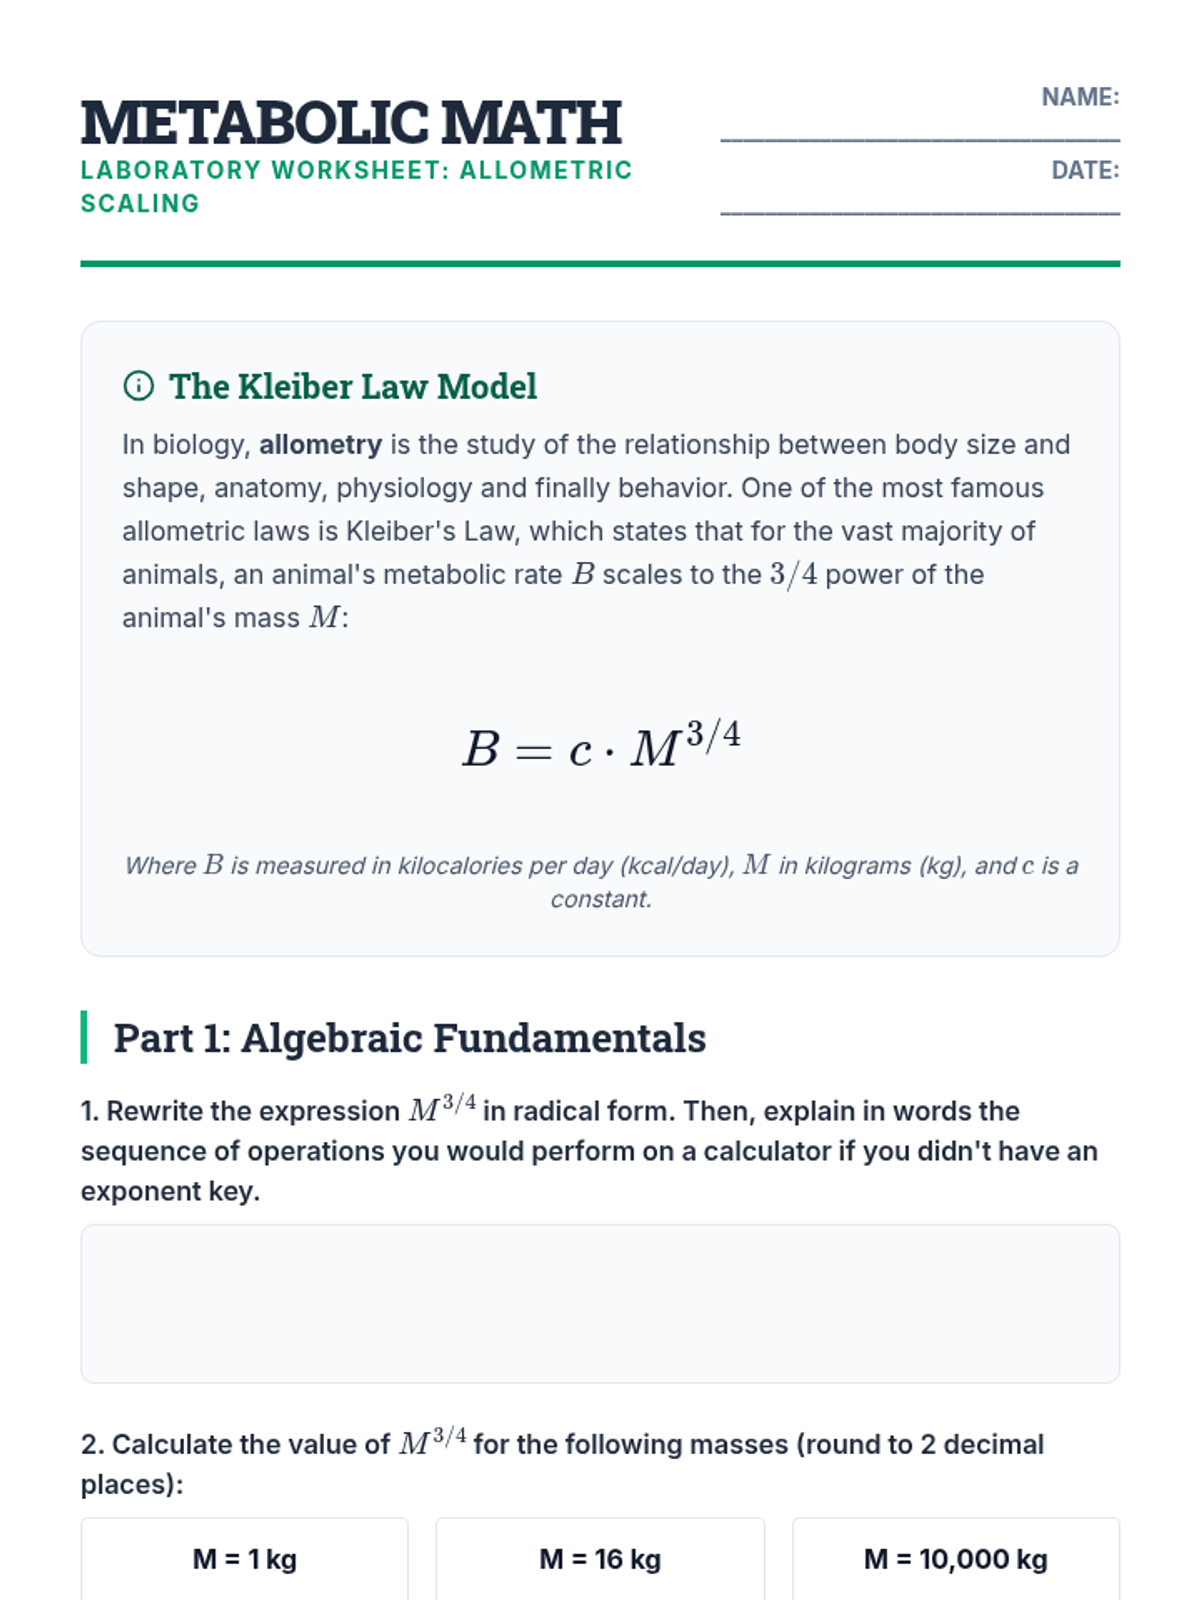
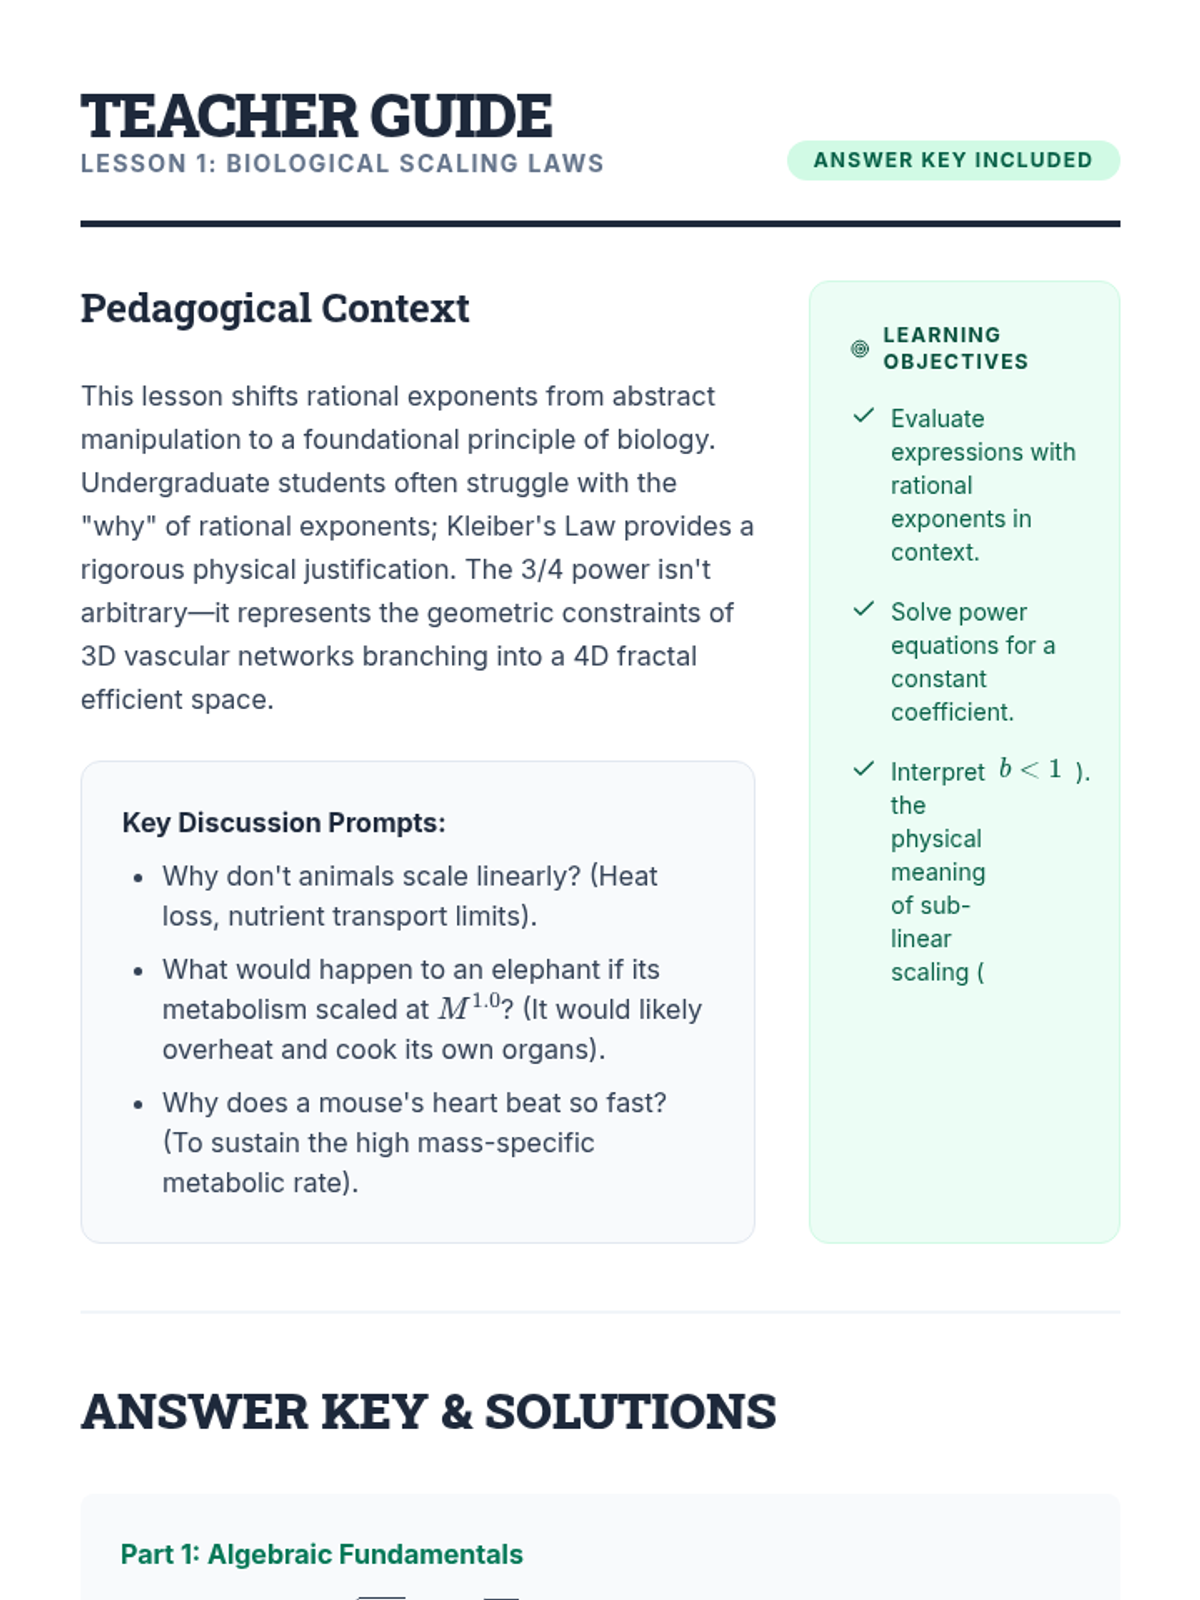
This sequence explores the practical application of rational exponents and power functions in biology, physics, and finance. Students will progress from evaluating existing models like Kleiber's Law and Kepler's Third Law to constructing their own mathematical models from empirical data.
A comprehensive 5-lesson unit on evaluating the validity of linear regression models. Students move from basic residual calculation to sophisticated analysis of residual plots, correlation coefficients, outliers, and the fundamental distinction between correlation and causation.
This sequence explores the statistical evaluation of linear models, covering residuals, linear regression technology, correlation coefficients, residual plots, and the distinction between correlation and causation. Students will learn to assess the reliability of models and use statistical tools to interpret data accurately.
This sequence moves beyond simple error metrics to explore sophisticated selection criteria that penalize complexity, specifically AIC and BIC. Students learn to balance model fit with parsimony through real-world datasets and comparative analysis.
A project-based unit where students apply polynomial calculus concepts to real-world scenarios like business profits, projectile motion, and engineering design. Students transition from abstract solving to modeling data and optimizing outcomes using regression, intercepts, and extrema.
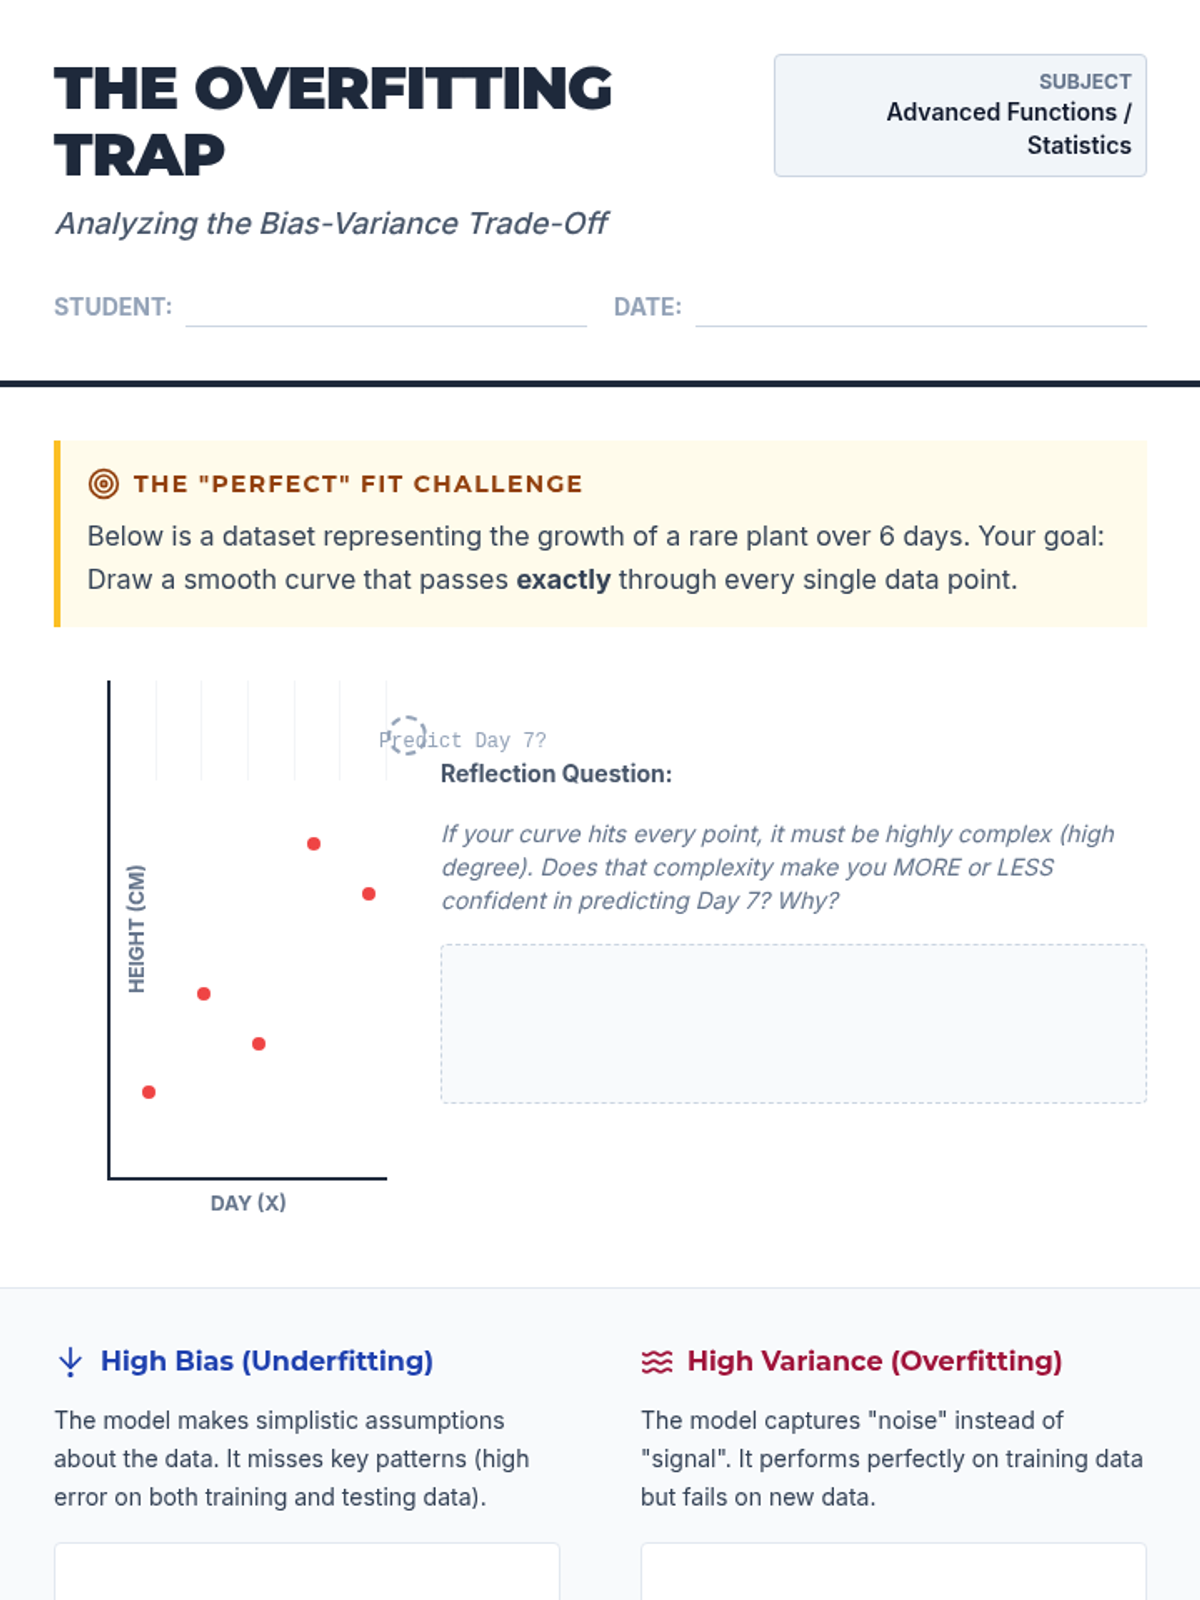
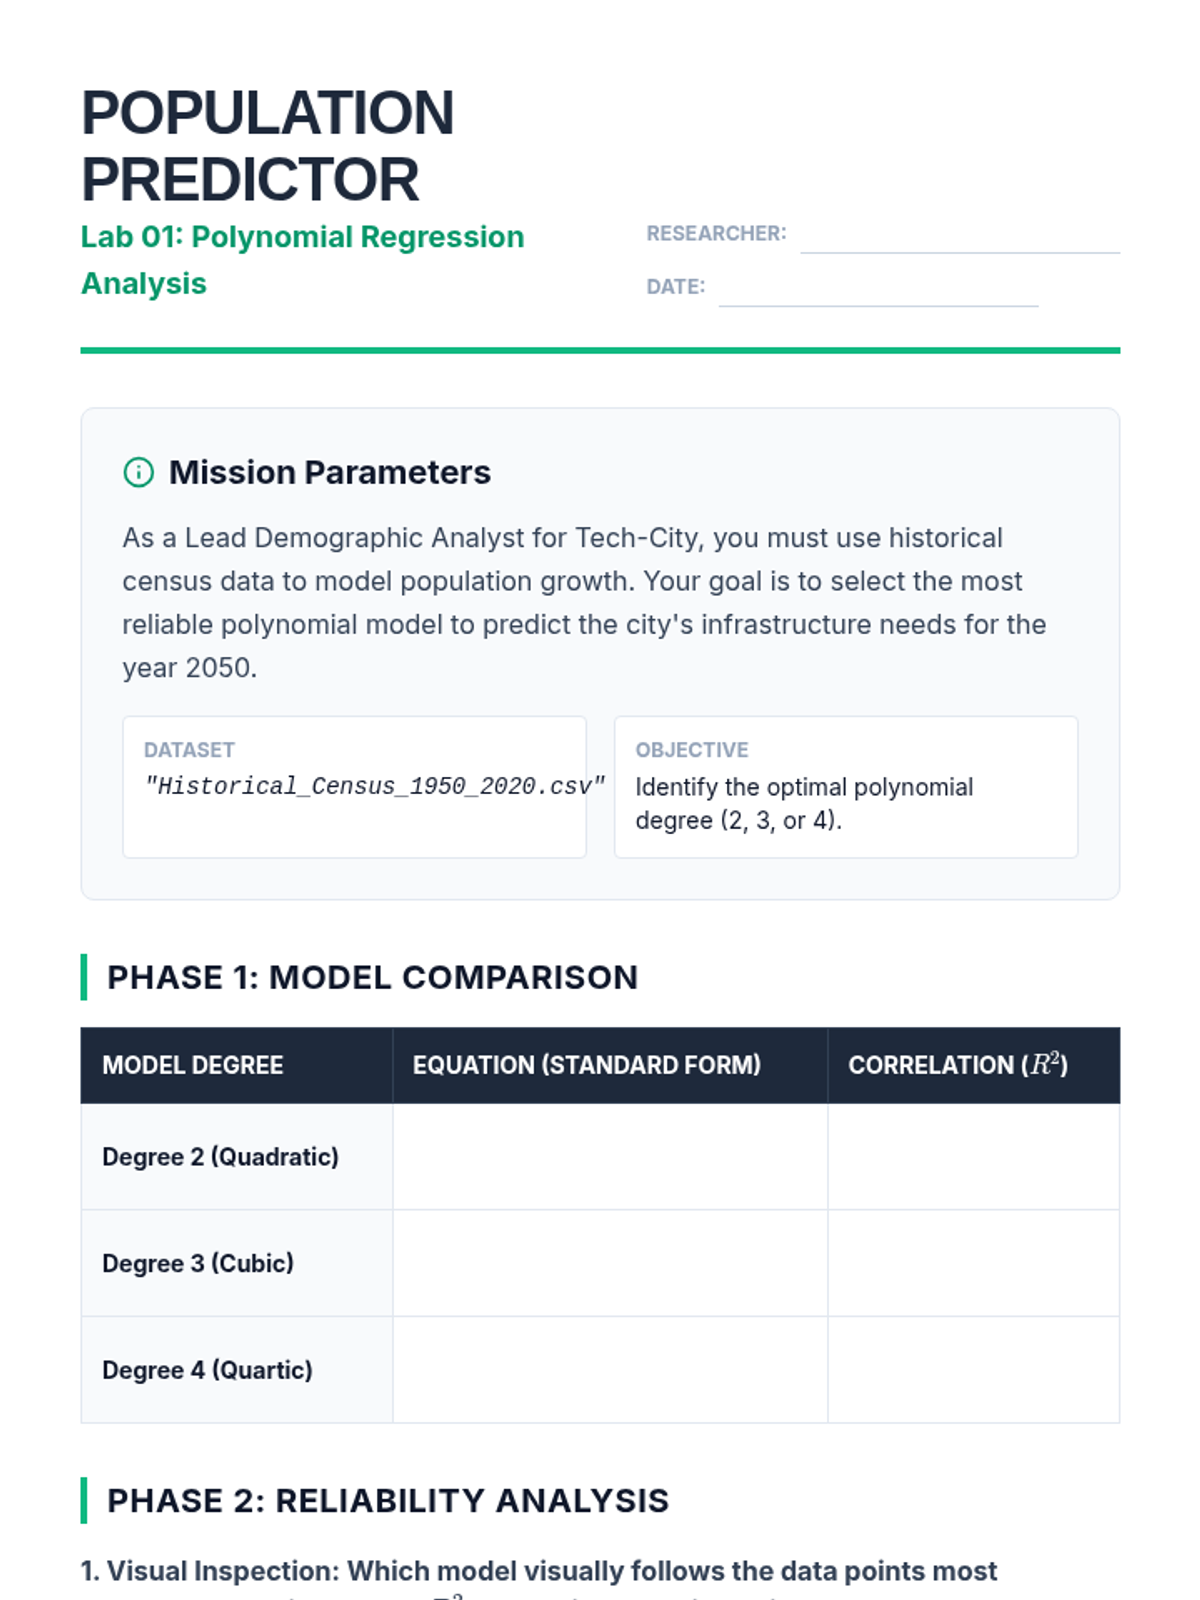
This advanced 12th Grade sequence explores how to evaluate mathematical models for predictive accuracy. Students move from identifying overfitting and underfitting to implementing cross-validation, understanding the bias-variance tradeoff, and using information criteria (AIC/BIC) to select robust models.
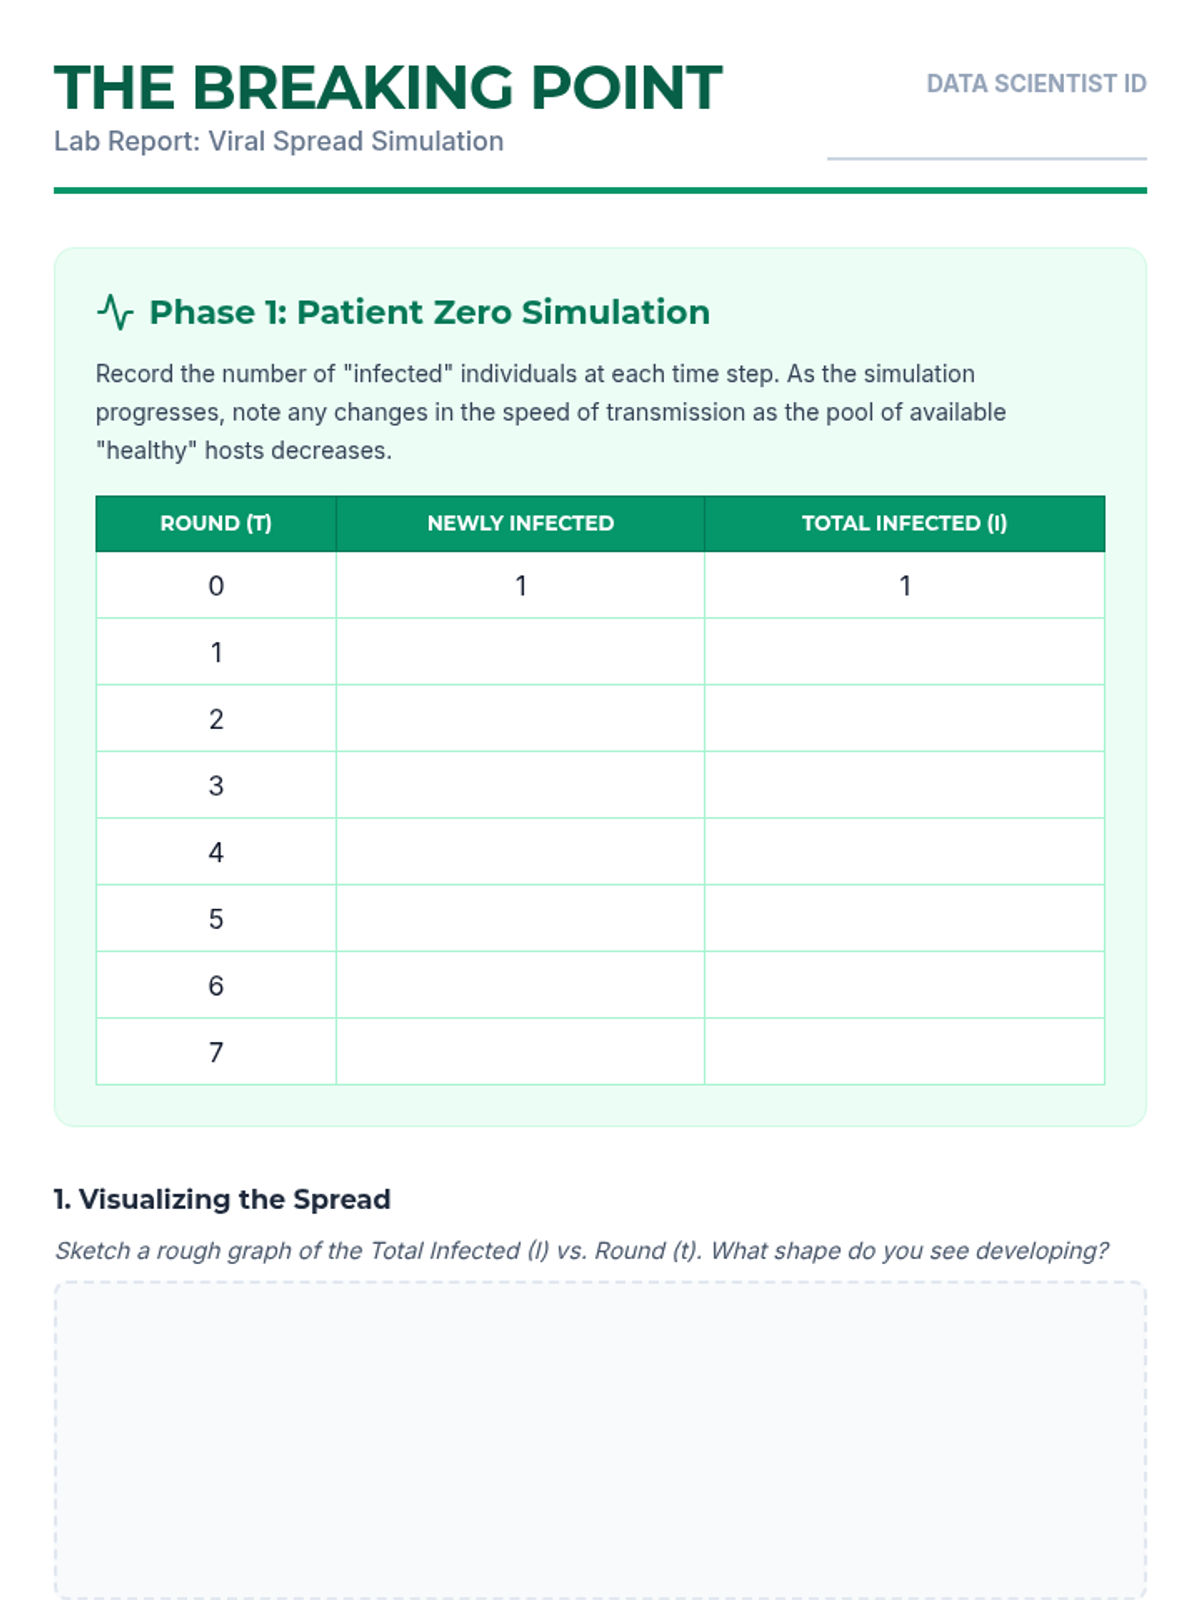
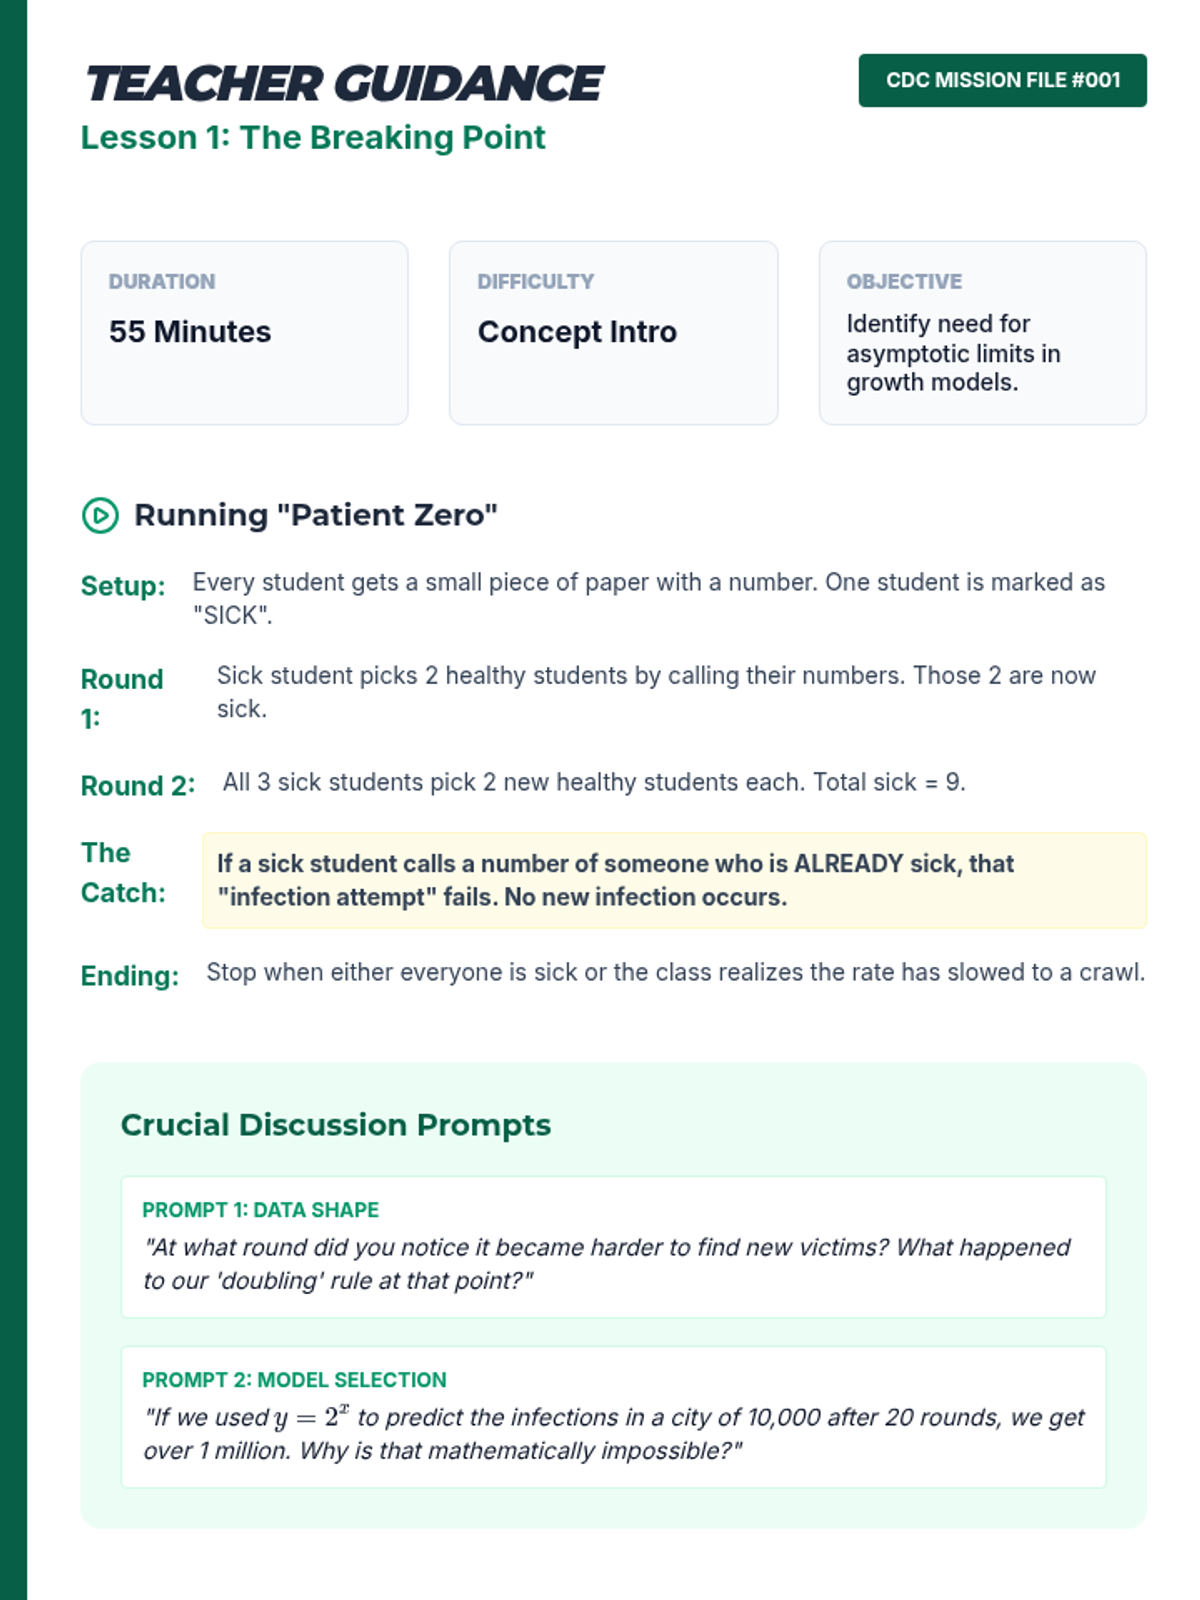
A high-level mathematics sequence for 12th-grade students exploring the transition from exponential growth to logistic models in the context of epidemiology. Students will analyze parameters, perform regression on real-world data, and use mathematical modeling to inform policy decisions.
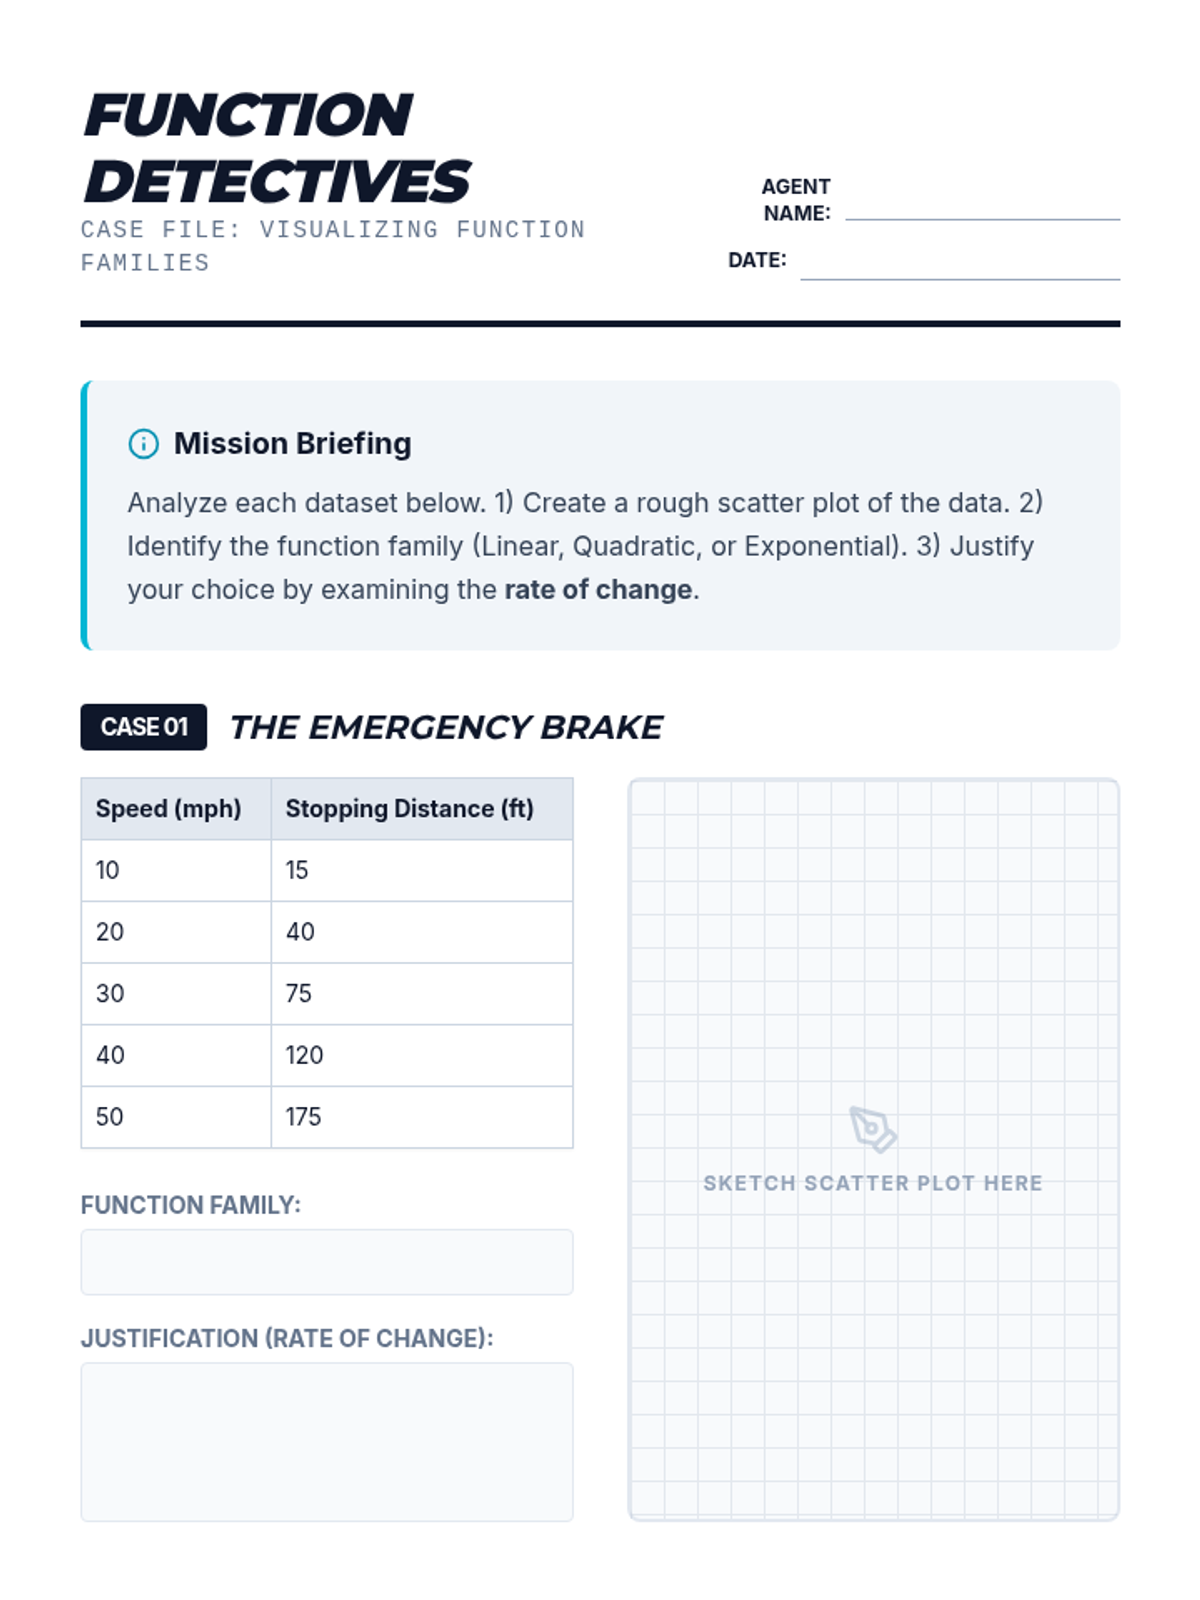
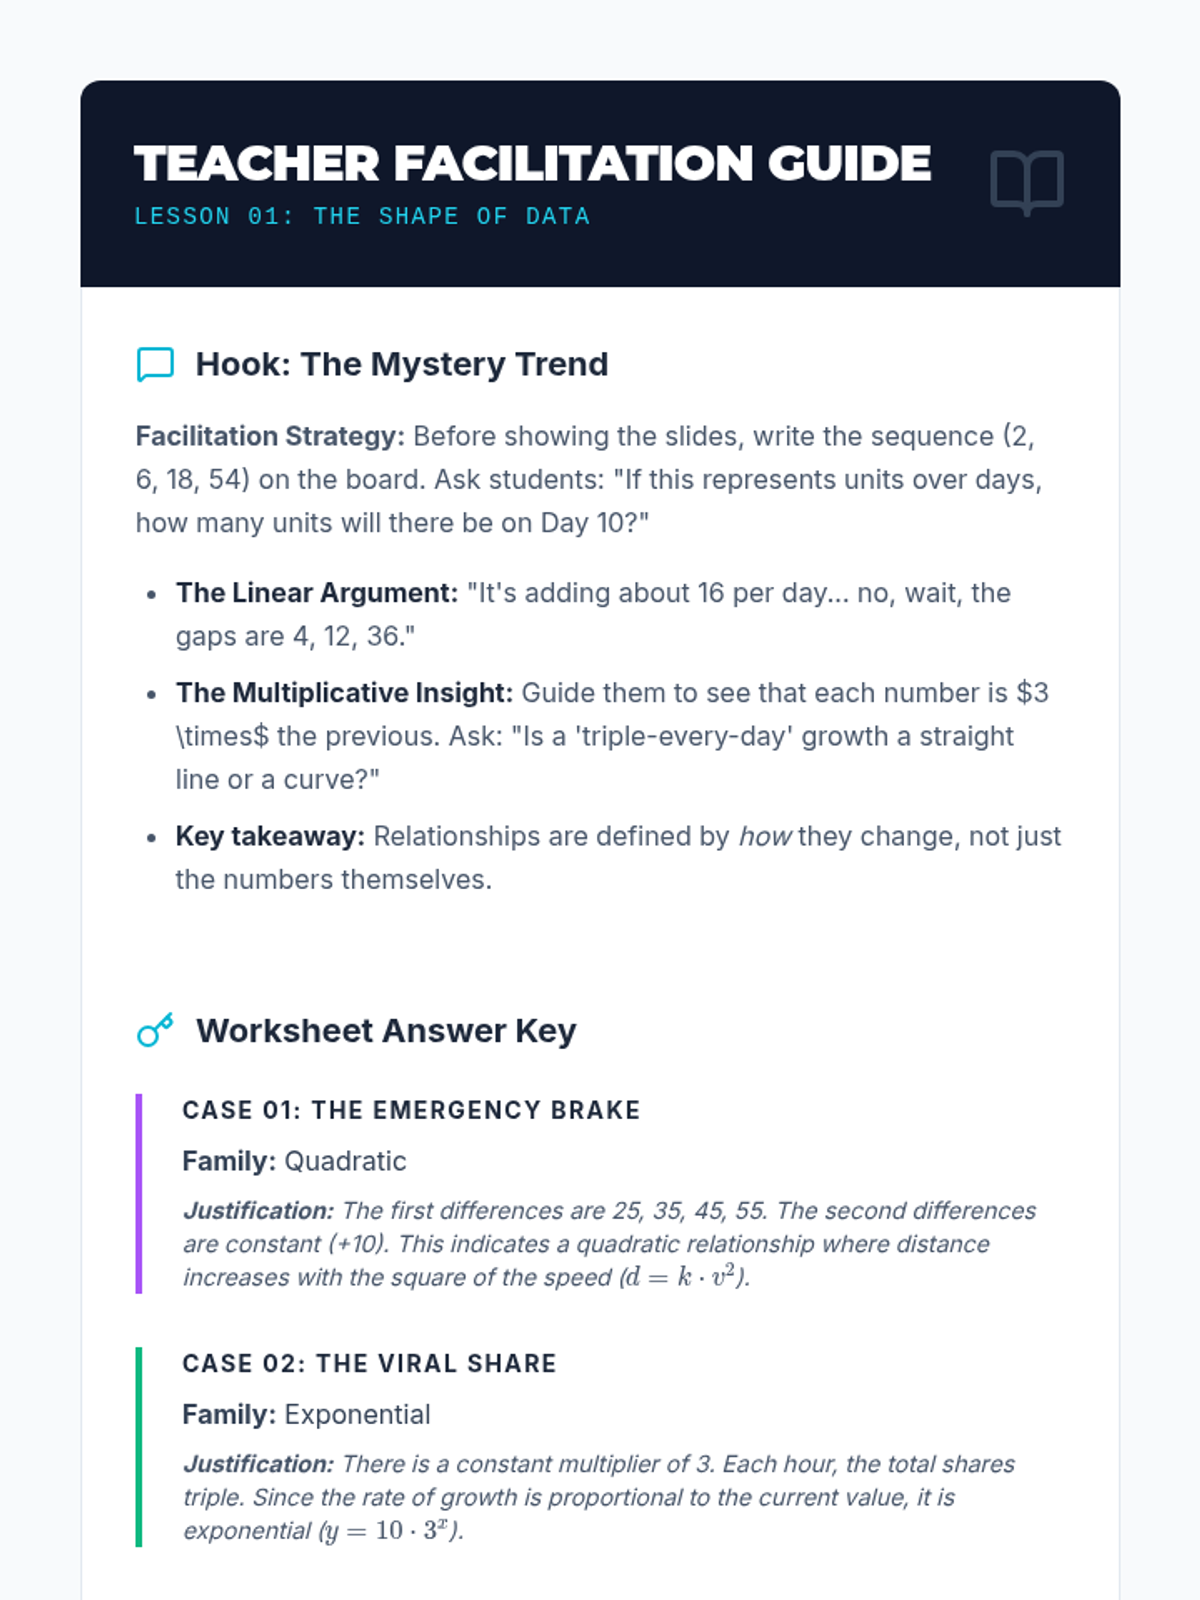
Students assume the role of data analysts to interpret complex real-world datasets related to economics, population dynamics, and environmental science. They identify function families, construct algebraic models using regression, evaluate 'goodness of fit' via residuals, and apply their models for predictions while critically analyzing domain limitations.
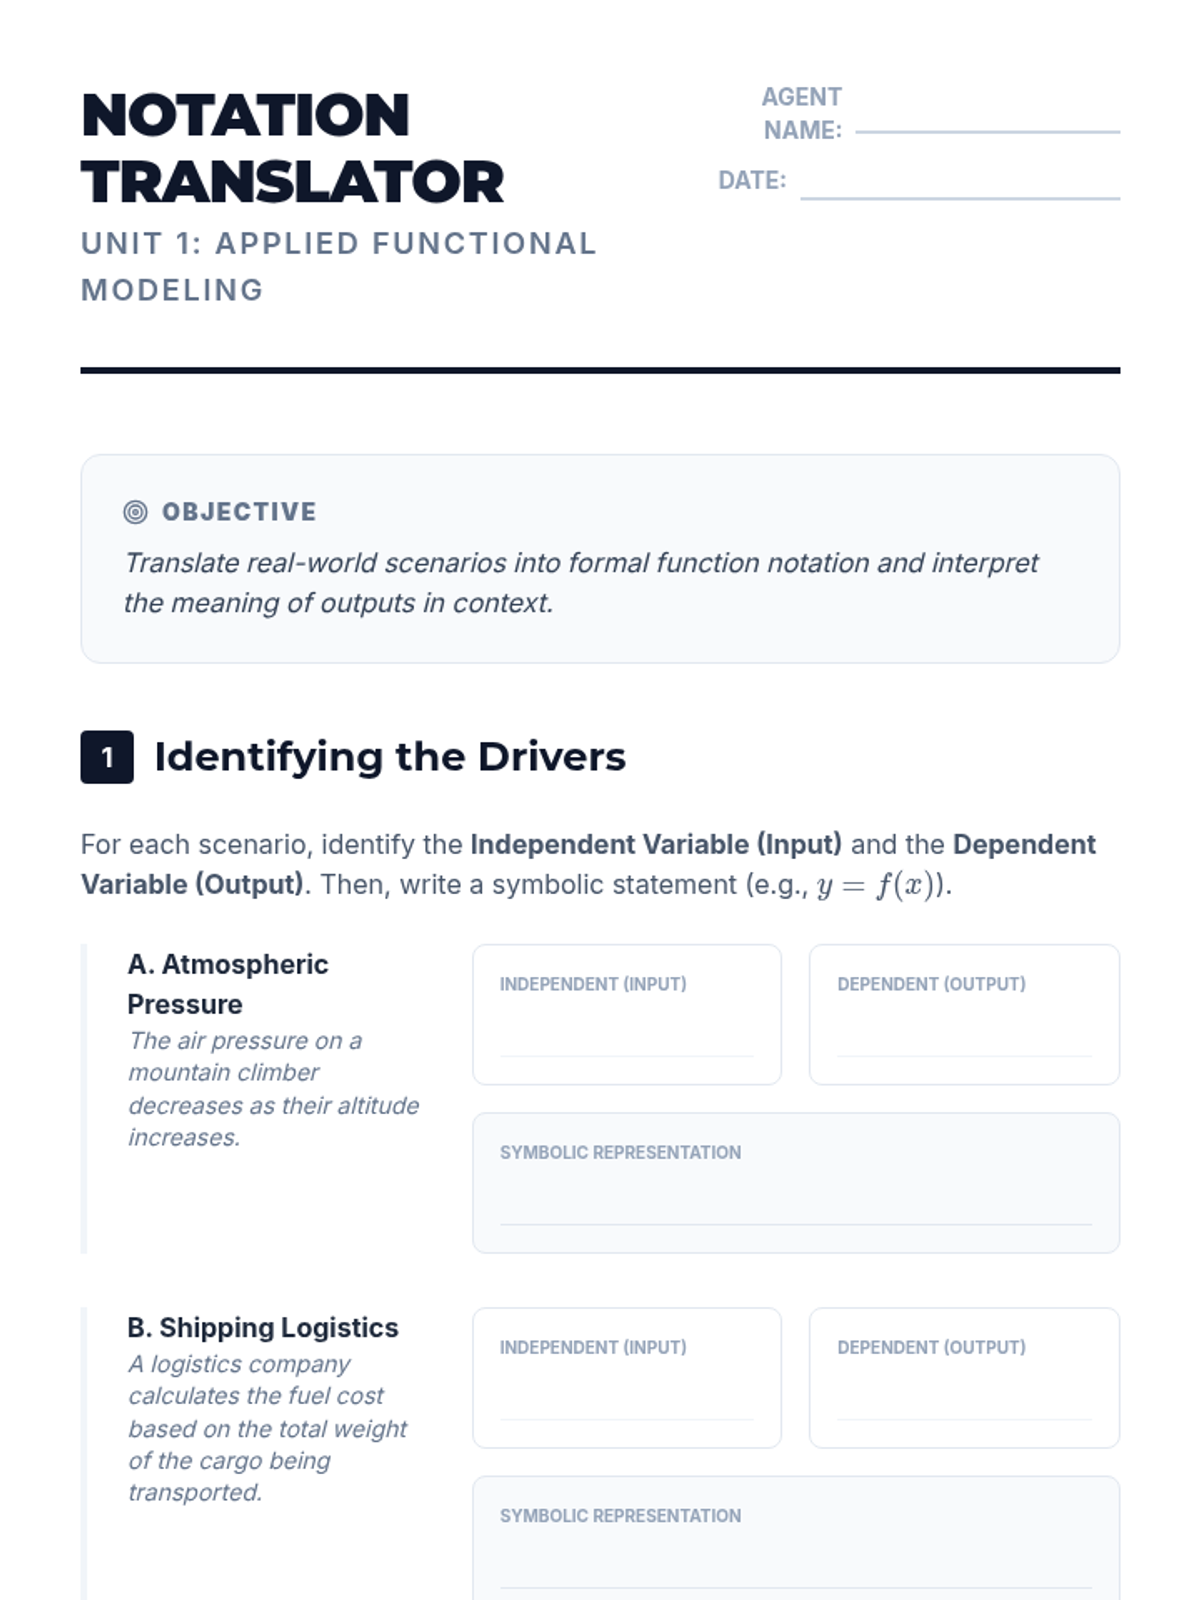
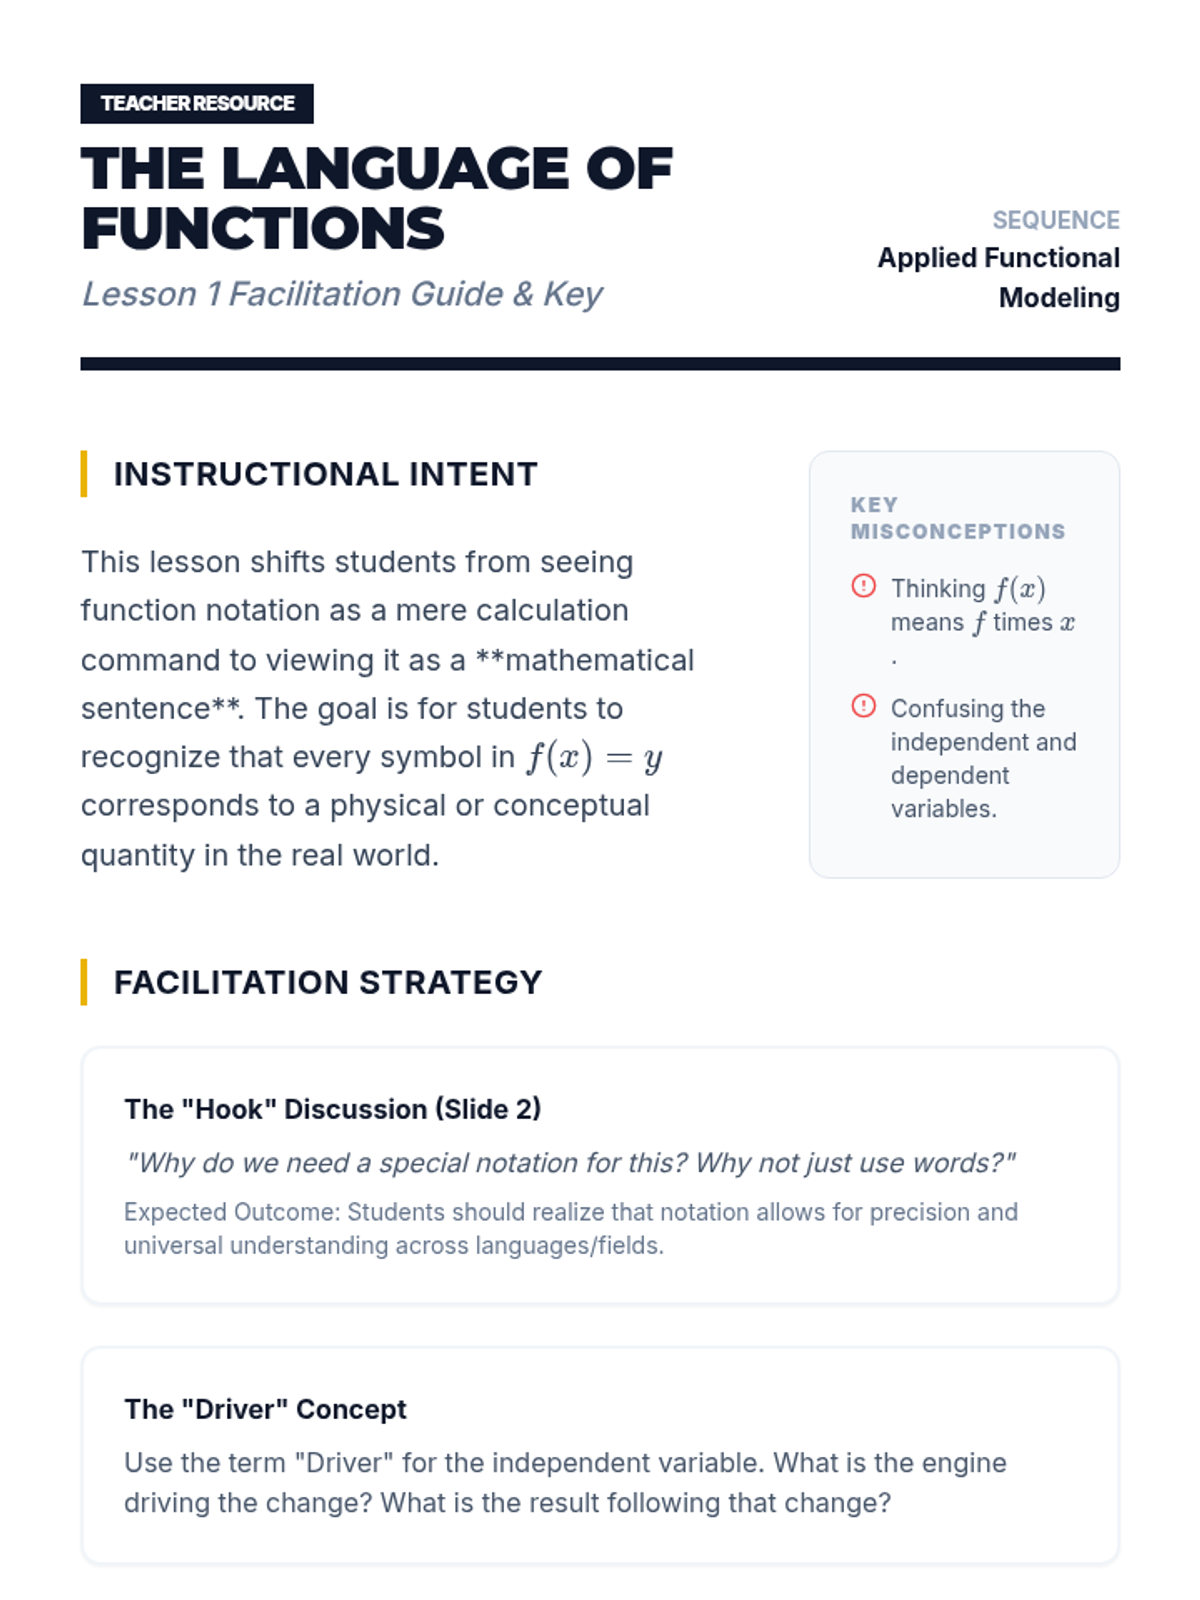
This 12th-grade sequence treats functions as essential tools for modeling real-world phenomena in business, physics, and social sciences. Students move from interpreting function notation as a language to creating their own models from data sets, emphasizing practical domain and range constraints and the translation between multiple representations.
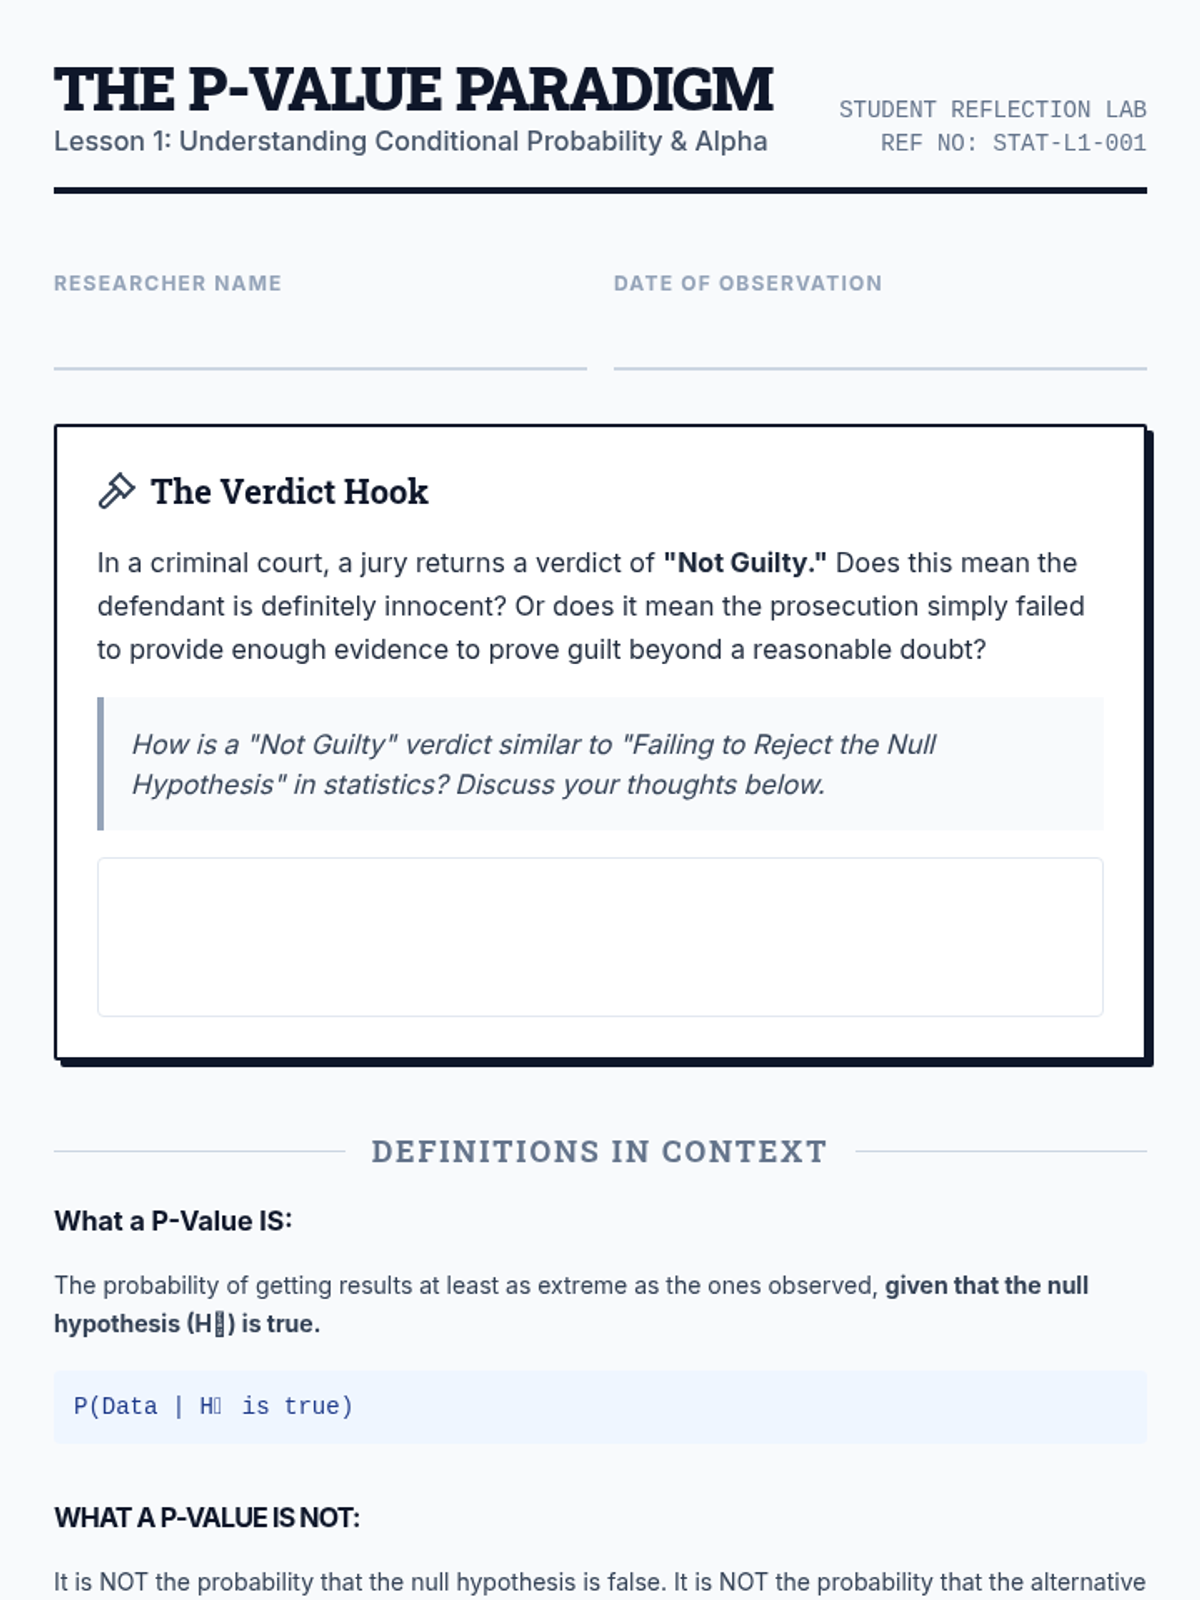
An advanced statistics sequence for 10th graders focusing on the nuance of hypothesis testing. Students move beyond calculations to explore P-values, Type I/II errors, practical significance, and effect size through real-world case studies and a culminating funding simulation.
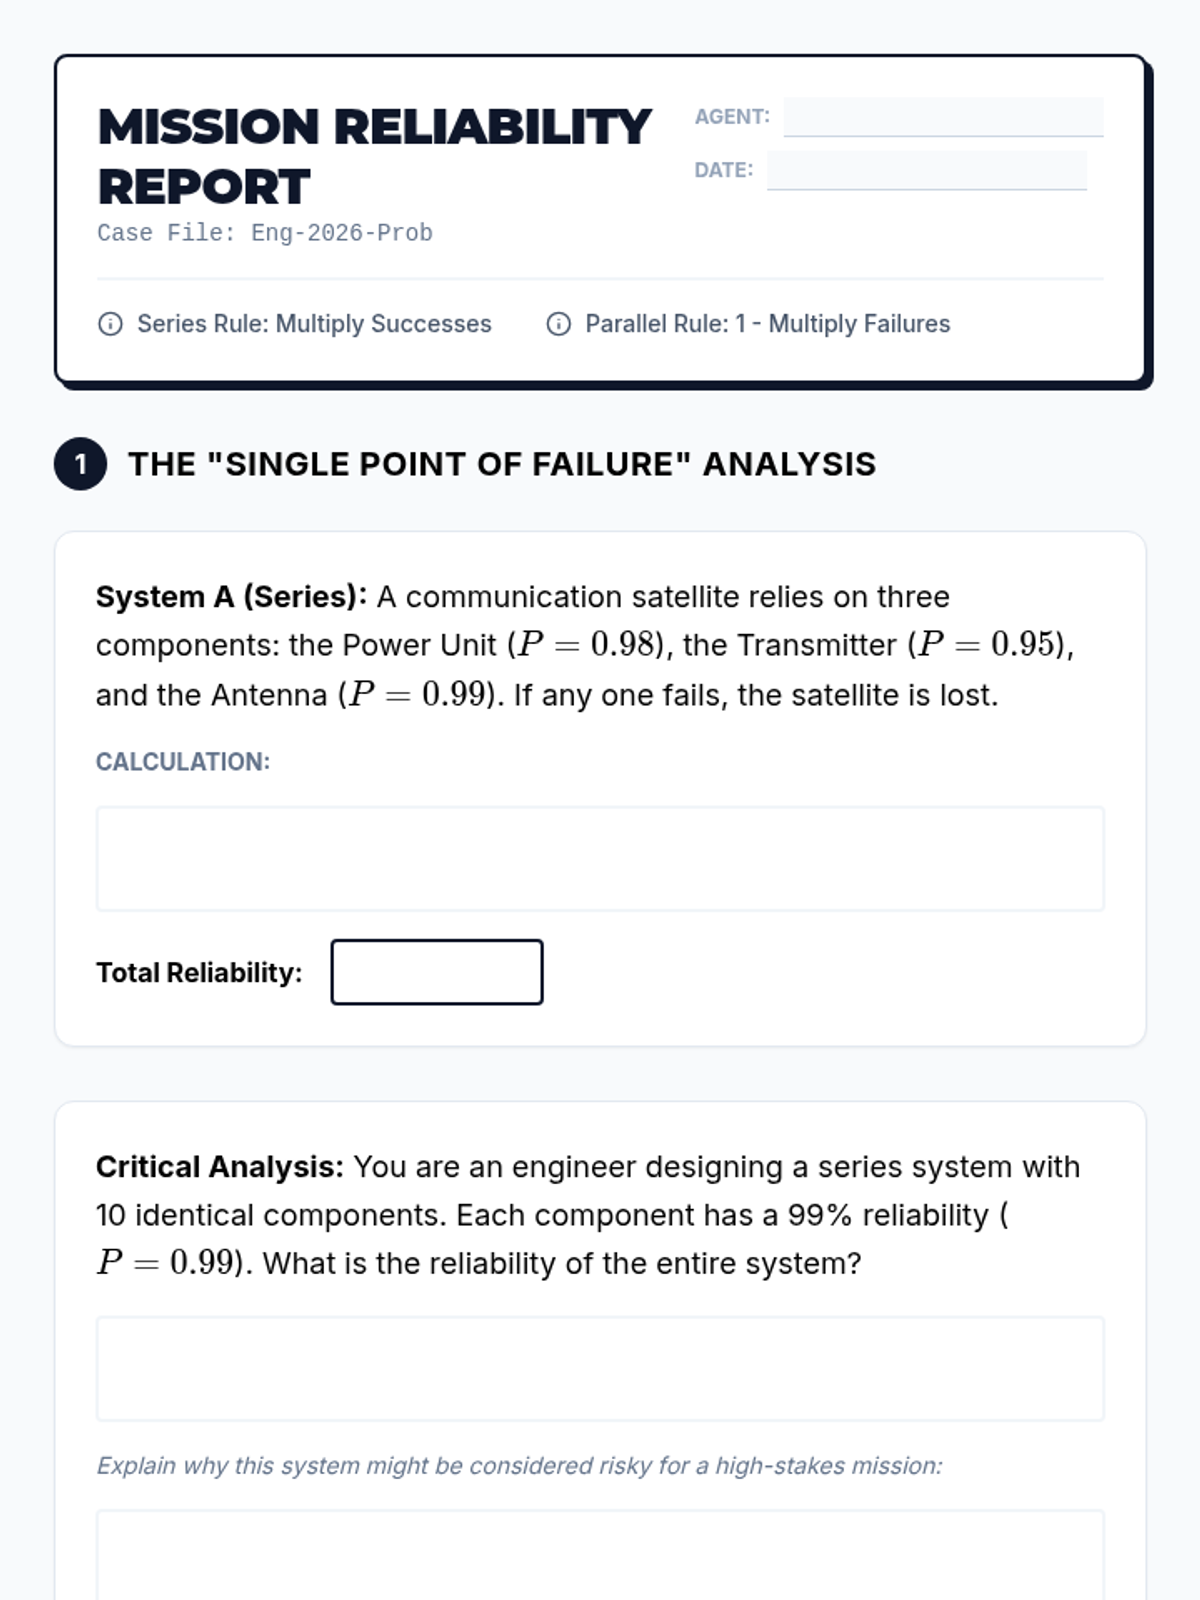
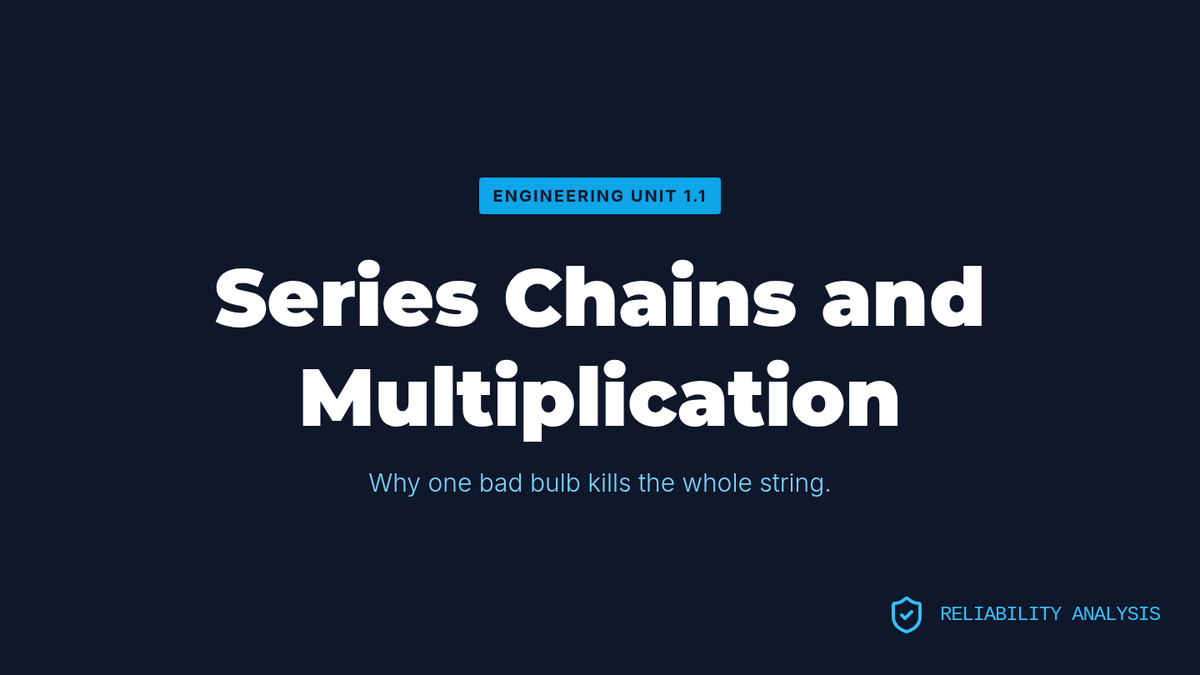
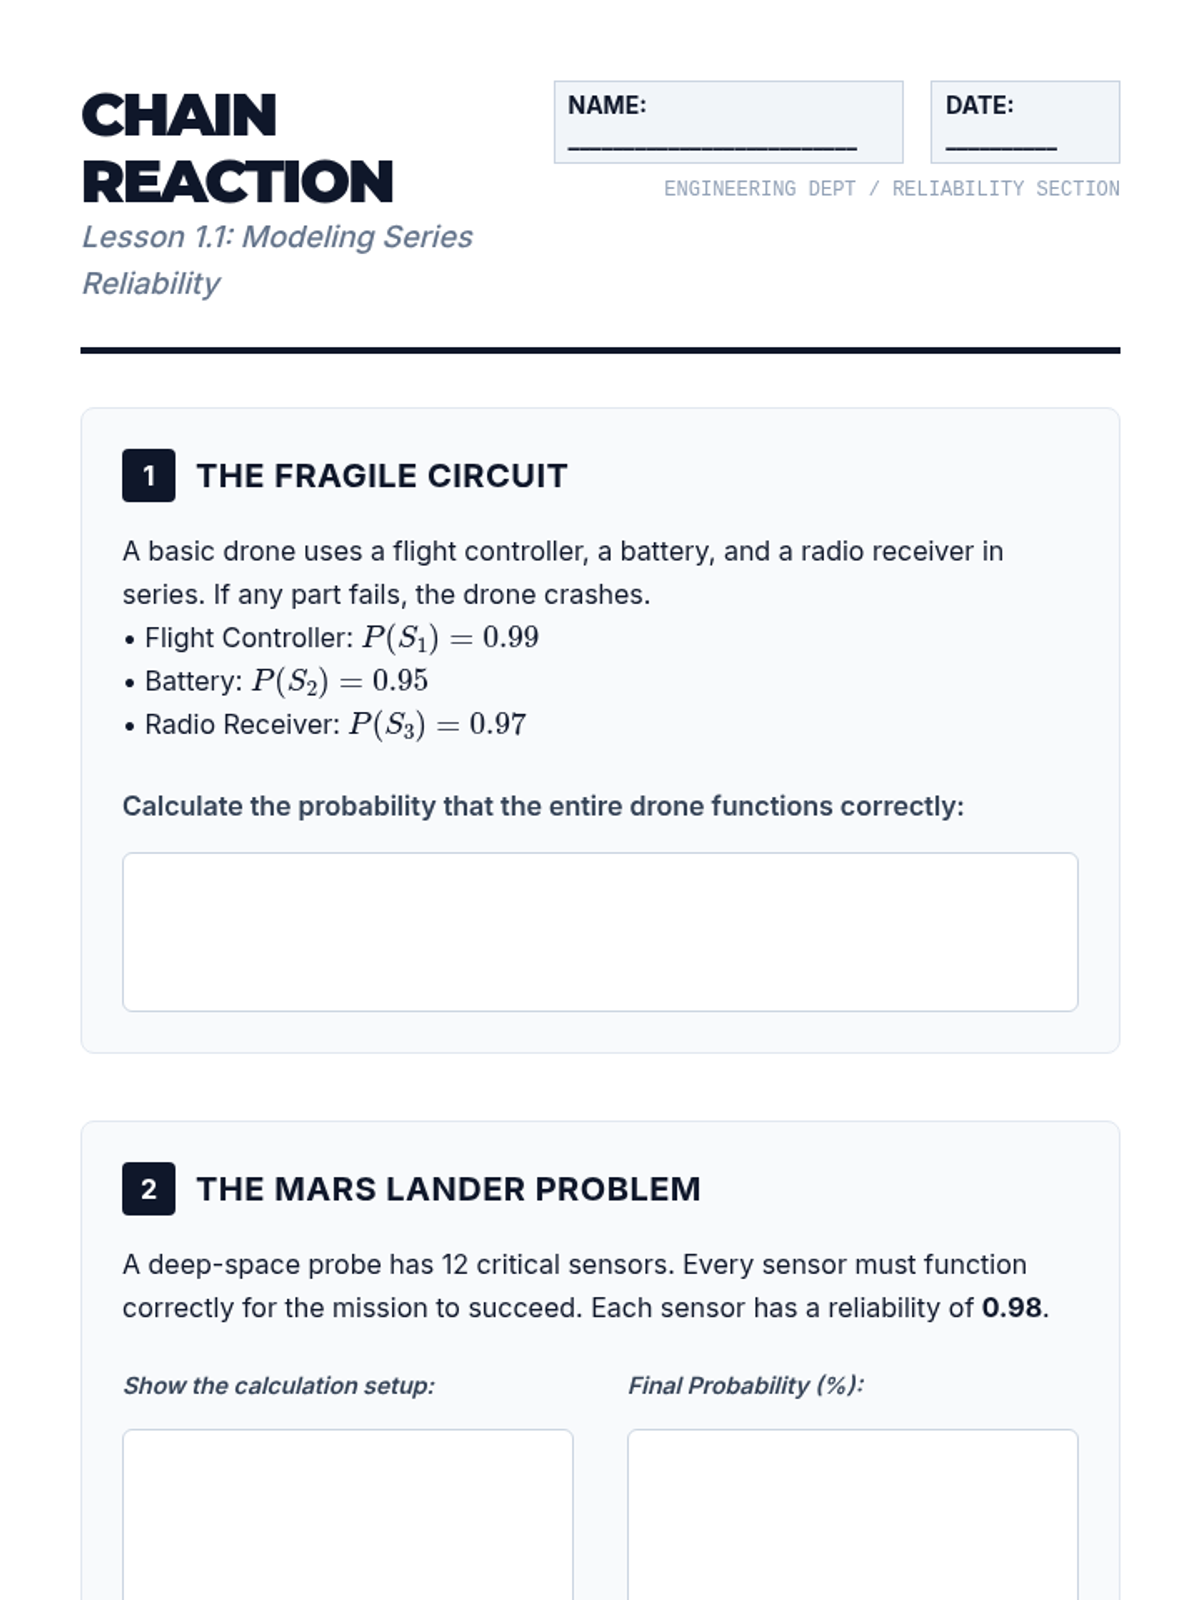
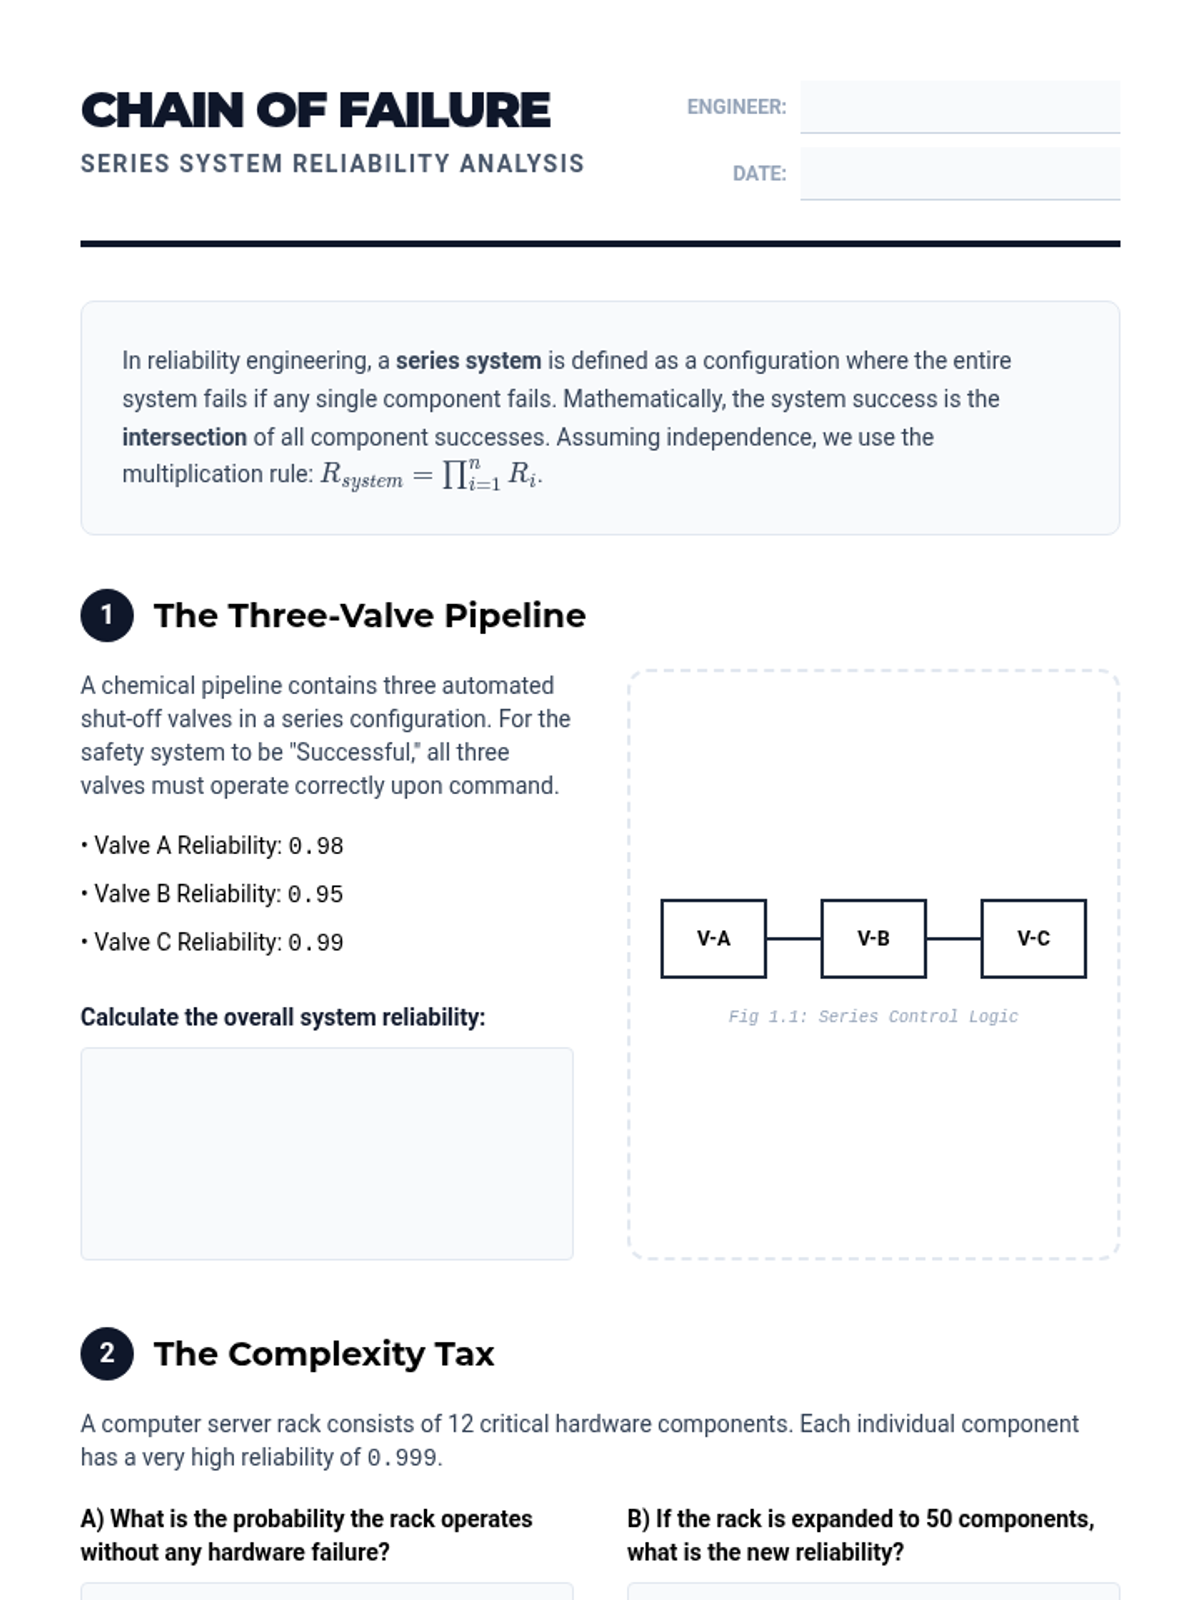
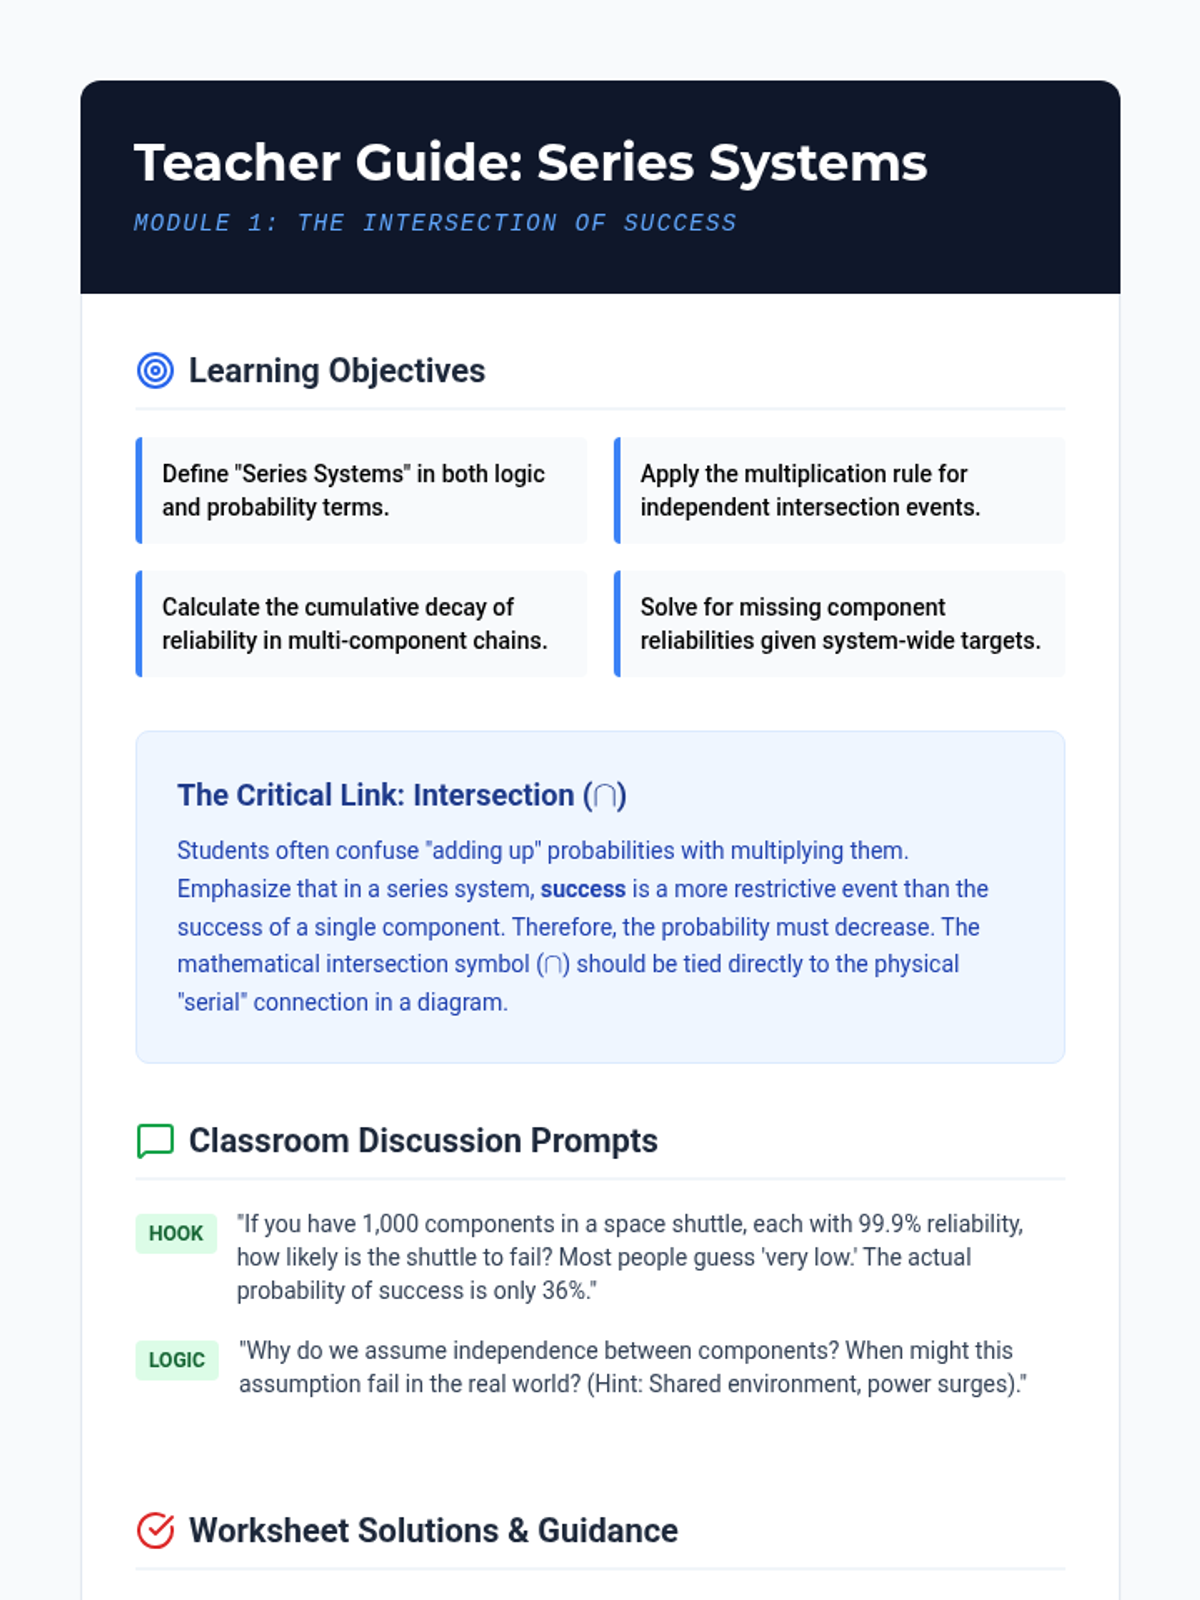
A 12th-grade mathematics sequence exploring compound probability through the lens of engineering reliability. Students learn to model series and parallel systems, use complement rules for redundancy, and optimize system designs within budgetary constraints.
A comprehensive 12th-grade sequence exploring conditional probability through high-stakes real-world applications in medicine, forensics, and public safety. Students move from tabular data analysis to Bayesian reasoning, learning to navigate the counter-intuitive nature of false positives and the logical pitfalls of legal evidence.
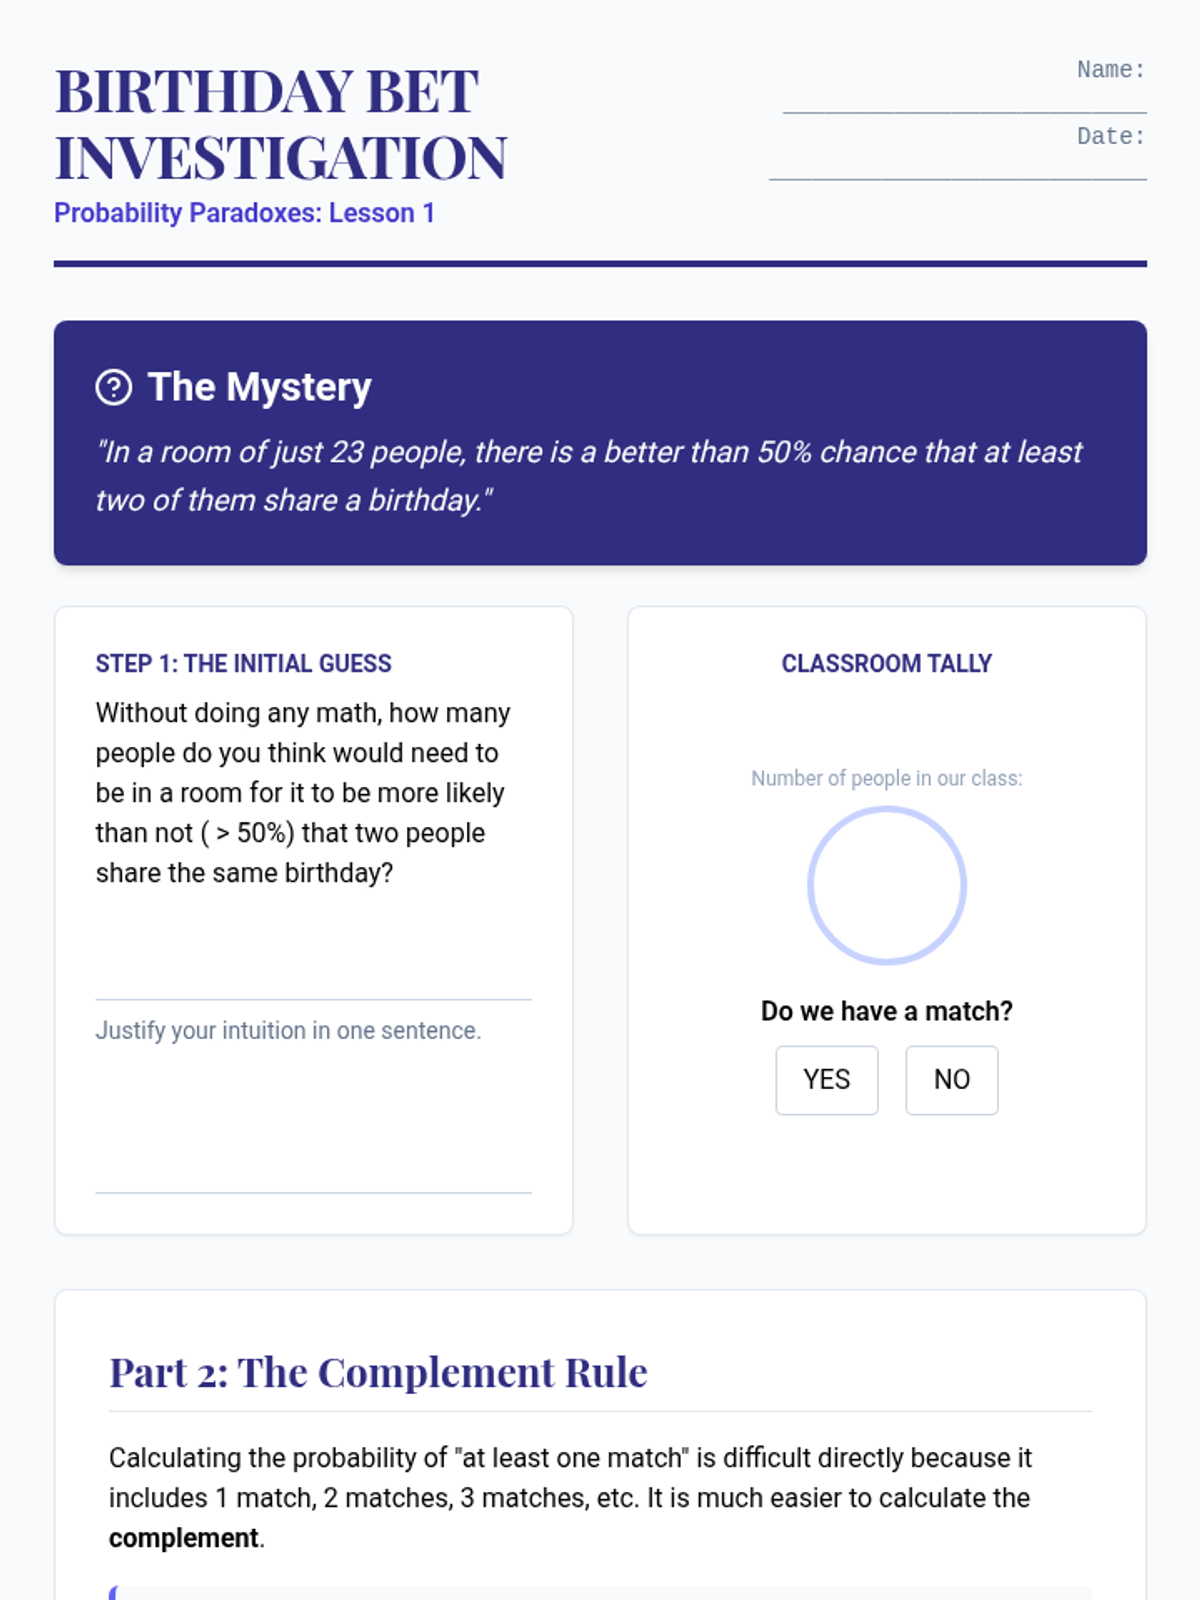
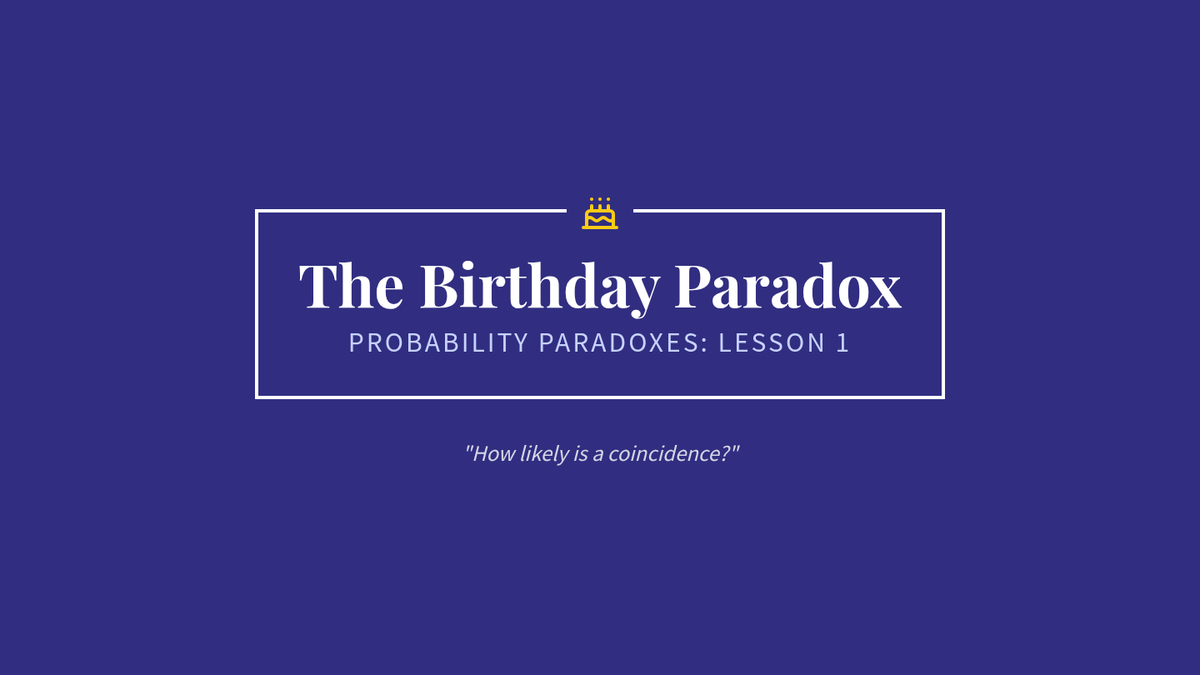
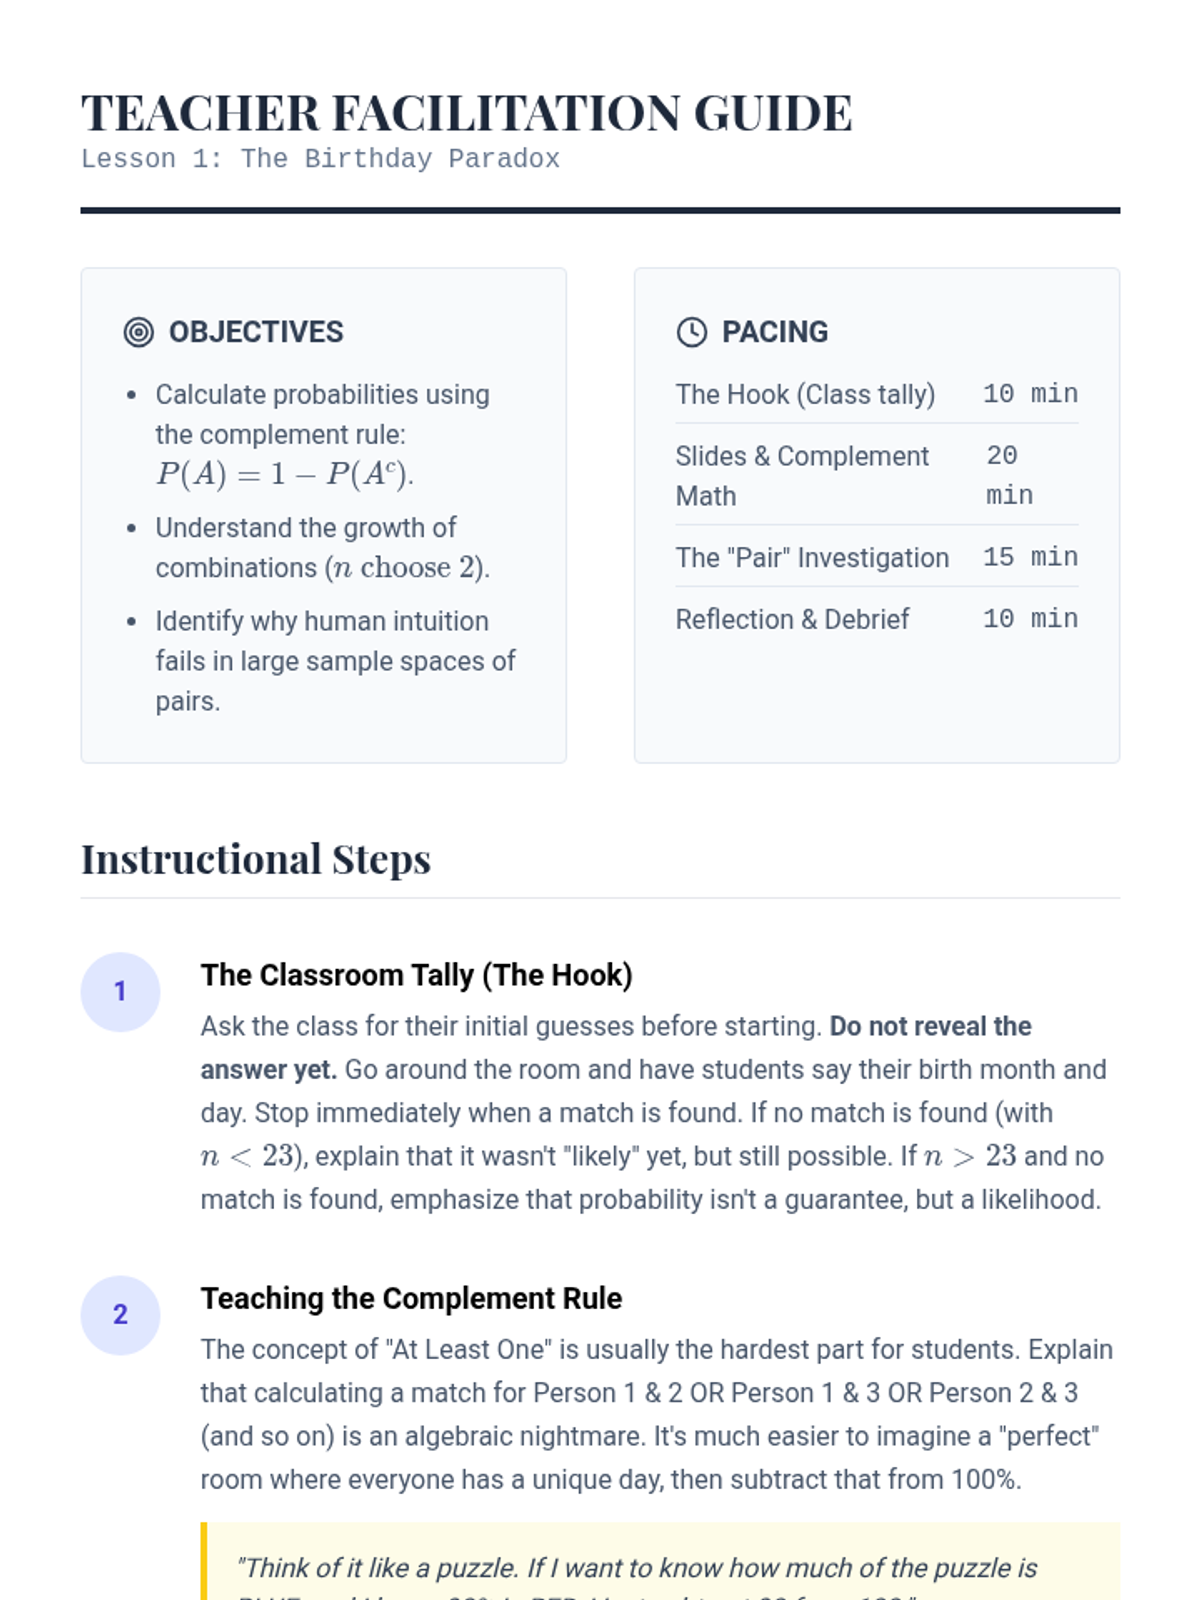
An inquiry-driven investigation into counter-intuitive probability. Students explore the Birthday Problem, Gambler's Fallacy, Monty Hall Problem, and Simpson's Paradox to understand why human intuition often fails in the face of compound event logic.
This sequence explores compound probability through the lens of engineering reliability. Students learn to model series and parallel systems, analyze hybrid structures, and account for dependent failures in complex risk environments.
A high school statistics sequence investigating economic disparity through measures of spread (Range, IQR, MAD), emphasizing how variability reveals truths hidden by averages.
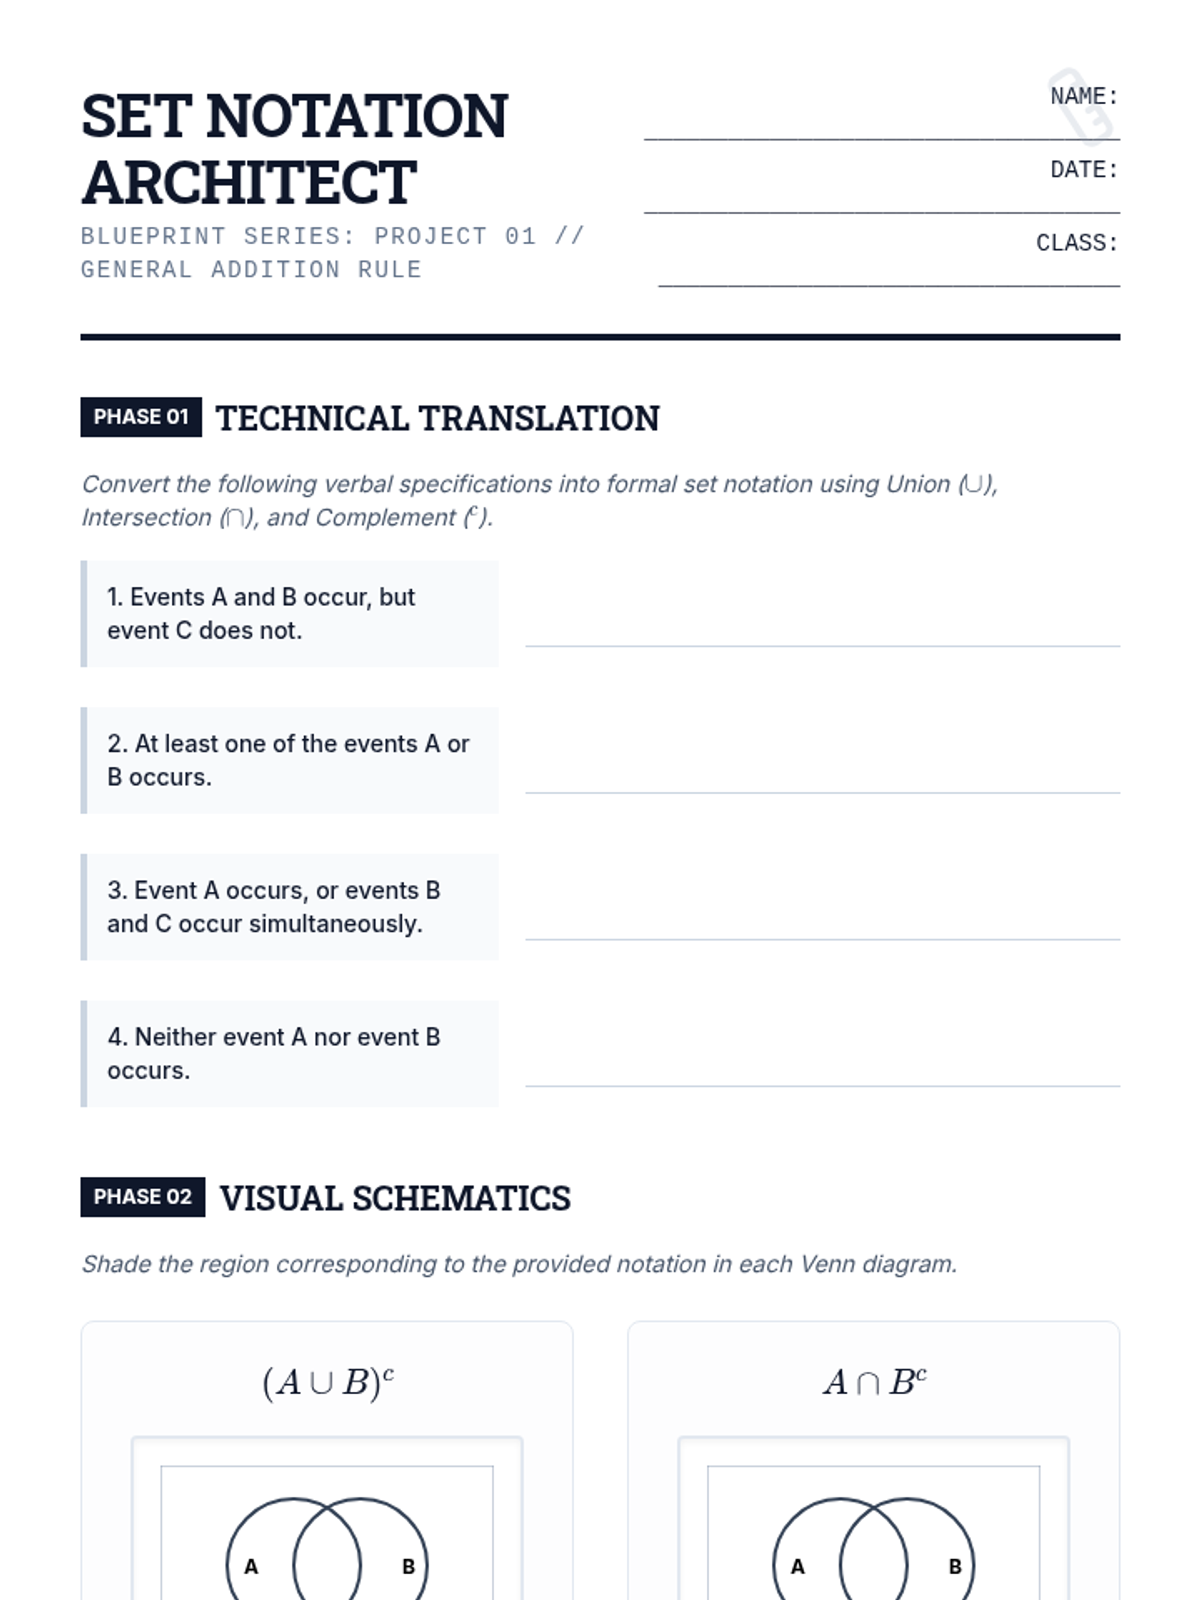
A rigorous, theoretical approach to compound event probabilities for 12th-grade students. This sequence covers set notation, formal definitions of independence, the general addition and multiplication rules, and the distinction between mutually exclusive and independent events.
A comprehensive 12th-grade probability unit focusing on visualizing multi-stage experiments, distinguishing between independent and dependent events, and applying formal multiplication rules to solve complex compound scenarios.
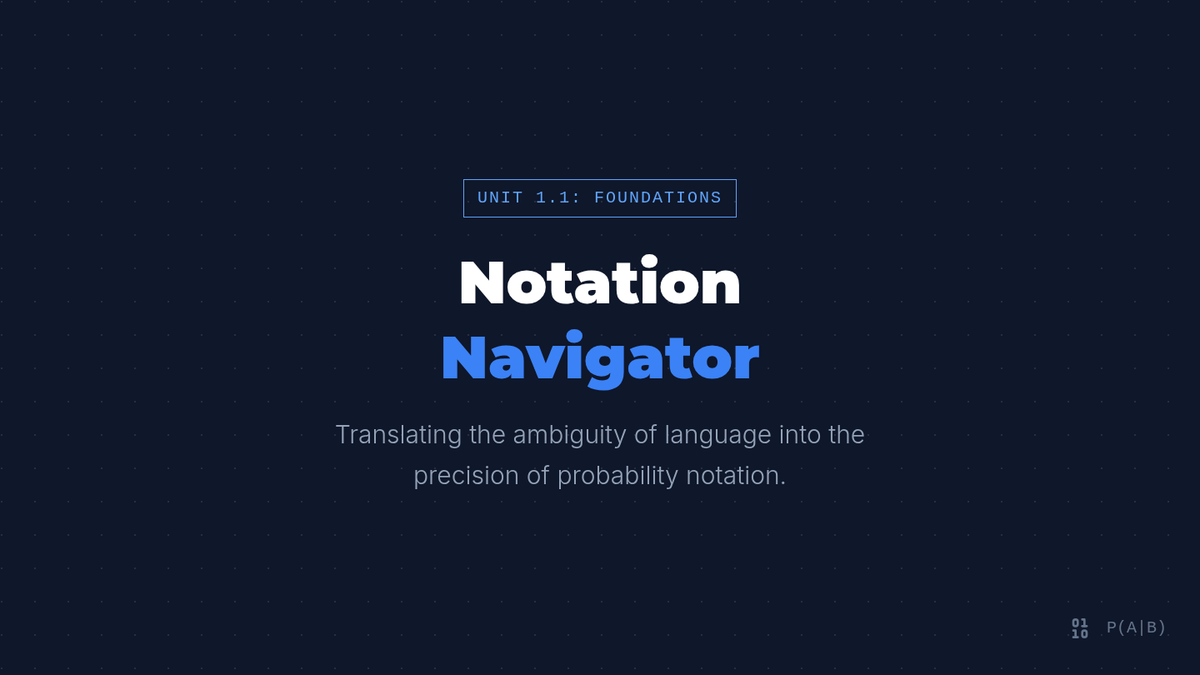
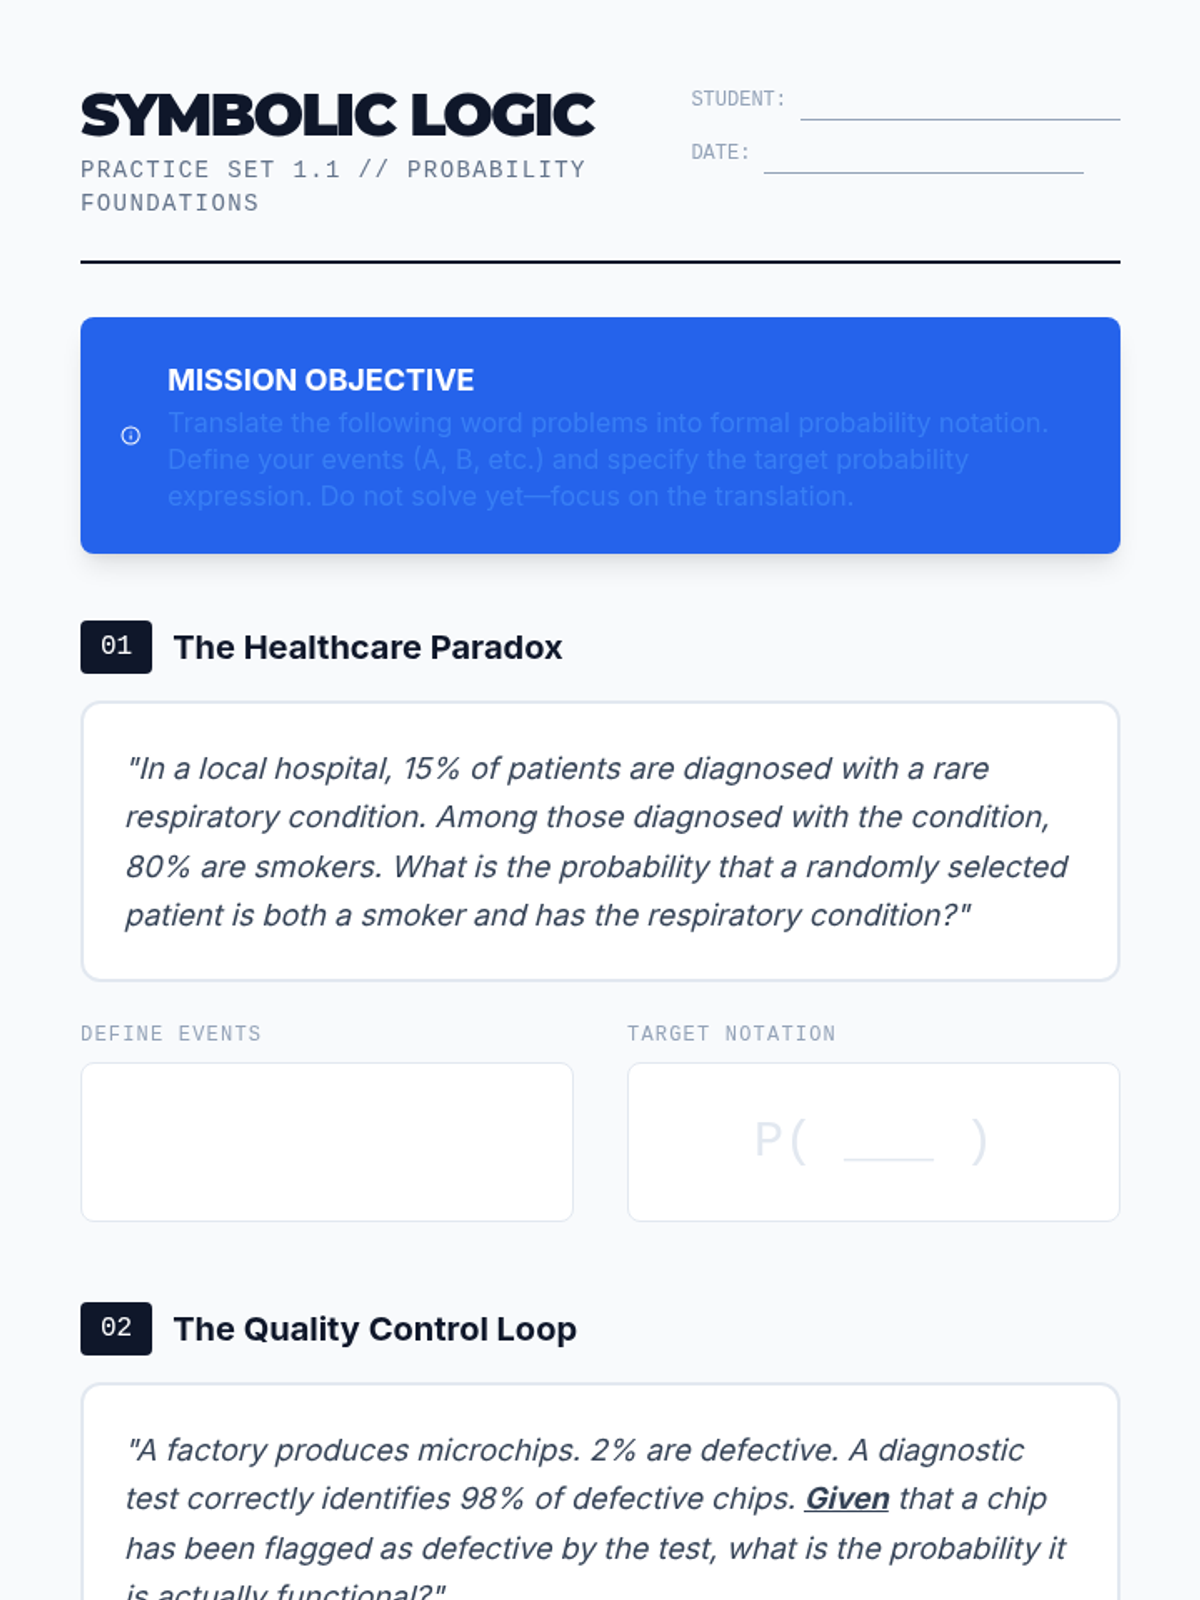
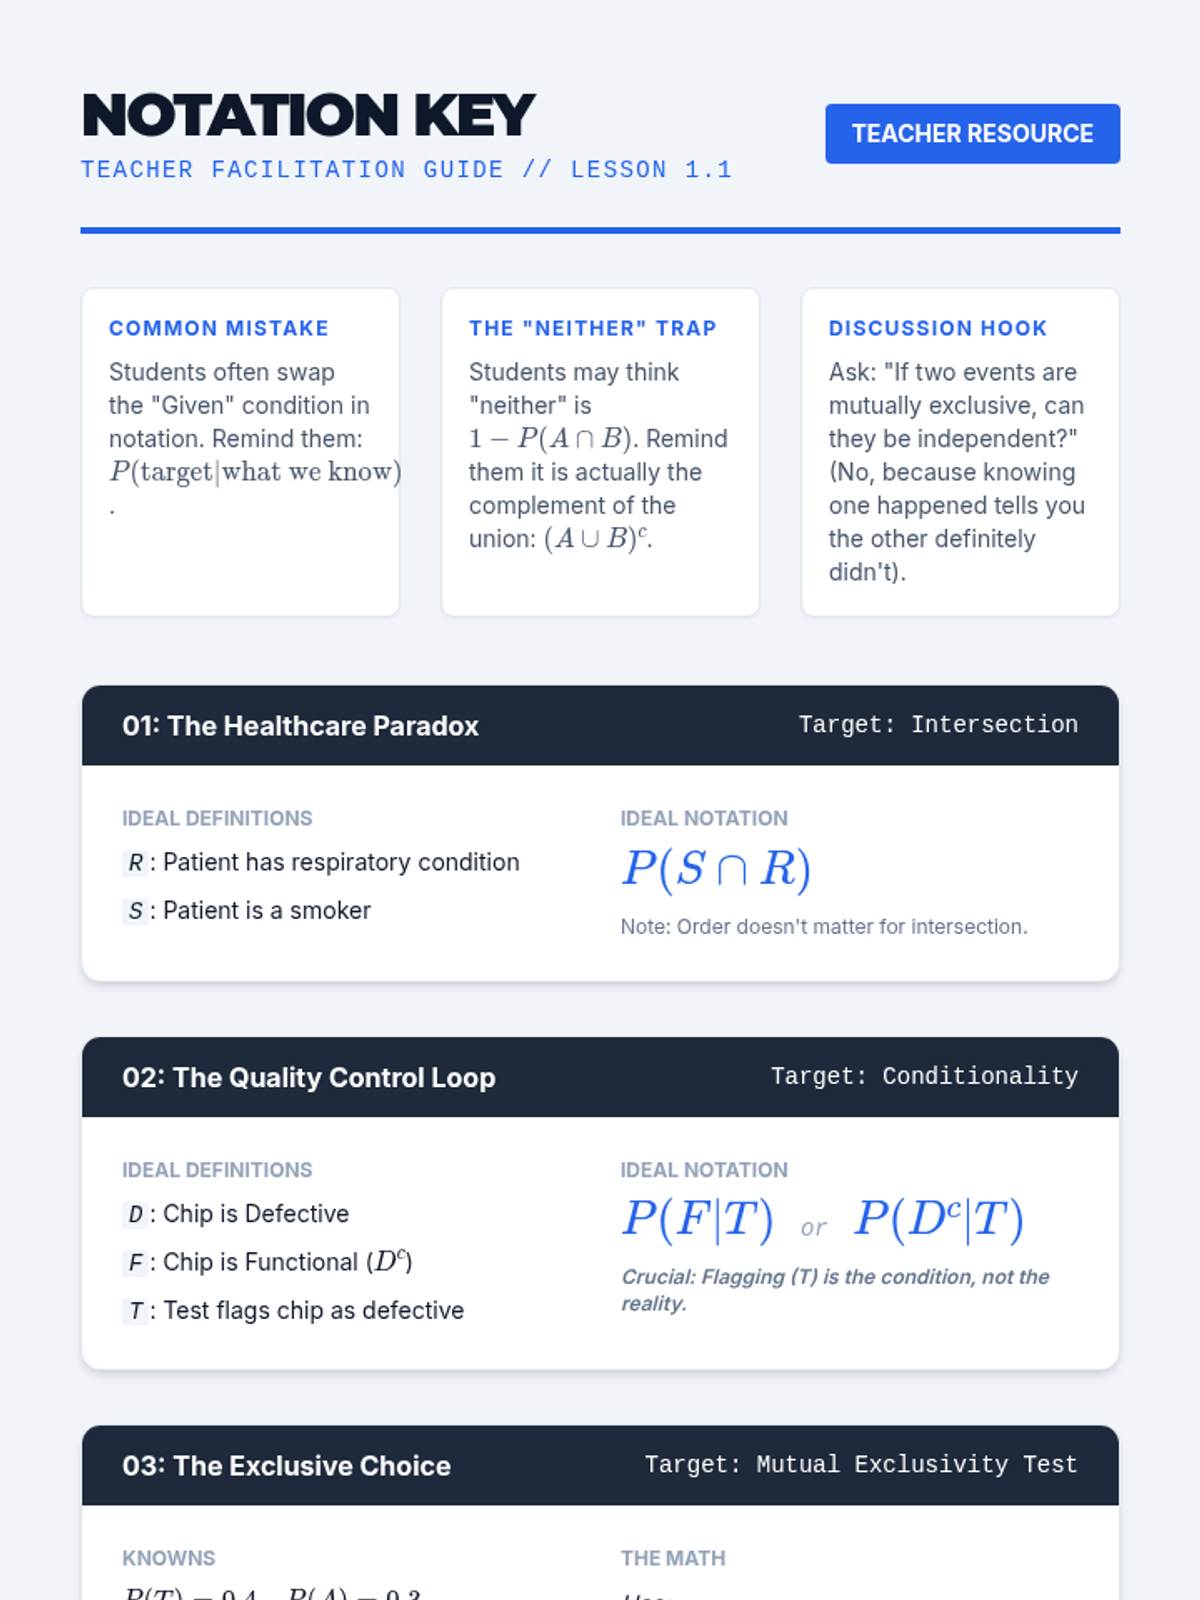
A high-level probability sequence for 11th grade students focusing on translating complex word problems into symbolic notation and solving multi-stage compound events. The sequence utilizes a flipped classroom model to prioritize collaborative problem-solving and mastery of advanced concepts like the complement rule and asymmetric probability trees.
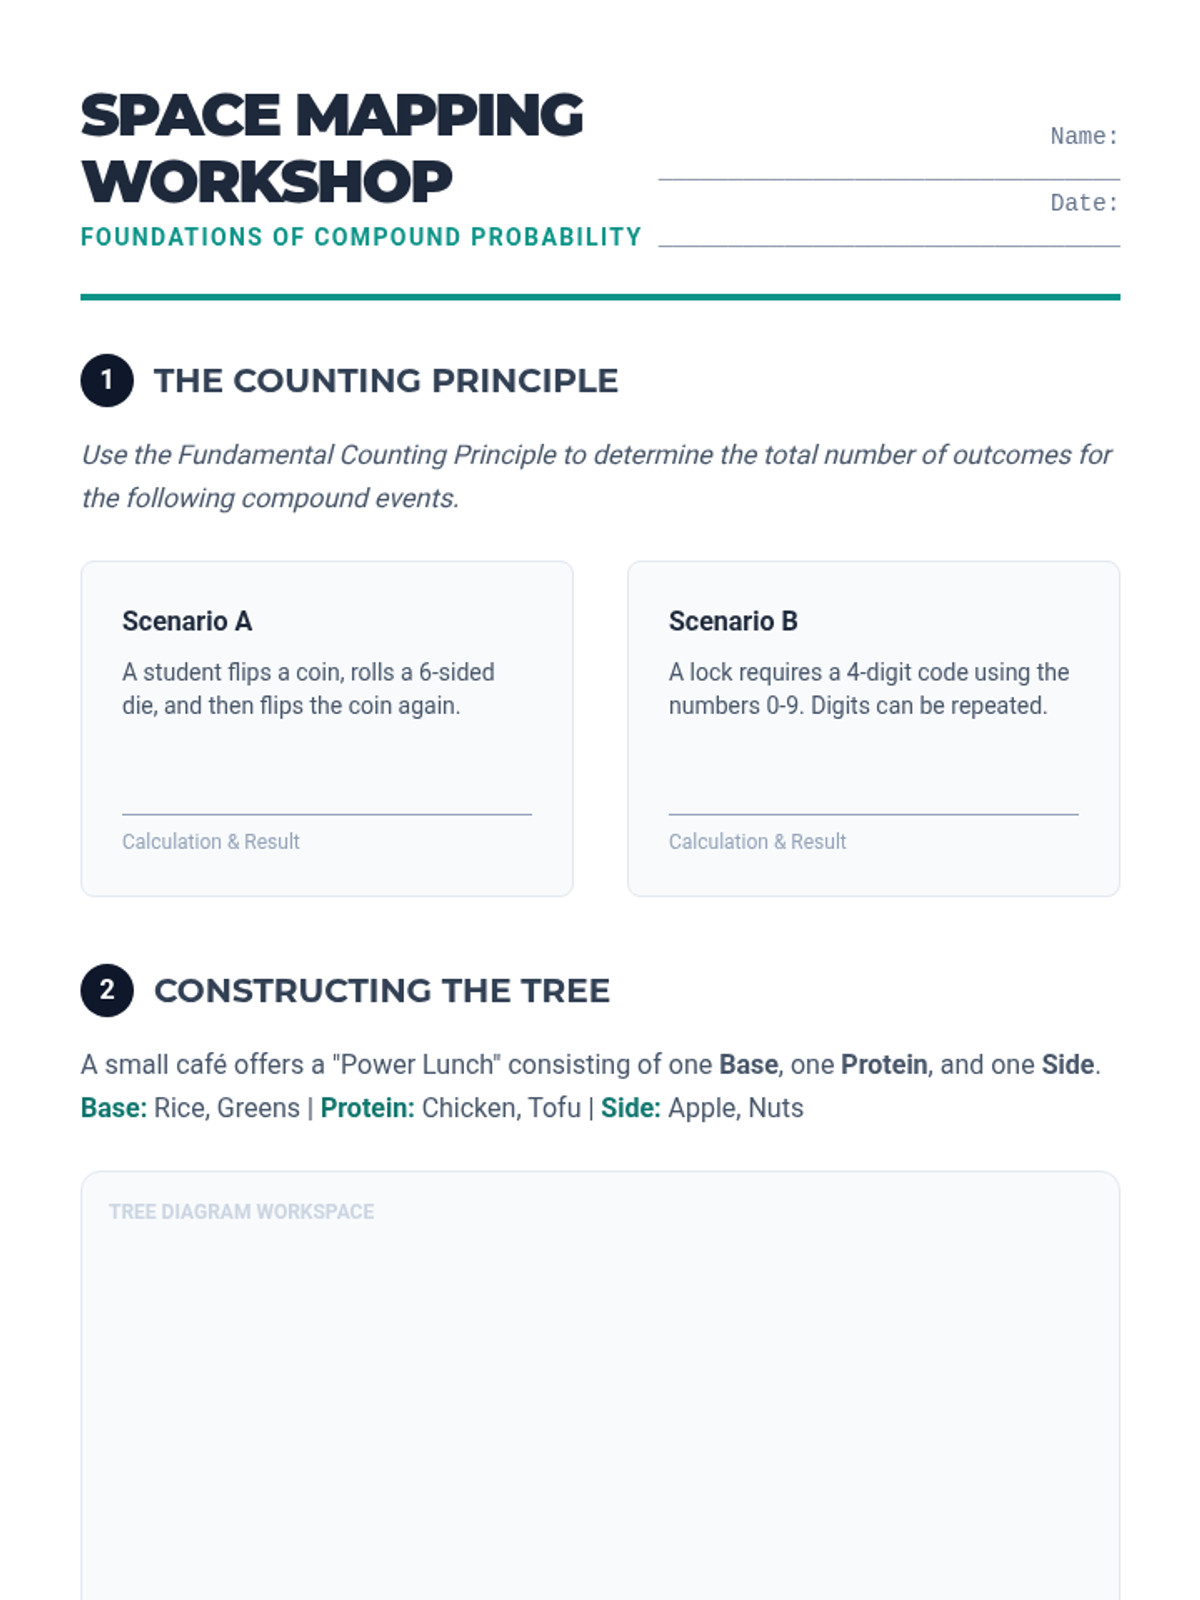
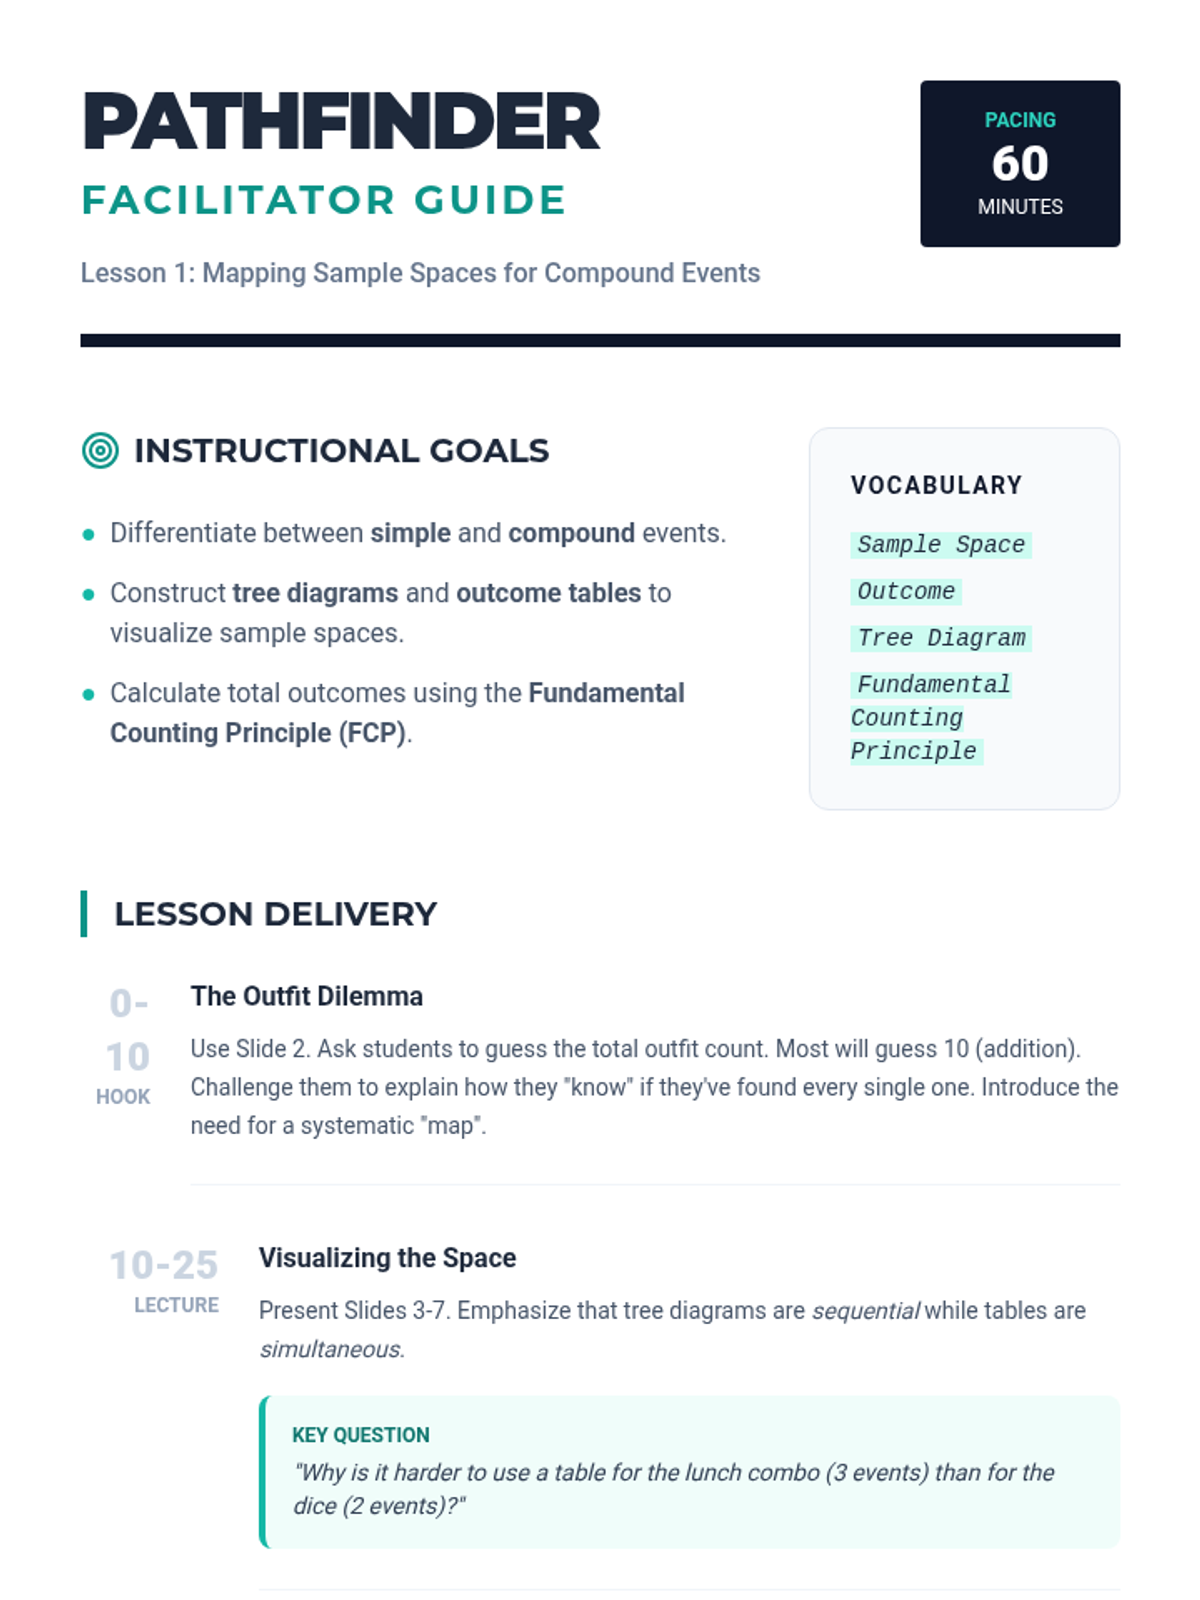
This 11th-grade statistics sequence builds a deep understanding of compound probability, from visualizing sample spaces to applying the General Multiplication Rule. Students progress through independent and dependent events, conditional probability, and complex multi-stage scenarios including the 'at least one' rule.
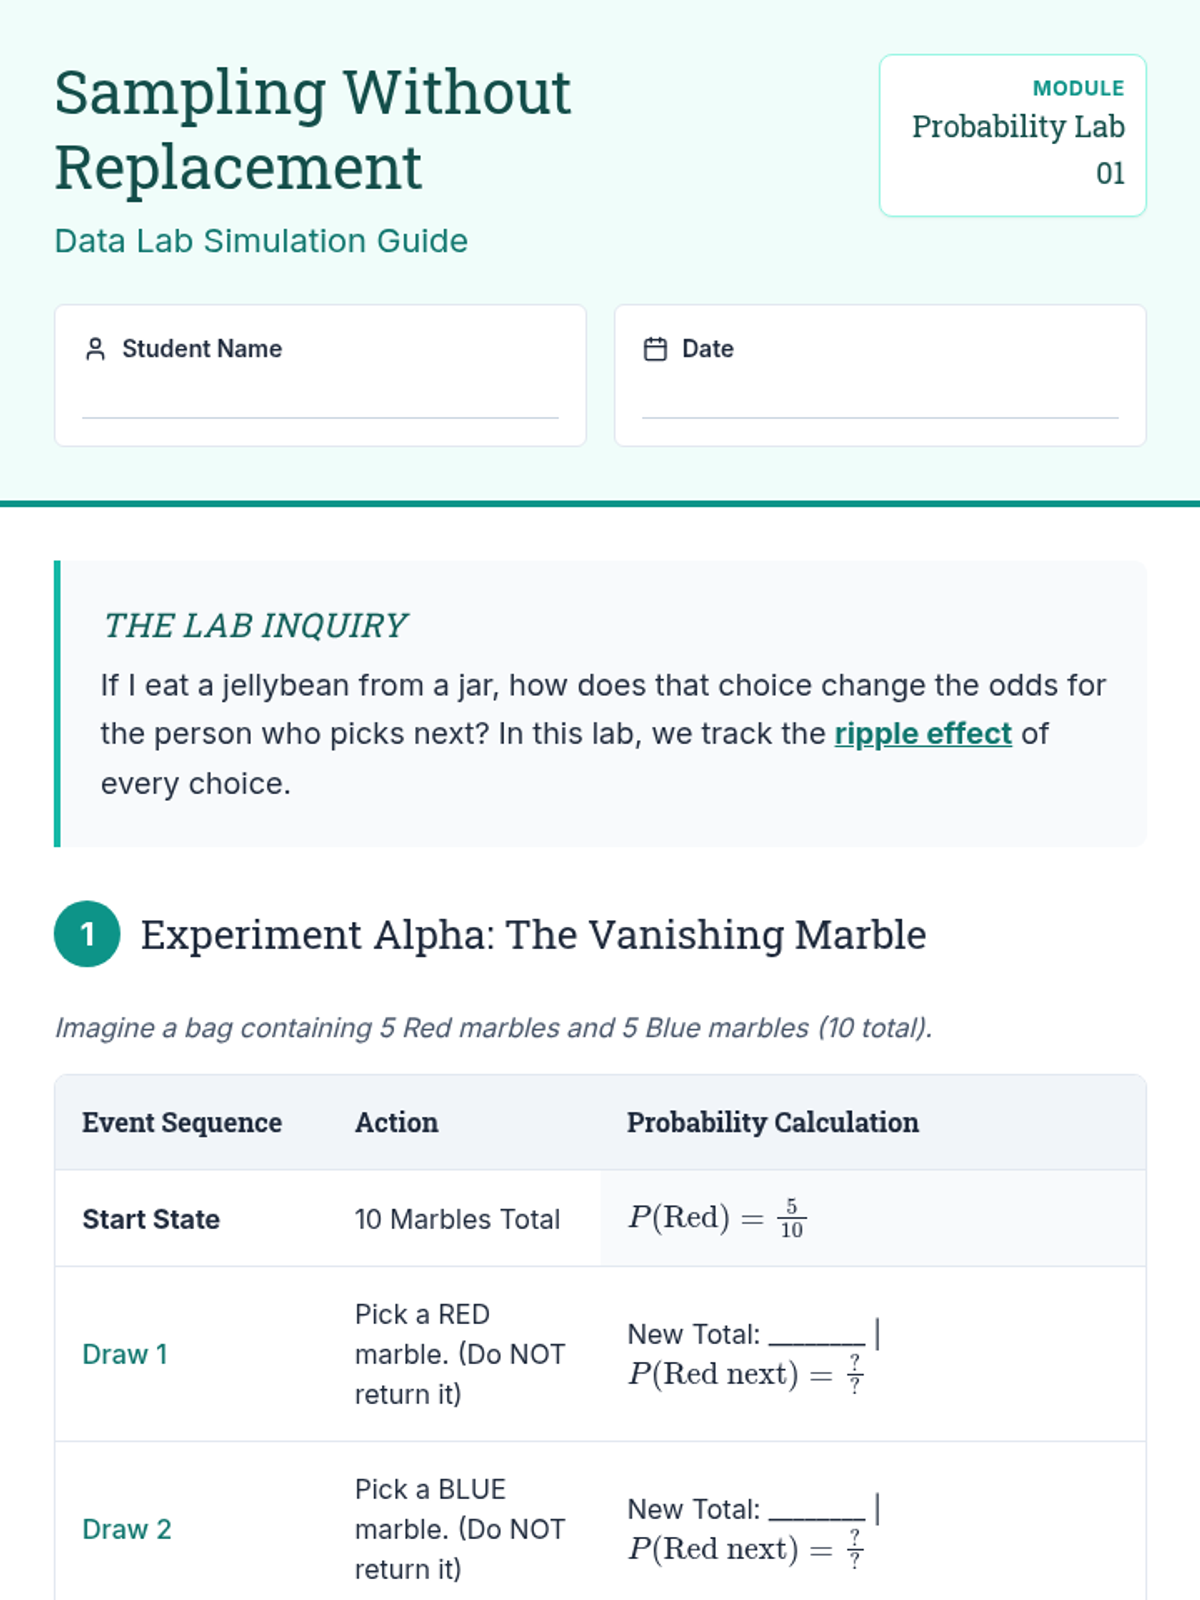
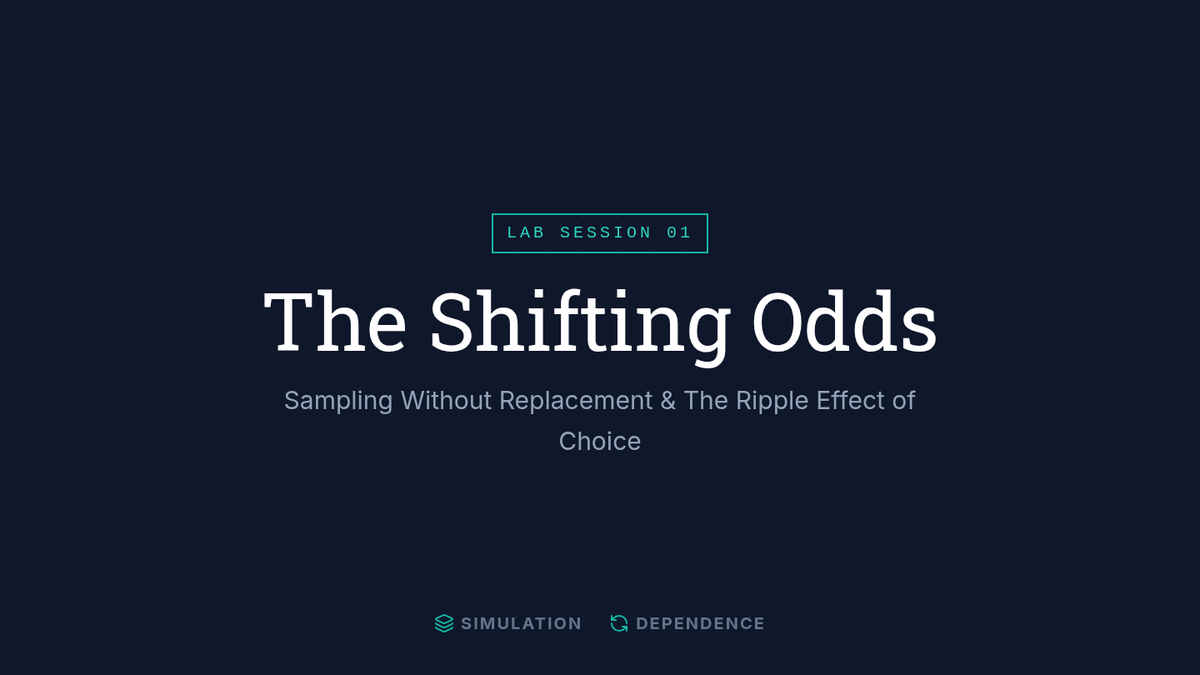
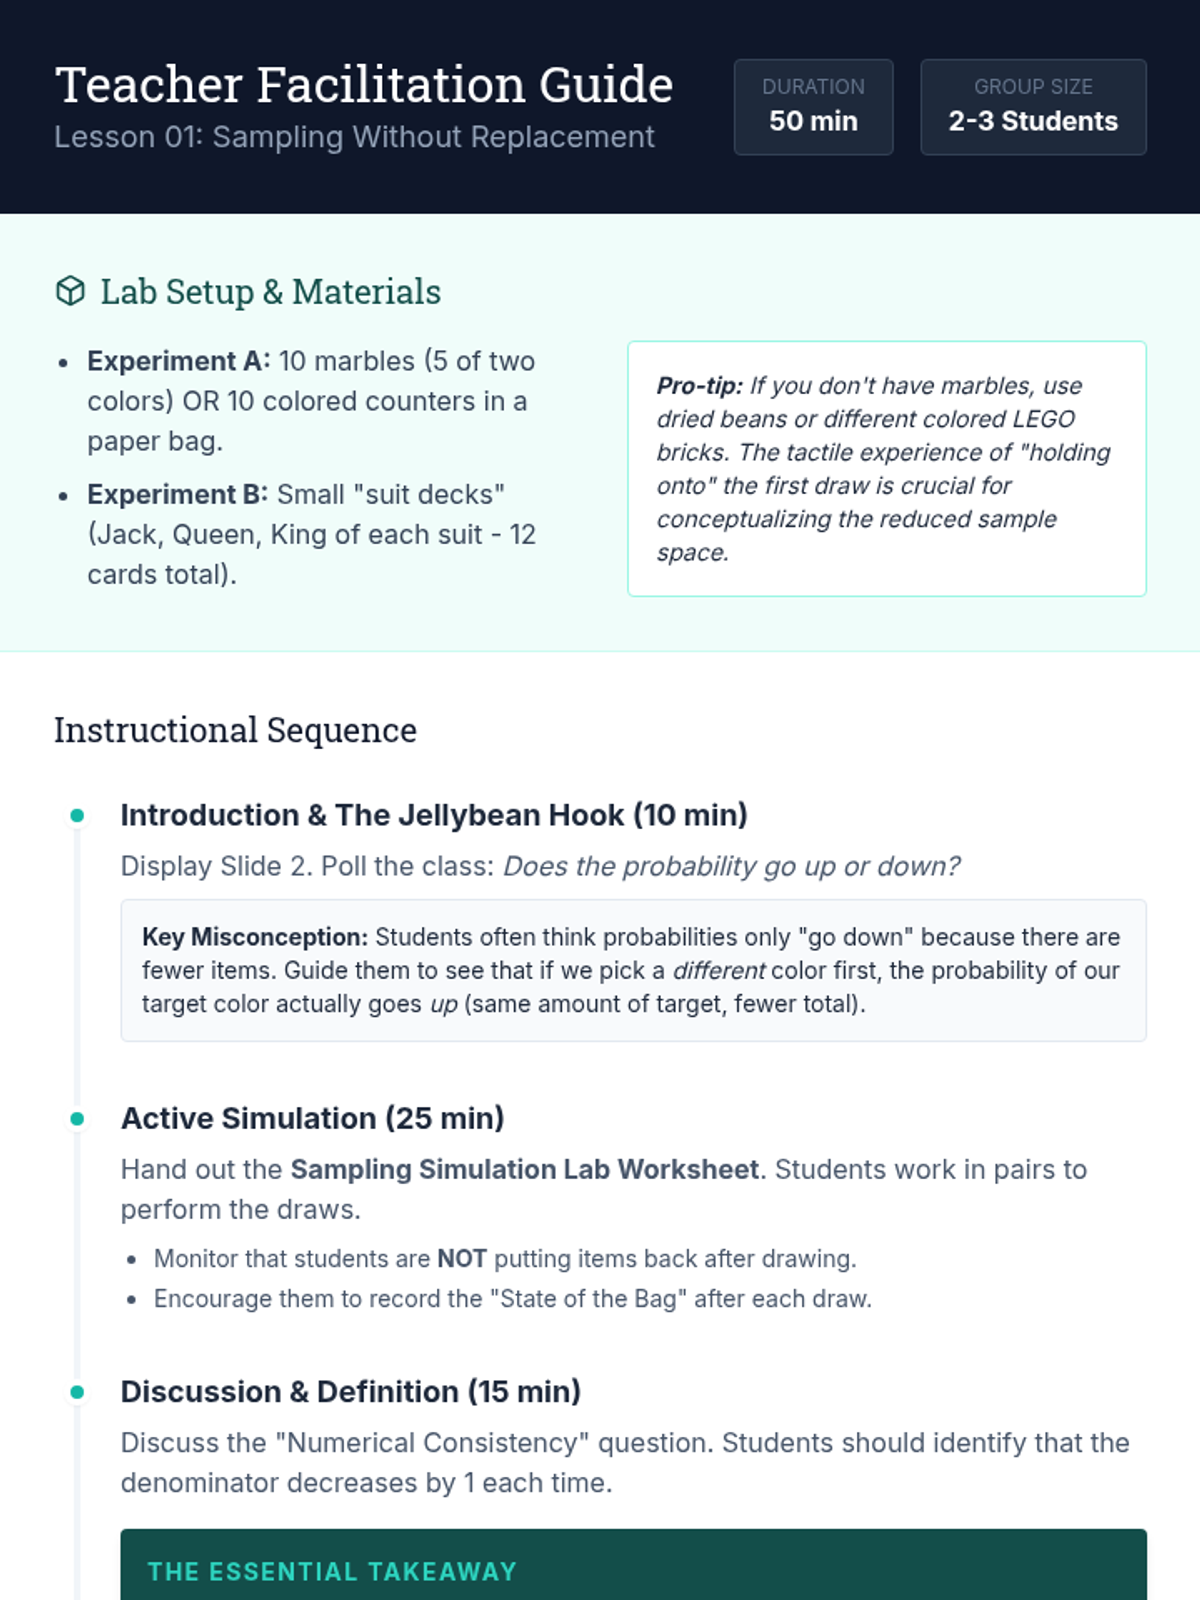
A comprehensive unit on dependent events and conditional probability, exploring how sequential choices change outcomes through simulations, formal notation, and real-world case studies.
A 9th-grade exploration into the world of independent events, where students use game-based inquiry to discover the multiplication rule of probability and apply it to design fair (and unfair) games.
A deep dive into compound event probability, moving from conceptual independence to the algebraic rigor of the Multiplication Rule and conditional logic. Students analyze sports streaks, card games, and forensic evidence to master independent and dependent probabilities.
A 10-day intensive review sequence for the Texas Algebra I EOC exam, focusing on two high-stakes vocabulary terms each day with definitions, visual samples, and practice problems.