Data representation, distributions, and statistical variability using sampling and inference techniques. Integrates probability models, compound events, bivariate patterns, and linear models to guide data-driven decision making.
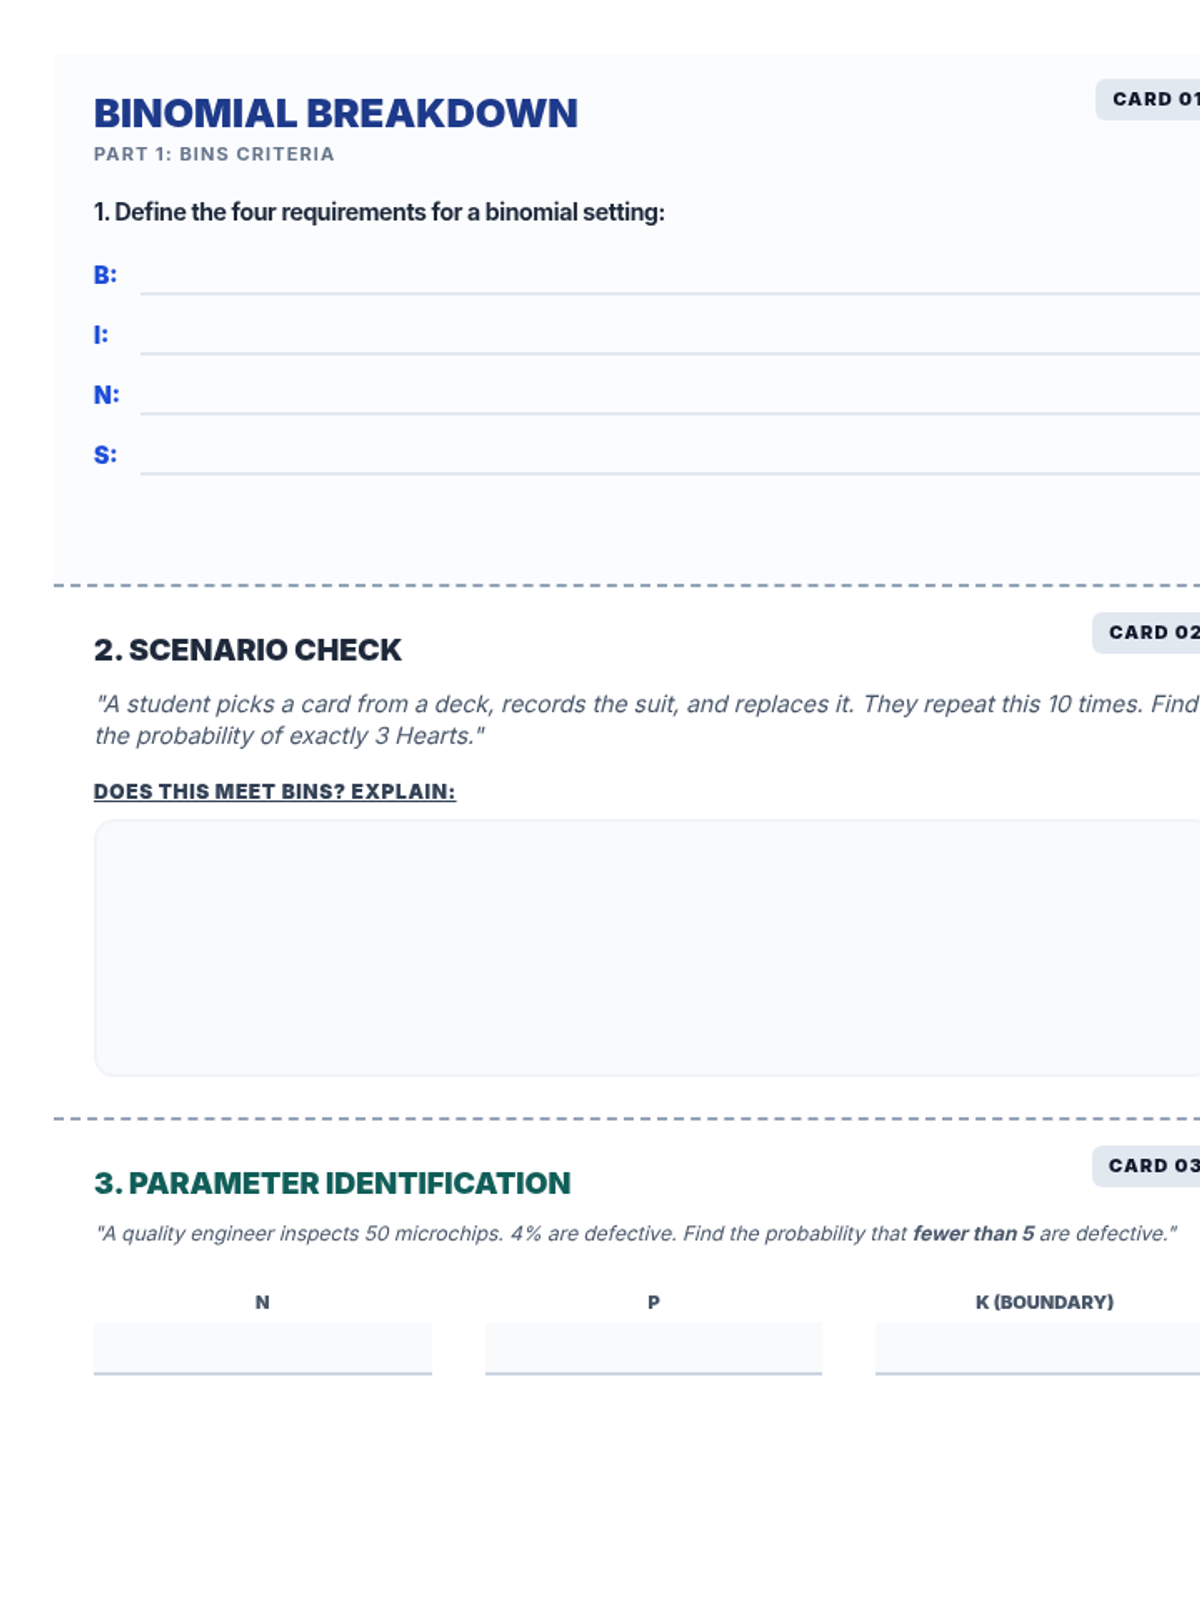
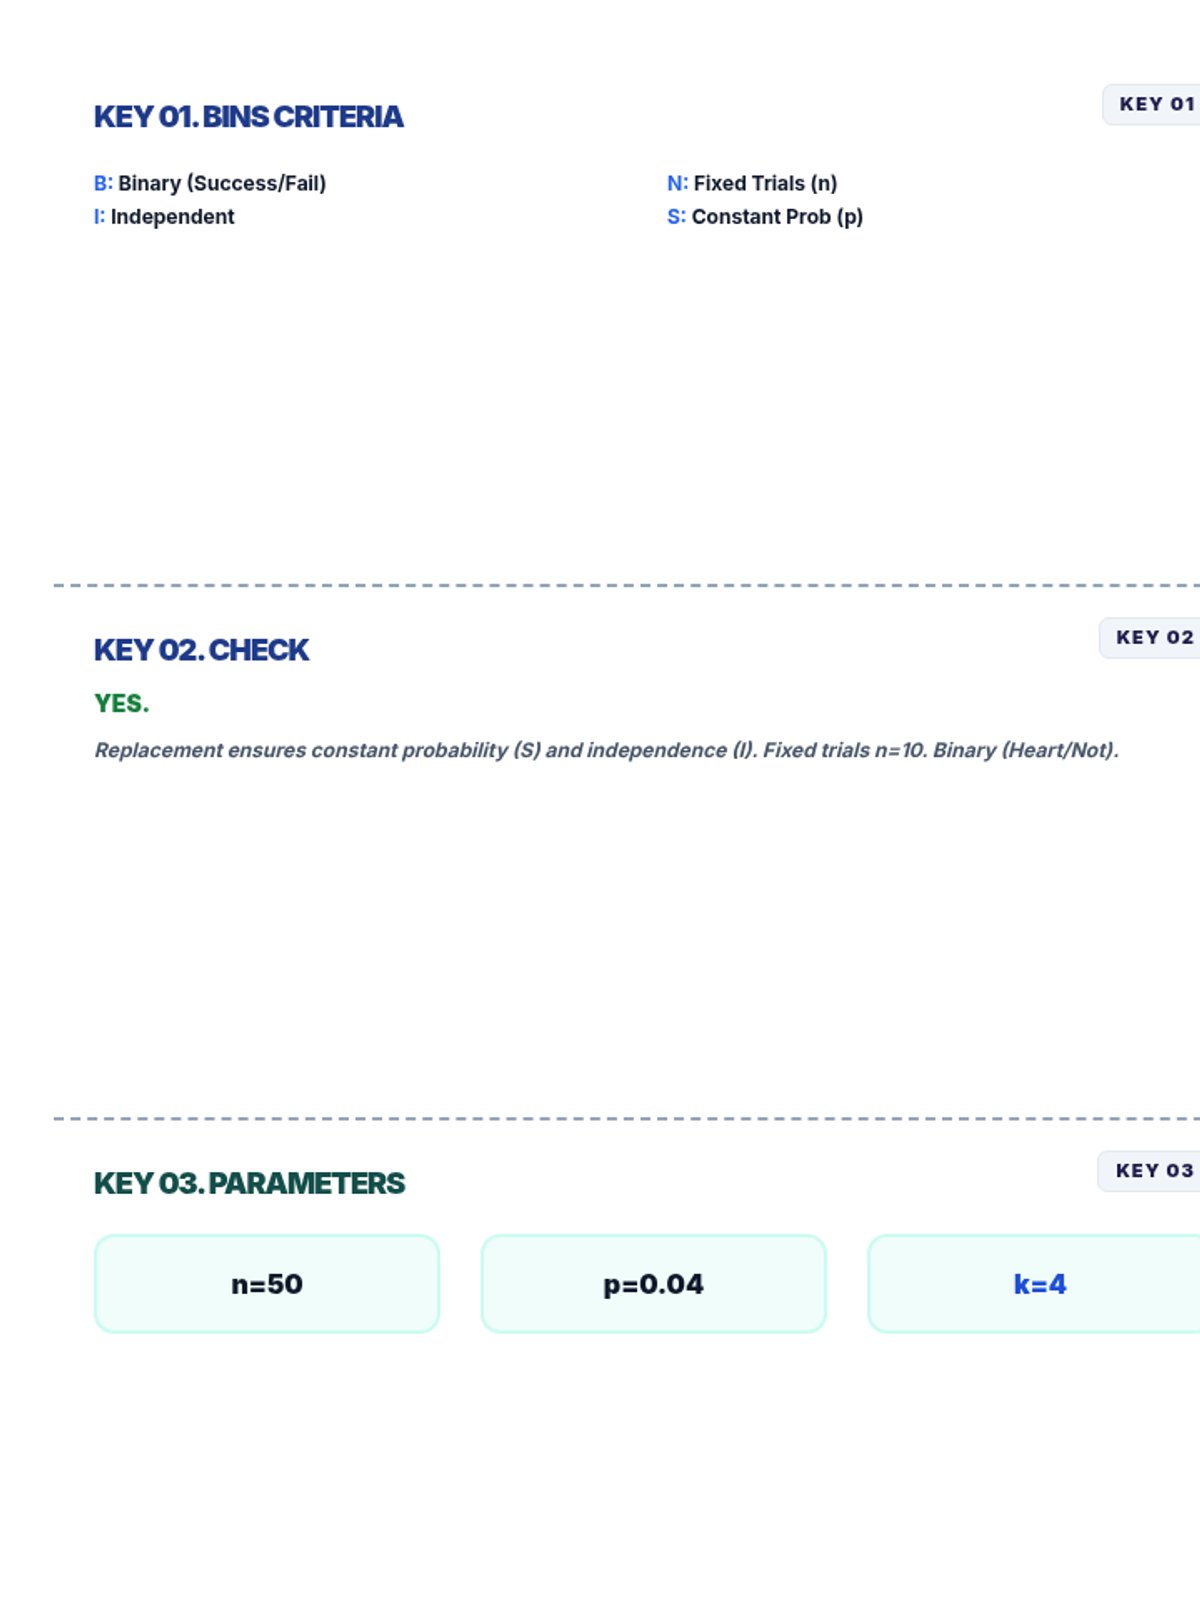
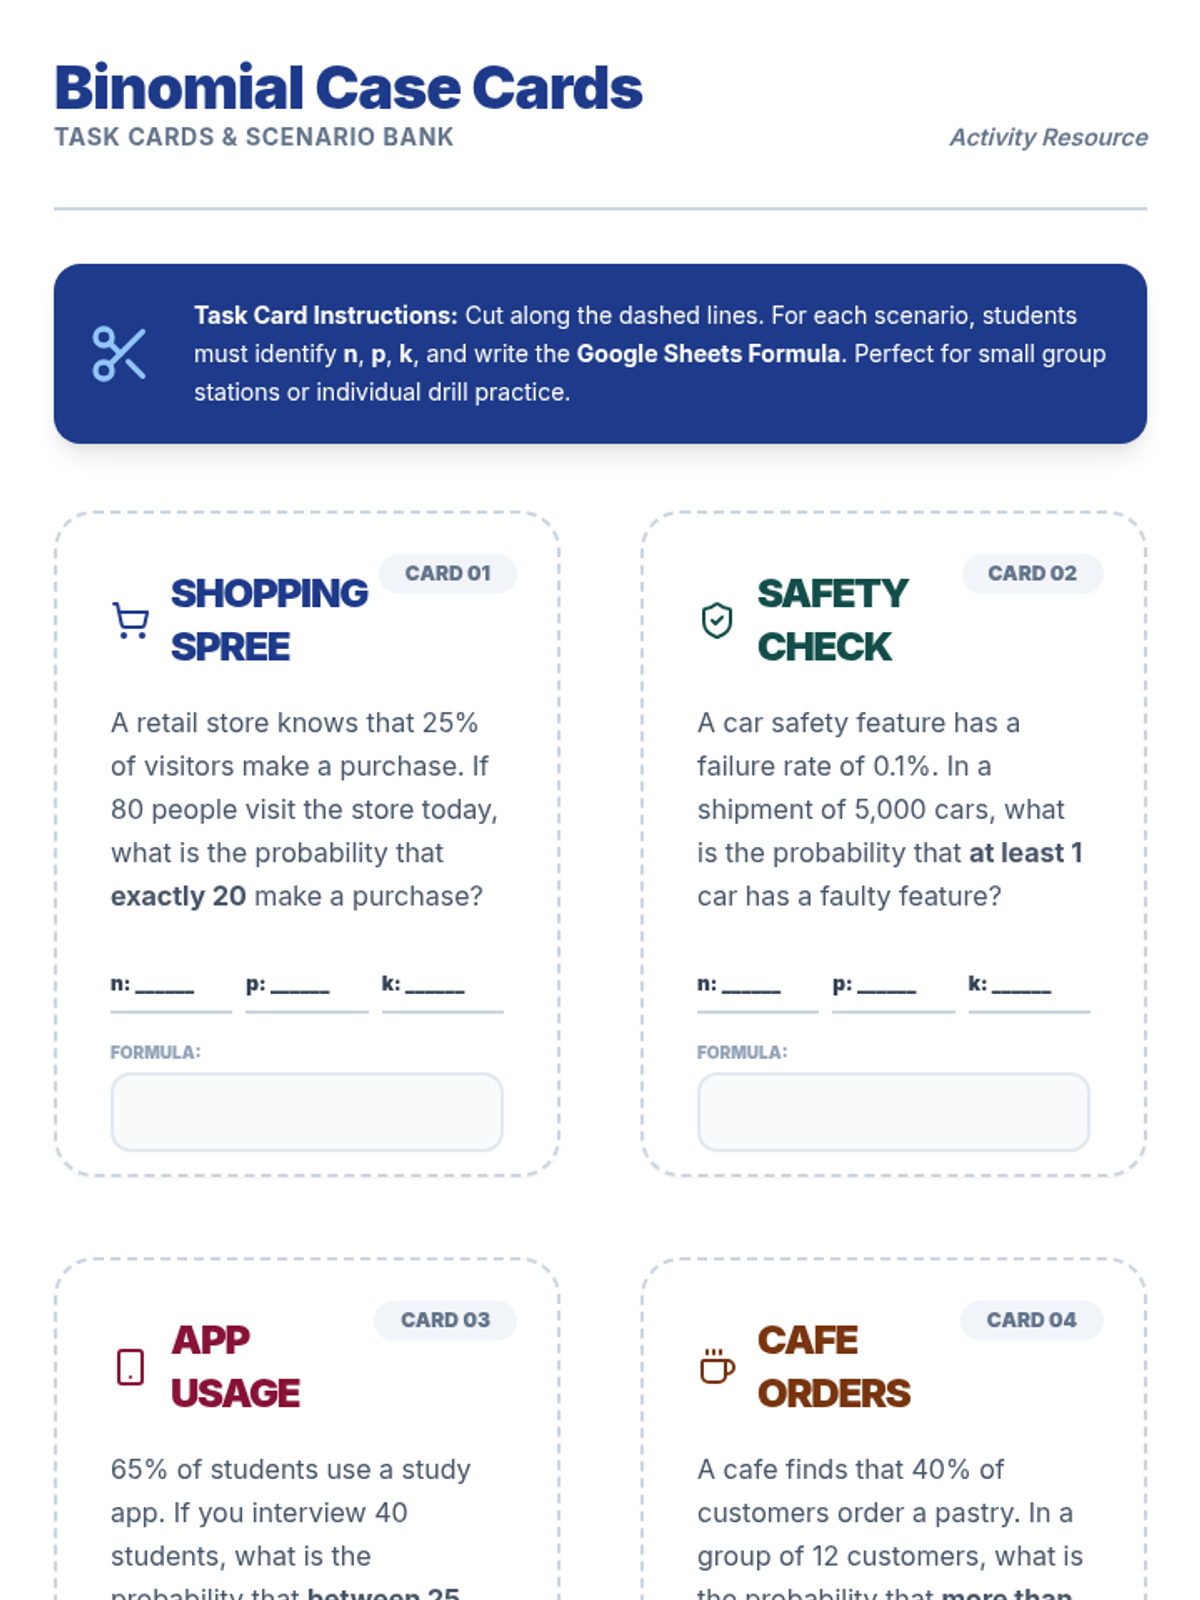
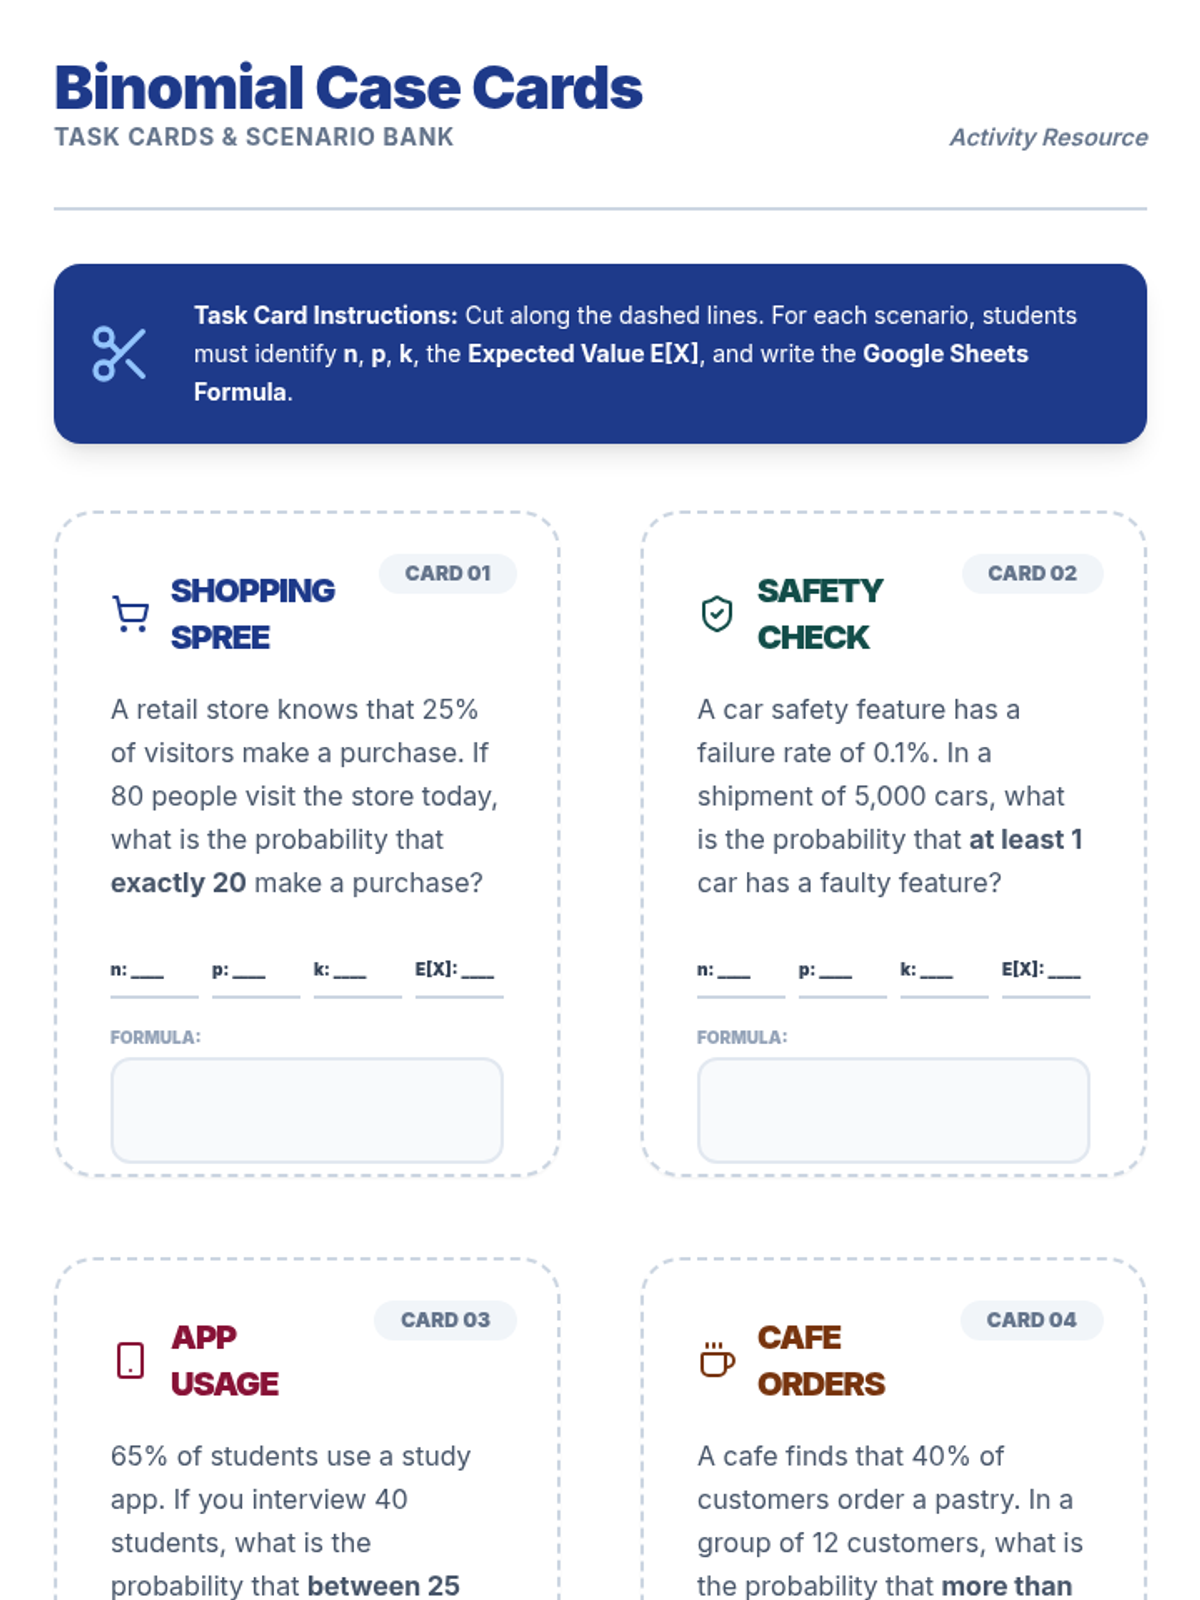
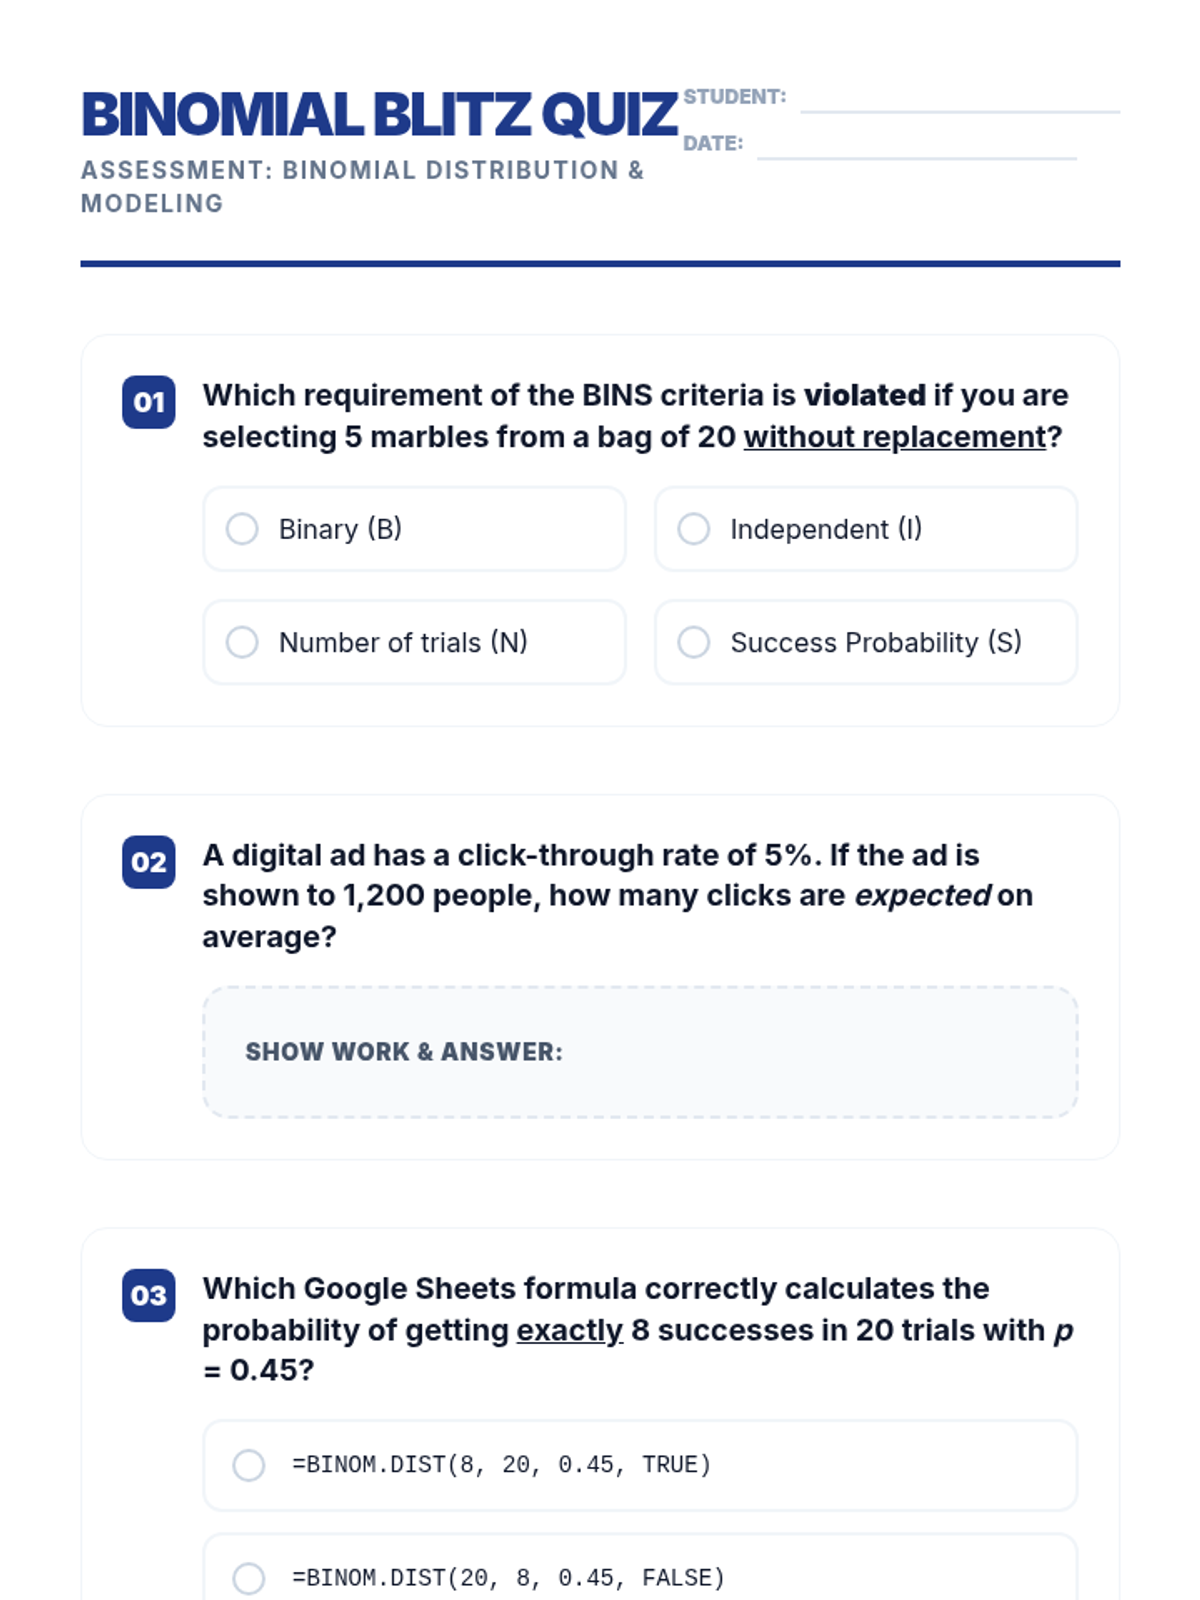
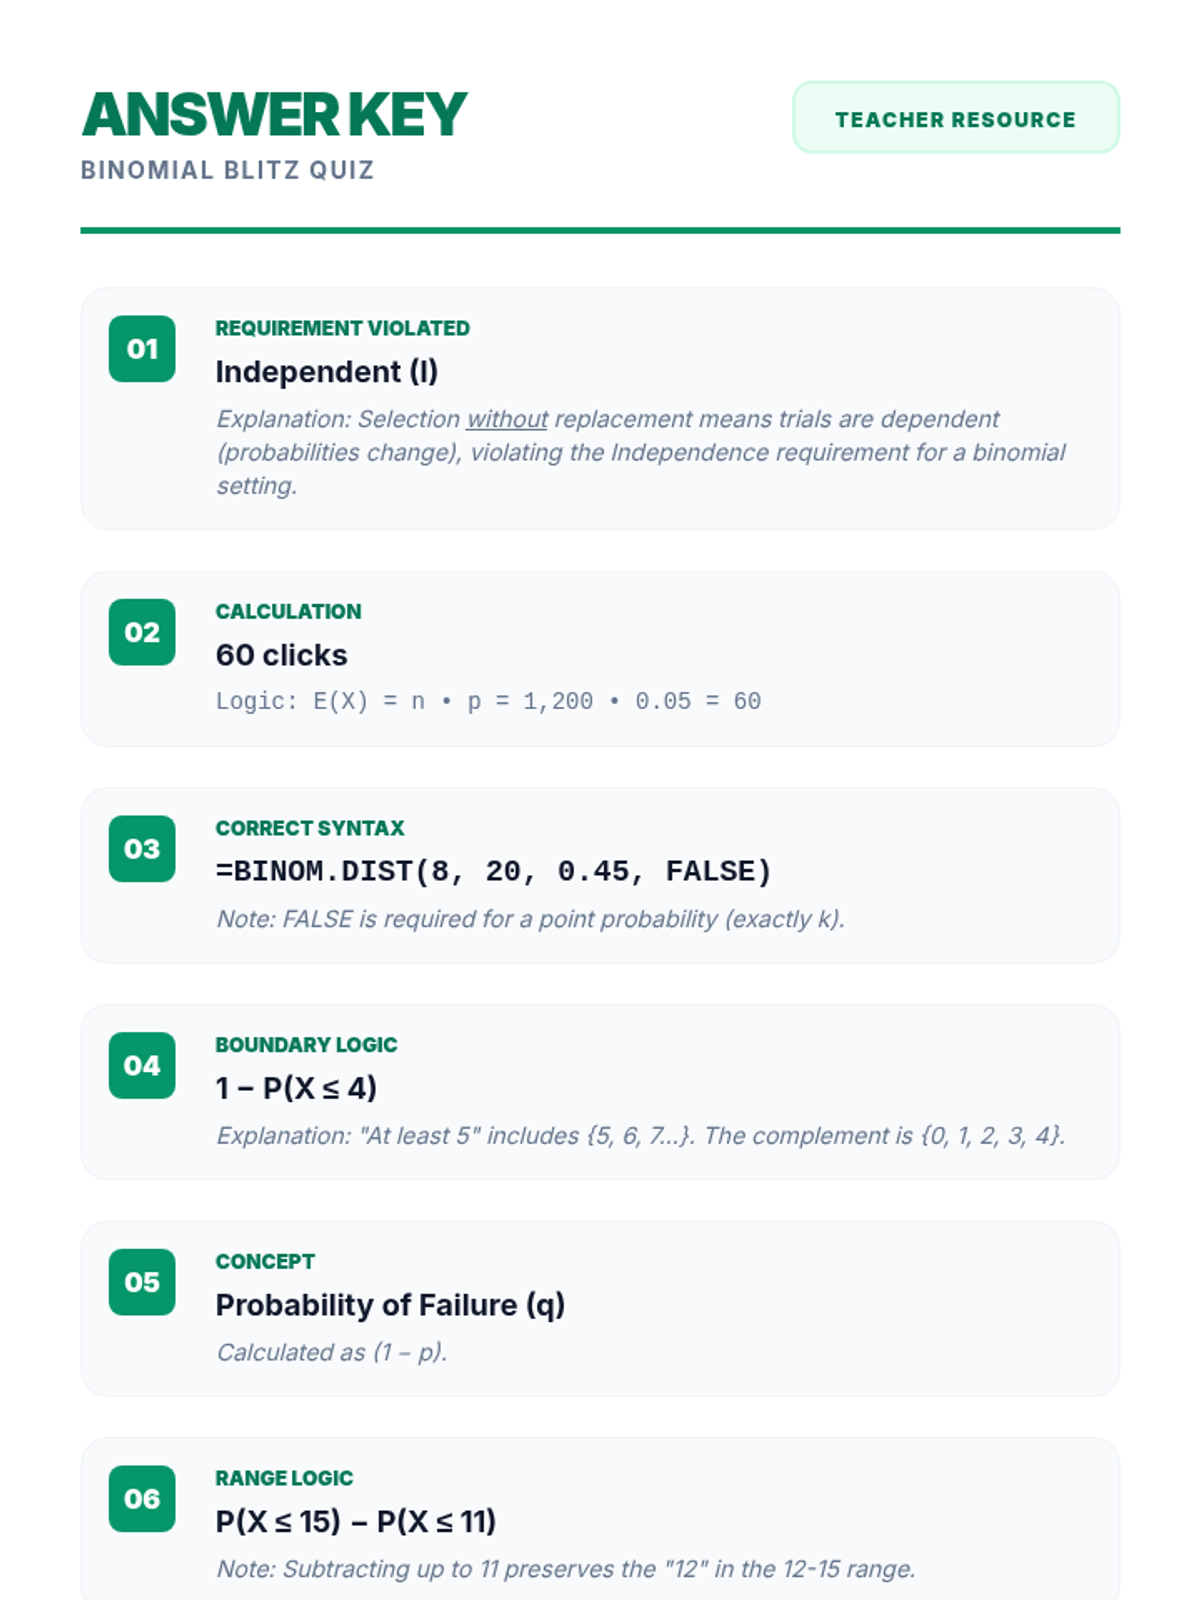
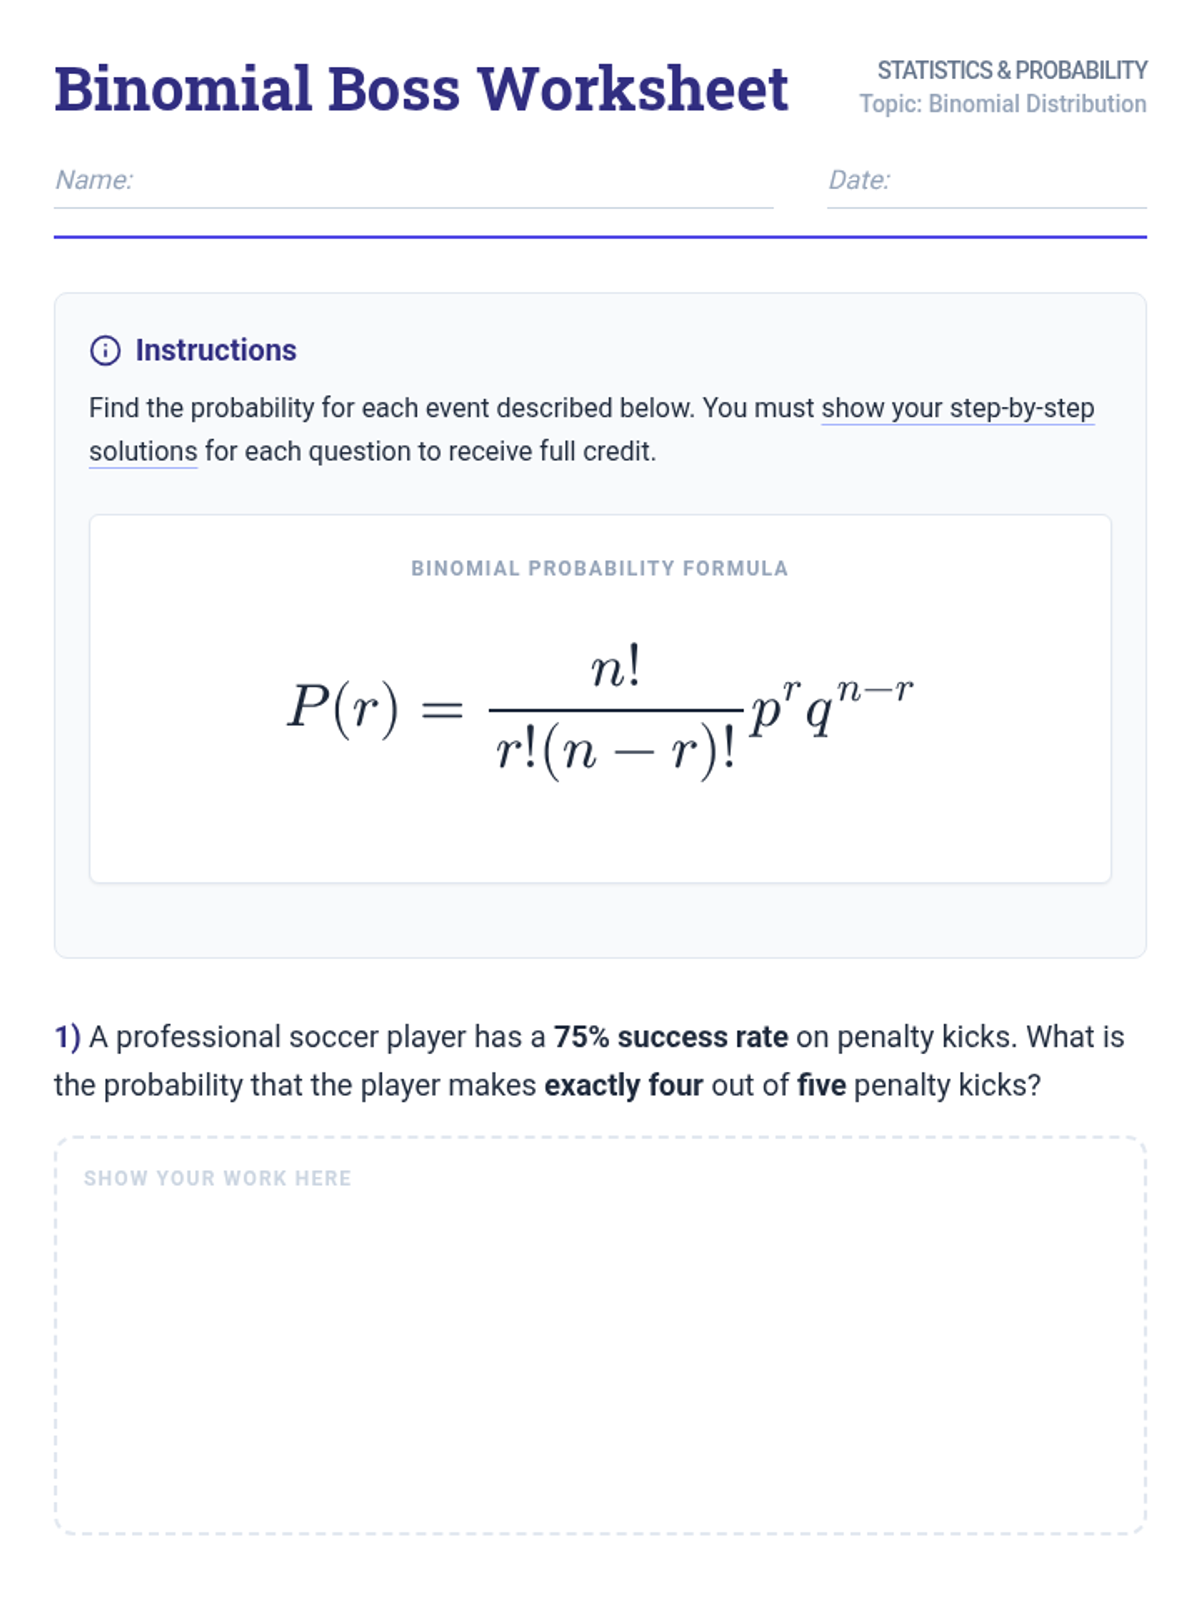
A focused lesson on the binomial distribution, covering the BINS criteria, identifying parameters, and calculating probabilities using digital spreadsheet tools.
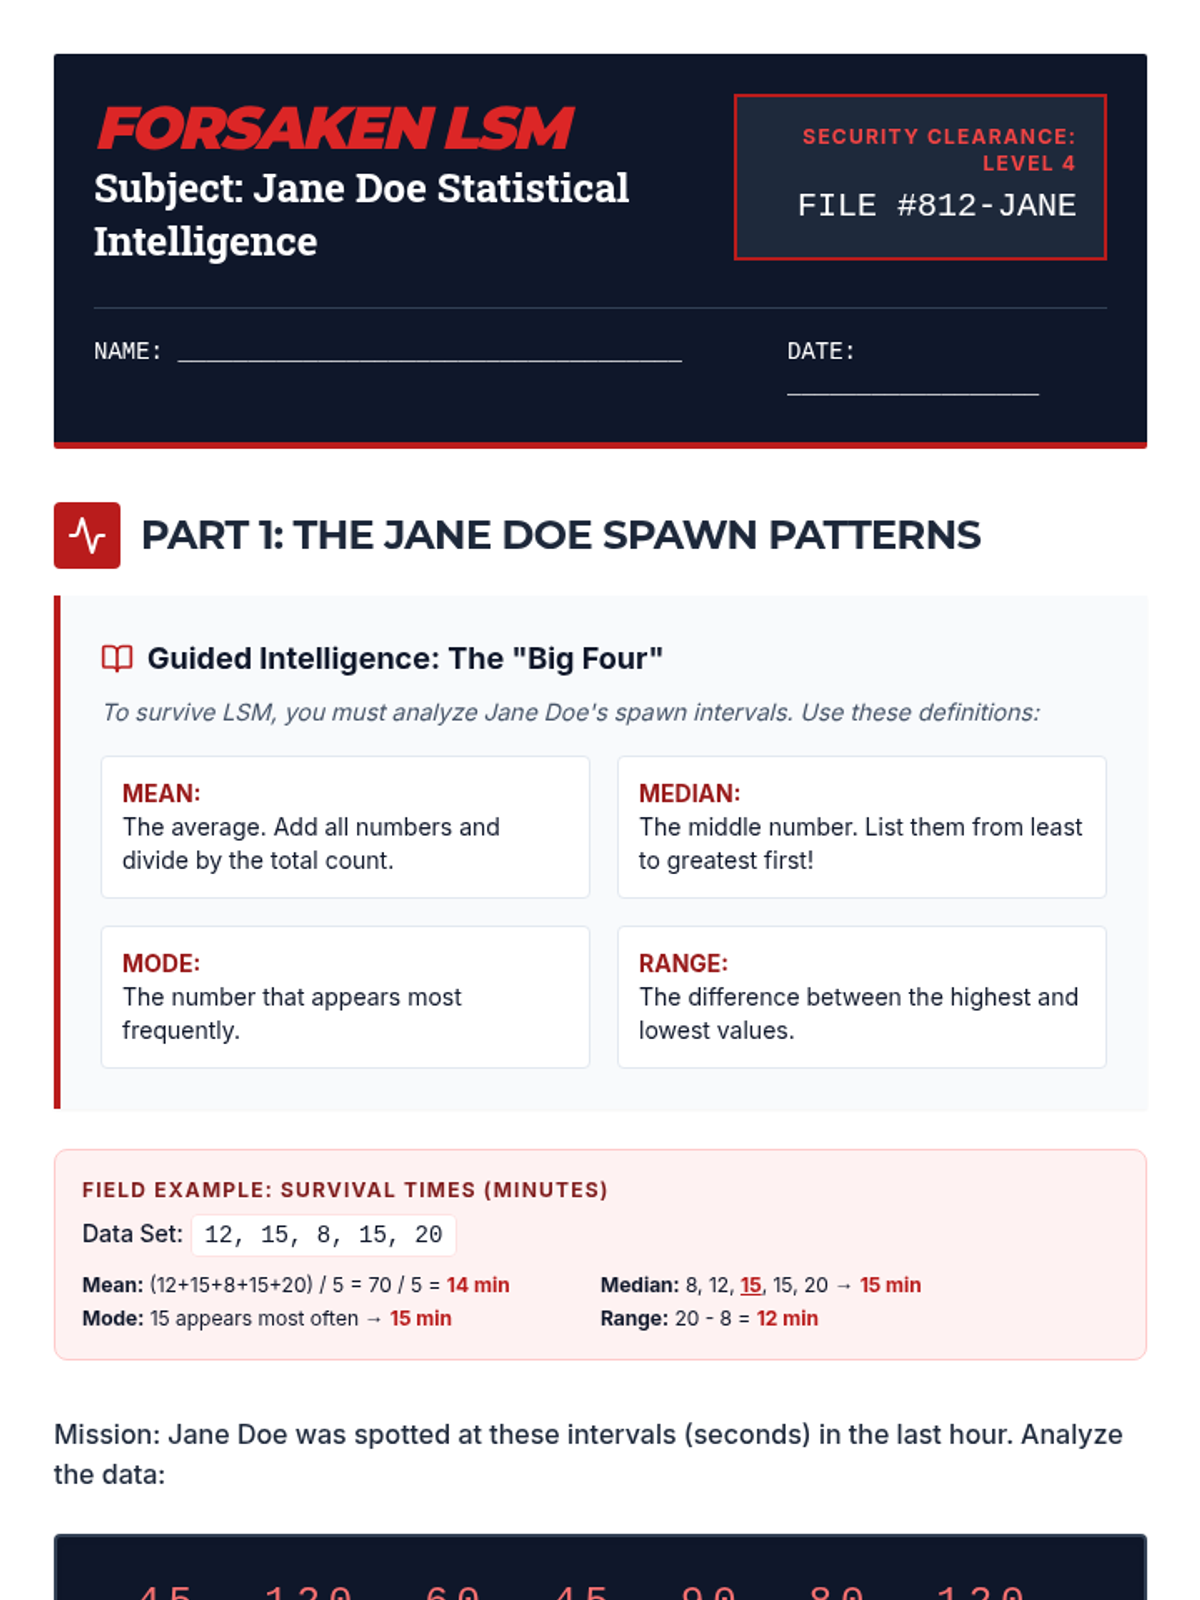
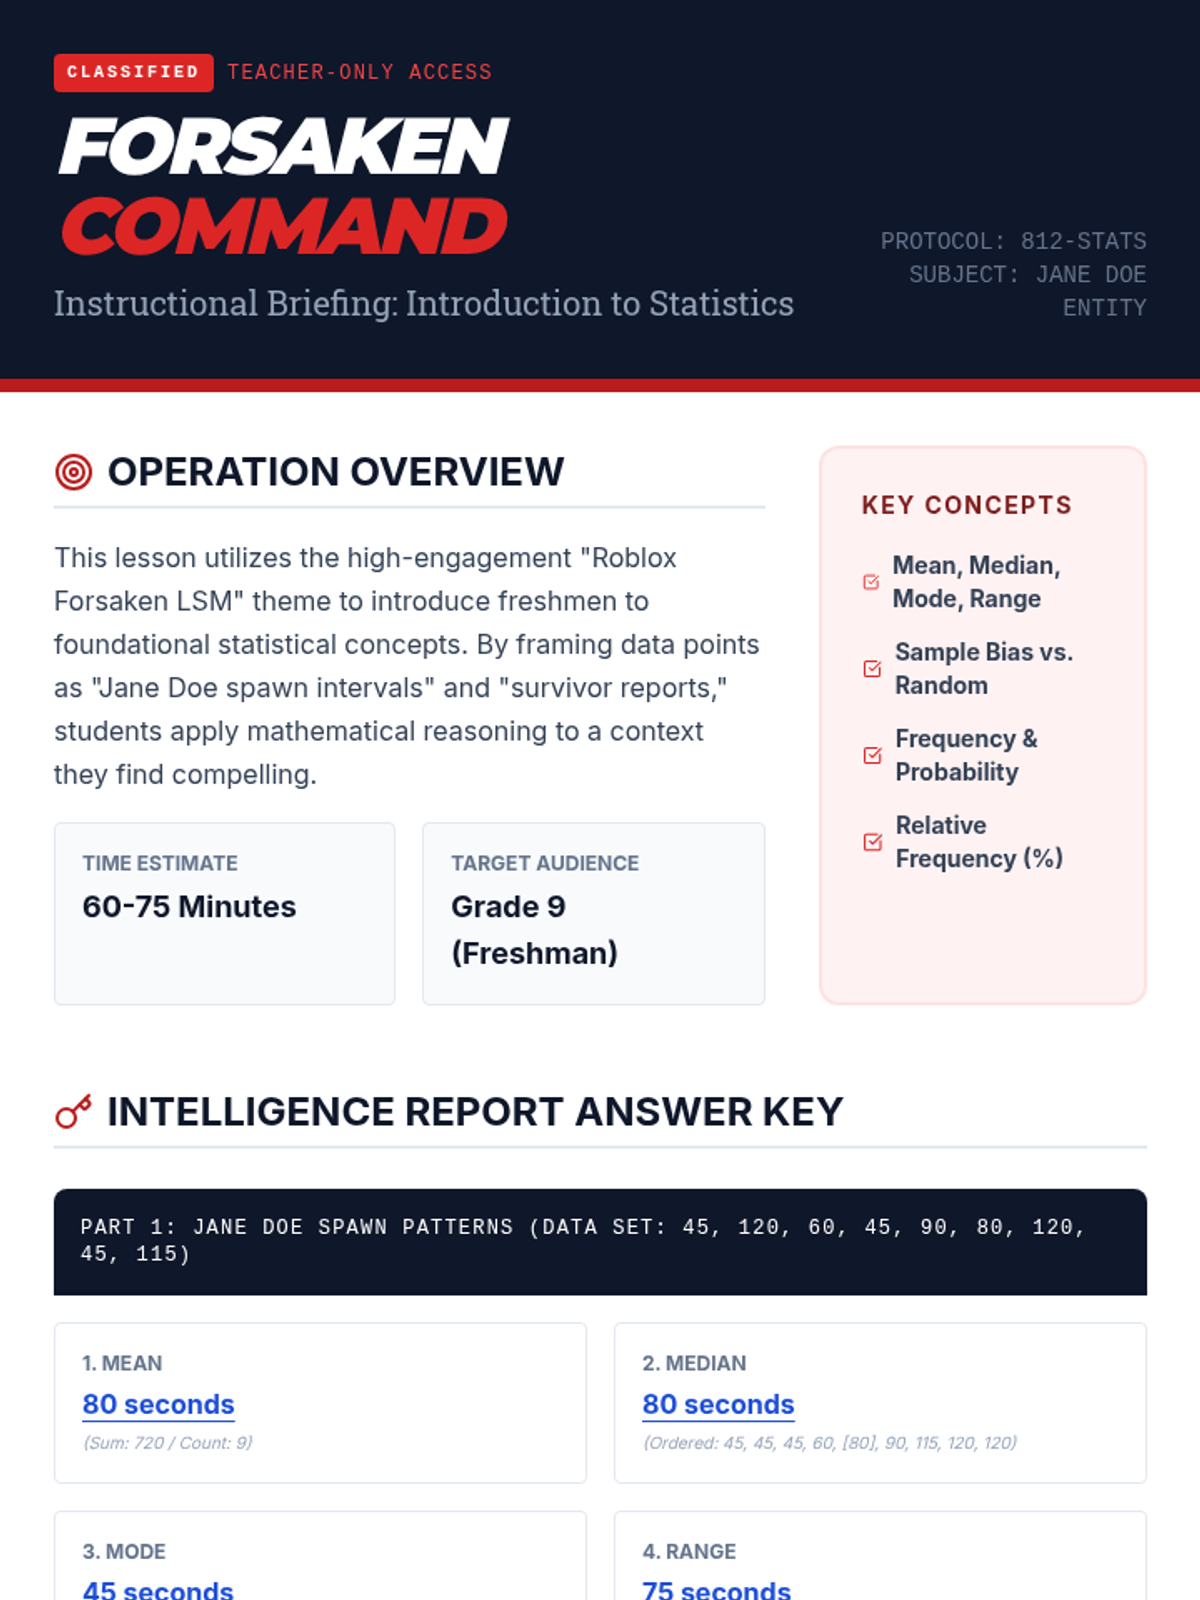
An introductory statistics lesson themed around Roblox Forsaken LSM and the Jane Doe entity, covering central tendency, data collection, and probability.
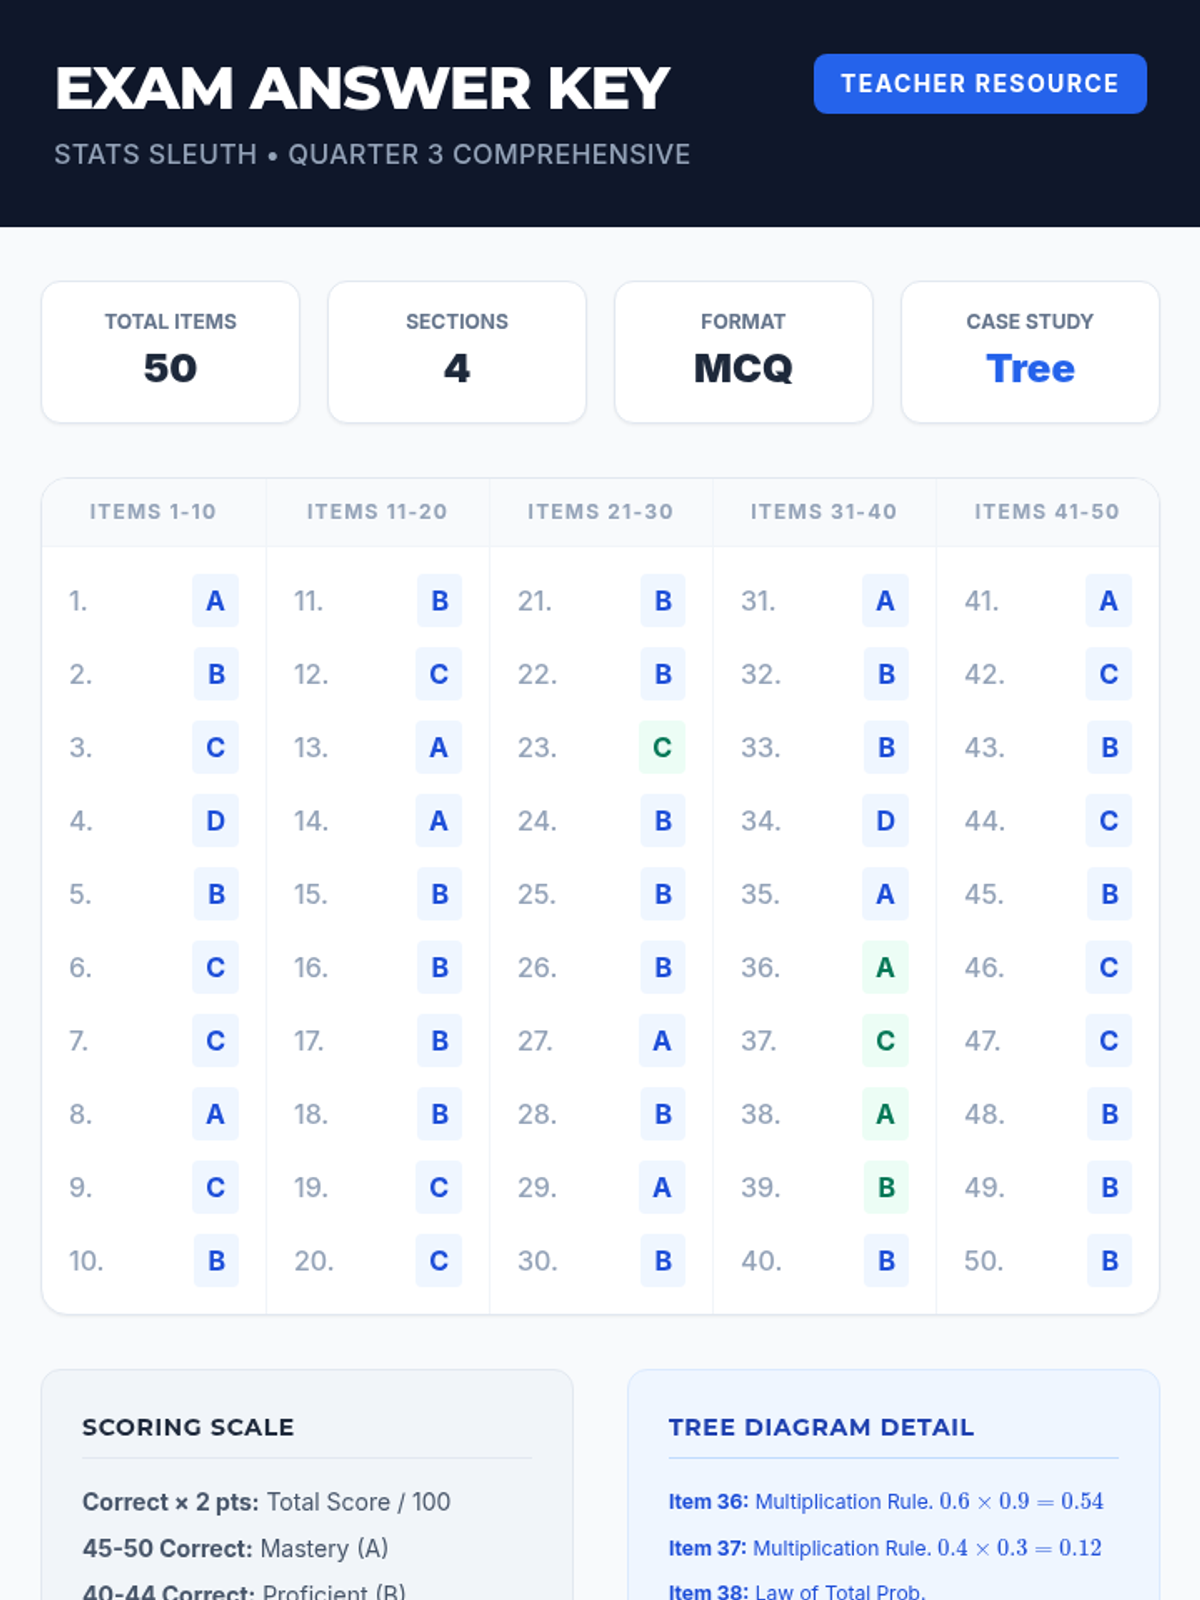
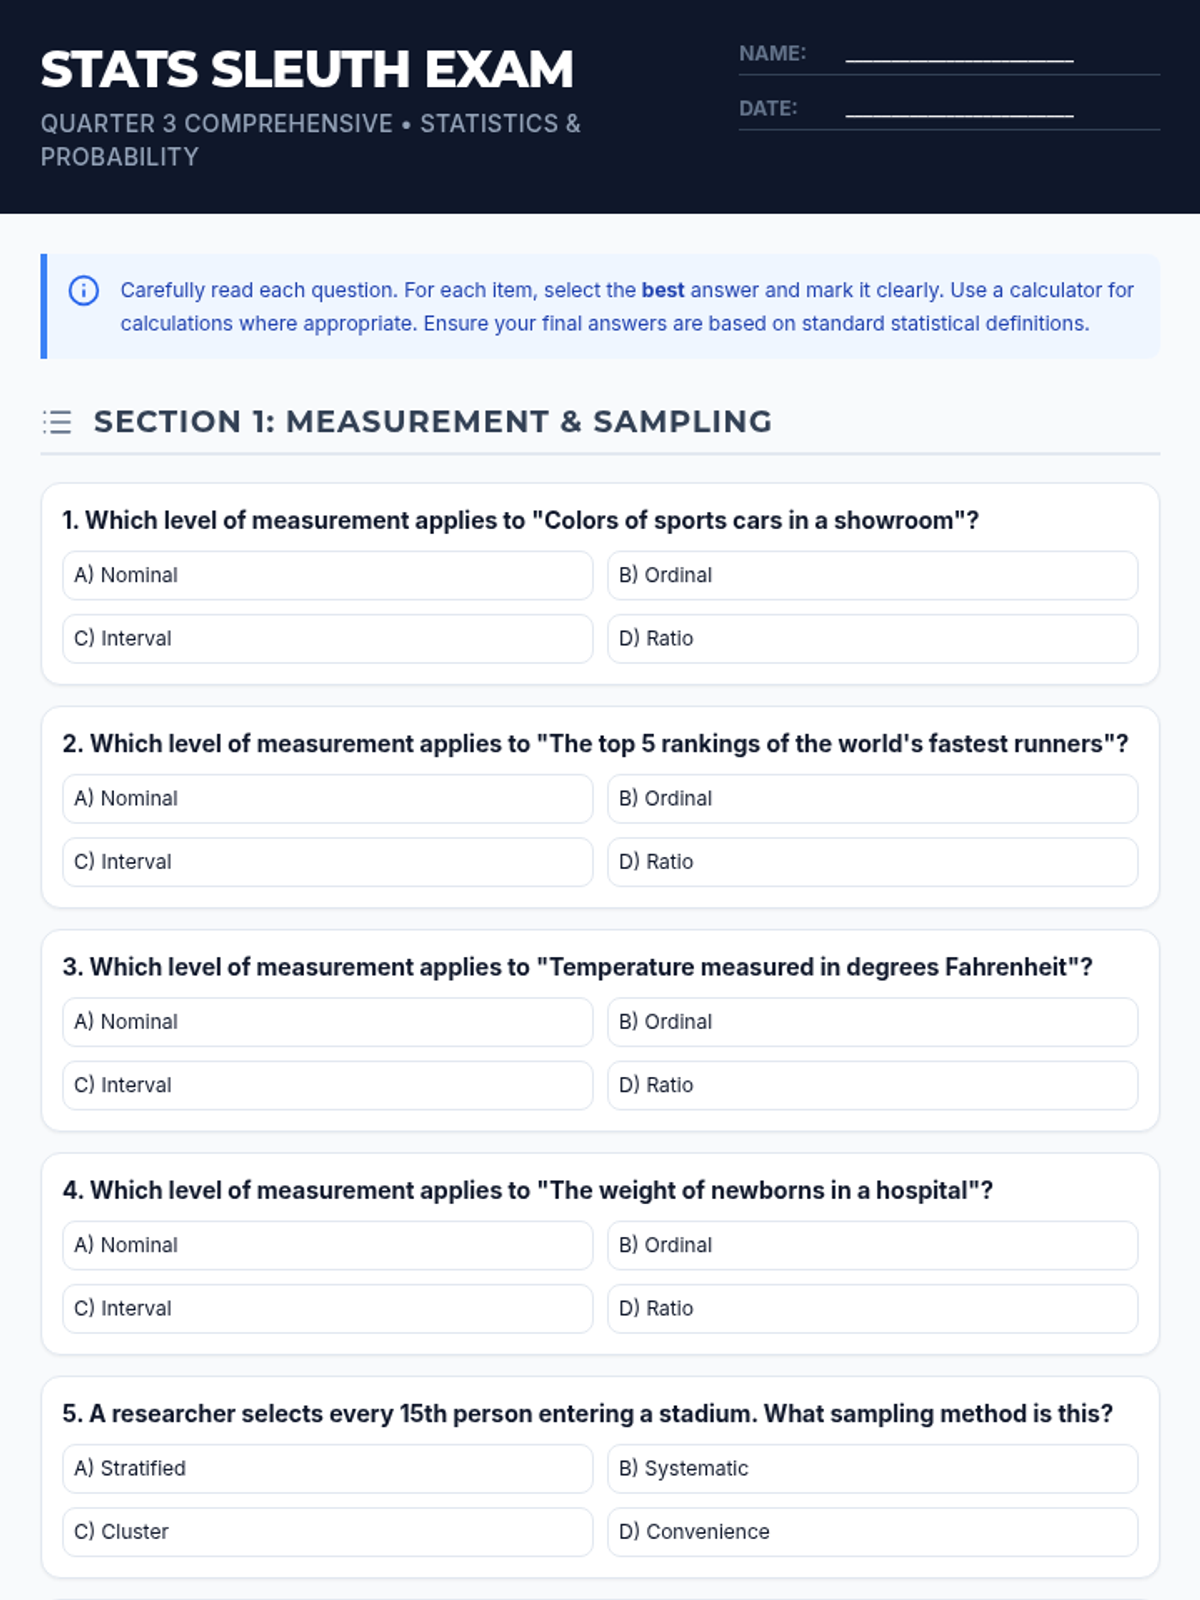
A comprehensive assessment covering descriptive statistics, data distributions, measures of variation, and basic probability theory including tree diagrams.
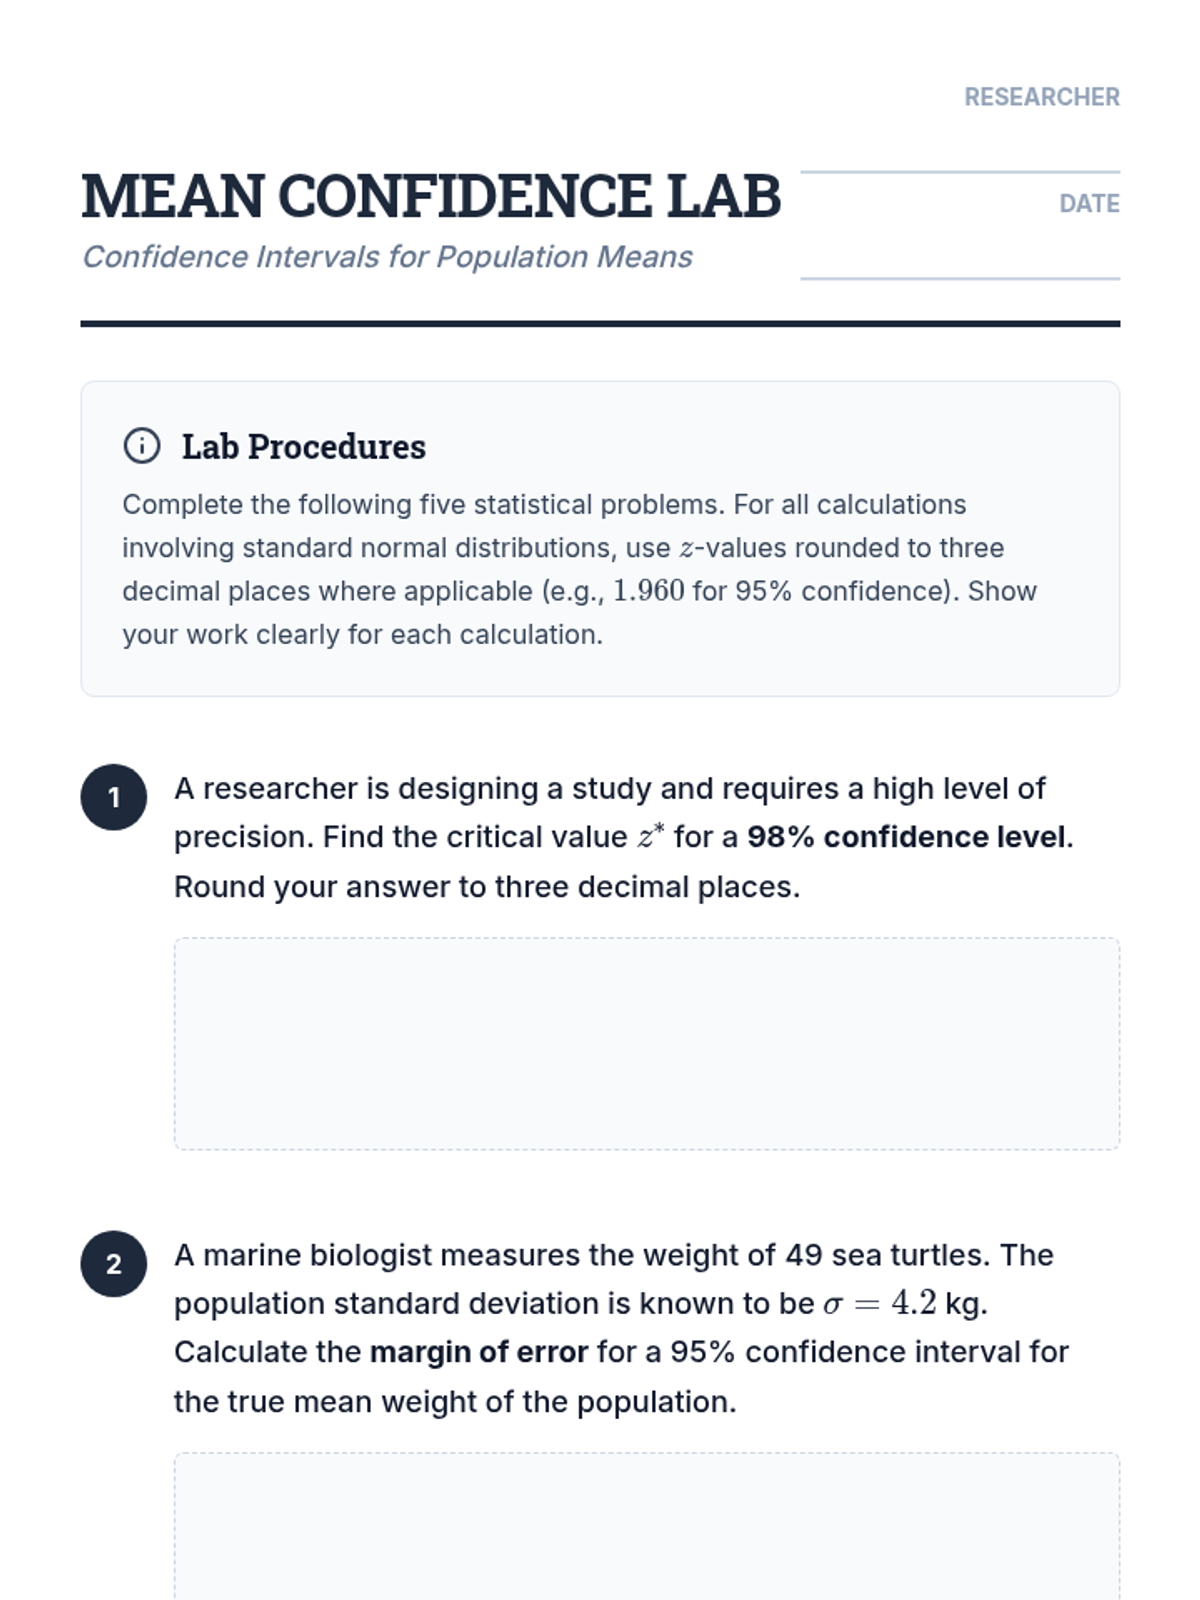
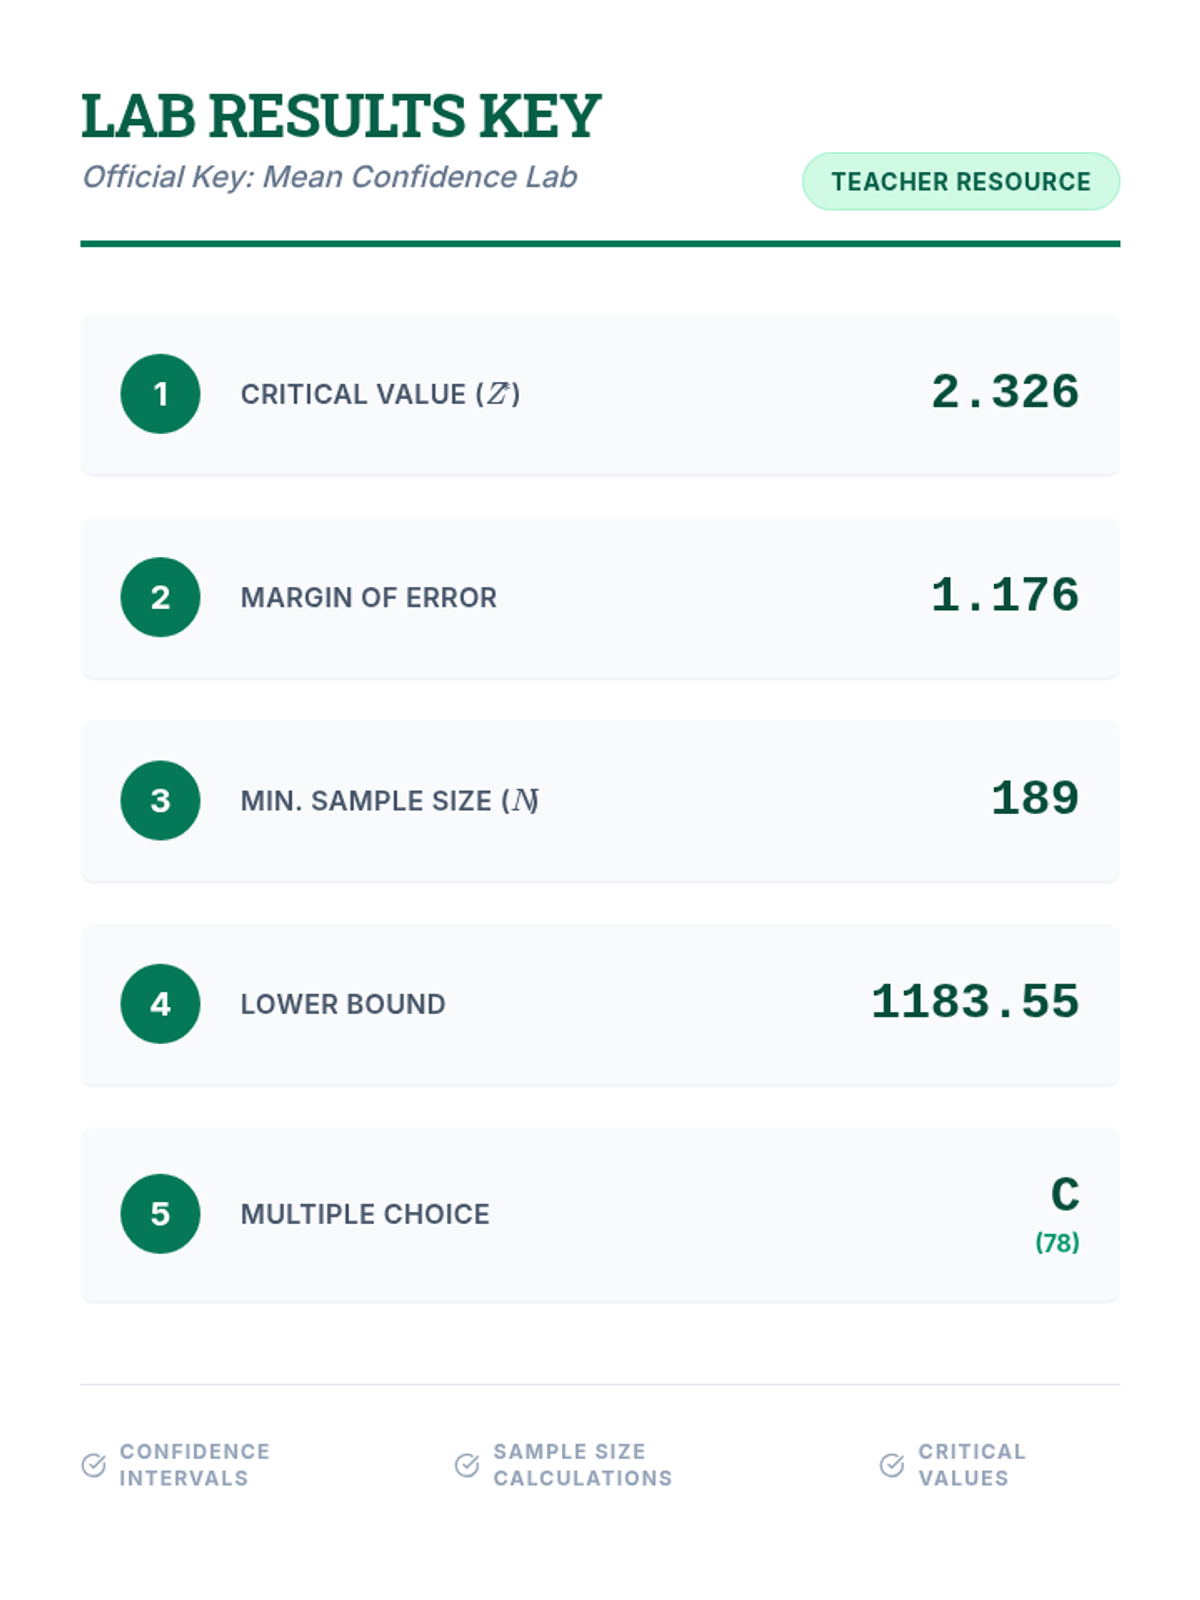
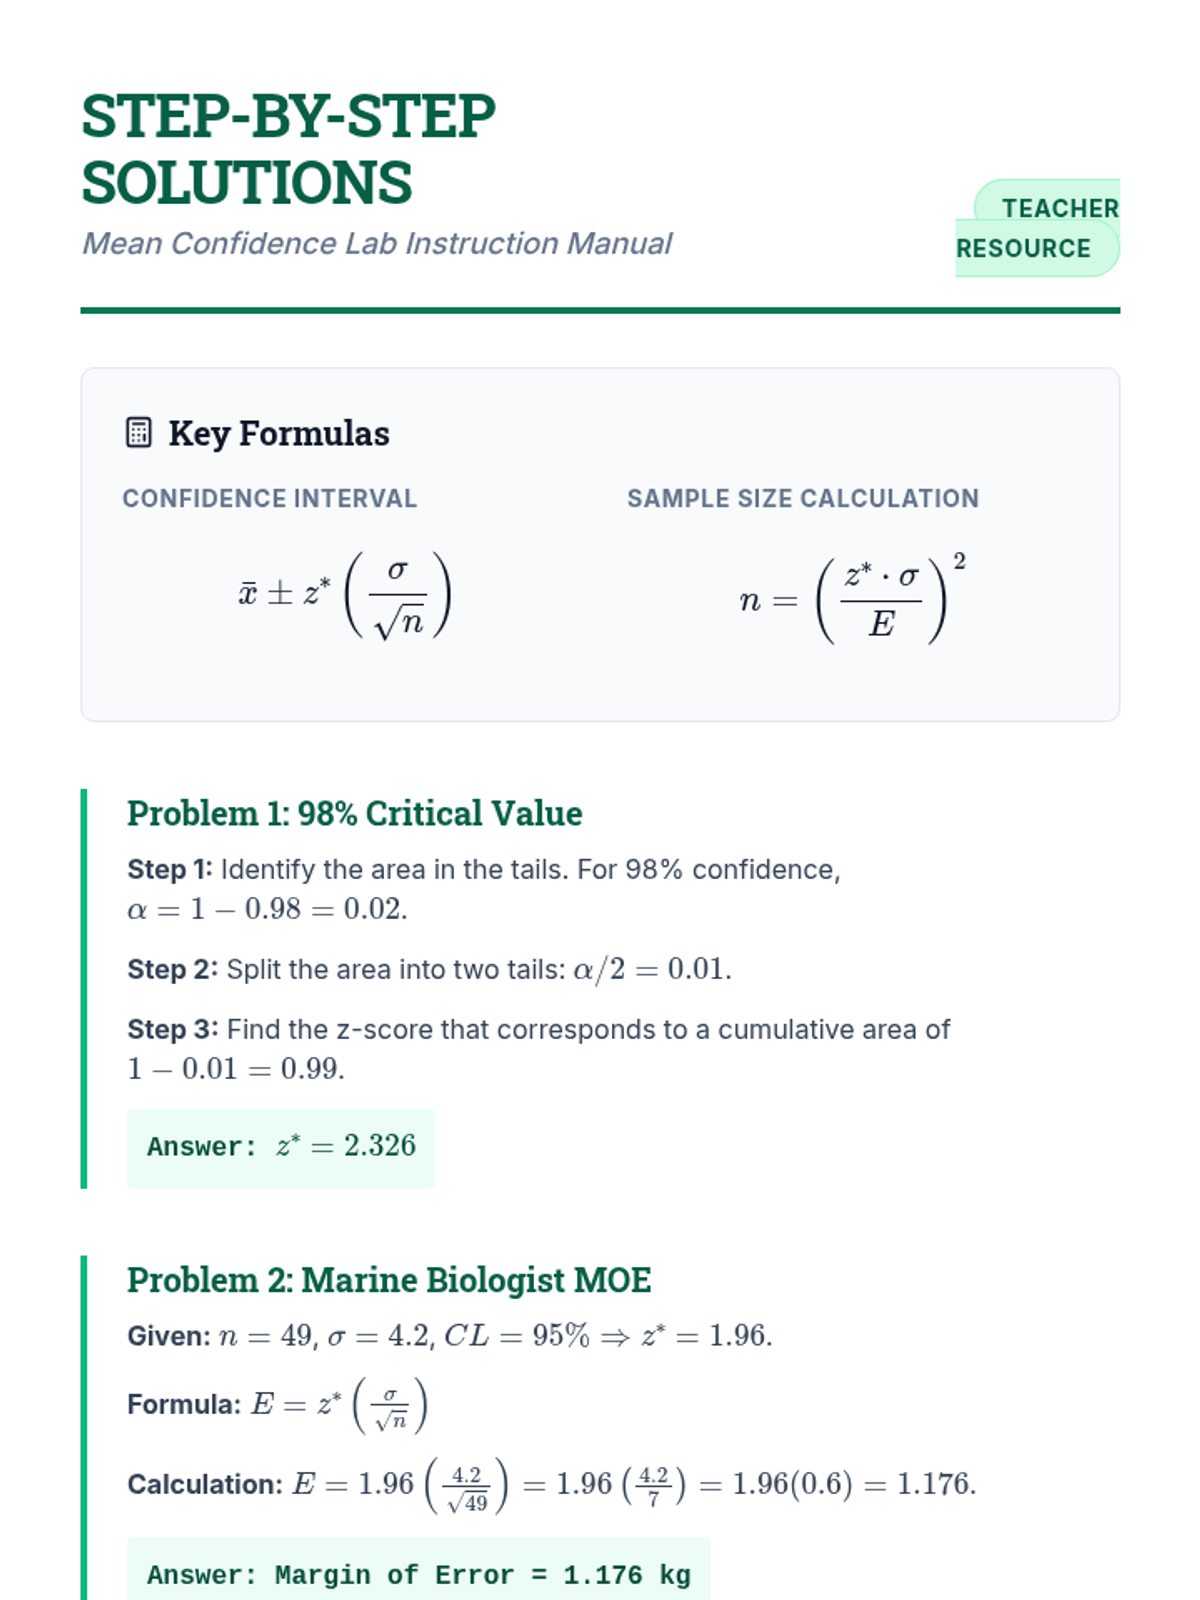
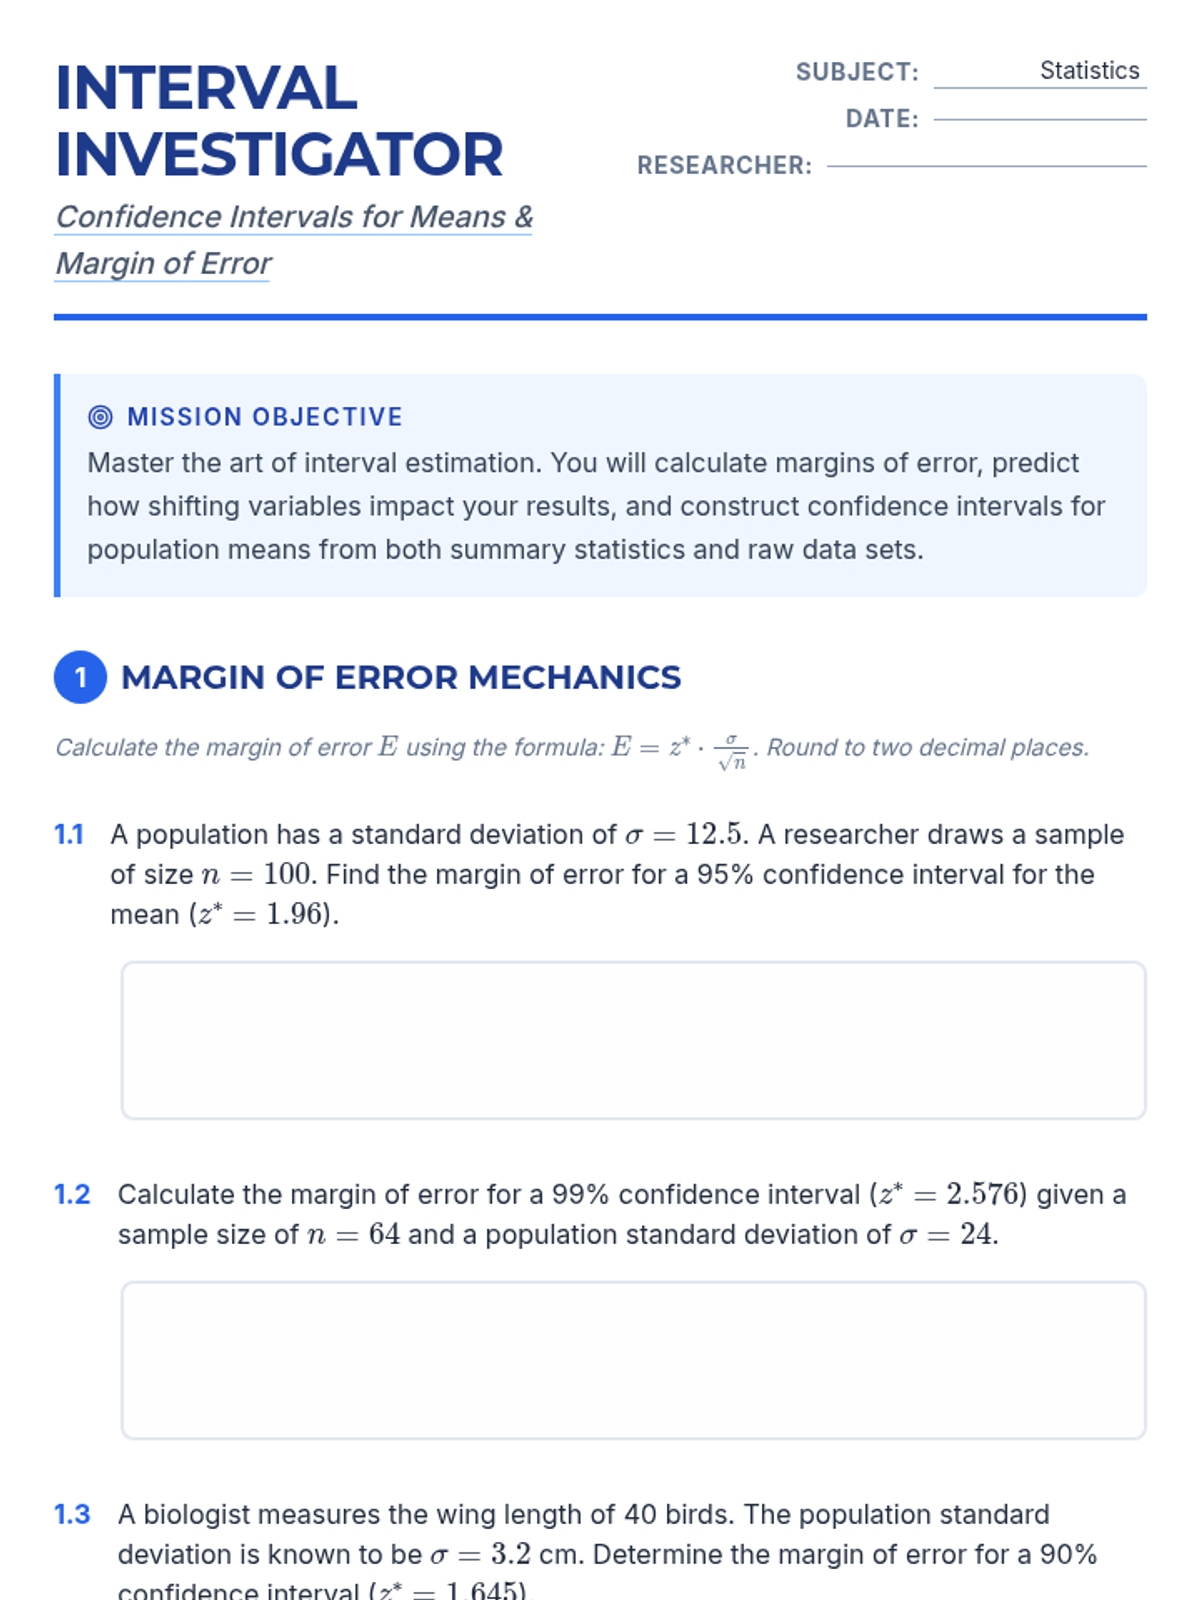
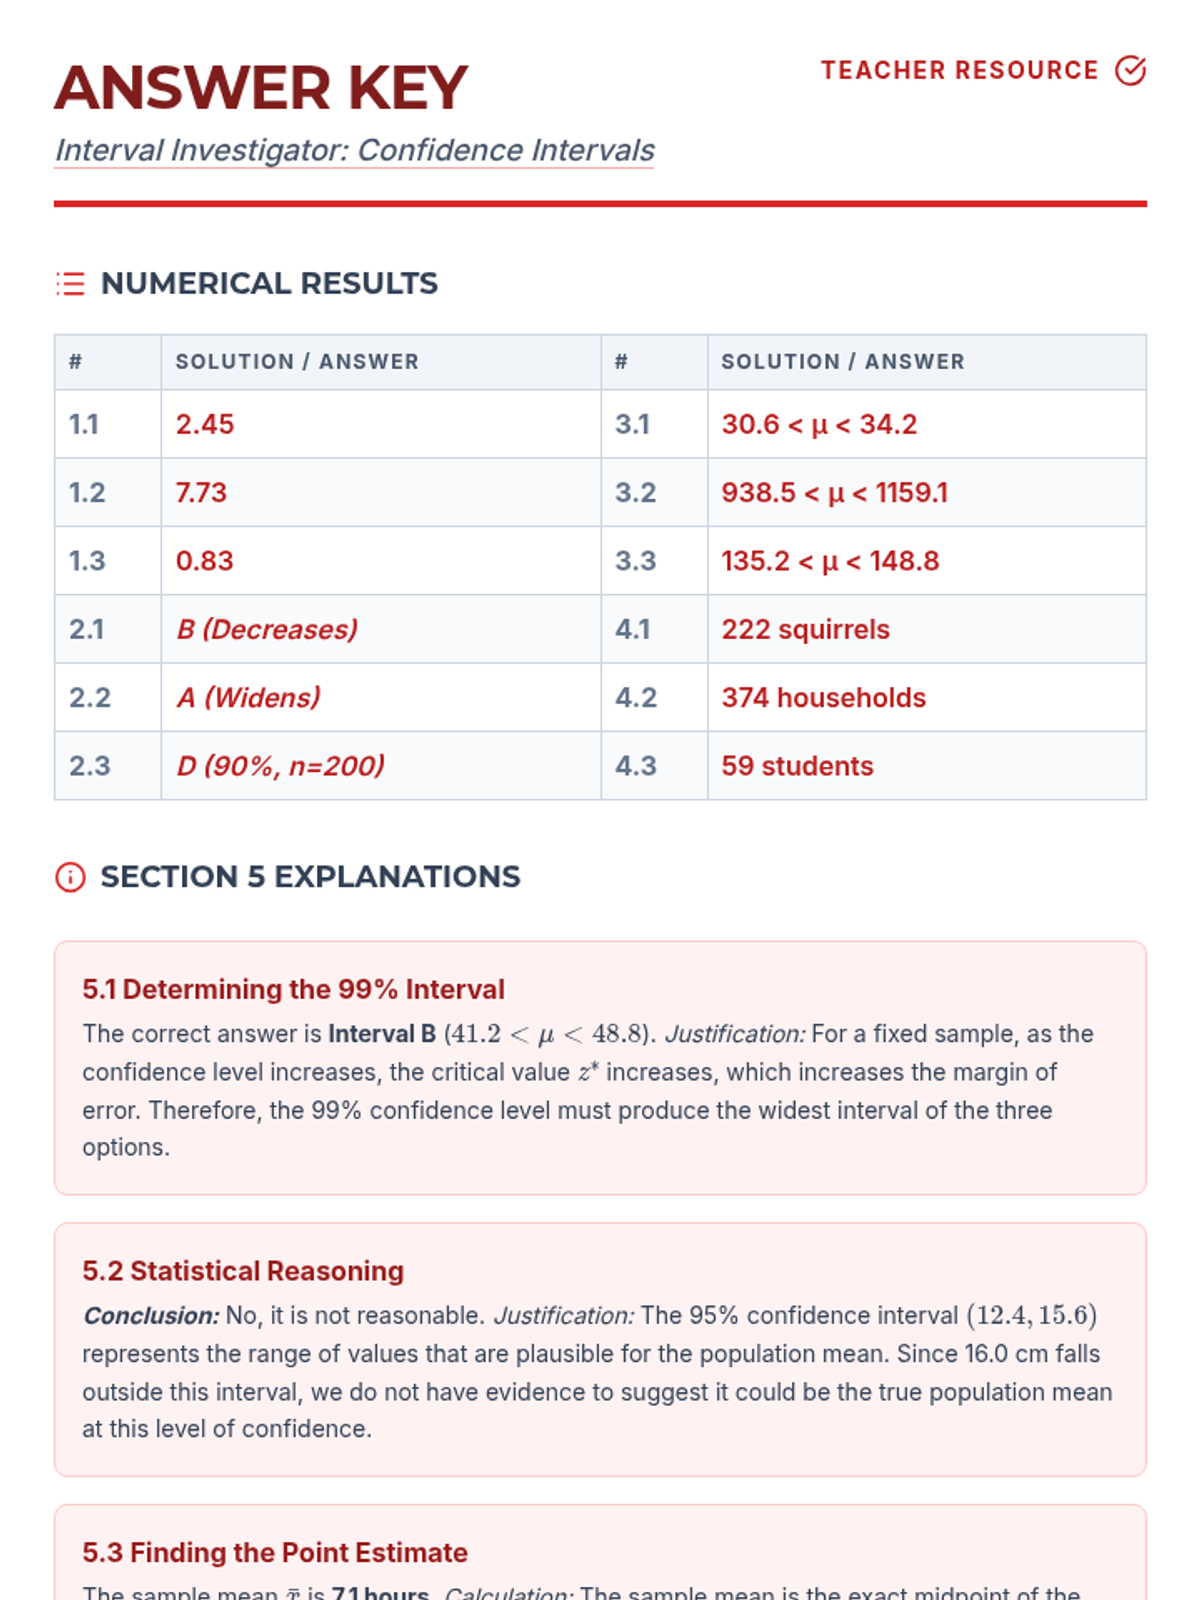
A focused practice set on calculating confidence intervals for means, finding critical values, and determining minimum sample sizes for specific margins of error.
A comprehensive lesson focusing on constructing and interpreting confidence intervals for population means, specifically targeting how various factors like sample size and confidence level influence the margin of error.
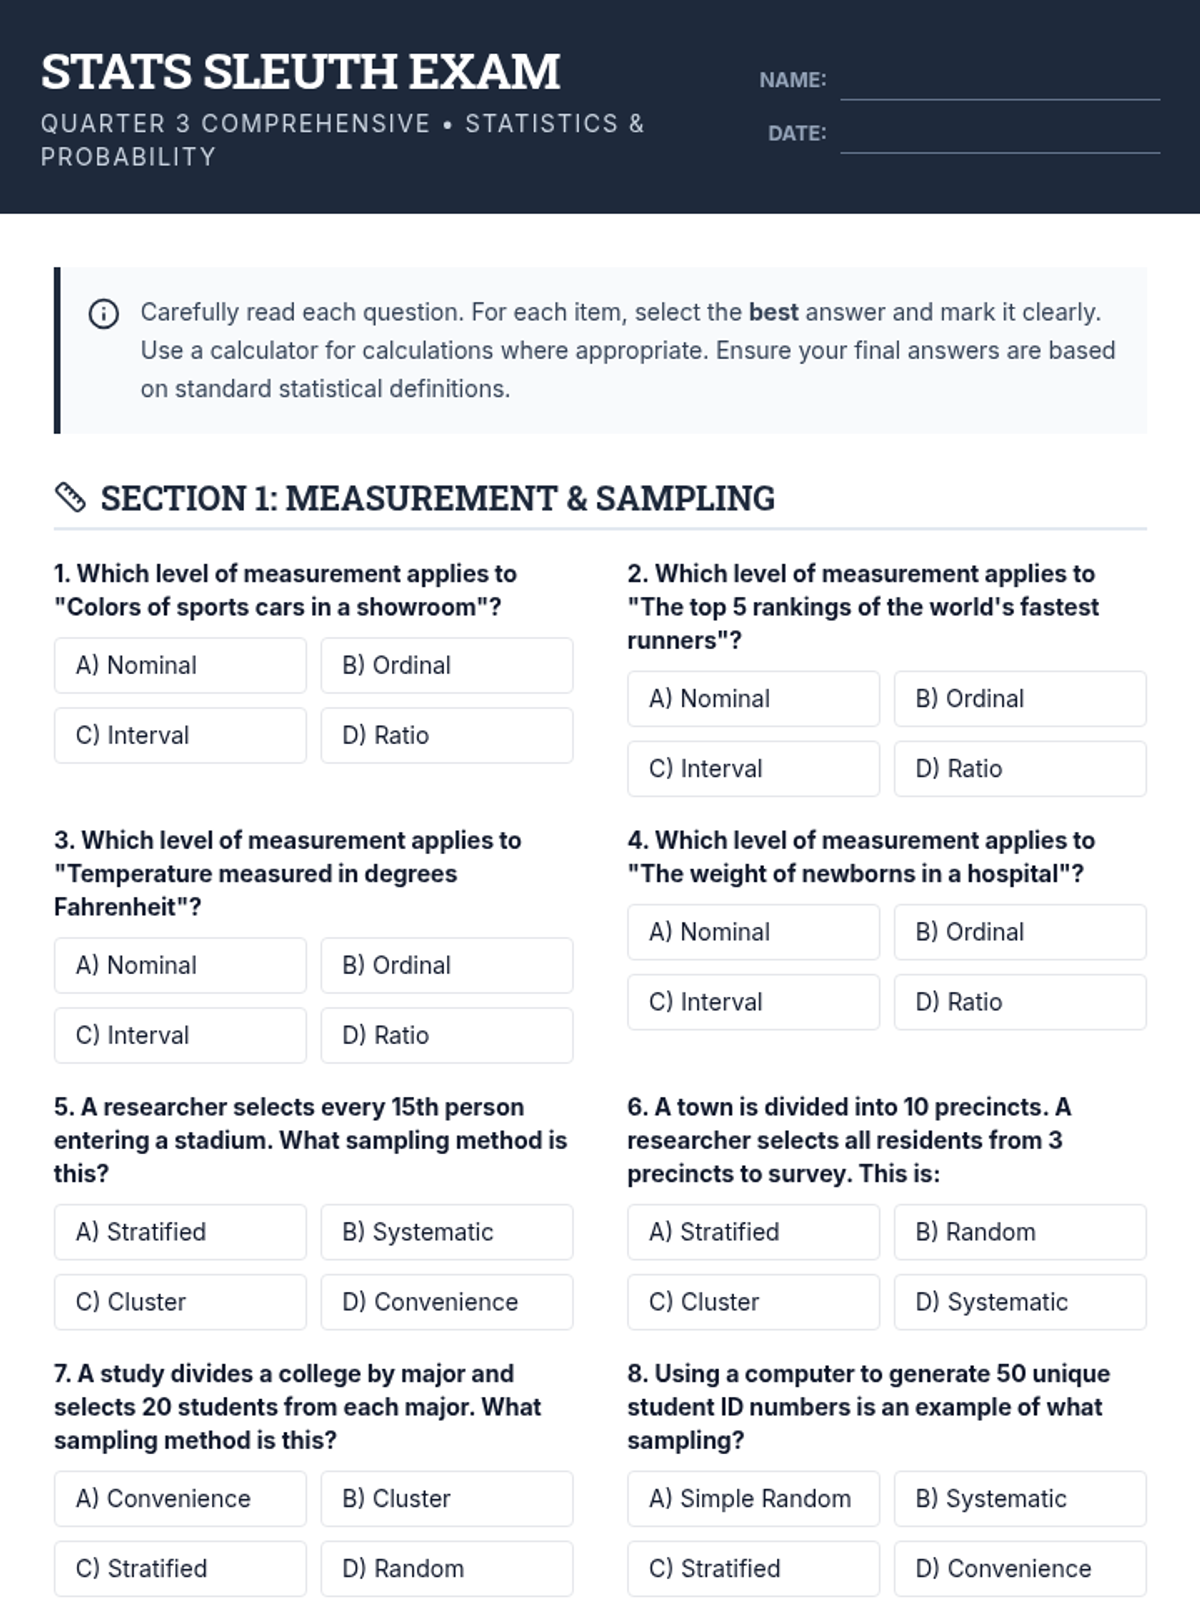
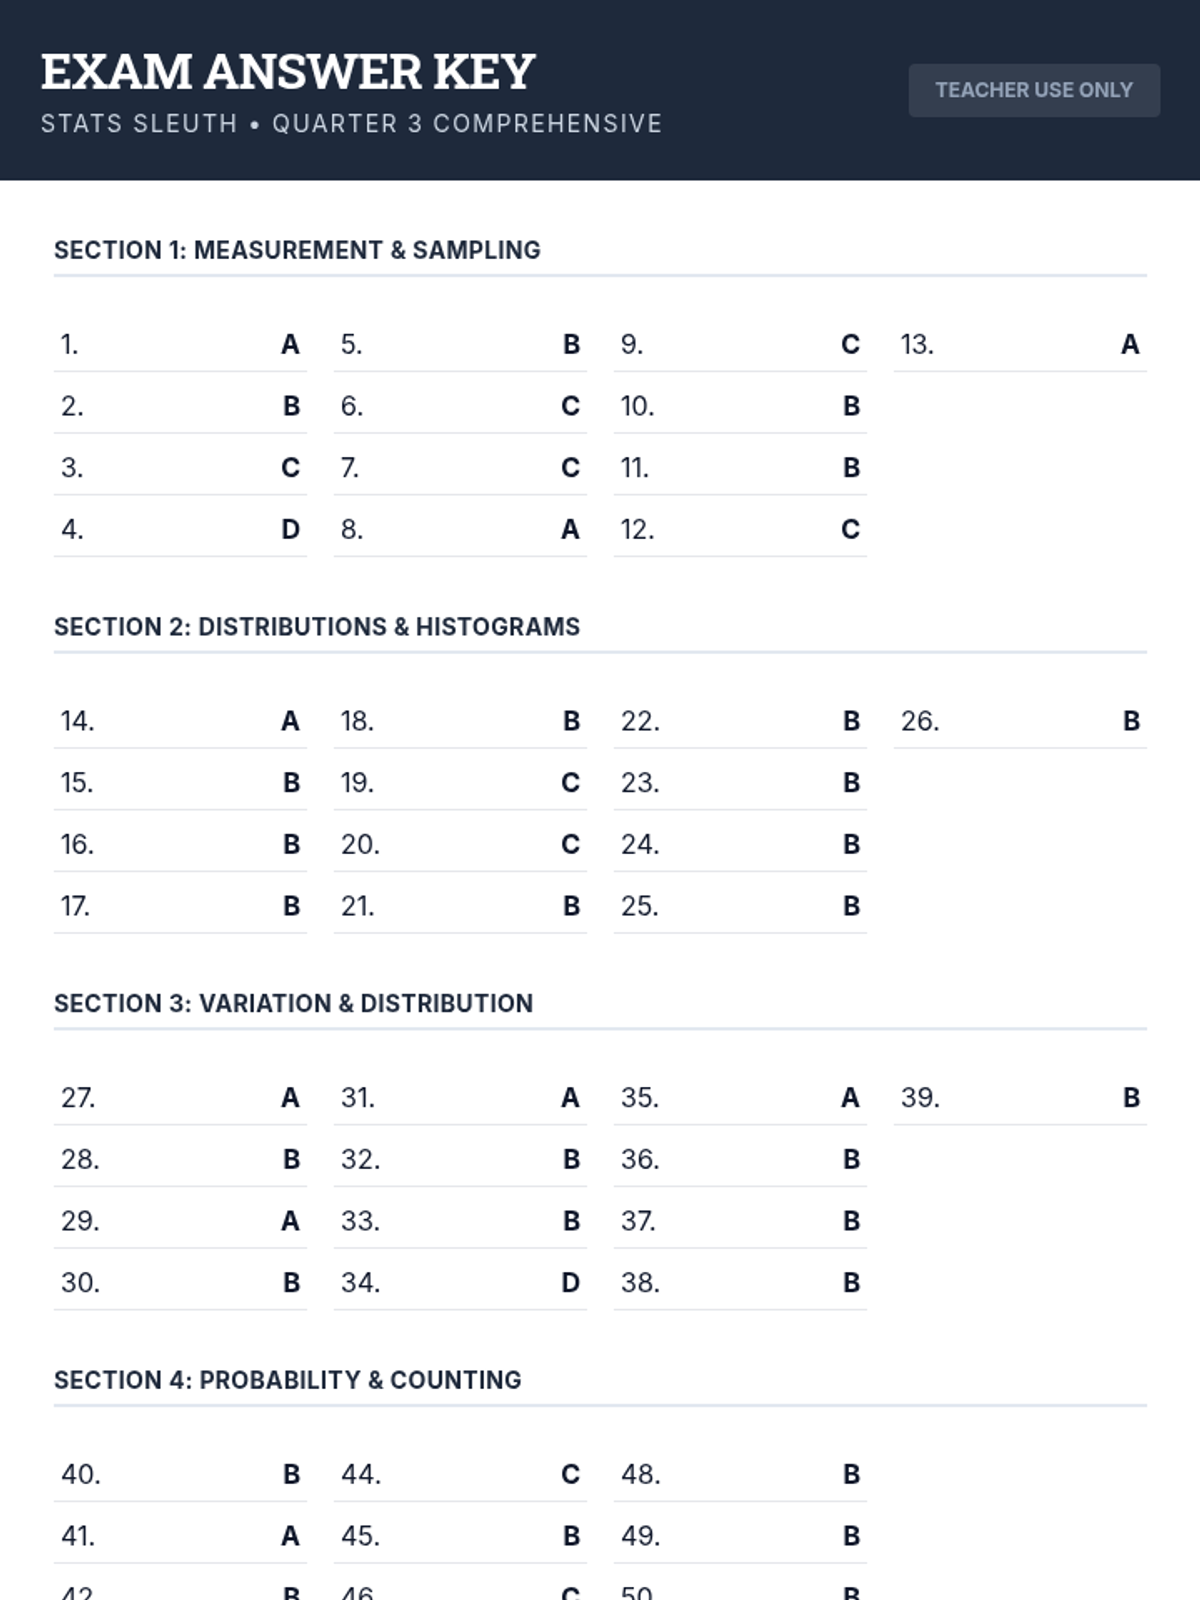
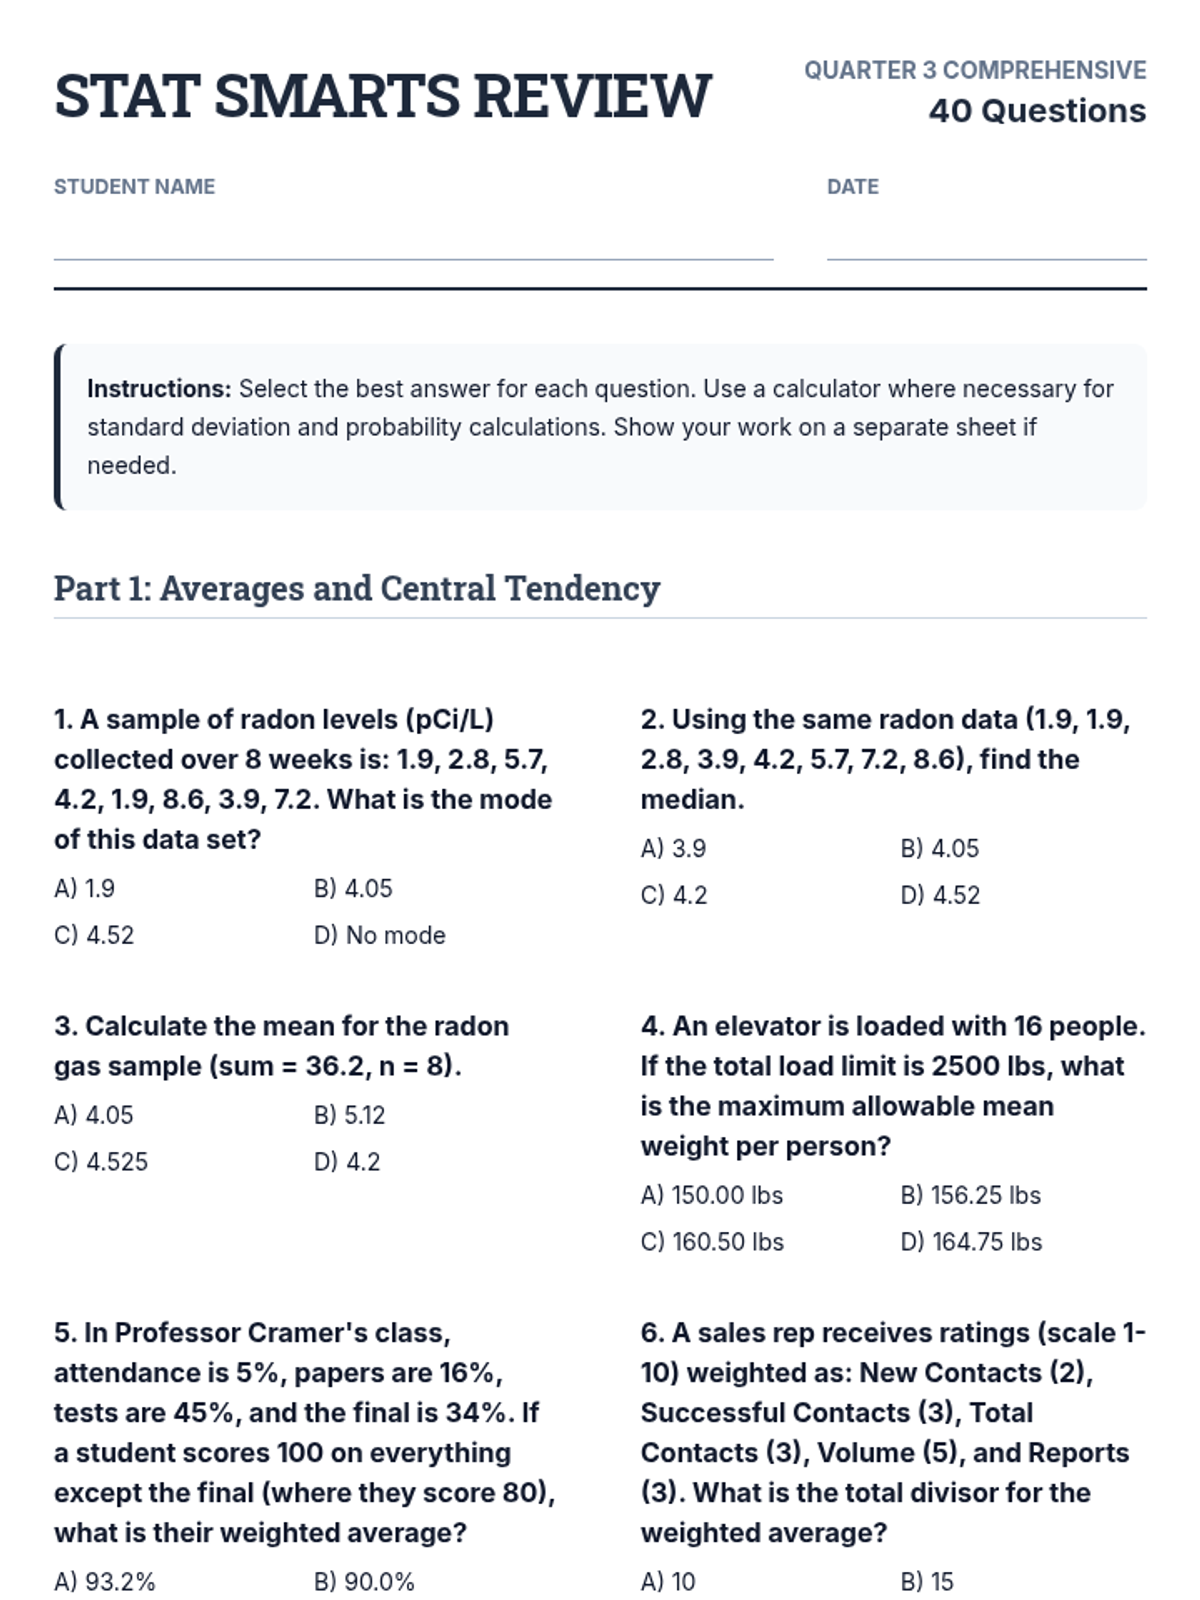
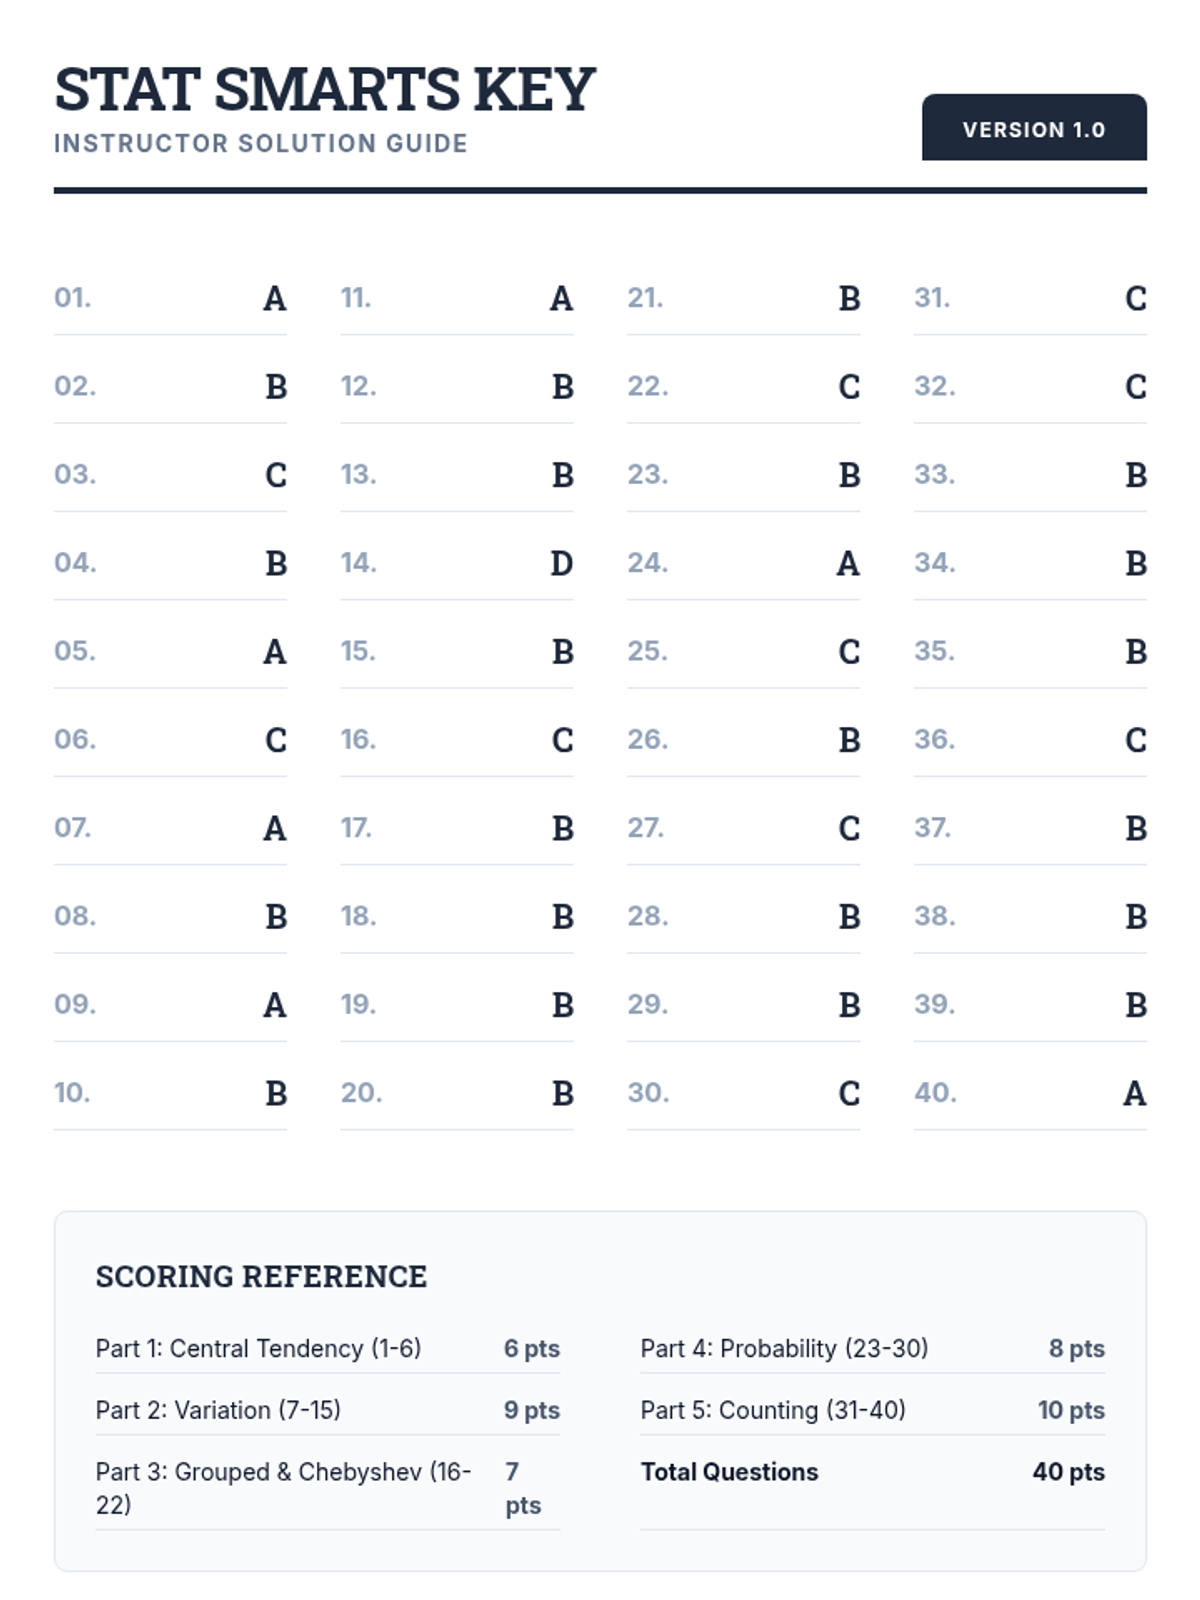
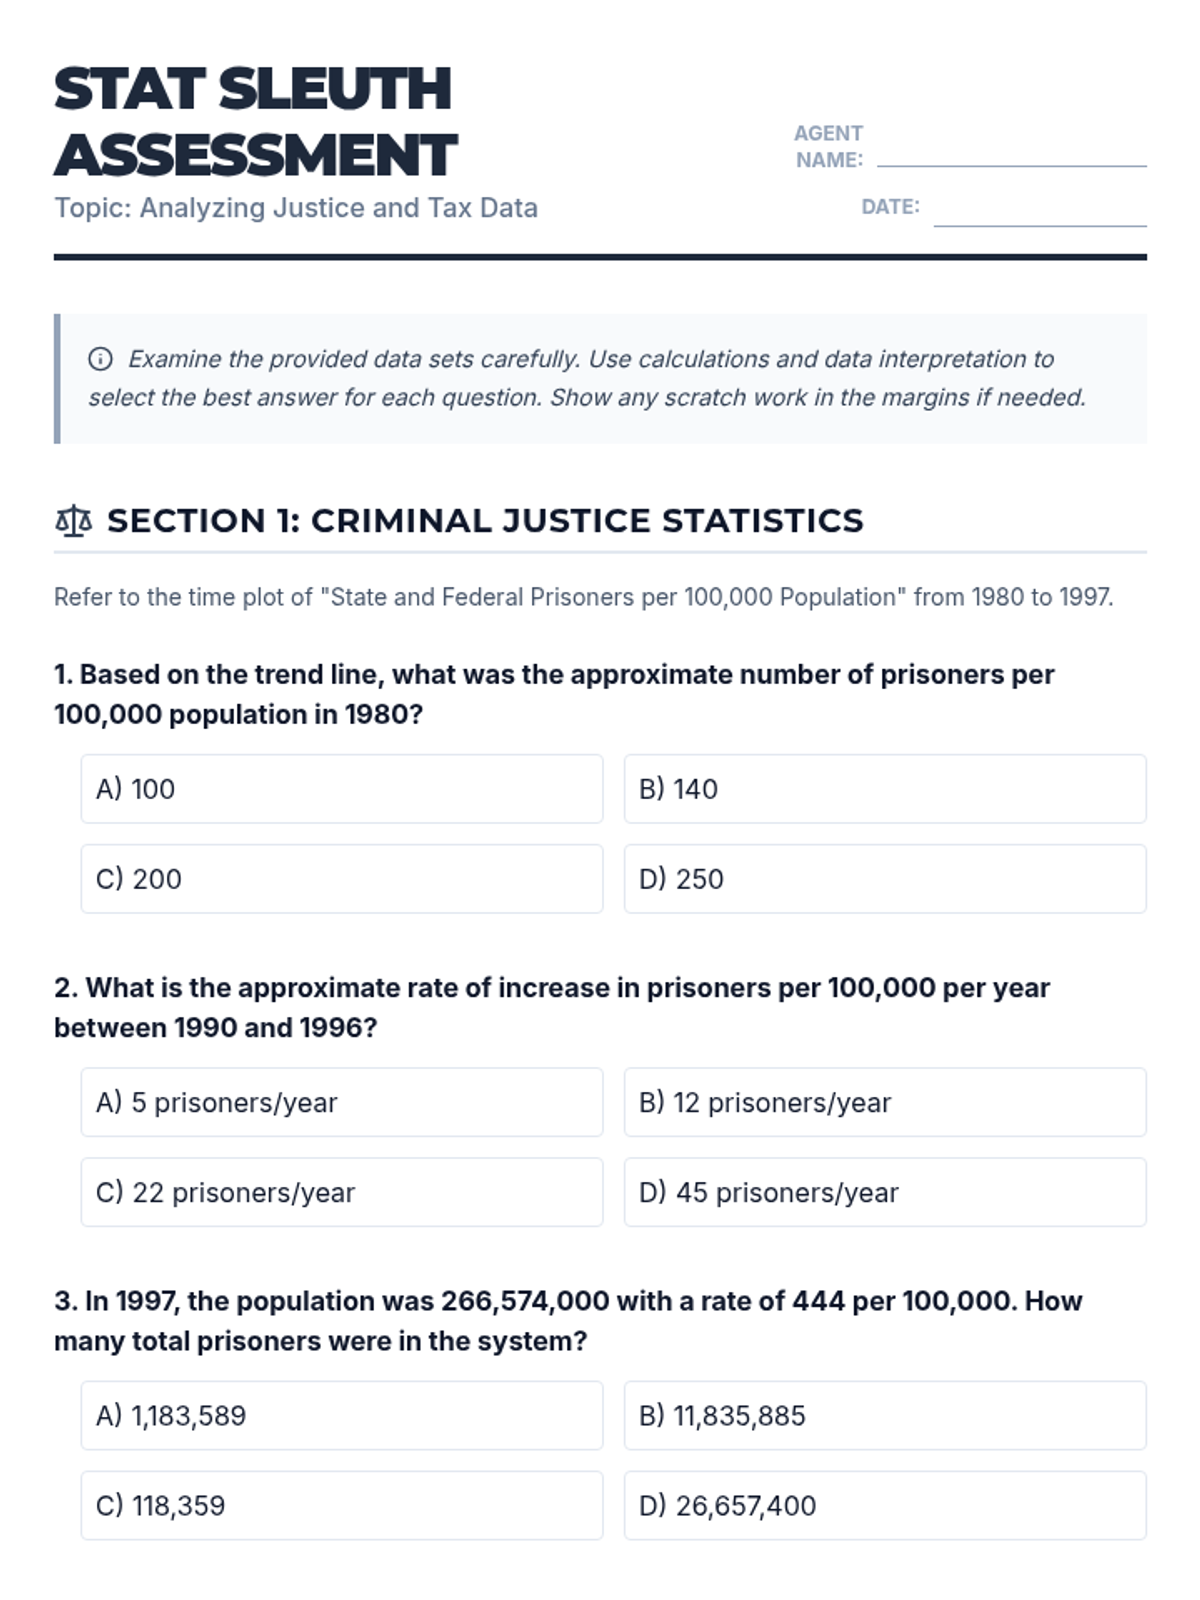
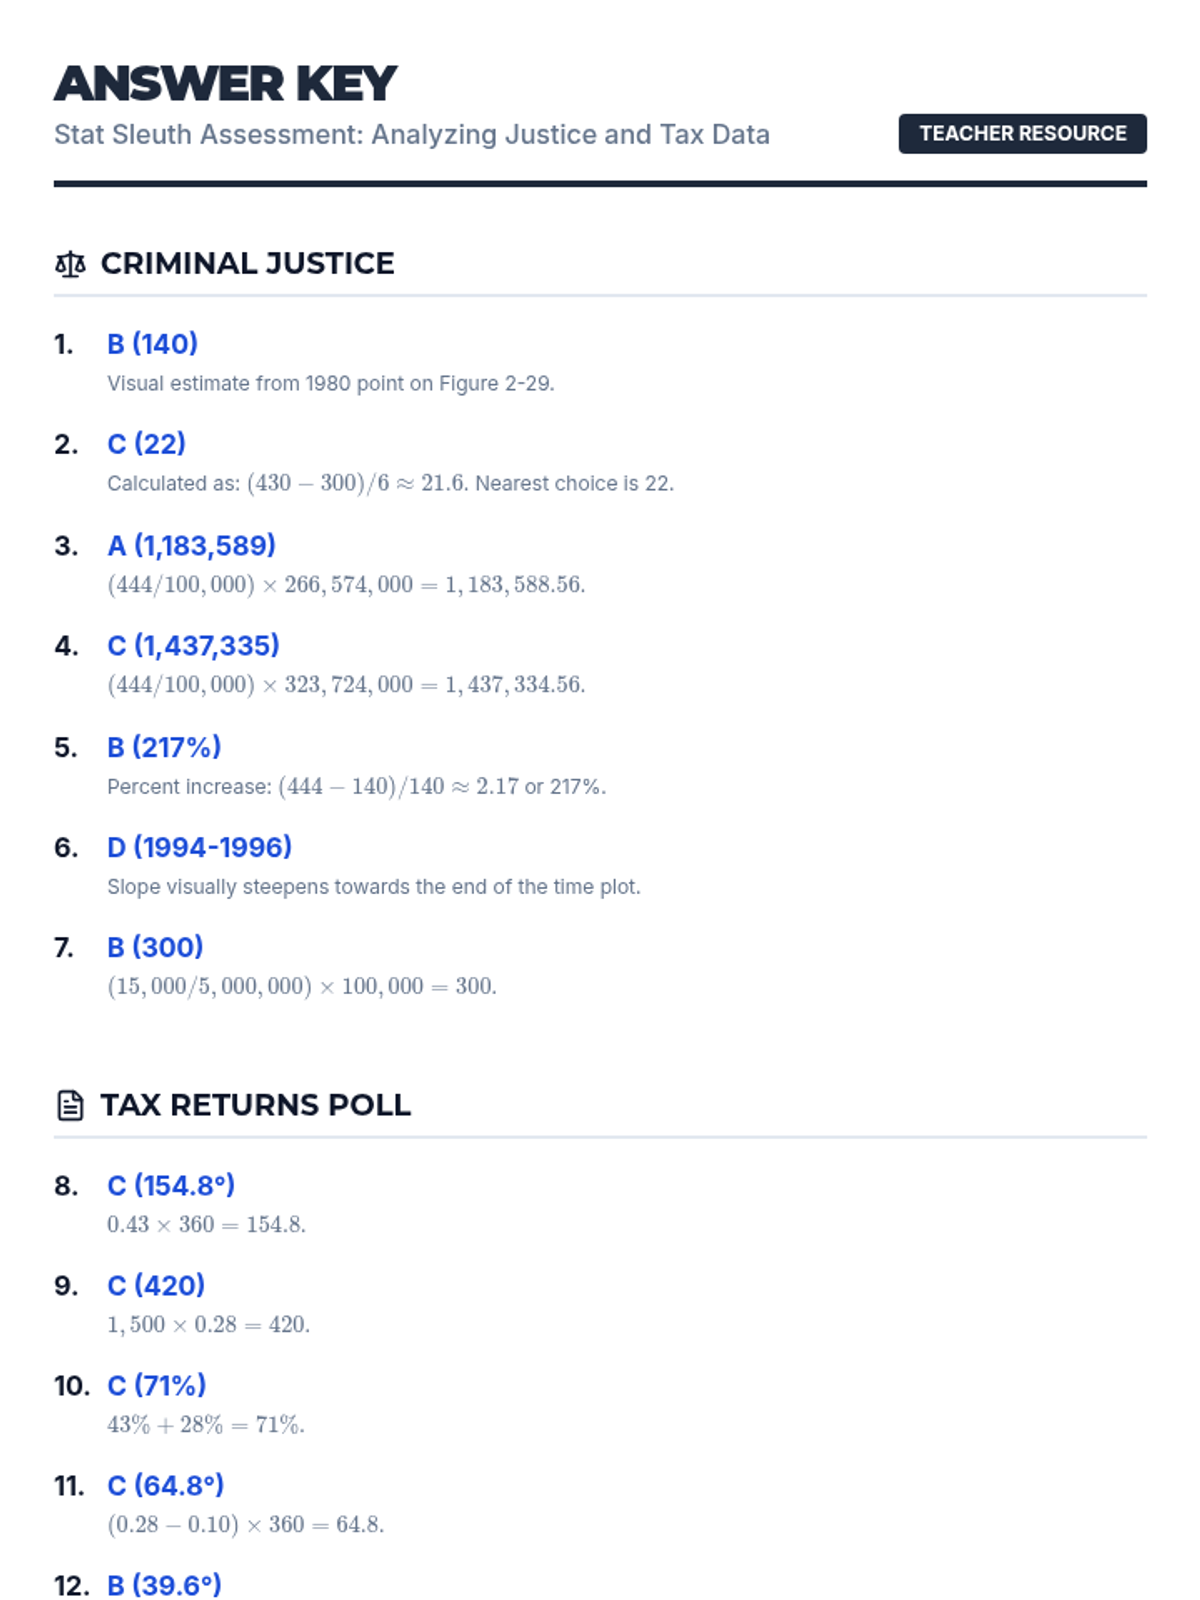
A comprehensive 3rd-quarter statistics assessment combining data interpretation, central tendency, variation, probability, and counting techniques. Students analyze real-world scenarios including justice system data, tax polls, and probability models.
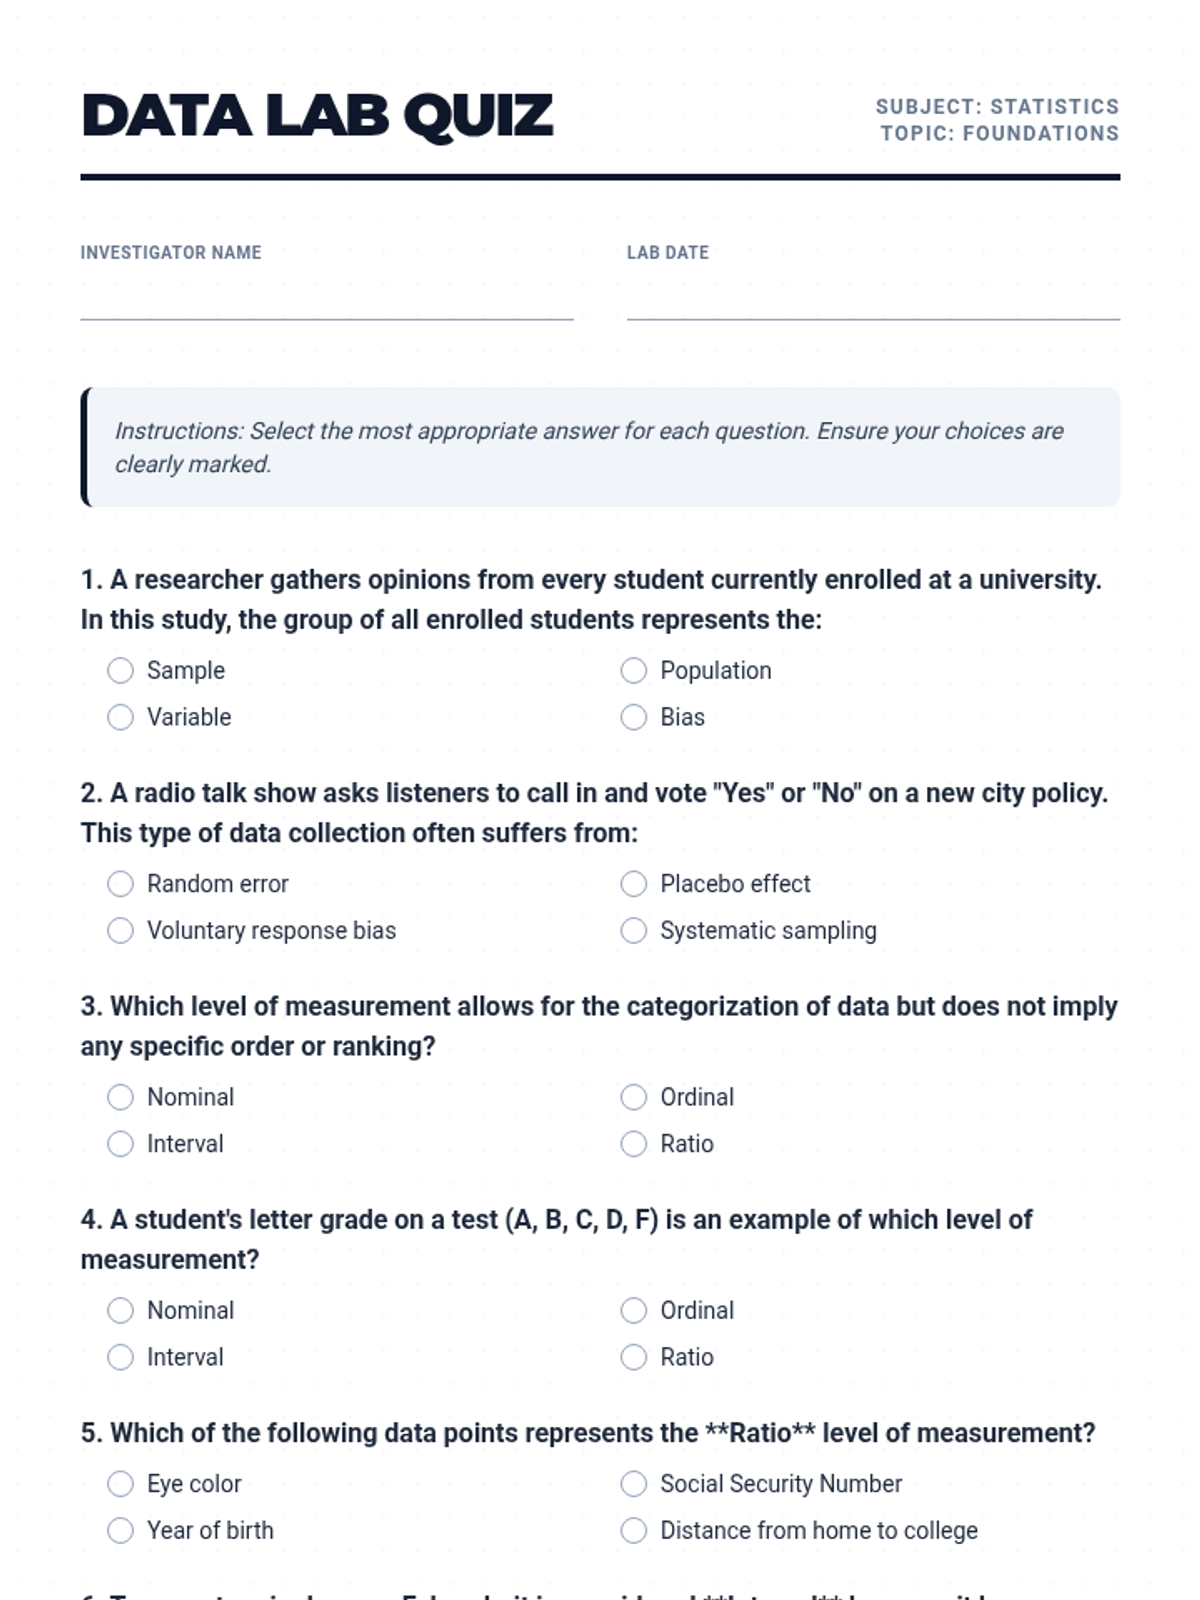
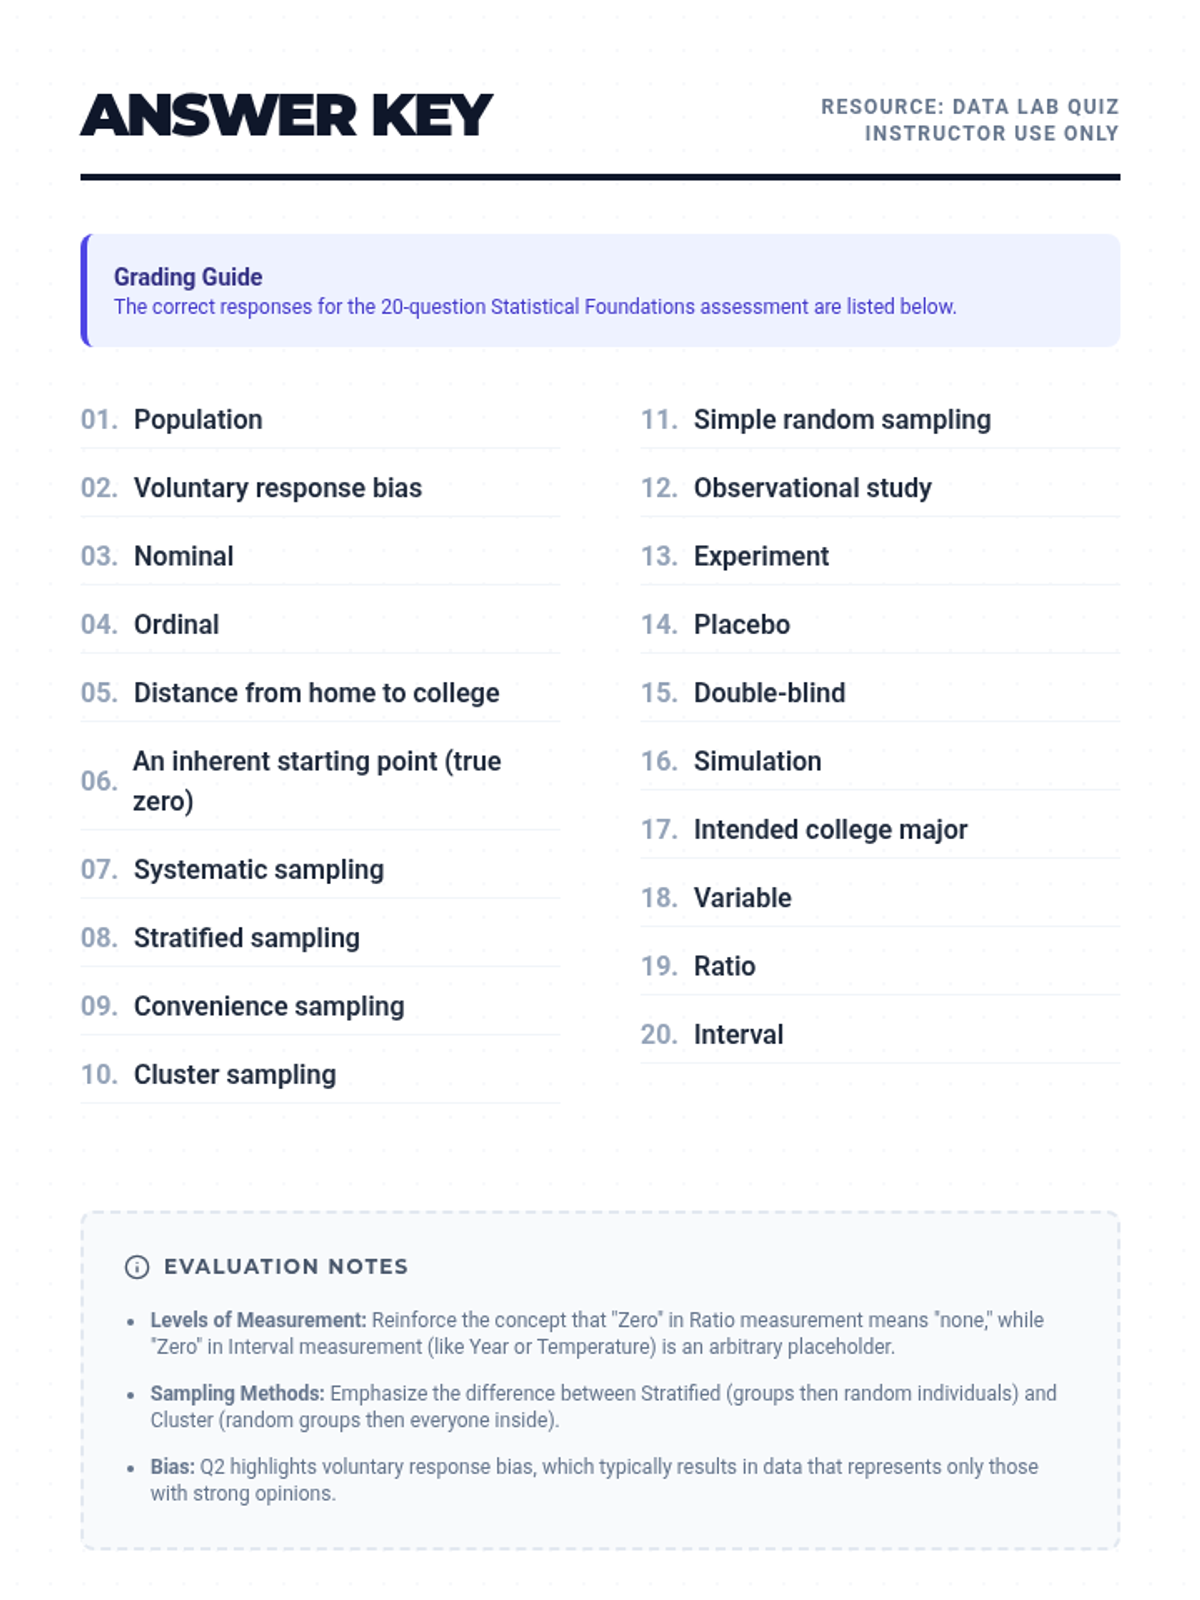
A comprehensive introduction to the fundamental concepts of statistics, including data classification, sampling methods, and experimental design.
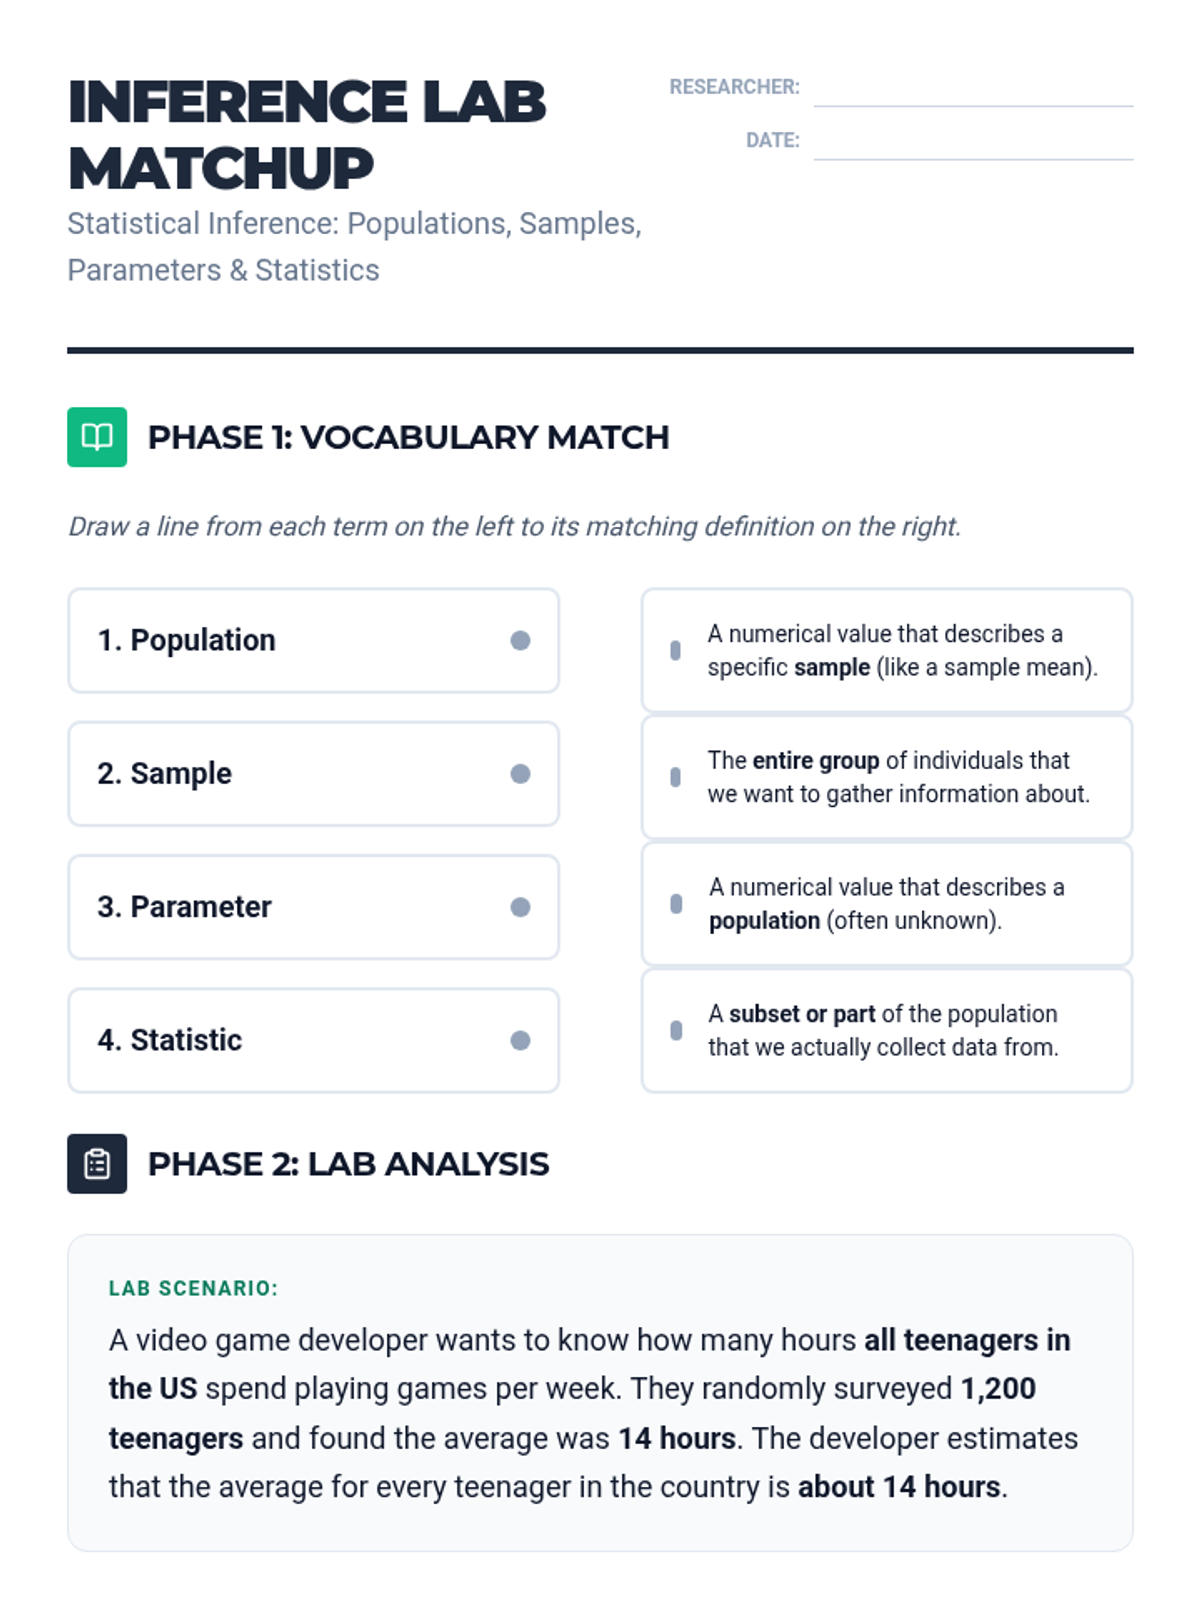
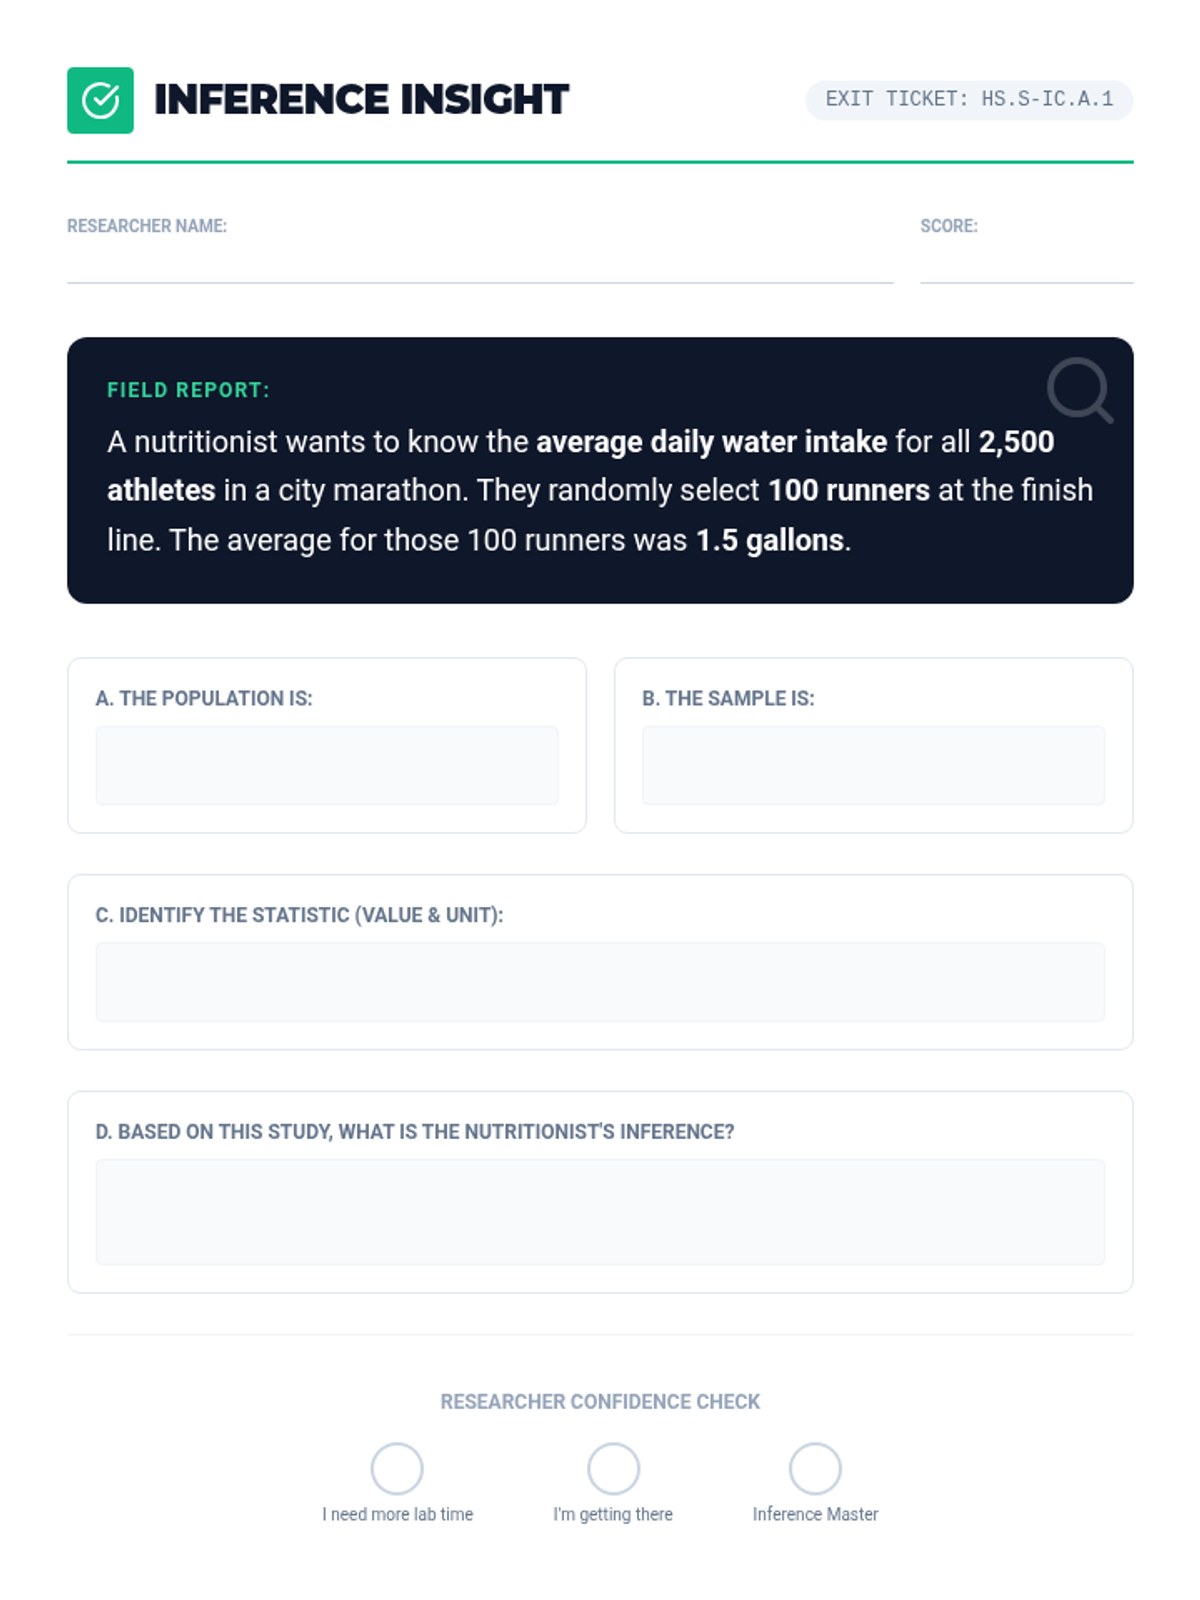
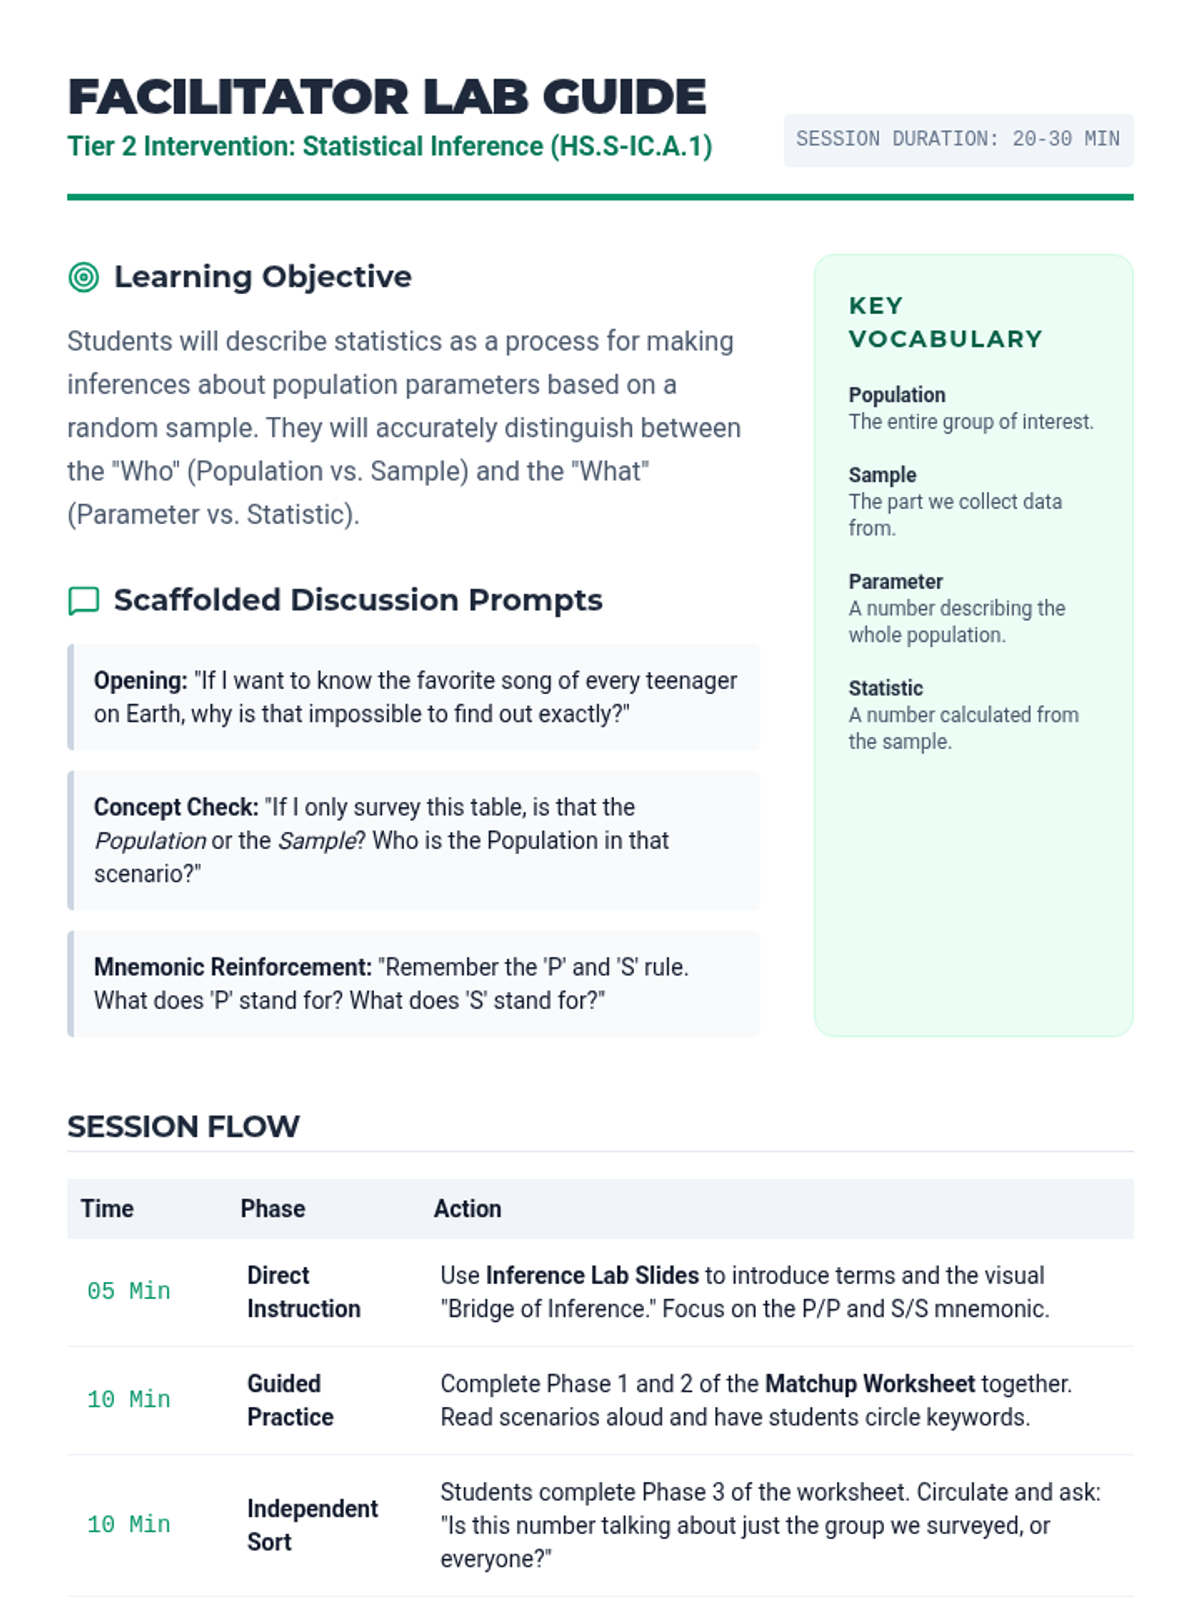
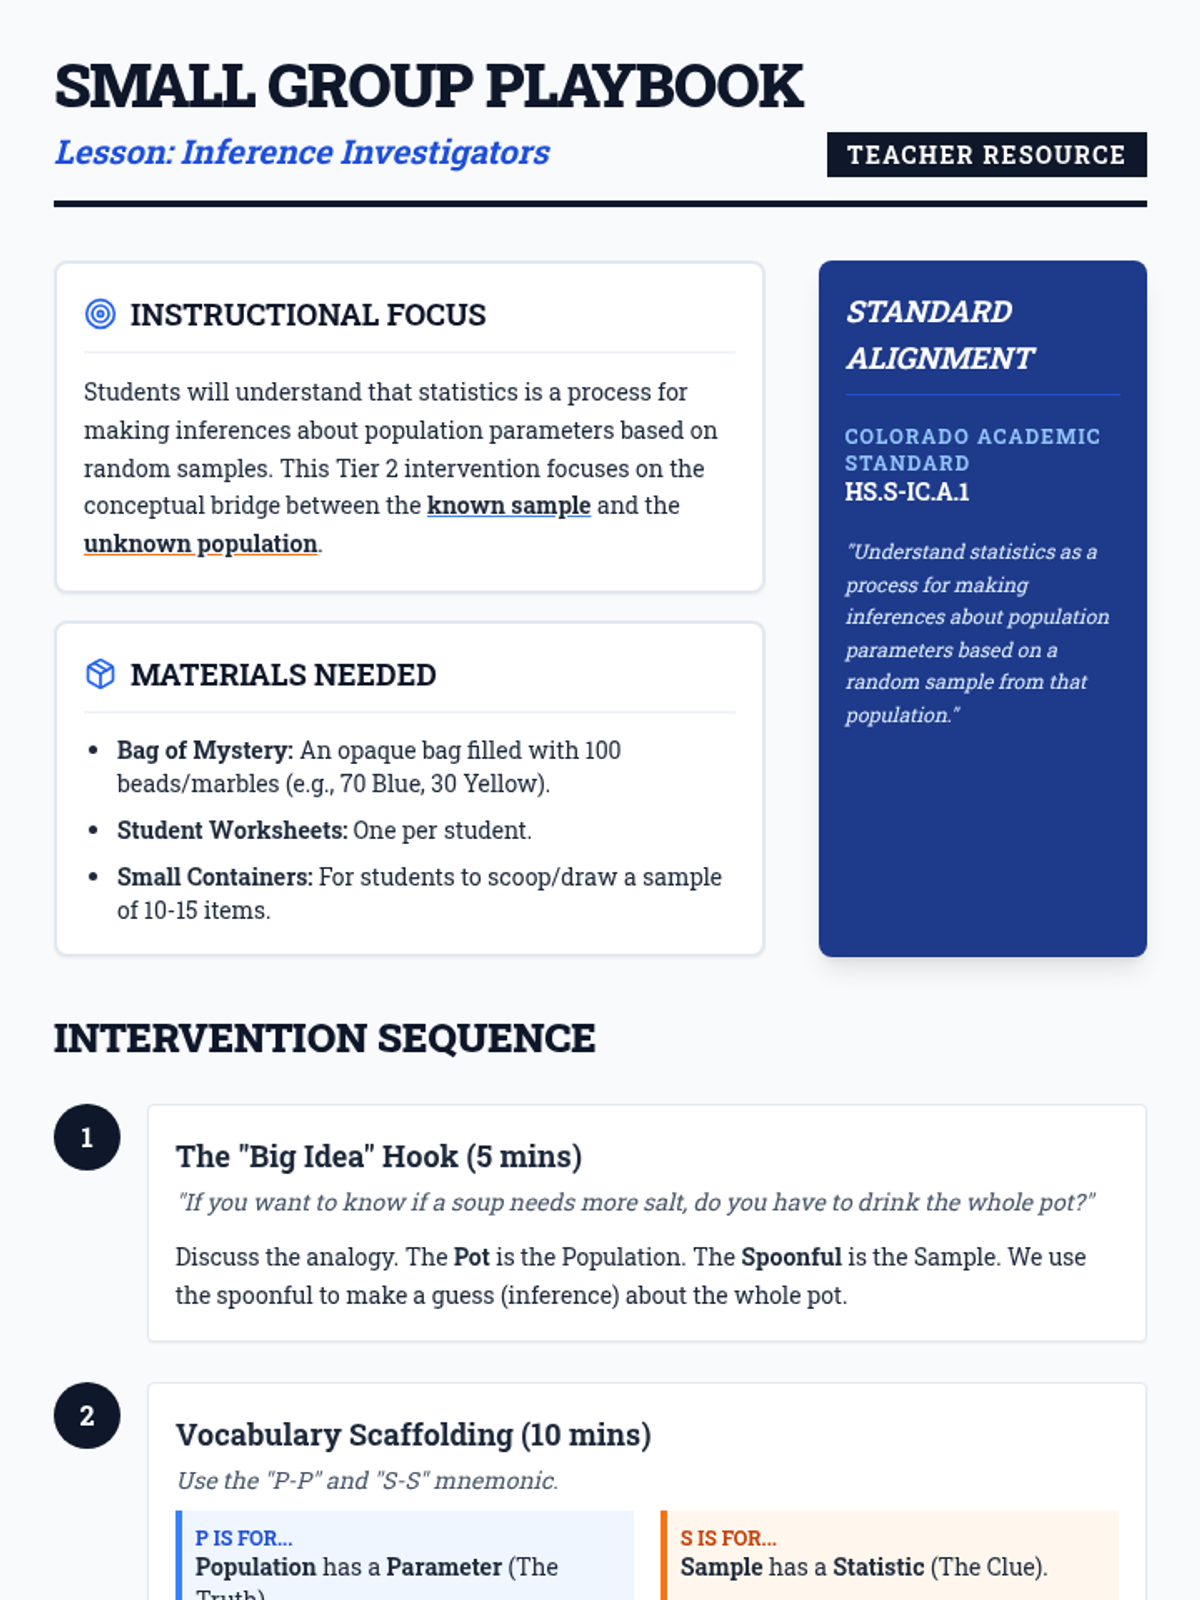
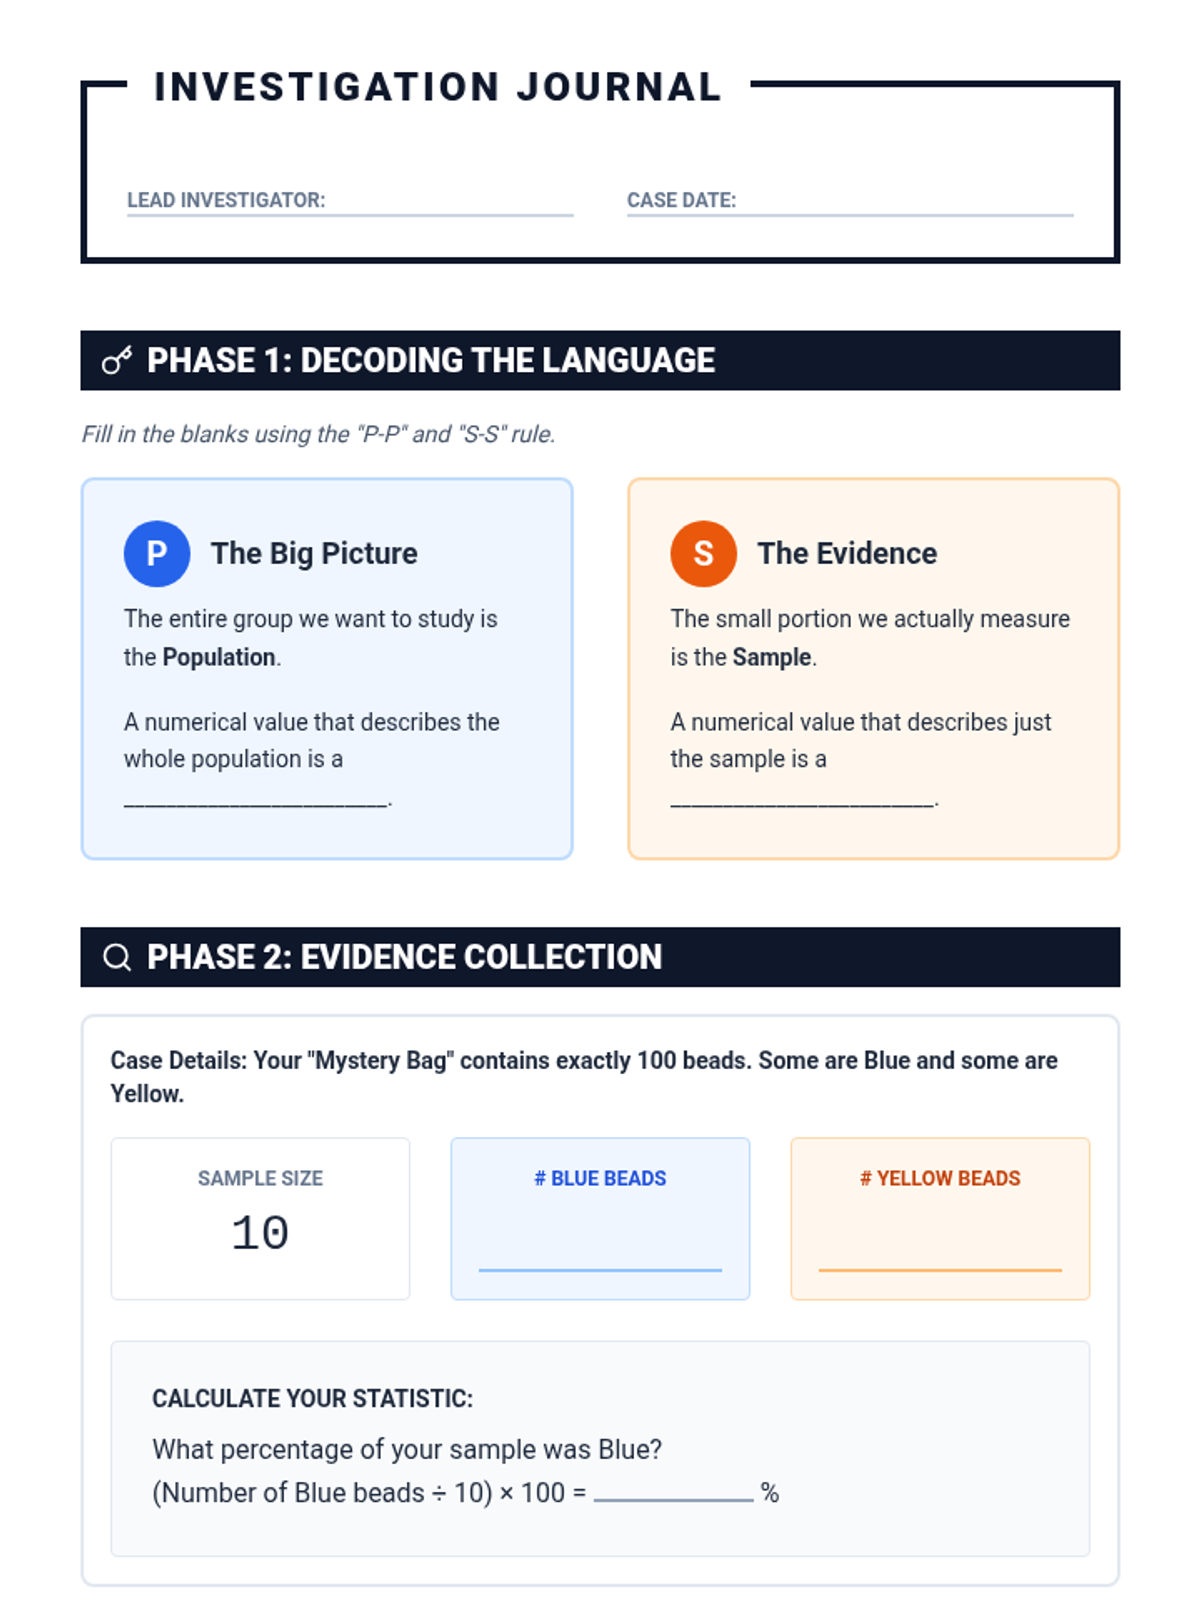
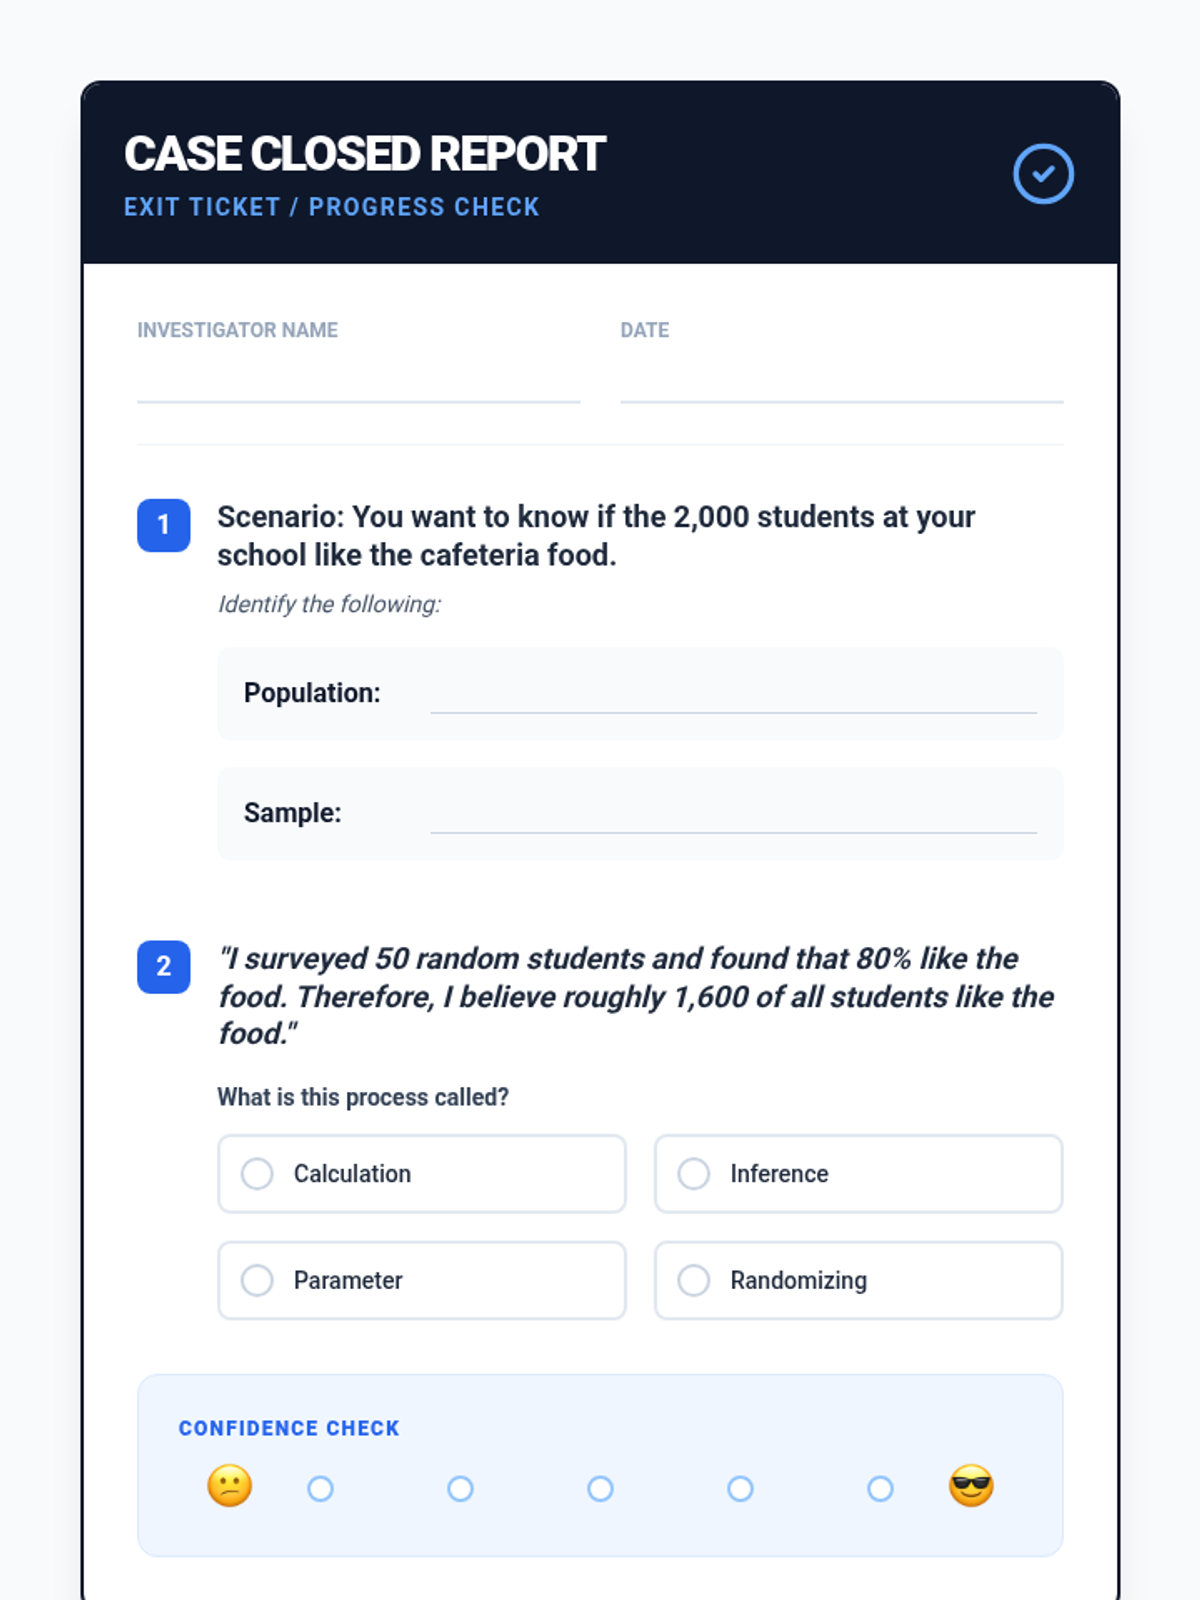
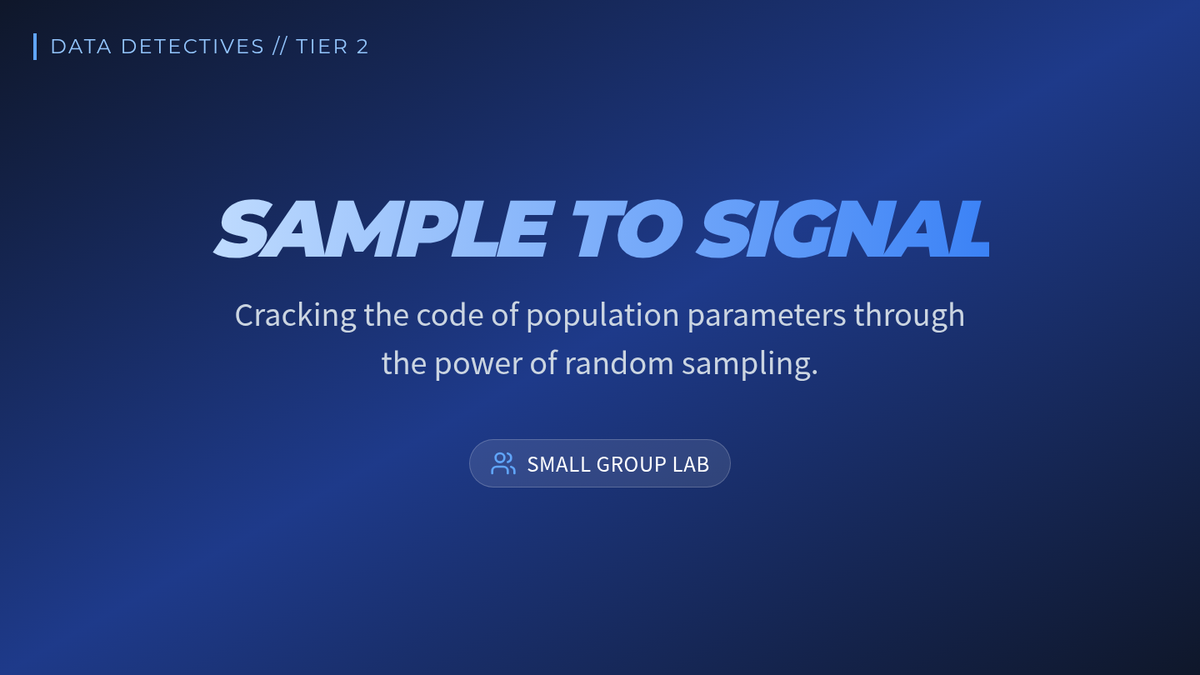
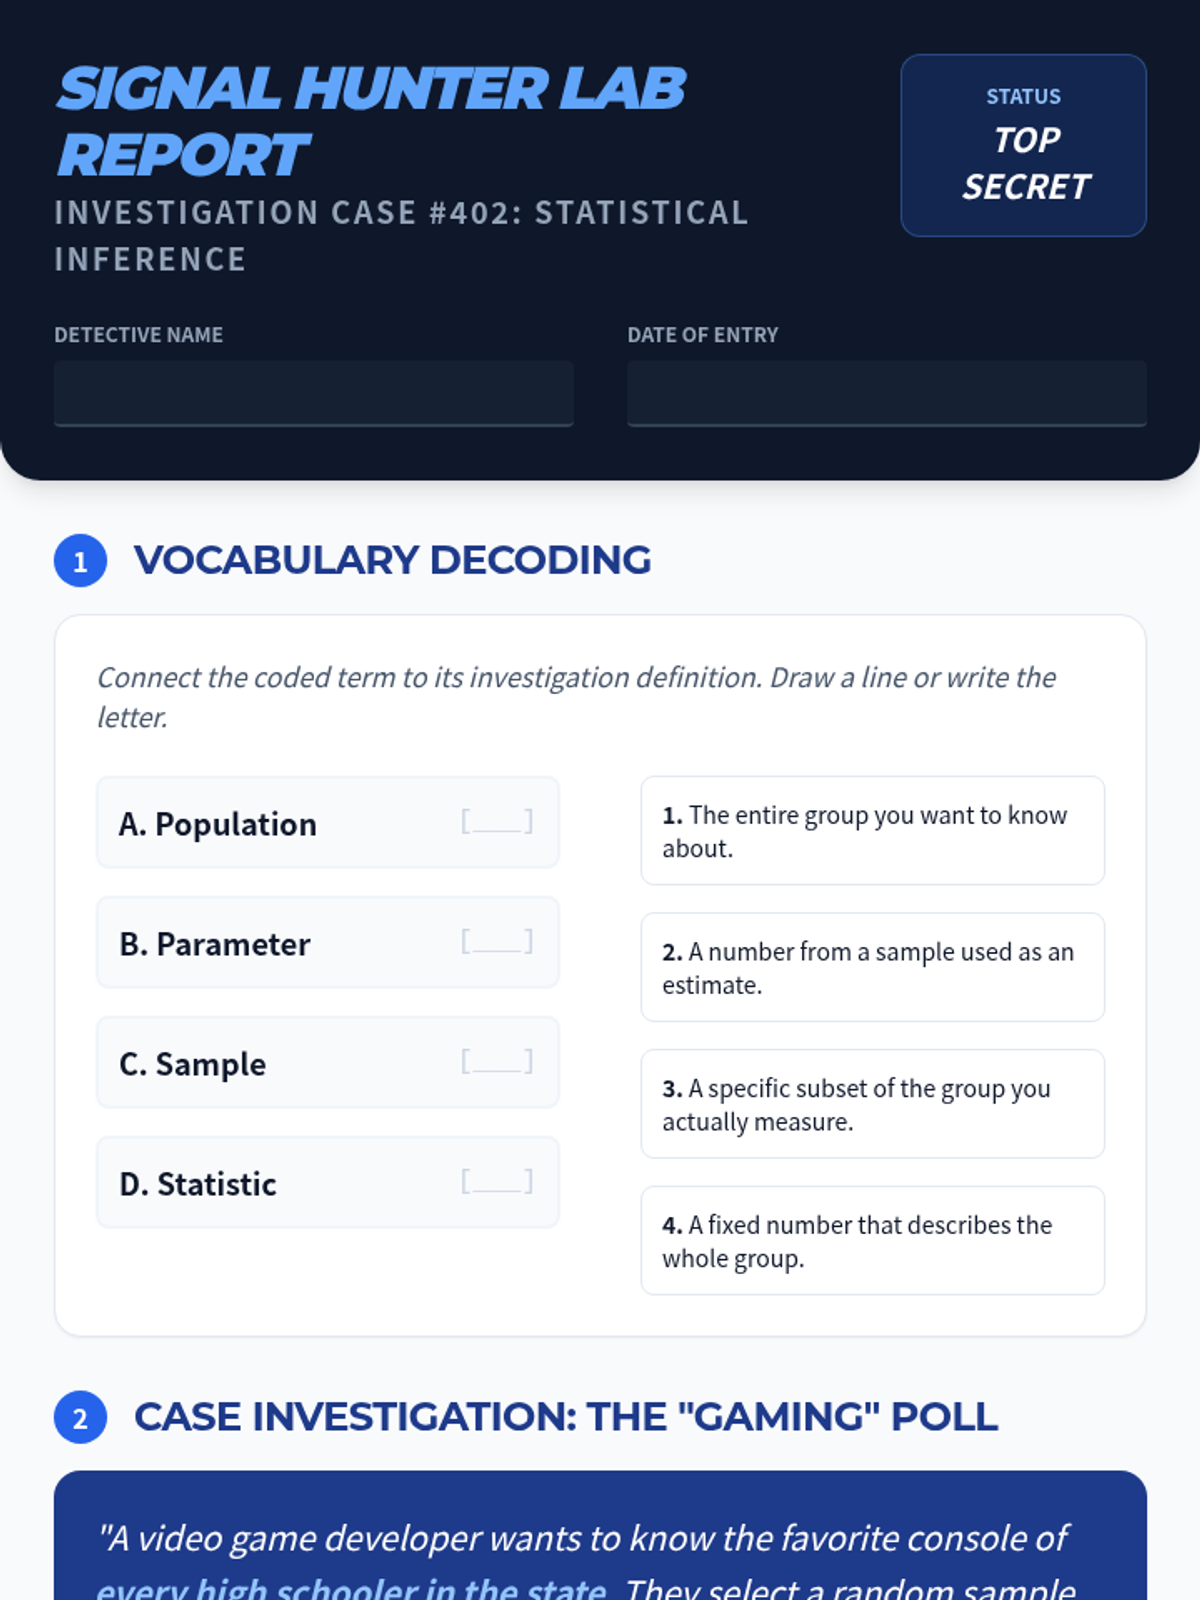
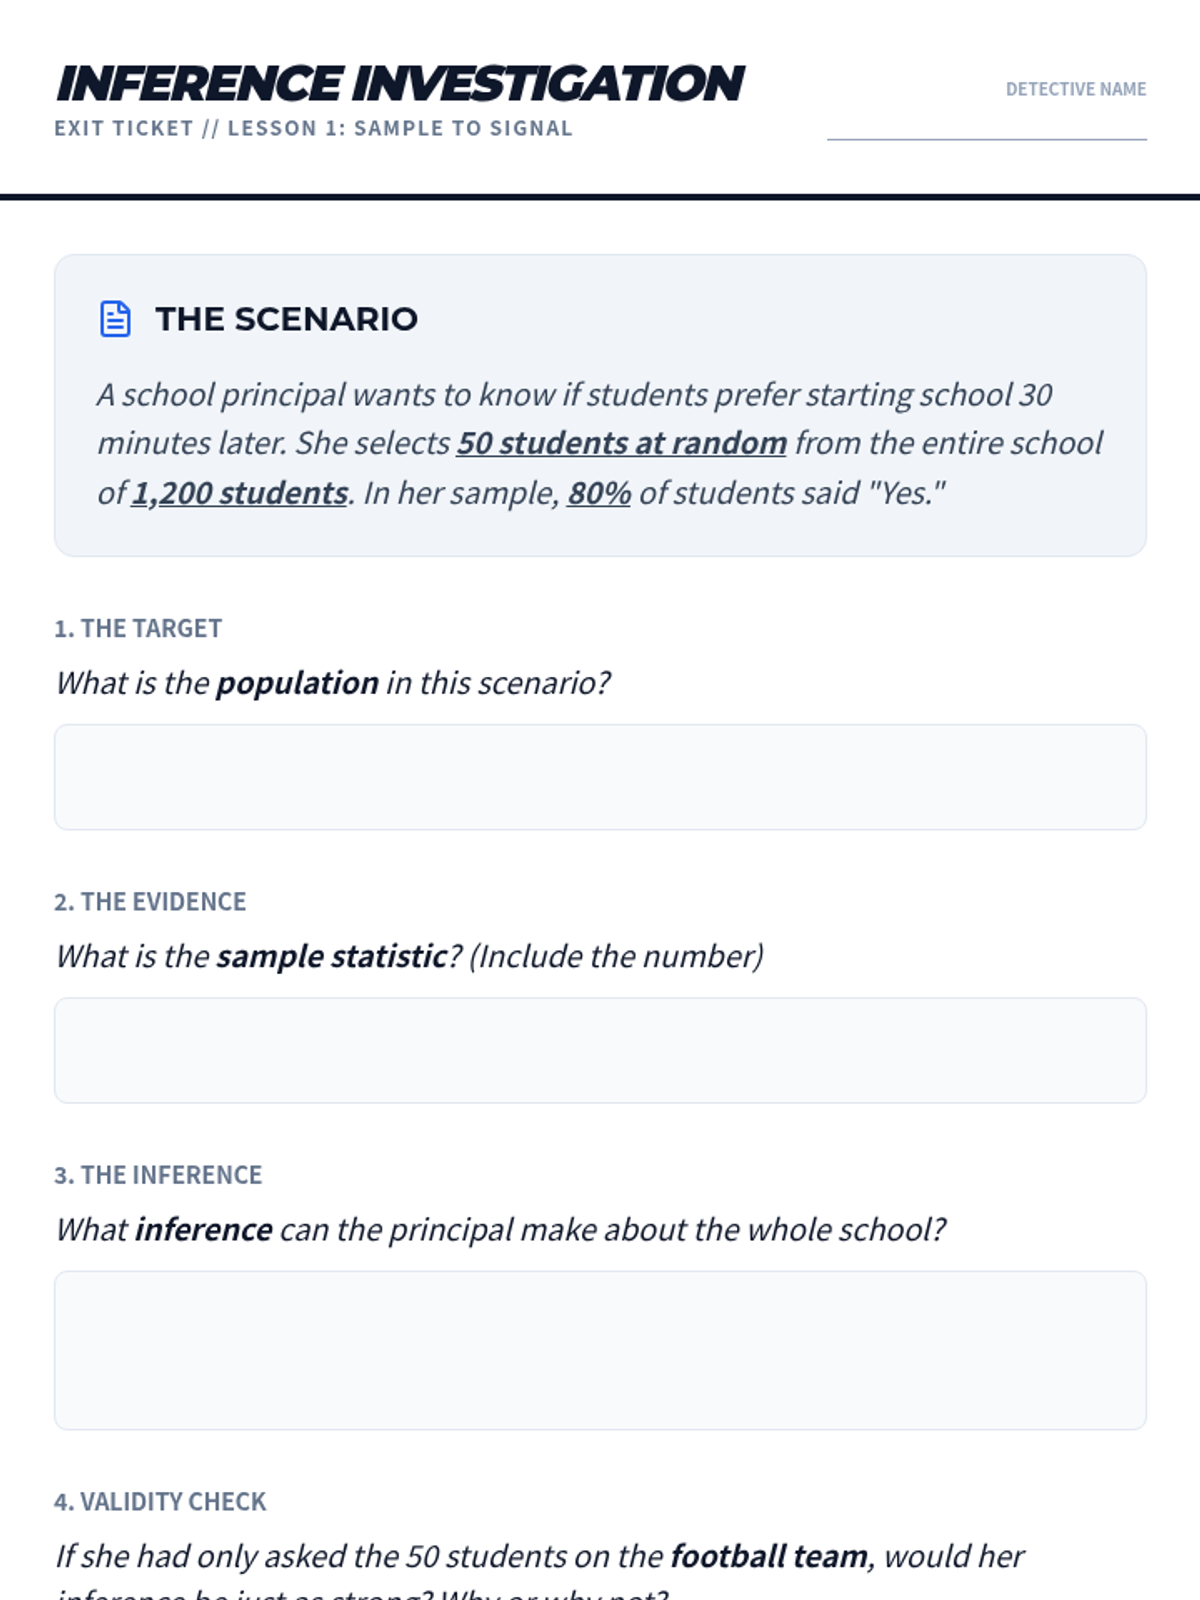
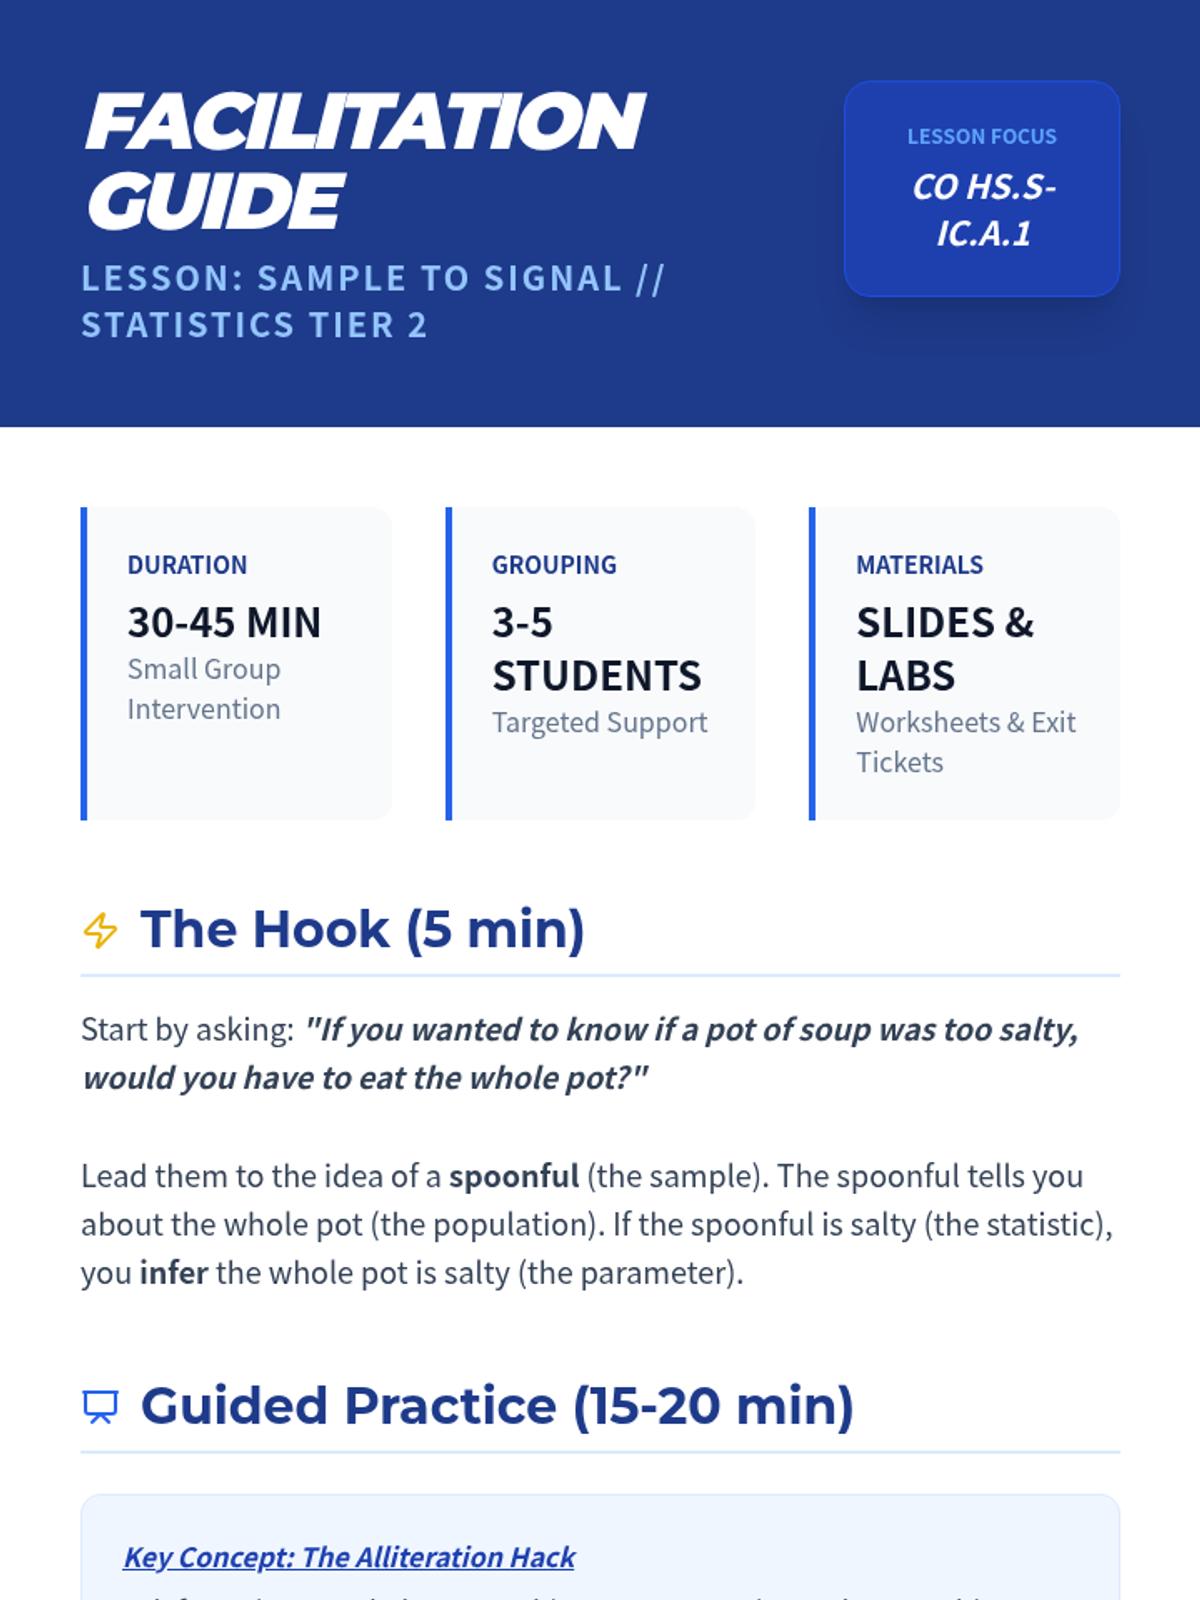
This lesson focuses on the statistical inference process, helping students distinguish between populations and samples, and parameters and statistics. It is designed for Tier 2 intervention, utilizing scaffolded vocabulary activities and scenario-based sorting to build conceptual understanding.
A Tier 2 intervention lesson focusing on the core logic of statistical inference. Students move from physical sampling to conceptual understanding of how samples represent populations.
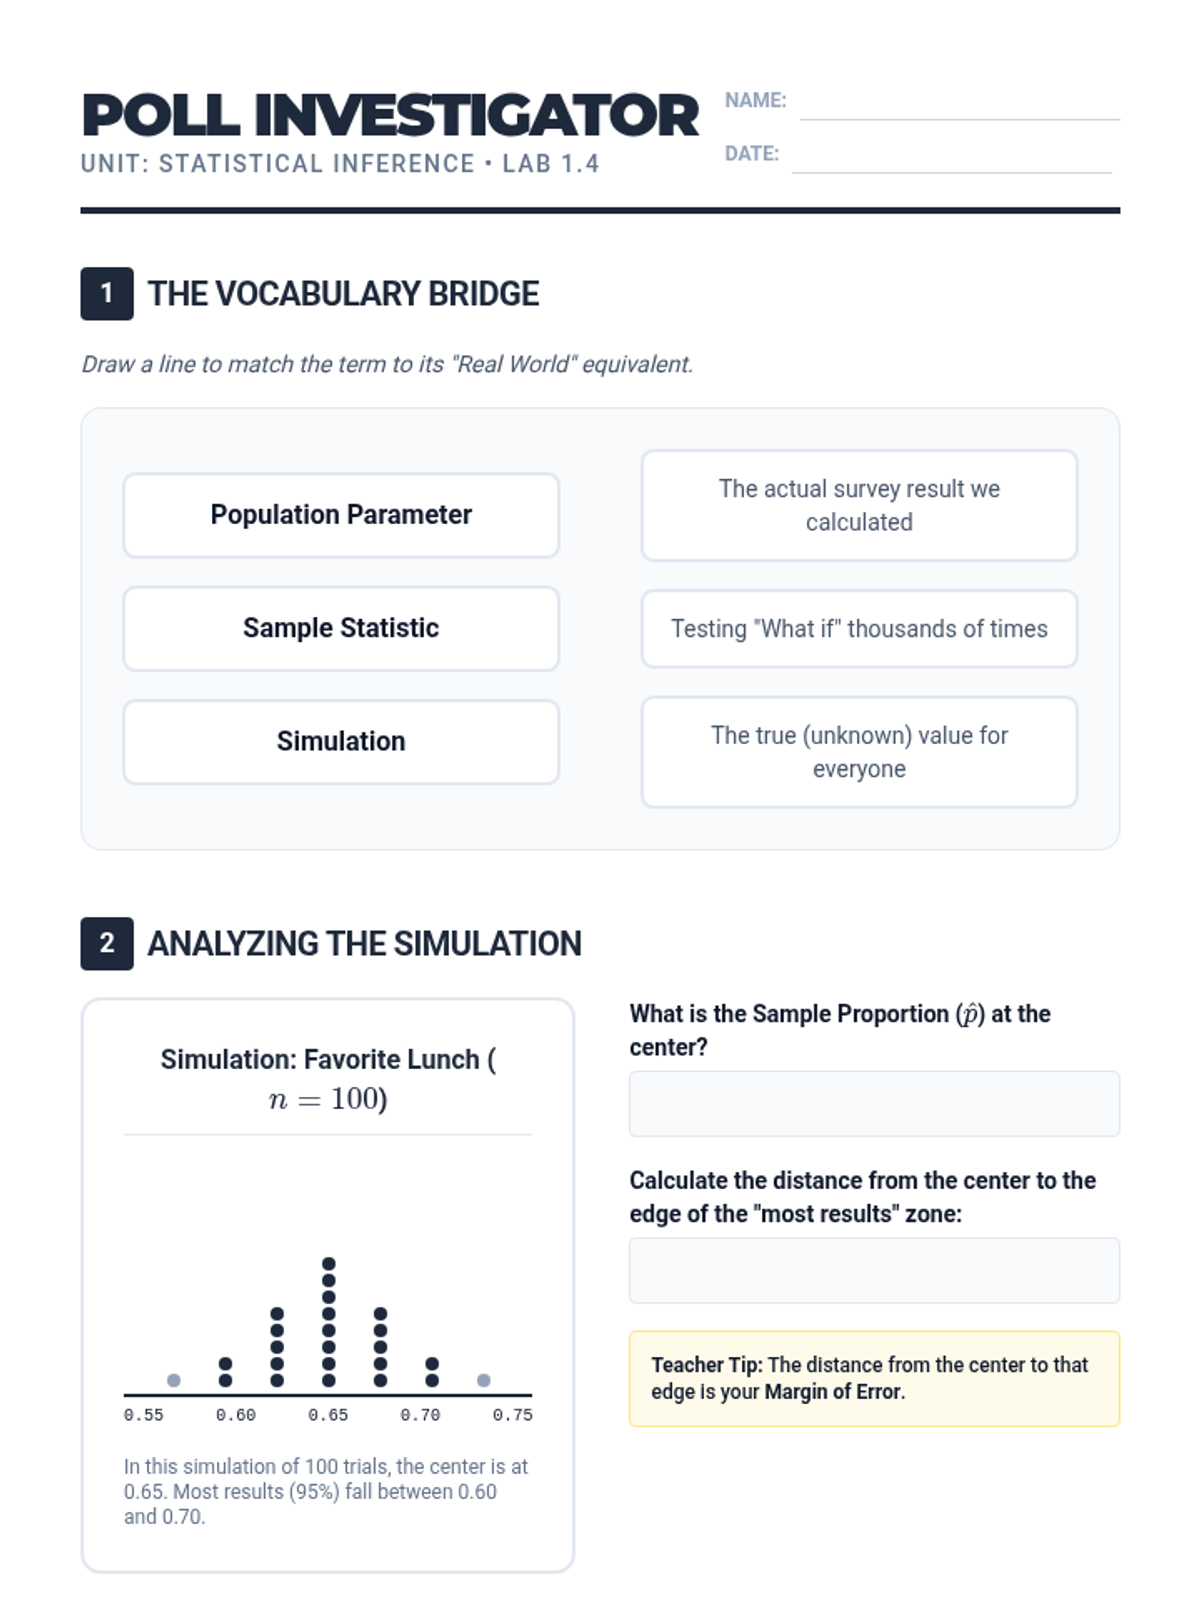
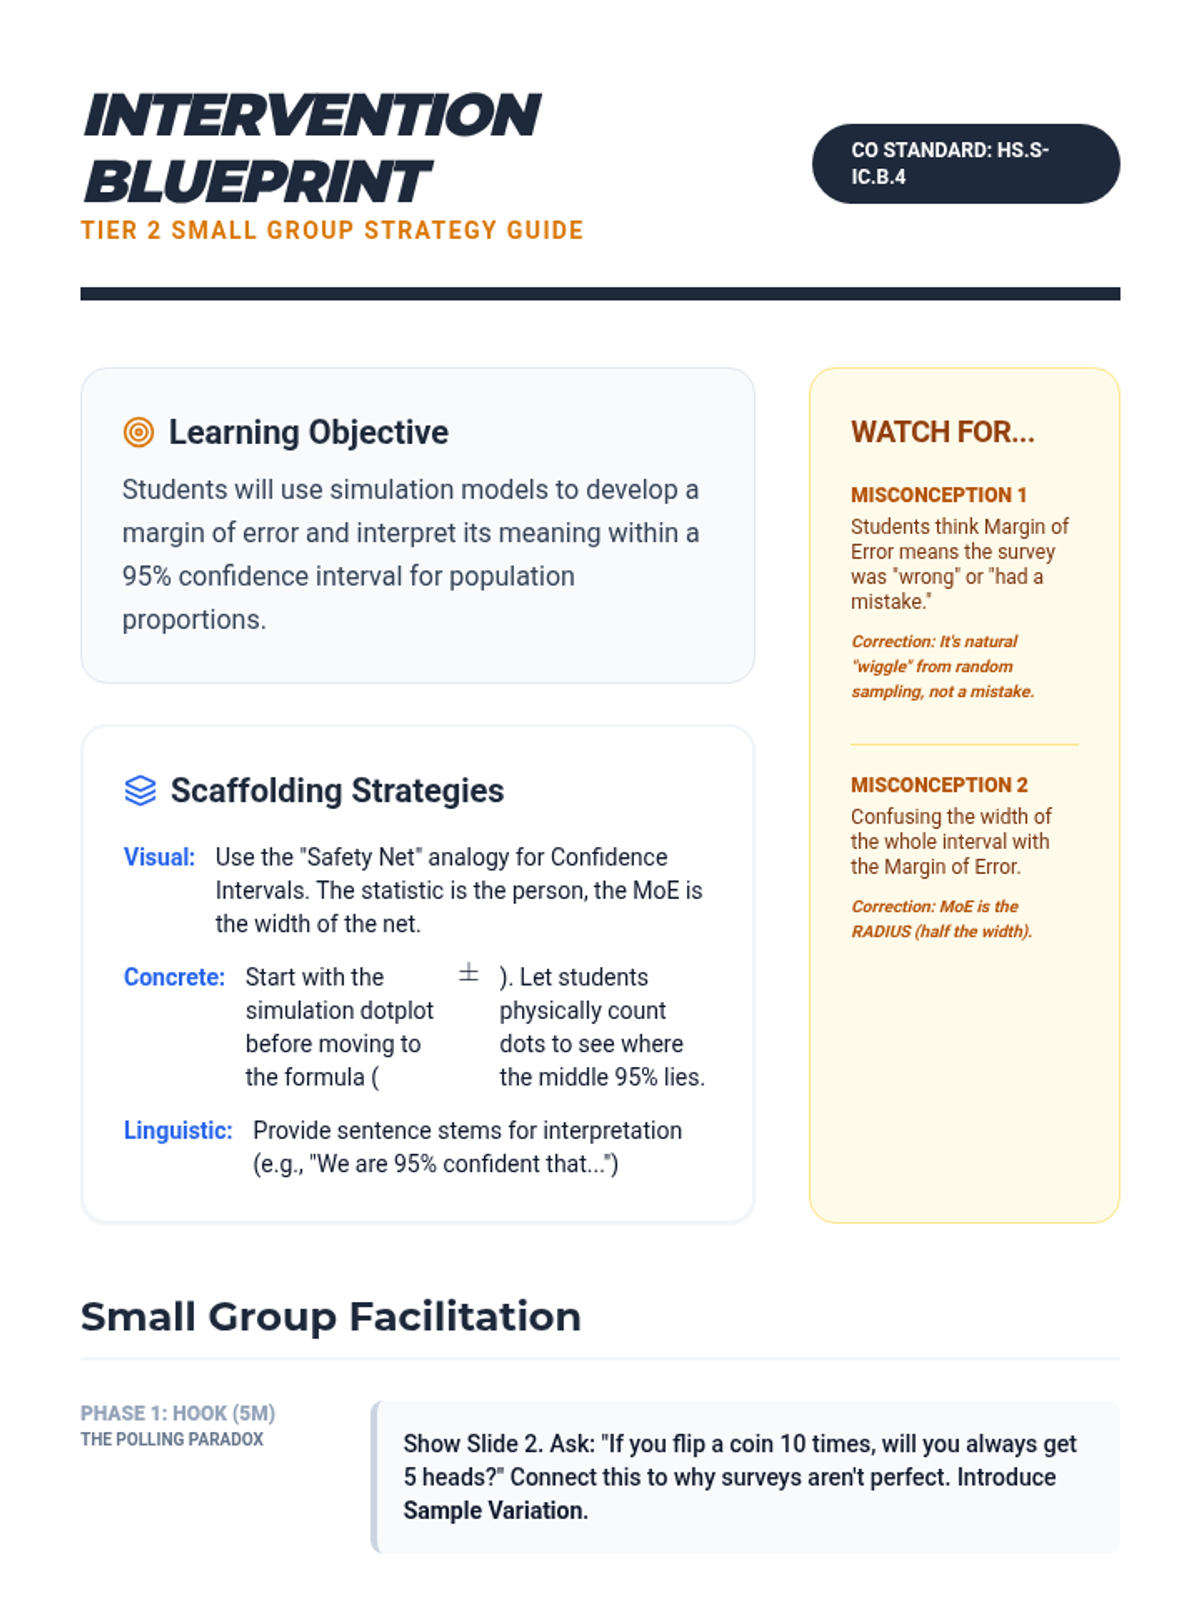
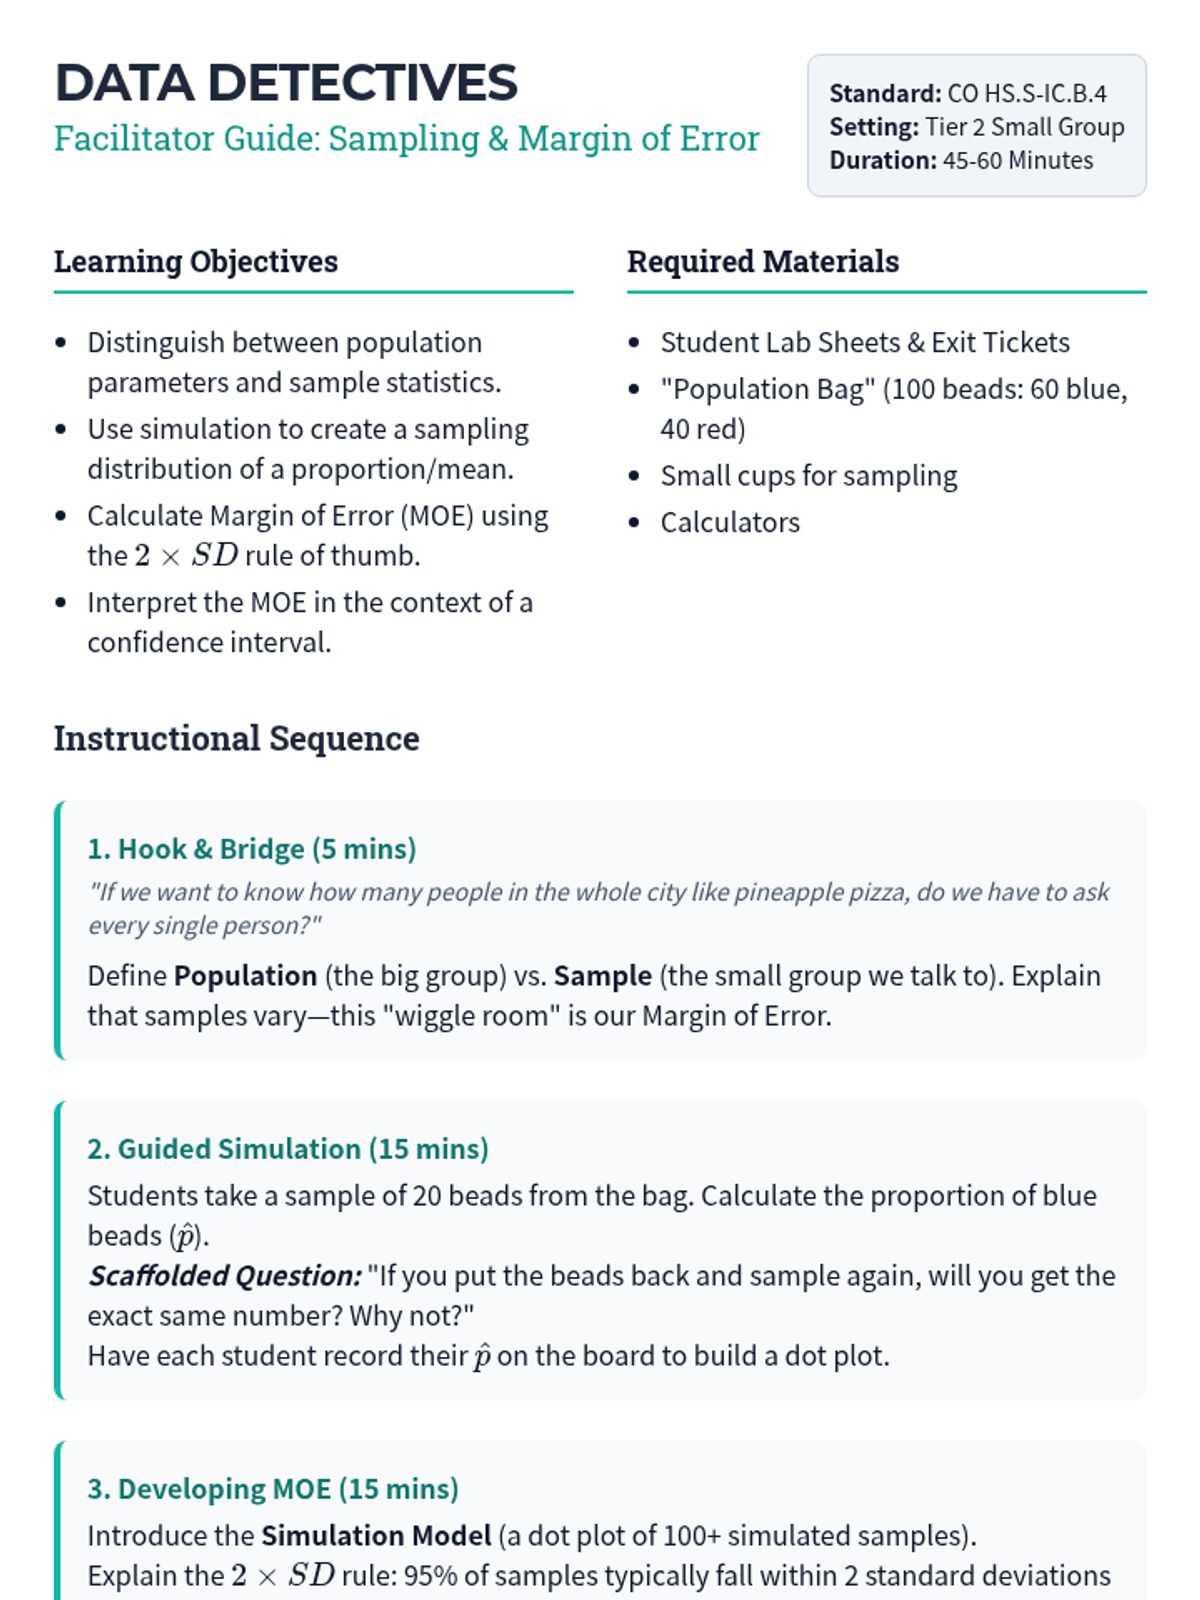
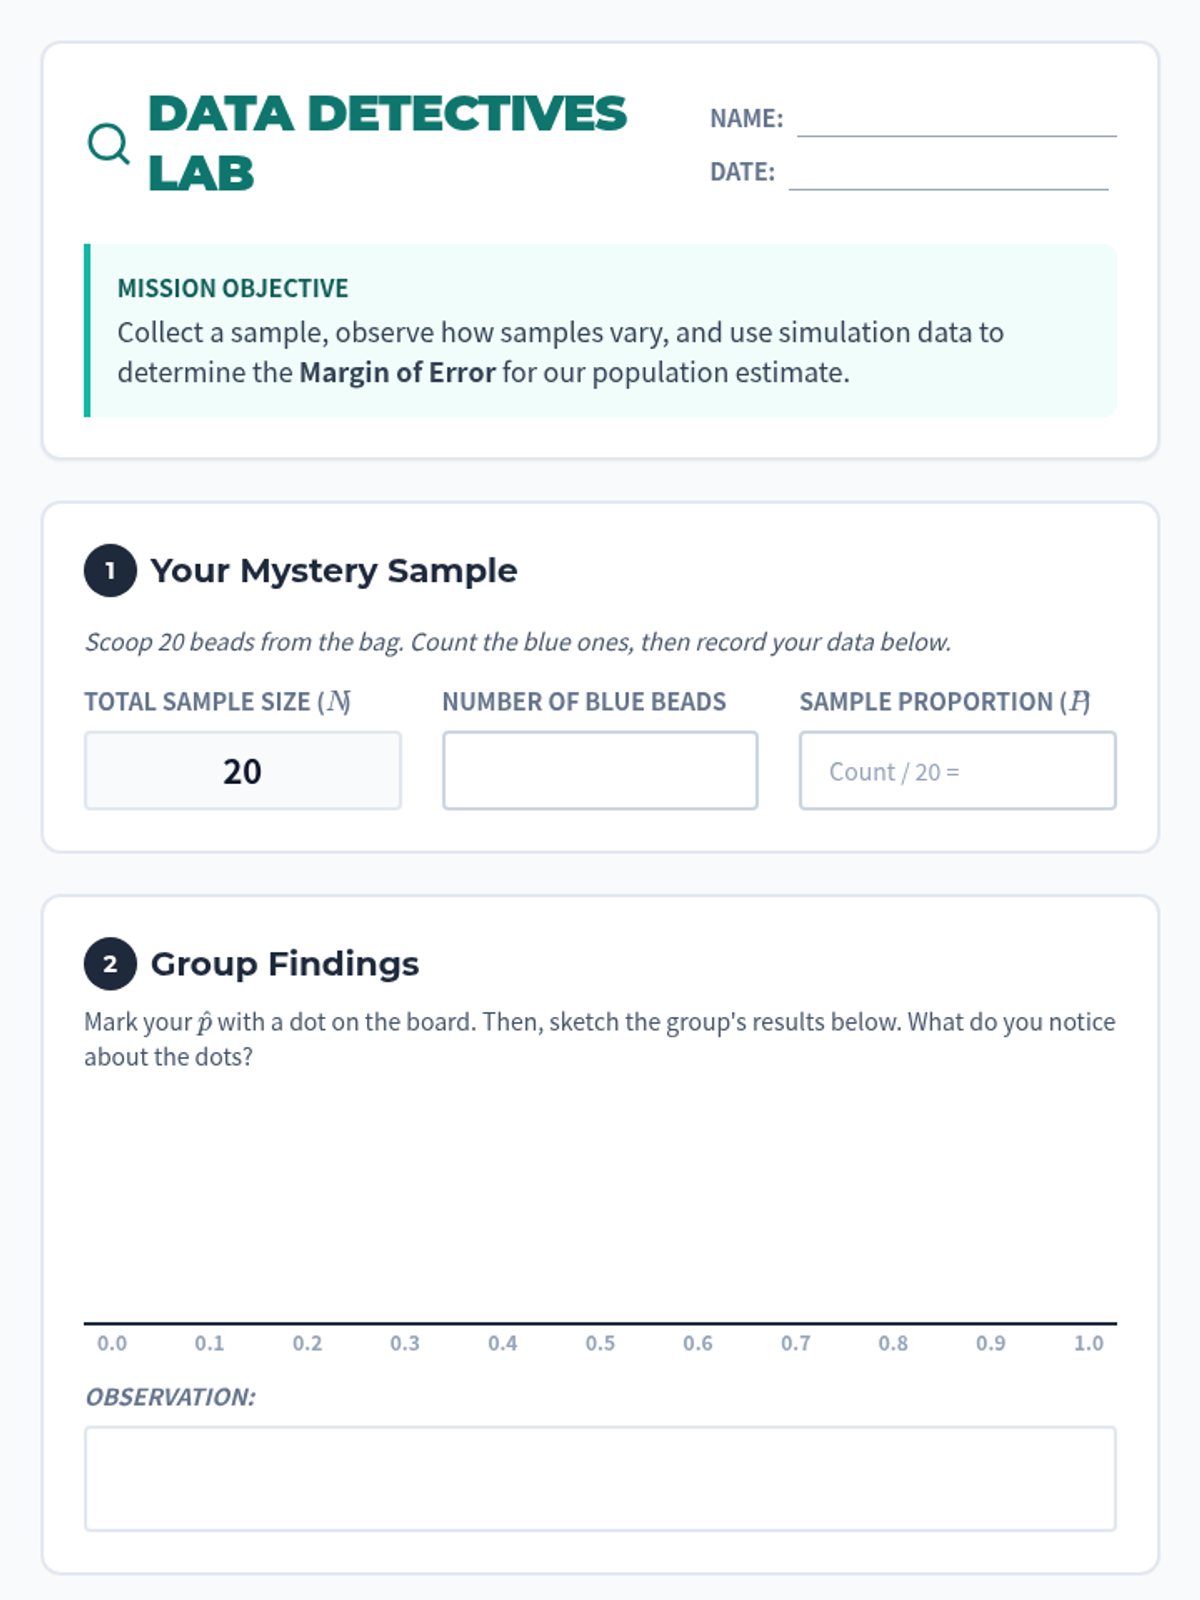
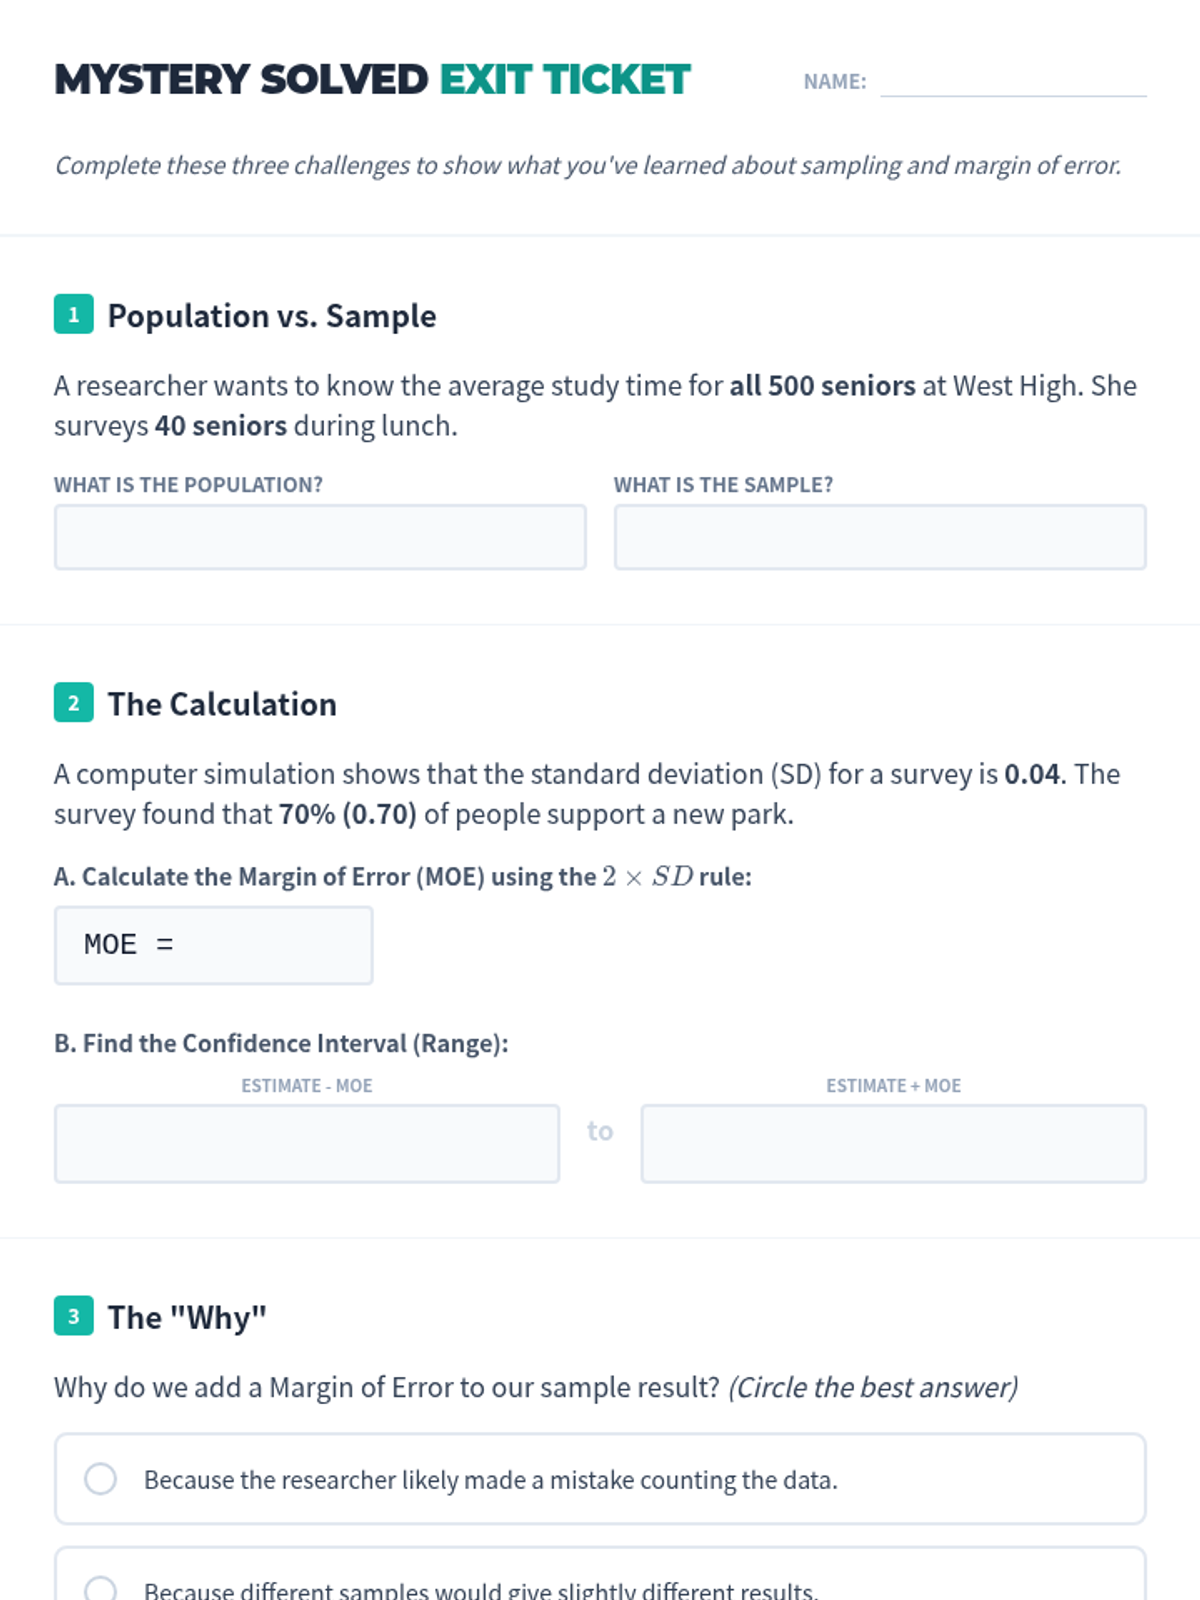
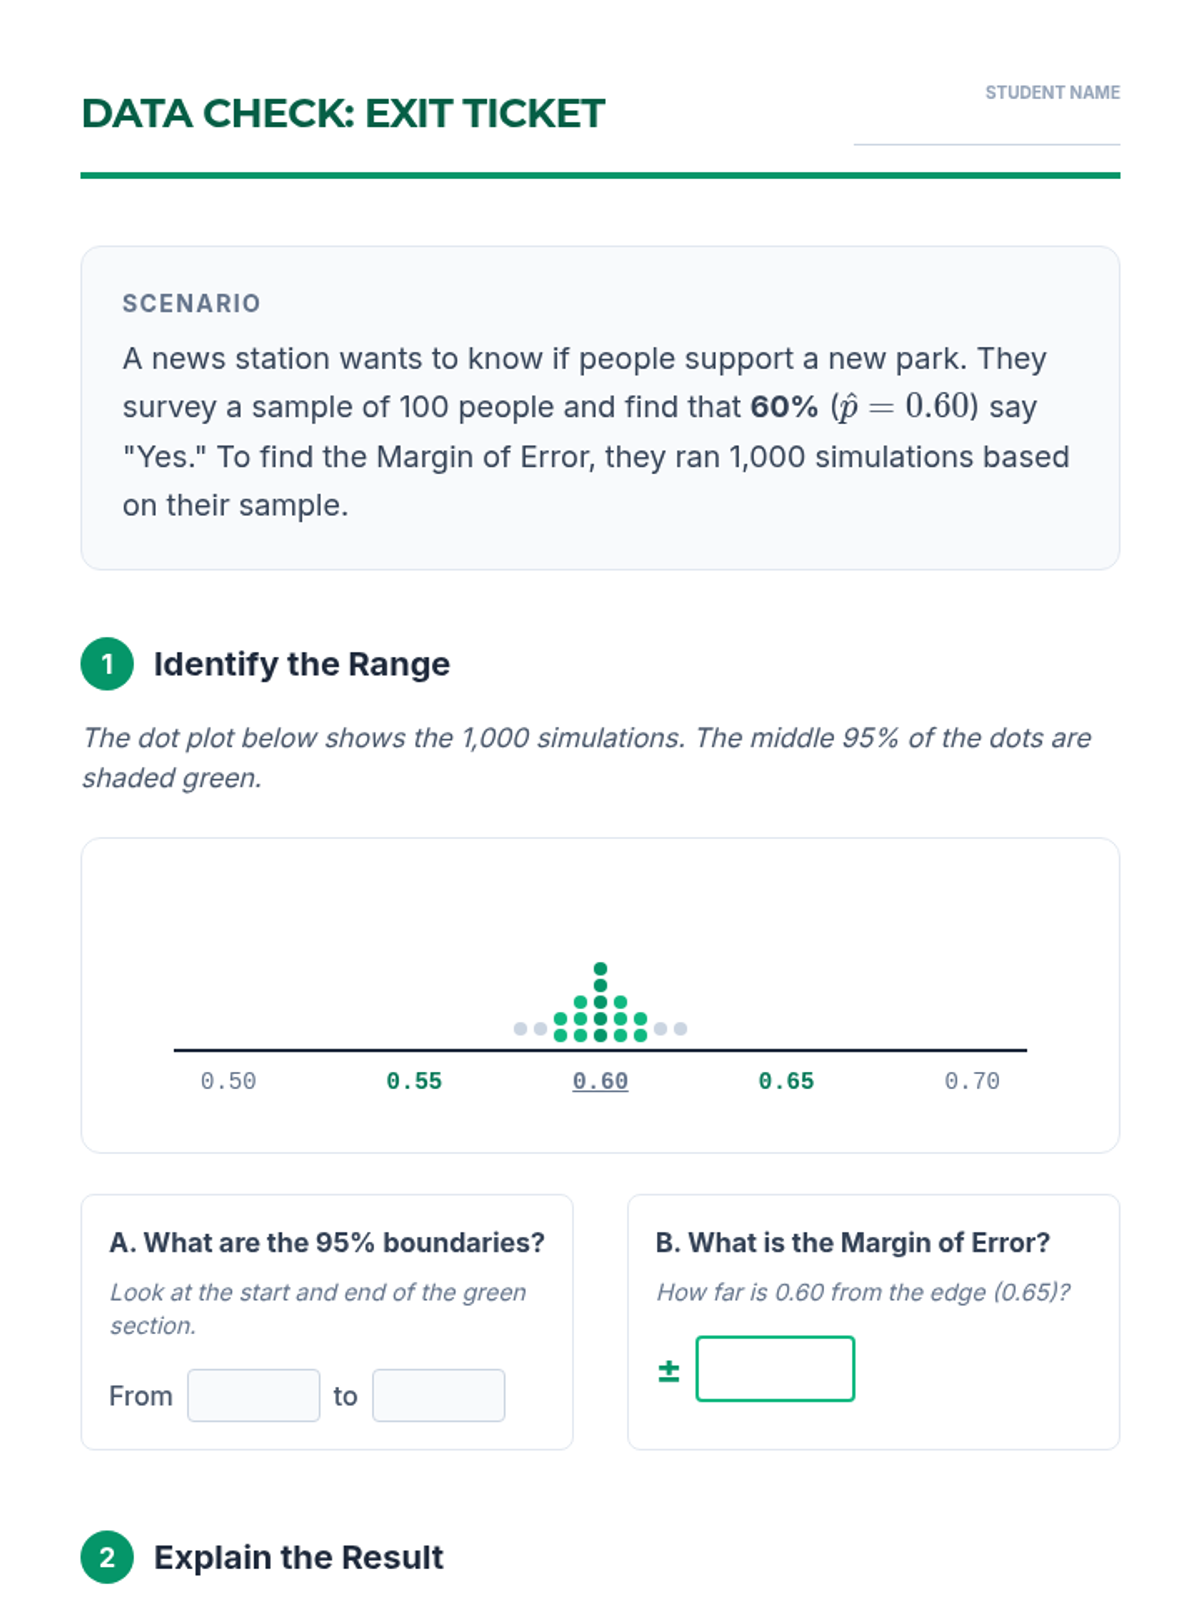
A Tier 2 intervention lesson focusing on using sample data to estimate population parameters. Students use simulations to develop and interpret margin of error in real-world polling contexts.
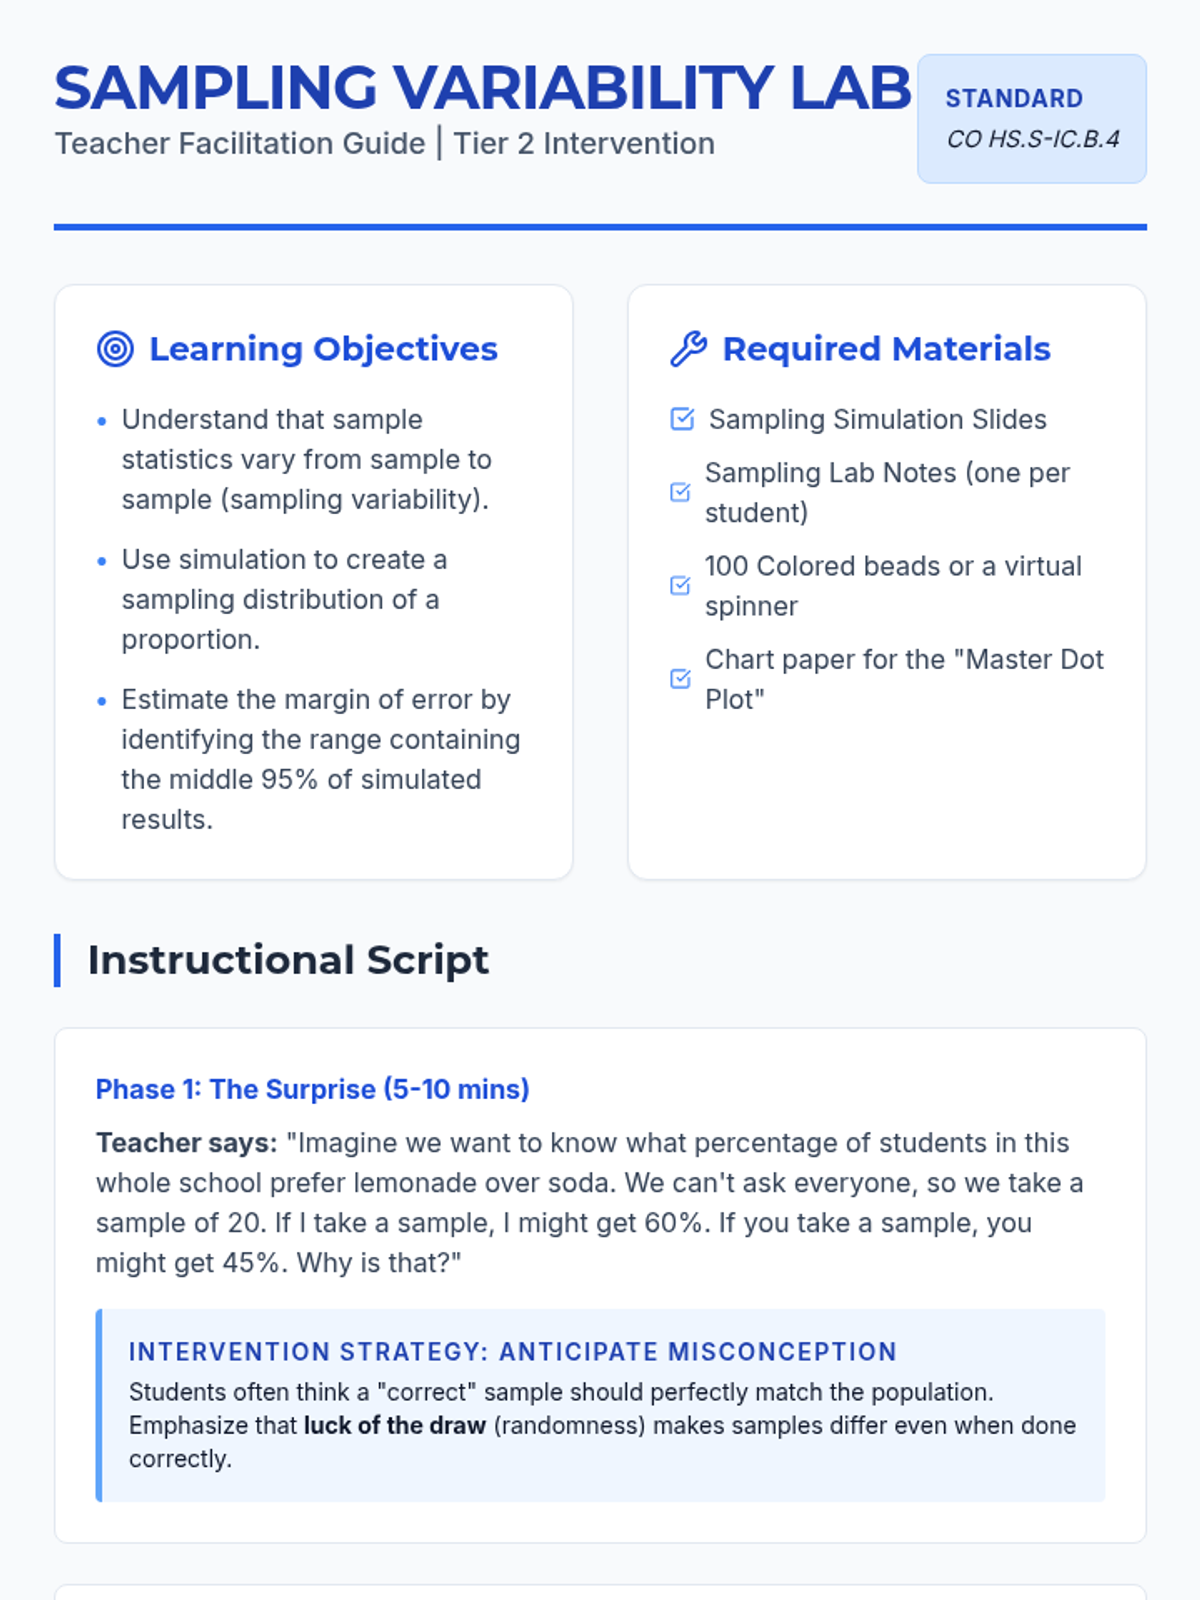
A Tier 2 intervention lesson focused on using simulation to estimate population parameters and determine the margin of error, aligned with Colorado standard HS.S-IC.B.4. Students engage in hands-on data collection and visual analysis of sampling distributions.
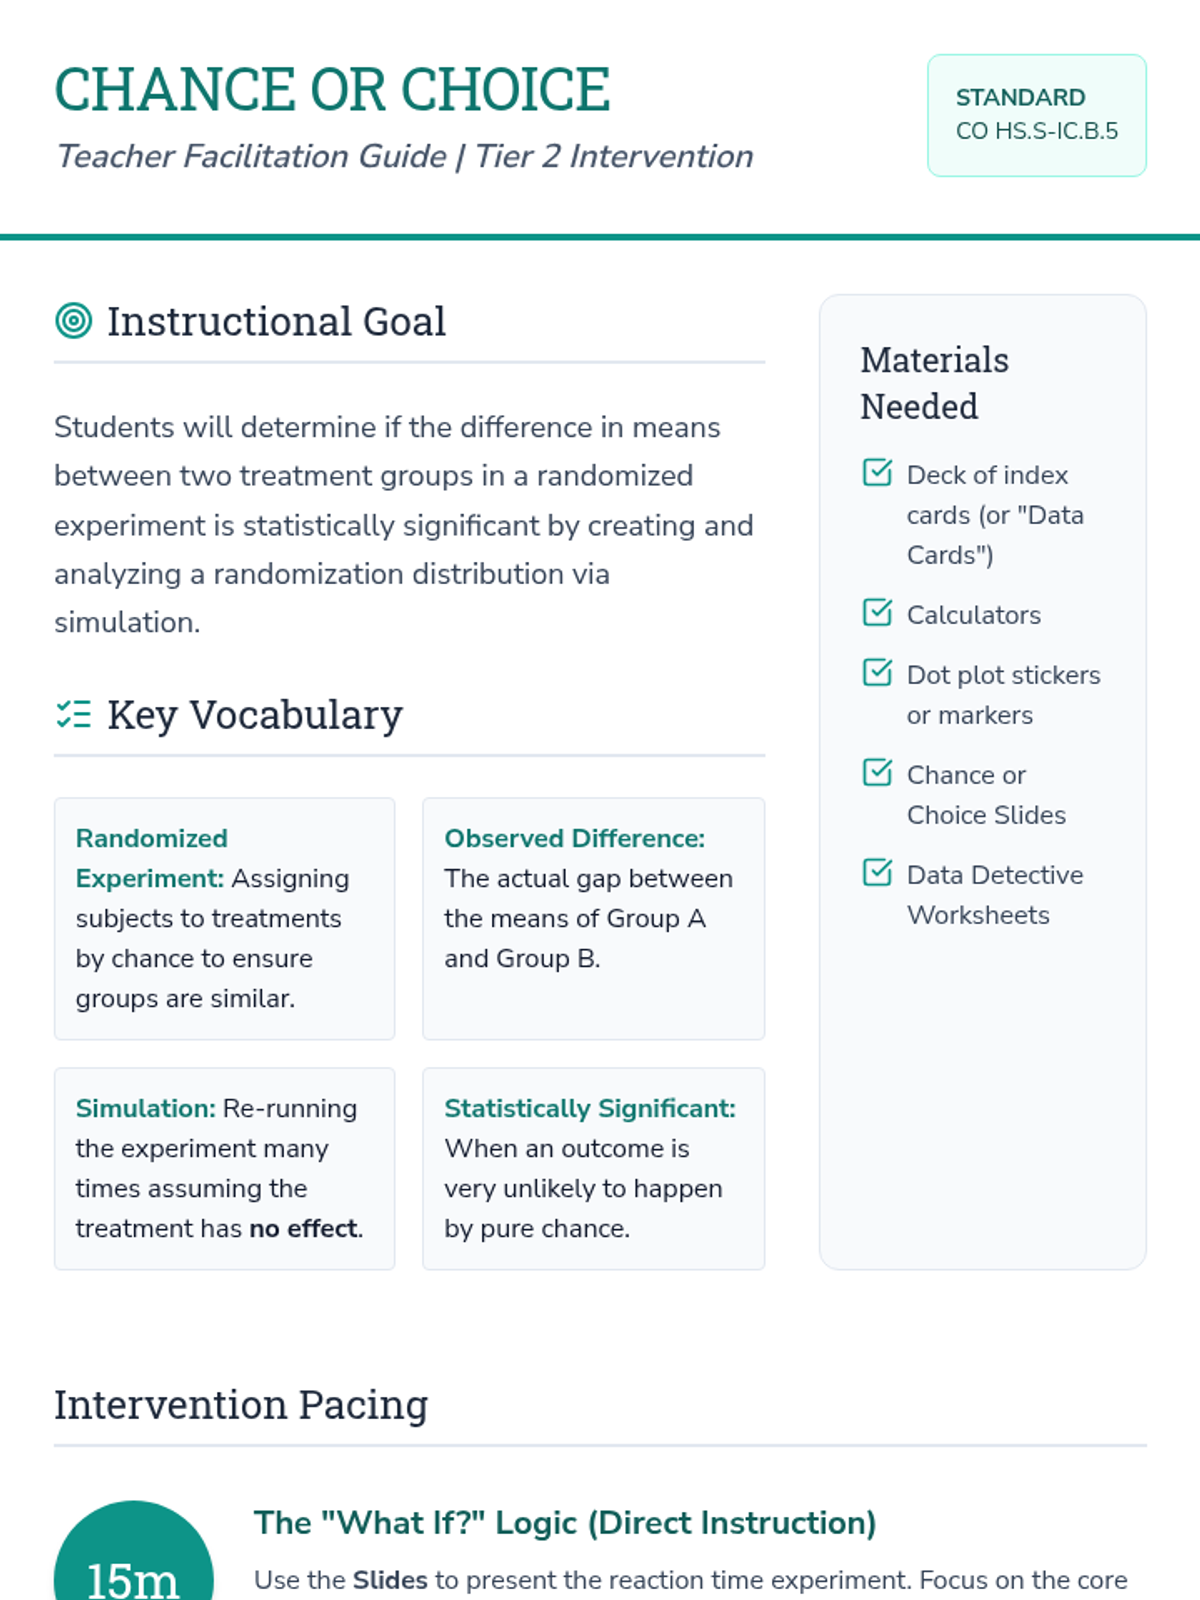
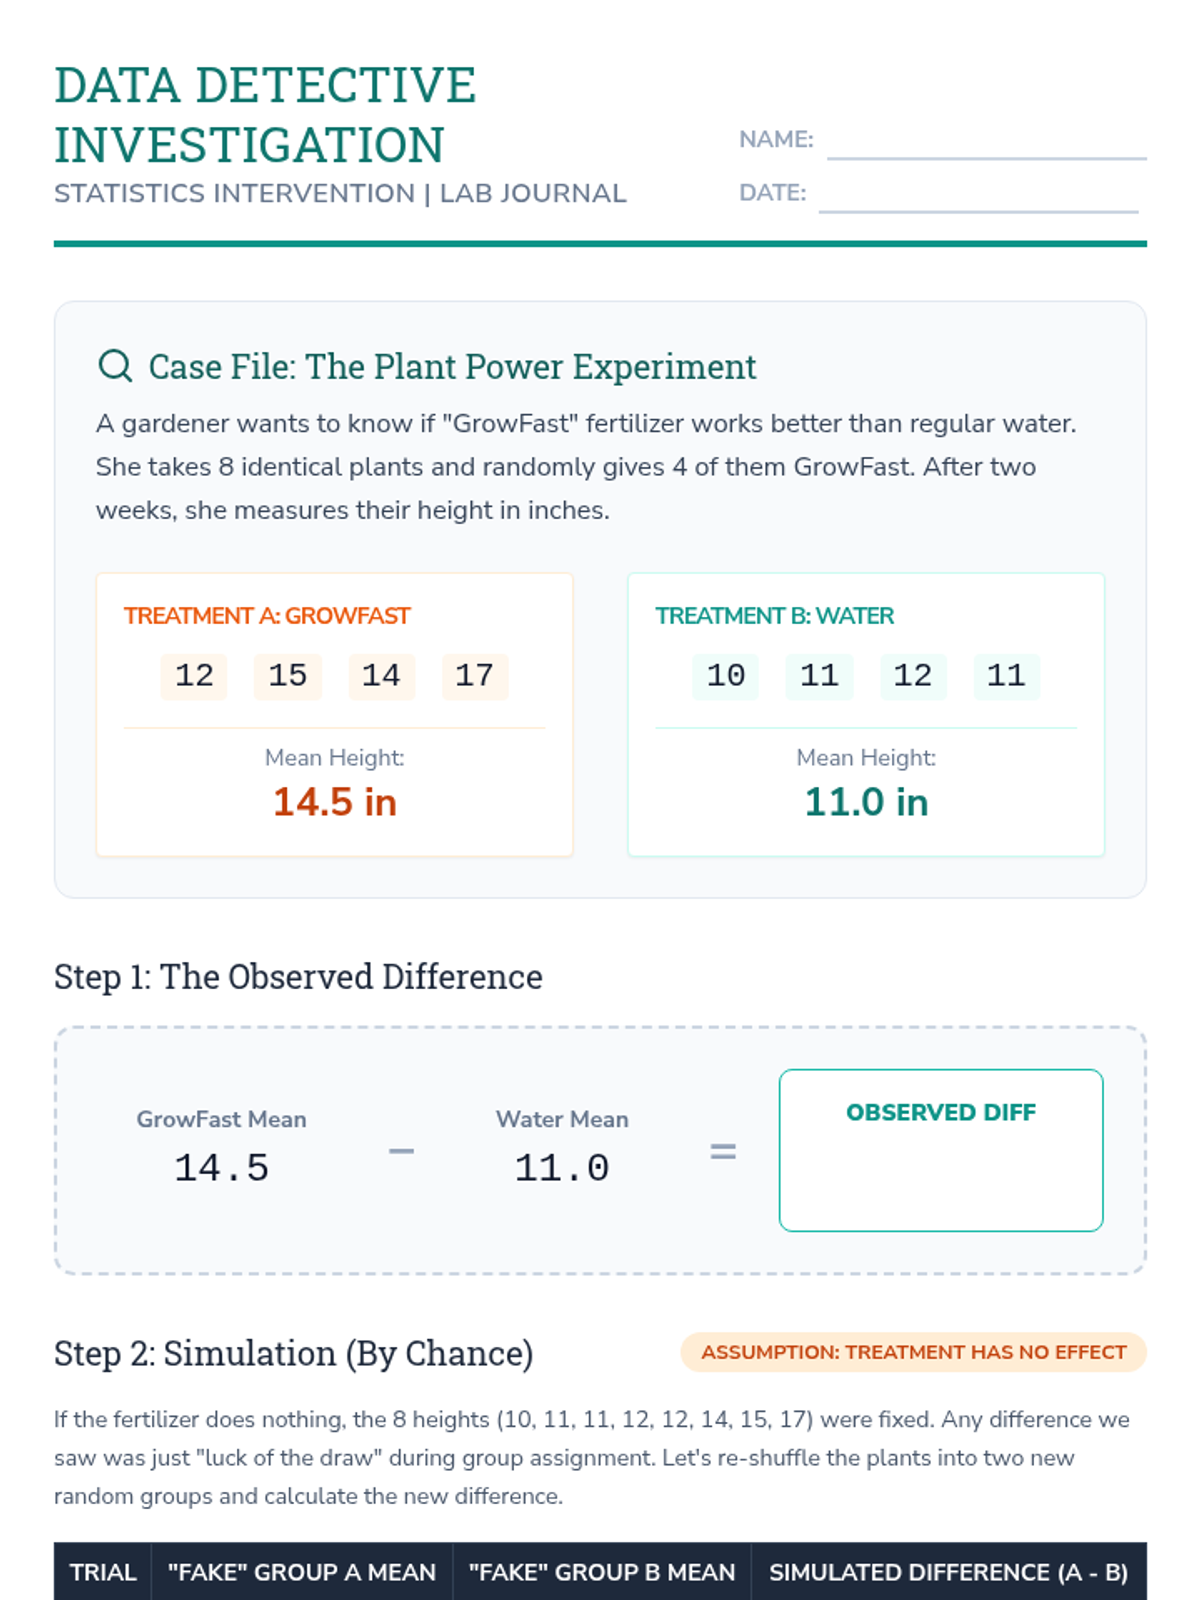
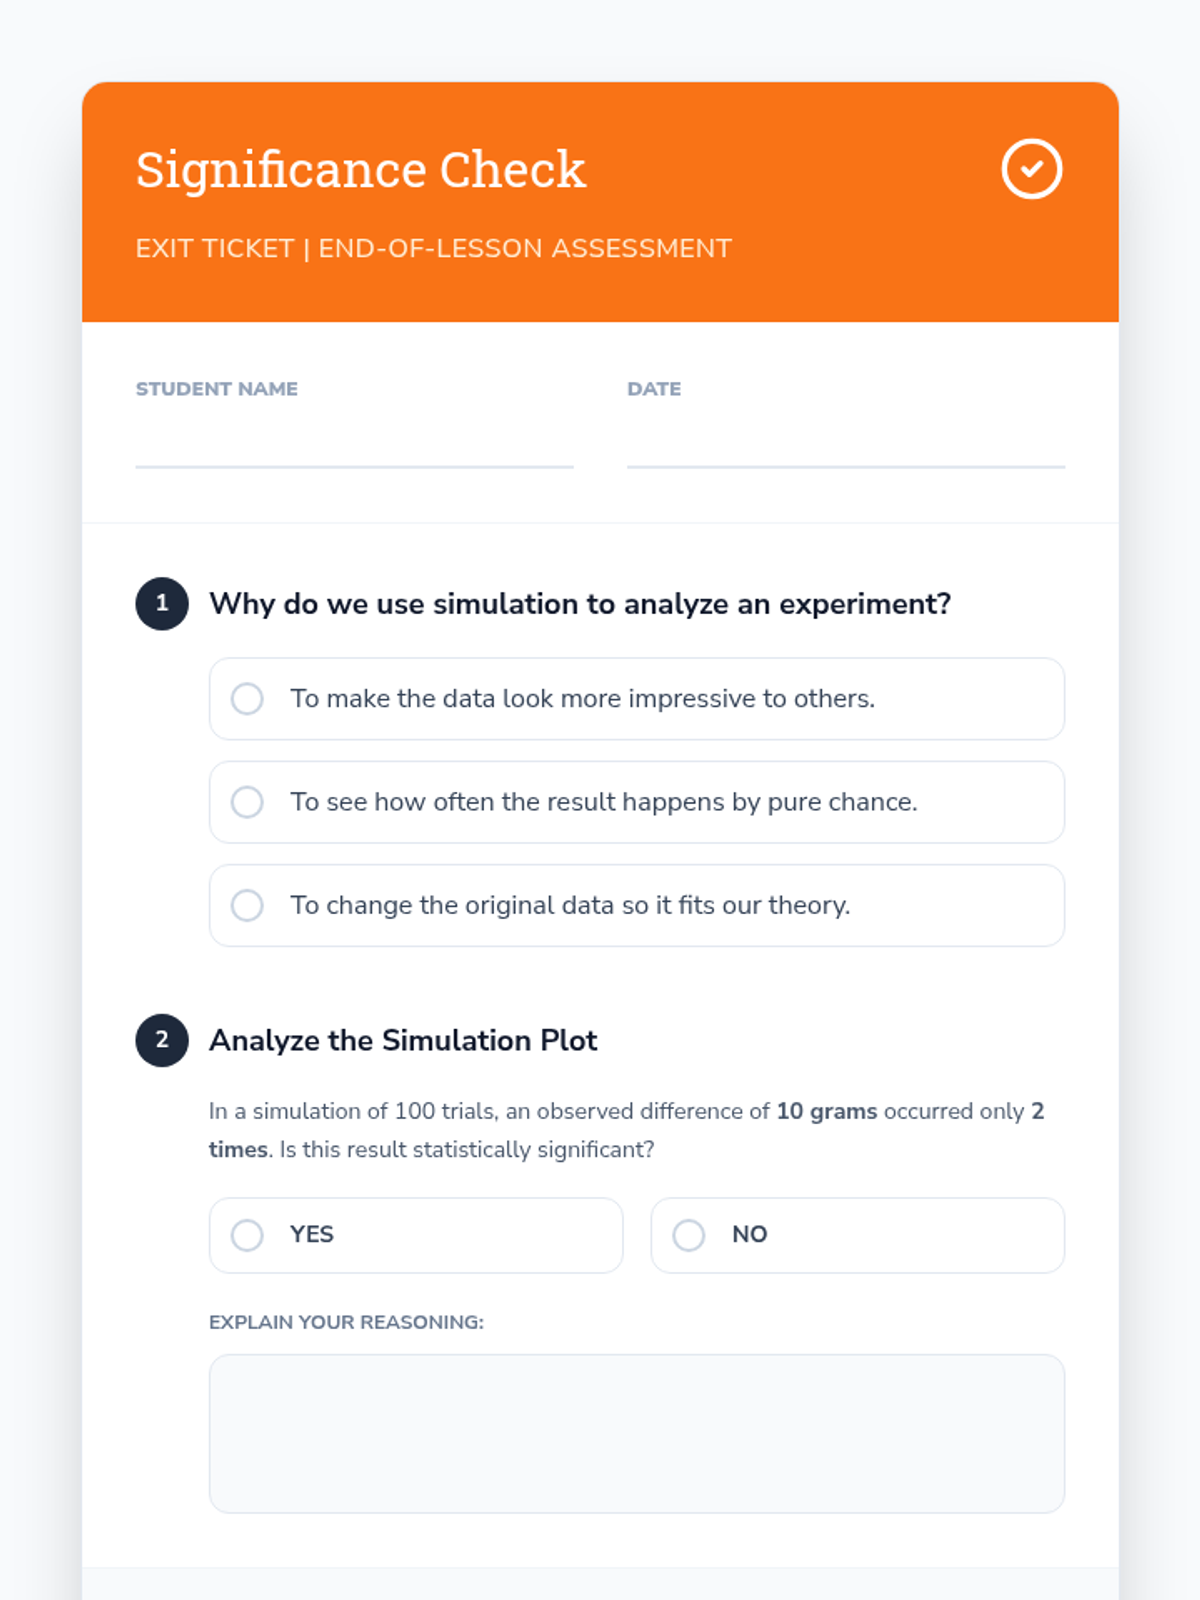
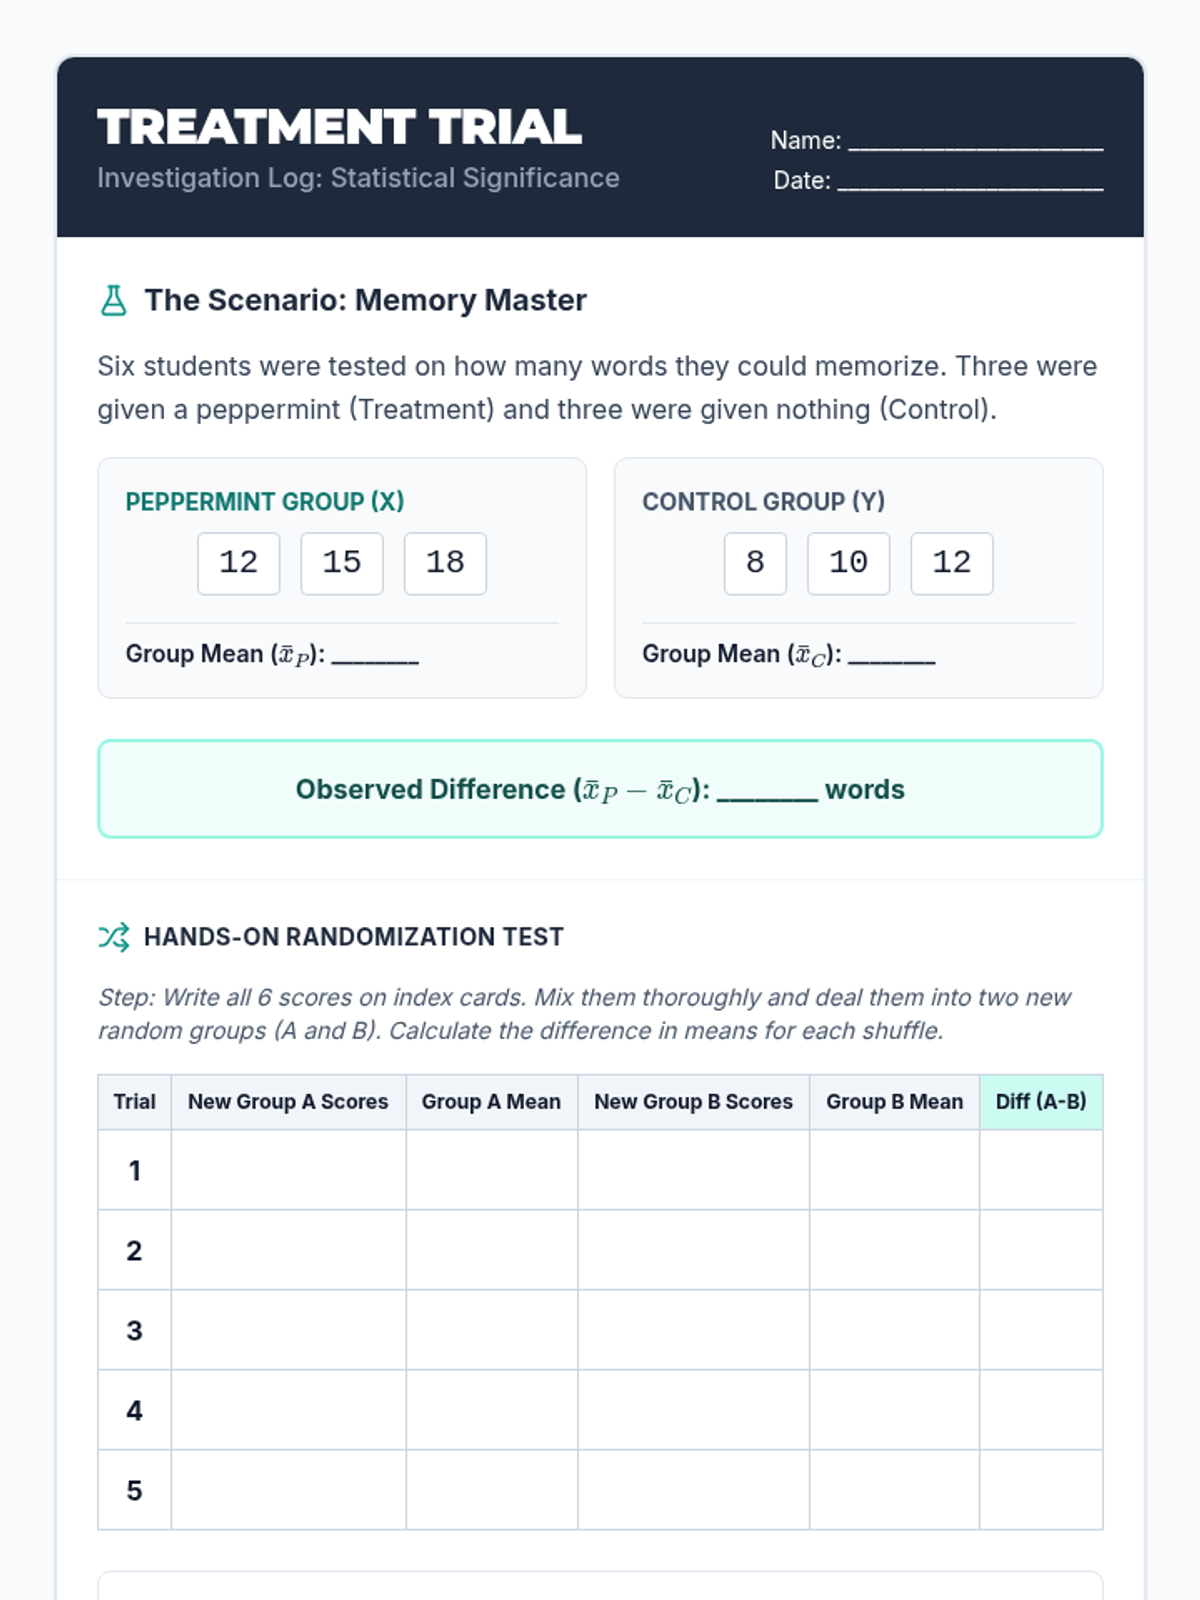
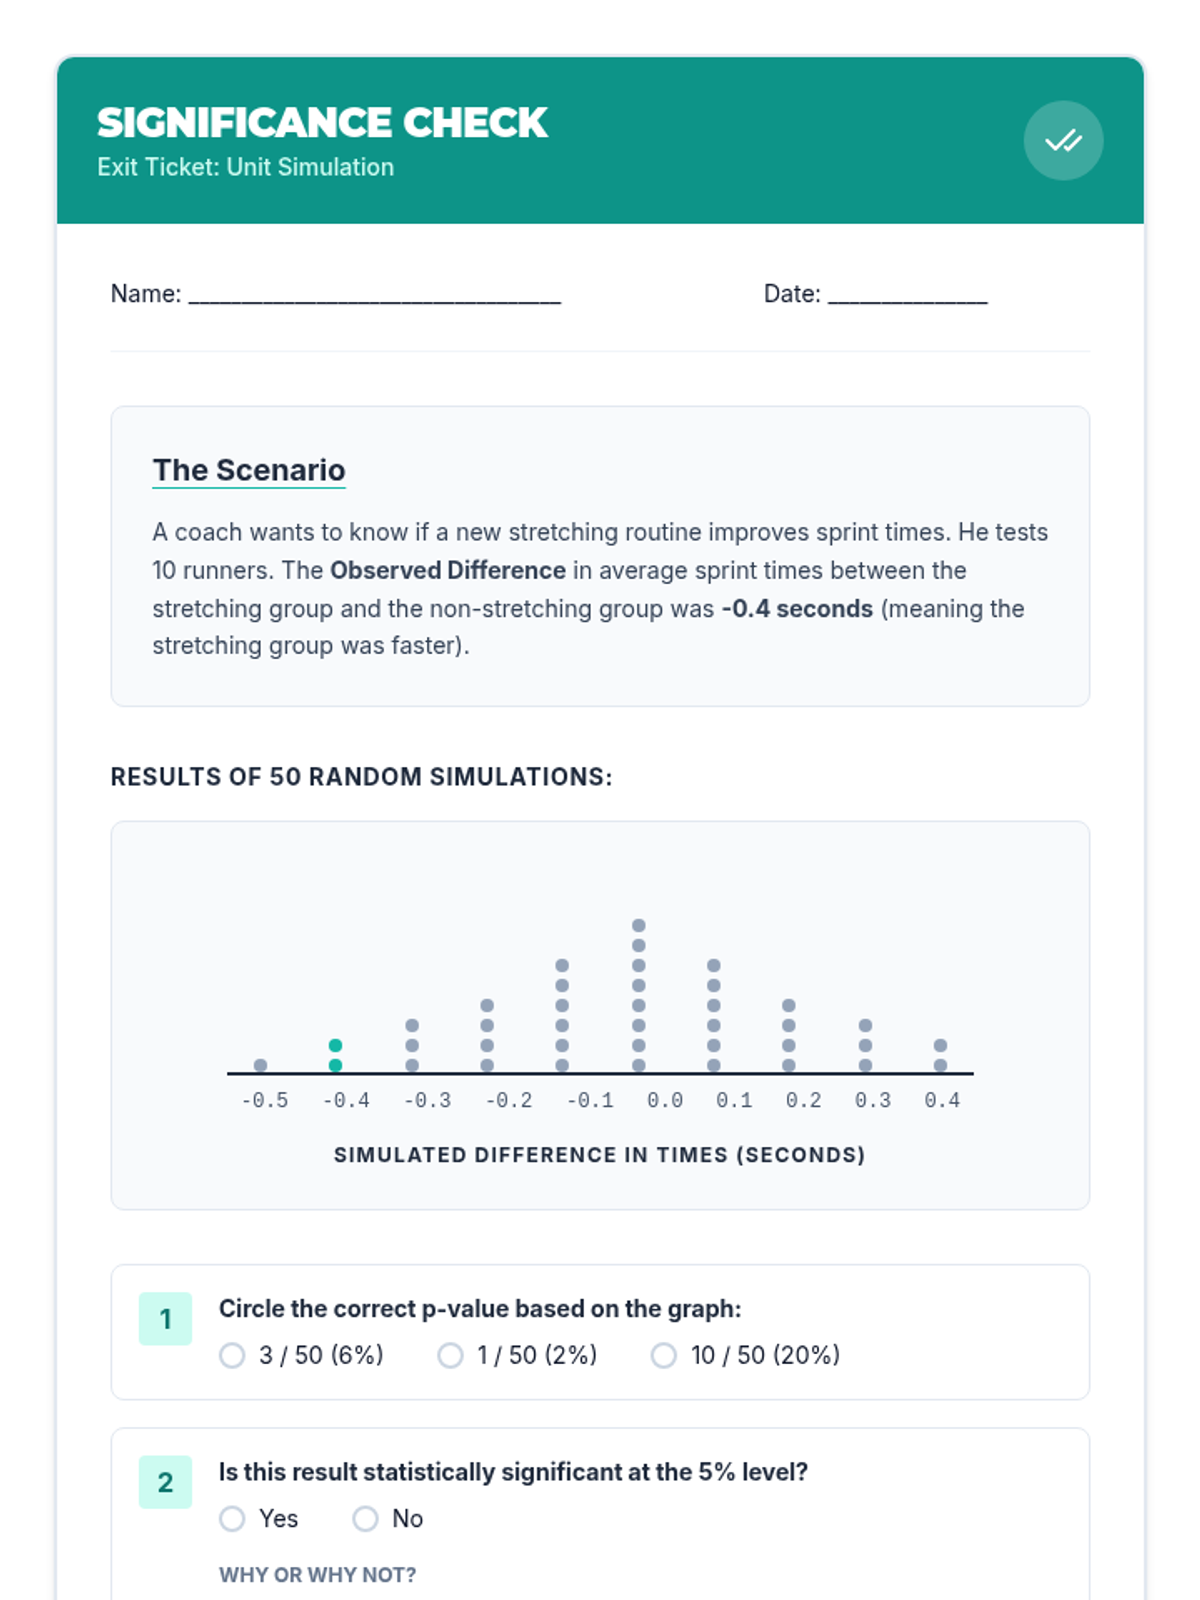
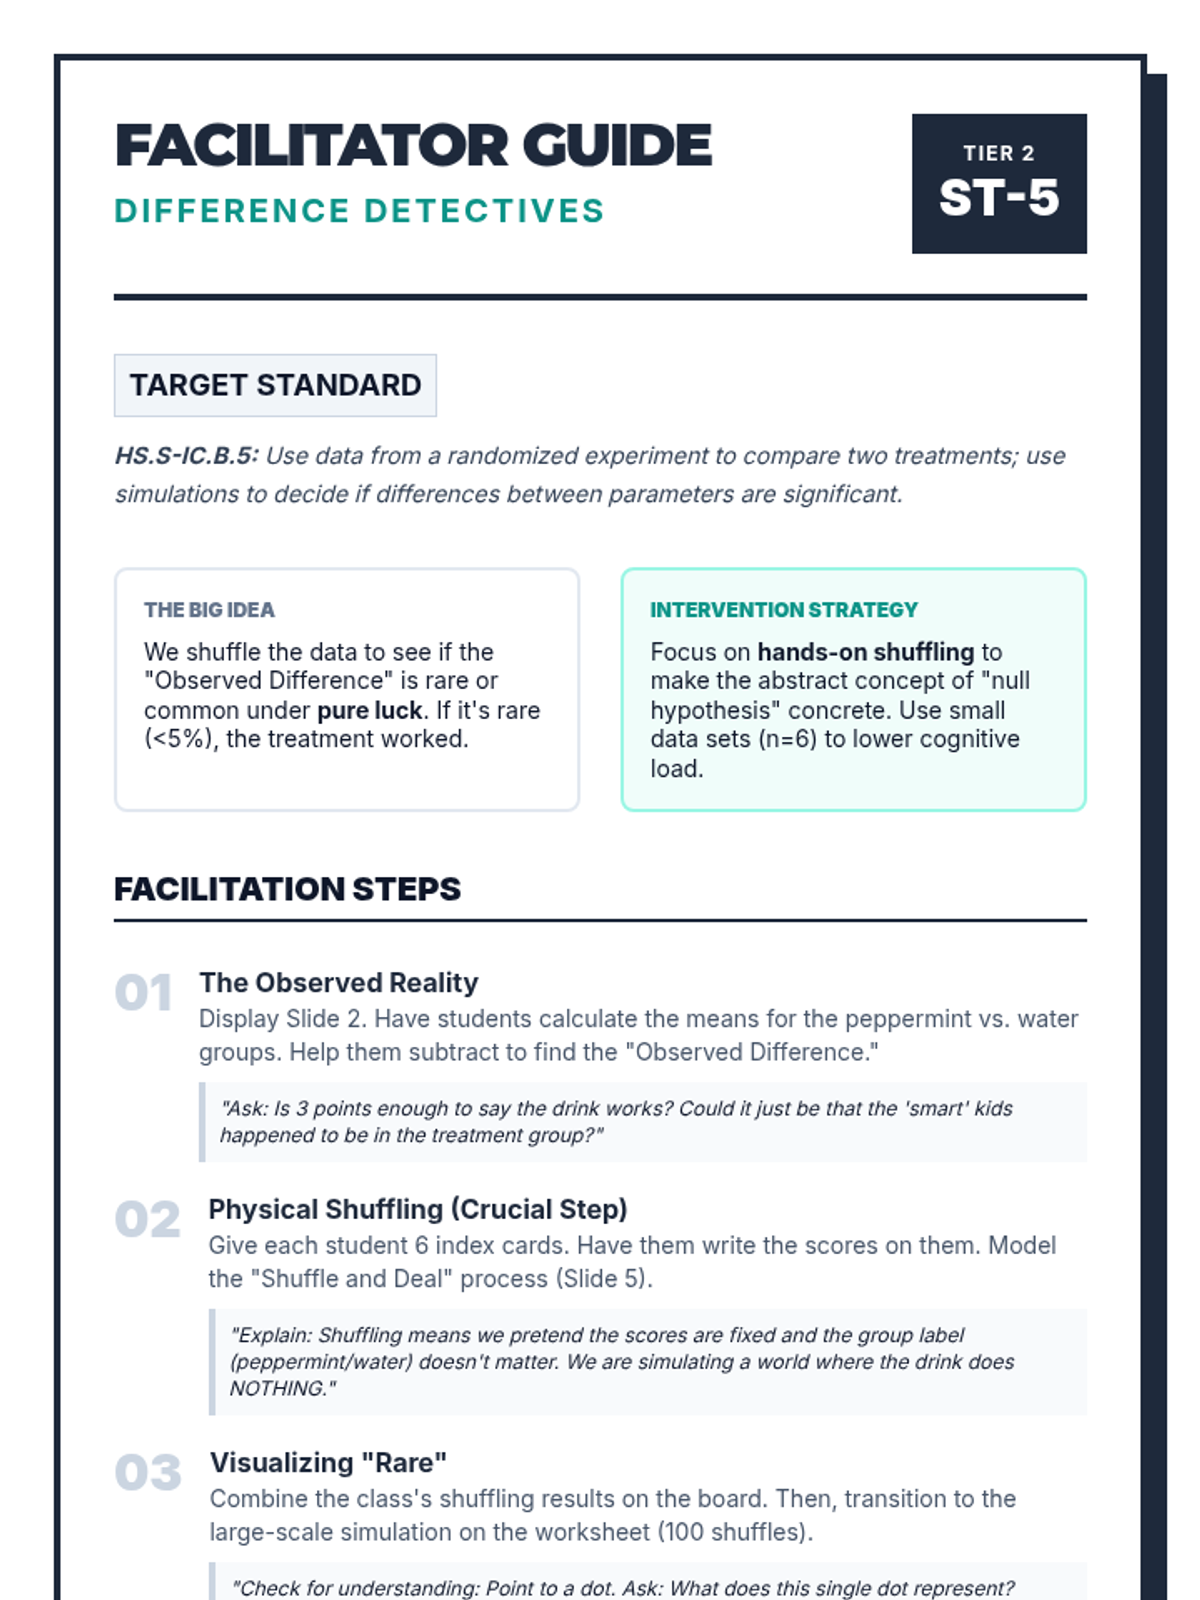
A Tier 2 intervention lesson focusing on randomized experiments and simulation-based significance testing. Students learn to determine if observed differences between two treatments are statistically significant using a hands-on shuffling simulation approach.
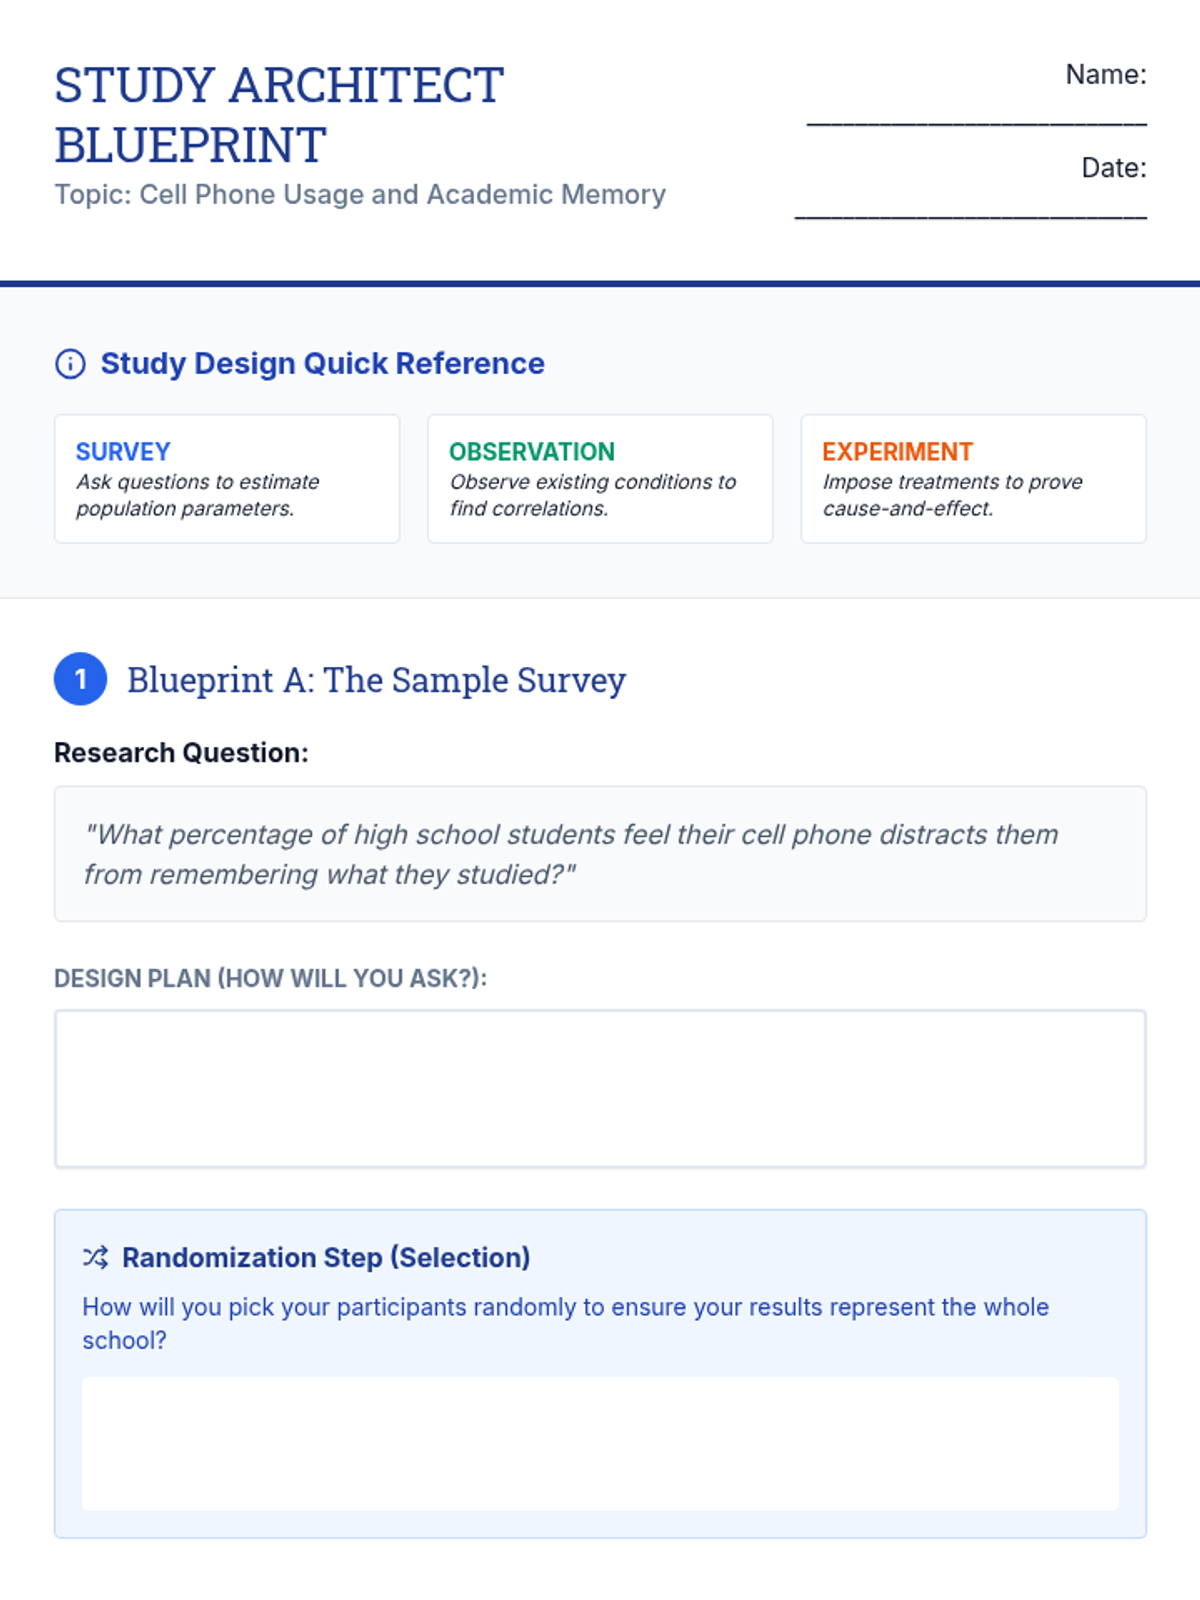
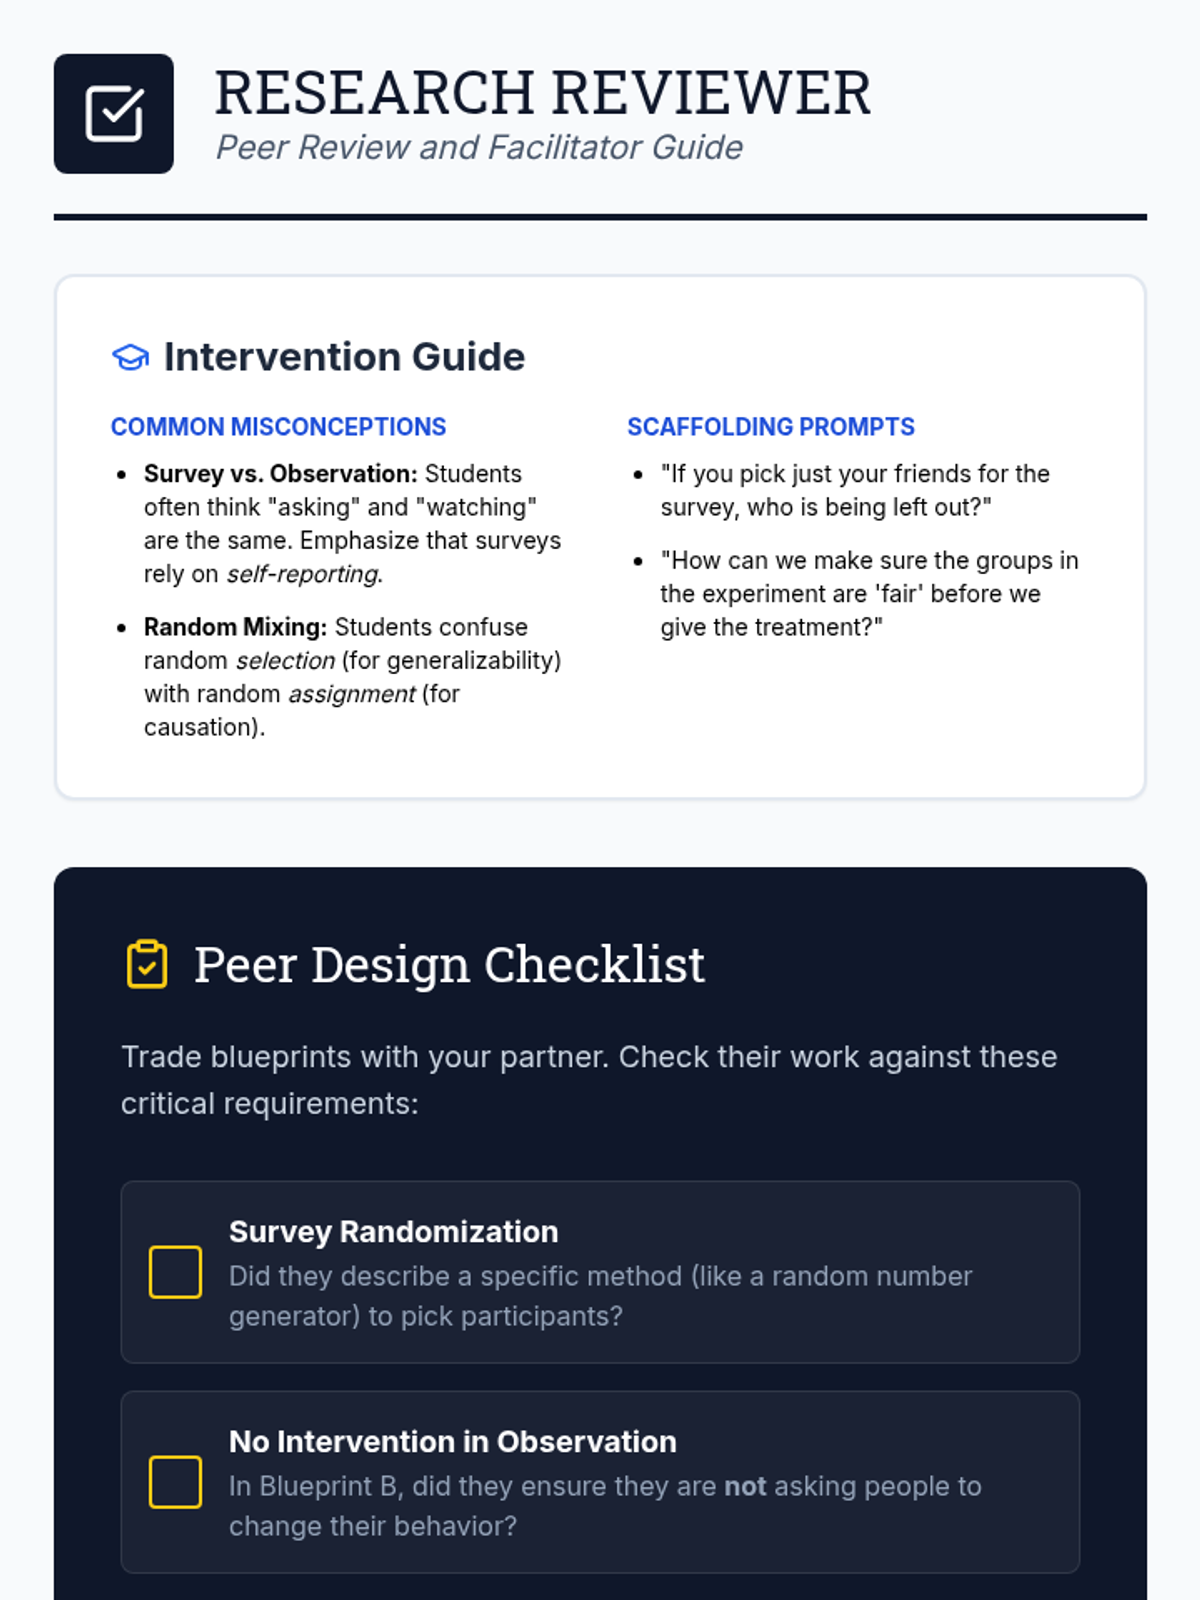
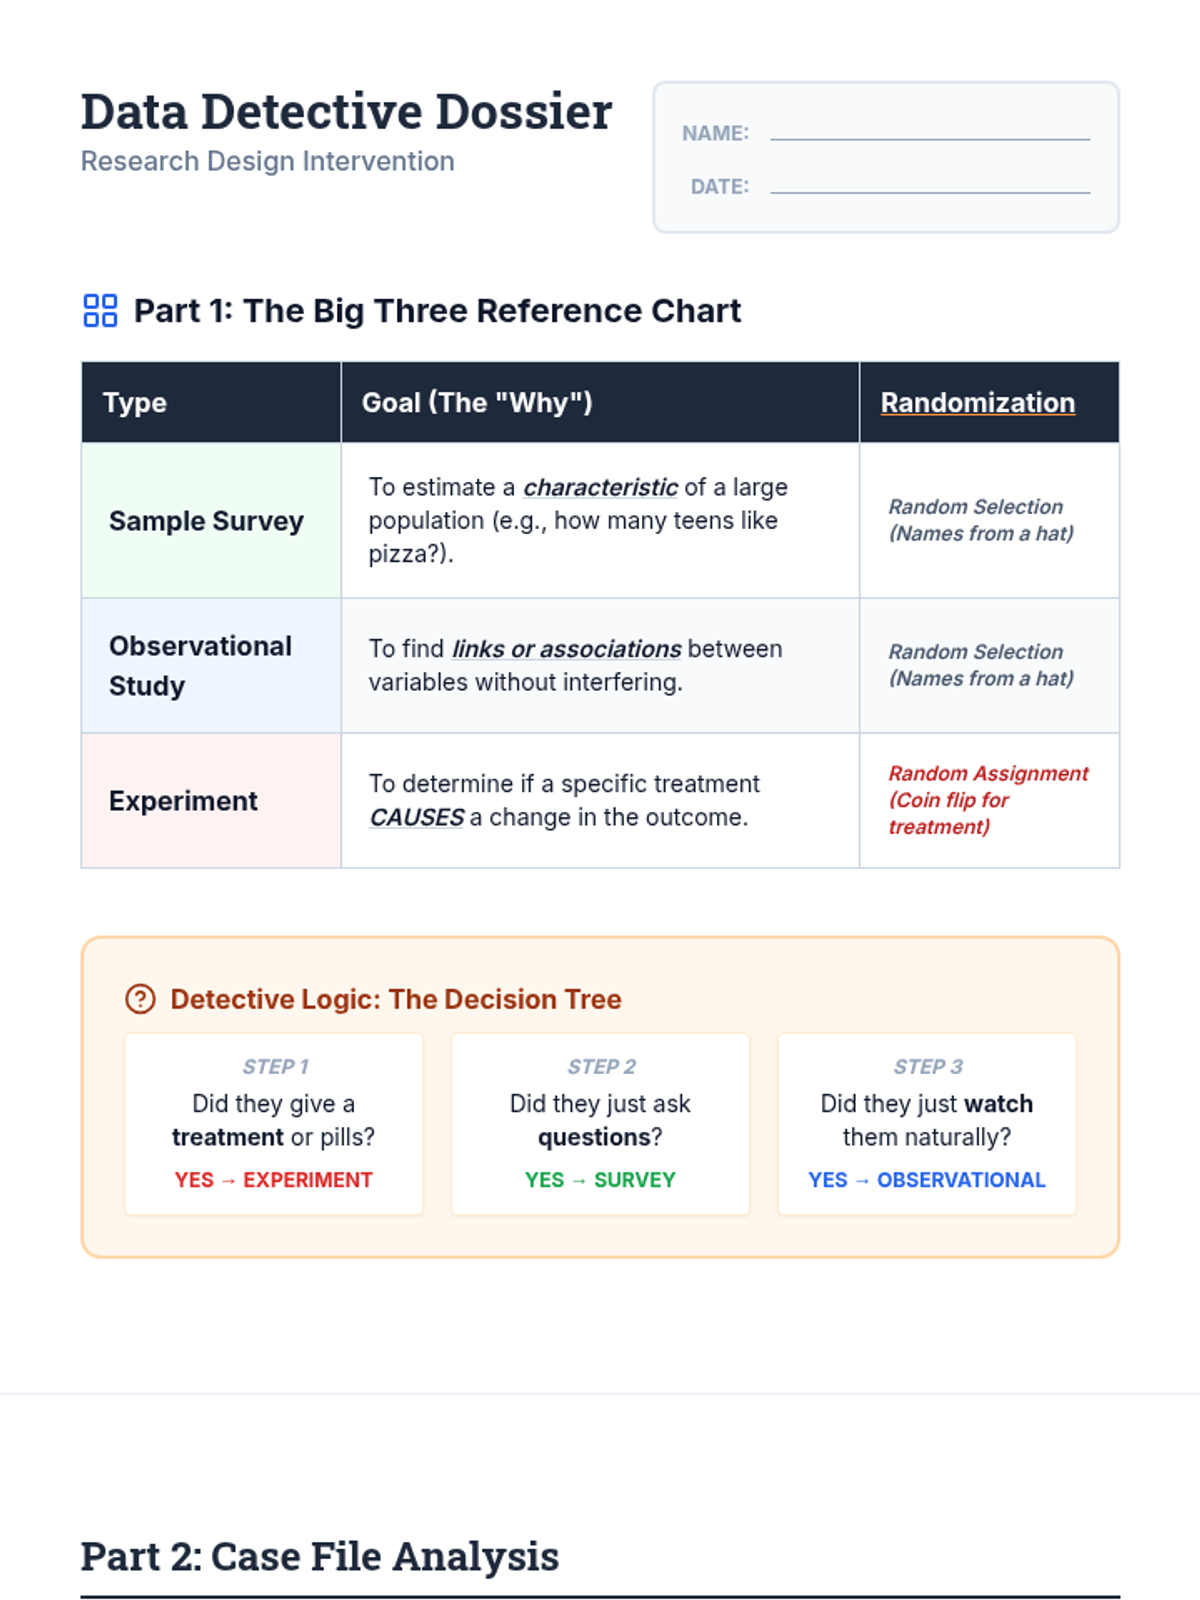
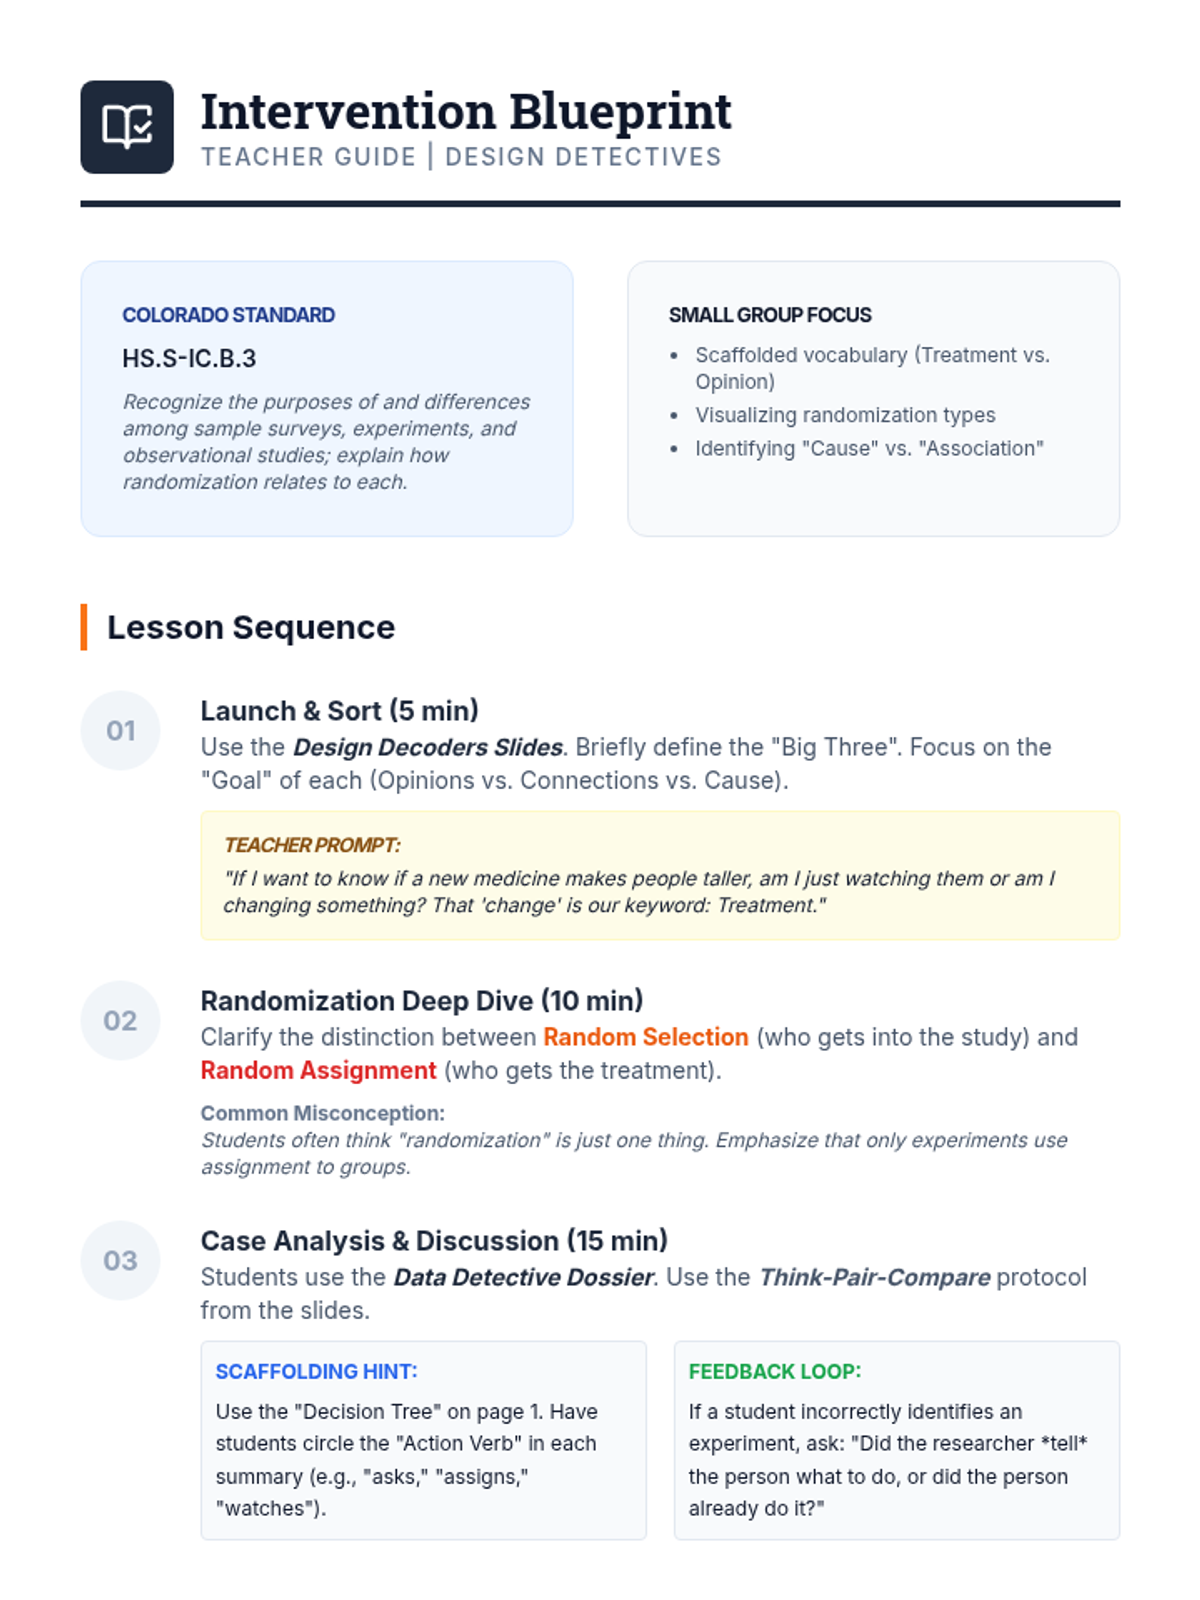
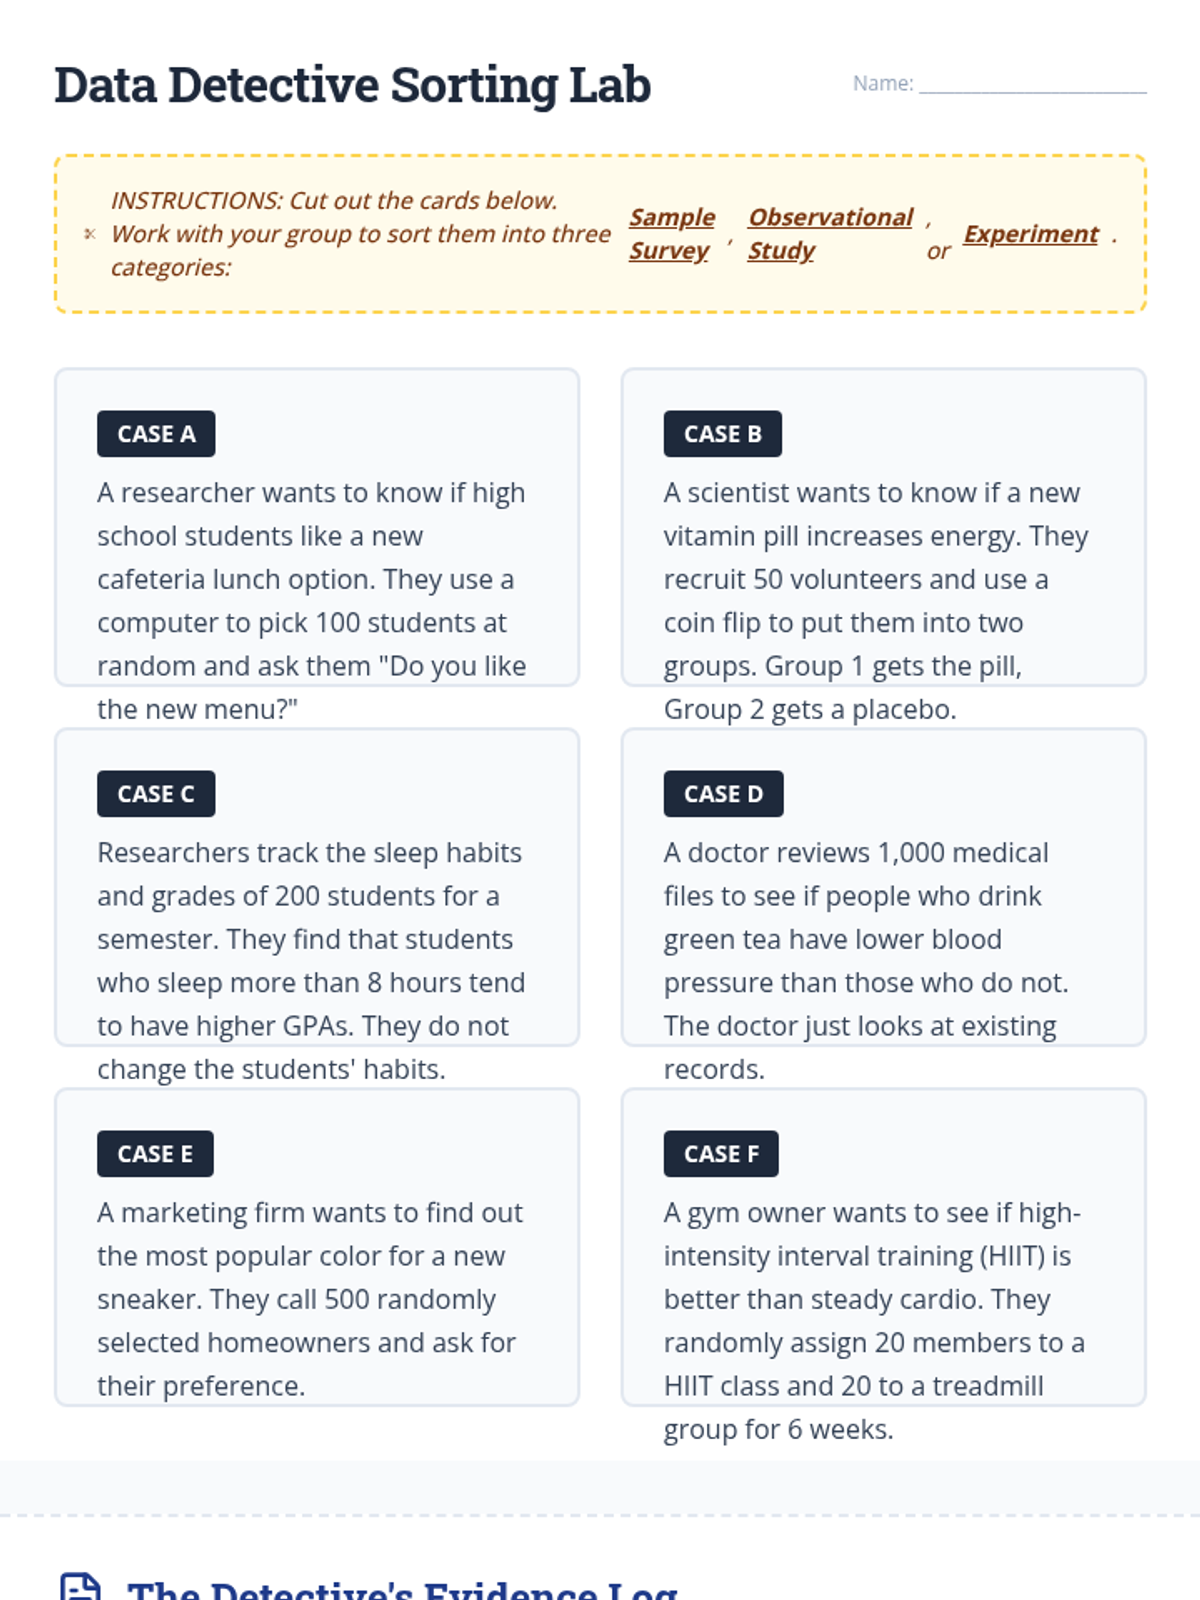
A targeted Tier 2 intervention lesson where students act as 'Study Architects' to master the design of sample surveys, experiments, and observational studies. The lesson emphasizes the critical role of randomization in each design type through collaborative mini-study planning and peer critique.
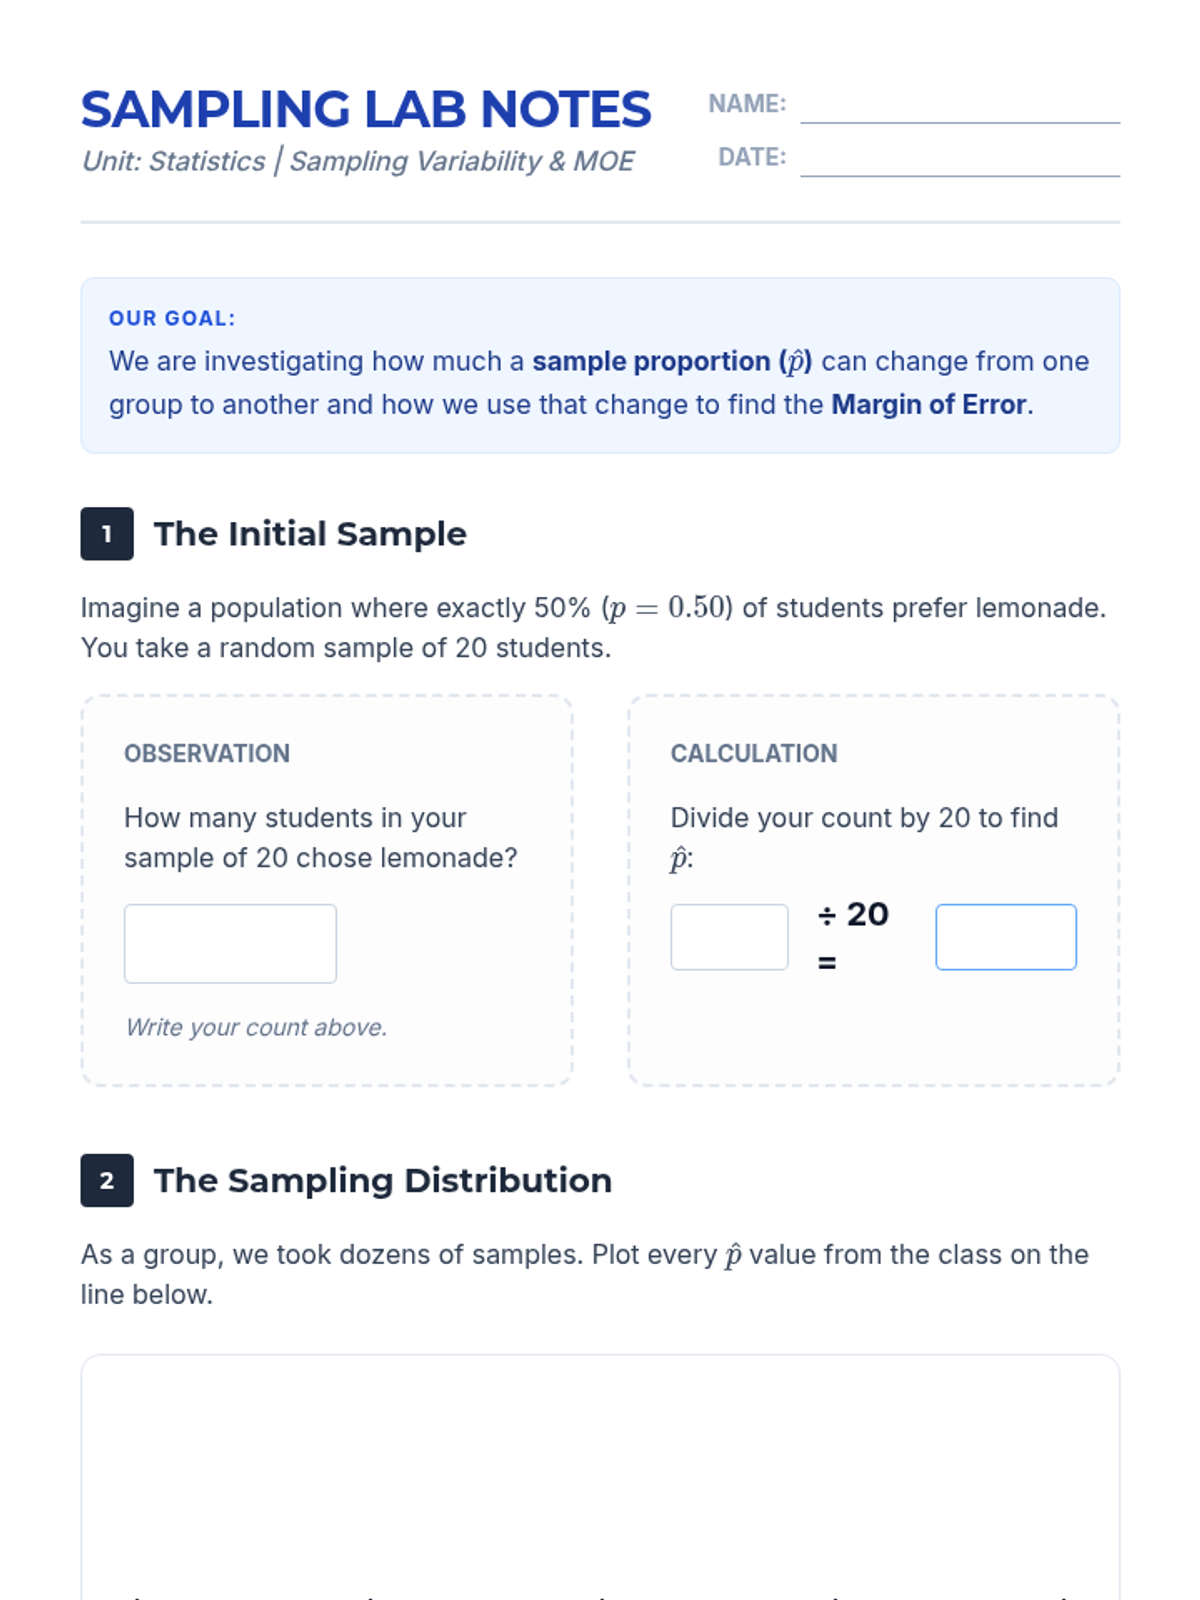
A Tier 2 intervention lesson focusing on the conceptual understanding of sampling variability and the margin of error using simulation models. Students transition from individual samples to distributions of many samples to estimate population parameters.
A scaffolded intervention lesson focusing on the relationship between populations and samples, and how statistics allow us to make educated guesses (inferences) about the world.
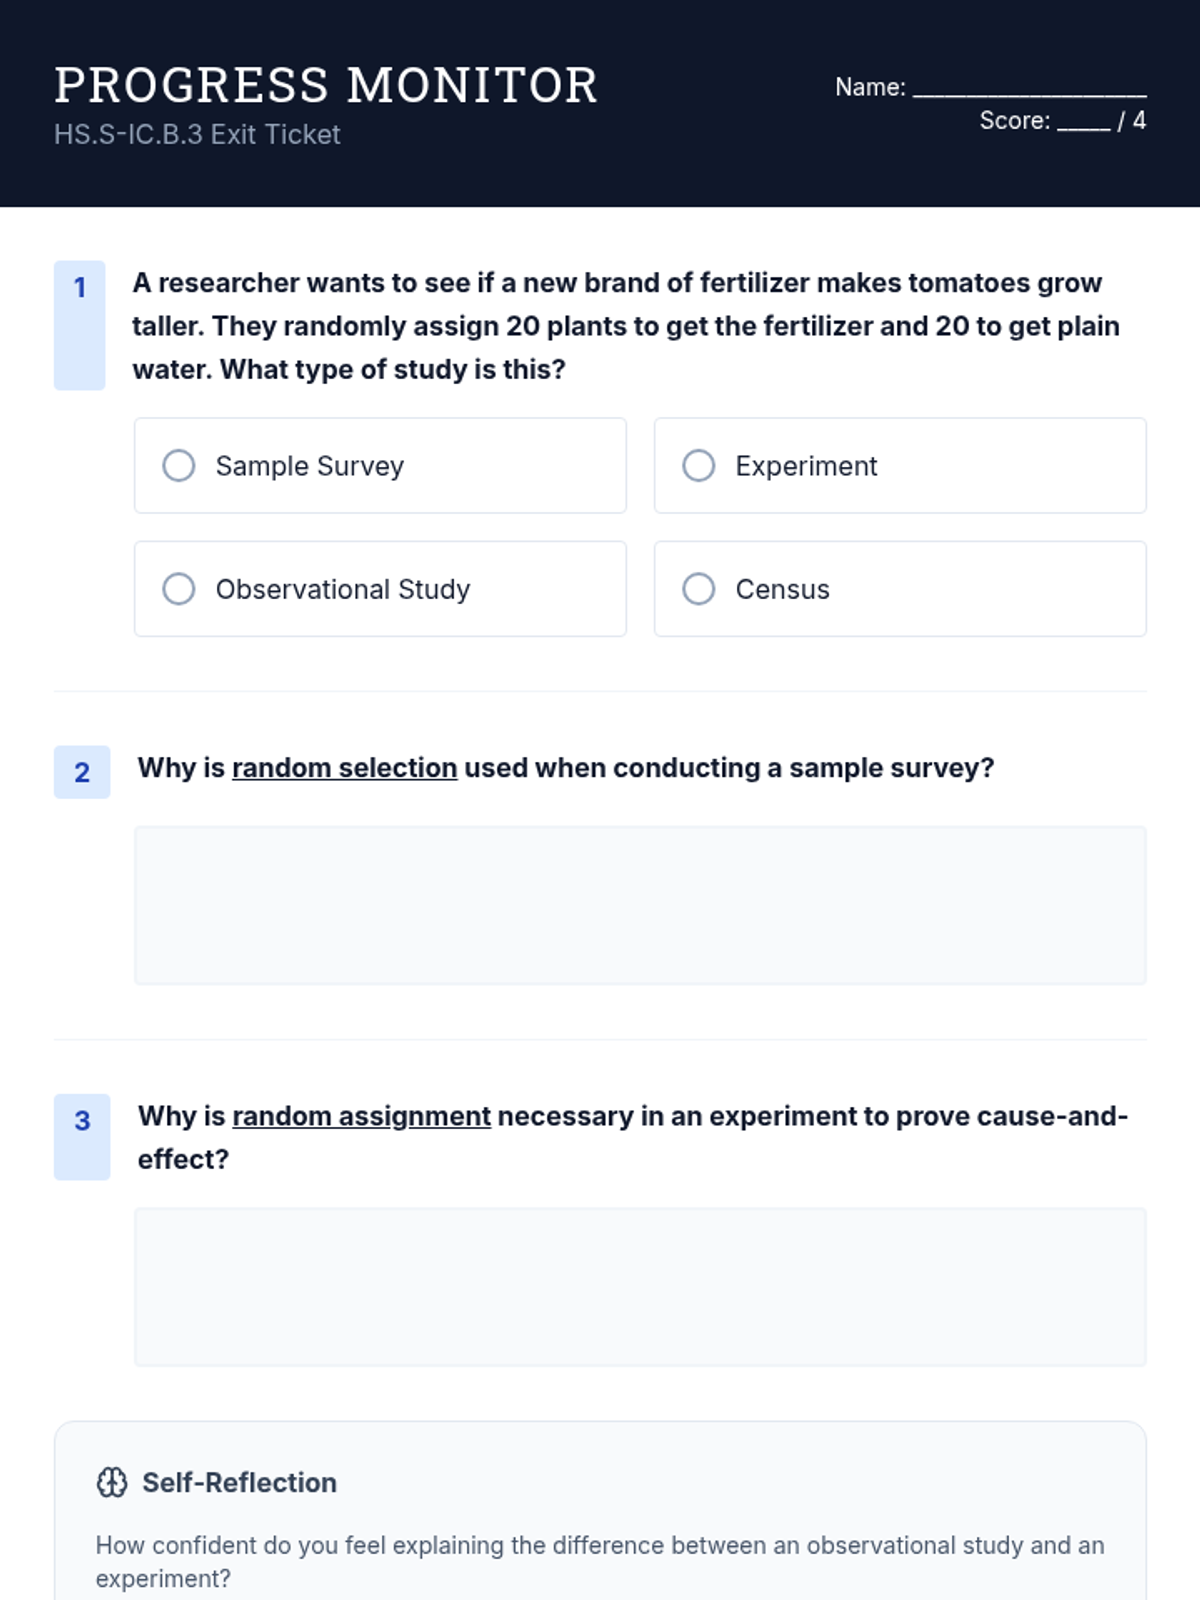
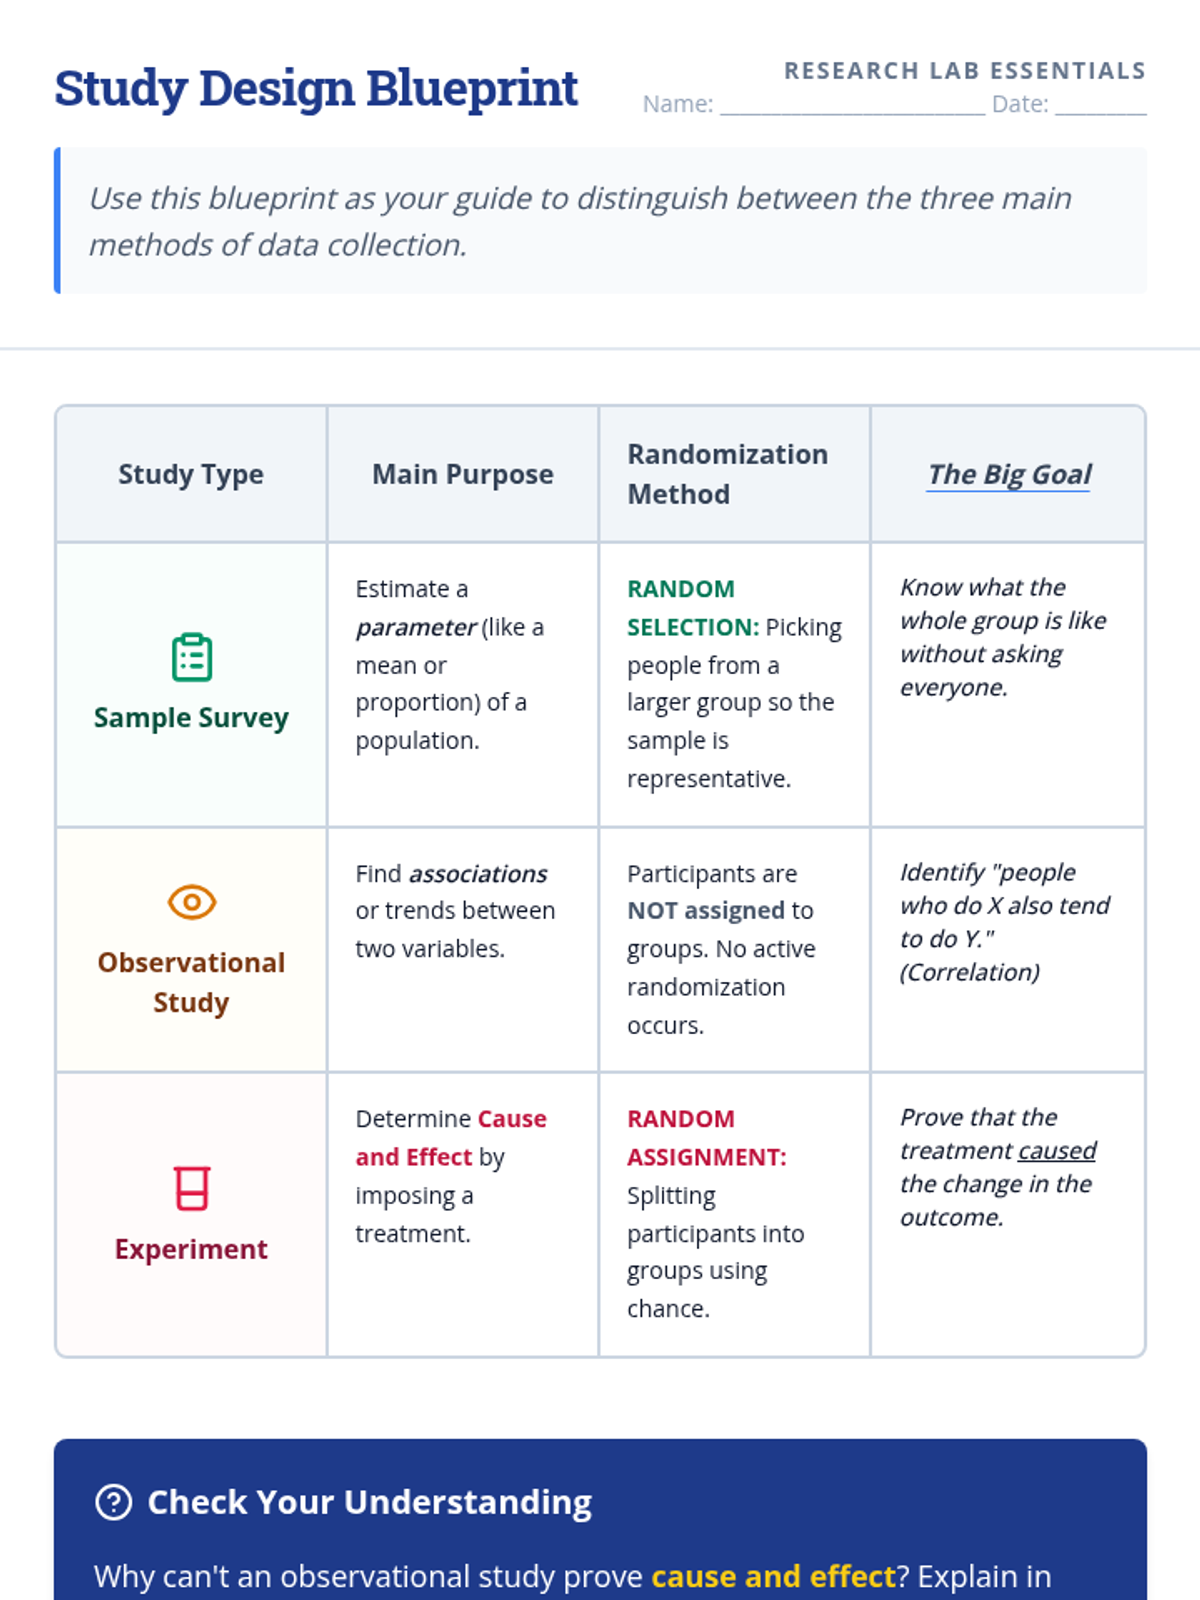
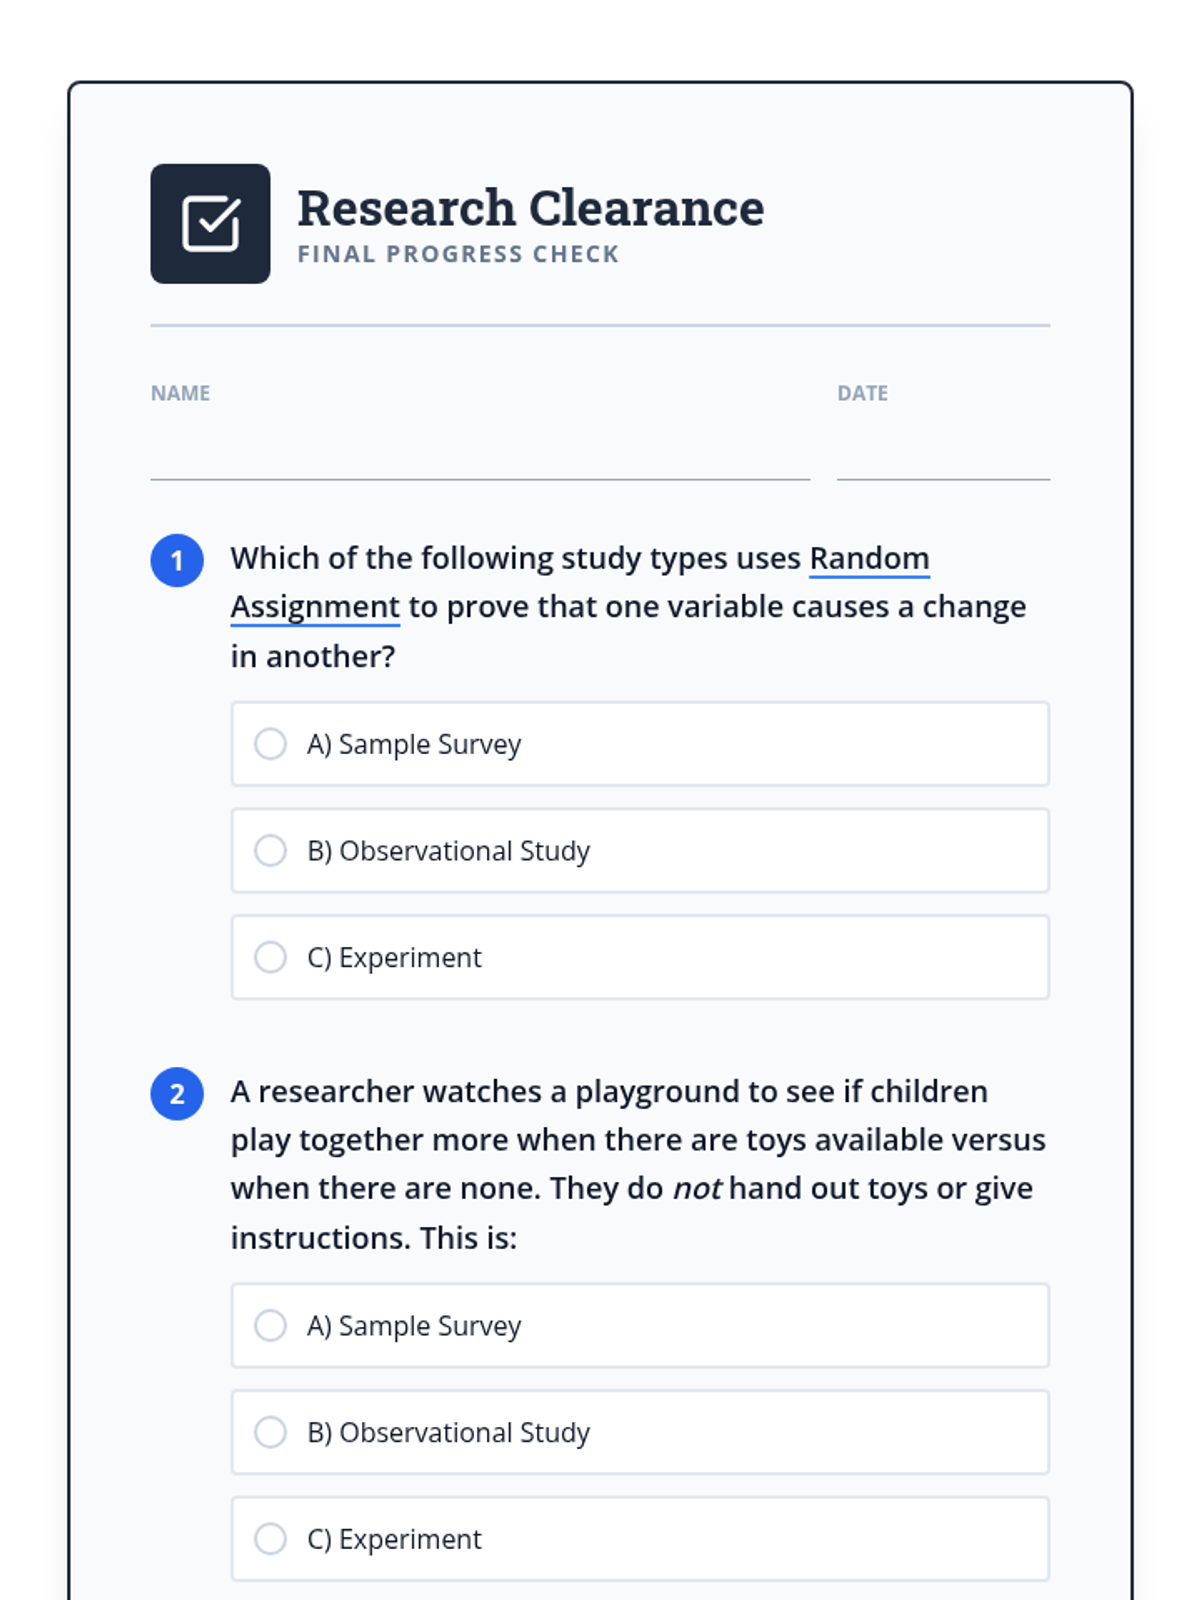
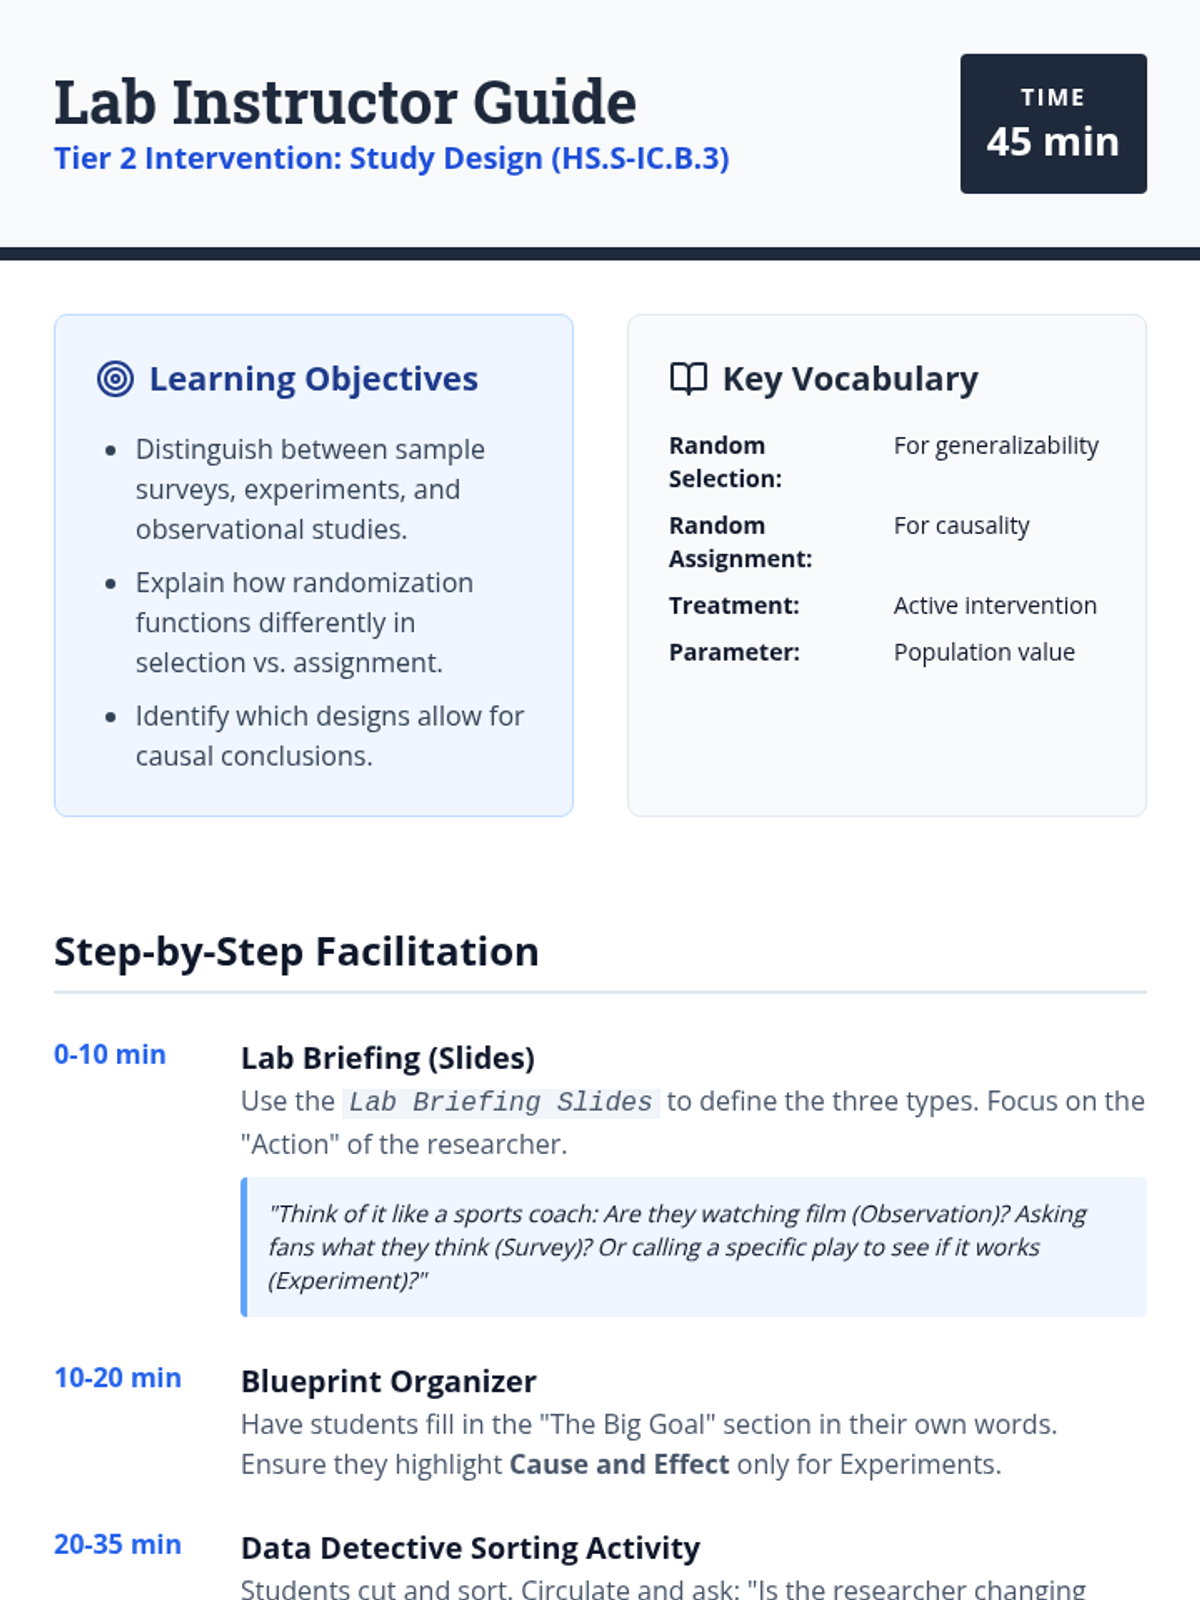
A Tier 2 intervention lesson focused on distinguishing between sample surveys, experiments, and observational studies, with a specific focus on the role of randomization in each. This lesson uses scaffolded comparison charts and structured research analysis to help students master Colorado standard HS.S-IC.B.3.
A targeted small-group intervention for high school statistics students to distinguish between surveys, experiments, and observational studies, emphasizing the role of randomization.
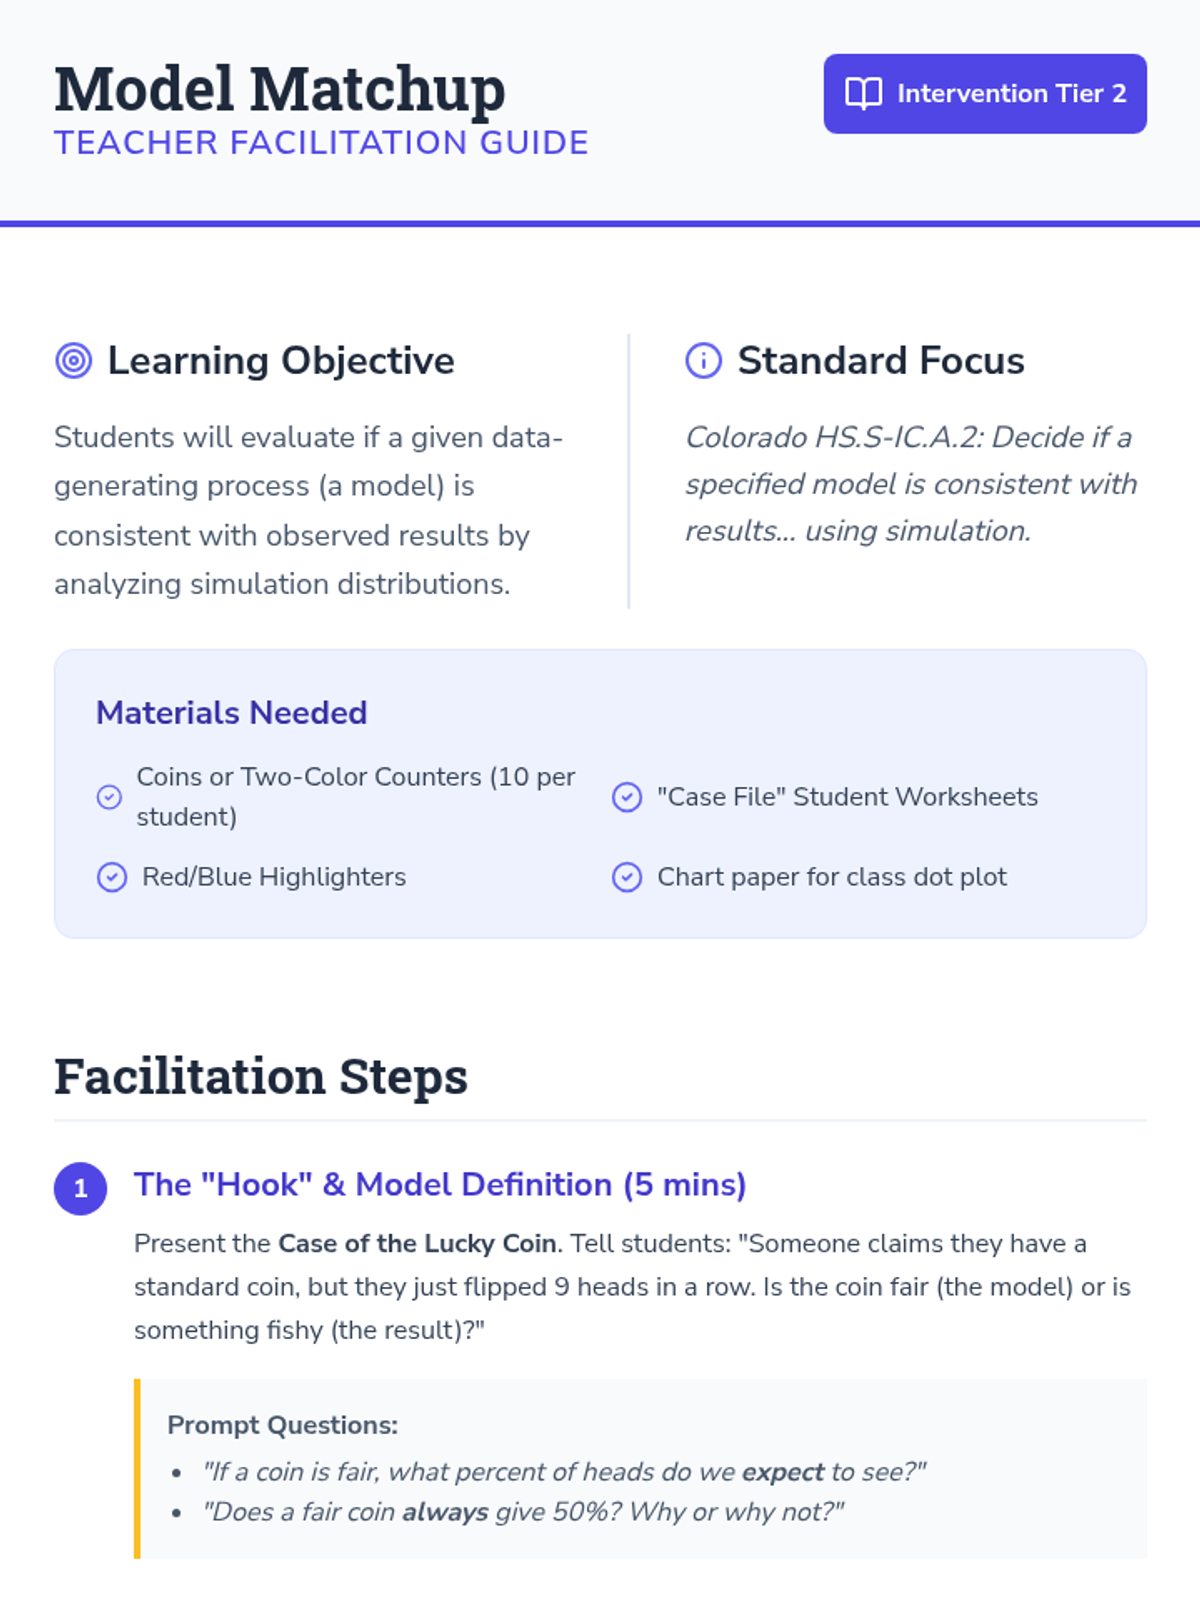
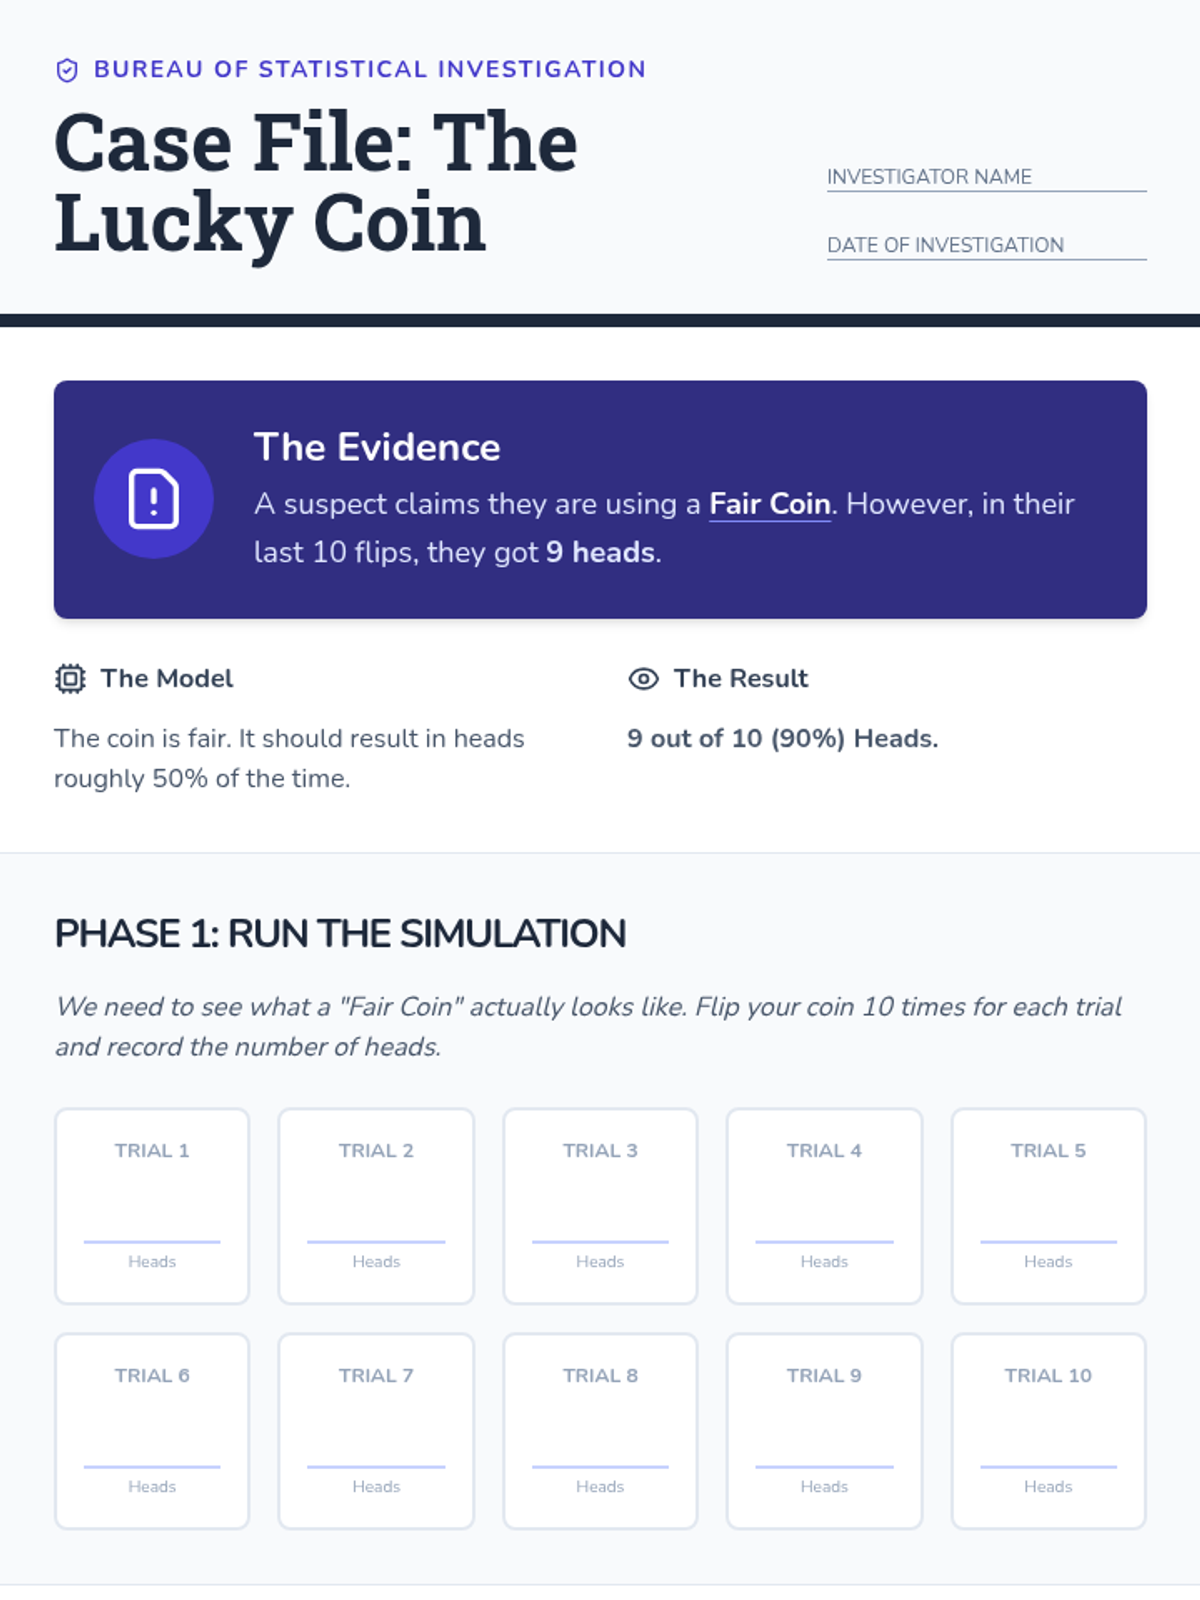
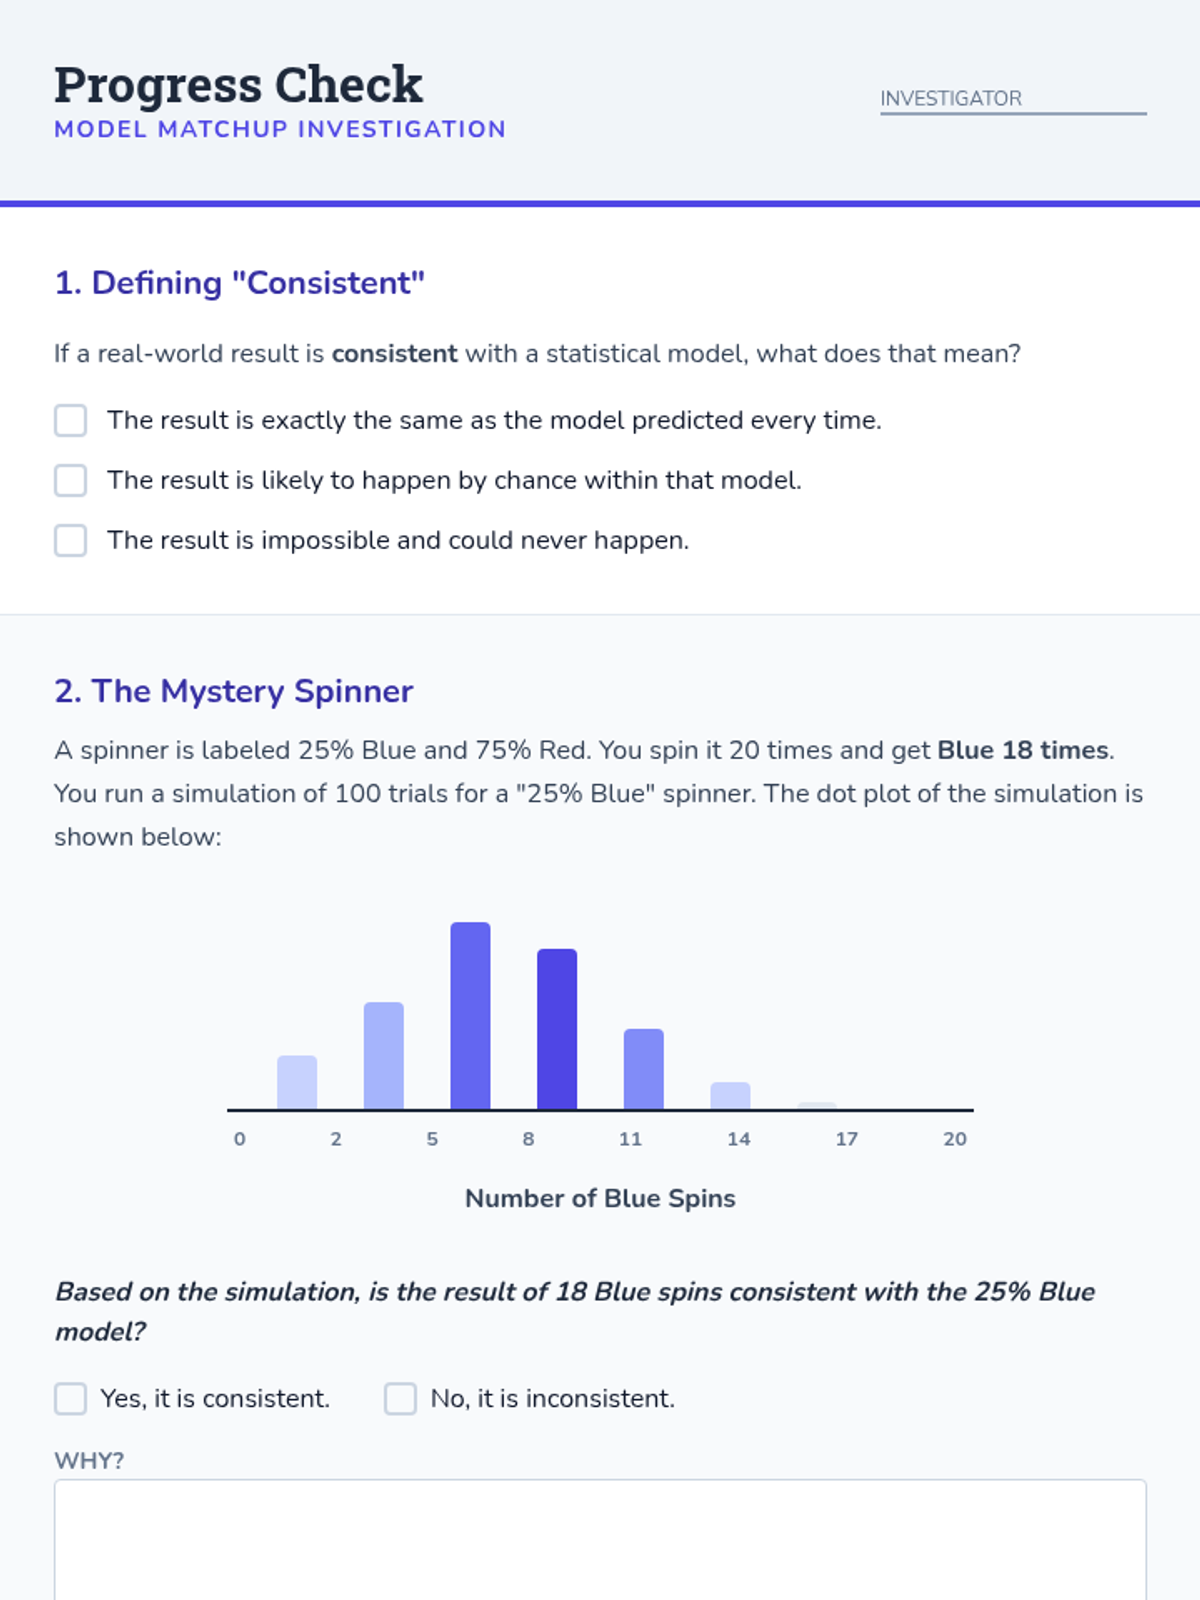
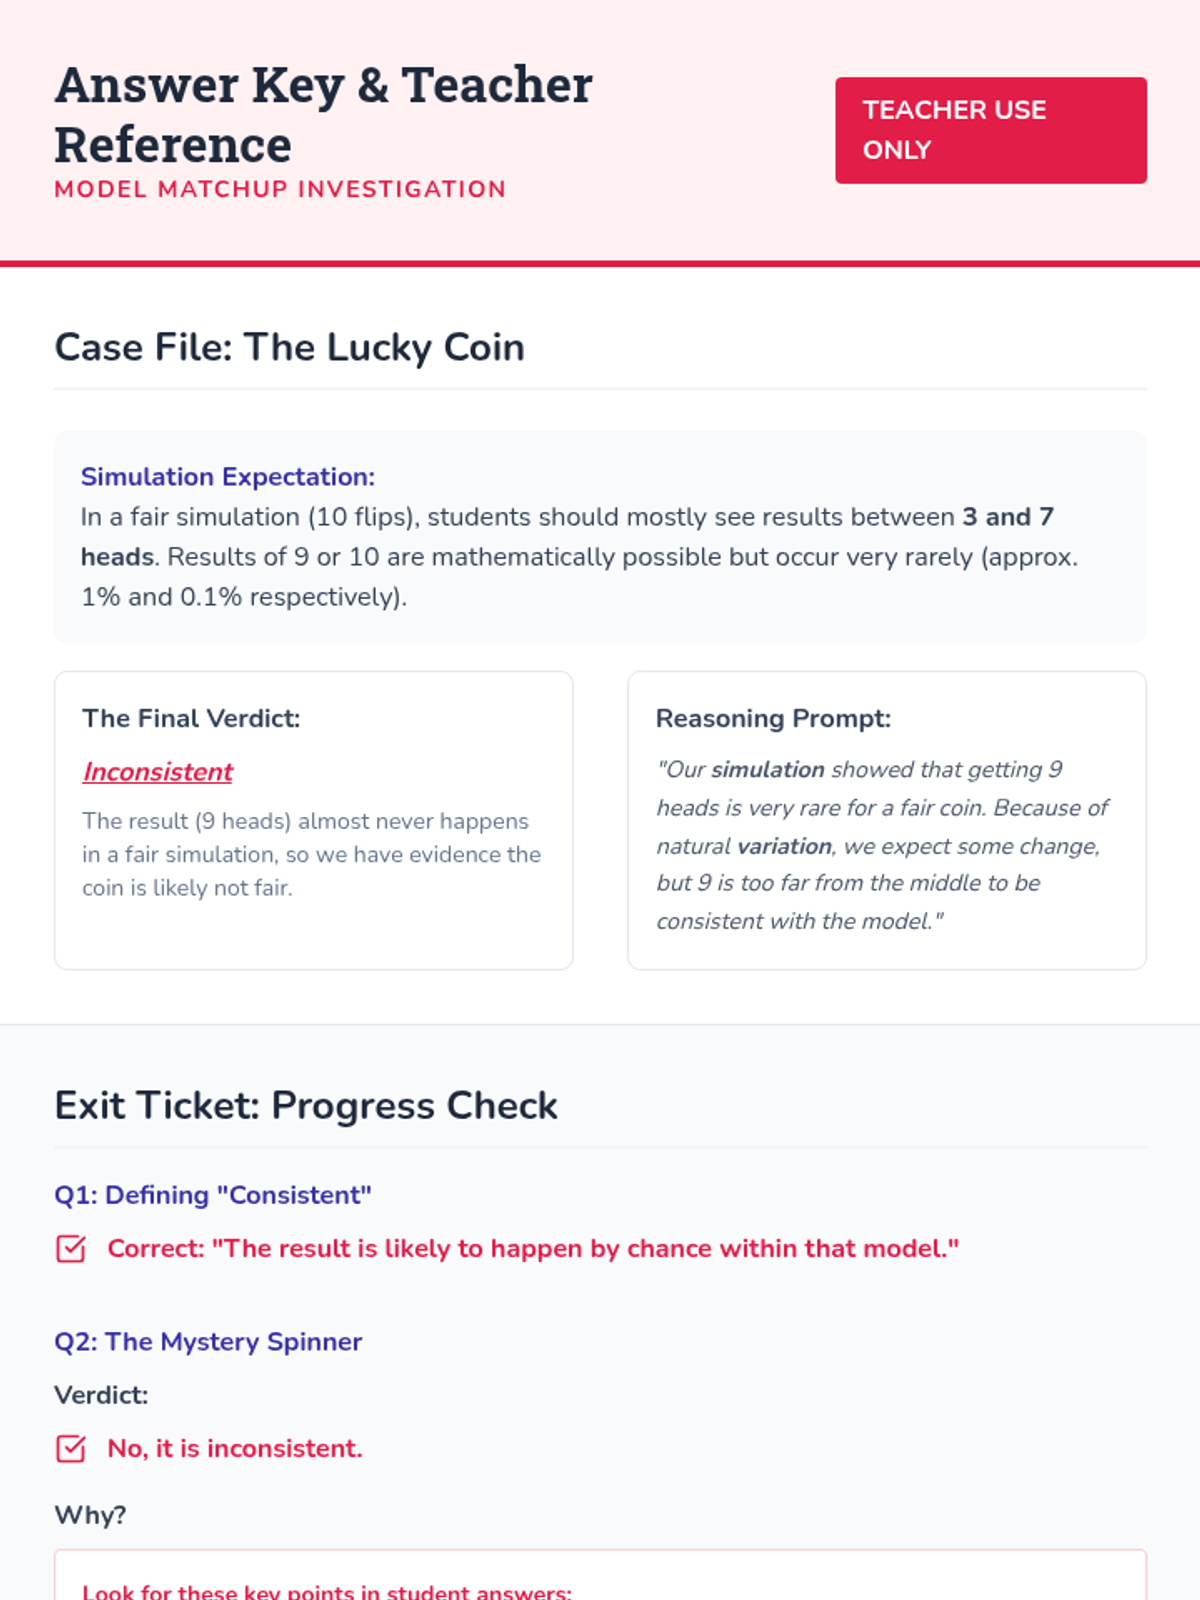
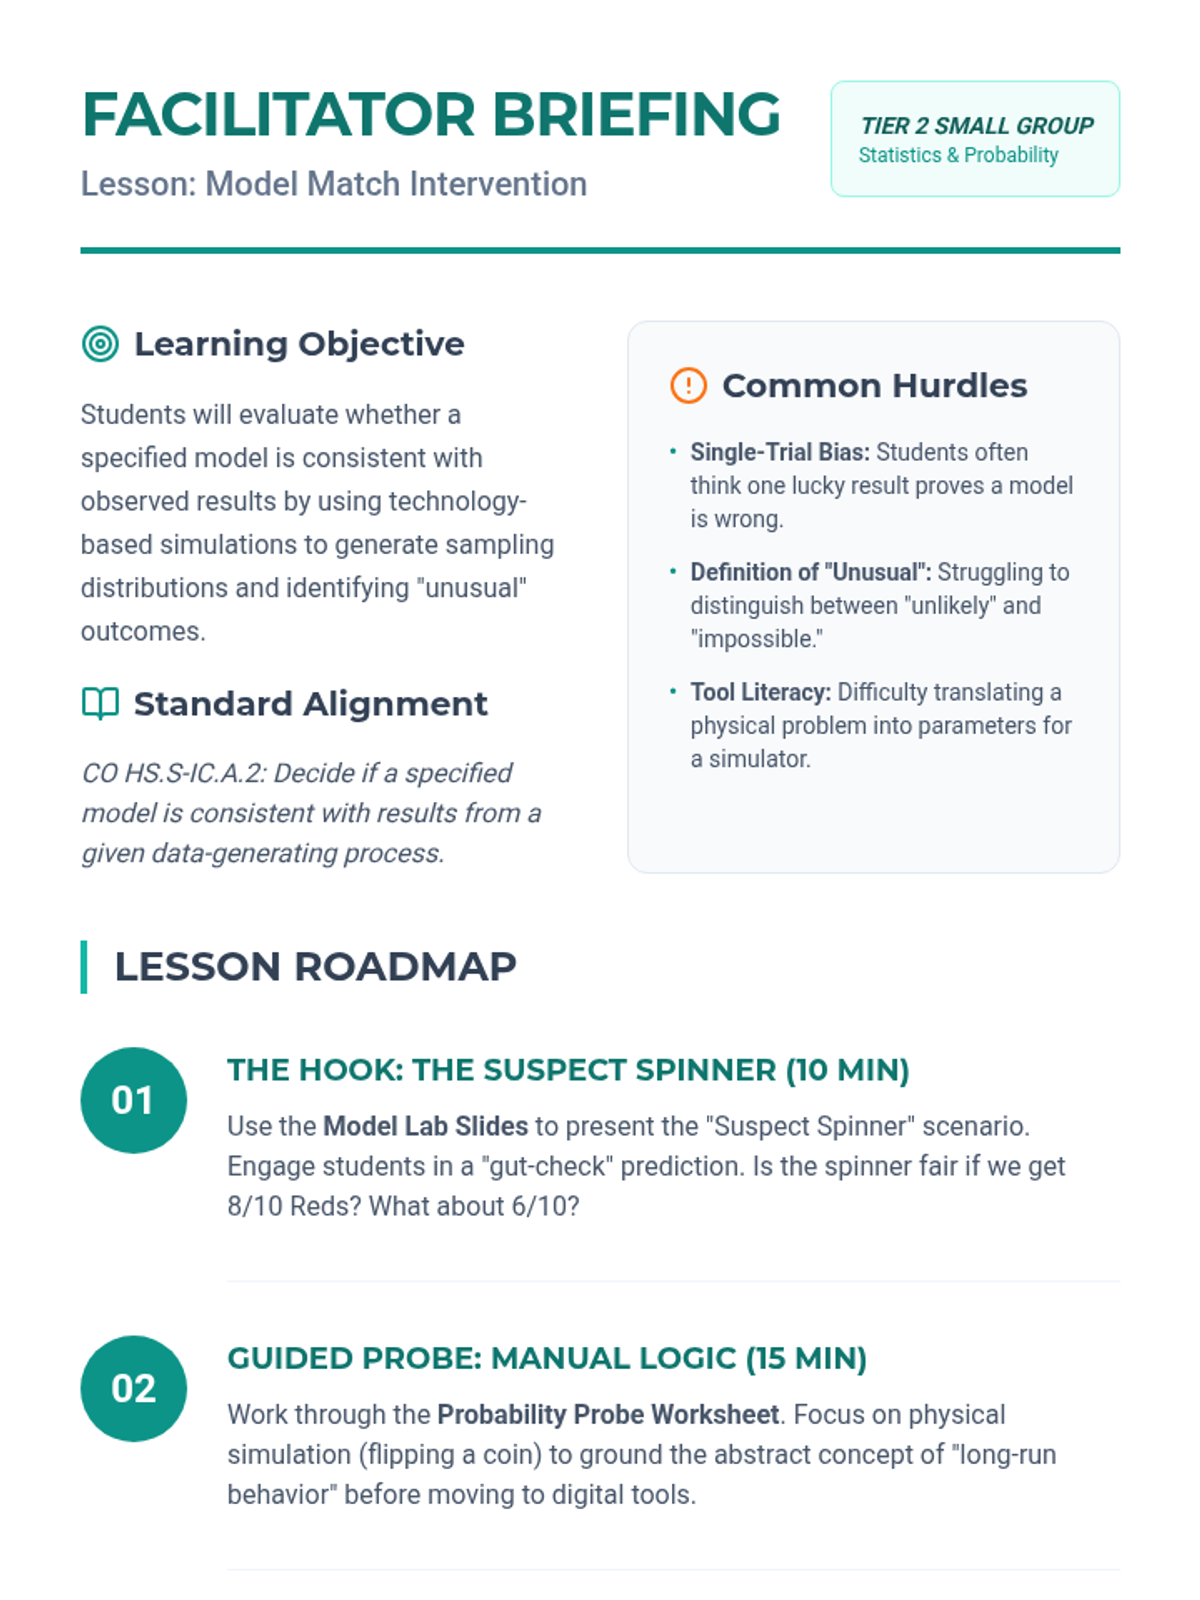
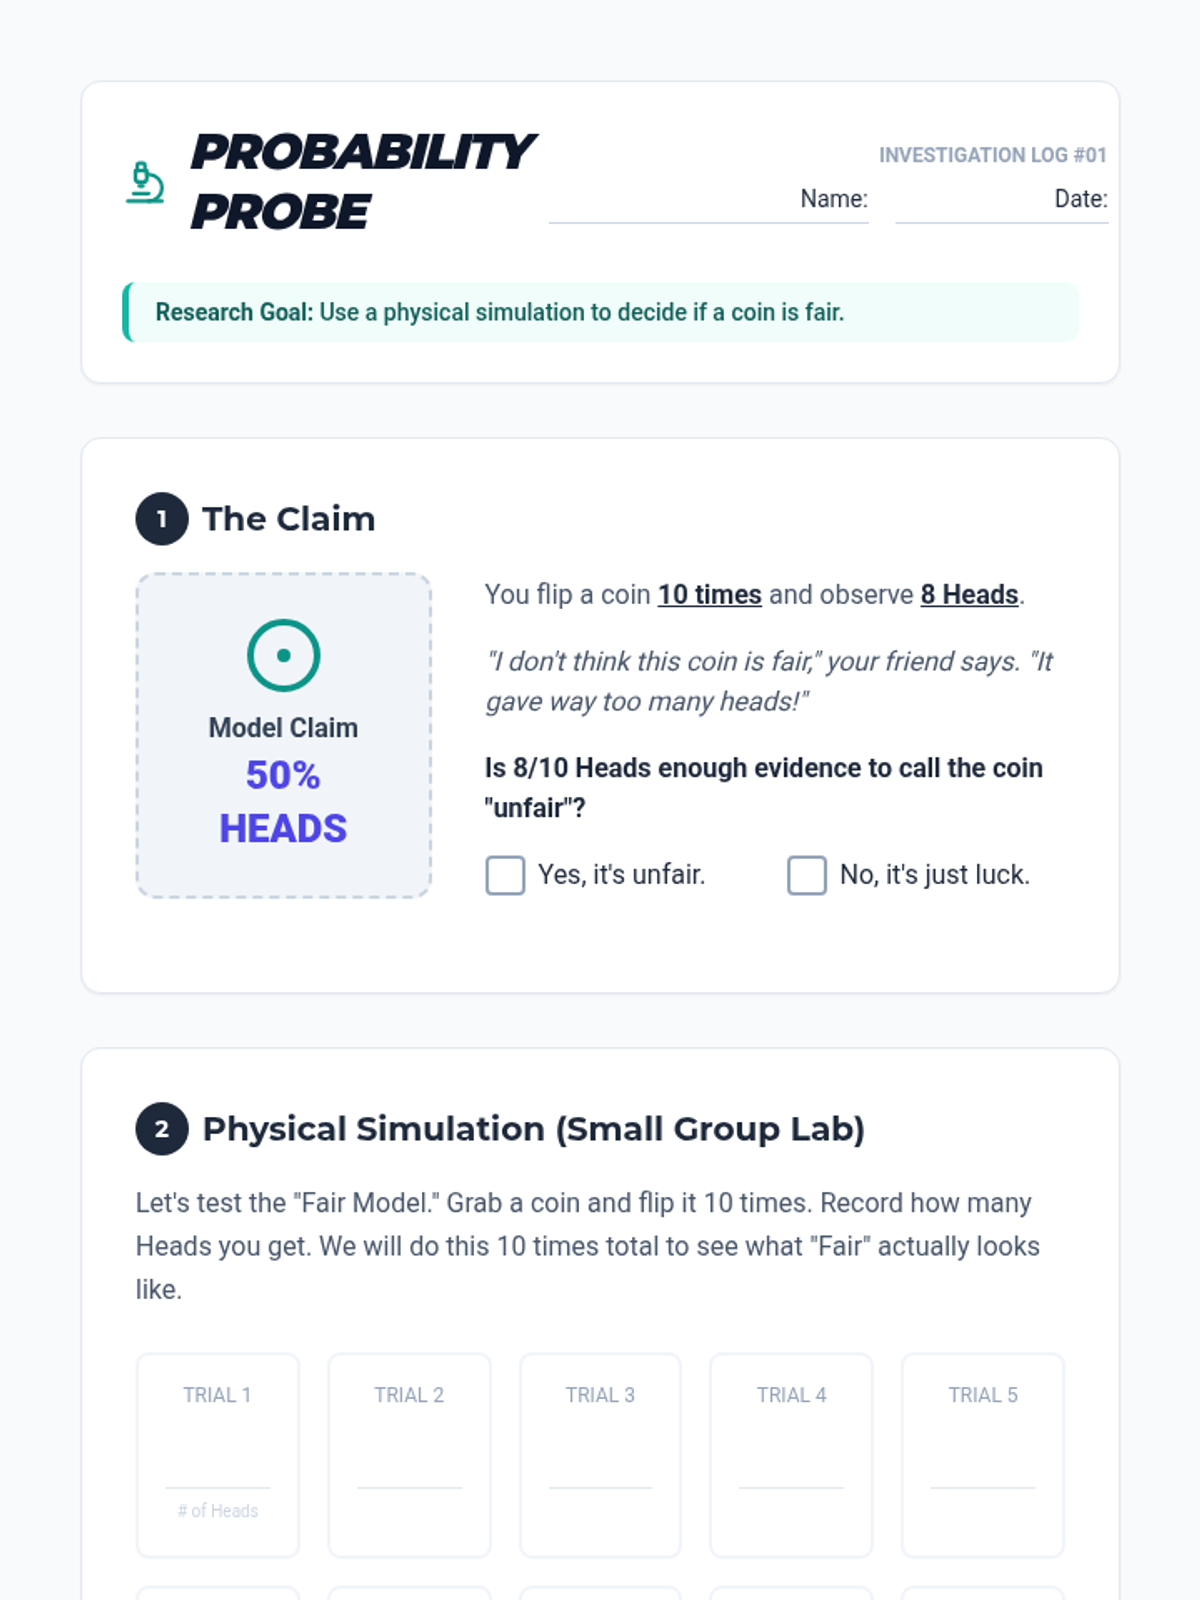
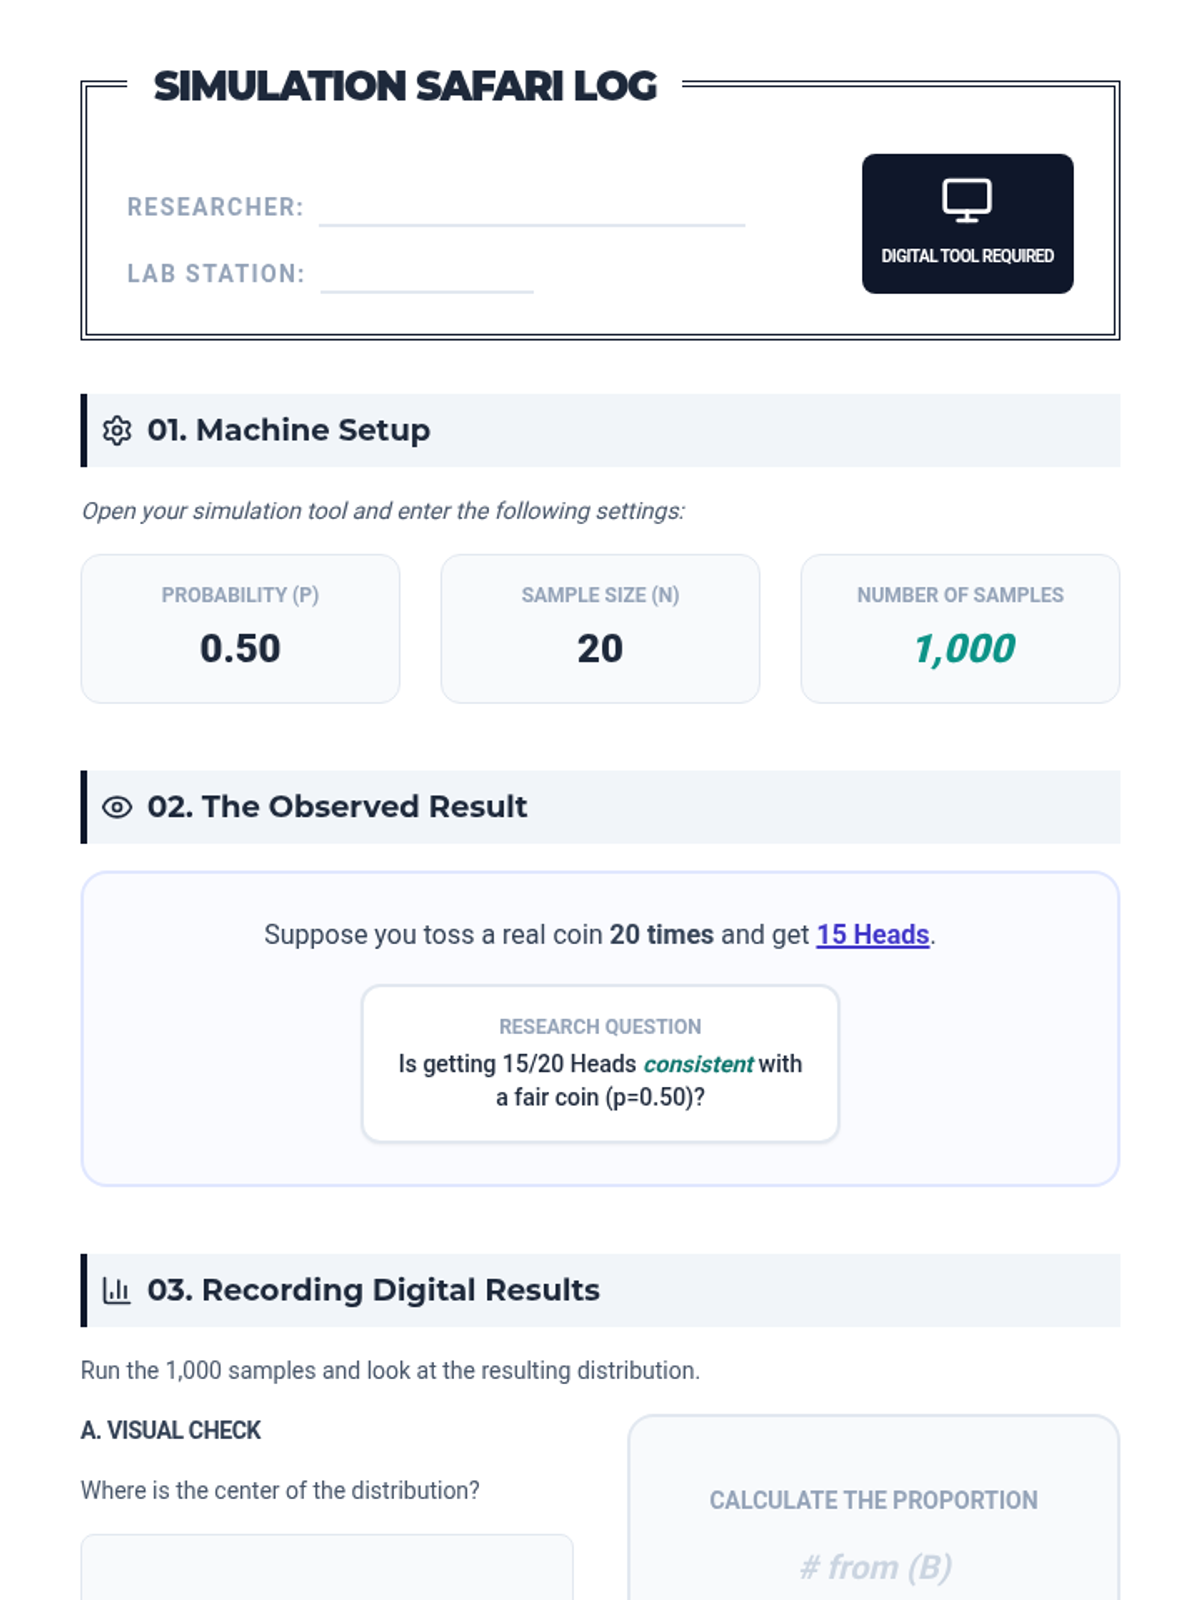
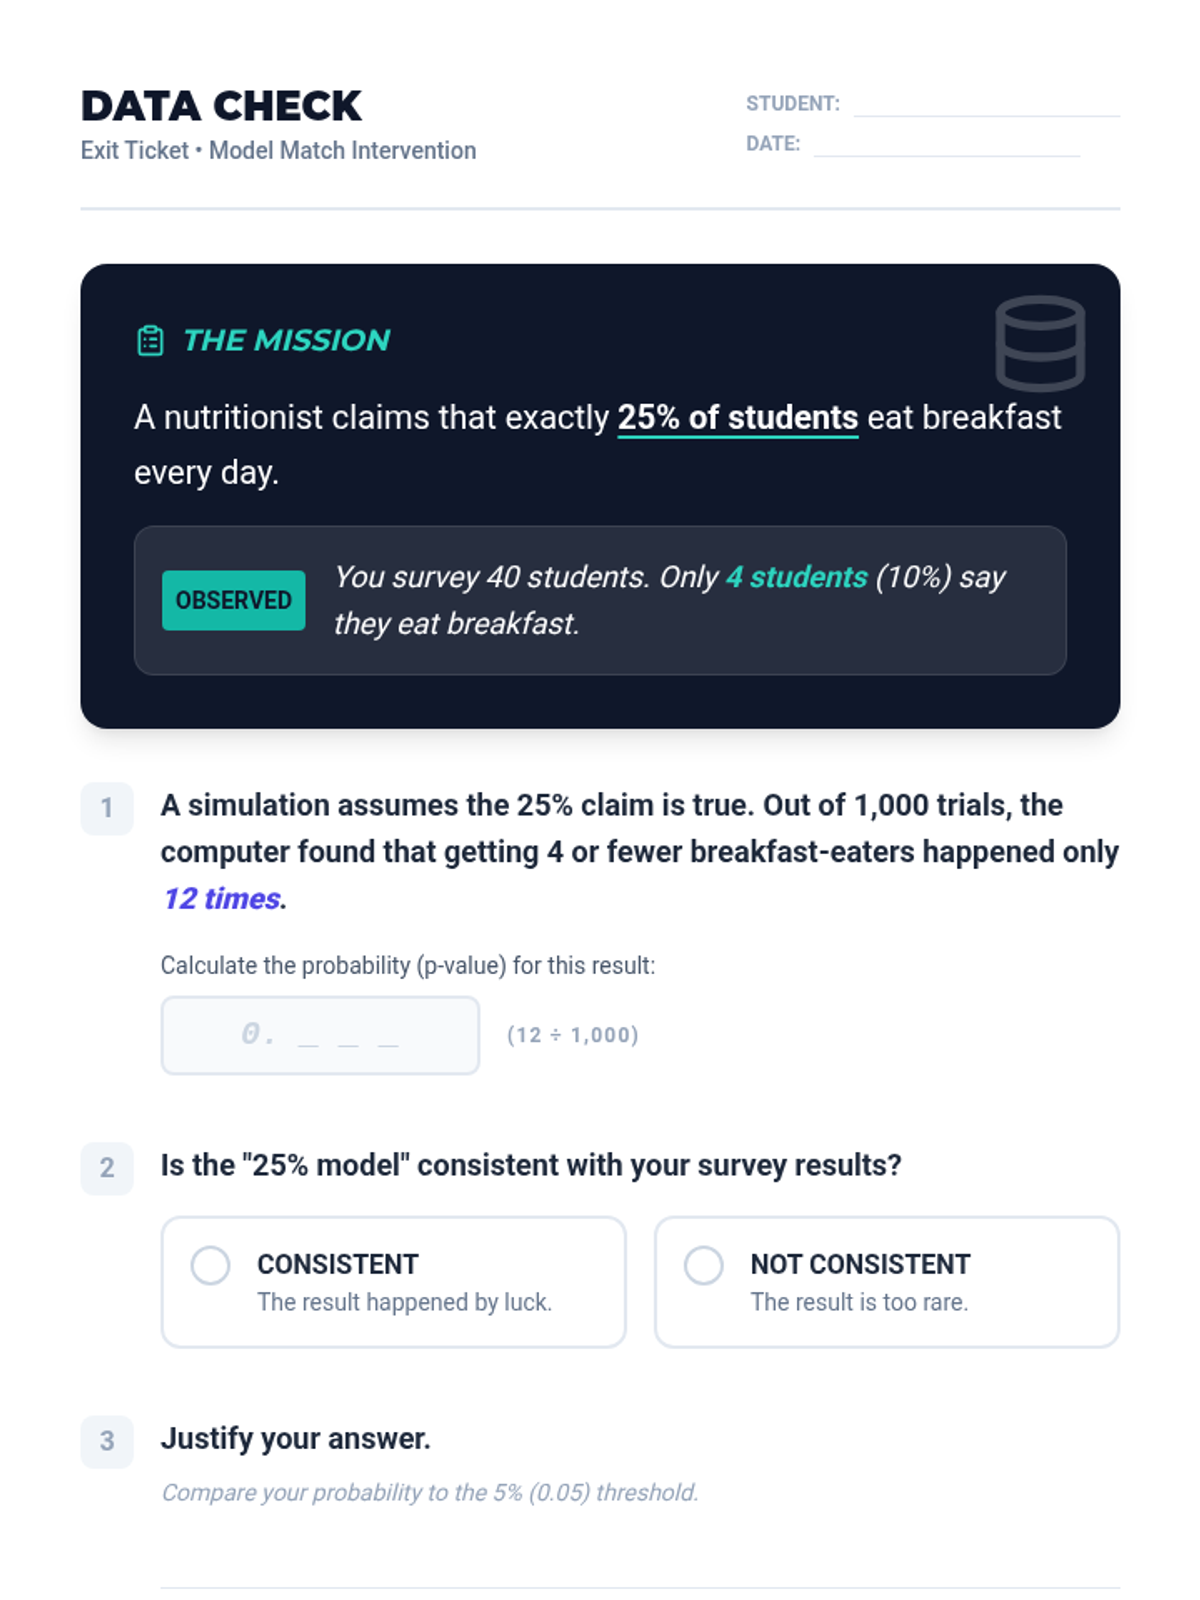
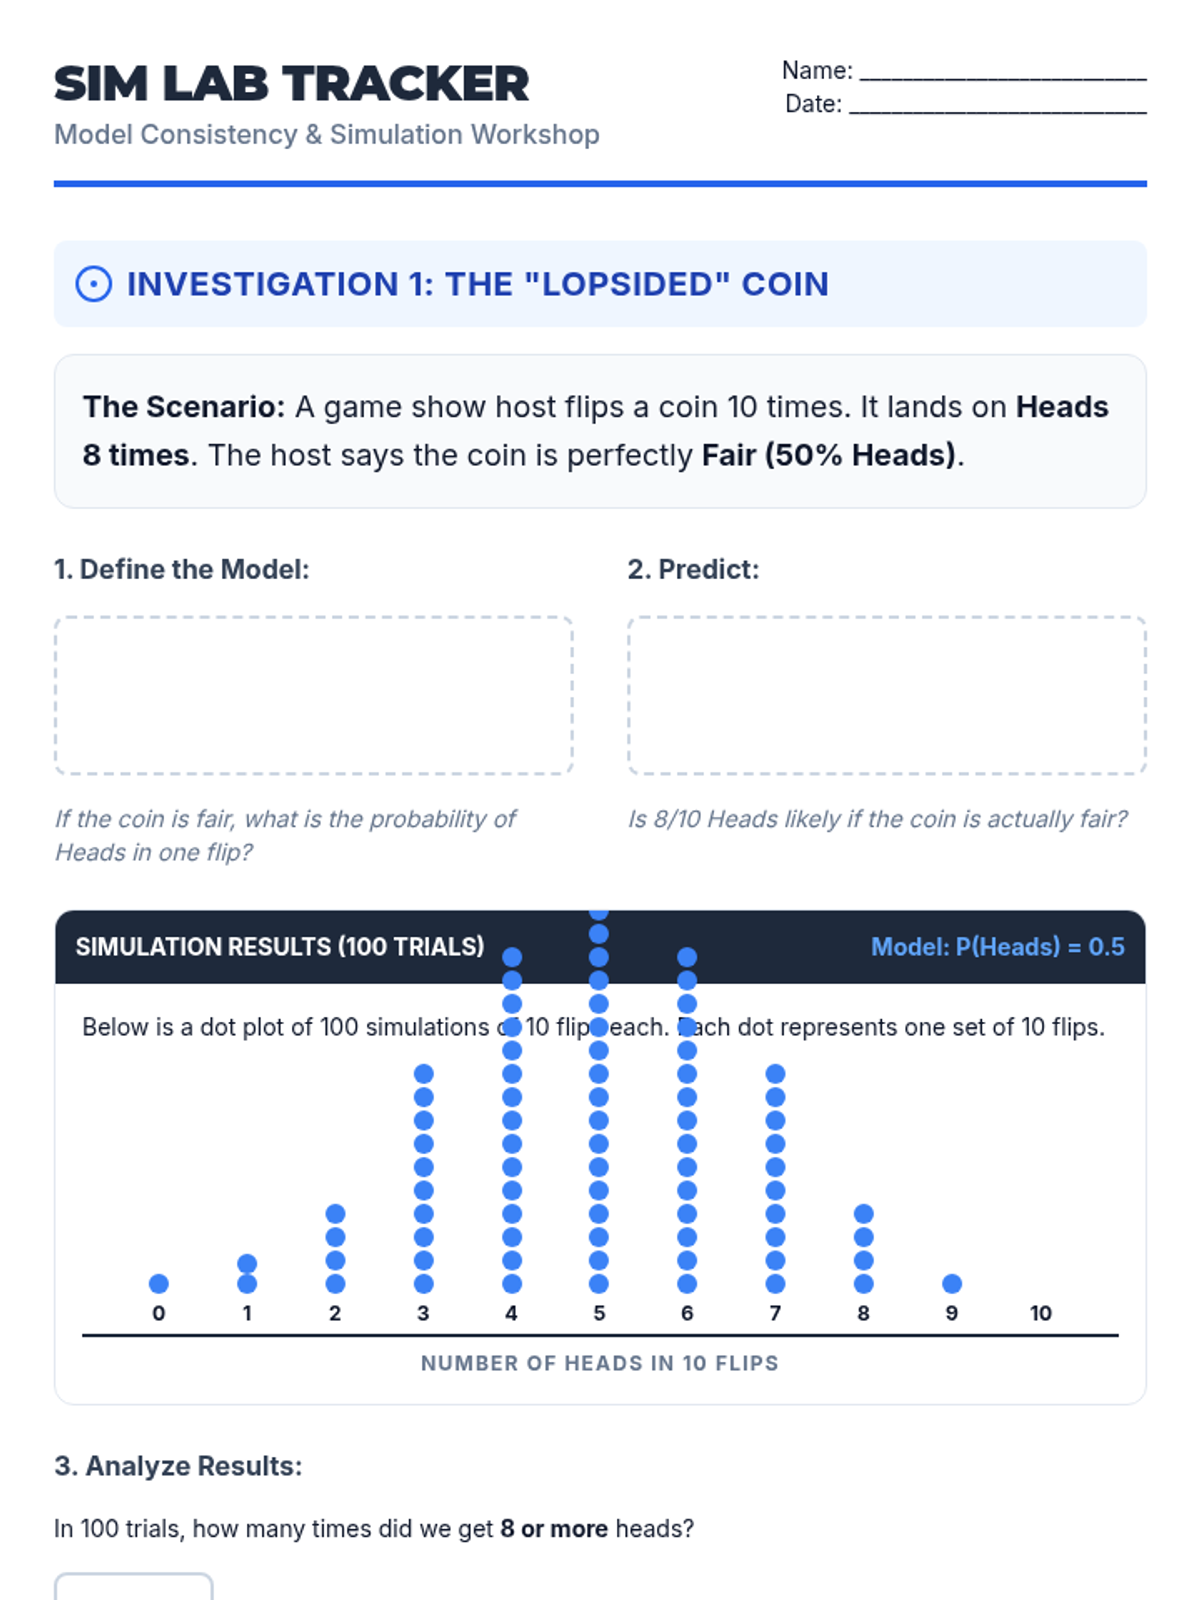
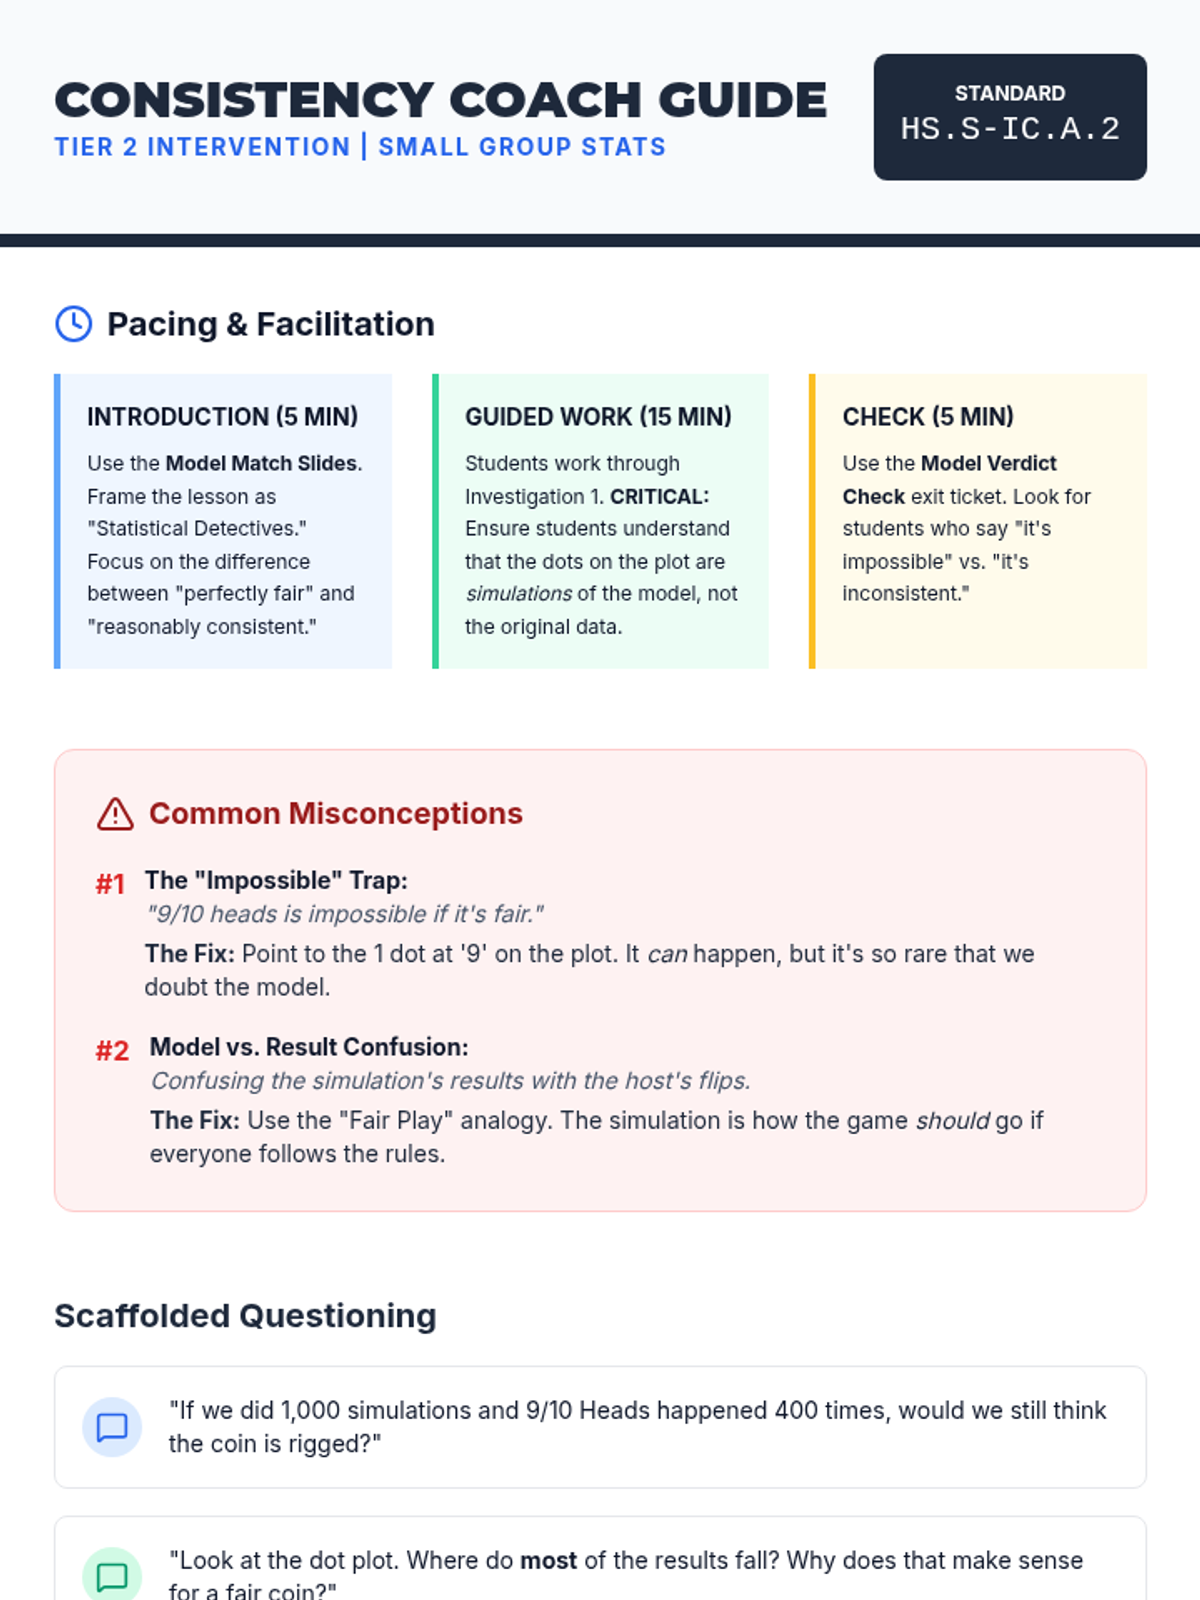
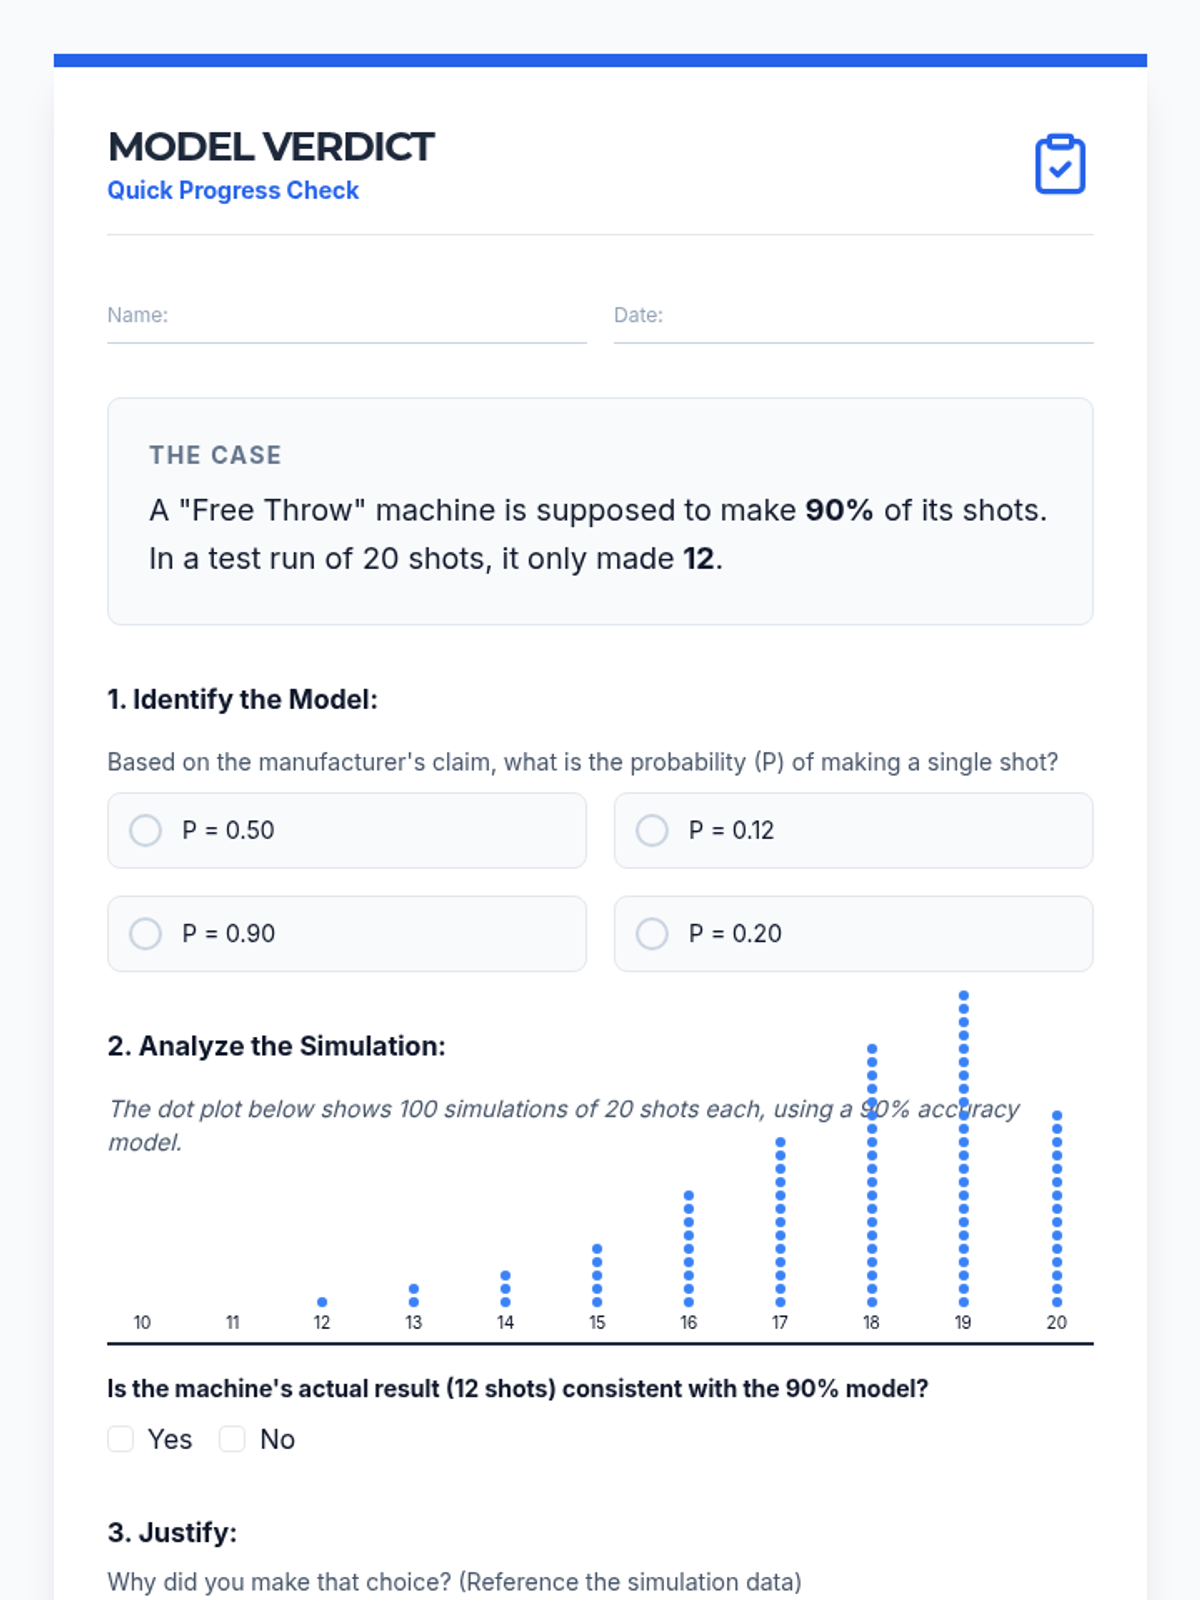
A targeted intervention lesson focused on evaluating model consistency through simulations, helping students develop intuition about natural variation and statistical significance.
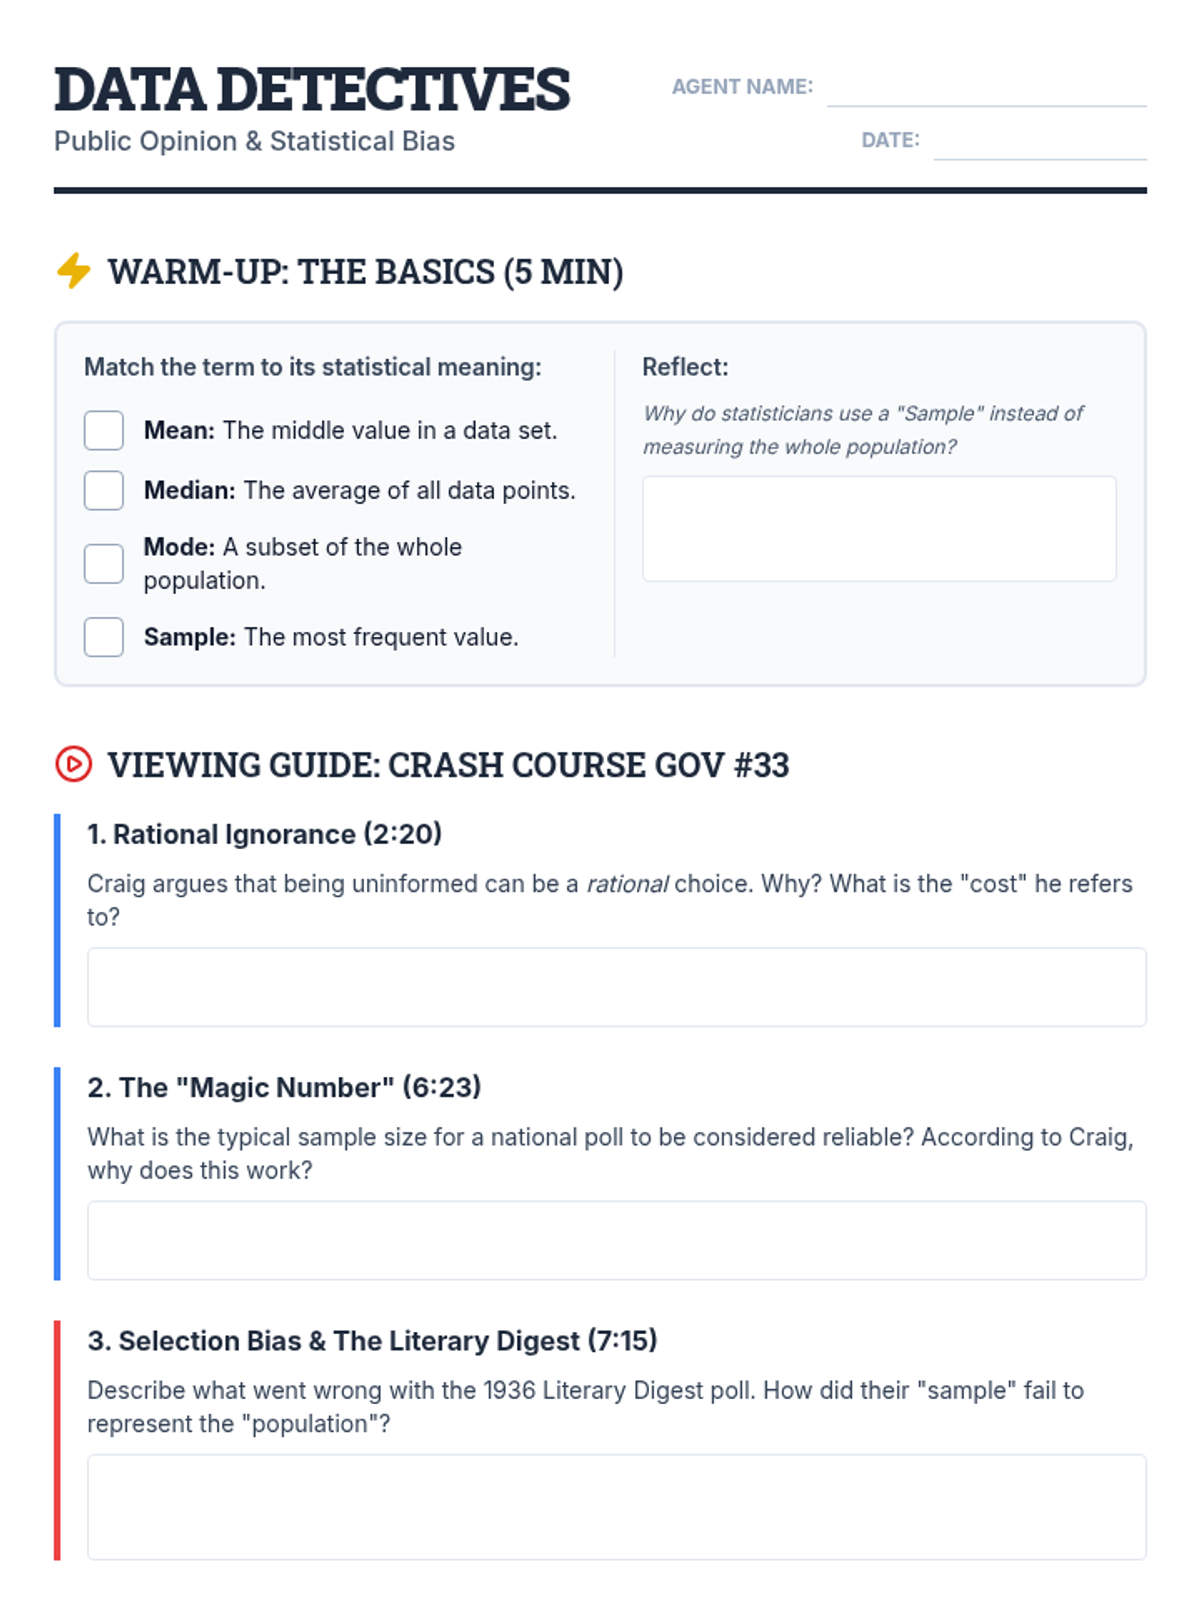
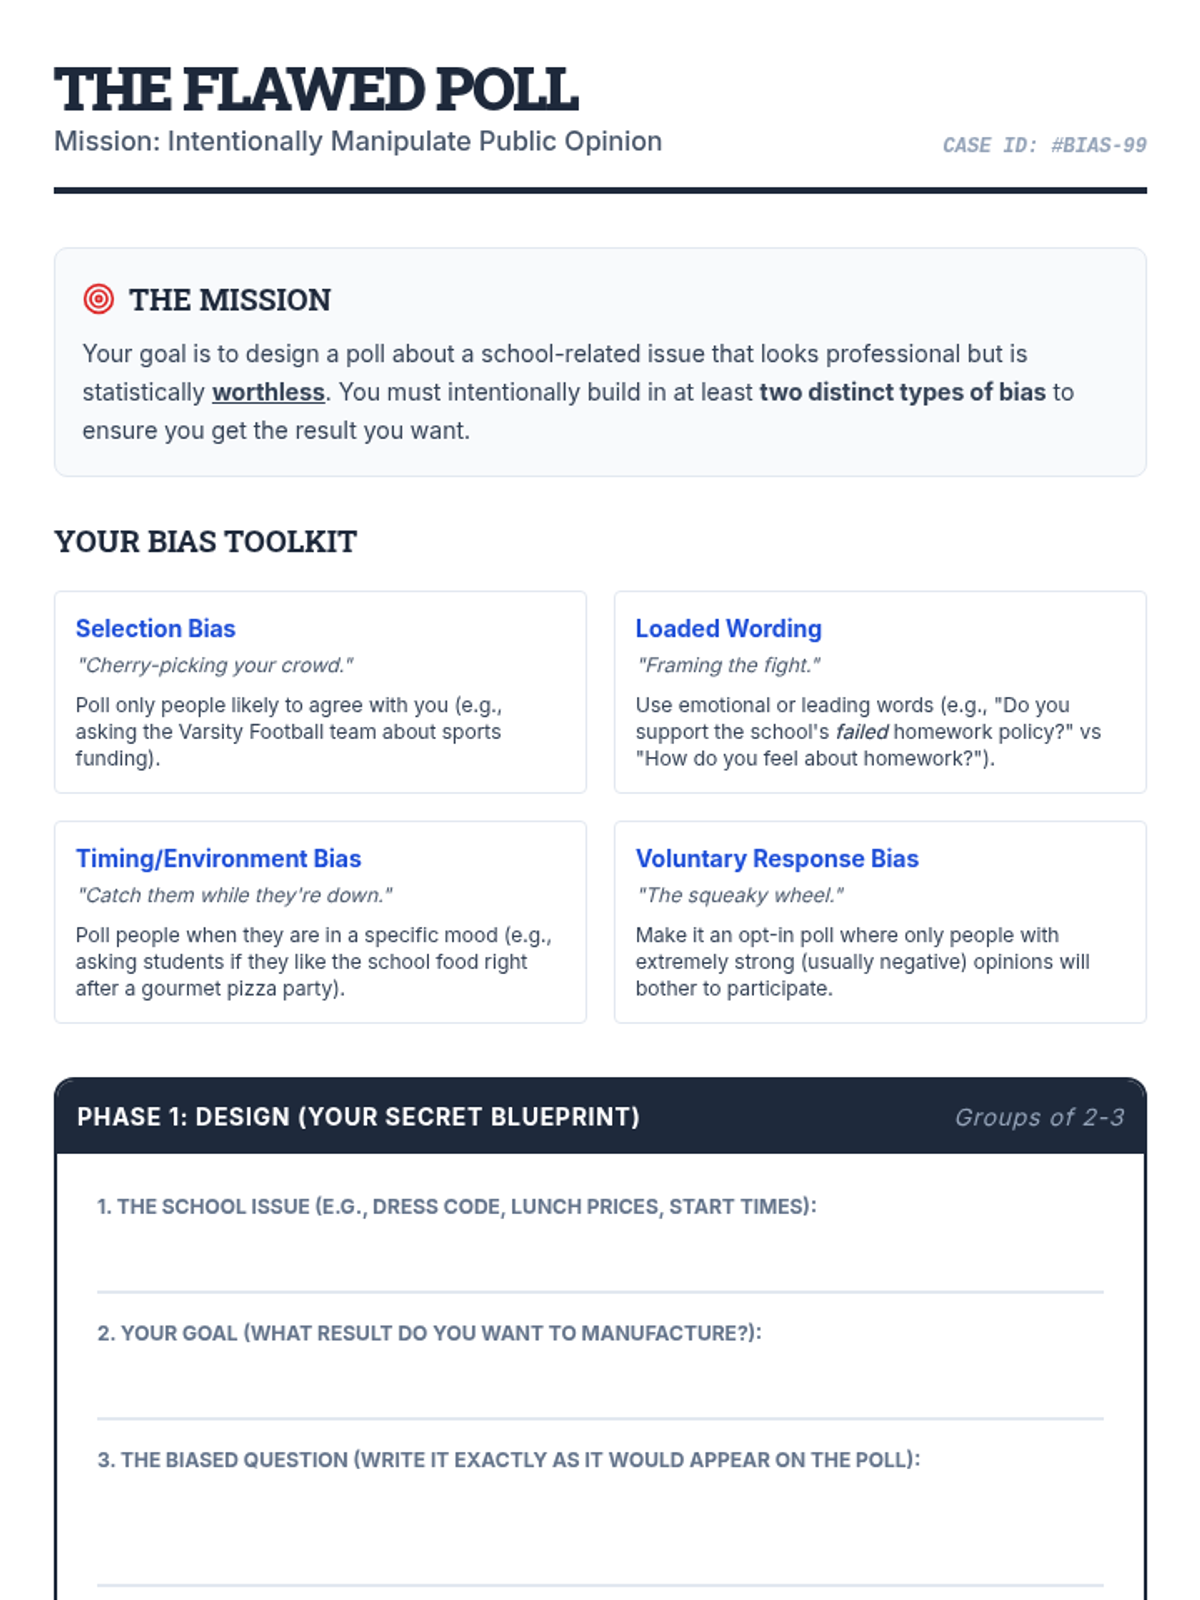
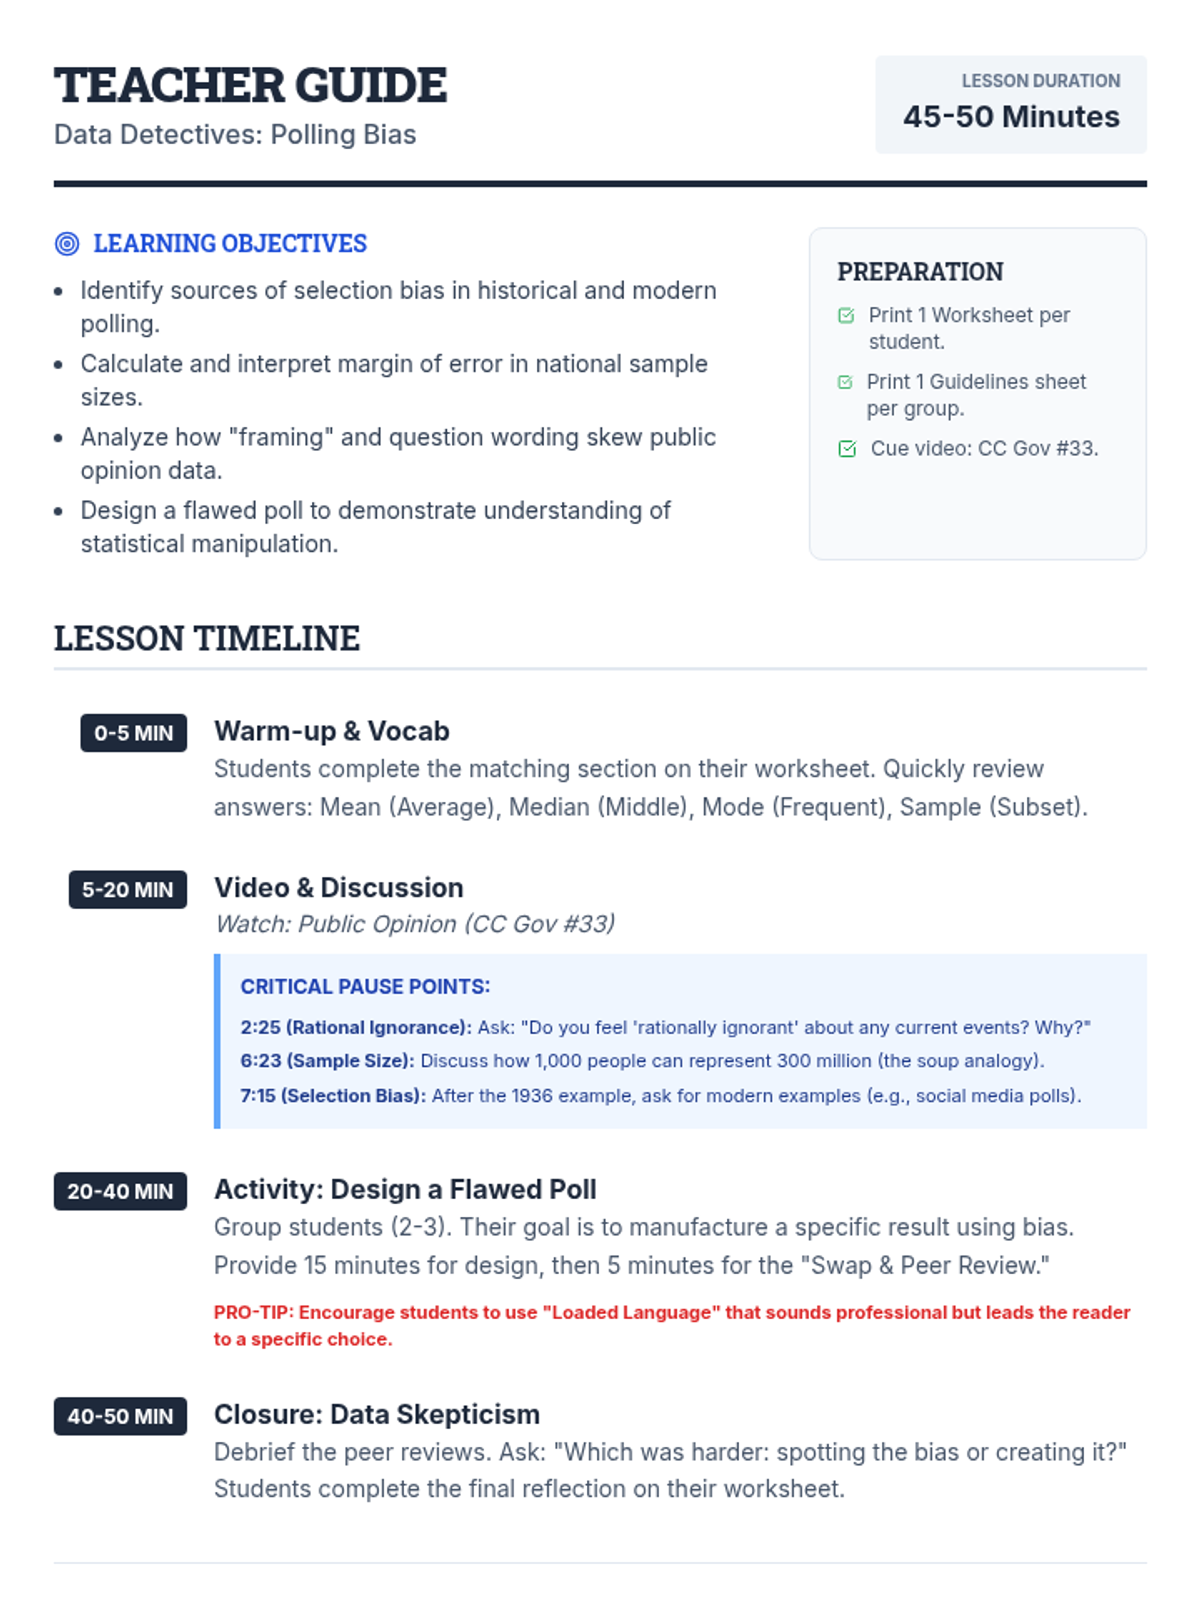
A high school statistics lesson focused on identifying and creating biased polls to understand sampling error and selection bias in political contexts.
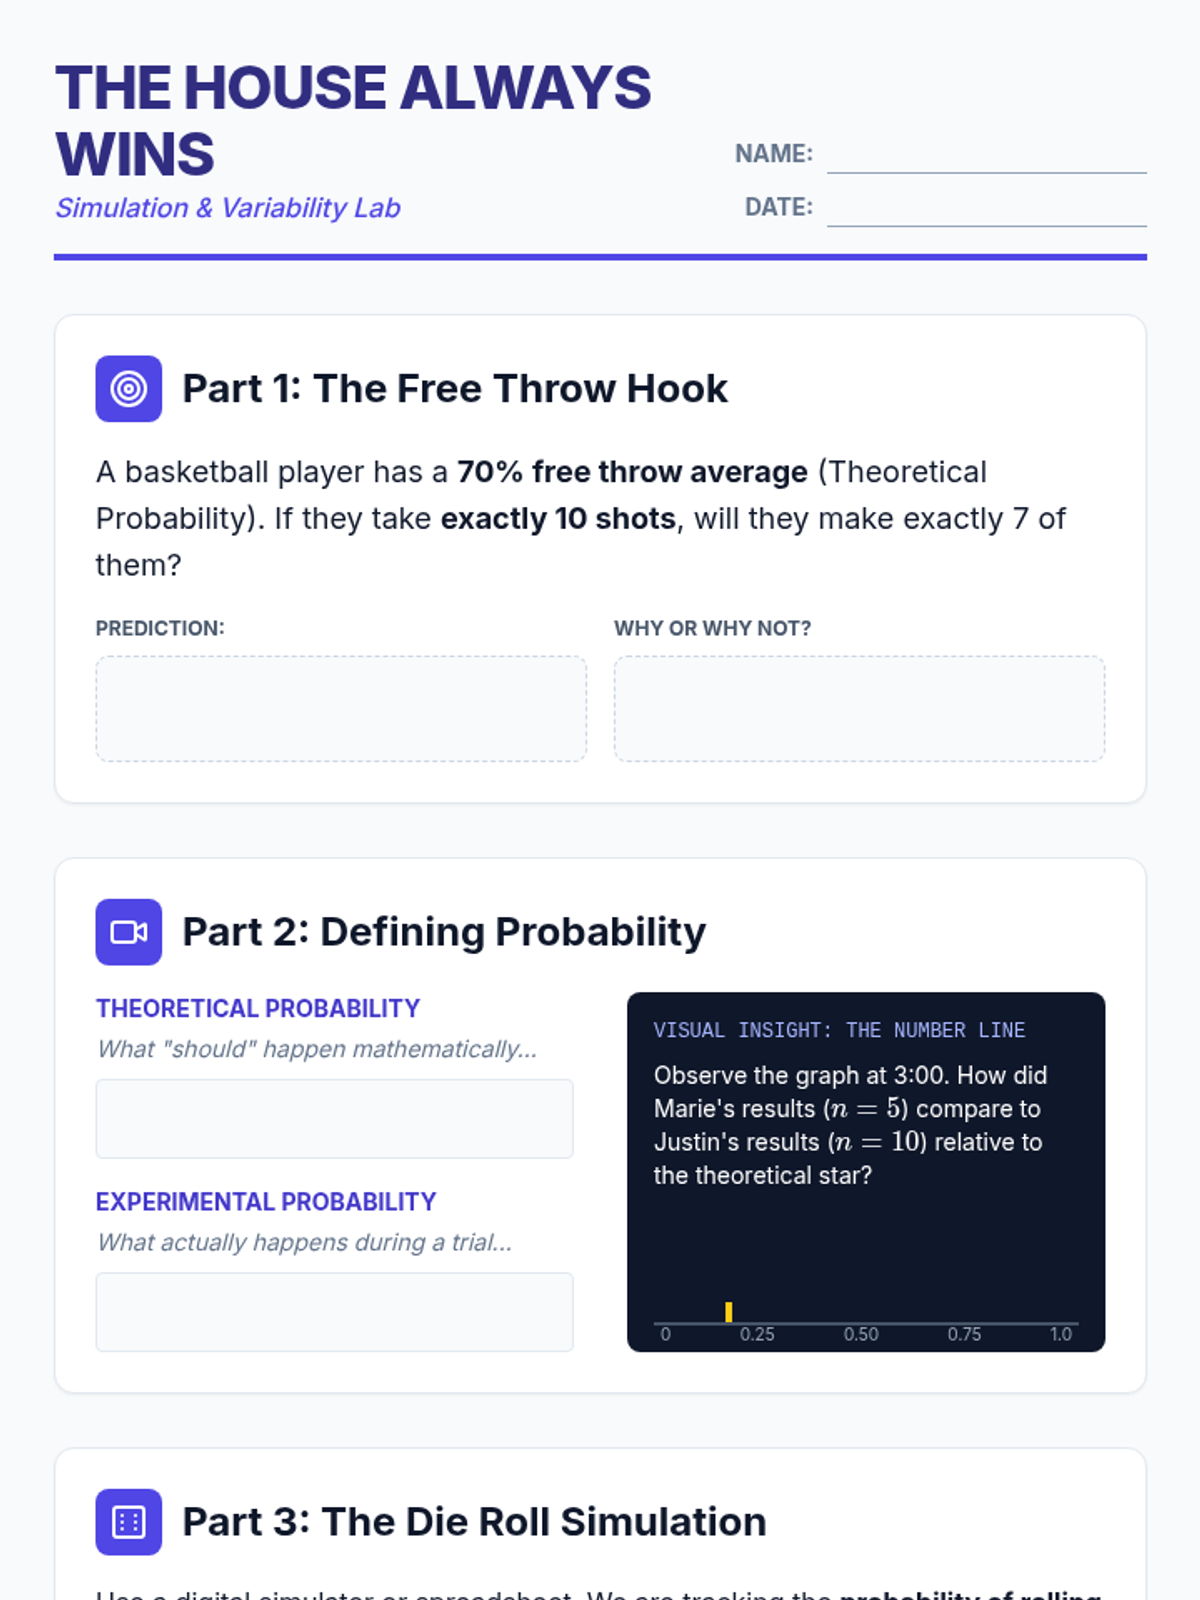
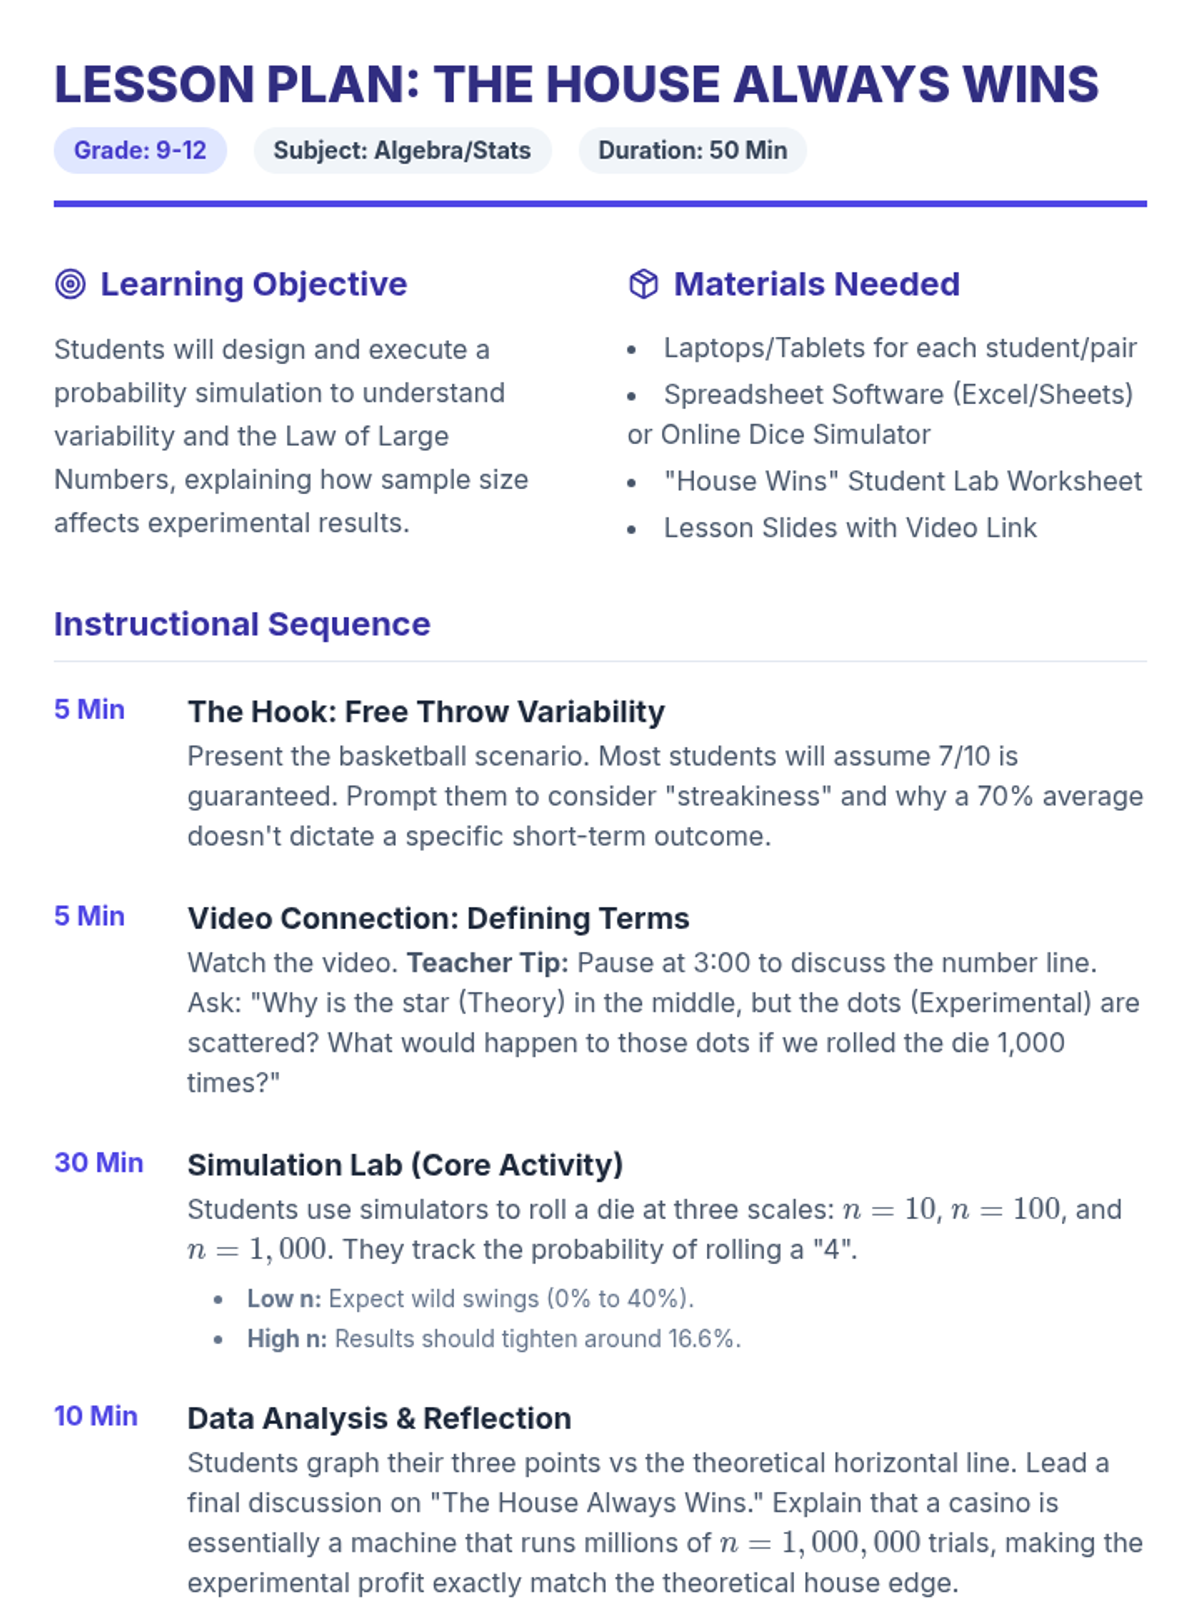
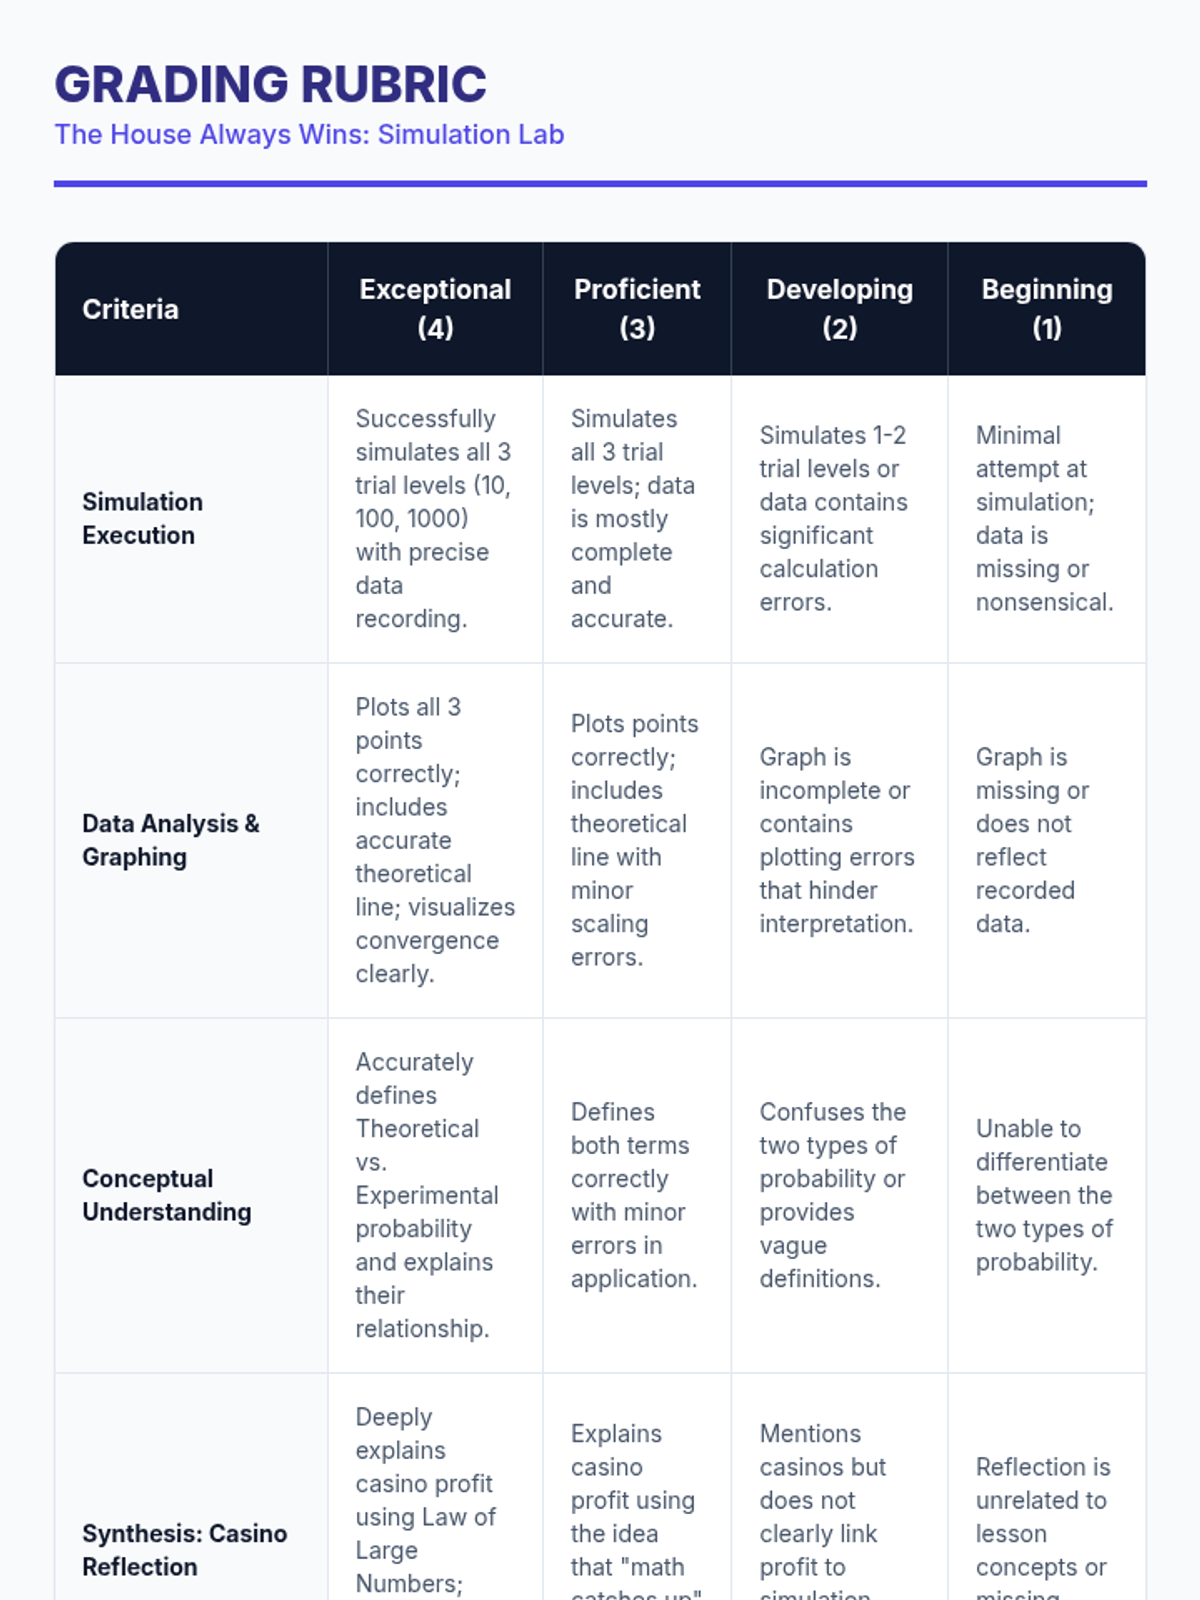
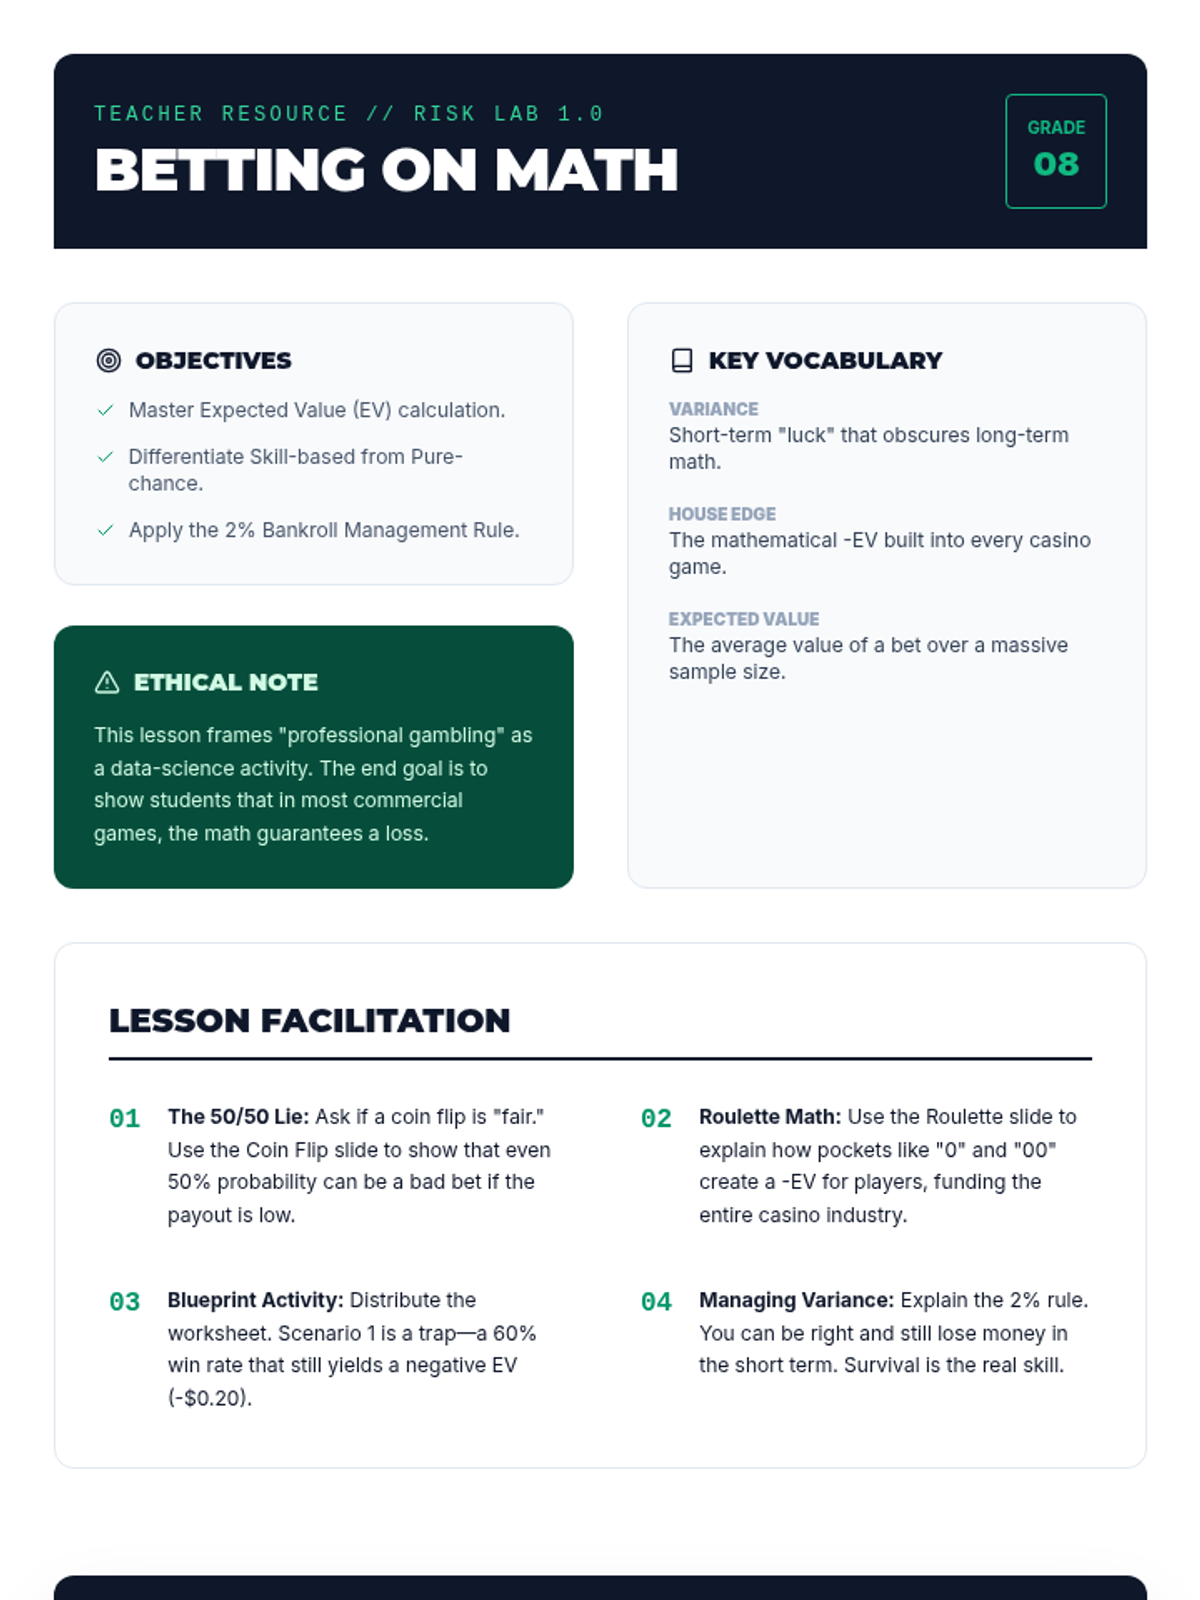
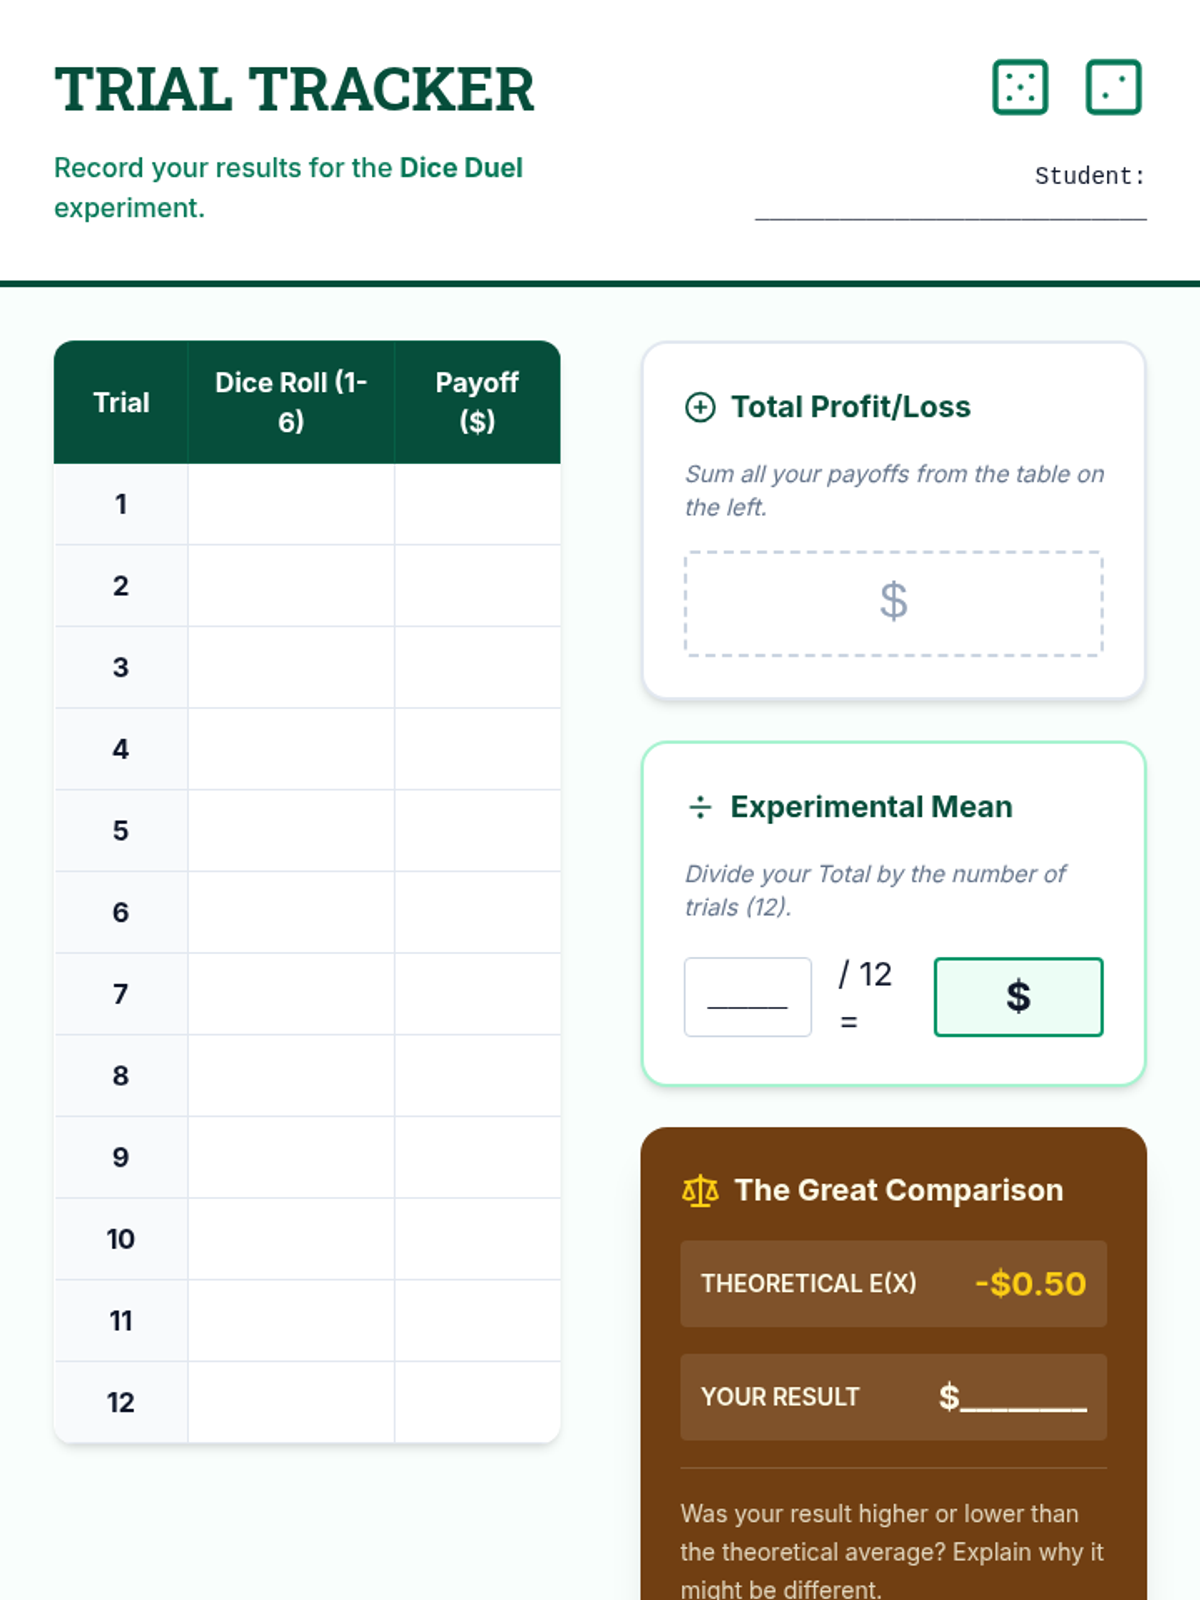
A high school math lesson exploring the gap between theoretical and experimental probability through a die-roll simulation. Students investigate the Law of Large Numbers and analyze why variability decreases as sample sizes increase, concluding with a real-world look at casino economics.
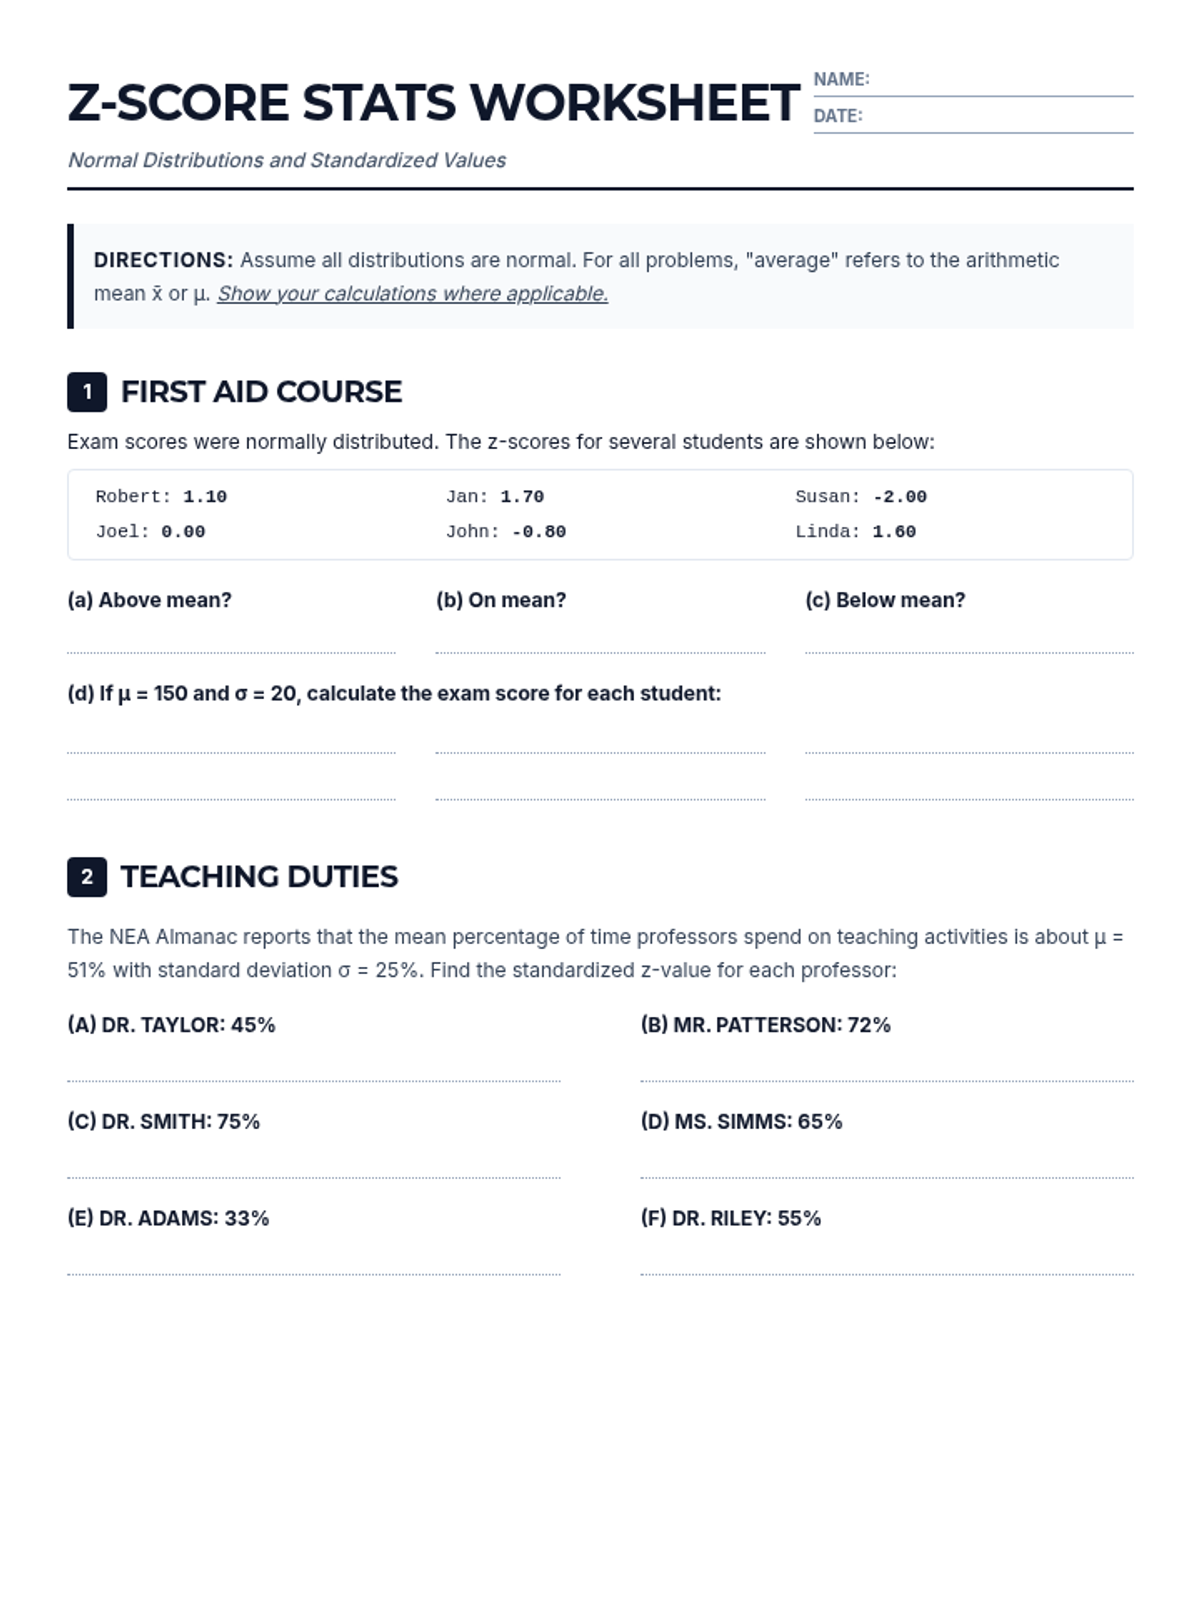
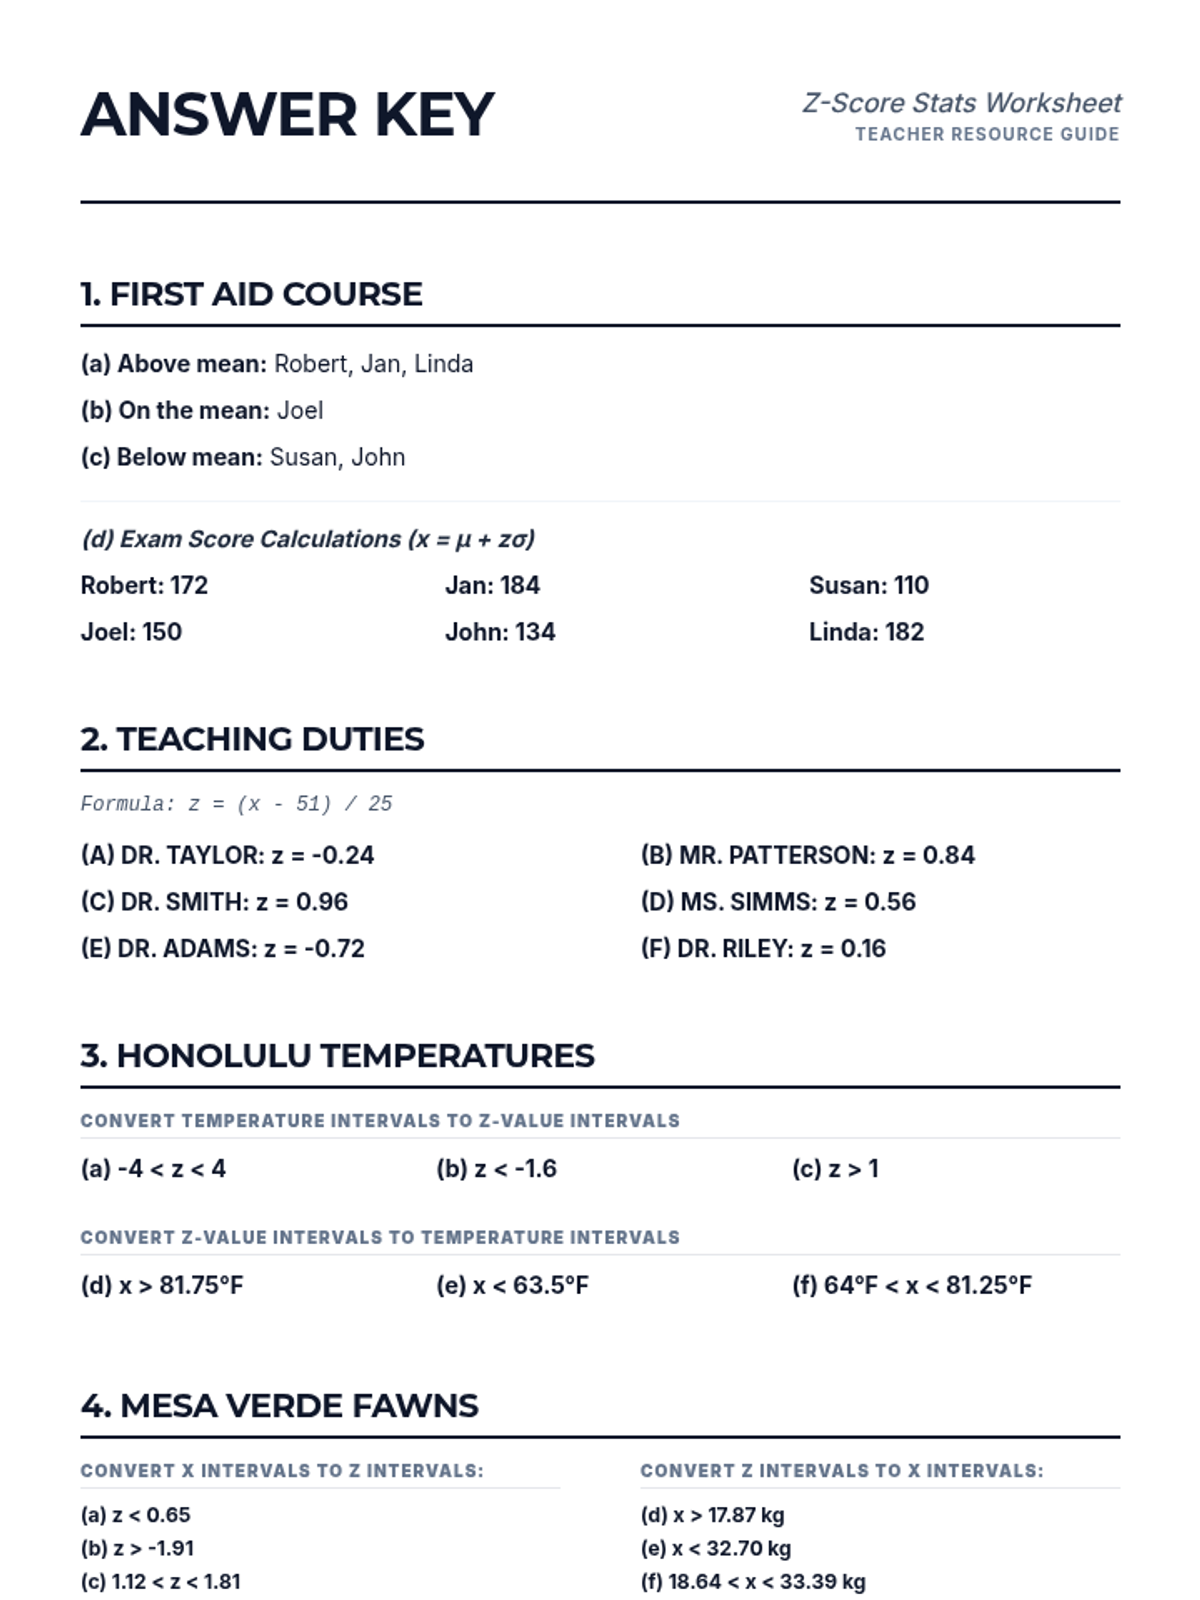
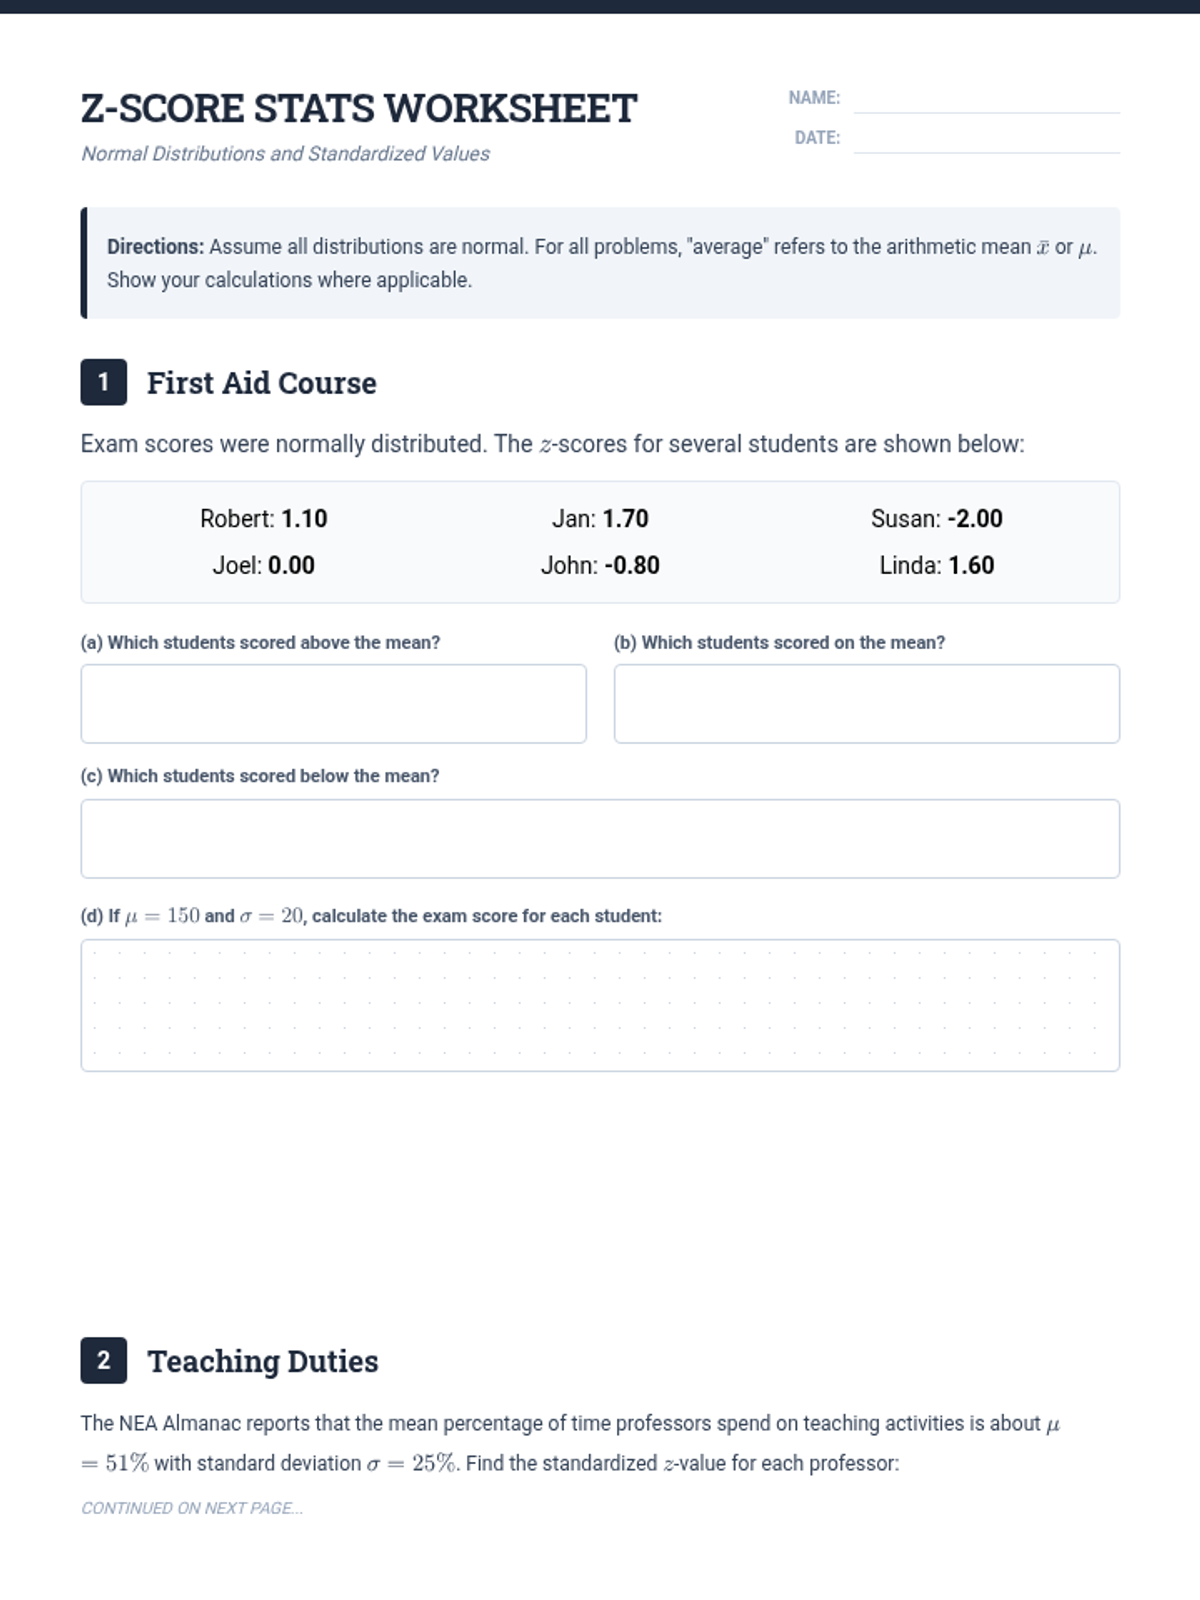
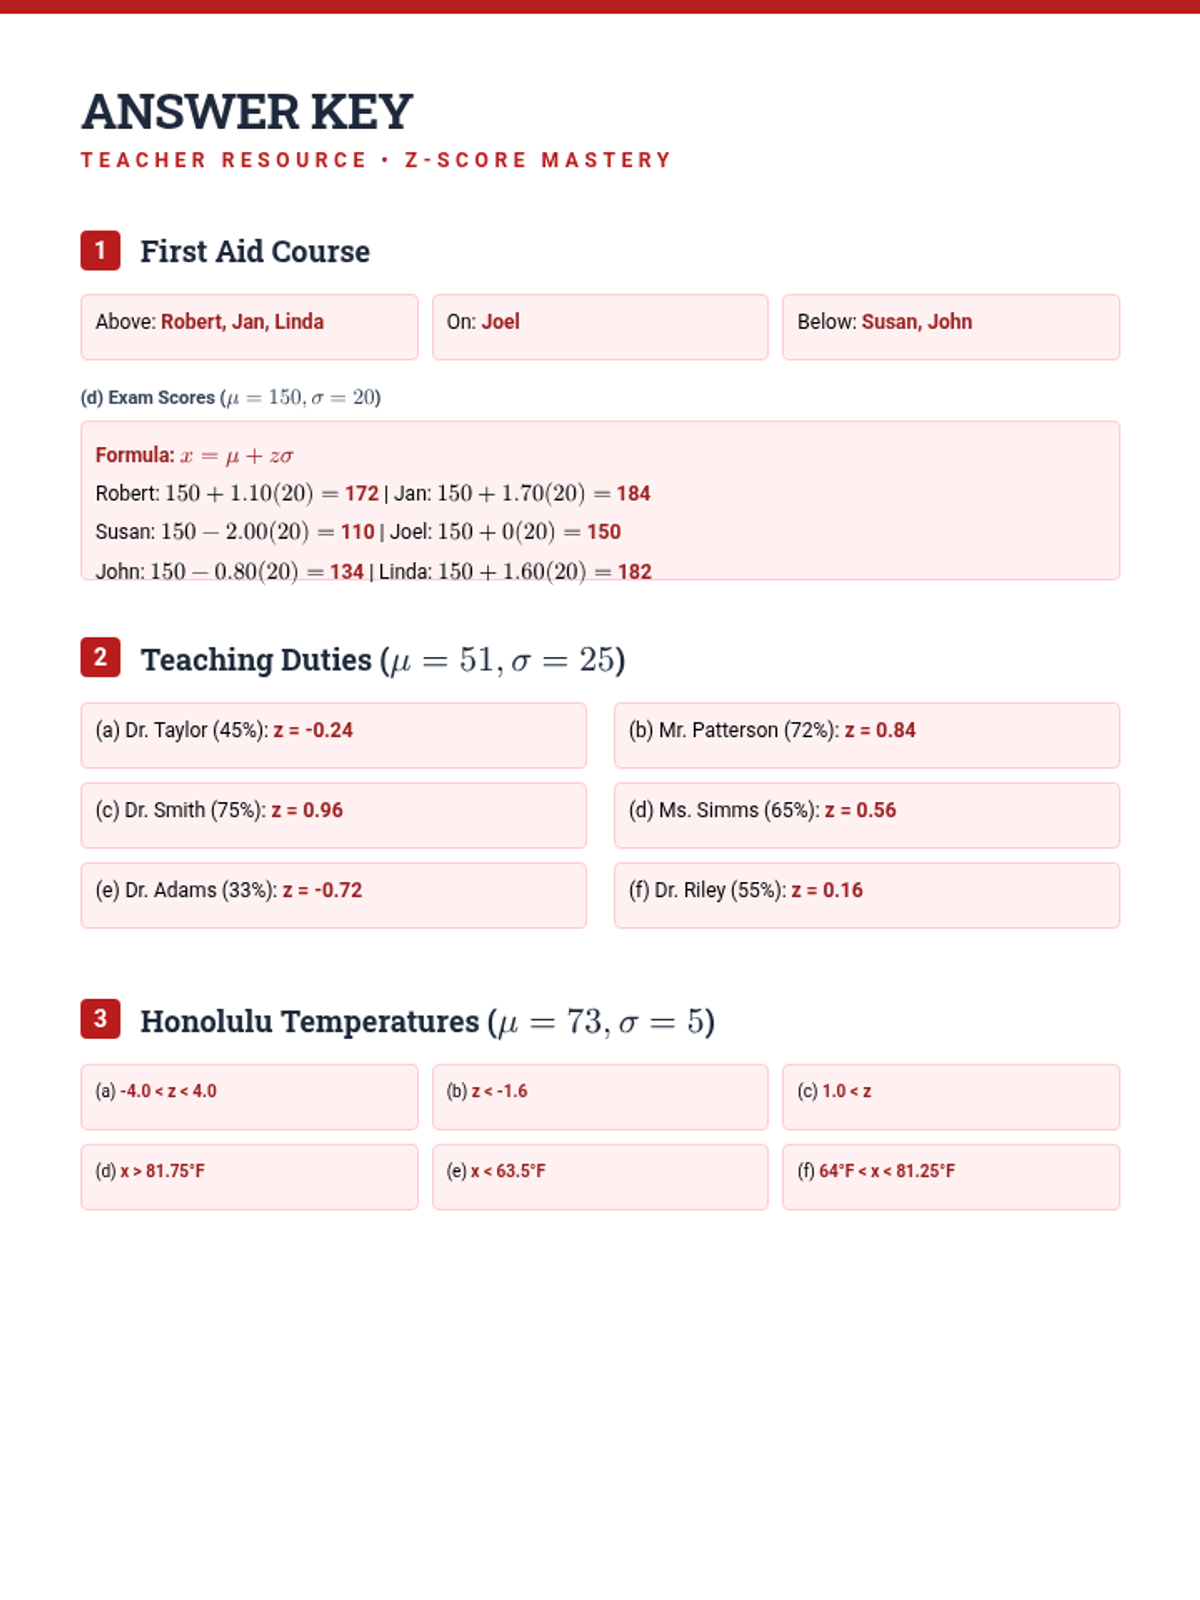
A lesson focused on understanding and applying z-scores to compare values from different normal distributions and interpret real-world statistical data.
A lesson focused on calculating and interpreting z-scores within the context of normal distributions, featuring real-world data from ecology to education.
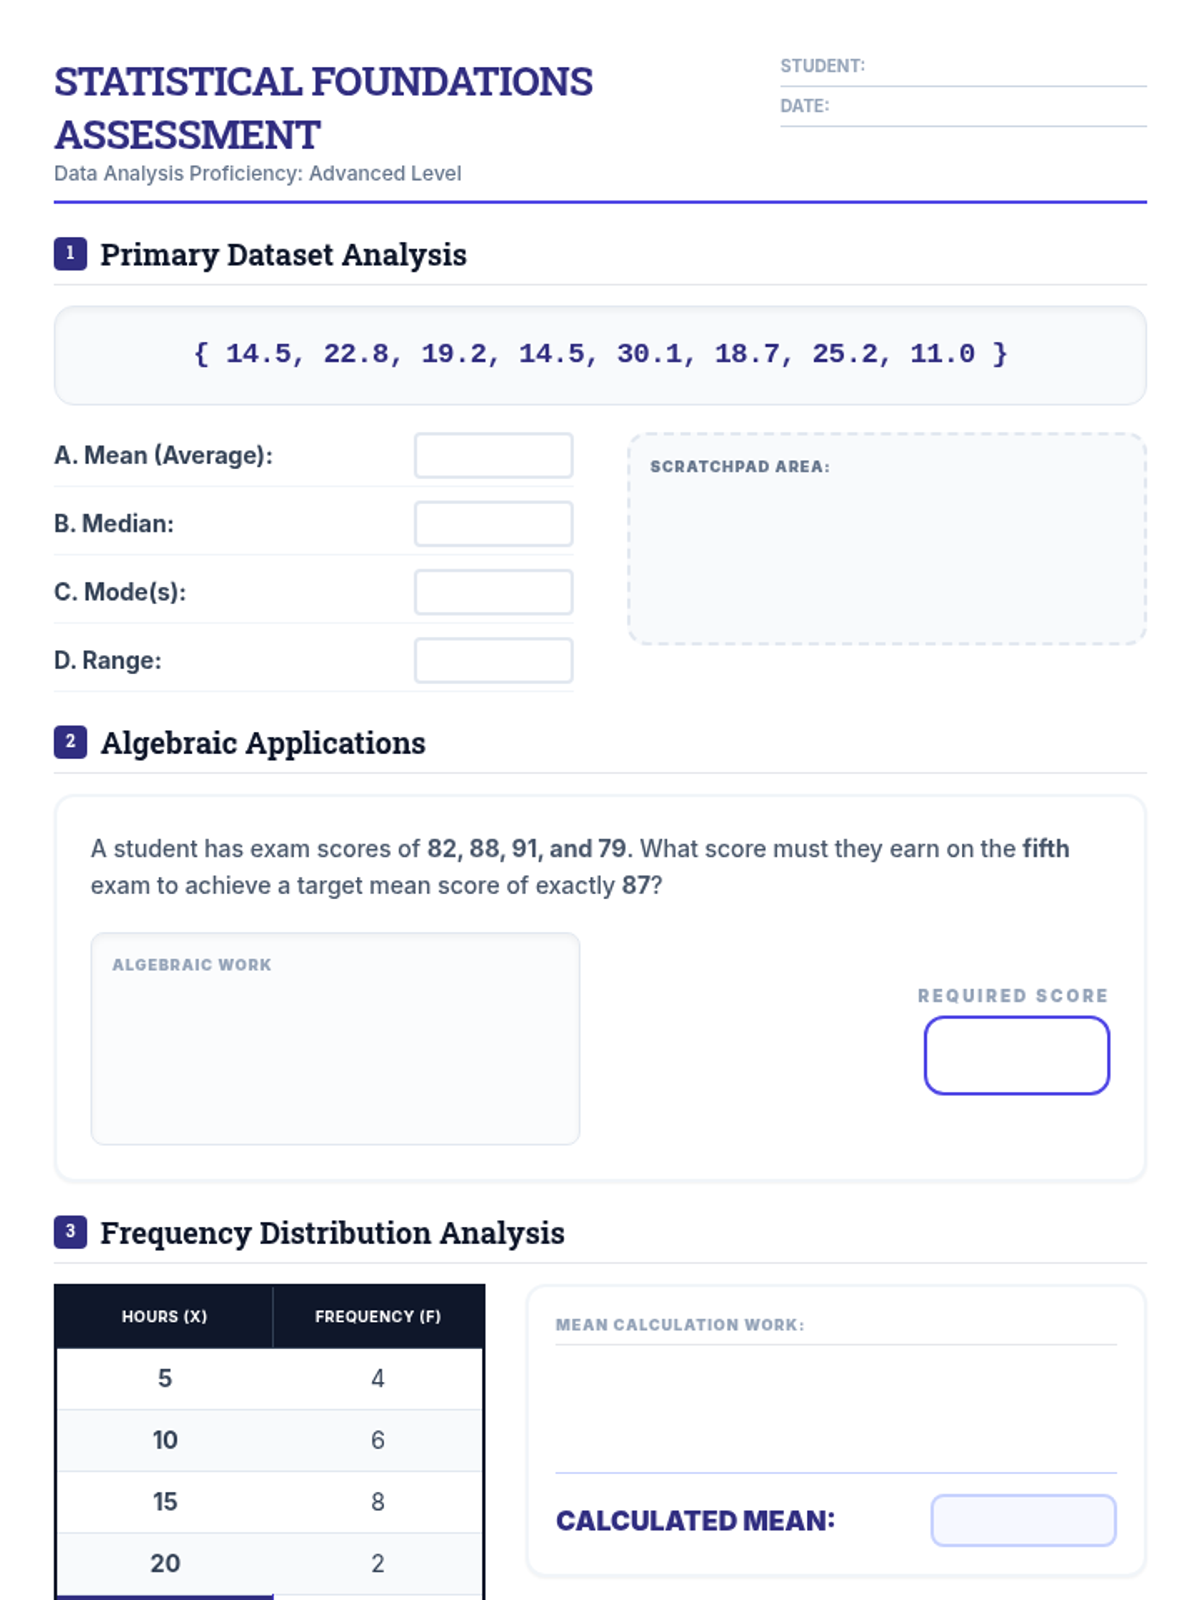
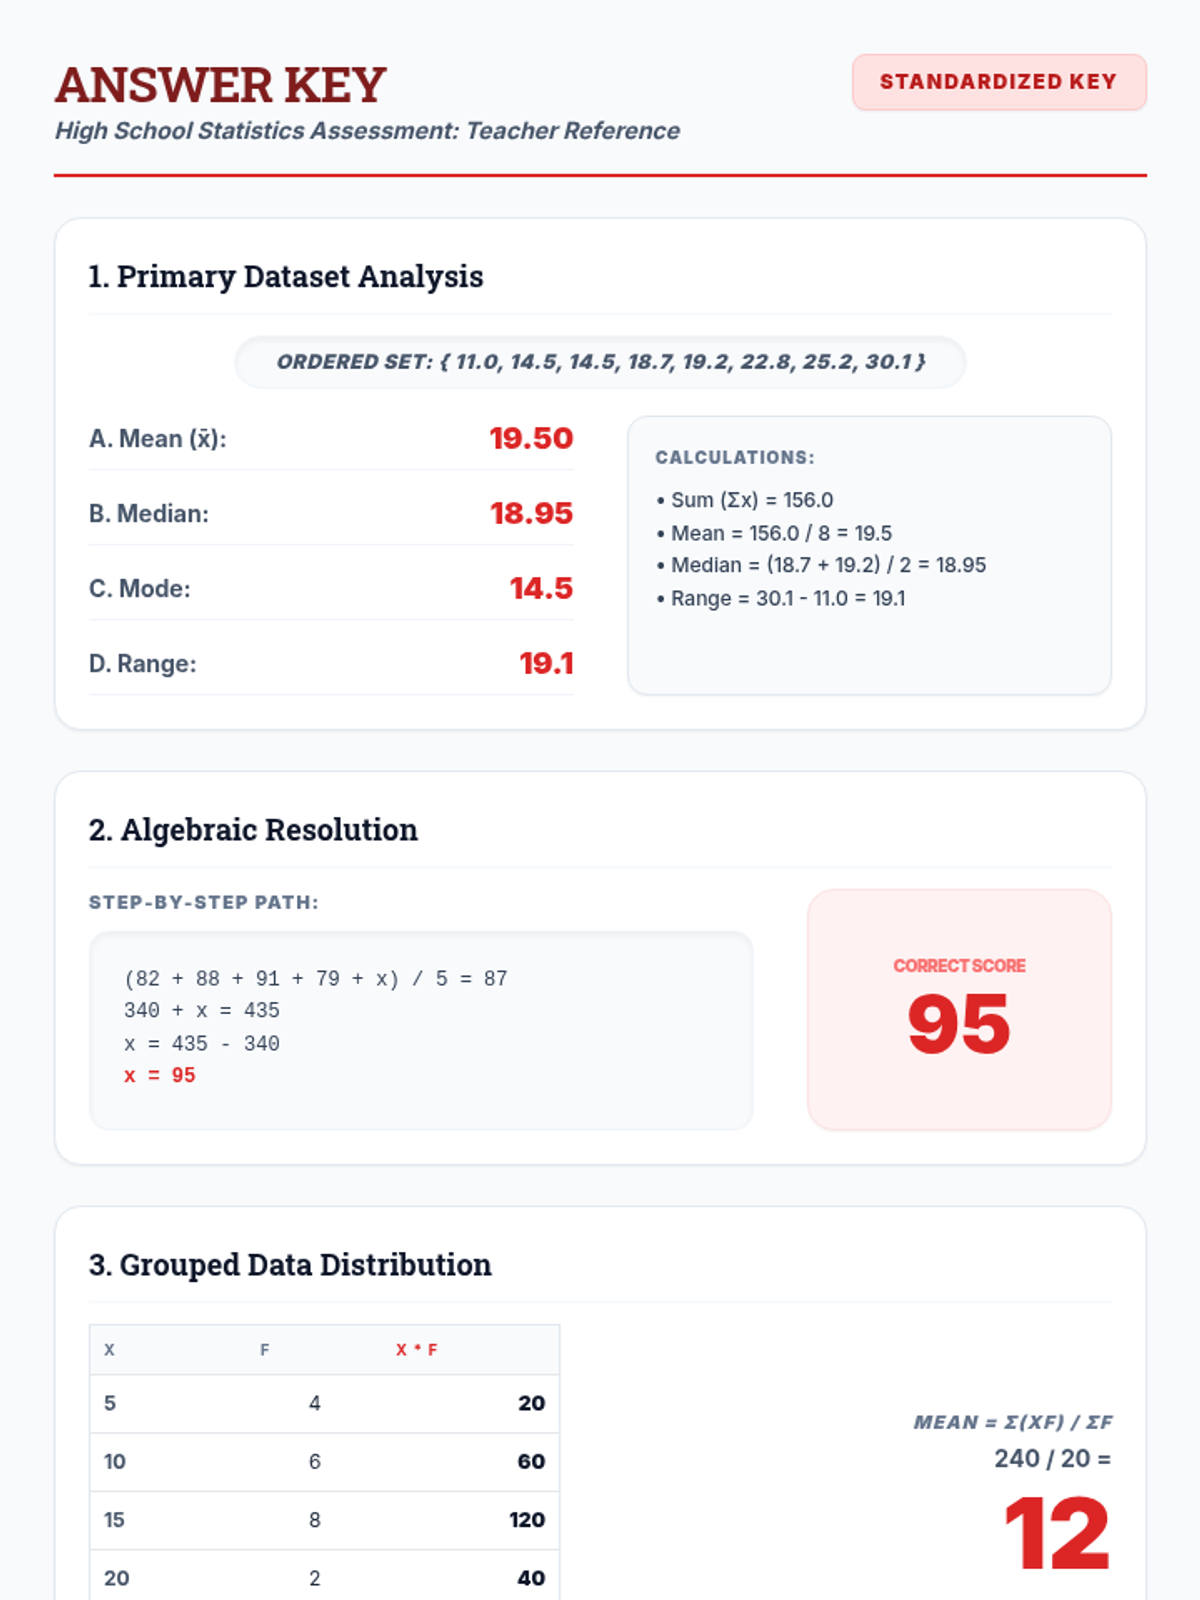
Advanced applications of central tendency and spread, including algebraic problem-solving, weighted means, and the mathematical impact of outliers for high school students.
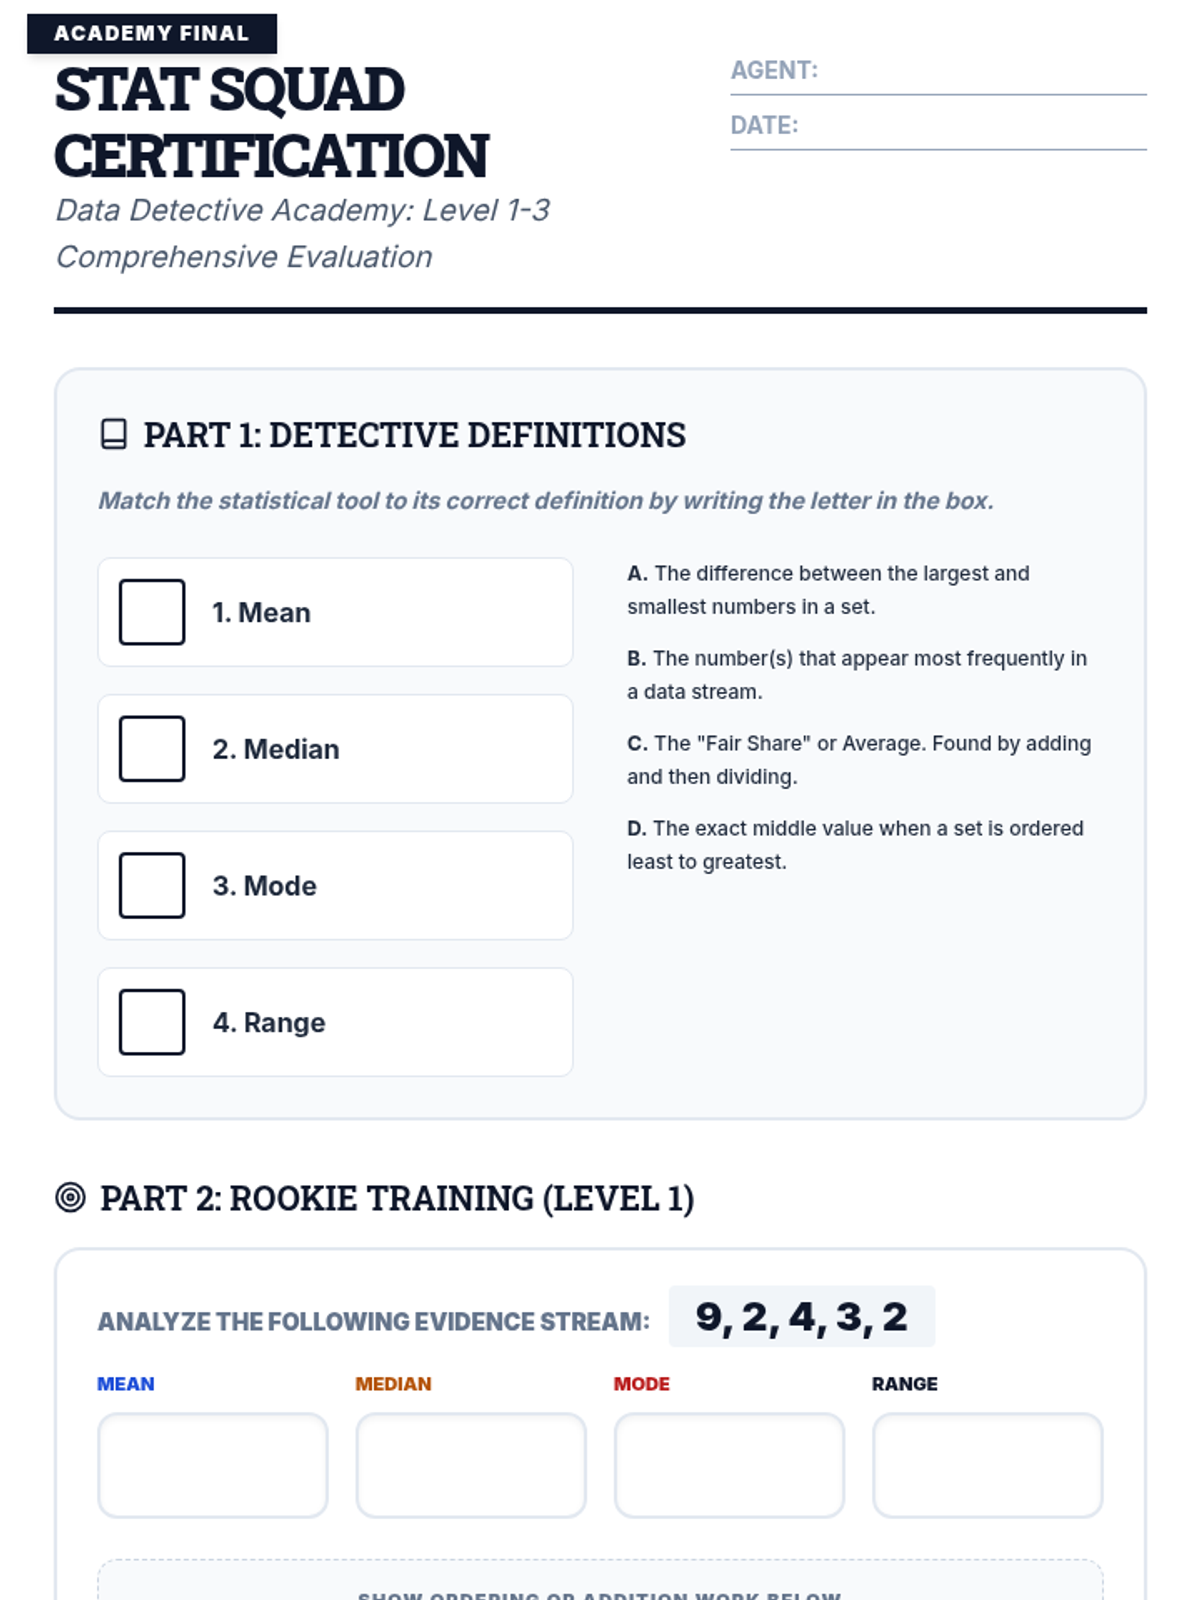
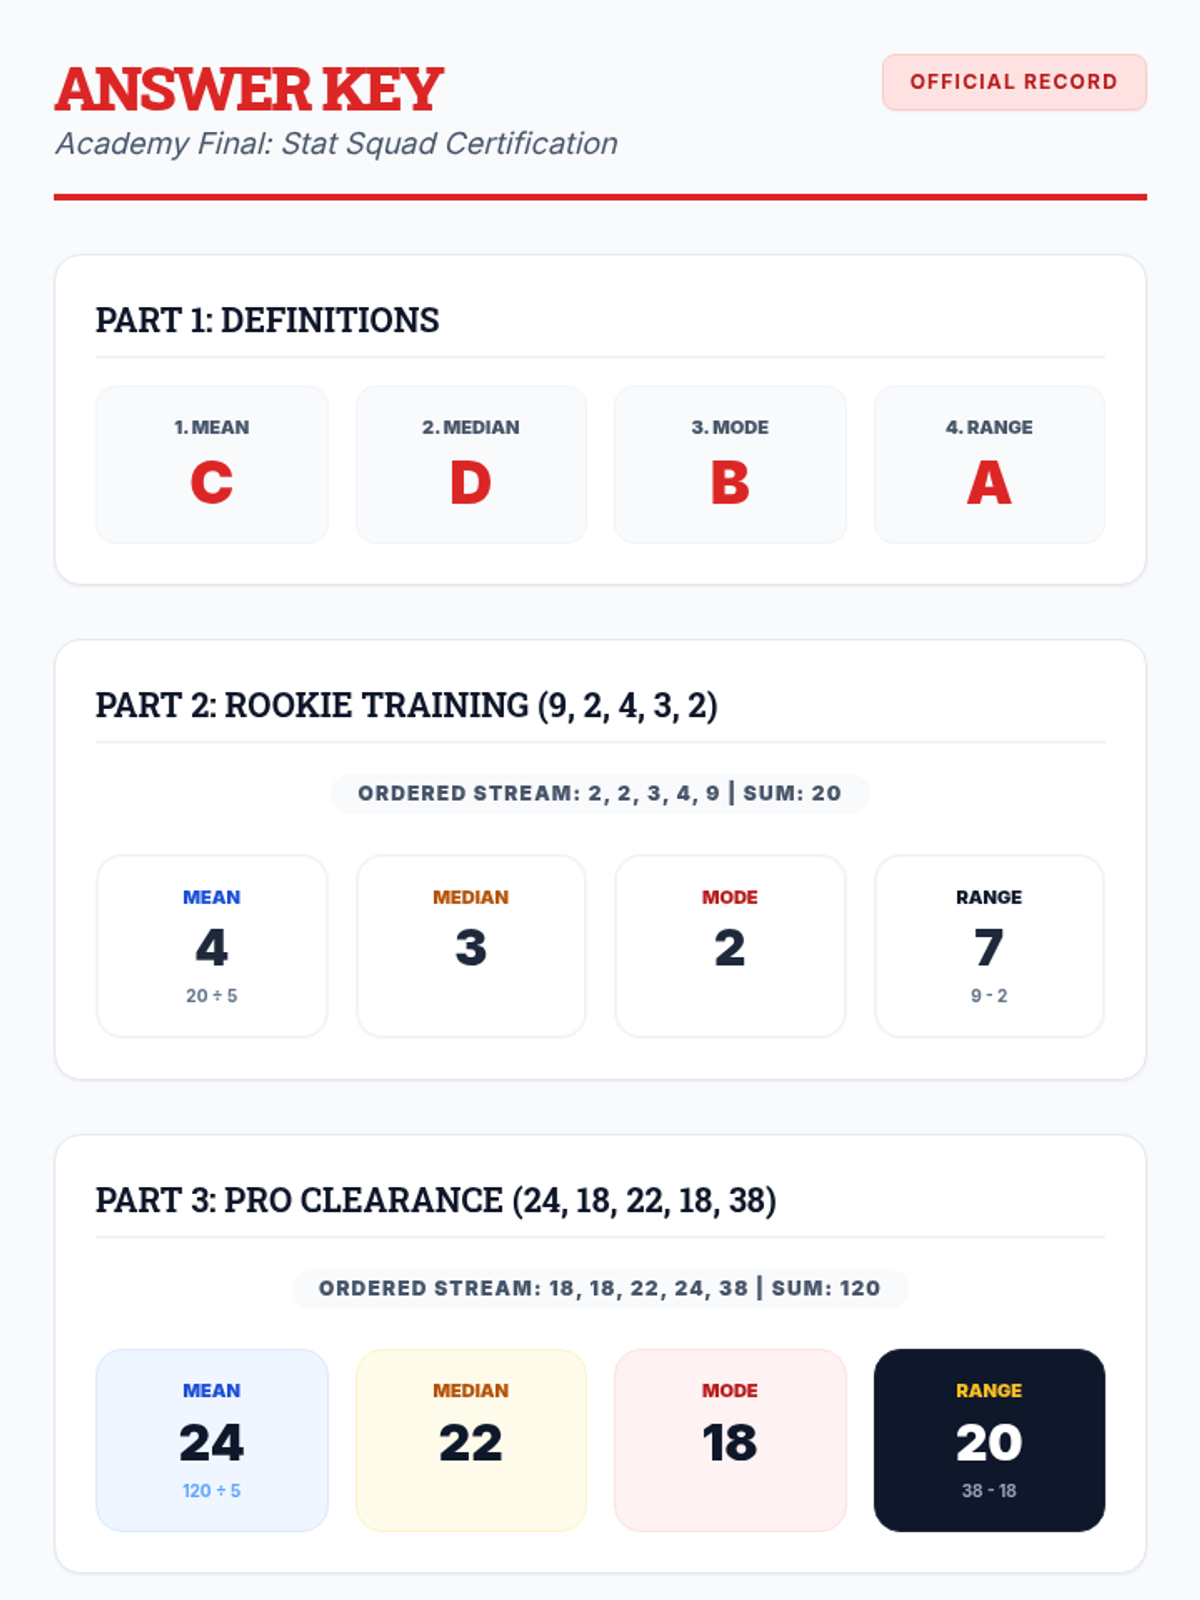
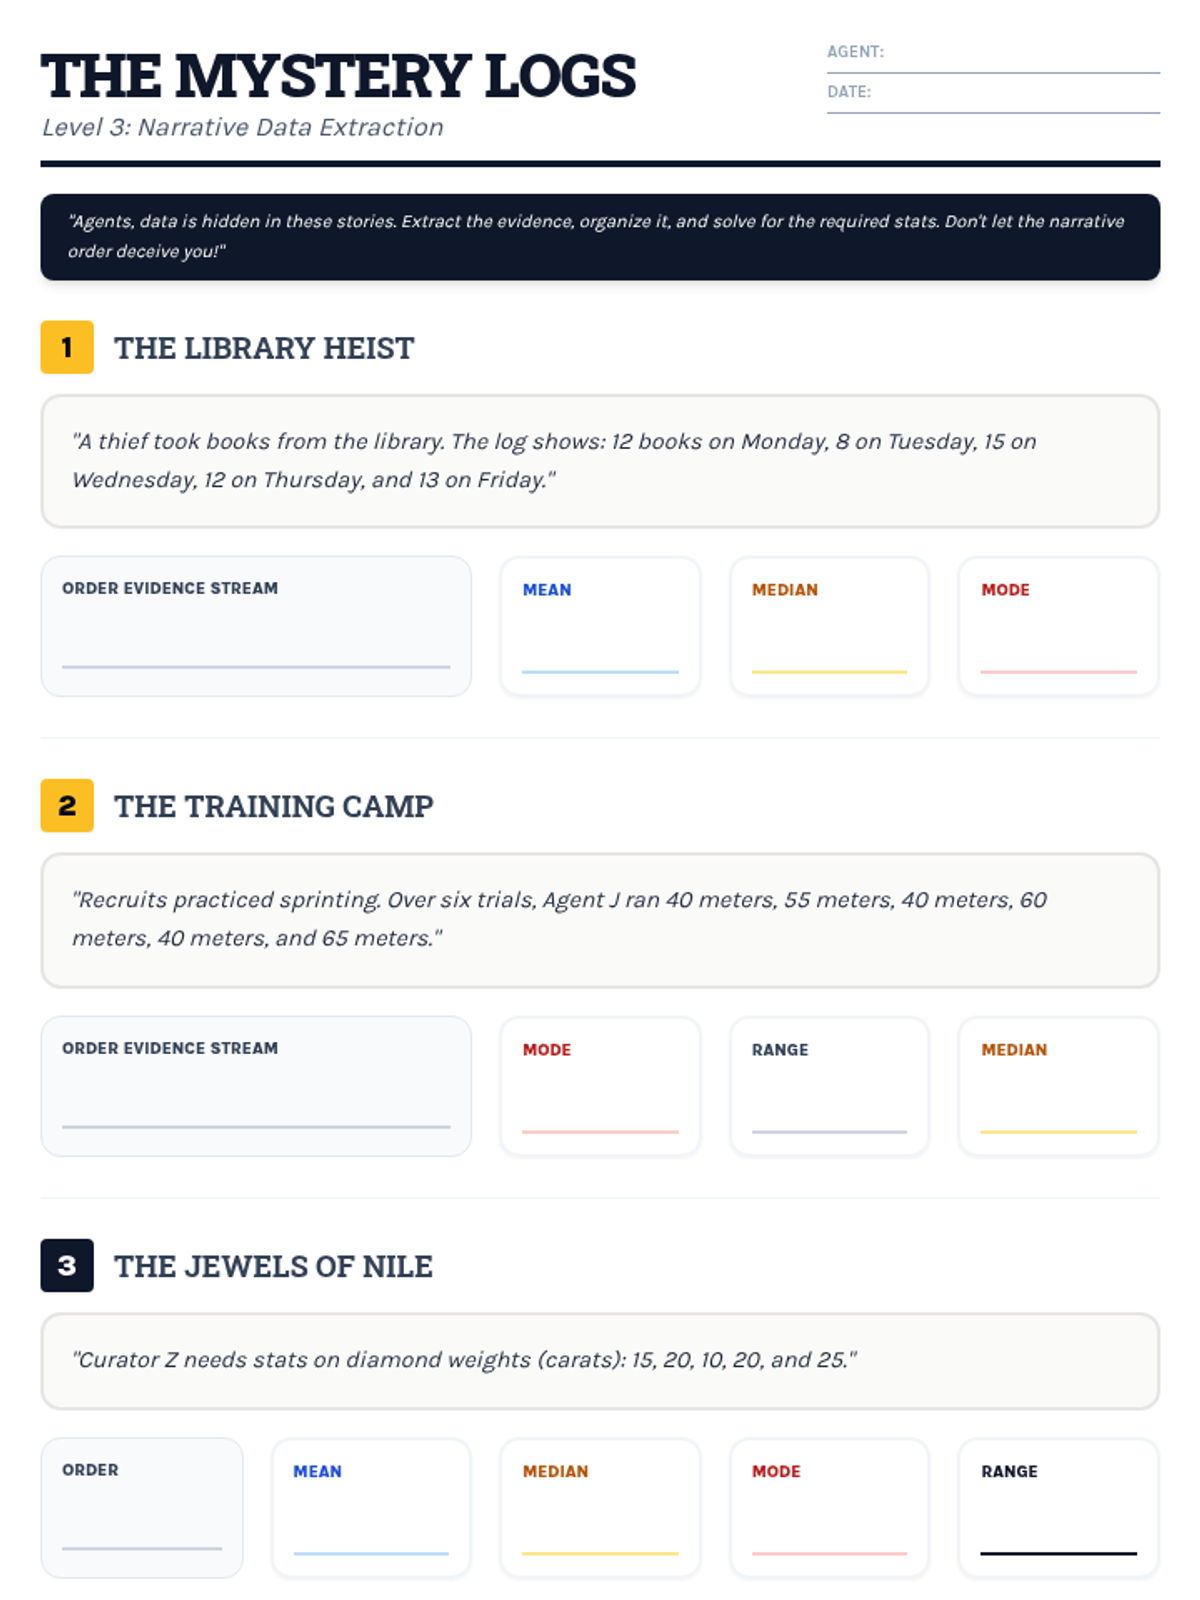
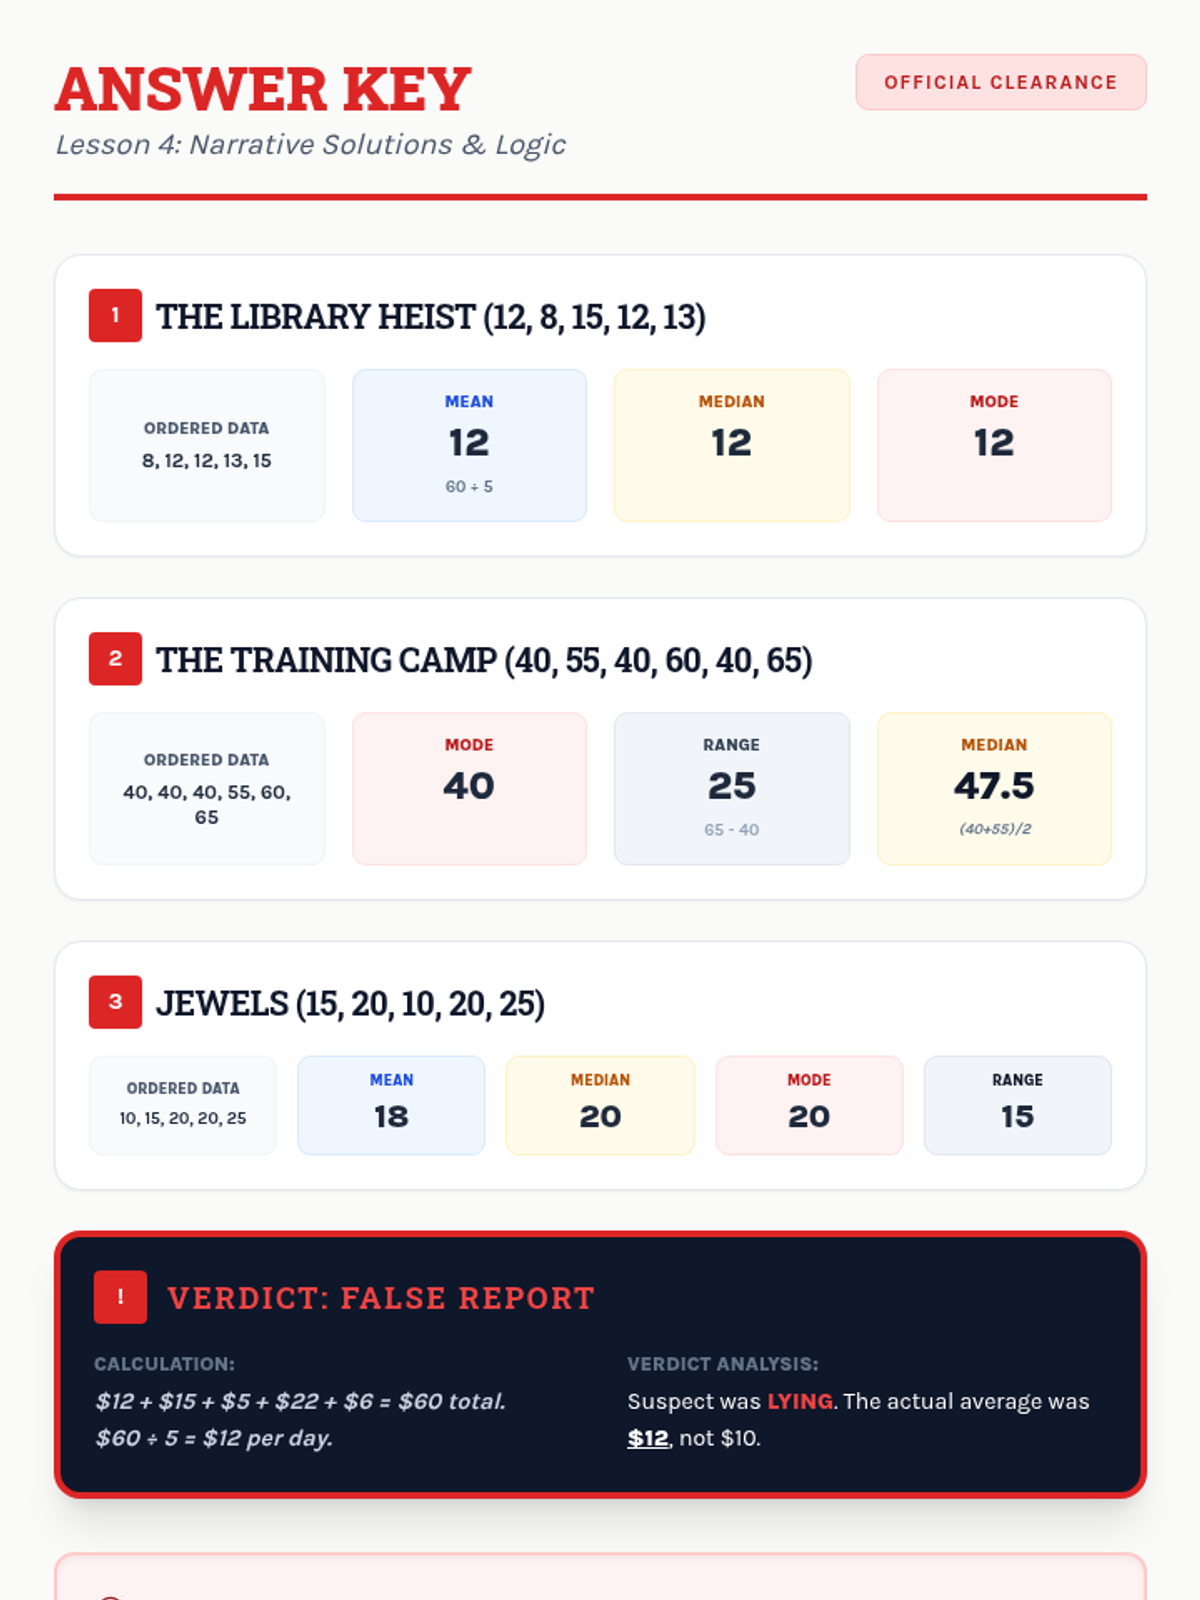
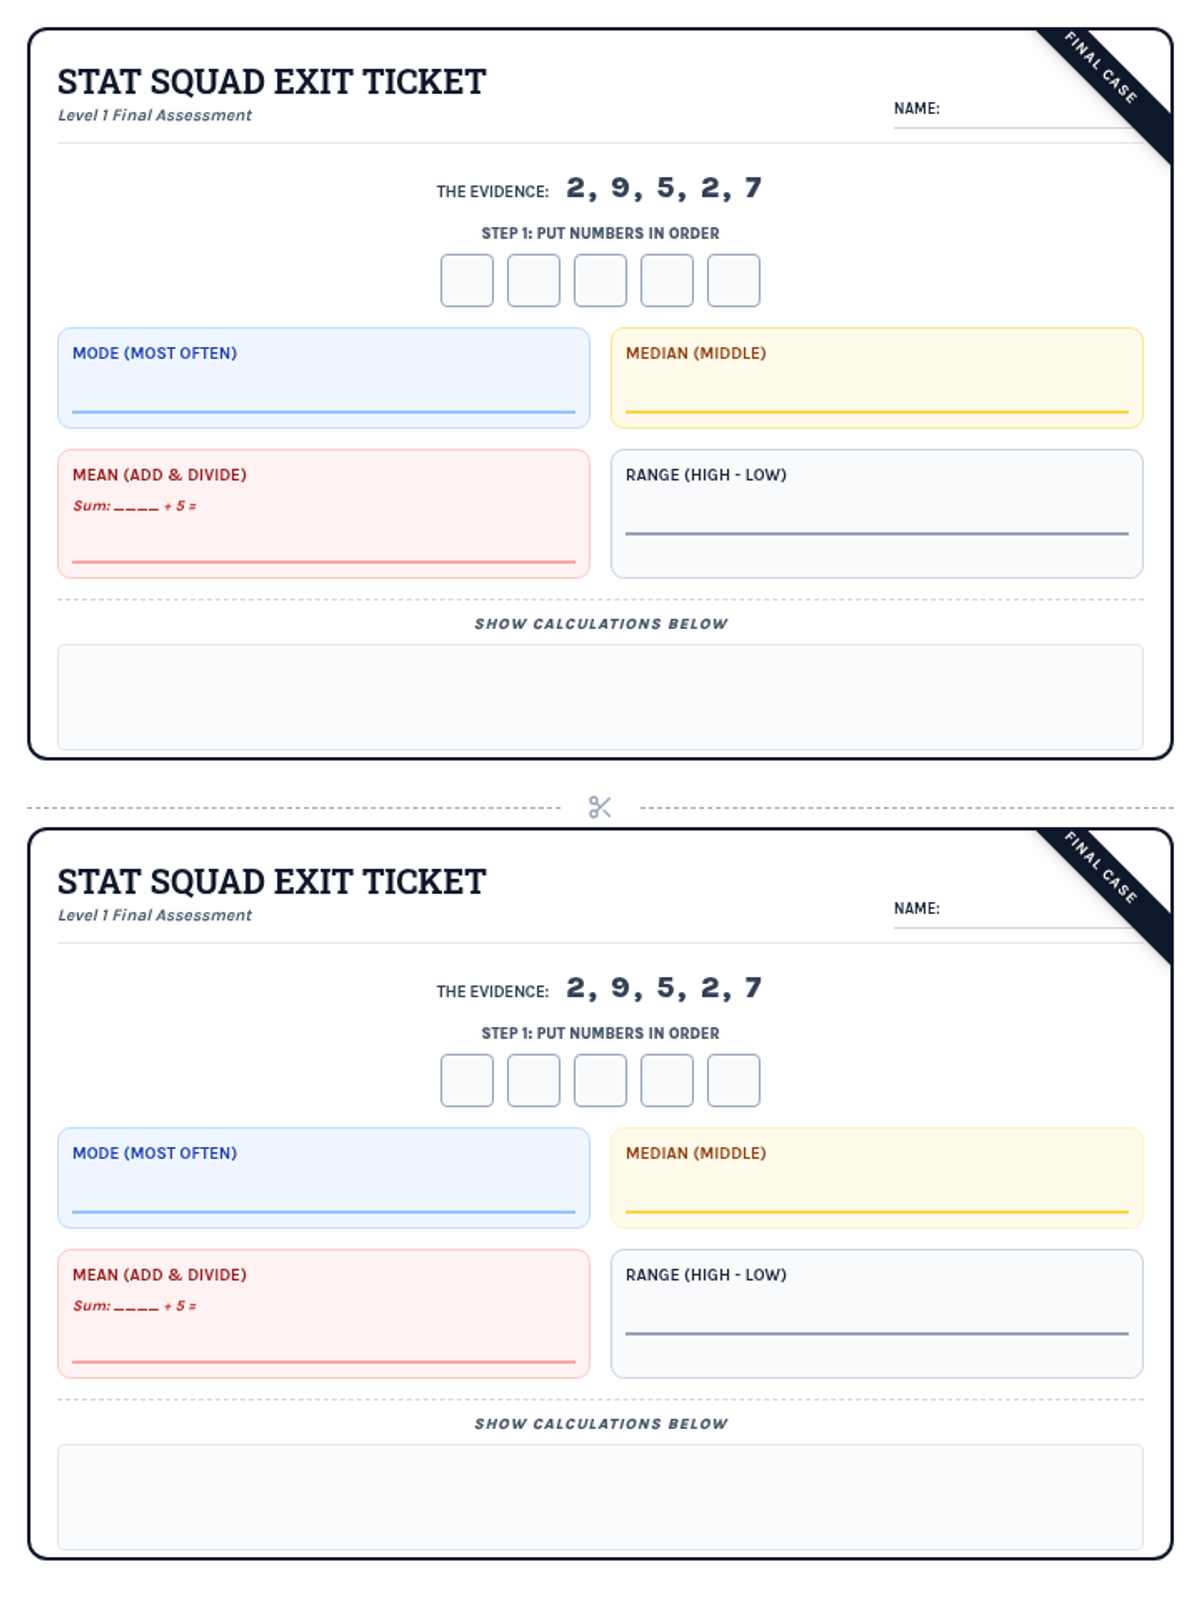
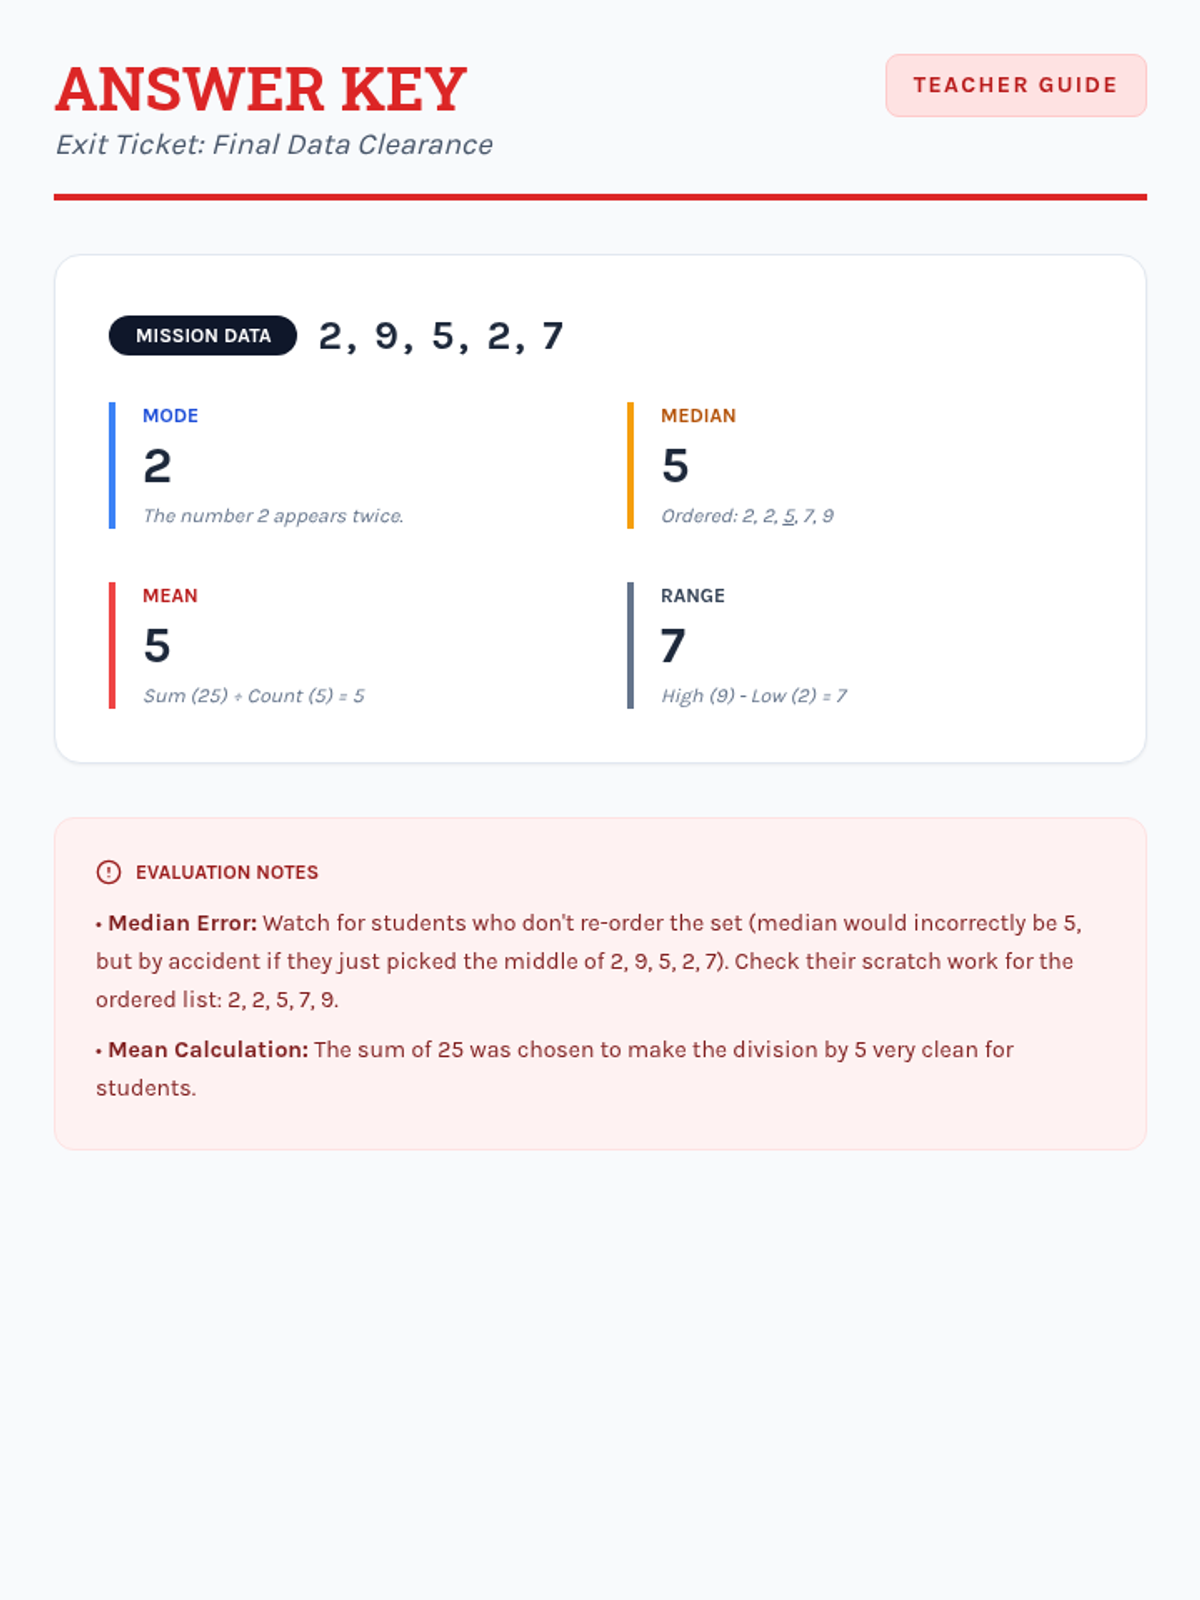
A comprehensive assessment covering Level 1, Level 2, and Level 3 data analysis, designed to evaluate mastery of mean, median, mode, and range in both numerical and narrative contexts.
Students interpret and solve word problems involving mean, median, mode, and range, focusing on extracting data from narrative contexts and real-world scenarios.
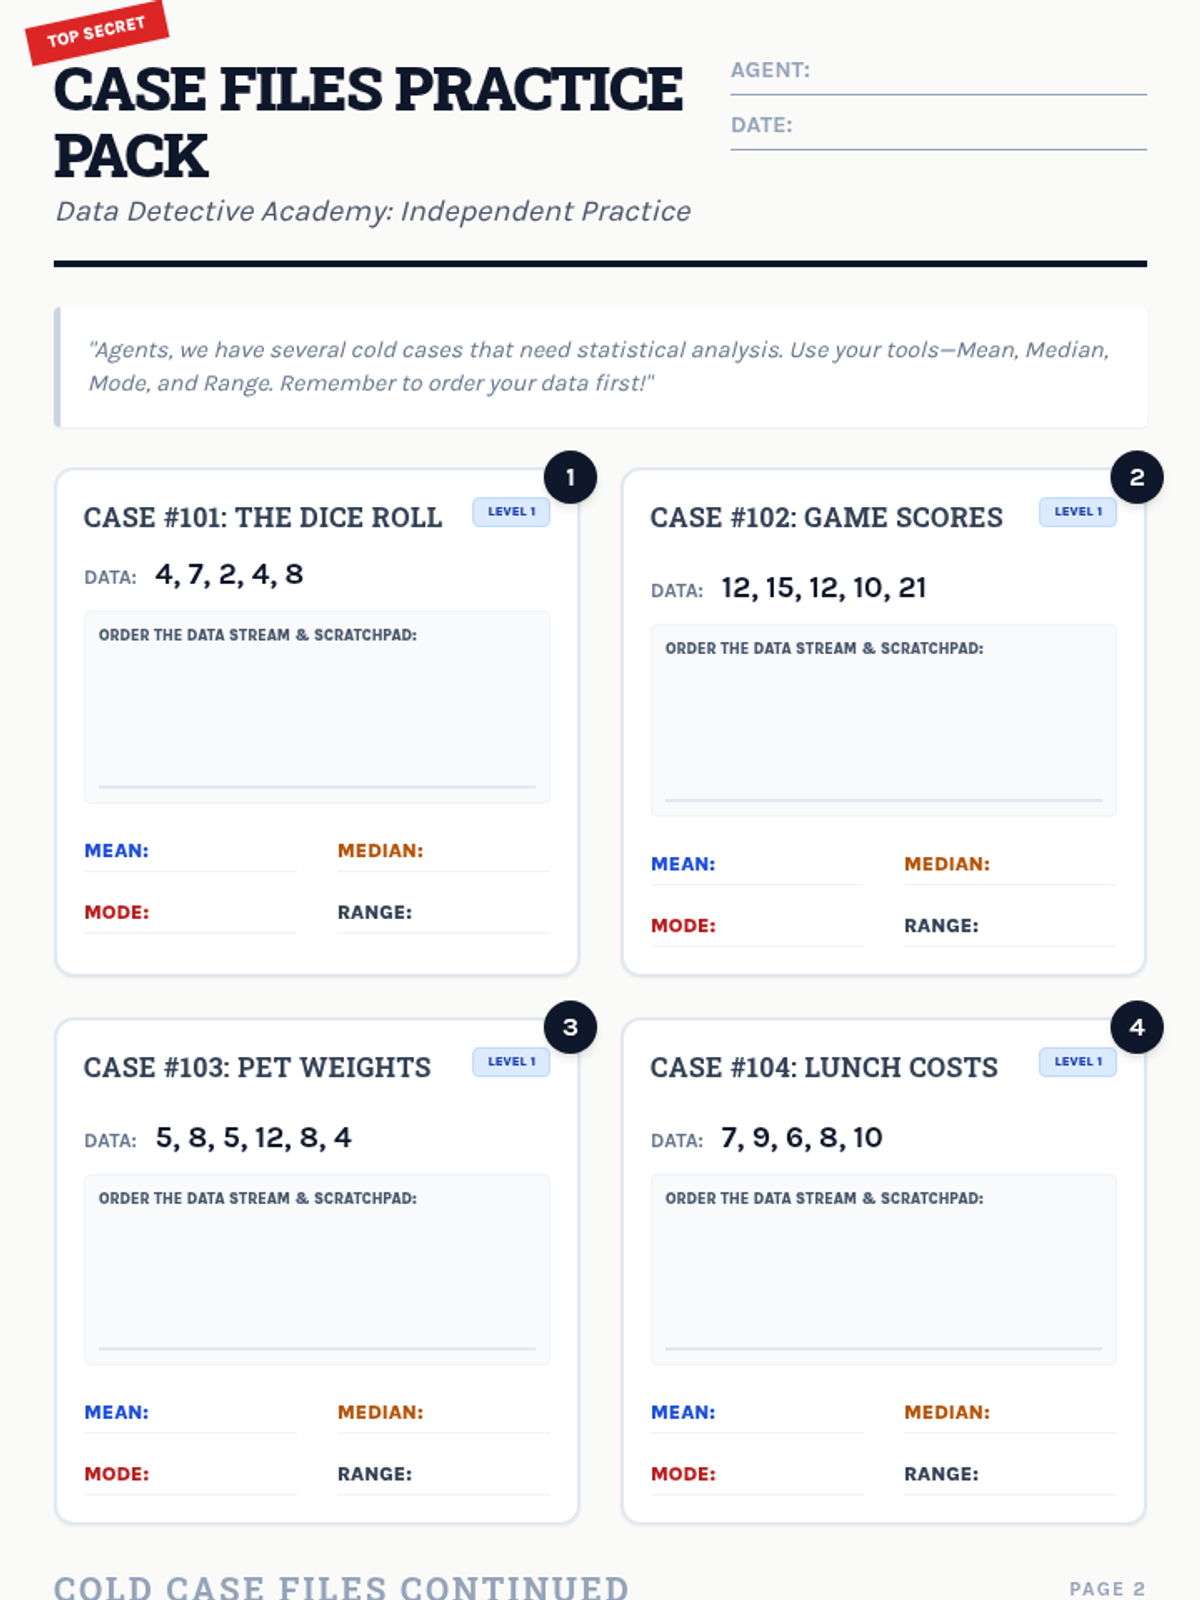
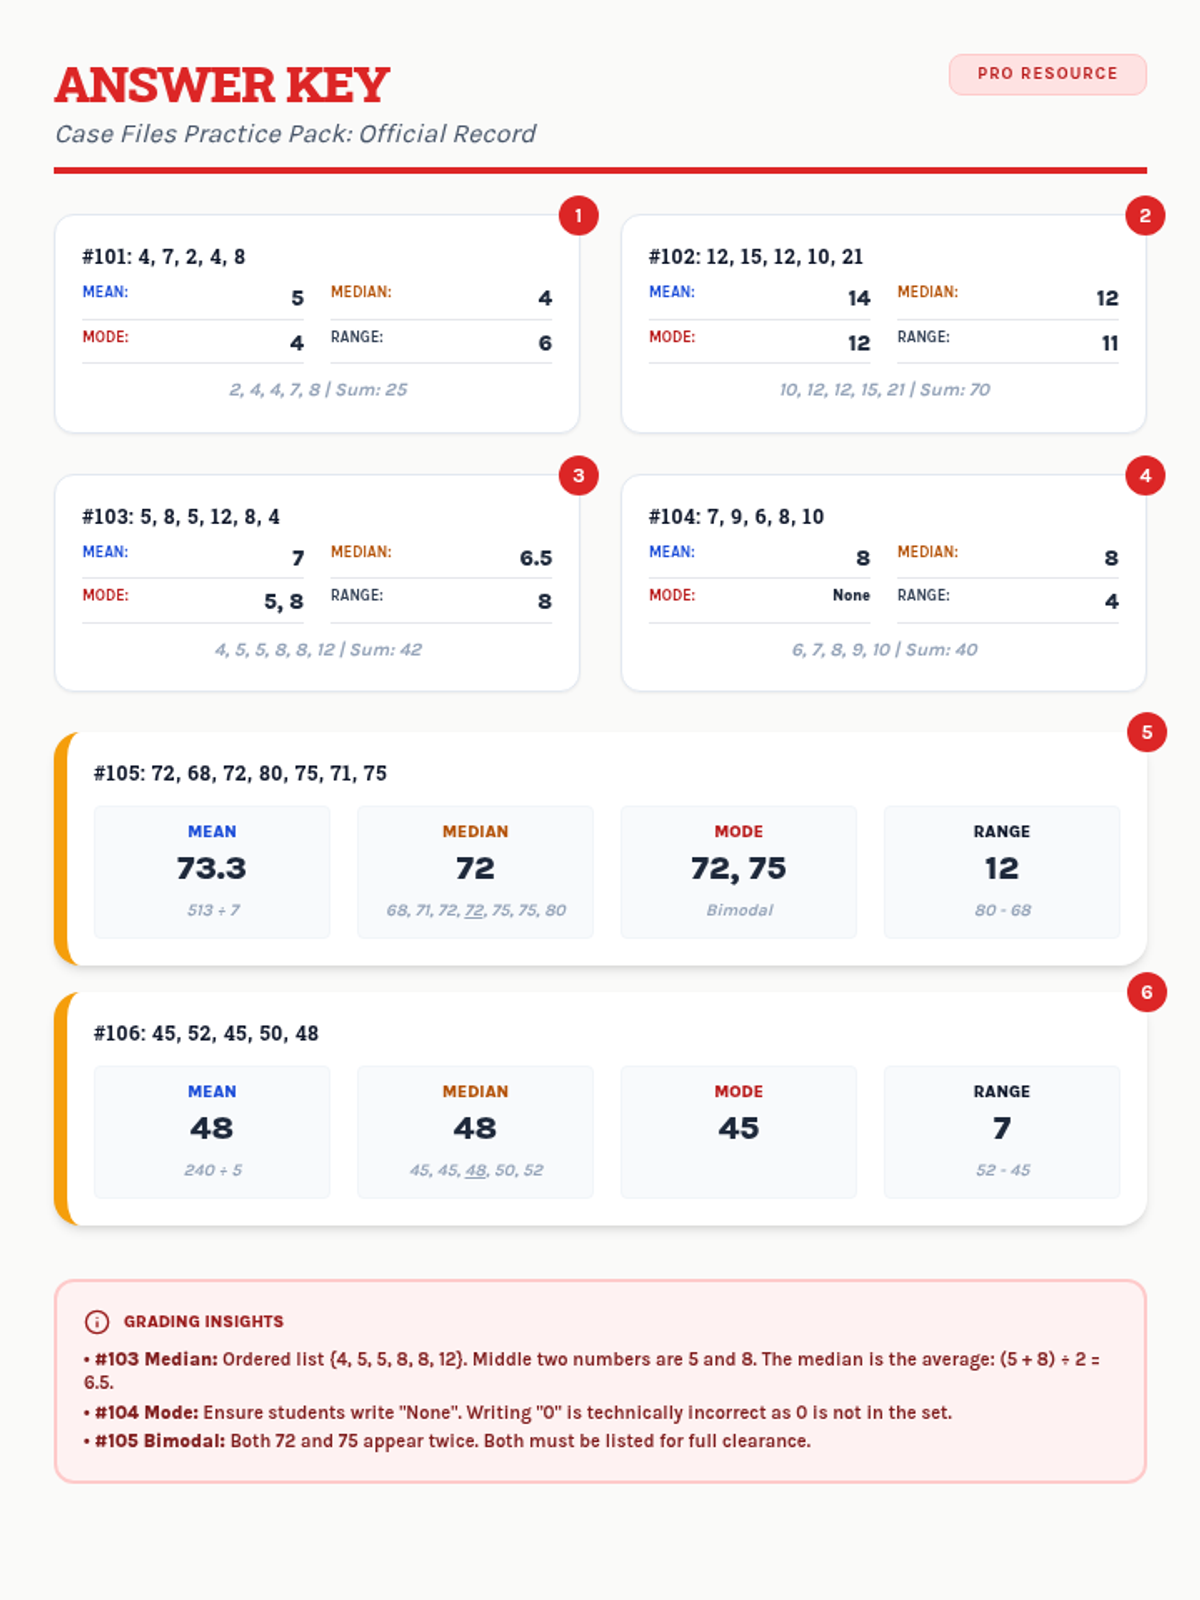
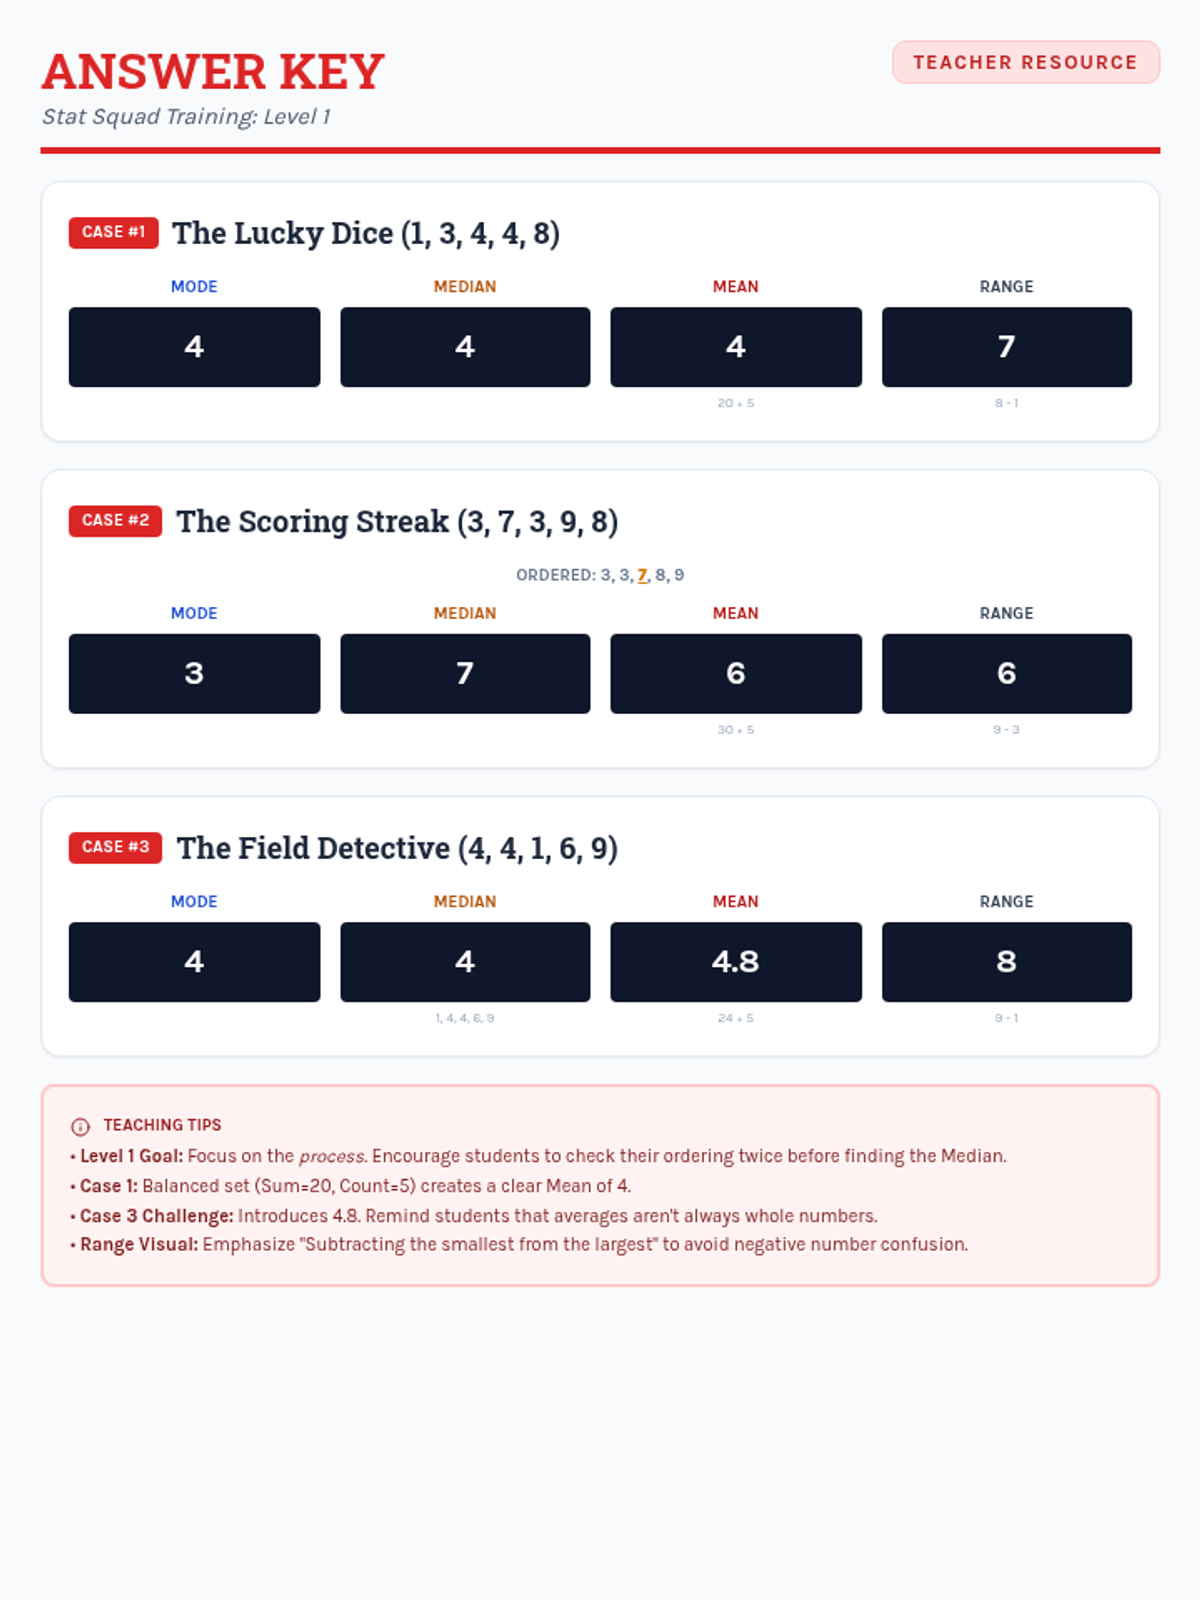
A collection of extra practice cases for mean, median, mode, and range, ranging from single-digit warmups to double-digit challenges, themed as unsolved detective files.
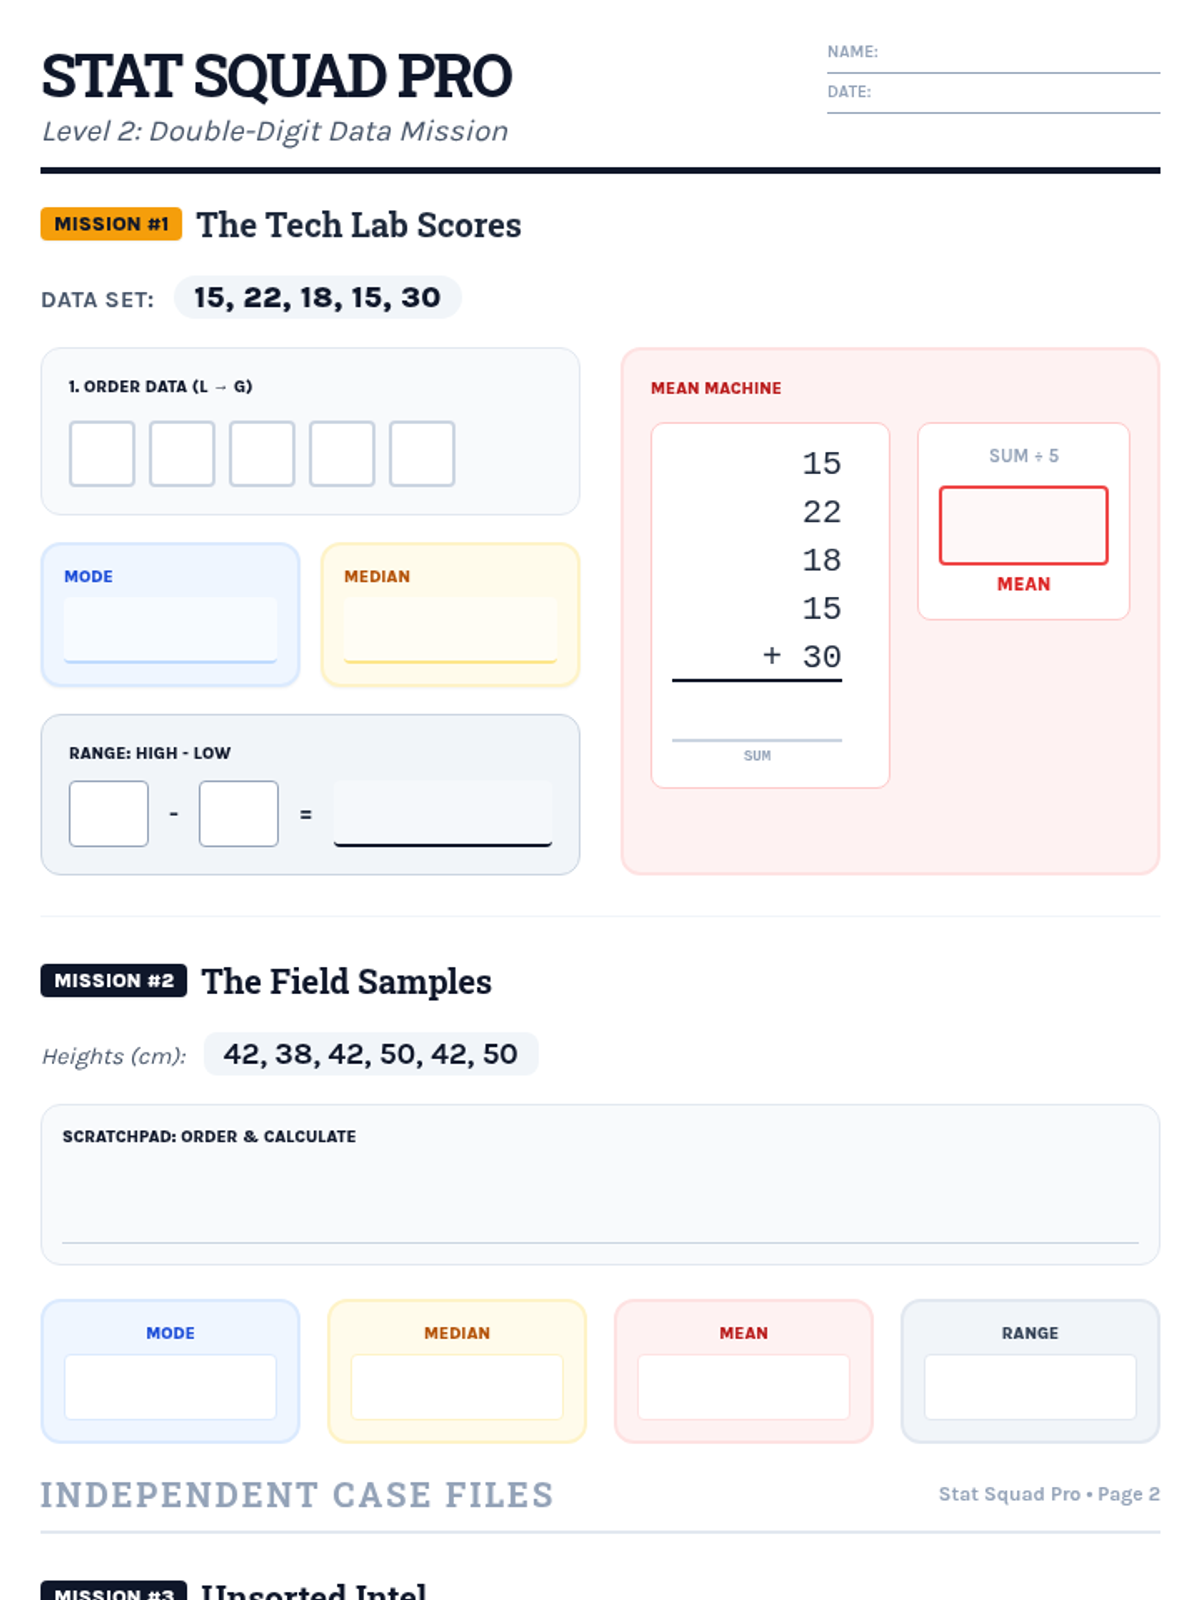
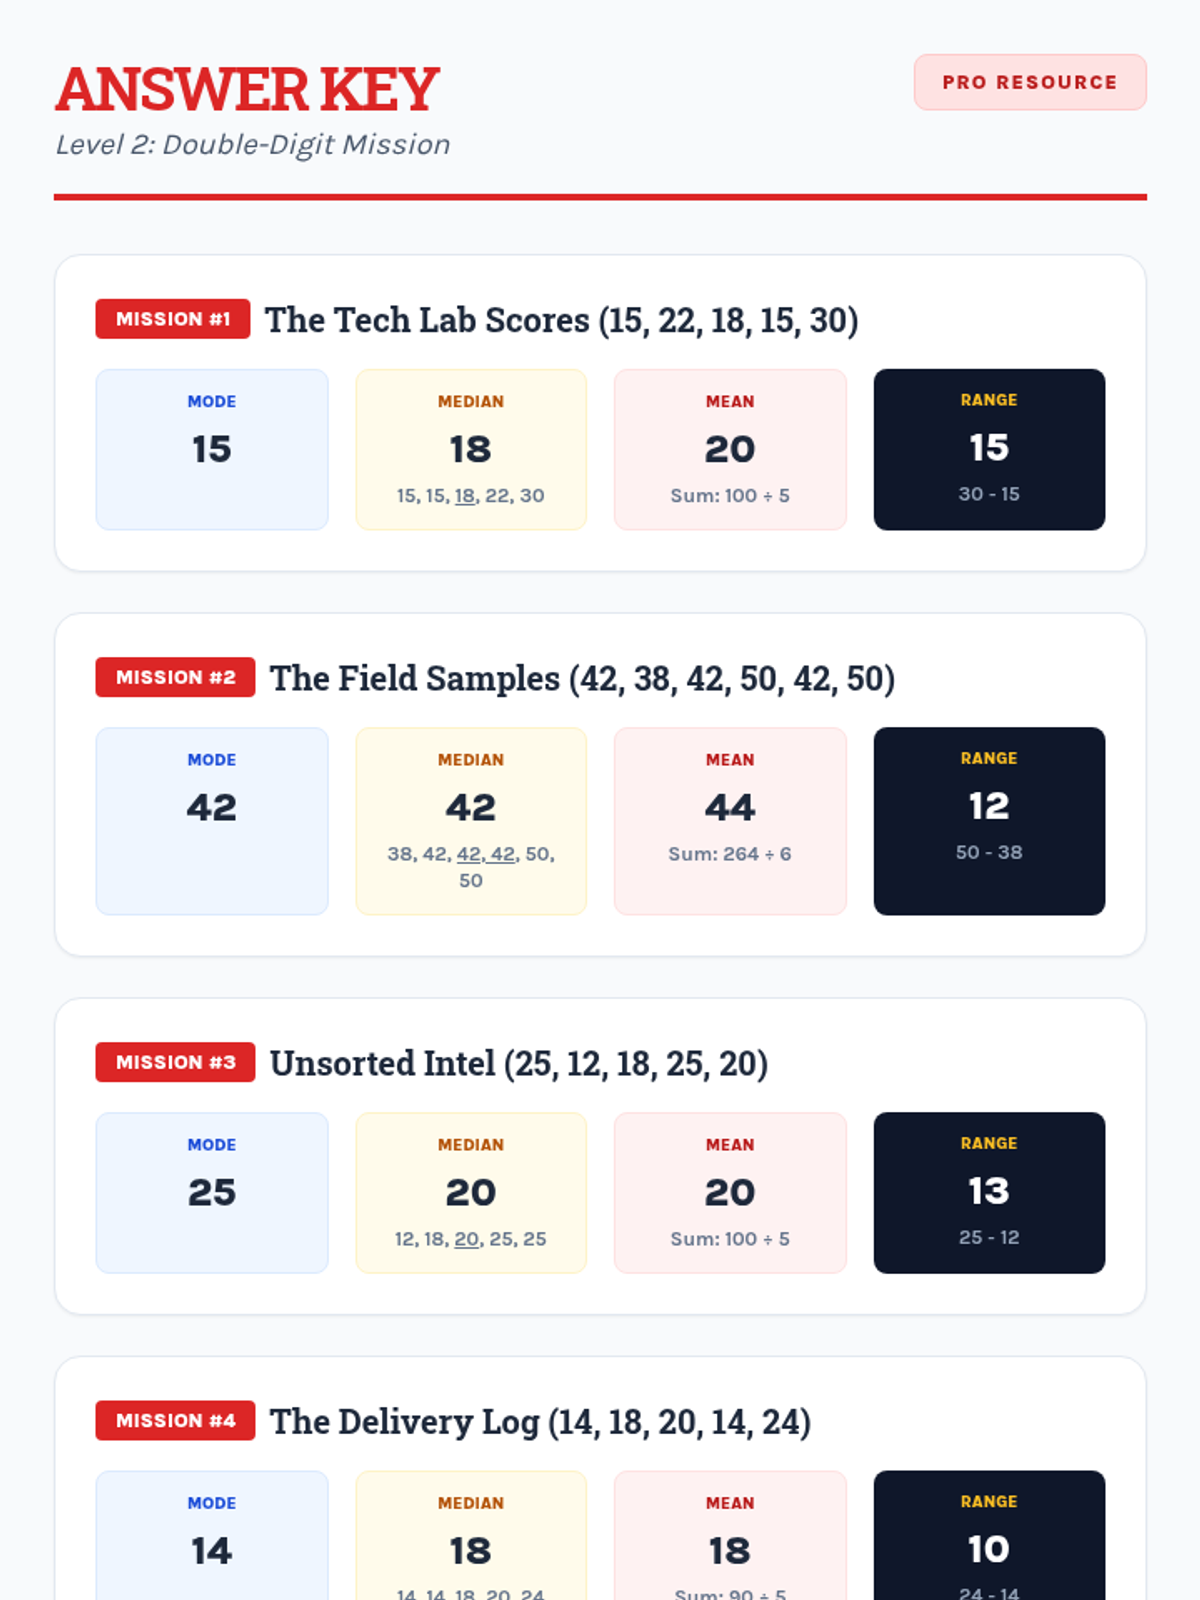
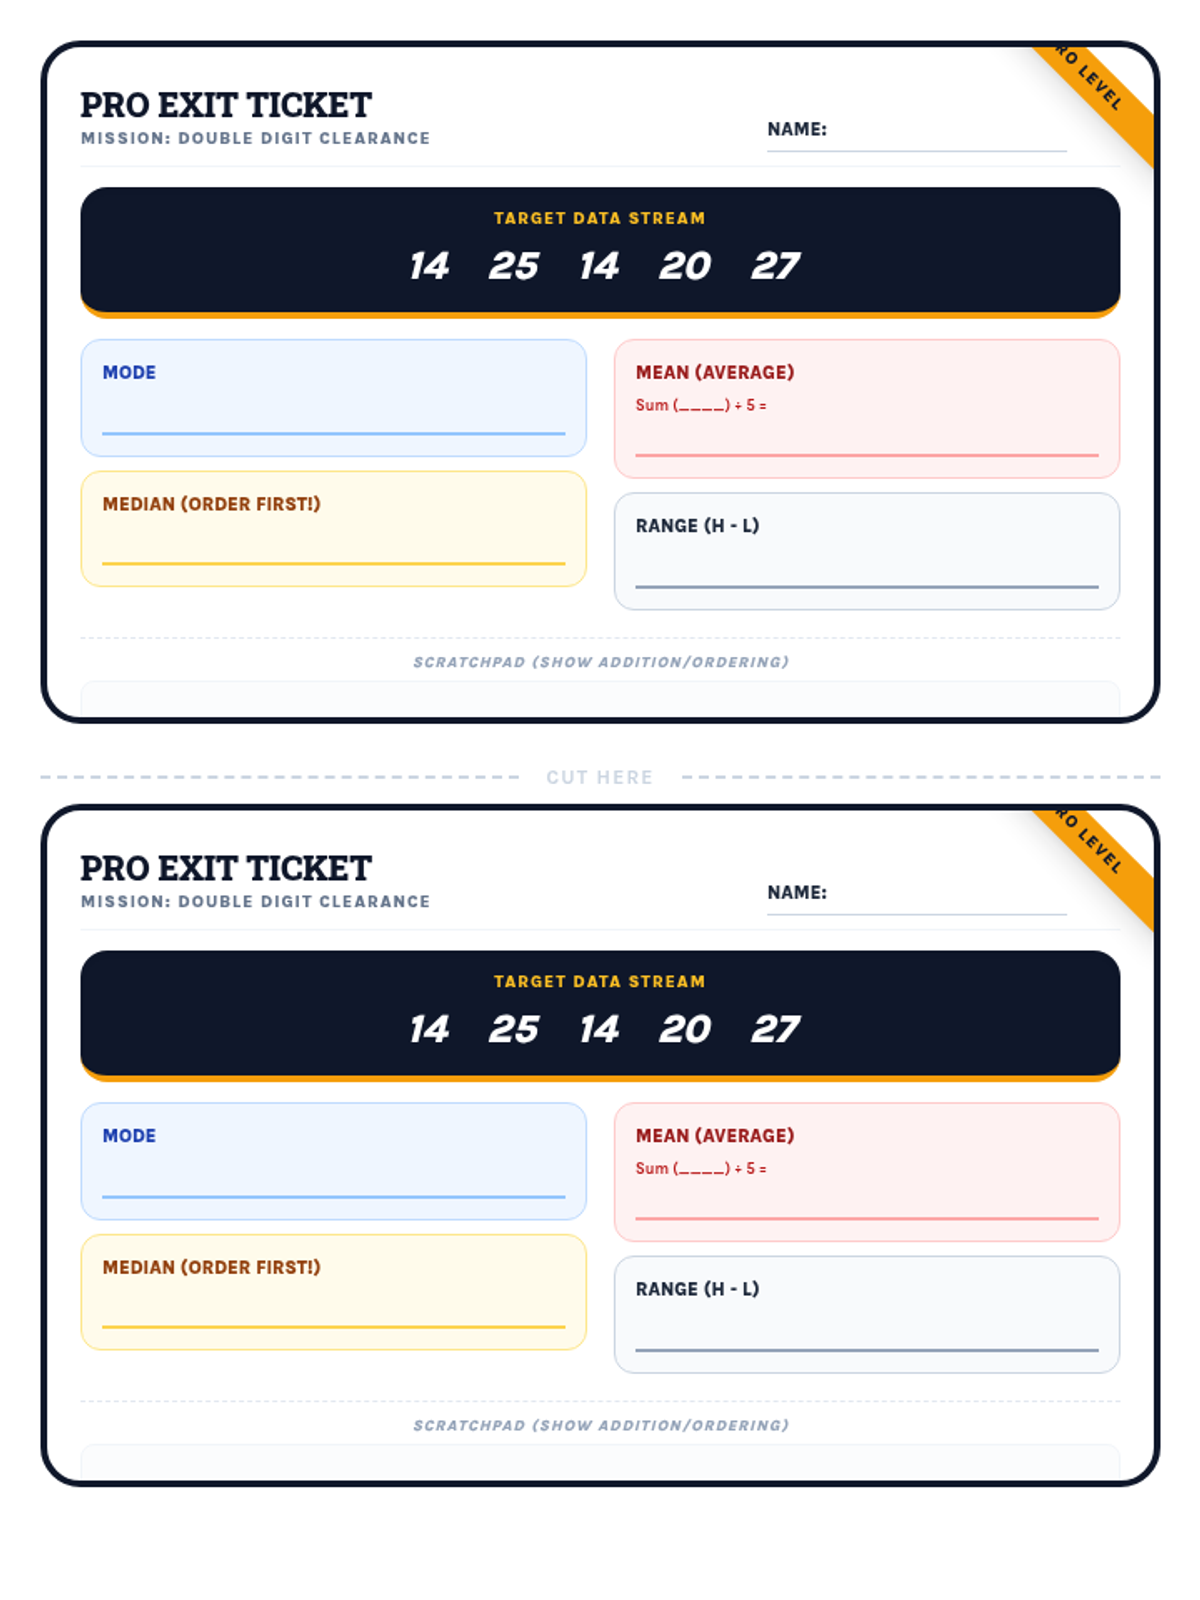
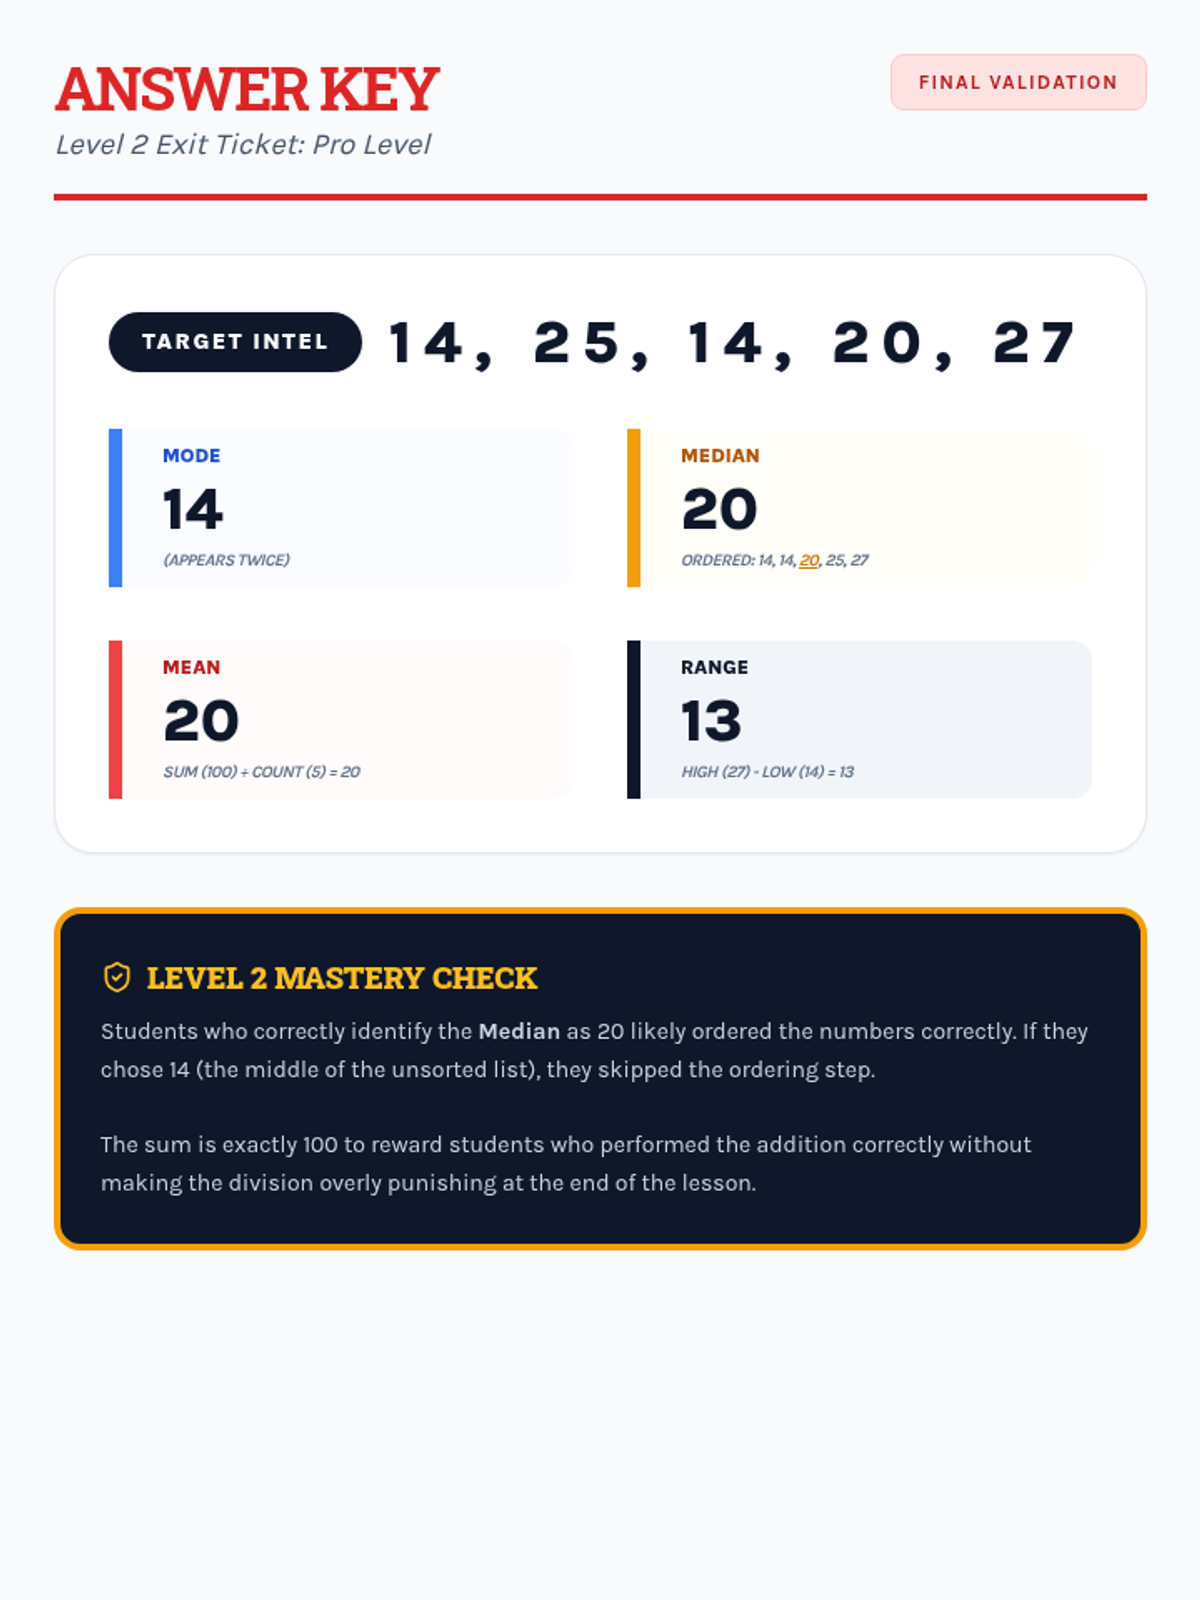
Students apply their knowledge of mean, median, mode, and range to data sets featuring two-digit numbers, focusing on multi-digit addition and division.
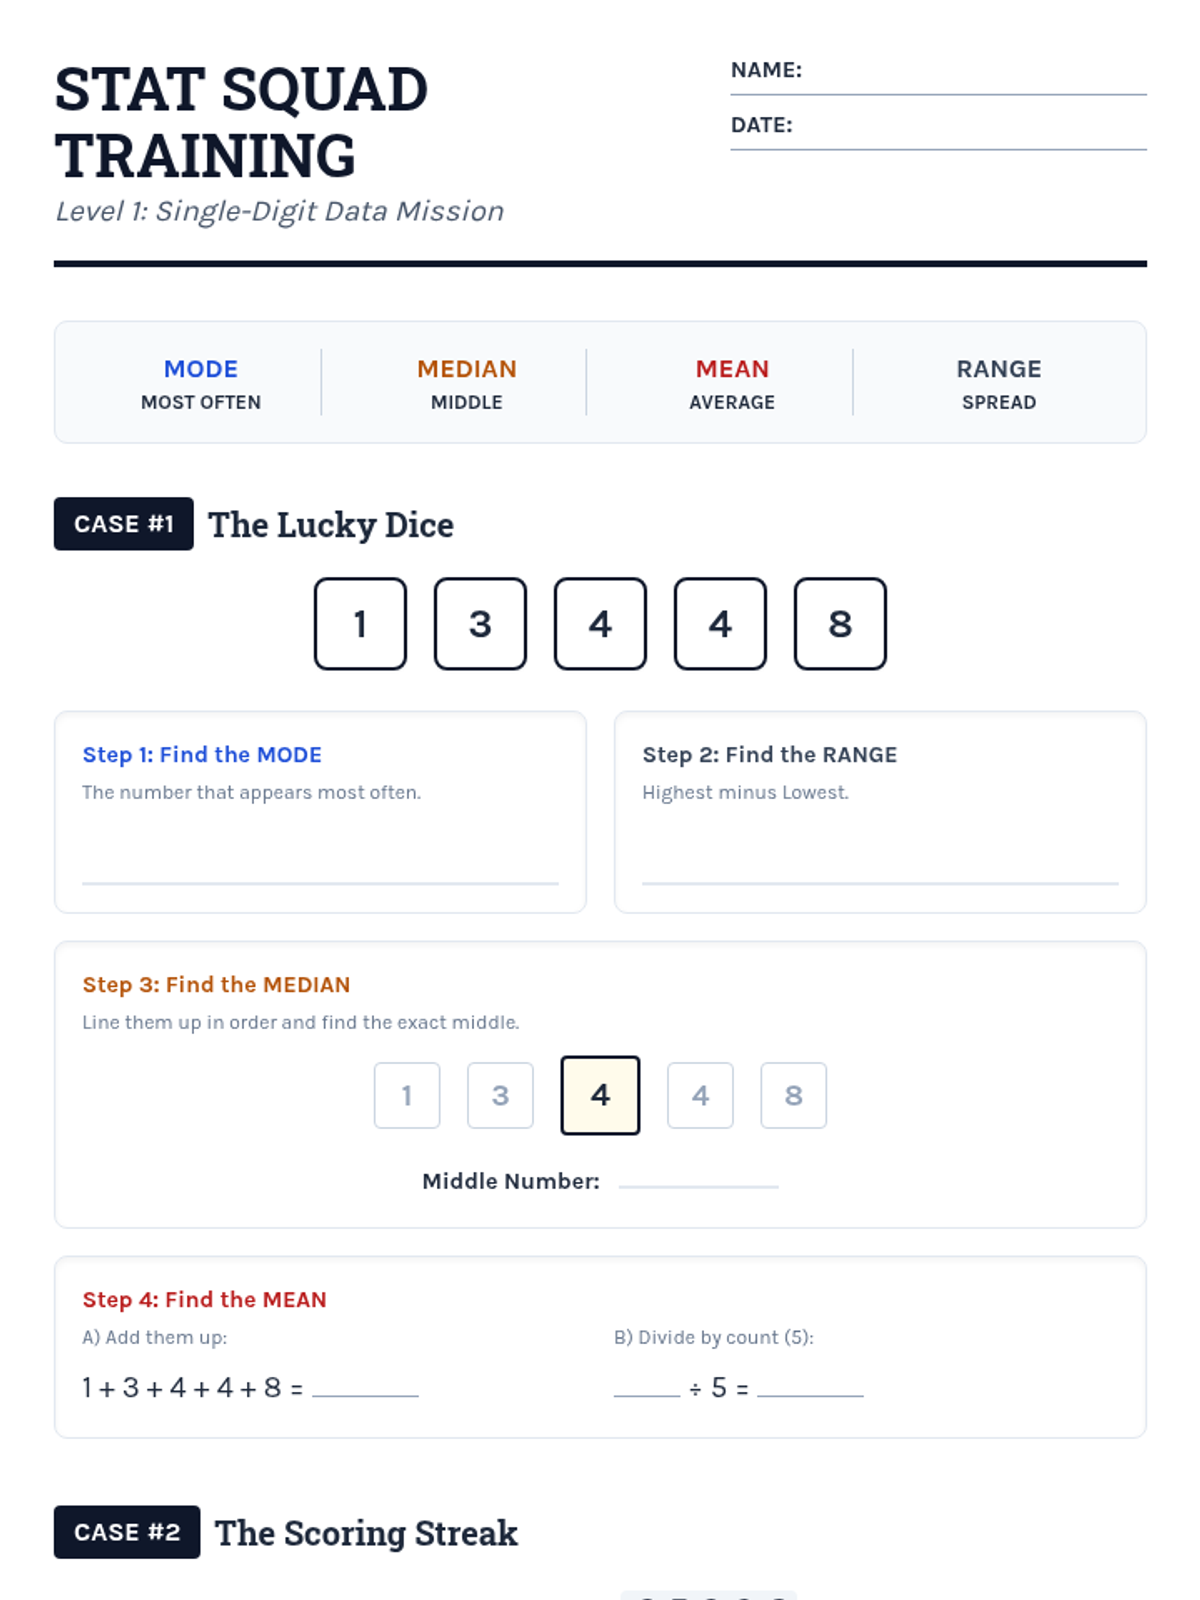
Students learn to calculate mean, median, mode, and range using single-digit data sets through structured, step-by-step guided practice and visual aids.
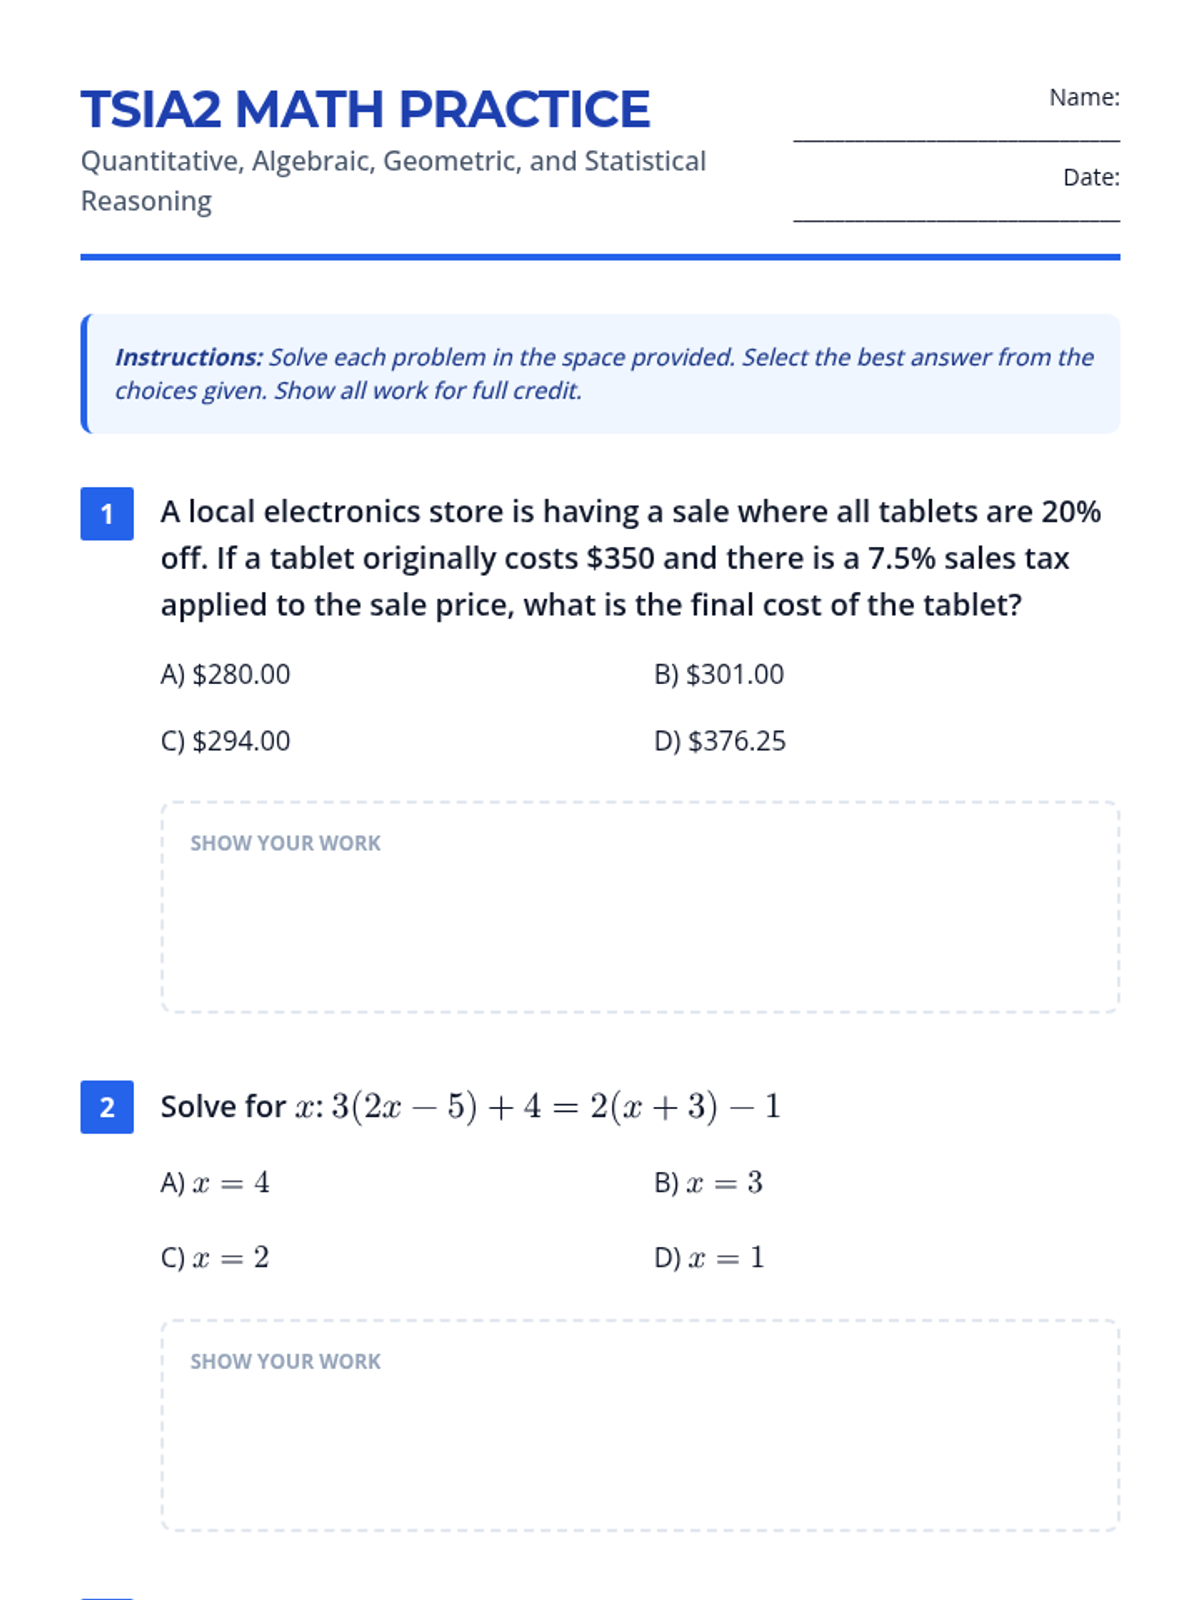
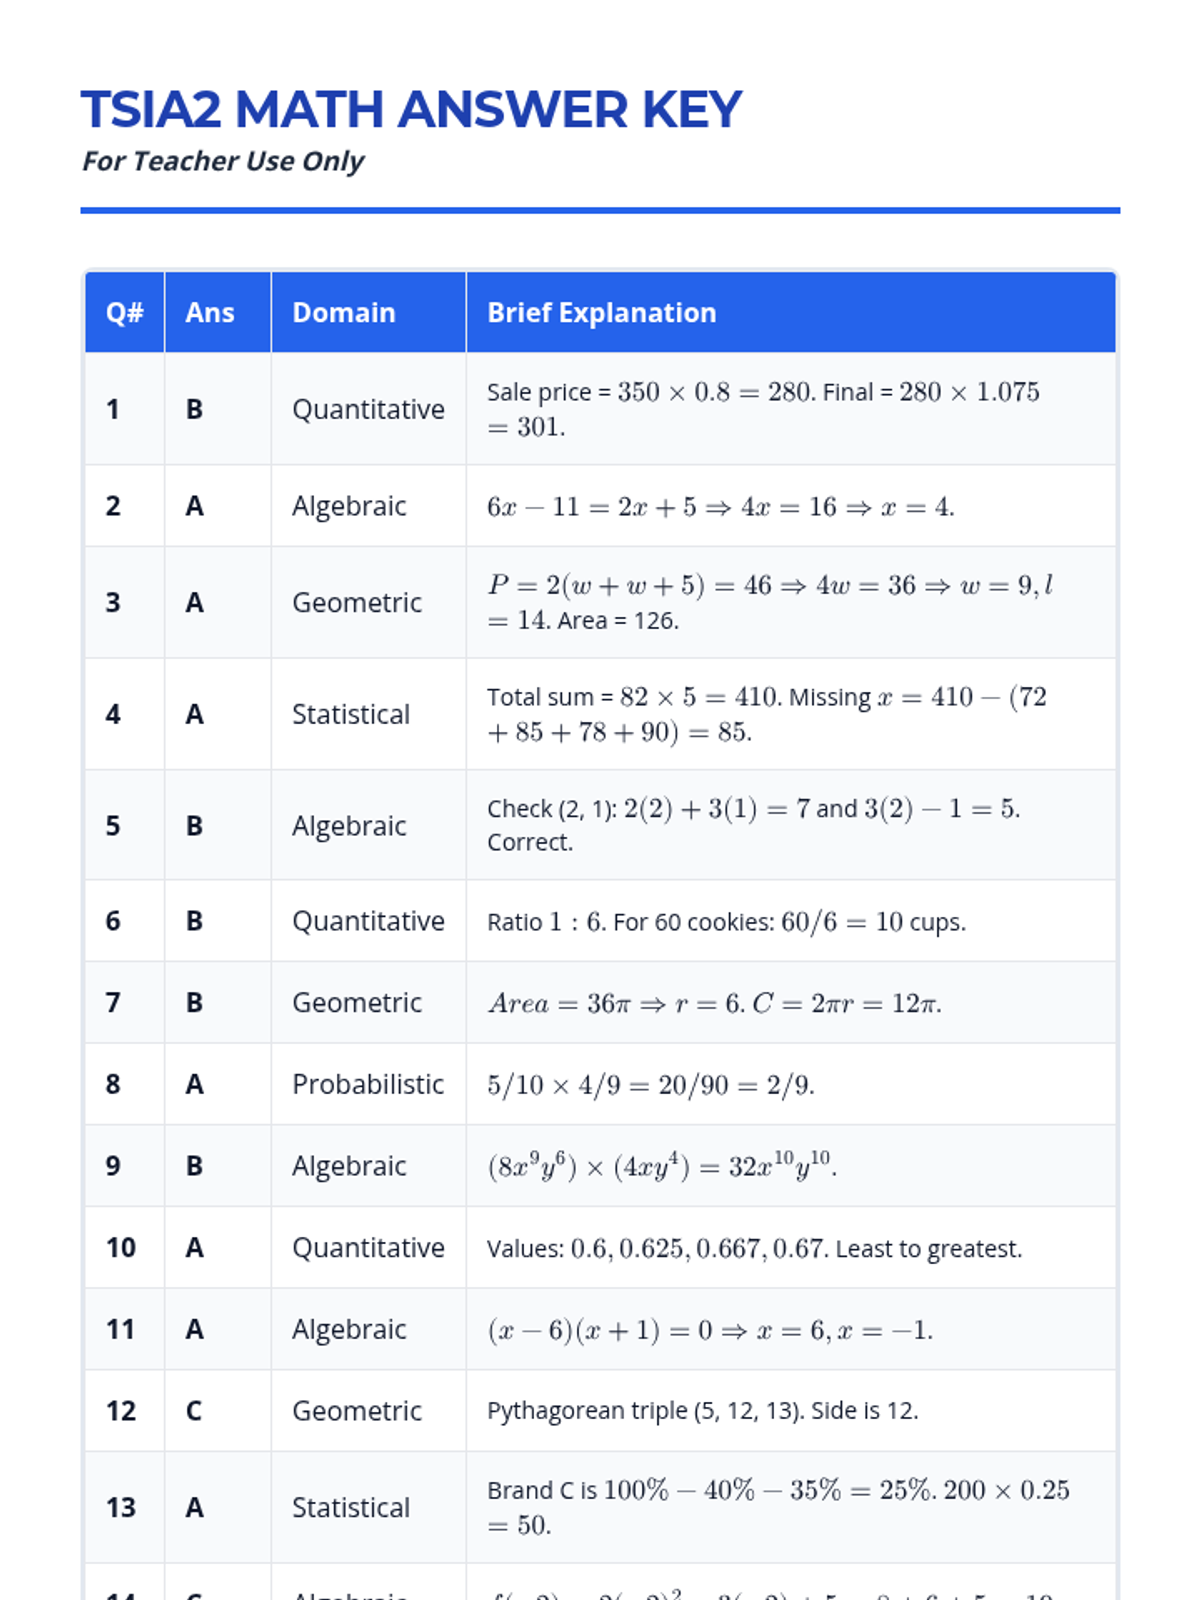
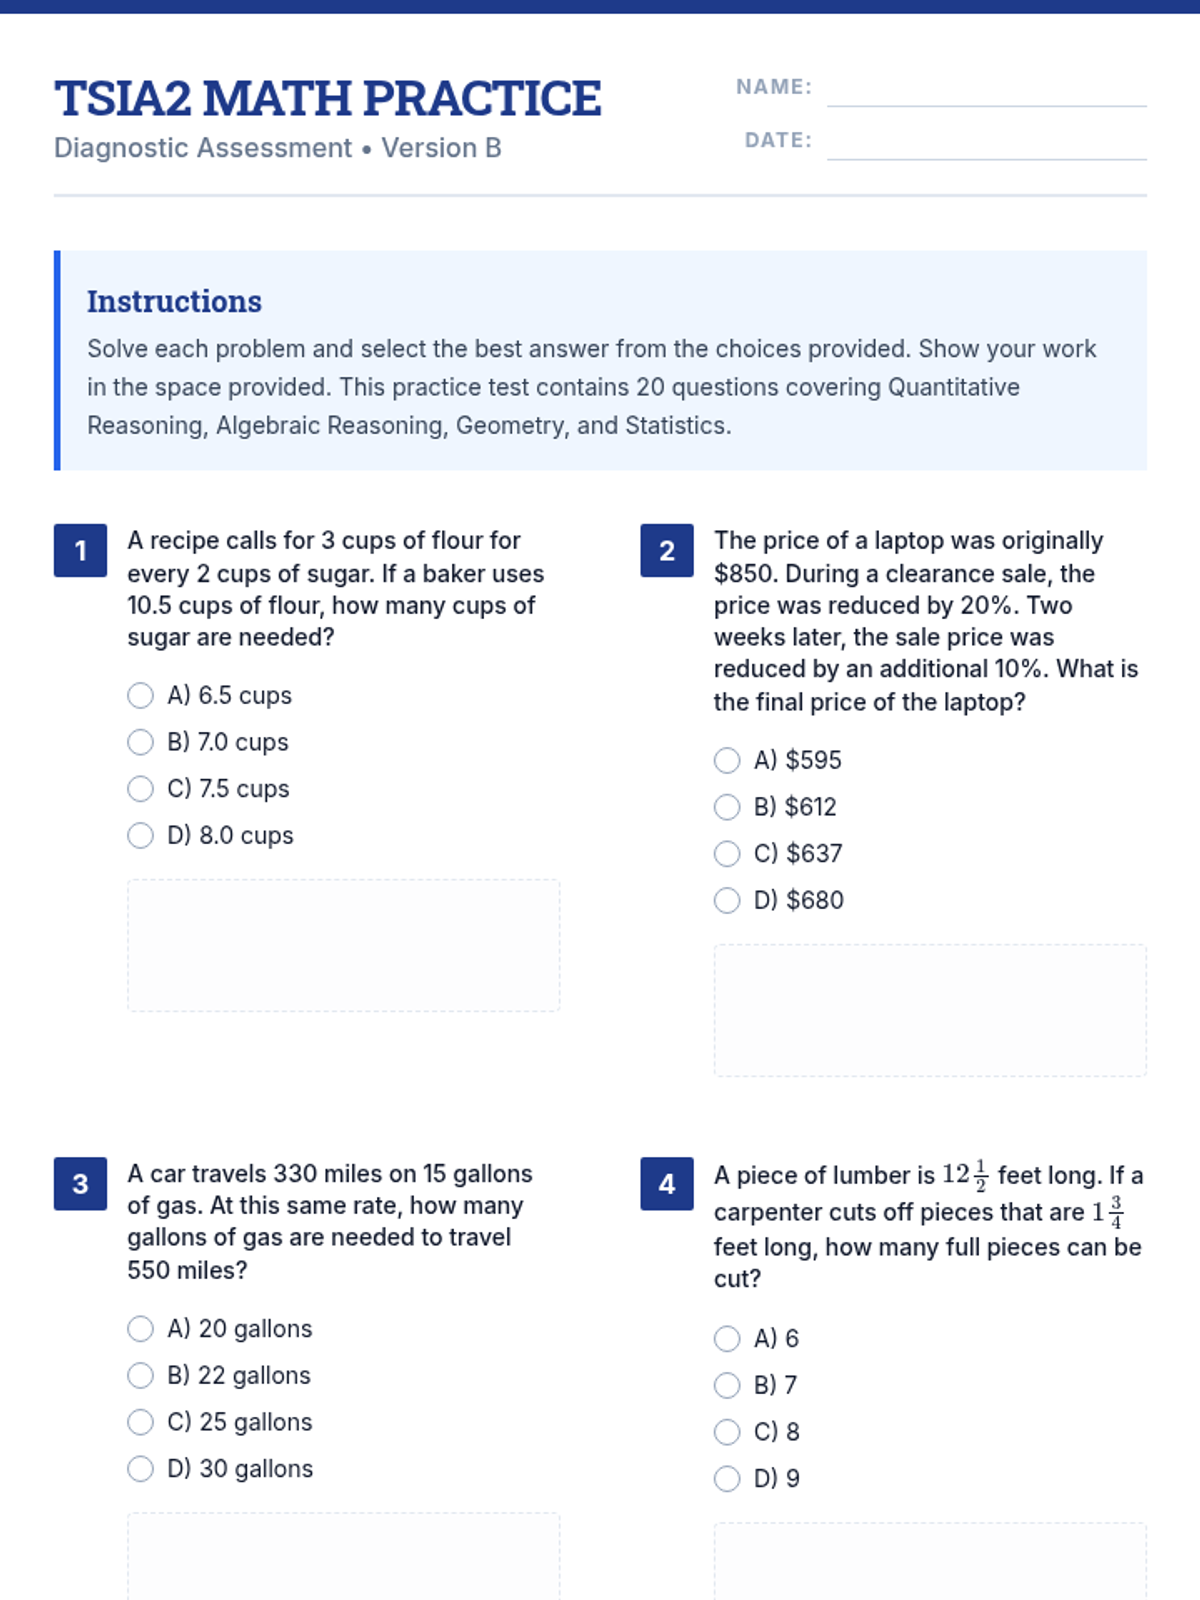
A comprehensive practice set and review presentation for the TSIA2 Math exam, covering Quantitative, Algebraic, Geometric, and Statistical reasoning.
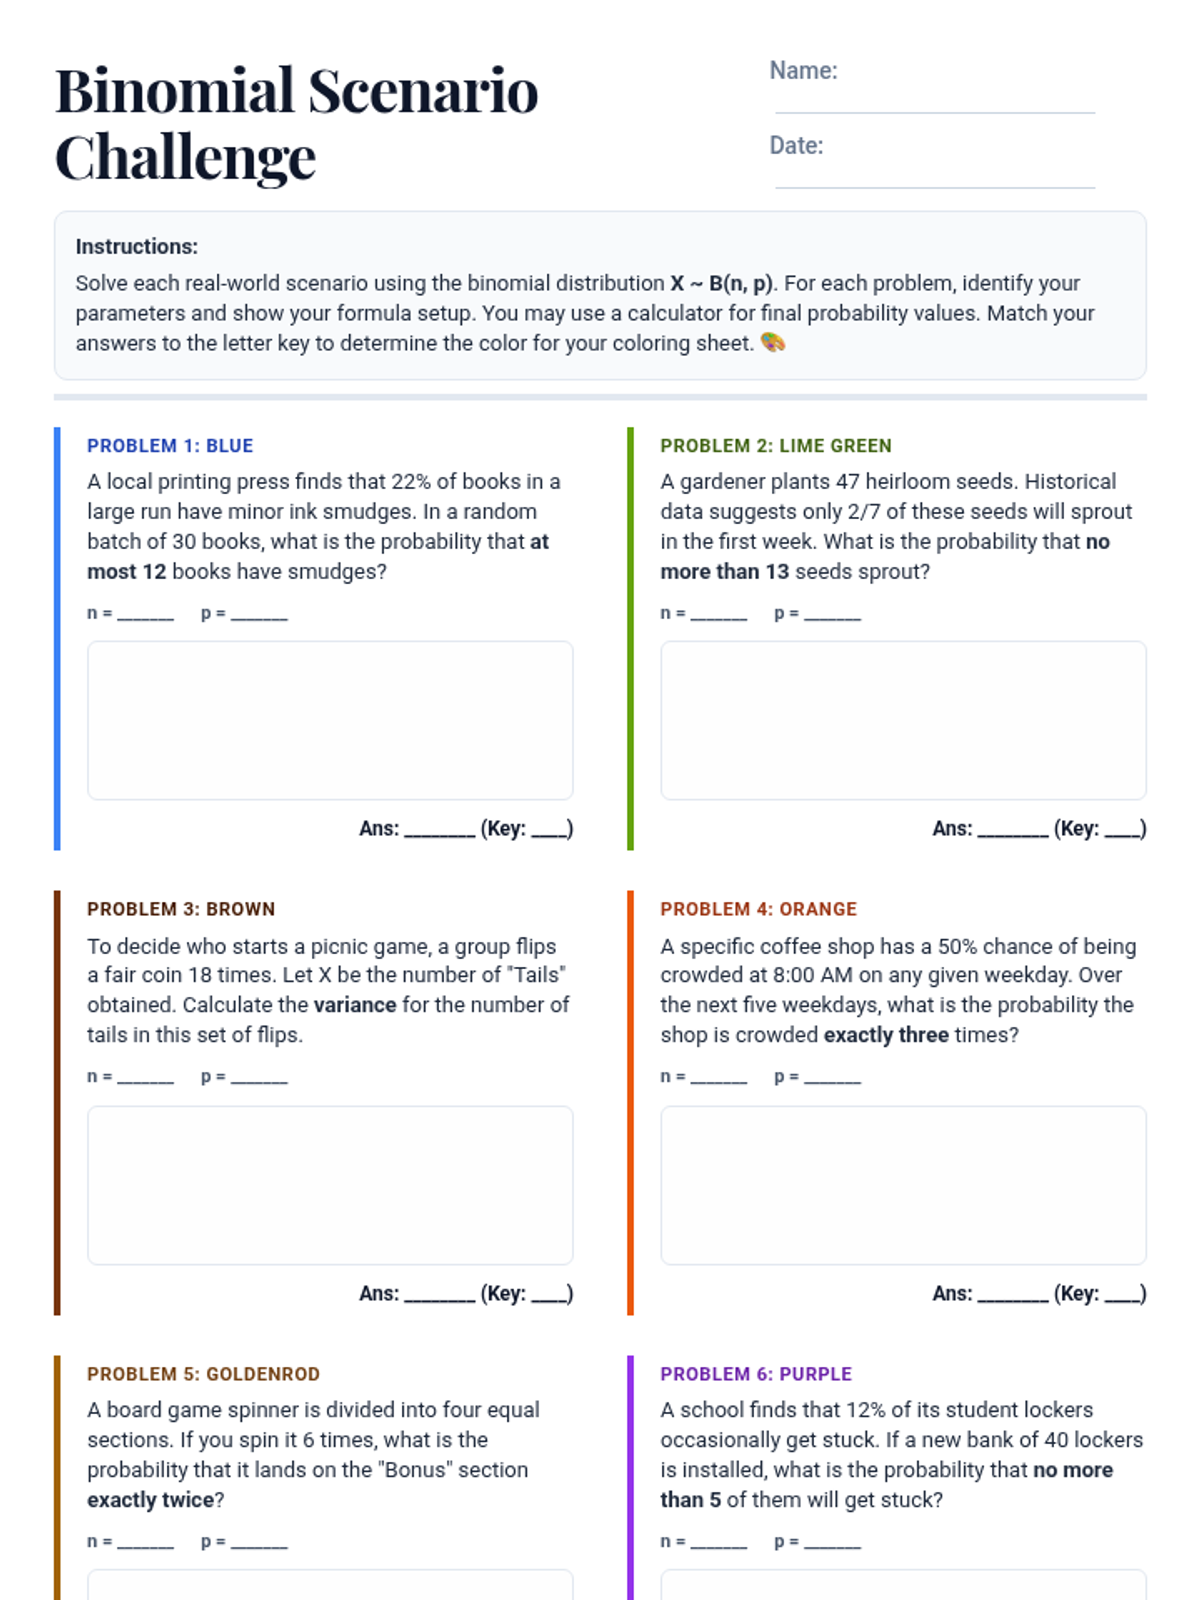
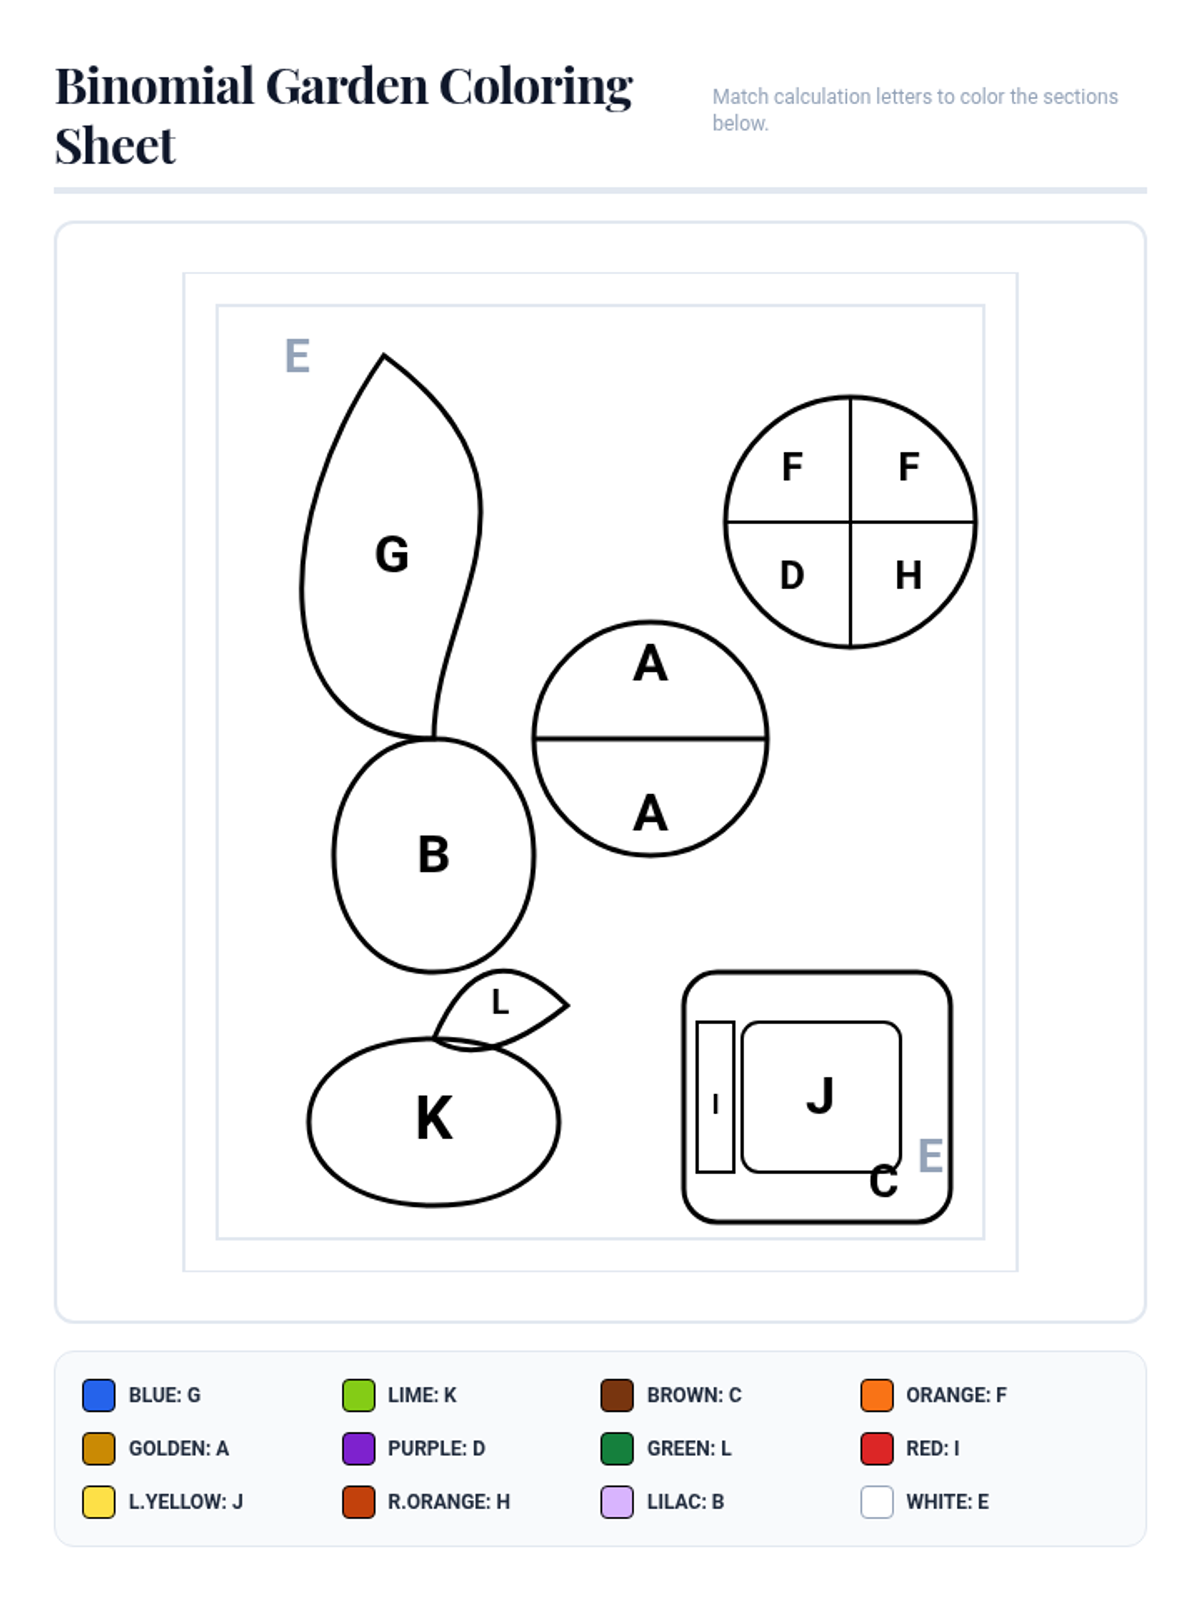
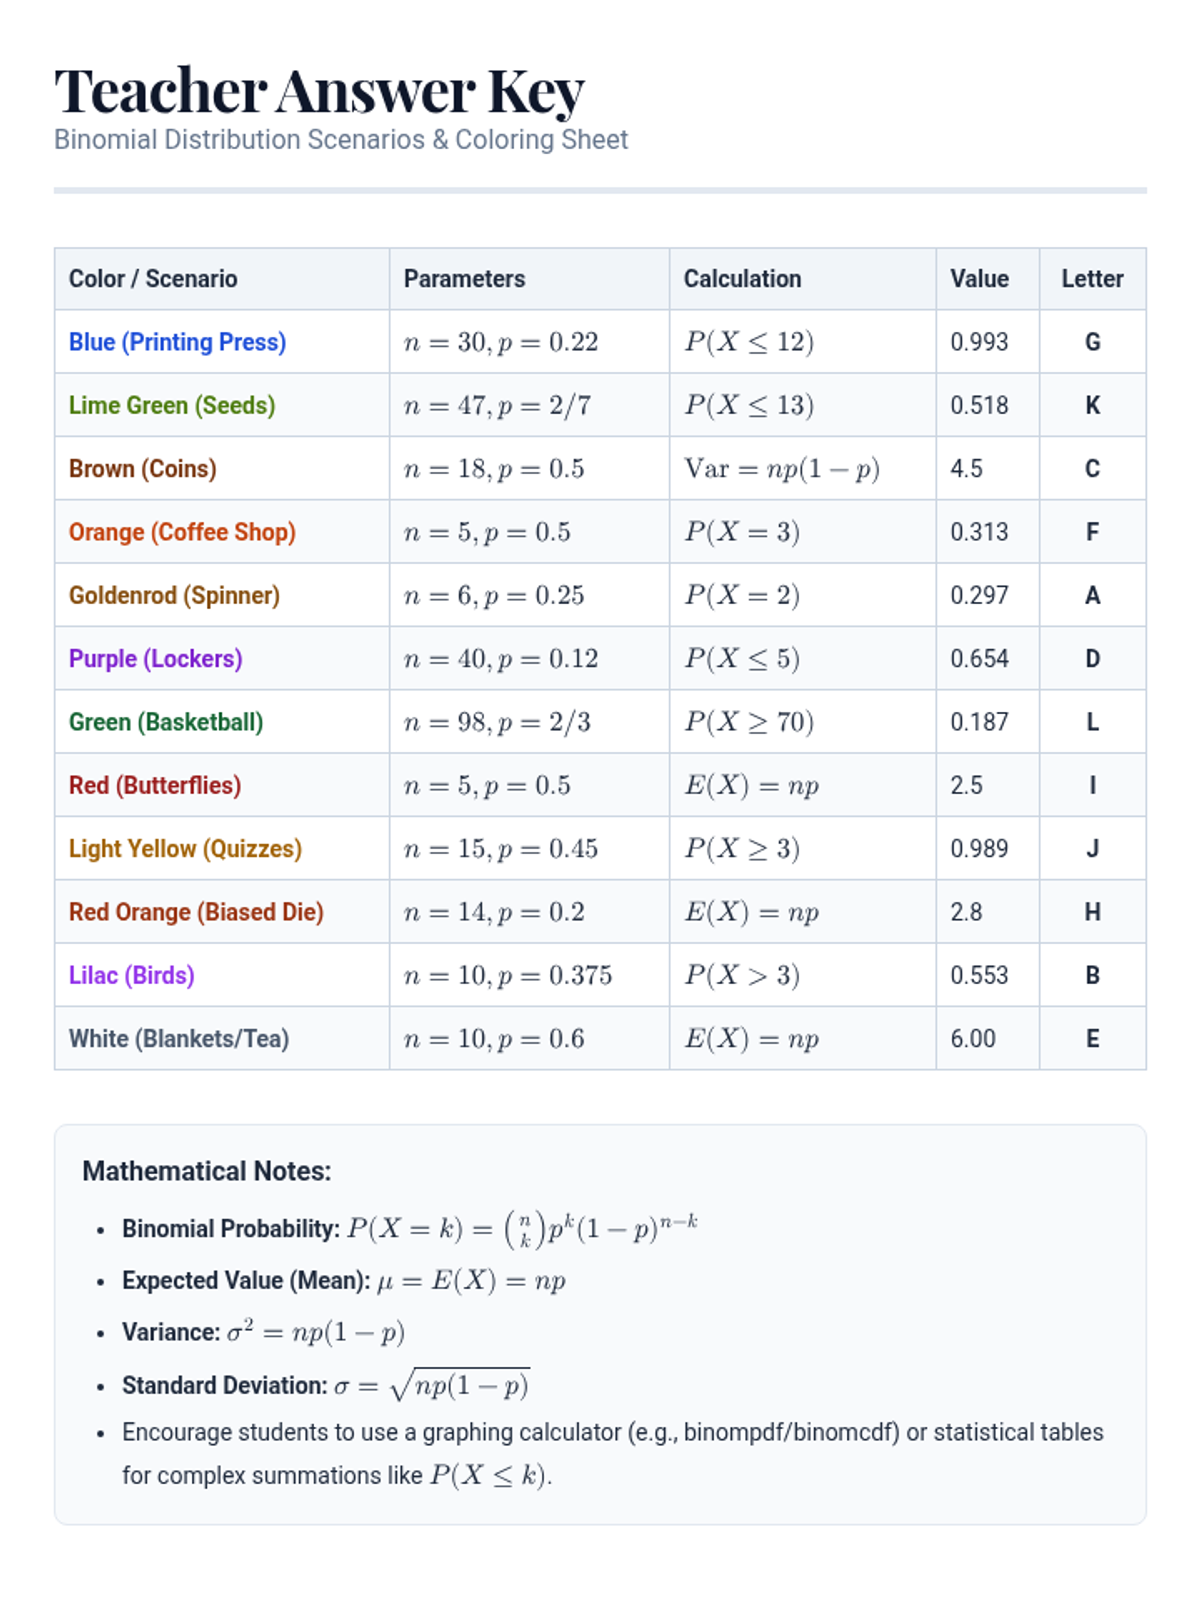
A lesson focused on applying binomial distribution concepts to real-world scenarios through a creative coloring activity. Students translate narrative word problems into mathematical models to calculate probabilities, means, and variances.
The final week of the TSIA2 Math Marathon, reviewing complex problems and multi-step reasoning.
The second week of the TSIA2 Math Marathon, expanding into geometric and statistical reasoning.
The first week of the TSIA2 Math Marathon, focusing on foundational algebraic and quantitative reasoning.
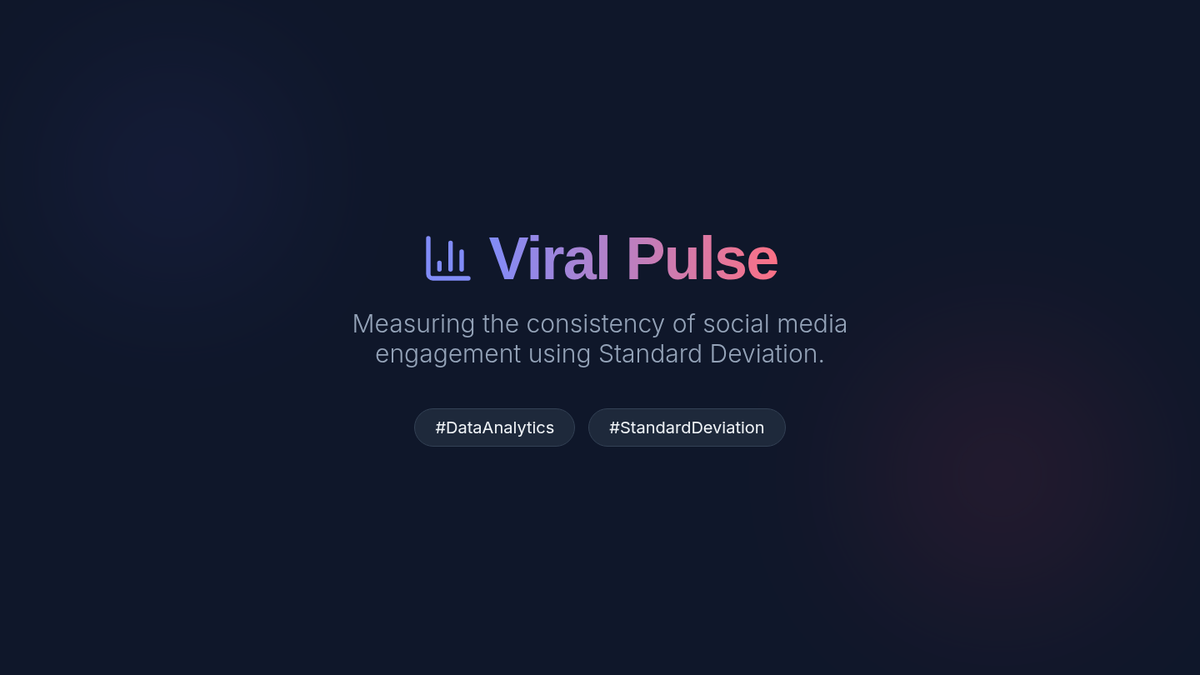
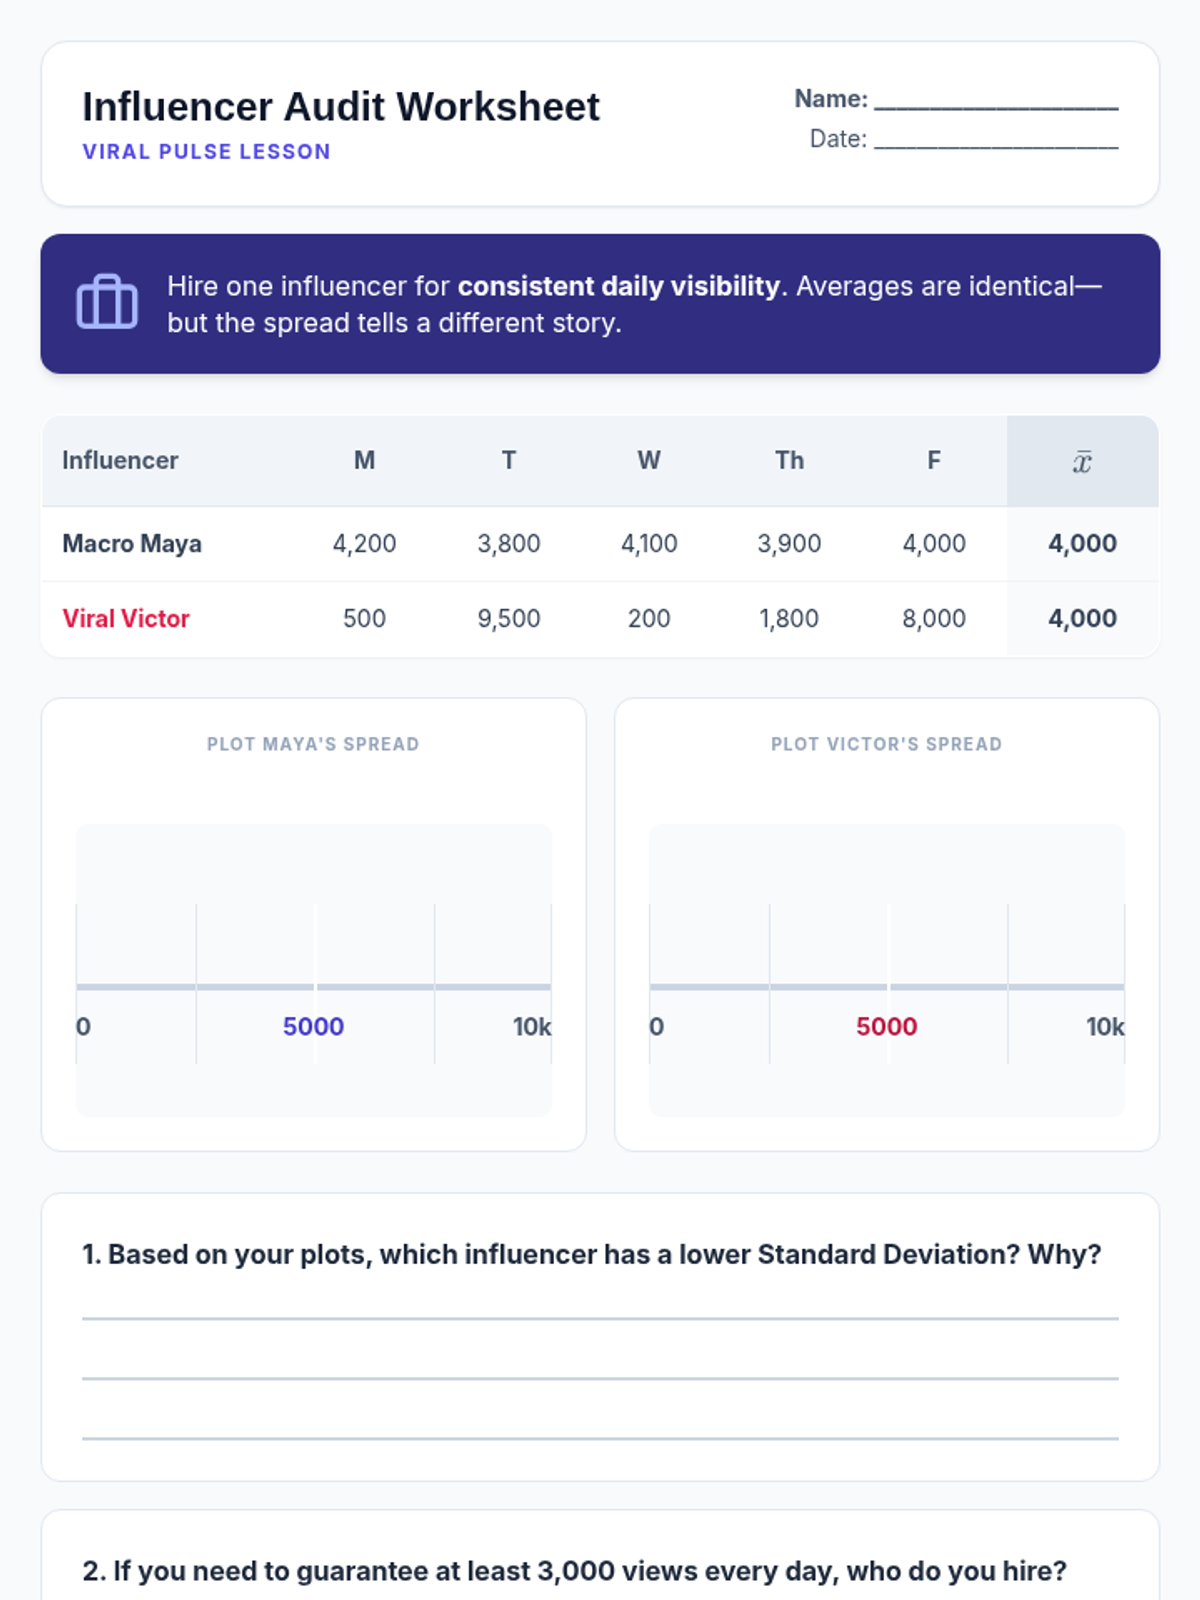
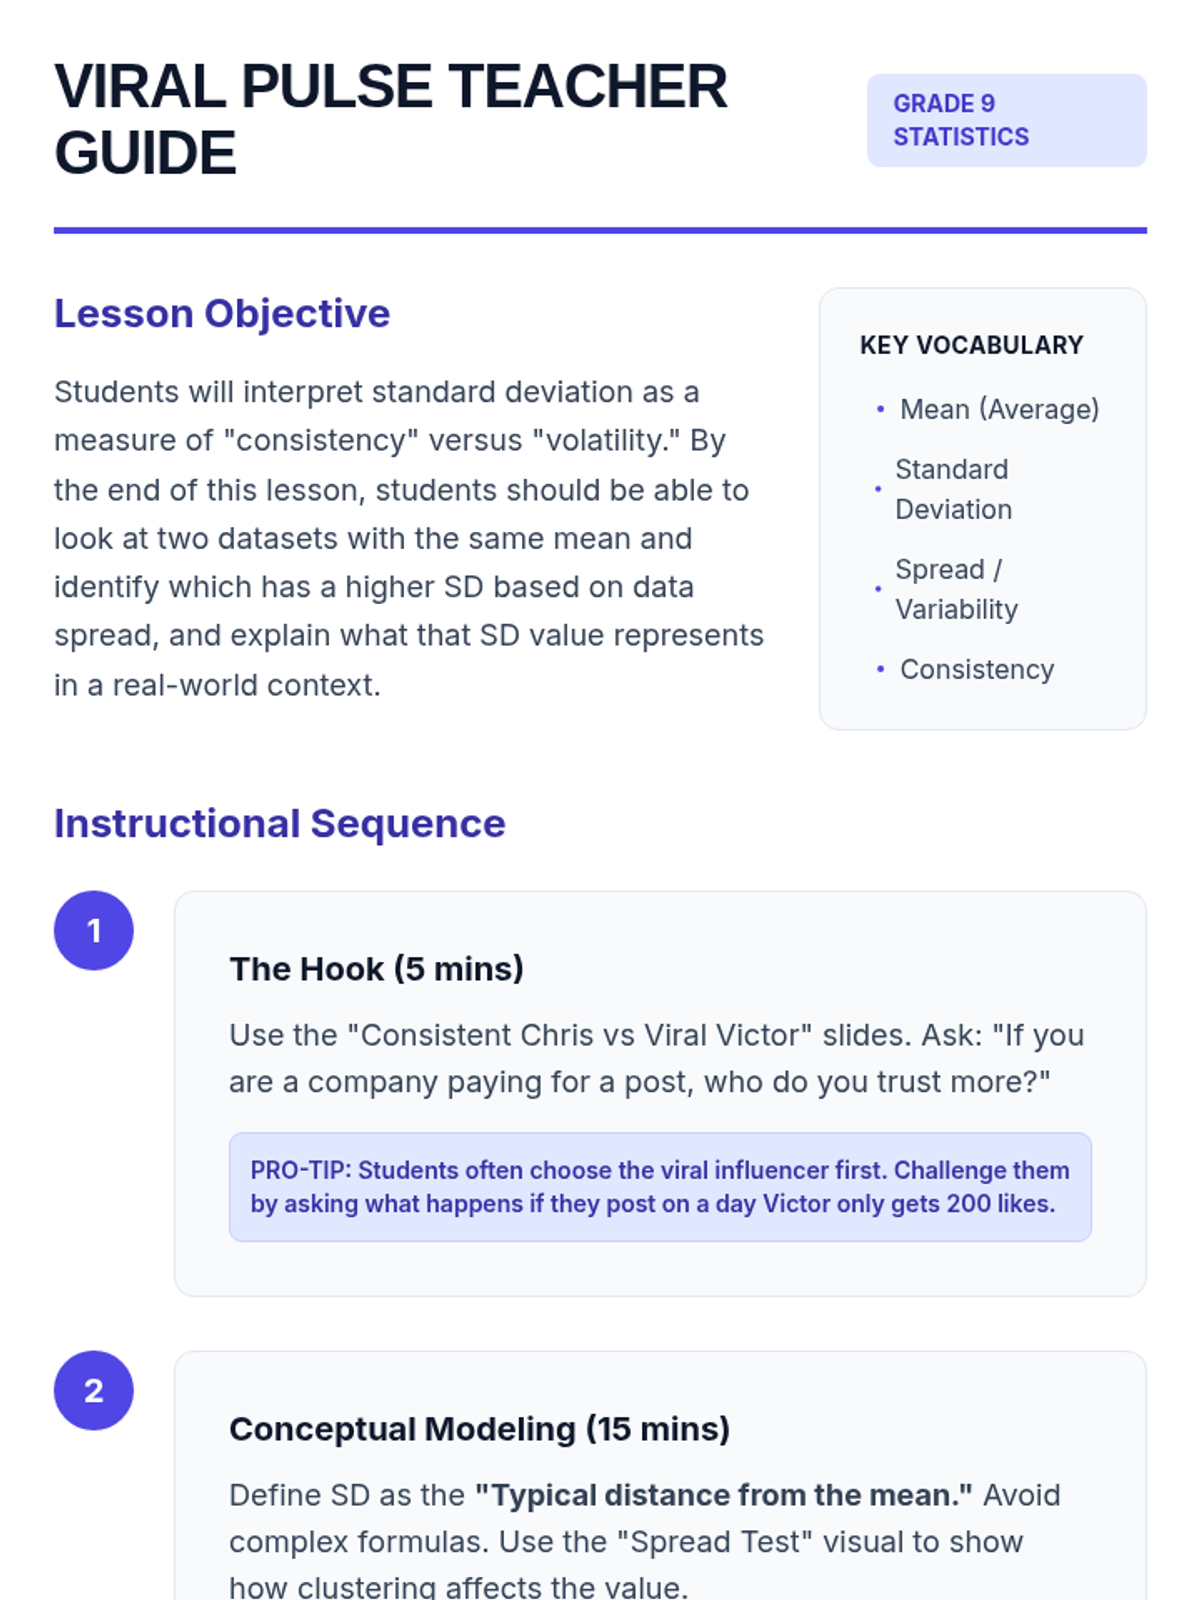
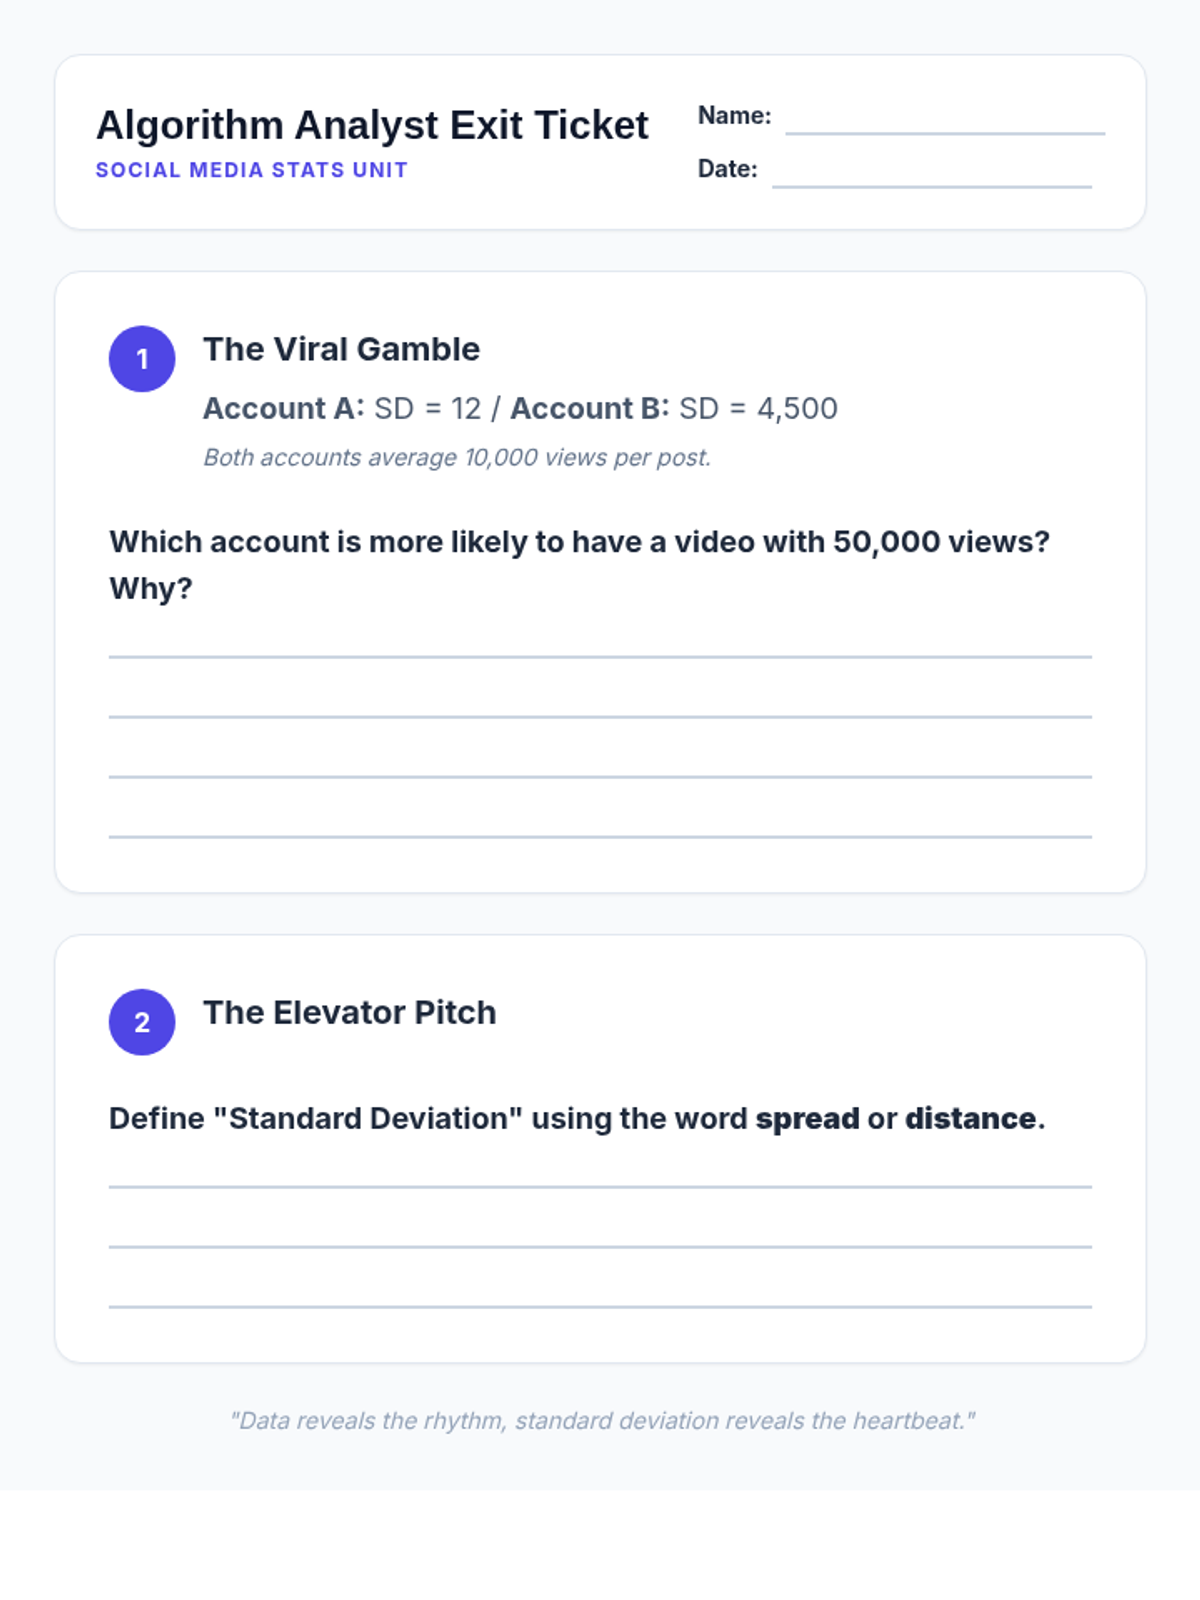
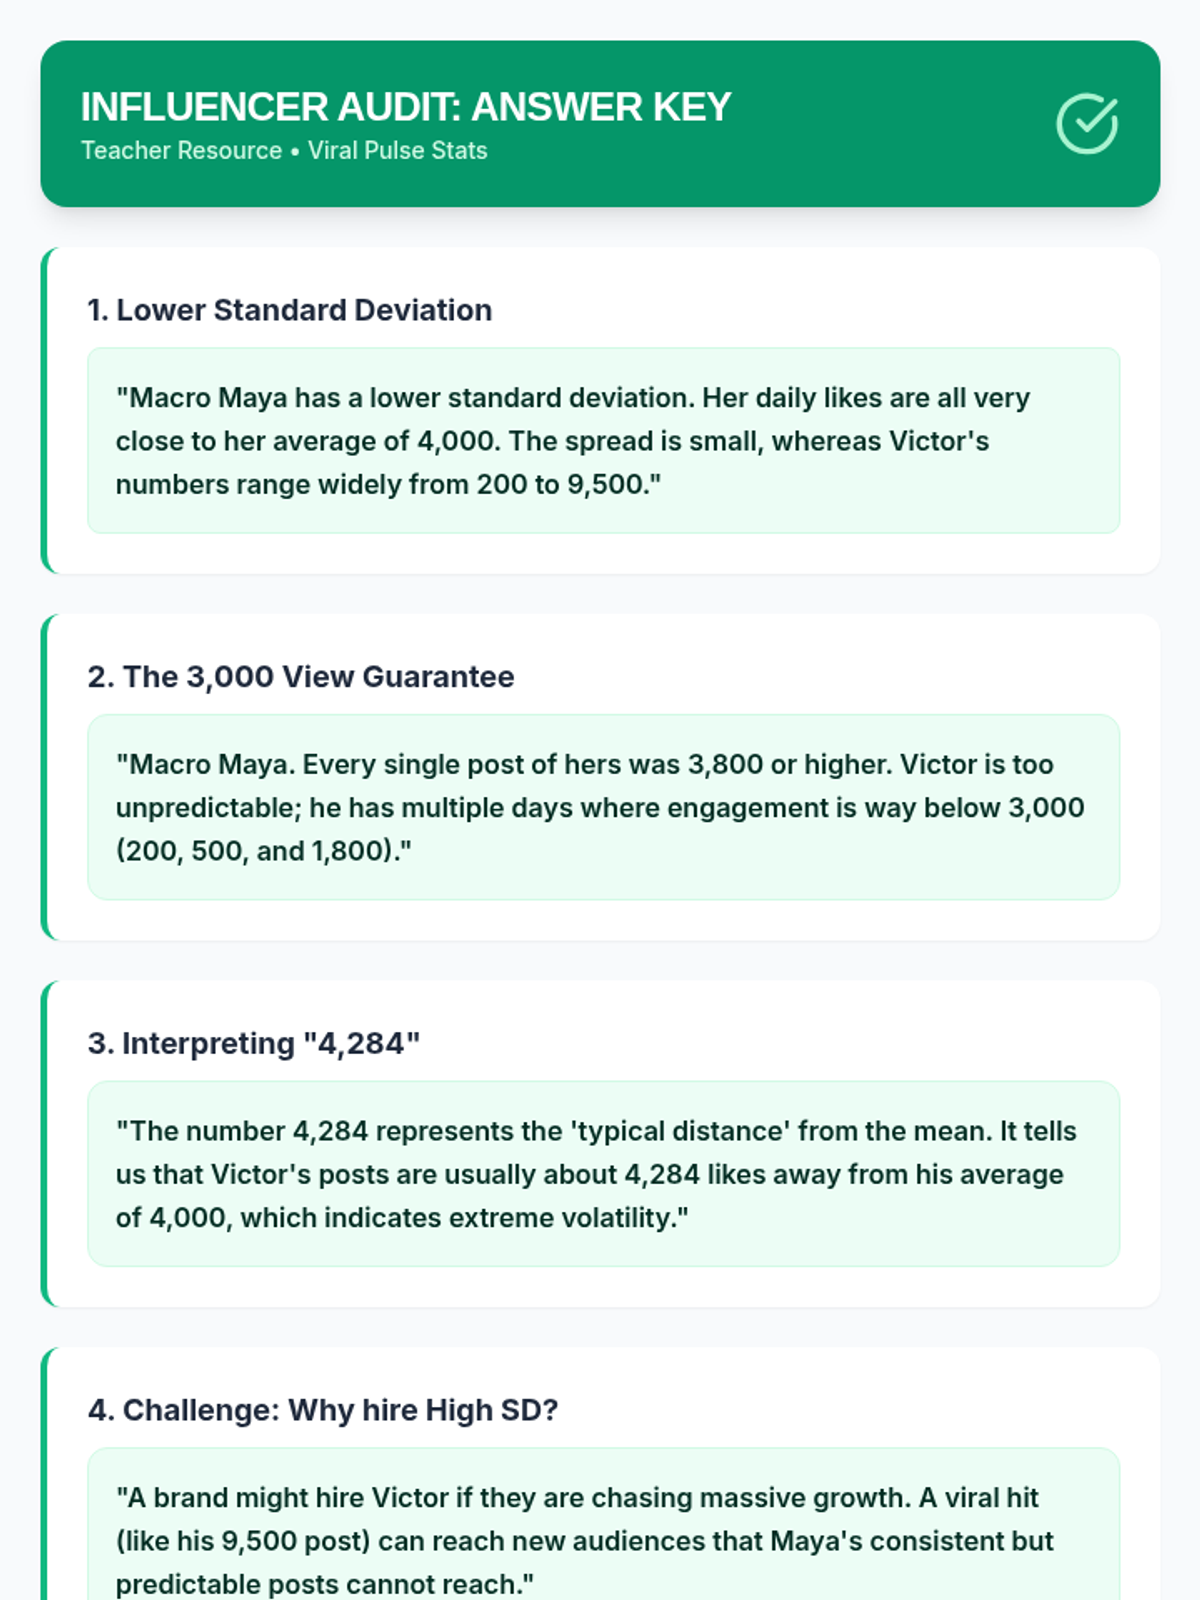
A lesson exploring standard deviation through social media analytics, focusing on how 'consistency' and 'volatility' are measured in the digital world. Students will interpret data spread to make marketing decisions without complex manual calculations.
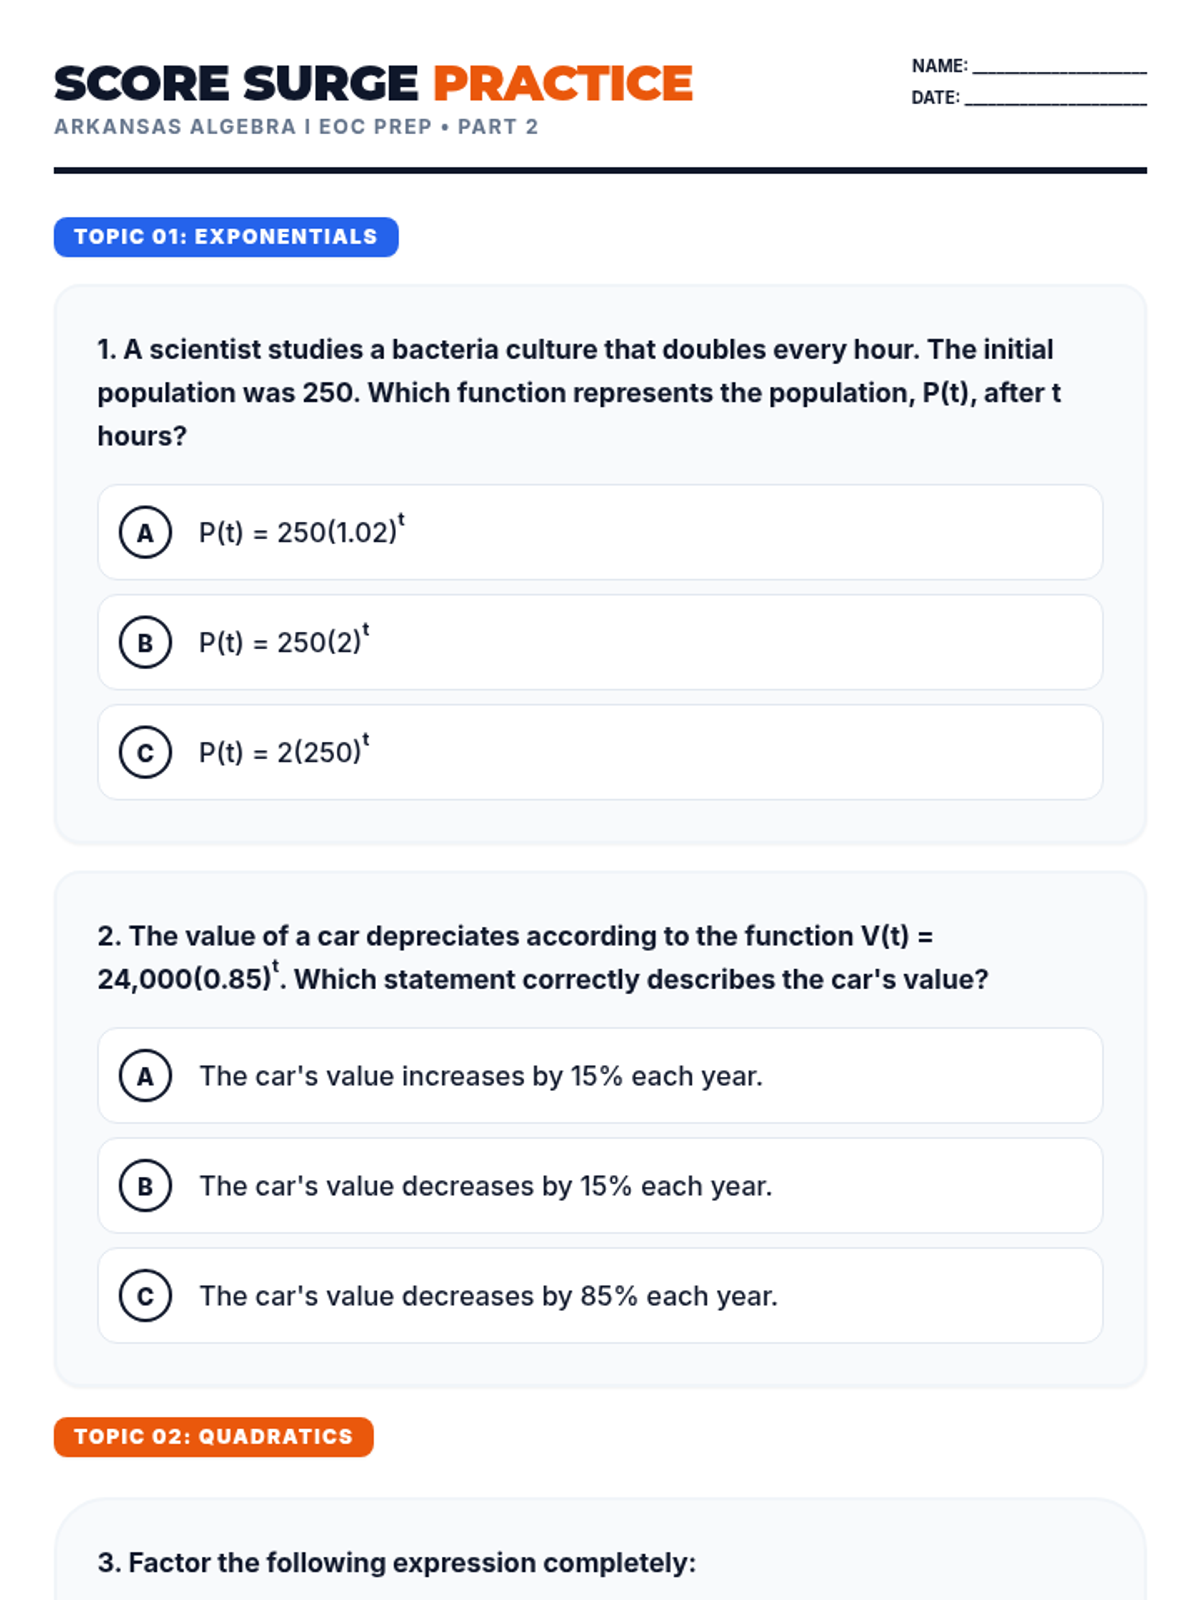
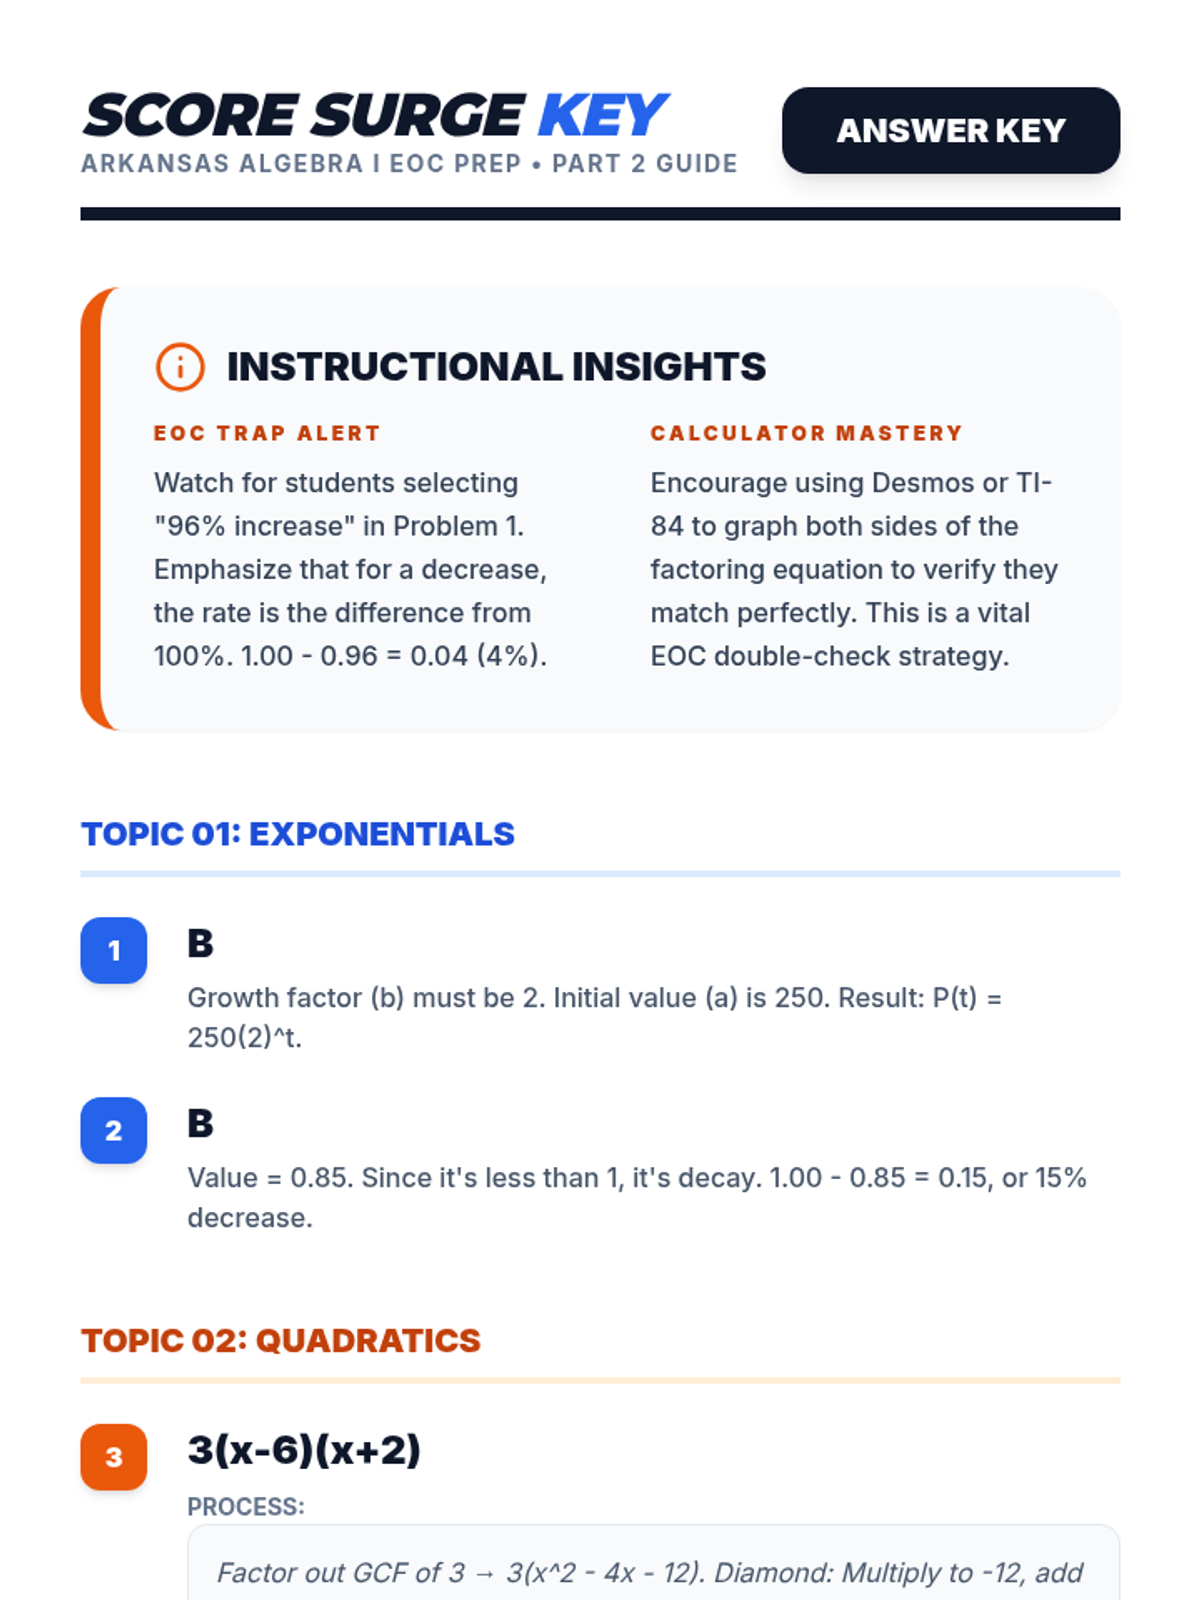
A high-intensity EOC preparation lesson focused on mastering exponential functions, quadratic expressions, and data statistics for the Arkansas Algebra I state exam.
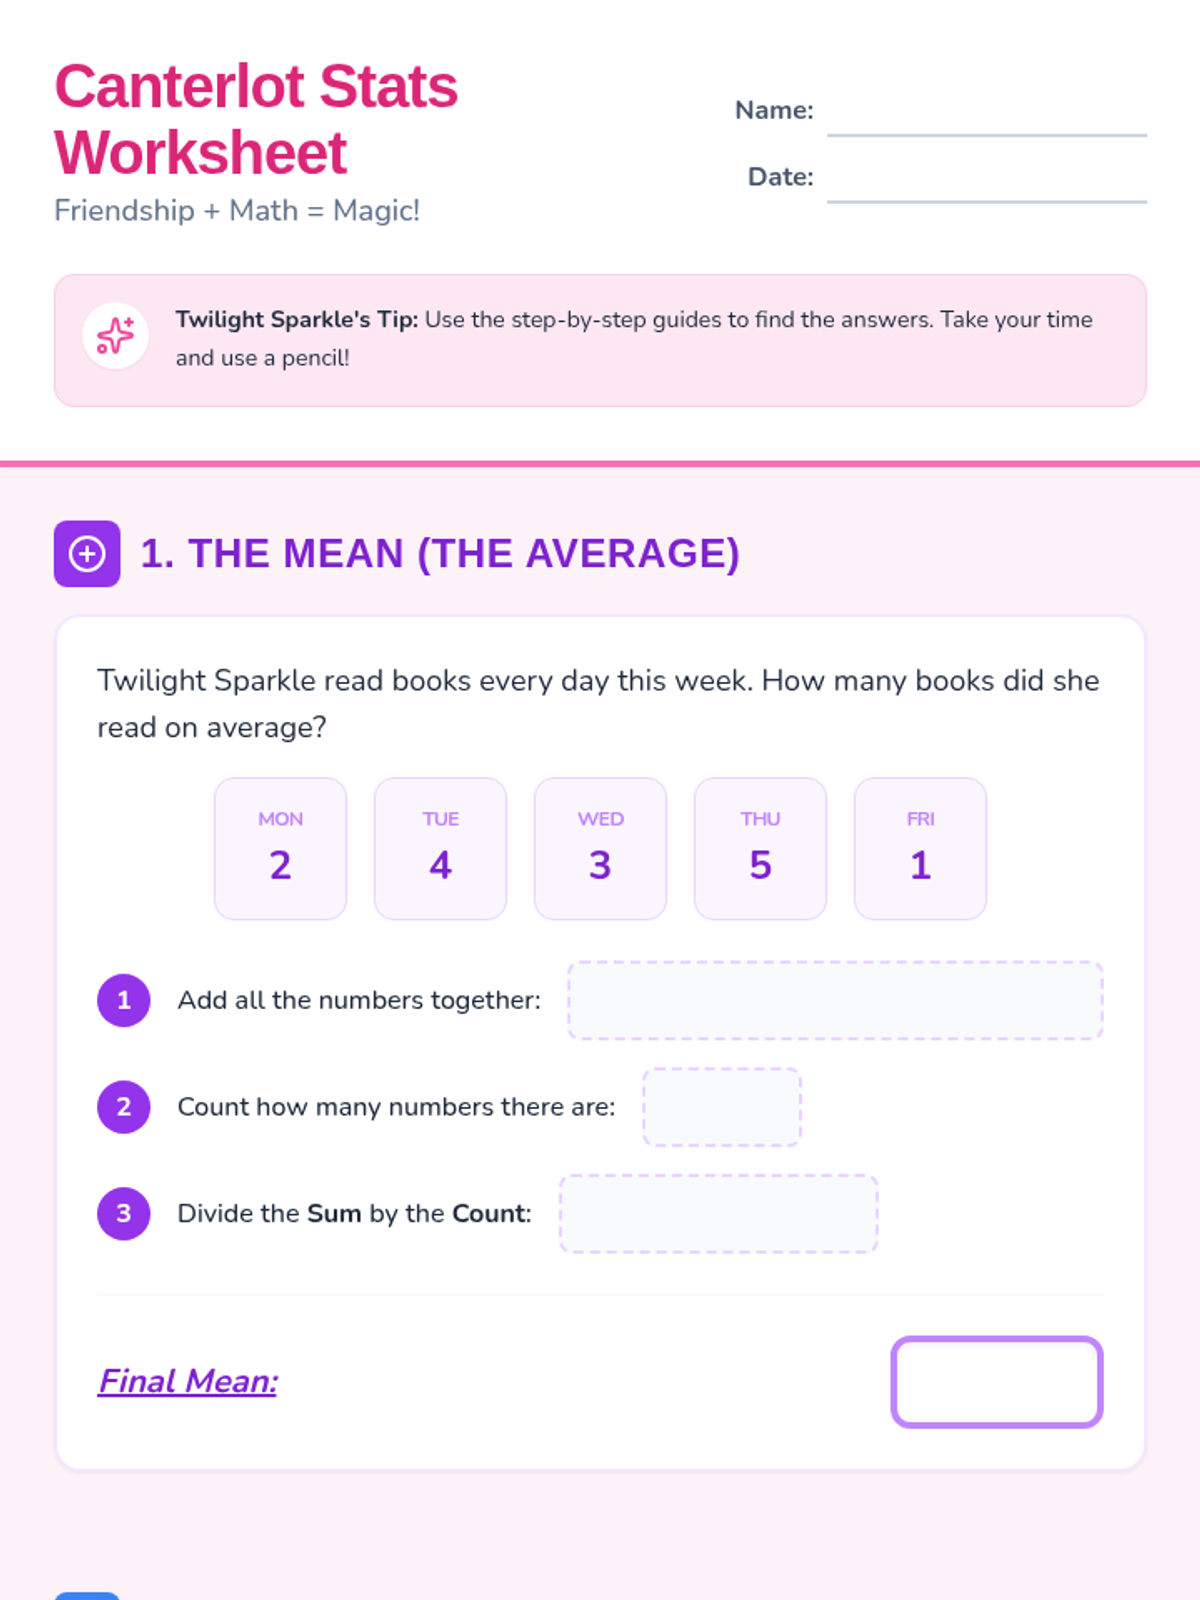
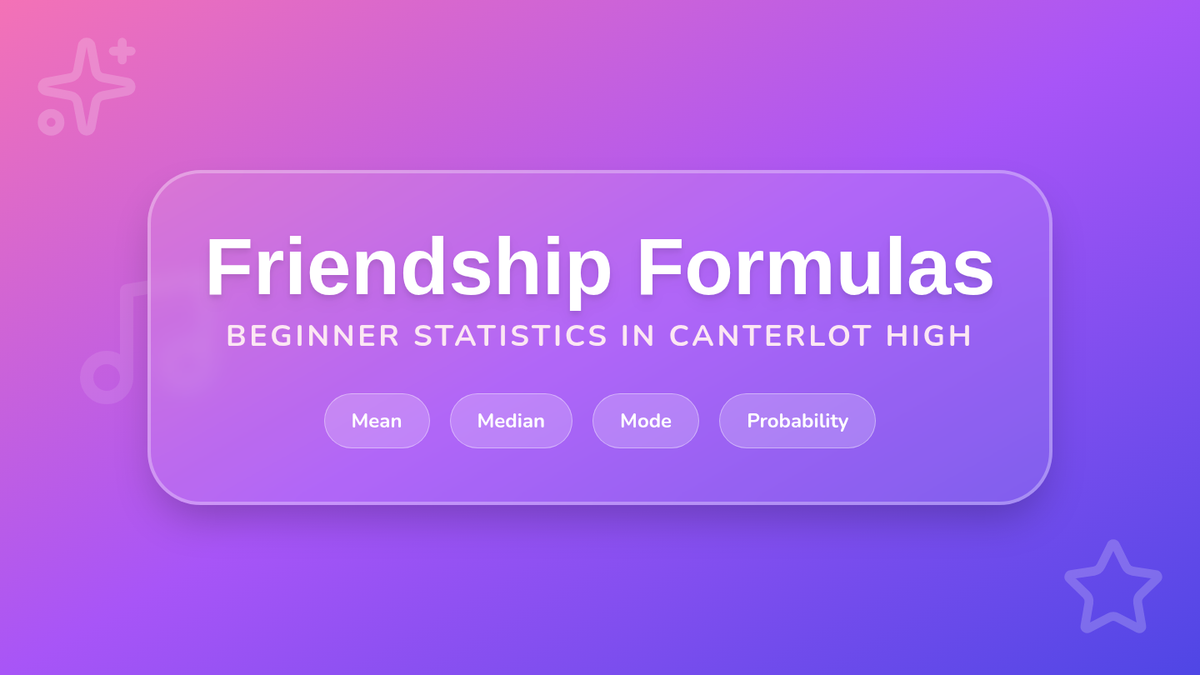
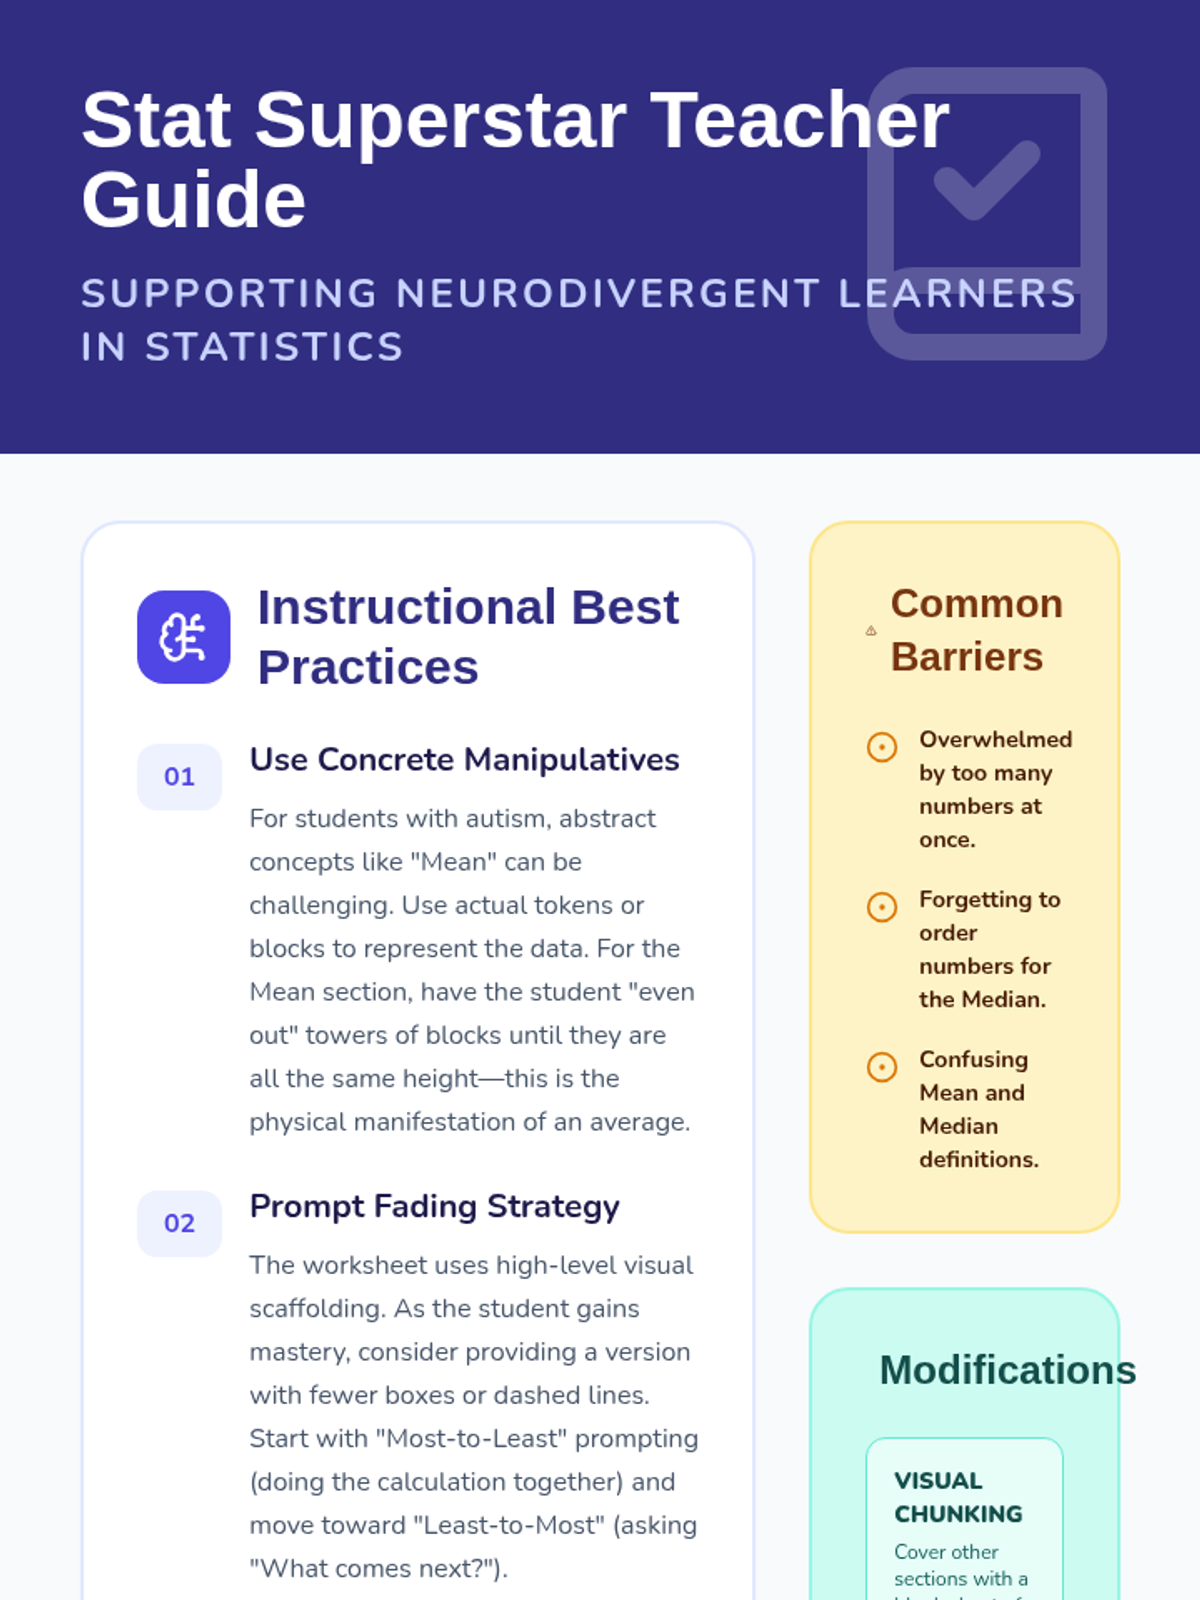
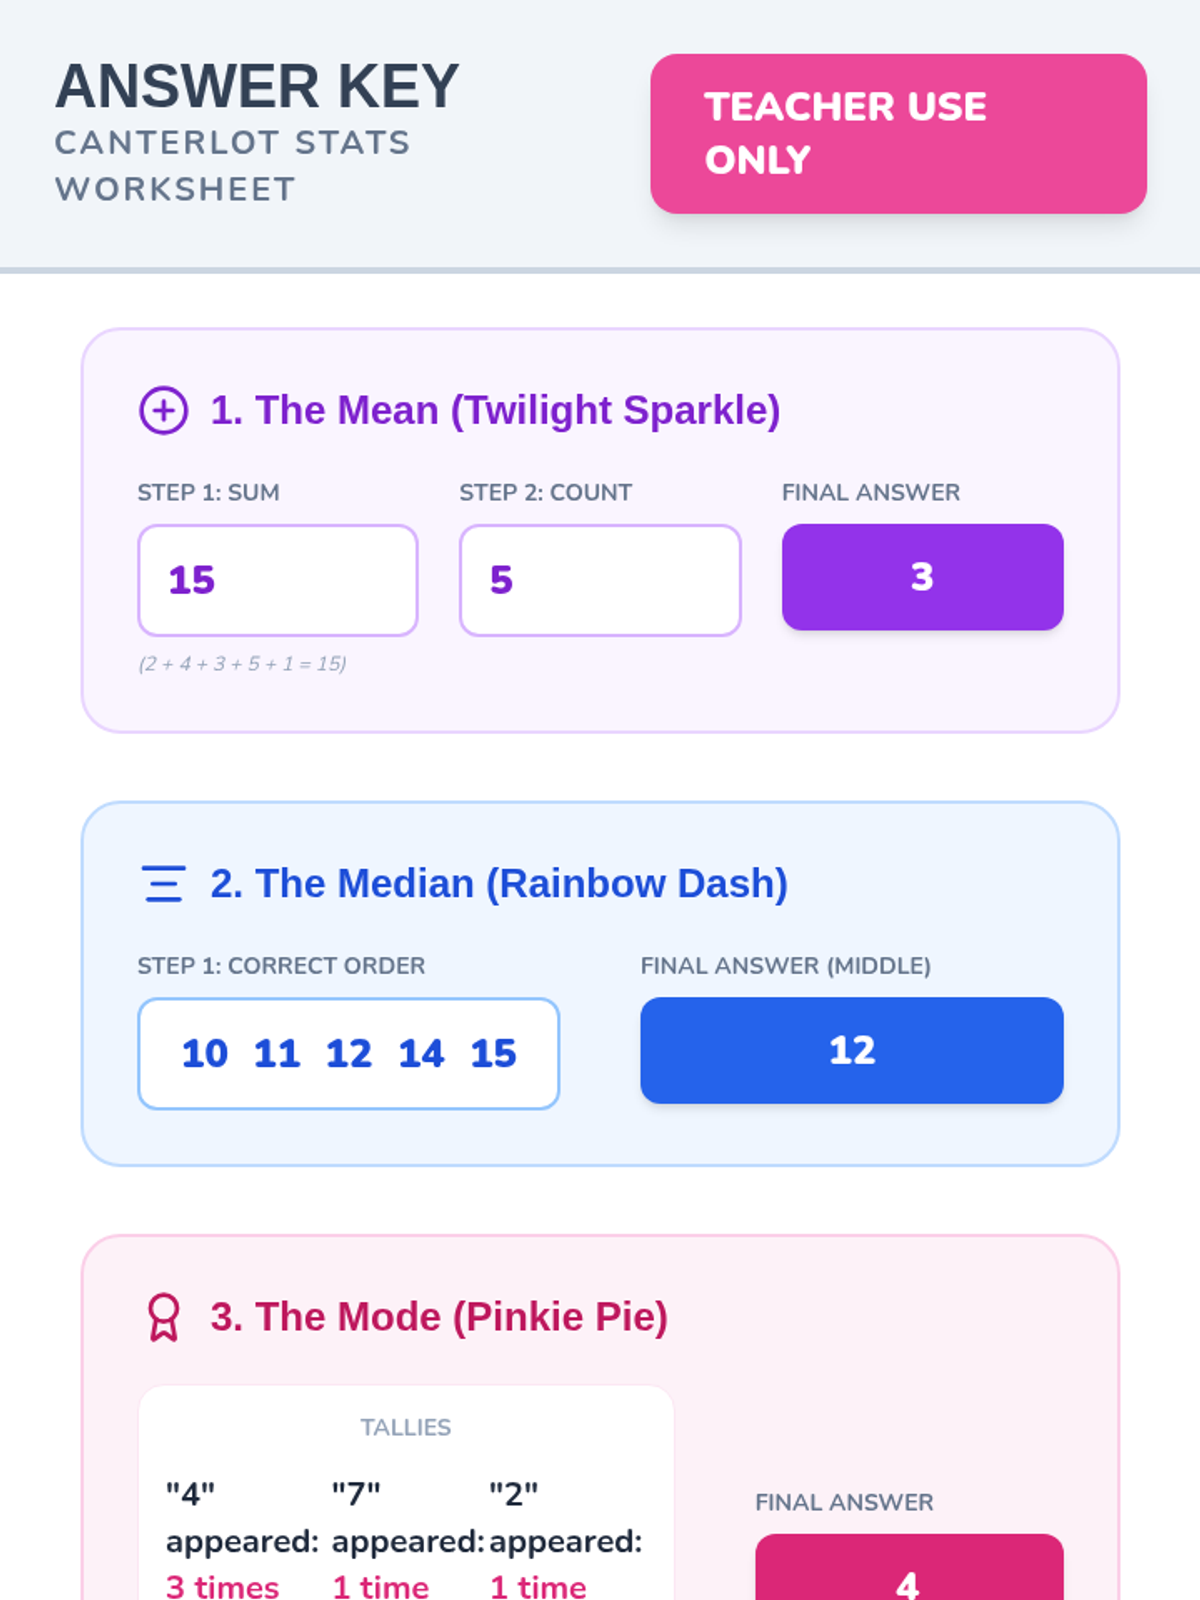
A beginner statistics lesson themed around Equestria Girls, focusing on mean, median, mode, range, and basic probability with highly visual step-by-step guides.
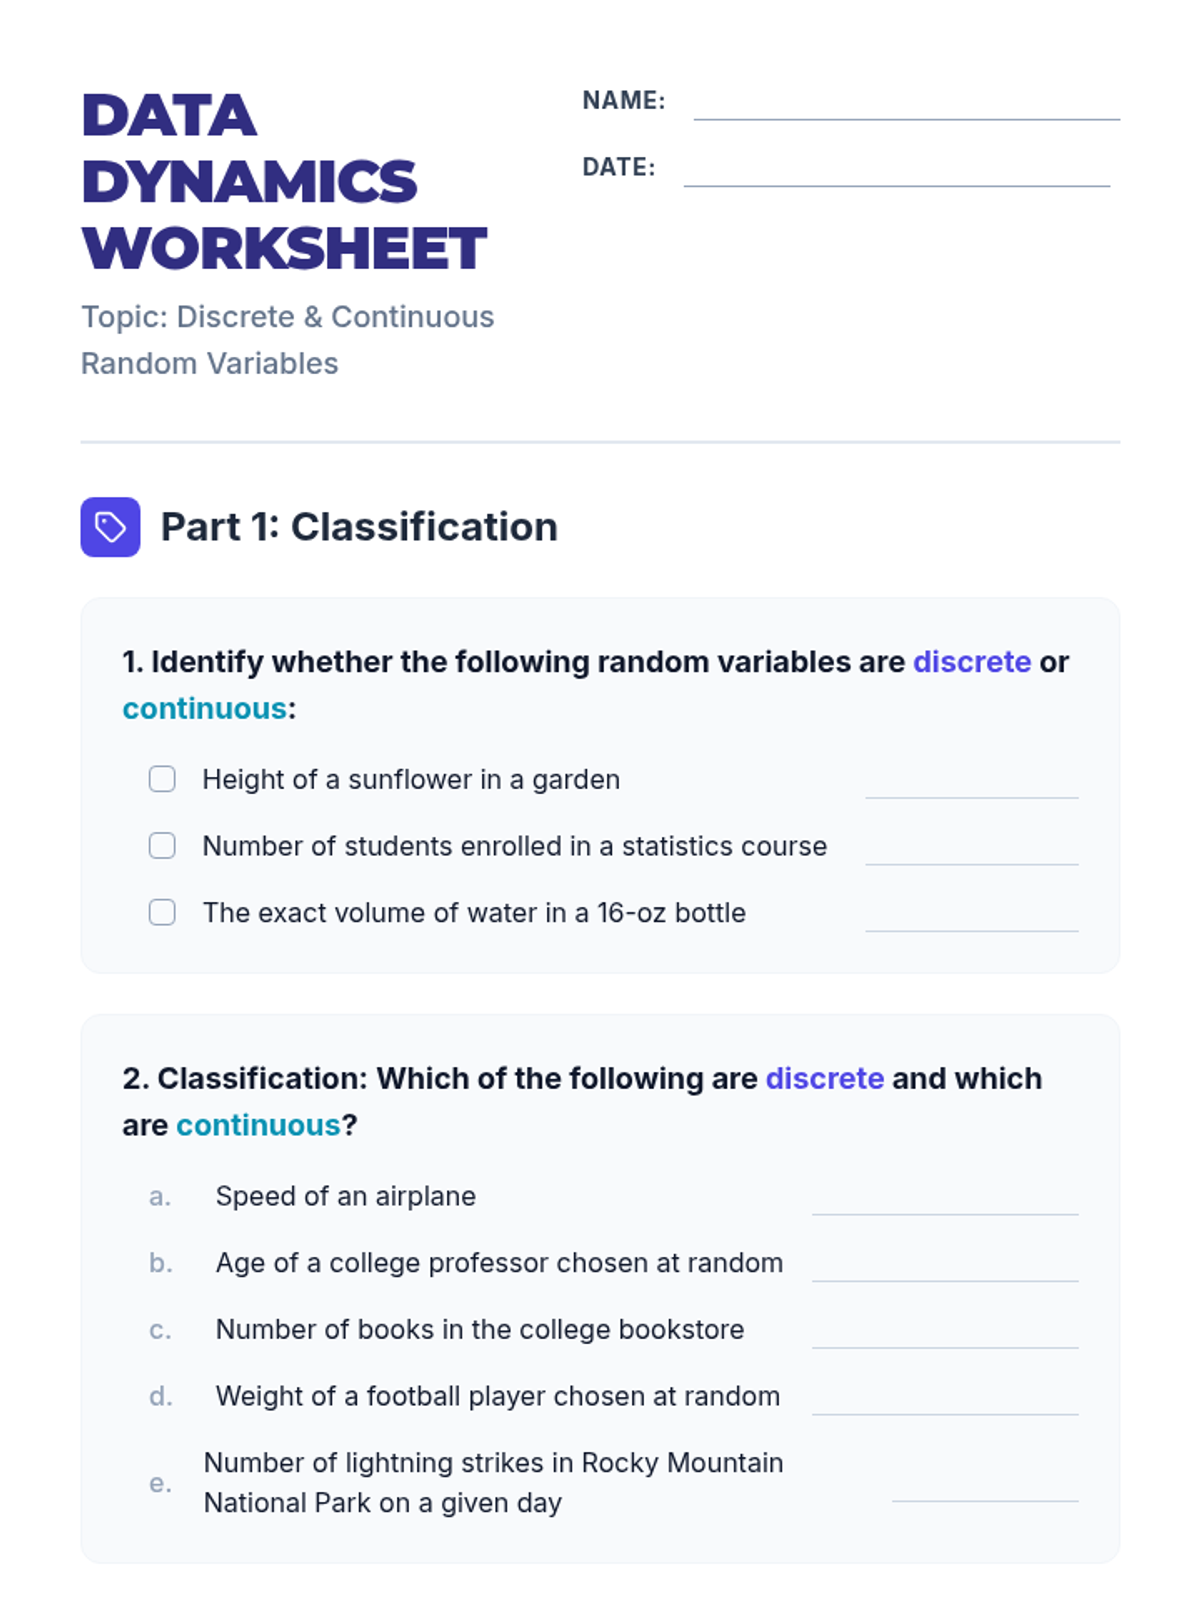
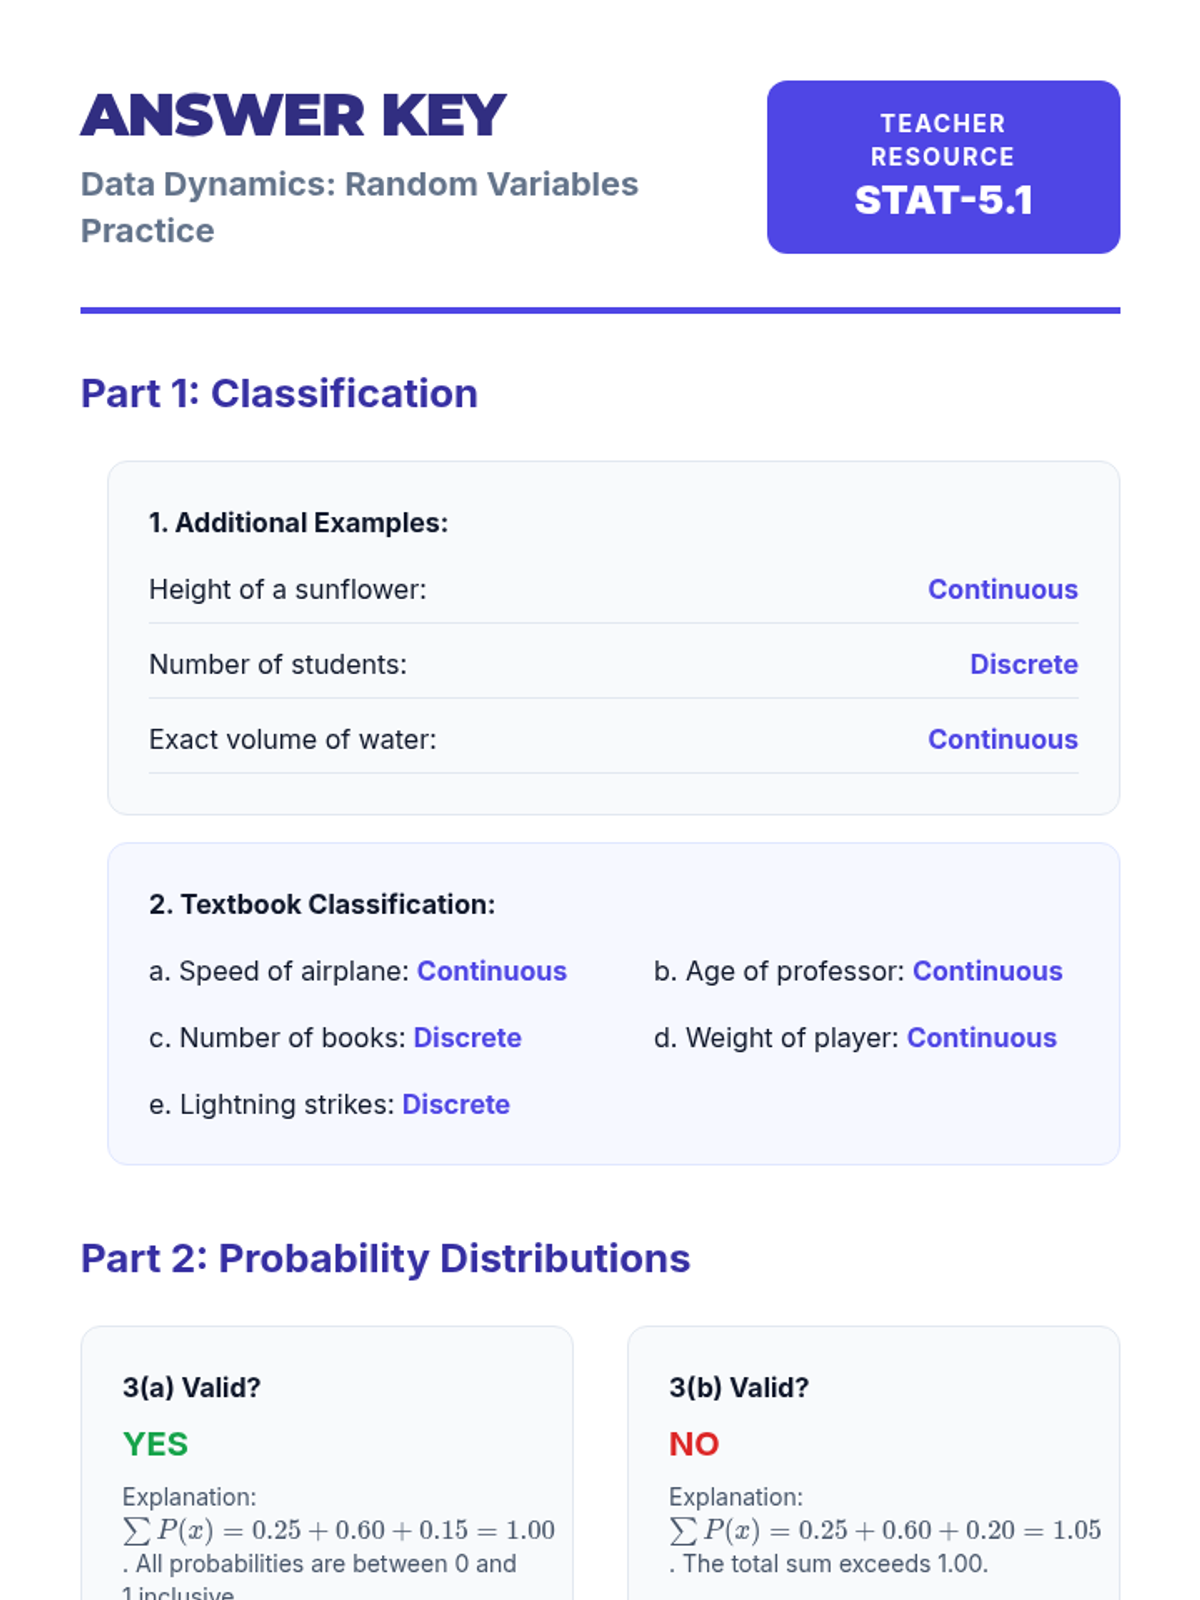
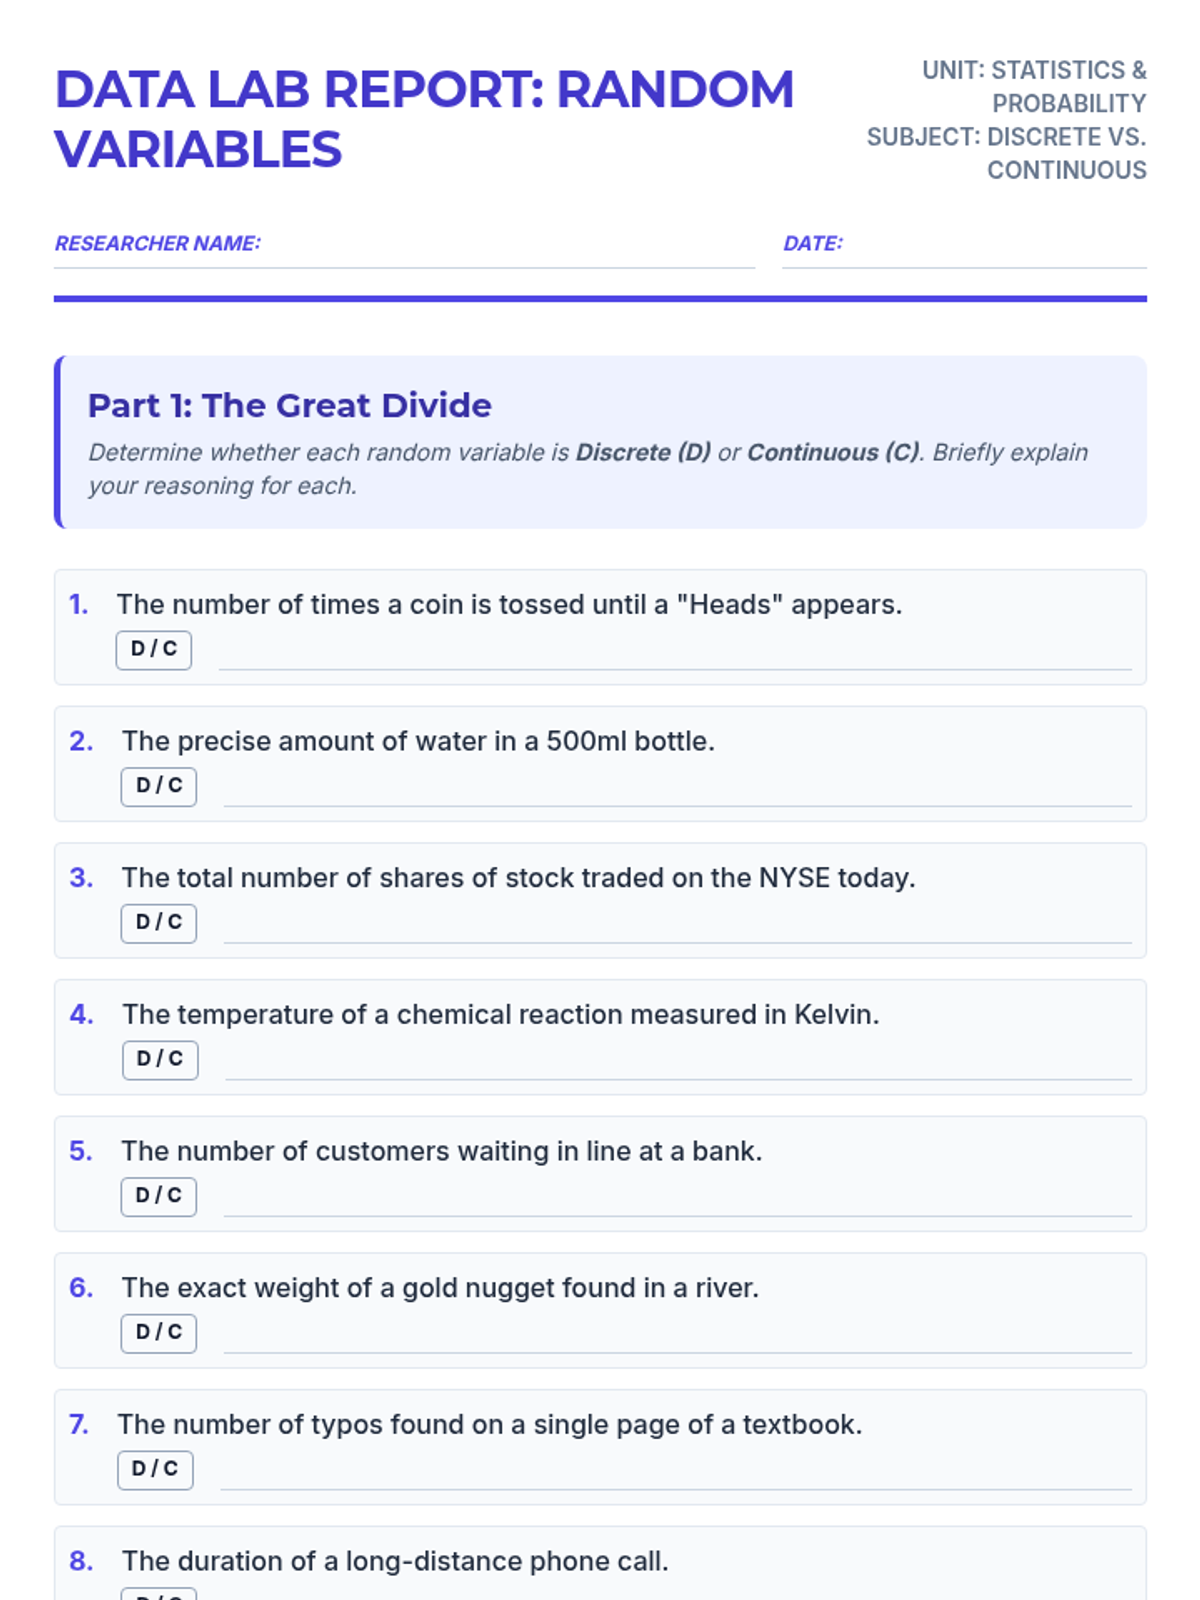
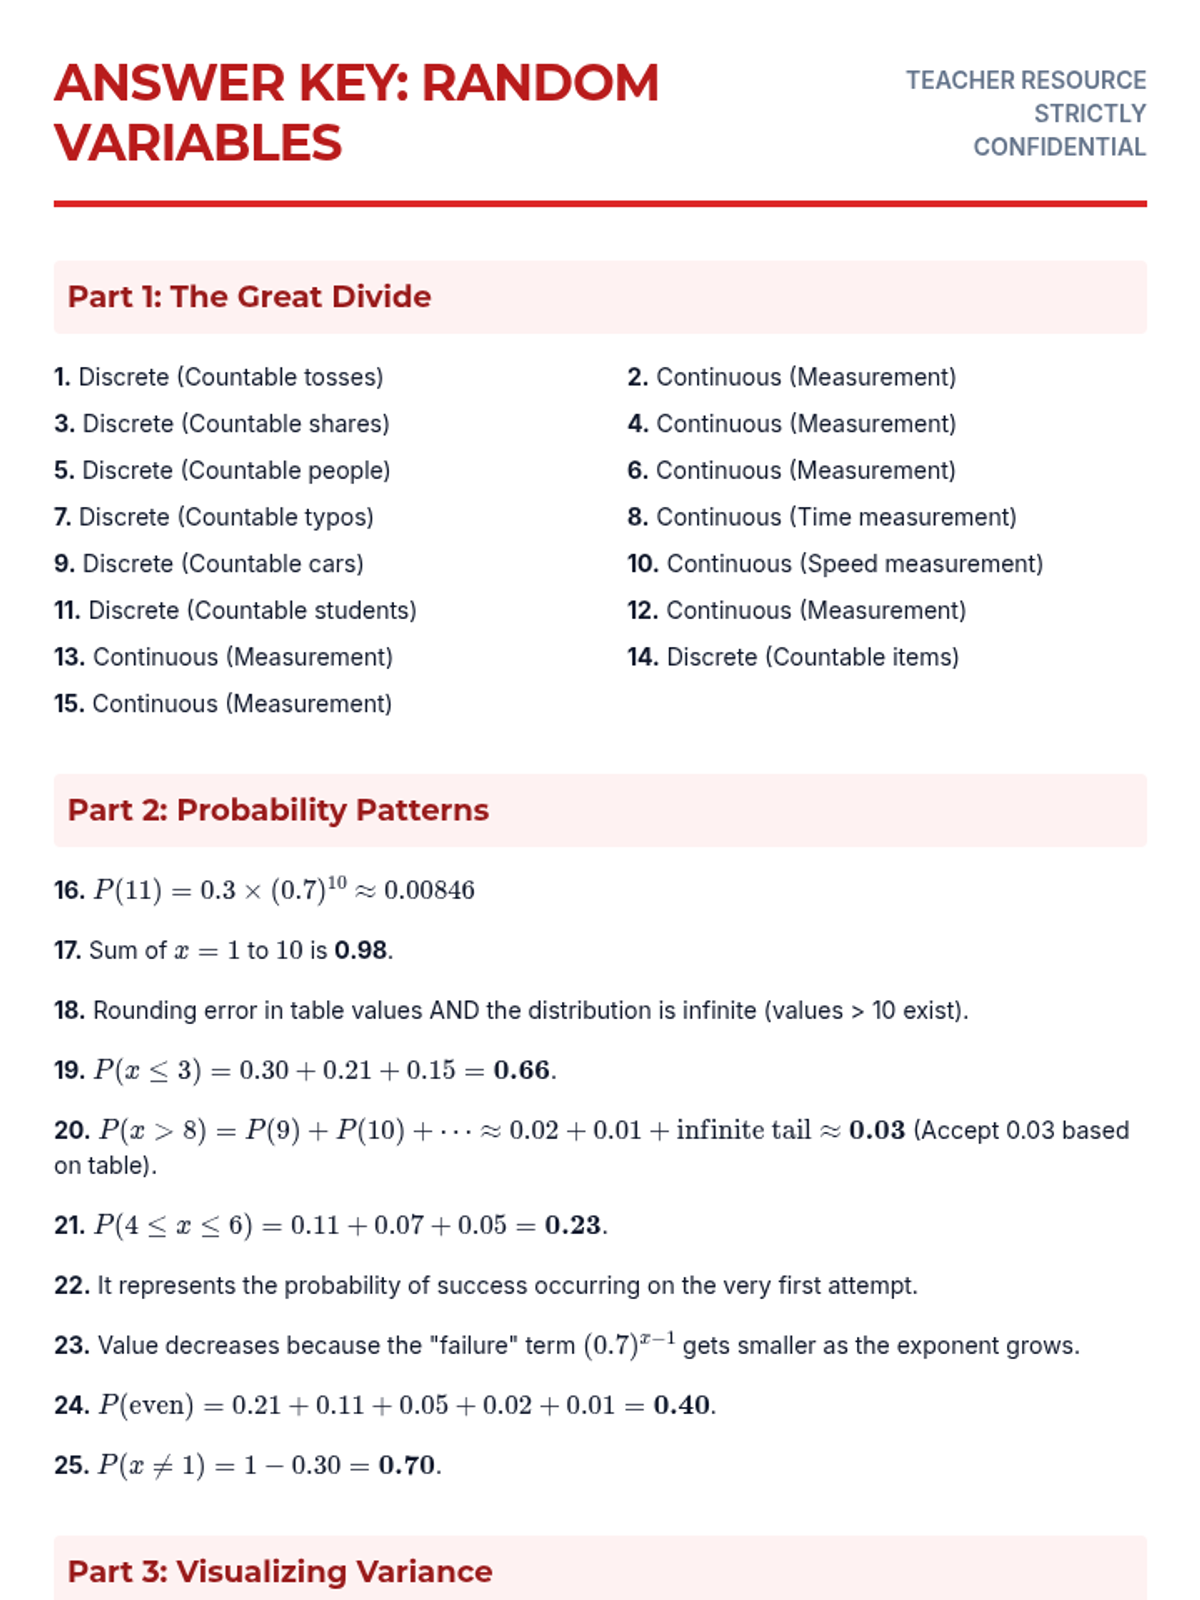
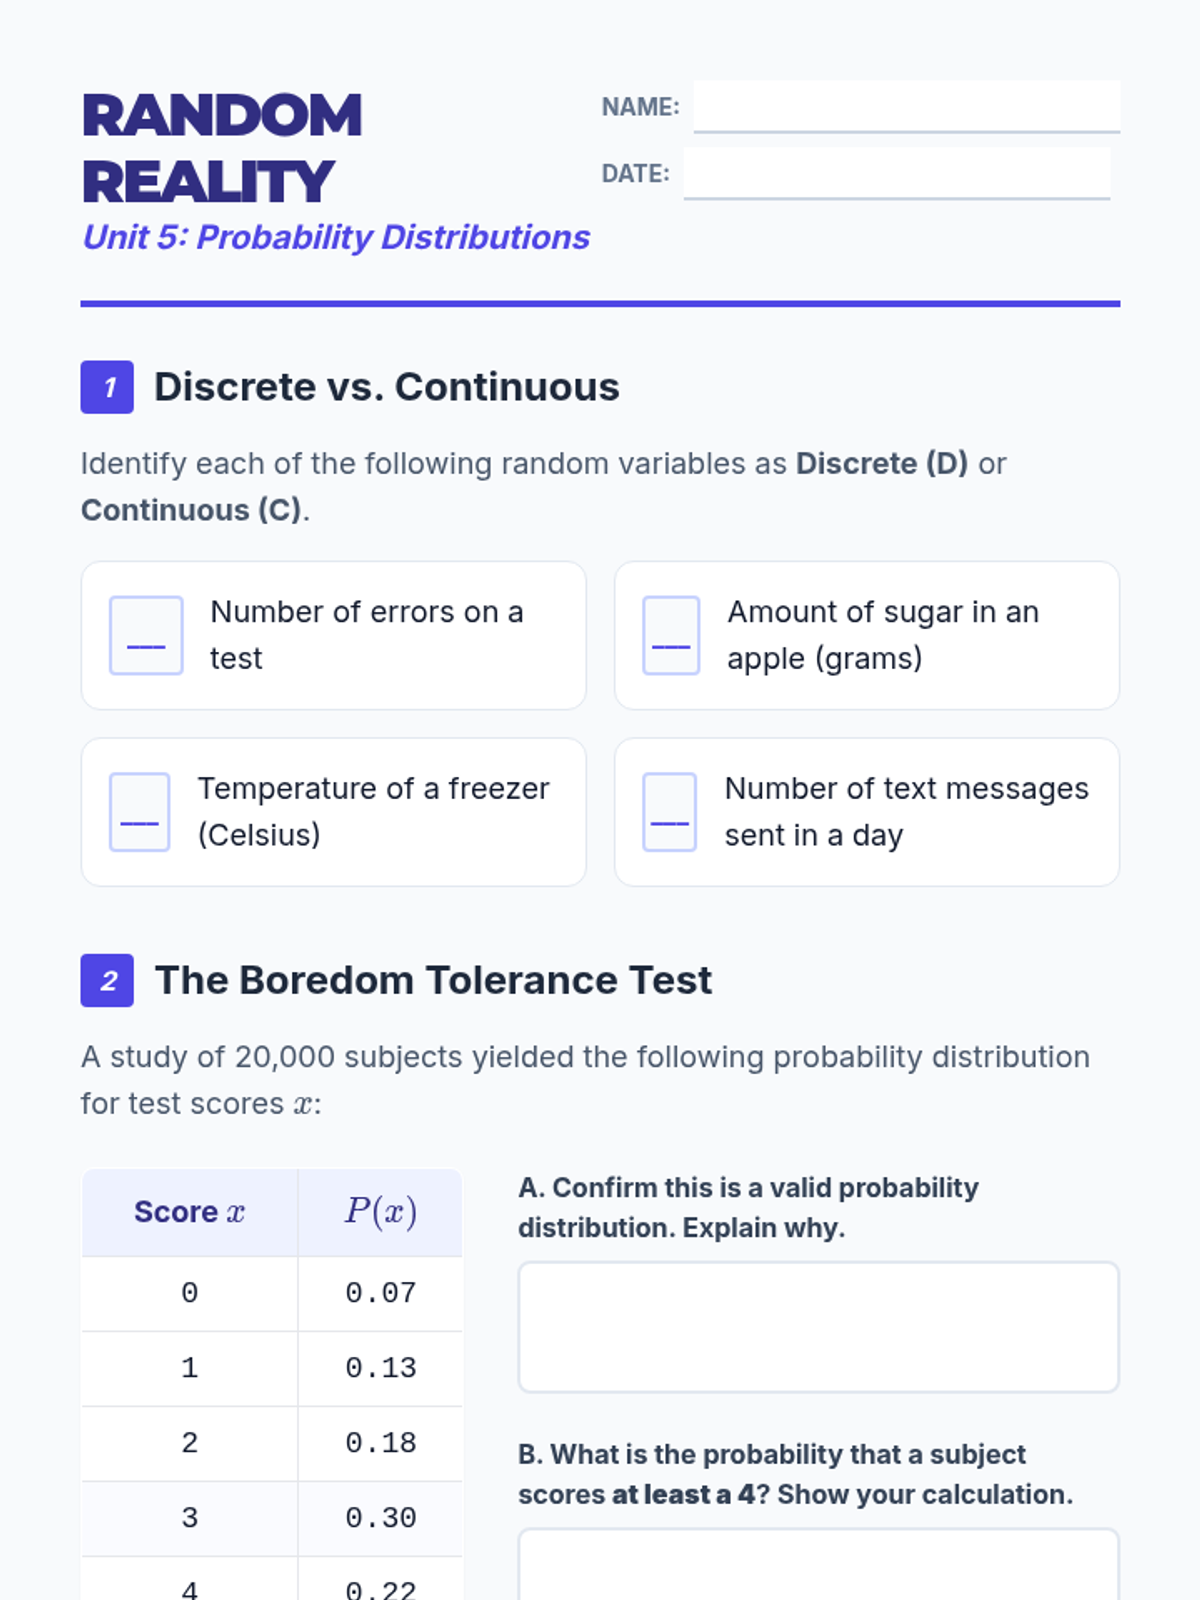
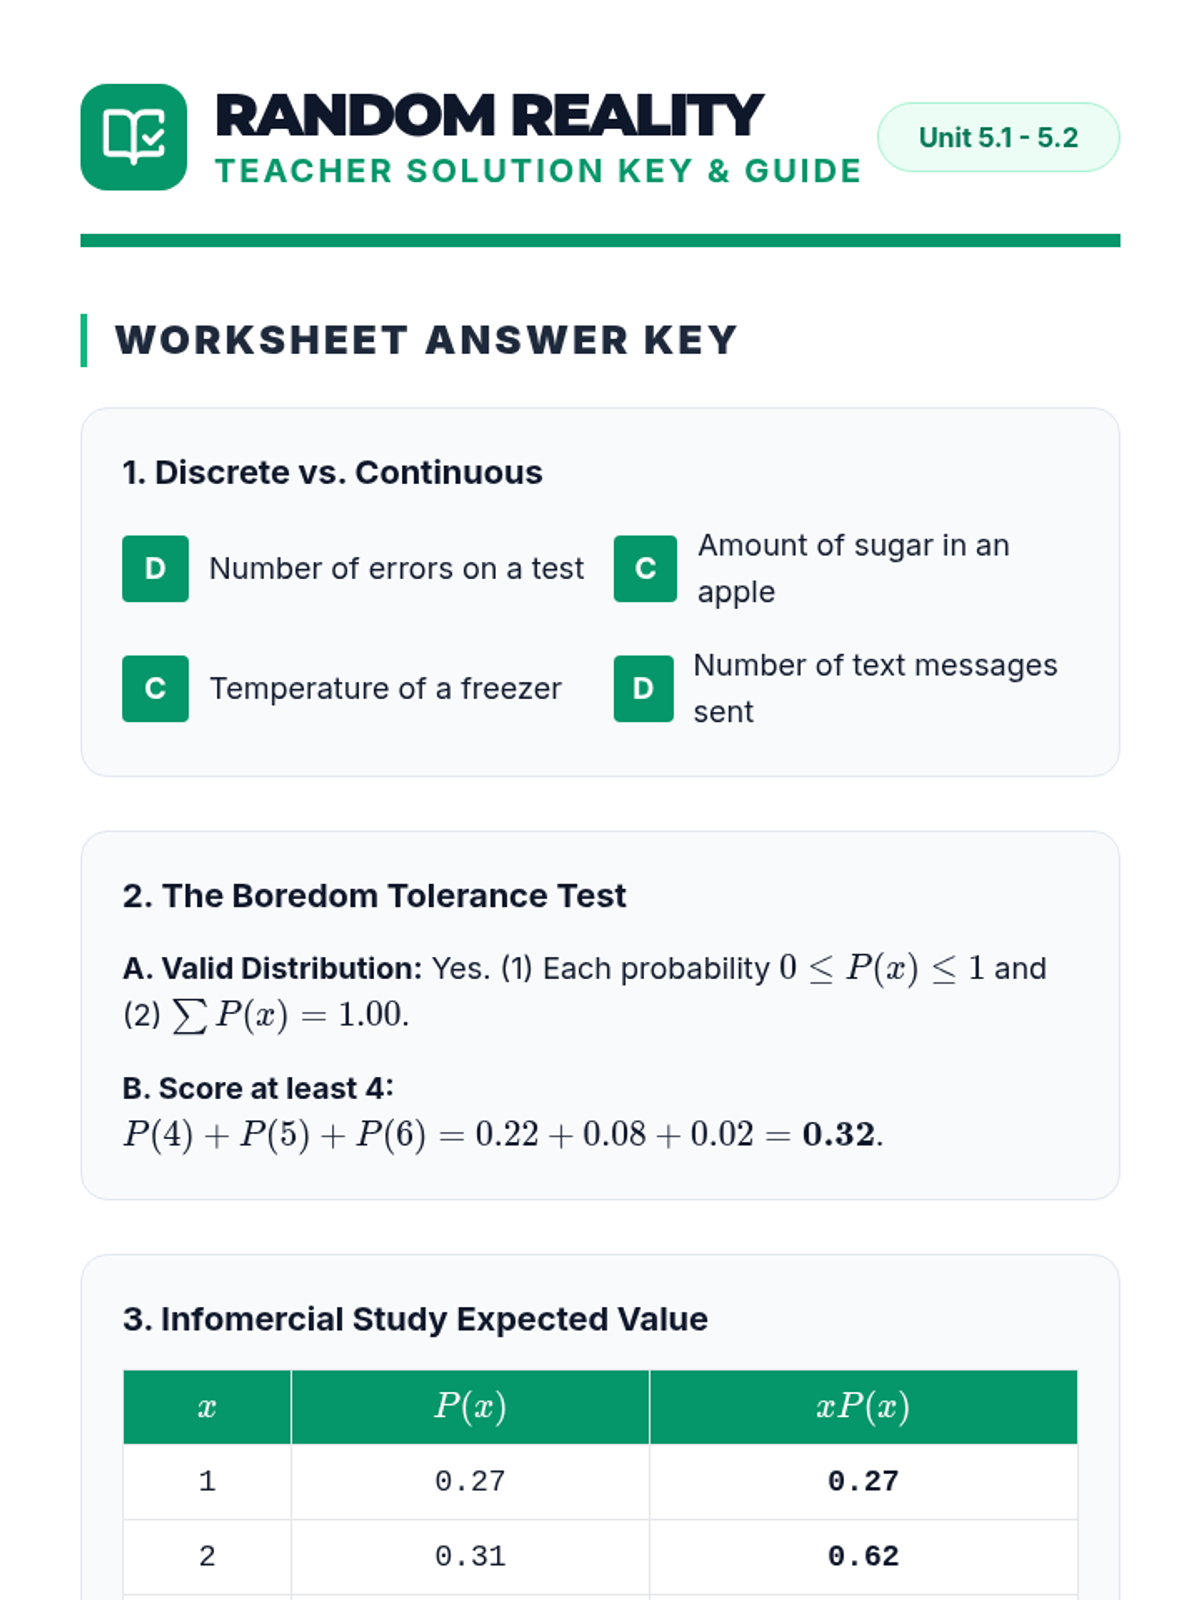
An introduction to random variables, distinguishing between discrete and continuous types, graphing probability distributions, and calculating mean and standard deviation.
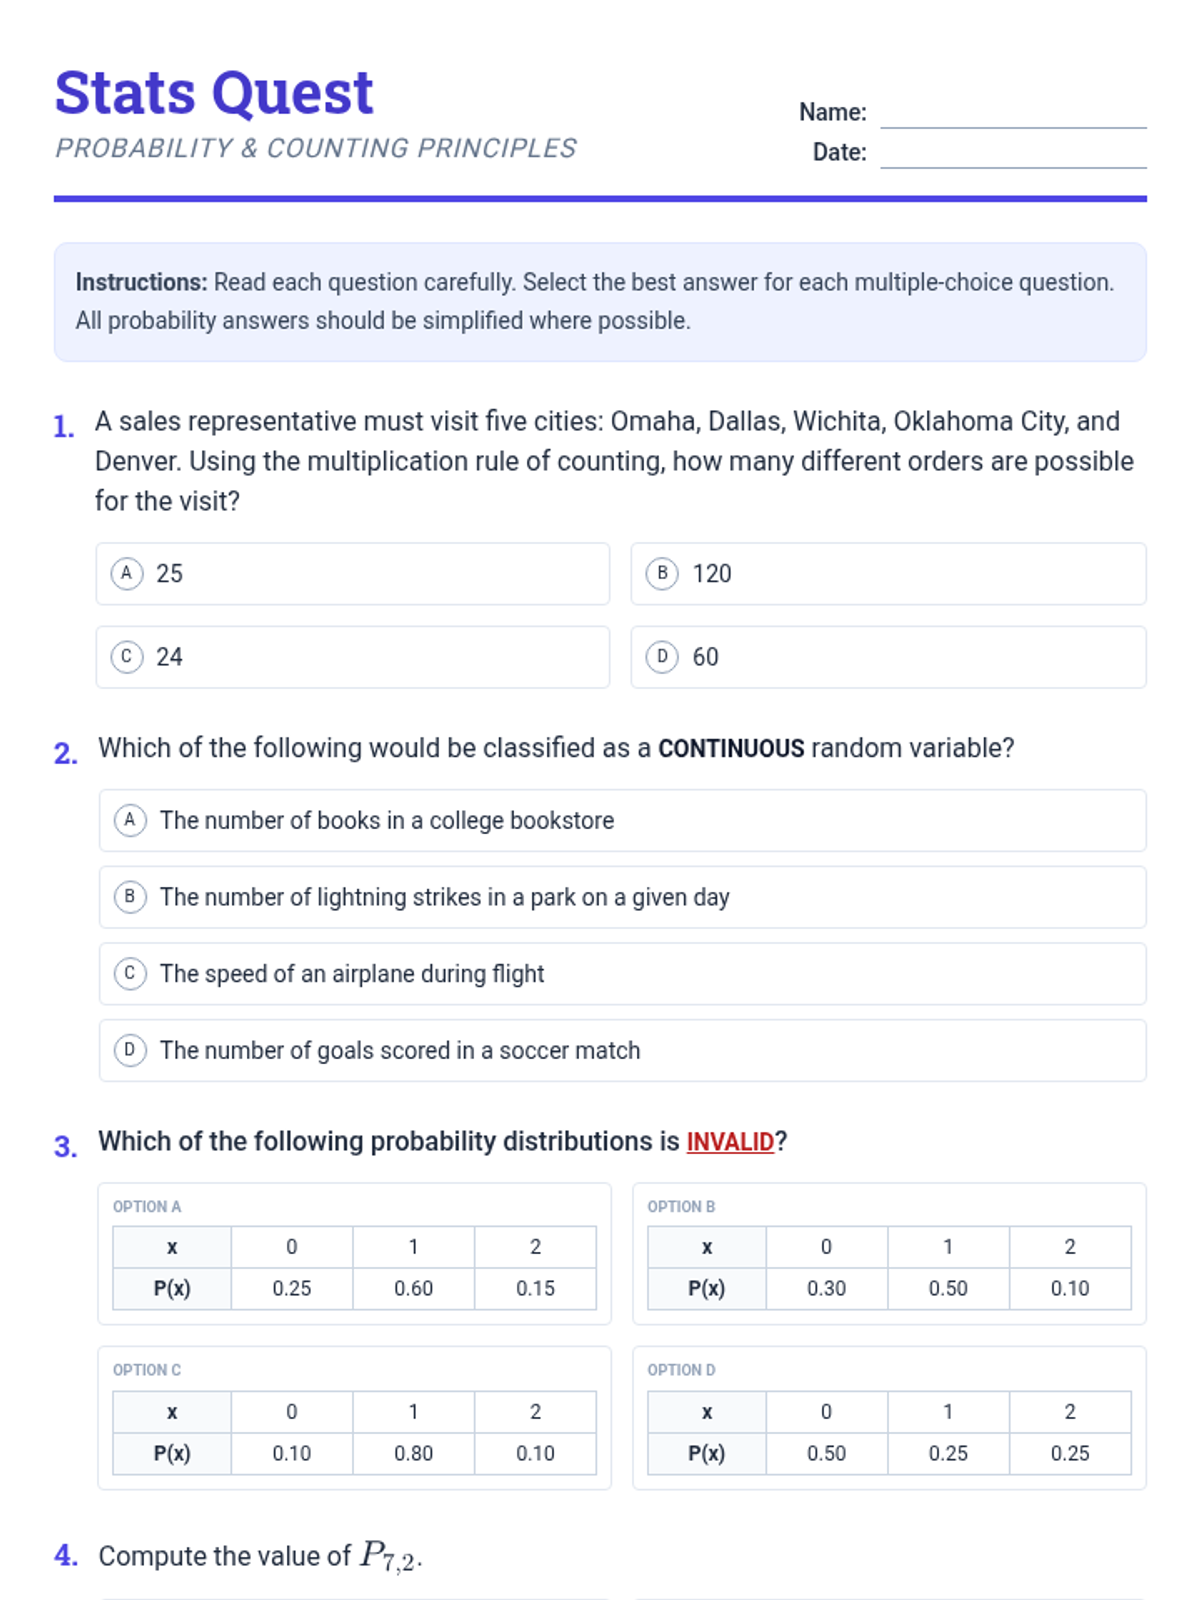
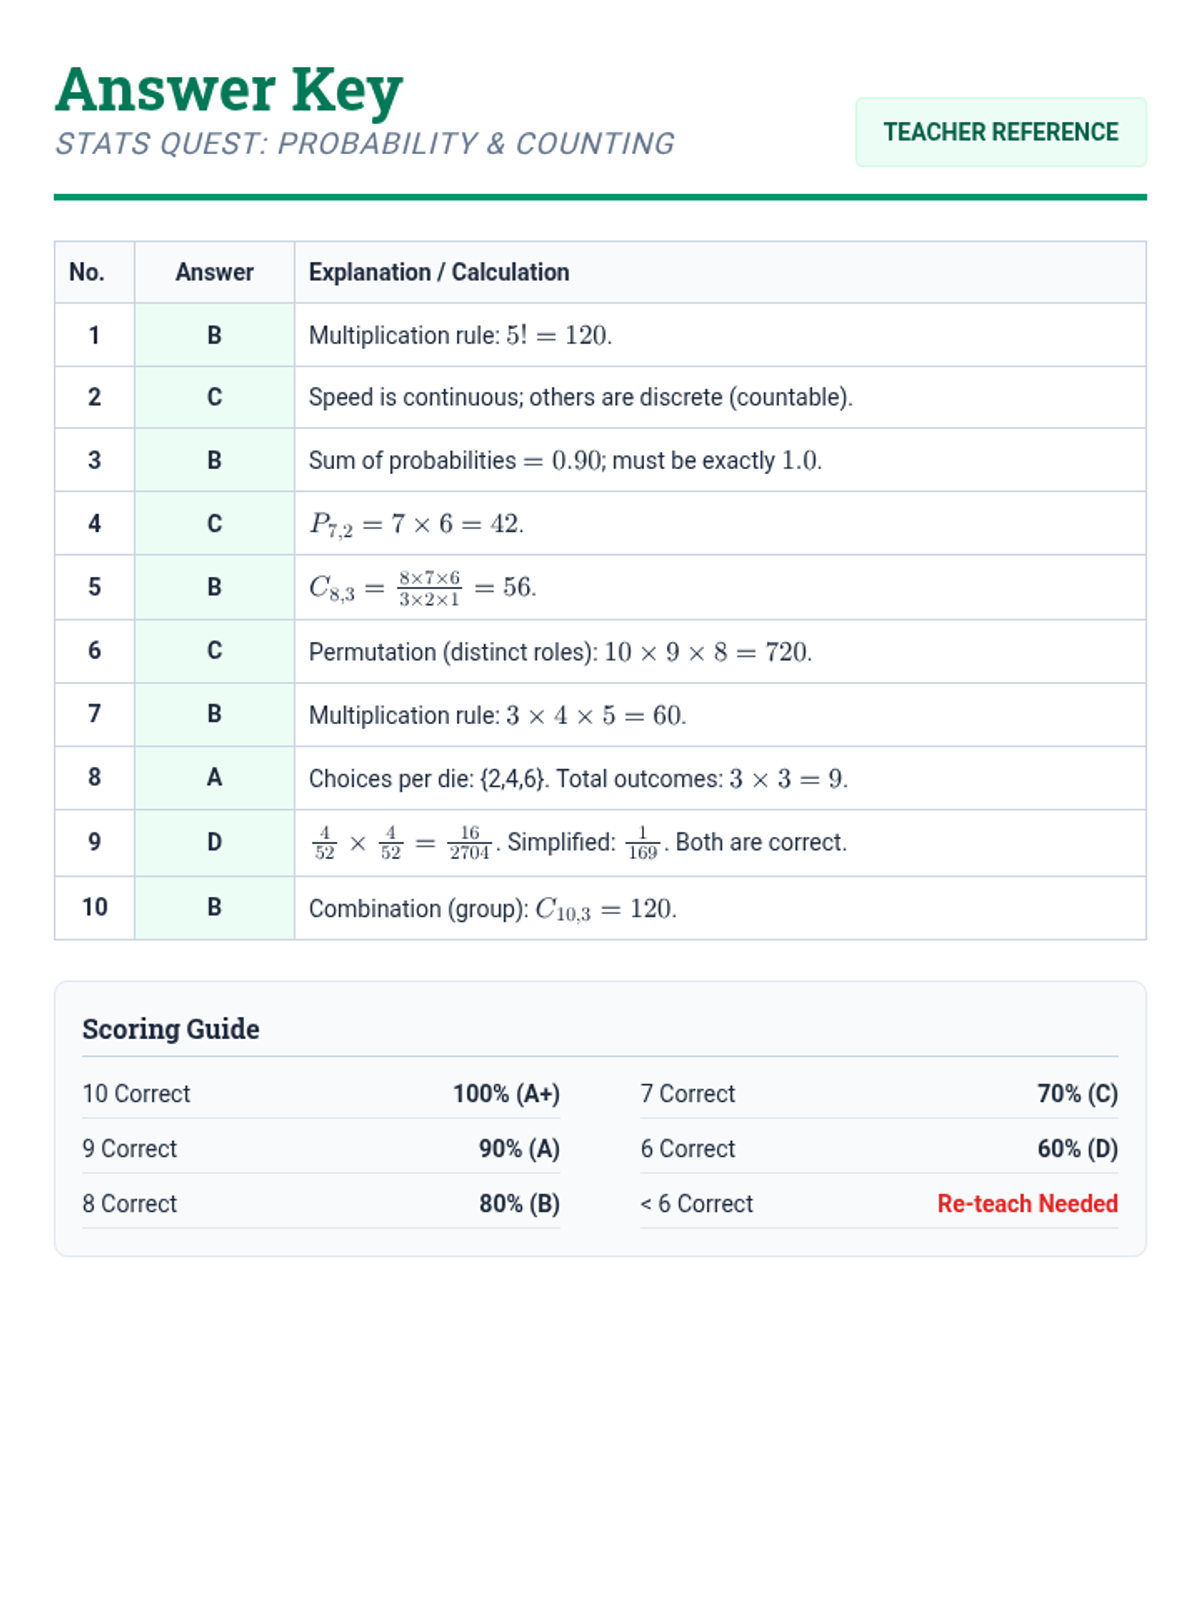
A comprehensive 40-question review covering descriptive statistics, elementary probability, and counting techniques based on Algebra 1 and Statistics curriculum.
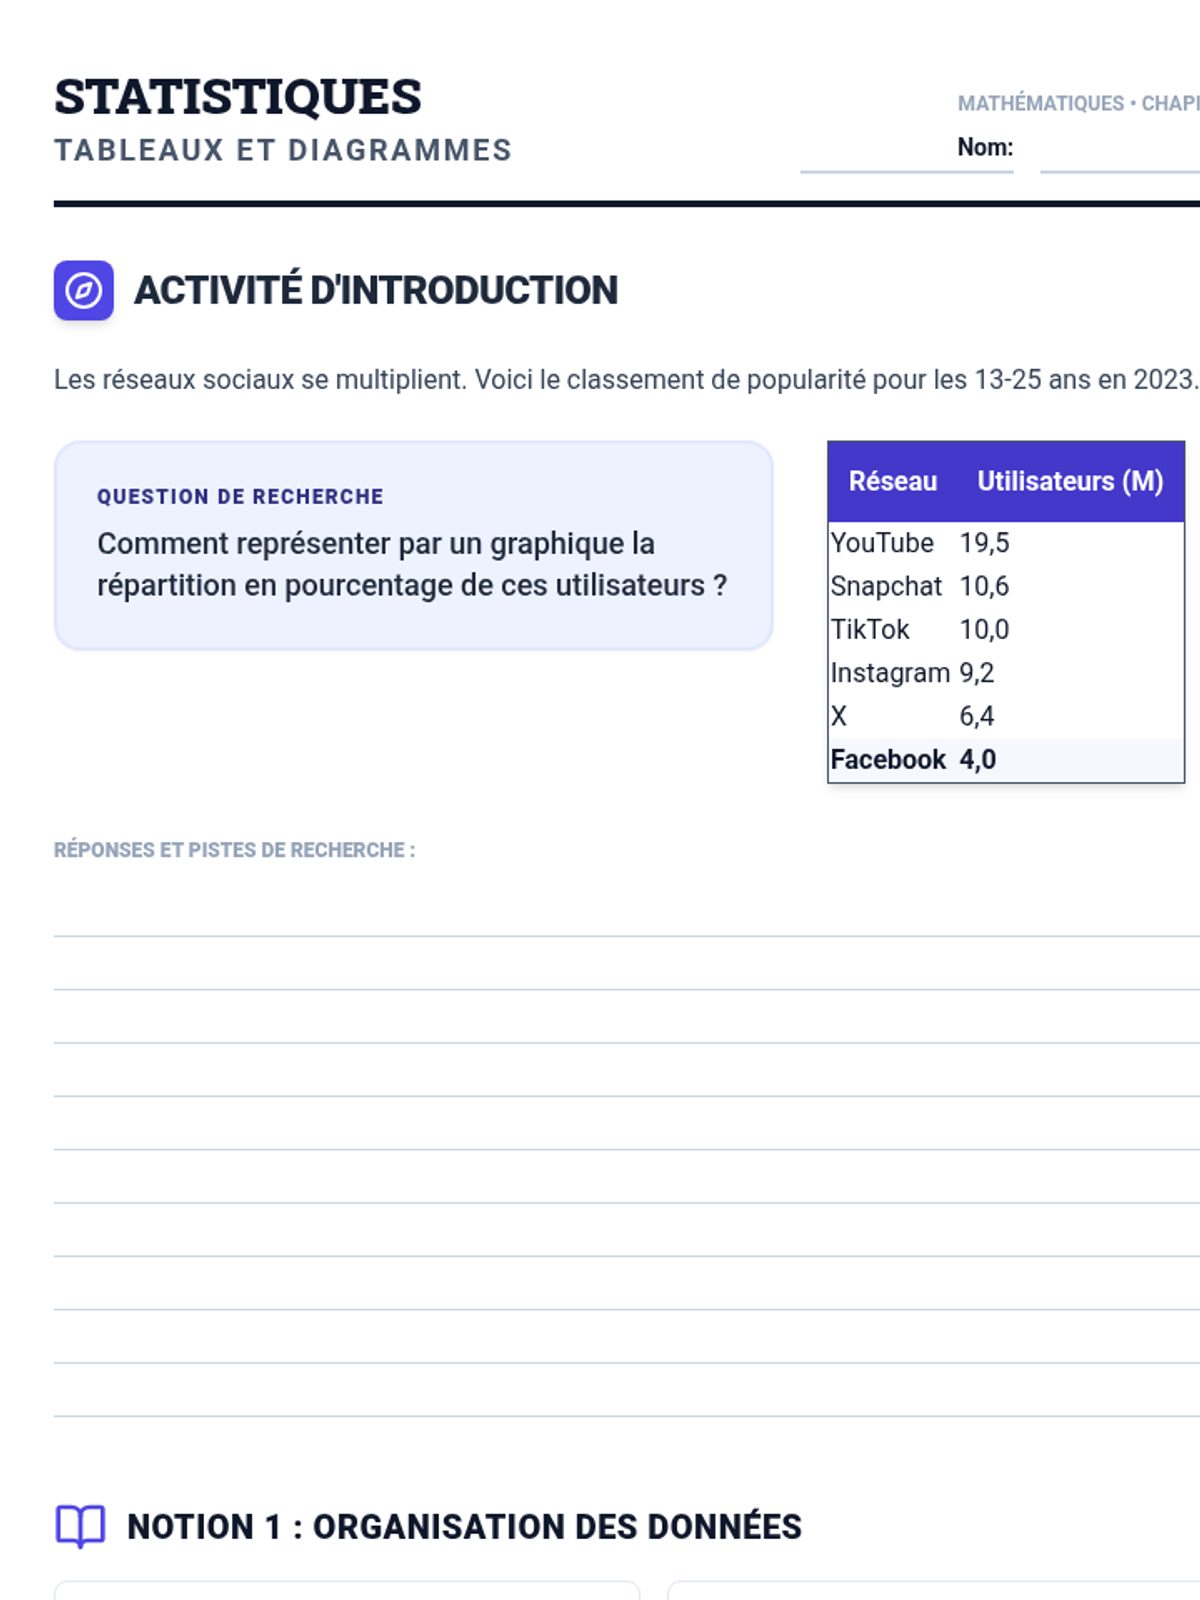
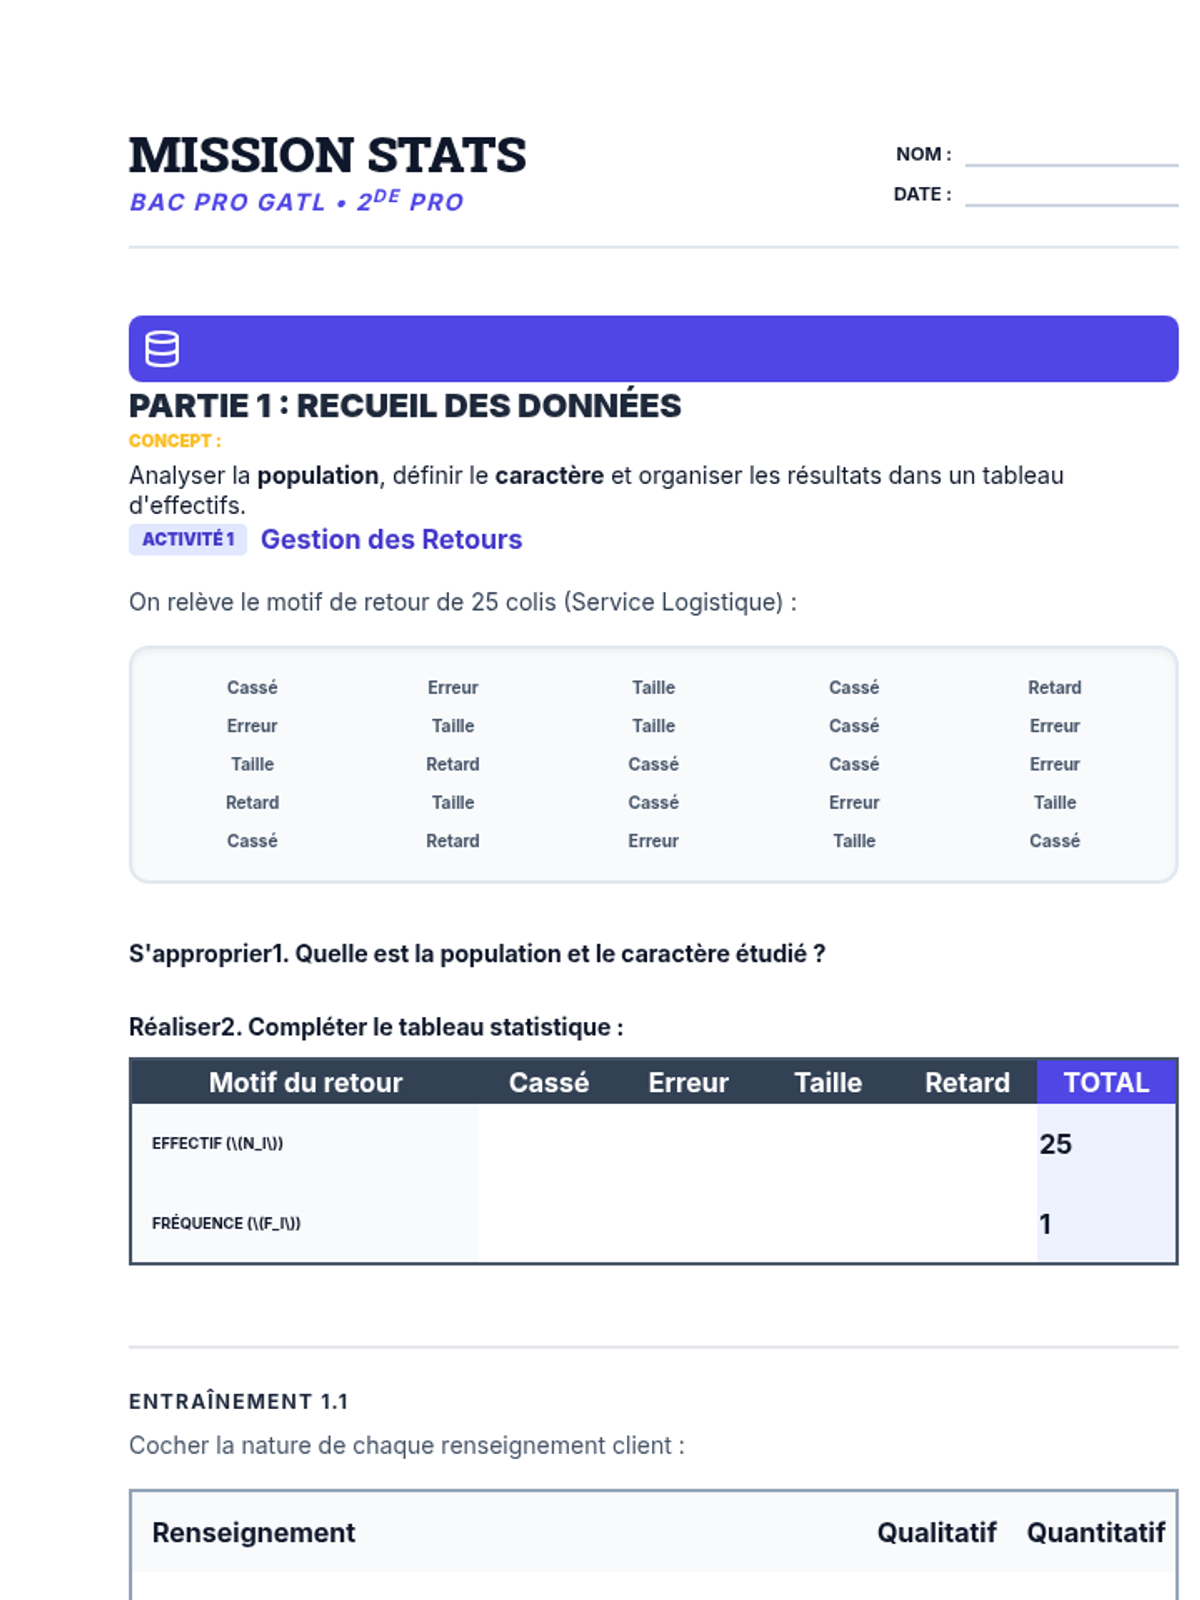
Une leçon complète sur les statistiques à une variable, couvrant la collecte de données, l'organisation en tableaux et la représentation graphique à travers divers exercices pratiques et activités d'introduction.
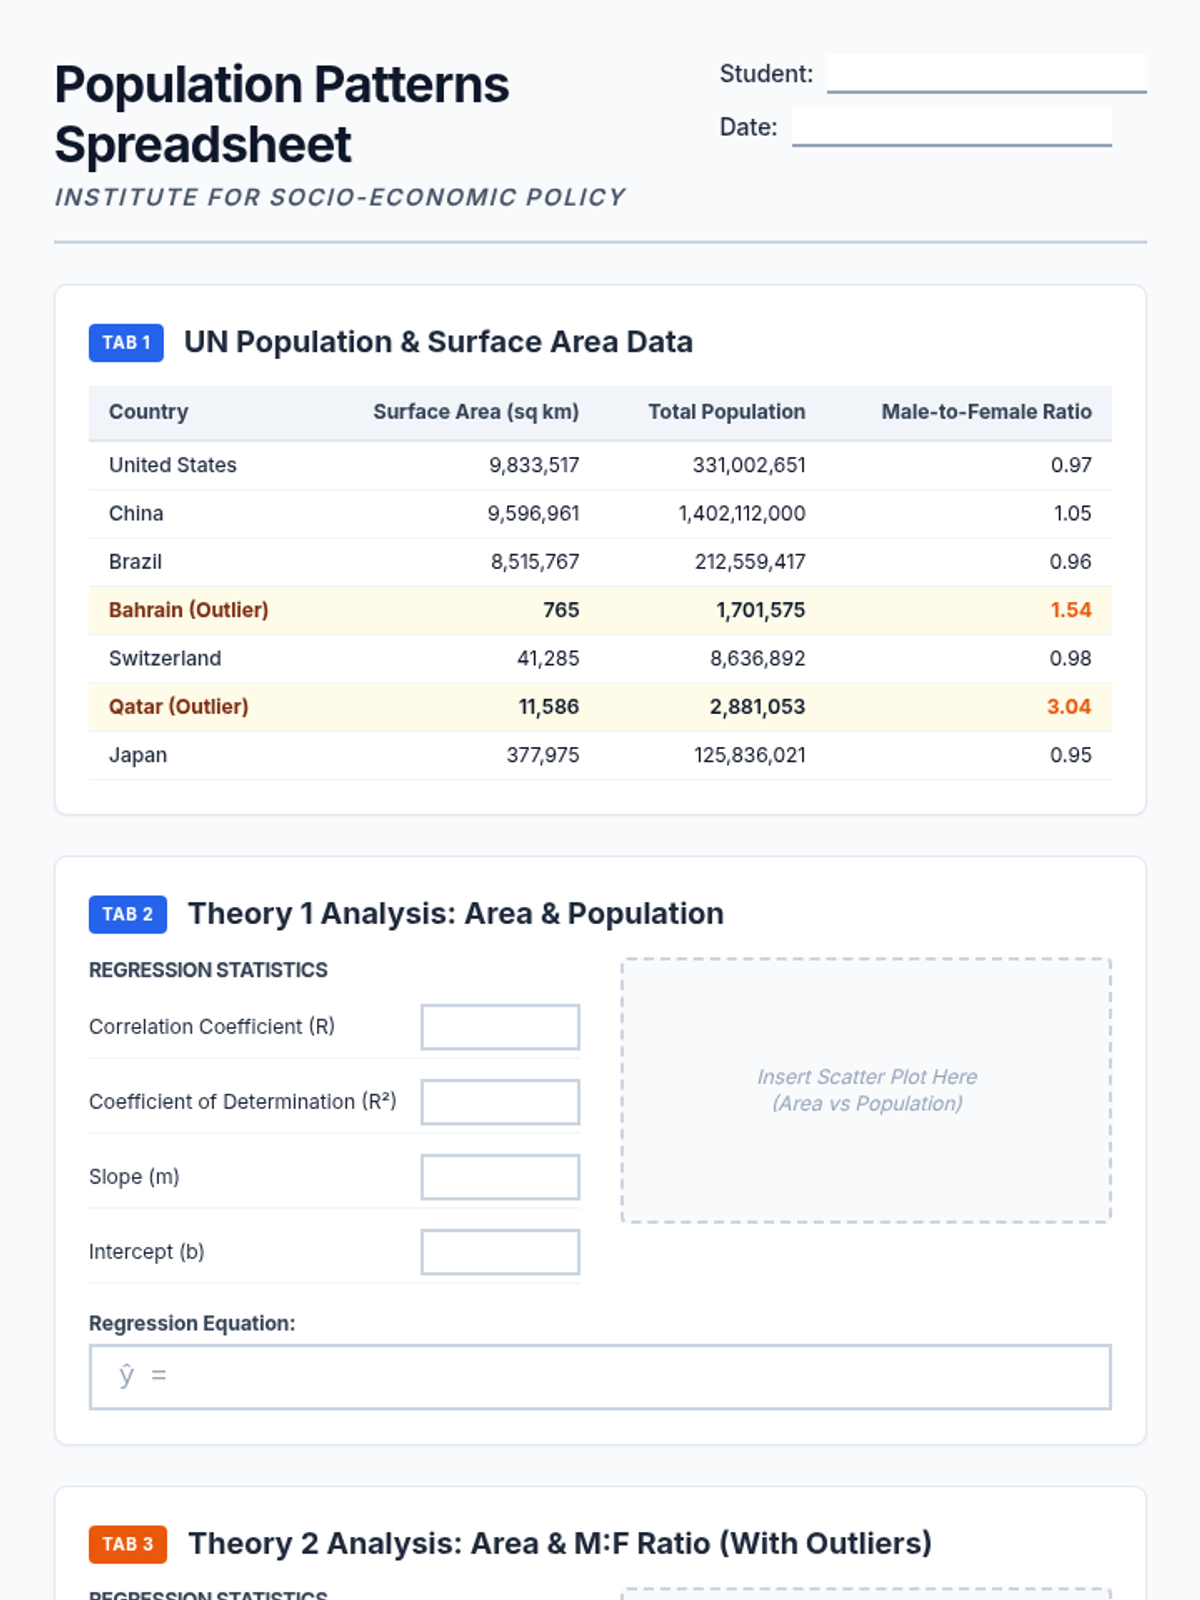
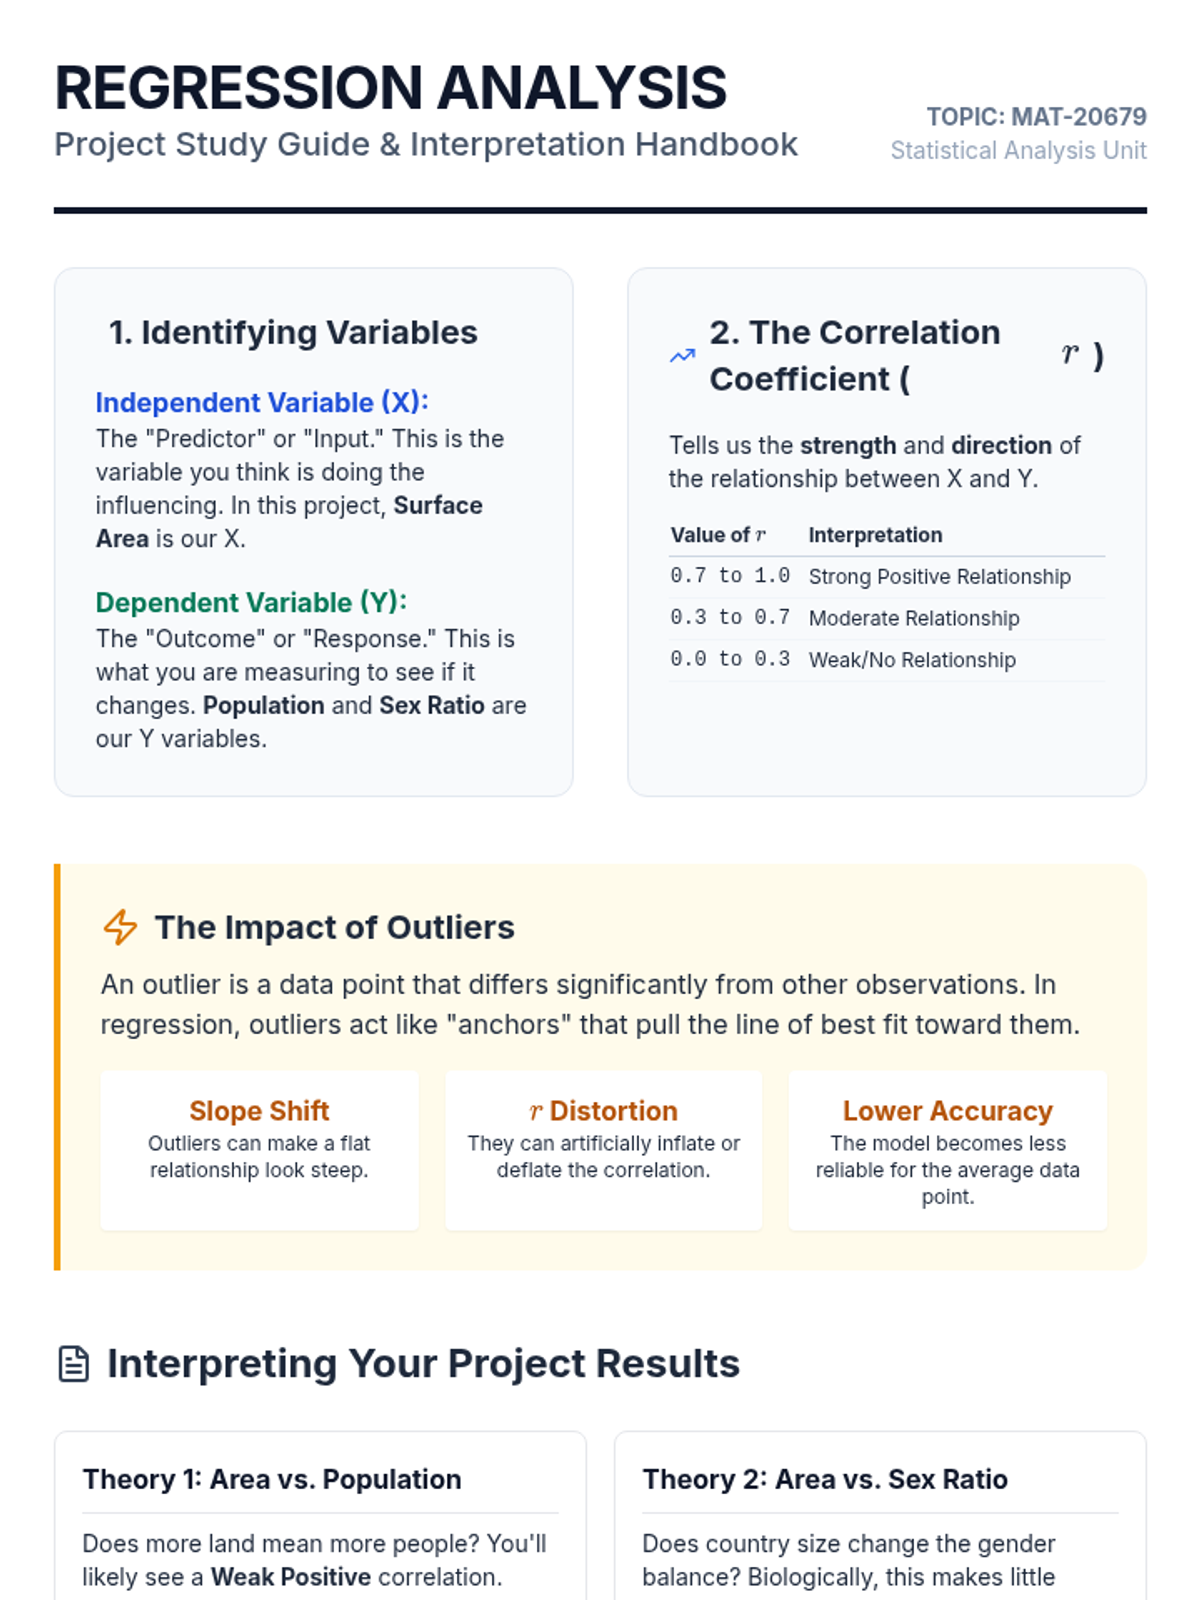
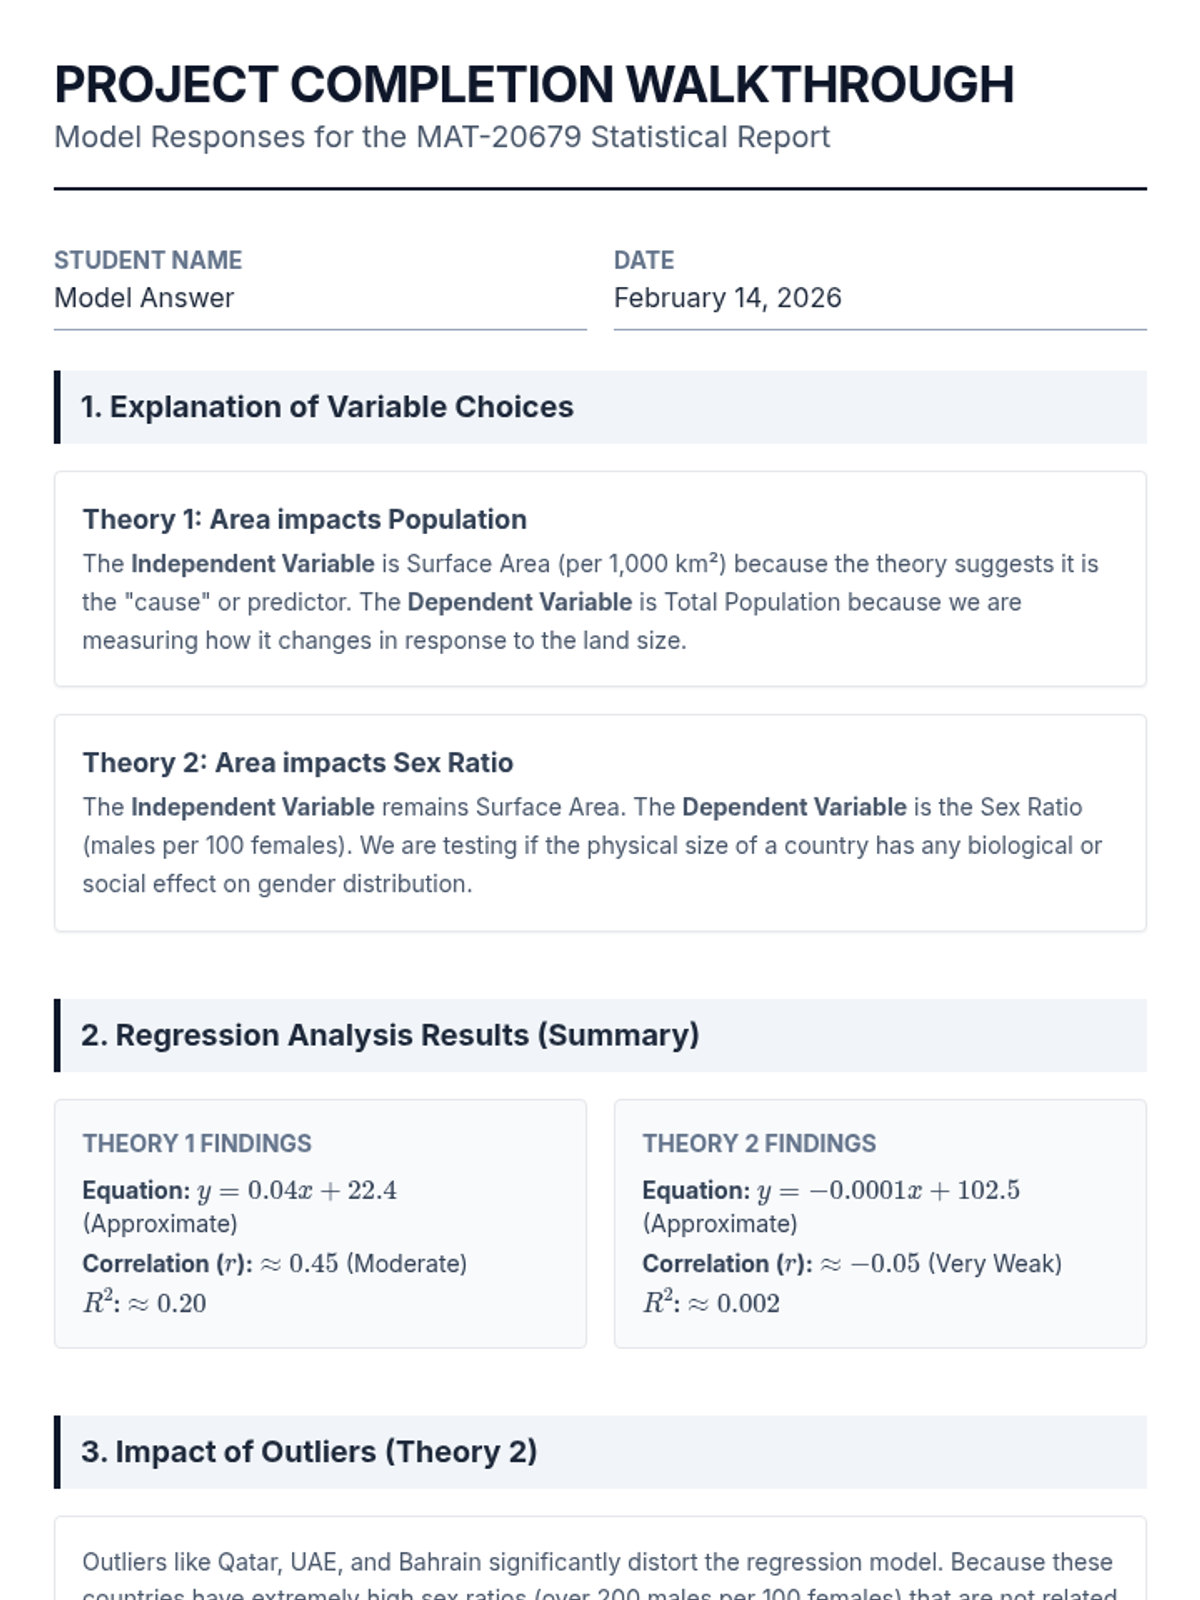
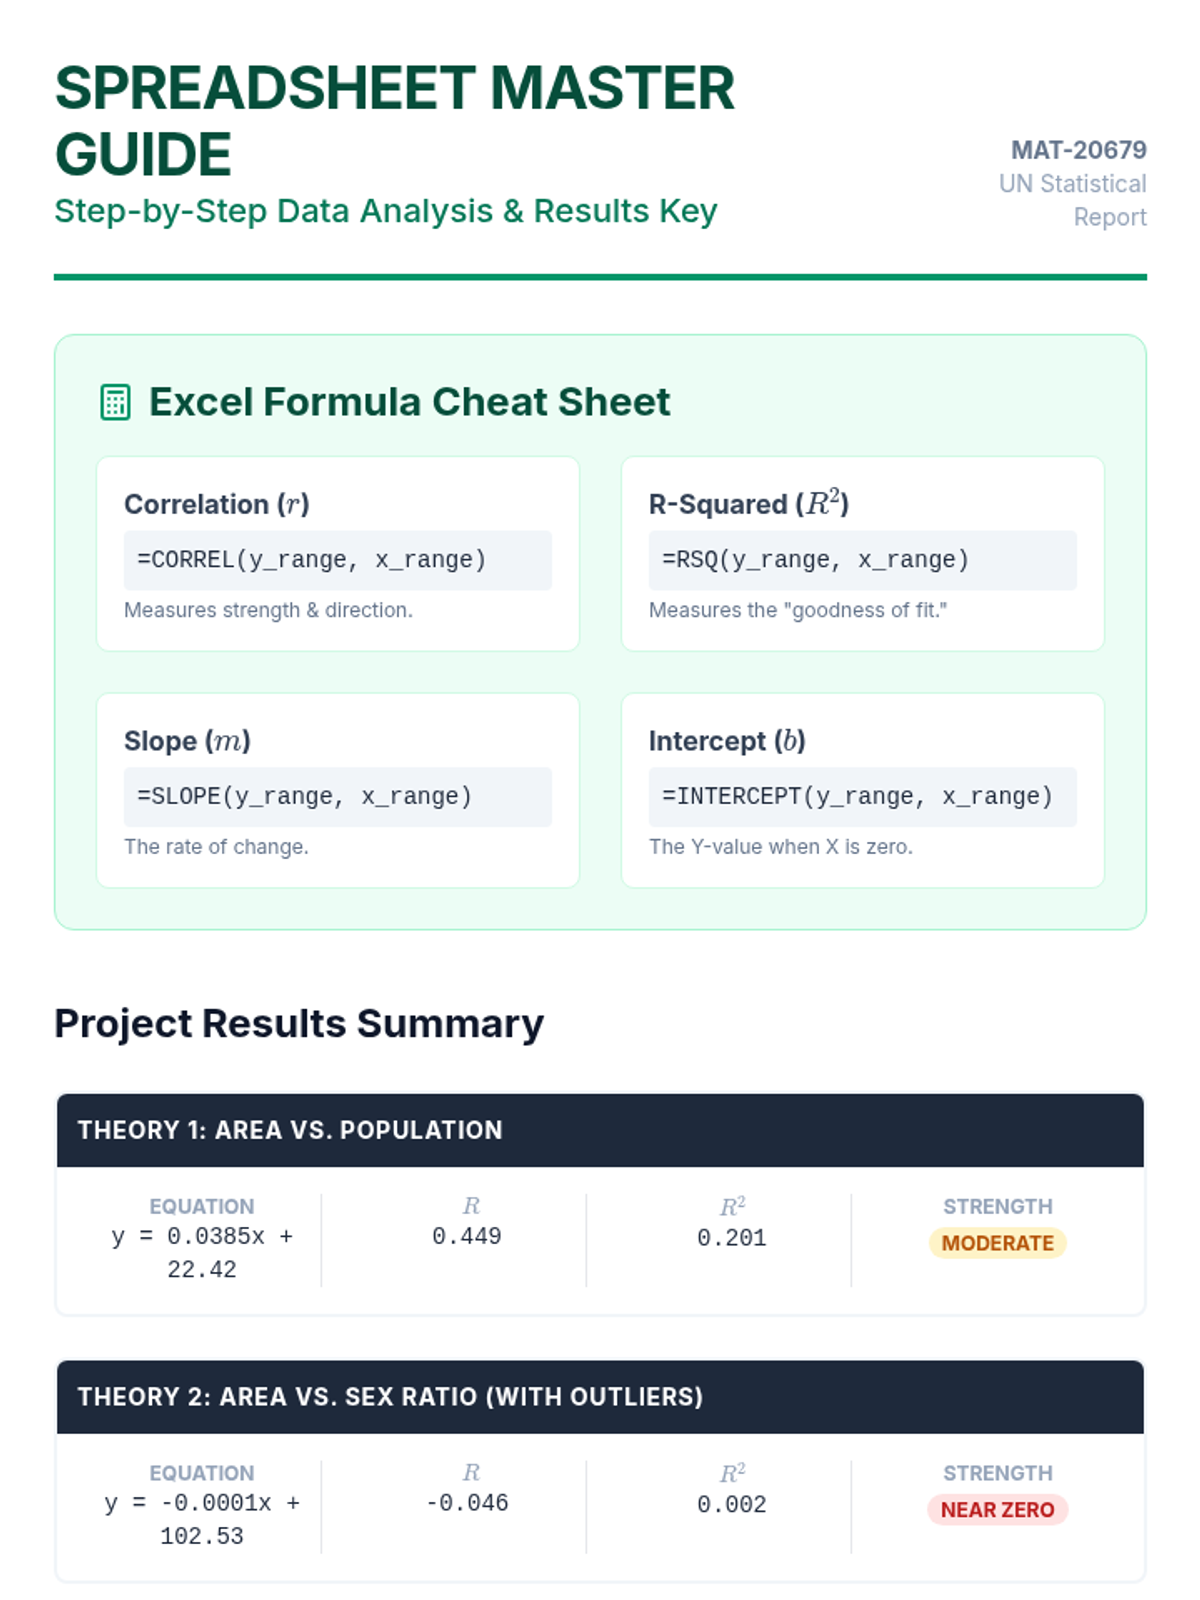
A project-based lesson on performing linear regression analysis using United Nations population and surface area data to test socio-economic theories.
A comprehensive lesson on identifying random variable types, working with discrete probability distributions, and visualizing data through histograms.
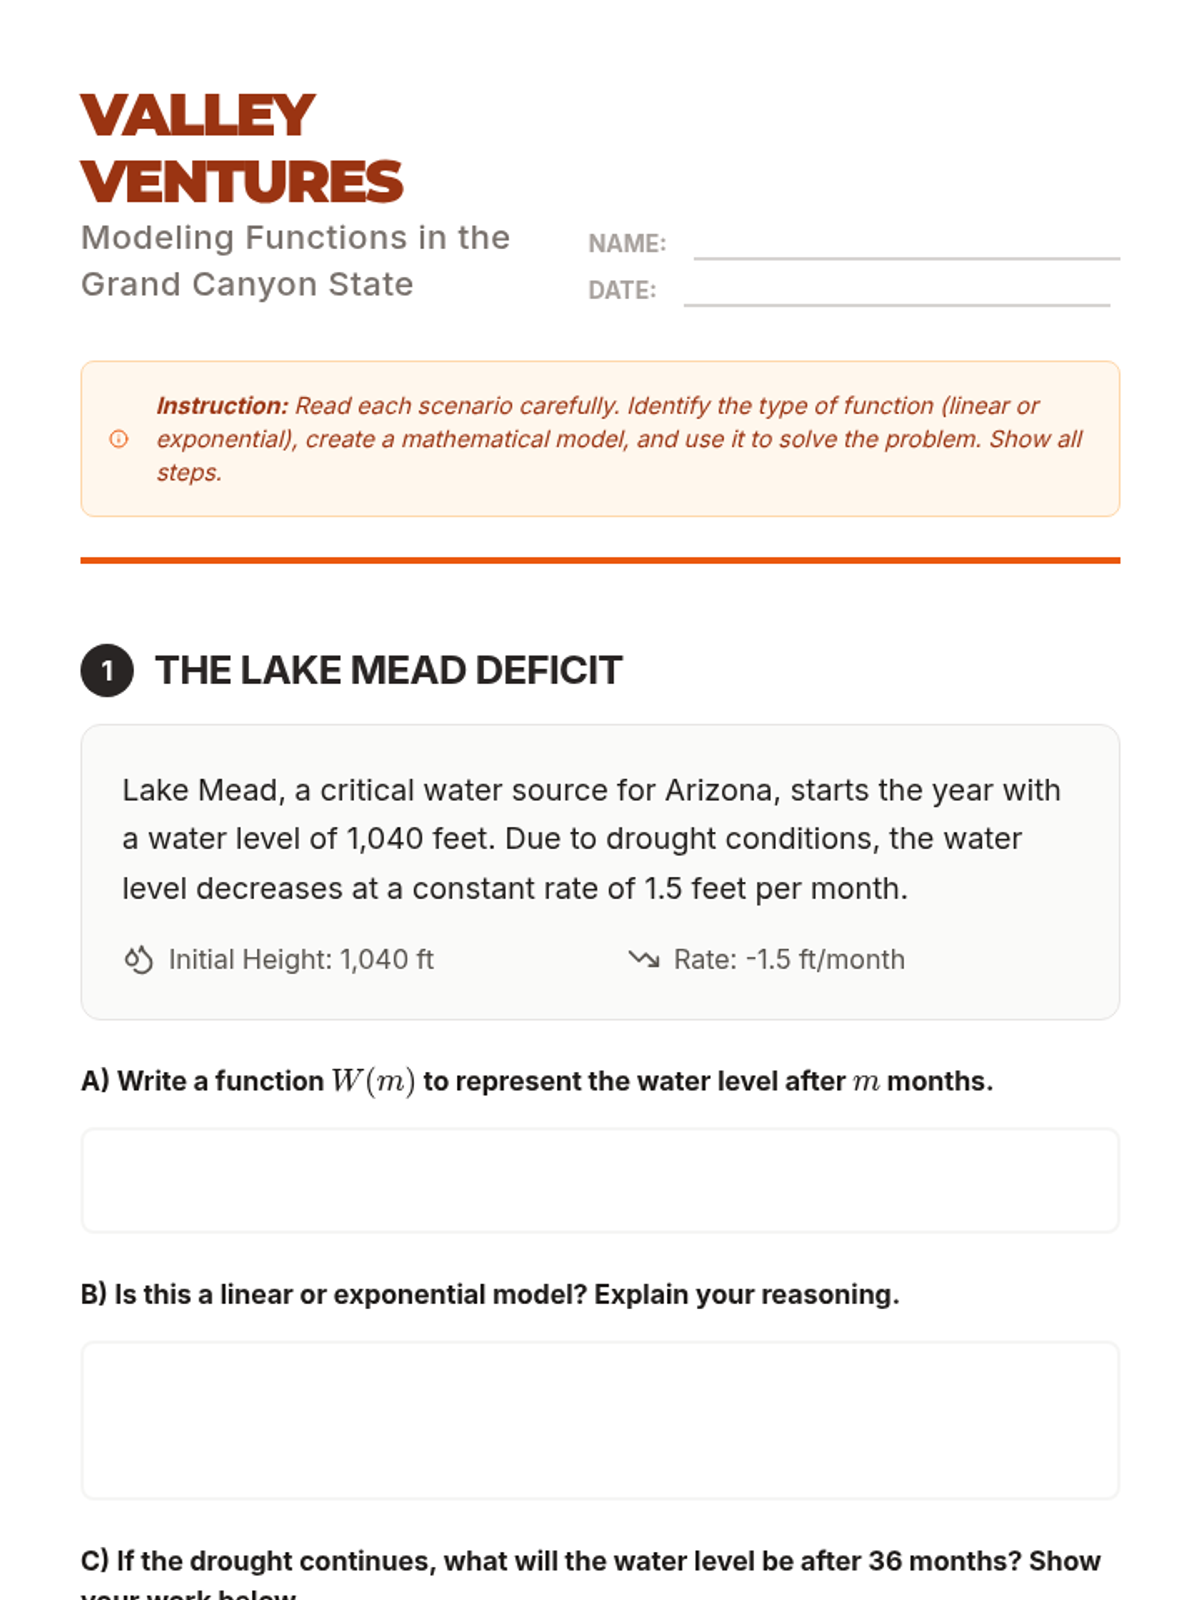
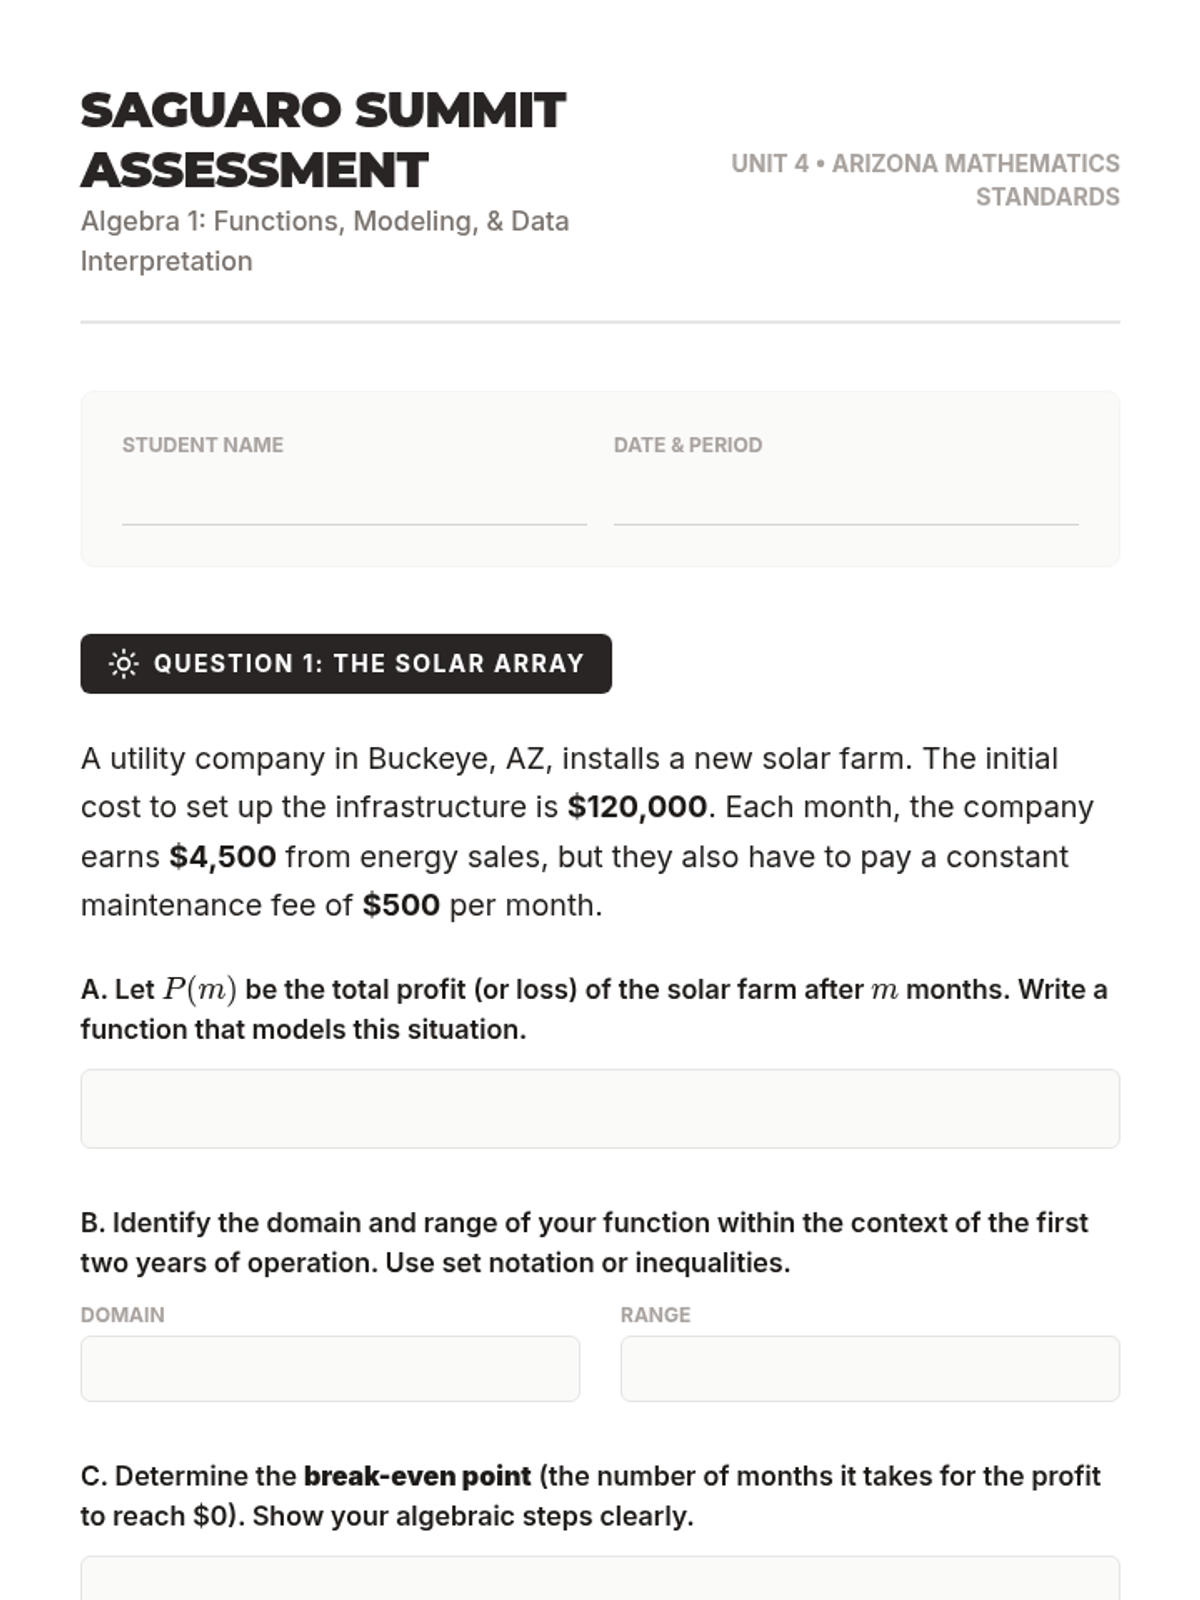
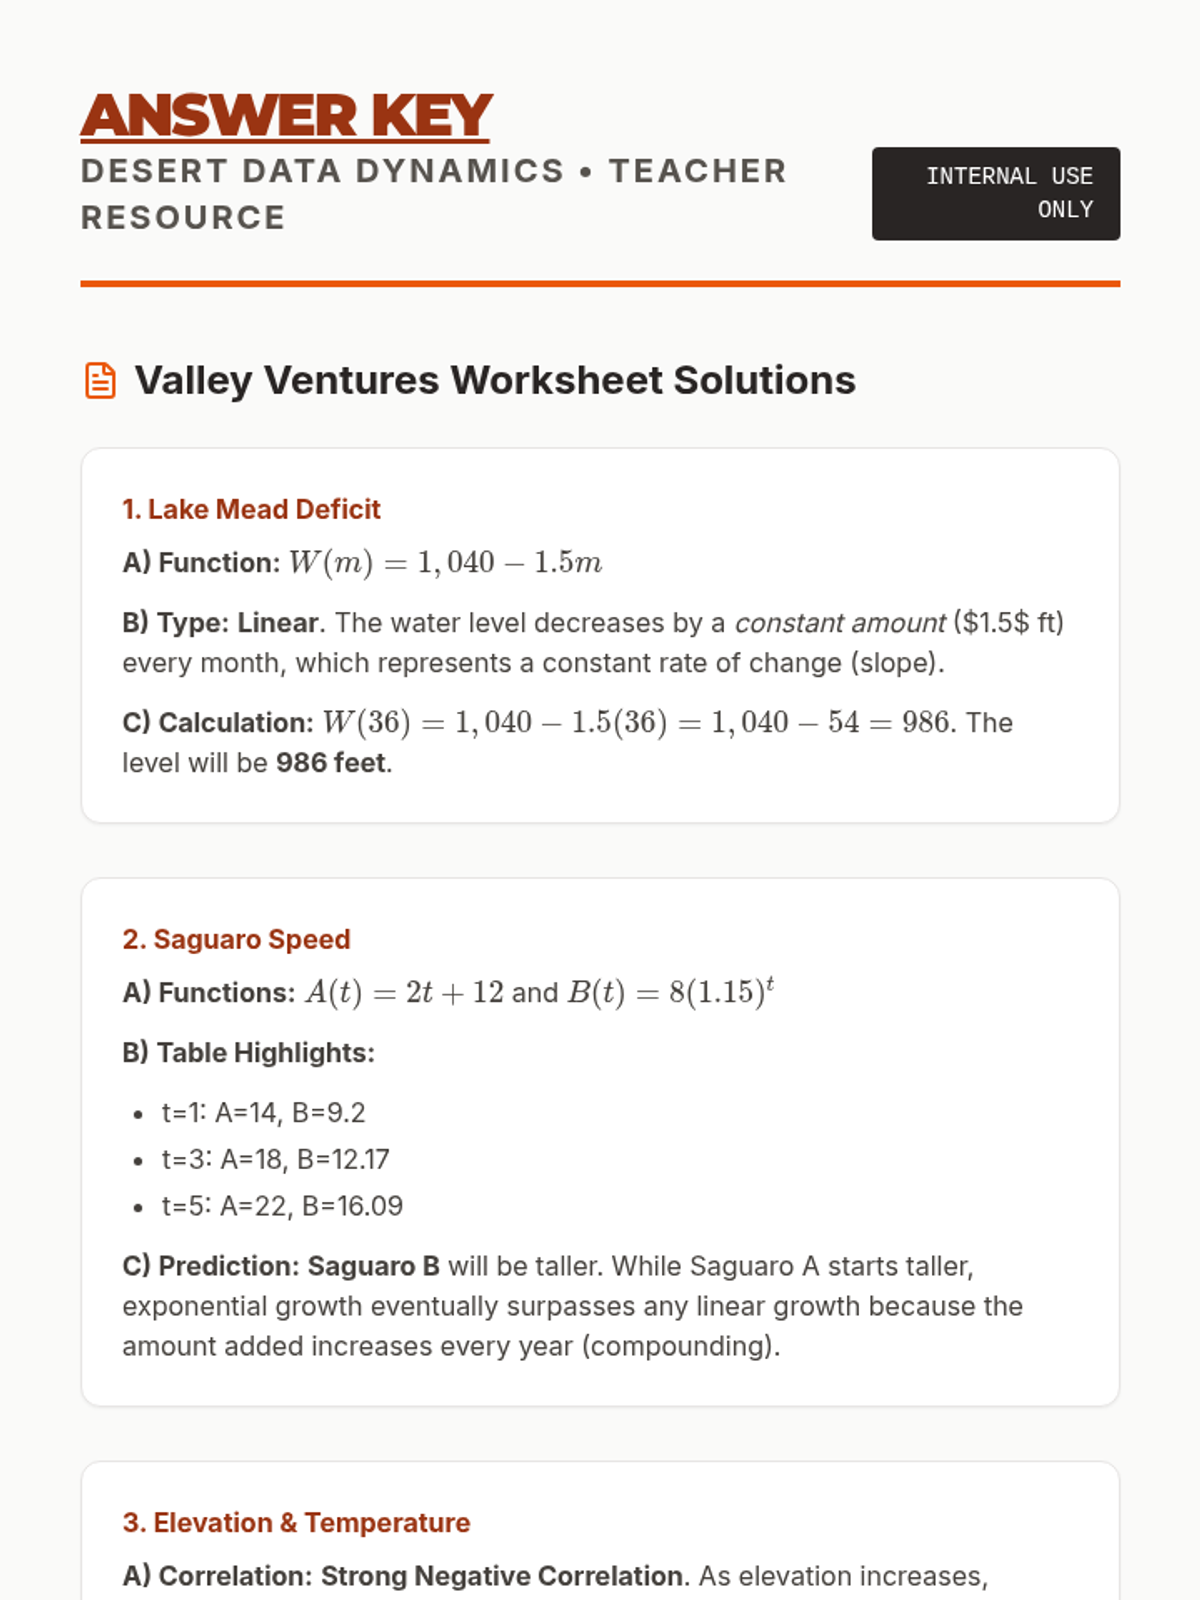
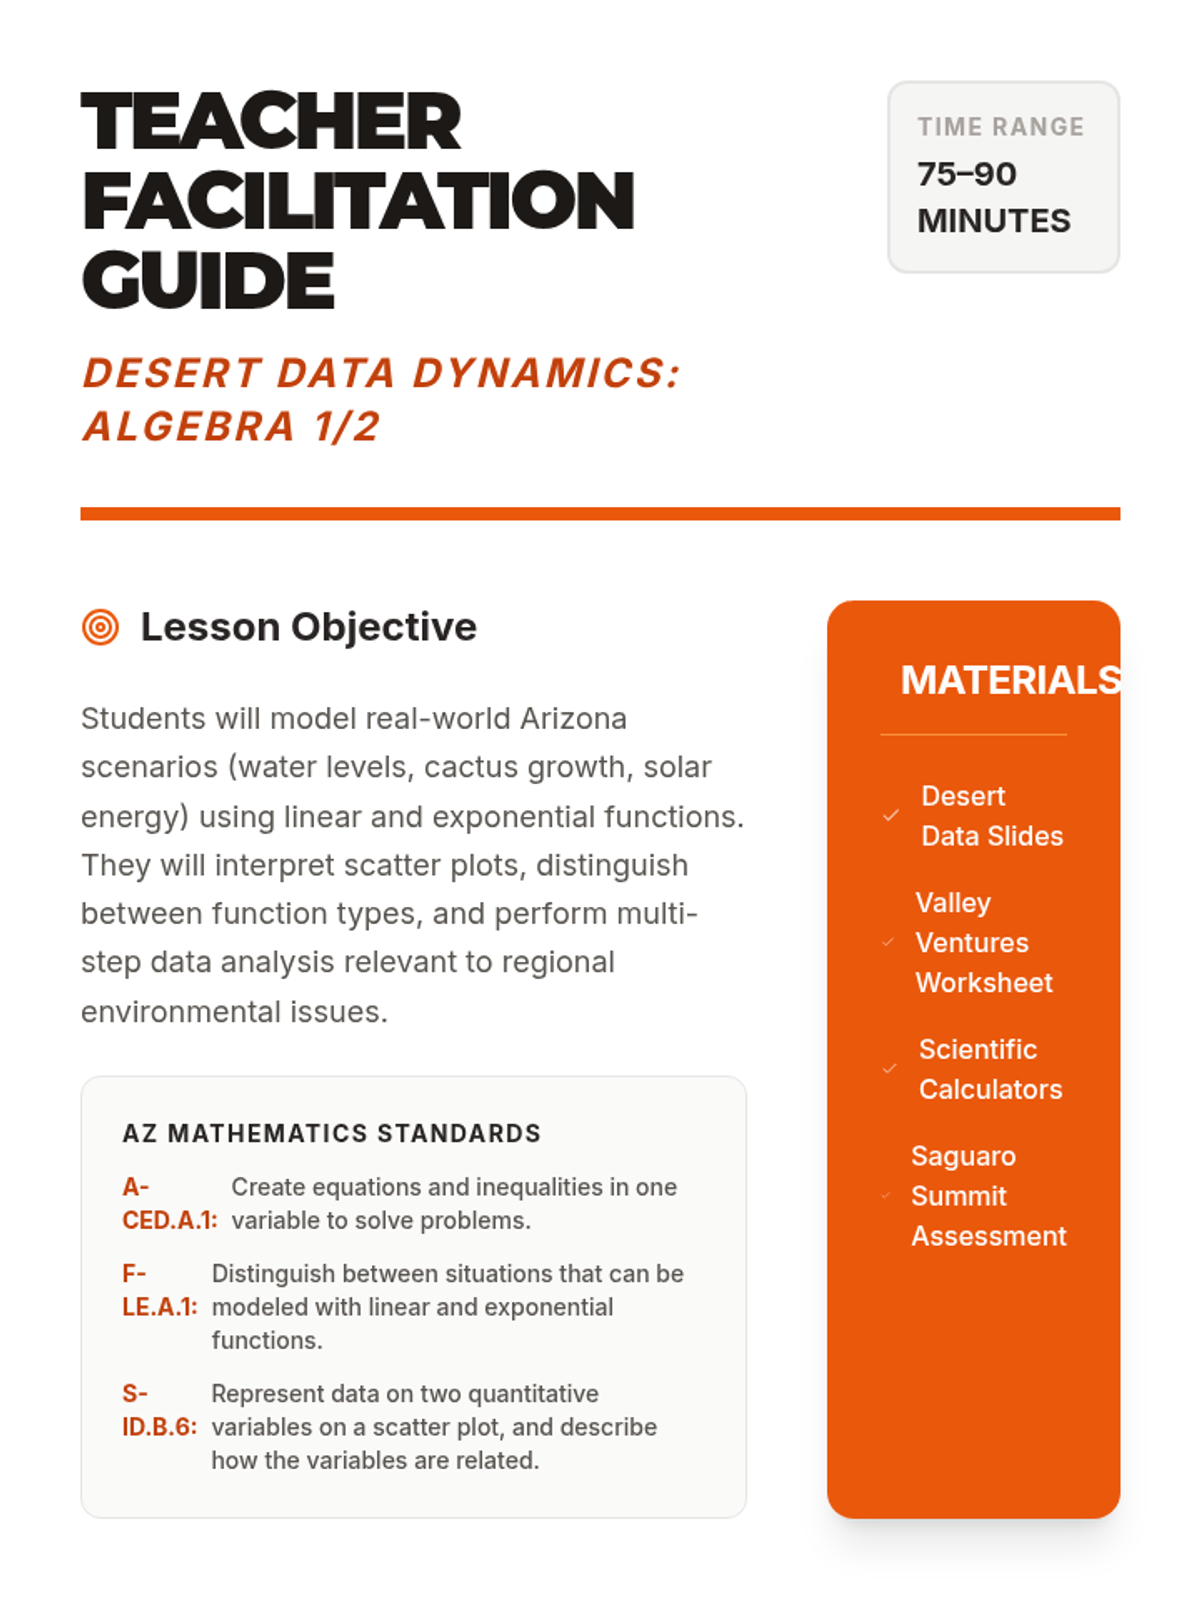
A comprehensive Algebra lesson focusing on modeling real-world Arizona scenarios using functions and data interpretation. Students will master identifying function types, constructing equations, and analyzing statistical trends.
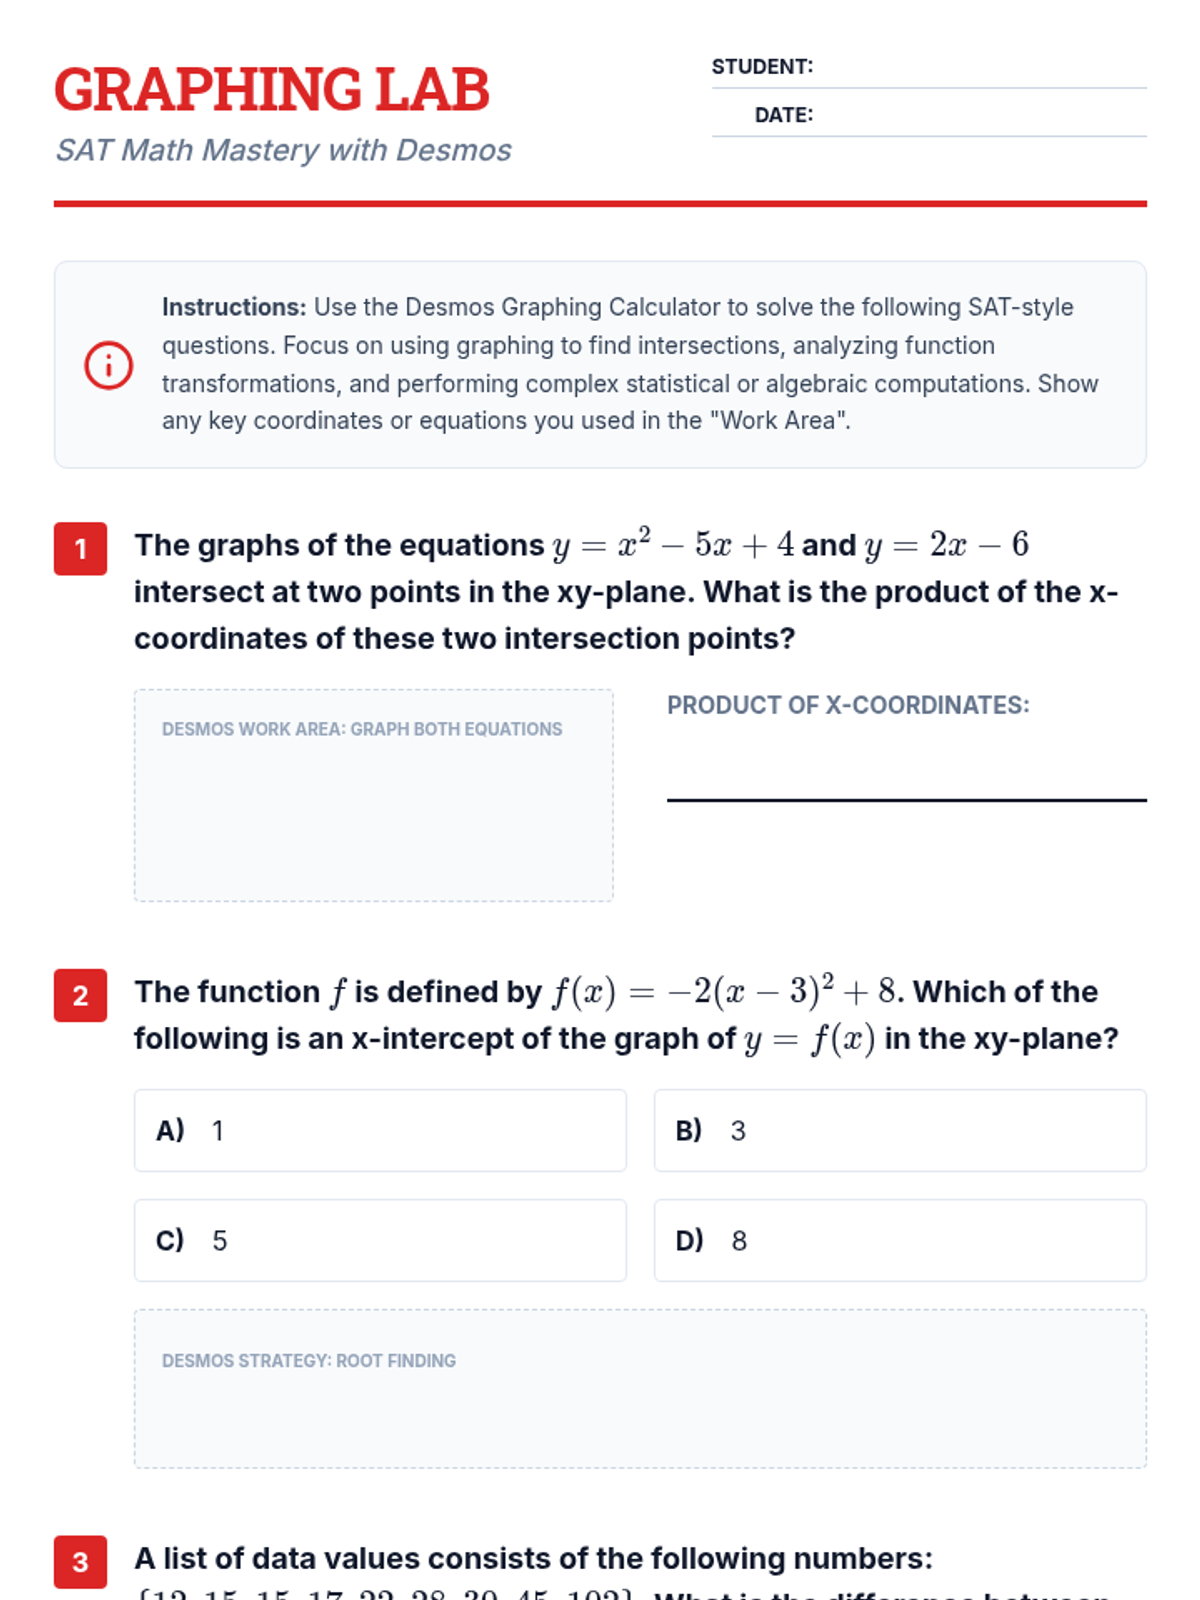
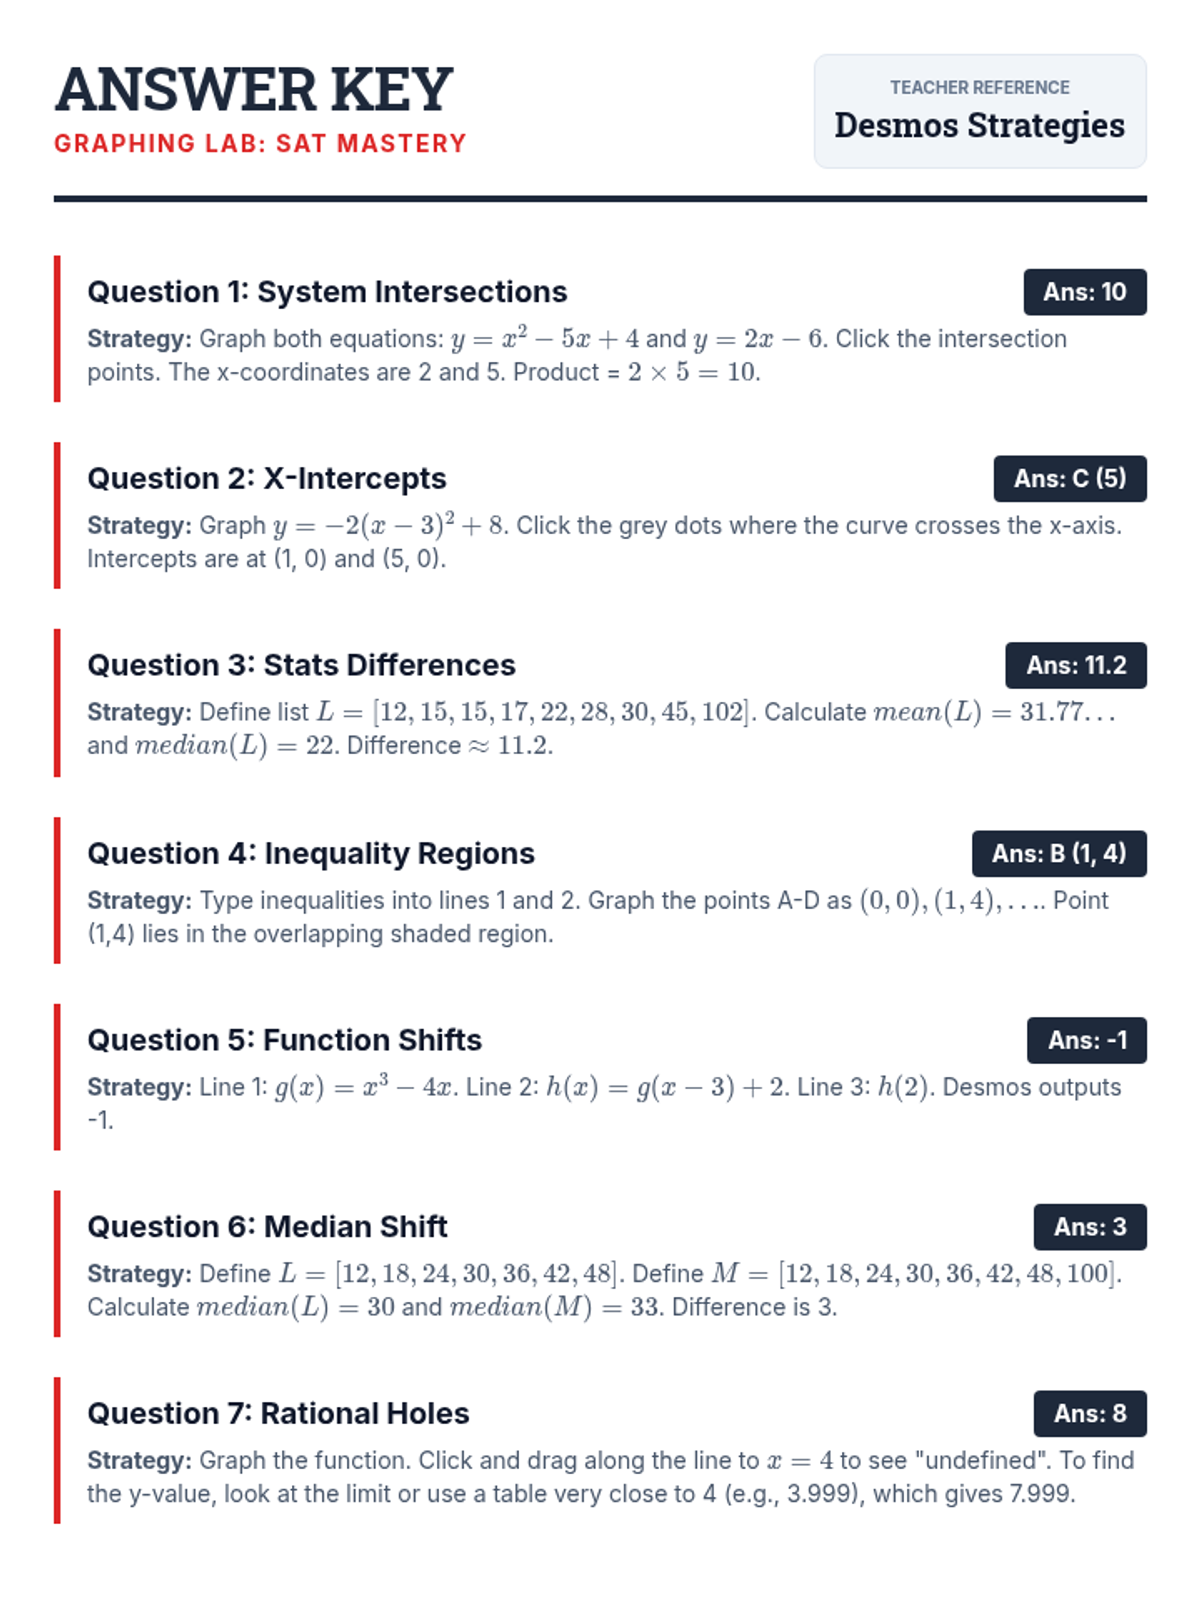
This lesson focuses on leveraging the Desmos graphing calculator to solve SAT Math problems efficiently across Heart of Algebra, Problem Solving and Data Analysis, and Passport to Advanced Math. Students will practice graphing systems, finding key features of nonlinear functions, and performing statistical calculations.
A lesson focused on interpreting and analyzing real-world data from criminal justice, tax returns, and law enforcement statistics using calculations like rates of change, percentages, and frequency distributions.
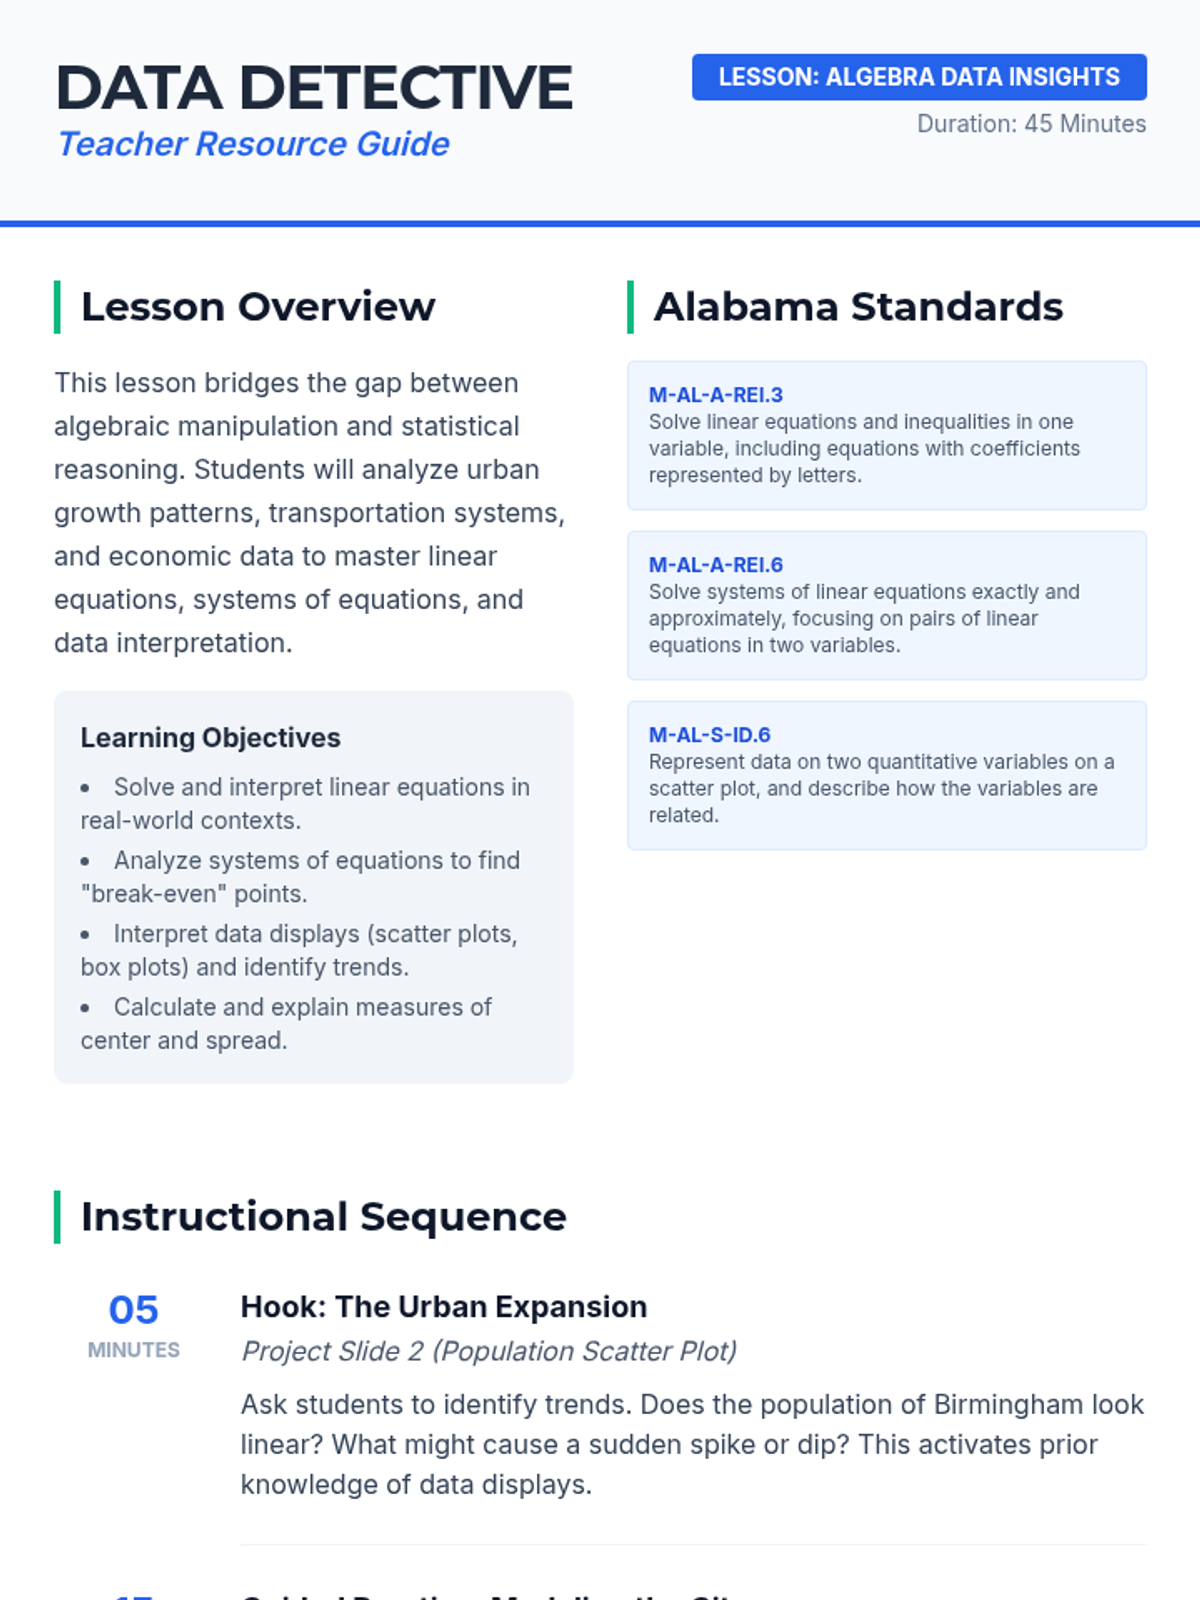
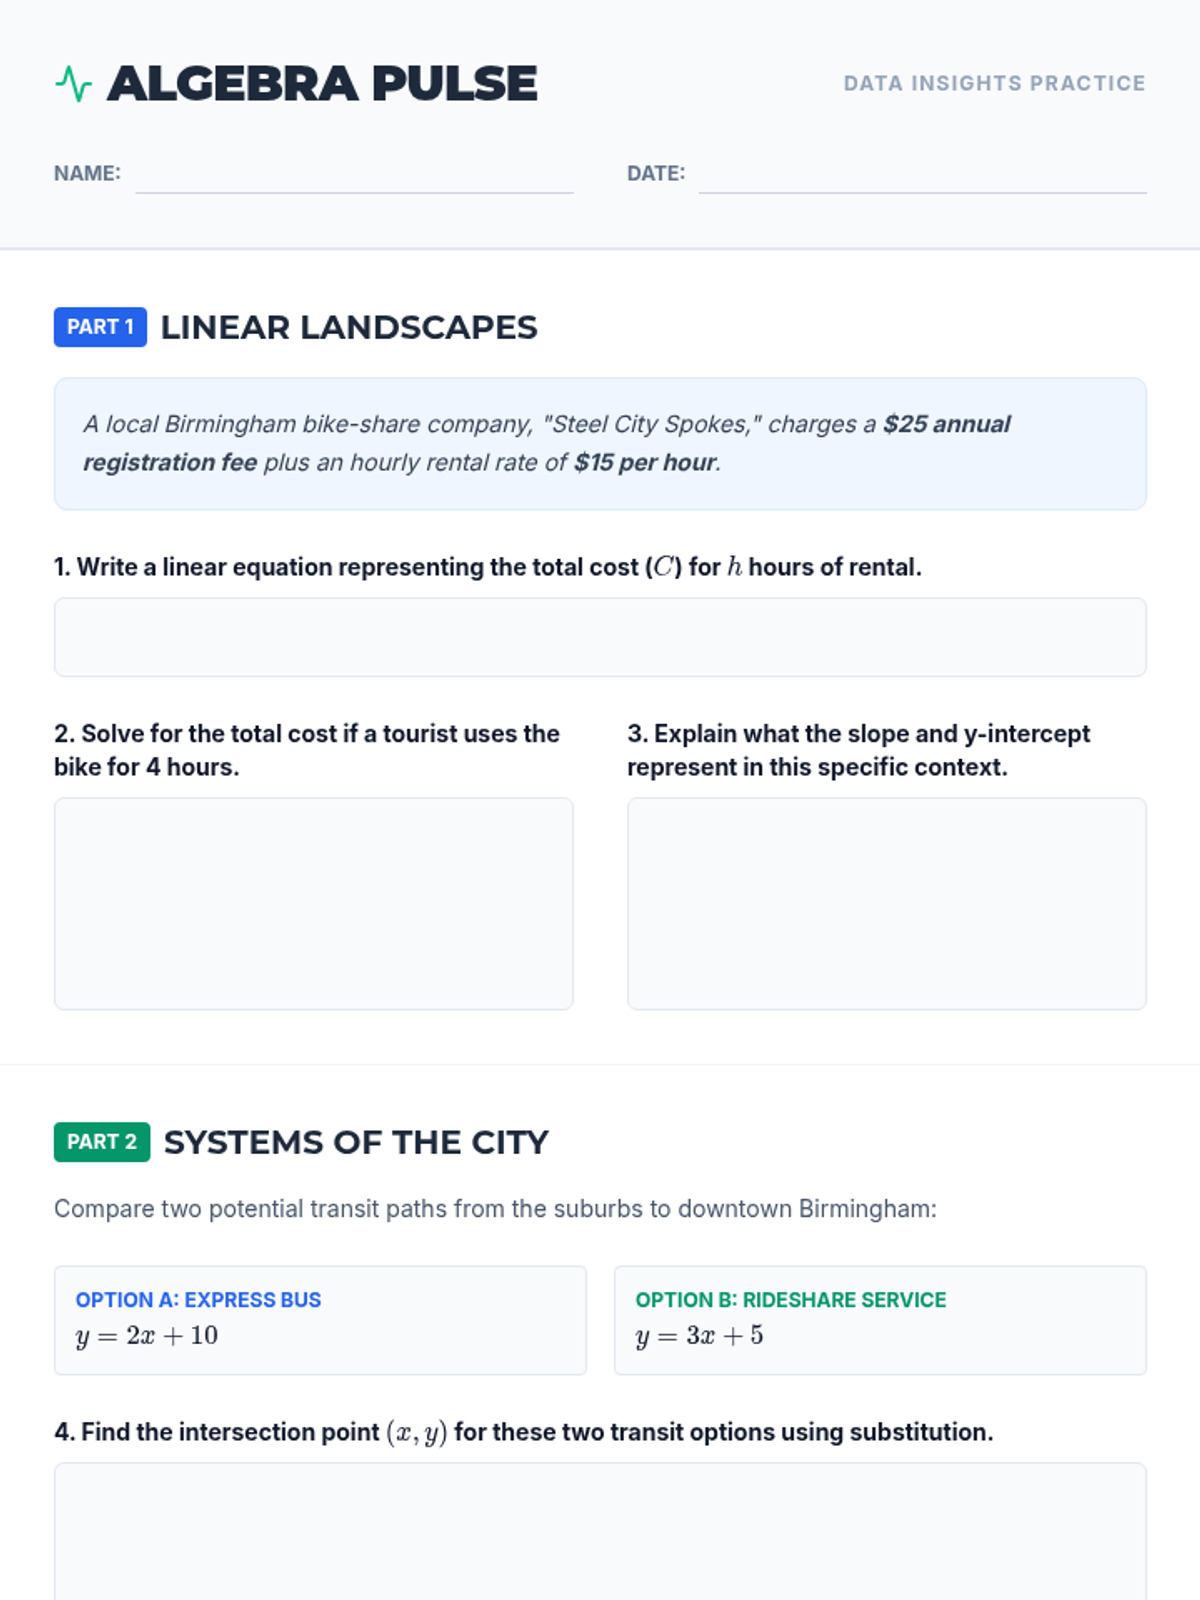
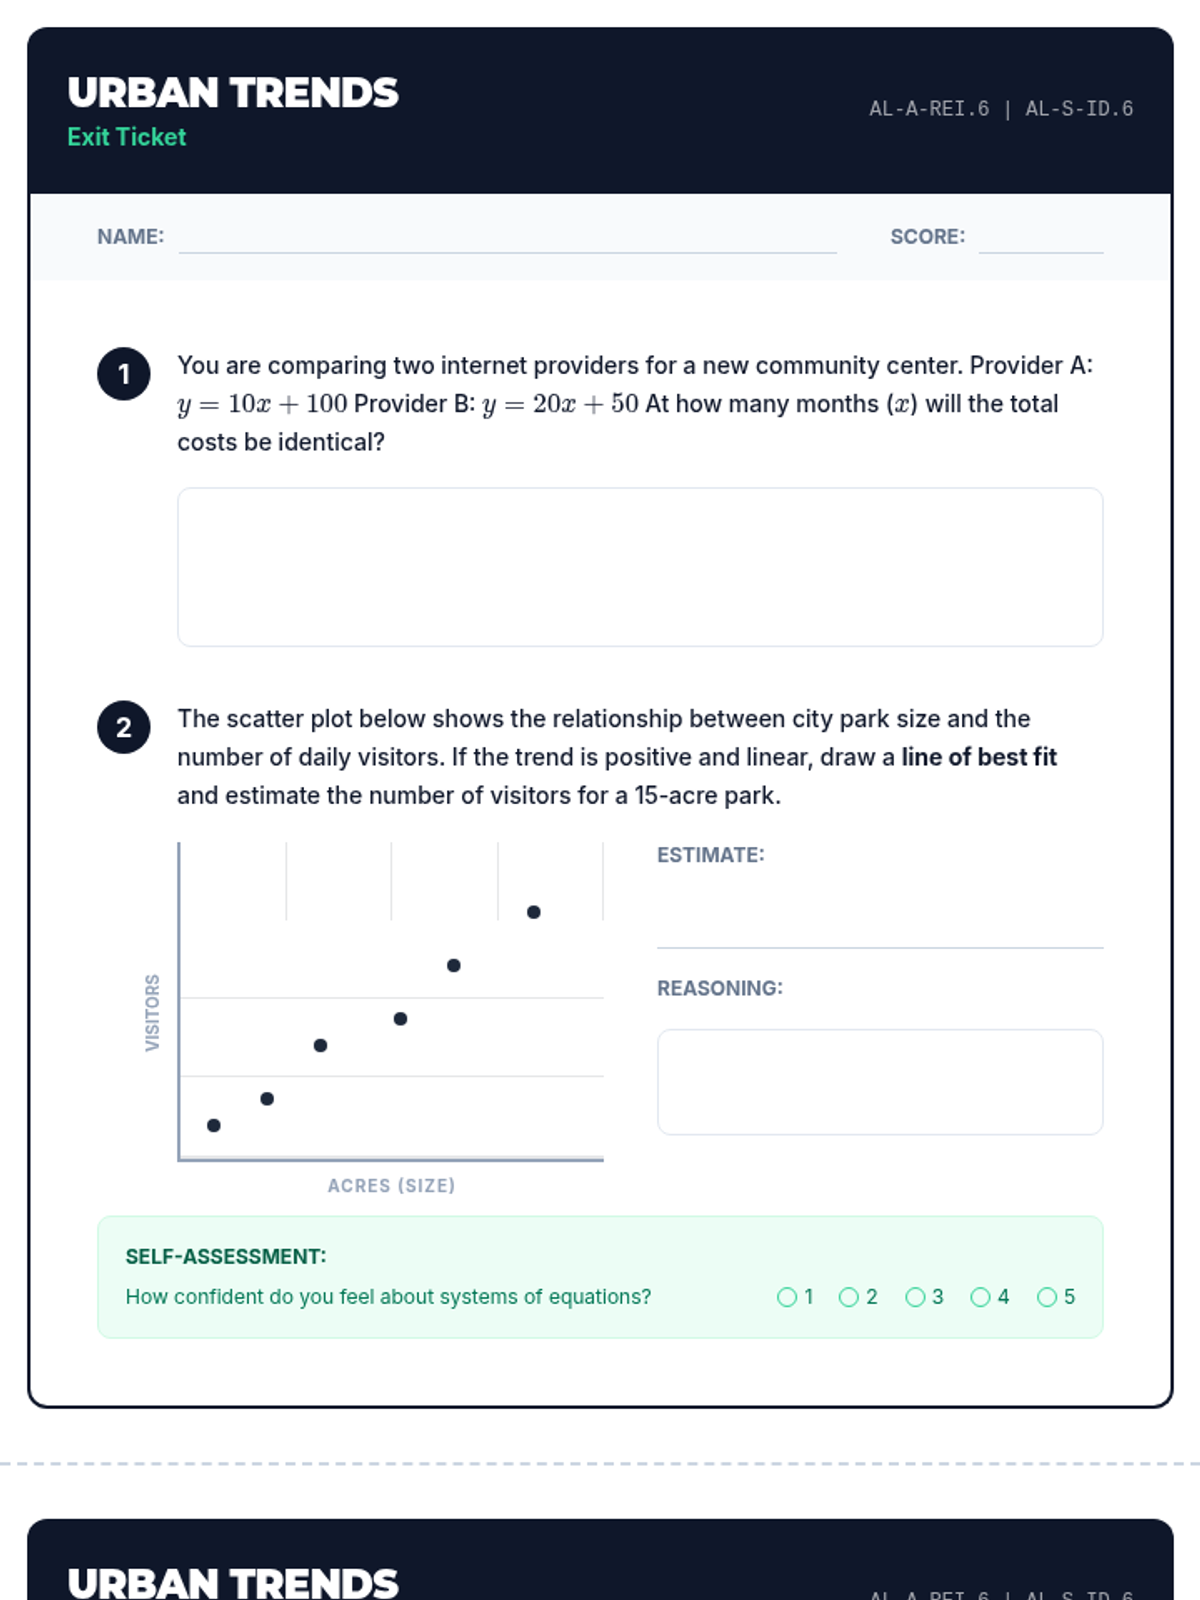
A comprehensive review of linear equations, systems, and data analysis designed for Alabama high school students. This lesson uses real-world urban data to bridge algebraic manipulation with statistical interpretation.
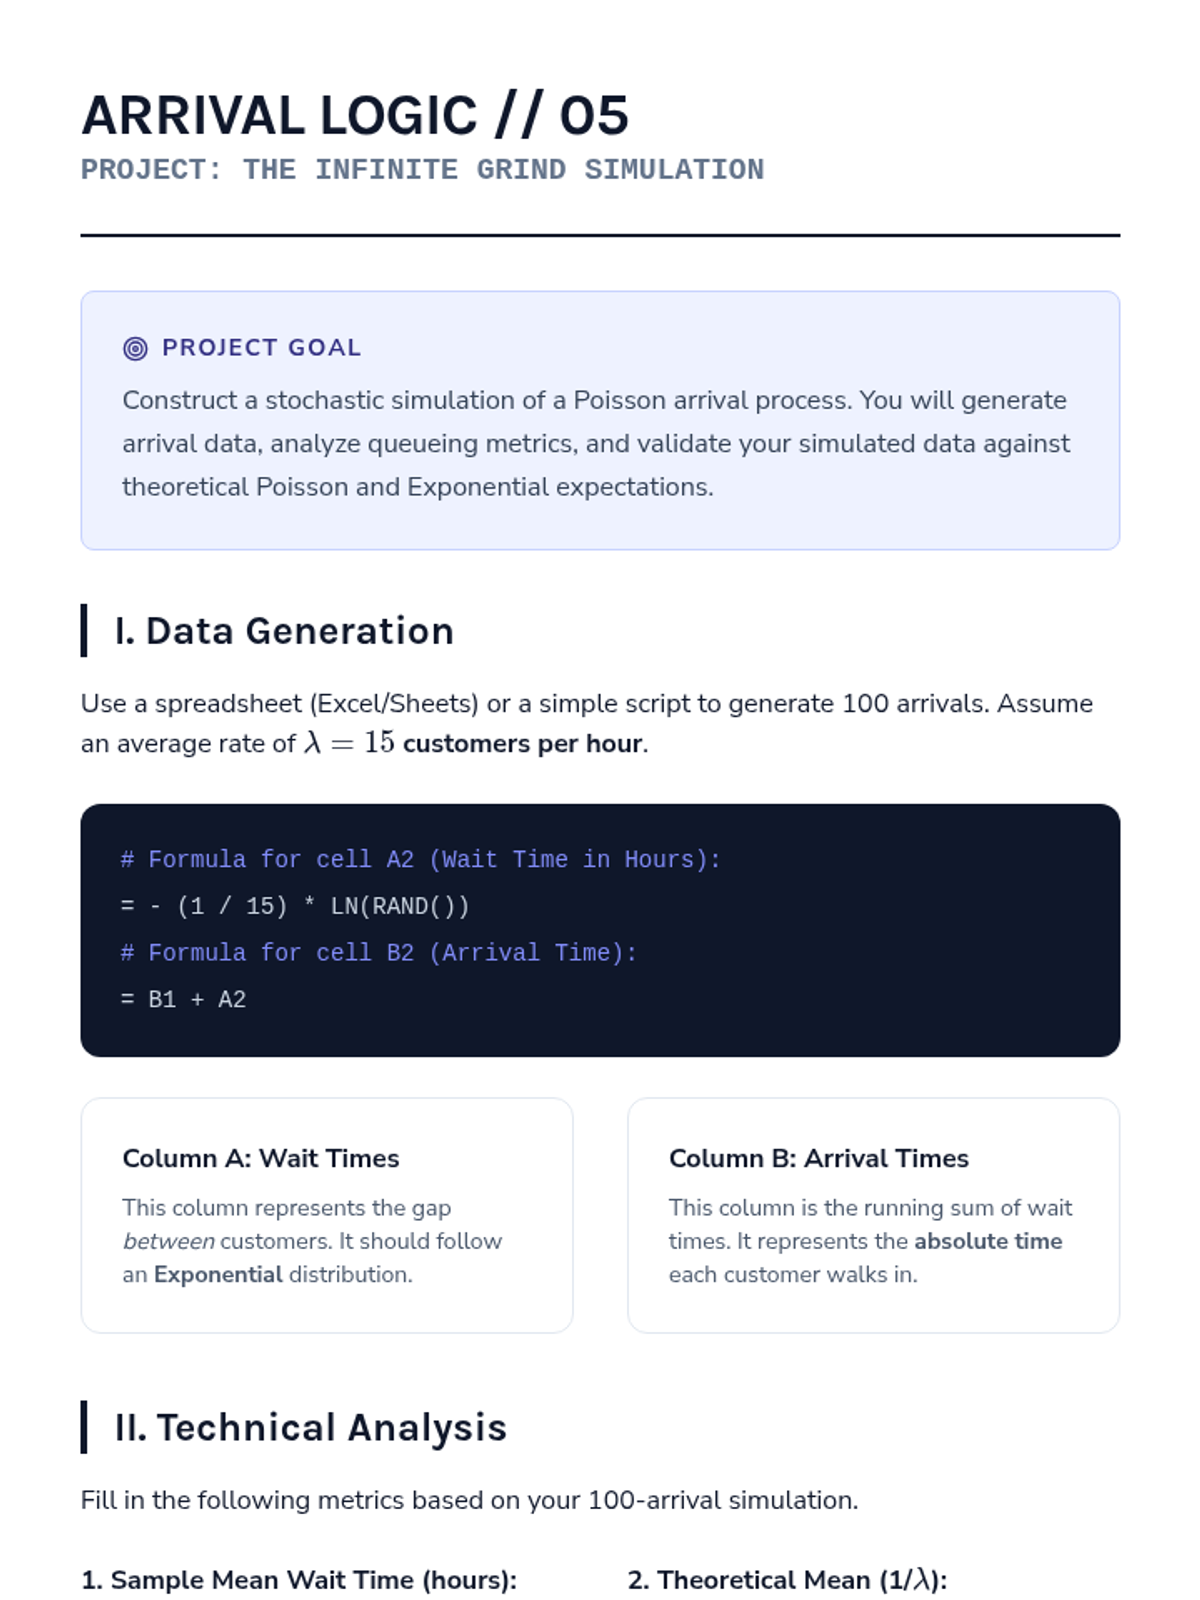
Students use simulation techniques to generate Poisson arrival data and validate their findings against theoretical Poisson and Exponential models.
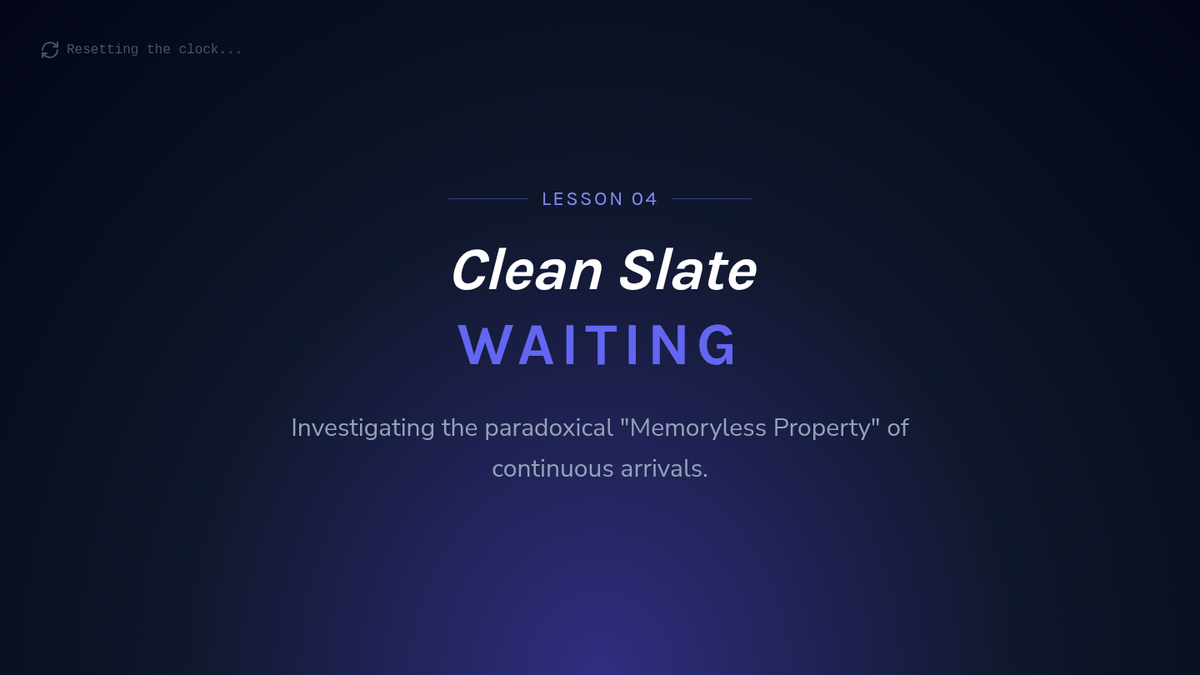
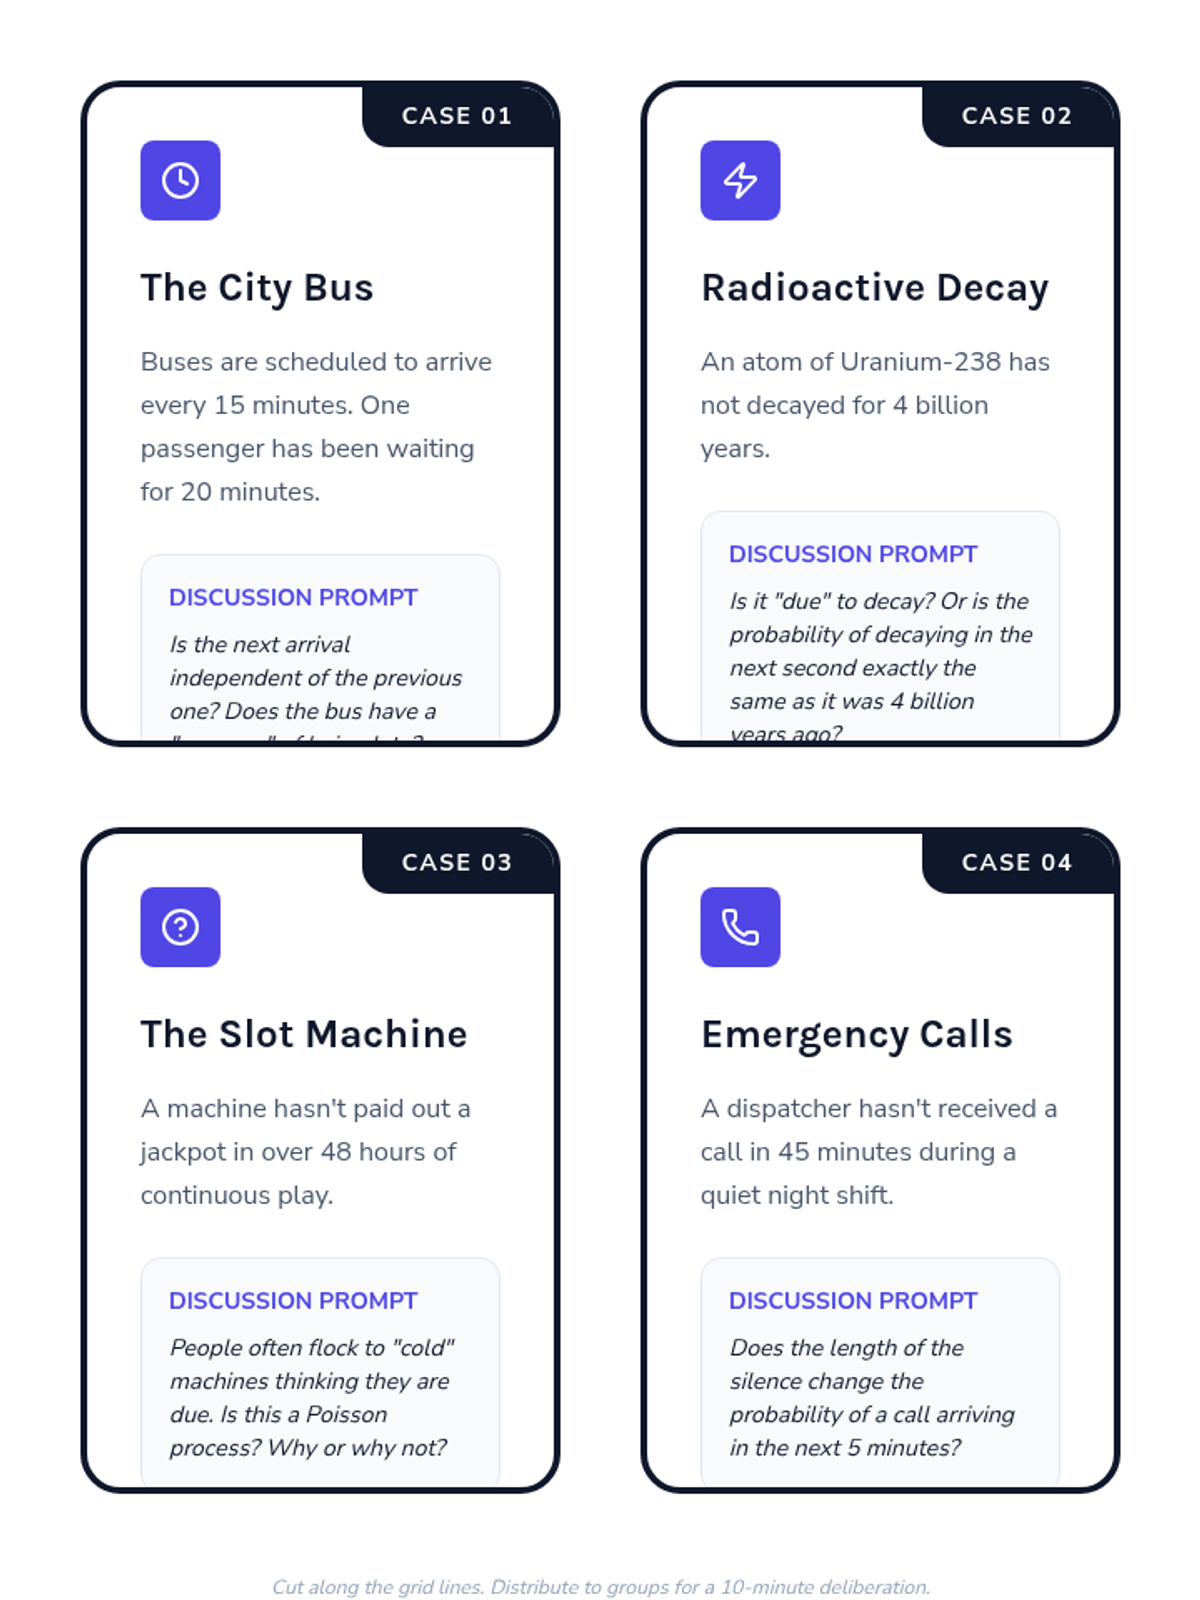
Students investigate the memoryless property of the Exponential distribution through paradoxes and proofs, understanding why past wait times don't predict future ones.
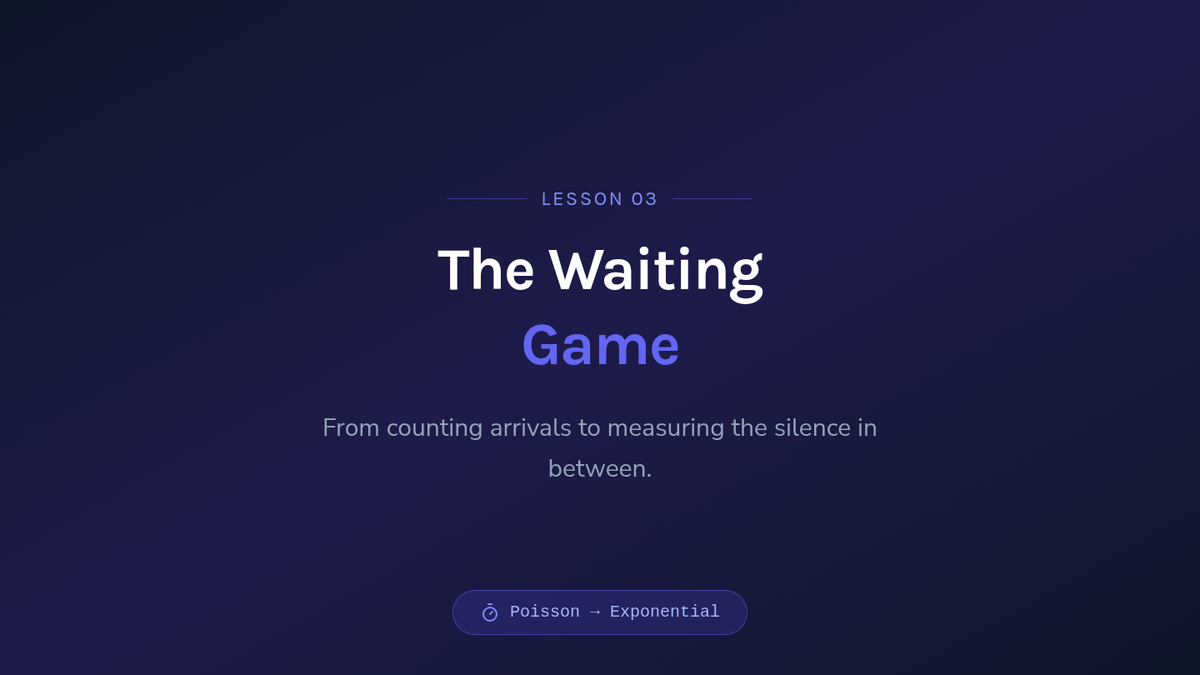
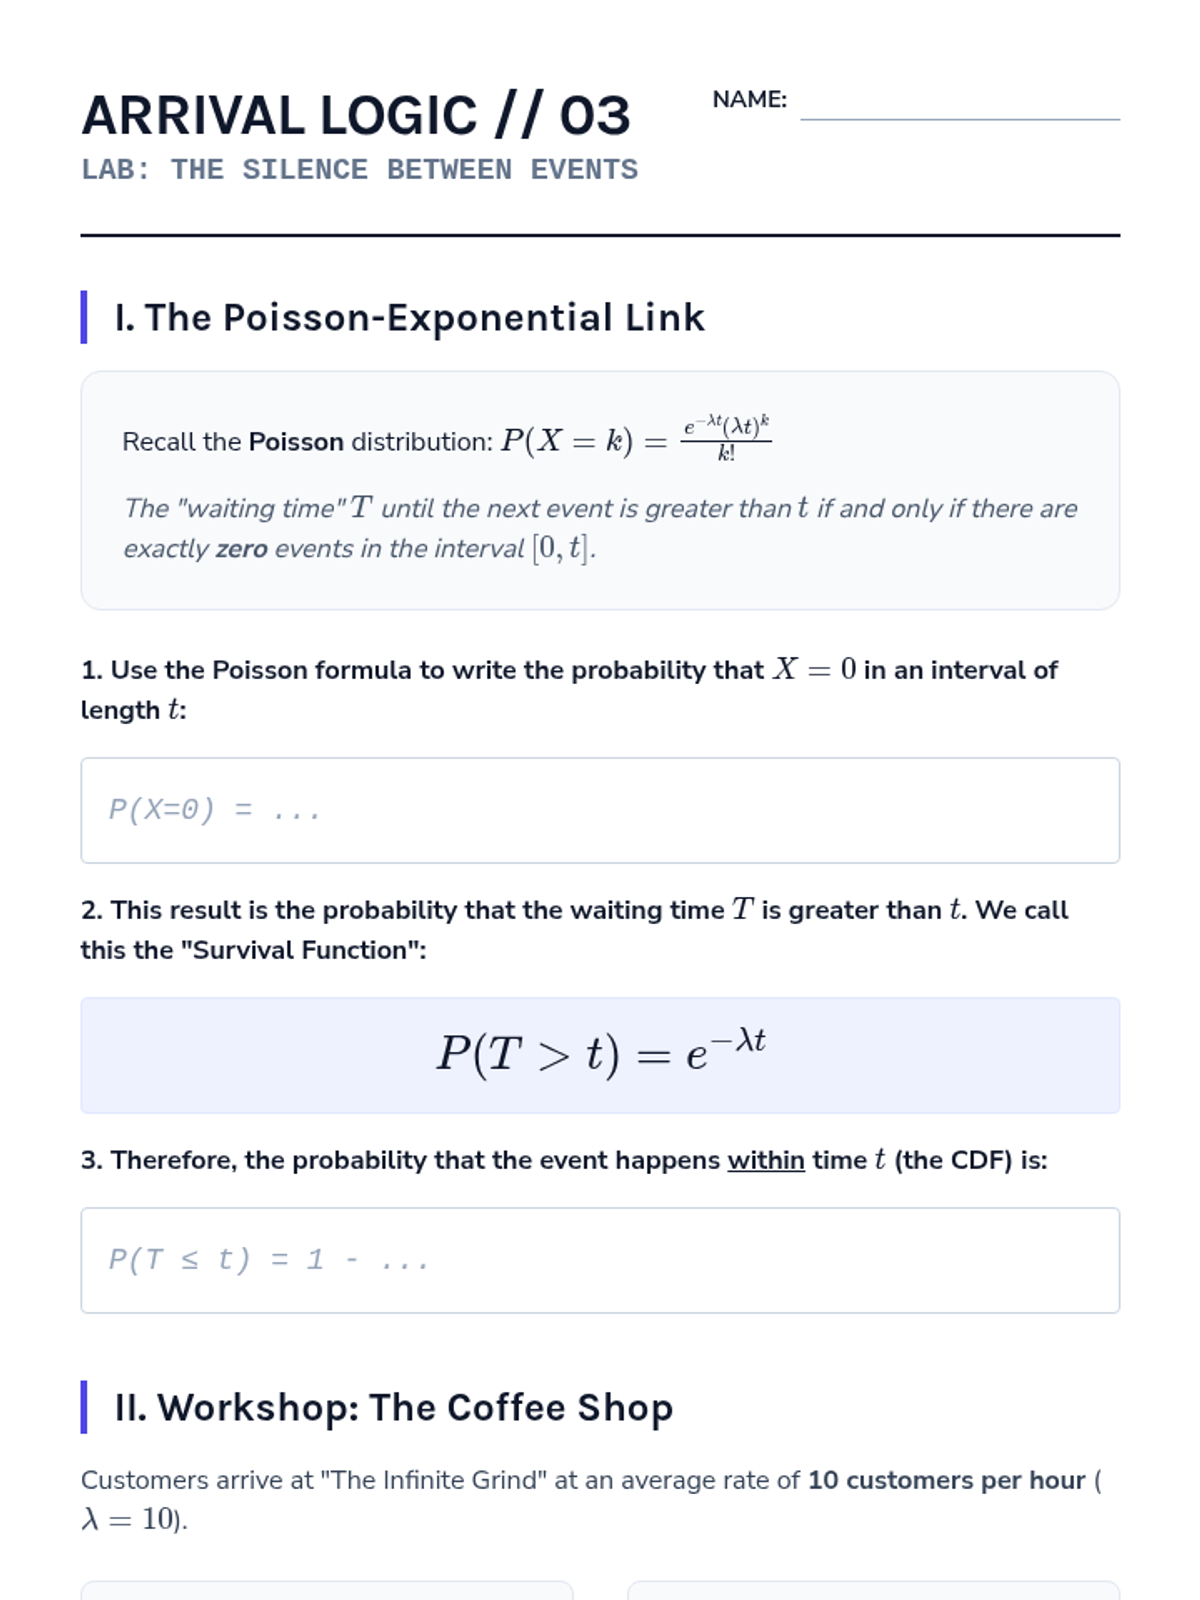
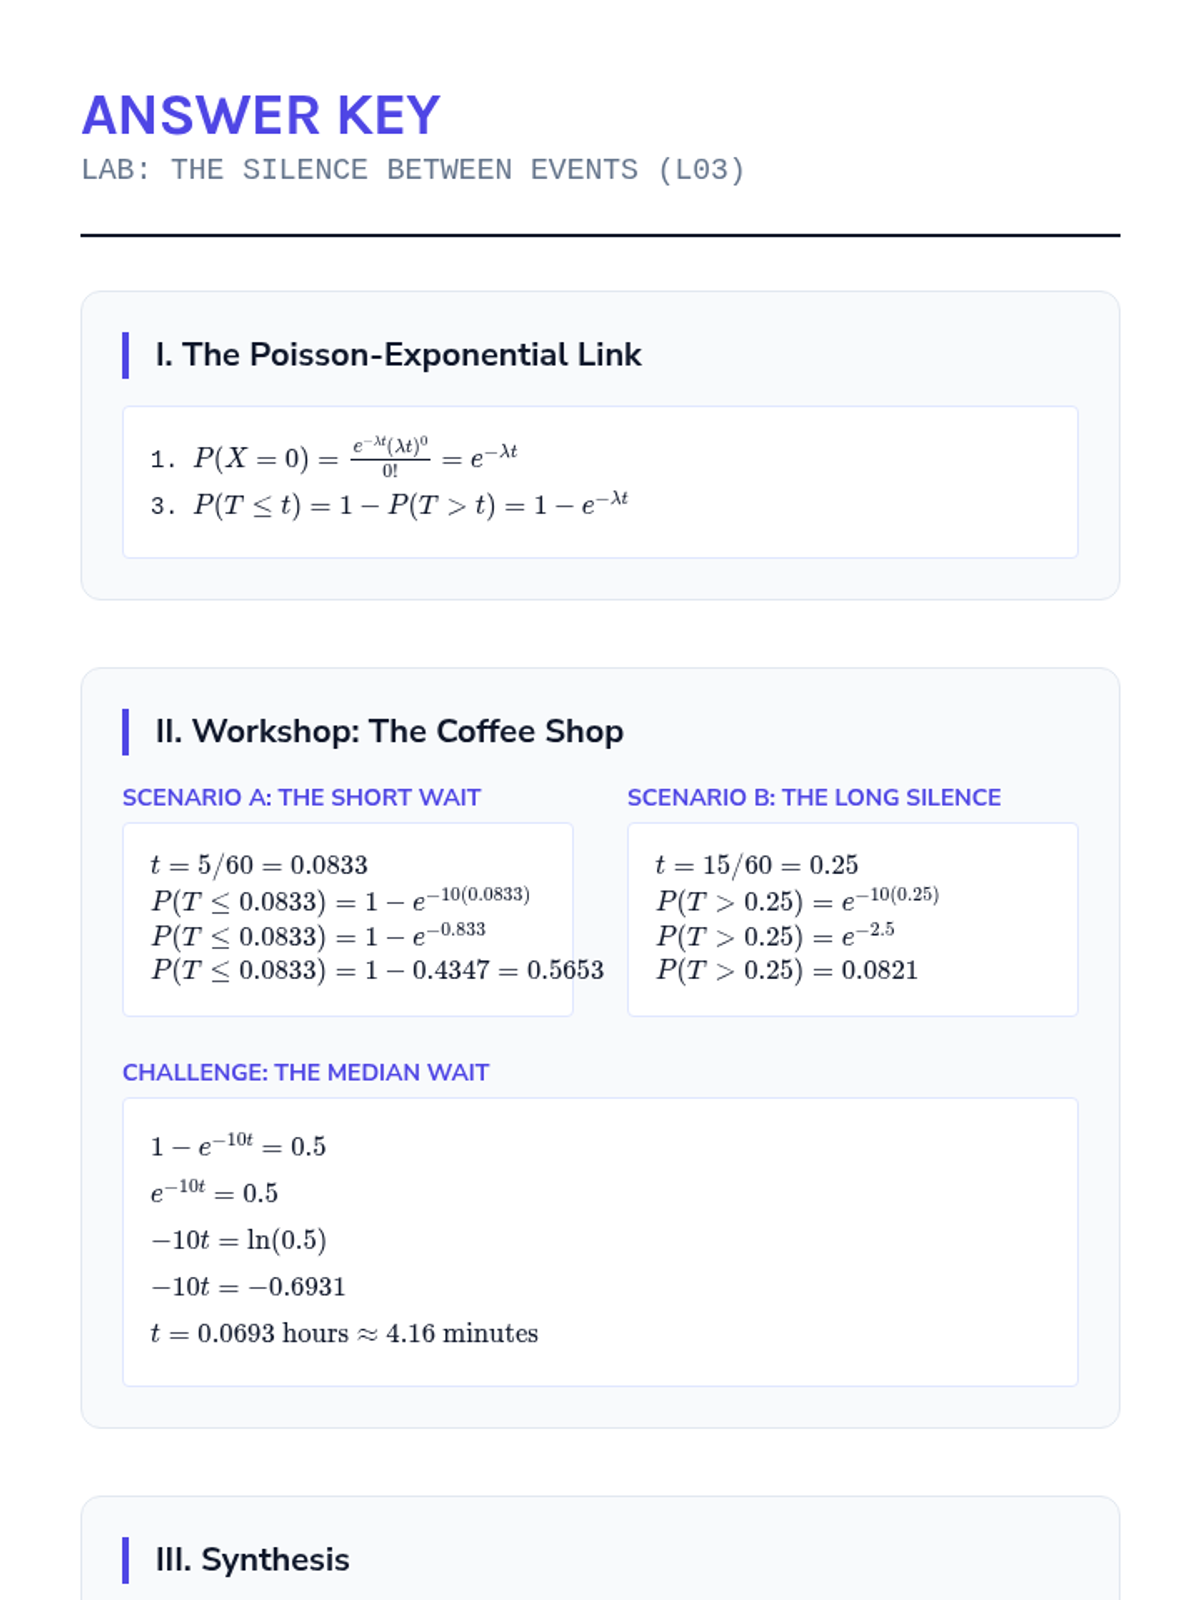
Students shift from event counts to waiting times, examining the Exponential distribution and its application to inter-arrival intervals in Poisson processes.
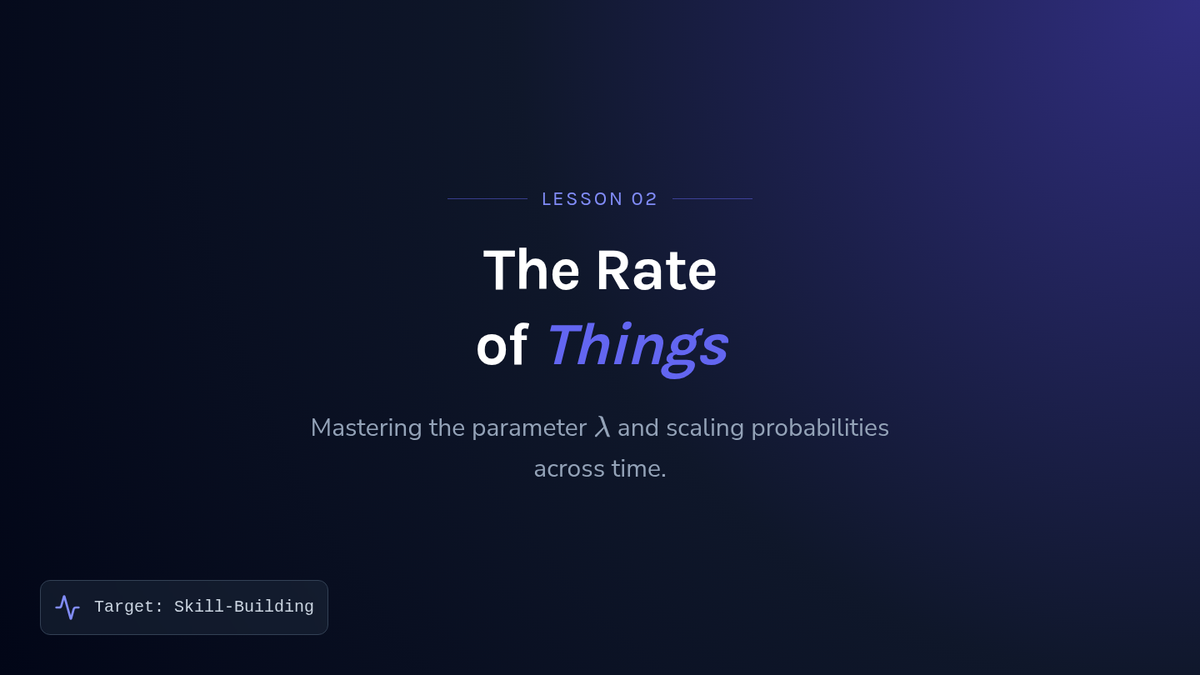
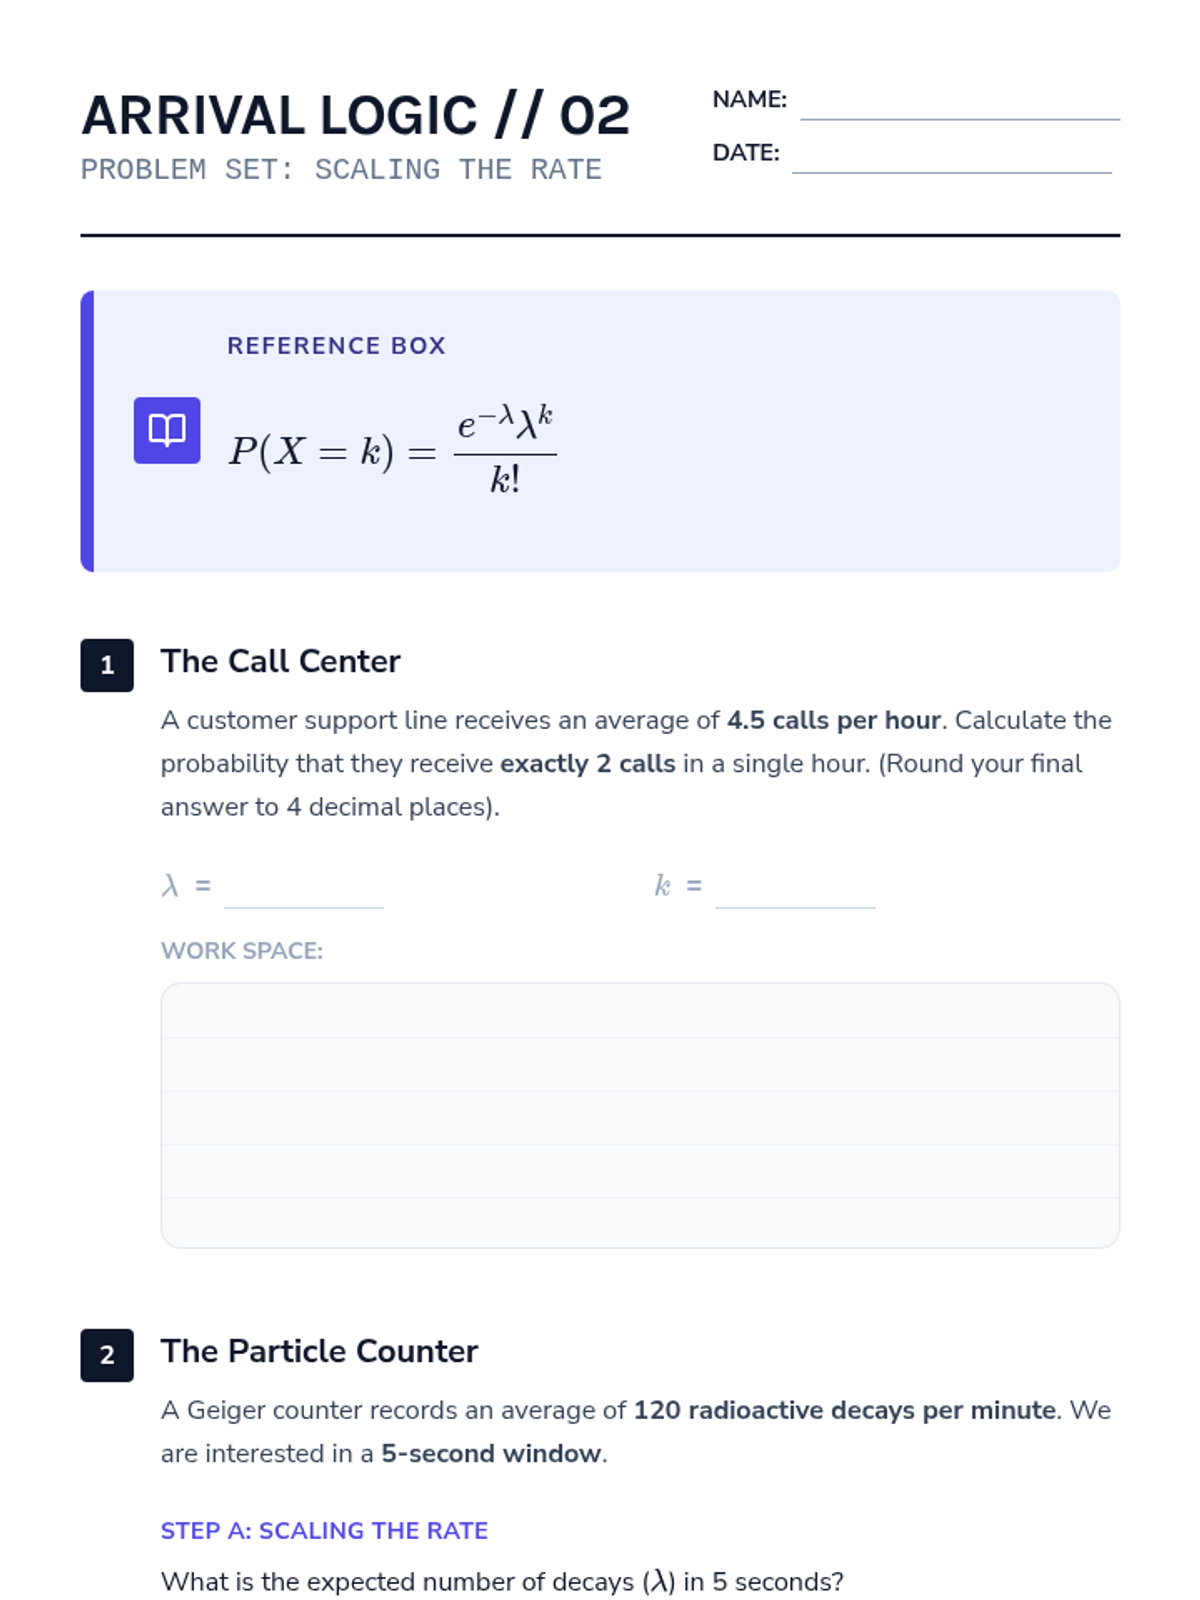
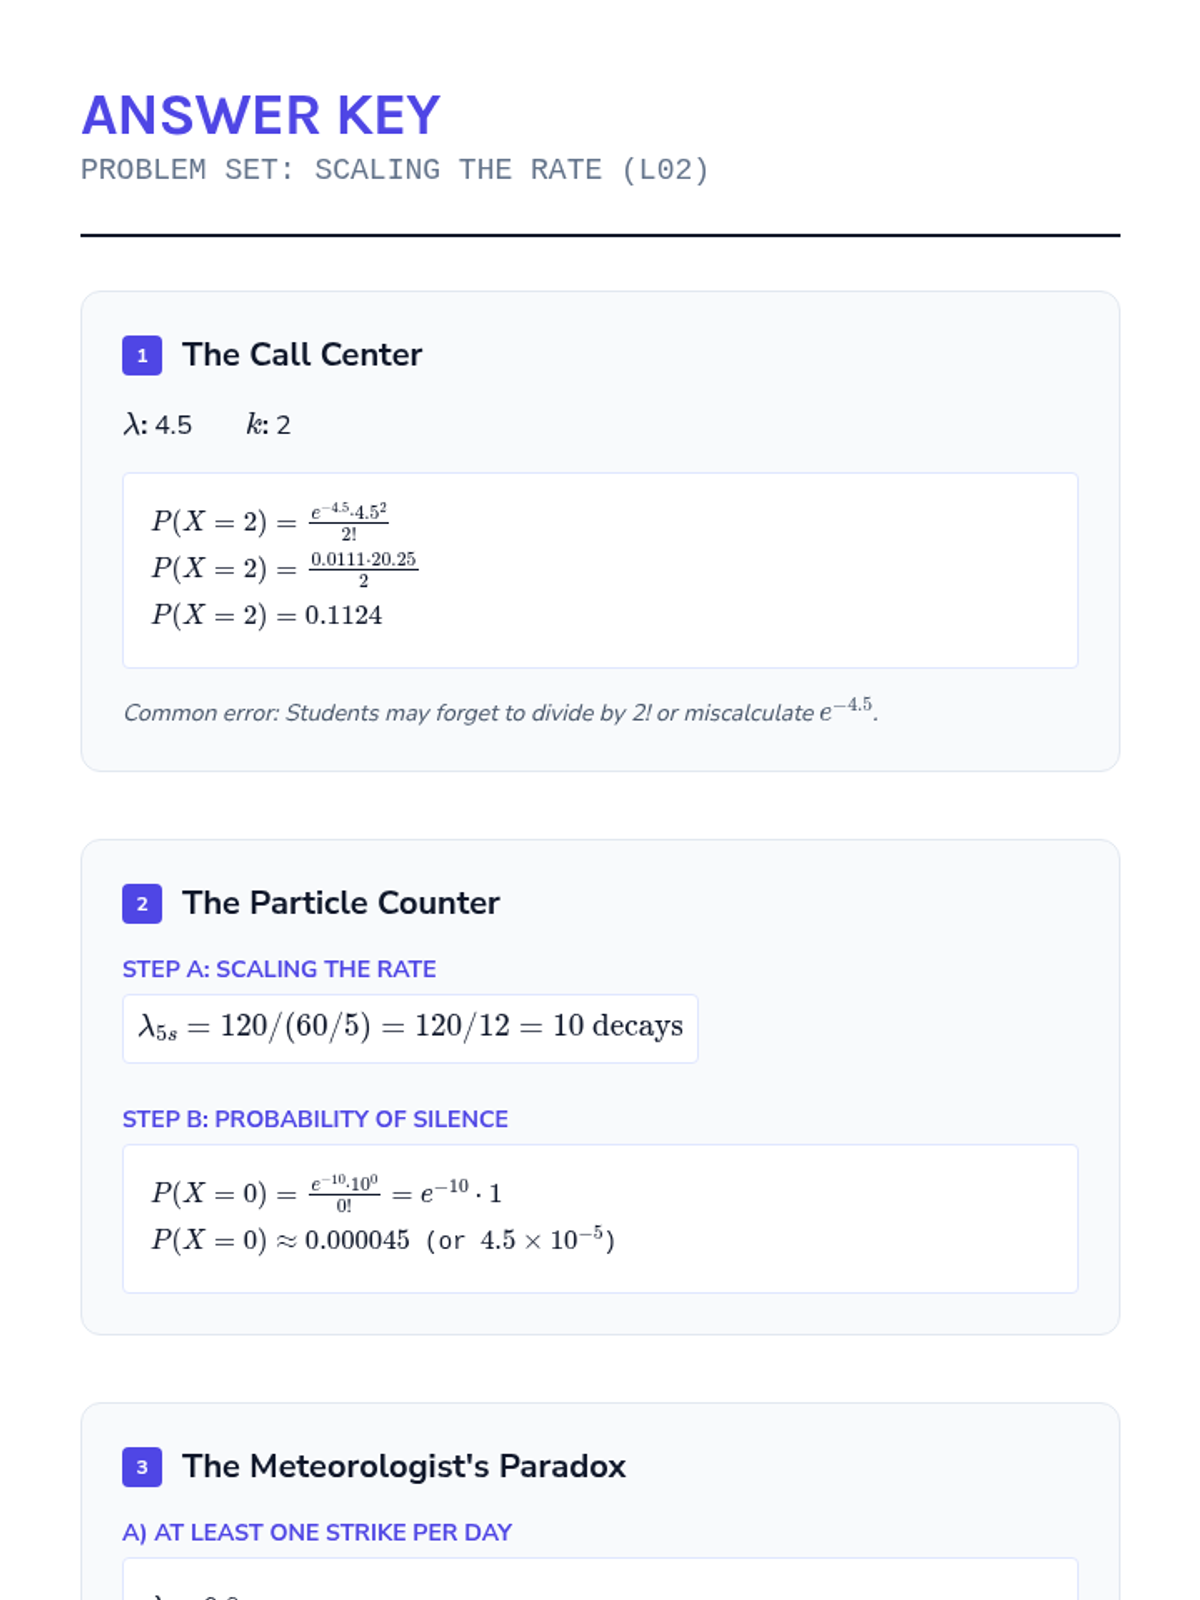
Focusing on the parameter lambda (rate), students calculate probabilities for specific numbers of events in fixed windows and practice scaling rates across different time intervals.
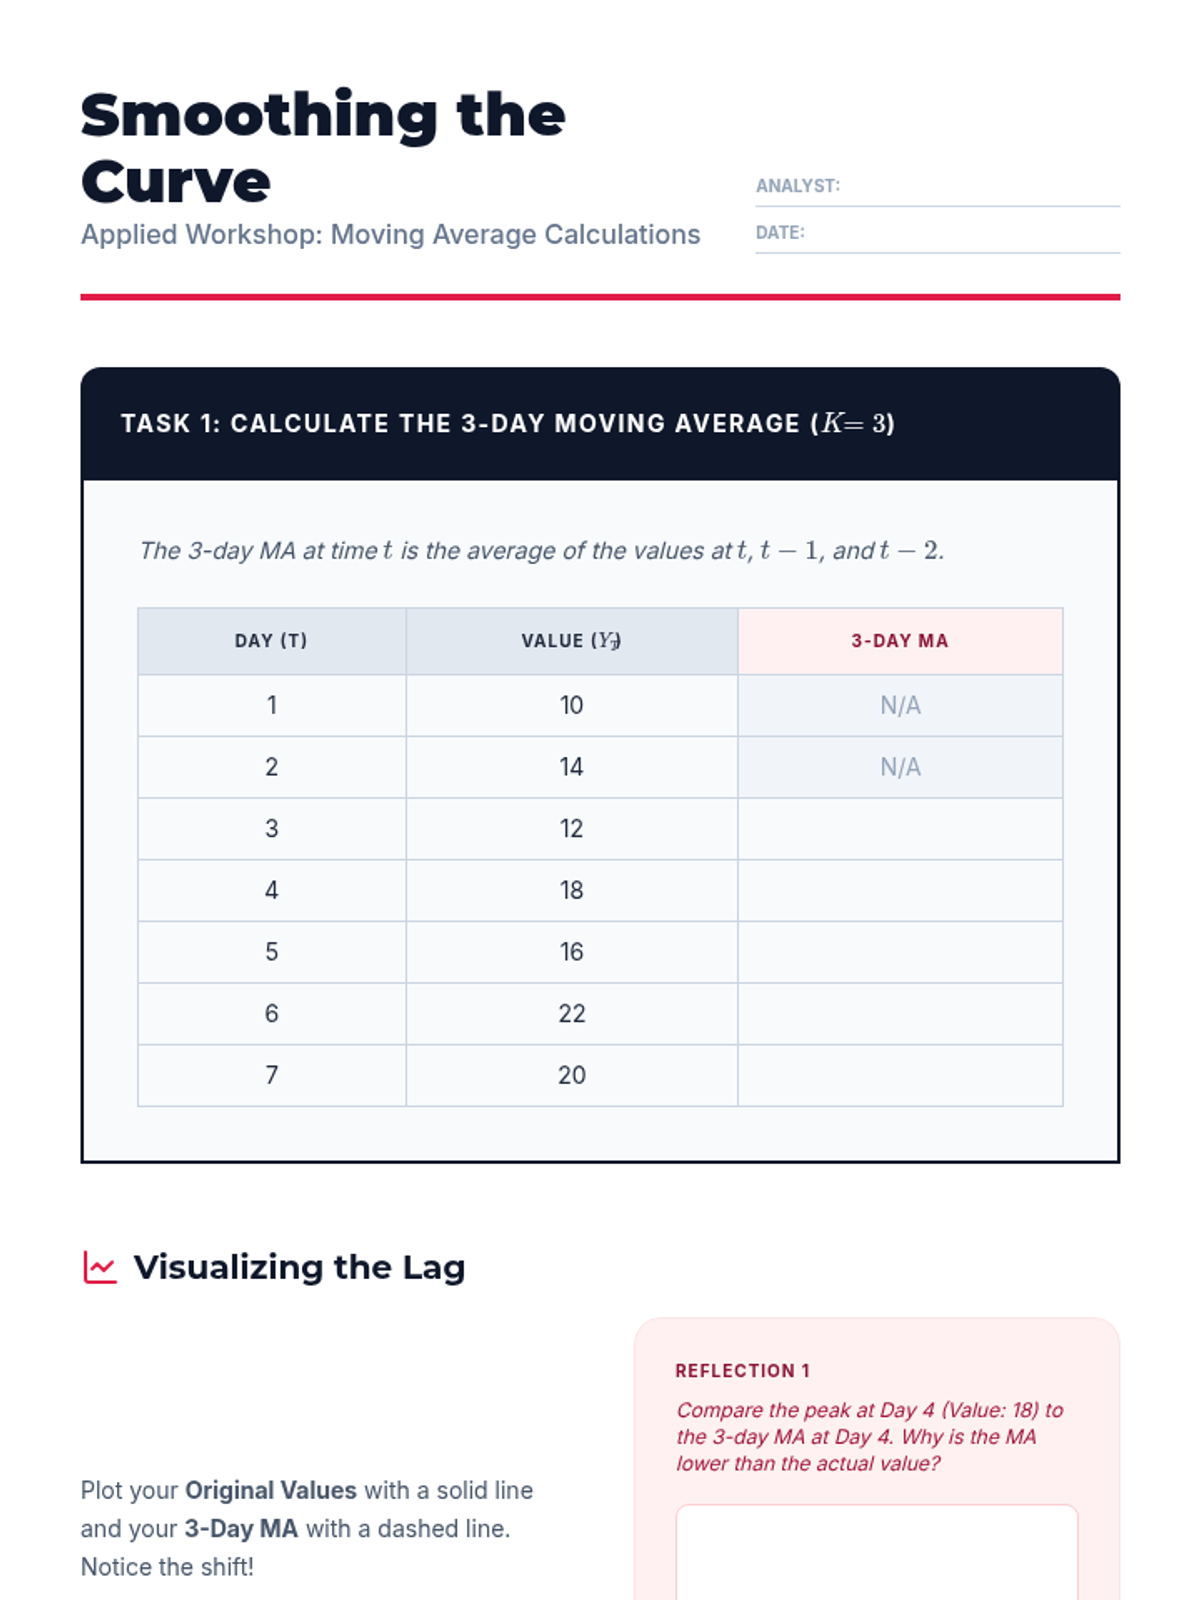
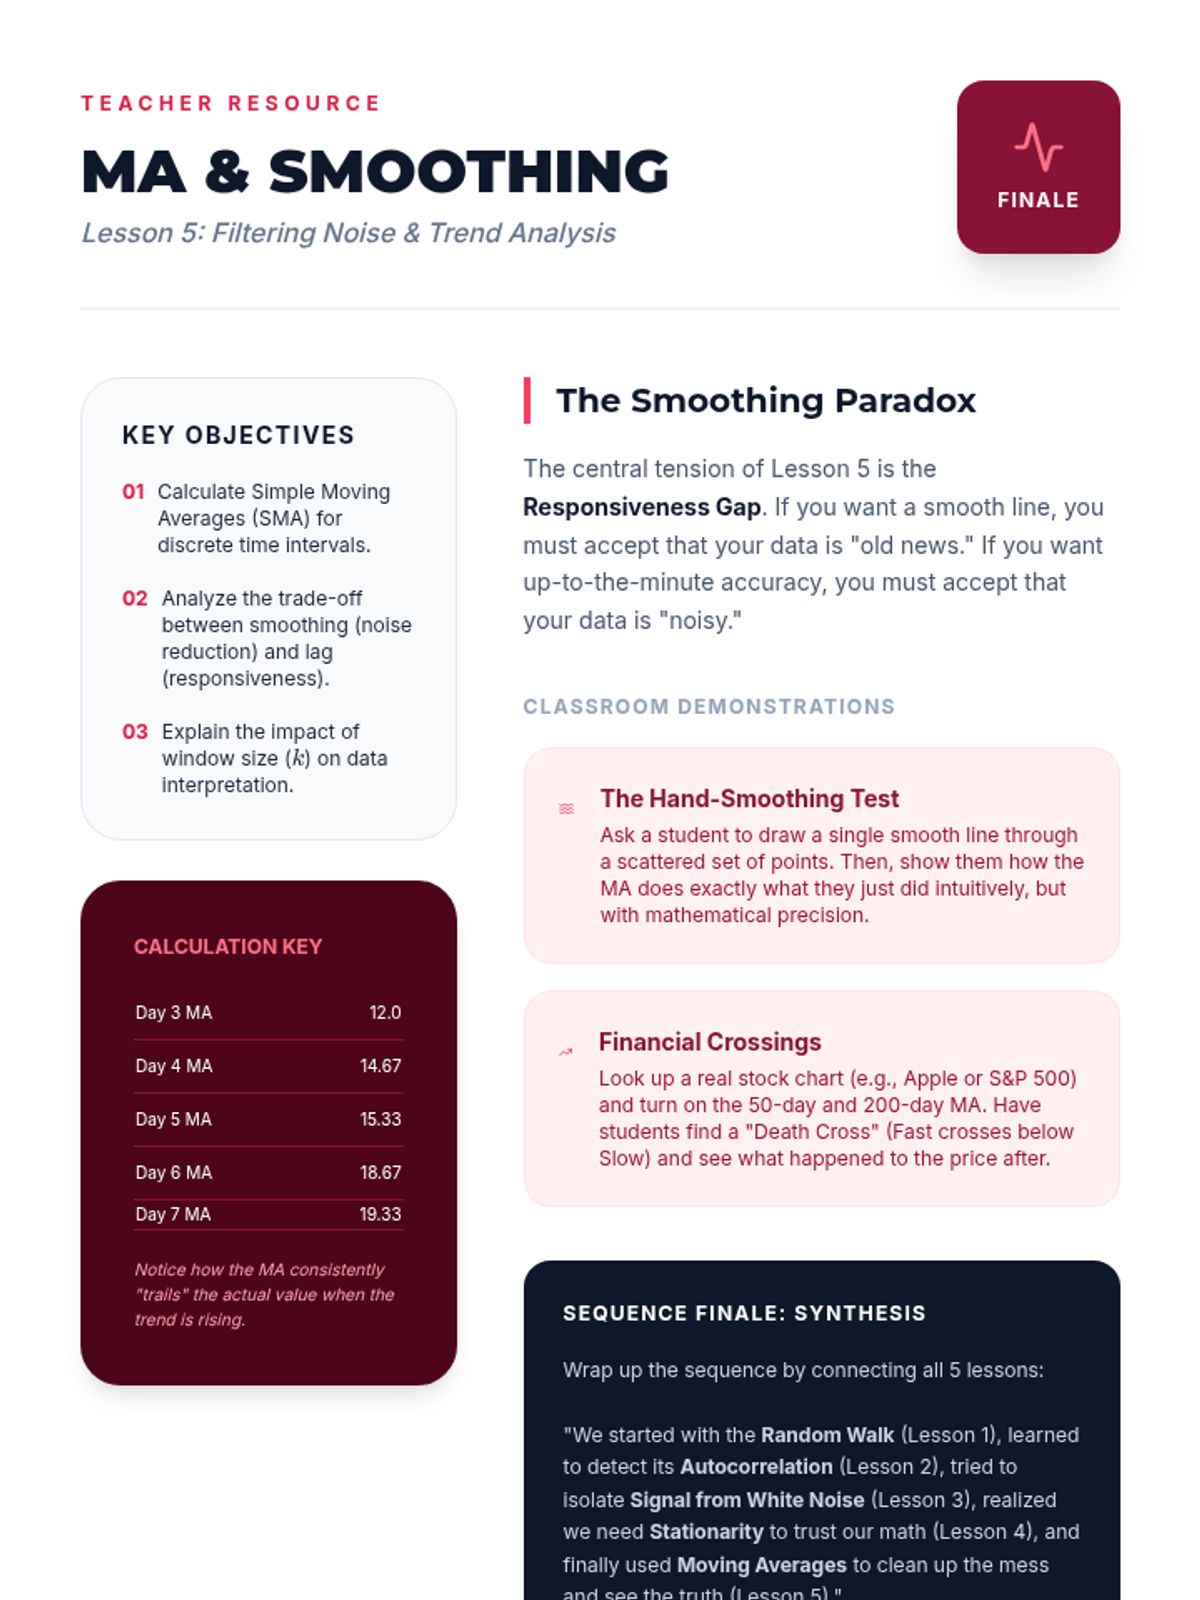
Students apply Moving Average (MA) models to smooth out noise and reveal underlying trends in messy temporal data.
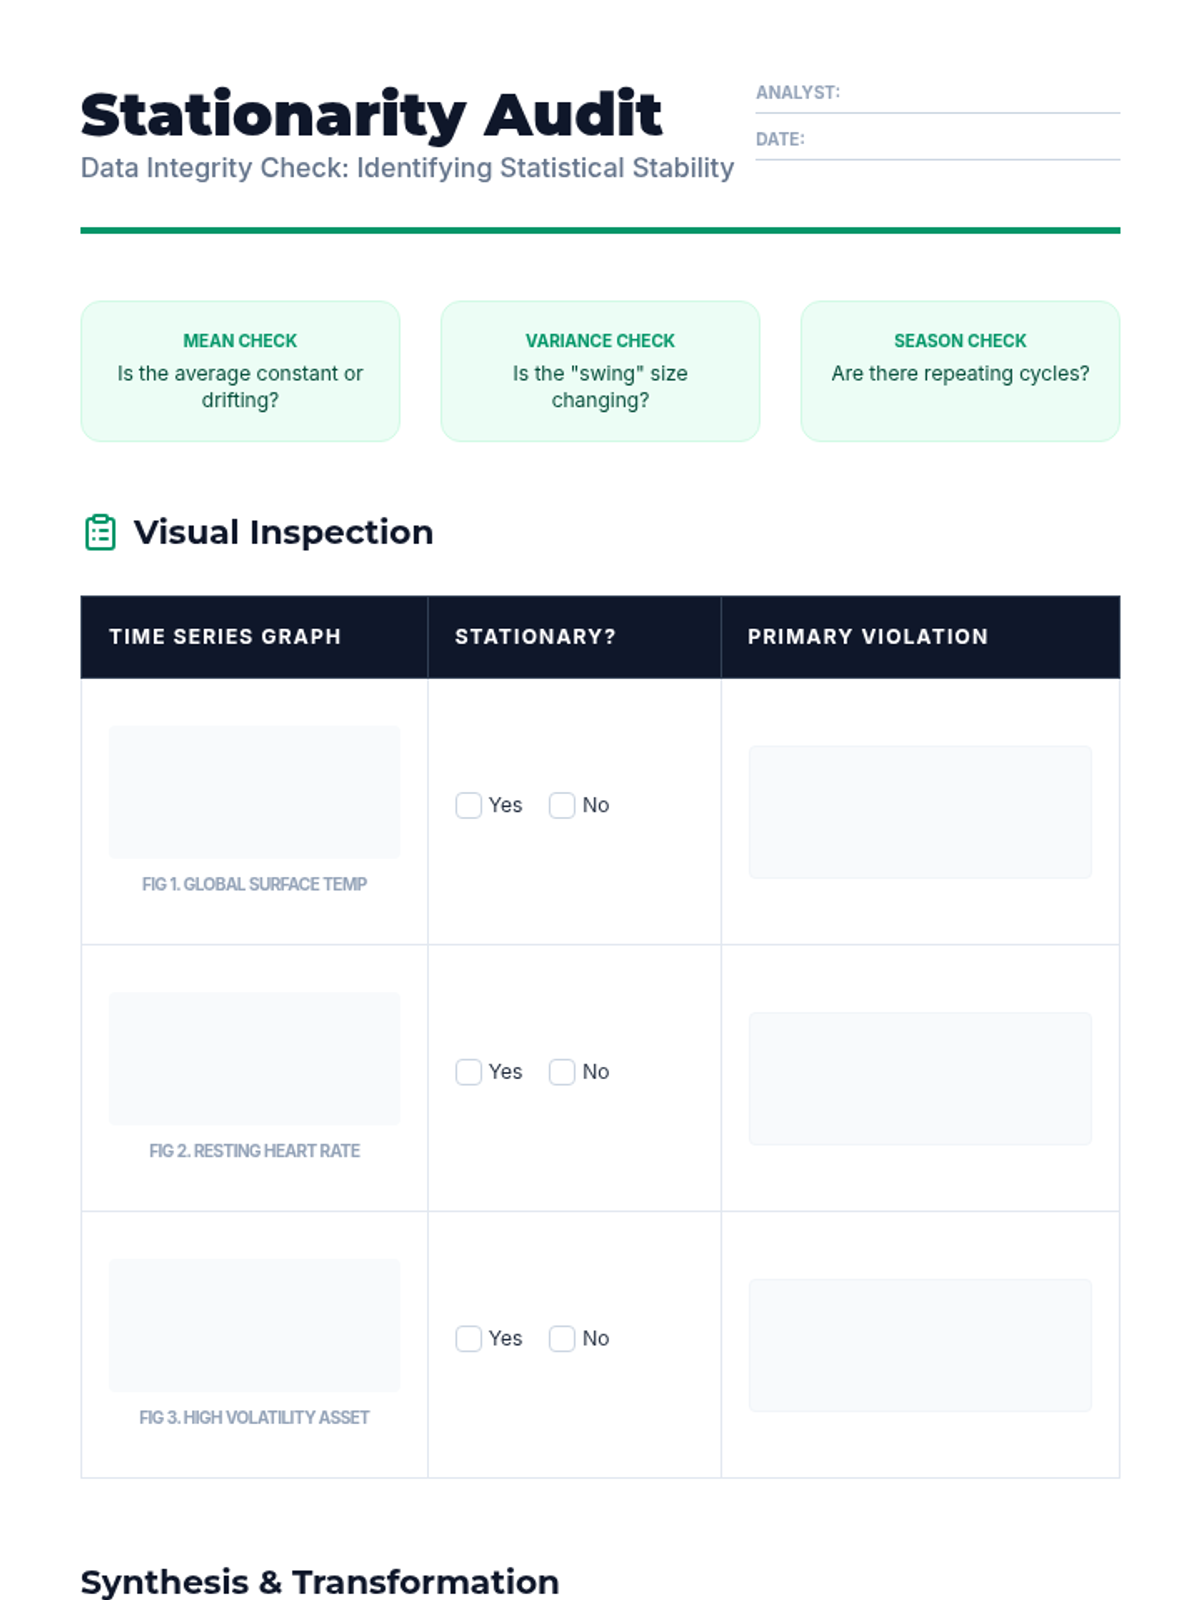
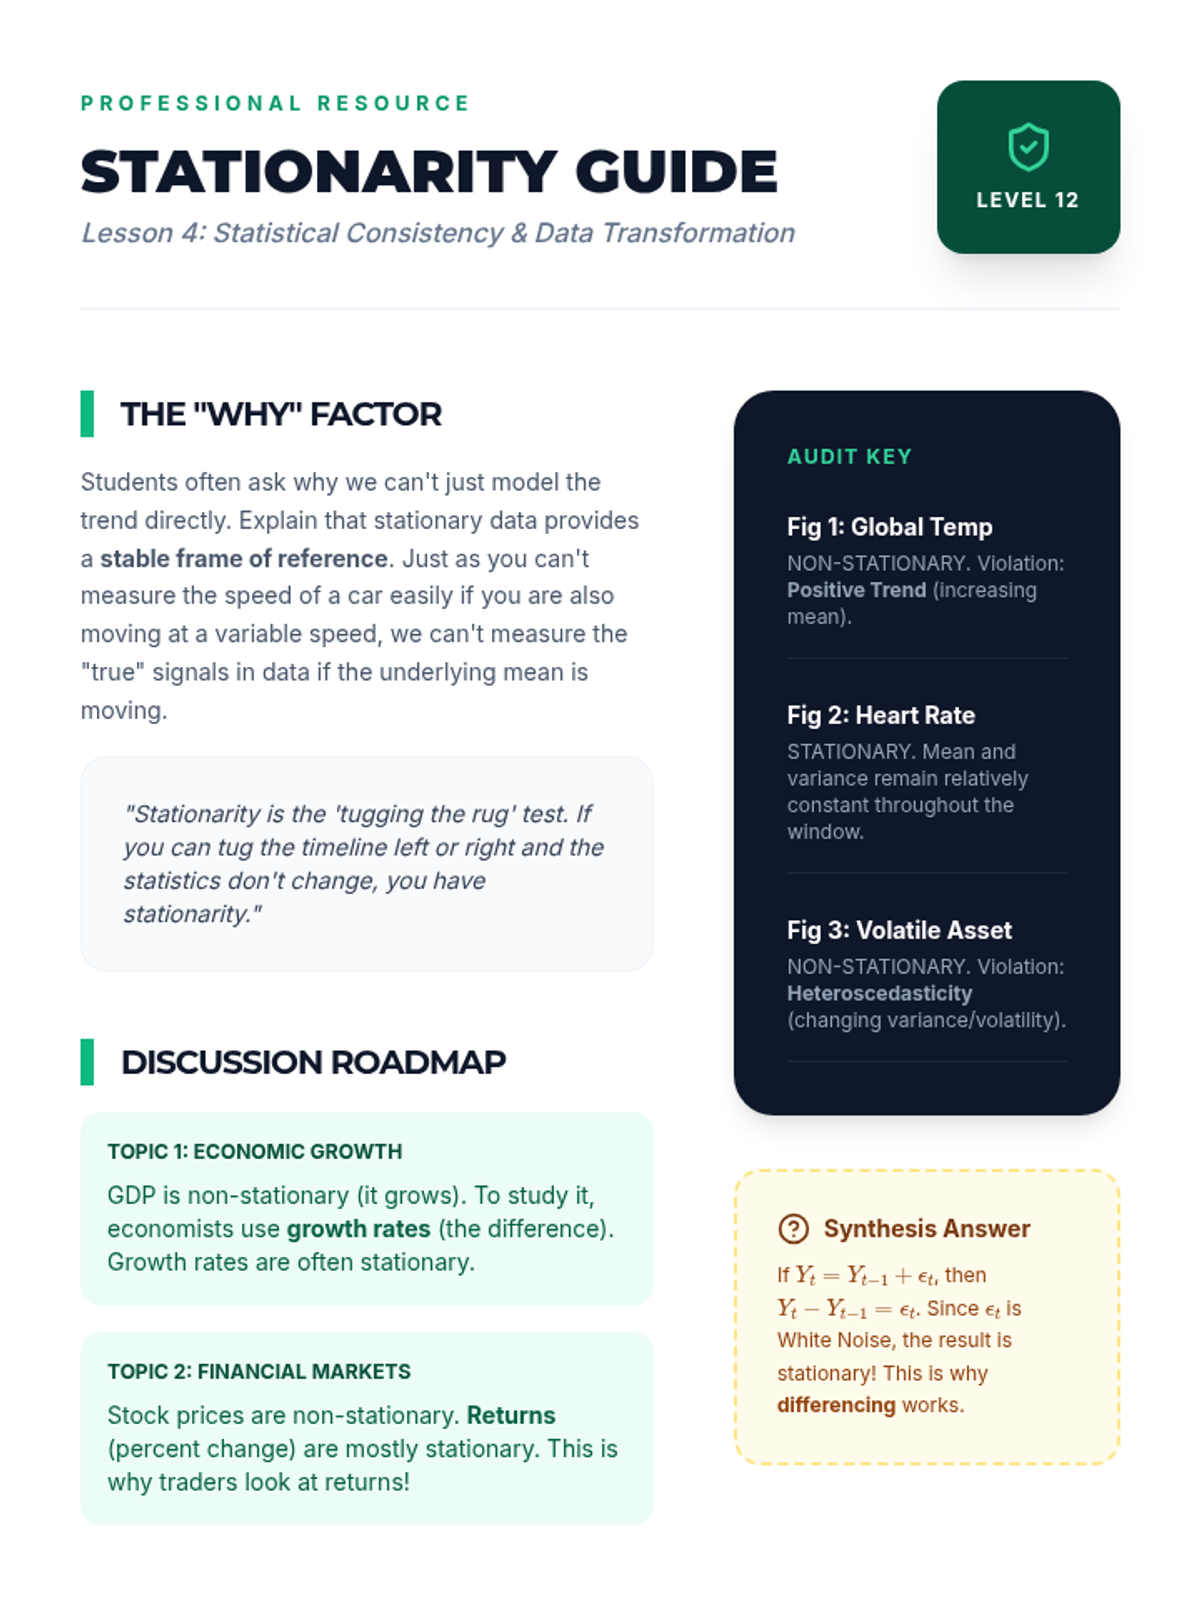
Students define and identify stationarity in time series, understanding why constant mean and variance are critical for statistical modeling.
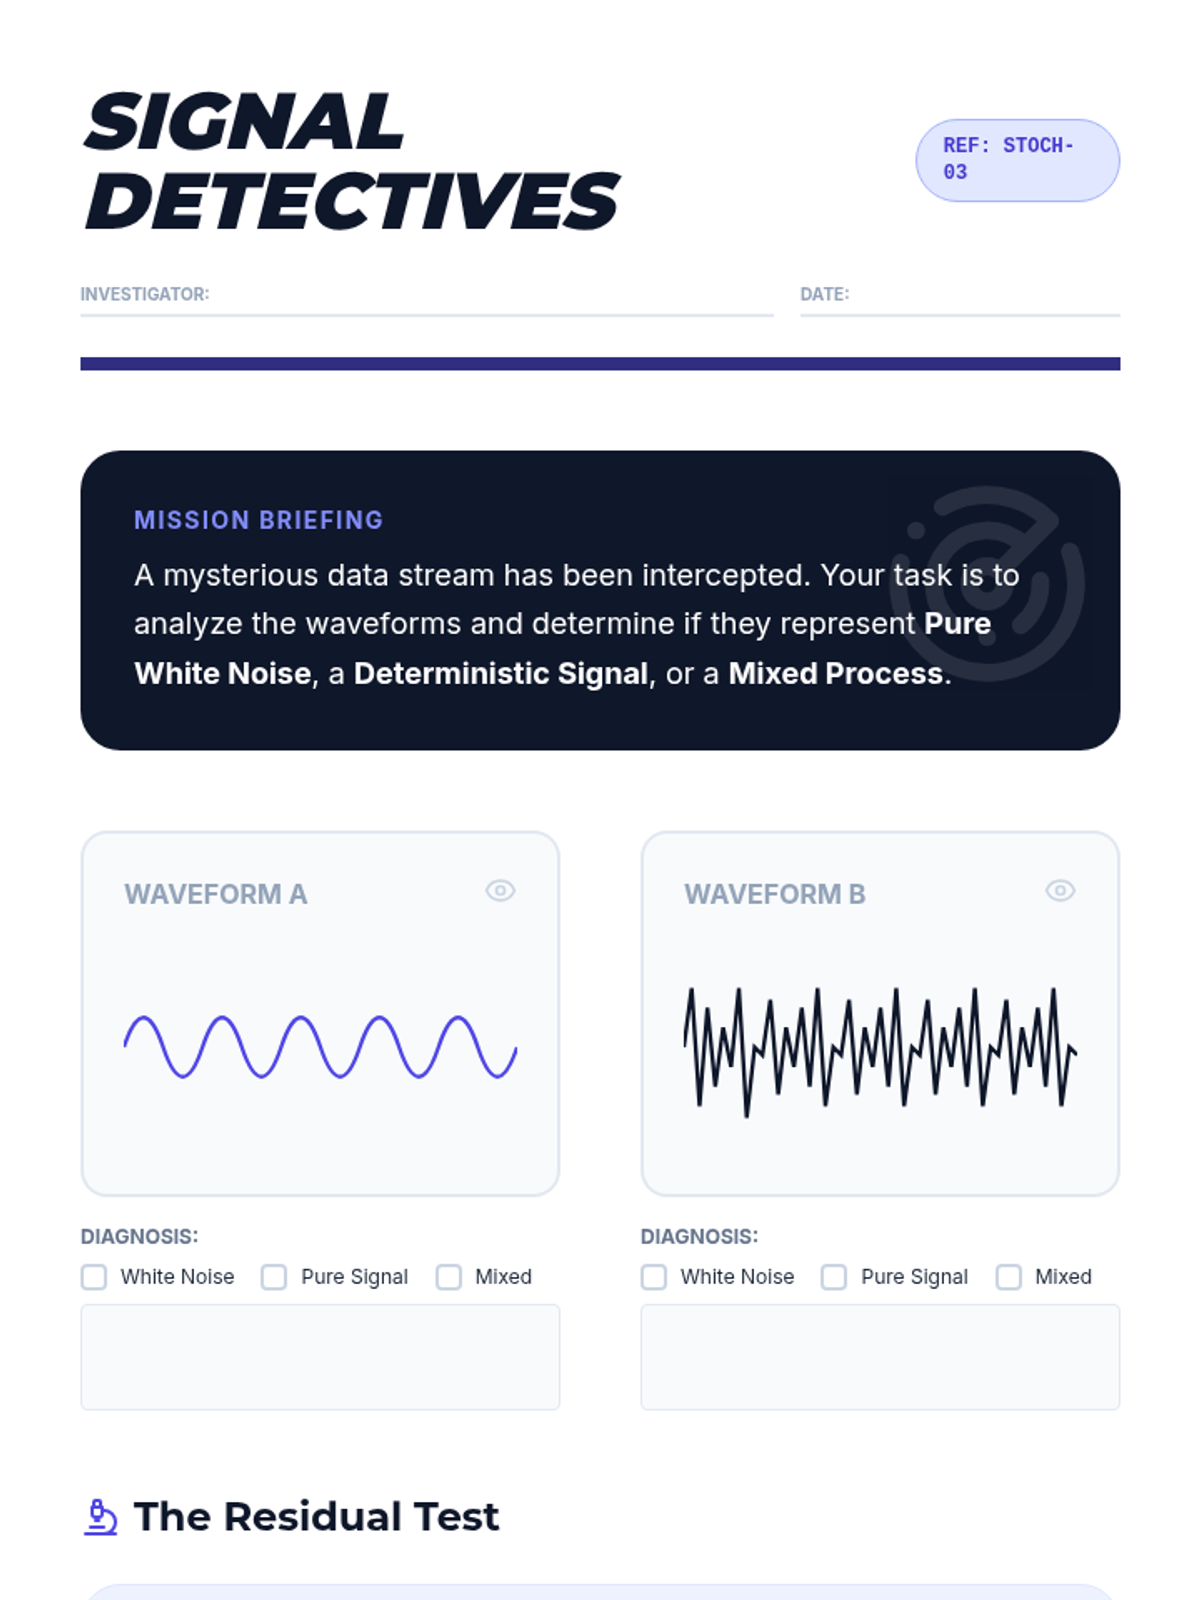
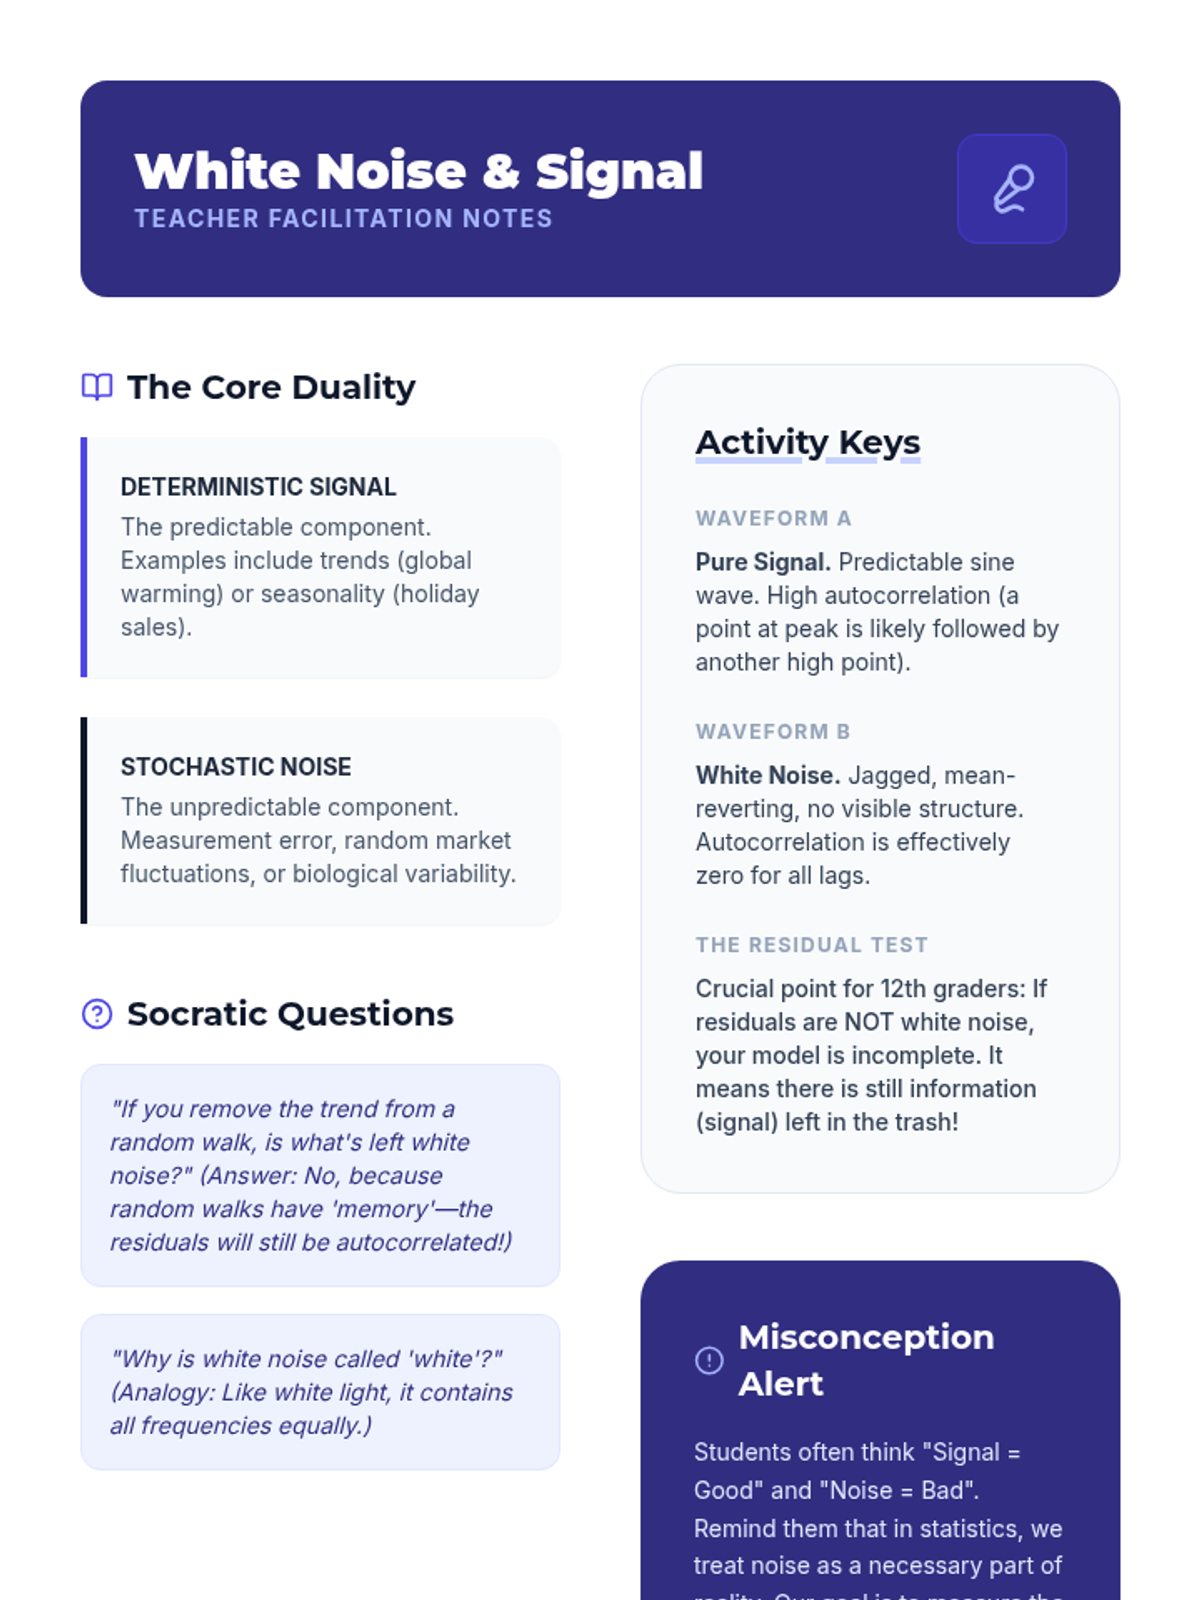
This lesson differentiates between 'White Noise' and structured processes, teaching students to identify signals within messy data.
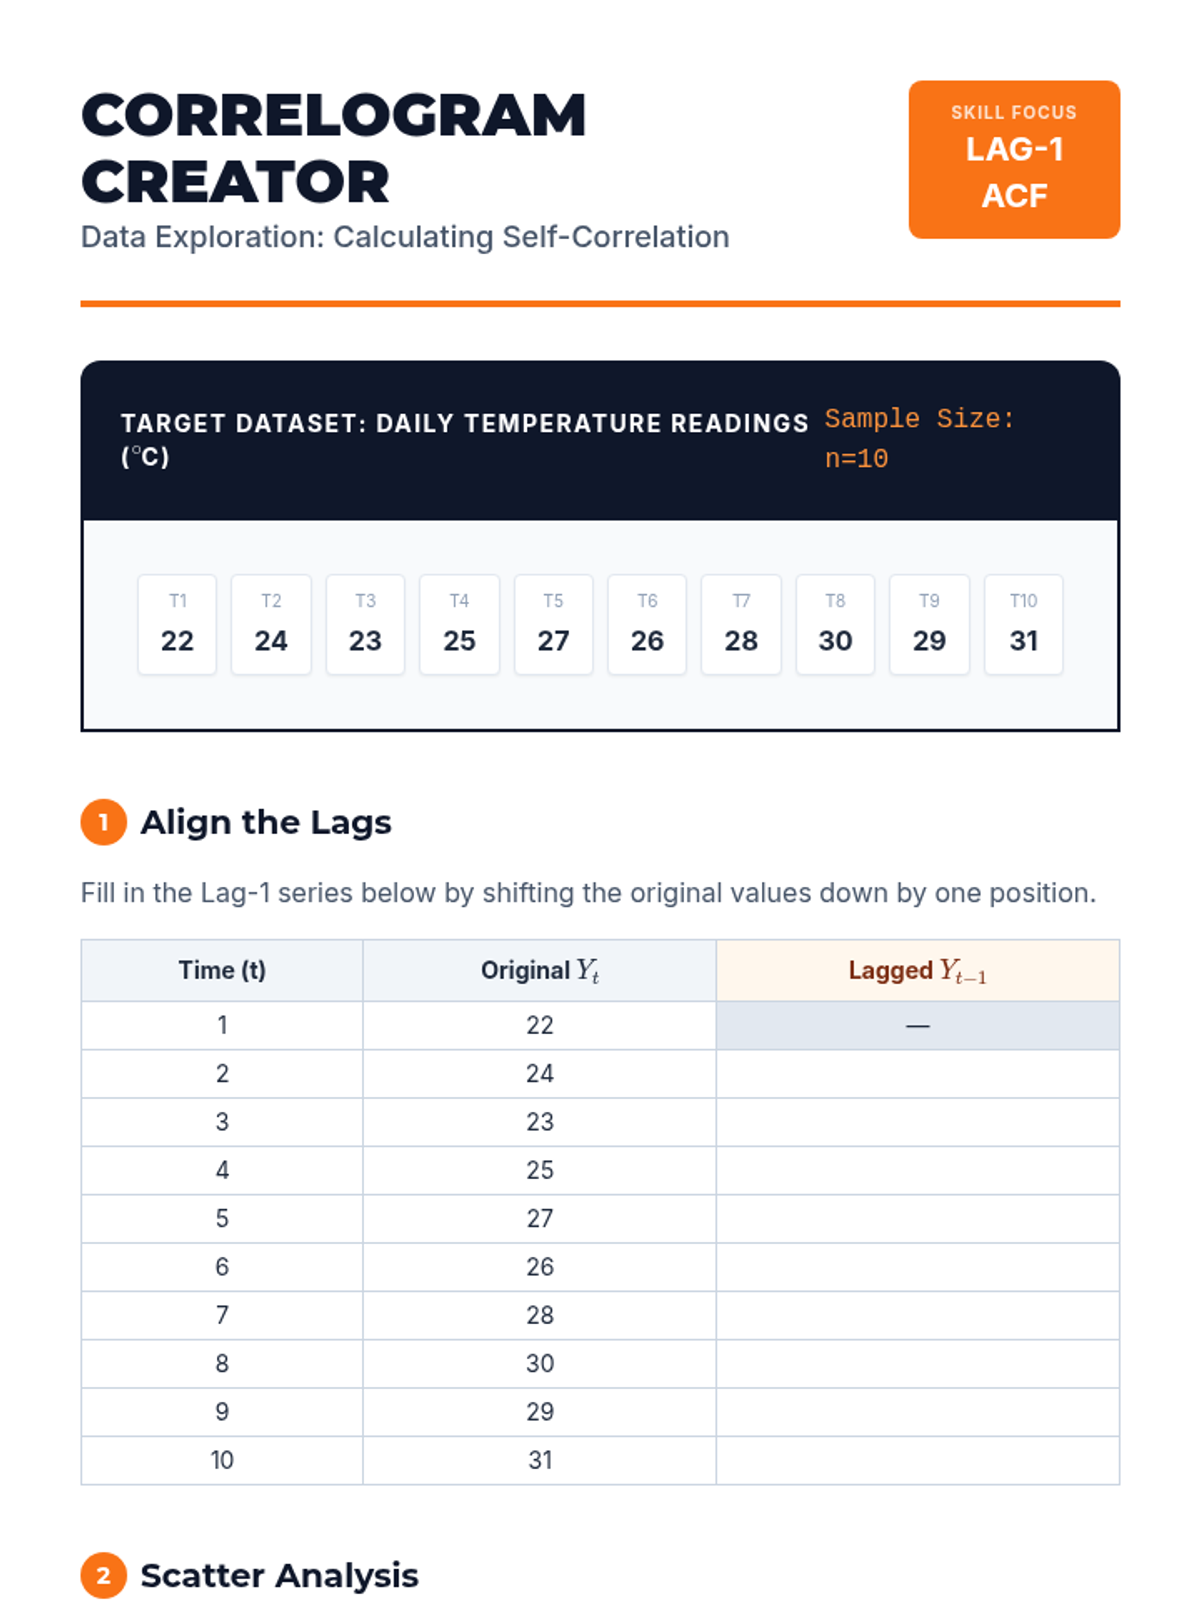
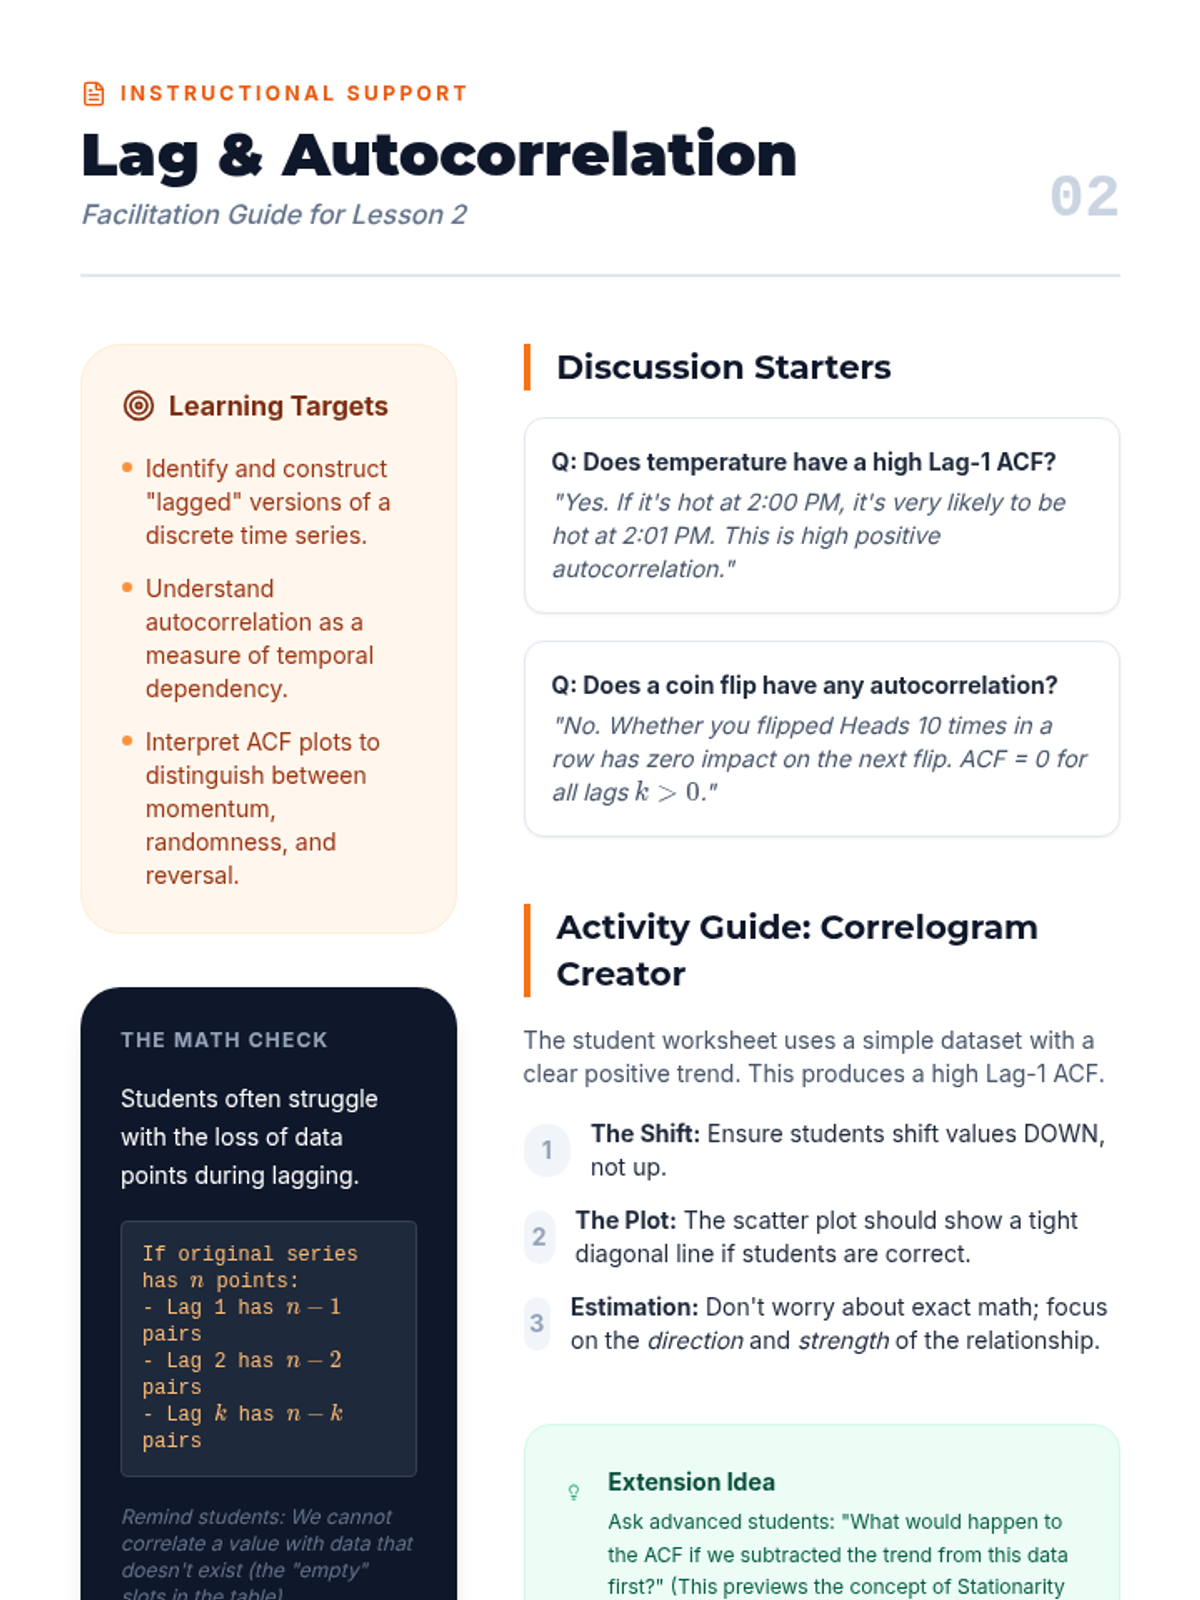
Students learn the concept of 'lag' and calculate the correlation of a time series with itself, using correlograms to visualize temporal dependencies.
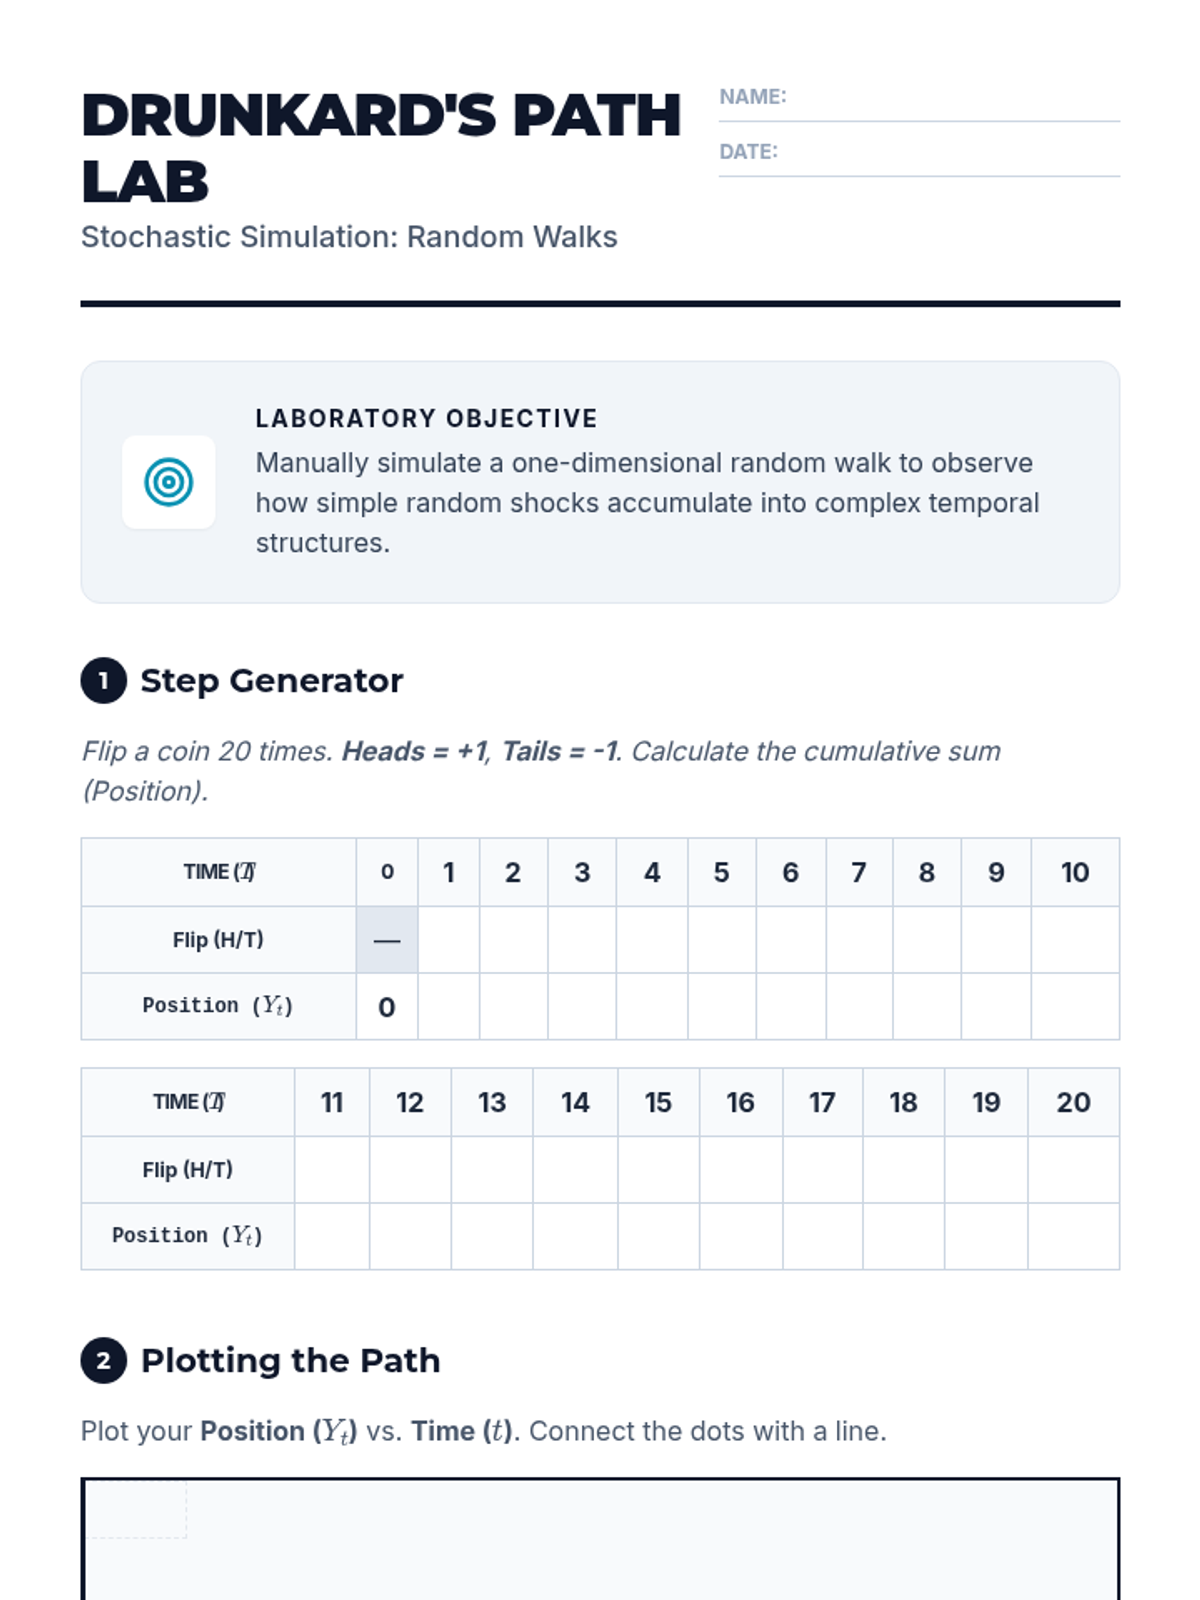
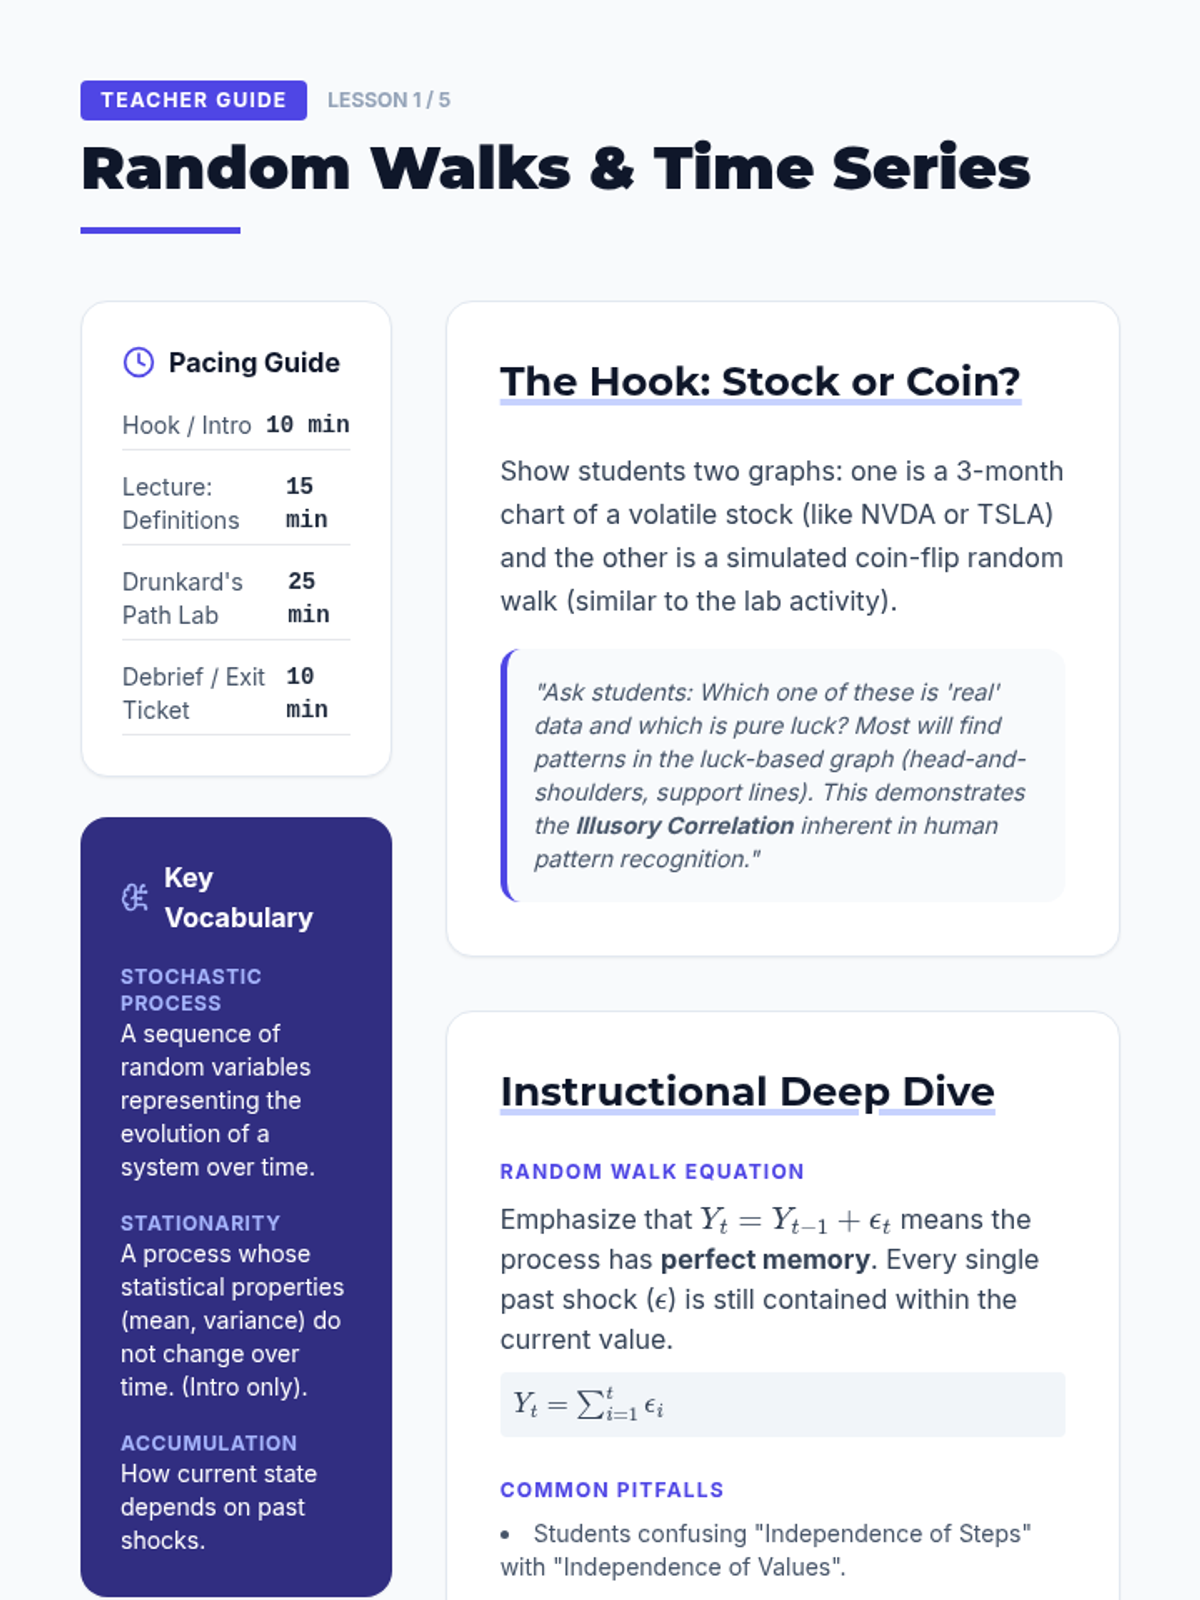
Students define time series data and explore the concept of a Random Walk as a cumulative sum of random variables, comparing it to deterministic trends.
Final analysis and presentation of findings, where students make data-driven recommendations for system optimization.
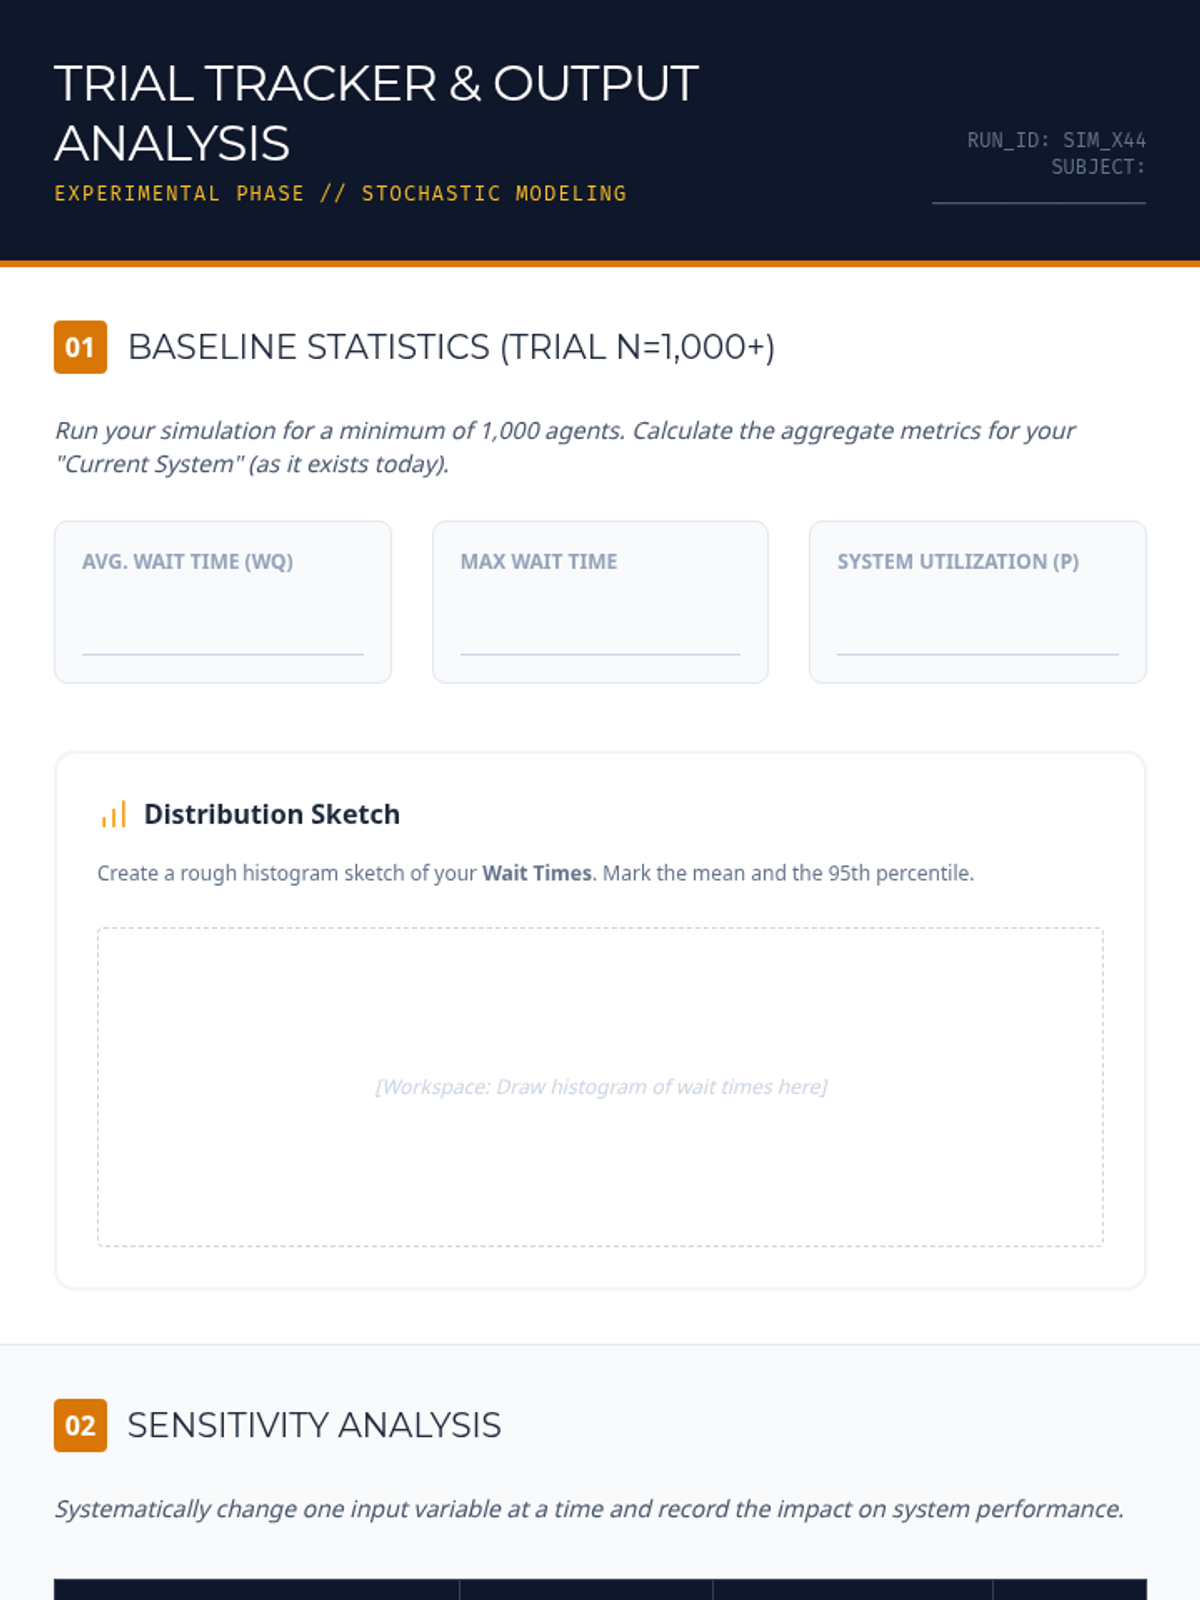
Students execute large-scale trials of their simulations, gathering aggregate data to analyze average wait times and system efficiency.
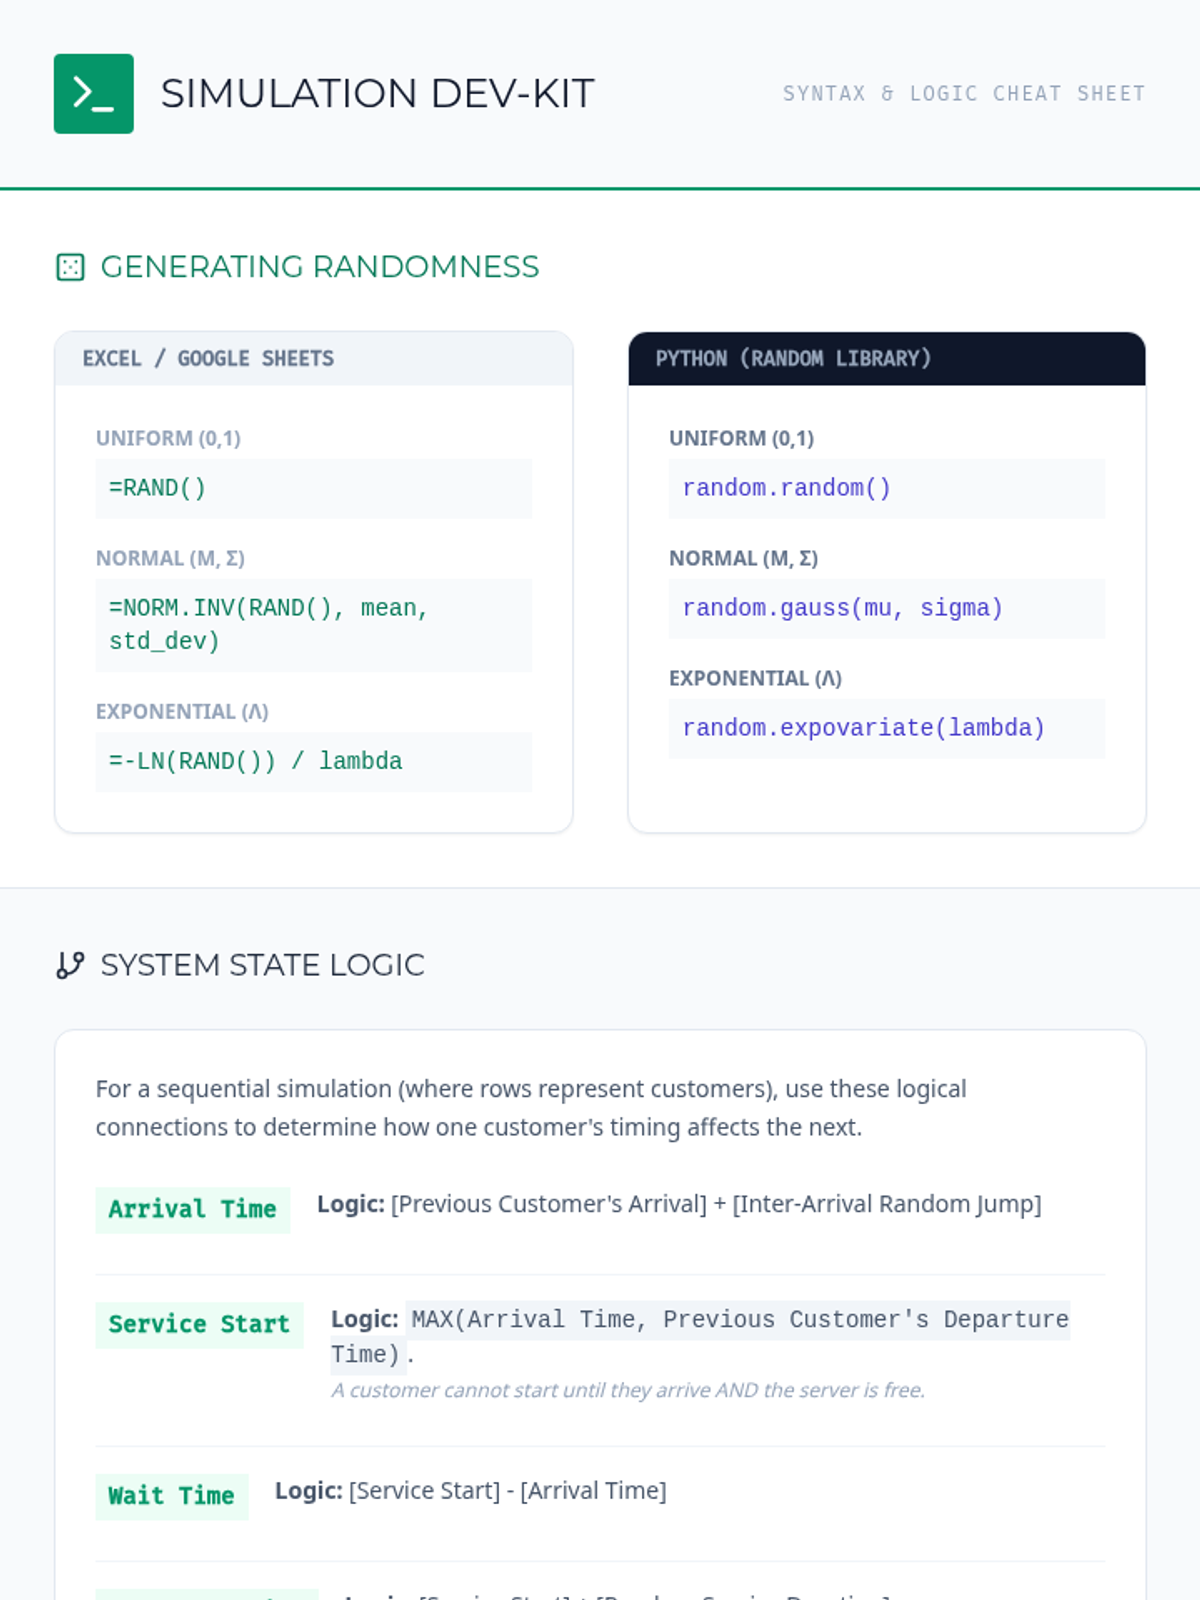
The 'workshop' phase where students implement their simulation logic using spreadsheet software or code, building the random number engine.
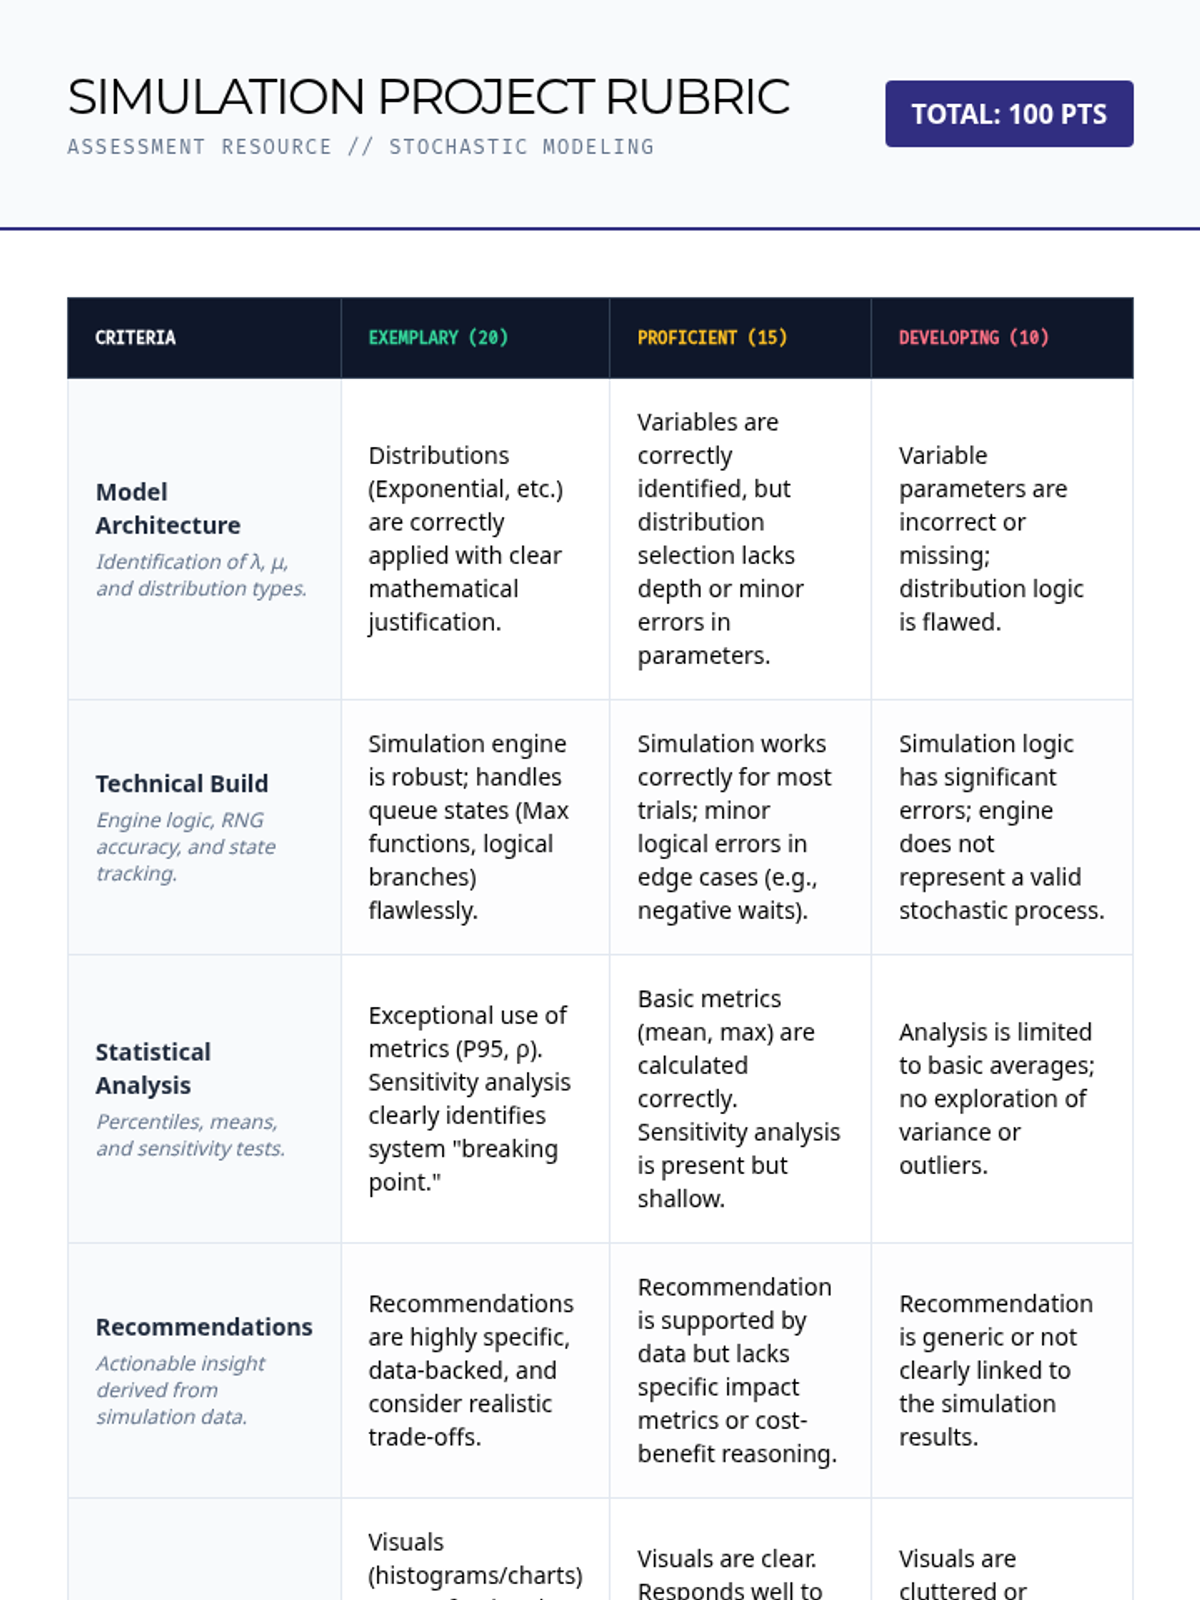
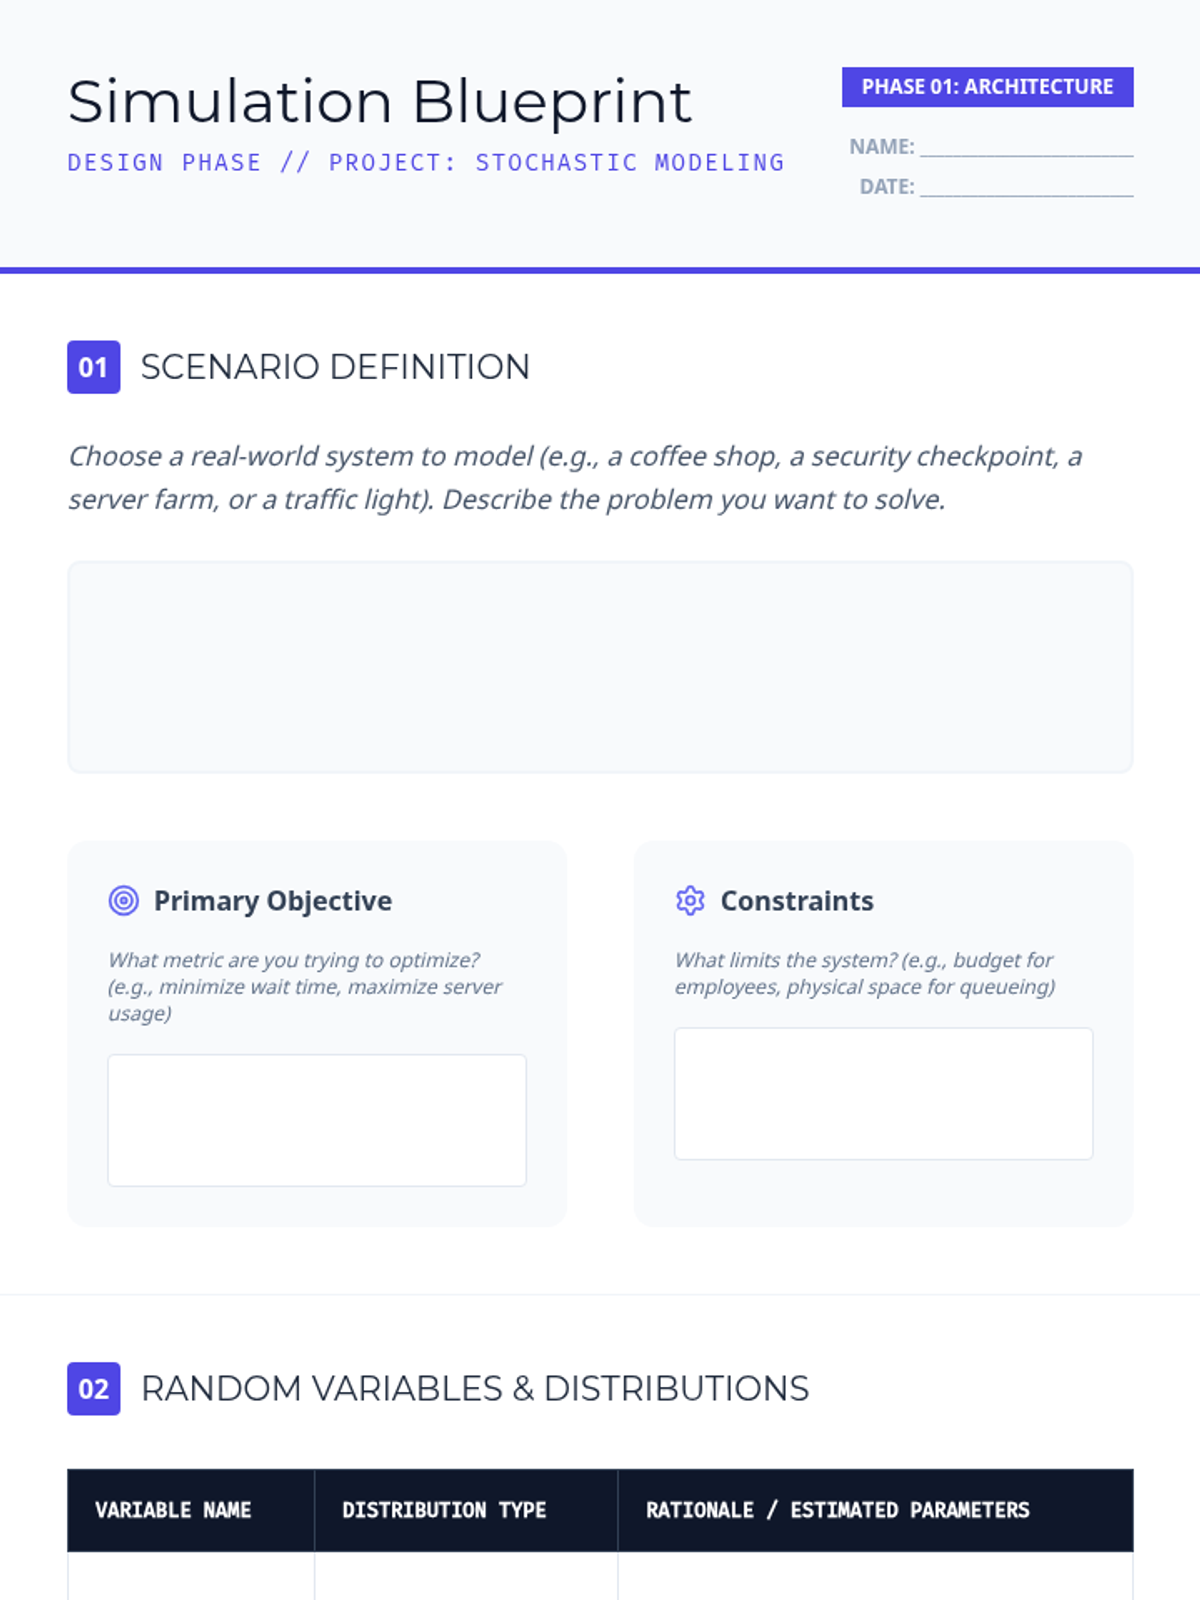
Students plan their own Monte Carlo simulations by identifying input variables, selecting appropriate random distributions, and outlining the simulation logic.
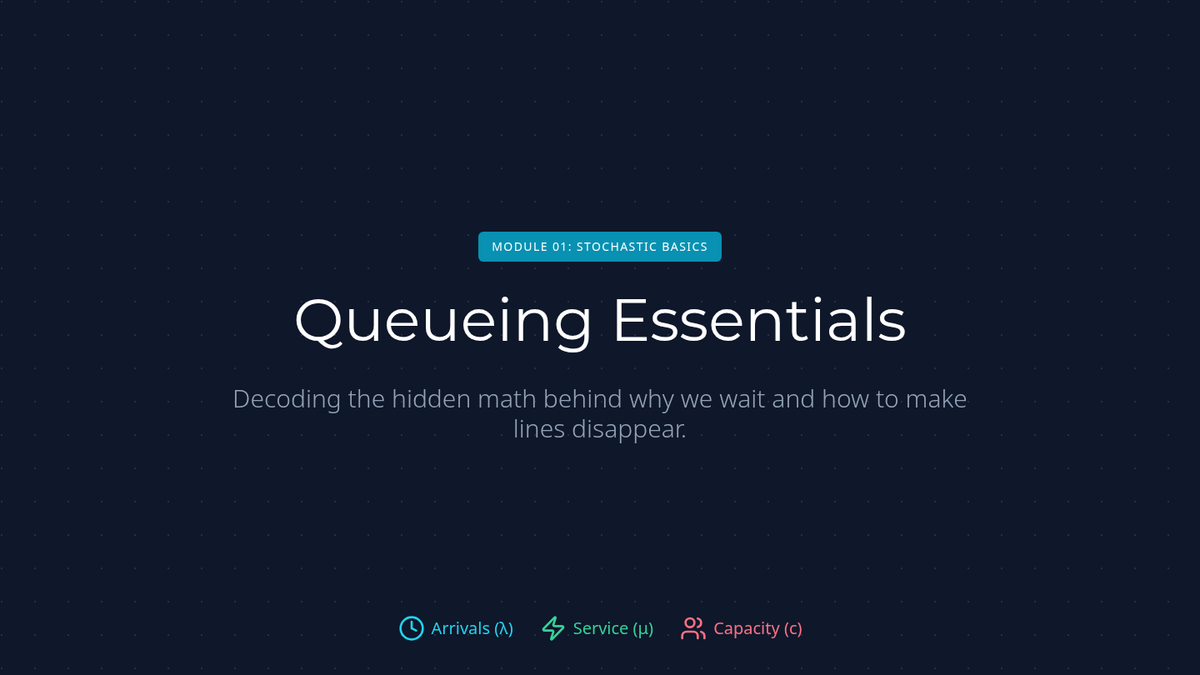
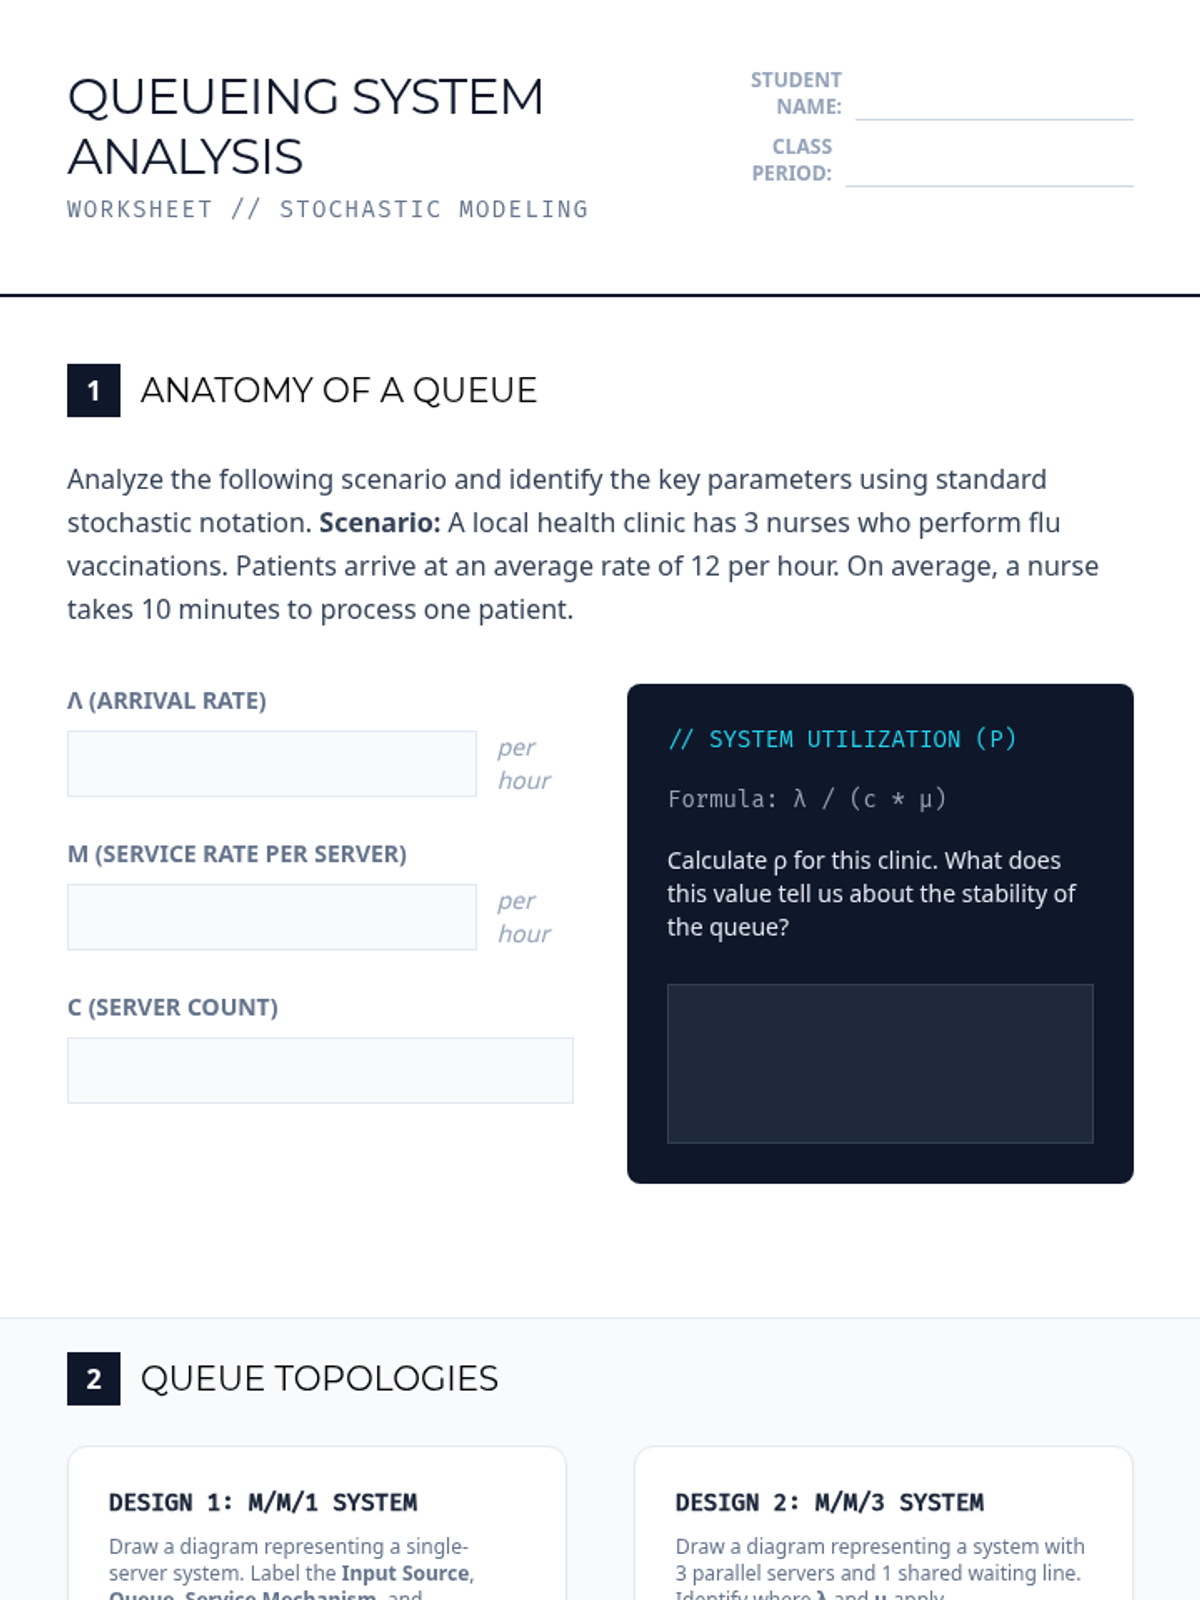
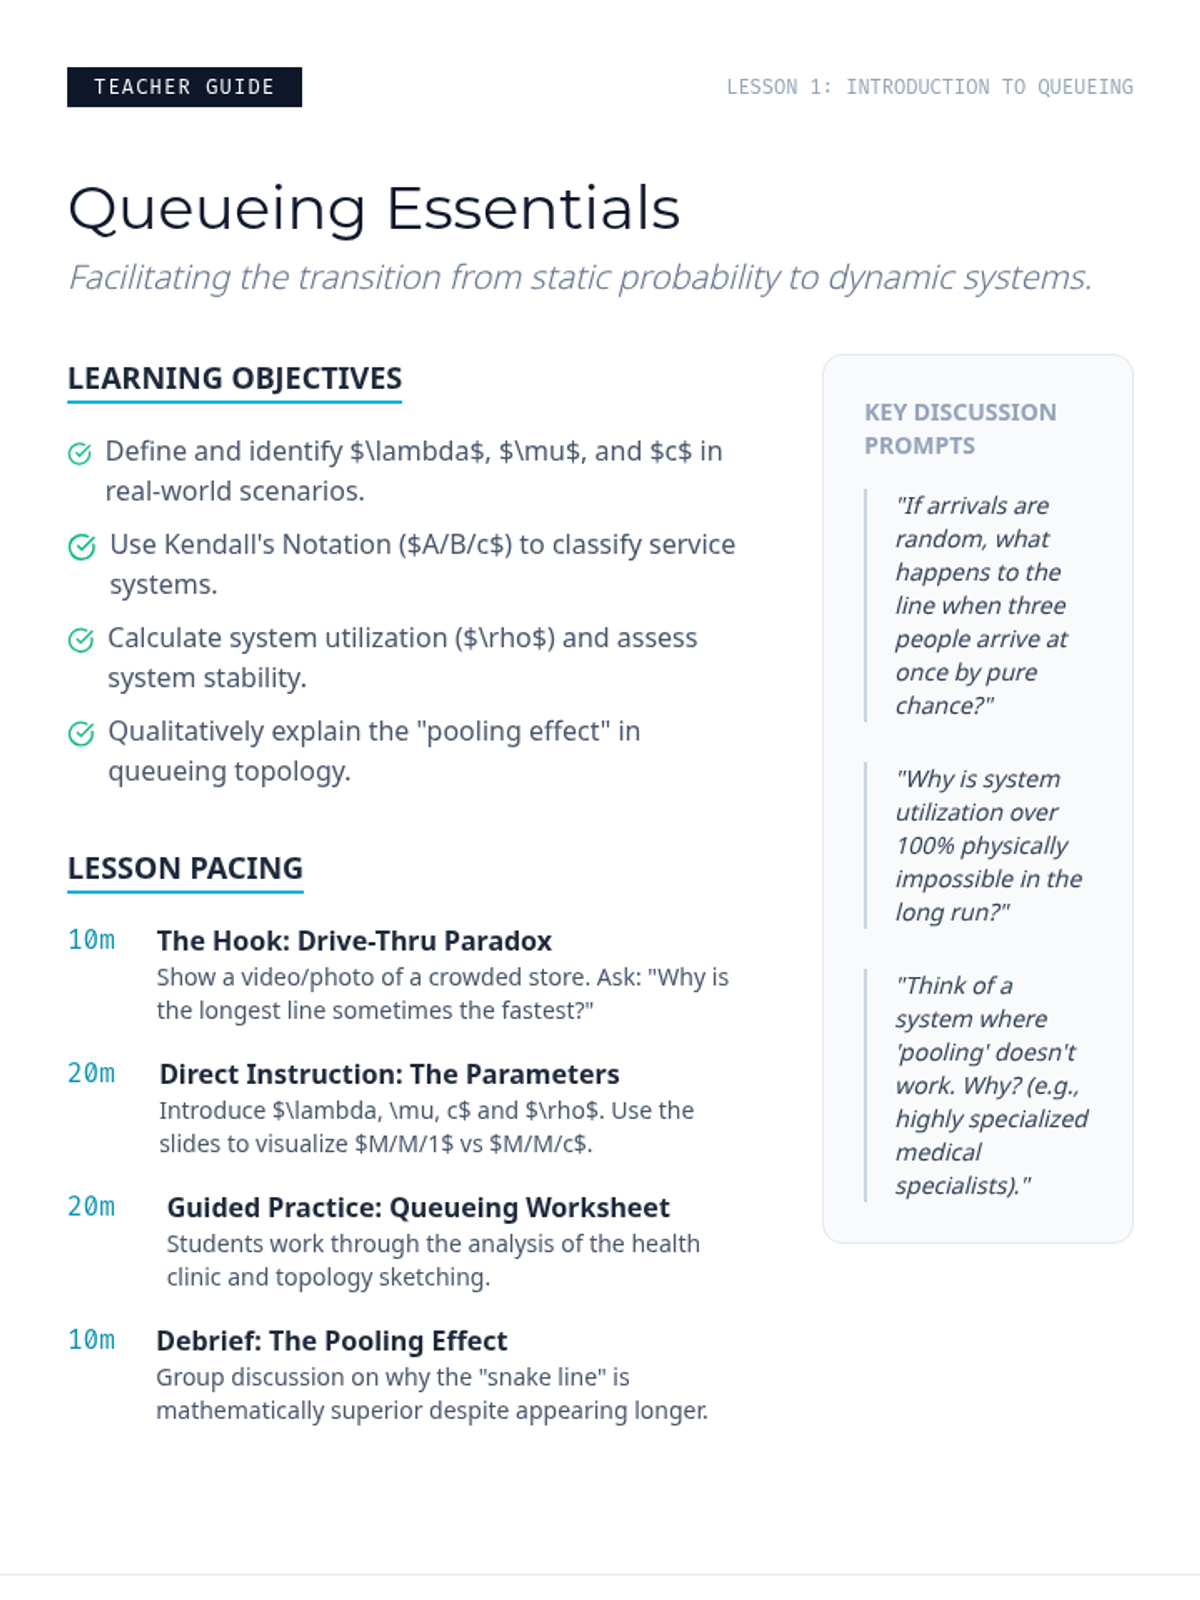
Introduces students to the components of queueing systems, including arrival rates, service rates, and server topology. Students analyze different queue structures and identify real-world examples.
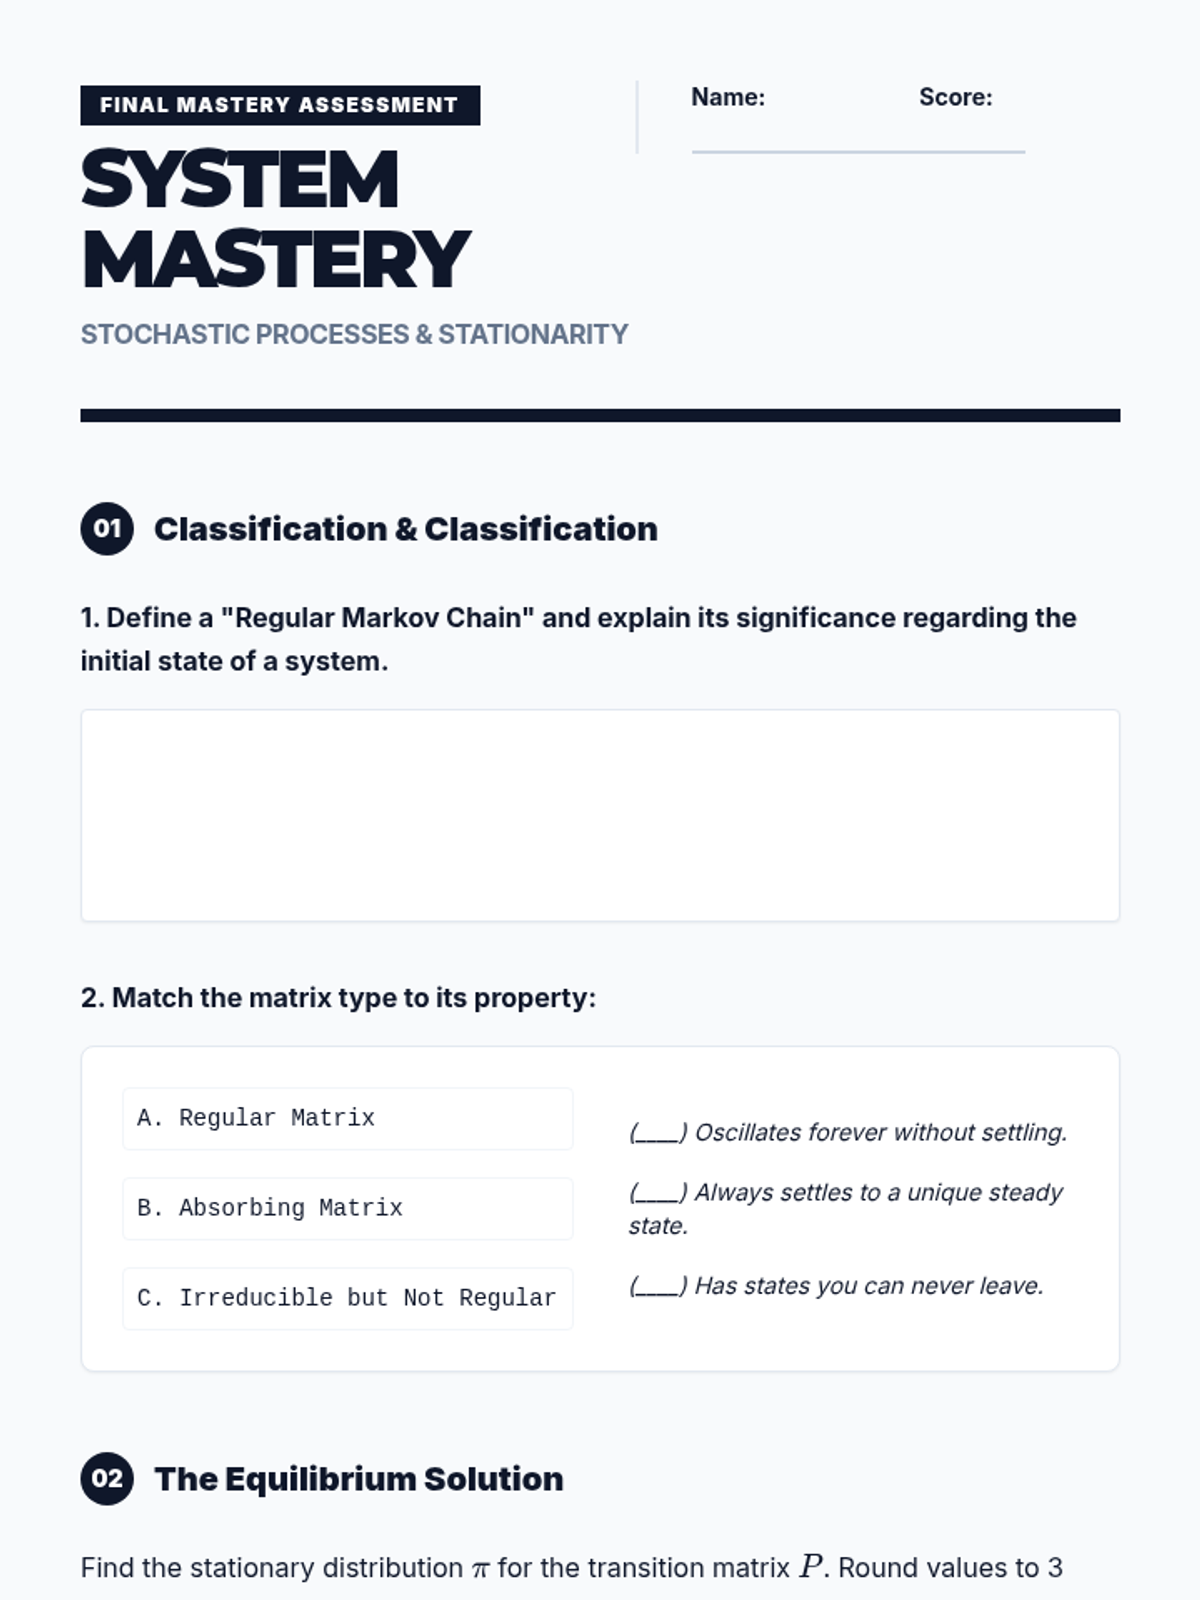
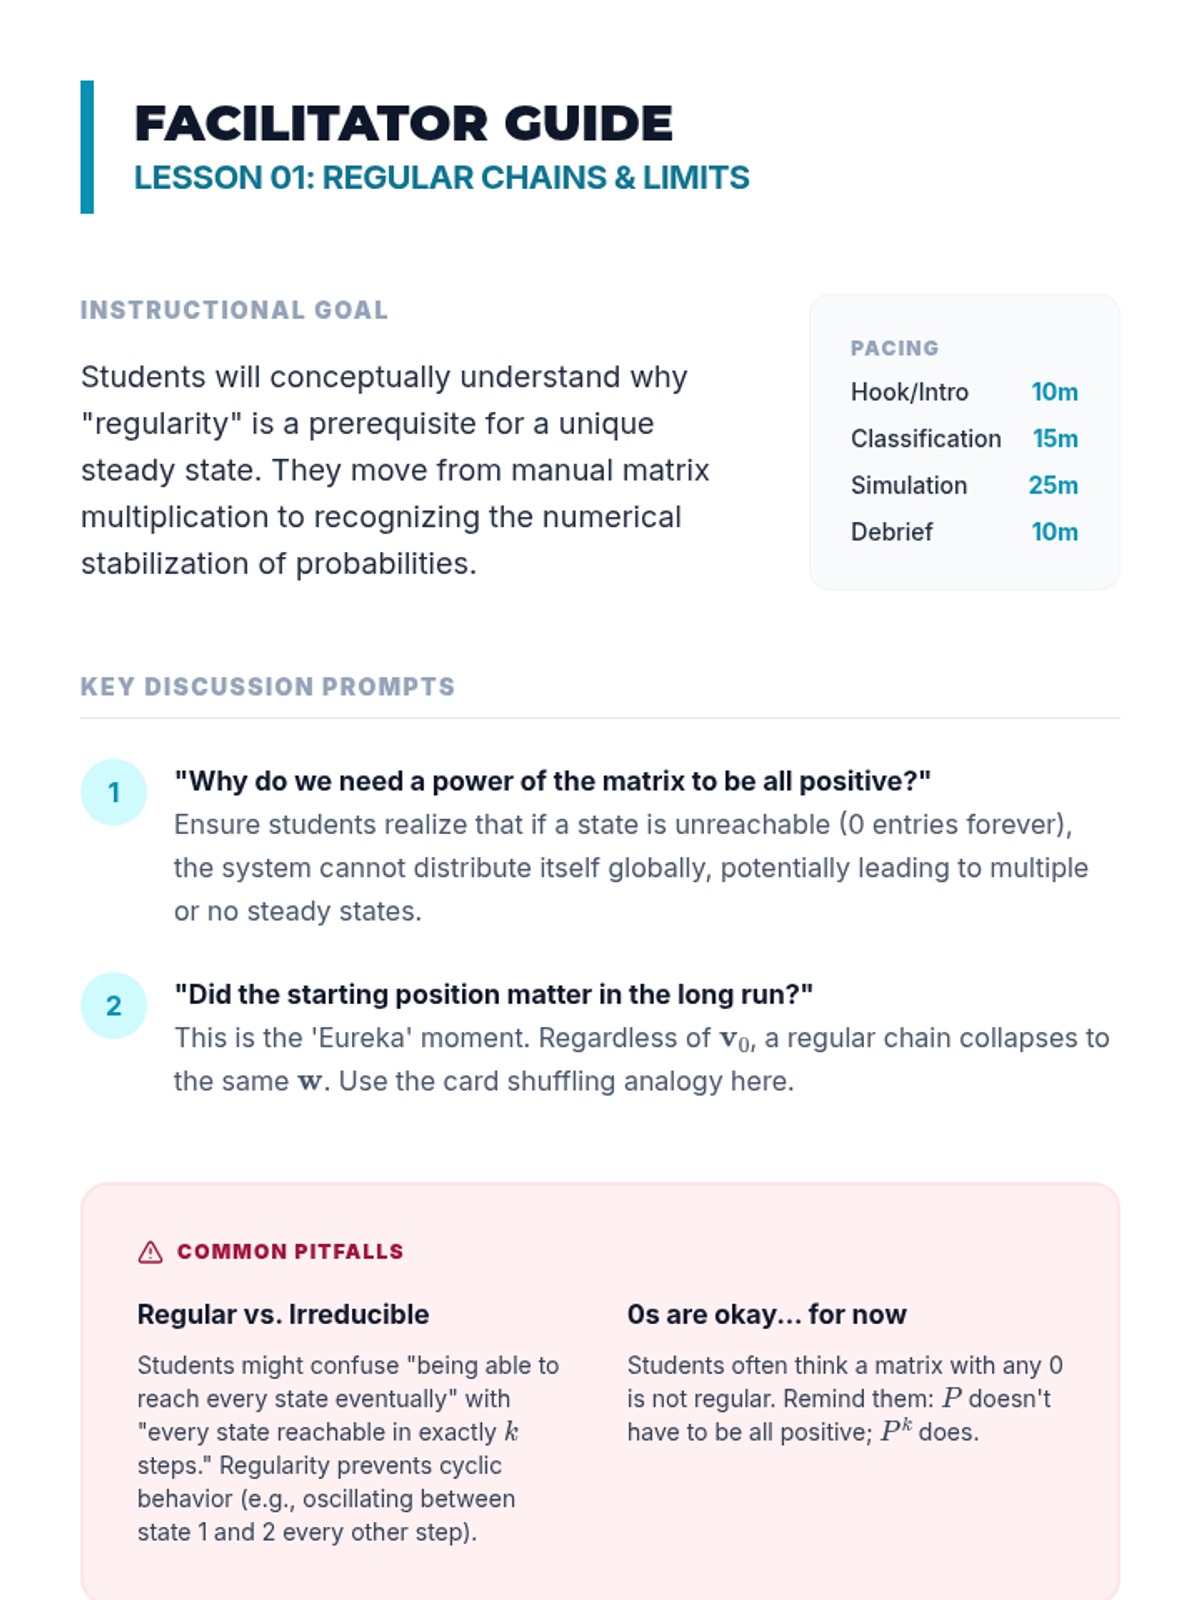
Students synthesize their knowledge of regular and absorbing chains to analyze a novel scenario, proving mastery of steady-state calculations and system classification.
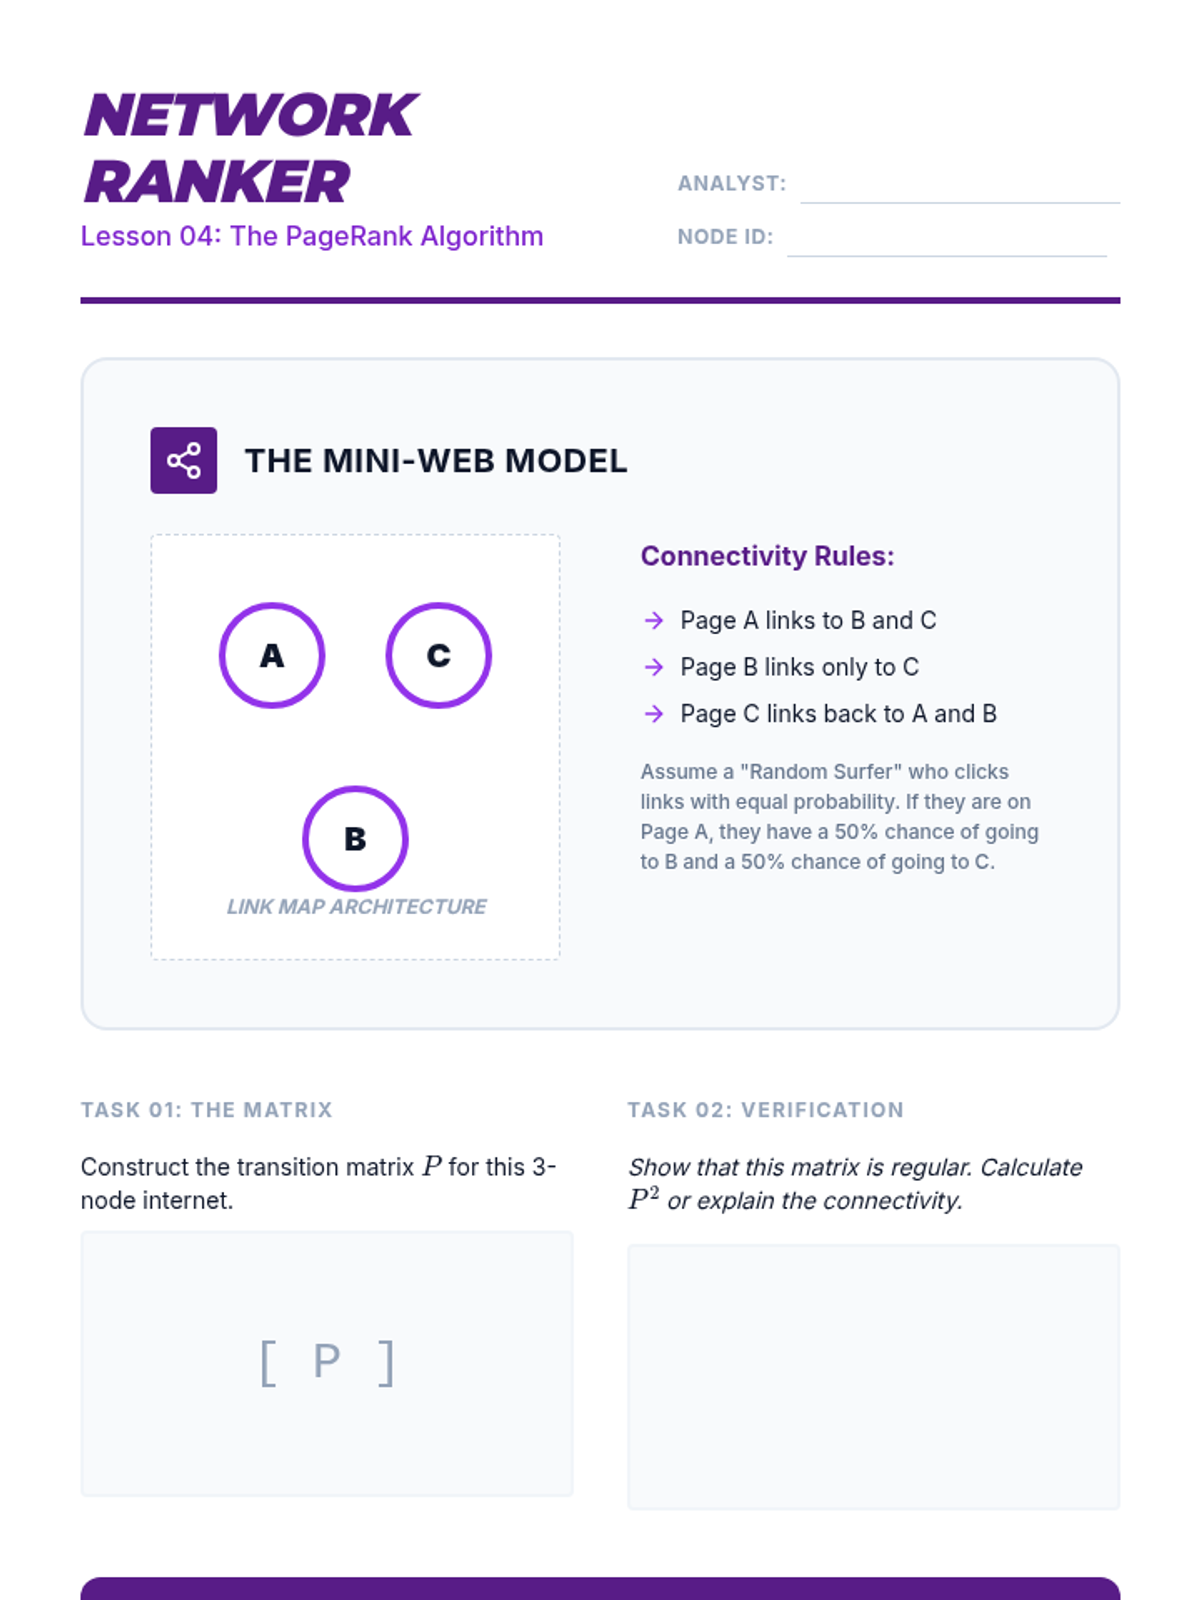
An application of stationary distributions to web search. Students model the internet as a graph and use Markov chains to rank the importance of pages.
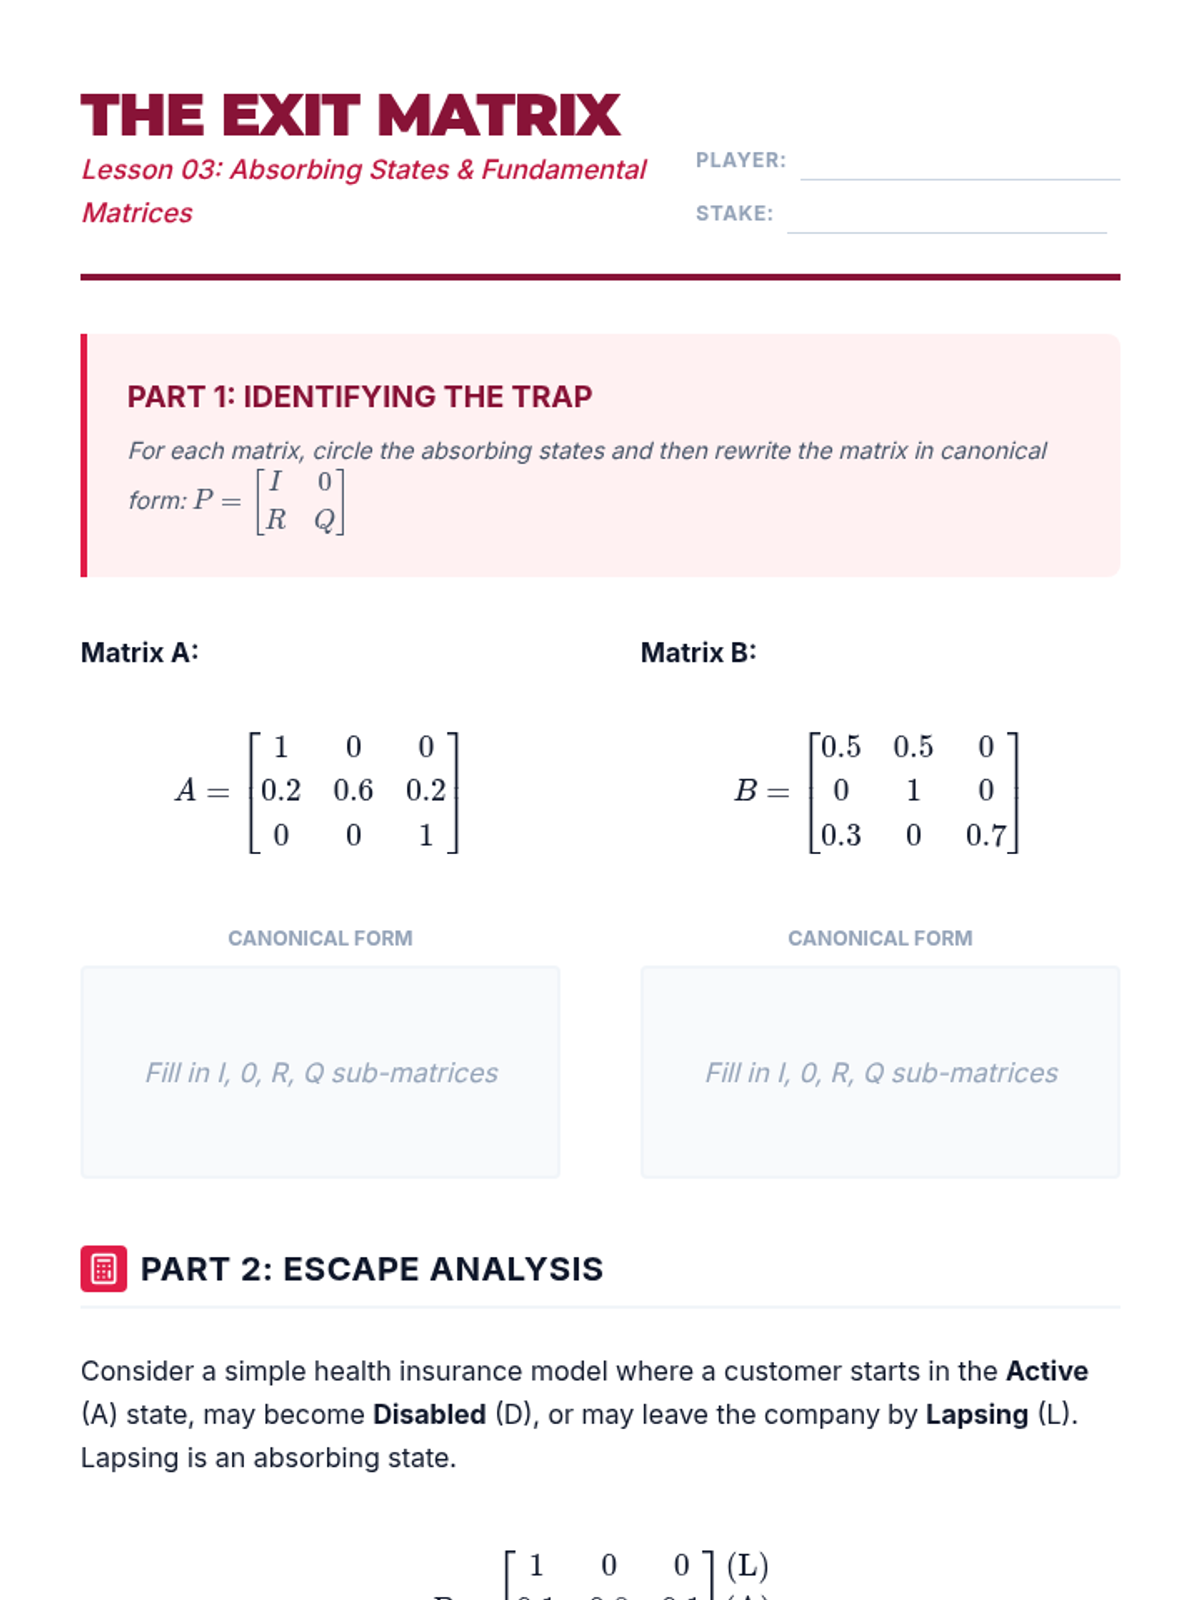
A study of absorbing Markov chains where certain states are 'traps.' Students calculate absorption probabilities and the expected time to reach an absorbing state.
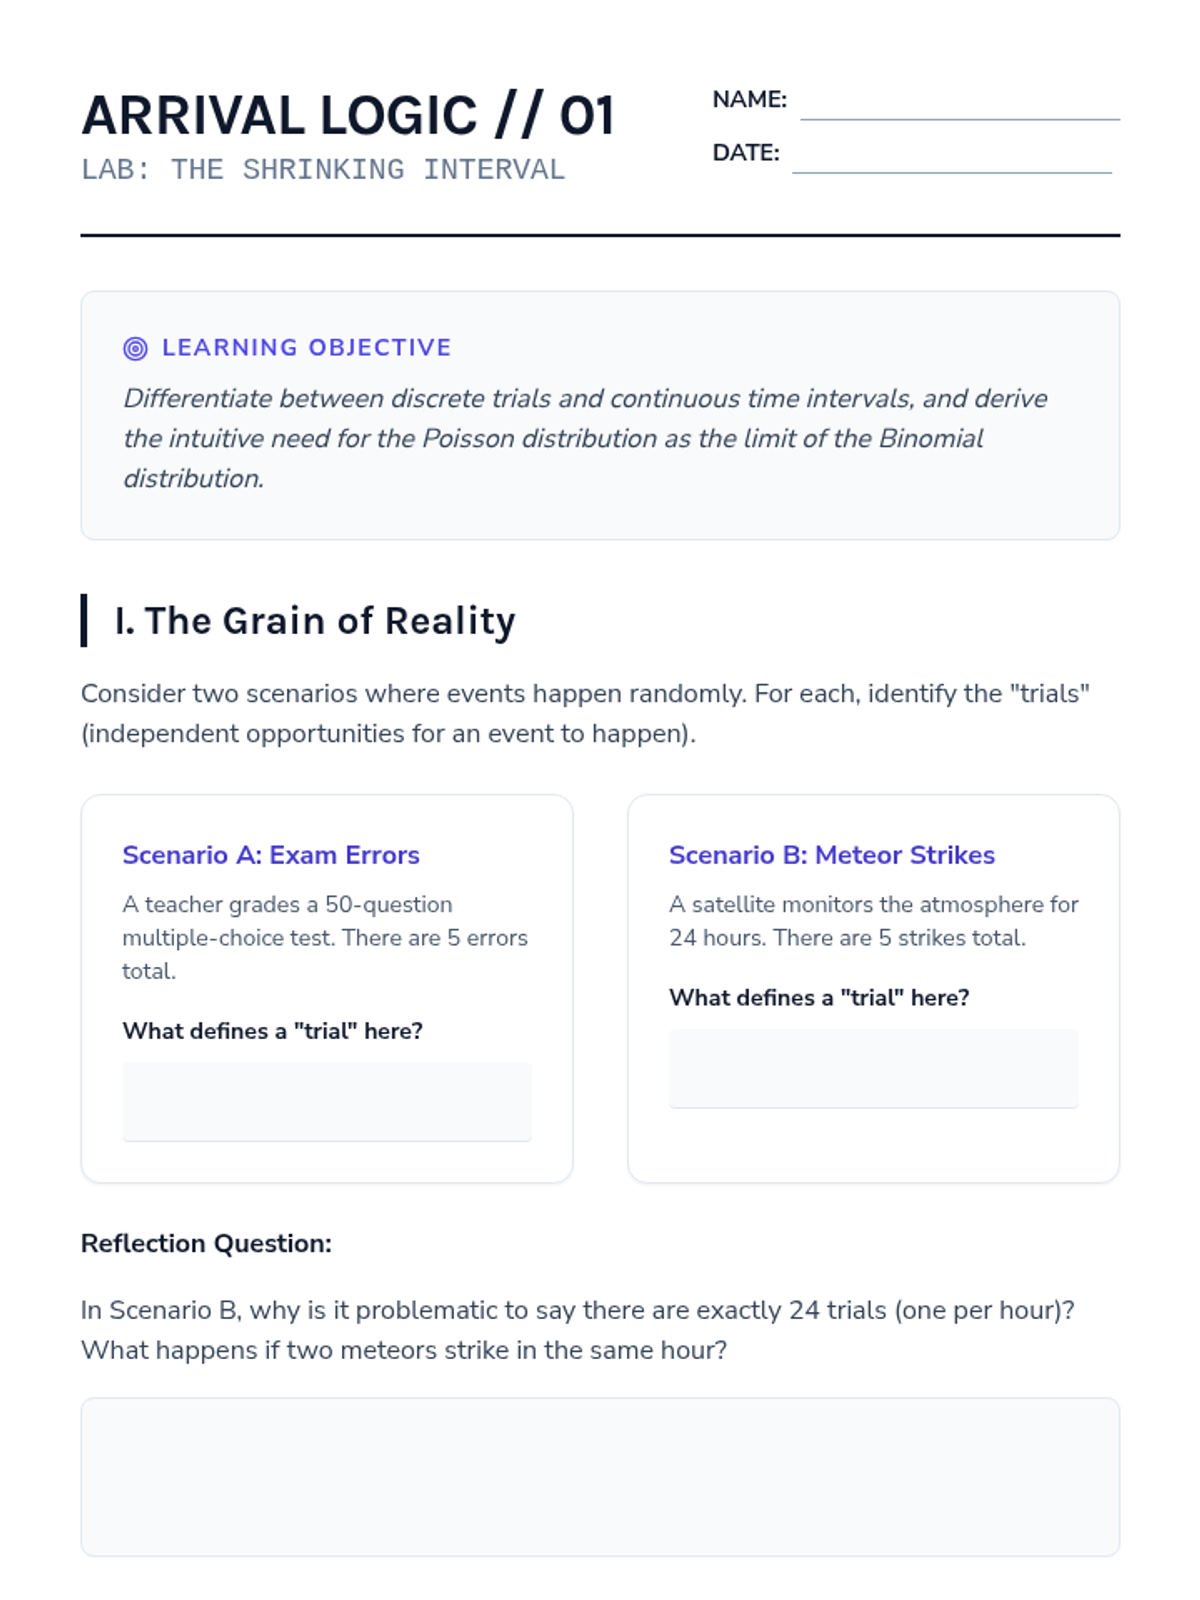
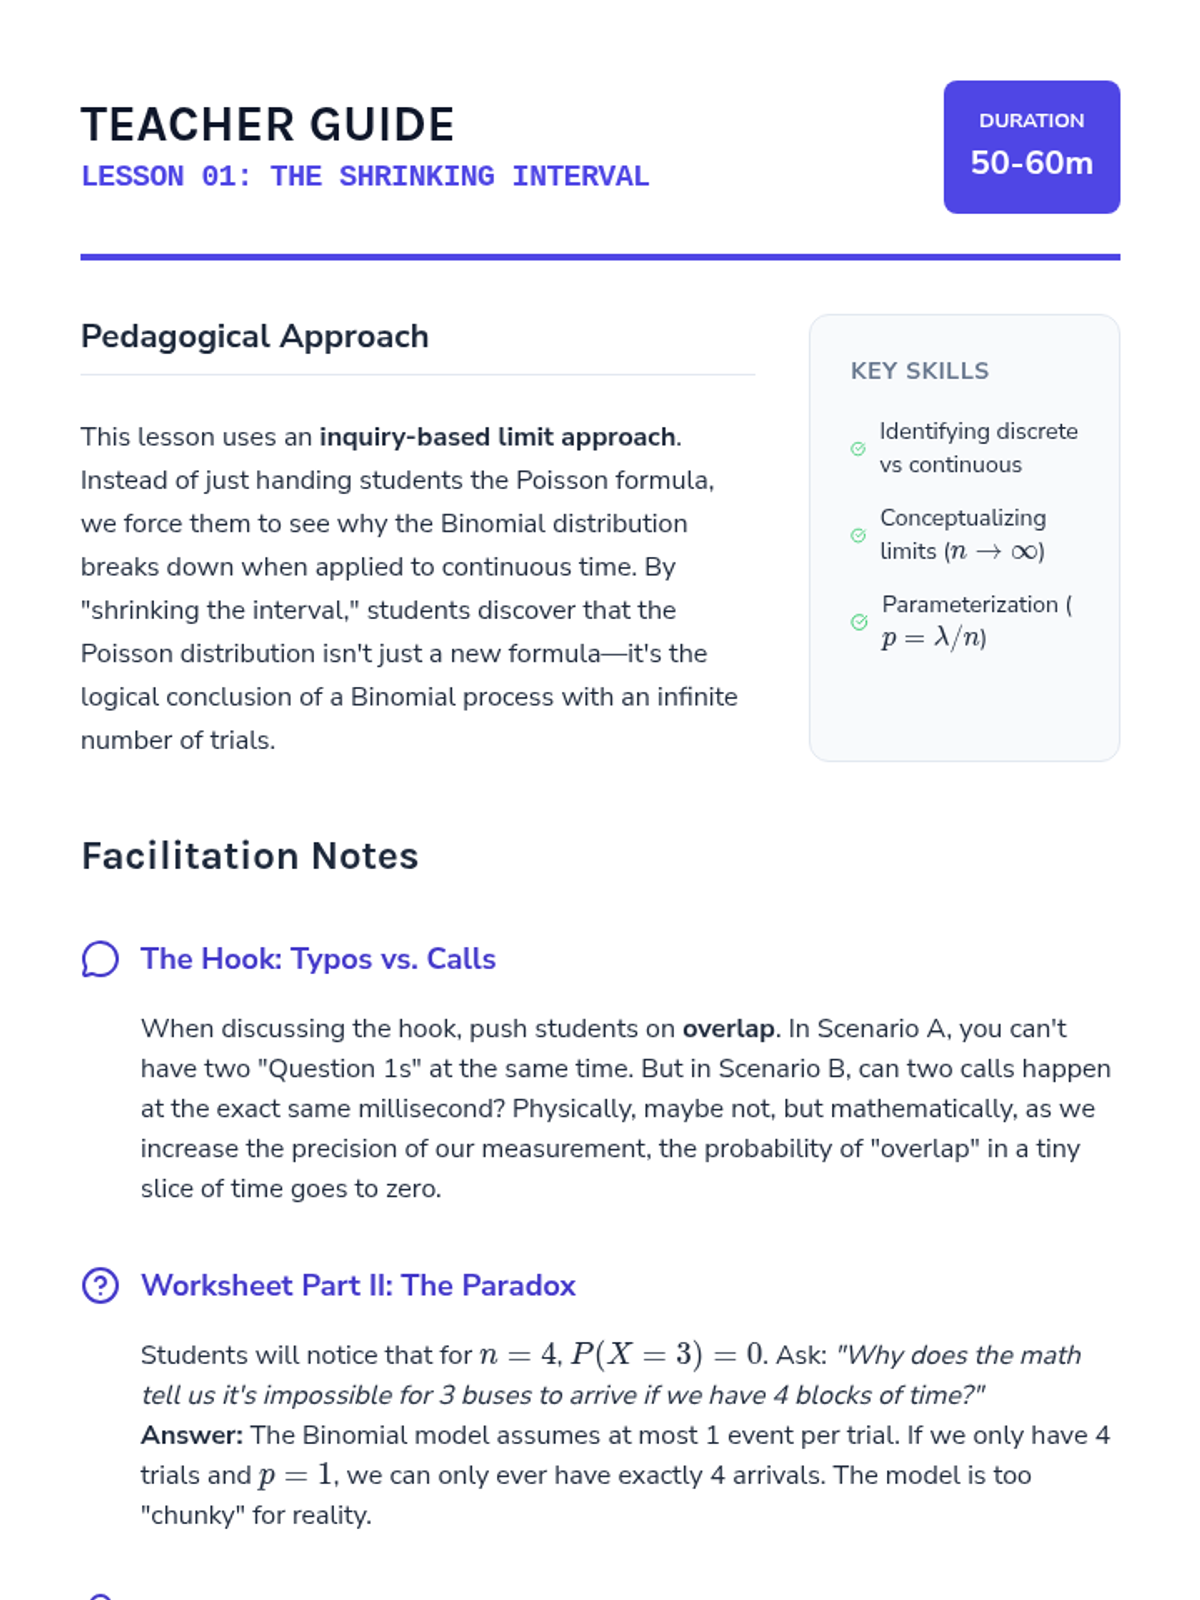
Students explore the limit of the Binomial distribution as intervals get smaller, deriving the need for the Poisson distribution to model rare events in continuous time.
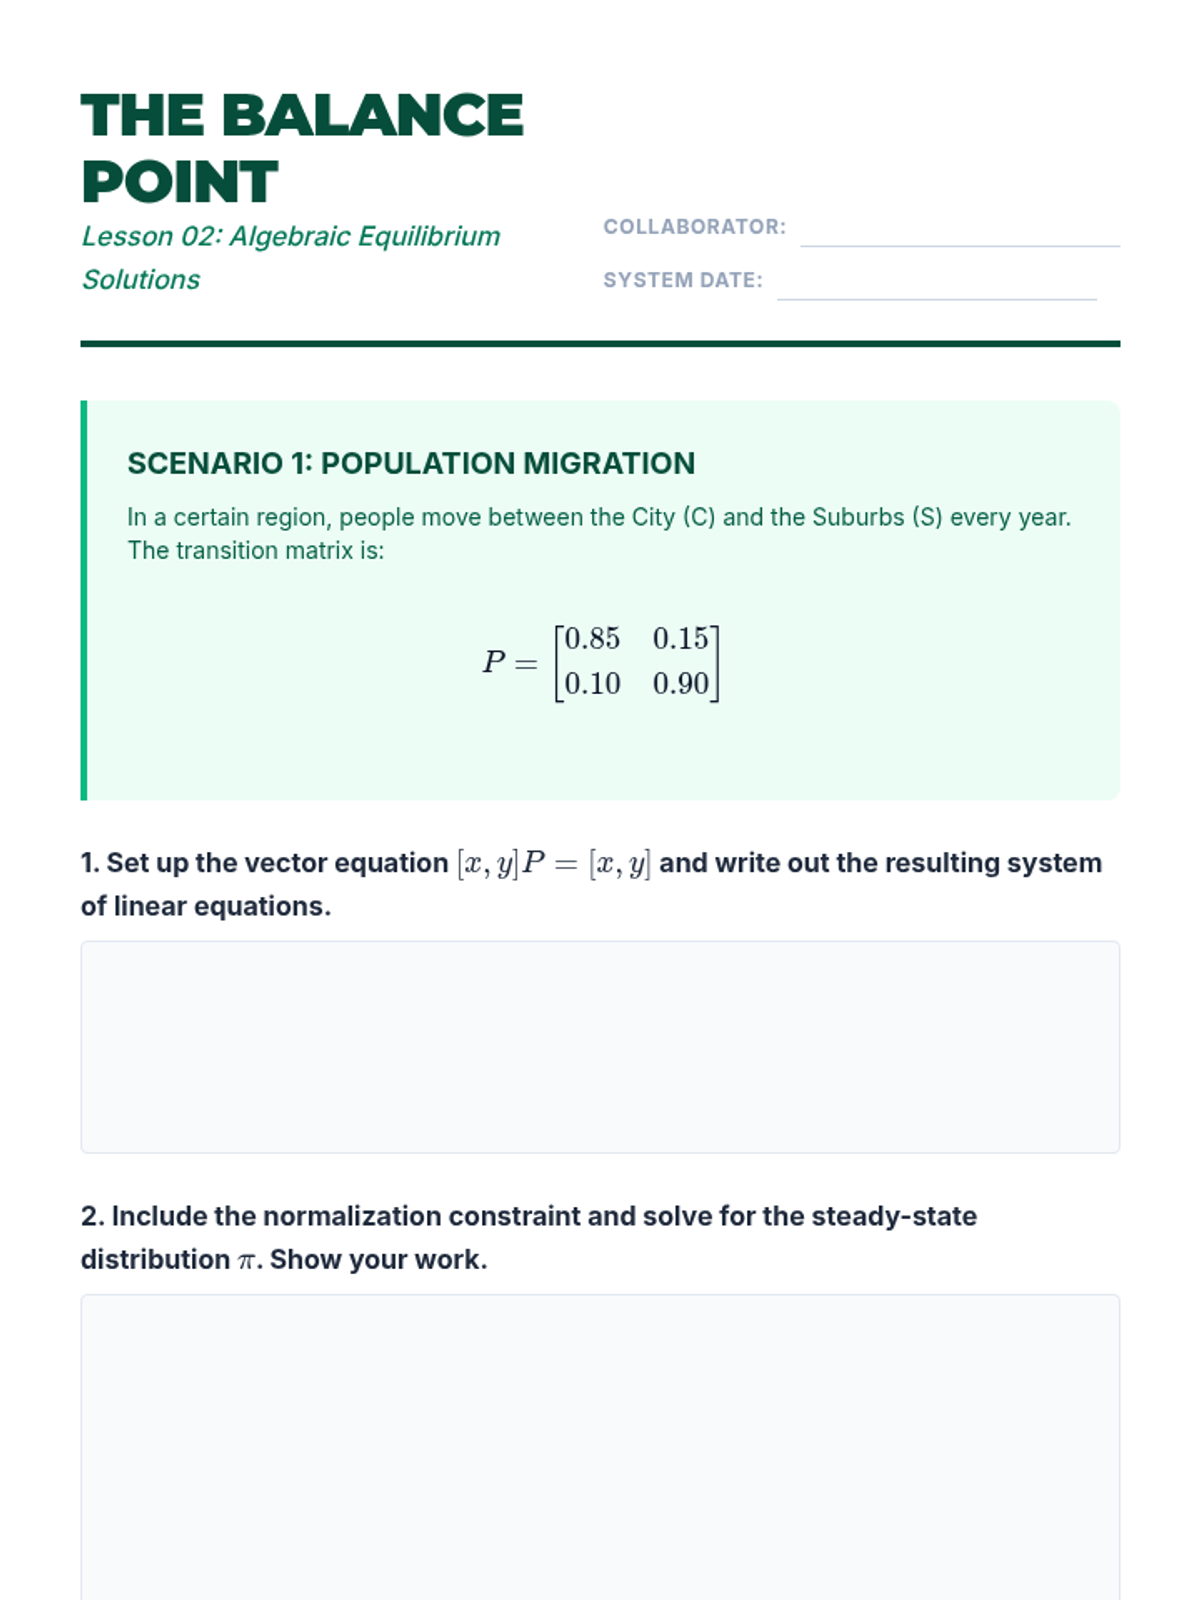
Transitioning from iteration to algebra, students learn to solve the matrix equation PI = P * PI to find stationary distributions using systems of linear equations.
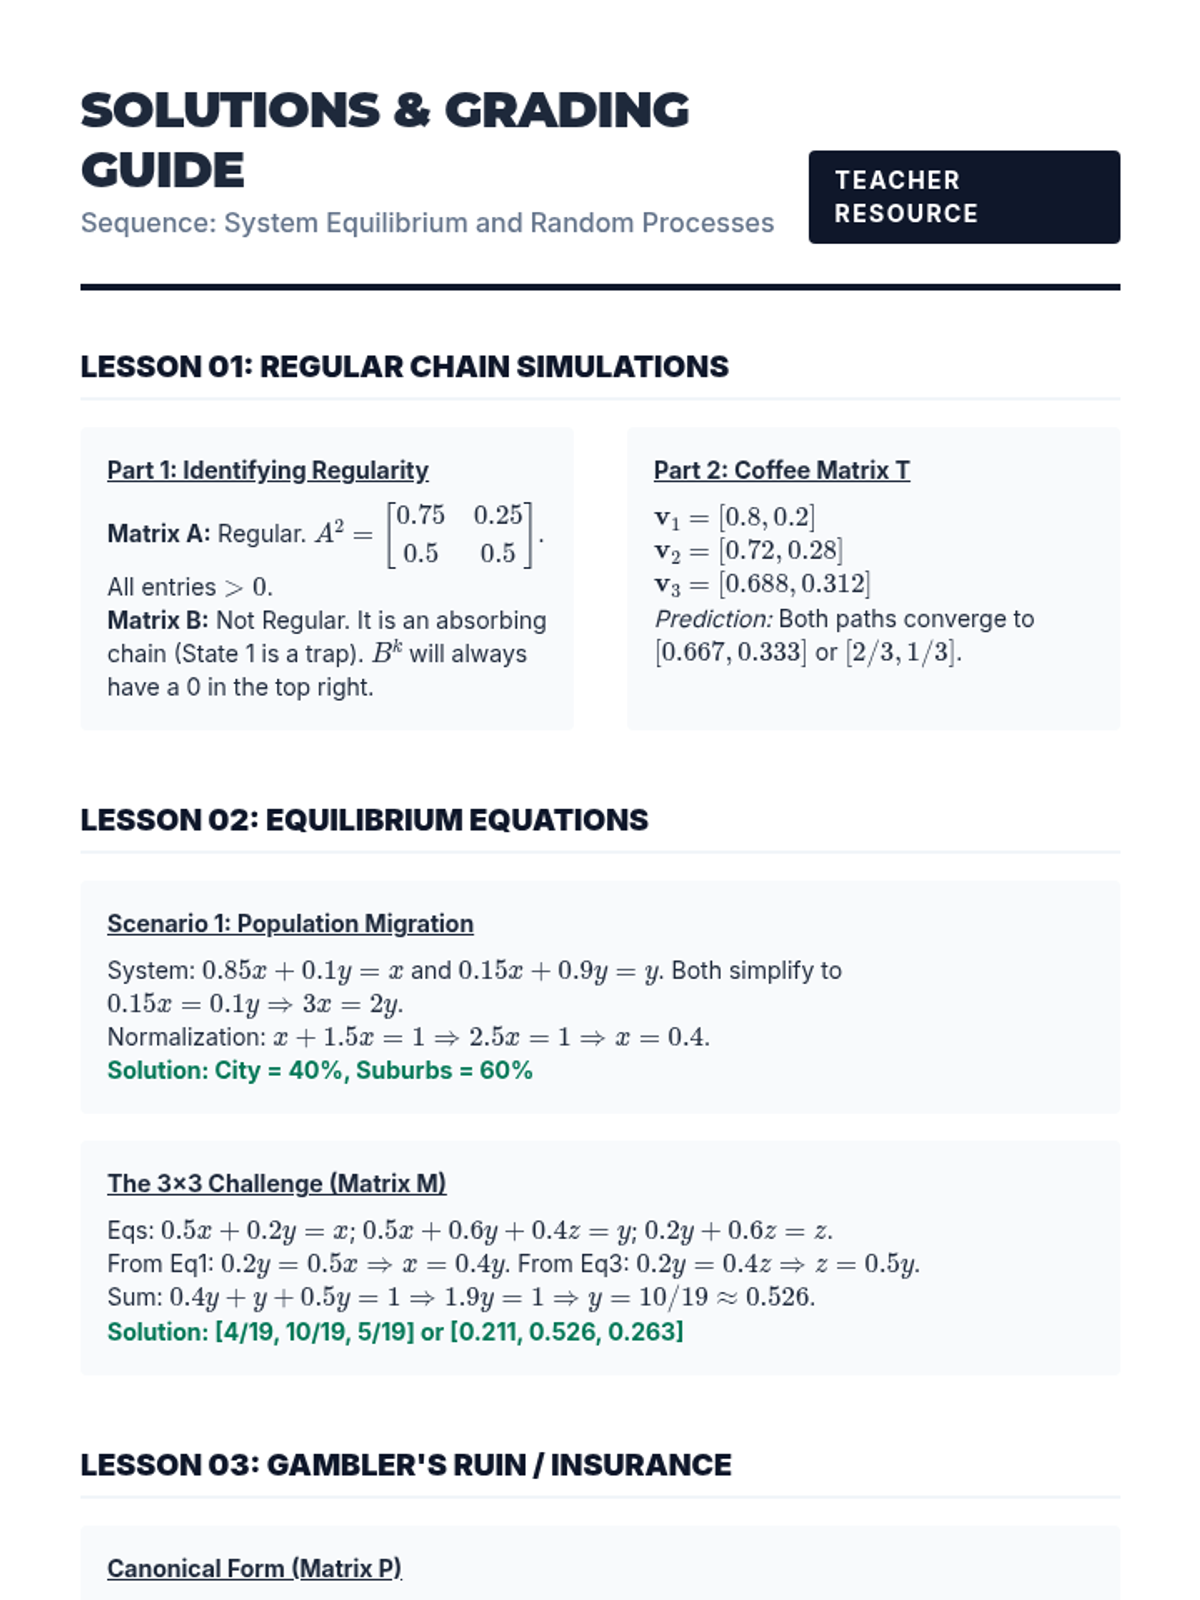
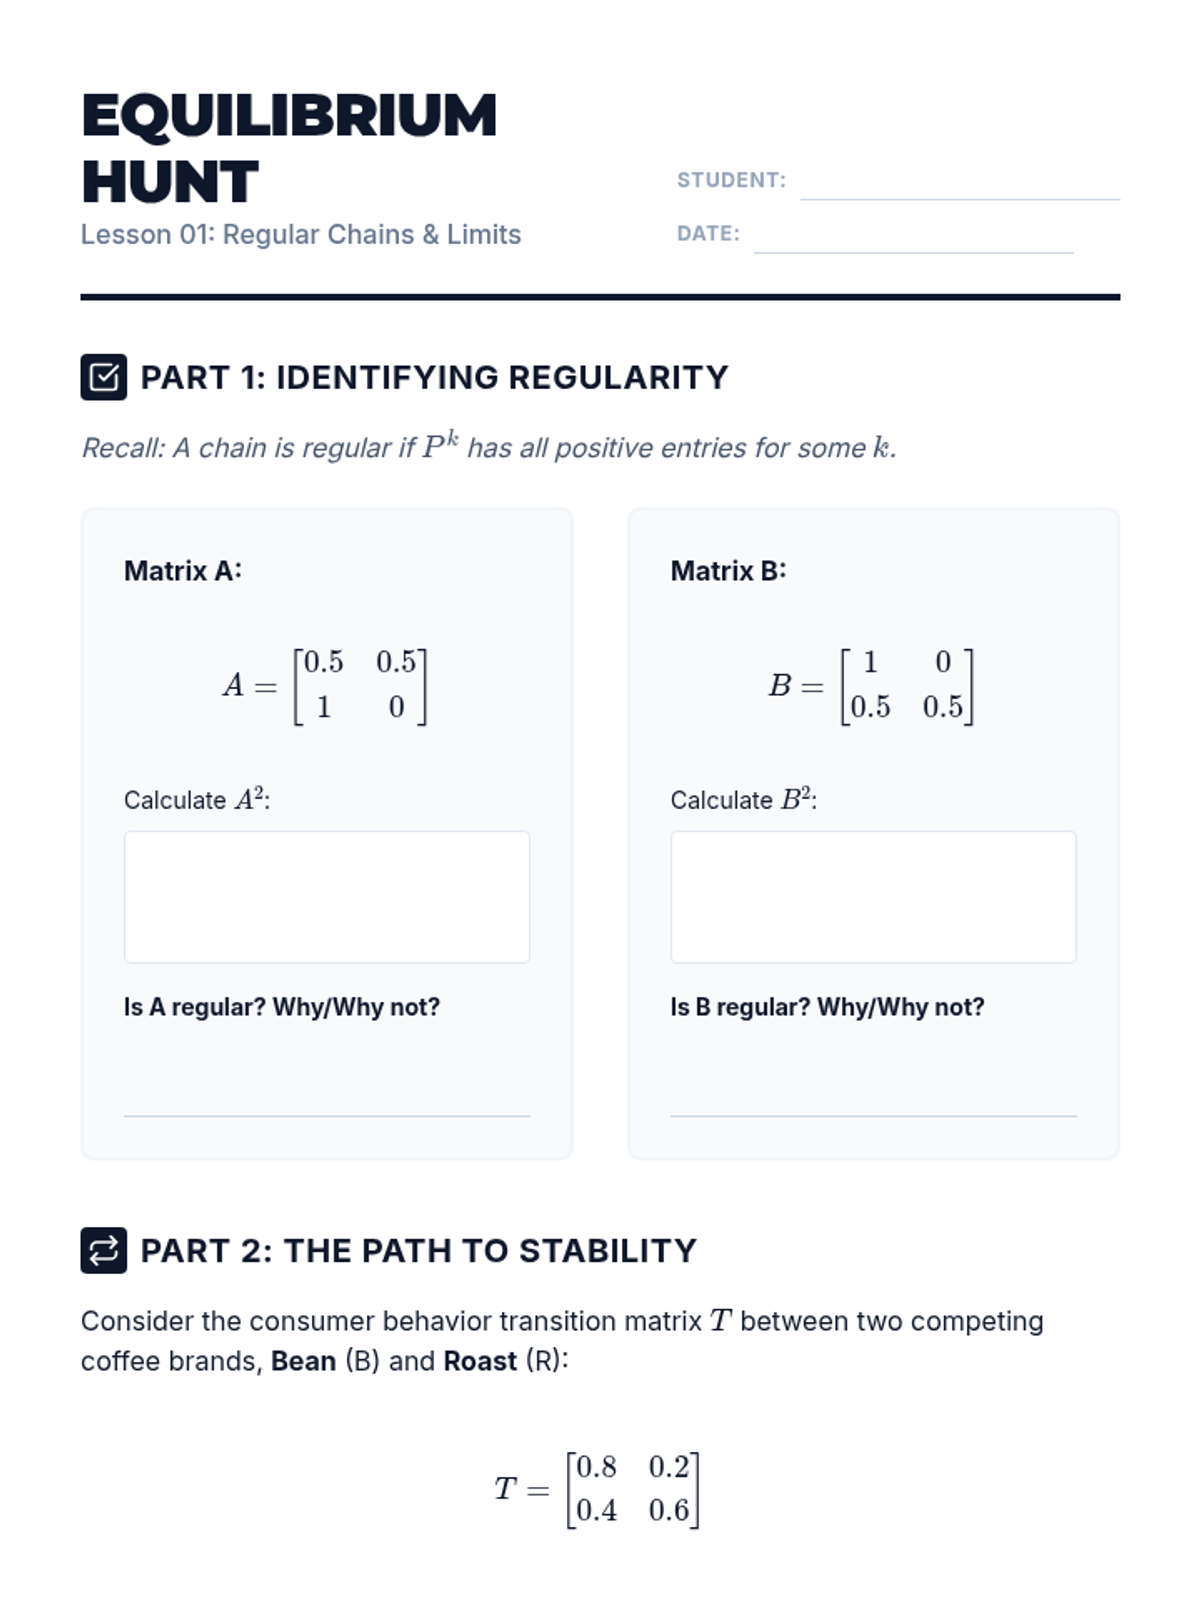
Students discover regular Markov chains and explore how systems converge to a limiting distribution regardless of their starting state through simulations and iterative multiplication.
Day 10 of the EOC review focusing on Asymptotes and Correlation Coefficients.
Day 9 of the EOC review focusing on Exponential Growth and Decay.
Day 8 of the EOC review focusing on Roots, Zeros, and Solutions of quadratics.
Day 7 of the EOC review focusing on Quadratic Vertex and Axis of Symmetry.
Day 6 of the EOC review focusing on the Laws of Exponents and Polynomial operations.
Day 5 of the EOC review focusing on Systems of Equations and finding their Solutions.
Day 4 of the EOC review focusing on Parent Functions and basic Transformations.
Day 3 of the EOC review focusing on identifying Zeros and x-intercepts in various representations.
Day 2 of the EOC review focusing on the core components of linear equations: Slope and y-intercept.
Day 1 of the EOC review focusing on the fundamental concepts of Domain and Range.
A comprehensive lesson focused on performing and interpreting linear regression analysis using real-world UN population and surface area data. Students will learn to identify variables, evaluate the impact of outliers, and draw conclusions based on correlation coefficients.
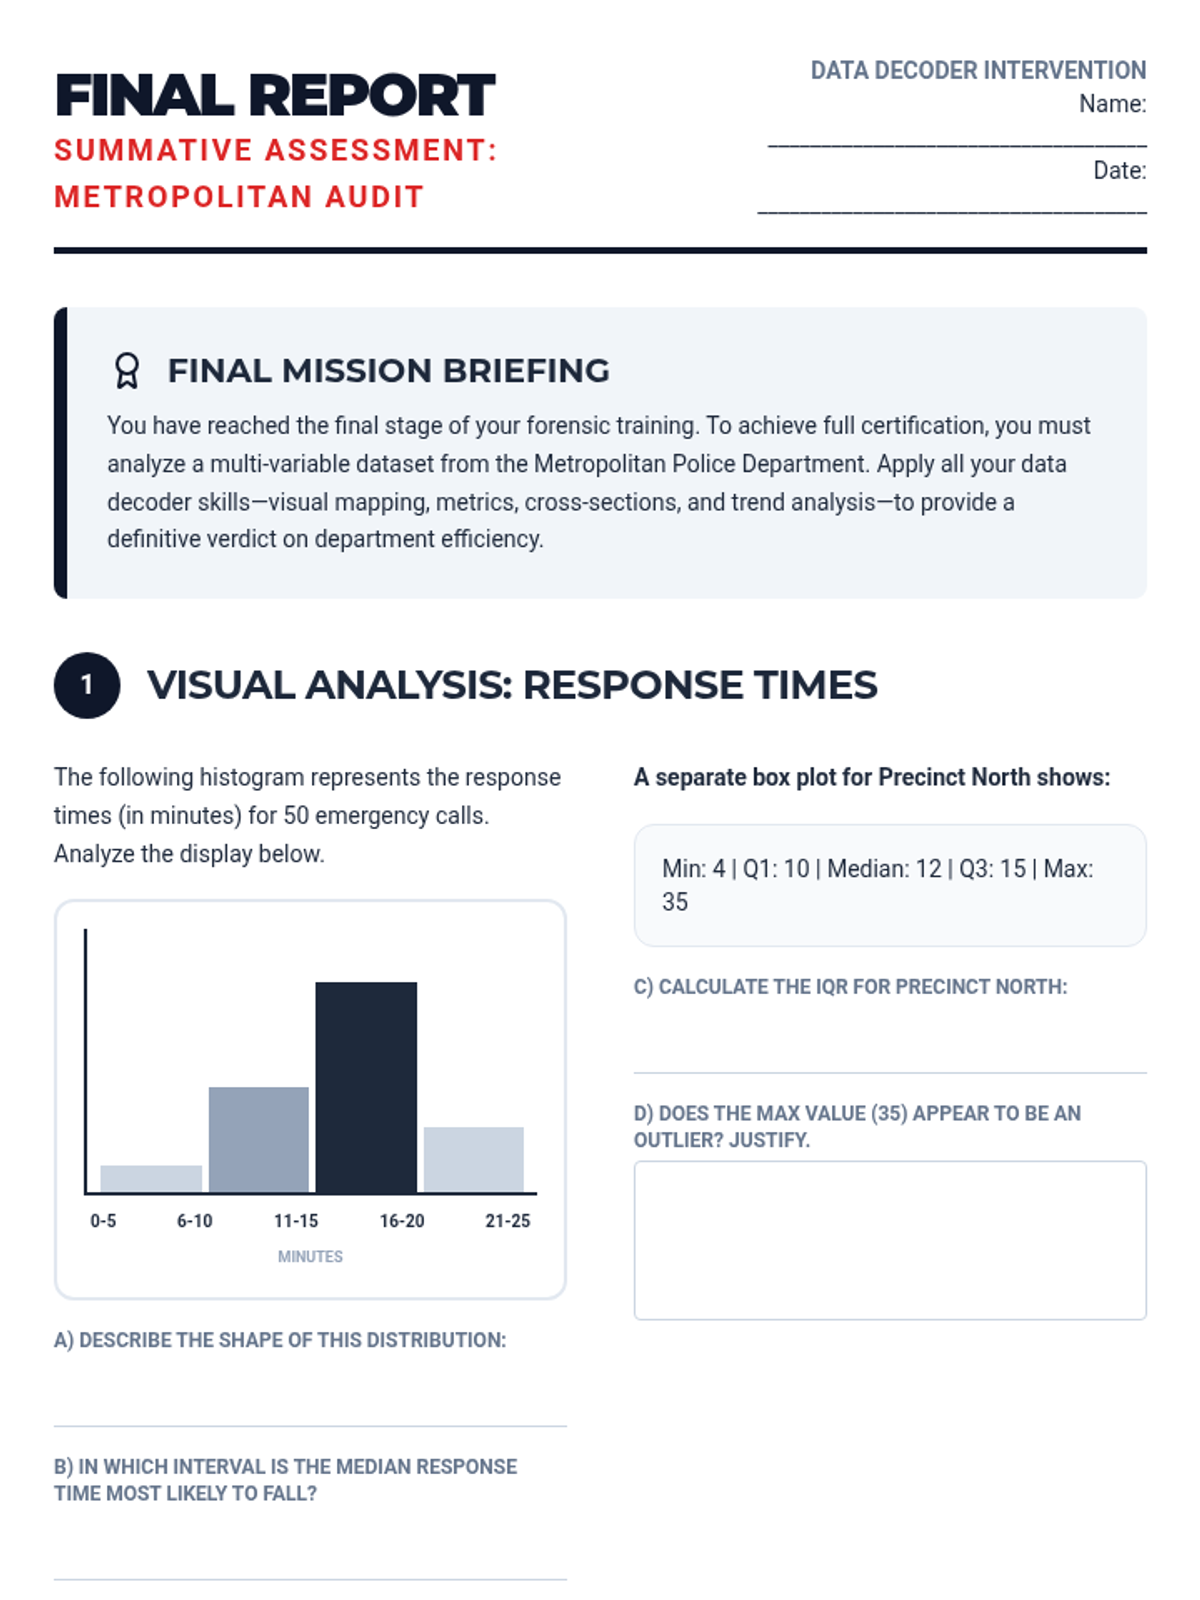
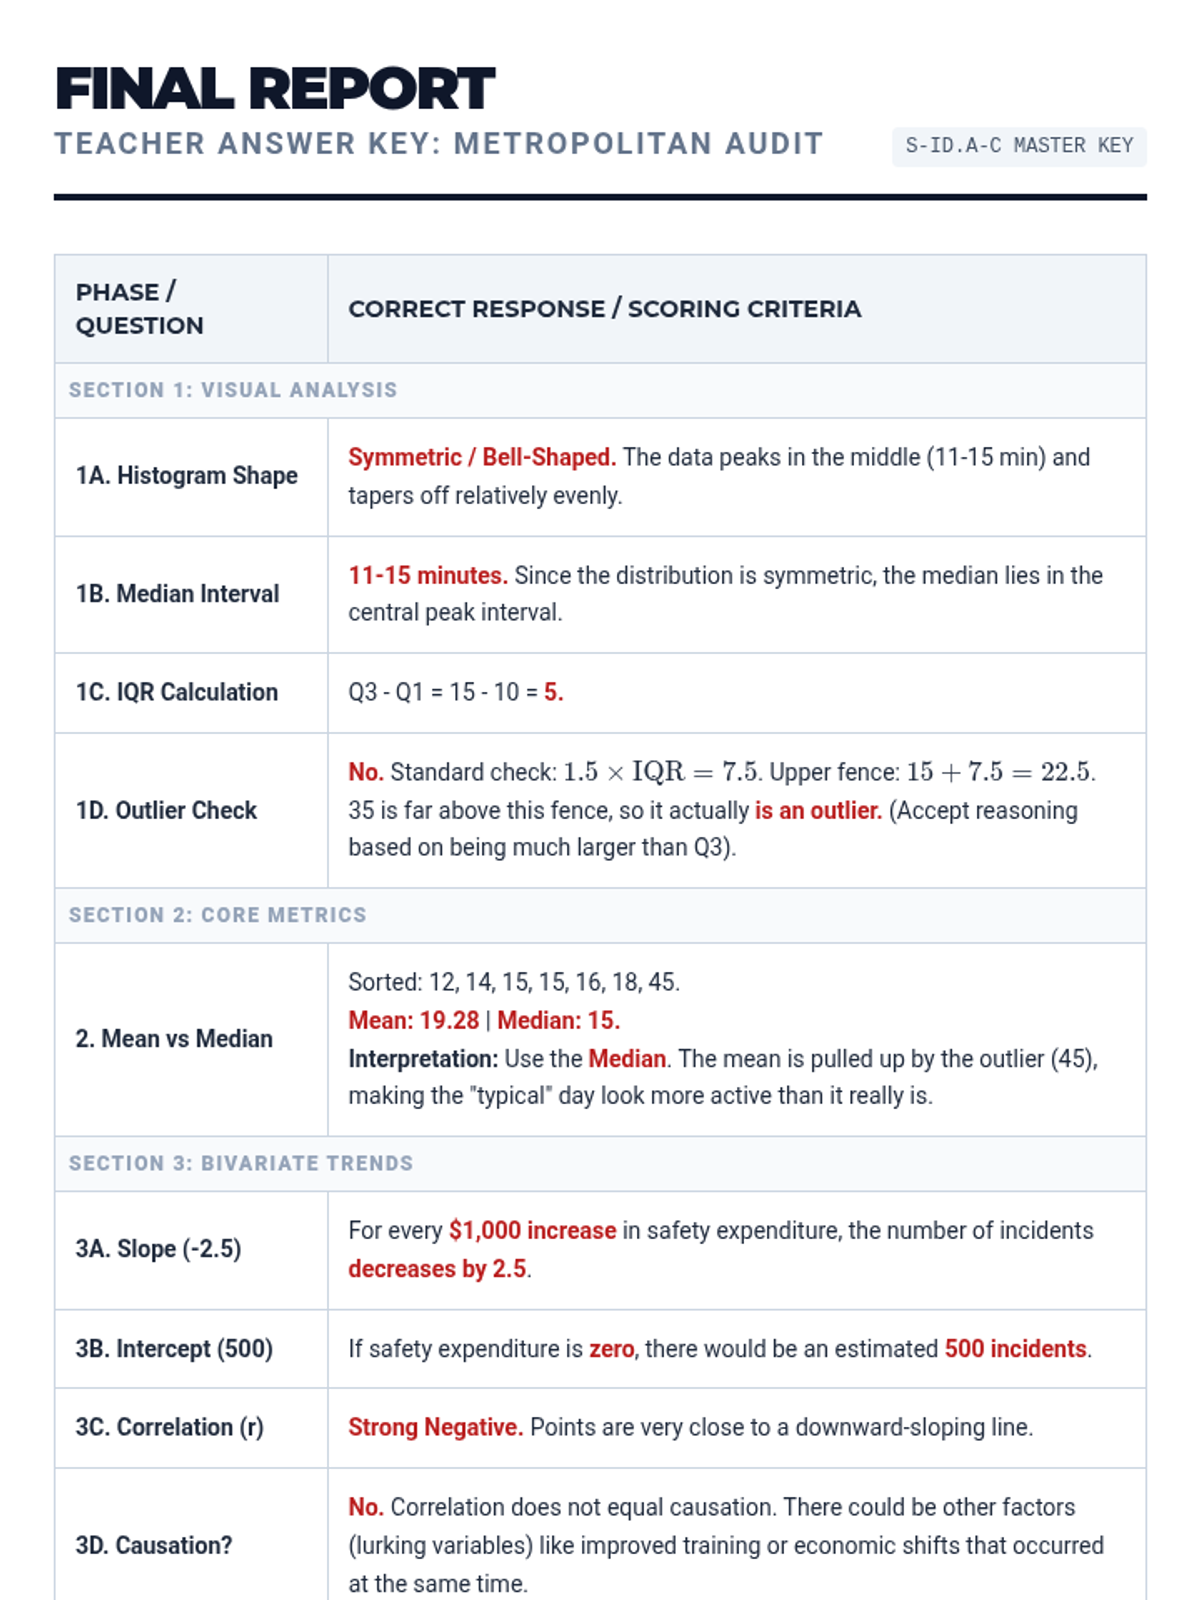
A summative assessment evaluating mastery of the Data Decoder sequence. Students apply their skills to a final case study involving complex data analysis and interpretation.
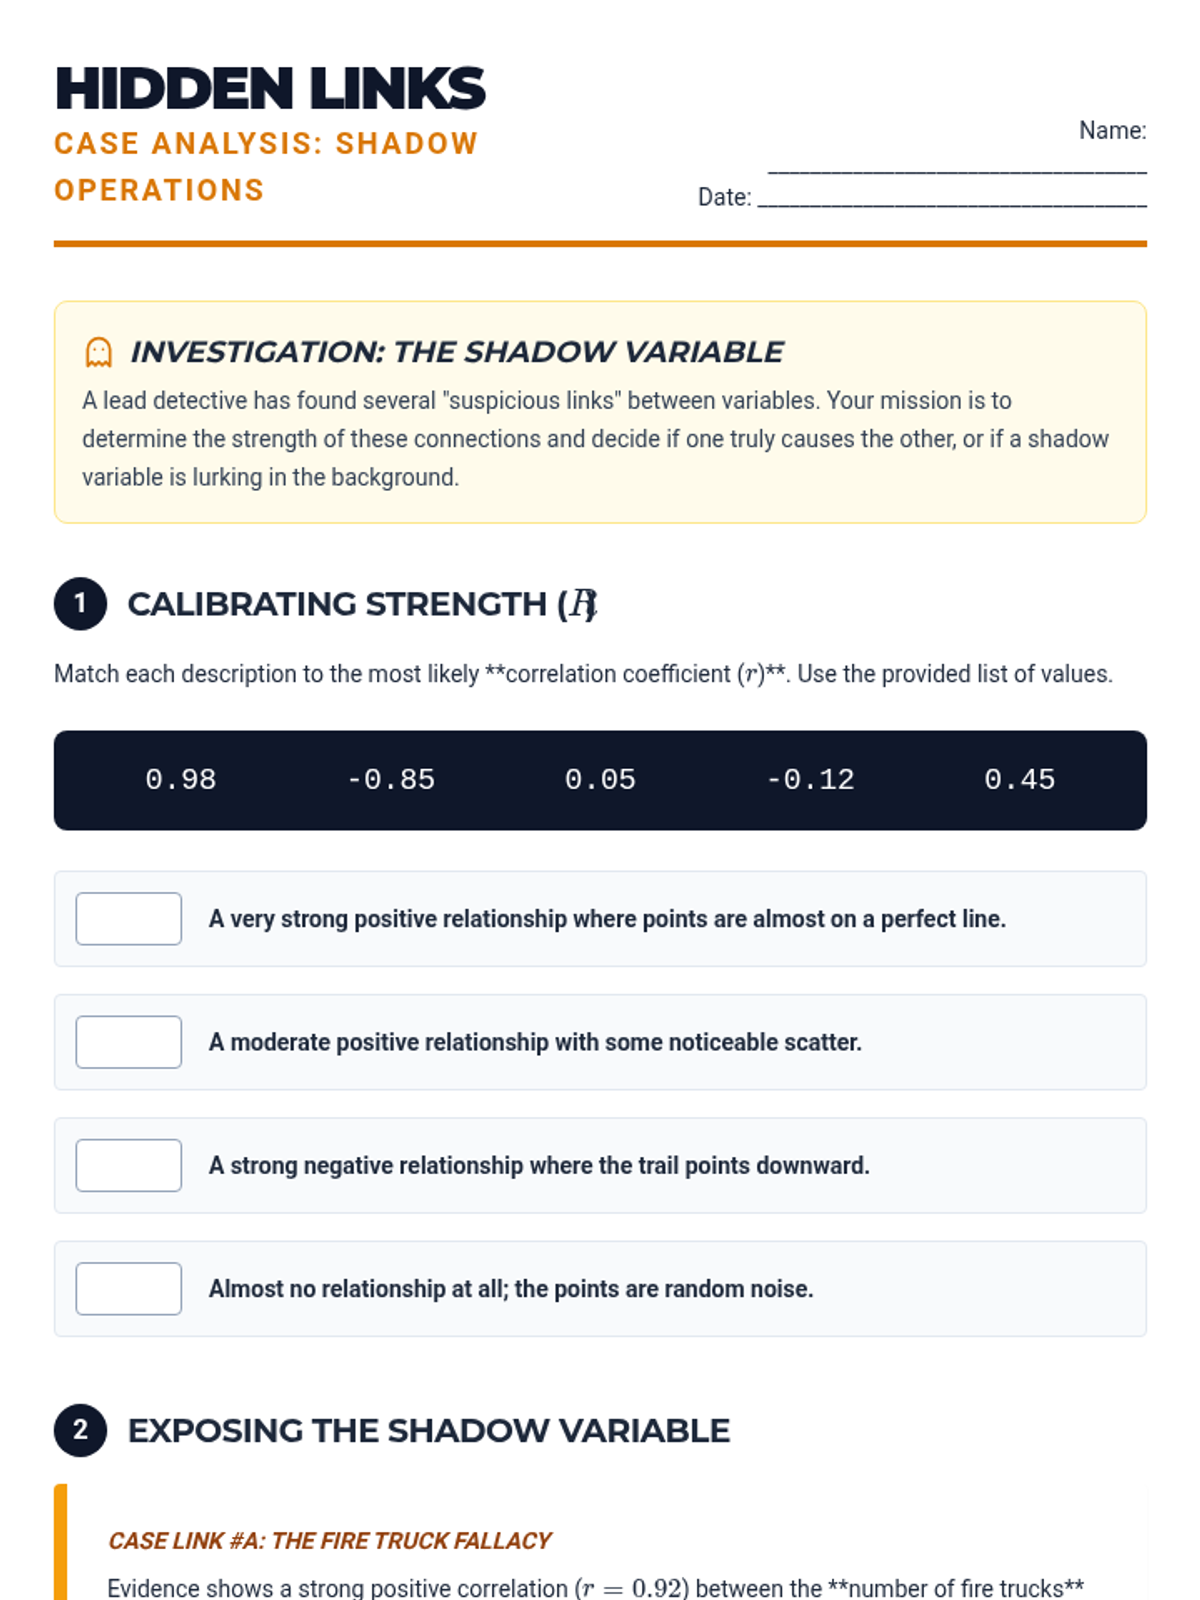
A deep dive into distinguishing between correlation and causation. Students analyze the correlation coefficient (r) and explore how external factors can influence perceived relationships between variables.
Explores bivariate data through scatter plots, trend lines, and the basics of linear regression. Students learn to use technology or manual methods to find the line of best fit and interpret the slope and intercept.
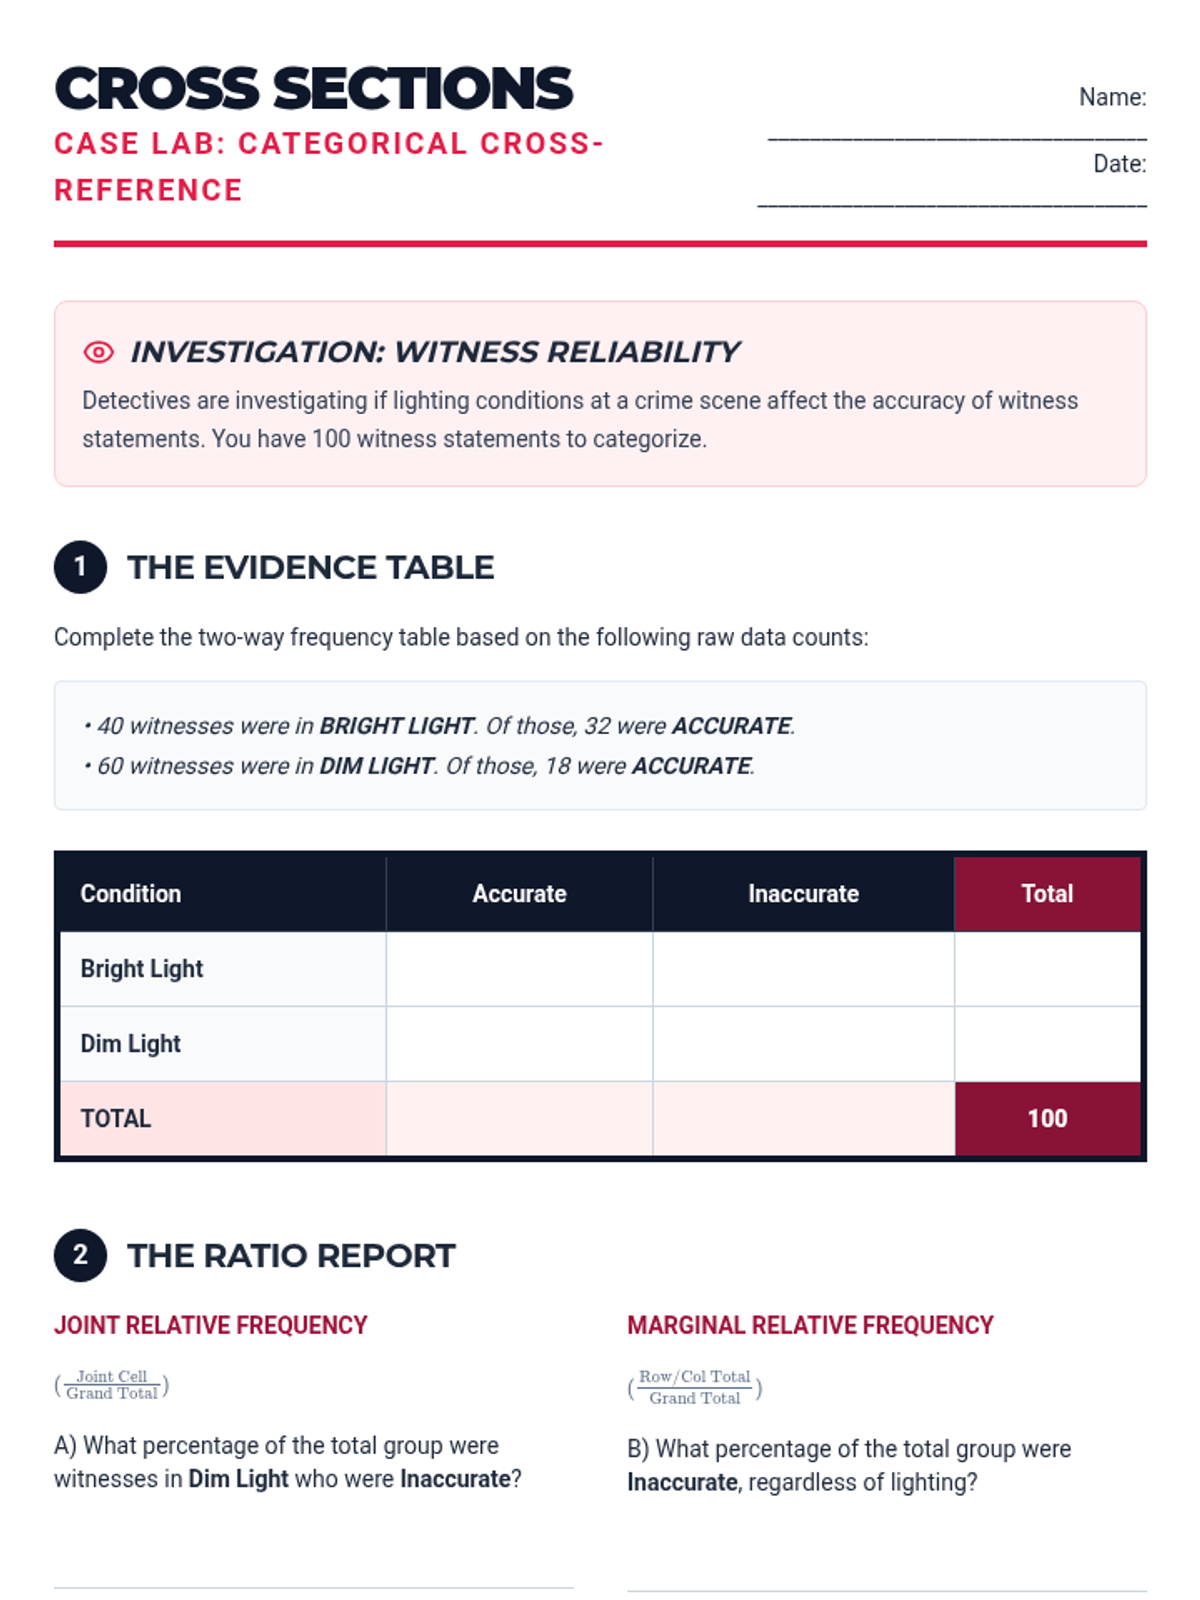
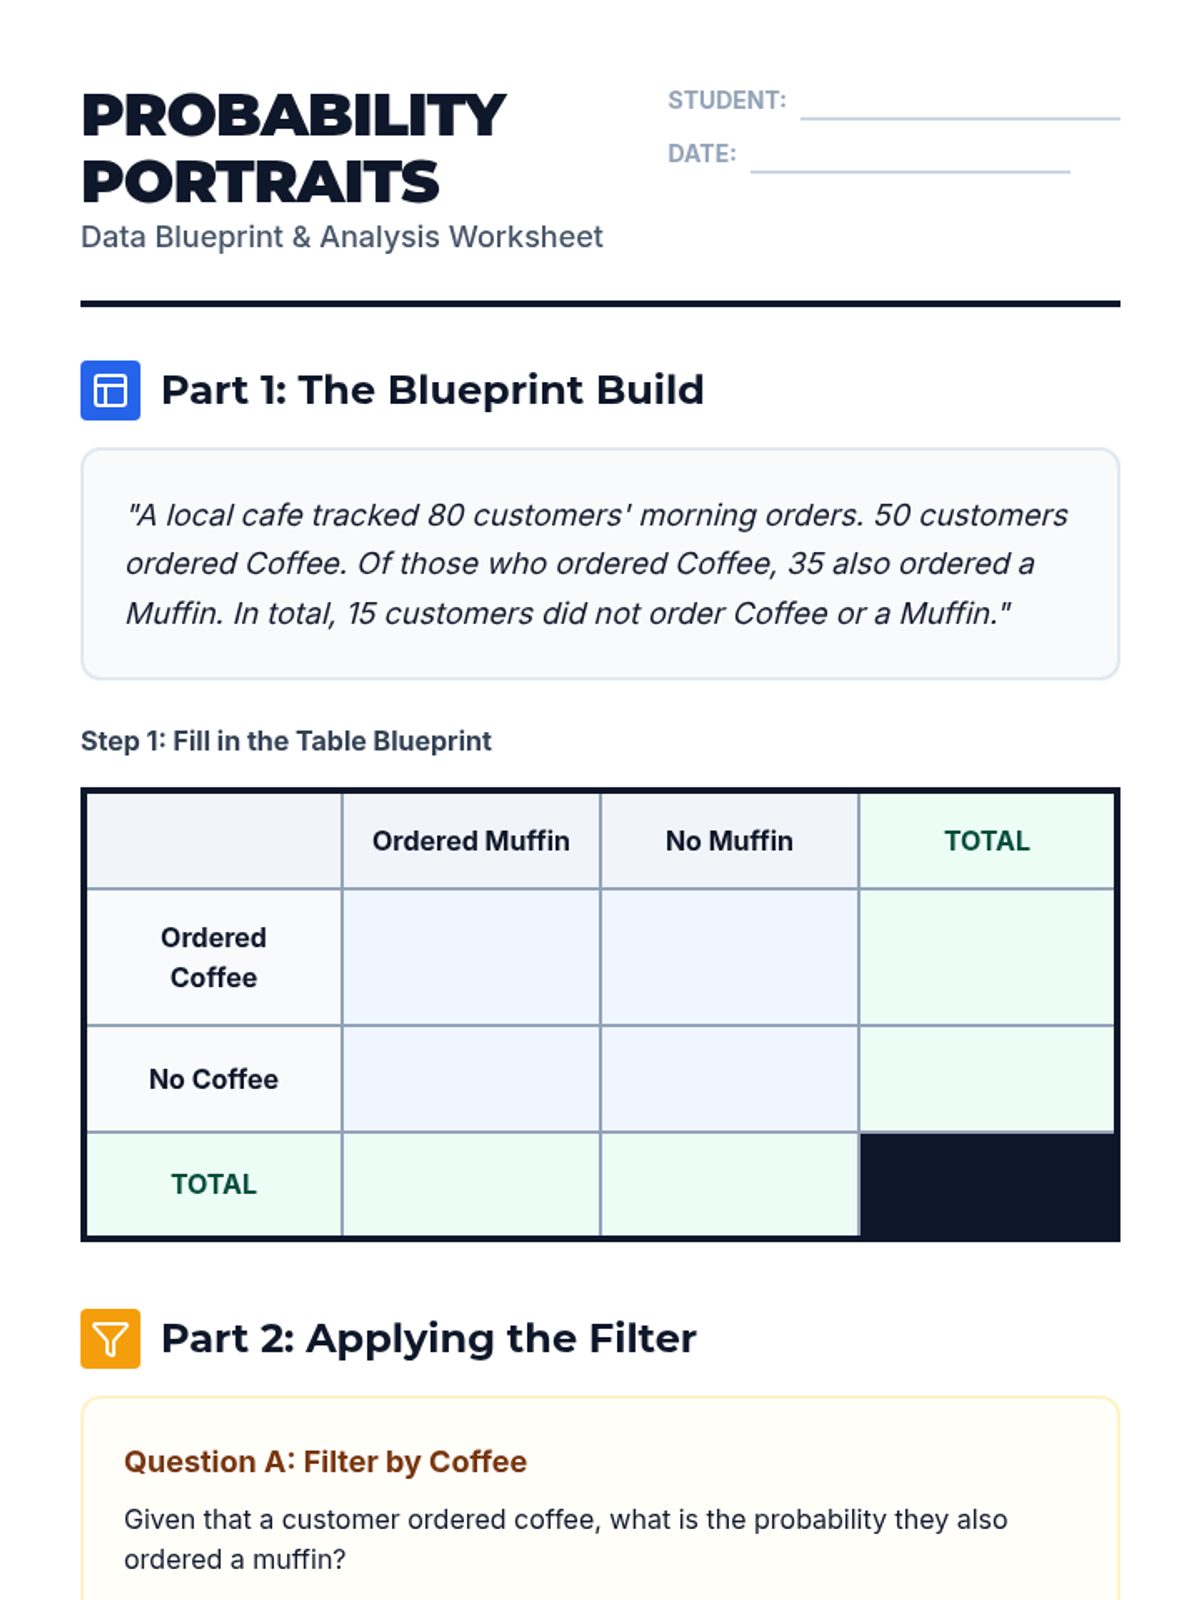
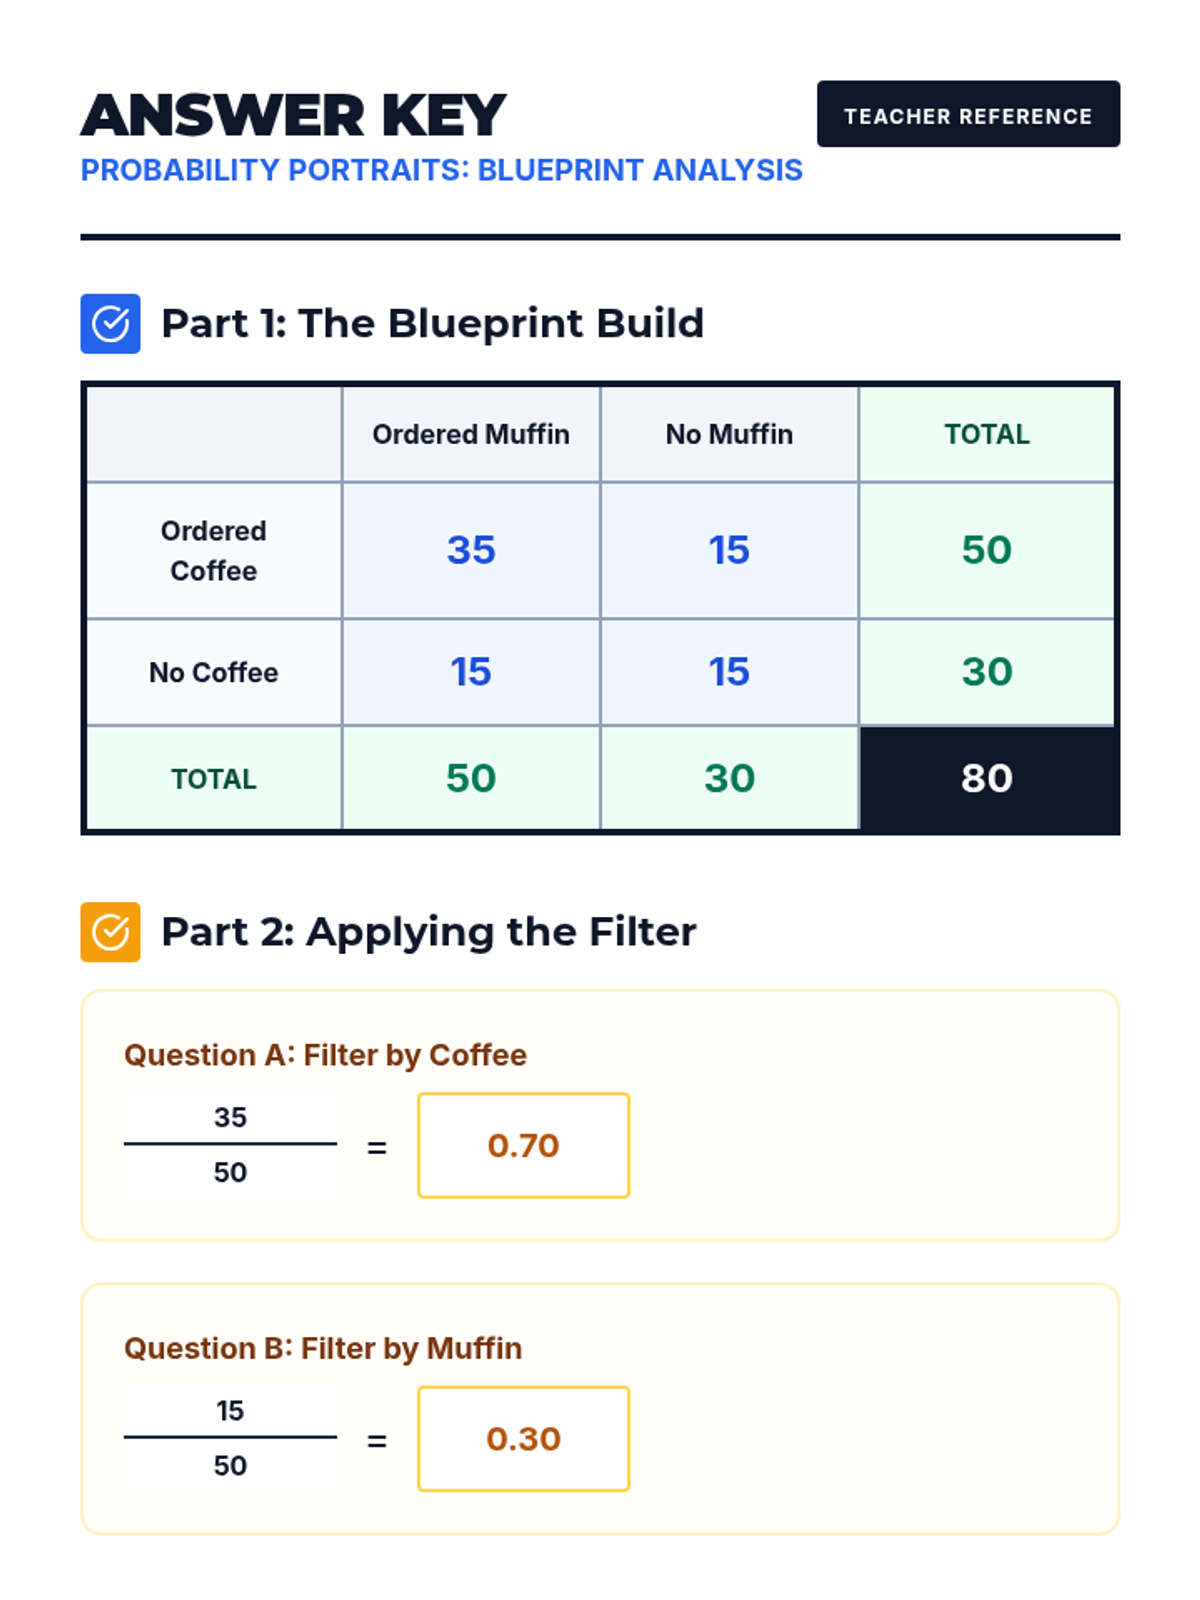
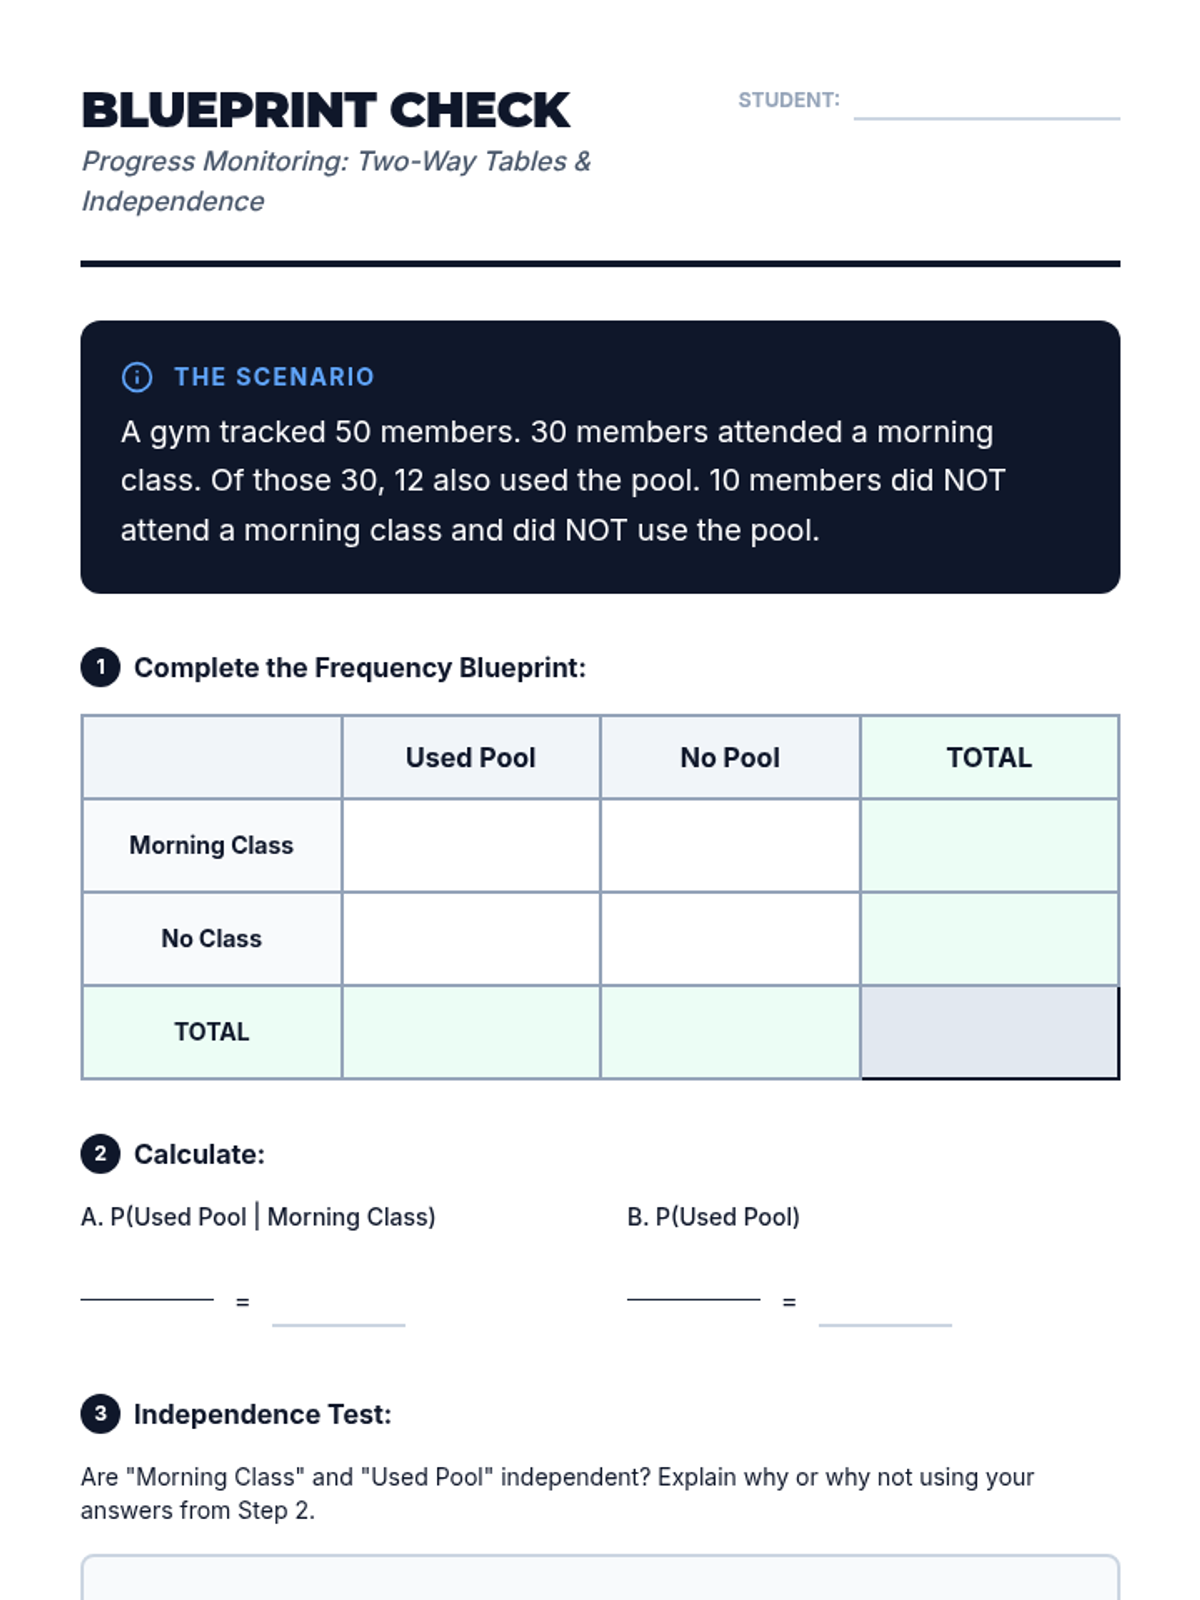
Instruction on organizing and interpreting categorical data using two-way frequency tables. Students calculate joint, marginal, and conditional relative frequencies to find associations between variables.
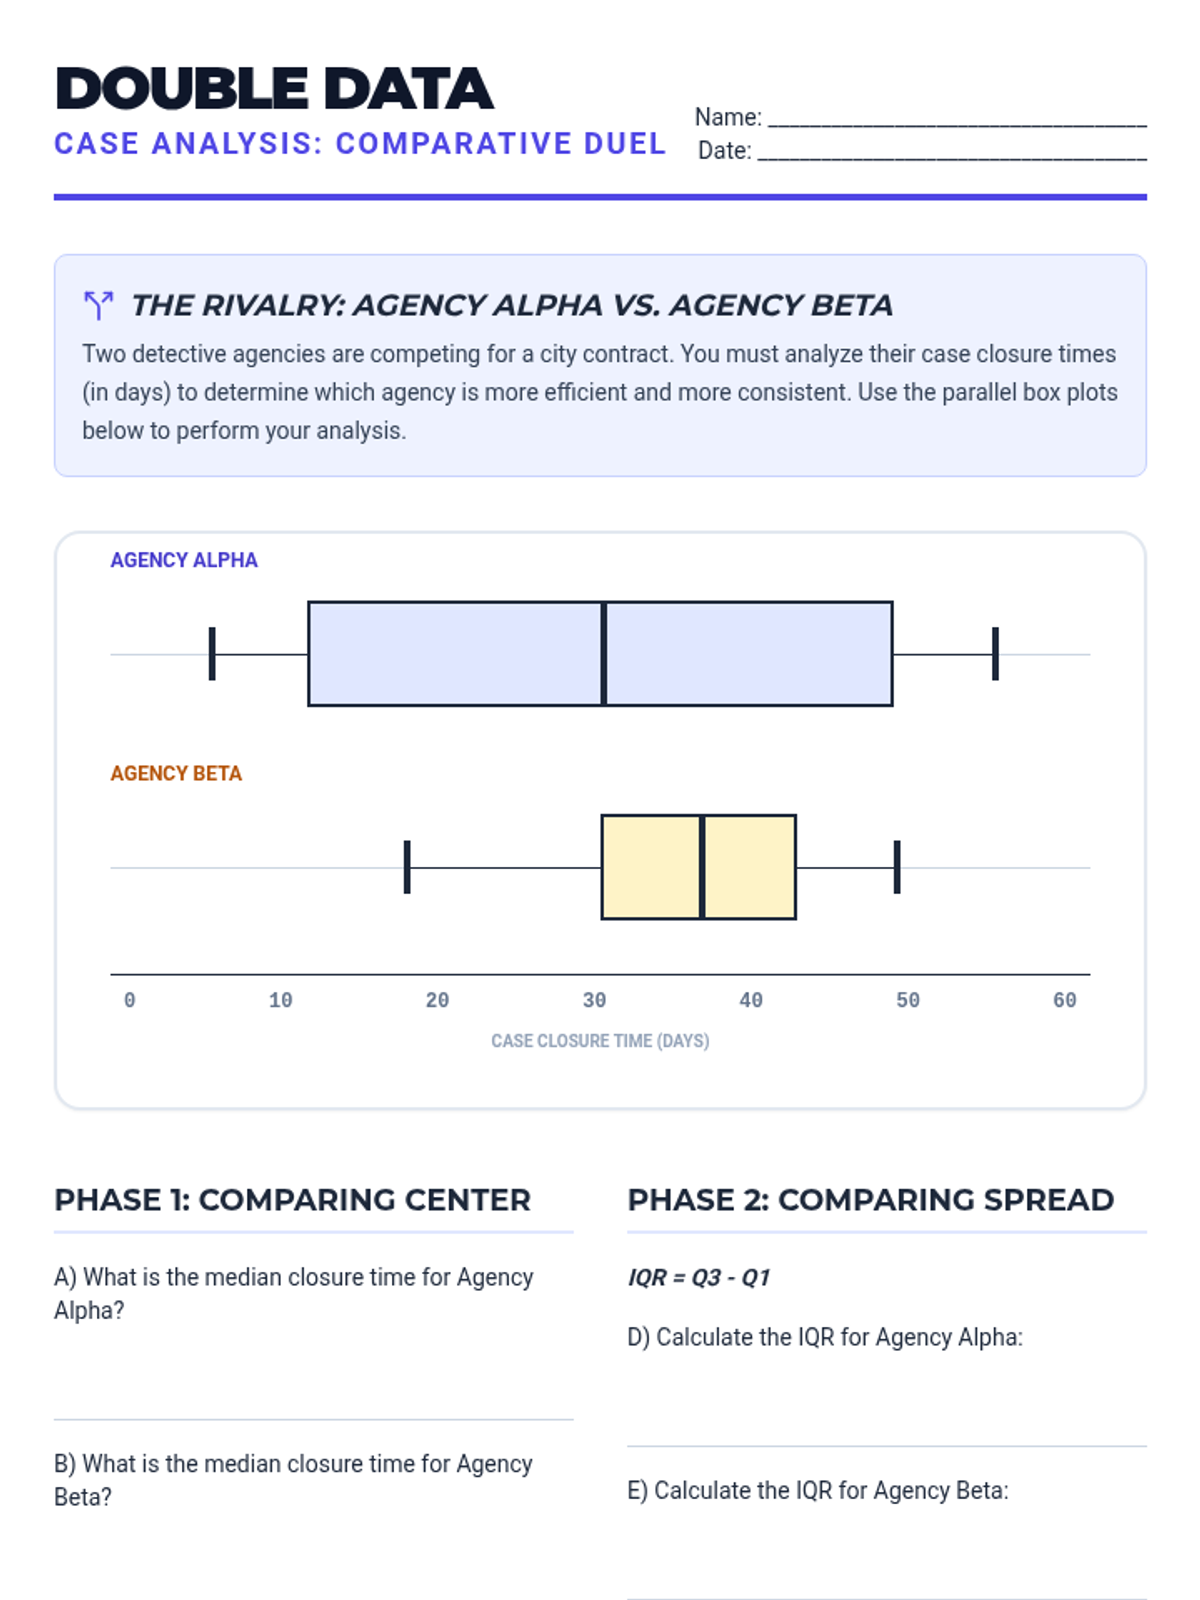
Guided practice in comparing two or more datasets using visual displays and summary statistics. Students analyze differences in shape, center, and spread to draw meaningful conclusions.
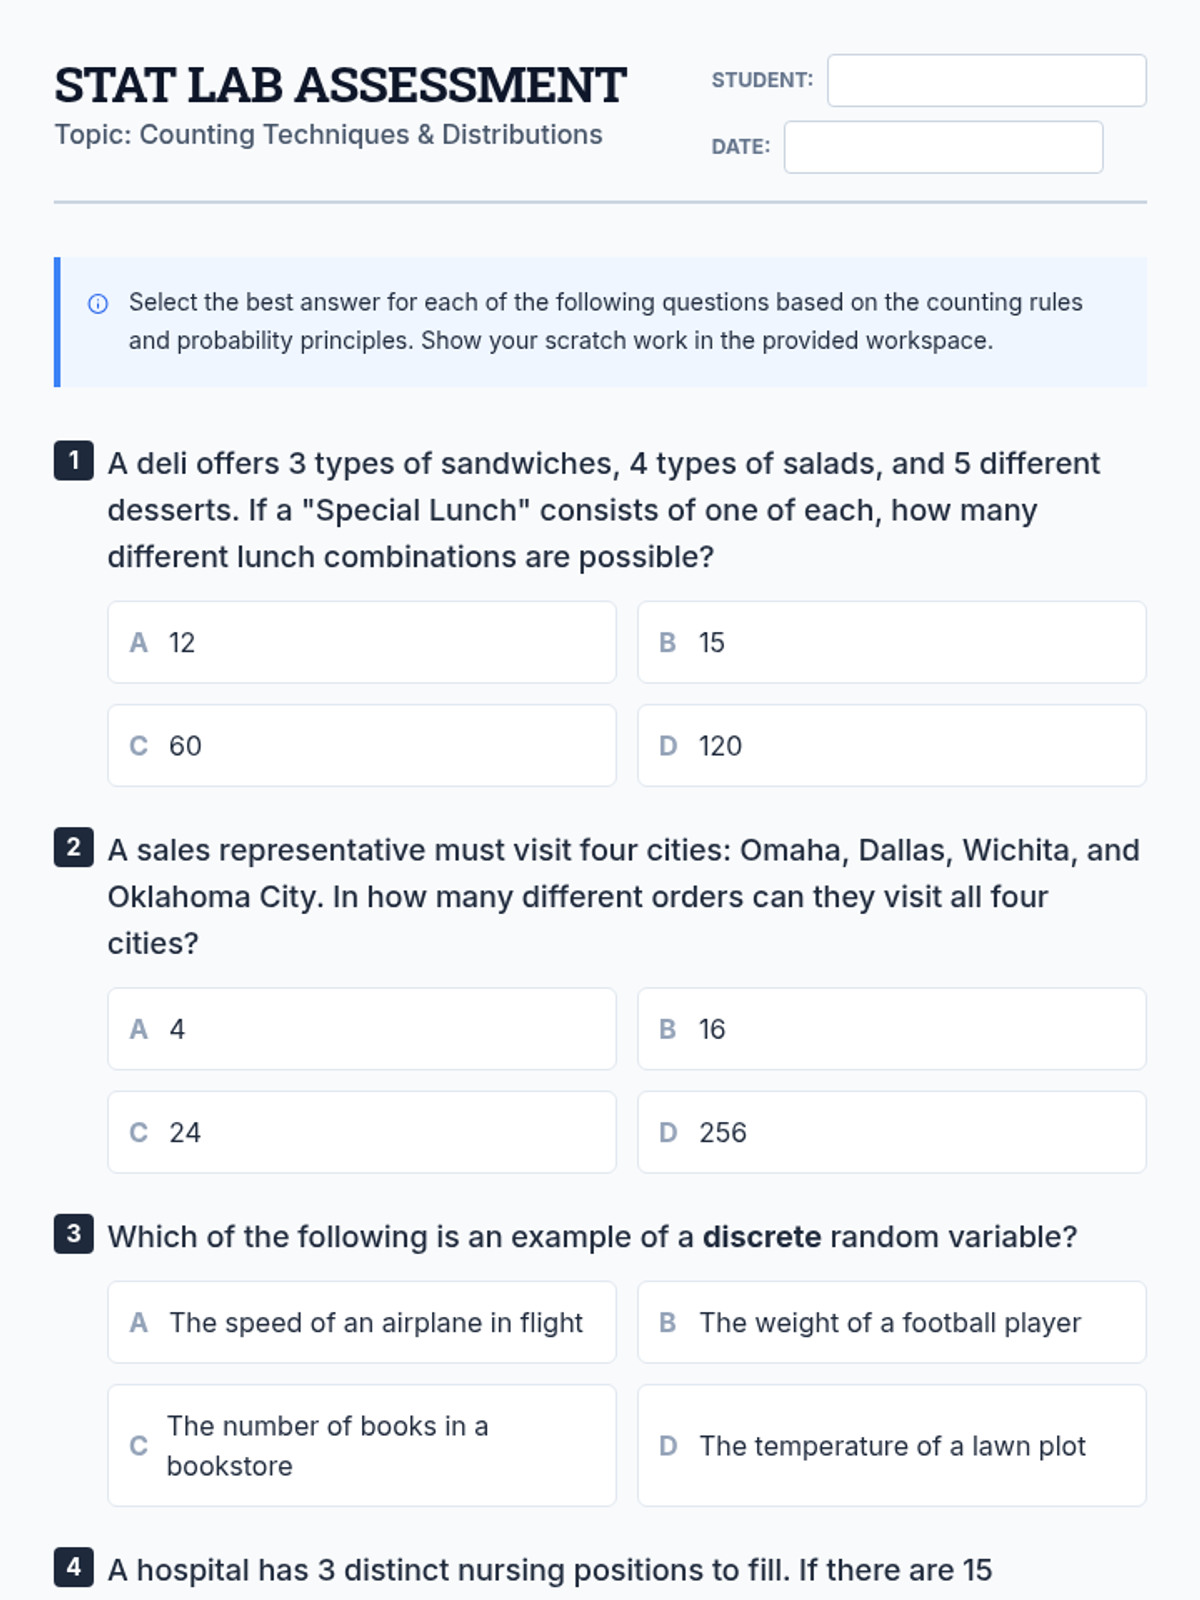
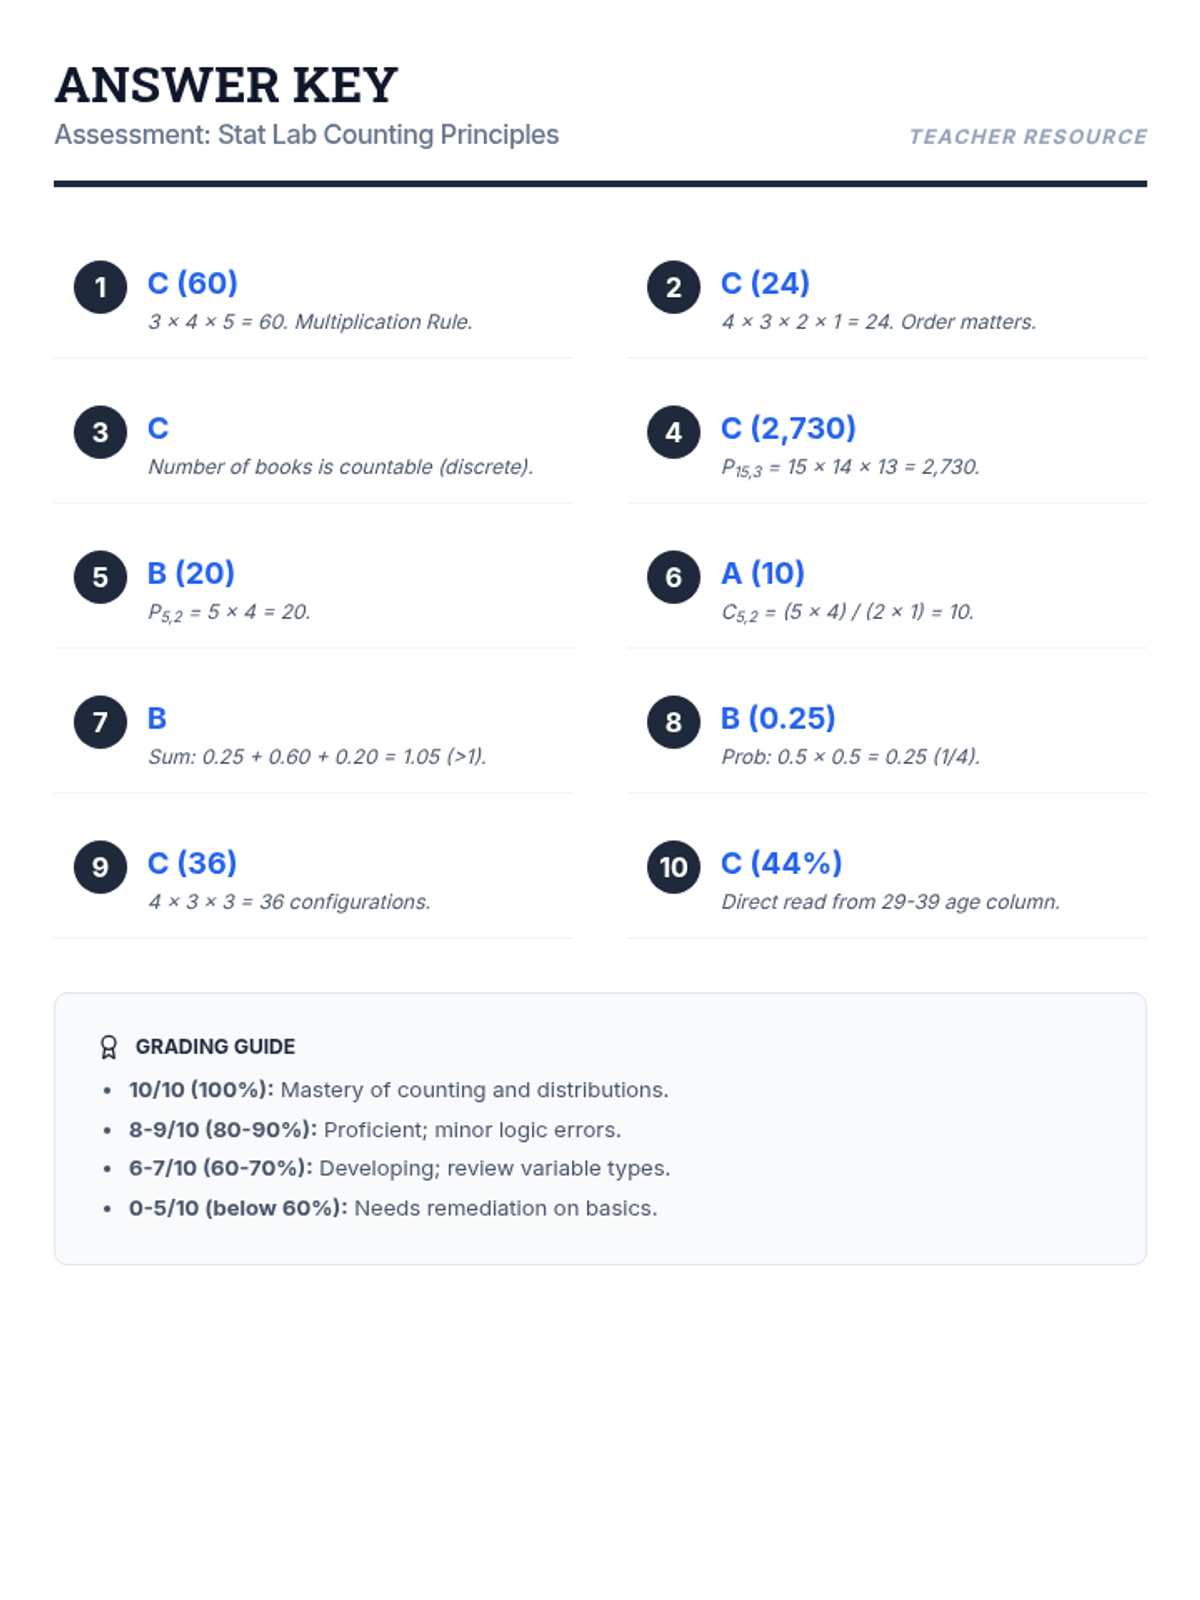
A comprehensive lesson covering counting techniques, permutations, combinations, and basic probability distributions based on statistical principles.
A comprehensive assessment covering discrete random variables, permutations, combinations, and the binomial probability distribution based on real-world statistical data.
A comprehensive preparation set for the TSIA2 Mathematics assessment, featuring a full-length practice test, detailed step-by-step solutions, and a strategic review presentation.
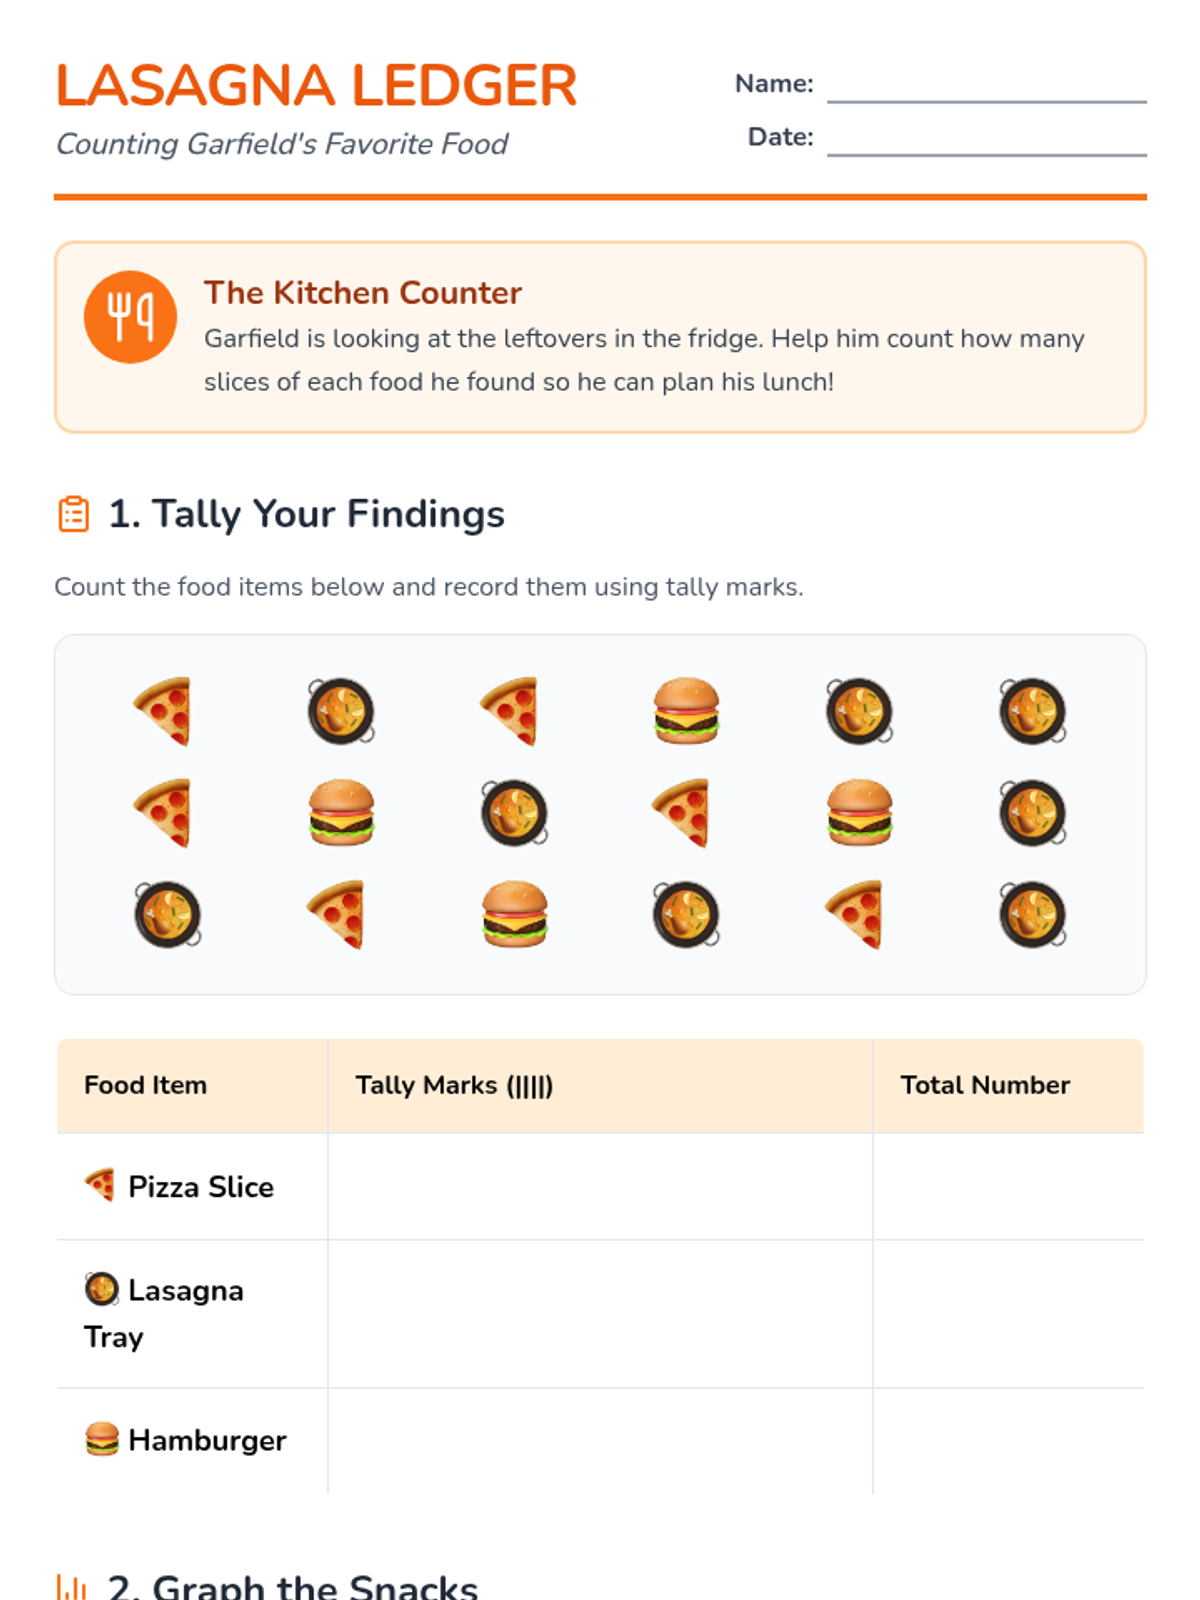
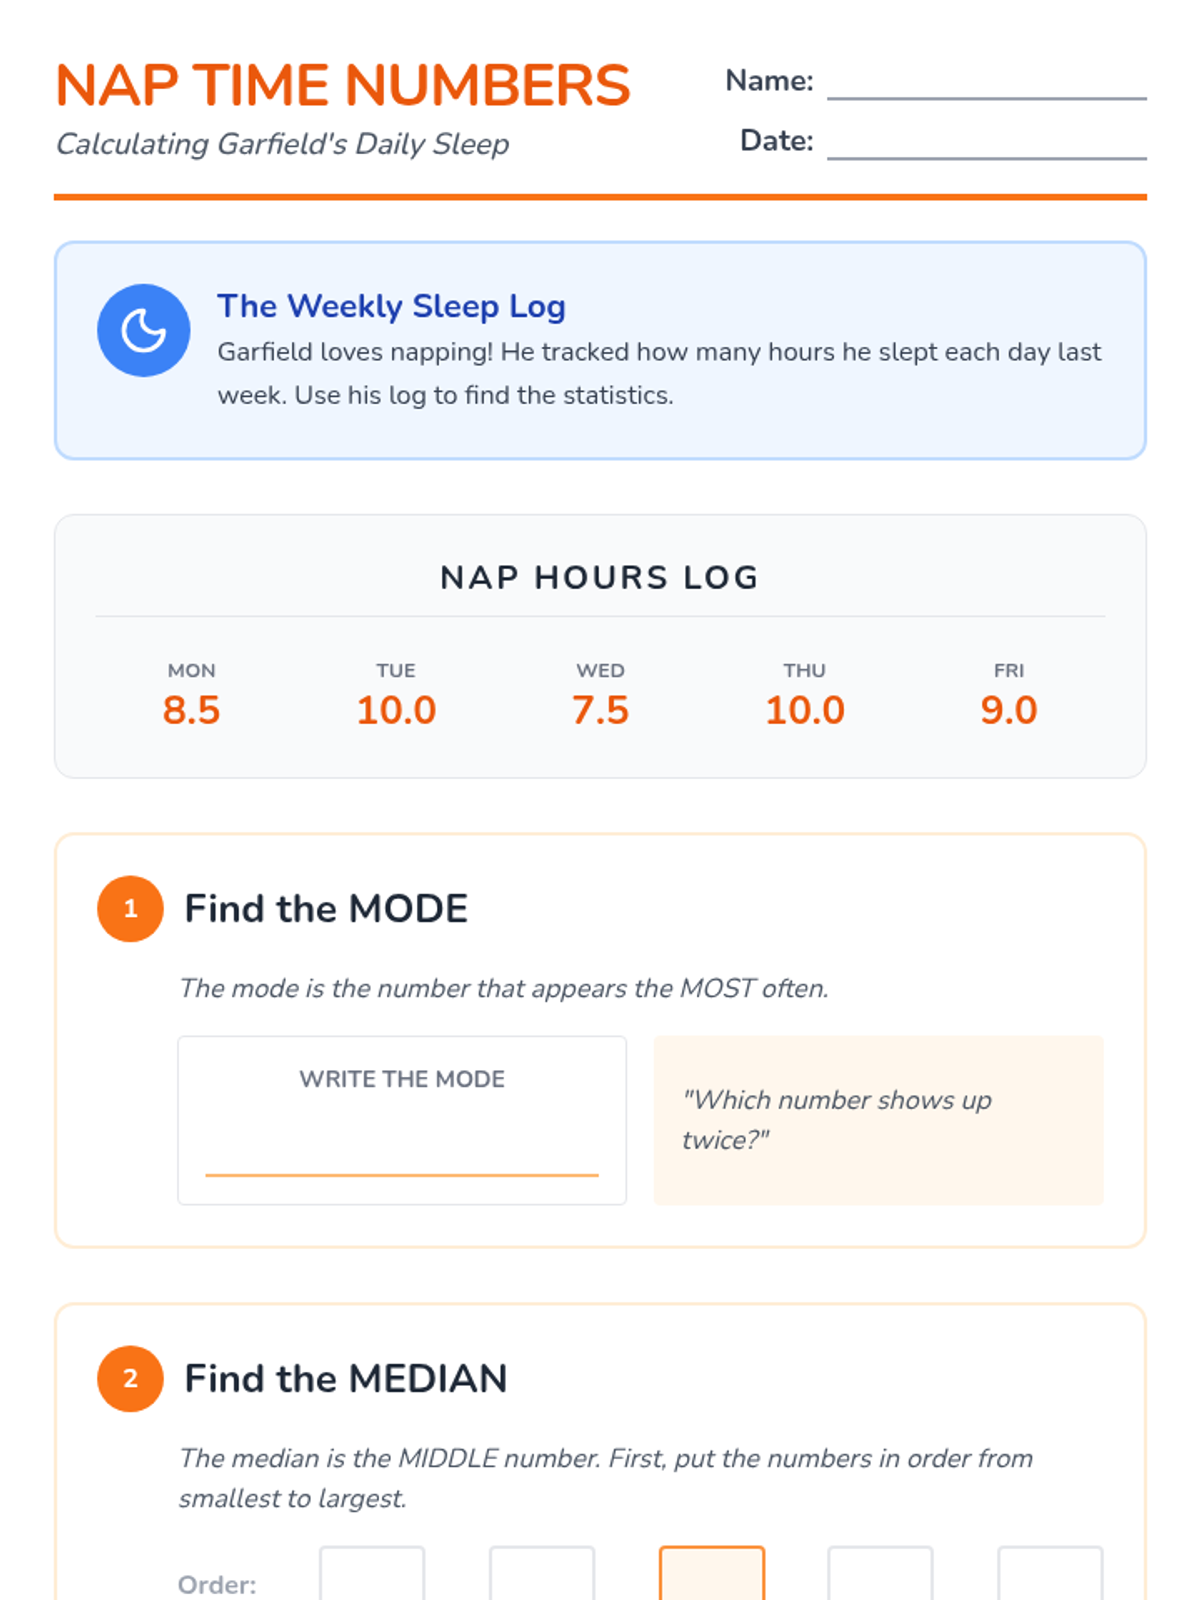
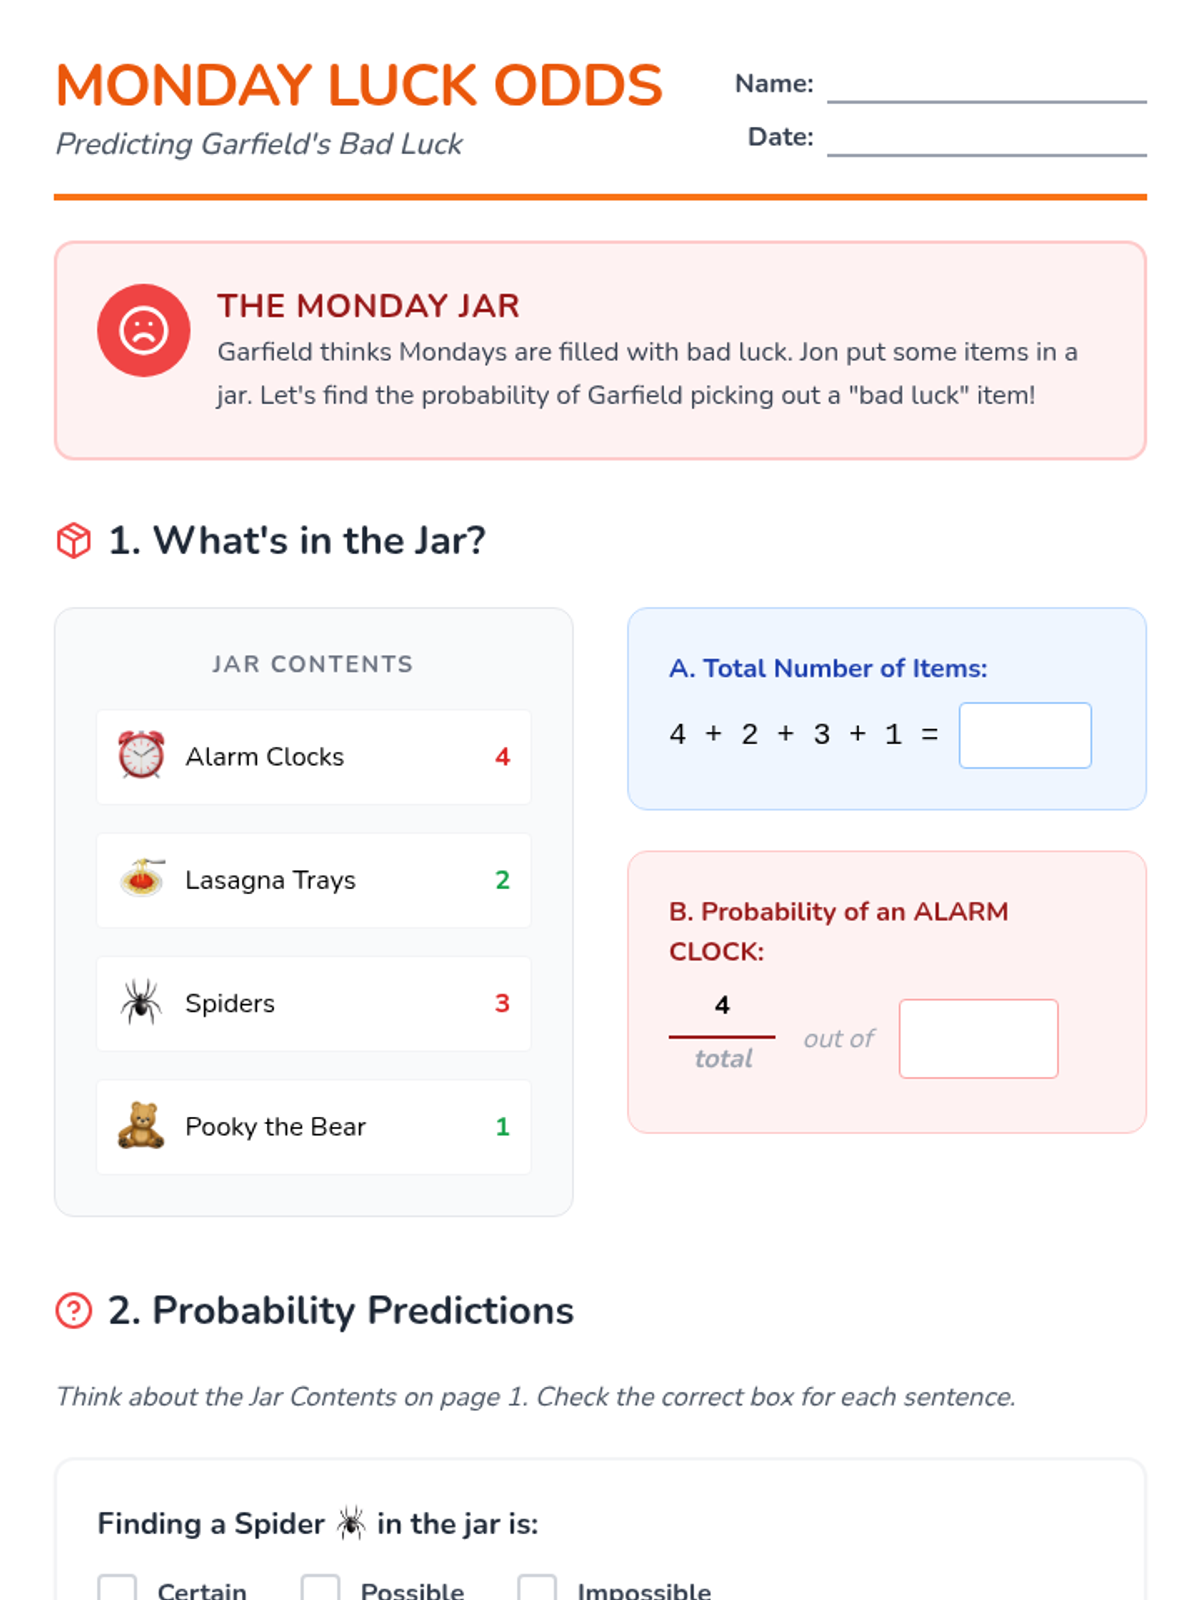
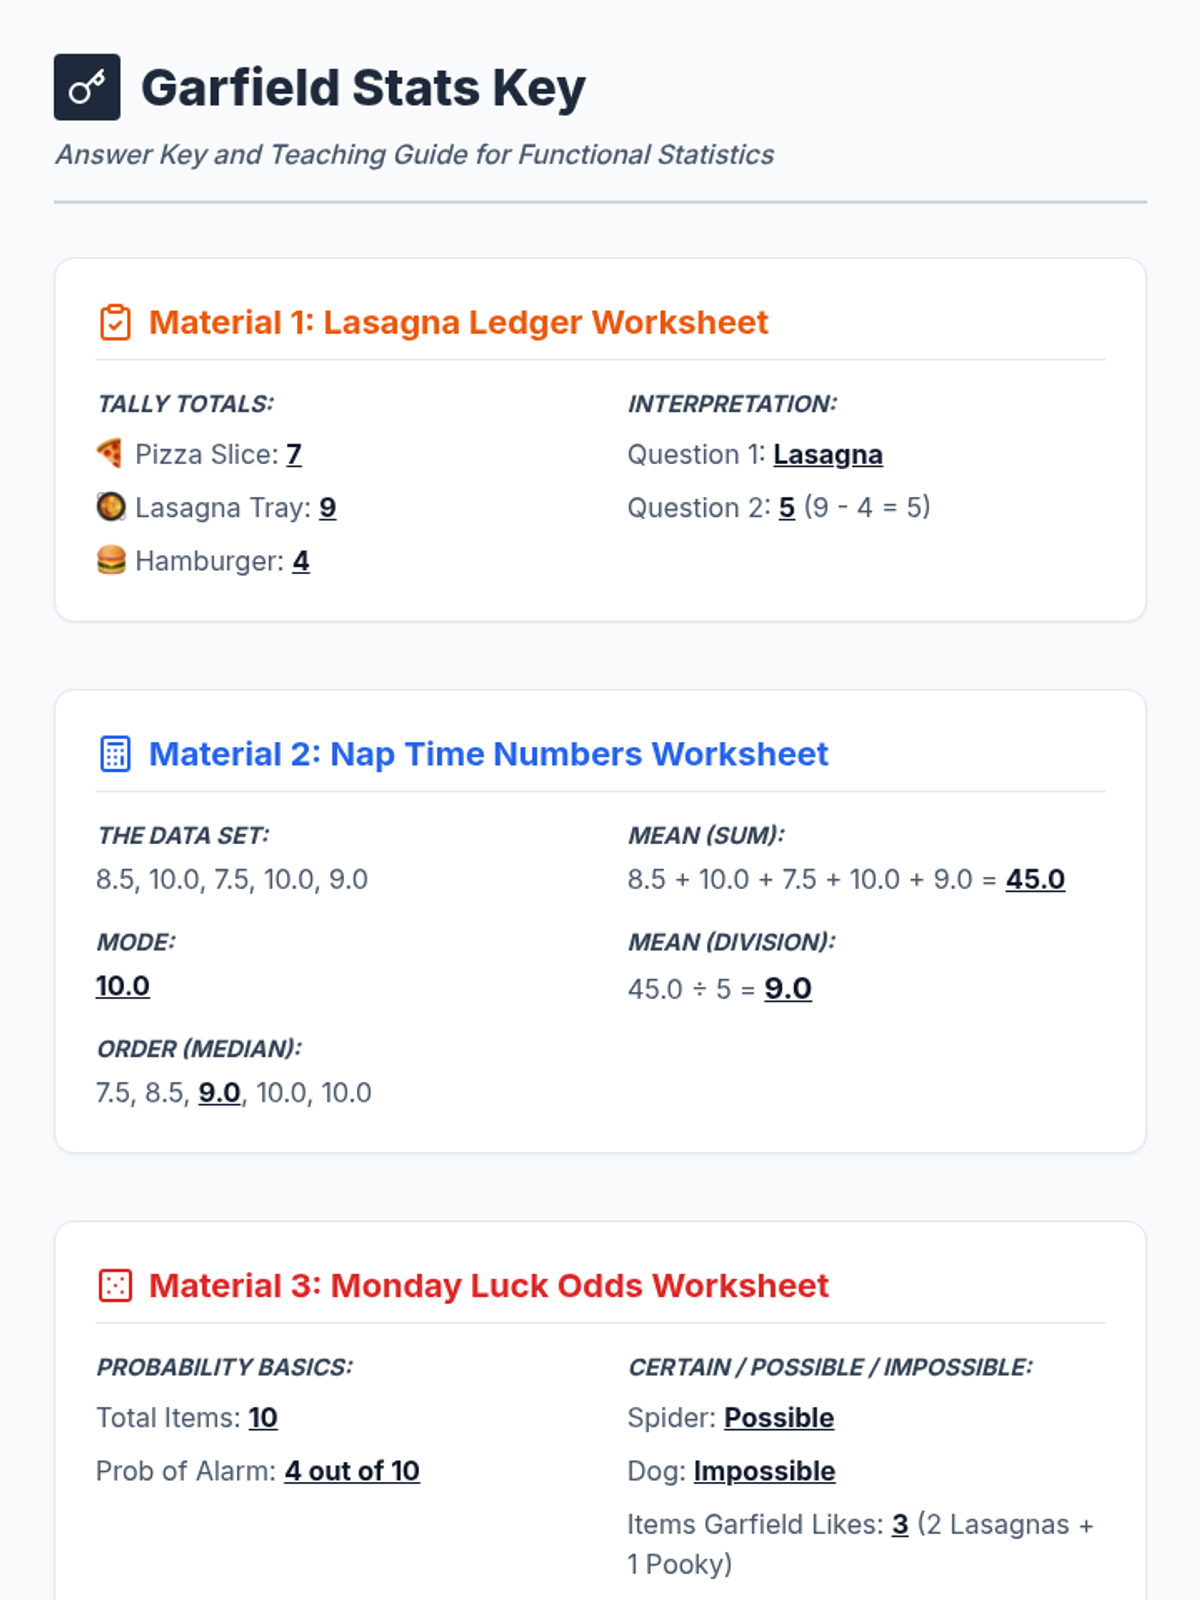
A collection of statistics activities themed around Garfield the cat, covering data collection, central tendency, and probability for students working with functional math and decimals.
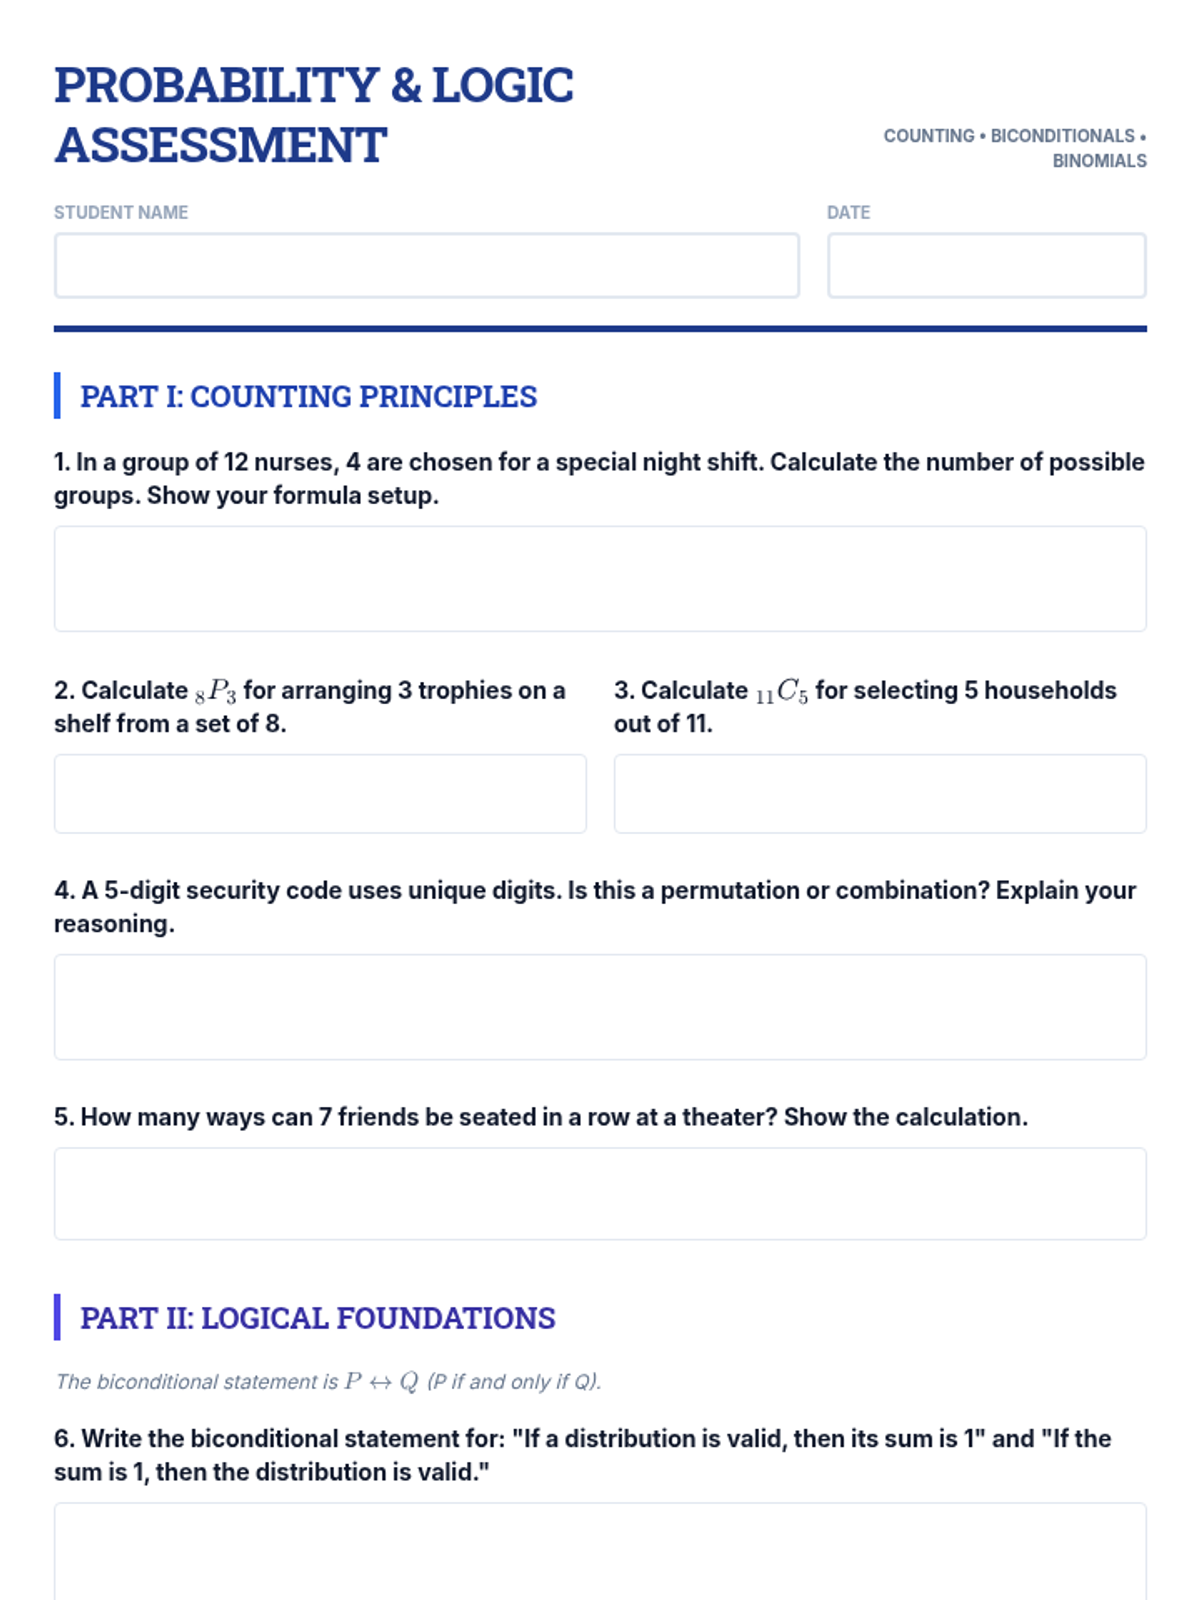
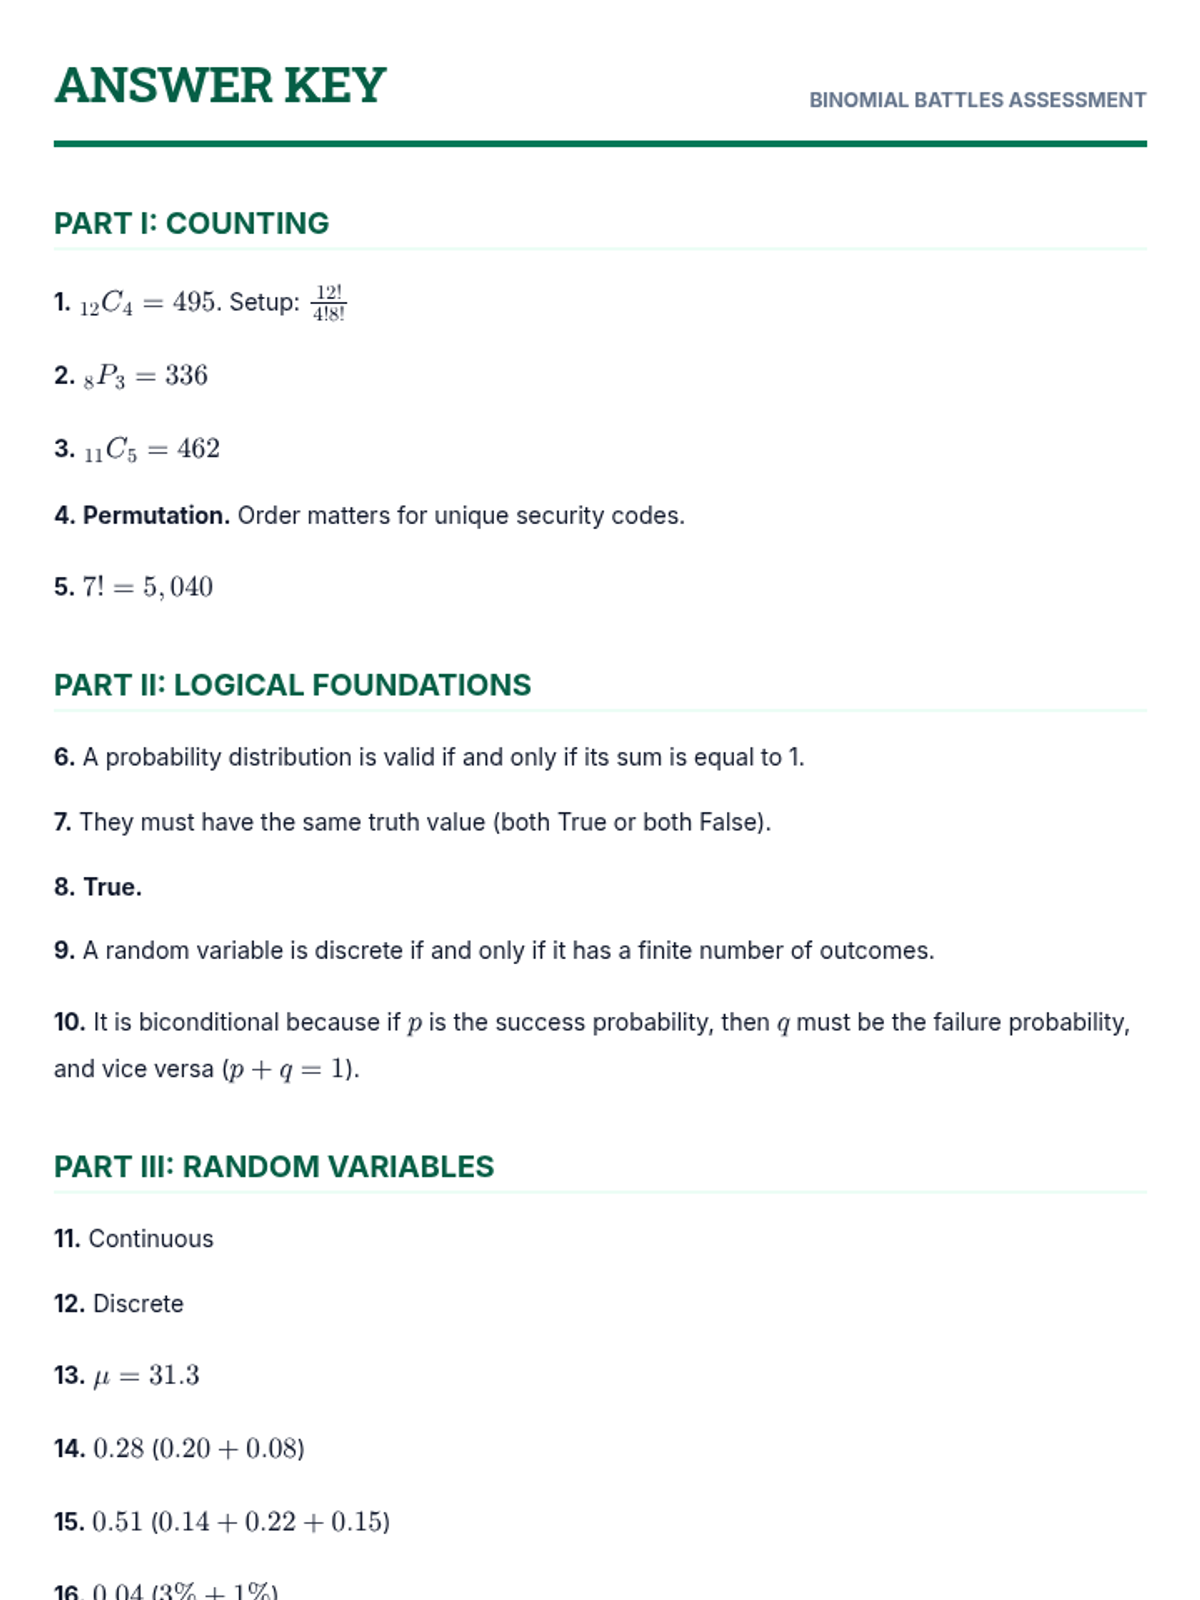
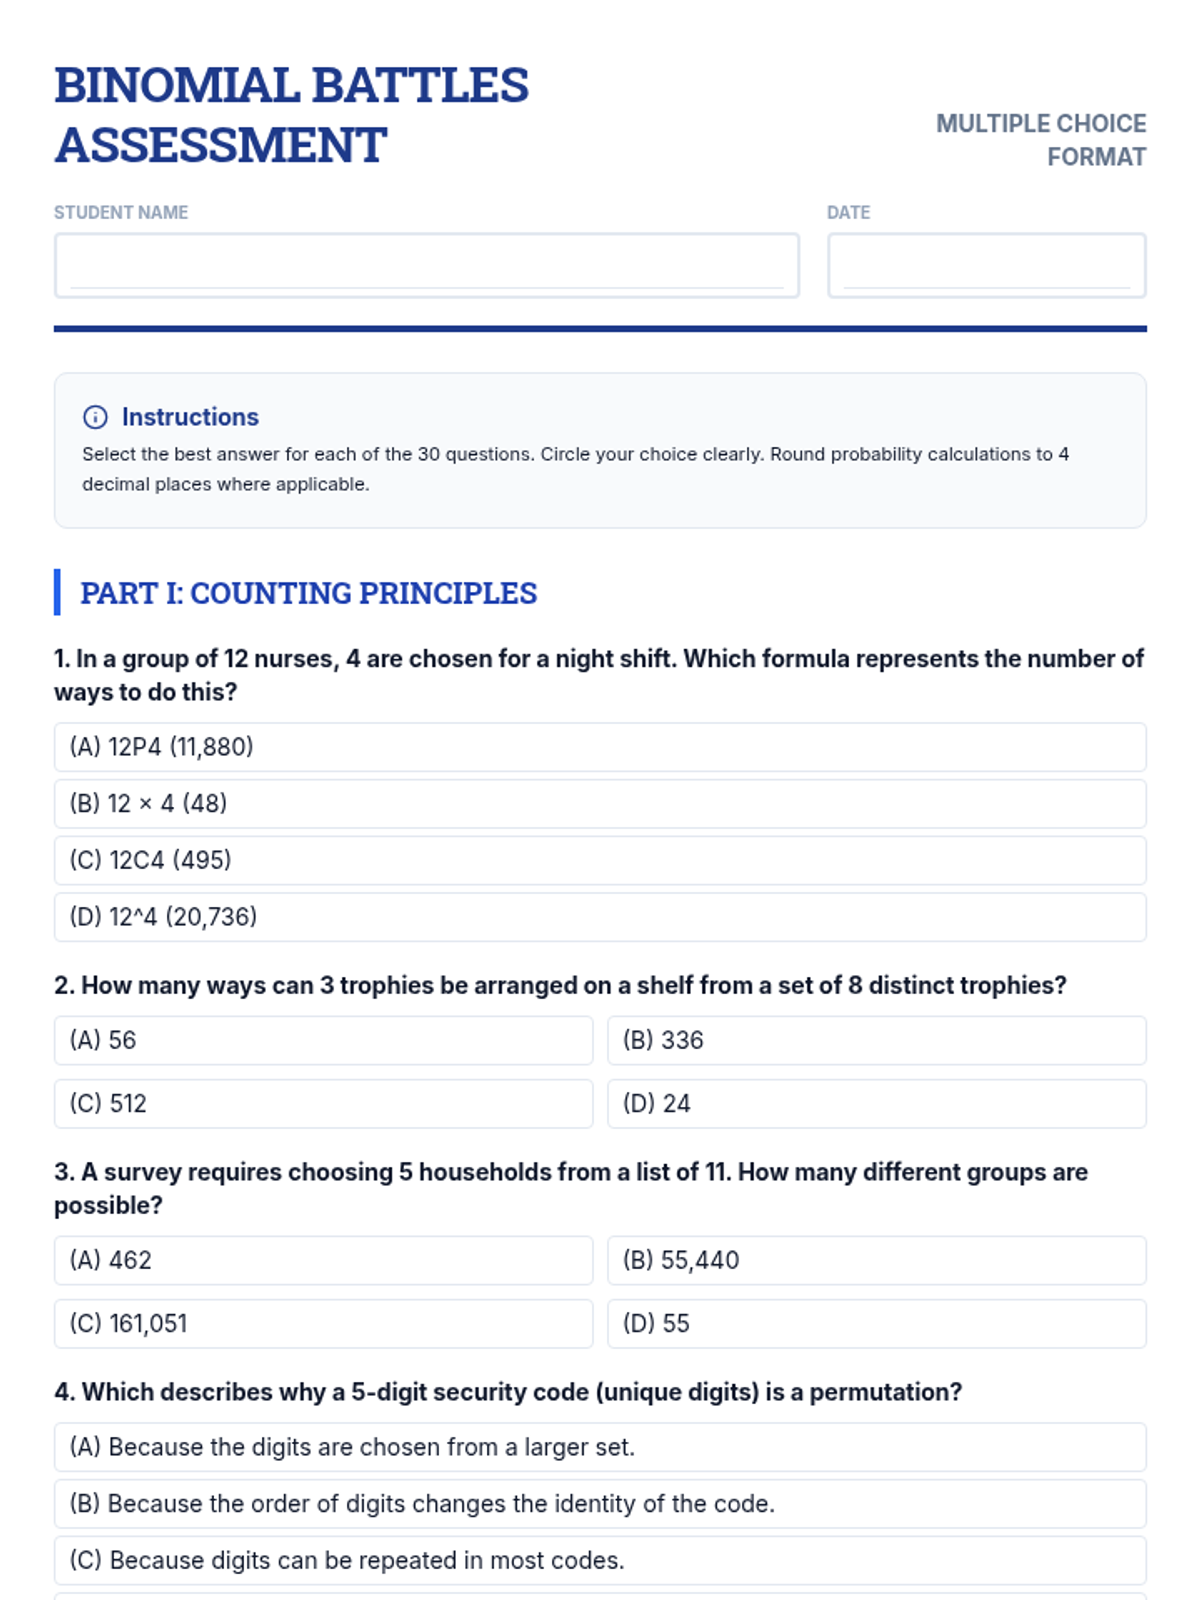
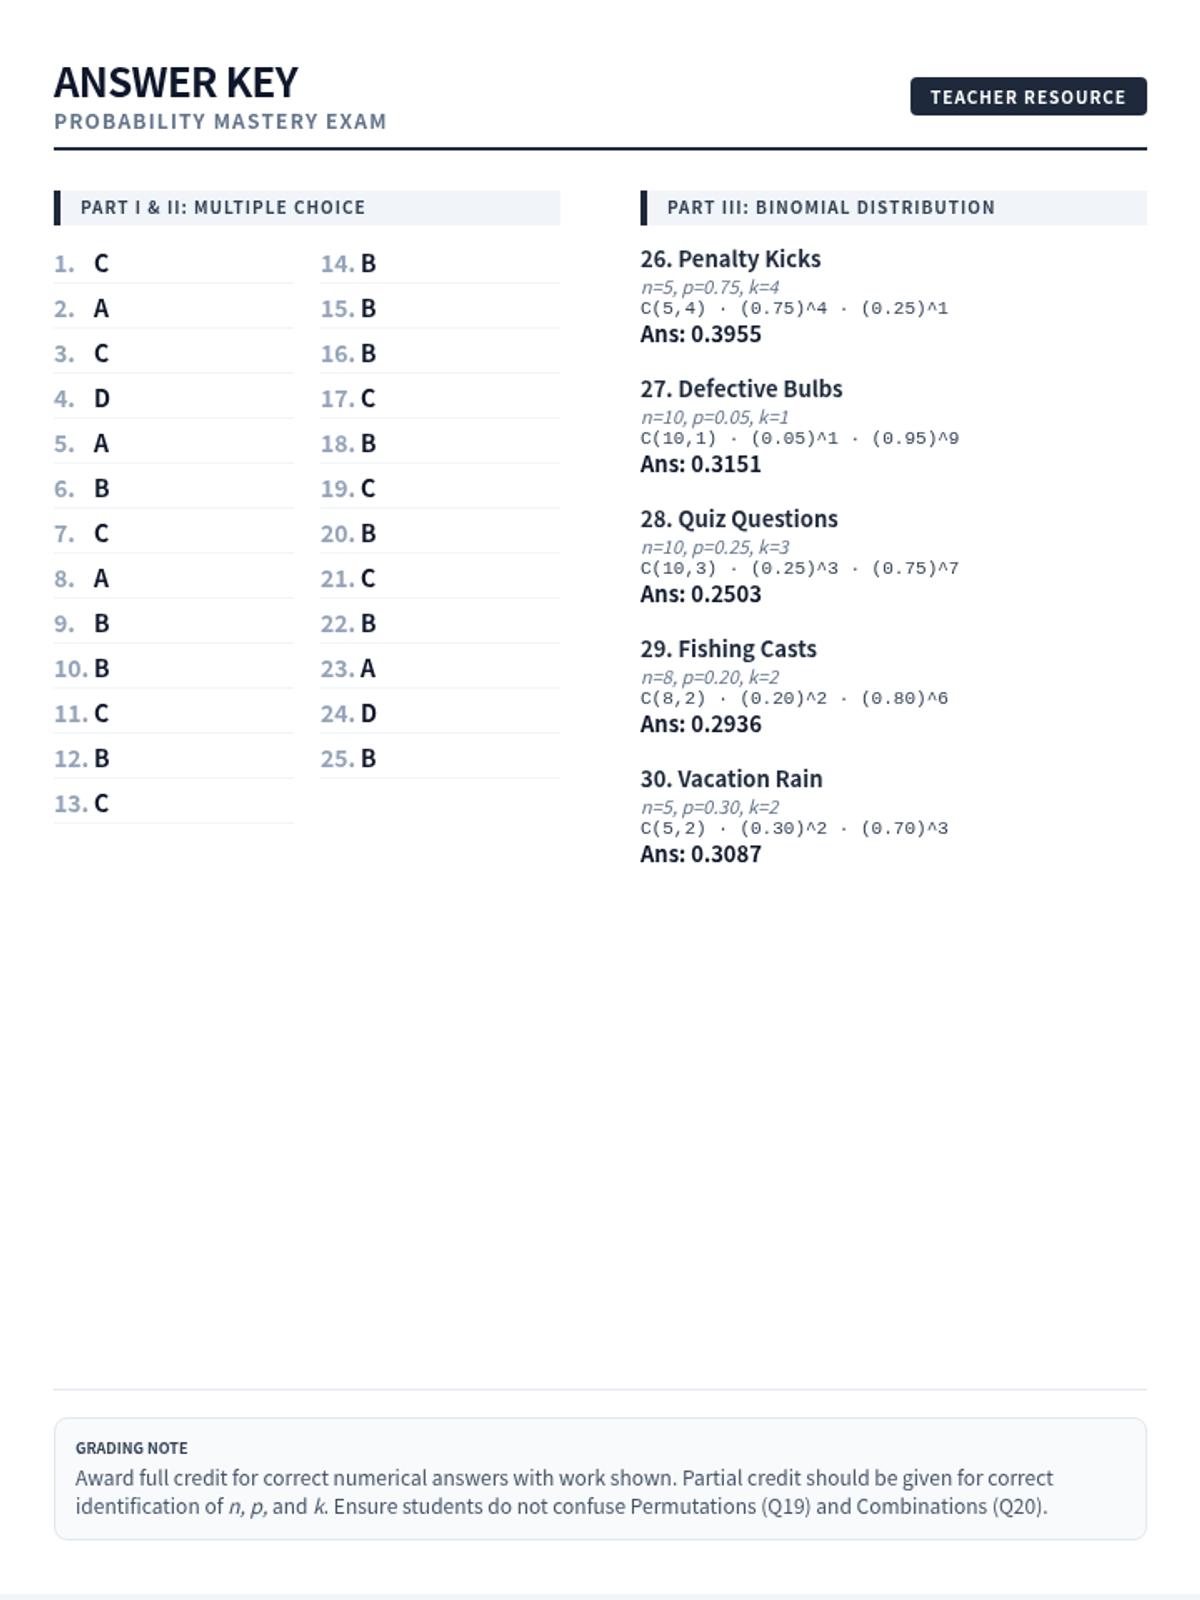
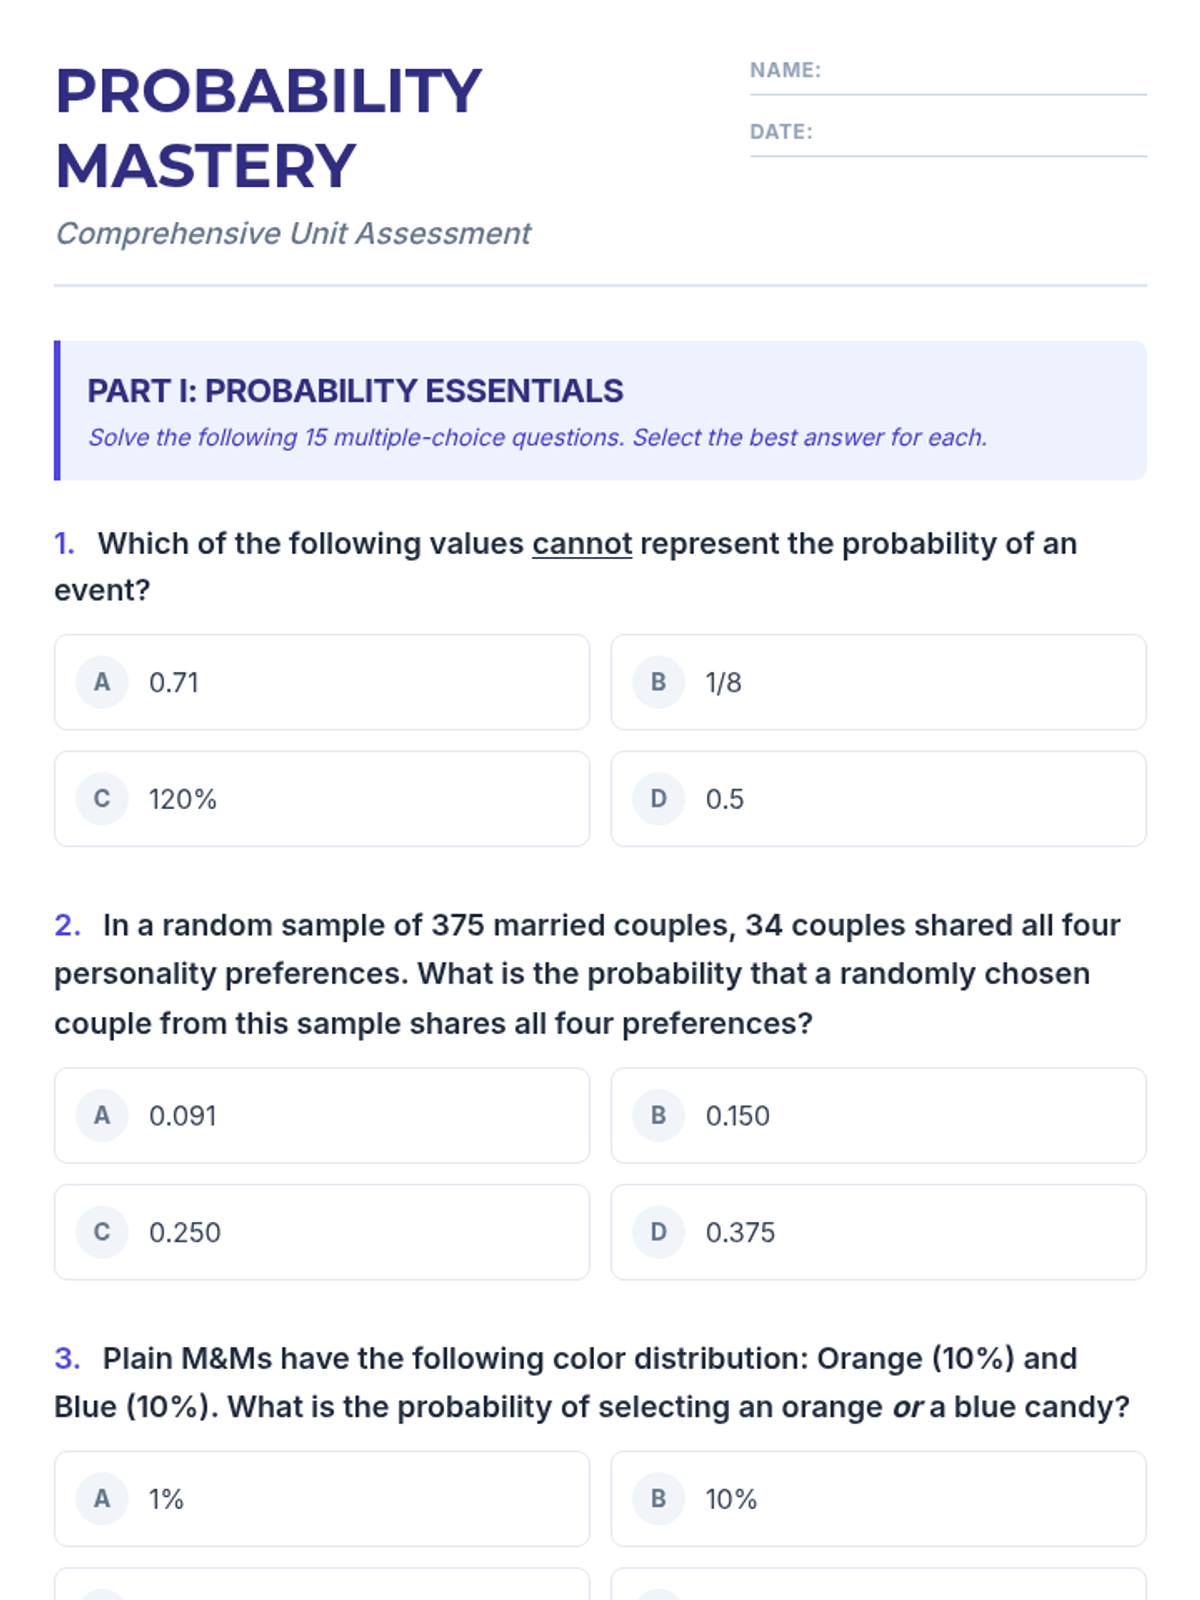
A comprehensive lesson covering probability basics, counting principles, and the binomial distribution, concluding with a summative 30-question mastery exam.
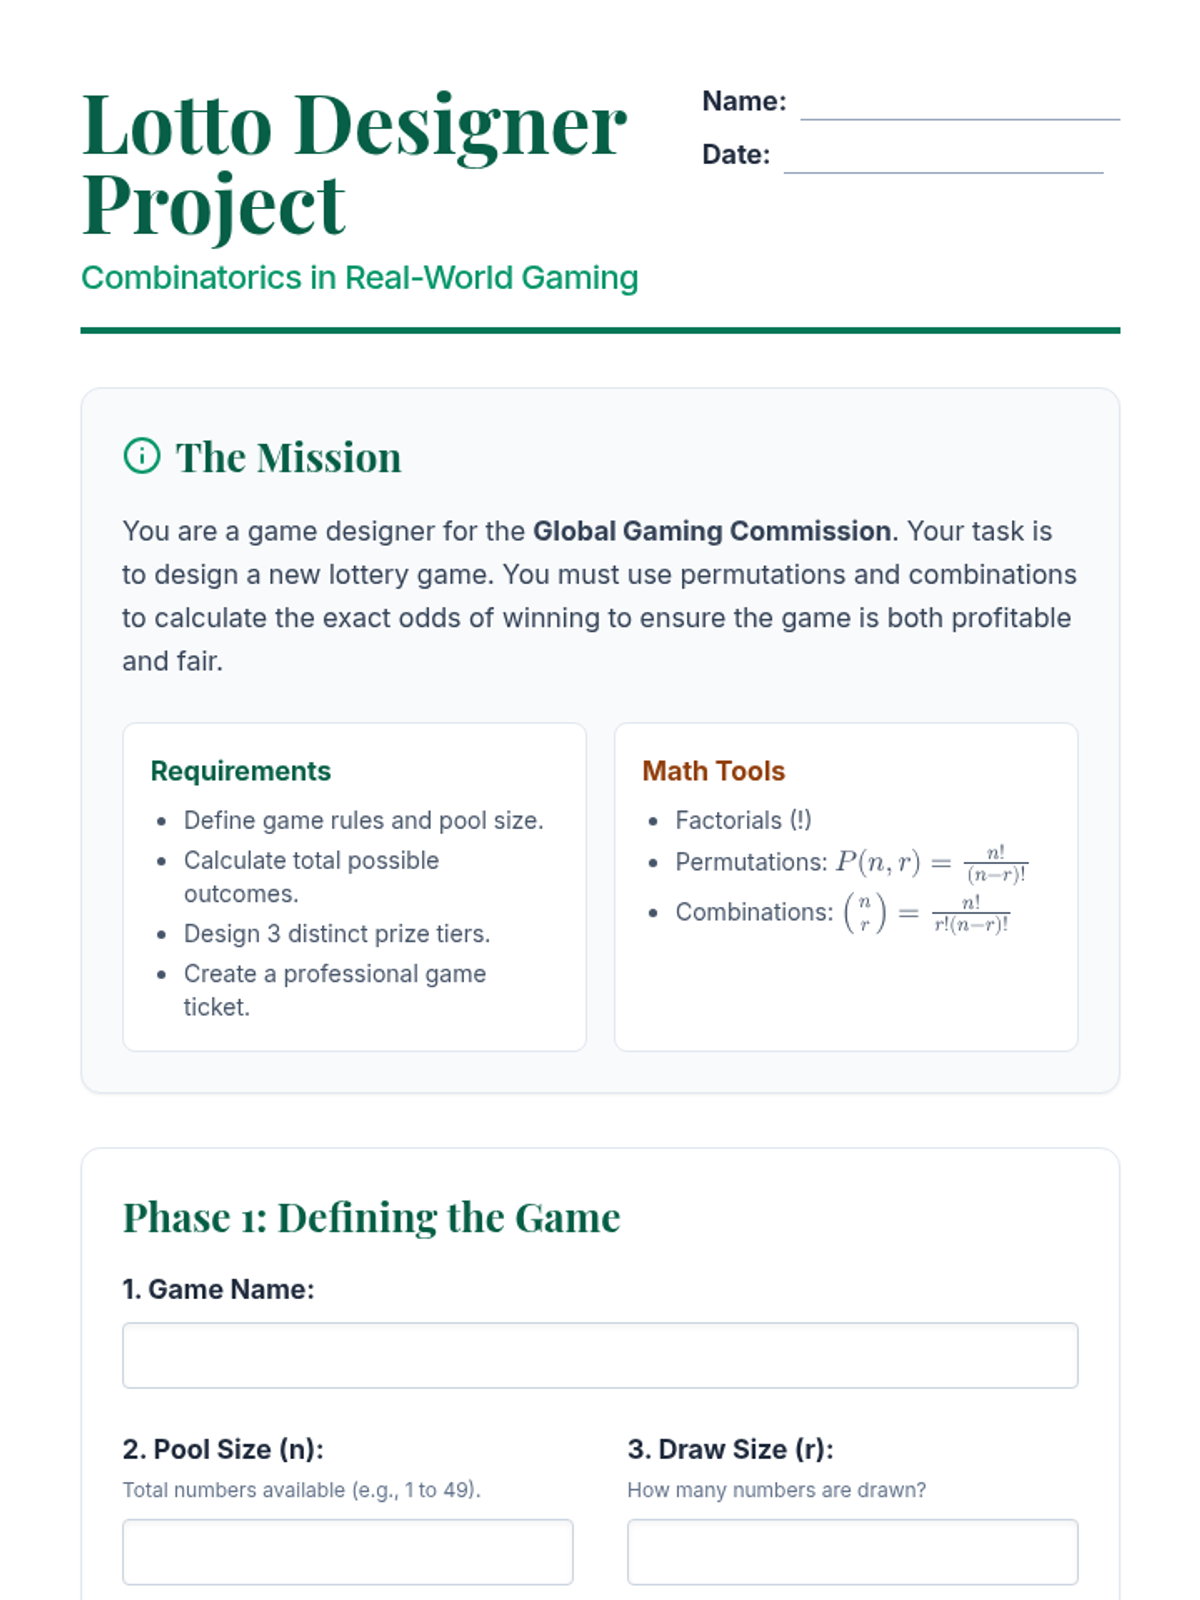
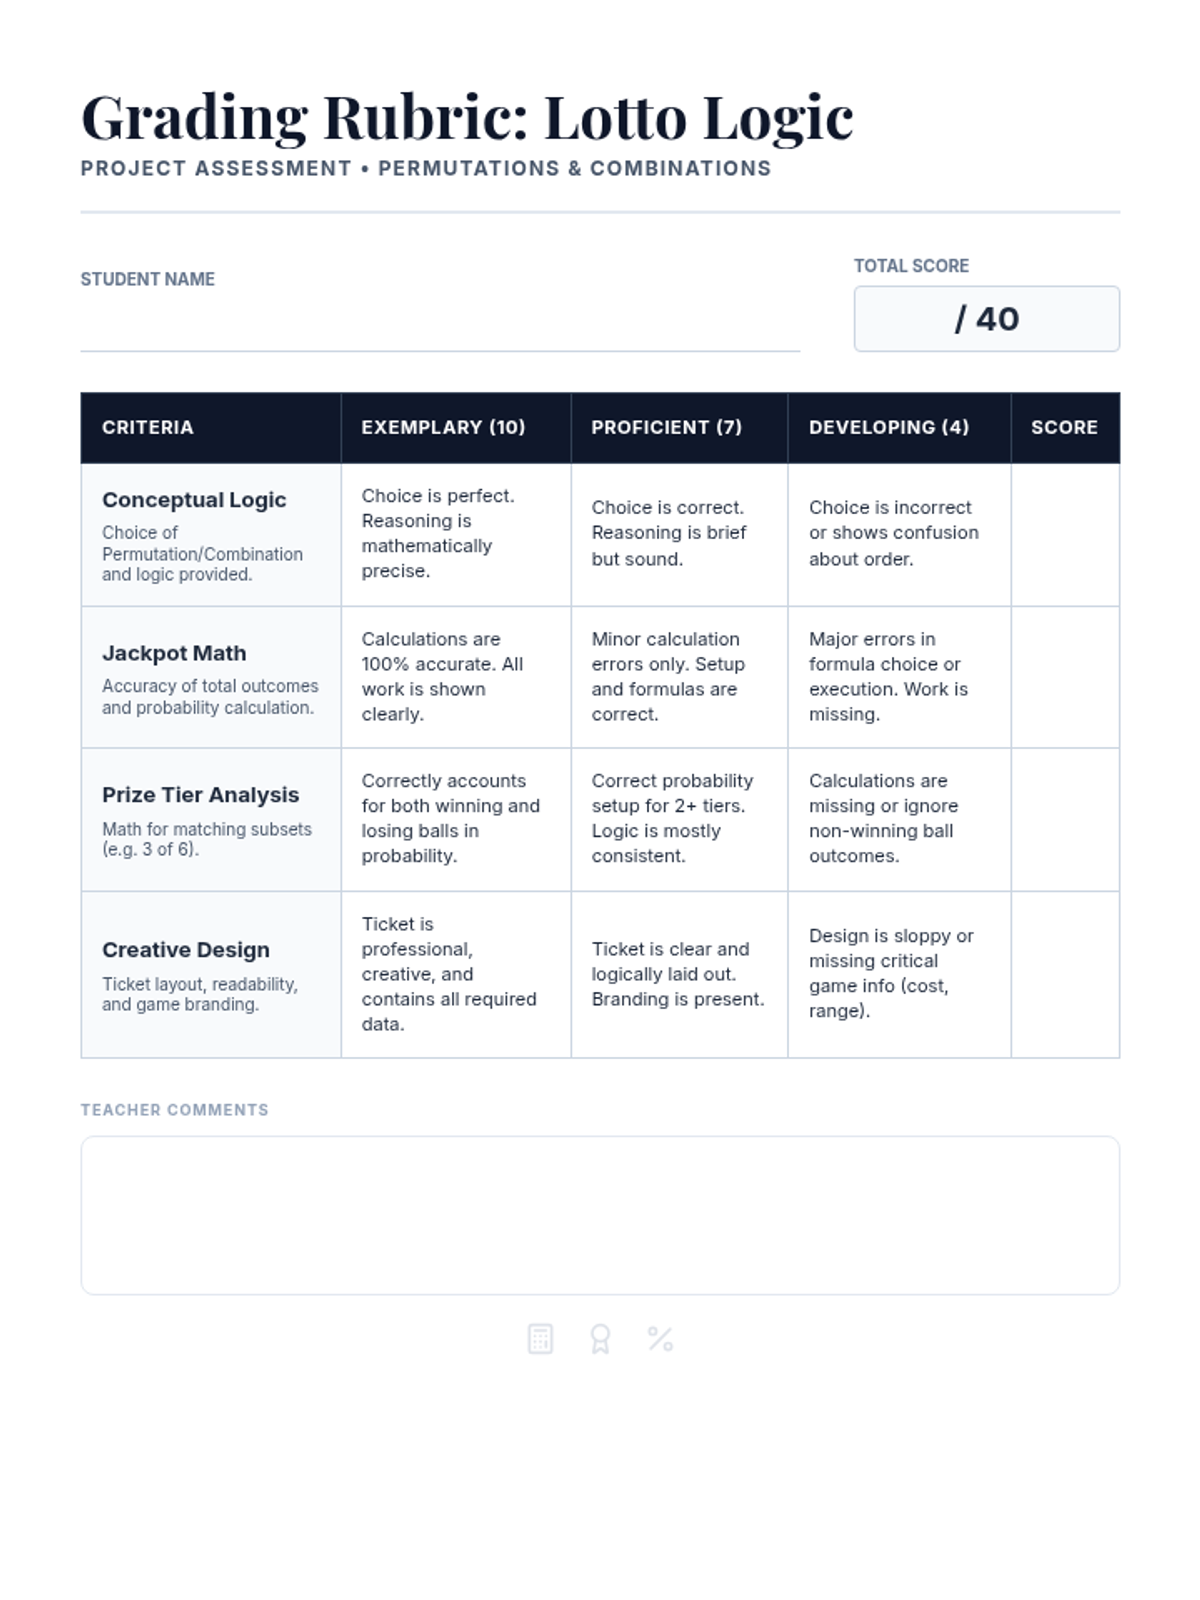
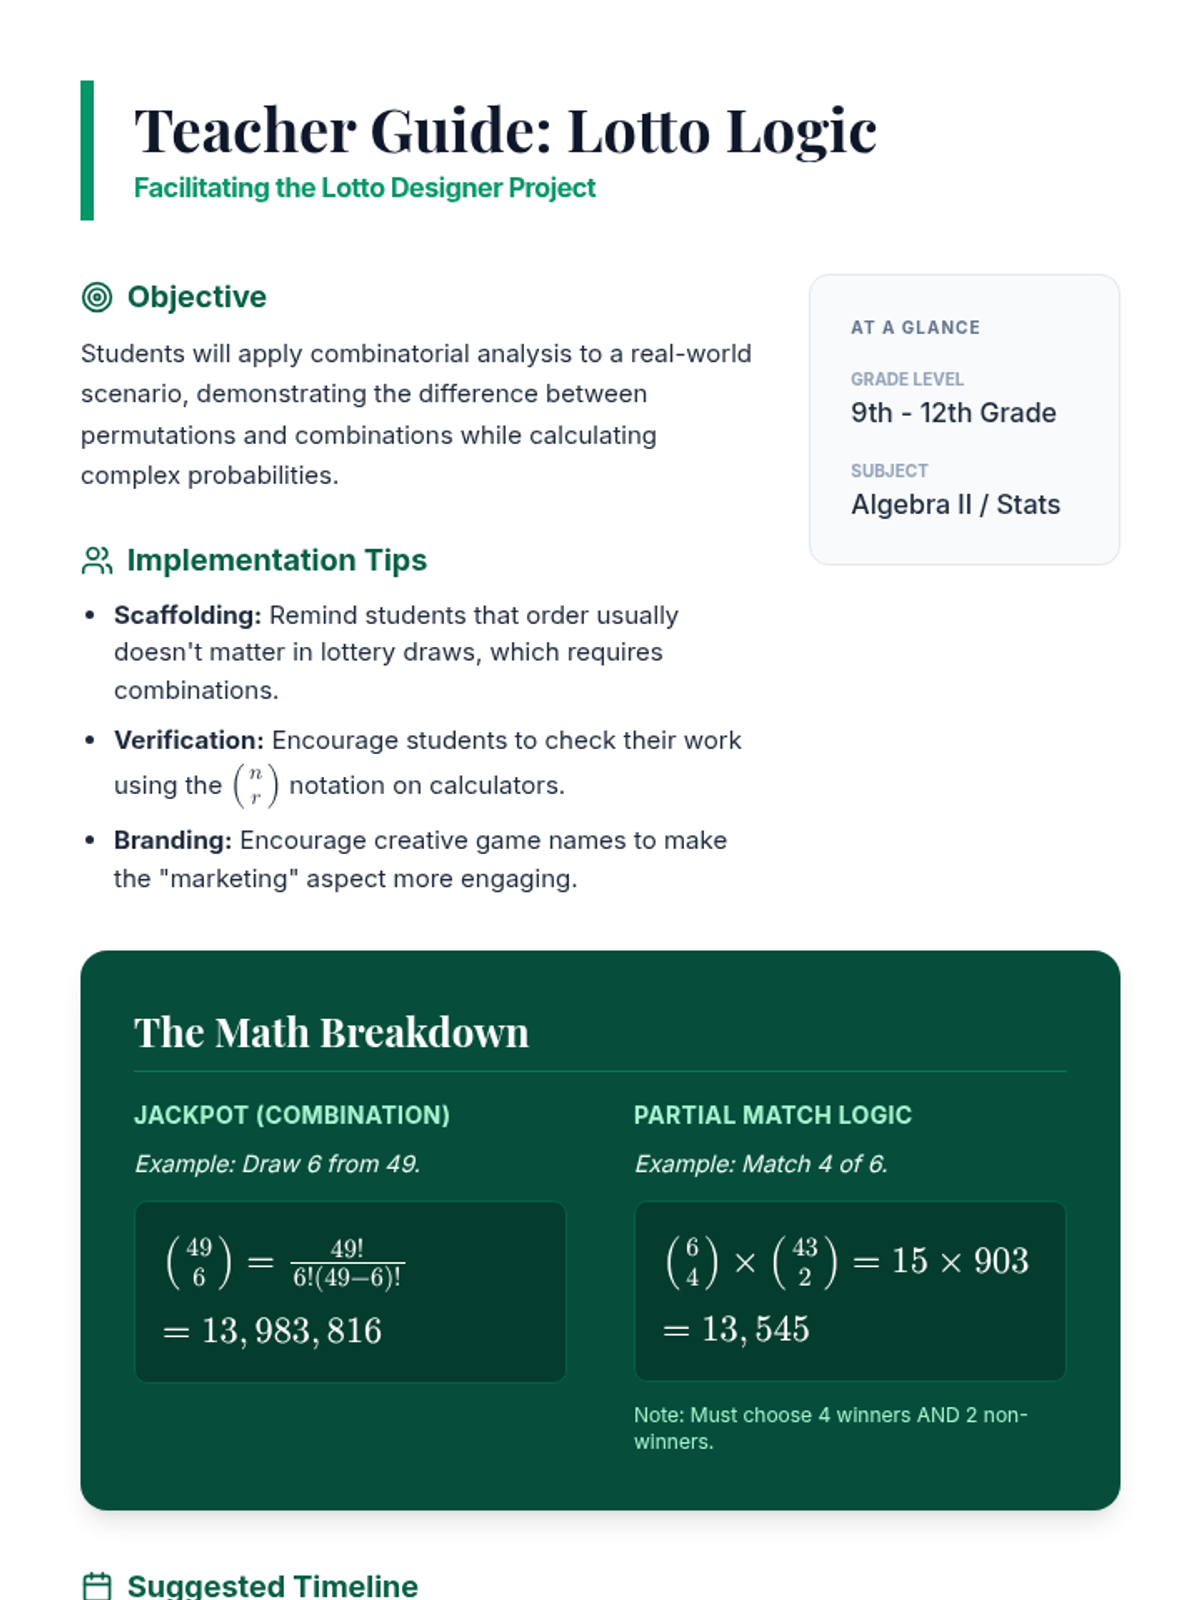
Students apply their knowledge of permutations and combinations to design their own lottery game, calculating the odds of winning and presenting their mathematical findings in a professional format.
A comprehensive examination combining elementary probability theory, counting principles, and binomial distribution problems into a single rigorous assessment.
A lesson covering fundamental counting techniques, random variable classification, and probability distributions based on statistical principles.
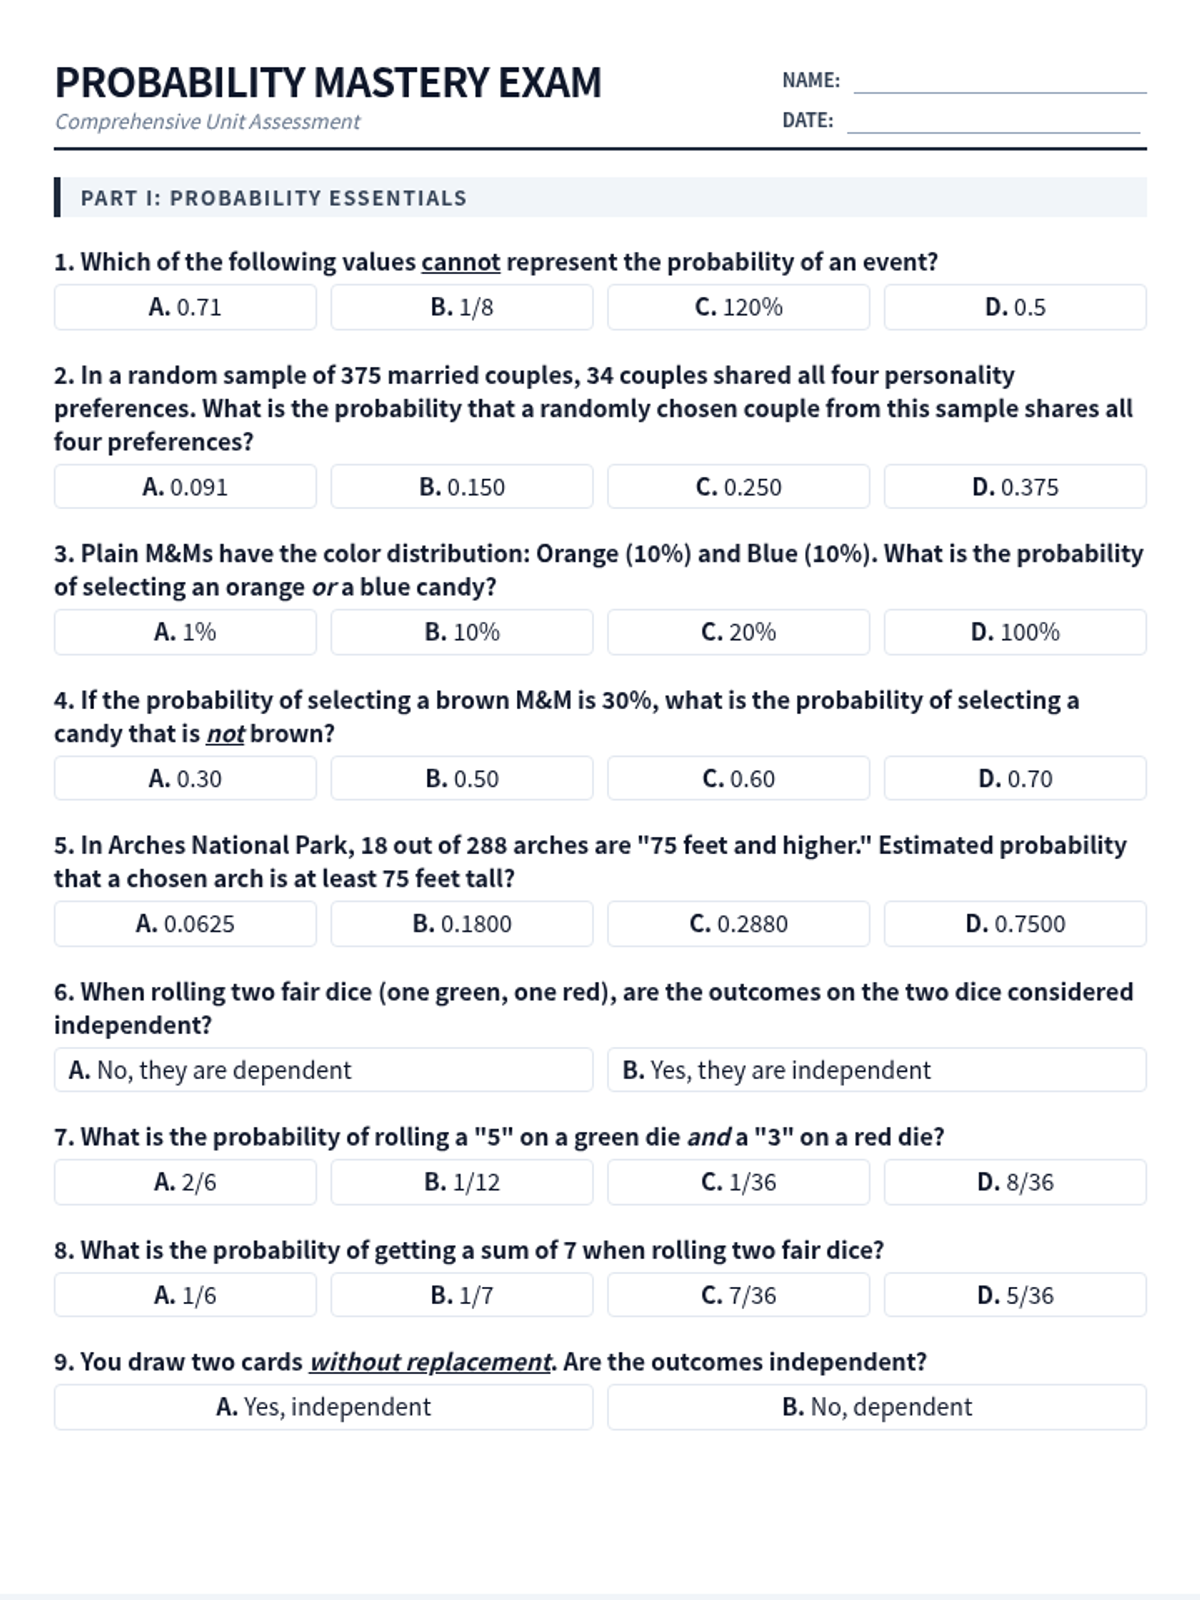
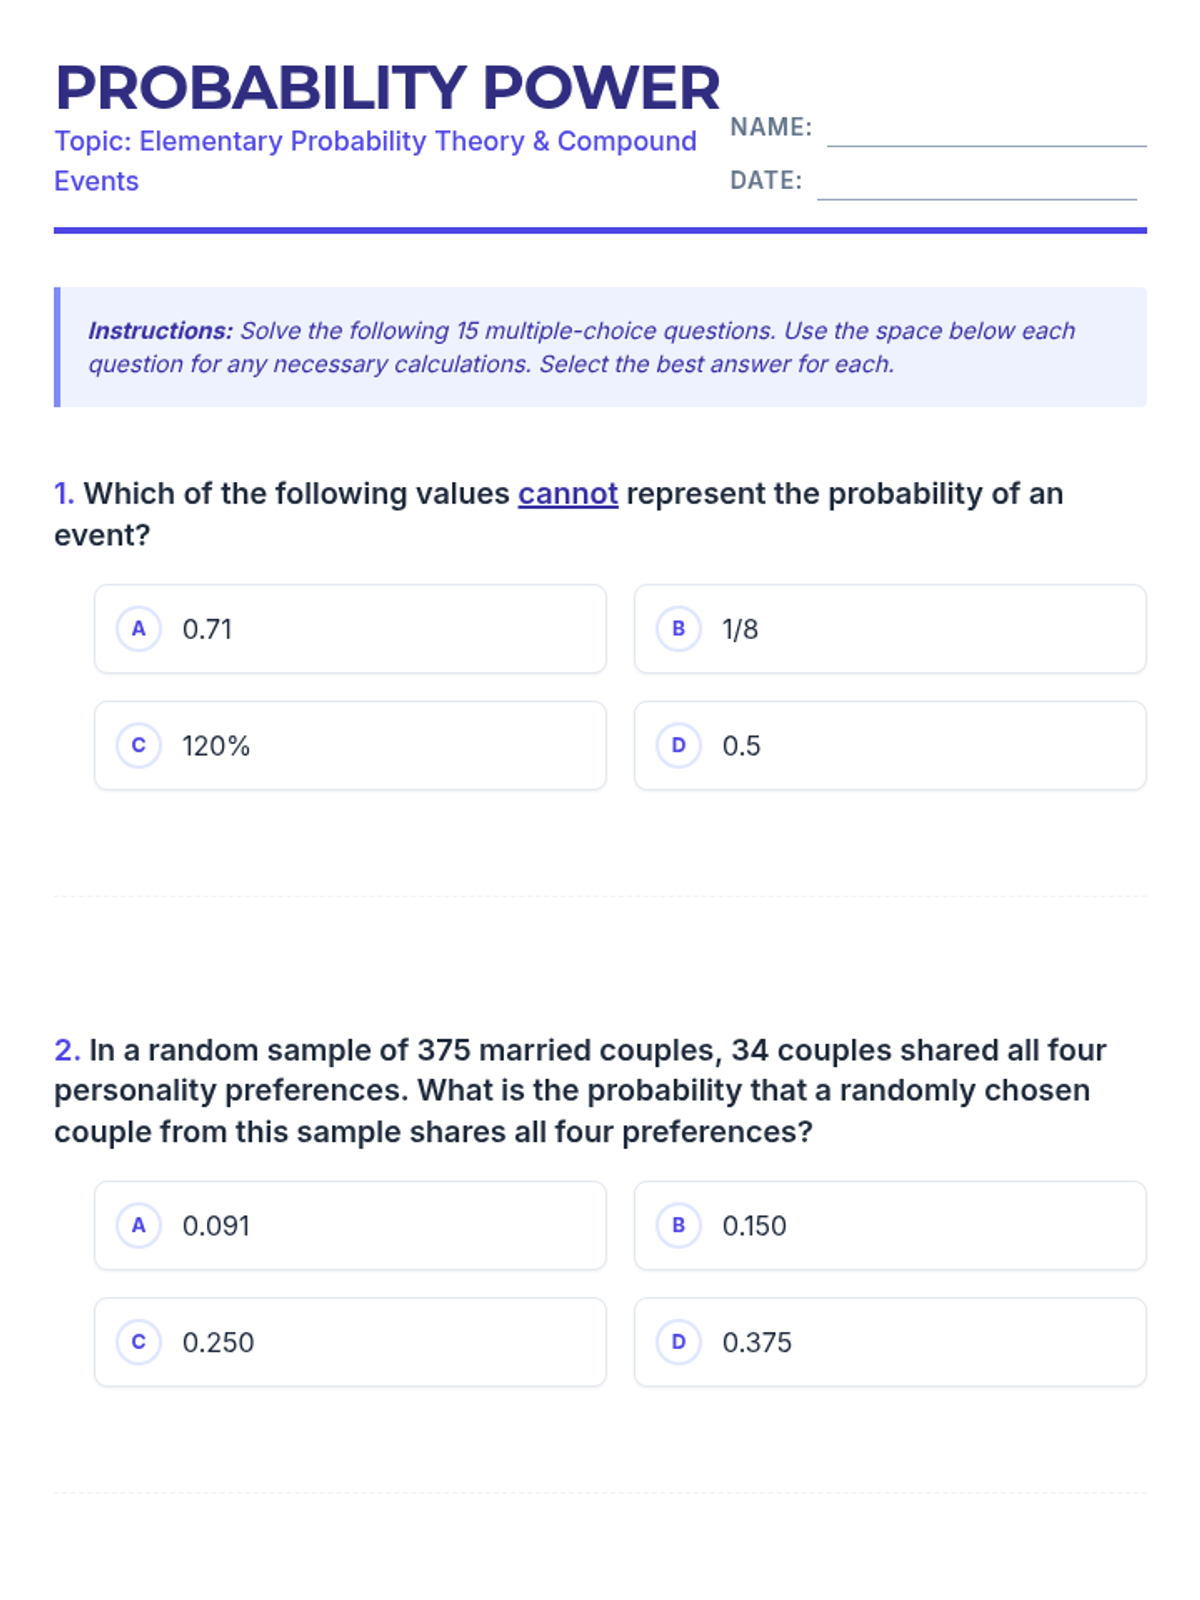
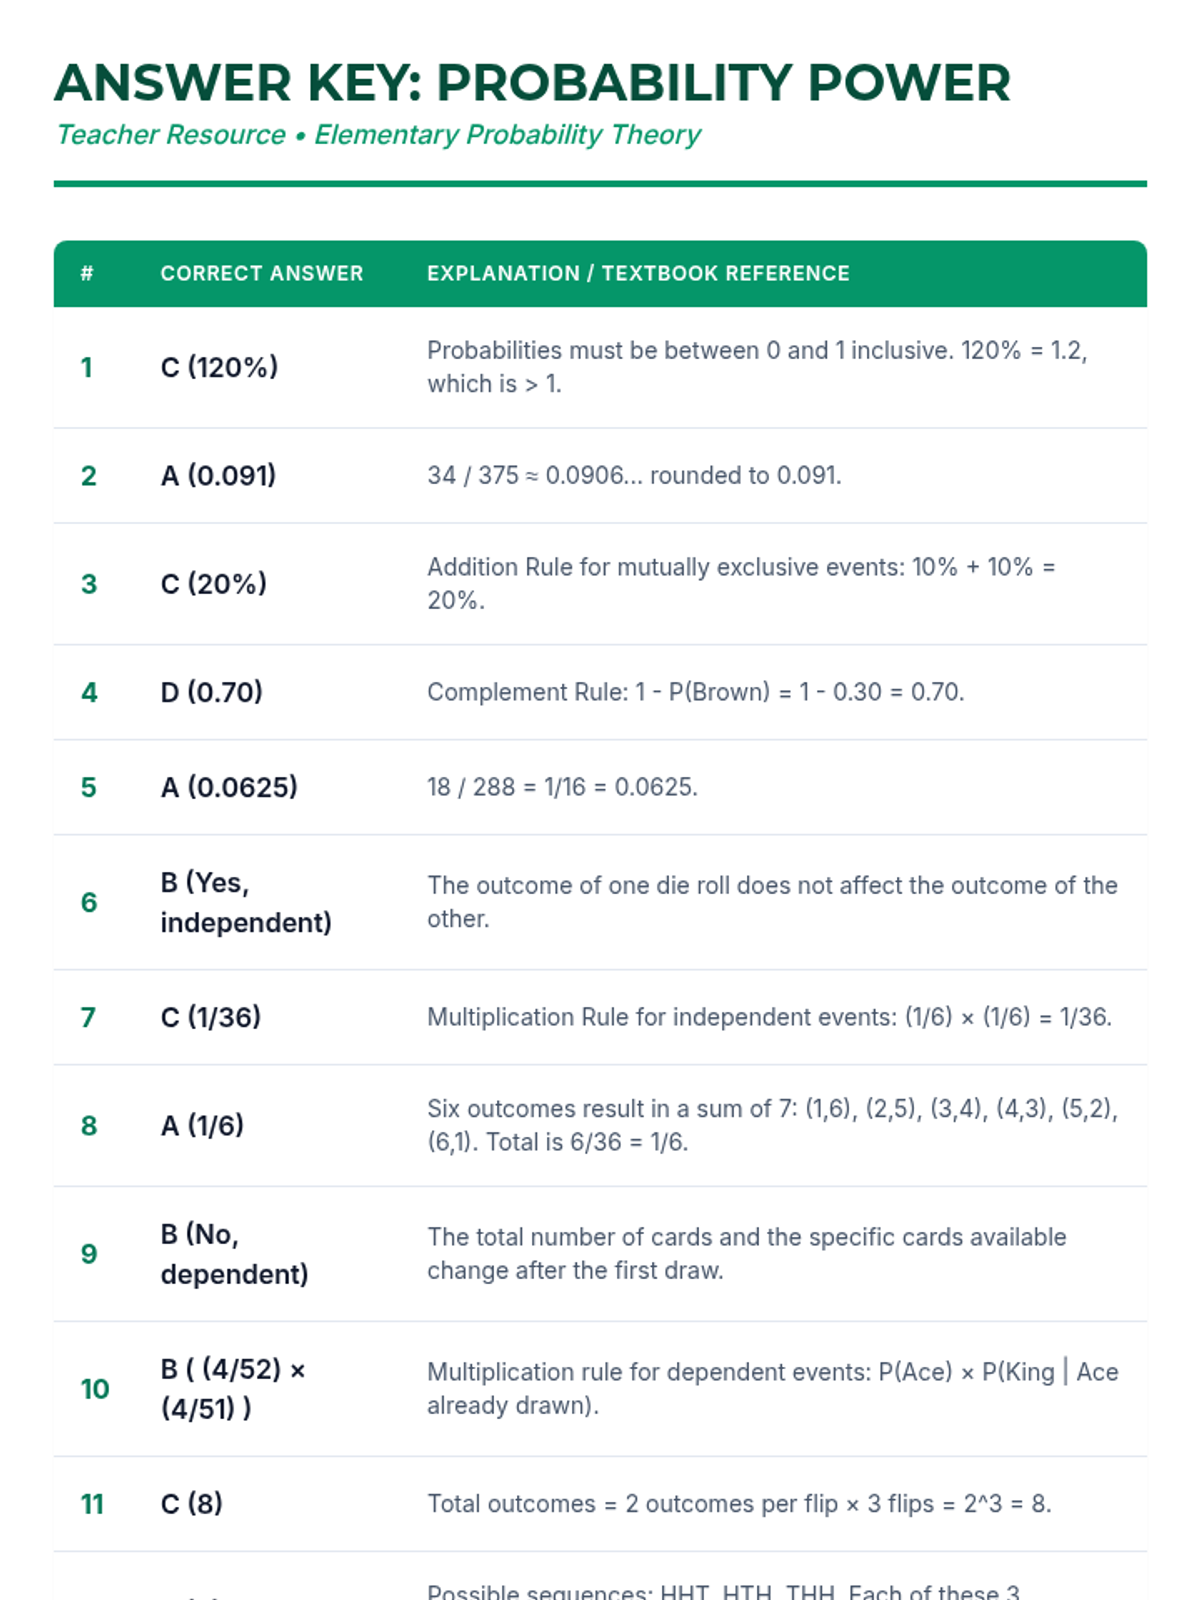
A comprehensive lesson on elementary probability theory covering valid probability ranges, compound events, independent and dependent outcomes, and tree diagrams based on textbook problems.
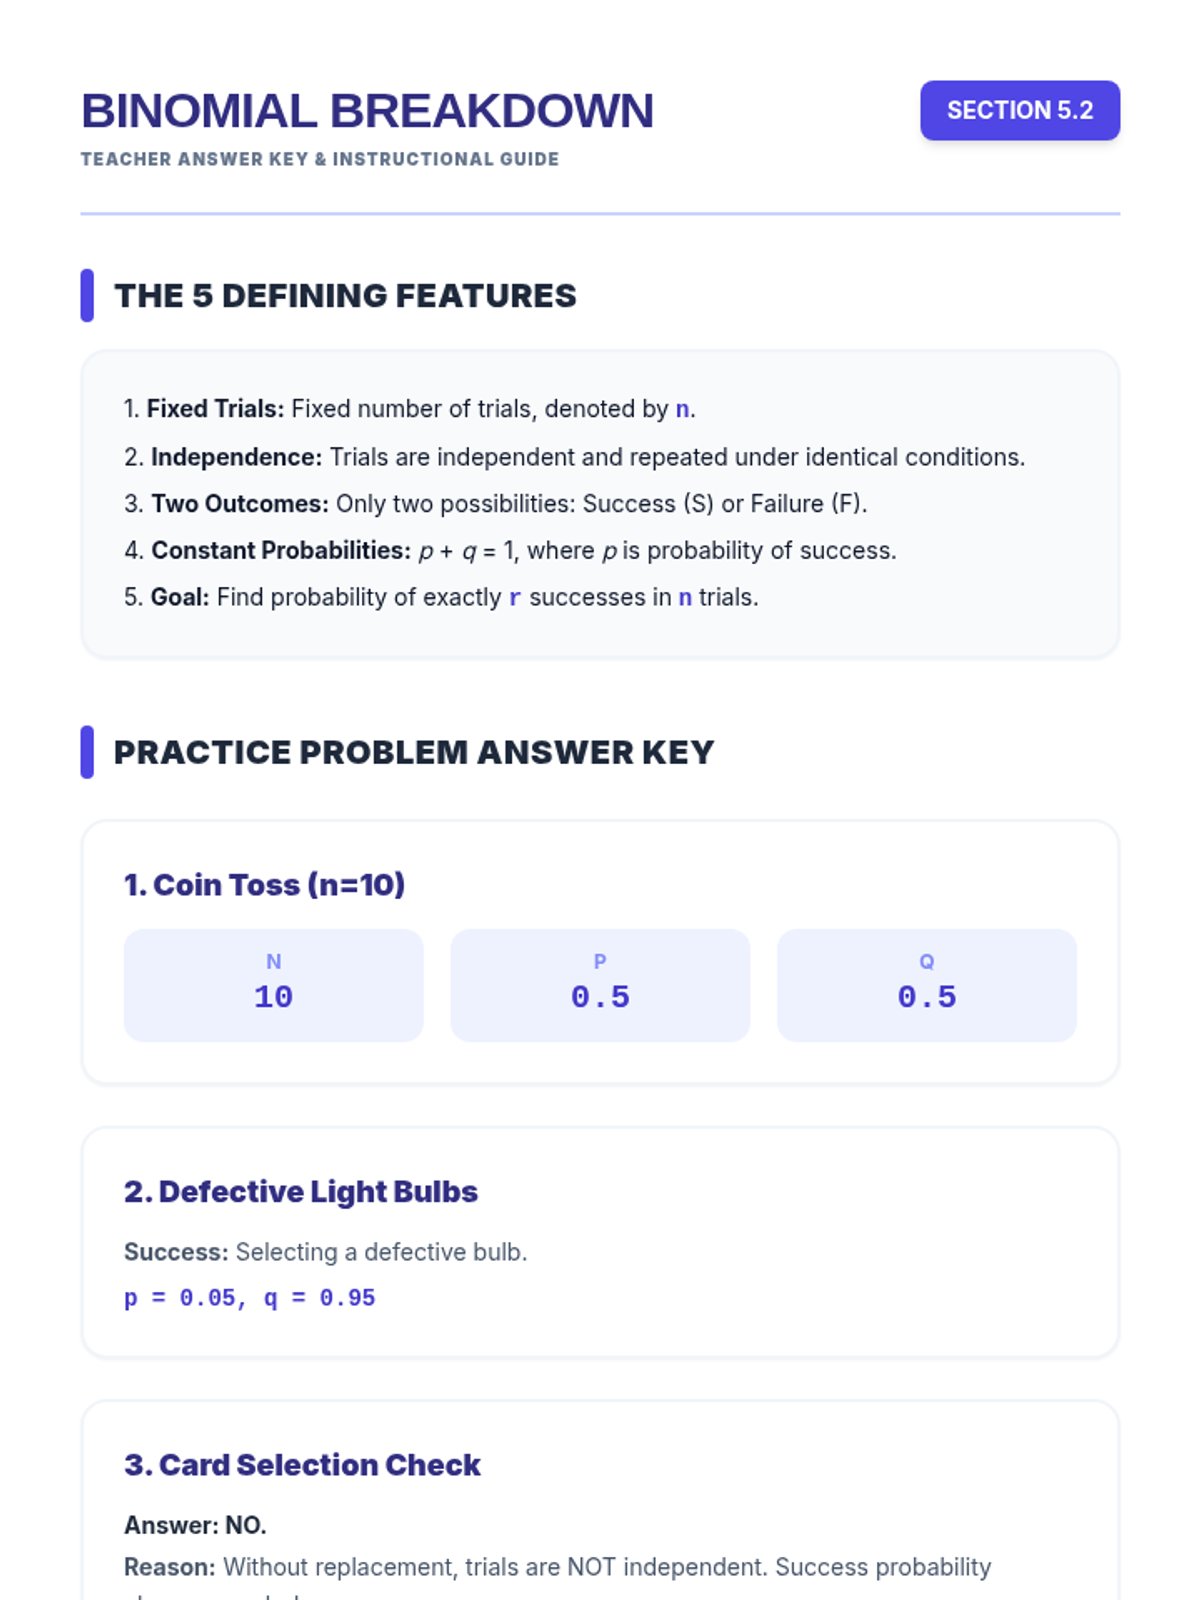
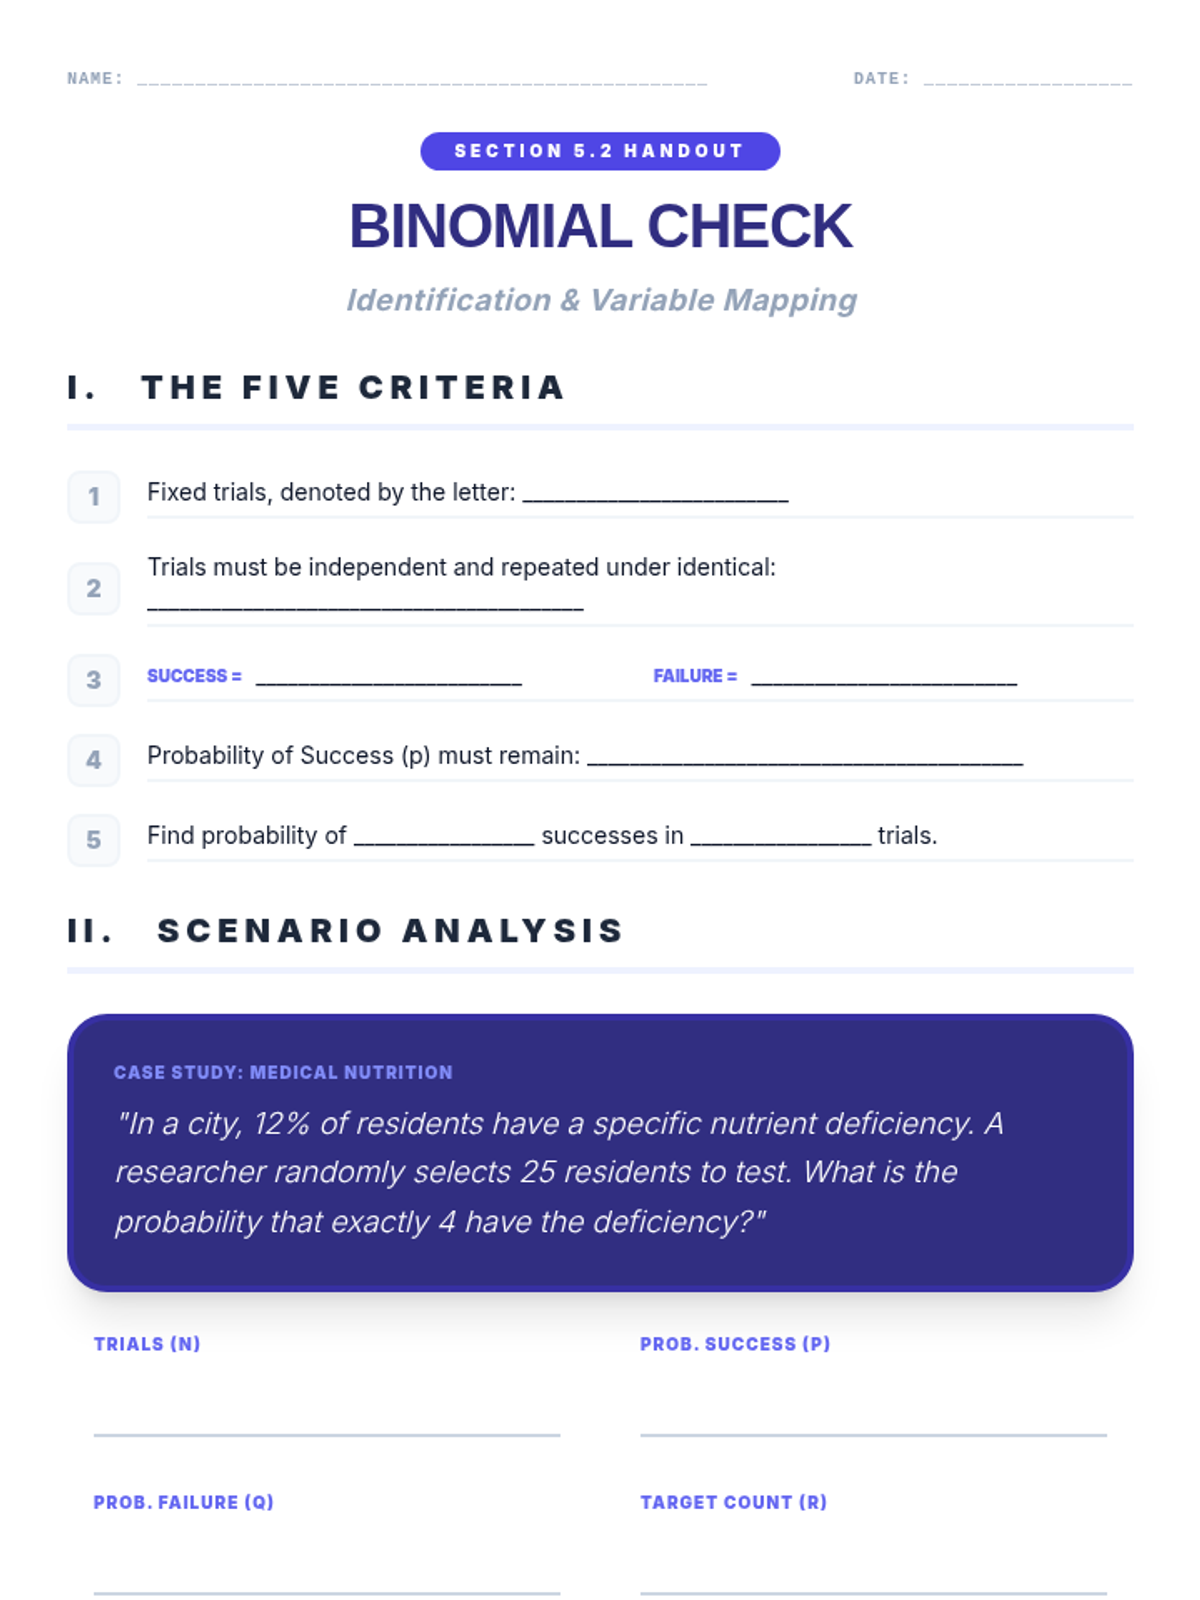
A comprehensive introduction to binomial experiments, covering the five core criteria, Bernoulli trials, and practical probability examples.
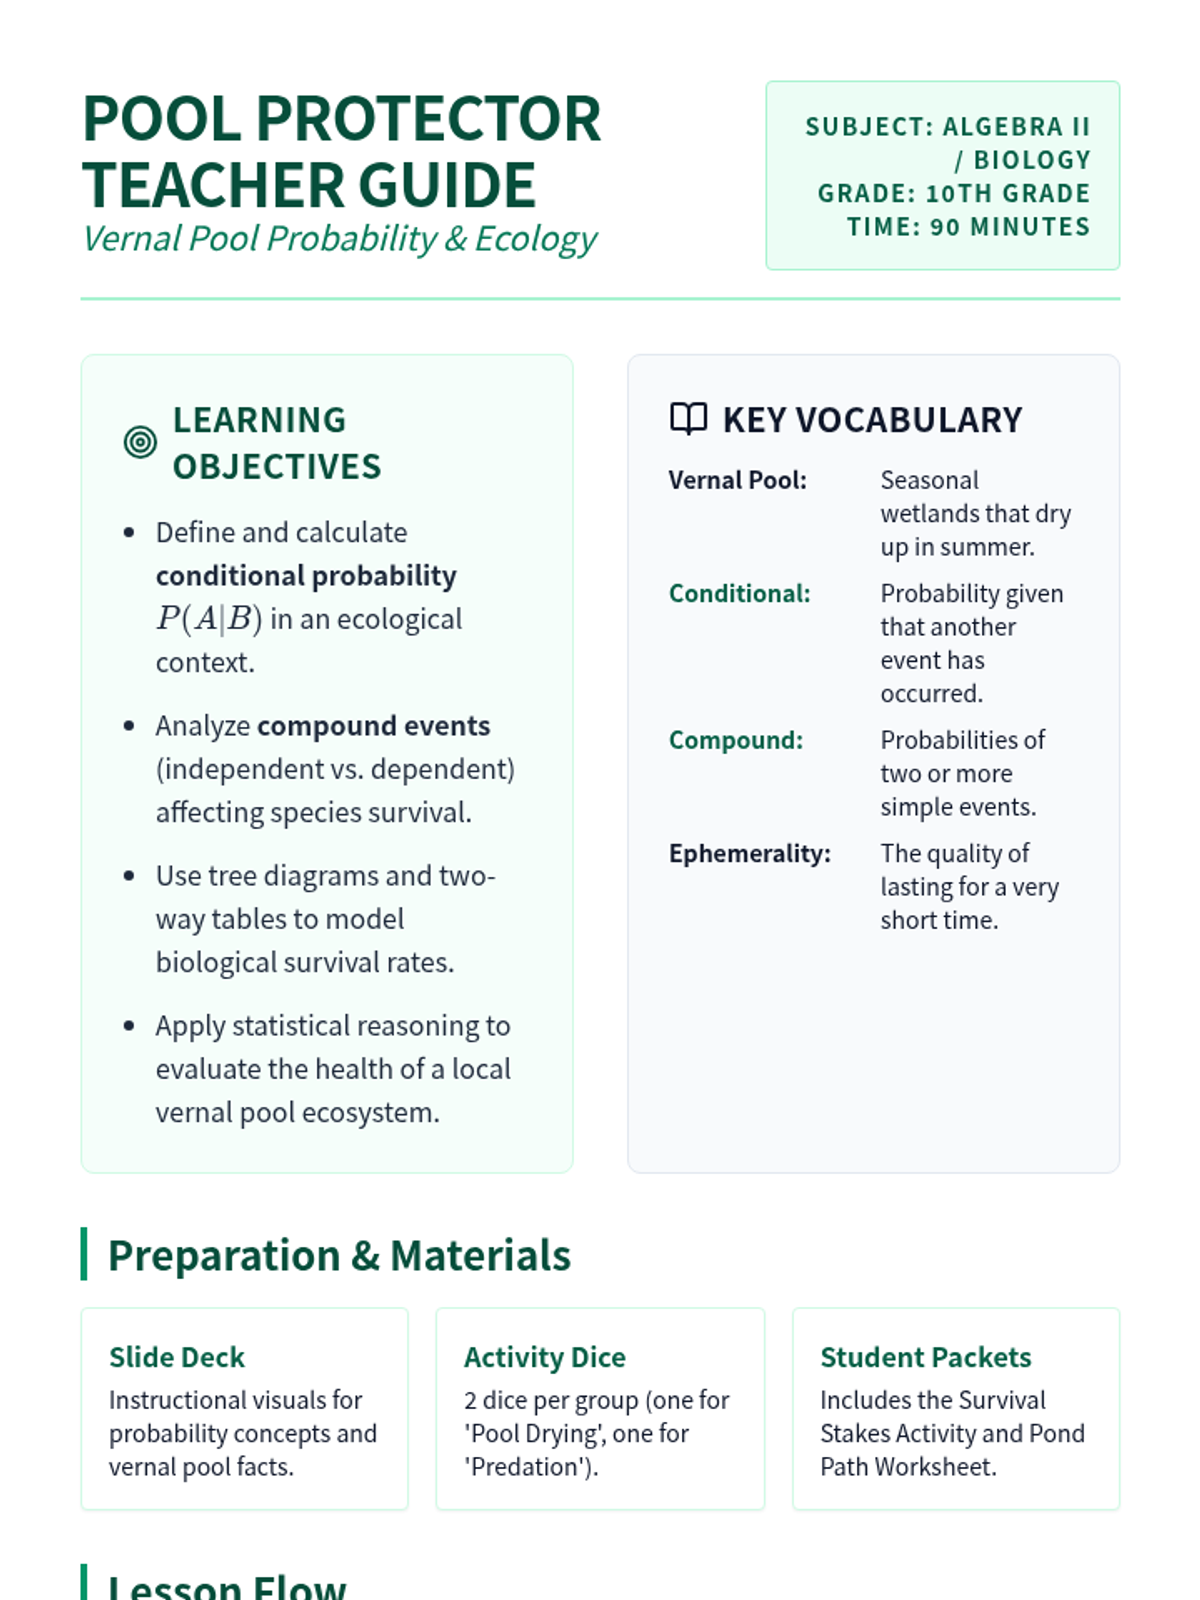
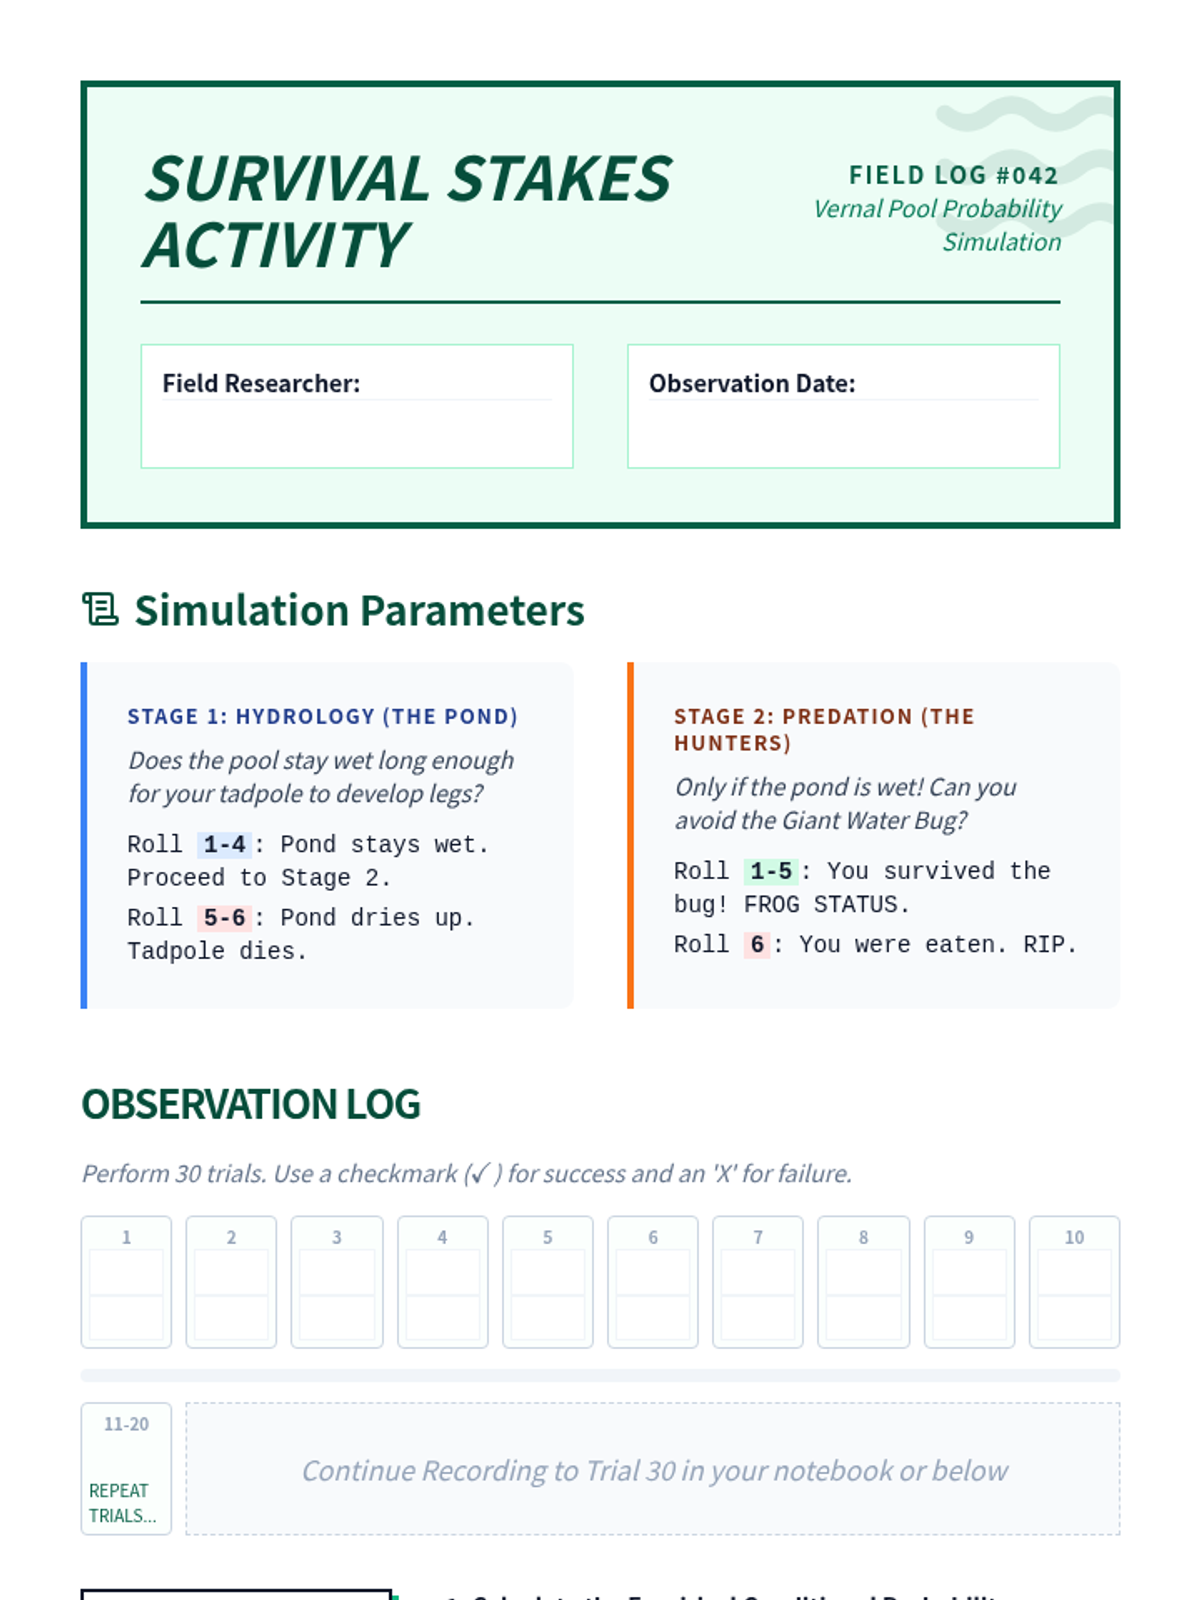
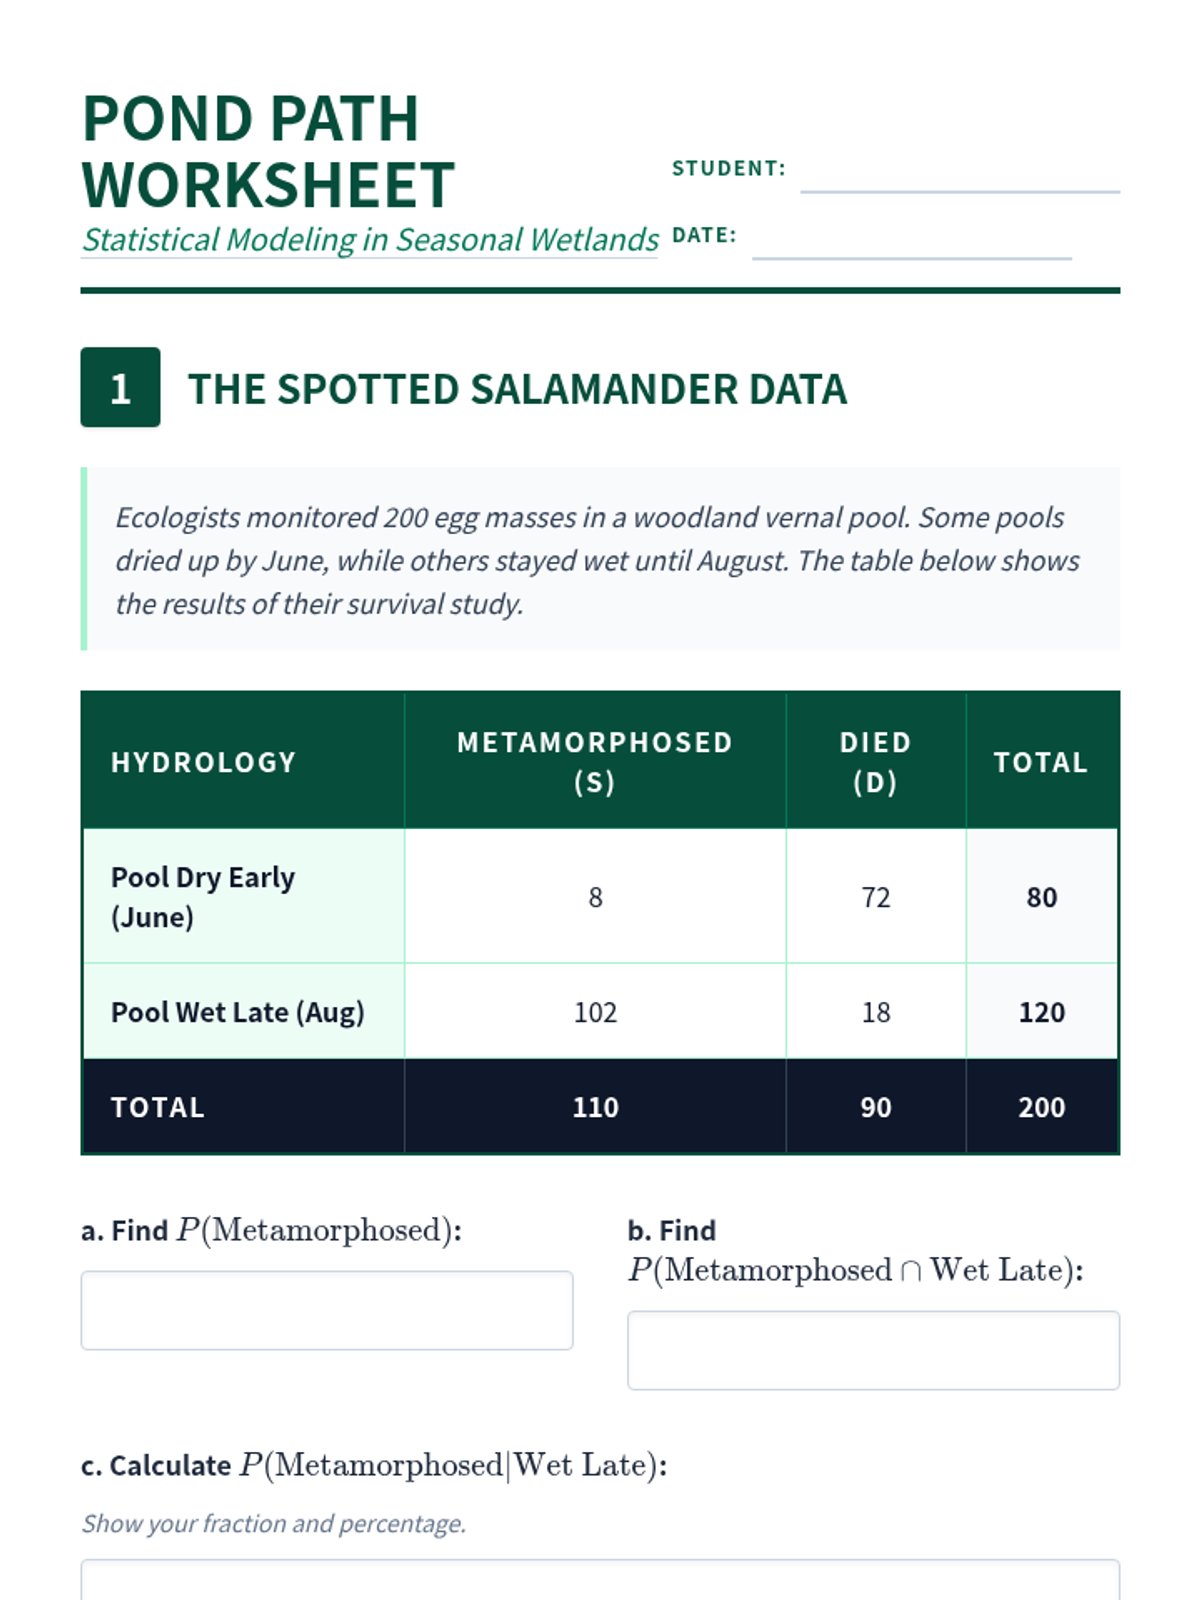
Students apply conditional probability and compound event analysis to understand the survival dynamics of species in vernal pools, bridging biology and statistical reasoning.
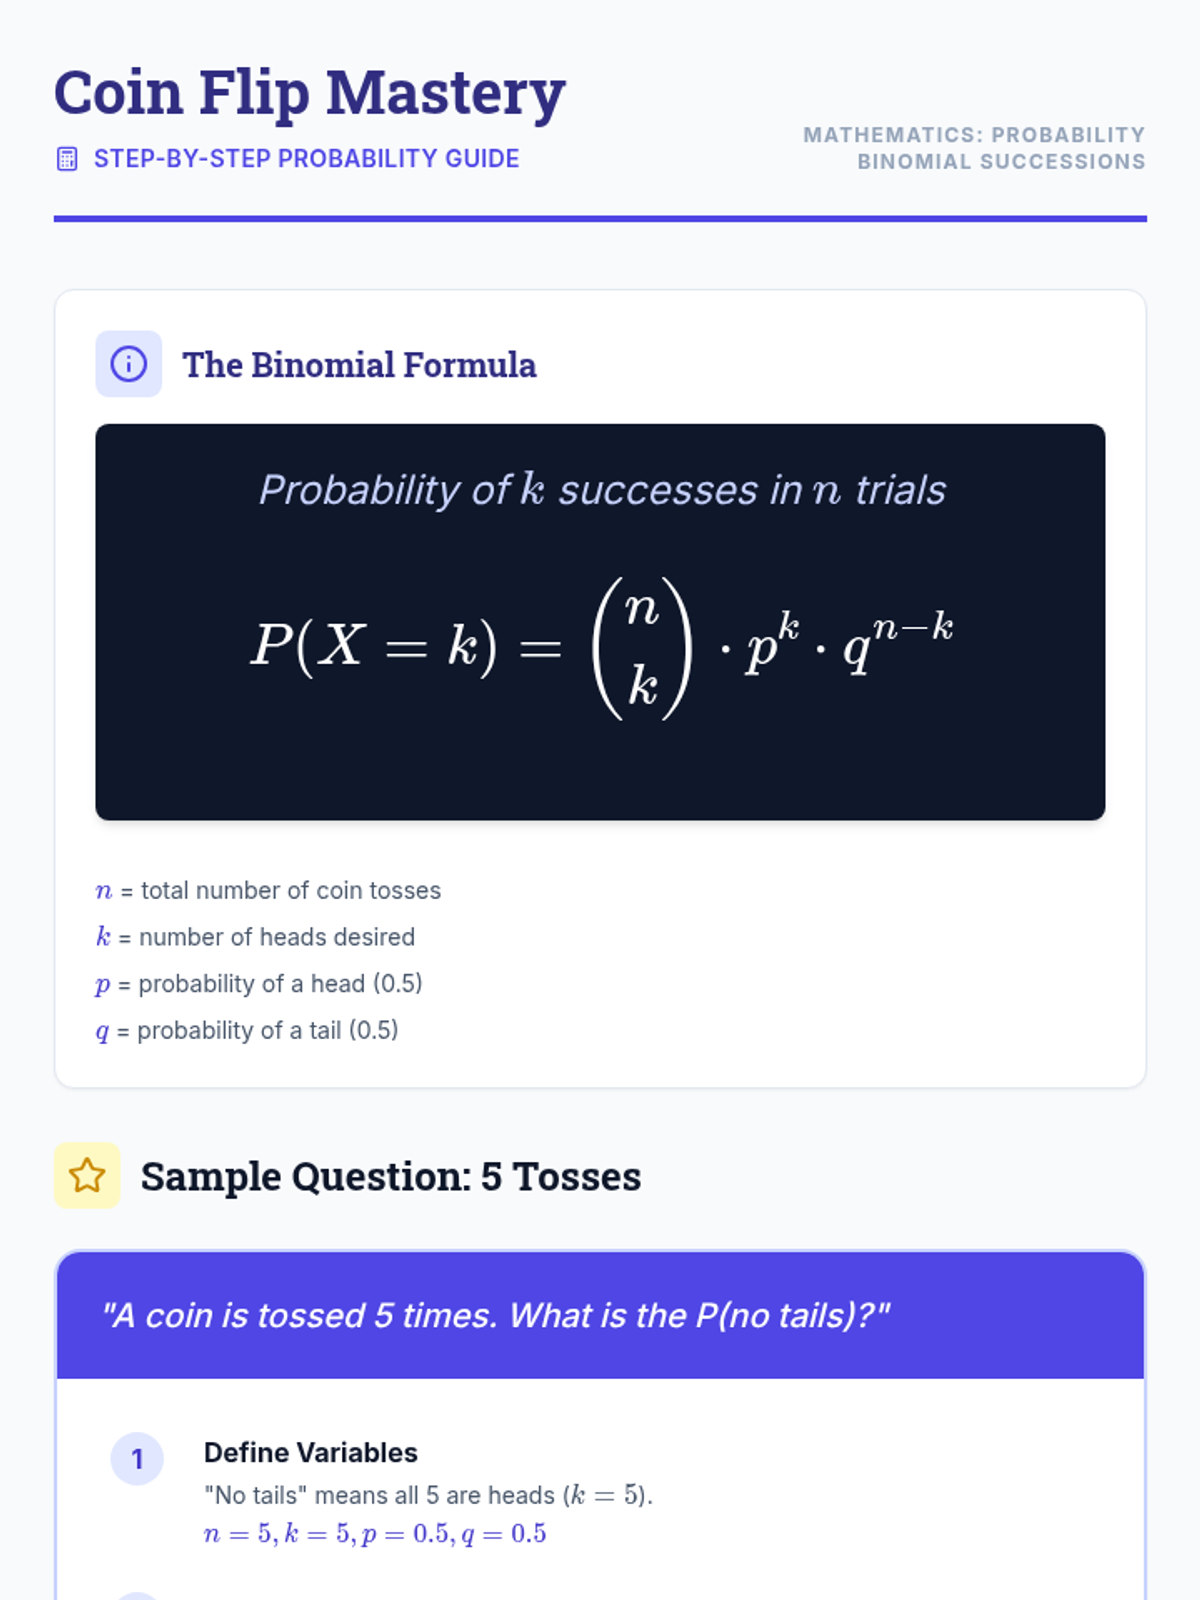
A focused lesson on calculating binomial probabilities for independent coin toss events, specifically focusing on 'all-or-nothing' outcomes.
A comprehensive practice session for the TSIA2 Math exam, focusing on quantitative reasoning, algebraic reasoning, geometry, and statistics.
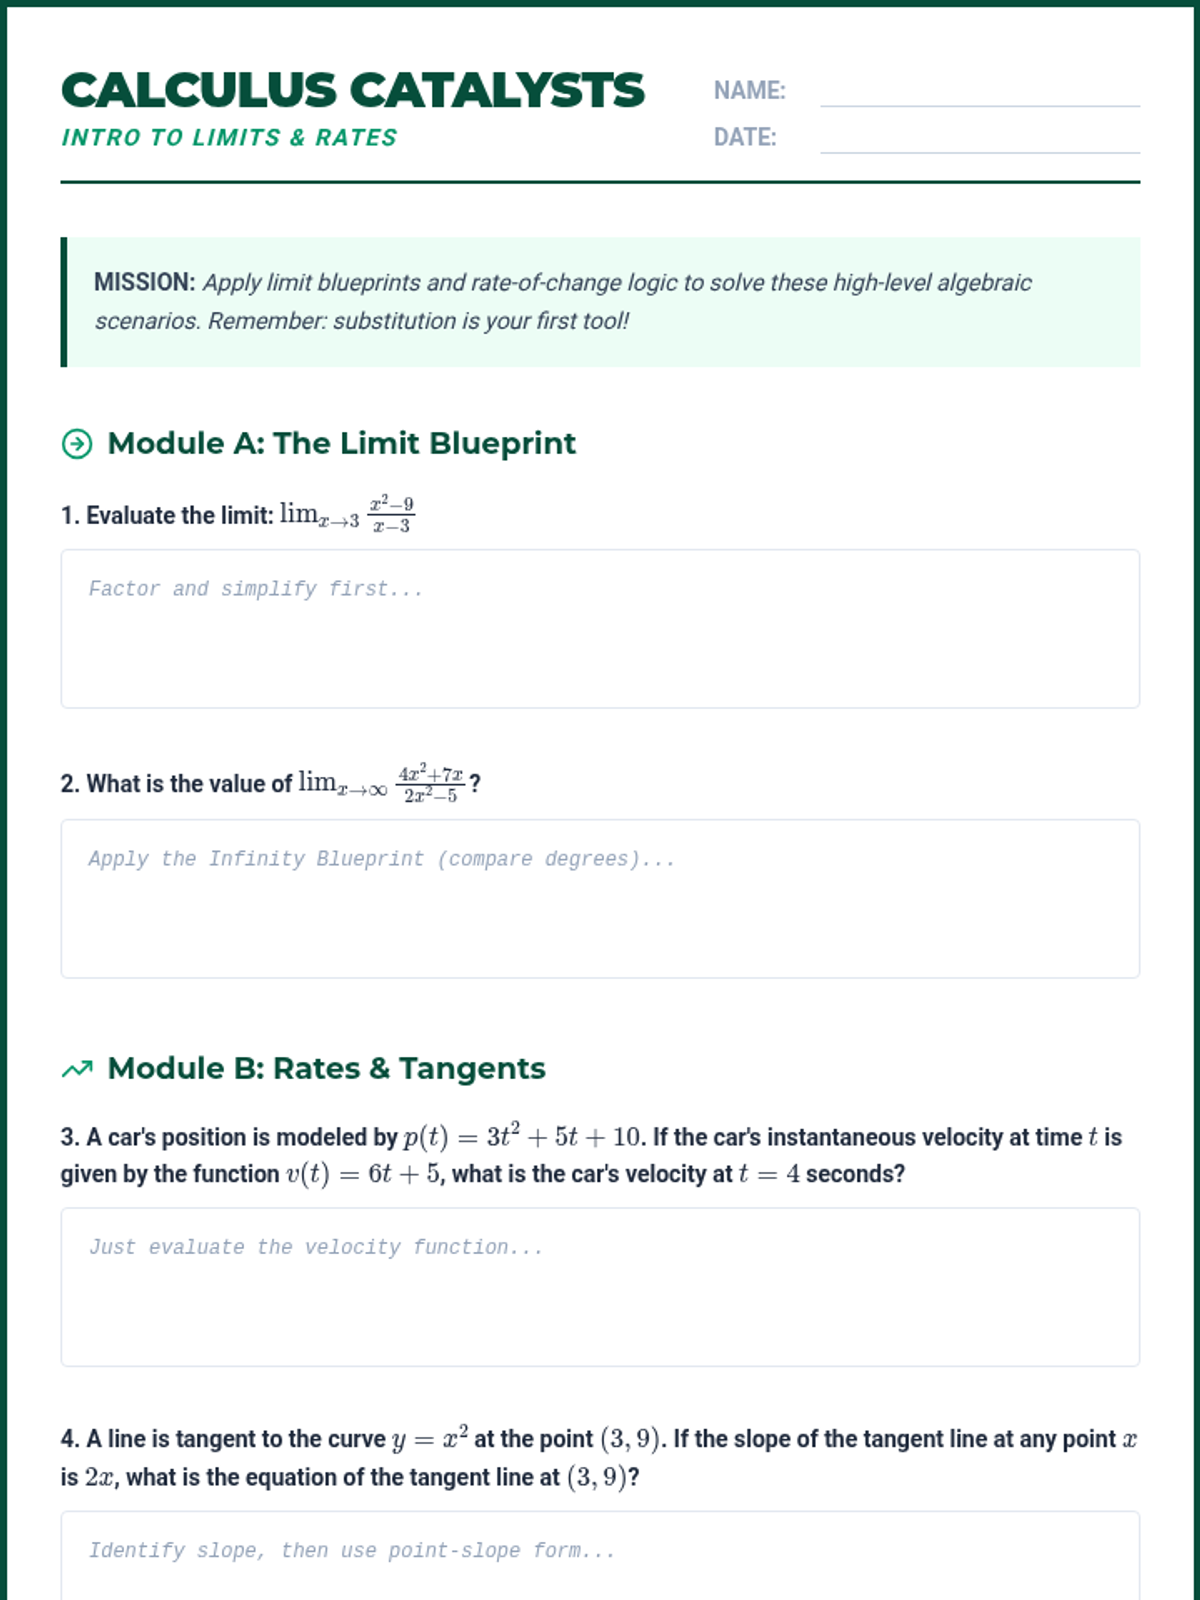
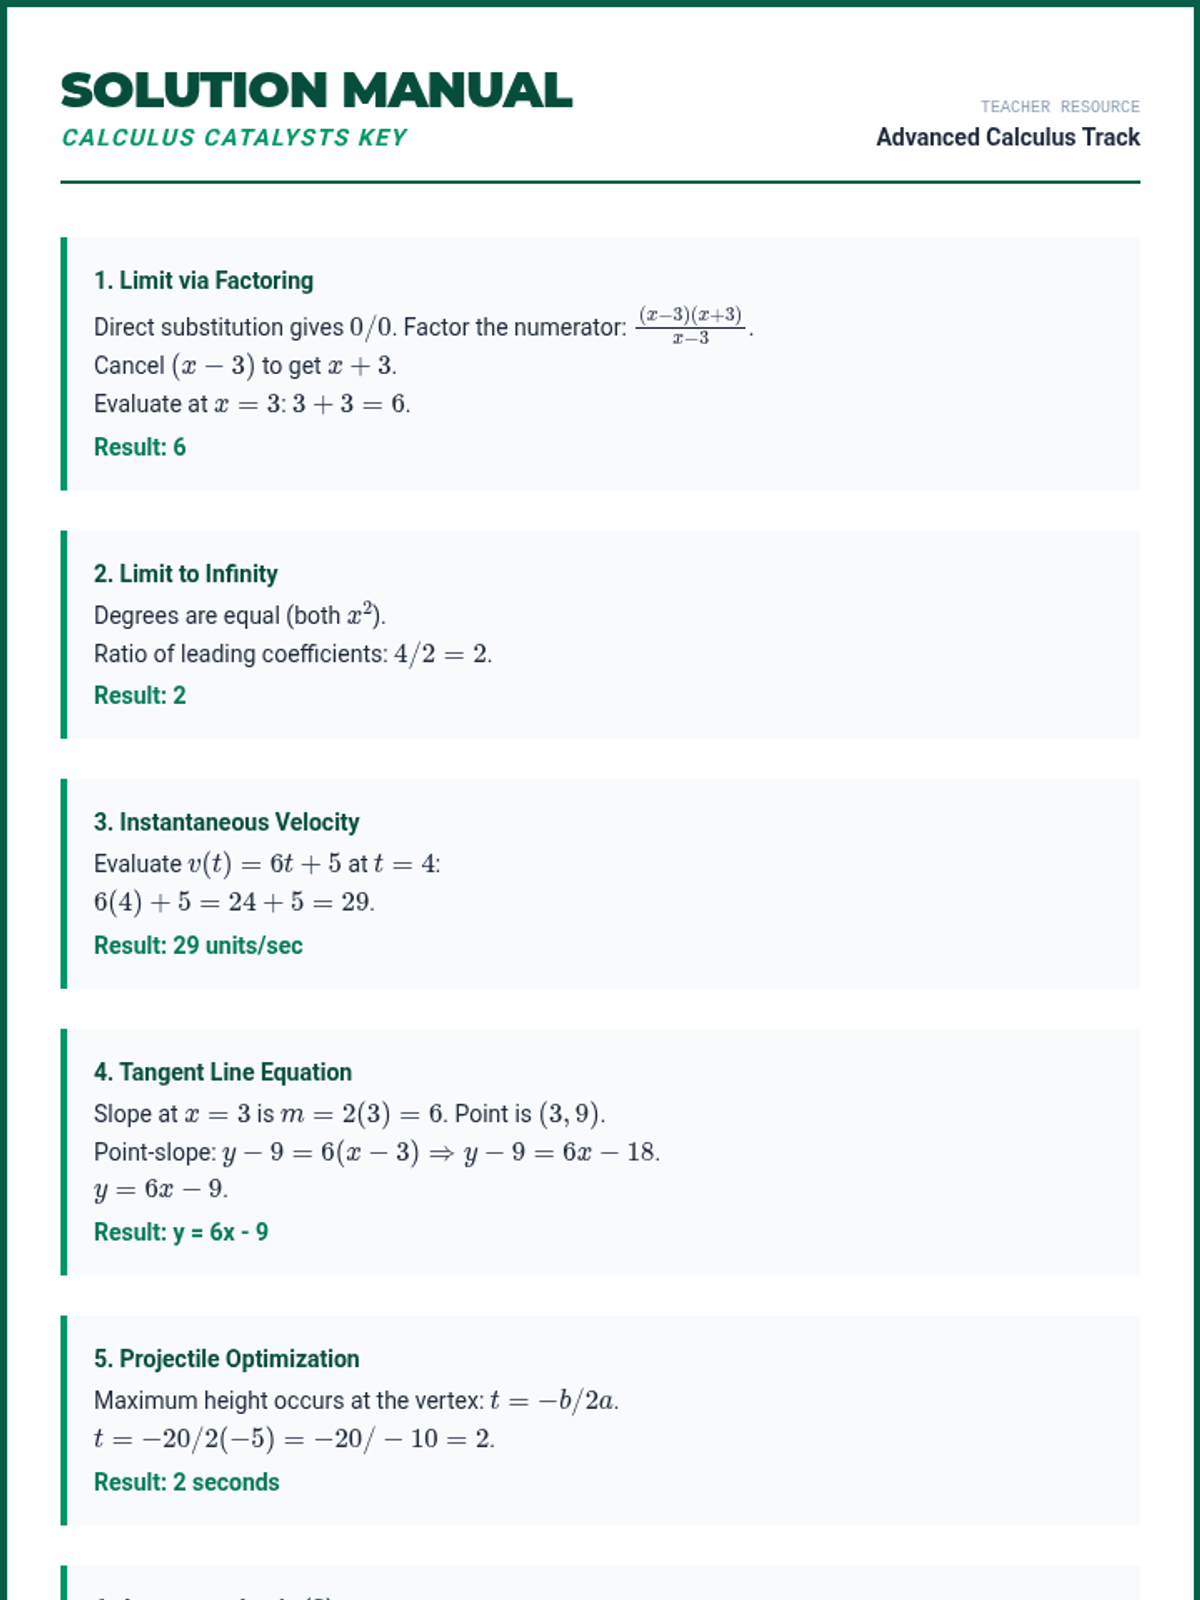
An introductory exploration of calculus-adjacent concepts tested on the ACT, focusing on limits, instantaneous rates of change, and function optimization. Students will master the Limit Blueprint and apply rate-of-change logic to complex algebraic scenarios.
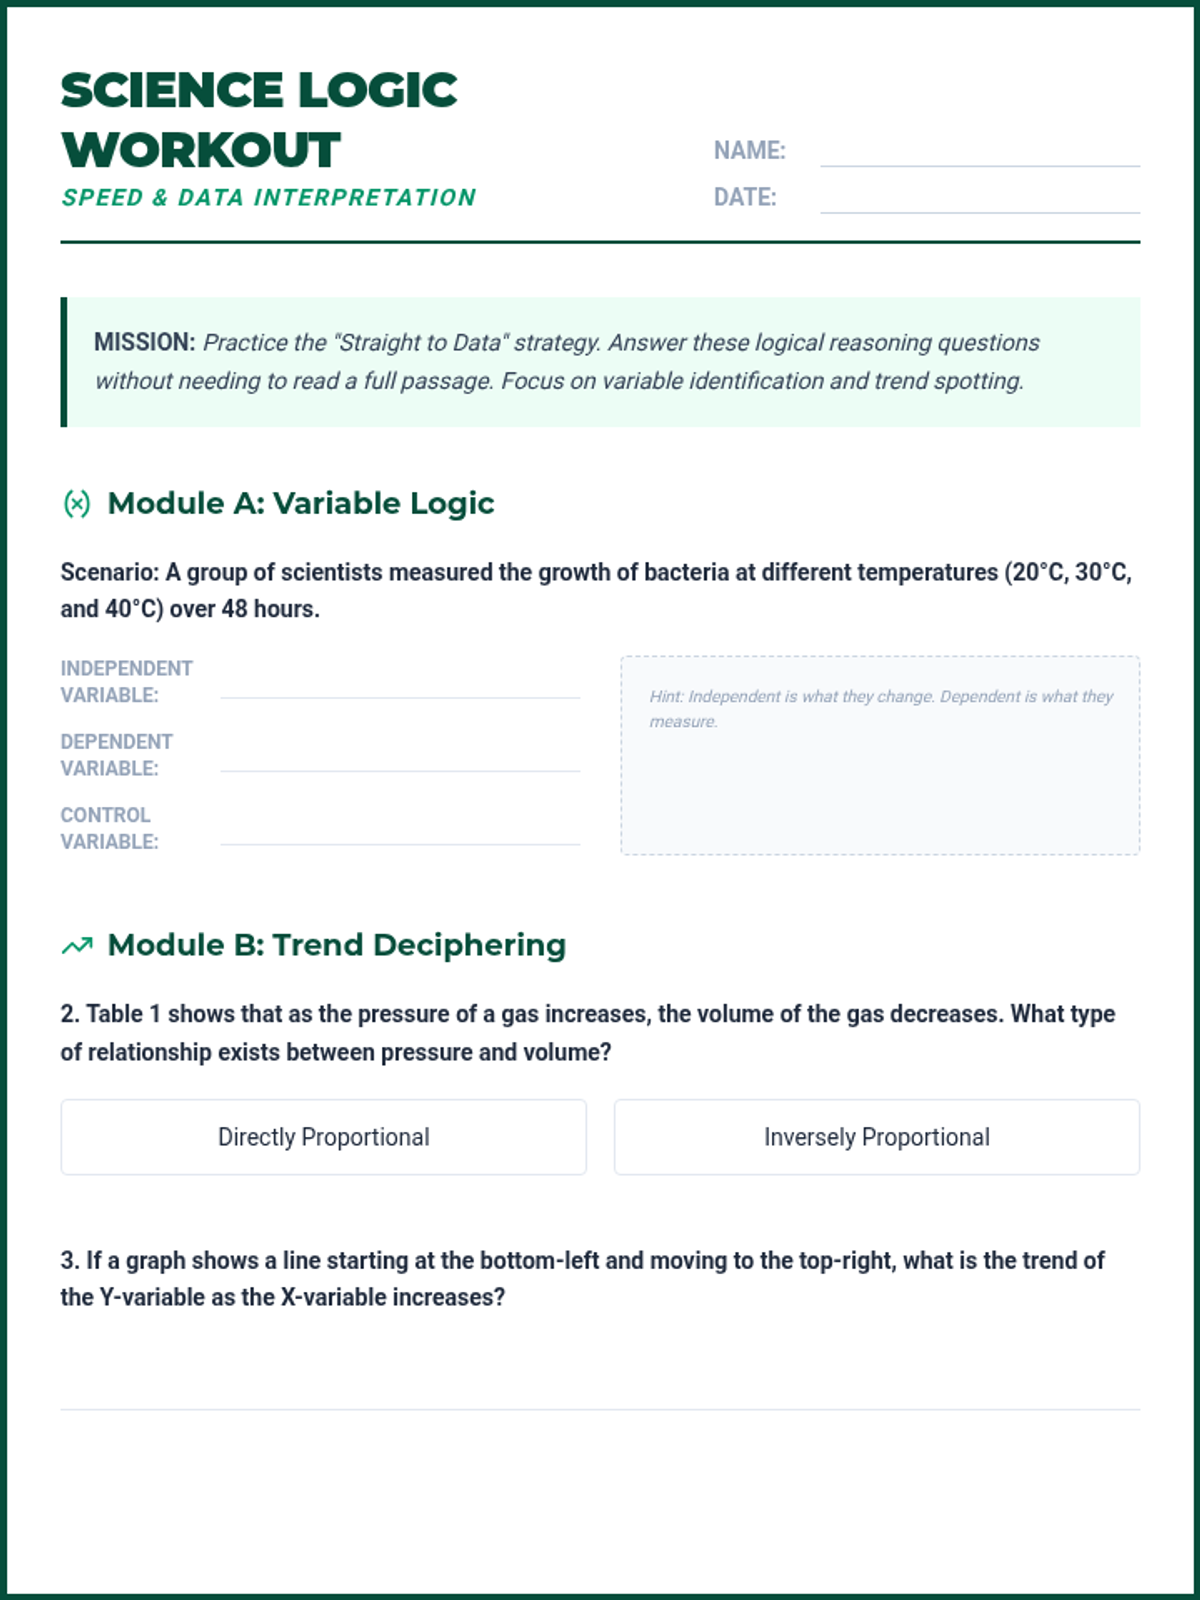
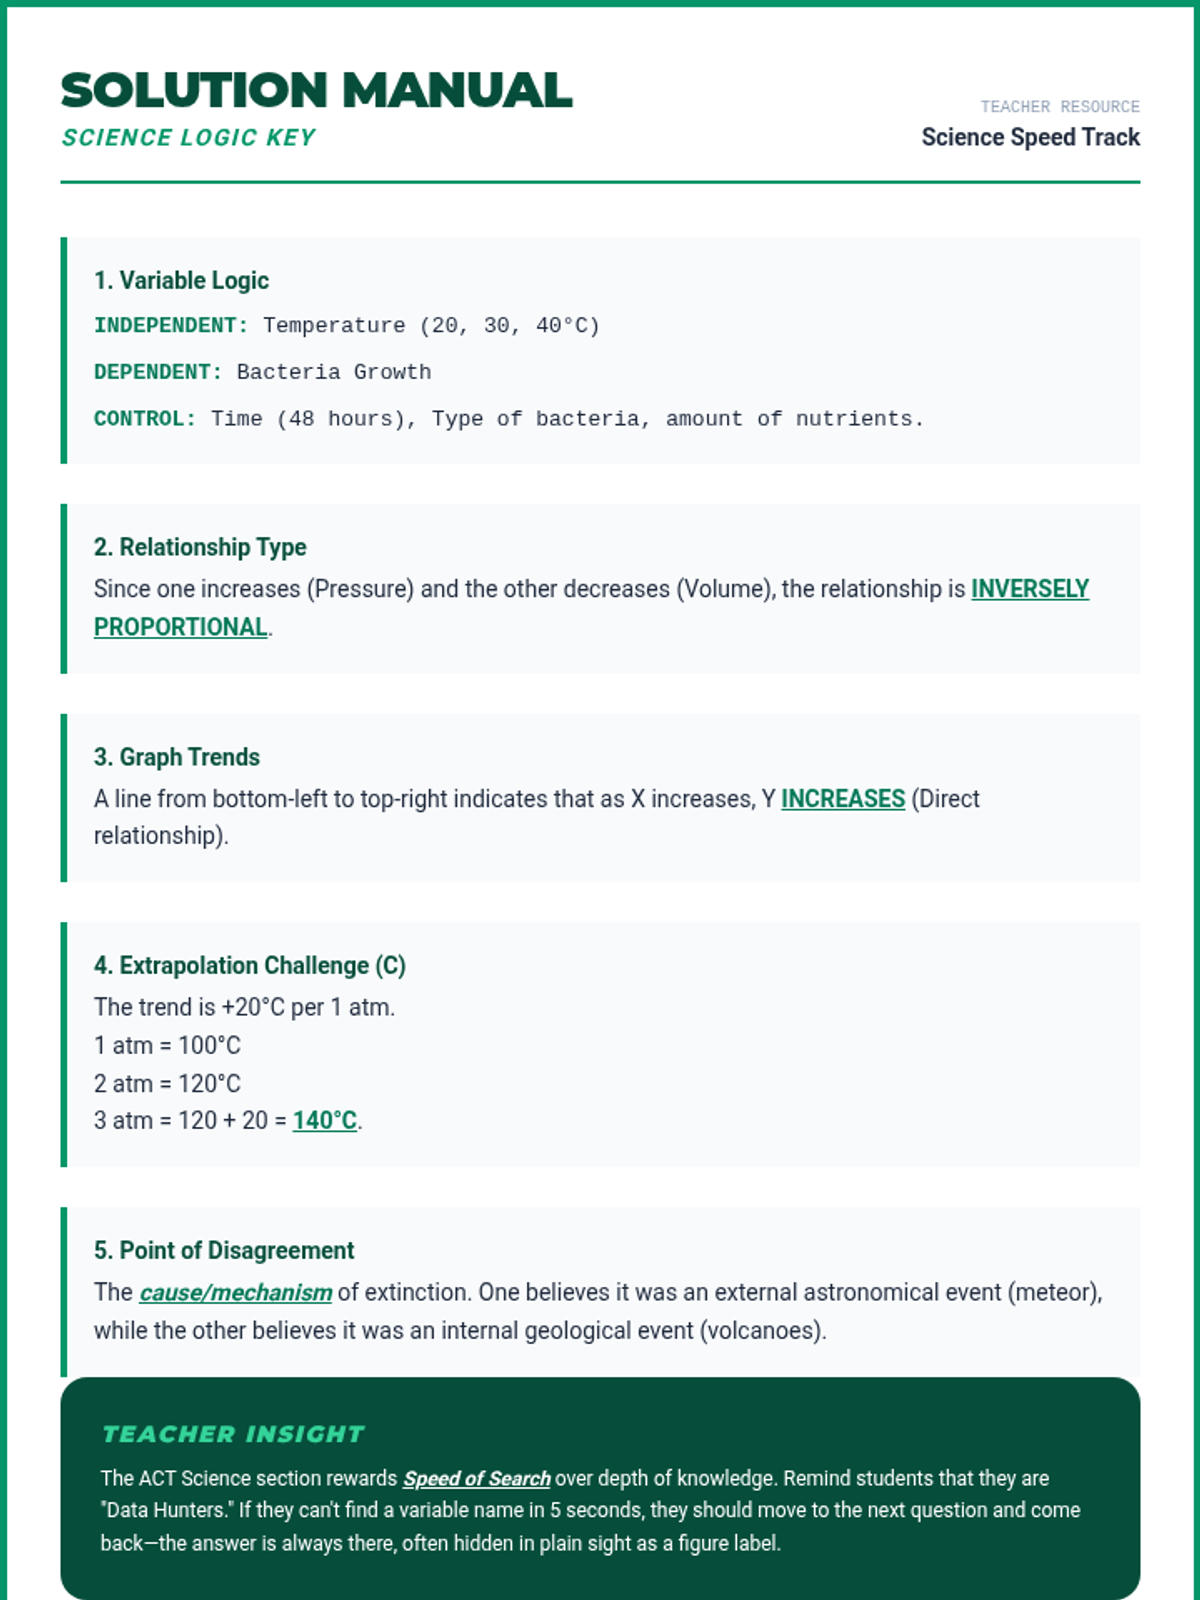
A strategic masterclass for the ACT Science section, focusing on speed-reading data sets, identifying experimental variables, and decoding scientific logic. This lesson emphasizes the 'Straight to the Data' approach to maximize score in the 35-minute time limit.
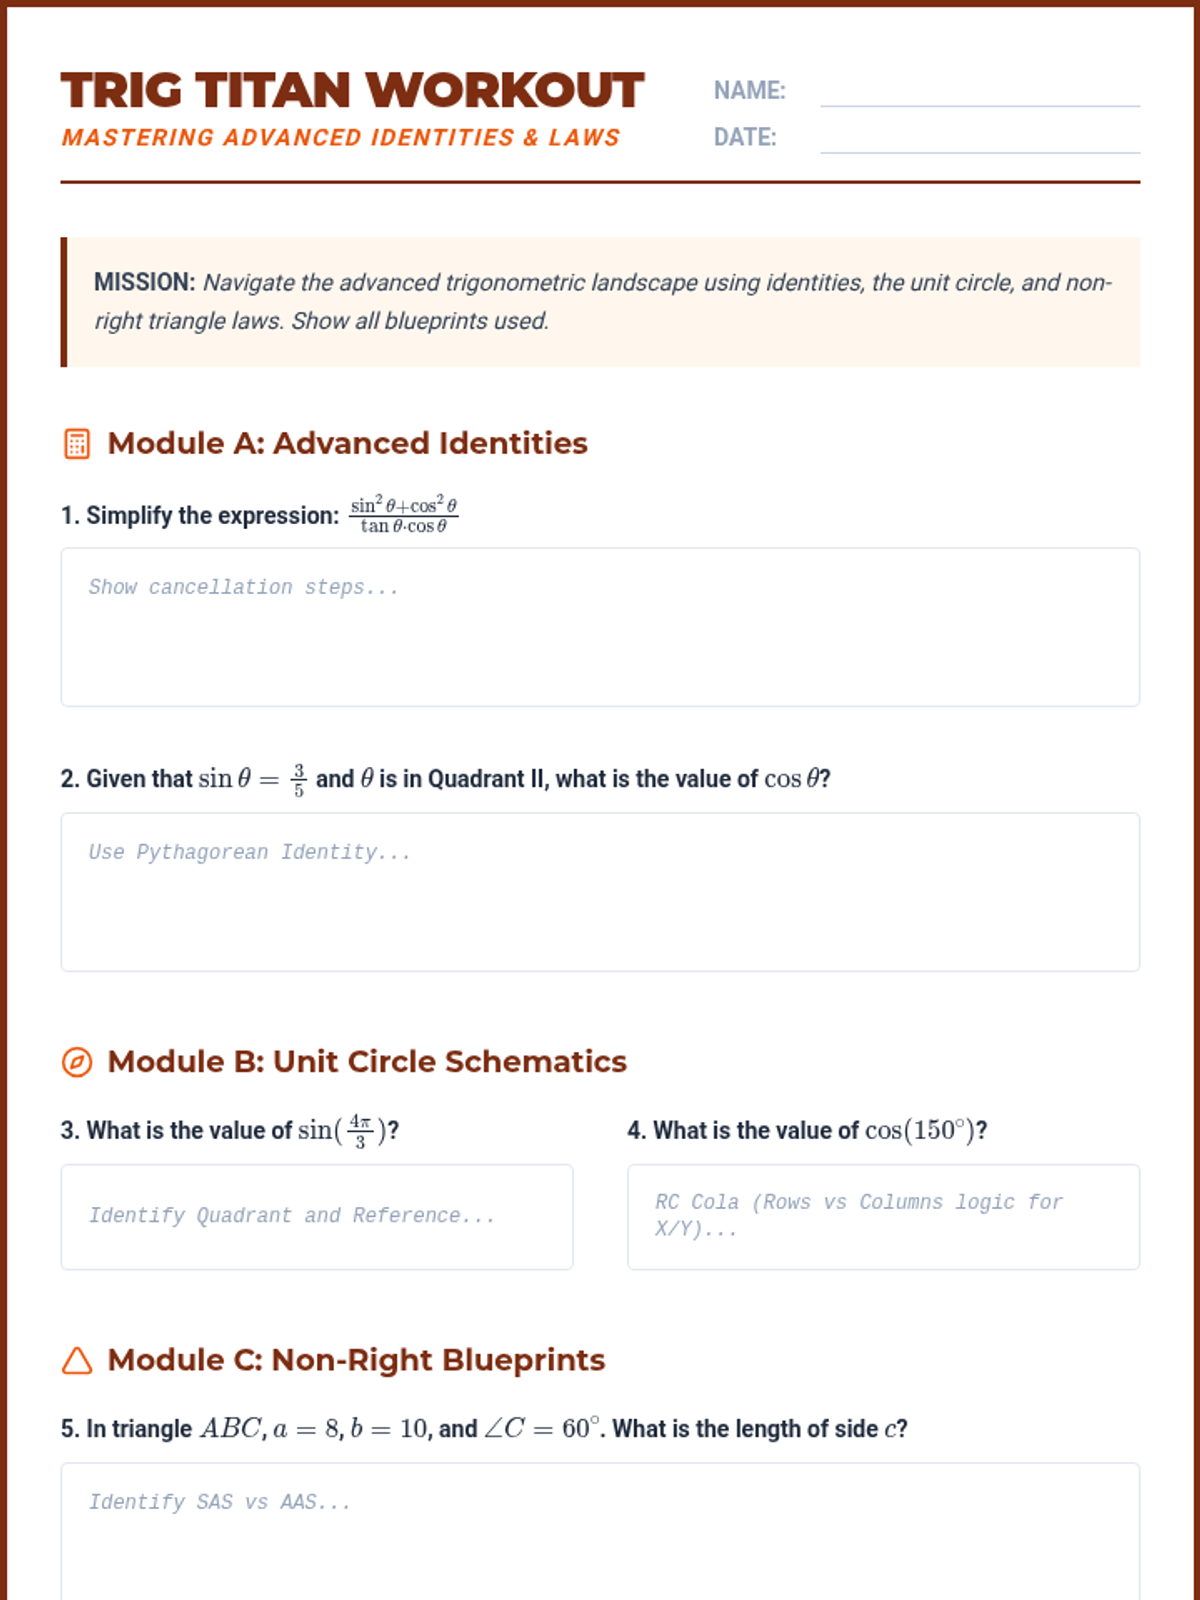
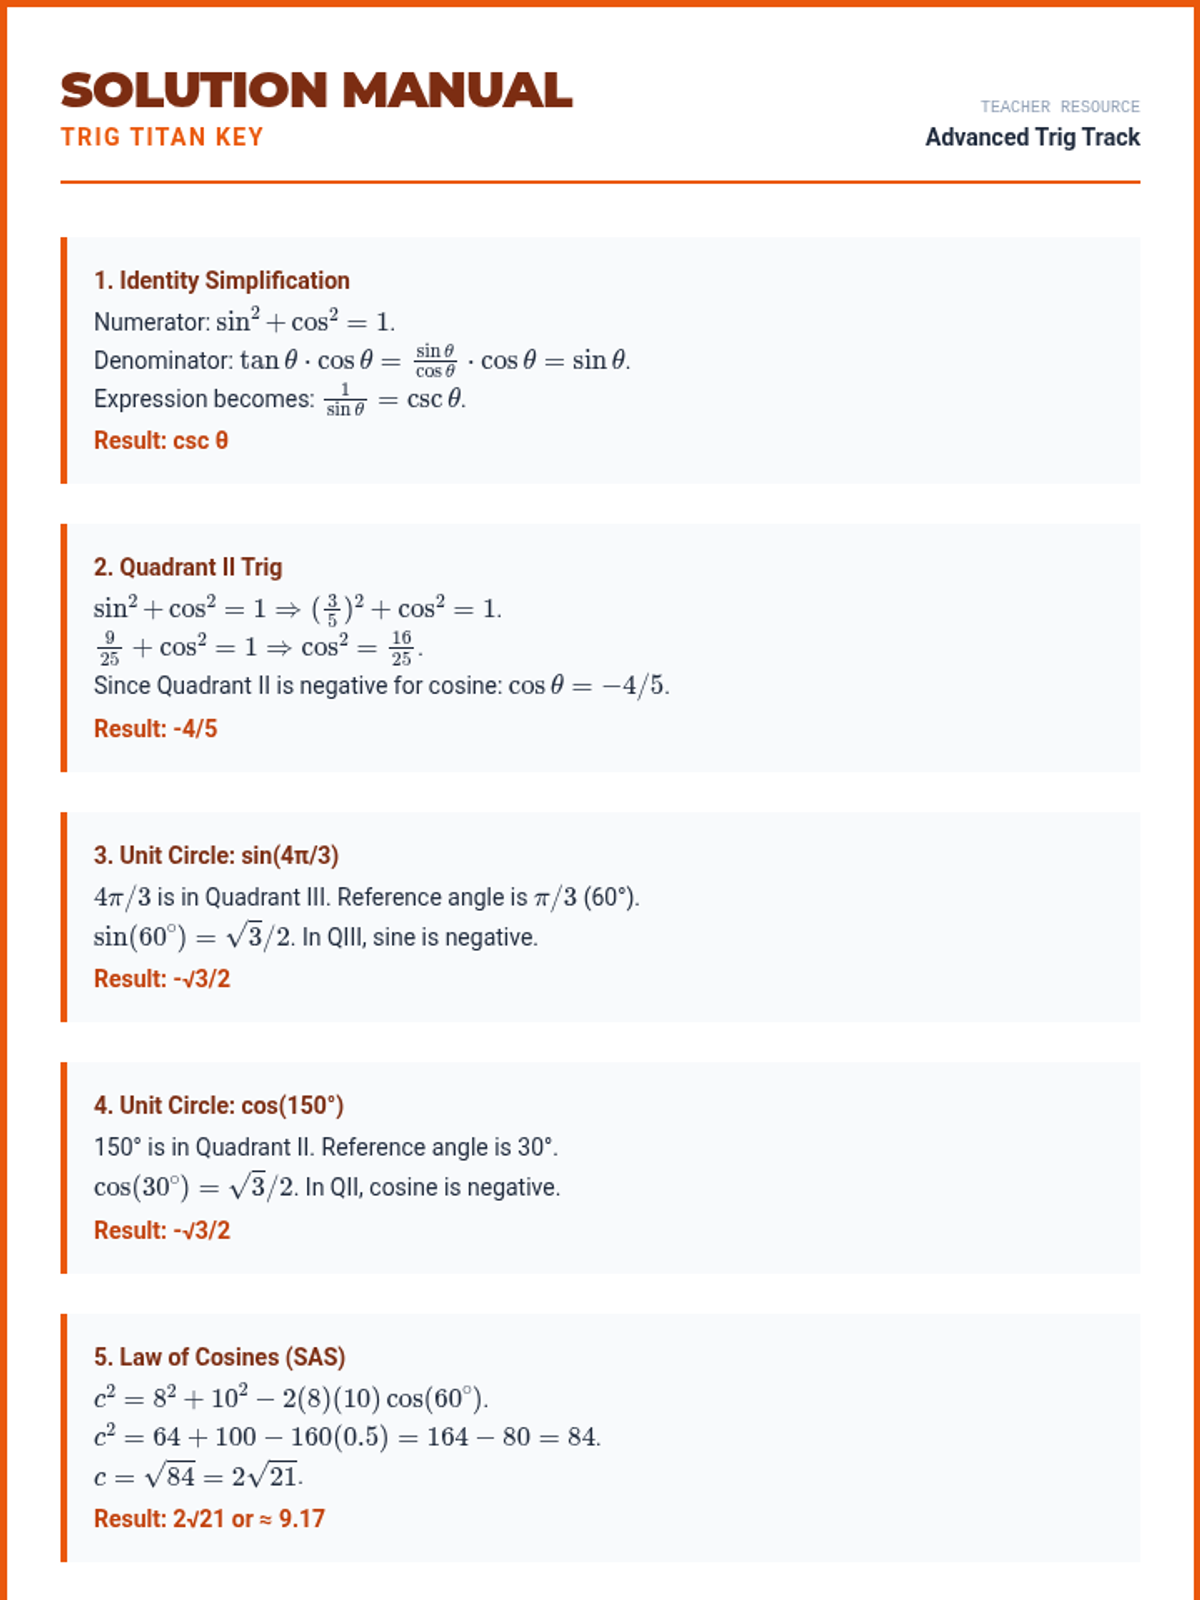
An intensive masterclass on advanced trigonometric identities, the unit circle, and non-right triangle laws. Students will master the Pythagorean identities, Law of Sines/Cosines, and the specific ACT-style unit circle coordinates required for top-tier scores.
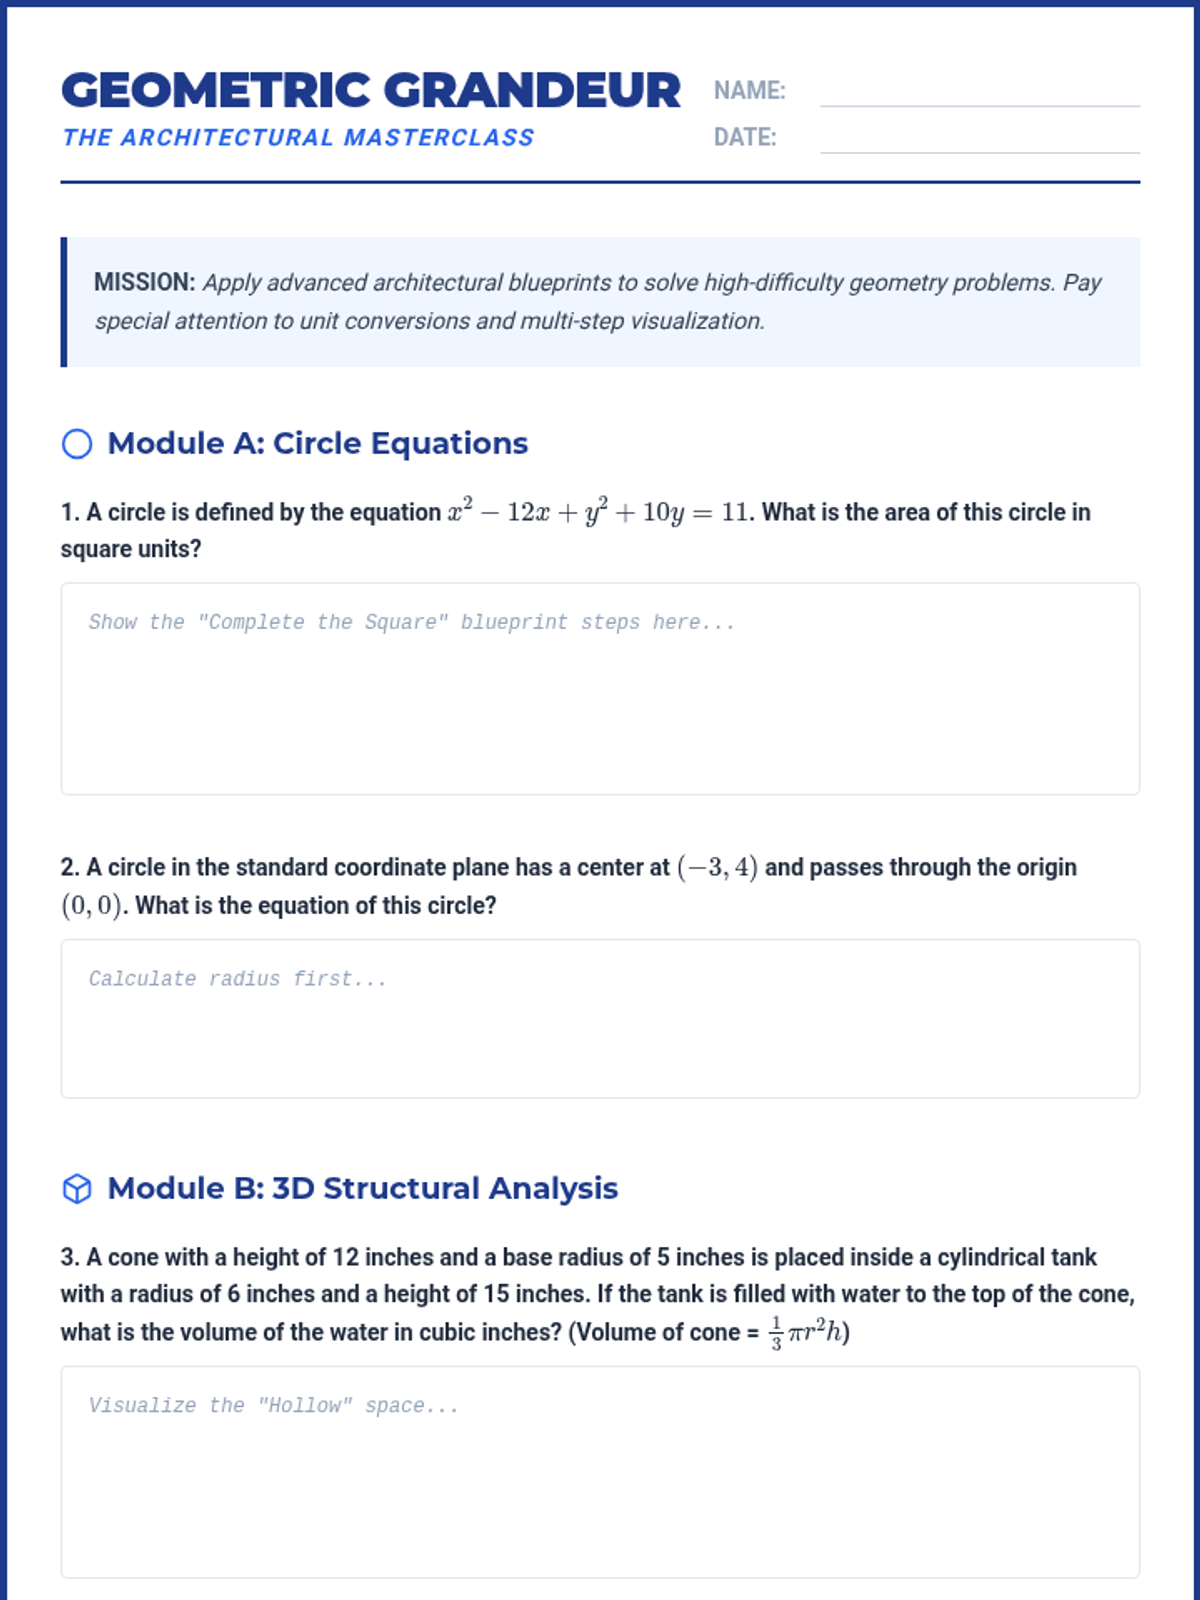
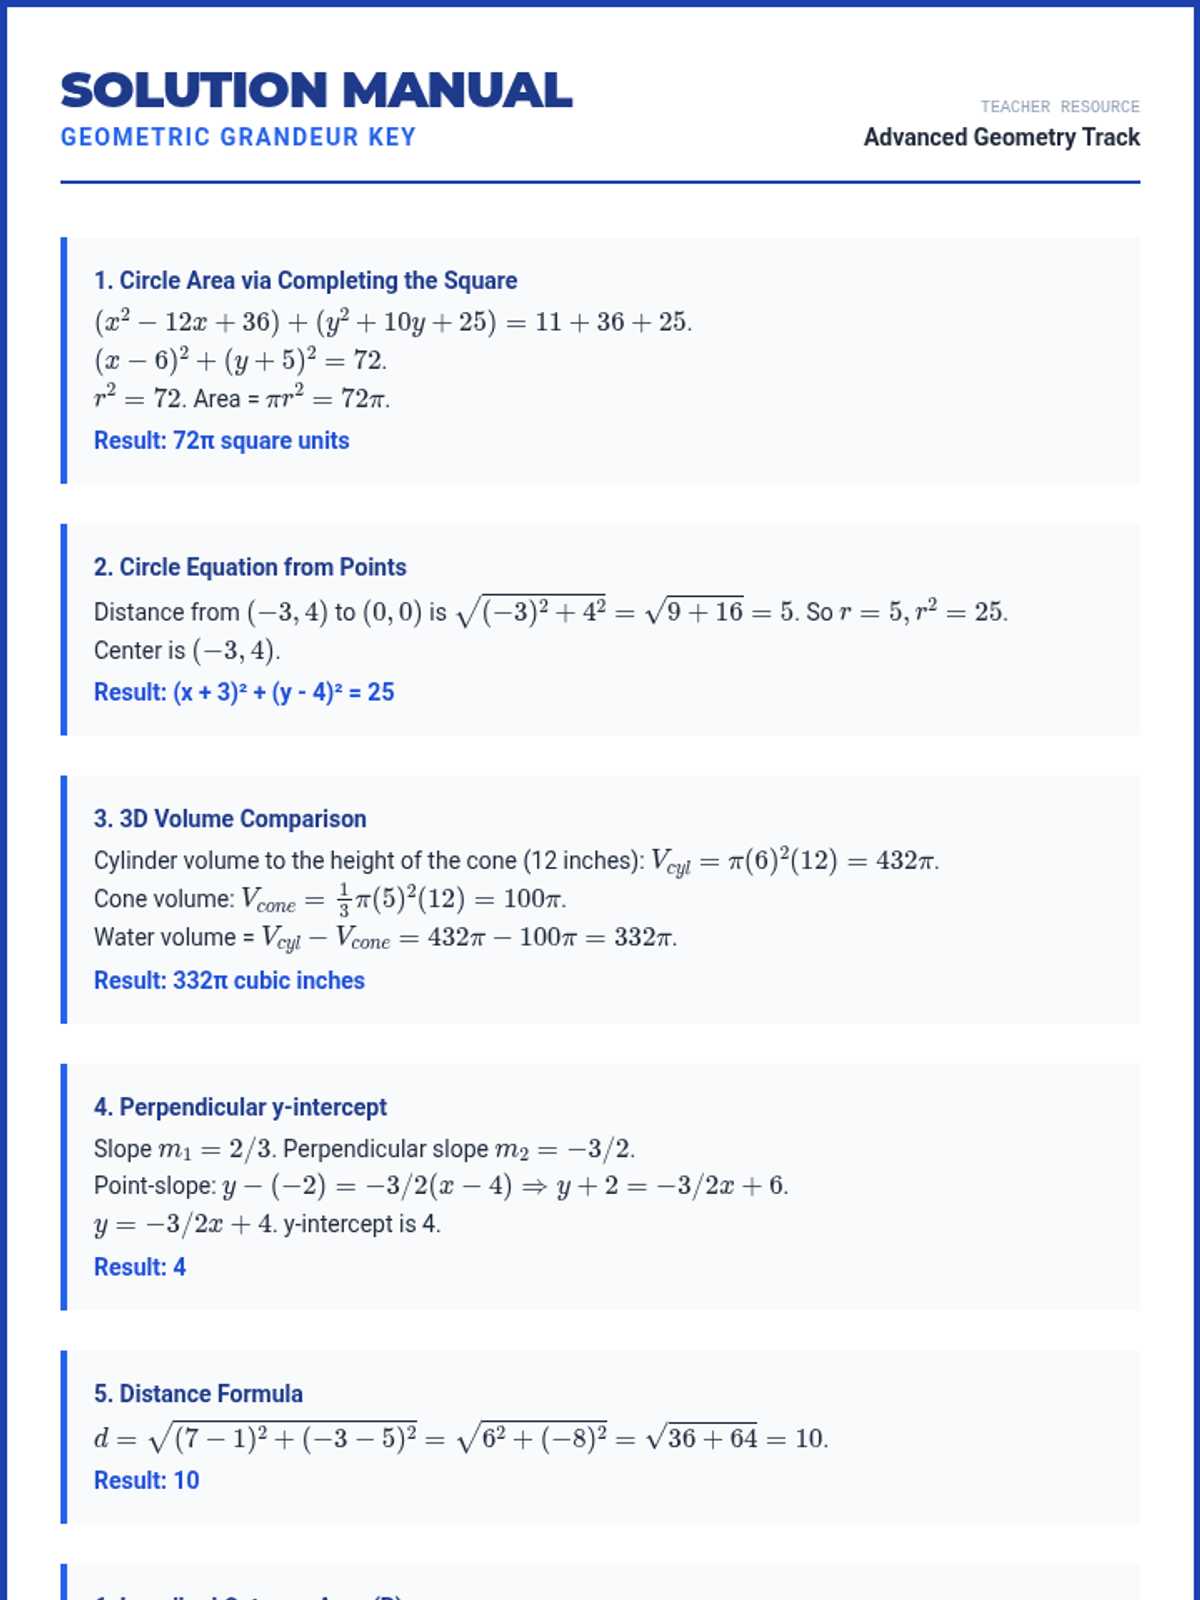
A specialized deep dive into advanced geometry concepts including circle equations, 3D volume/surface area of complex shapes, and coordinate geometry involving perpendicularity and distance. Students will master completing the square for circles and visualizing 3D cross-sections.
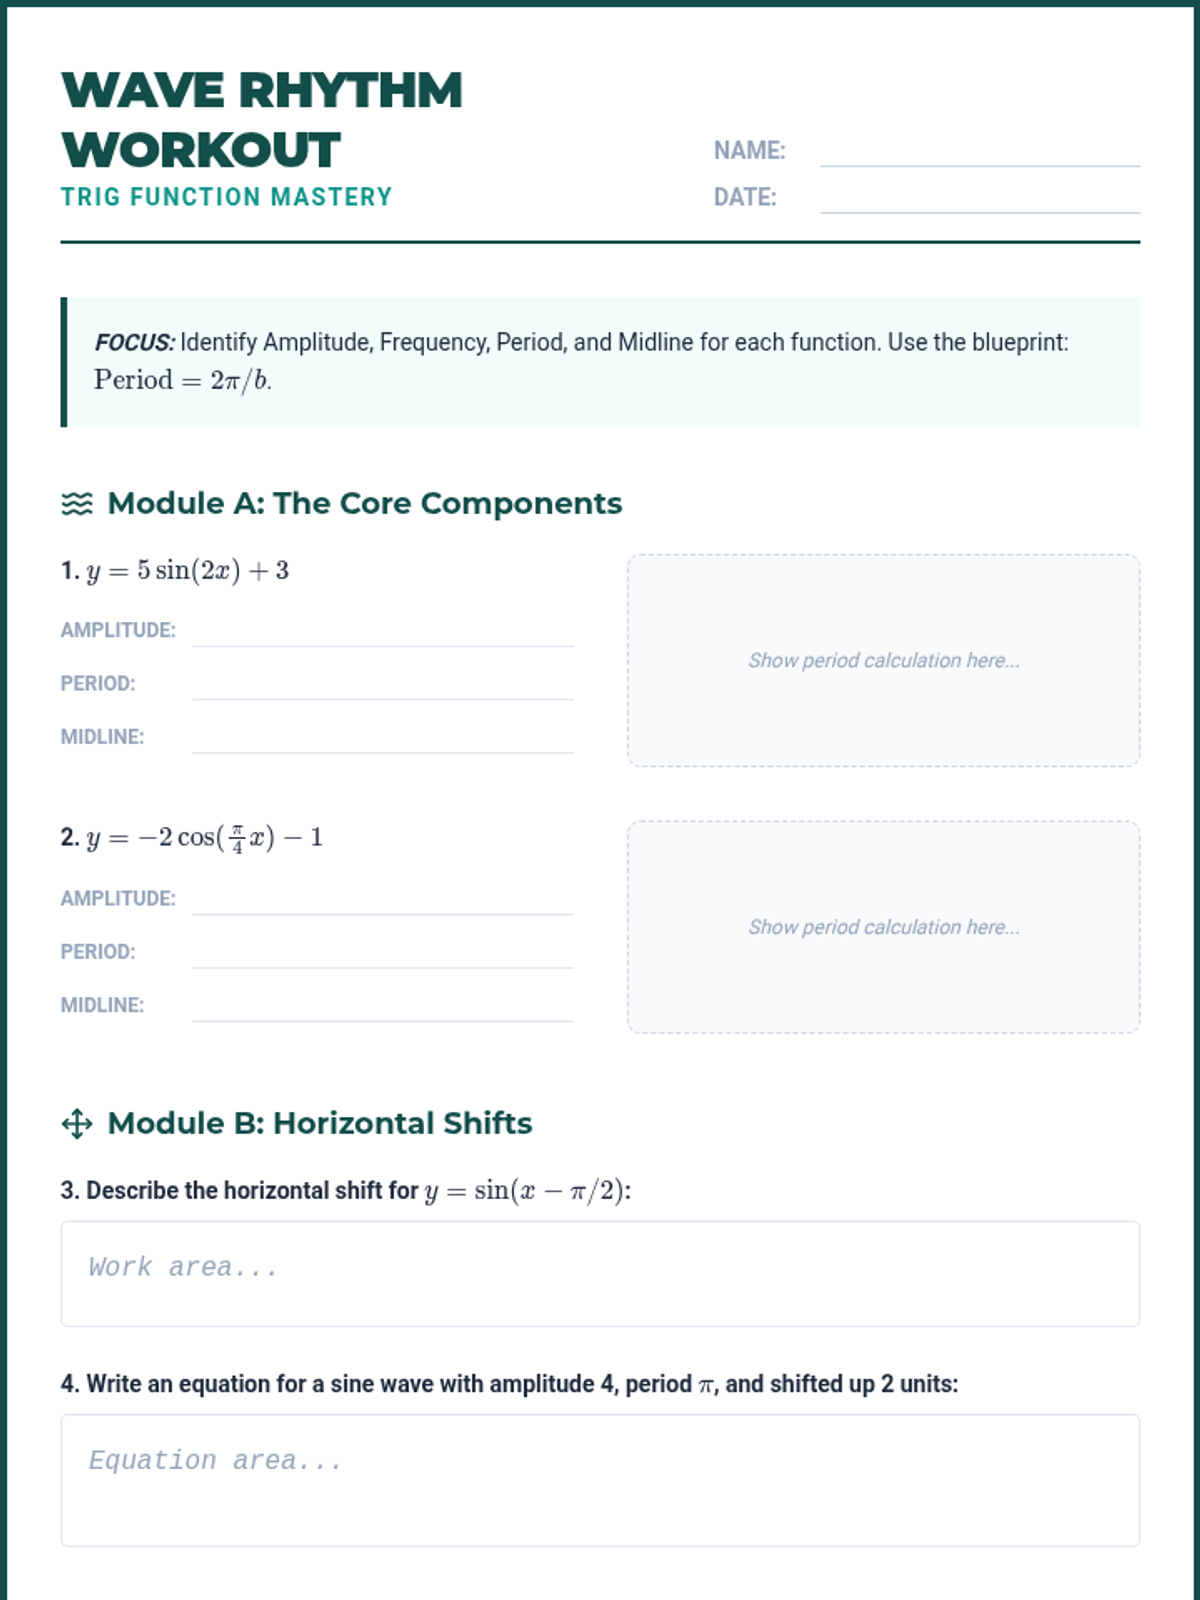
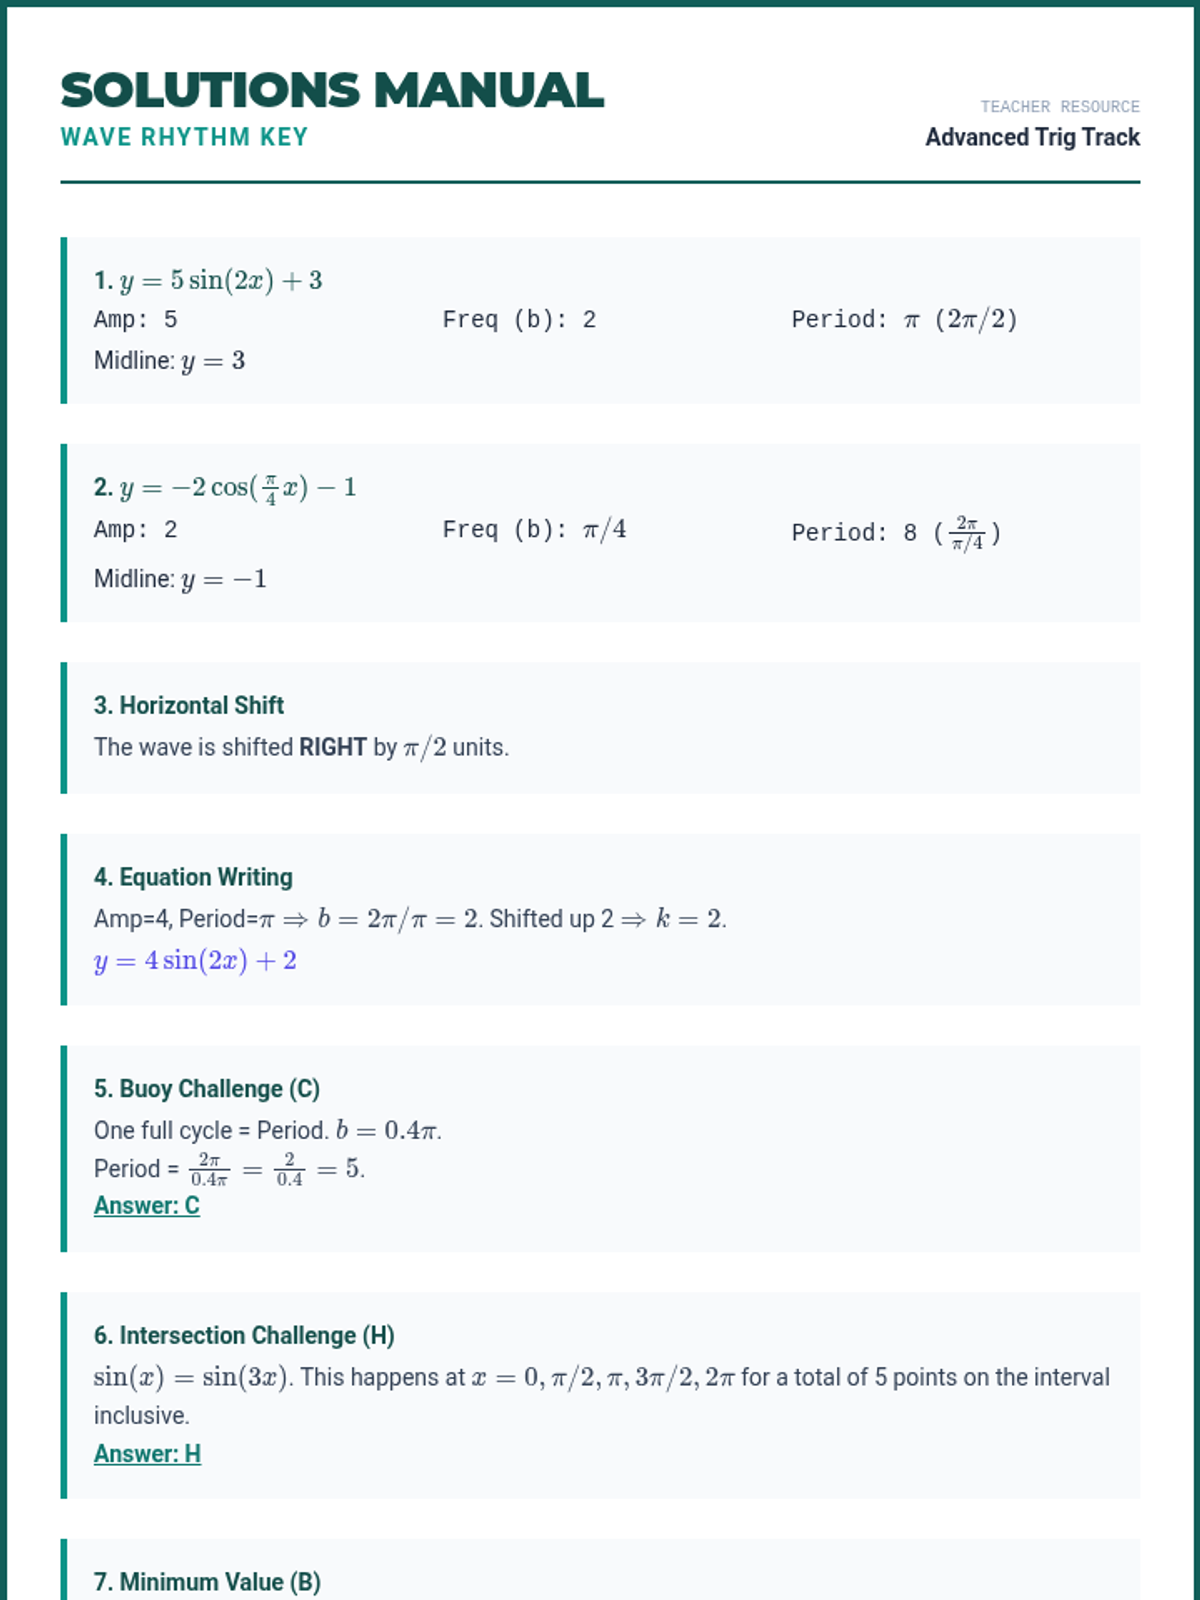
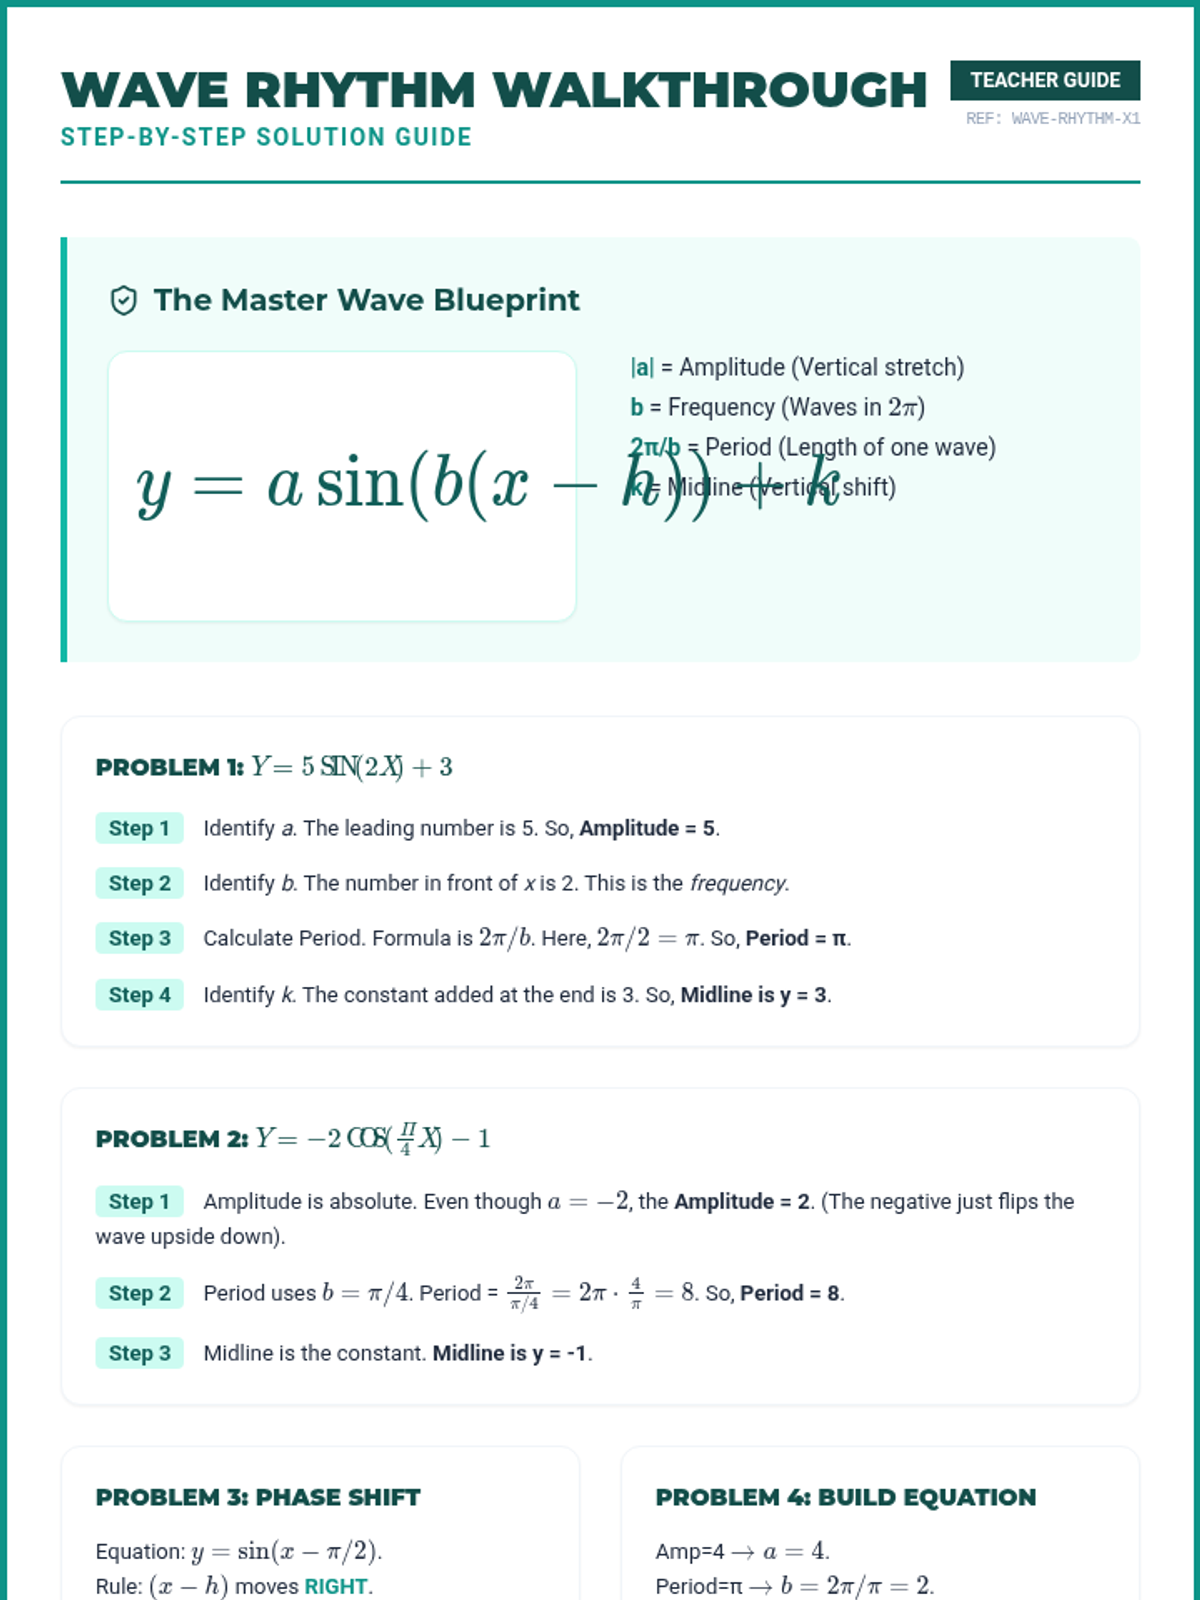
A specialized deep dive into trigonometric functions, mastering the critical distinction between period and frequency. Students will apply the 2π/b blueprint to decode sine and cosine graphs and solve high-difficulty periodic motion problems.
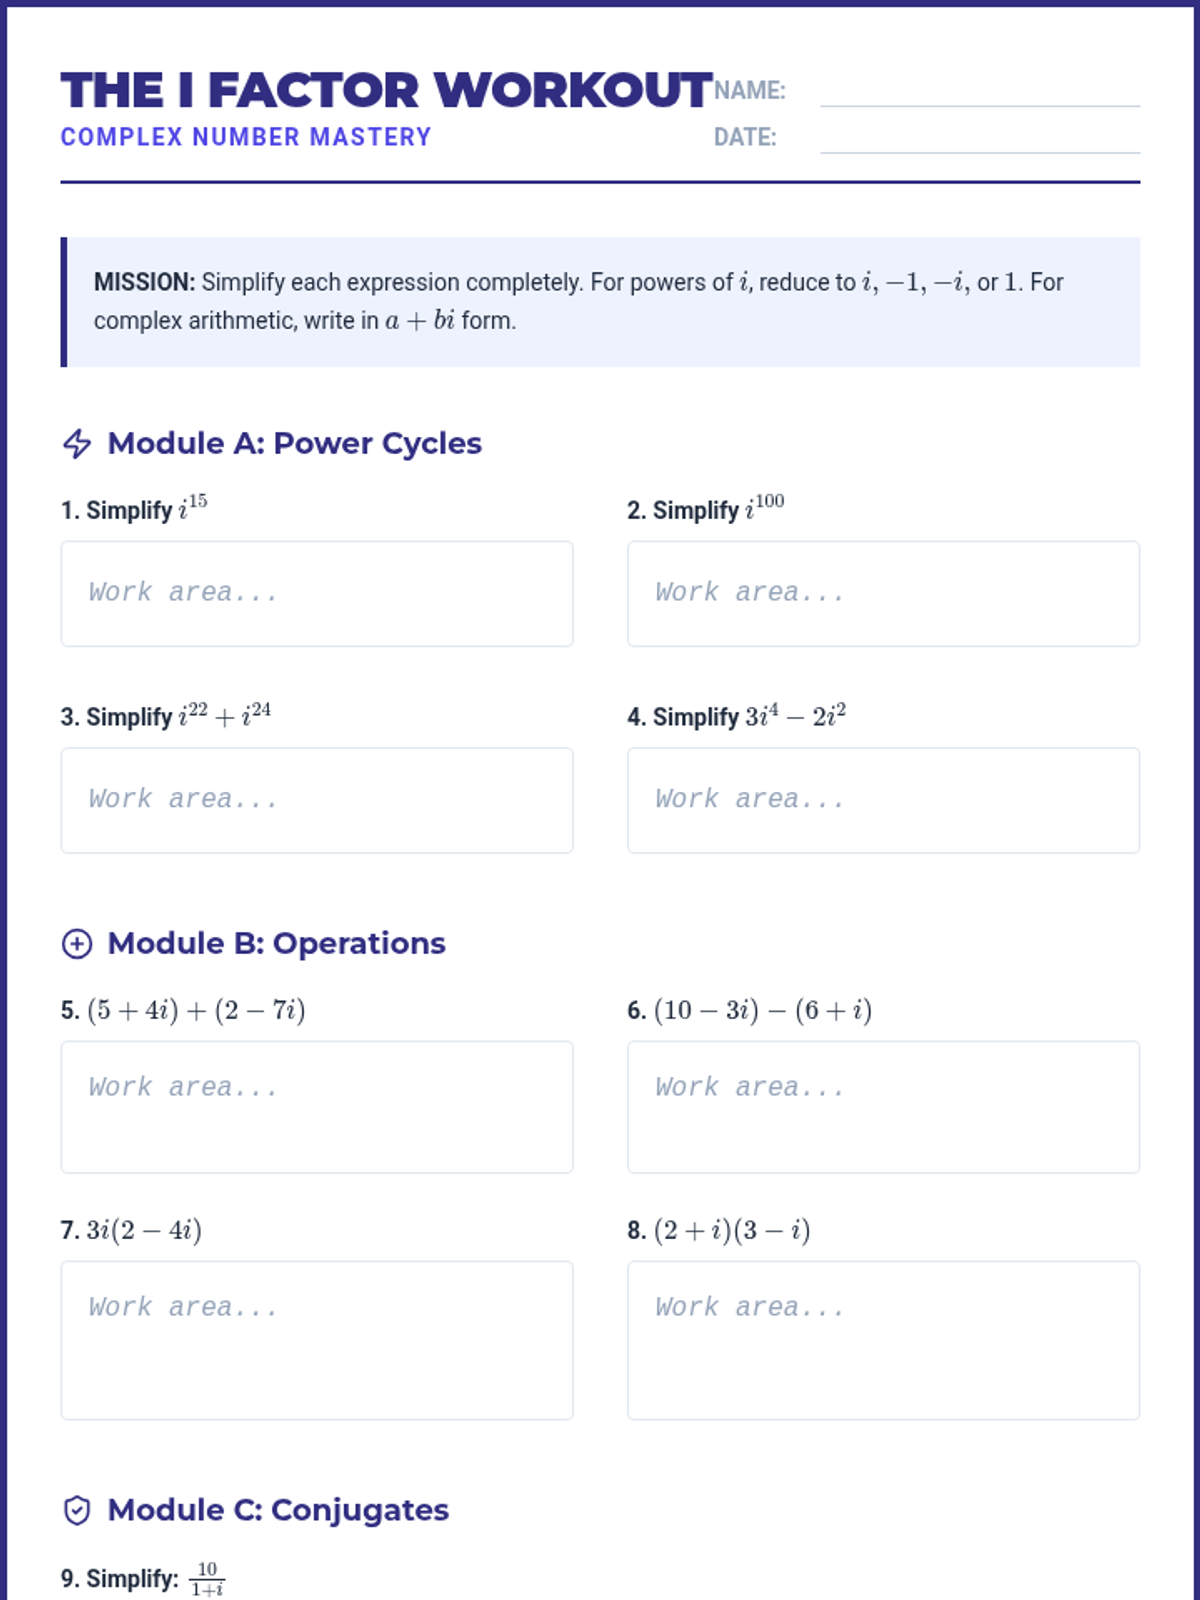
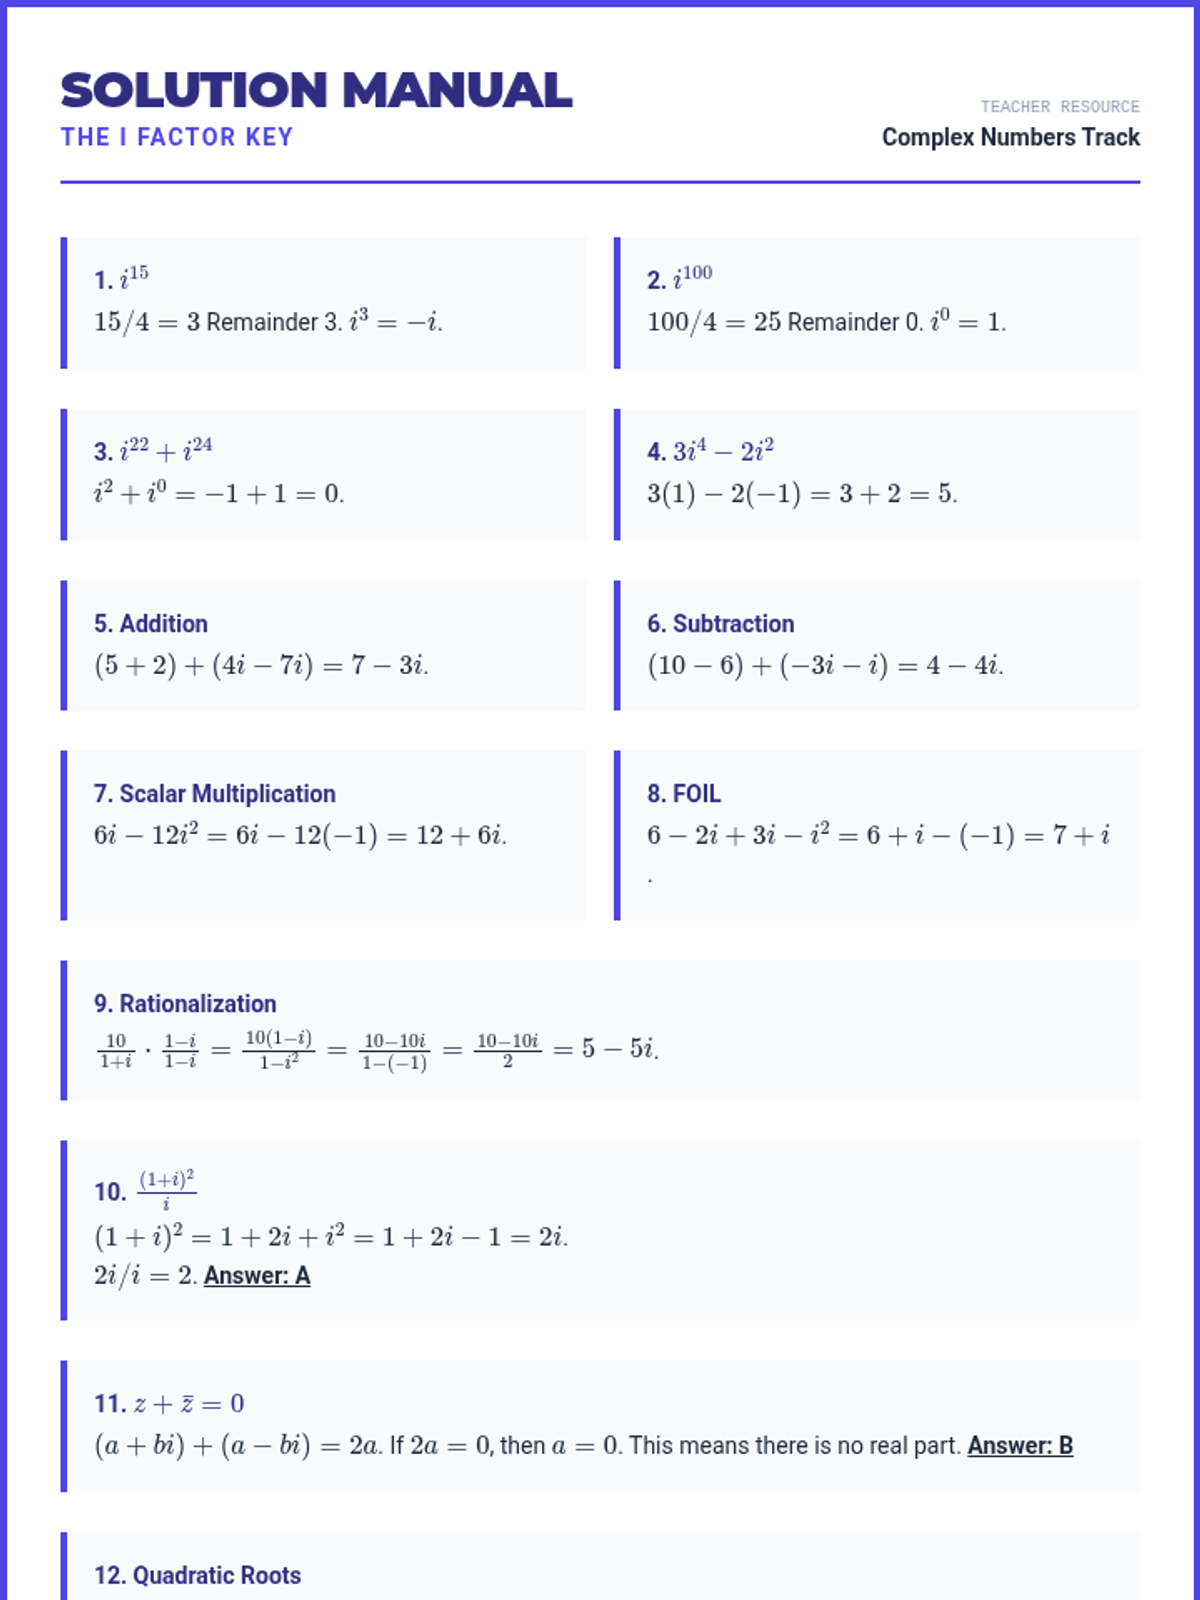
A focused deep dive into imaginary and complex numbers. Students will master powers of i, arithmetic with complex conjugates, and solving quadratic equations with complex roots—all through the lens of ACT-style 'Final Ten' questions.
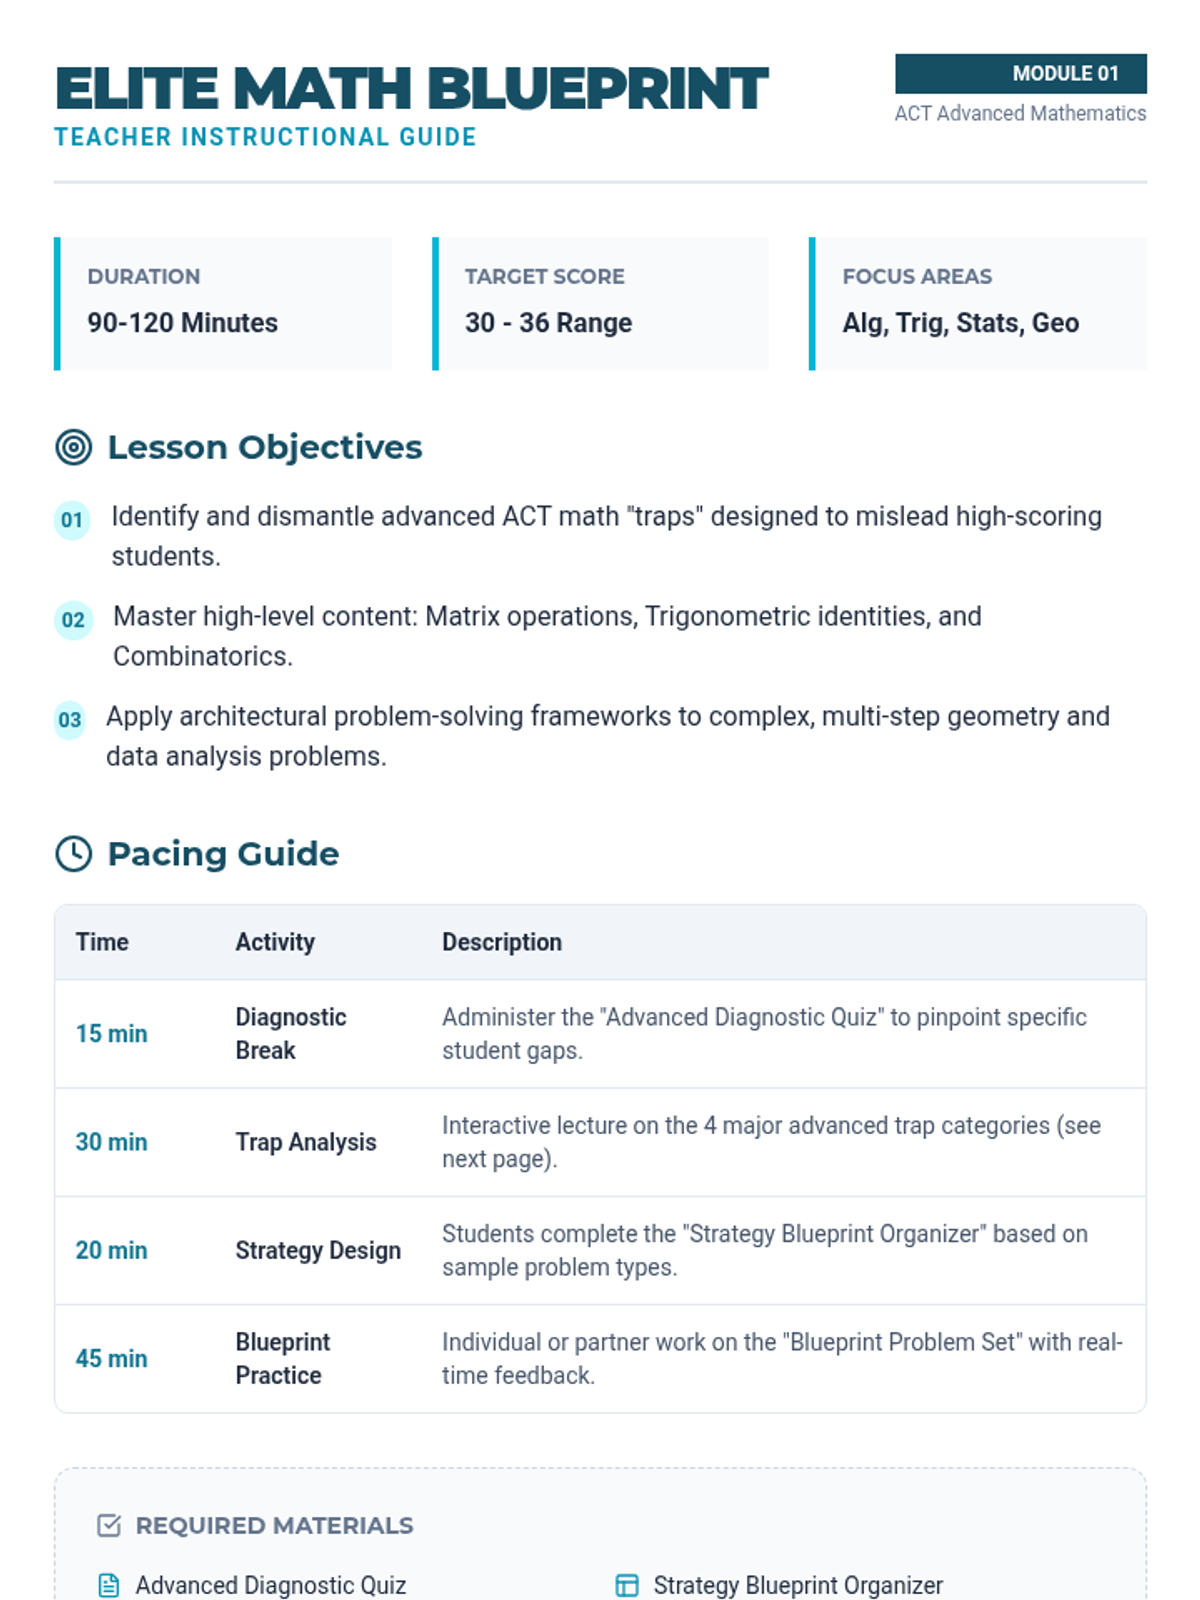
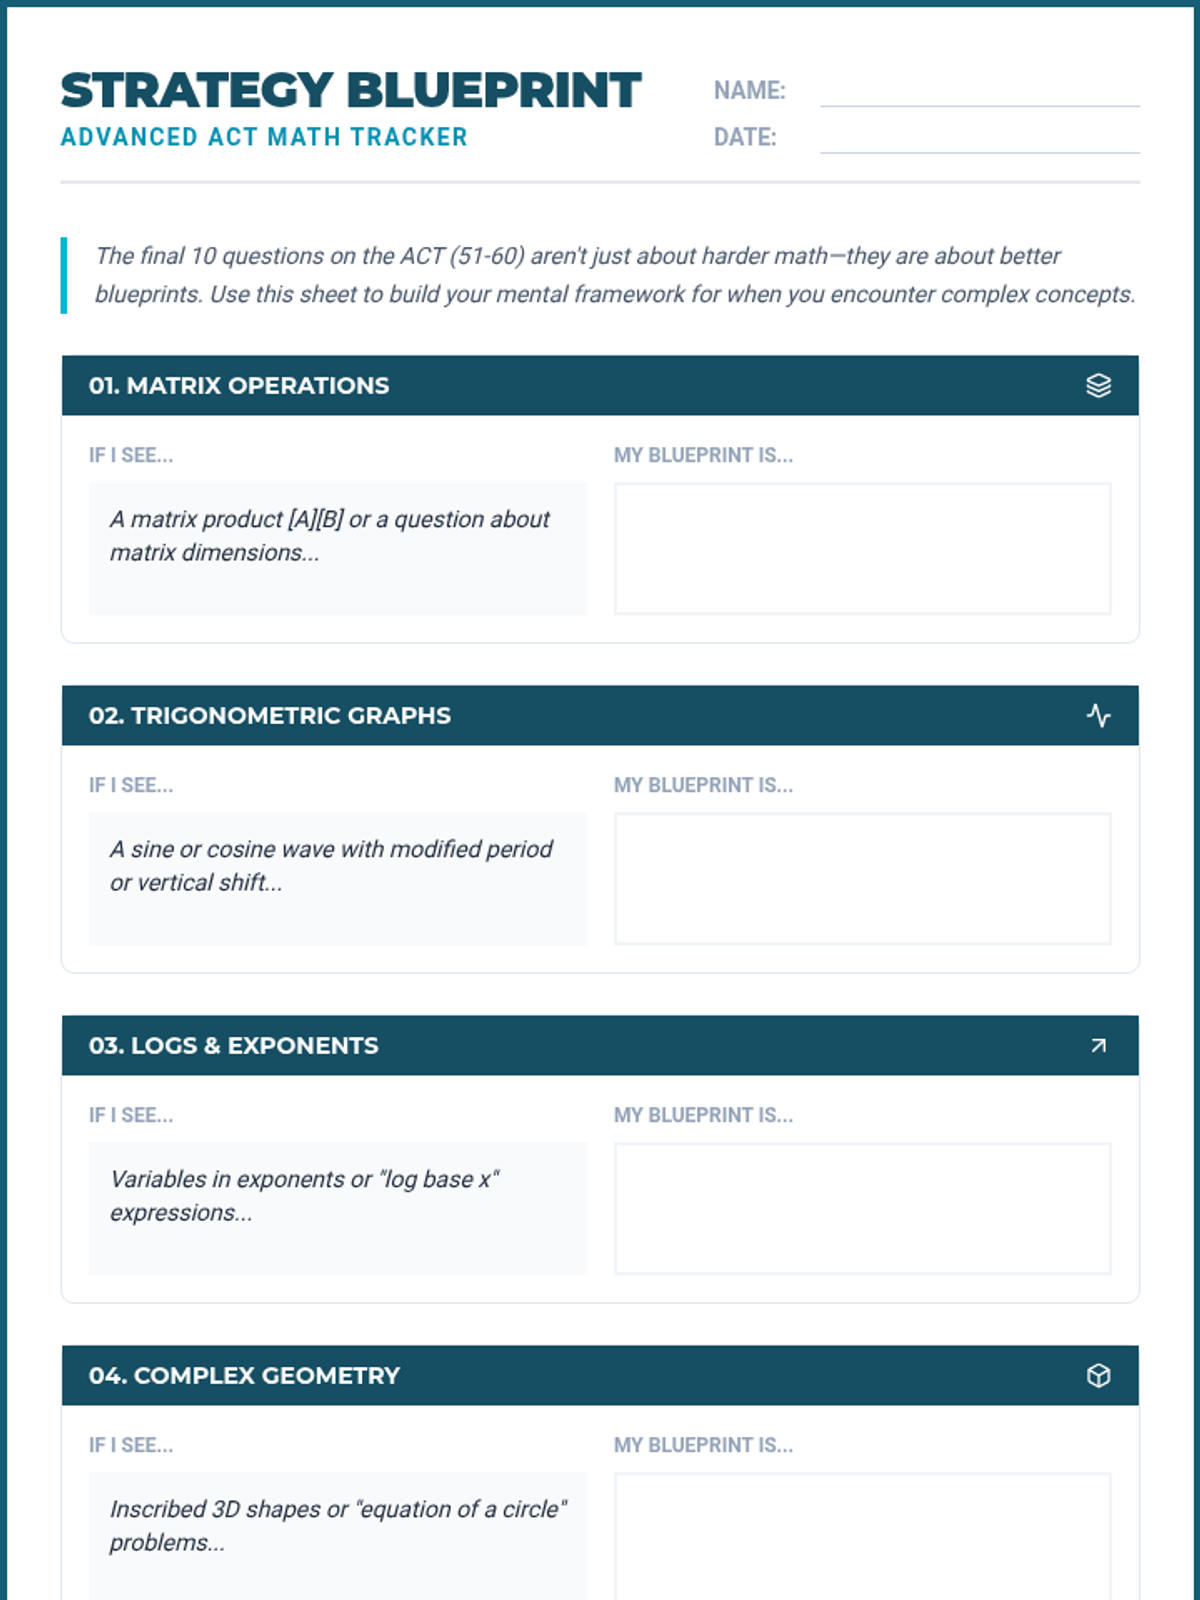
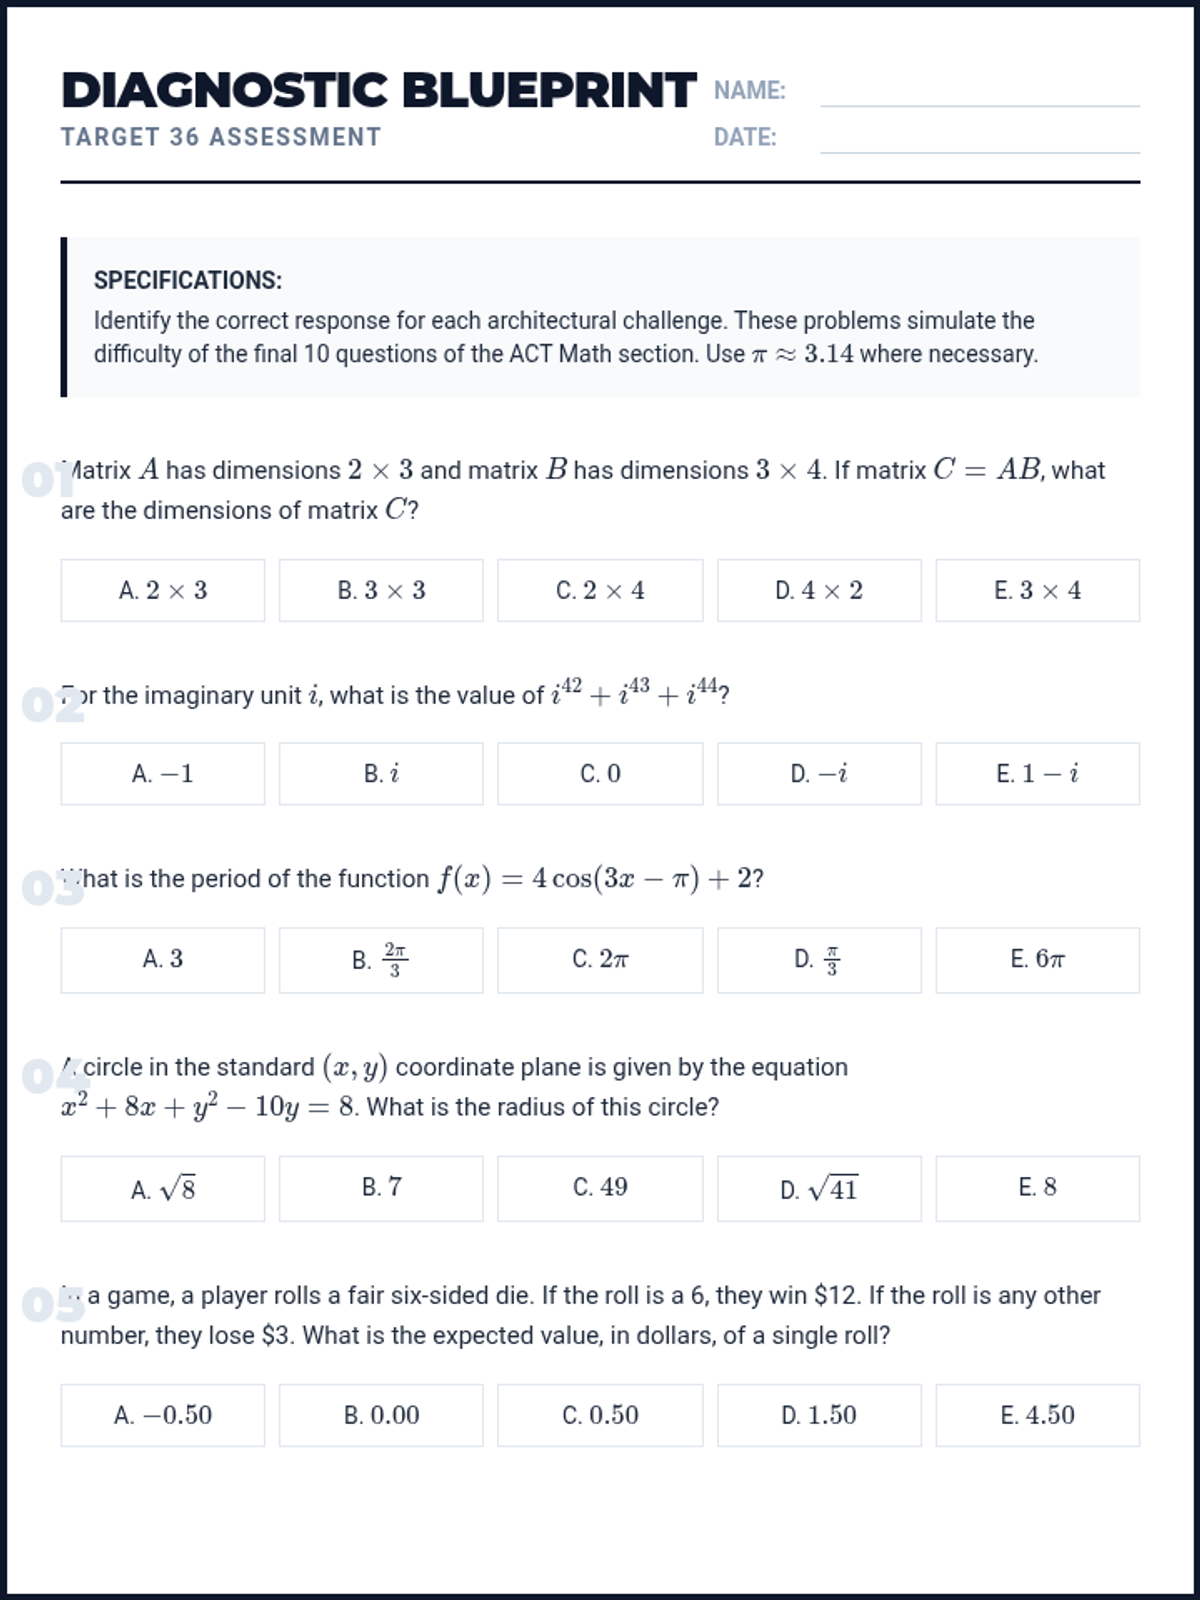
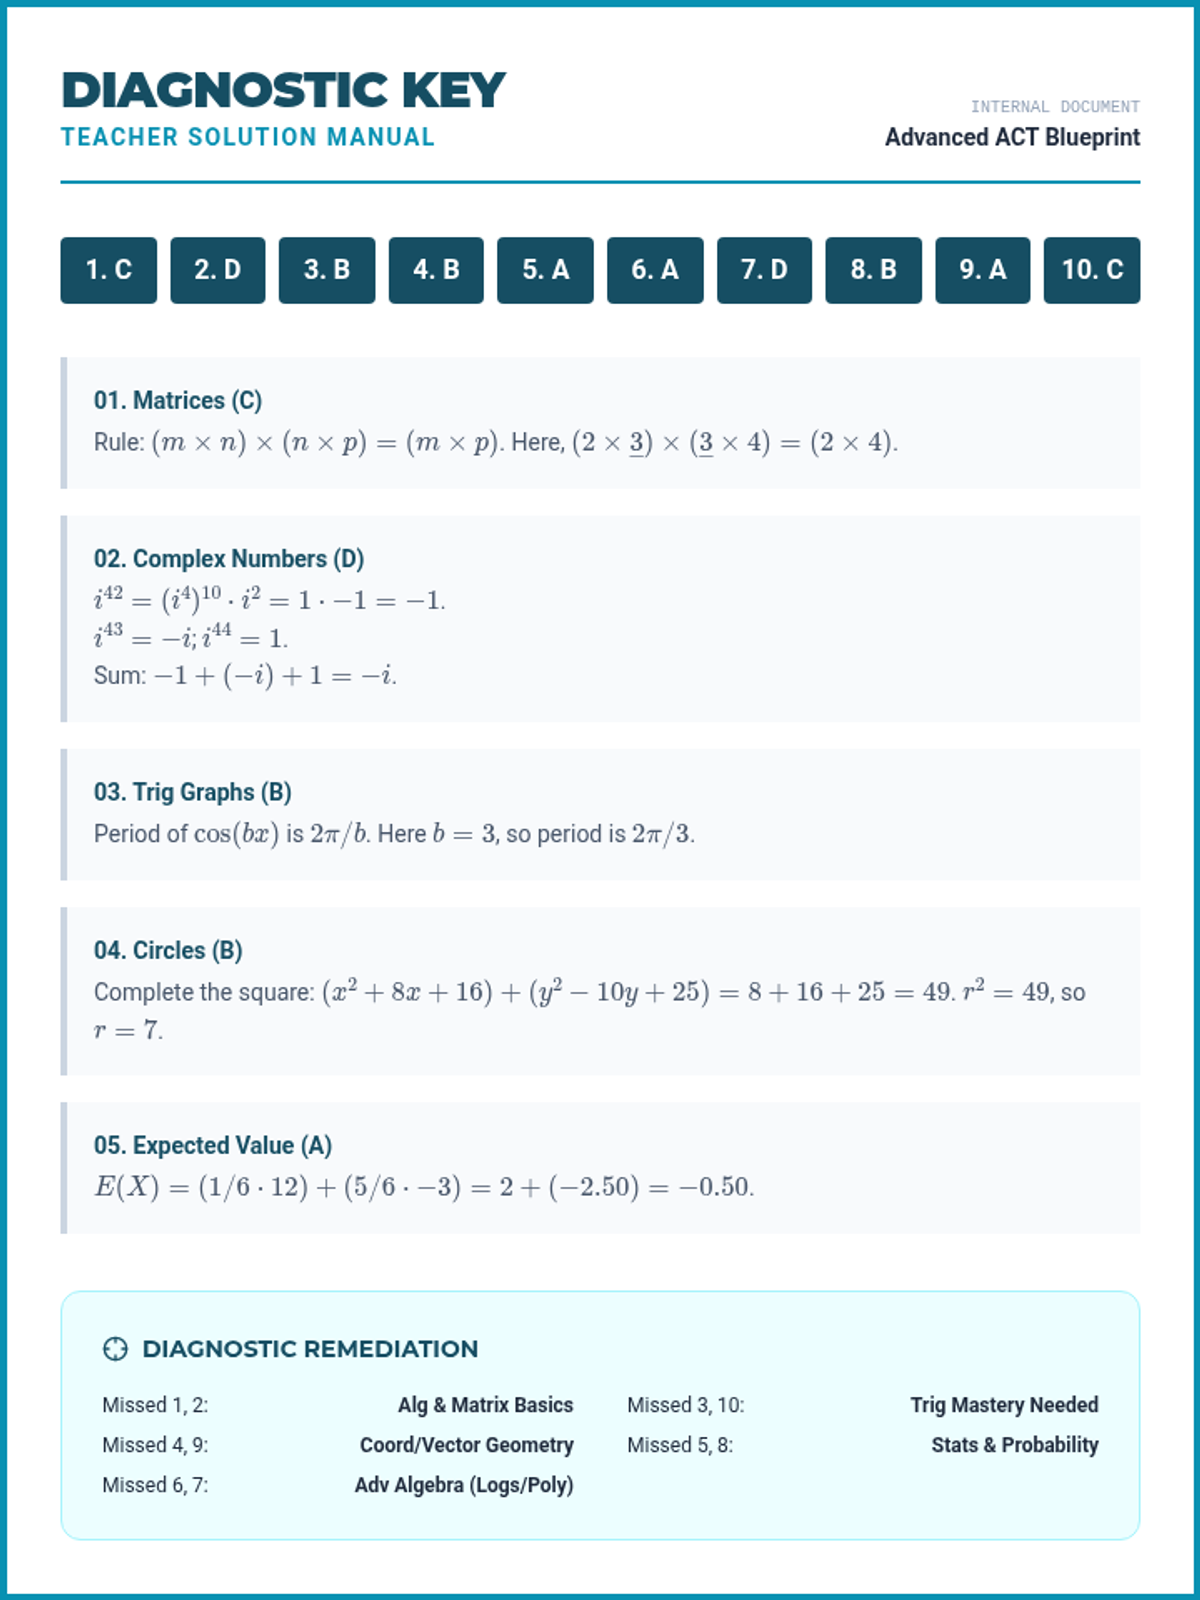
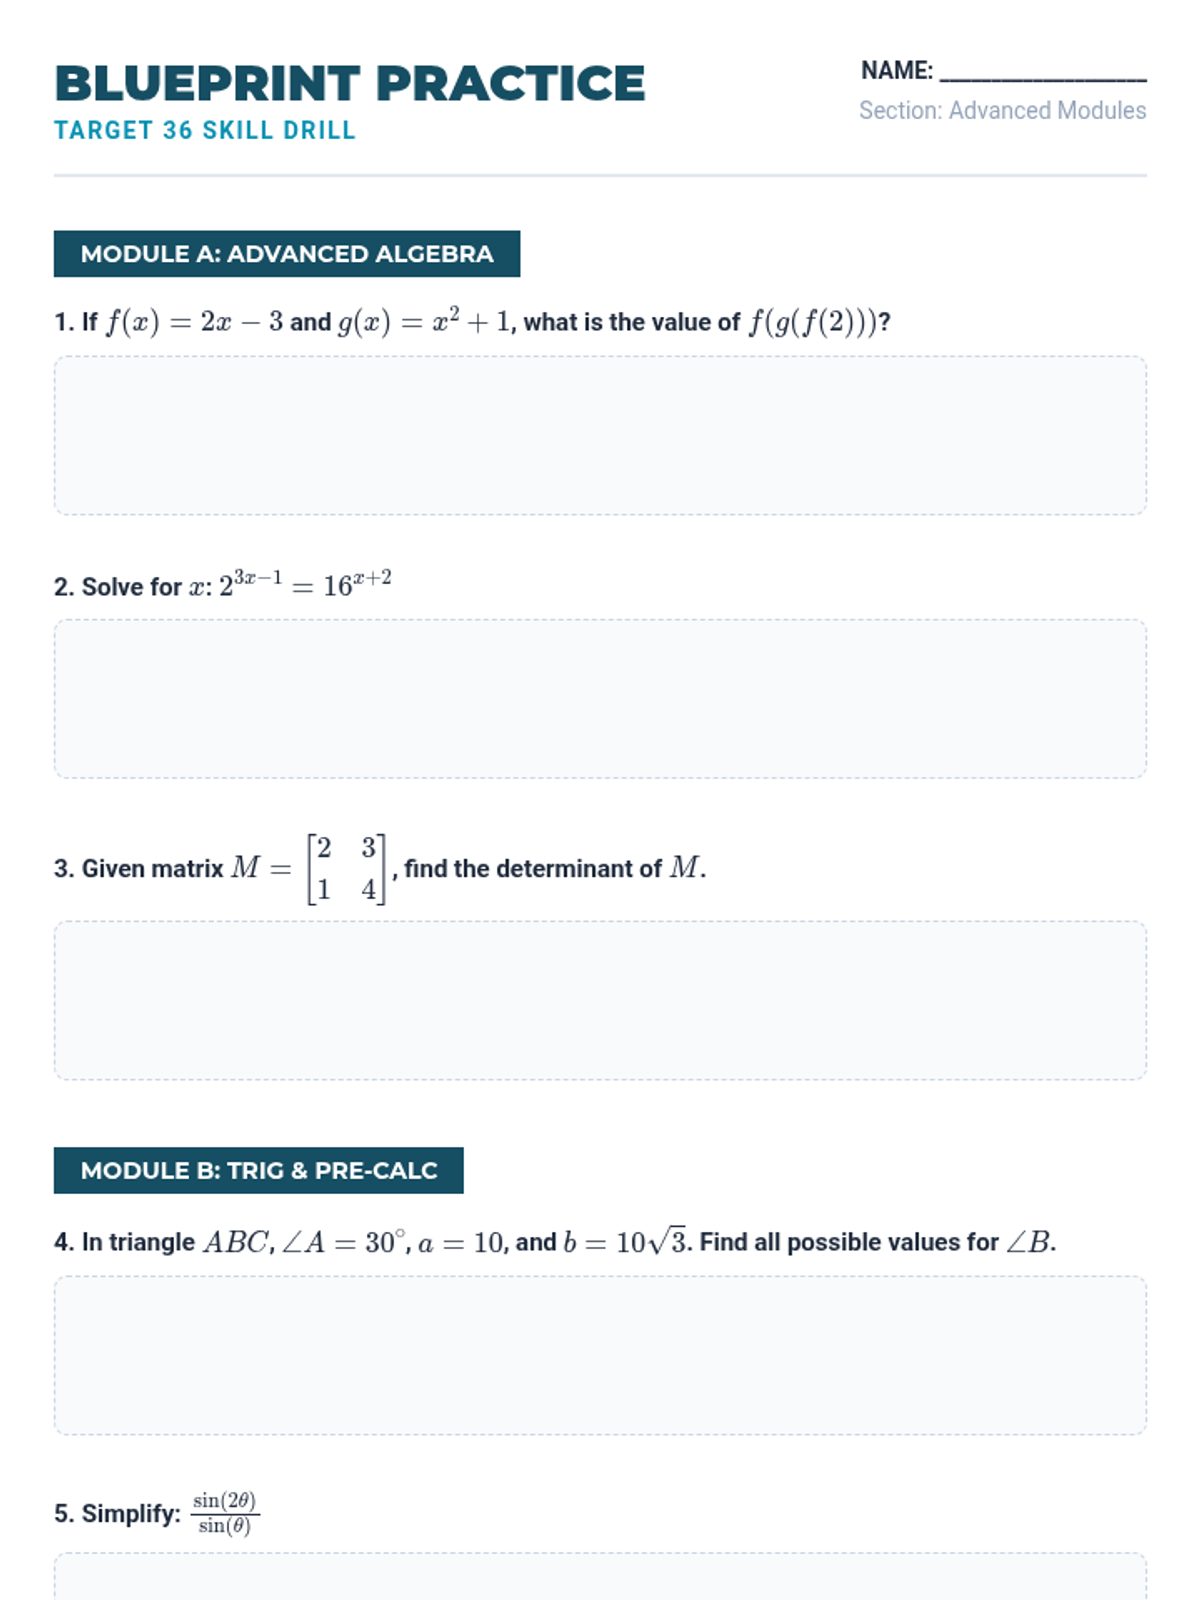
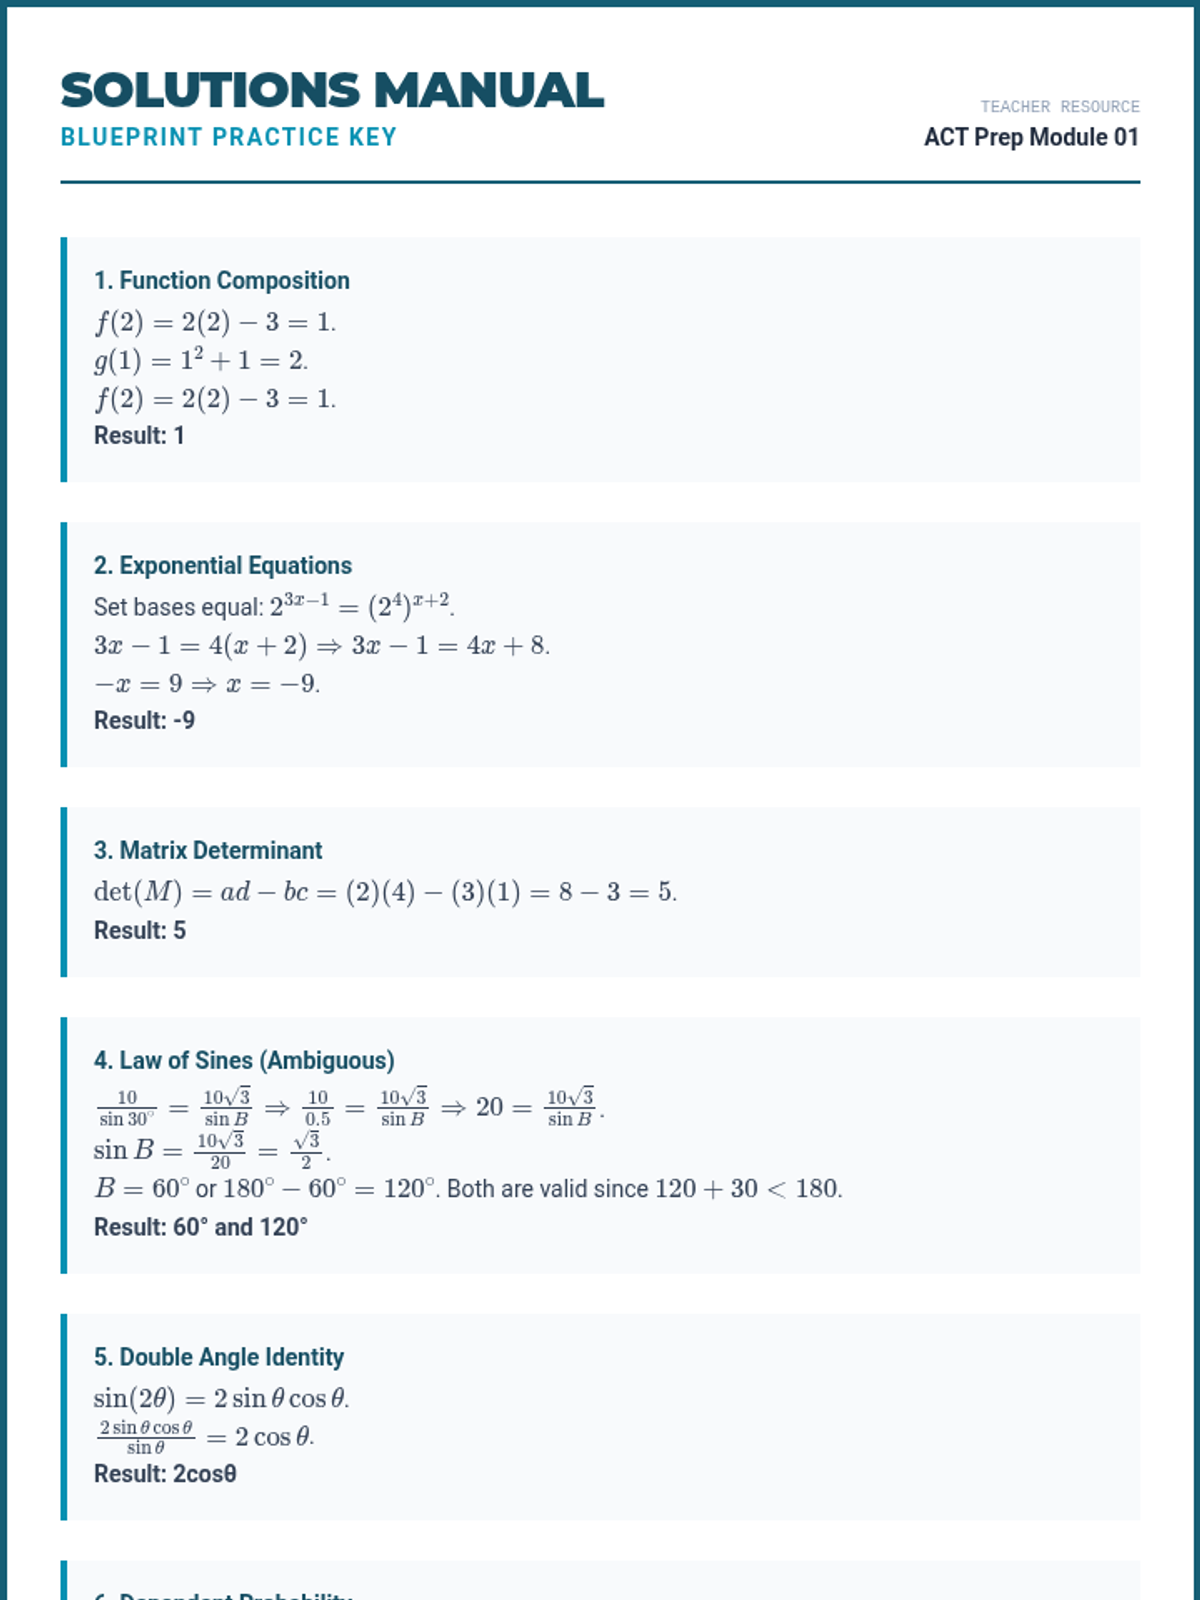
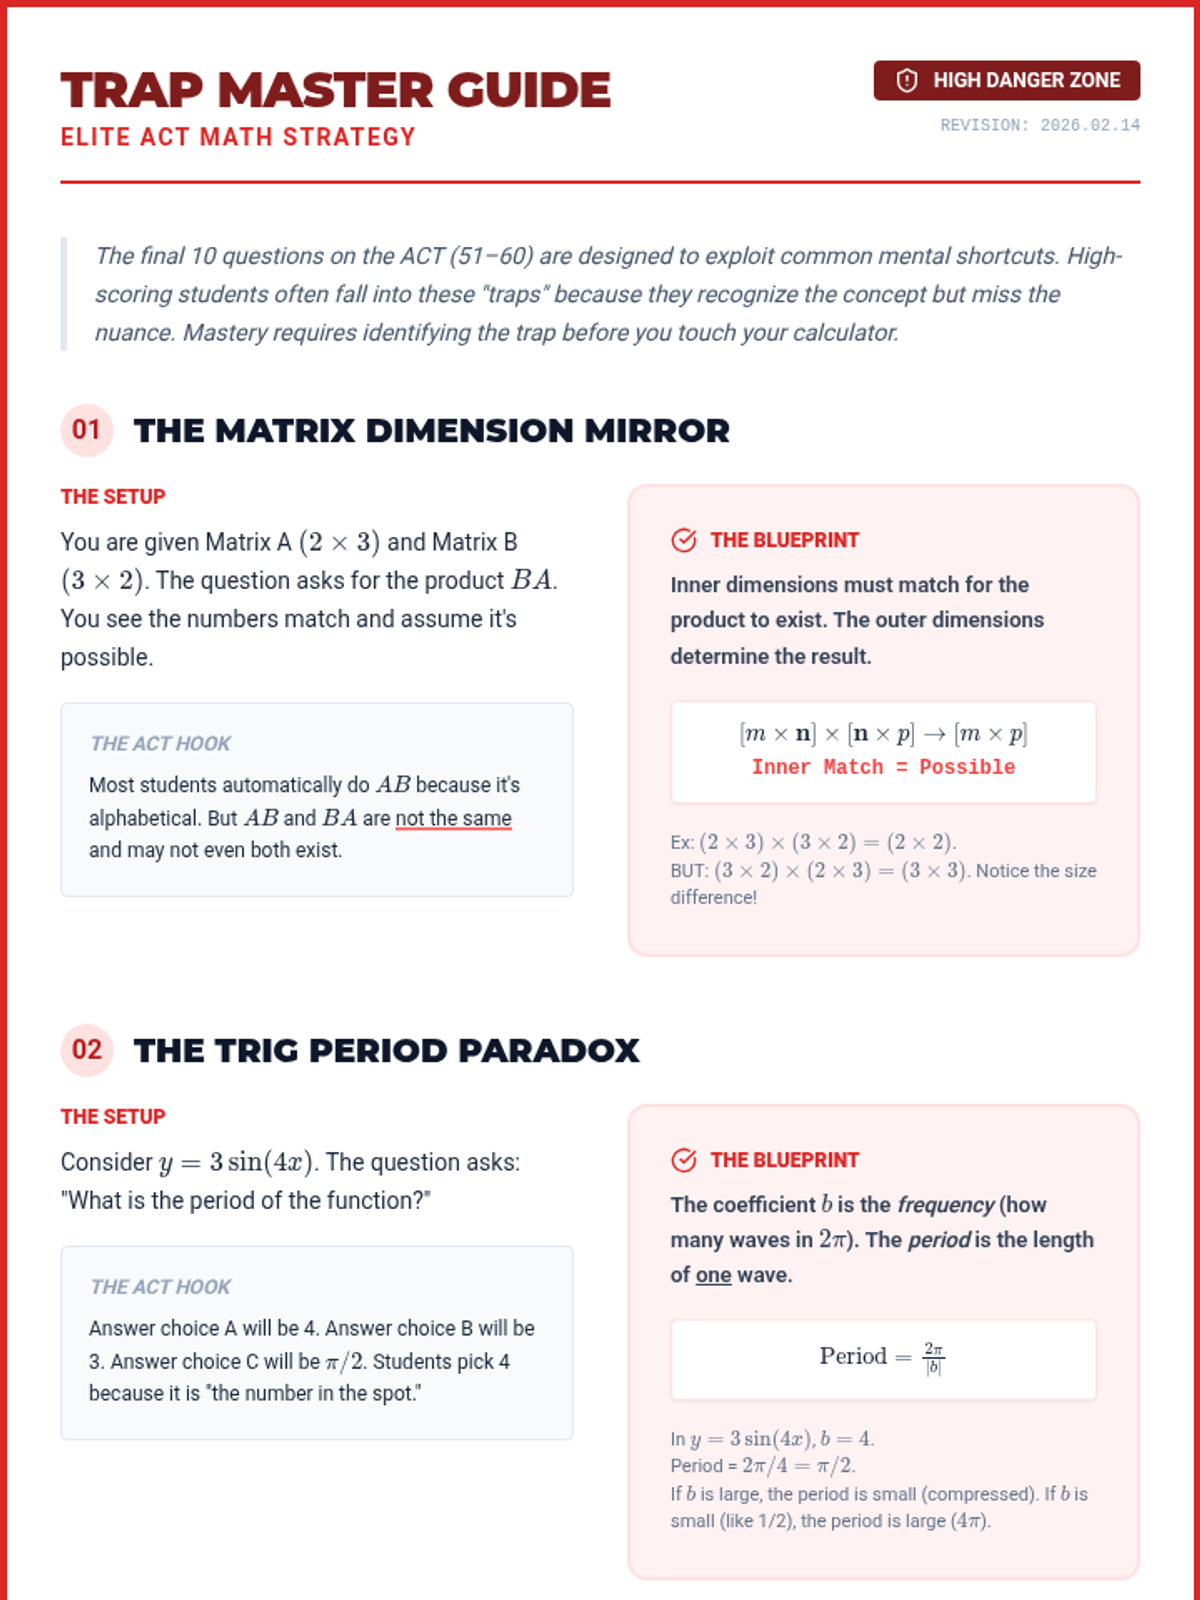
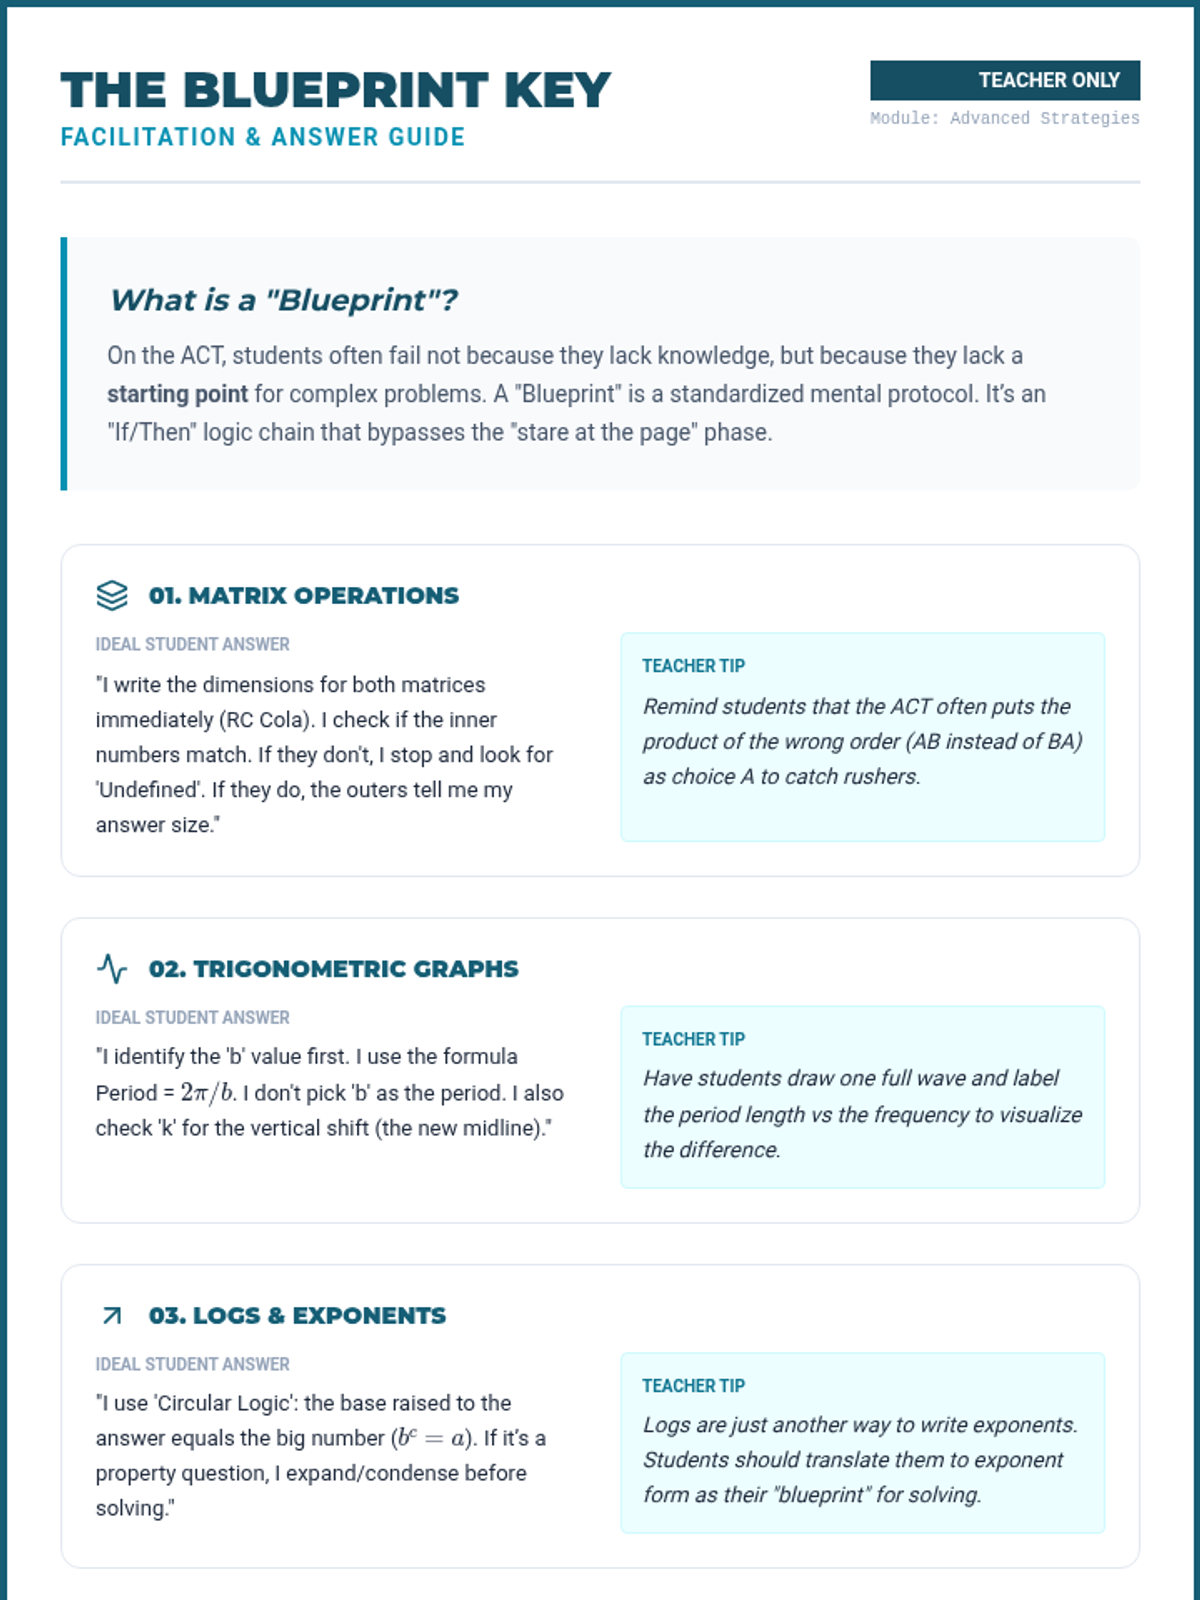
A comprehensive lesson focused on high-level ACT Math topics including matrices, complex functions, trigonometry, and advanced statistics. The lesson emphasizes identifying common 'traps' and applying architectural-style problem-solving strategies.
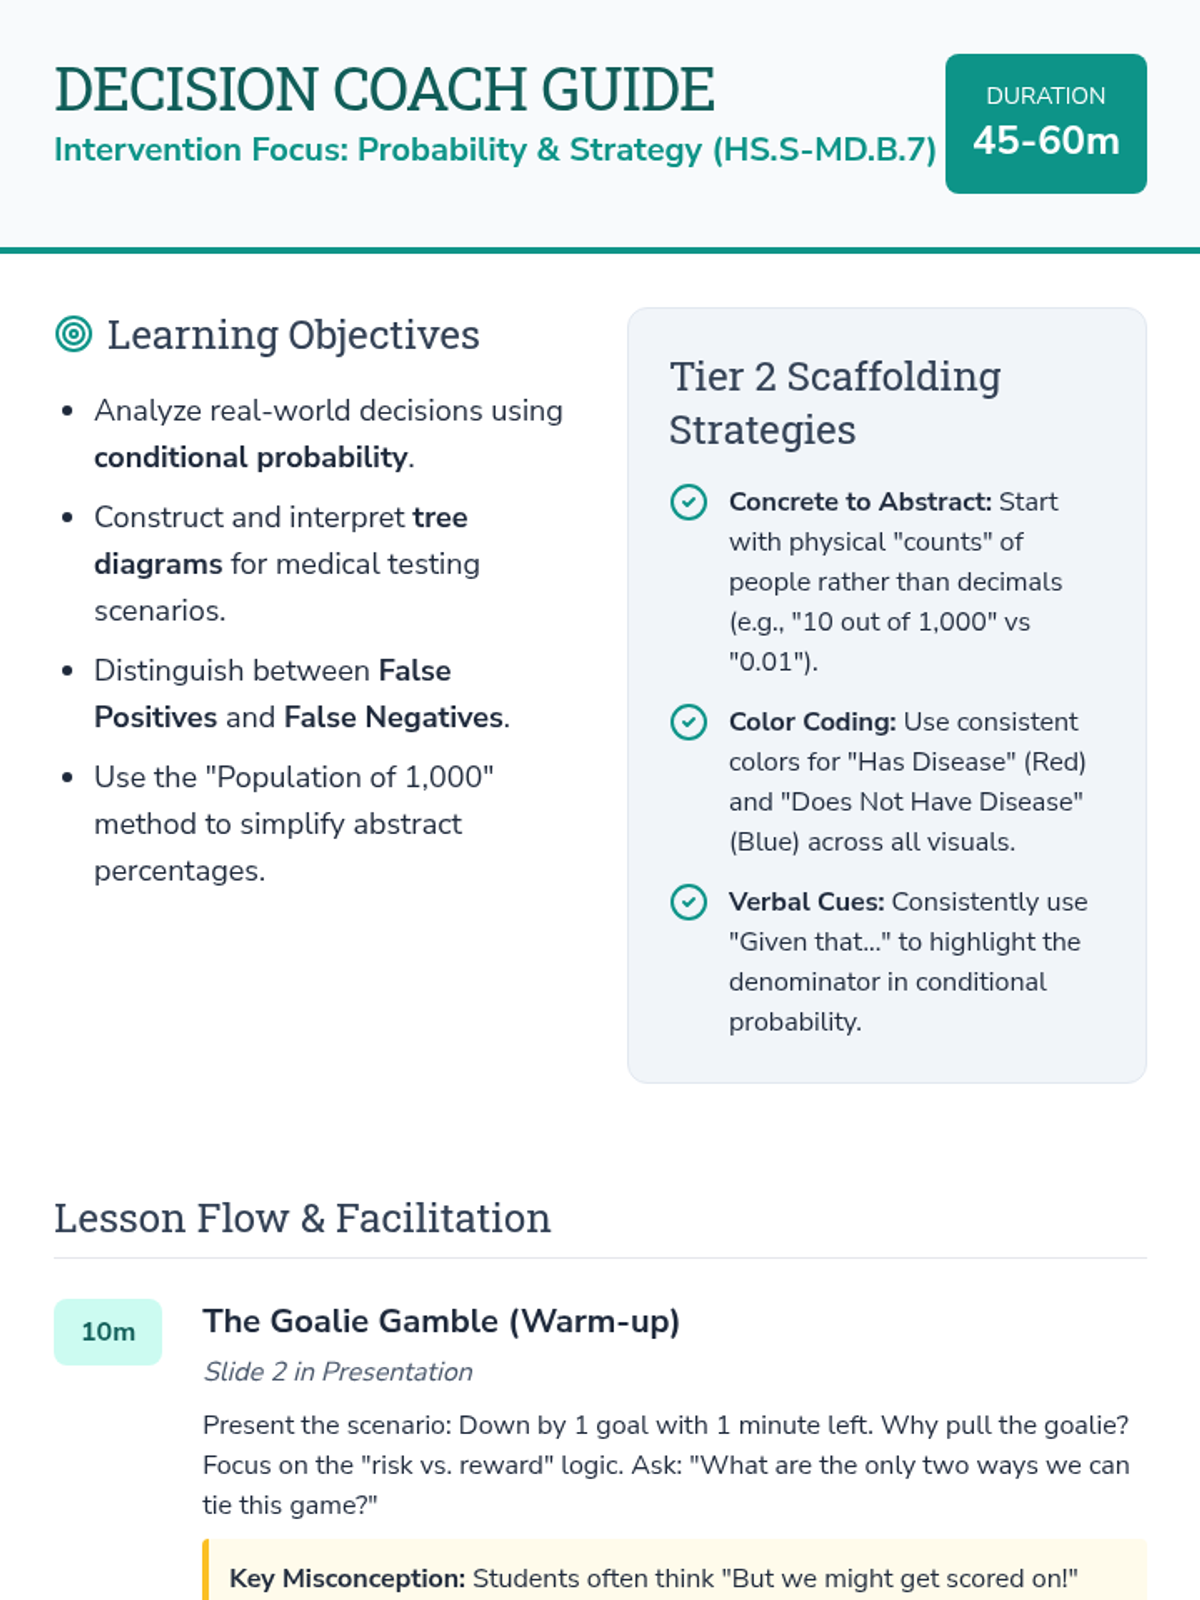
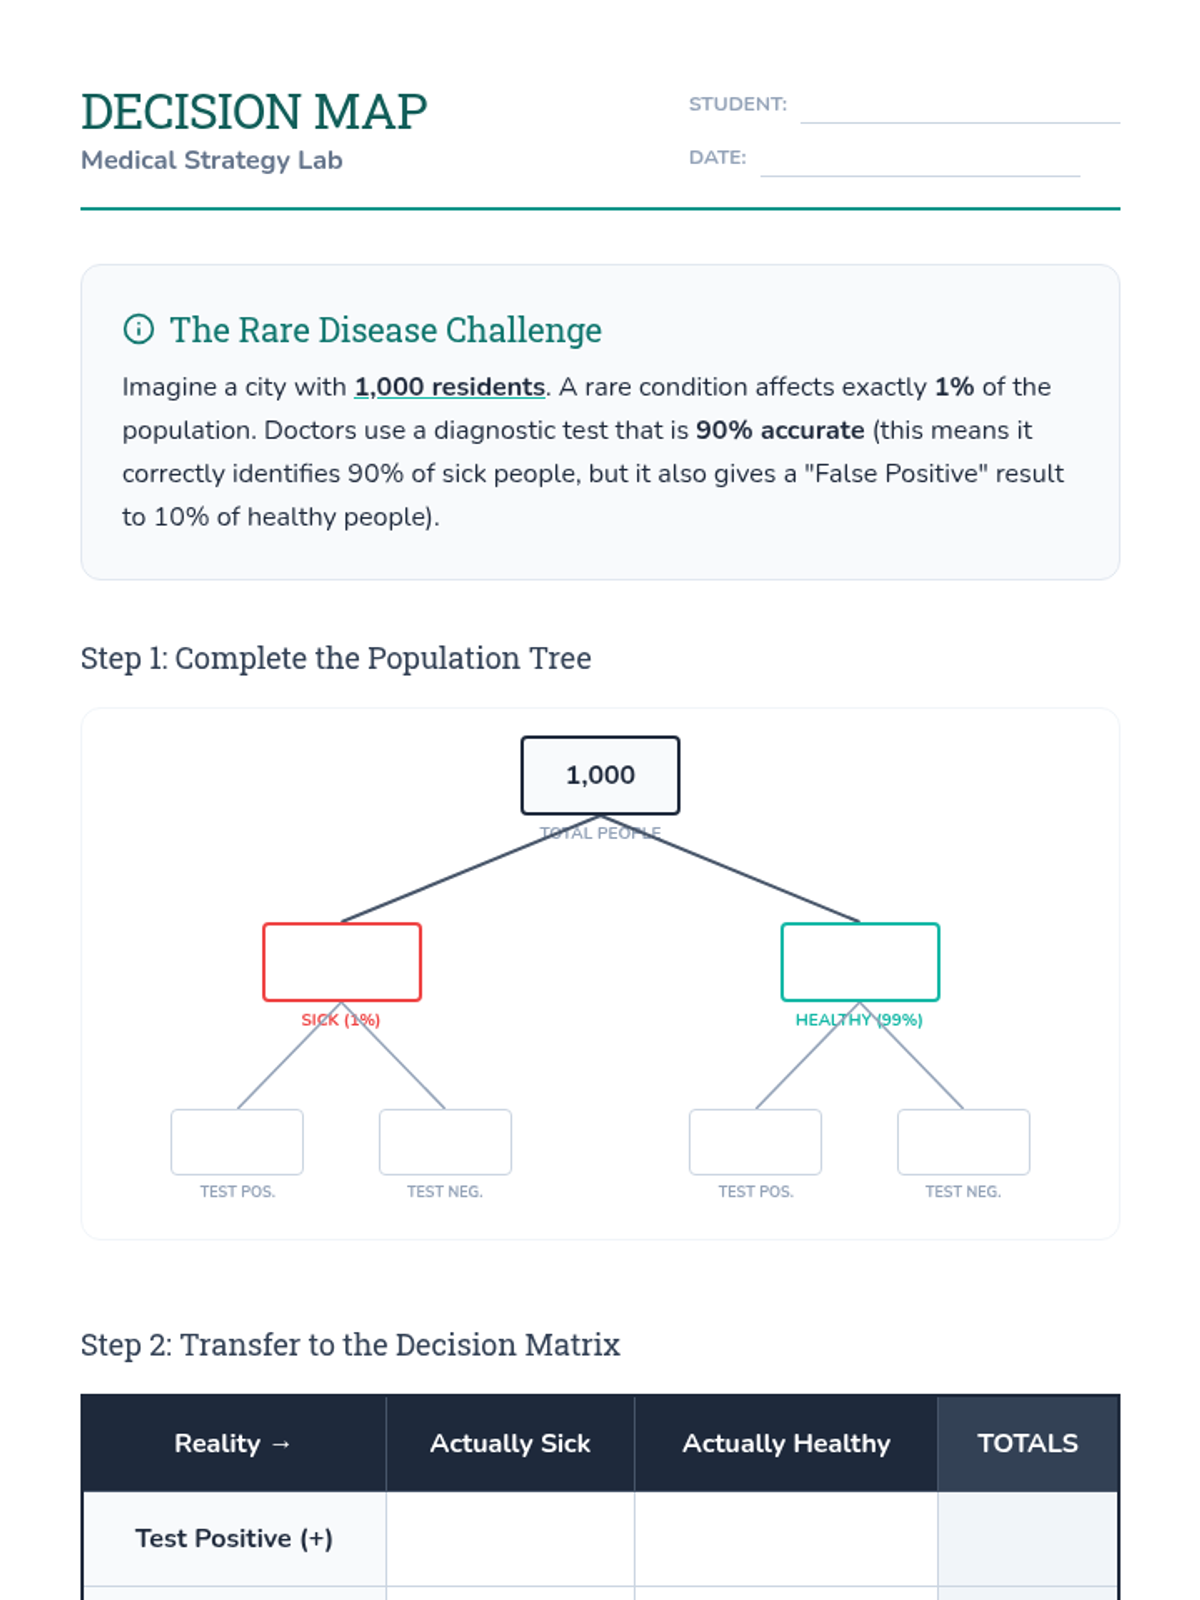
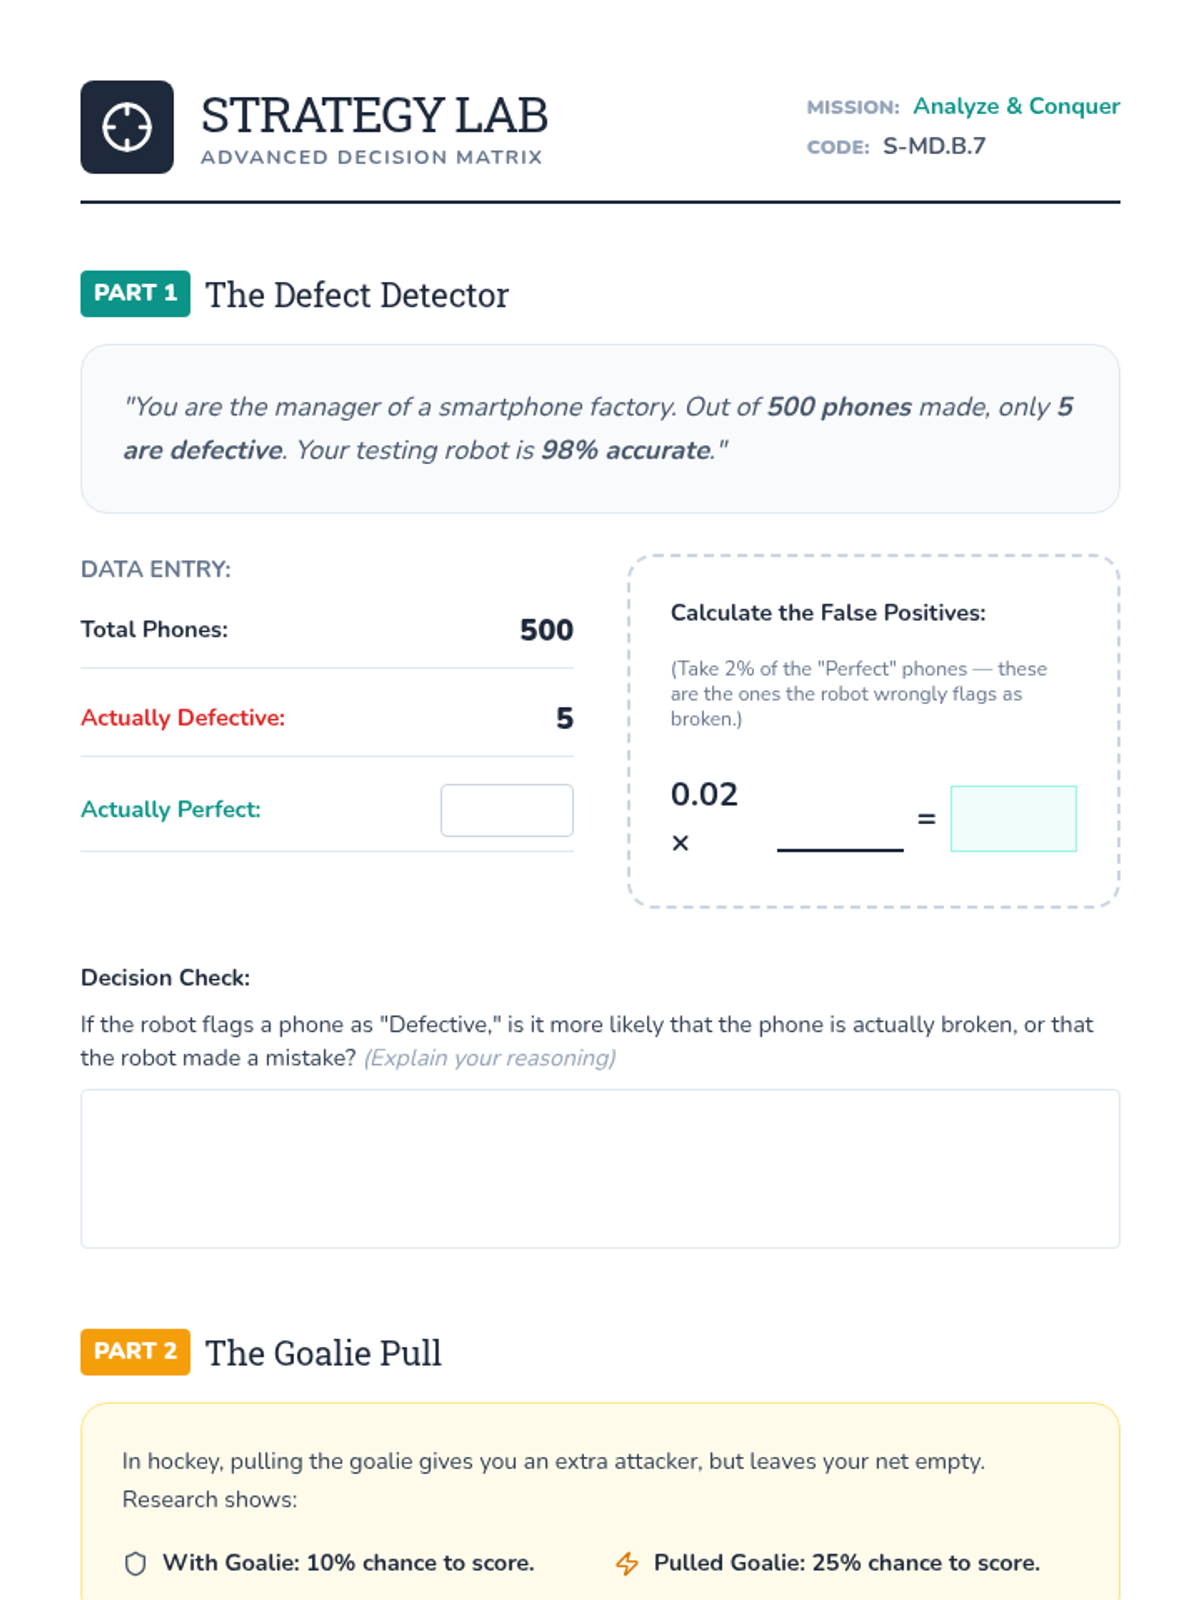
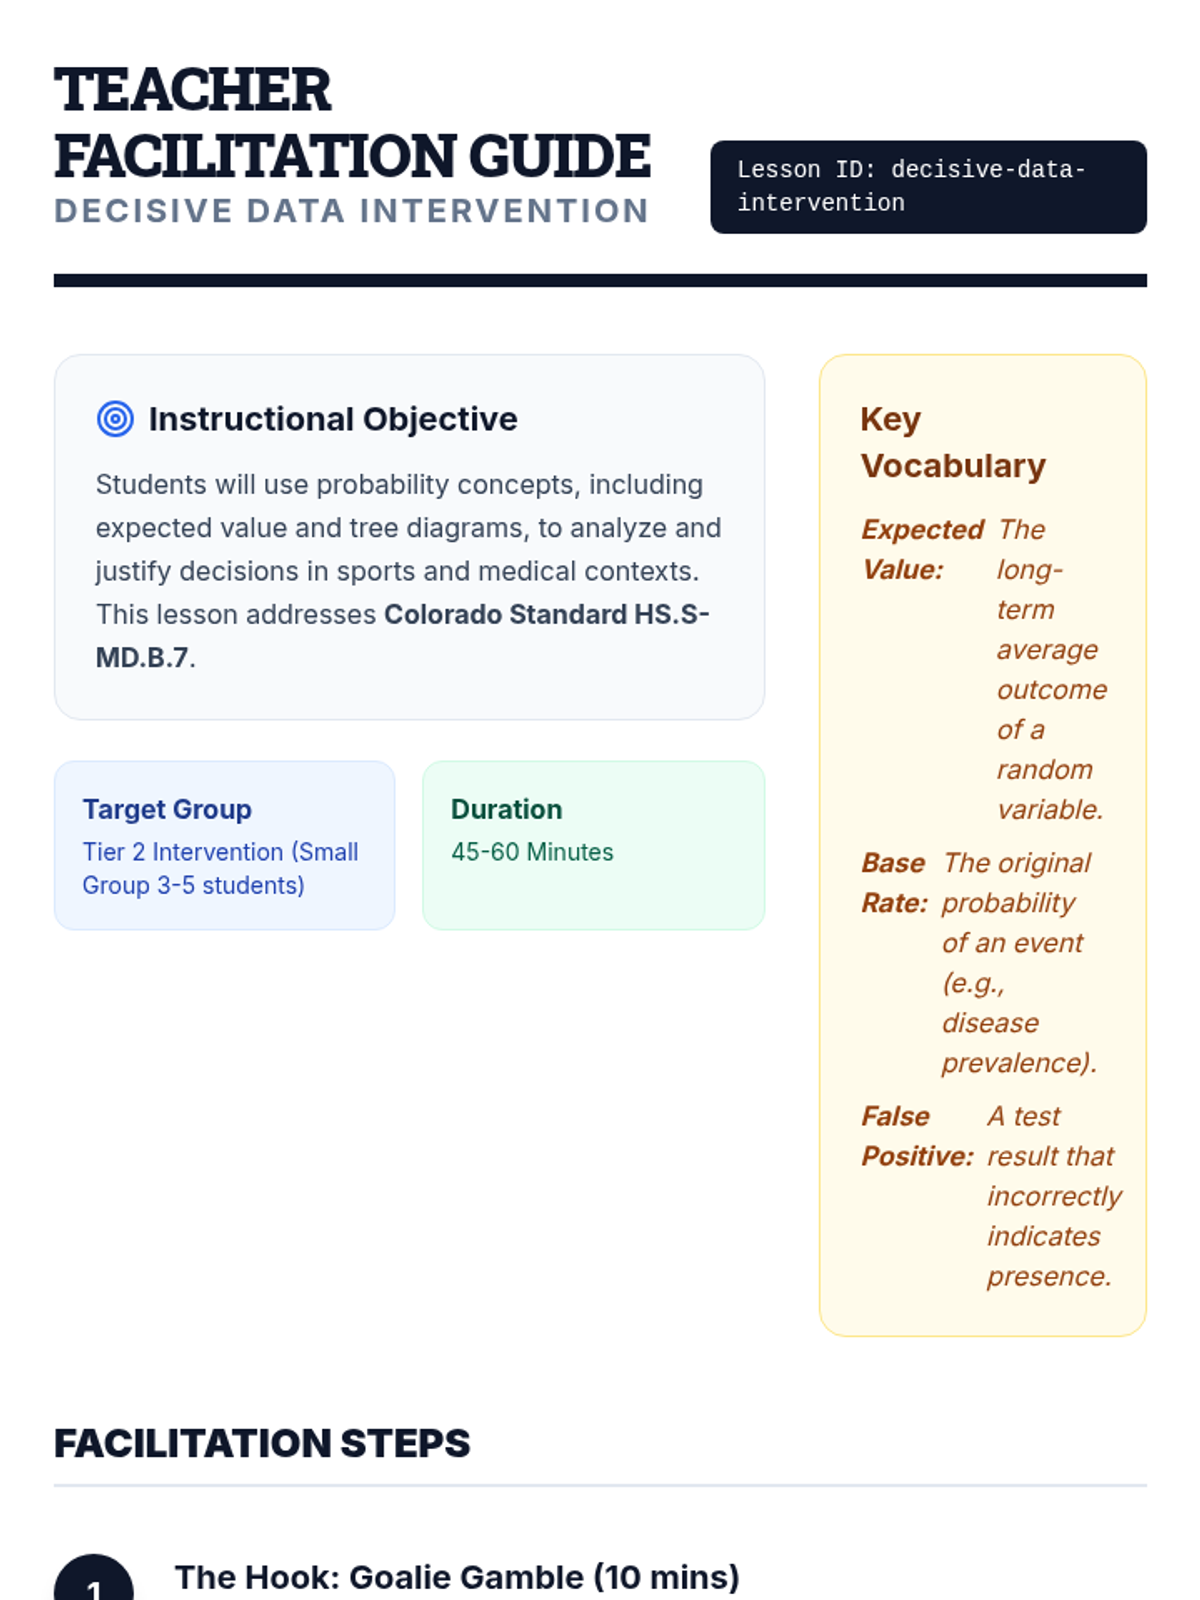
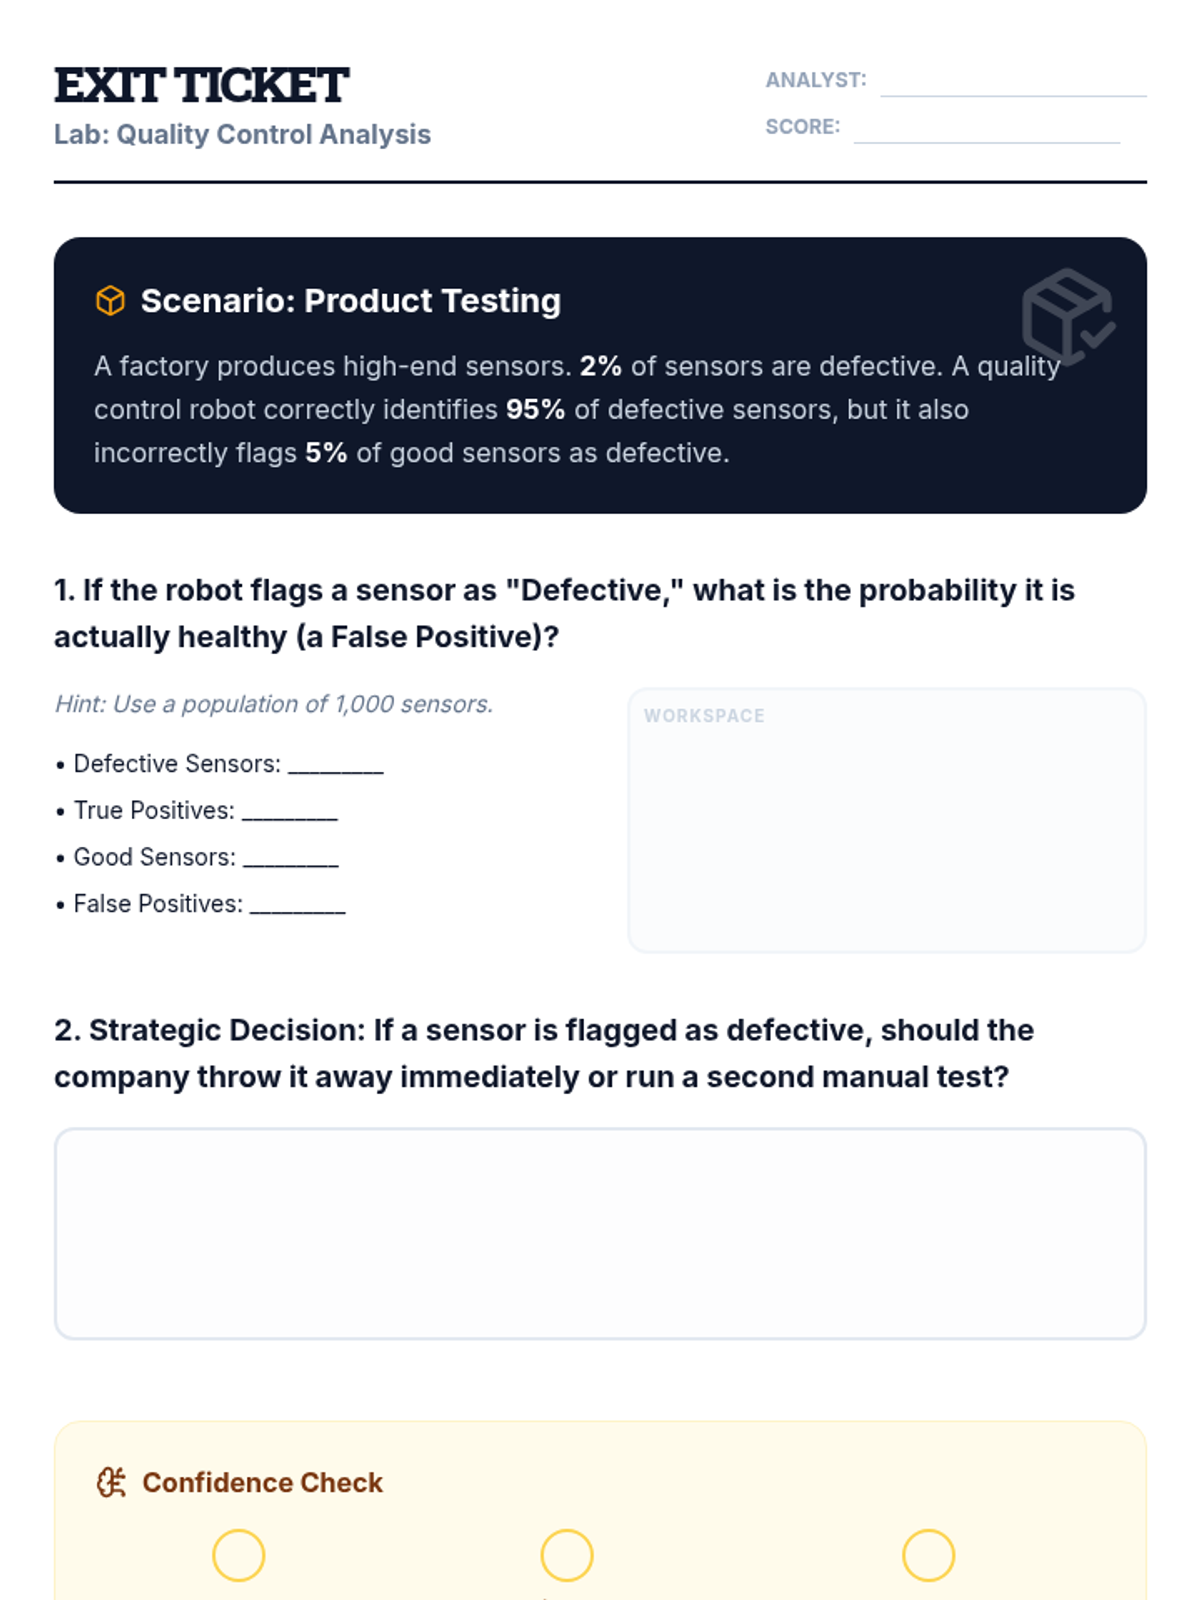
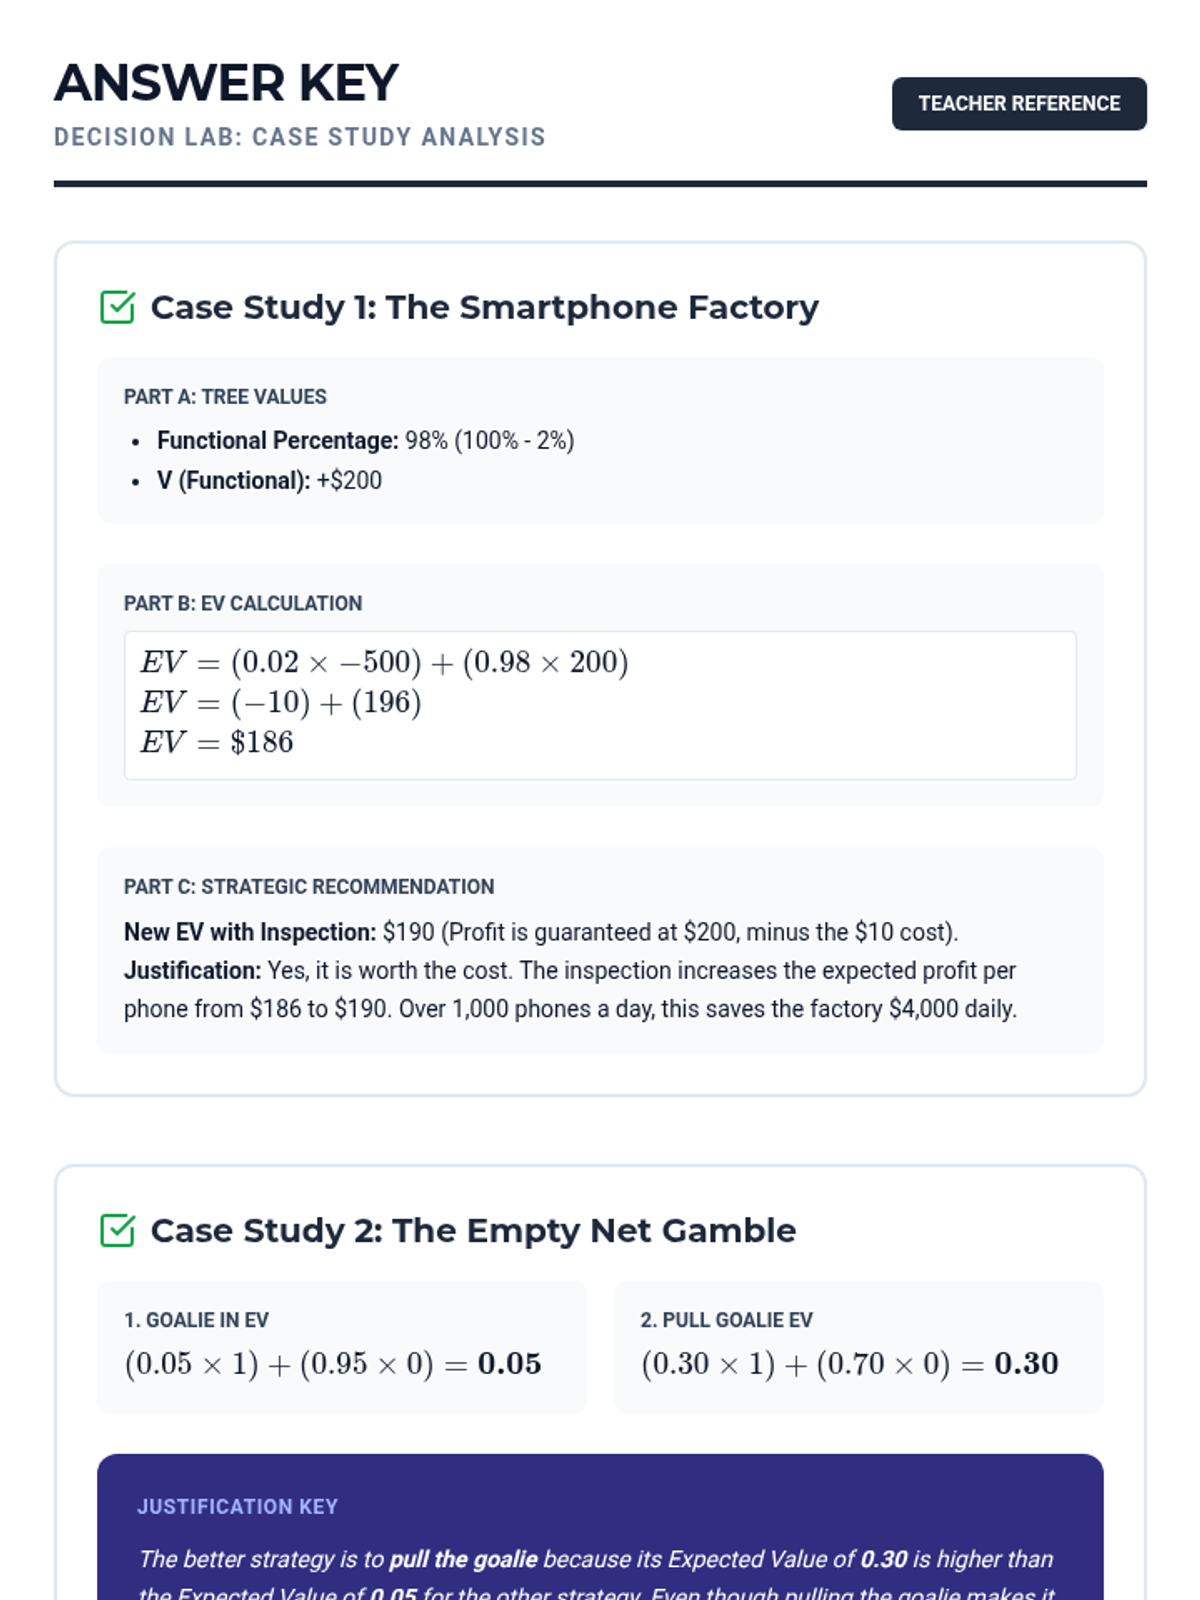
A scaffolded intervention lesson where students analyze the effectiveness of medical tests and strategic decisions using tree diagrams and expected value. Focused on High School Statistics standard HS.S-MD.B.7 with a heavy emphasis on visual logic and false positive/negative reasoning.
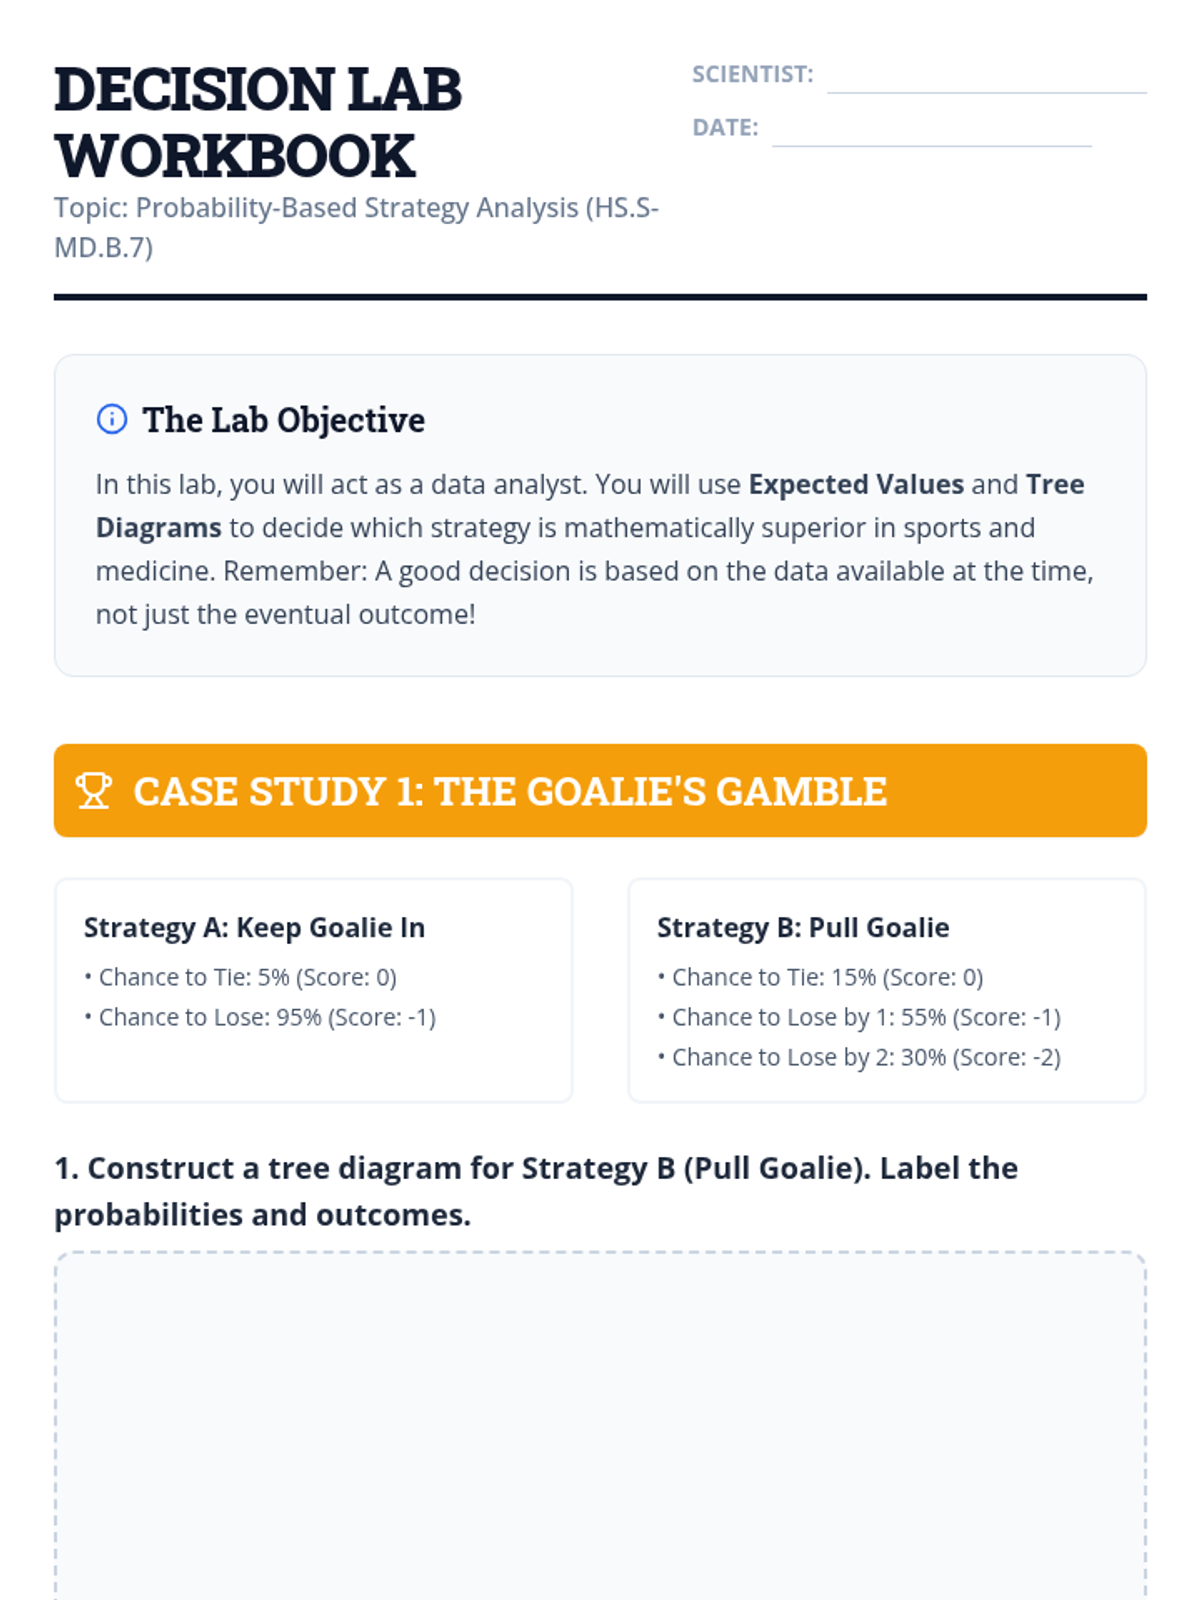
A targeted small group intervention lesson focused on using probability to make and analyze real-world decisions in sports and medicine. Students will use expected value and tree diagrams to justify strategies like pulling a hockey goalie or interpreting medical tests.
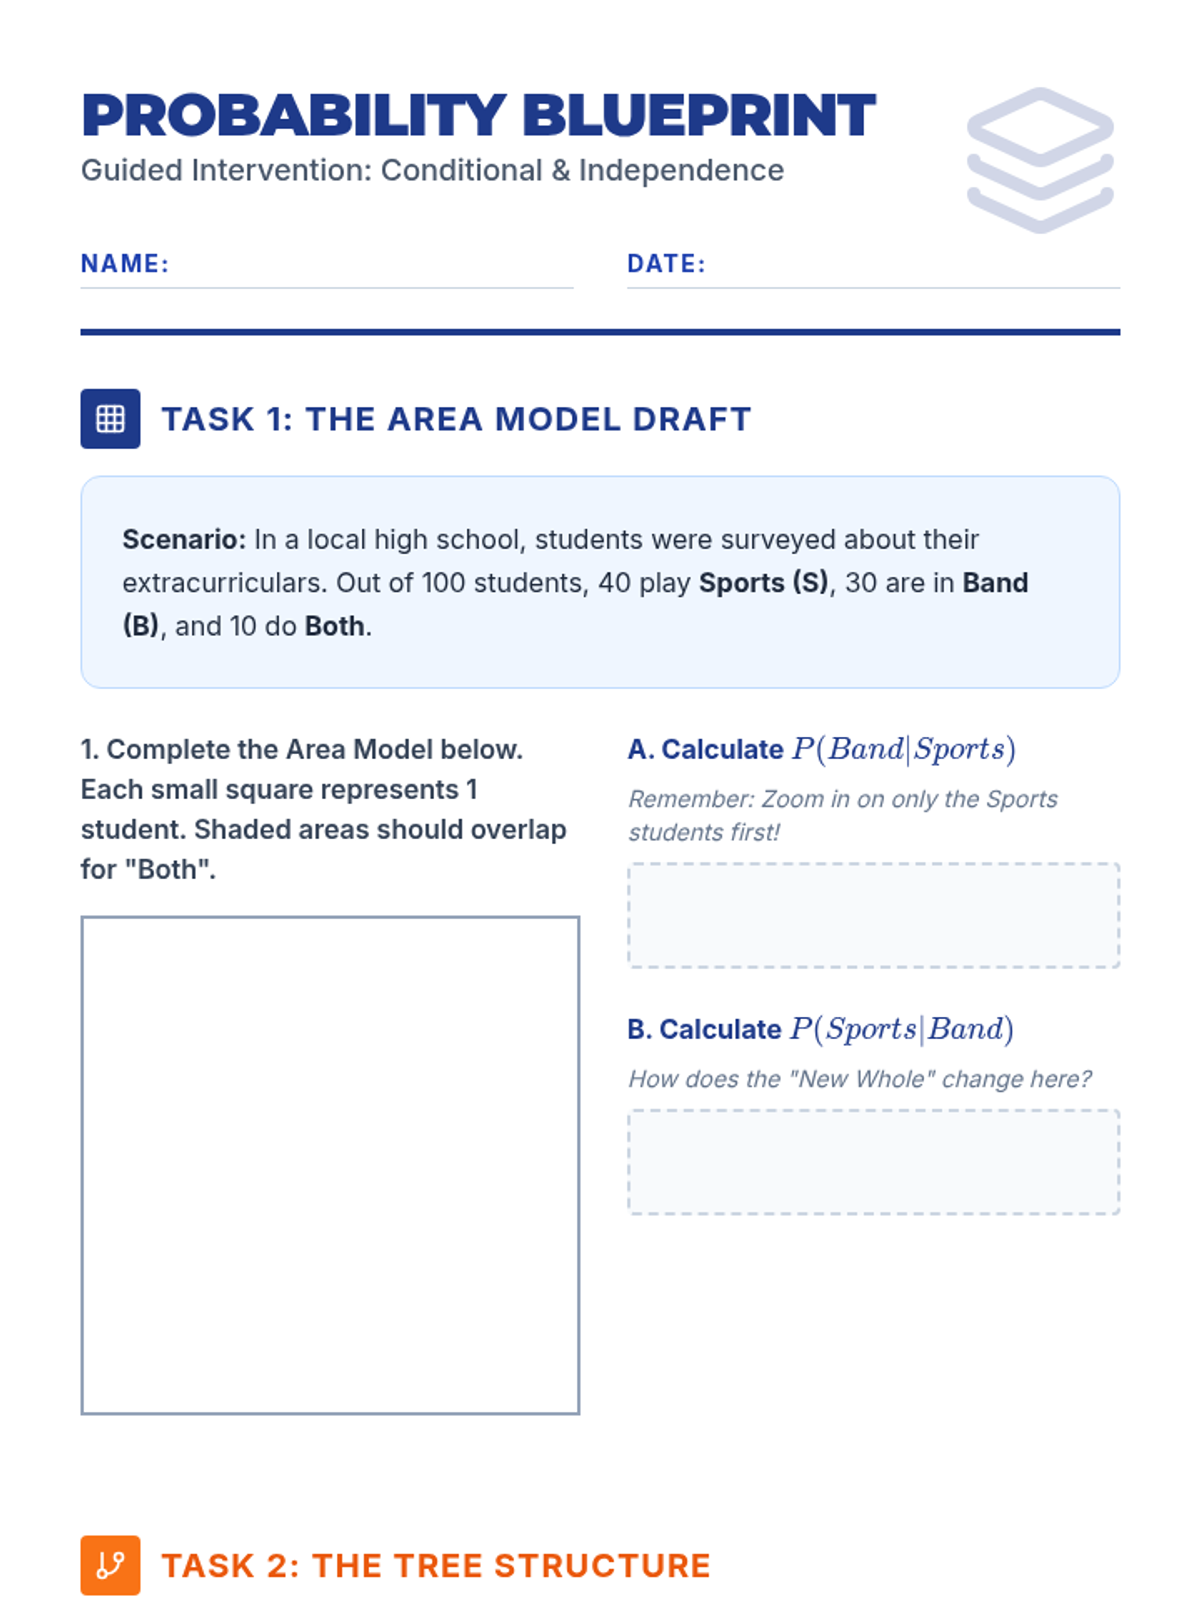
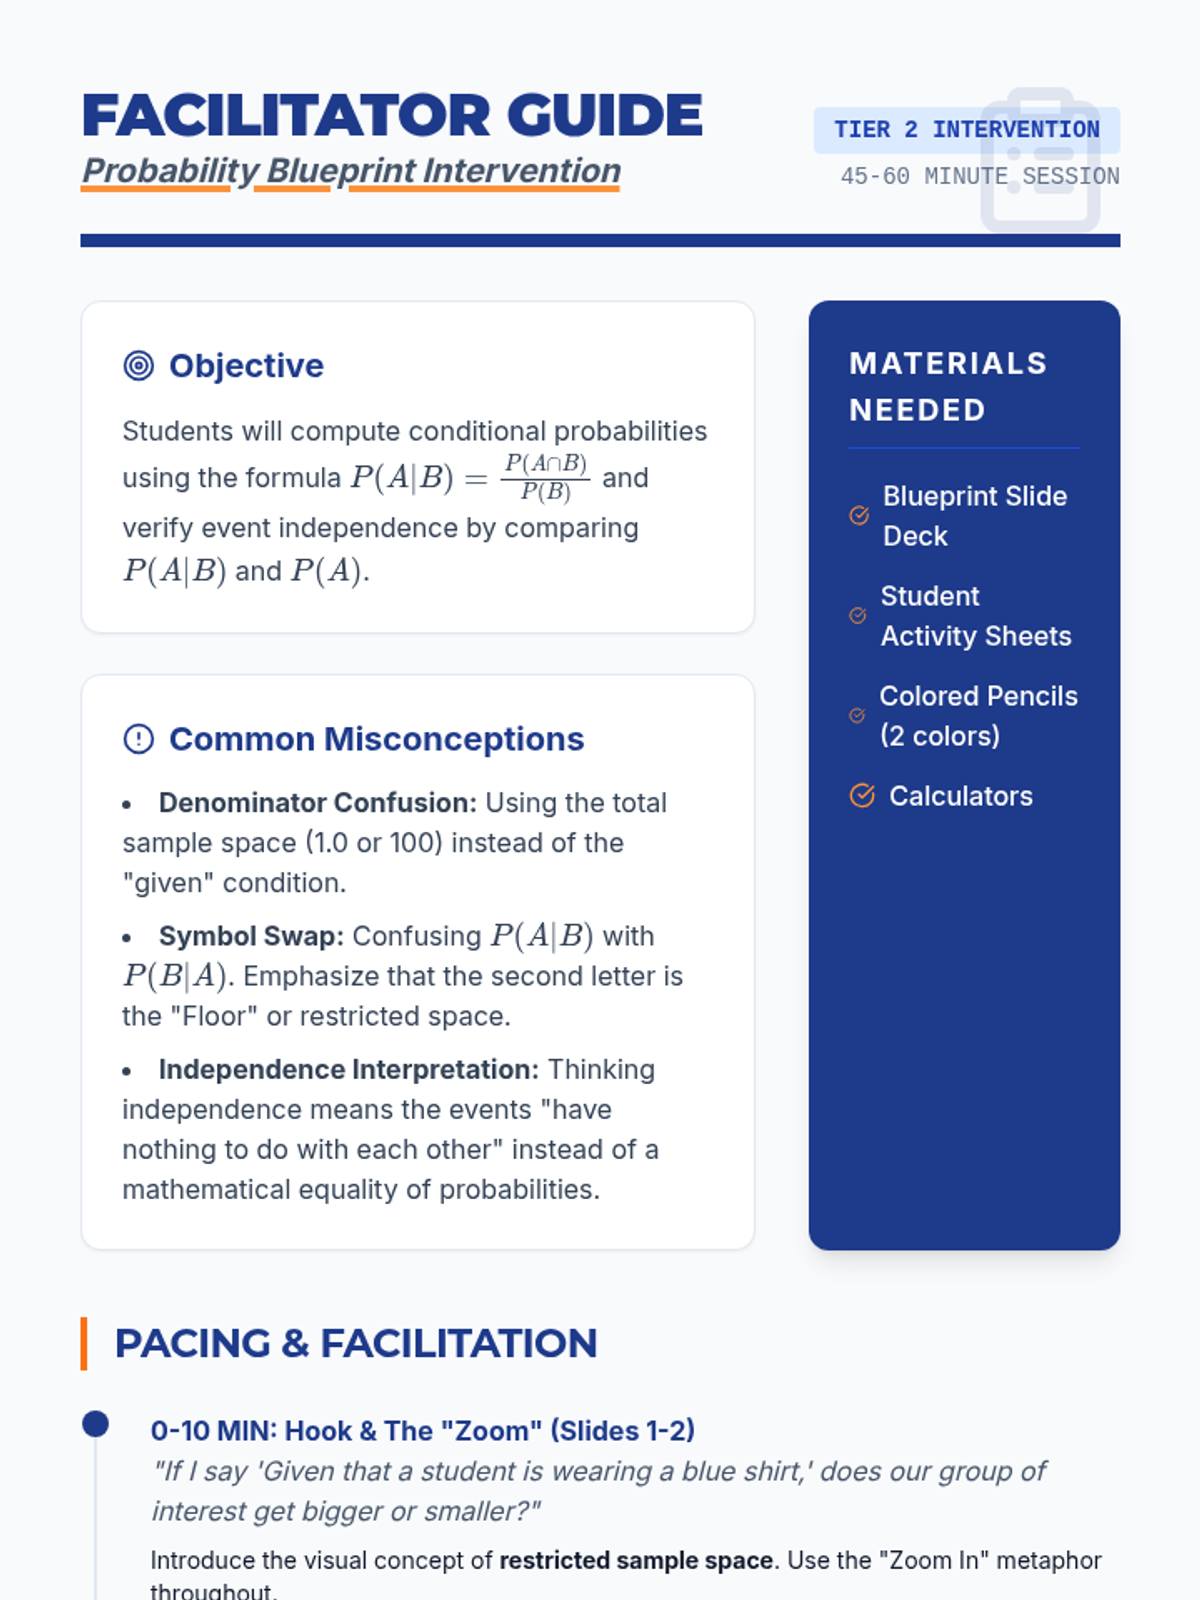
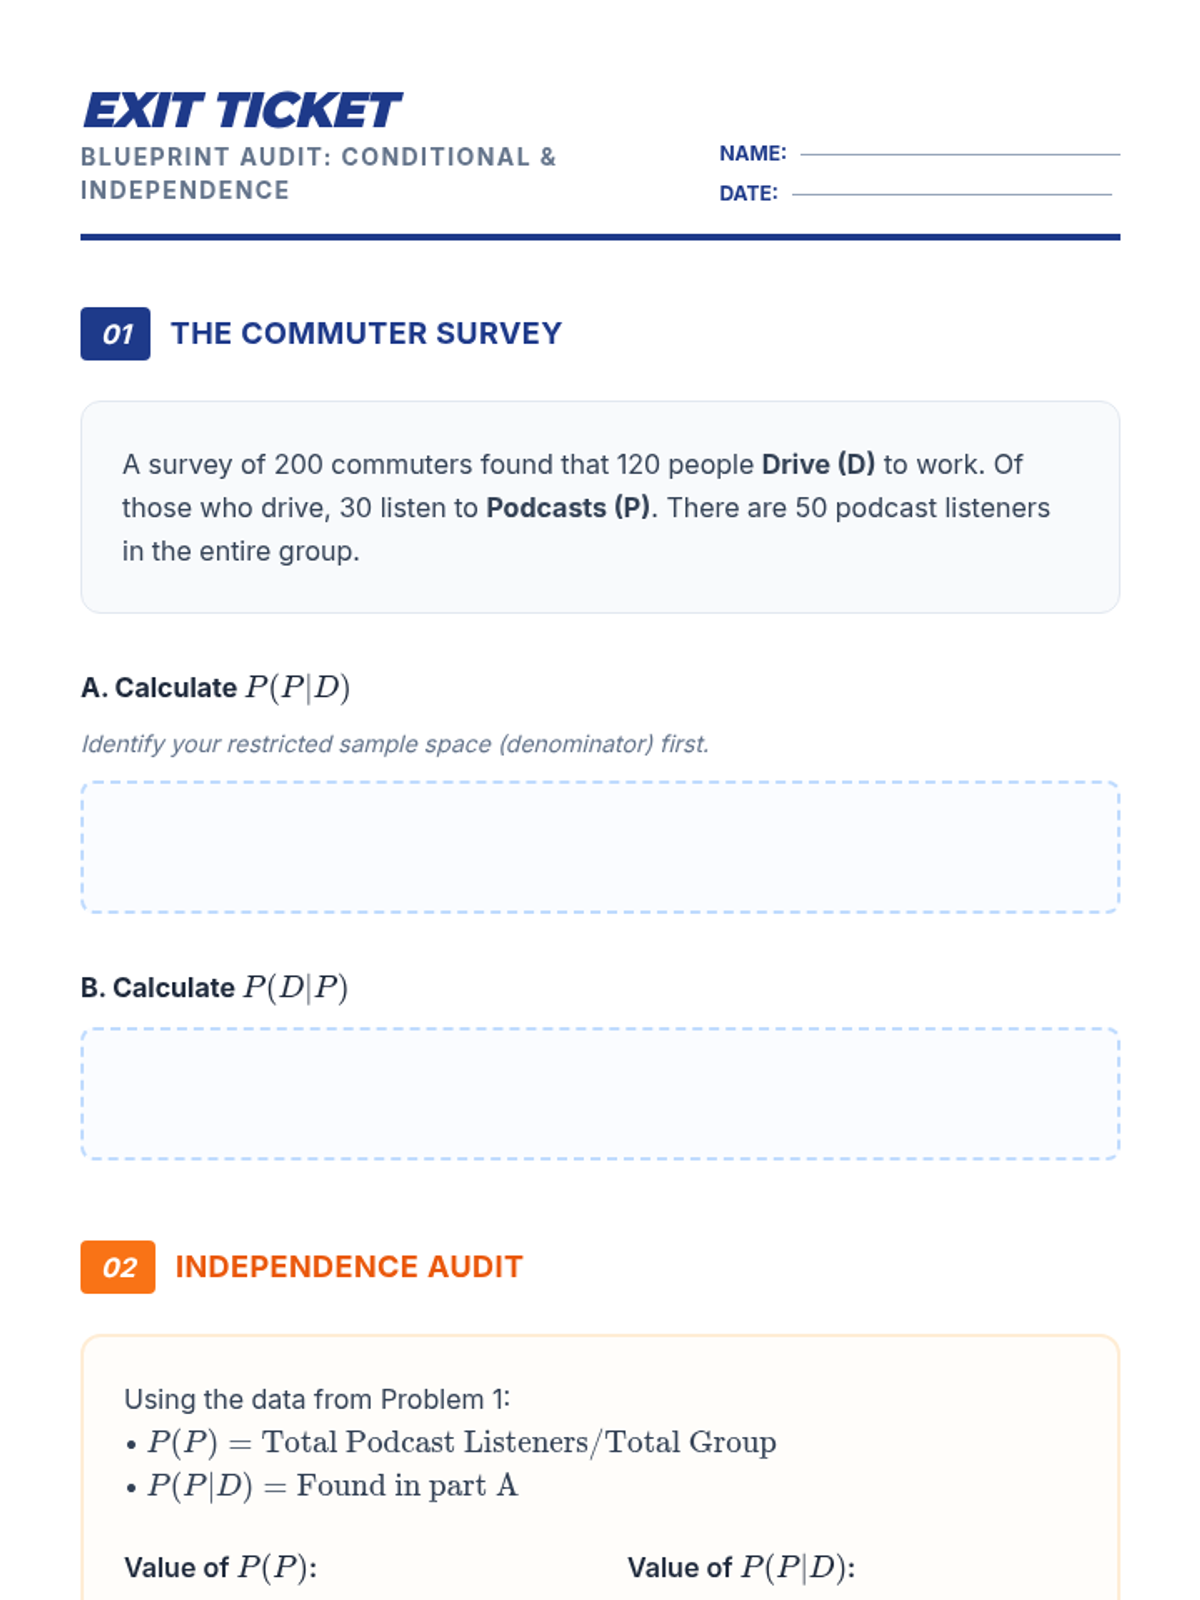
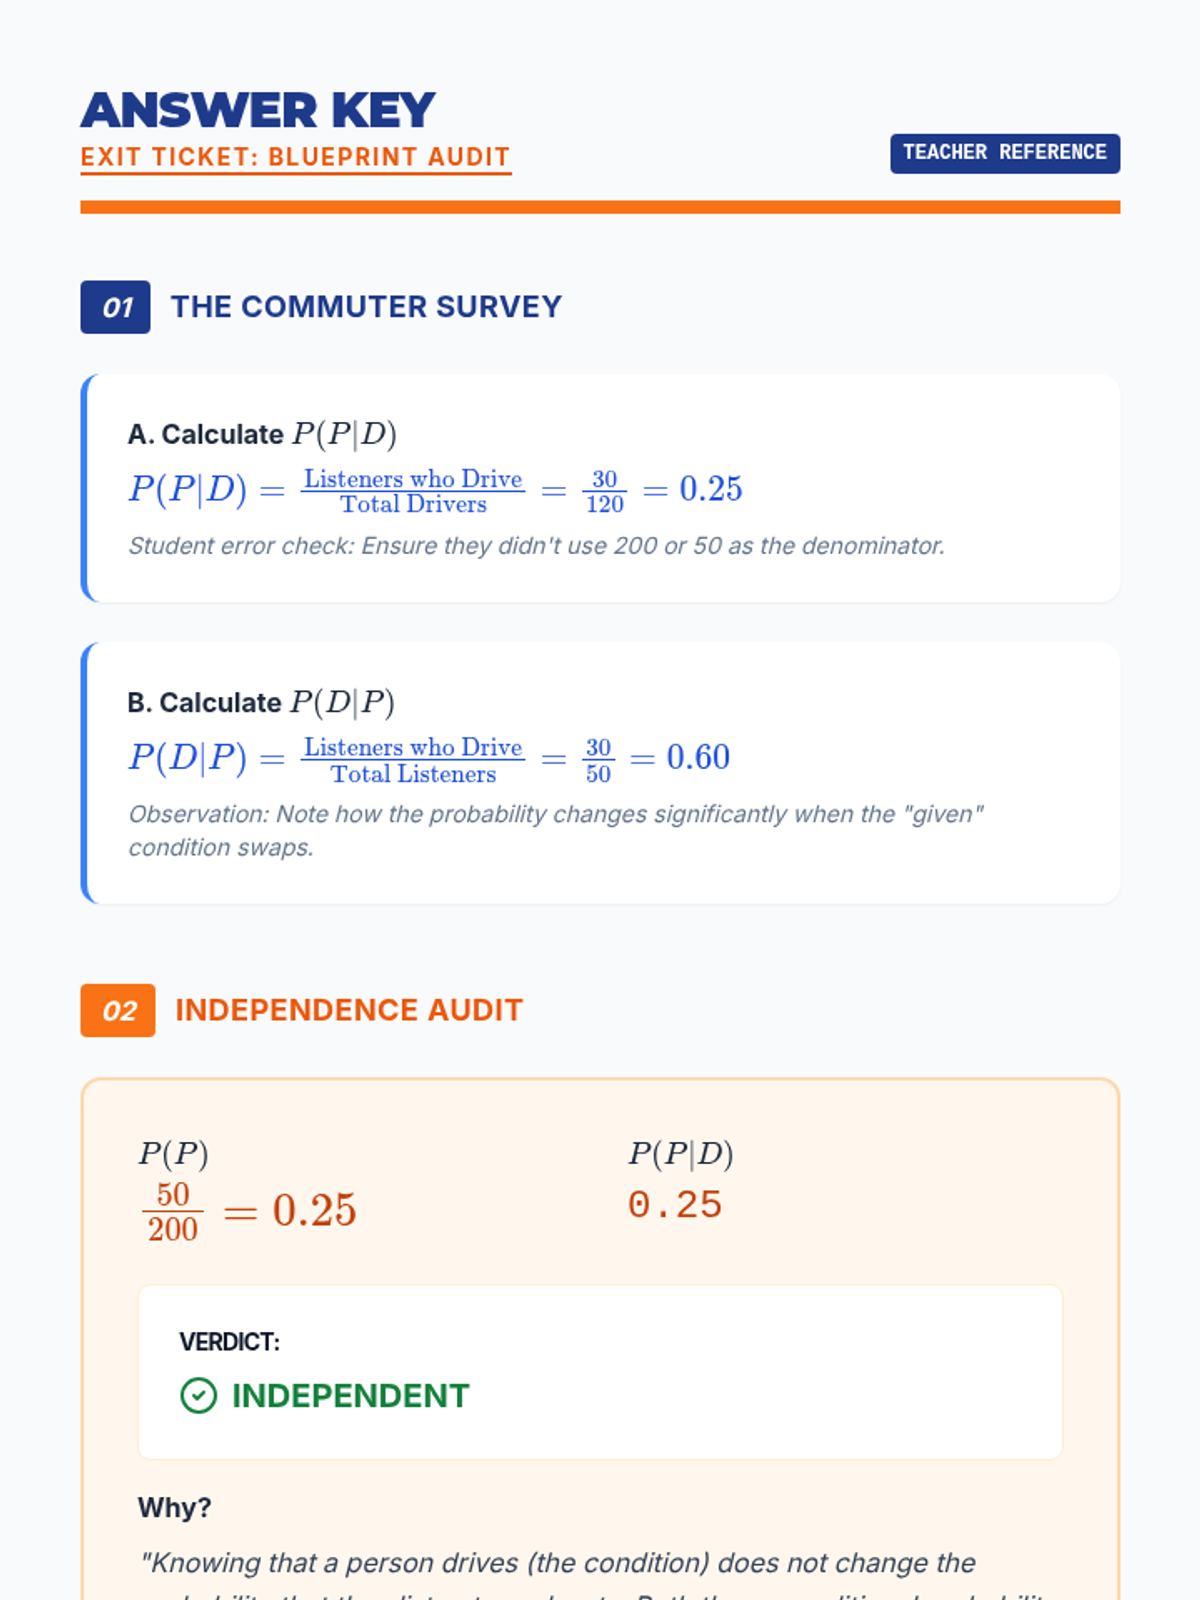
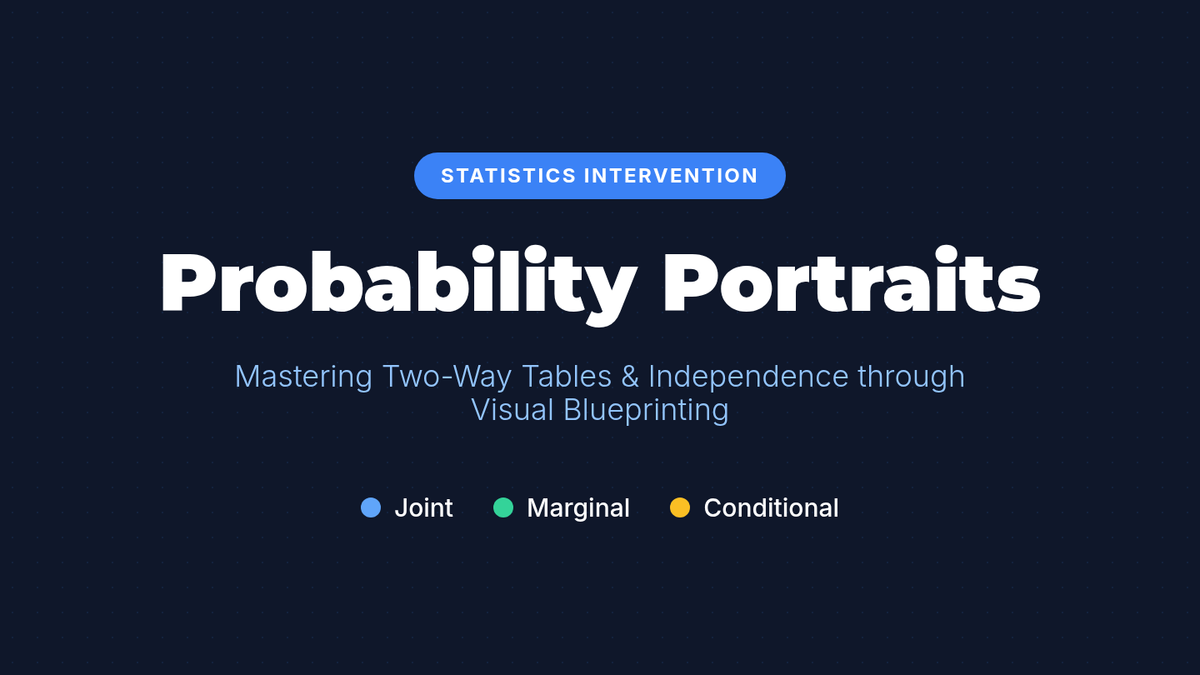
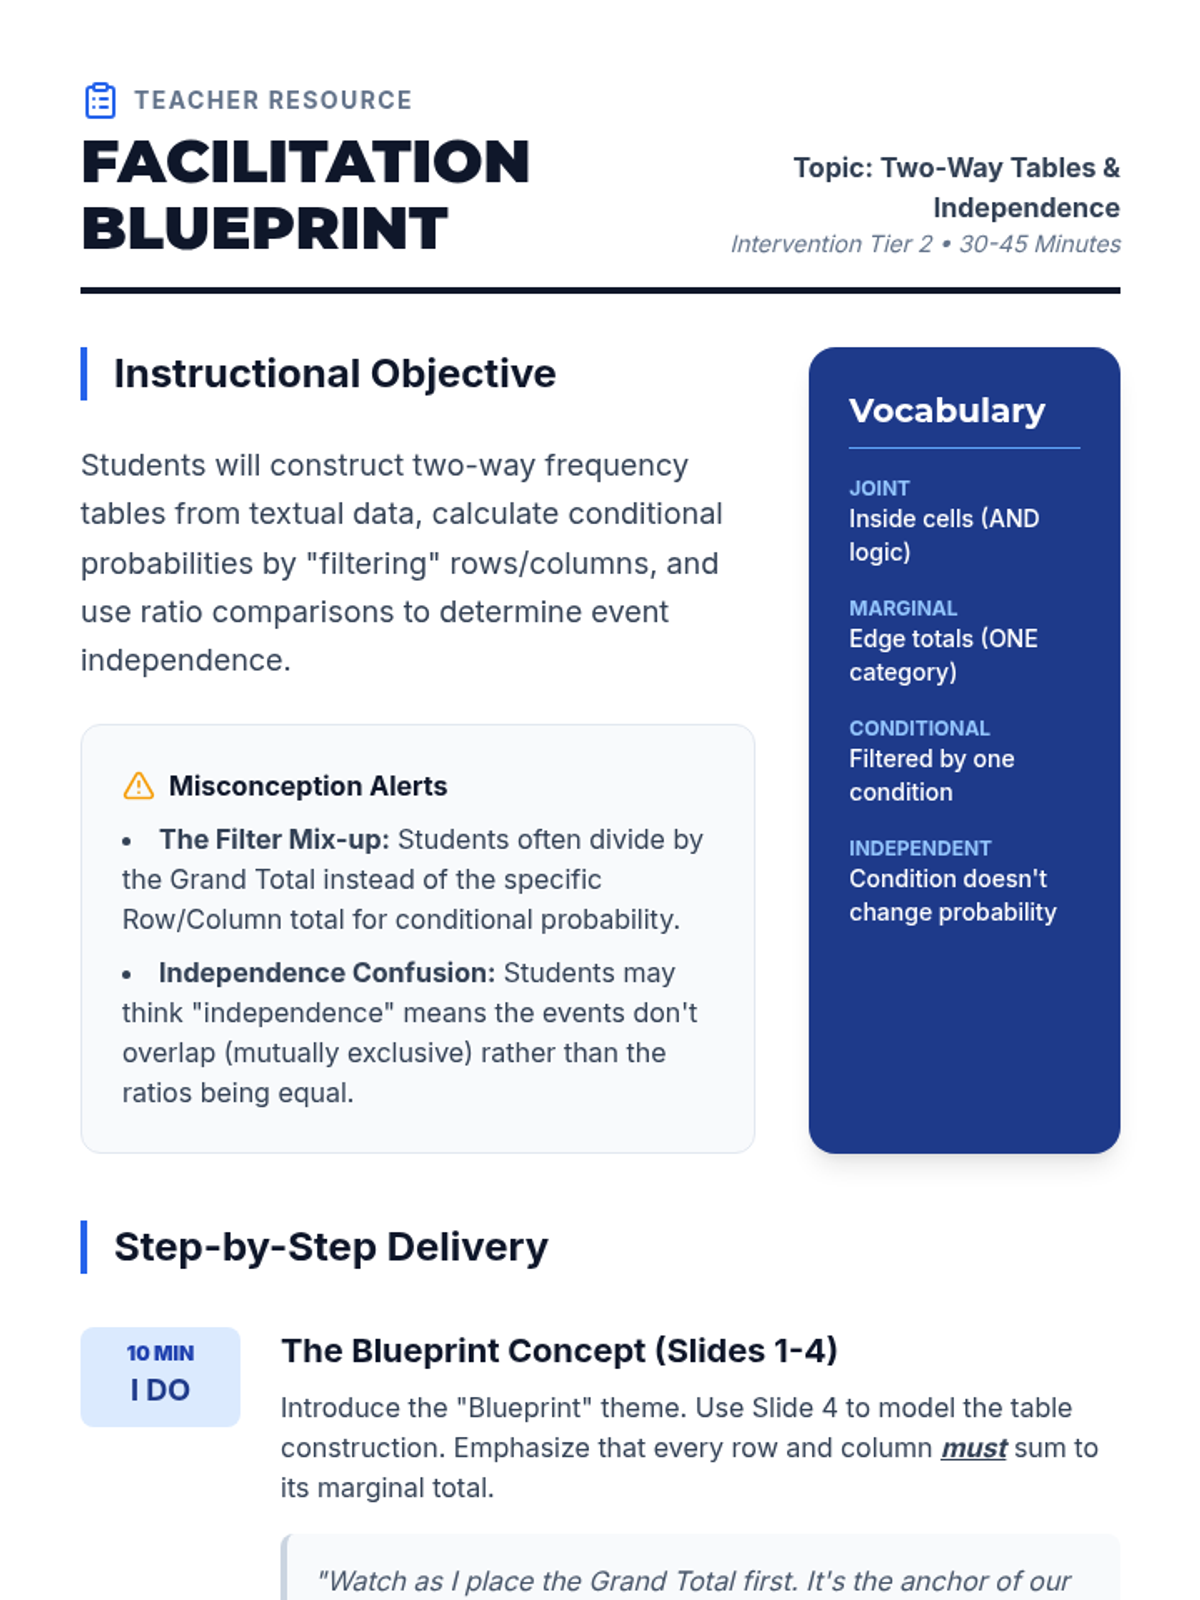
A small-group intervention lesson focusing on interpreting conditional probability as a restricted sample space and testing for independence using visual models and the formal formula.
A targeted Tier 2 intervention lesson focusing on constructing two-way frequency tables, calculating conditional probabilities, and testing for independence using a color-coded blueprint approach.
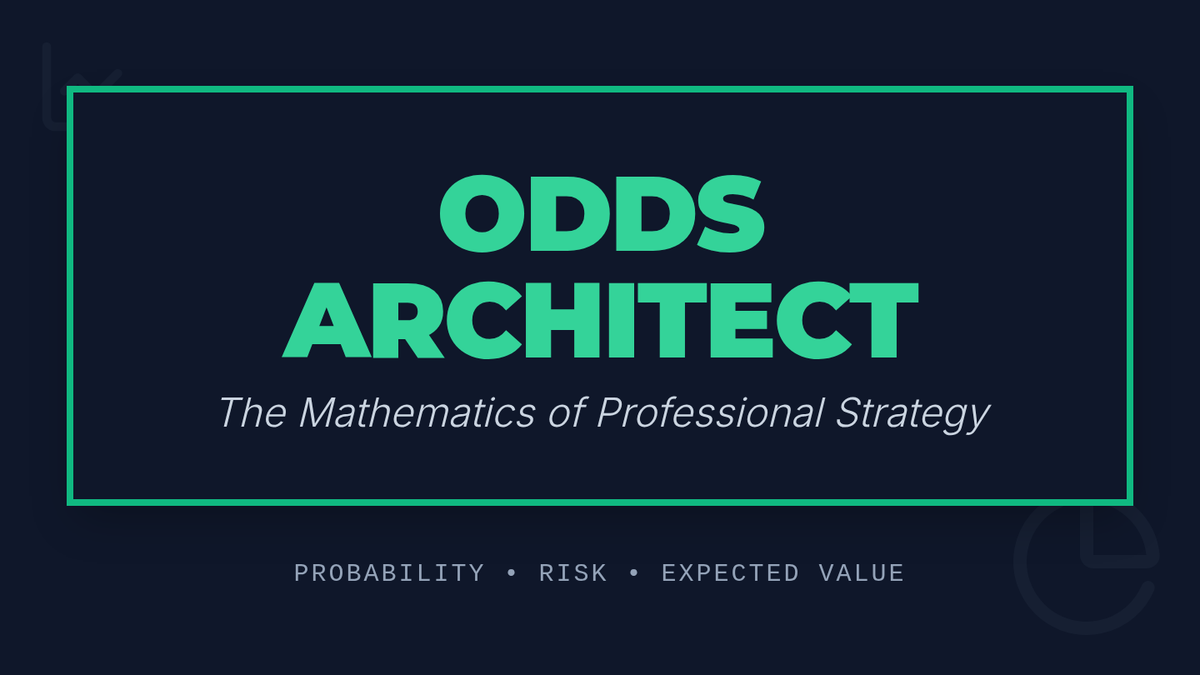
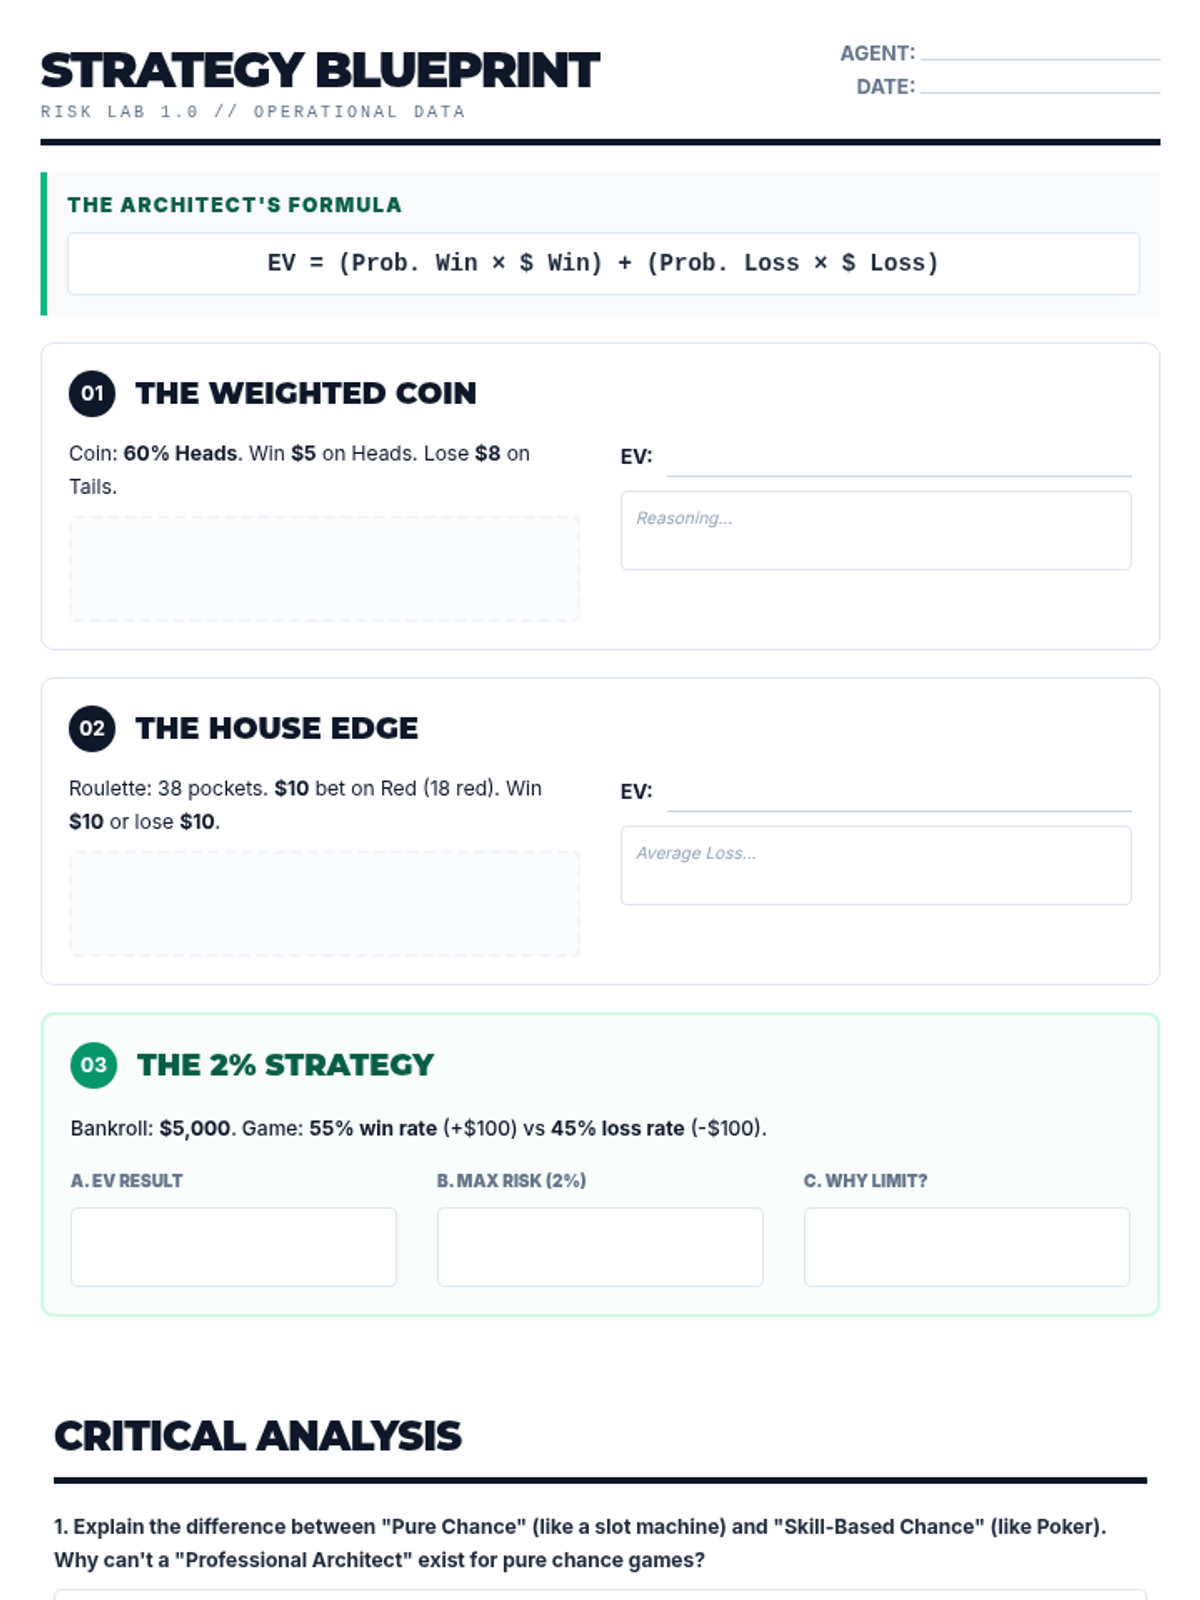
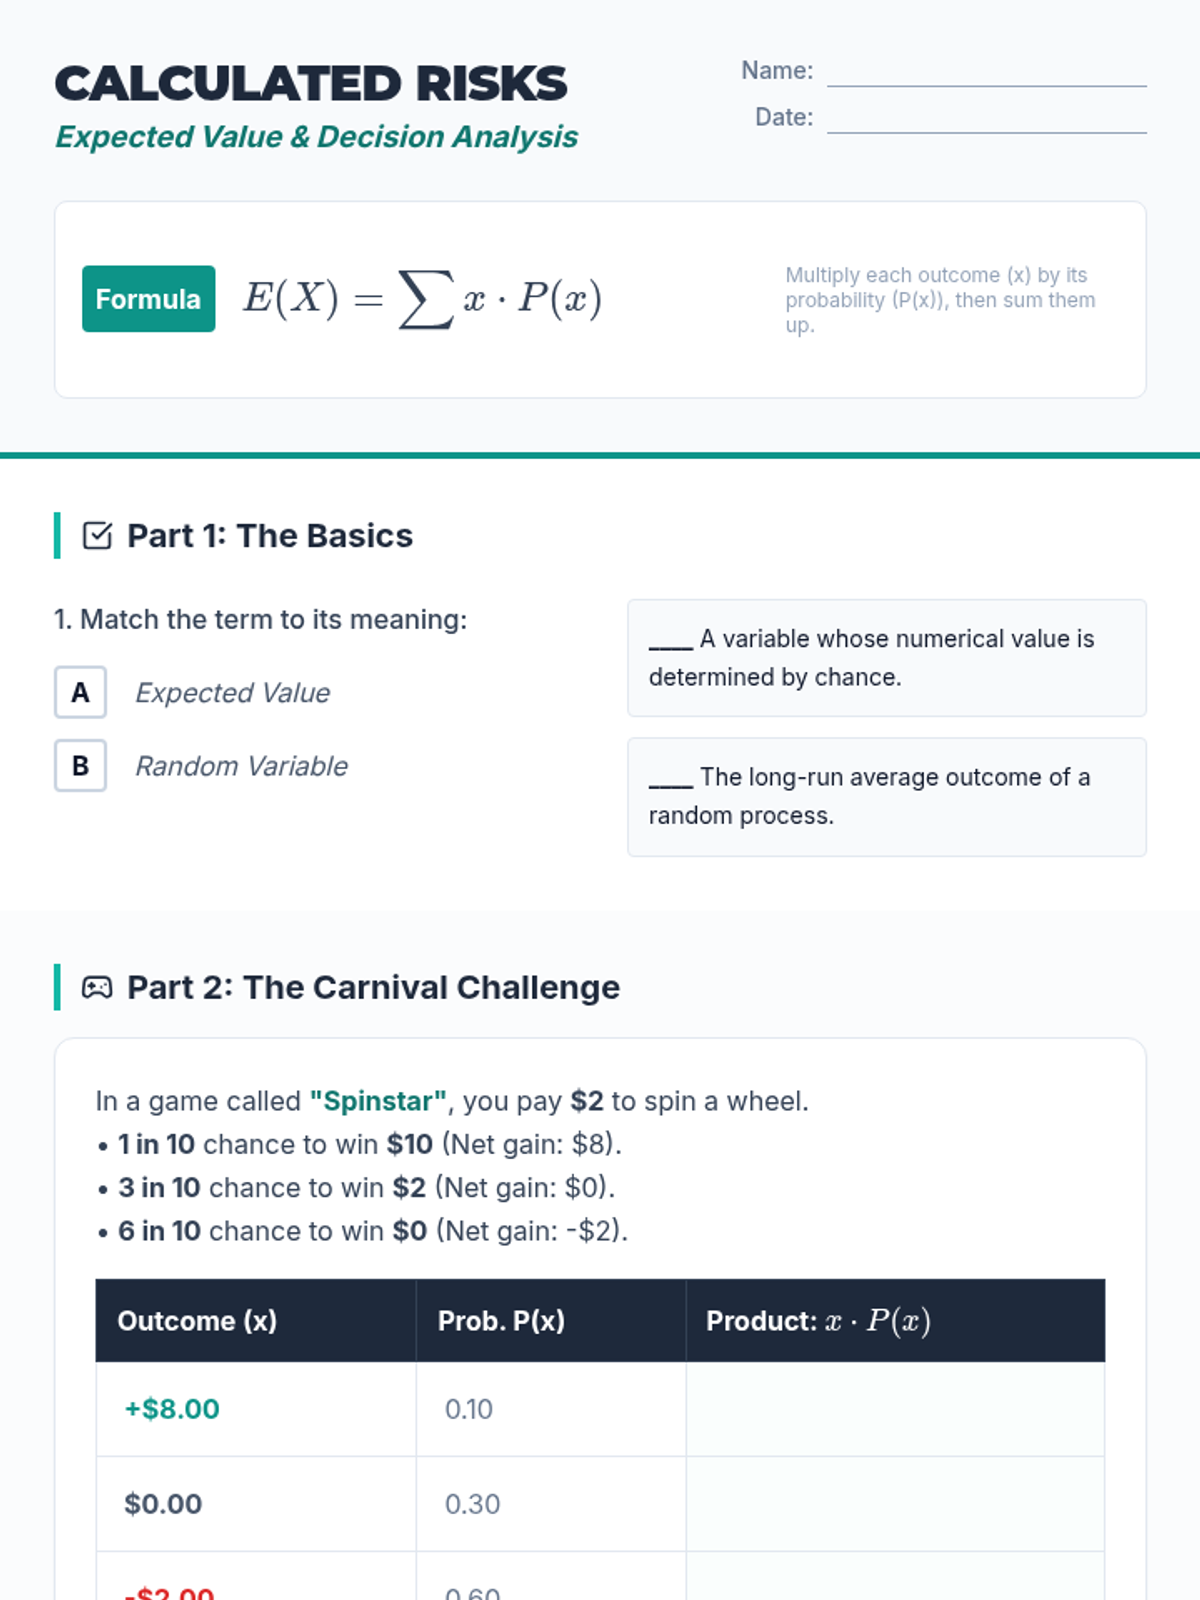
Students explore the concept of expected value and house edge to understand why certain strategies succeed while others are designed to fail.
An introductory exploration of random variables, probability distributions, and statistical measurements including mean, standard deviation, and linear transformations.
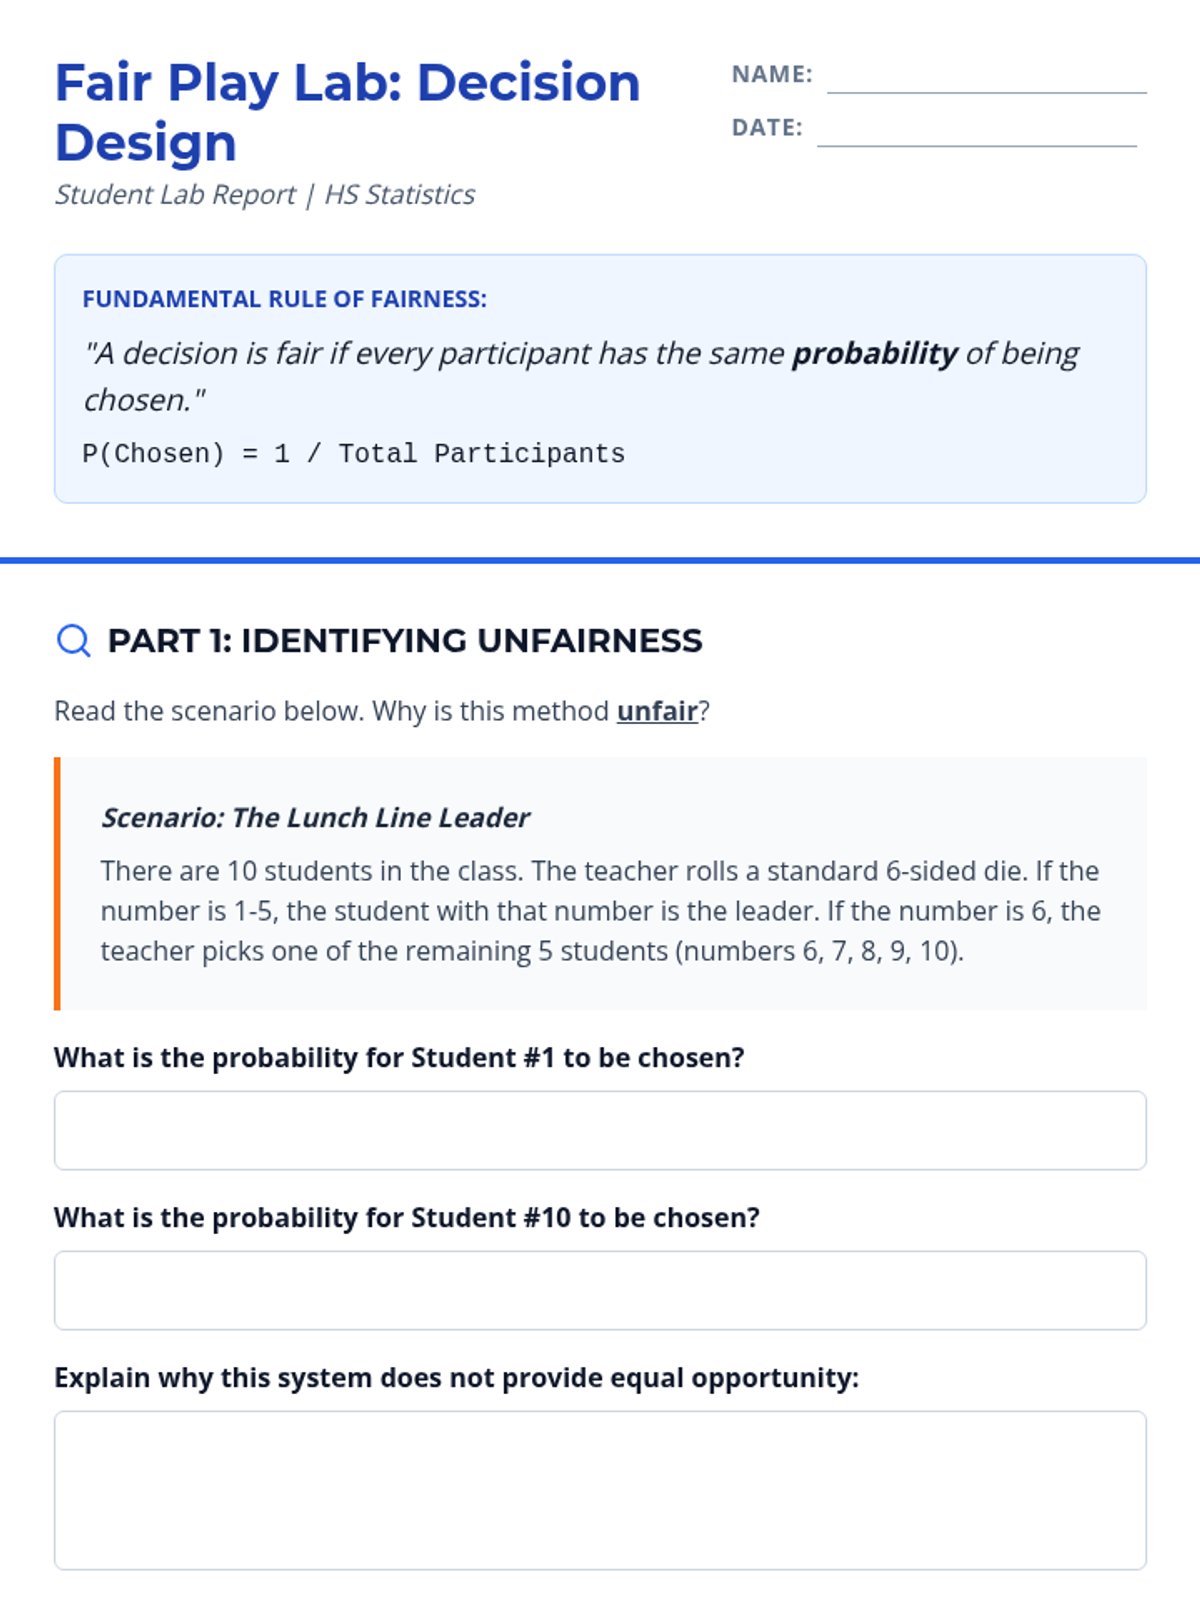
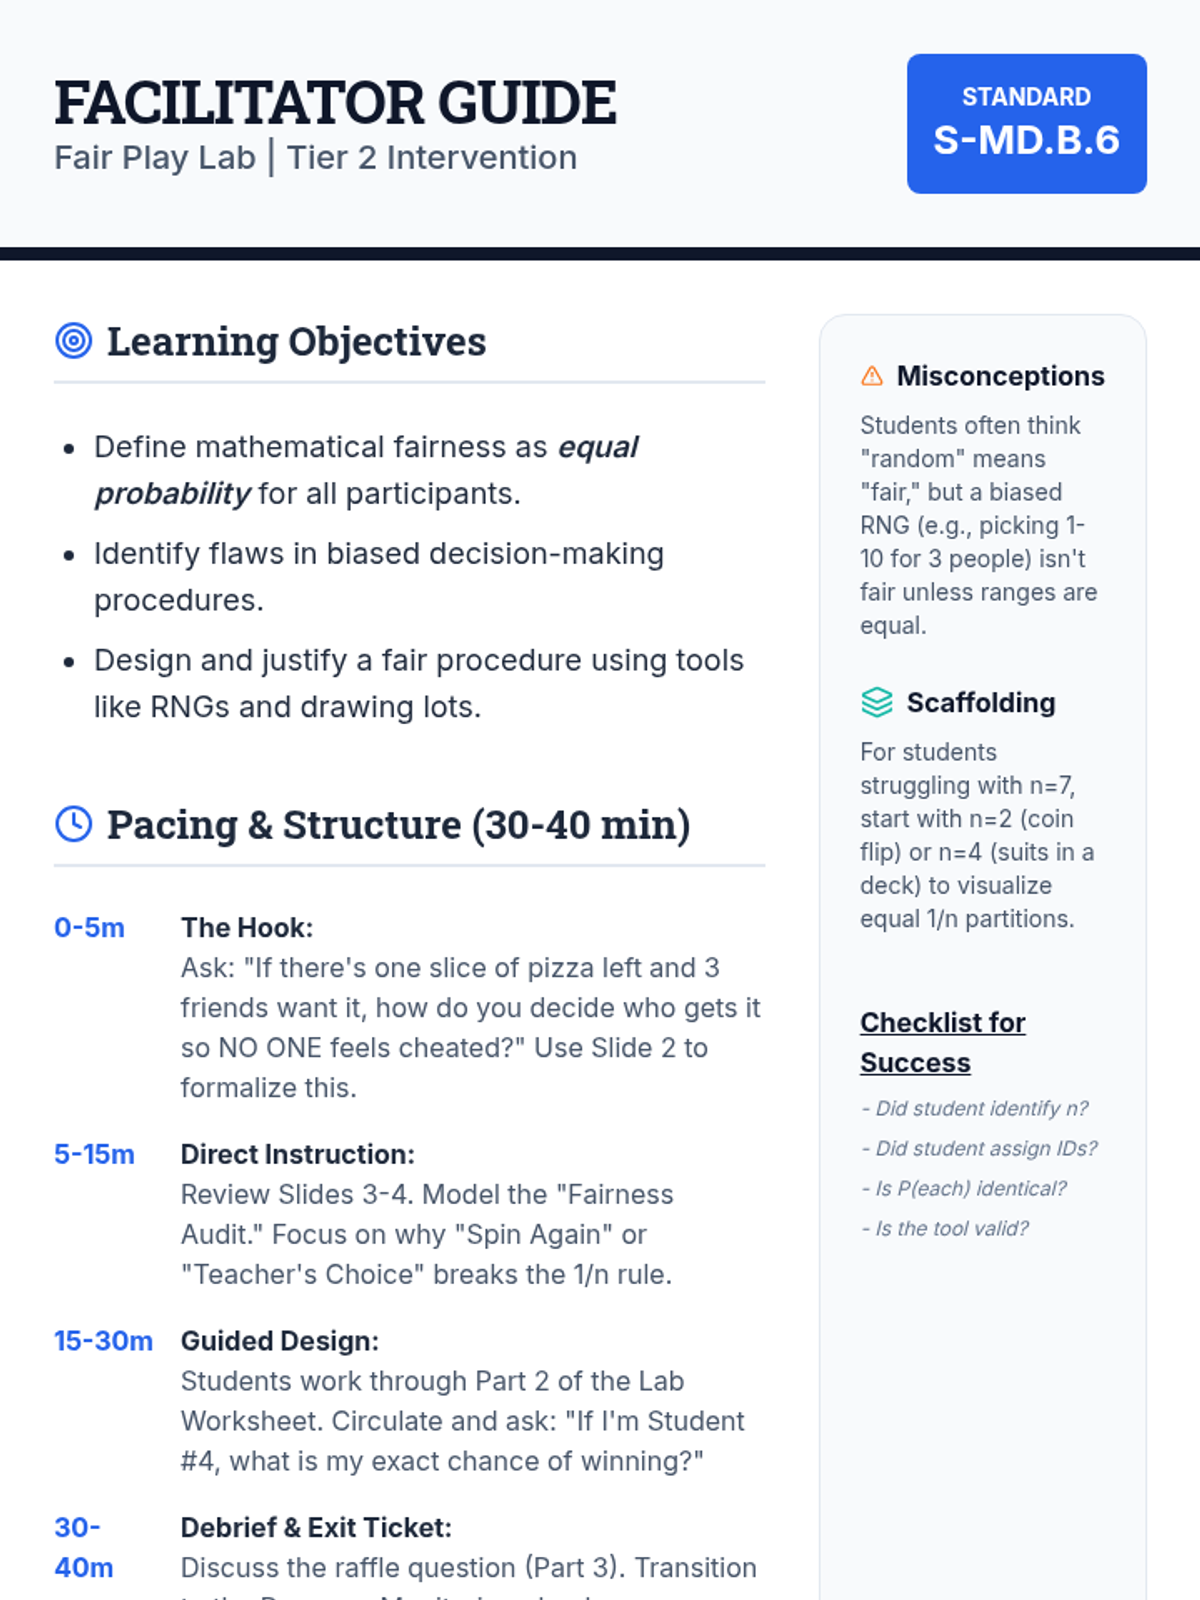
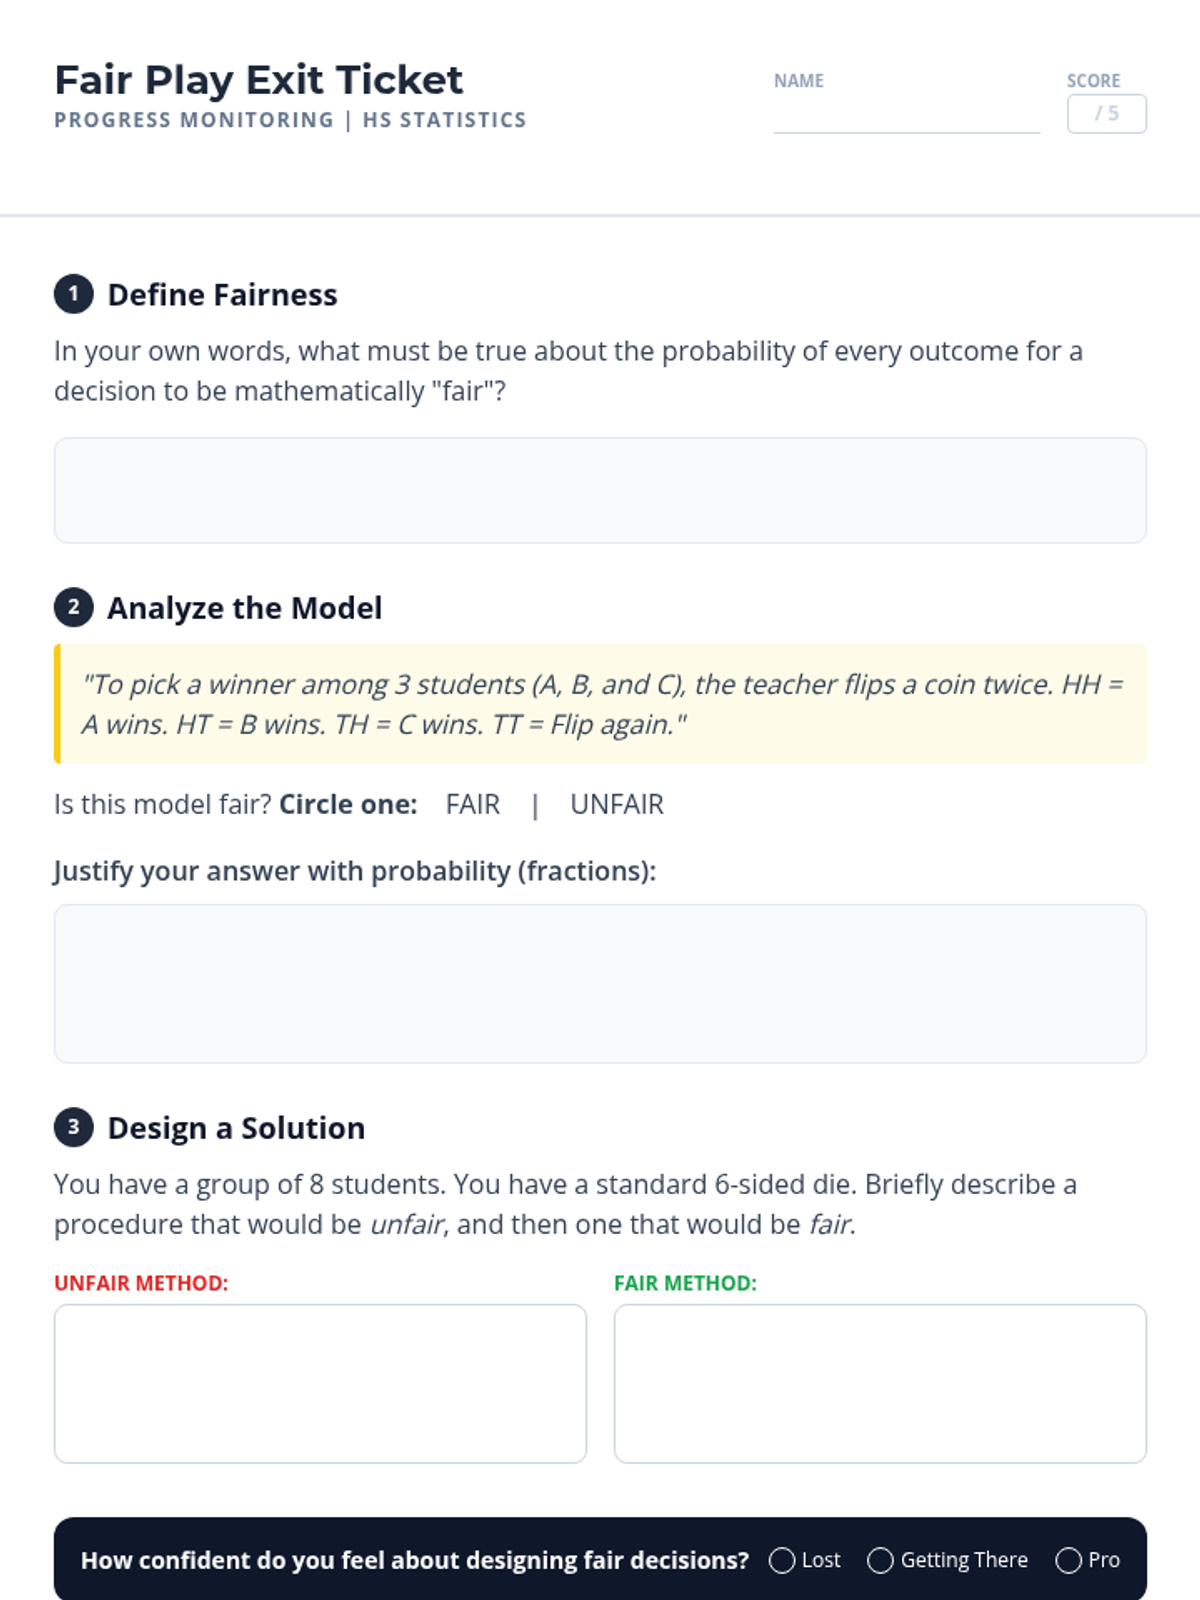
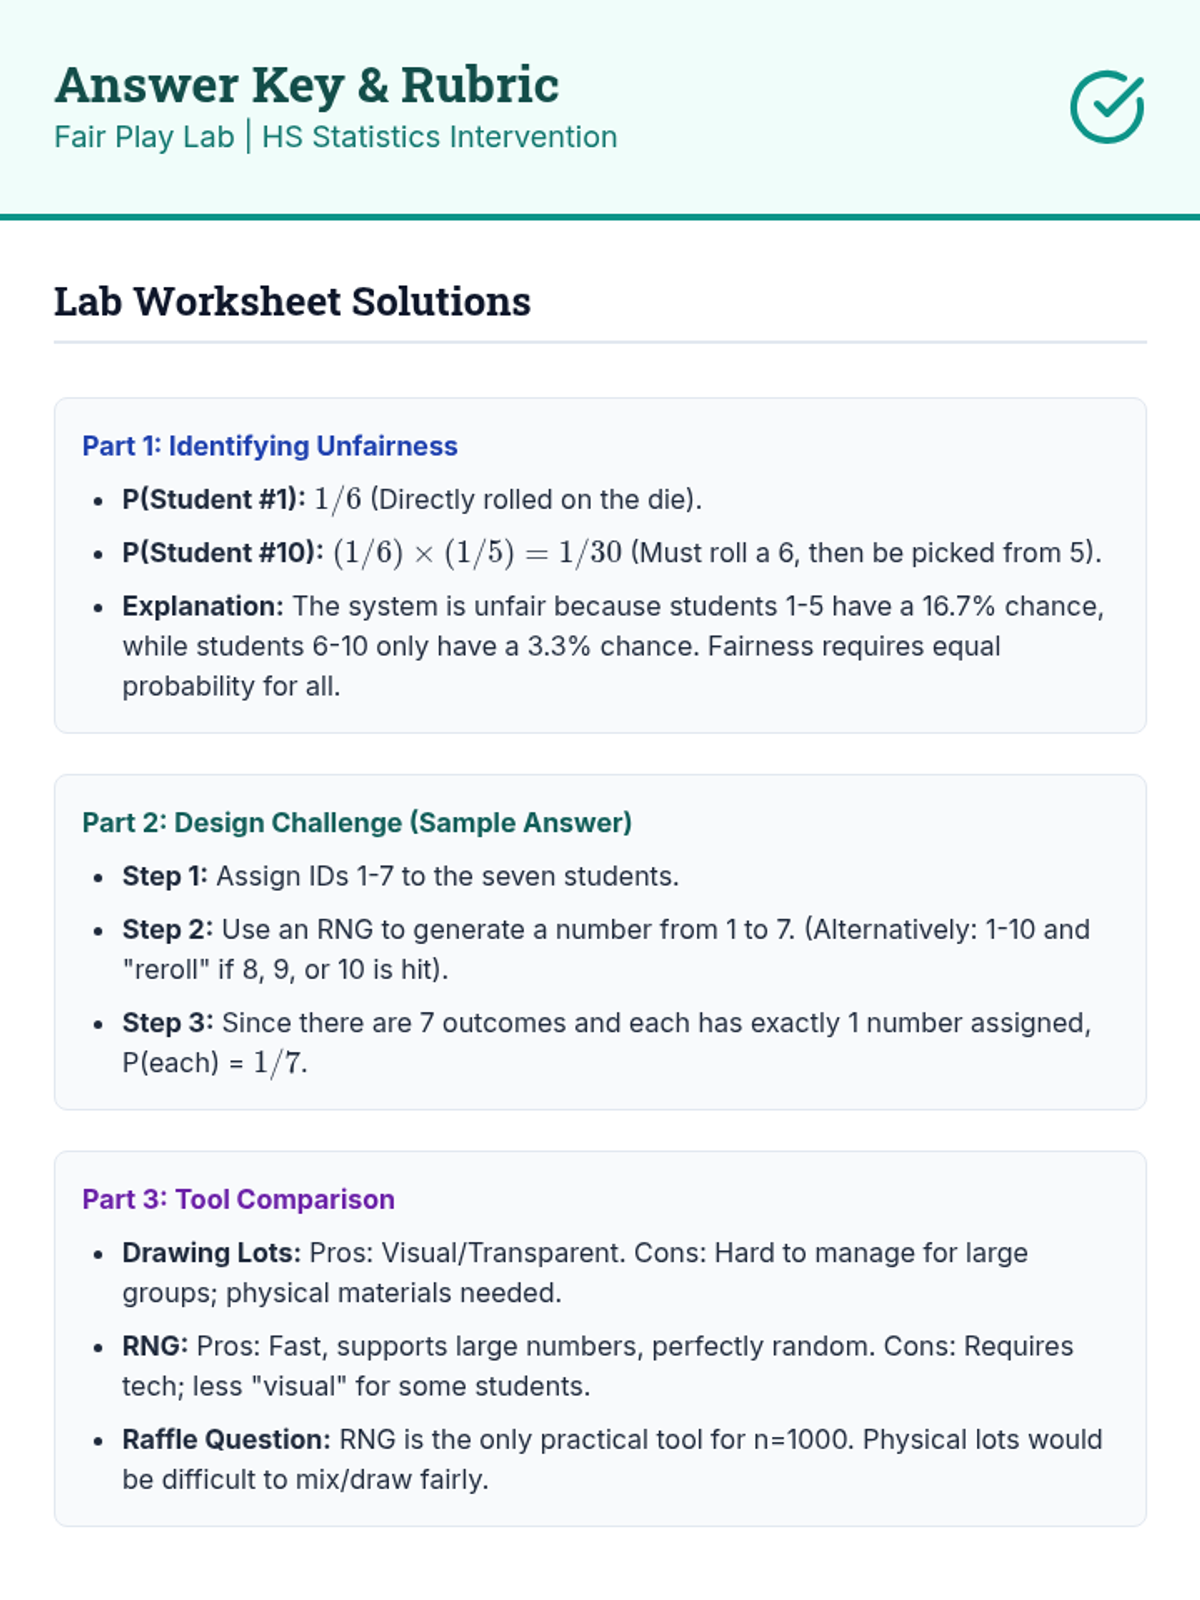
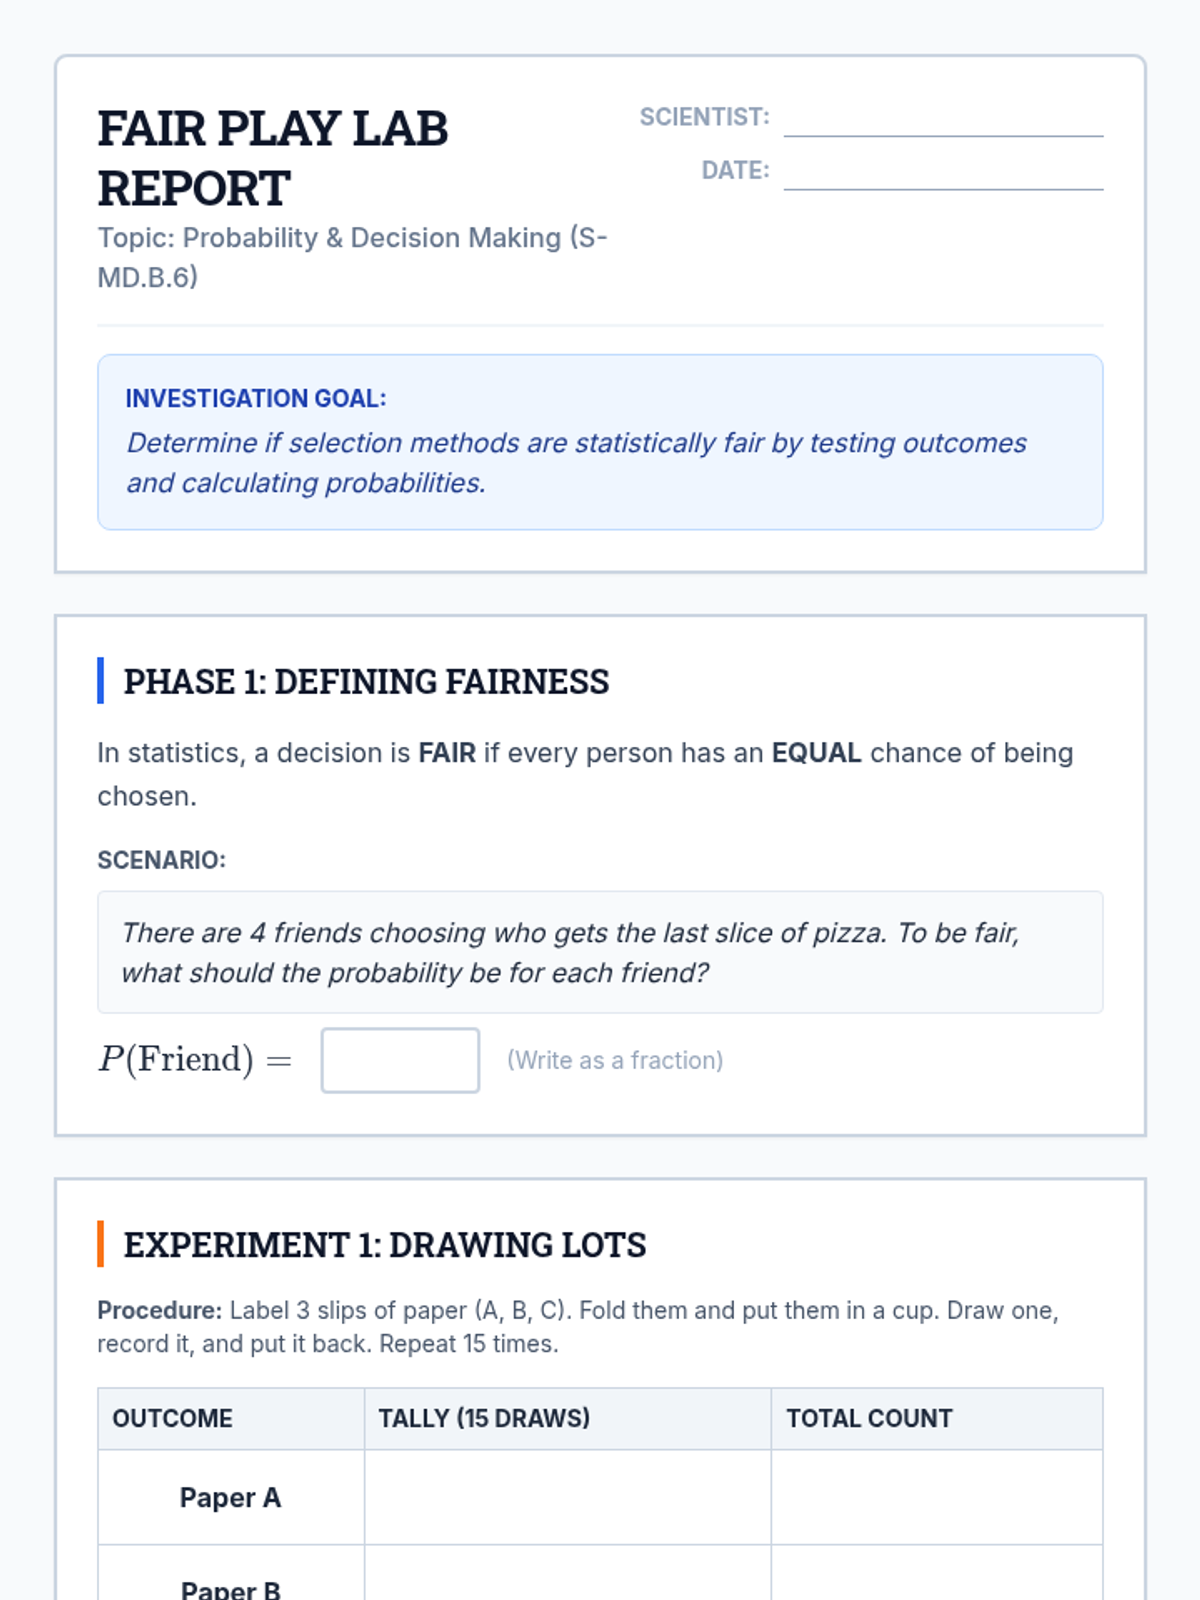
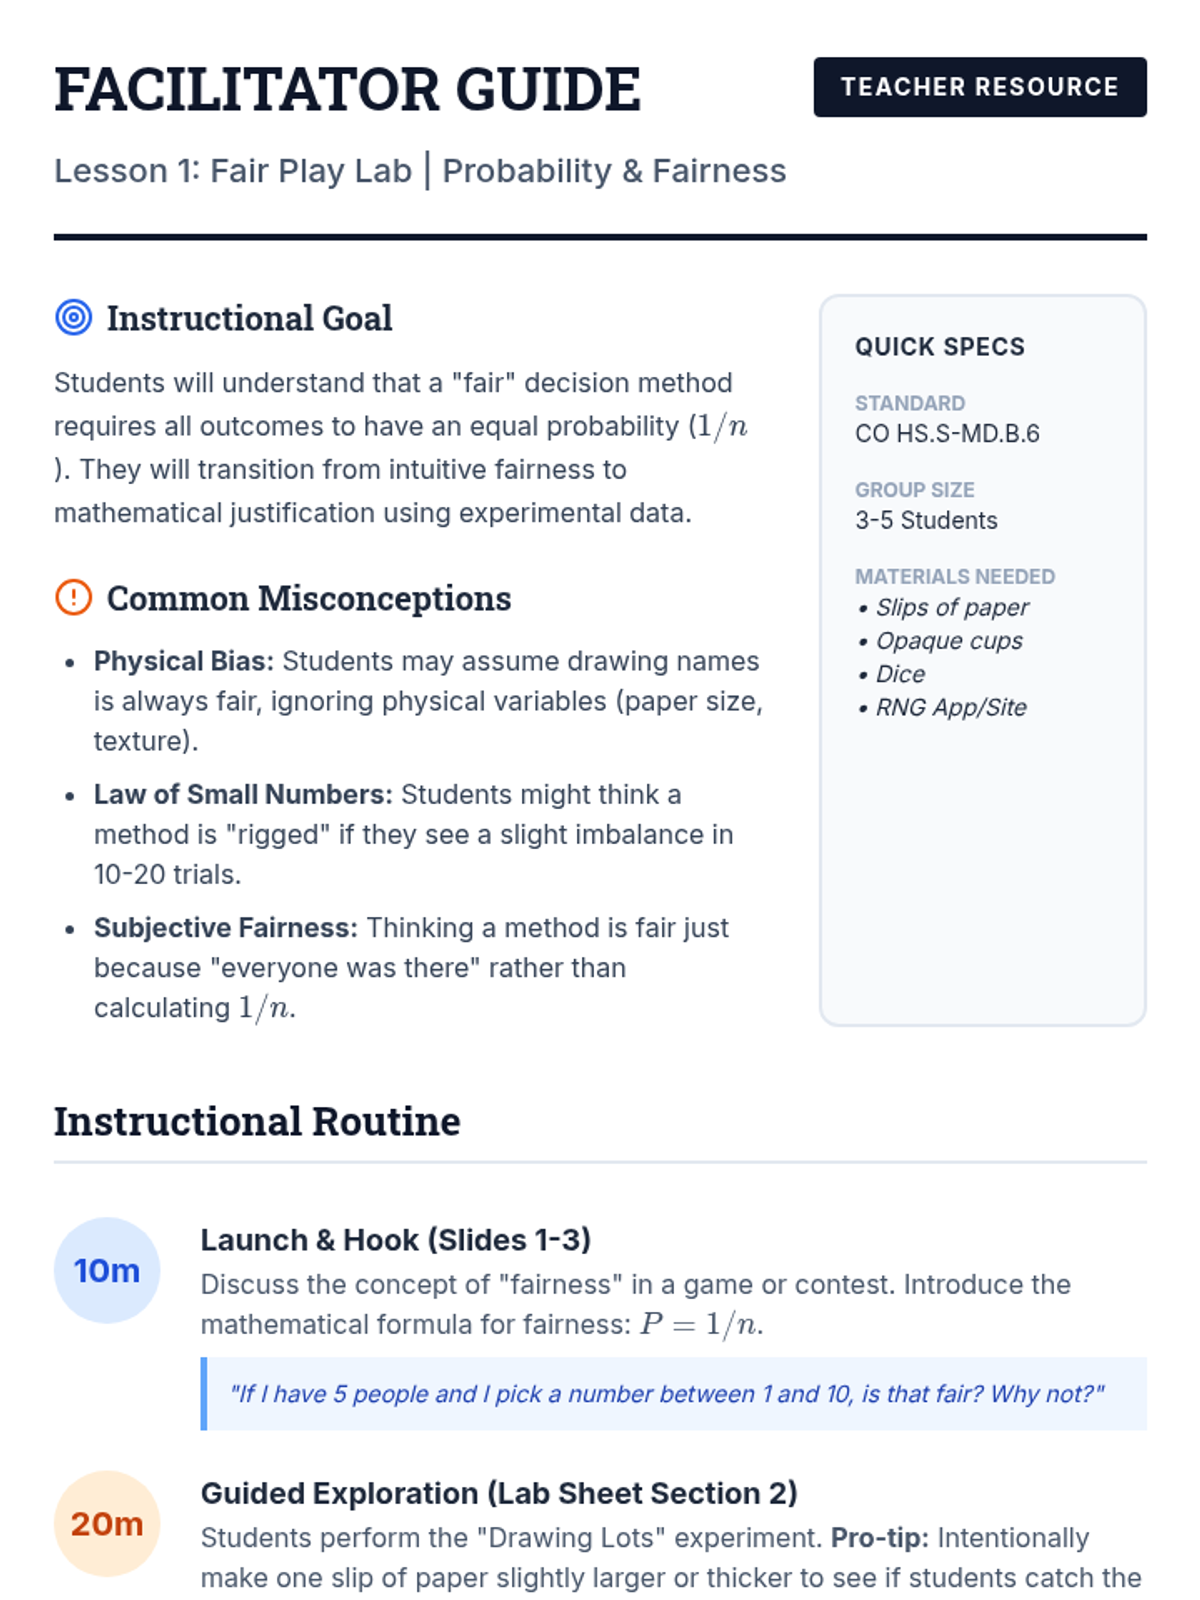
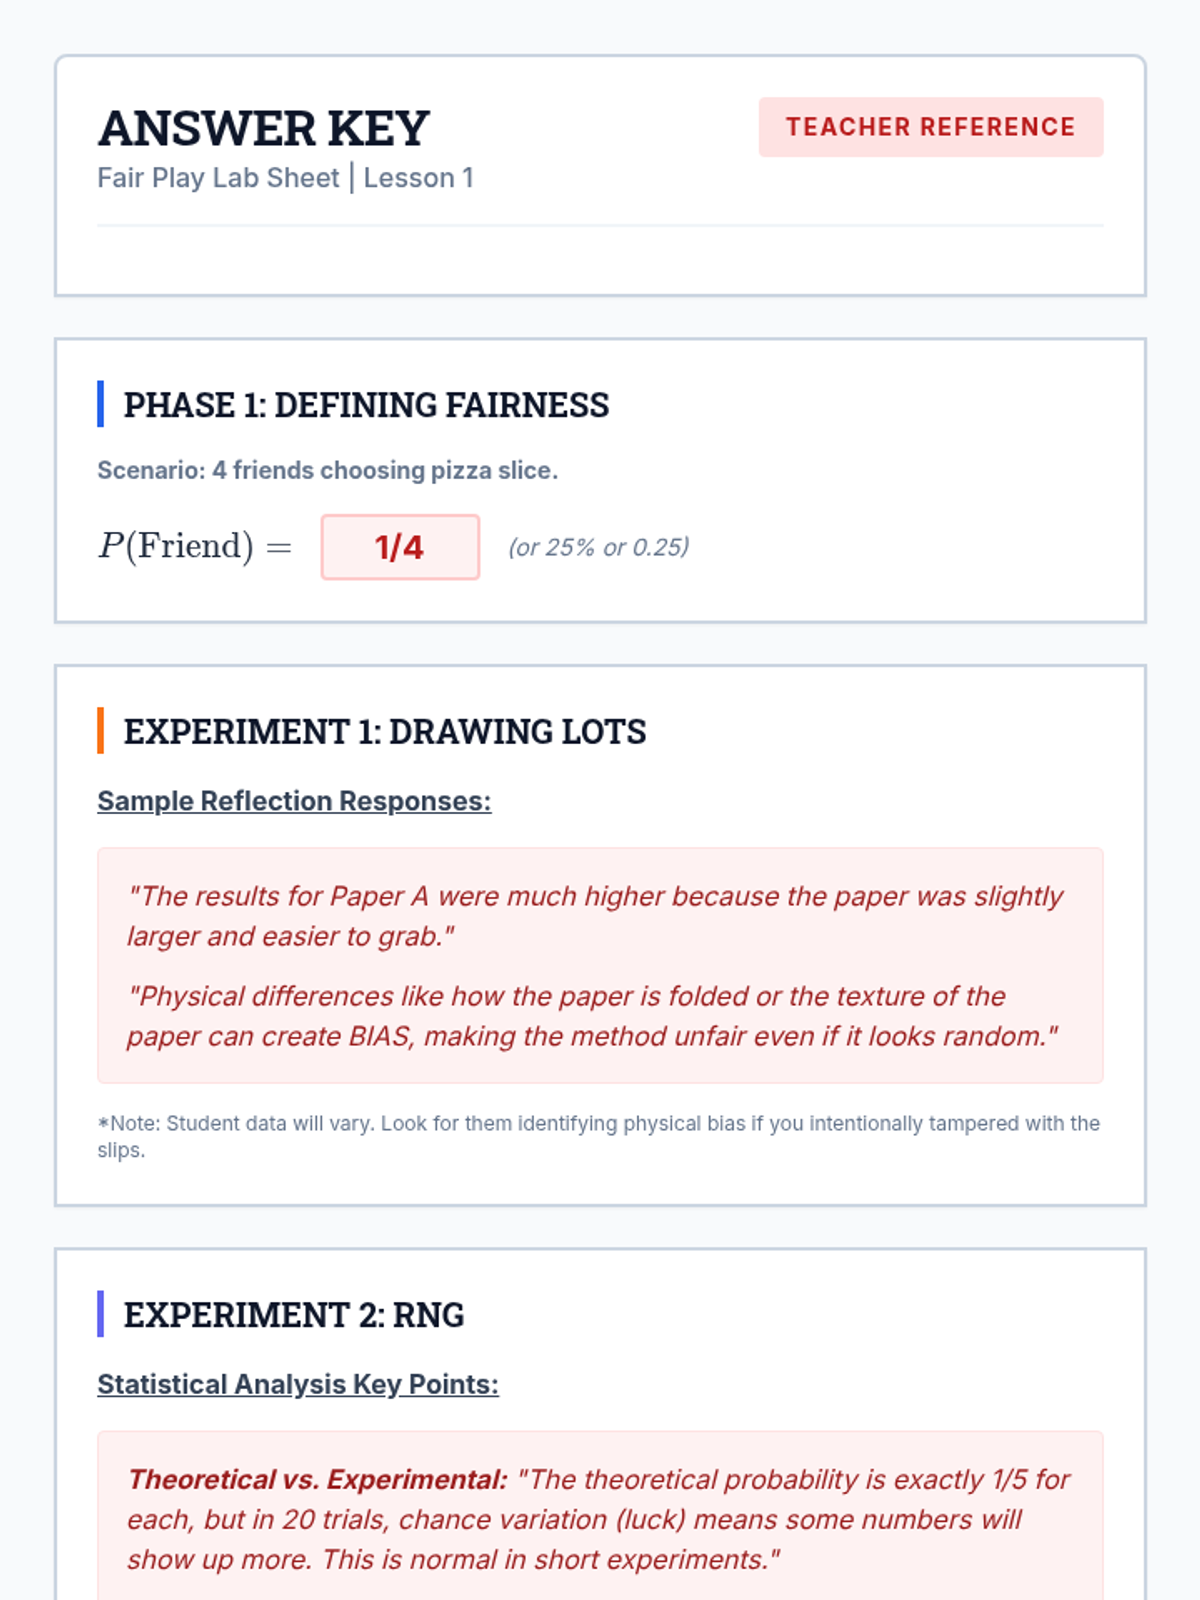
A Tier 2 intervention lesson focusing on using probability to design and evaluate fair decision-making procedures. Students learn to use tools like random number generators and drawing lots to ensure equal opportunity.
A scaffolded lesson where students test various random selection methods (drawing lots, dice, RNG) to determine if they are fair and use probability to justify their findings.
A targeted Tier 2 intervention lesson focusing on evaluating model consistency through simulations, designed for small group support in High School Statistics.
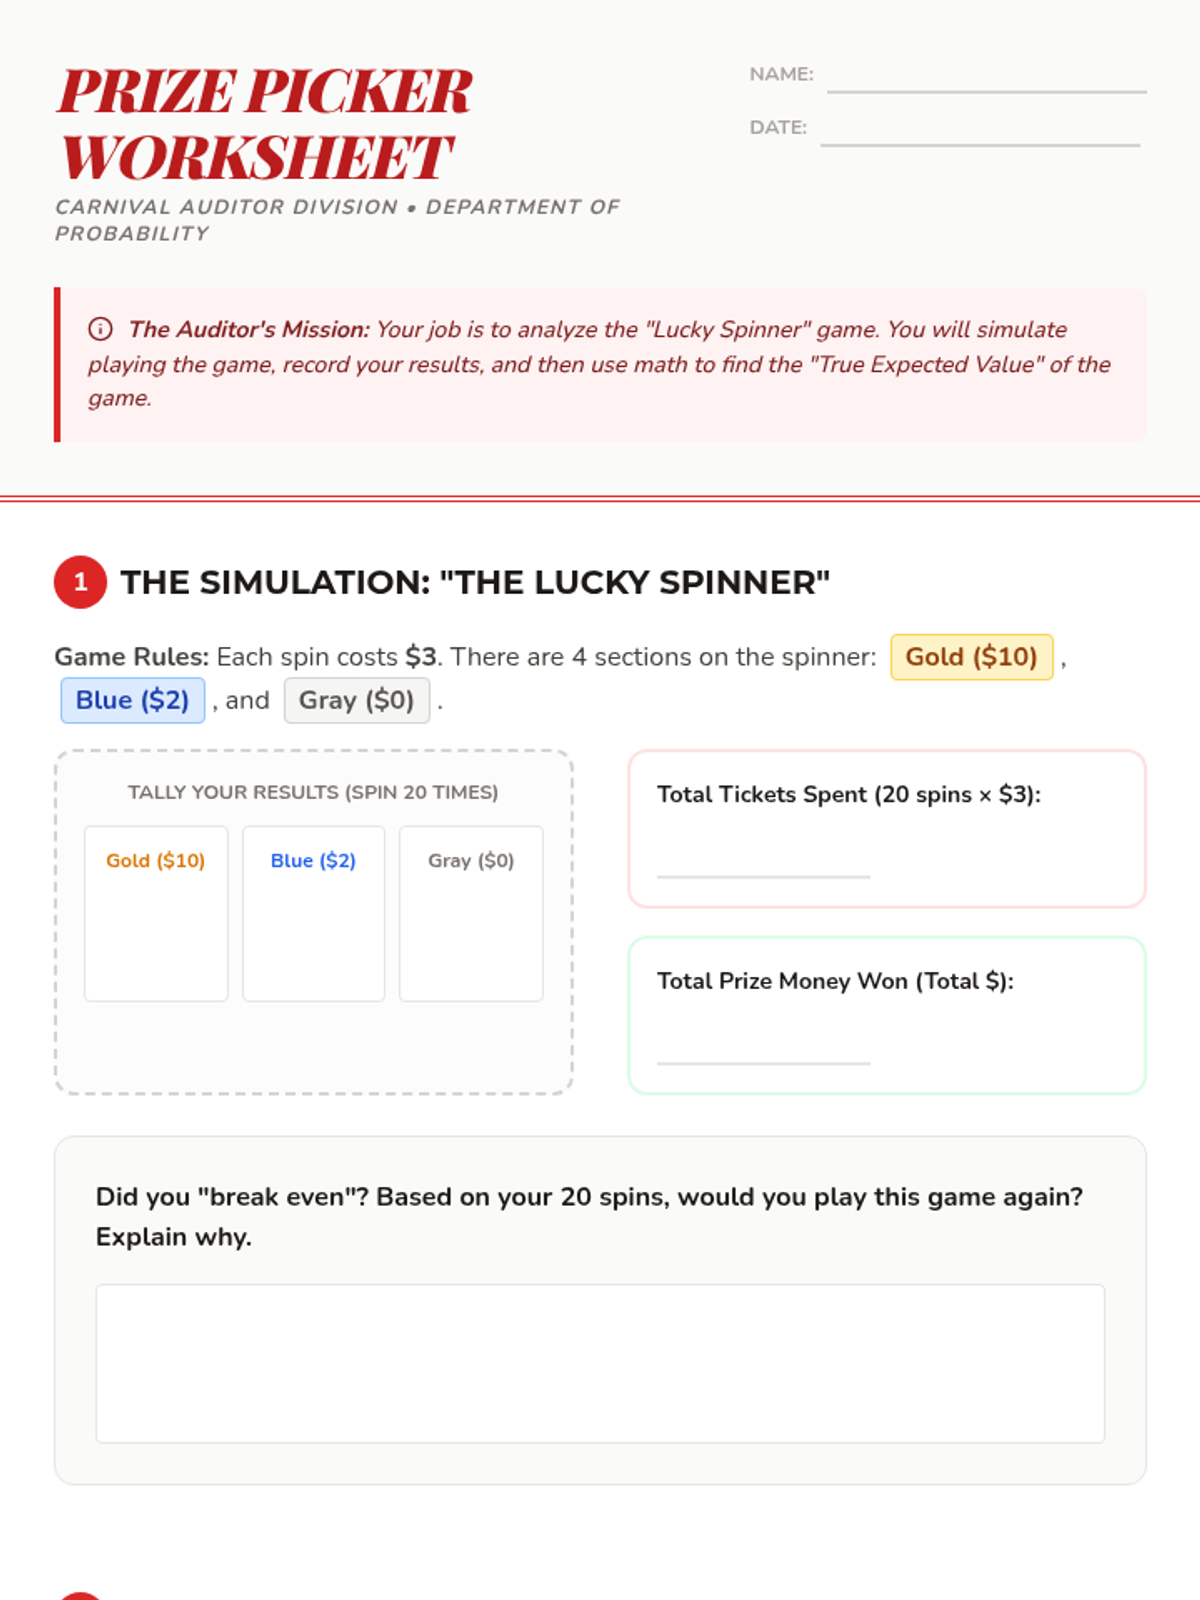
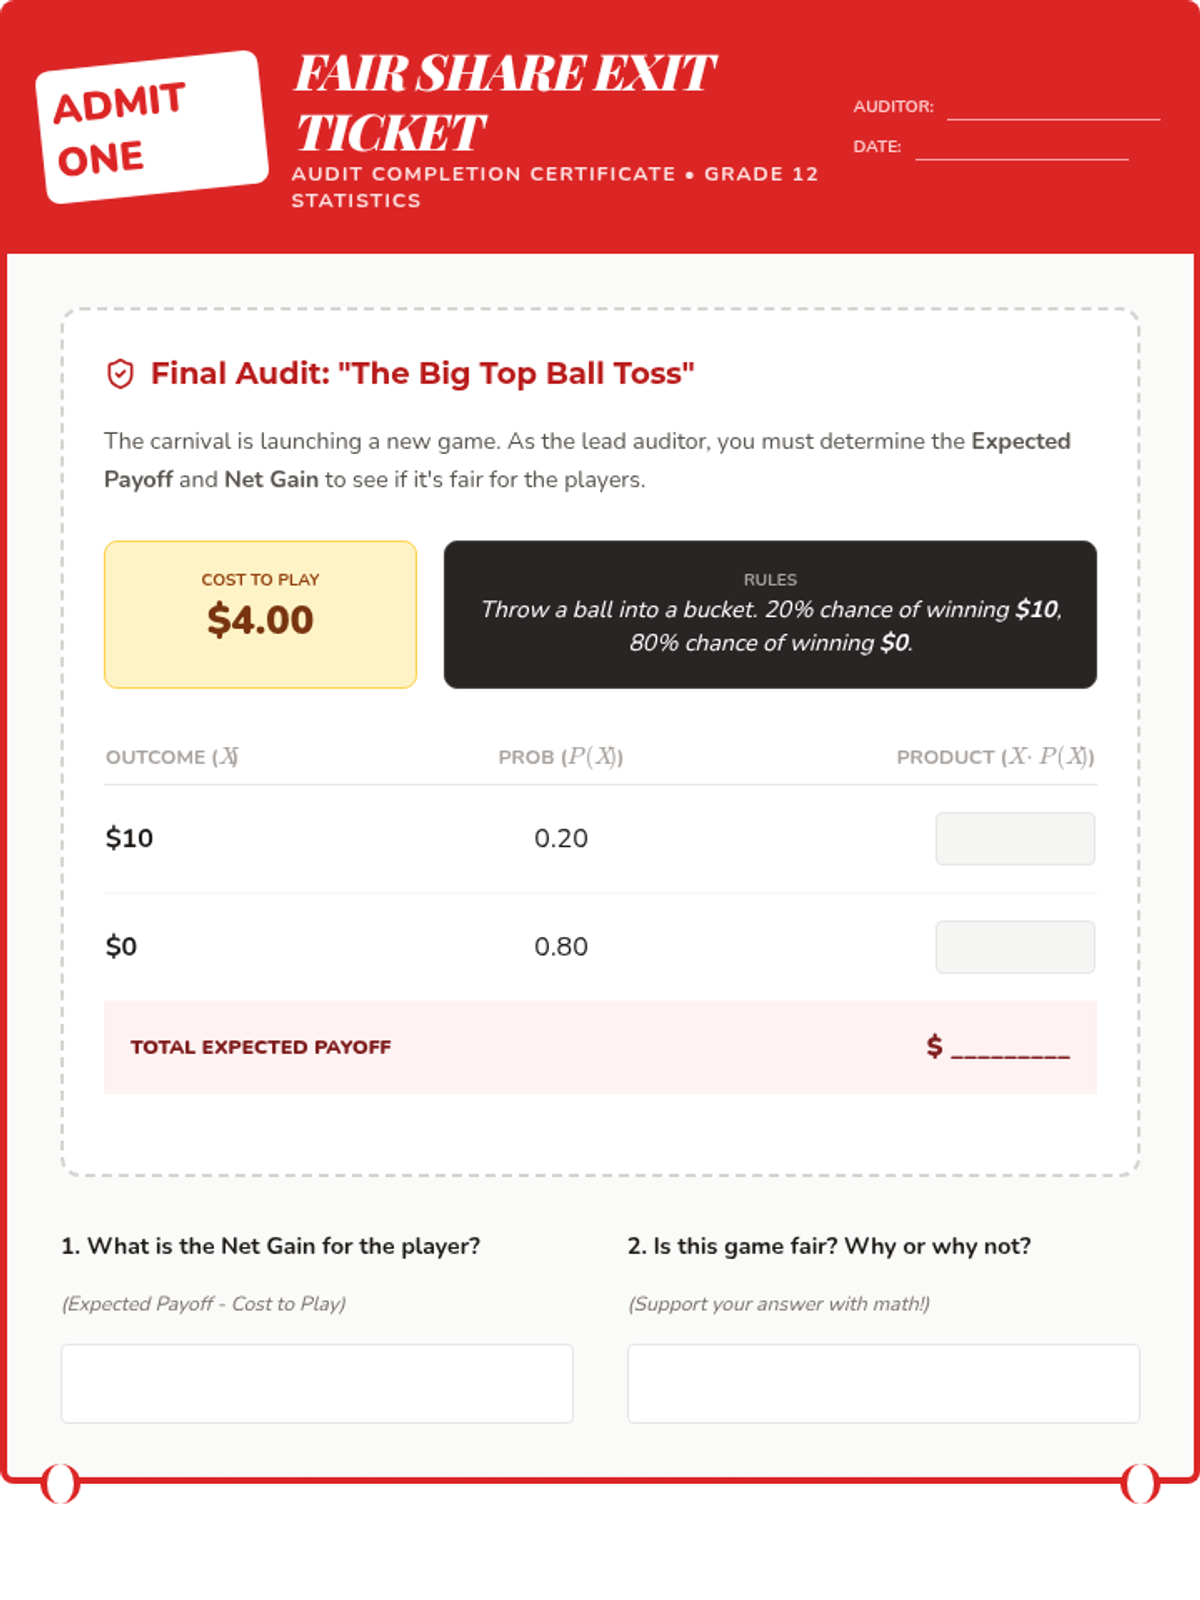
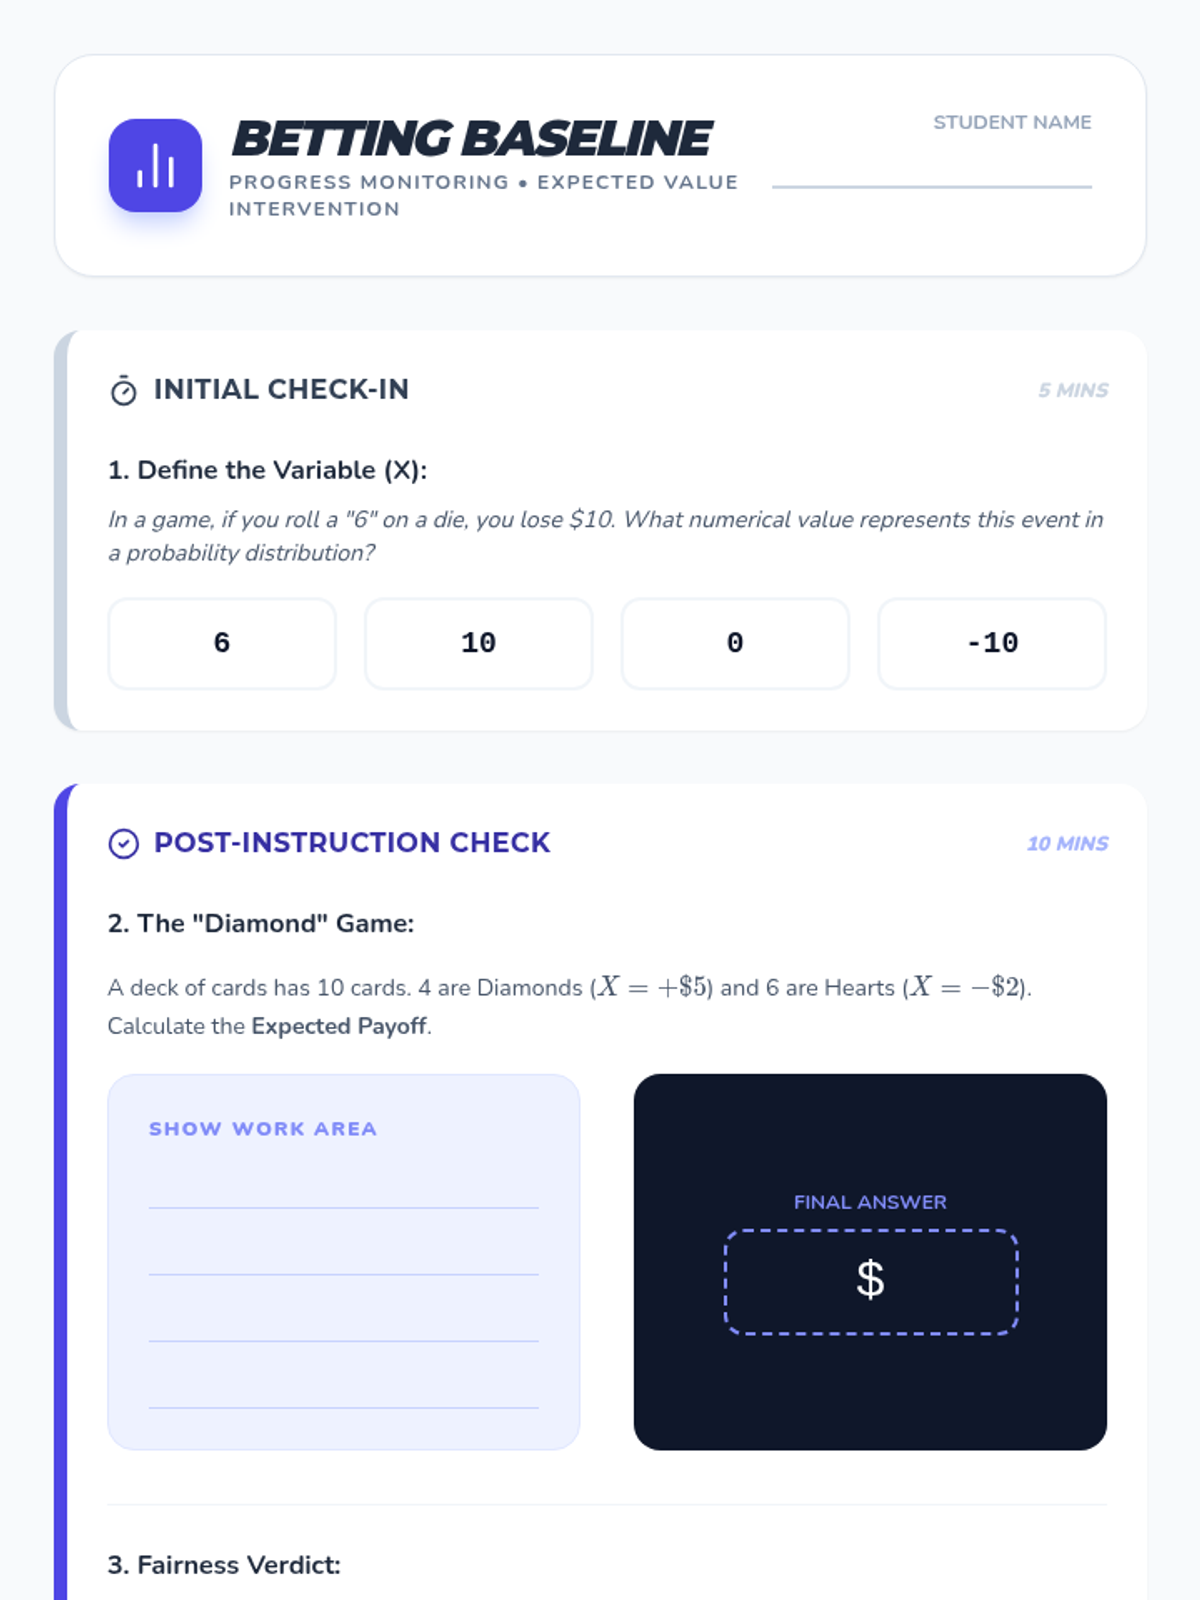
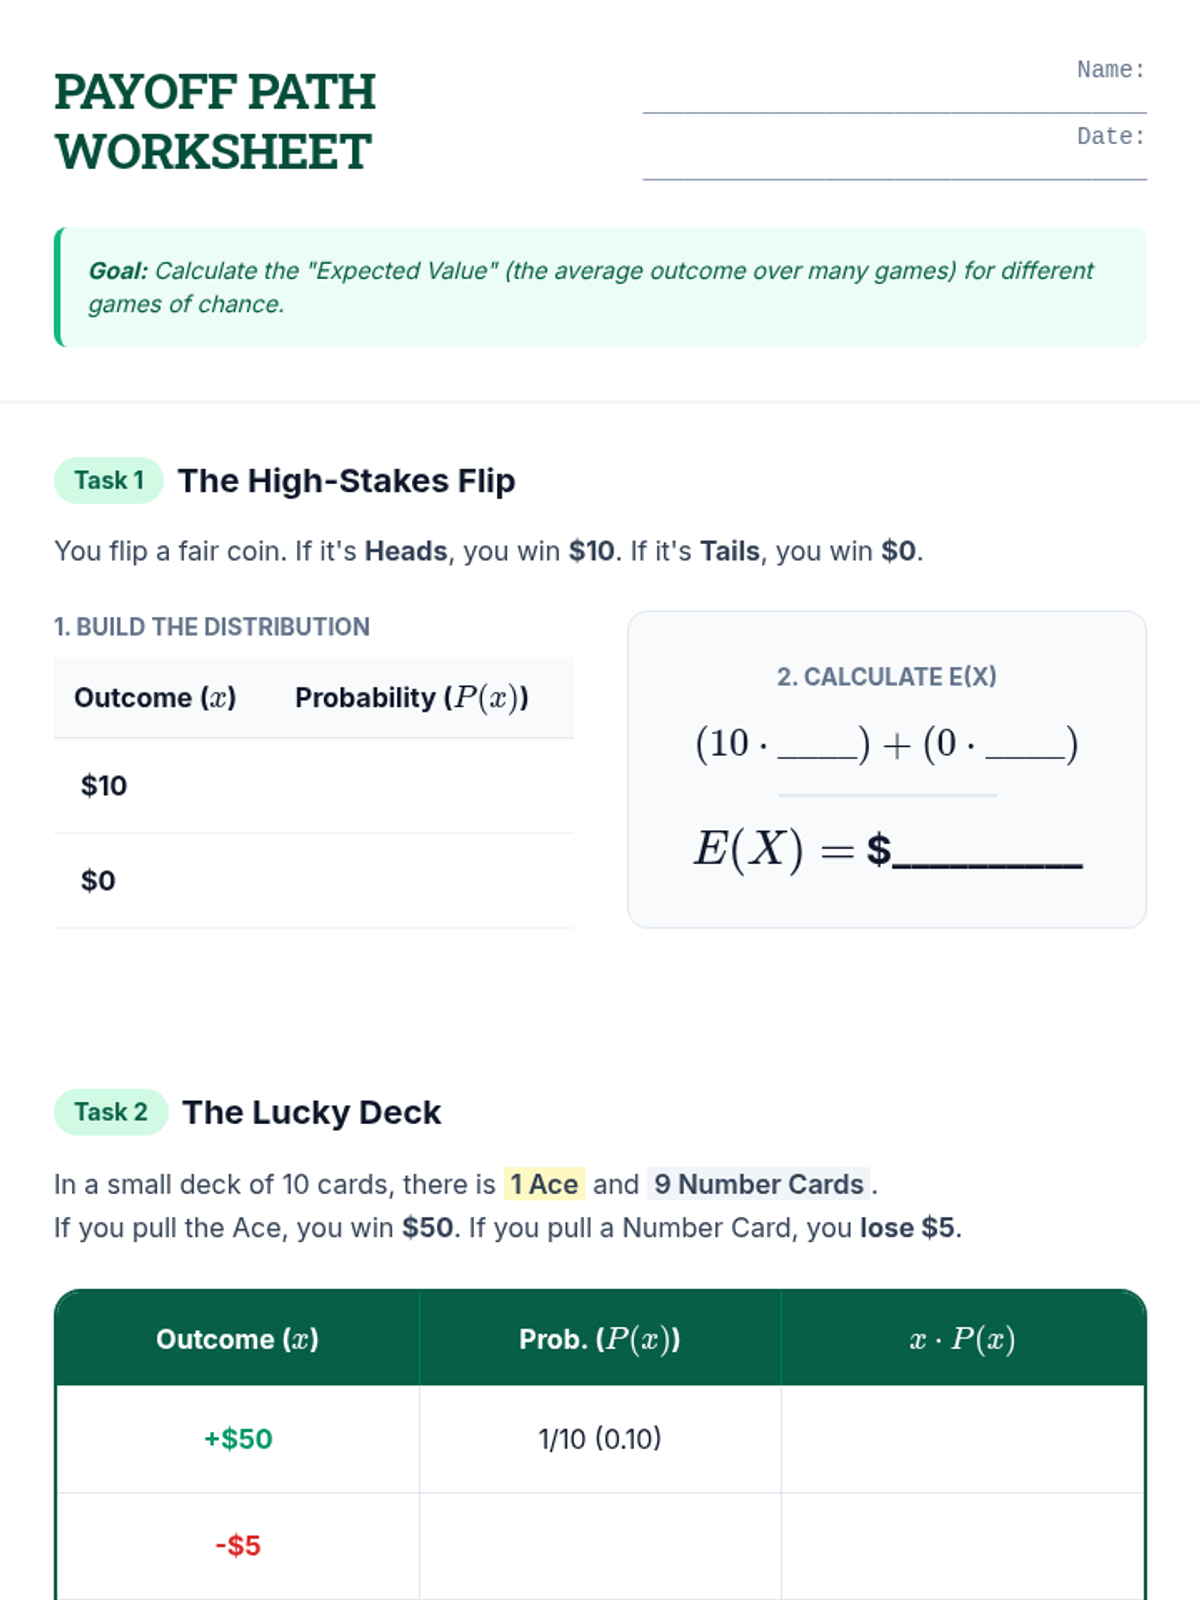
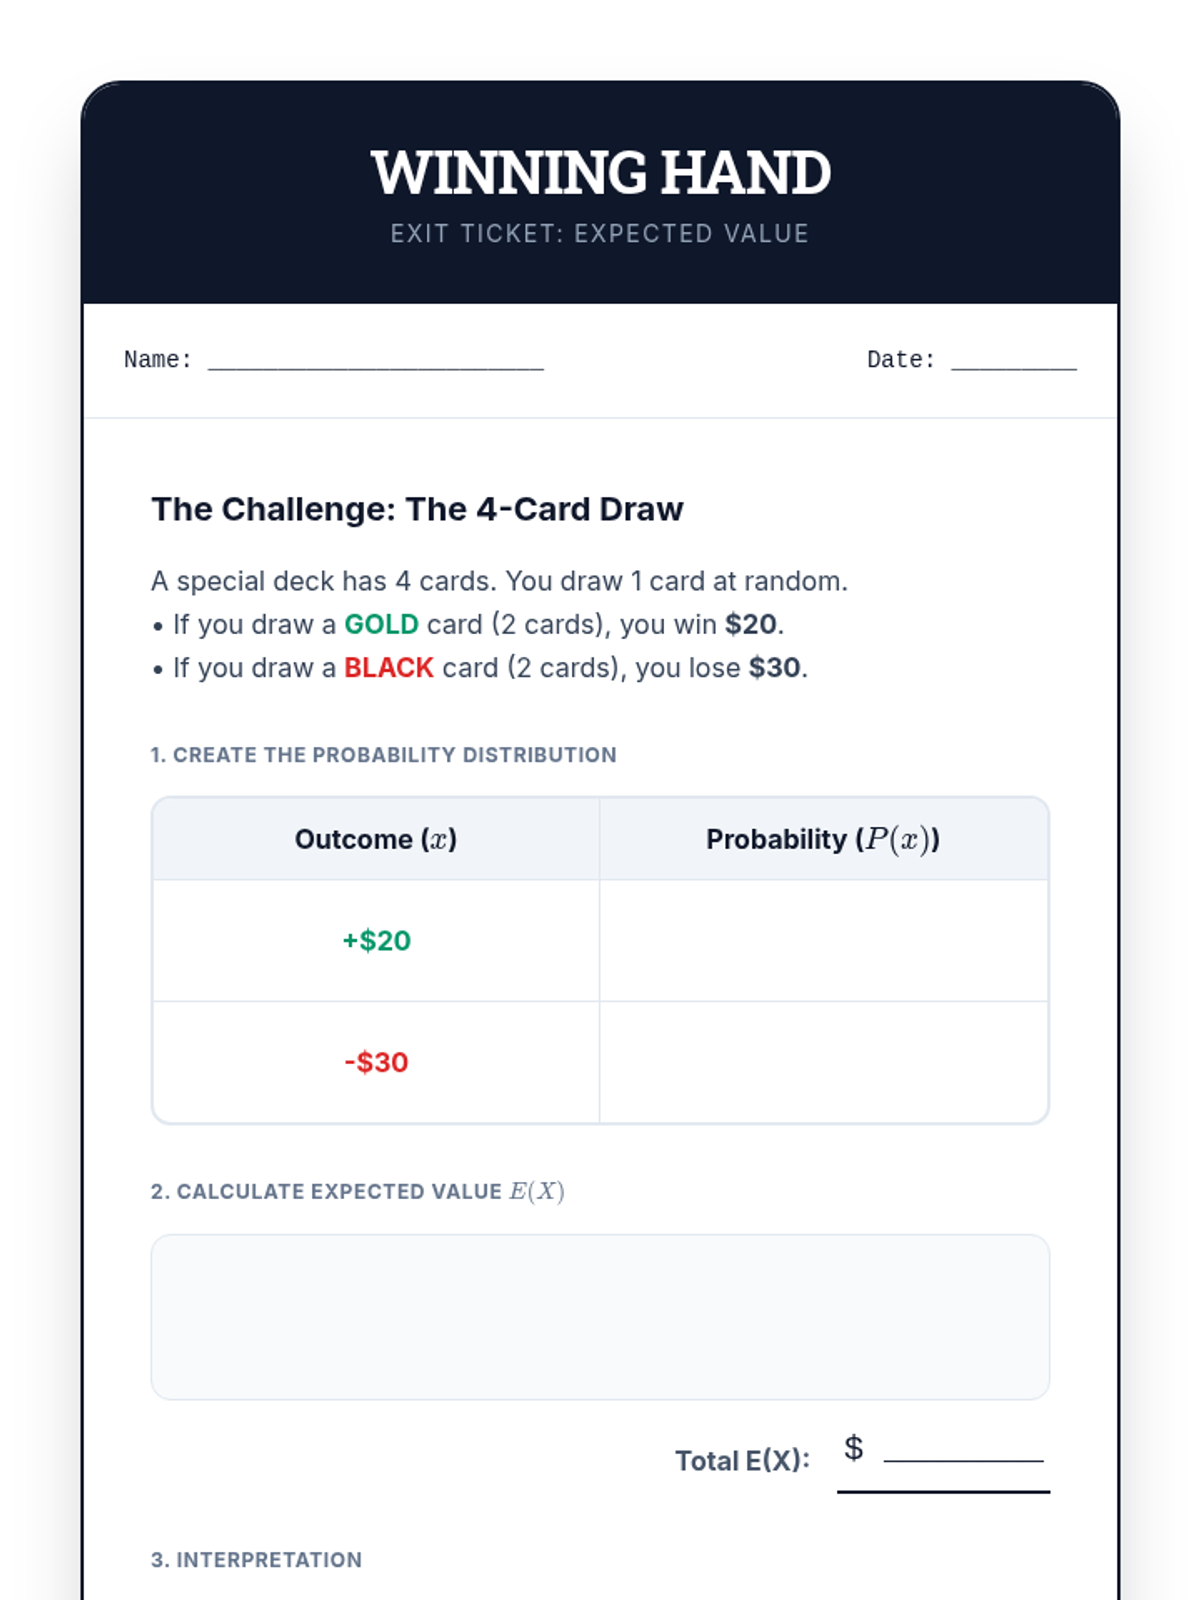
A Tier 2 intervention lesson focused on calculating expected payoffs for games of chance using a vintage carnival theme. Students use probability distributions to determine if carnival games are 'fair' through scaffolded, hands-on simulations.
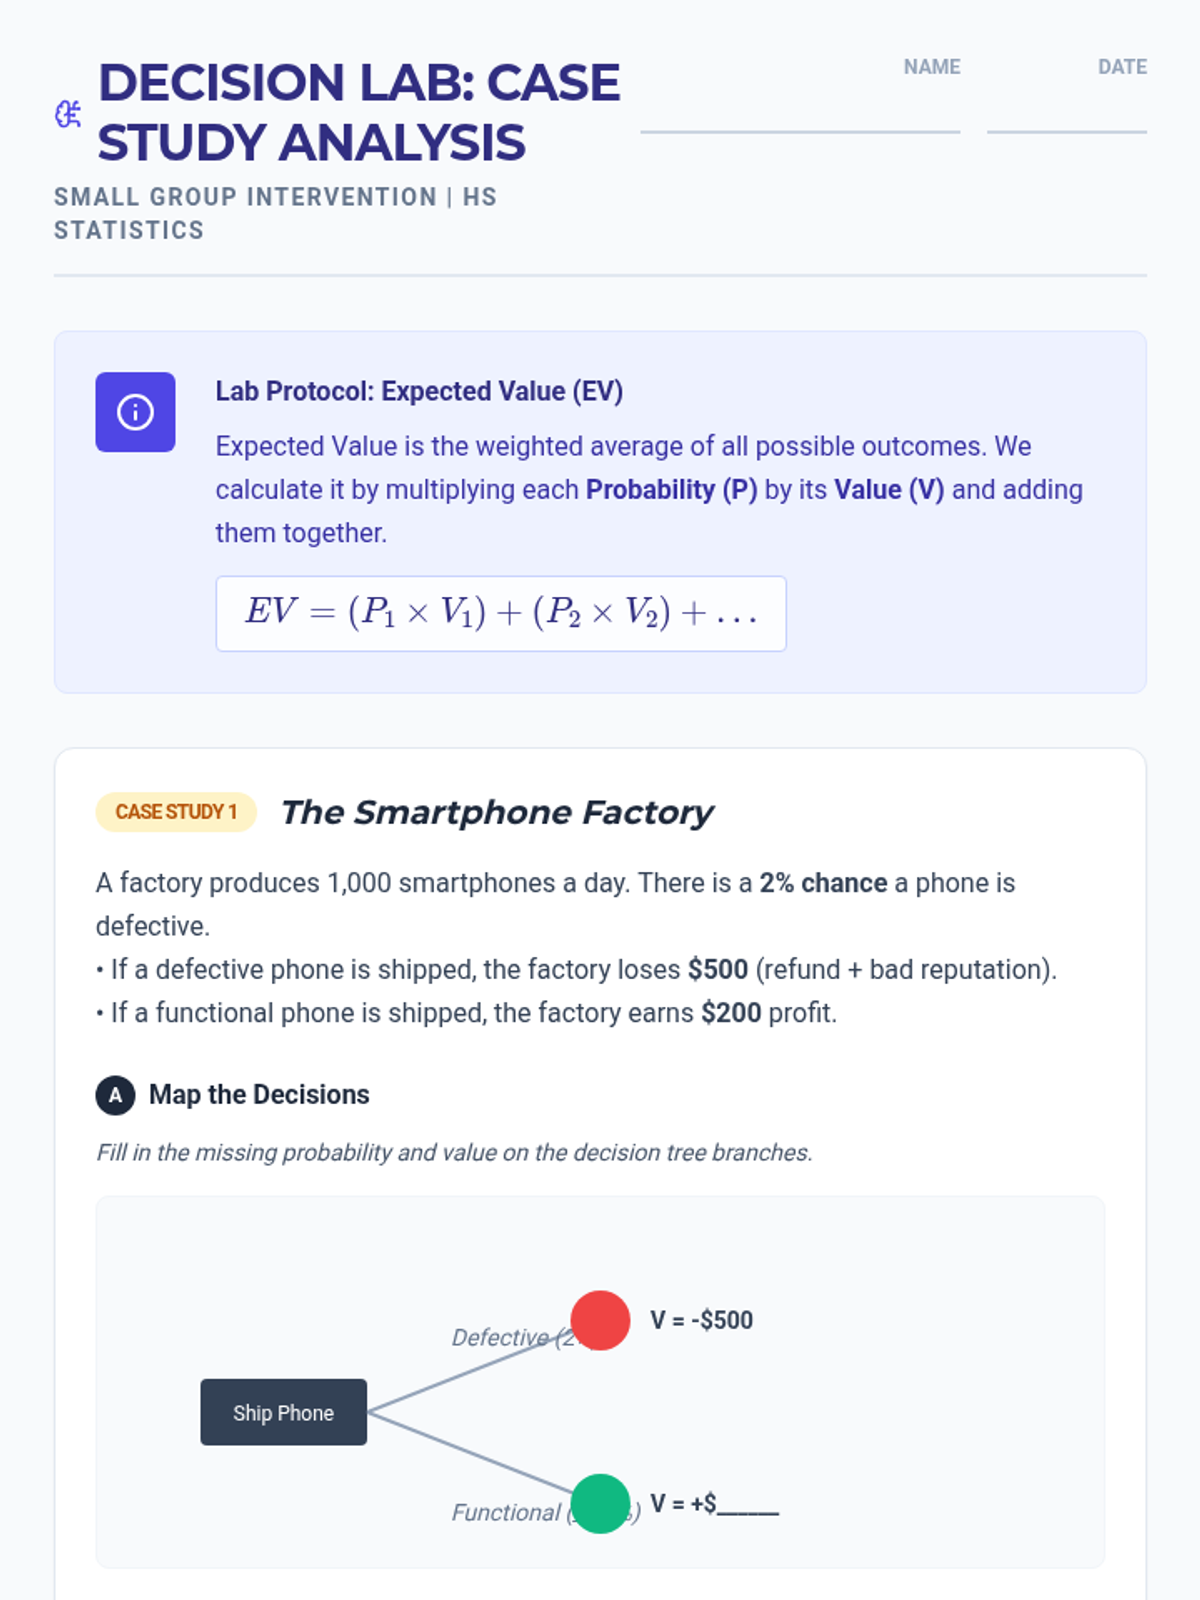
A Tier 2 intervention lesson focusing on using probability and expected value to analyze real-world decisions in medical testing, product quality, and sports strategy. Students use decision trees and justification templates to move from calculations to reasoned arguments.
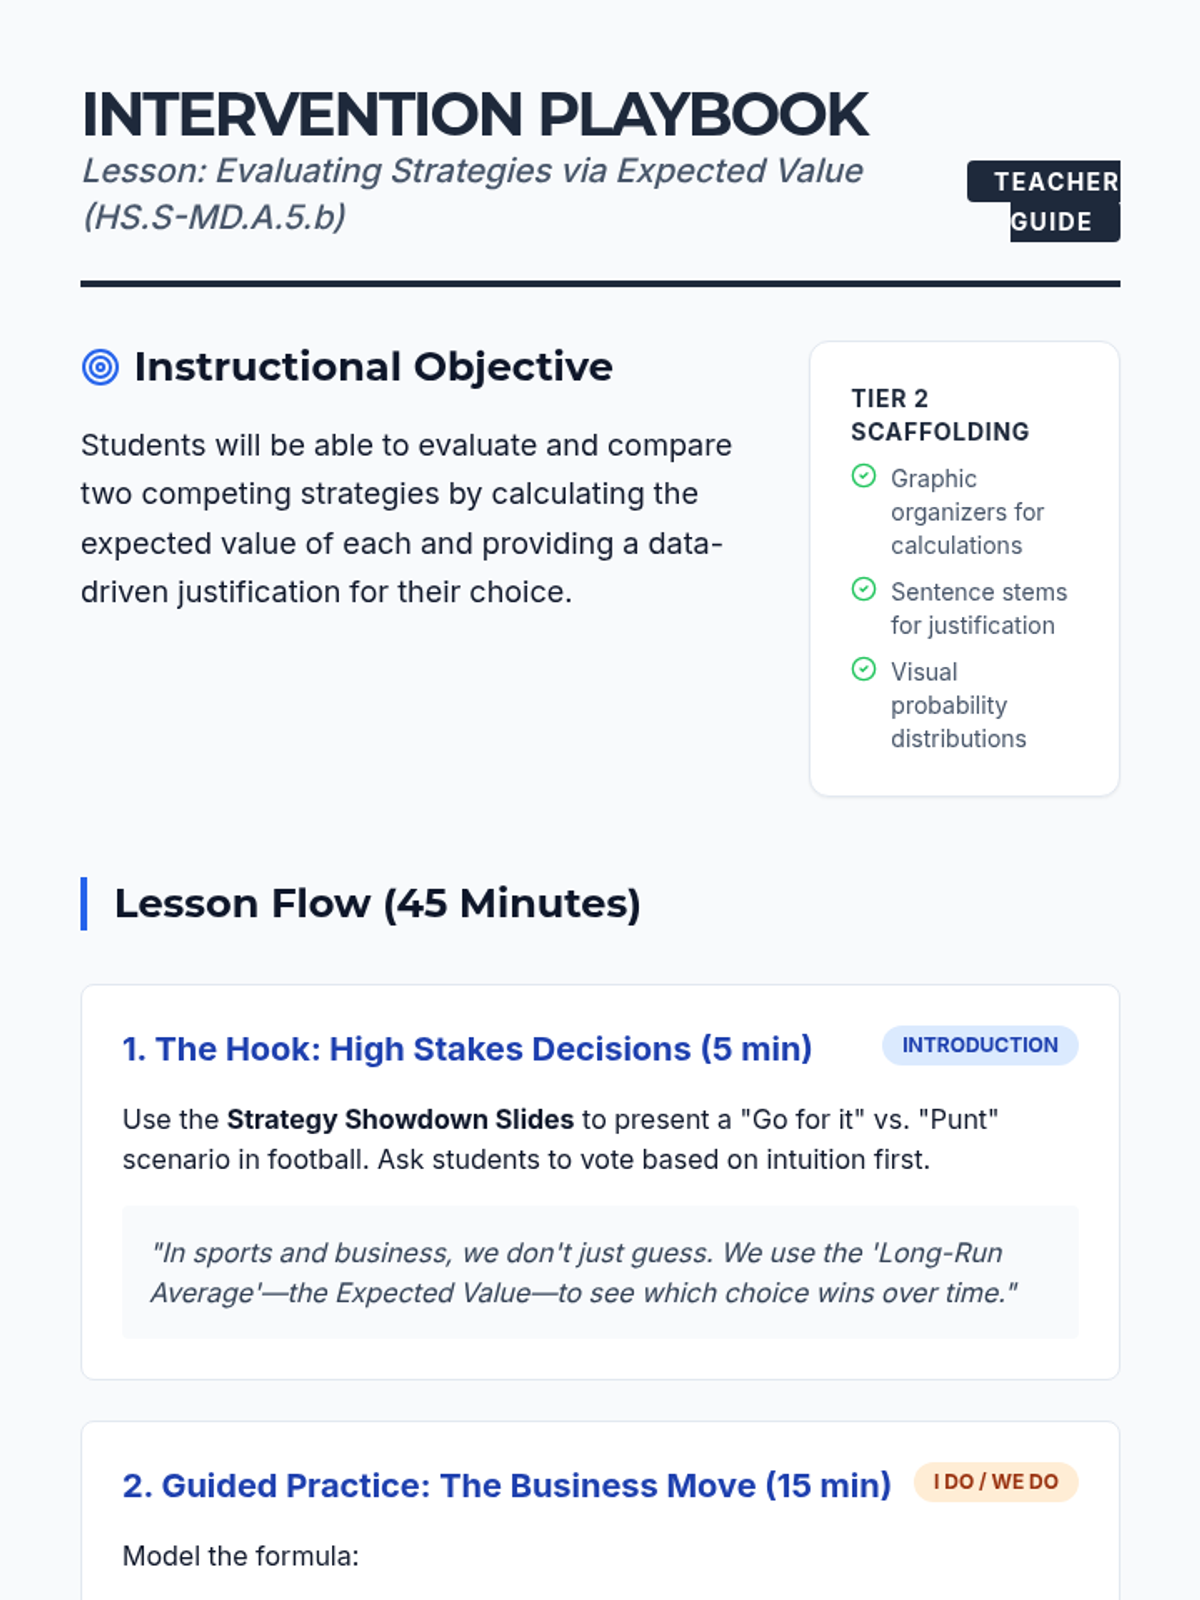
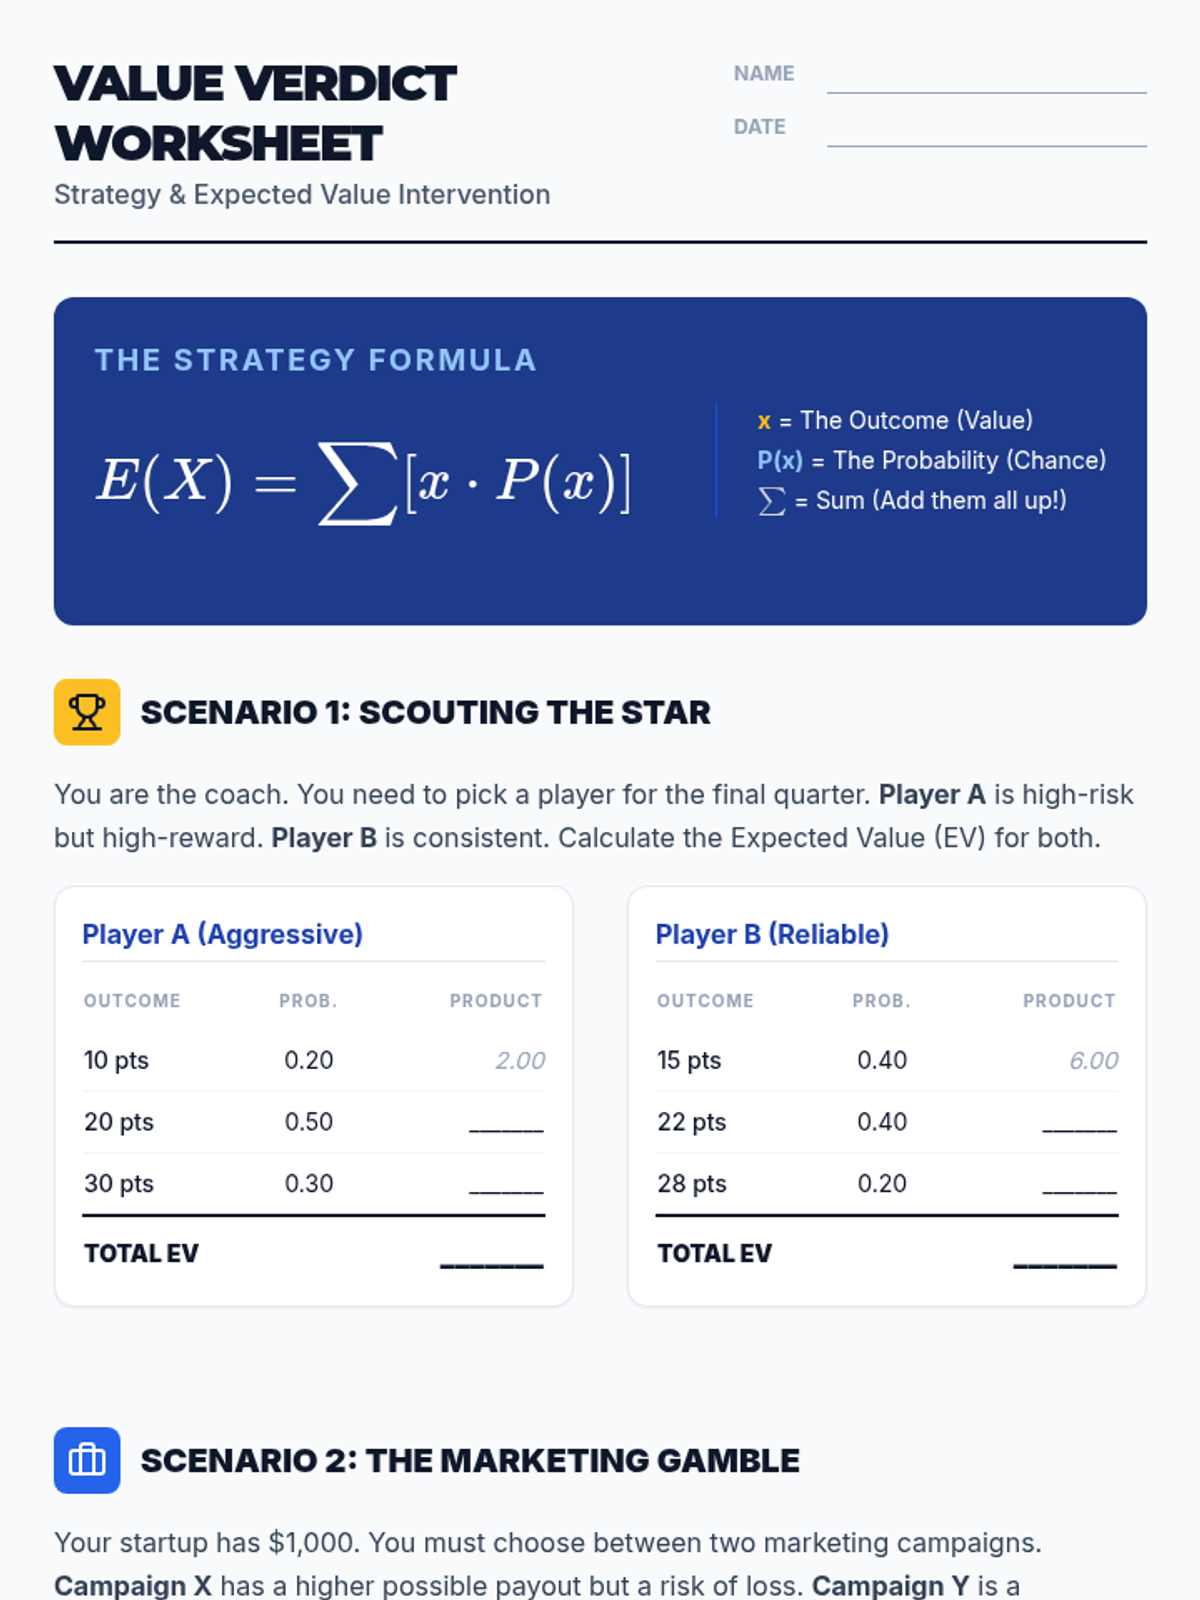
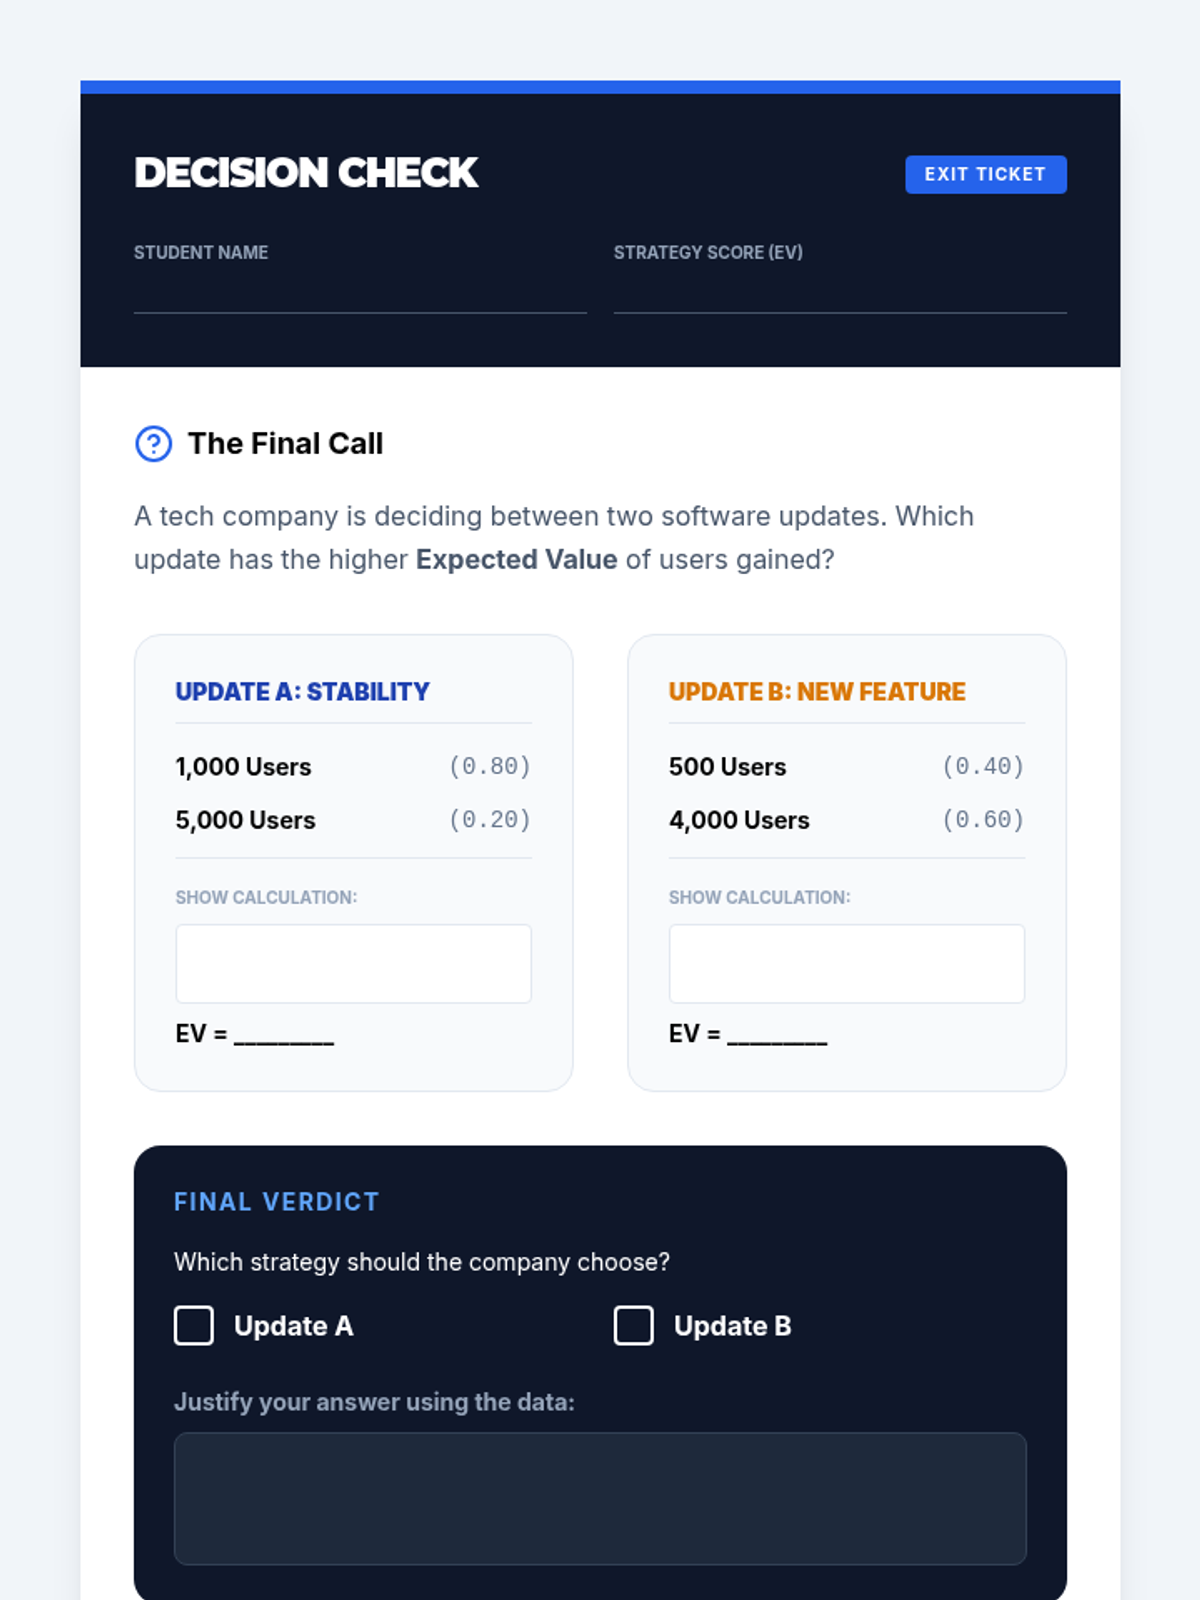
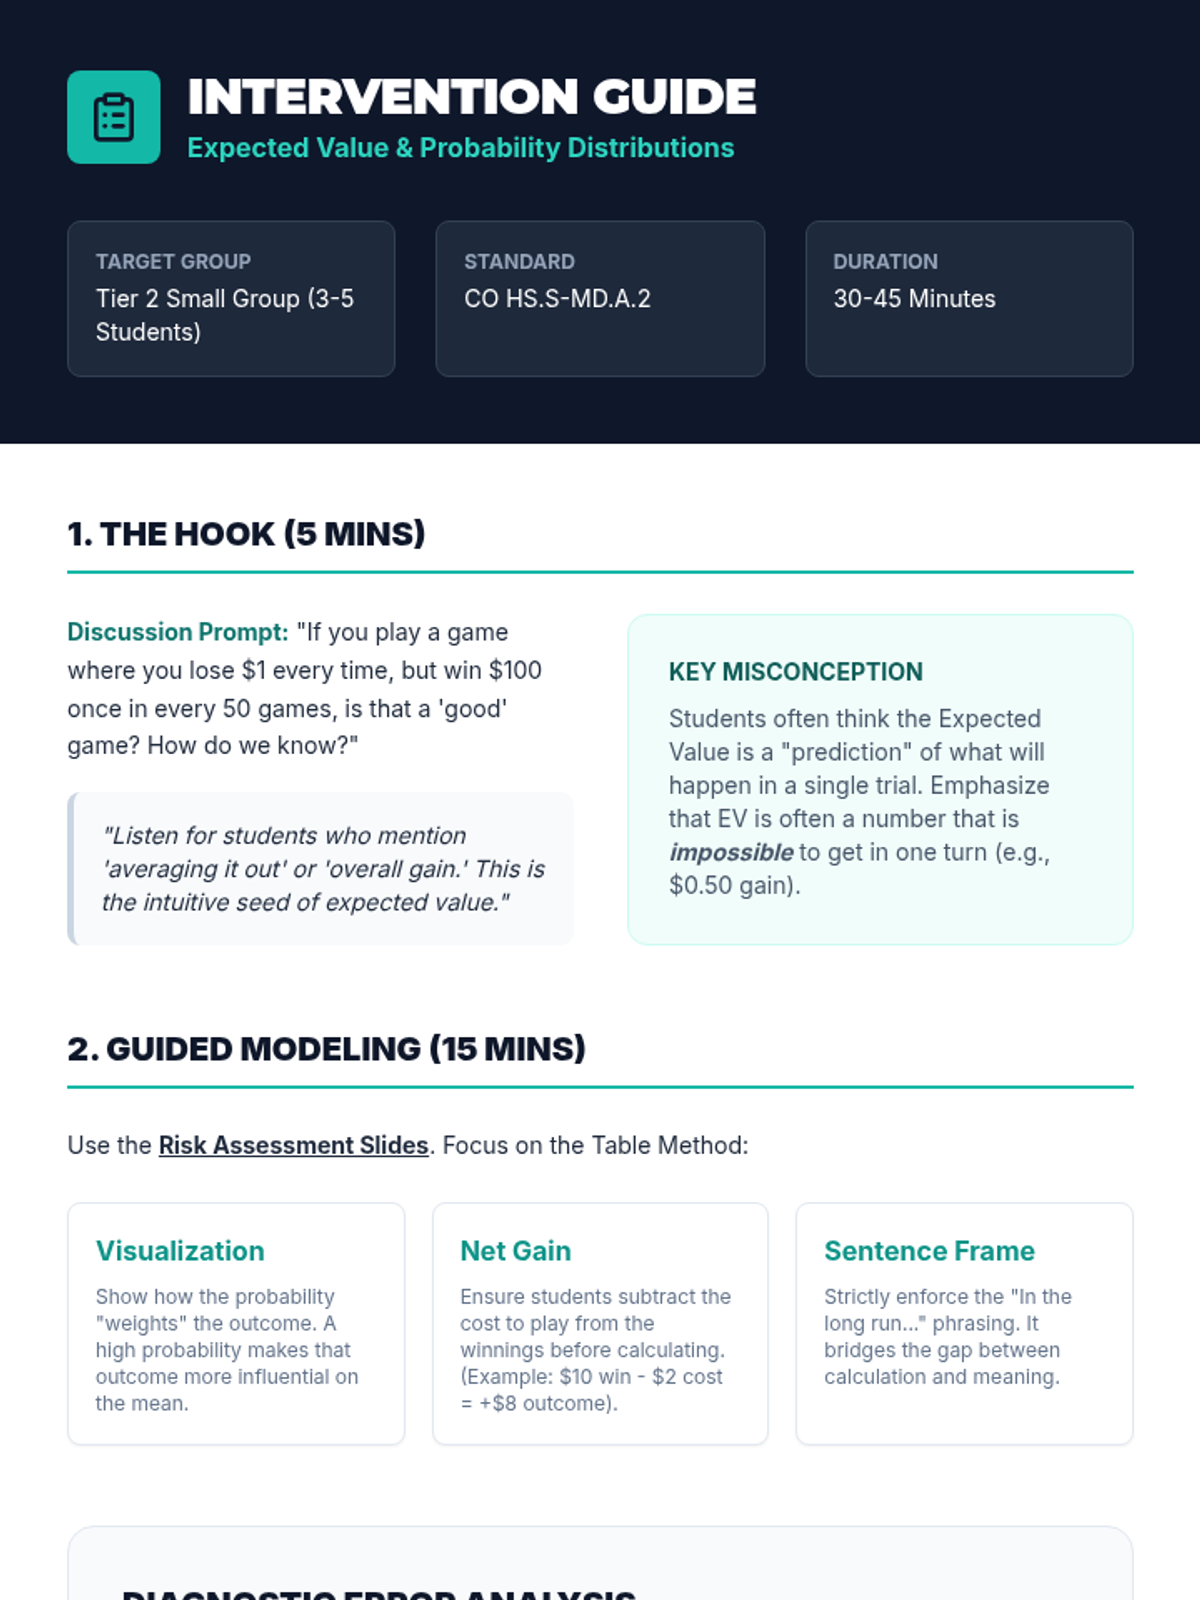
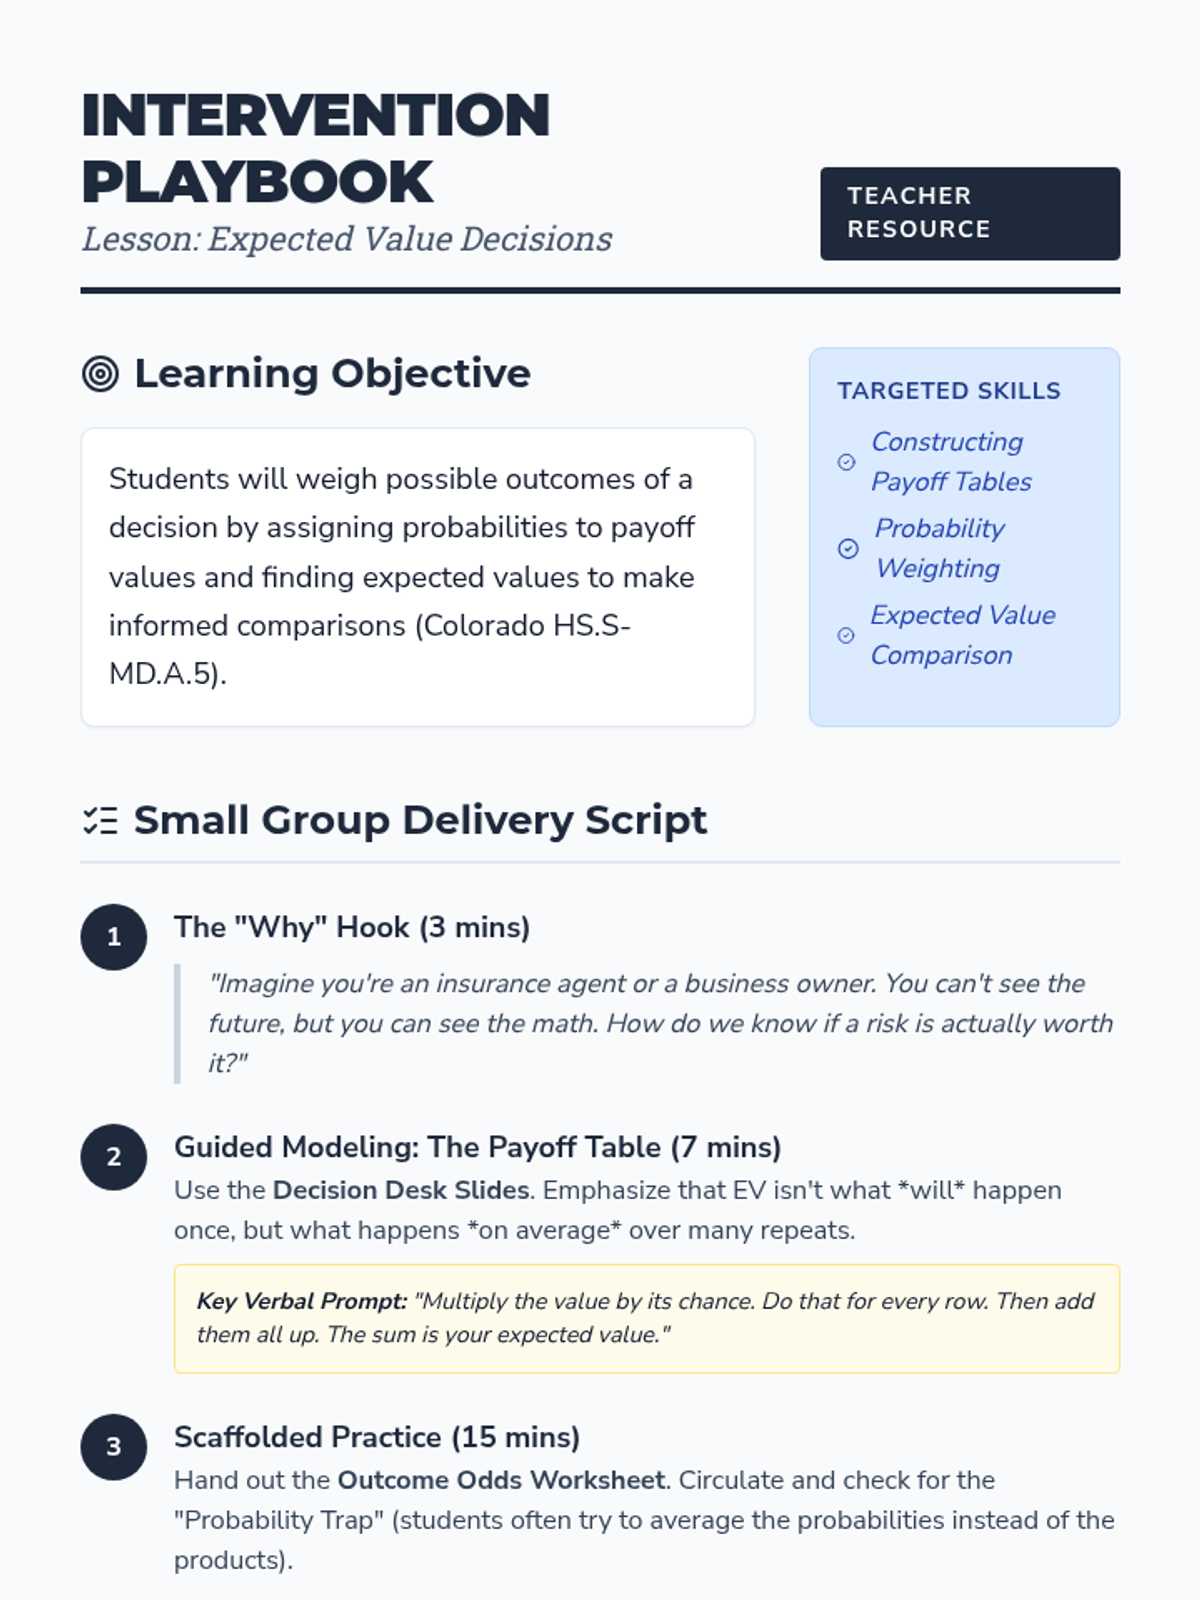
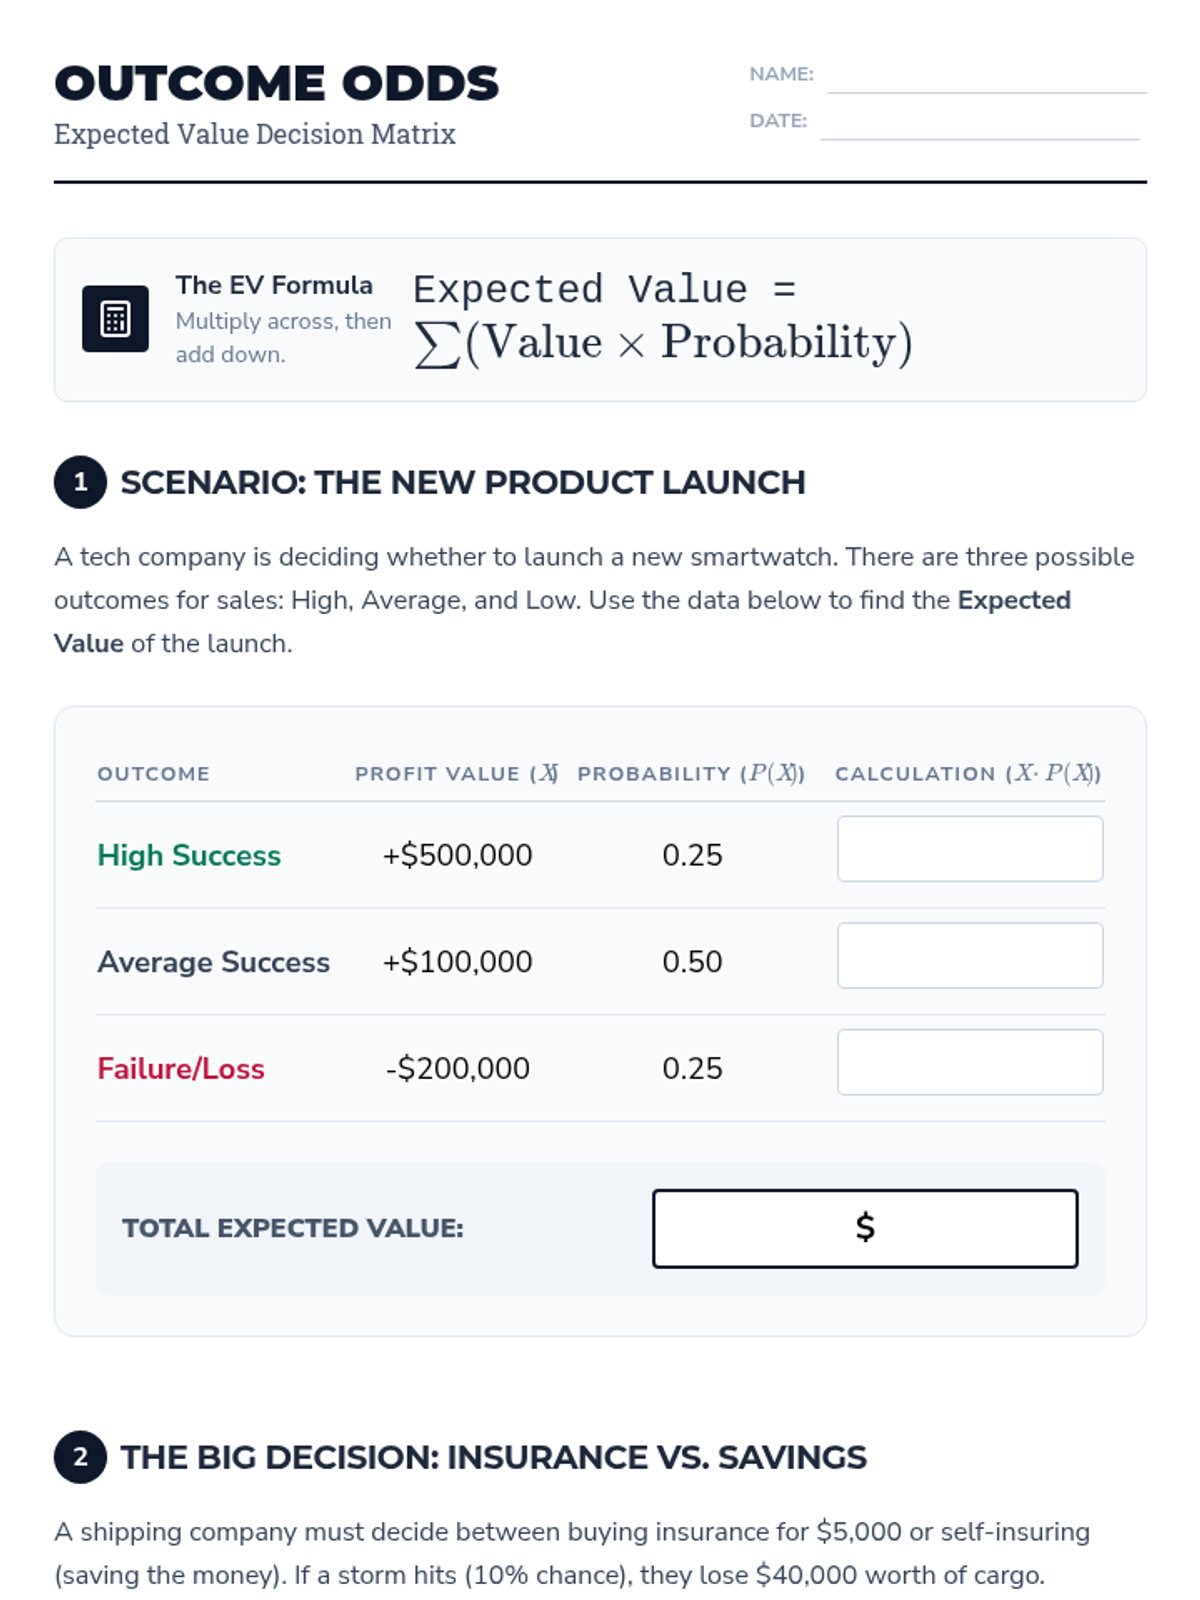
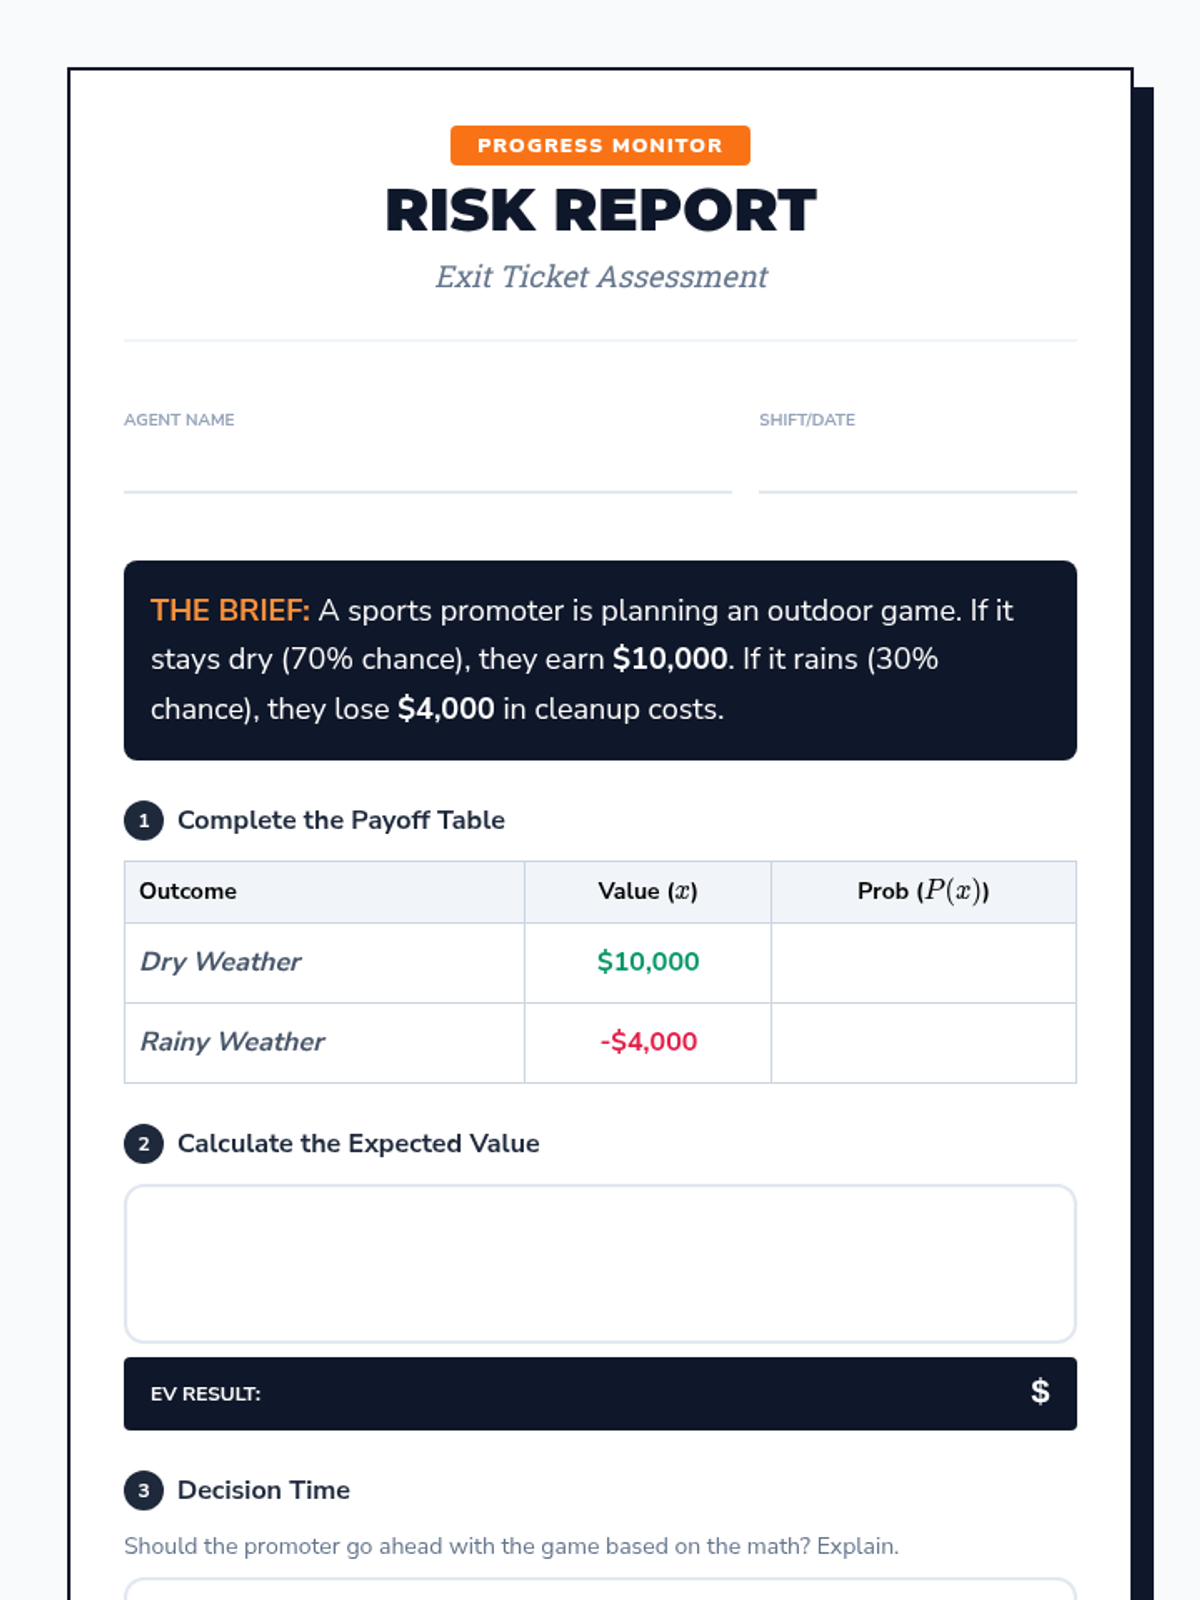
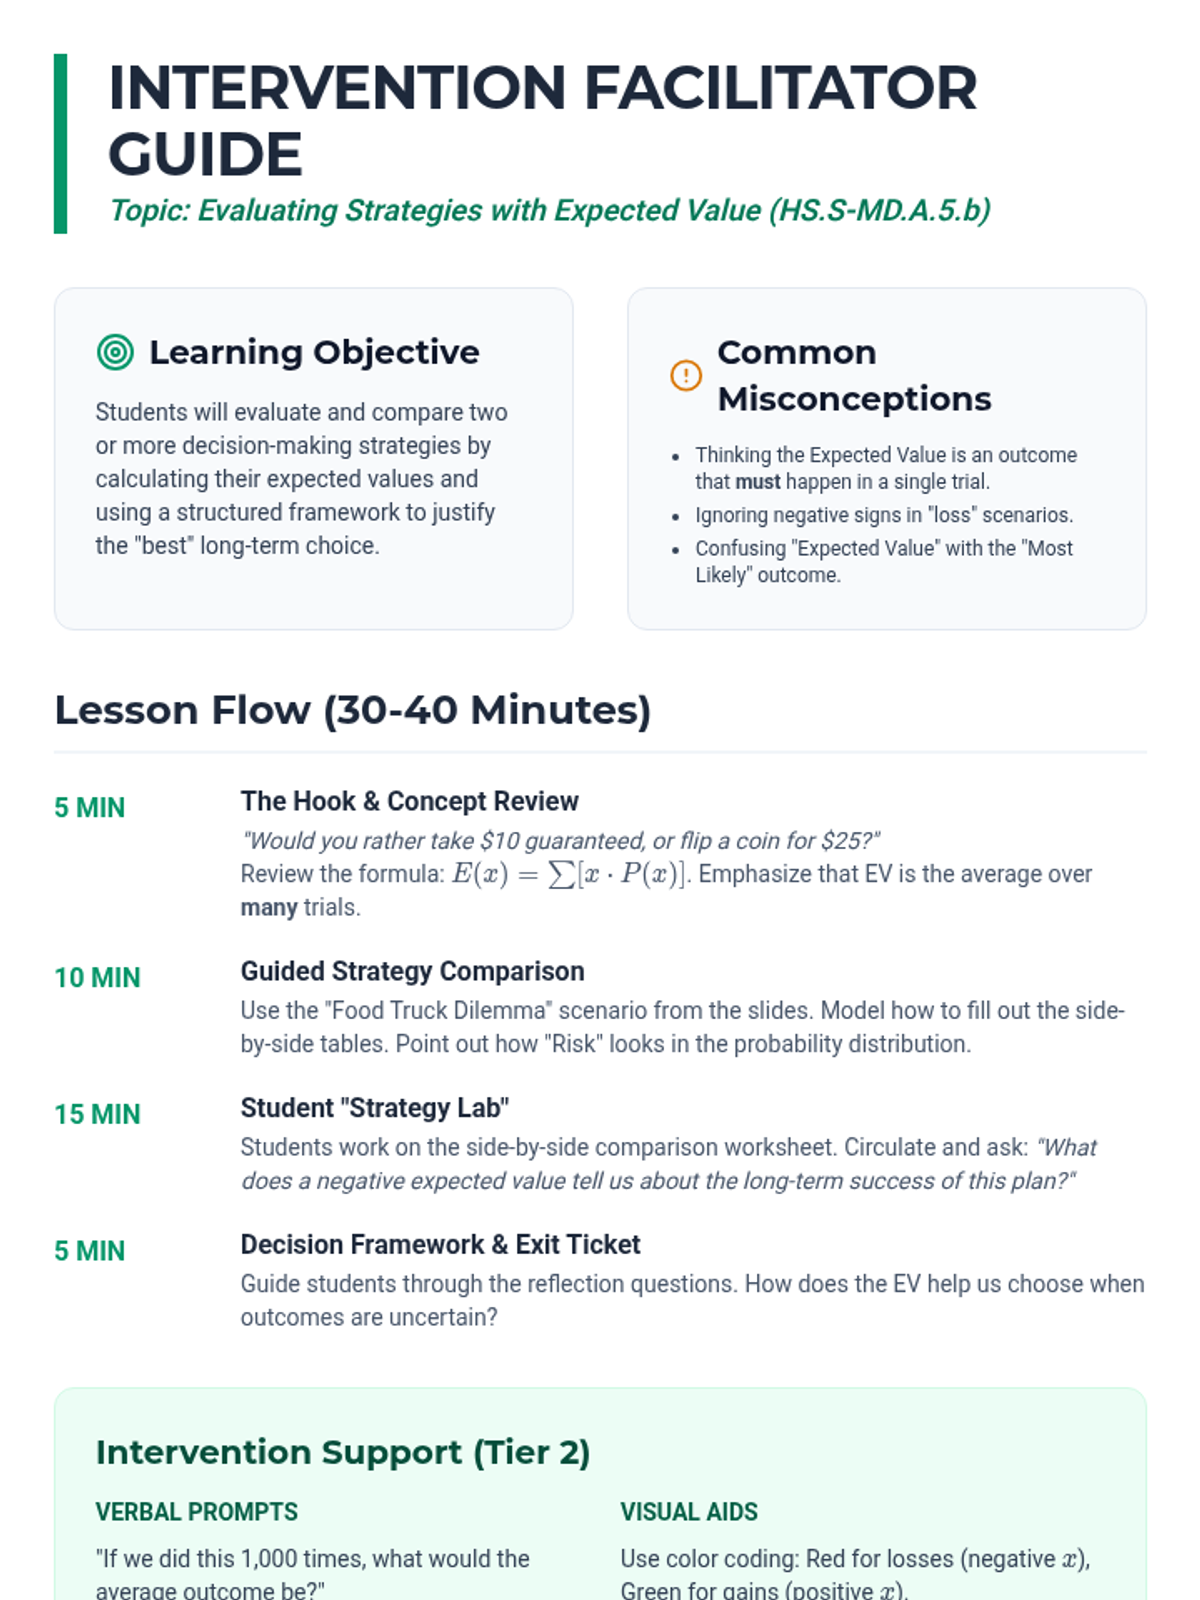
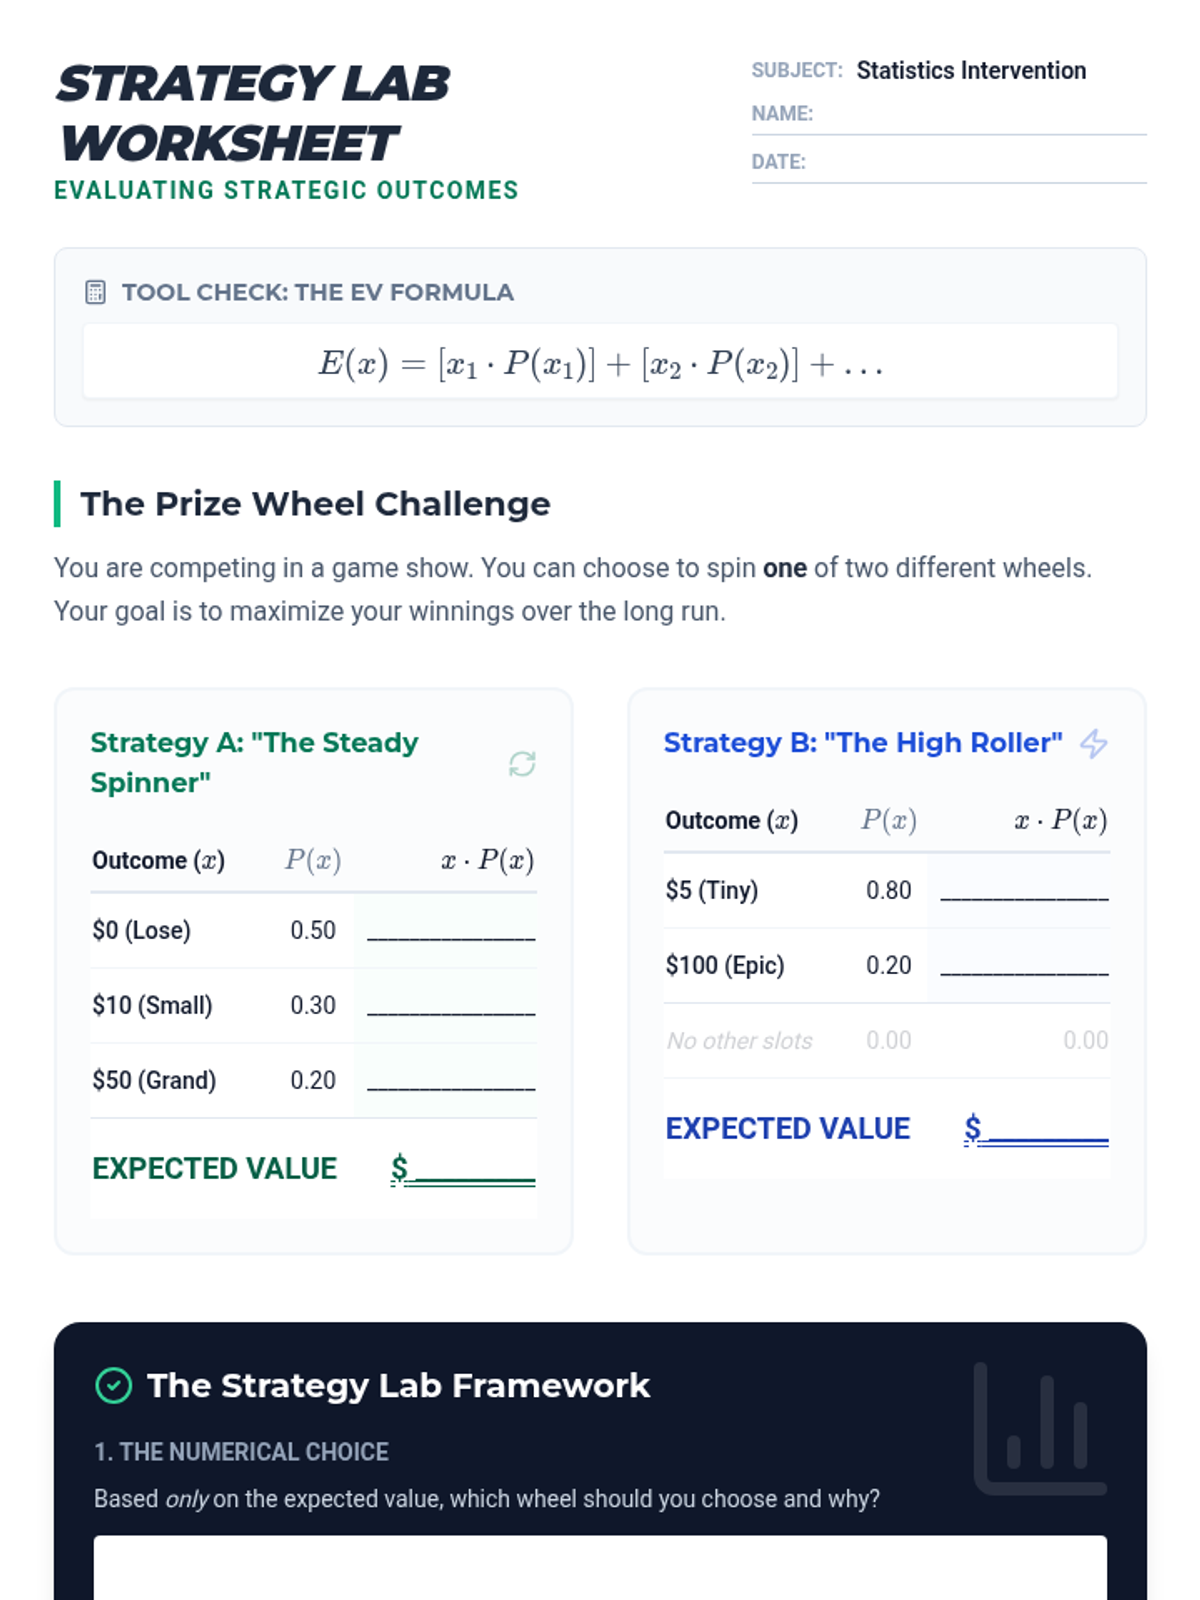
A targeted Tier 2 intervention lesson focused on calculating and comparing expected values to make informed decisions in sports and business contexts. Students will learn to evaluate competing strategies through scaffolded practice and peer justification.
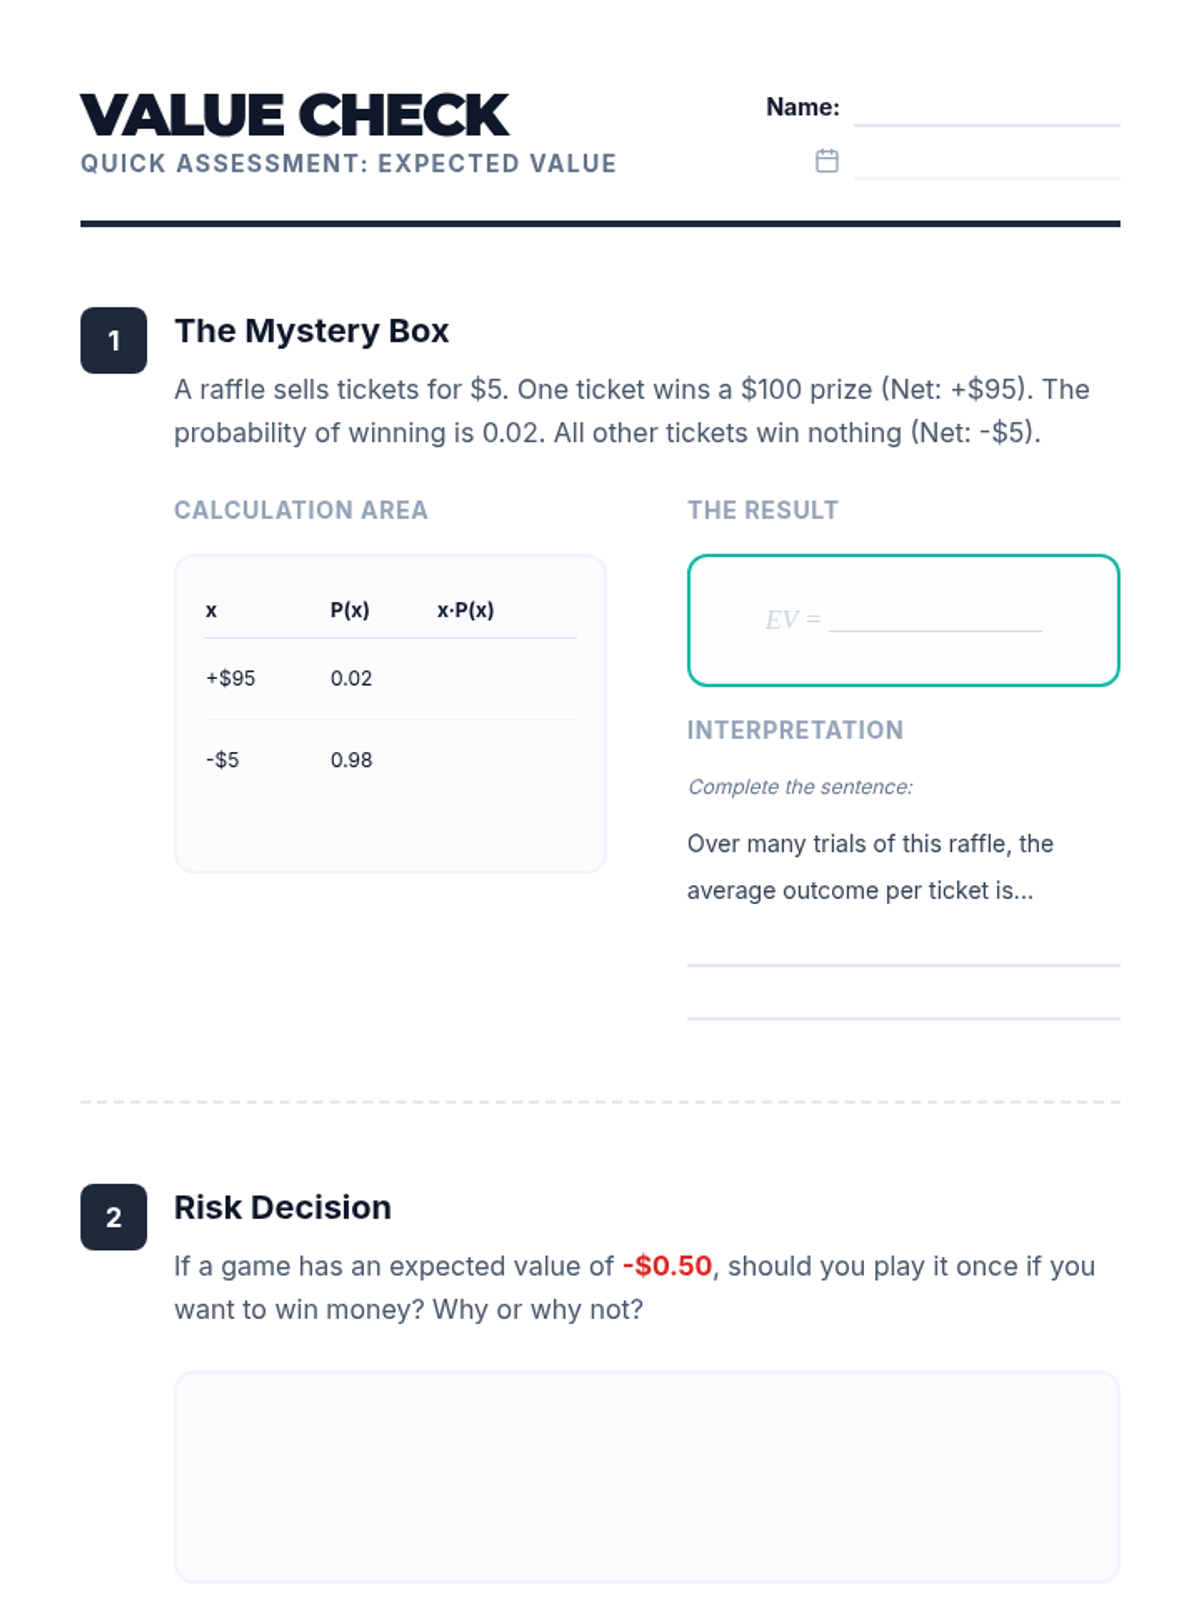
A Tier 2 intervention lesson designed for small groups to master calculating and interpreting expected value through scaffolded practice with real-world scenarios like smartphone insurance and carnival games.
A targeted intervention lesson for high school students to master calculating expected values for decision-making. Includes guided practice with payoff tables and scaffolded comparisons of multiple options.
A targeted Tier 2 intervention lesson designed to help high school students evaluate and compare different strategies using expected value calculations and decision-making frameworks.
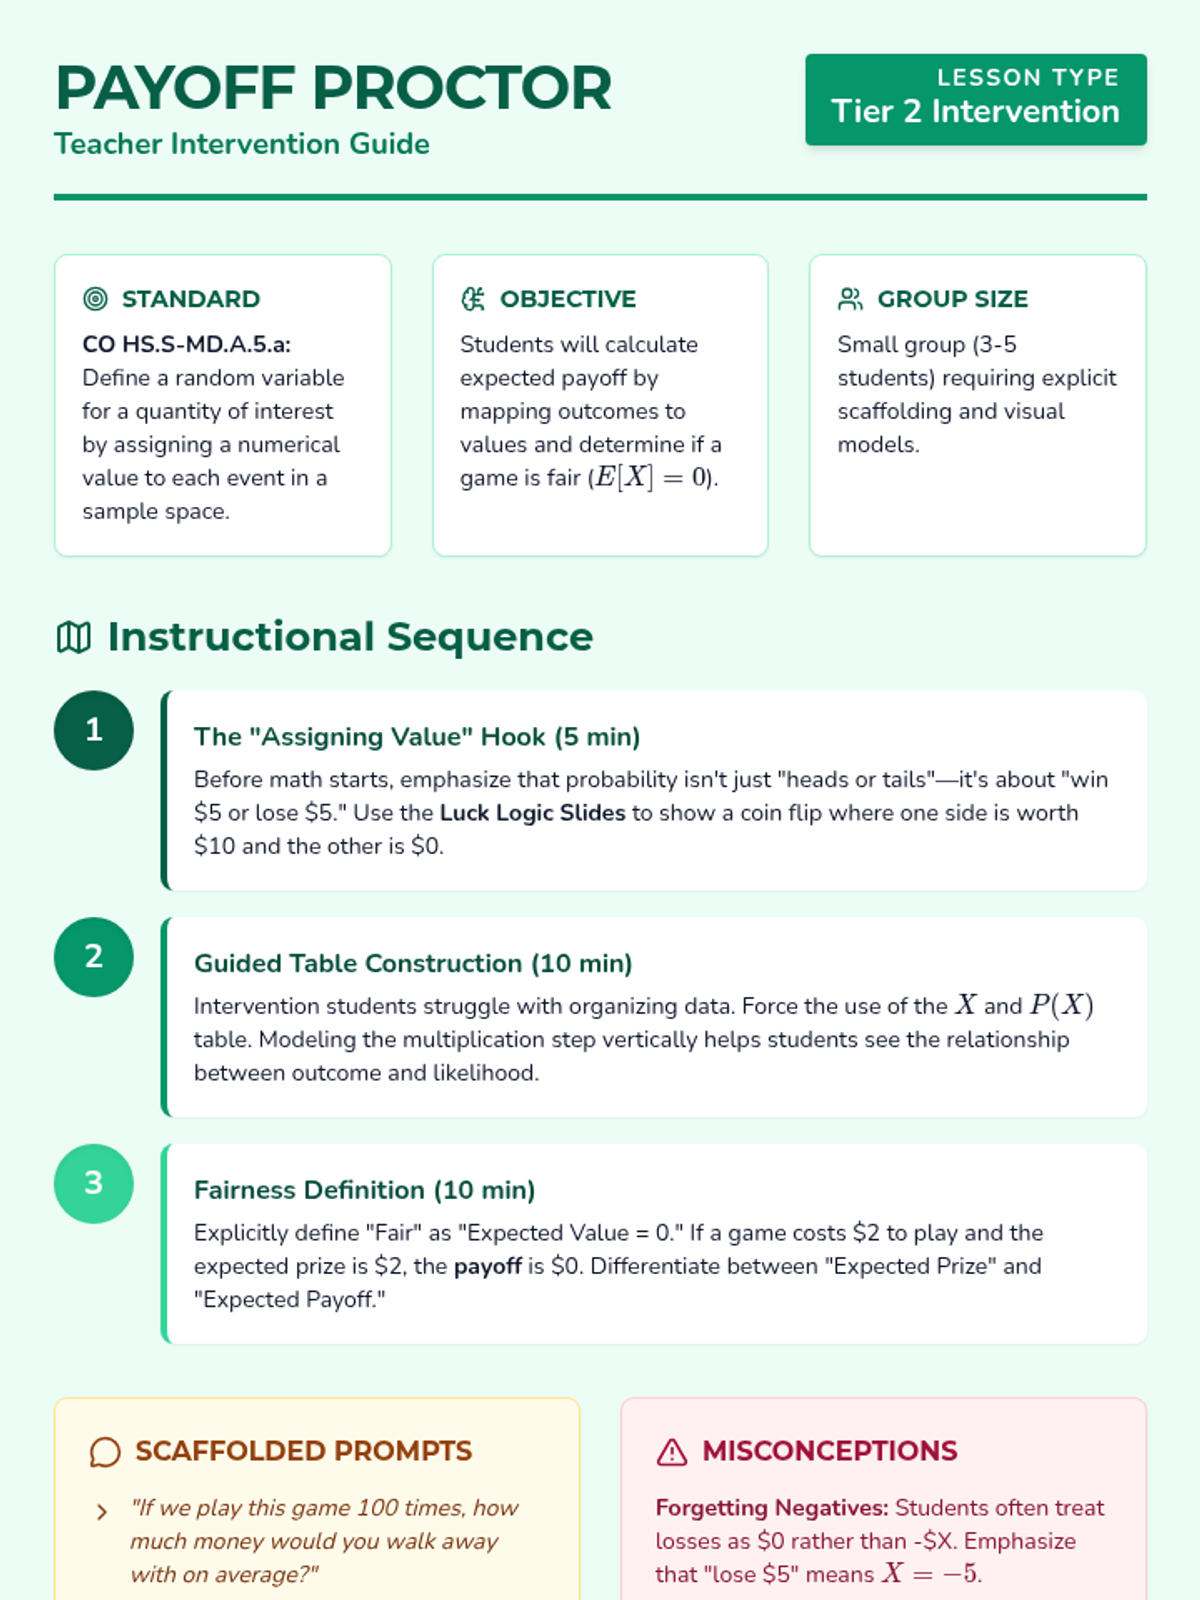
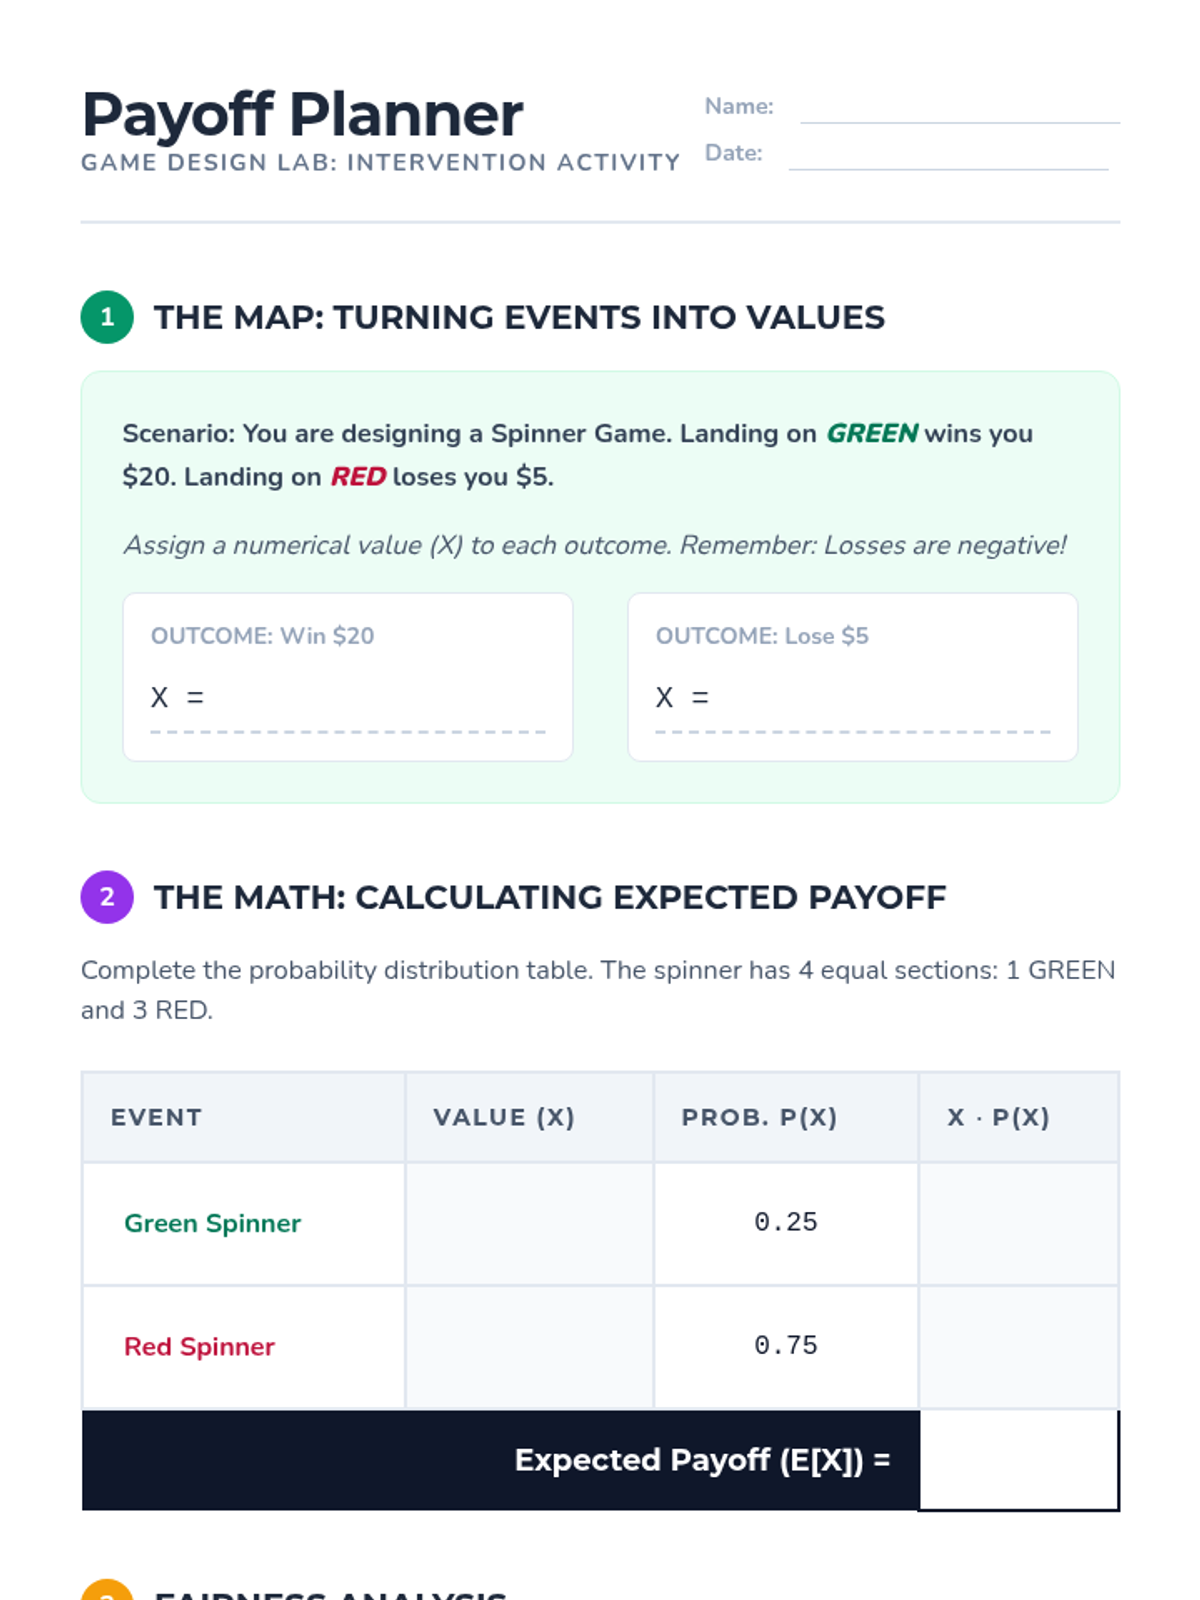
A targeted intervention lesson for high school students to master the calculation of expected value in games of chance, focusing on defining random variables and determining game fairness.
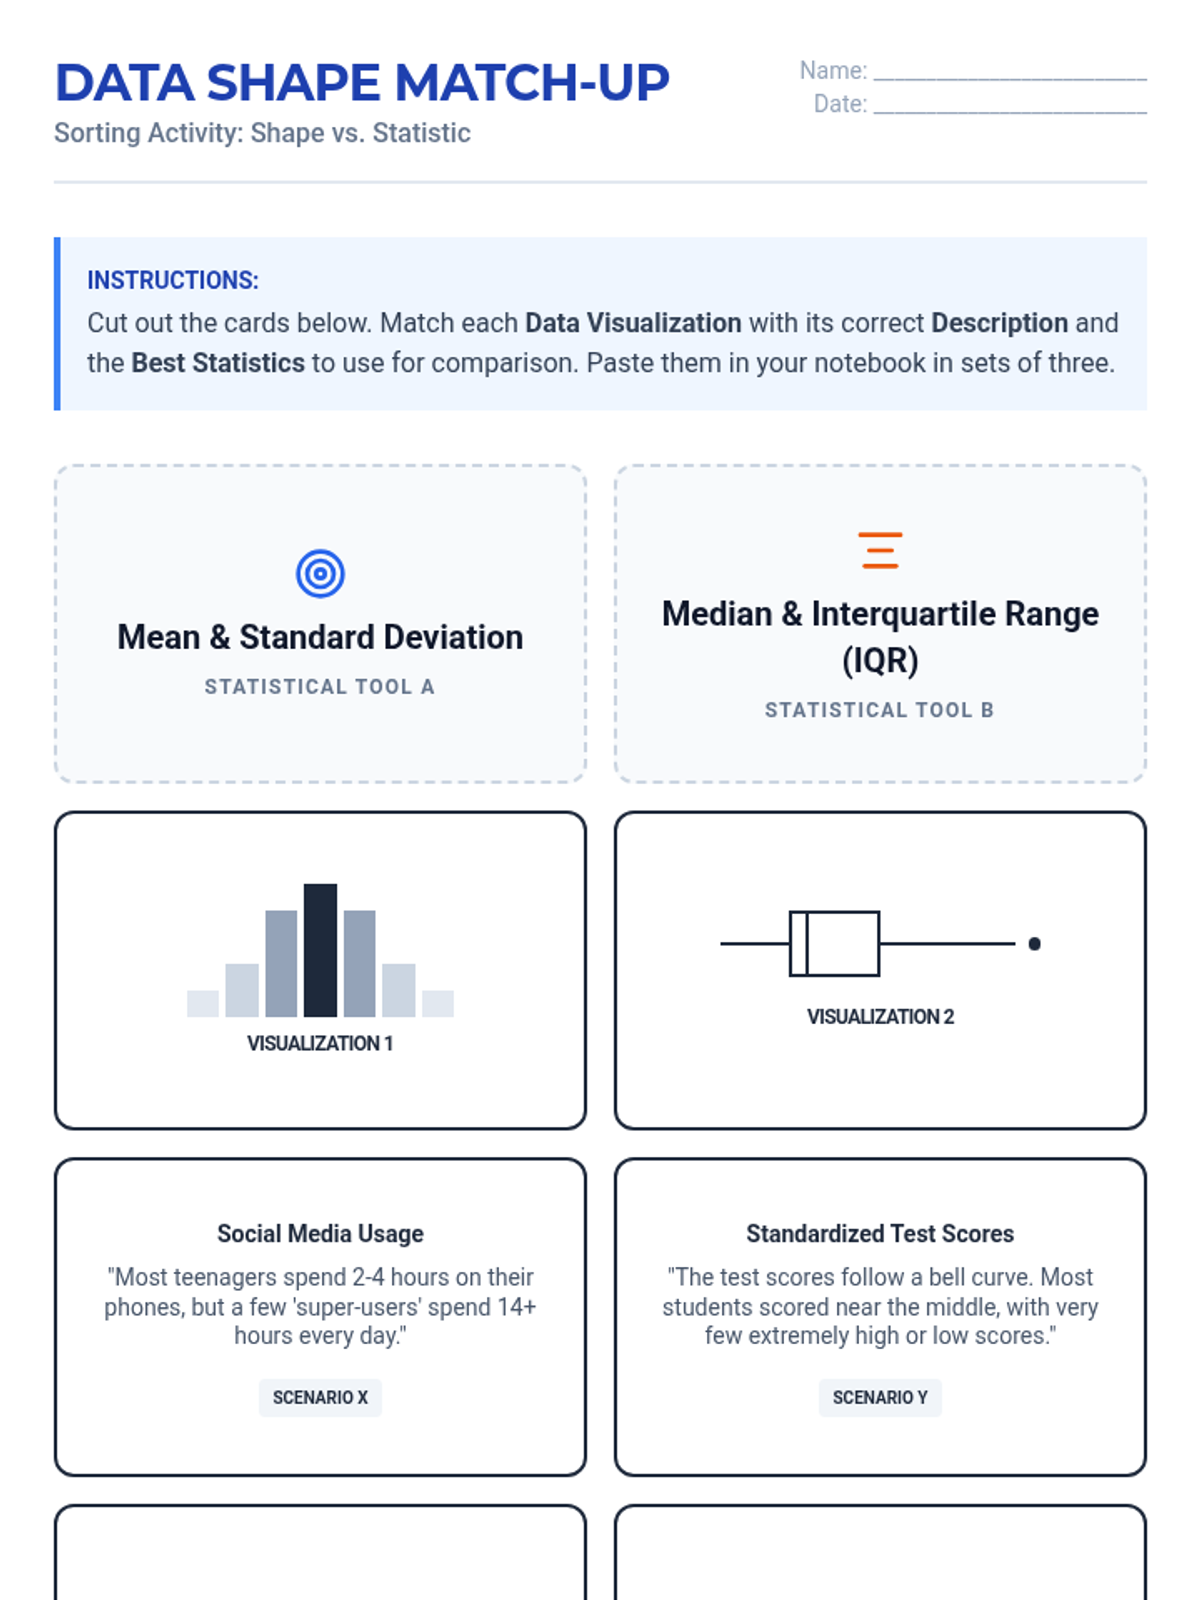
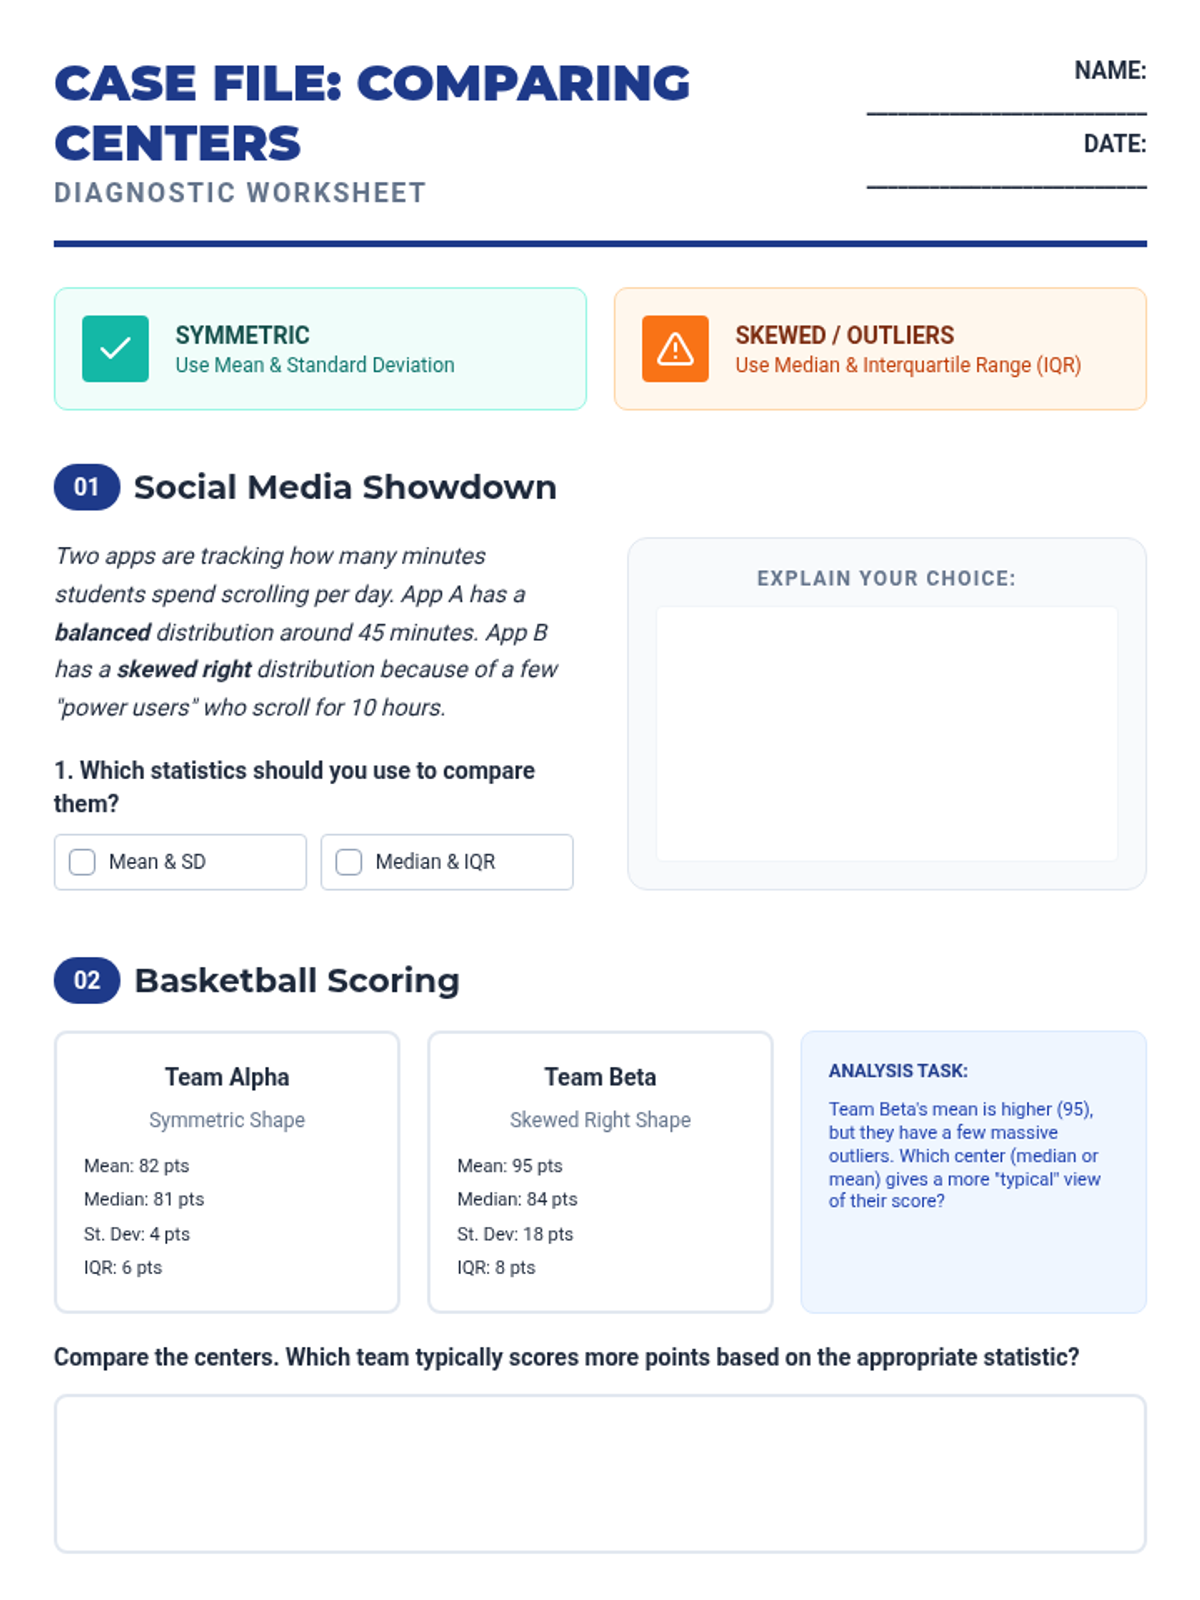
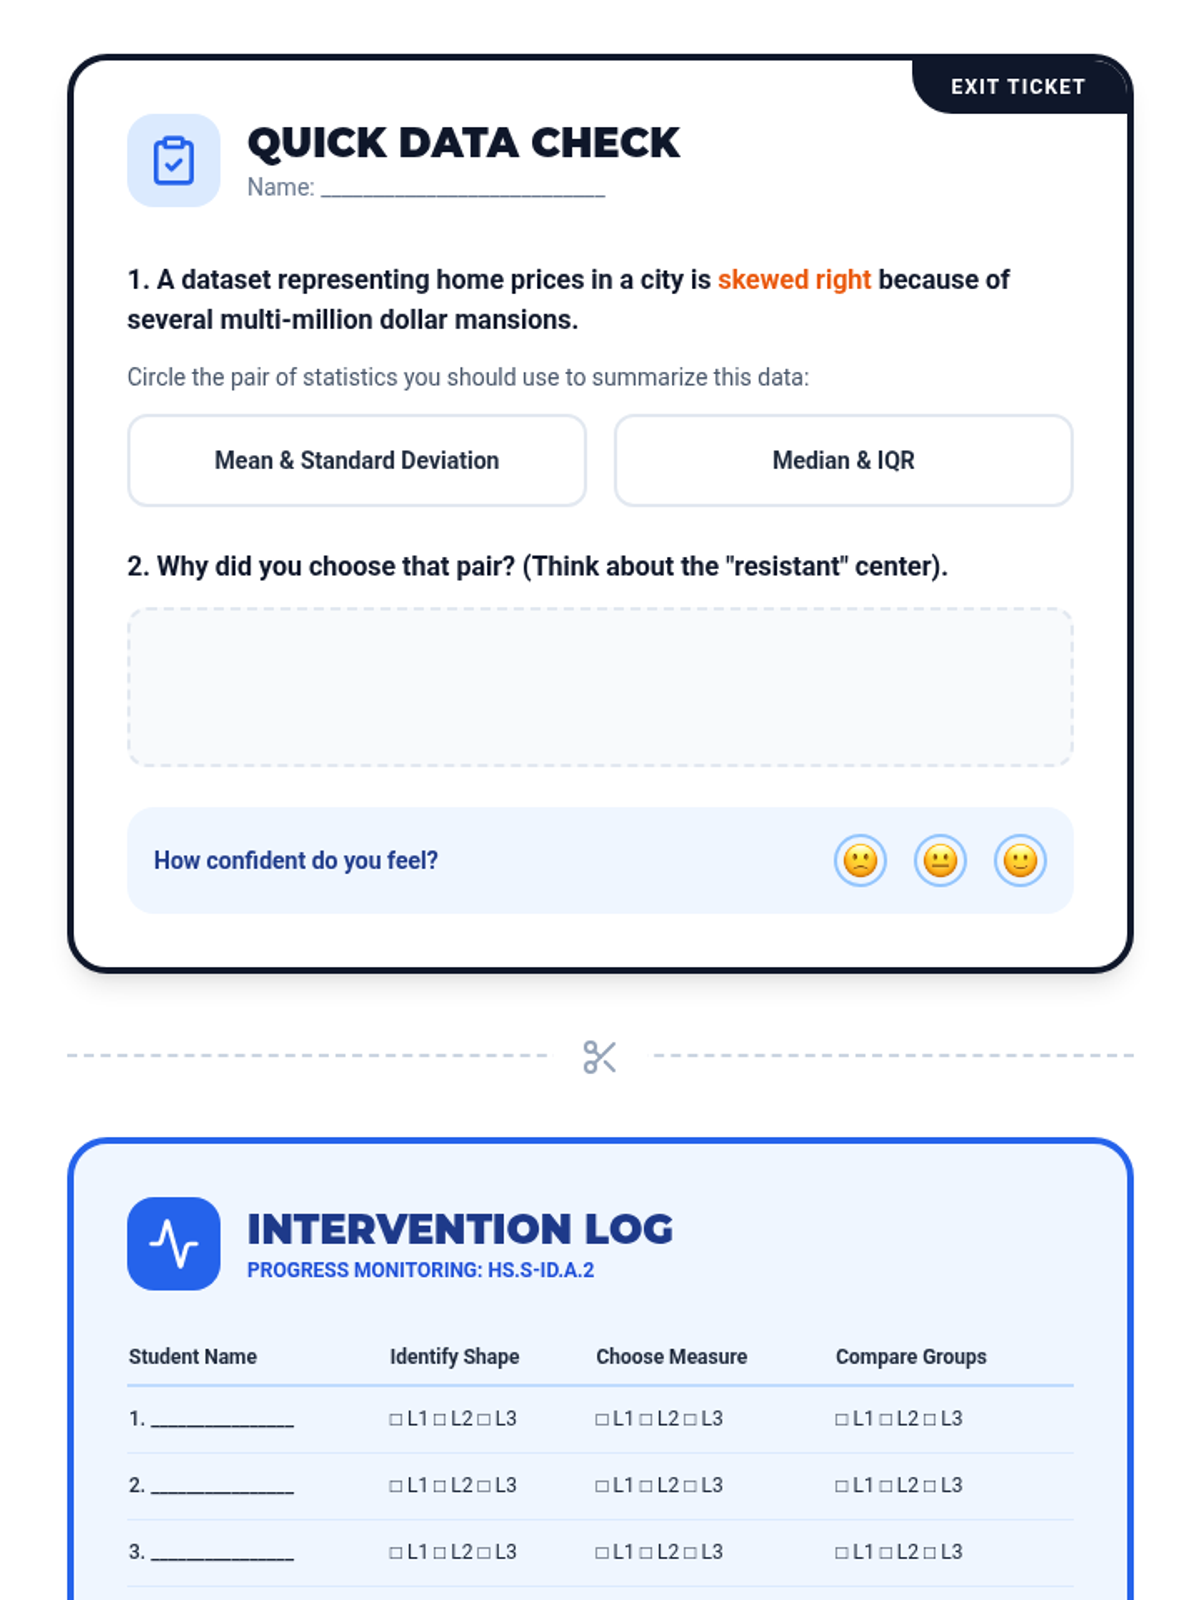
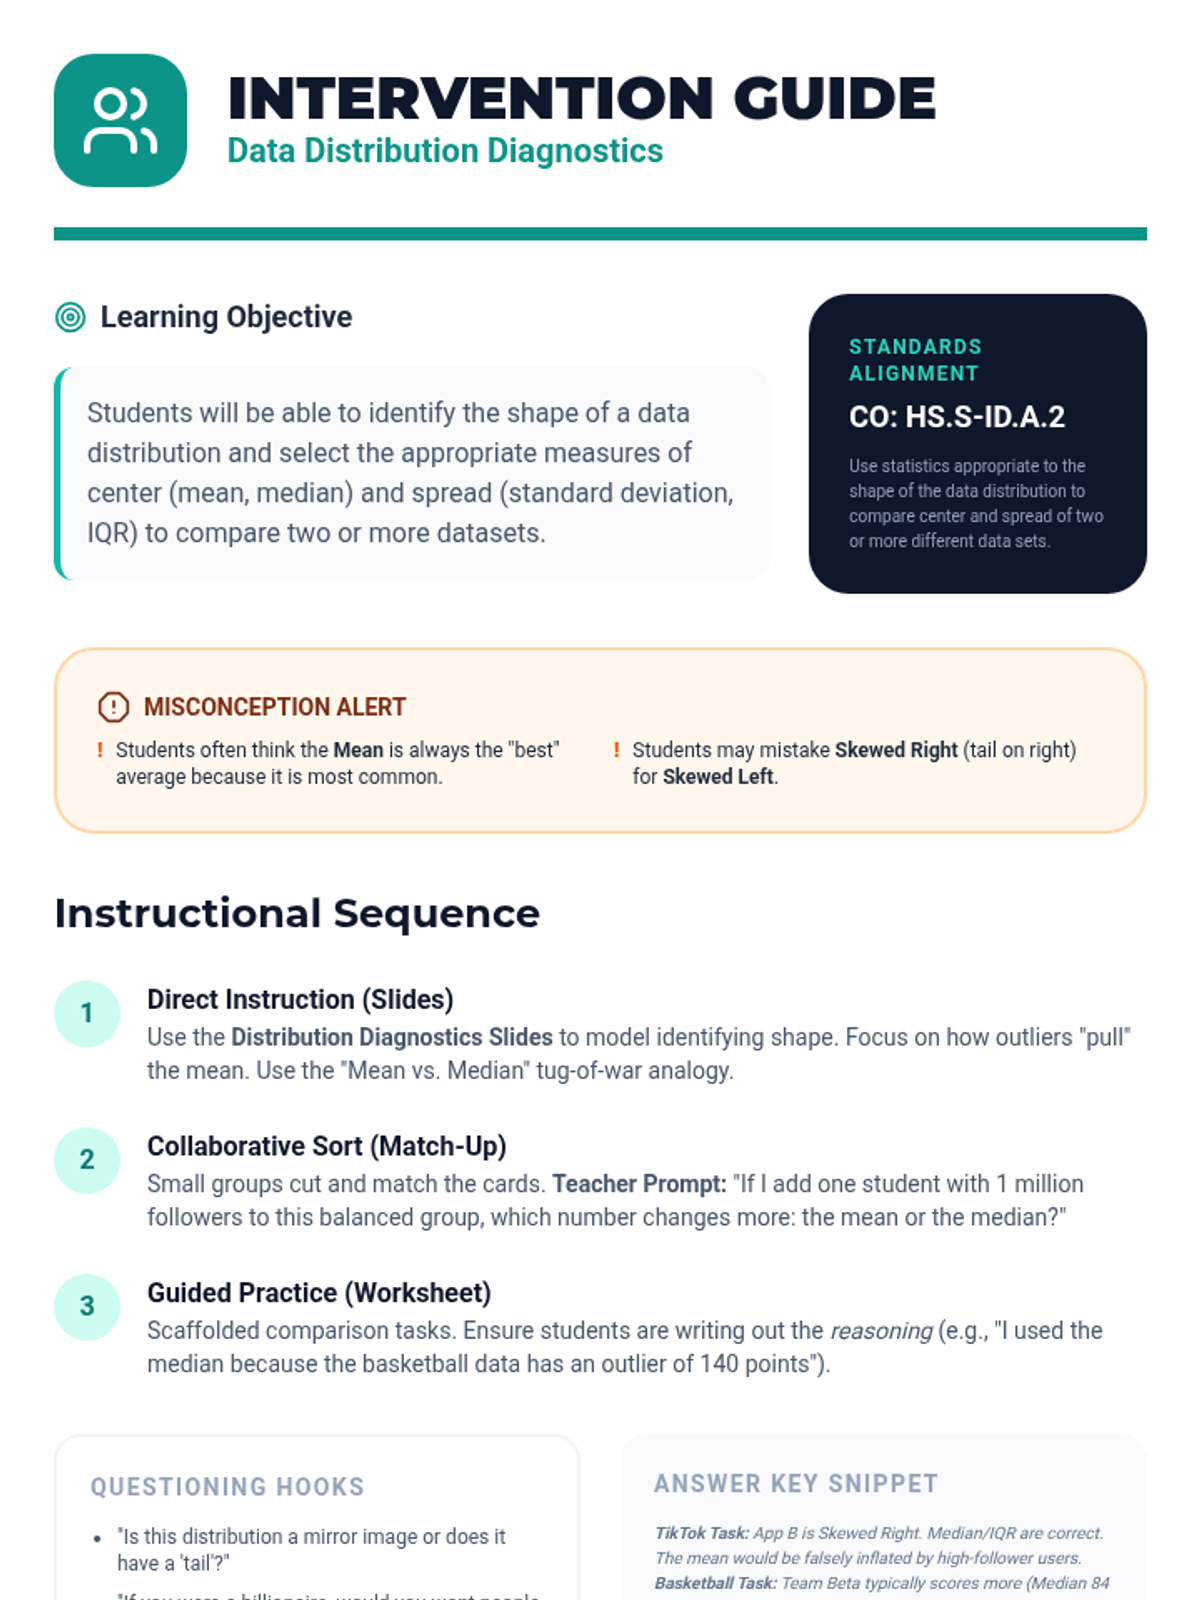
A targeted Tier 2 intervention lesson focusing on choosing the correct measures of center and spread based on data distribution shape to compare datasets. Includes scaffolded matching activities and real-world contexts like social media and sports.
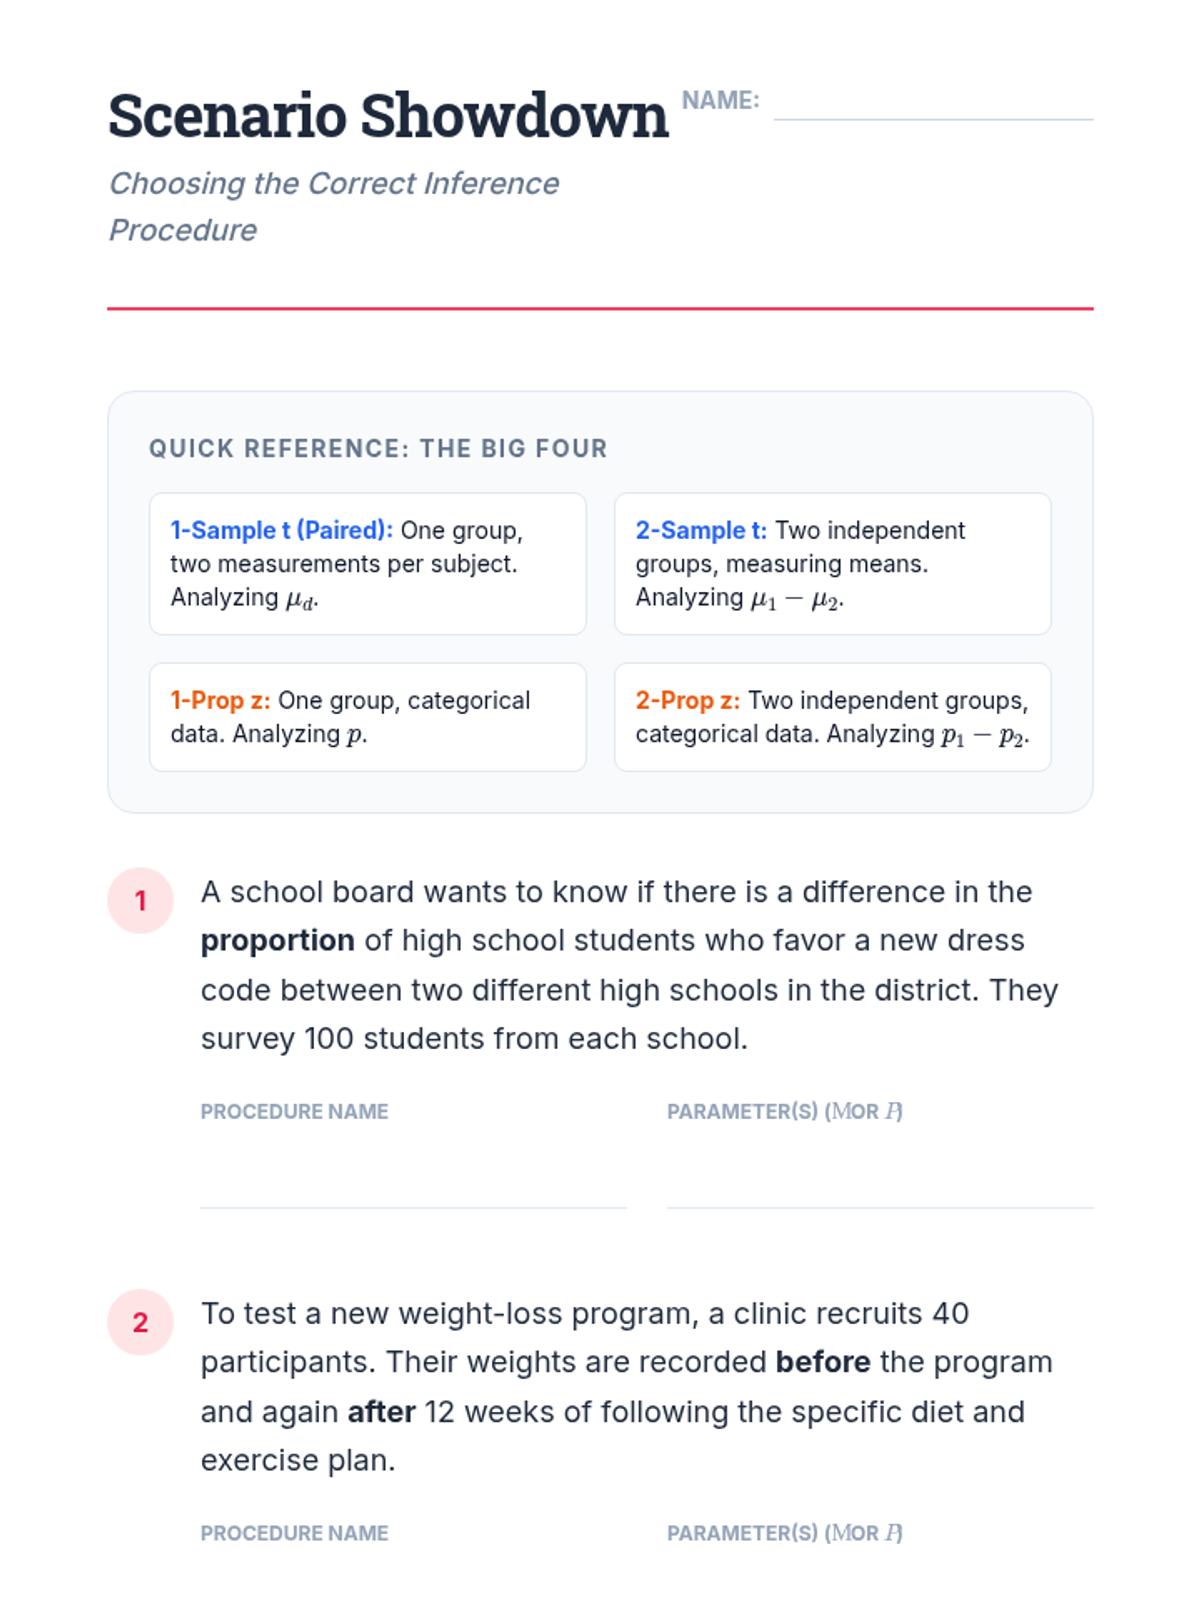
A review lesson where students are presented with mixed scenarios (proportions vs. means, paired vs. independent). They must select the appropriate test and justify their choice, reinforcing the decision-making skills required for the AP exam or real-world analysis.
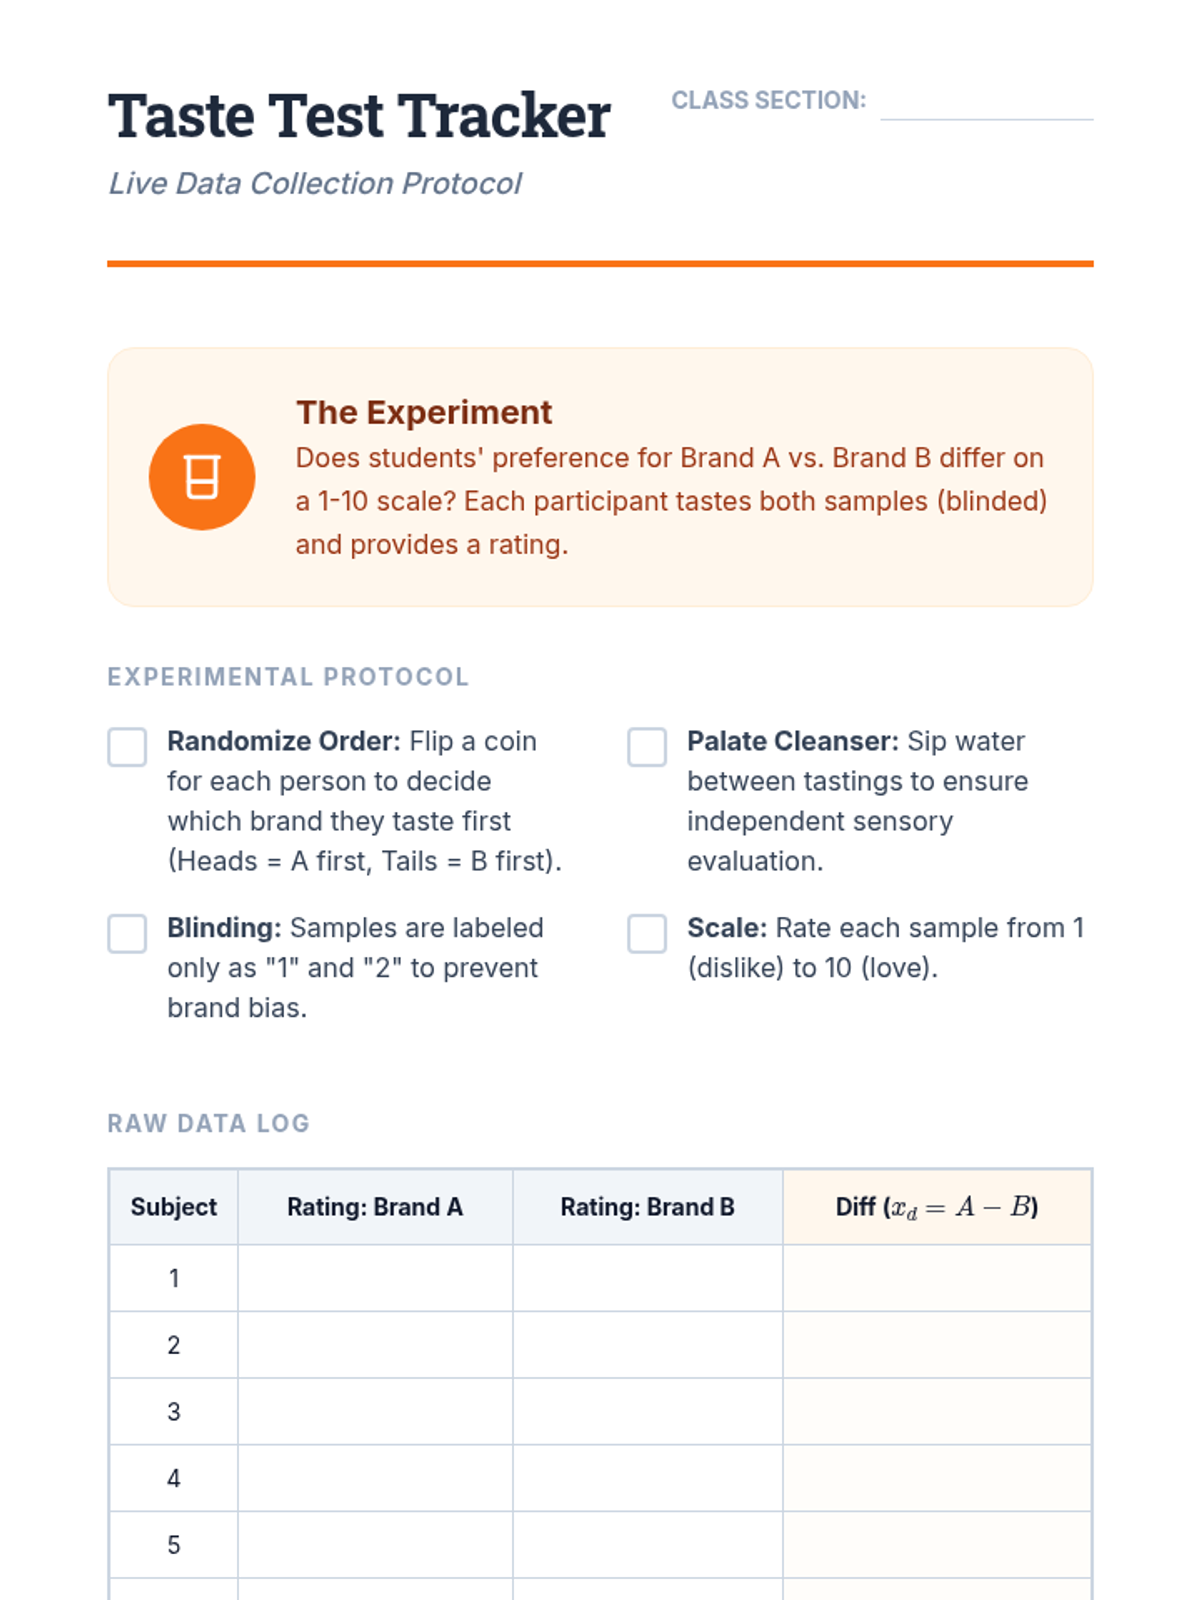
Students participate in a live sensory experiment to generate paired data, performing the complete inference procedure to determine if a preference exists between two products.
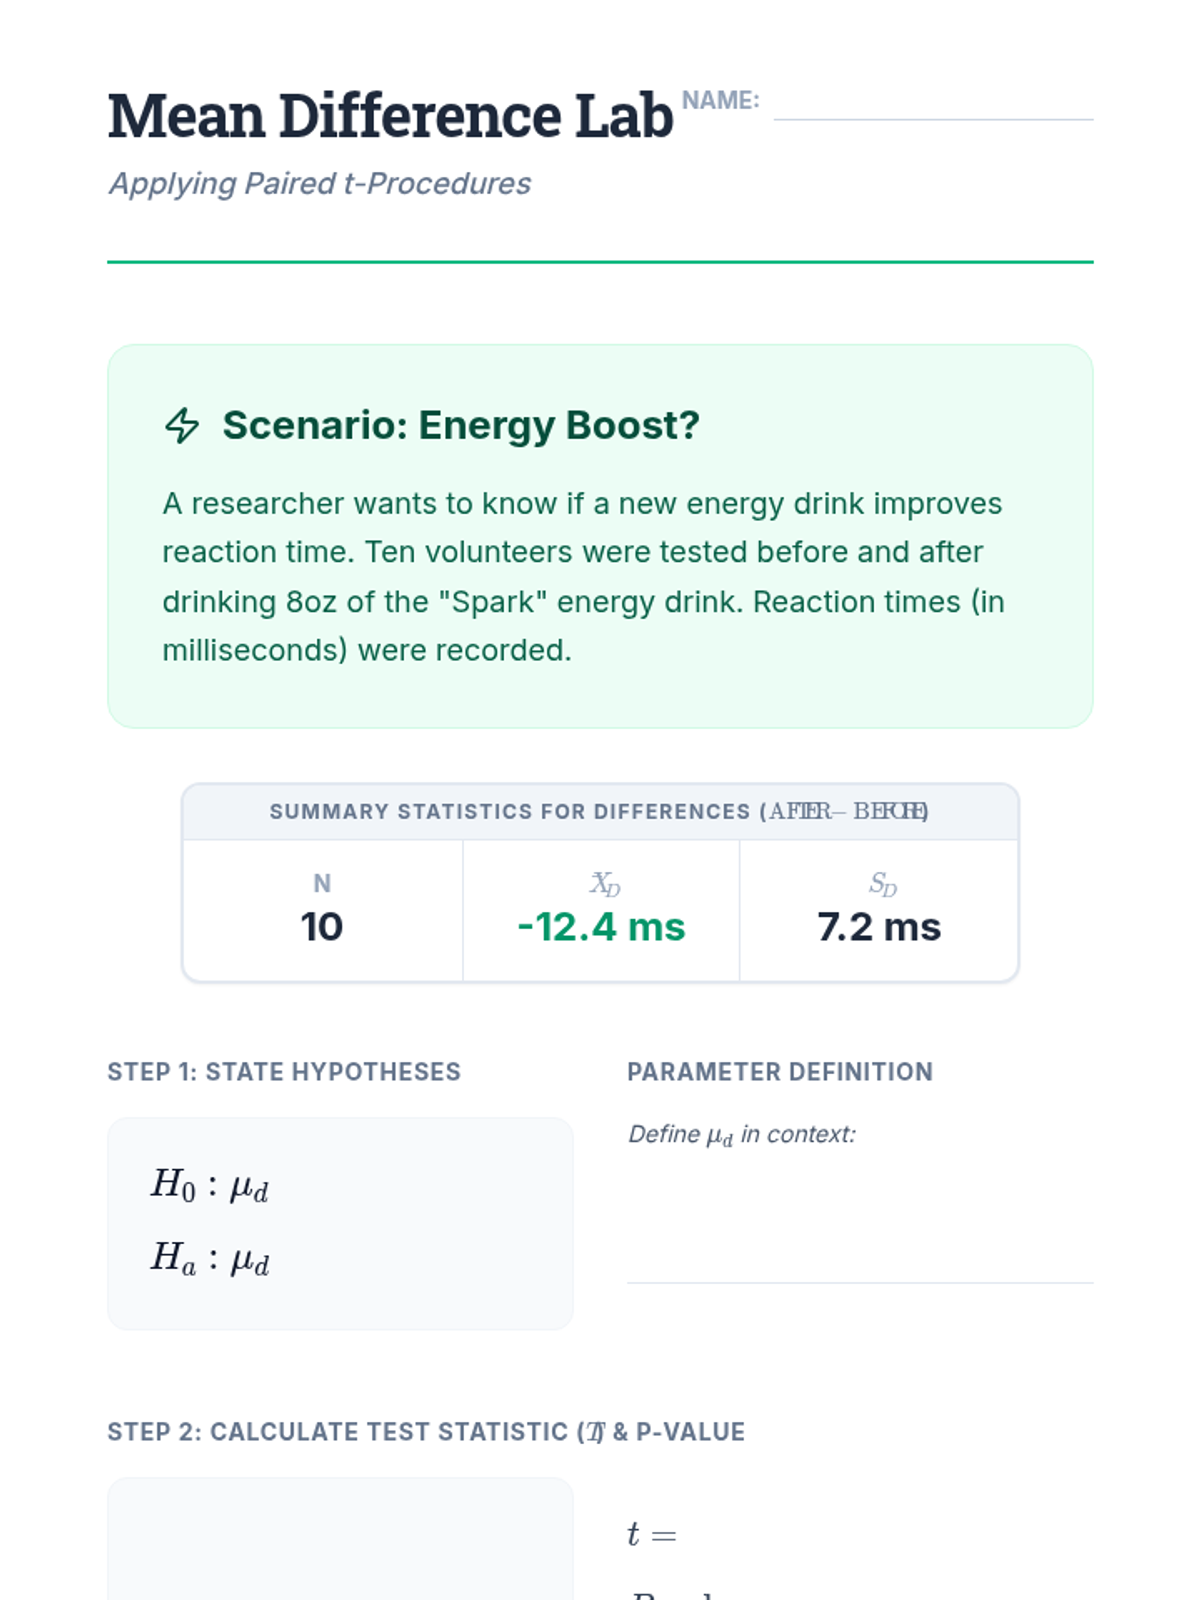
Students perform hypothesis tests and calculate confidence intervals for the mean difference. The lesson emphasizes treating the differences as a single sample for a one-sample t-procedure.
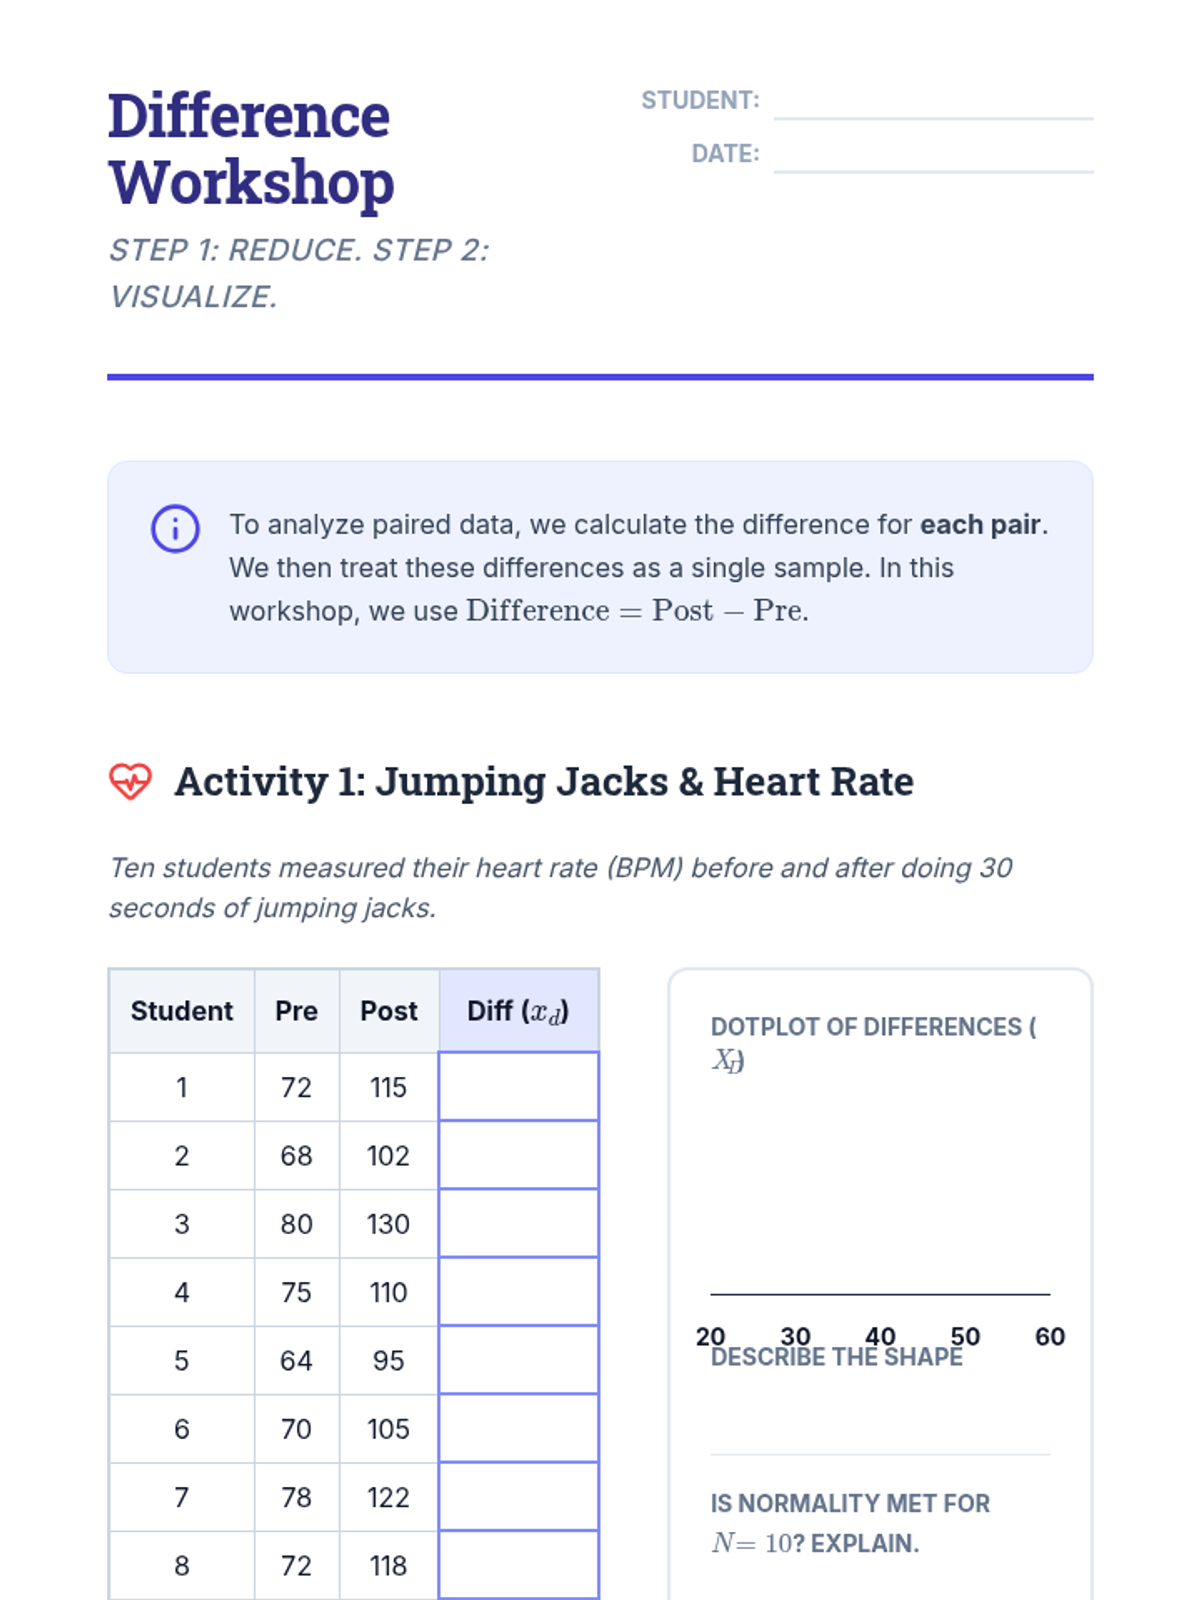
Students focus on the mechanics of calculating differences for matched pairs and visualizing these differences to check for normality before inference.
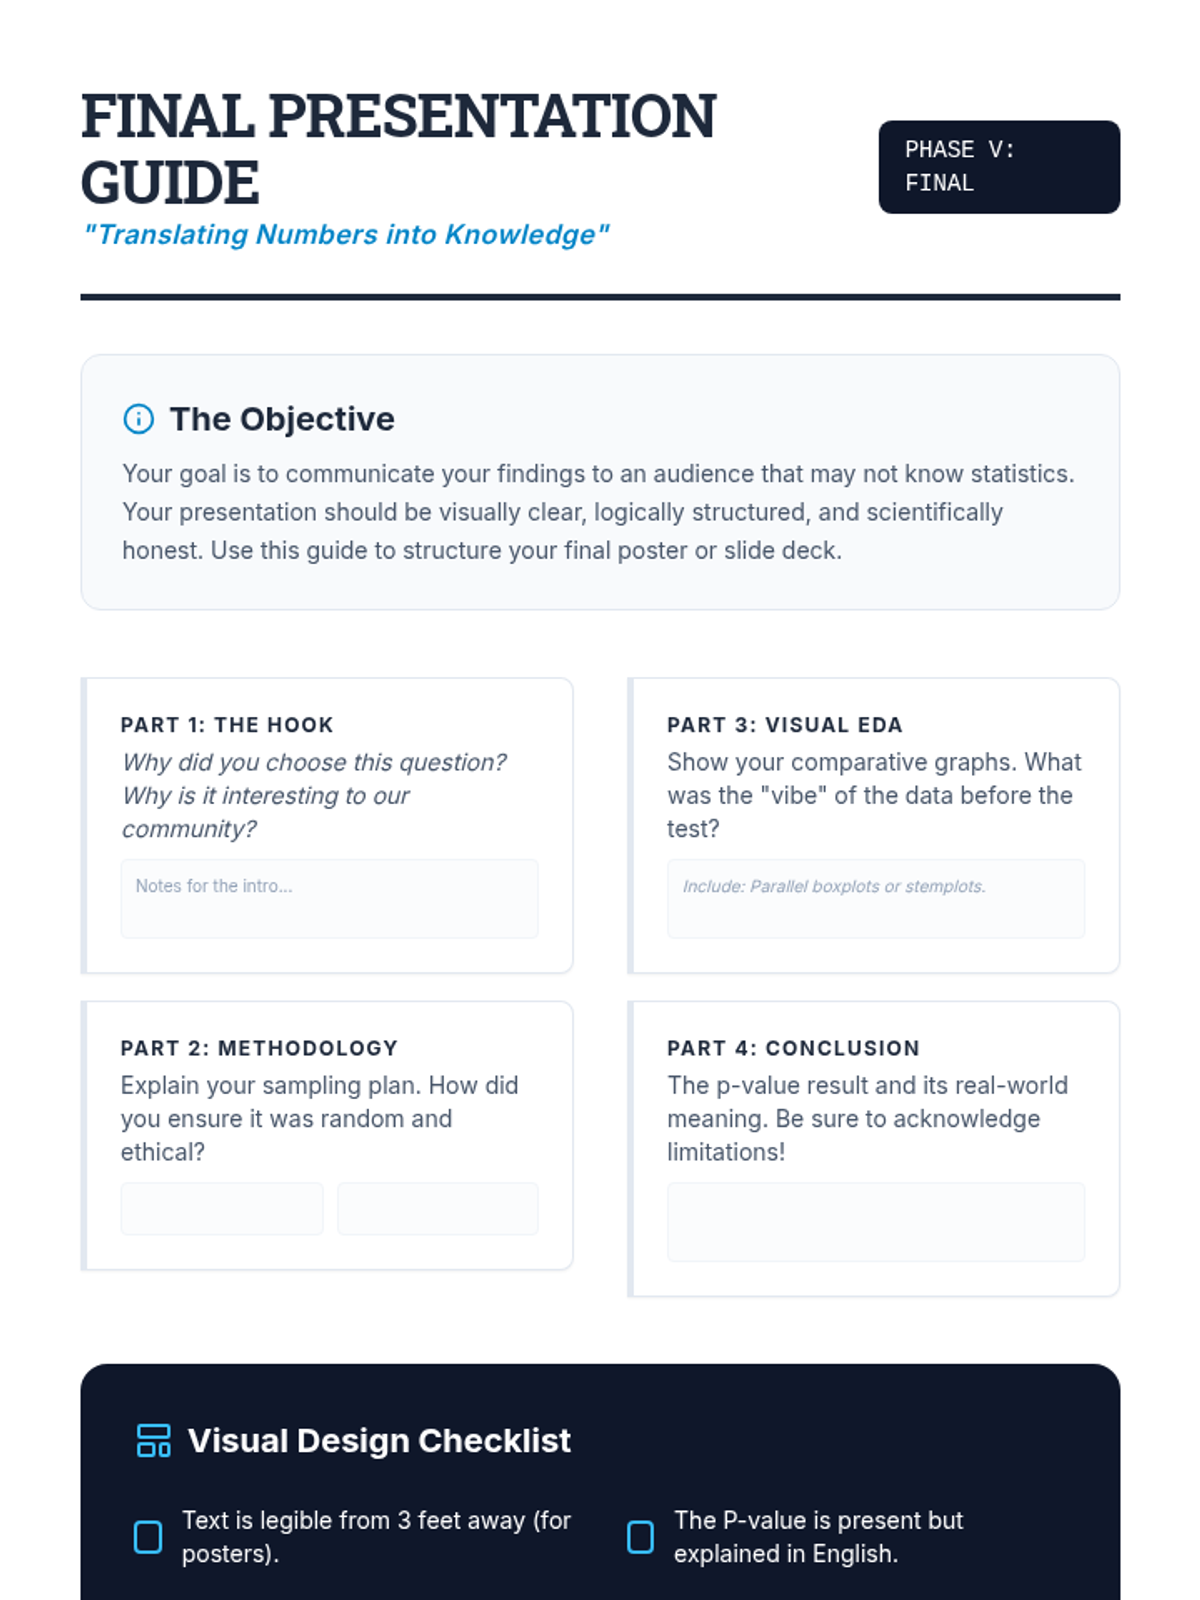
The project concludes with students synthesizing their findings into a final presentation, focusing on clear communication of complex statistical results to a general audience.
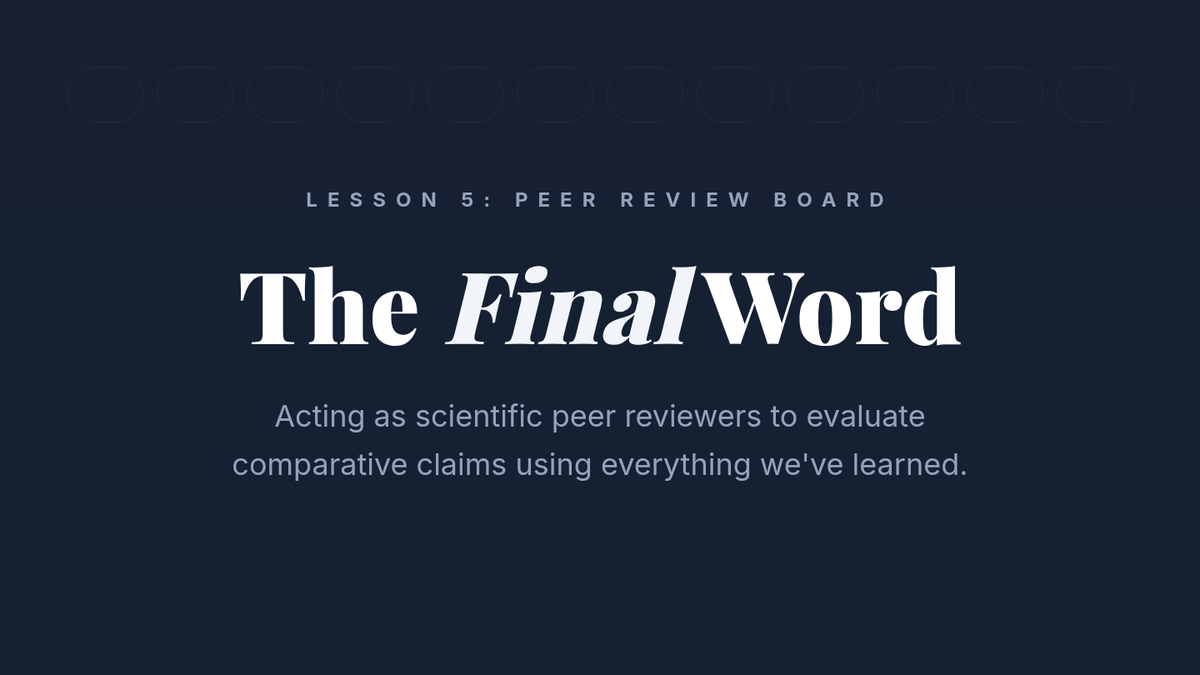
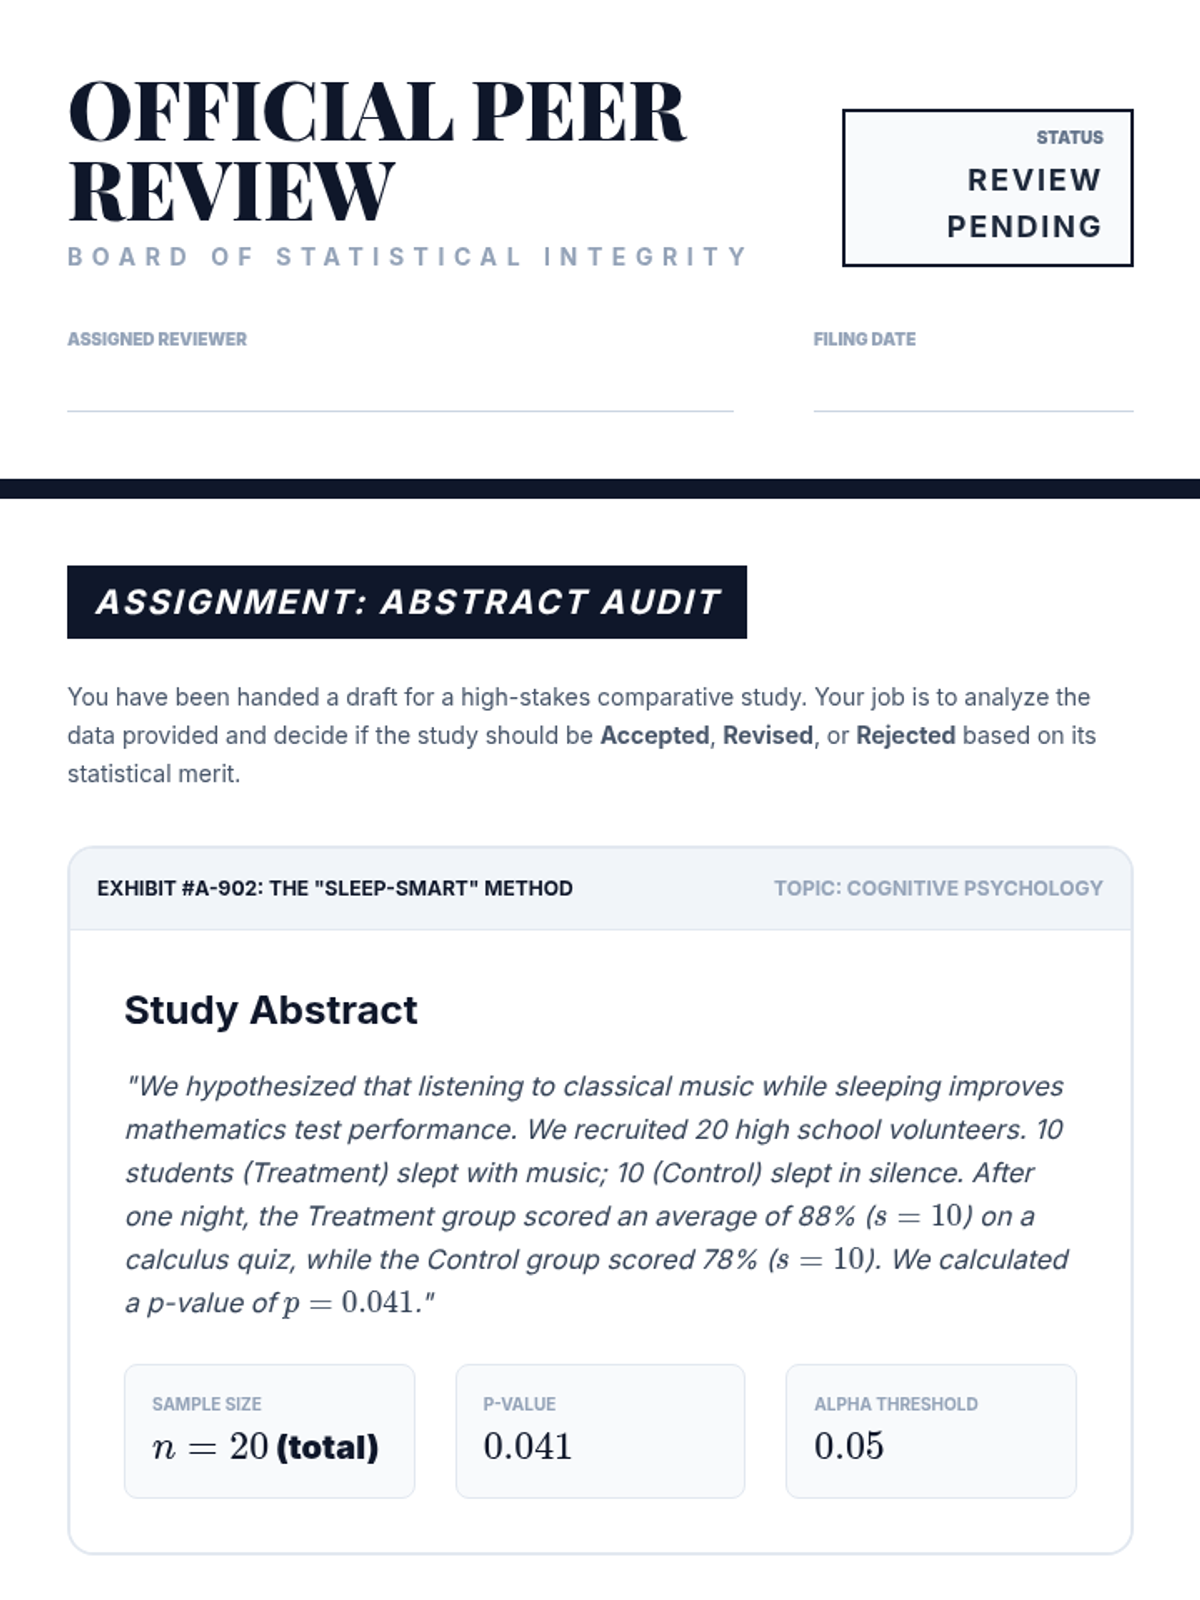
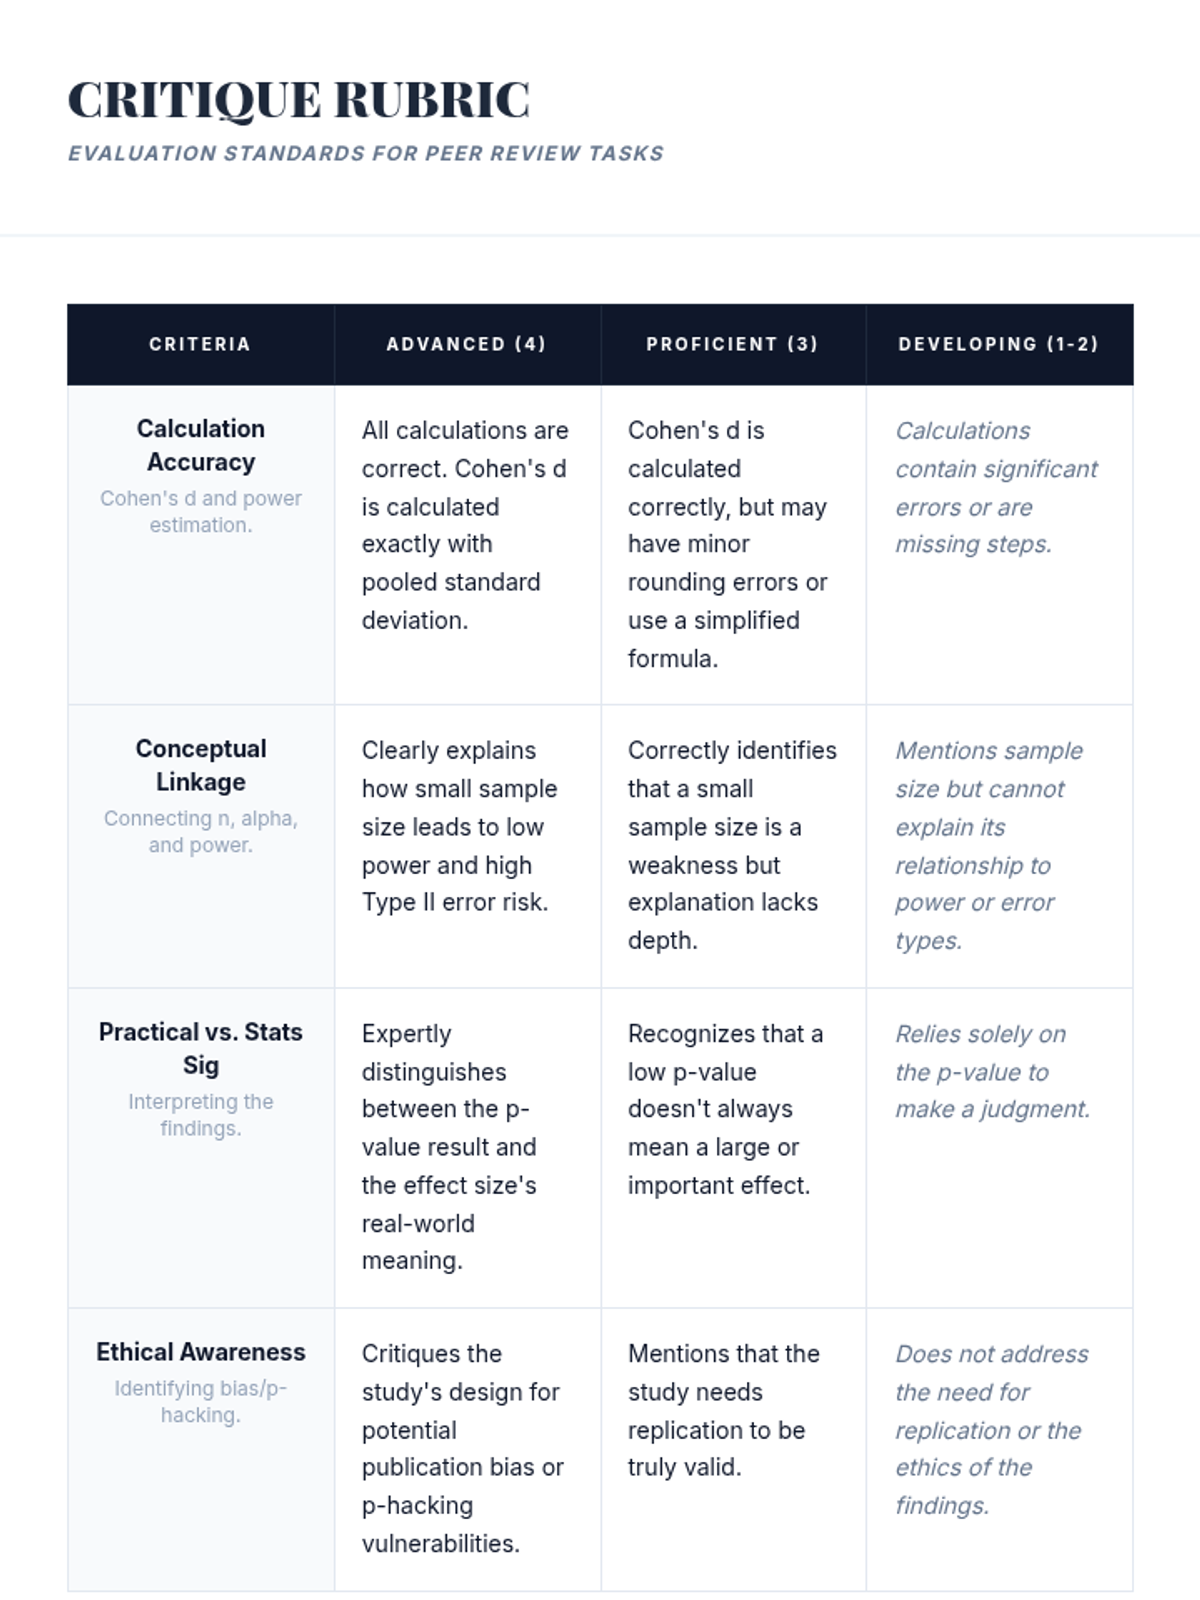
A capstone workshop where students apply their knowledge to critique actual research abstracts, acting as peer reviewers to evaluate the validity of comparative claims.
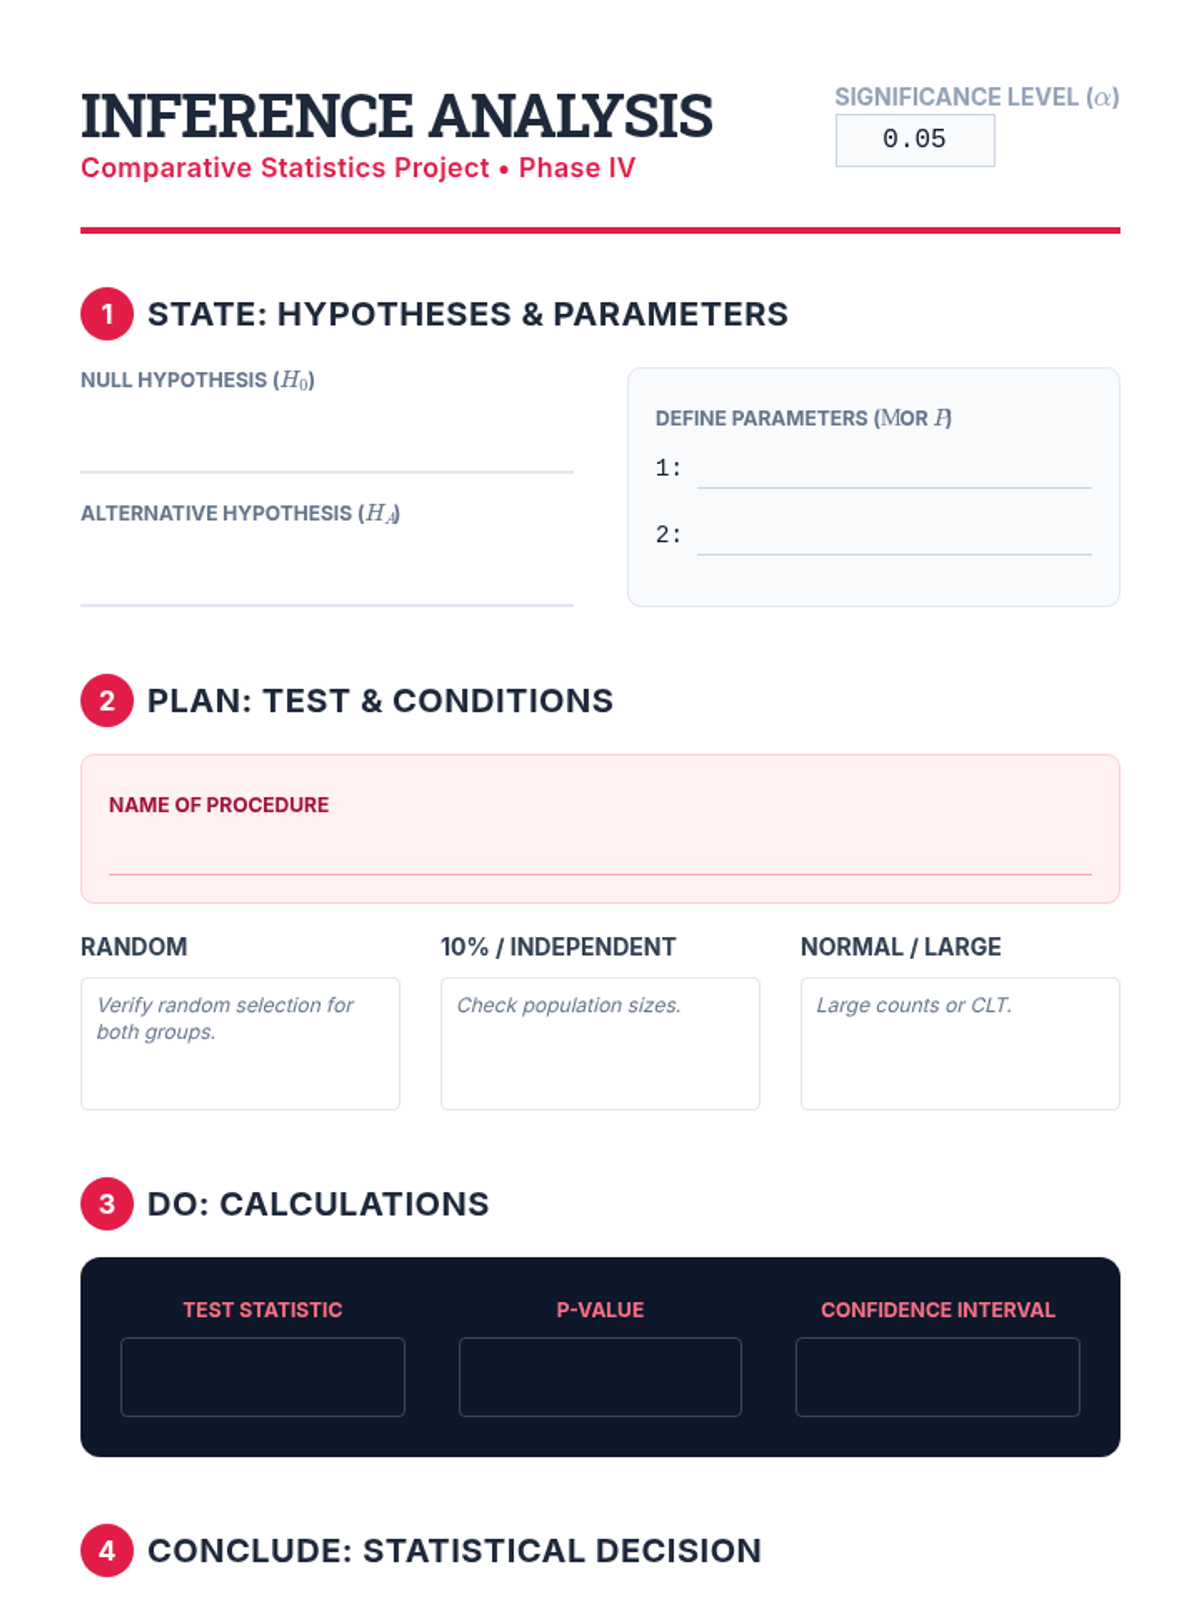
Teams select and perform appropriate hypothesis tests and confidence intervals, verifying conditions and interpreting p-values in the context of their specific research questions.
An investigation into the replication crisis and unethical practices like p-hacking, emphasizing the ethical responsibility of statisticians in reporting findings.
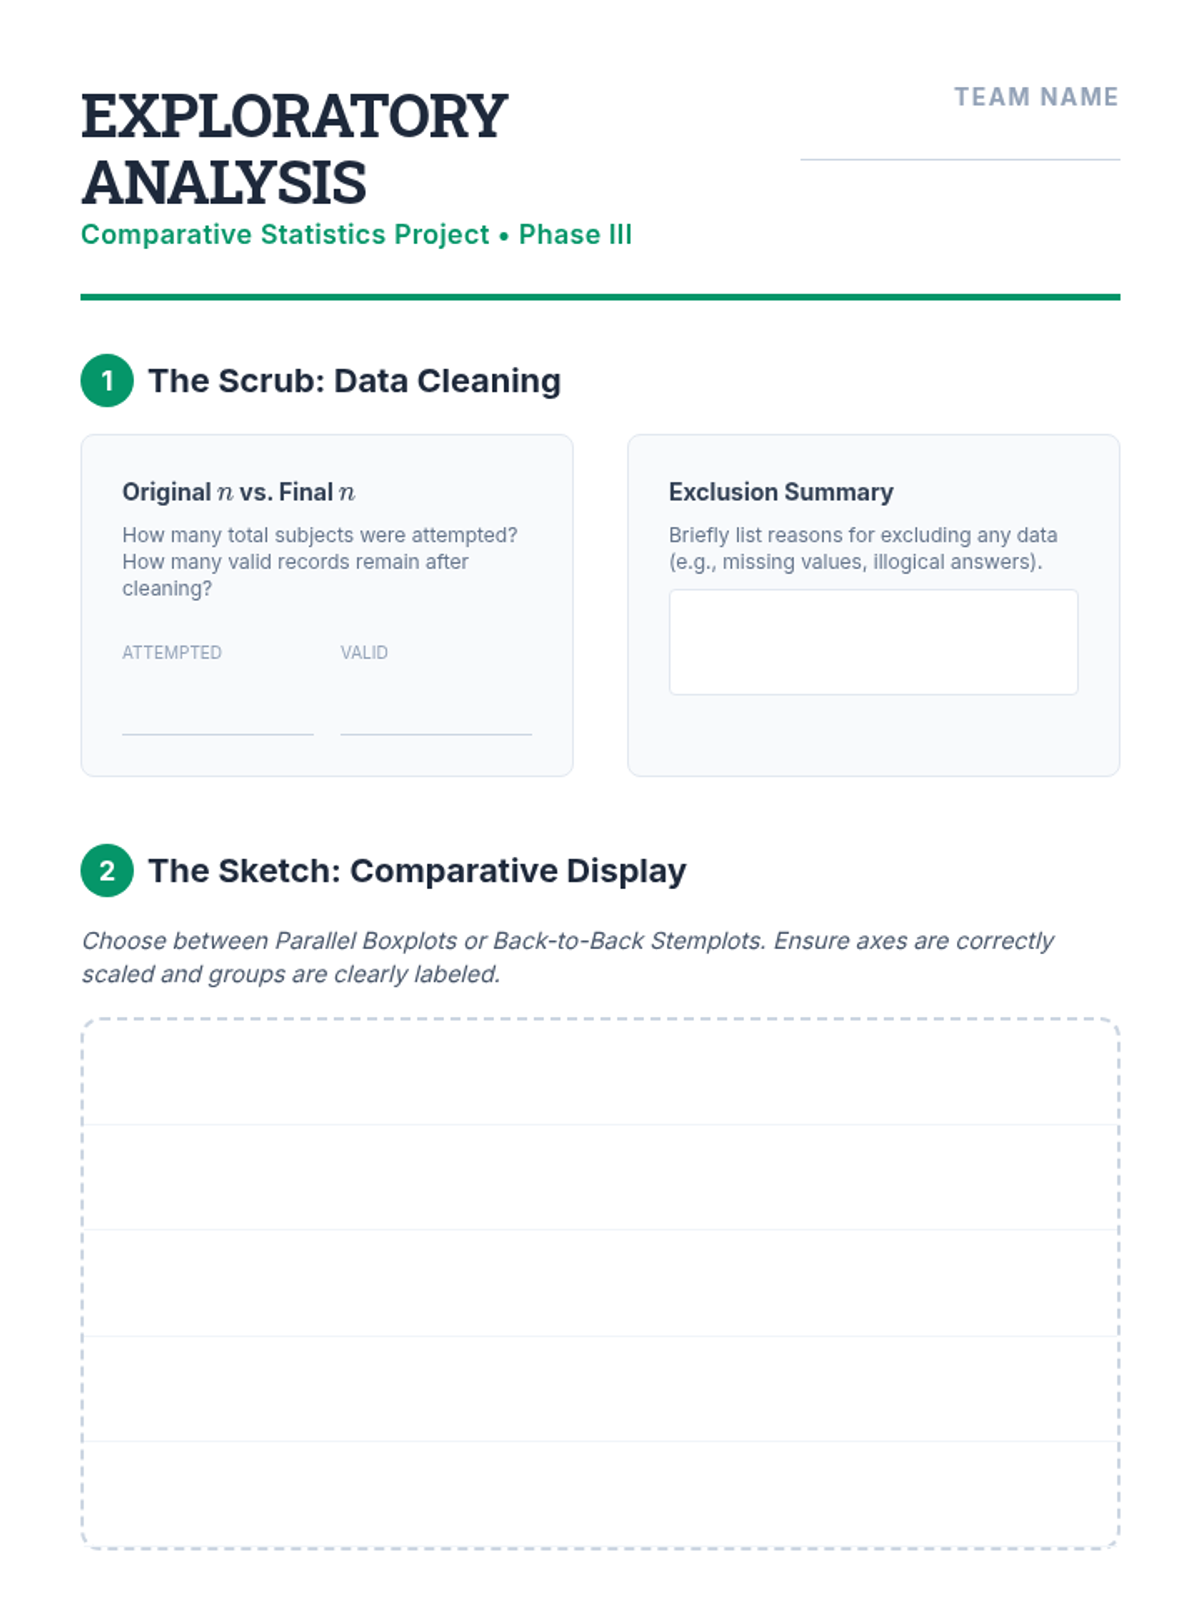
Students use graphical displays and summary statistics to explore their collected data, cleaning datasets and identifying preliminary trends before formal inference.
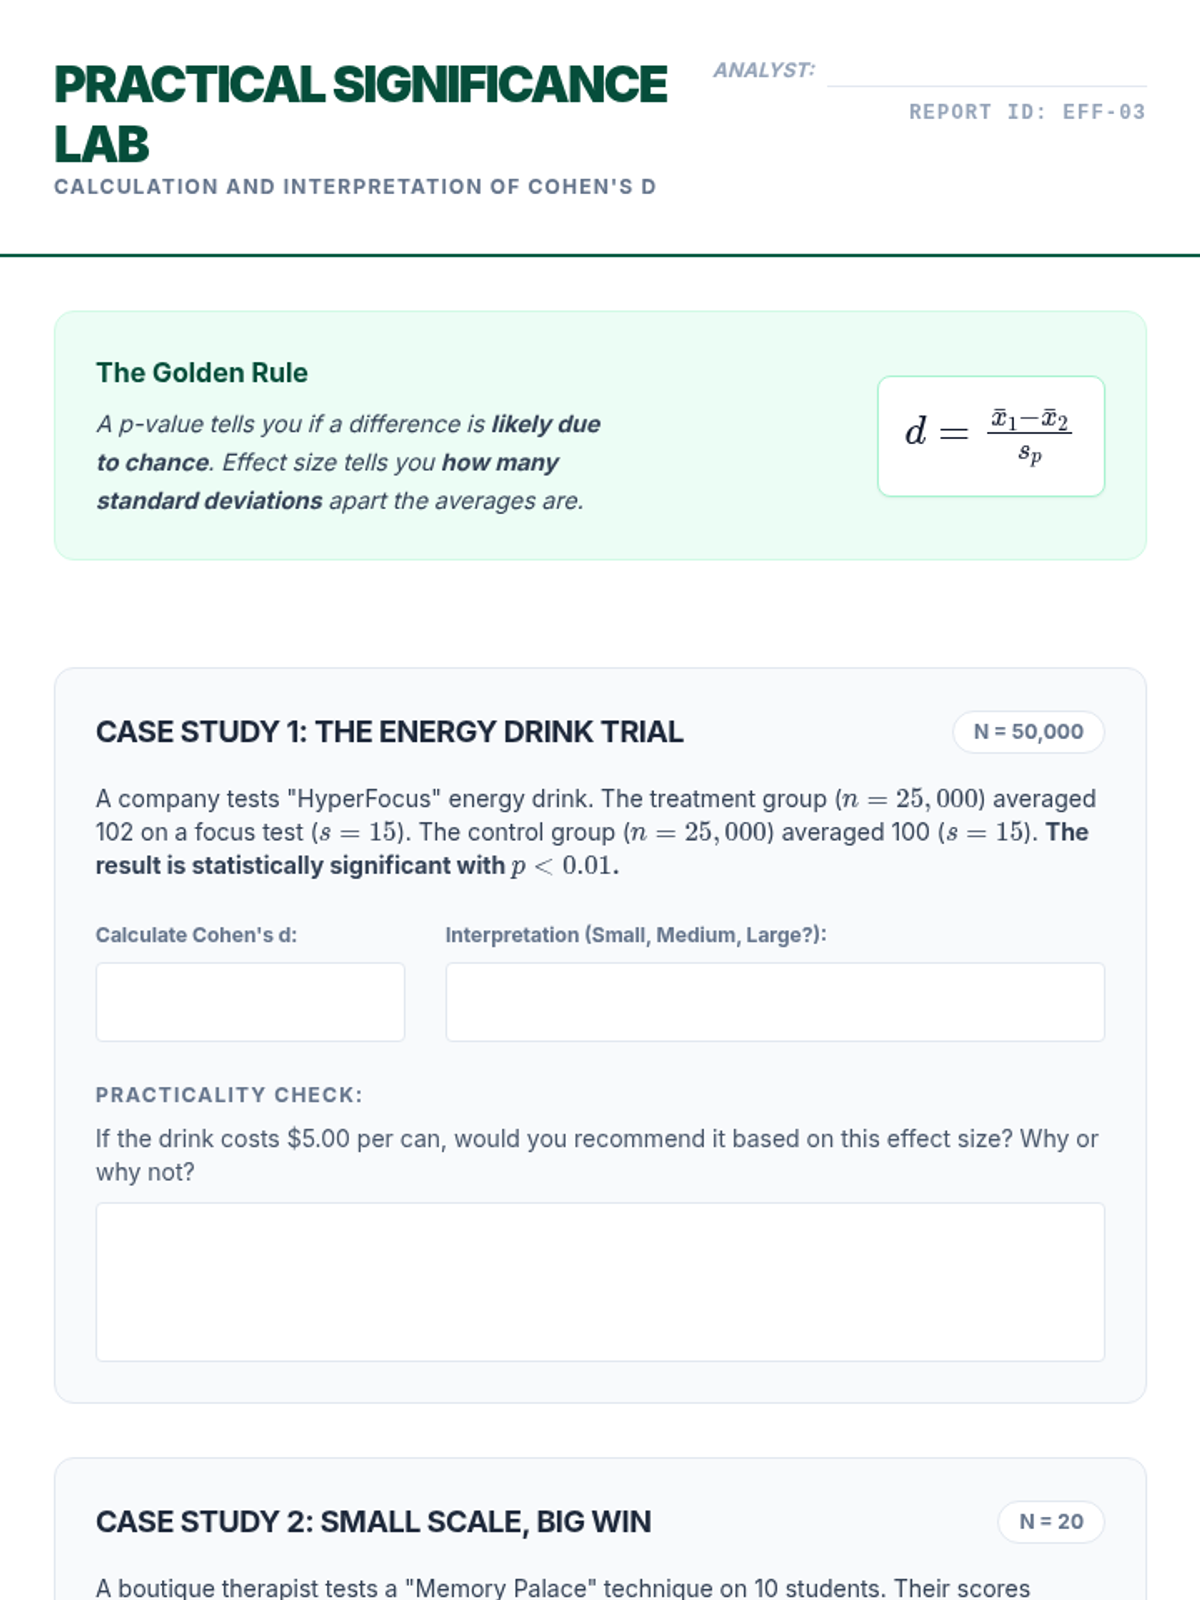
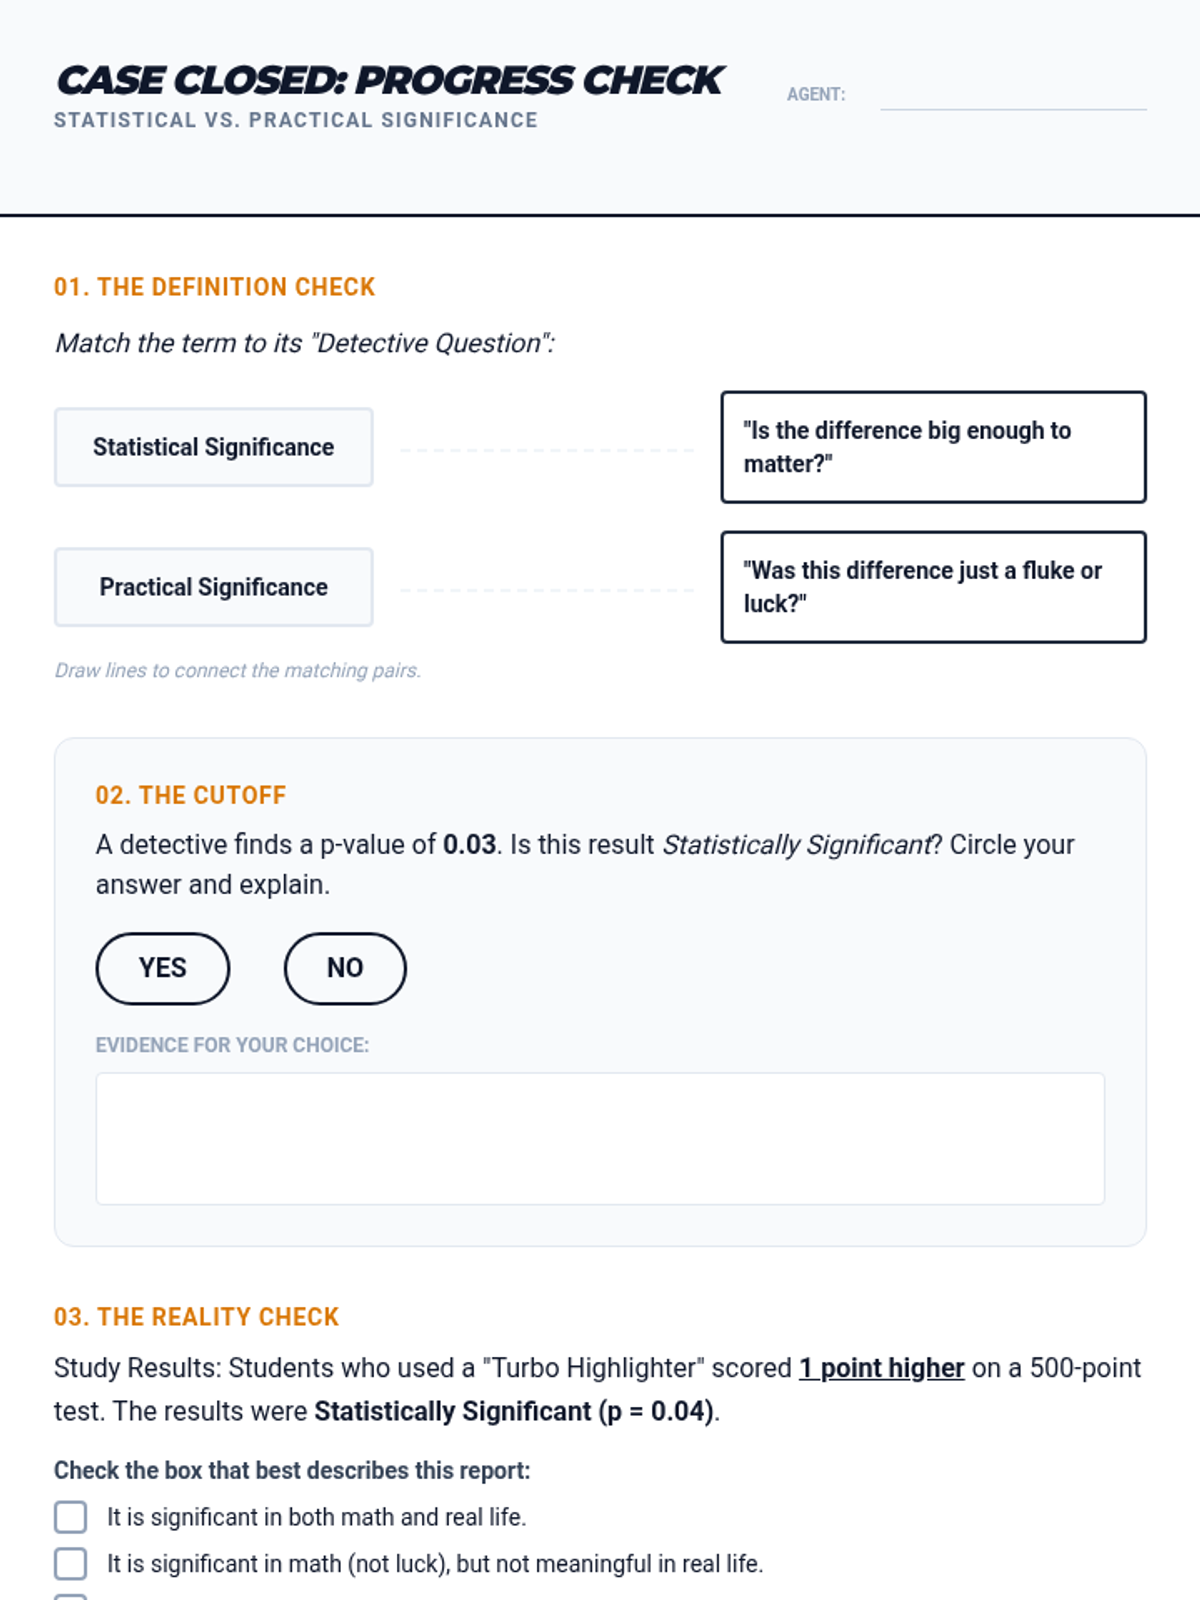
Students learn to calculate and interpret Cohen's d, distinguishing between statistical significance (is there an effect?) and practical importance (how big is the effect?).
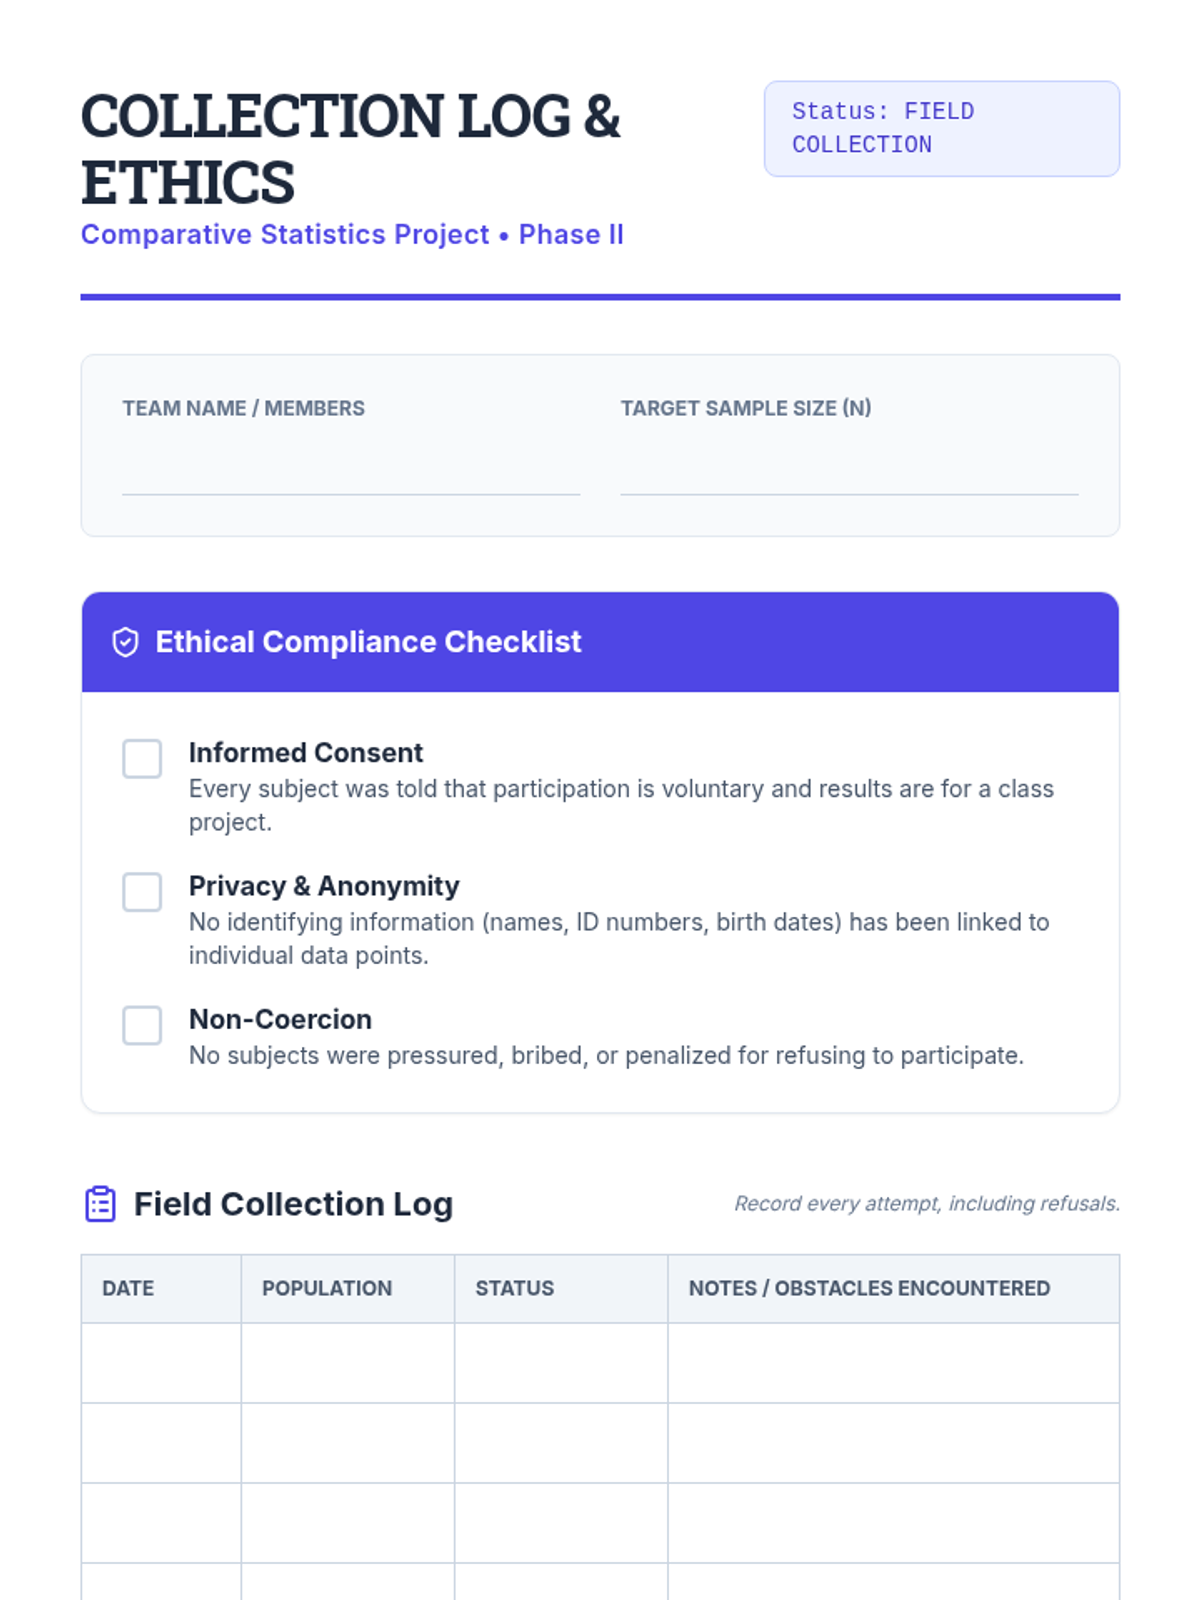
Focusing on the practical and ethical aspects of research, students execute their sampling plans while addressing challenges like non-response bias and ensuring participant anonymity.
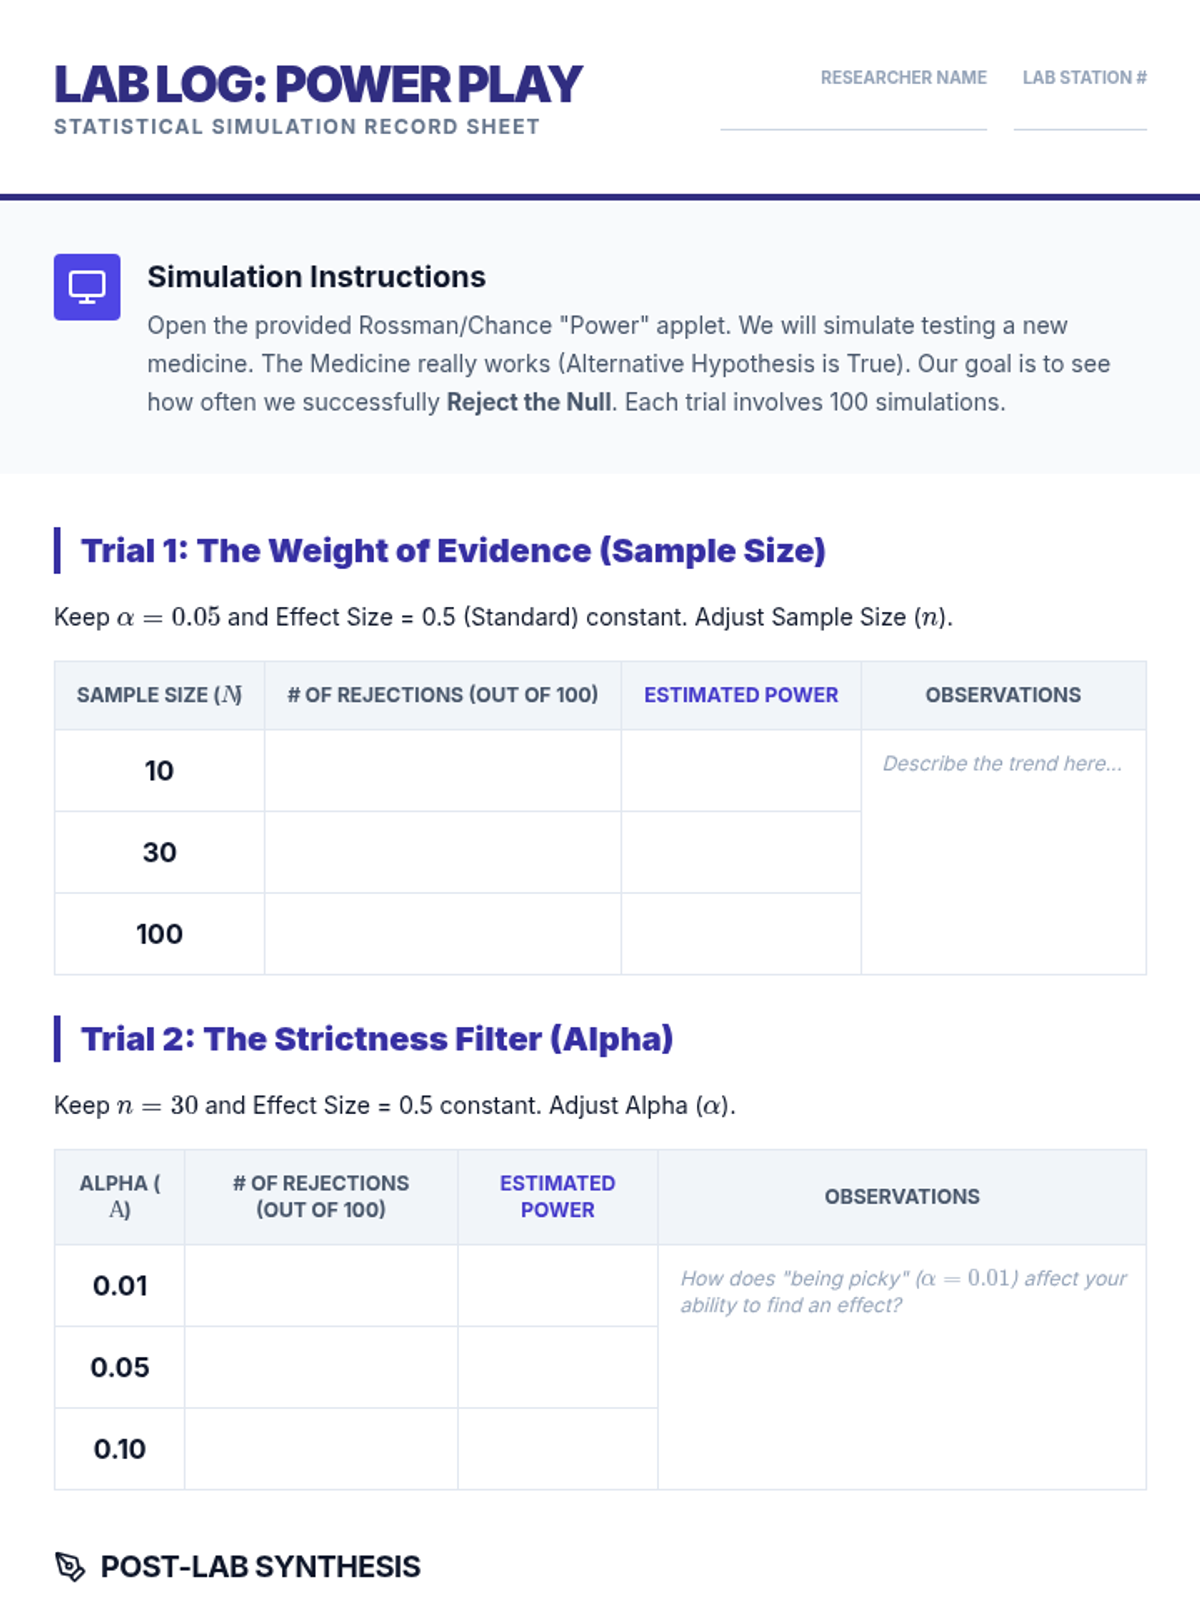
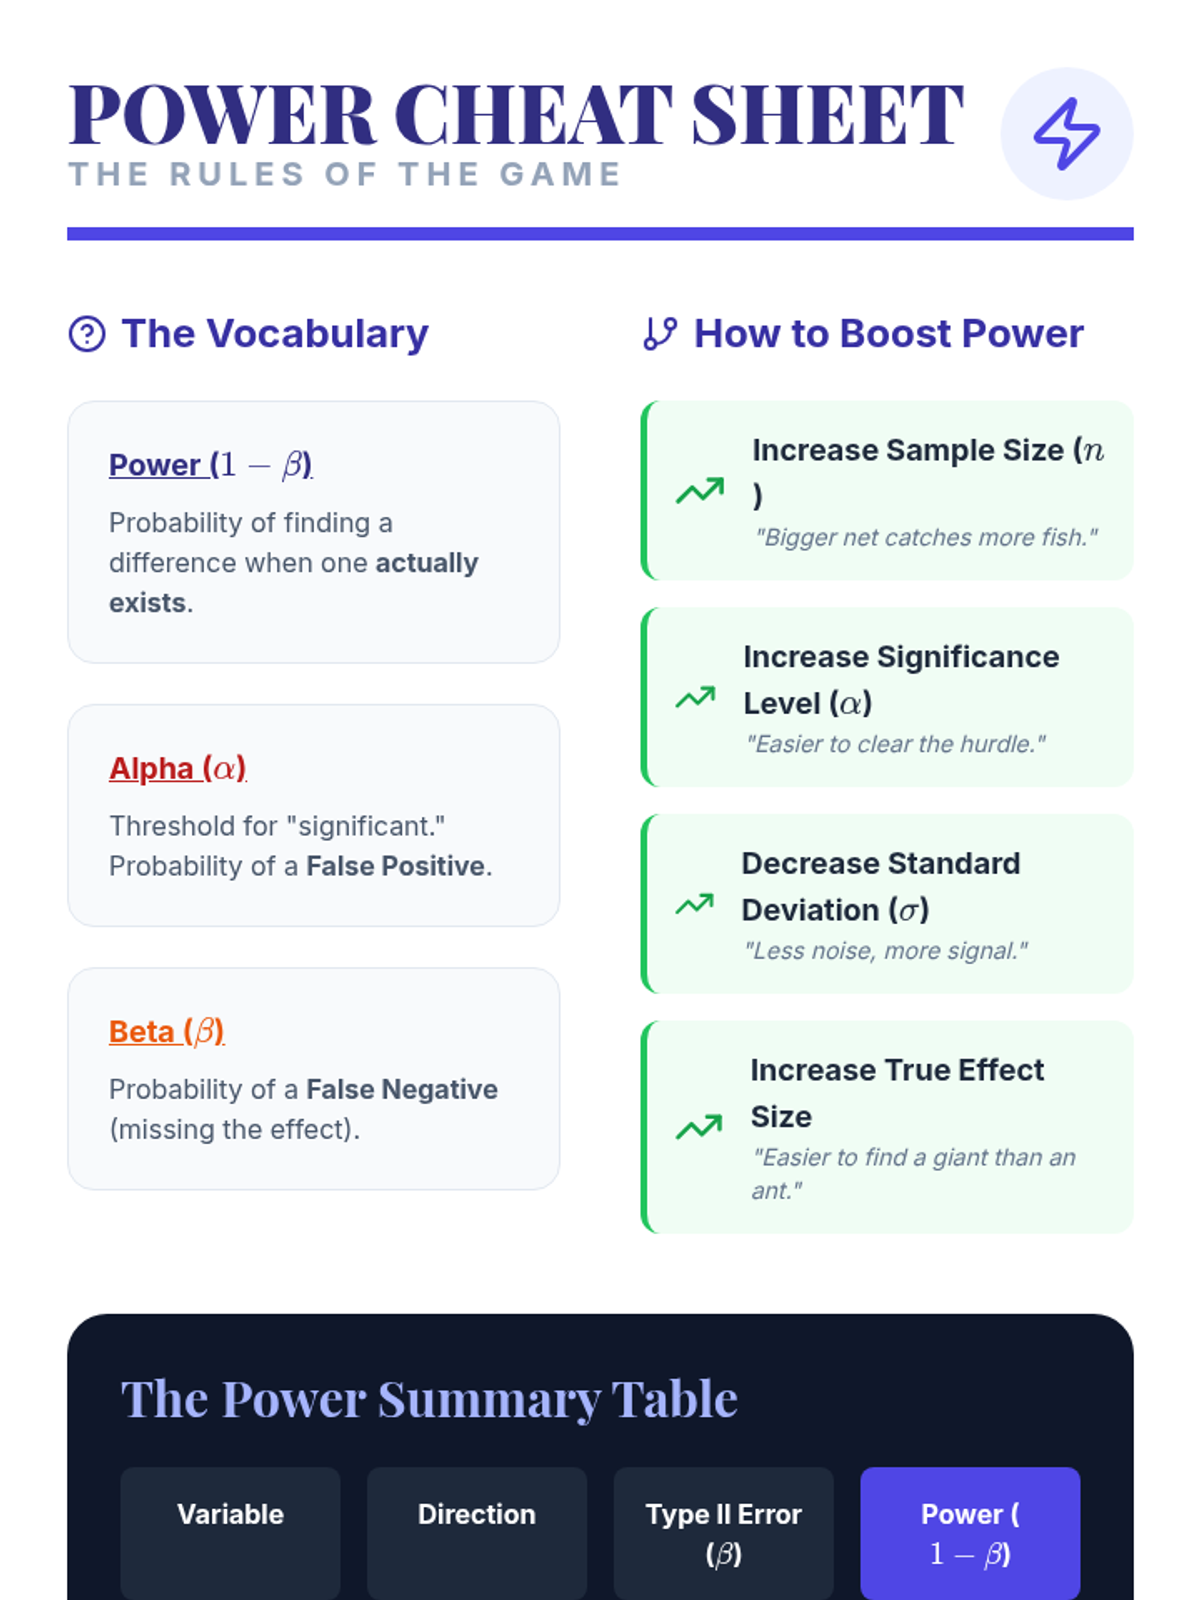
A simulation-based lesson where students manipulate sample size, alpha levels, and effect size to see how they influence a test's ability to detect a true difference between populations.
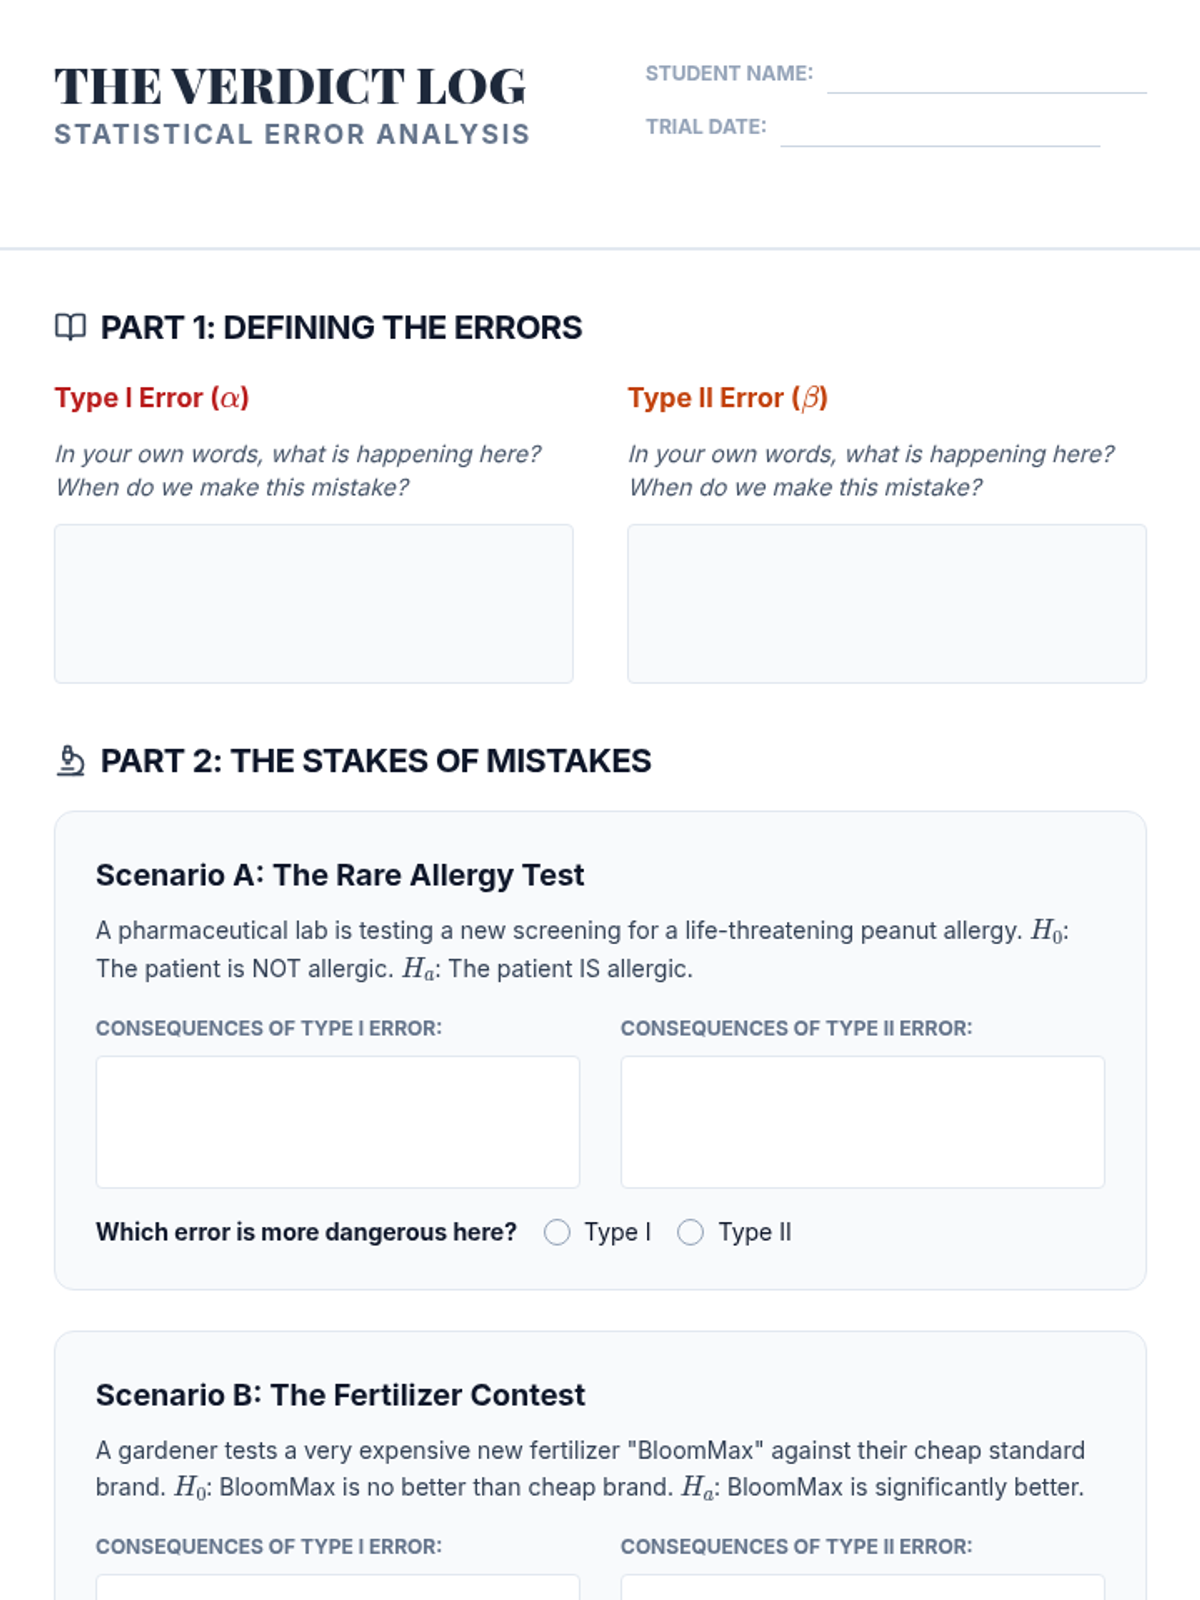
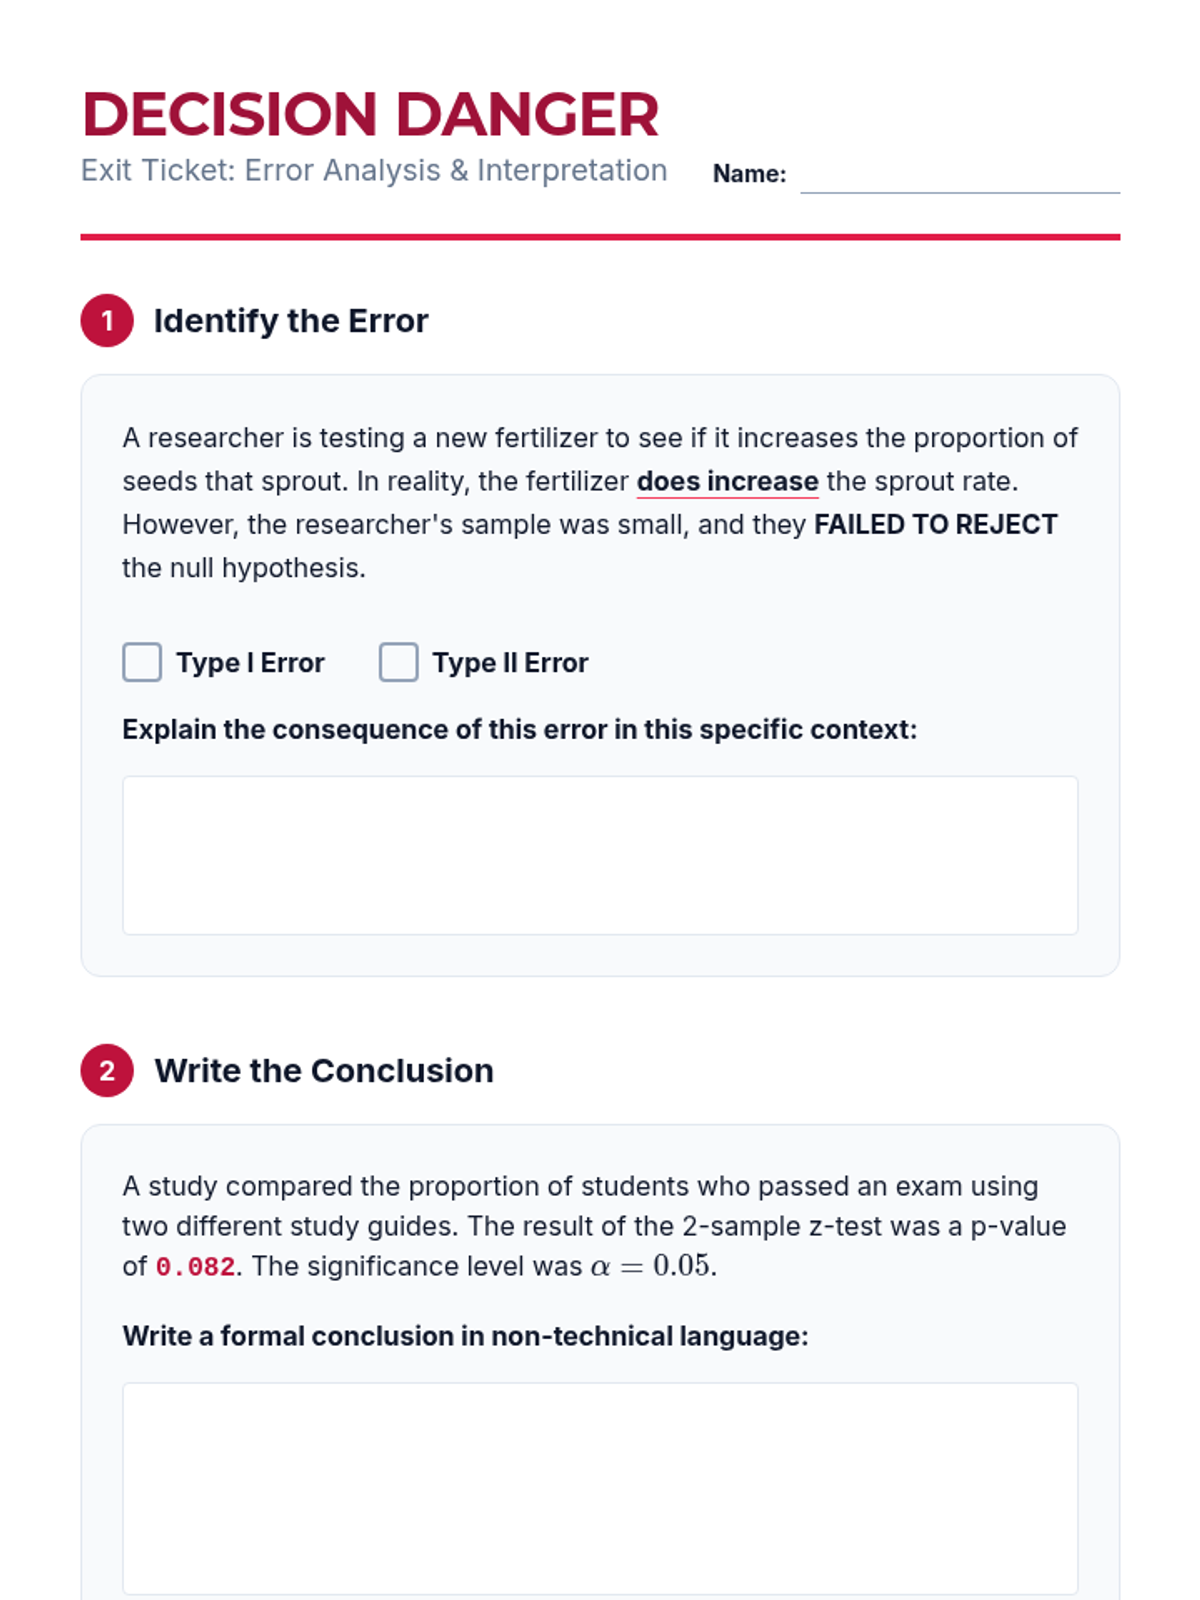
Students explore the trade-offs between Type I and Type II errors through a courtroom analogy and medical scenarios, understanding the real-world consequences of statistical decision-making.
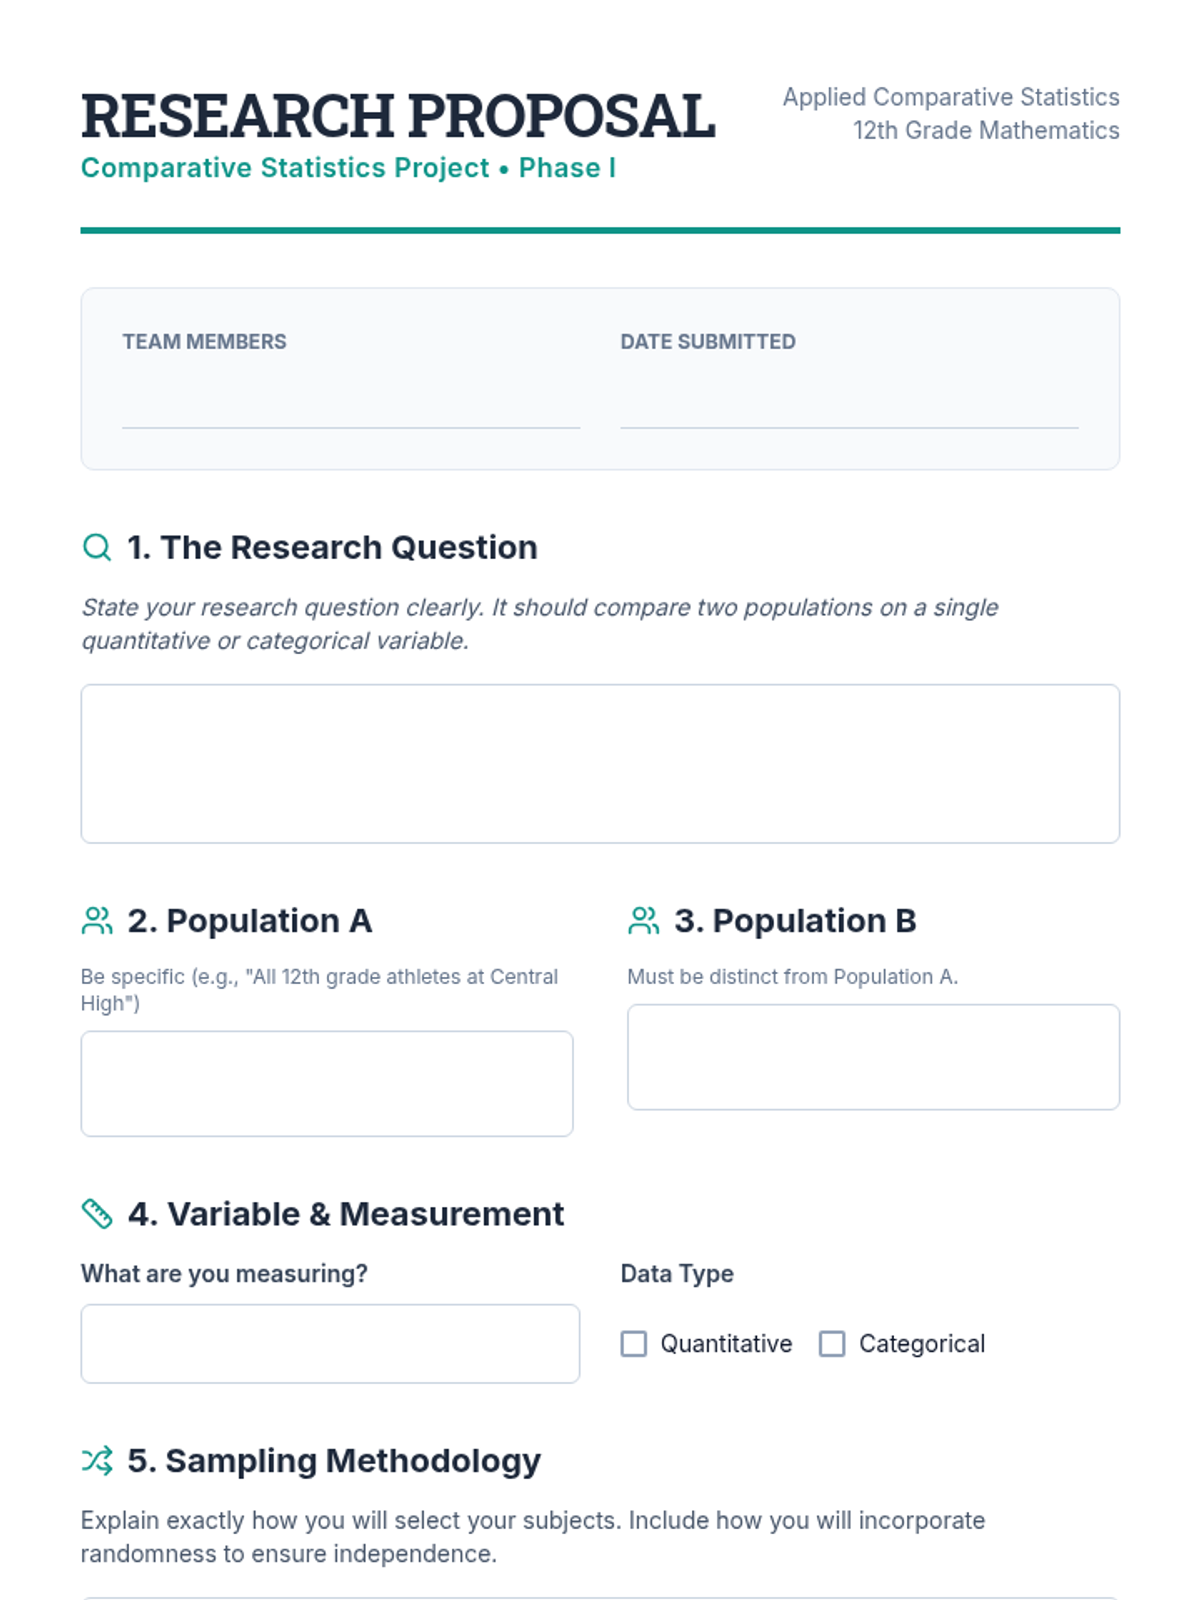
Students formulate a research question comparing two populations and design a sampling methodology that minimizes bias. They submit a formal research proposal for approval before beginning data collection.
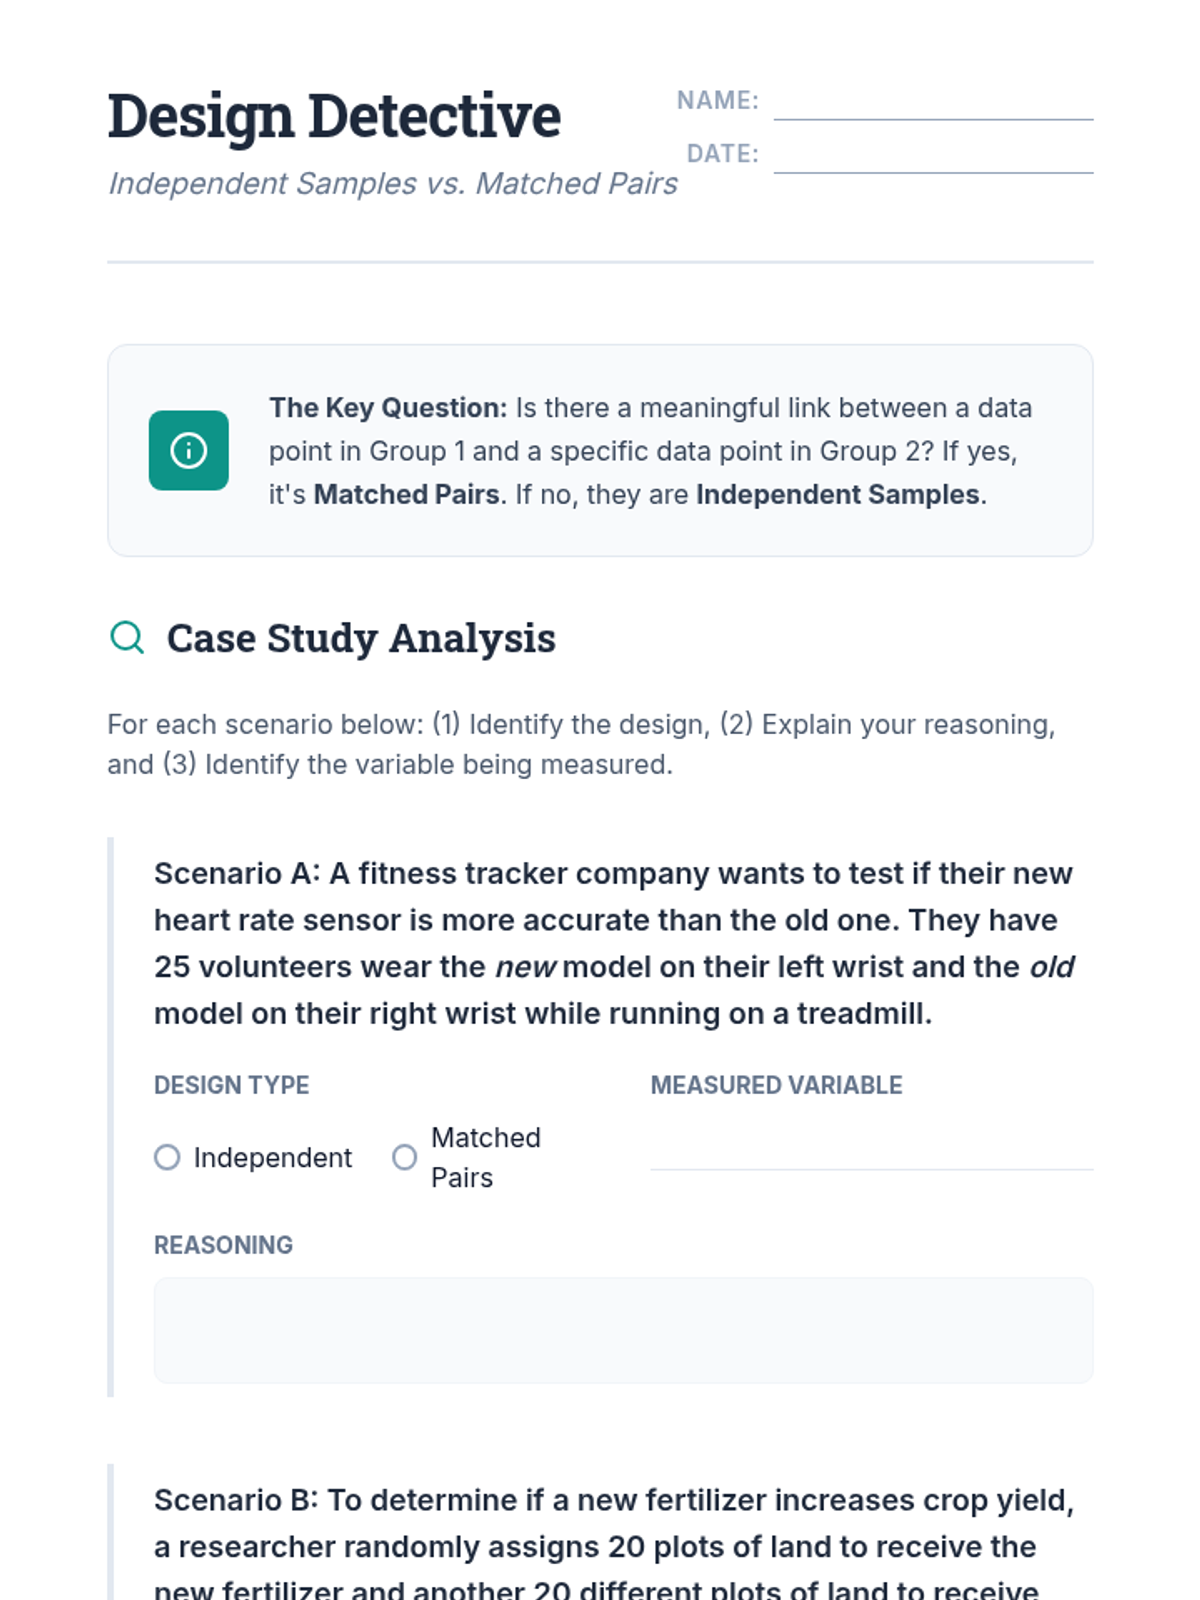
Students distinguish between independent and paired designs, understanding how matching reduces nuisance variation and when each design is appropriate.
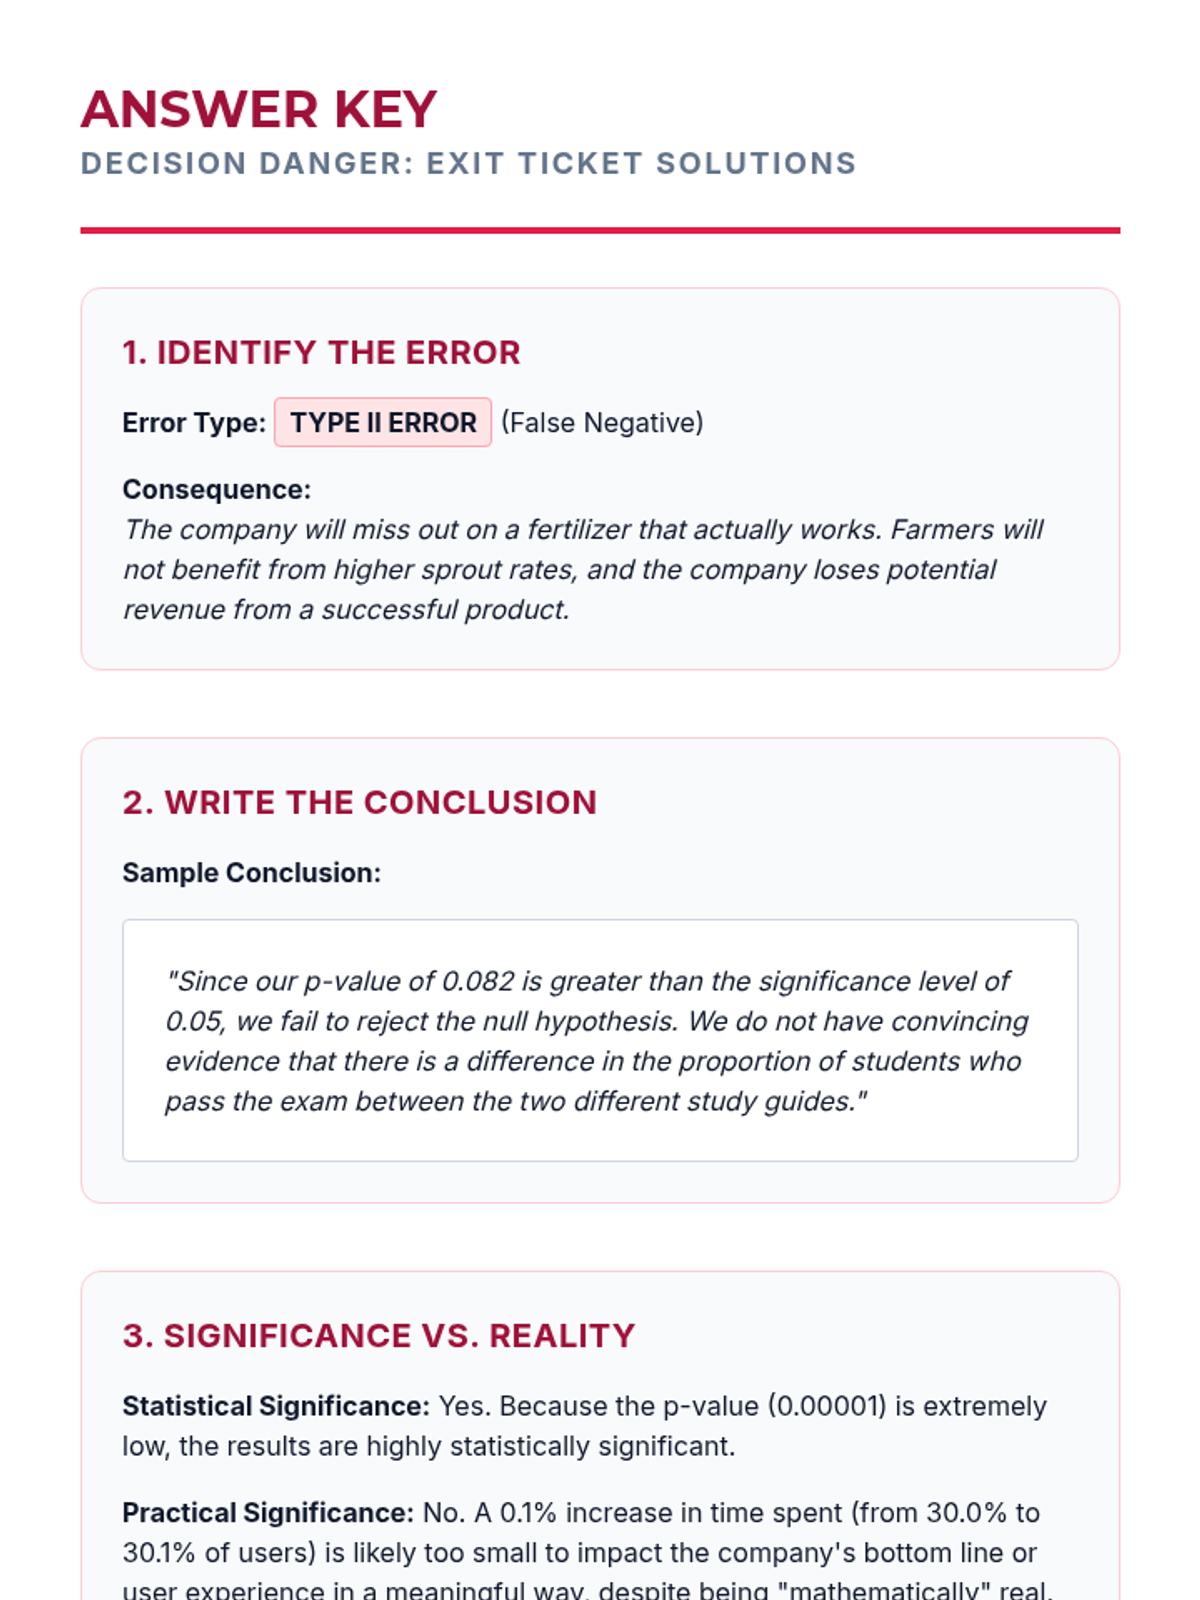
Focus on articulating conclusions in non-technical language and discussing Type I and Type II errors. Students differentiate between statistical and practical significance.
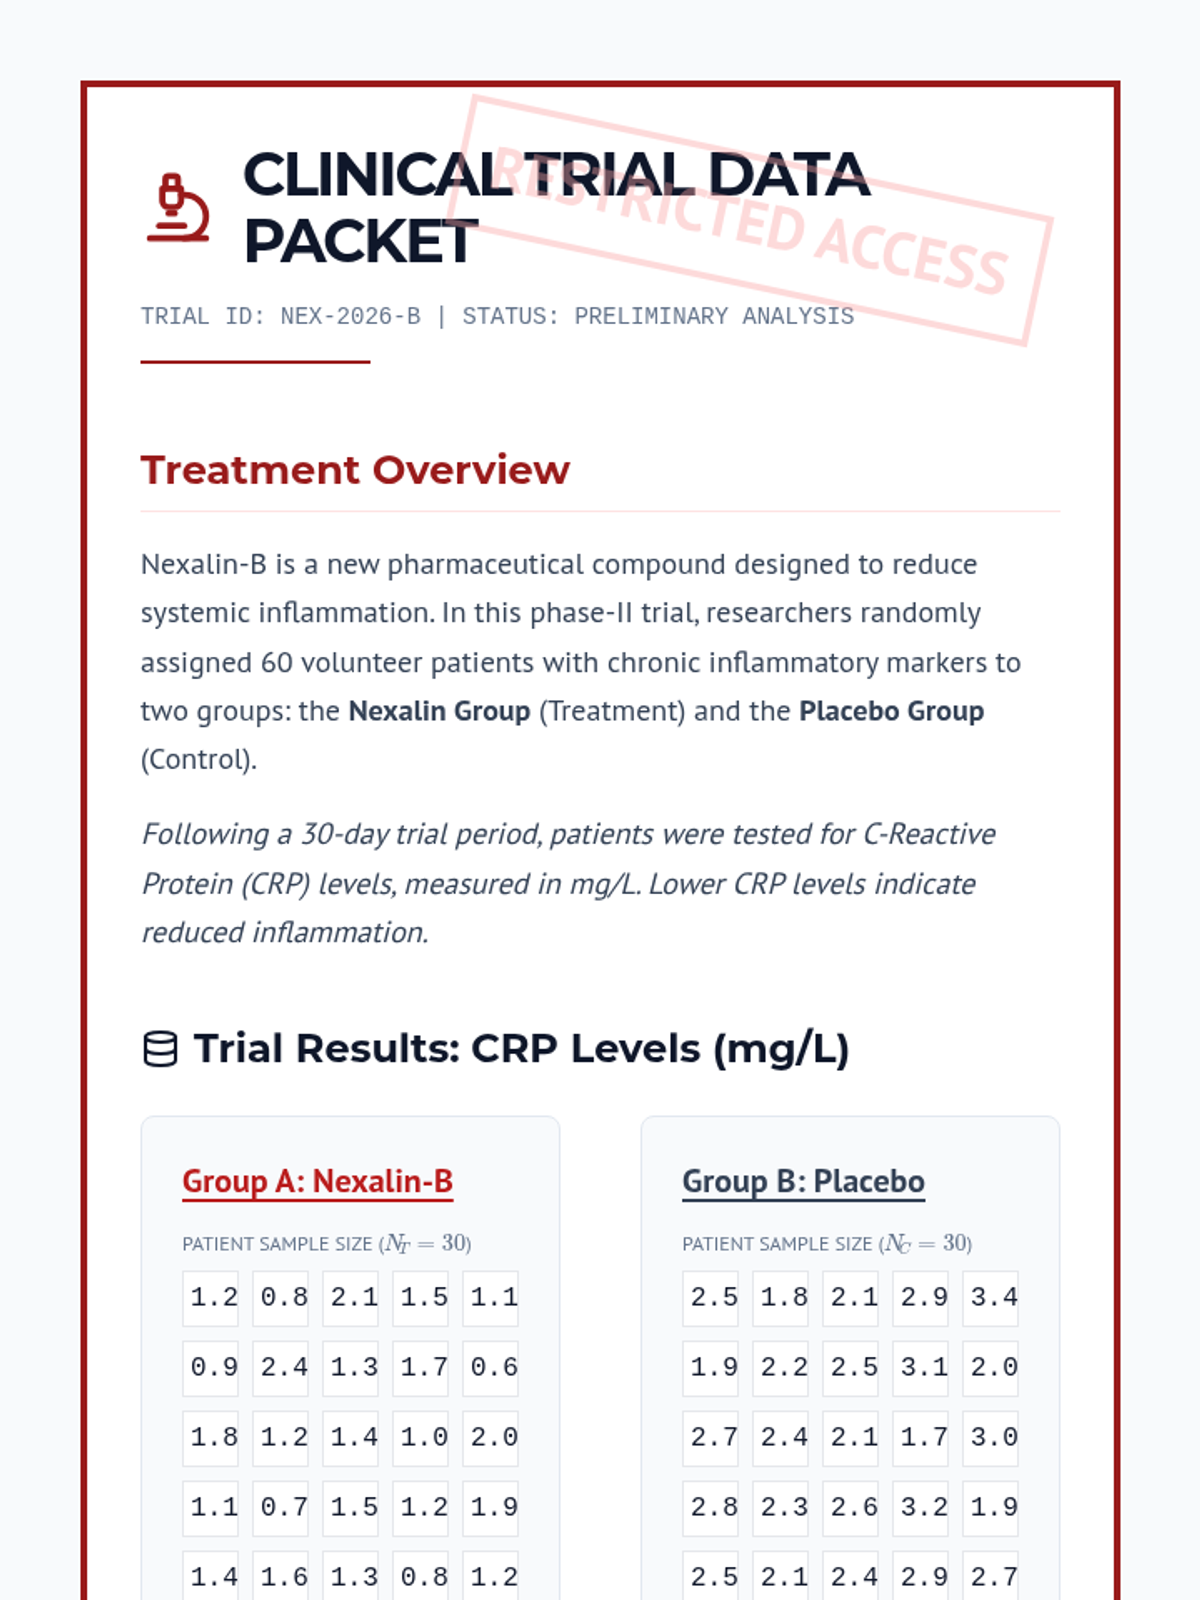
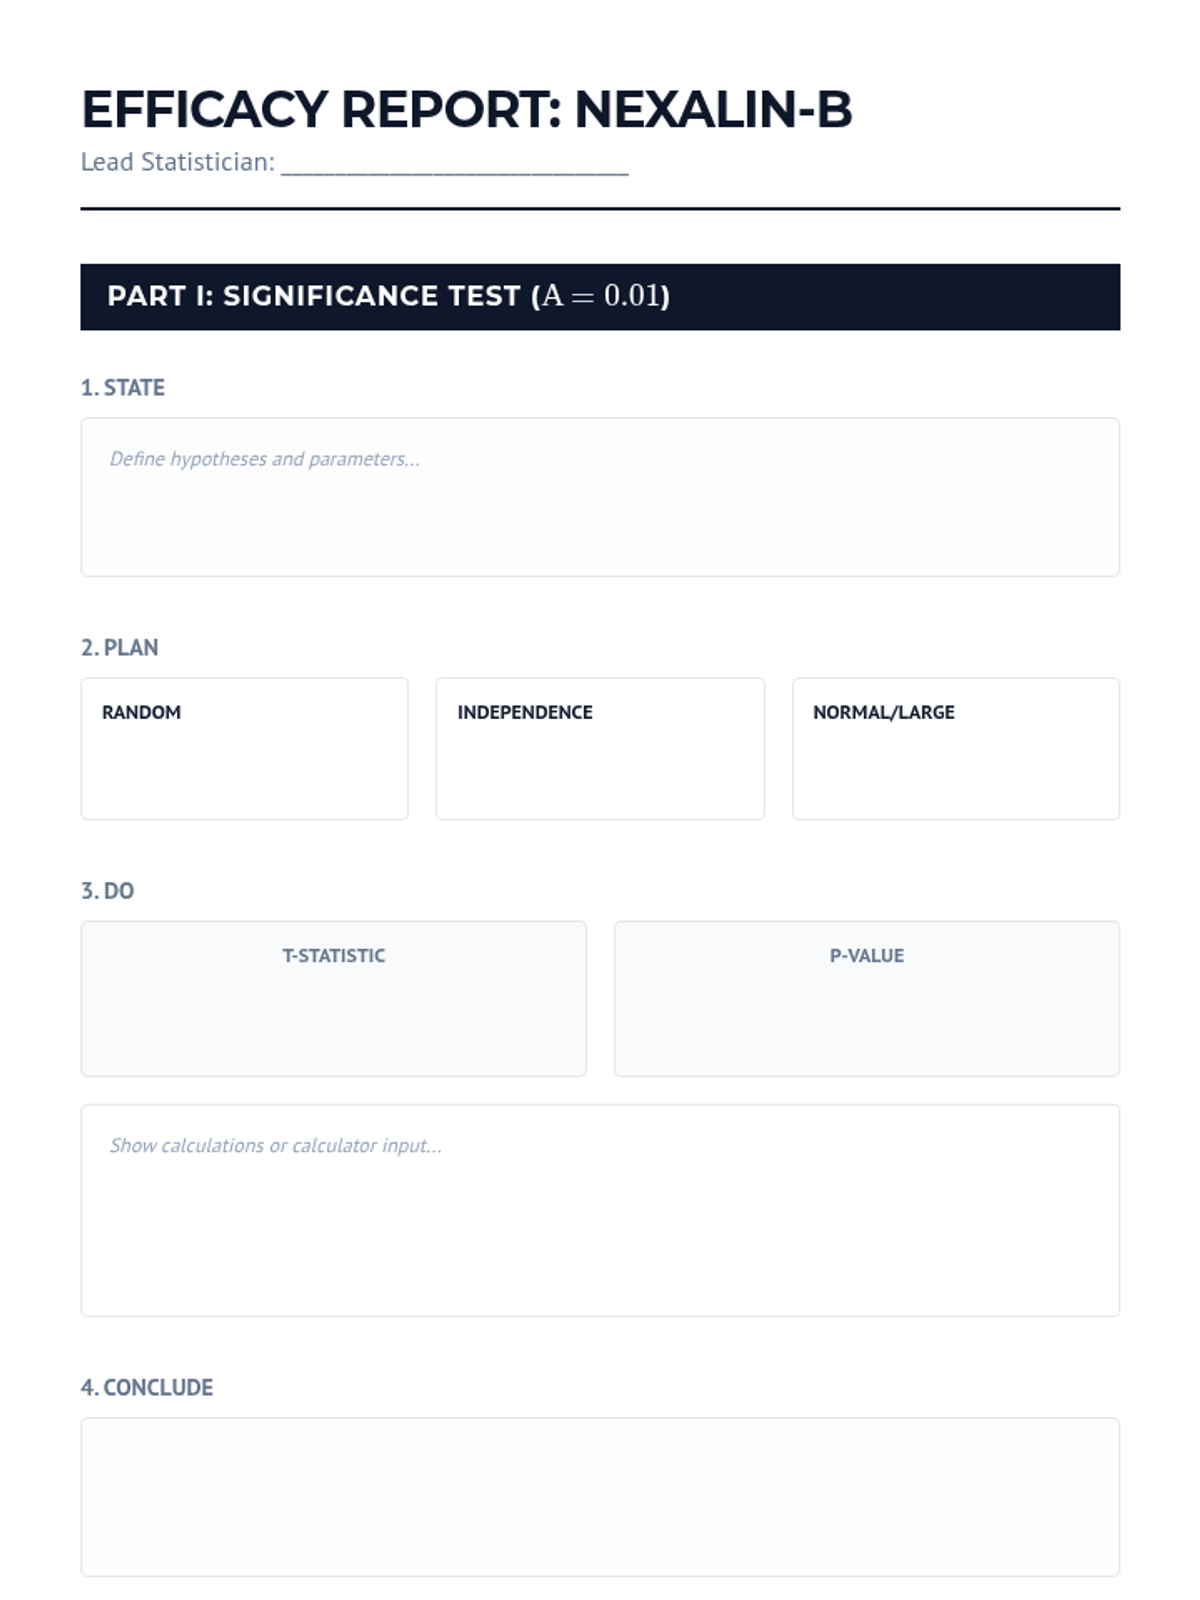
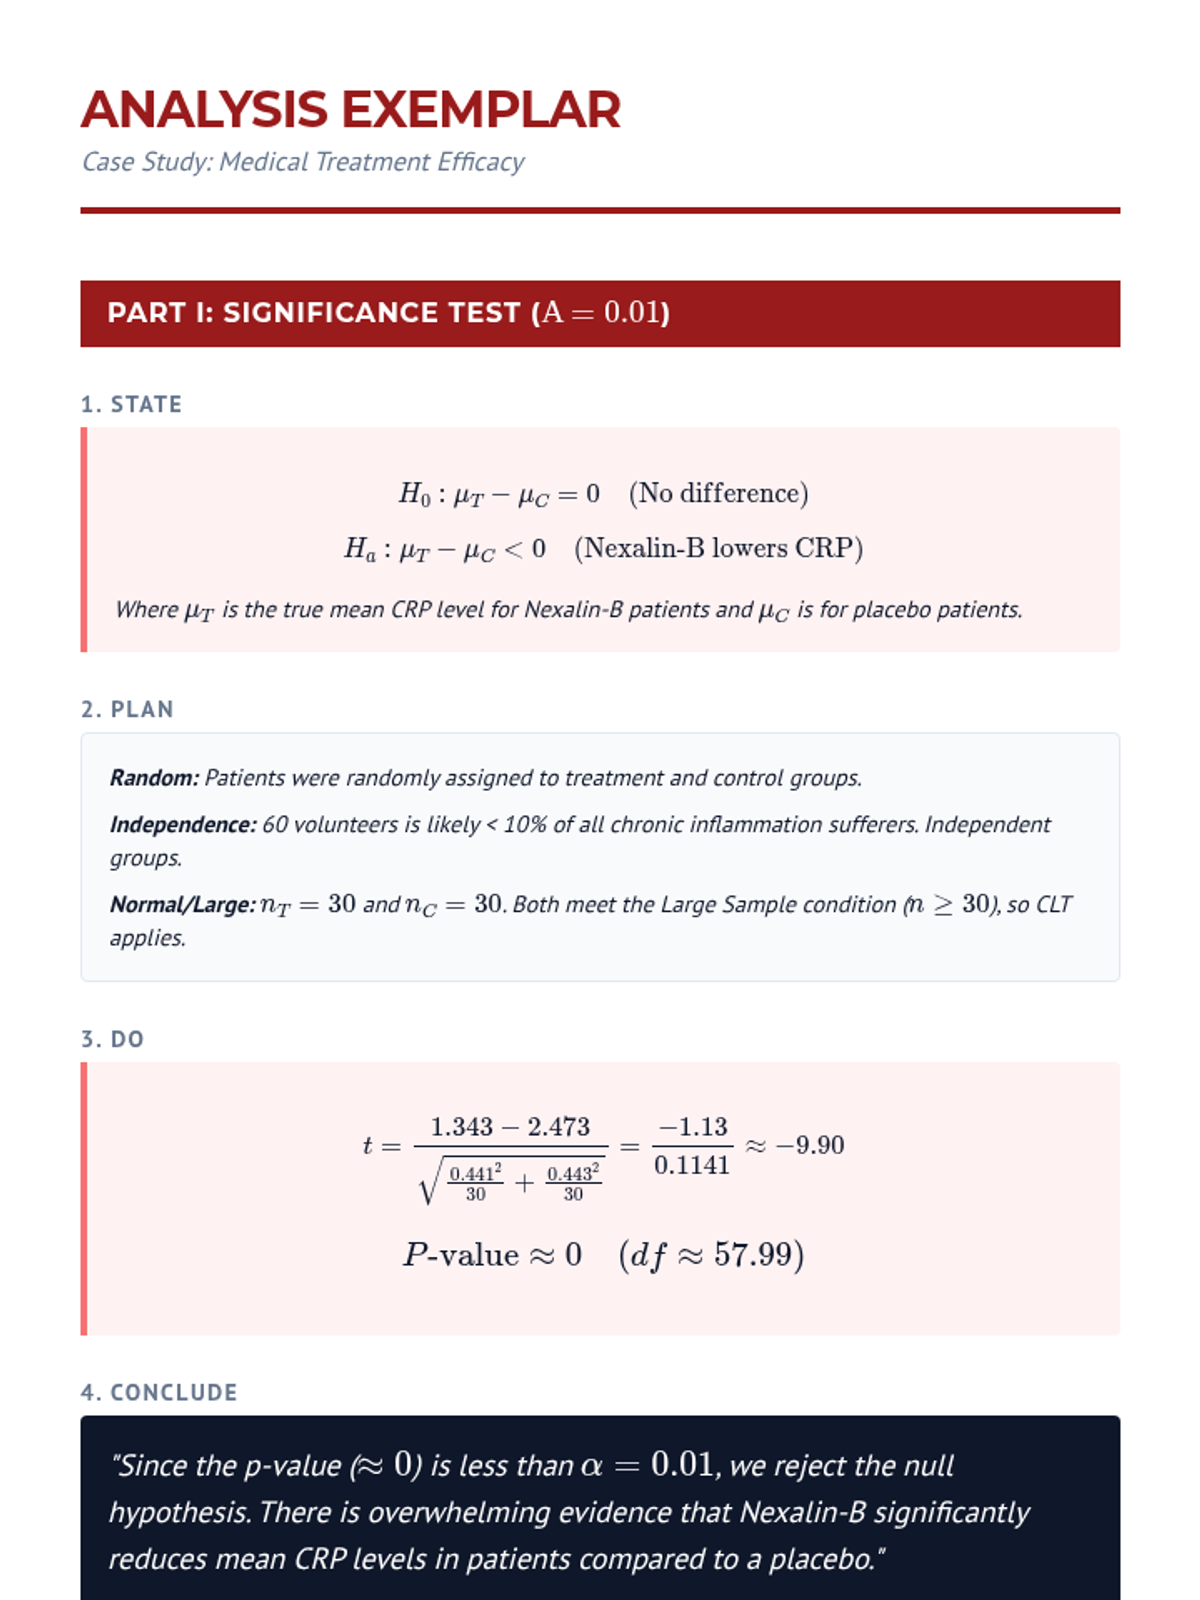
A culminating case study where students analyze clinical trial data to determine treatment efficacy and write a formal statistical report.
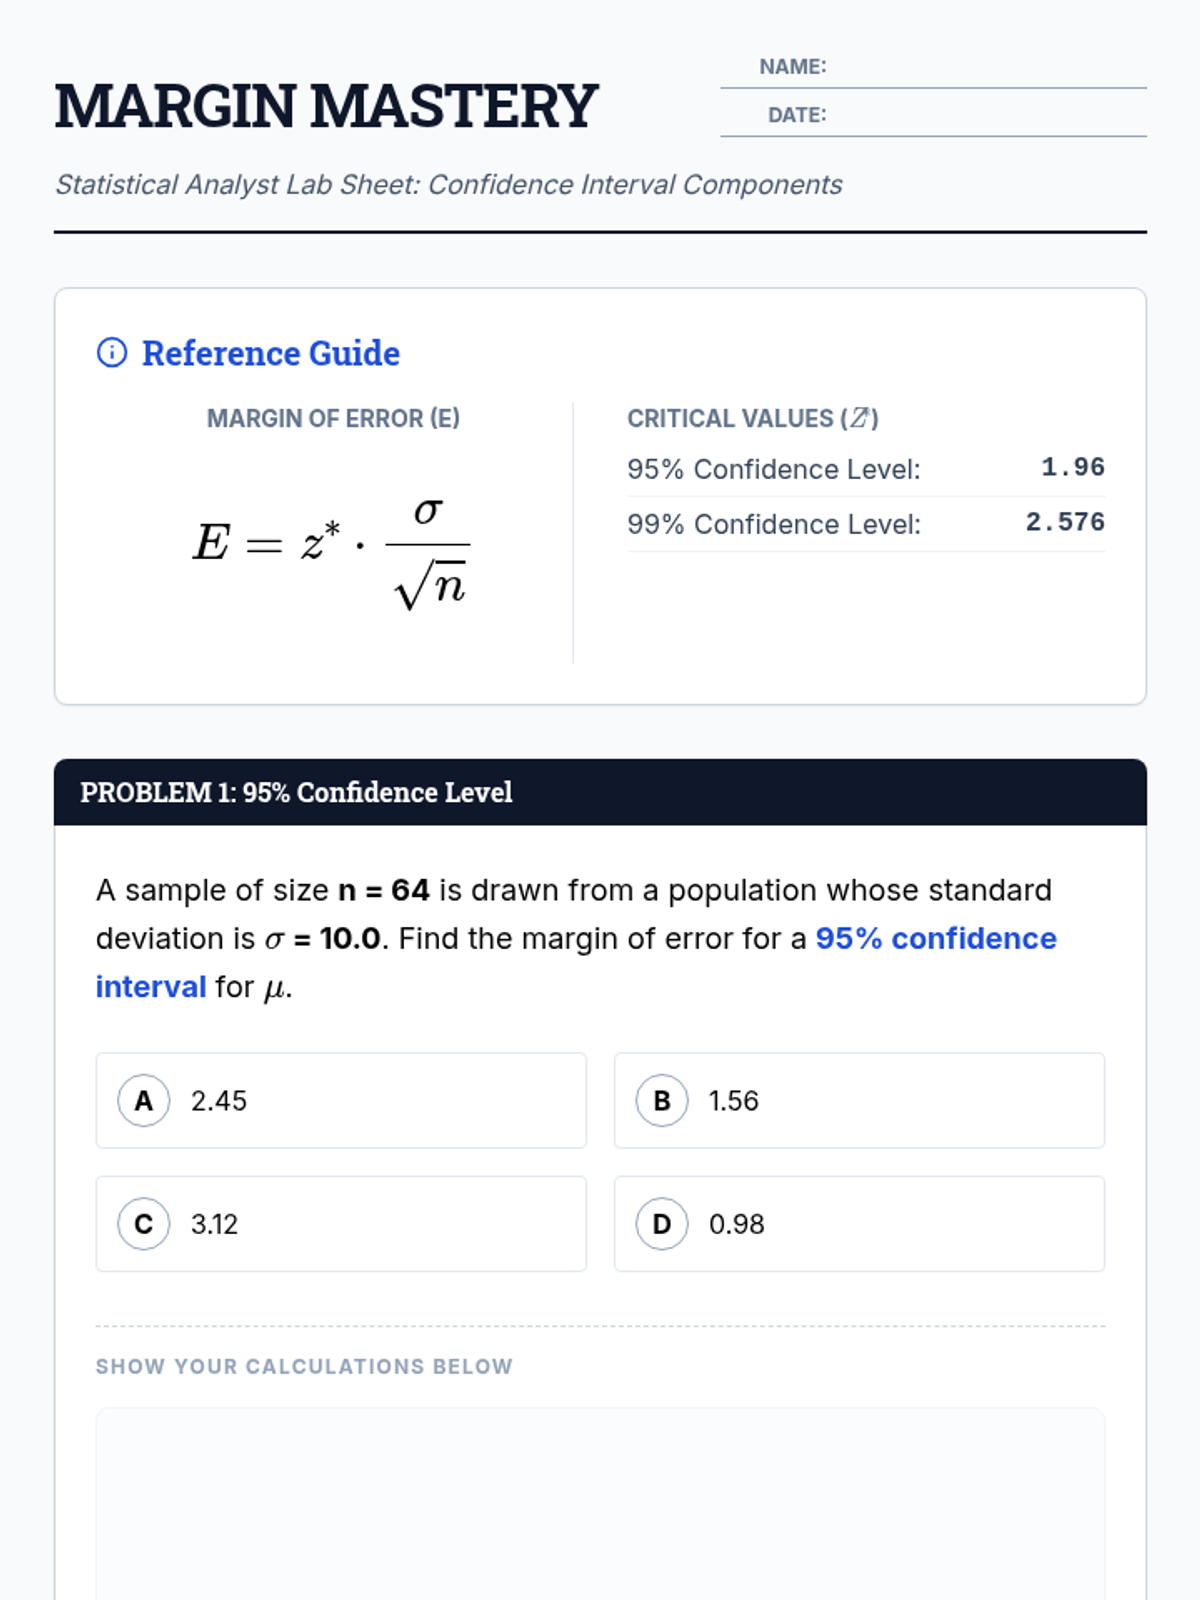
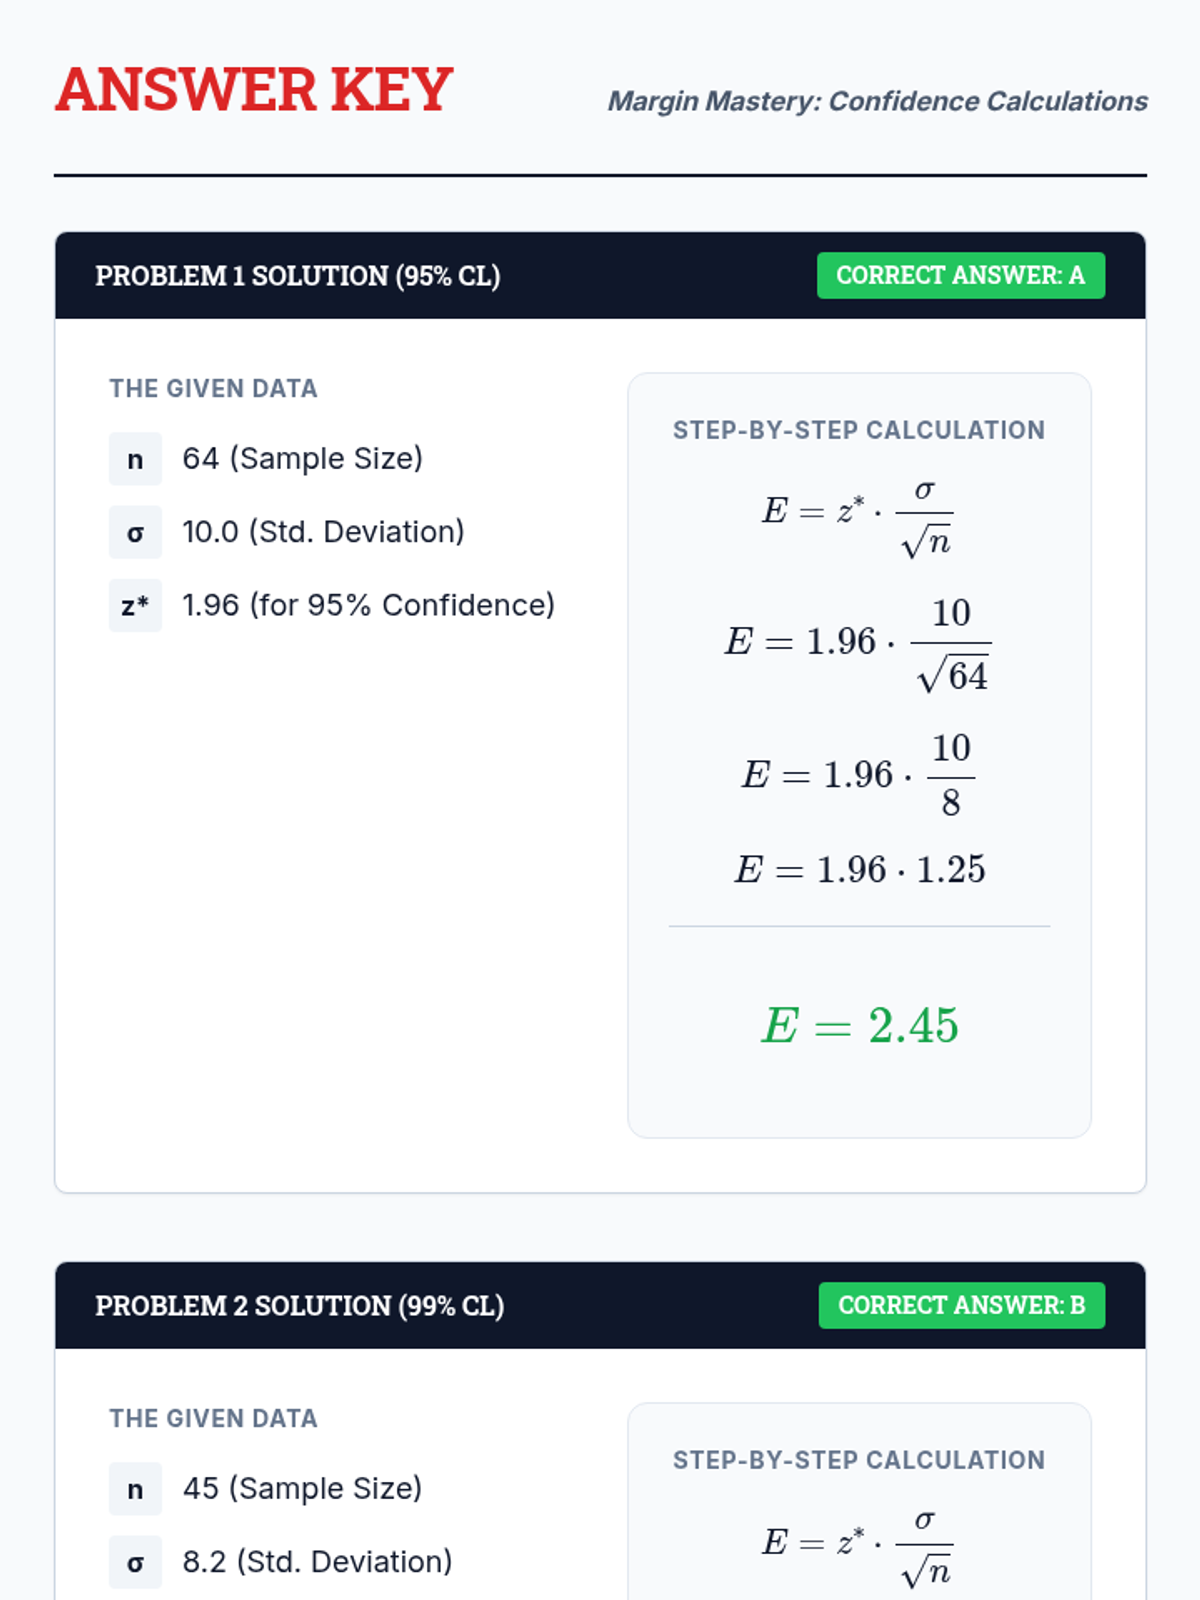
A lesson focused on calculating the margin of error for population means when the population standard deviation is known. Students practice using z-scores for different confidence levels.
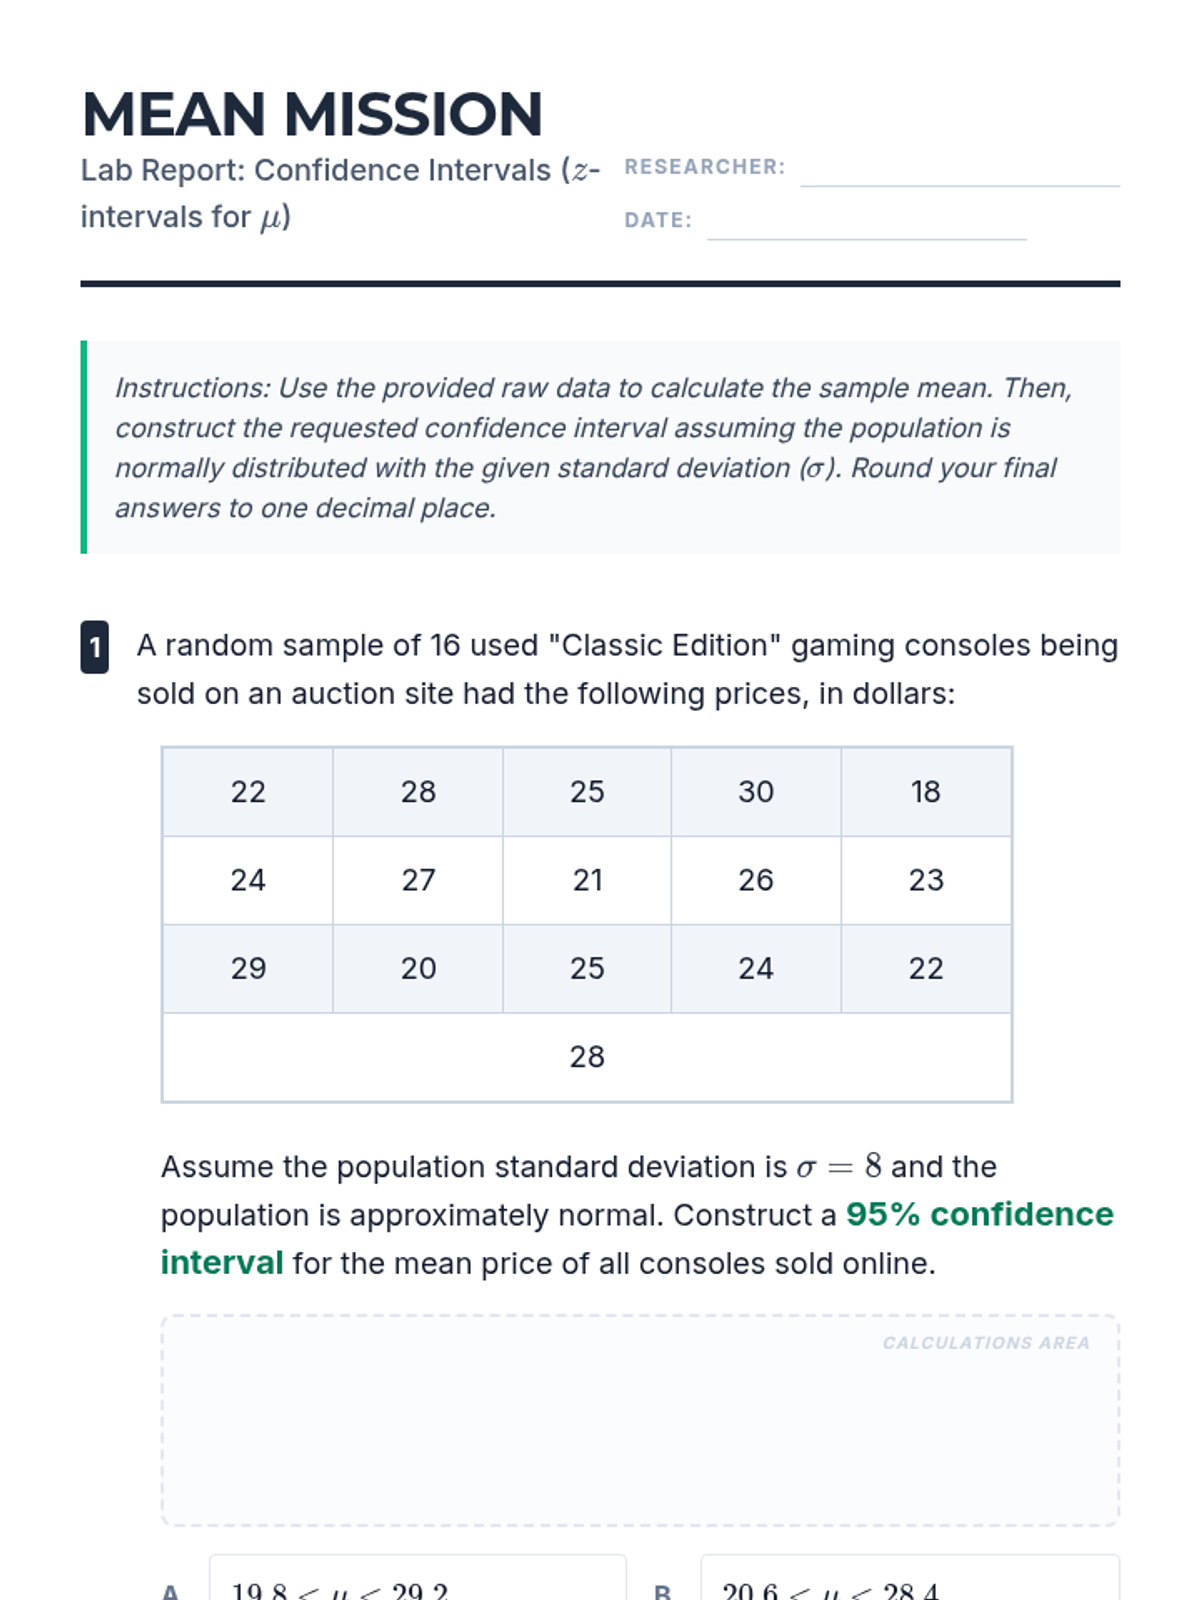
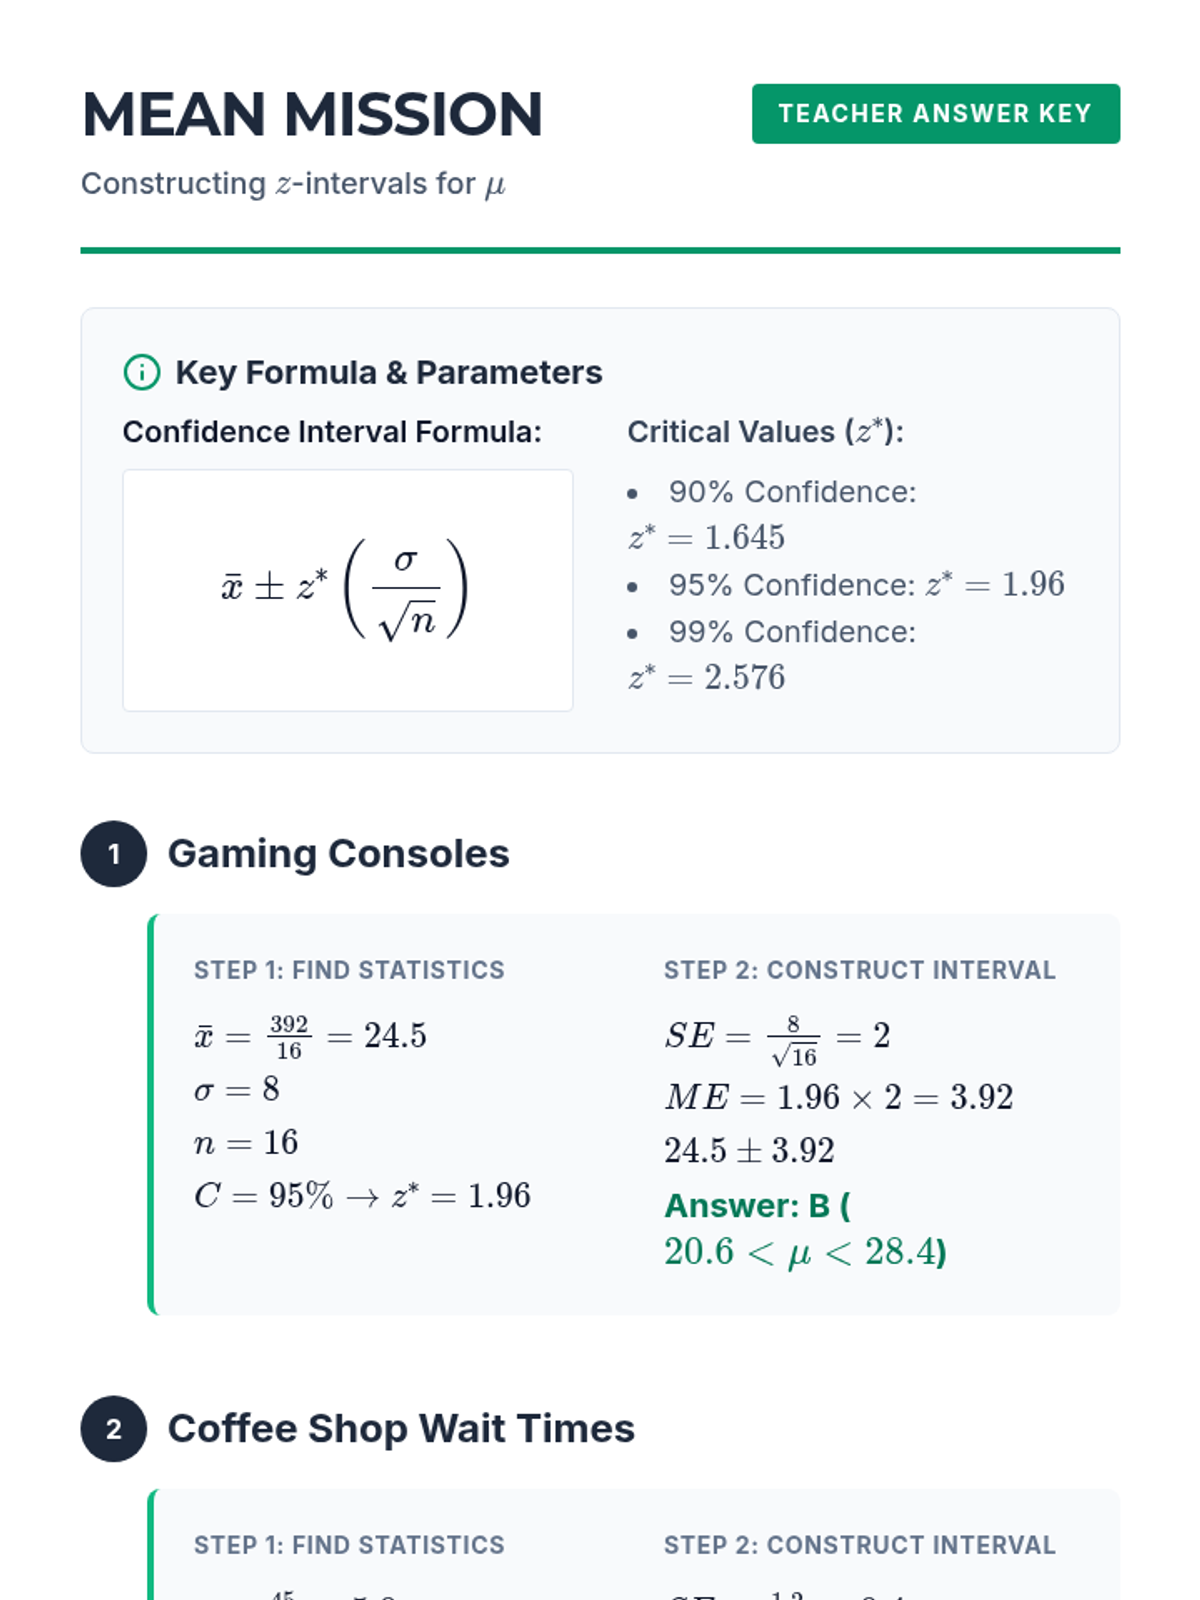
A focused practice session on constructing z-confidence intervals for the mean using raw data and known population standard deviations.
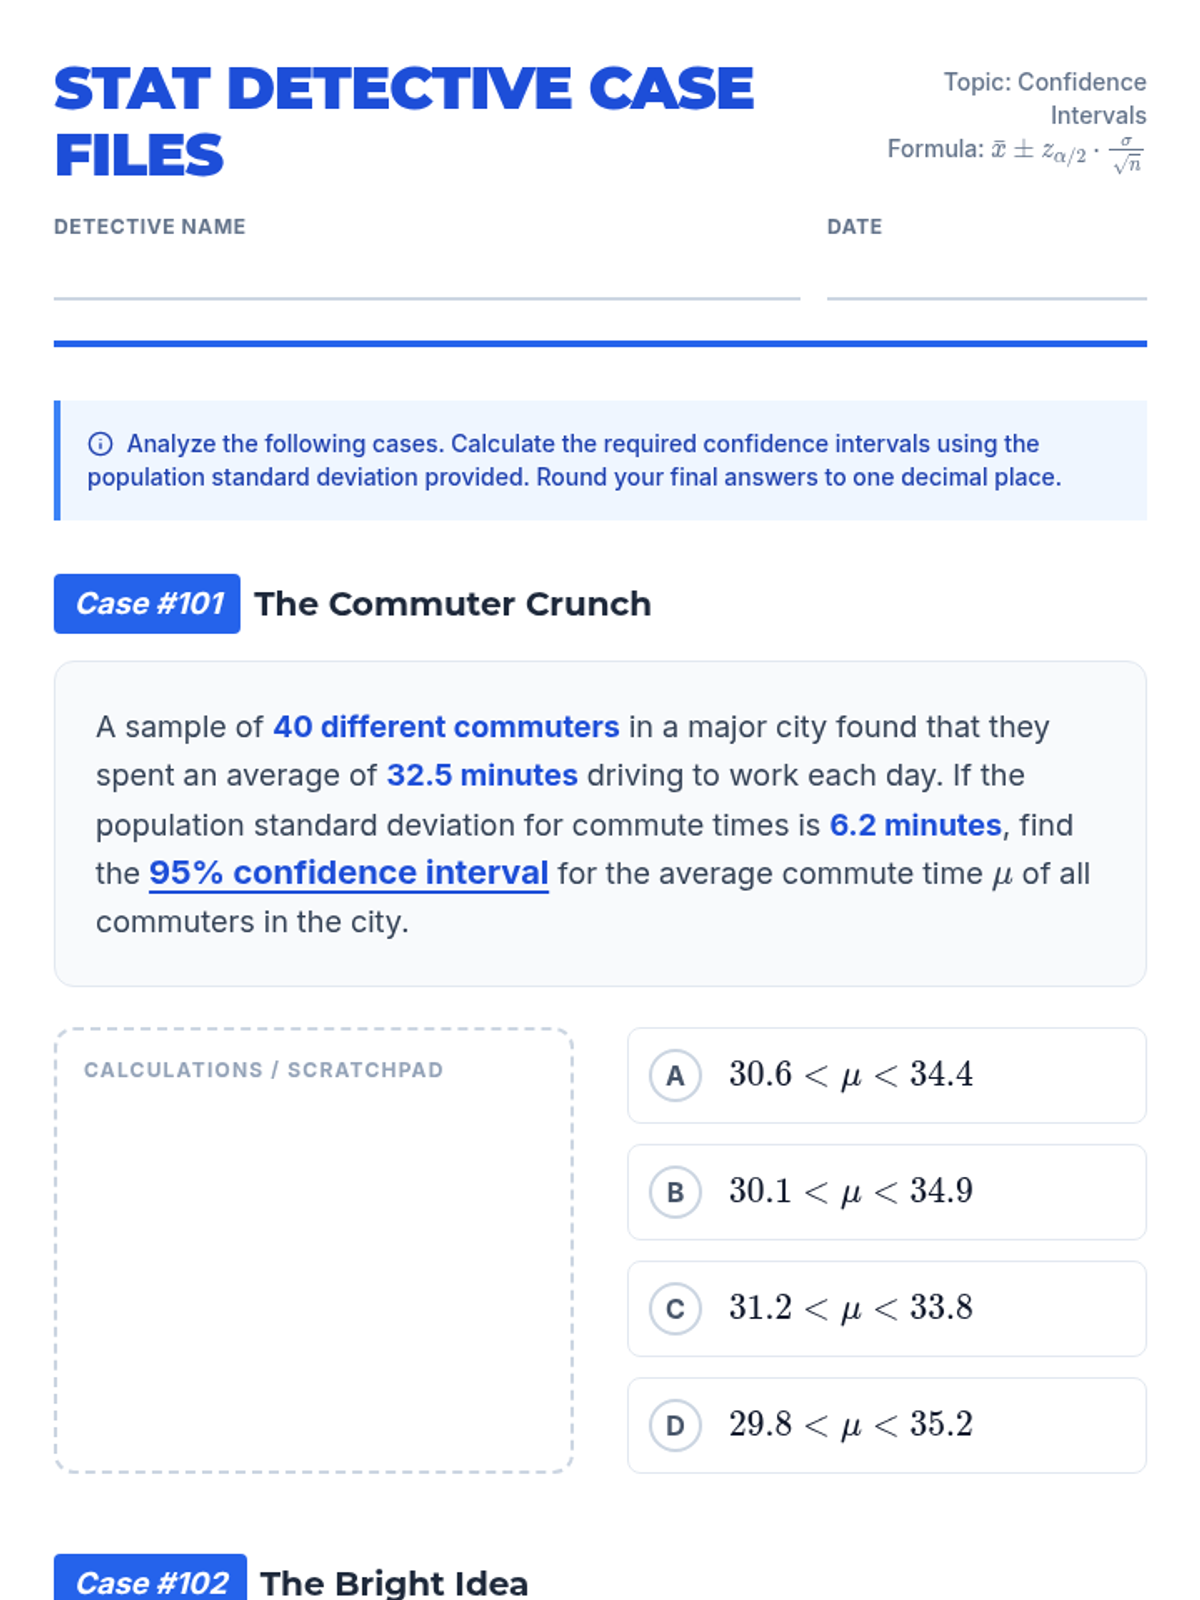
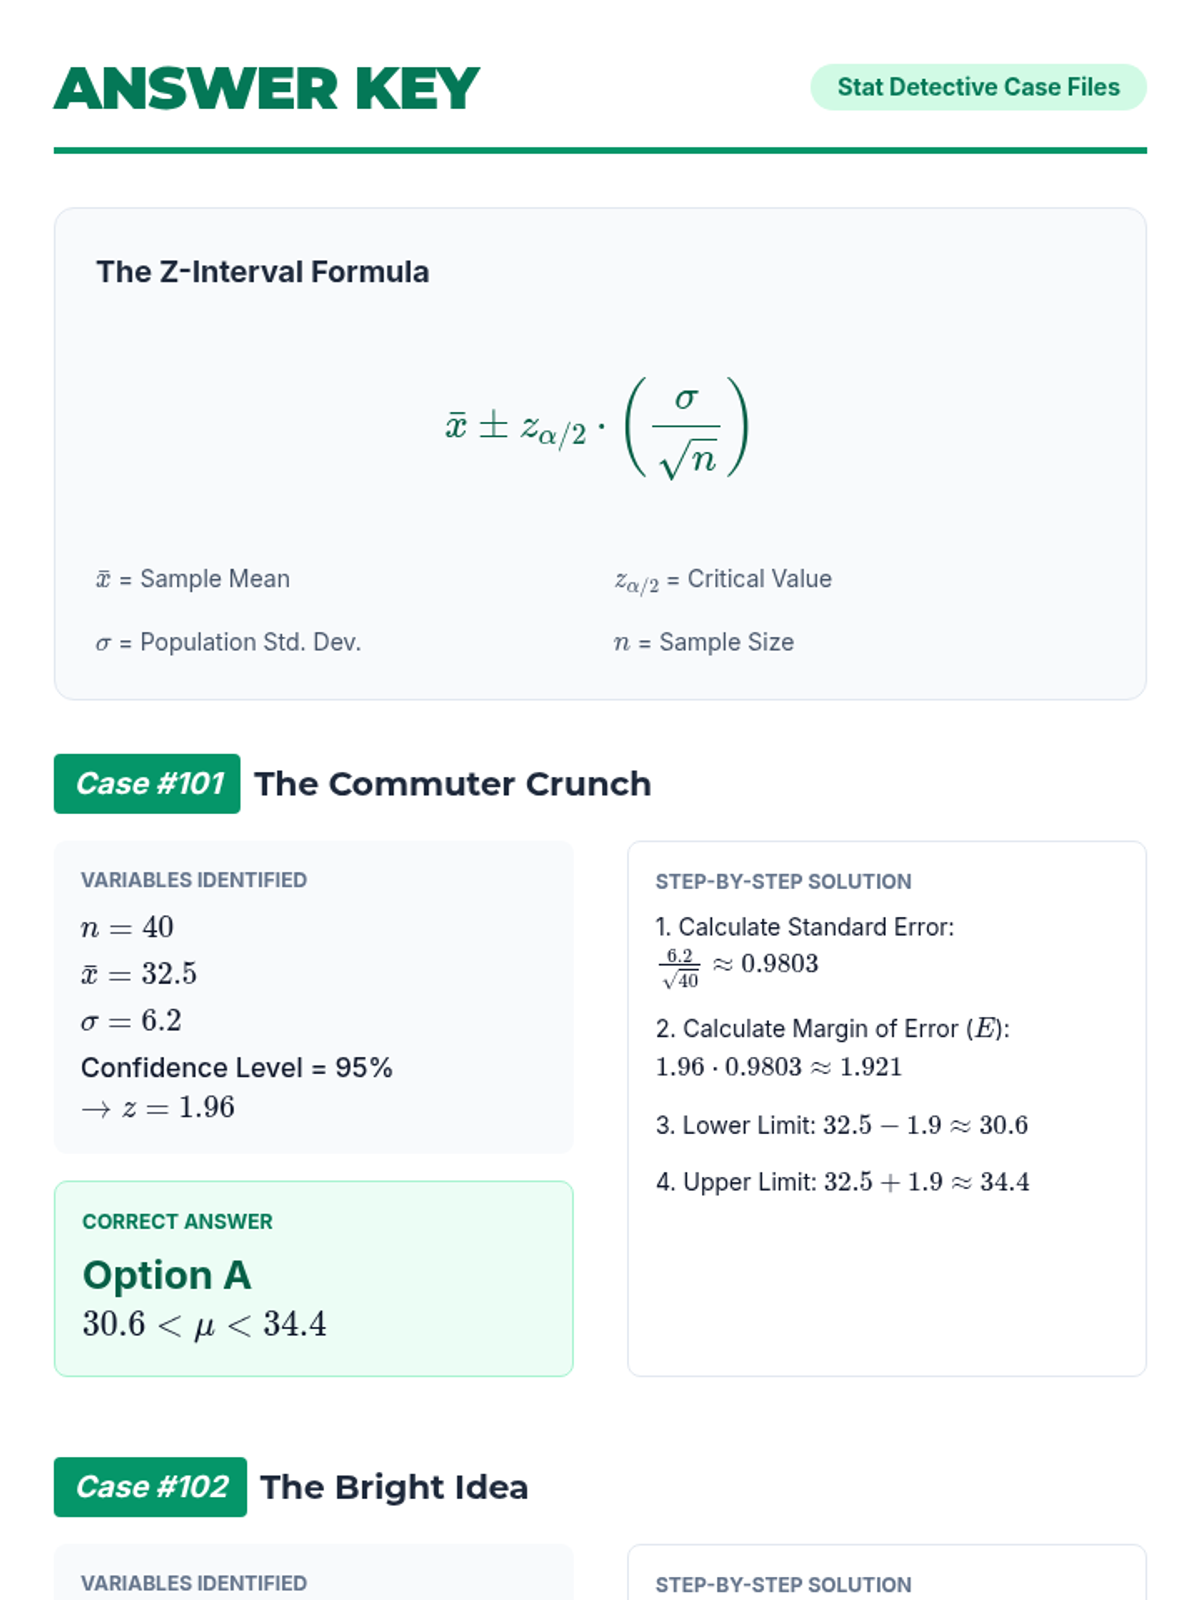
A lesson focused on calculating and interpreting confidence intervals for population means when the population standard deviation is known. Students practice identifying key statistics and applying the Z-interval formula to real-world scenarios.
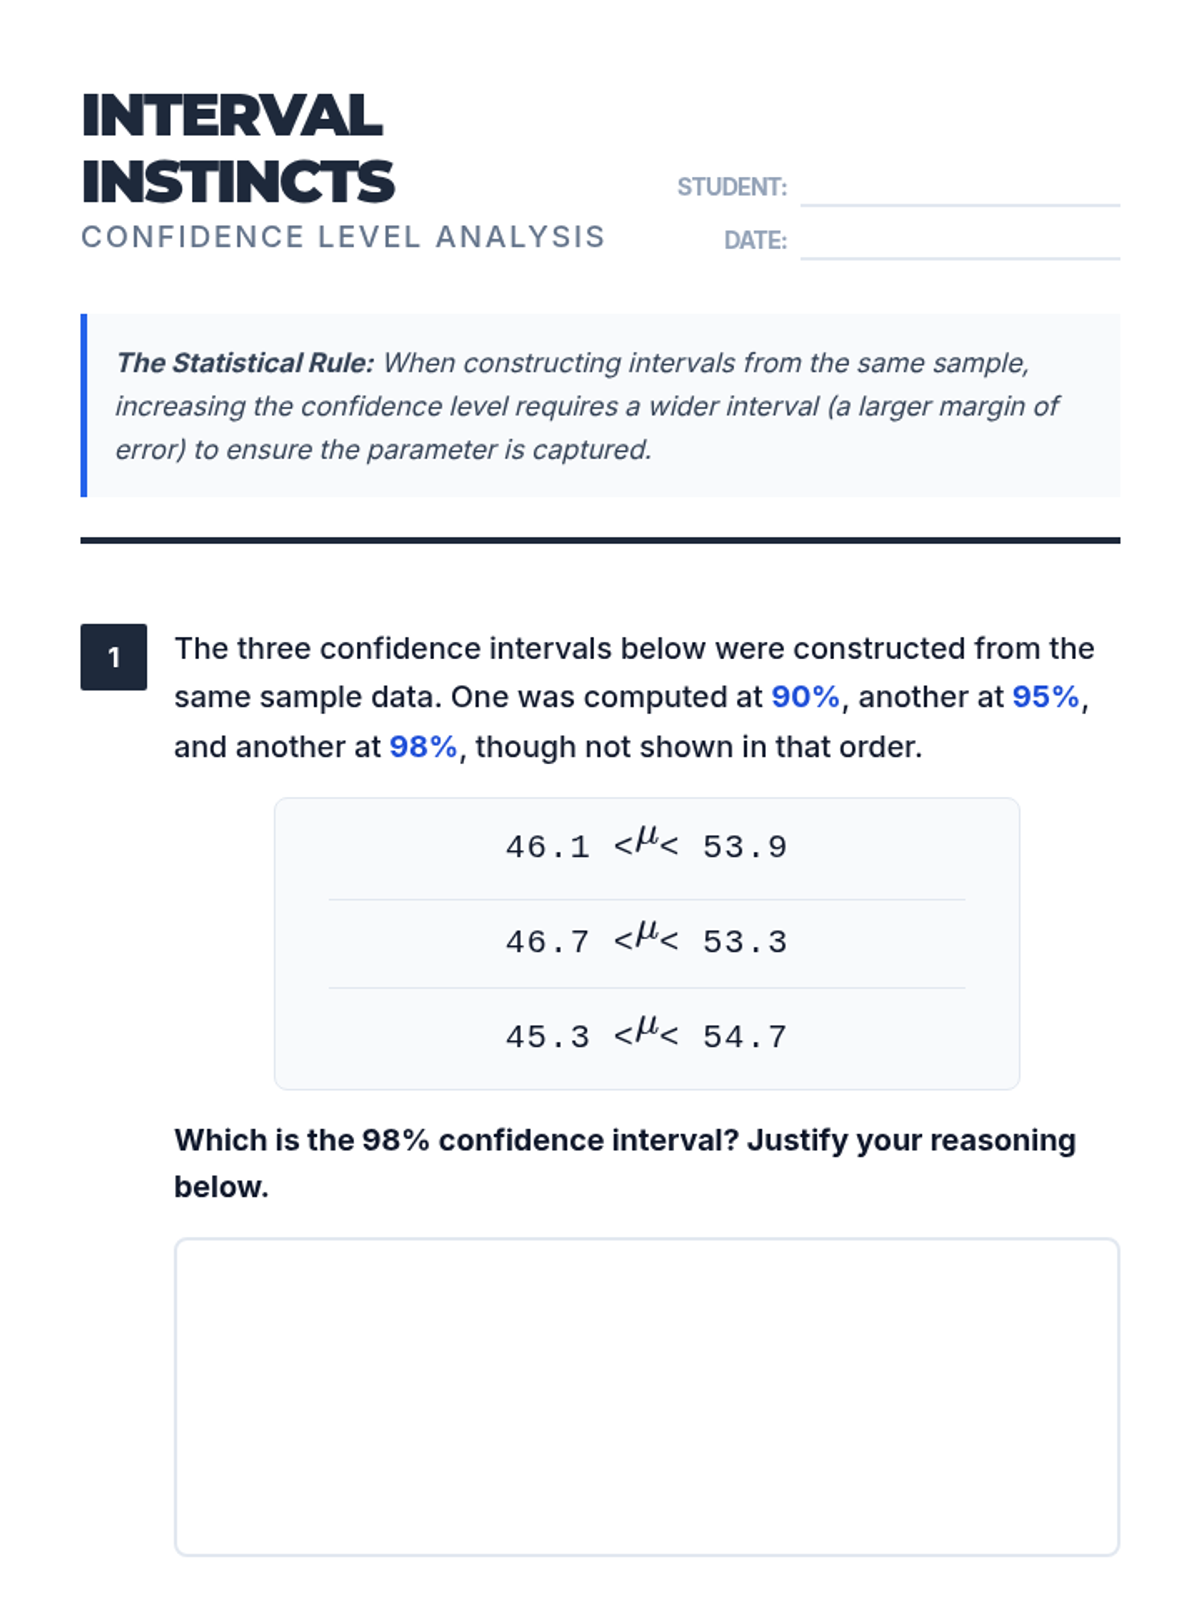
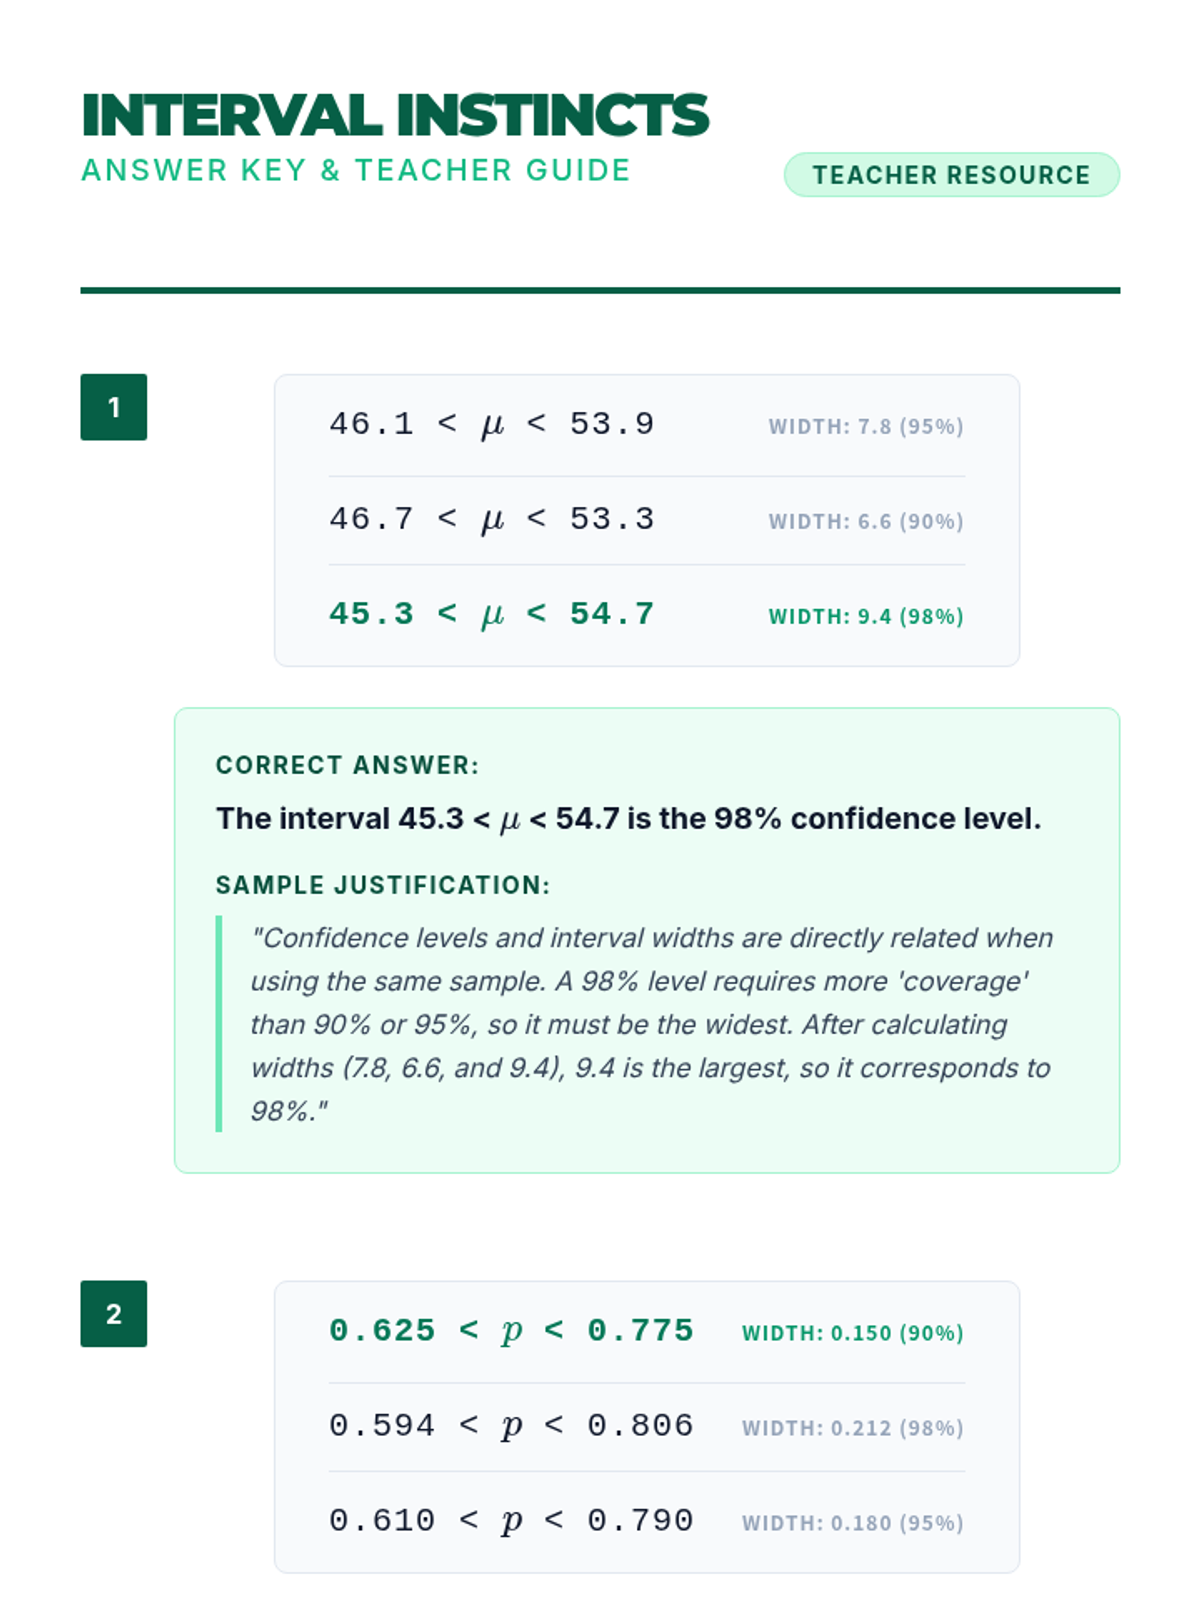
A practice lesson focusing on the relationship between confidence levels and interval width. Students analyze sets of intervals to identify specific confidence levels based on their precision.
A Tier 2 intervention lesson focusing on the logic of randomization tests, using physical shuffling to simulate the null hypothesis and determine if experimental results are statistically significant.
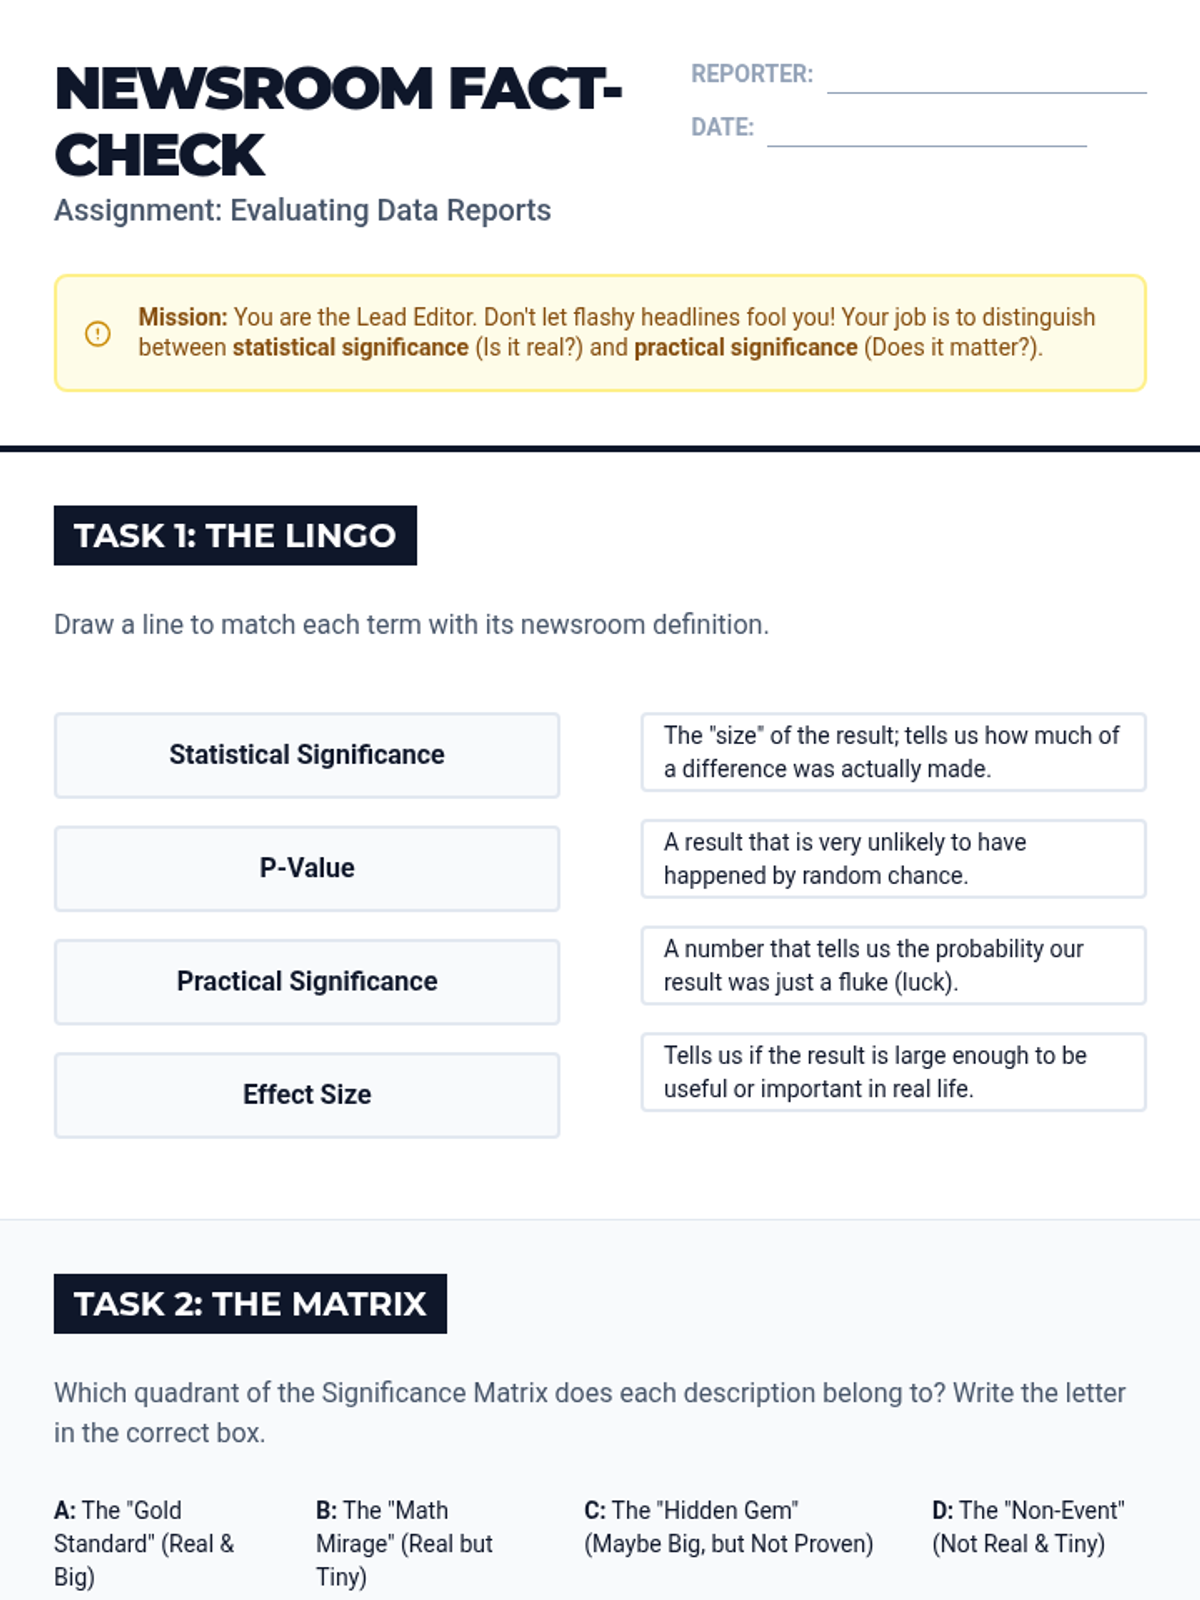
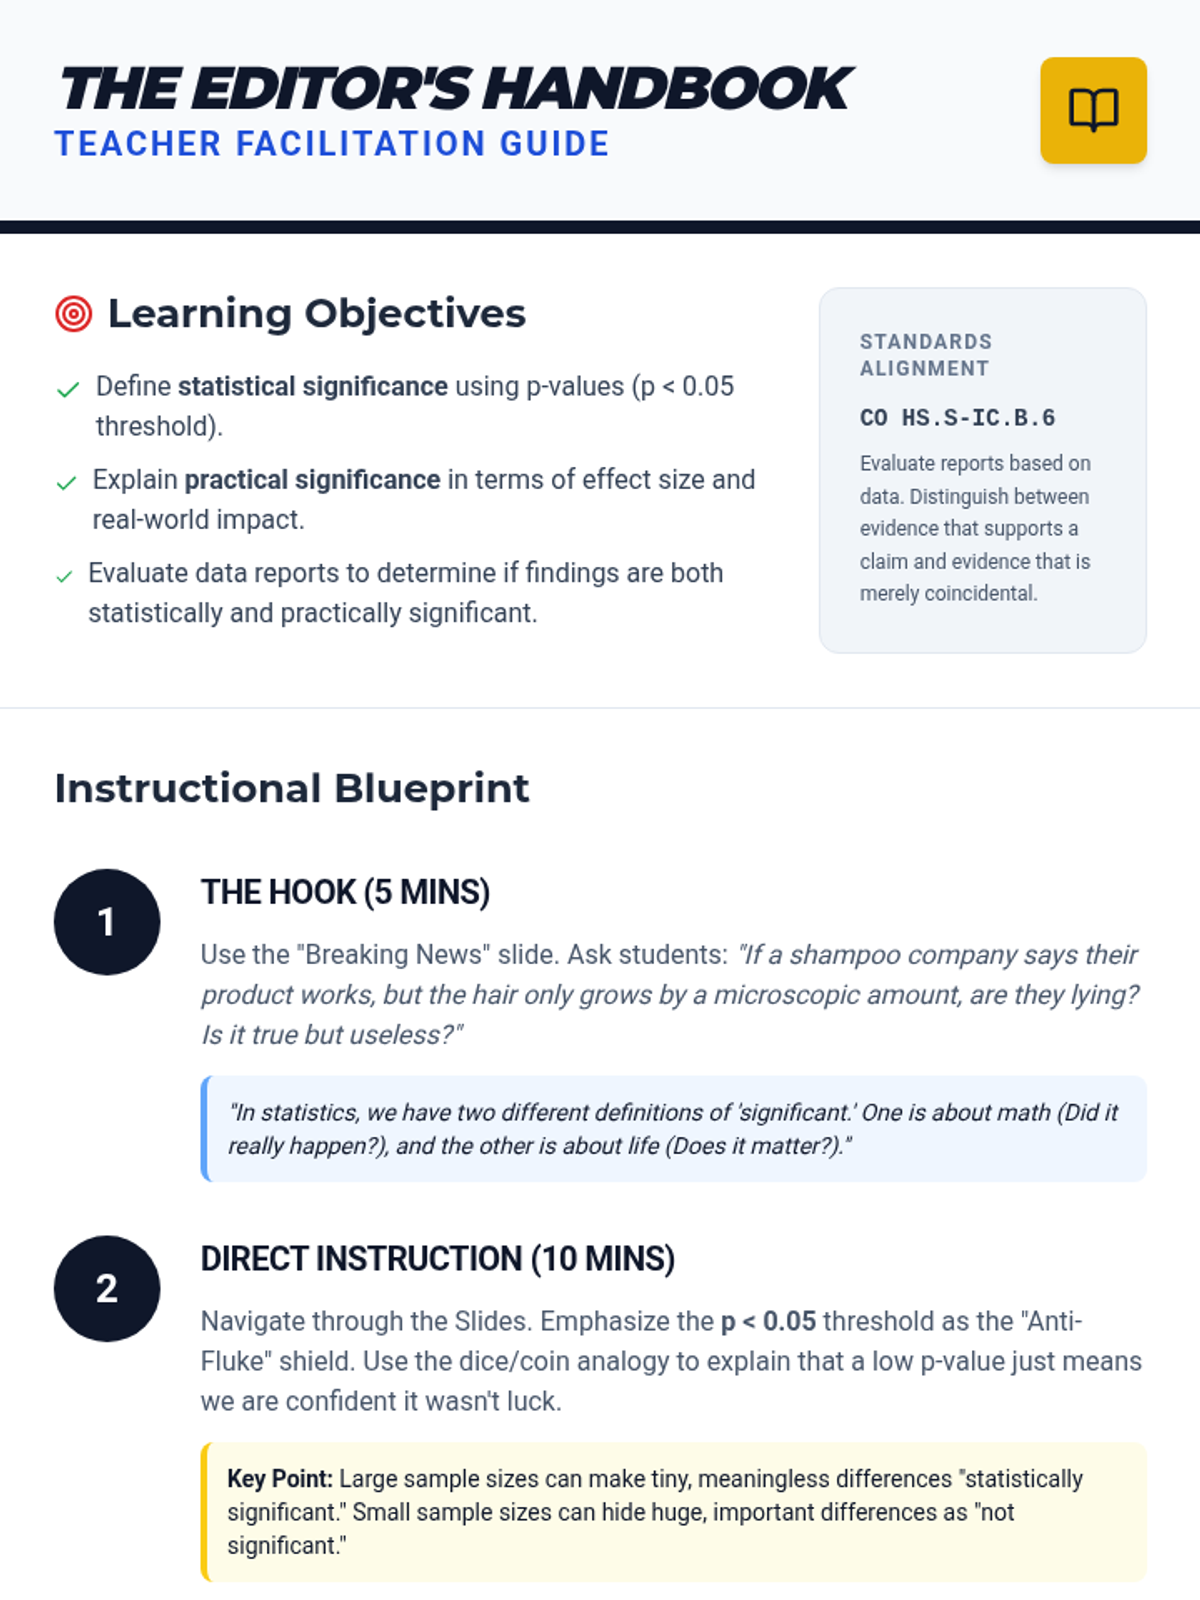
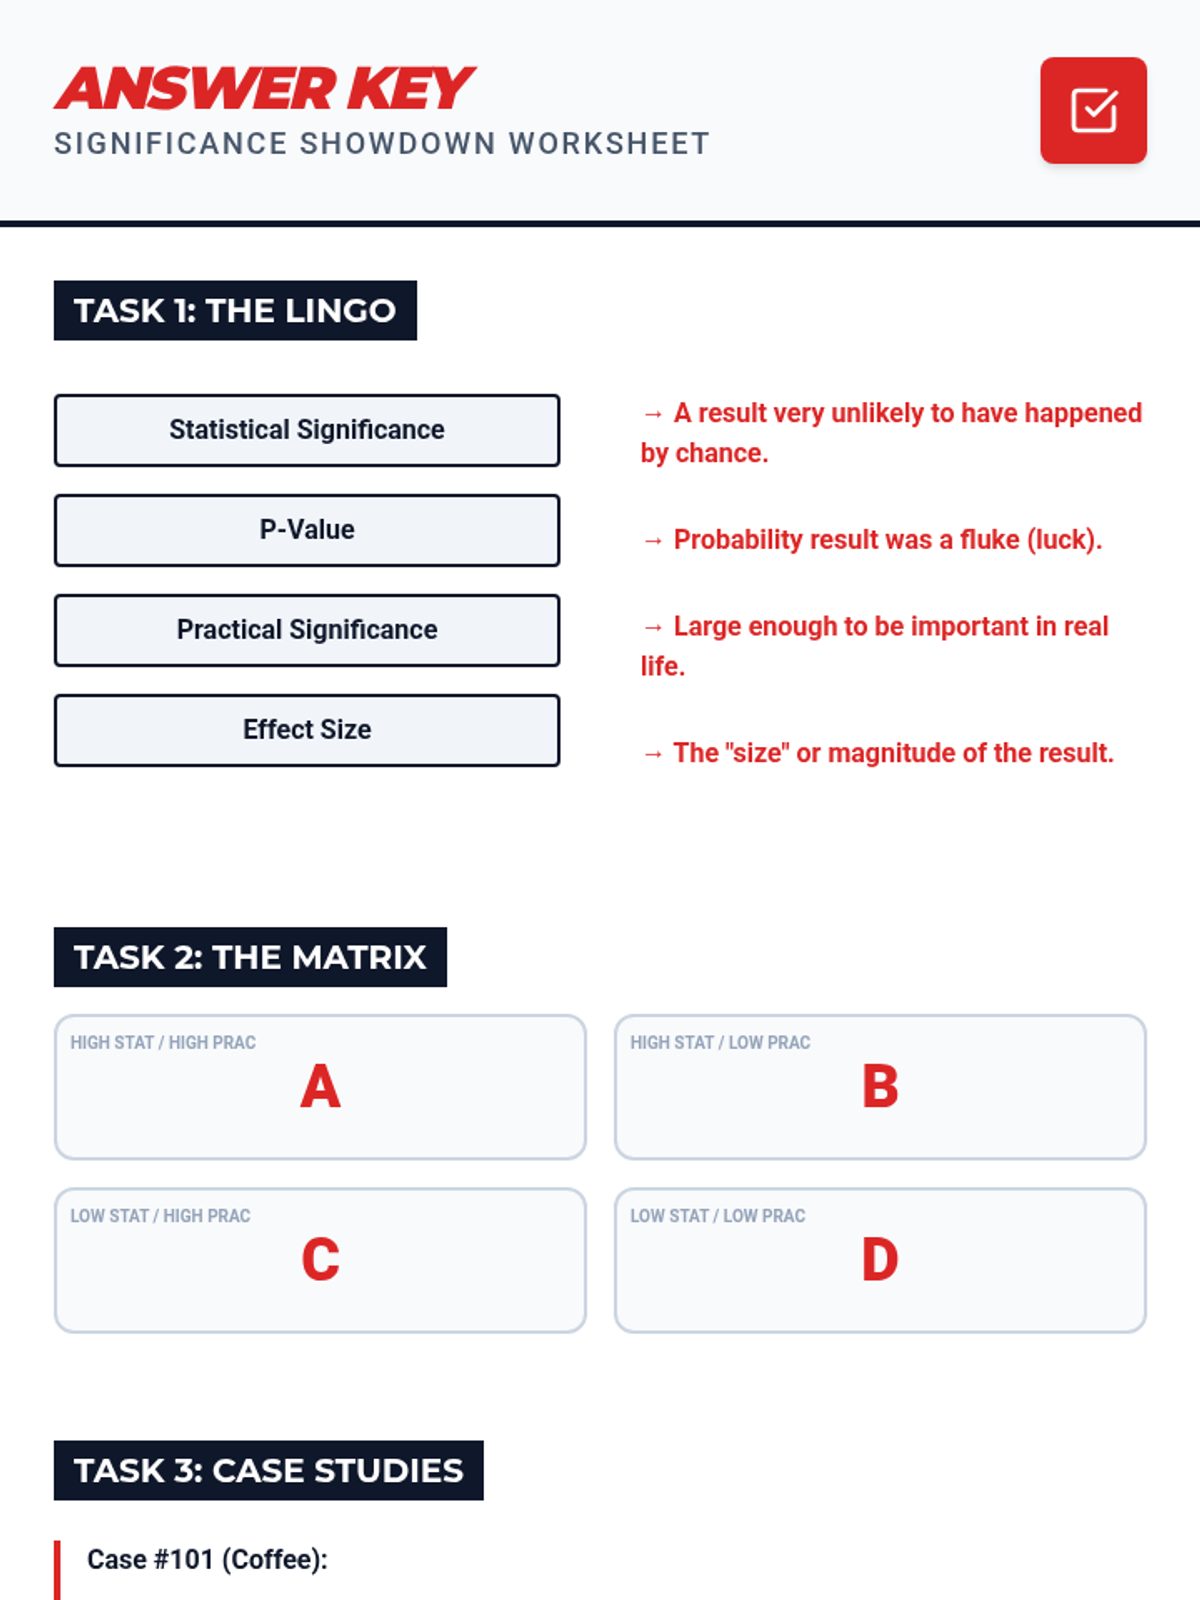
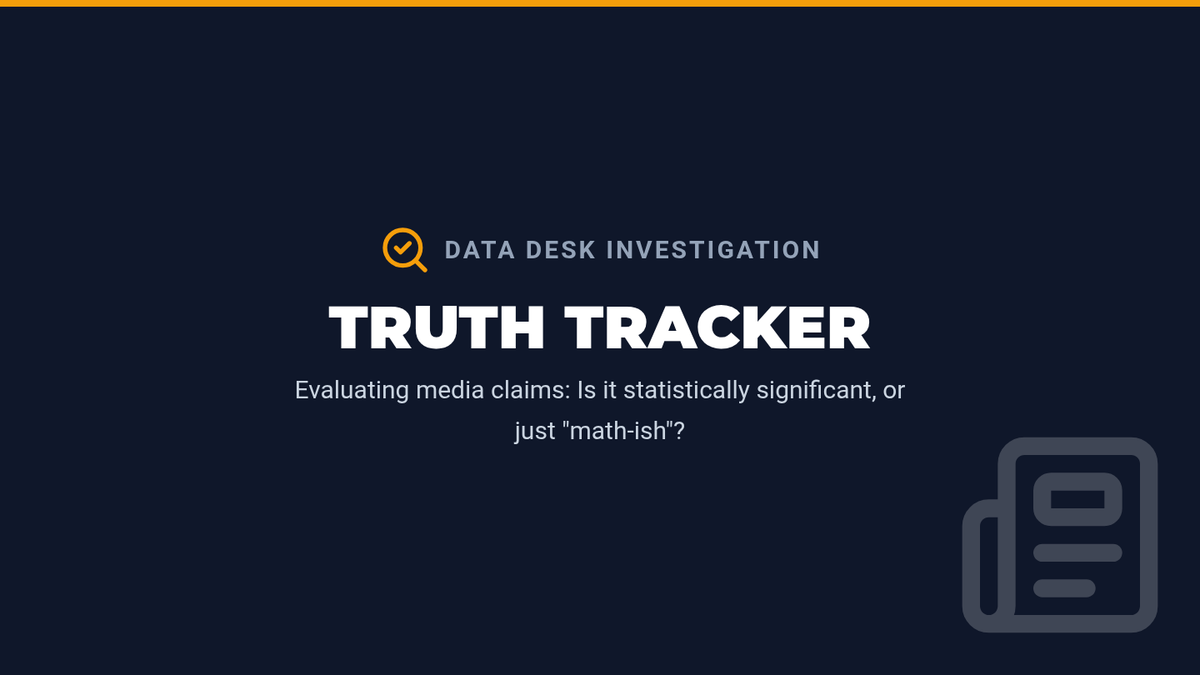
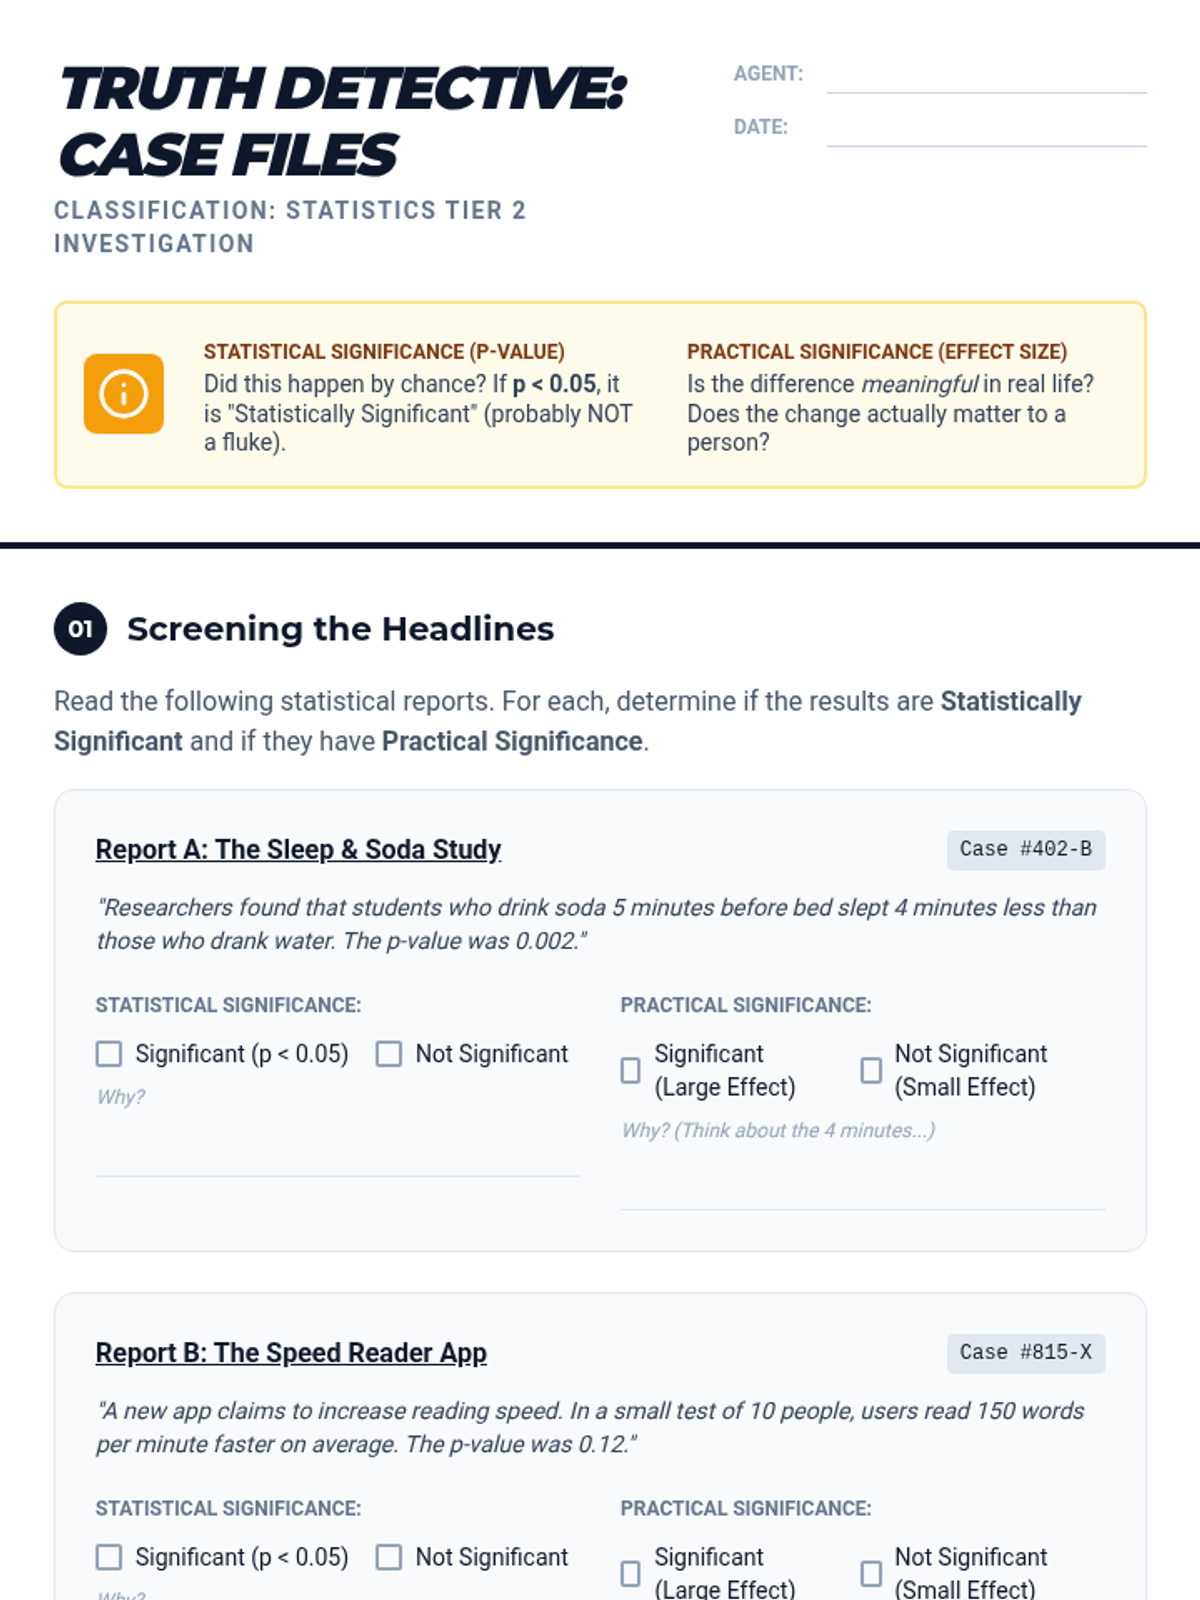
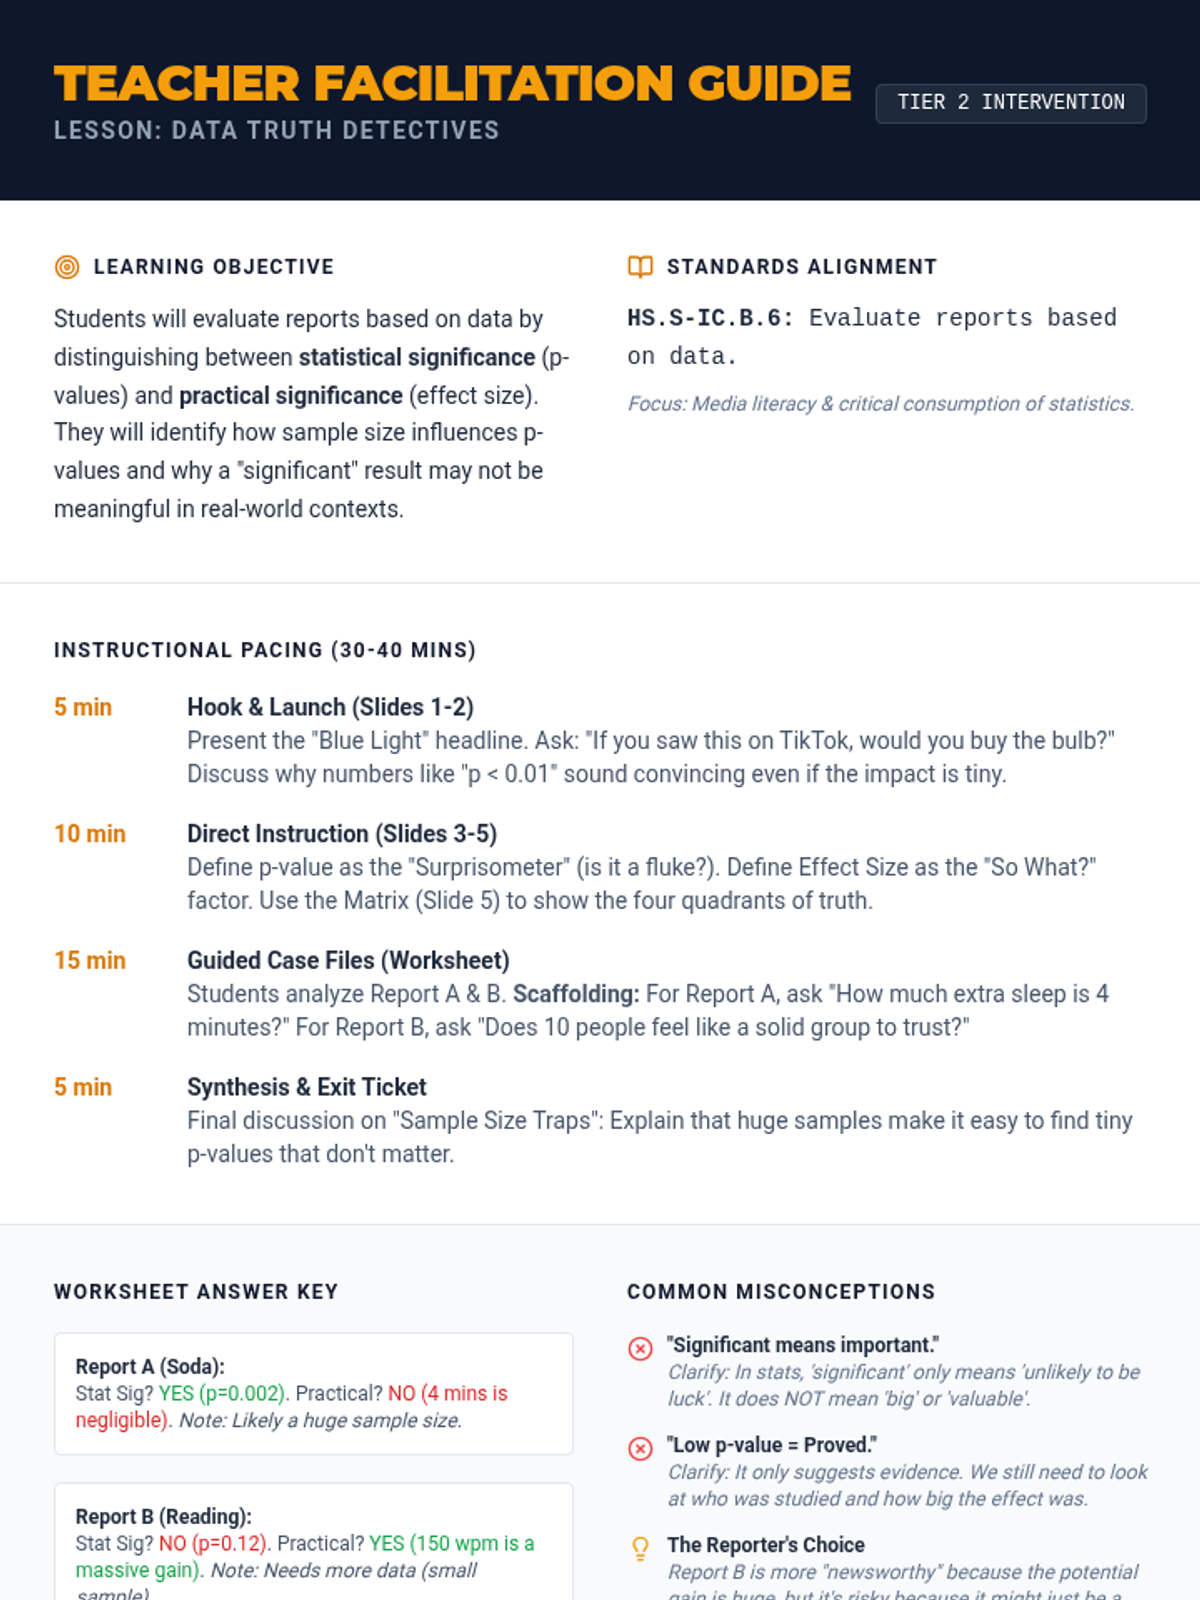
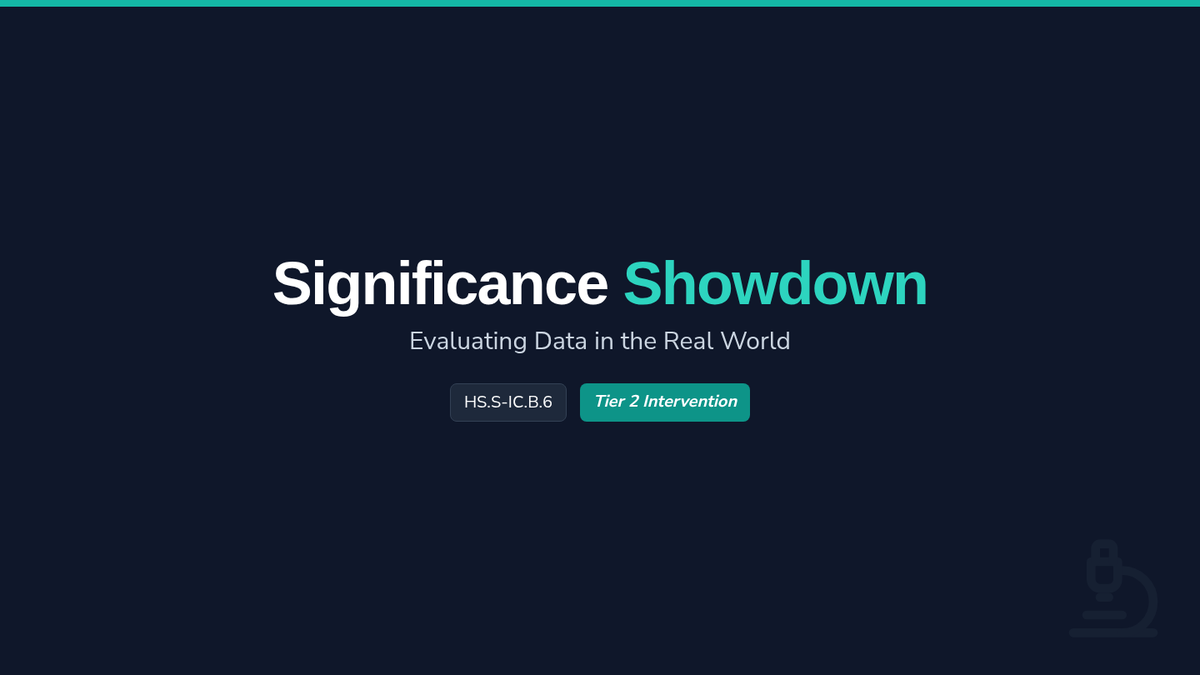
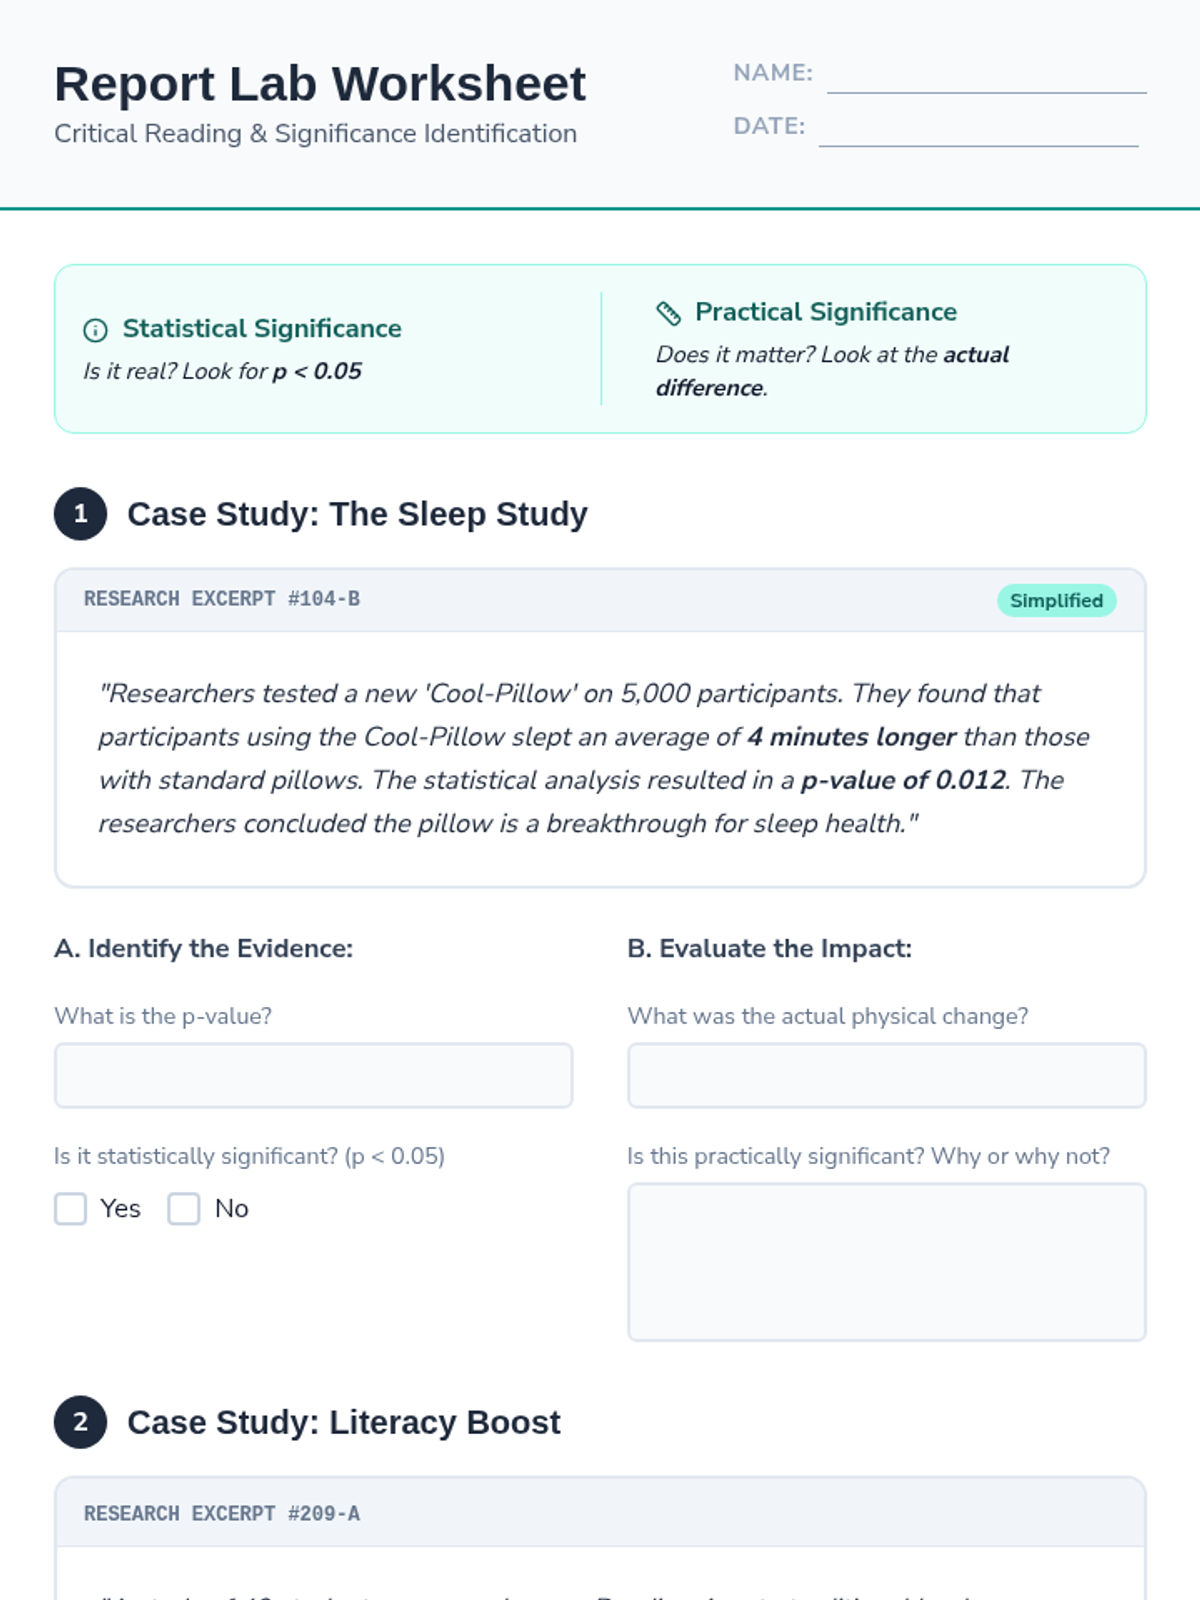
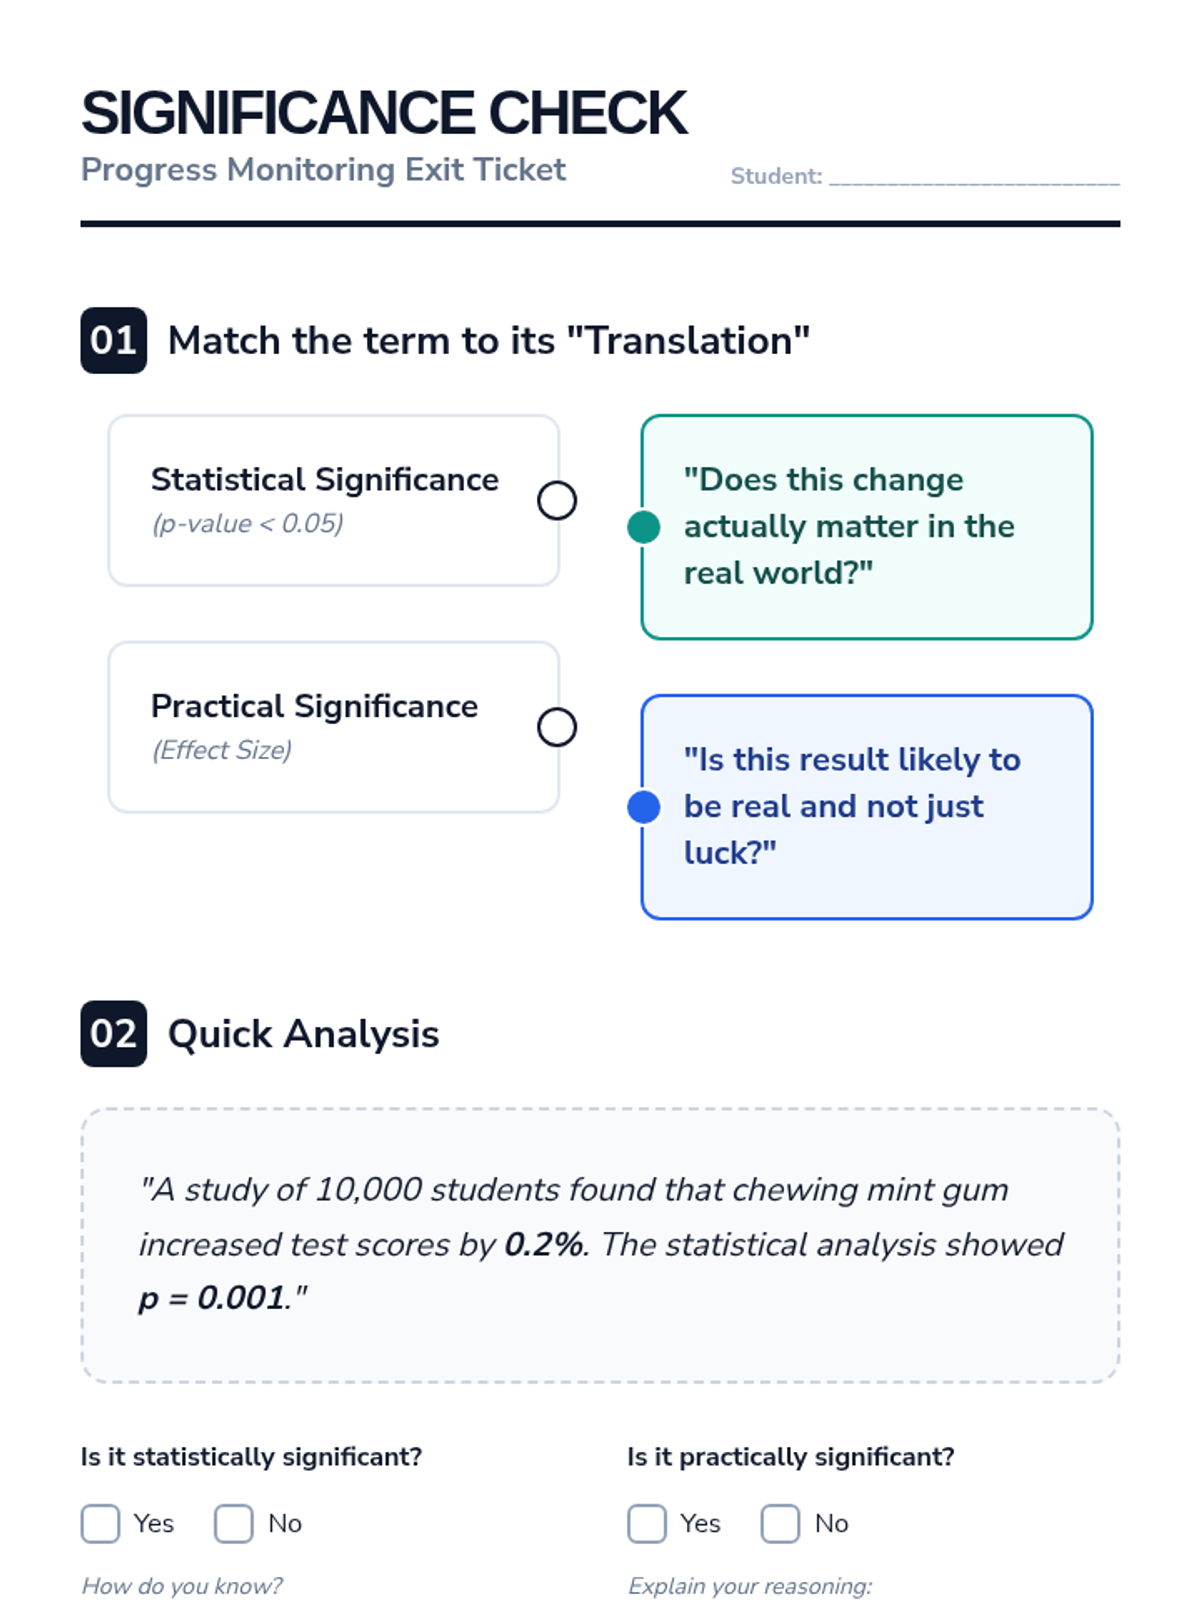
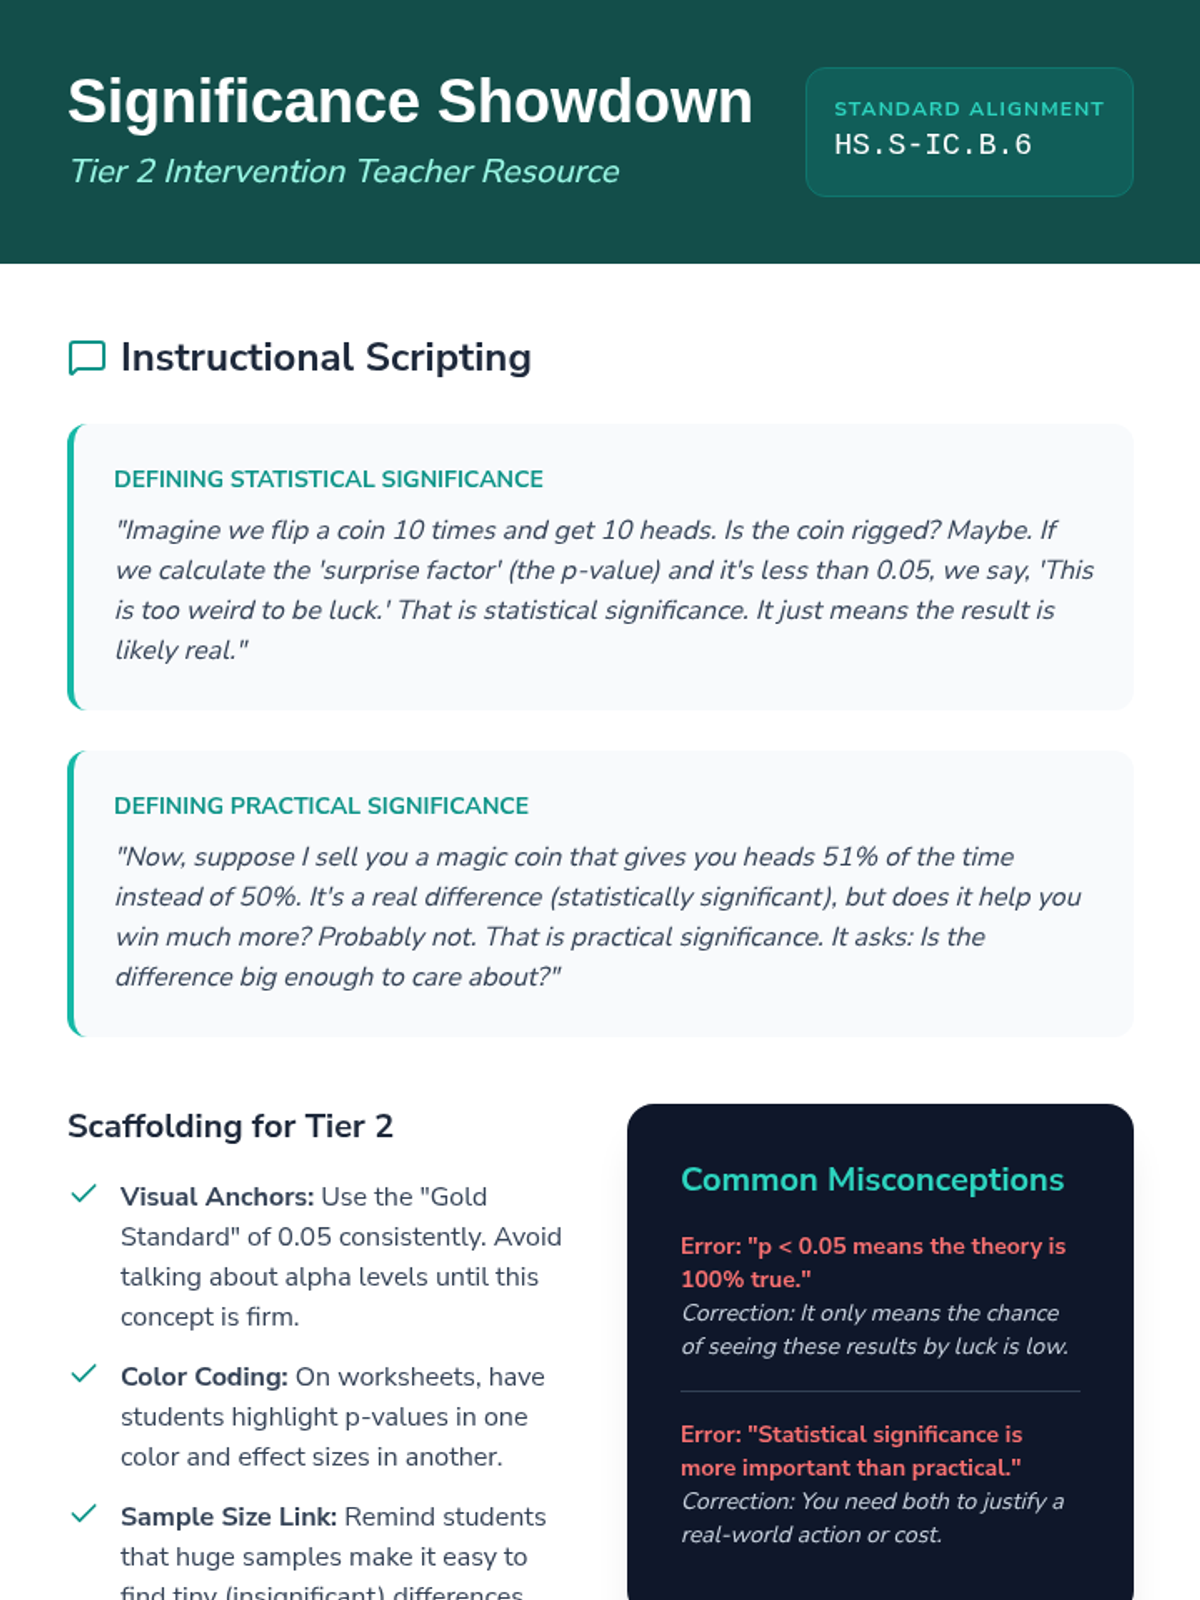
A Tier 2 intervention lesson focused on distinguishing statistical significance (p-values) from practical significance (effect size) when evaluating data reports. Students learn to critically analyze headlines and data claims through scaffolded examples and structured comparison activities.
A targeted Tier 2 intervention lesson focusing on evaluating statistical claims in the media, distinguishing between statistical significance (p-values) and practical significance (effect sizes). Students will analyze real-world scenarios to become critical consumers of data-driven reports.
A Tier 2 intervention lesson focusing on evaluating research reports, specifically distinguishing between statistical significance (p-values) and practical significance (effect size) for high school statistics students.
A Tier 2 intervention lesson for high school statistics focused on using simulations to determine if experimental results are consistent with a theoretical model. Students use coin flips and dice rolls to understand the boundary between 'random chance' and 'likely rigged' outcomes.
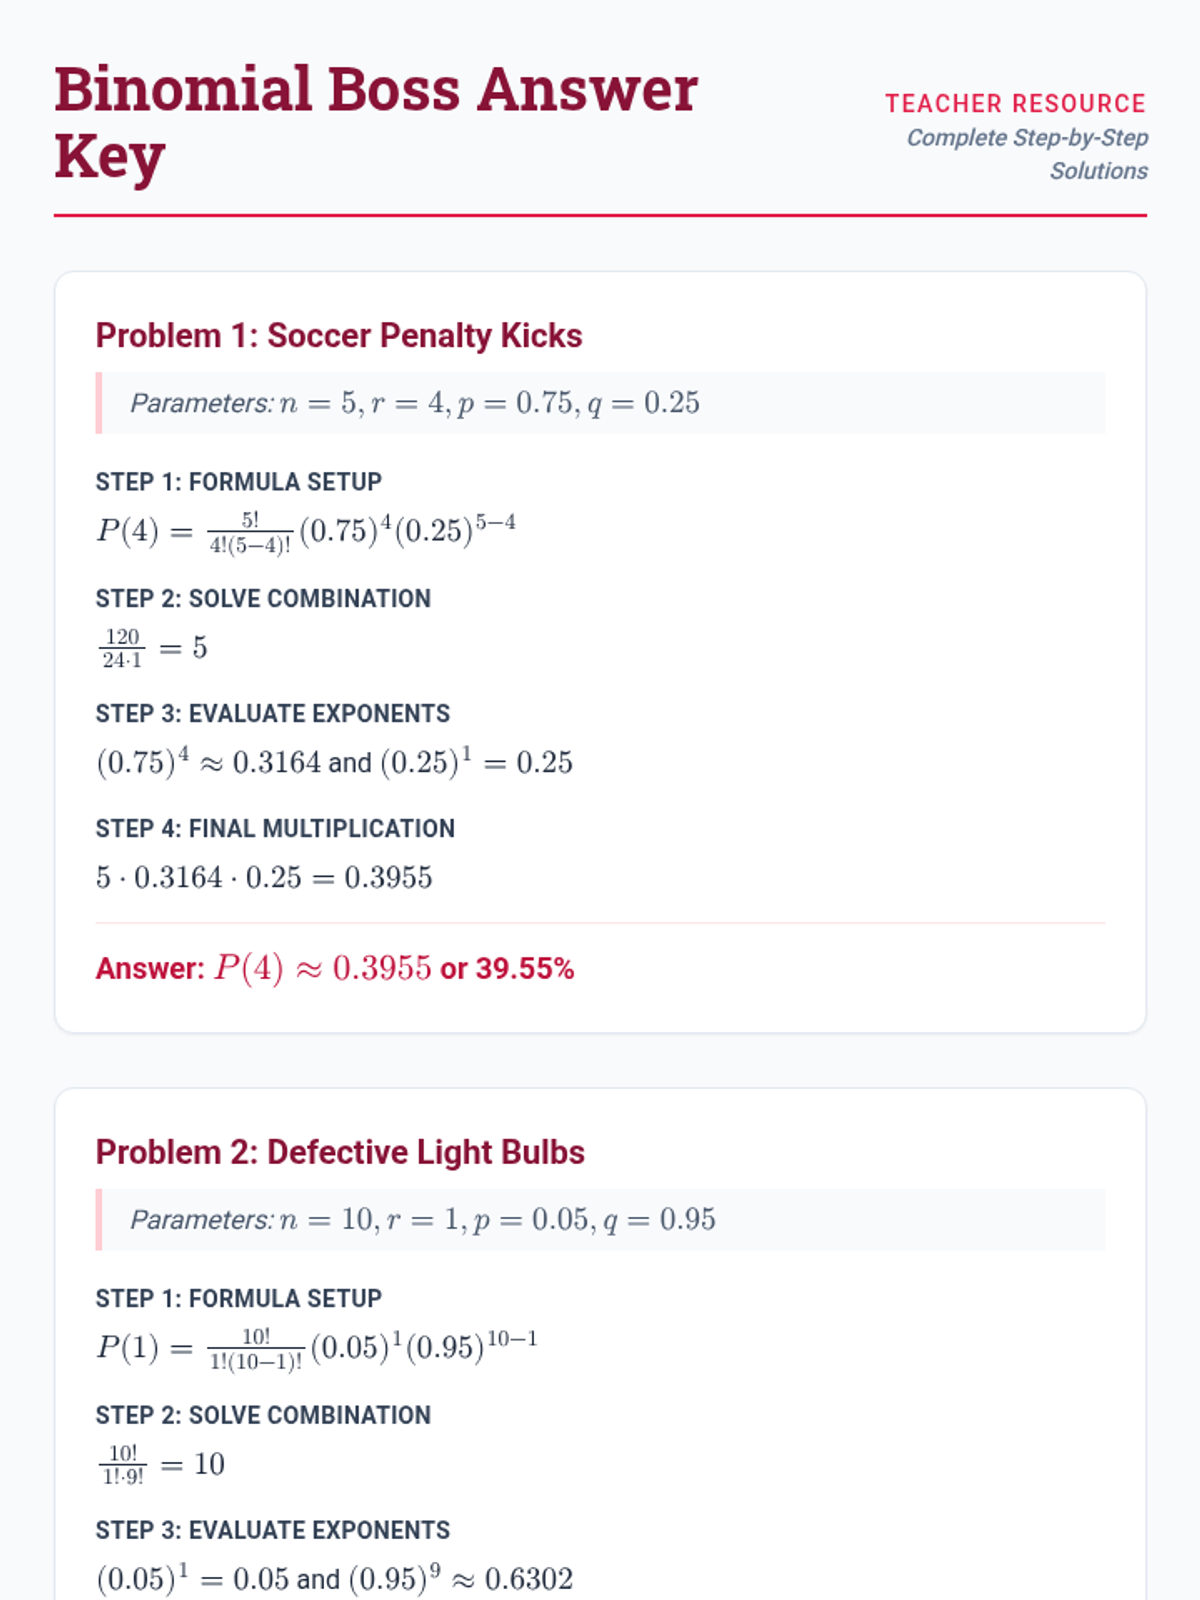
A lesson focused on solving word problems using the binomial probability distribution formula, featuring real-world scenarios and step-by-step calculations.
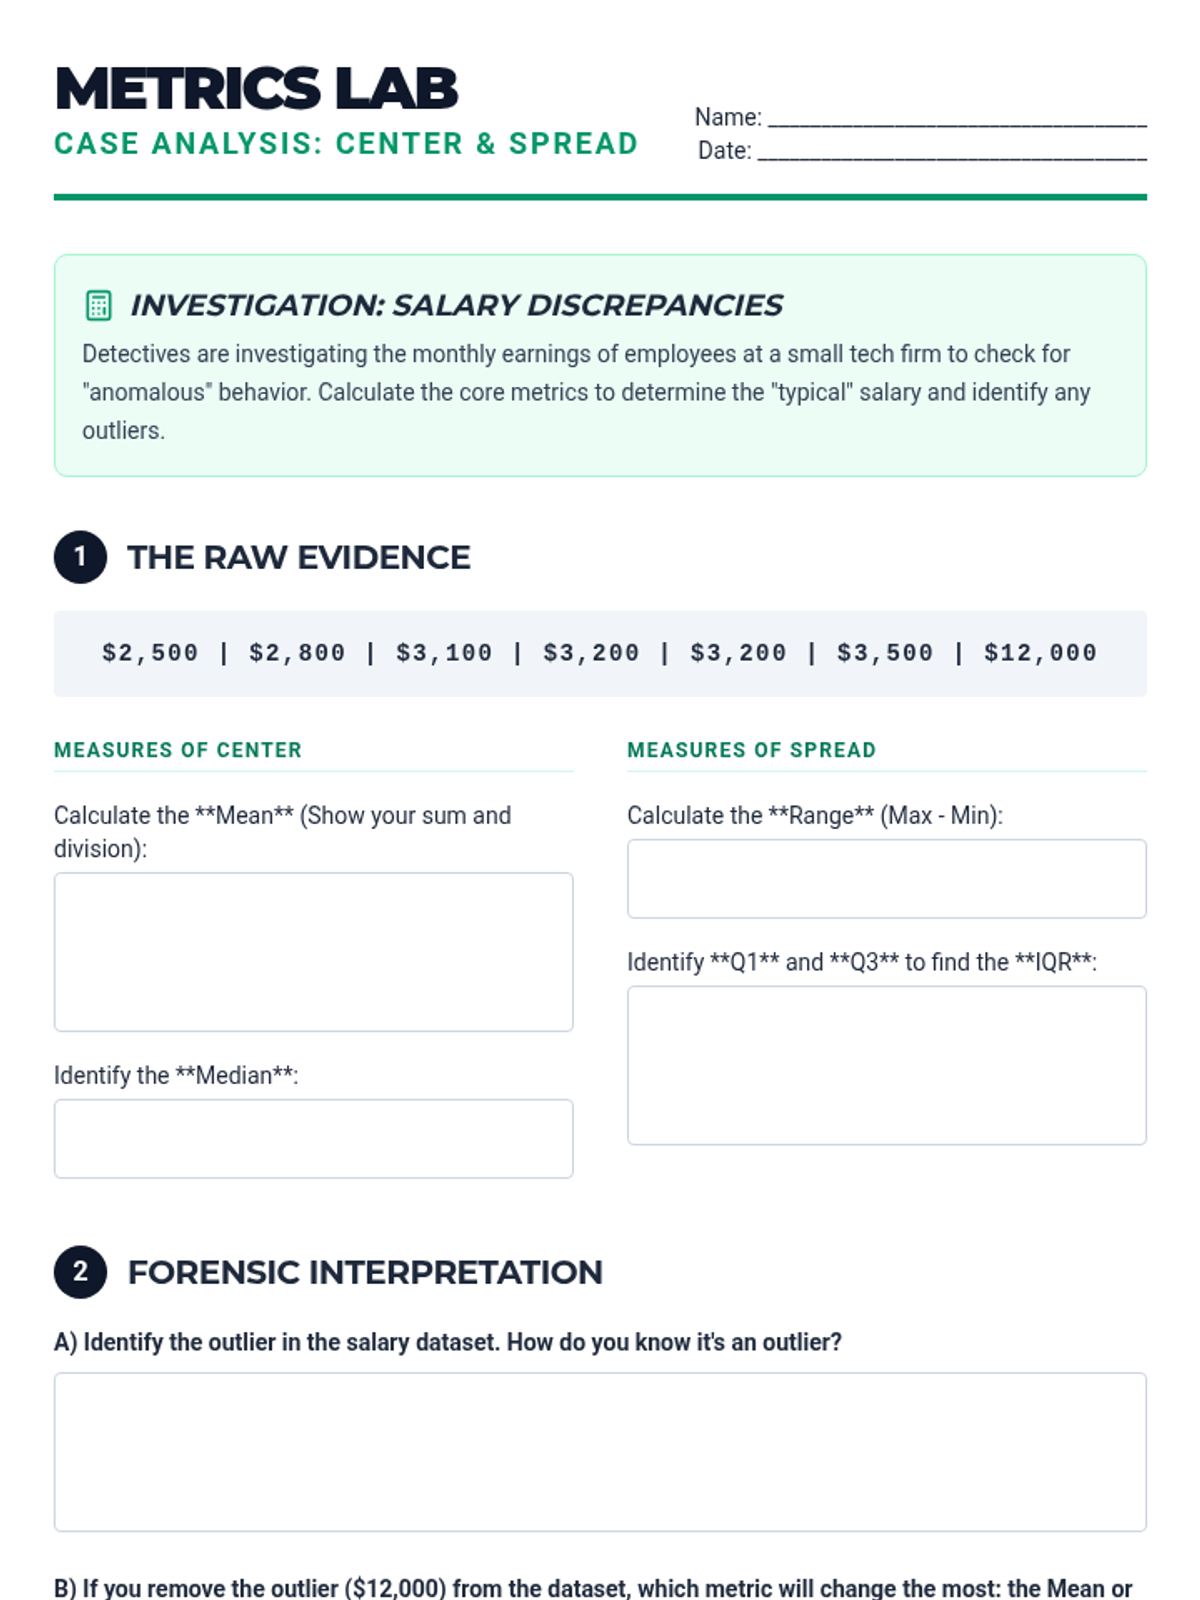
Introduces measures of center (mean, median) and spread (range, interquartile range, standard deviation basics). Students learn how to calculate these values and understand what they represent in the context of a dataset.
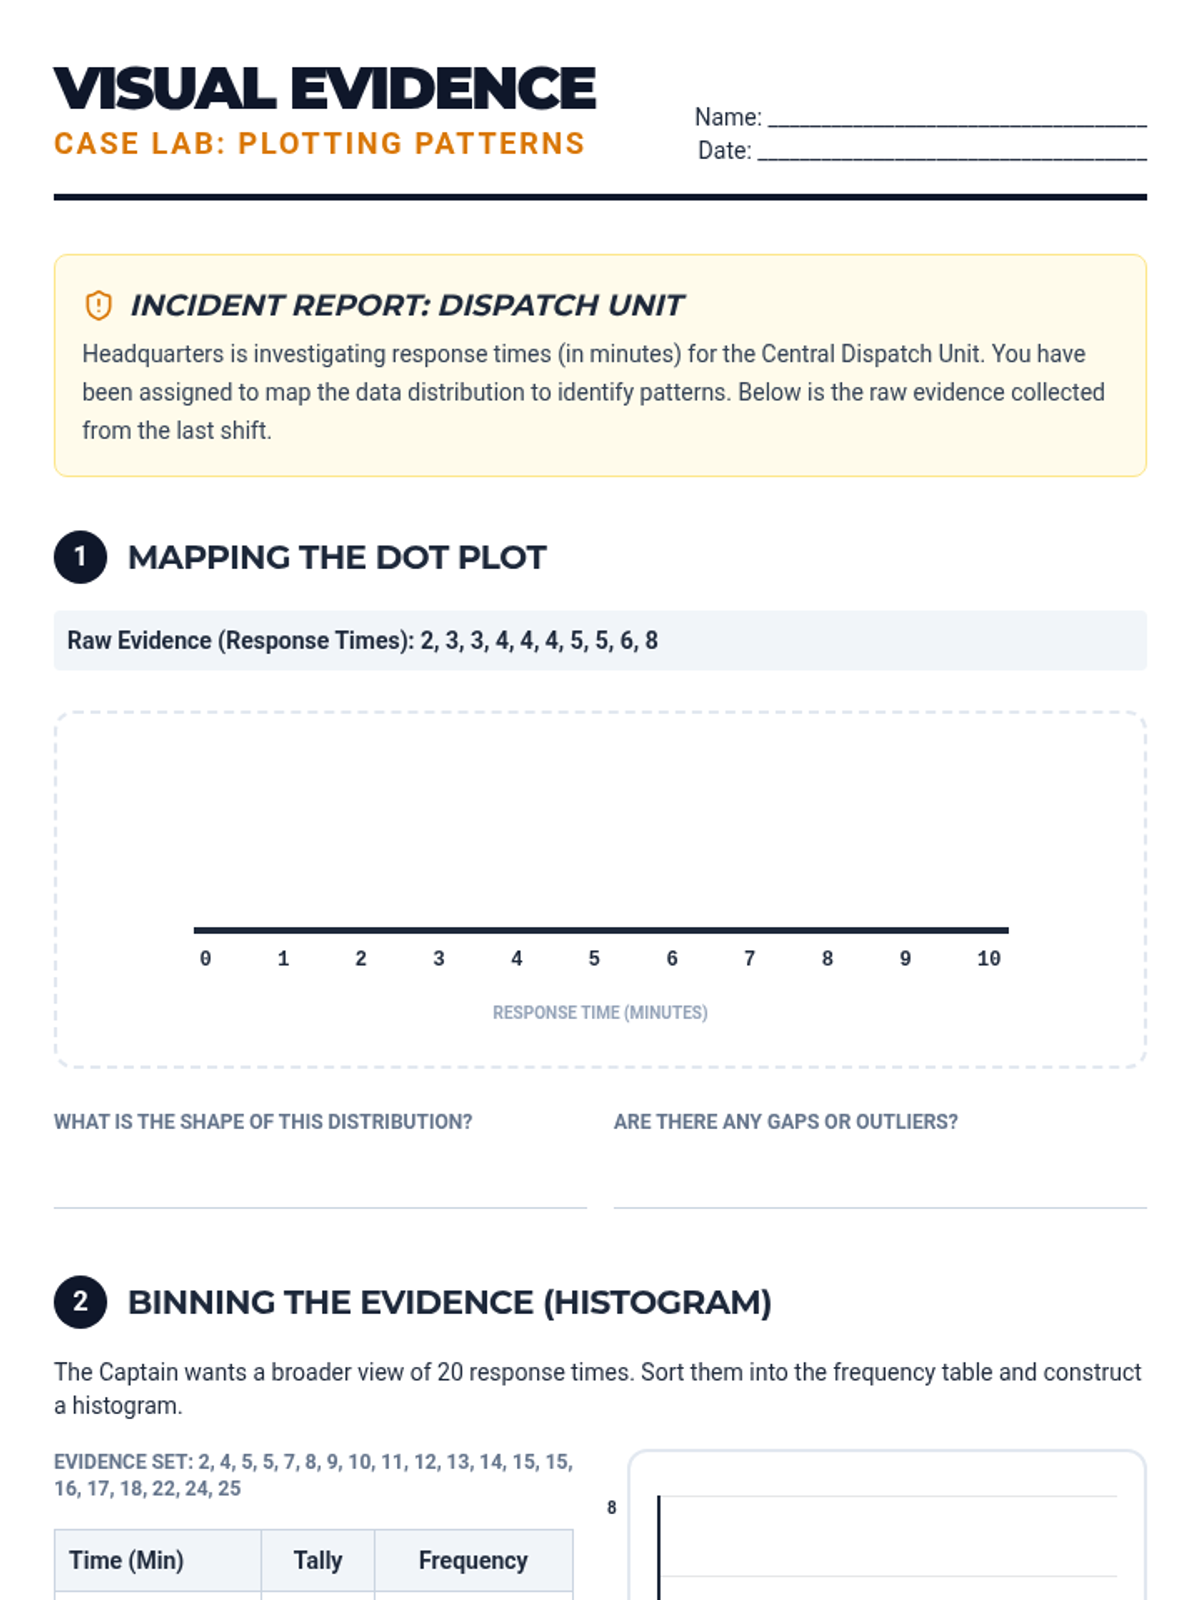
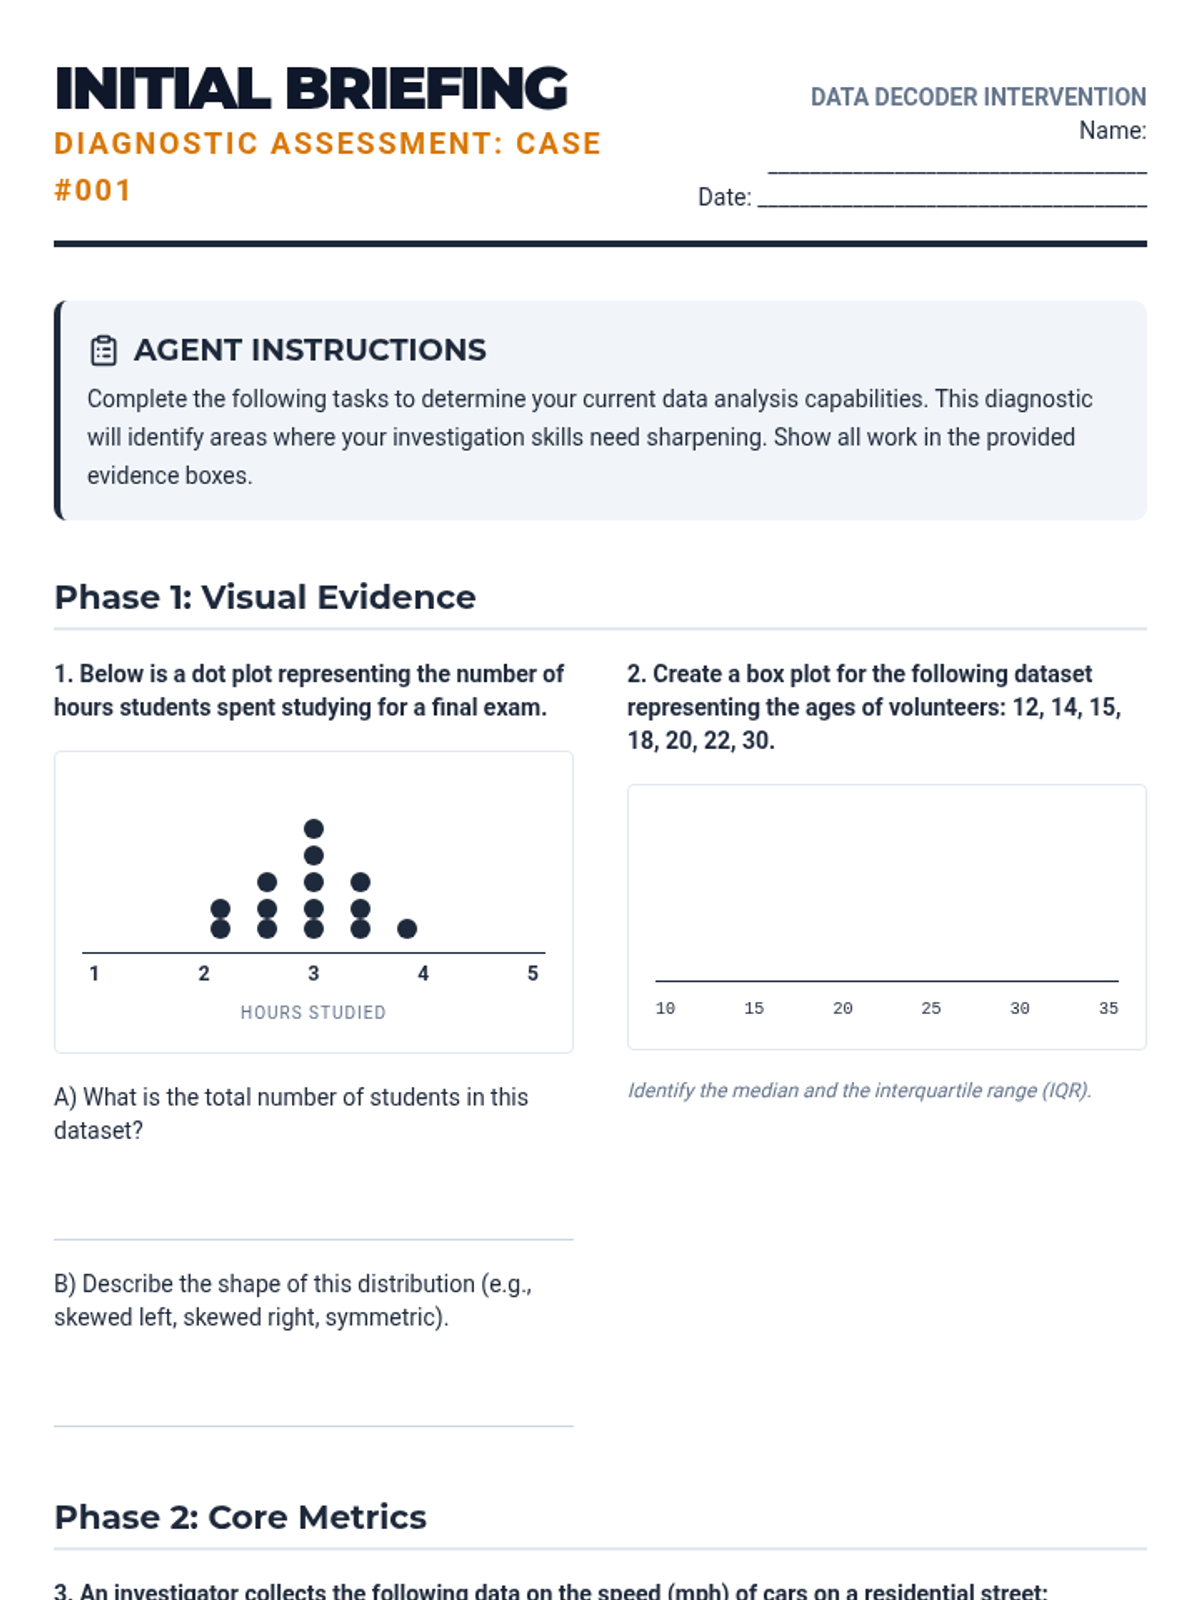
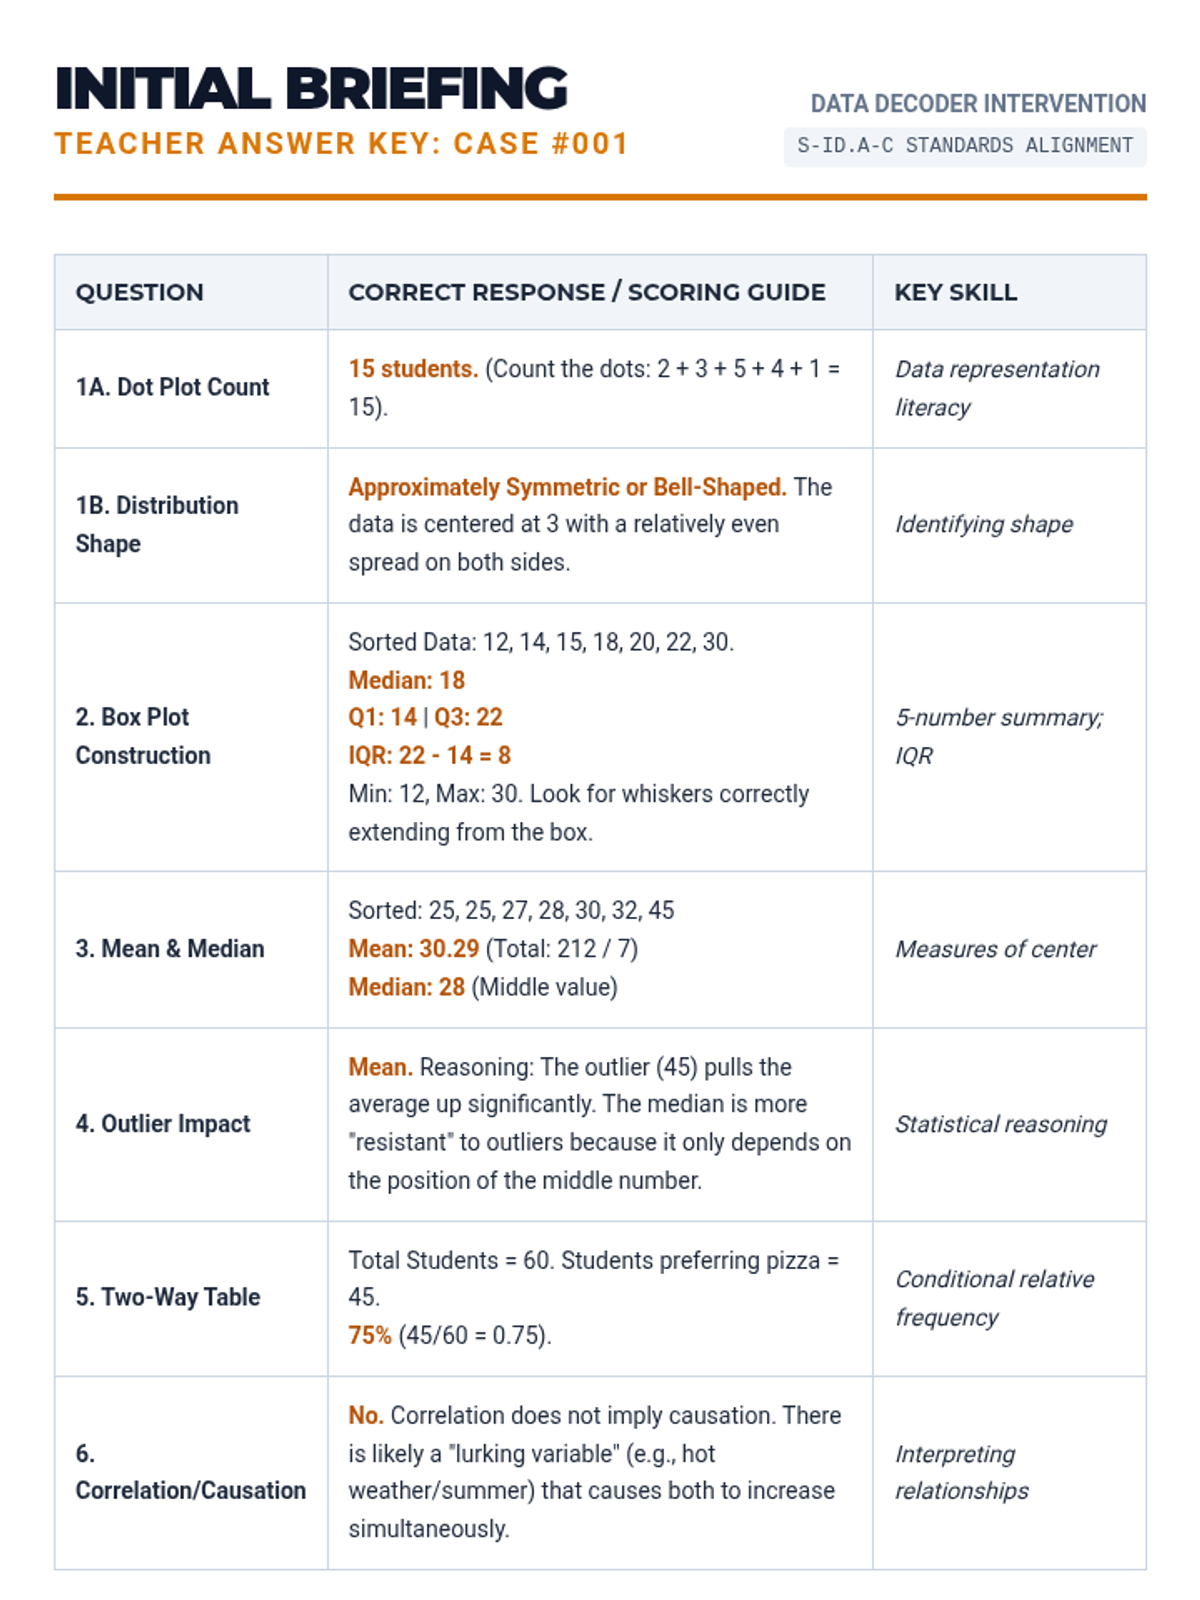
Focuses on constructing and interpreting visual data displays including histograms, box plots, and dot plots. Students learn to identify the most appropriate display for different data types and describe the shape of distributions.
A baseline assessment designed to identify student gaps in data interpretation, display construction, and statistical reasoning. Includes a variety of item types to gauge prior knowledge of histograms, box plots, and measures of center.
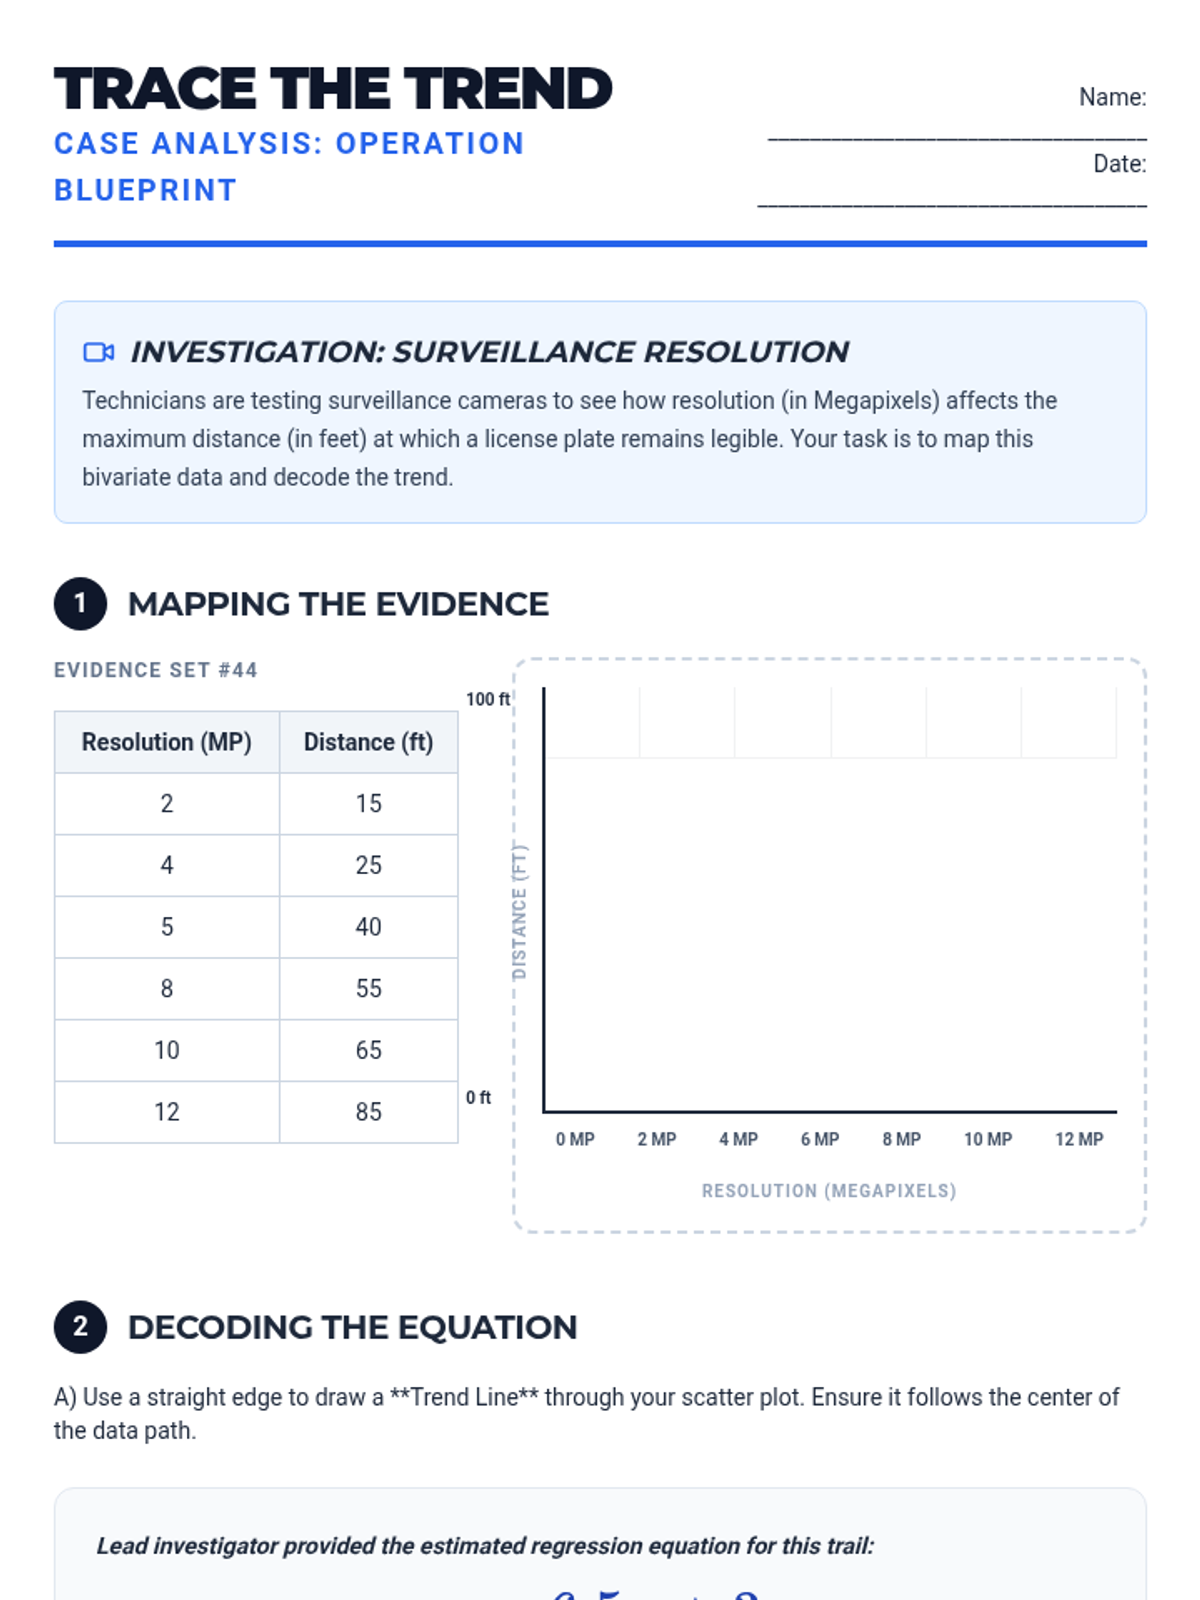
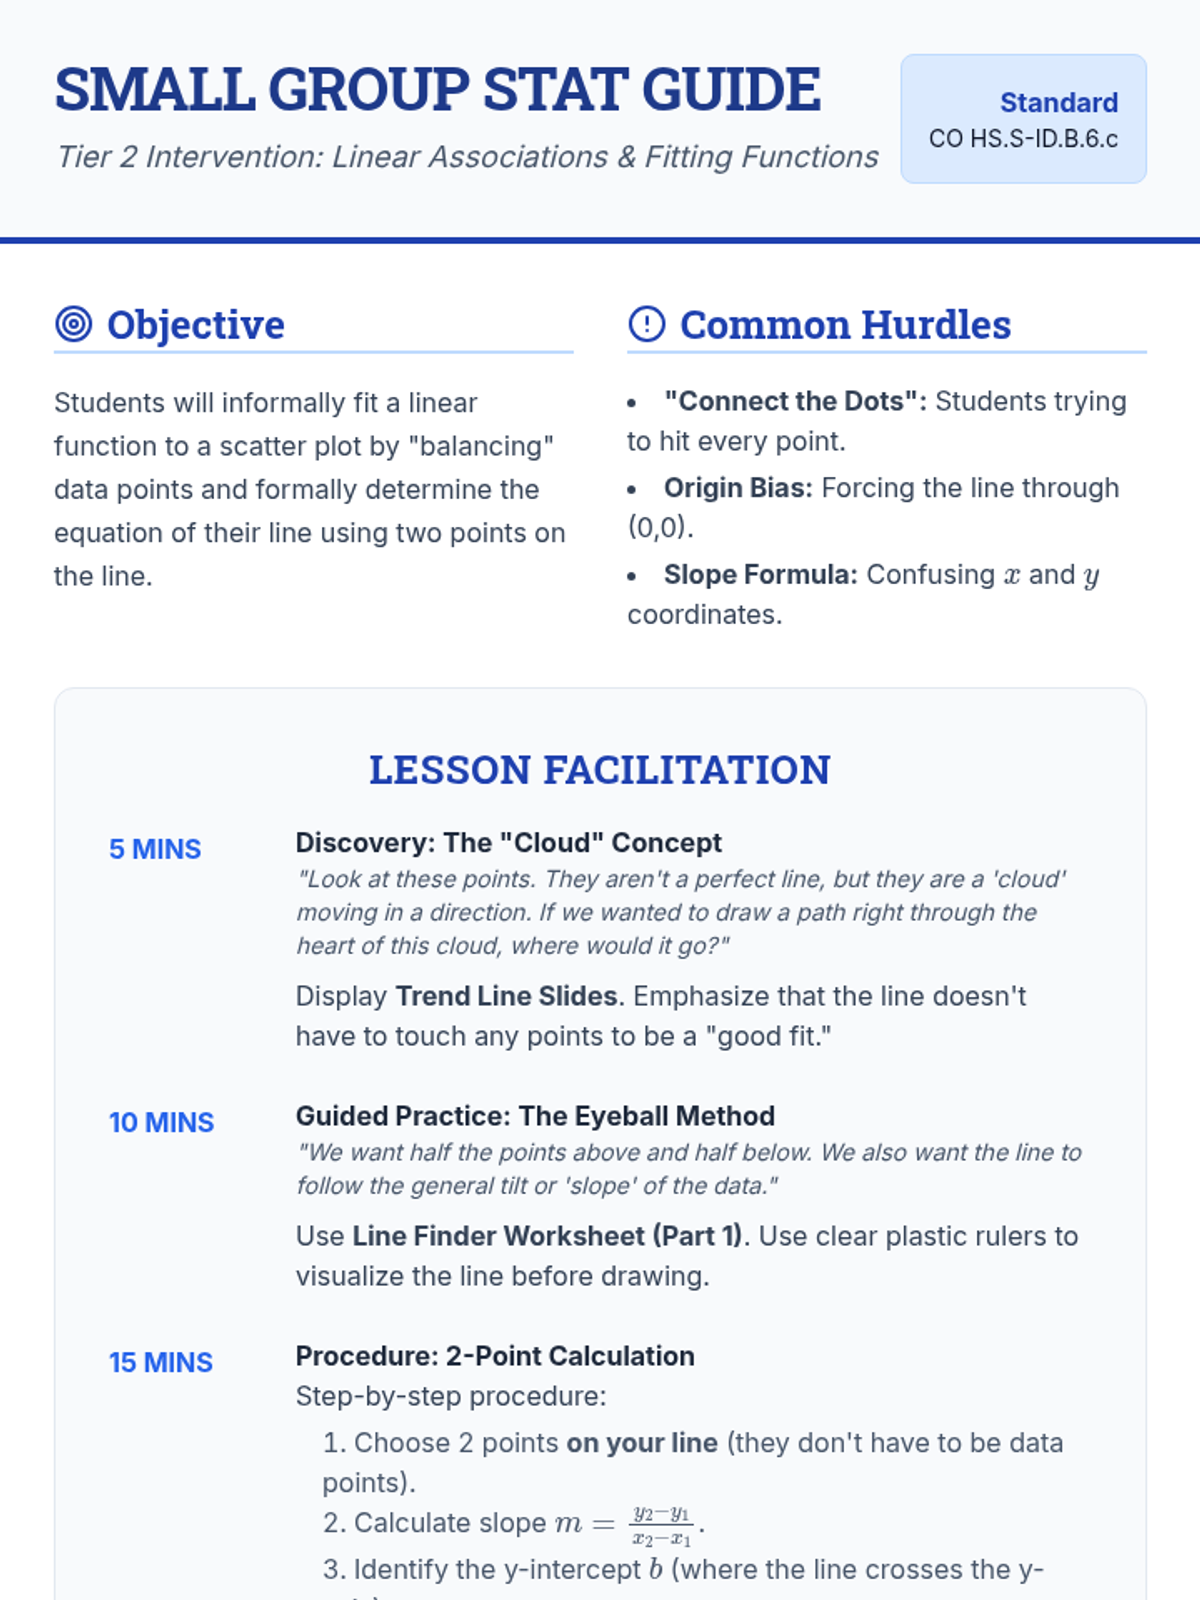
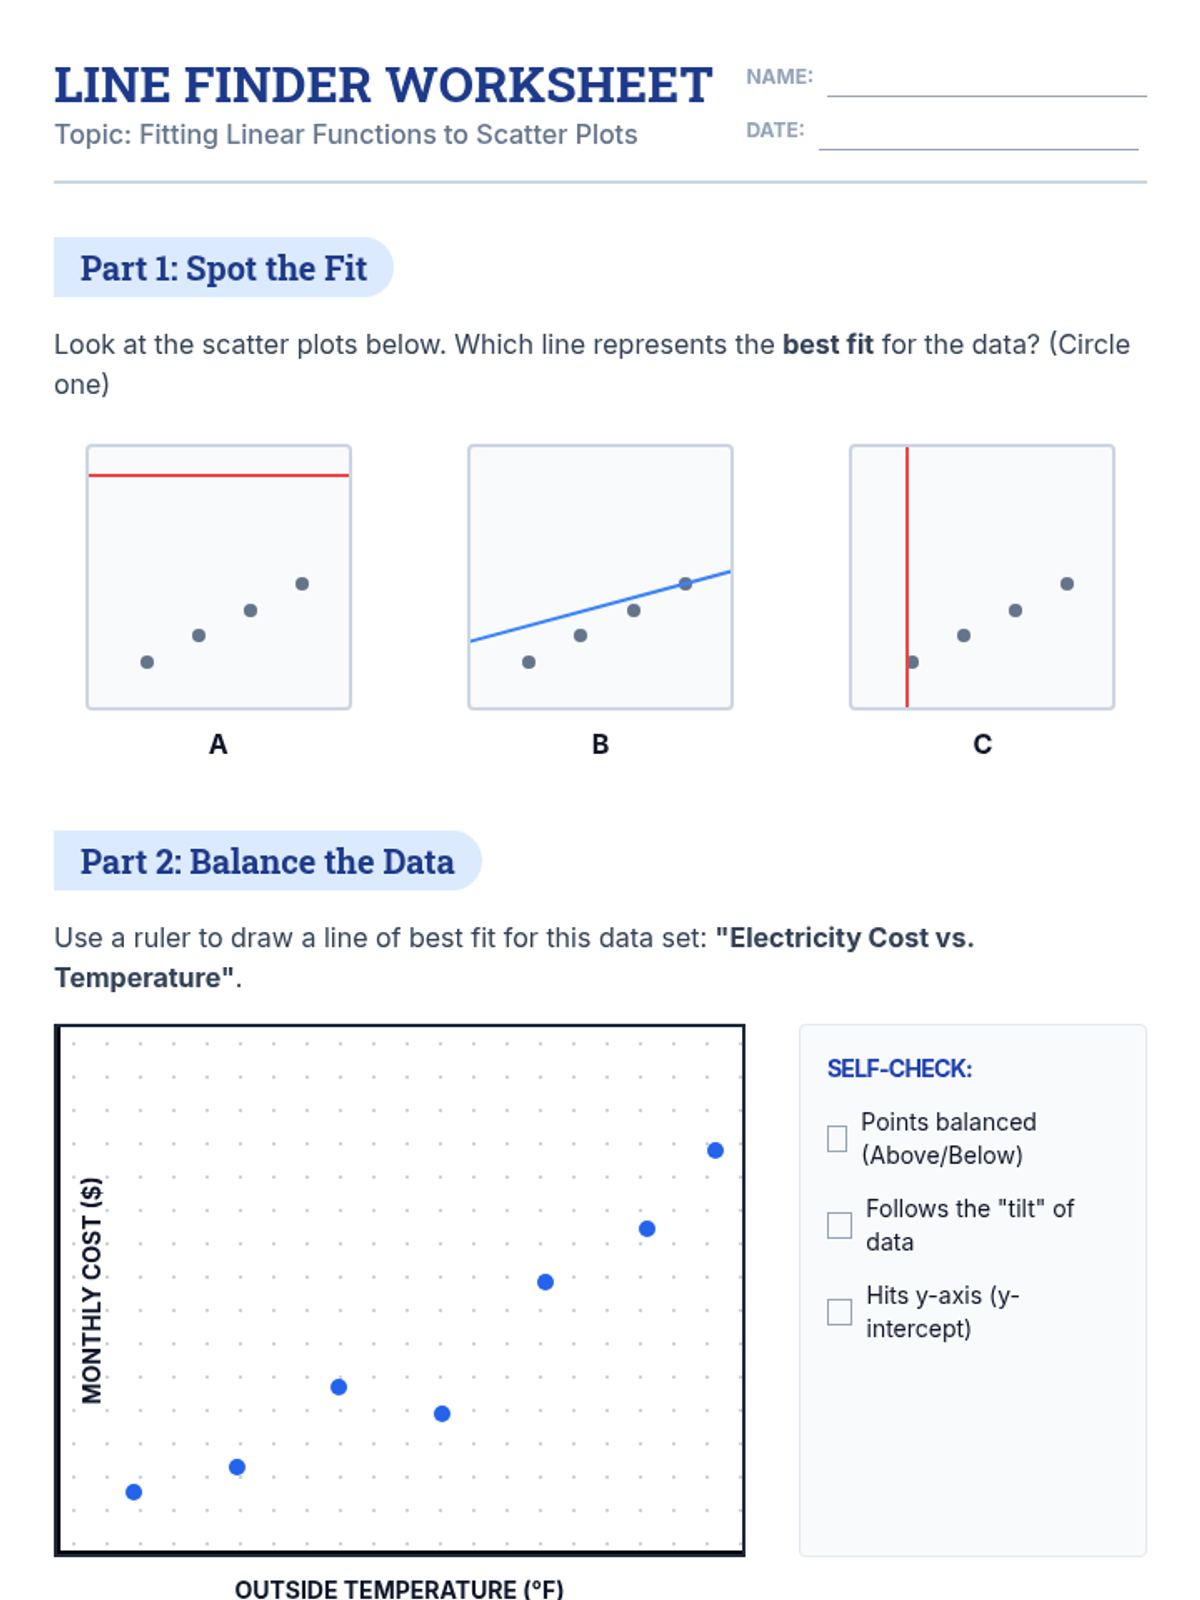
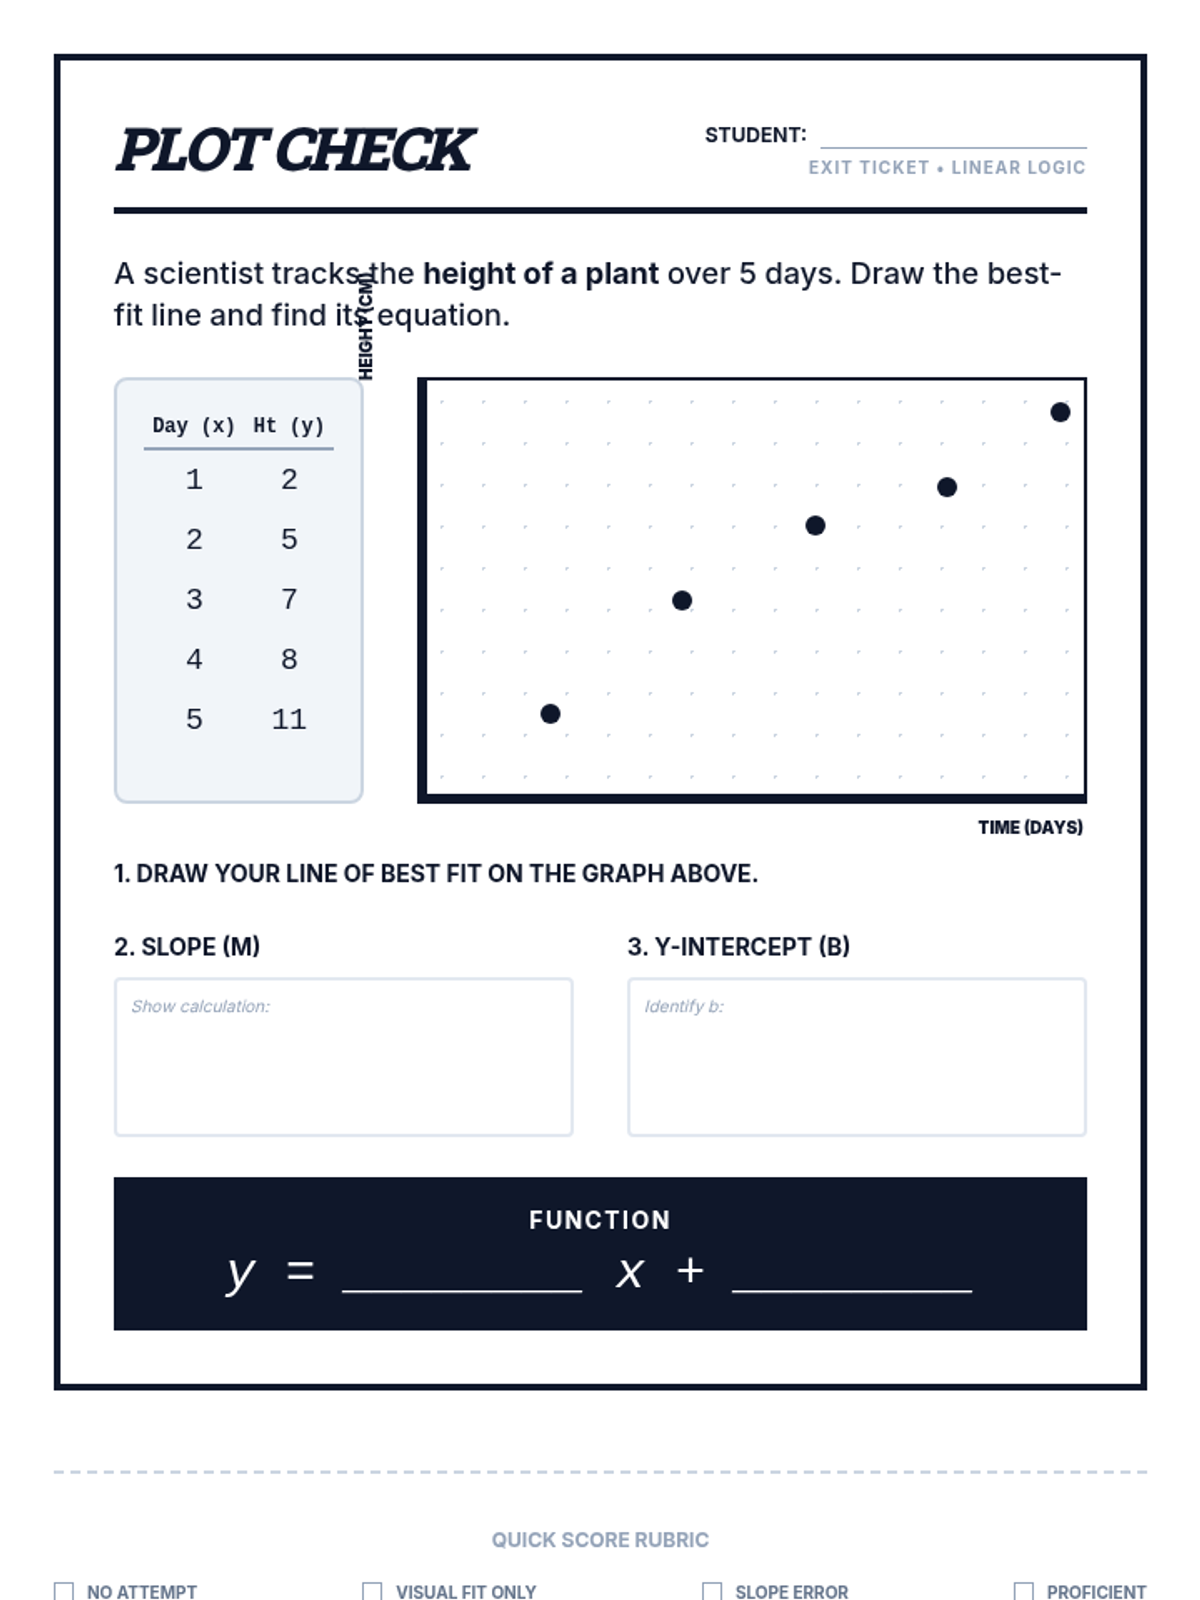
This lesson focuses on the informal and formal methods of fitting a linear function to a scatter plot. Students learn to visually balance points and use two-point slope-intercept form to define the line.
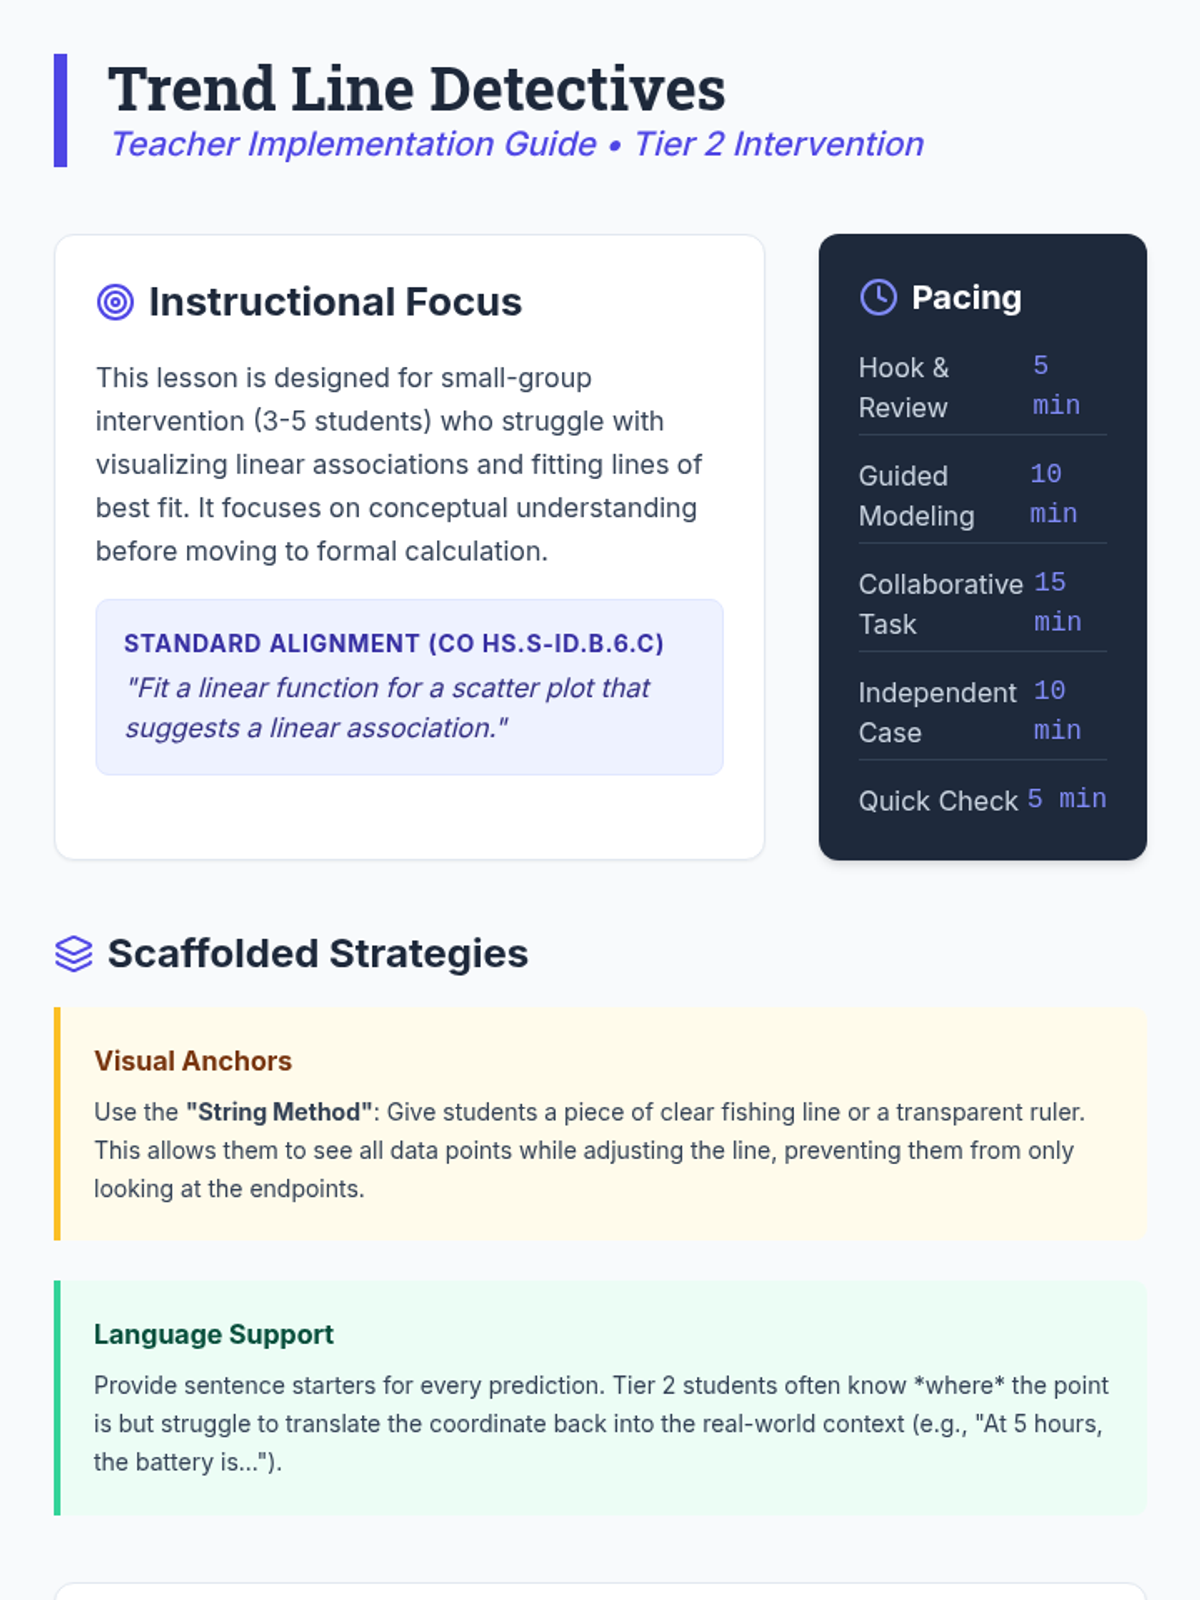
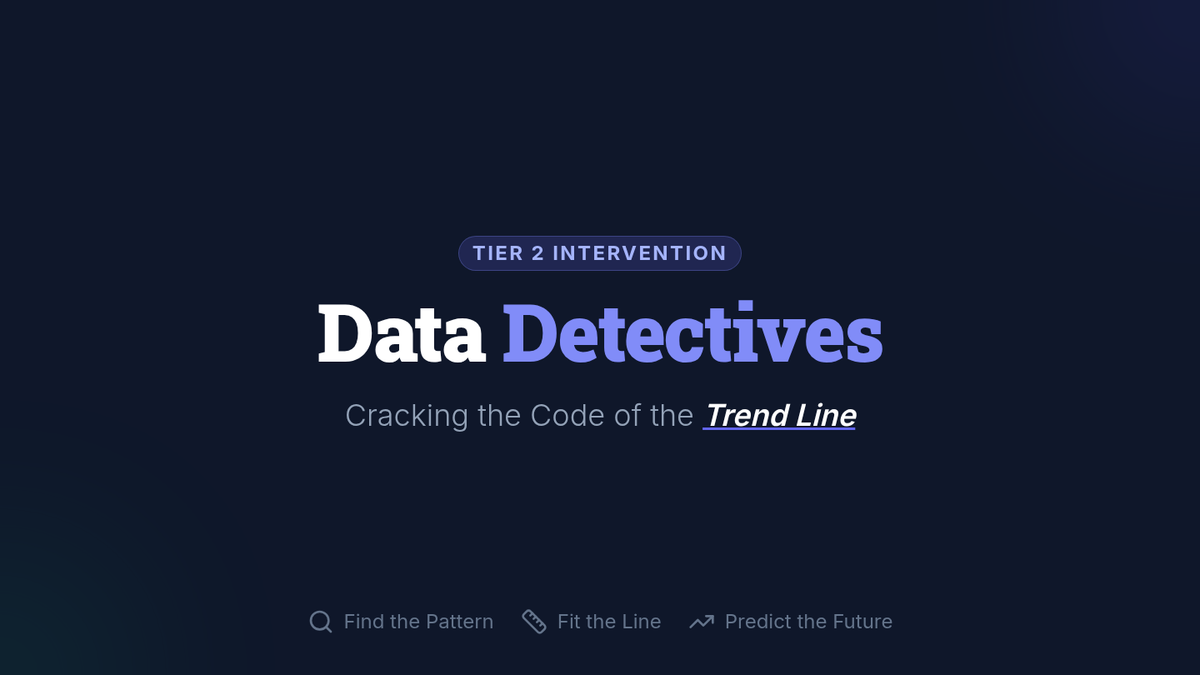
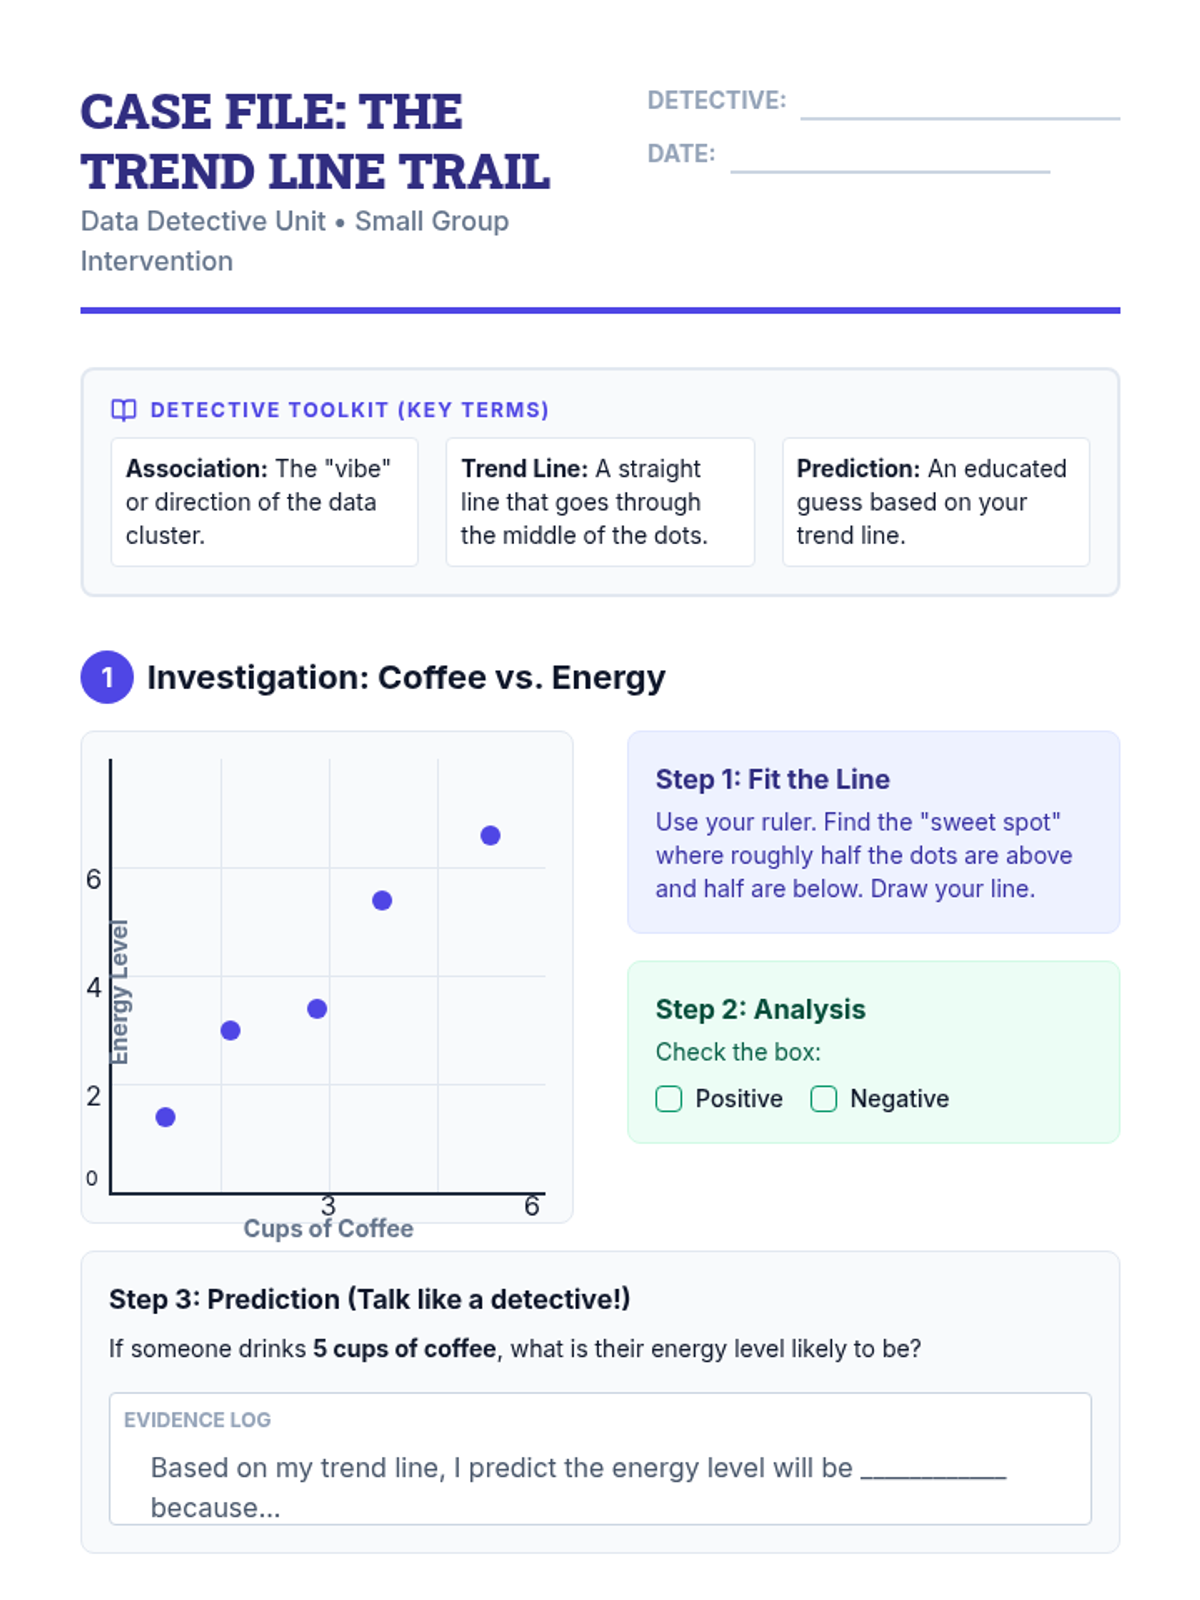
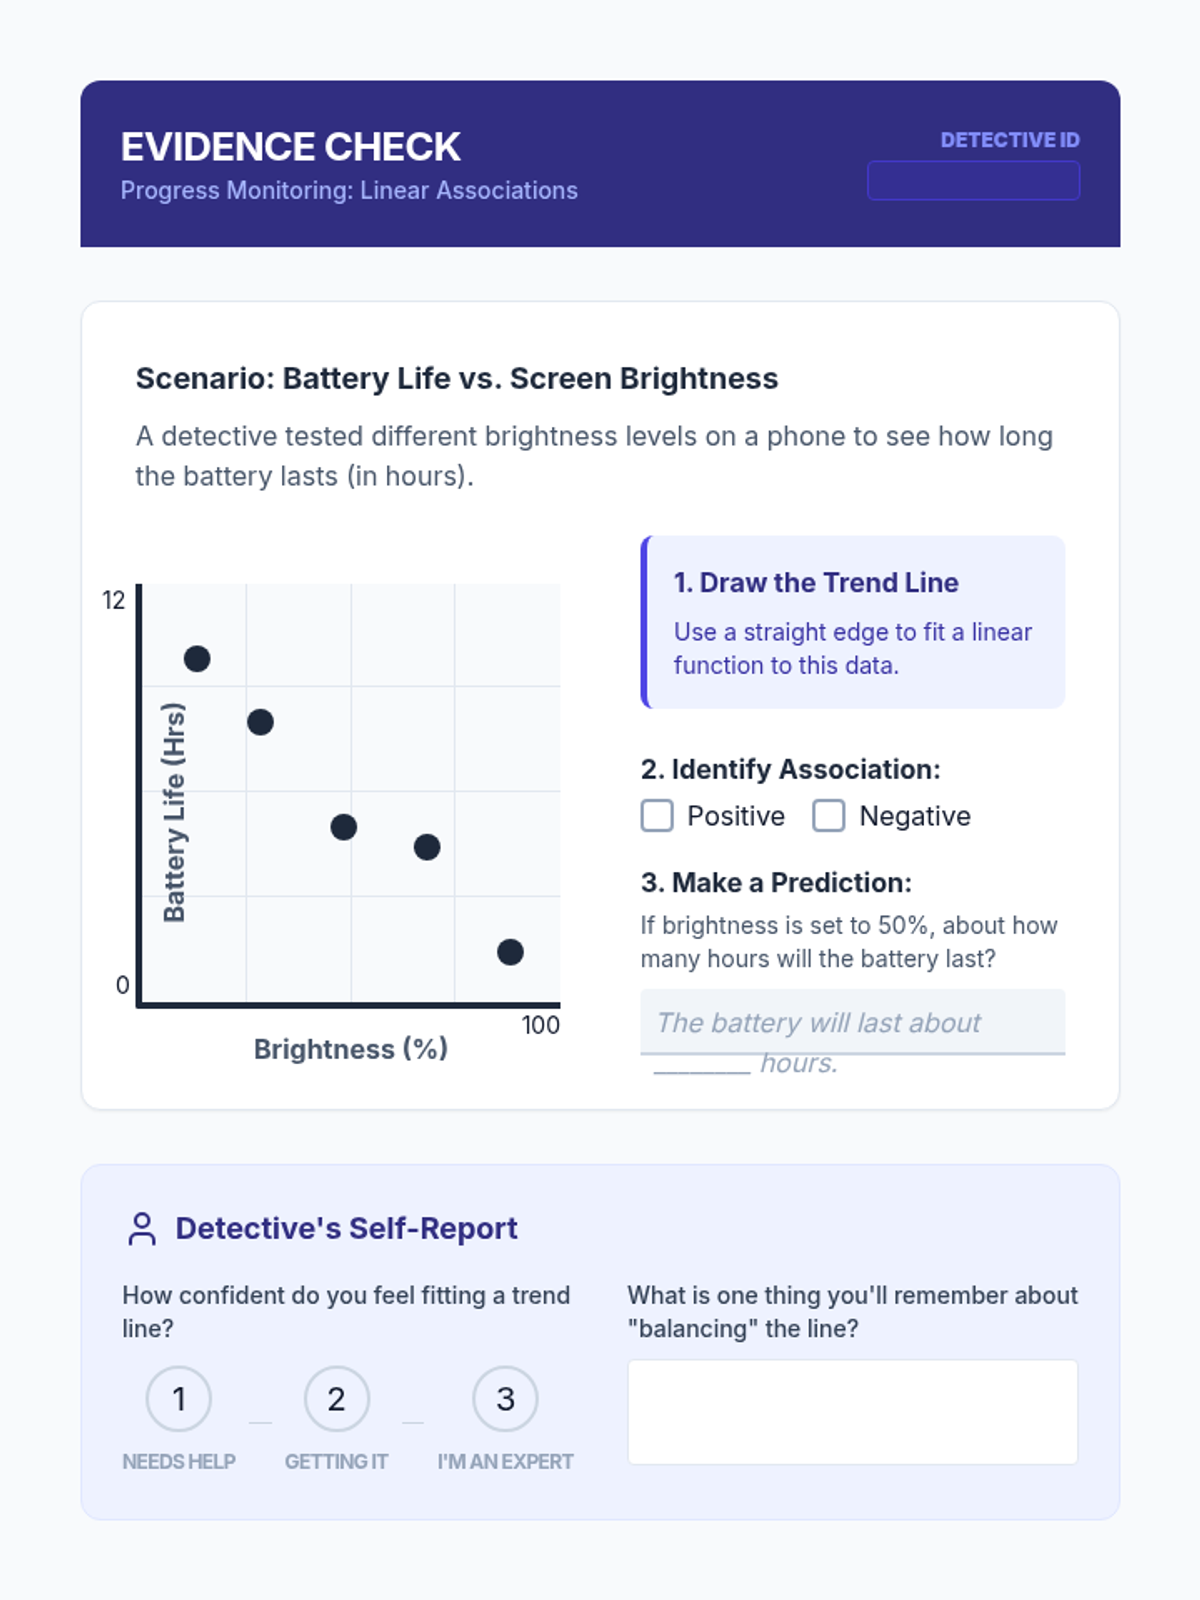
A targeted Tier 2 intervention lesson for high school students focusing on fitting linear functions to scatter plots. This lesson uses a 'Data Detective' theme to engage students in real-world prediction tasks with scaffolded support and sentence starters.
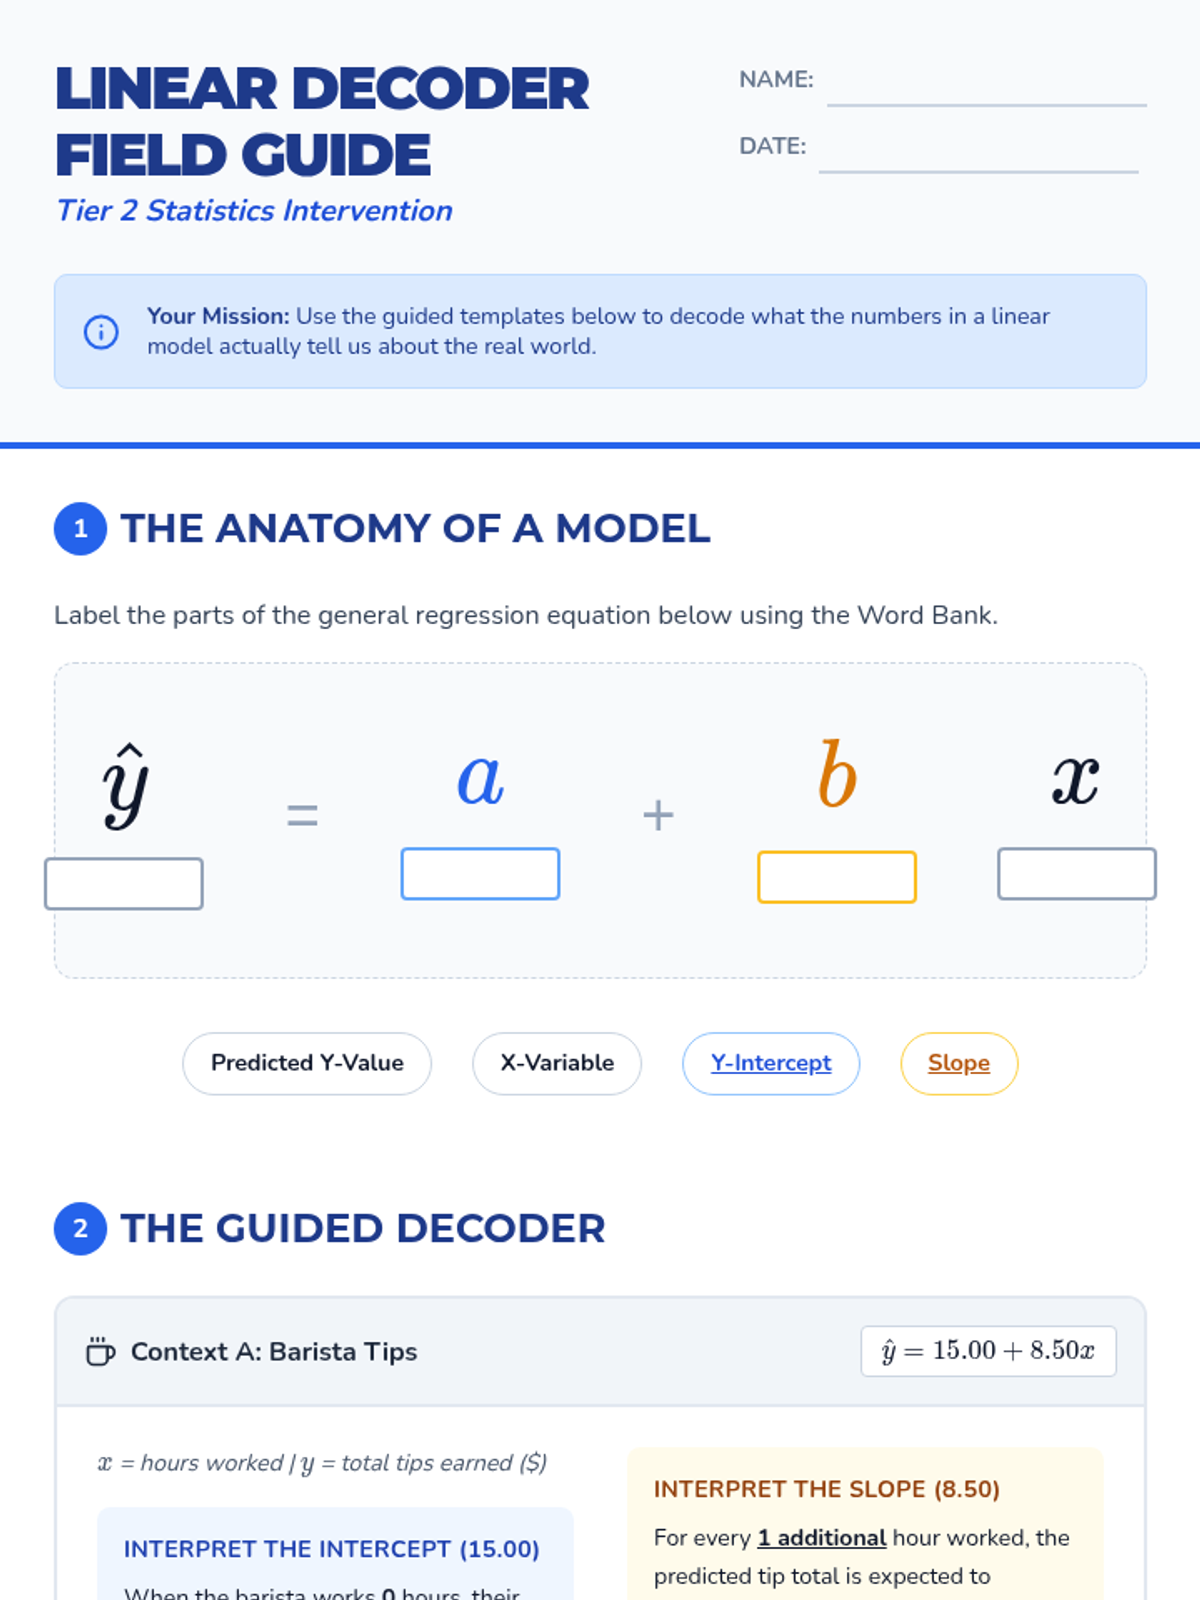
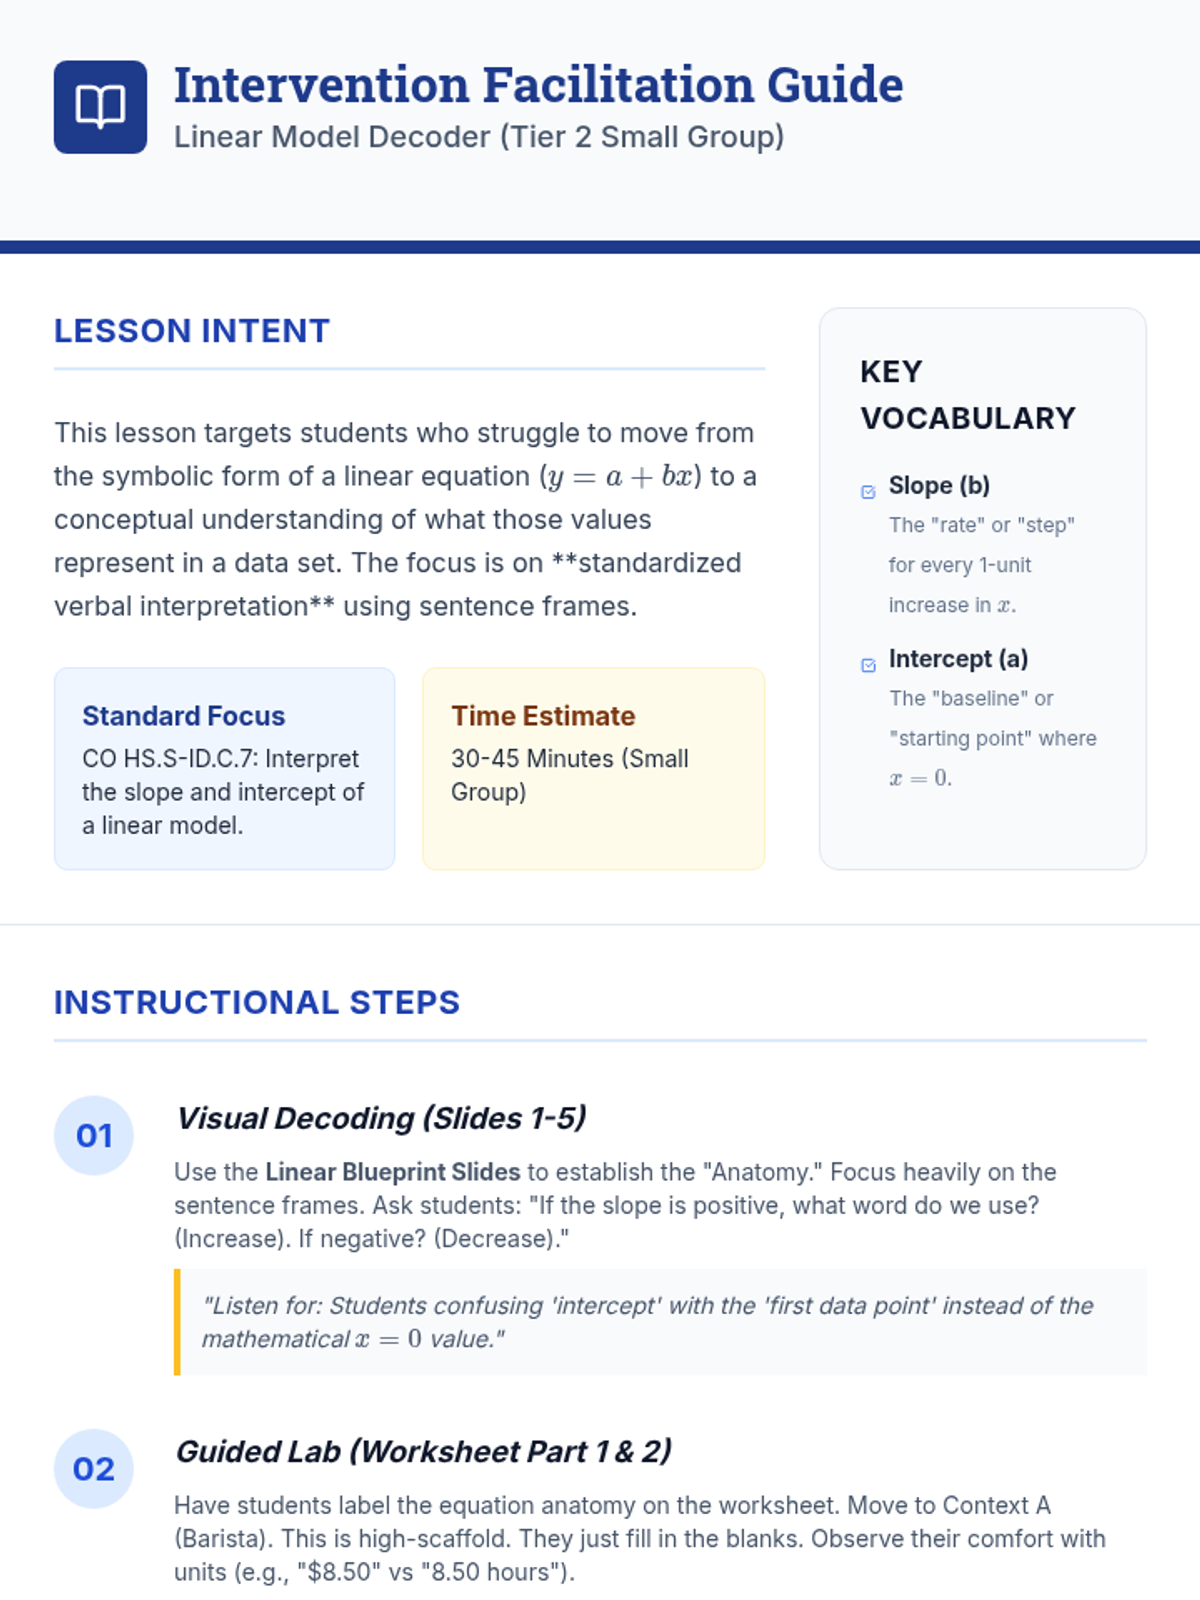
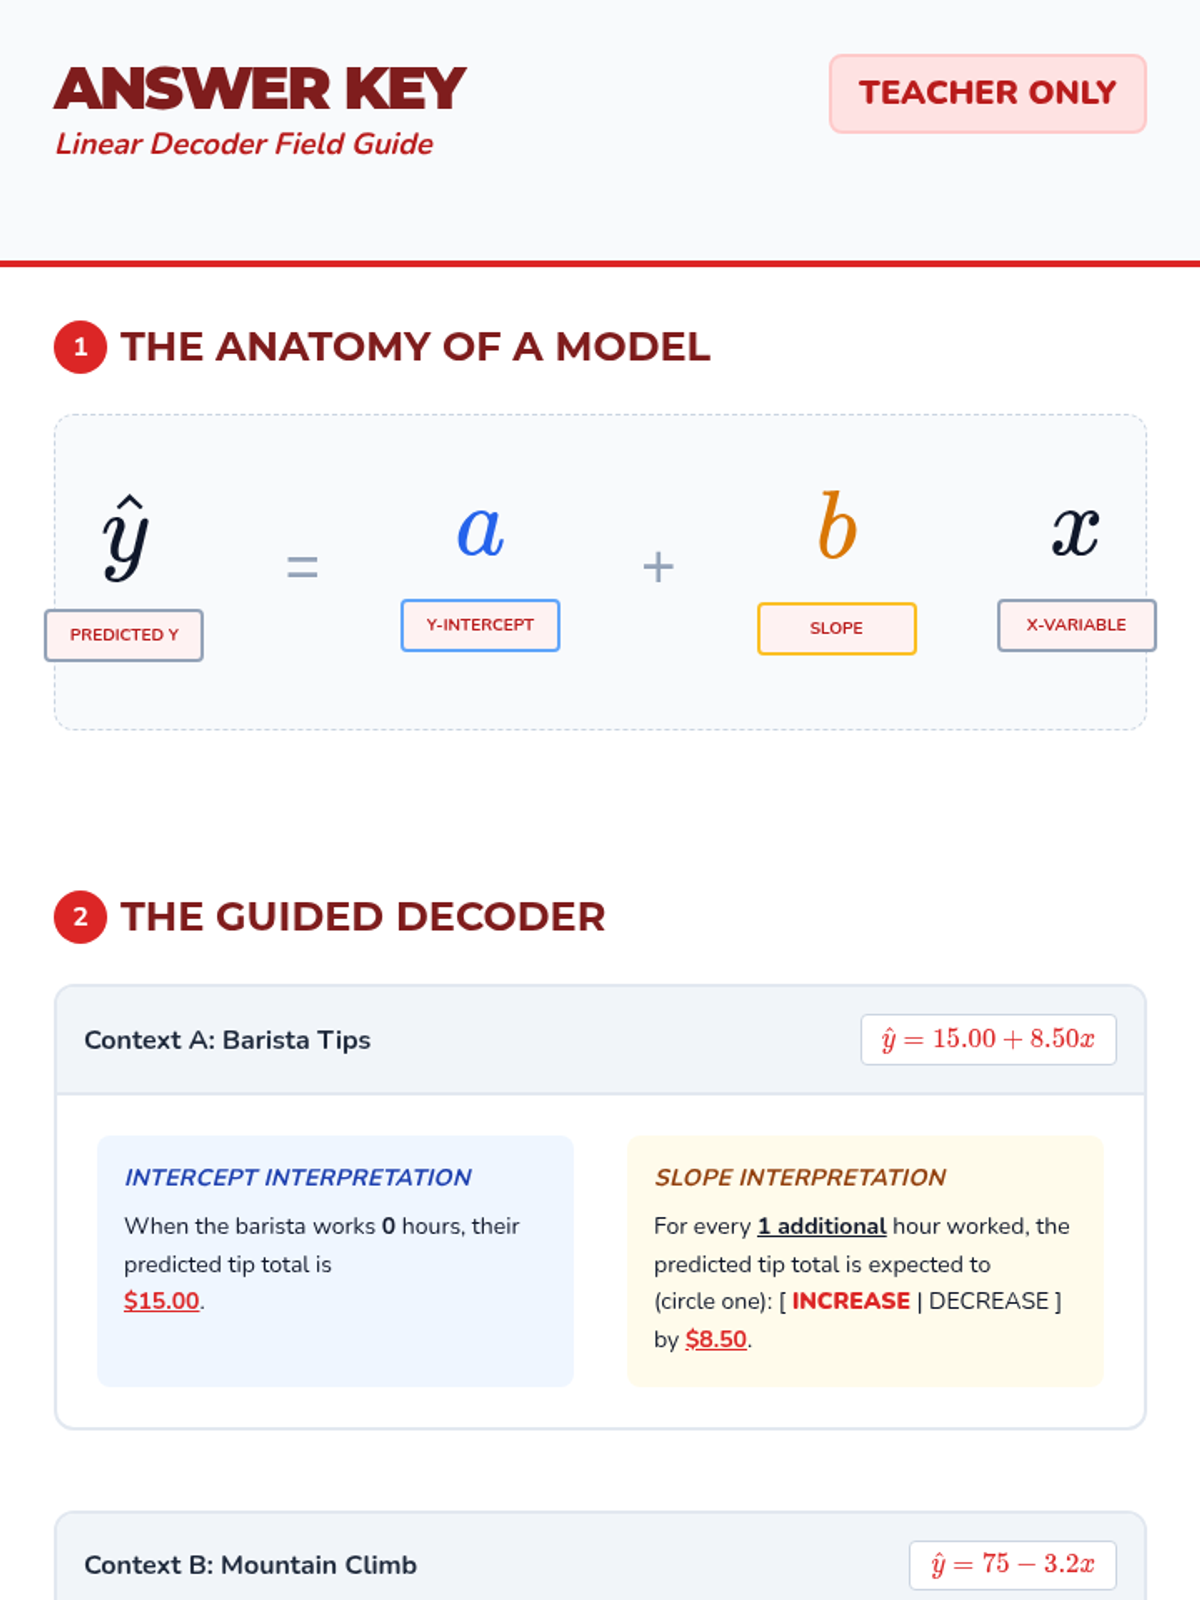
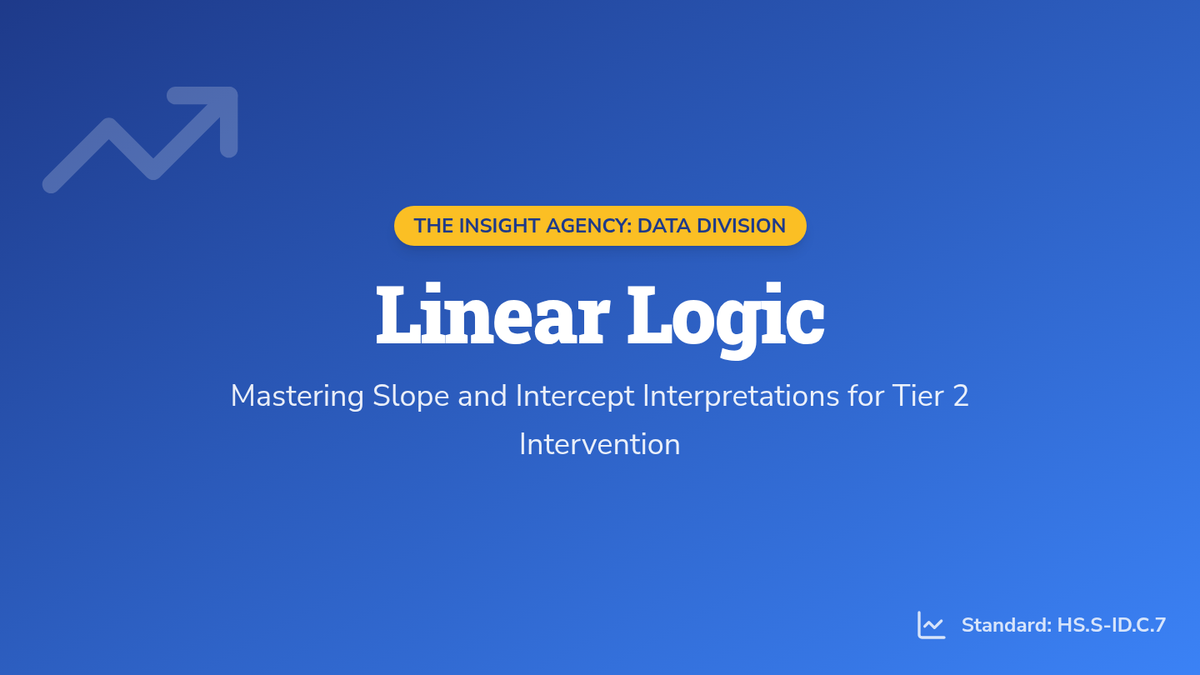
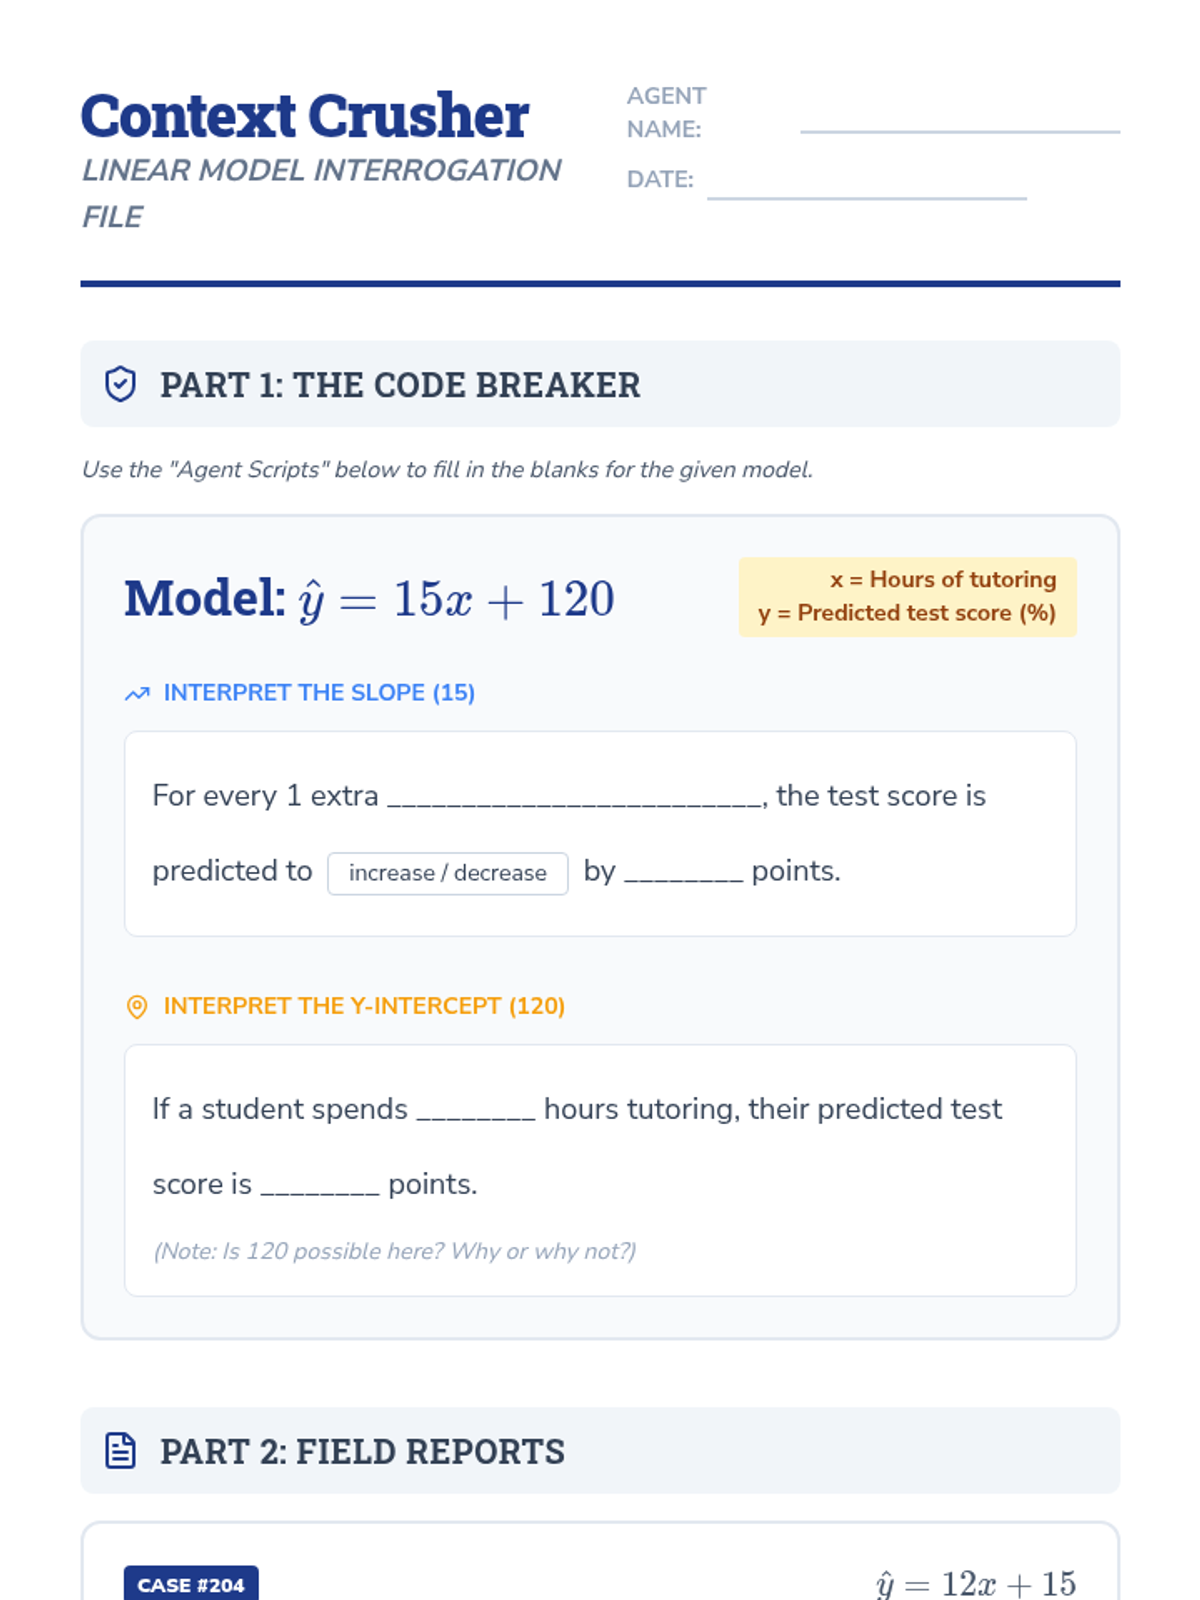
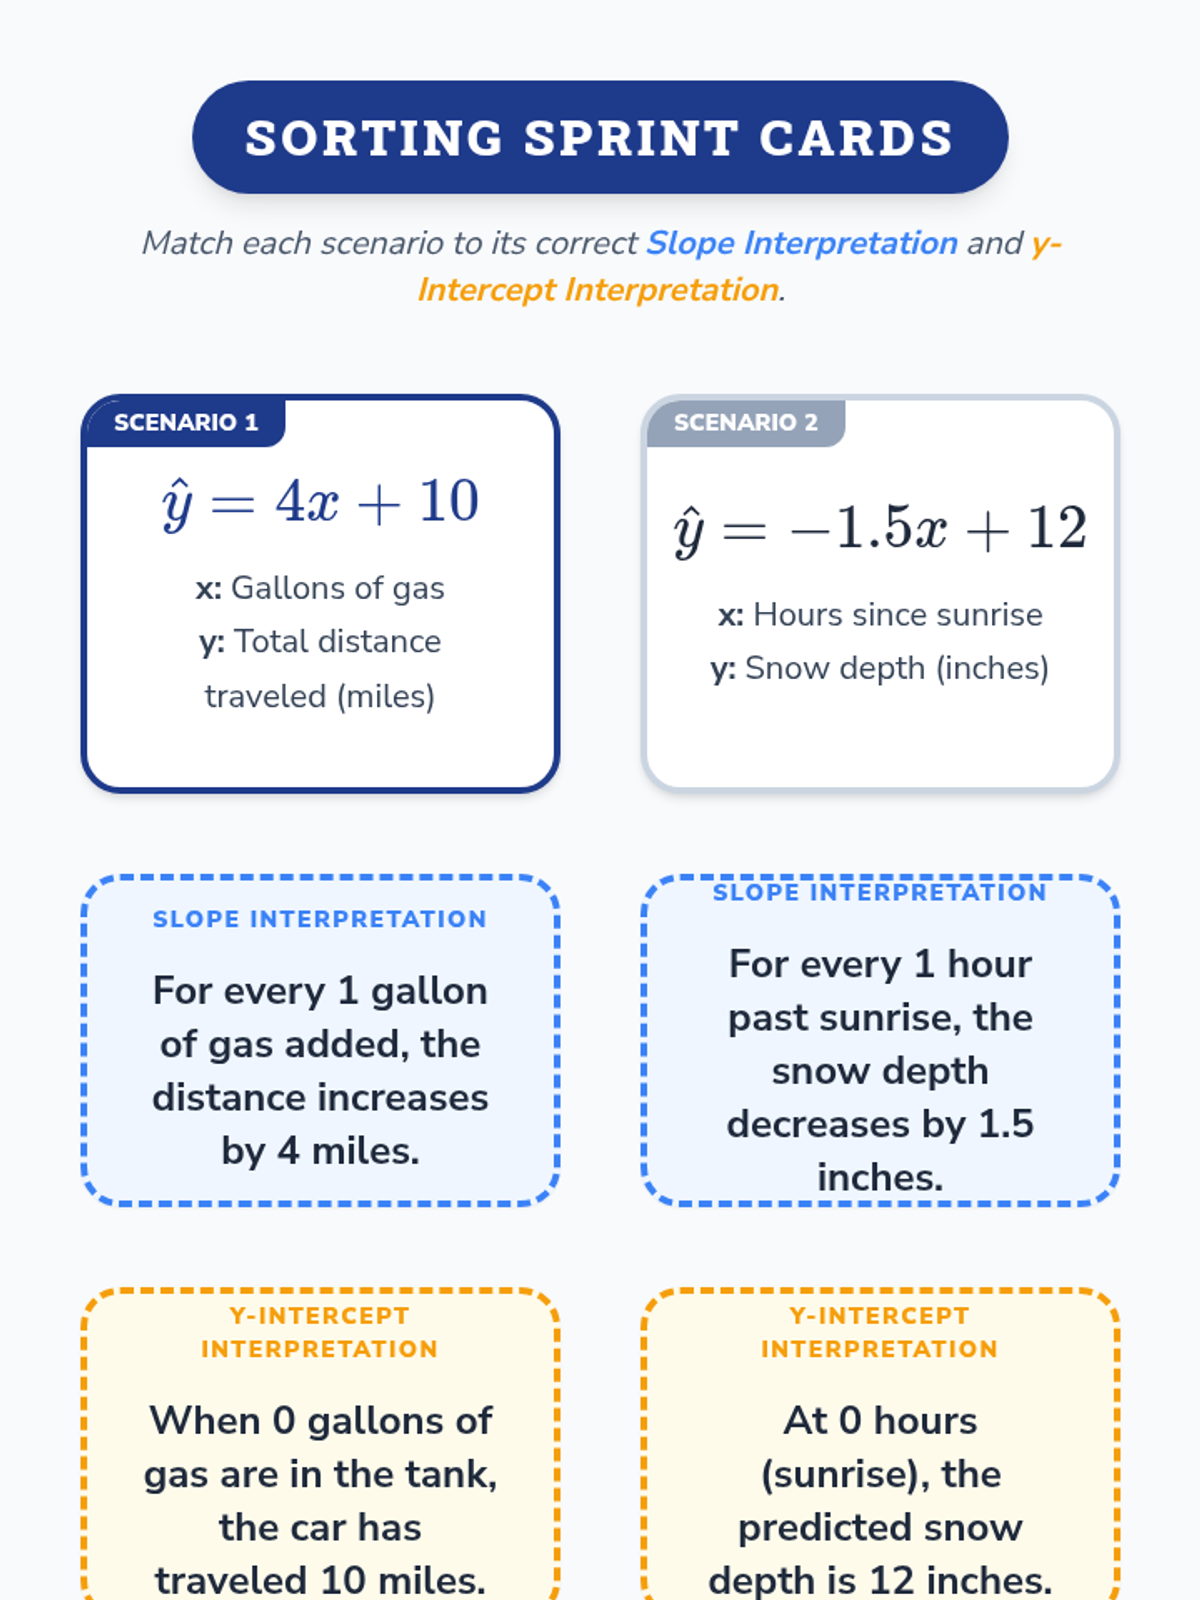
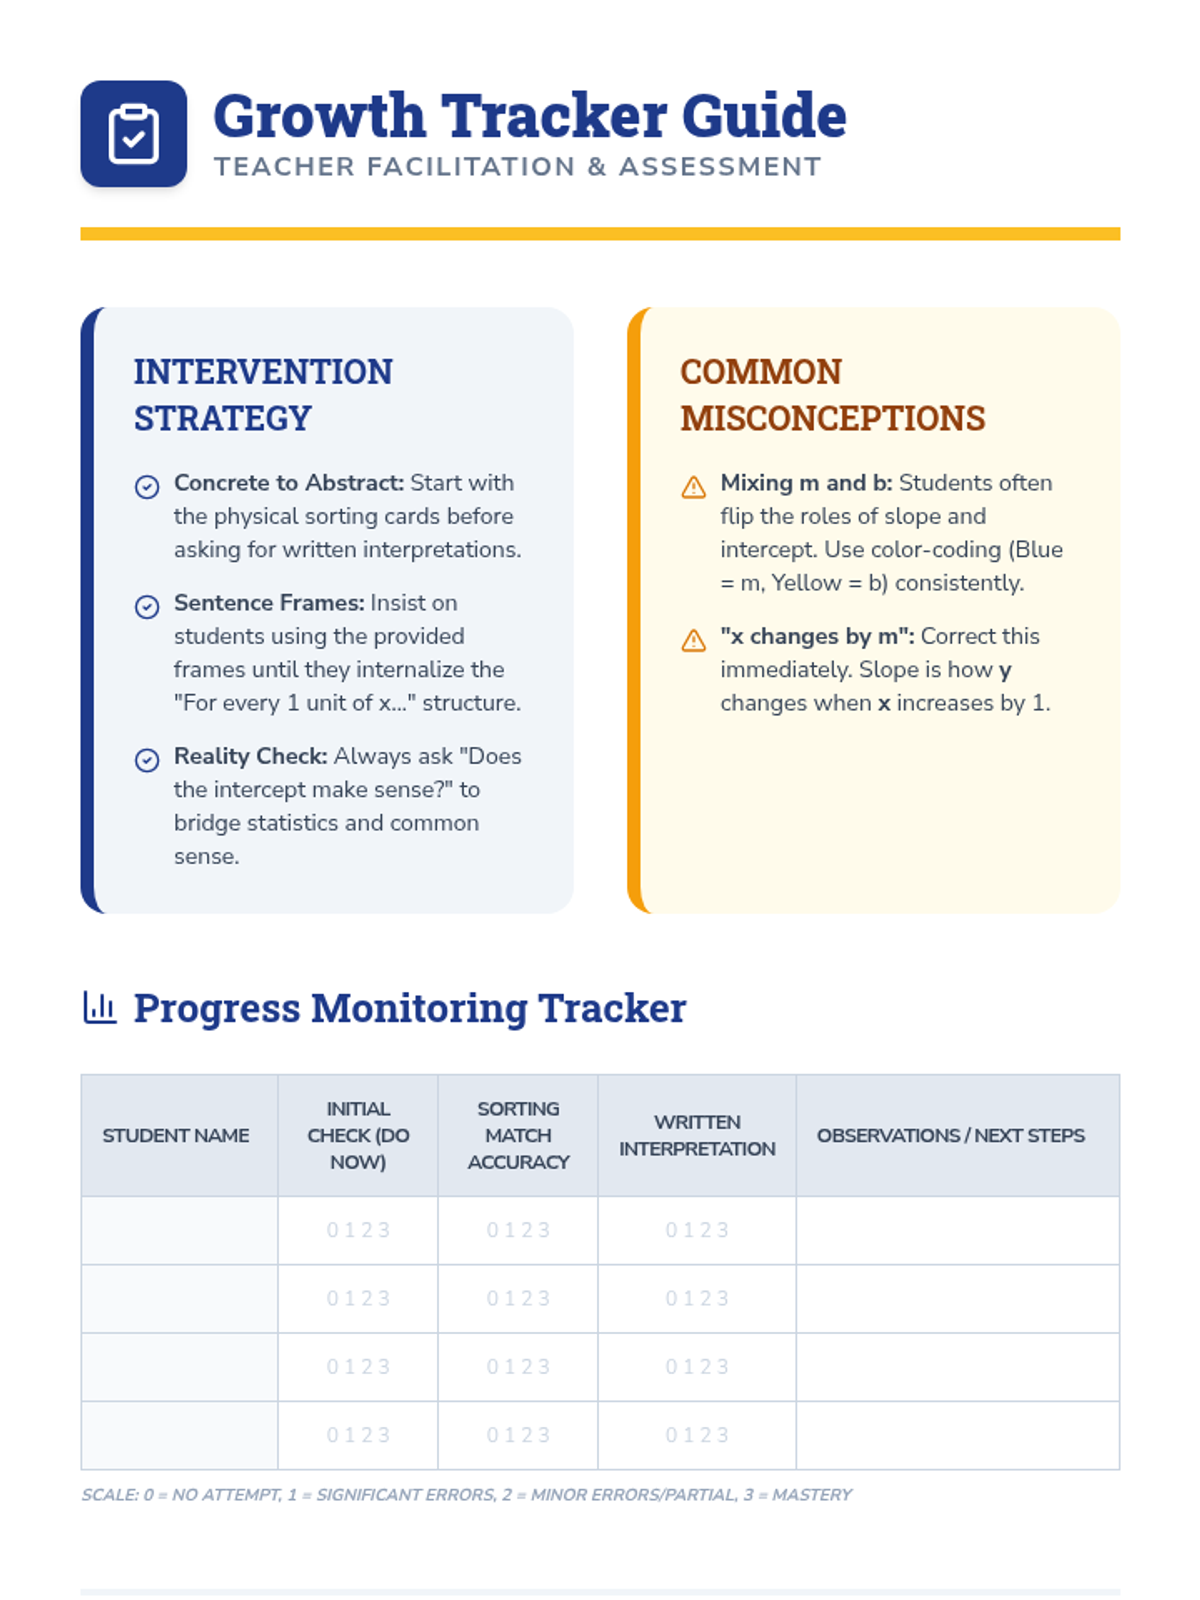
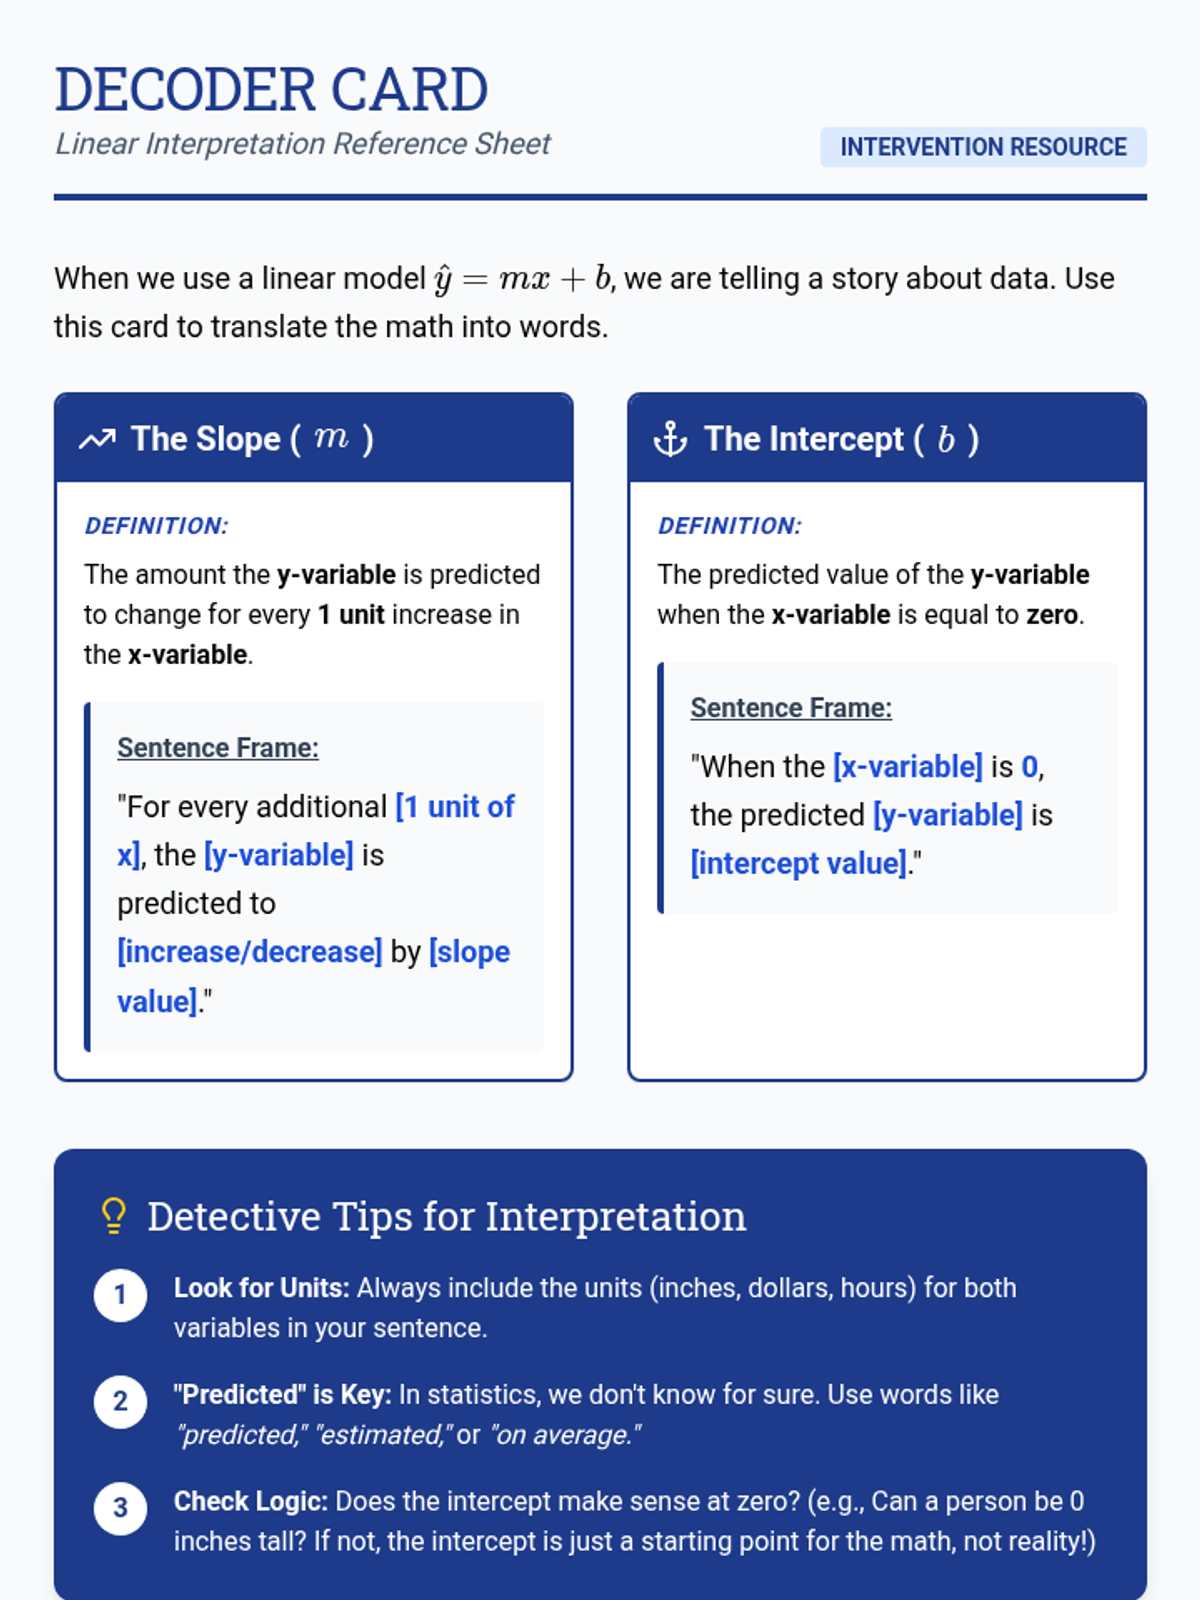
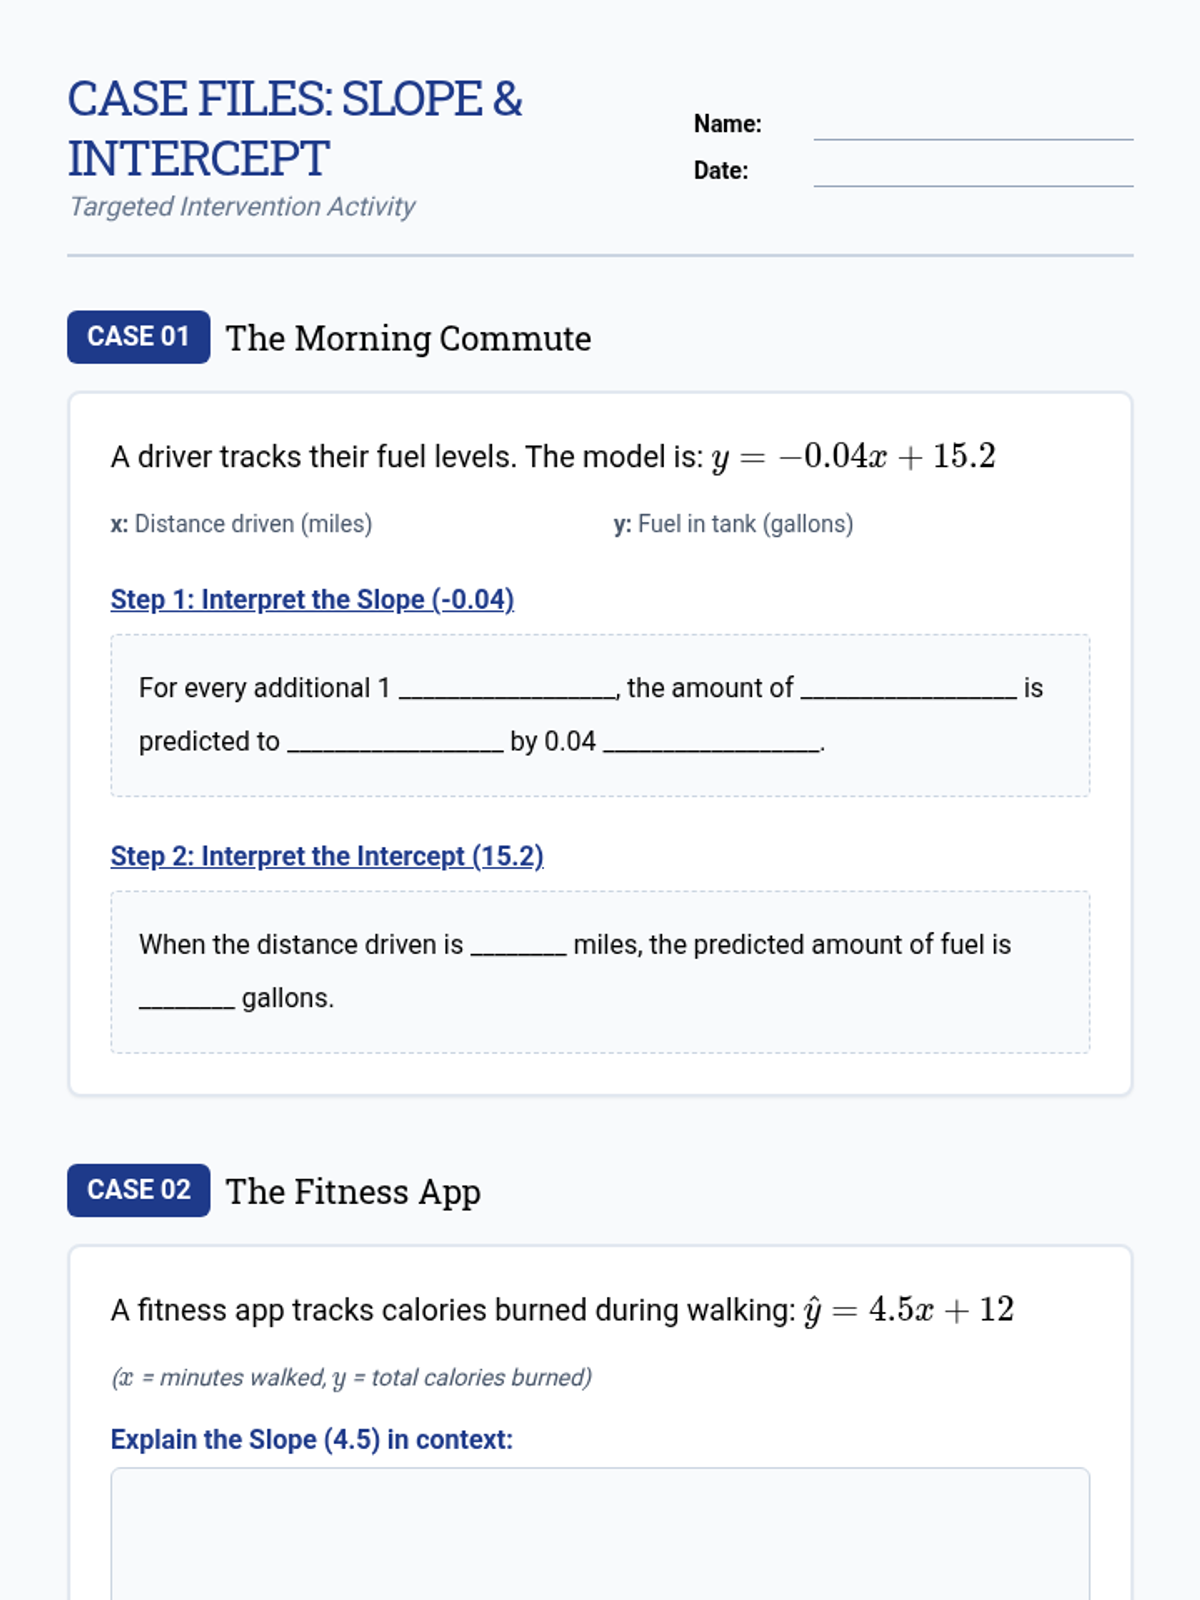
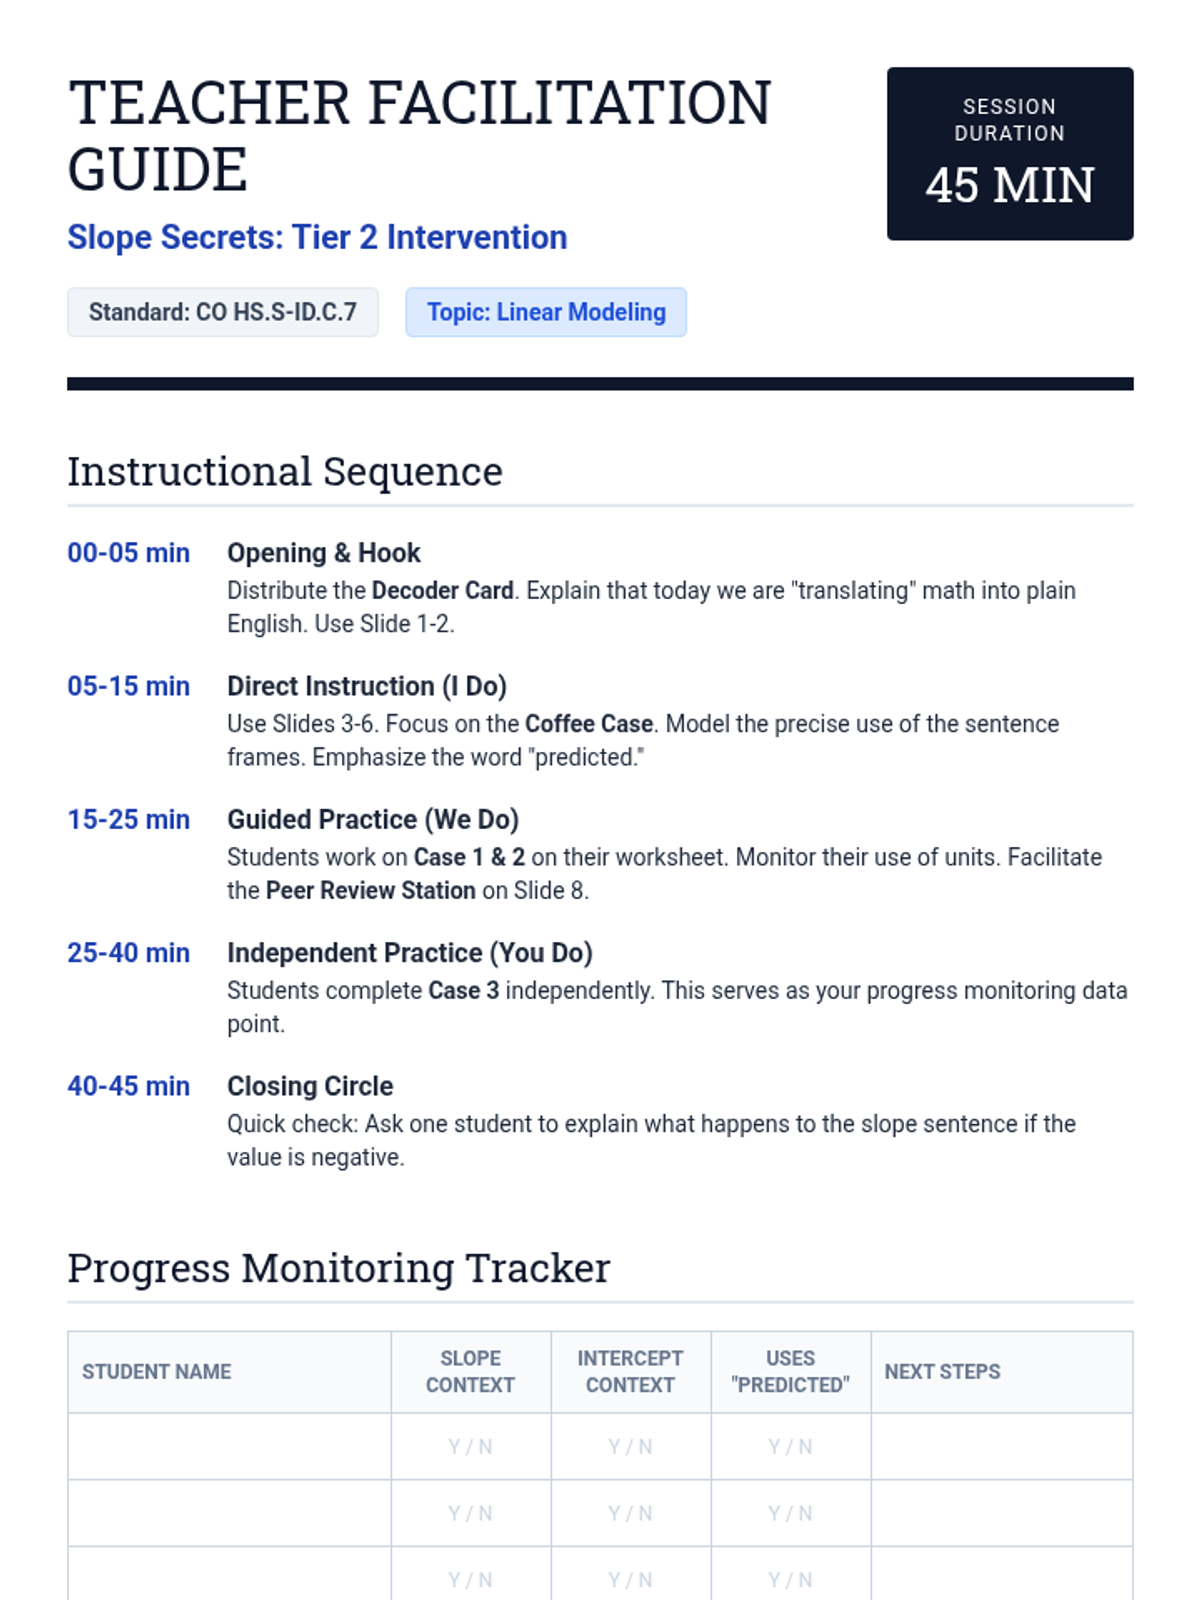
A Tier 2 intervention lesson focused on decoding linear models. Students learn to use structured sentence frames to interpret the slope and y-intercept of regression lines within real-world contexts like phone battery life and career earnings.
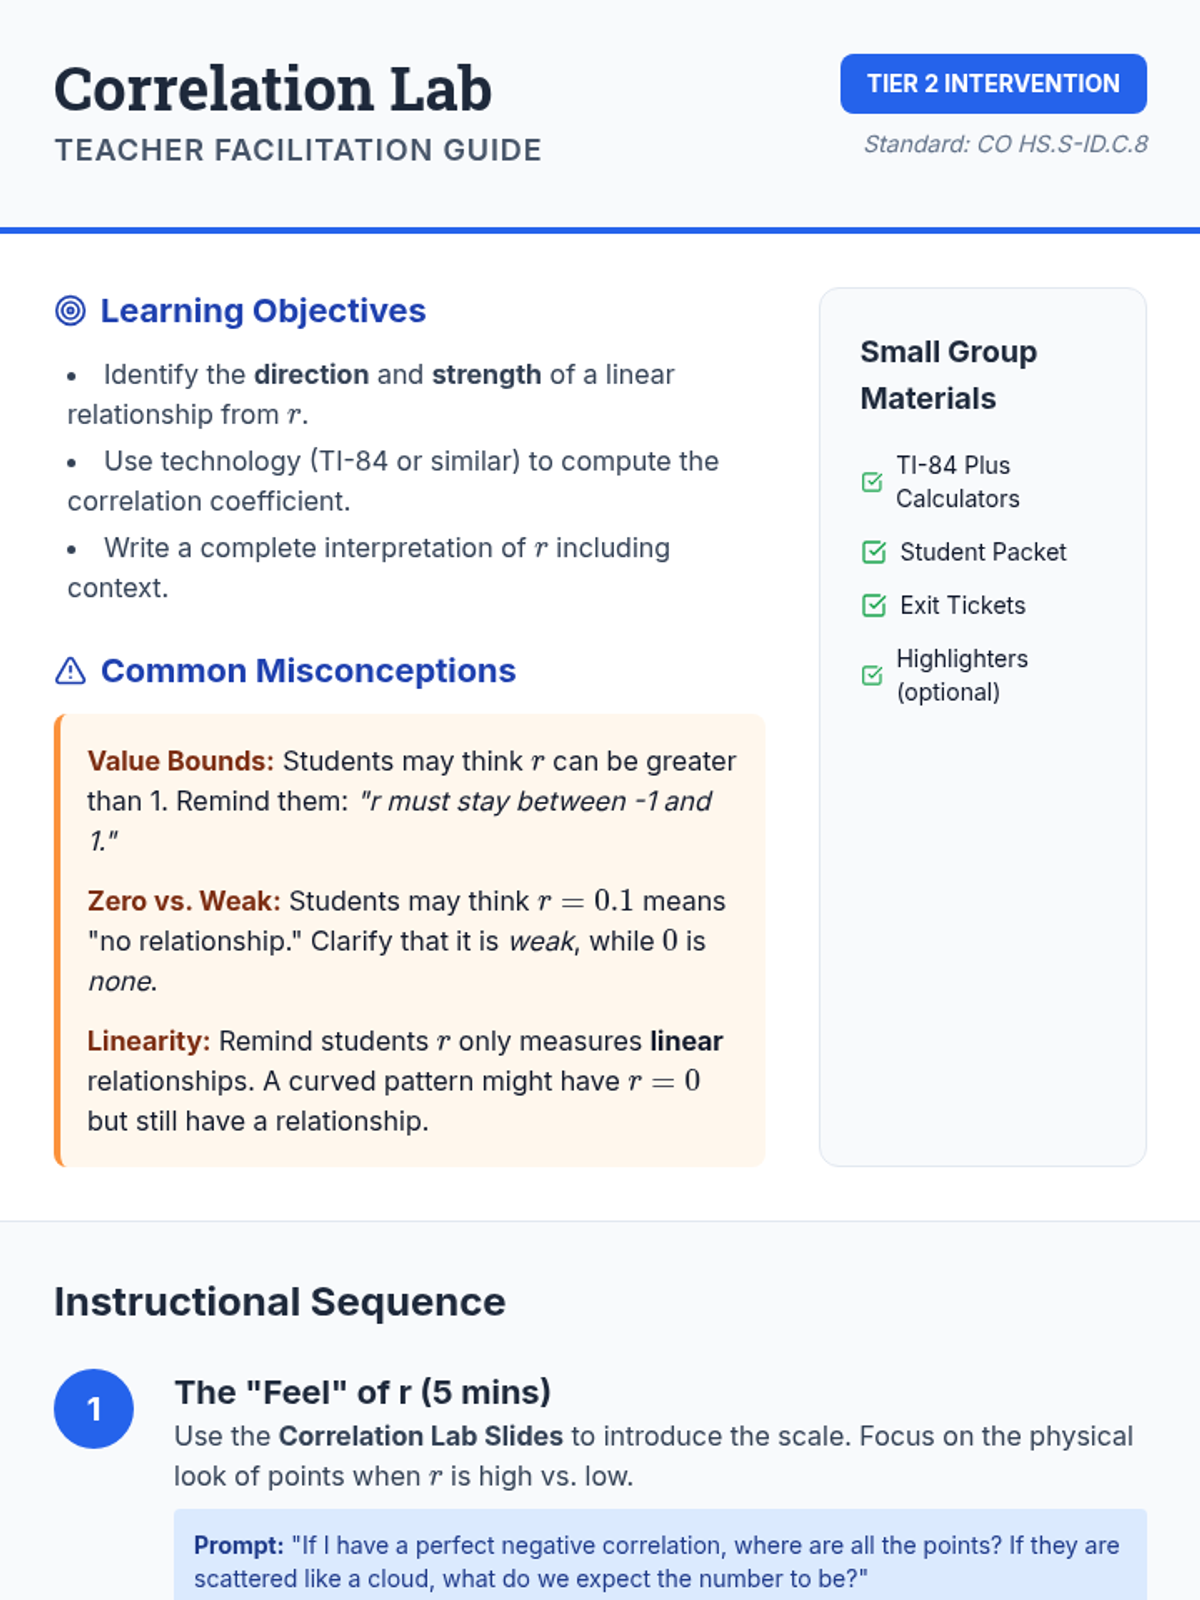
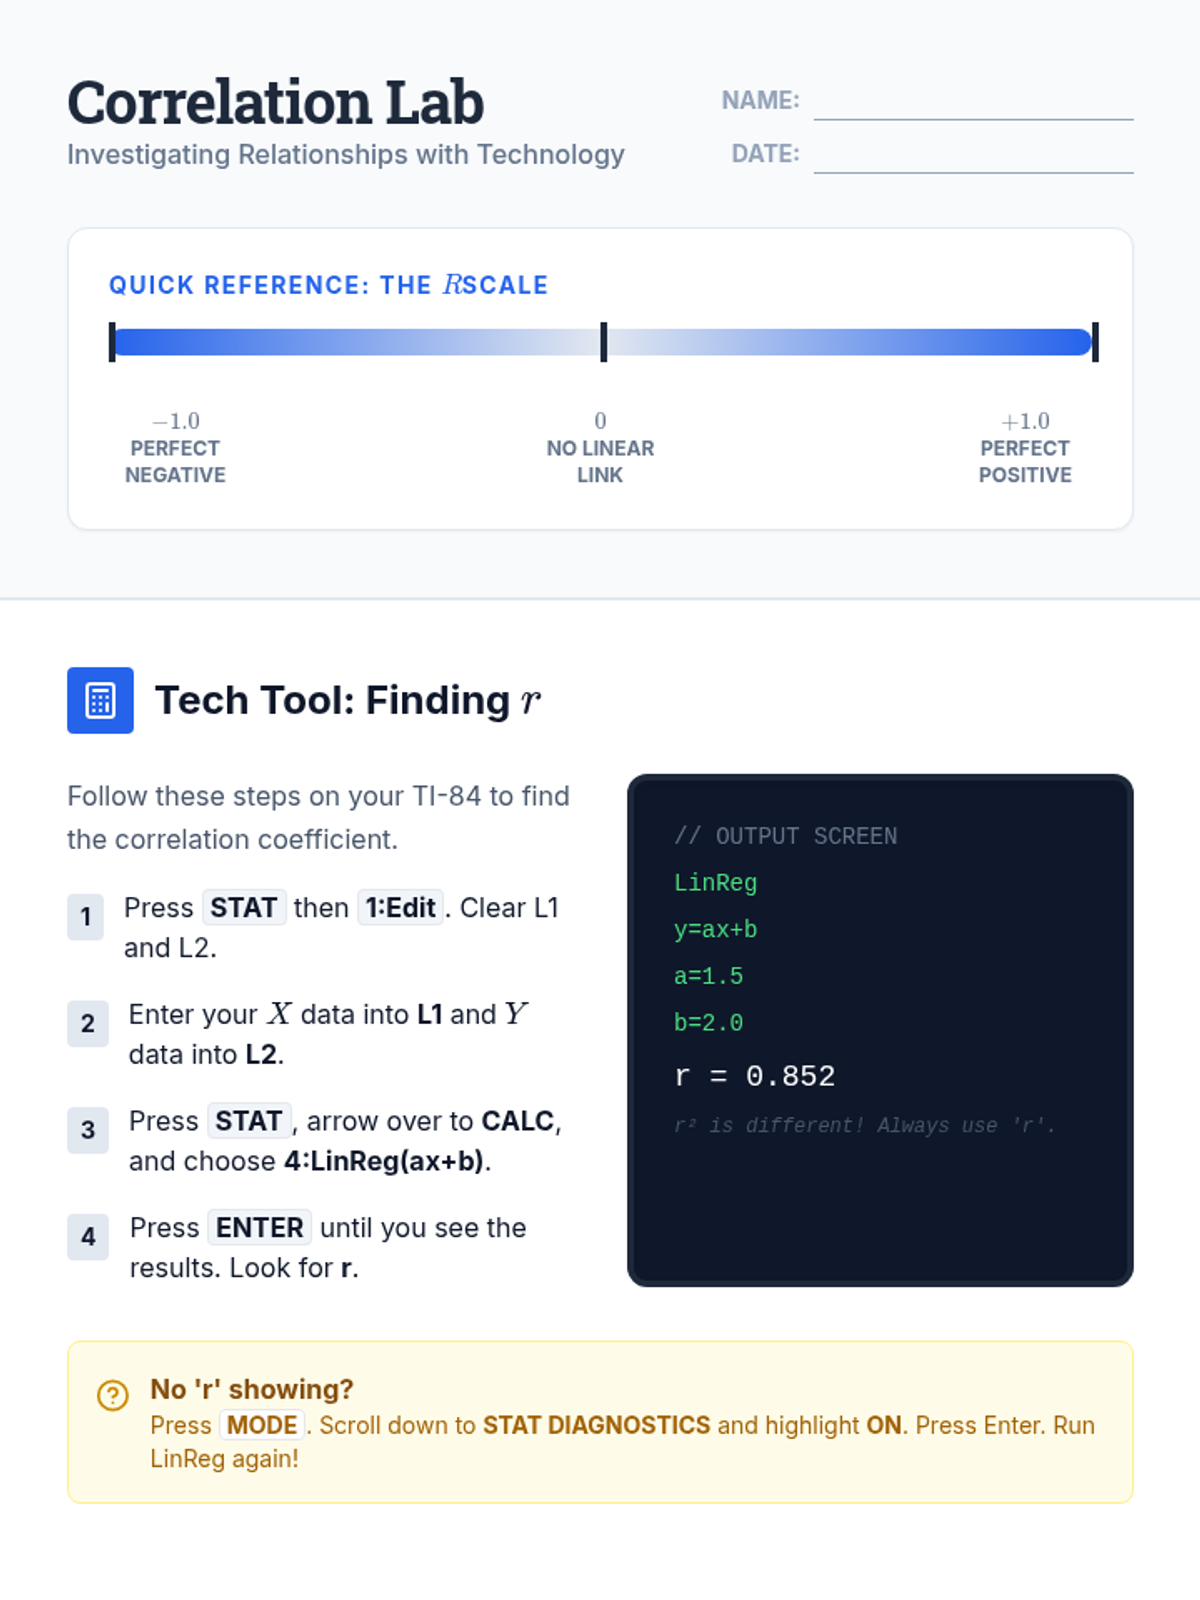
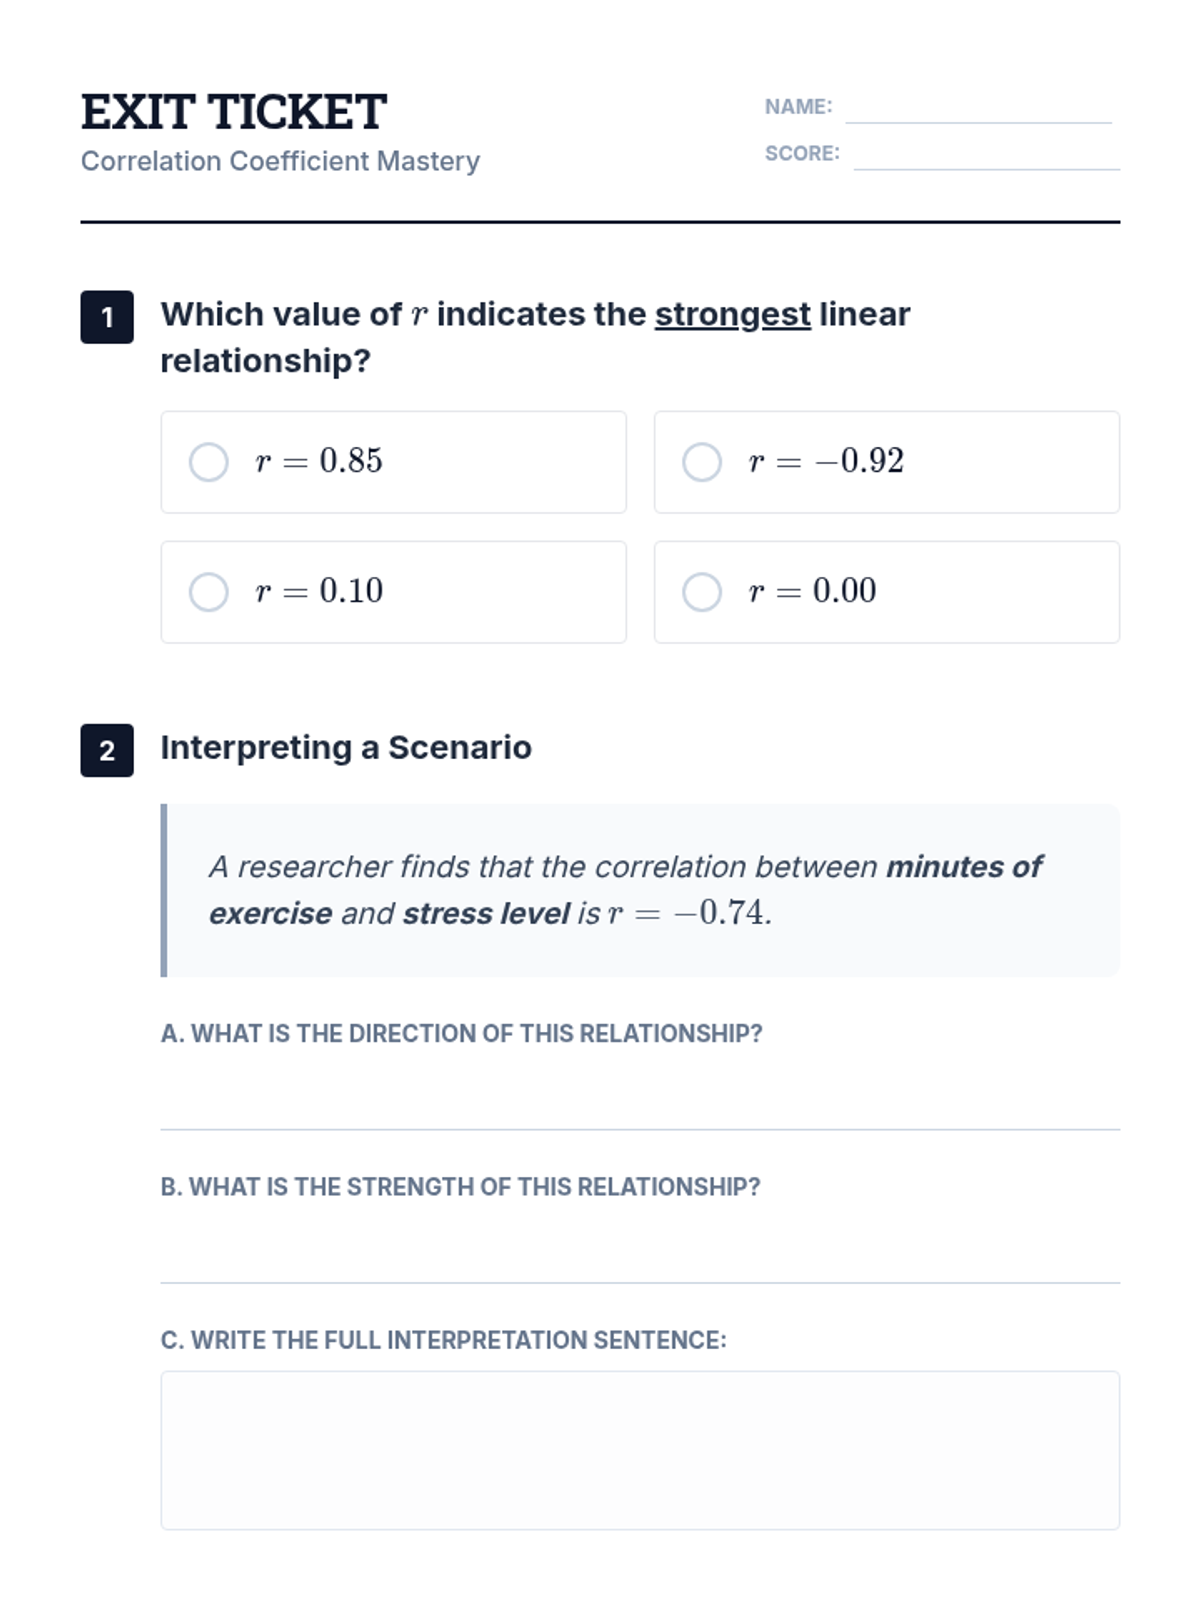
A small-group intervention lesson focused on the relationship between variables, the scale of the correlation coefficient, and using technology to find 'r'.
A targeted Tier 2 intervention lesson focusing on interpreting the components of linear models. Students will master the language used to describe slope (rate of change) and the y-intercept (constant term) through scaffolded sentence frames and interactive sorting activities.
A targeted intervention lesson on interpreting the slope and intercept of linear models. Students use sentence frames and peer feedback to master contextual explanations.
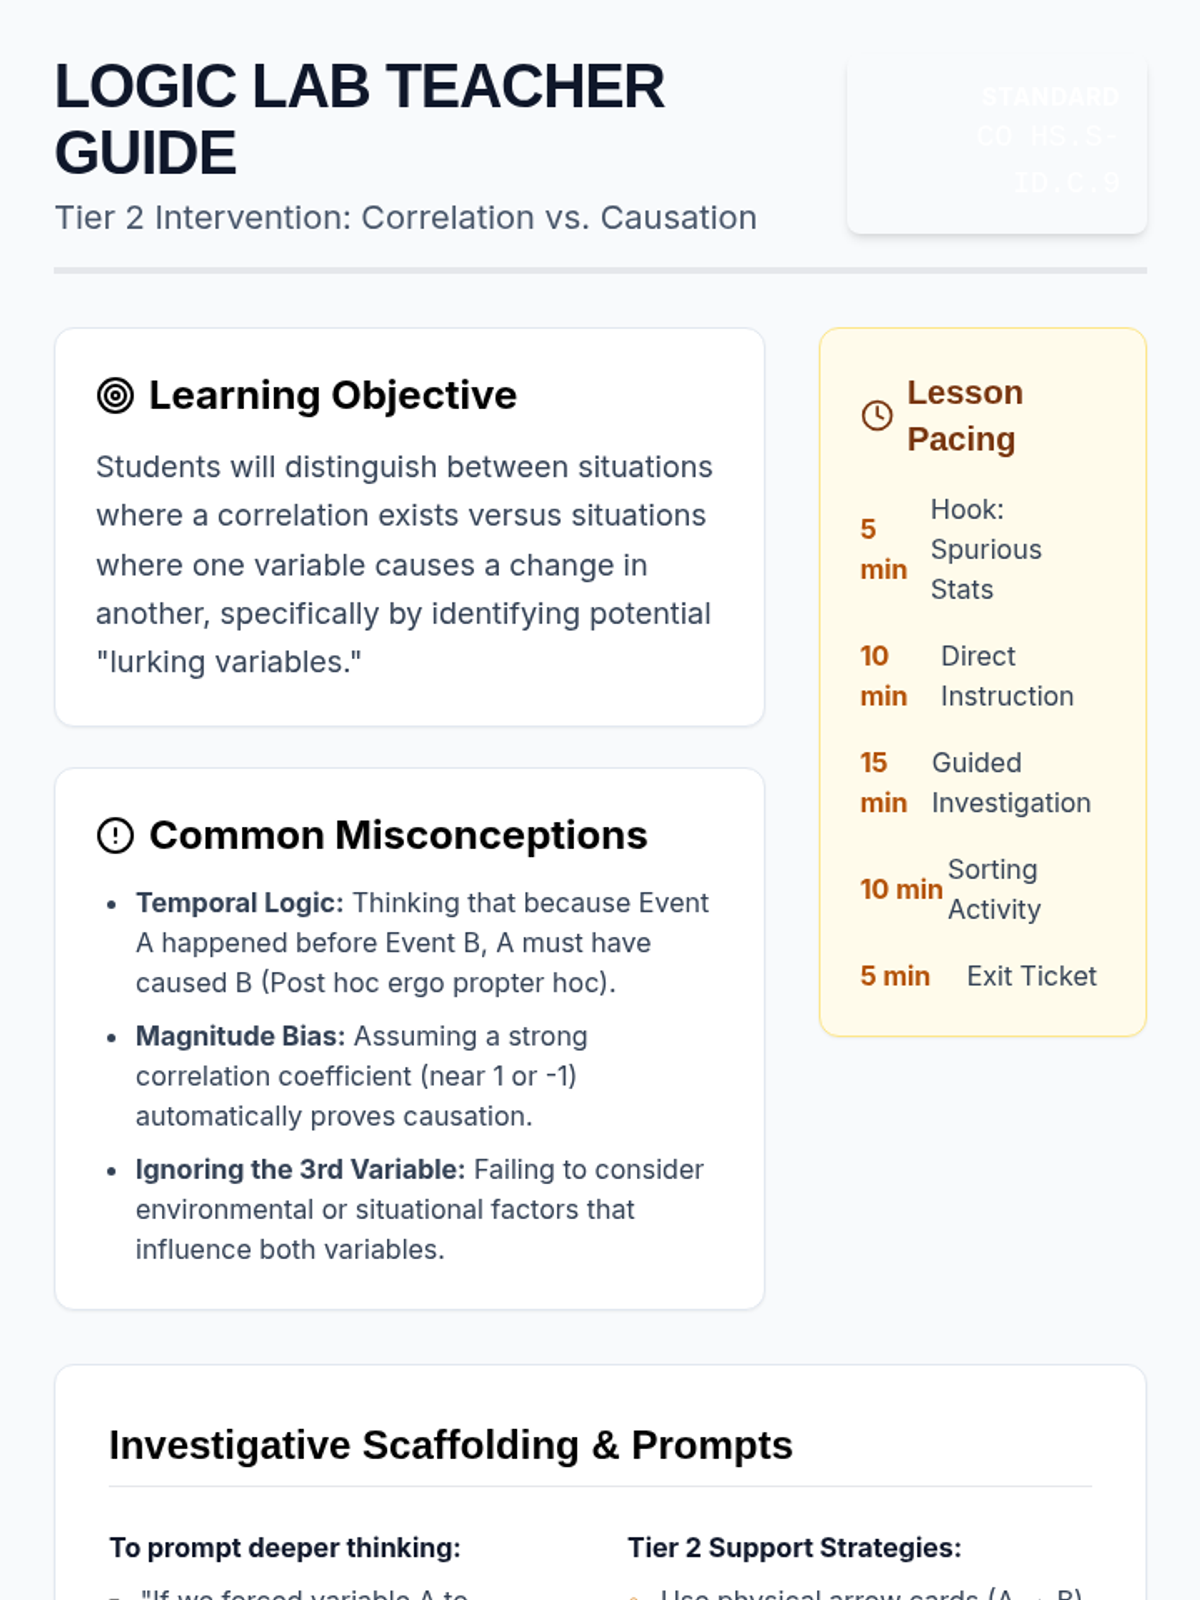
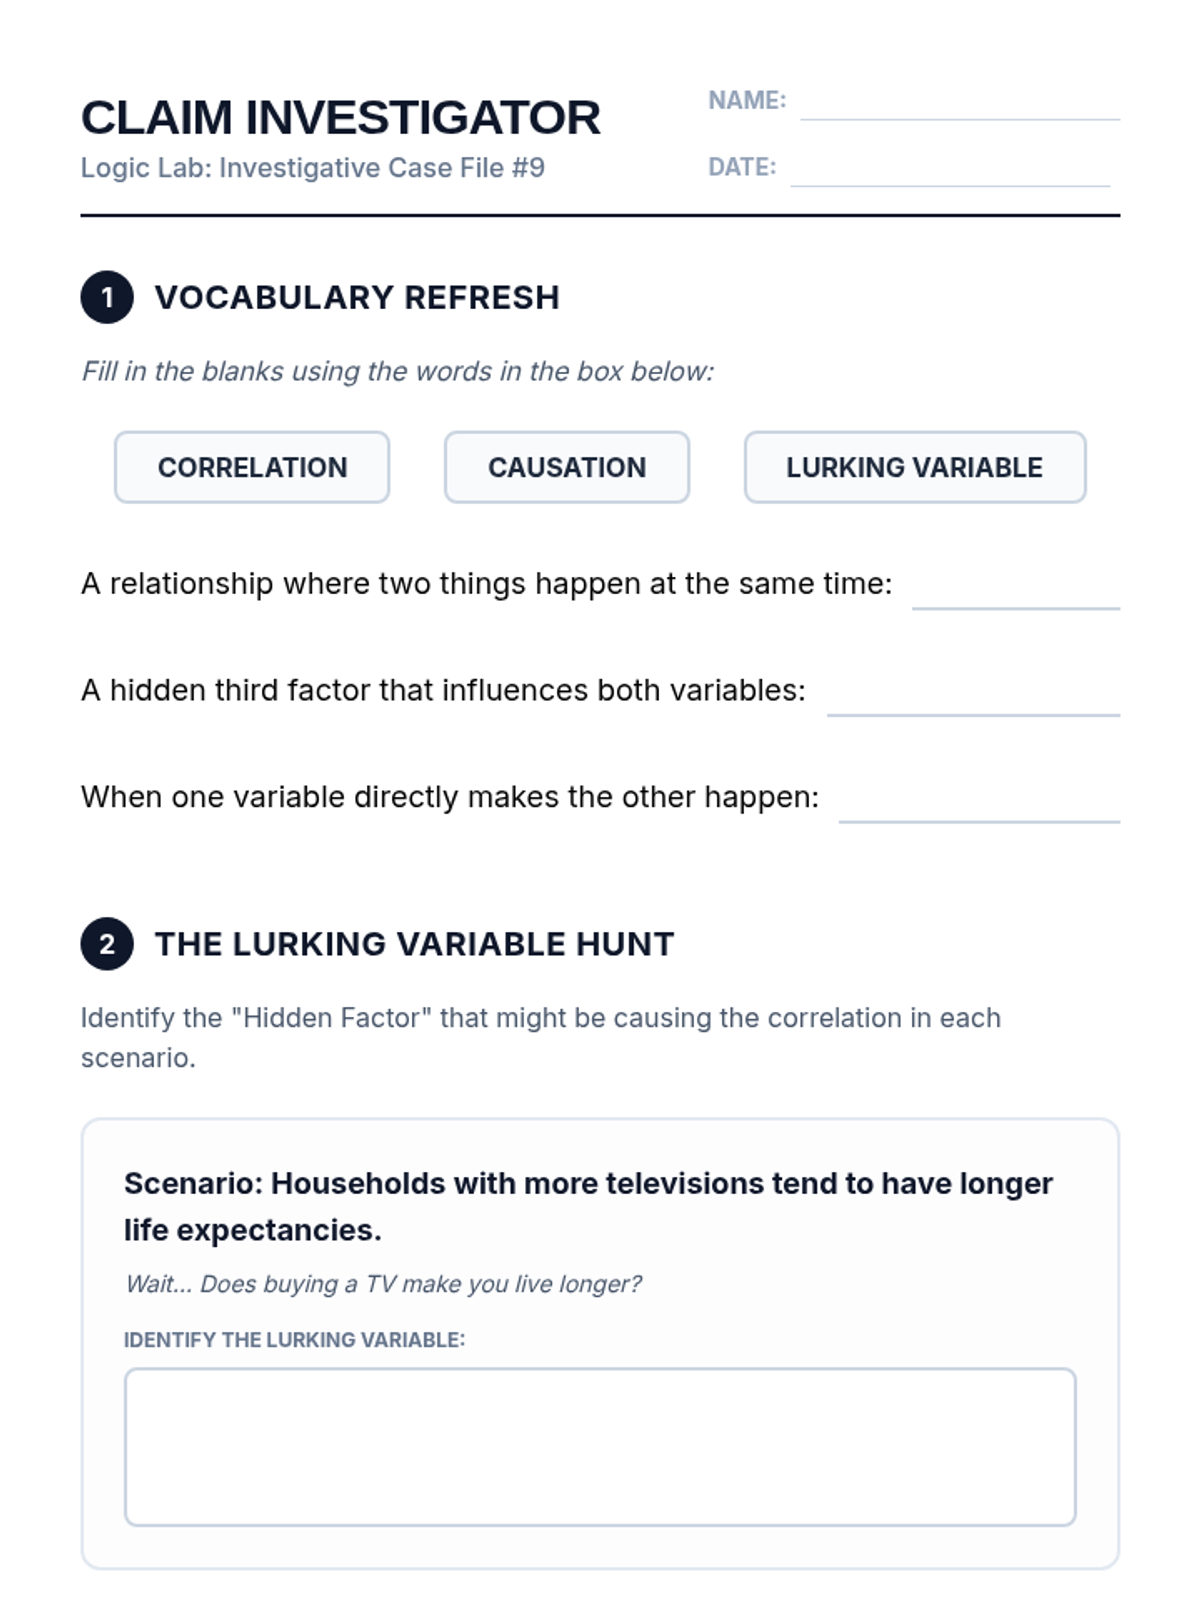
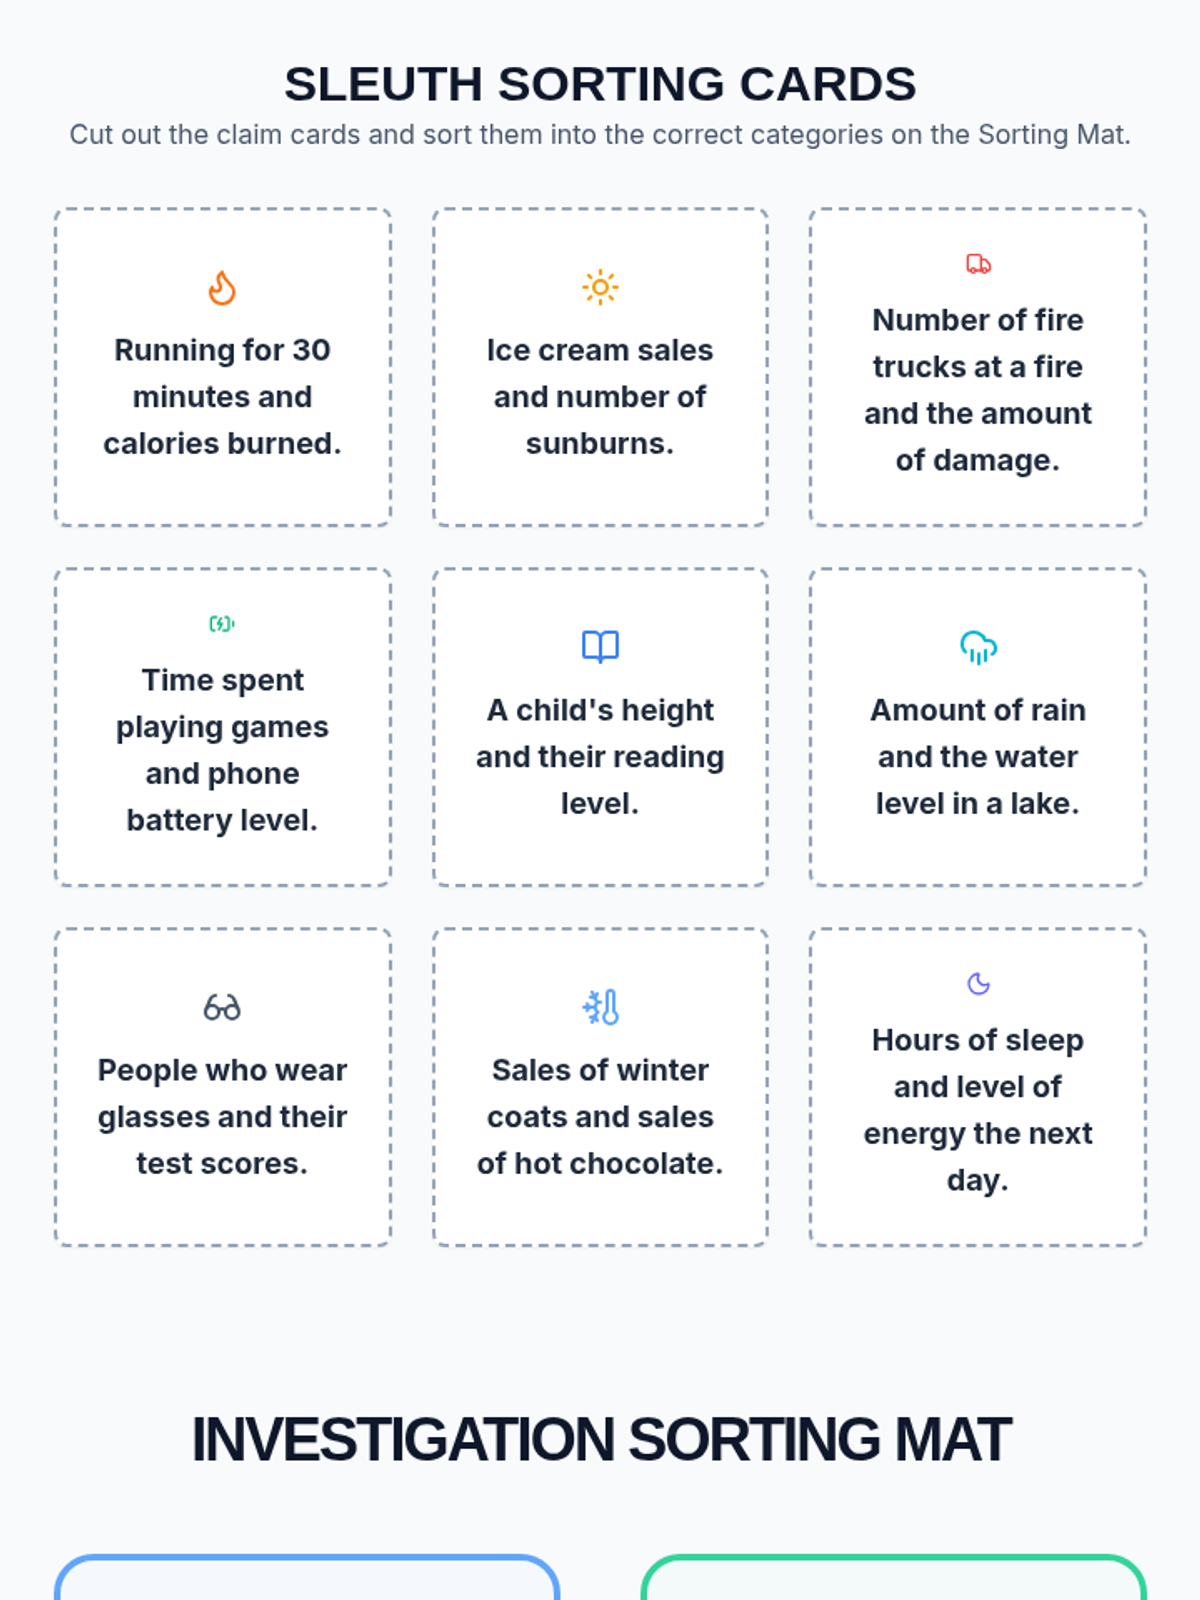
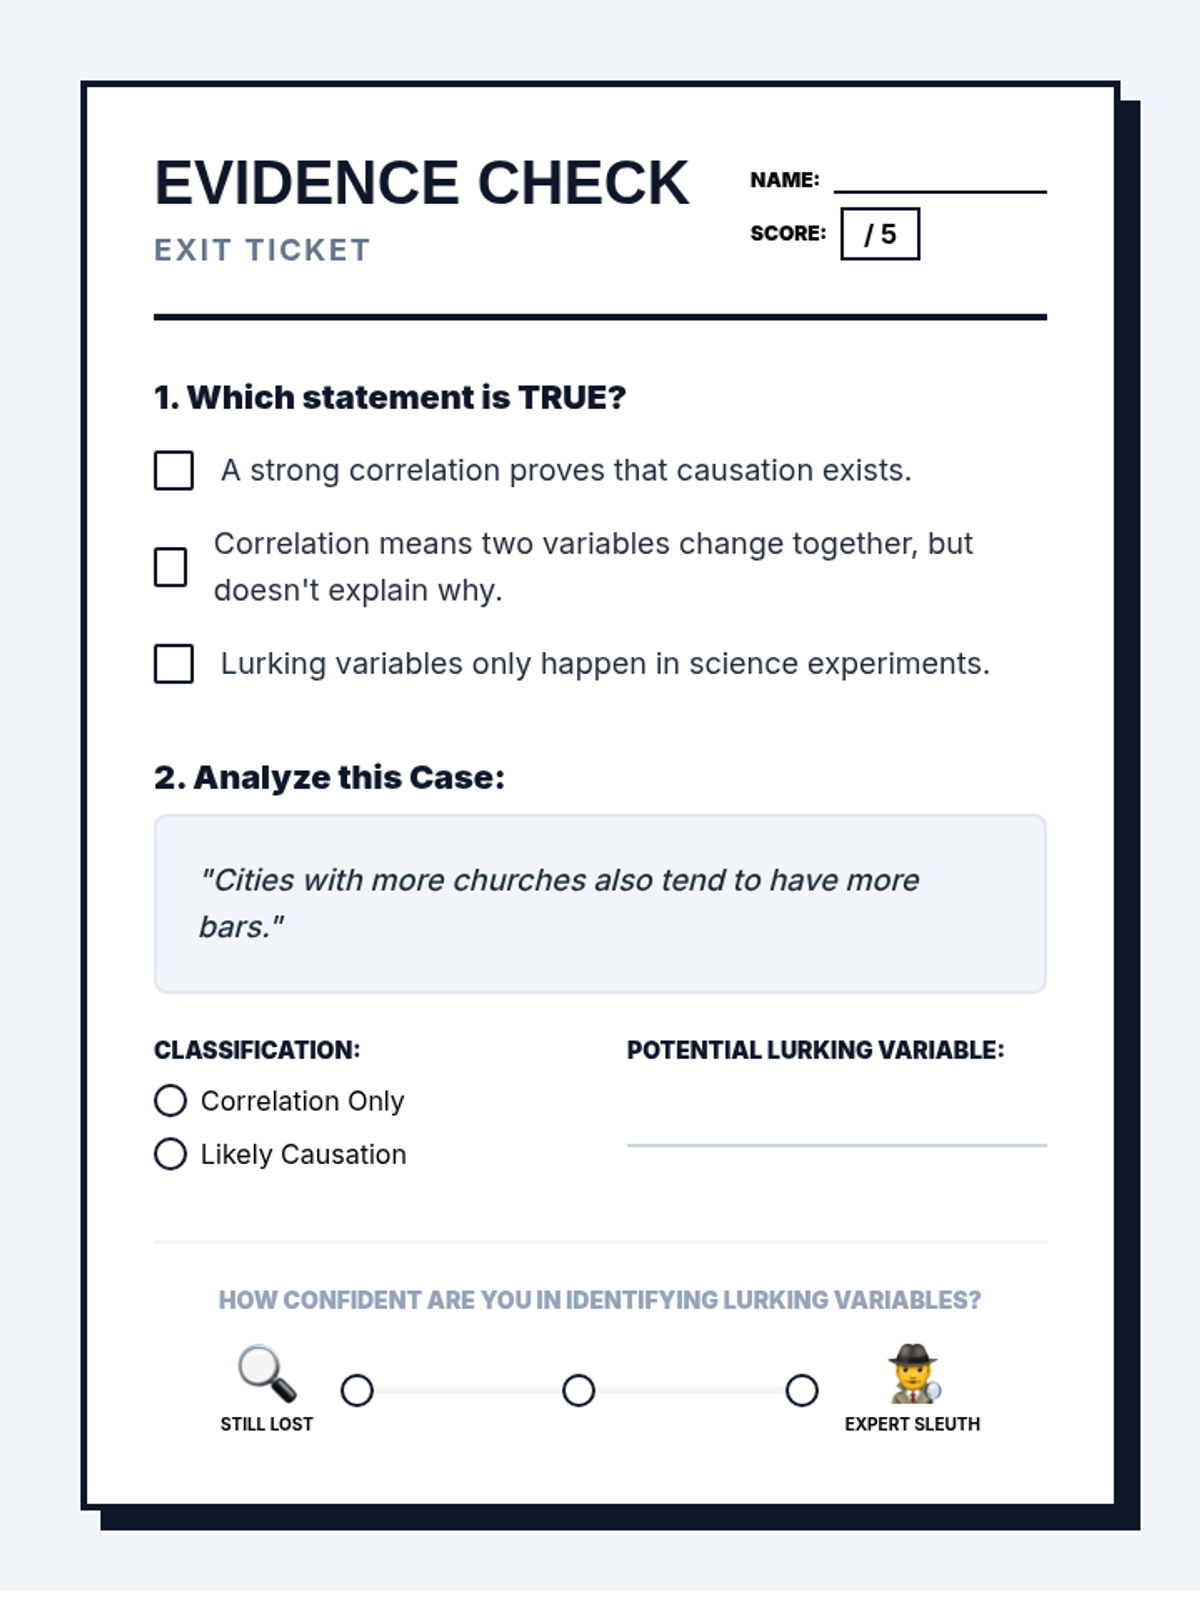
A targeted Tier 2 intervention lesson focused on distinguishing between correlation and causation through investigative scenarios, lurking variable identification, and sorting activities.
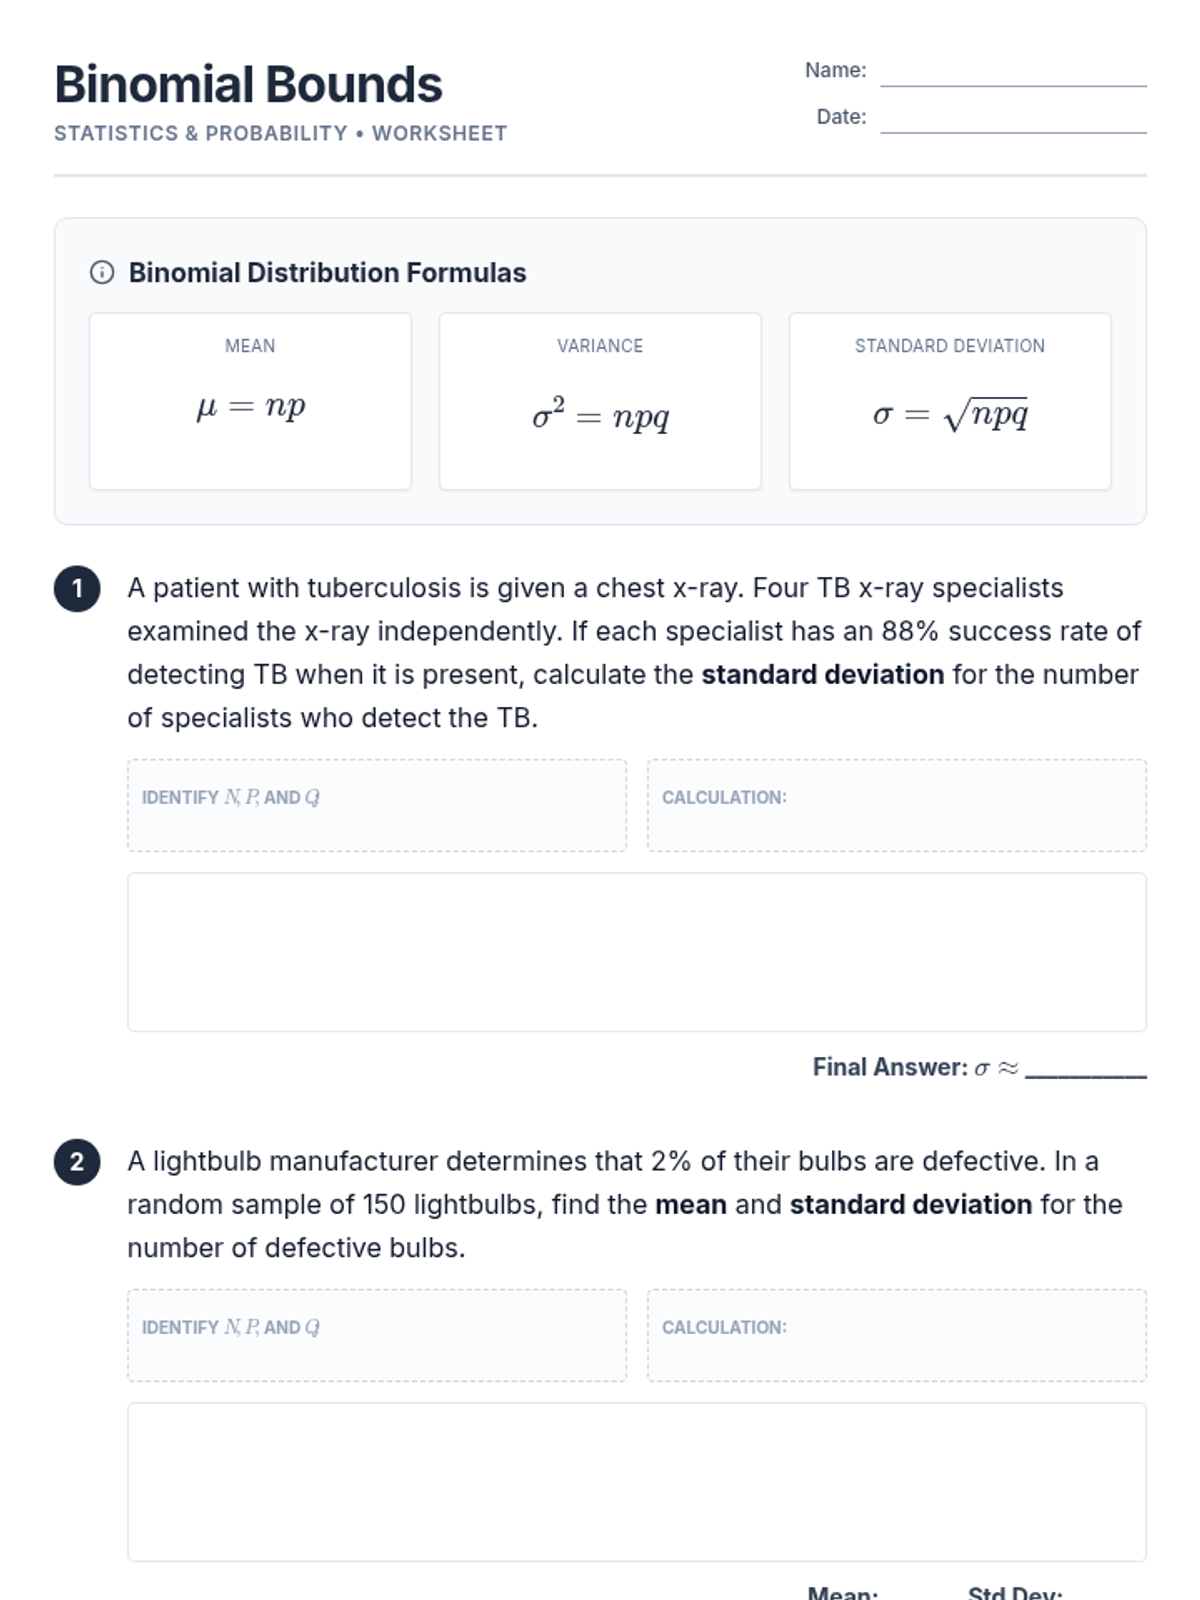
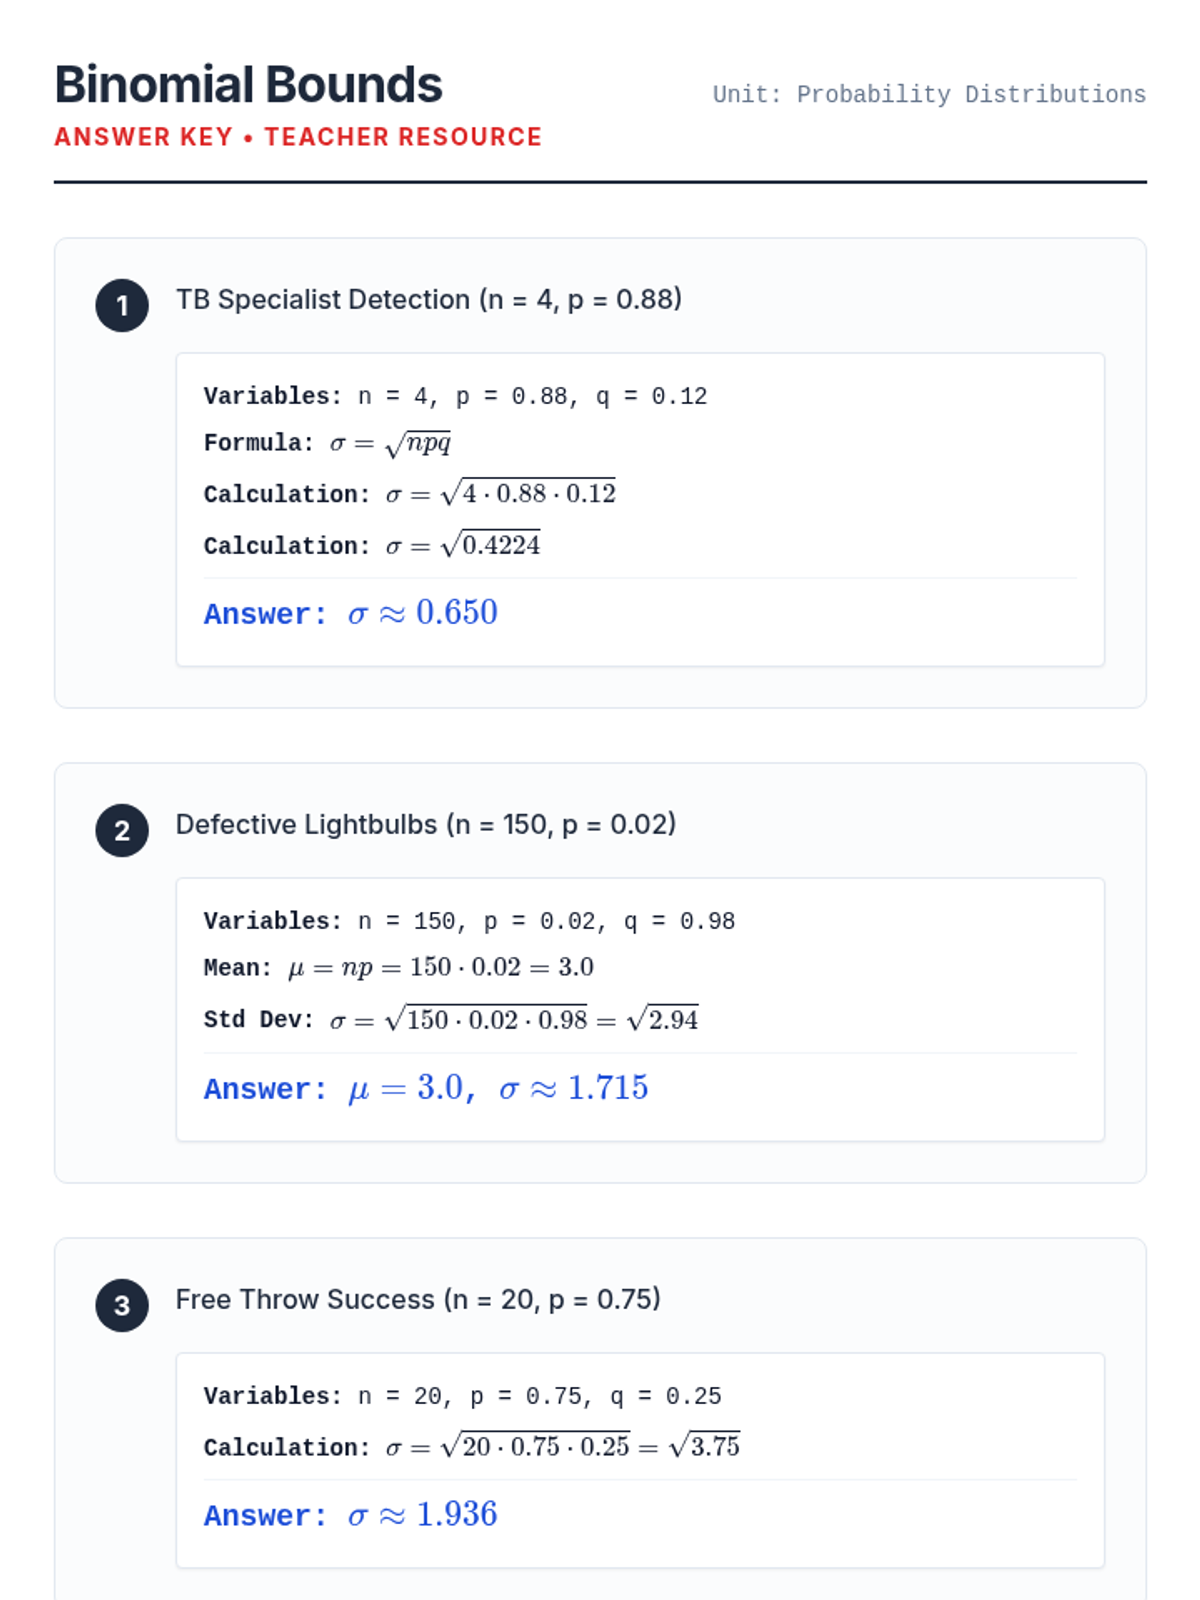
A lesson focused on calculating the mean, variance, and standard deviation of binomial probability distributions in real-world contexts.
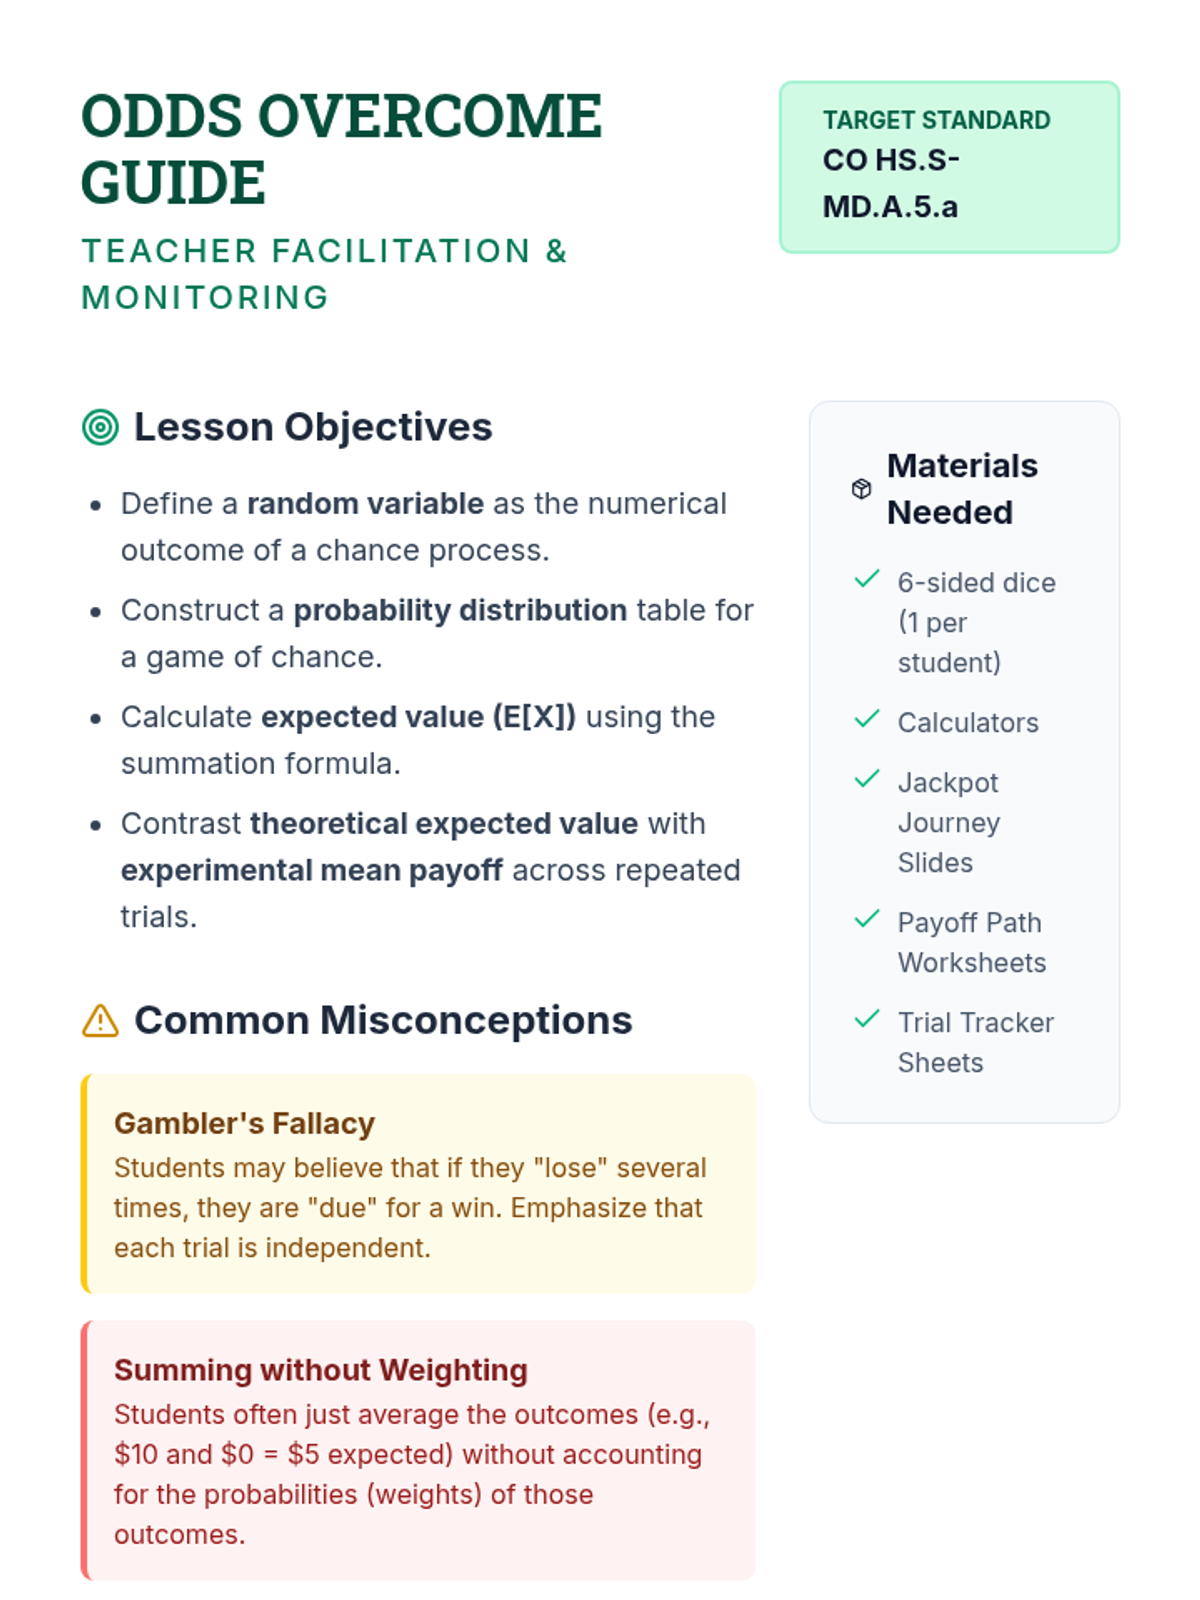
Students define random variables, create probability distributions, and calculate the expected value (mean) of a game of chance. The lesson concludes with a multi-trial experiment to see how experimental results converge on theoretical expectations.
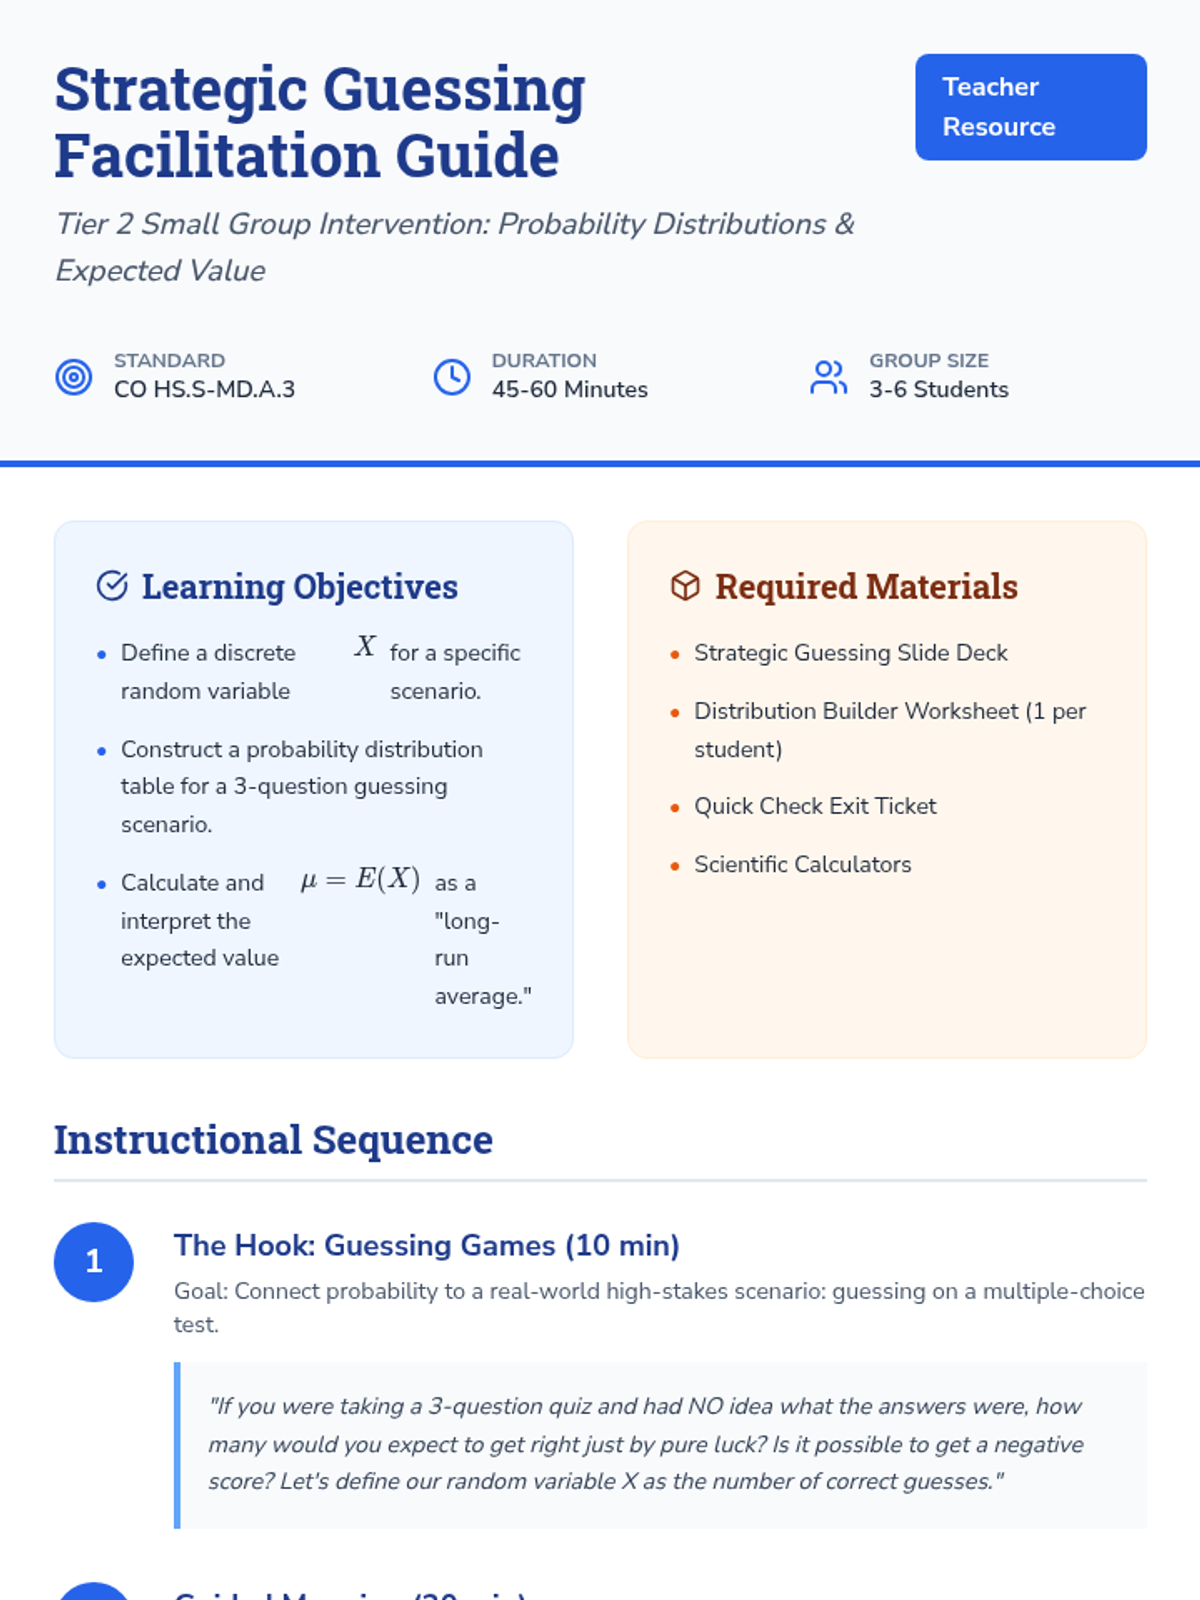
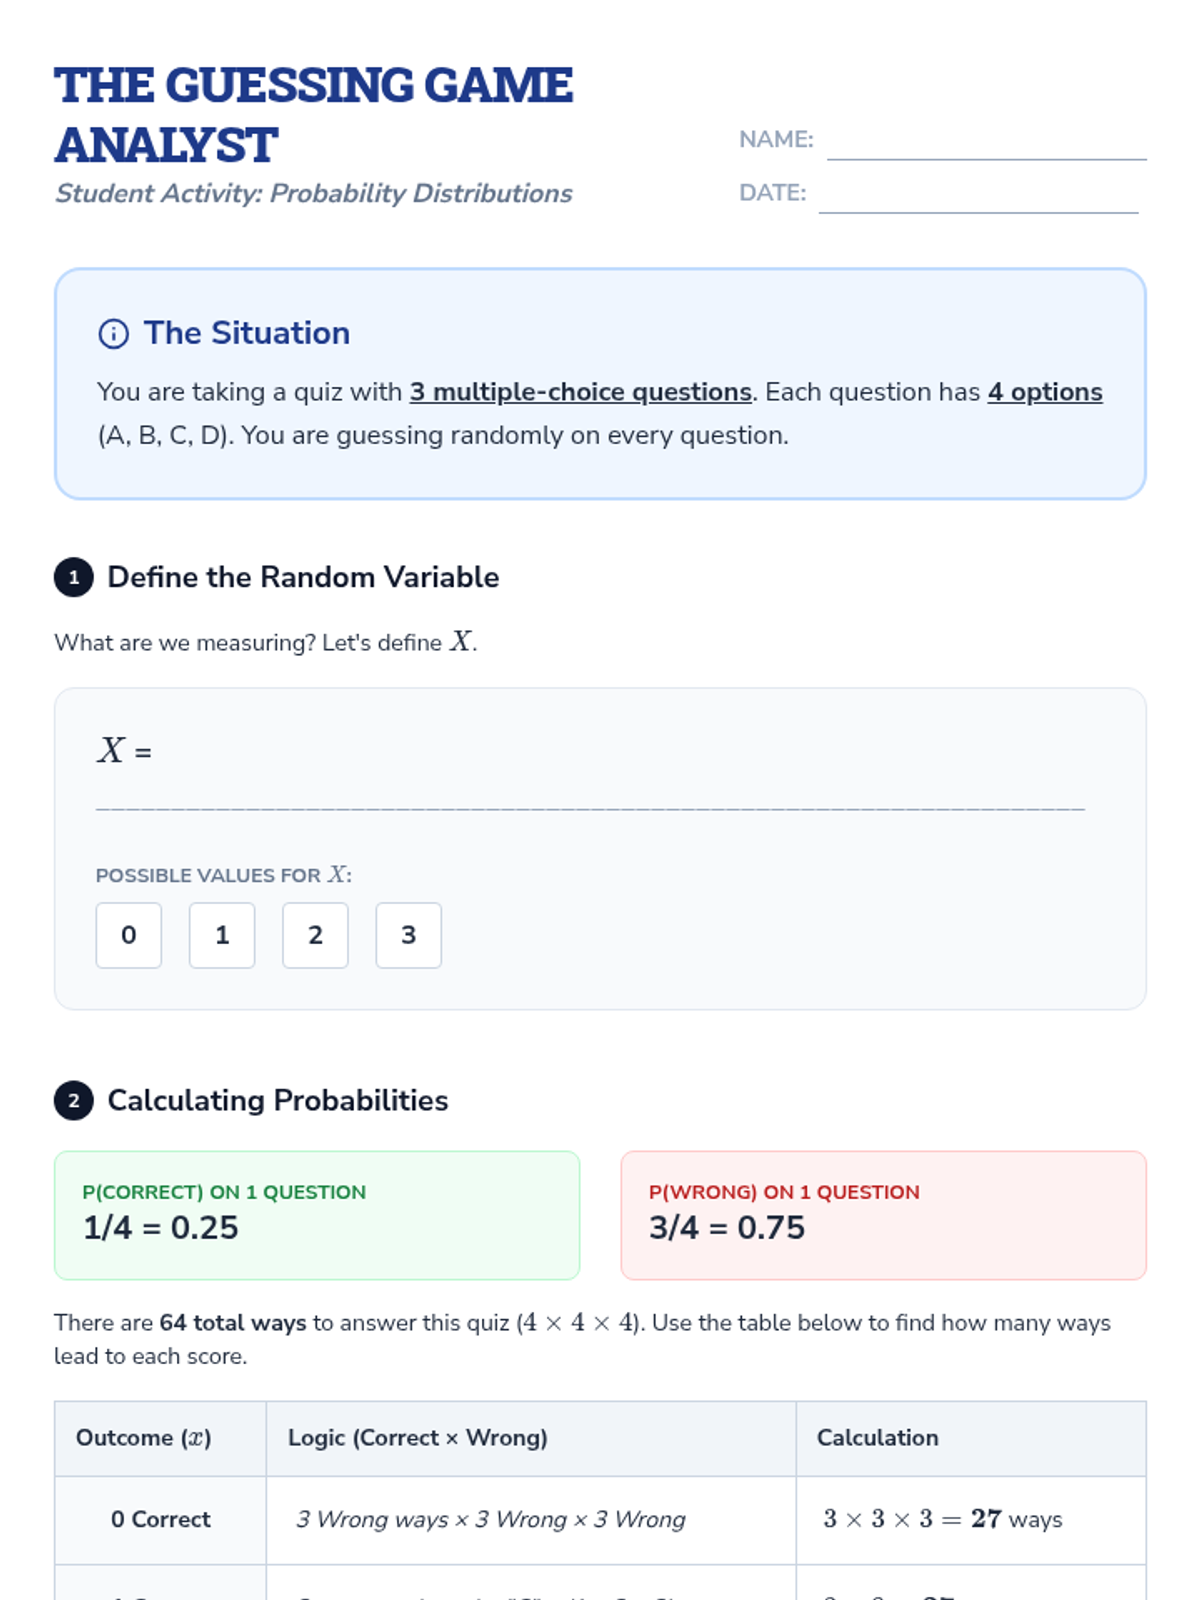
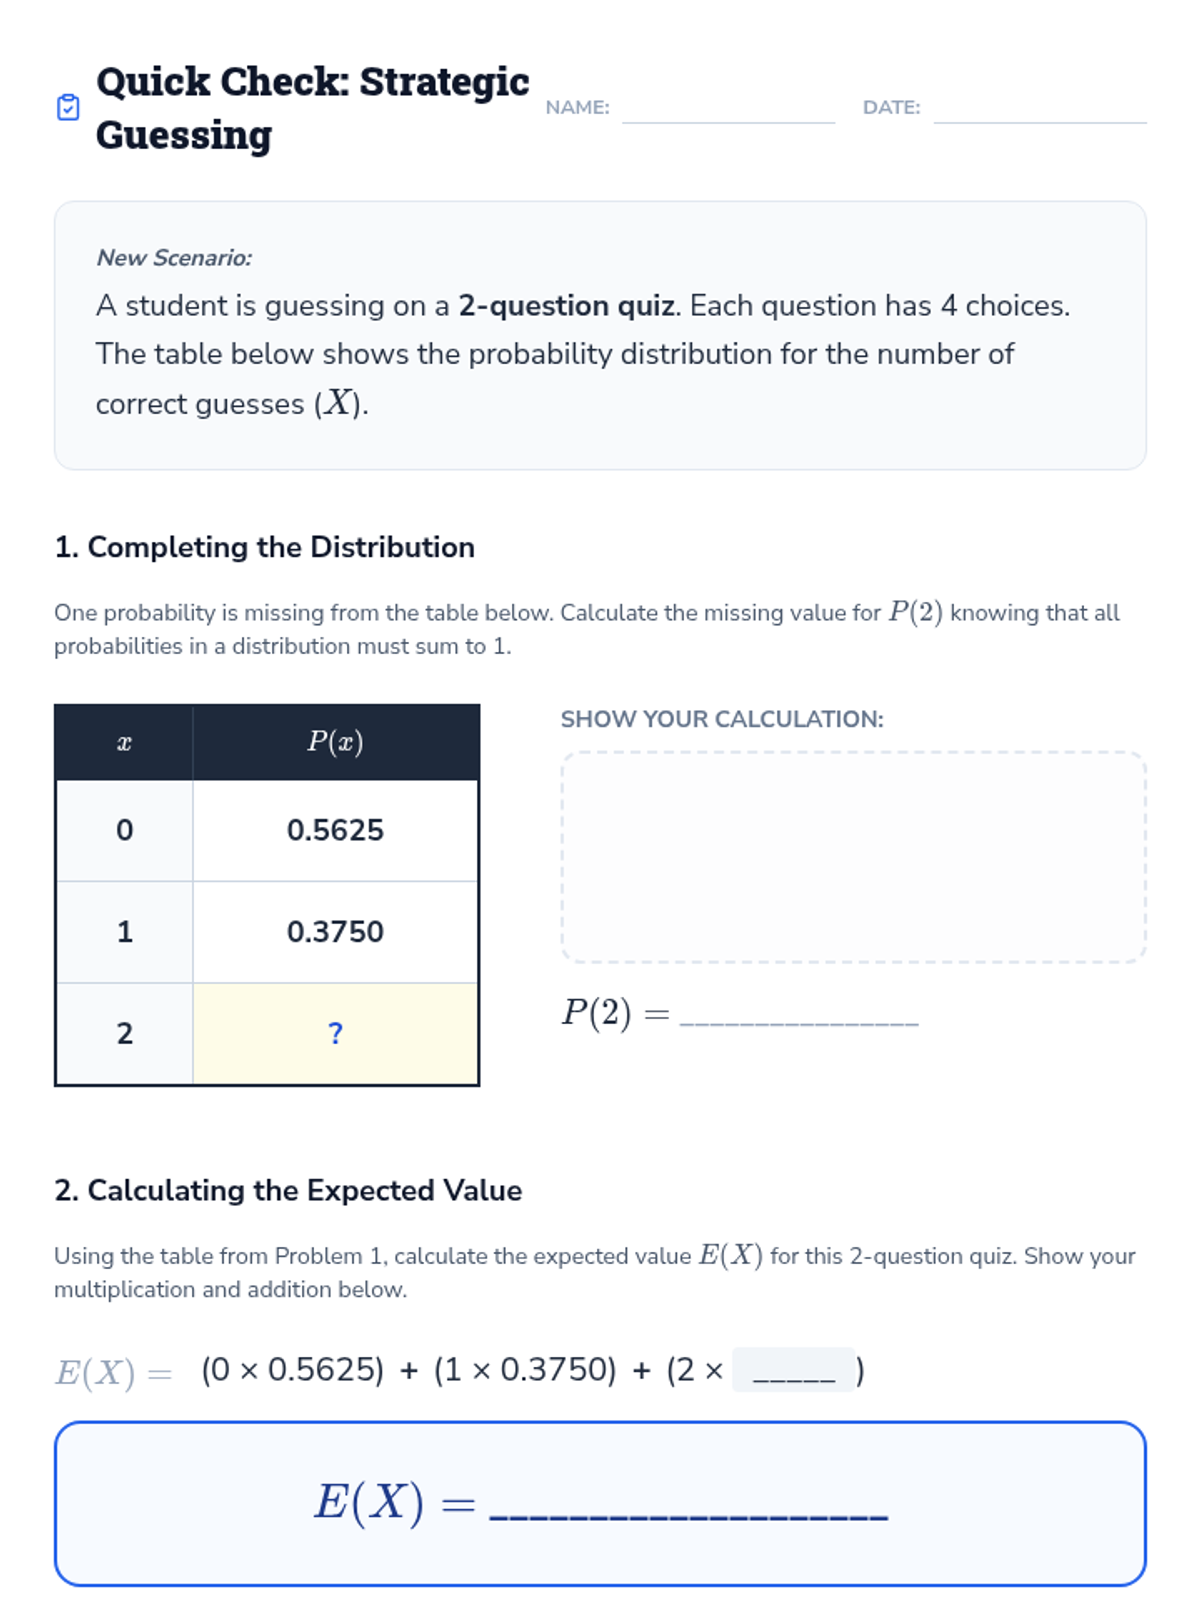
A Tier 2 intervention lesson focusing on creating probability distributions and calculating expected values through the lens of guessing on multiple-choice tests. Includes scaffolded instruction, visual models, and progress monitoring.