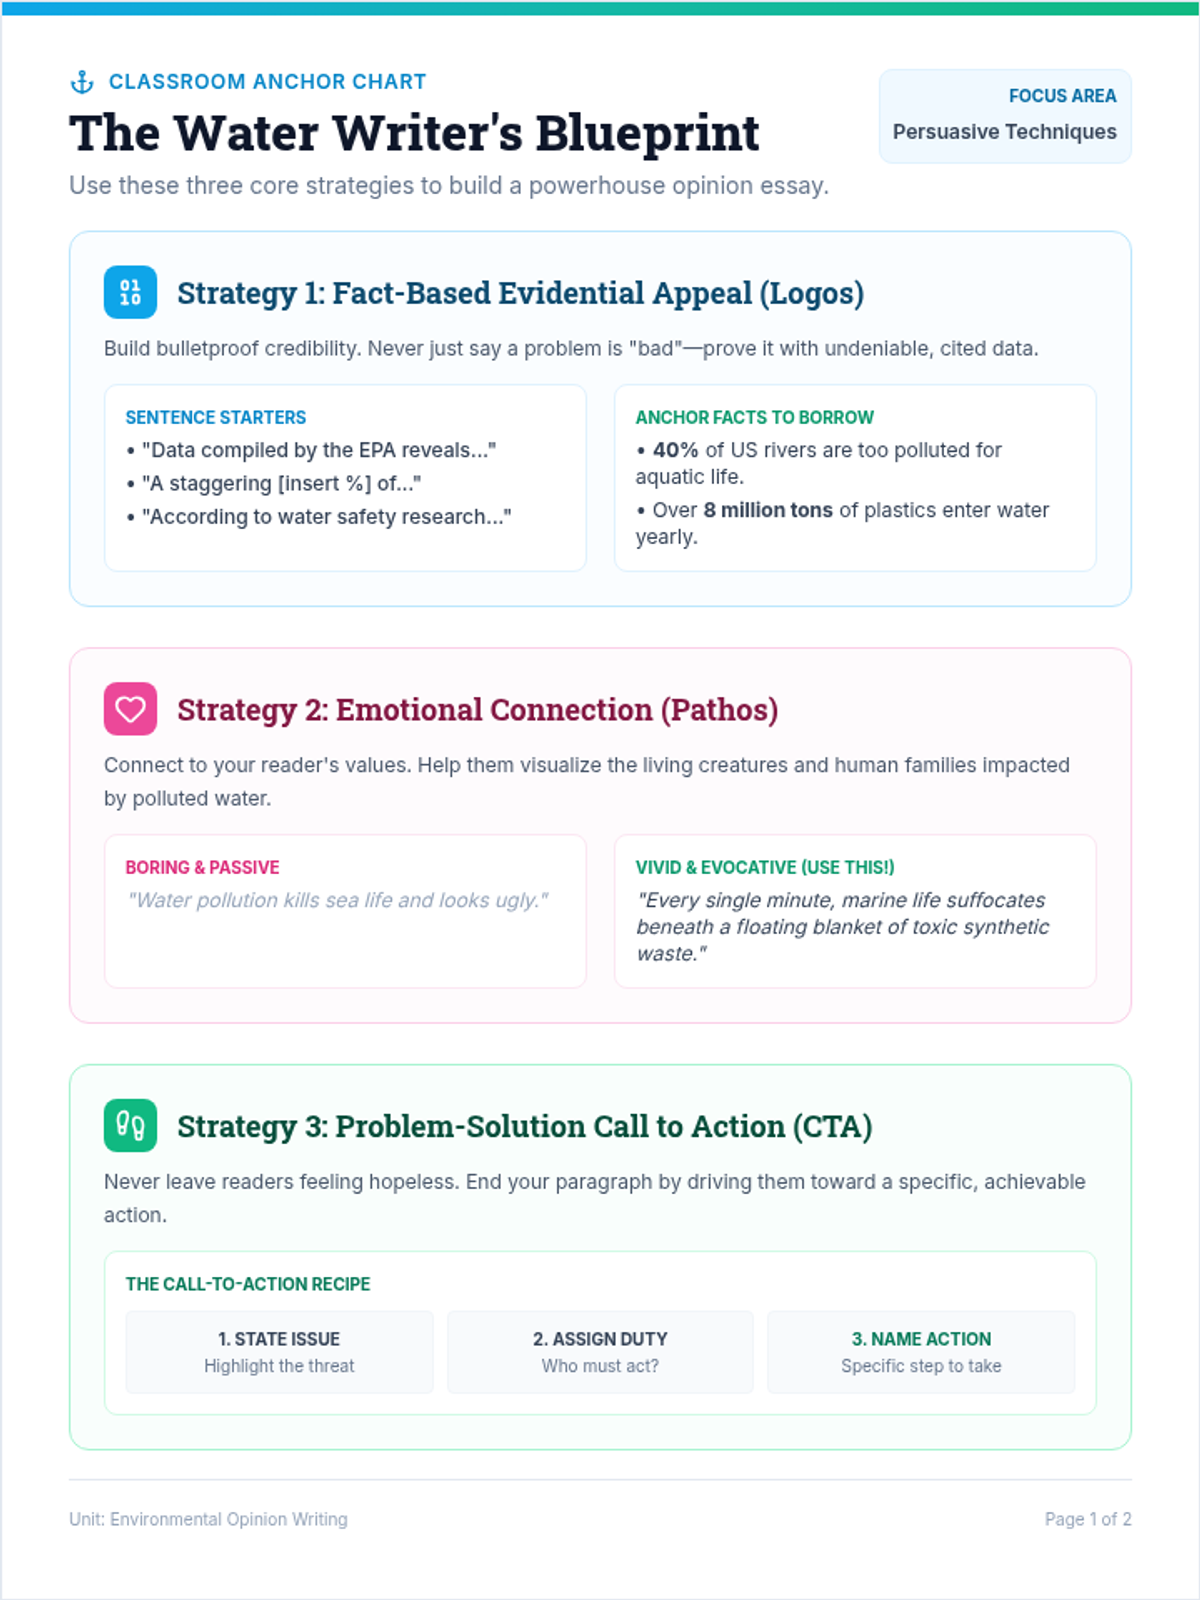
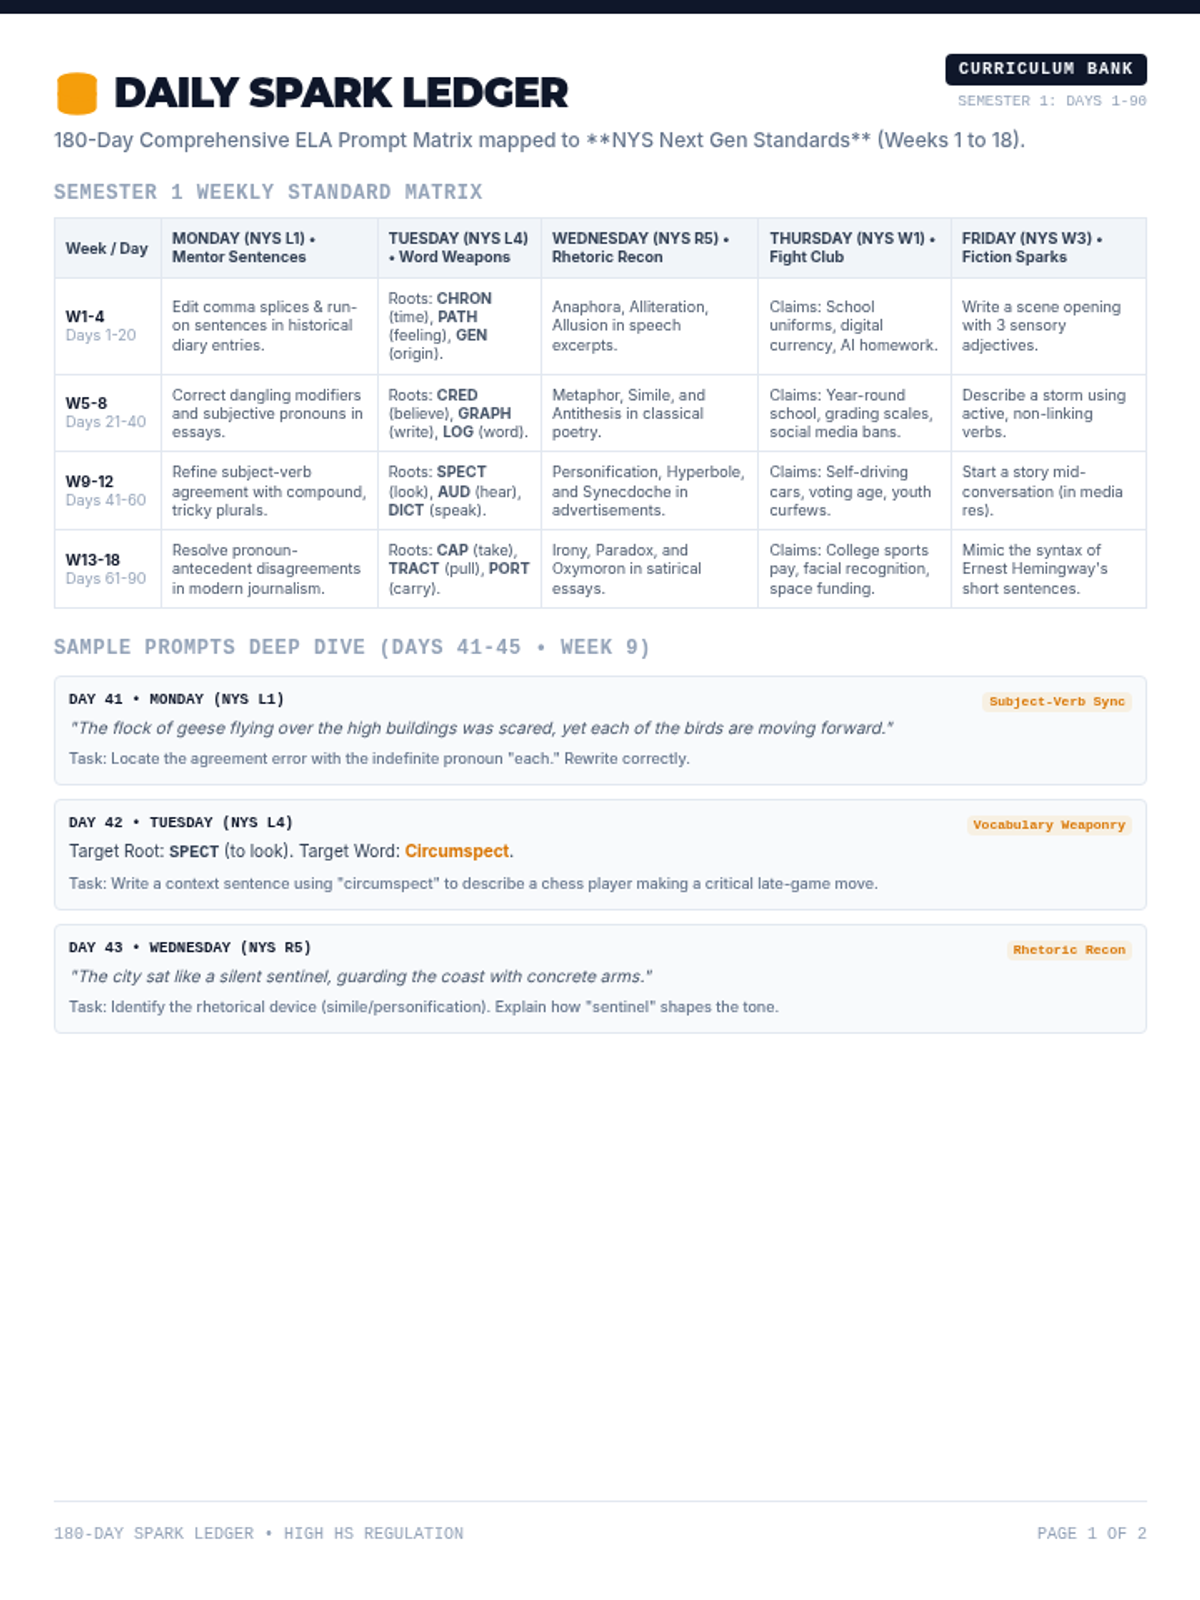
Students evaluate how data is presented visually within a text. They analyze existing charts or convert dense prose into visual infographics, focusing on data literacy and synthesis.
Students evaluate how data is presented visually within a text. They analyze existing charts or convert dense prose into visual infographics, focusing on data literacy and synthesis.