Develop strategies for comparing and ordering decimals by analyzing place value rather than just 'number length.'
A final assessment and performance task where students present their findings from a real-world data collection project.
A design-focused lesson where students create their own line plot scenarios based on 'blueprint' specifications.
Students use deductive reasoning and clues to place missing 'X's on a line plot.
Challenges students with multi-step word problems requiring both addition and subtraction based on line plot data.
Compares two different sets of data on the same scale, using subtraction to find differences between groups.
Introduces the concept of finding the difference between specific data points, such as the 'longest minus shortest'.
Students practice adding multiple data points together to find total lengths, using information directly from the line plot.
Focuses on identifying the maximum and minimum values on a line plot and determining which measurement occurs most frequently.
Teaches students how to transform a frequency table of fractional measurements into a clear, organized line plot.
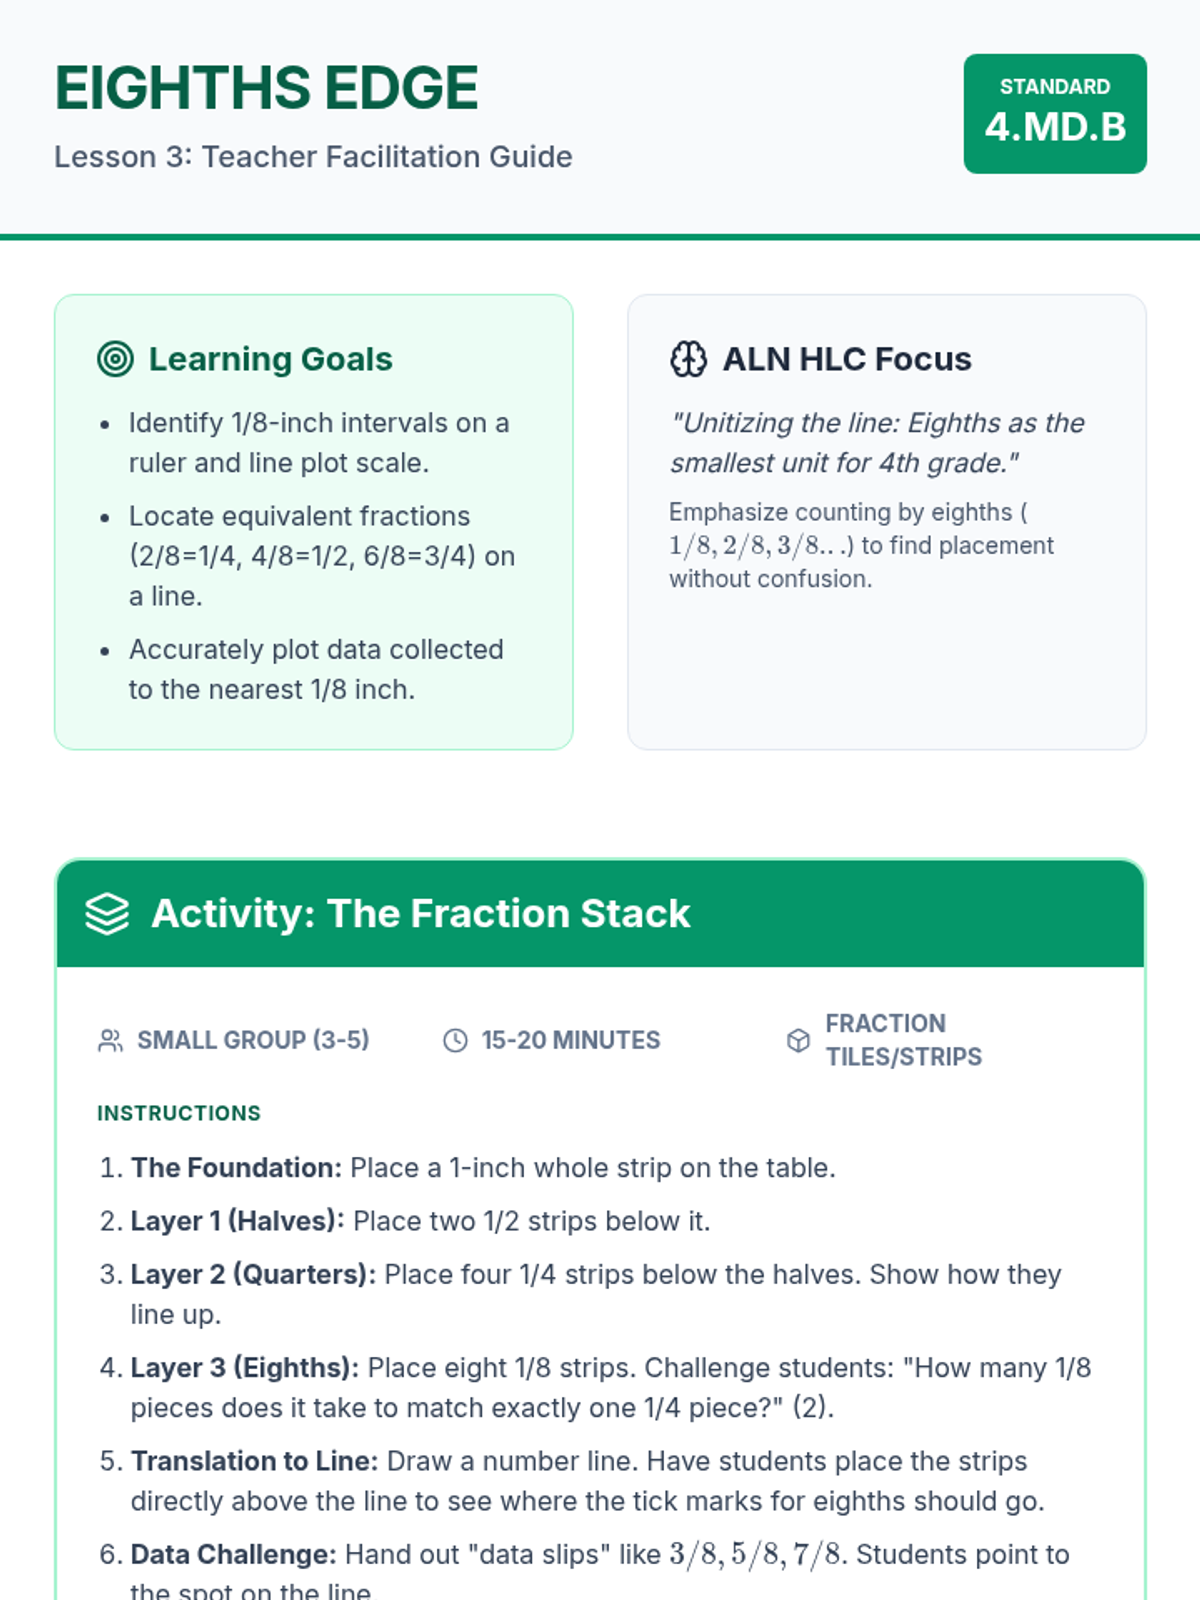
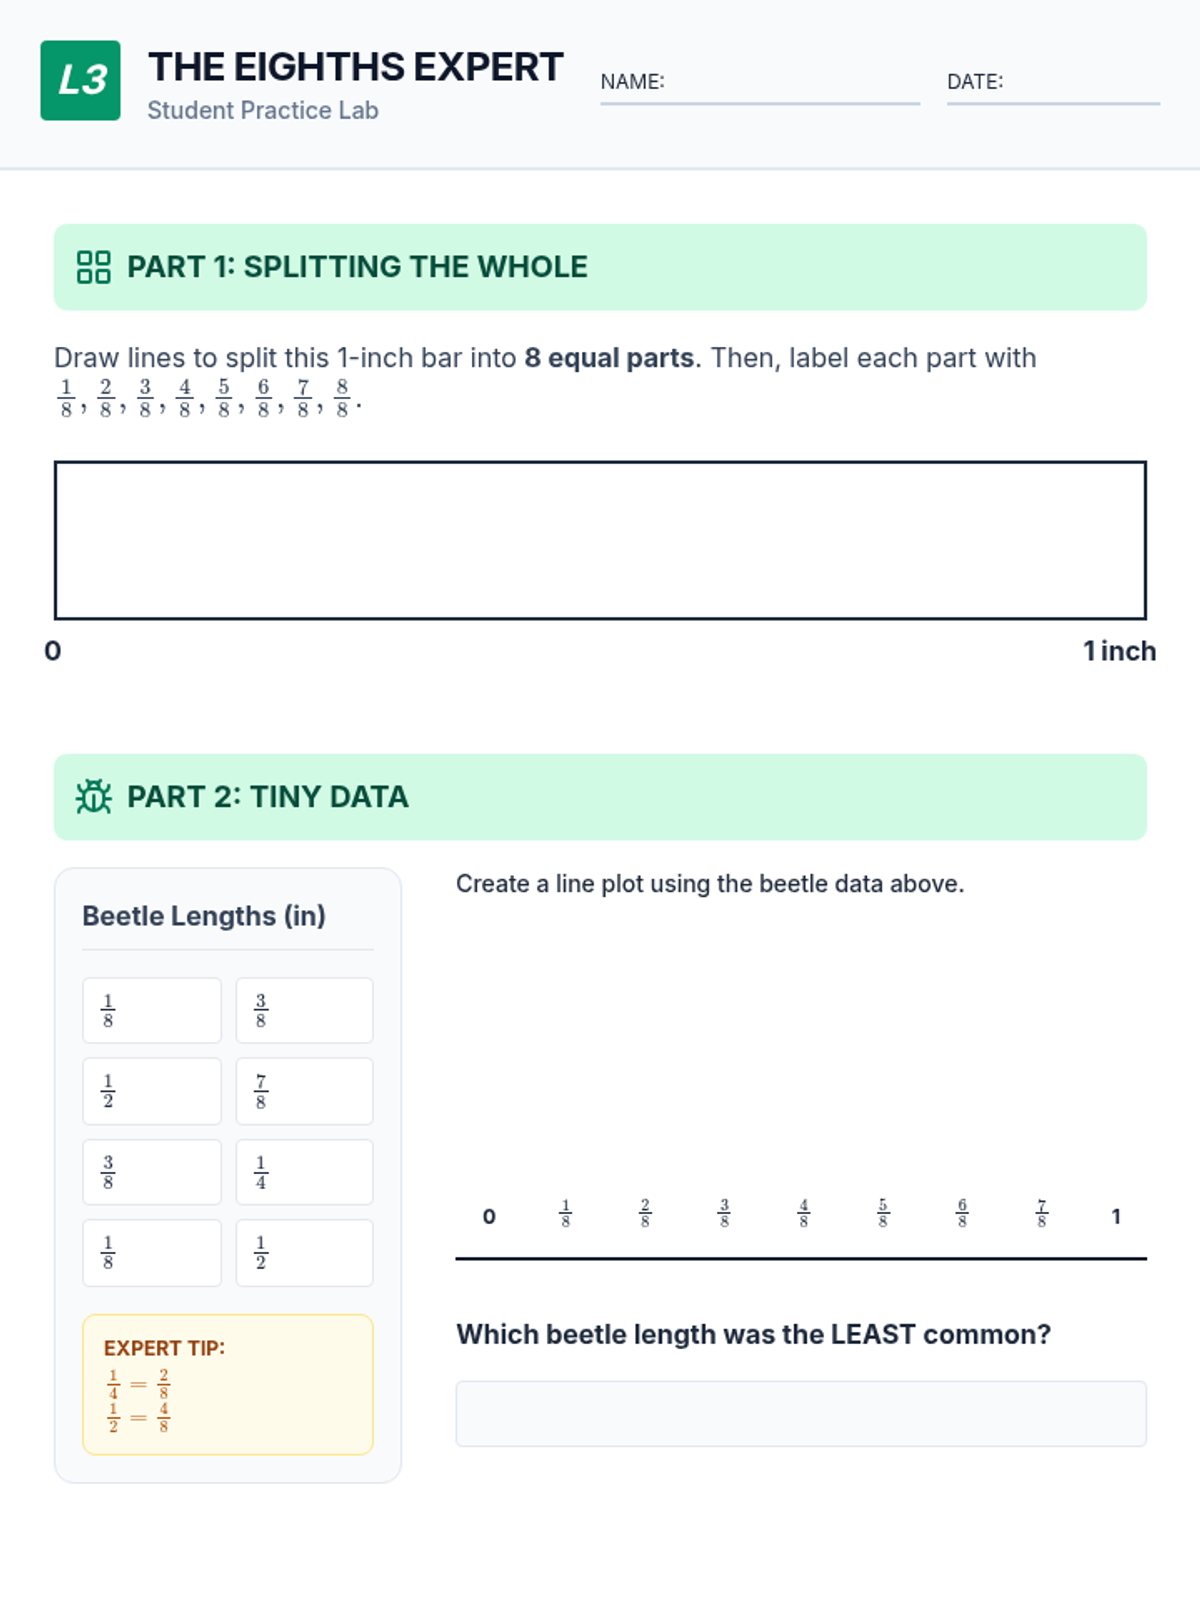
Extends precision to 1/8 inch, focusing on equivalent fractions (2/8 = 1/4) and accurately placing data points.