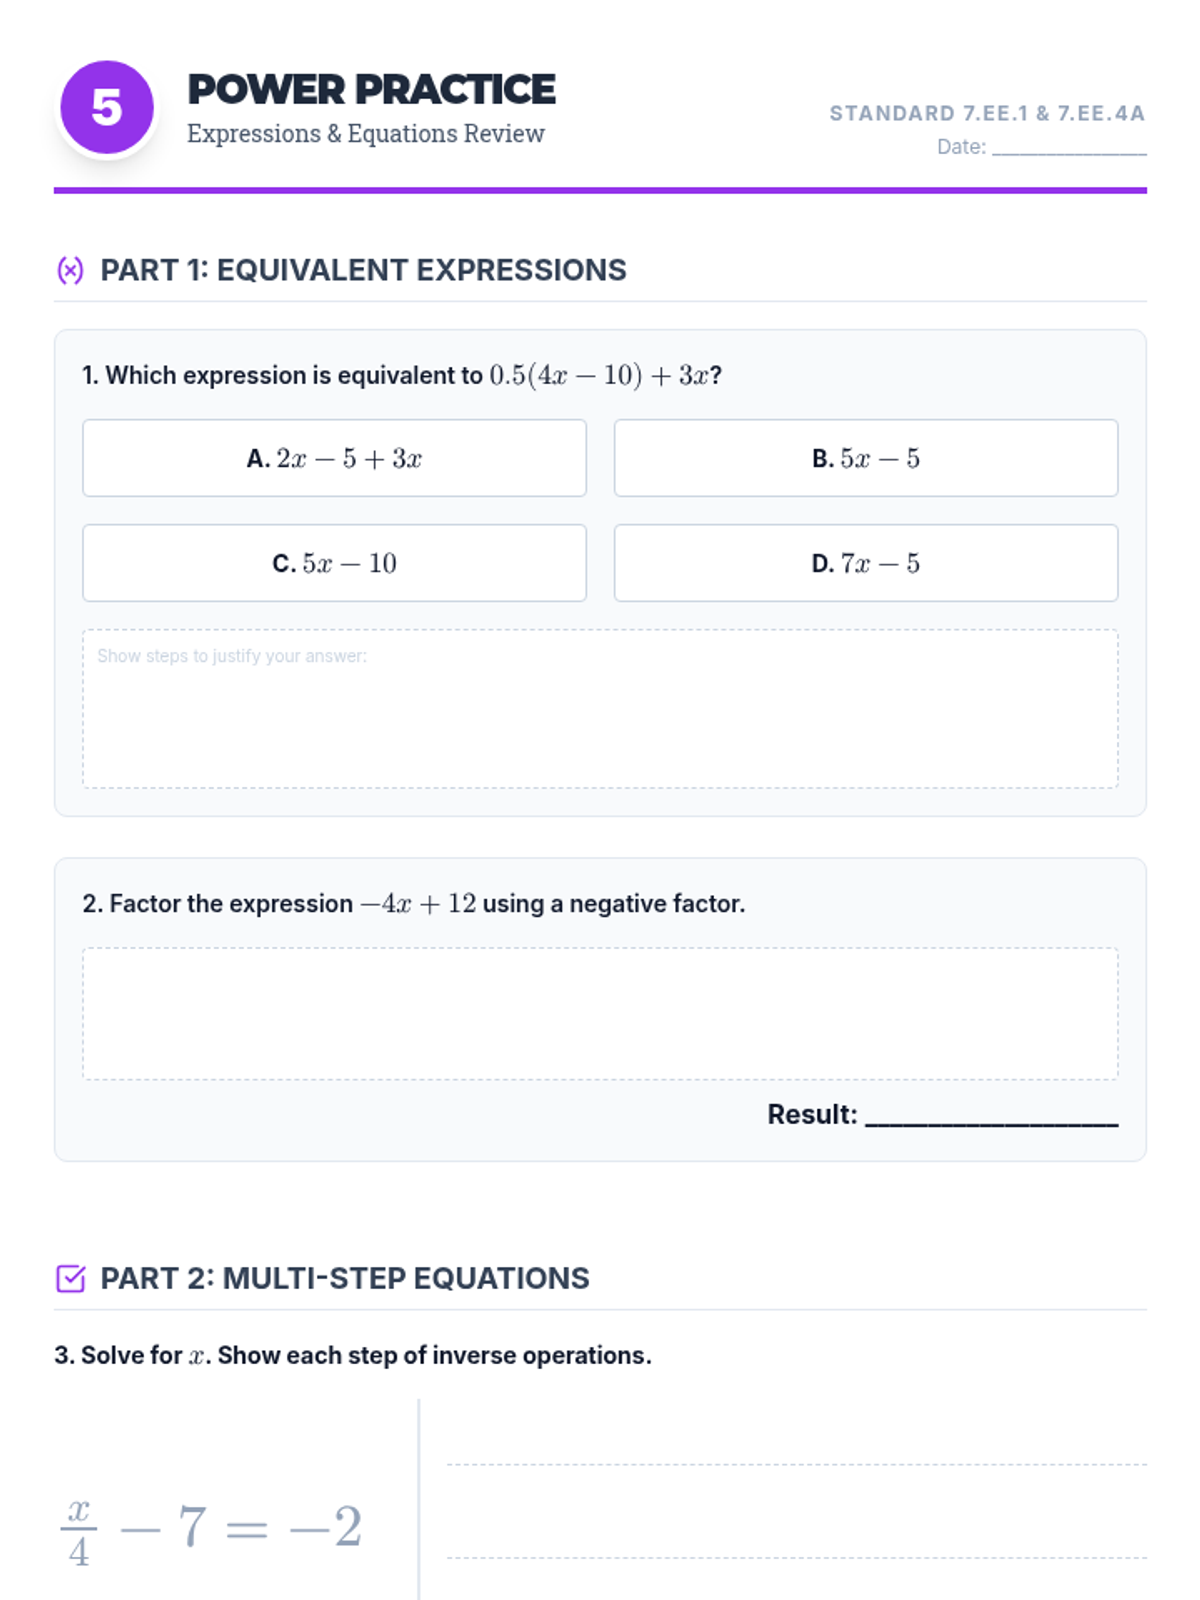
Focuses on mathematical justification where students use properties of equality to explain every step of their solution process.
Reviewing scale drawings, statistics, and probability to round out the comprehensive NYS Assessment preparation.
Solving and graphing linear inequalities and applying them to real-world NYS assessment scenarios.
Simplifying linear expressions and solving multi-step equations using properties of operations.
Advanced percent problems including simple interest, percent change (increase/decrease), and percent error.
Practical applications of percents, including calculating tax, tip, commissions, discounts, and markups.
Analyzing graphs of proportional relationships, finding the constant of proportionality, and writing equations in the form y = kx.
Review of ratios, unit rates with fractions, and identifying proportional relationships in tables and context.
A lesson focused on identifying and calculating the perimeters and circumferences of specific components within 3D solid figures like cylinders, rectangular prisms, and cones.
A lesson focused on identifying the 2D bases of 3D figures and calculating their perimeter or circumference. Students will practice sketching bases and applying geometry formulas in an architectural context.
A comprehensive lesson on adding fractions with like and unlike denominators, including mixed numbers and real-world word problems. Students progress from basic addition to complex multi-step problems using a blueprint-themed approach.
A high-energy math simulation where students manage a large budget, navigate financial constraints, and handle unexpected 'life events' while shopping for their dream items.
A math project where students analyze Olympic athlete performance and track difficulty using unit rates and slope concepts to determine who is the fastest and which courses are the steepest.
Students apply linear function concepts to model a real-world income and expense scenario. They will calculate rates of change, identify initial values, and visualize their budget through graphing.