Students transform their experimental data into bar graphs to visually analyze the impact of different surfaces on motion.
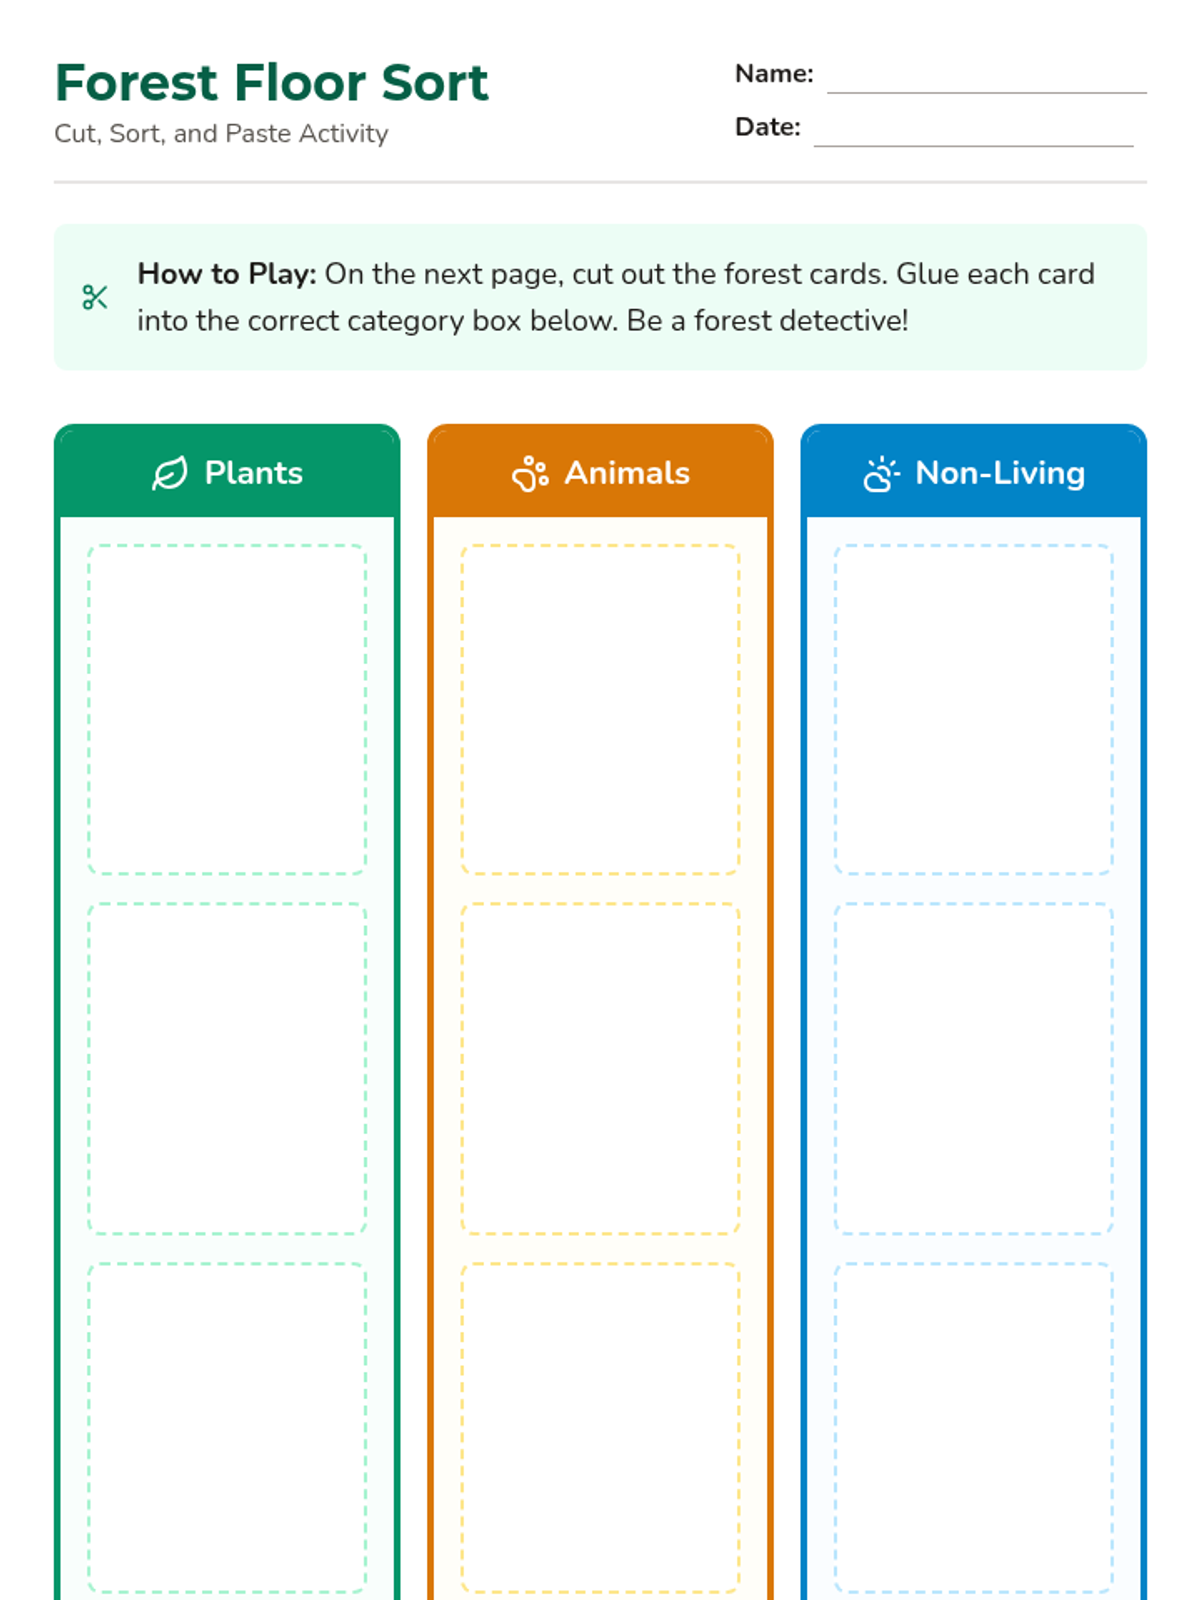
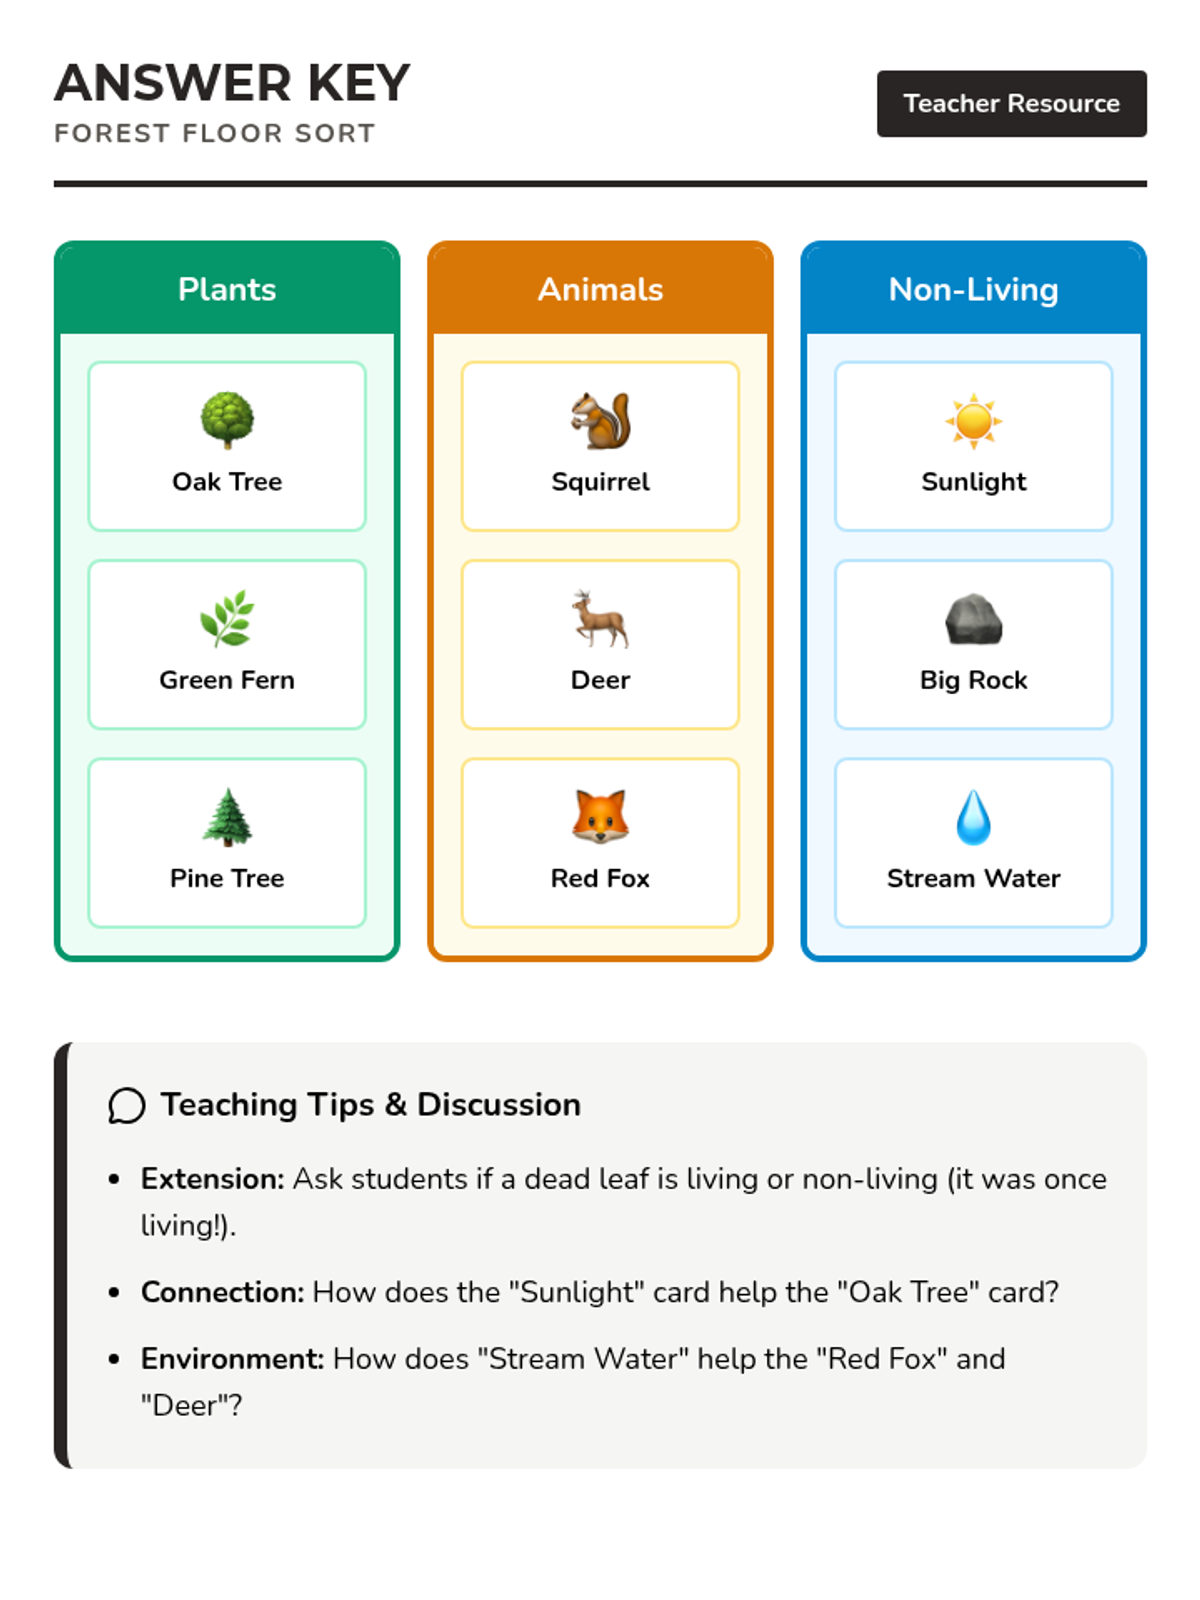
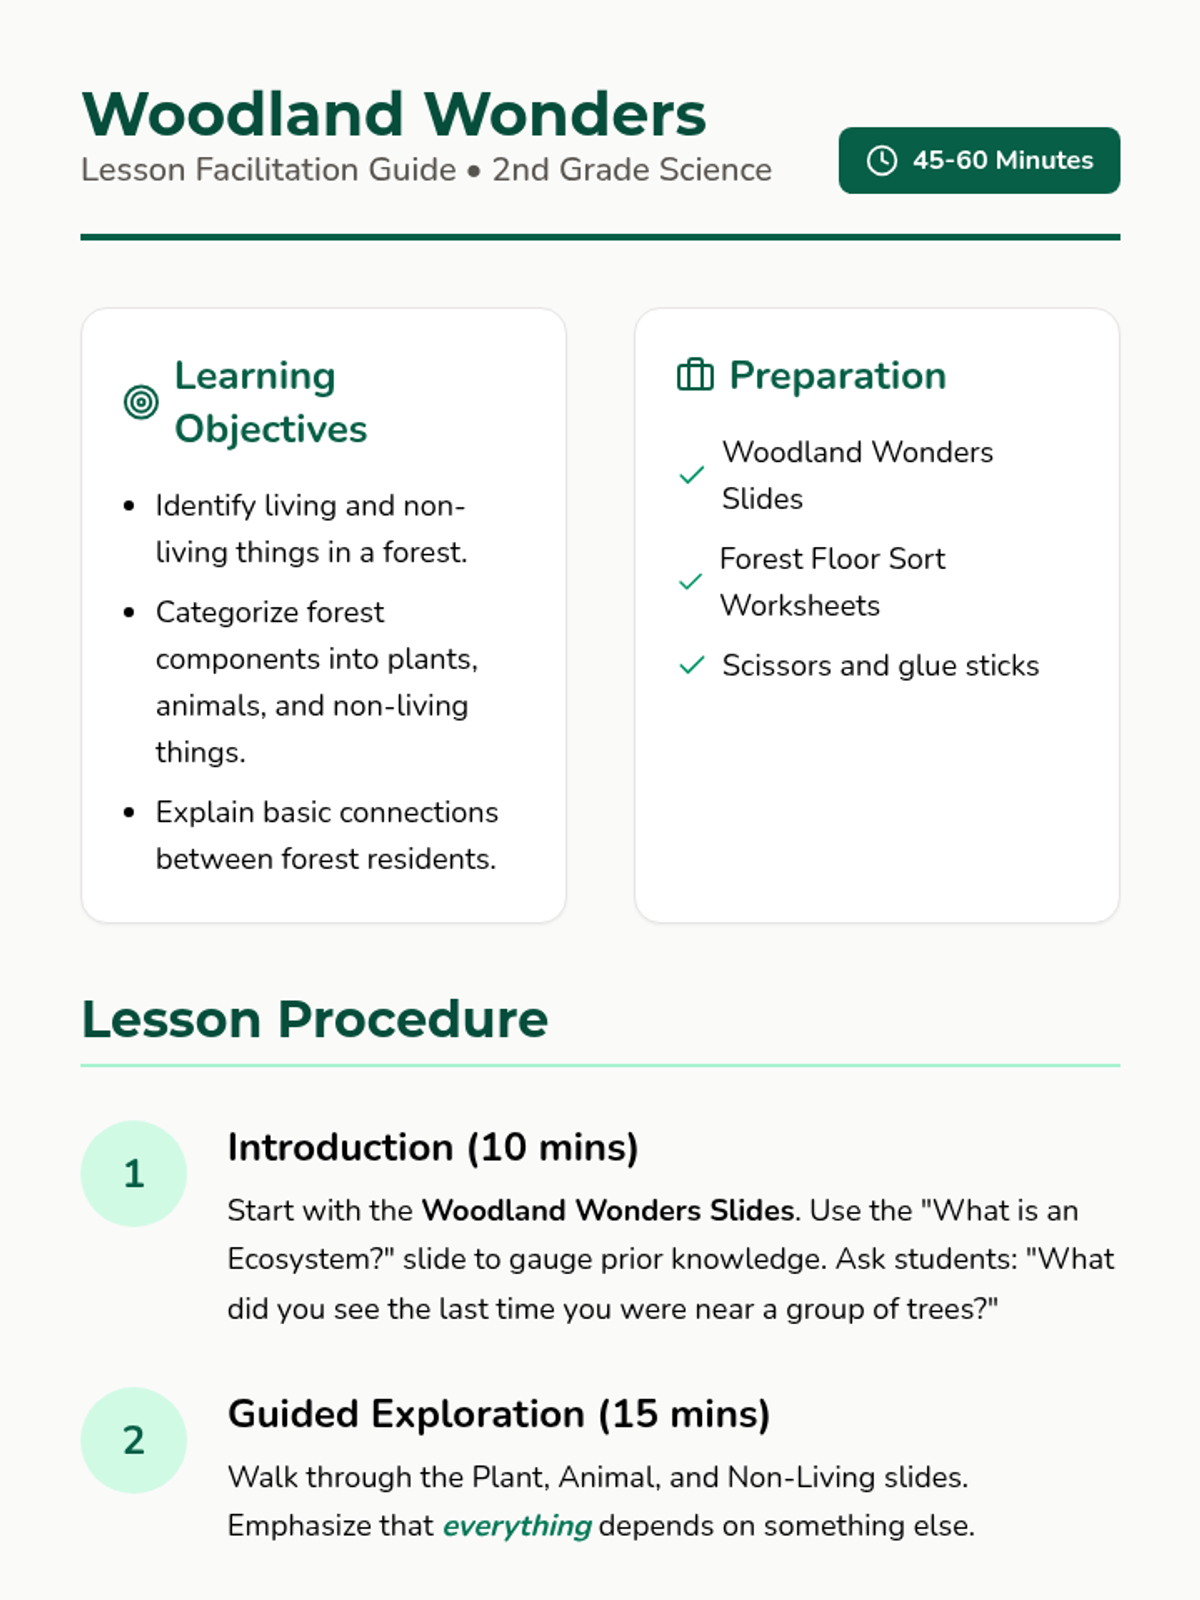
An introductory lesson on the forest ecosystem where students identify and categorize living and non-living components. Students will explore the roles of plants, animals, and the environment in a woodland setting.
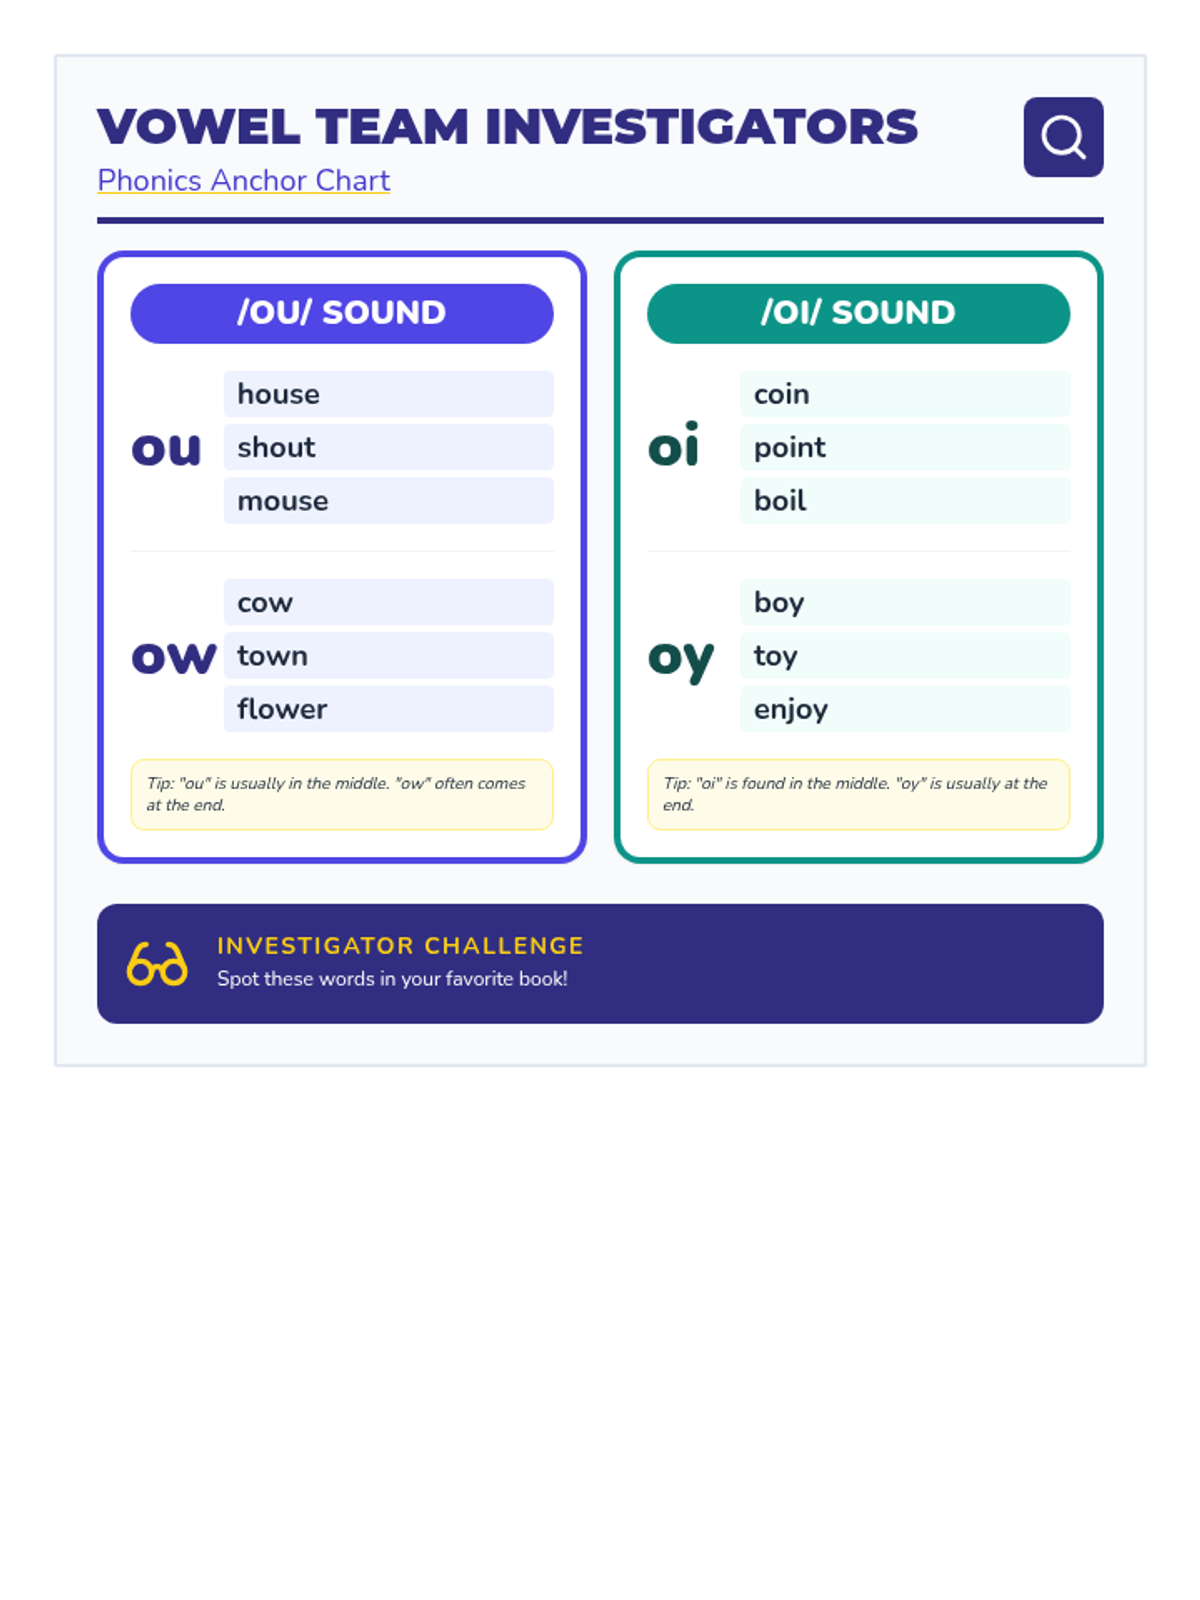
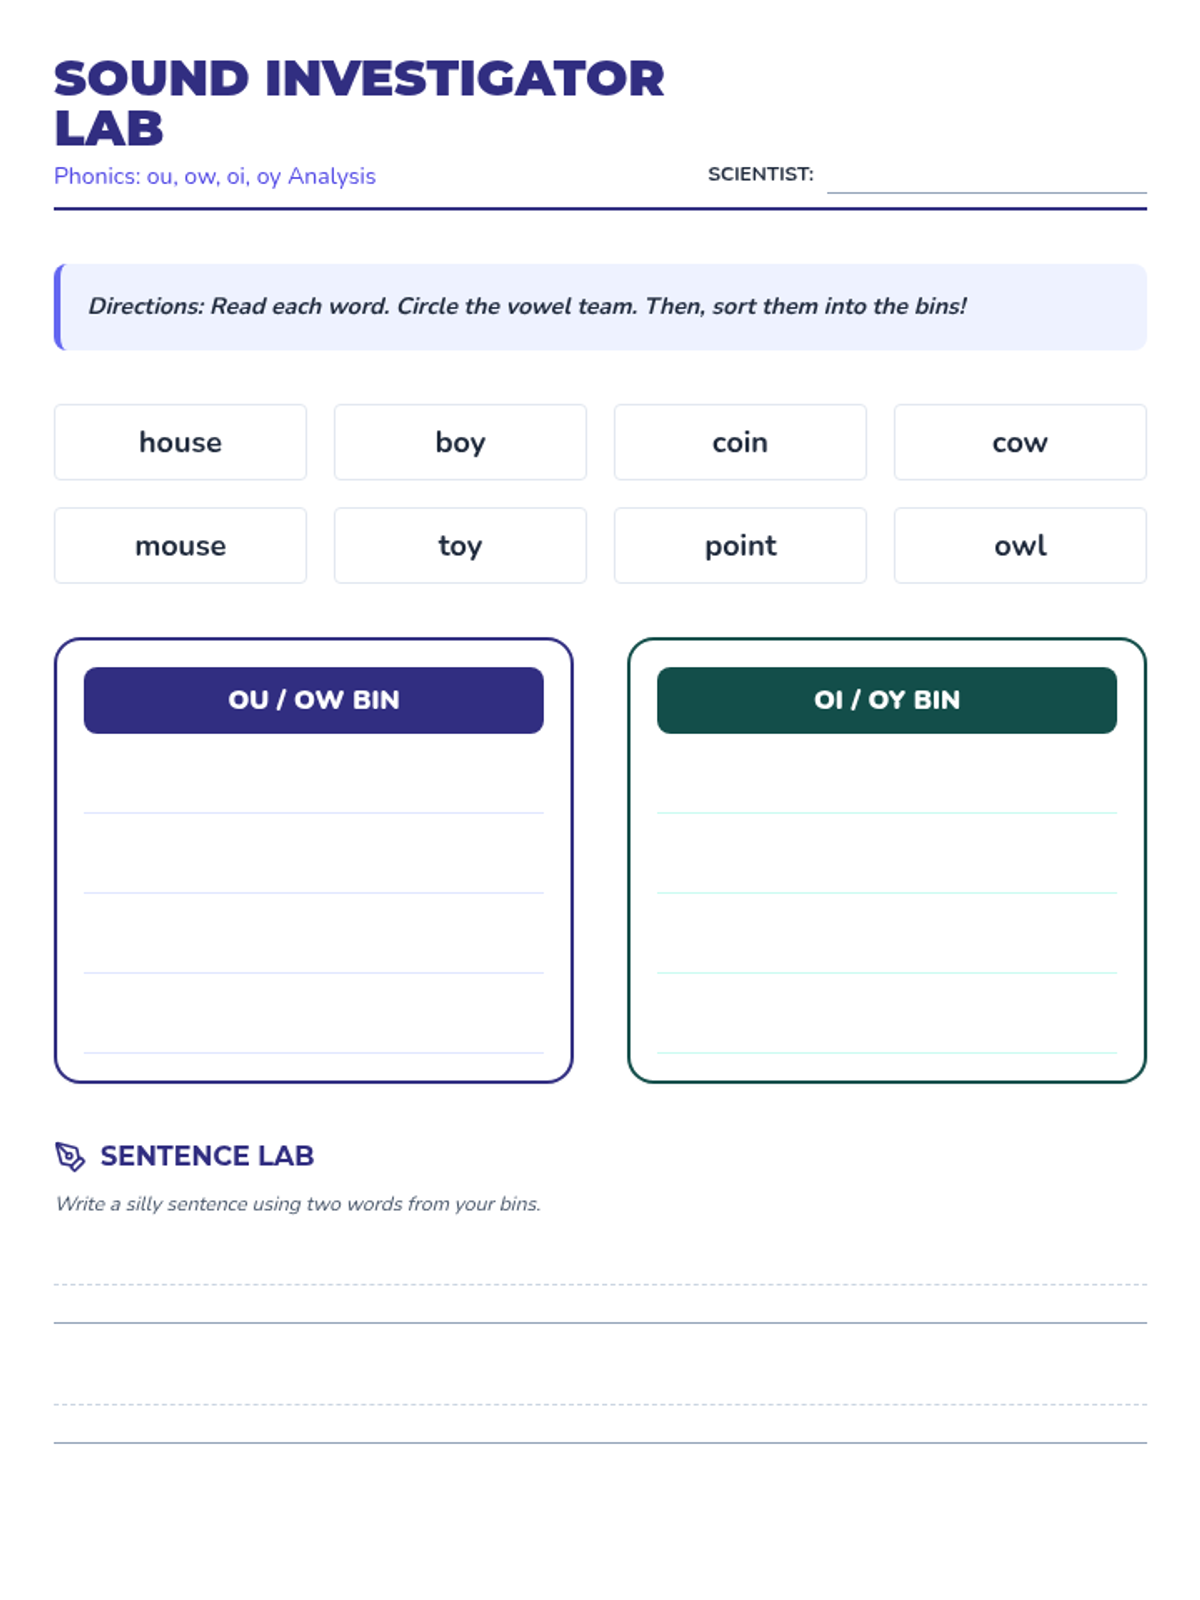
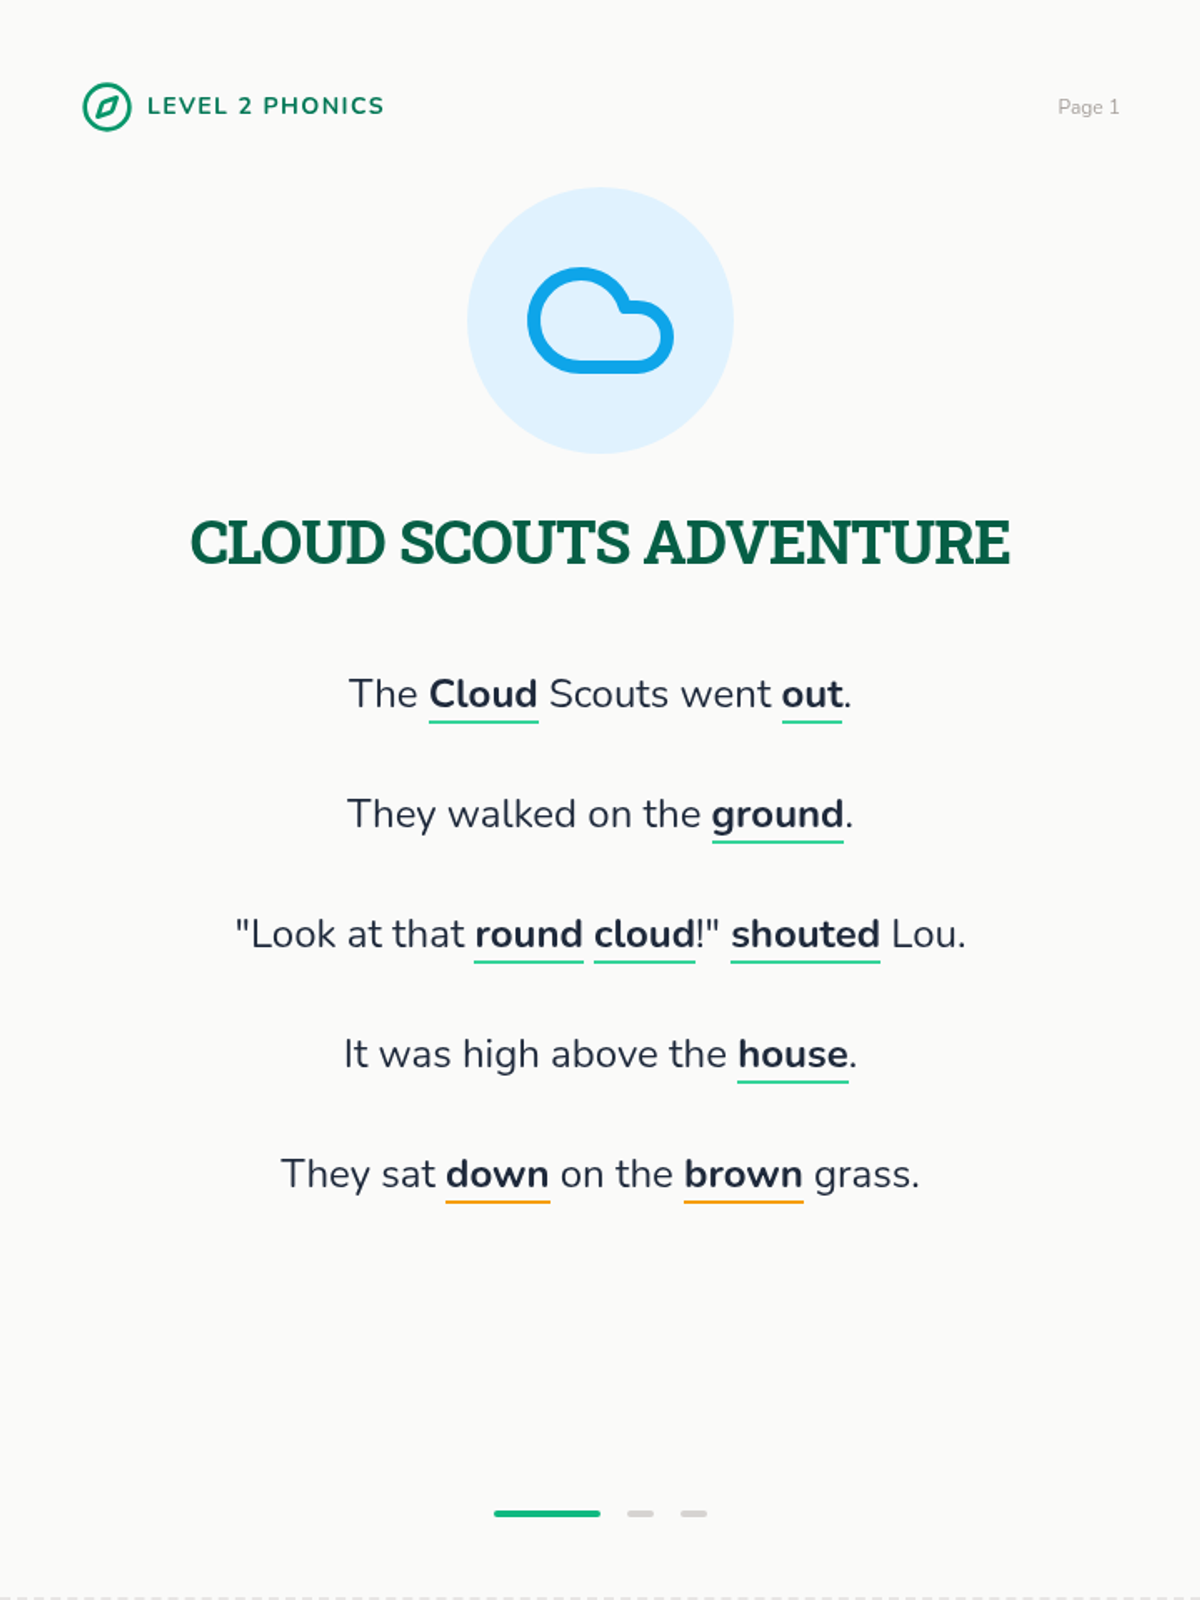
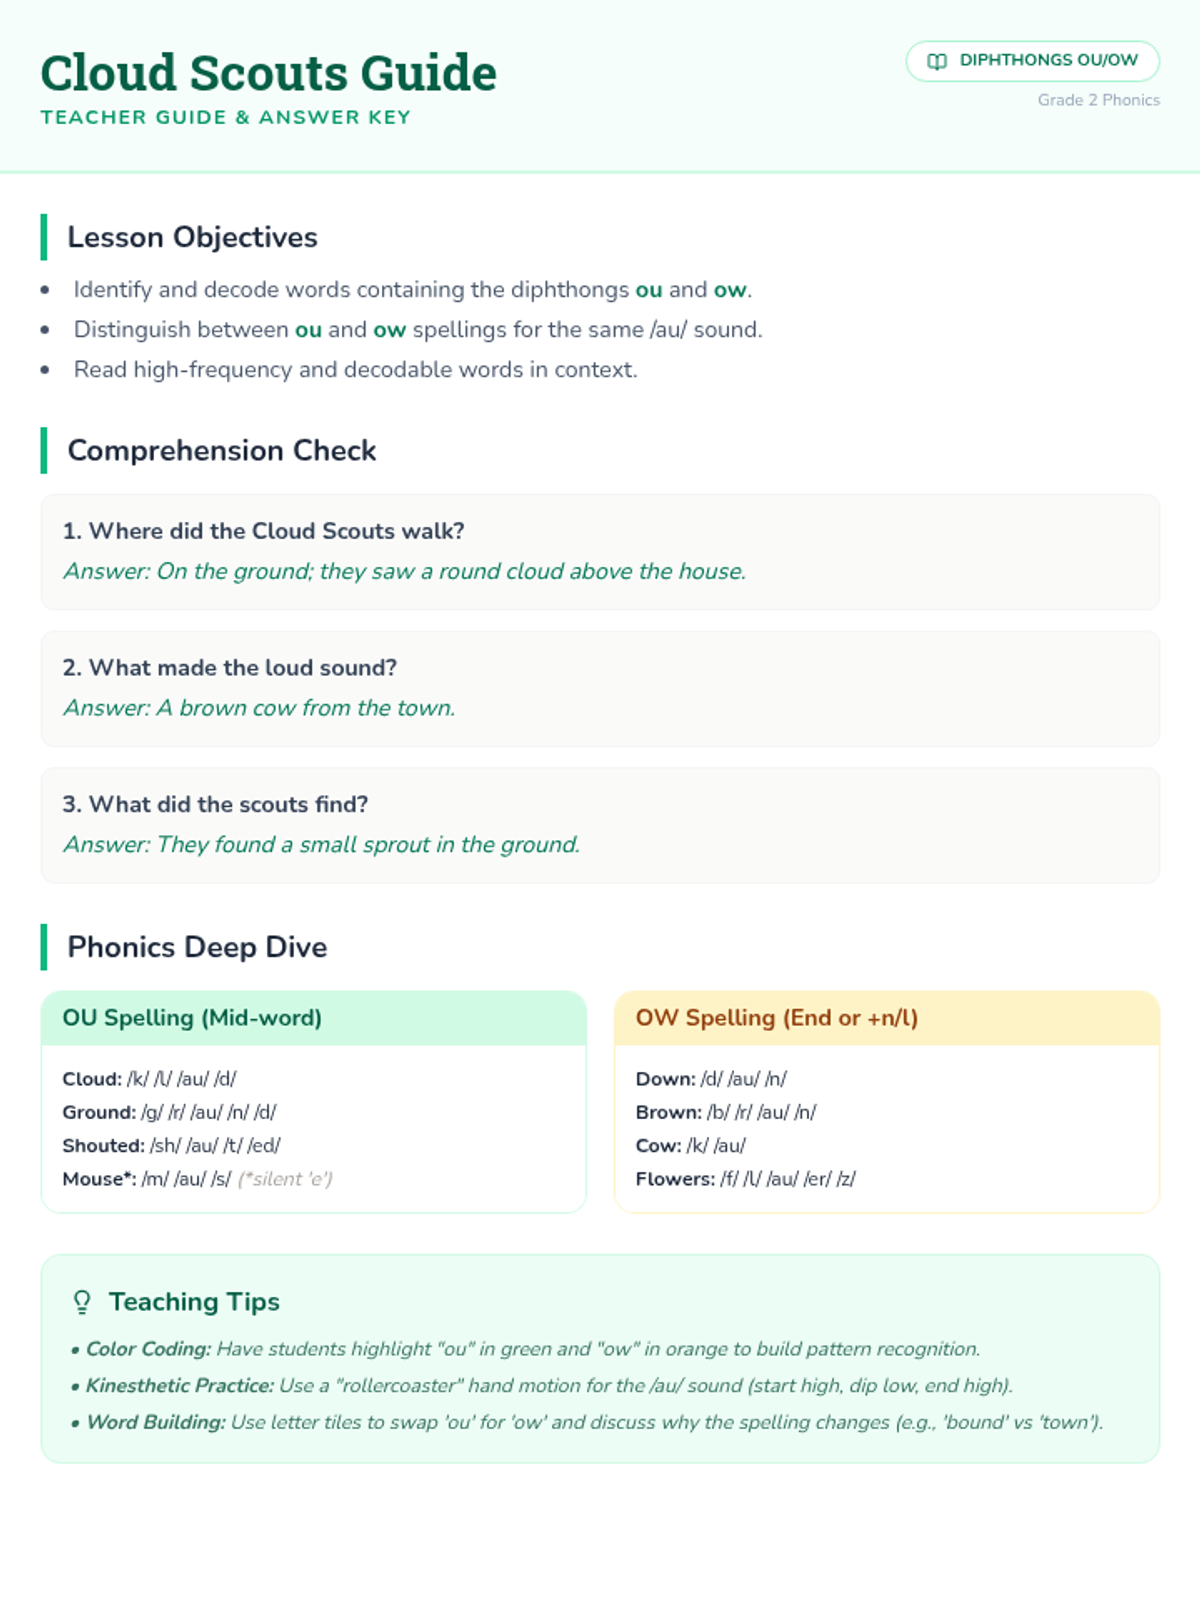
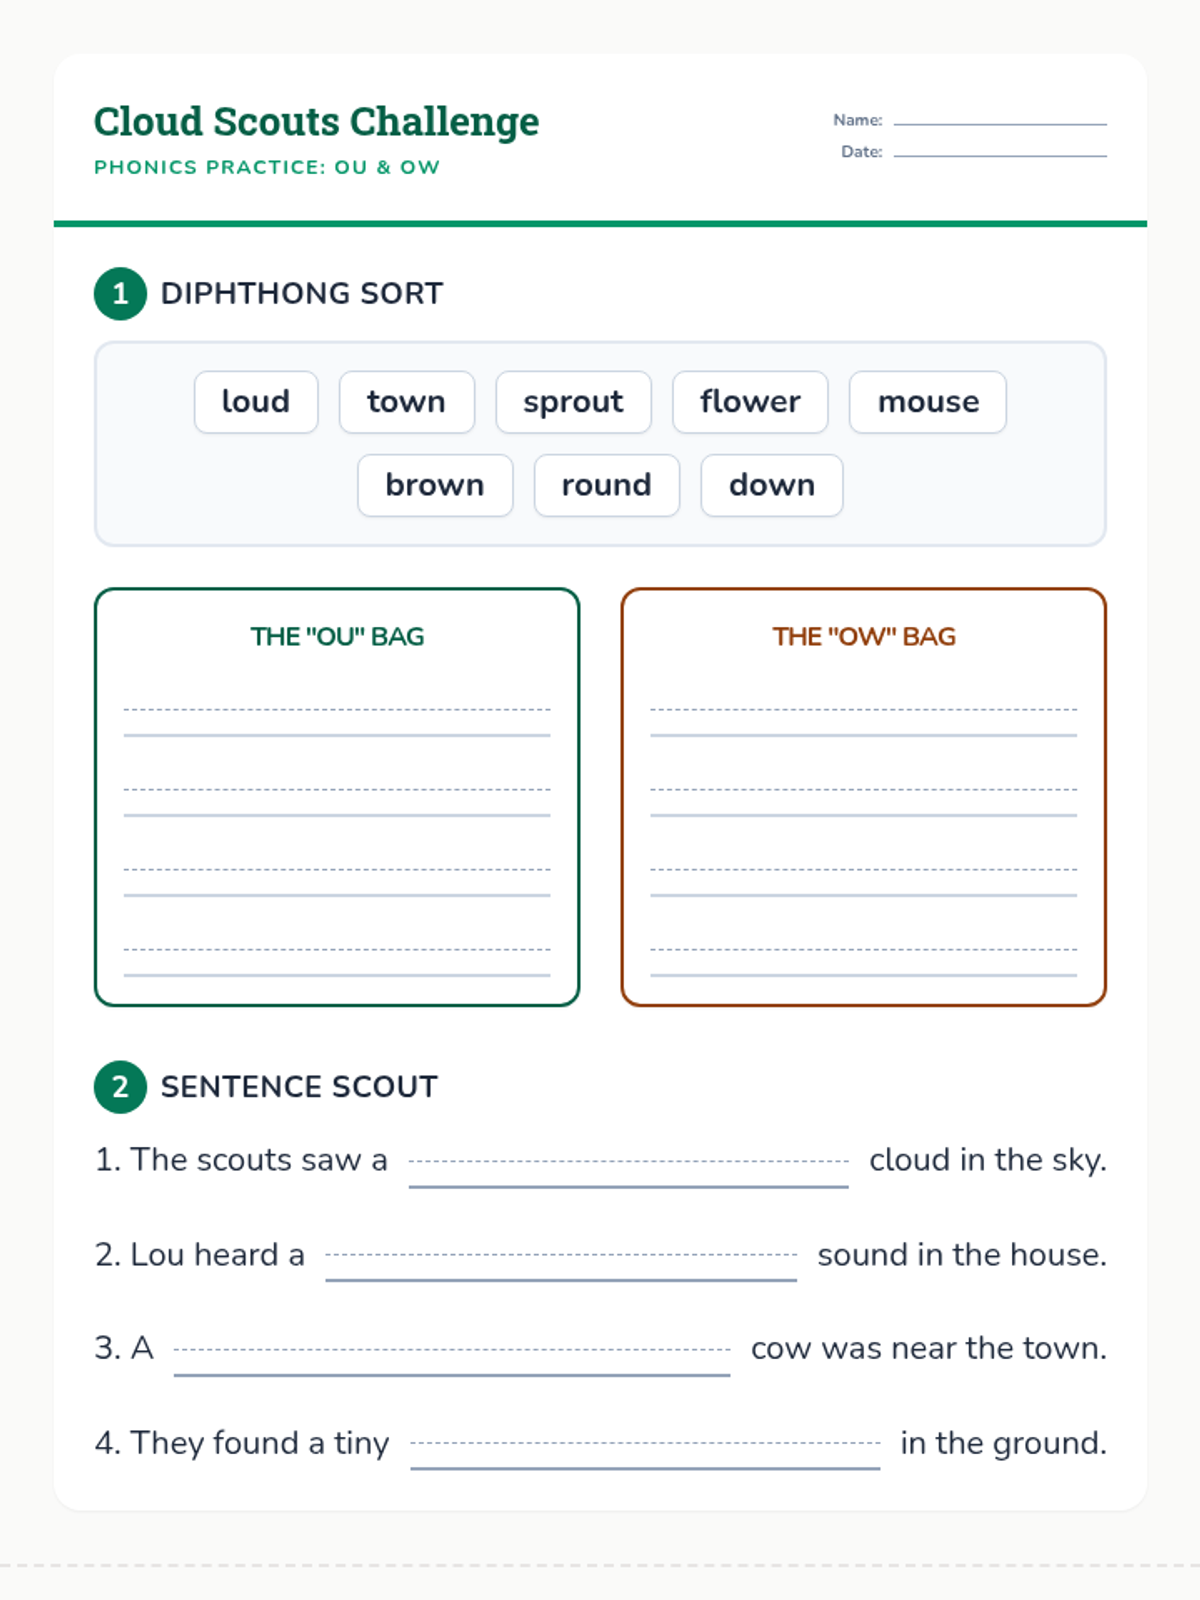
Students decode and apply knowledge of vowel teams and diphthongs (ou, ow, oi, oy) in multi-syllabic words.
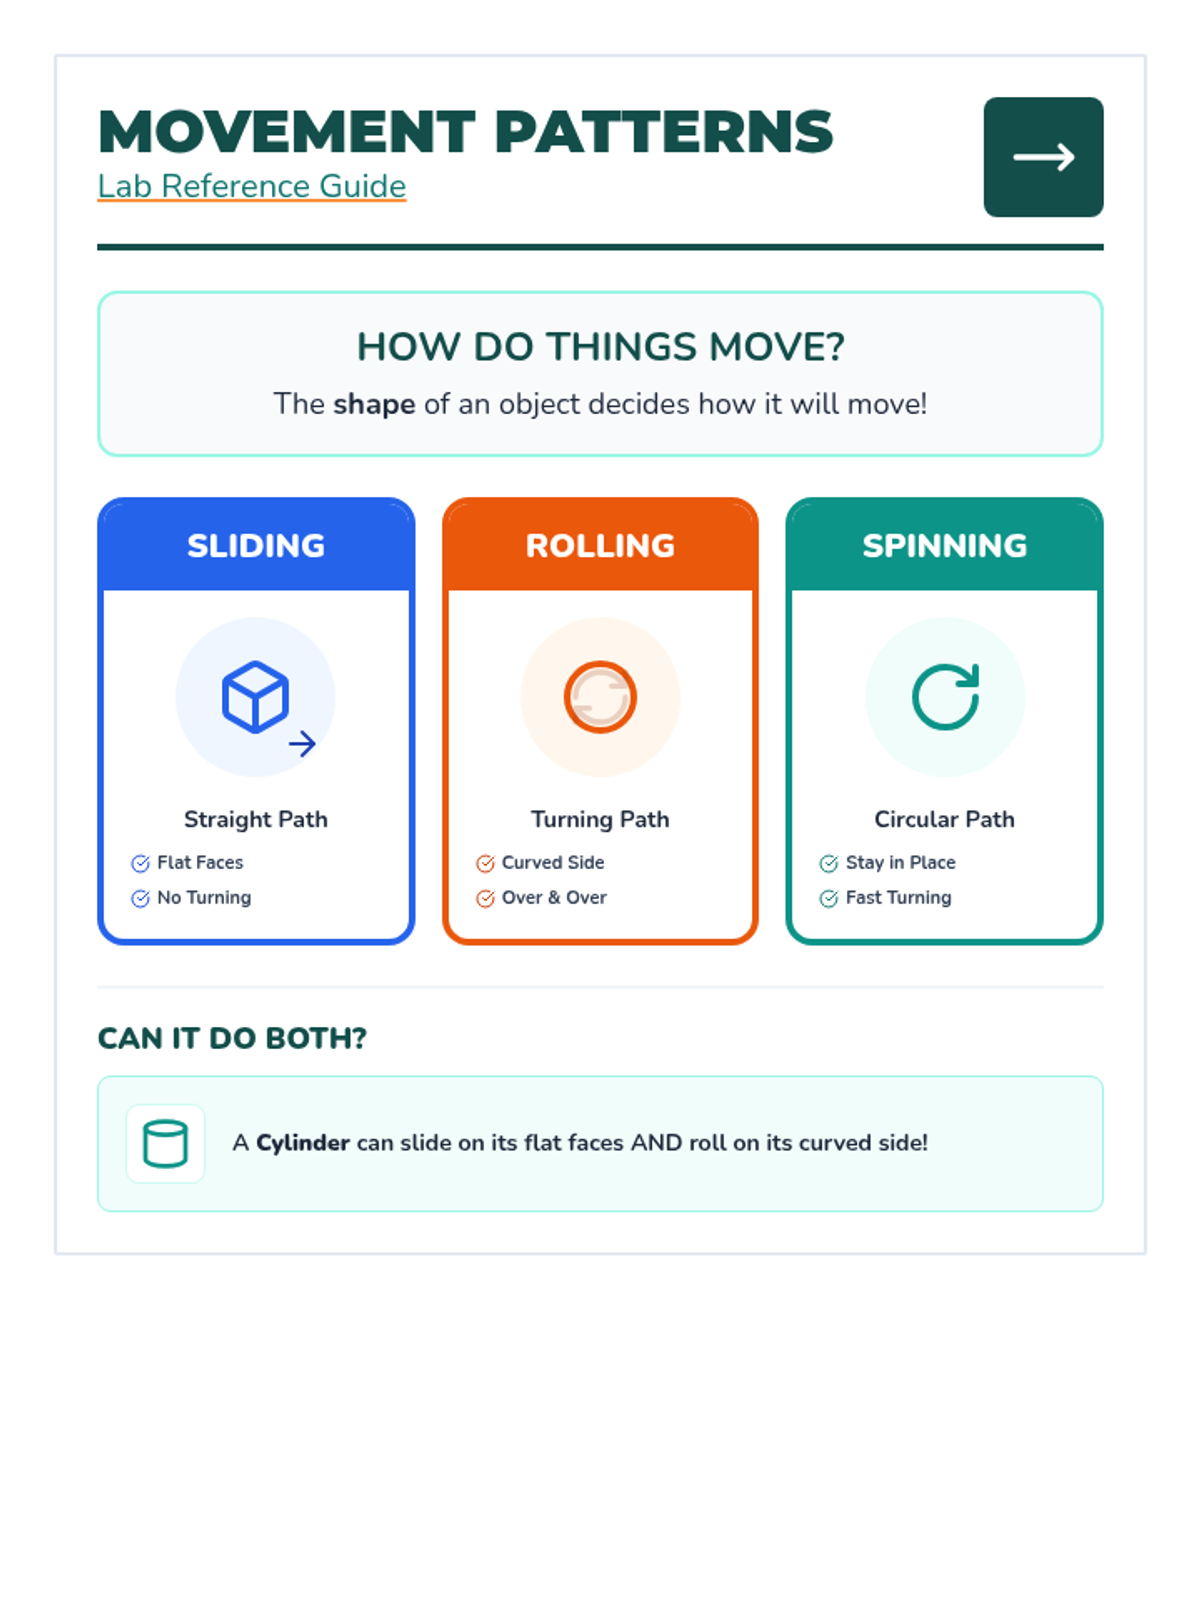
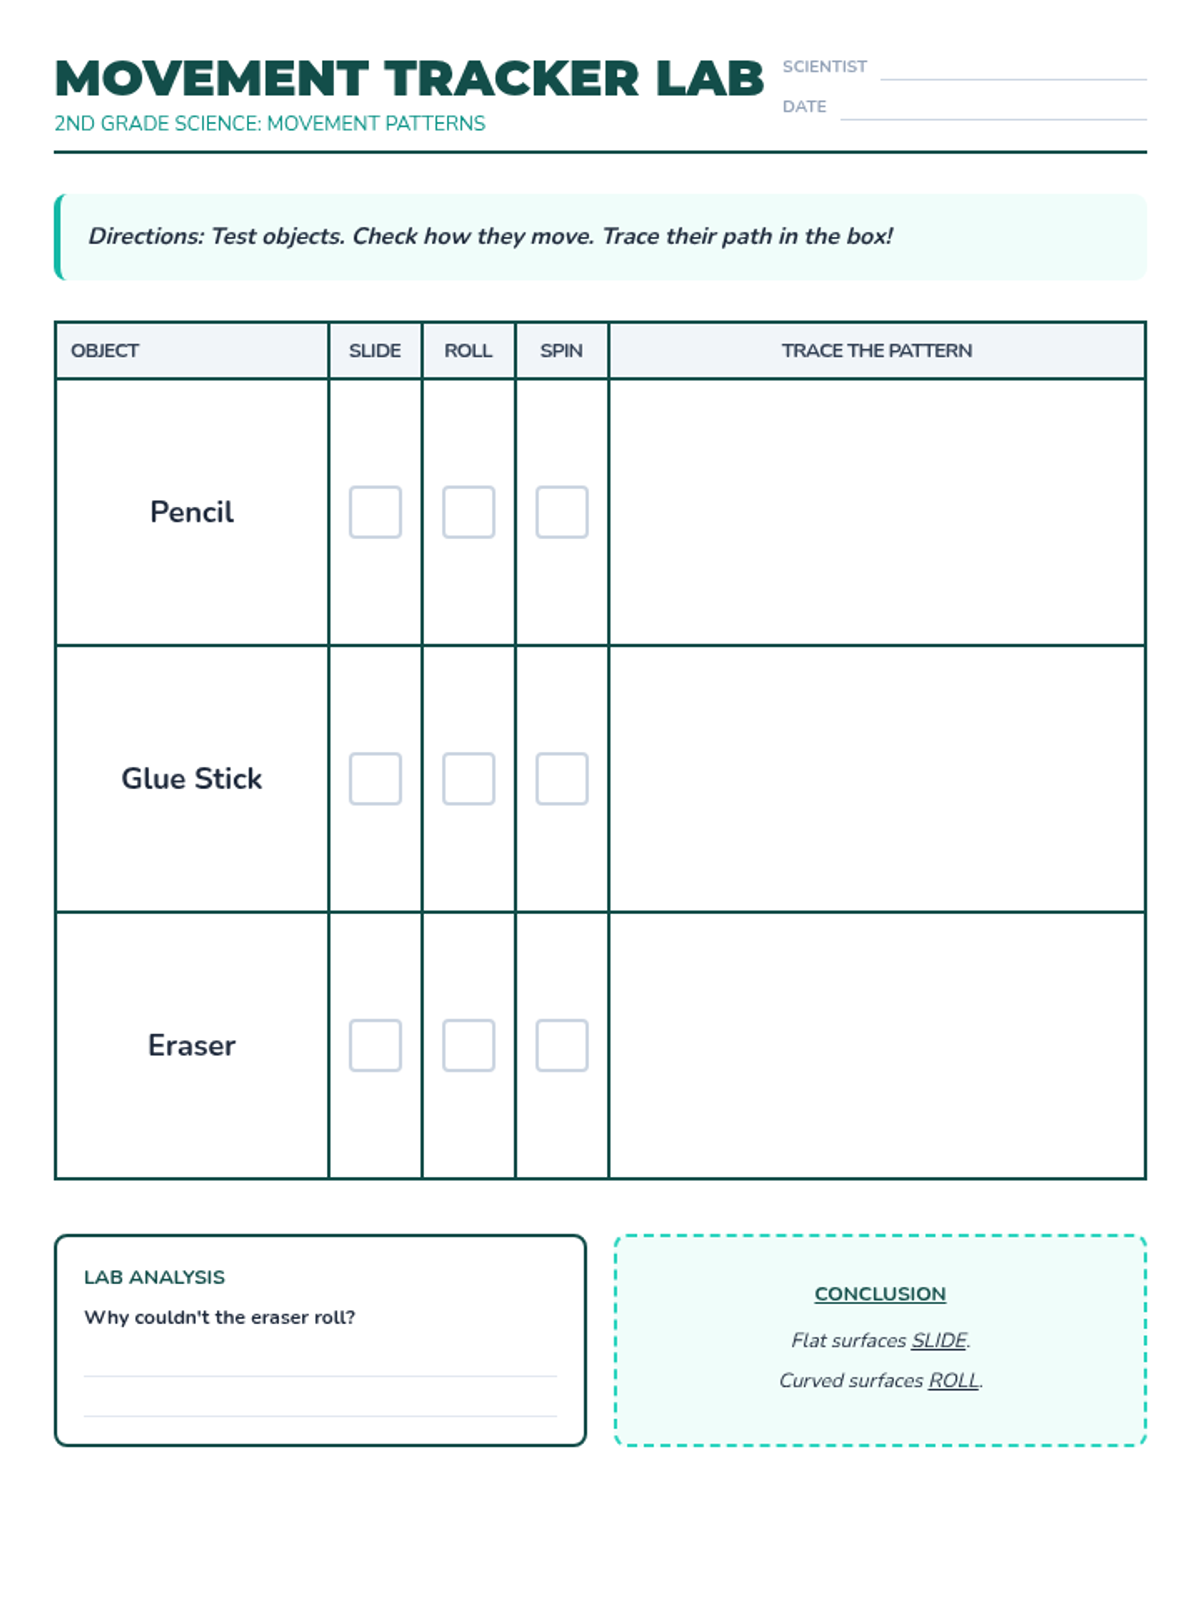
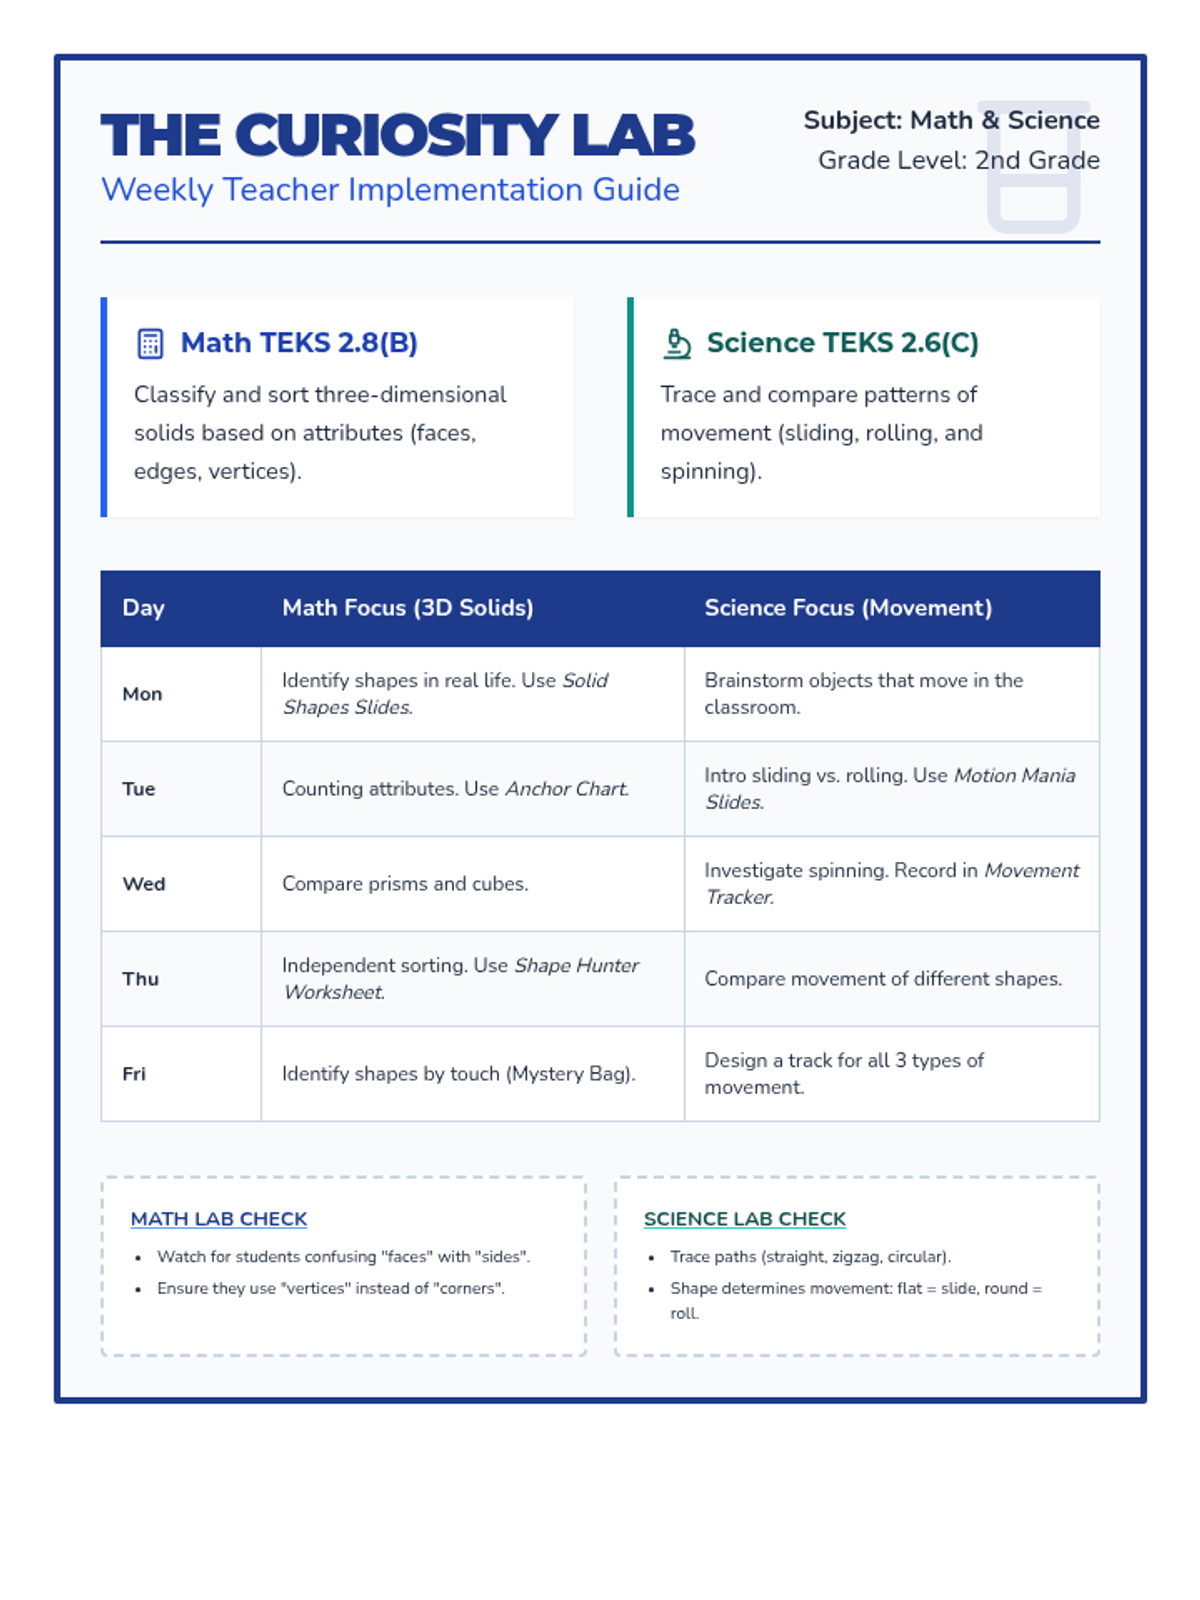
Students investigate and compare different patterns of movement, including sliding, rolling, and spinning, through hands-on observation.
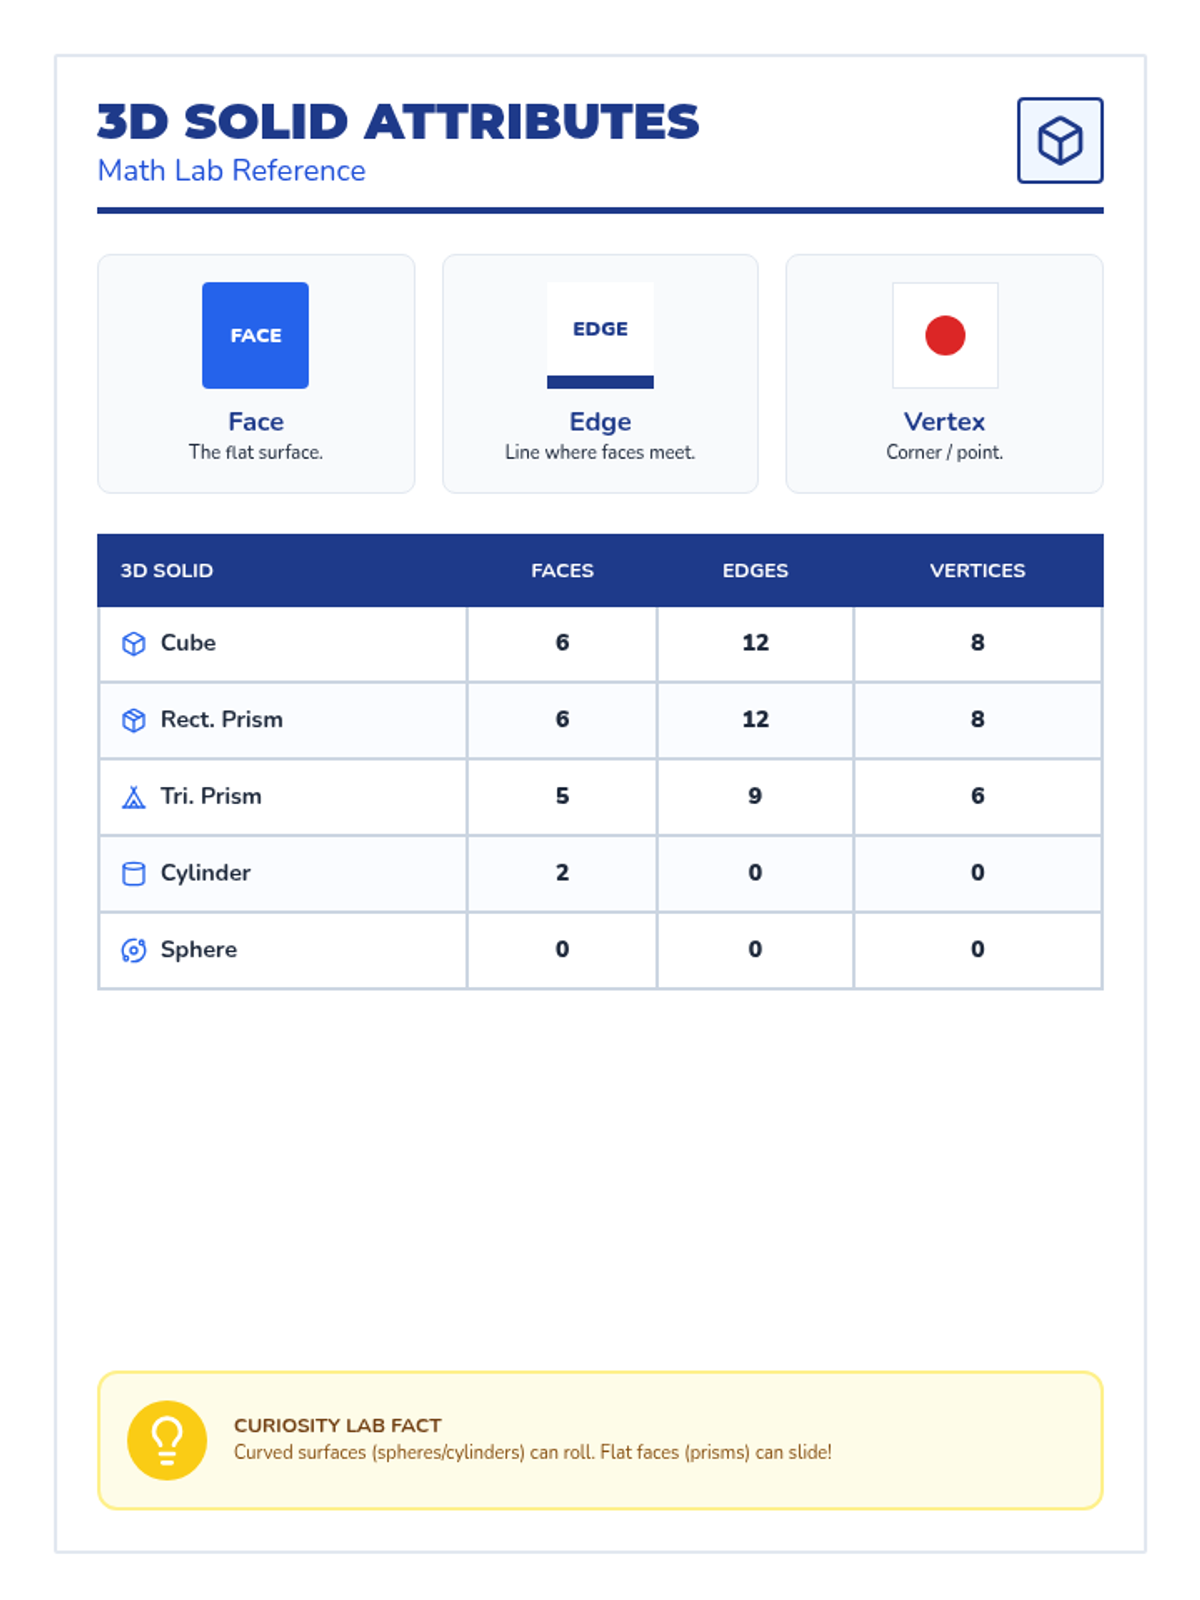
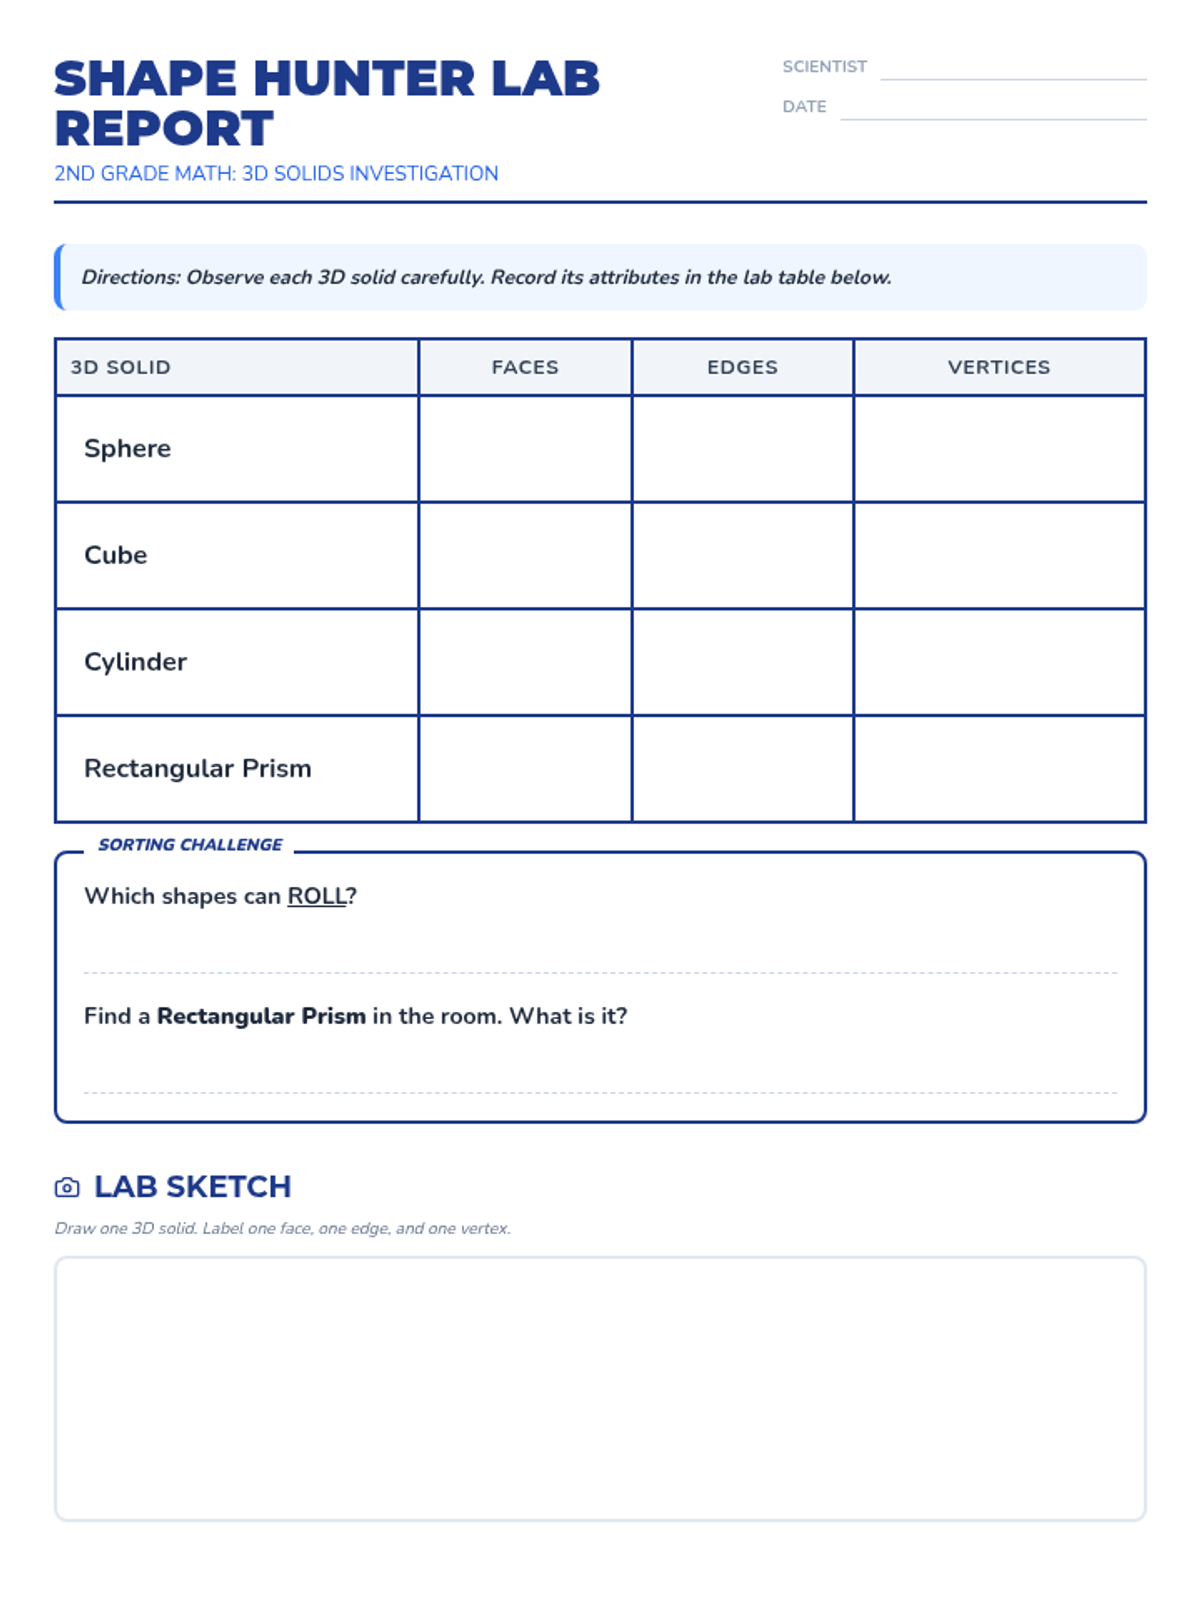
Students identify, classify, and sort three-dimensional solids using formal geometric language like faces, edges, and vertices.
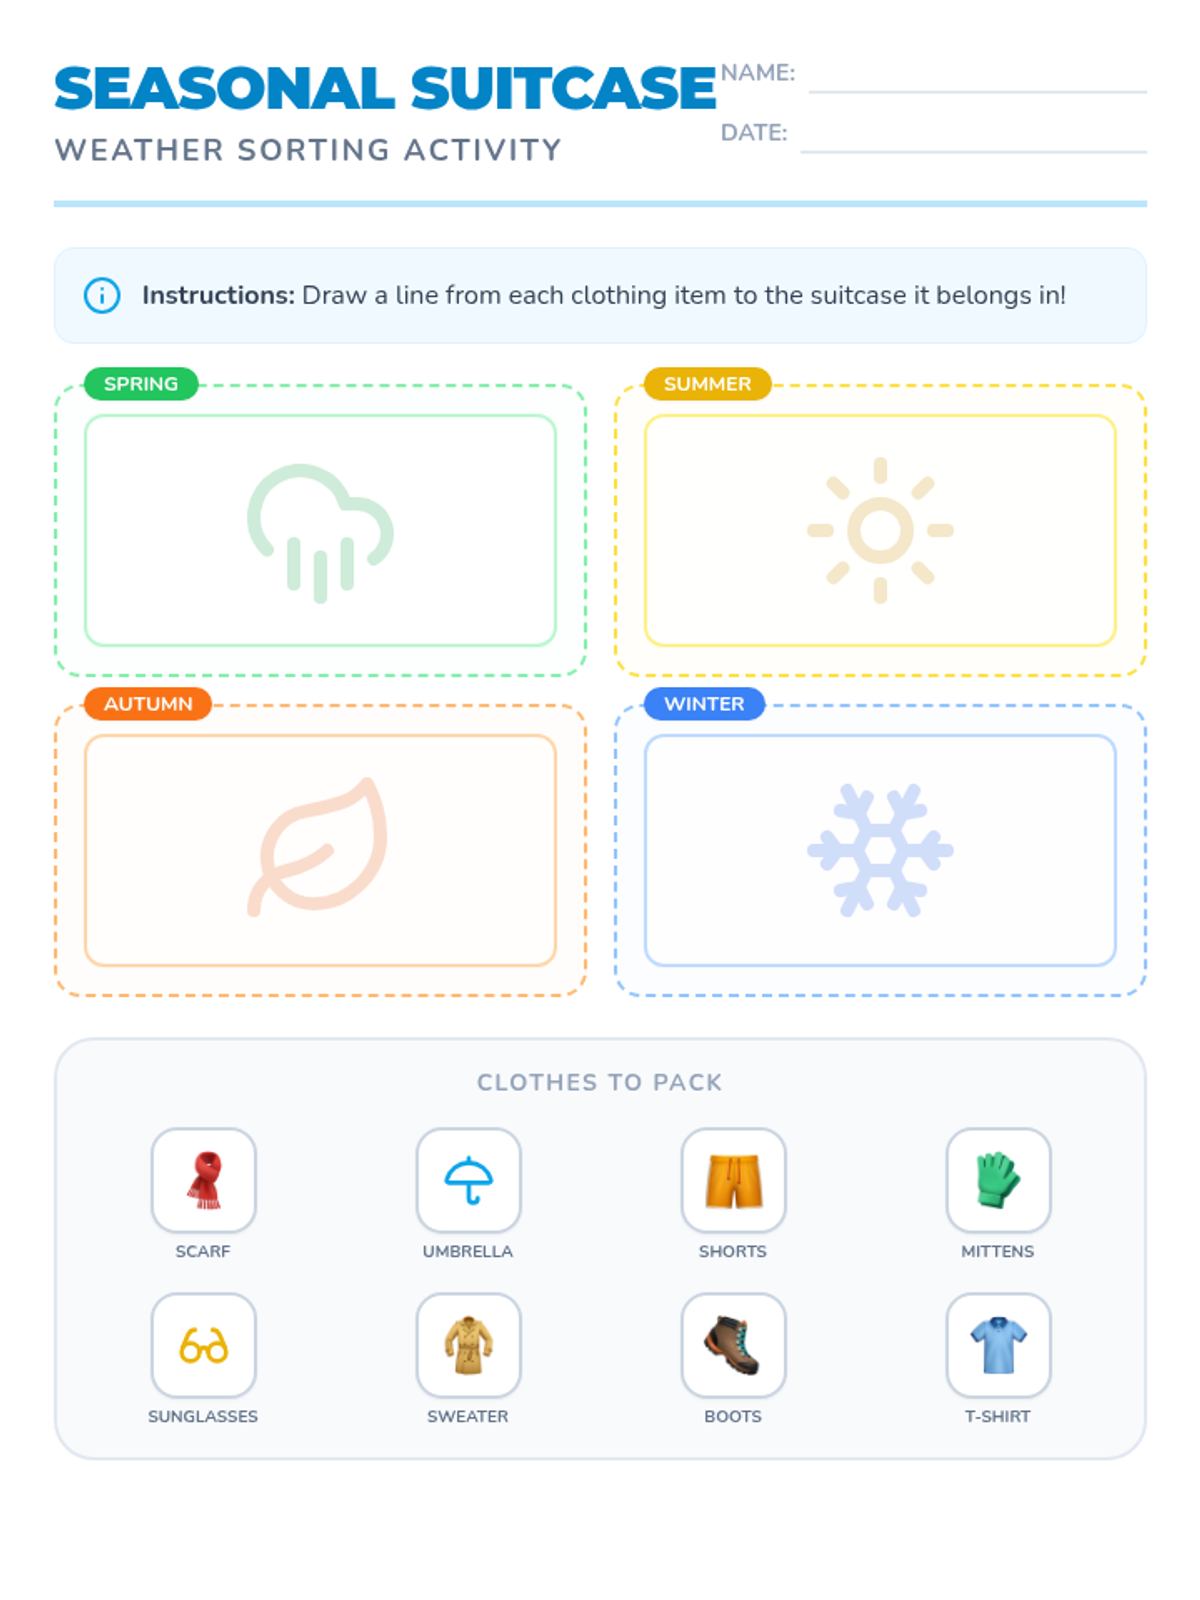
A 30-minute introduction to the four seasons and how we dress for different types of weather. Students will learn to identify seasonal patterns and select appropriate clothing for each.
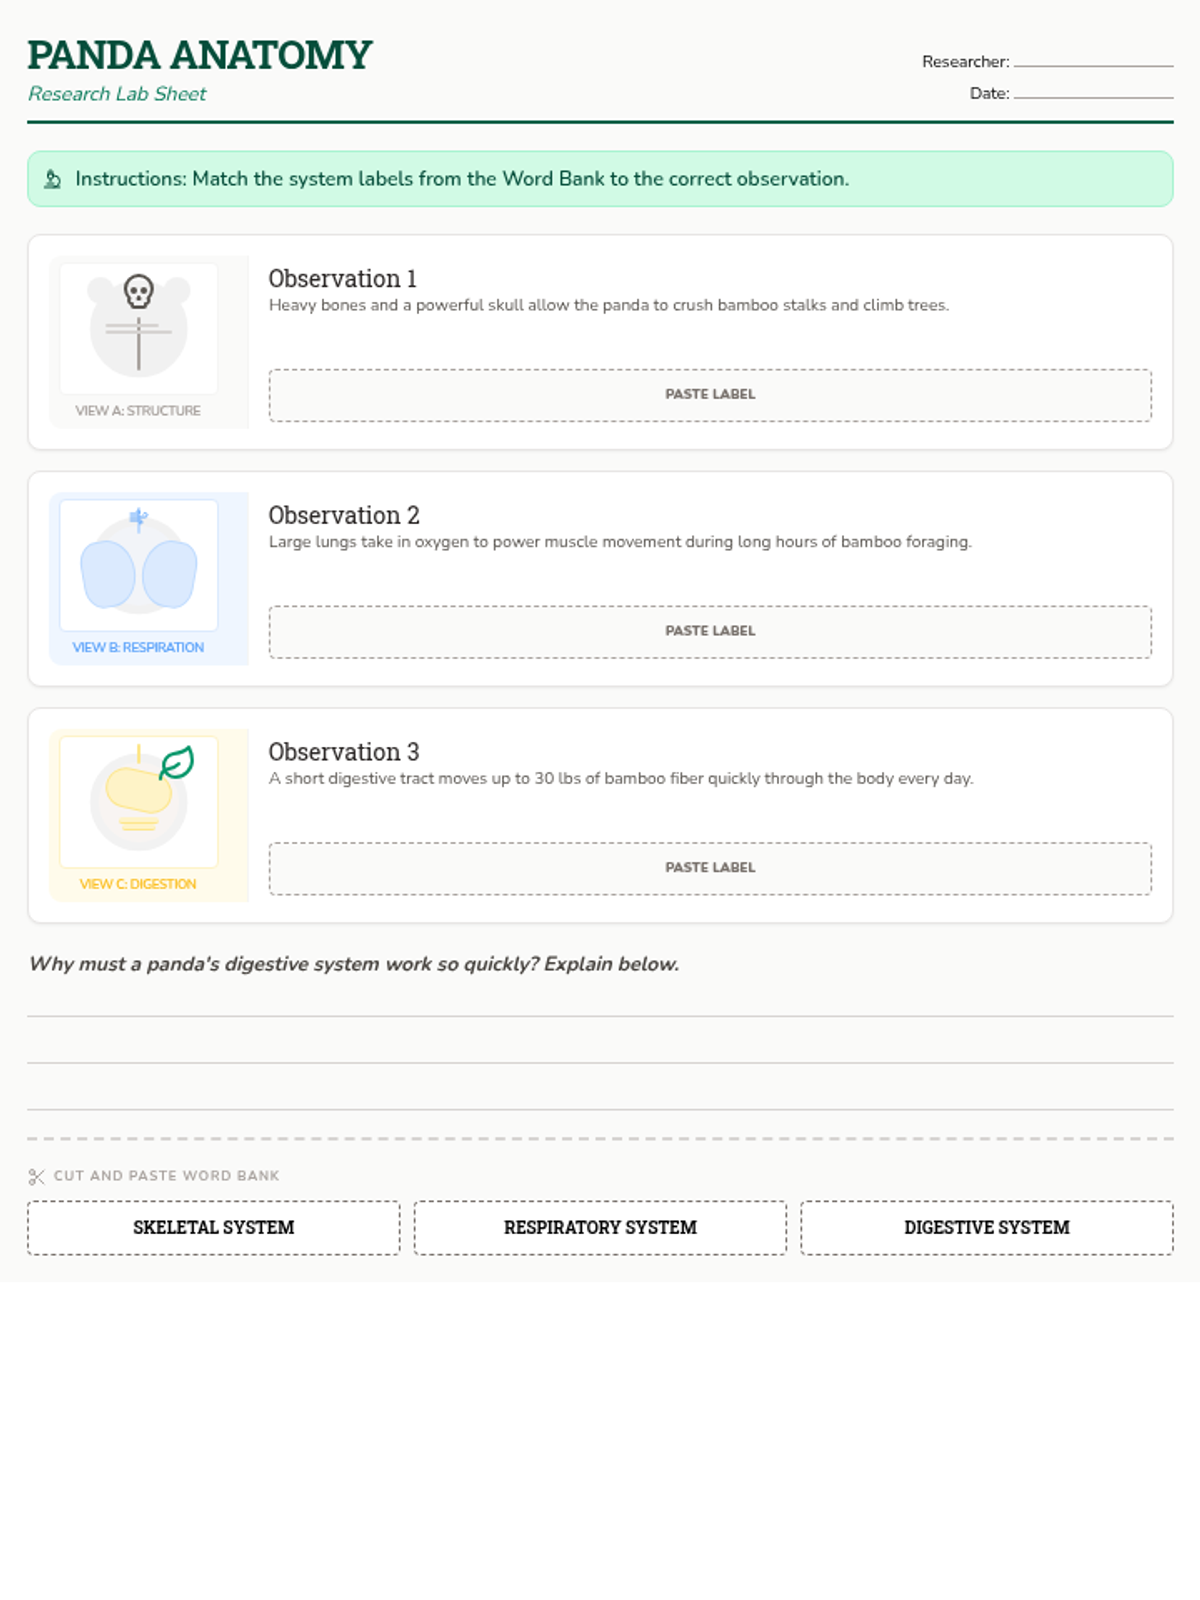
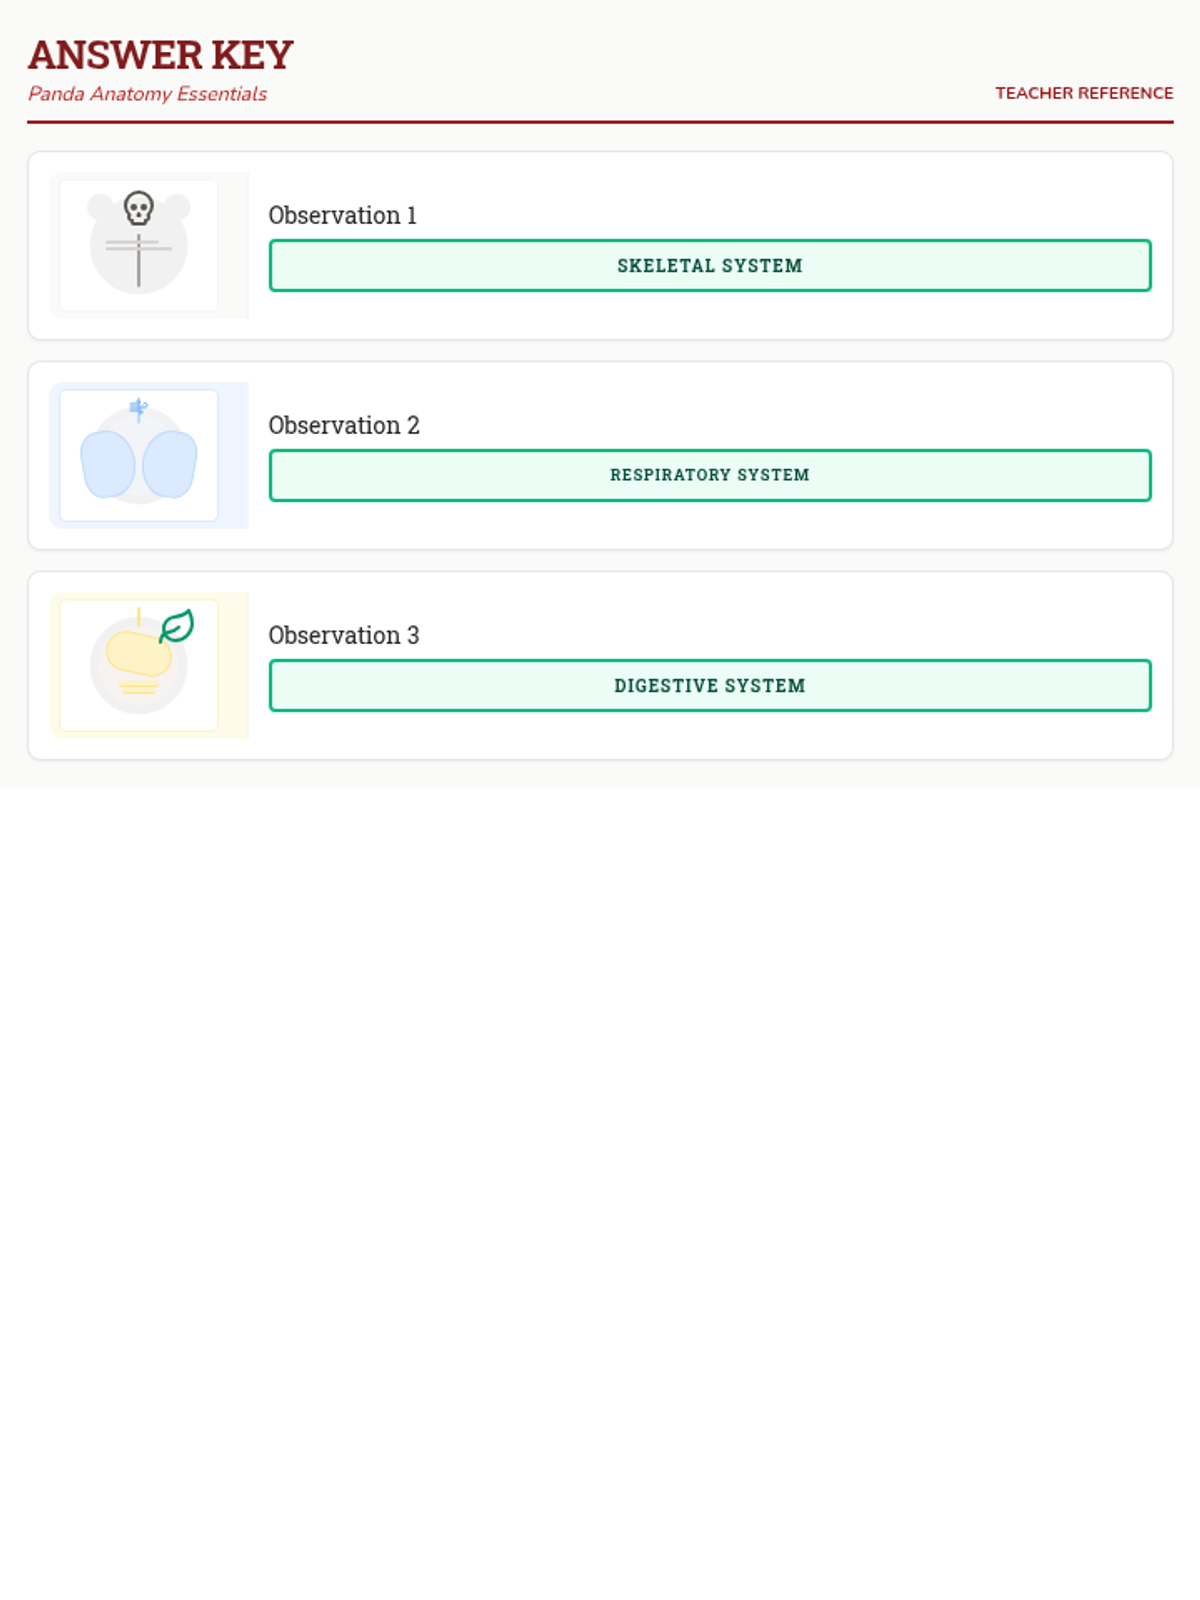
A hands-on lesson identifying the major internal systems of a Giant Panda, focusing on how their anatomy supports their unique bamboo-based diet and lifestyle.
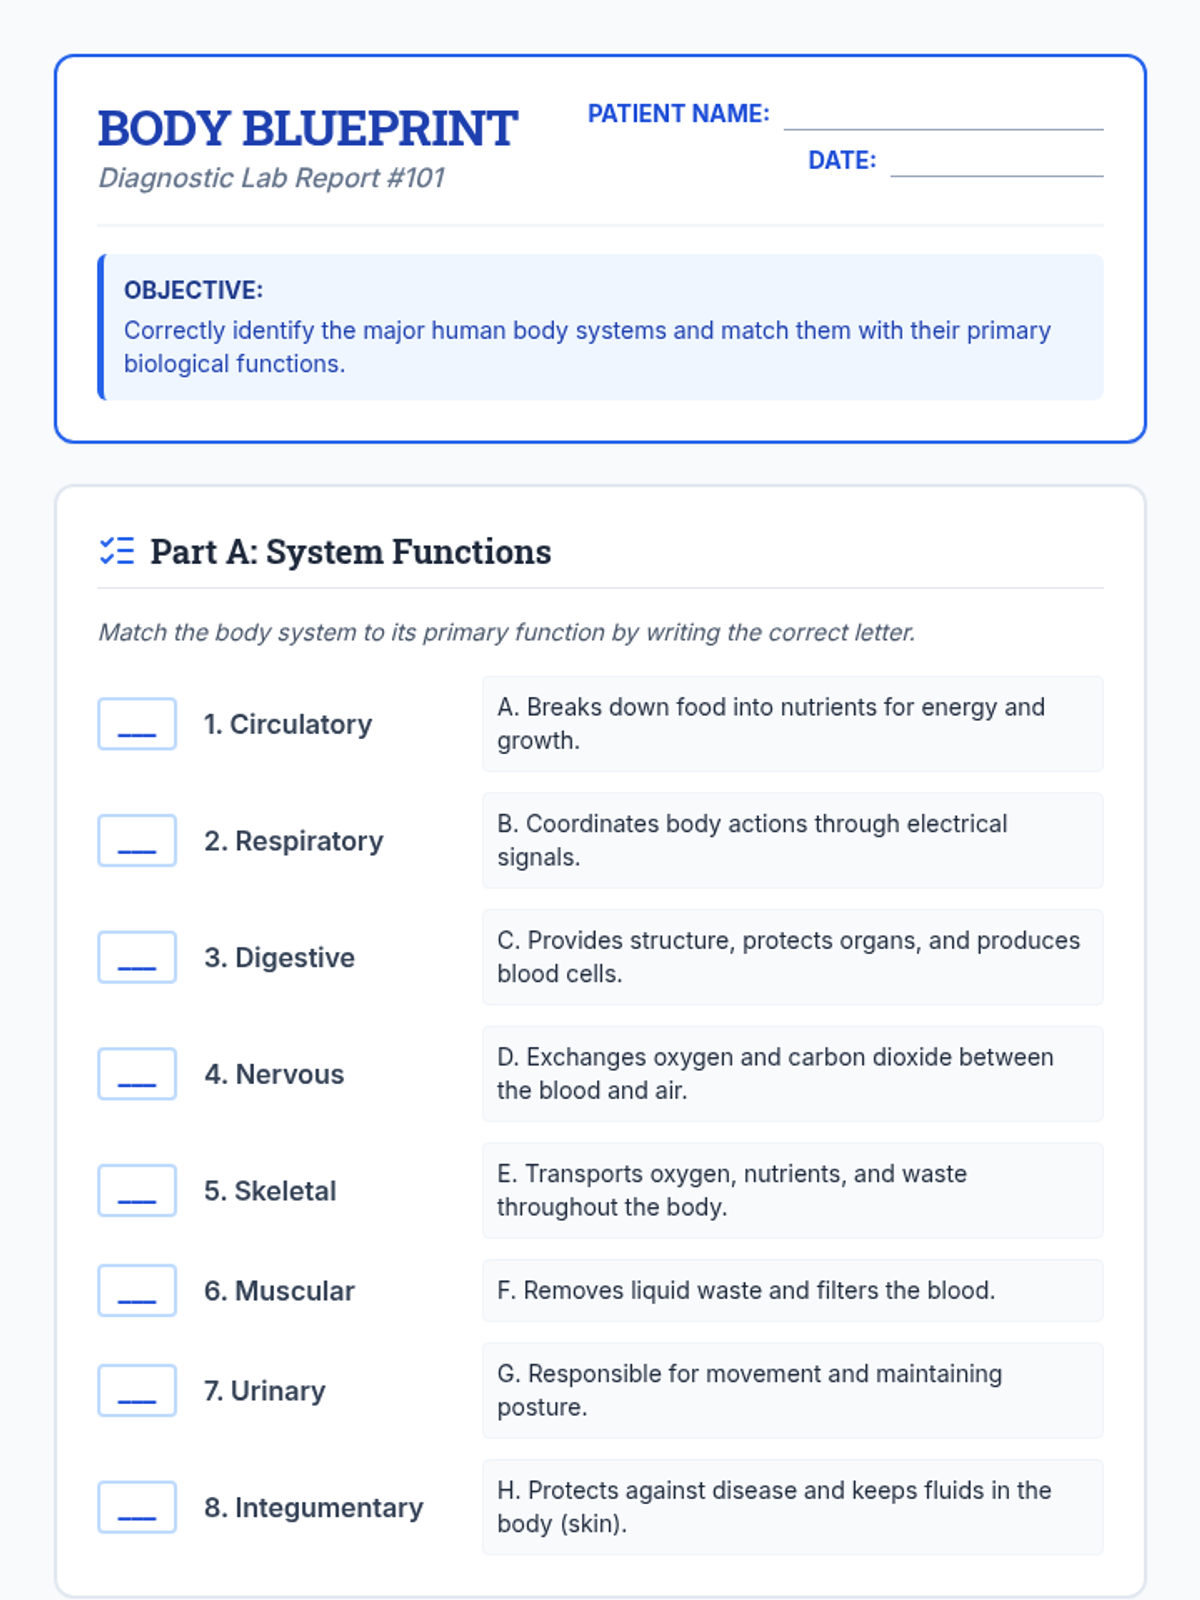
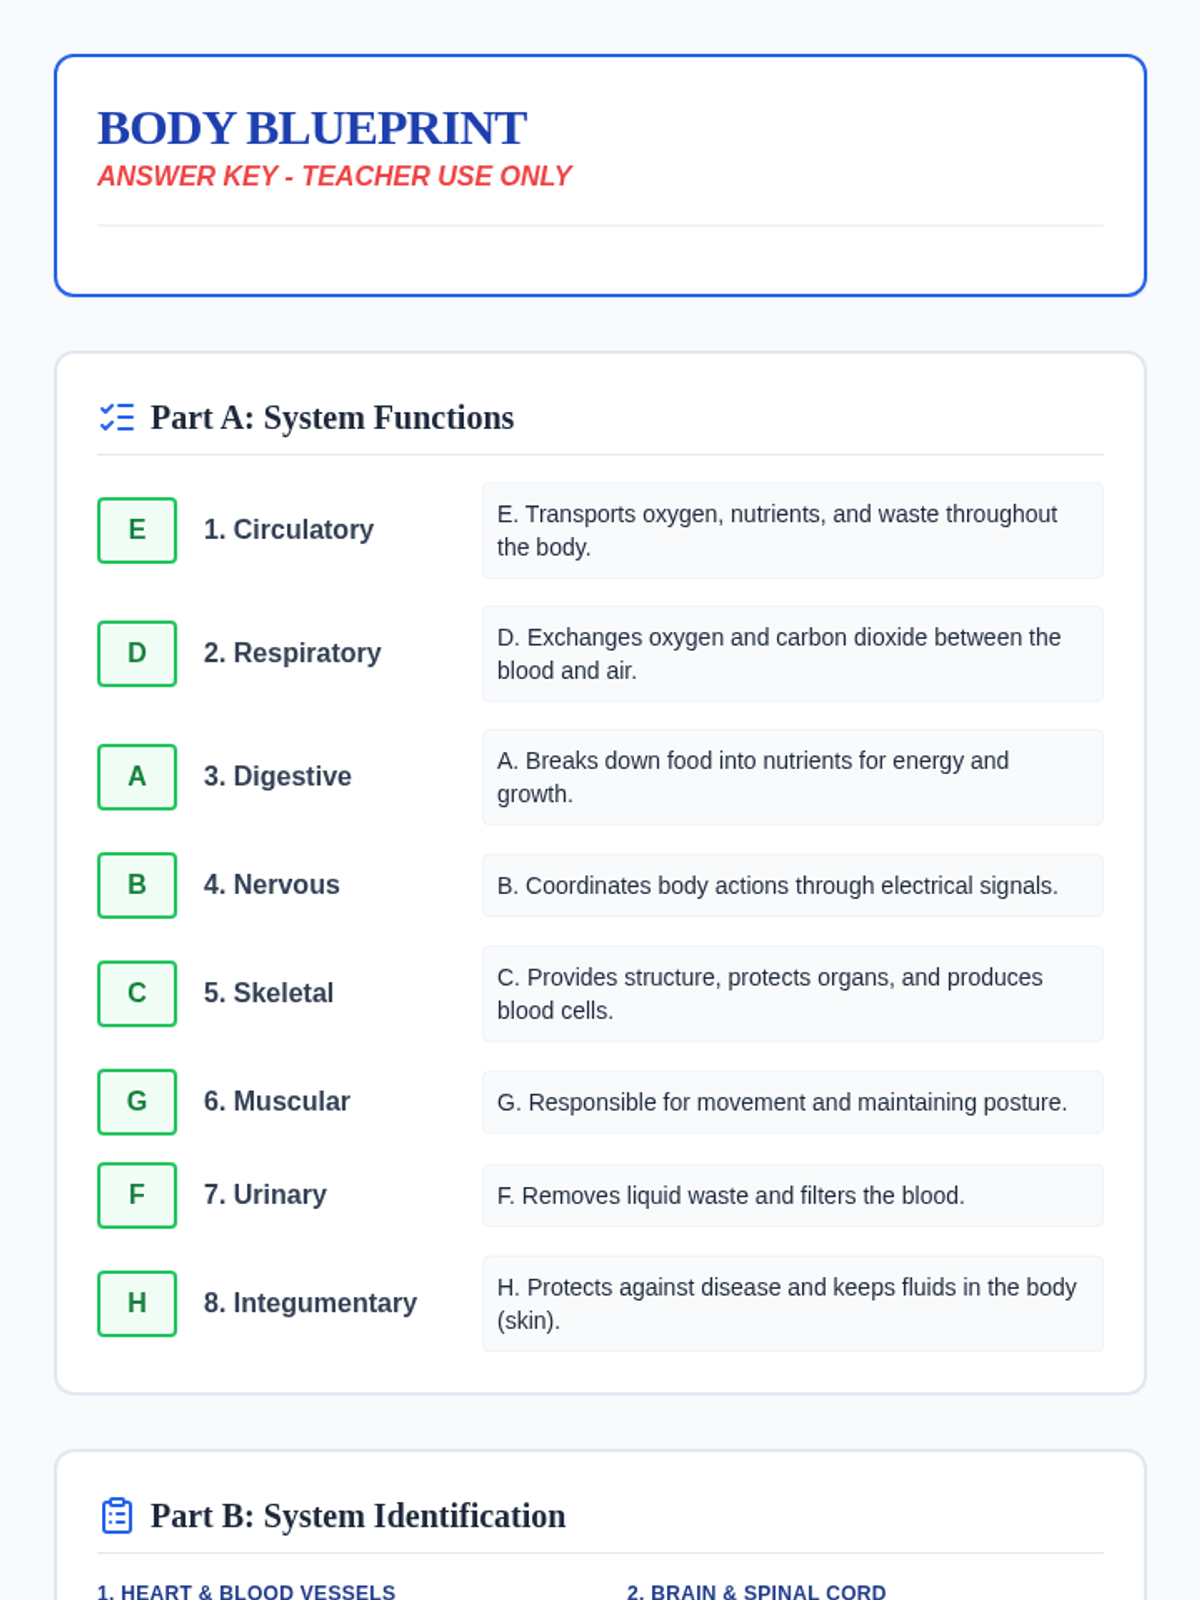
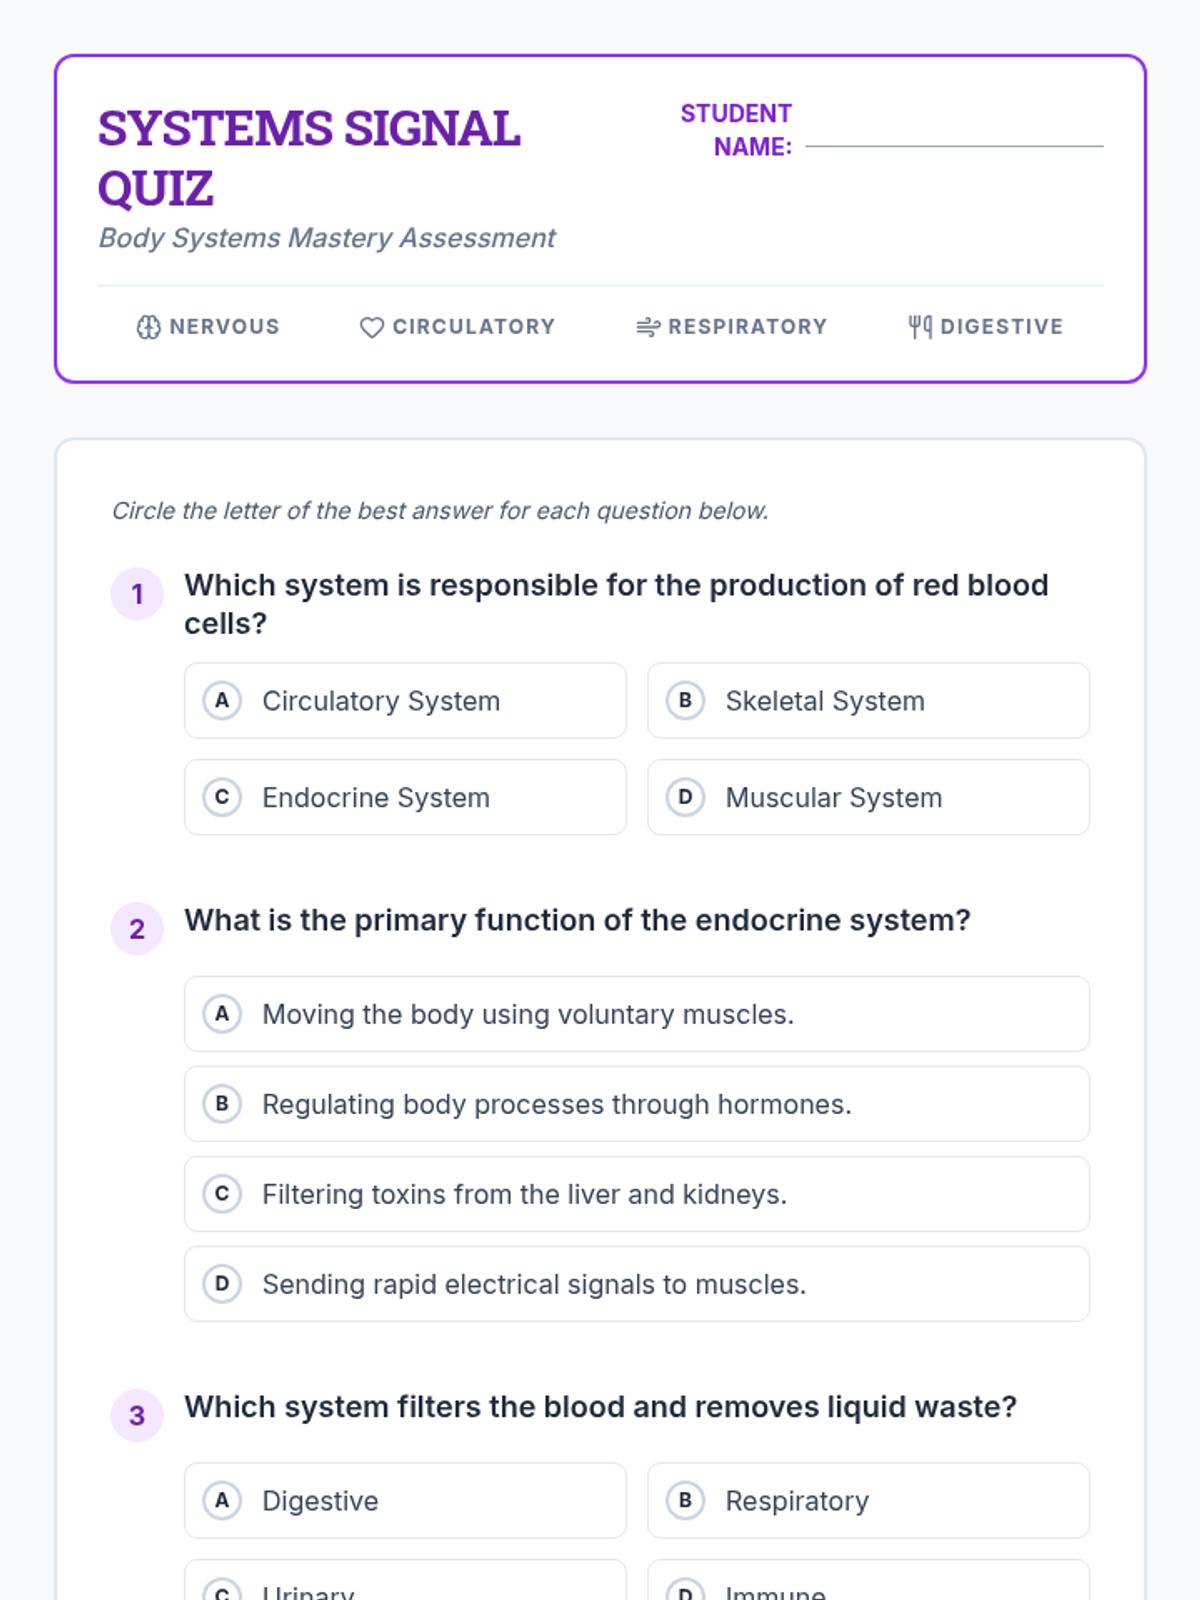
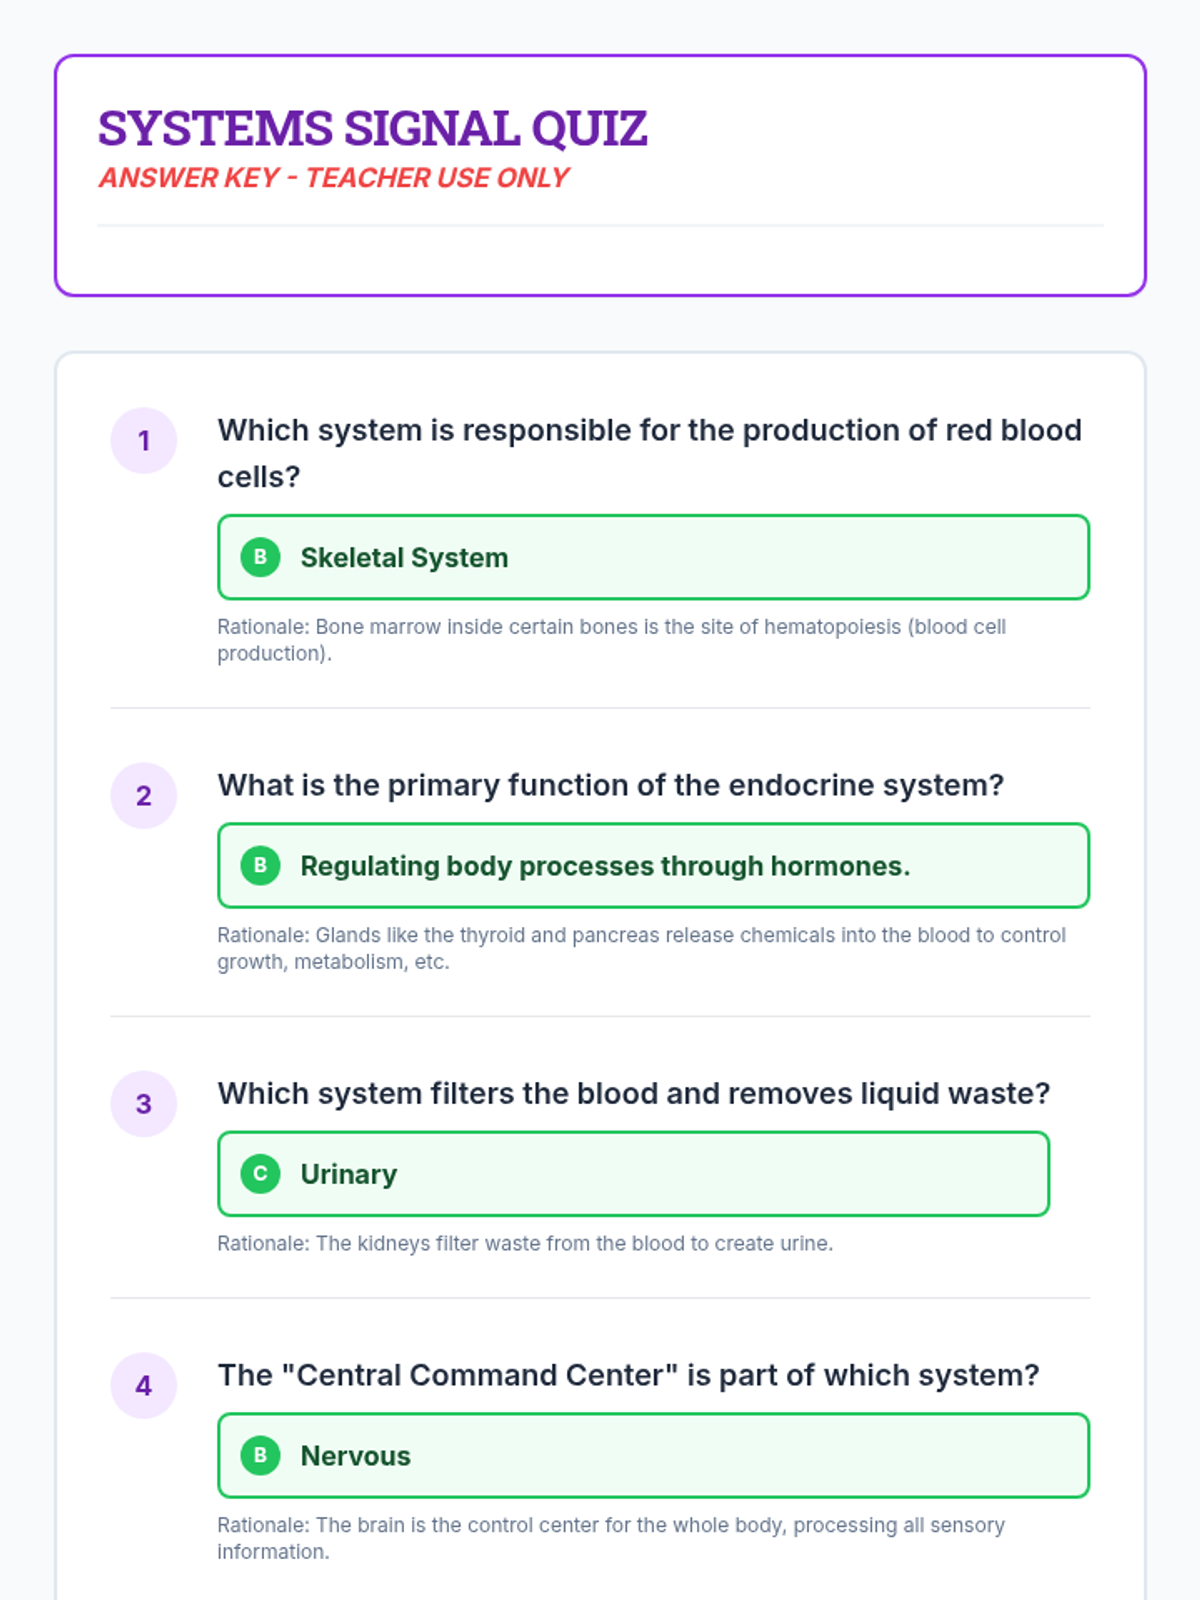
A comprehensive assessment suite to evaluate student understanding of the major human body systems, including their functions and key organs.
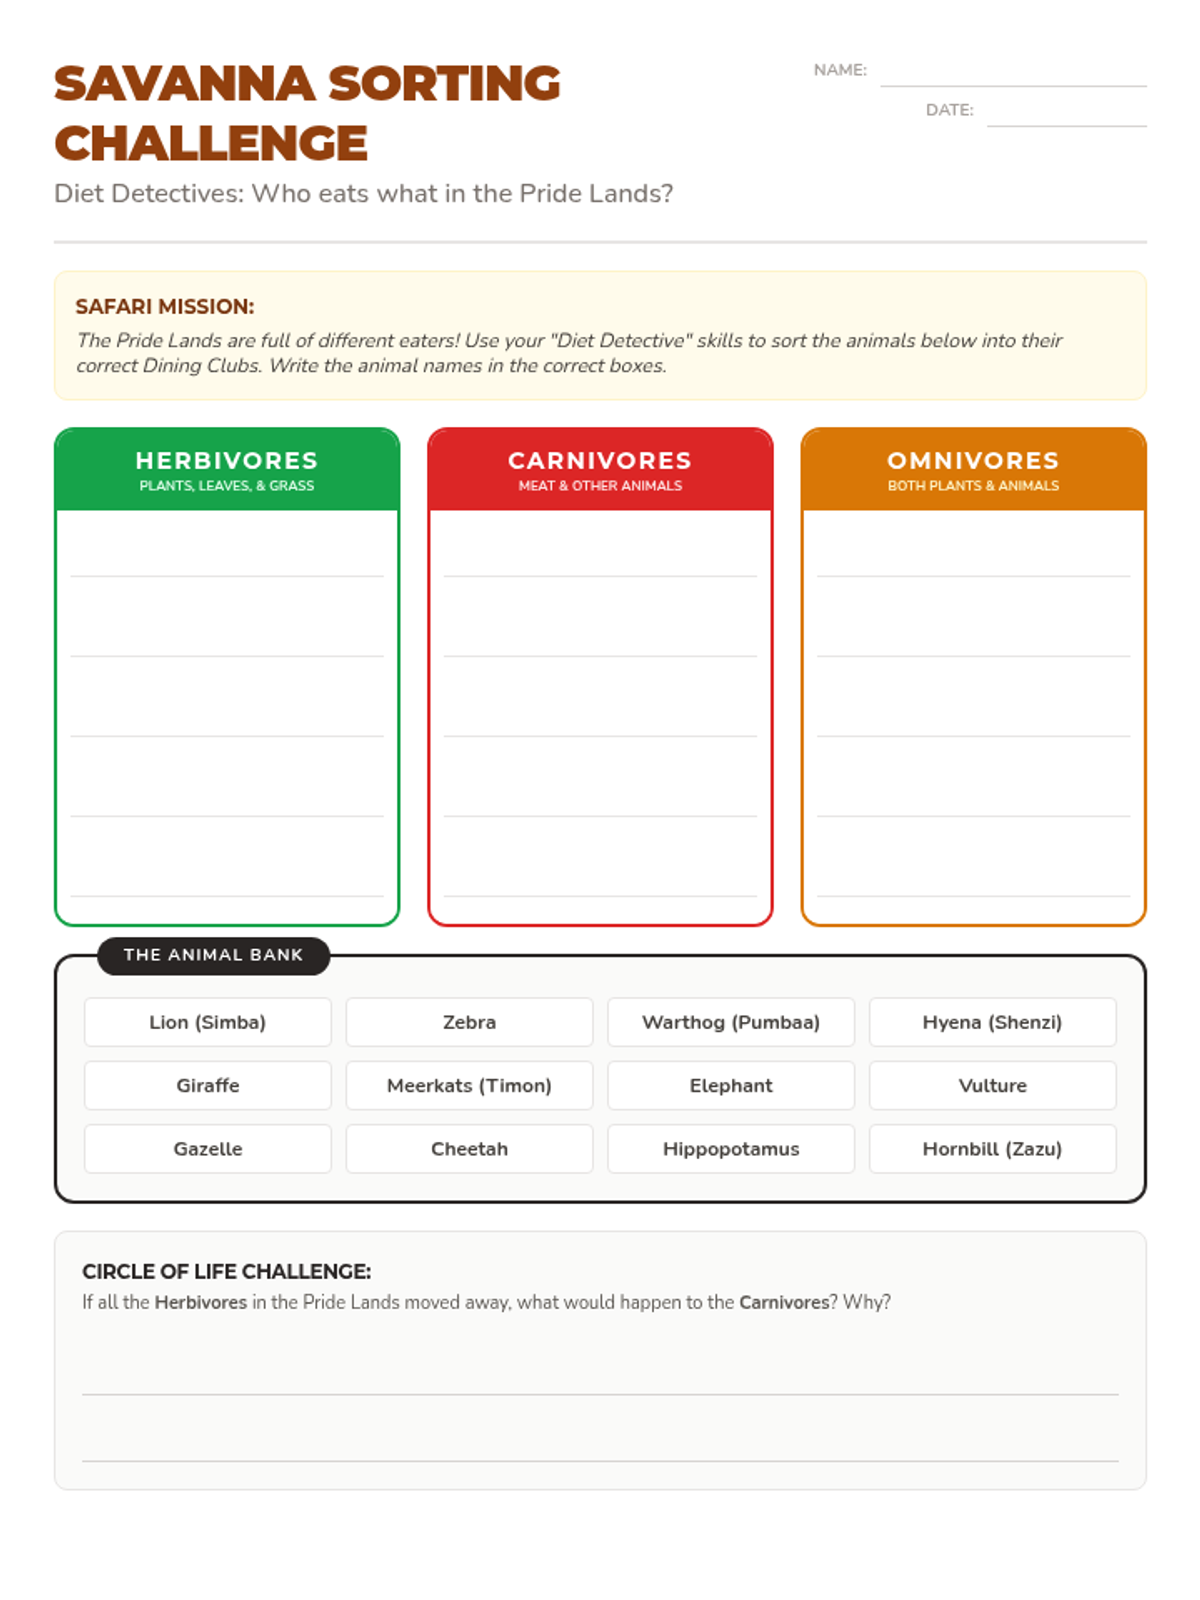
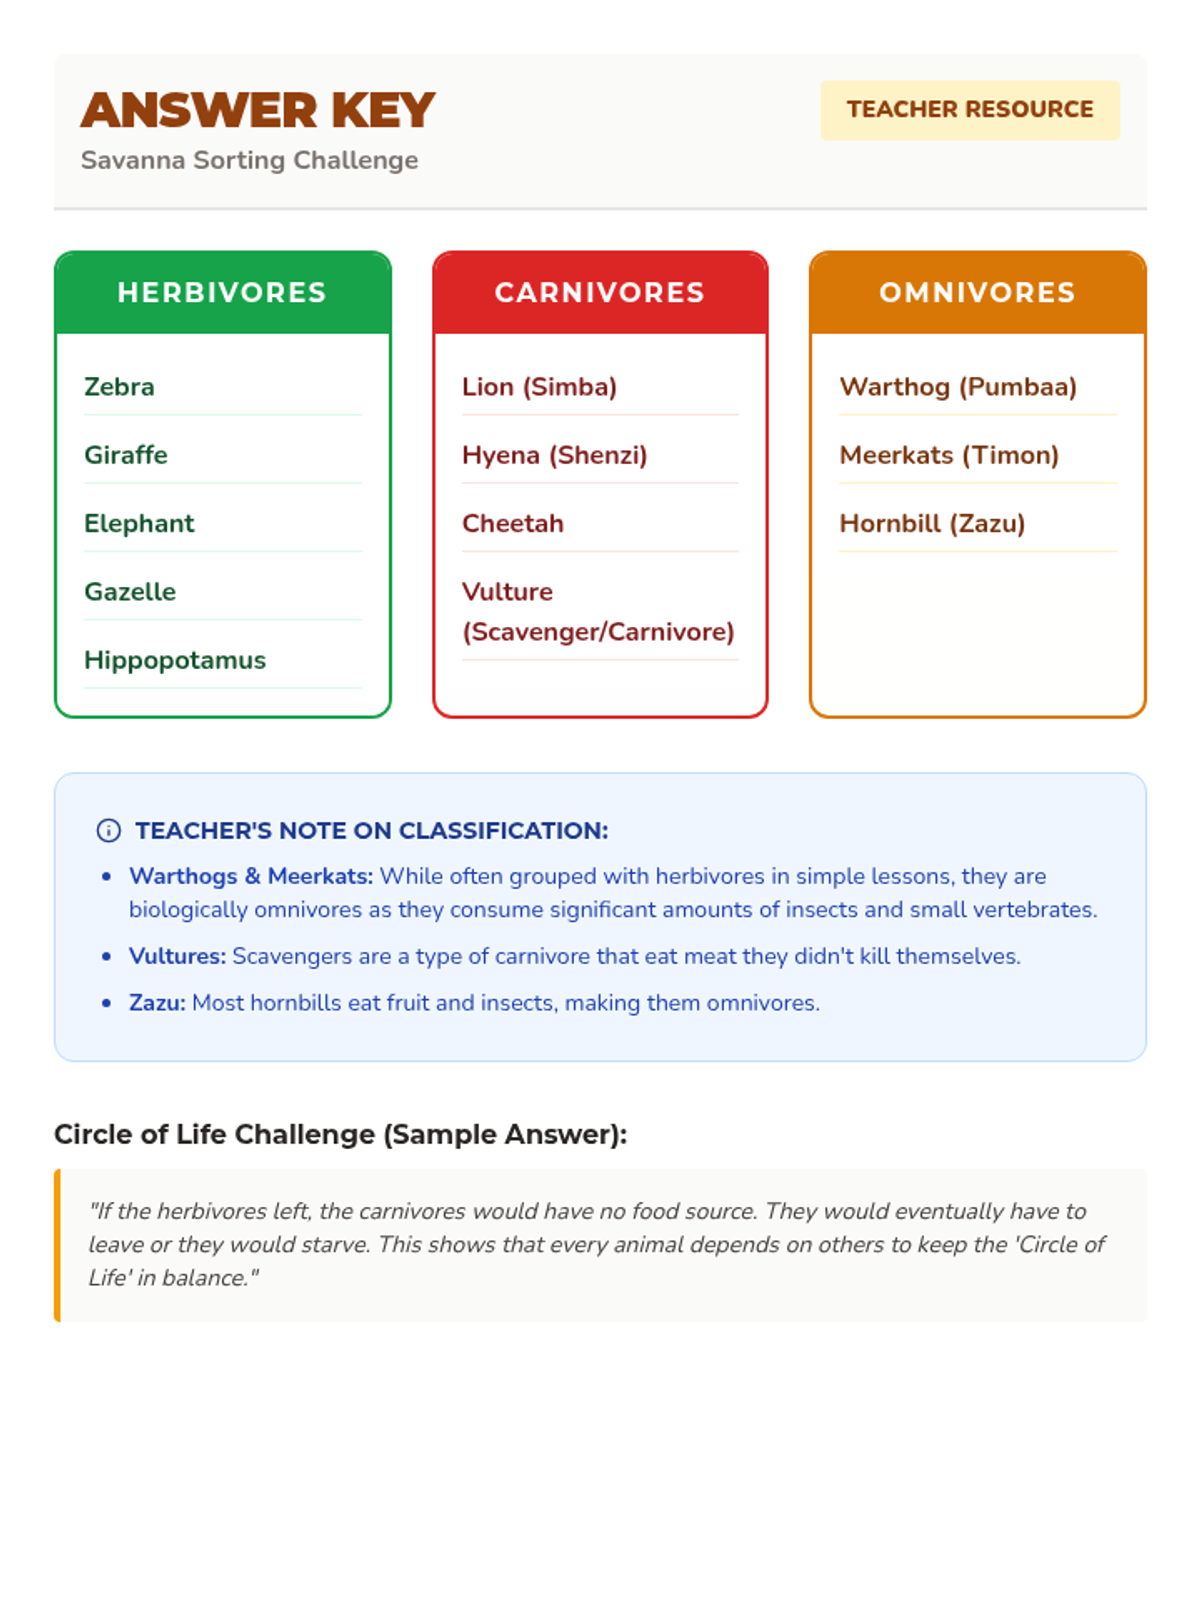
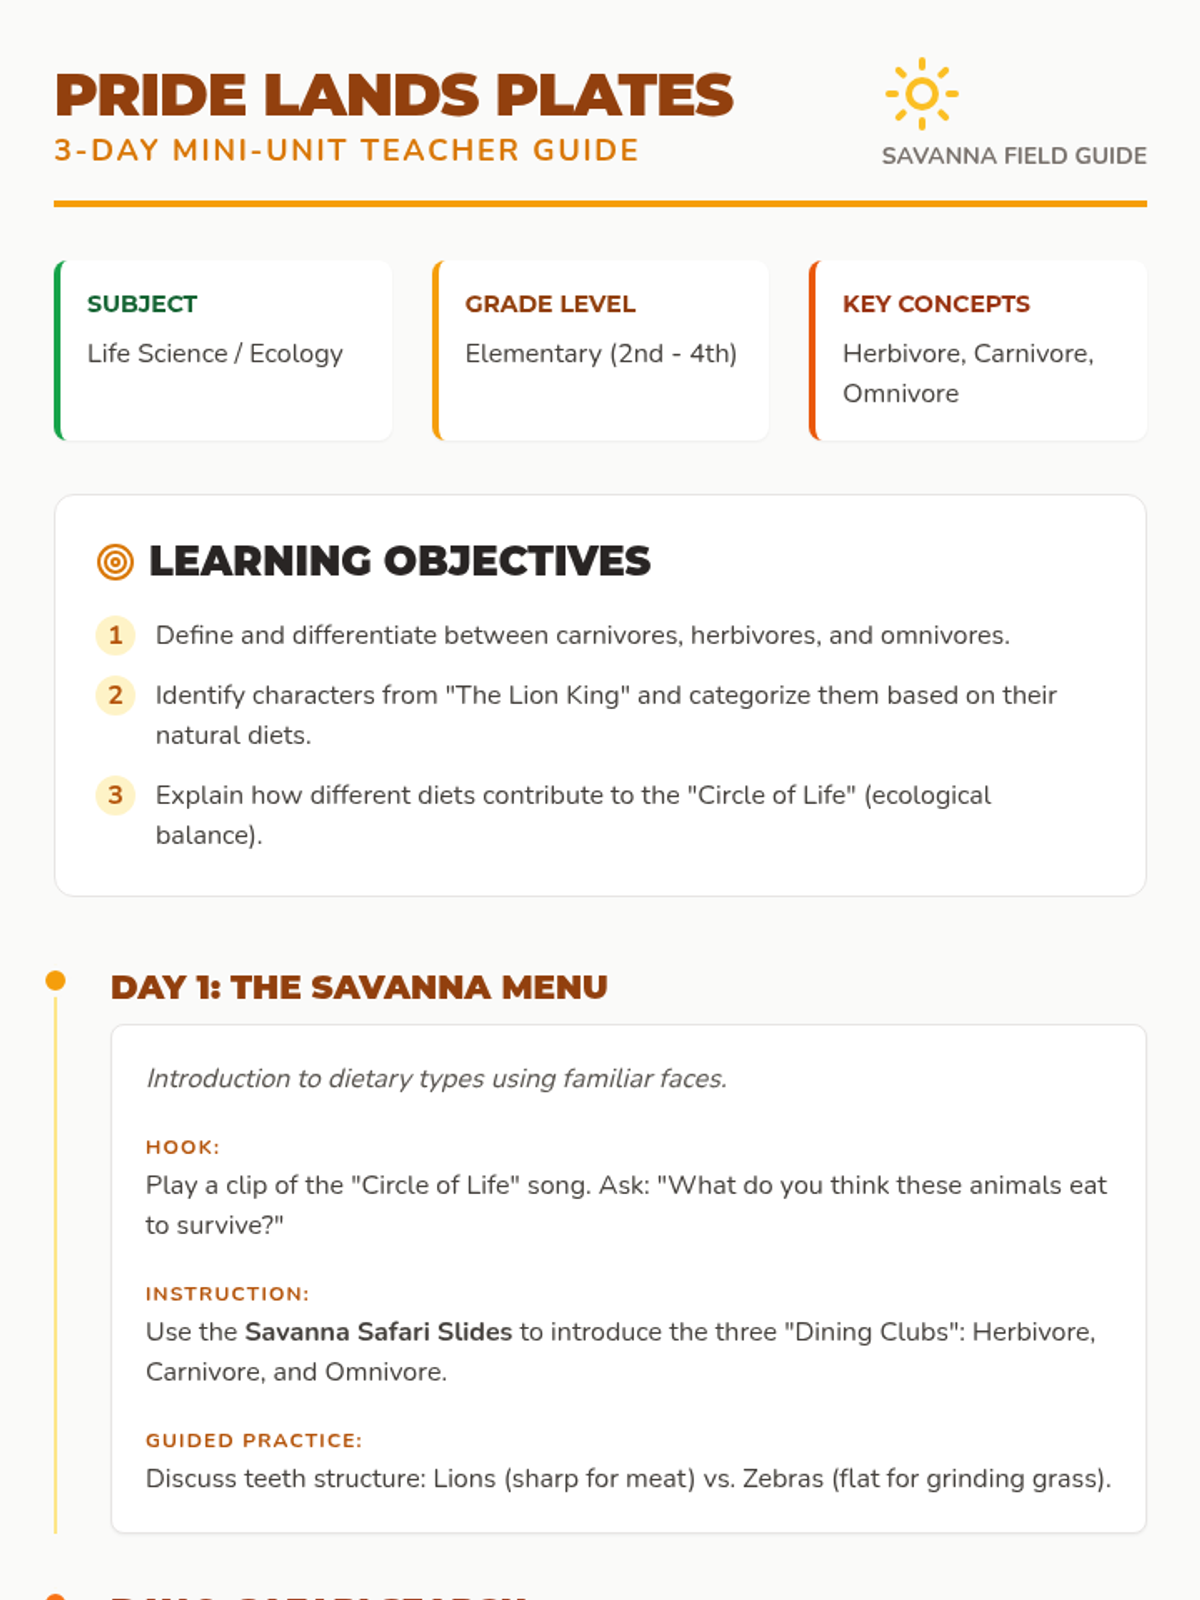
Culminating sorting activity where students categorize Lion King characters and other savanna animals by their diets, followed by a reflection on the 'Circle of Life'.
Students analyze the ecosystem of the Pride Lands, identifying various animals from the film and researching or discussing their real-world dietary habits.
Introduction to herbivores, carnivores, and omnivores using Pride Lands characters as examples. students learn to identify dietary traits and basic dental structures associated with each group.
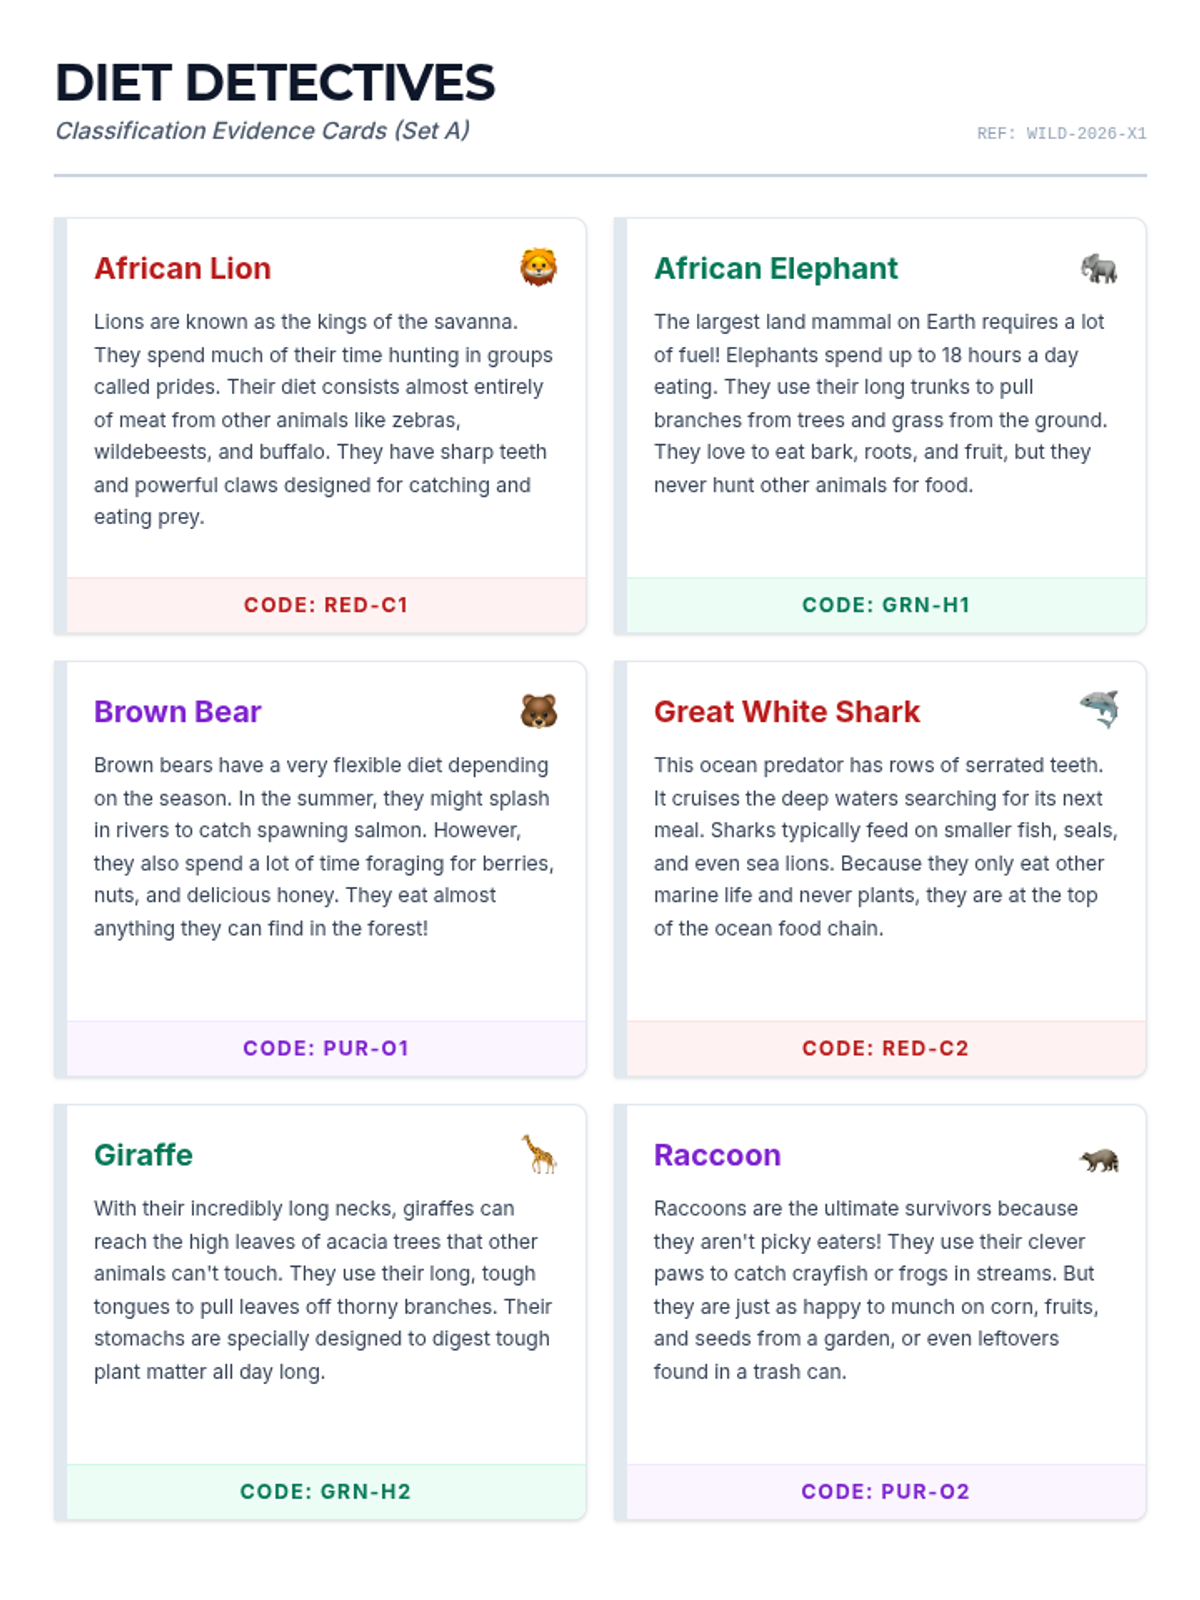
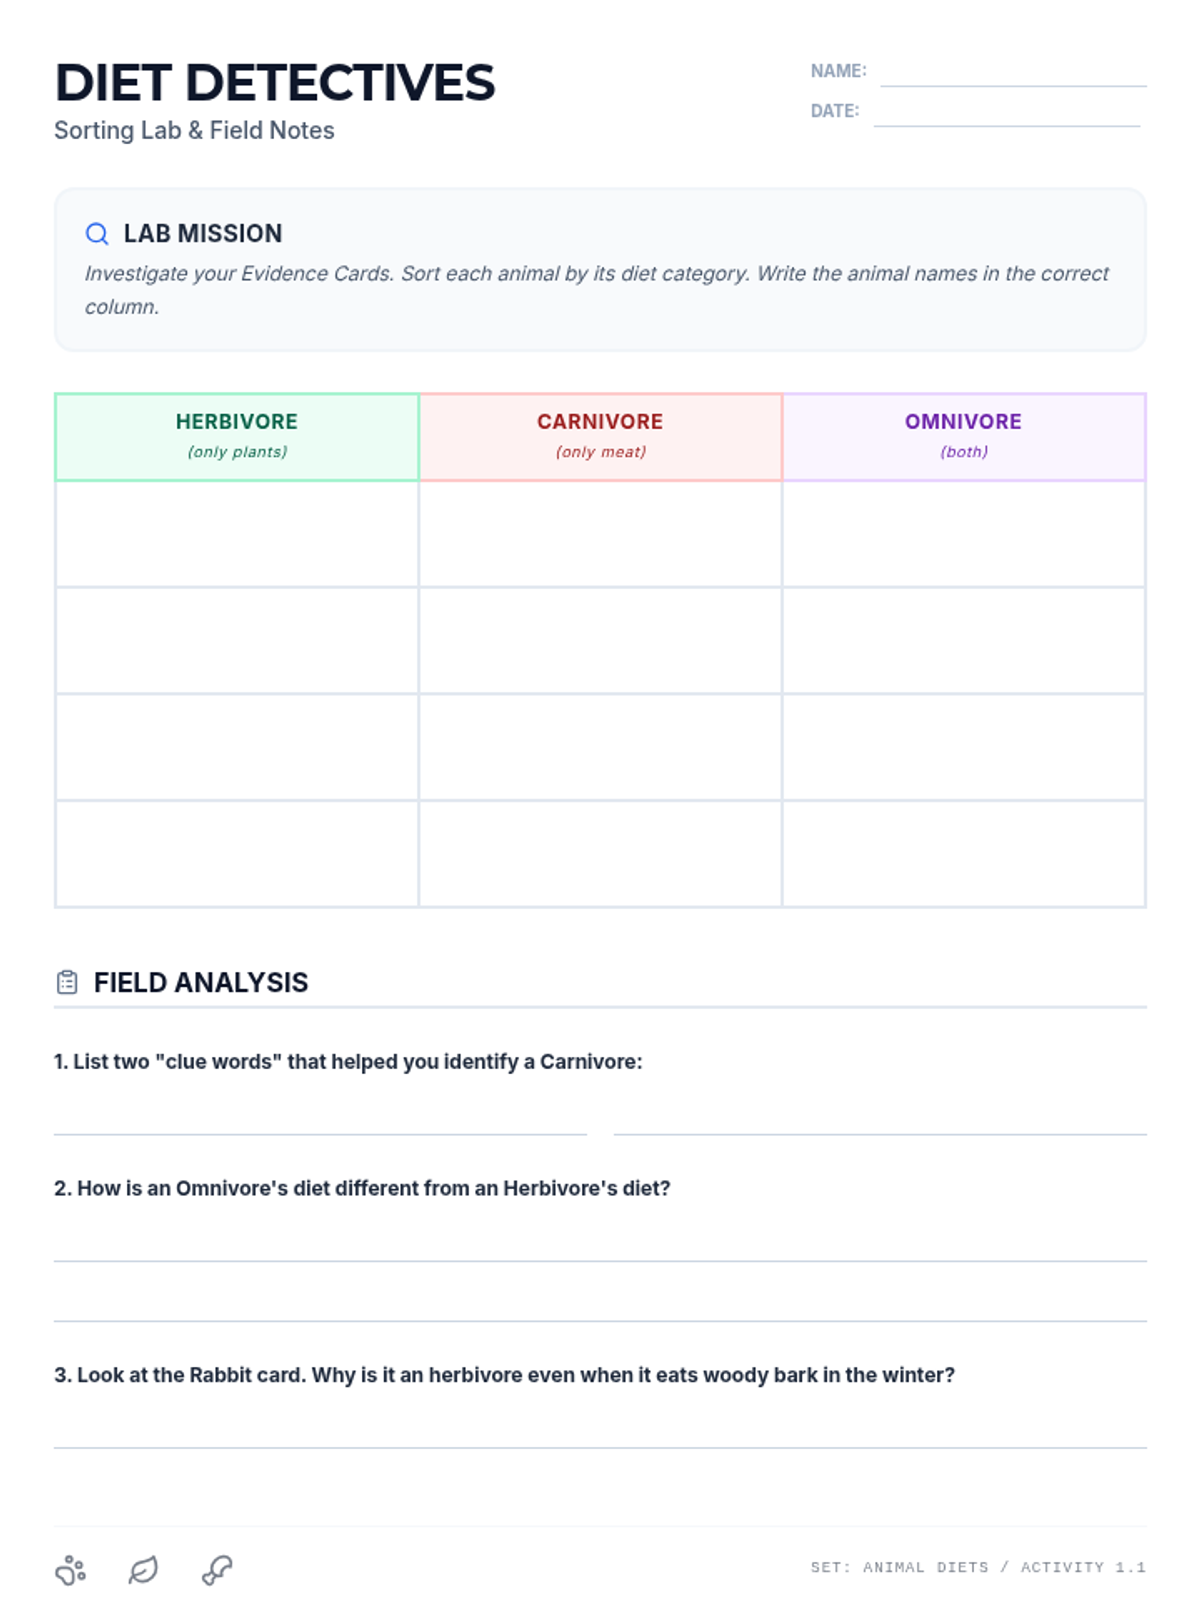
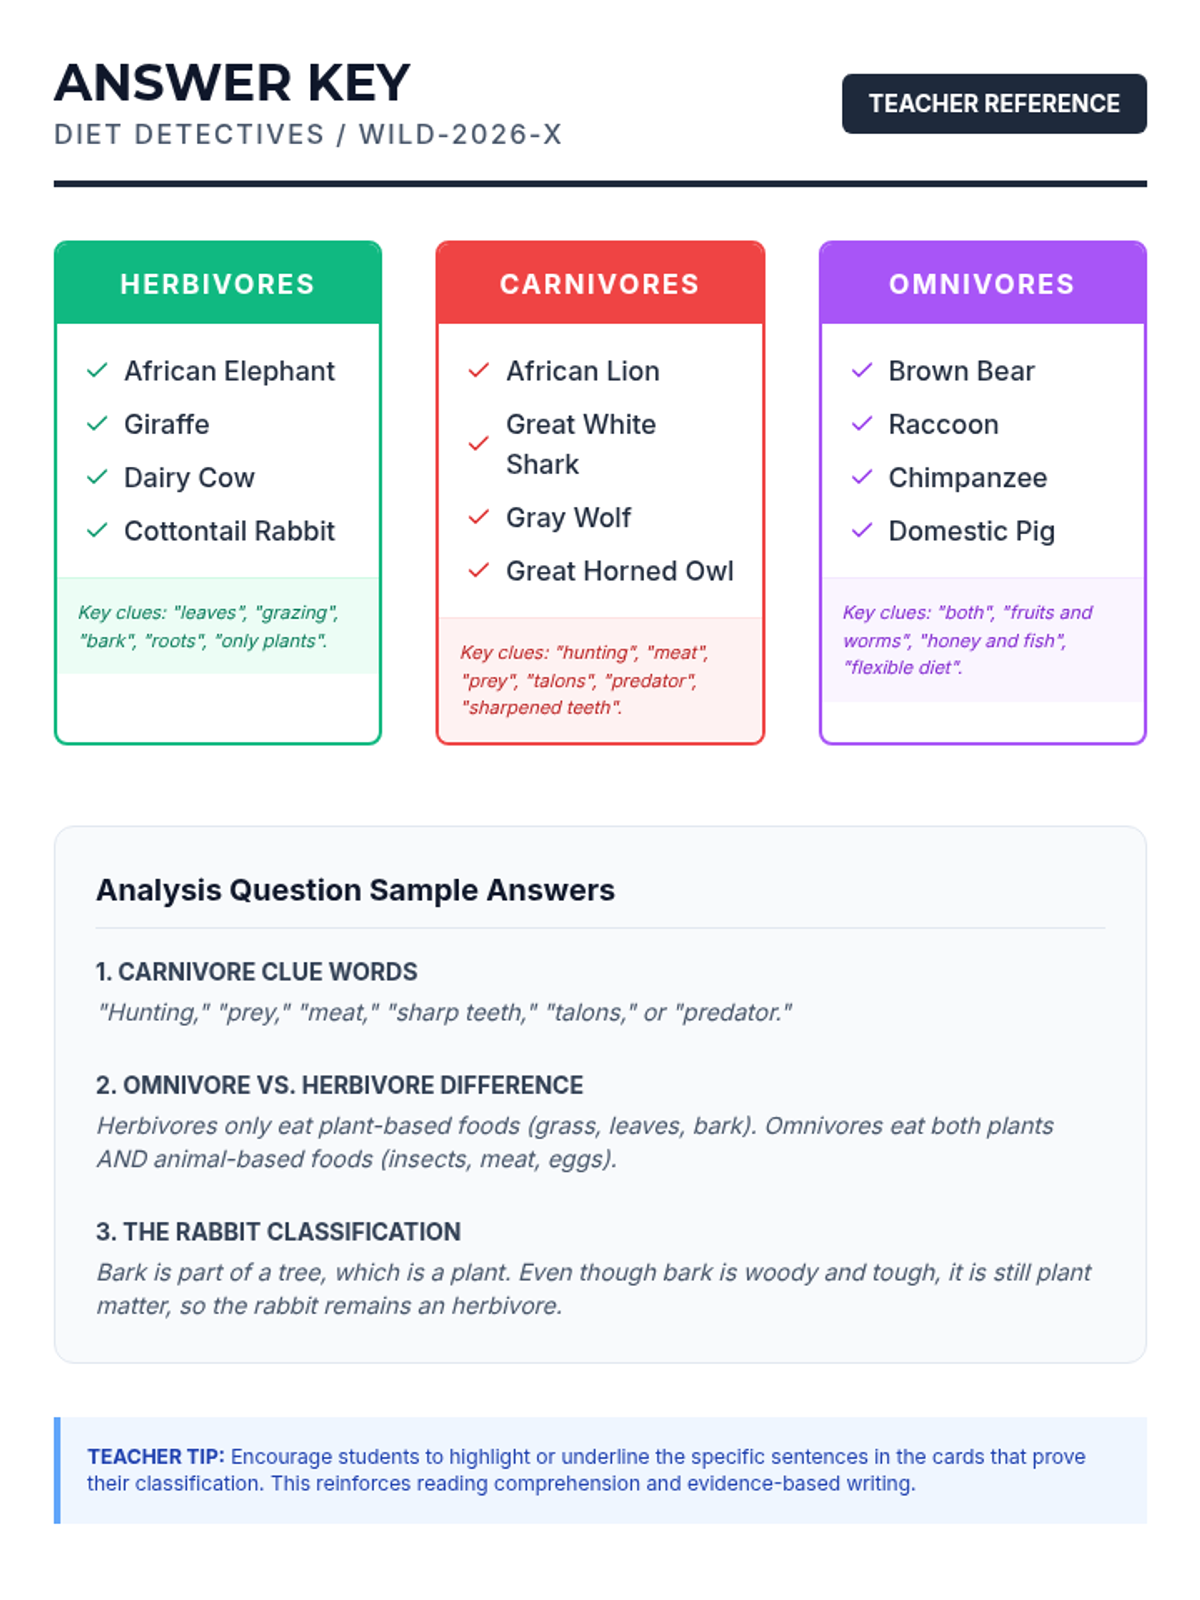
Students analyze short informational texts about various animals to classify them based on their diets using color-coded evidence cards.
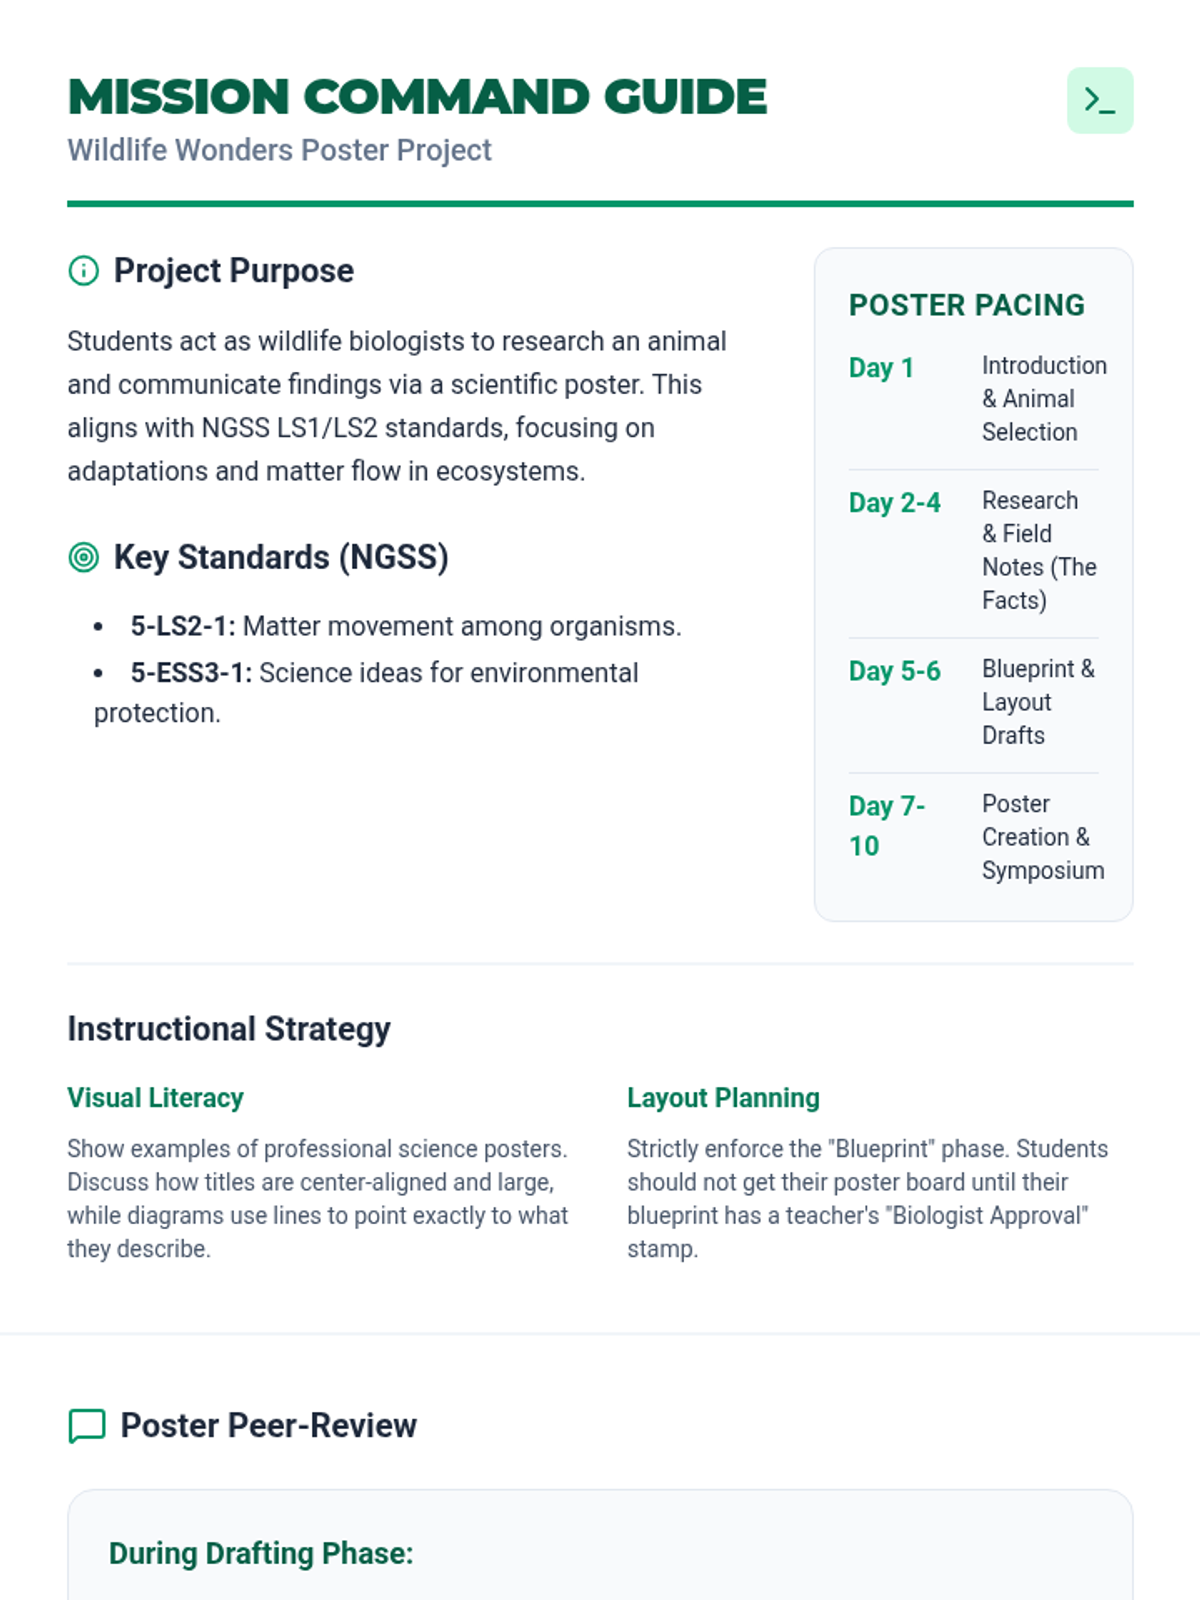
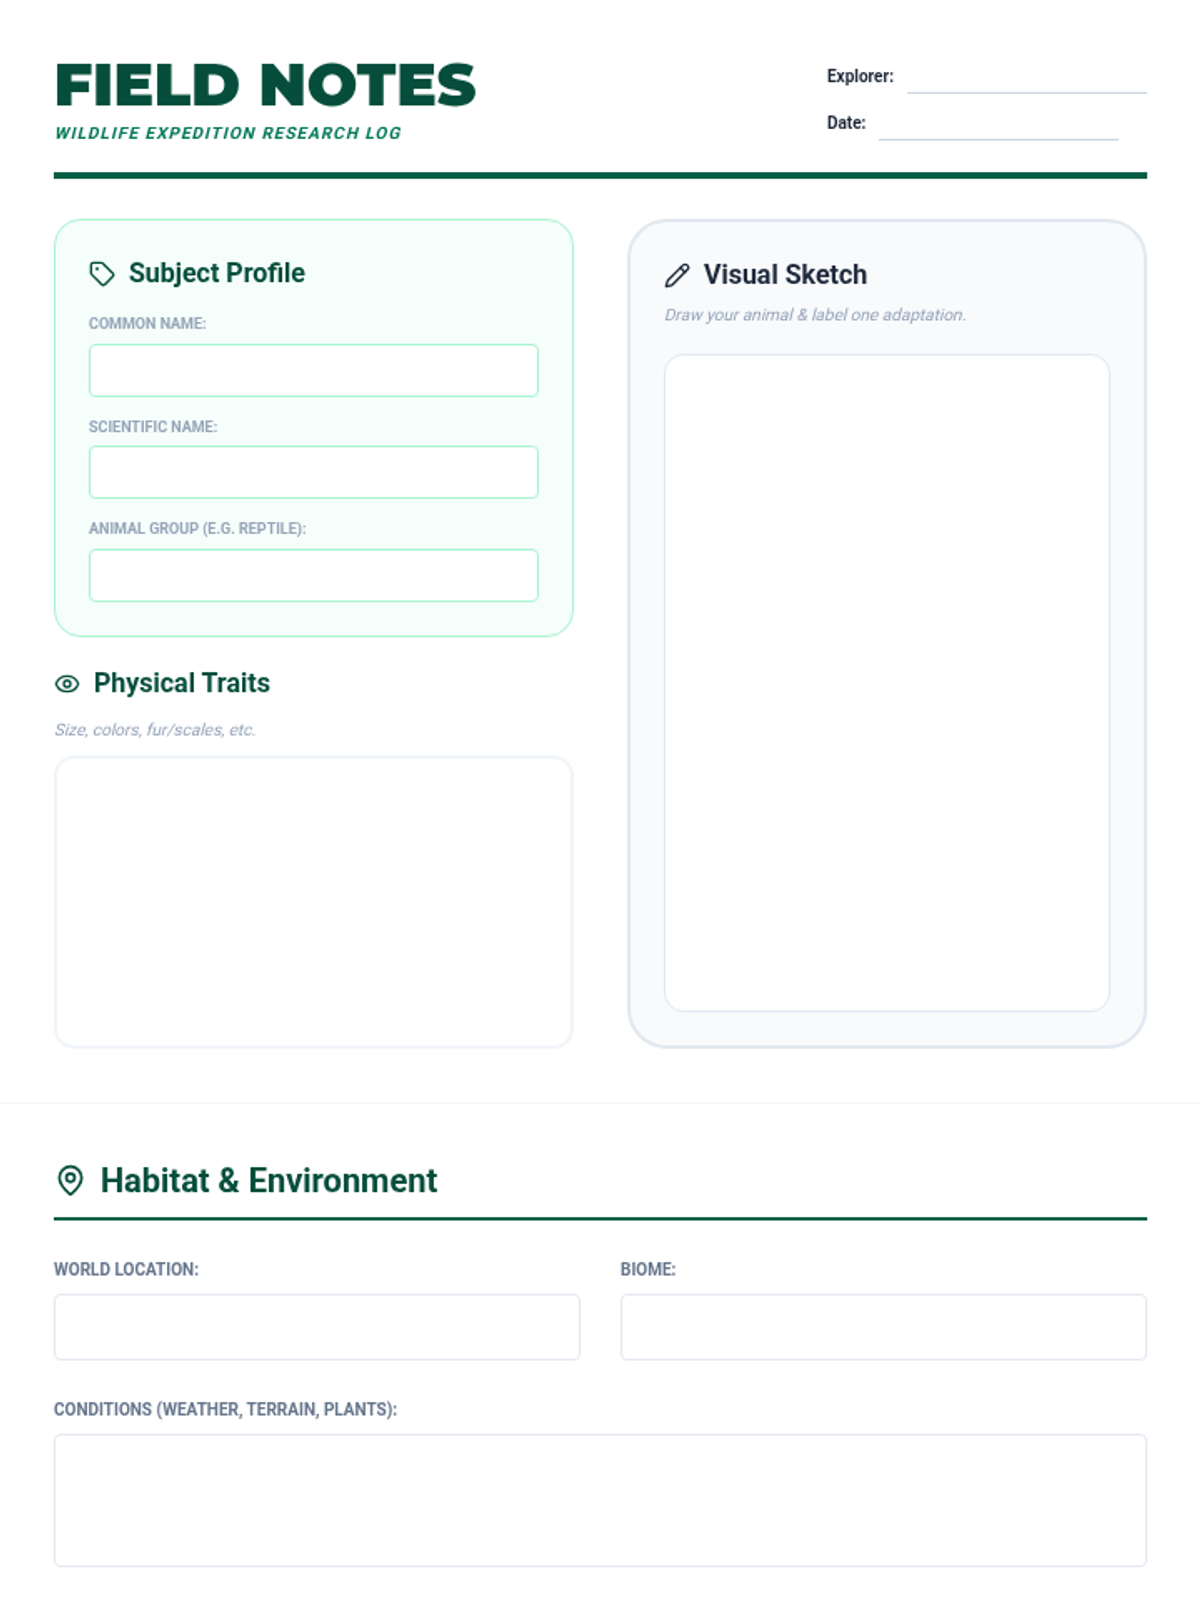
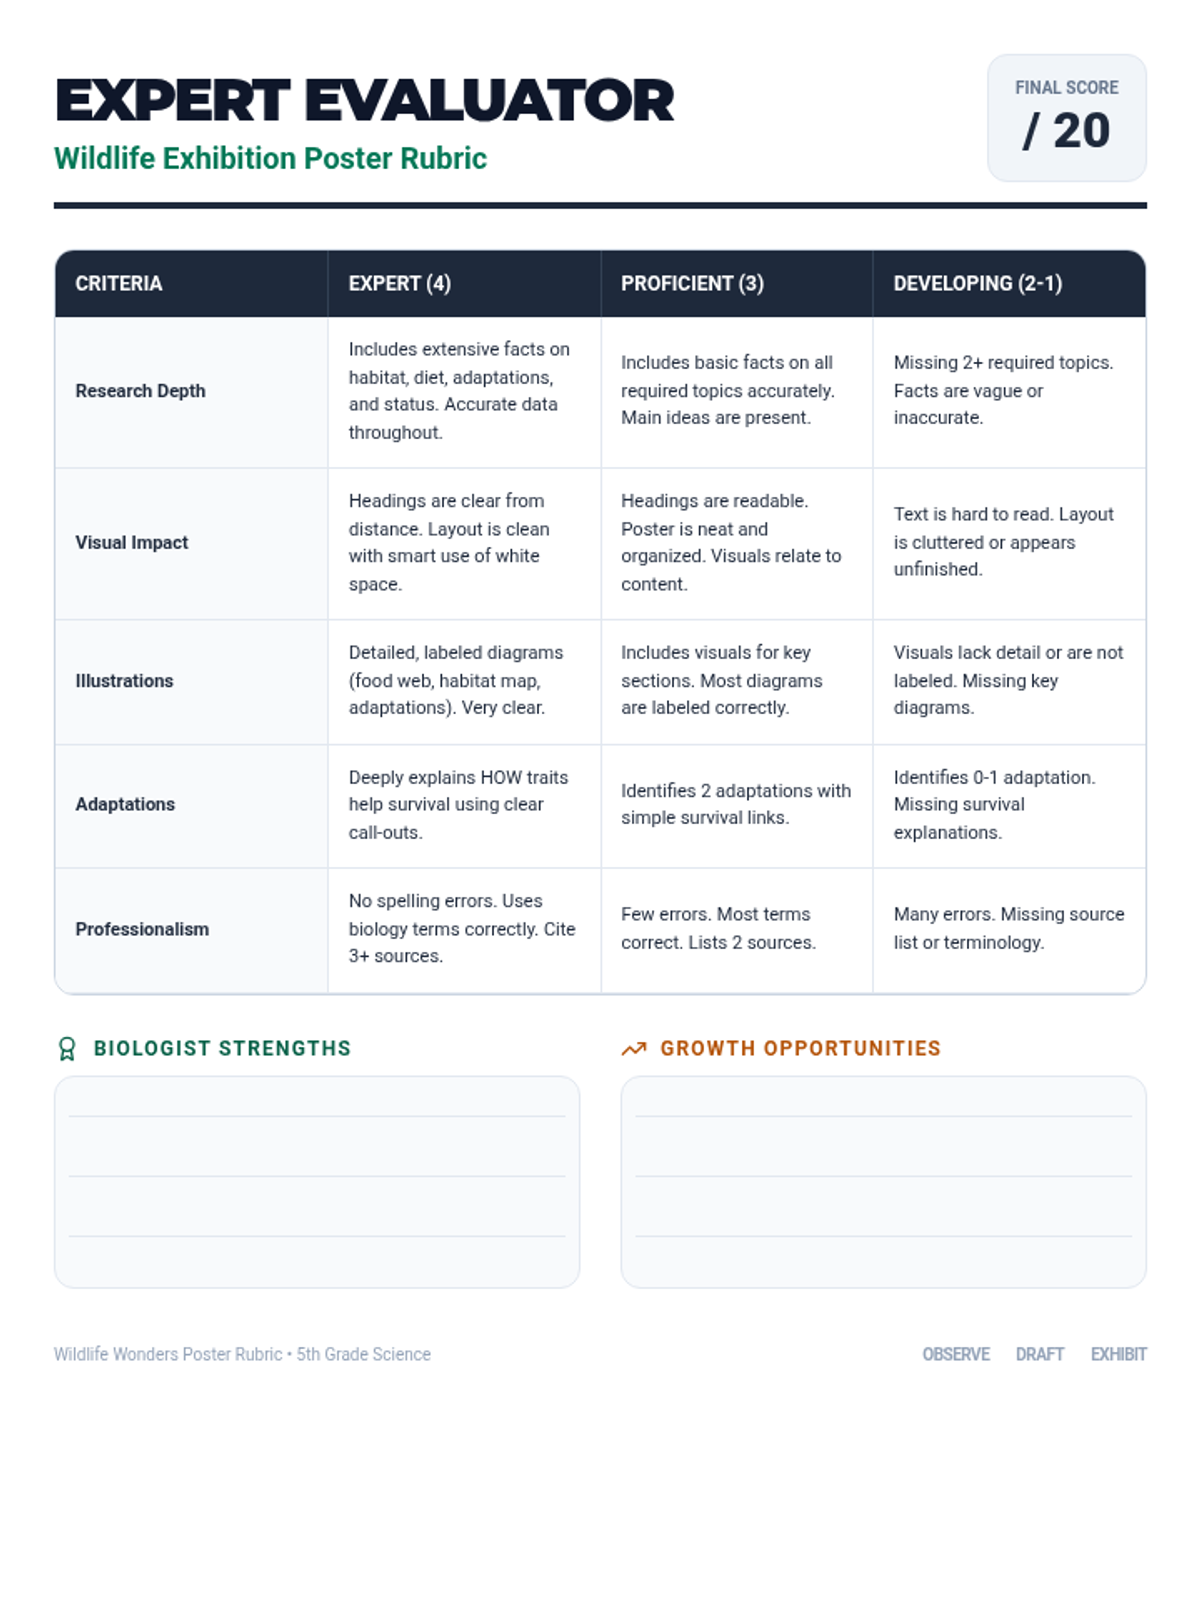
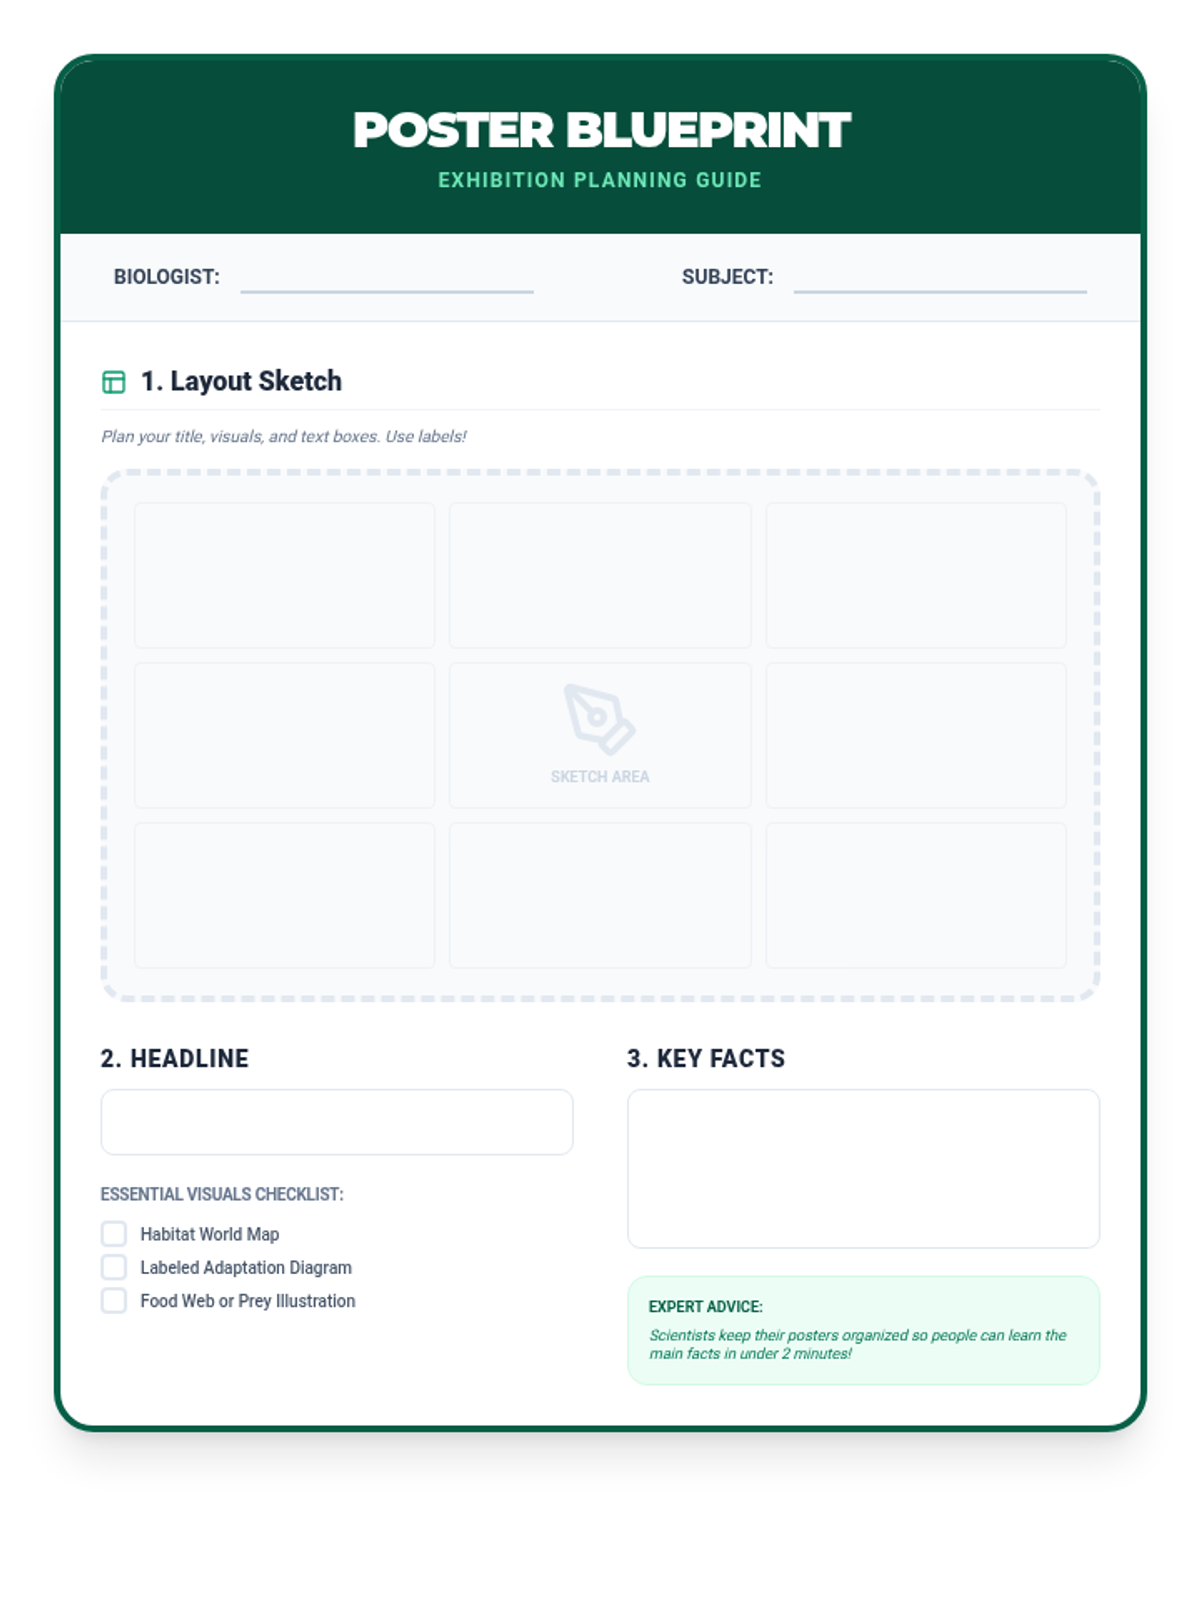
Students embark on a research journey, selecting a specific animal to study, gathering data on its biological needs and environmental role, and creating a final product to showcase their expertise.
A phonics lesson for 2nd graders focusing on the diphthongs 'ou' and 'ow', specifically emphasizing the /au/ sound as in 'cloud' and 'town'.
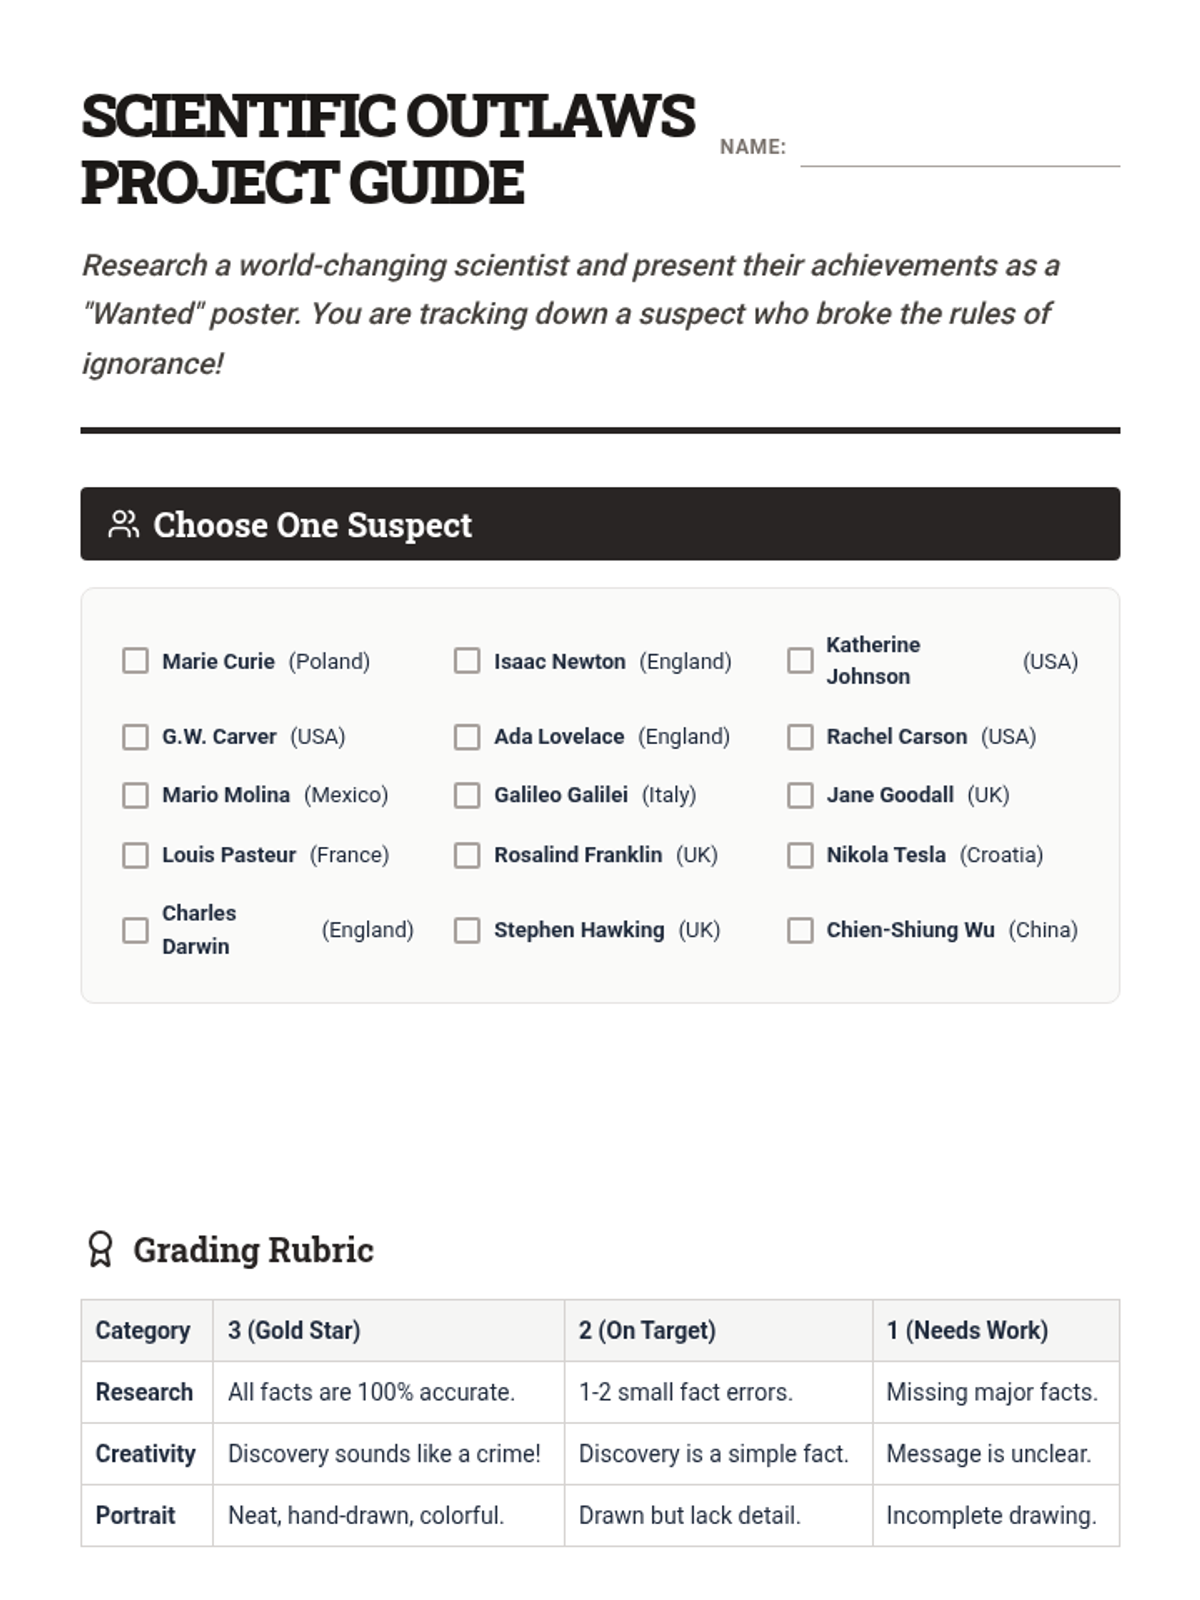
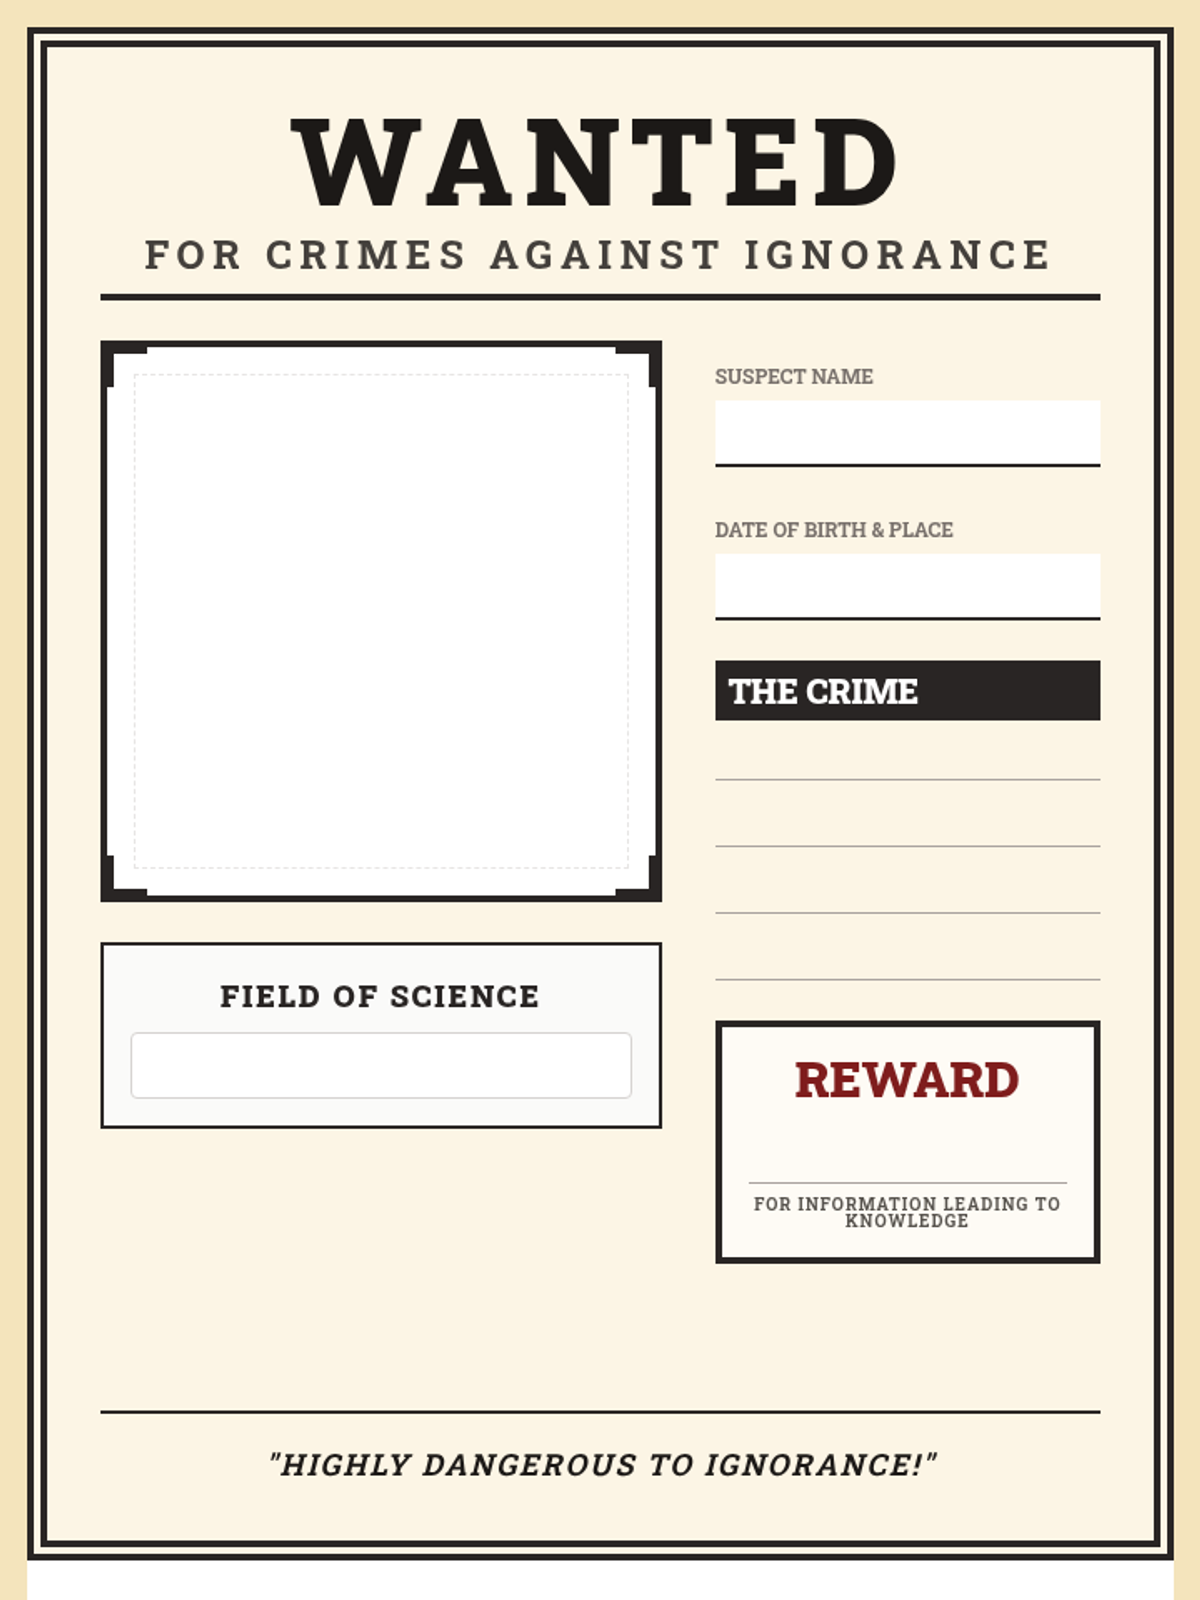
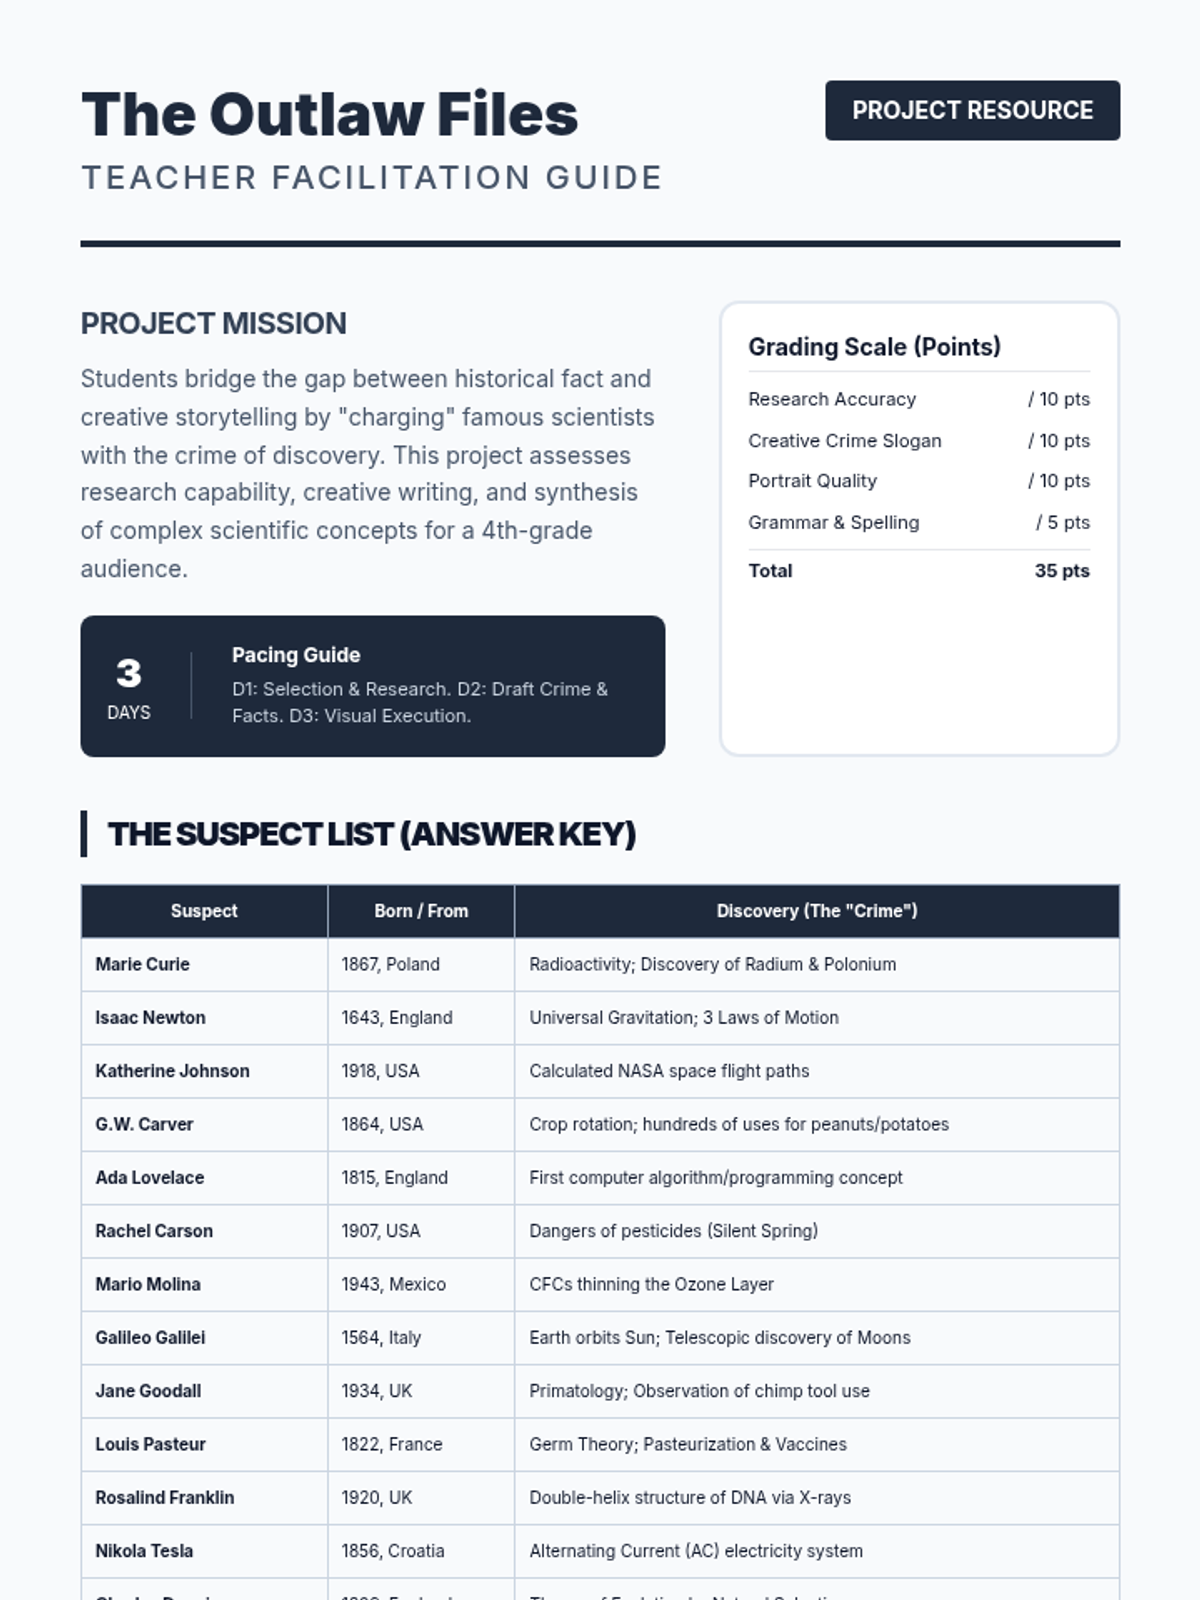
A creative science project where 4th-grade students research famous scientists and design 'Wanted' posters to showcase their discoveries as 'crimes against ignorance.'
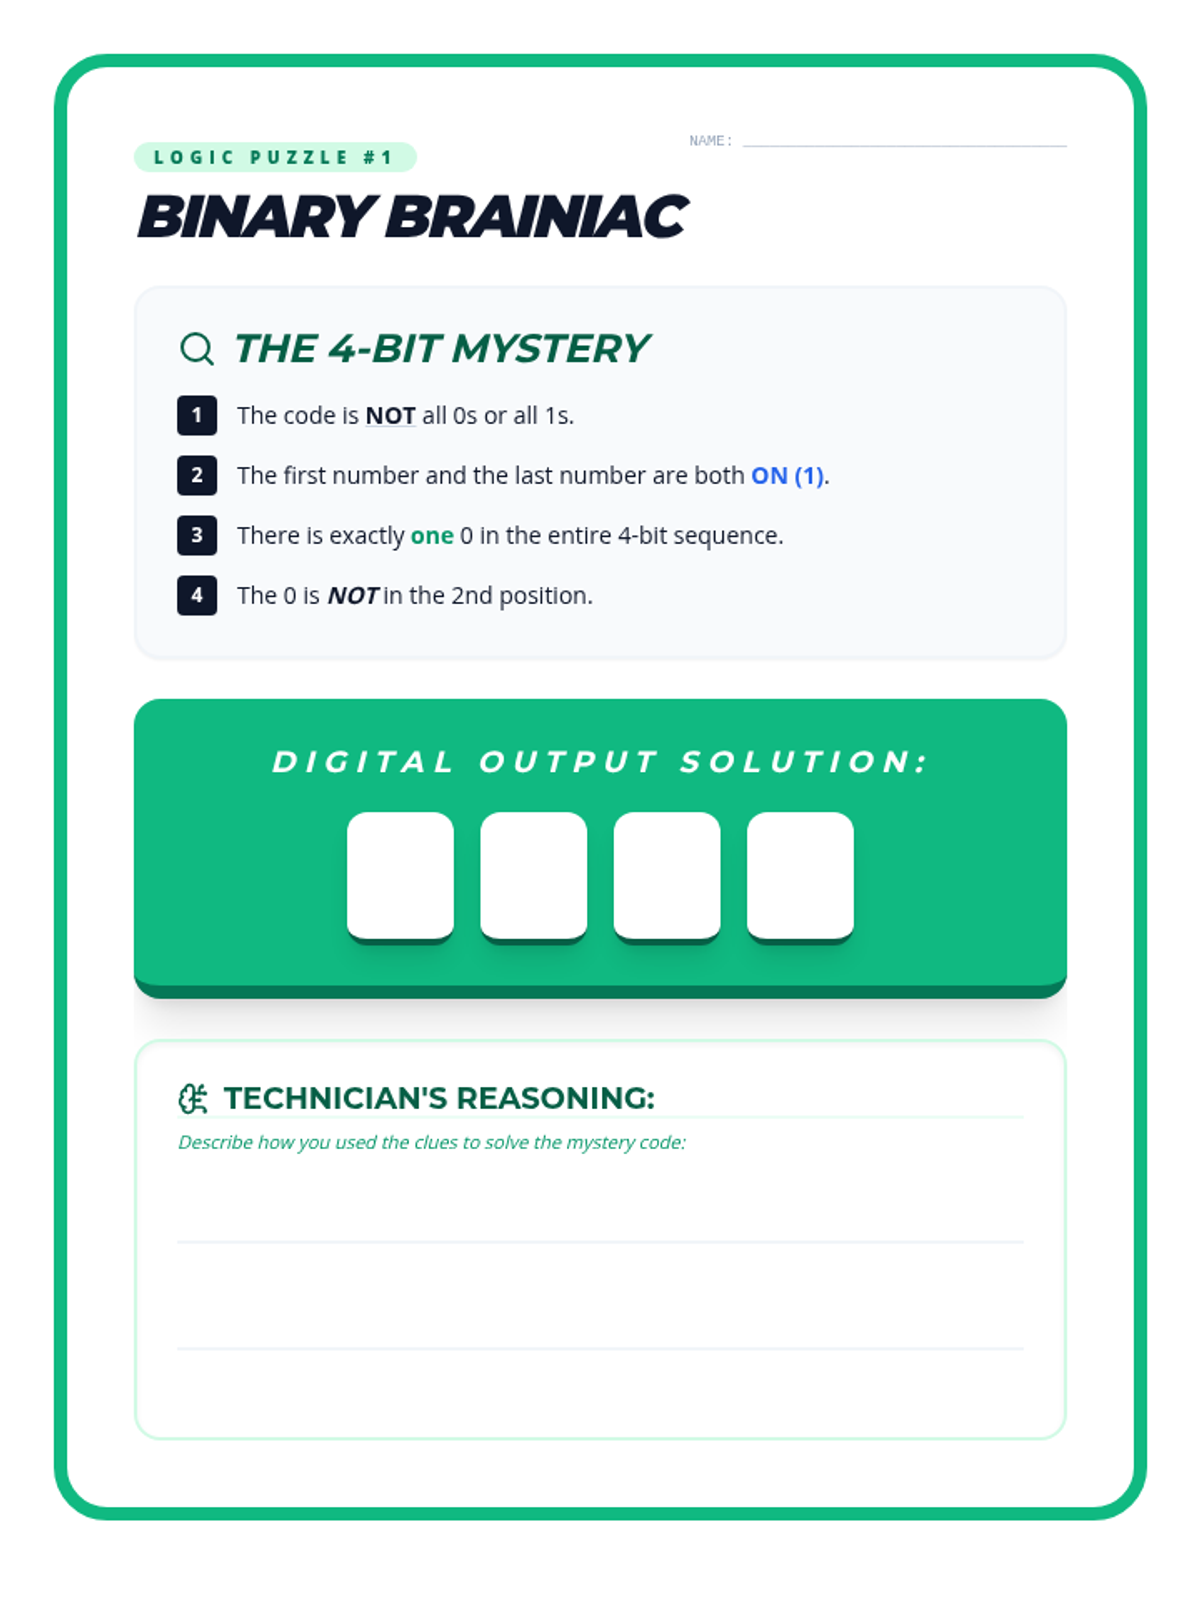
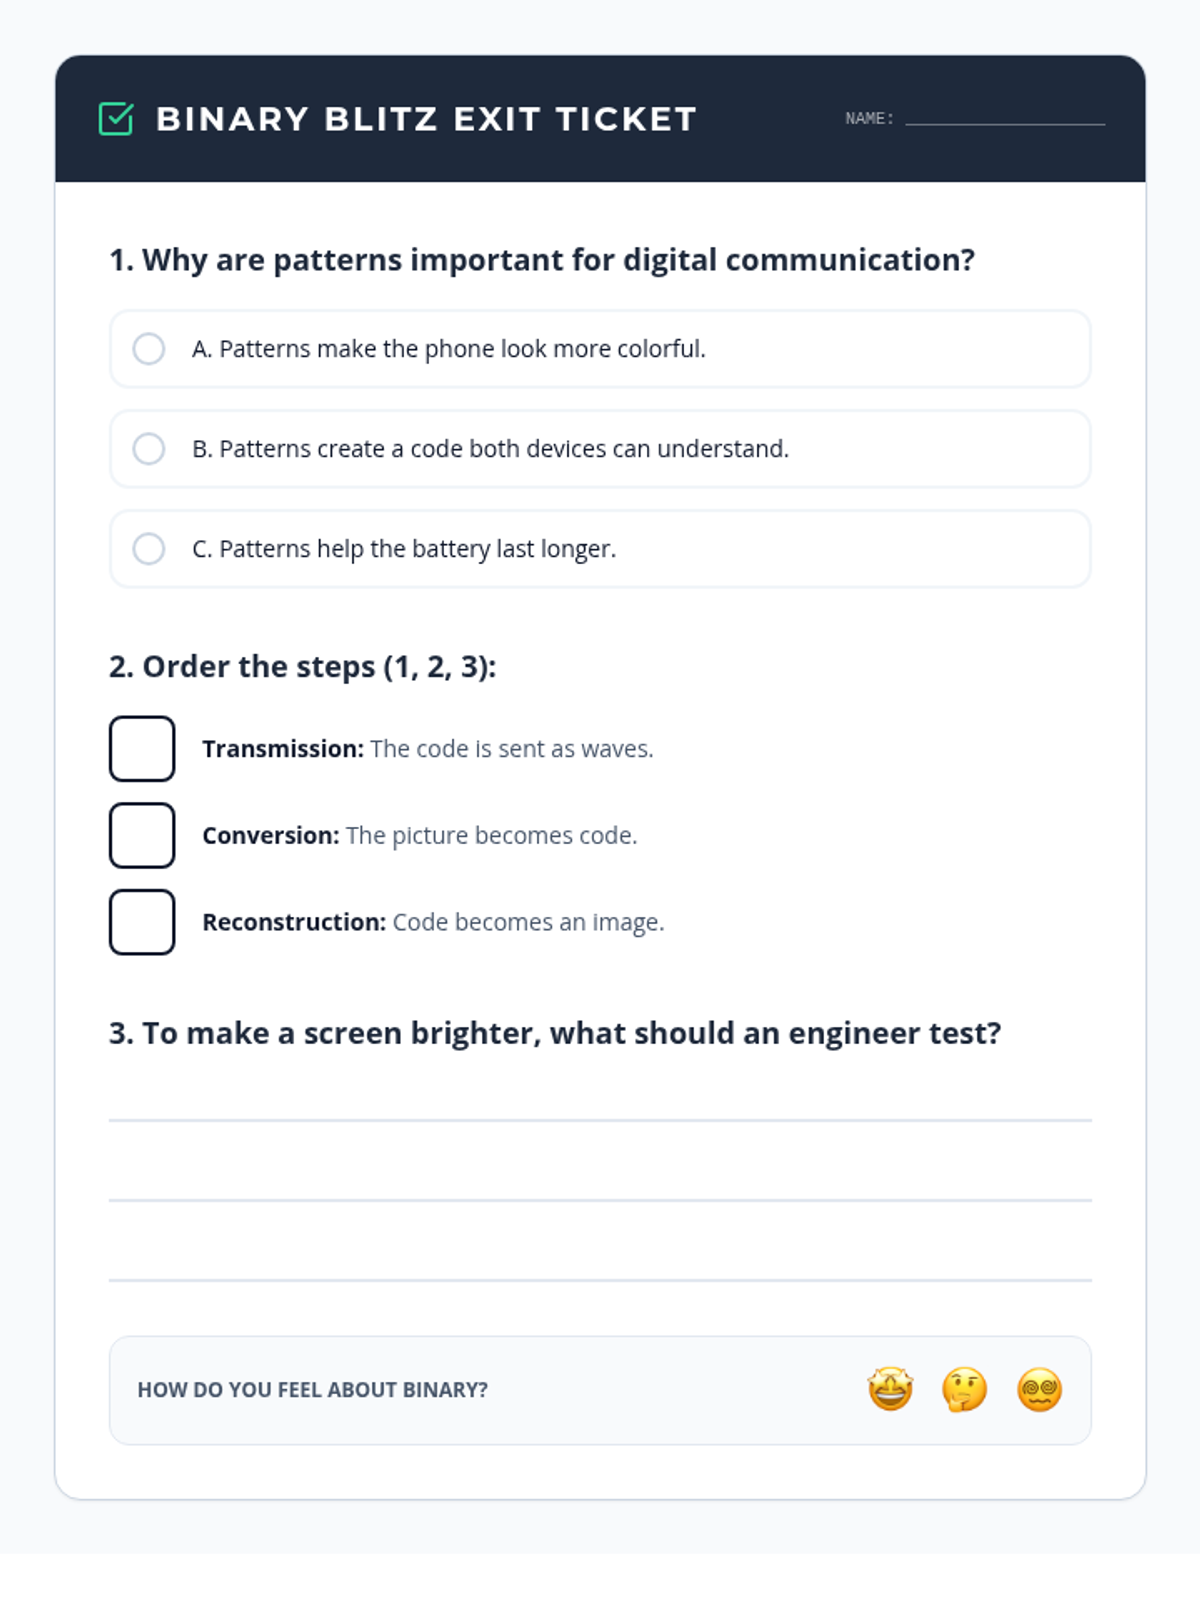
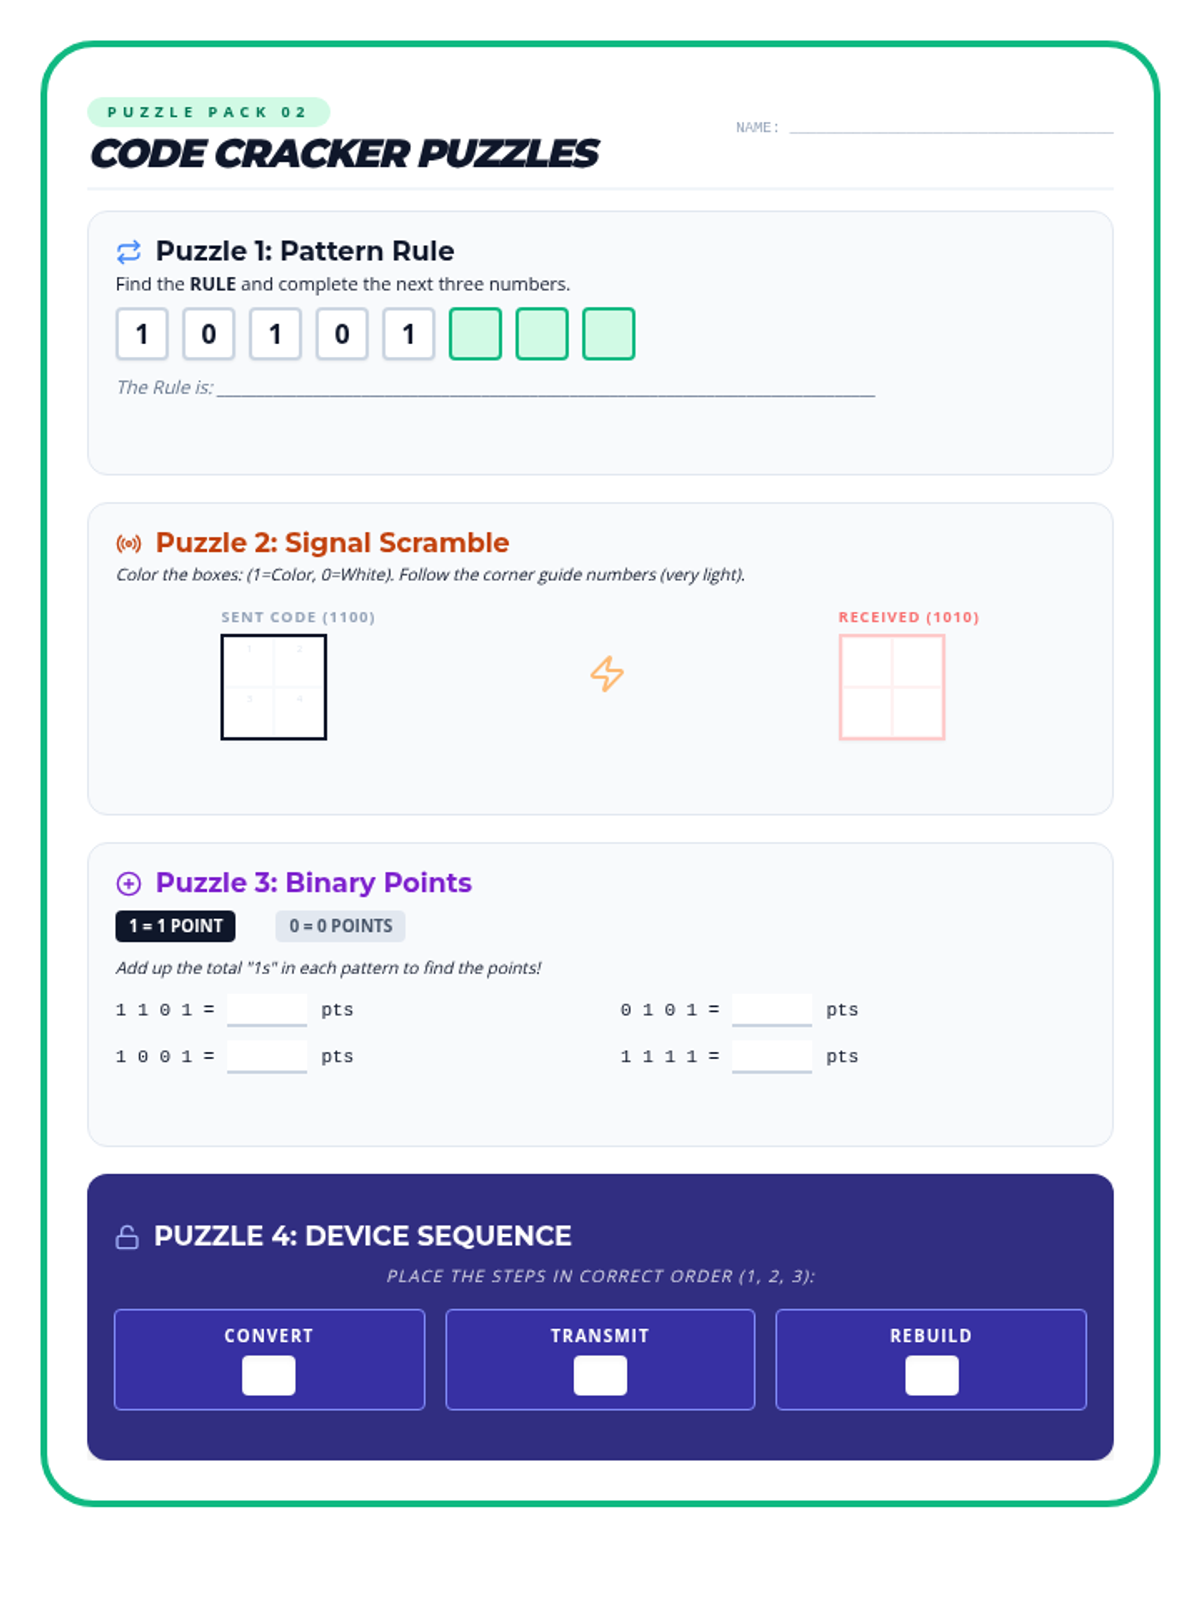
Synthesize learning with logic puzzles and a final assessment of binary concepts and communication patterns.
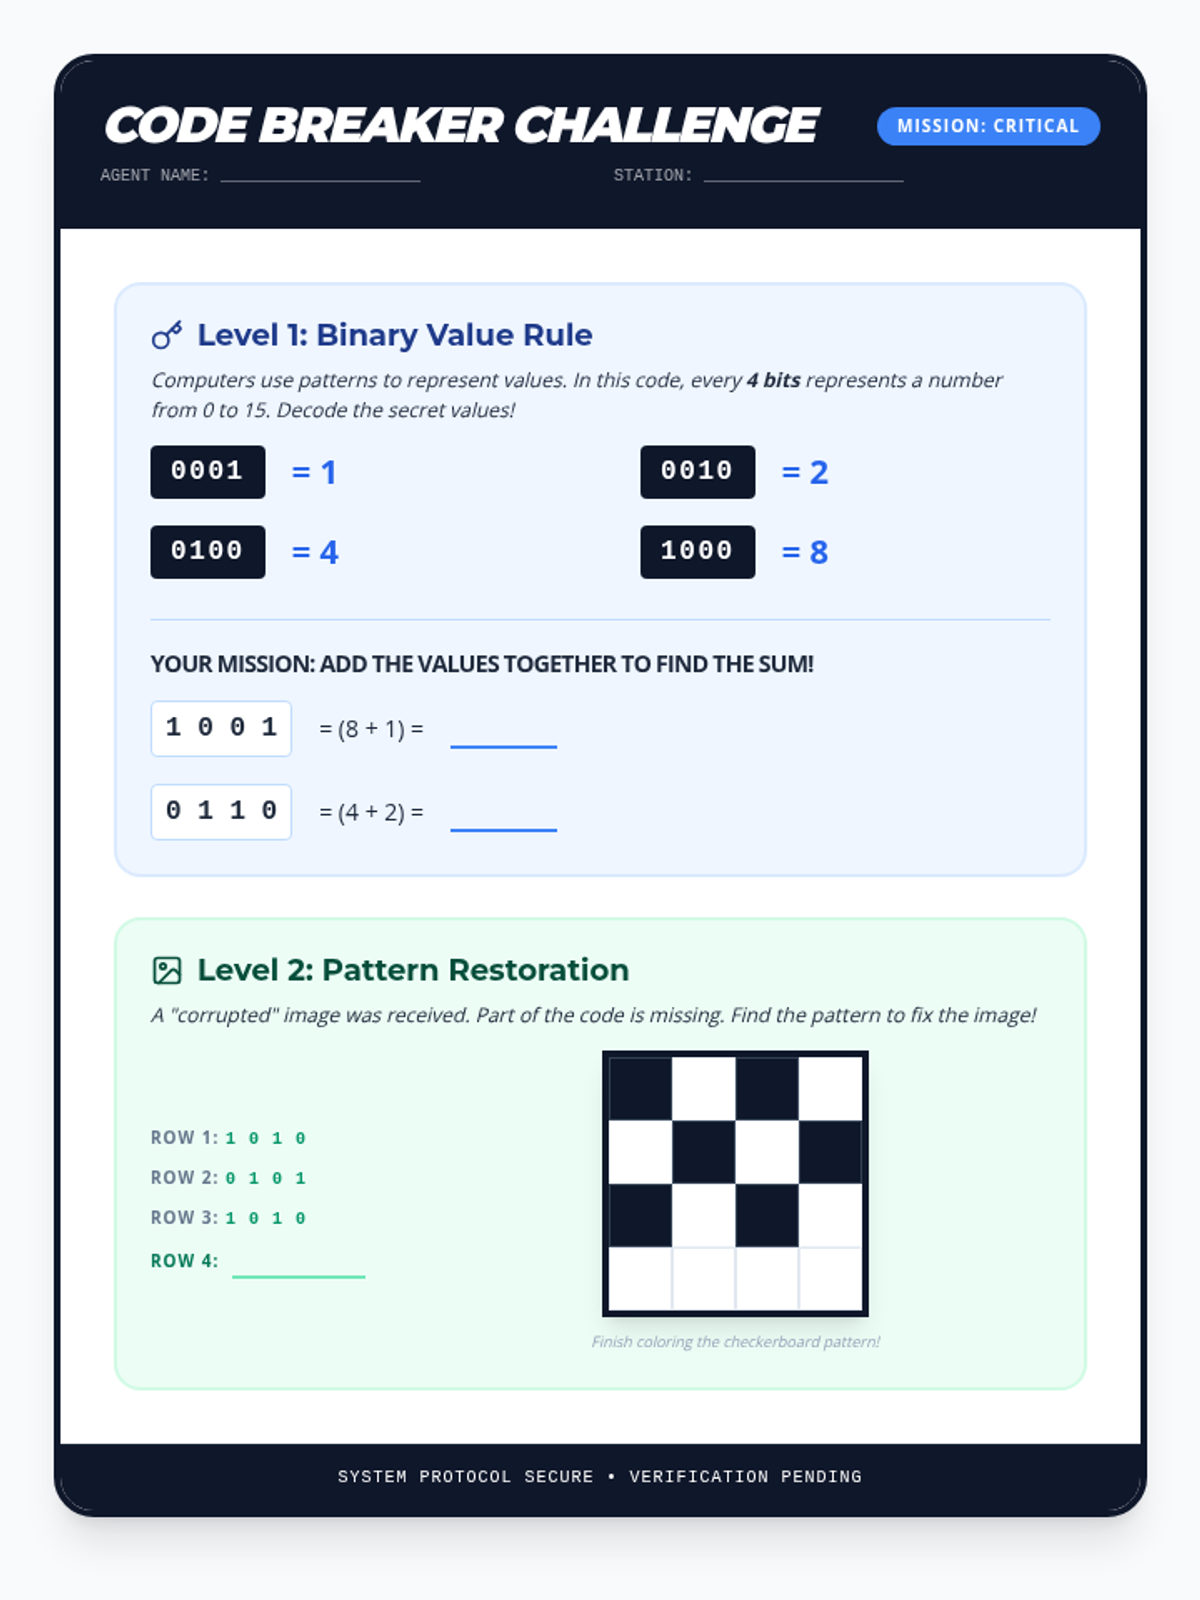
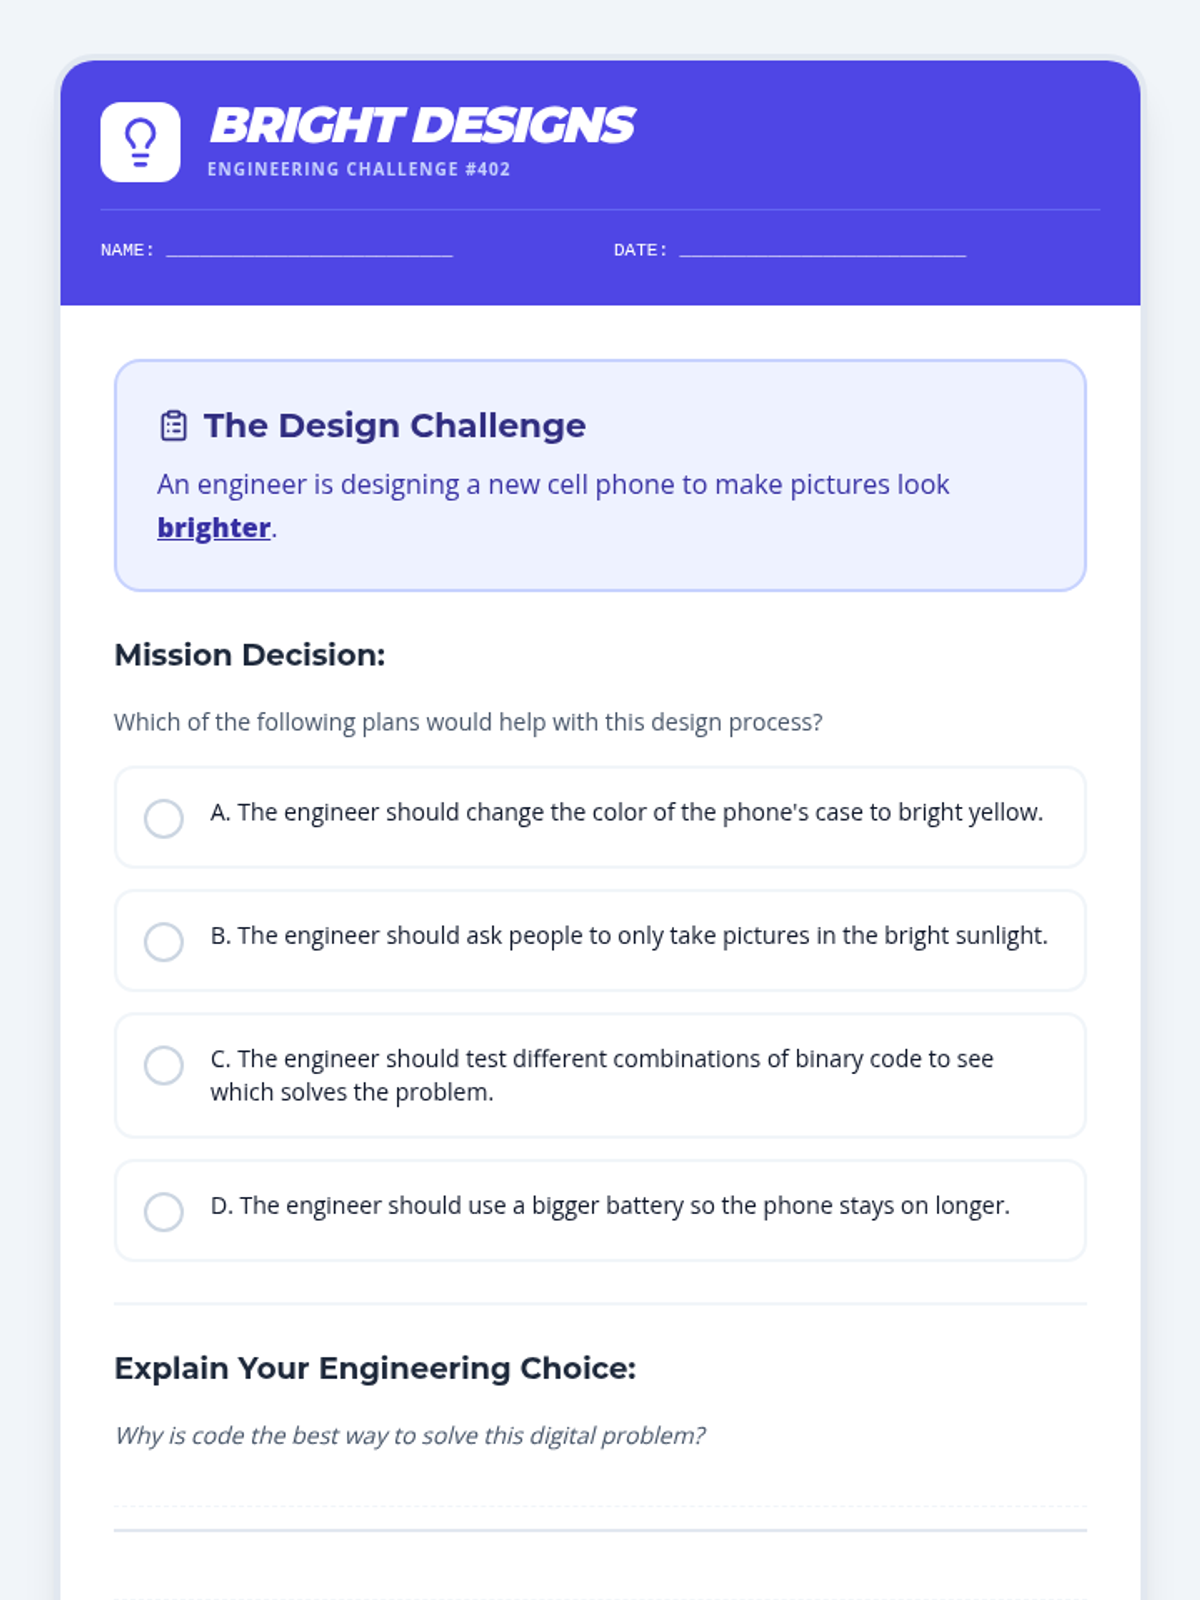
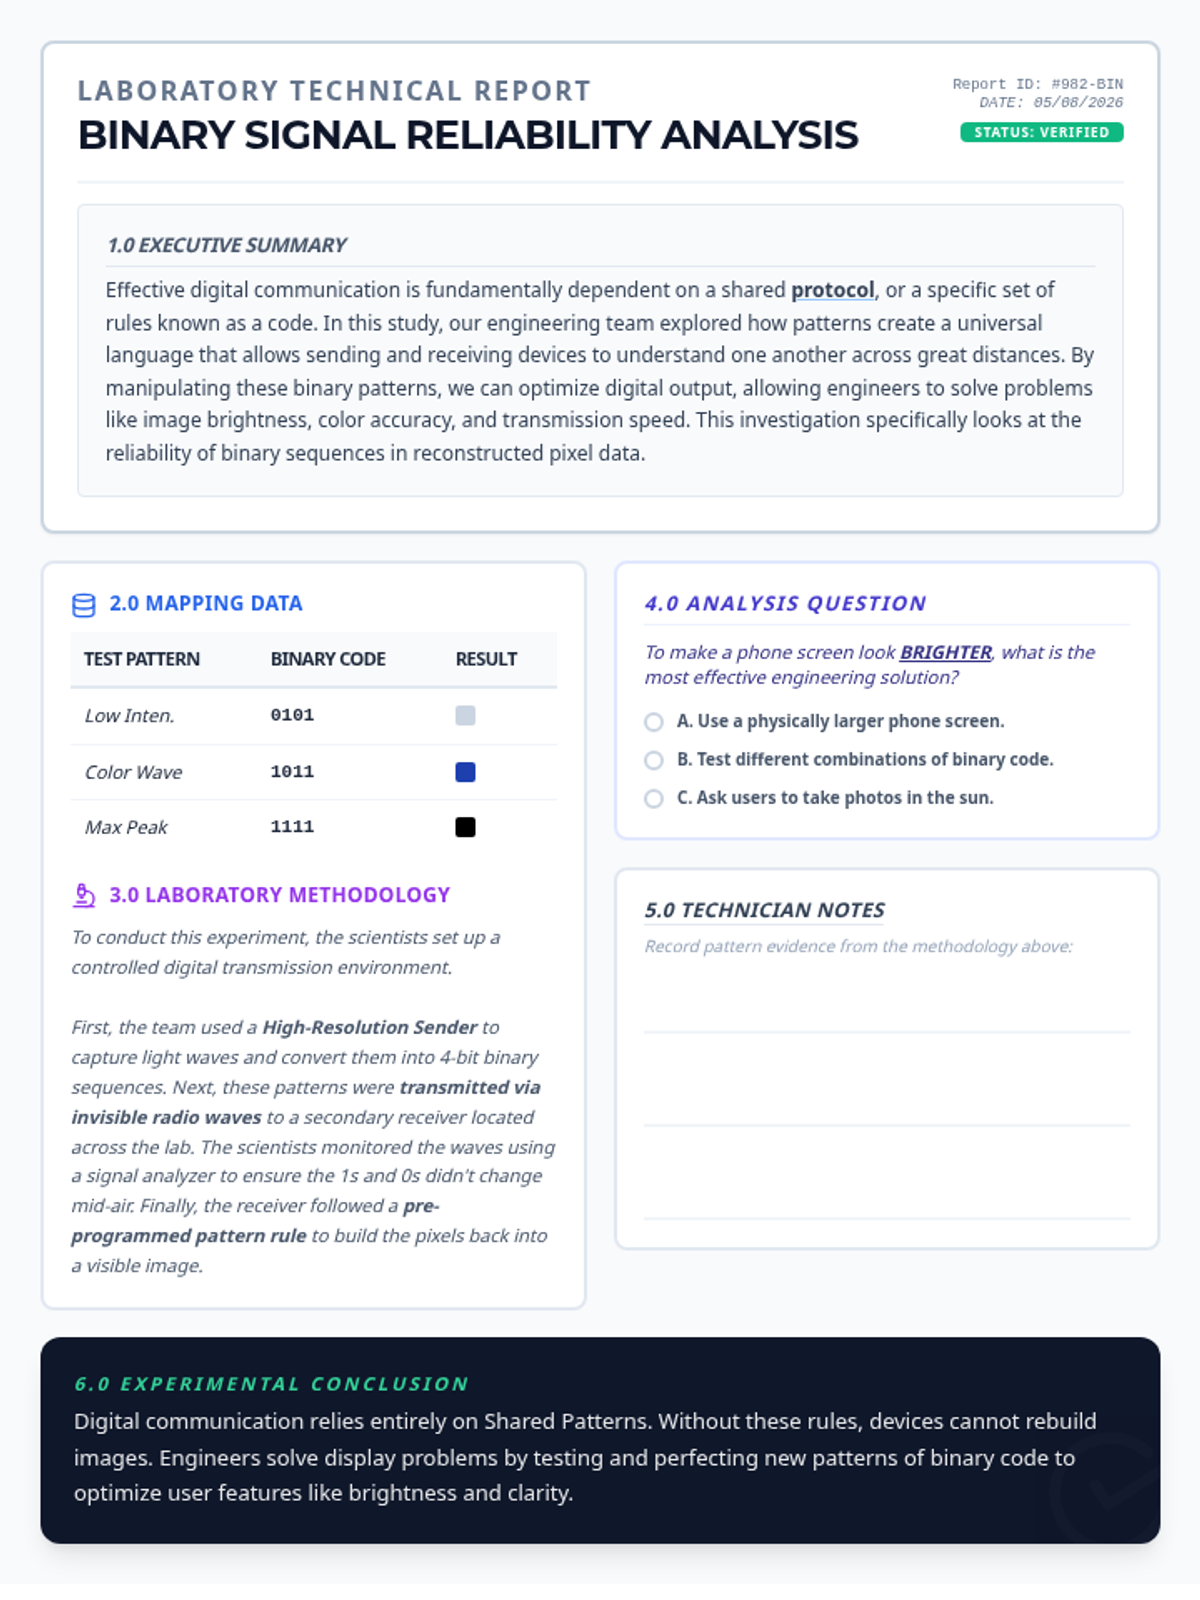
Apply binary knowledge to engineering challenges, specifically focusing on how code can be used to improve digital images.
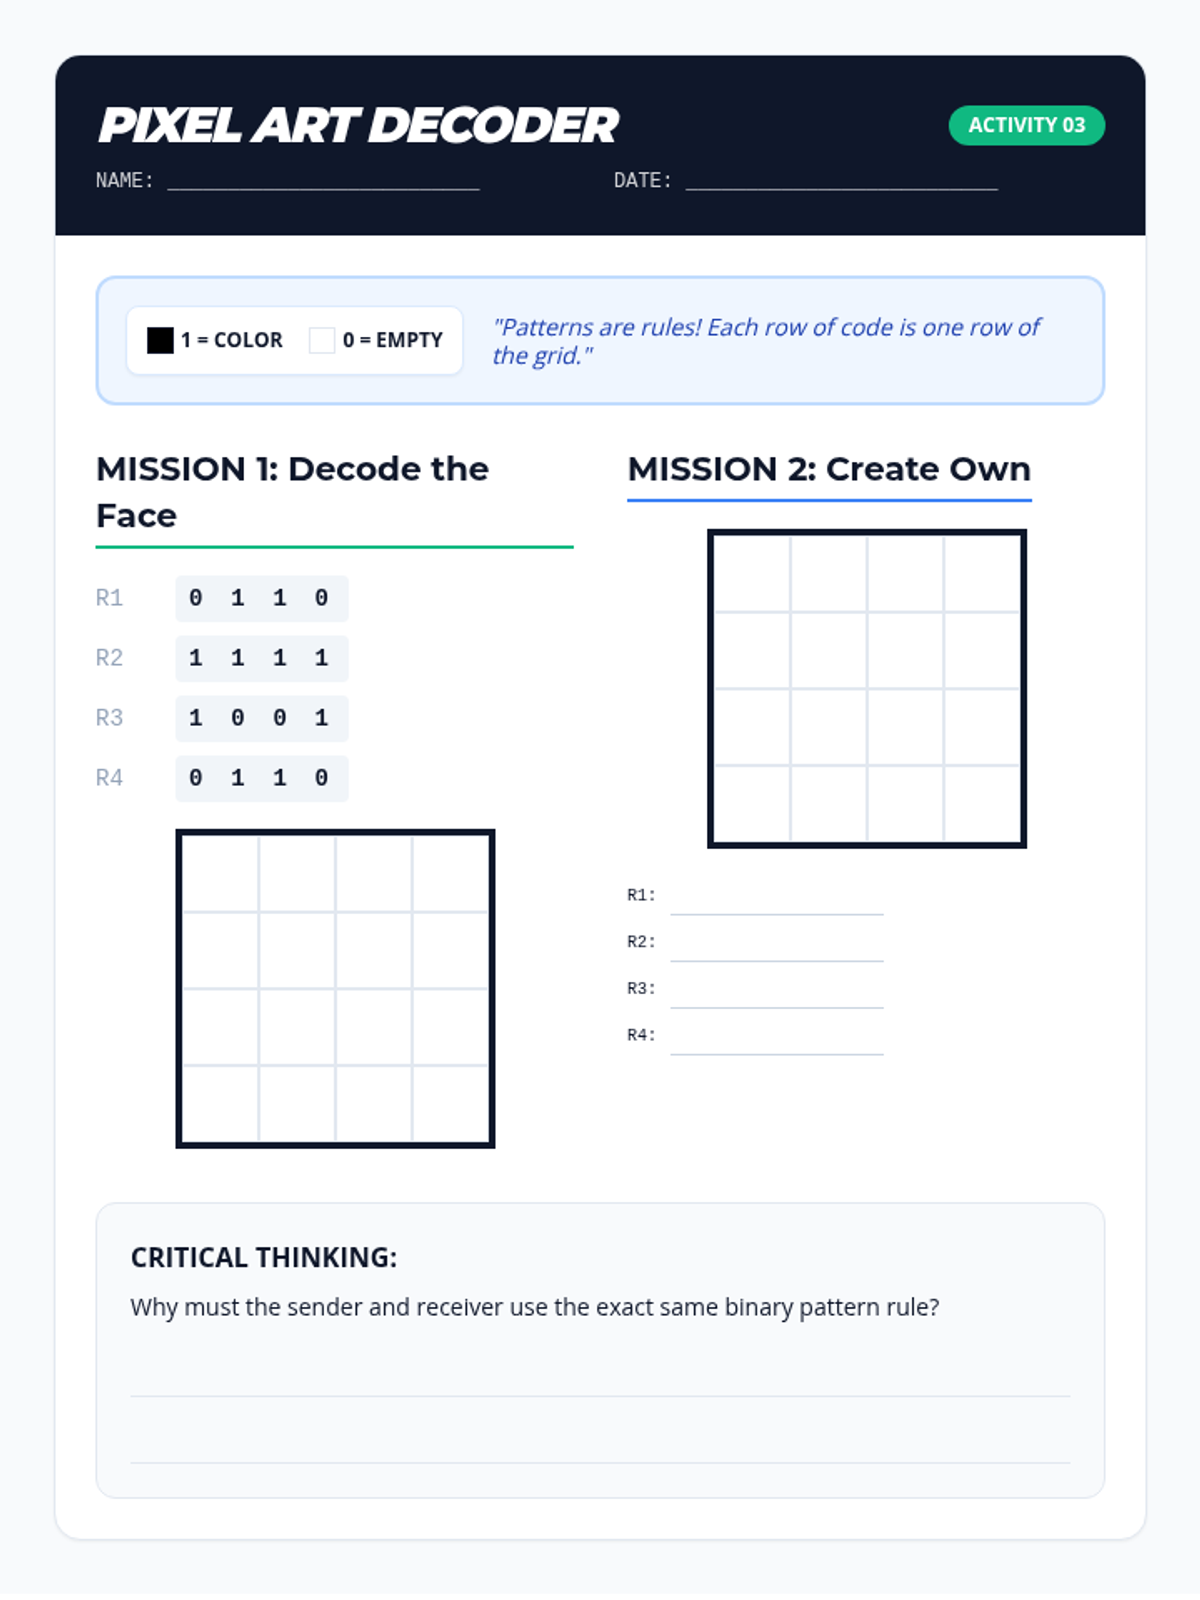
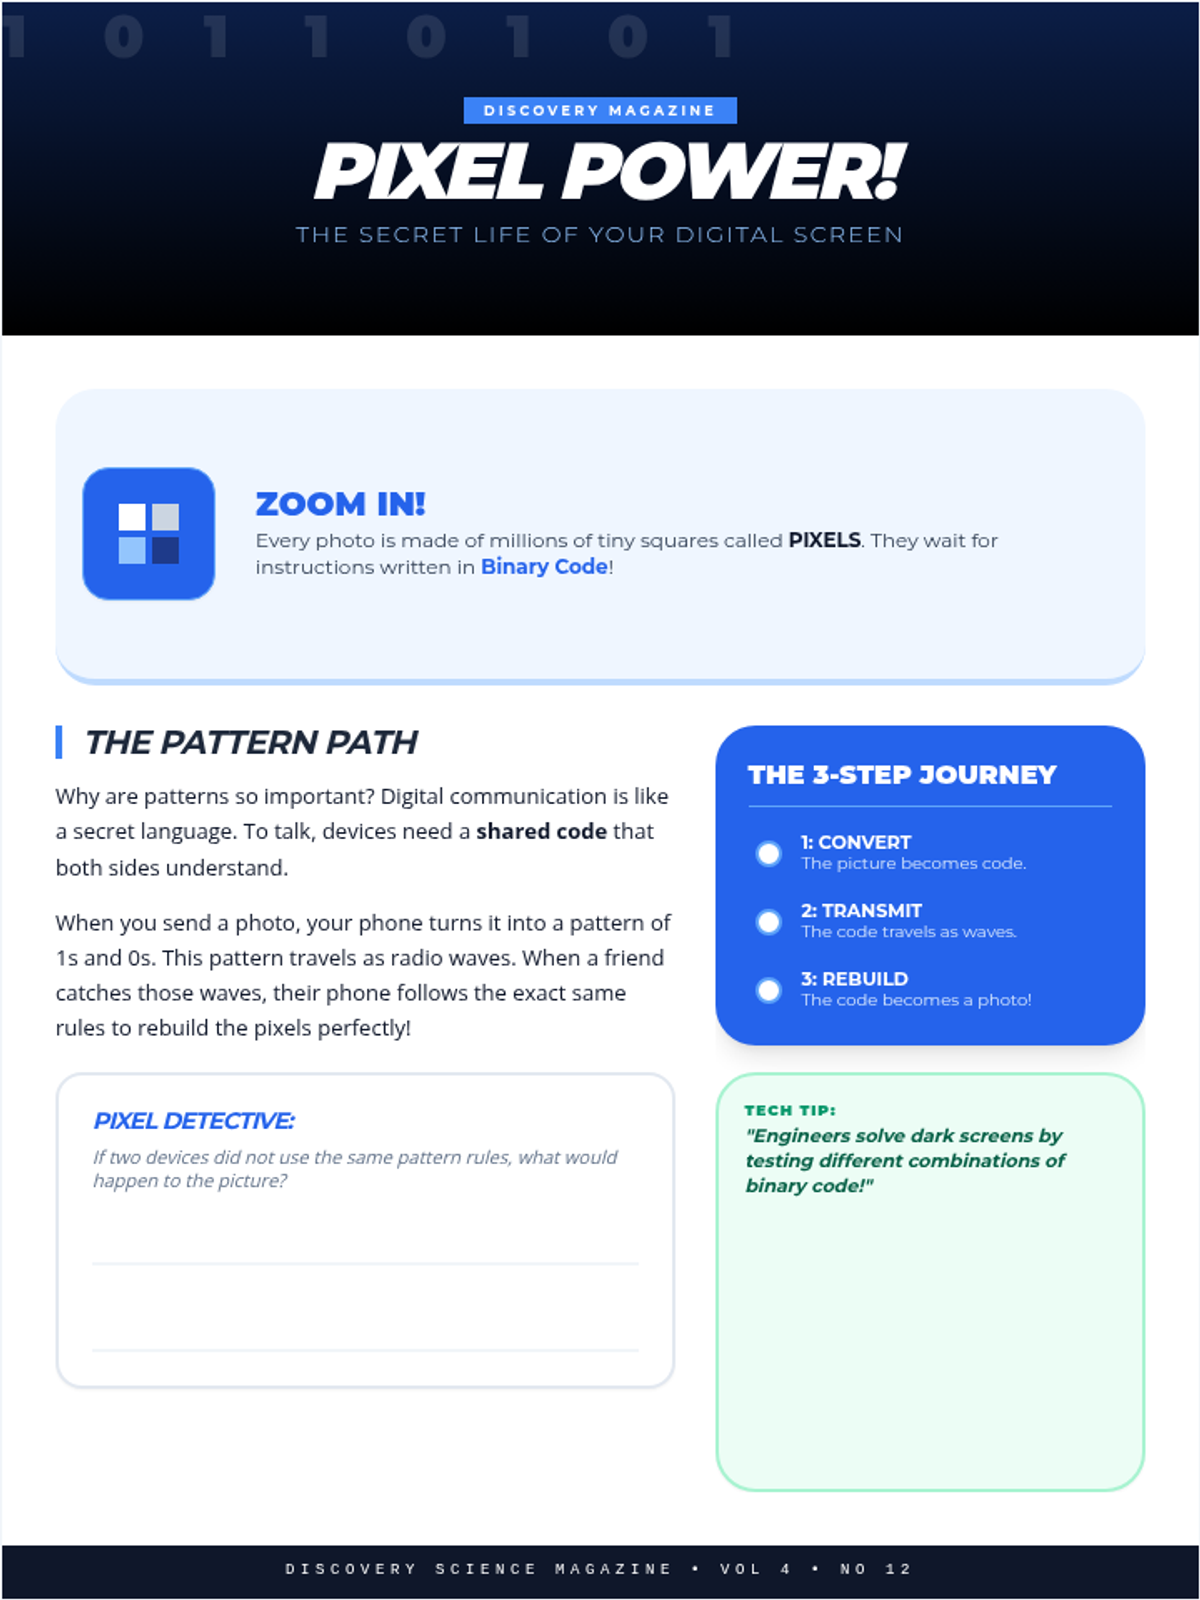
Discover how images are converted into binary code, transmitted, and reconstructed by receiving devices through hands-on pixel art.
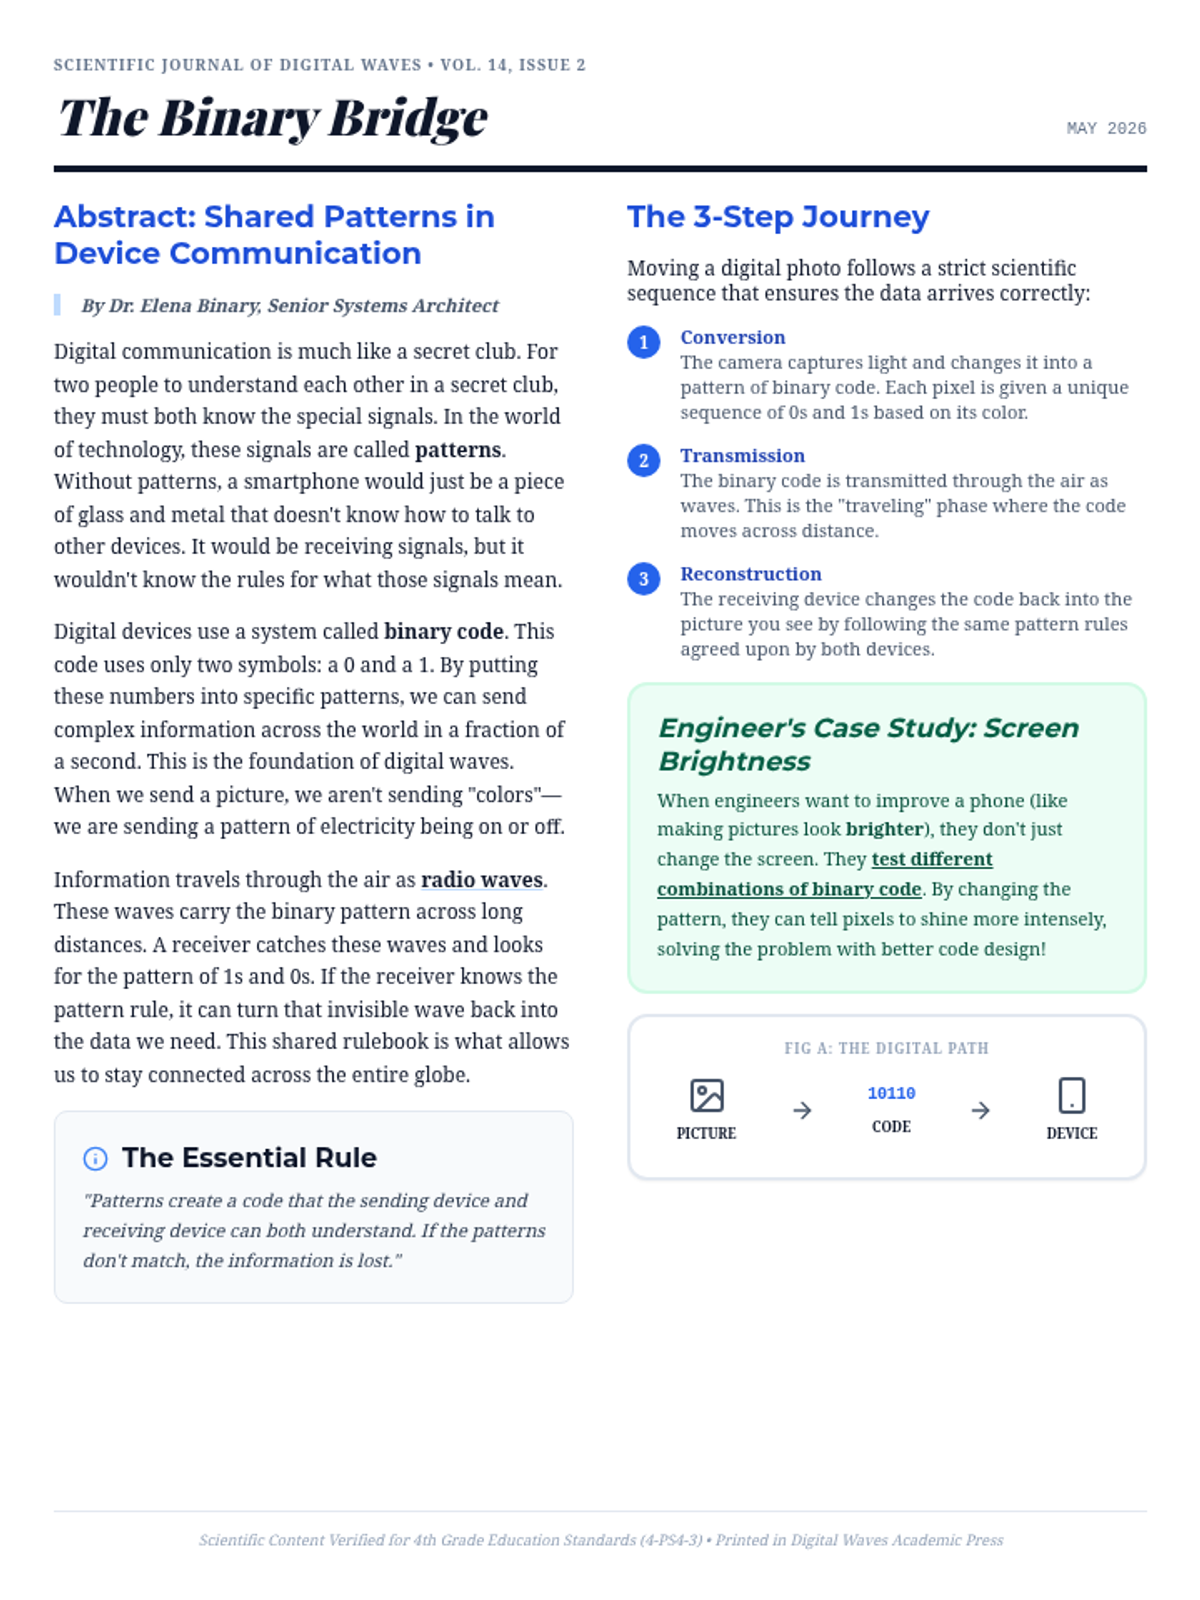
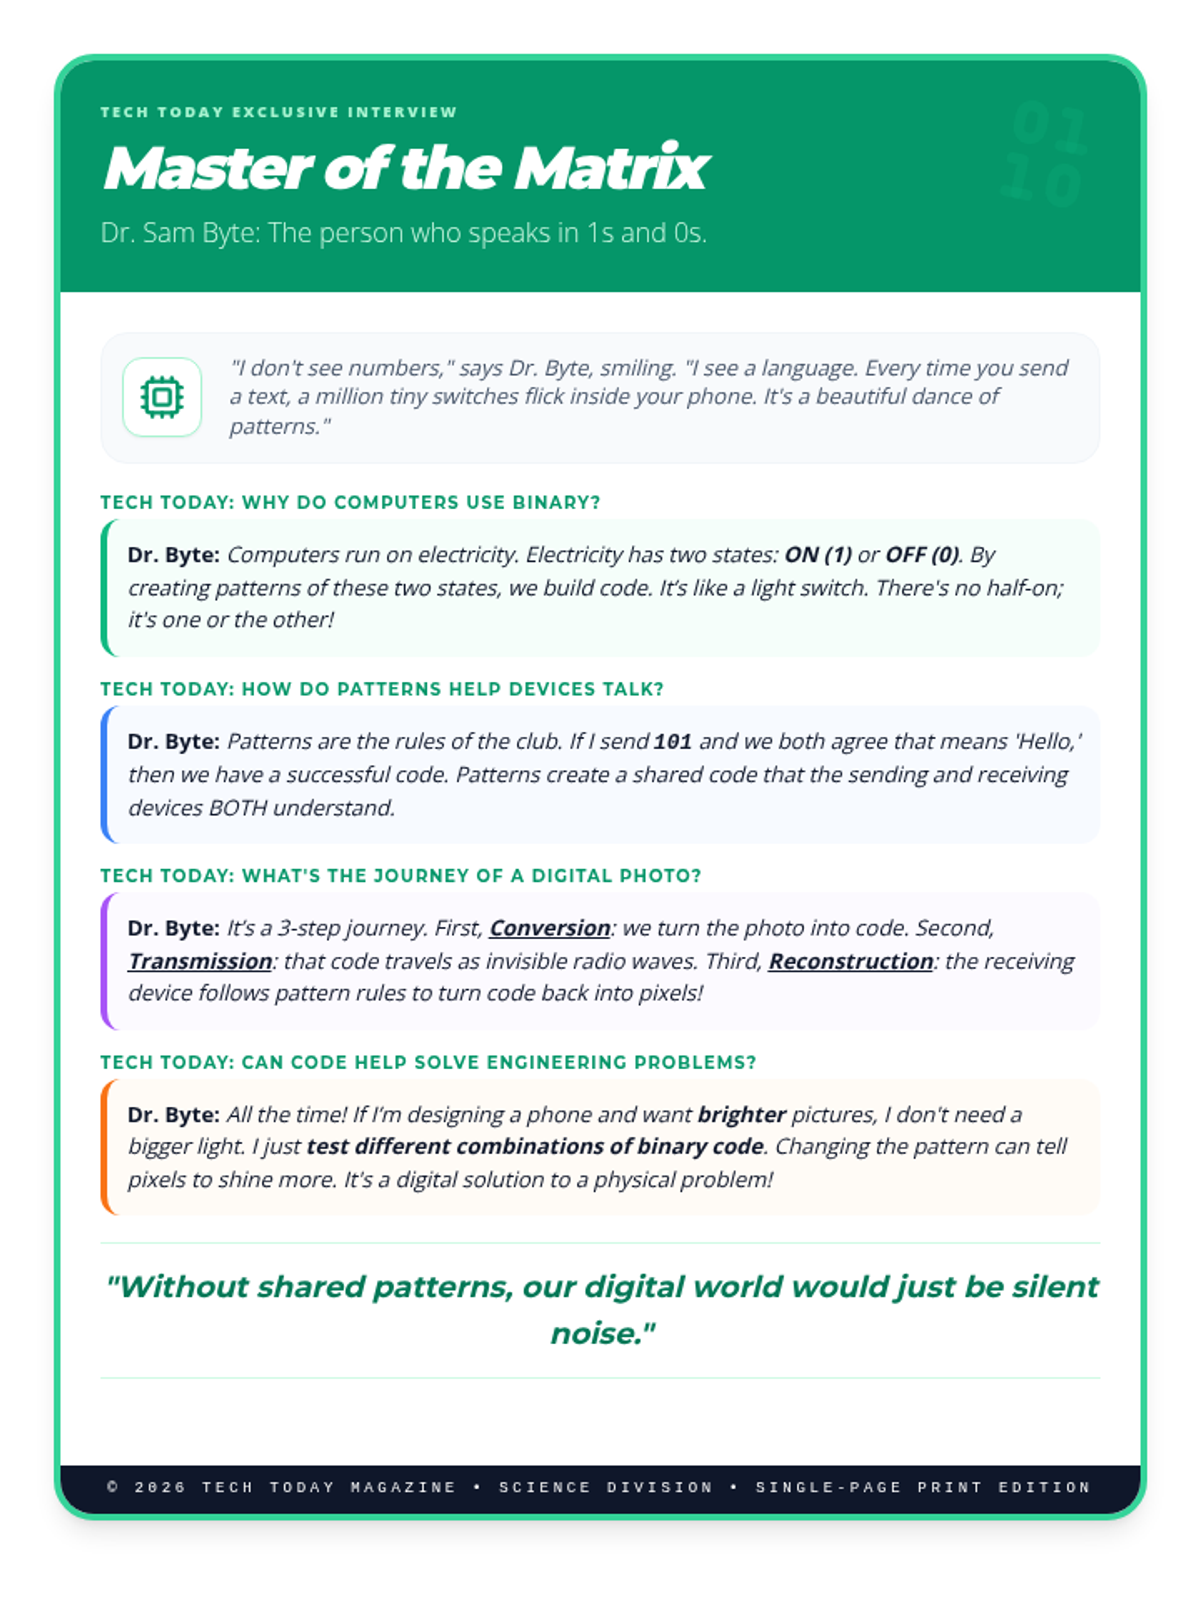
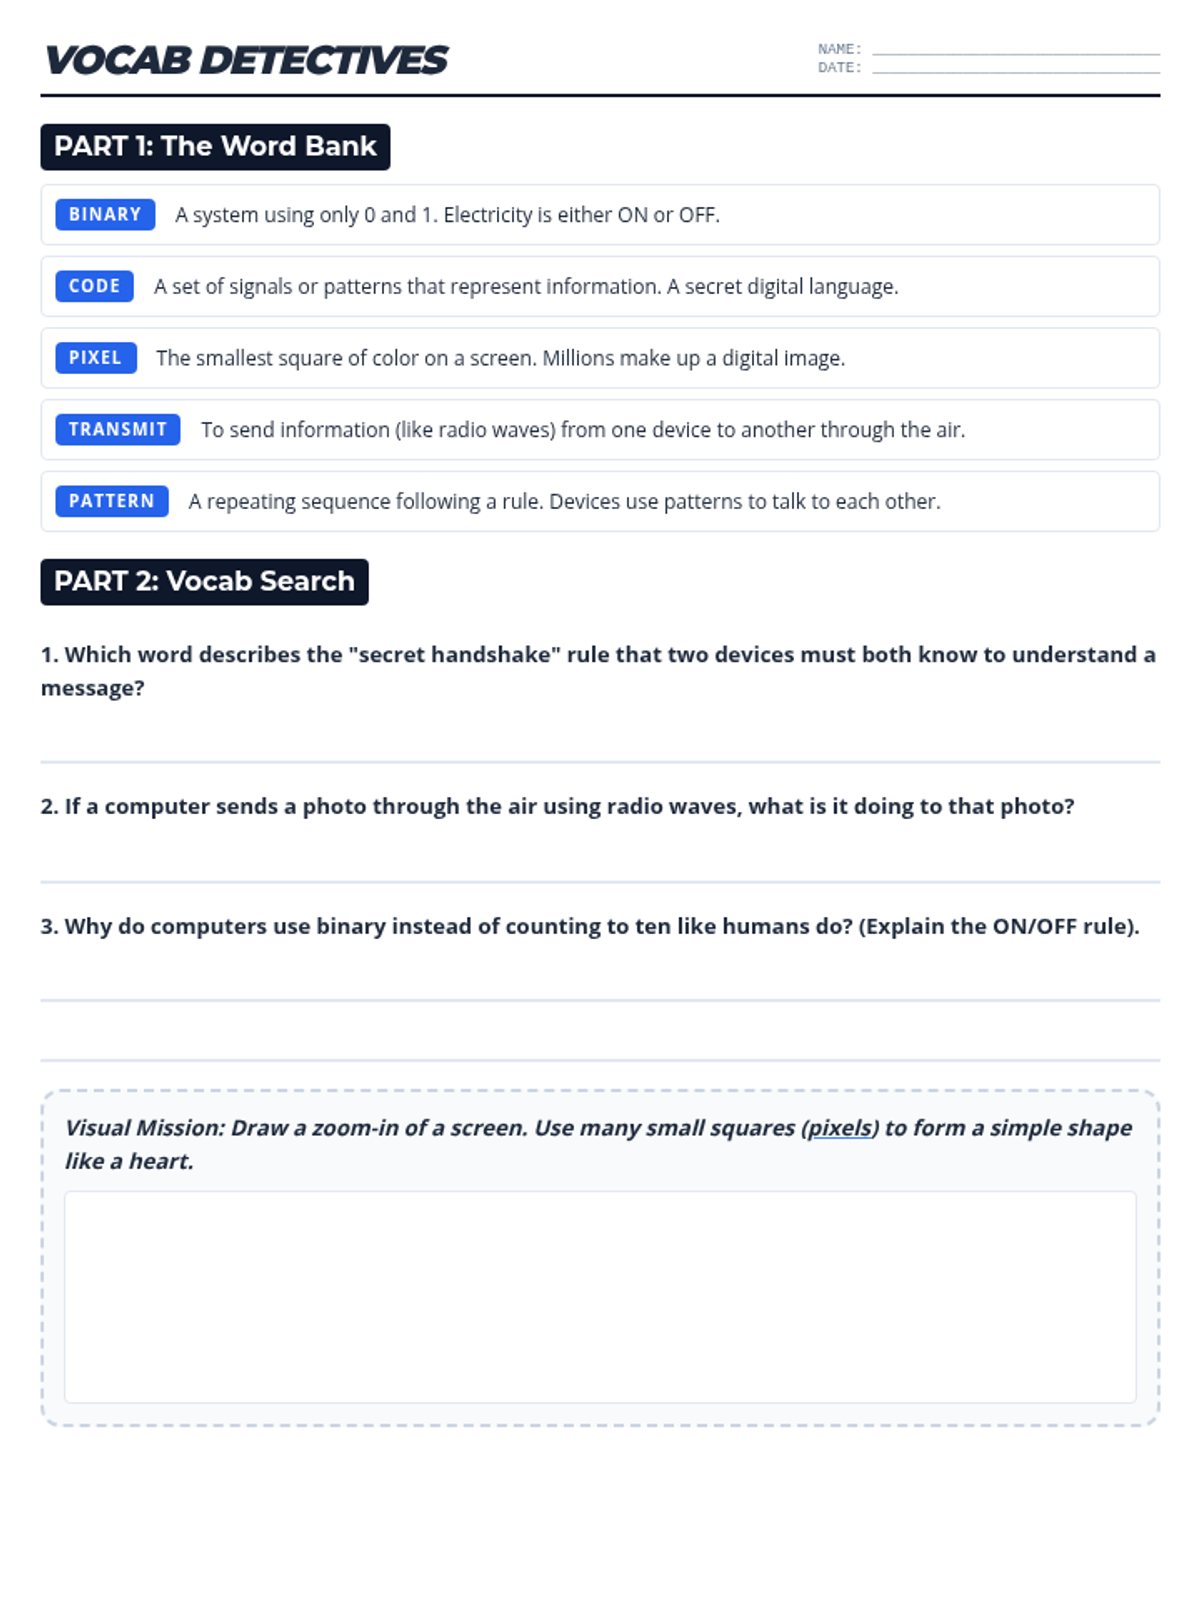
Explore binary code through various scientific reading formats, focusing on how devices use patterns to talk to each other.
Introduce students to the concept of patterns as a means of communication and define key vocabulary for the week.