Data representation, distributions, and statistical variability using sampling and inference techniques. Integrates probability models, compound events, bivariate patterns, and linear models to guide data-driven decision making.
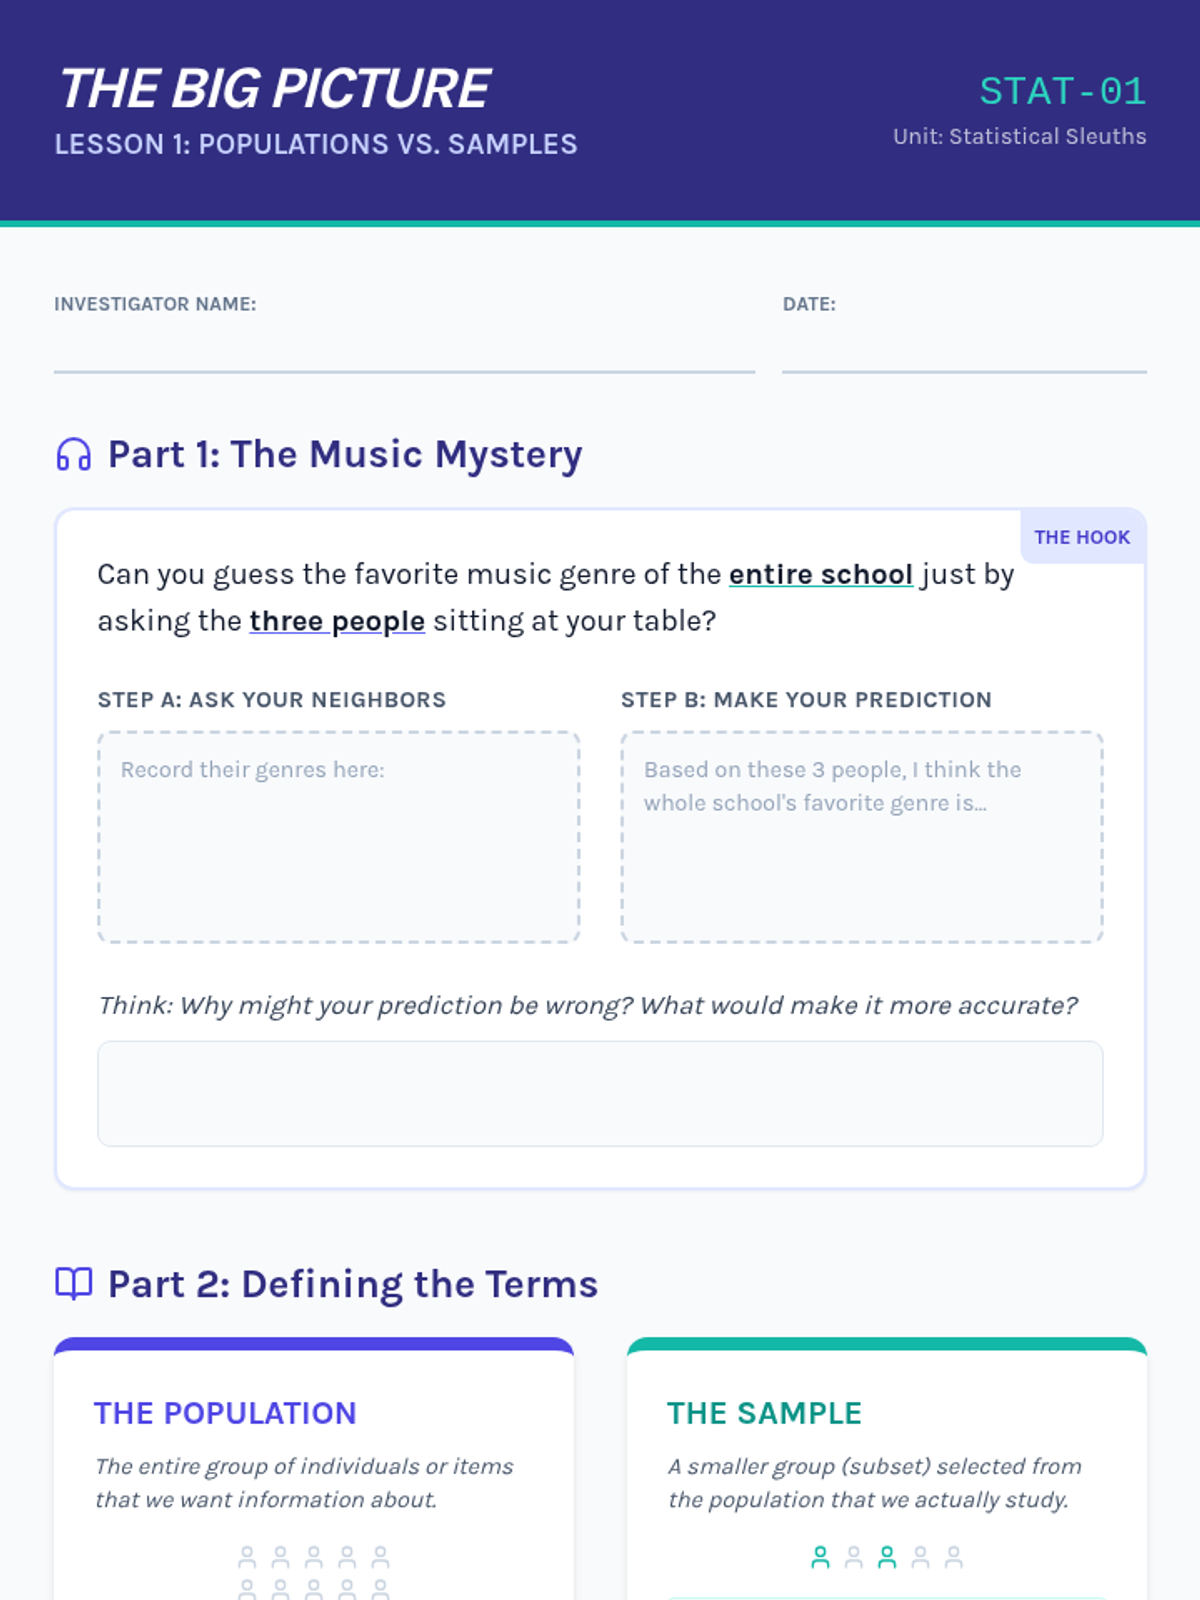
A targeted Tier 2 intervention sequence designed to help high school students master the fundamental concepts of statistical inference, moving from population parameters to sample statistics and back again through real-world applications.
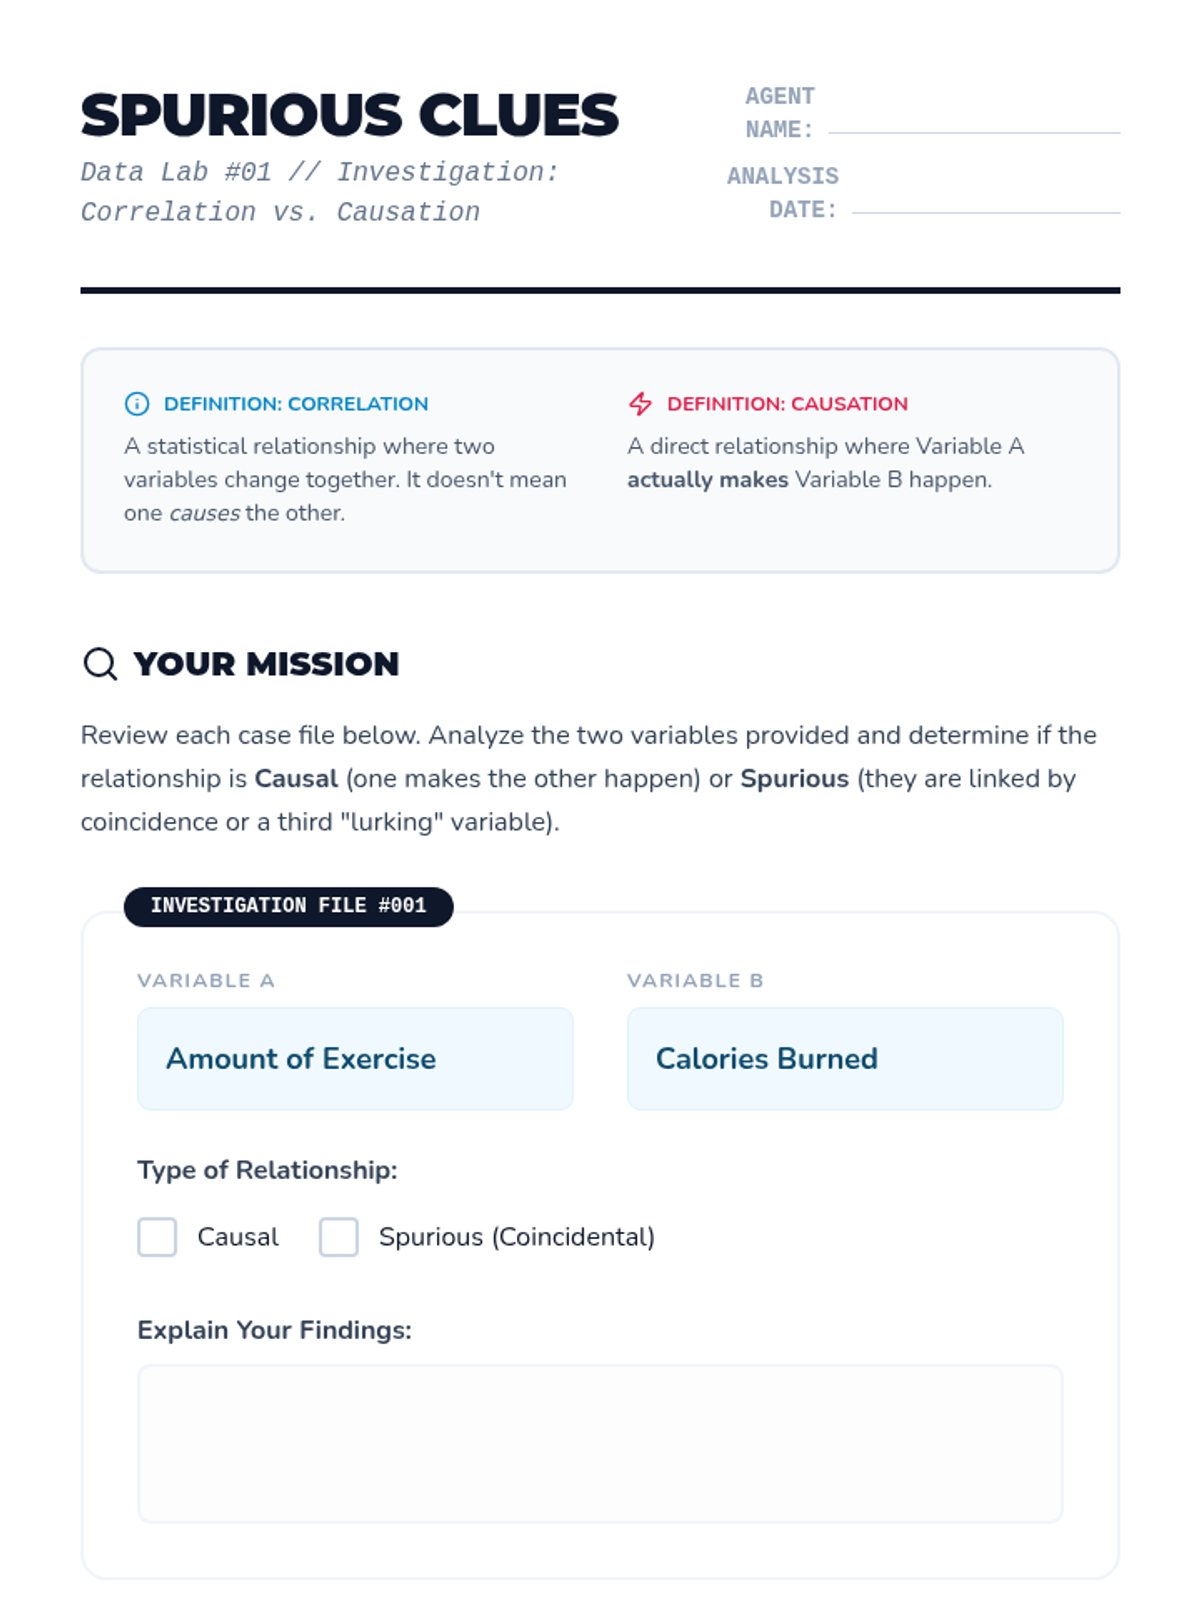
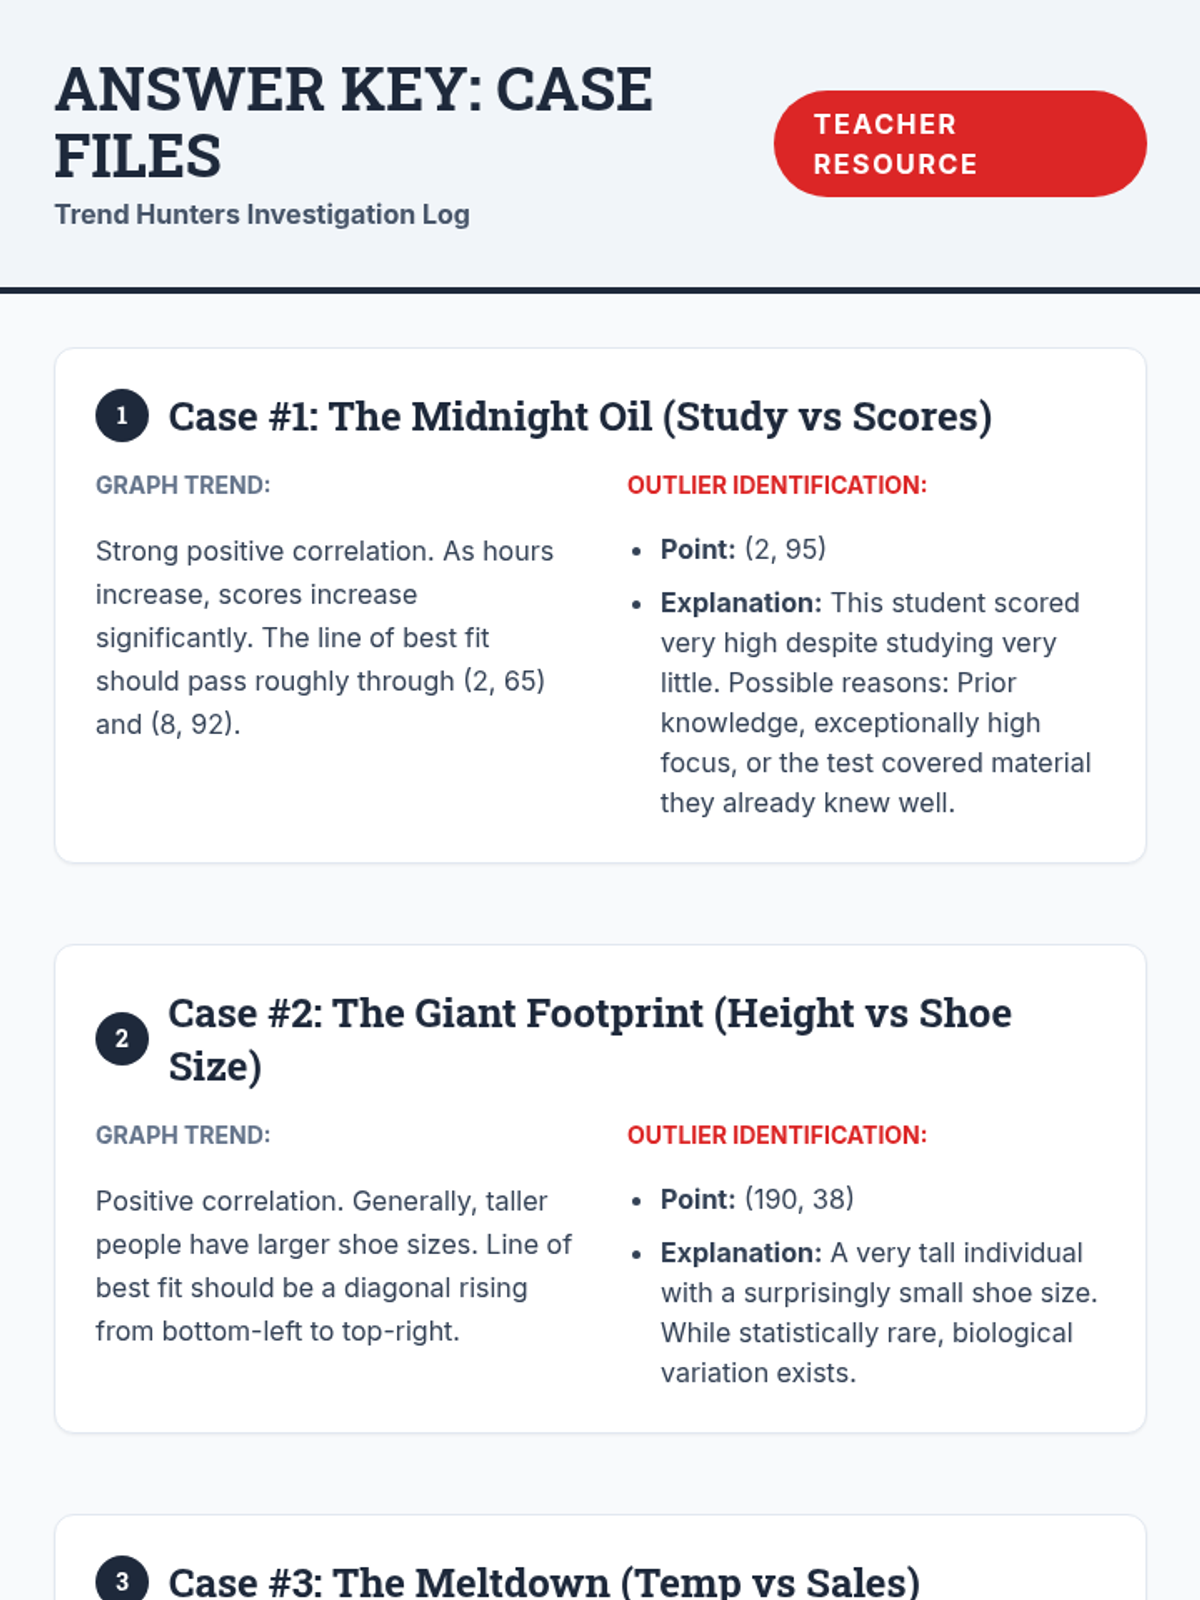
Students move from describing data to interpreting and modeling it. They explore correlation vs. causation, trend lines, predictive modeling, and the ethics of data bias using real-world datasets and case studies.
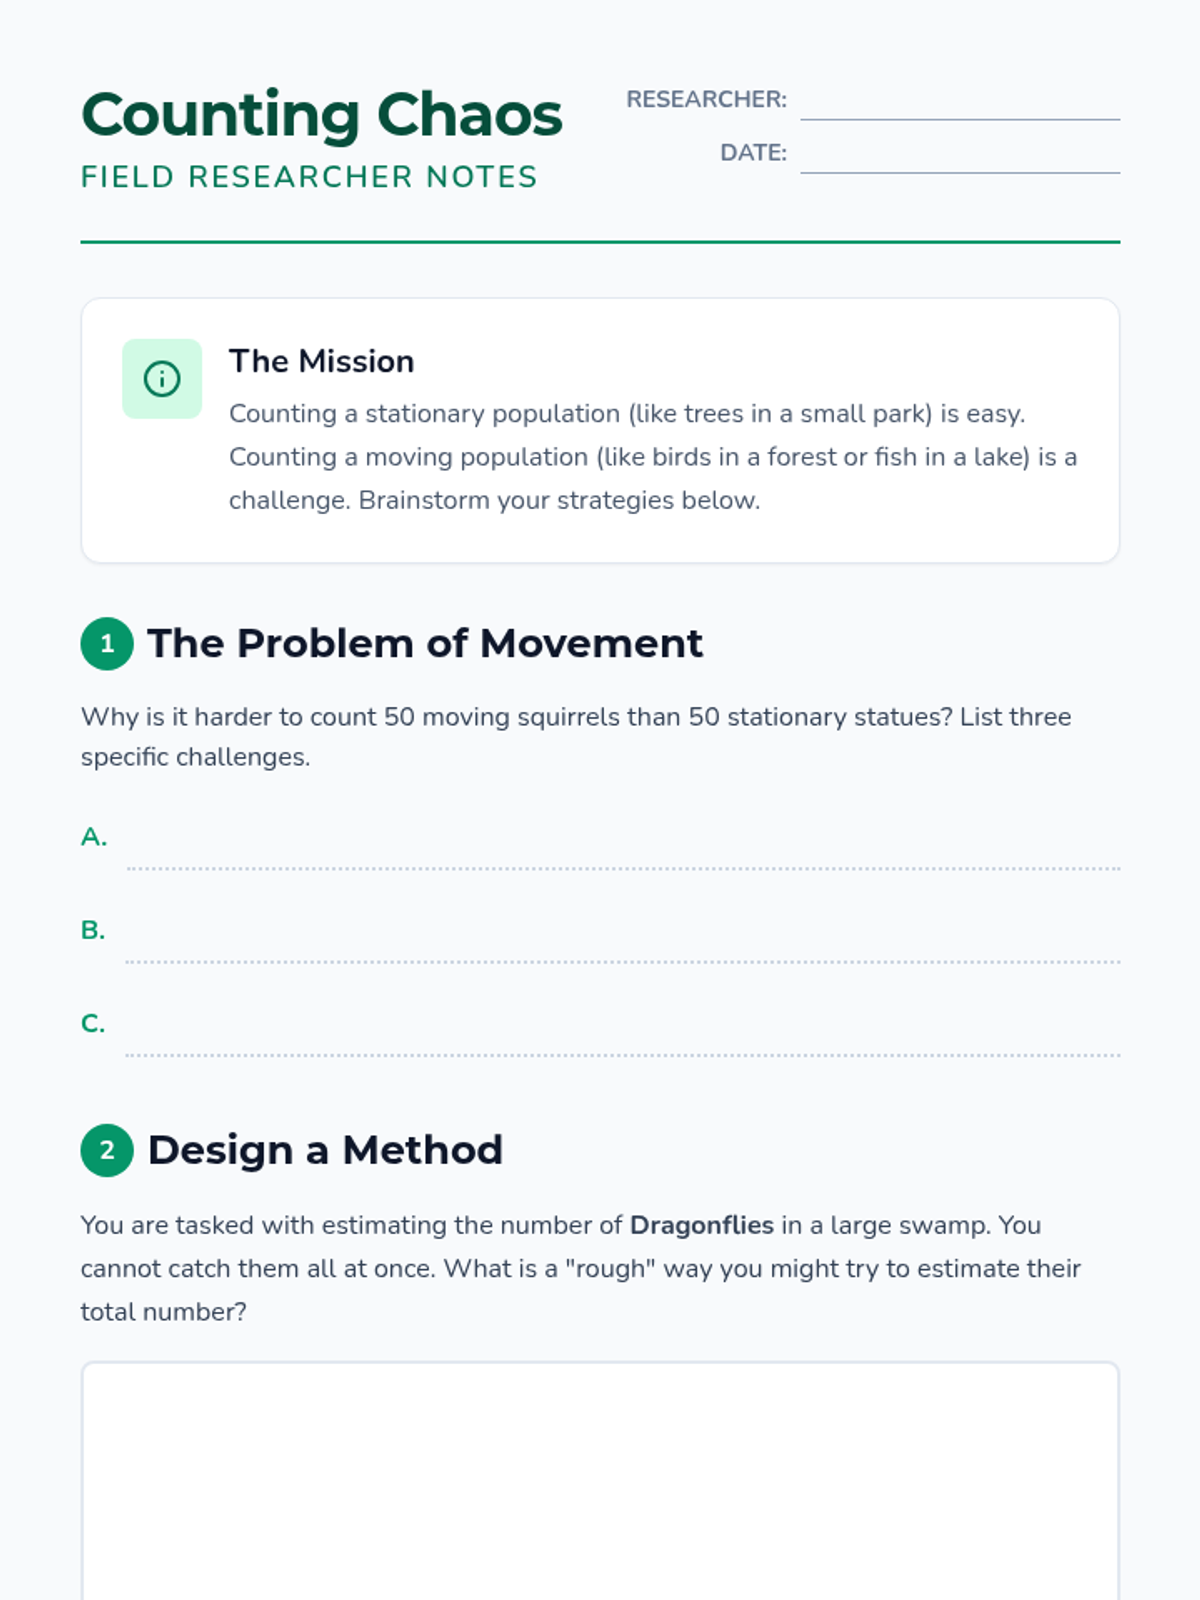
A game-based sequence where students use the Capture-Recapture method to estimate population sizes, progressing from physical simulations to proportional reasoning and real-world ecological analysis.
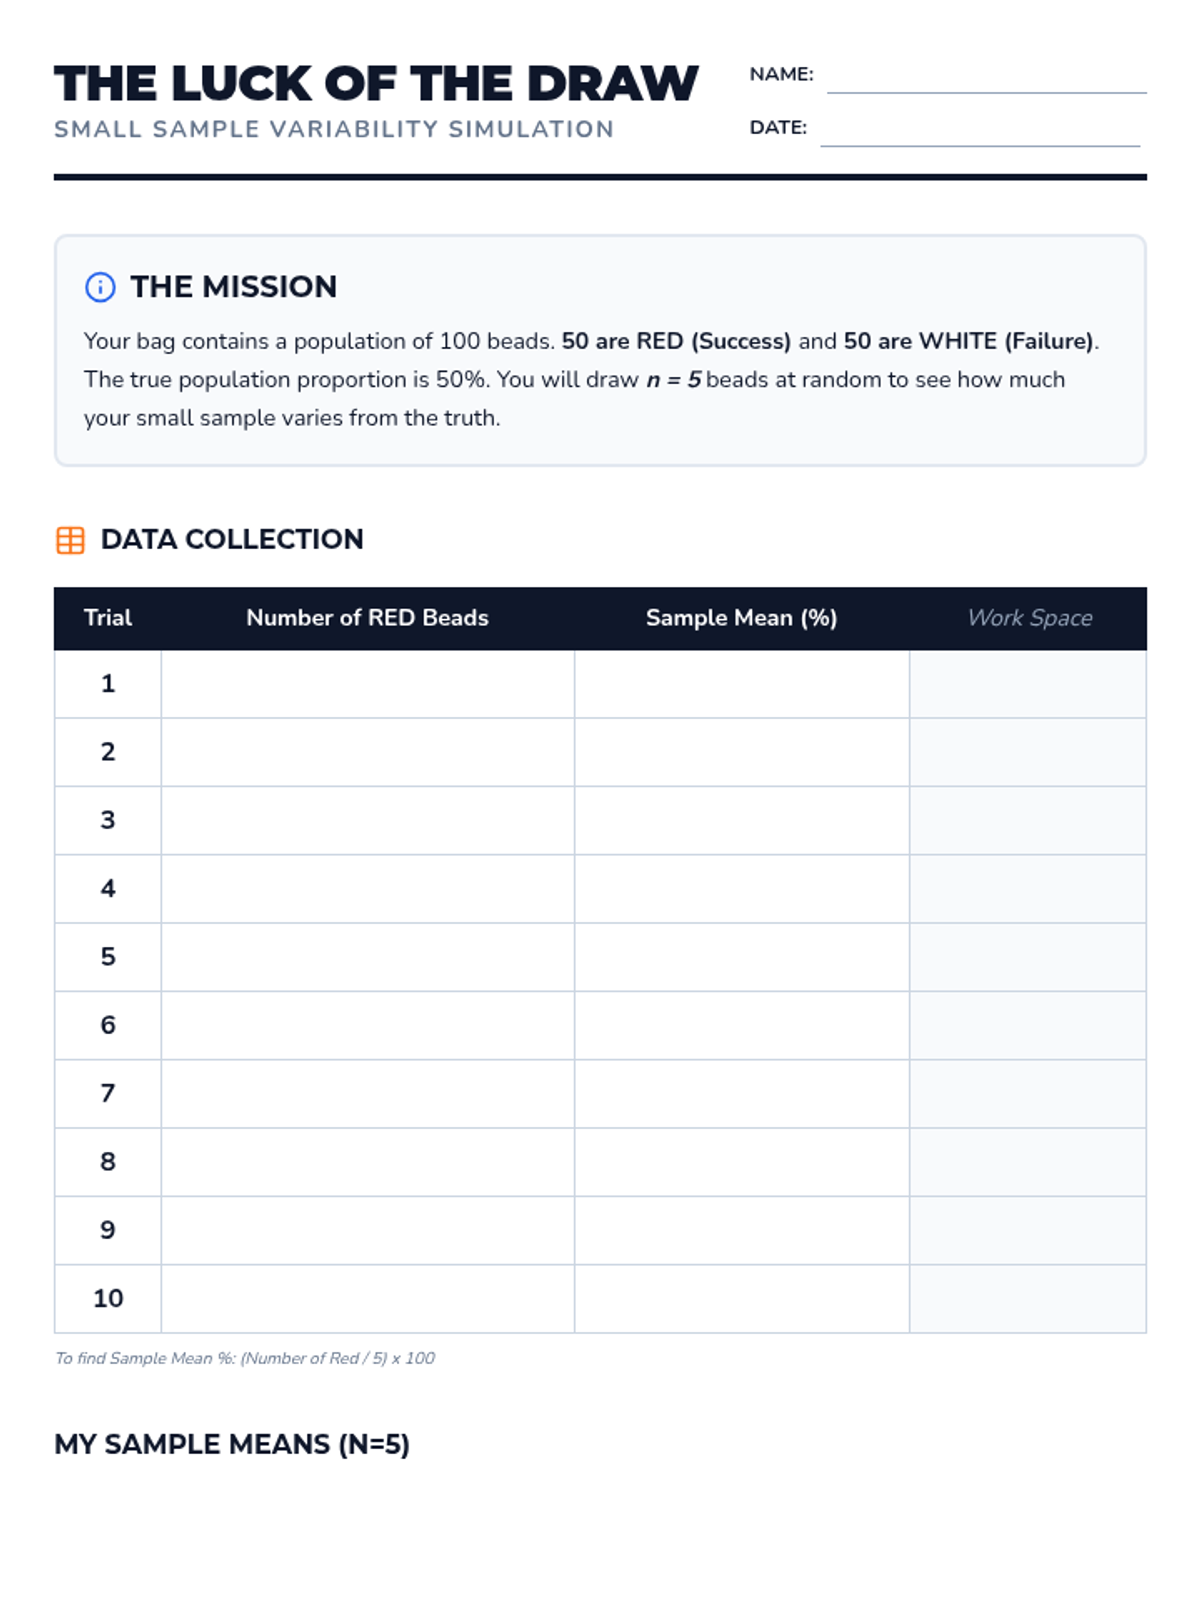
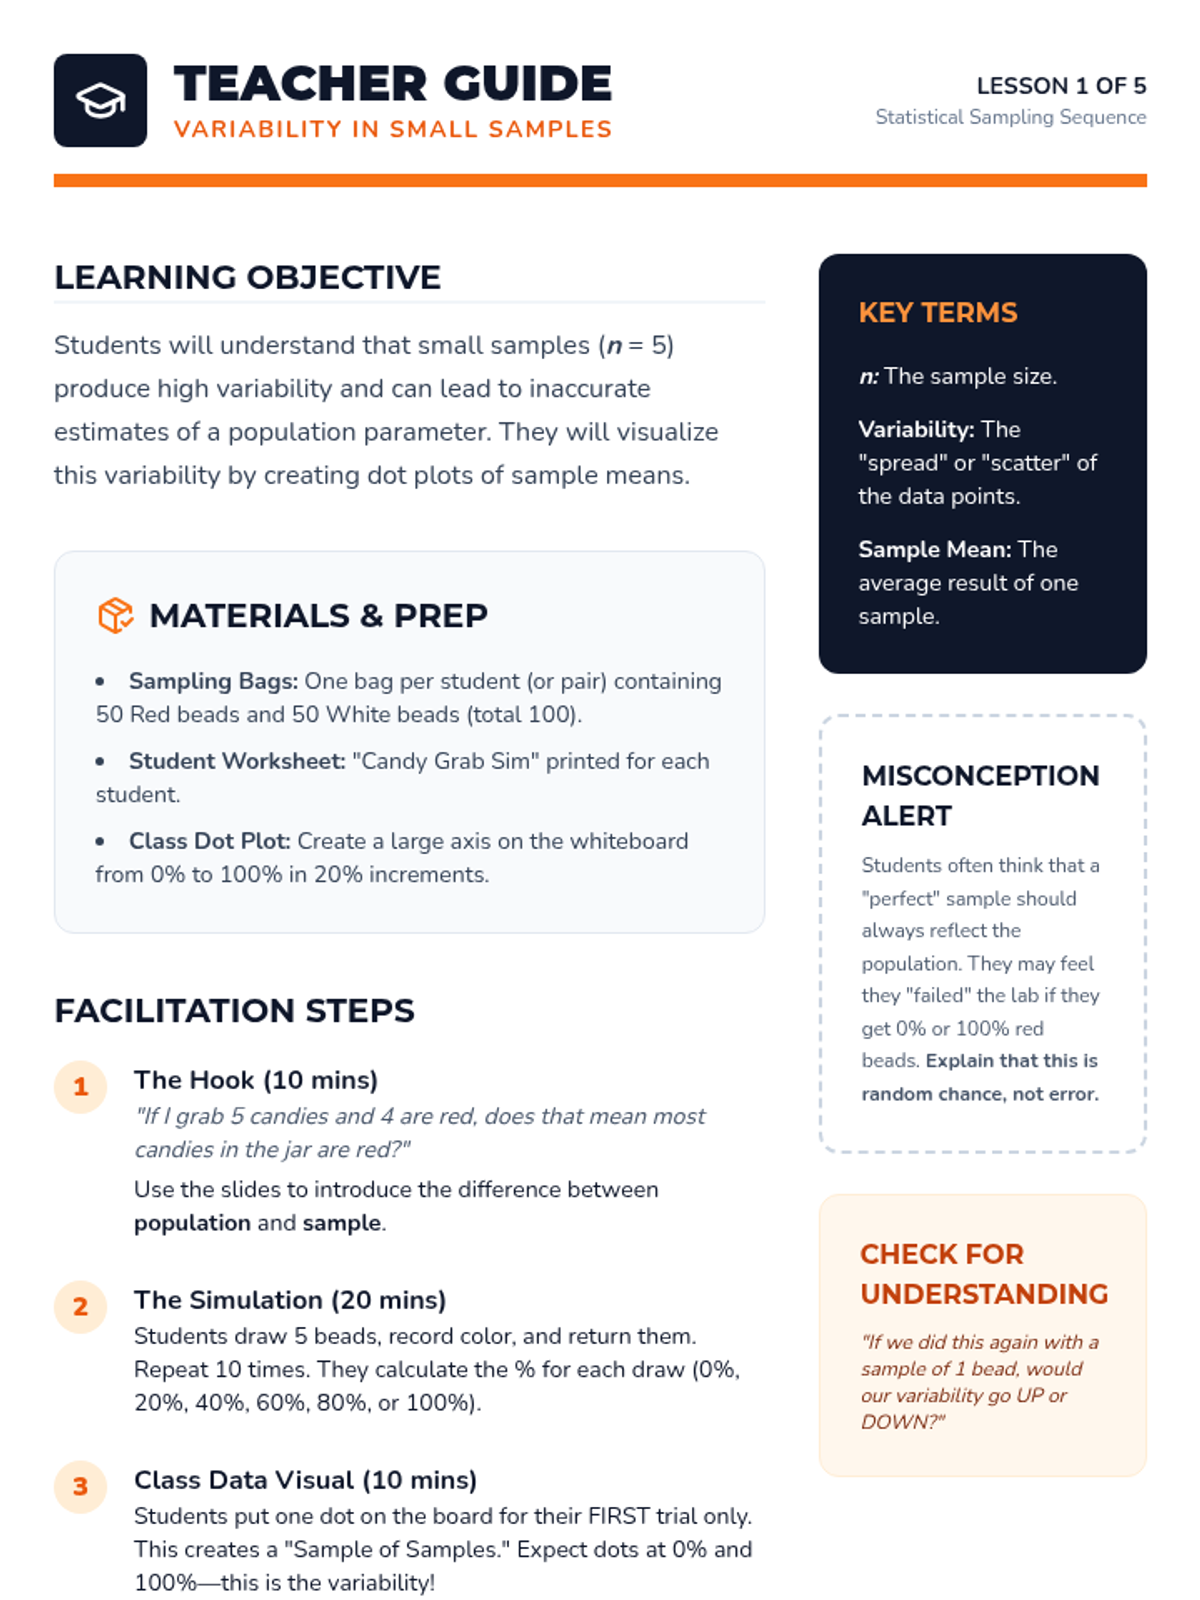
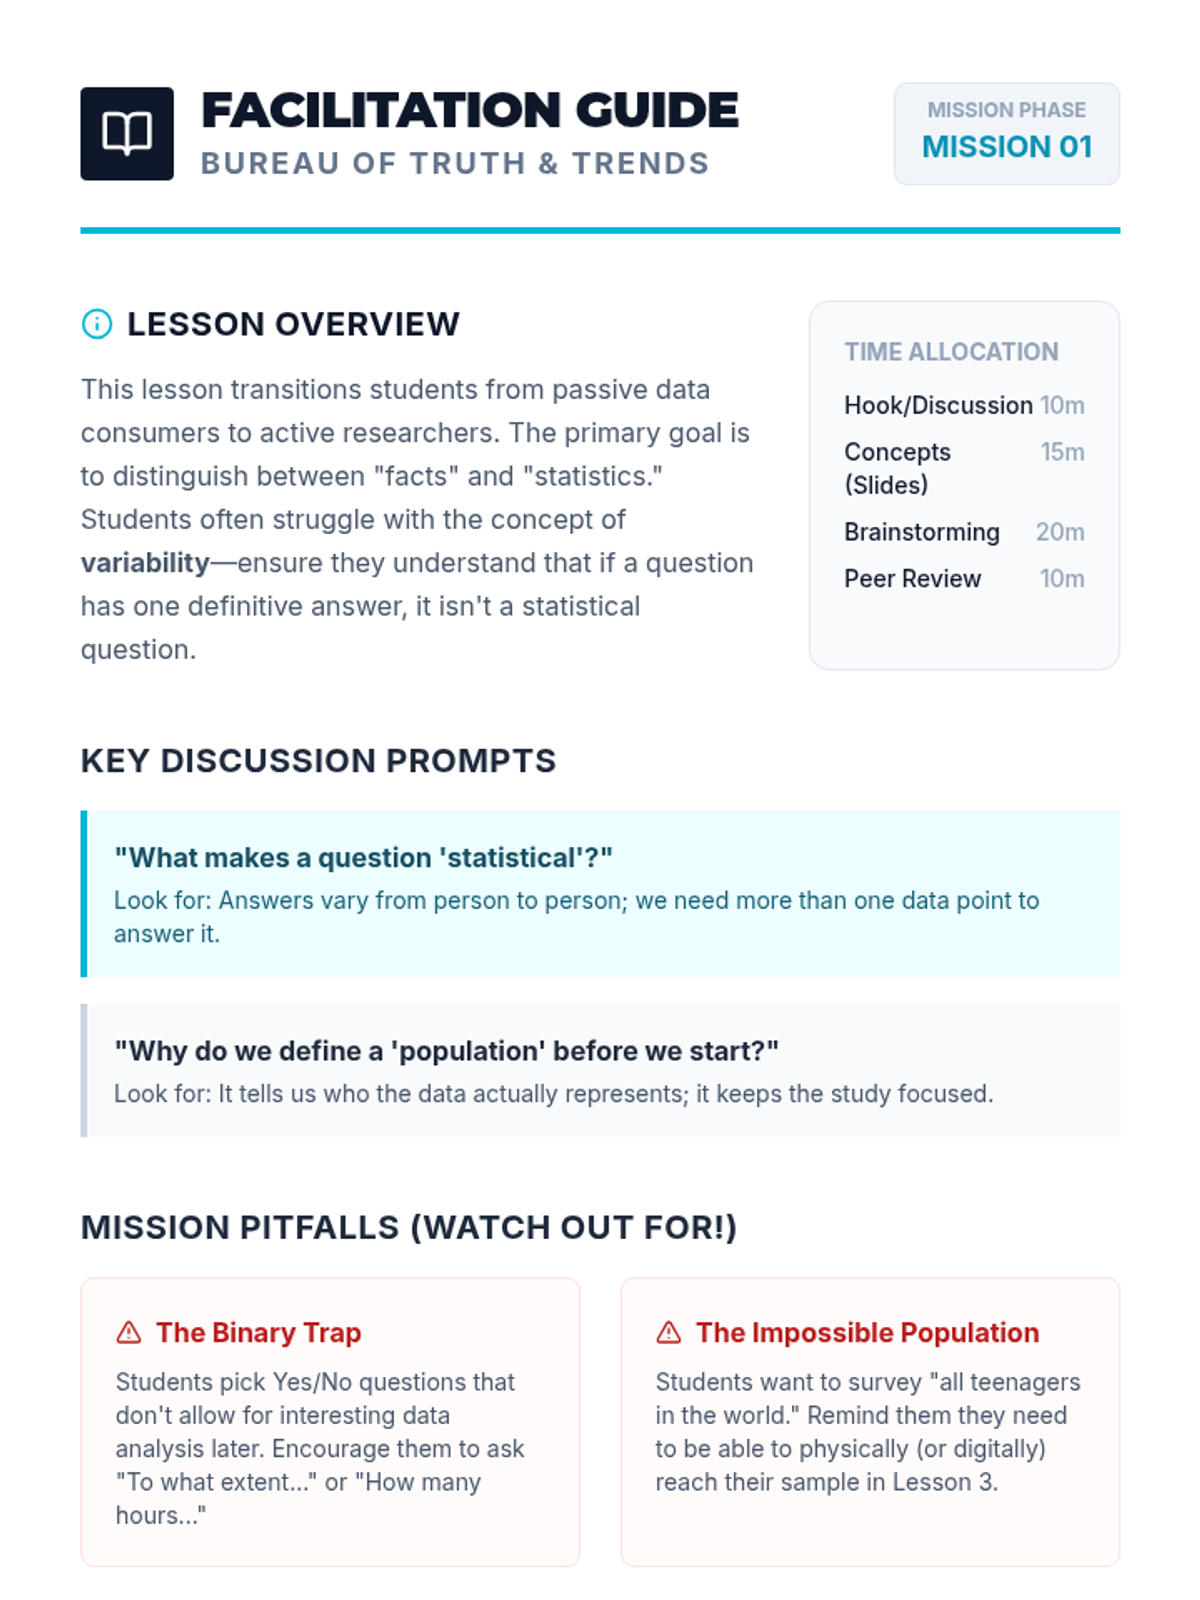
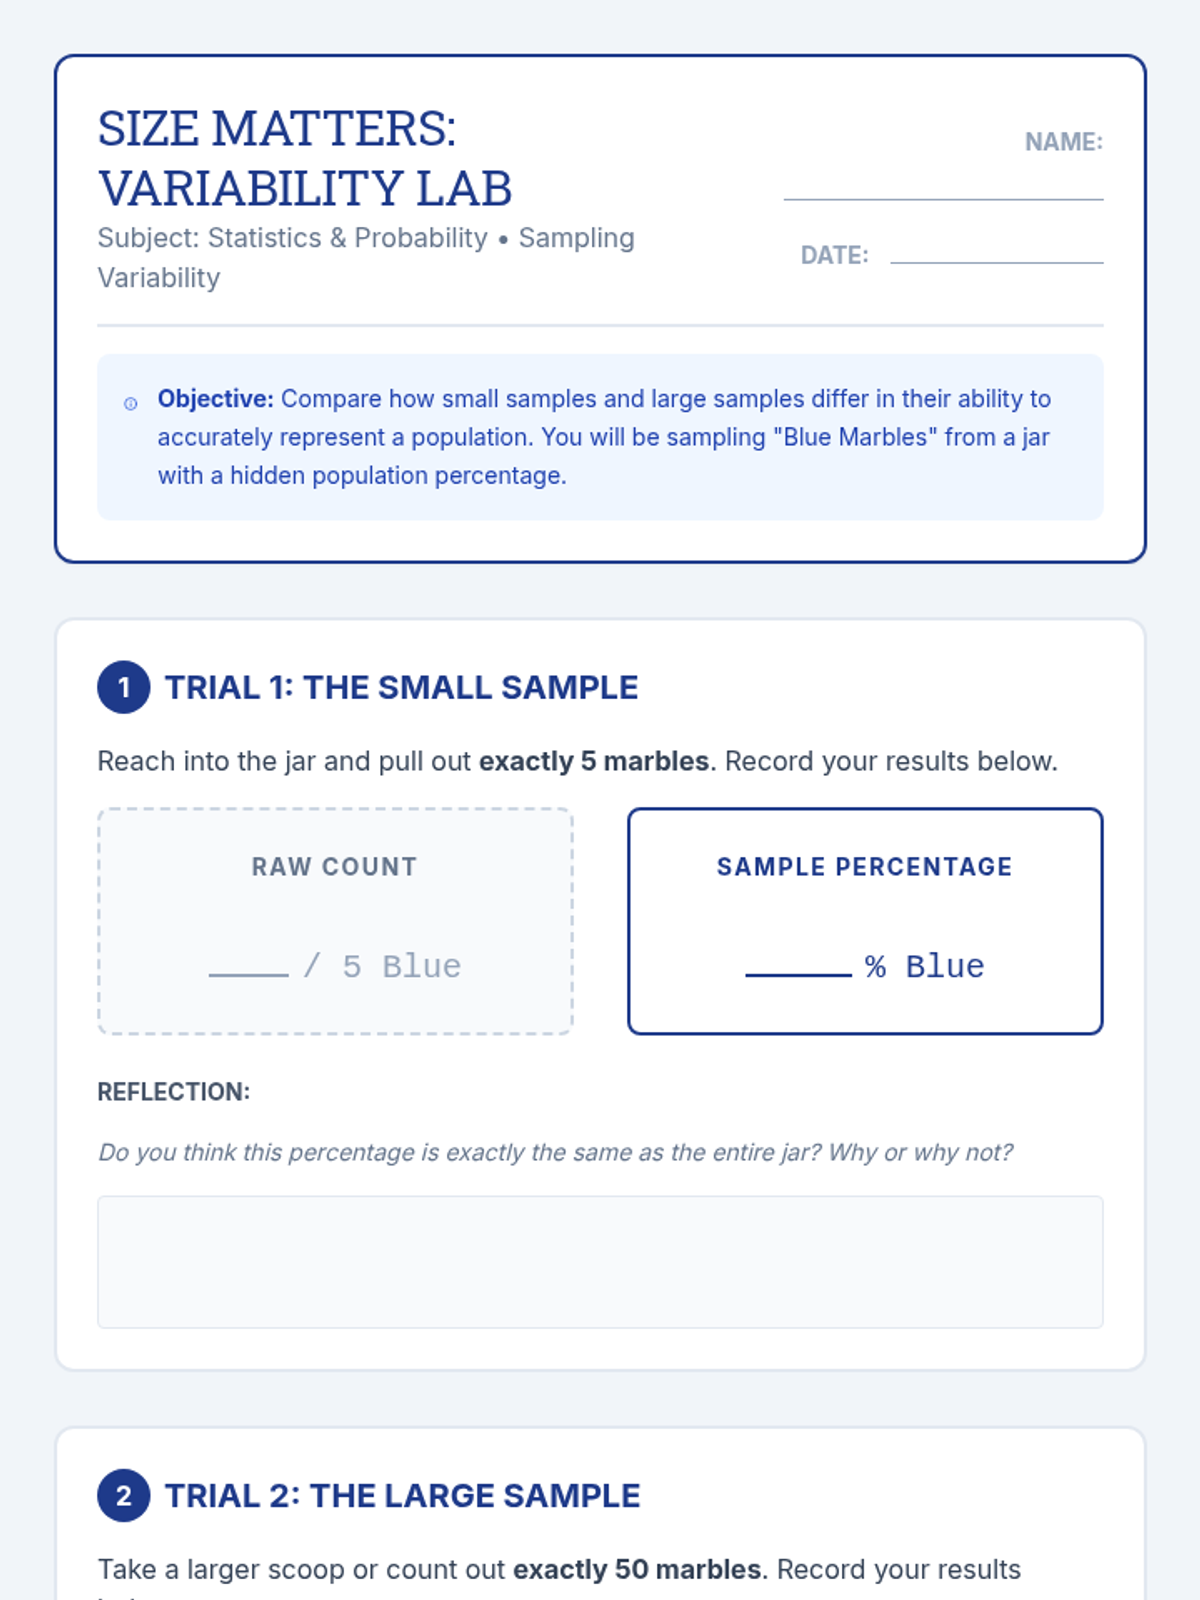
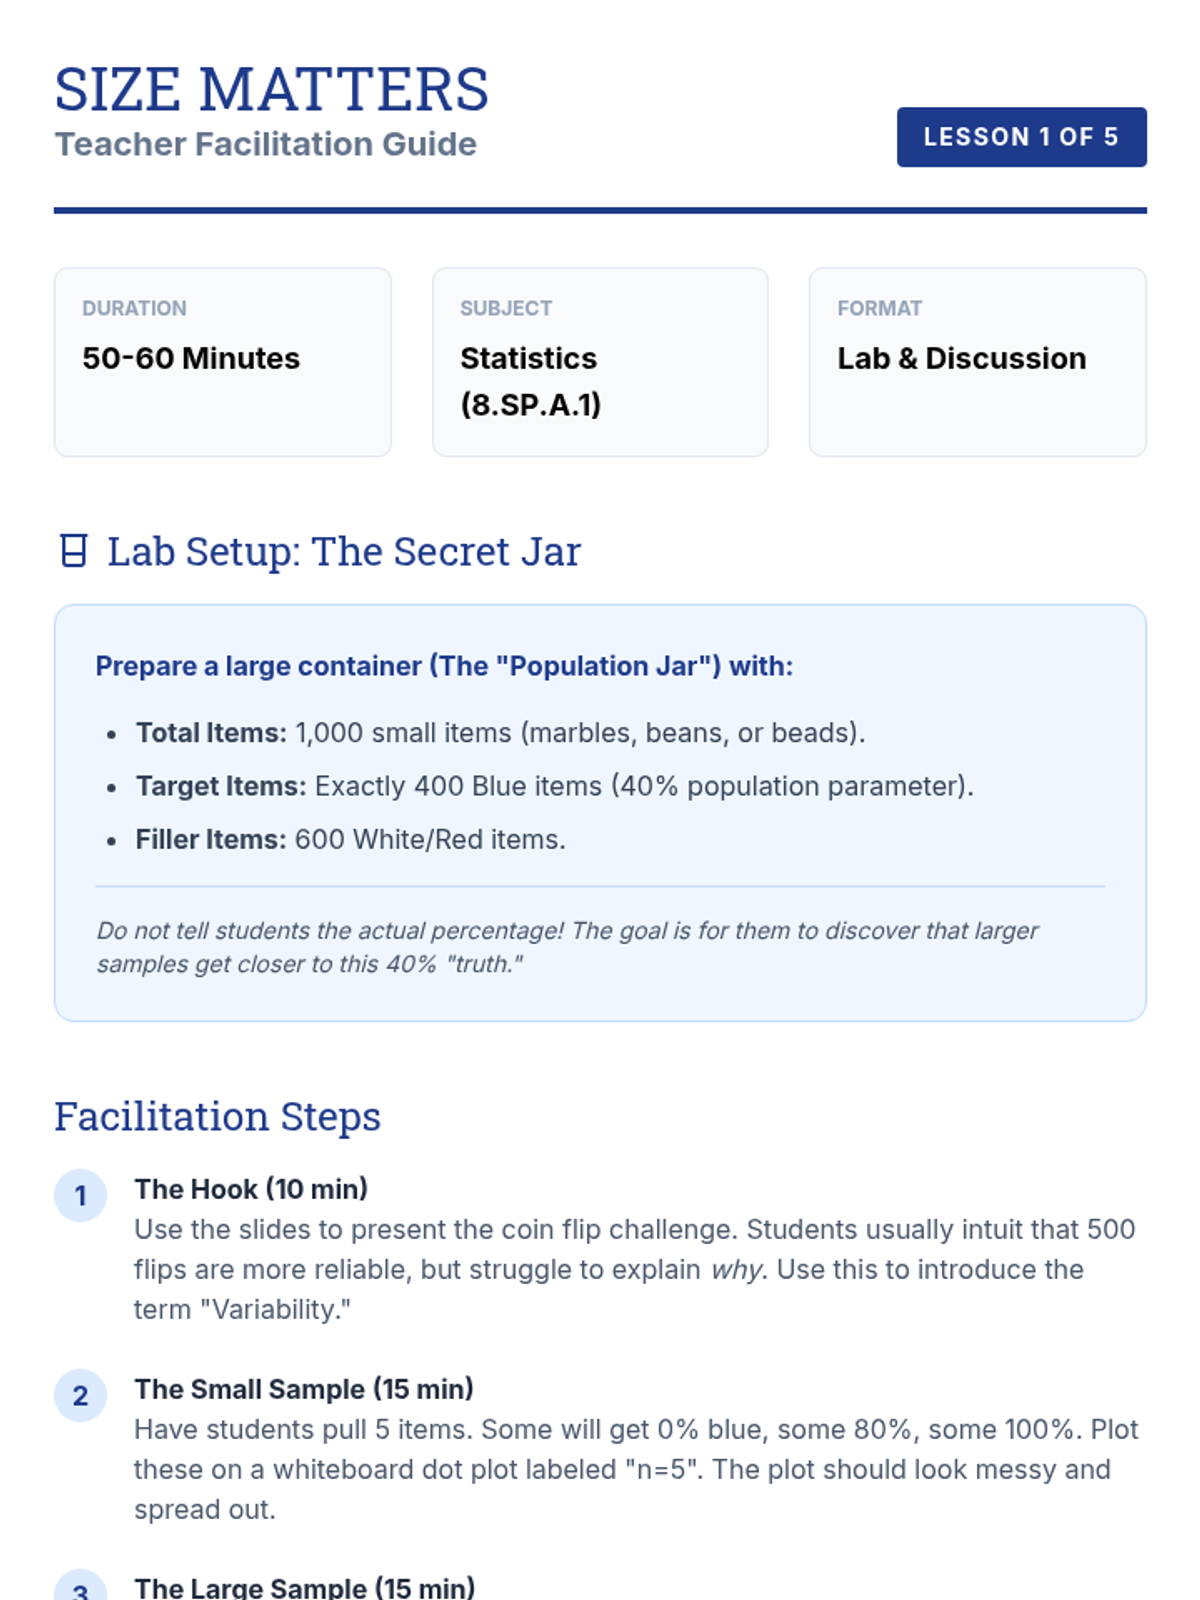
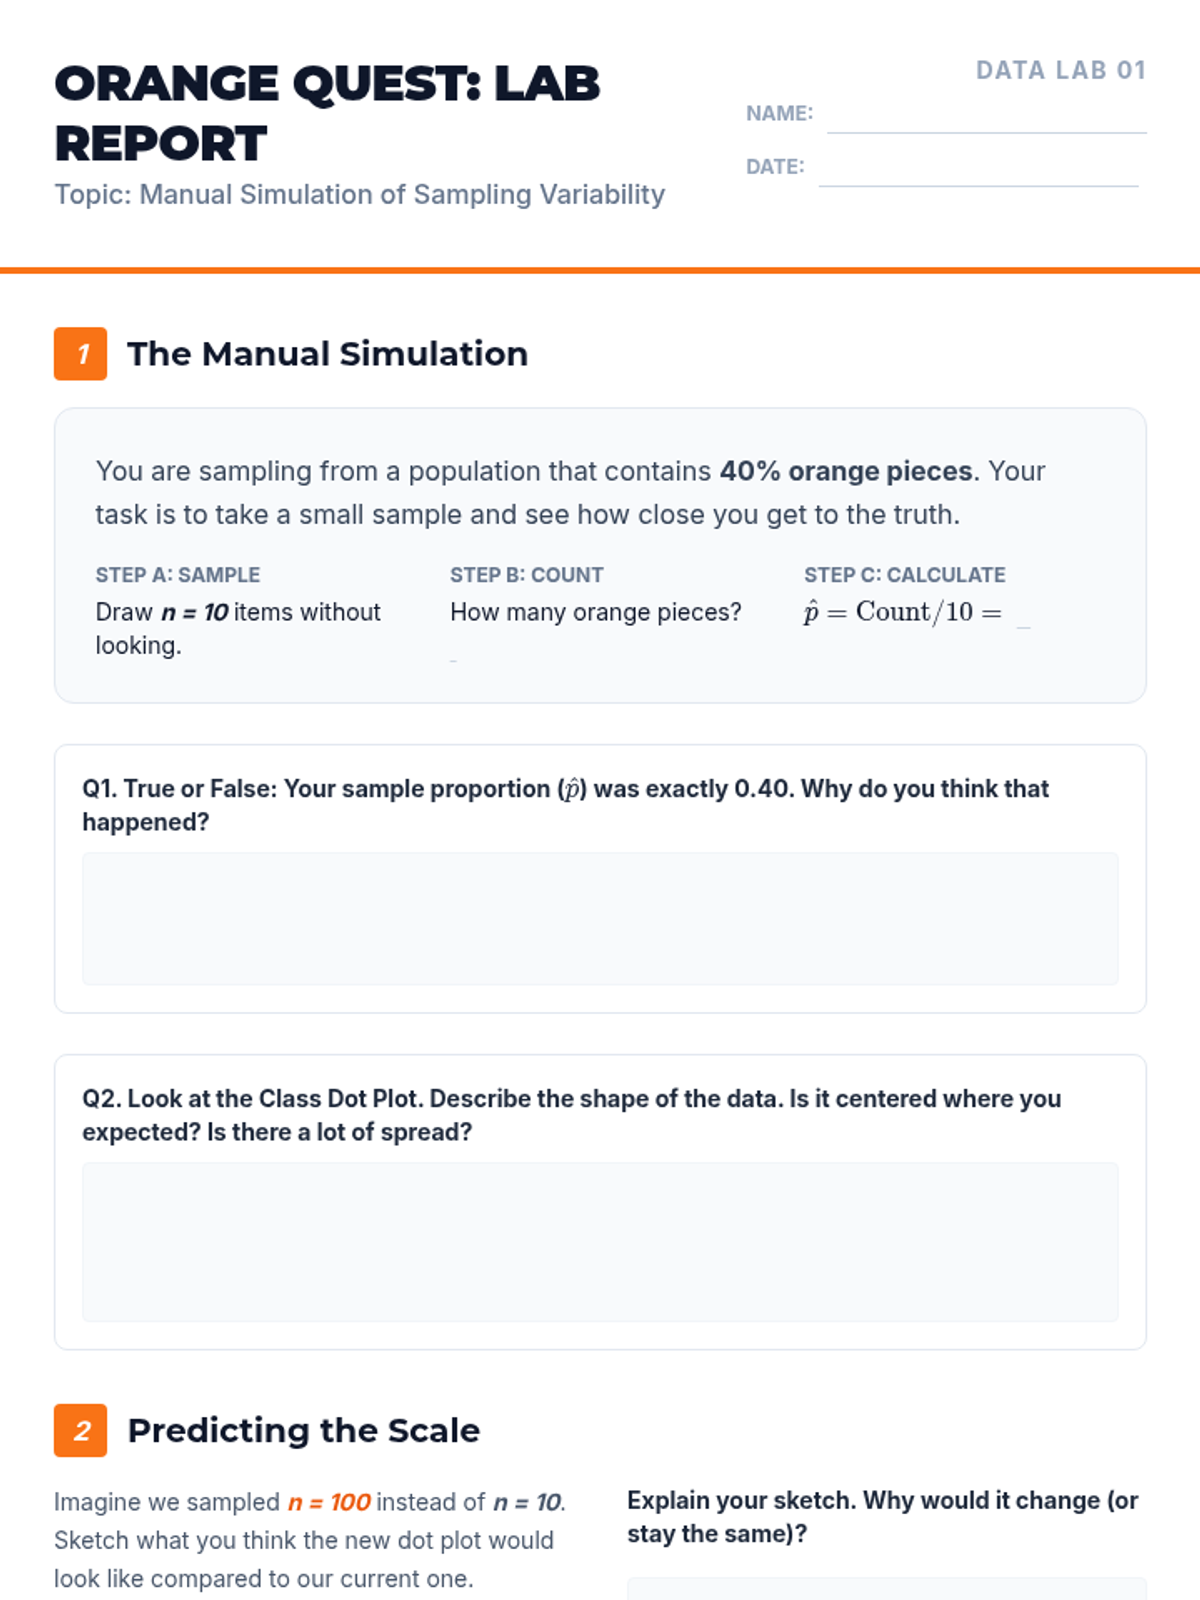
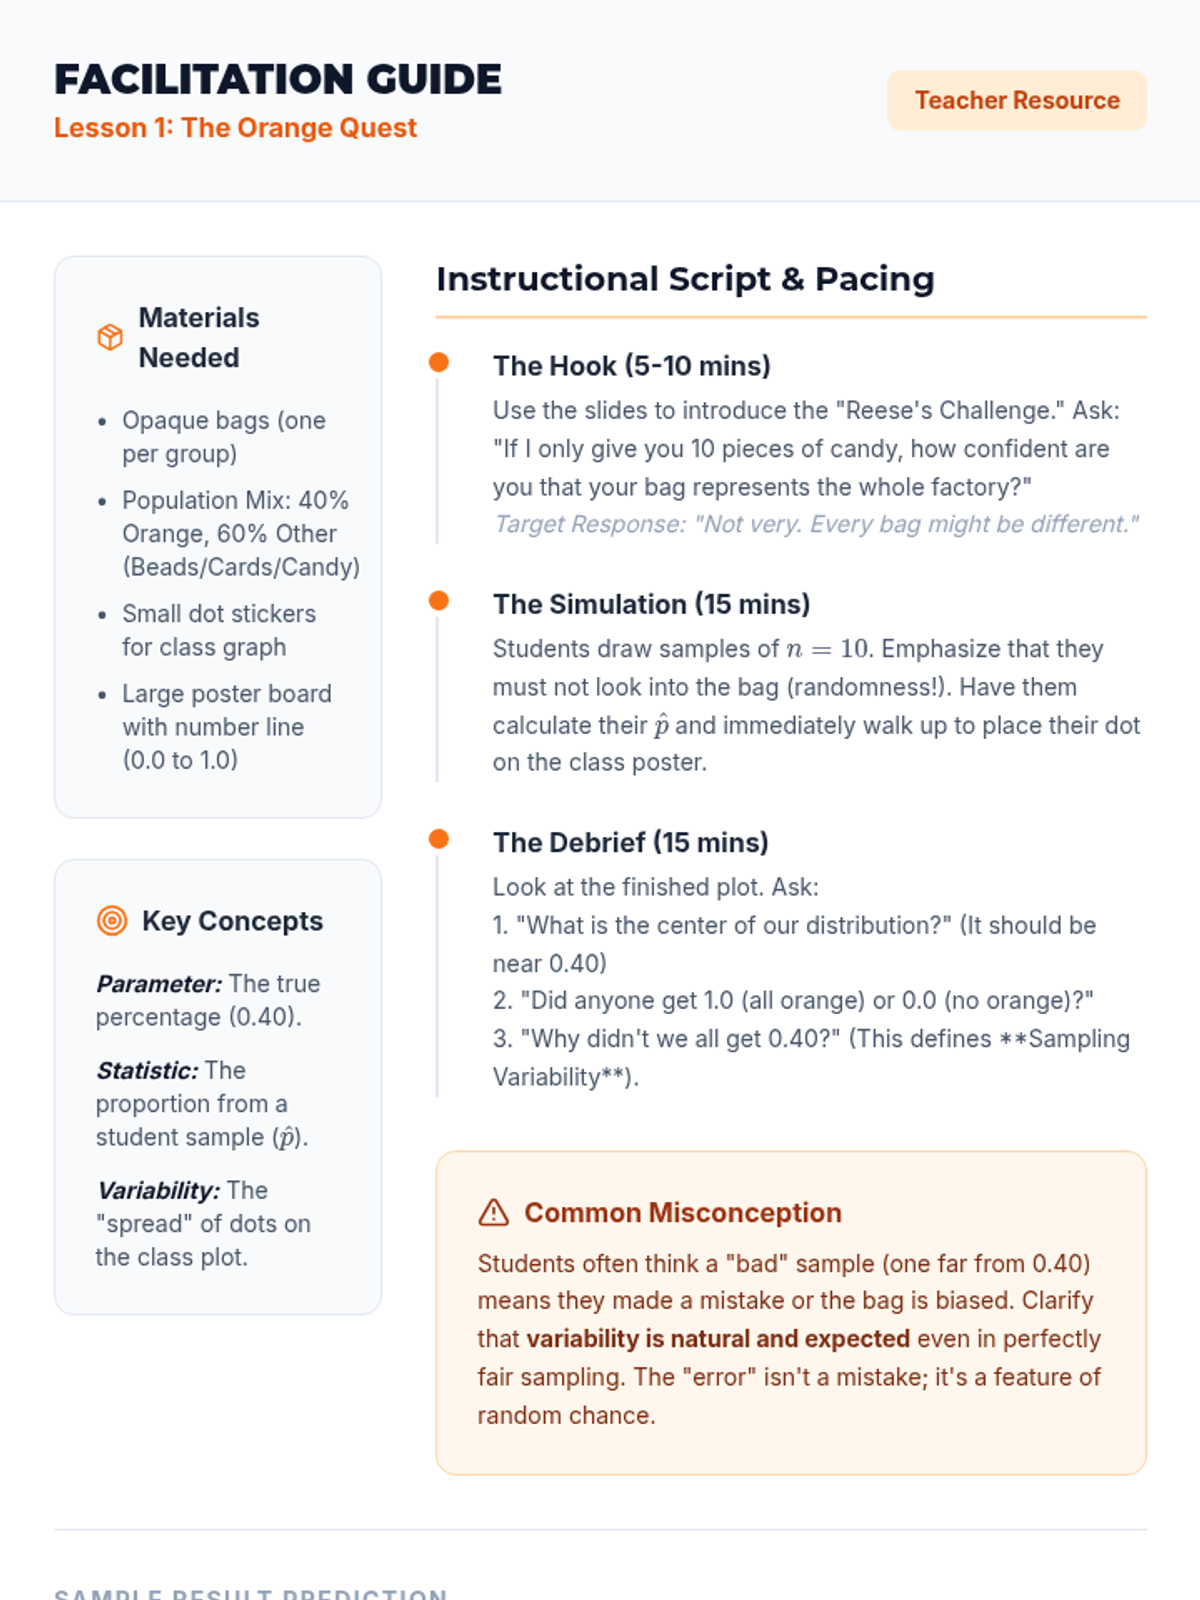
This 5-lesson sequence explores how sample size influences variability and the reliability of statistical inferences. Students participate in simulations to discover the law of large numbers, use Mean Absolute Deviation to quantify spread, and evaluate the validity of real-world sampling methods.
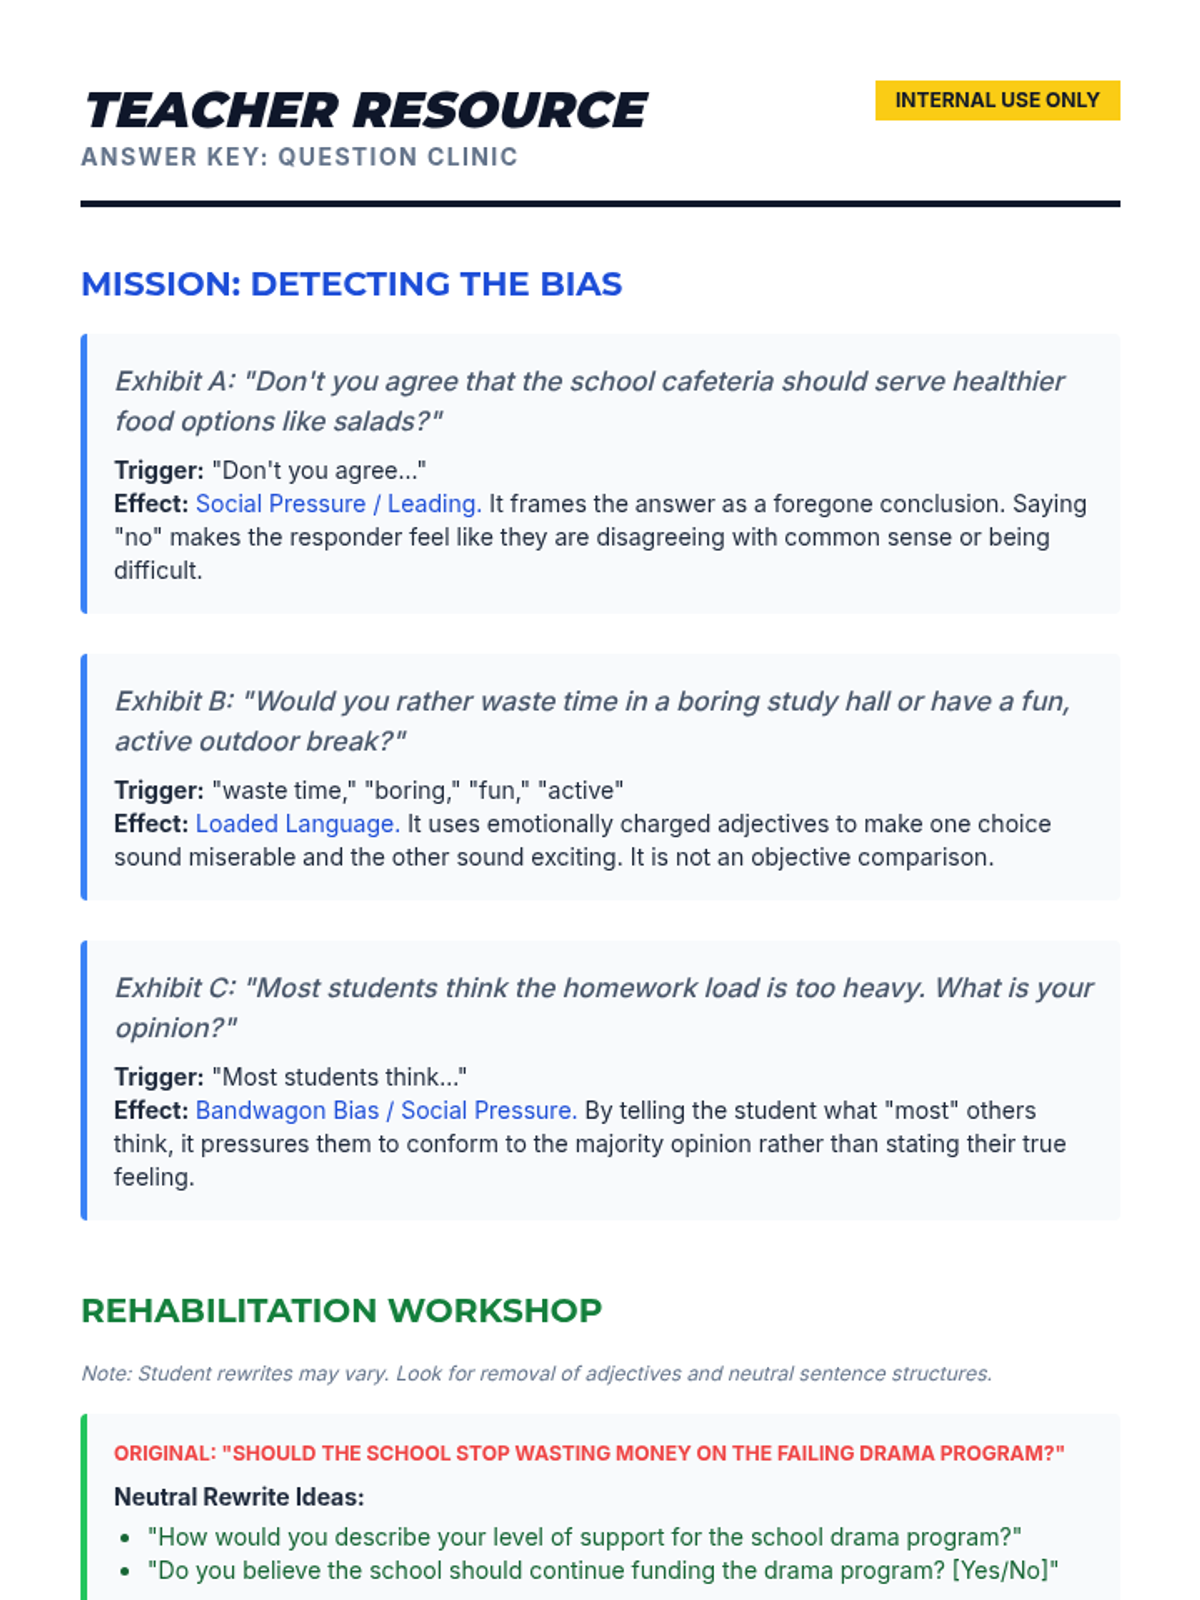
A project-based unit where 7th-grade students act as data consultants to solve school-wide problems. They learn to identify bias, design sampling plans, collect data, and present data-backed recommendations to administration.
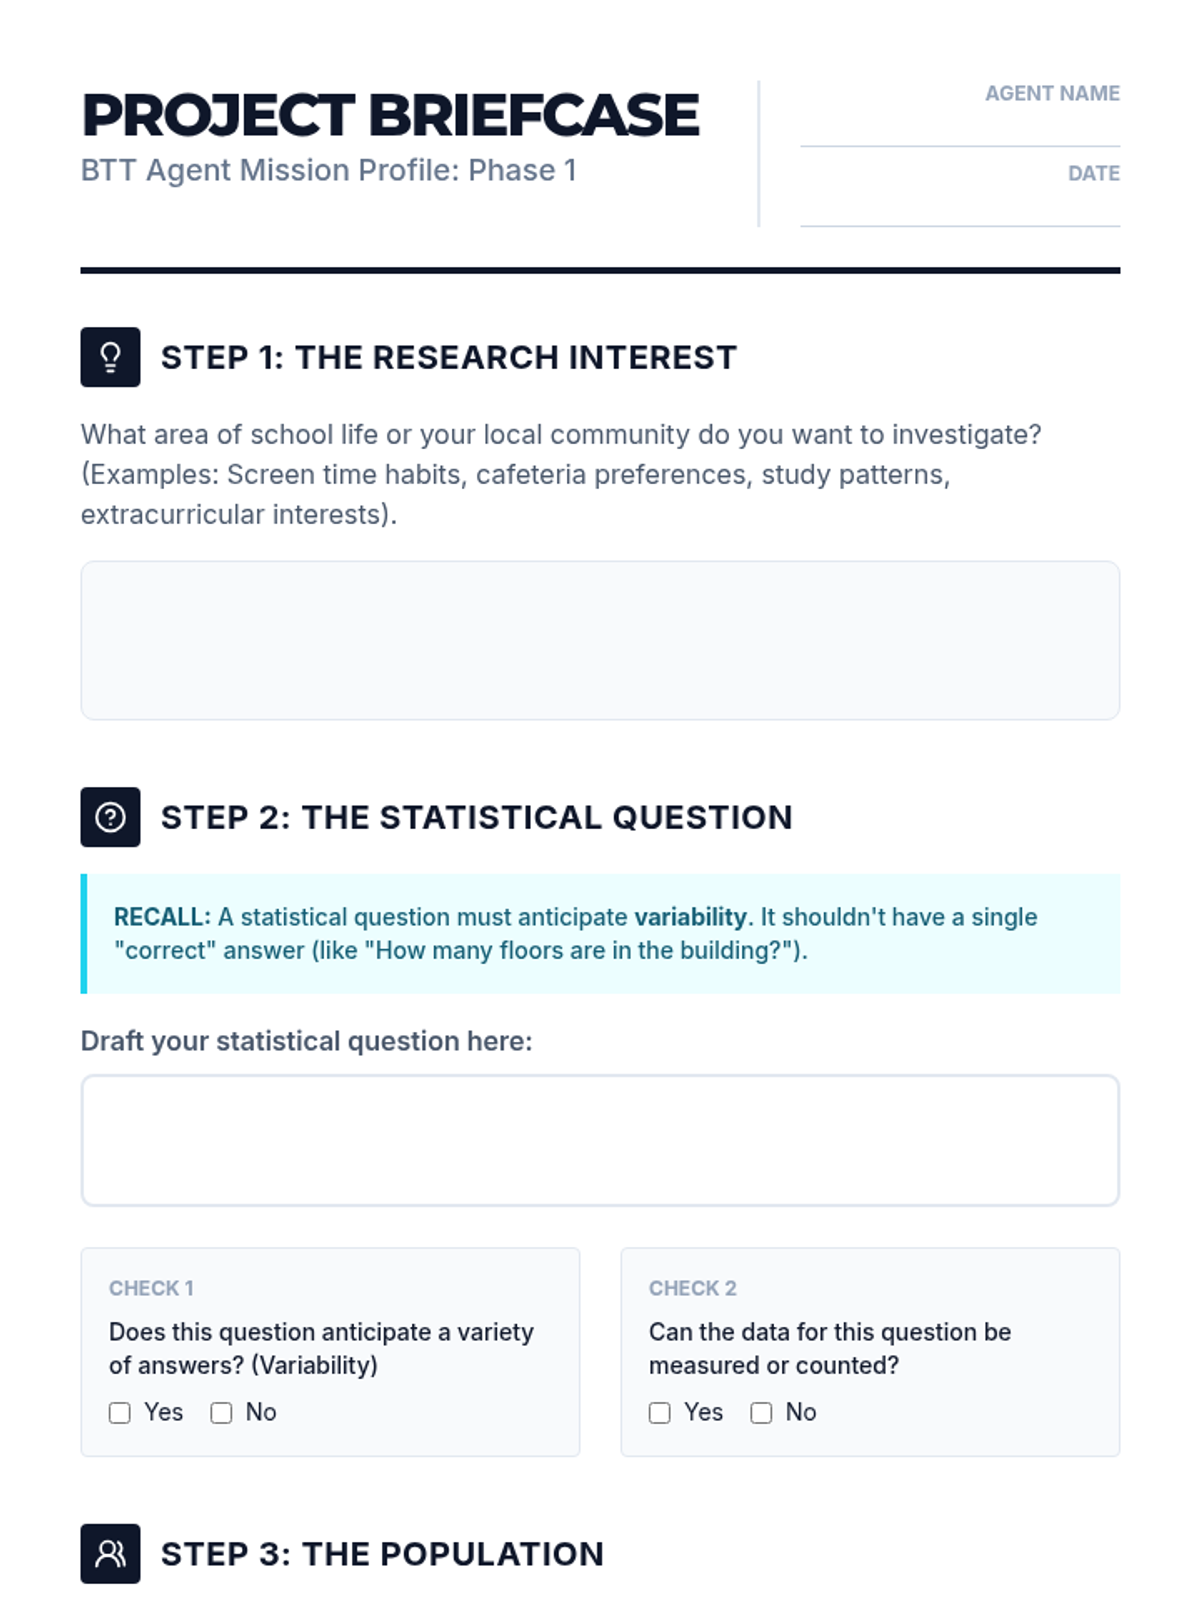
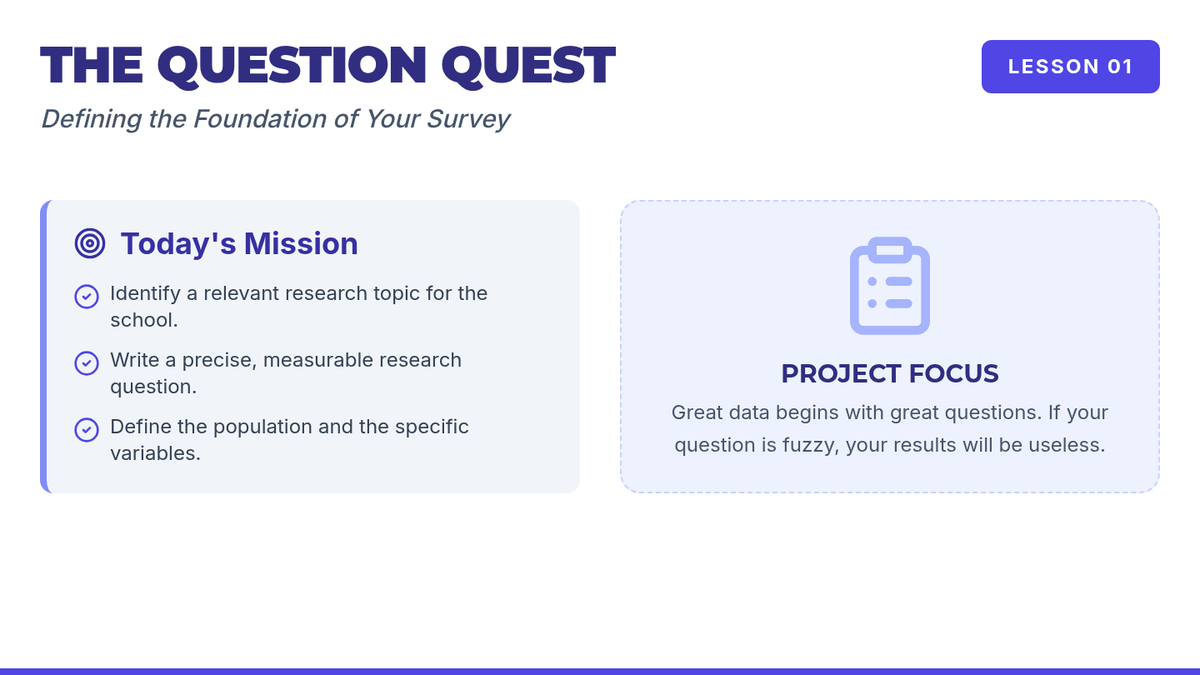
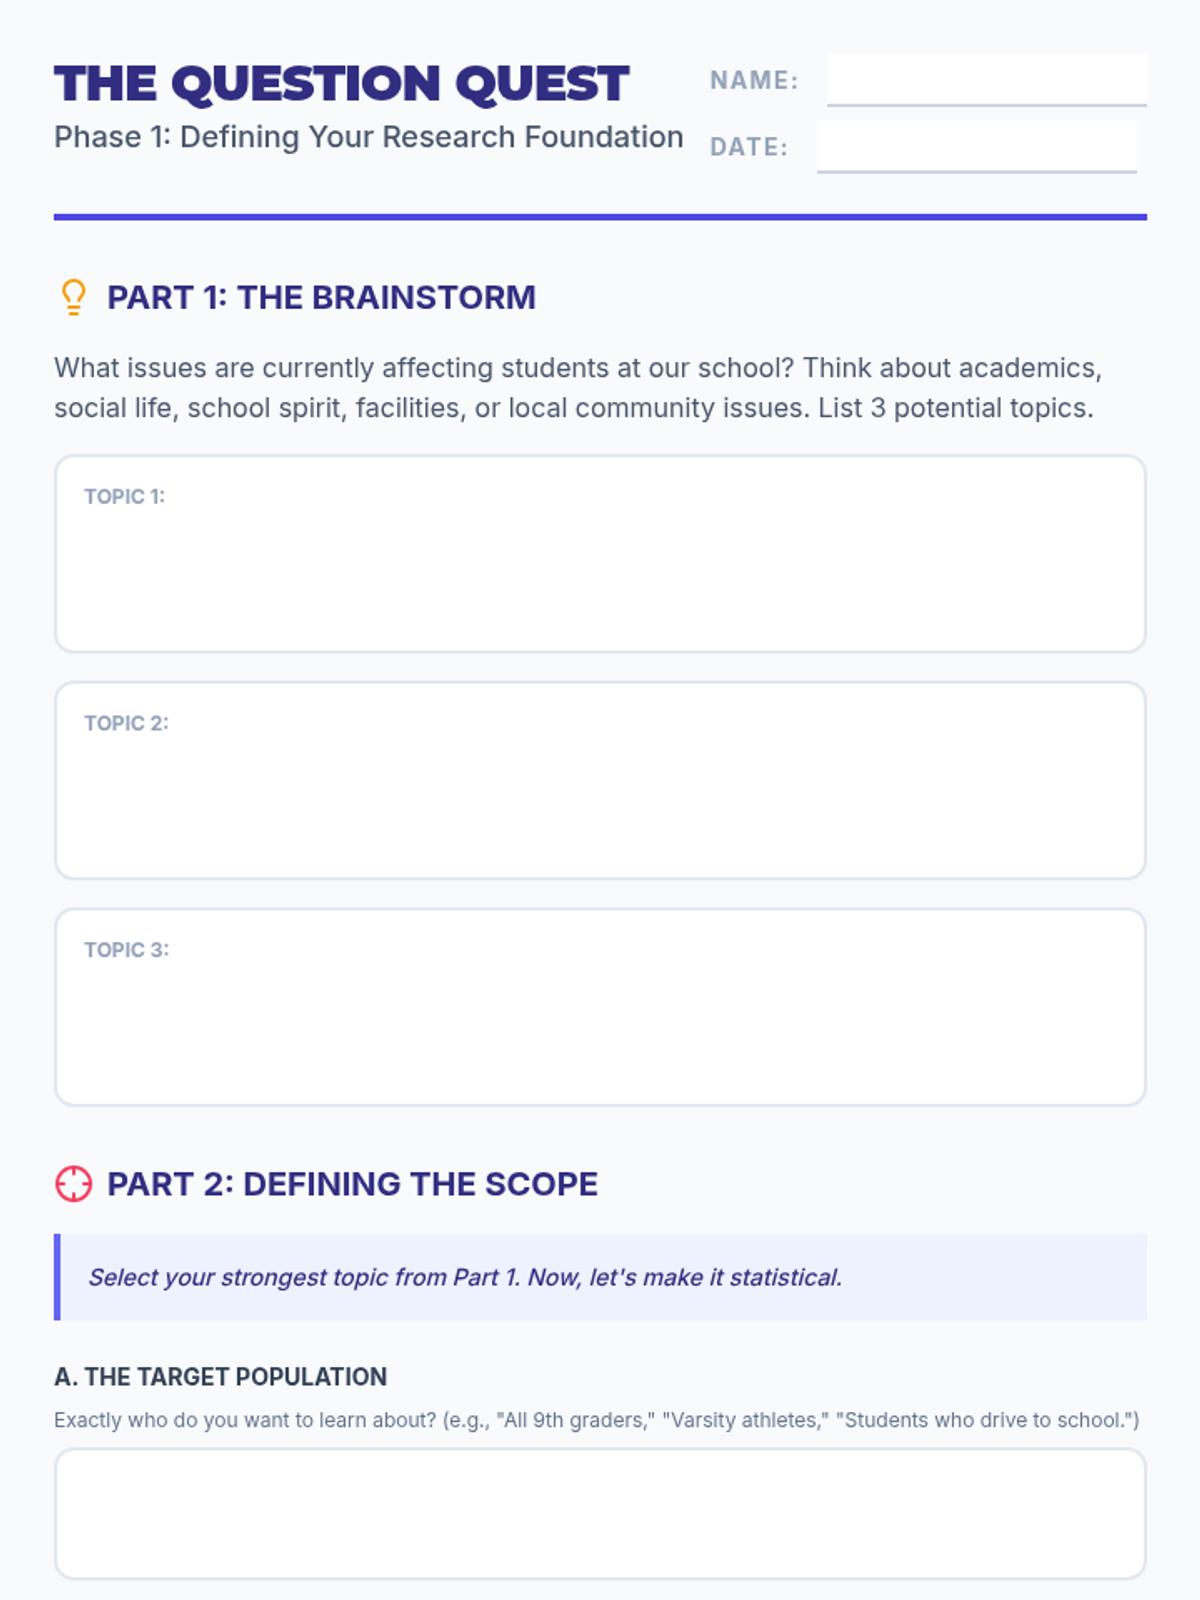
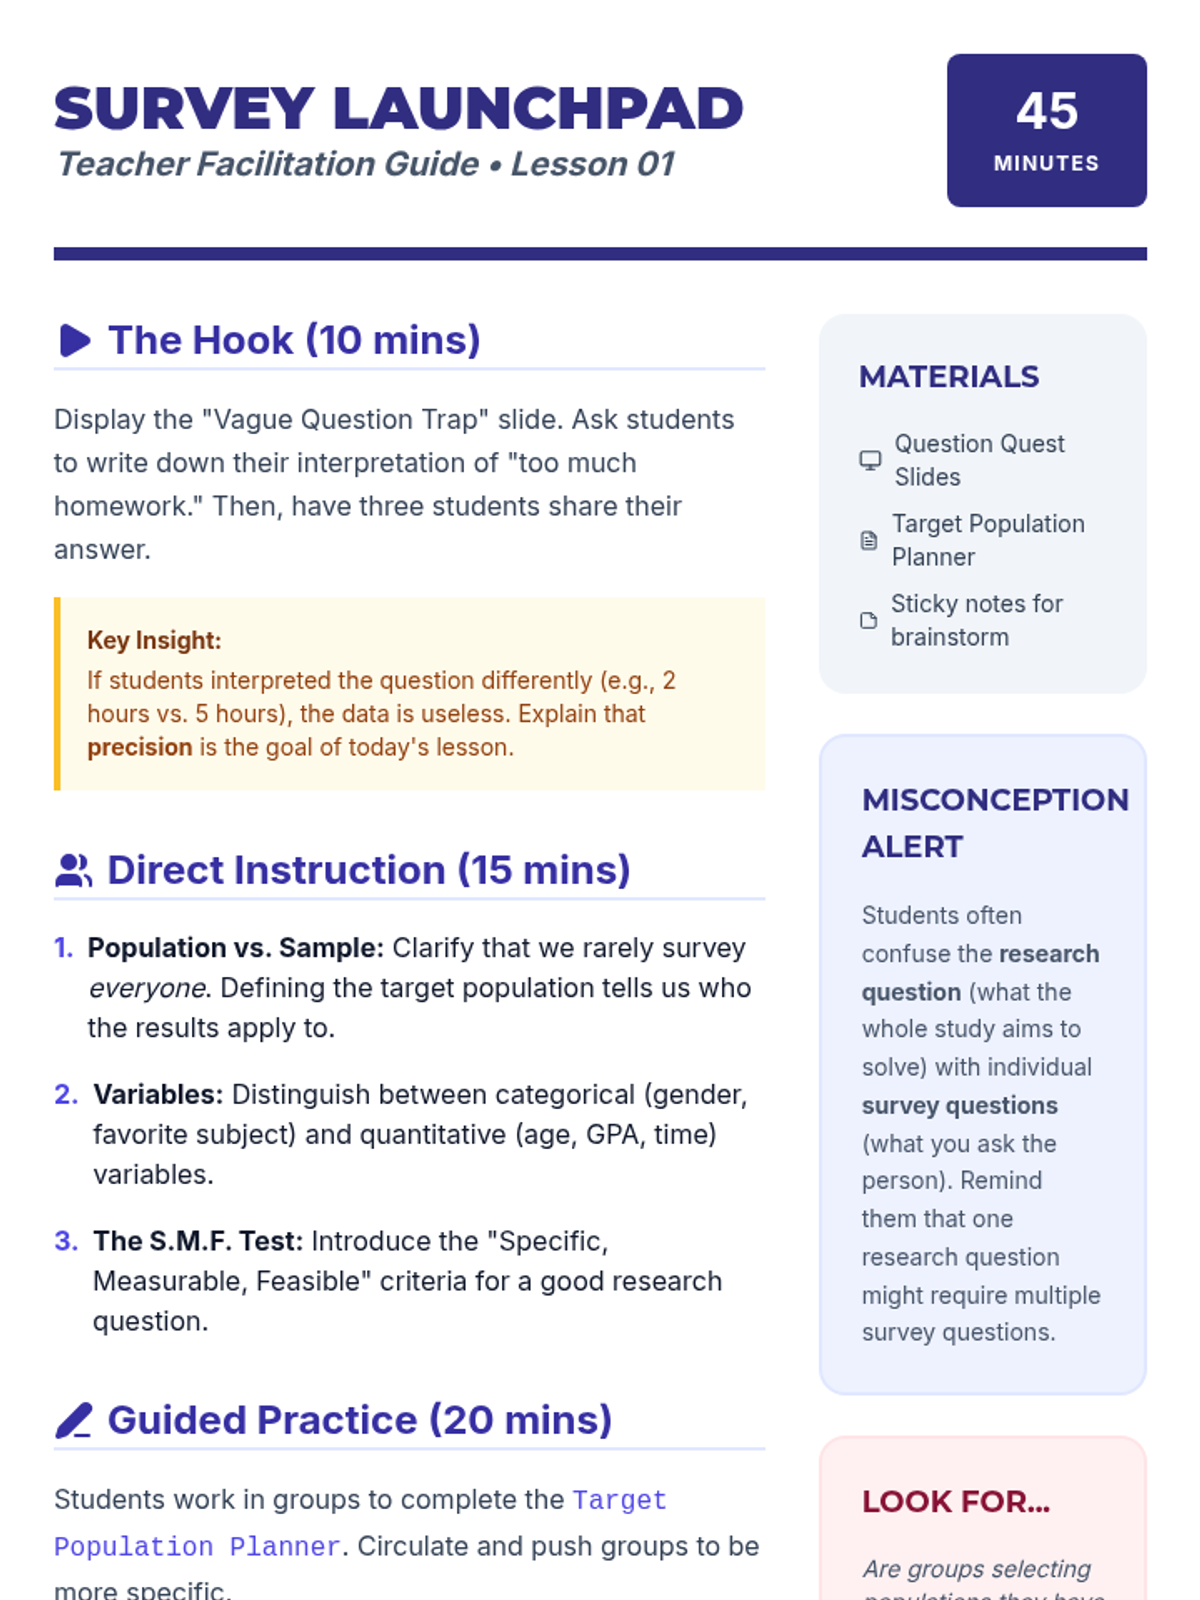
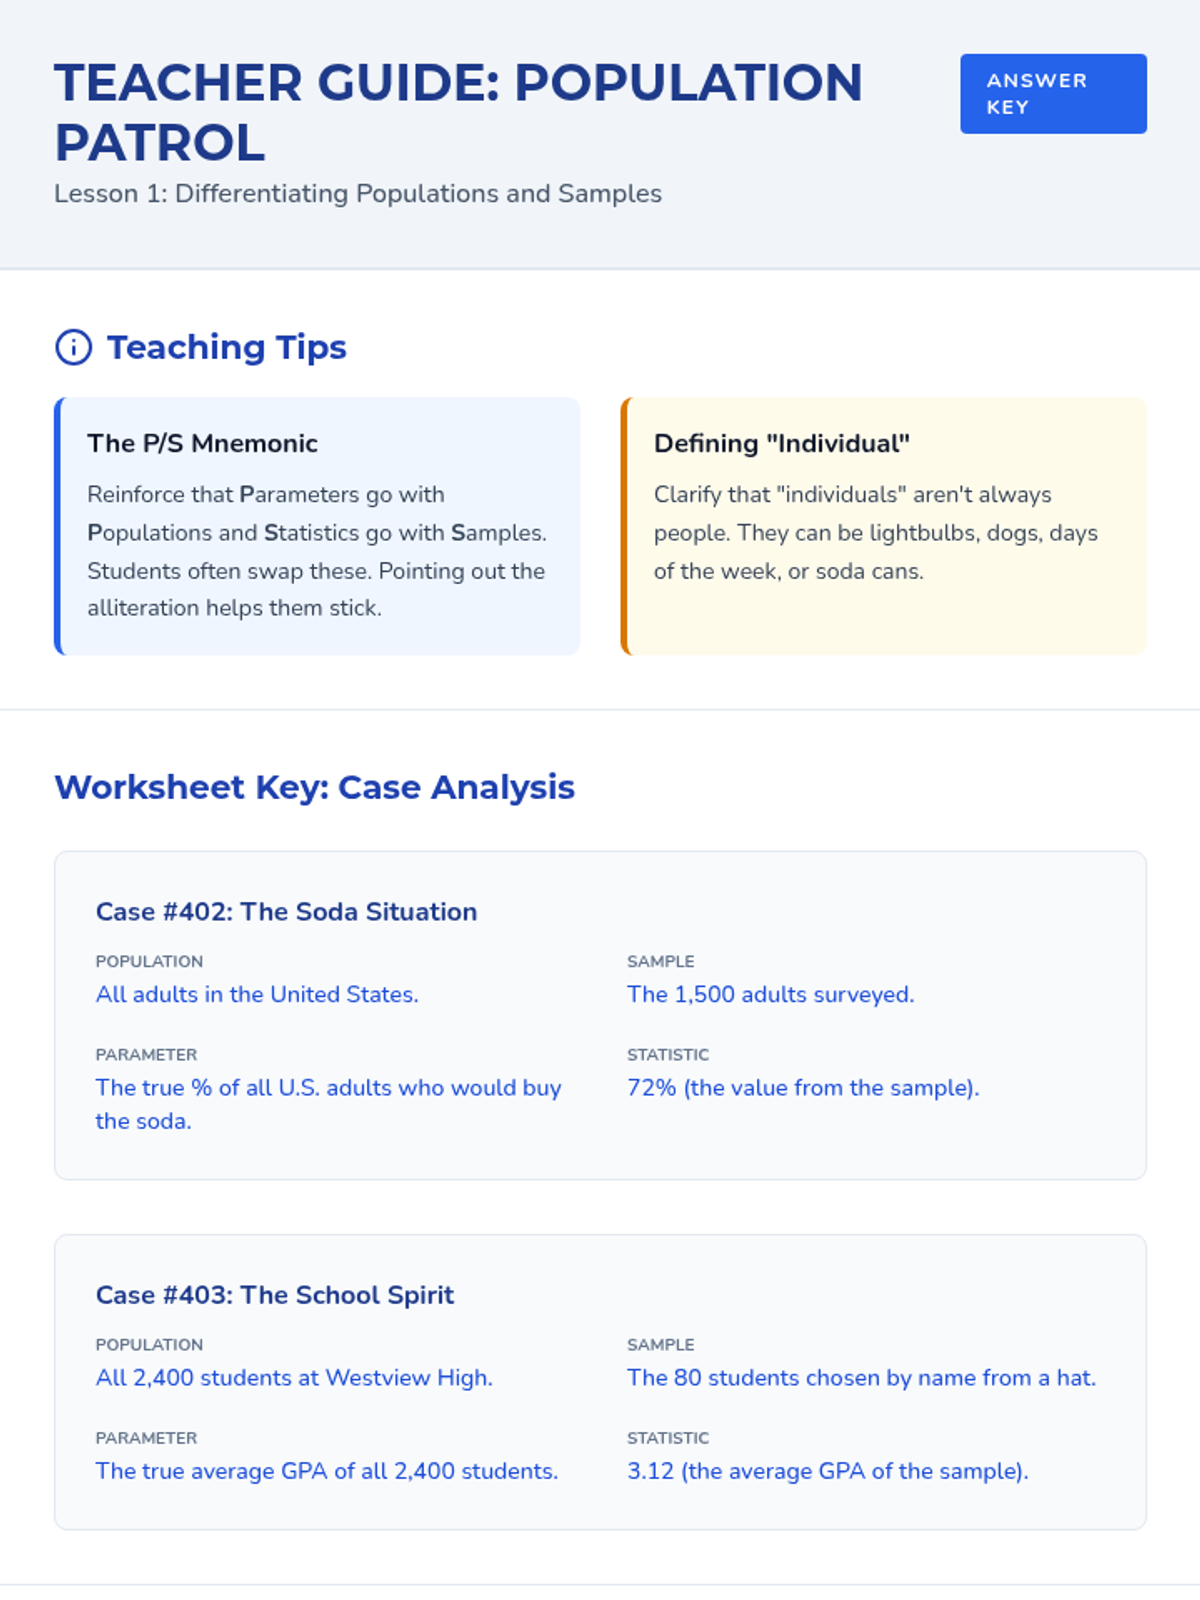
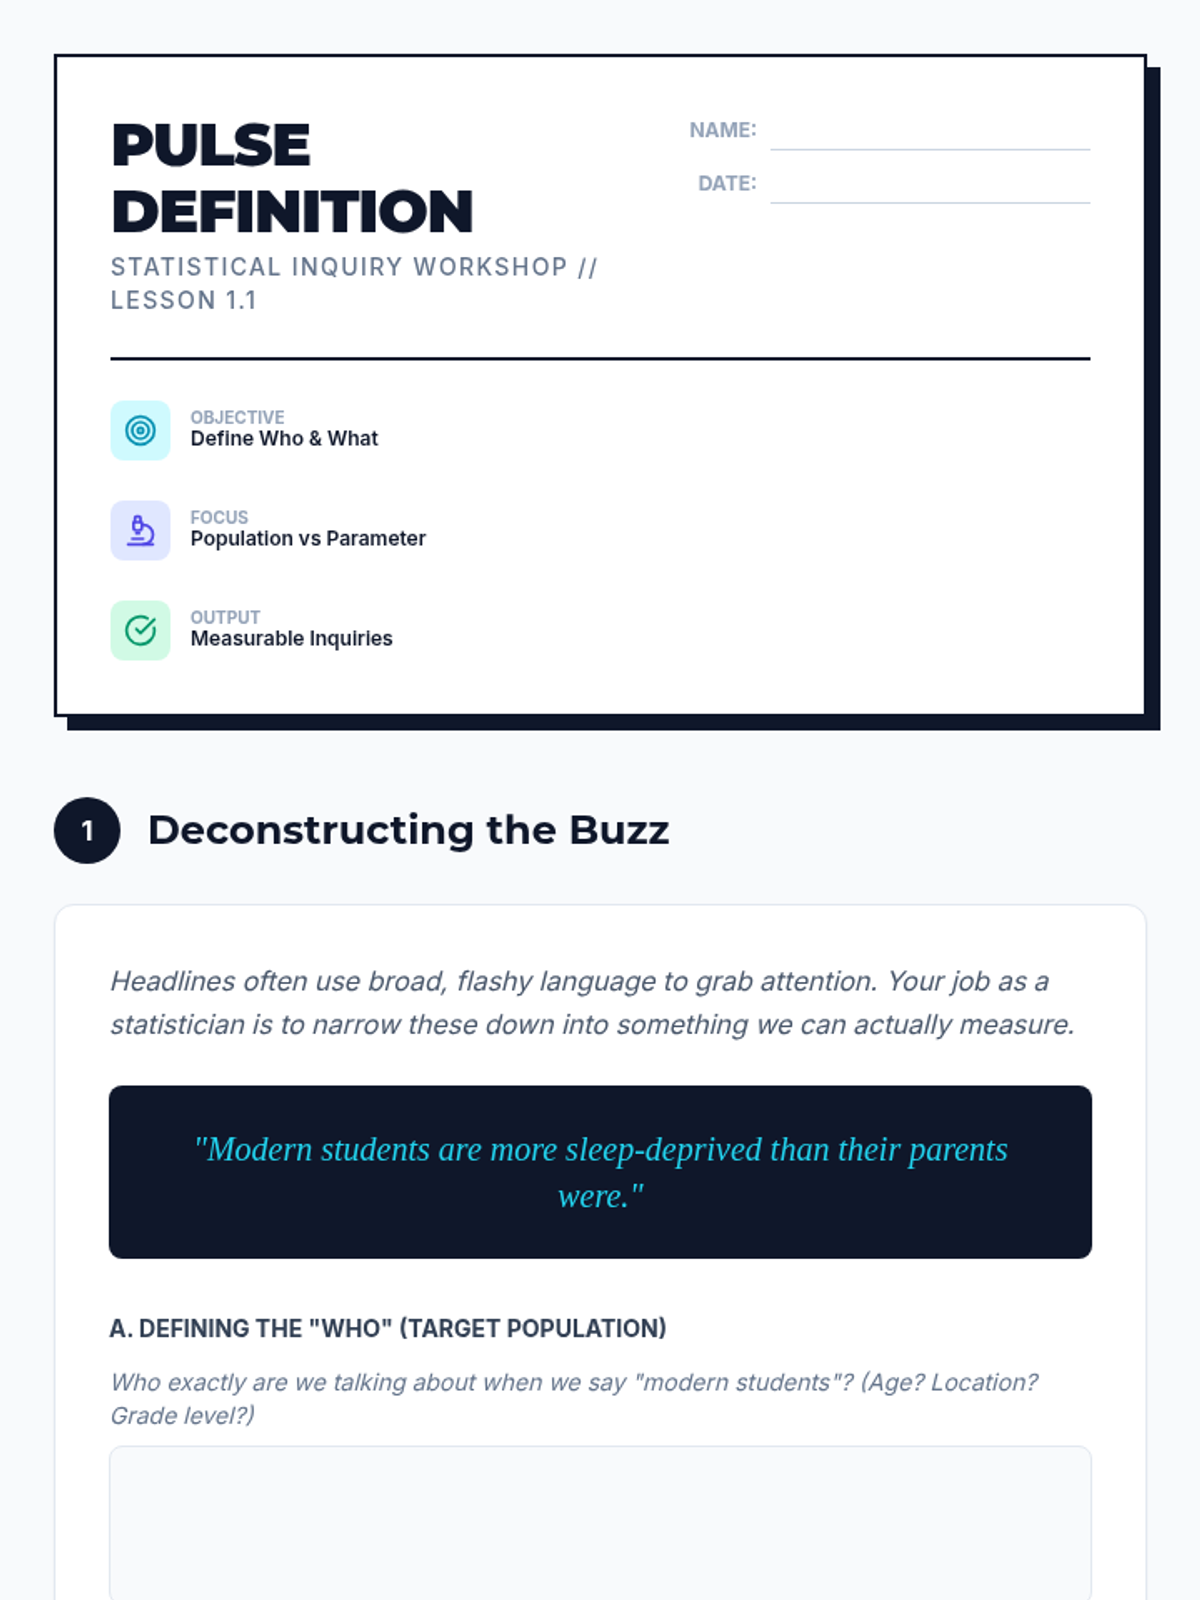
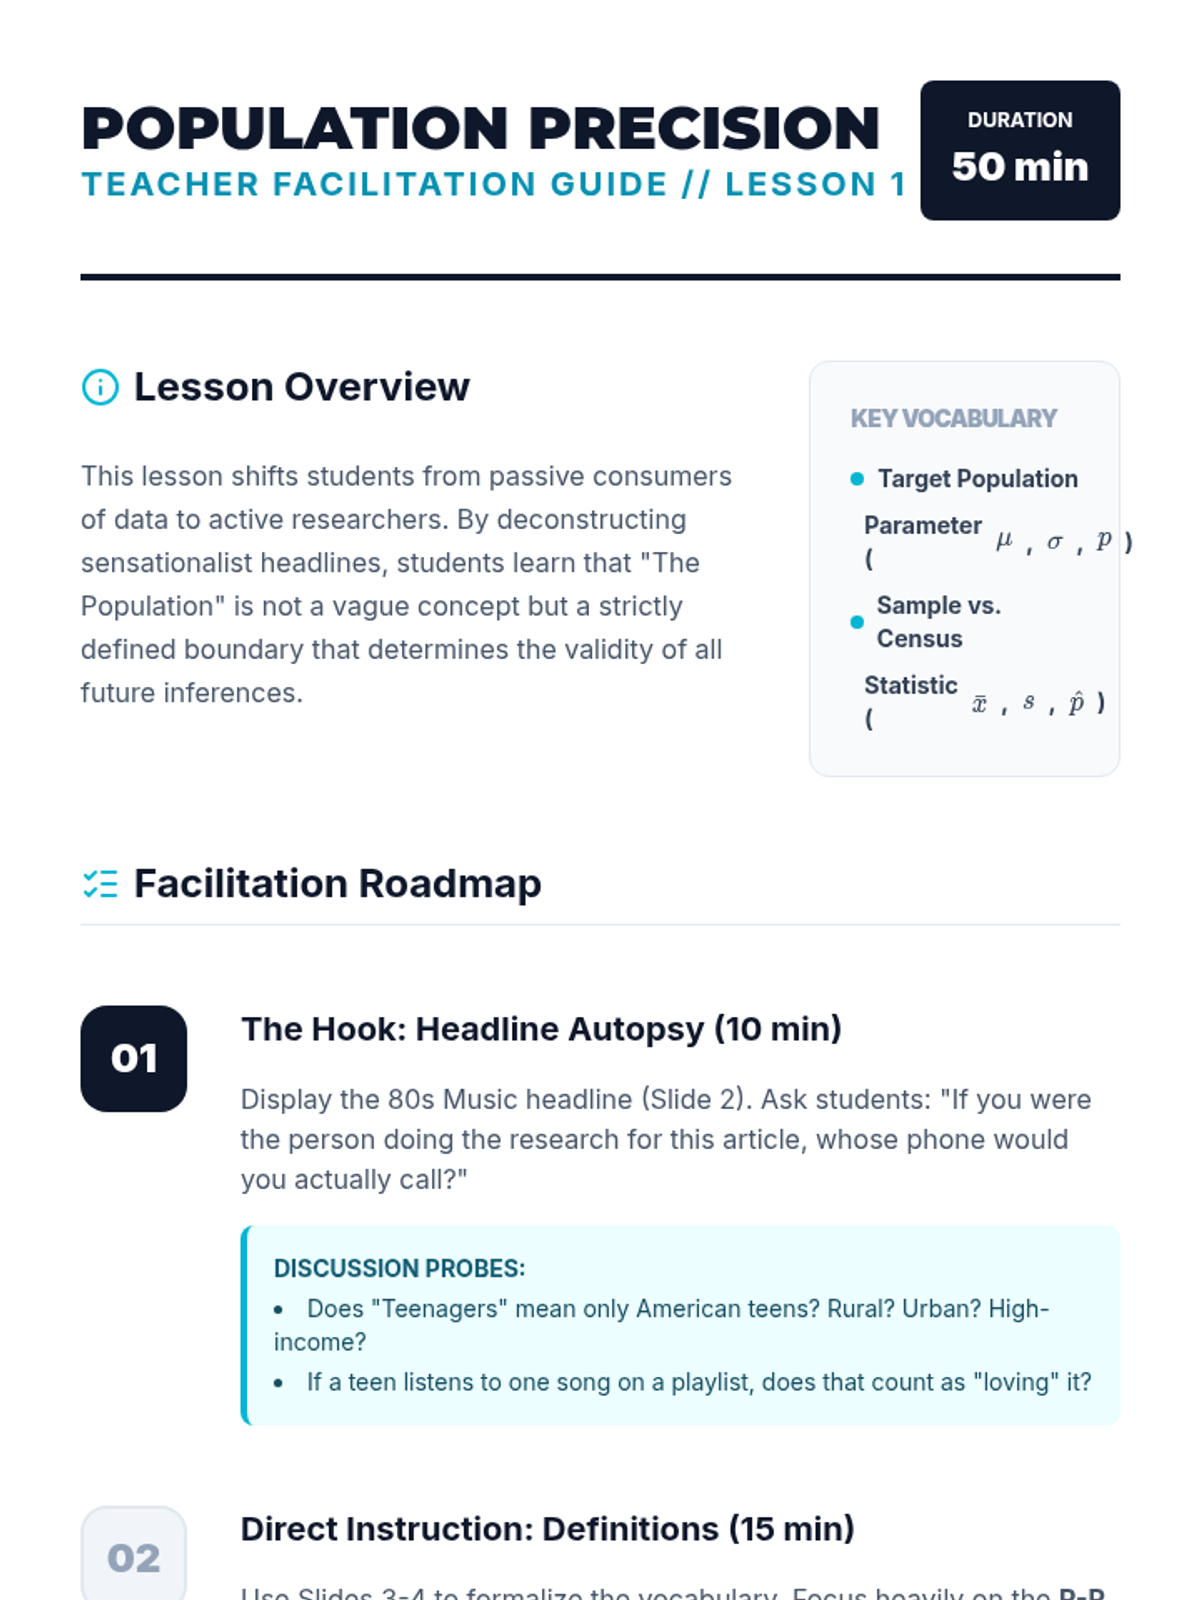
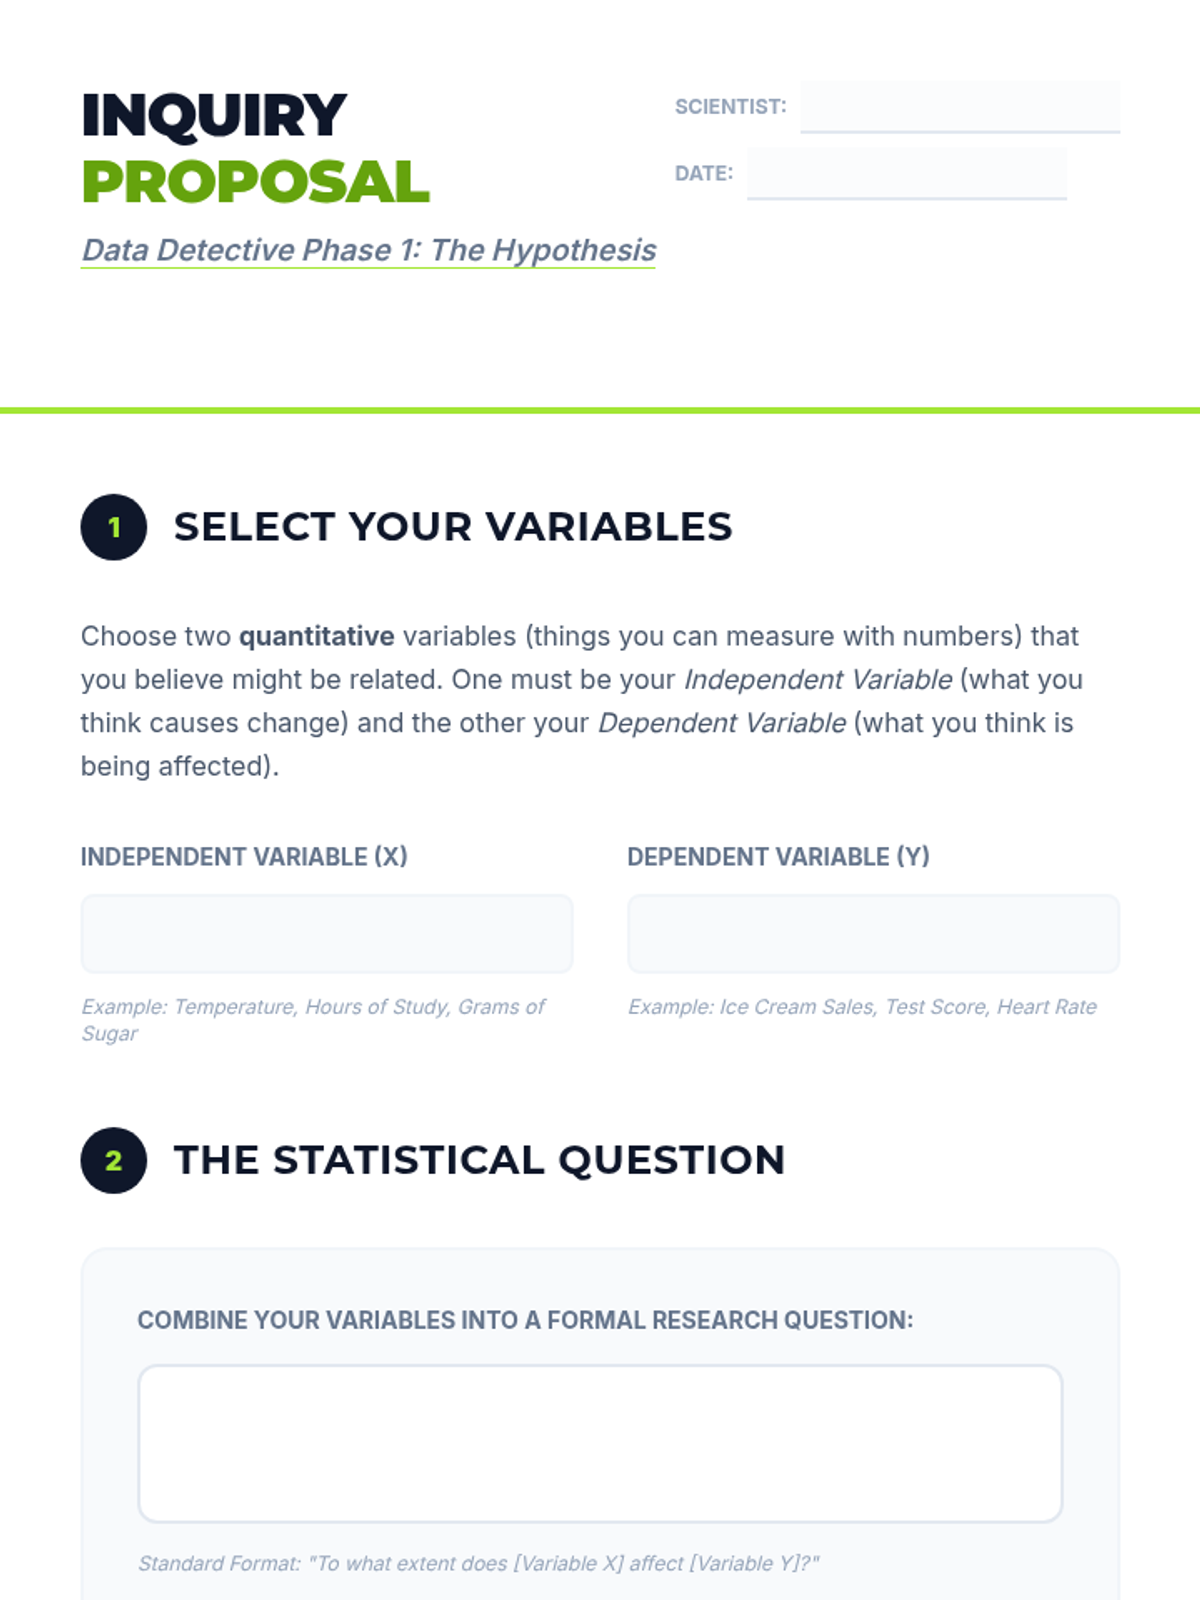
A project-based unit where students act as lead researchers, designing and executing a statistical study from question formulation to final validity reporting. Students learn to navigate population definitions, sampling methods, and question bias to ensure their data accurately reflects reality.
This inquiry-based sequence focuses on the relationship between sample size and the reliability of inferences. Students use technology and simulations to visualize how large samples stabilize around population parameters, introducing the Law of Large Numbers and Margin of Error concepts.
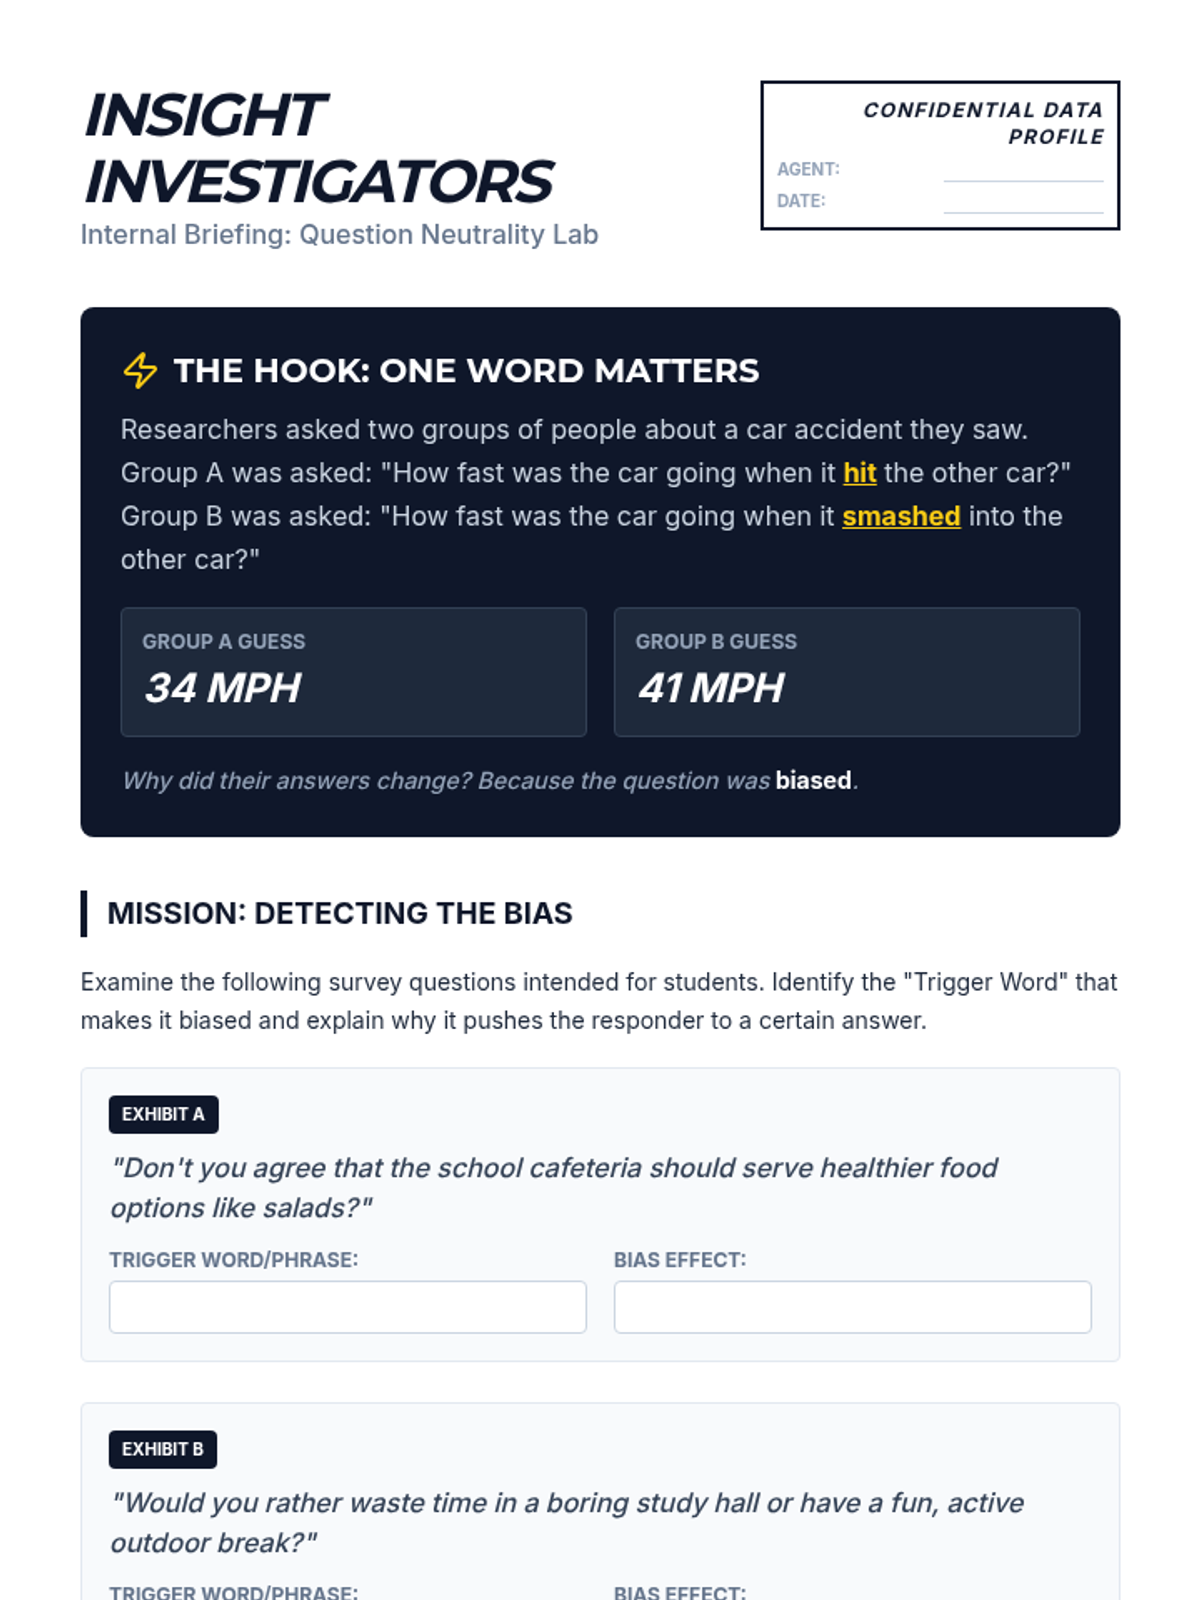
This sequence explores the critical world of statistical sampling, teaching students to identify bias, understand the importance of randomness, and evaluate the validity of data-driven claims in media and history.
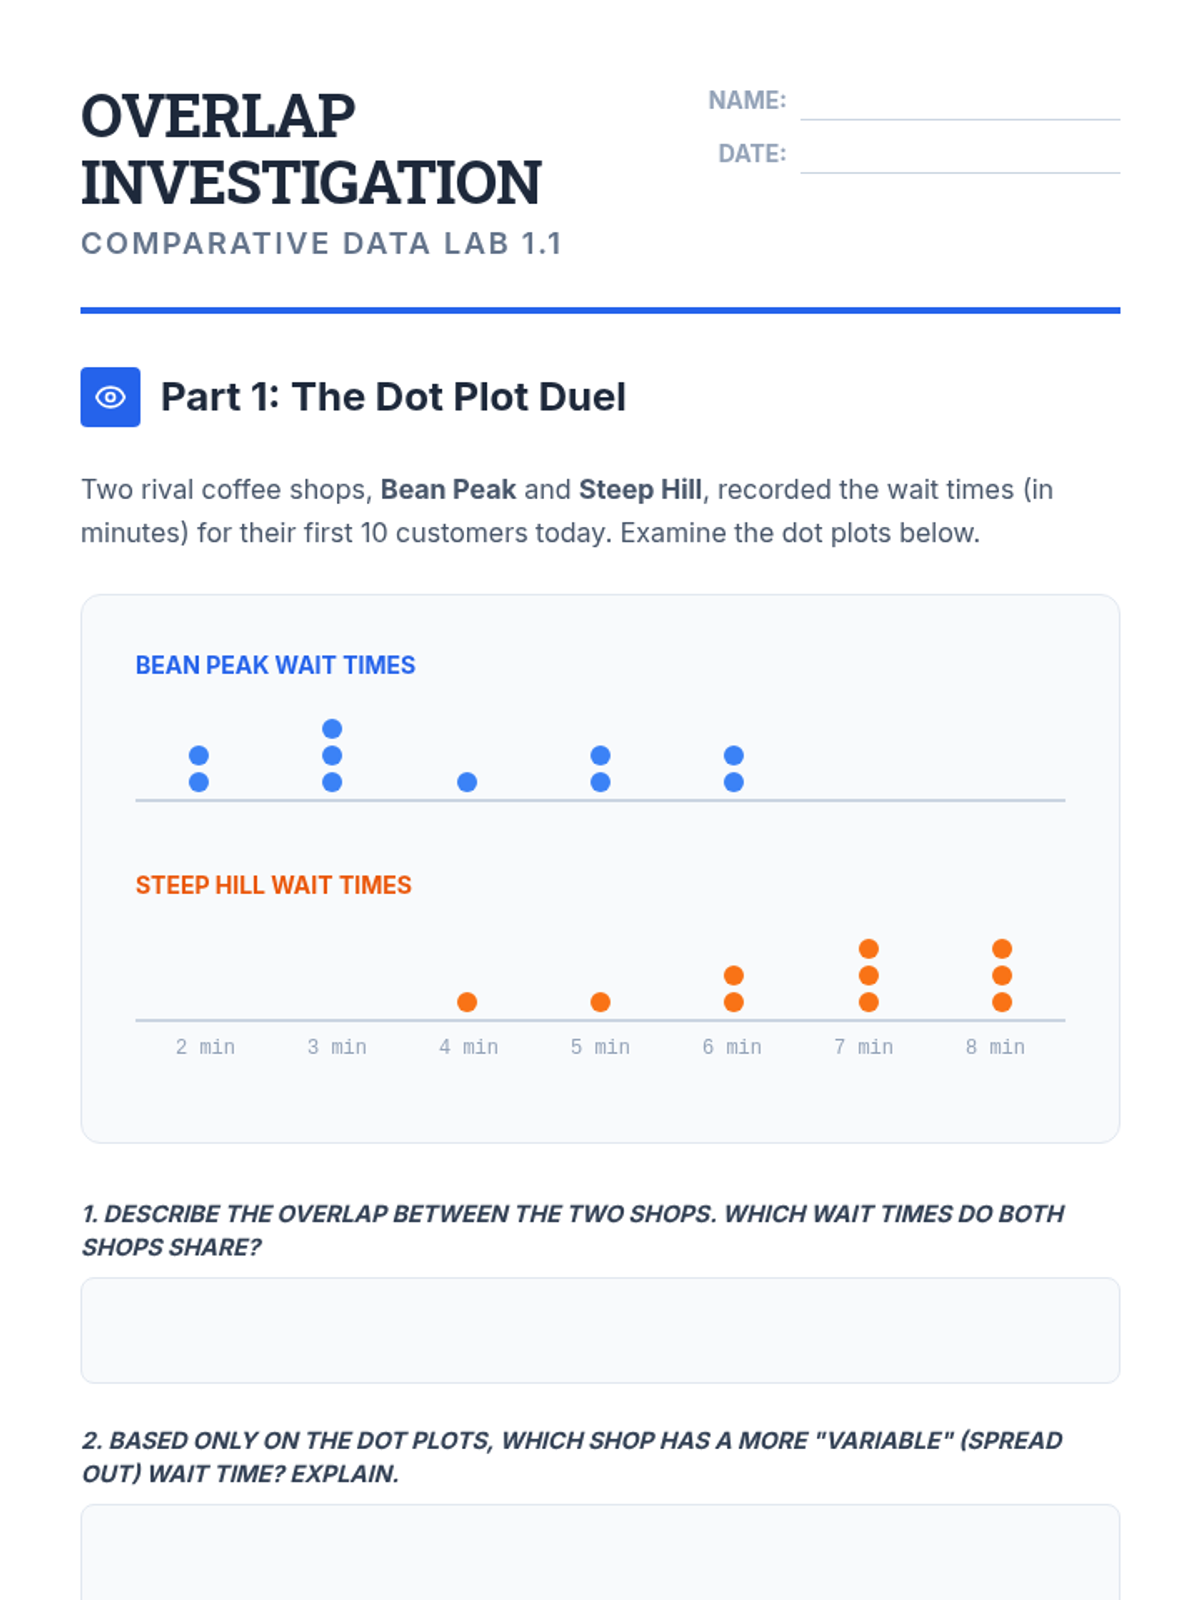
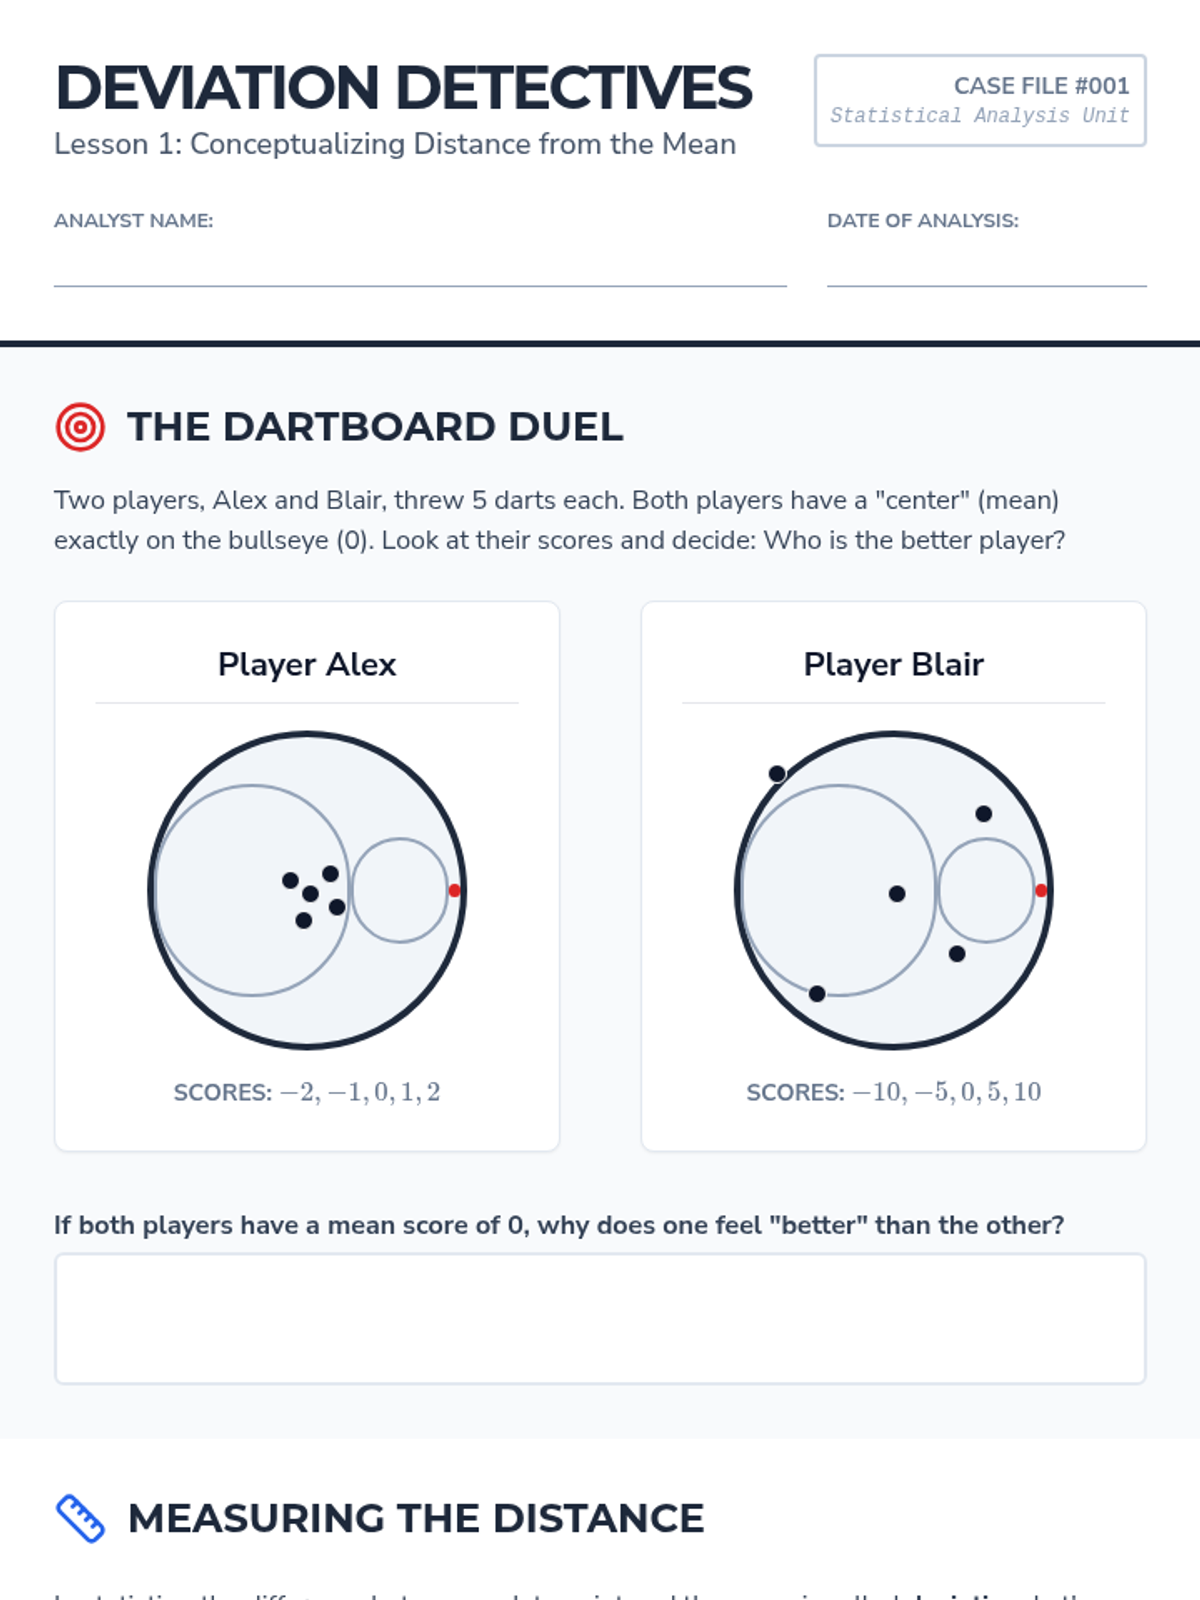
A 9th-grade statistics sequence focused on comparing populations through measures of center and variability. Students learn to interpret overlap, select appropriate metrics, and express differences in terms of spread to make informal inferences.
A simulation-based journey through statistical sampling, focusing on the Law of Large Numbers, variability, and the distinction between bias and precision. Students move from manual experiments to digital simulations to build intuition for statistical inference.
A project-based unit where 9th-grade students design a statistical study for their school community, focusing on sampling methods, survey design, and ethical data collection. Students progress from defining a research question to presenting a formal study proposal that minimizes bias.
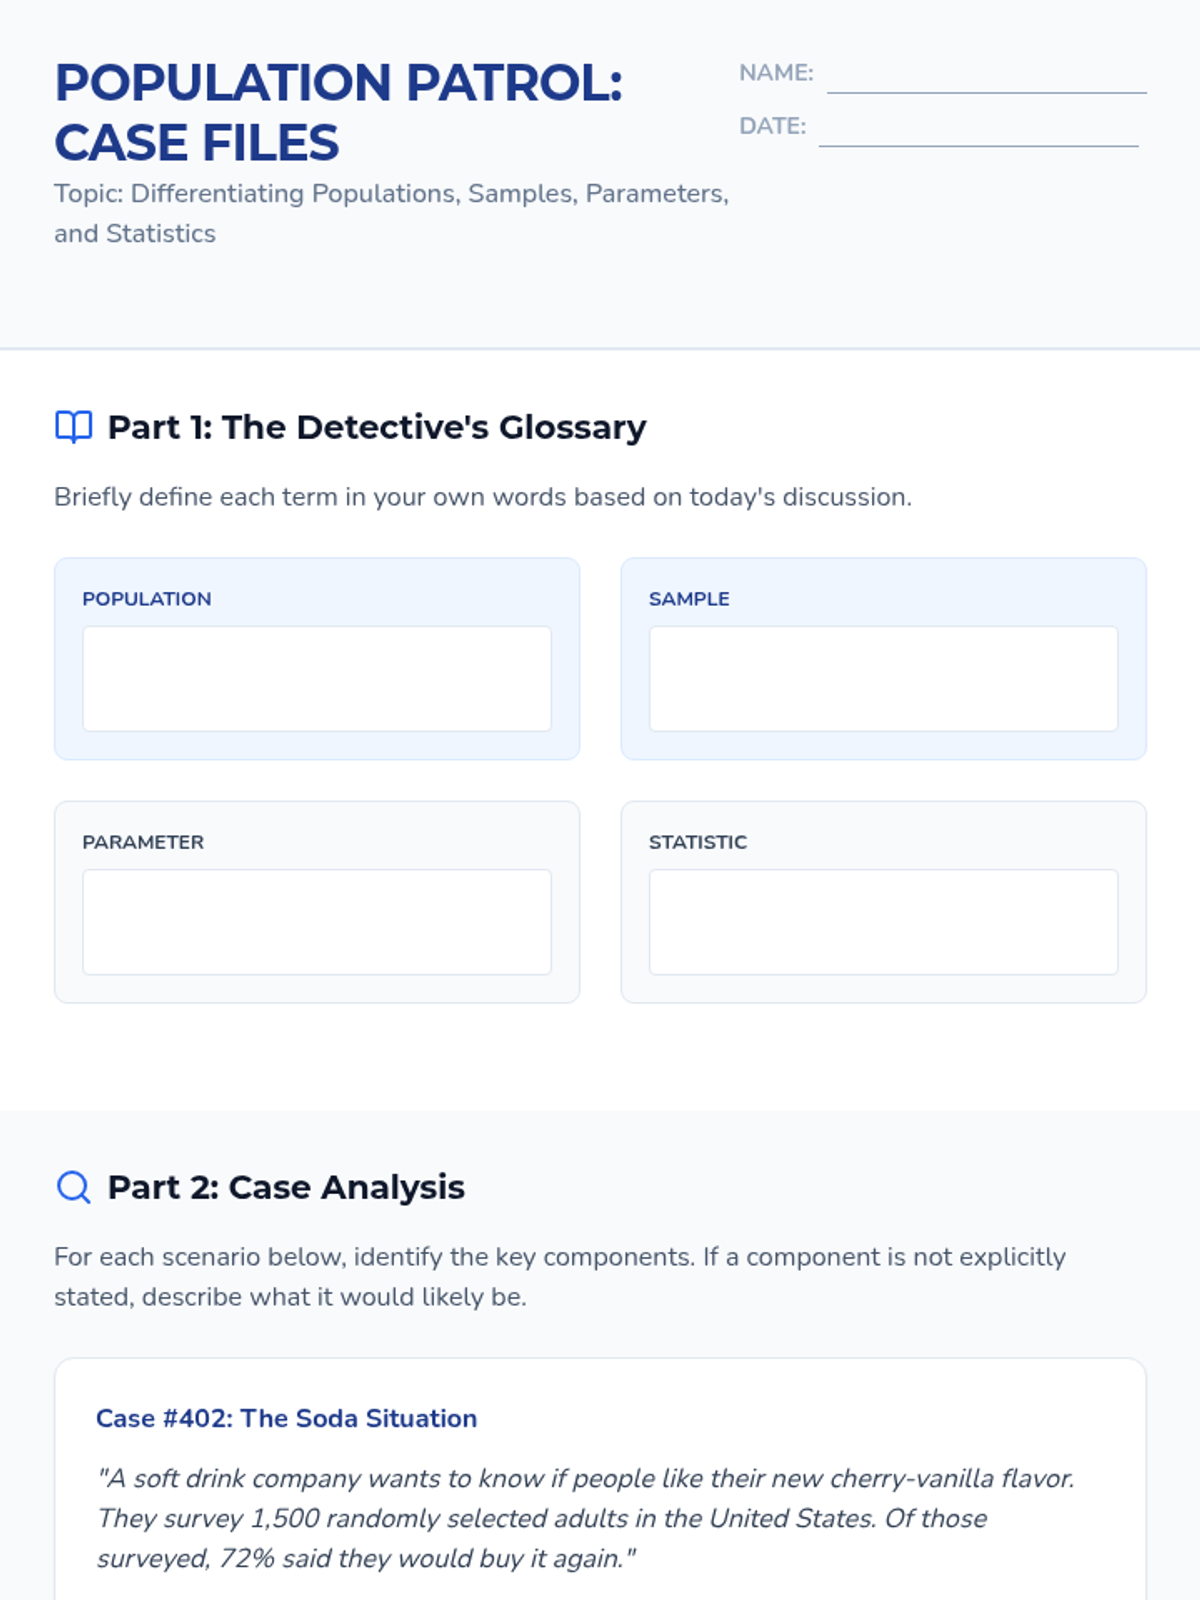
A comprehensive 9th-grade statistics sequence exploring populations, sampling methods (SRS, stratified, cluster, systematic), and the identification of bias in data collection. Students progress from foundational definitions to critiquing the validity of real-world statistical claims.
A project-based exploration of statistical sampling where students learn to define populations, determine sample sizes, design protocols, and make valid inferences. Students act as data consultants, moving from theoretical understanding to simulated data collection and analysis.
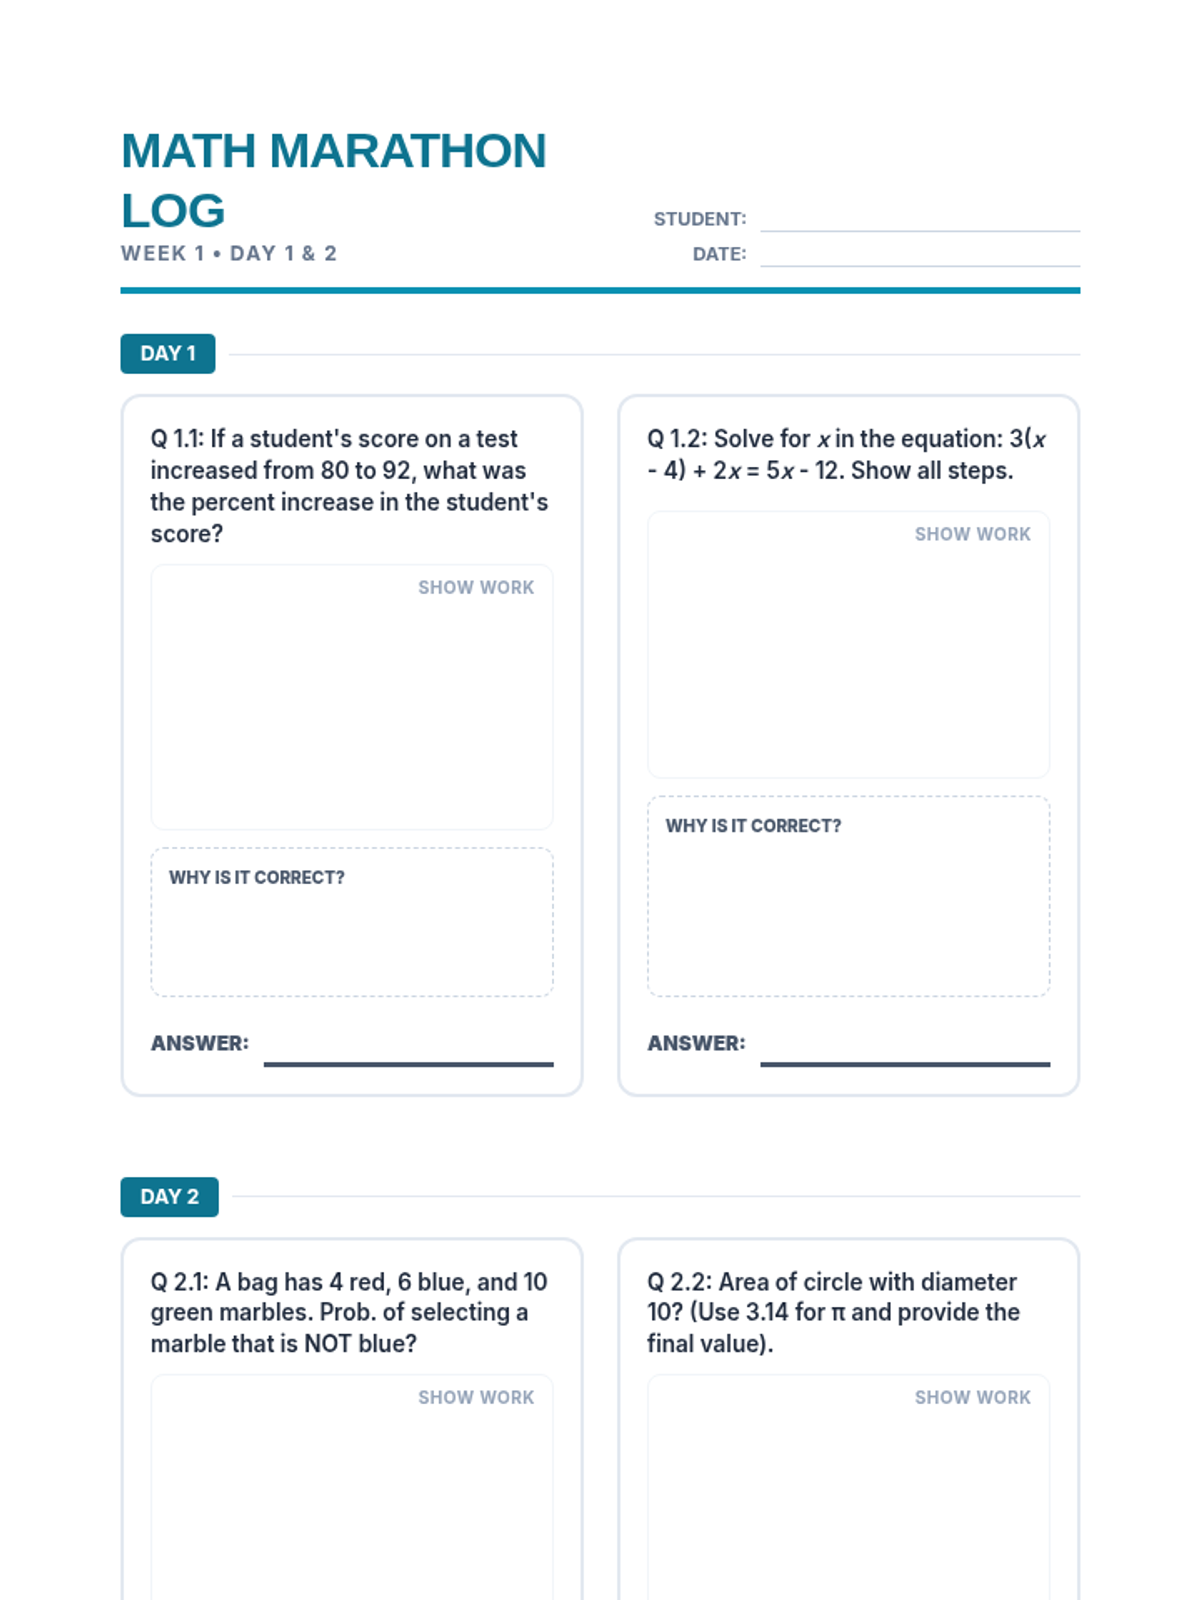
A comprehensive 15-day TSIA2 math review sequence featuring daily warm-up questions and weekly progress logs for students. The program covers all four TSIA2 domains through a "Math Marathon" theme.
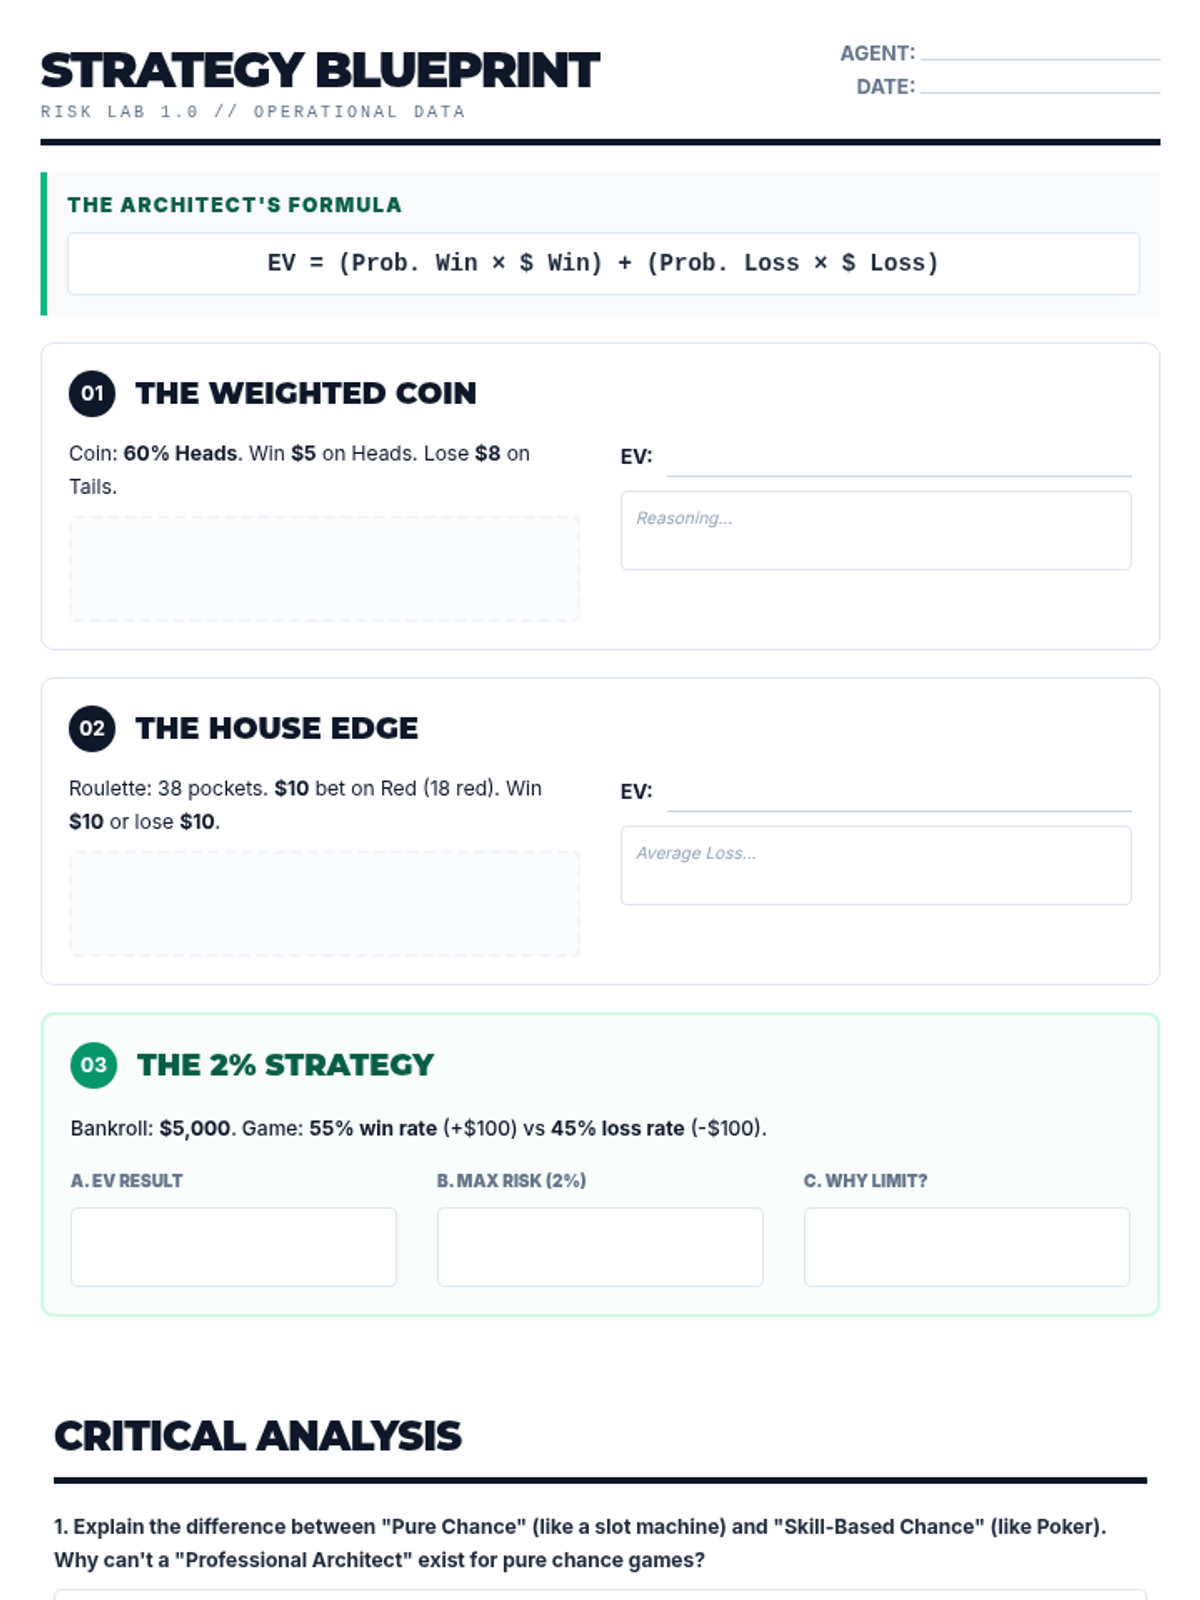
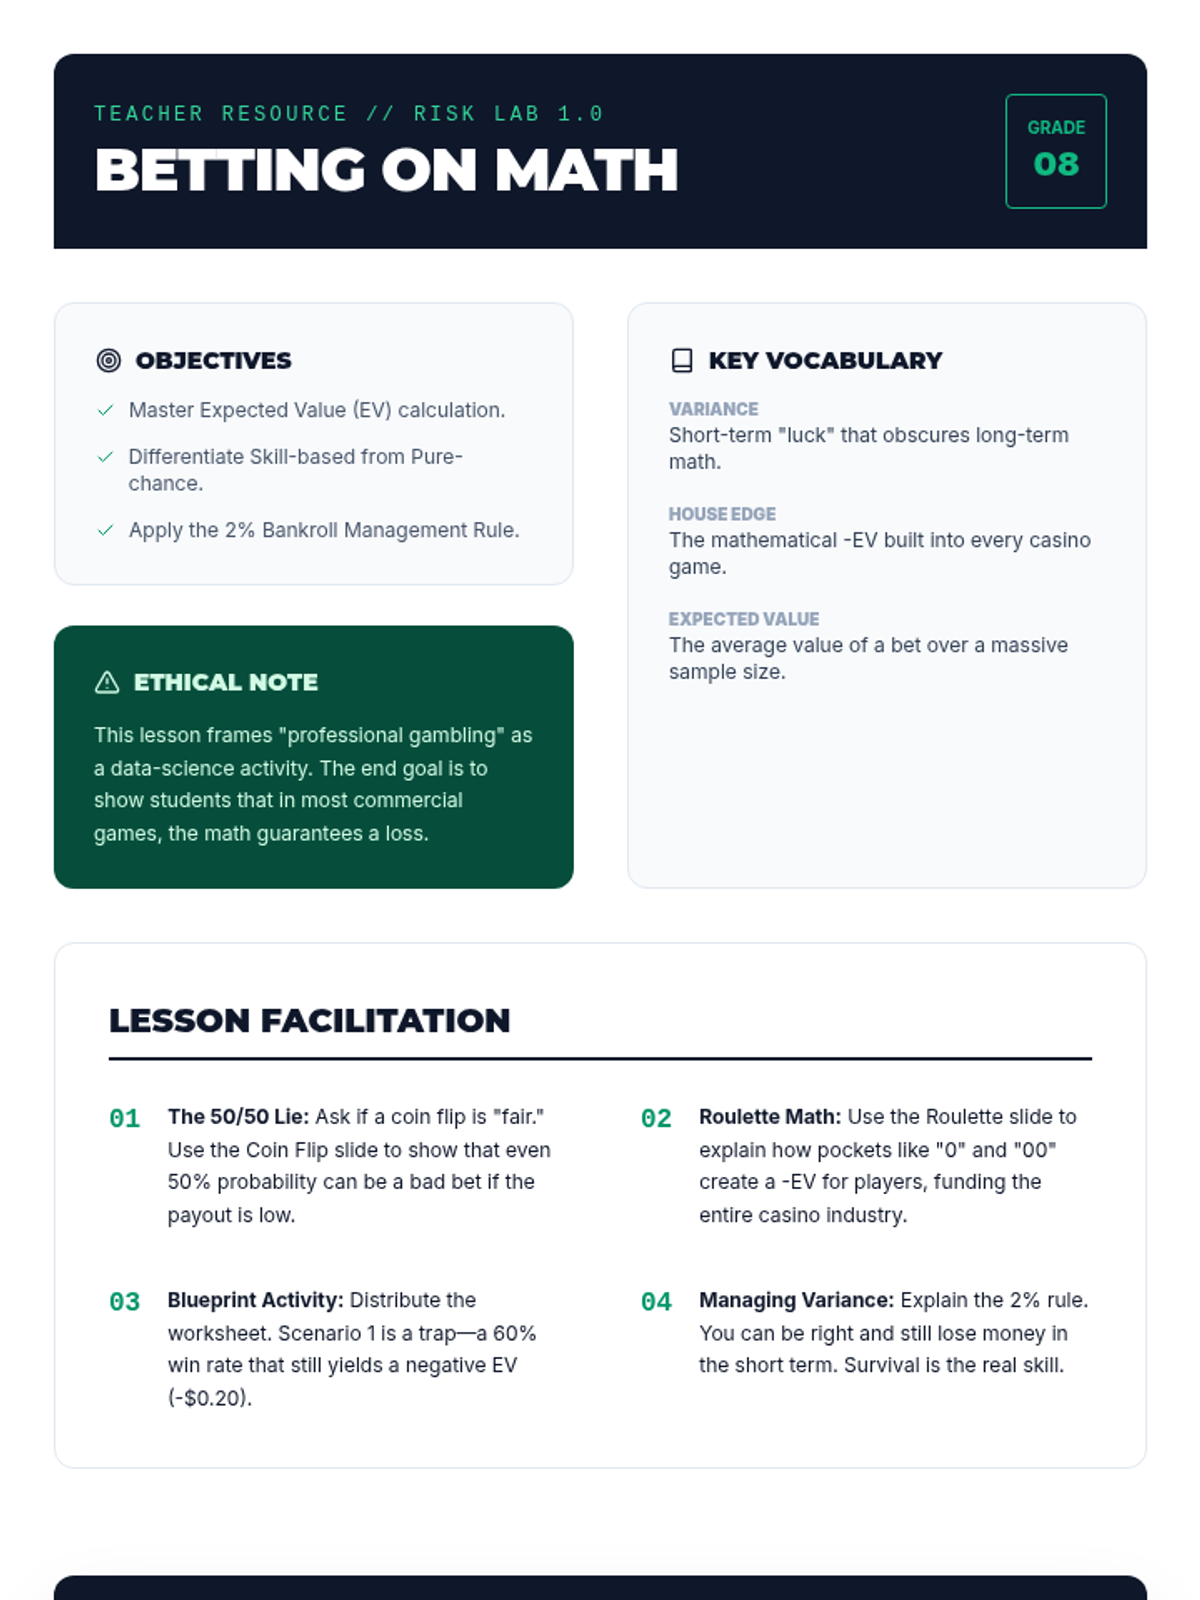
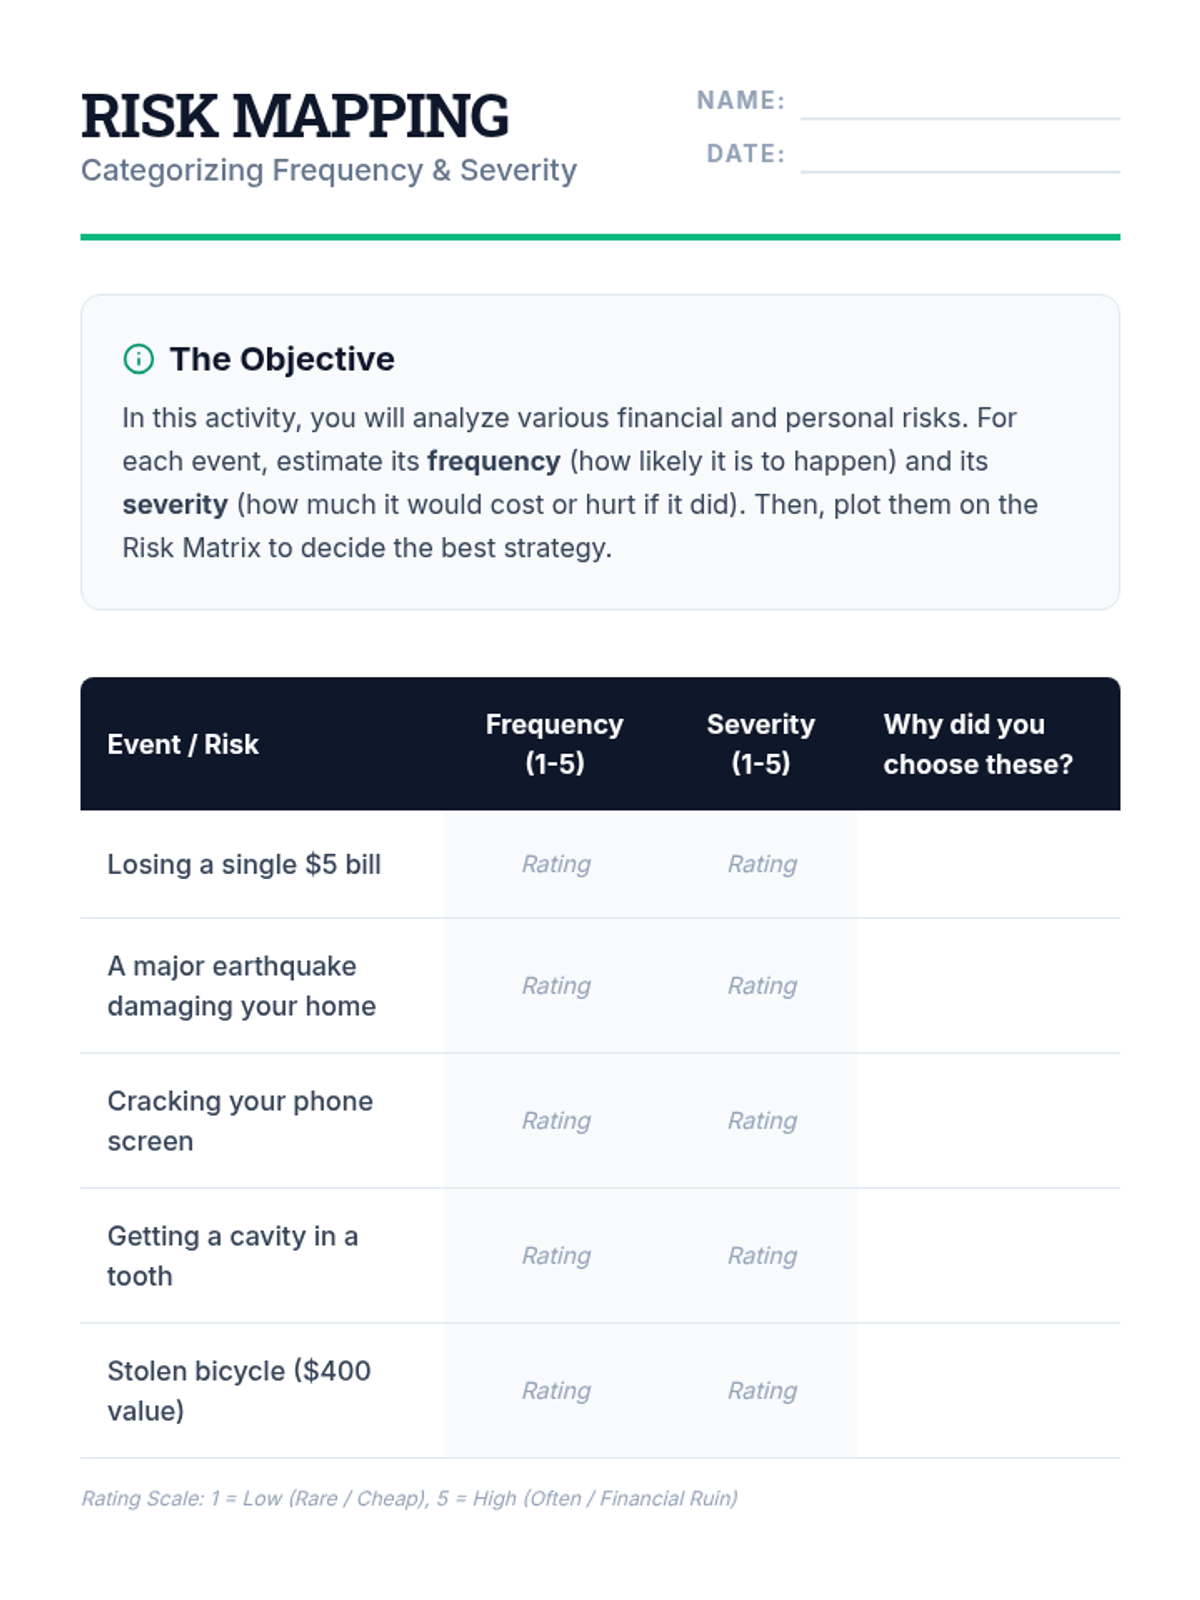
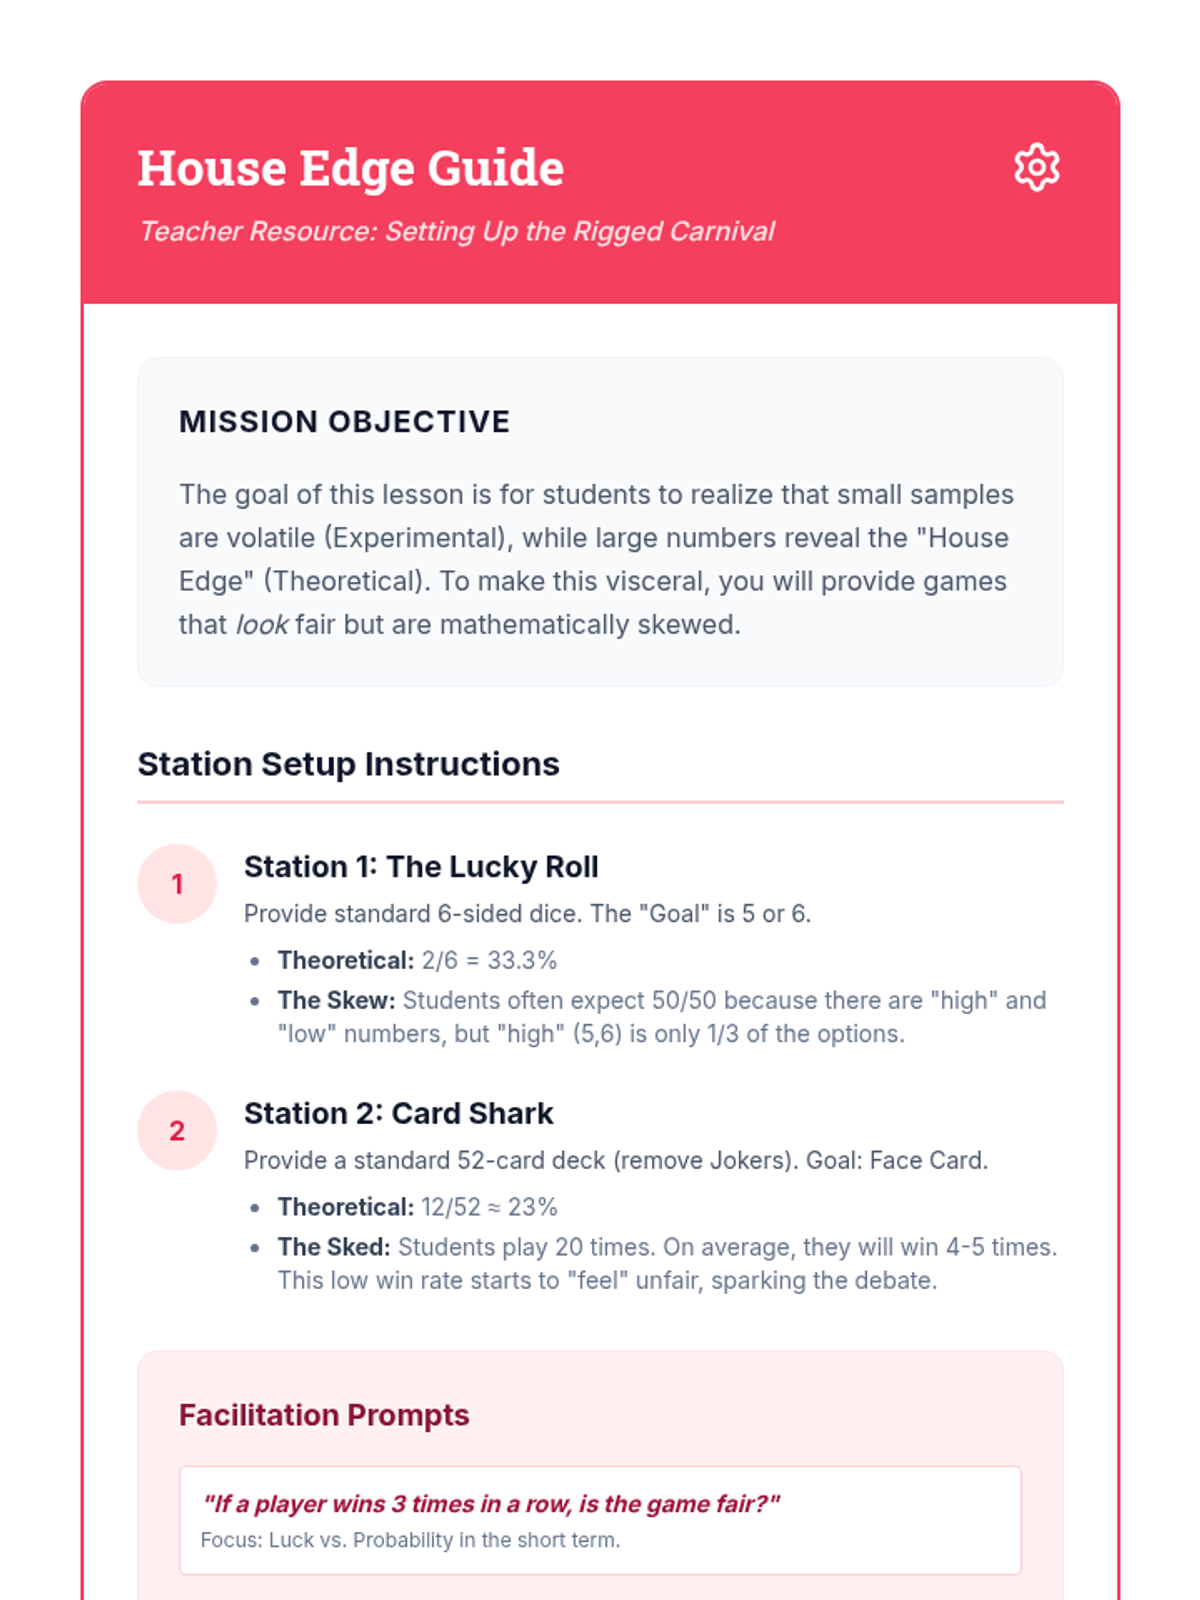
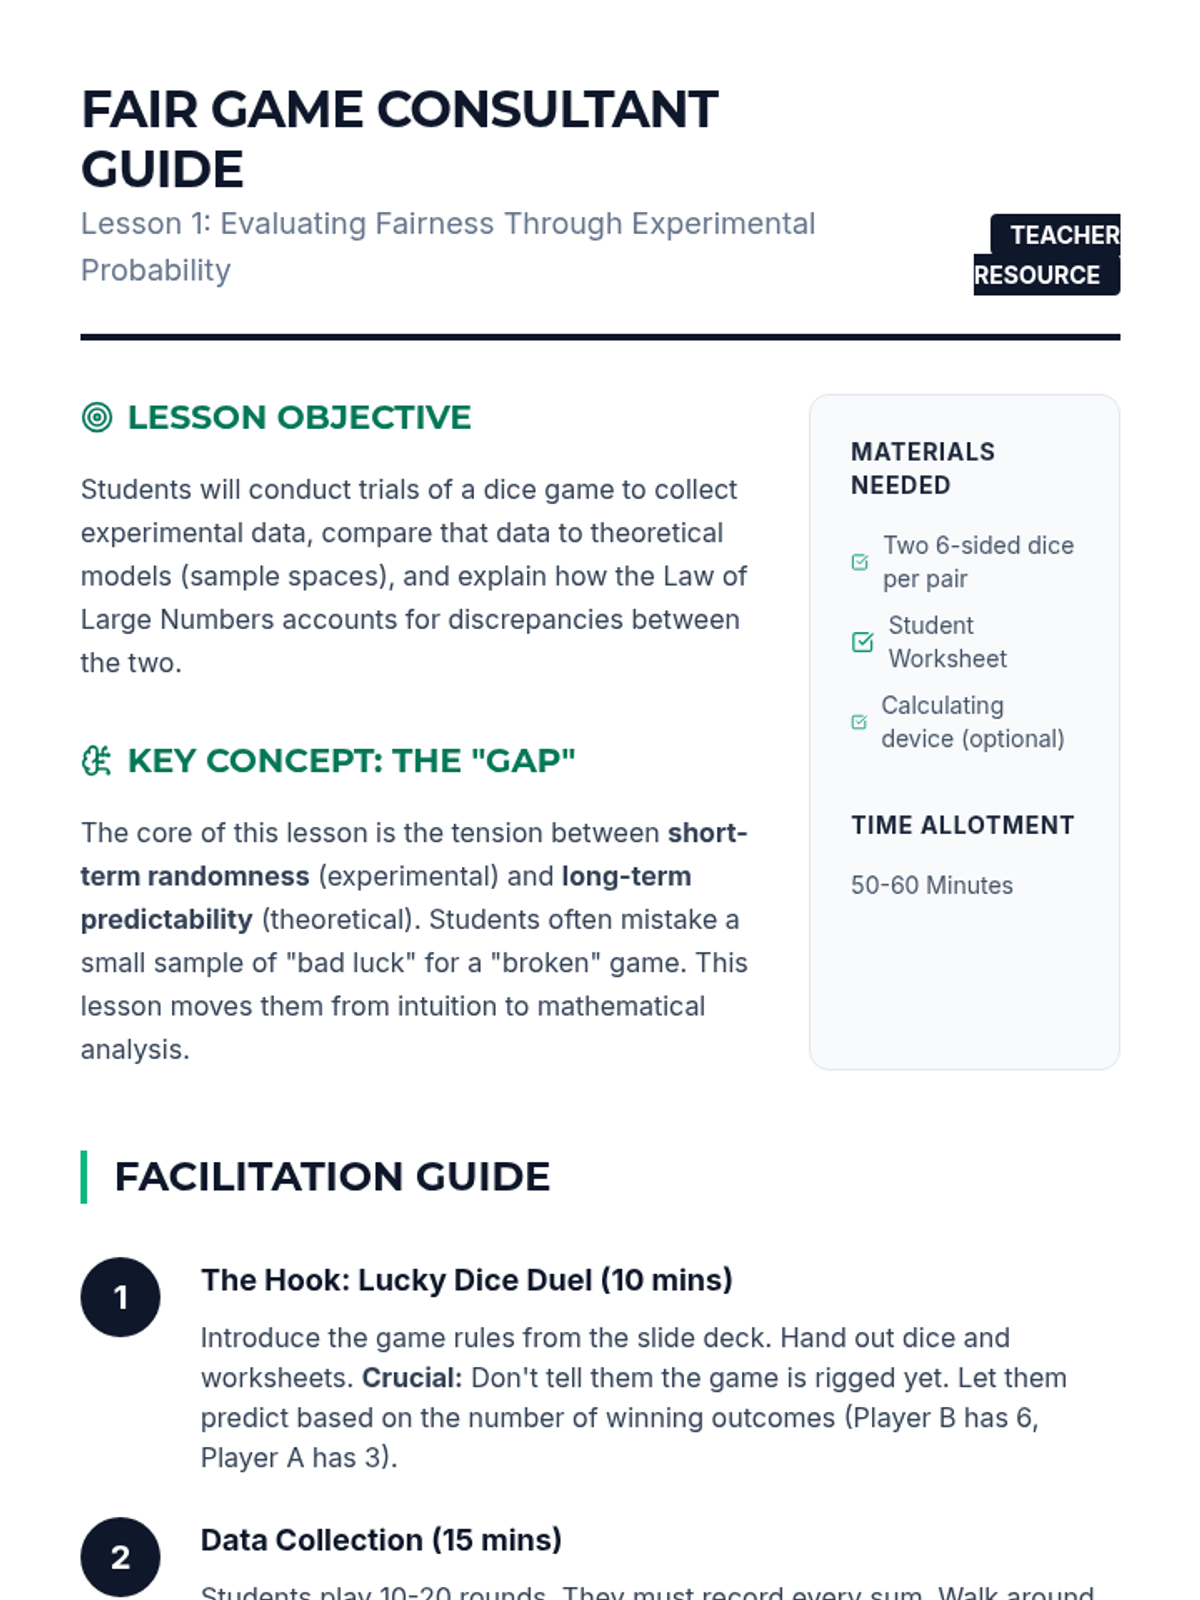
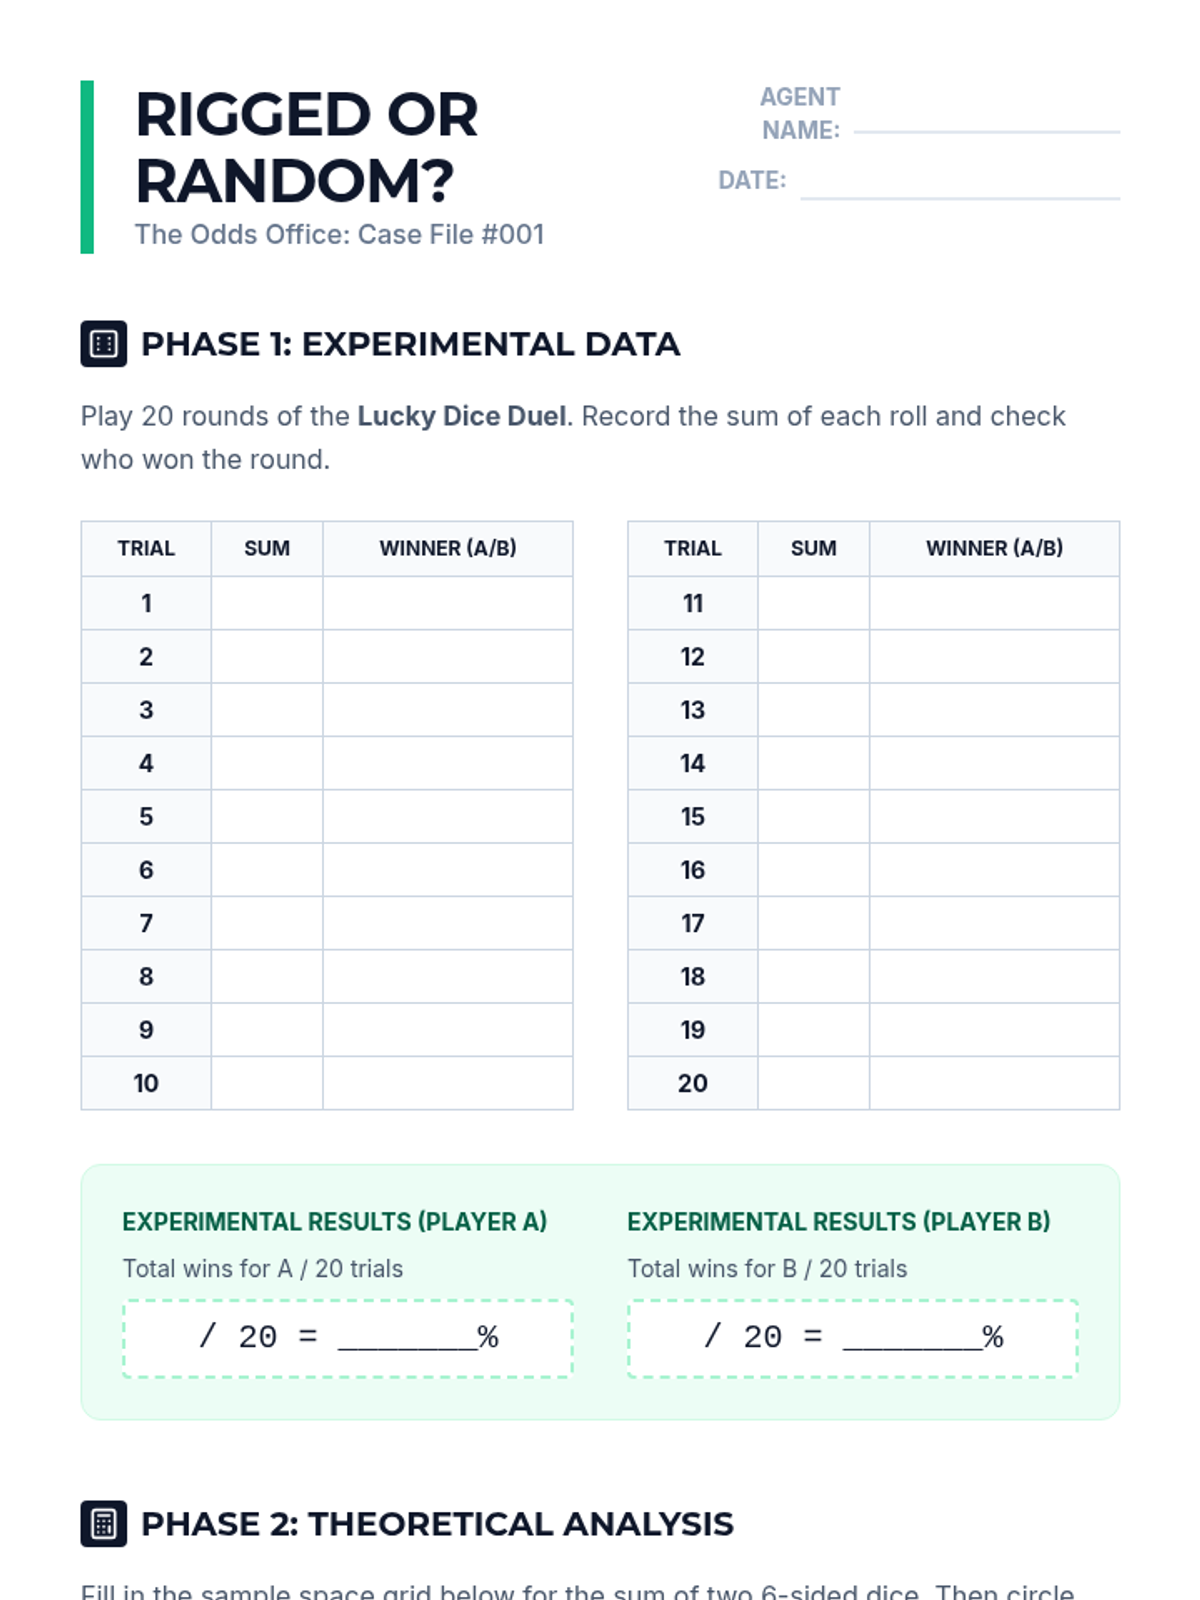
A high-stakes dive into the mathematics of probability, risk assessment, and expected value, teaching students how to analyze games of chance and skill through a professional lens.
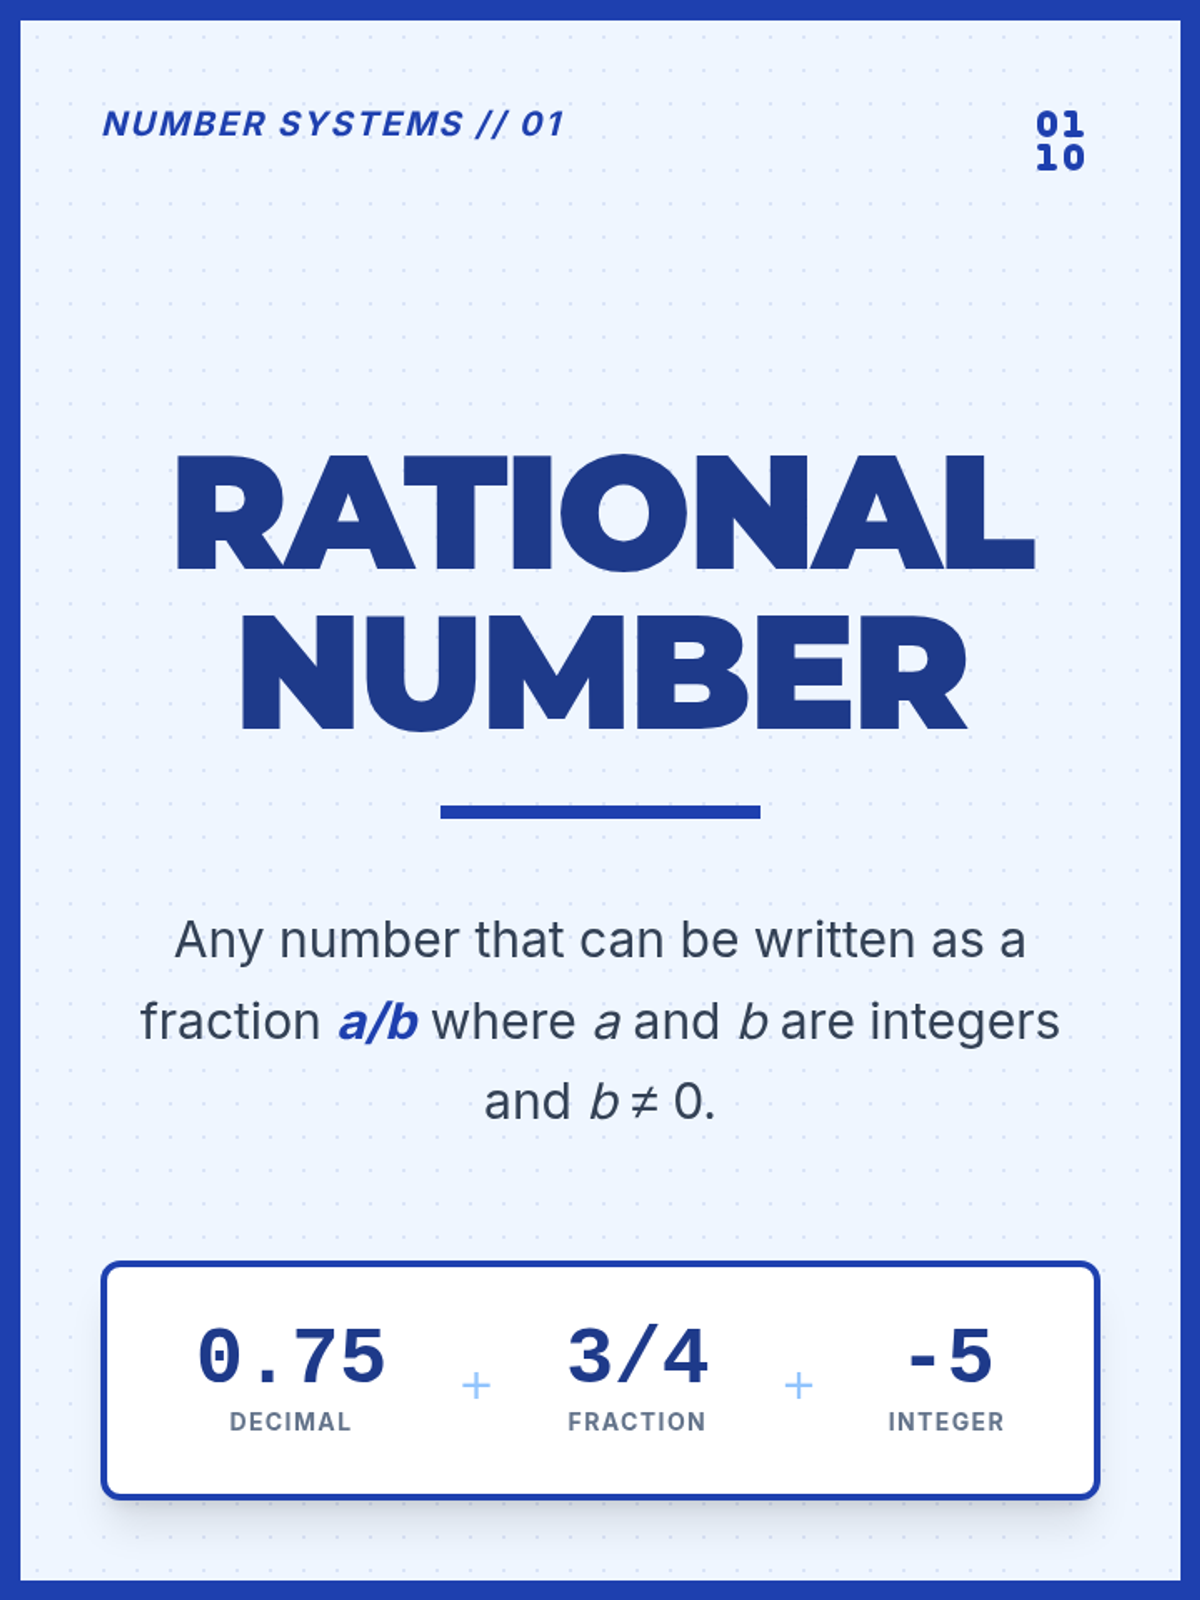
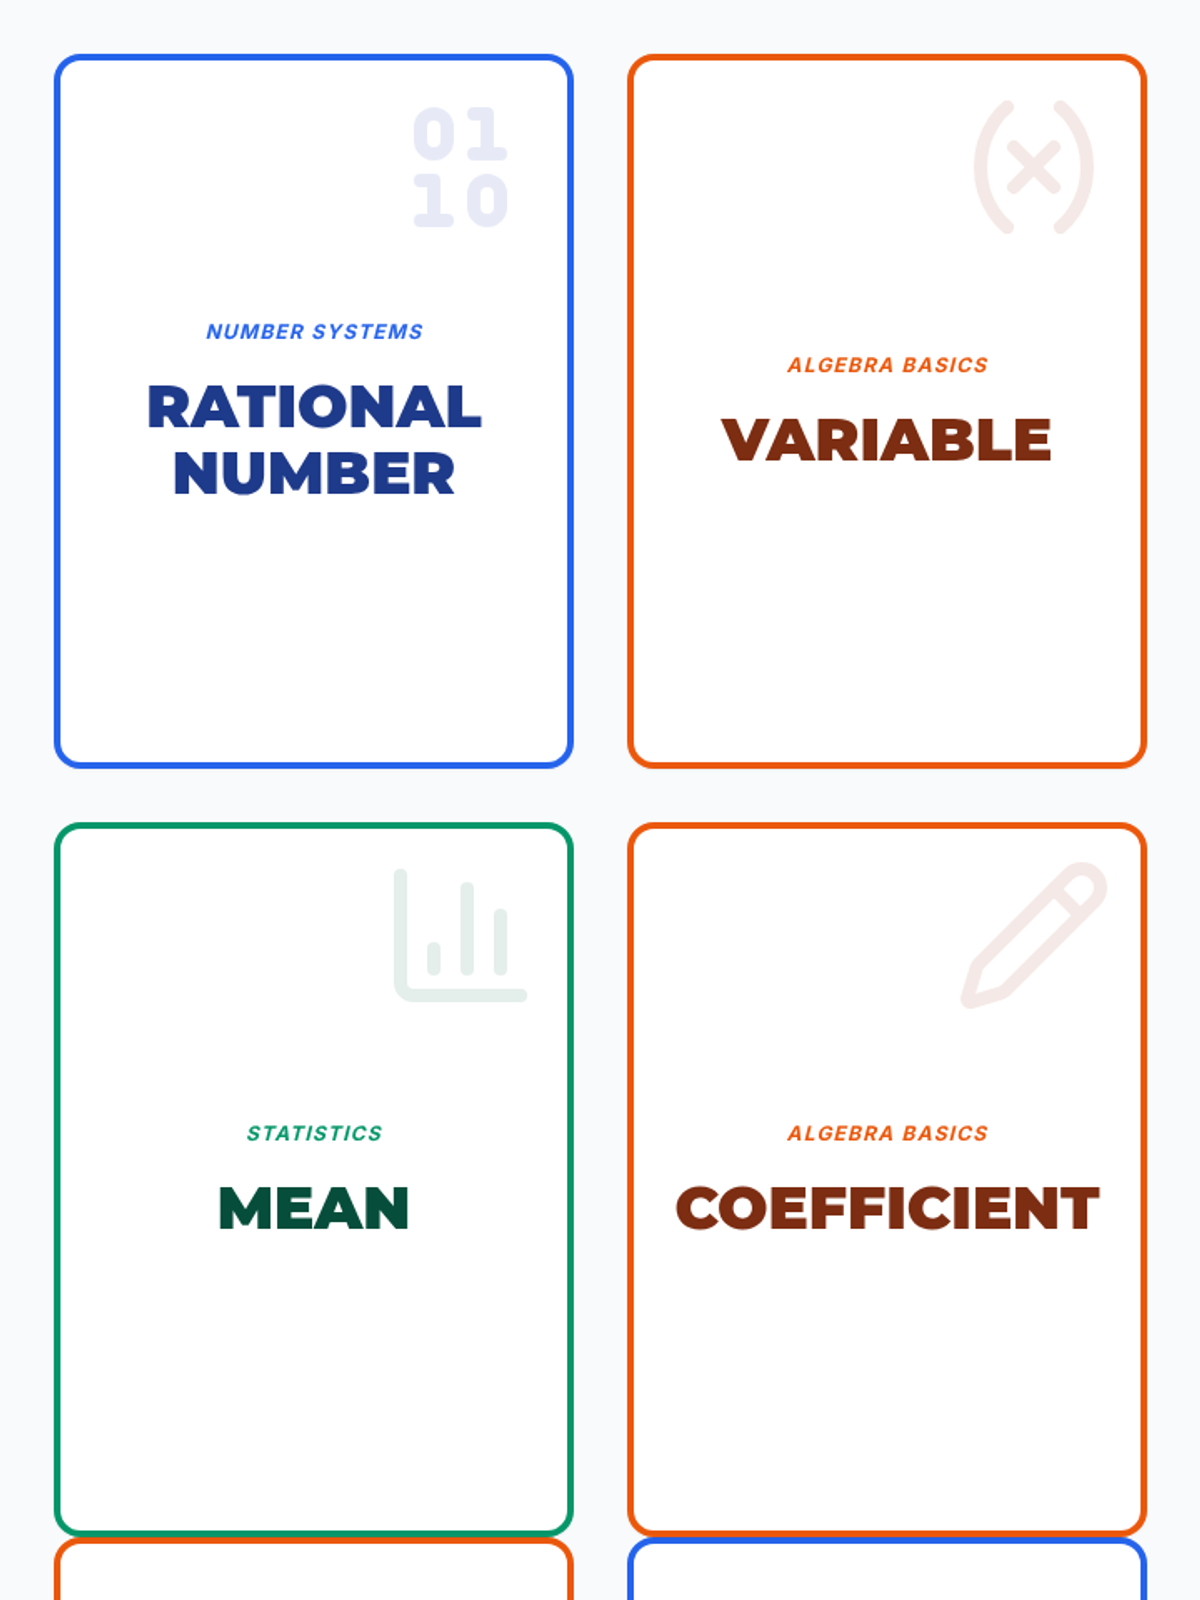
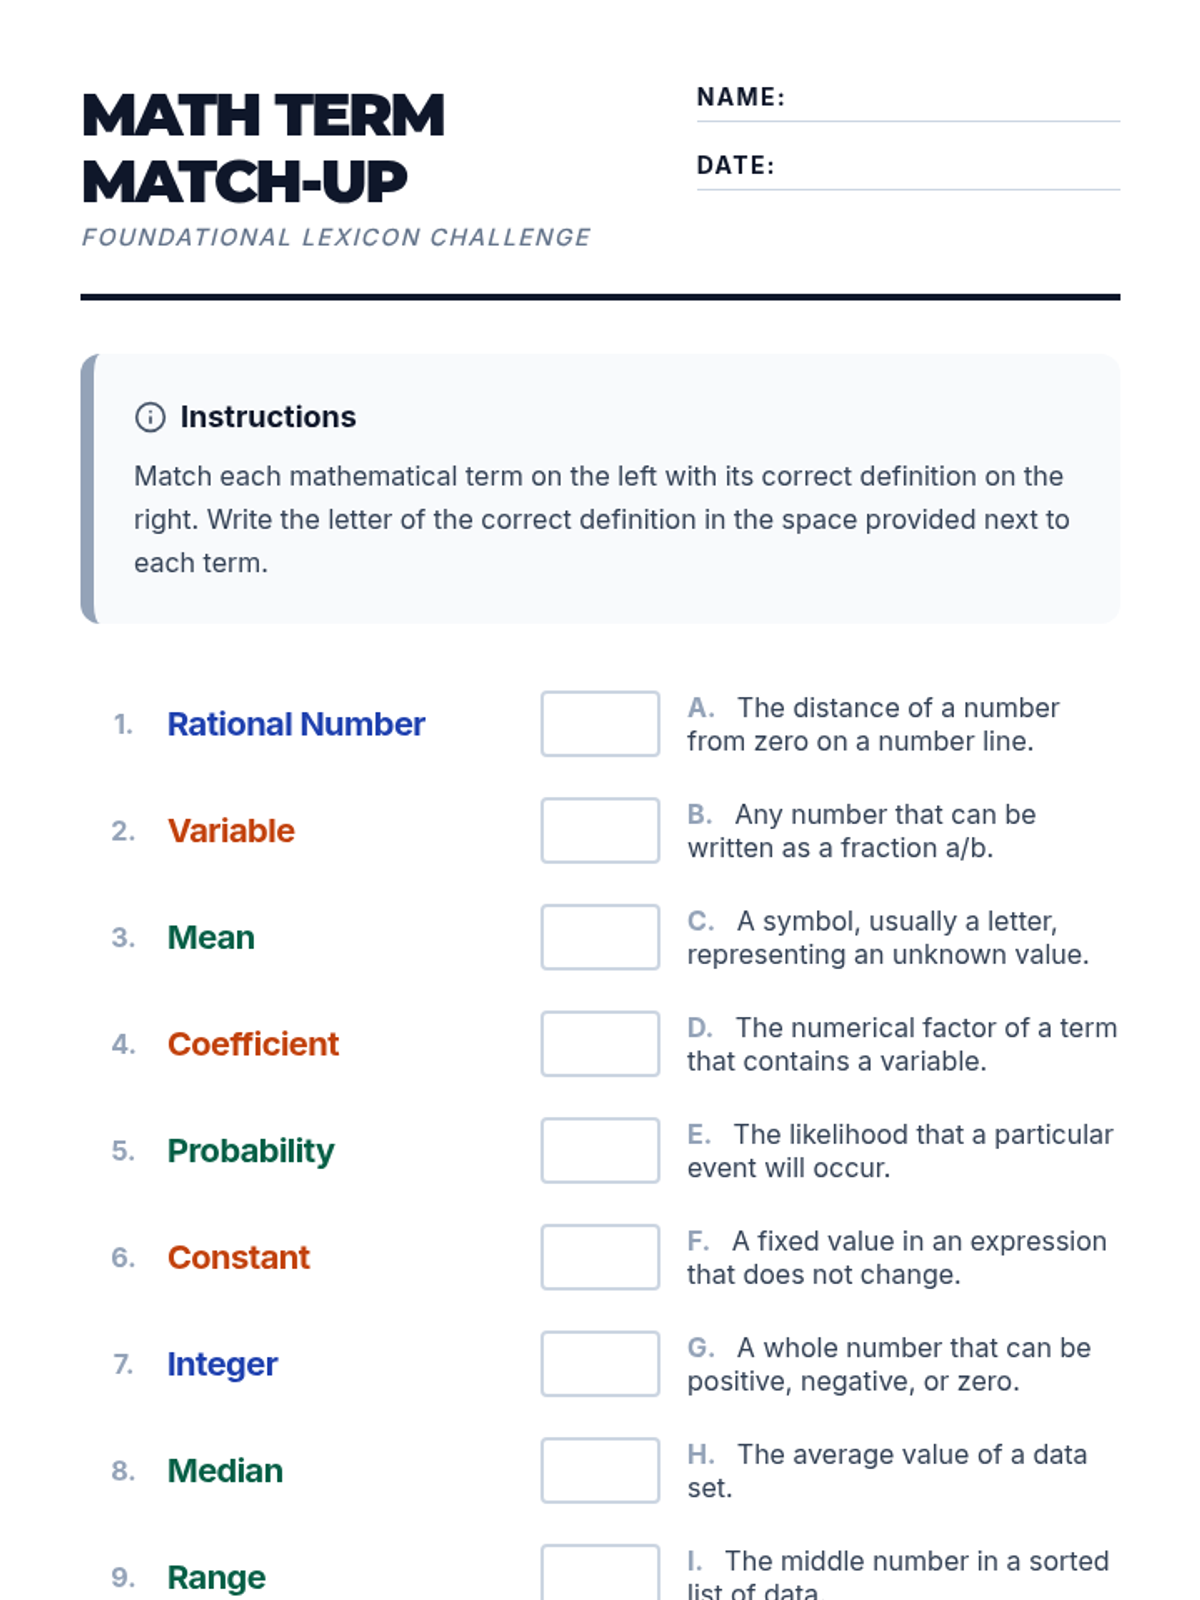
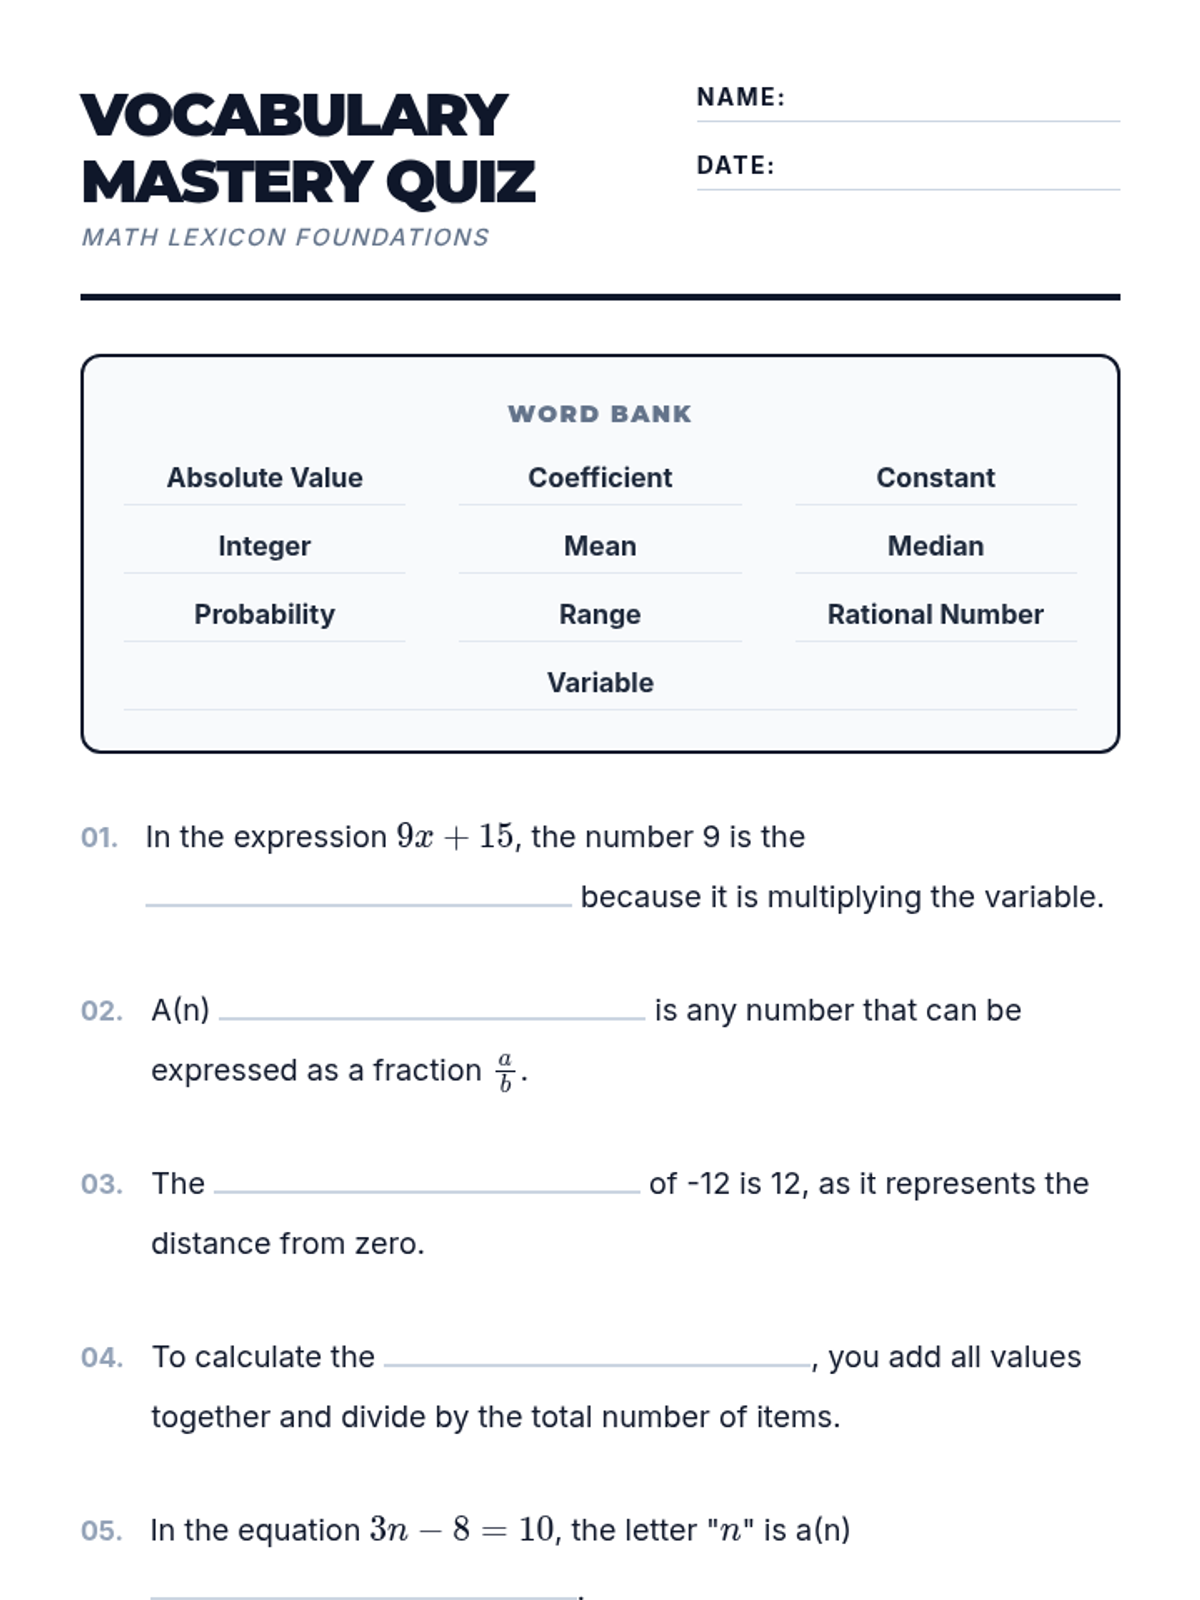
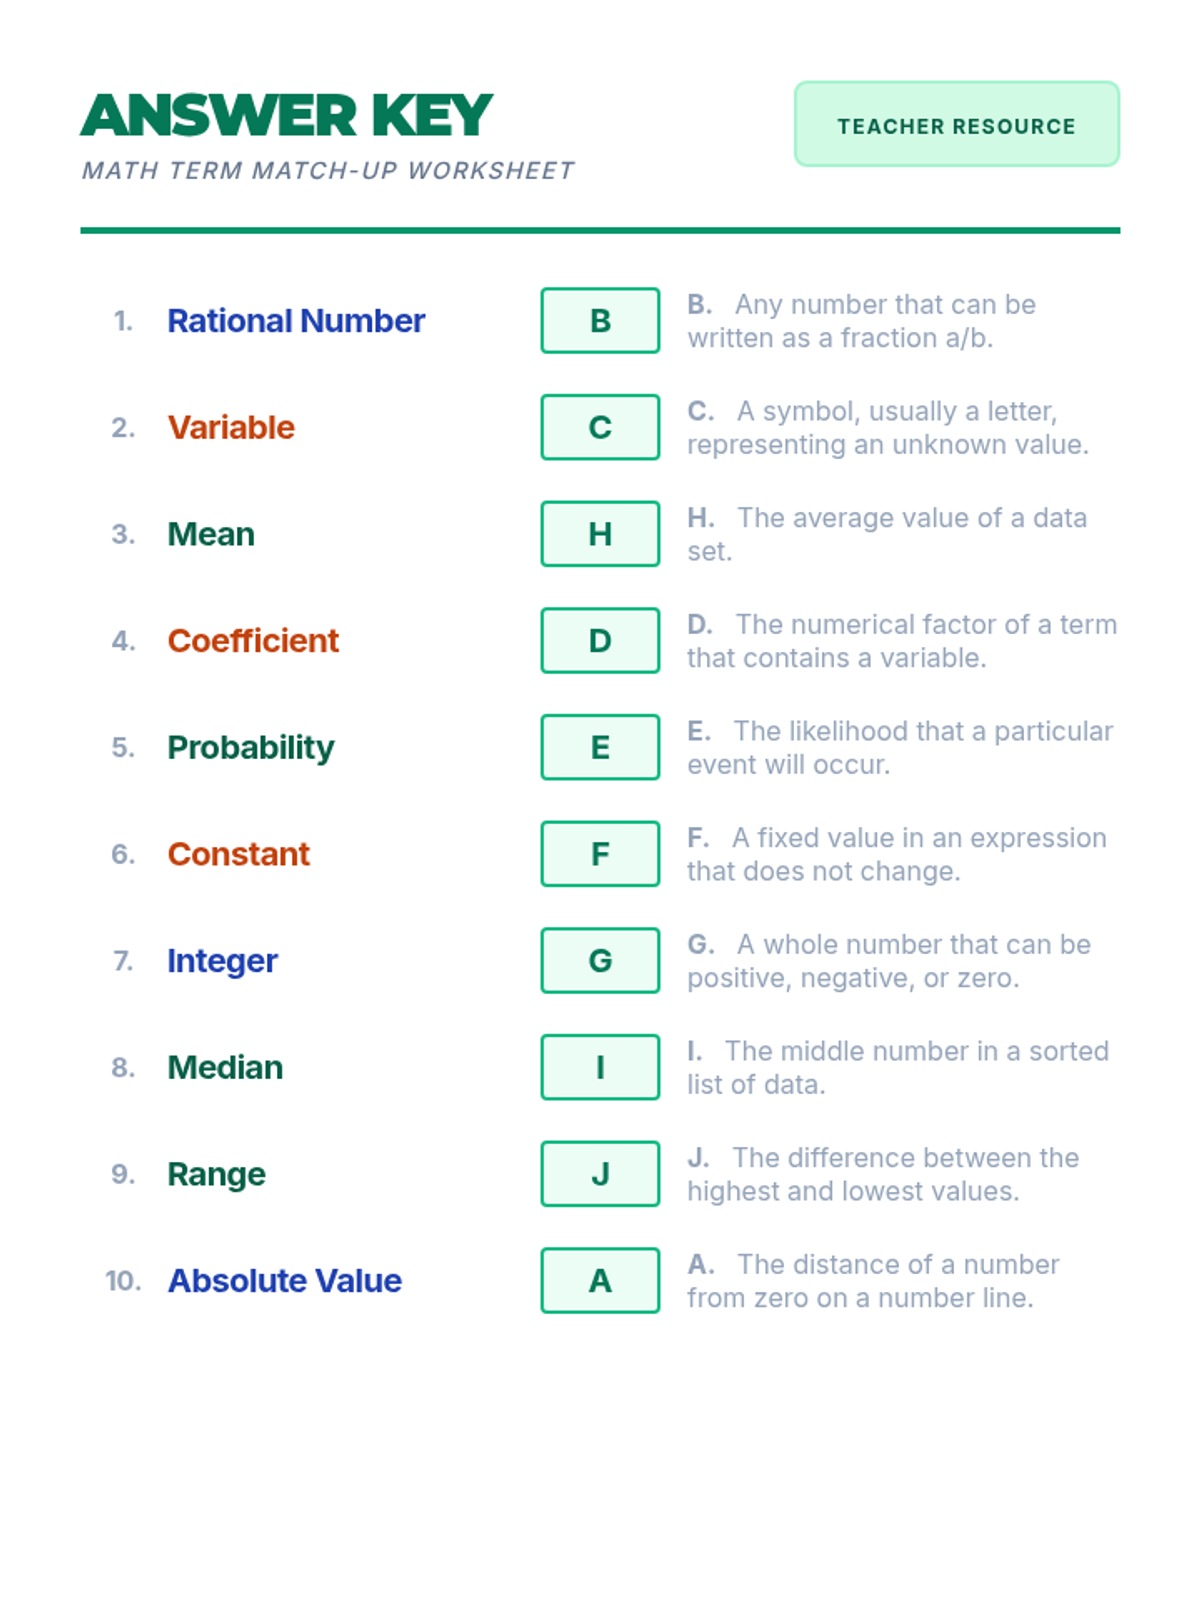
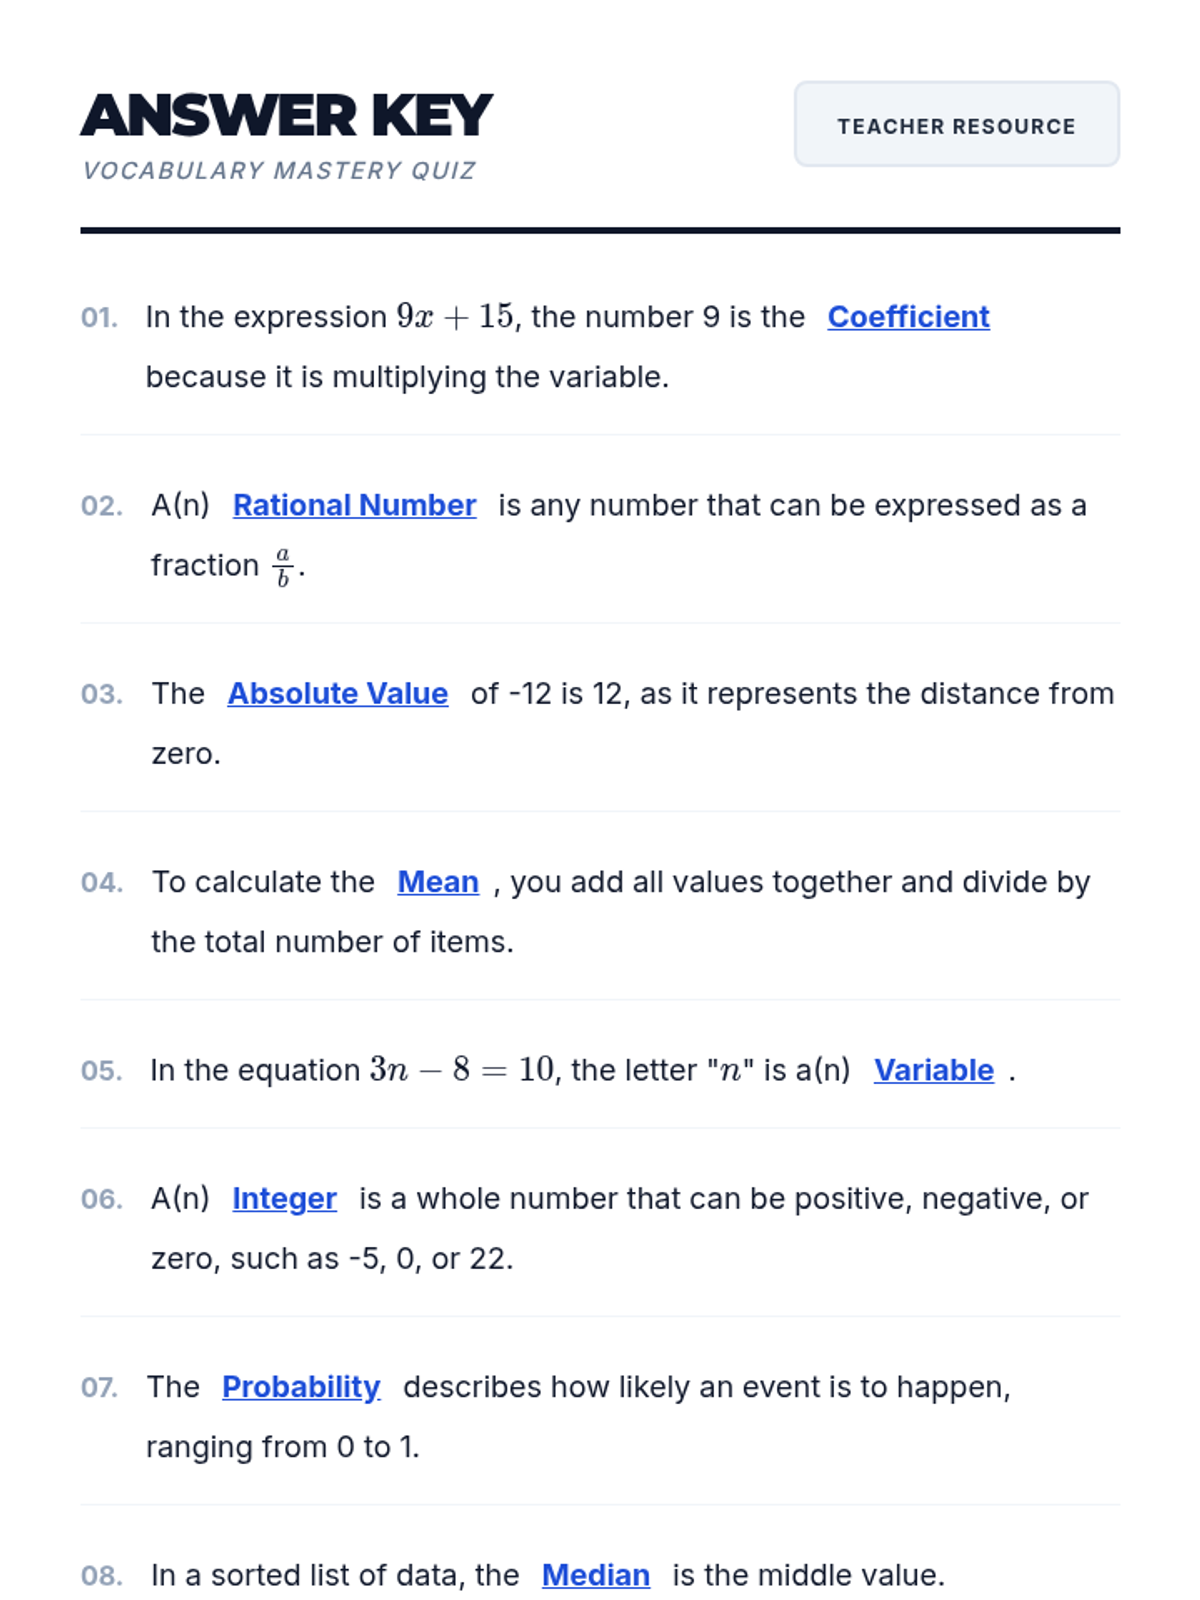
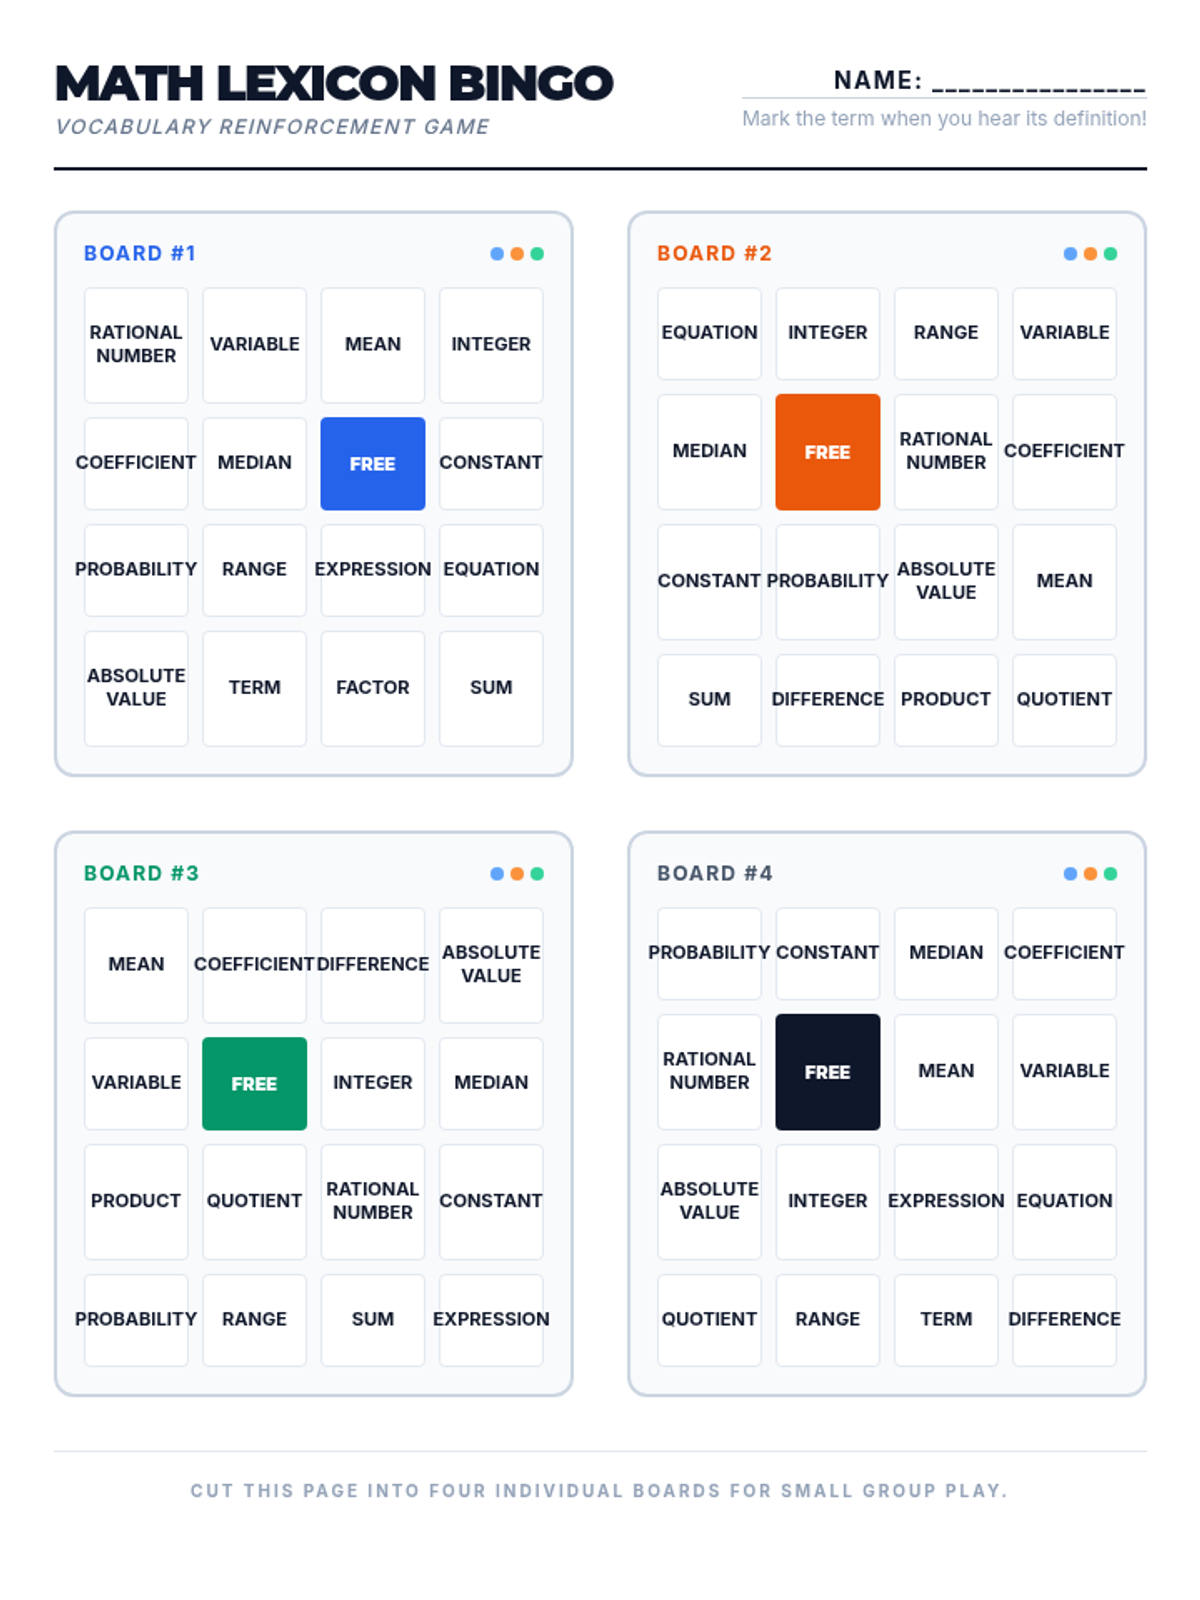
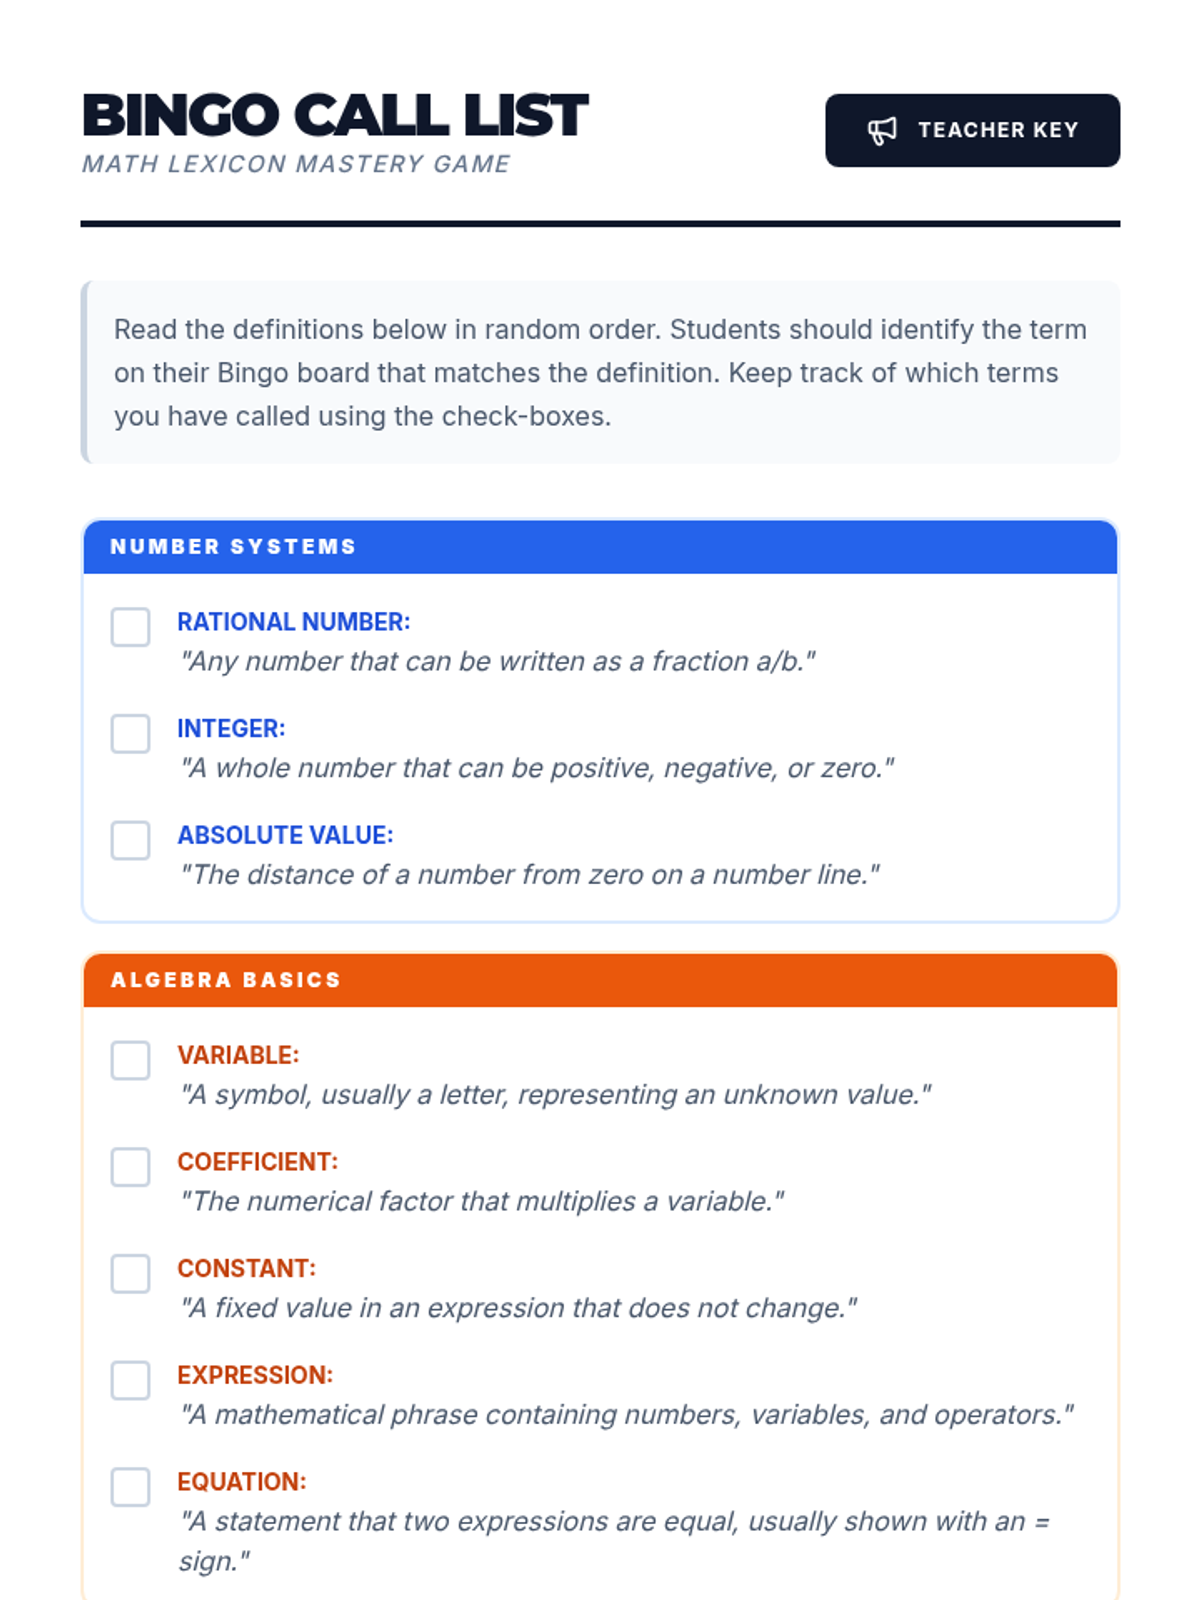
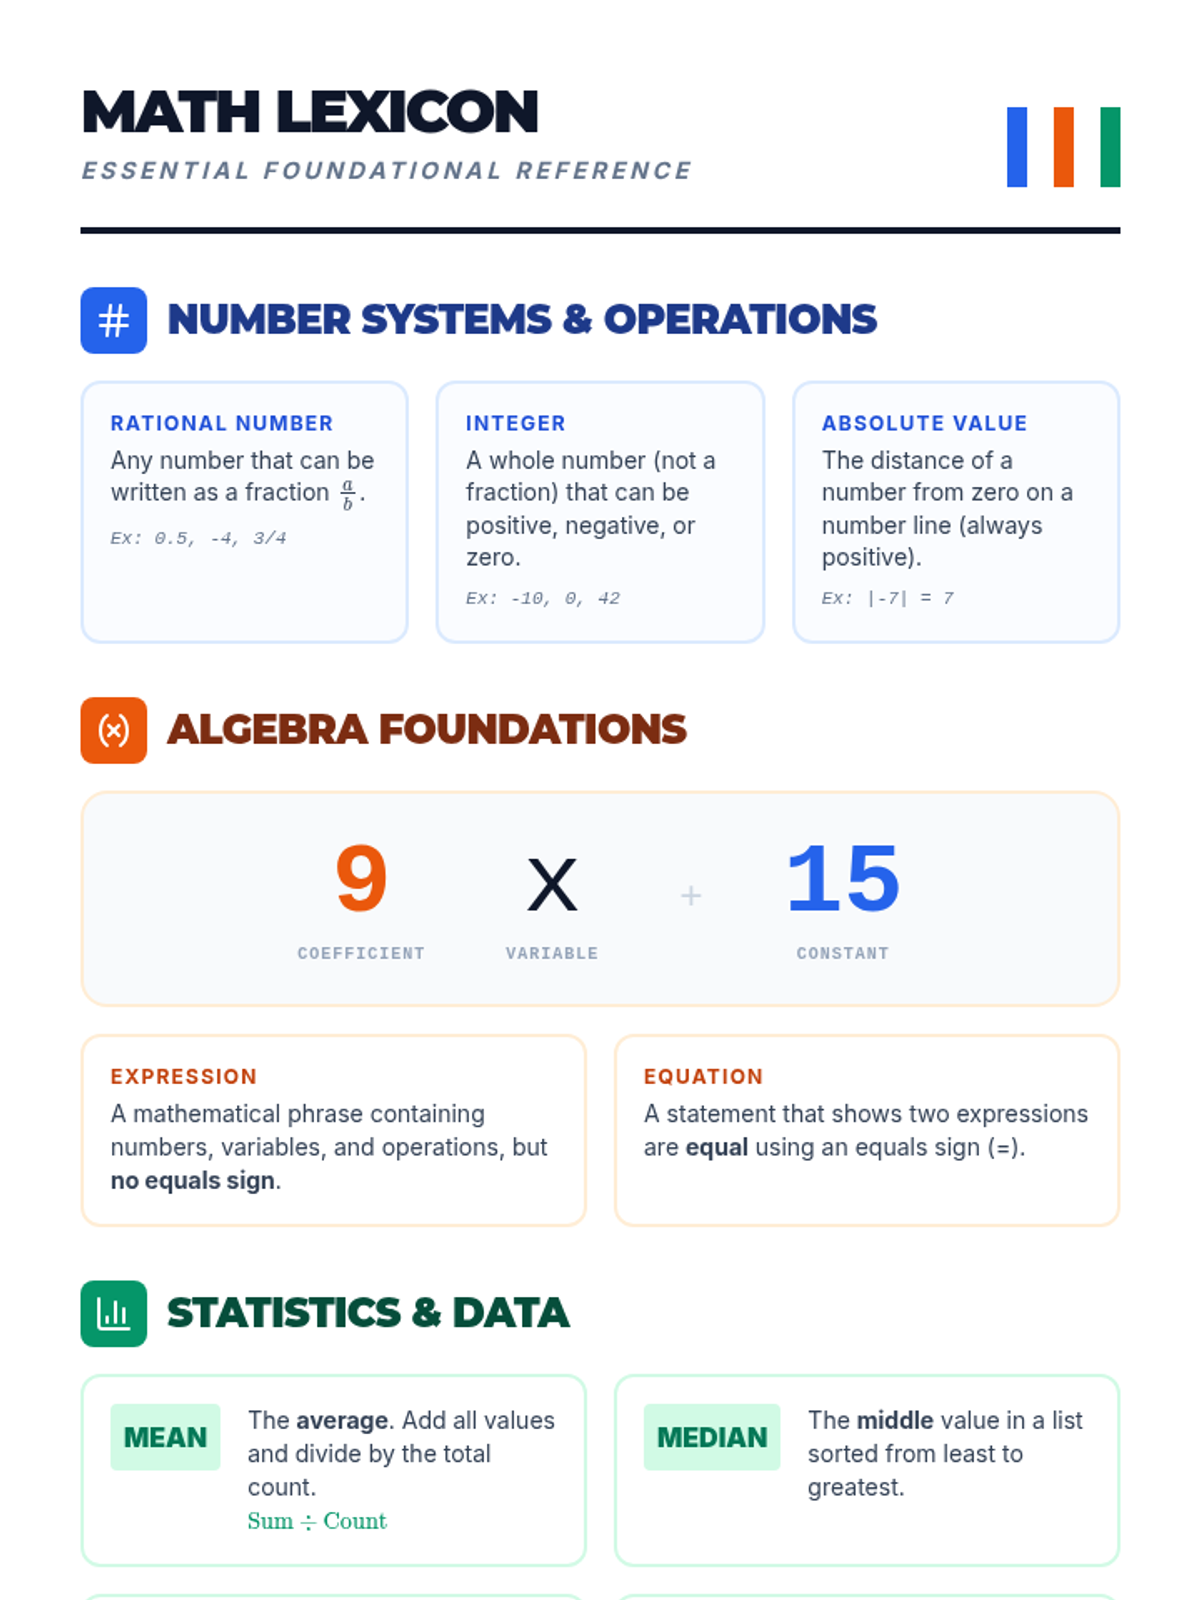
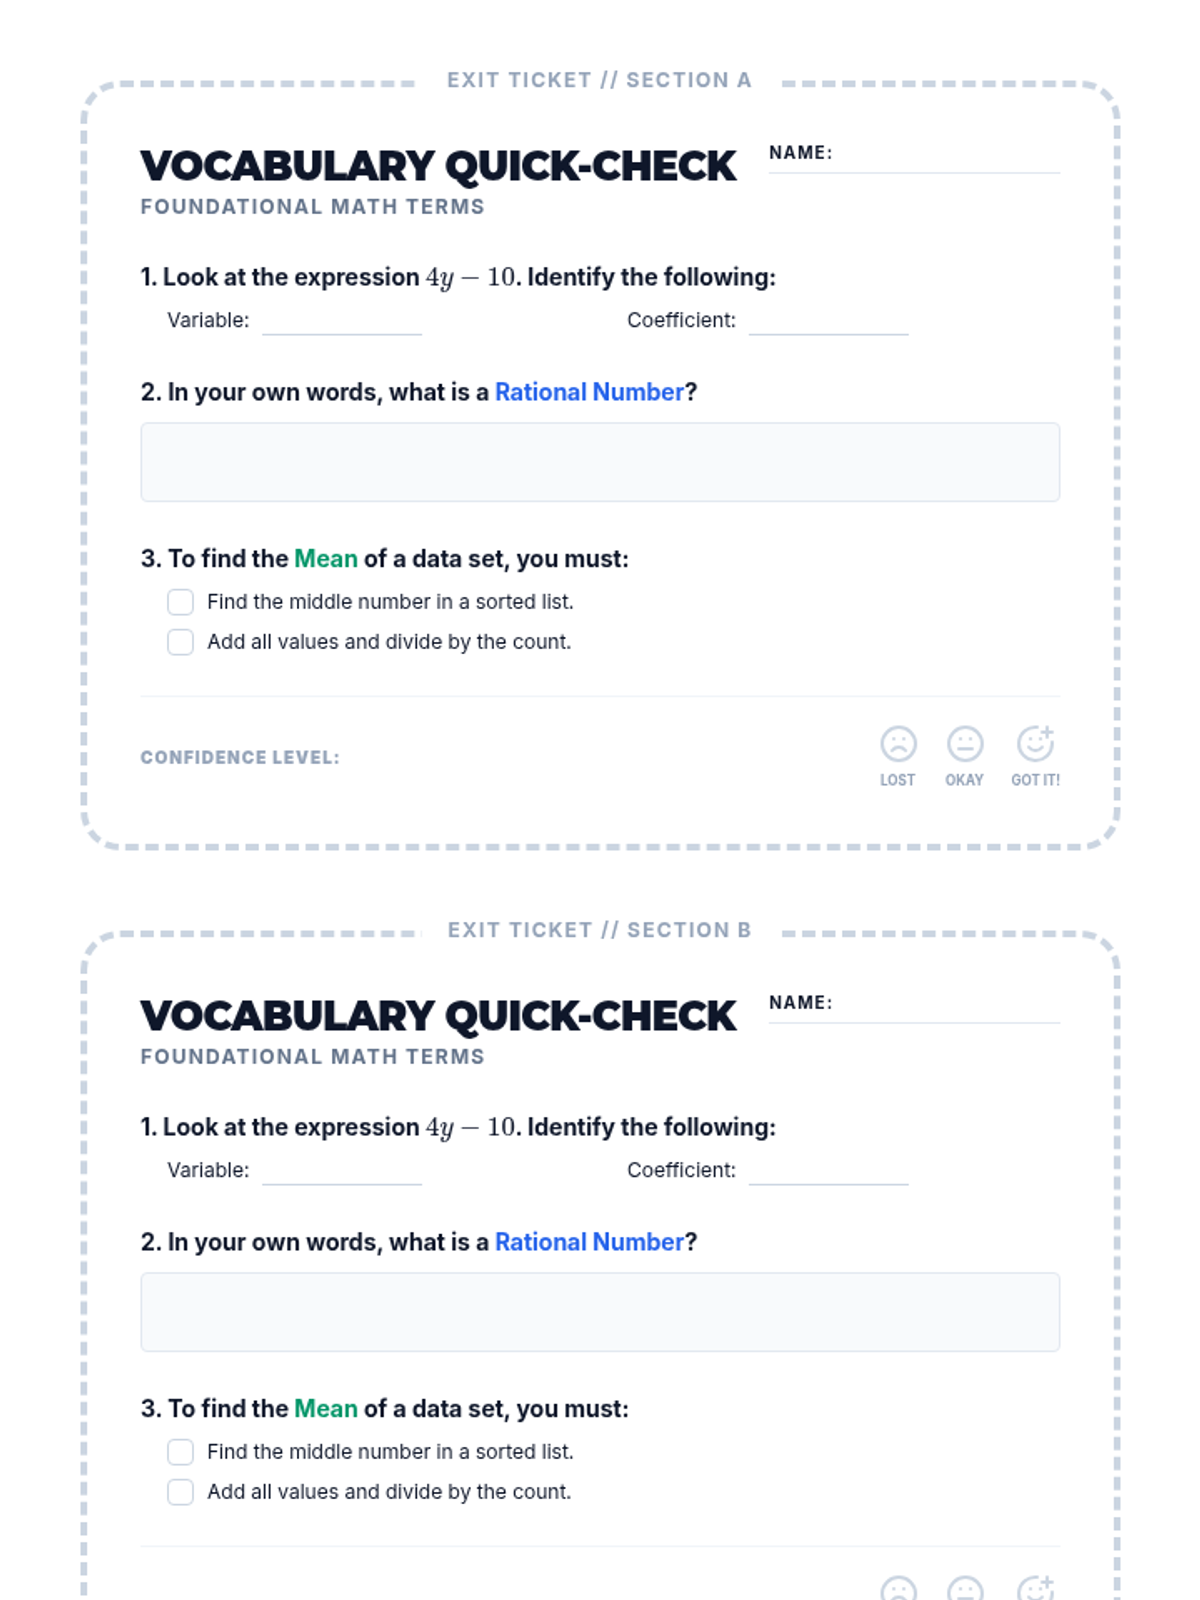
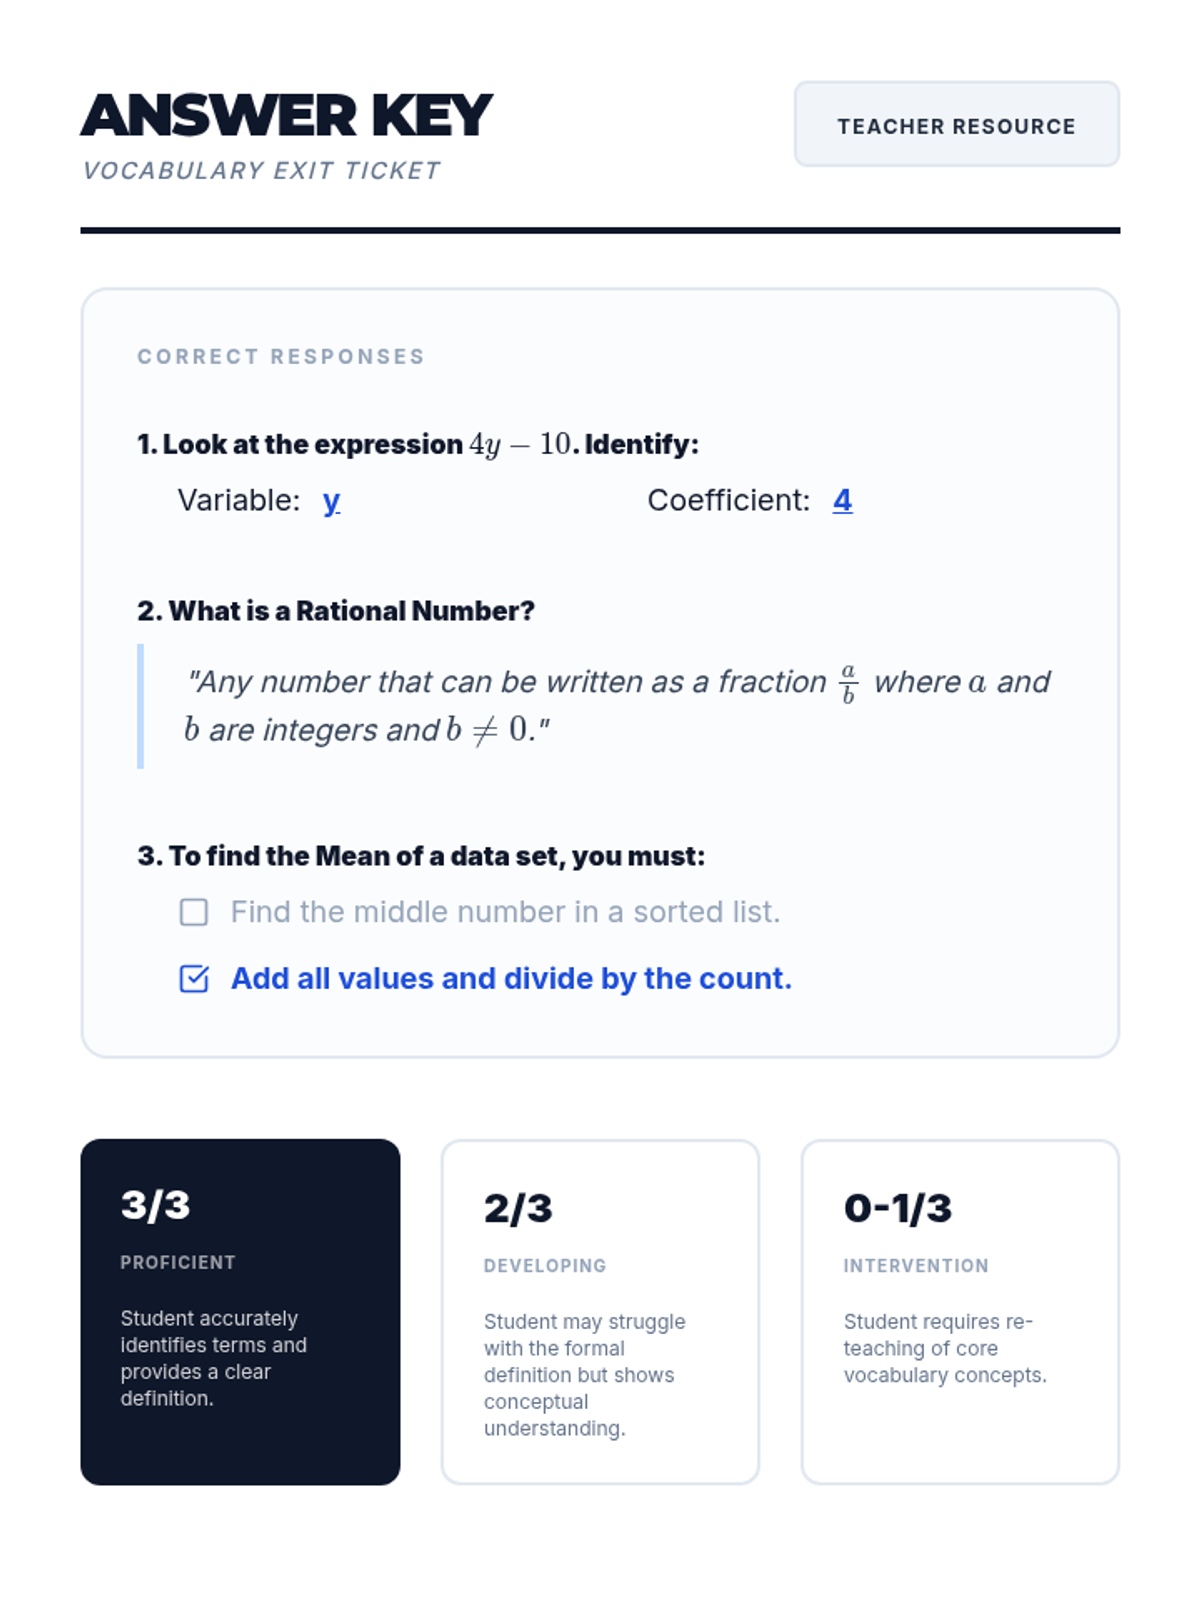
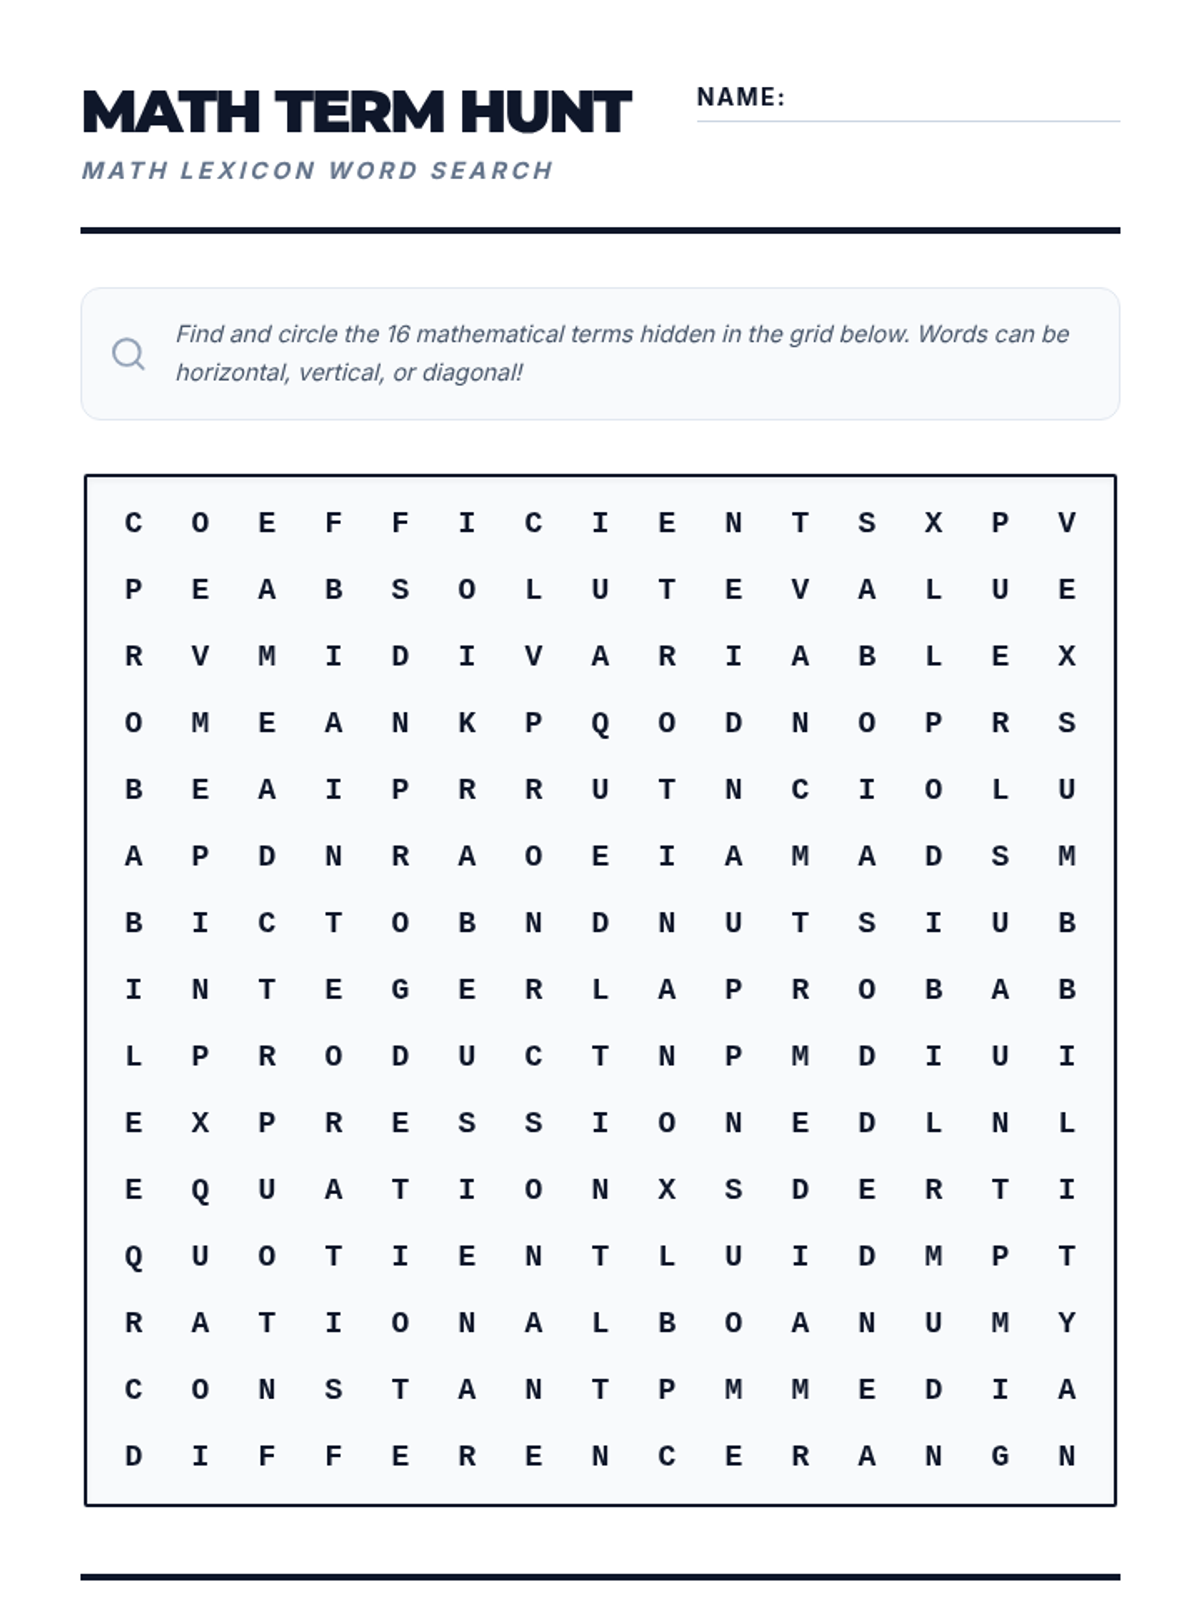
A comprehensive collection of mathematical vocabulary resources covering number systems, algebraic expressions, and statistical analysis. This unit focuses on building precise mathematical language for foundational concepts.
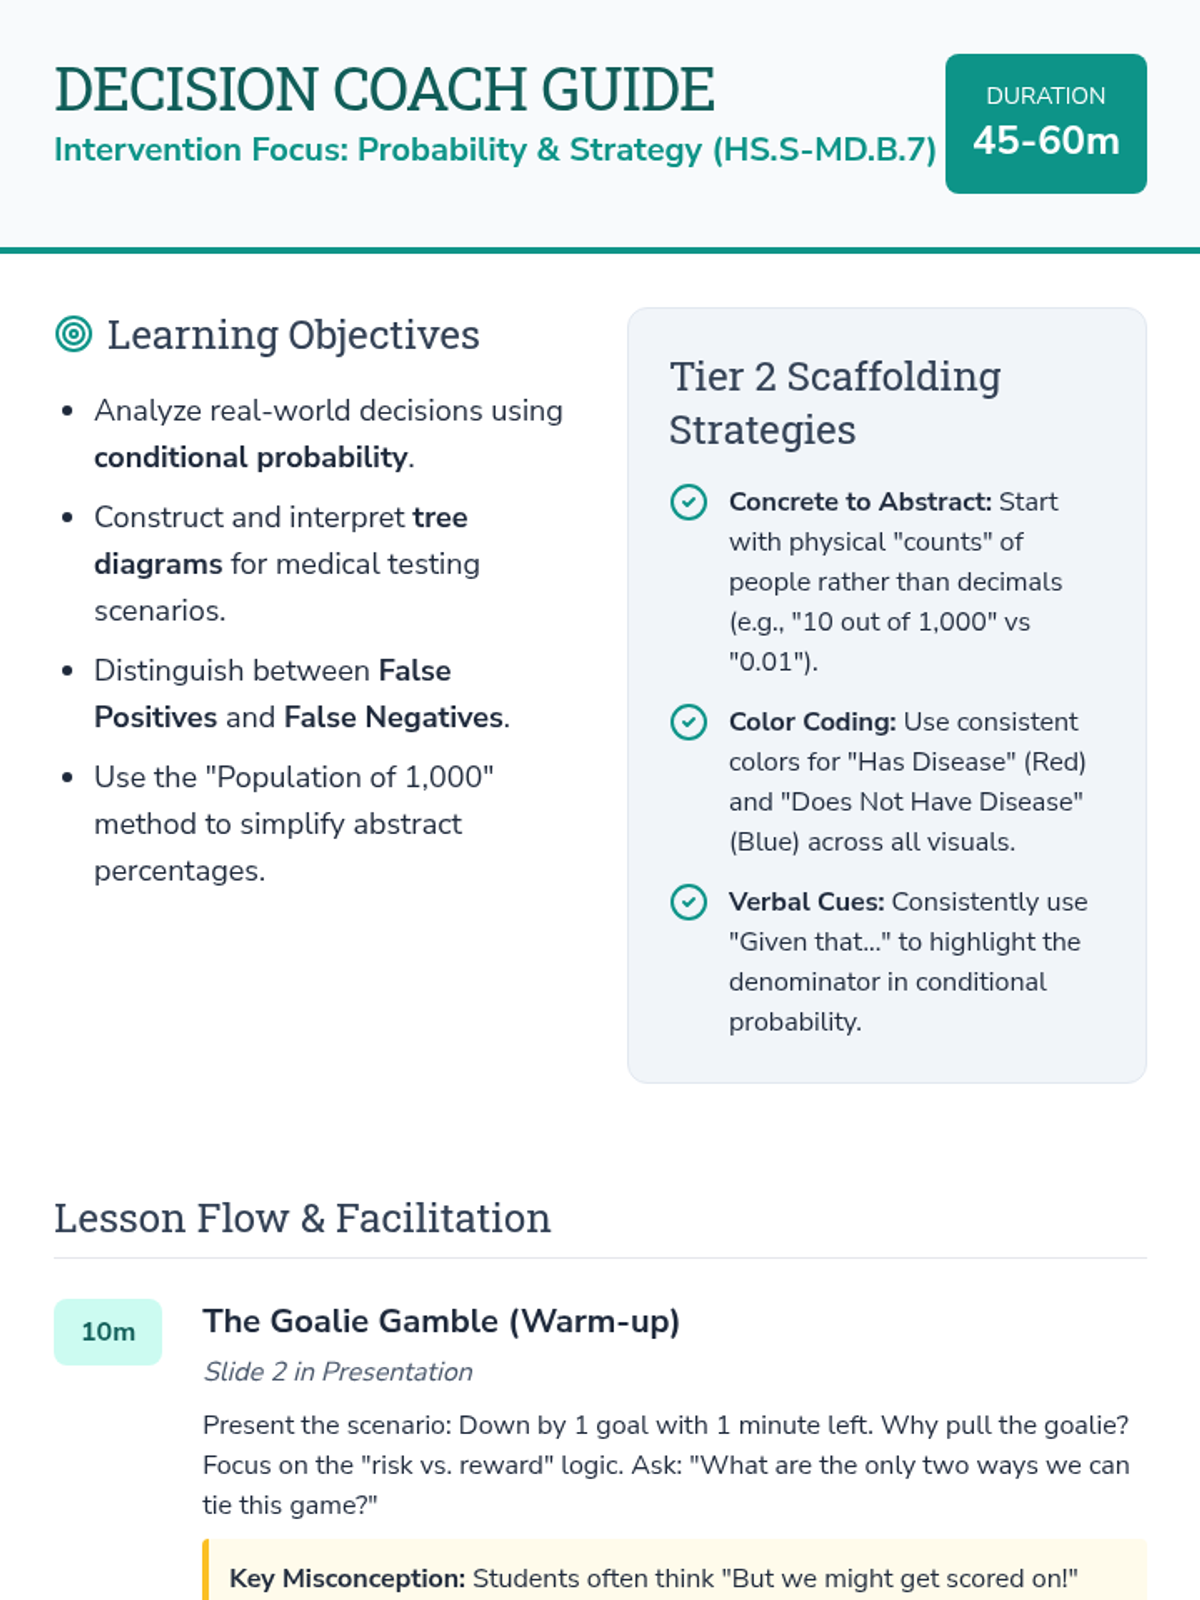
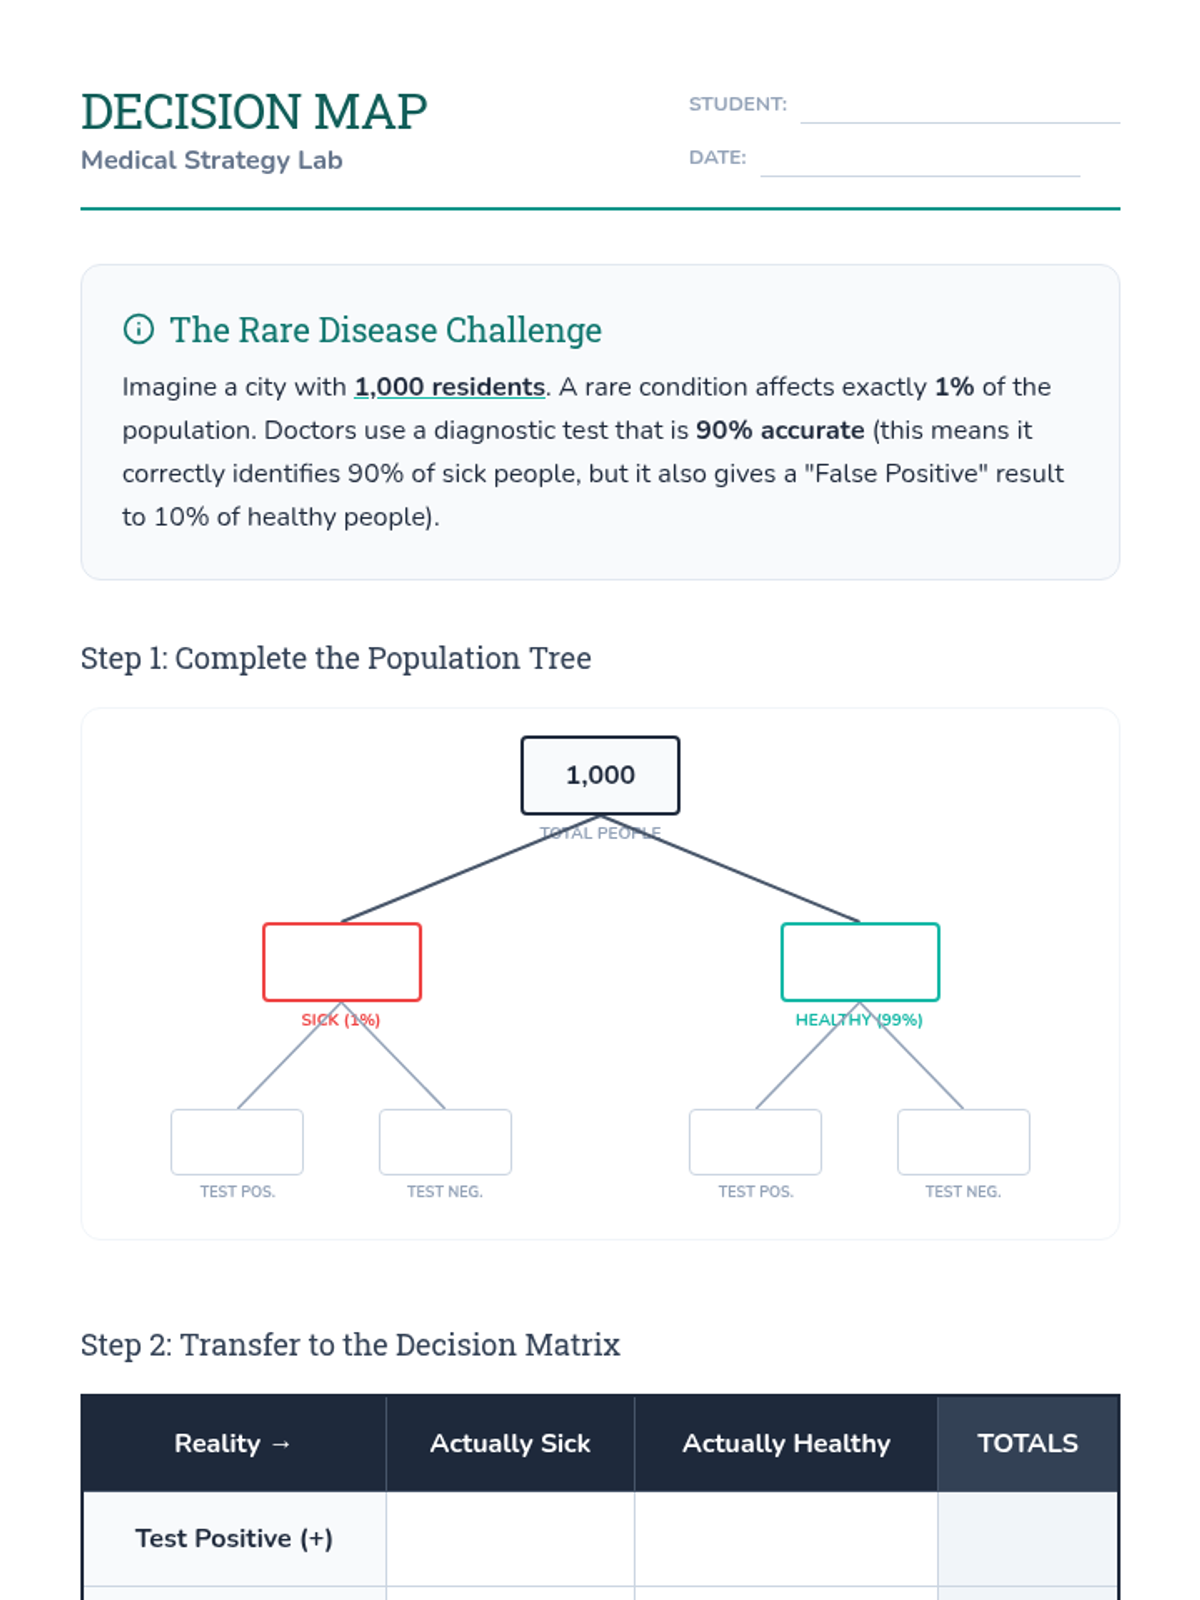
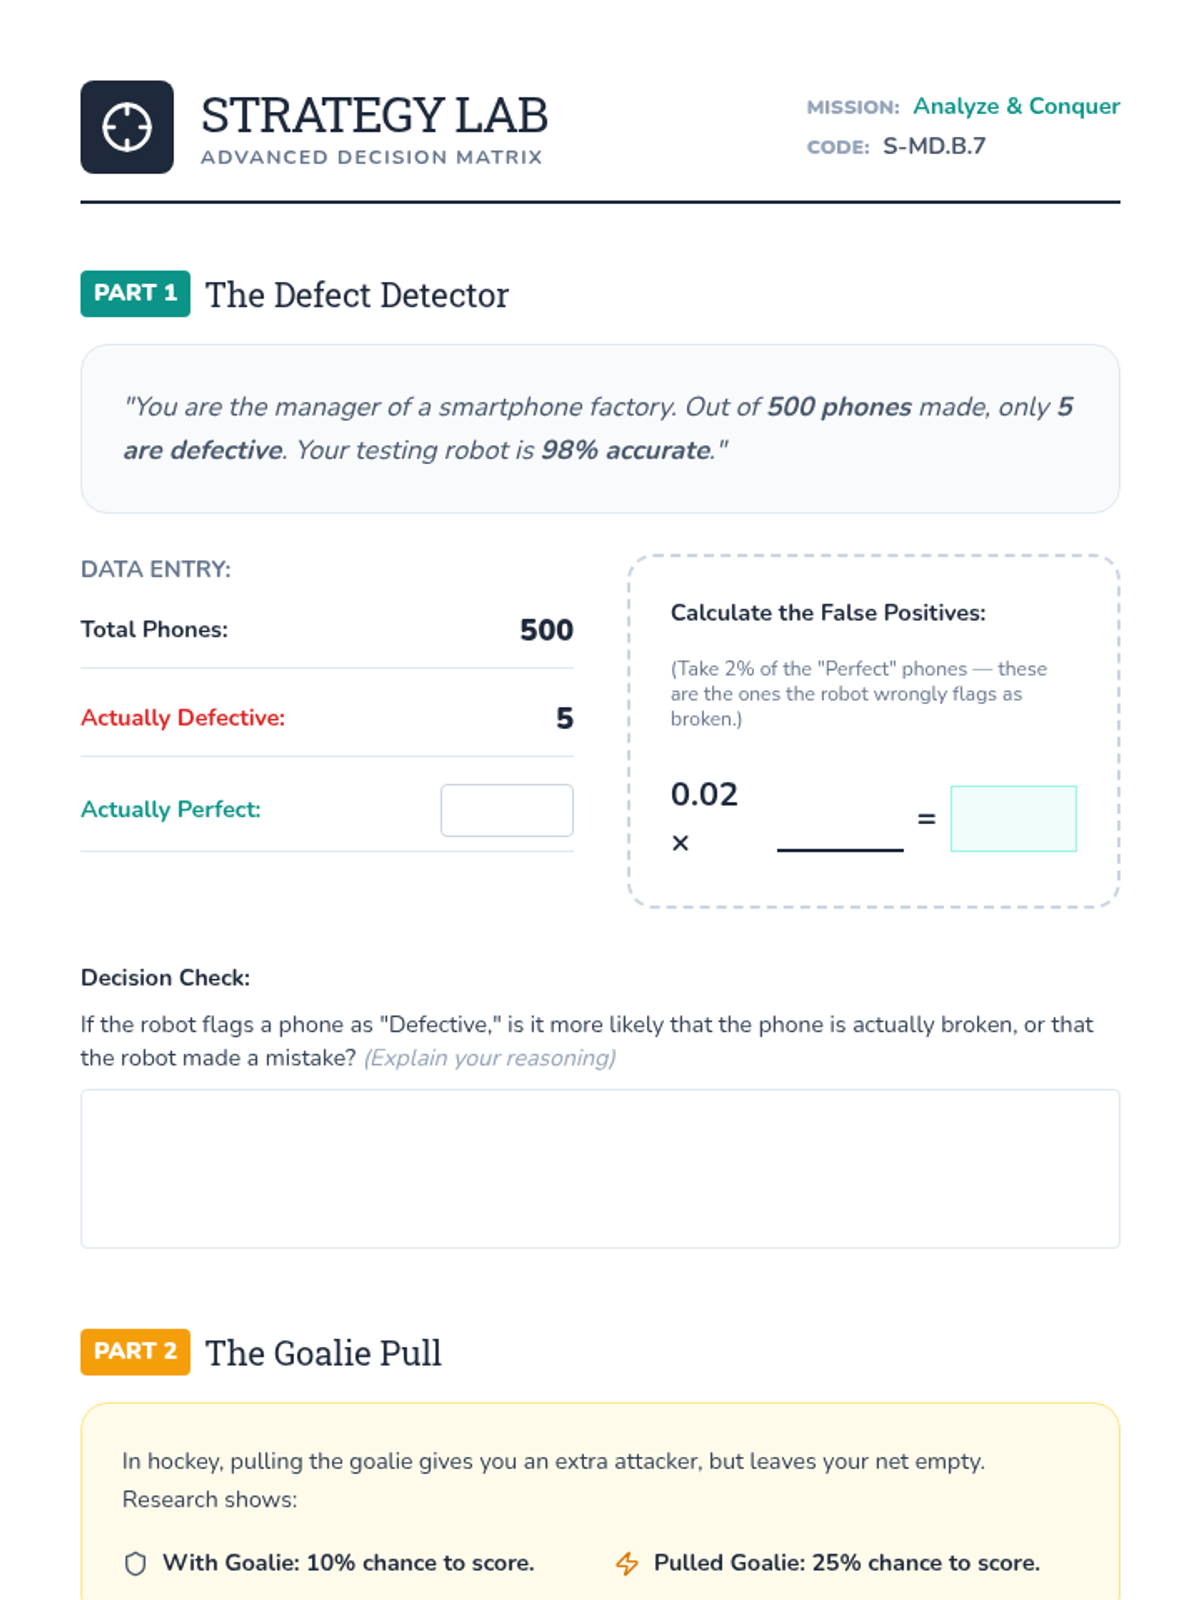
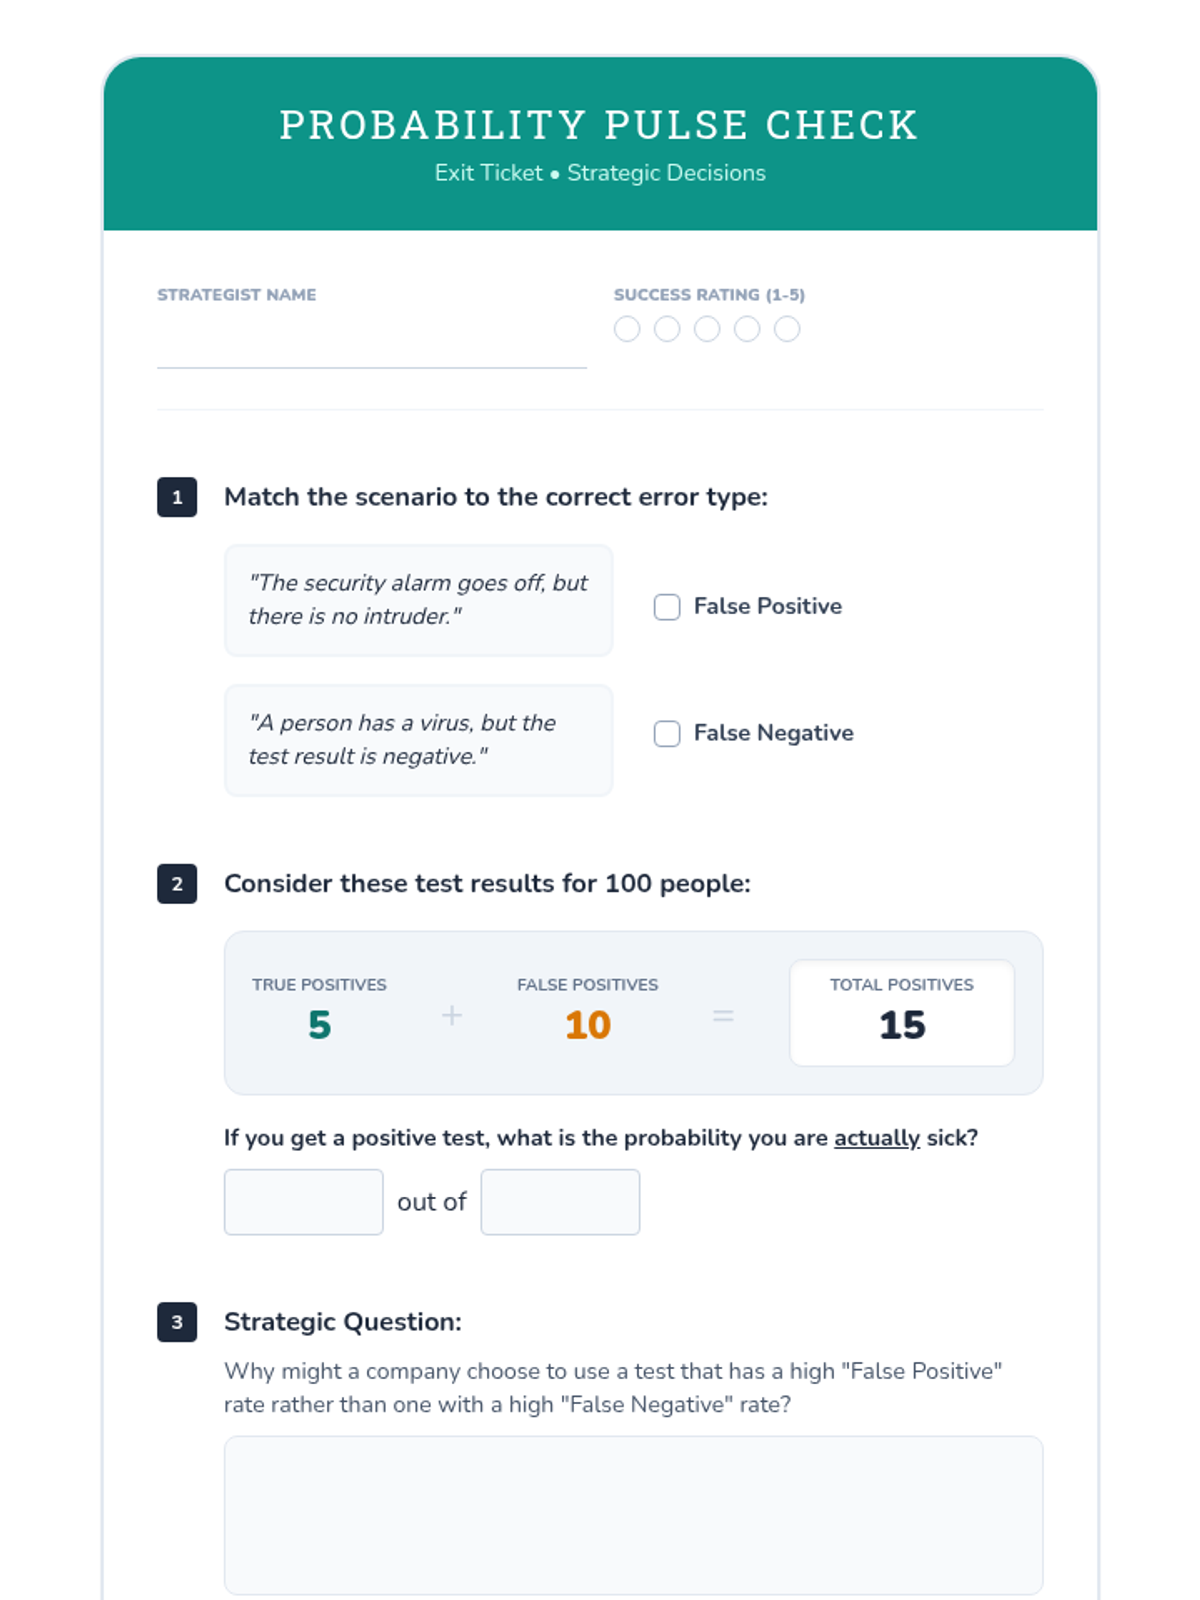
A Tier 2 intervention sequence focused on using probability to analyze decisions, specifically targeting medical testing (false positives/negatives) and game-time strategies. Students learn to use tree diagrams and contingency tables to navigate complex conditional probability scenarios.
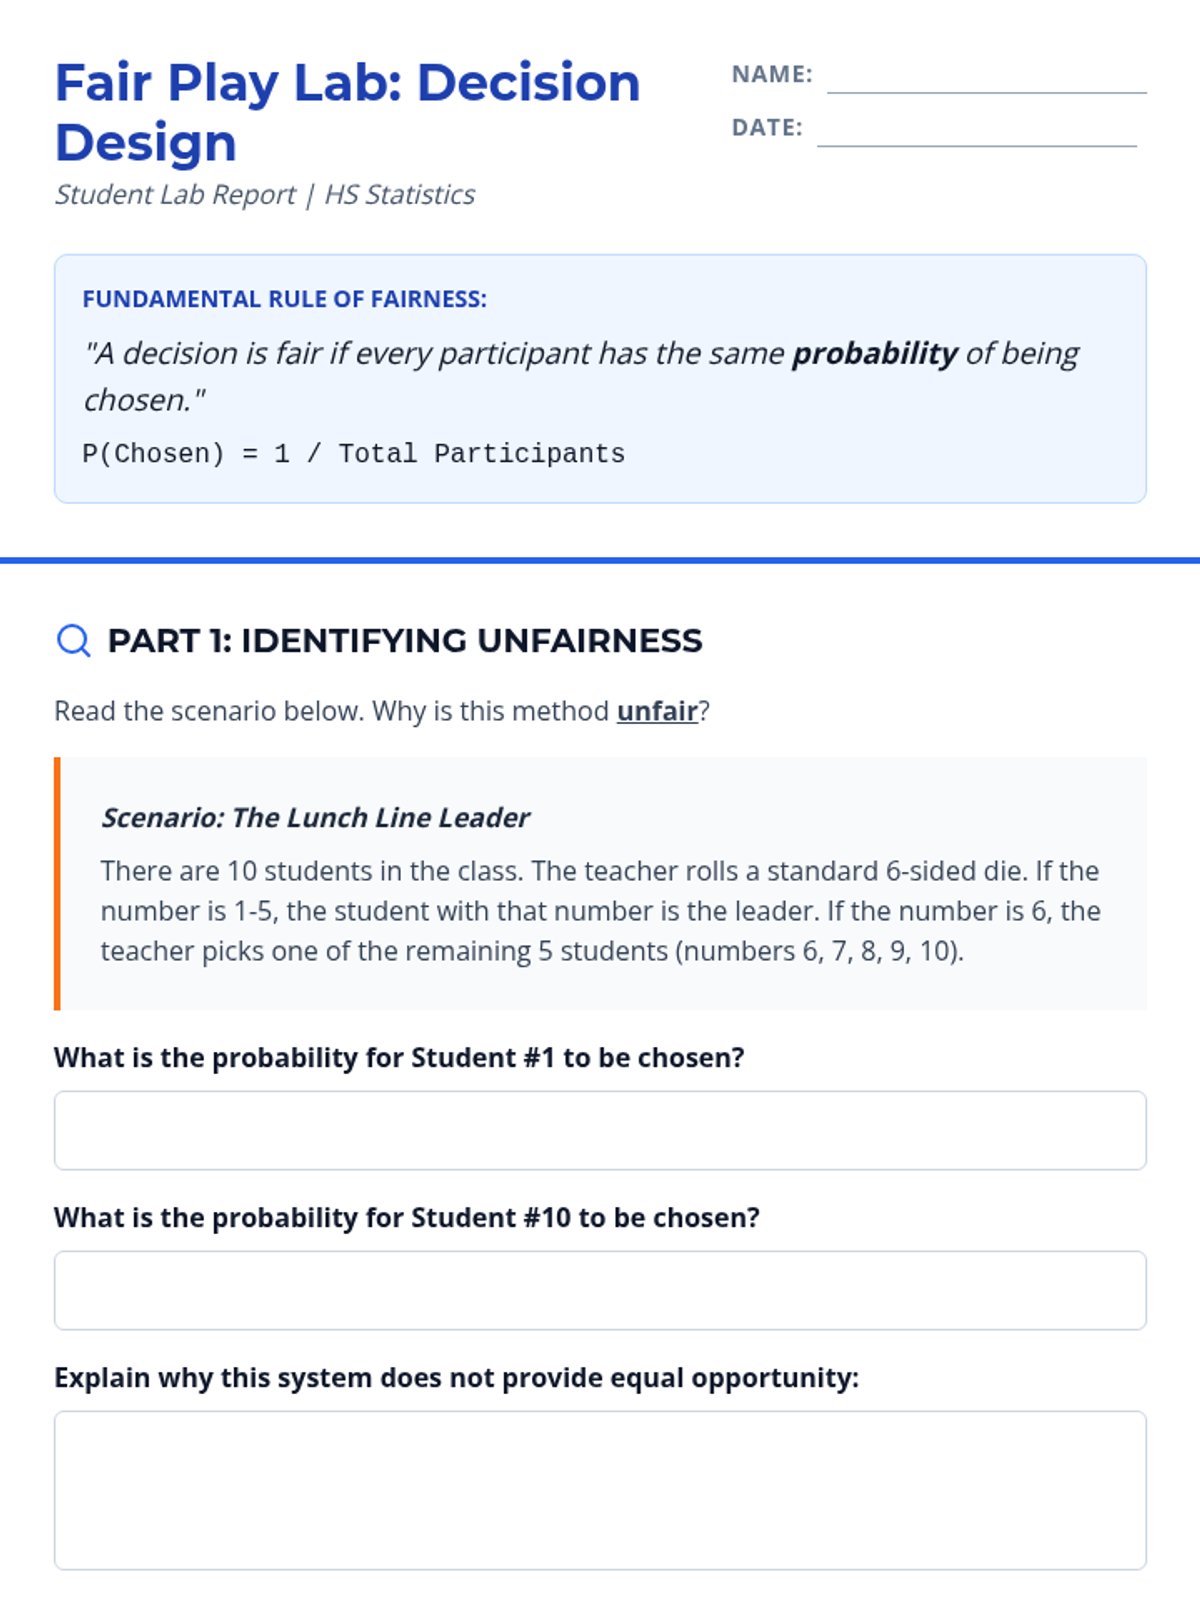
A comprehensive unit focused on practical applications of probability for high school students, emphasizing decision-making, fairness, and risk assessment.
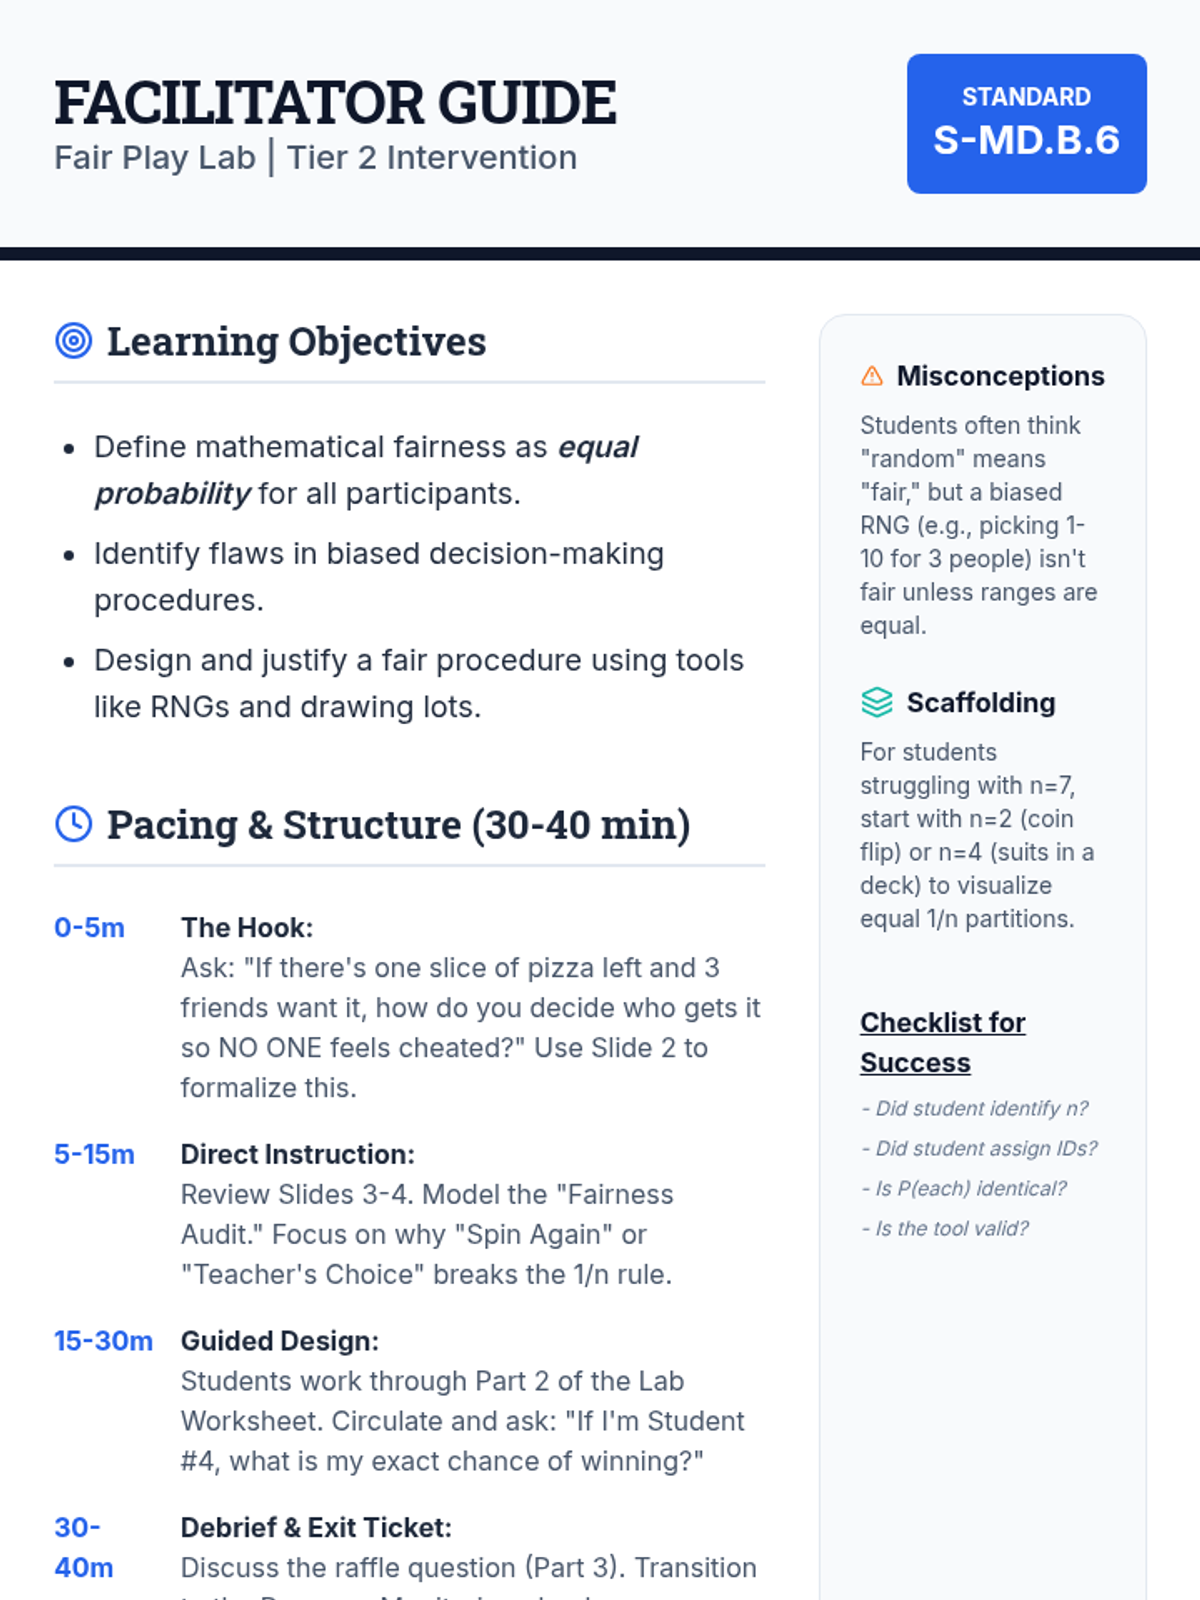
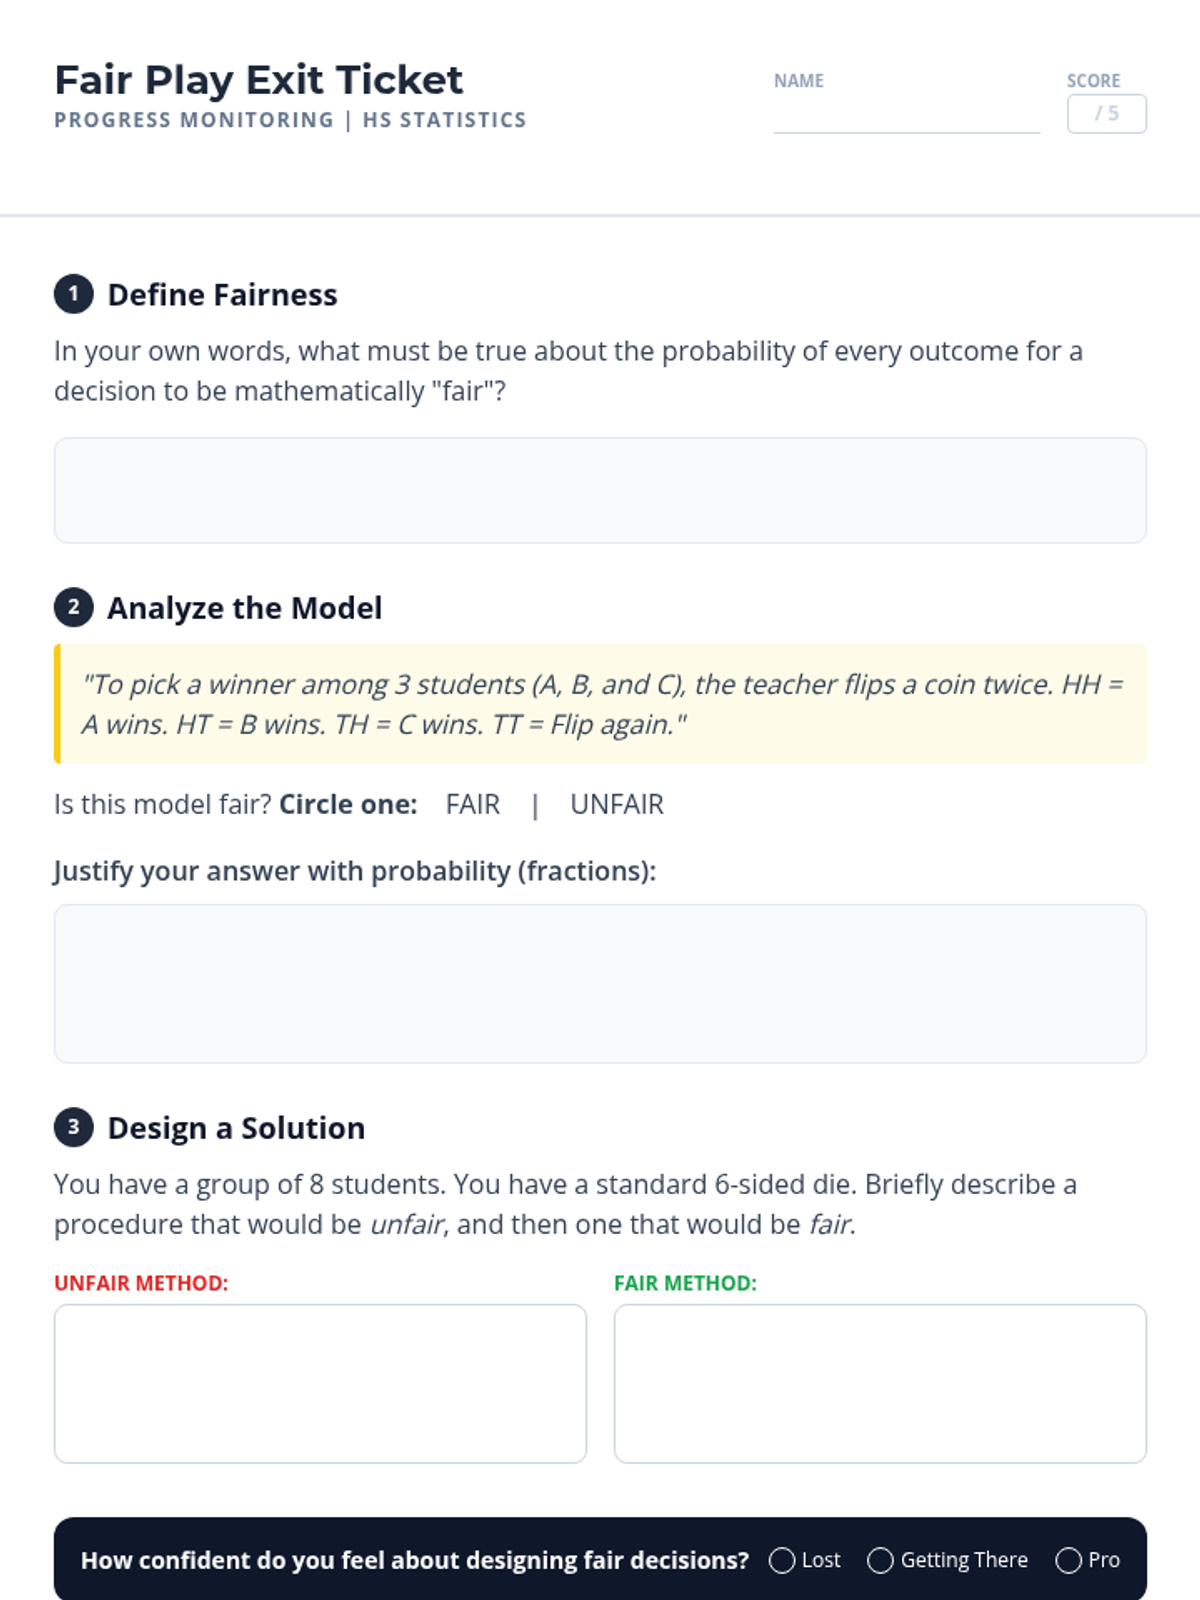
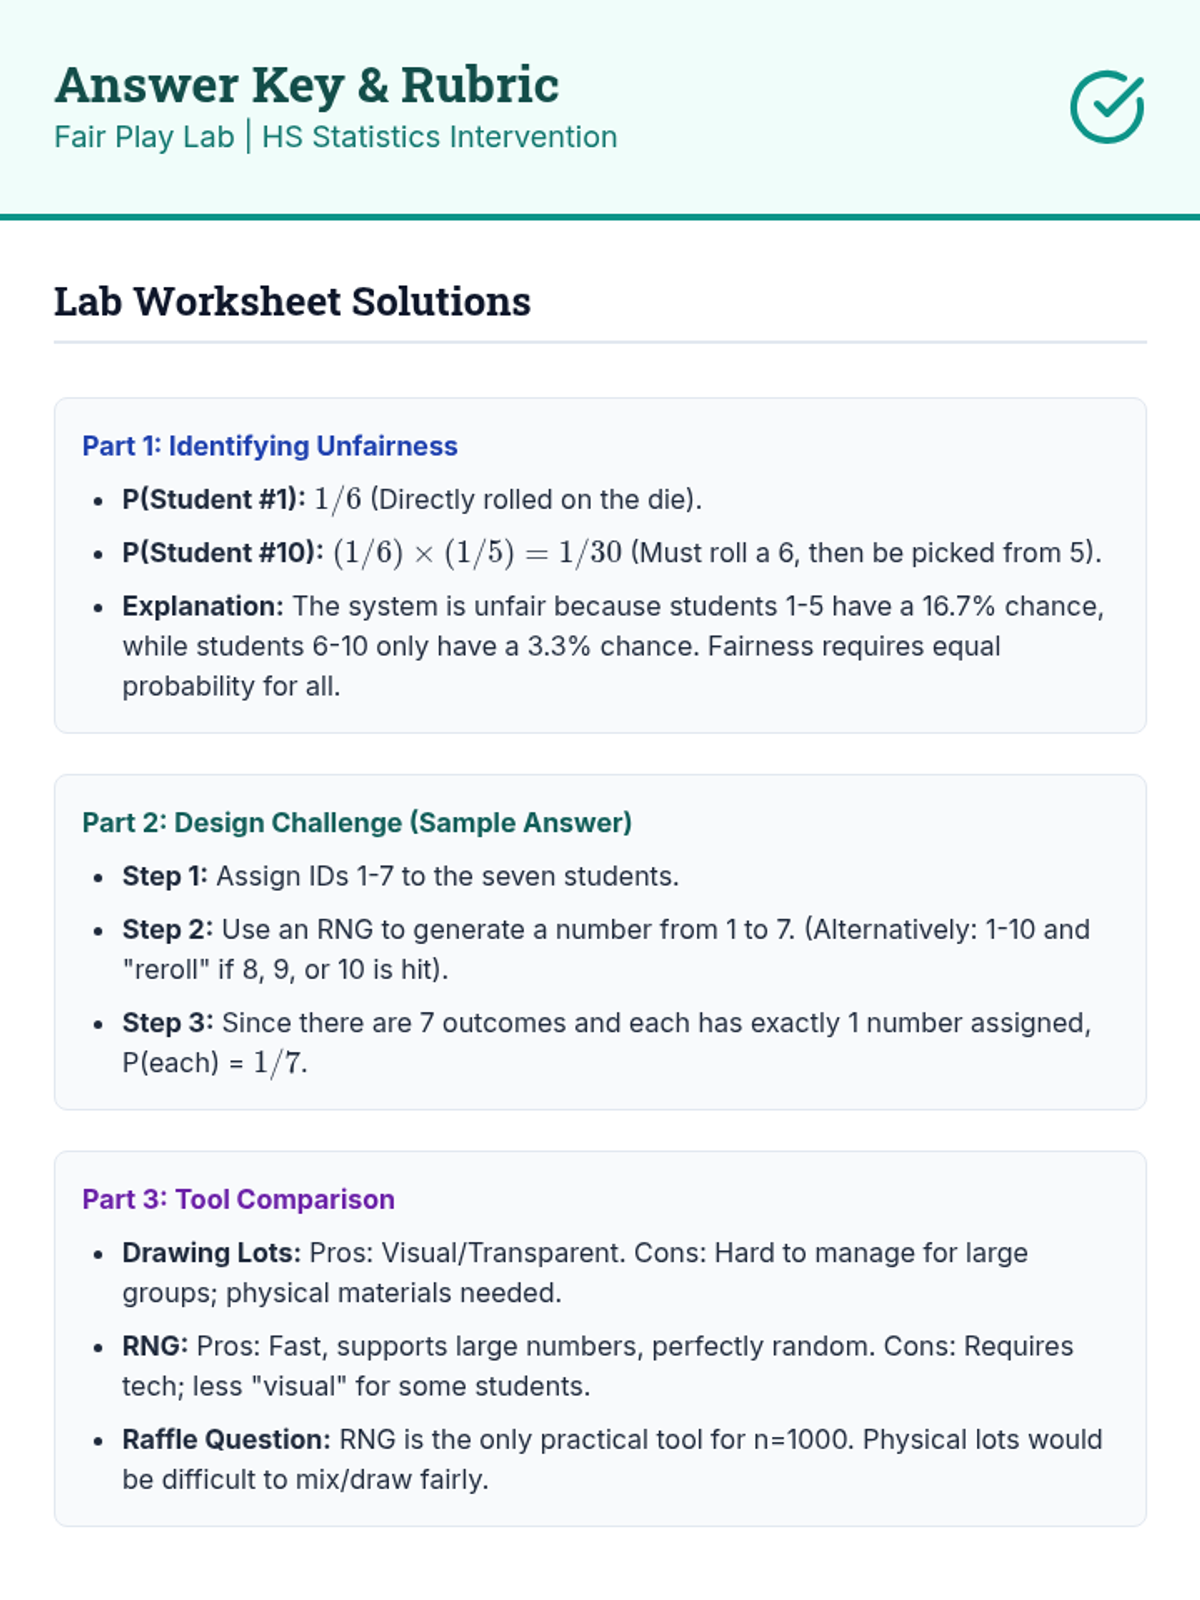
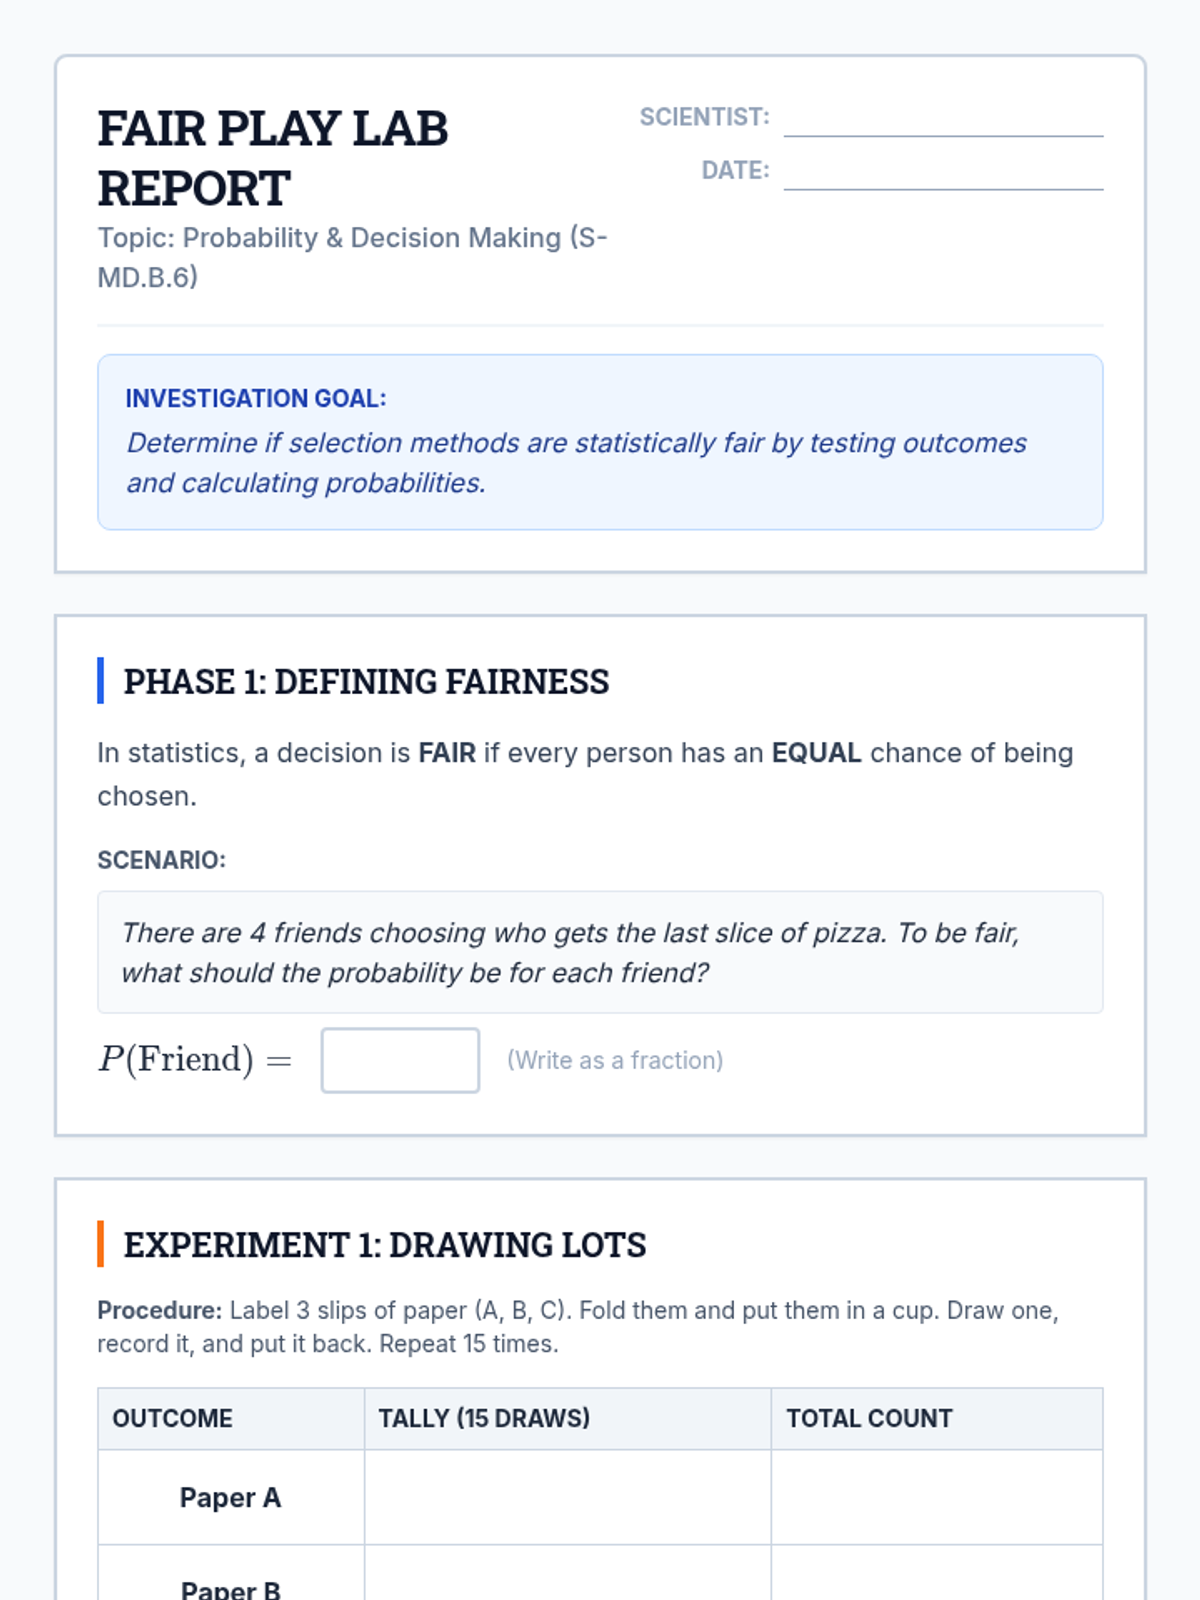
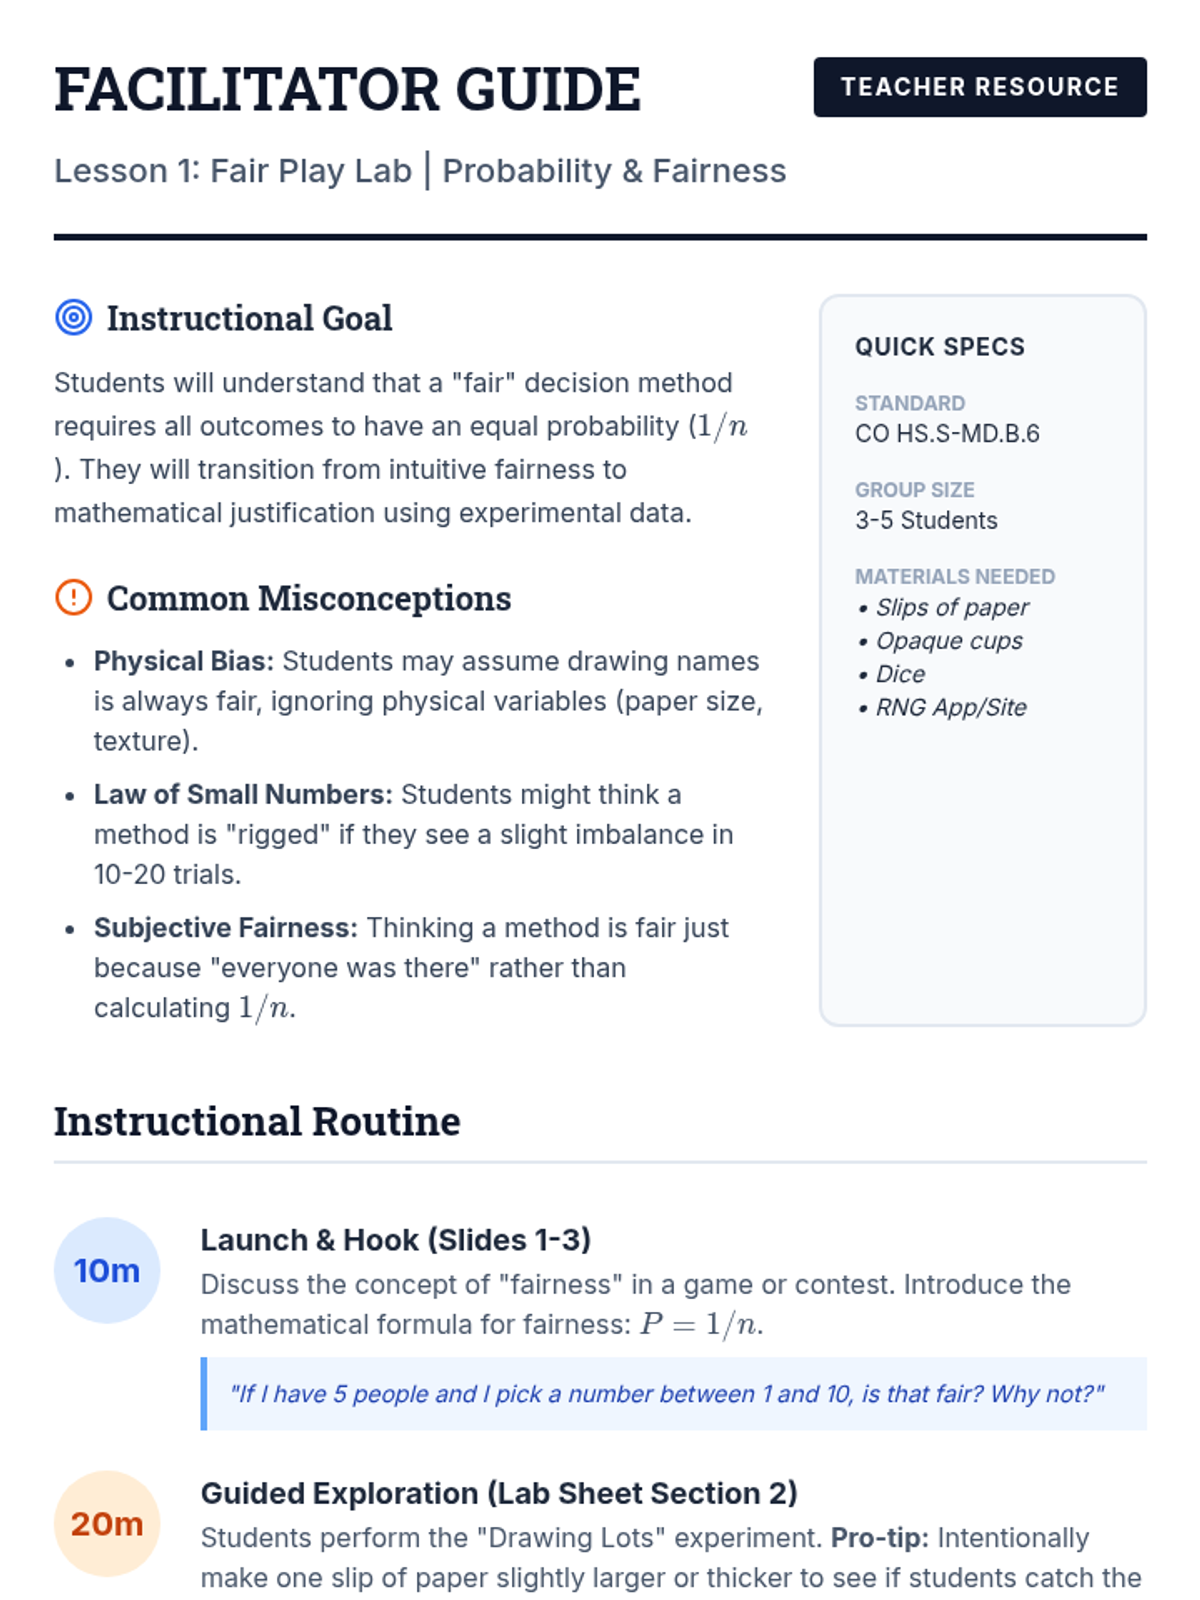
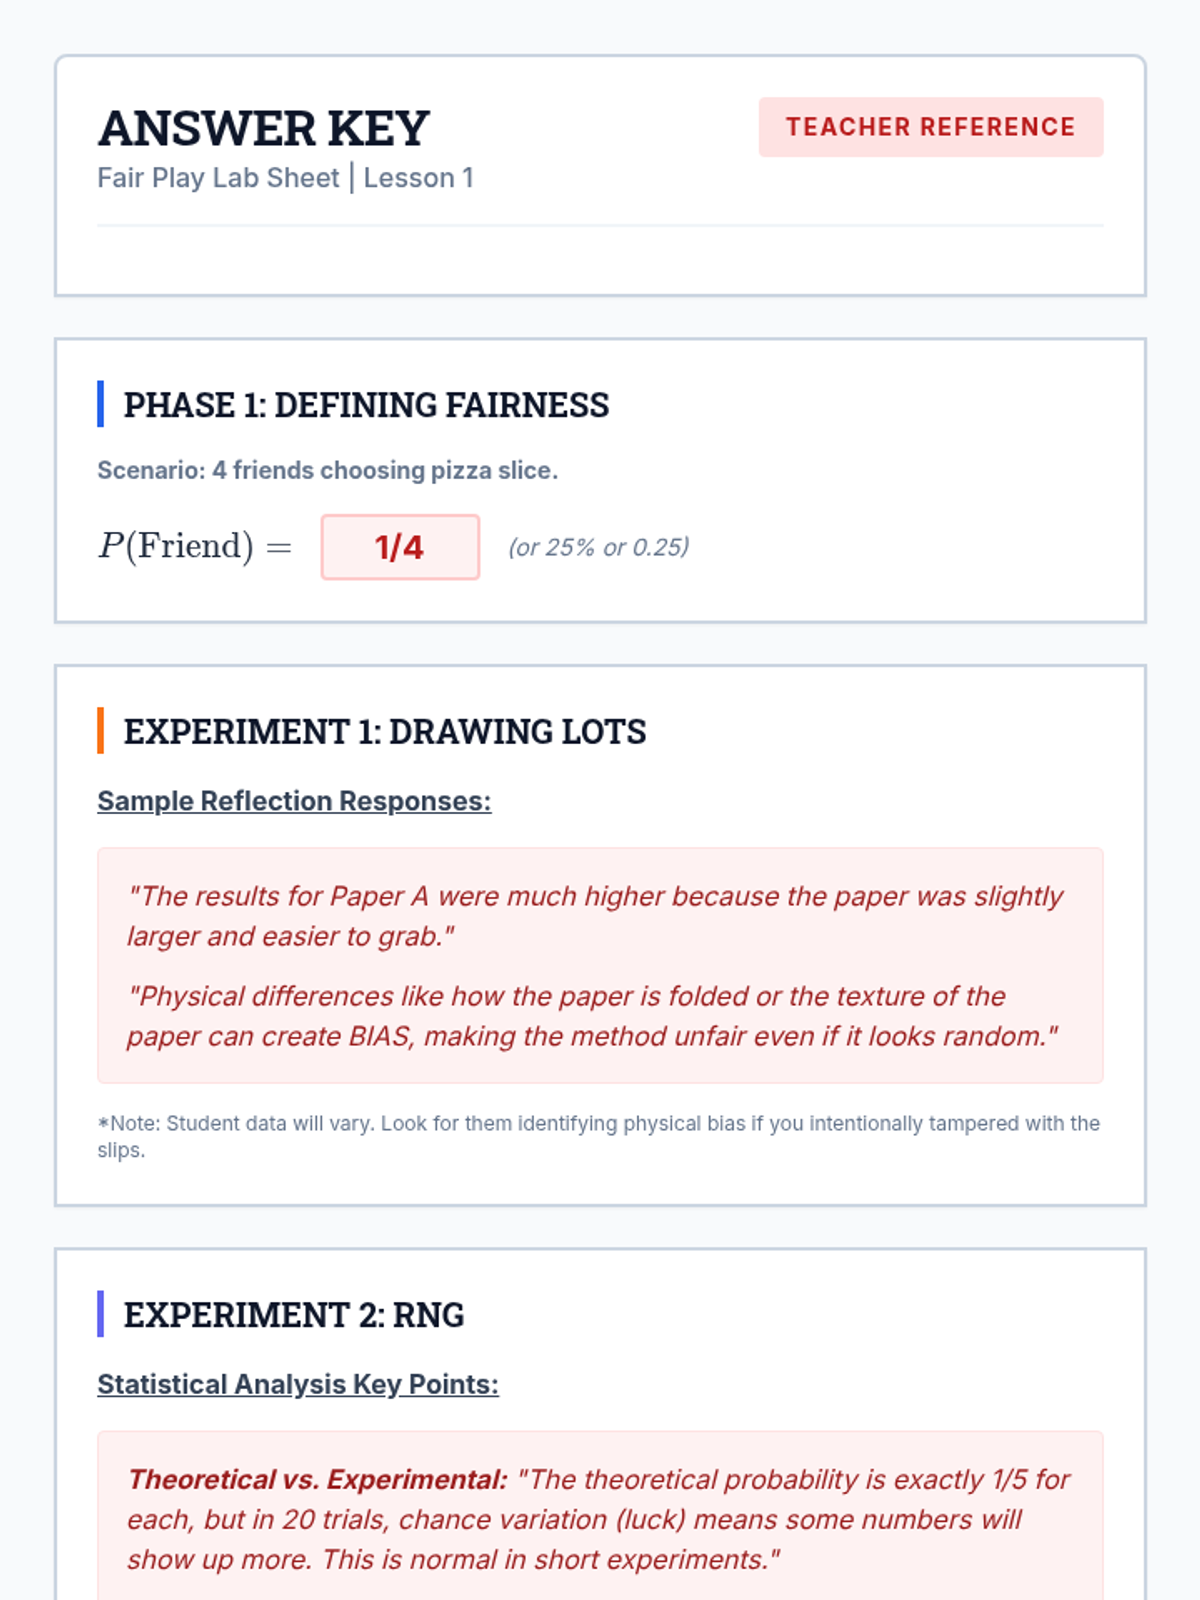
A small group intervention sequence focused on understanding and applying probability to ensure fair decision-making, specifically designed for students needing extra support in High School Statistics.
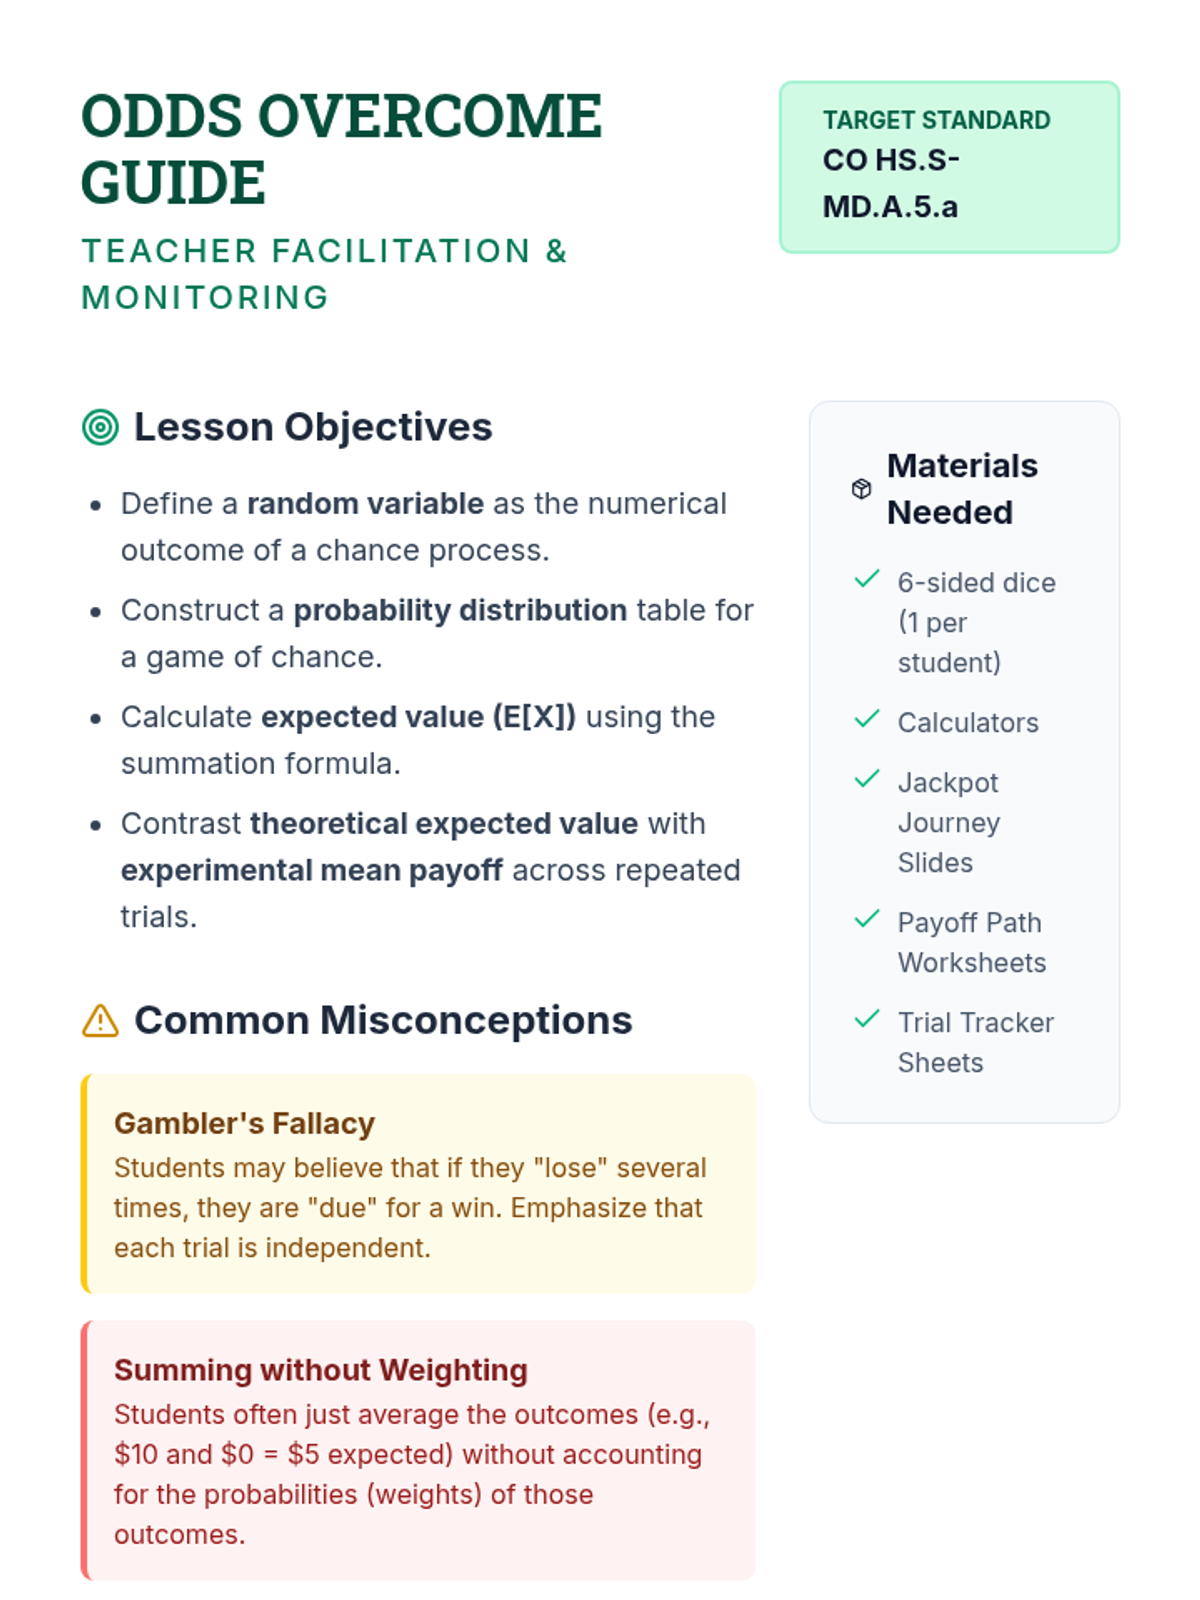
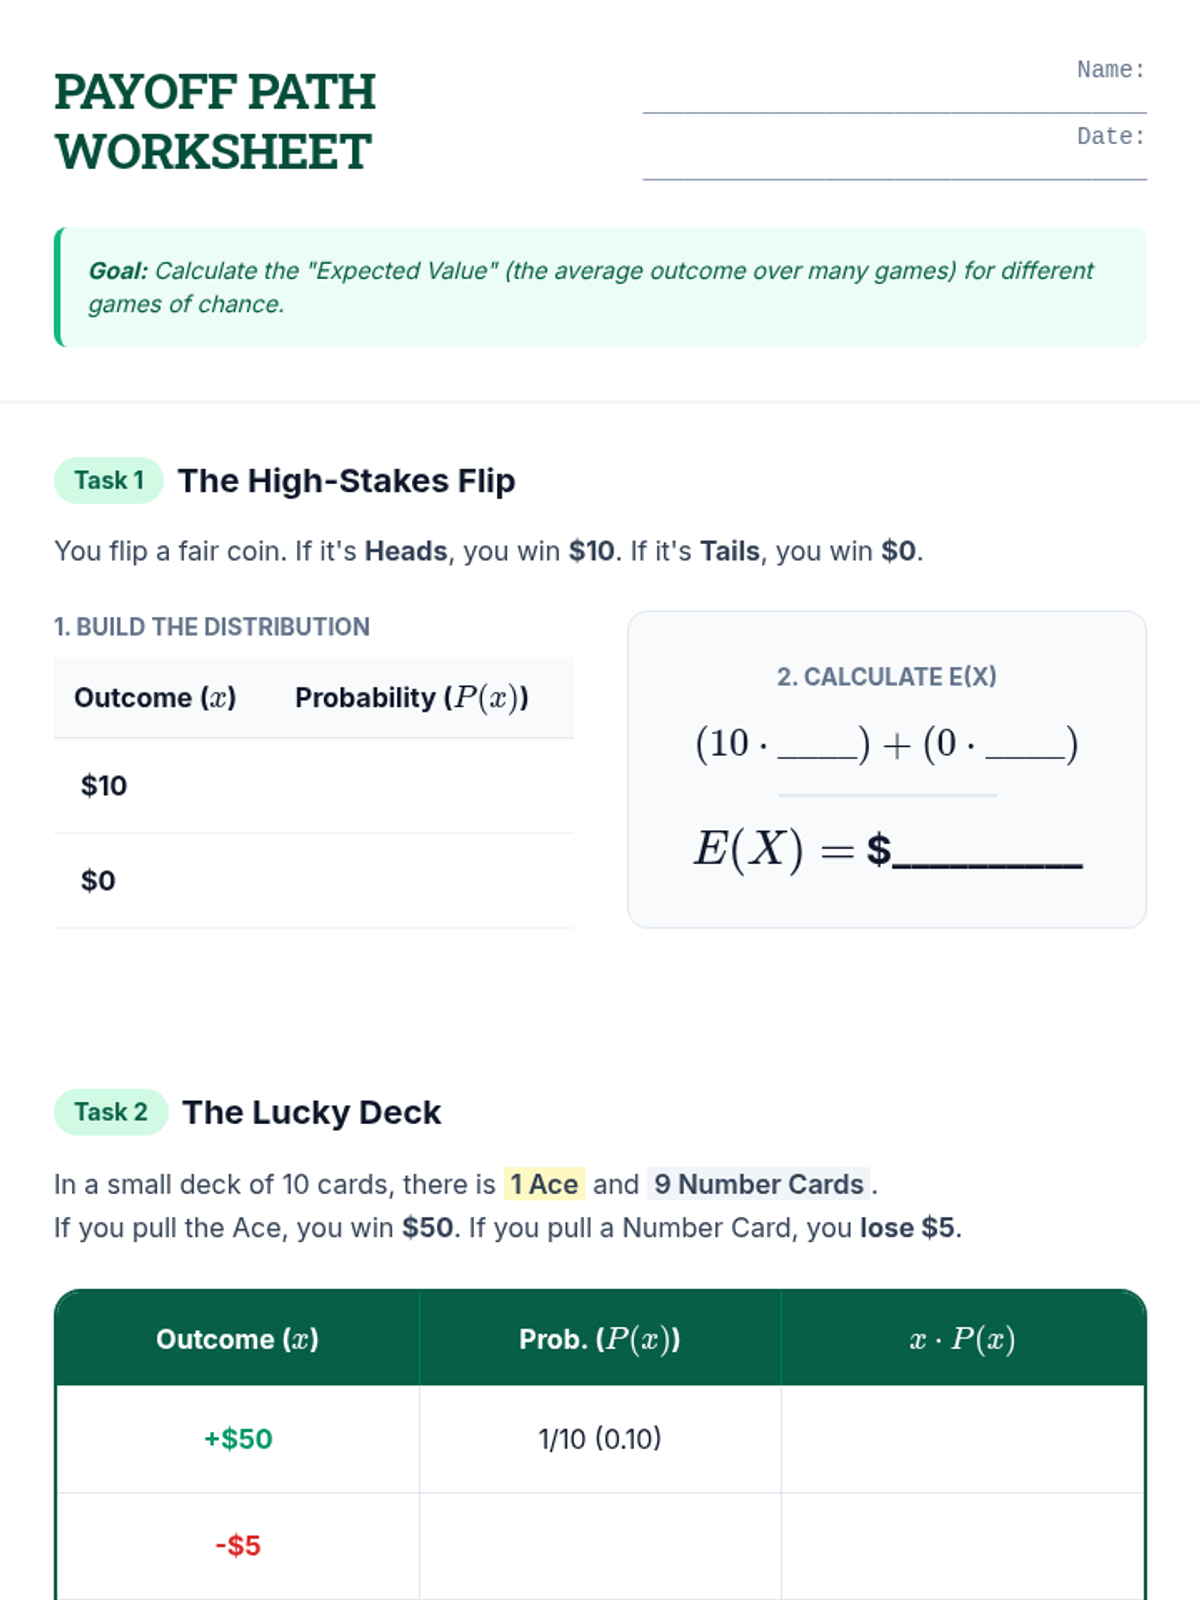
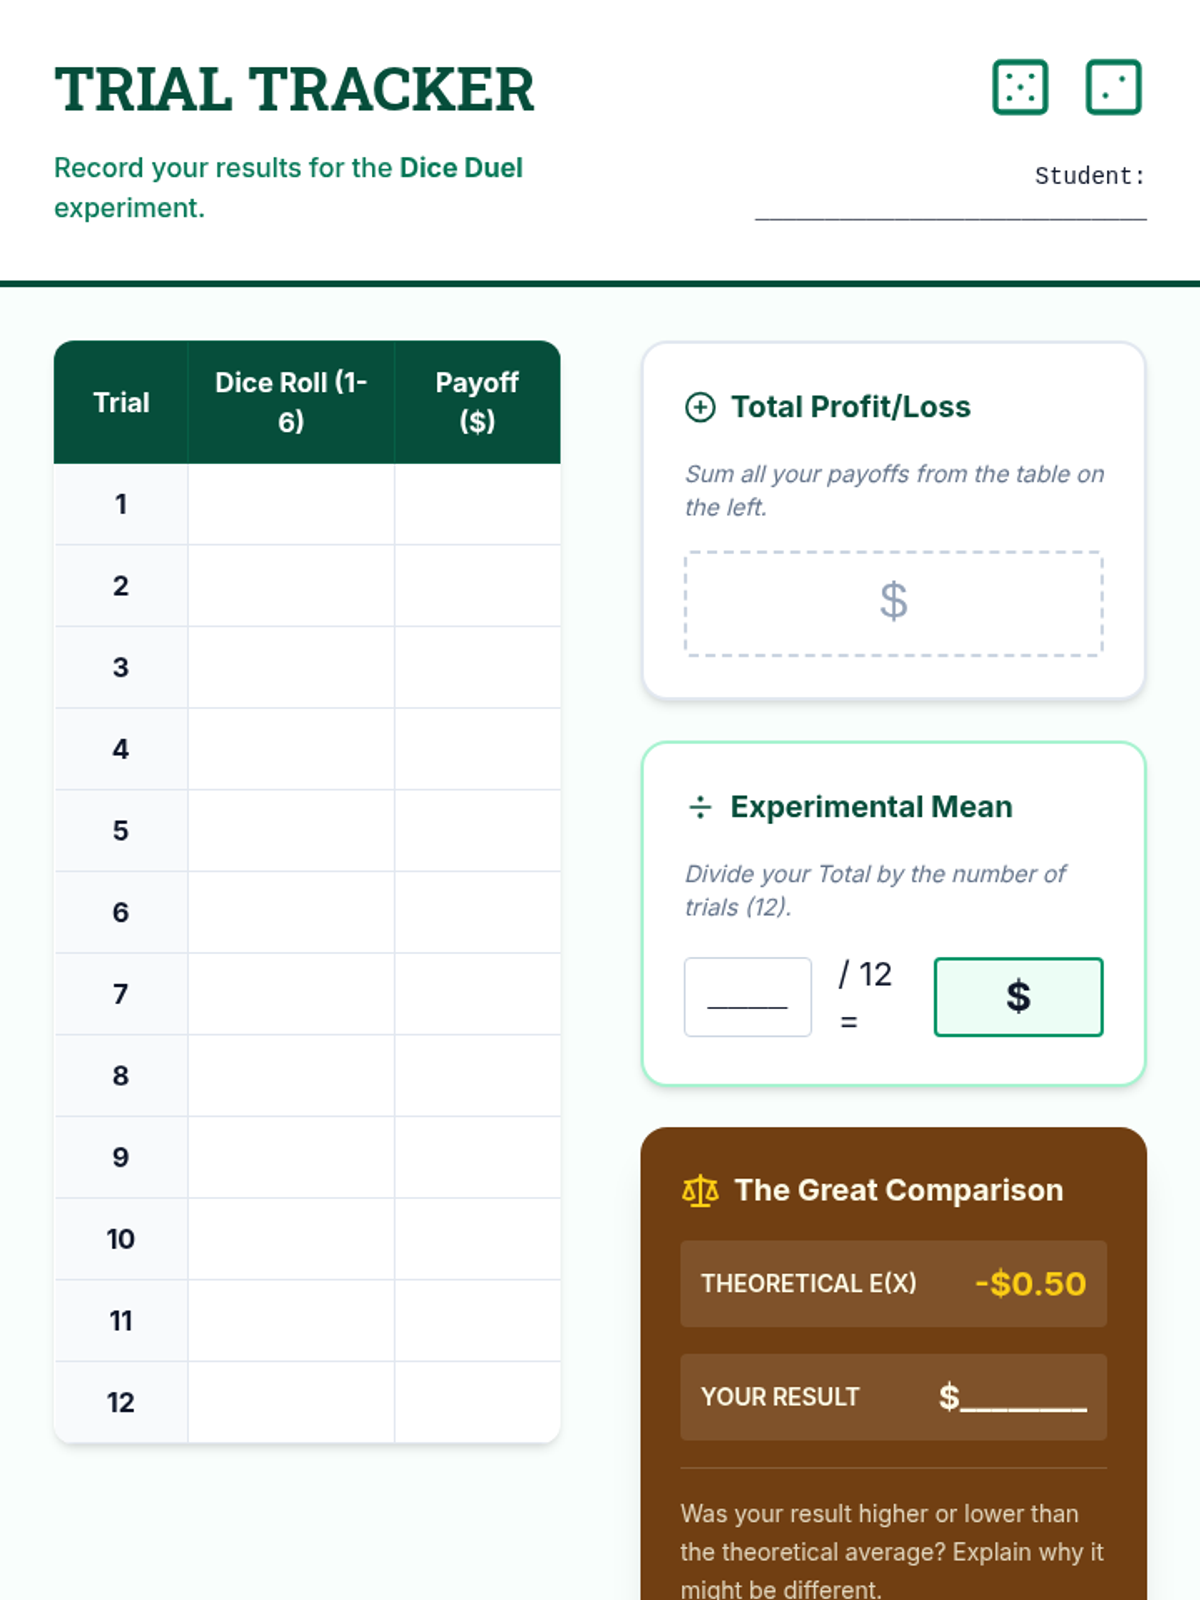
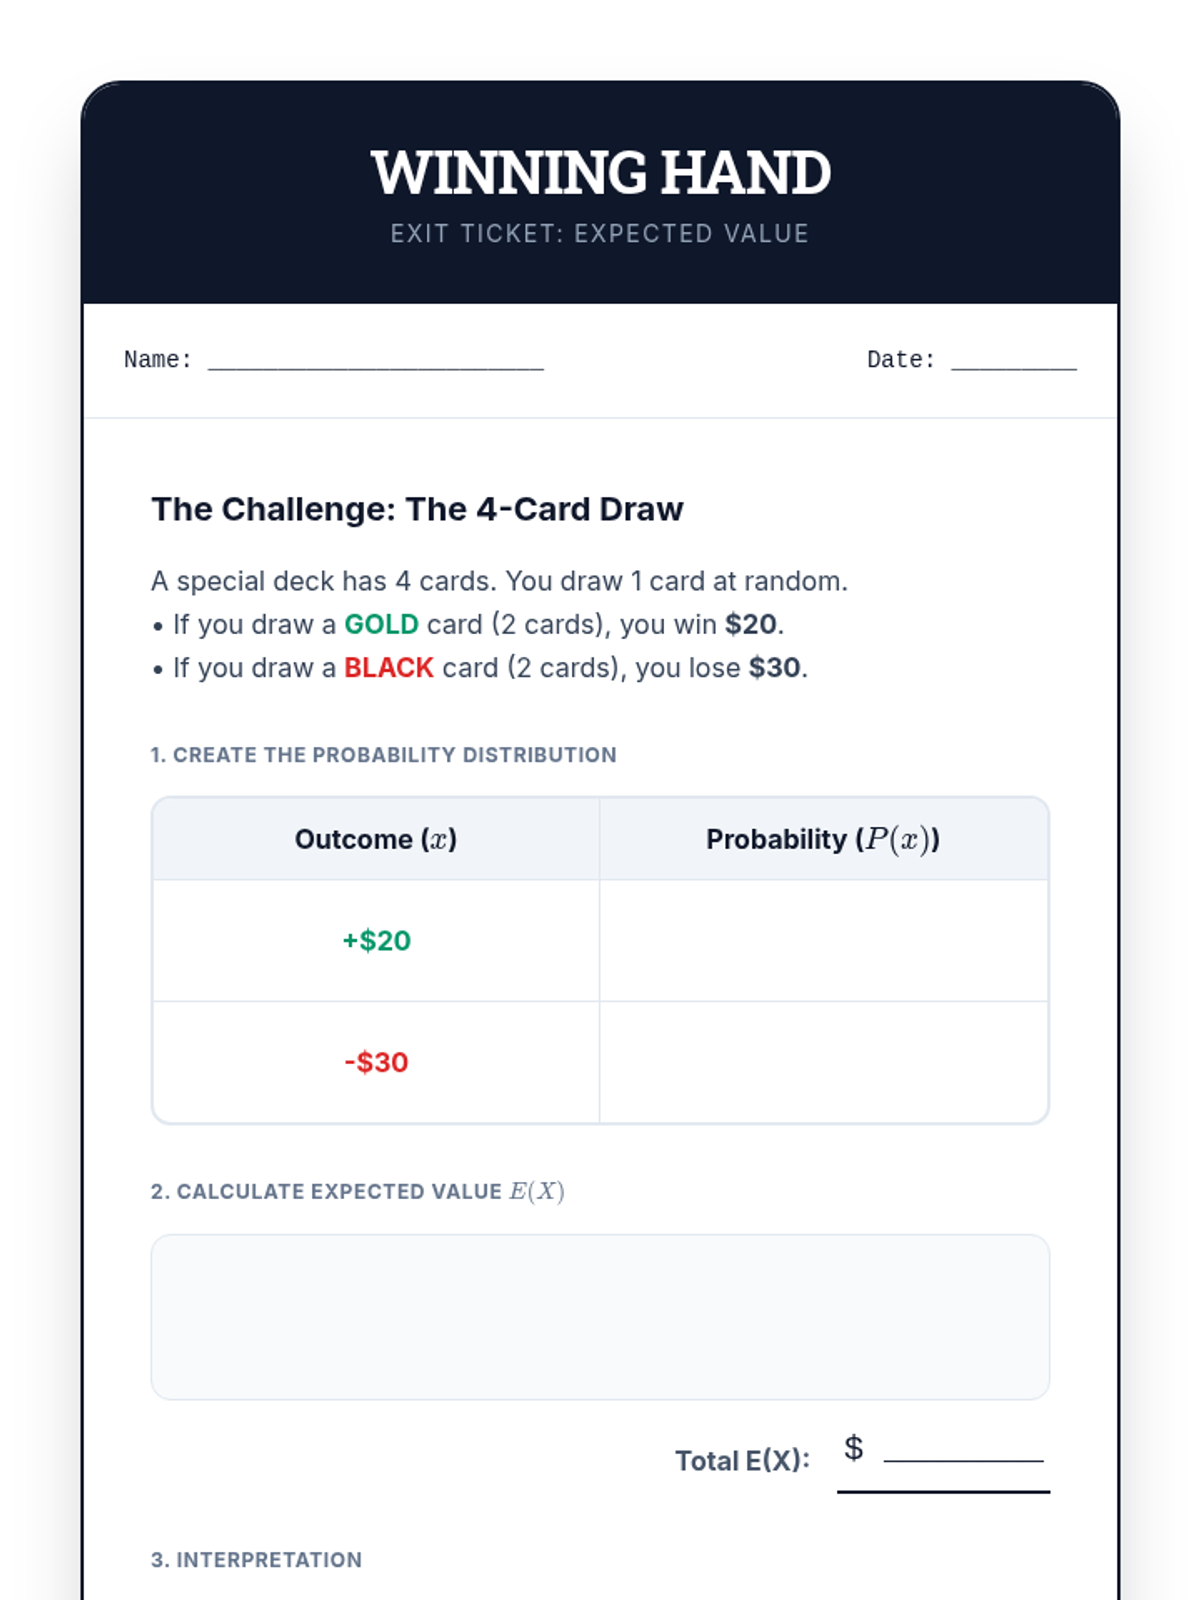
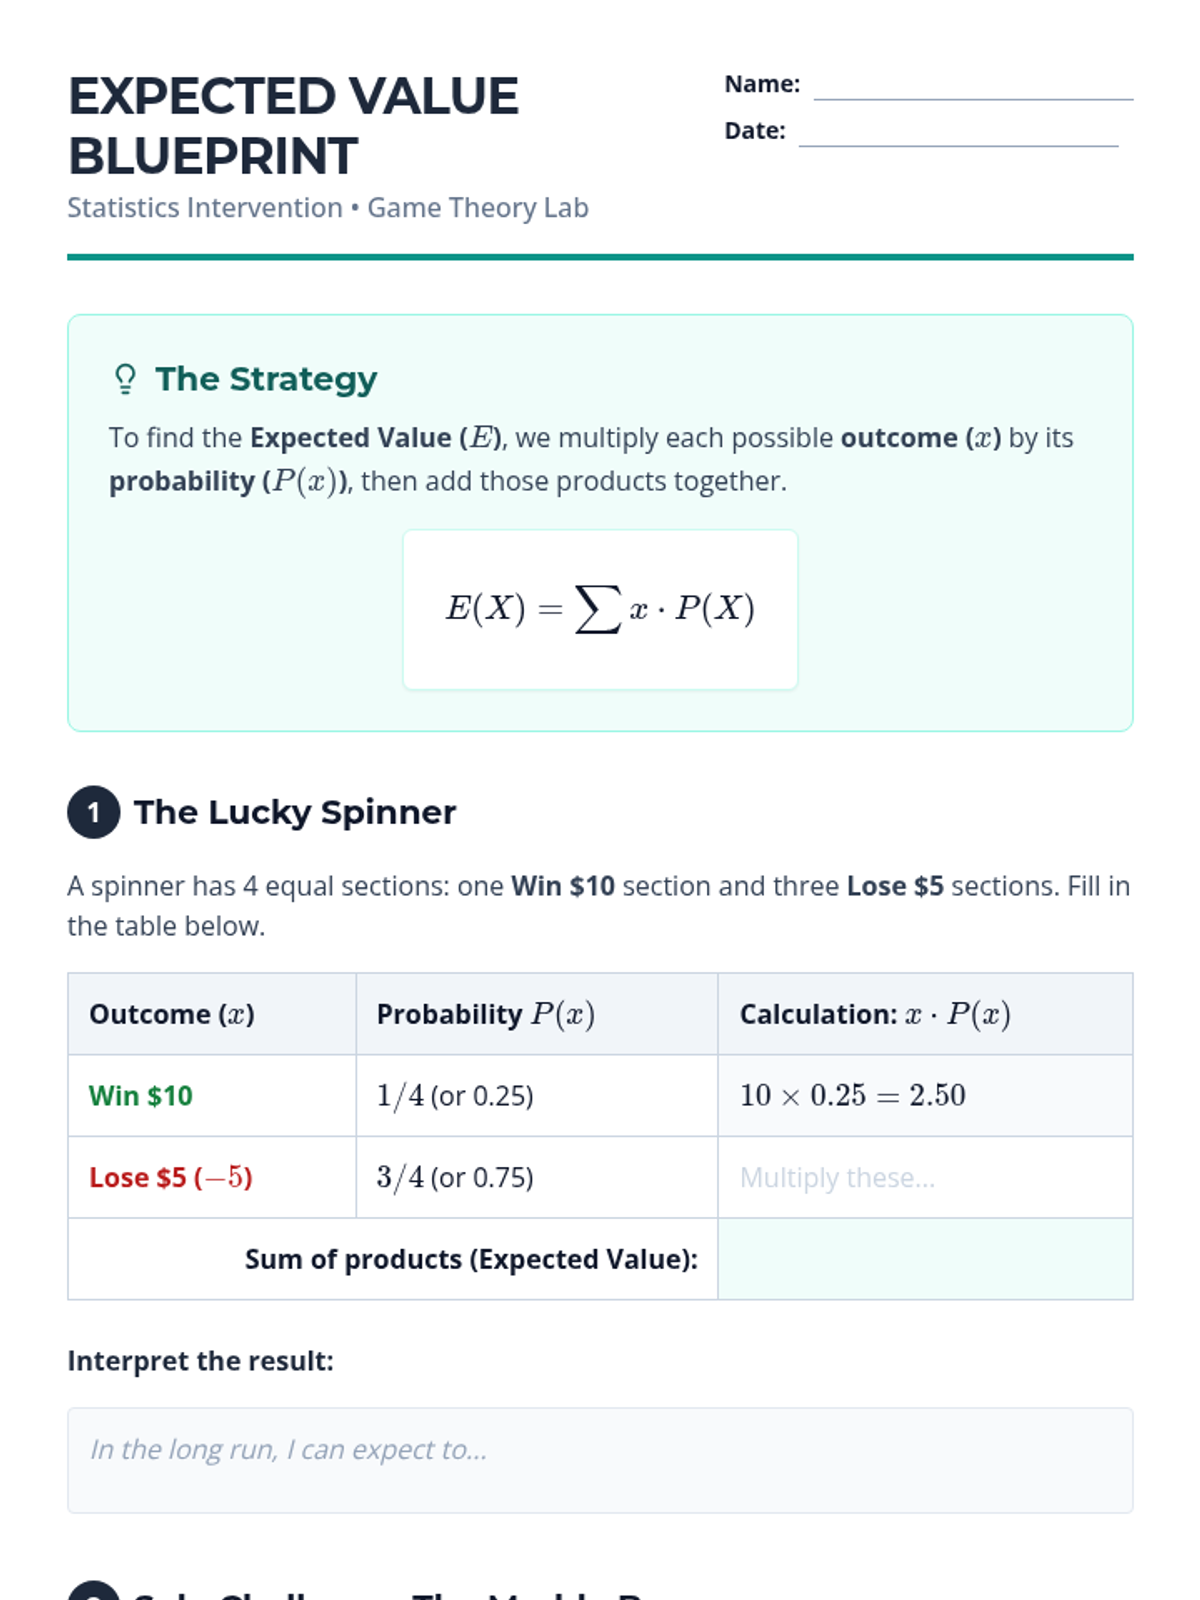
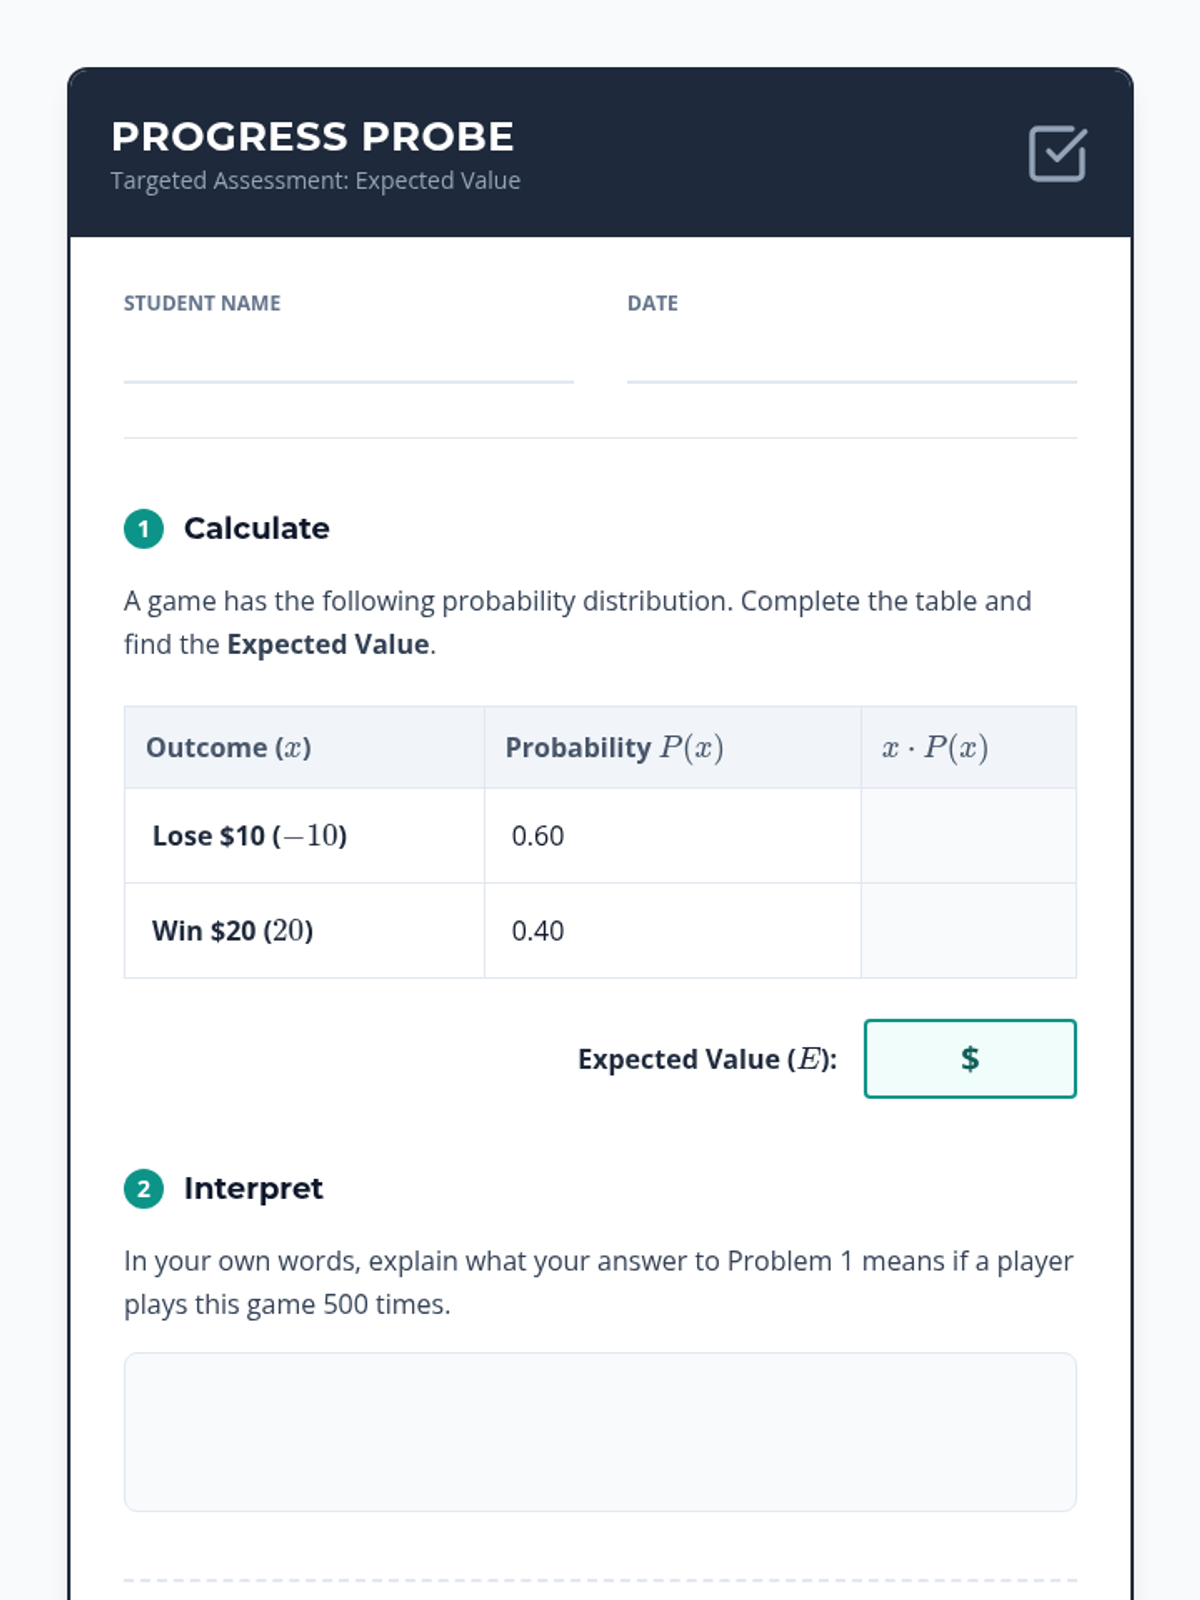
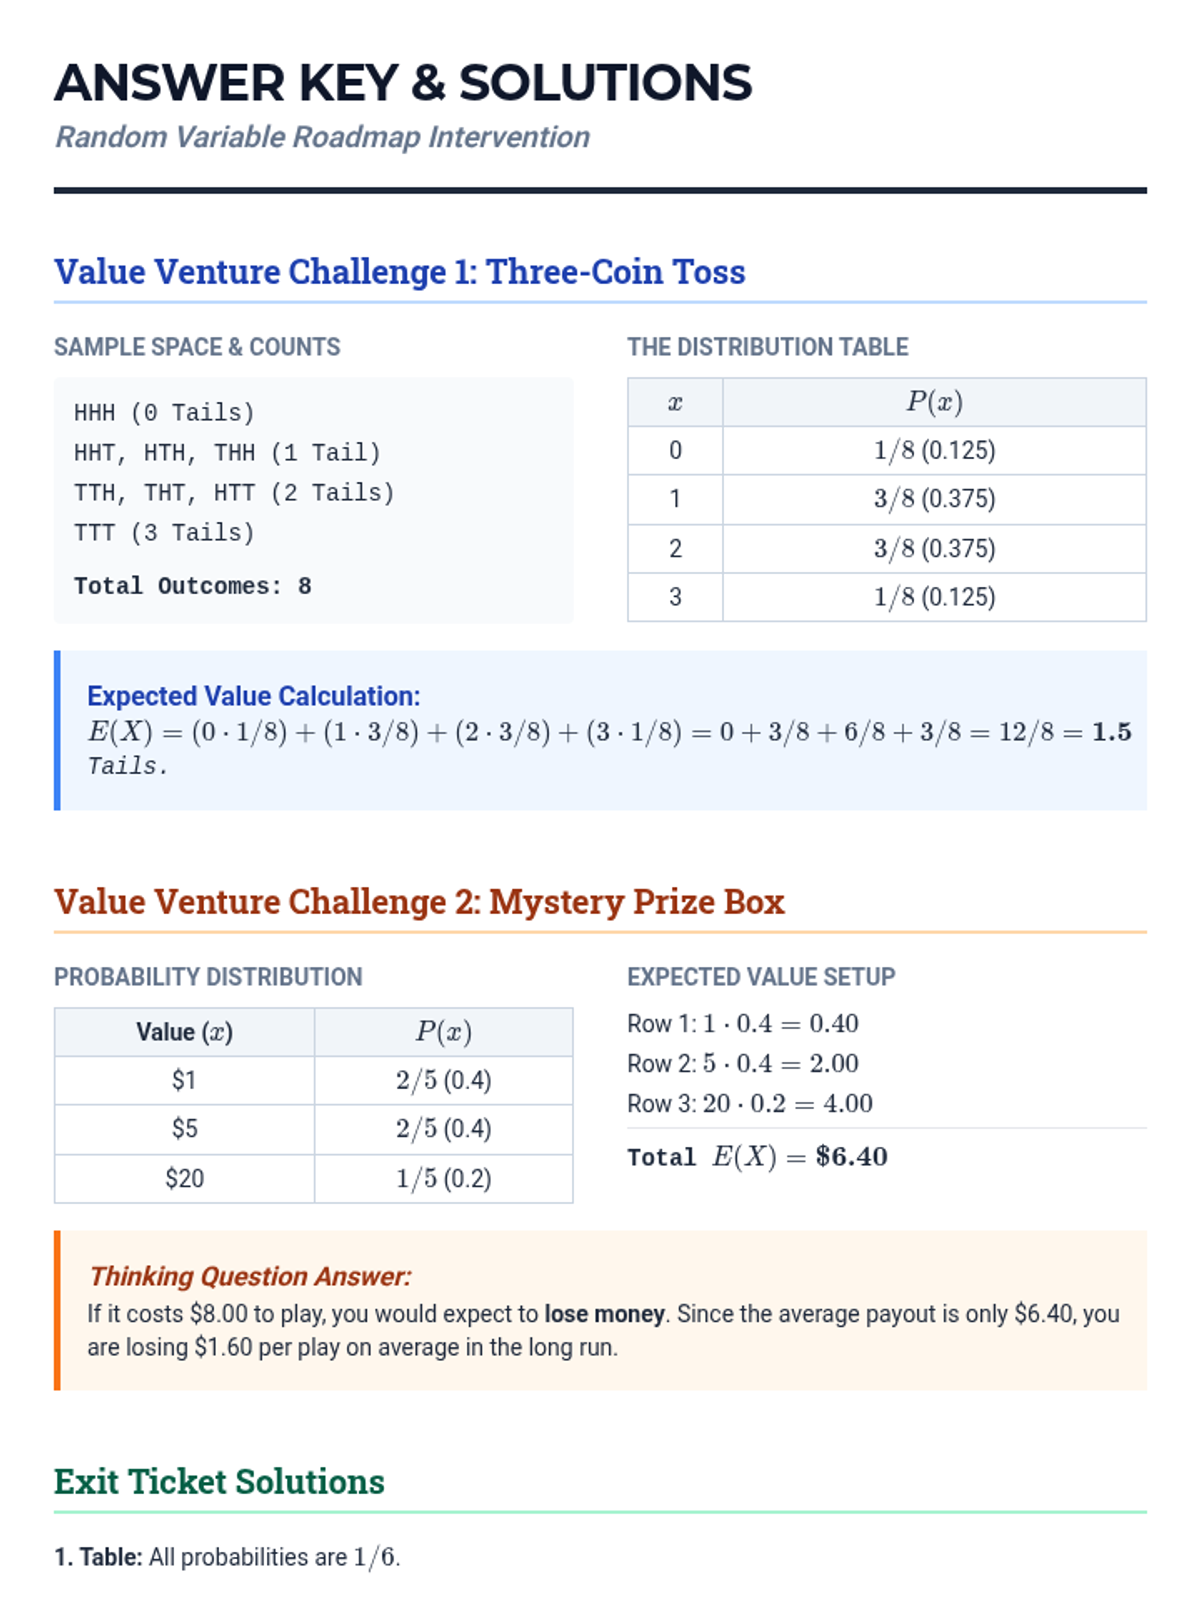
A Tier 2 statistics intervention focusing on calculating and interpreting expected values in games of chance. Students transition from intuitive guesses to formal probability distributions and compare experimental data to theoretical outcomes.
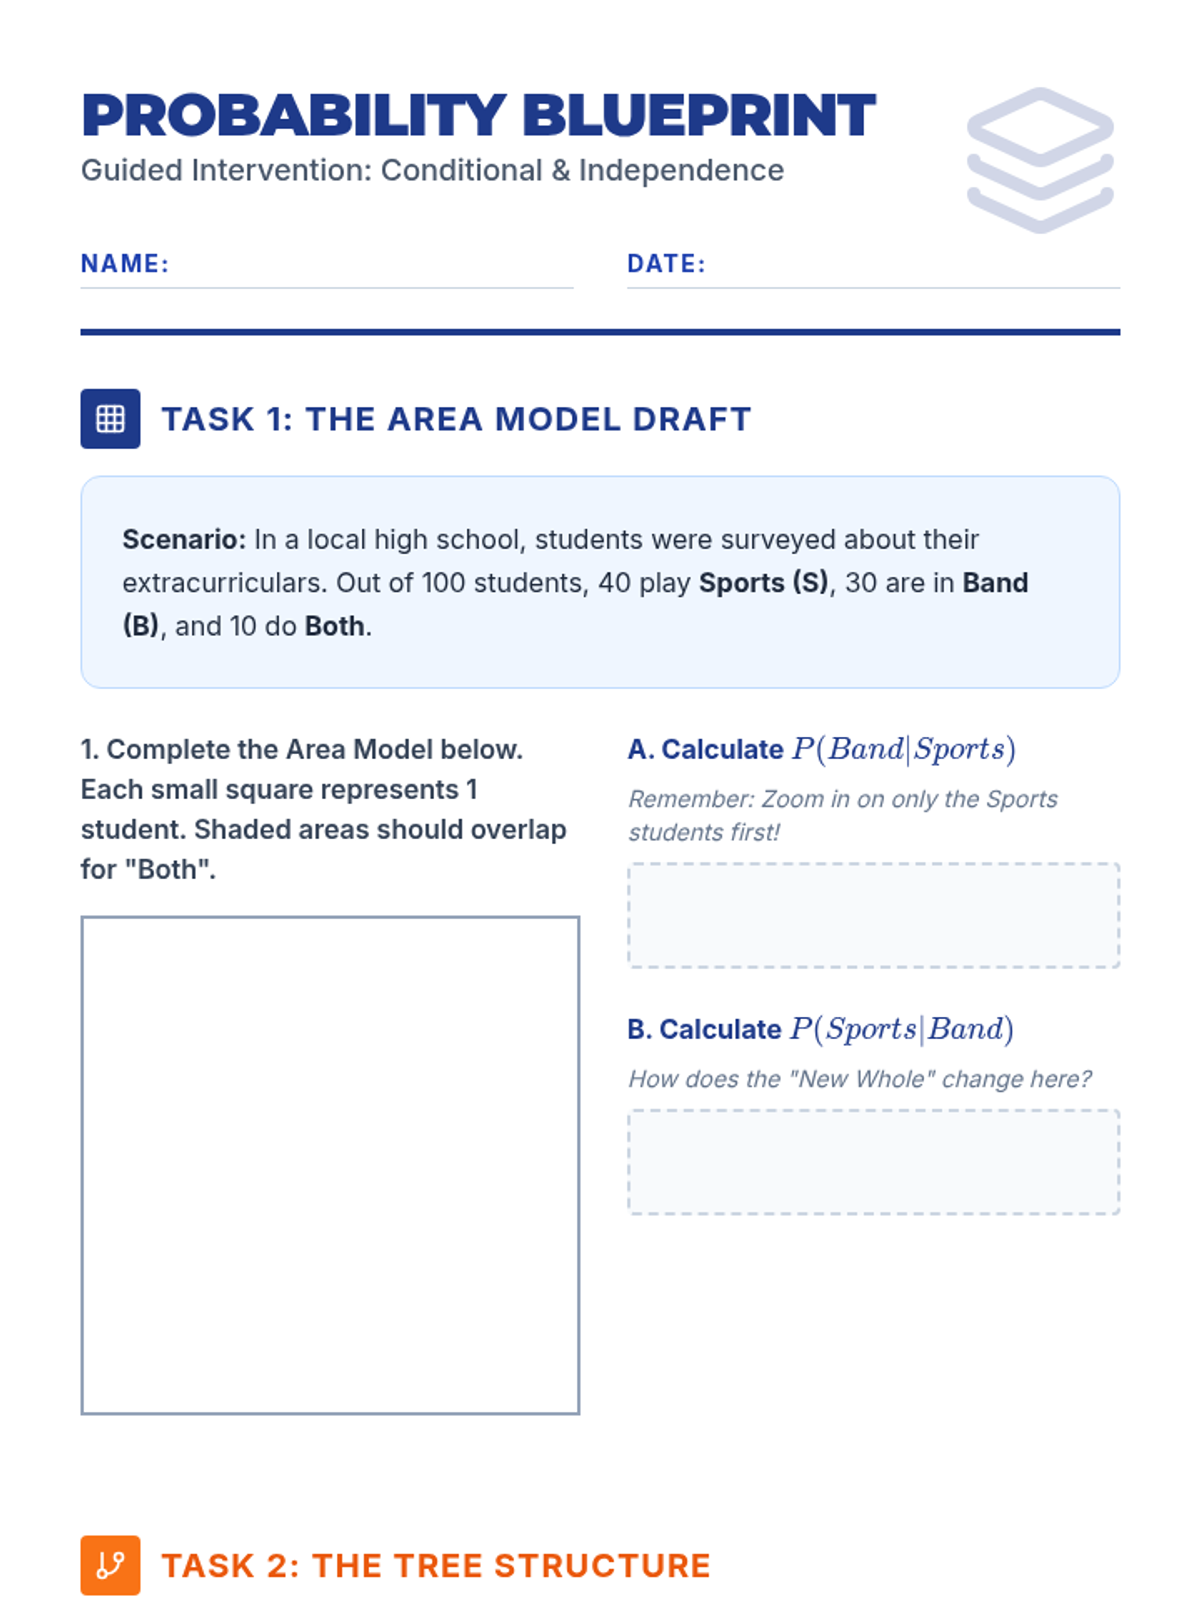
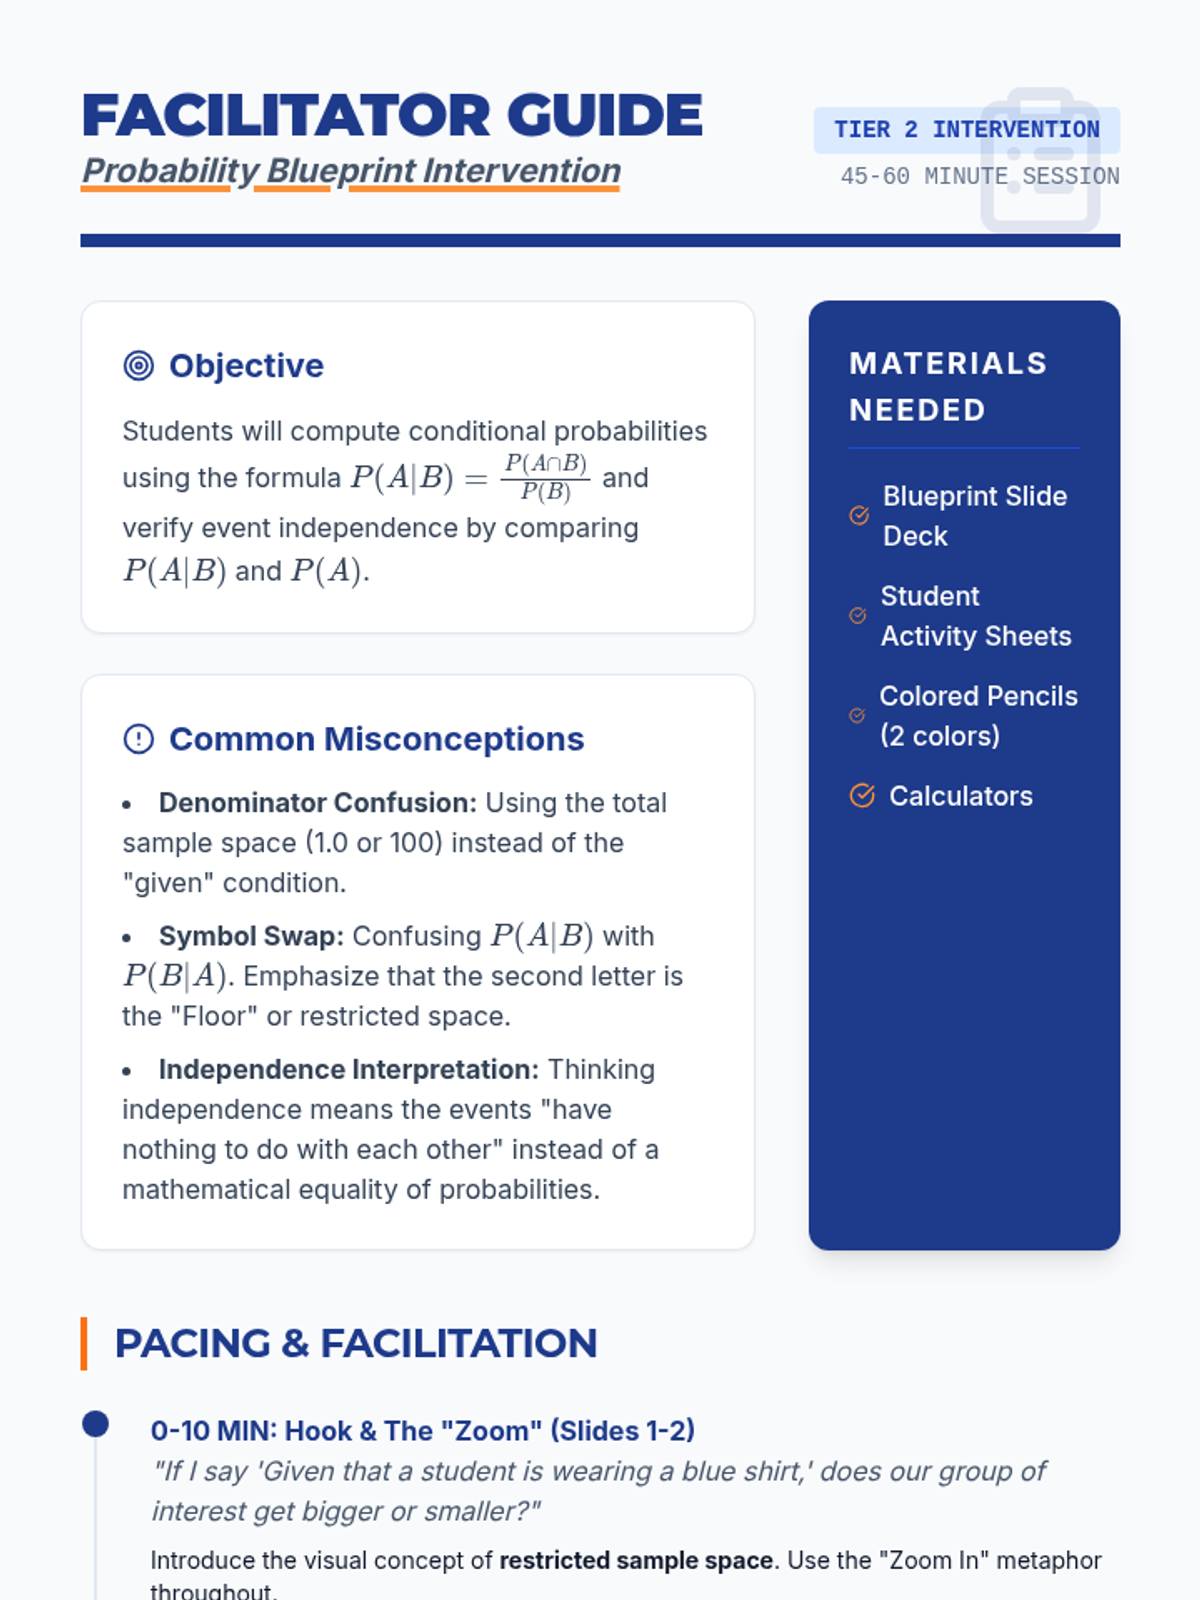
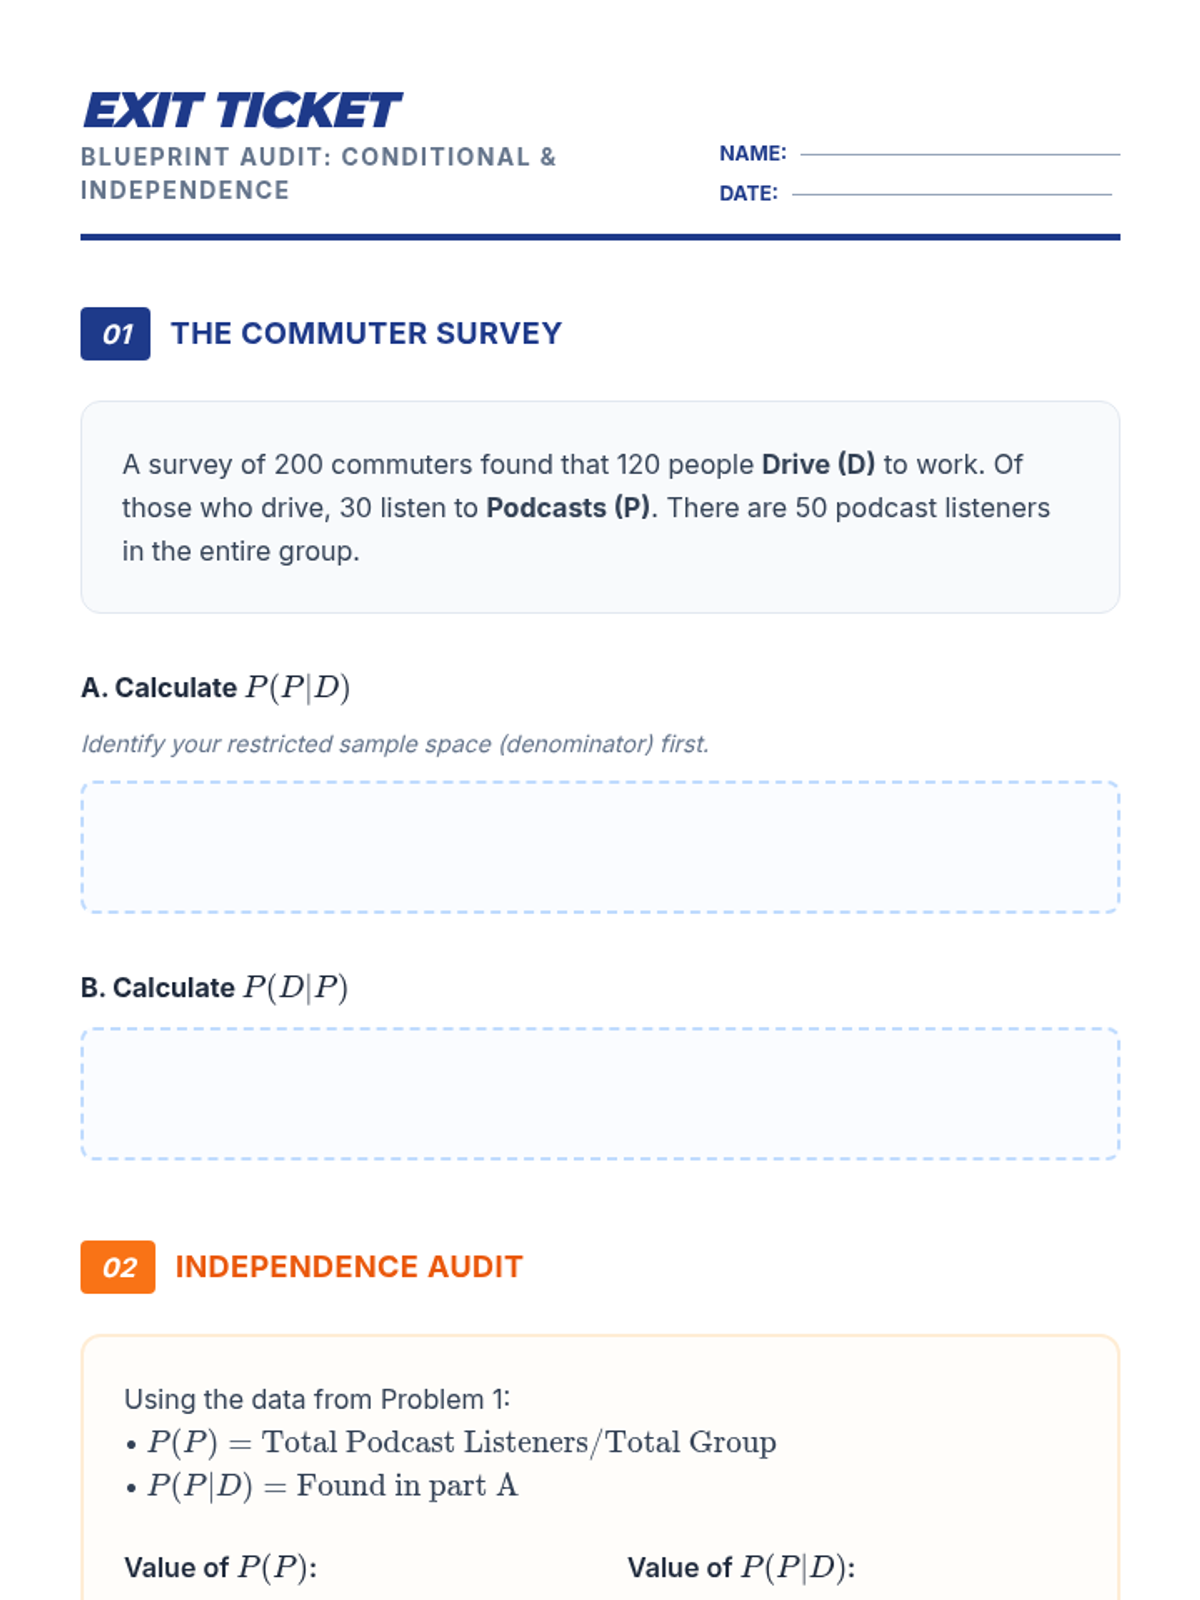
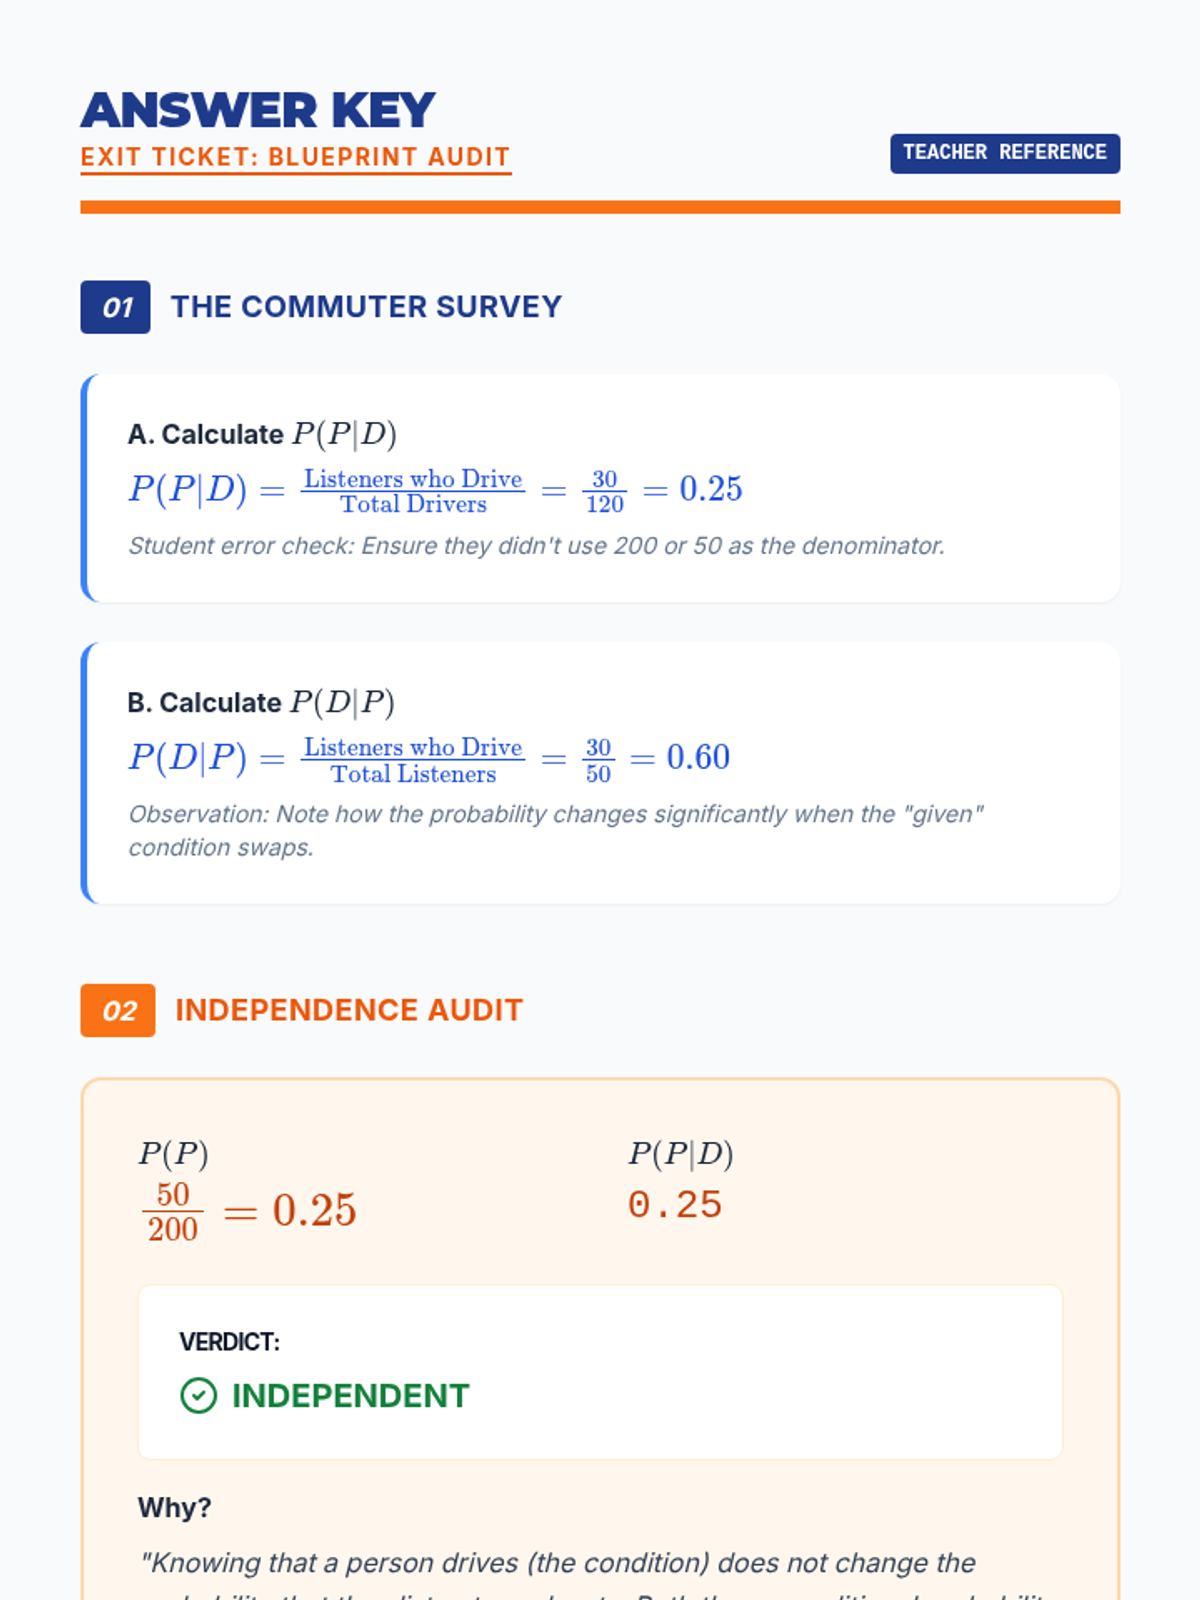
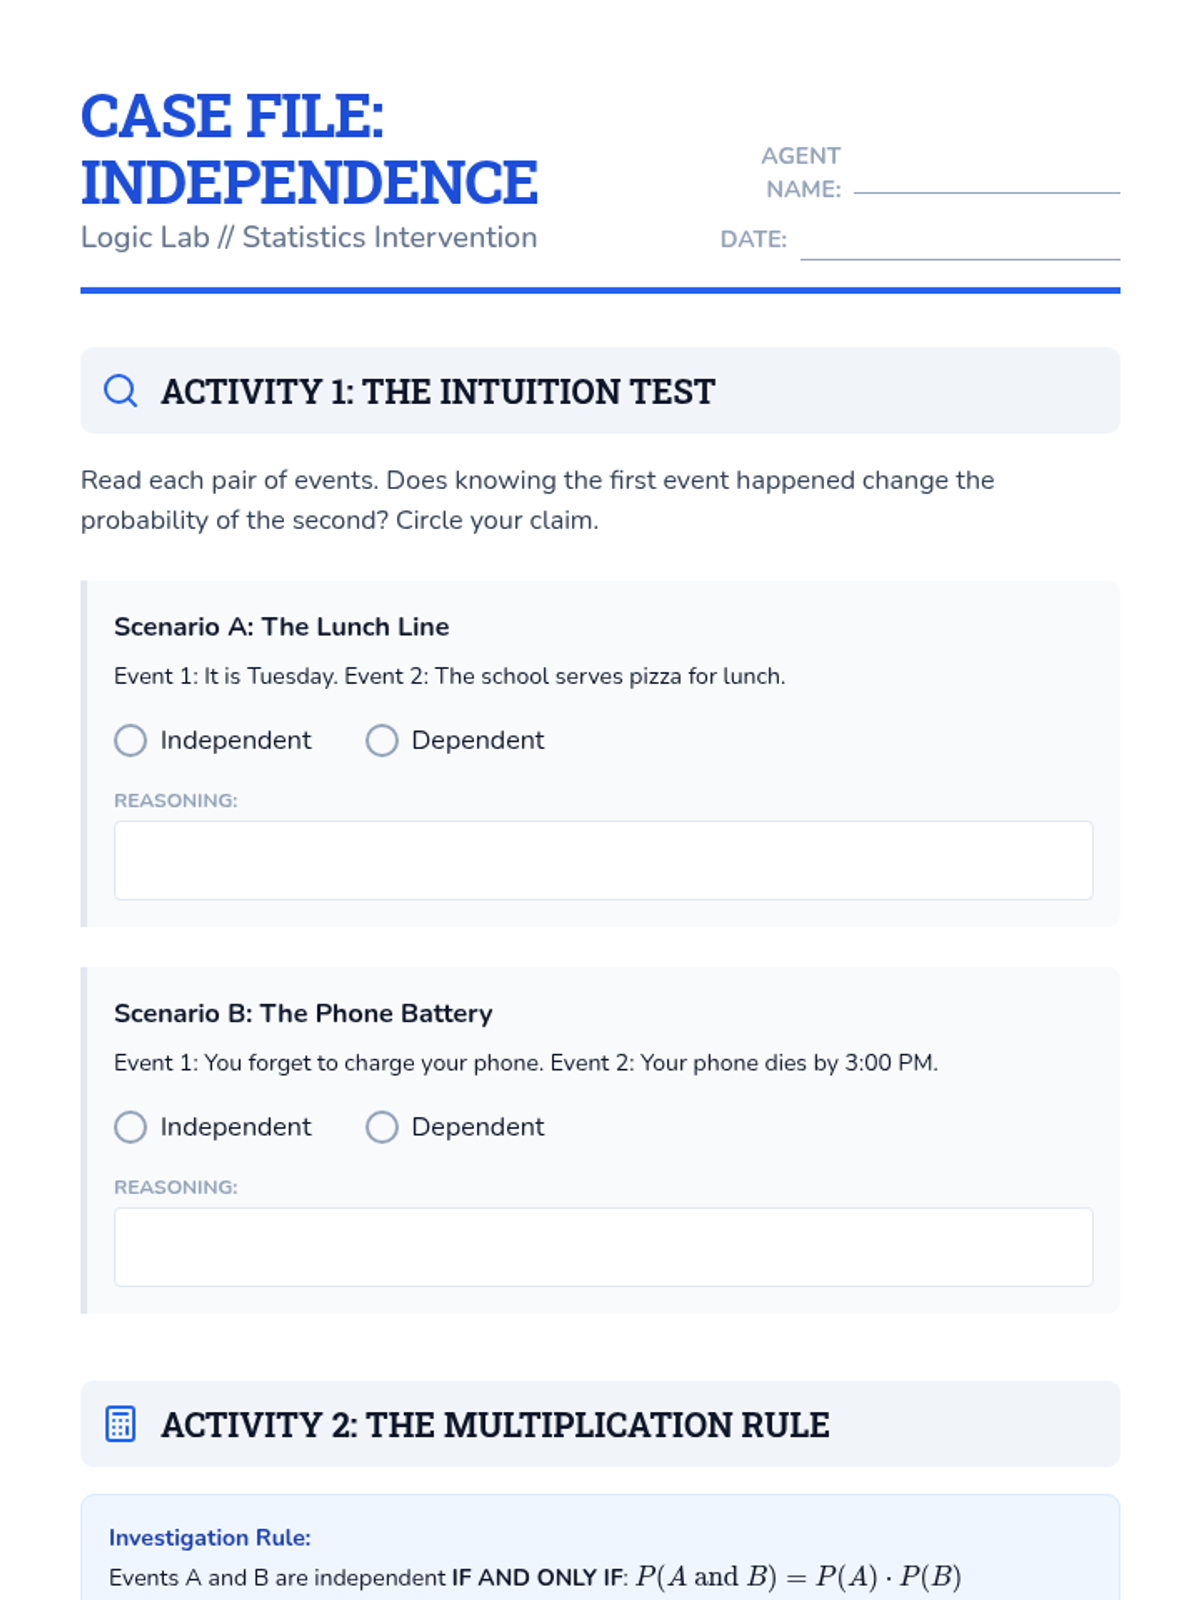
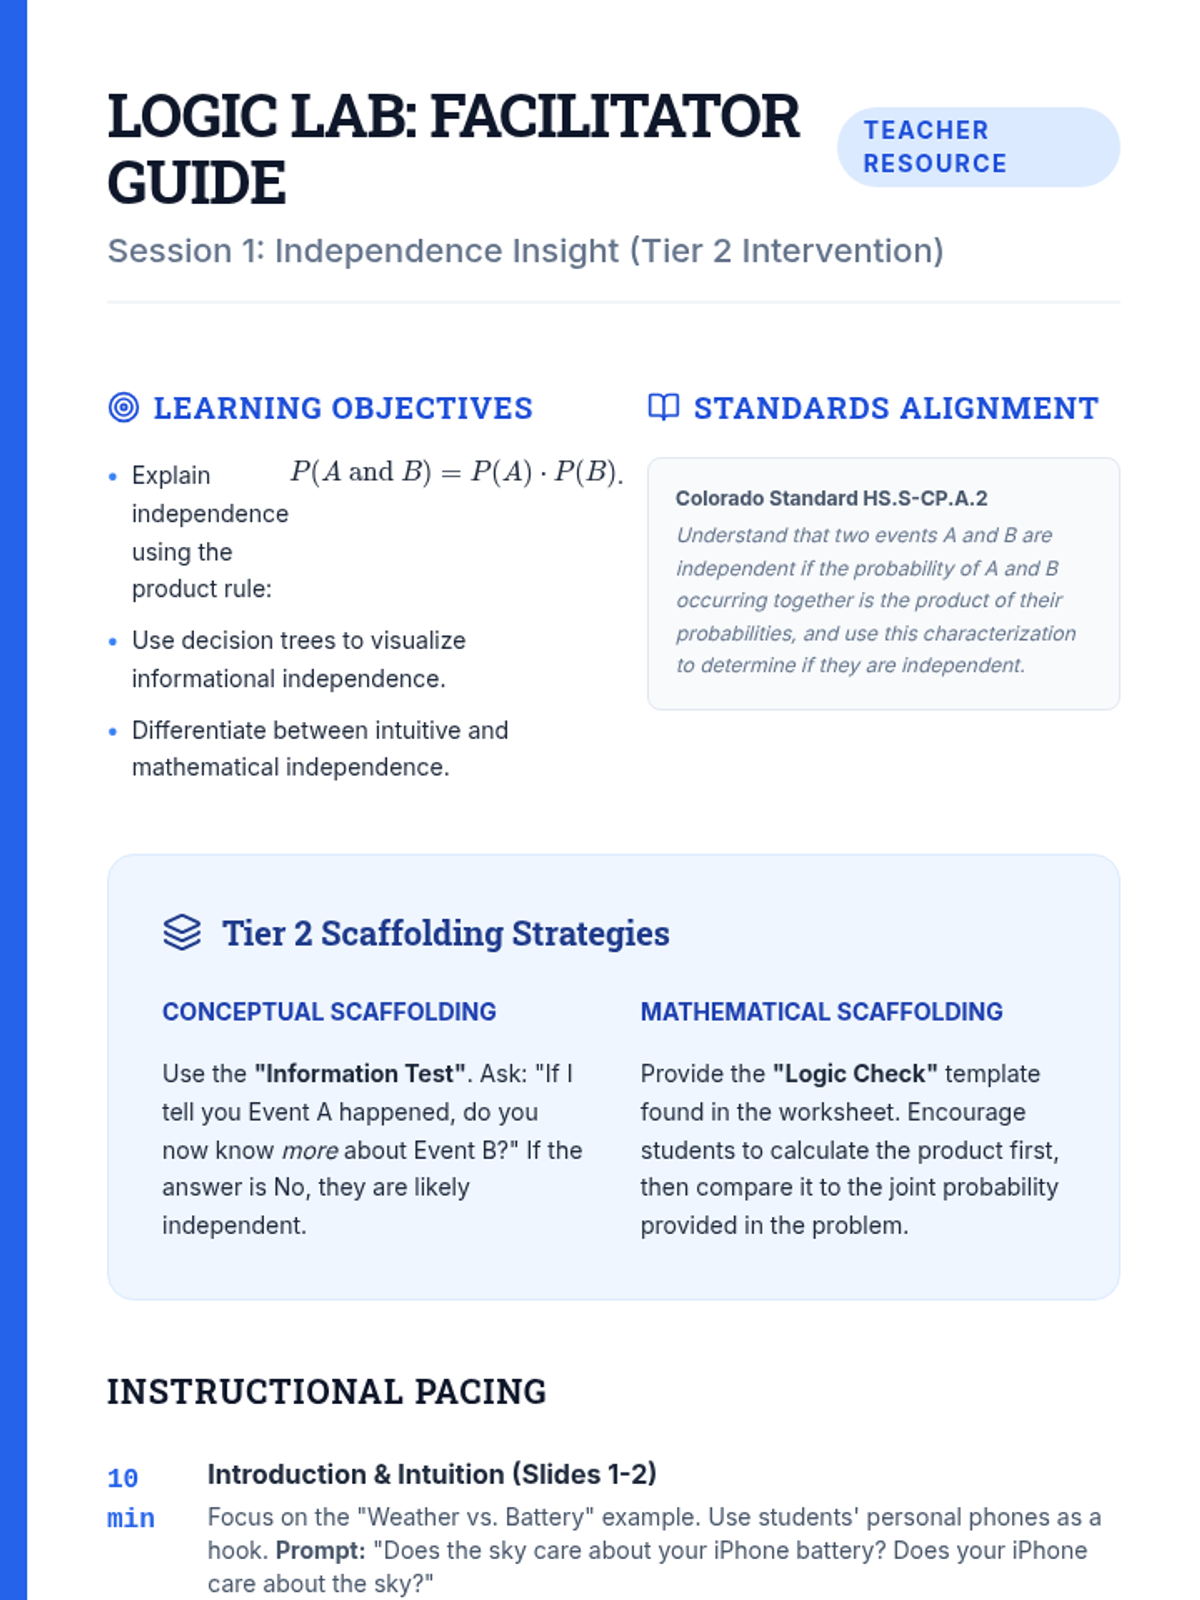
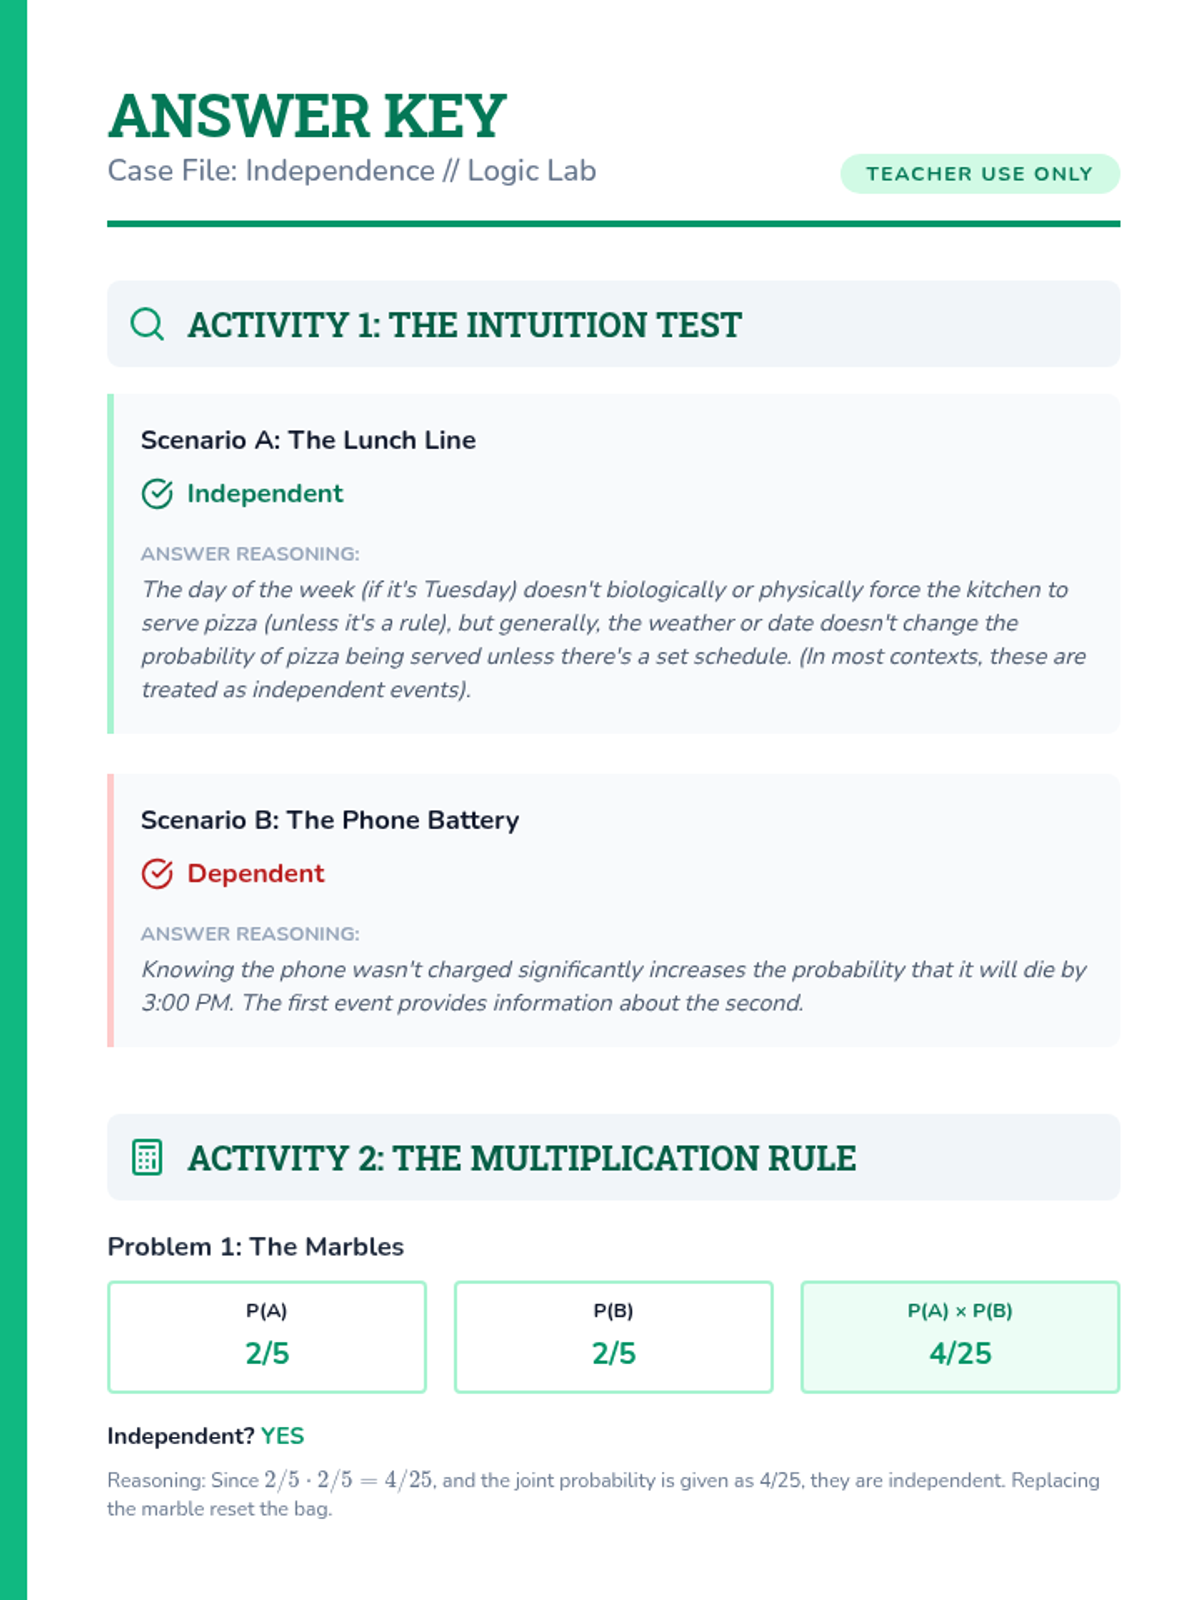
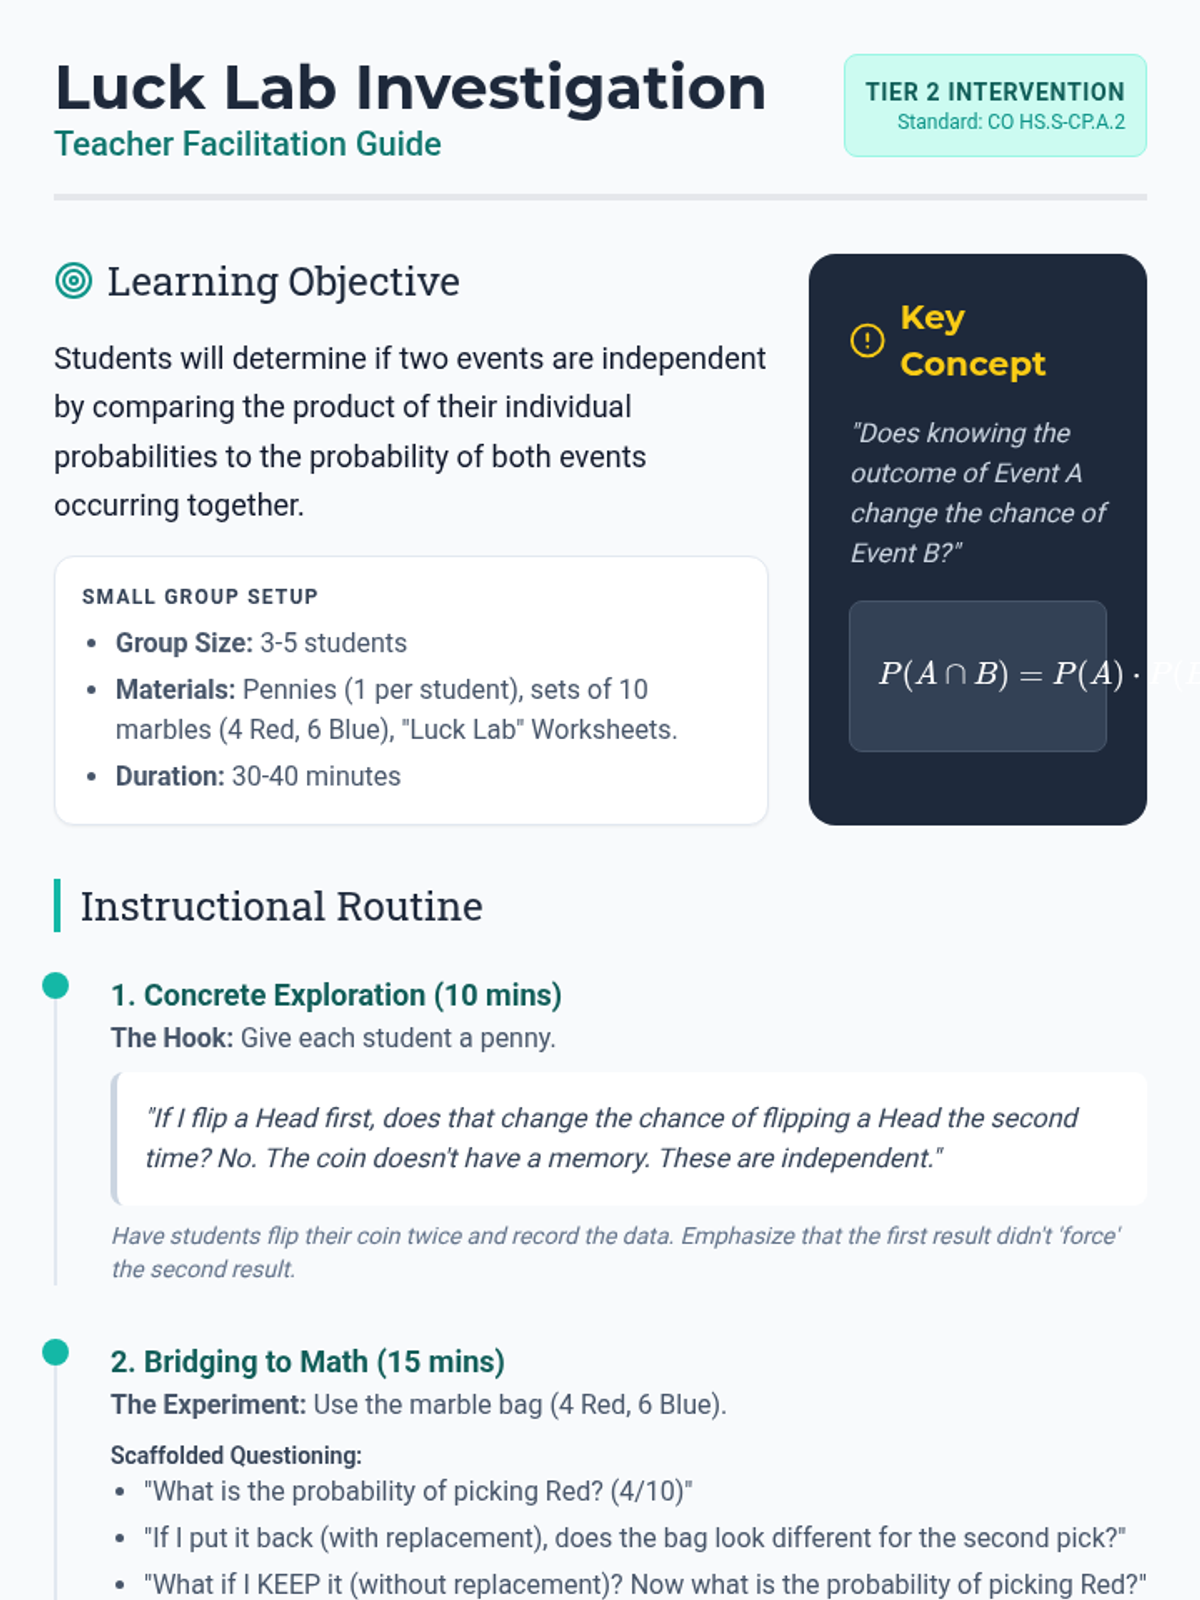
A targeted Tier 2 intervention sequence focused on conditional probability and independence for high school students. This sequence emphasizes visual models like tree diagrams and area models to bridge conceptual understanding to formal notation.
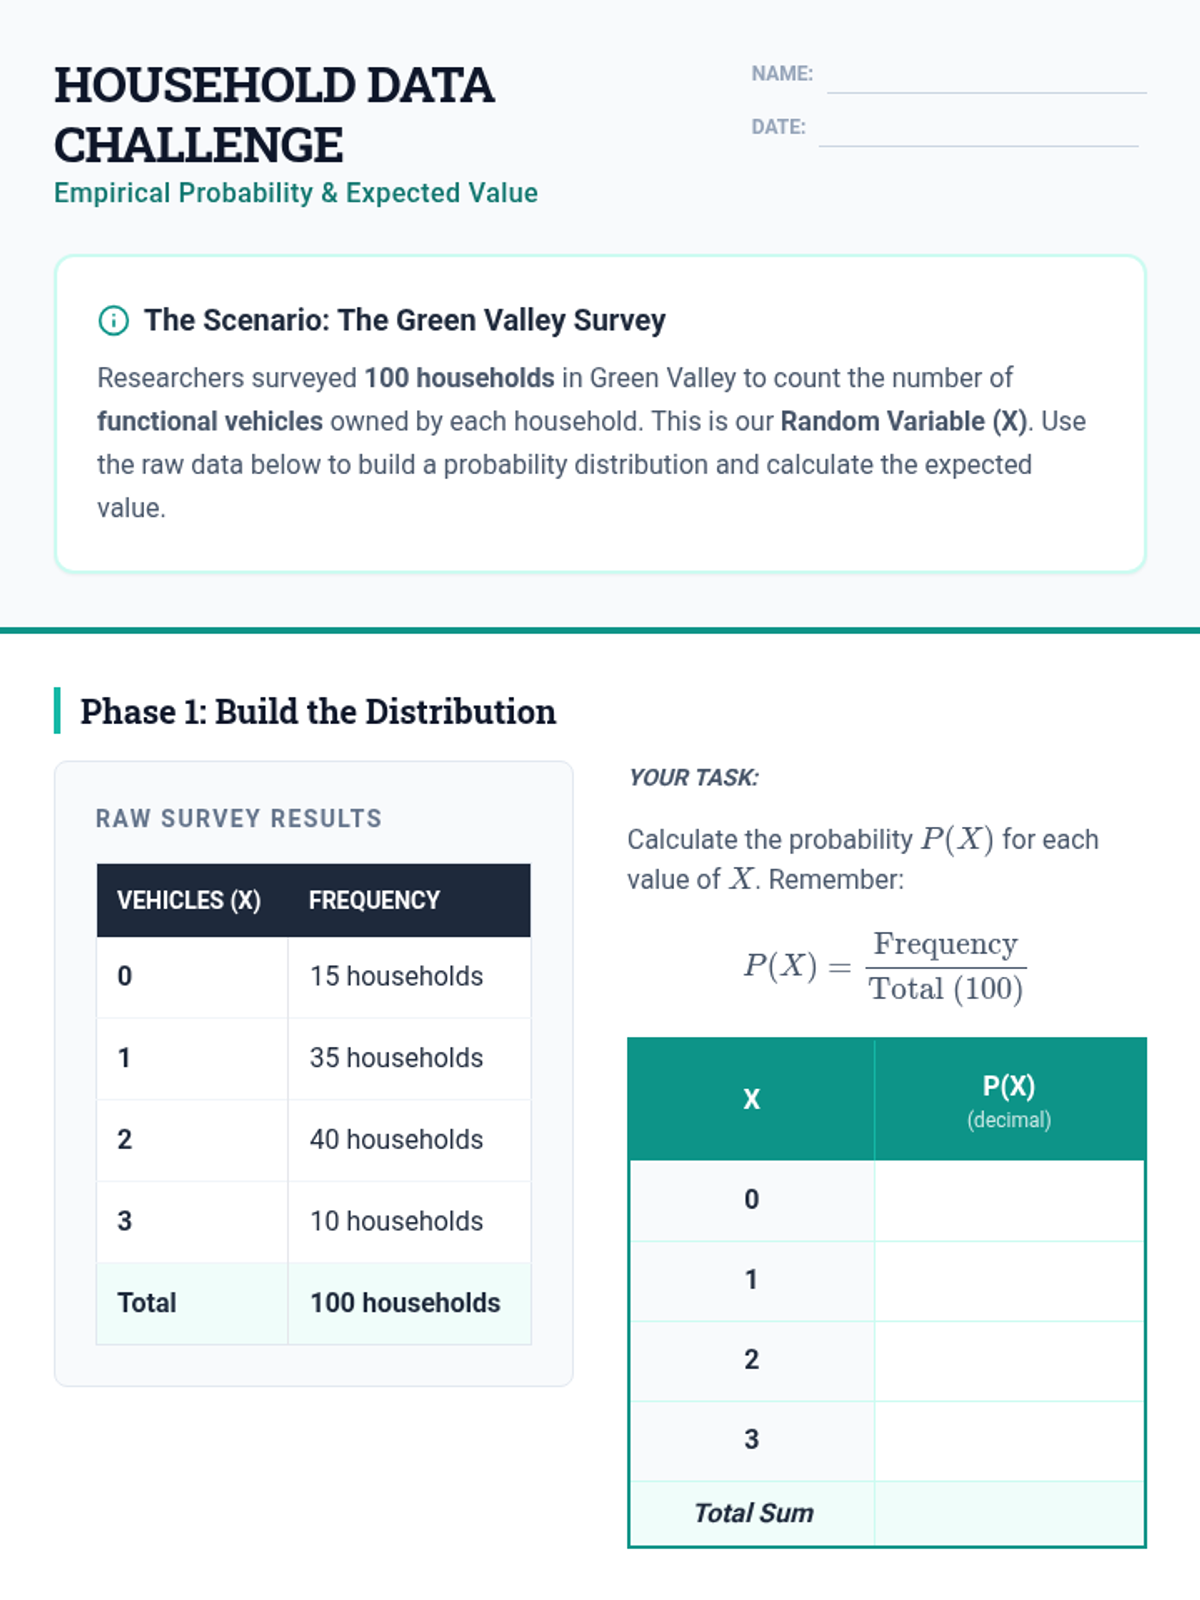
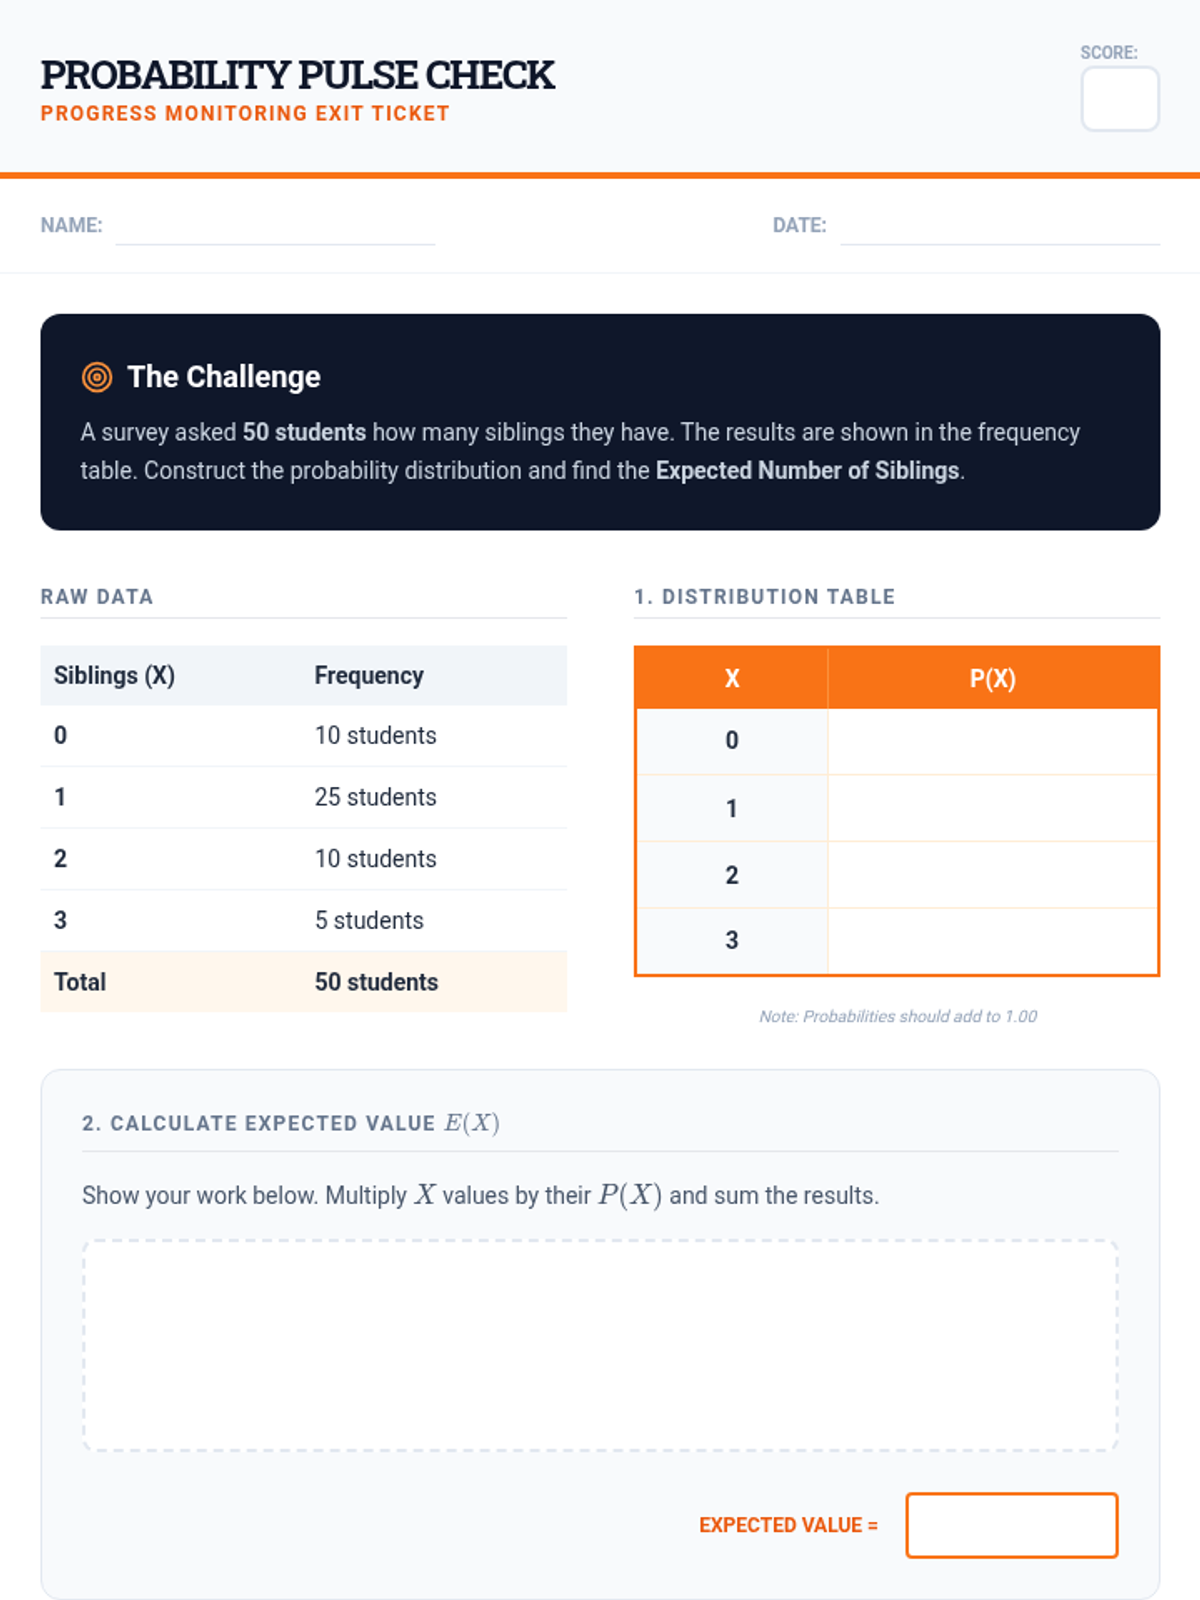
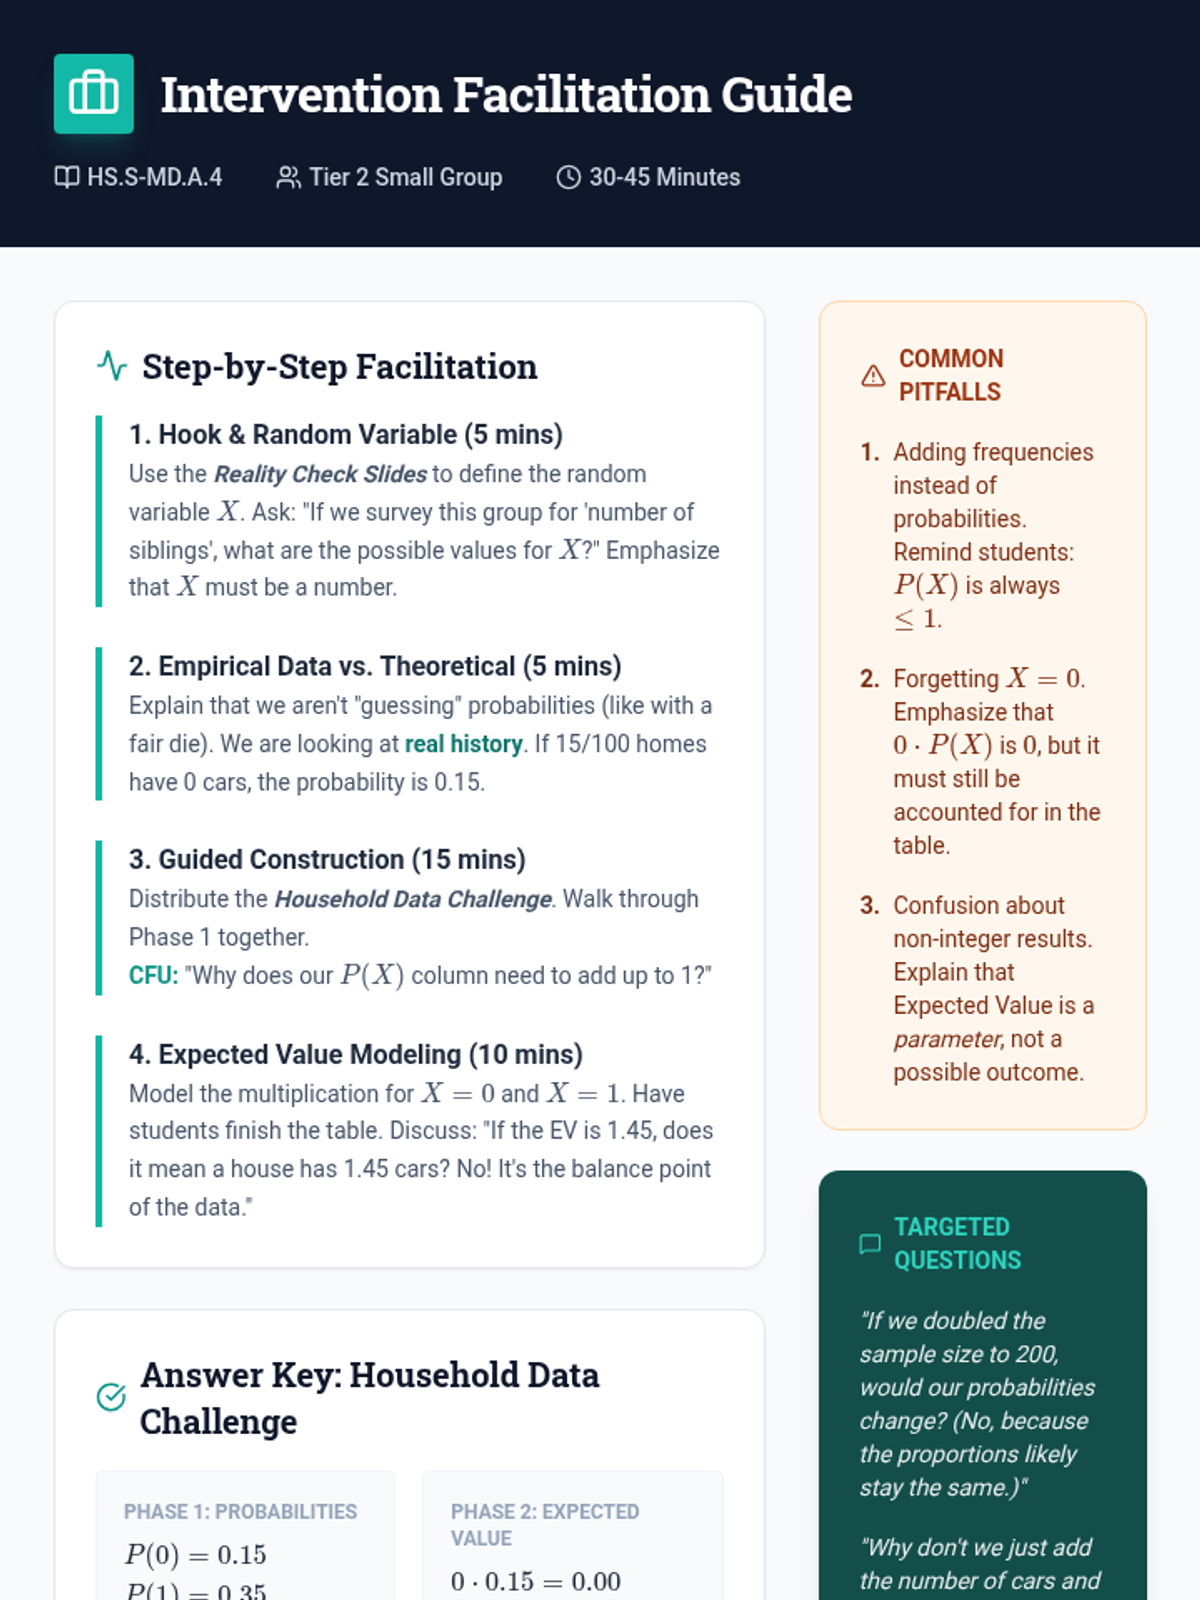
A Tier 2 intervention sequence focused on helping students develop empirical probability distributions and calculate expected values using real-world household data. This sequence provides high-scaffolding and structured practice for small group instruction.
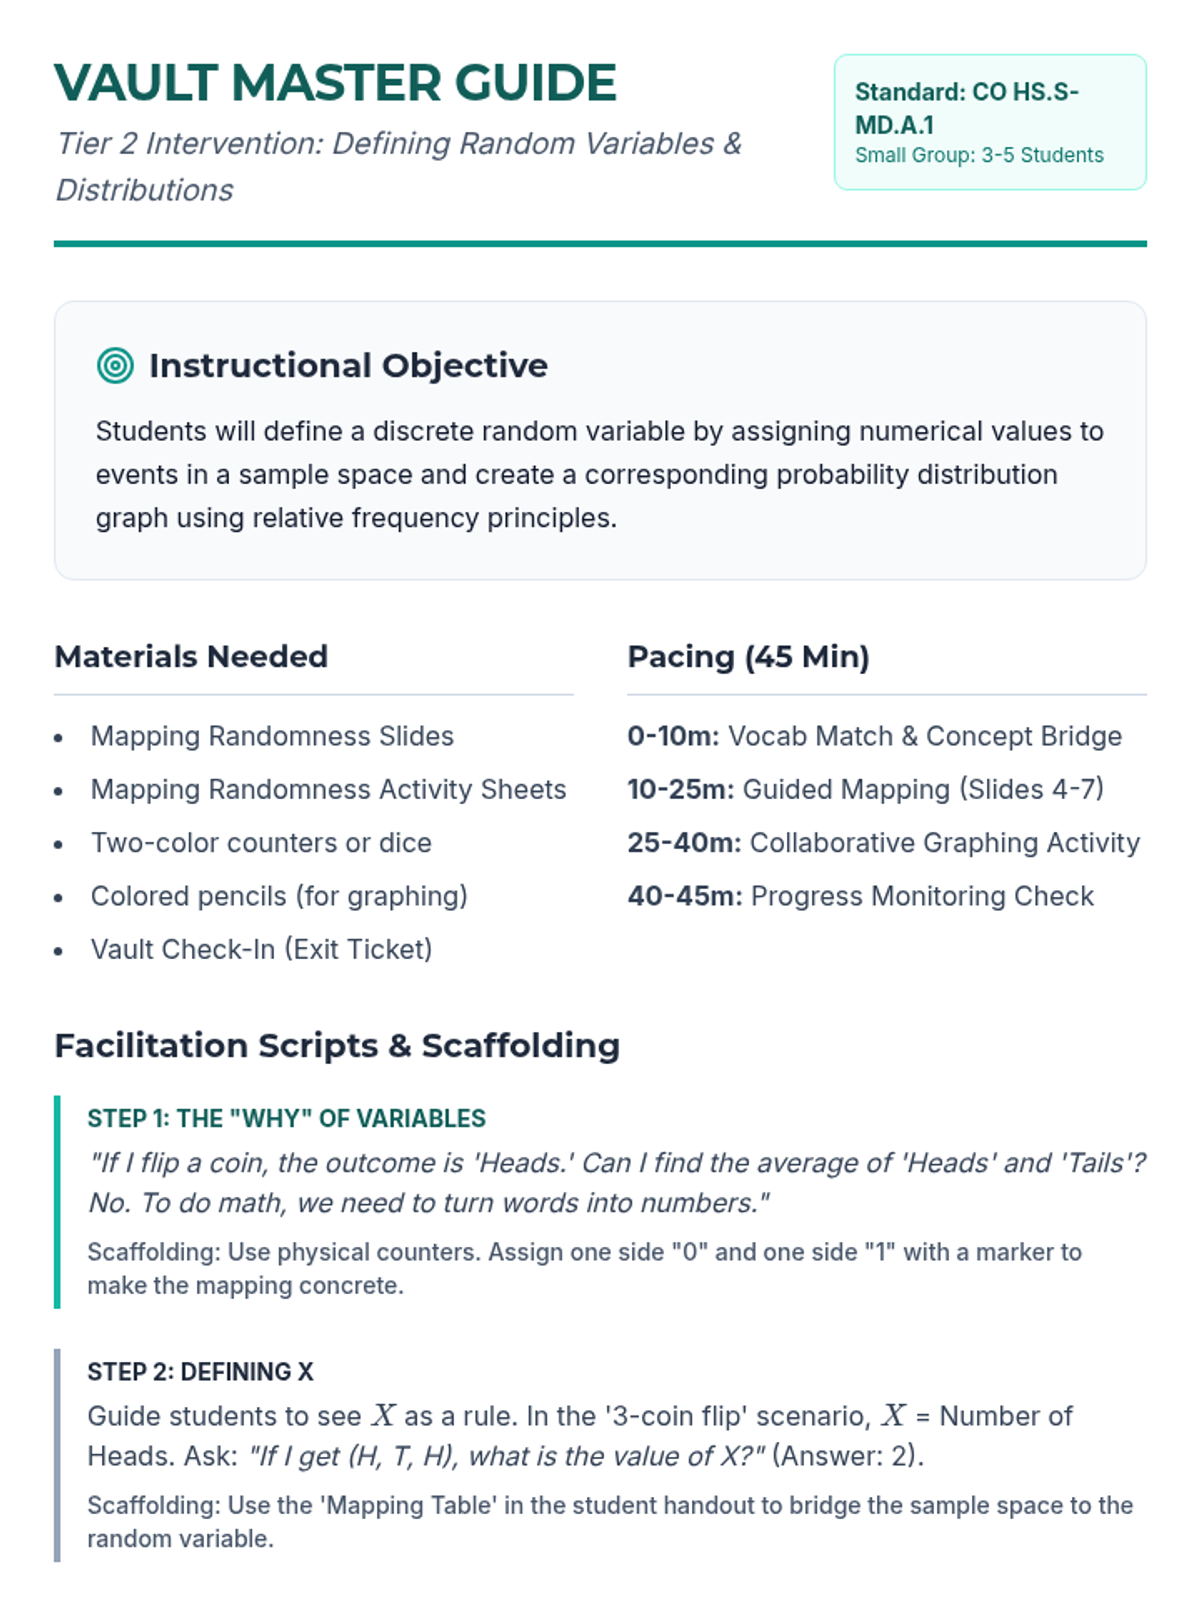
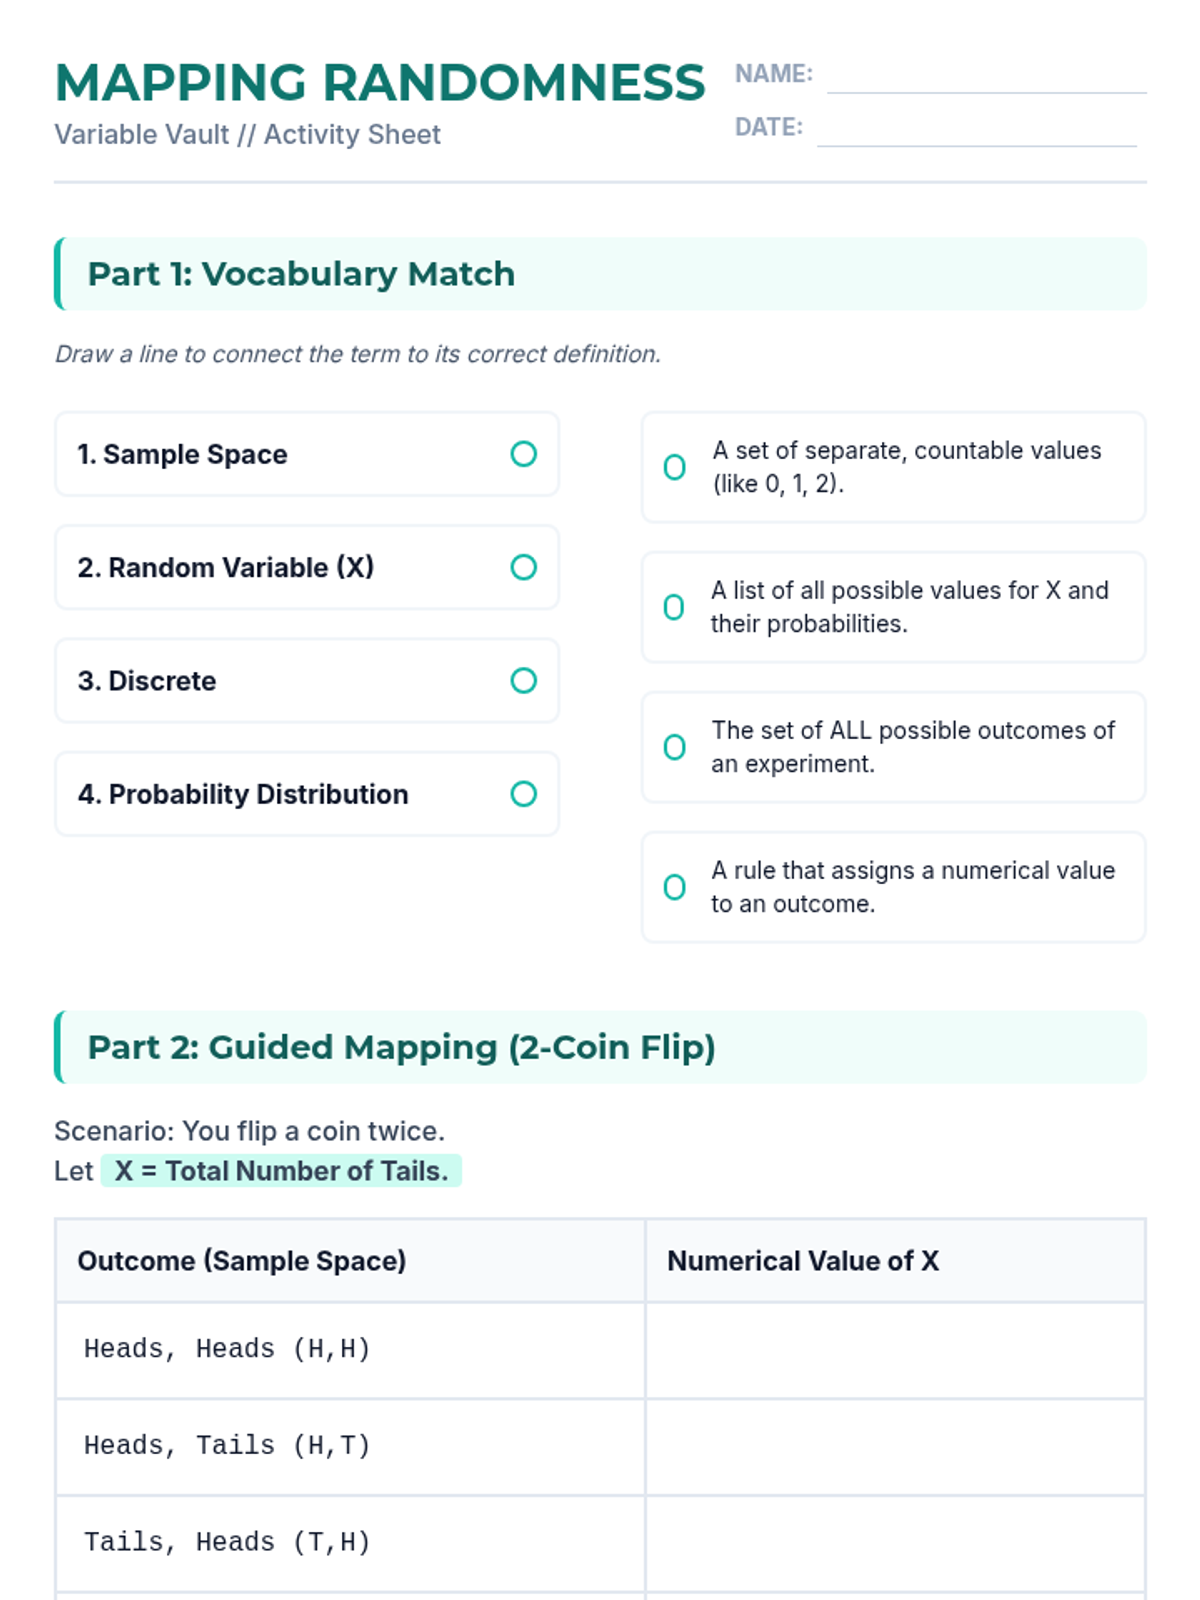
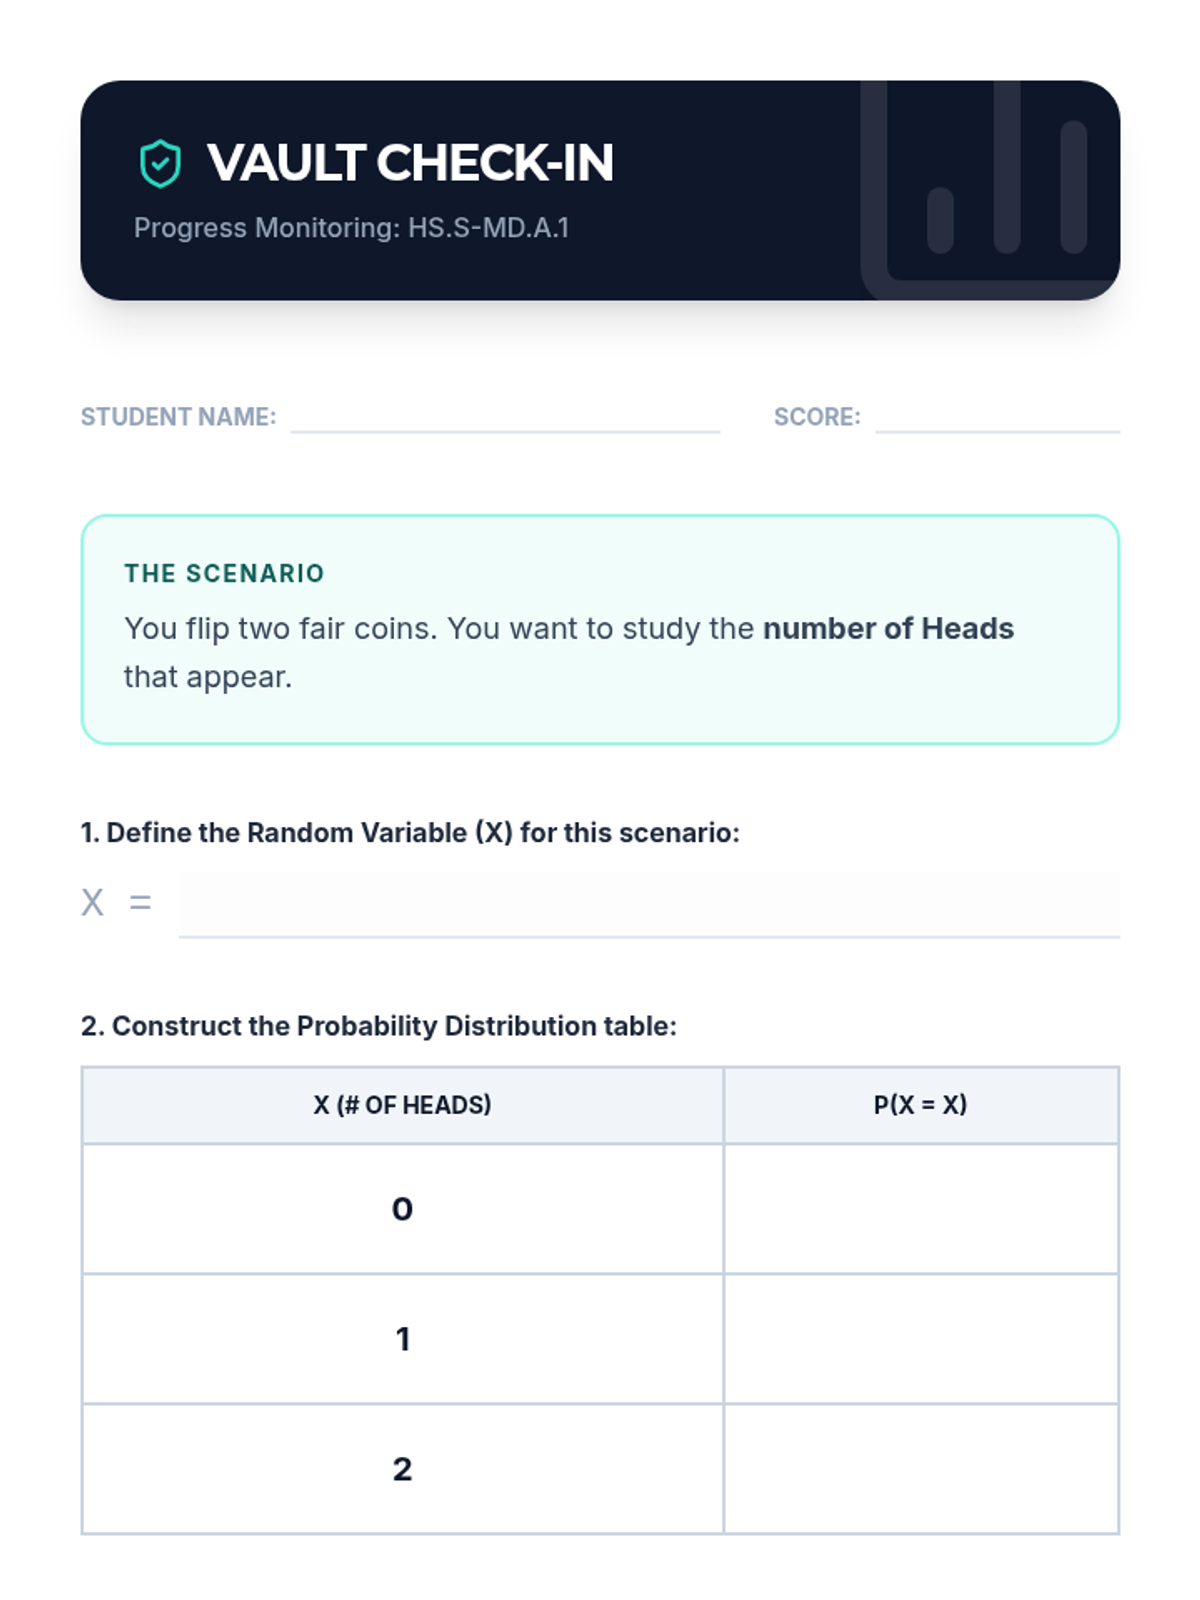
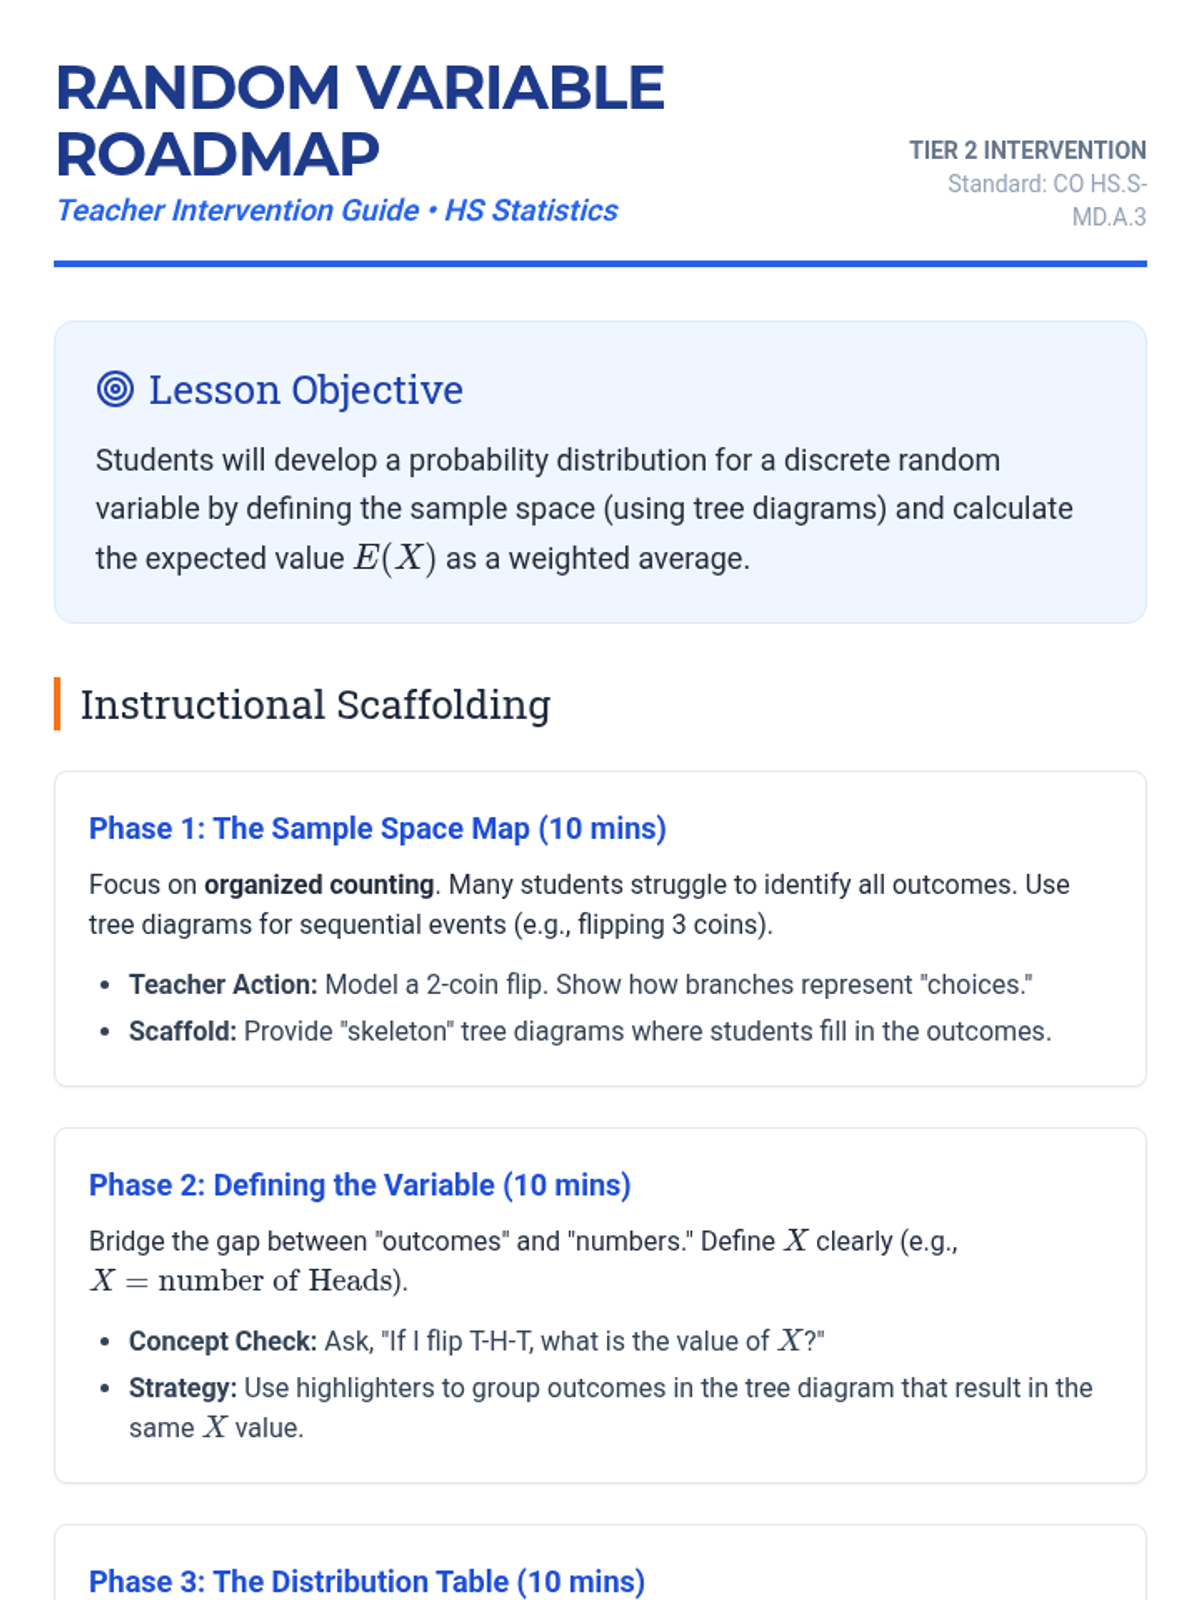
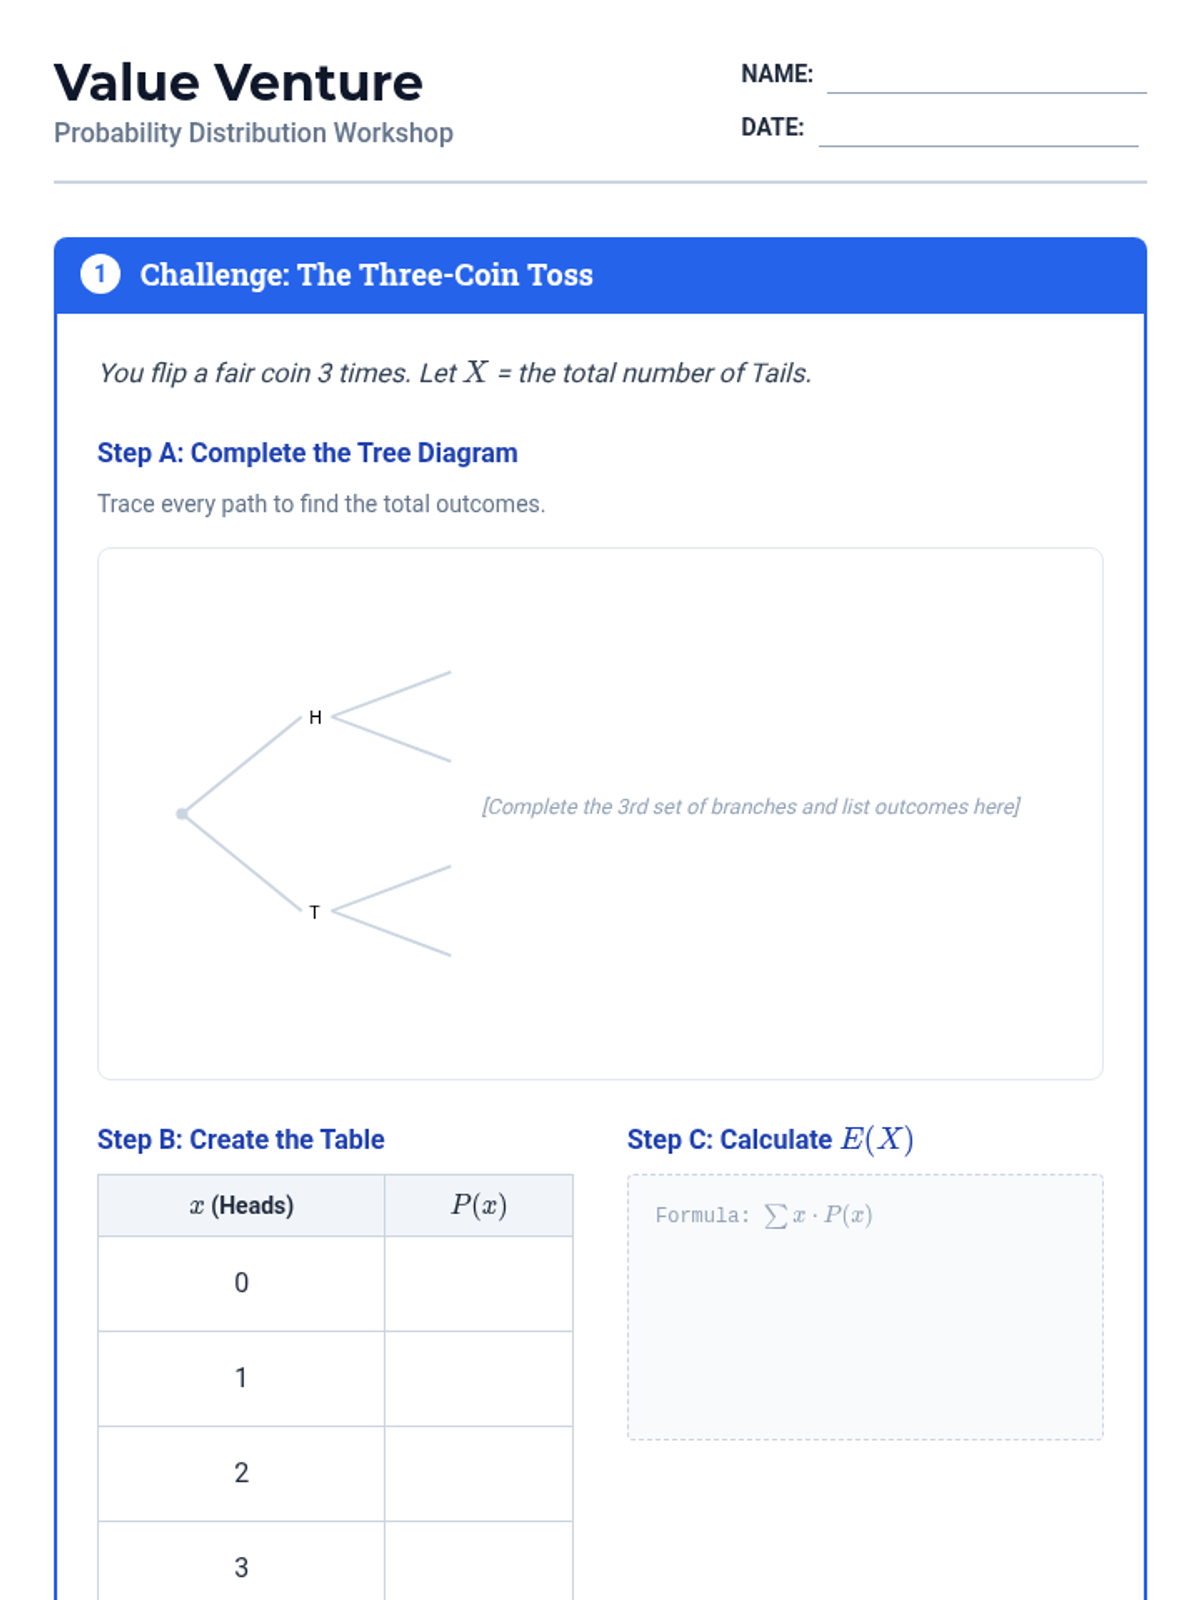
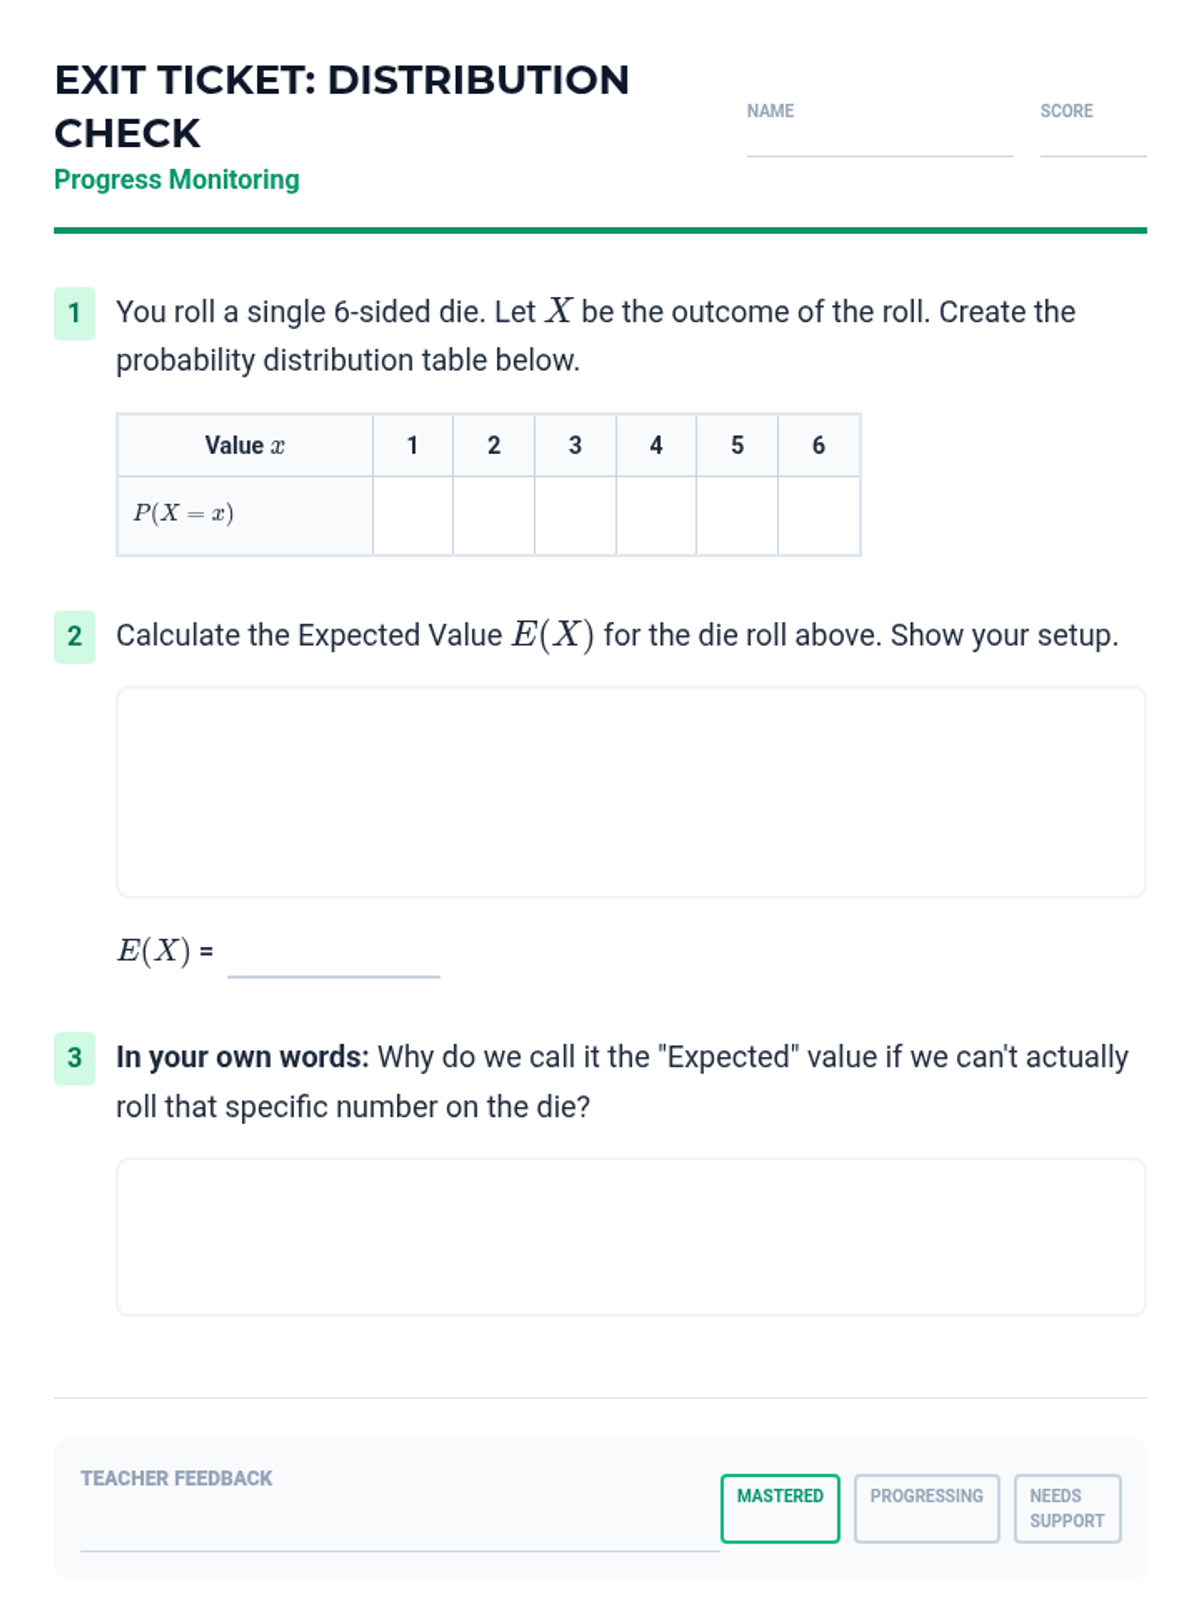
A targeted intervention sequence focused on foundational probability concepts, specifically defining random variables and constructing probability distributions for high school statistics students.
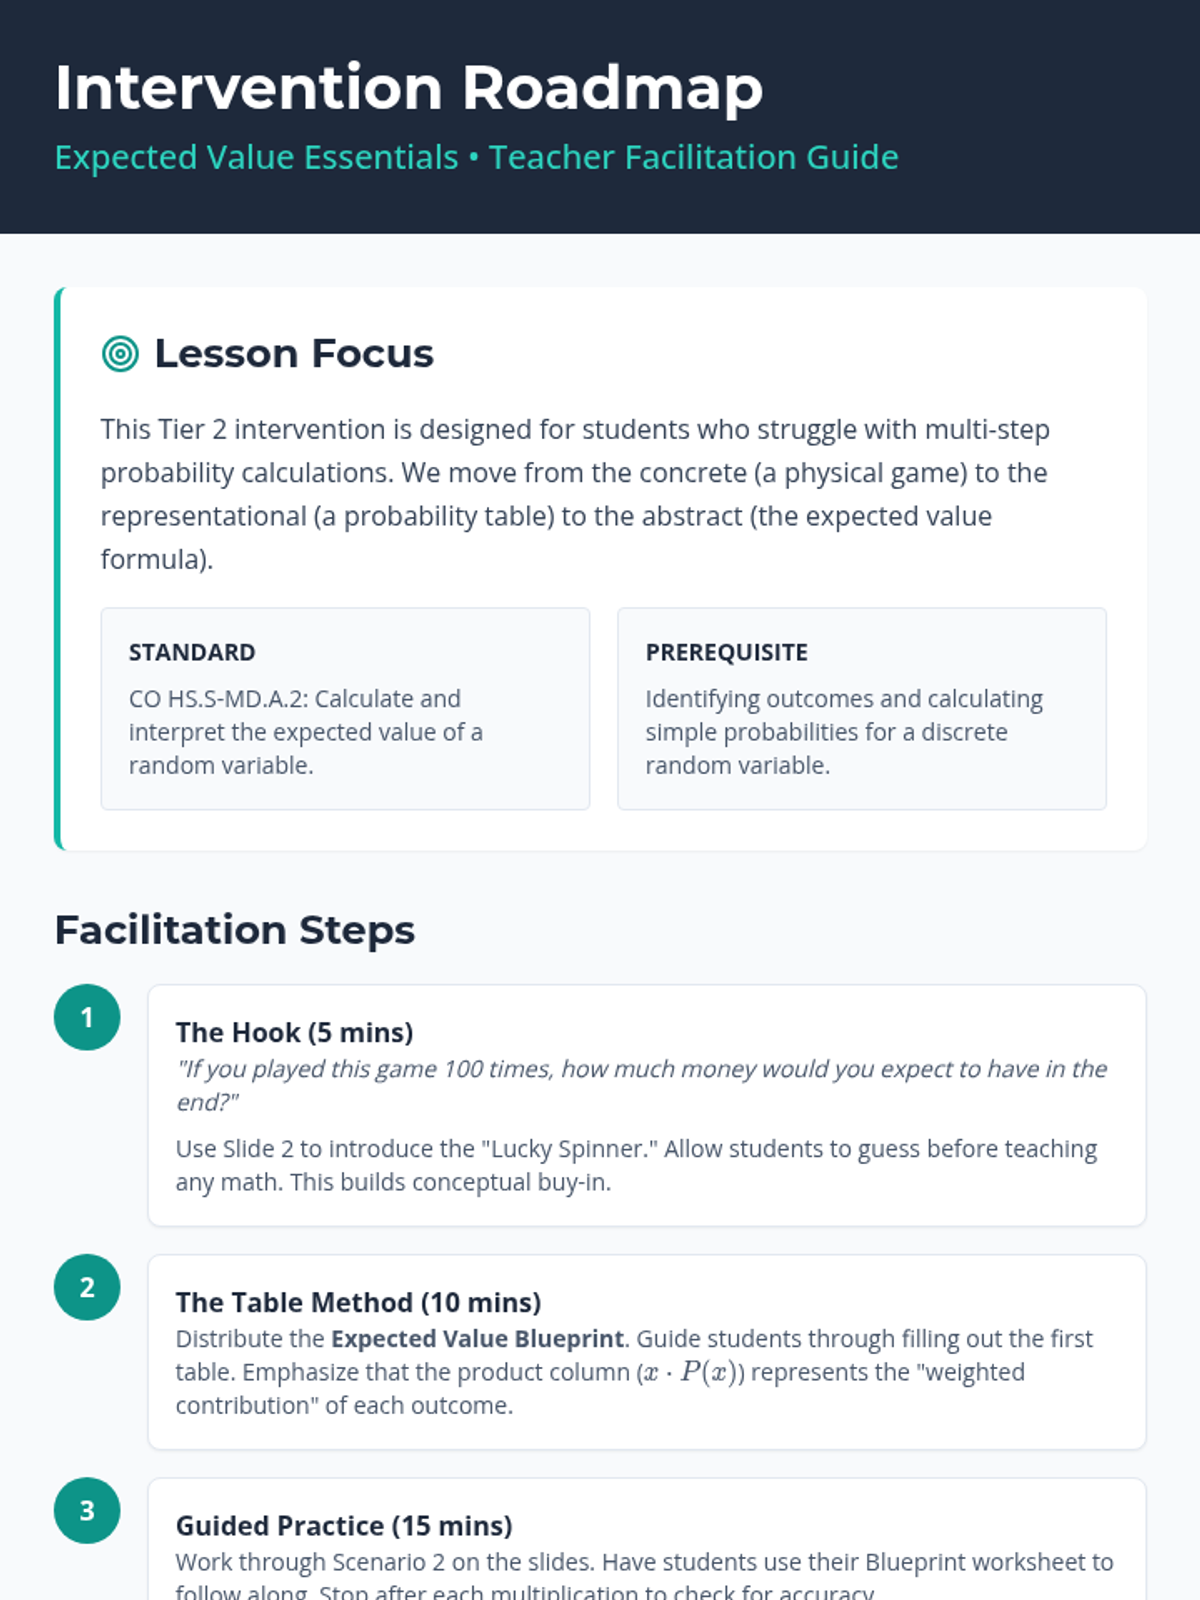
A targeted intervention sequence focused on helping High School students master the calculation and interpretation of expected value using concrete game scenarios and scaffolded table methods.
A targeted intervention sequence focused on foundational probability concepts, specifically developing discrete probability distributions and calculating expected values through visual scaffolds like tree diagrams and organized counting.
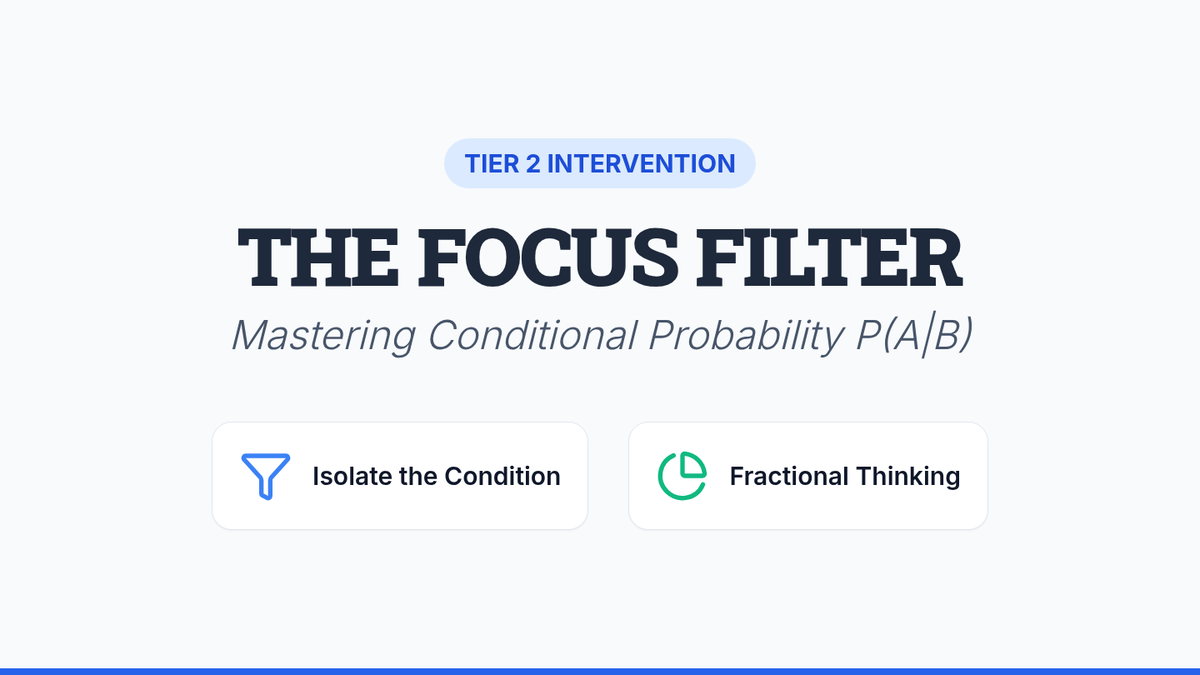
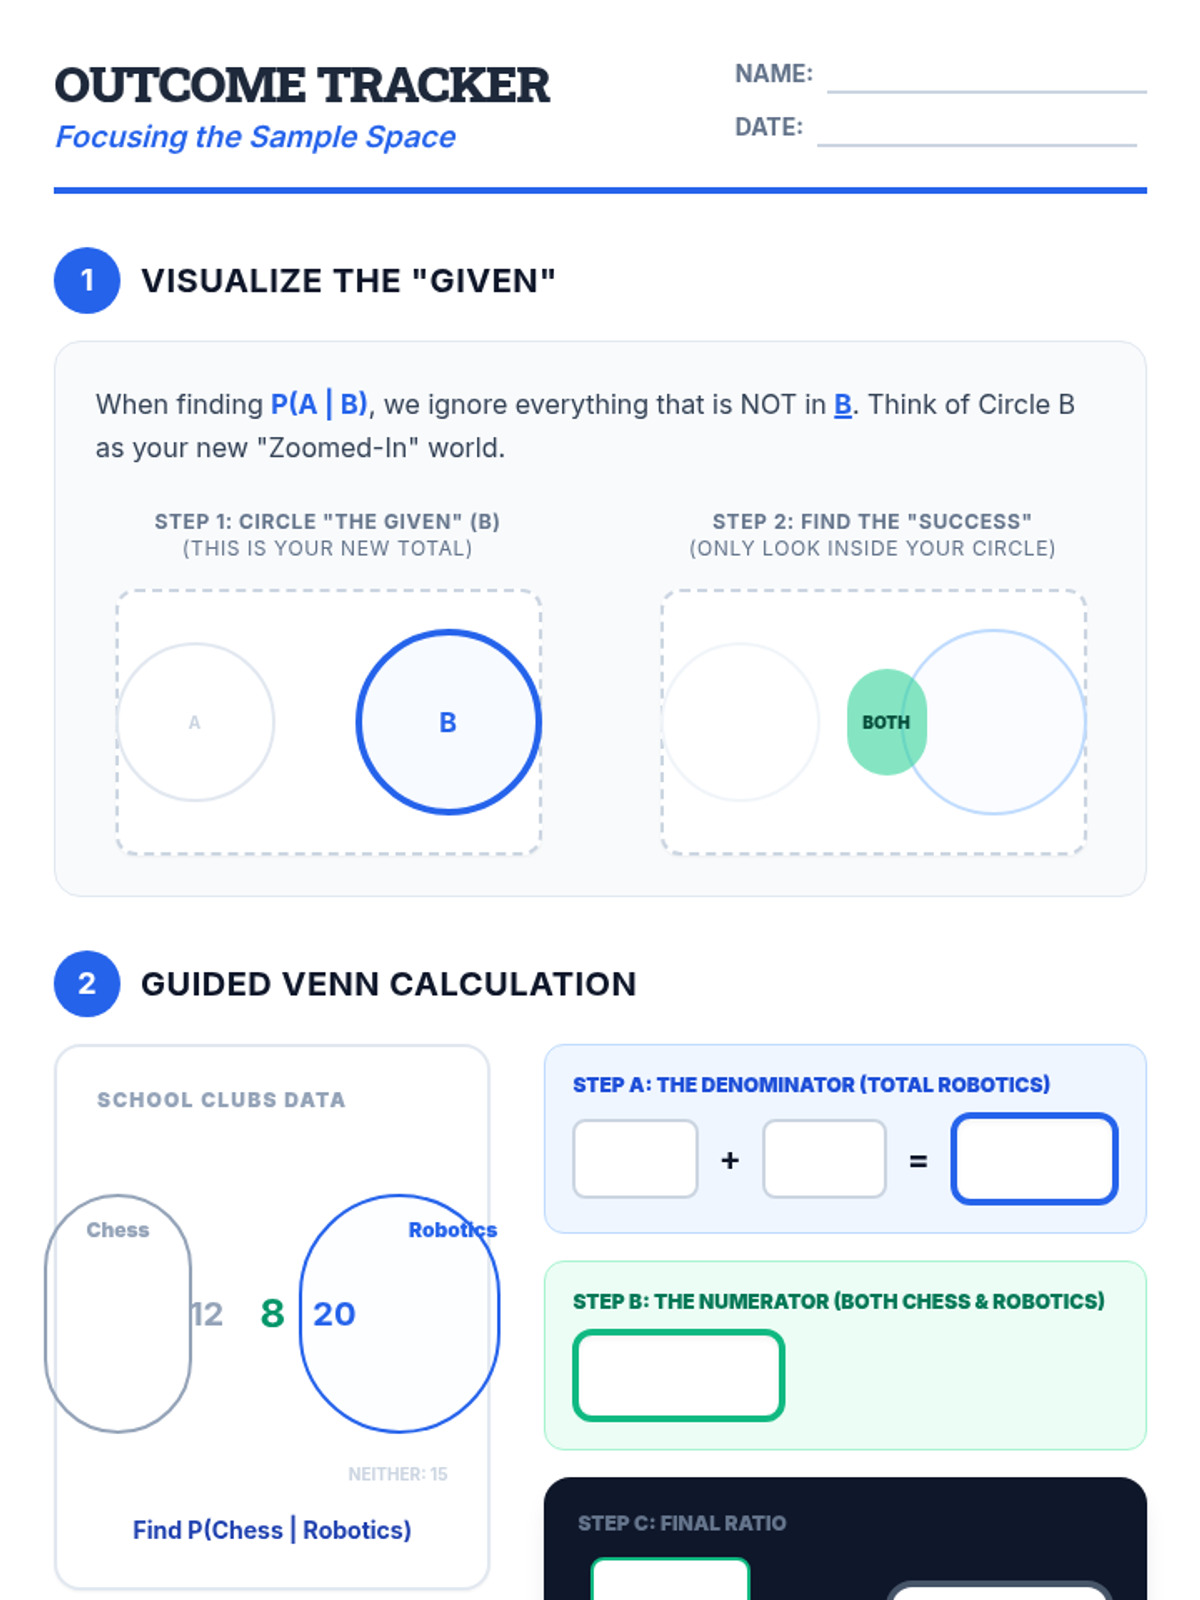
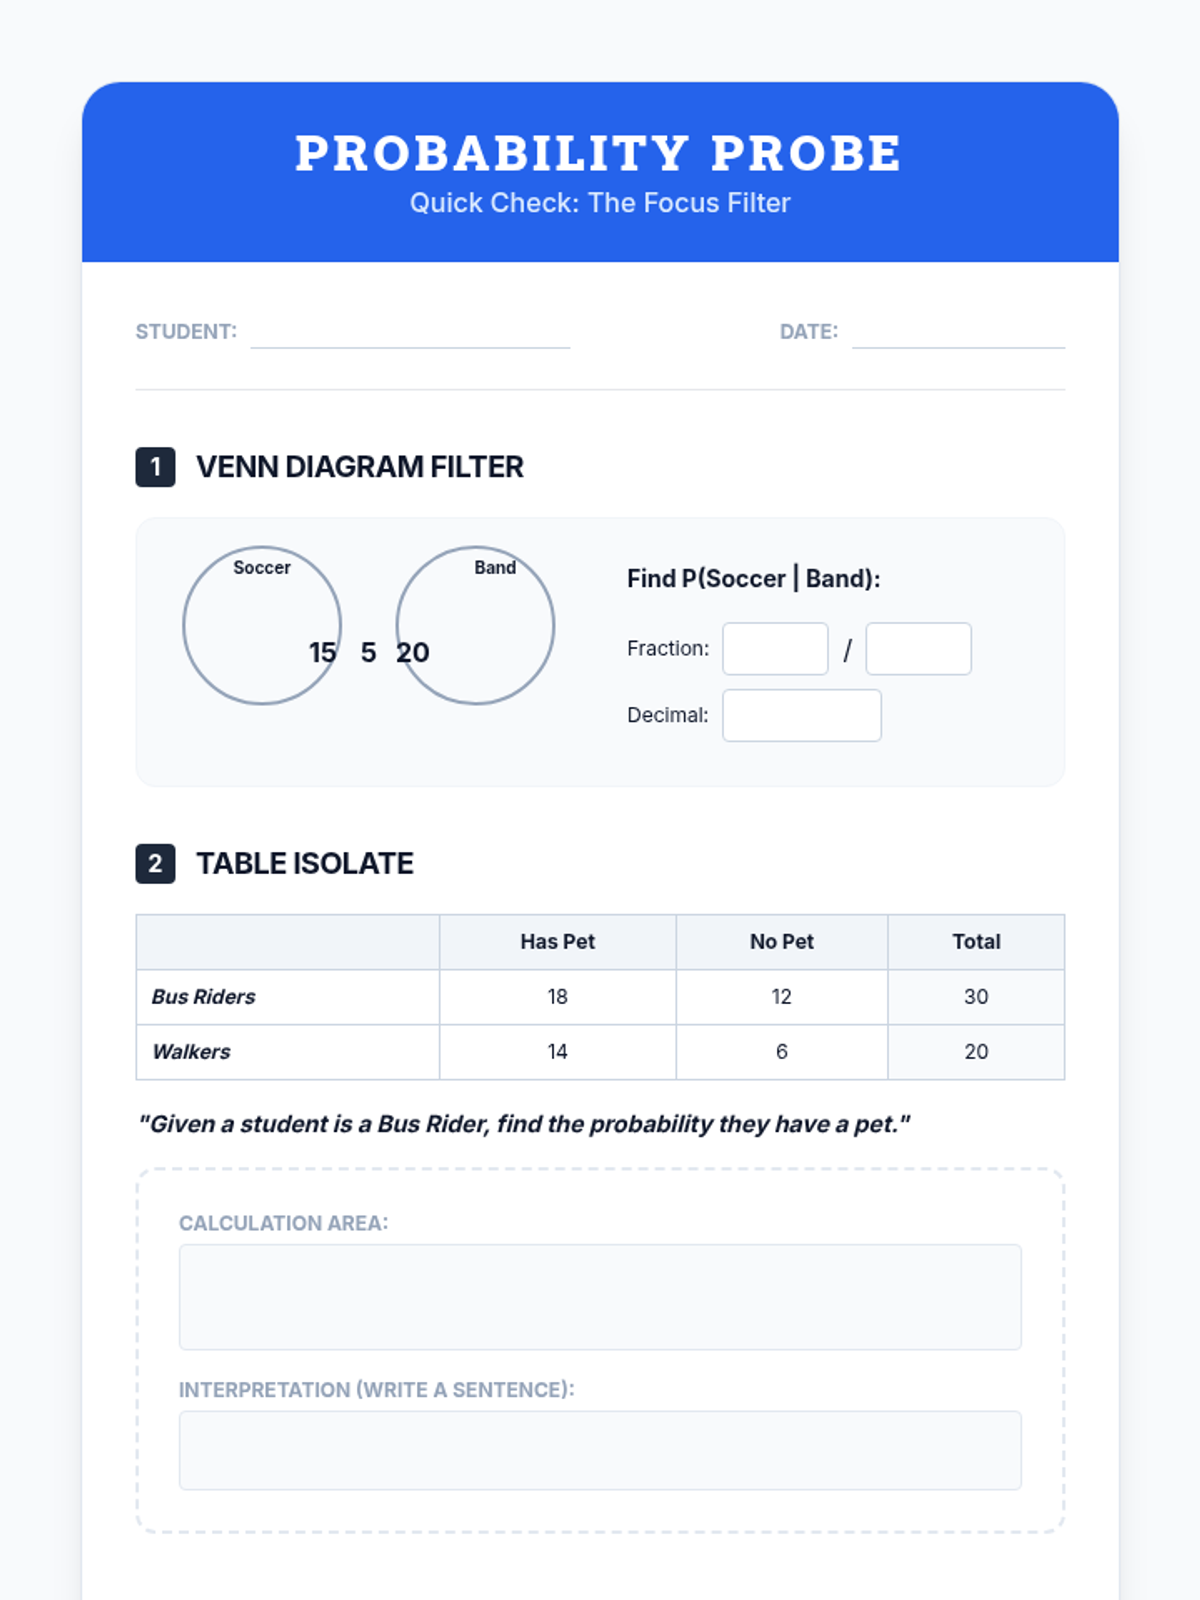
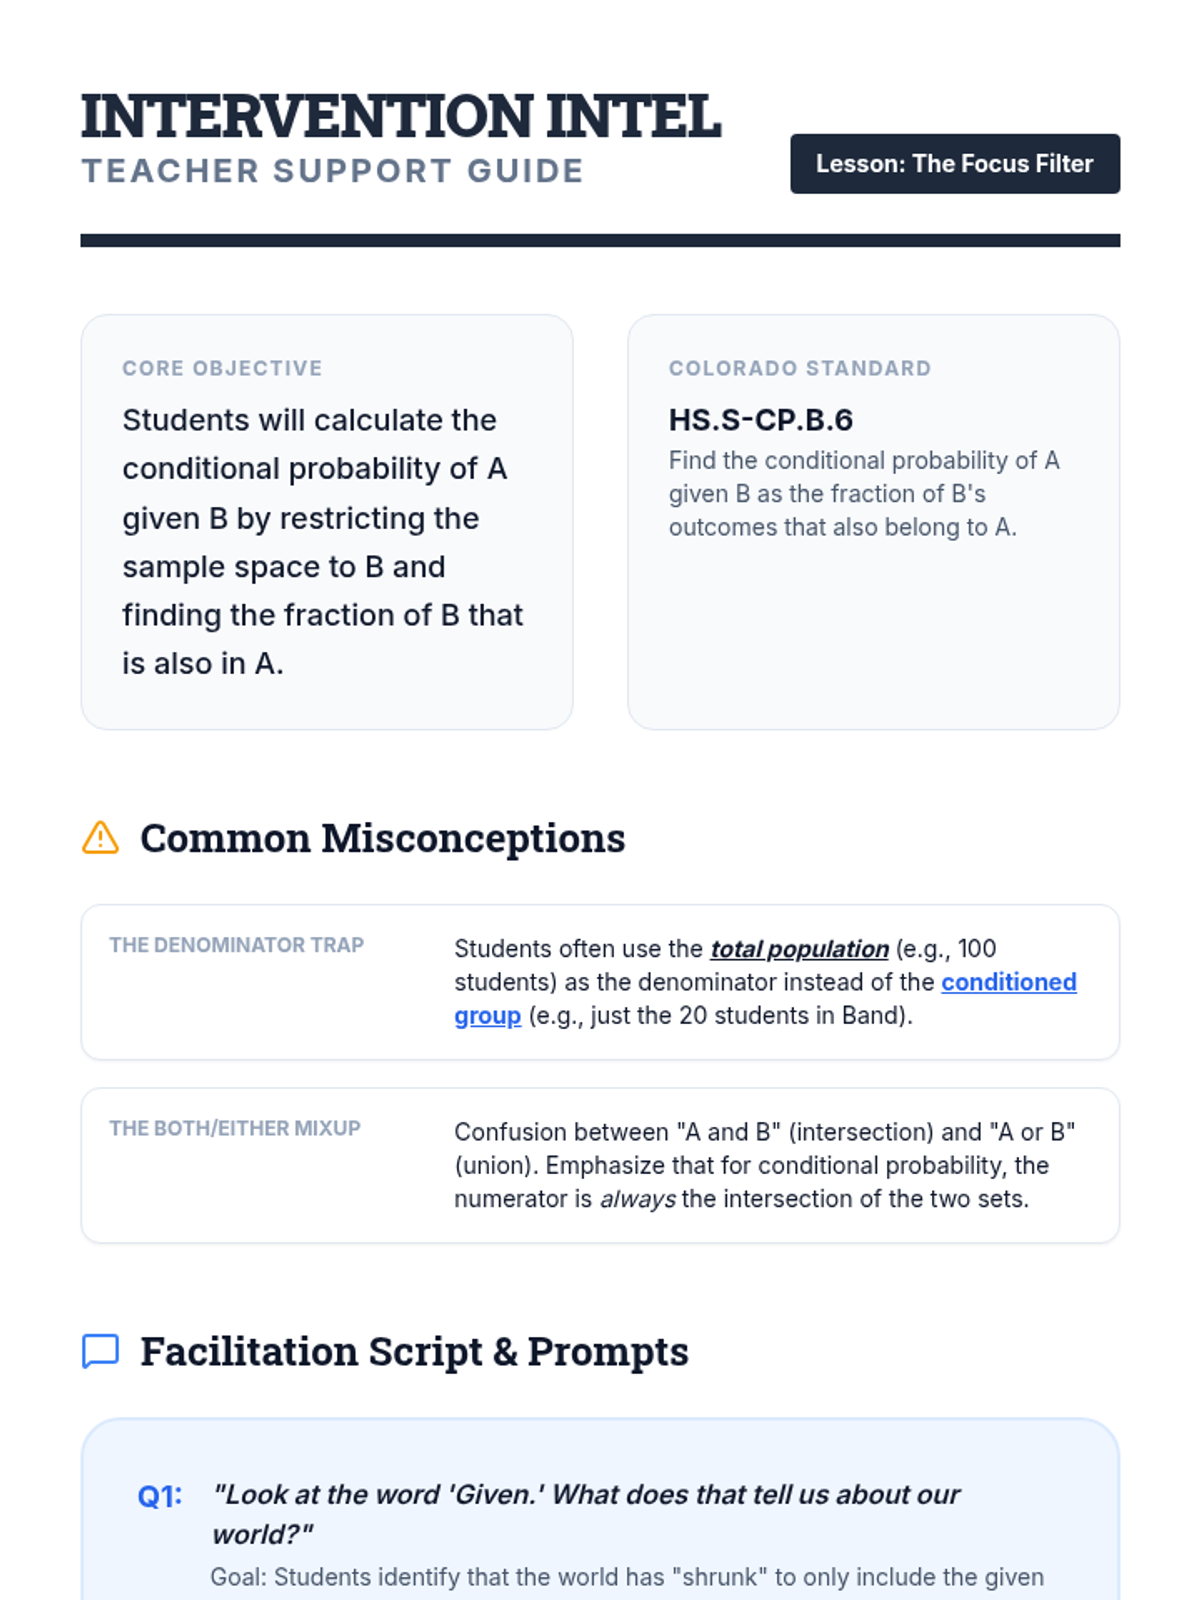
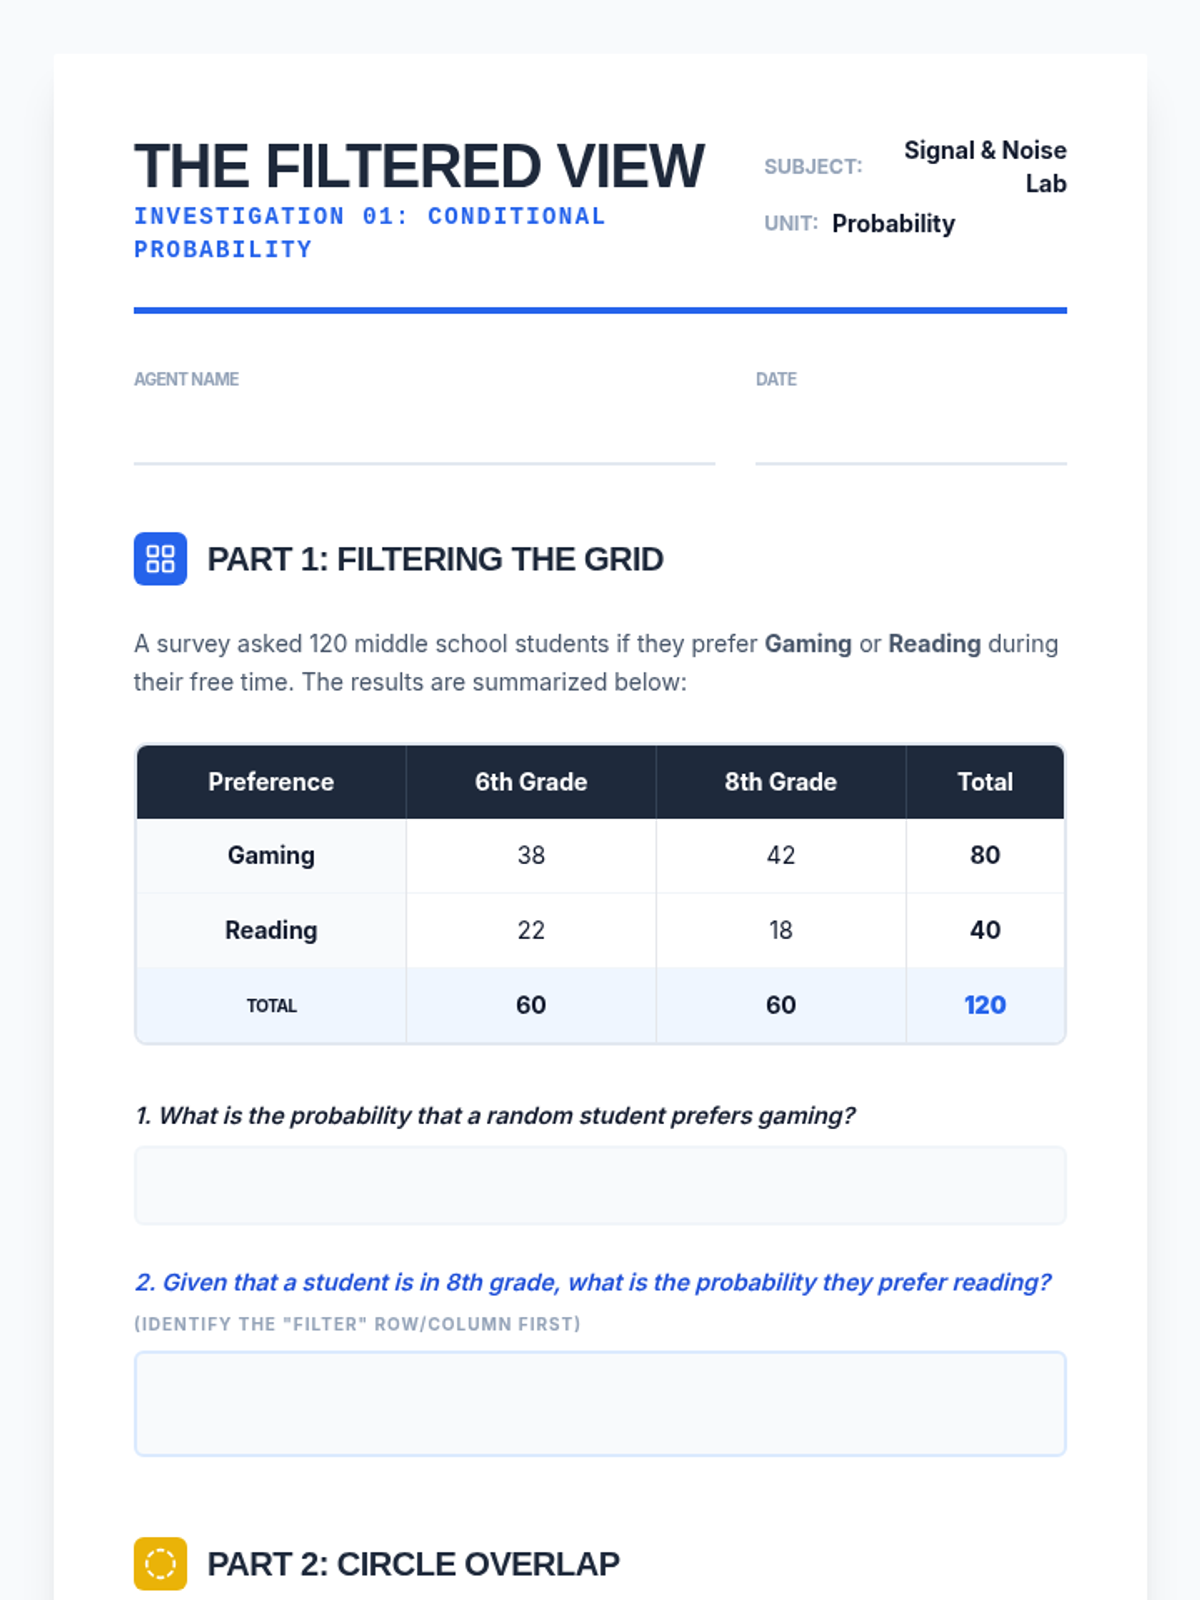
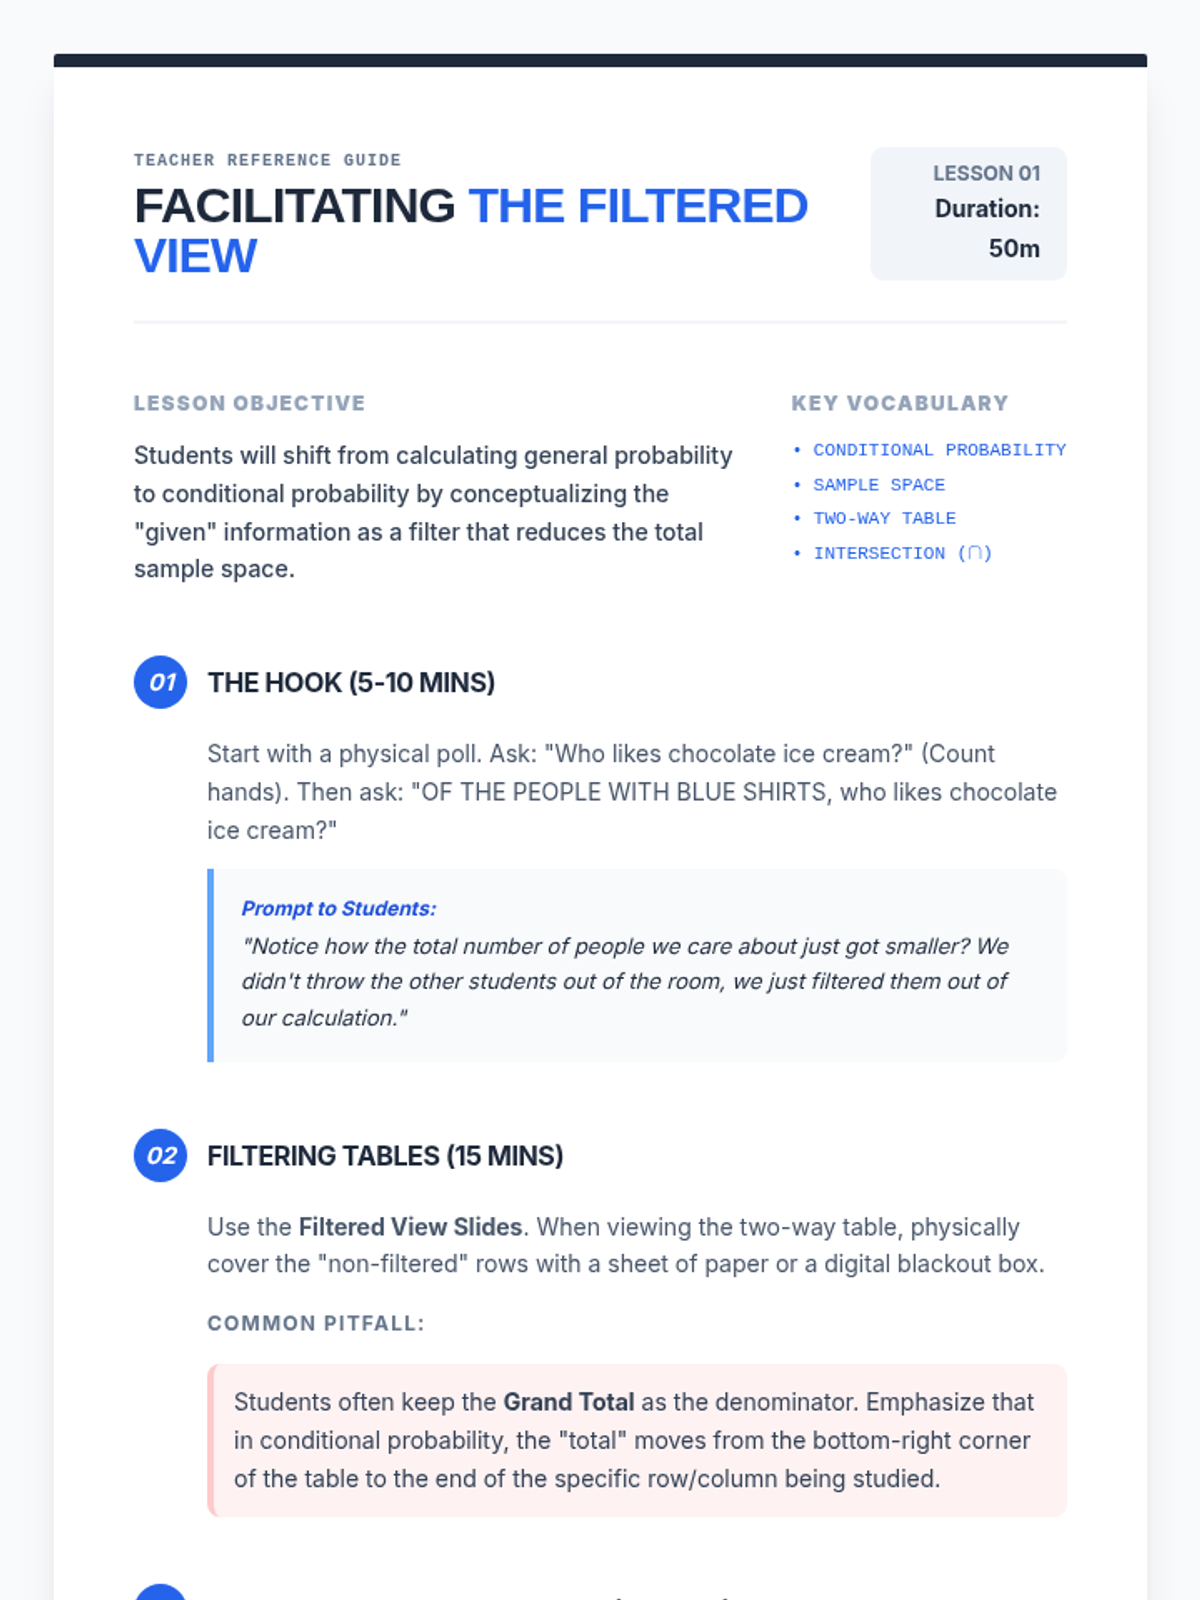
A Tier 2 intervention sequence focused on mastering conditional probability through visual filters and fractional reasoning. Students learn to restrict their sample space to the 'given' condition using Venn diagrams and tables.
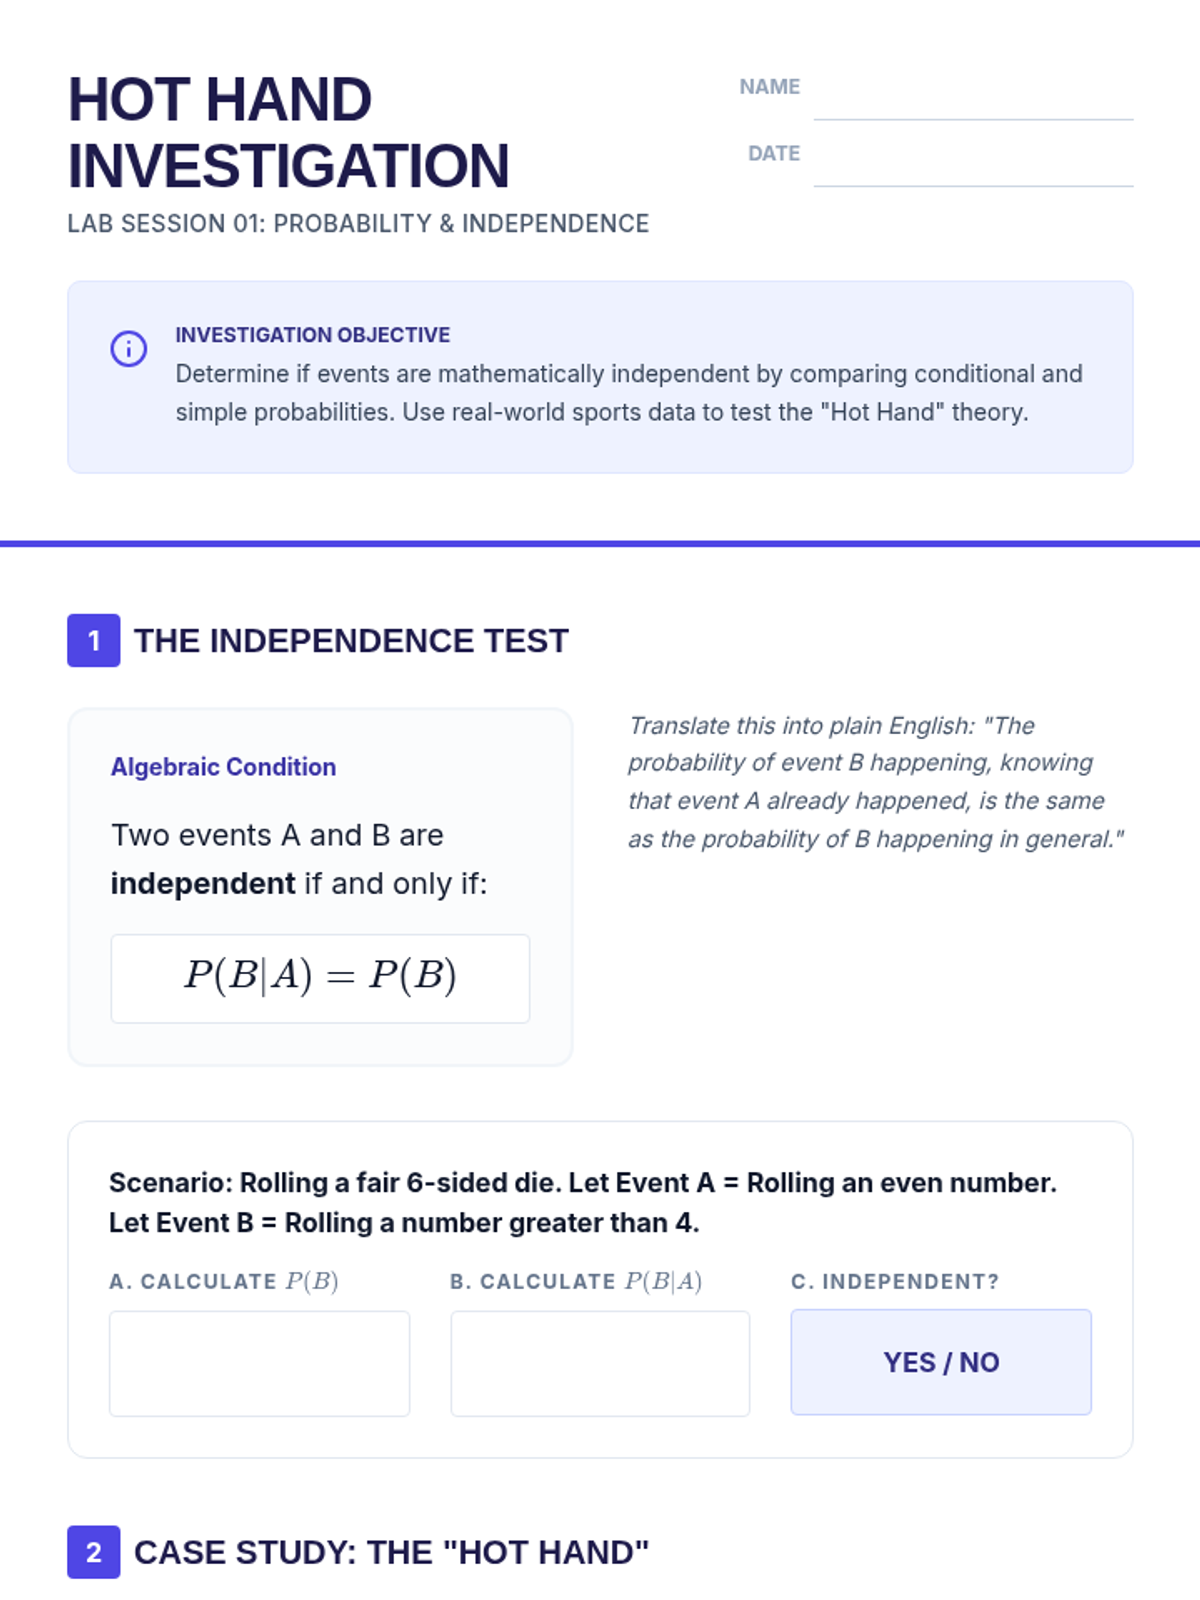
A targeted intervention sequence focused on understanding and calculating the independence of events through structured reasoning and decision trees.
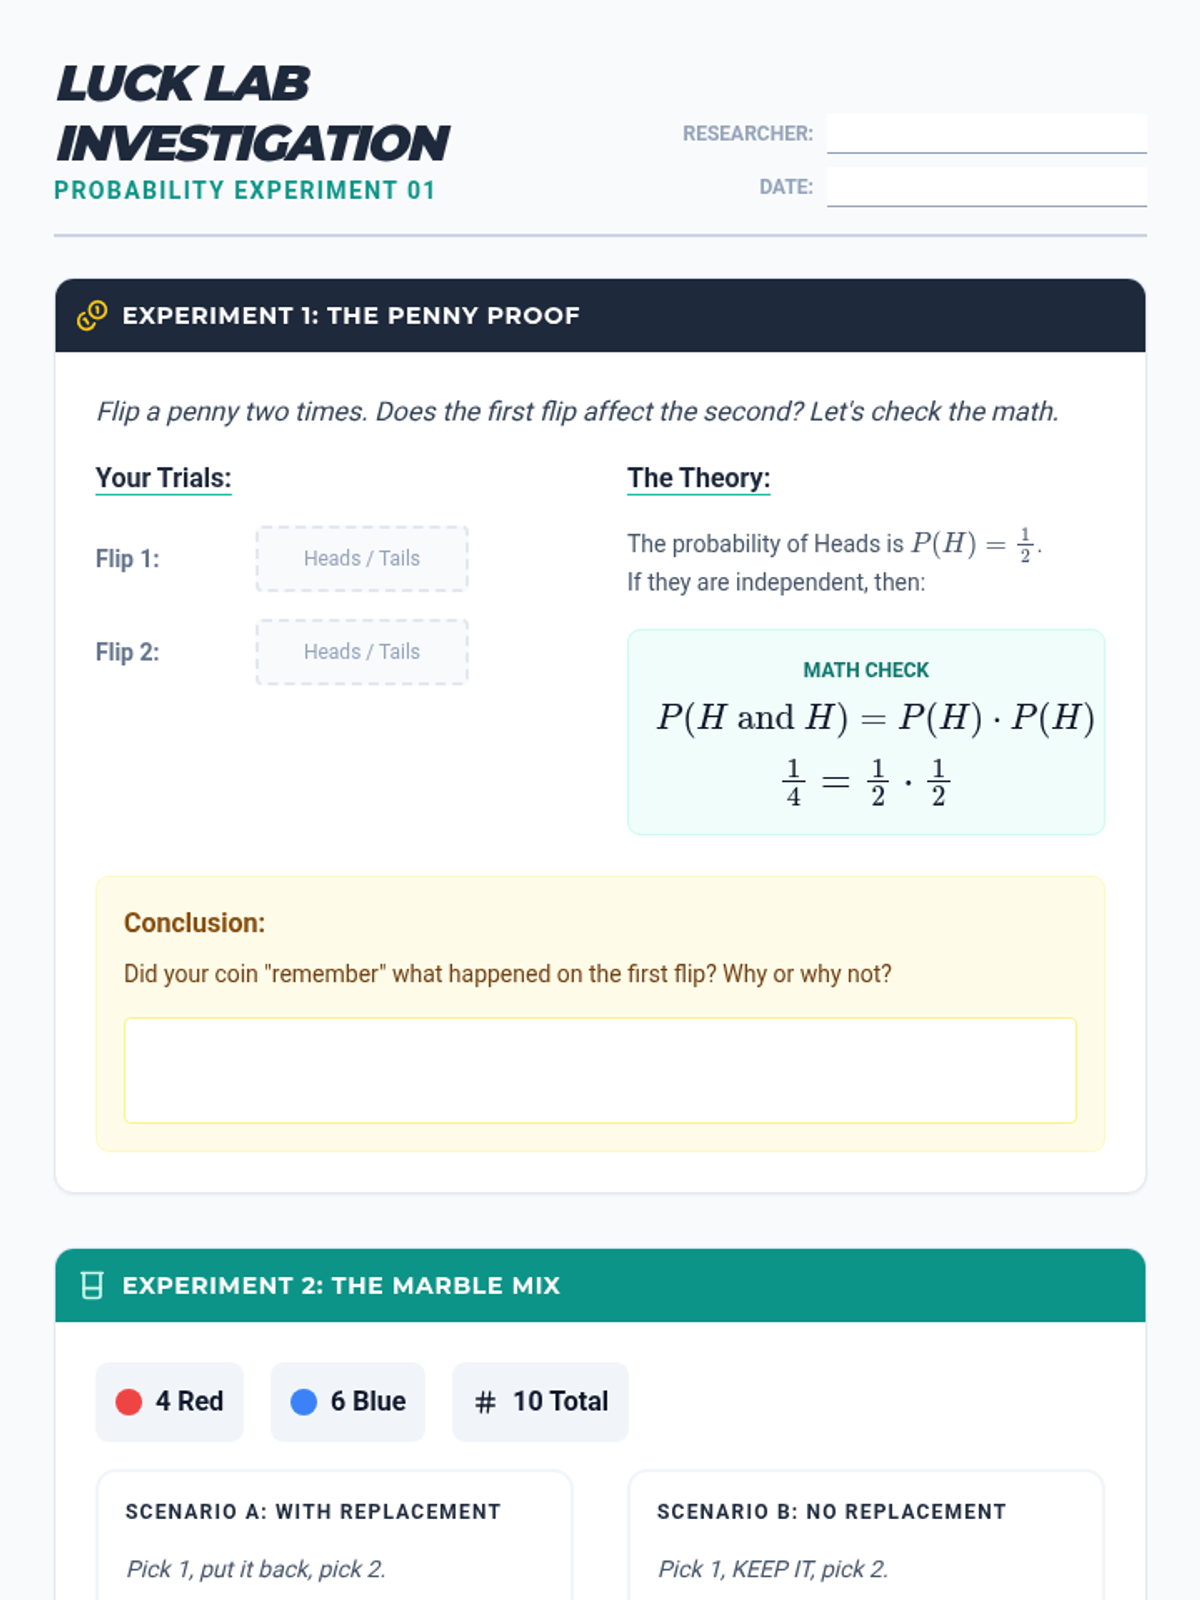
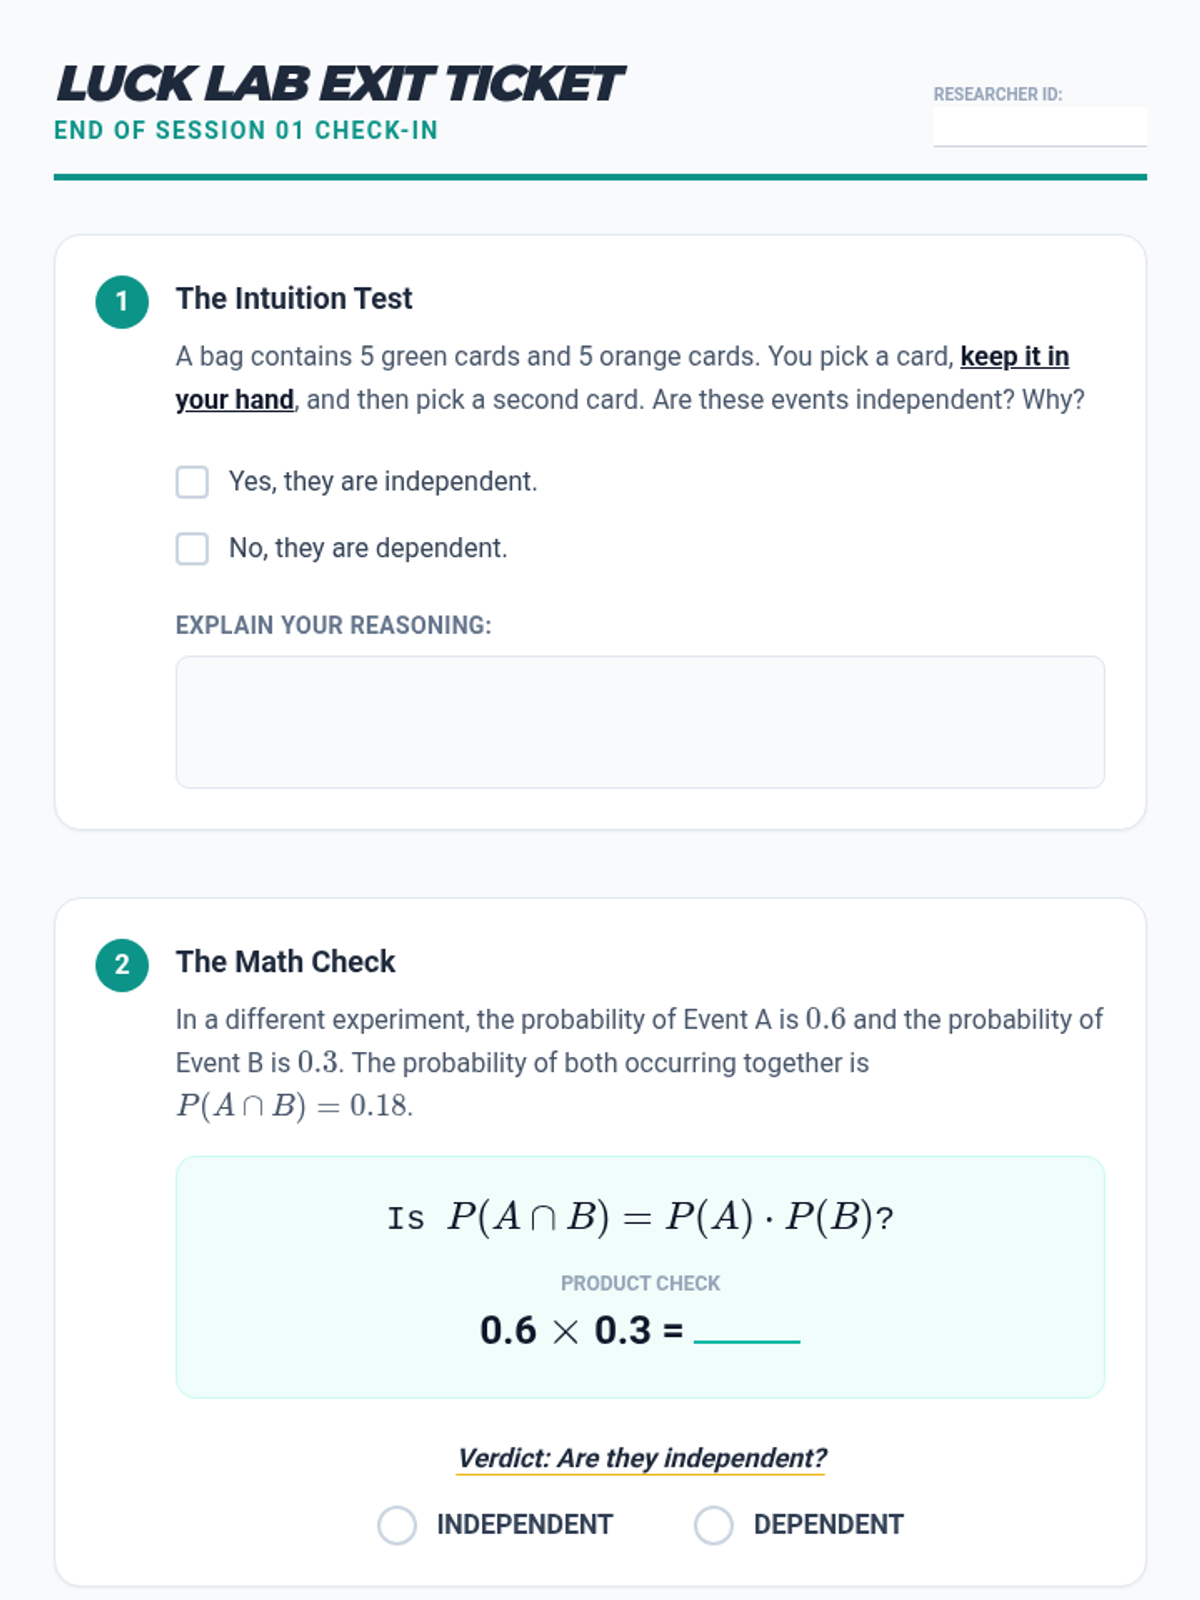
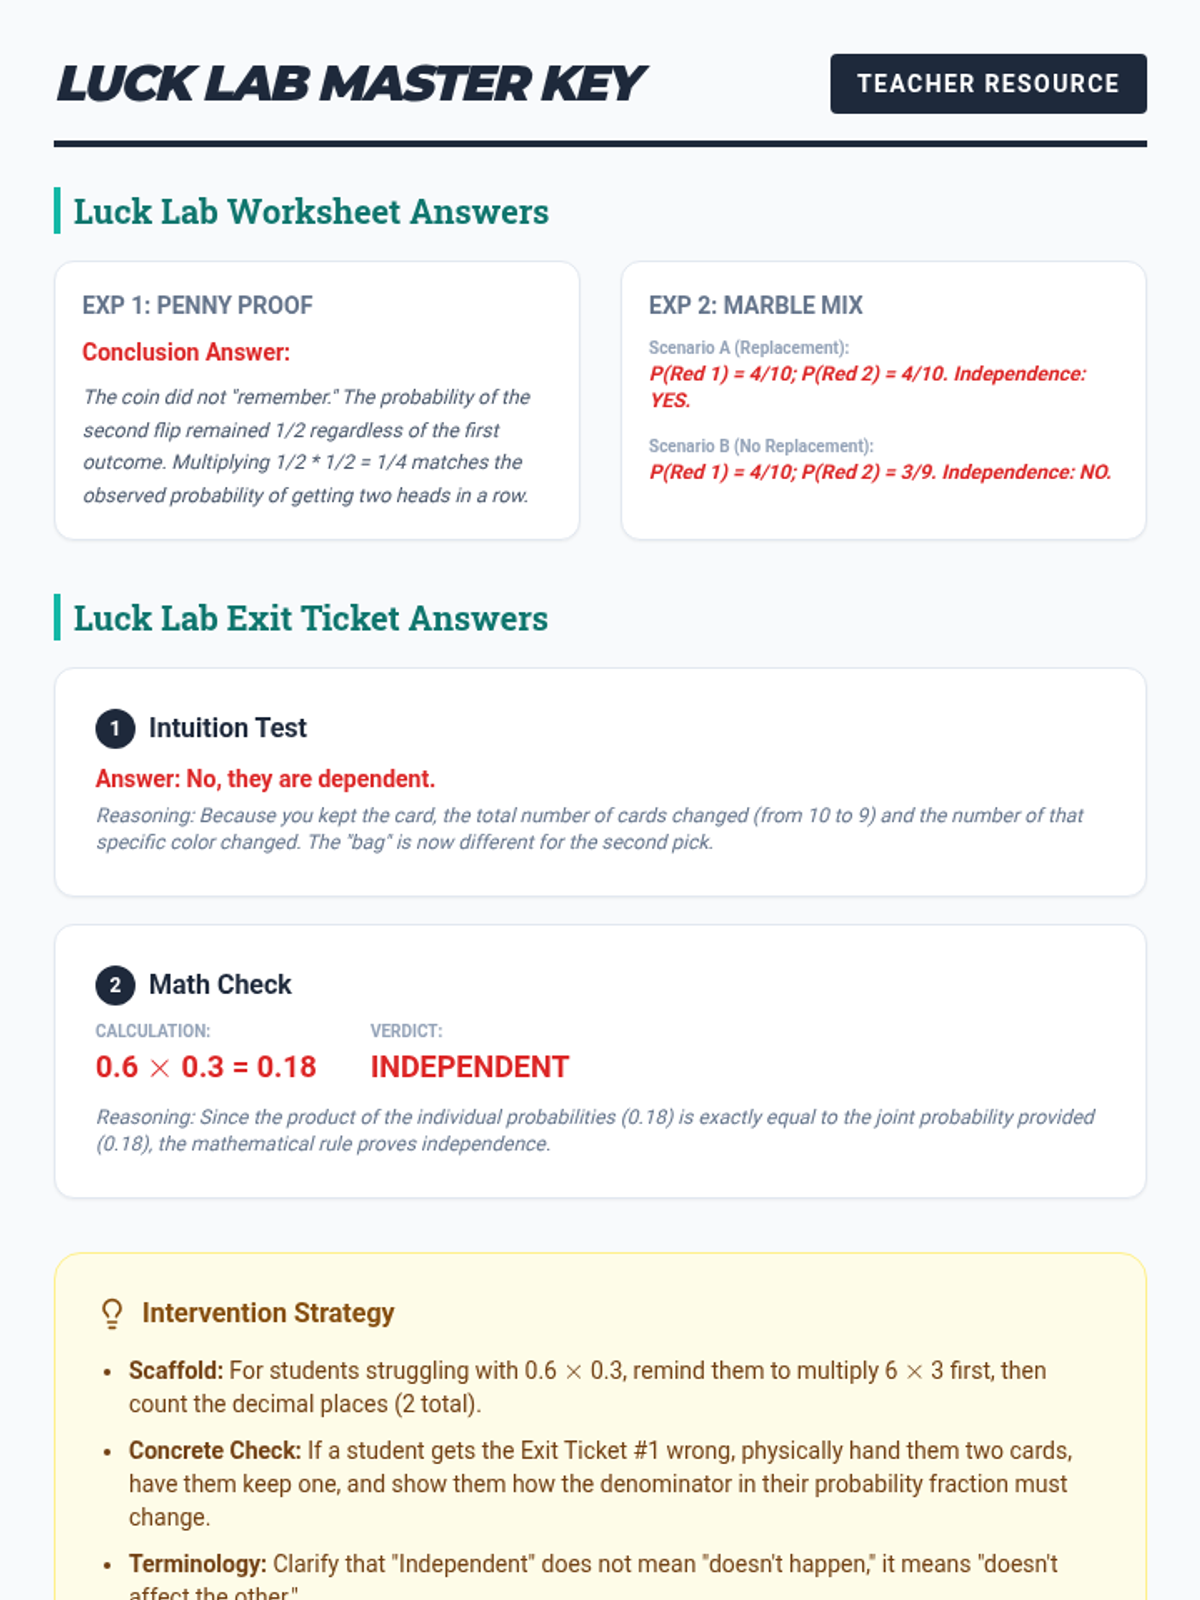
A targeted Tier 2 intervention unit focused on understanding and calculating the independence of two events using the multiplication rule. This sequence uses concrete manipulative-based experiments to bridge the gap between intuition and formal probability notation.
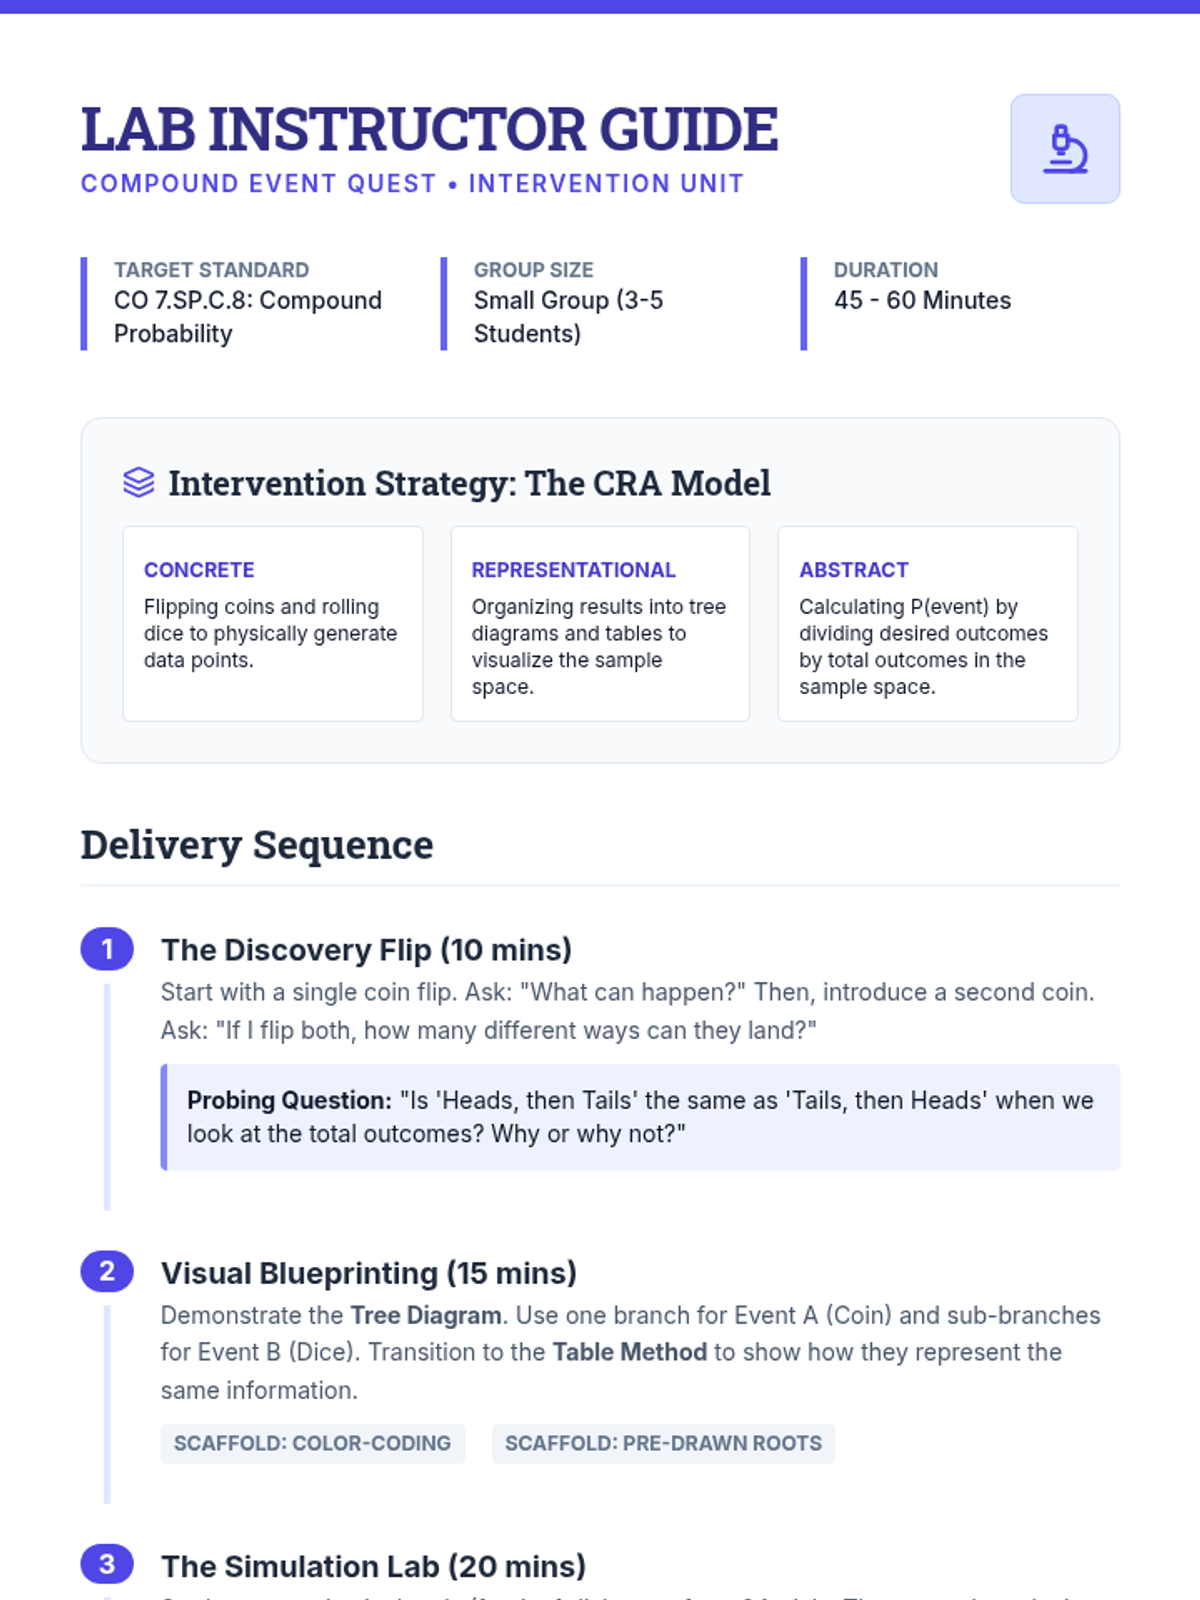
A targeted intervention sequence focused on compound probability, designed for small groups to master sample space construction and simulations.
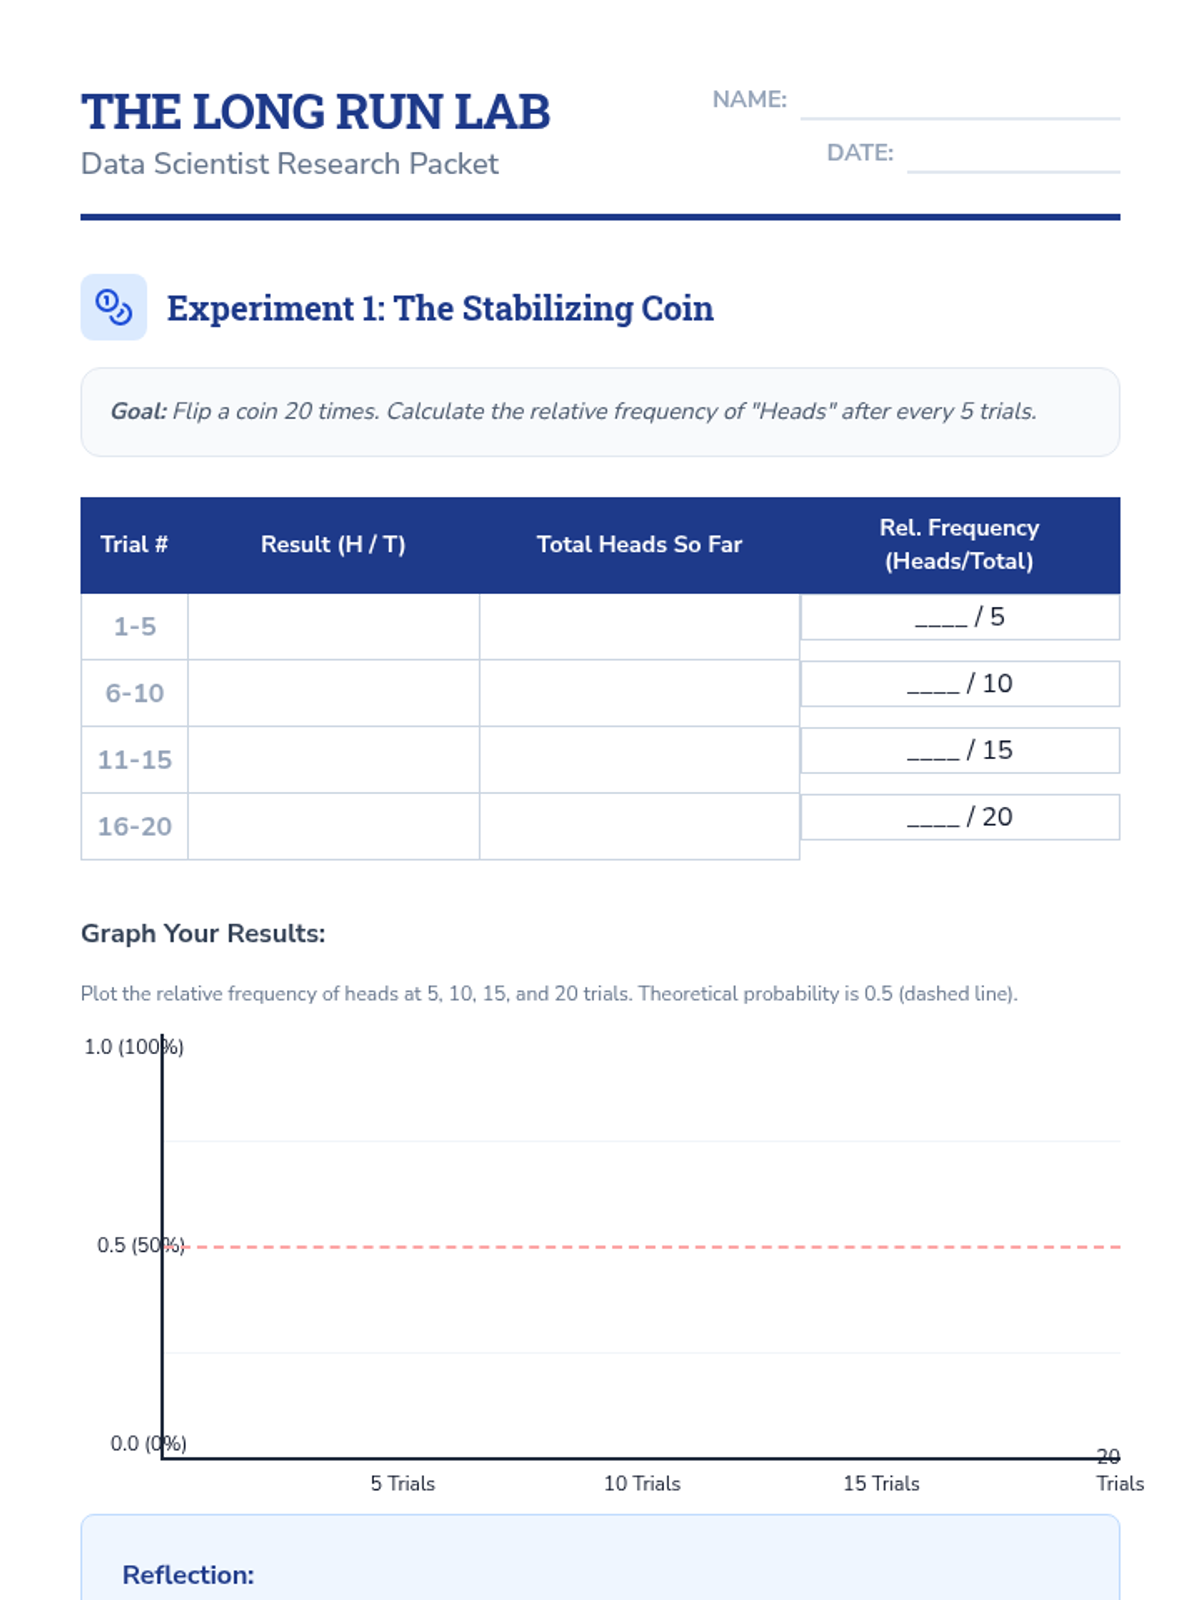
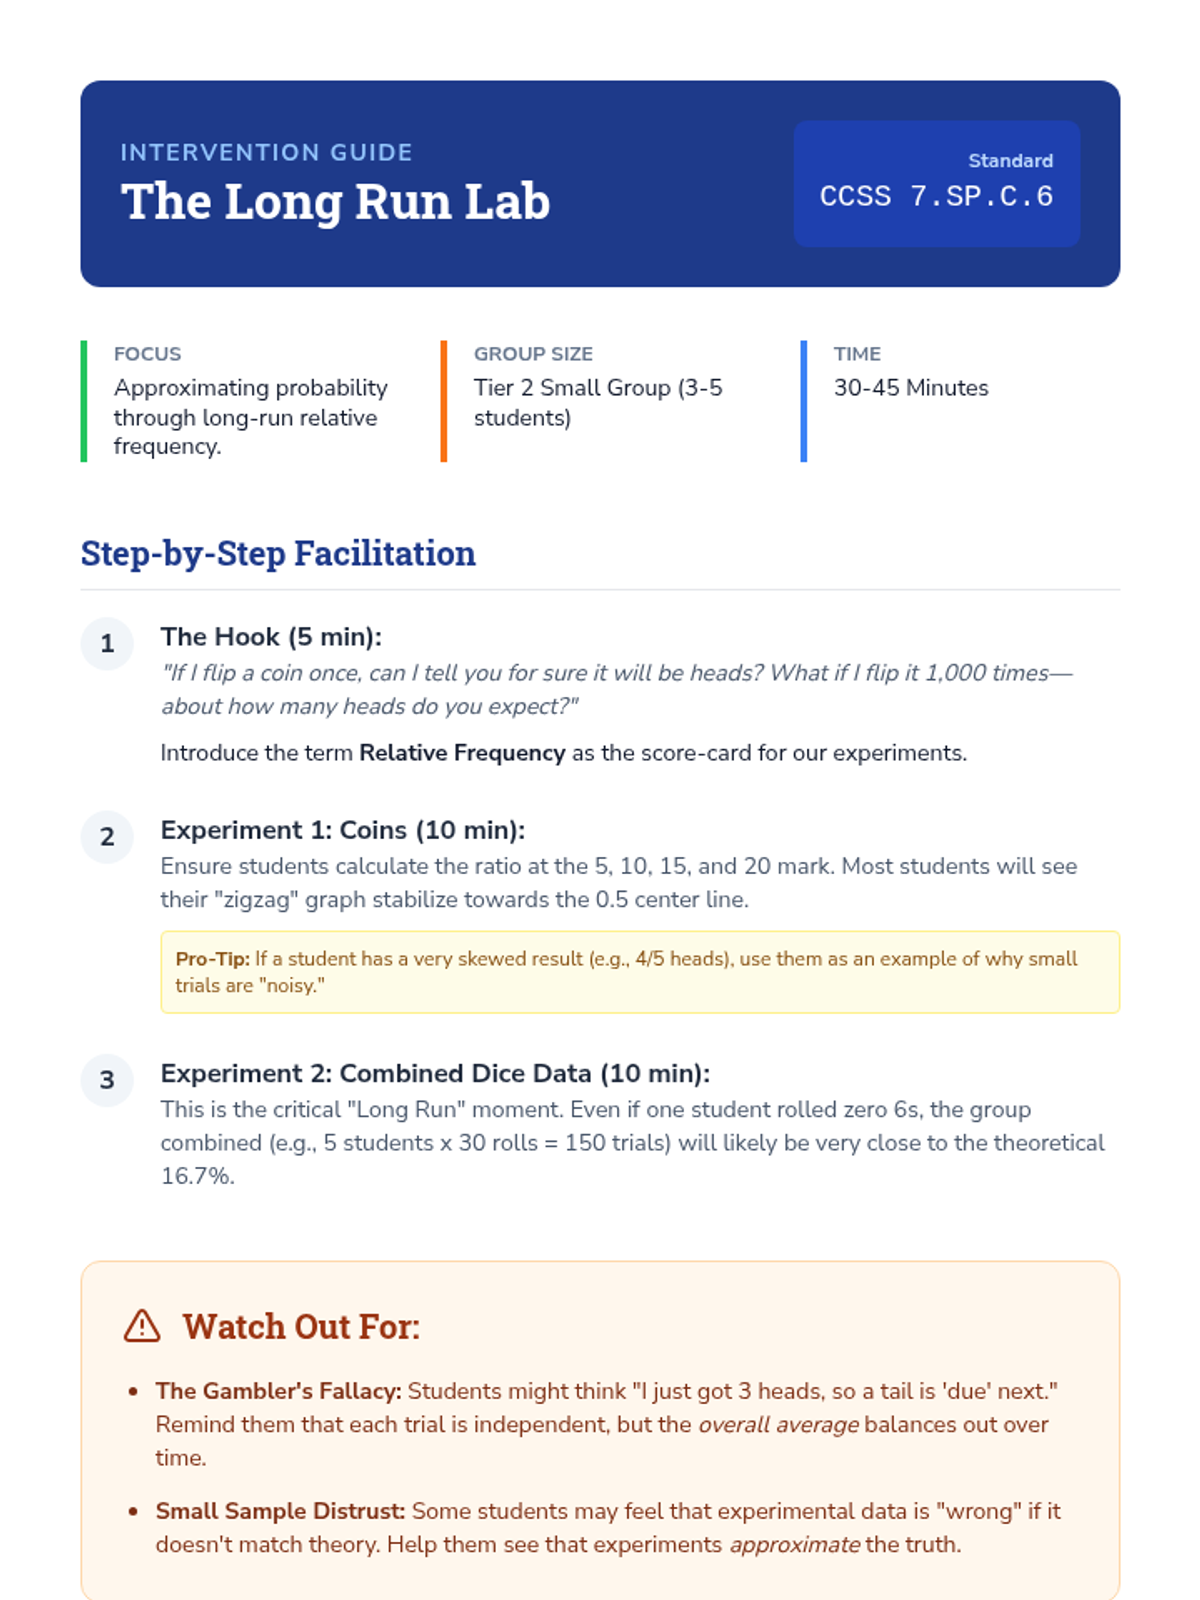
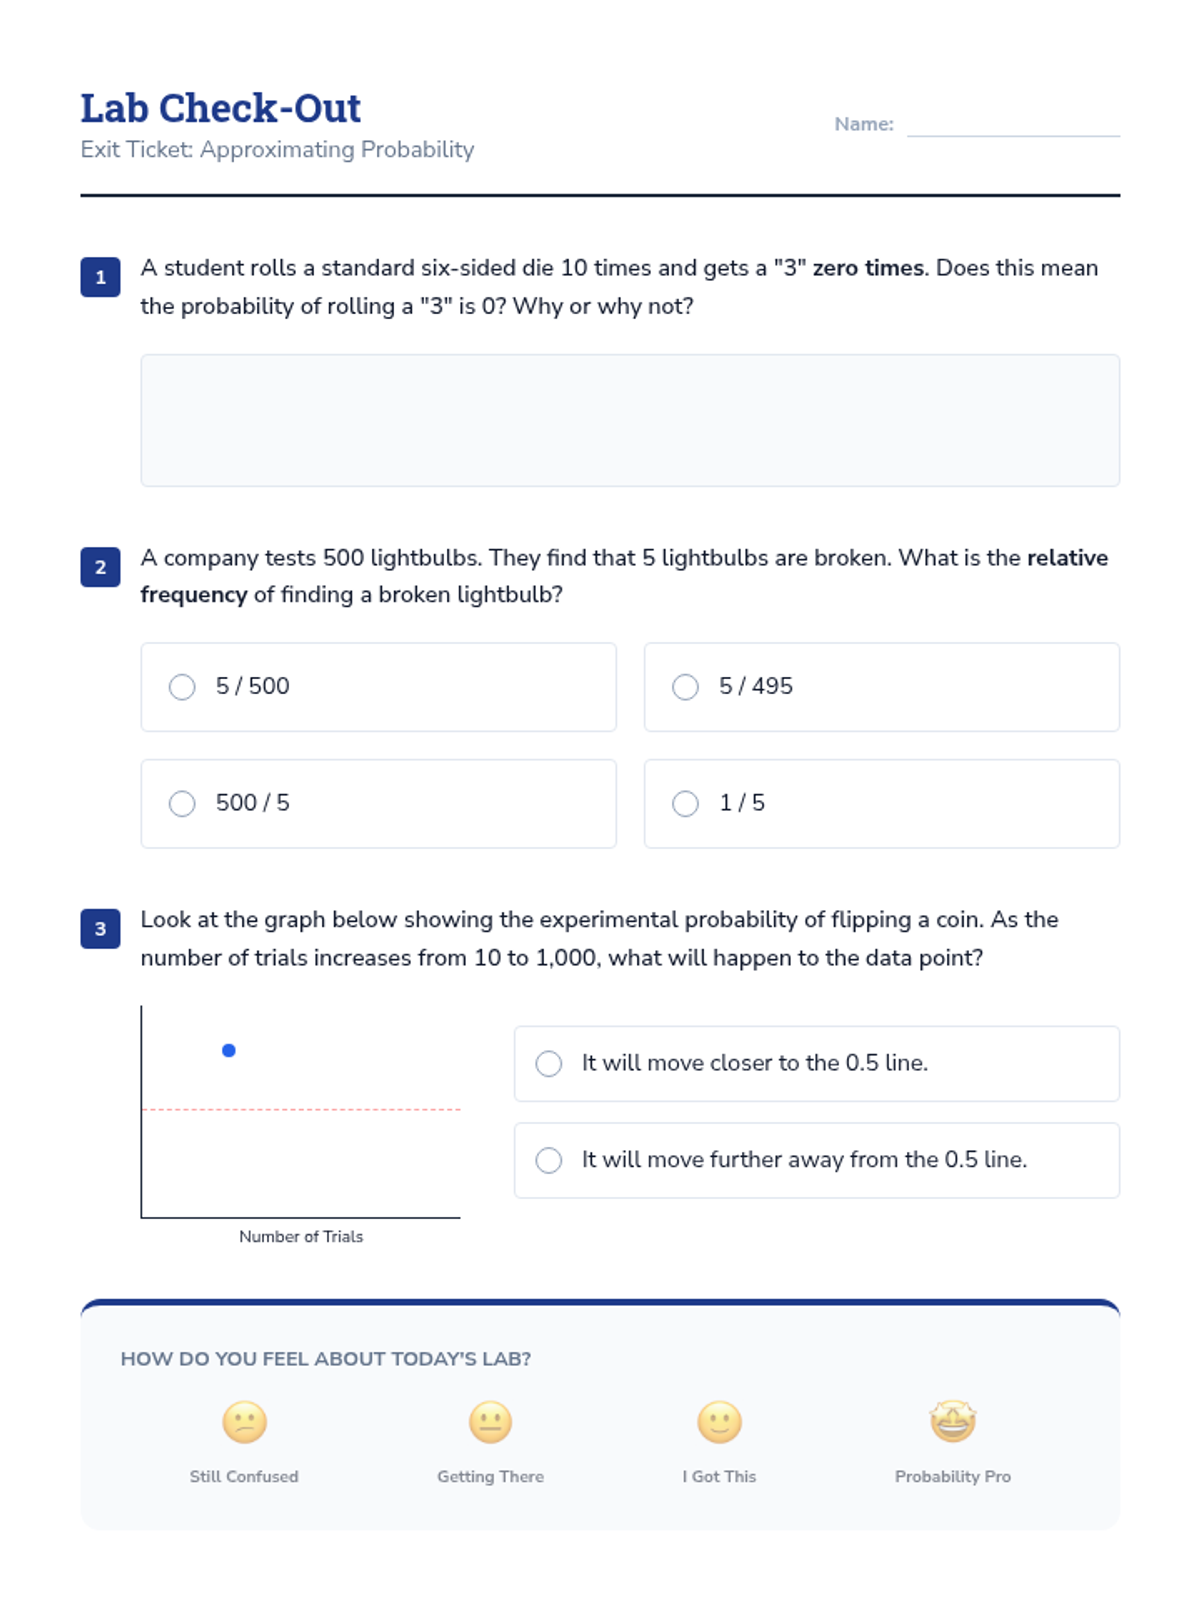
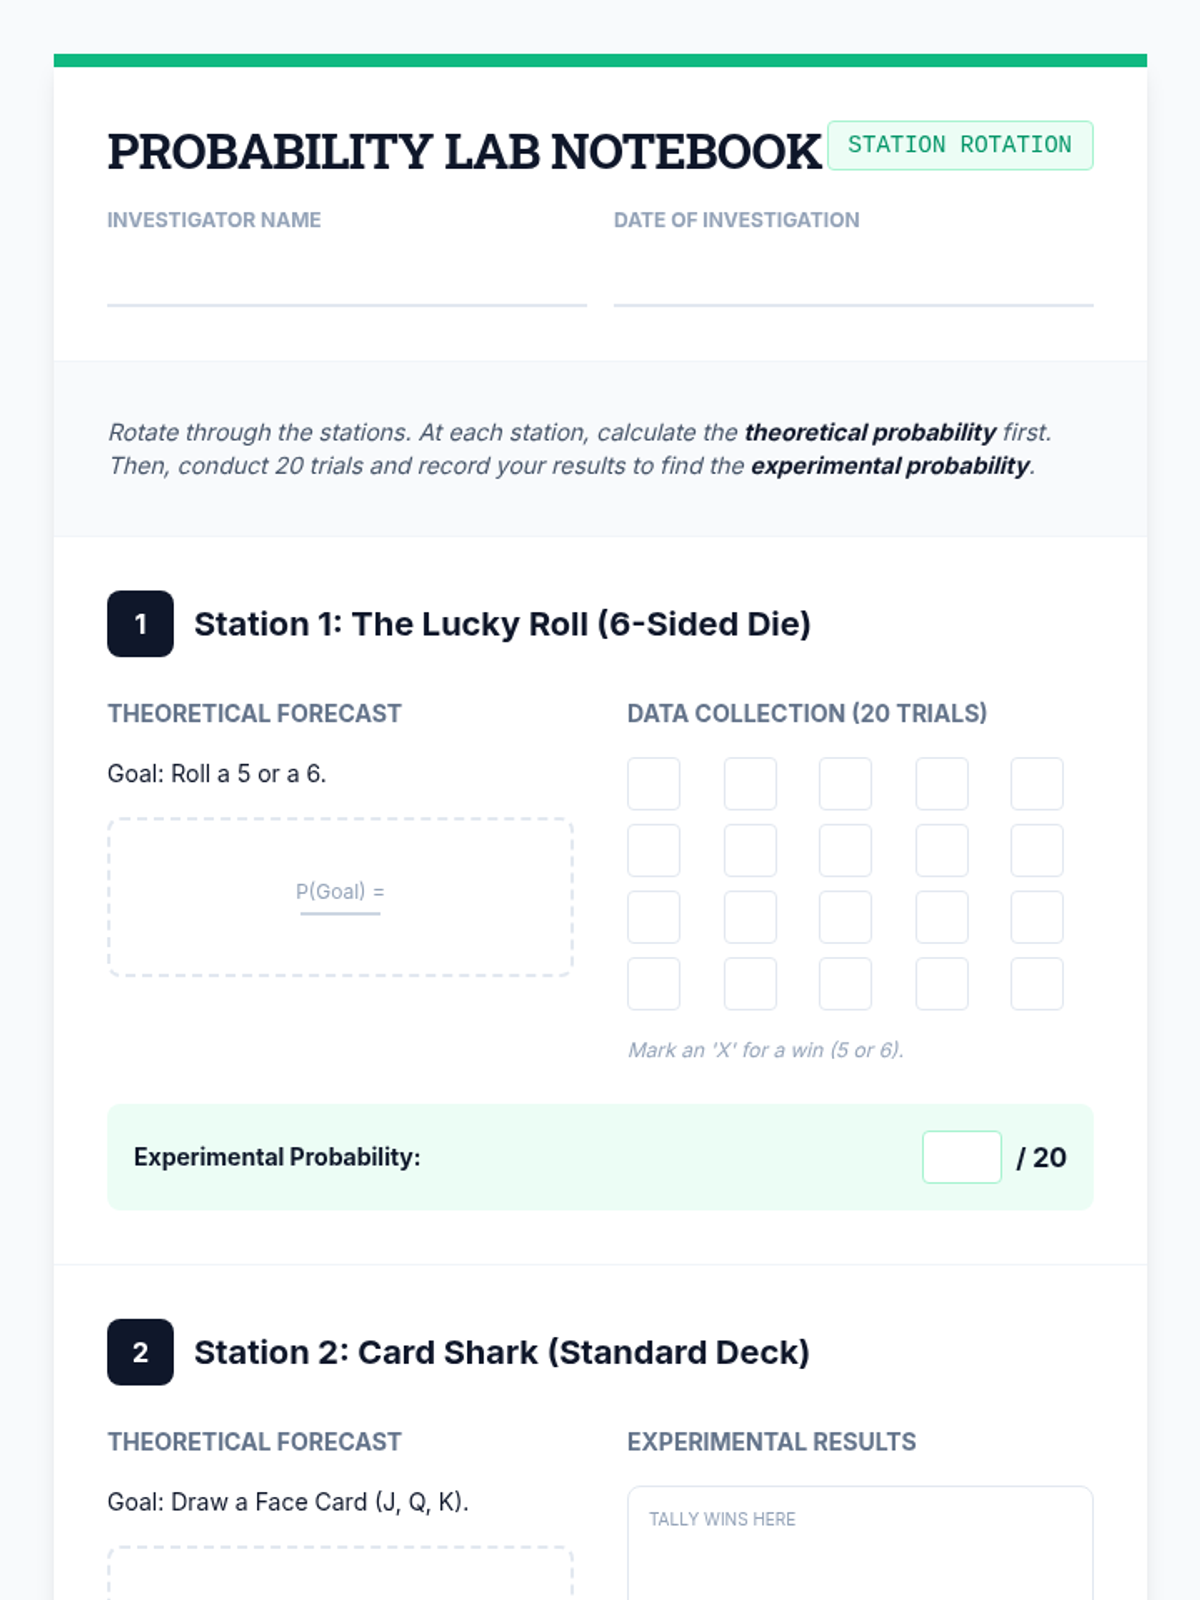
A targeted intervention sequence focused on understanding probability through experimental data, recording frequencies, and observing how relative frequency stabilizes over many trials.
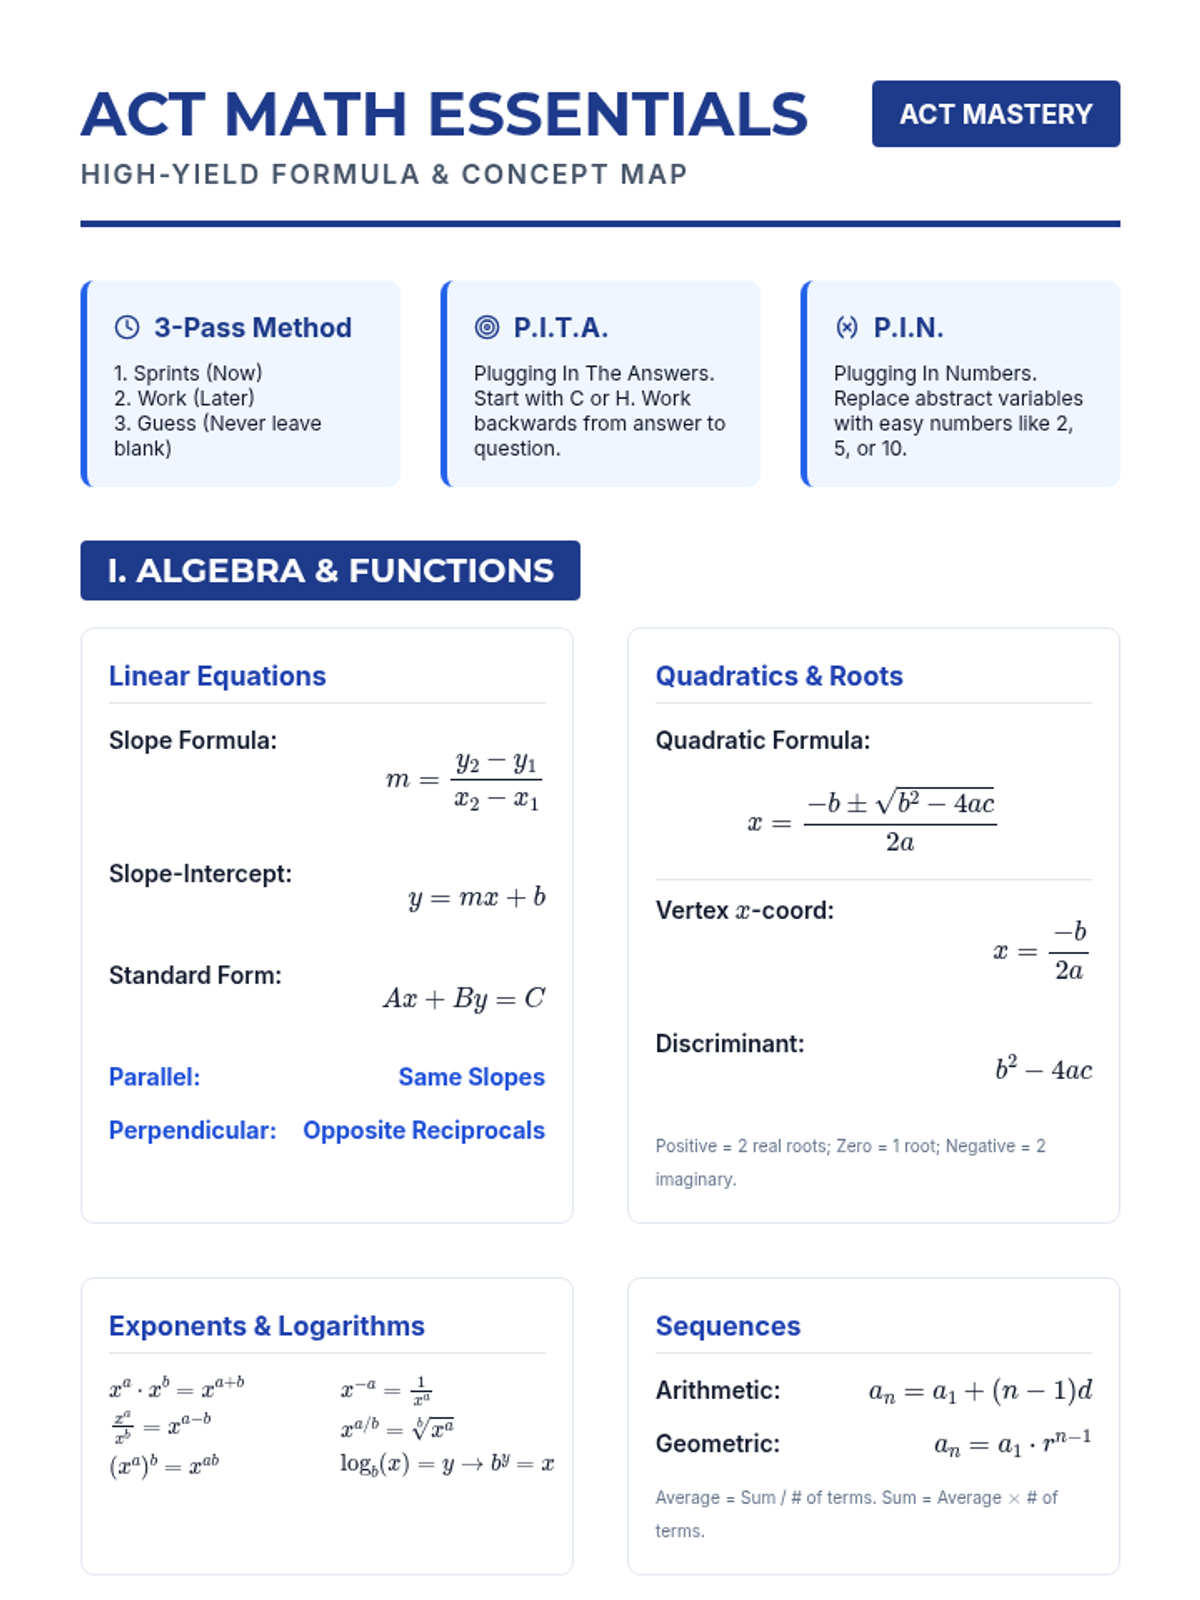
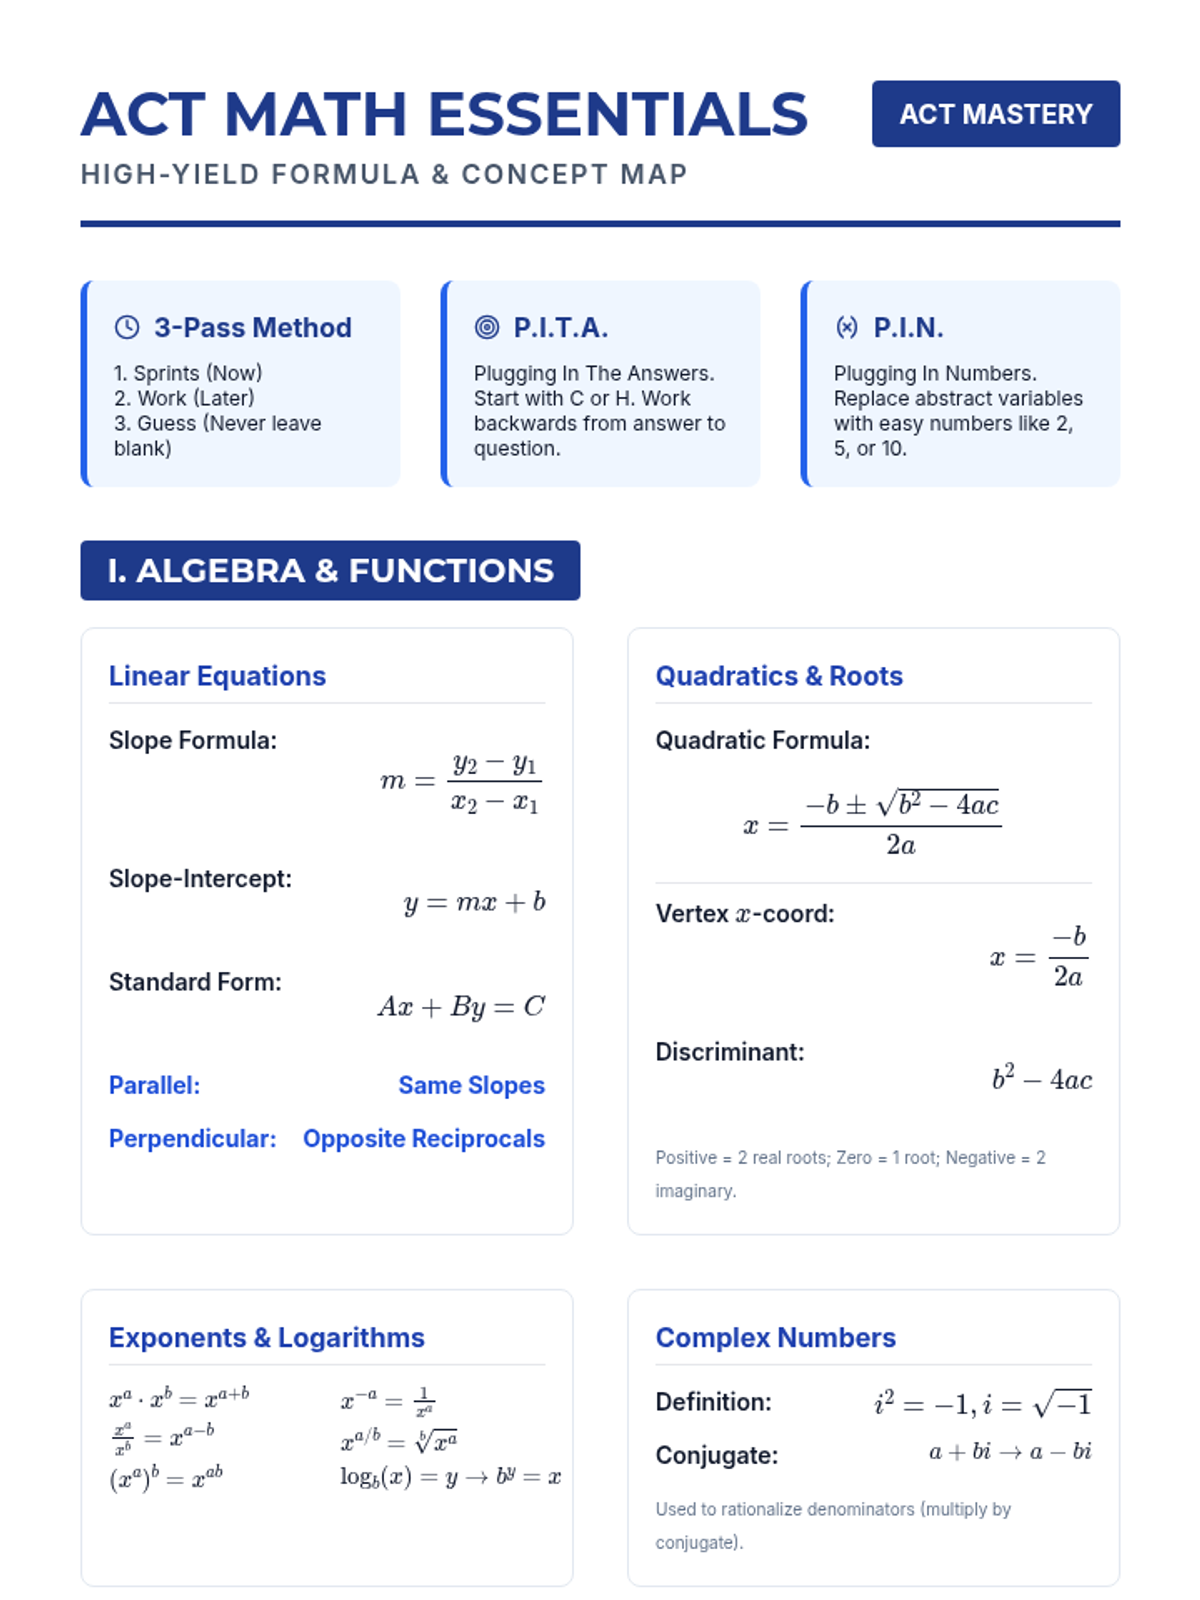
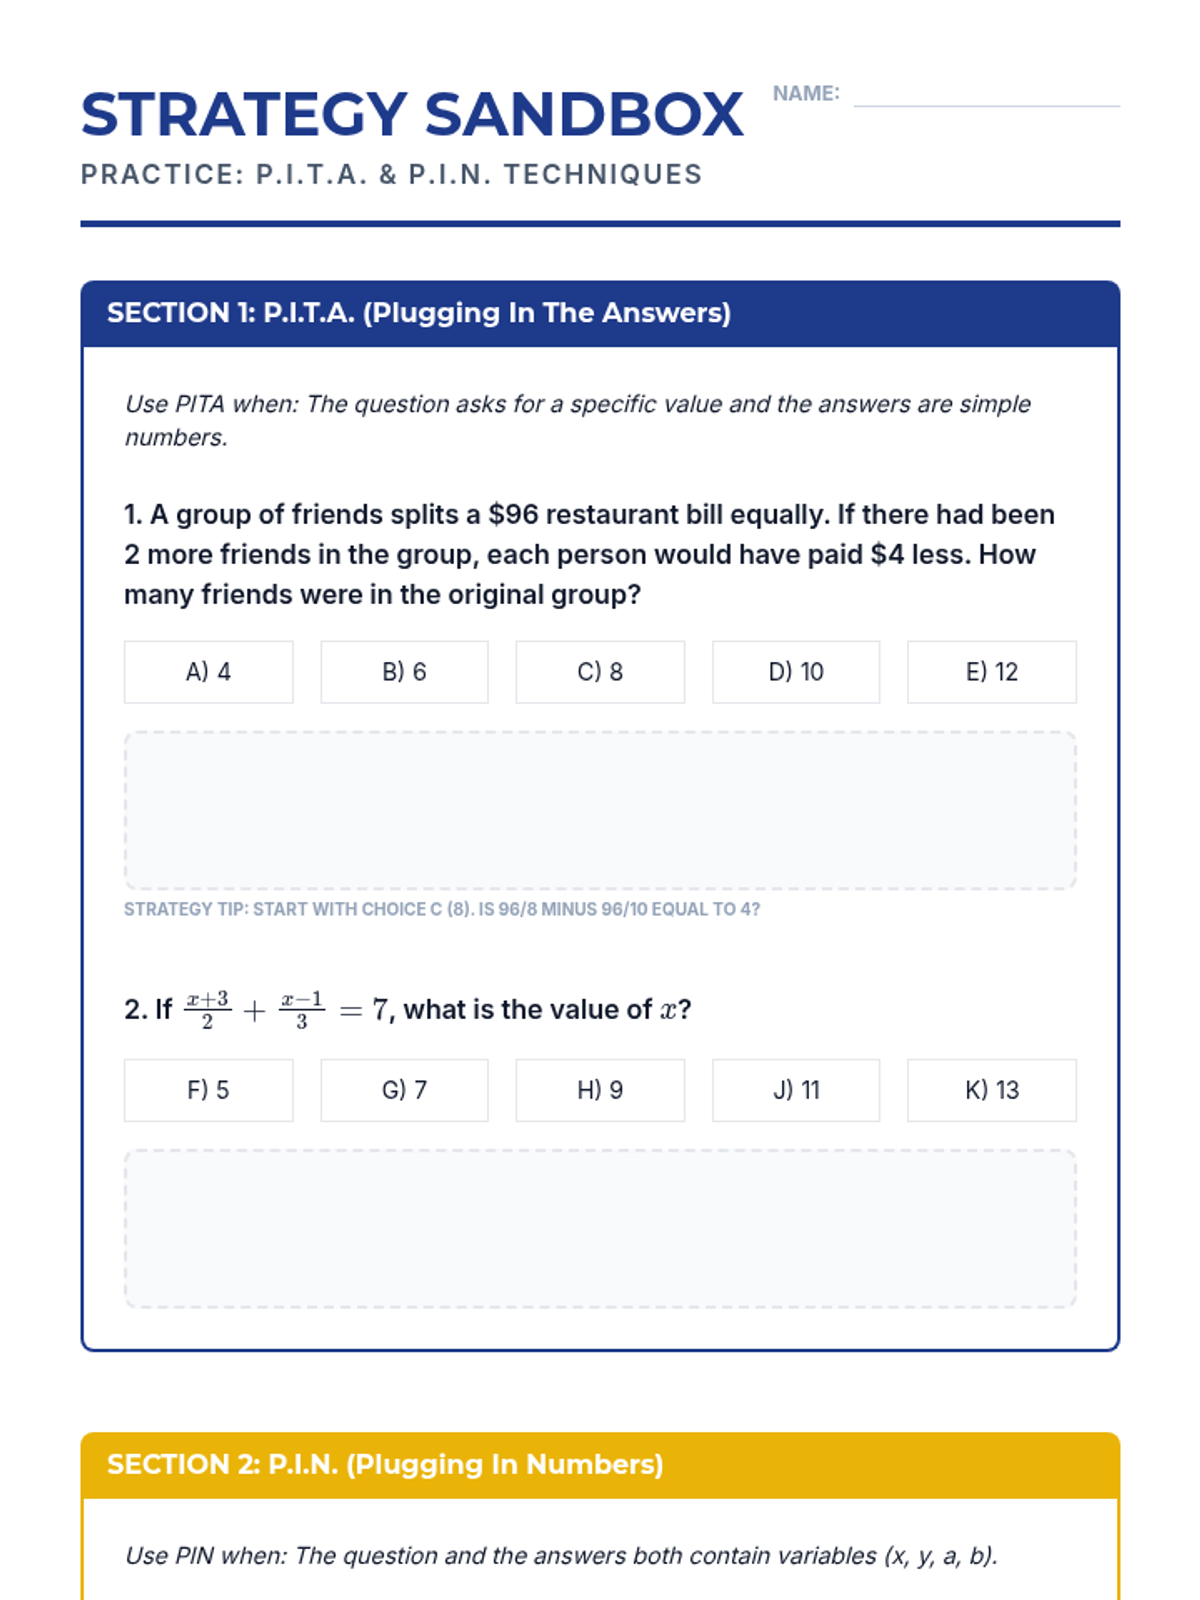
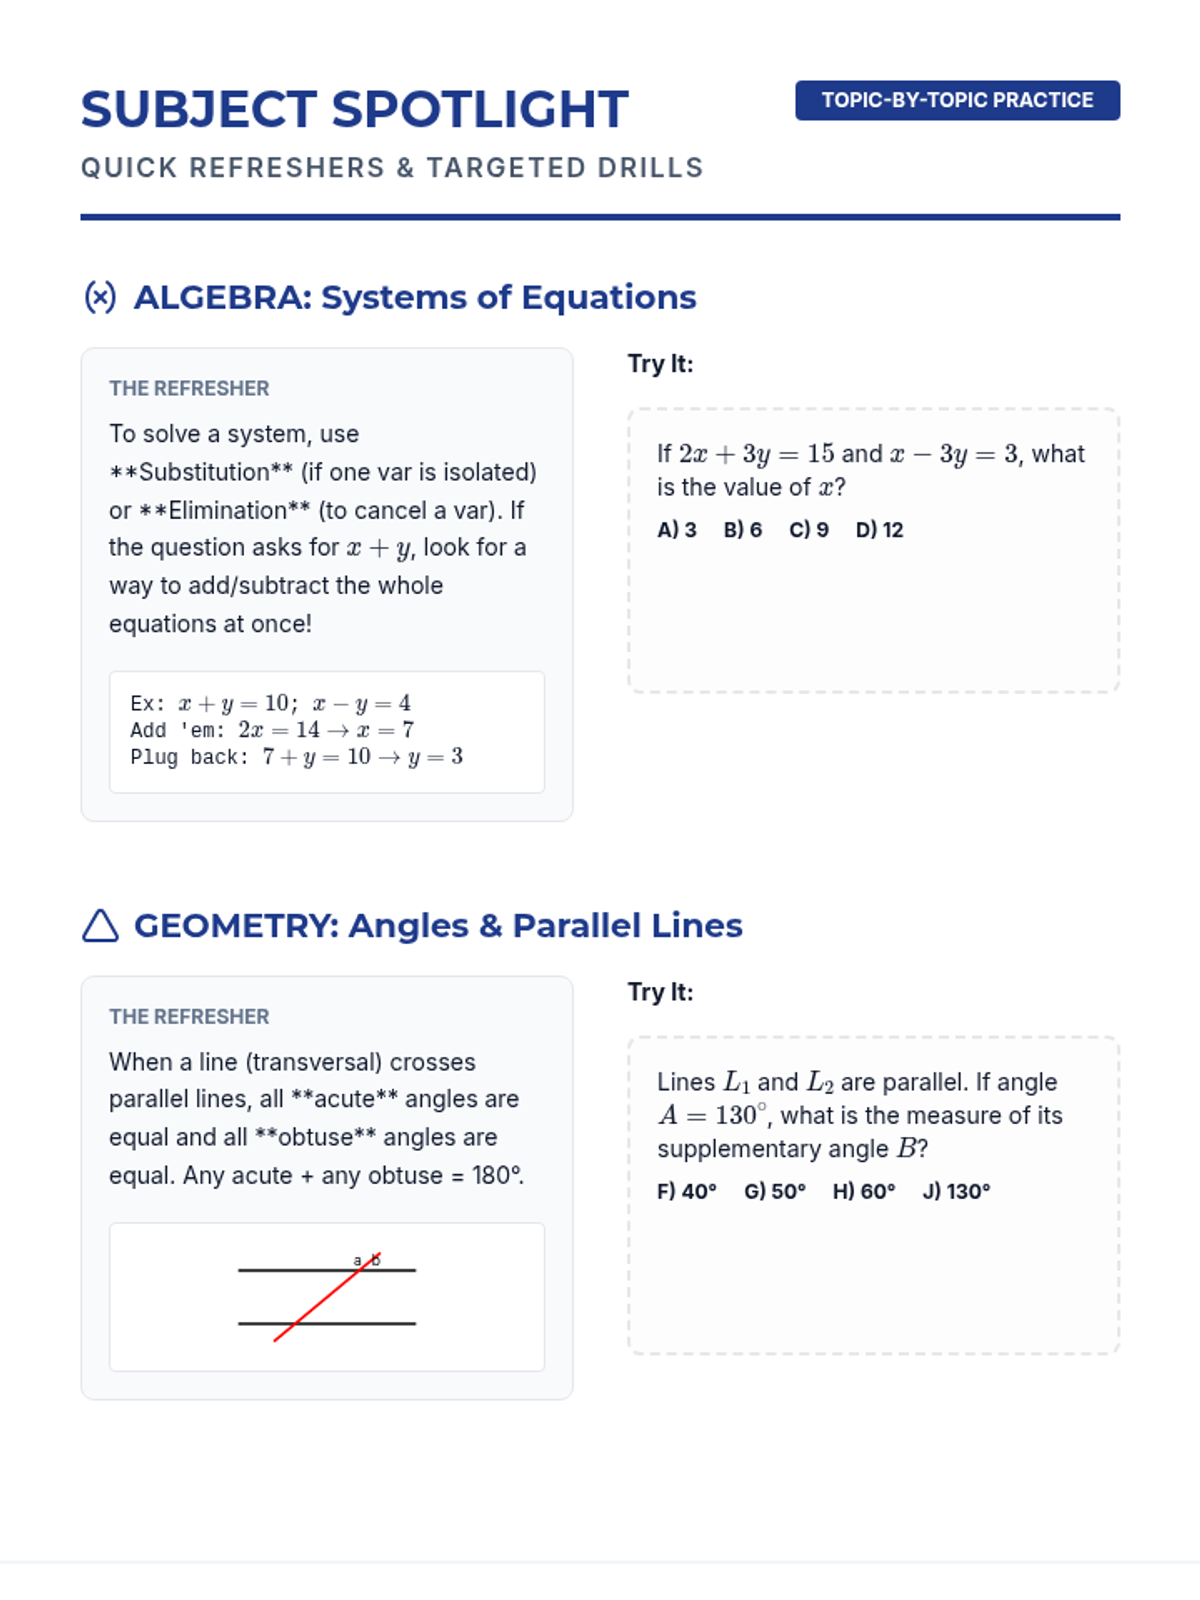
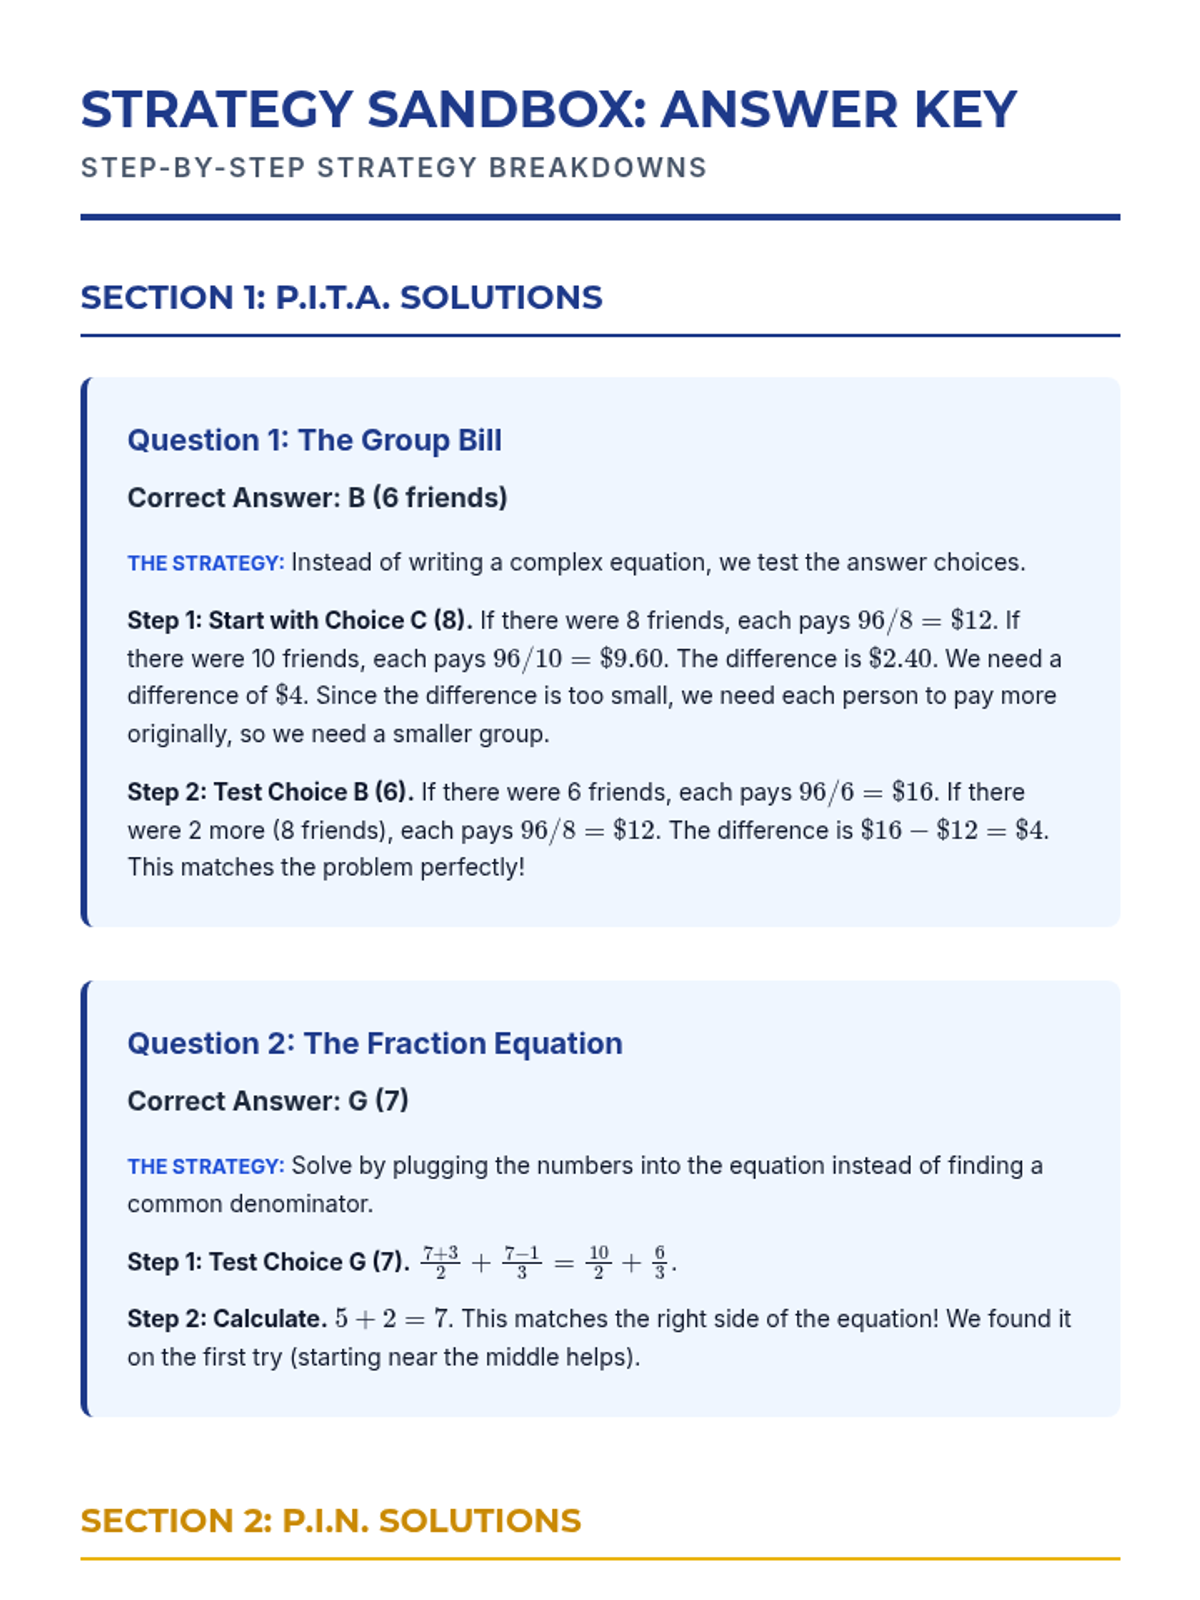
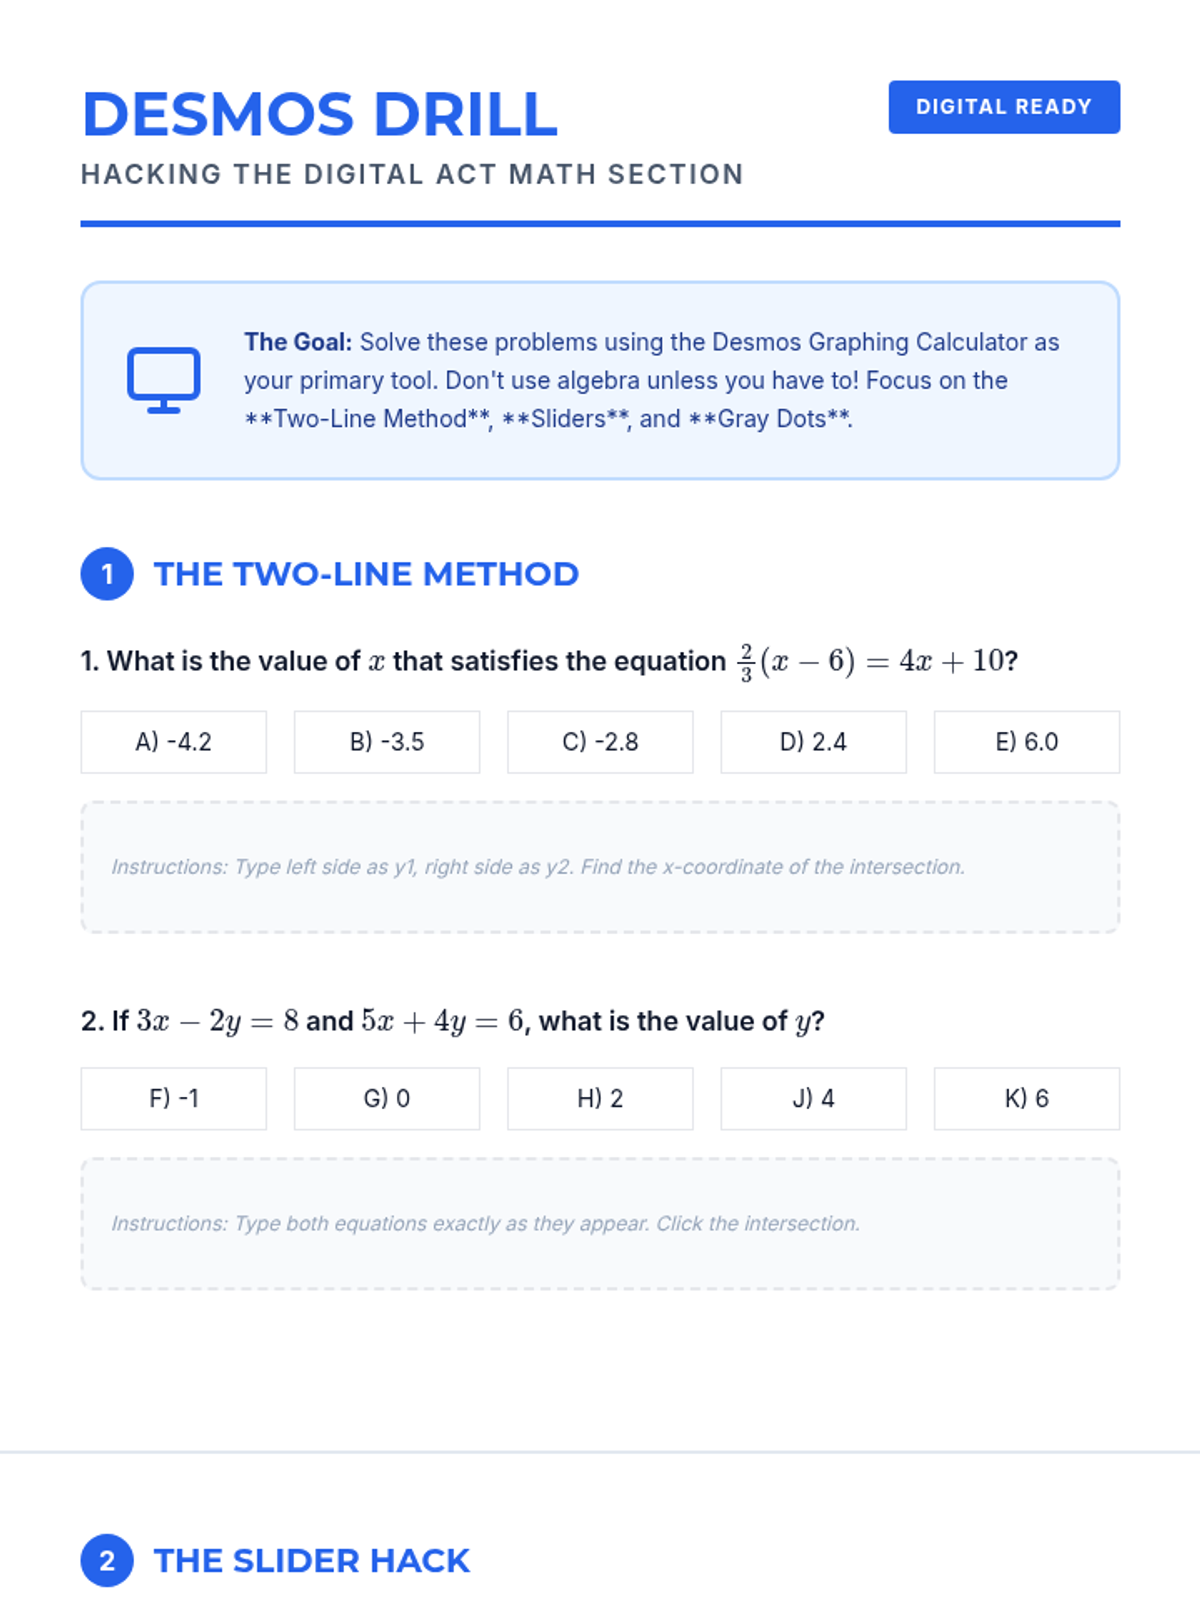
A comprehensive ACT Math preparation program focusing on essential strategies, high-yield Algebra and Geometry concepts, and realistic practice to boost scores.
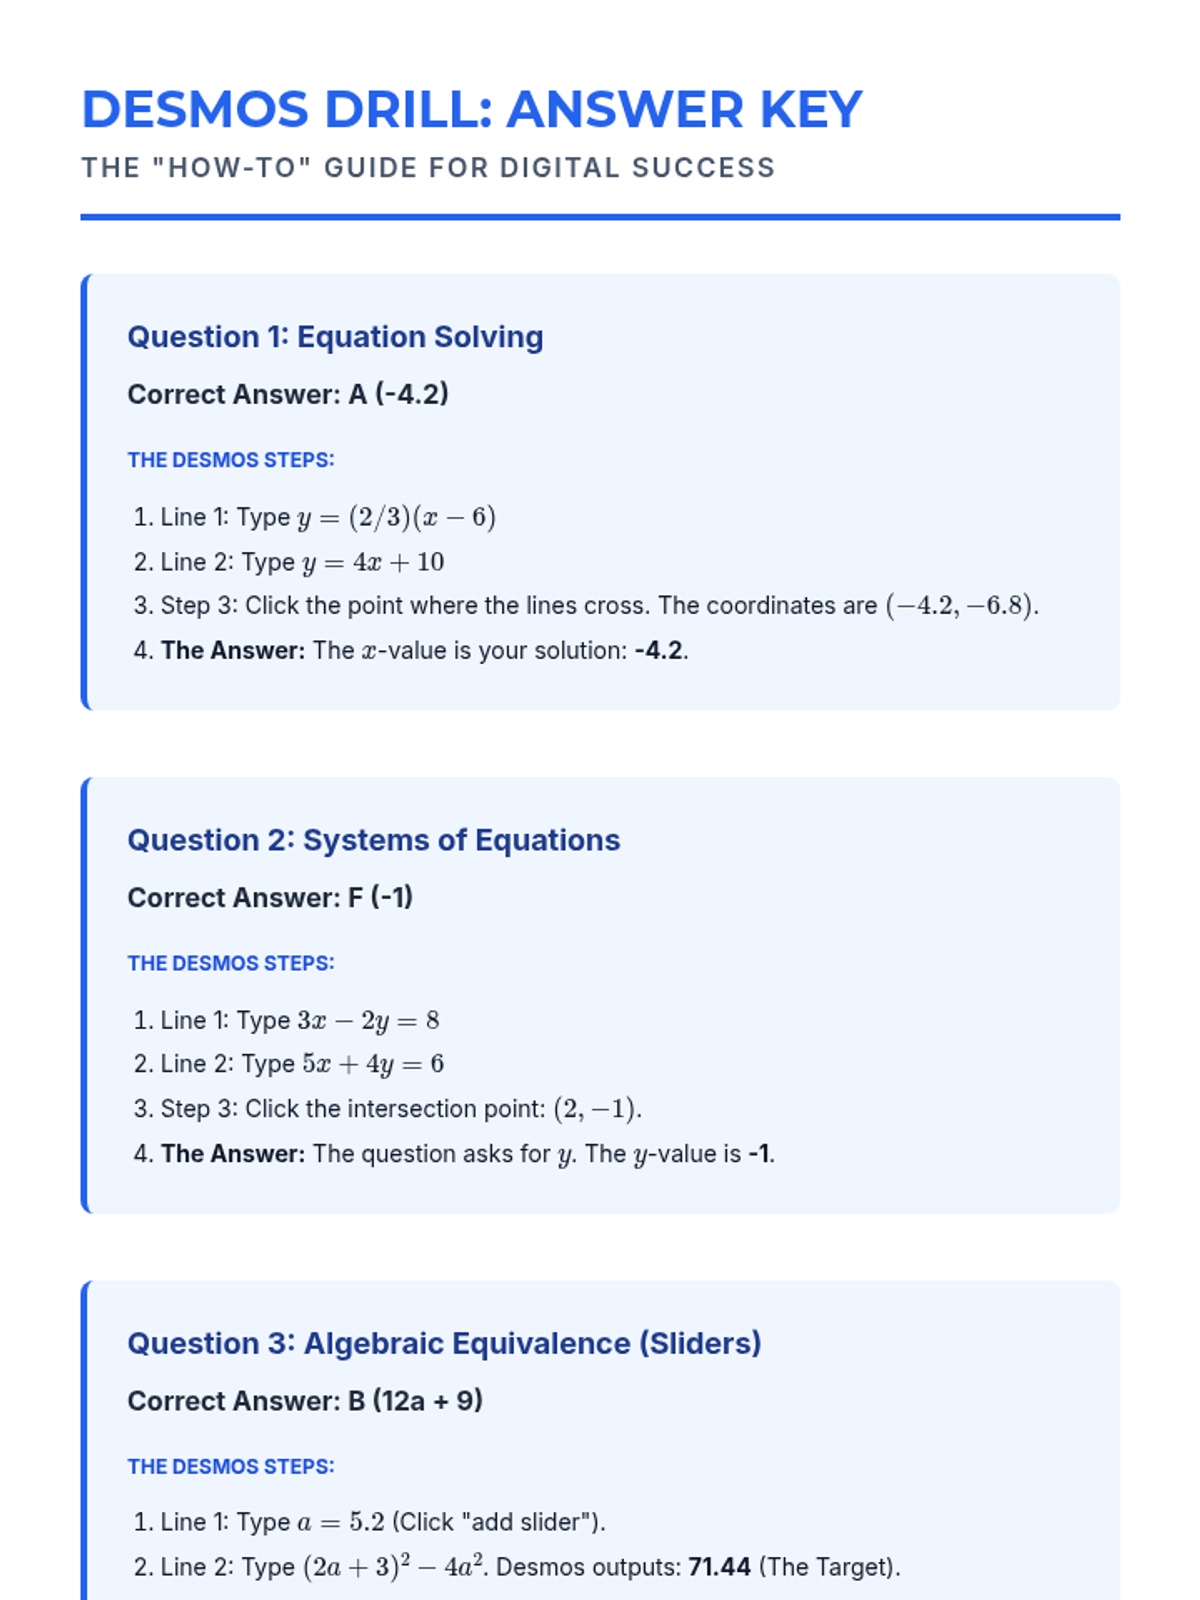
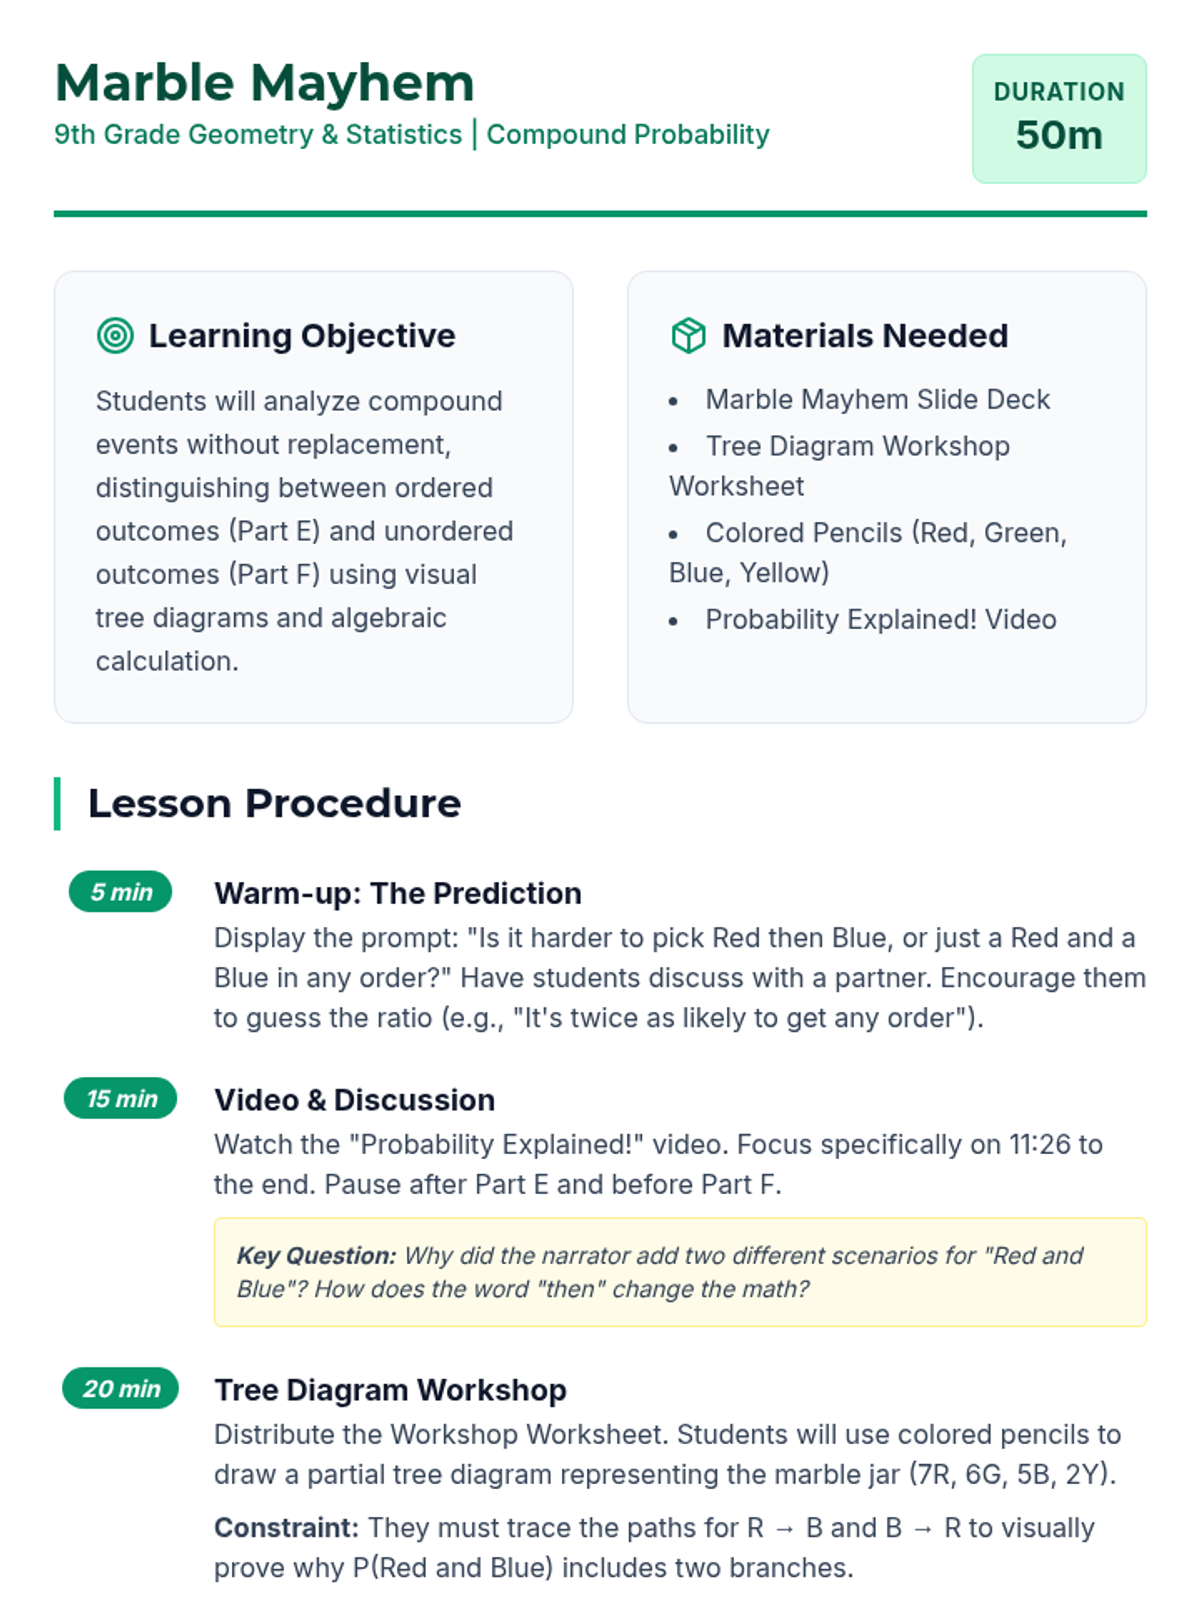
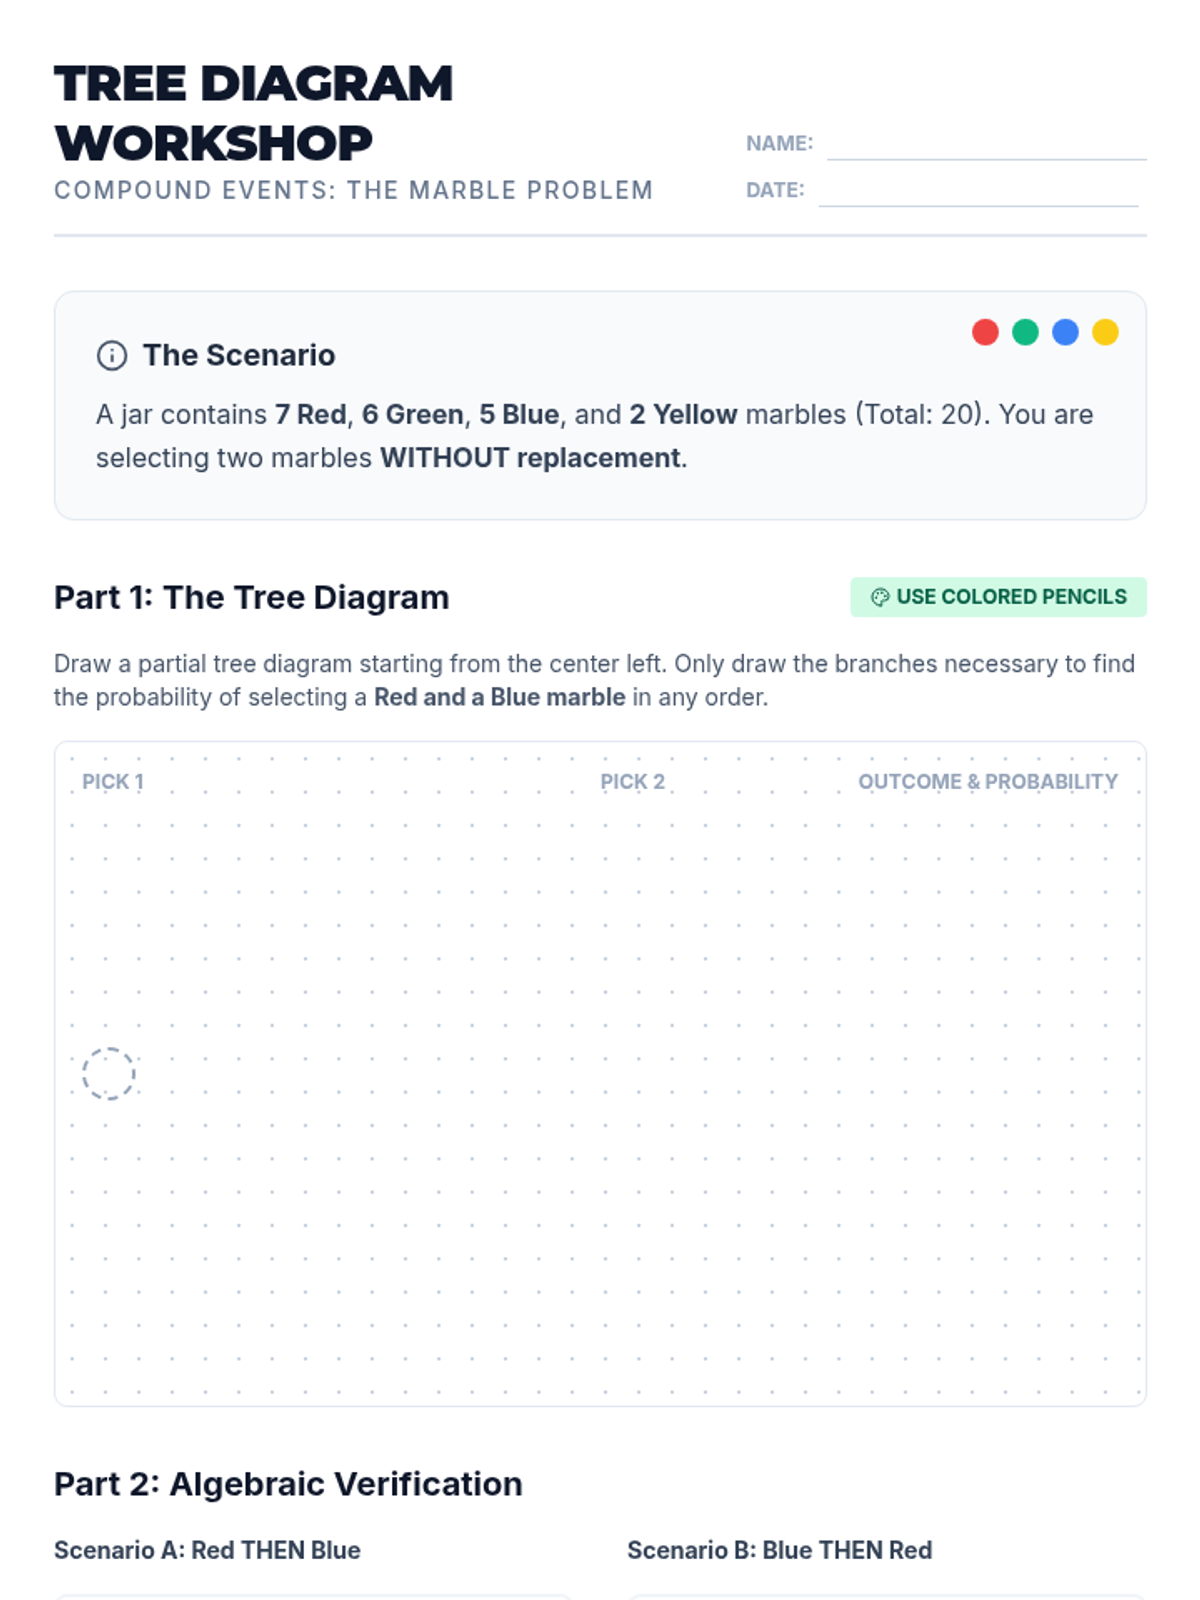
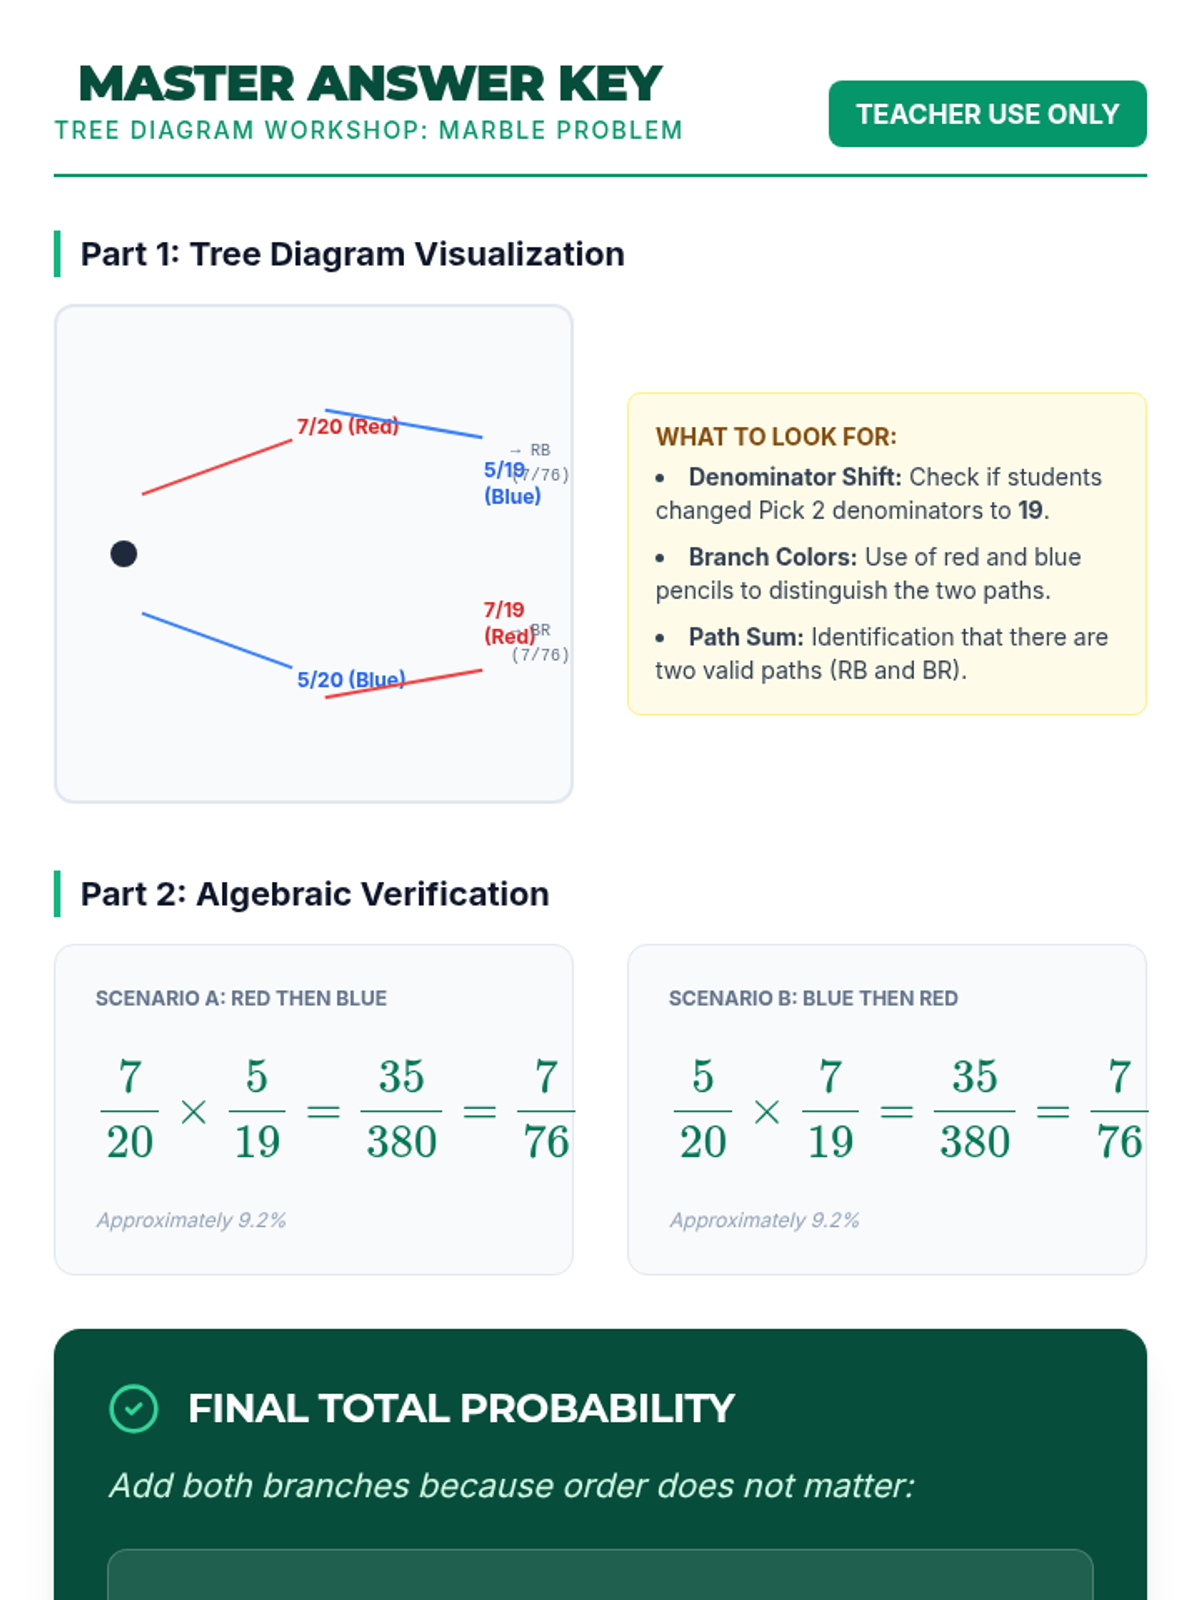
A lesson sequence focusing on compound probability, specifically analyzing events where order matters versus where it doesn't, using marble jar scenarios and tree diagrams.
This sequence explores conditional probability and the reliability of tests using frequency trees and area models. Students investigate 'false positives' and 'false negatives' in real-world contexts like medical testing and spam filters, ultimately debating the ethical implications of screening policies.
A comprehensive progression through descriptive statistics, from foundational calculations to high-school level analytical applications, including outlier effects and algebraic problem-solving.
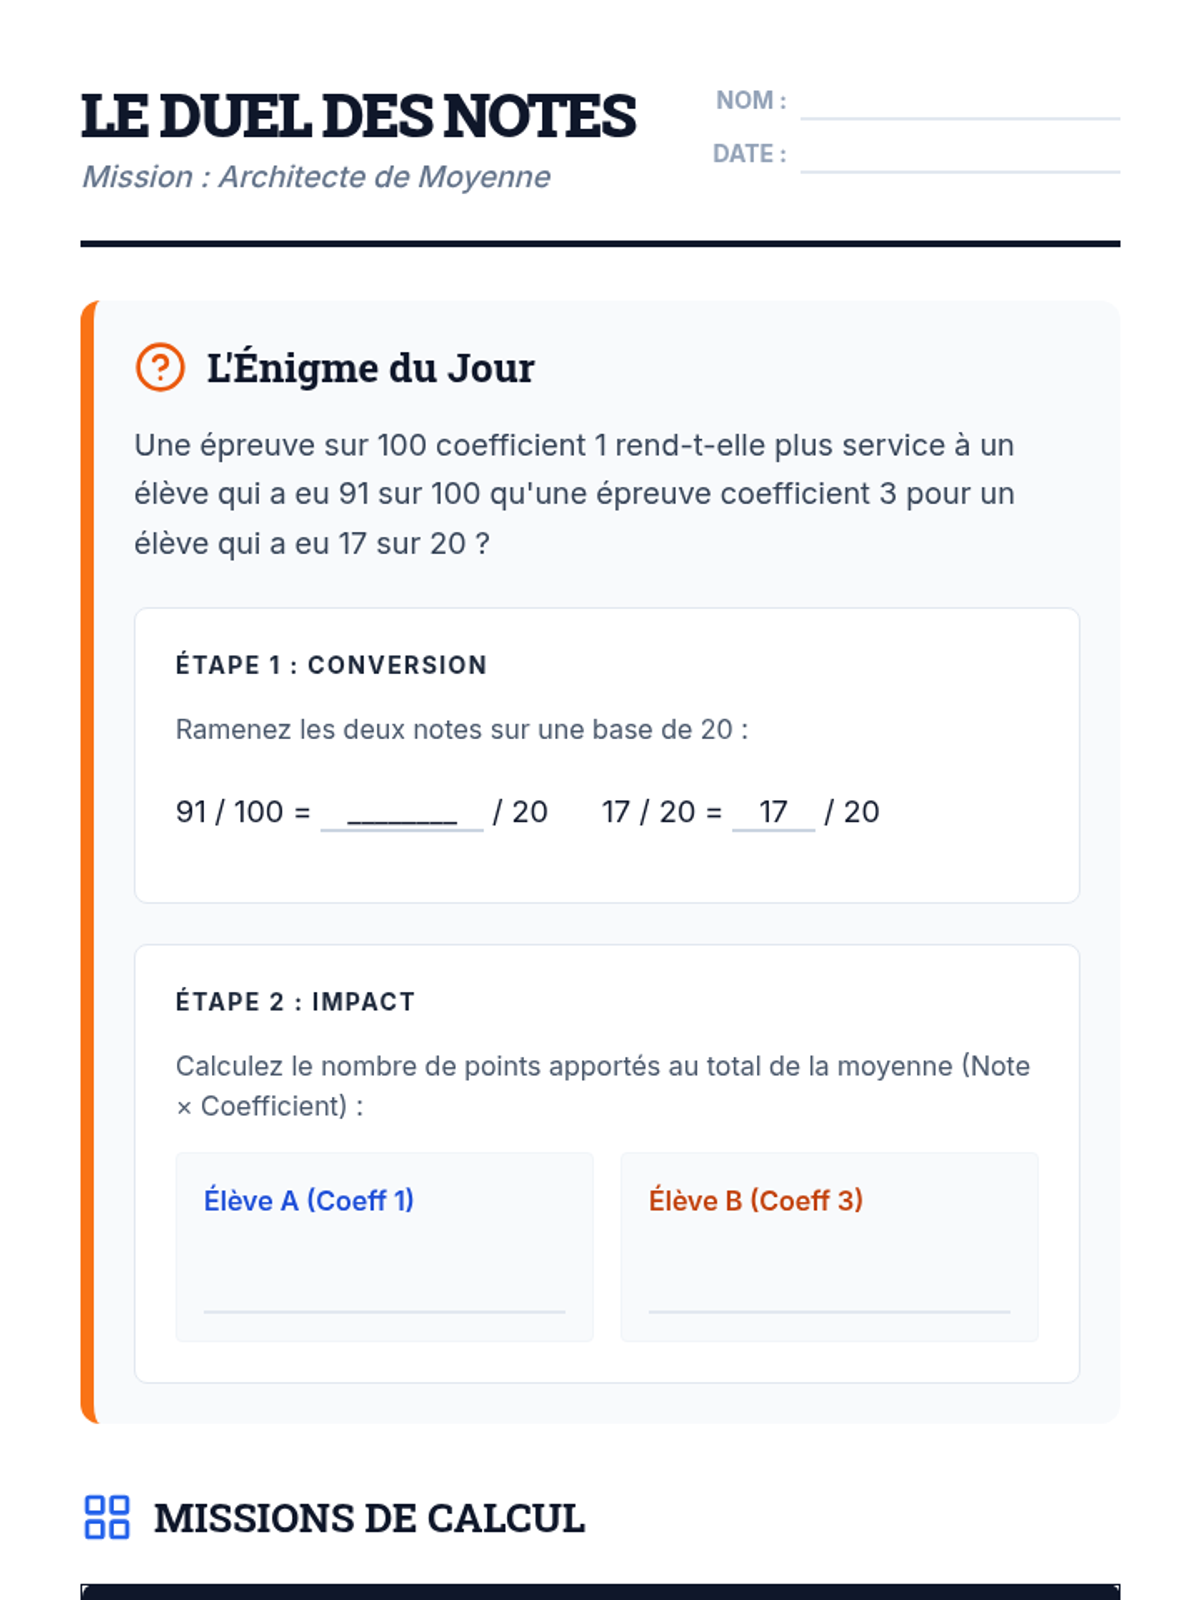
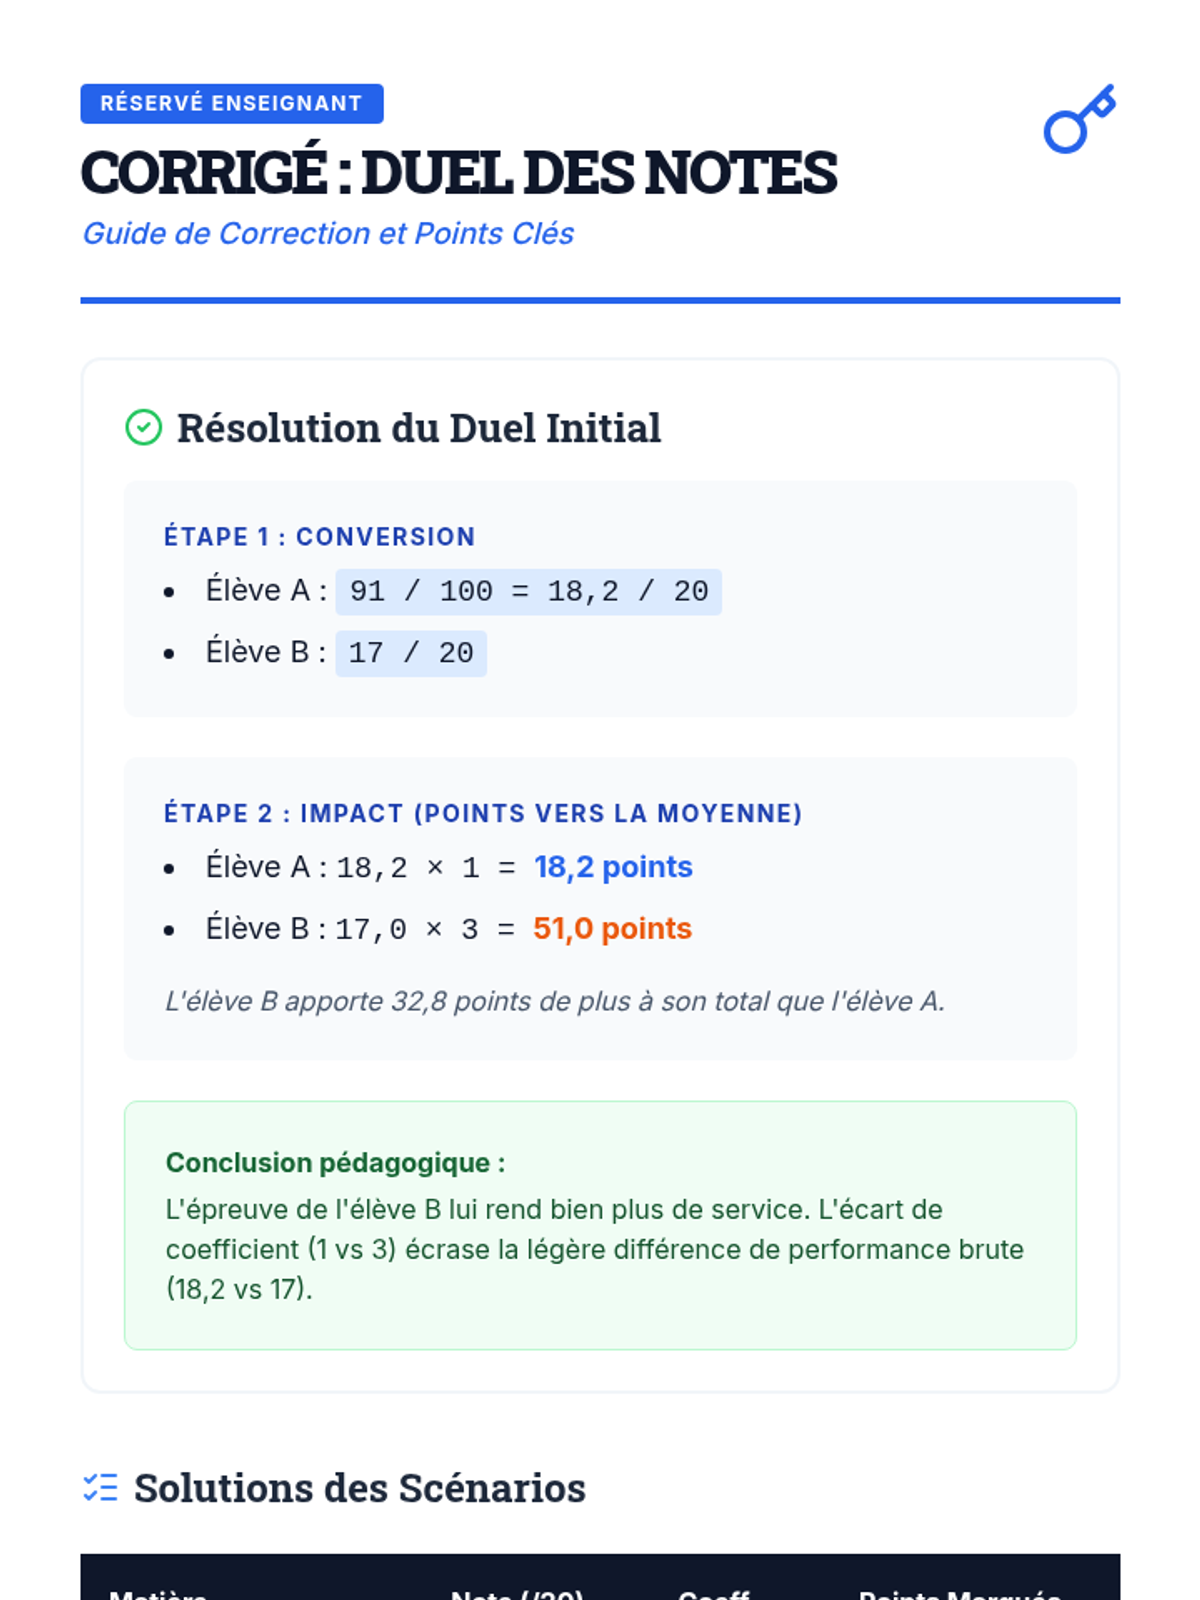
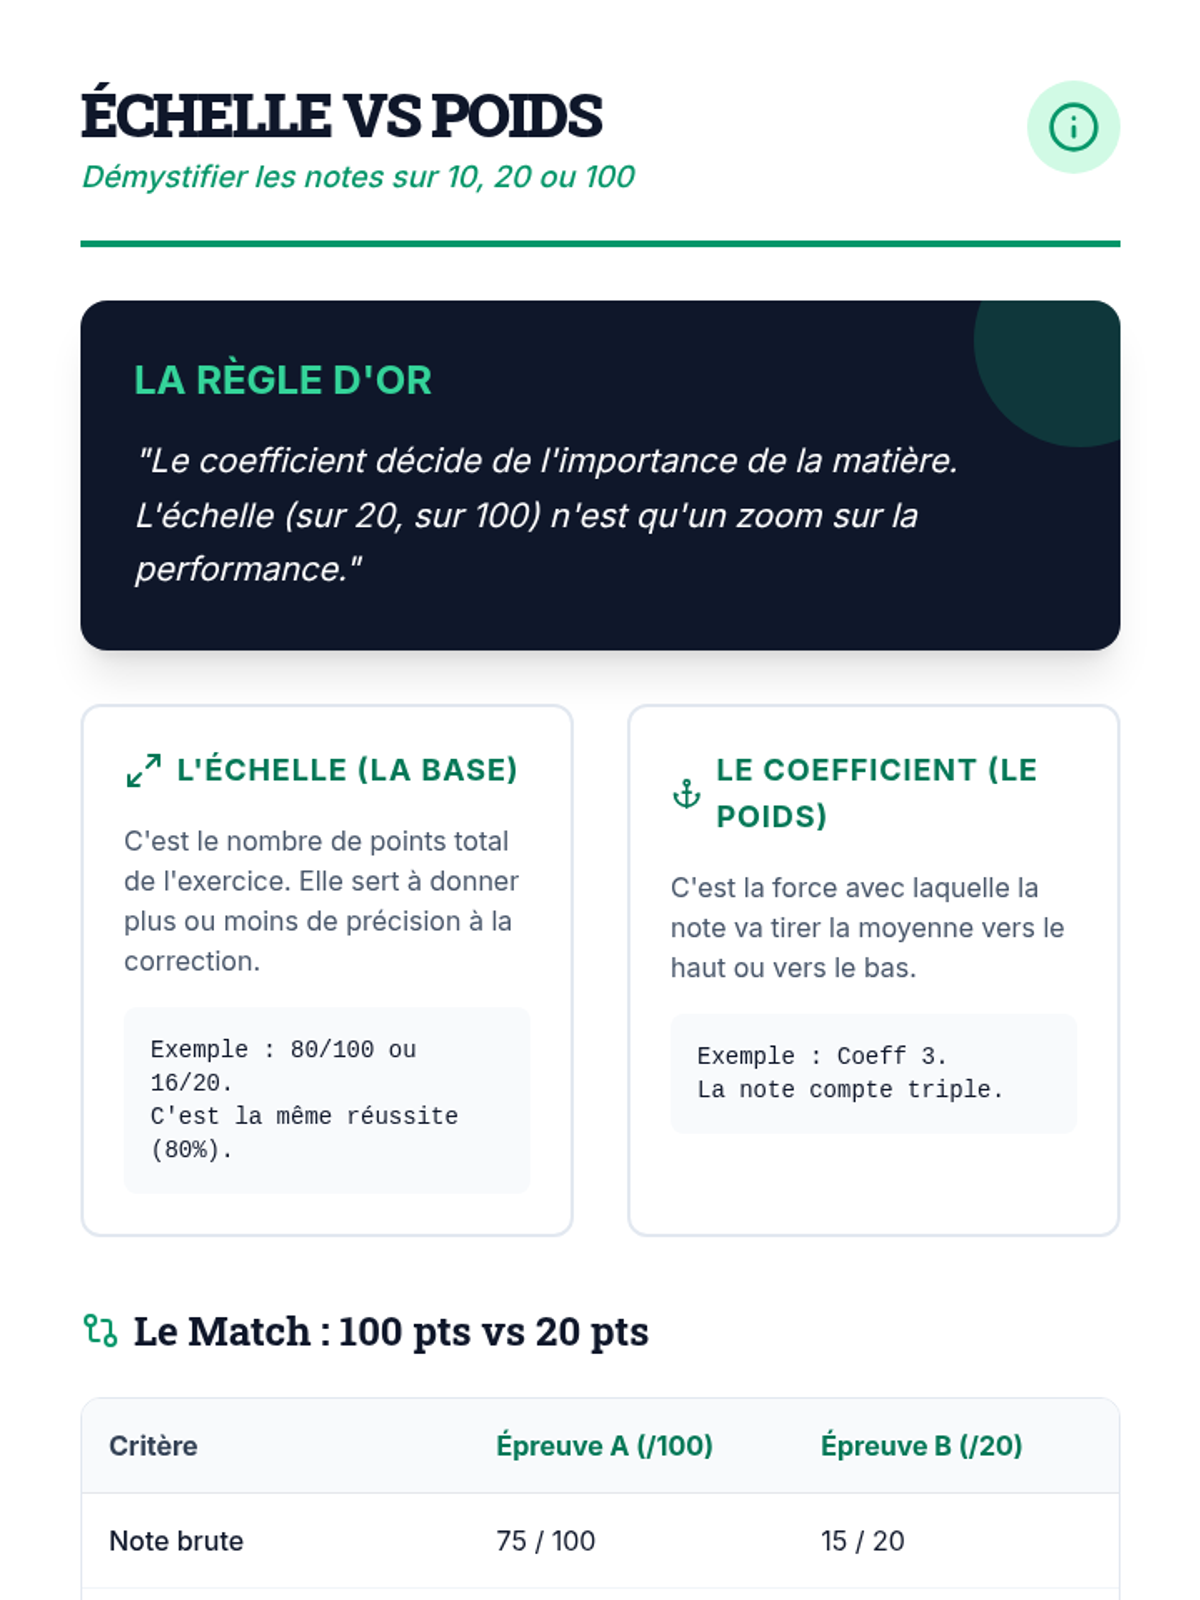
Une exploration mathématique de l'impact des coefficients sur les moyennes, utilisant des cas pratiques concrets pour comprendre la pondération et les moyennes pondérées.
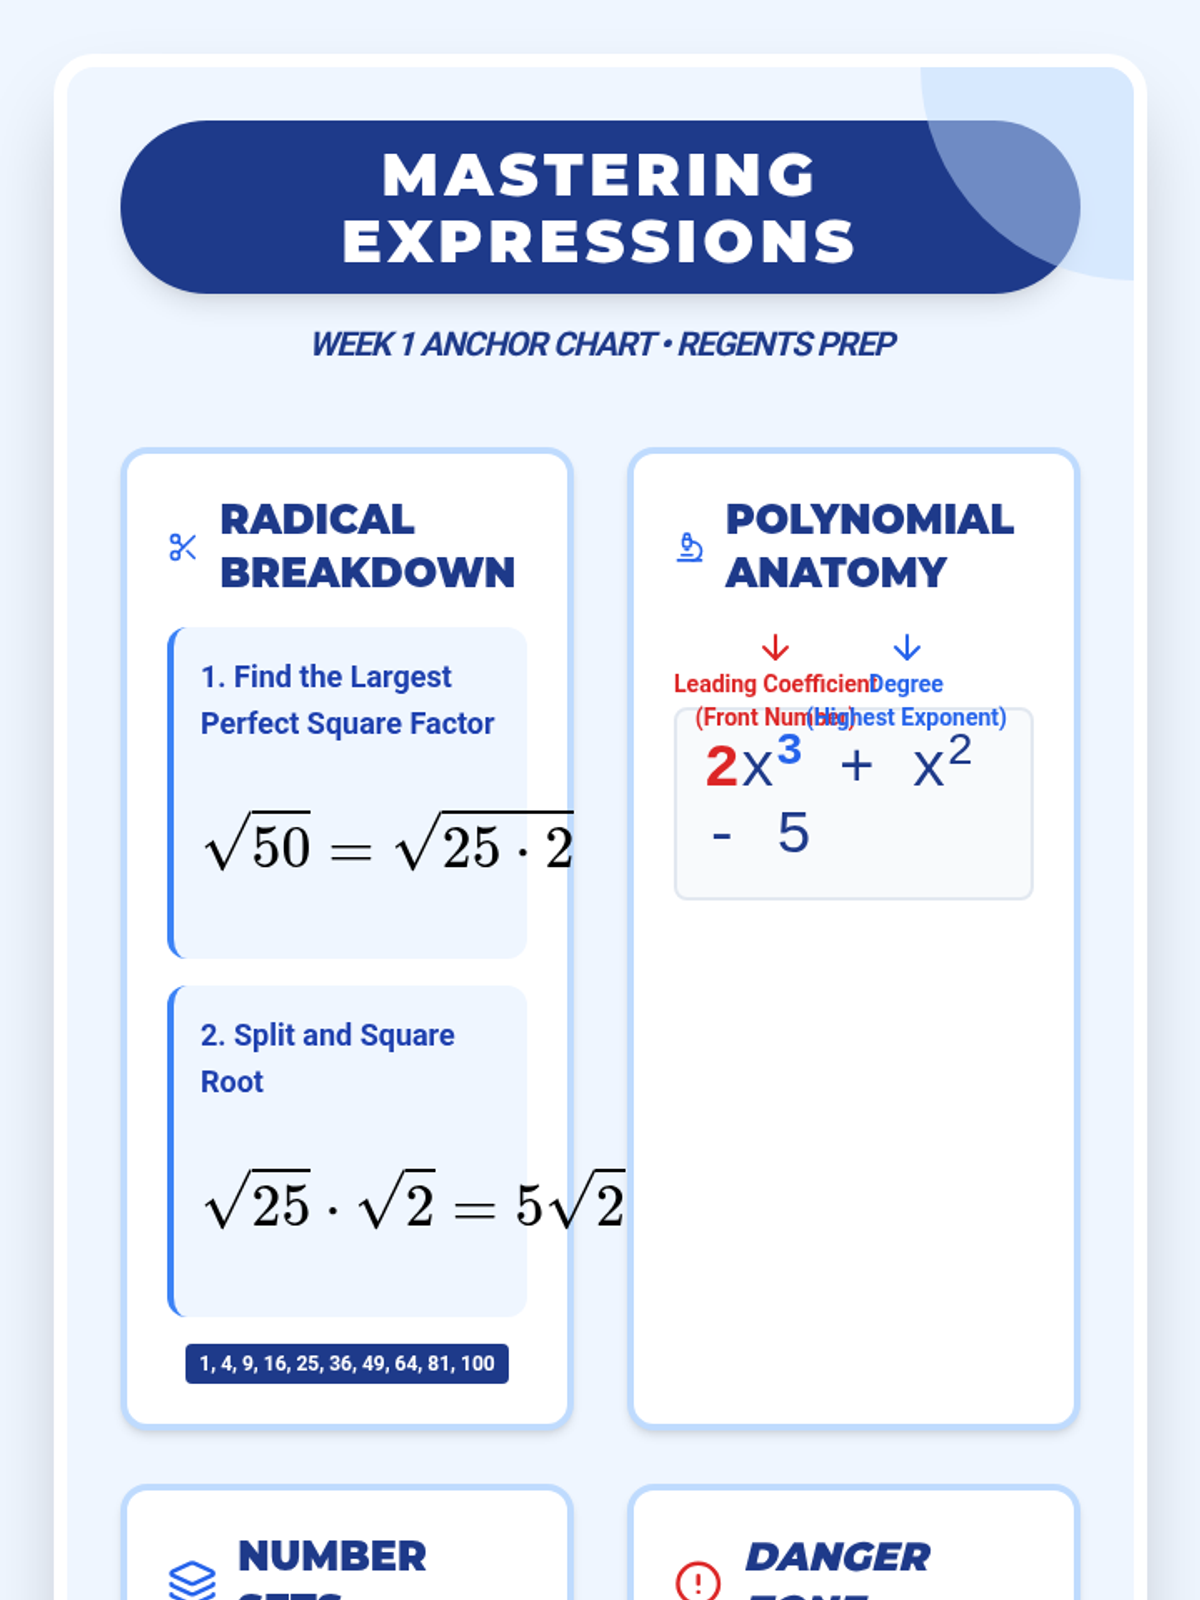
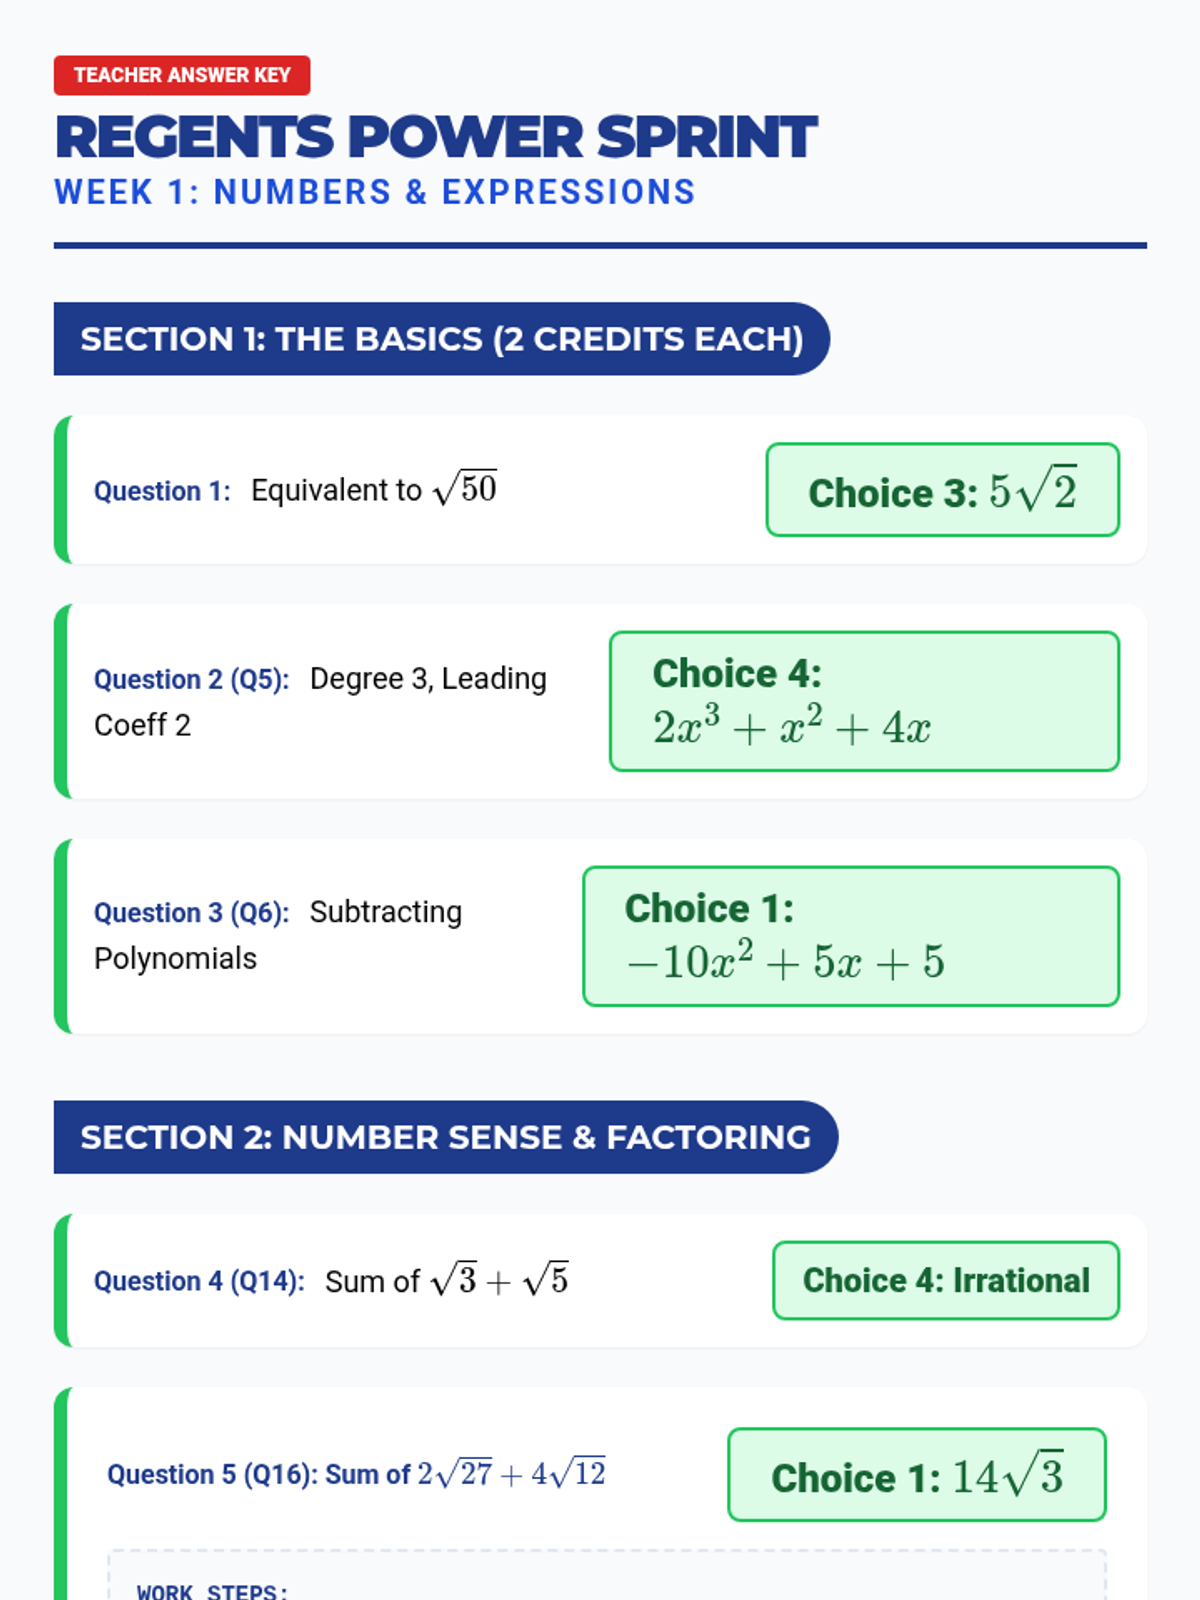
A comprehensive 10-week preparation sequence designed to get students ready for the Algebra I Regents exam by May 15th, featuring bi-weekly 30-minute practice sessions and visual anchor charts.
Une série de ressources éducatives couvrant divers concepts mathématiques essentiels comme les statistiques et la trigonométrie.
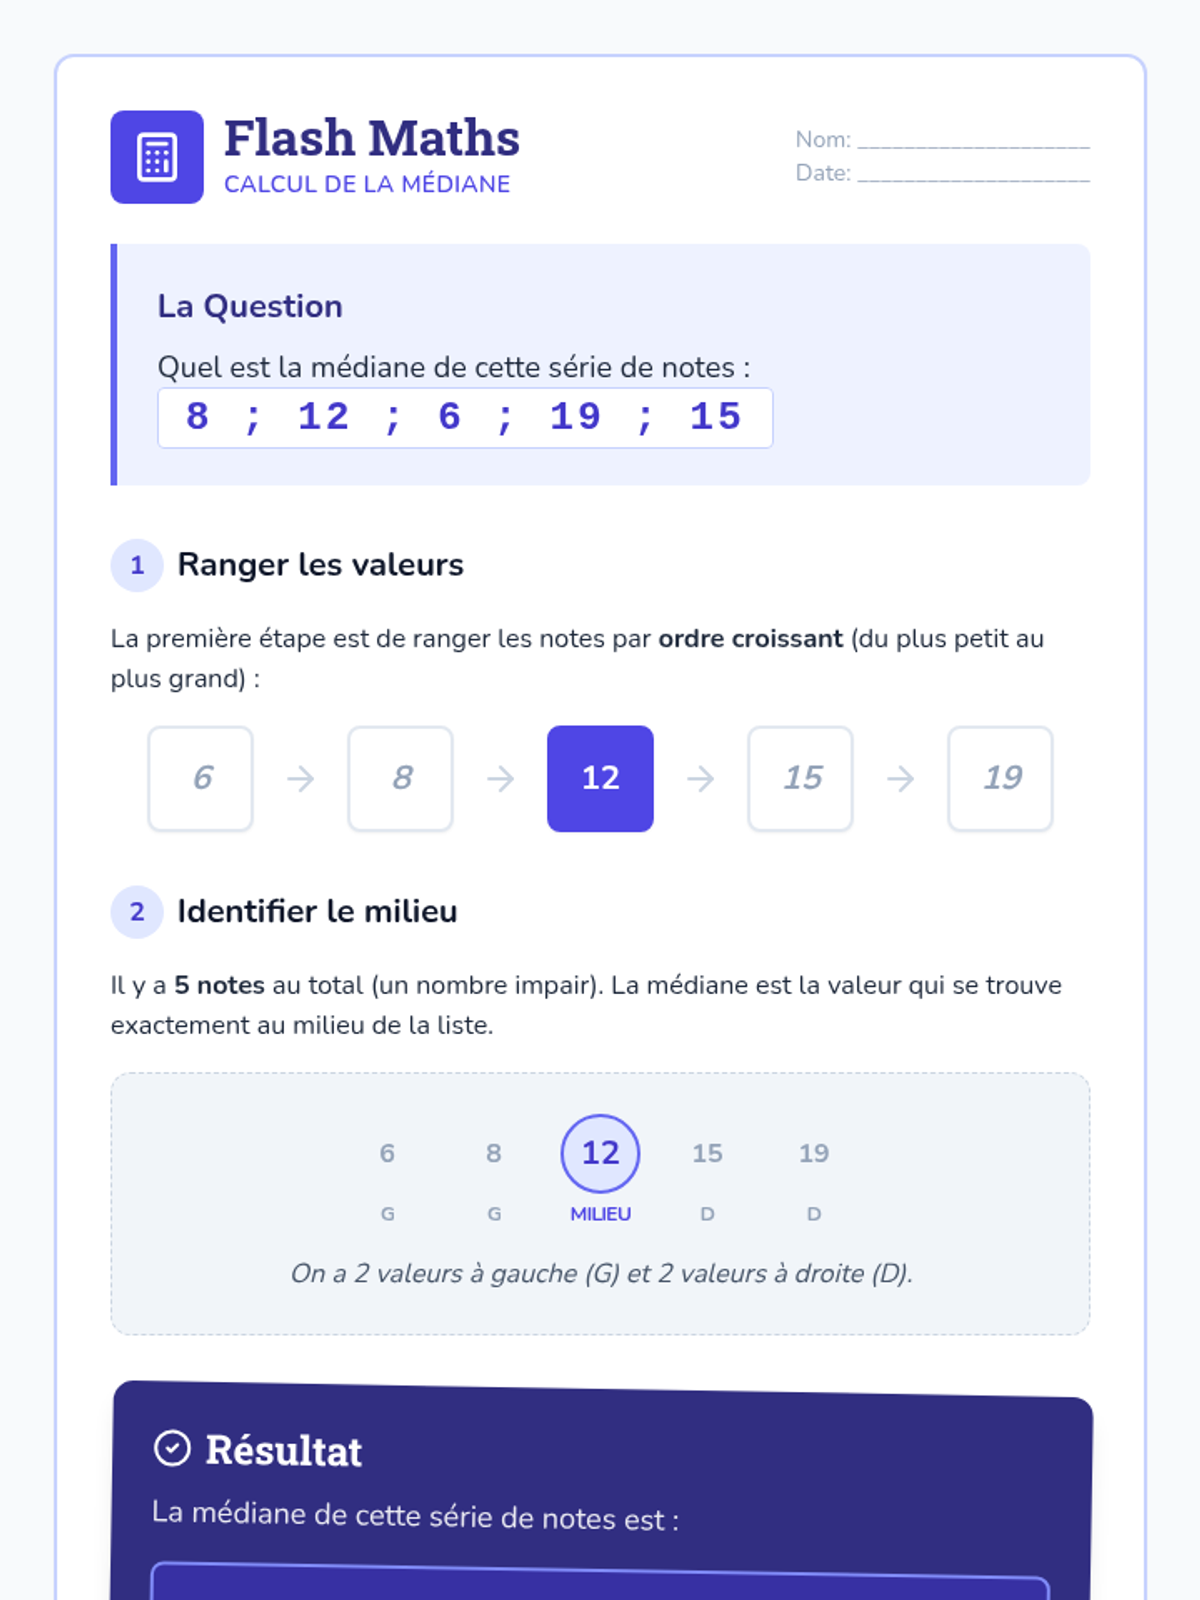
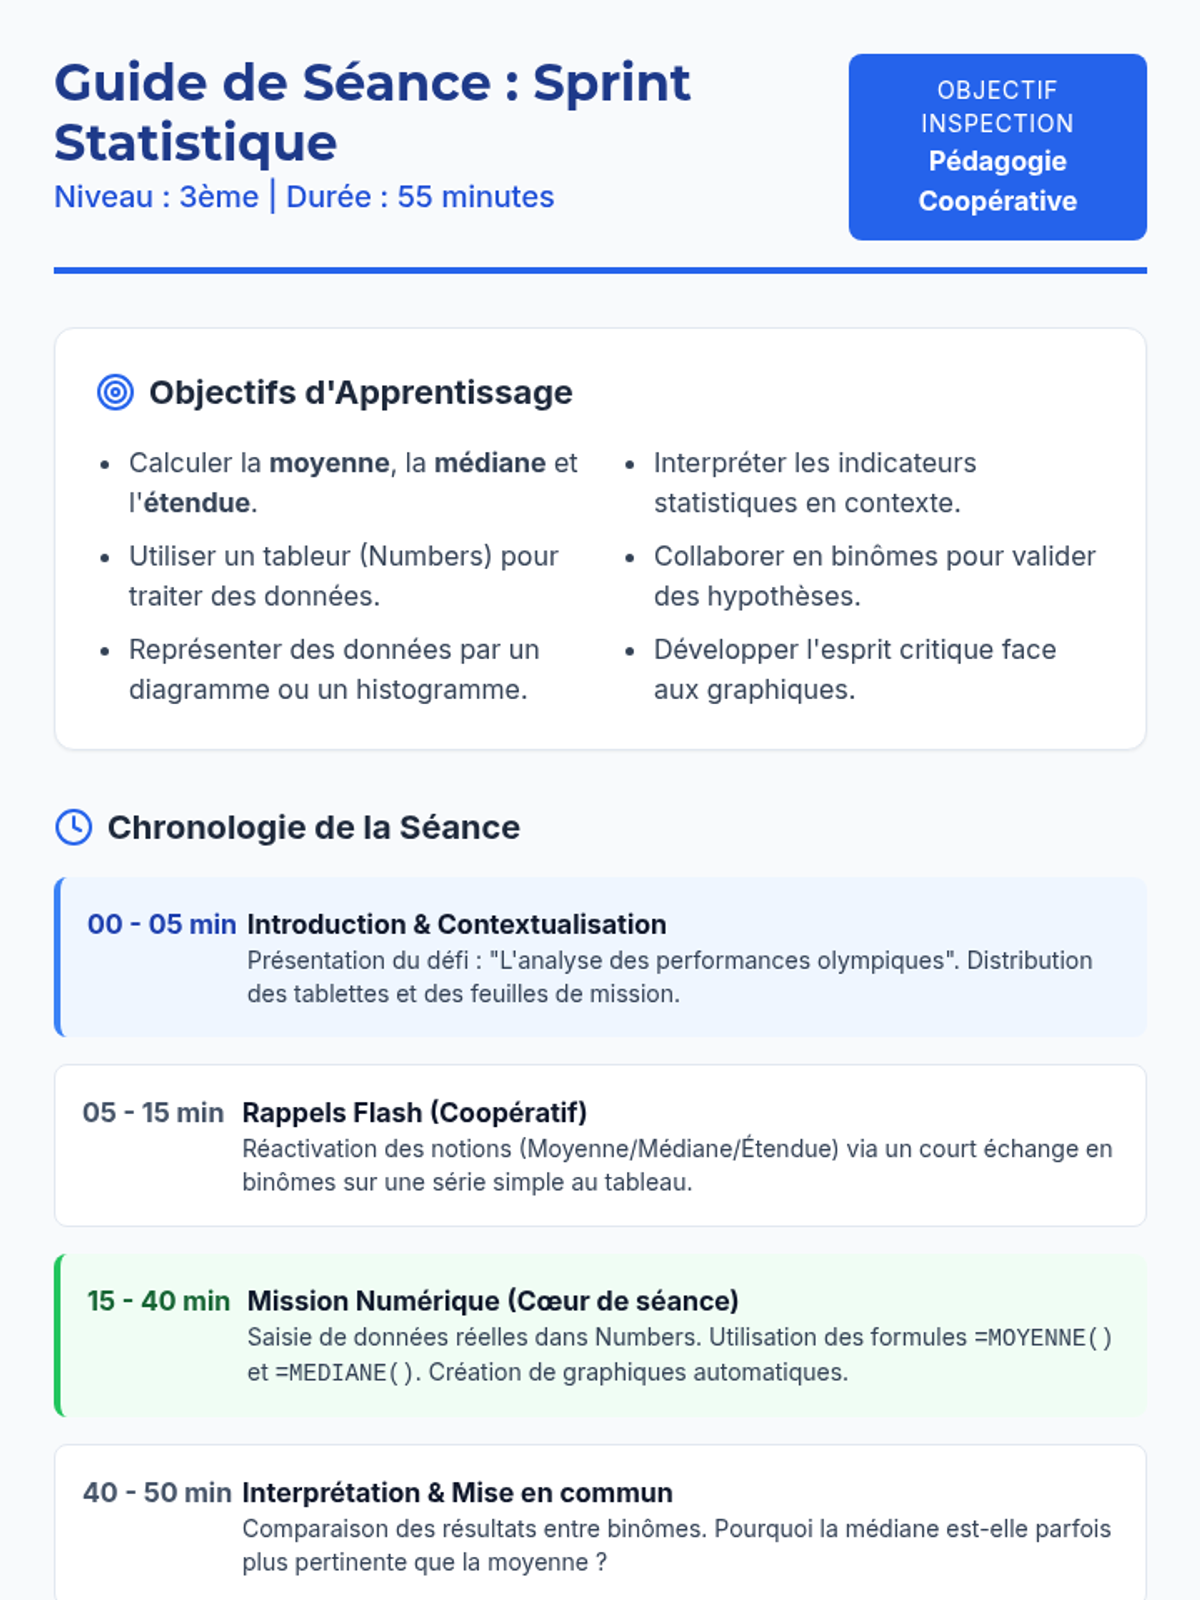
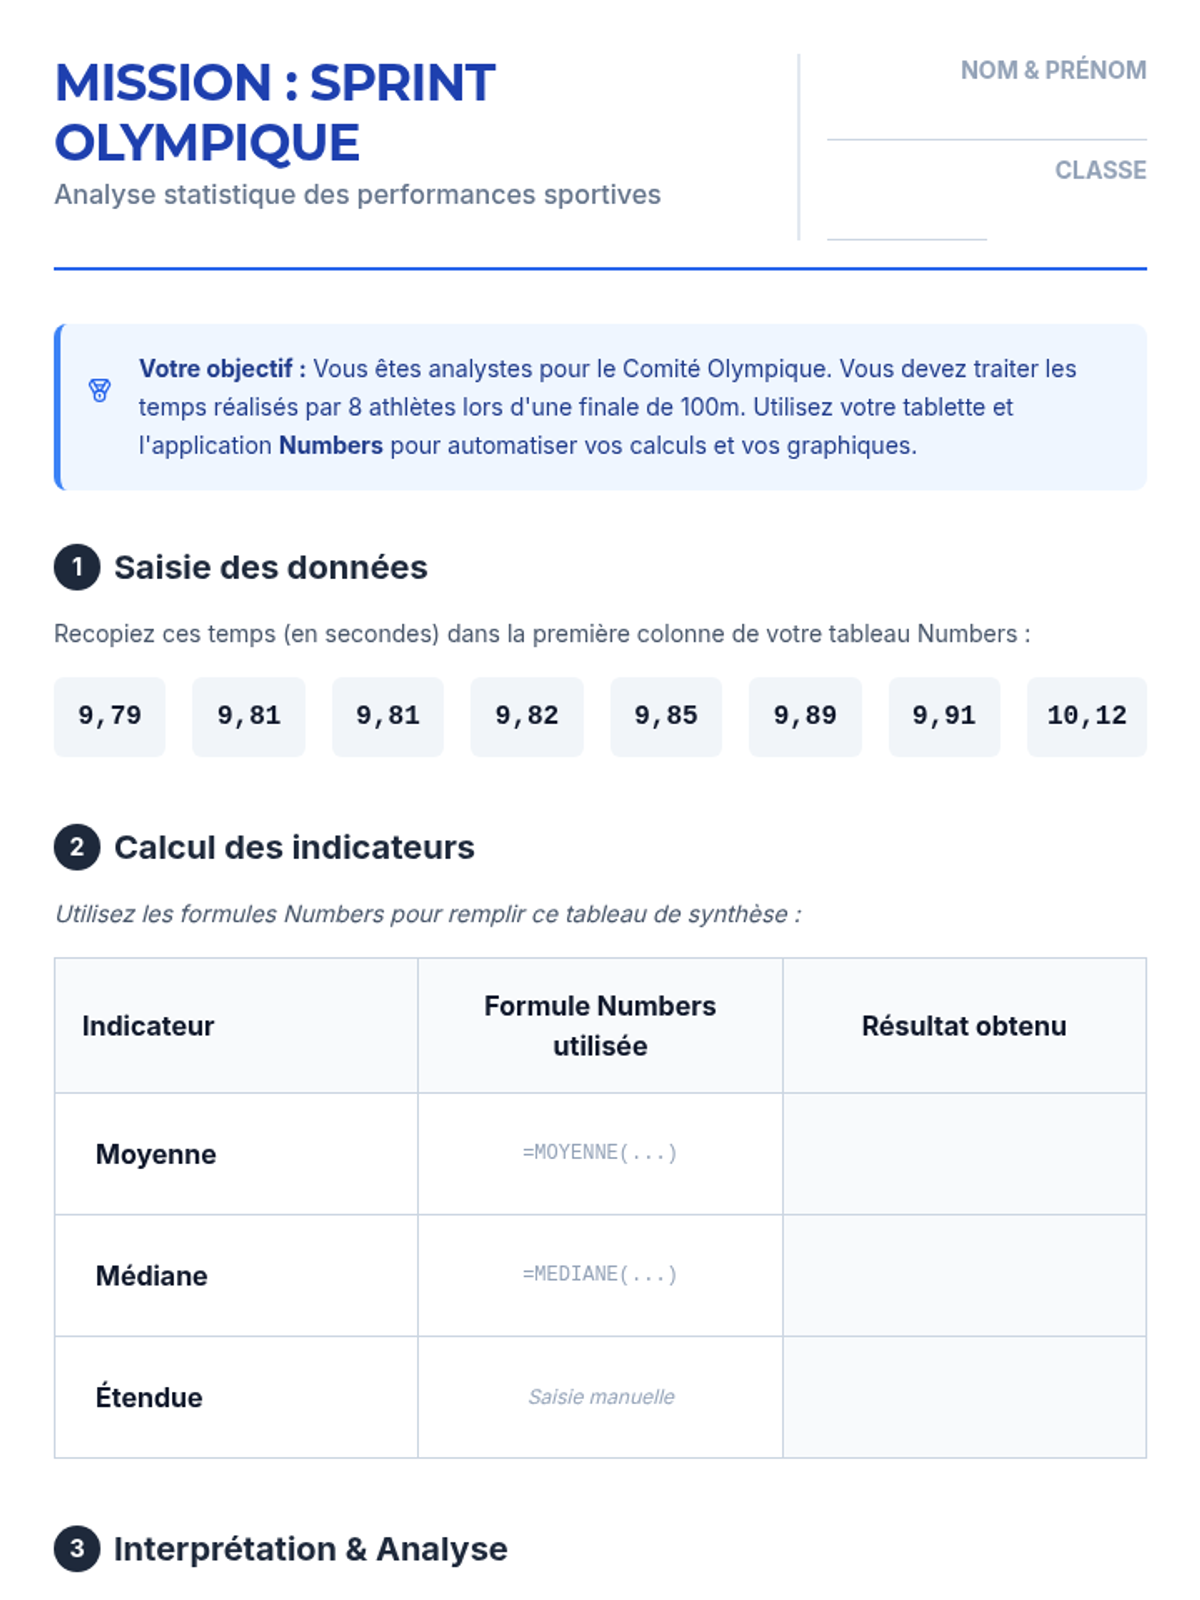
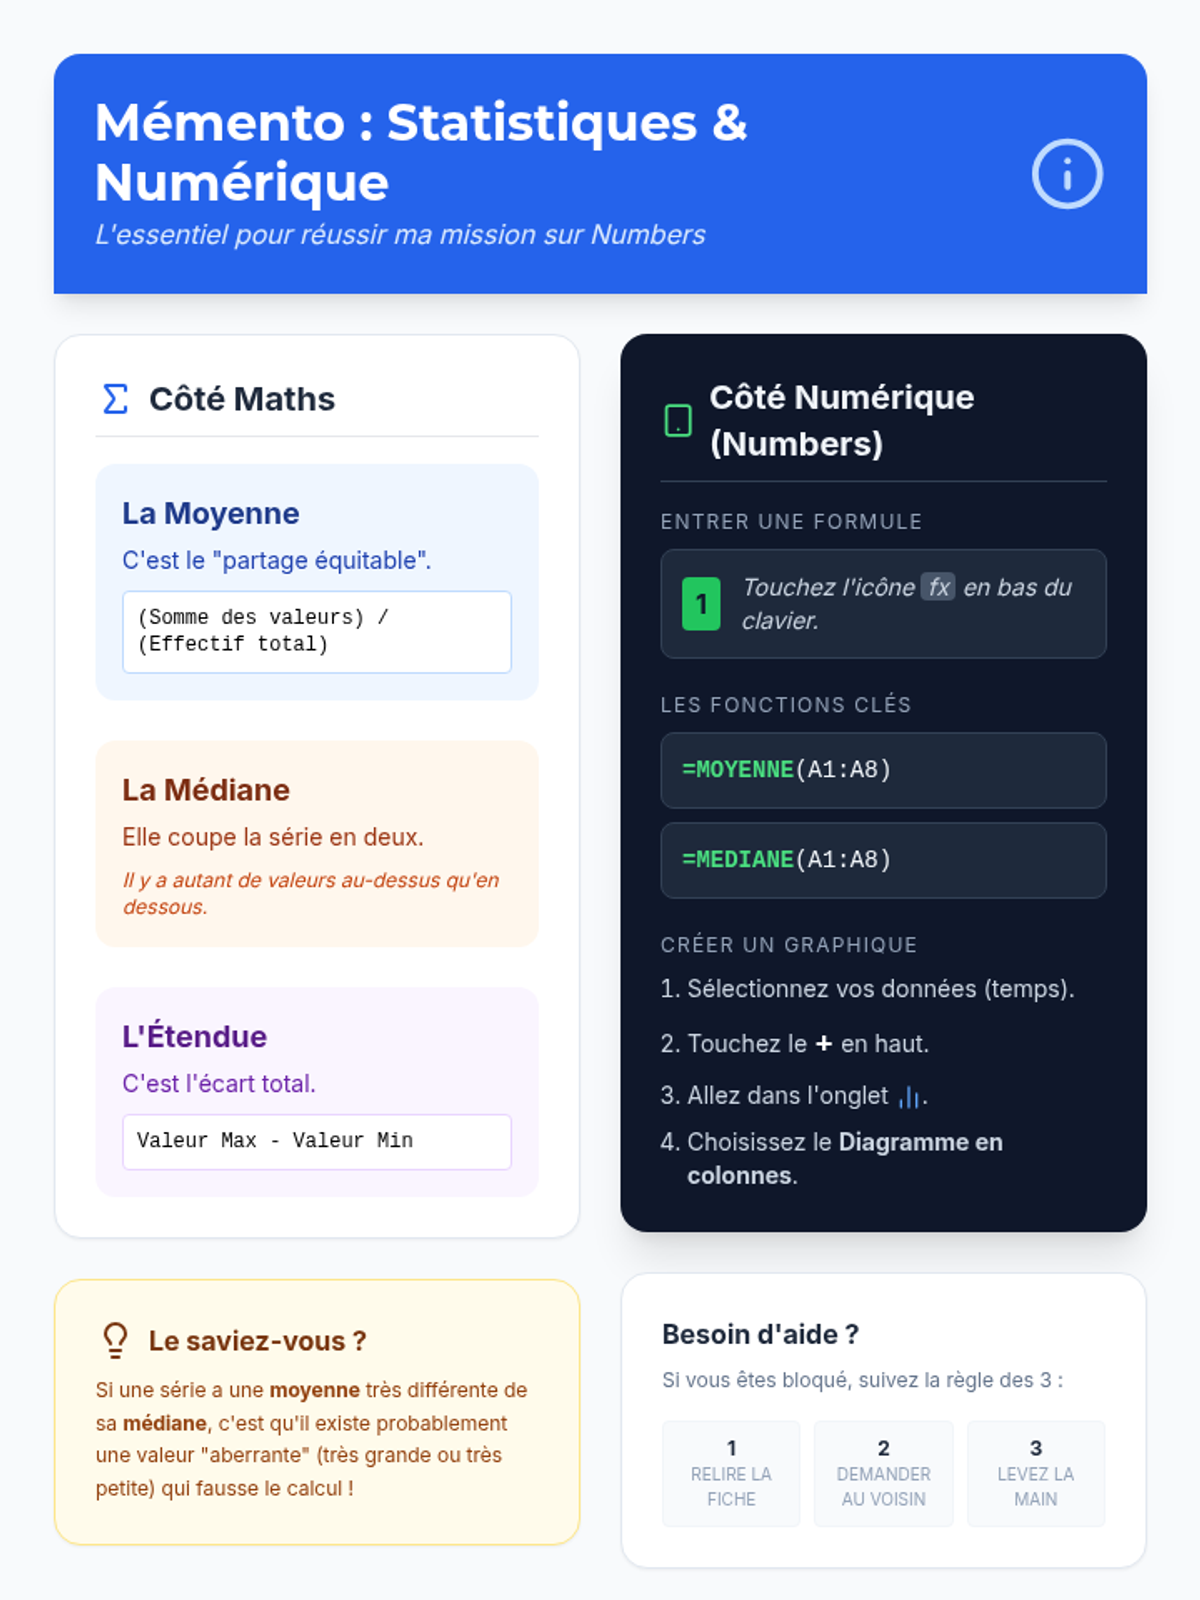
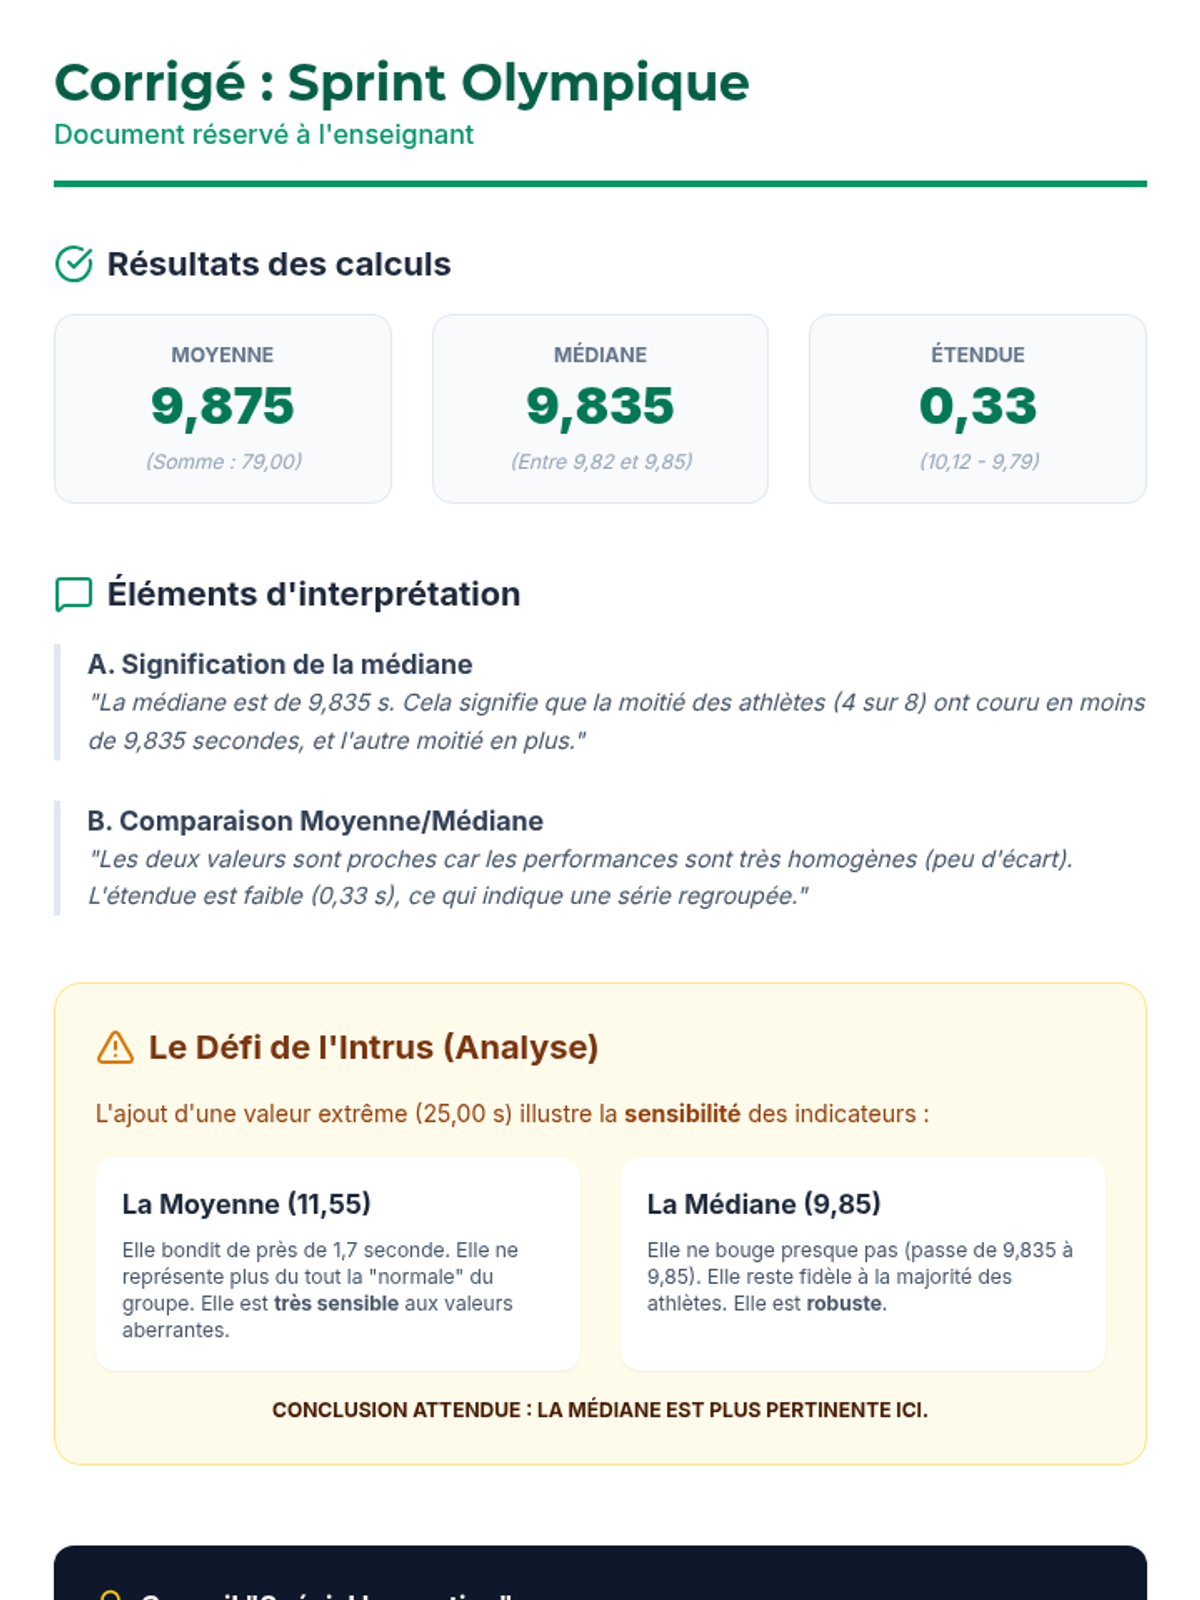
Une séquence complète sur les statistiques en 3ème, abordant la collecte, le traitement et l'interprétation de données avec des outils numériques.
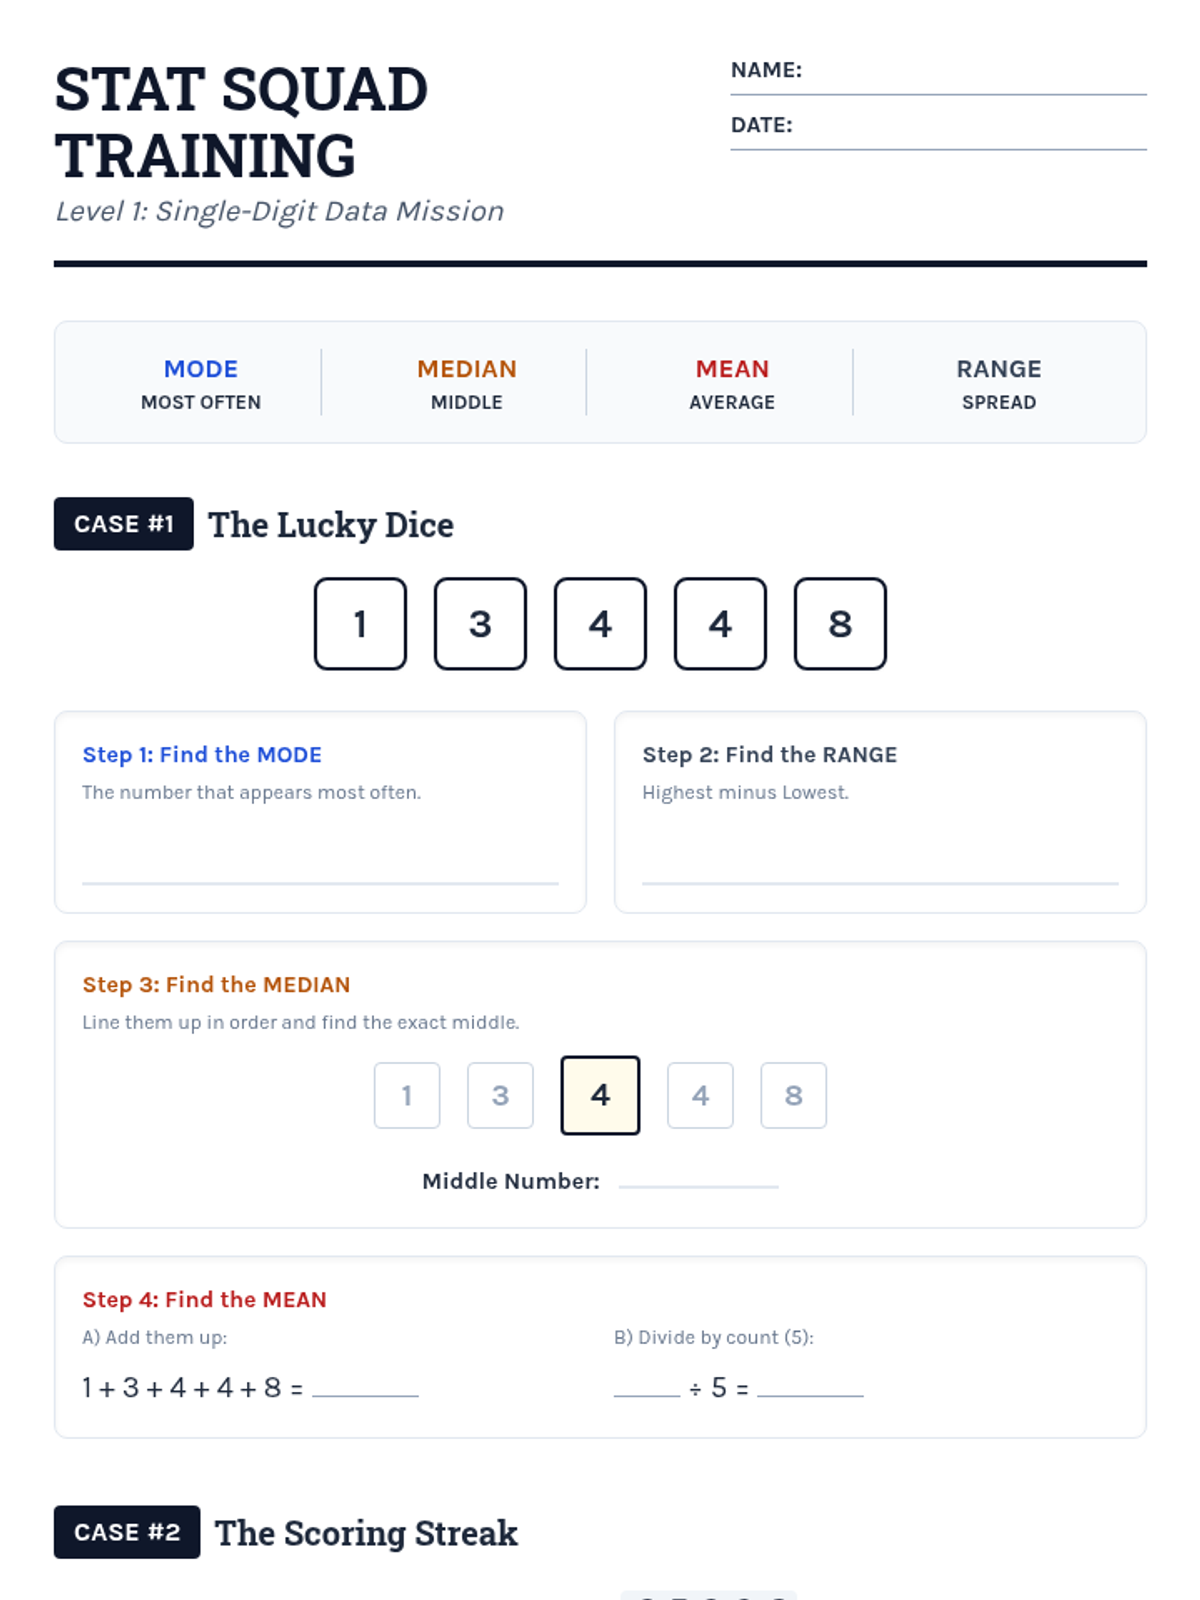
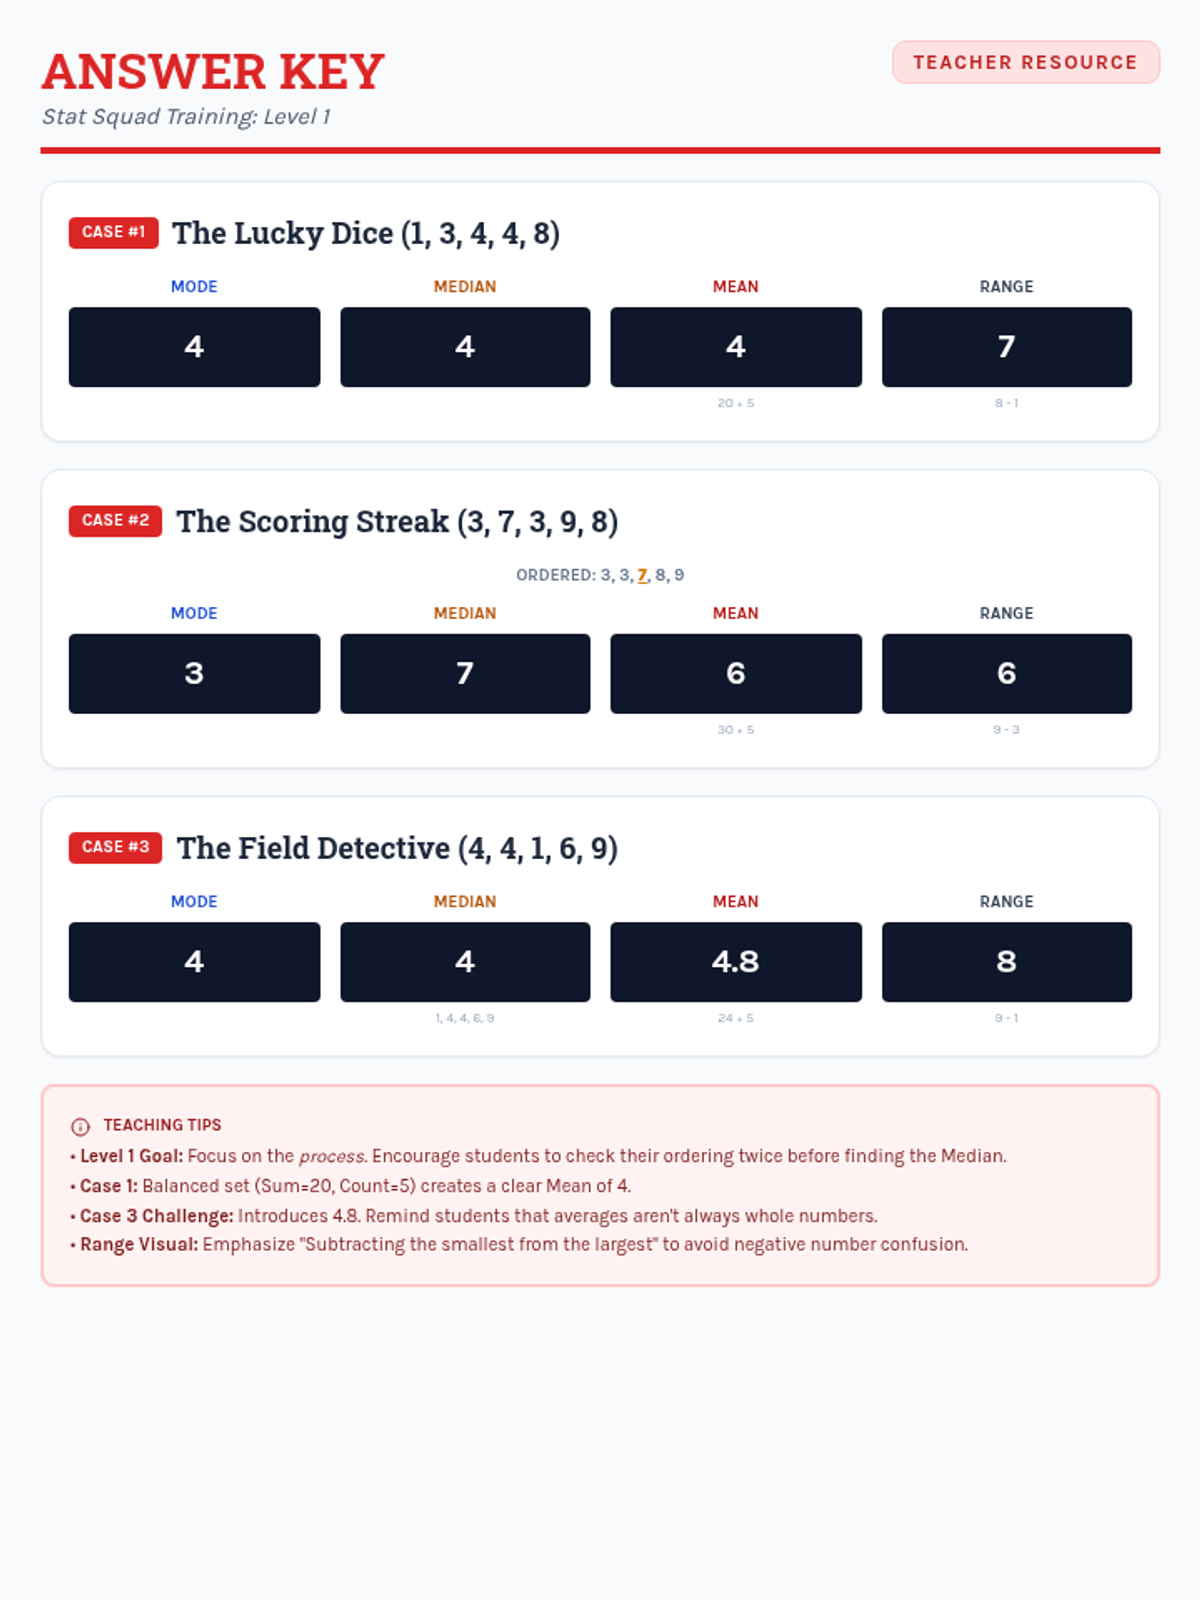
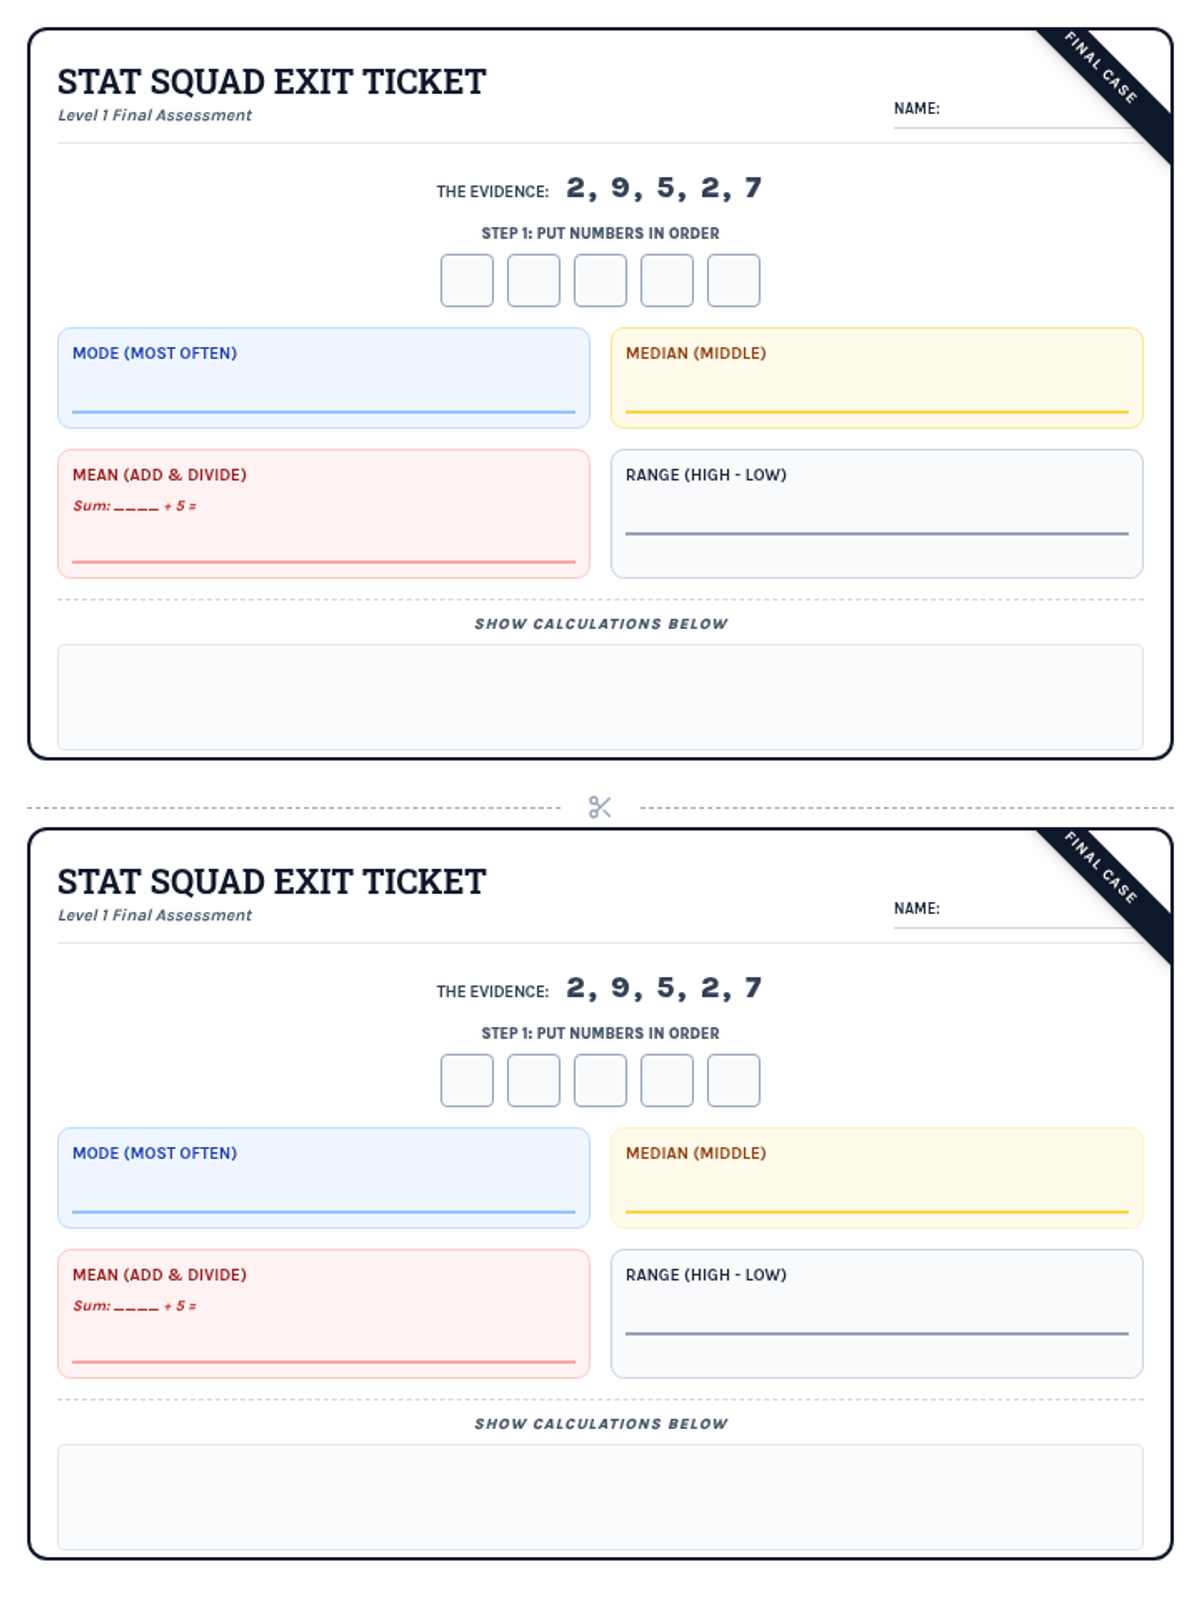
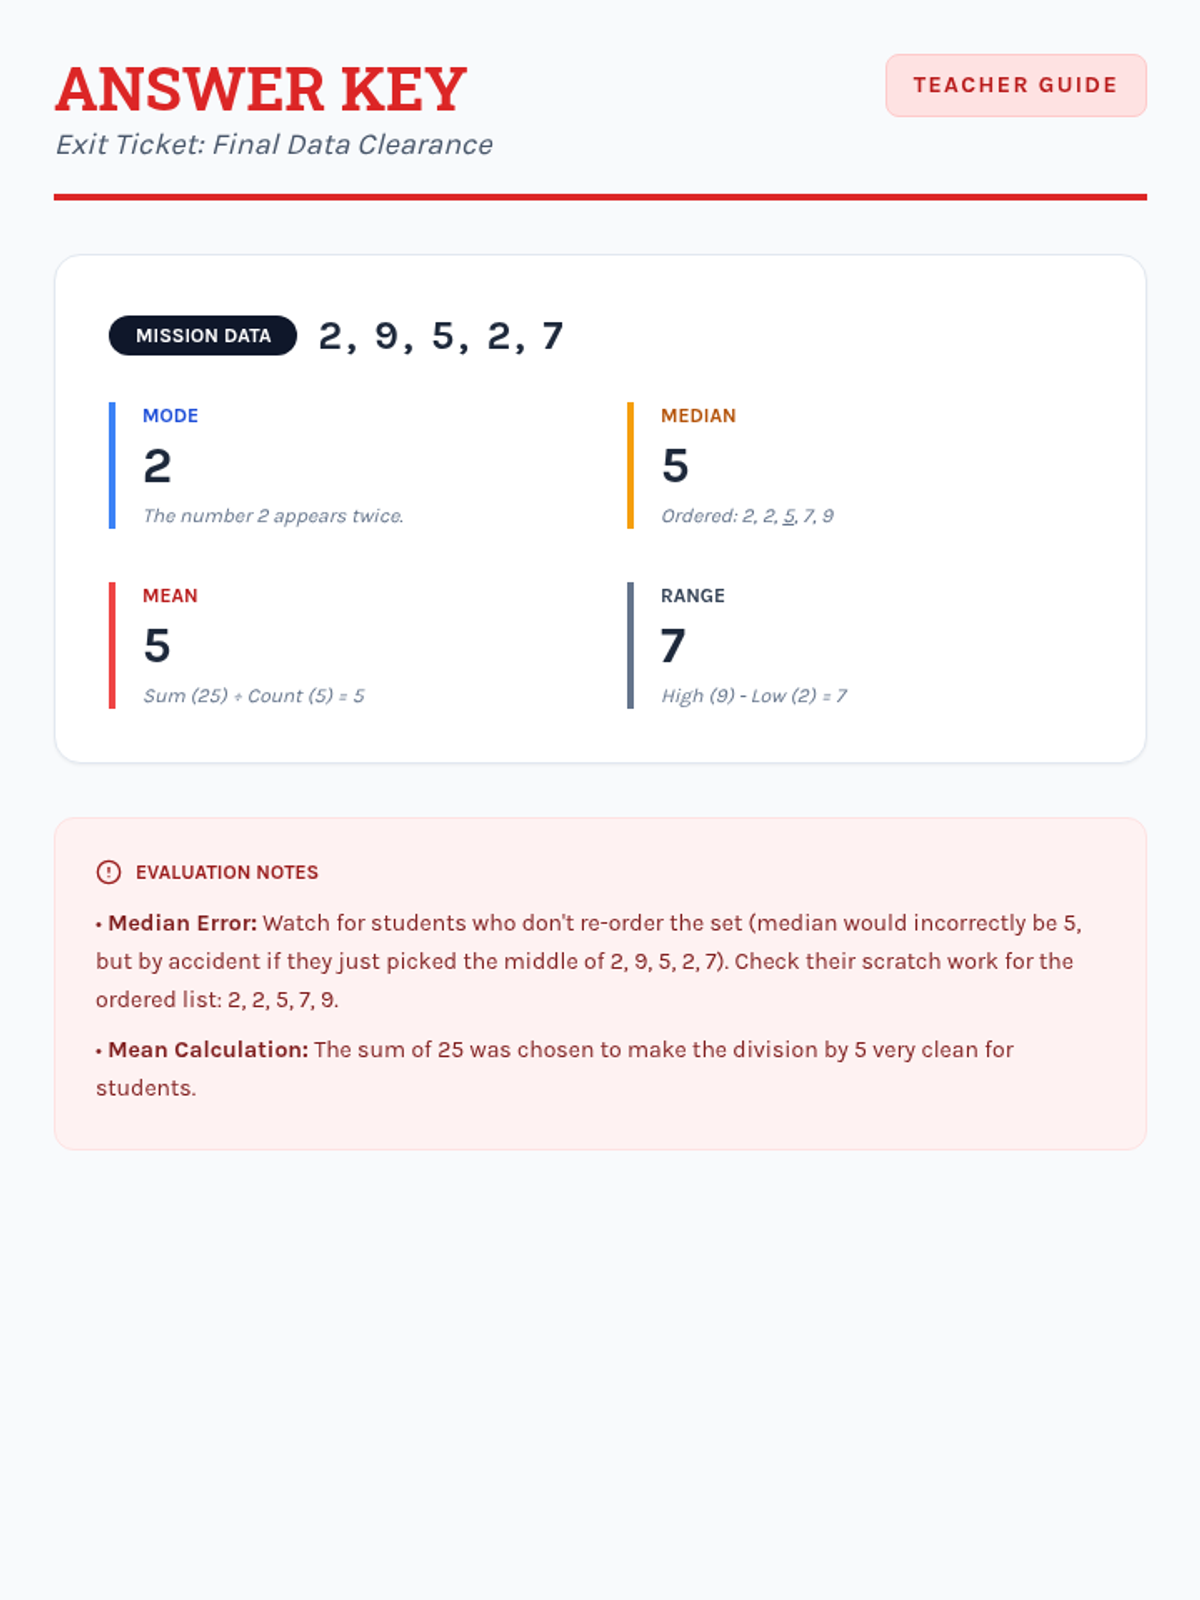
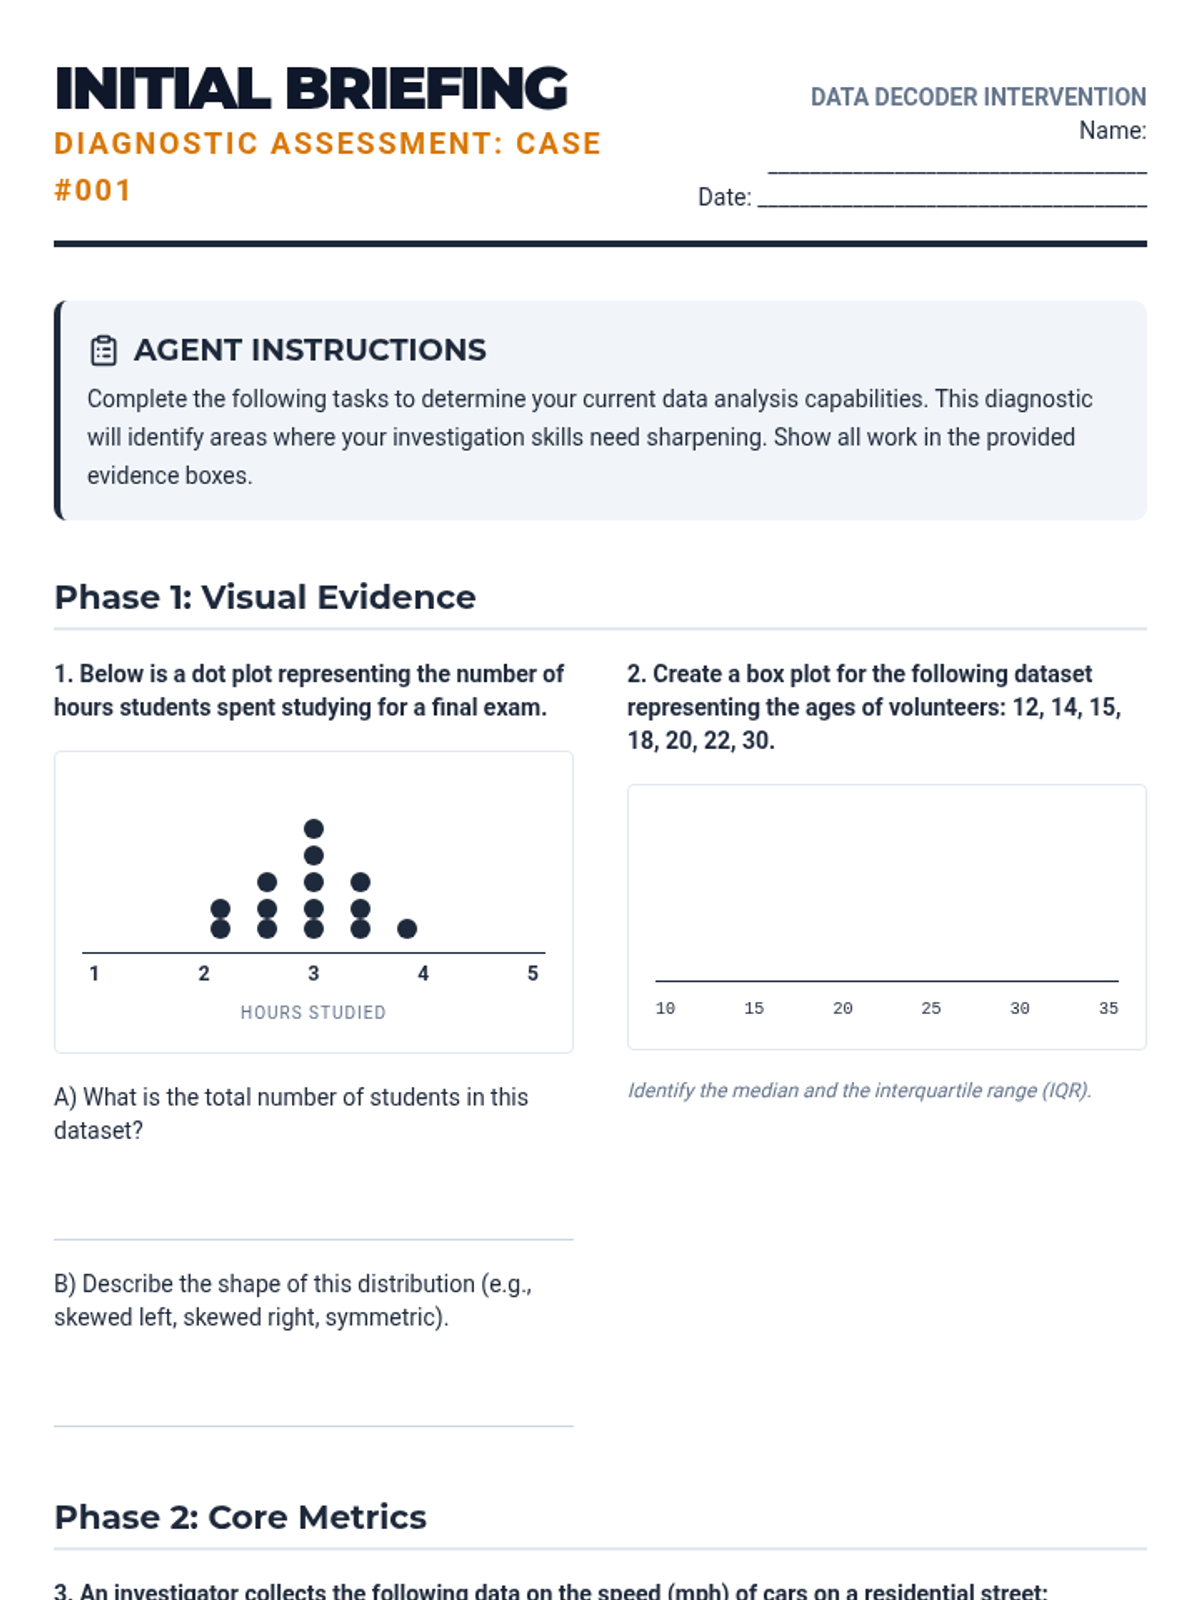
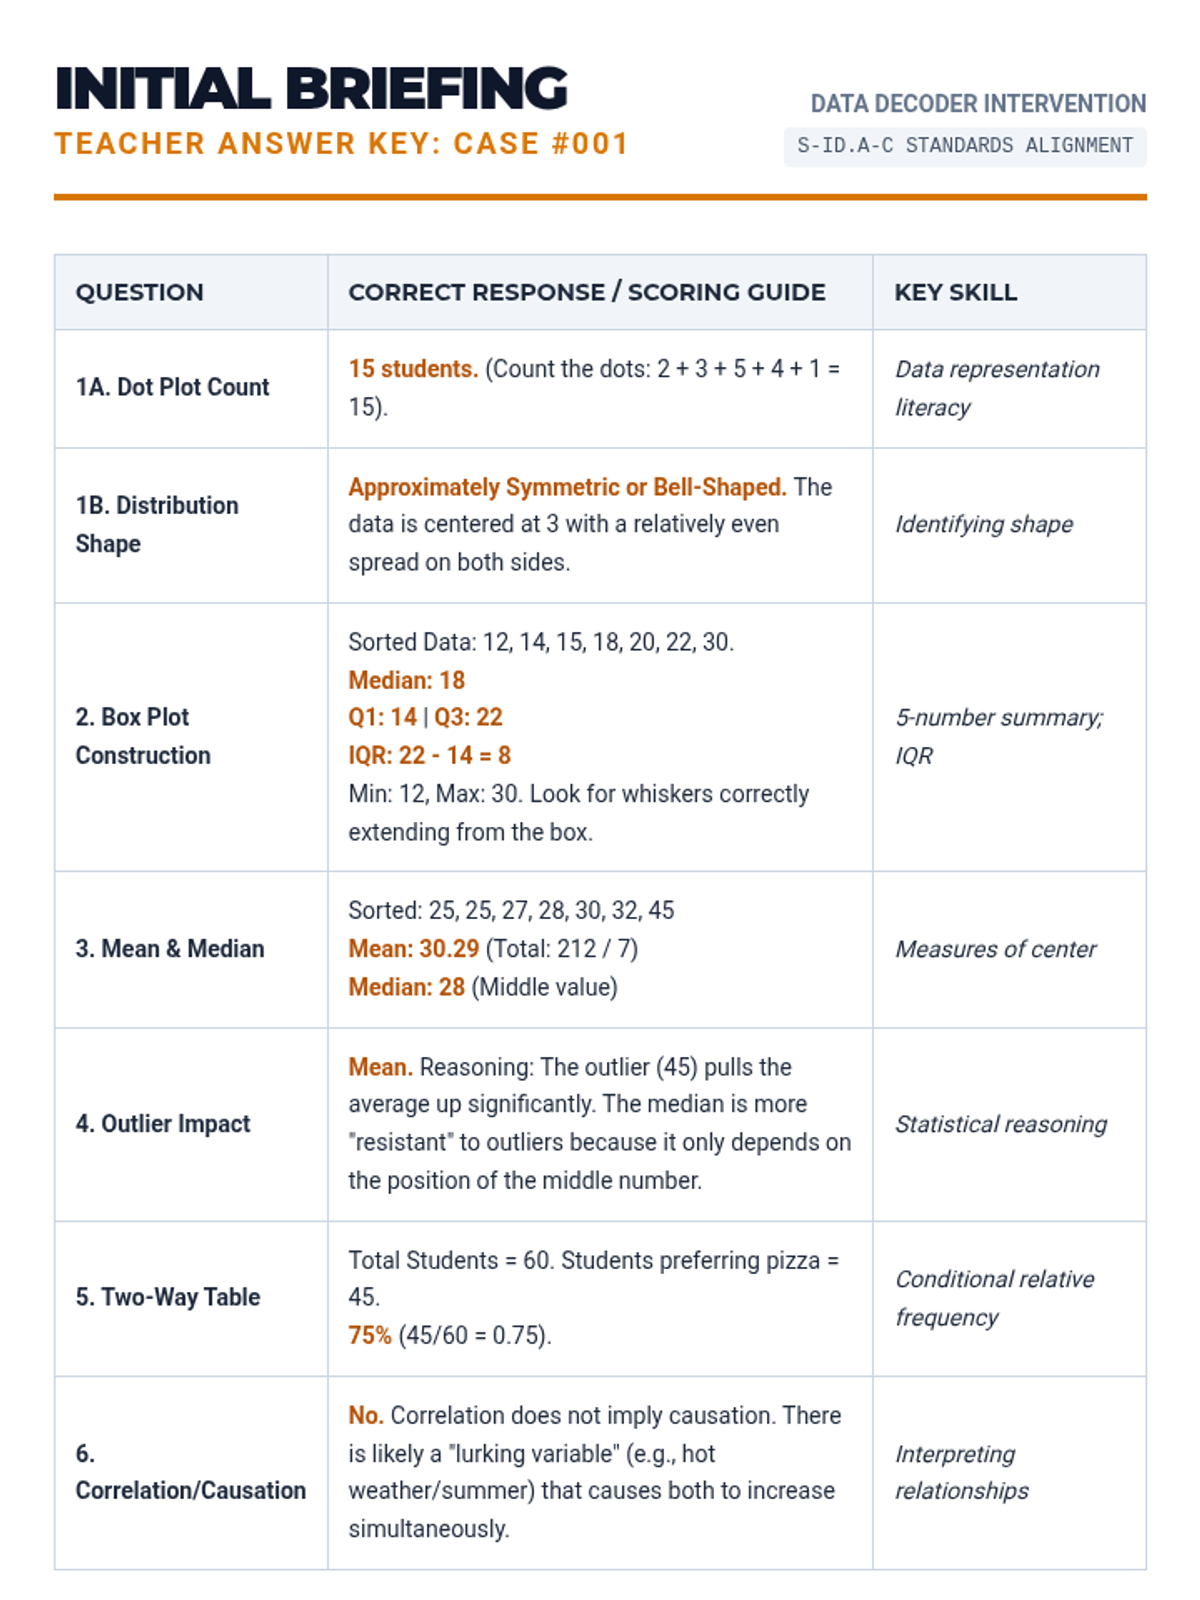
A comprehensive Tier 2 intervention sequence for high school students focused on summarizing, representing, and interpreting data, aligned with Colorado Standard 3. The program uses a 'Data Forensics' theme to engage students in uncovering insights from real-world datasets through scaffolded analysis and visual interpretation.
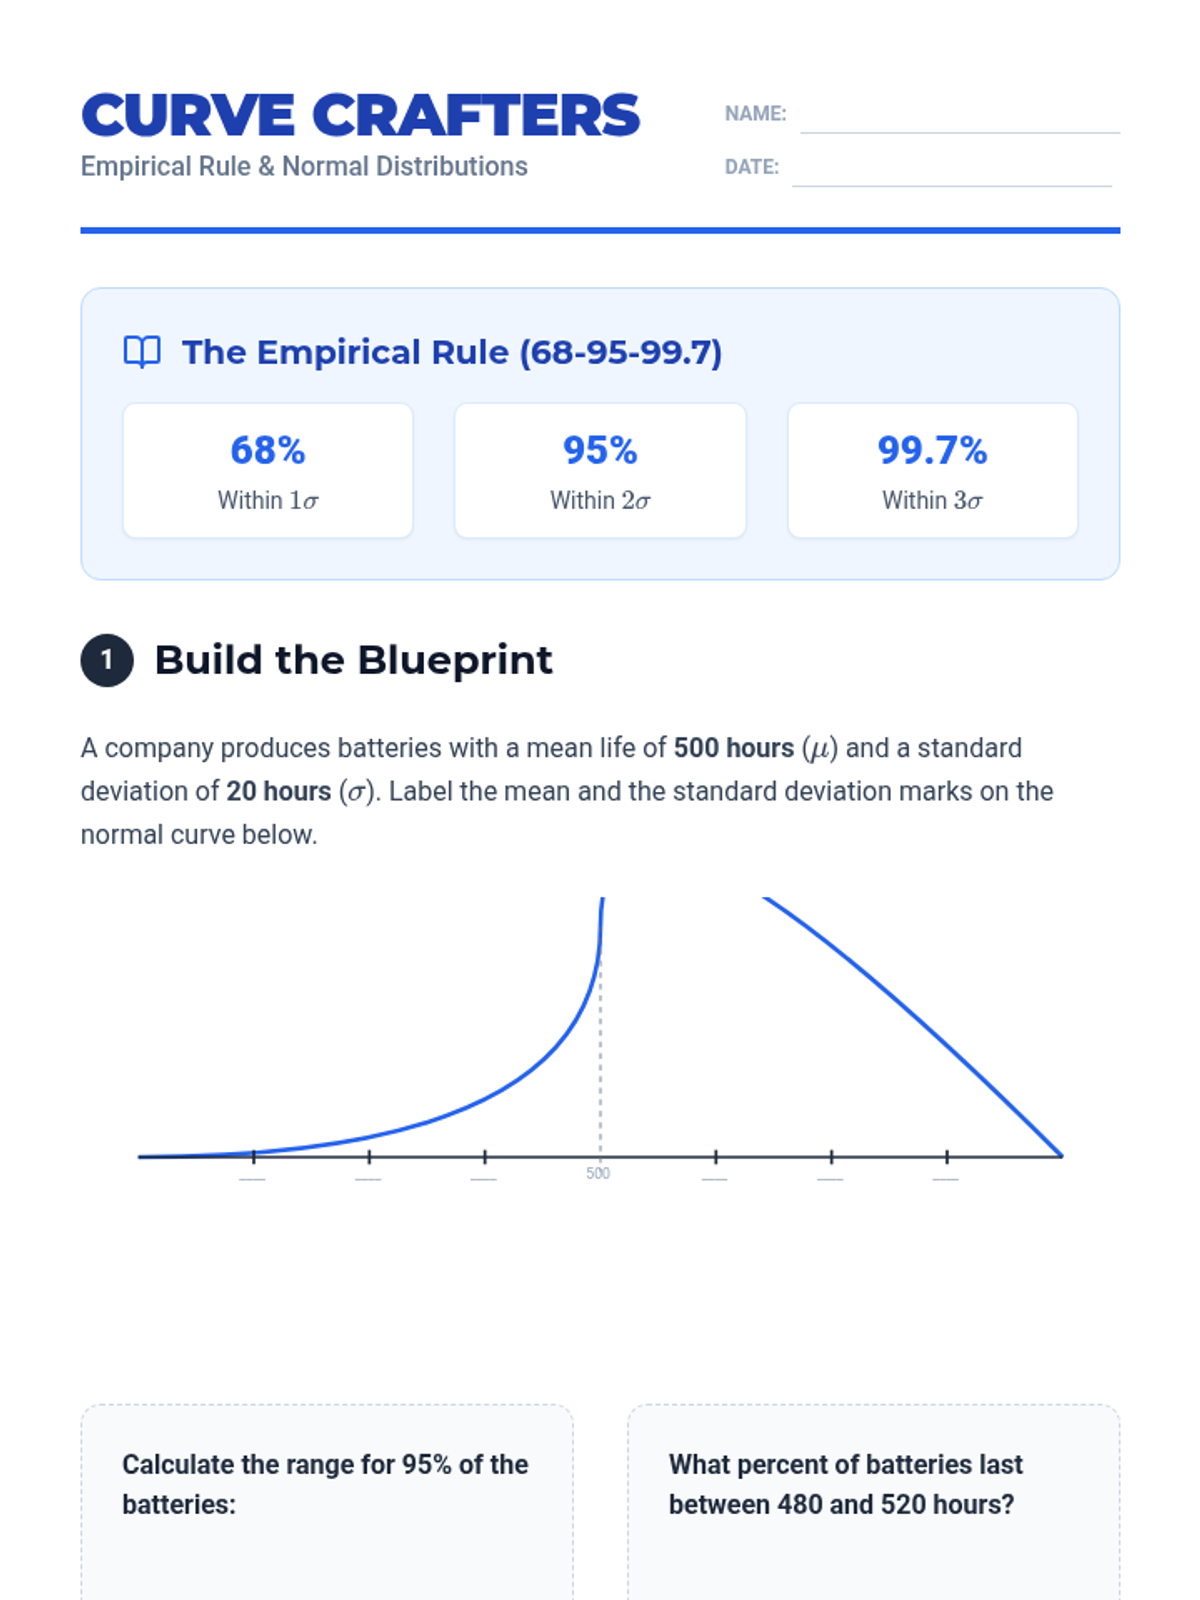
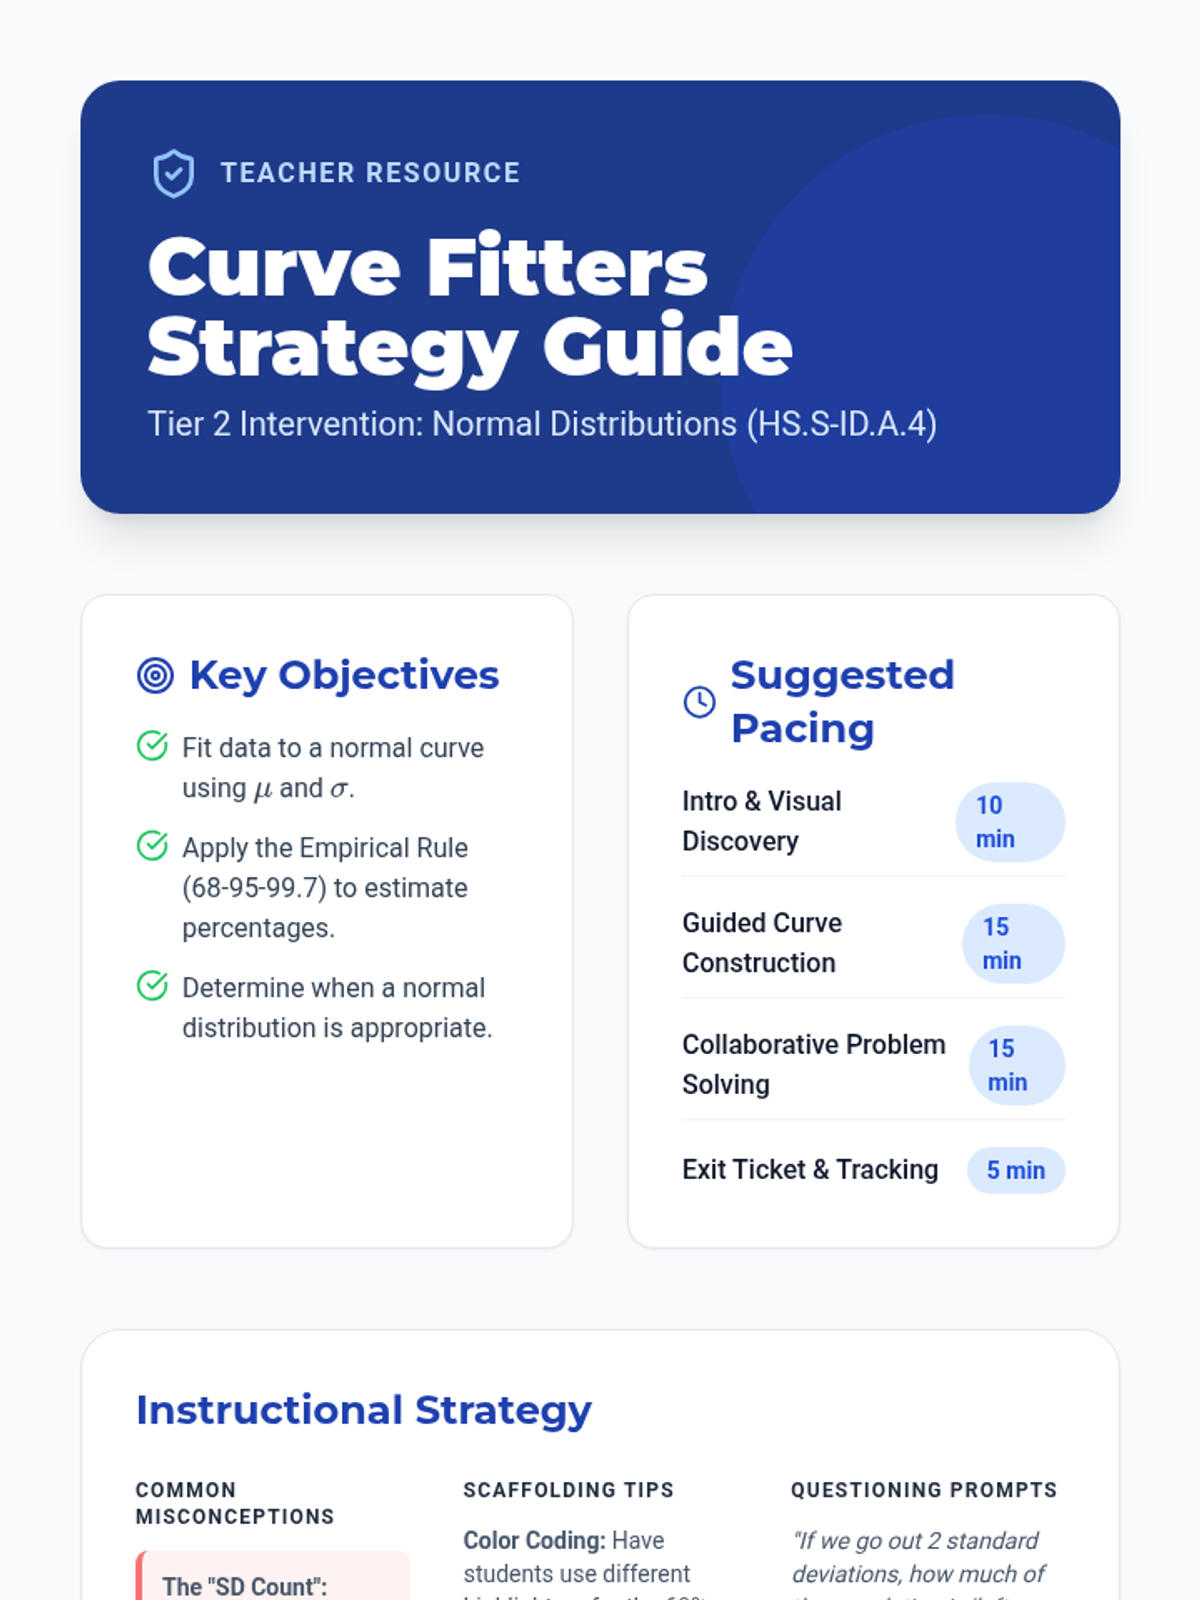
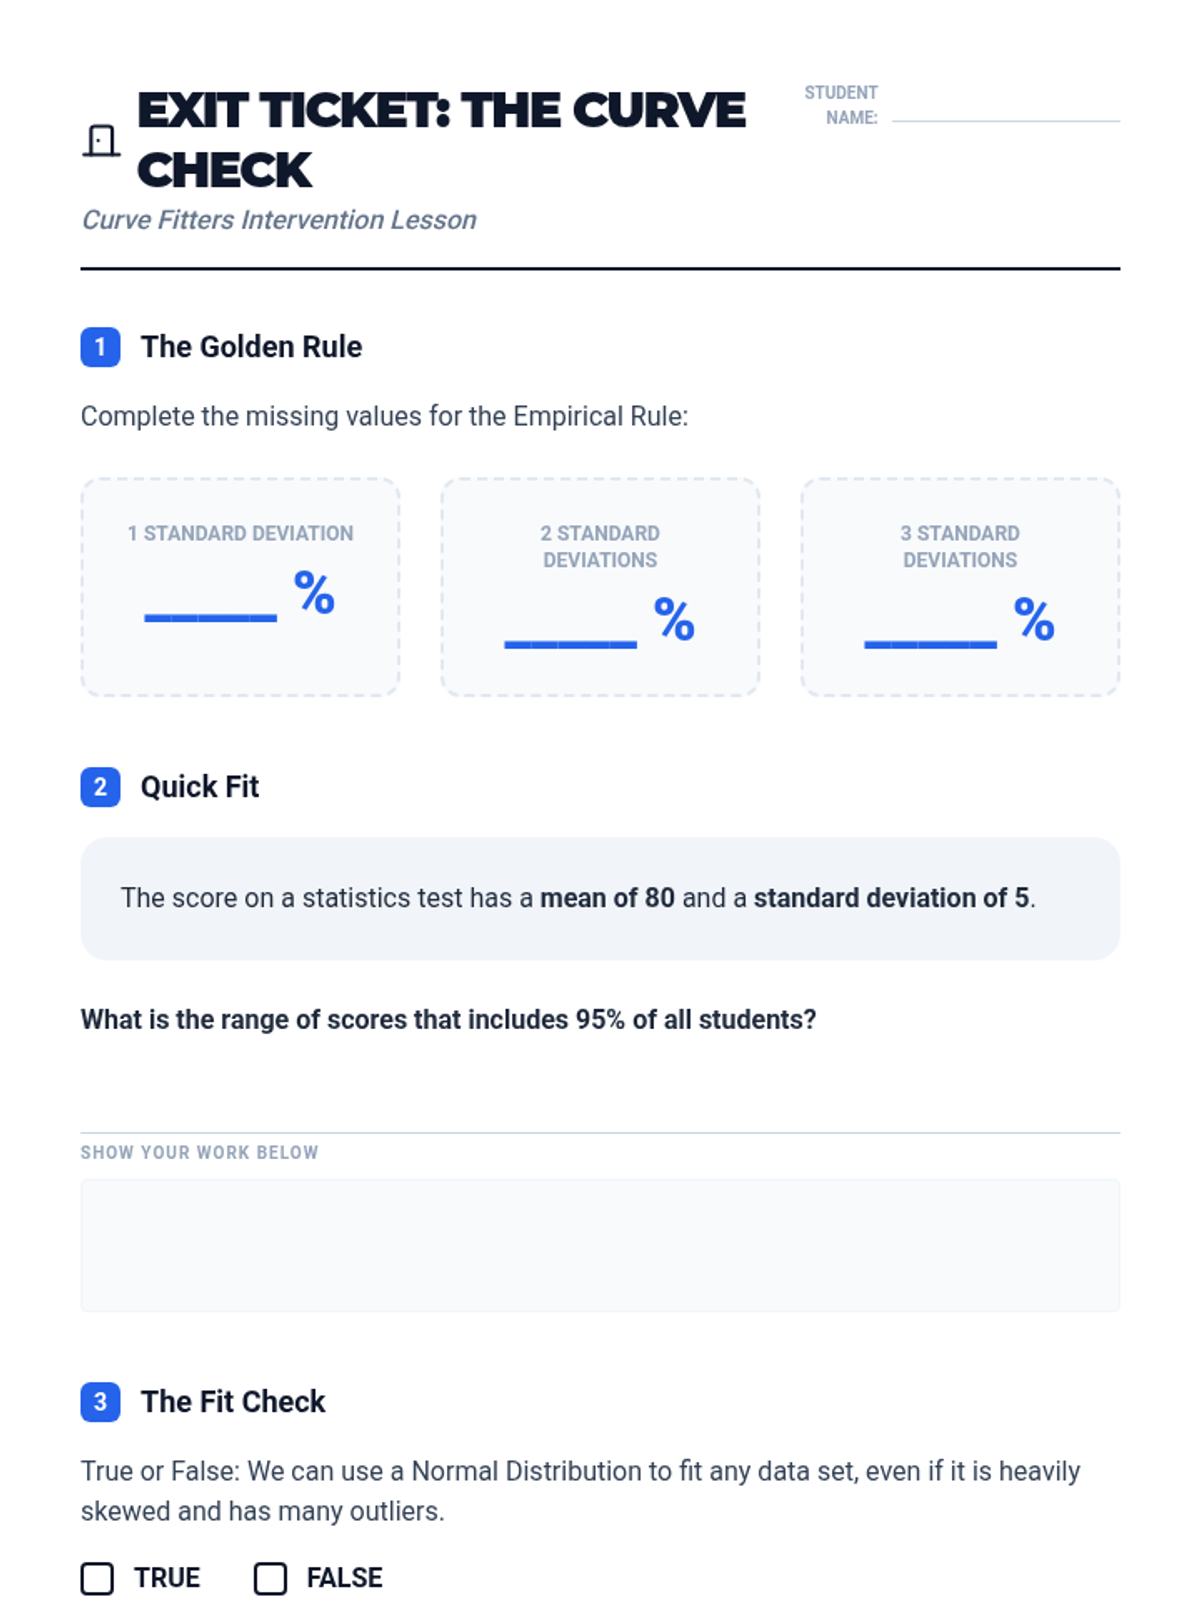
A Tier 2 intervention sequence focused on helping students master the Normal Distribution and the Empirical Rule through real-world applications and scaffolded practice.
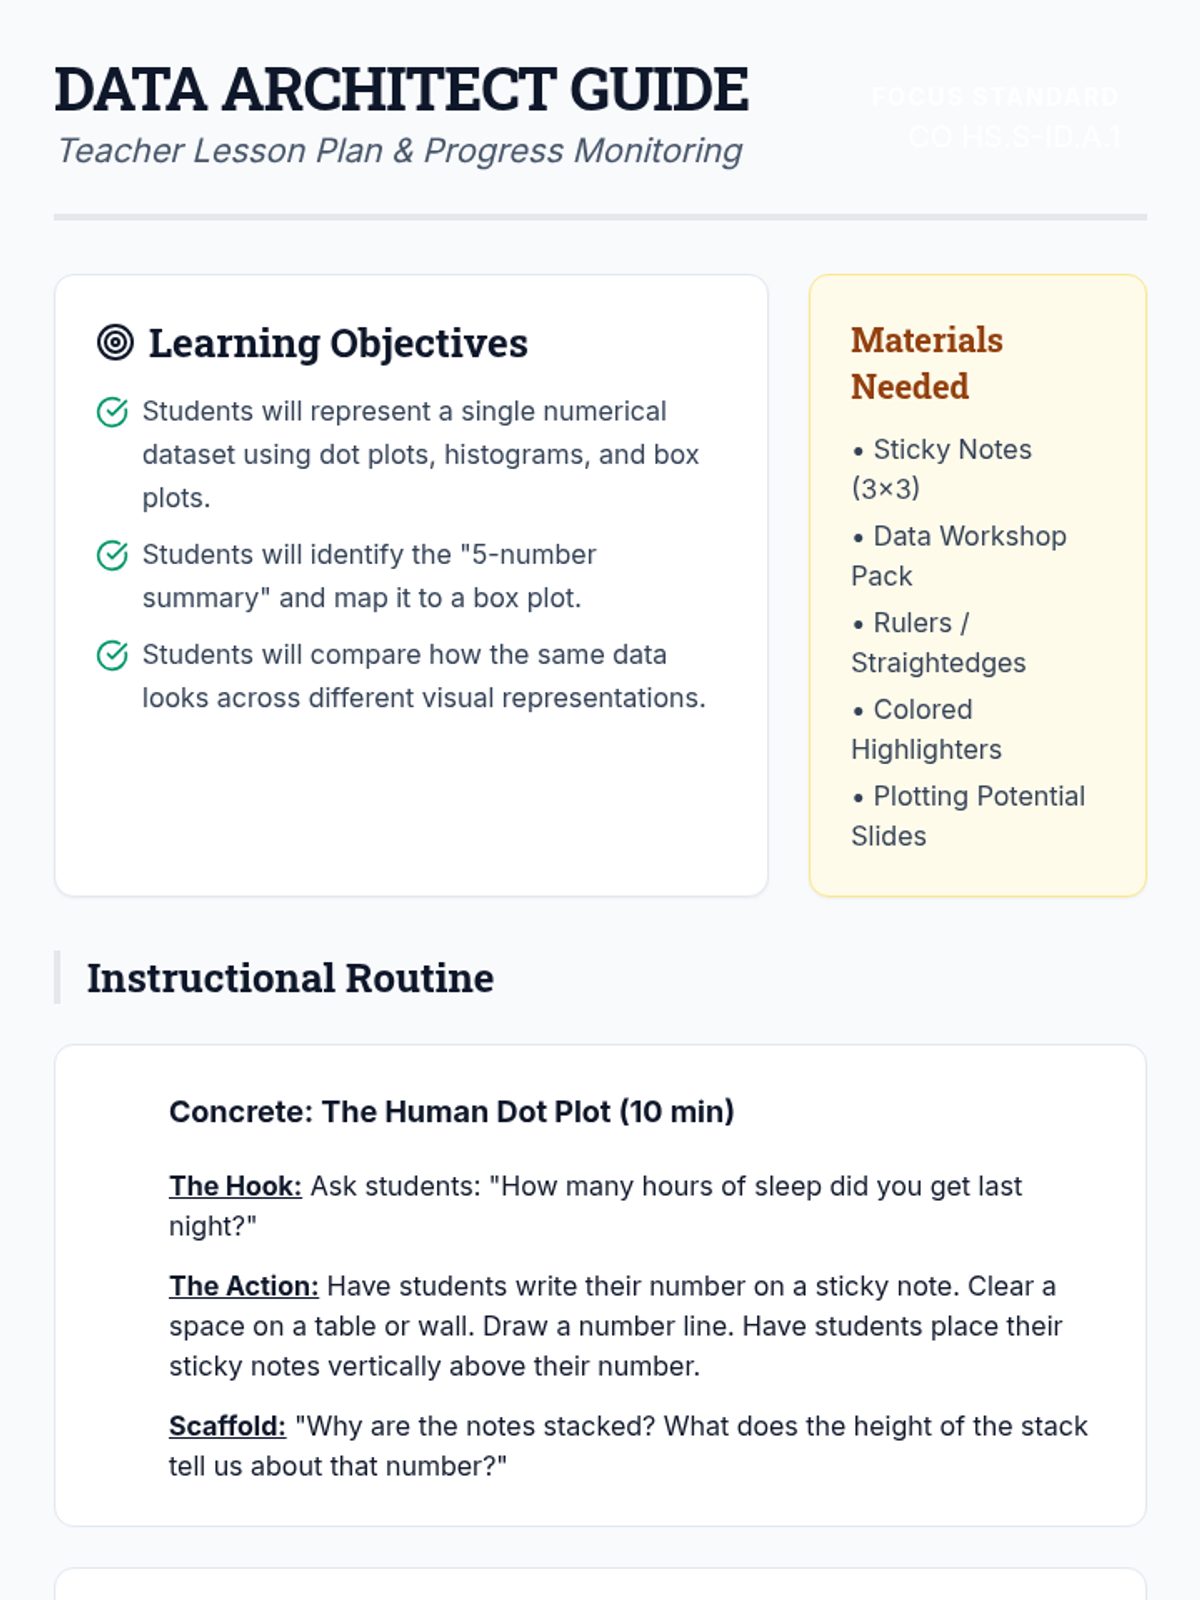
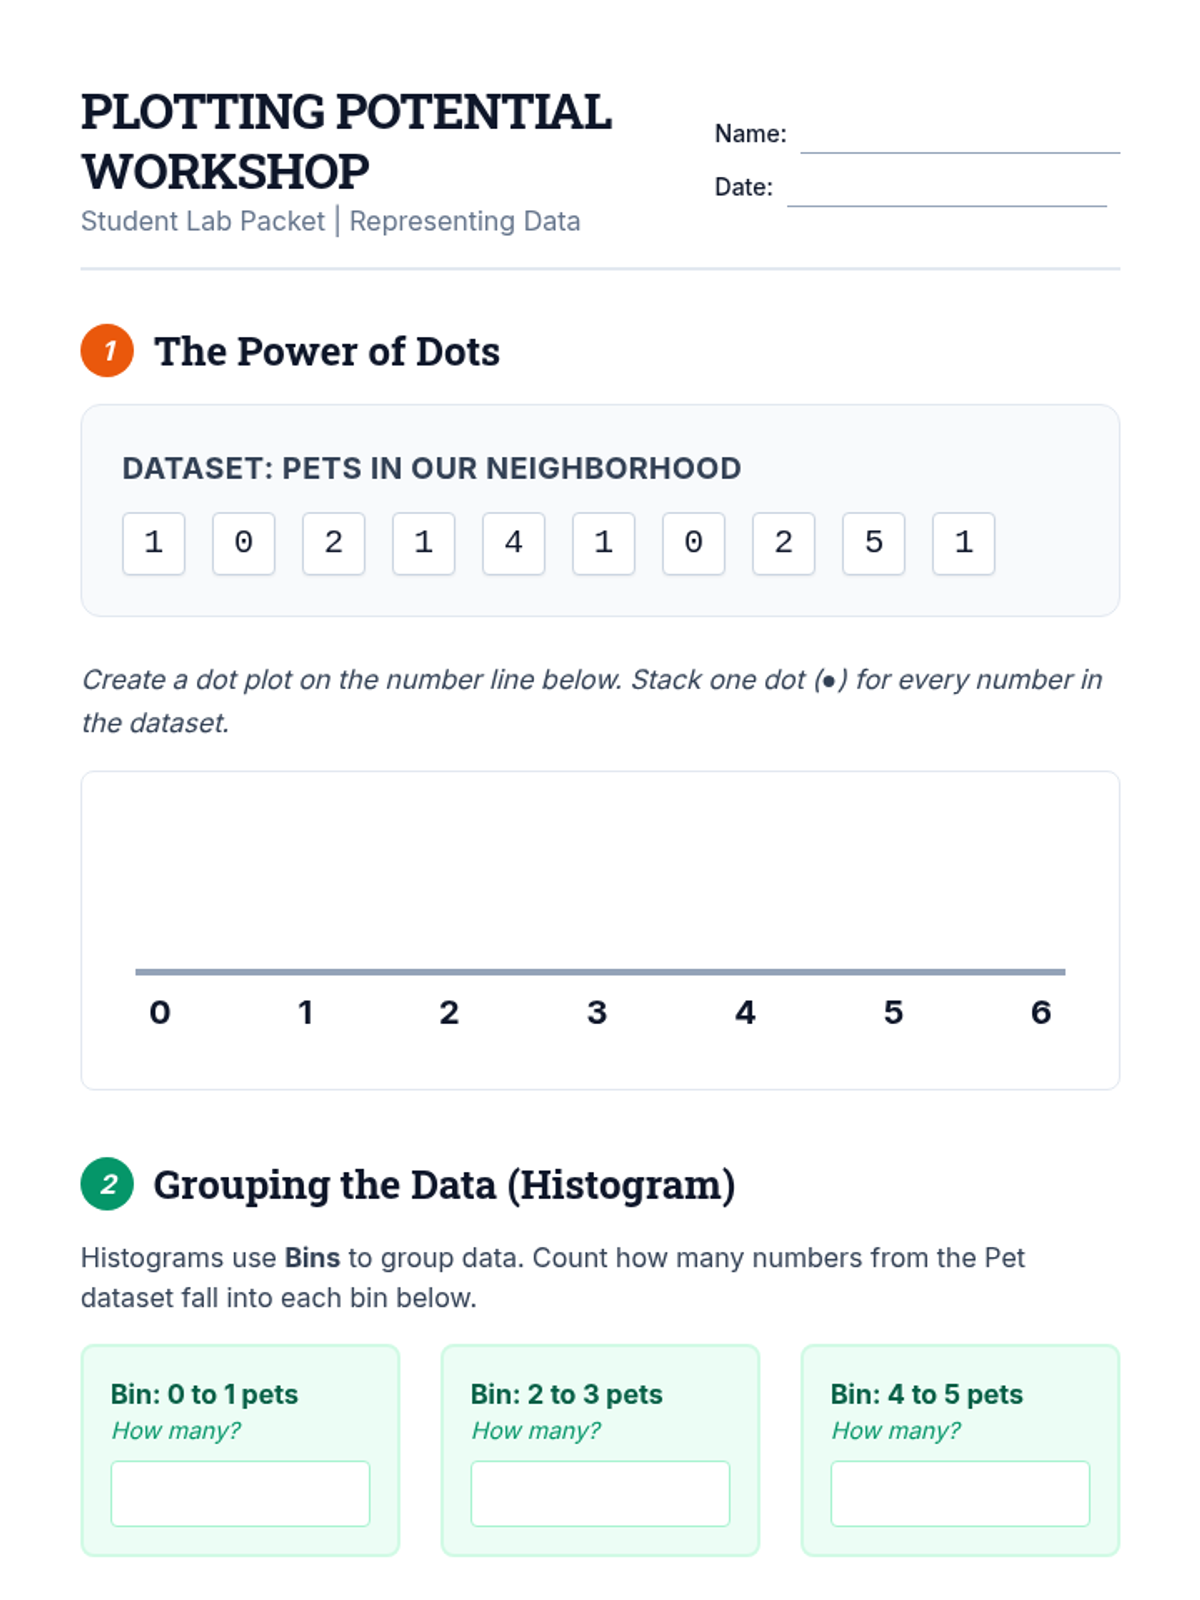
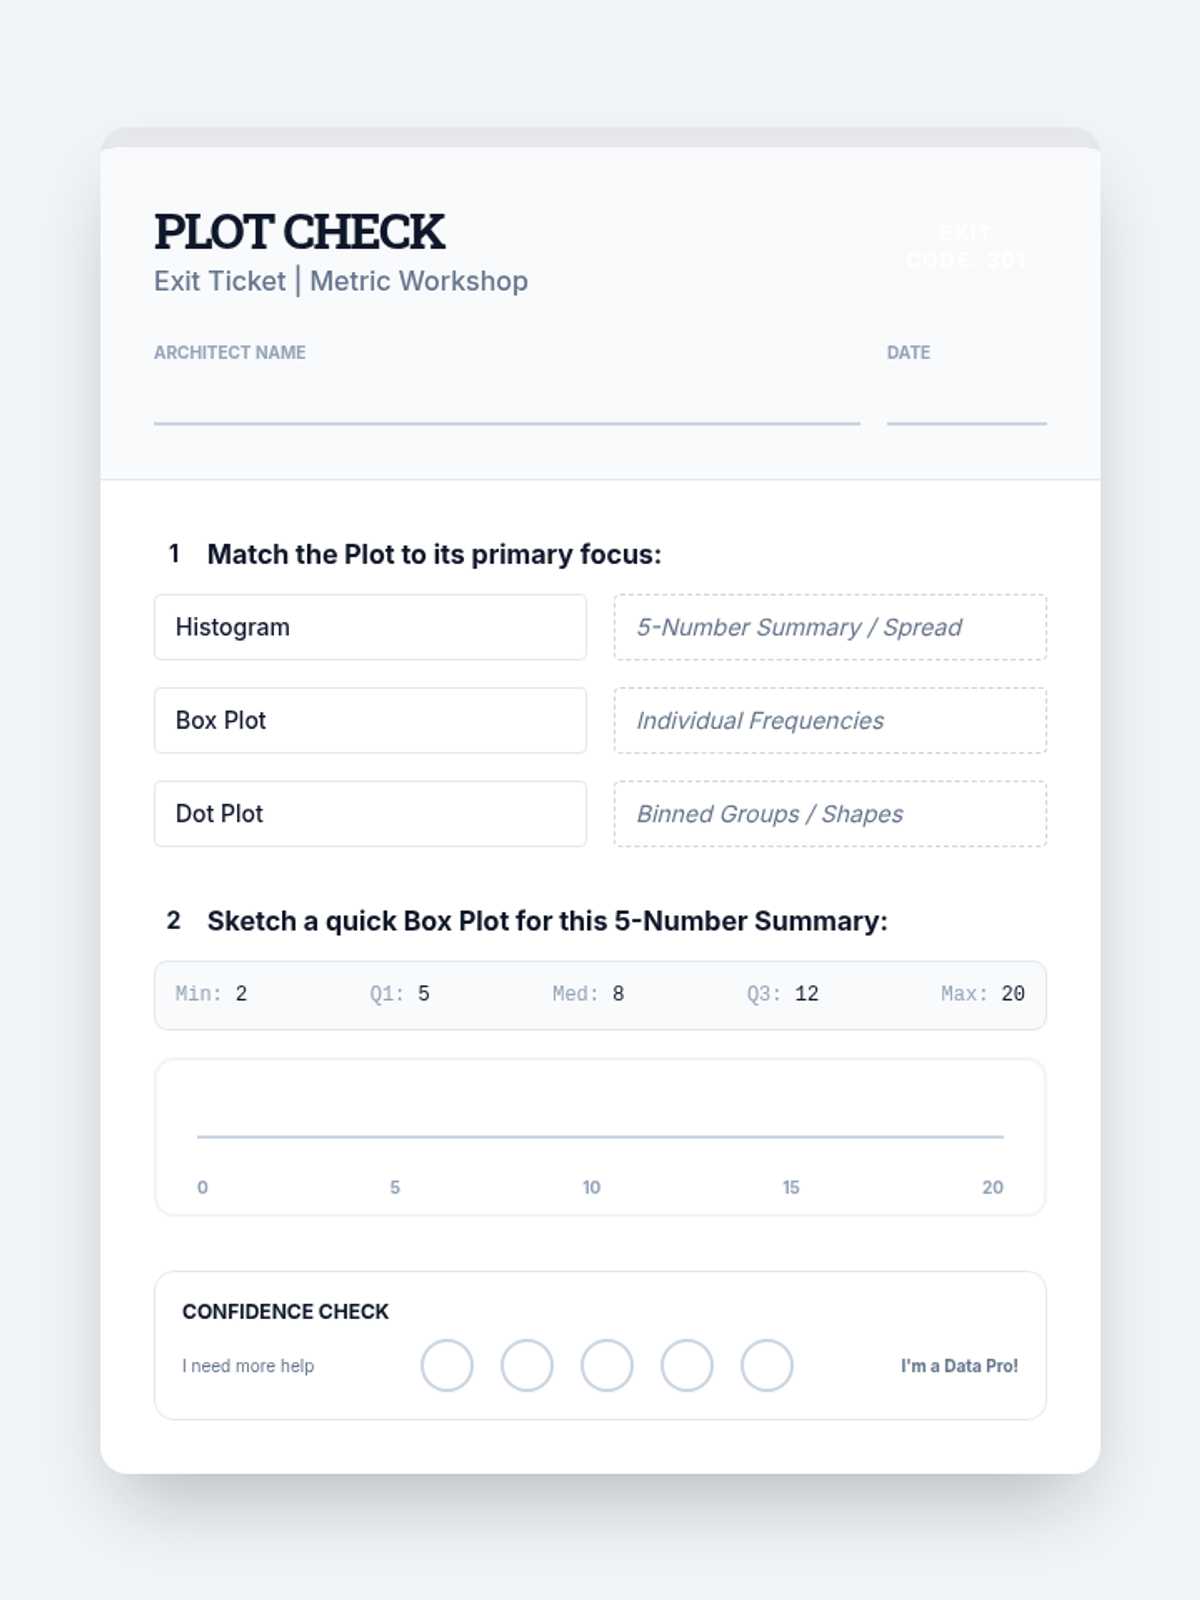
A Tier 2 intervention sequence focused on building concrete understanding of data representations including dot plots, histograms, and box plots for high school statistics students.
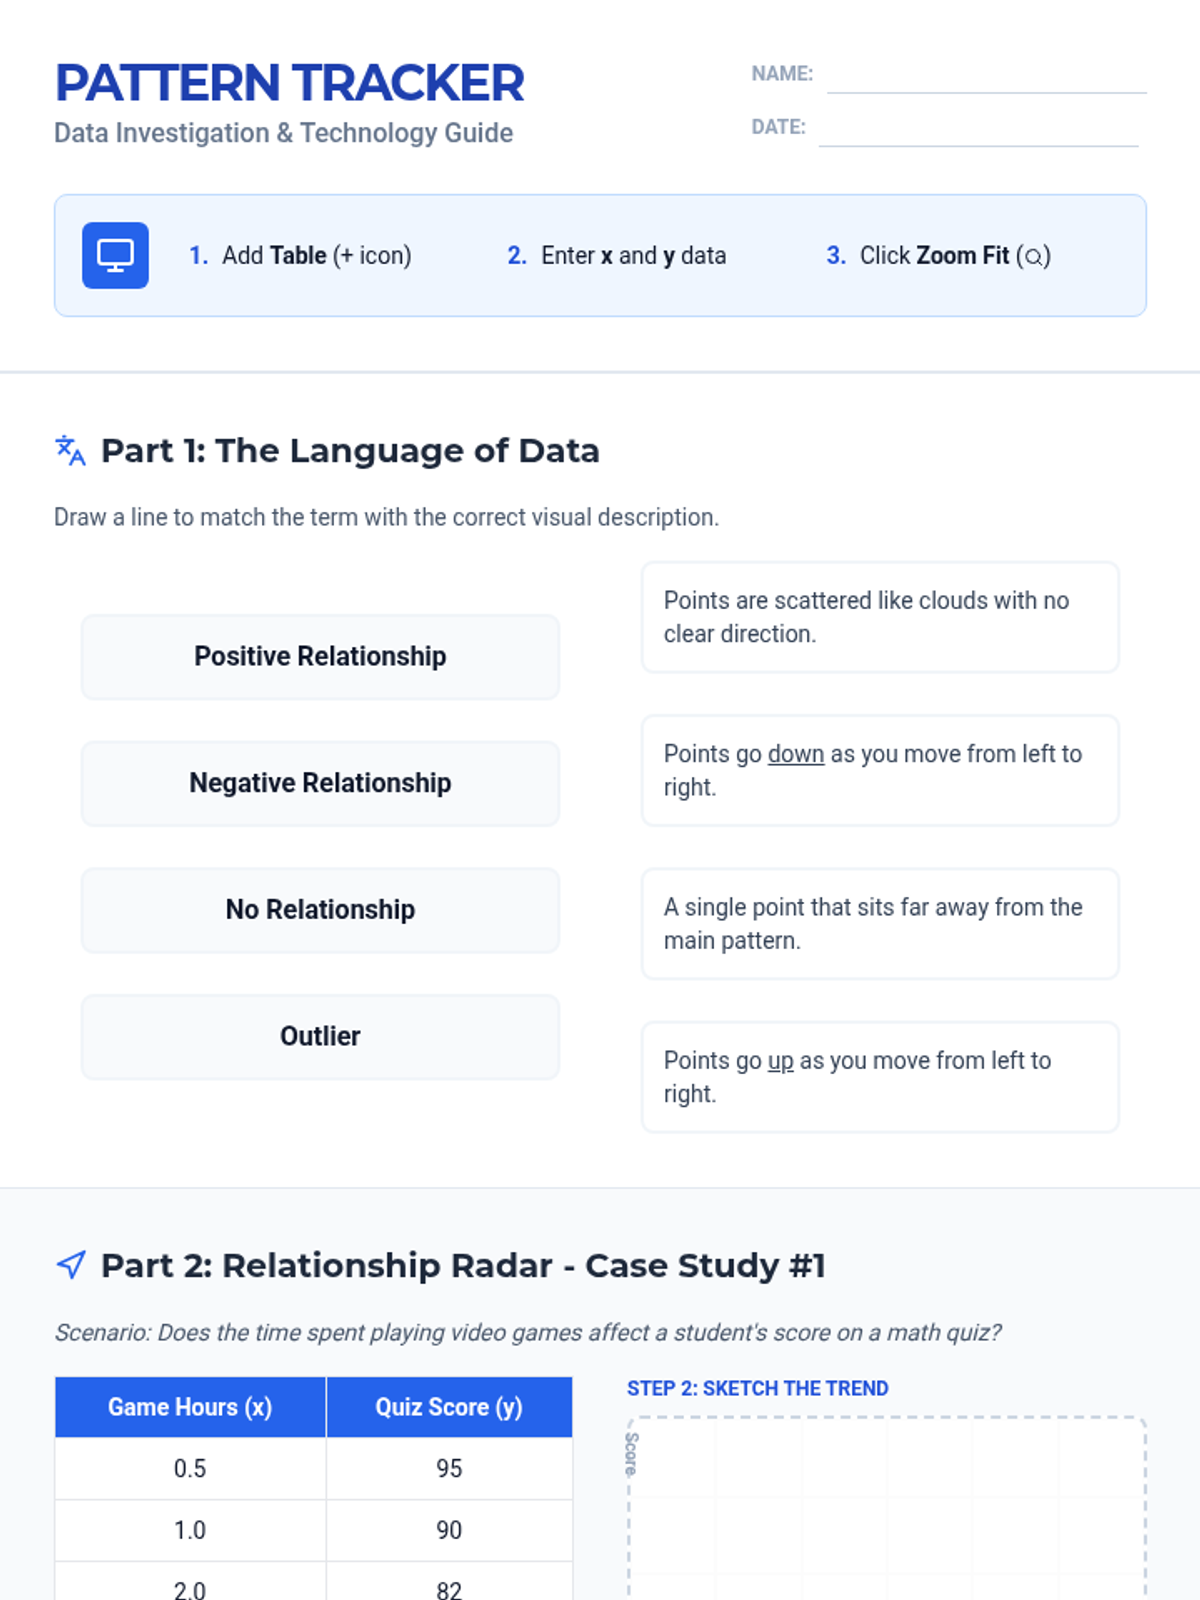
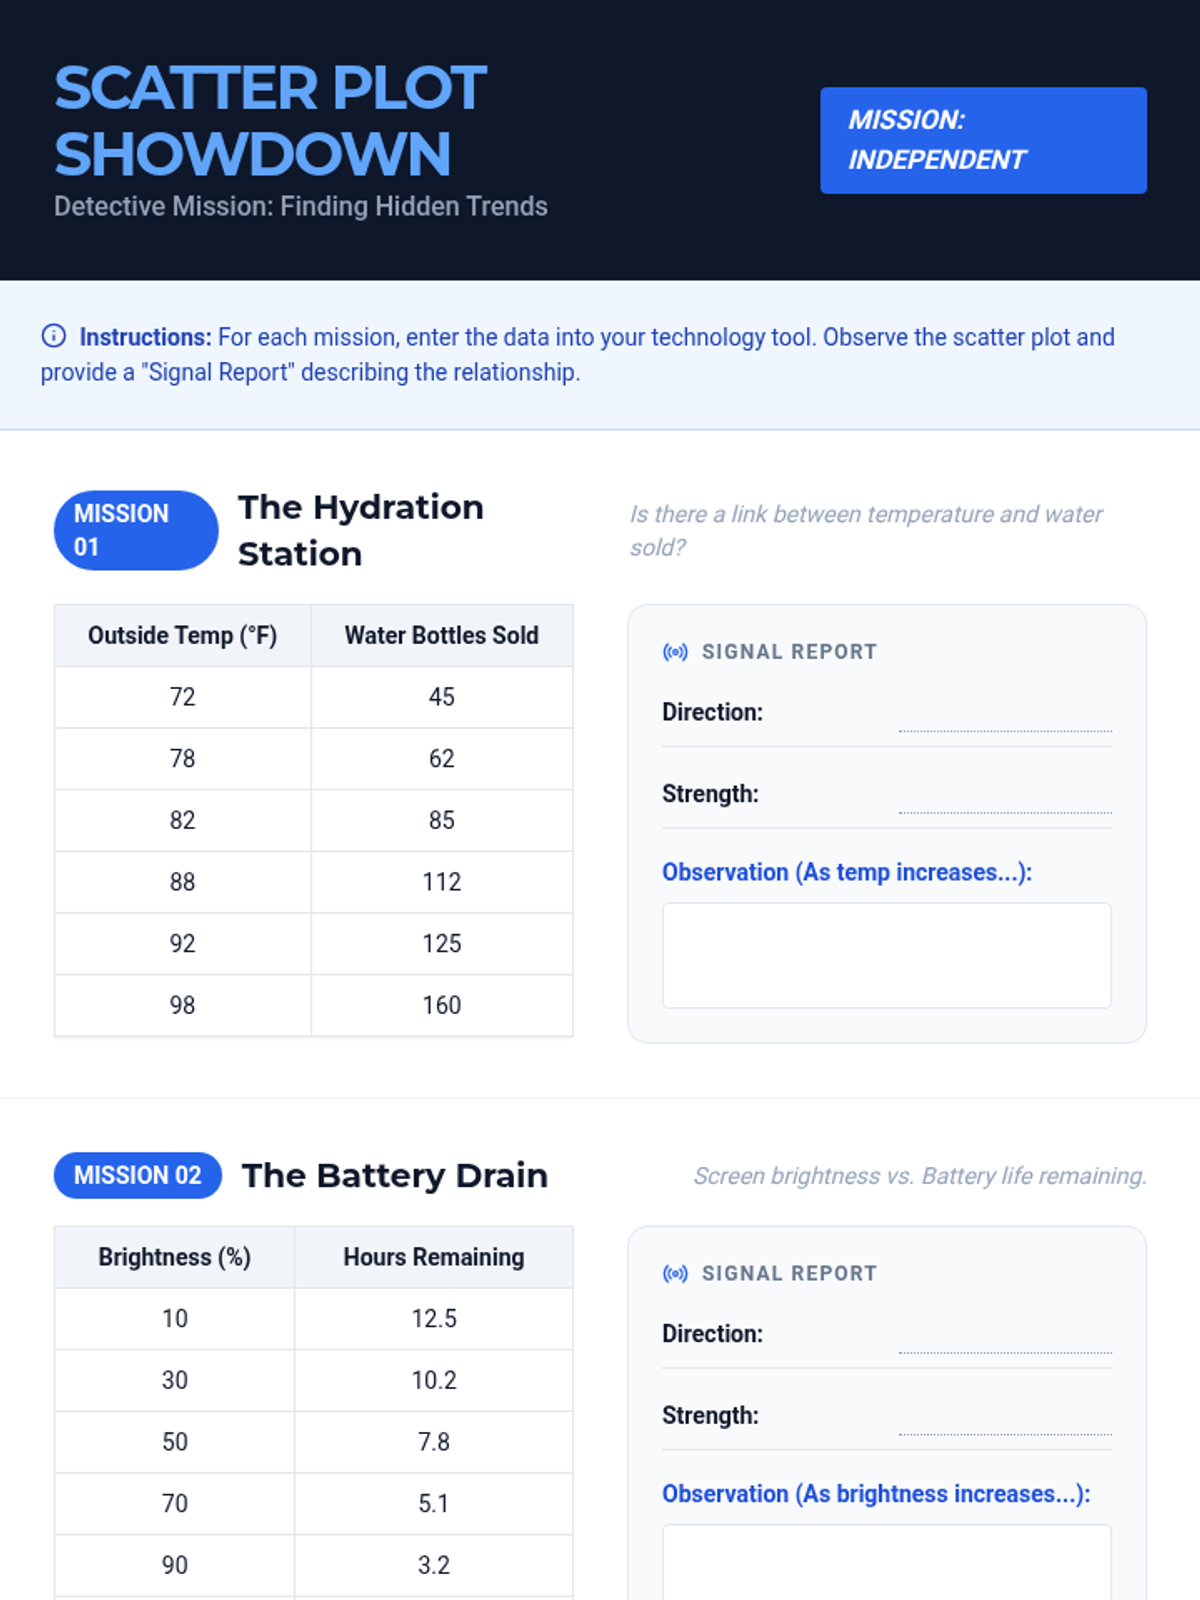
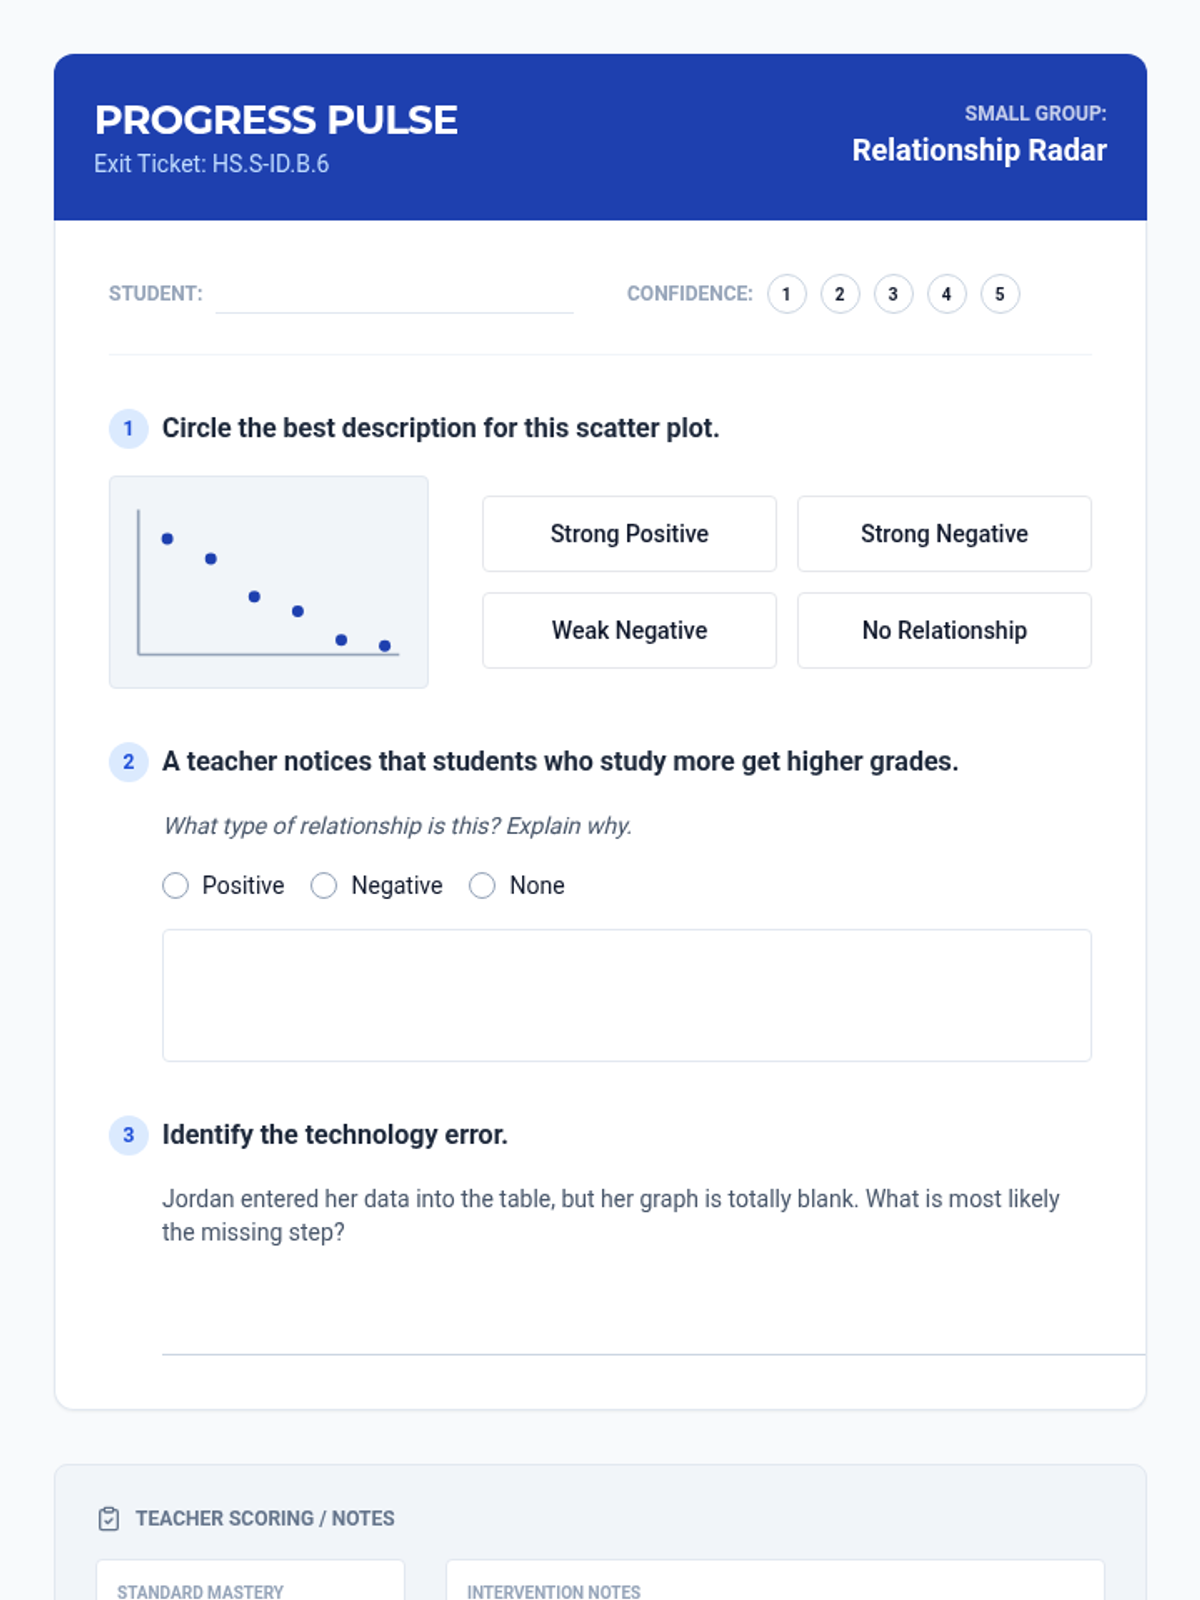
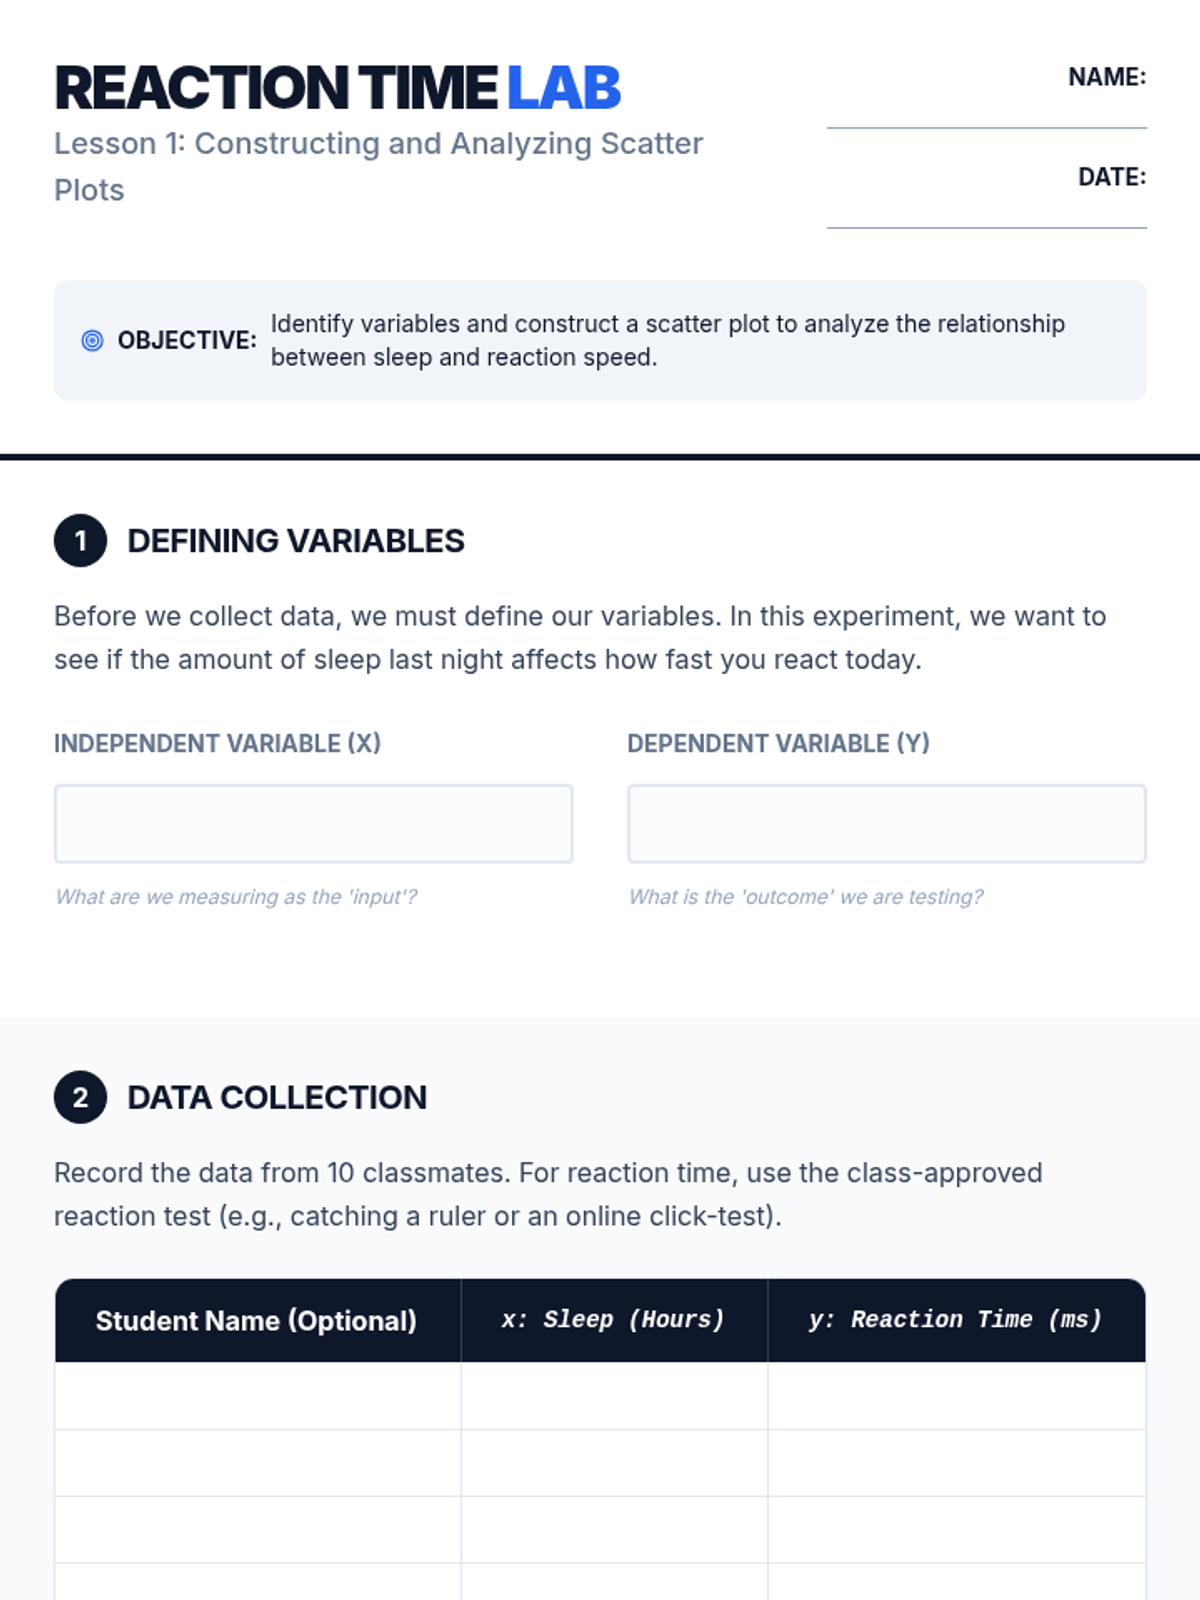
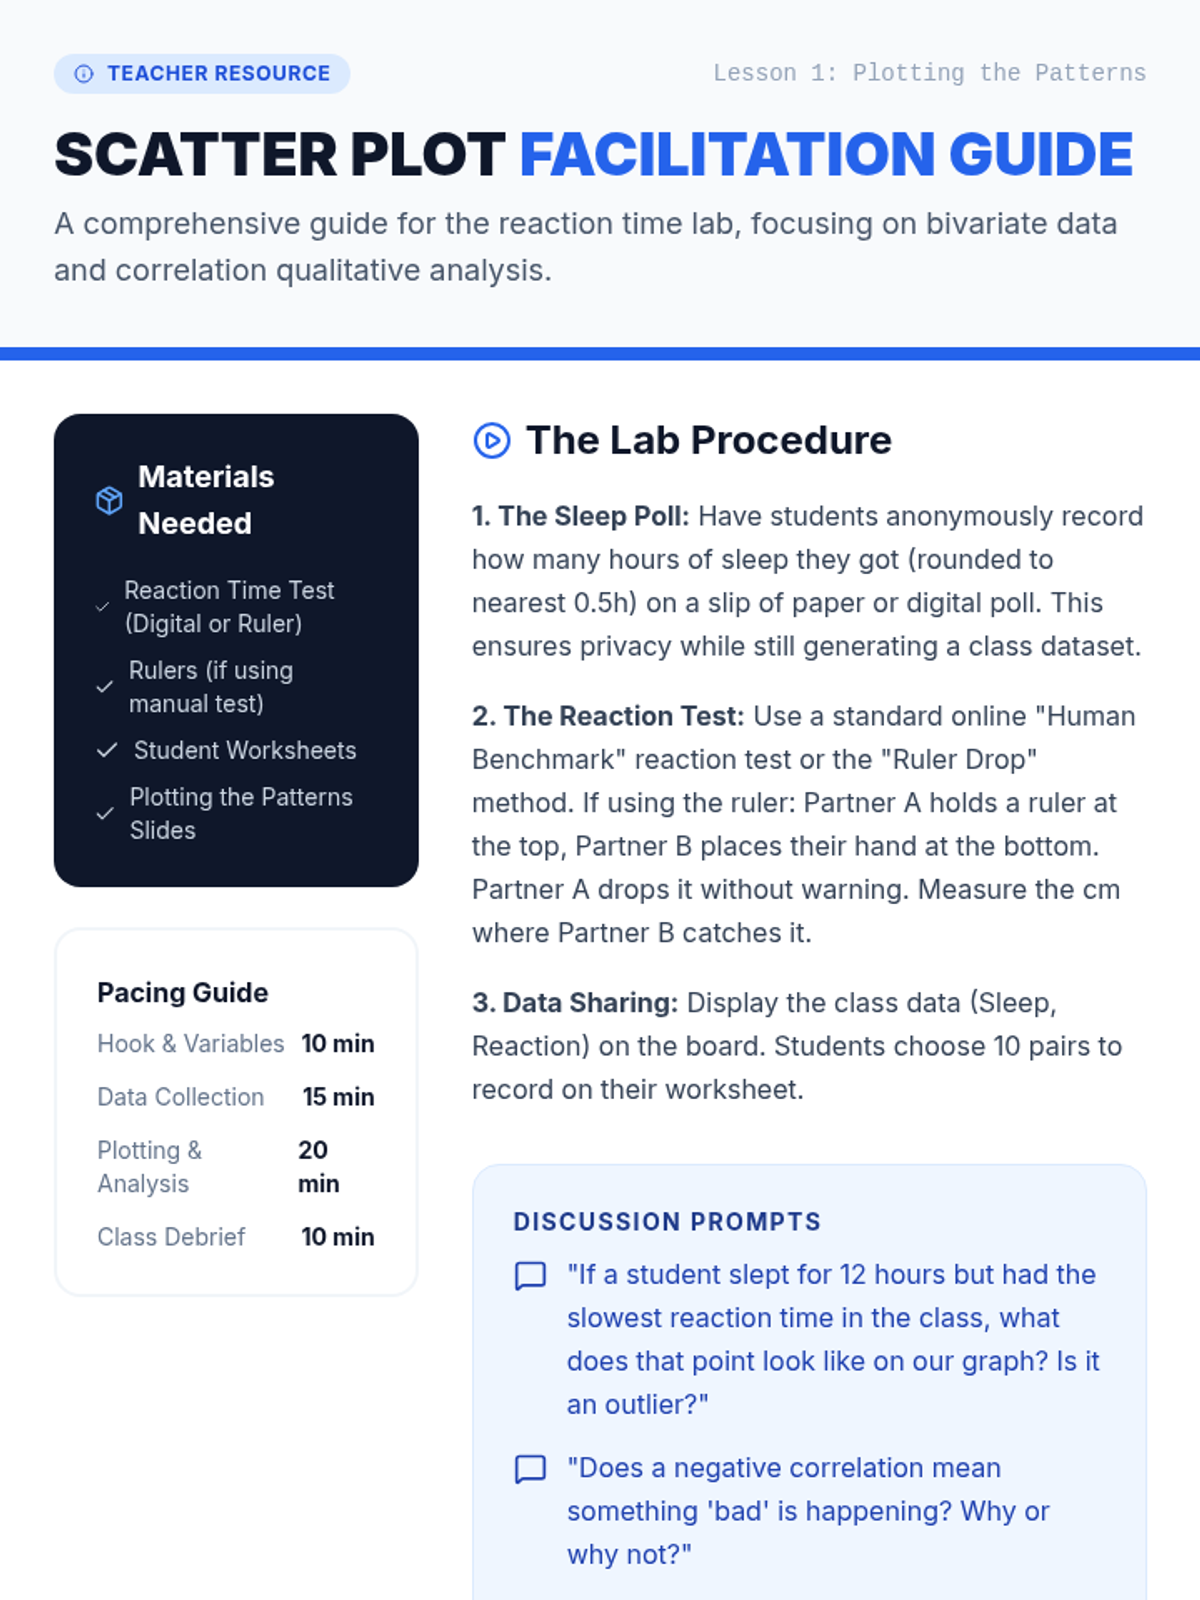
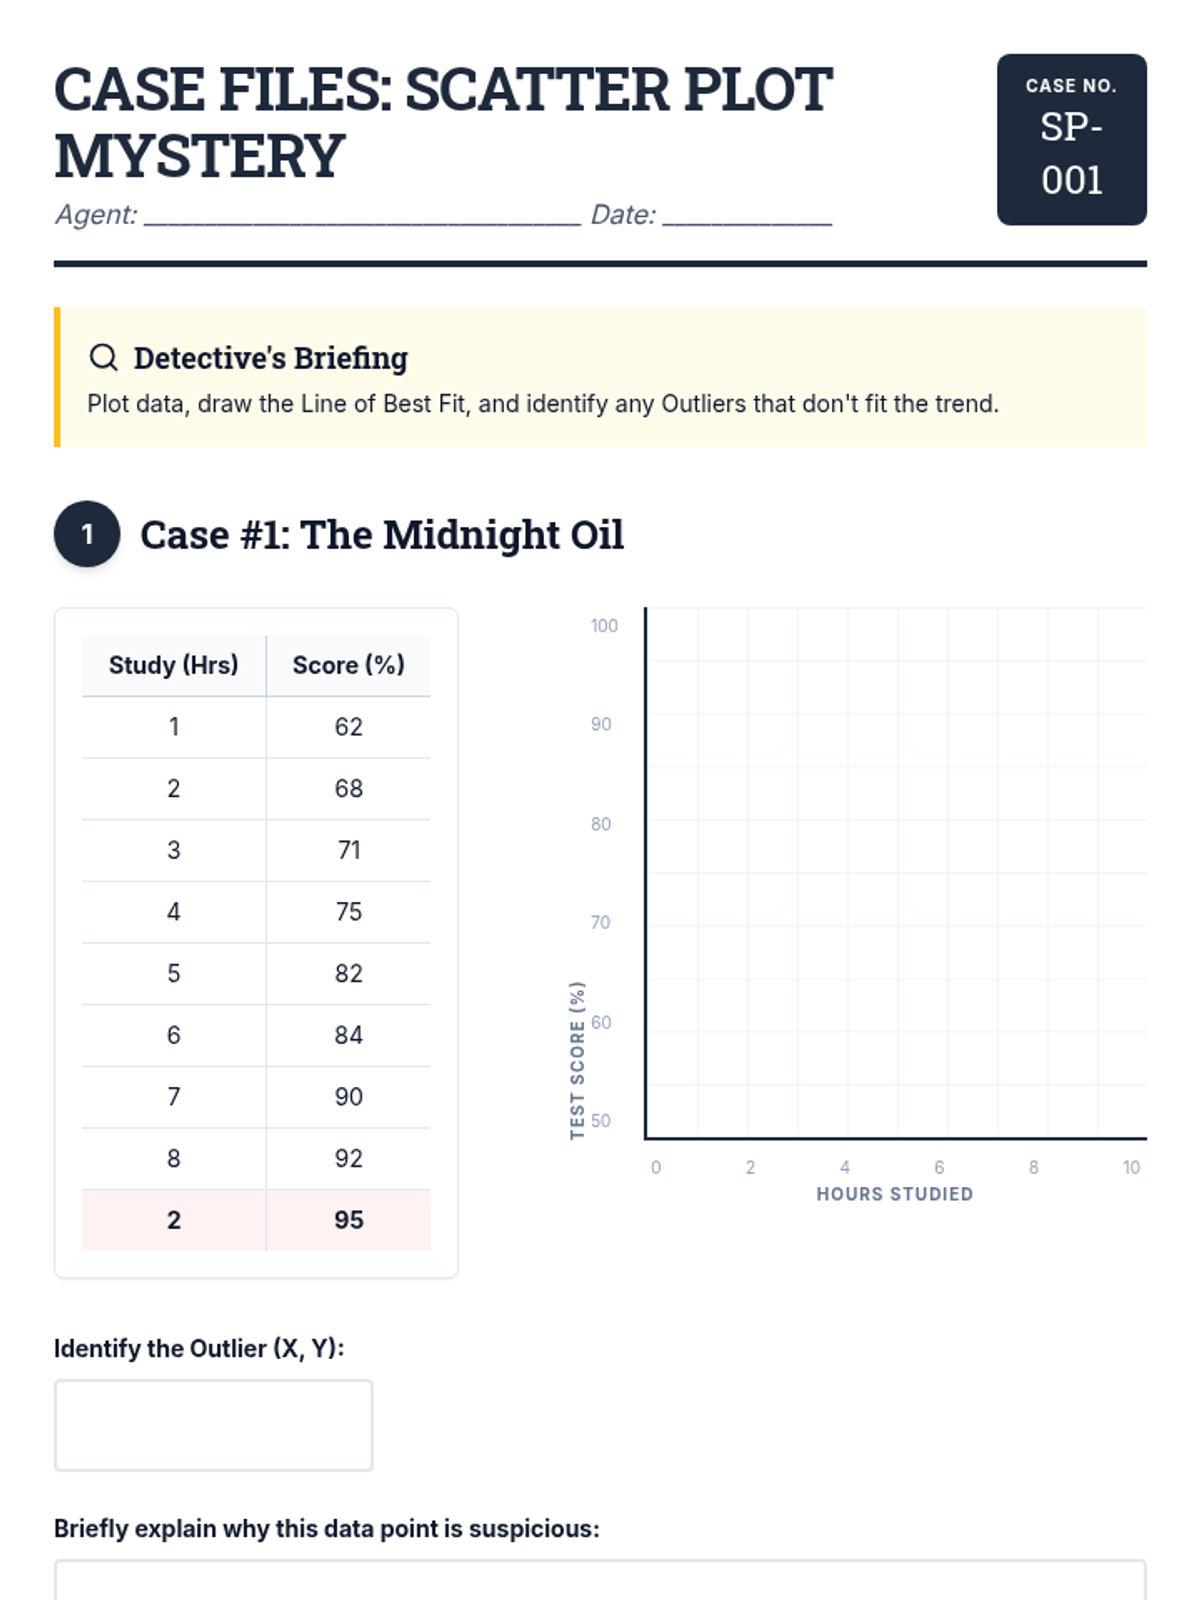
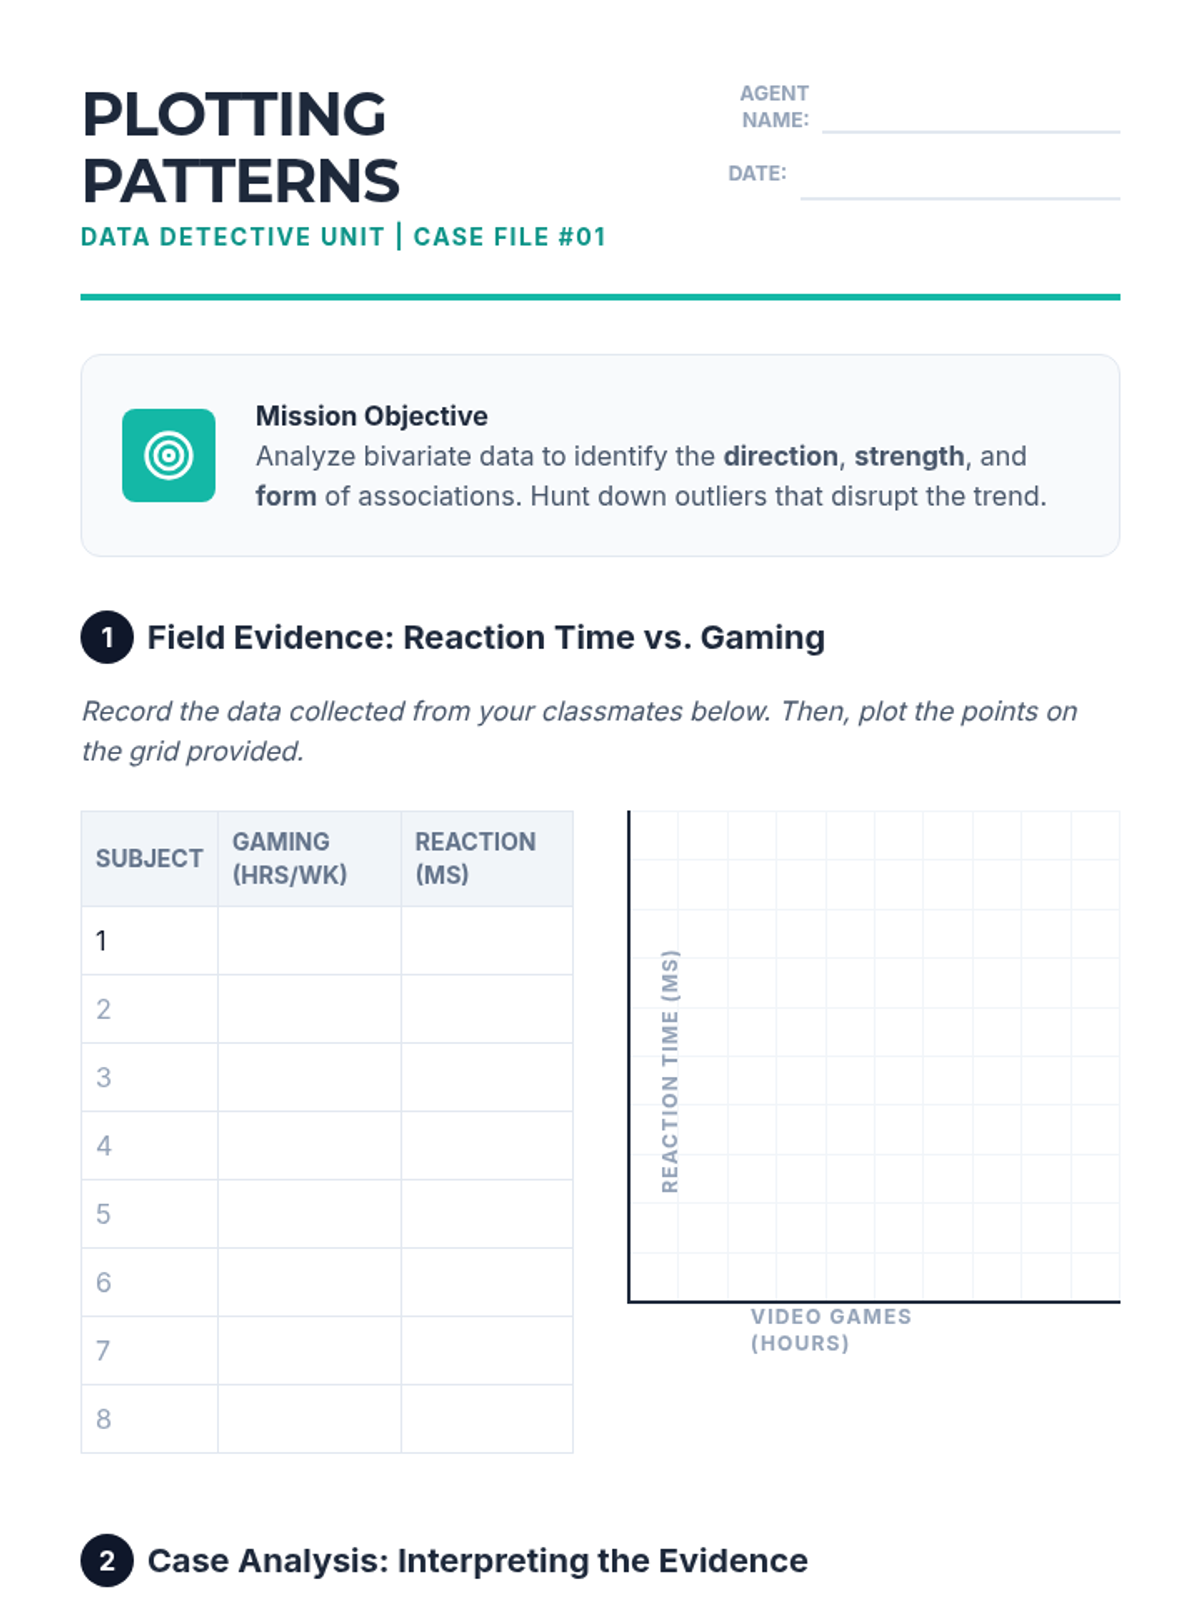
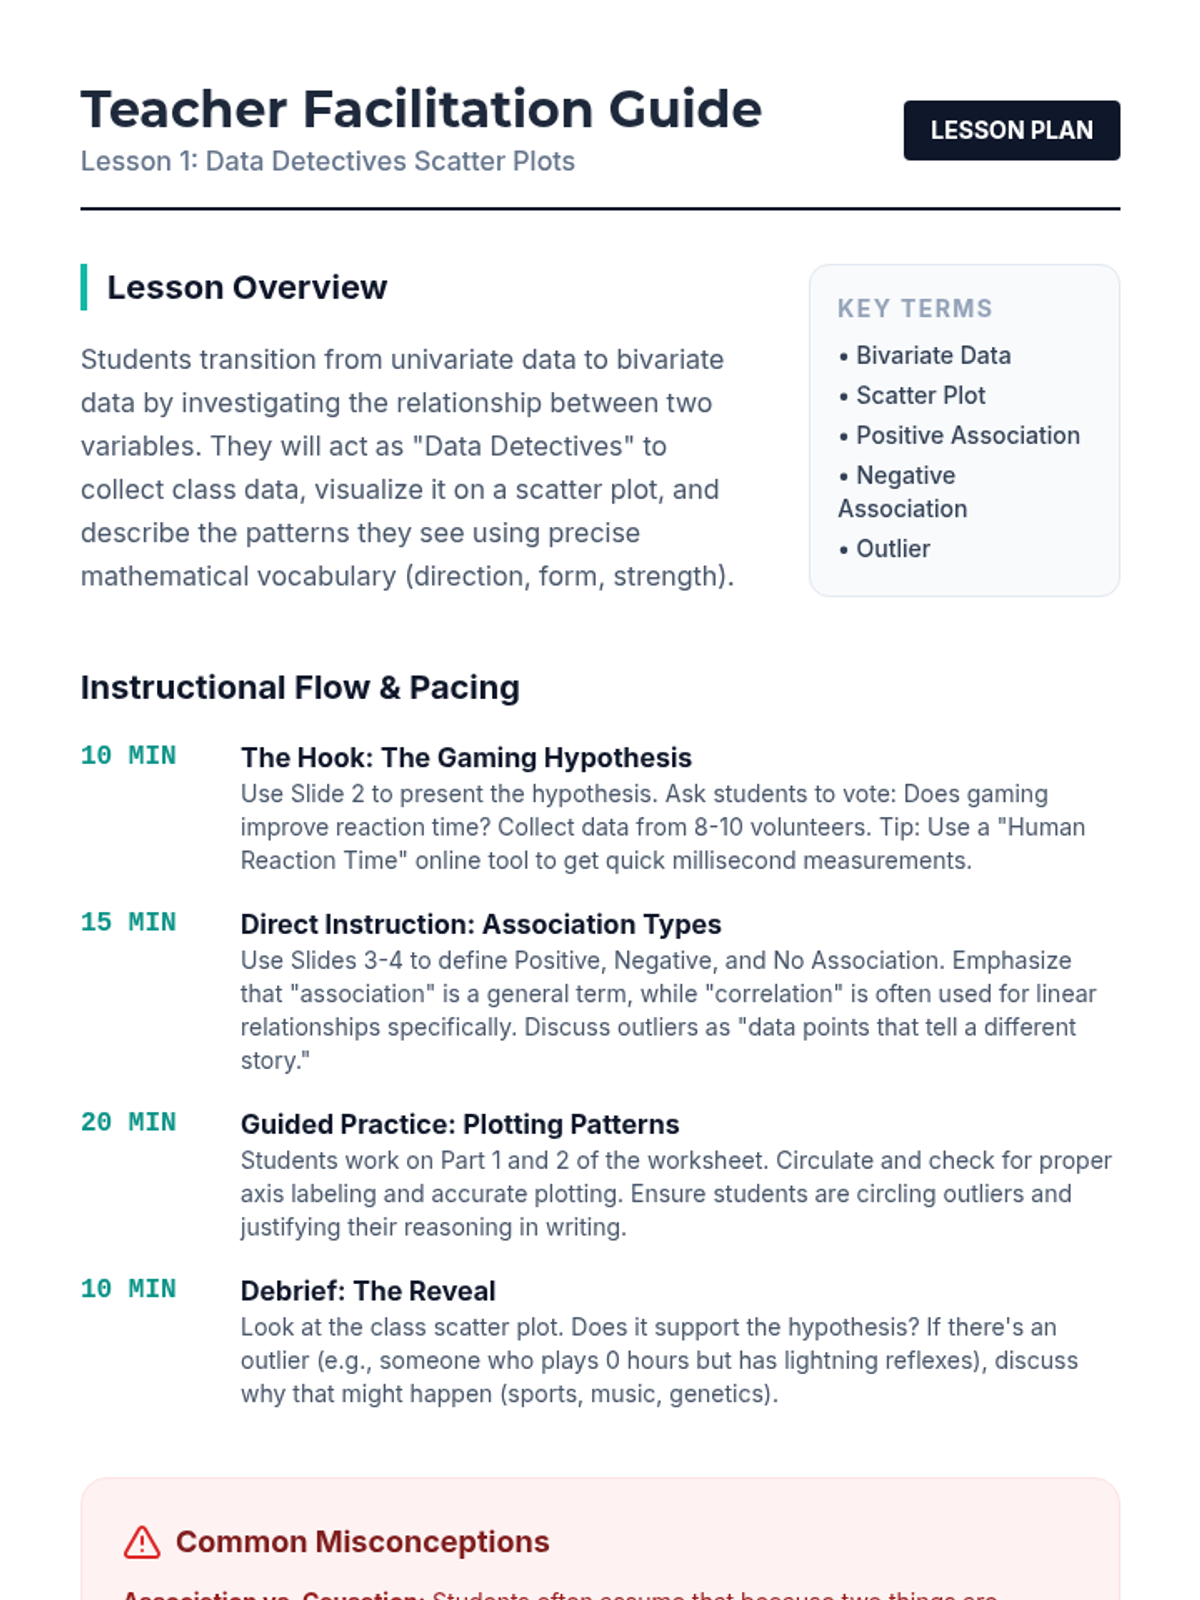
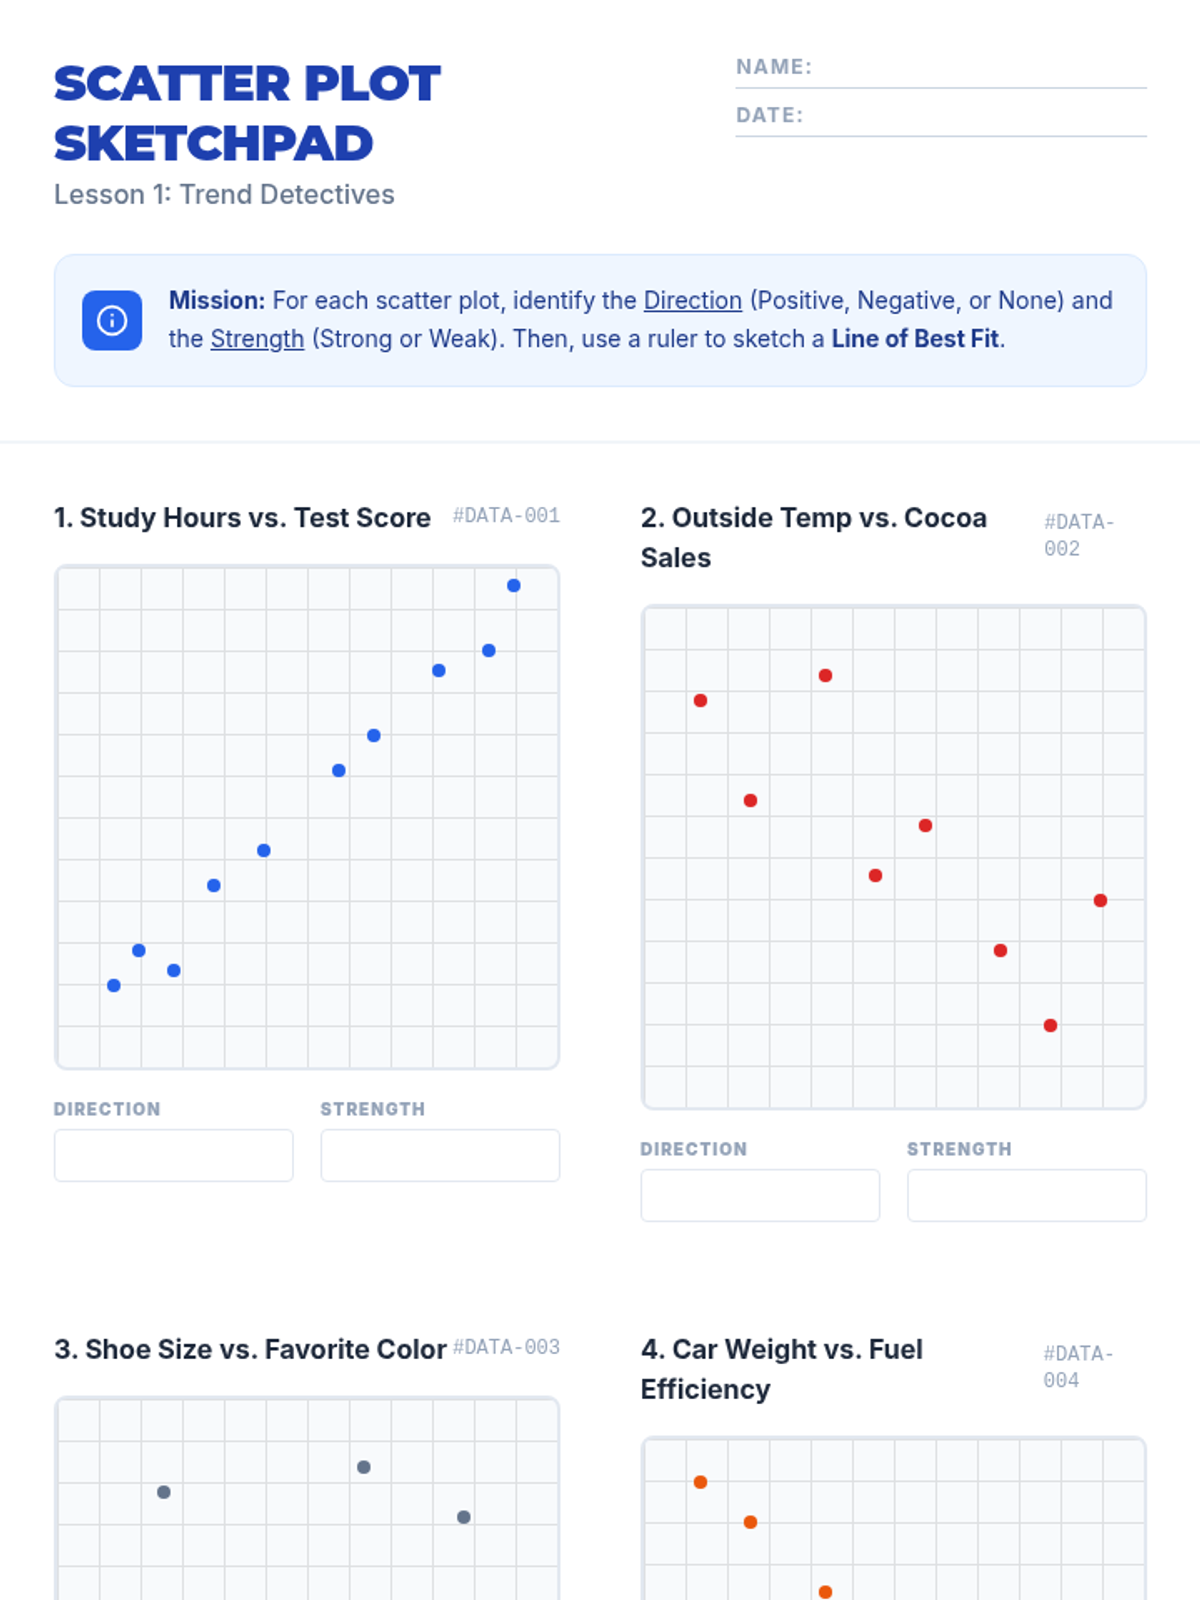
A Tier 2 intervention sequence focused on analyzing bivariate data. Students learn to use technology to create scatter plots and develop a precise vocabulary for describing relationships between quantitative variables.
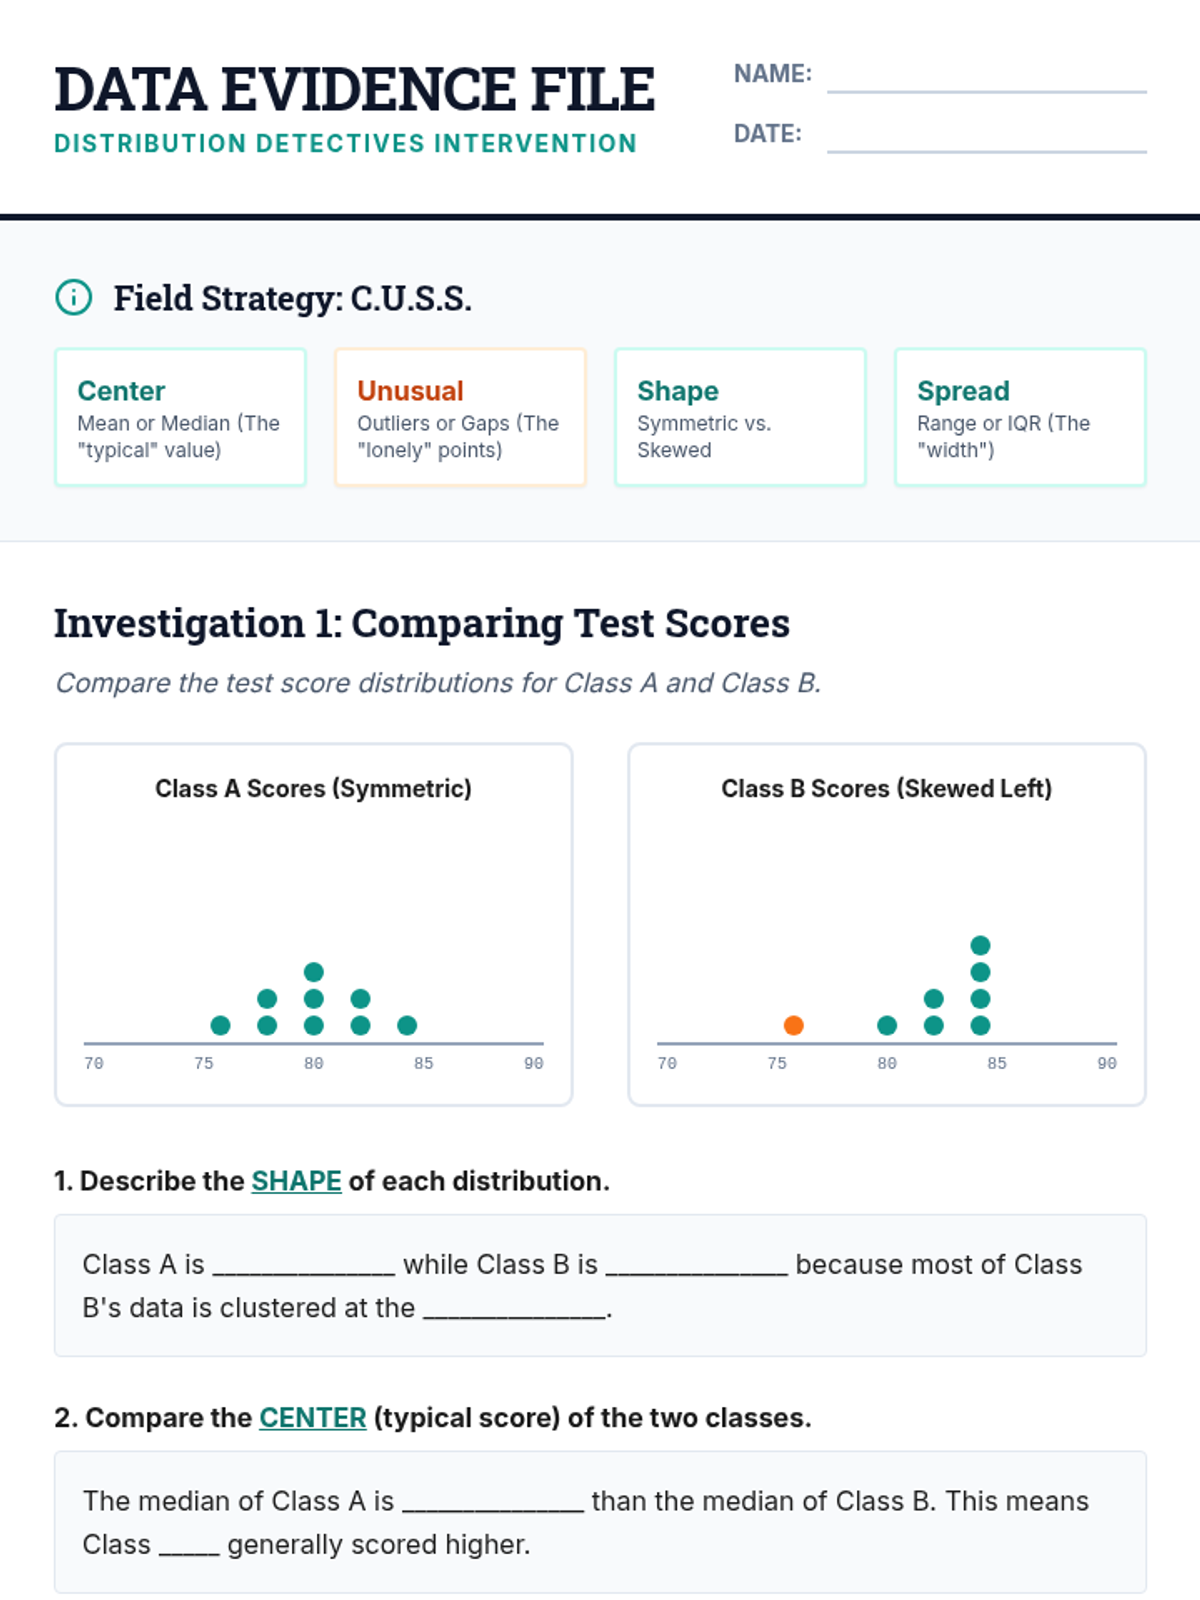
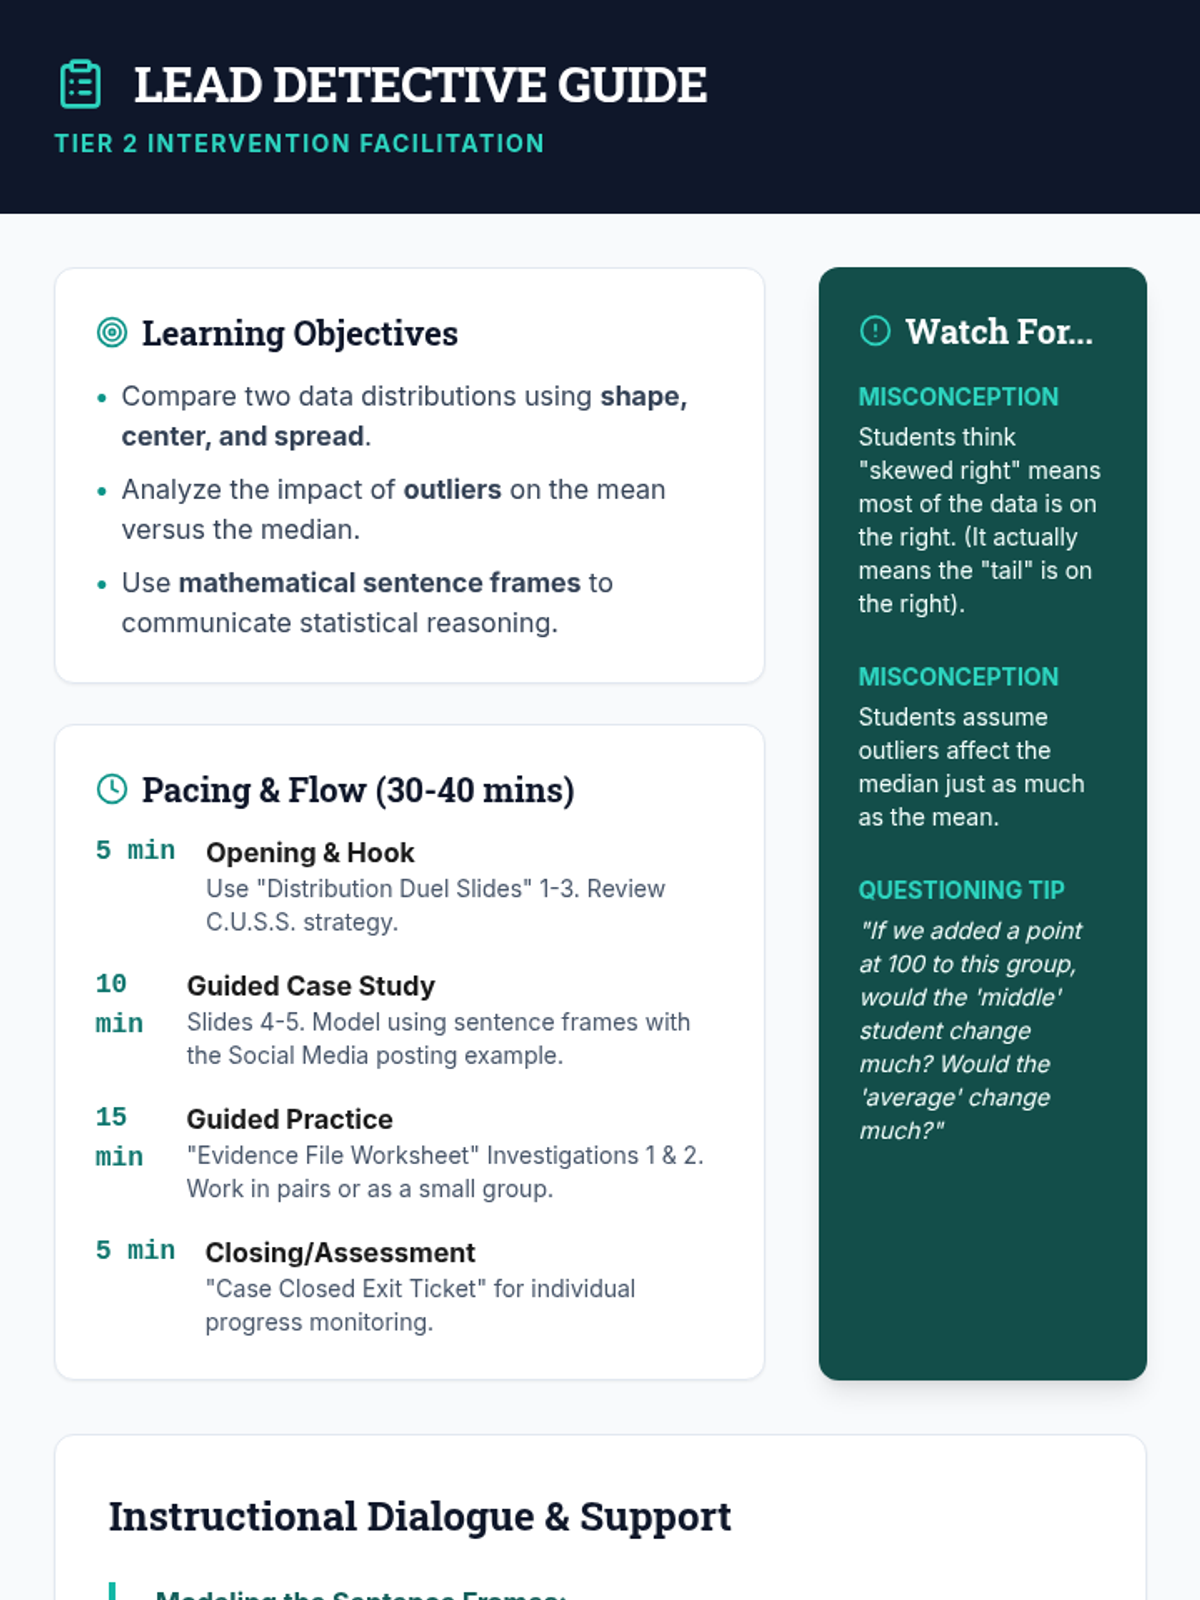
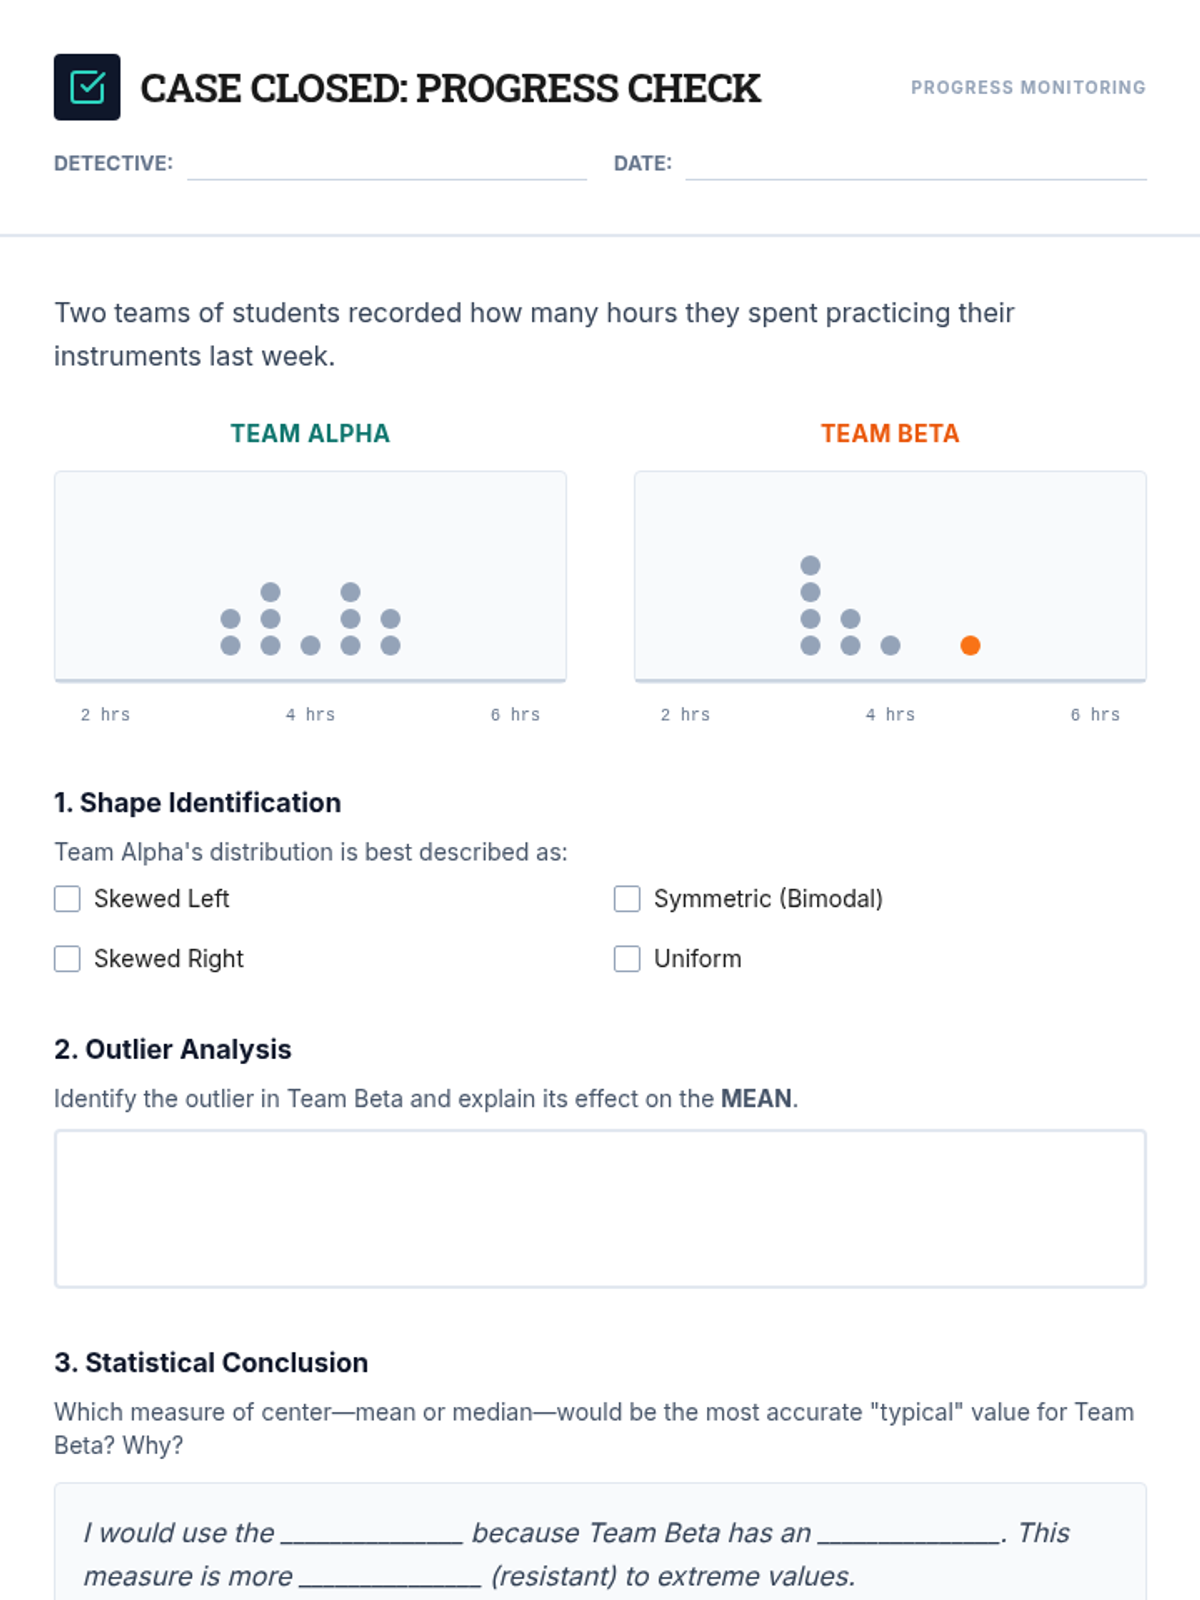
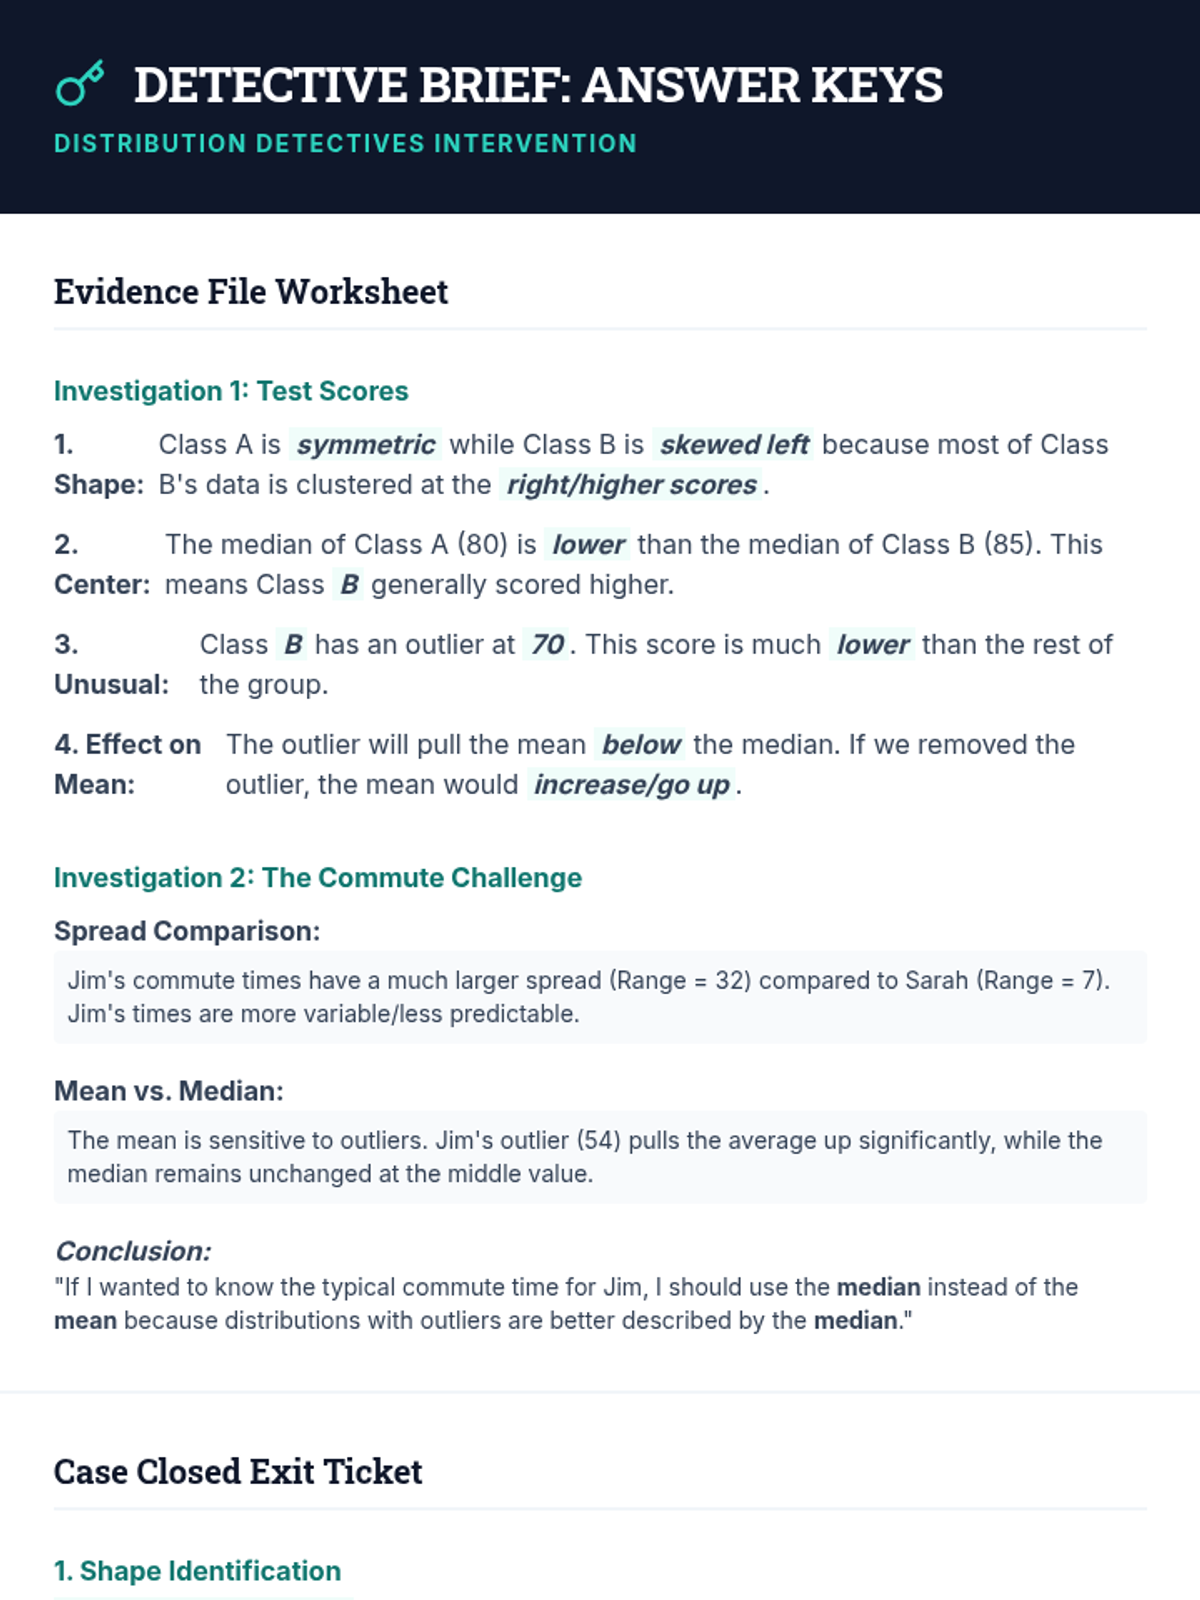
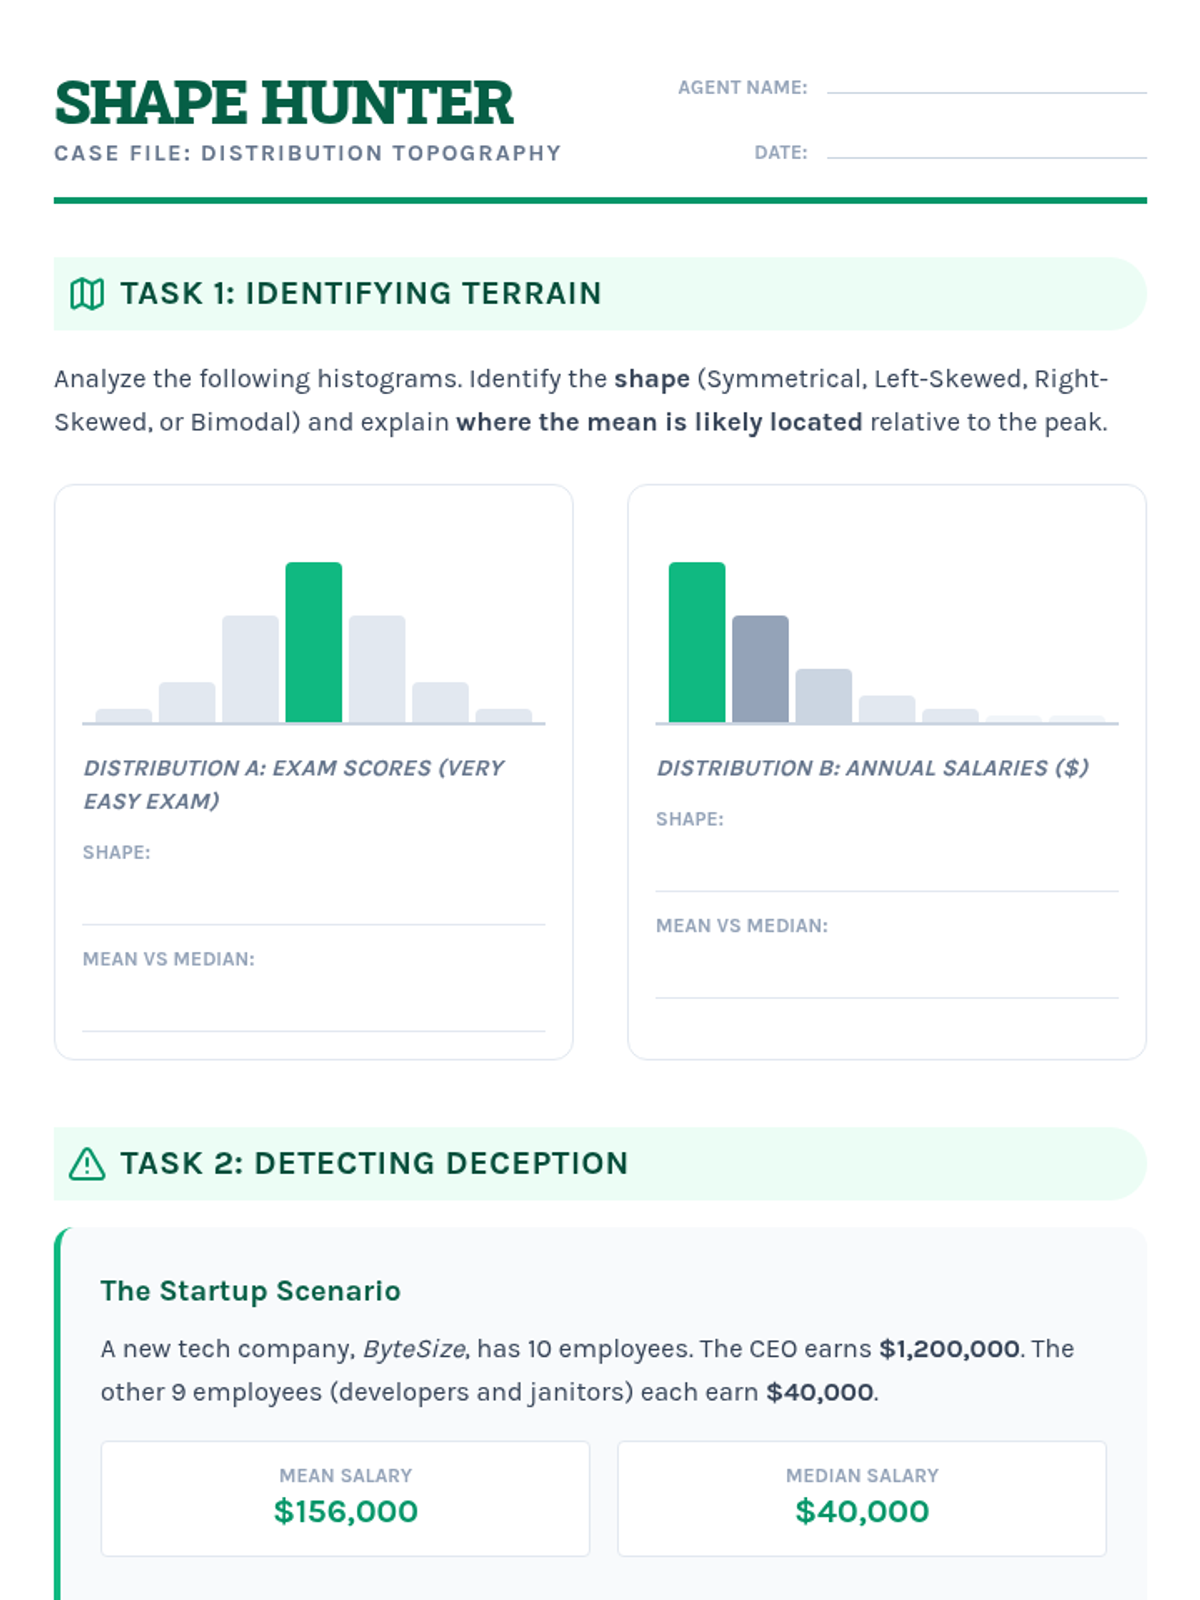
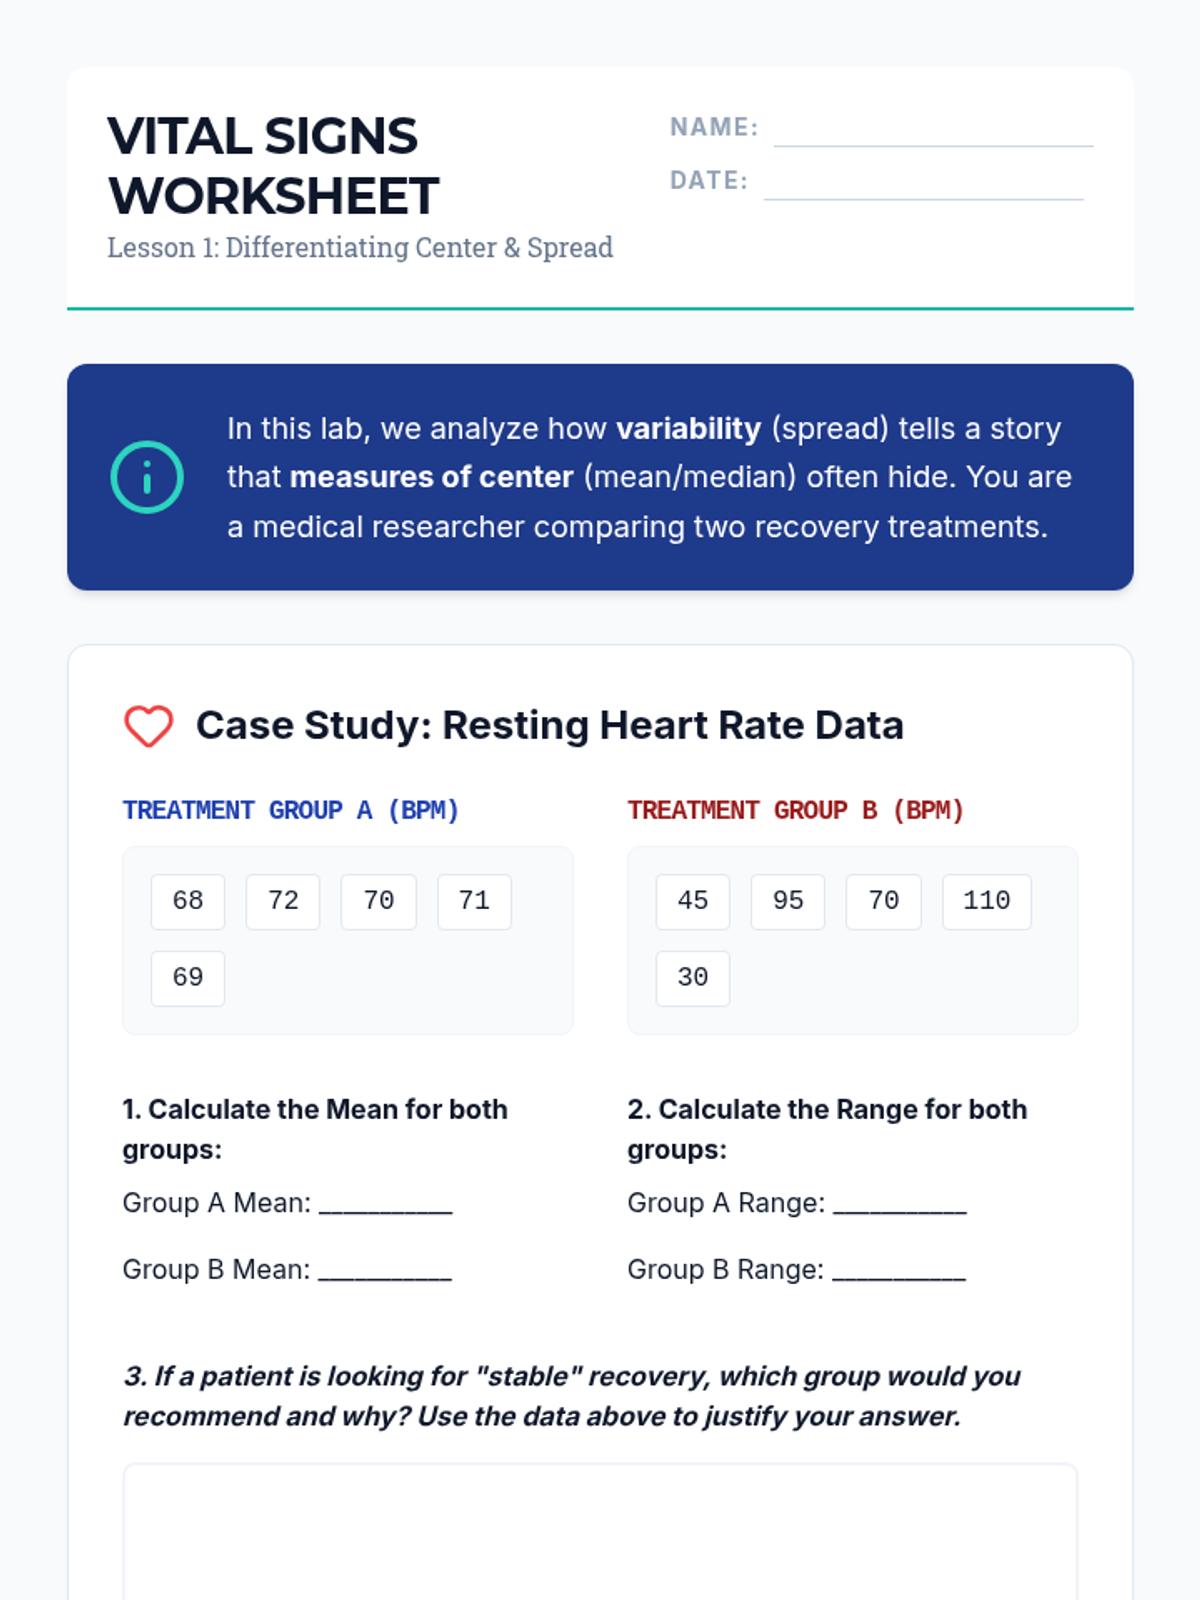
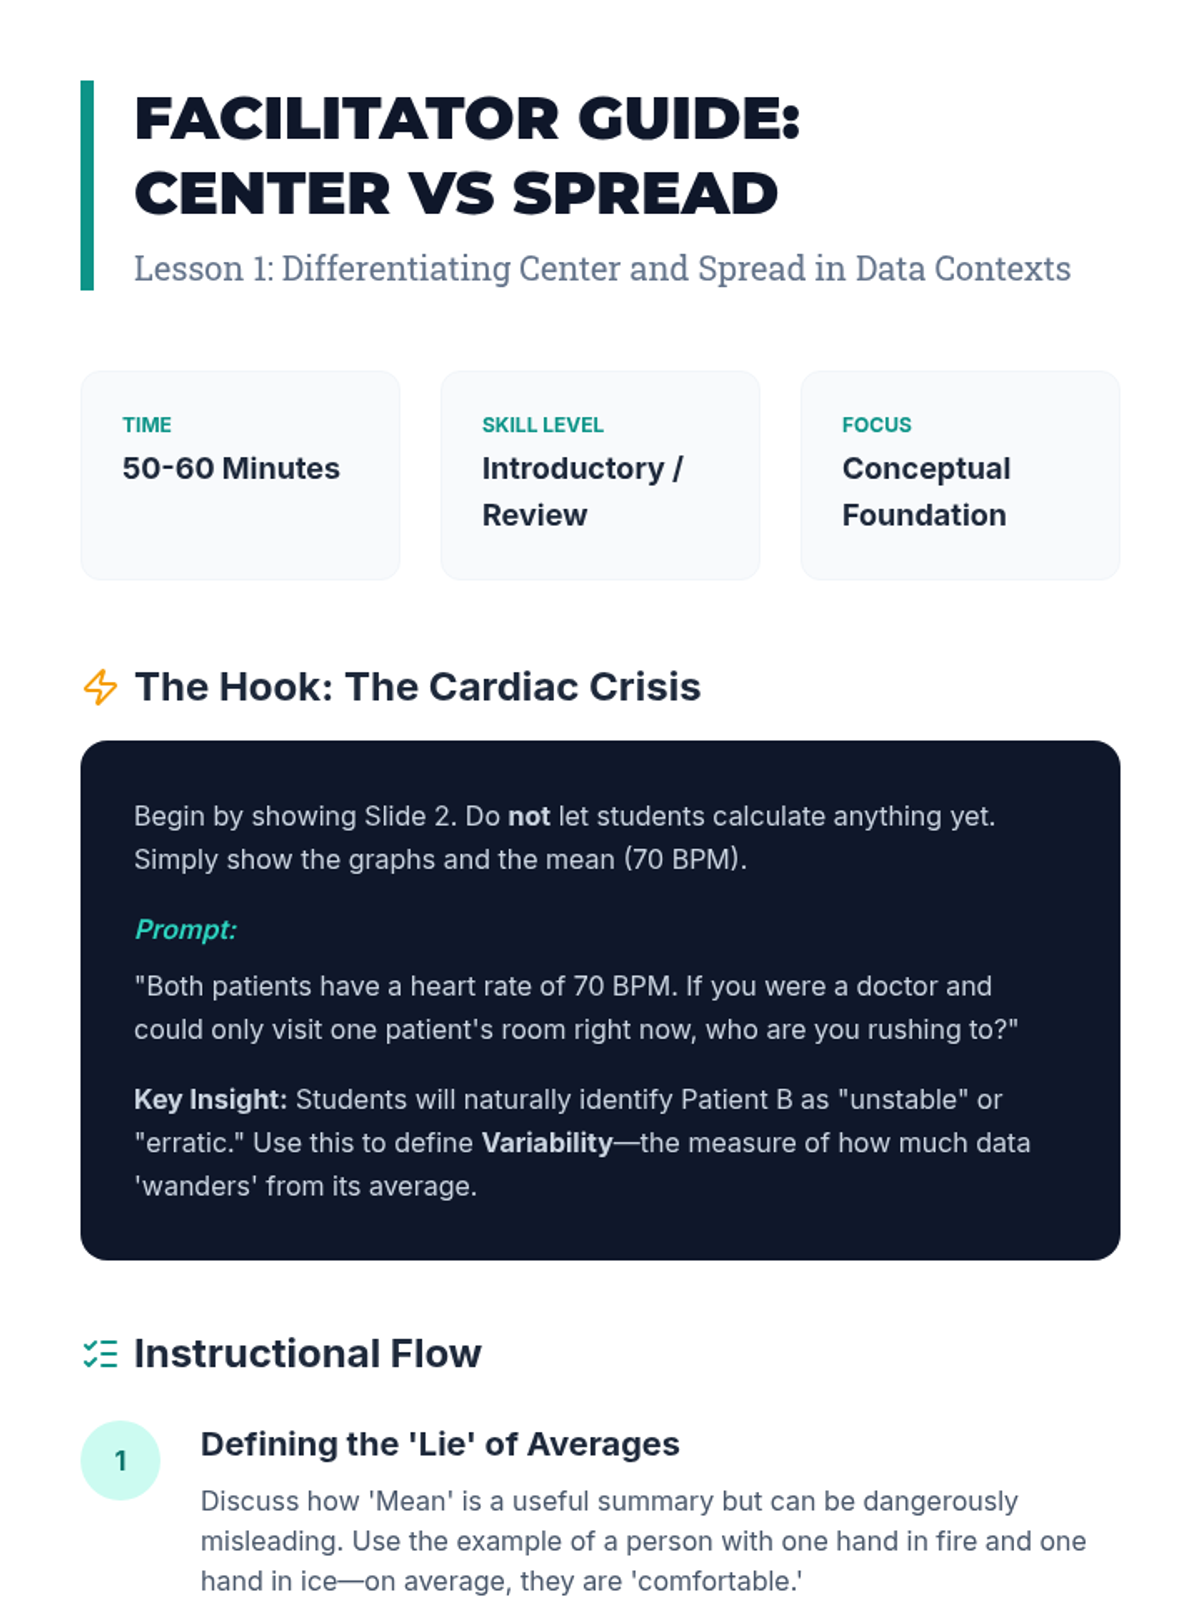
A targeted Tier 2 intervention for High School Statistics focusing on comparing data distributions (shape, center, spread) and understanding the impact of outliers. Includes scaffolded instruction, guided practice with sentence frames, and progress monitoring tools.
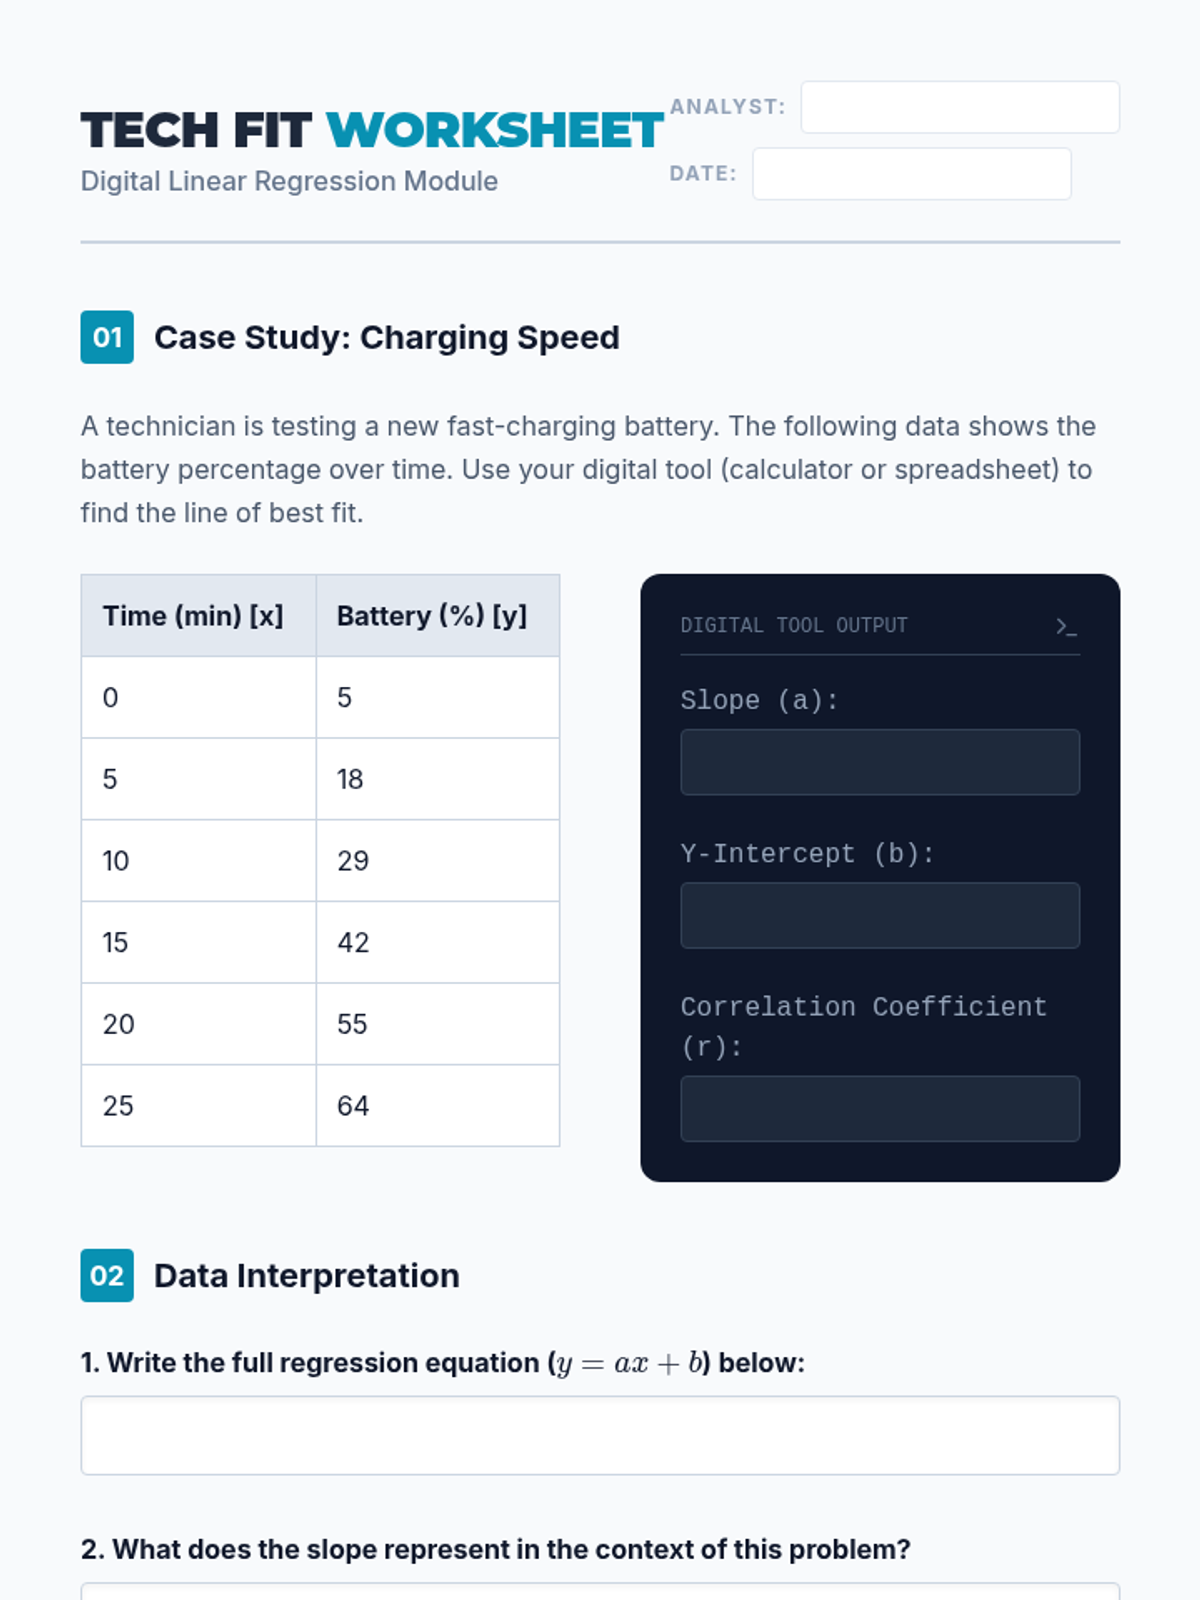
Students act as data analysts to investigate relationships between variables in fields like sports, economics, and environmental science. The learning arc progresses from constructing scatter plots and generating lines of best fit to deeply interpreting the specific meaning of slope and y-intercept in context, concluding with a capstone project on predictive modeling.
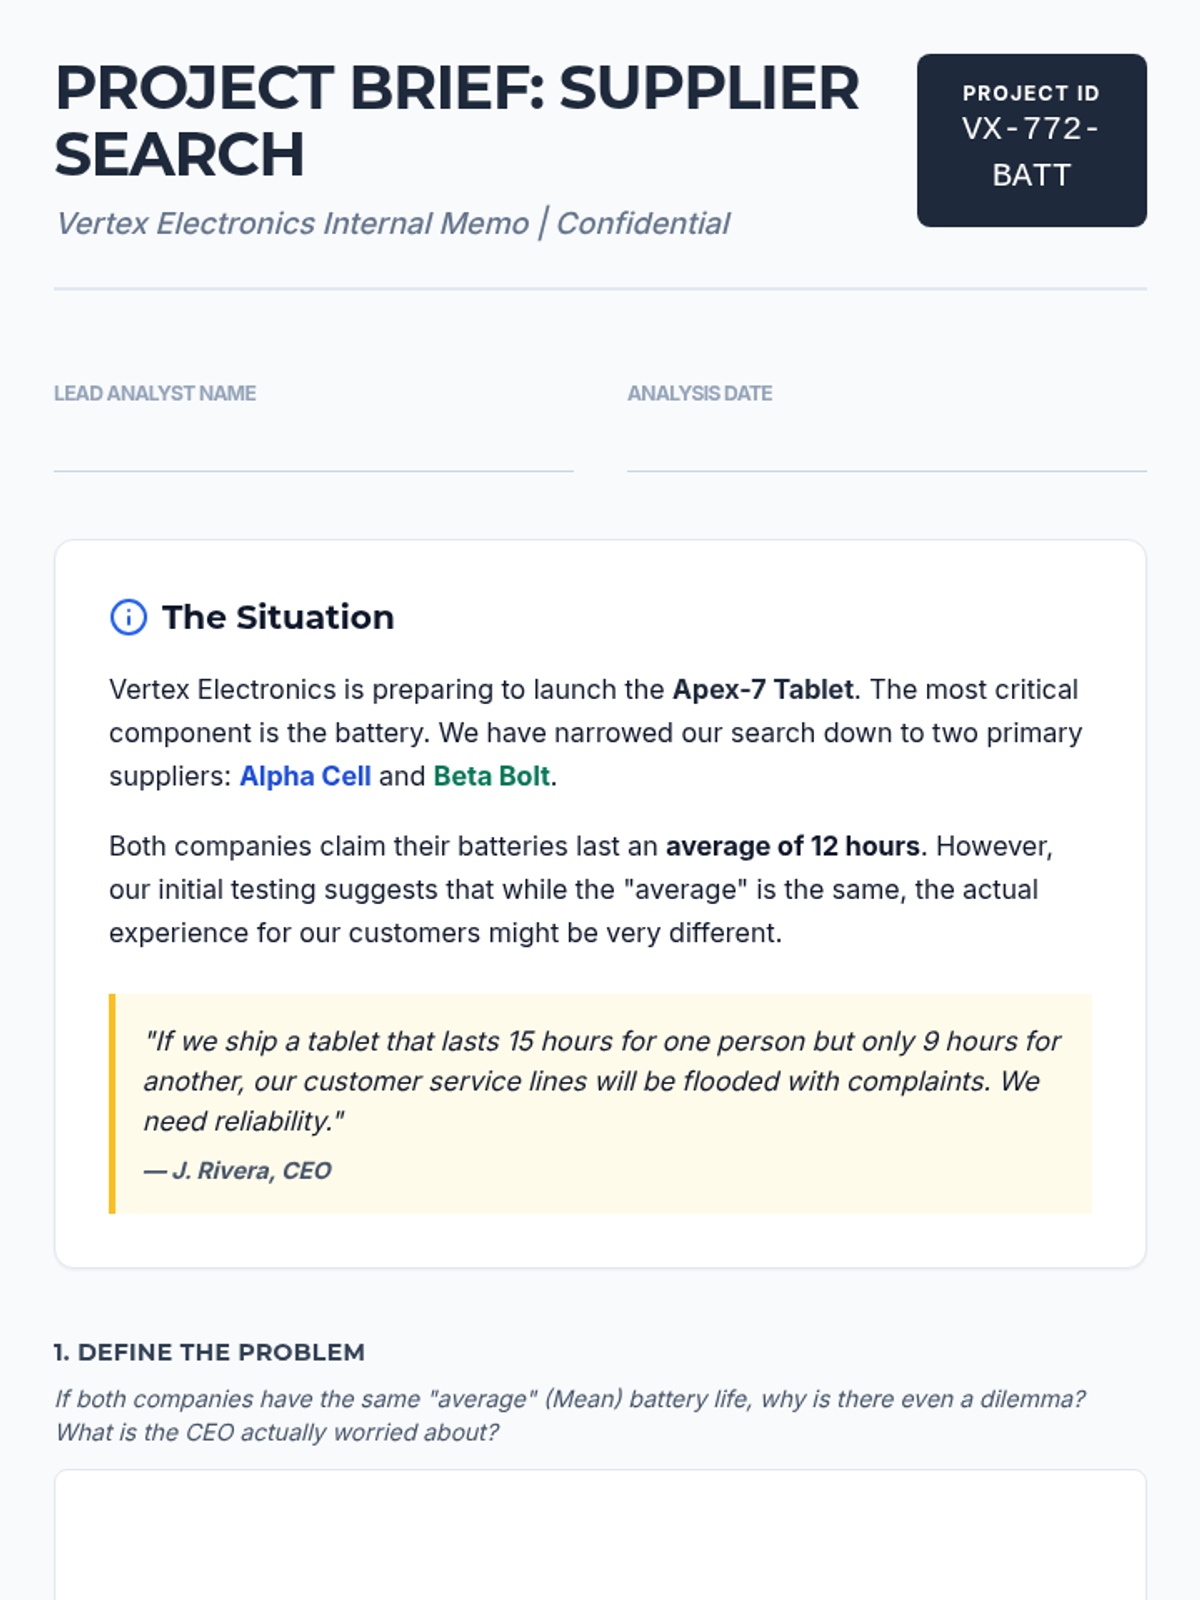
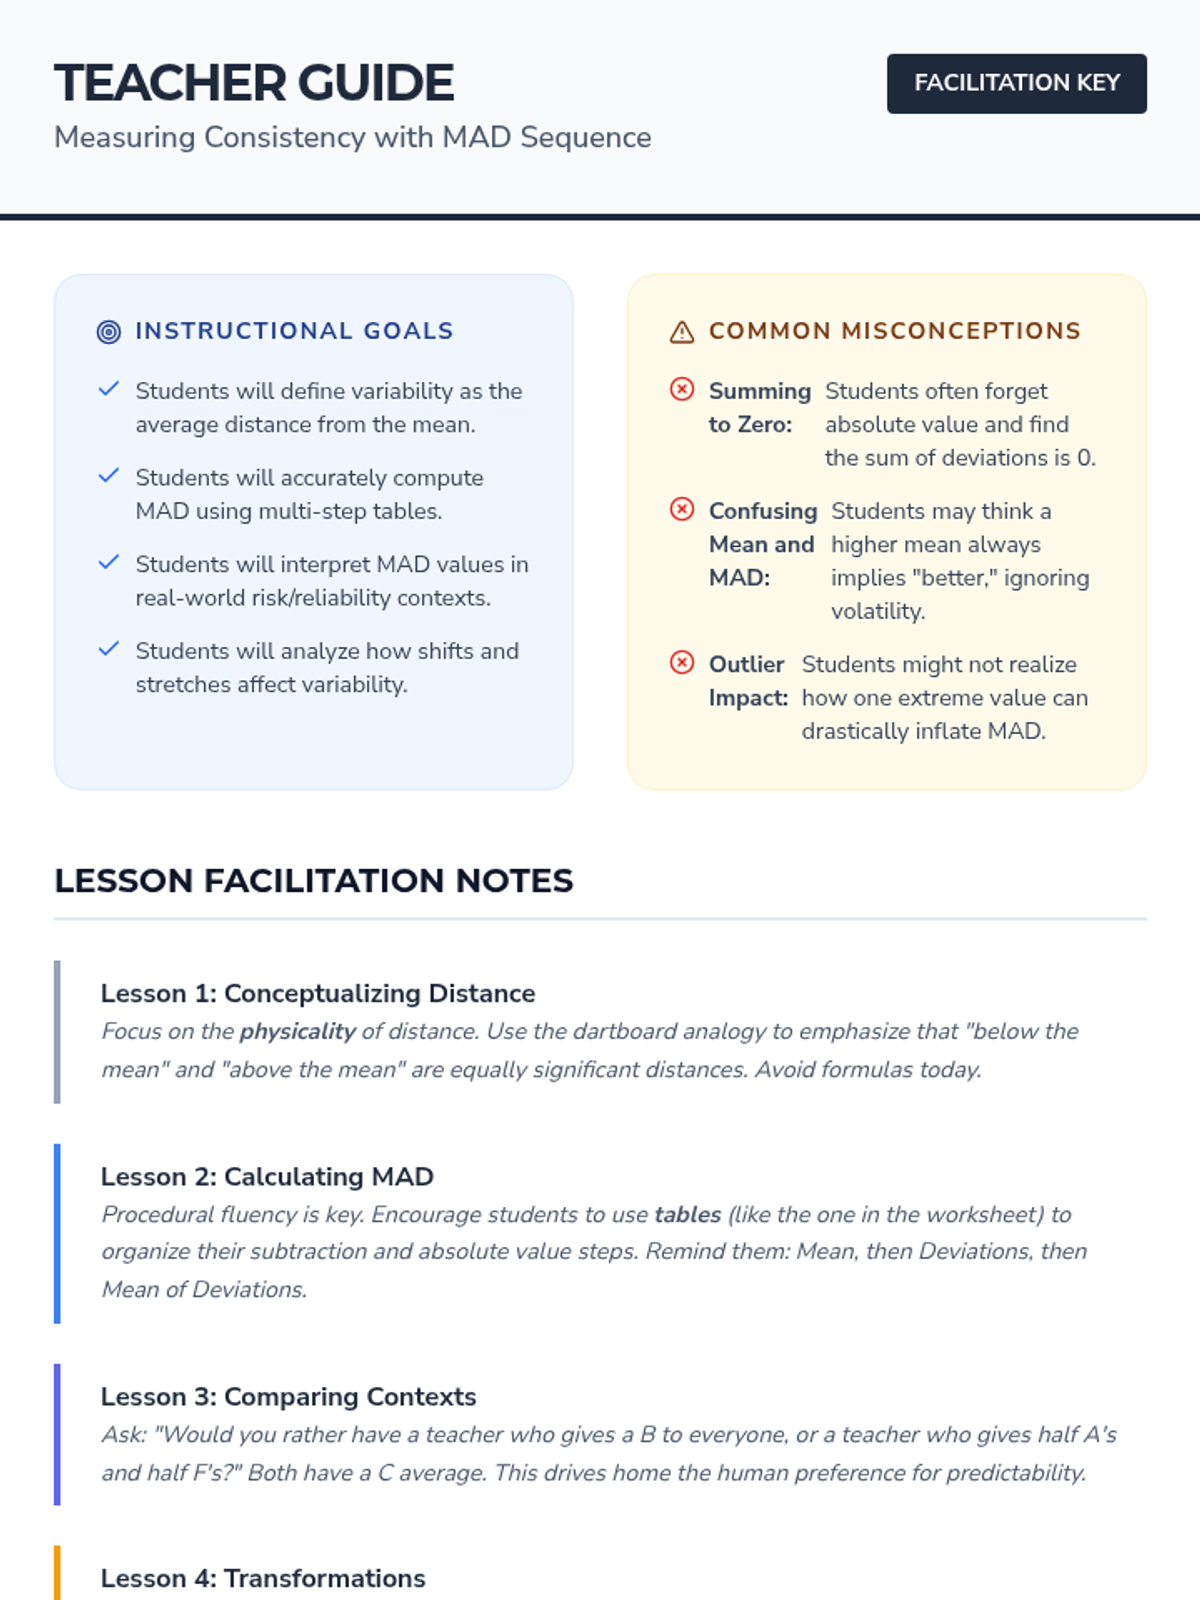
Students act as data analysts for a tech company to decide between two suppliers. They learn that averages don't tell the whole story, using Mean Absolute Deviation (MAD) and Interquartile Range (IQR) to assess risk and consistency in real-world decision making.
An inquiry-based exploration of statistical variability, focusing on how data spread reveals truths about inequality, climate instability, and diversity that averages often hide. Students transition from visual distribution analysis to quantifying disparity using IQR and MAD, culminating in an independent investigation.
A high school statistics sequence focused on quantifying risk and consistency through measures of variability. Students move from basic spread concepts to complex financial and industrial case studies, culminating in a data-driven risk assessment report.
This project-based sequence explores consistency and volatility through the lens of Mean Absolute Deviation (MAD). Students analyze real-world datasets to understand how variability quantifies 'reliability' beyond simple averages.
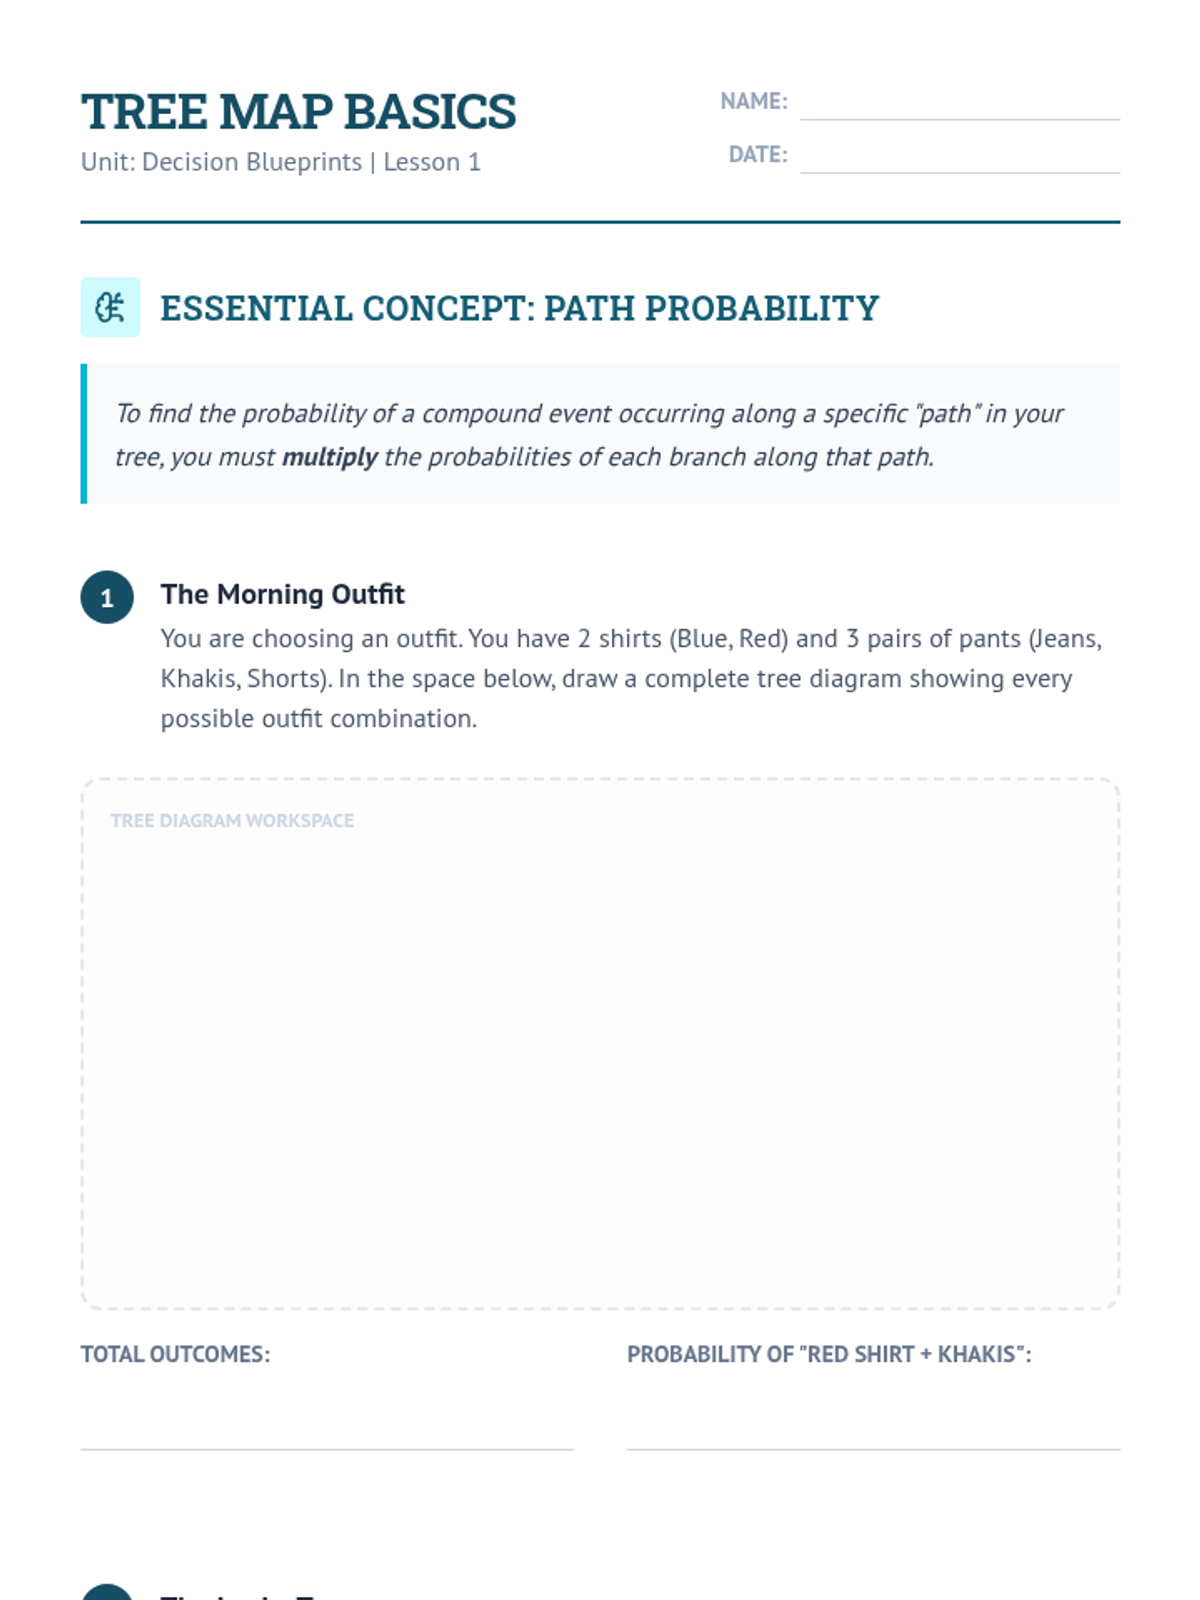
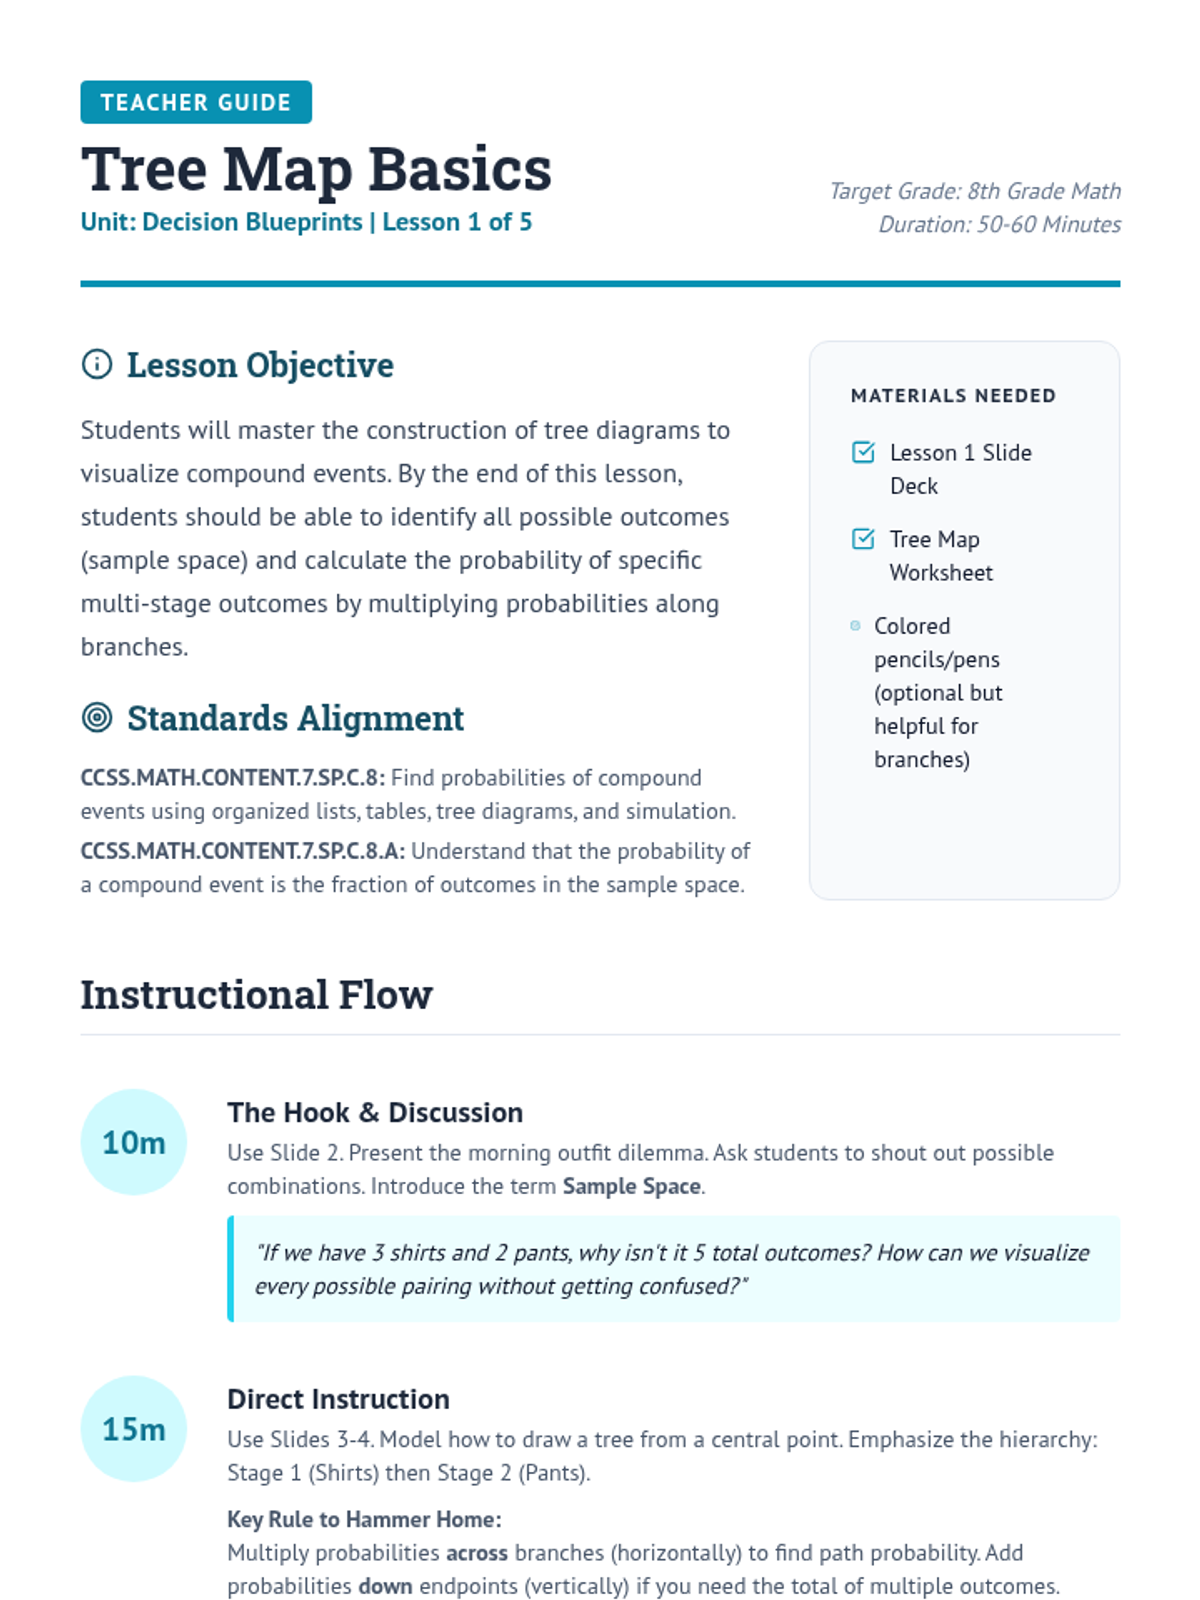
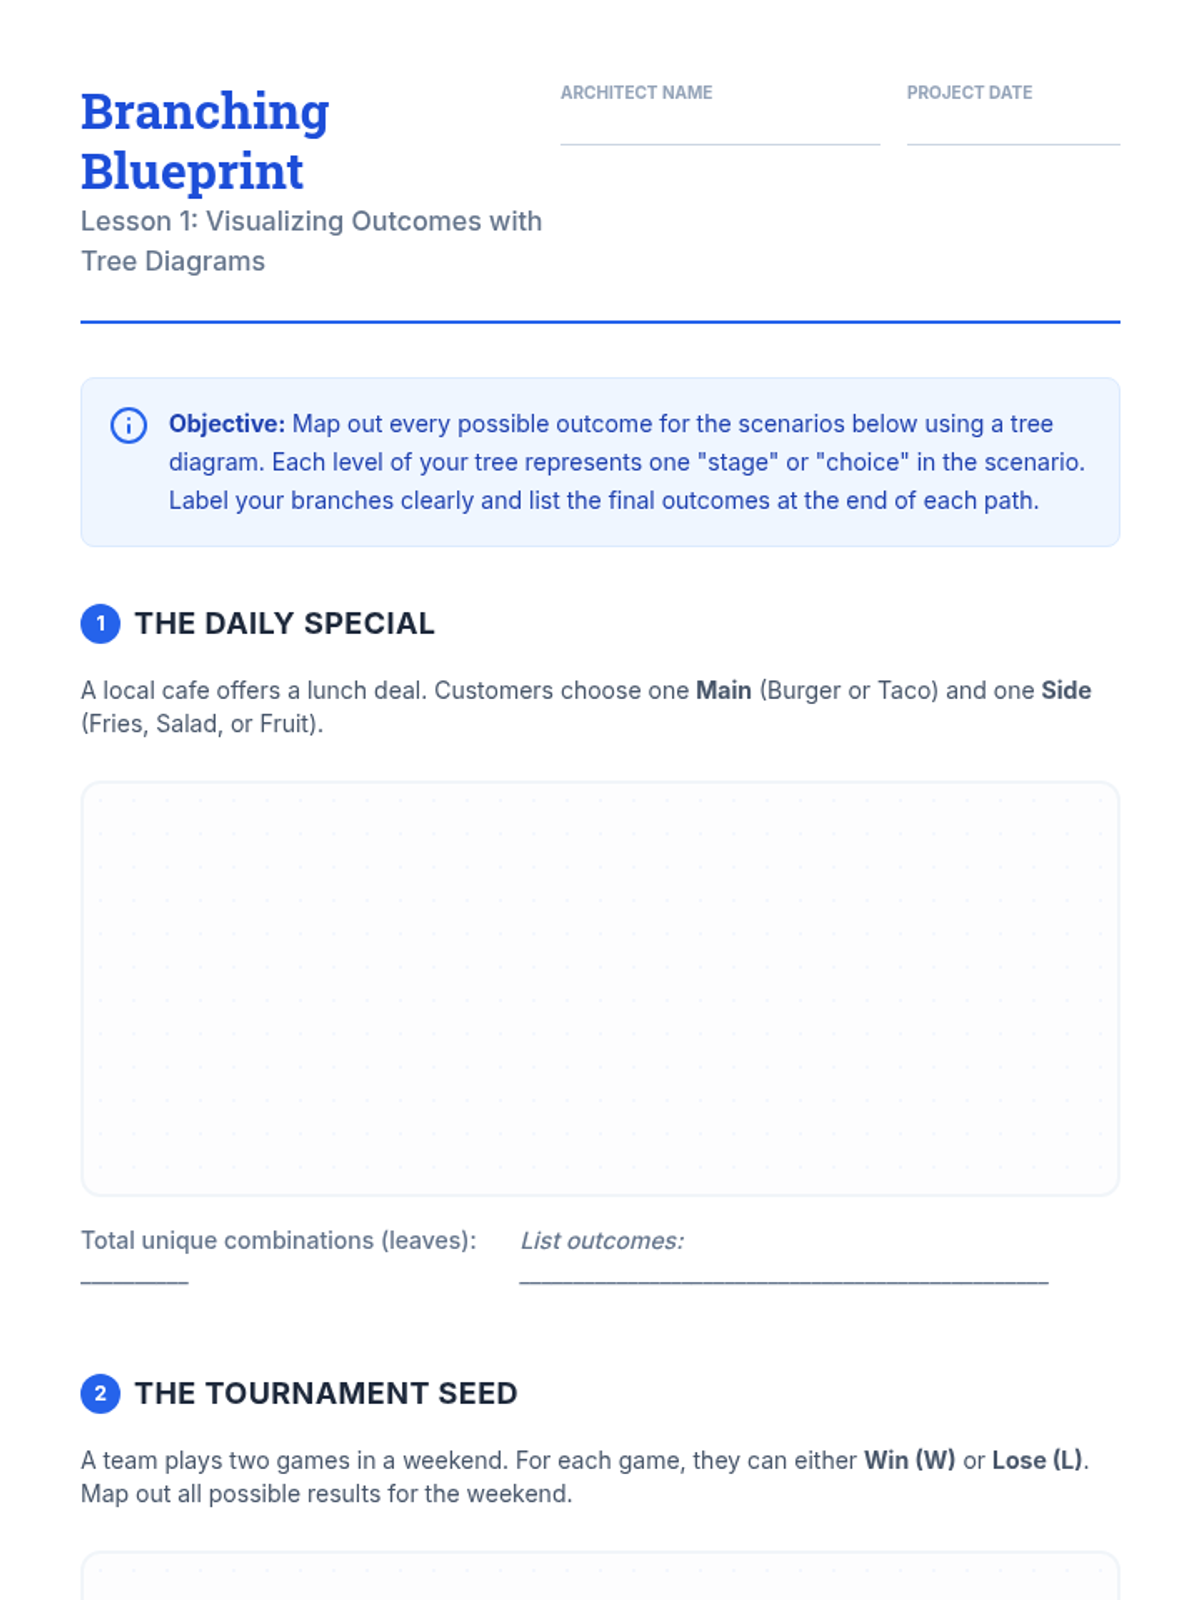
An 8th-grade mathematics unit focused on using probability trees to model and solve complex decision-making problems. Students progress from simple compound events to weighted averages and backward induction in real-world business and logistics scenarios.
This sequence guides students through the visualization and calculation of compound probabilities using tree diagrams. Students progress from basic branching to analyzing complex real-world decisions involving dependent and independent events.
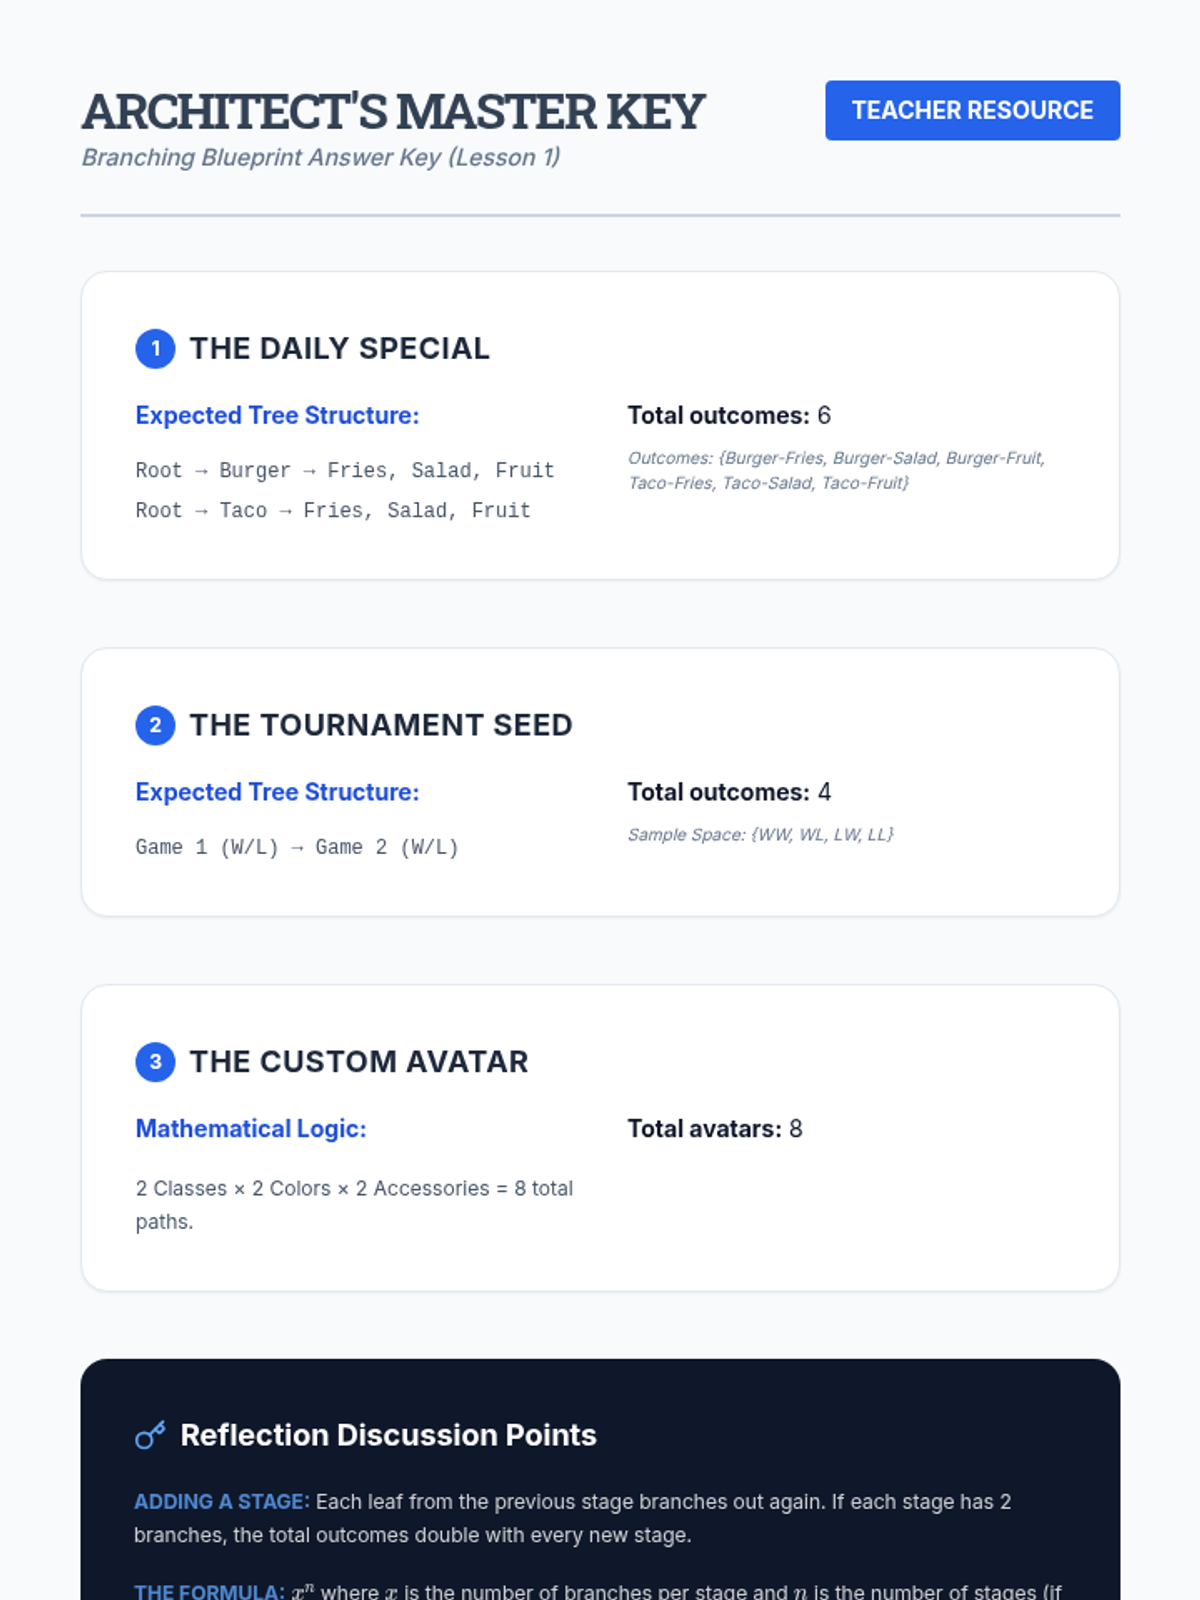
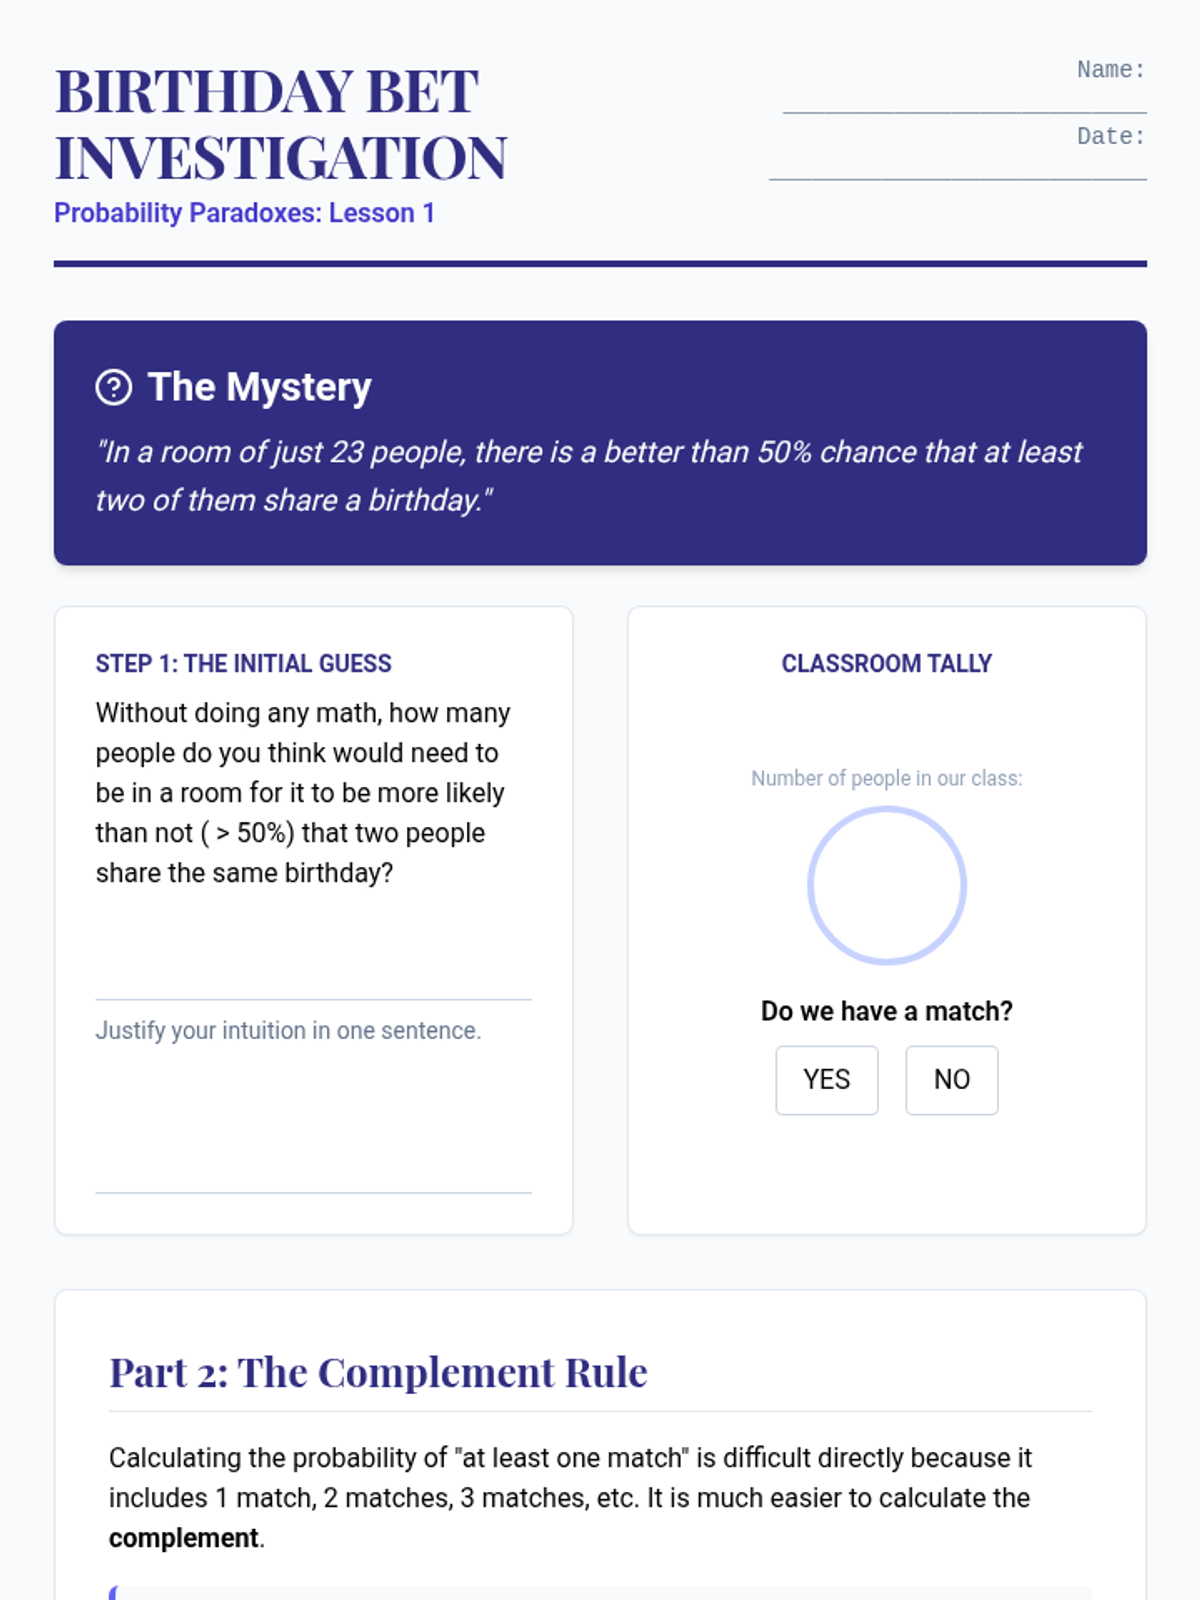
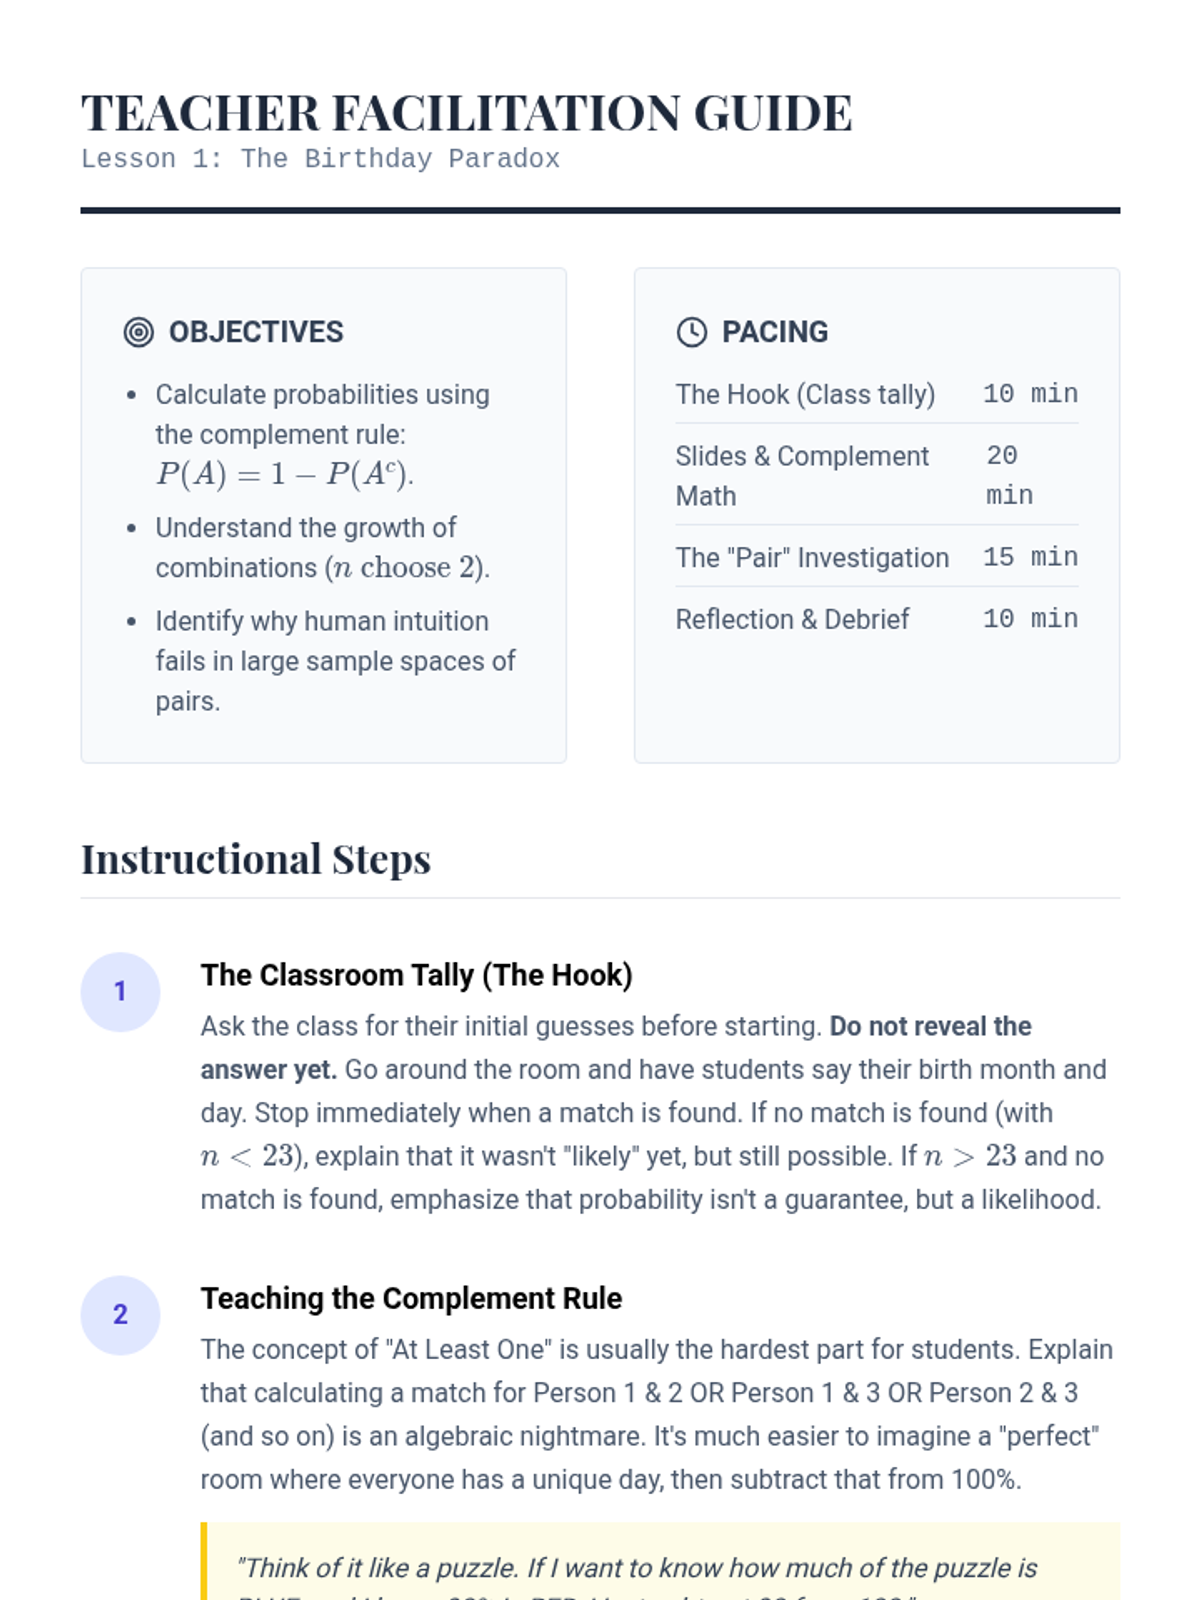
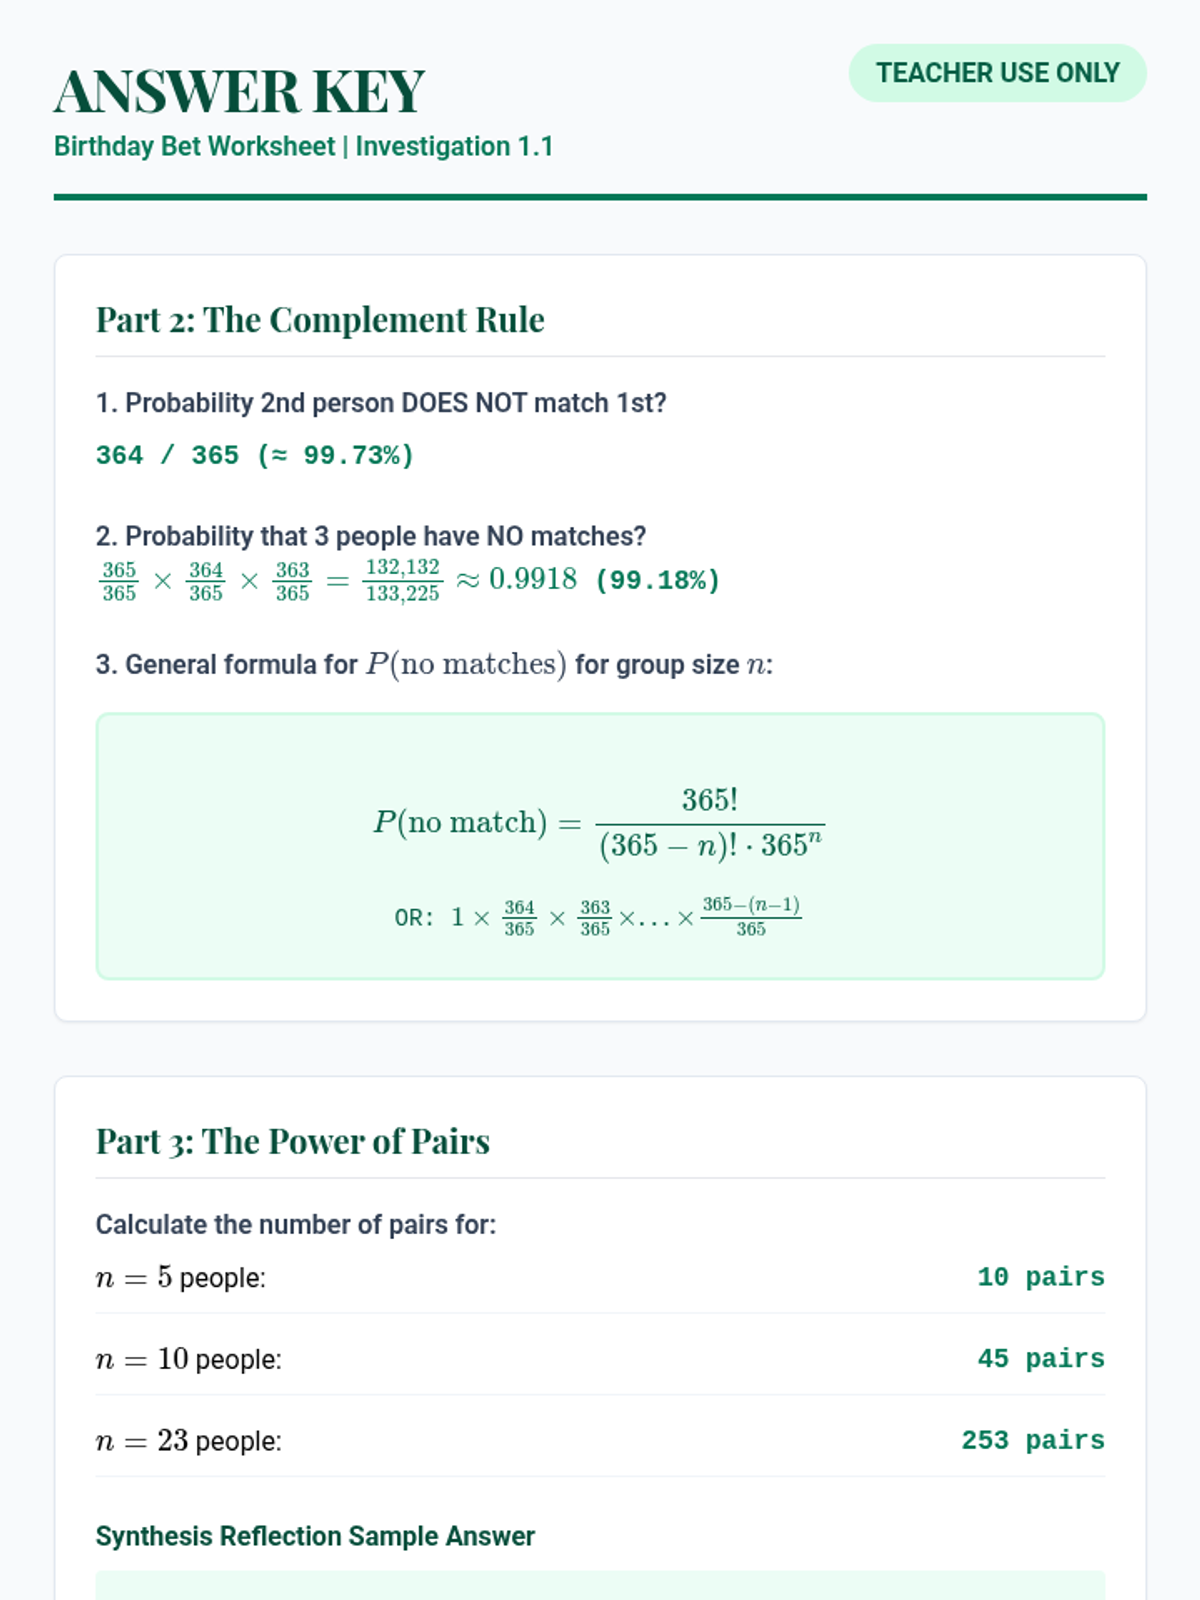
An inquiry-driven investigation into counter-intuitive probability. Students explore the Birthday Problem, Gambler's Fallacy, Monty Hall Problem, and Simpson's Paradox to understand why human intuition often fails in the face of compound event logic.
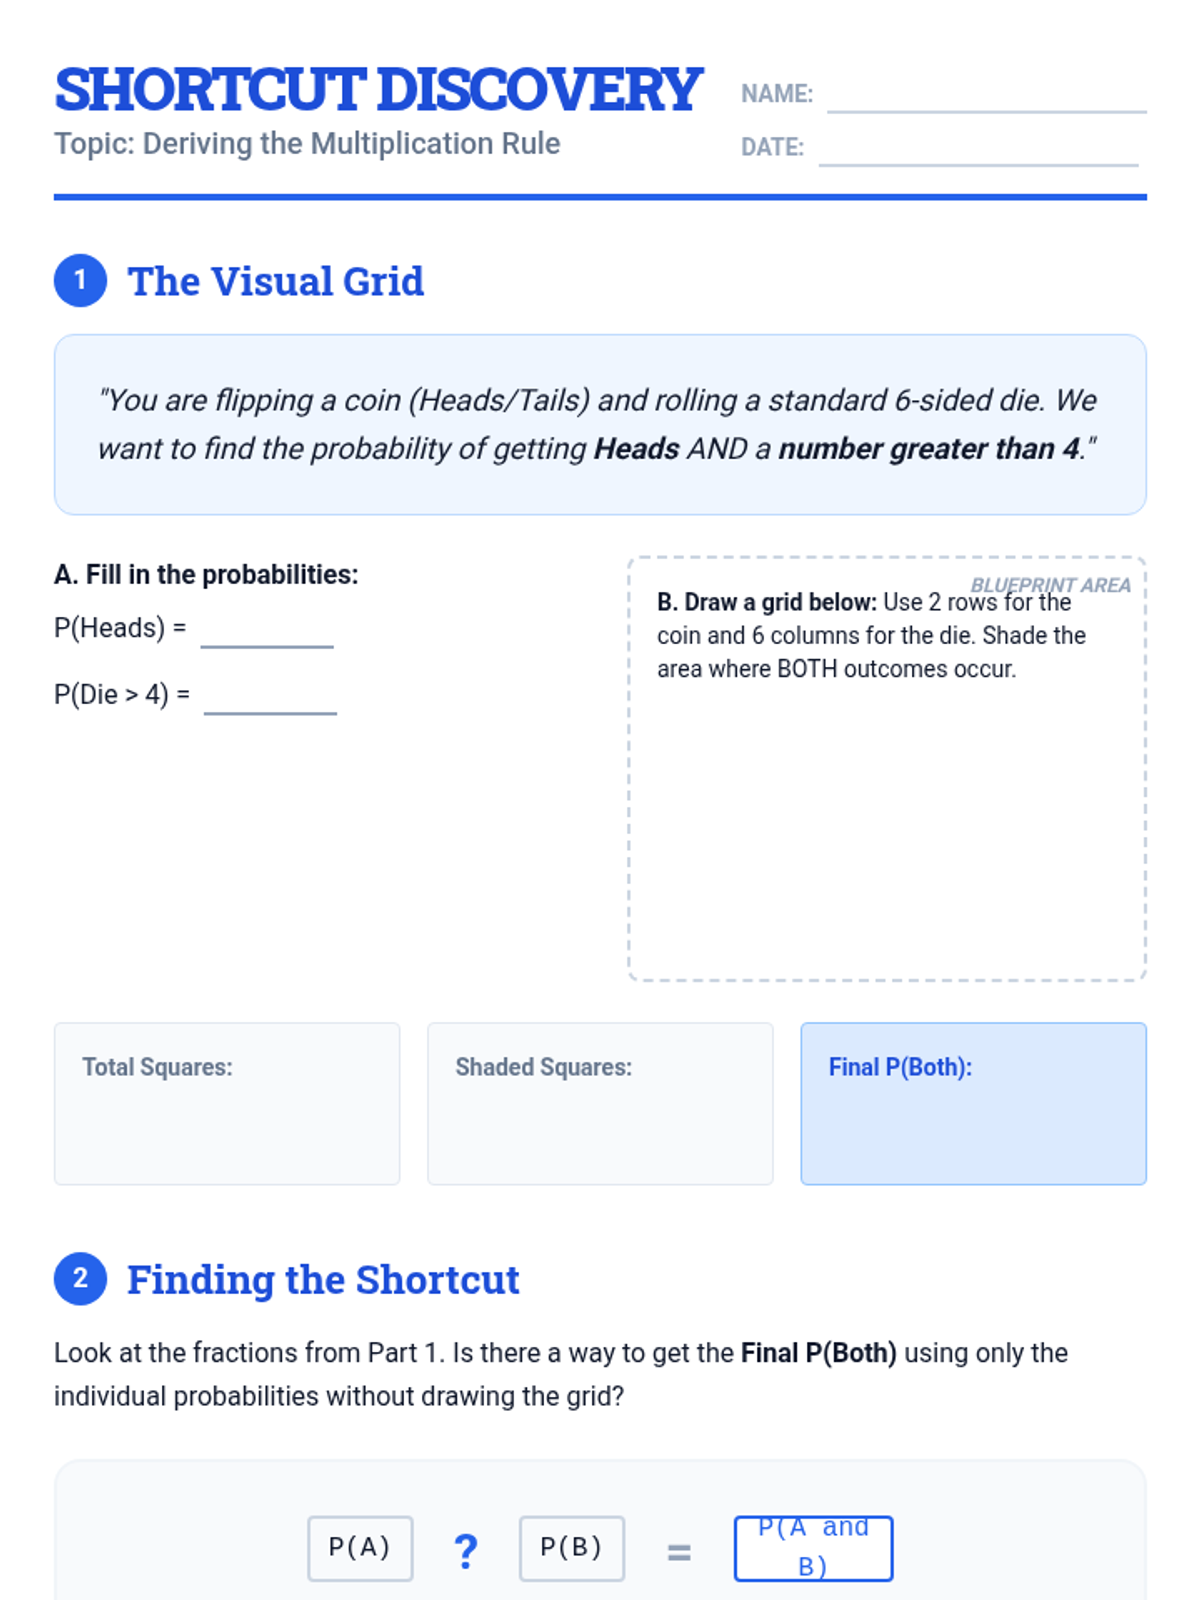
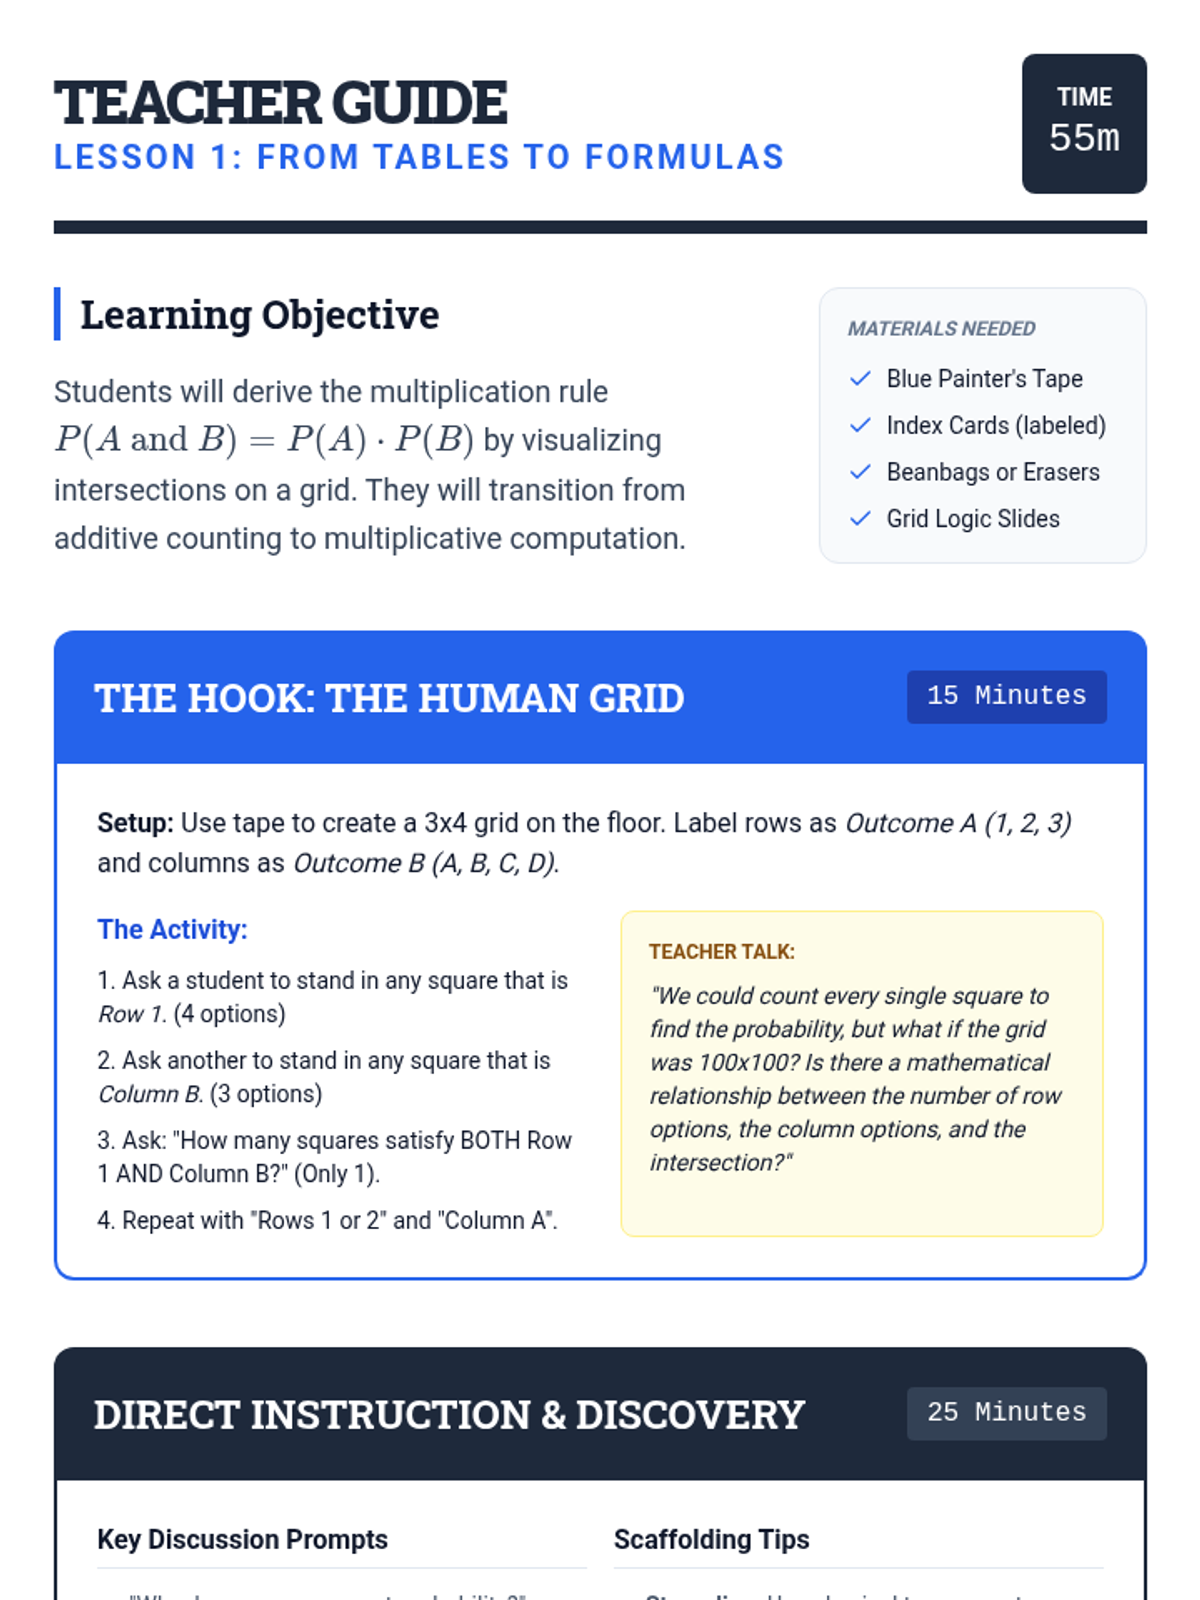
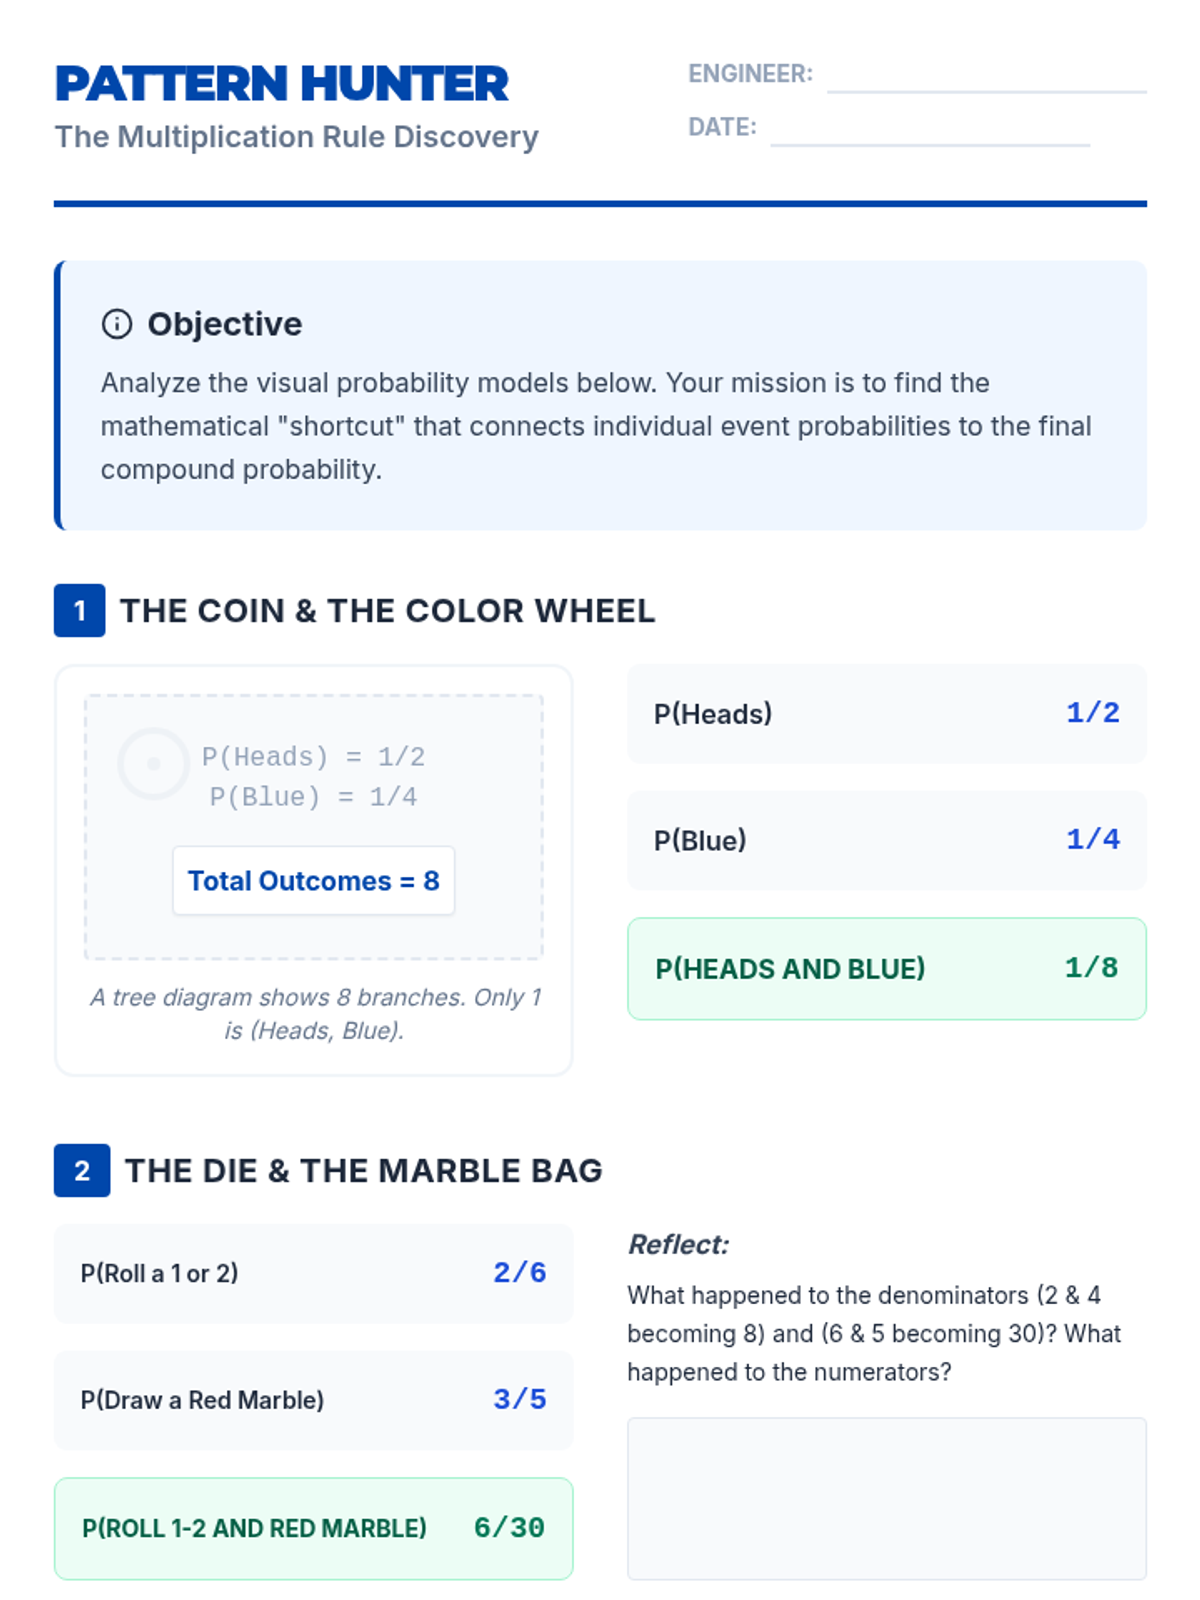
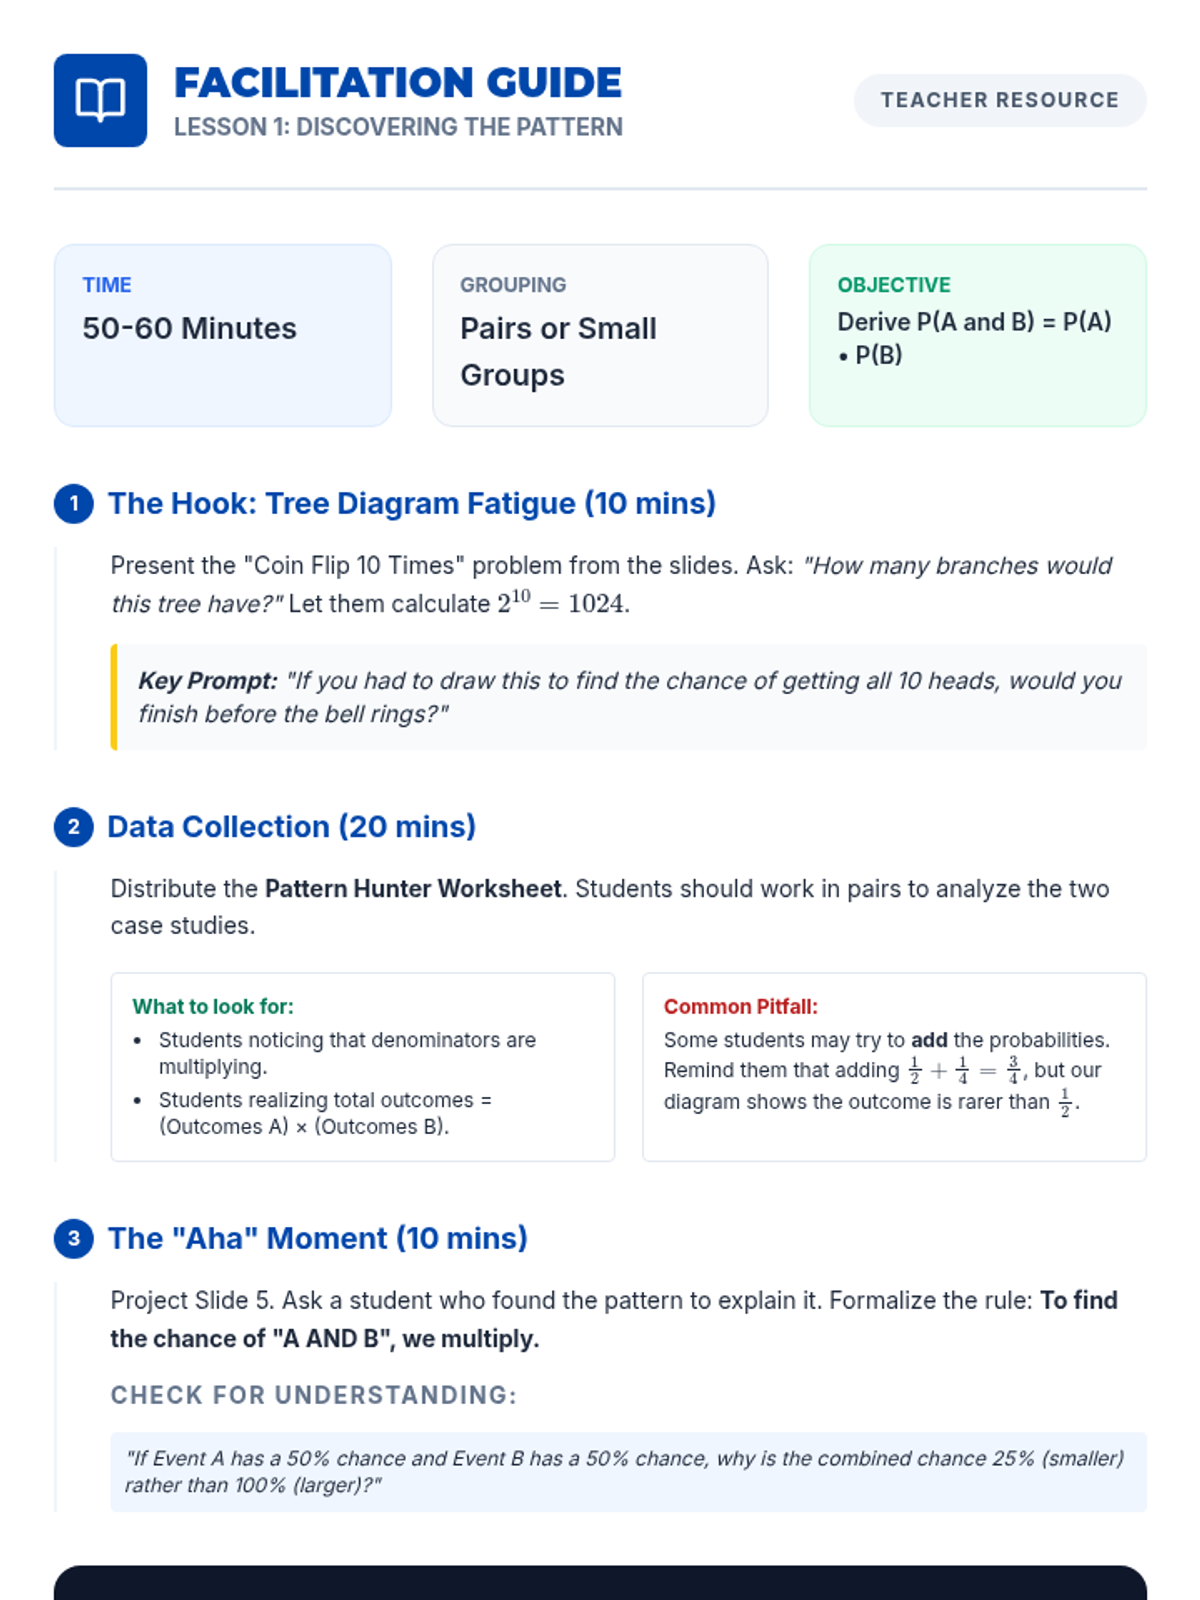
This mastery-based sequence focuses on the algebraic side of probability, specifically utilizing the multiplication rule for complex problems. Students progress from visual models to abstract formulas, covering independent and dependent events, 'at least one' scenarios using complements, and mixed strategy application.
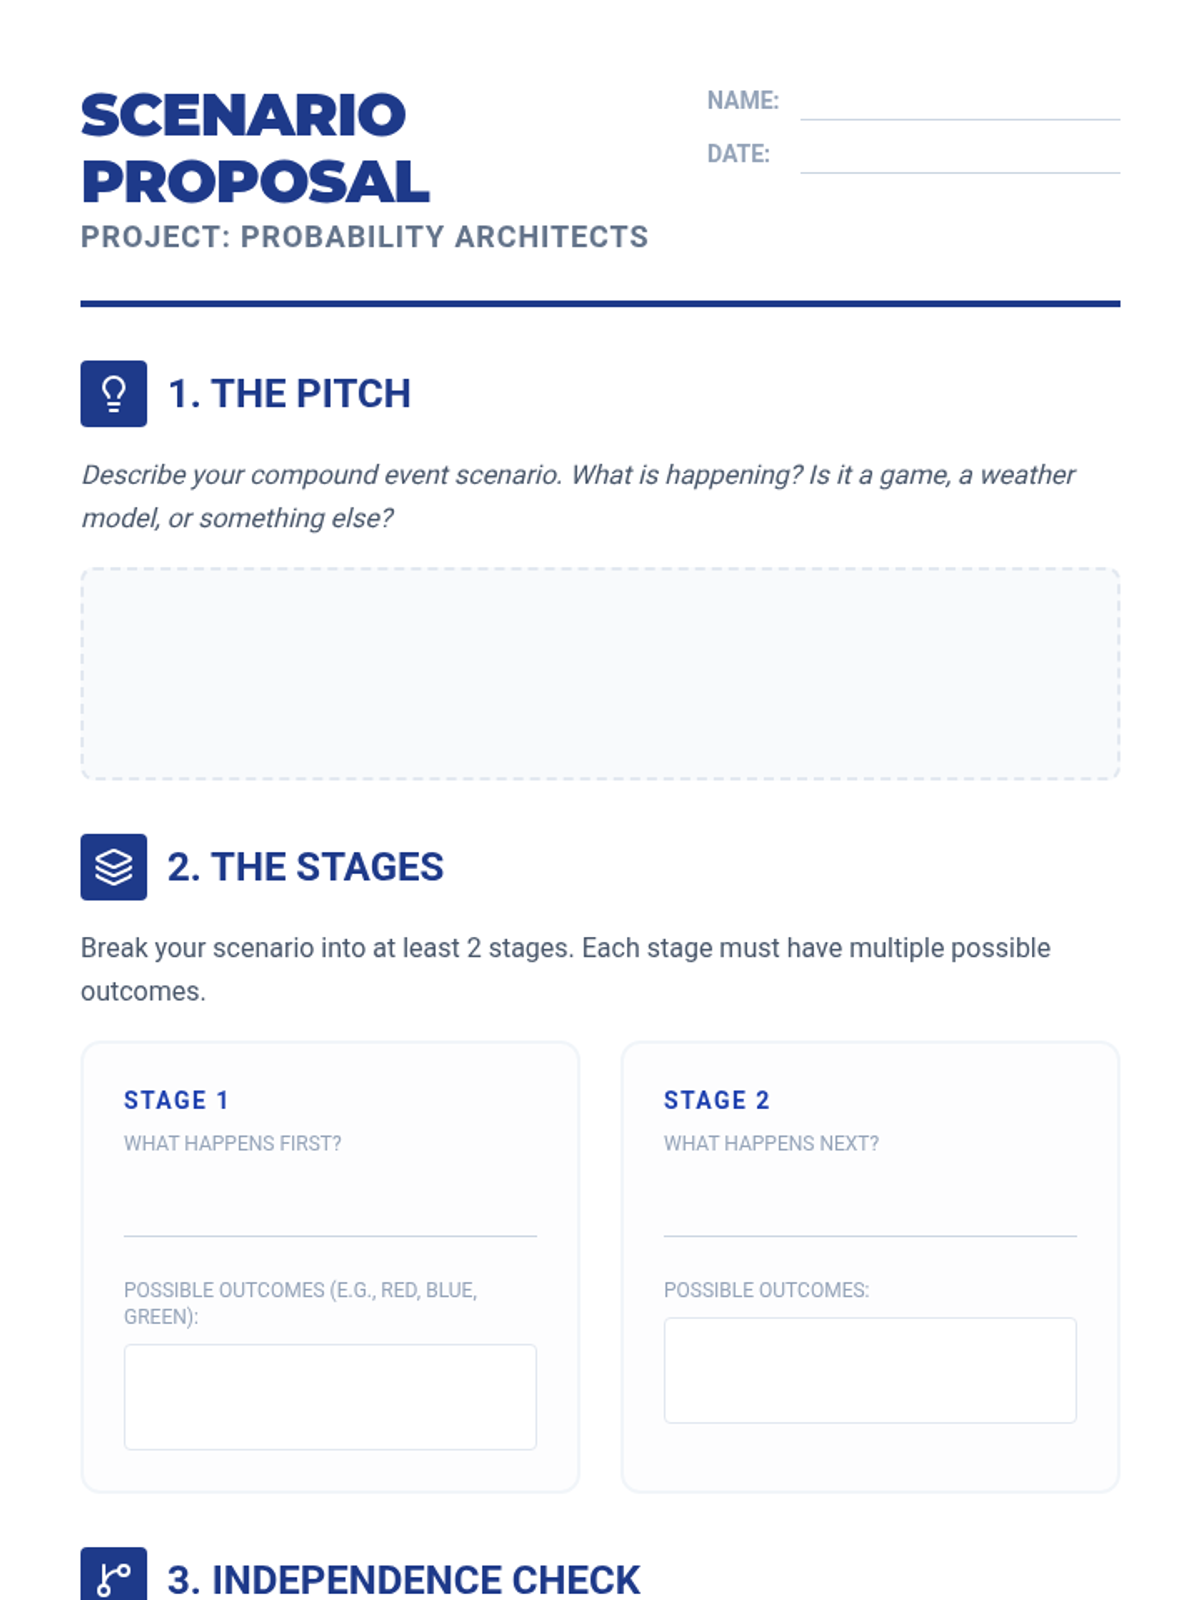
Students act as game designers to create, calculate, and simulate compound probability models. They move from brainstorming scenarios to analyzing experimental data, culminating in a gallery walk showcase.
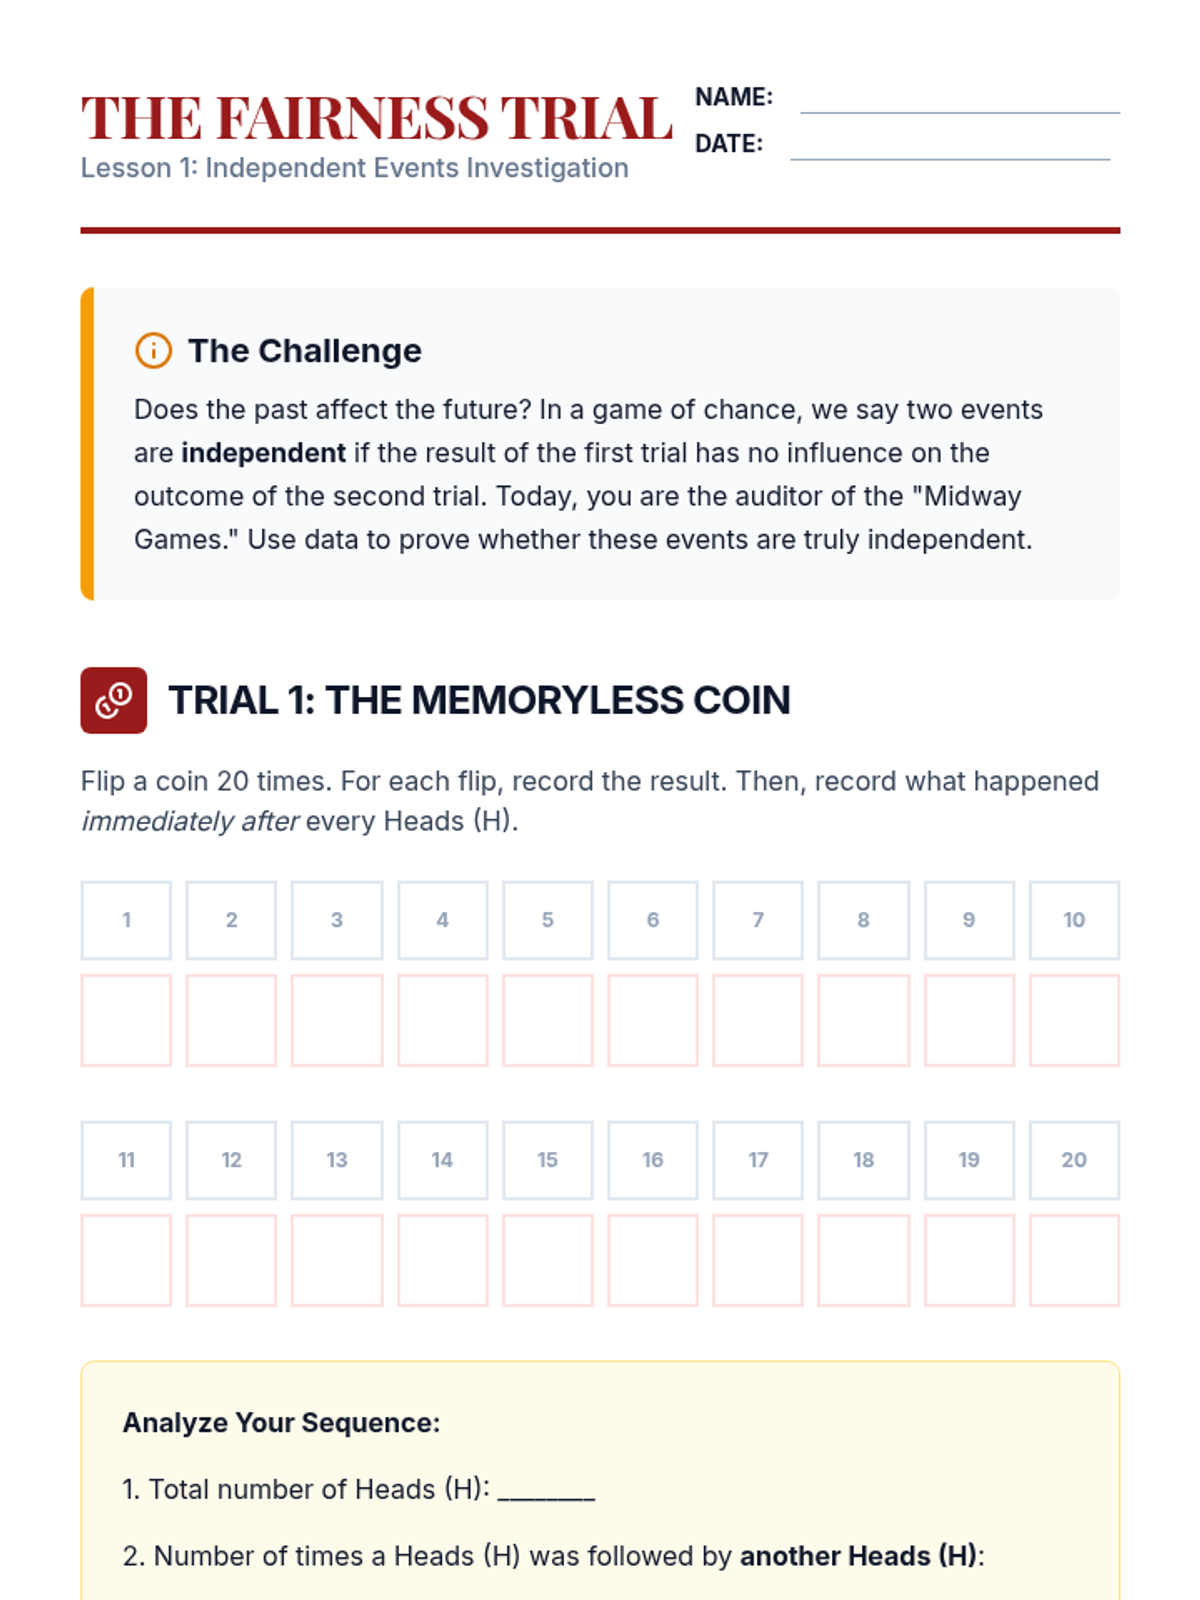
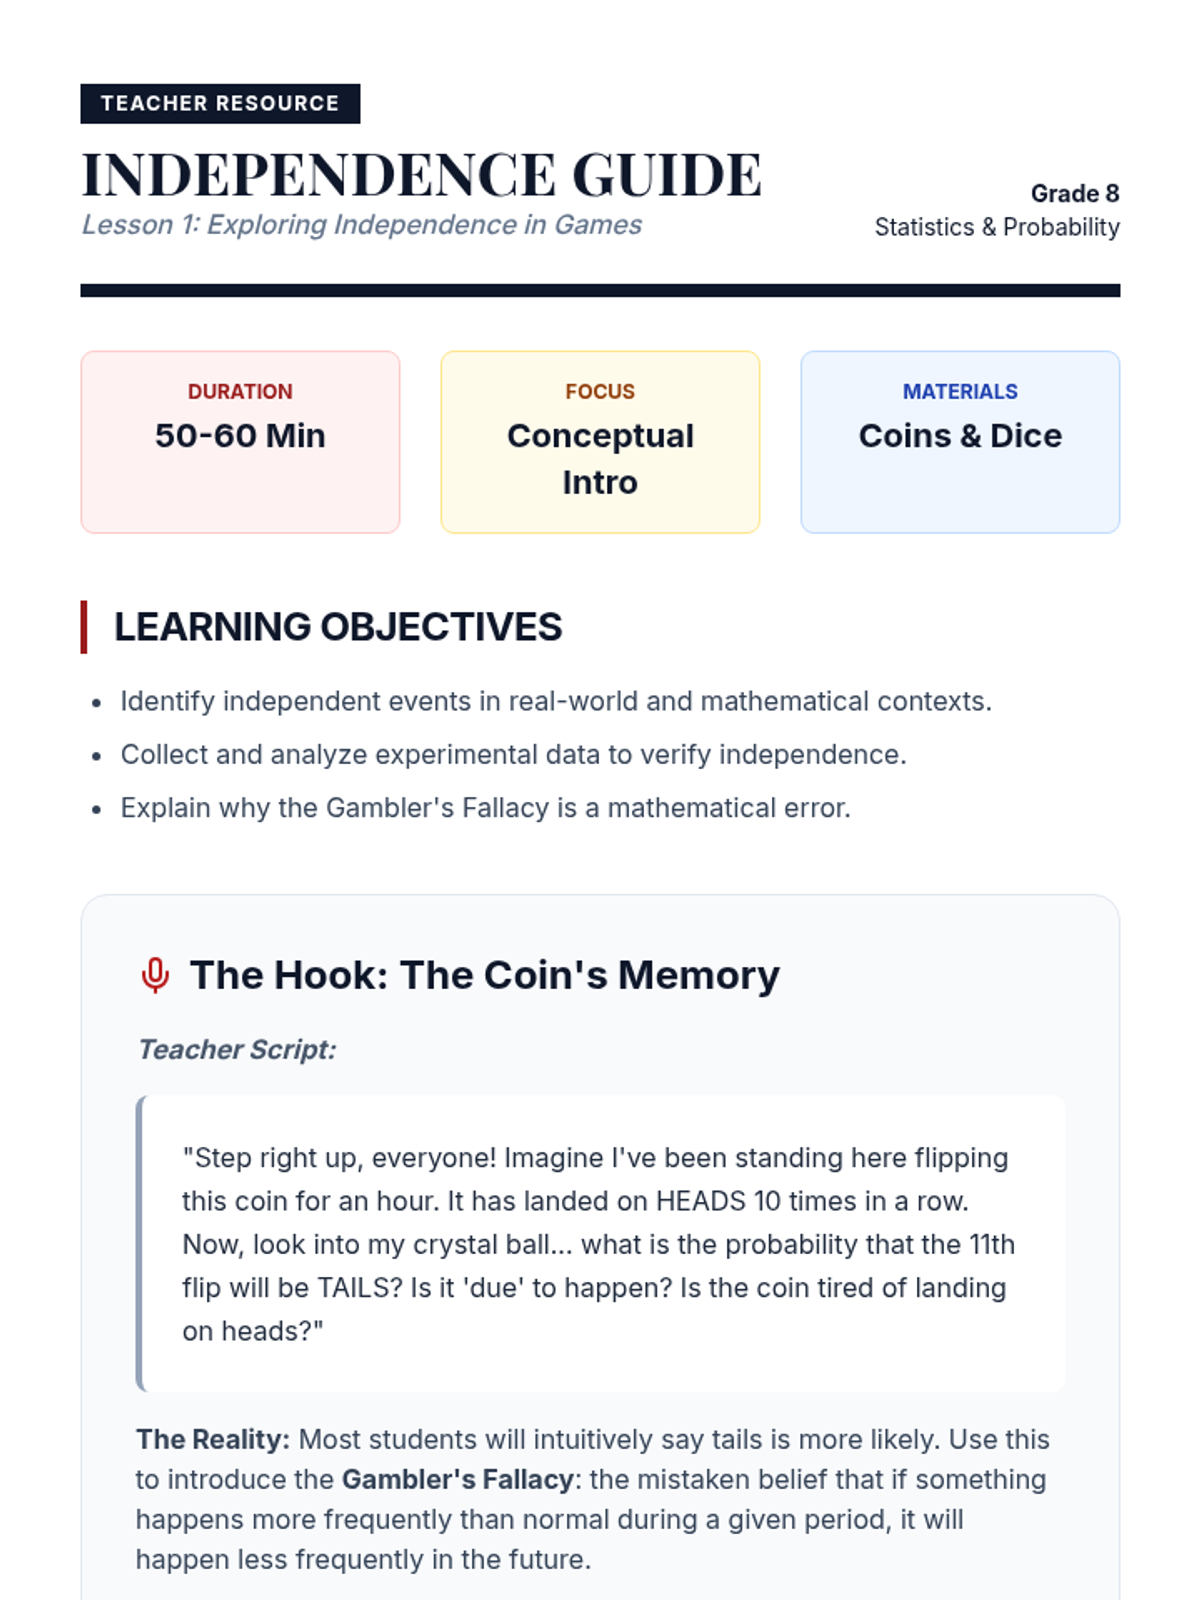
A game-based unit for 8th graders to explore compound independent events. Students move from experimental observation to theoretical calculation using the multiplication rule through the lens of carnival games and chance.
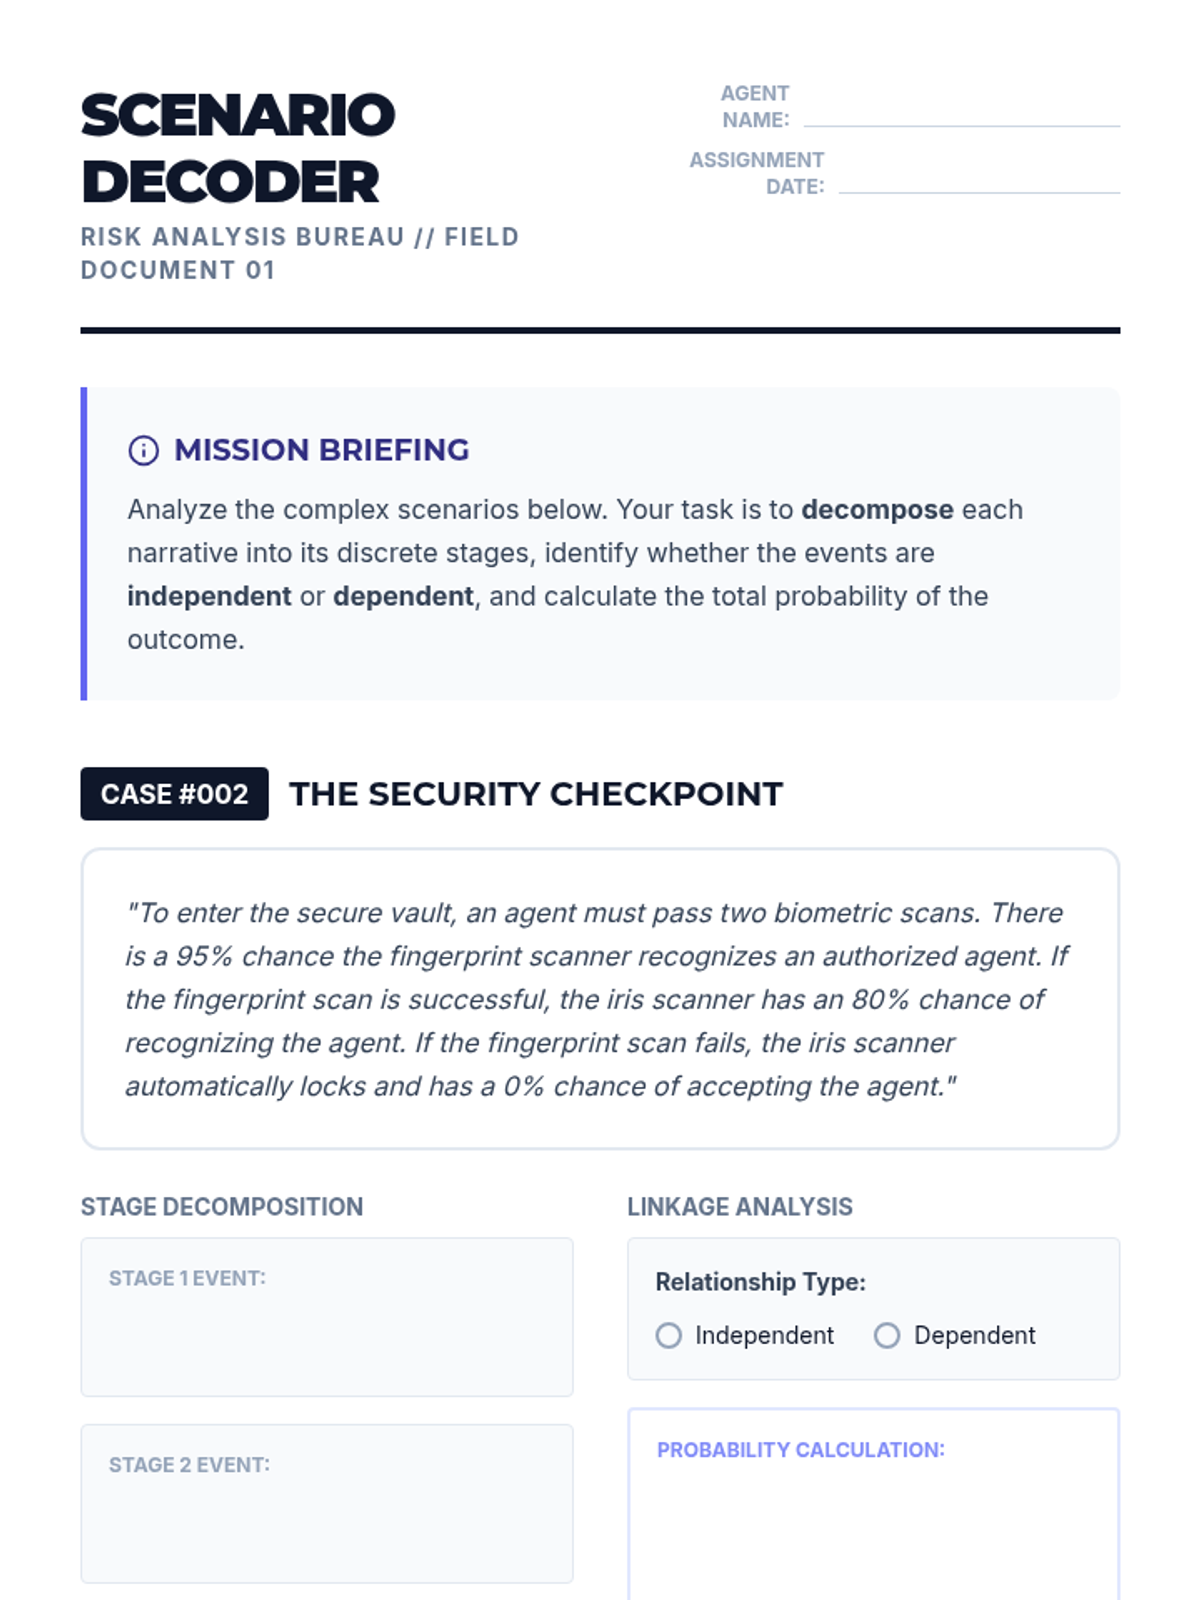
An advanced project-based sequence where 9th-grade students act as risk analysts, modeling complex multi-stage scenarios and calculating compound probabilities for independent and dependent events.
A comprehensive unit on dependent events and conditional probability, exploring how sequential choices change outcomes through simulations, formal notation, and real-world case studies.
A 9th-grade exploration into the world of independent events, where students use game-based inquiry to discover the multiplication rule of probability and apply it to design fair (and unfair) games.
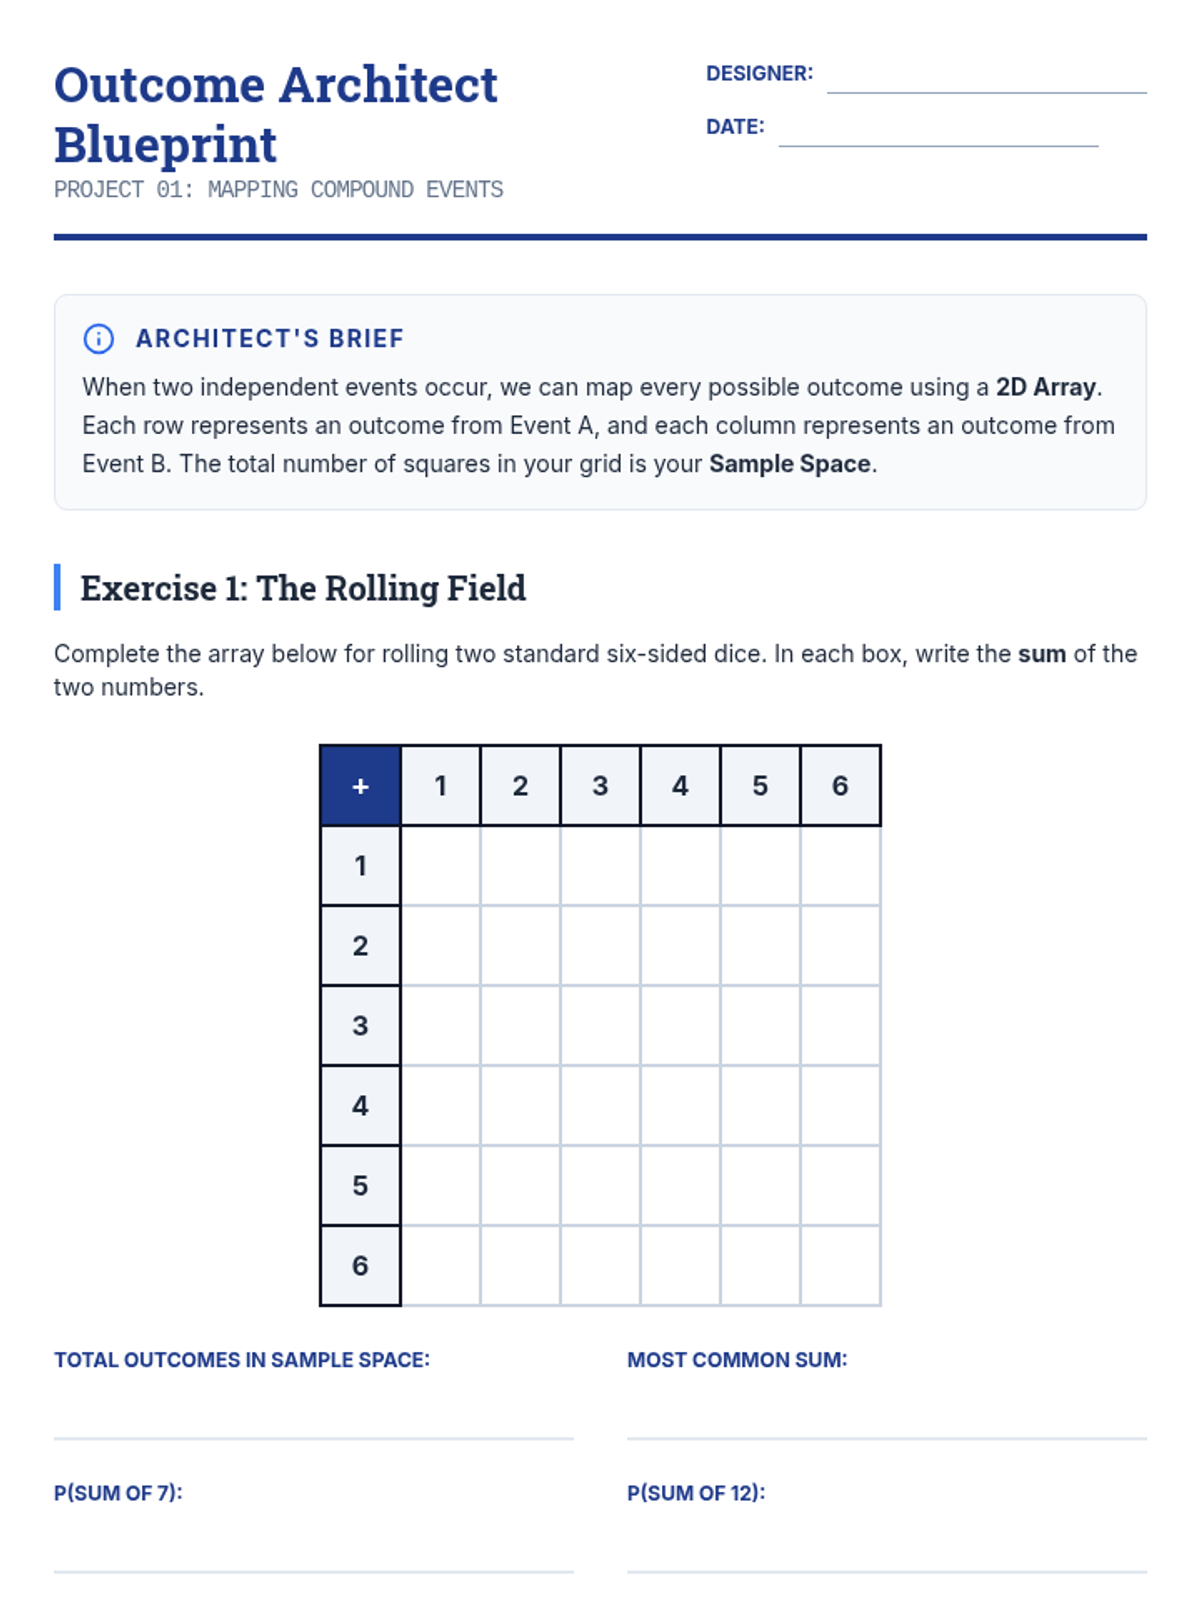
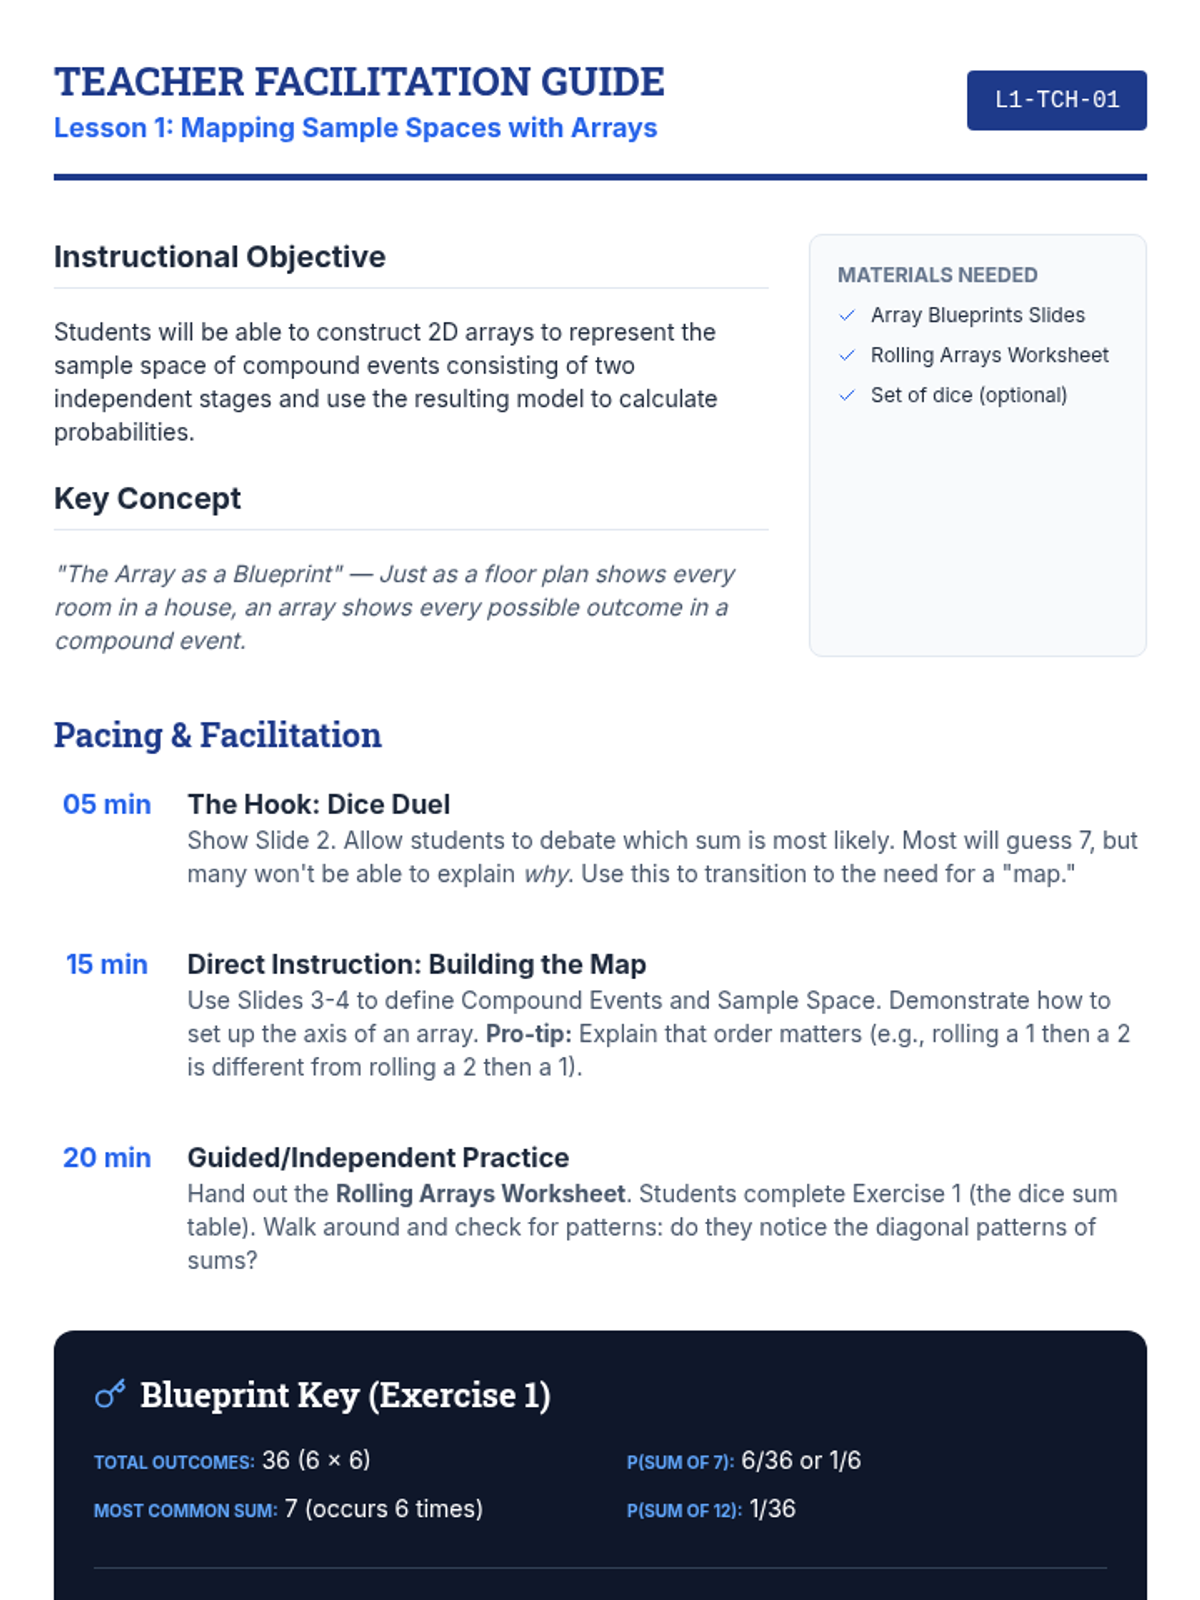
A foundational sequence for 9th-grade students focused on systematically representing sample spaces through arrays, tree diagrams, and the Fundamental Counting Principle to calculate compound event probabilities.
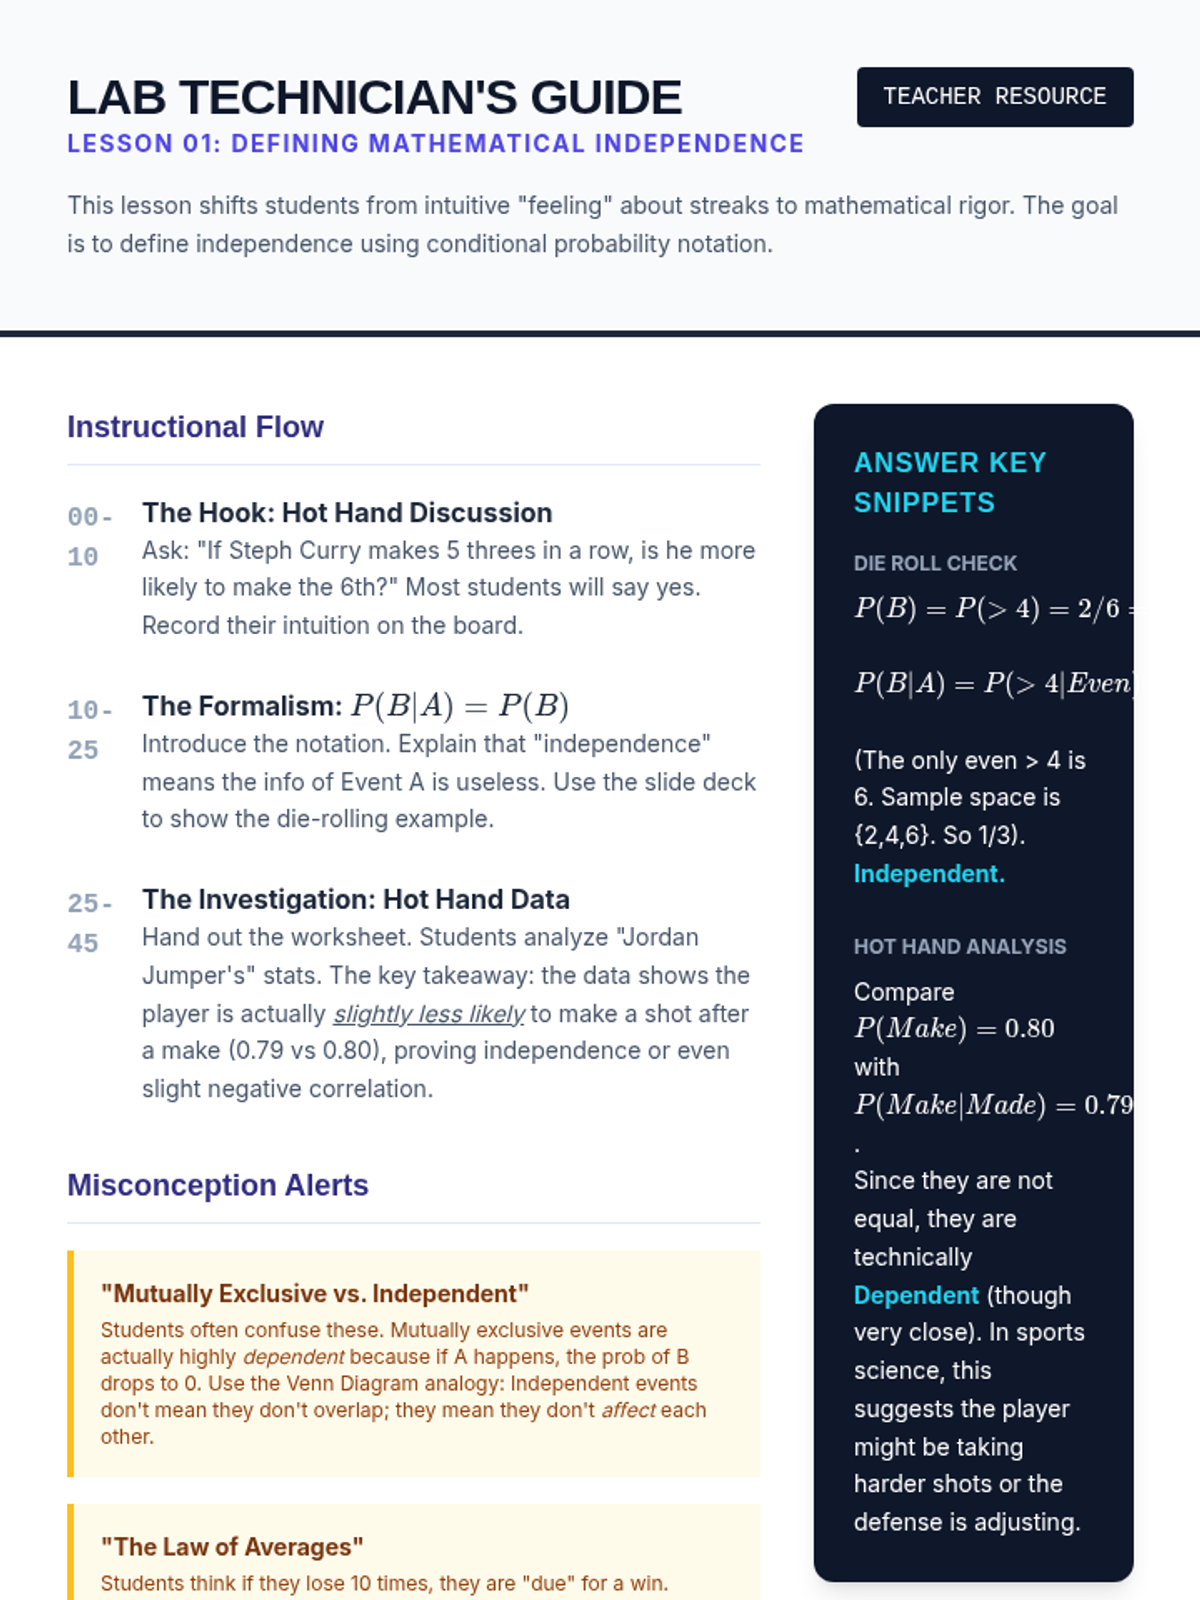
A deep dive into compound event probability, moving from conceptual independence to the algebraic rigor of the Multiplication Rule and conditional logic. Students analyze sports streaks, card games, and forensic evidence to master independent and dependent probabilities.
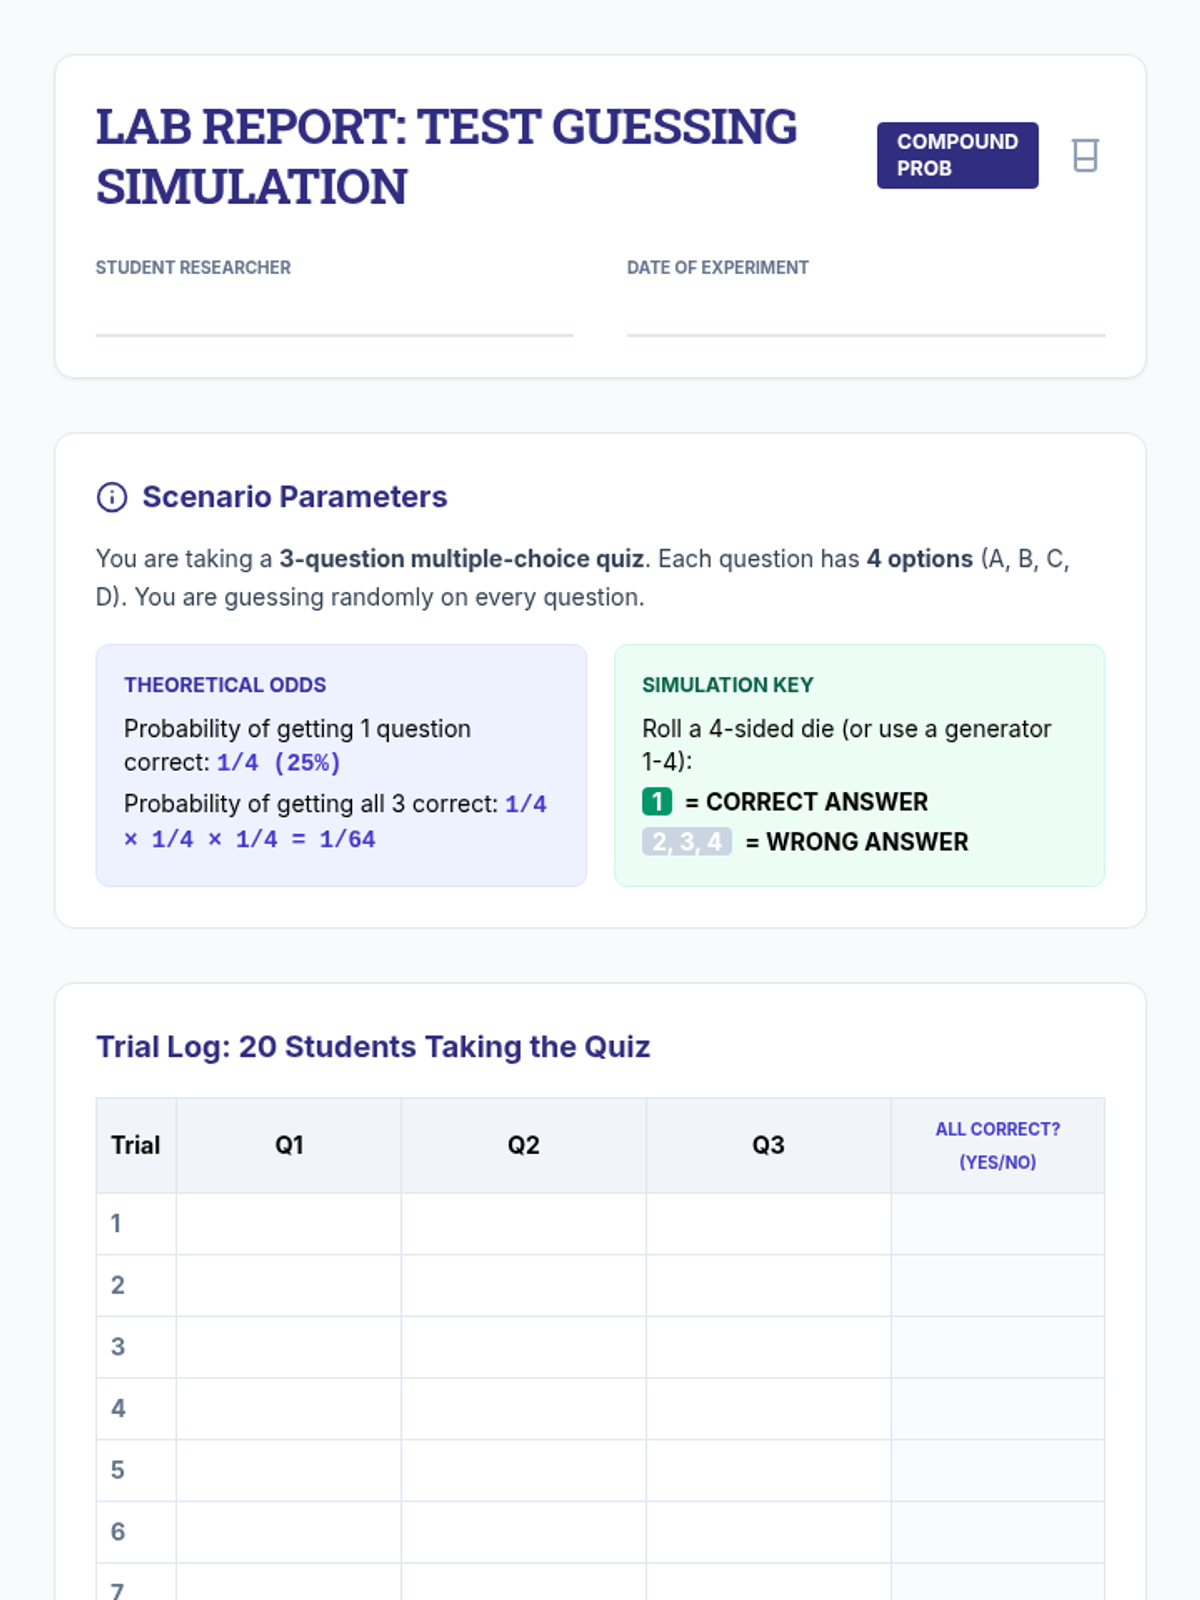
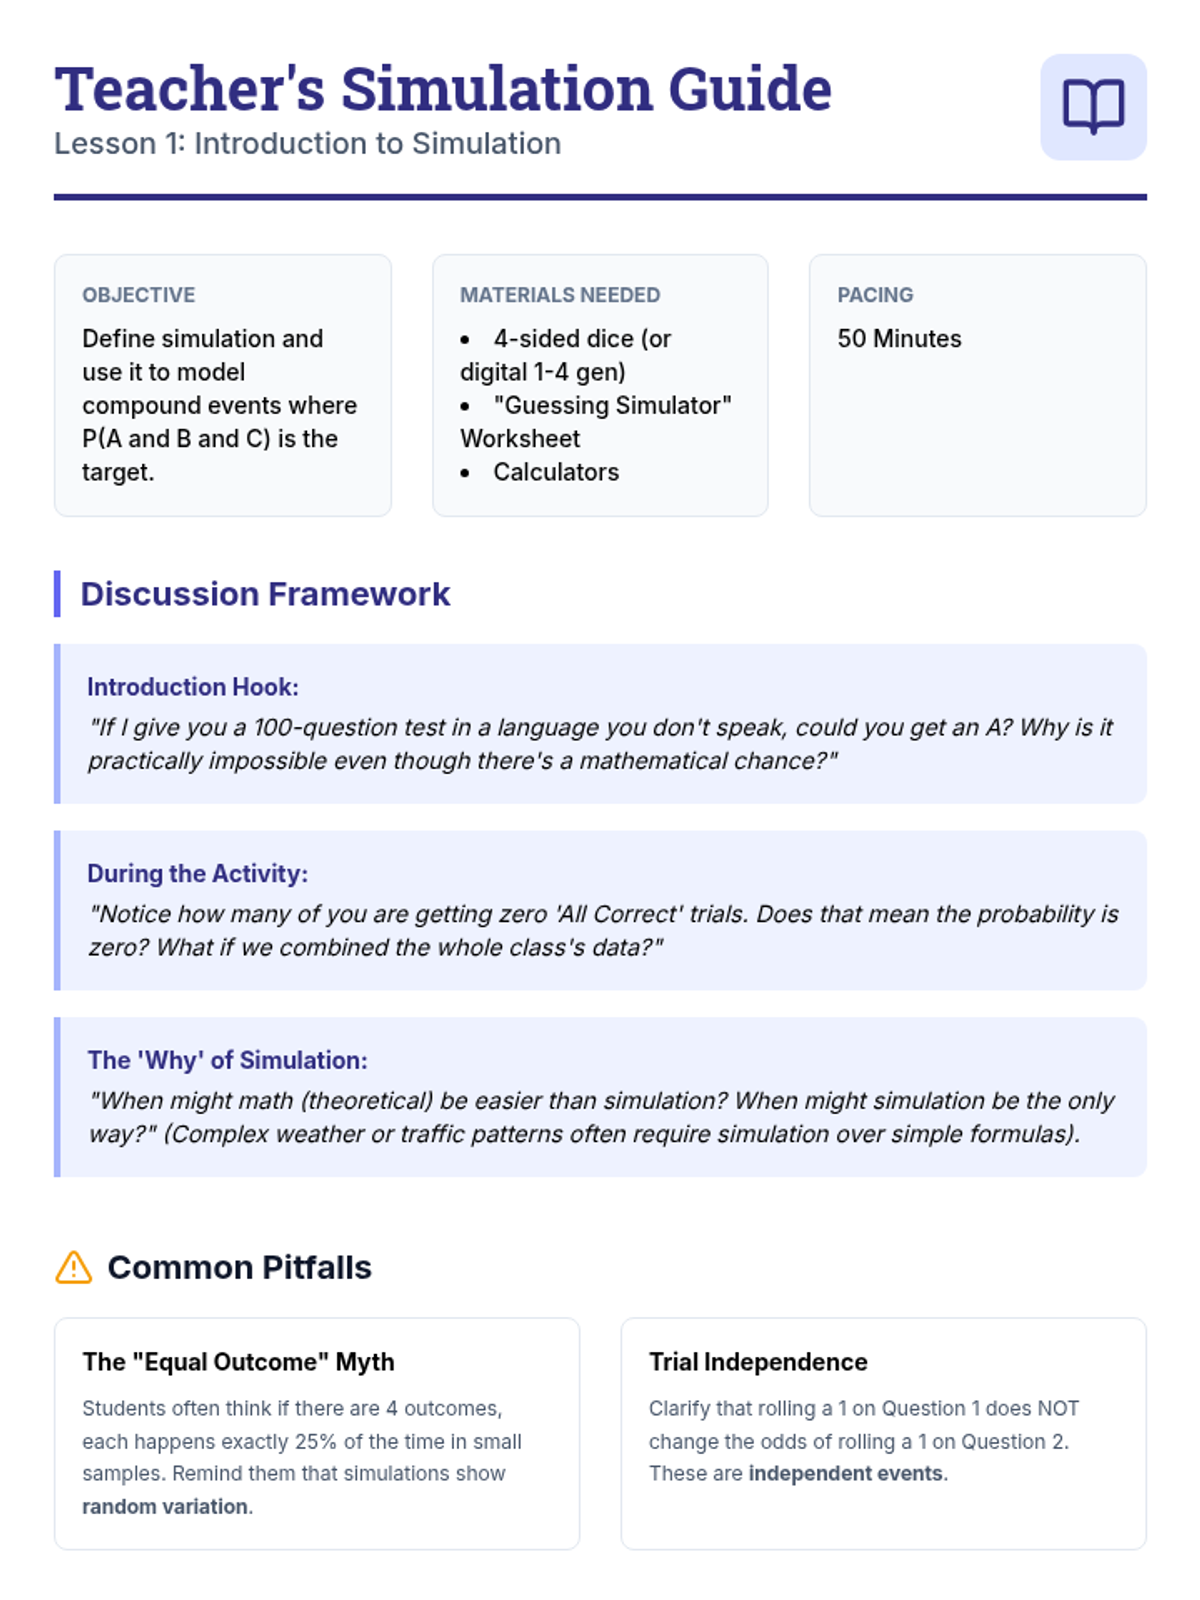
This 7th-grade sequence explores compound probability and simulations, connecting mathematical models to genetics, sports, and weather forecasting. Students move from basic simulations to designing their own complex models for real-world scenarios.
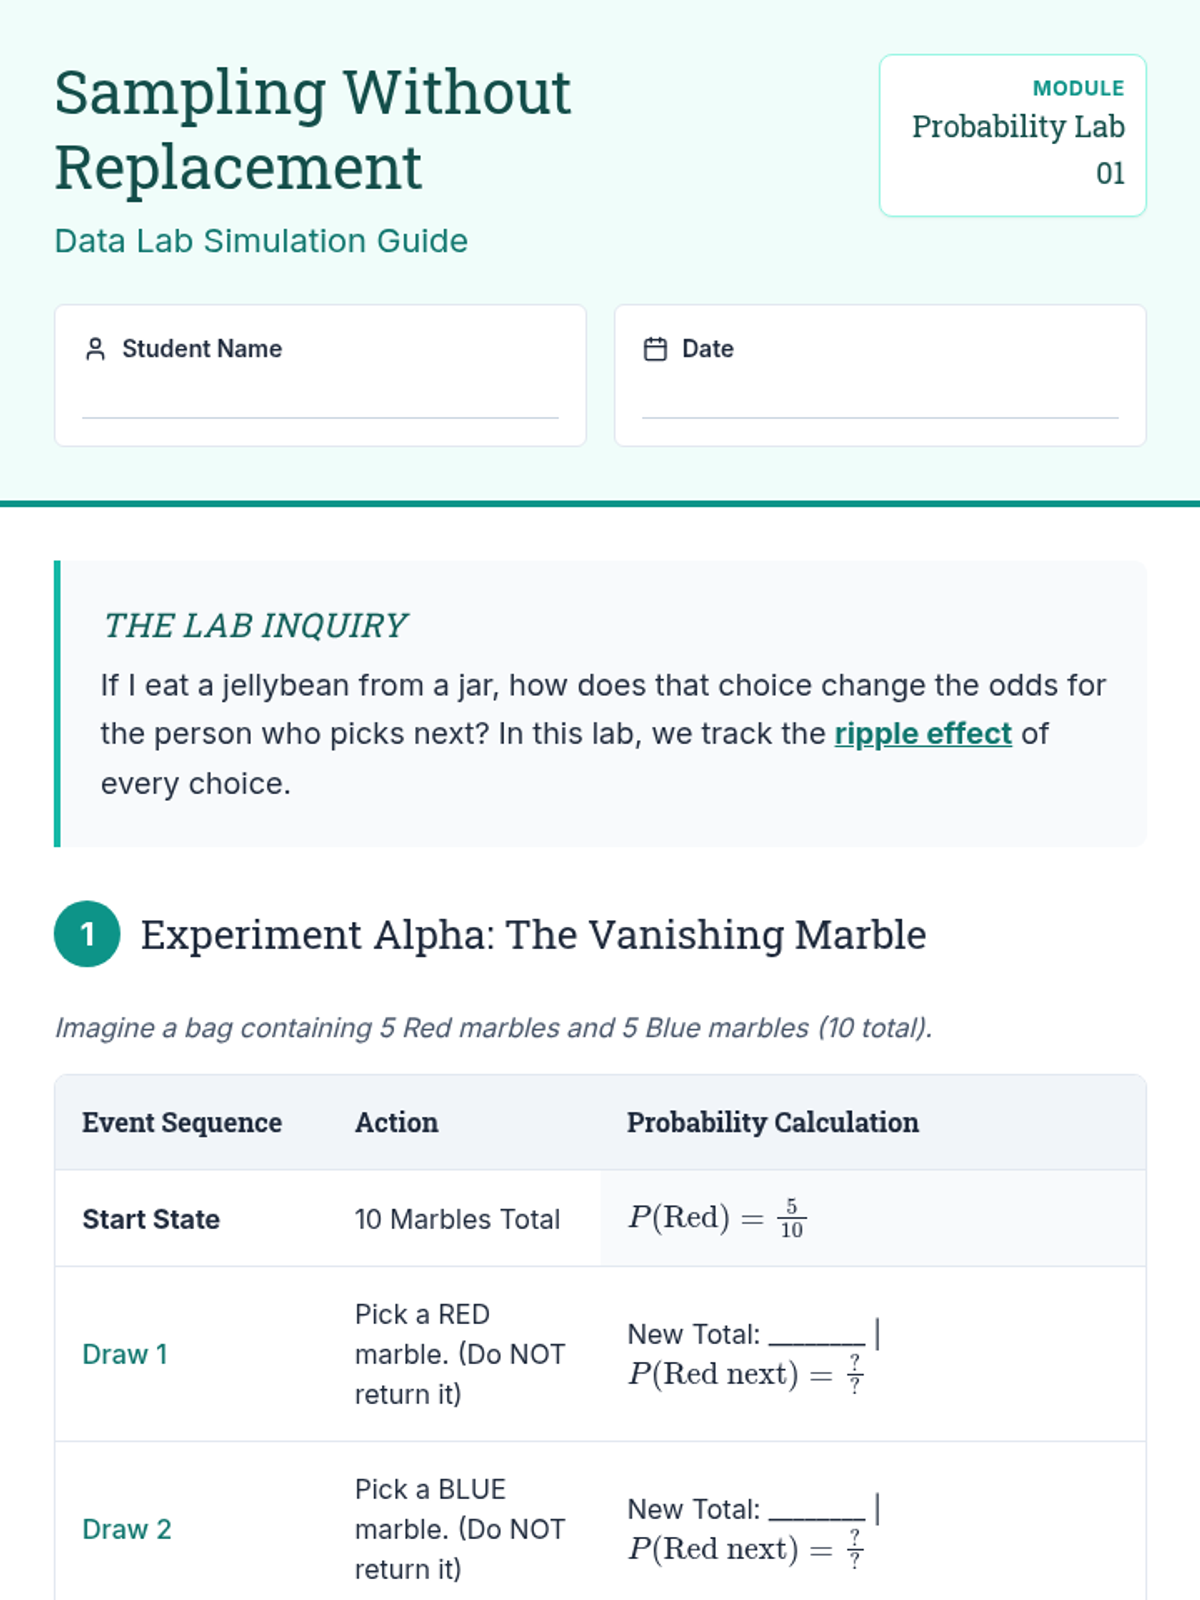
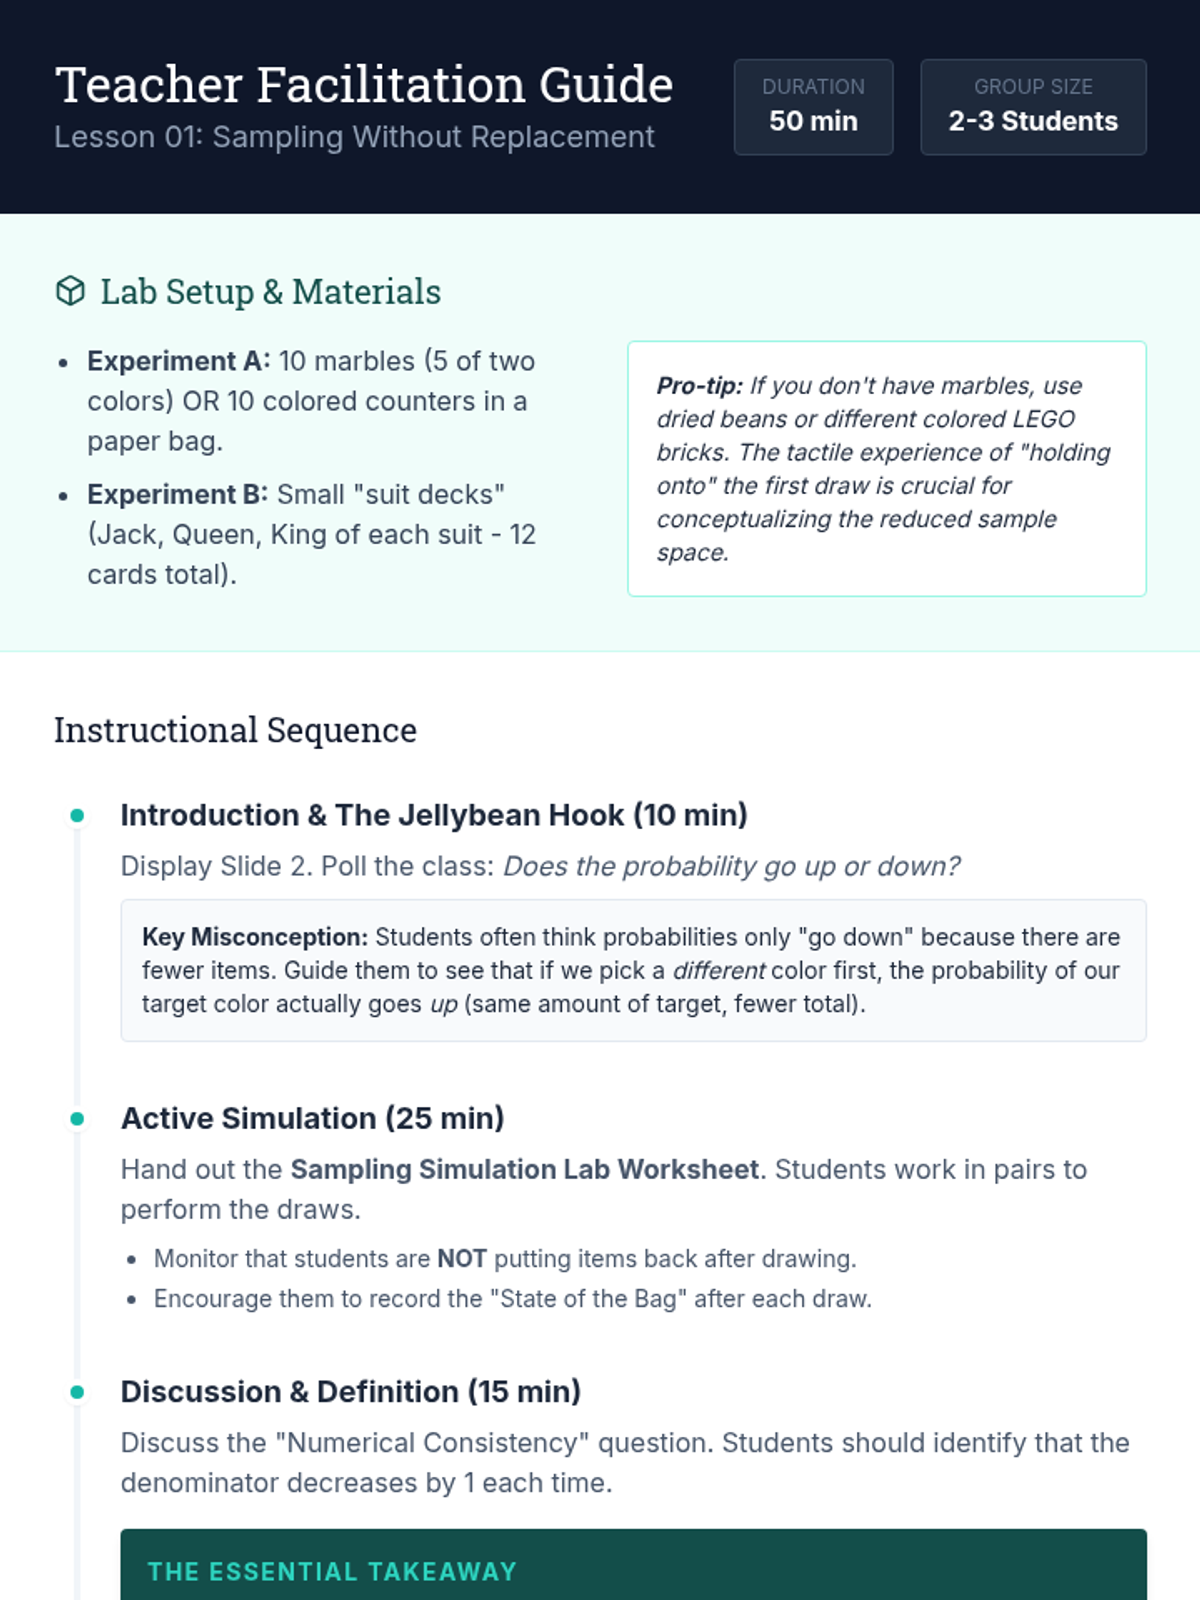
This sequence guides 7th-grade students from visual probability models (tree diagrams, area models) to the abstract Multiplication Rule for independent and dependent events. Students will discover the rule through inquiry, apply it to increasingly complex multi-stage scenarios, and master the distinction between replacement and non-replacement contexts.
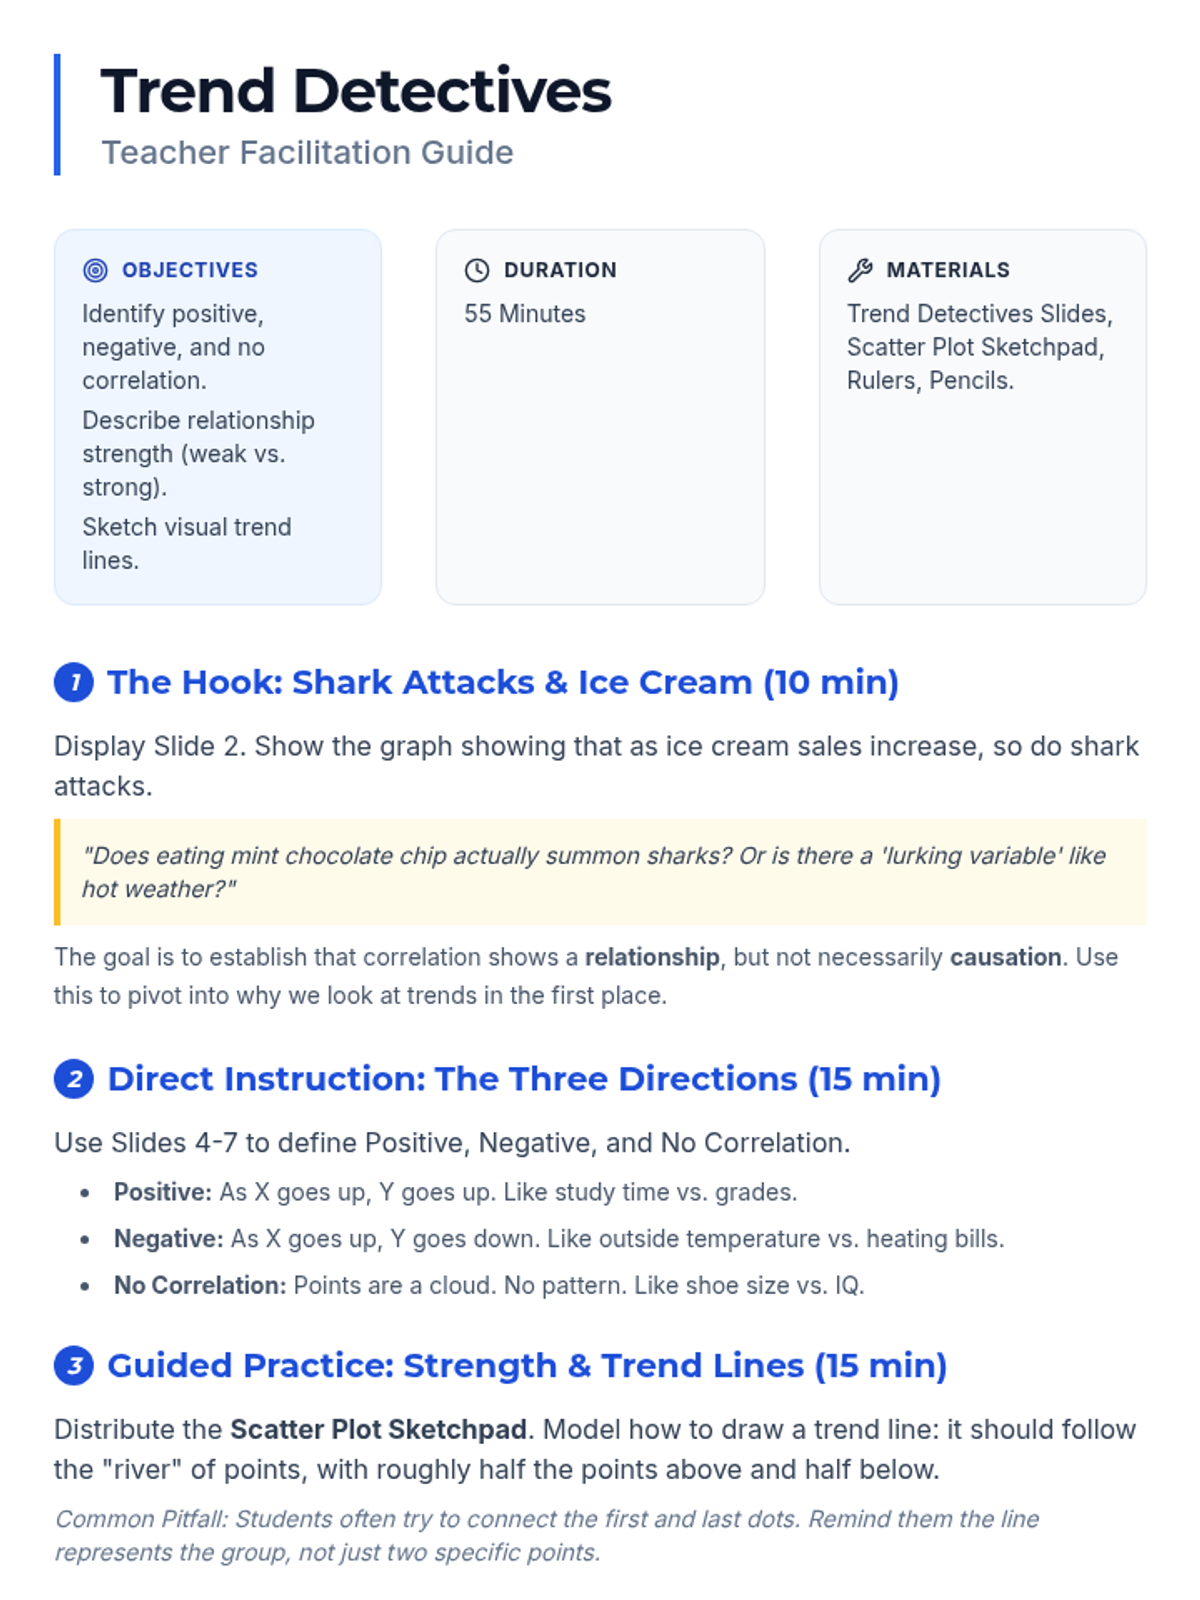
Mastering data visualization and interpretation through scatter plots and trend analysis.
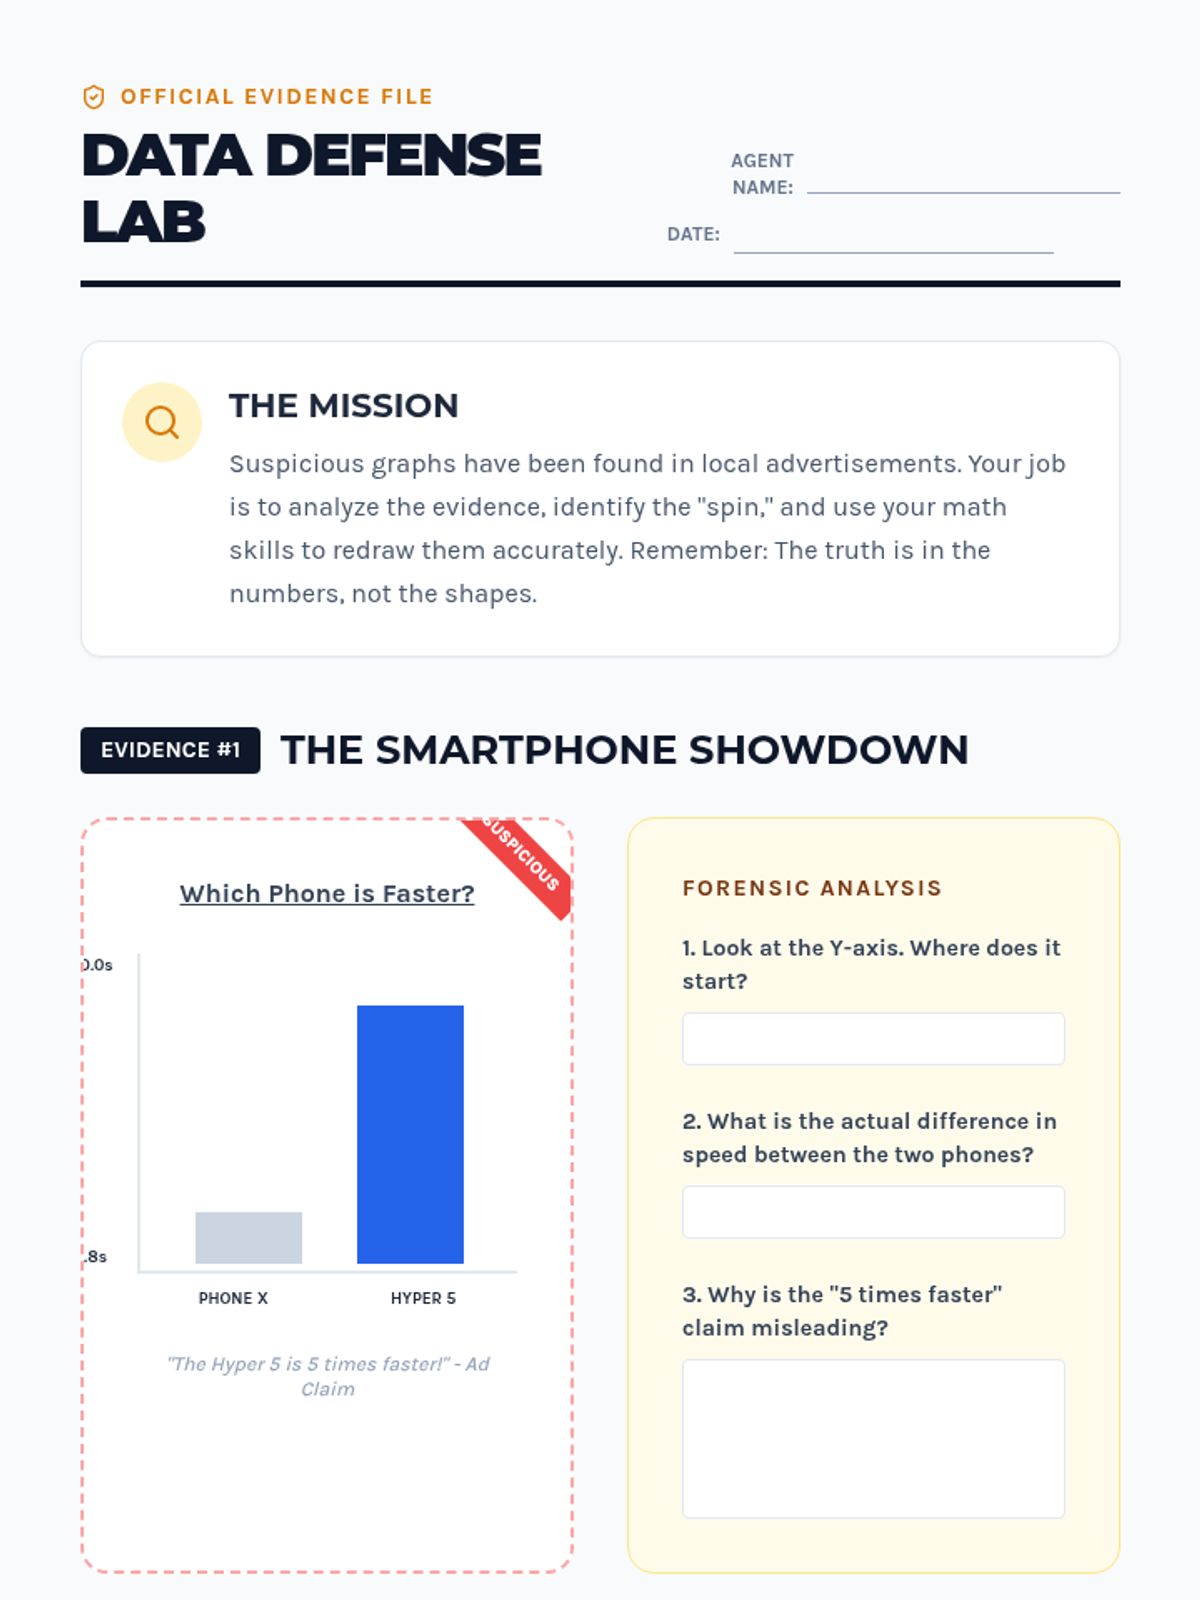
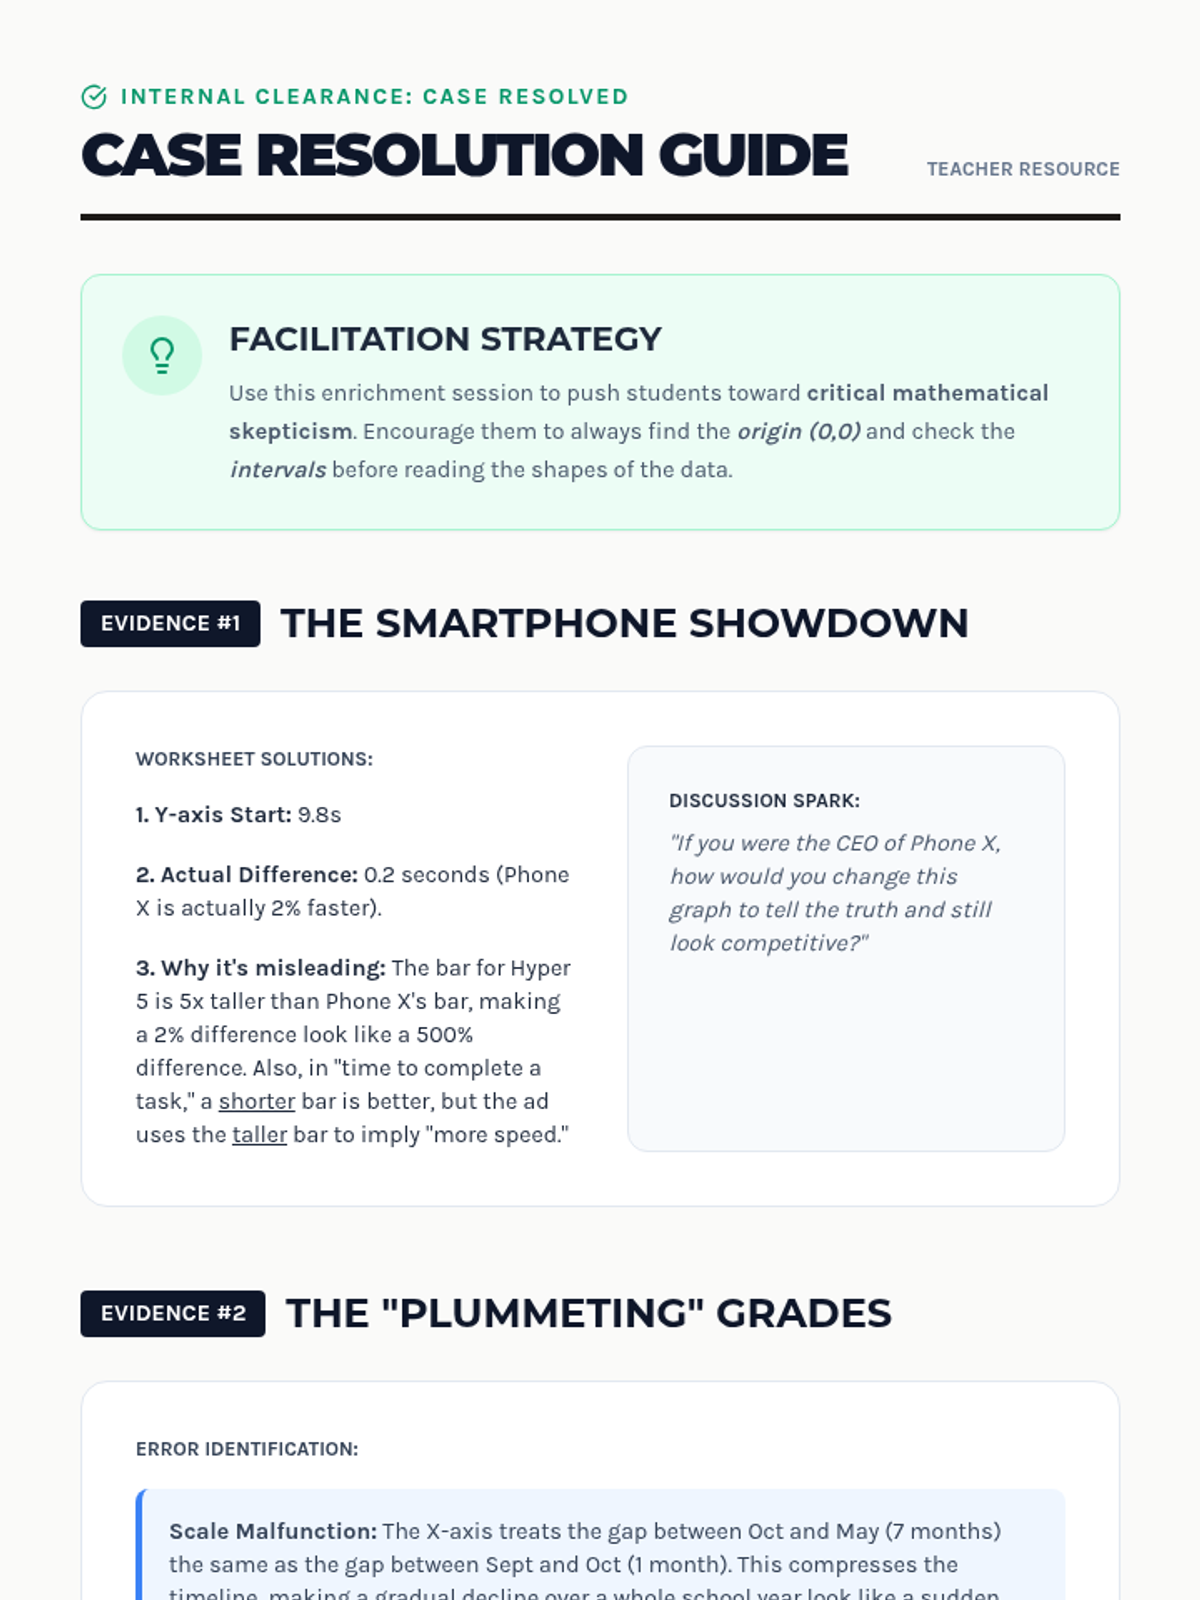
A deep dive into data literacy, focusing on how data can be manipulated and how to interpret it with a critical, mathematical eye. Students move beyond simple reading to evaluation and analysis.
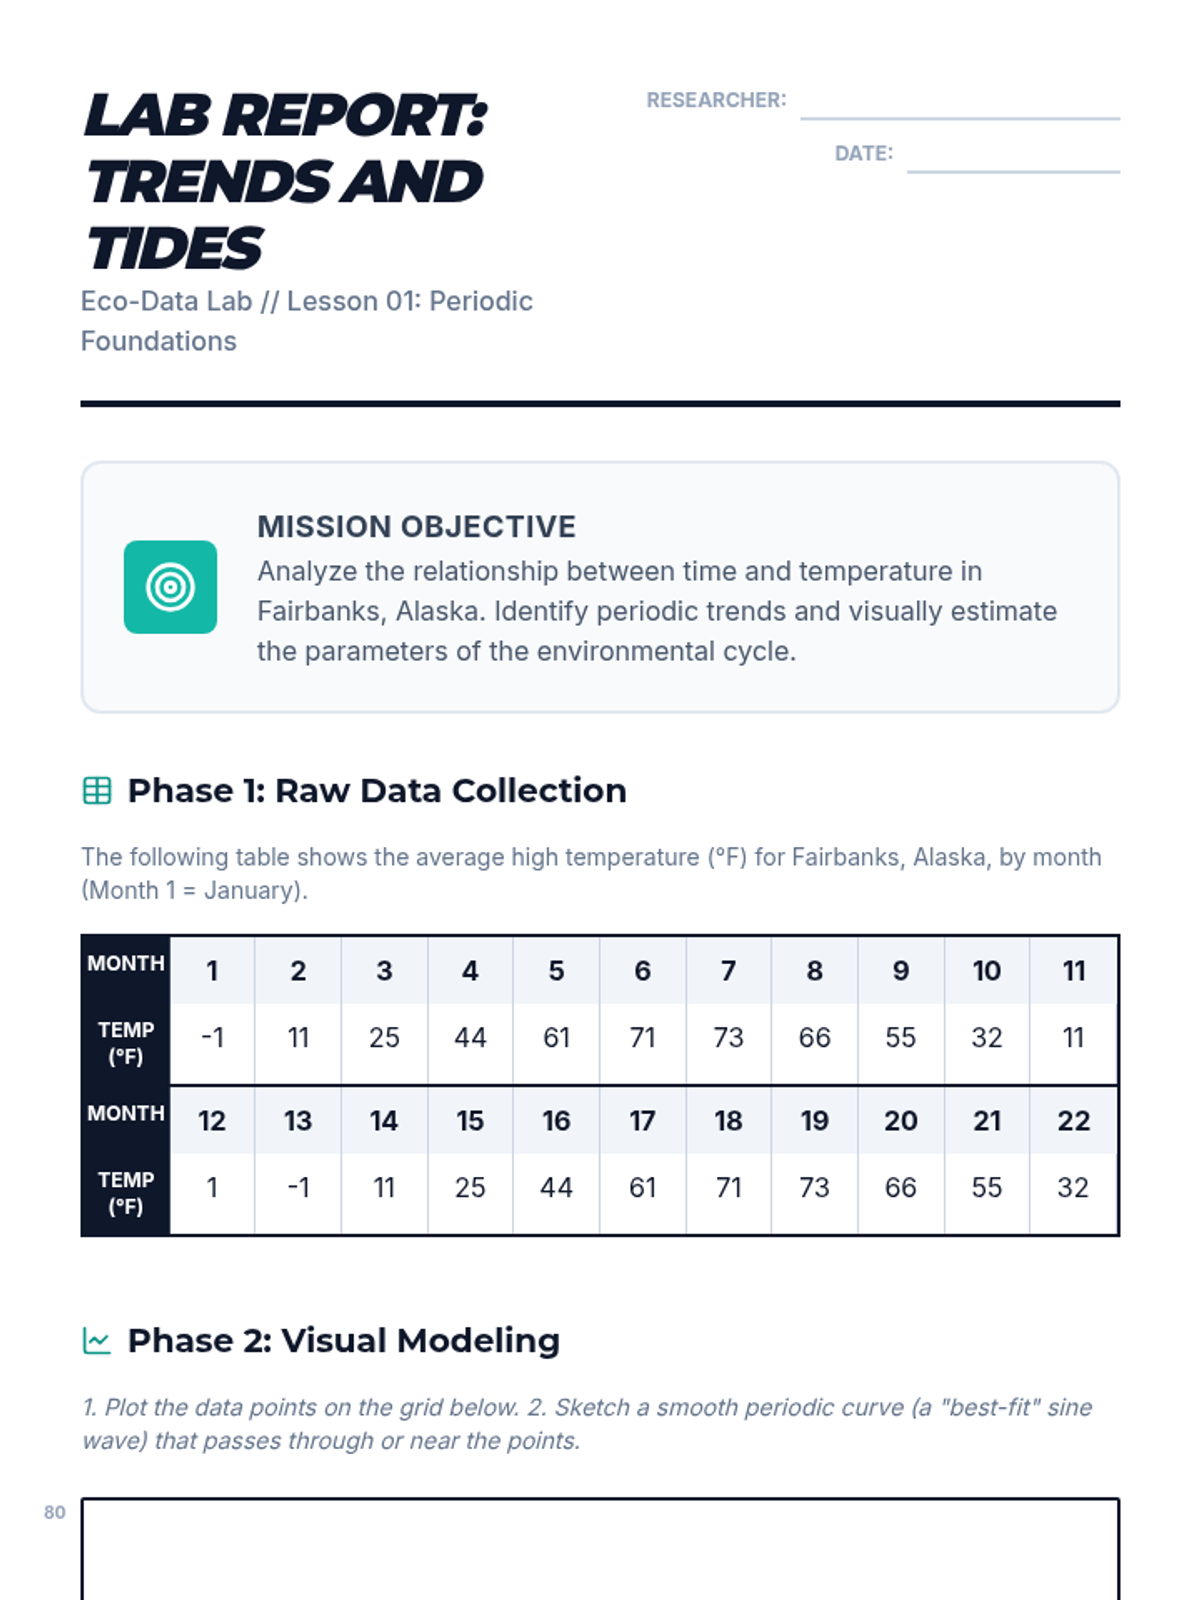
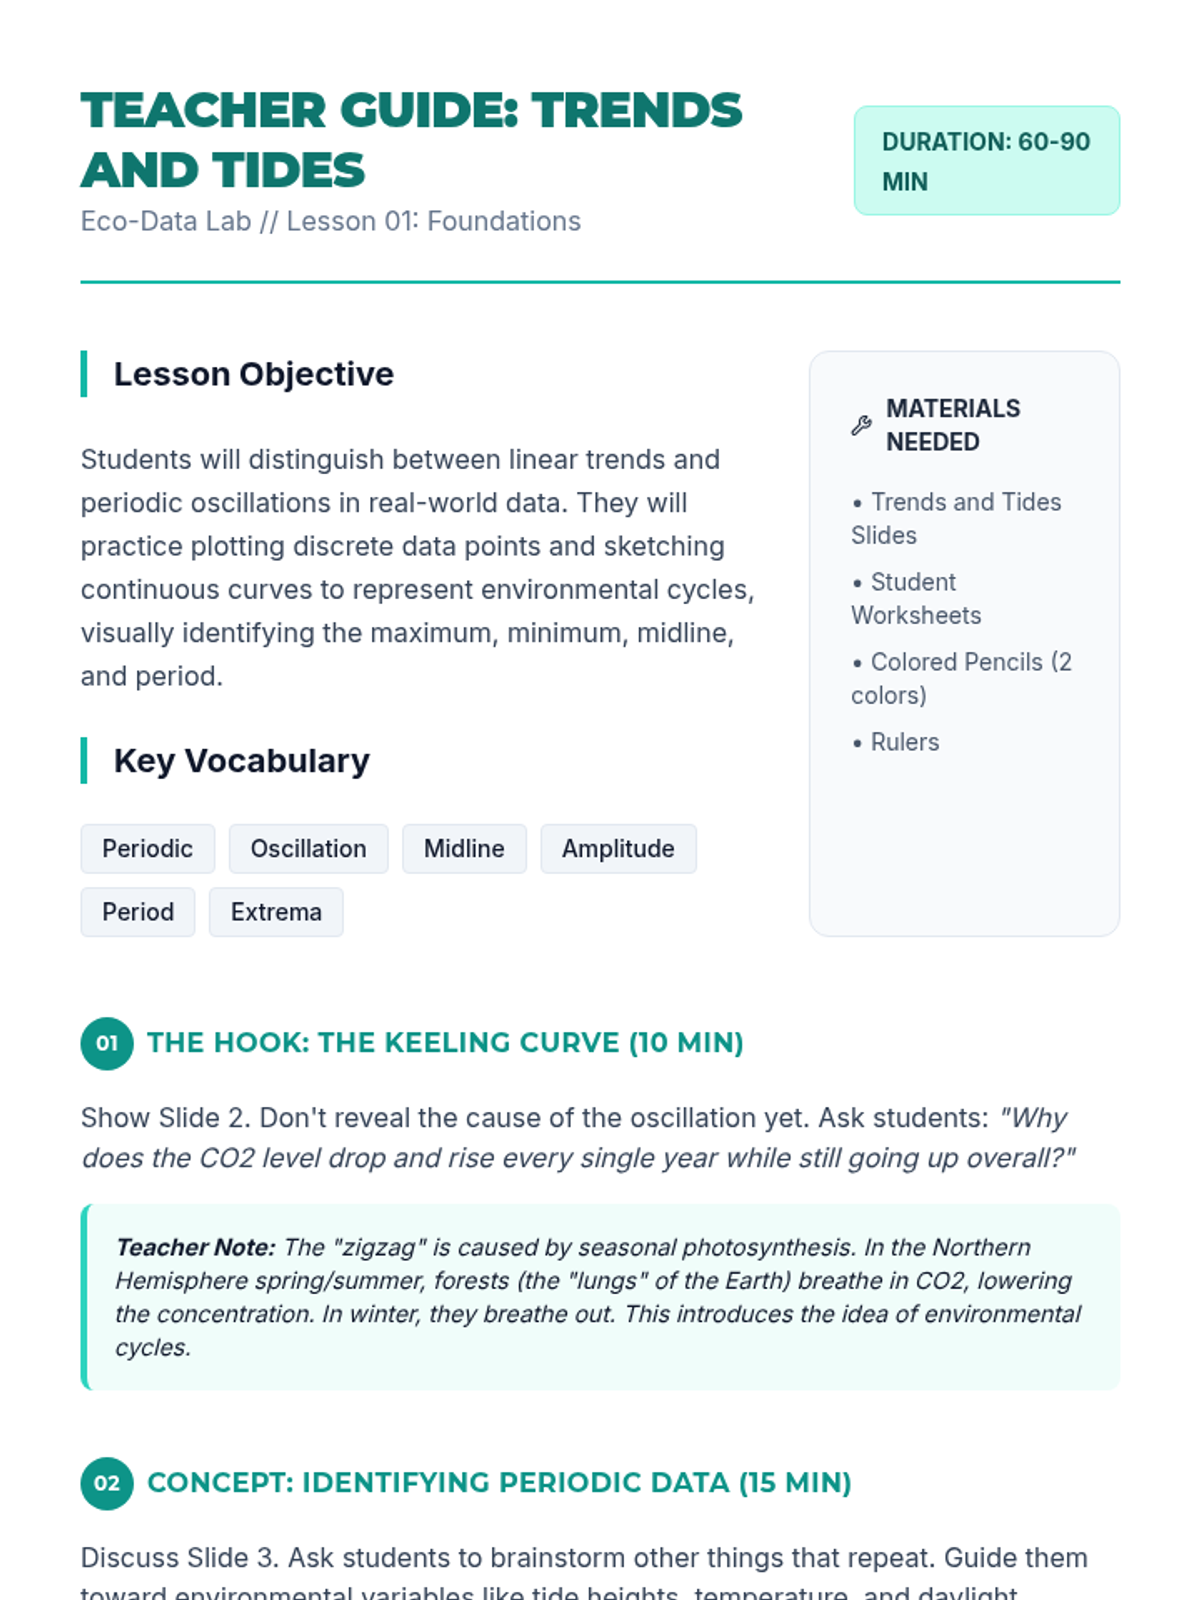
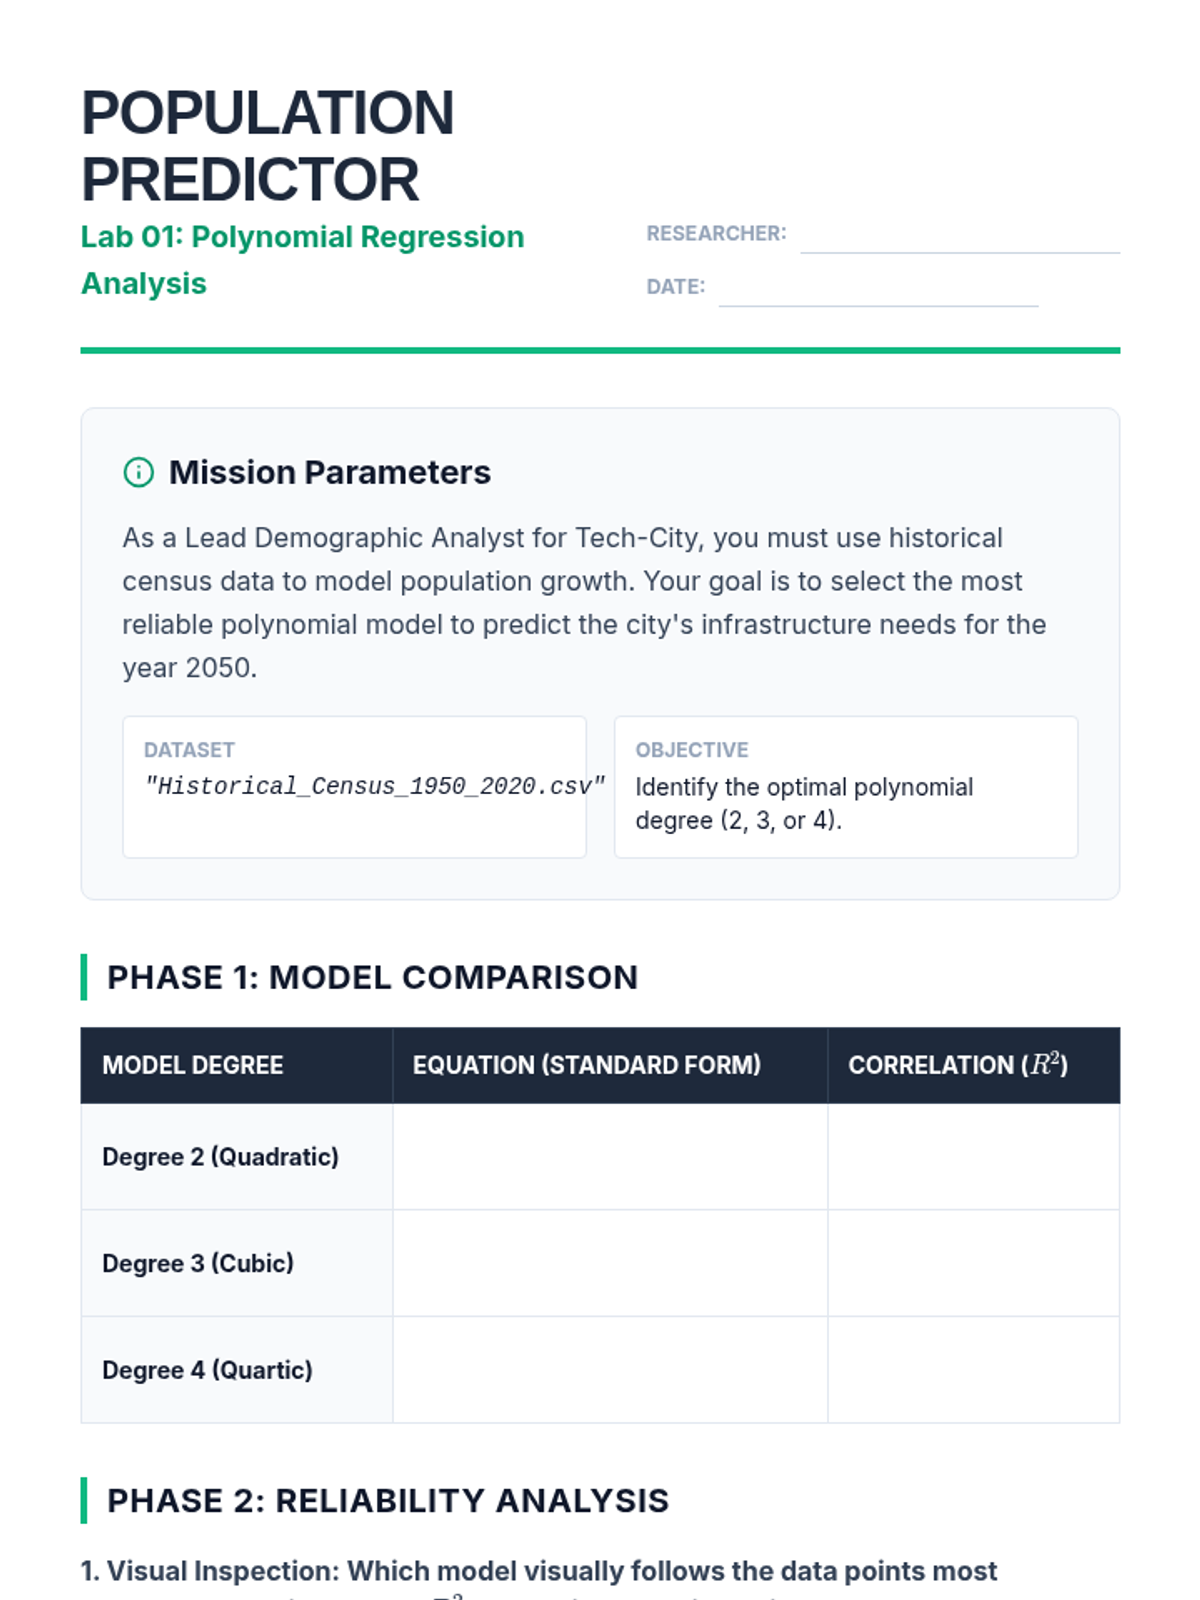
A comprehensive unit where students act as data scientists to model real-world environmental phenomena using trigonometric functions. They progress from visual estimation to precise algebraic modeling and technological regression to predict future environmental conditions.
A project-based unit where 8th-grade students act as data scientists to investigate real-world relationships, generate digital linear models, and defend their predictions based on data reliability.
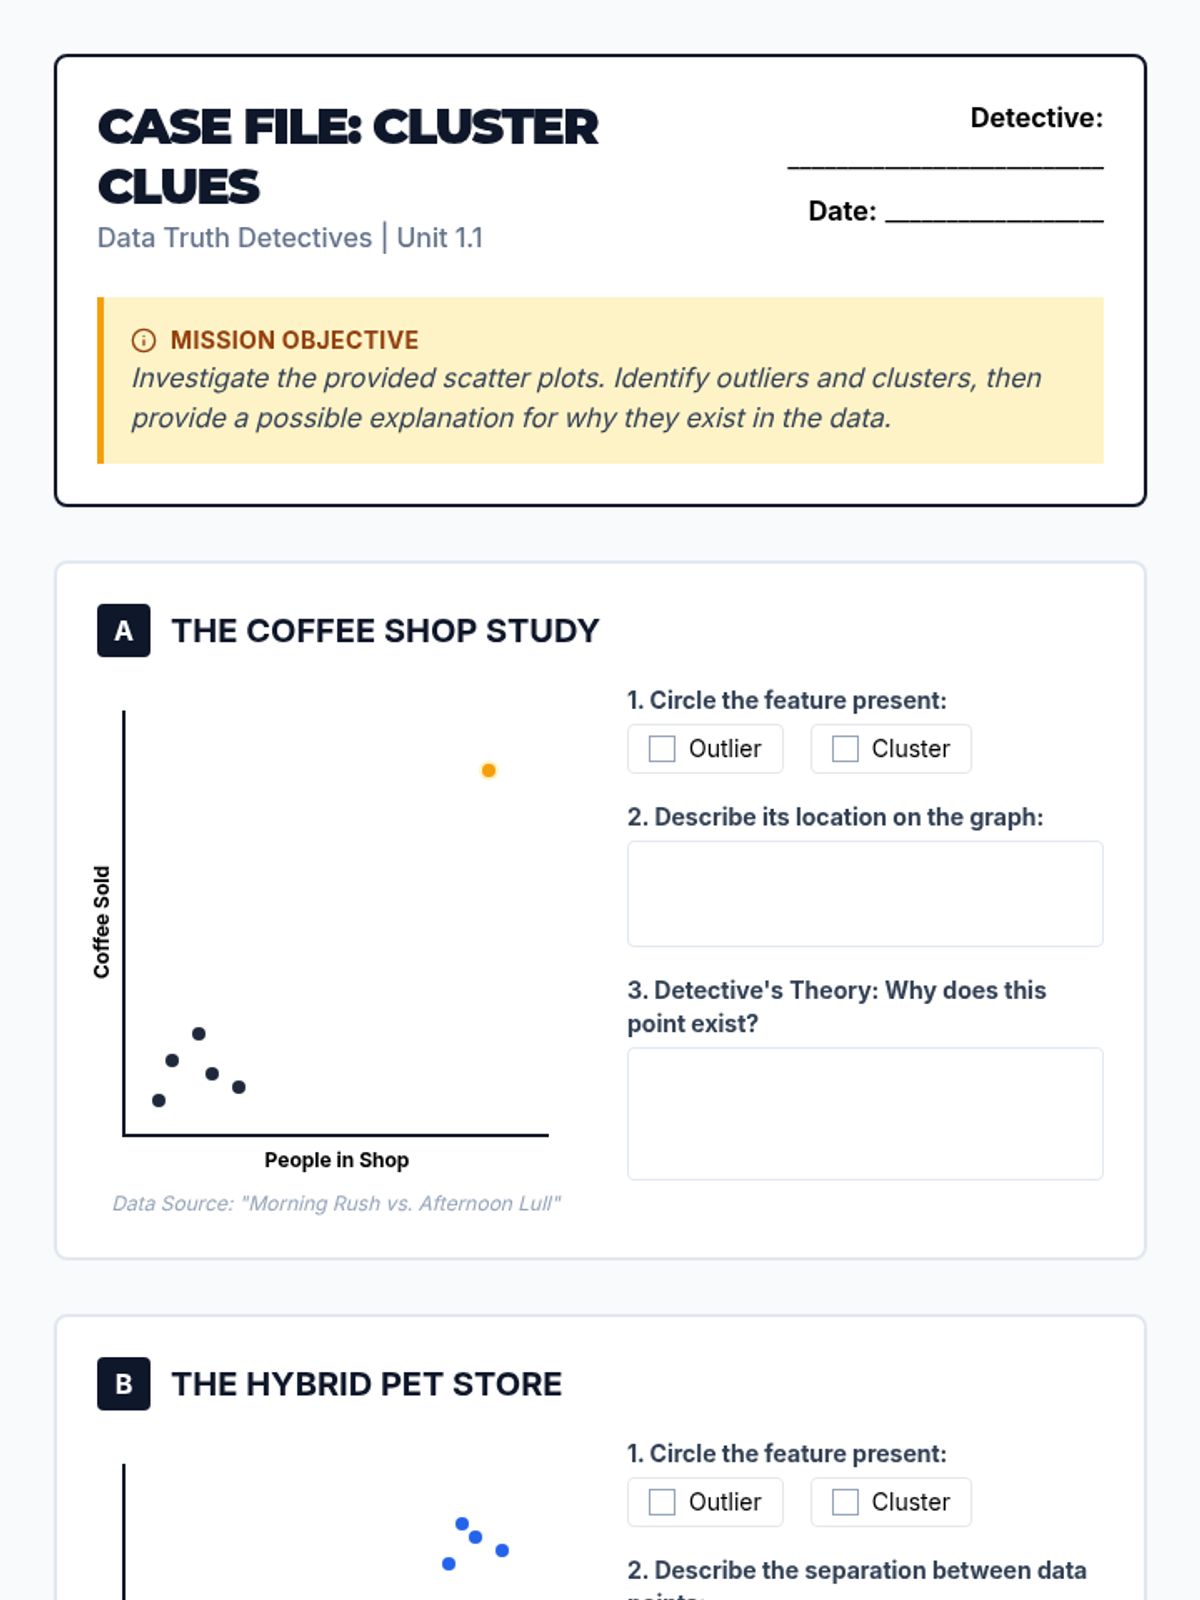
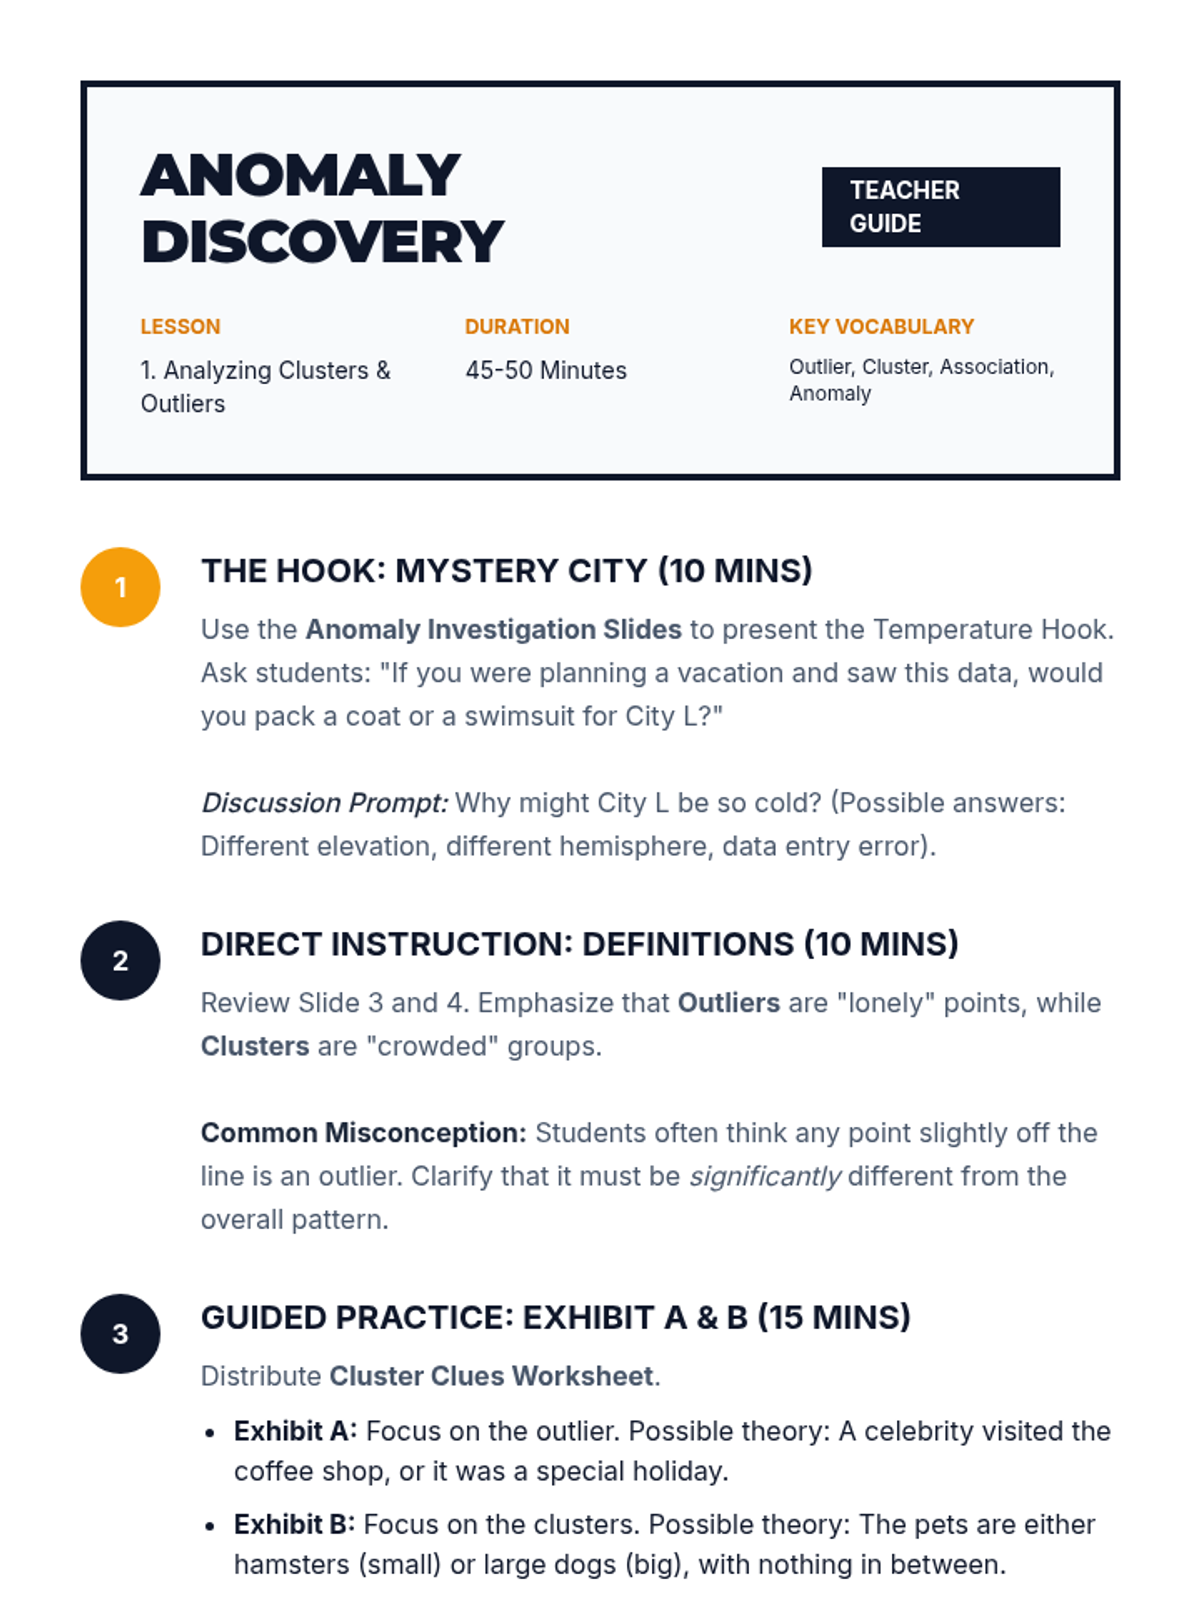
This sequence focuses on the critical analysis of data reliability, outliers, and the validity of linear associations. Students explore messy data, identify clusters and outliers, and evaluate when a linear model is appropriate versus when it might be misleading.
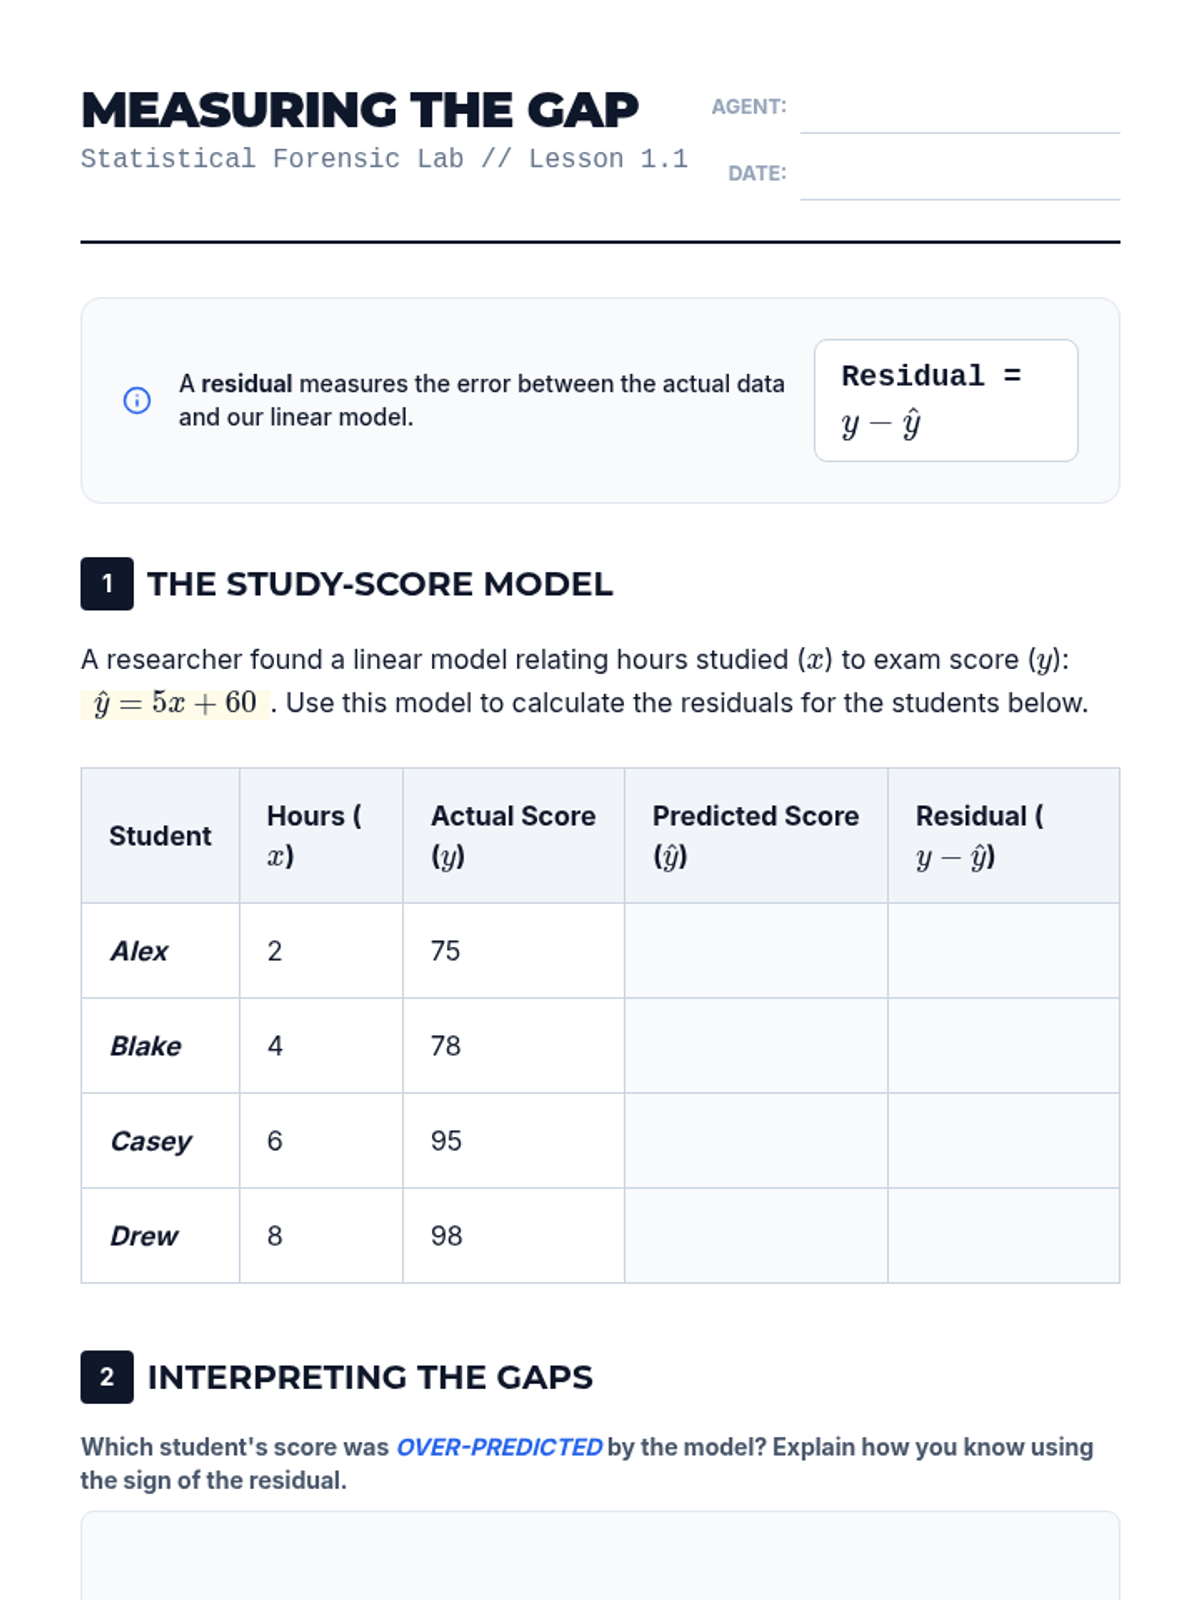
This sequence explores the statistical evaluation of linear models, covering residuals, linear regression technology, correlation coefficients, residual plots, and the distinction between correlation and causation. Students will learn to assess the reliability of models and use statistical tools to interpret data accurately.
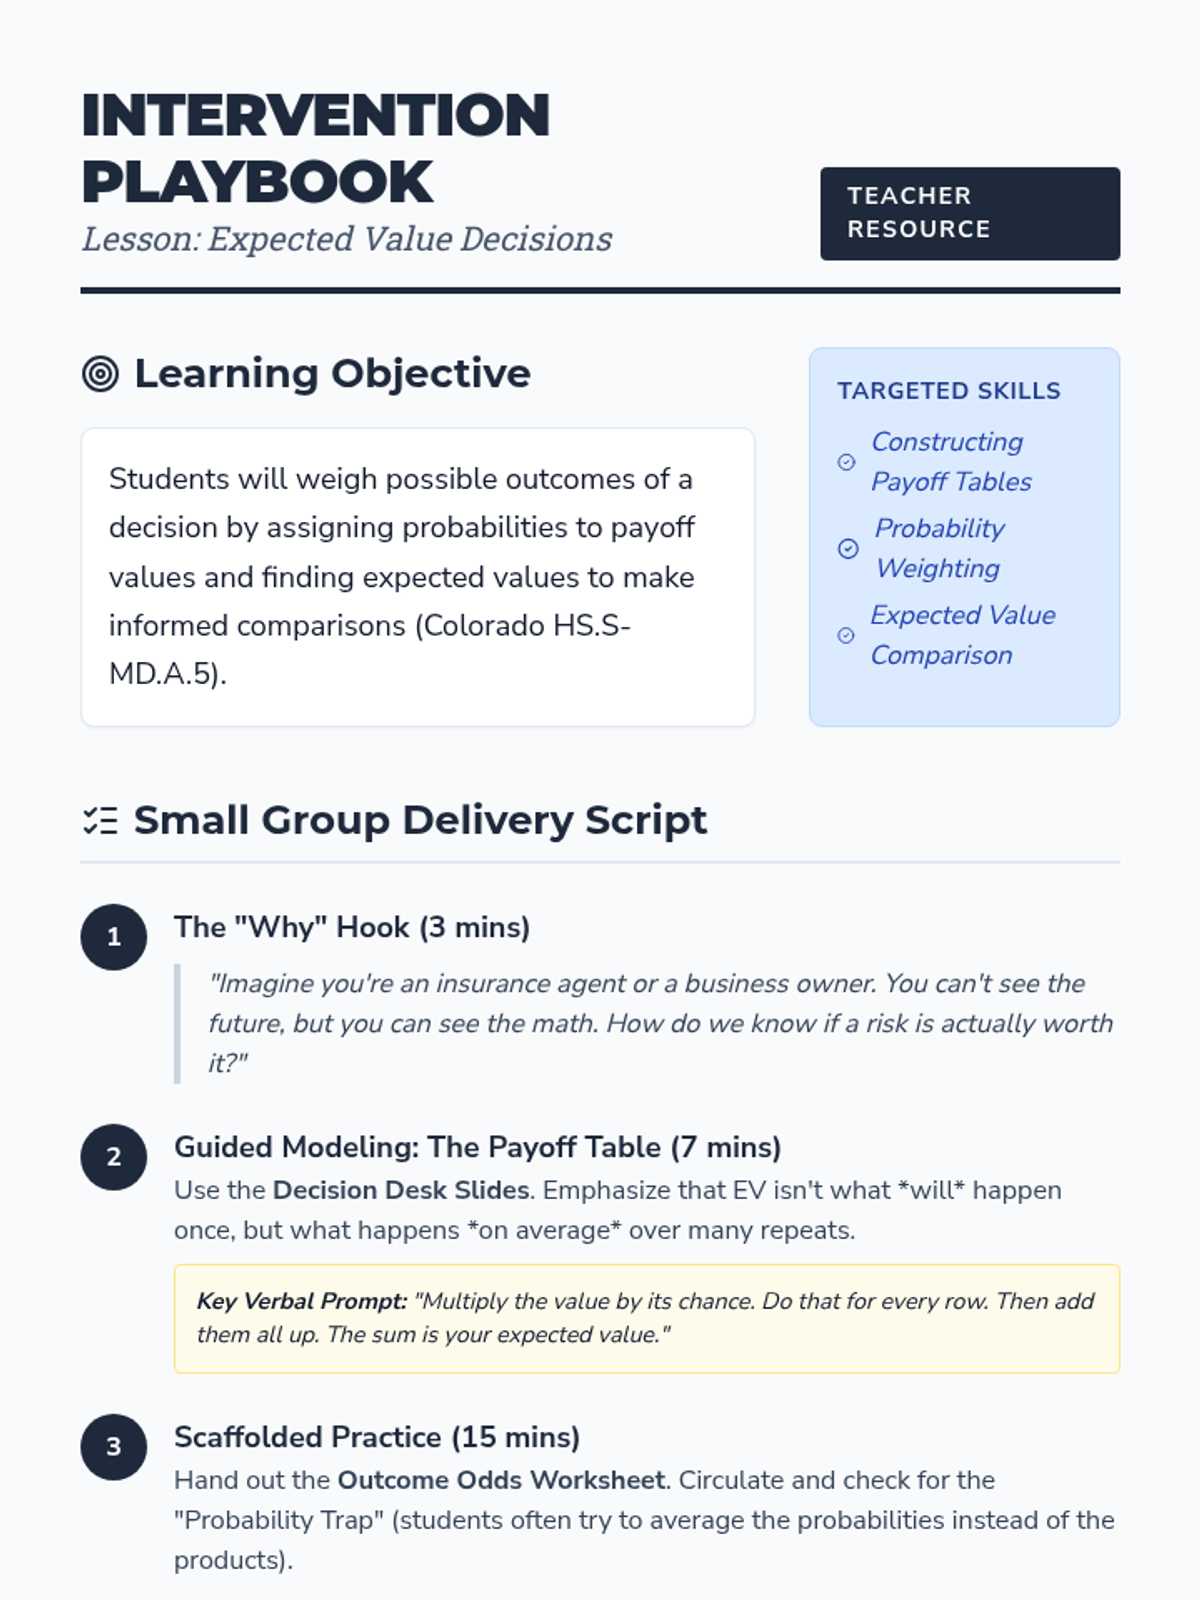
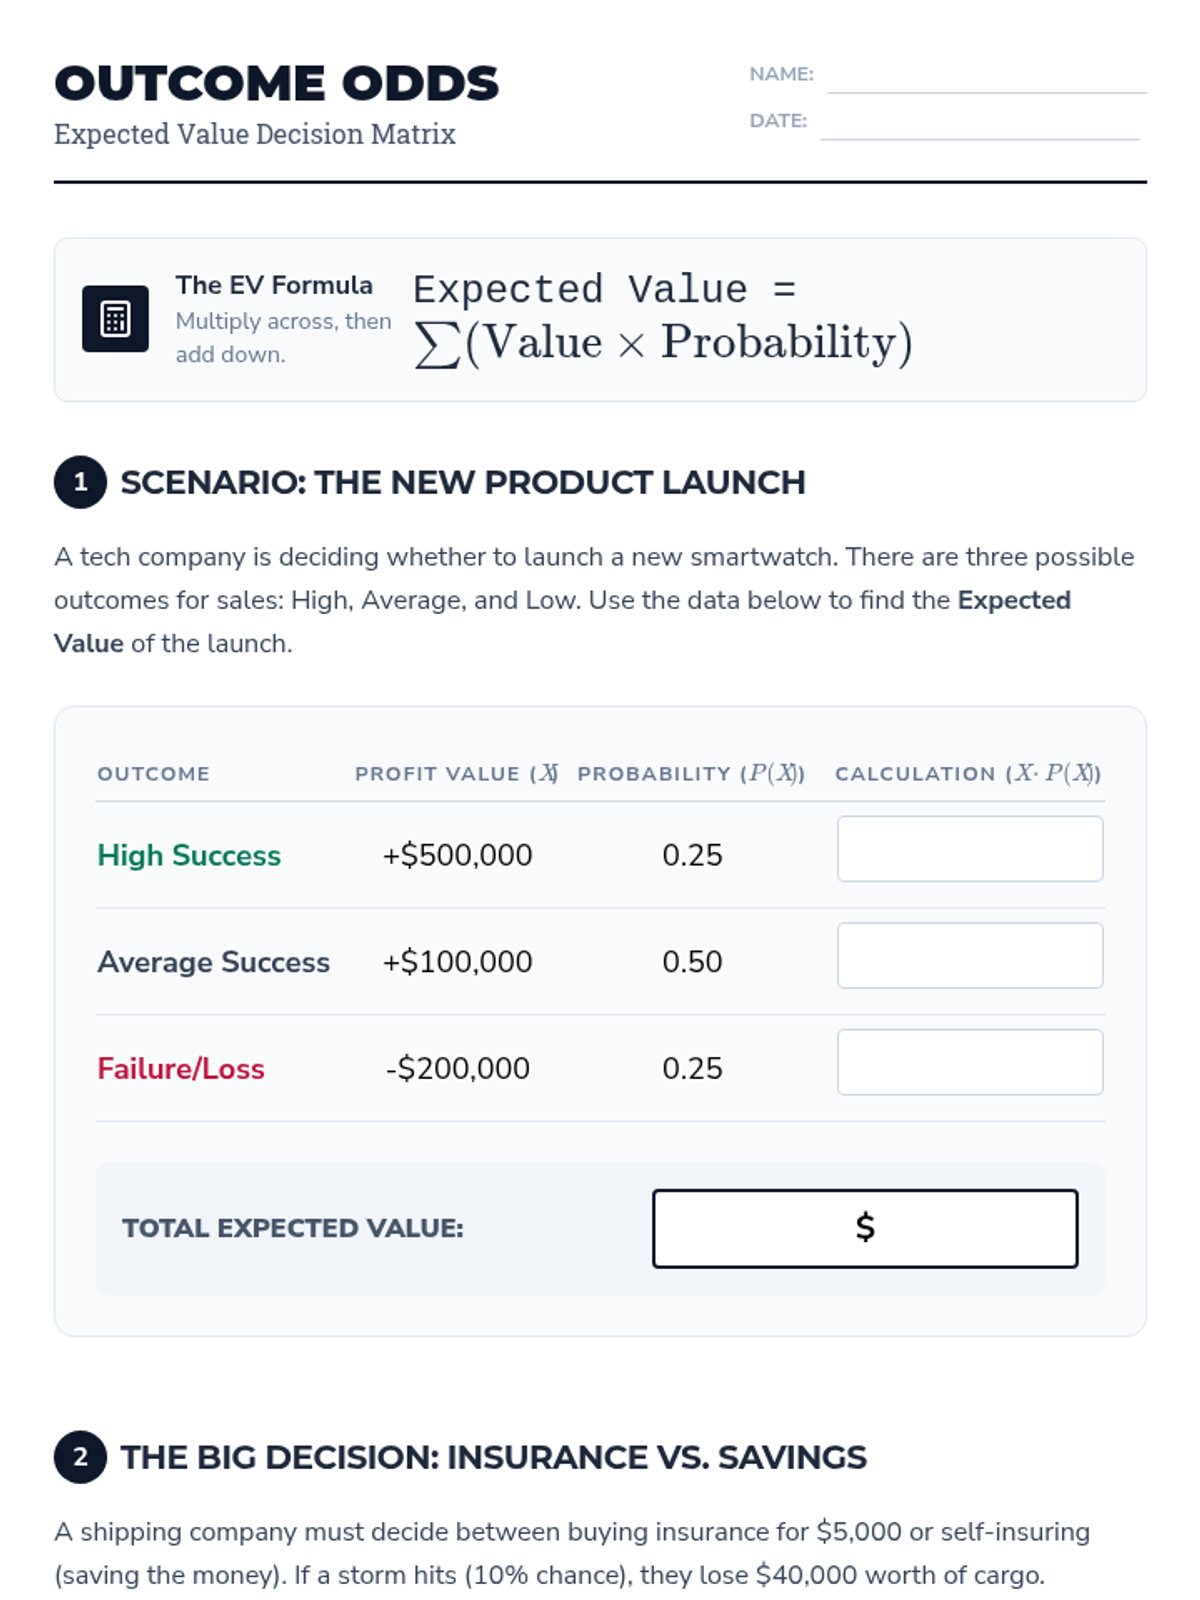
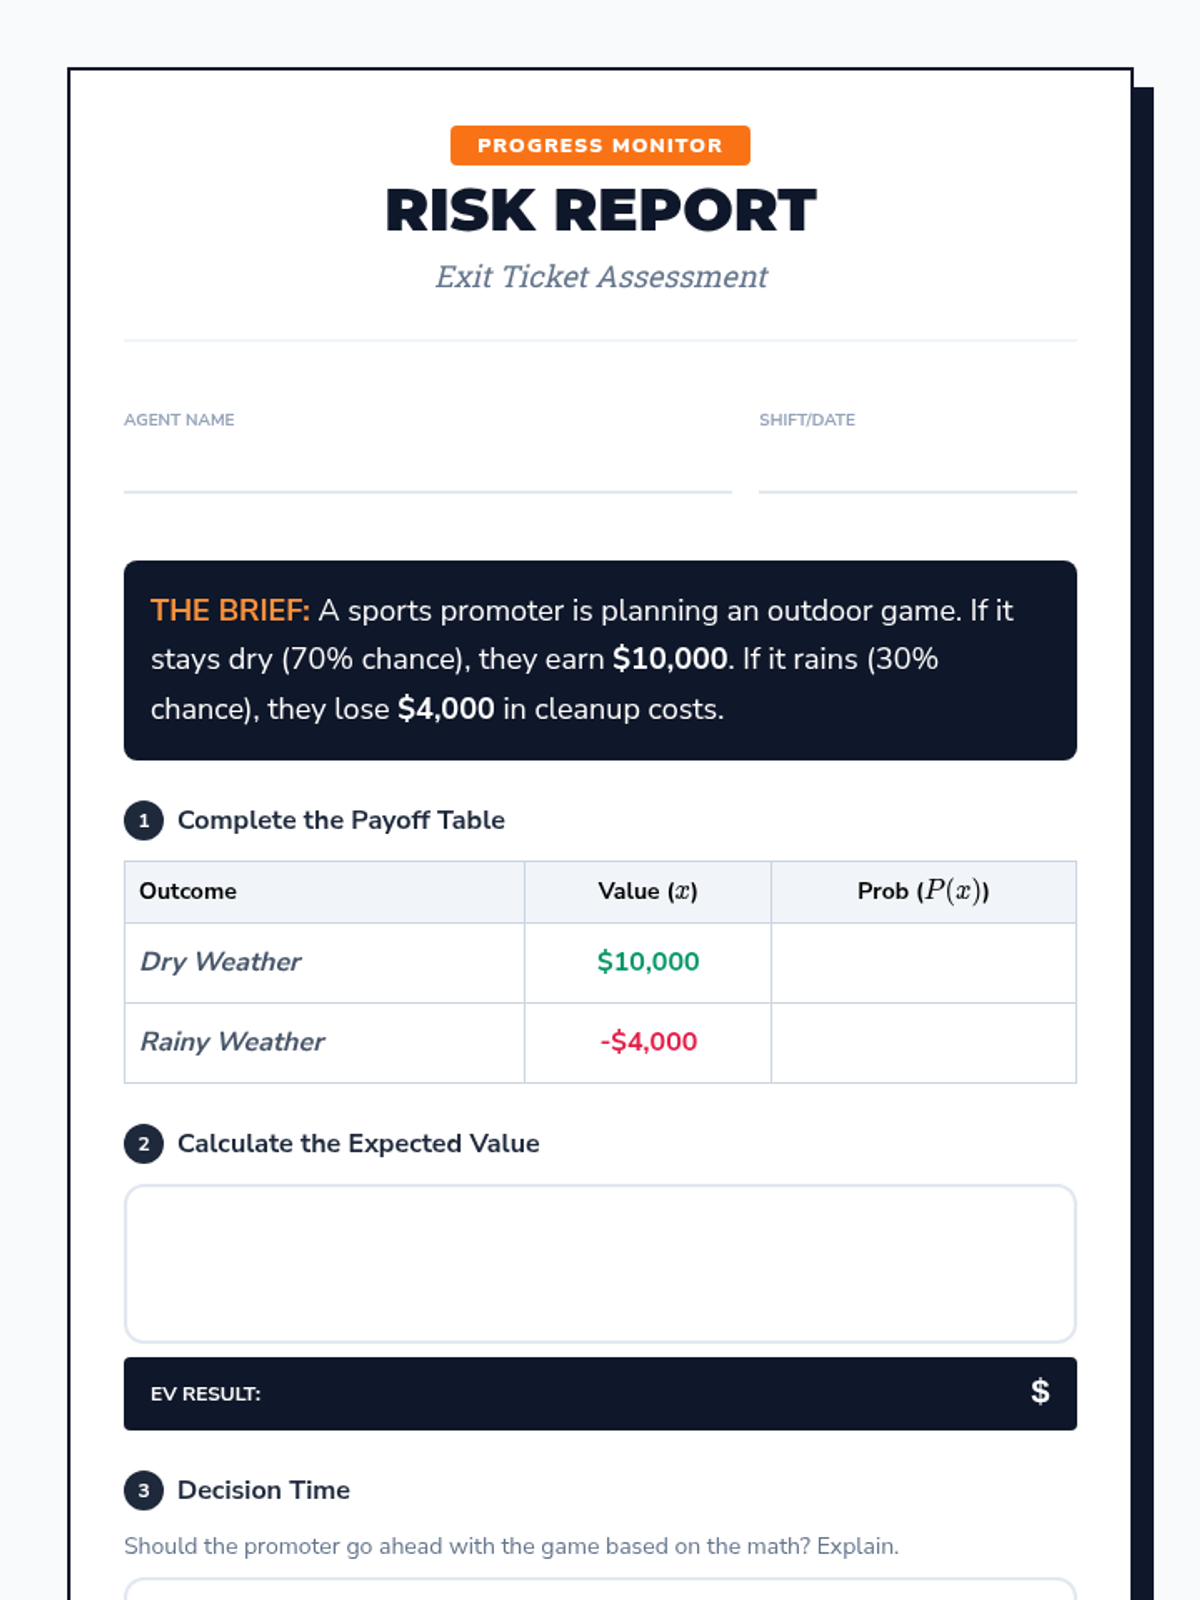
A high school statistics intervention sequence focused on decision-making through expected value calculations. Students learn to construct payoff tables, assign probabilities, and compare outcomes in real-world scenarios.
This sequence explores probability-based decision making through the lens of financial literacy. Students apply expected value and risk assessment to evaluate insurance, extended warranties, and the mathematical trade-off between known costs and unknown risks.
A game-based sequence where 8th-grade students explore probability, weighted averages, and expected value to analyze fairness and long-term trends in games of chance.
In this sequence, students explore how mathematical probability guides rational decision-making in uncertain situations. Learners progress from simple compound events to constructing decision trees and calculating expected values to evaluate the fairness and potential payoff of various choices.
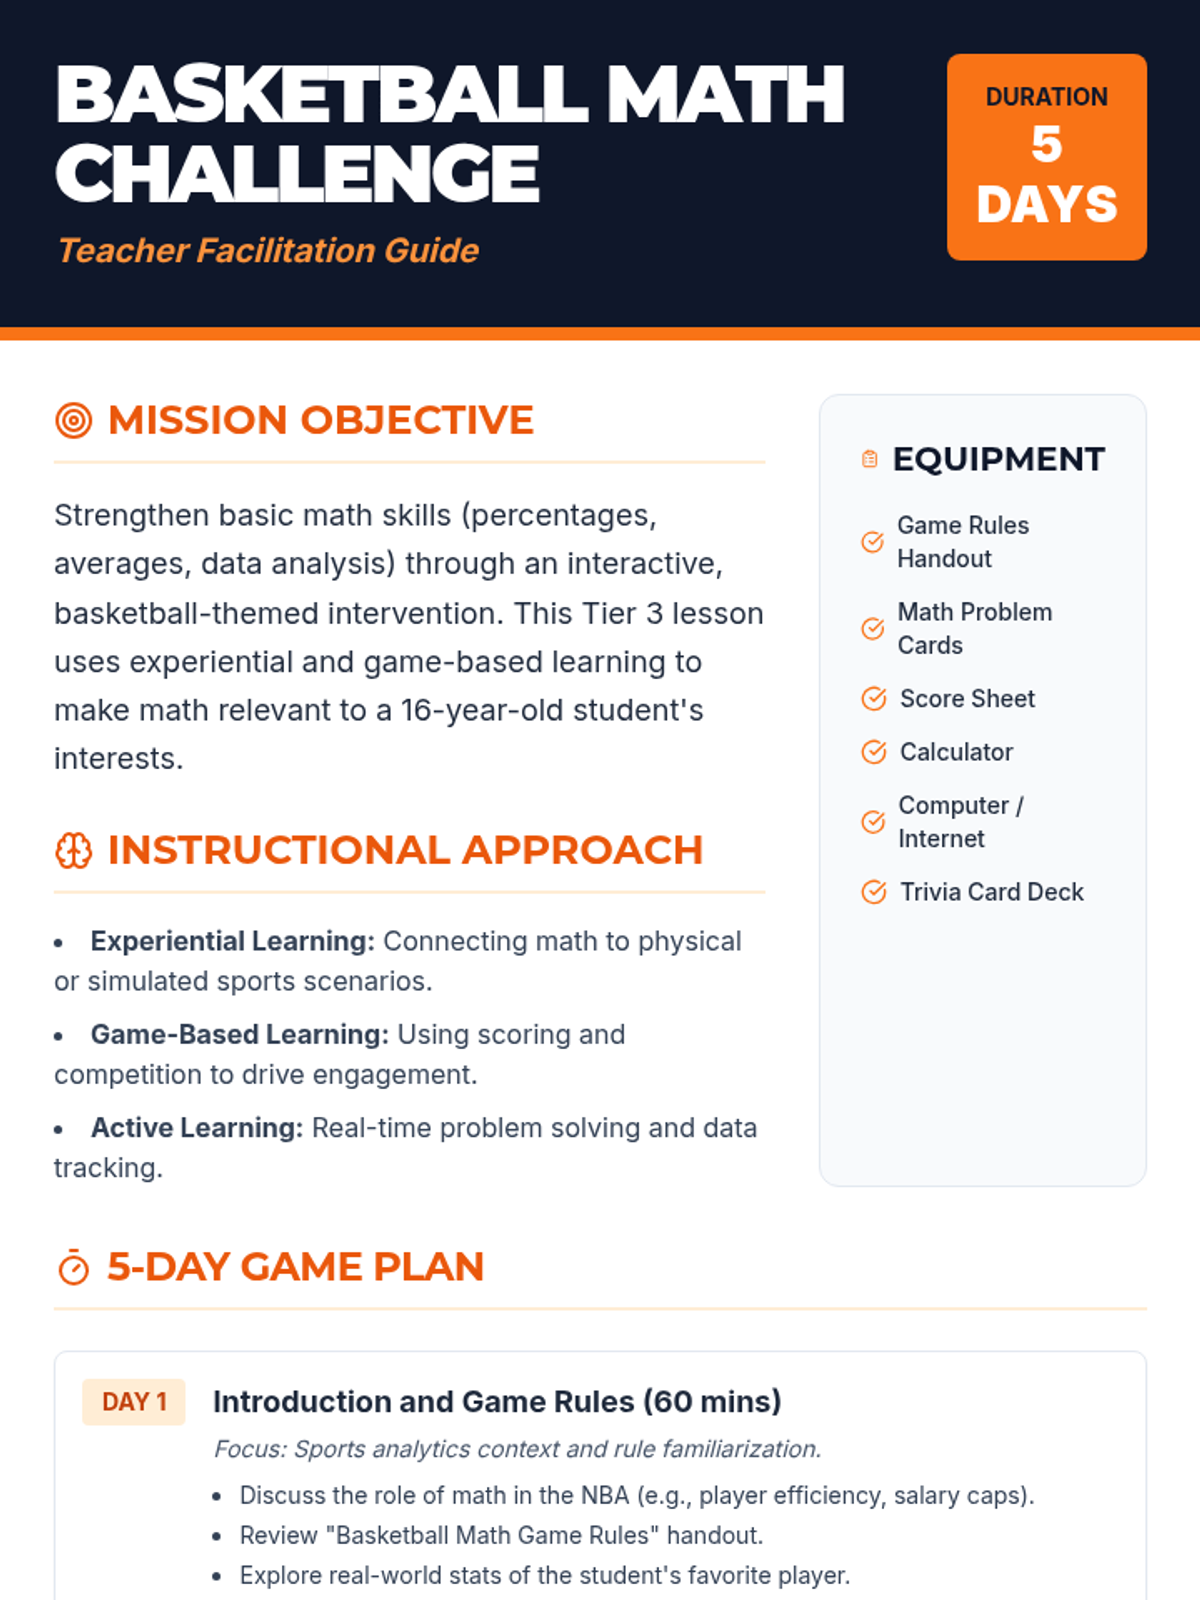
A 5-day math intervention for a high school student that uses basketball statistics and simulation to teach percentages, averages, and data analysis.
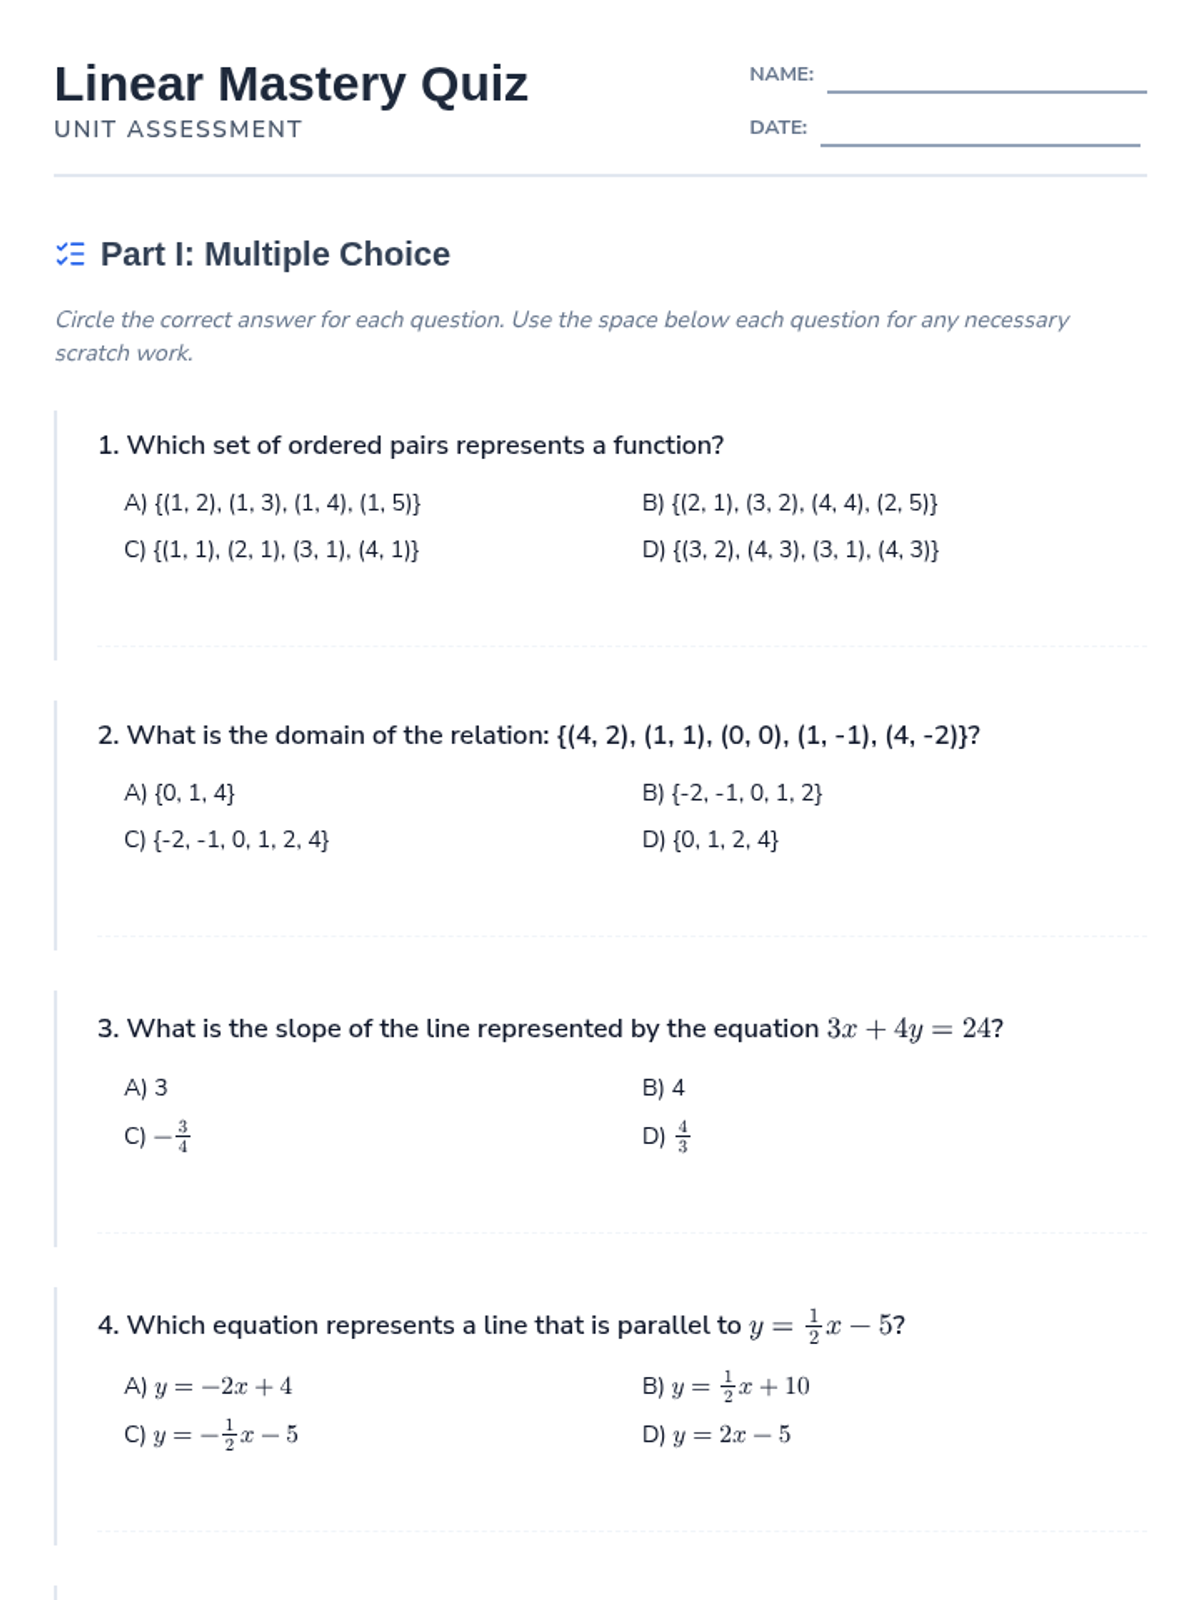
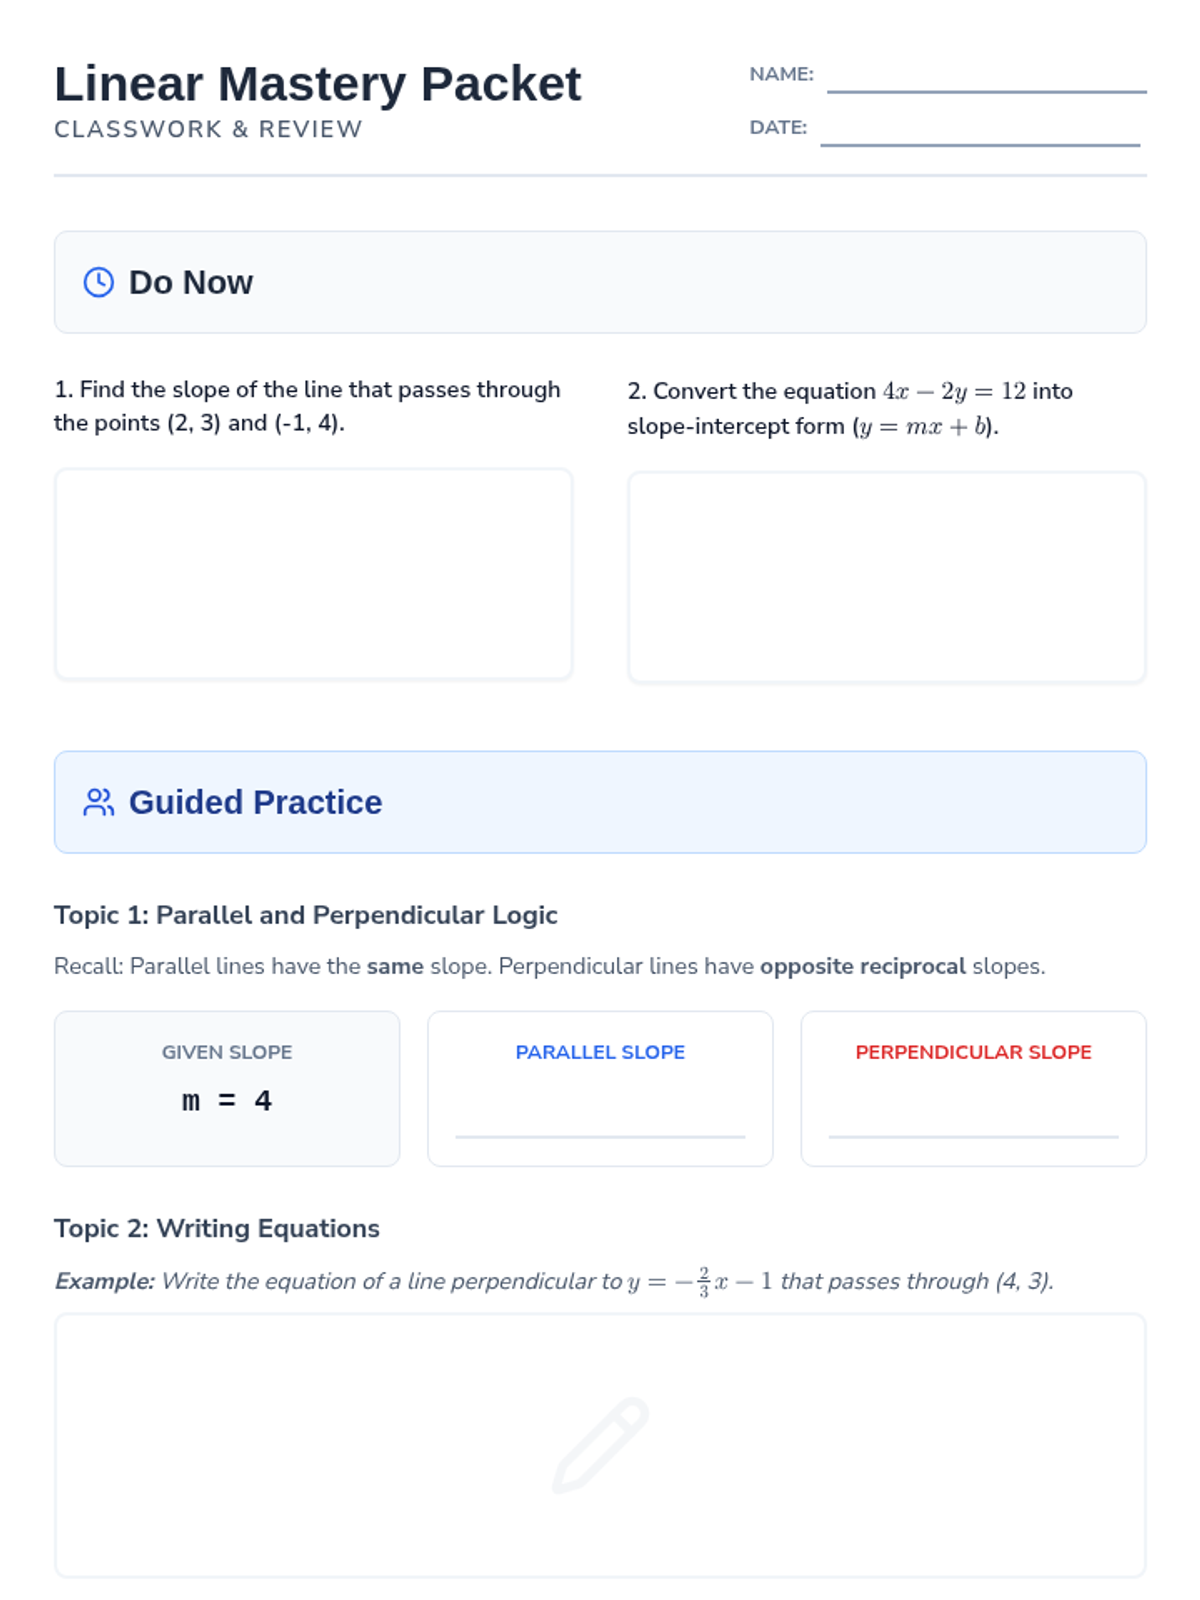
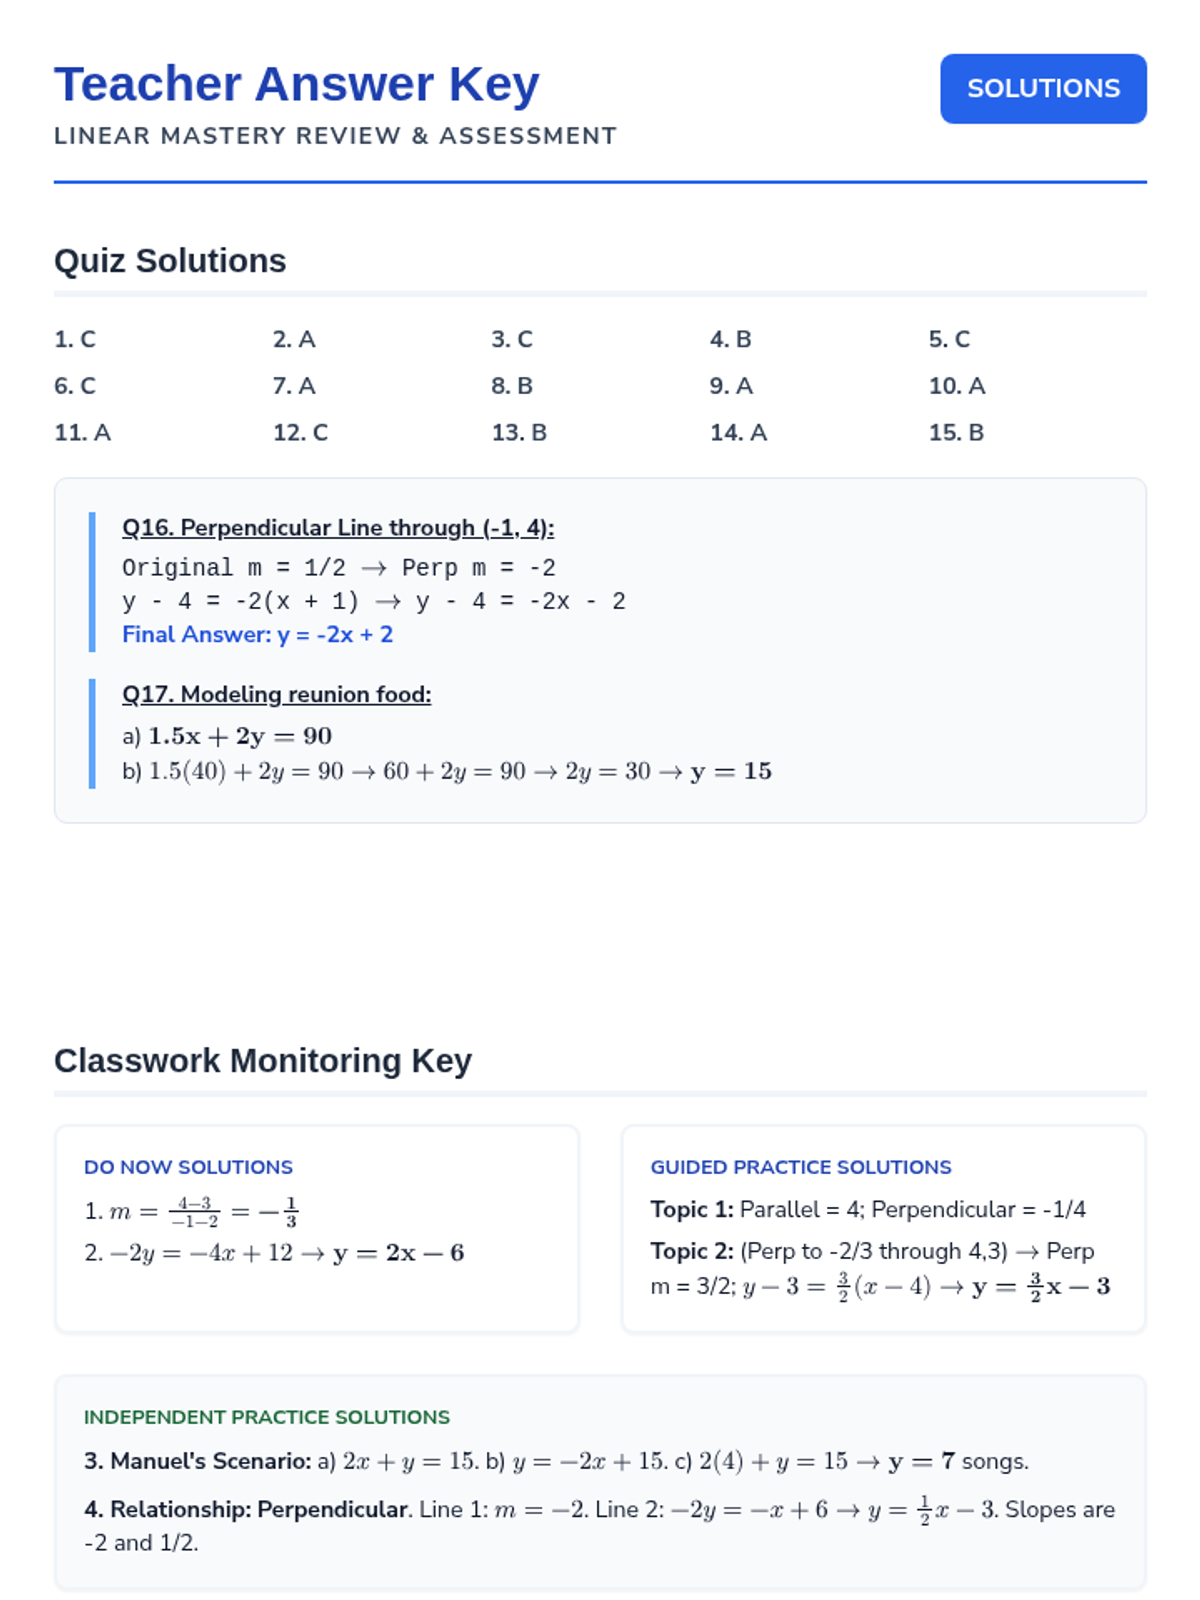
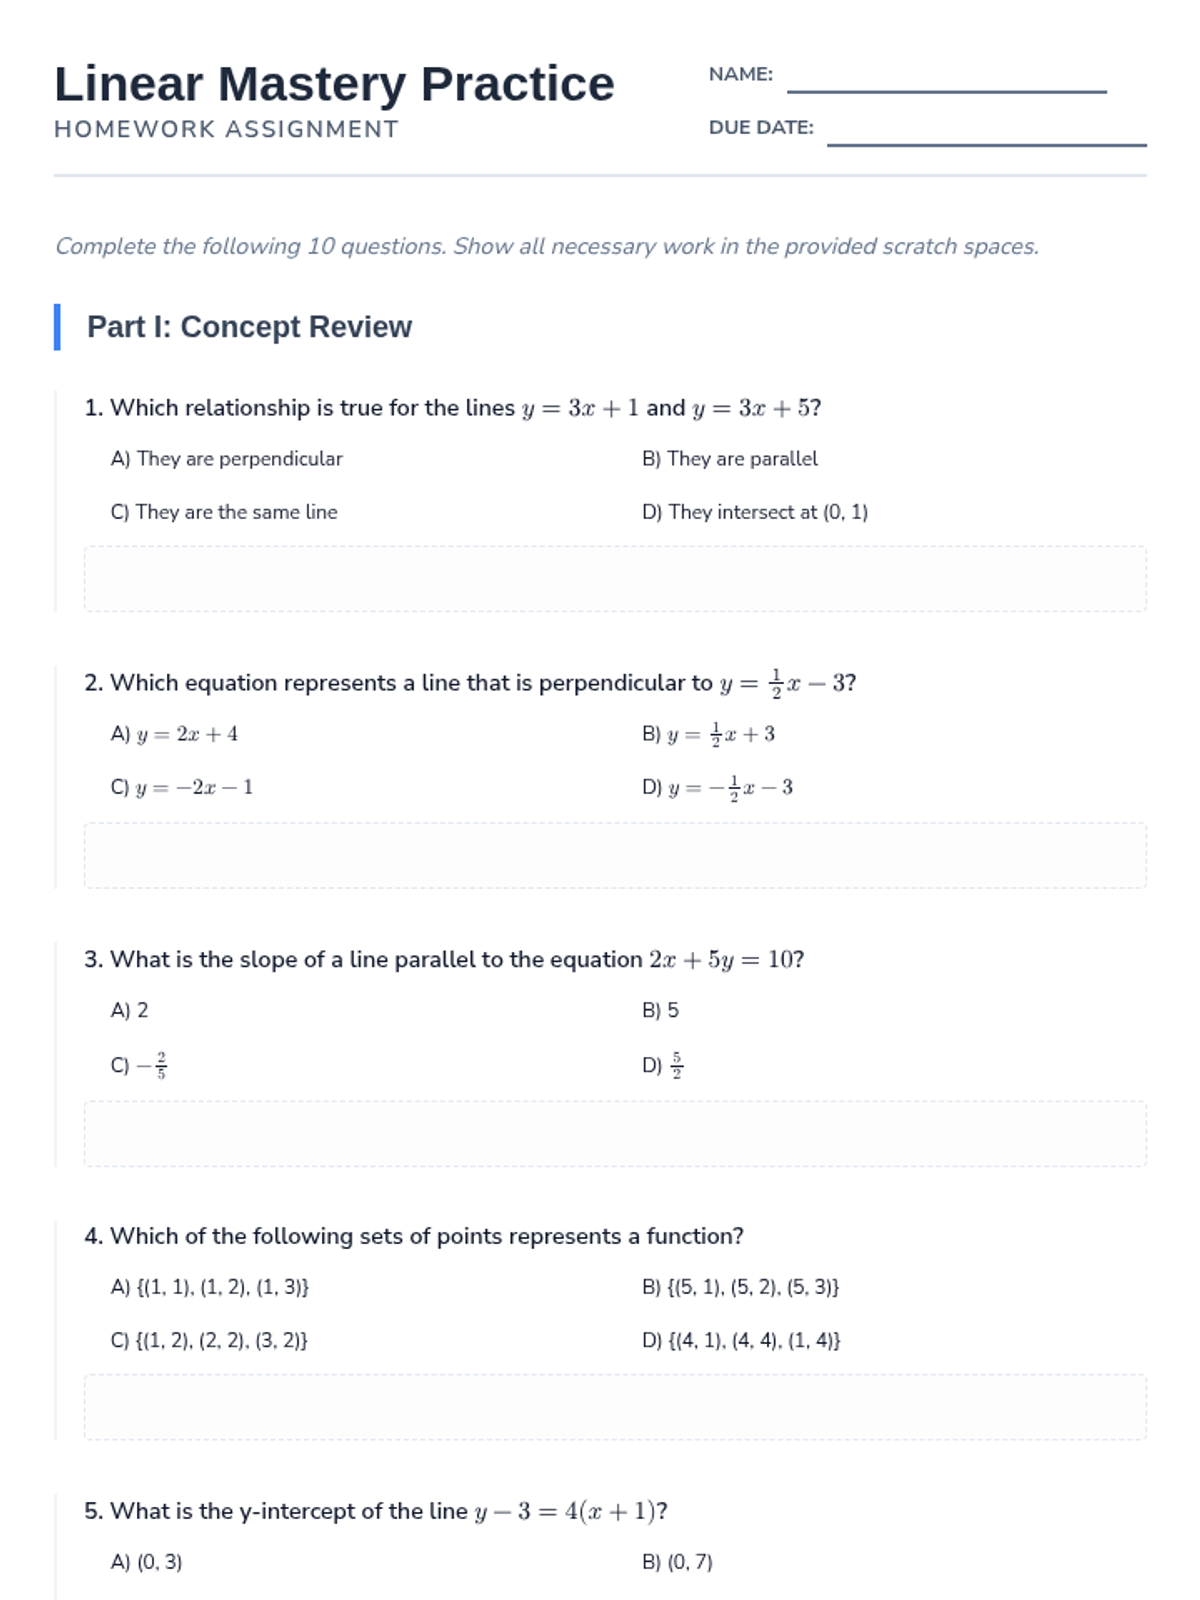
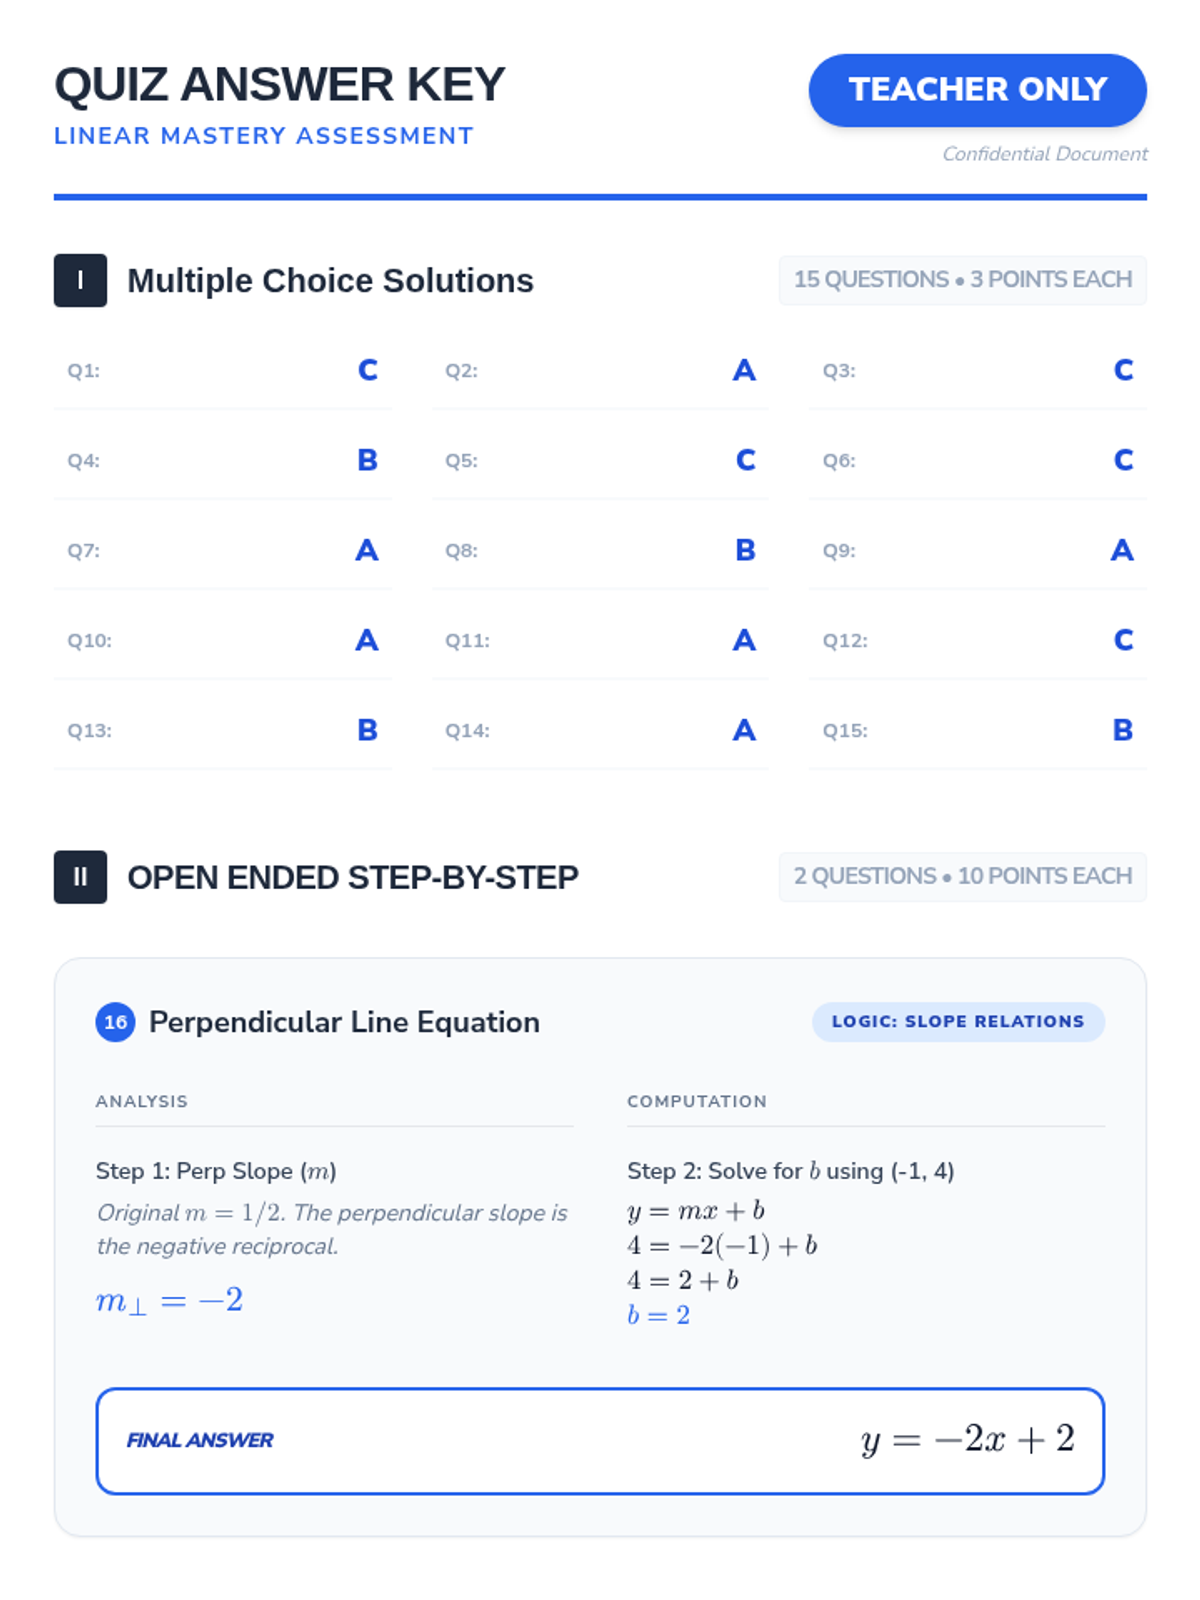
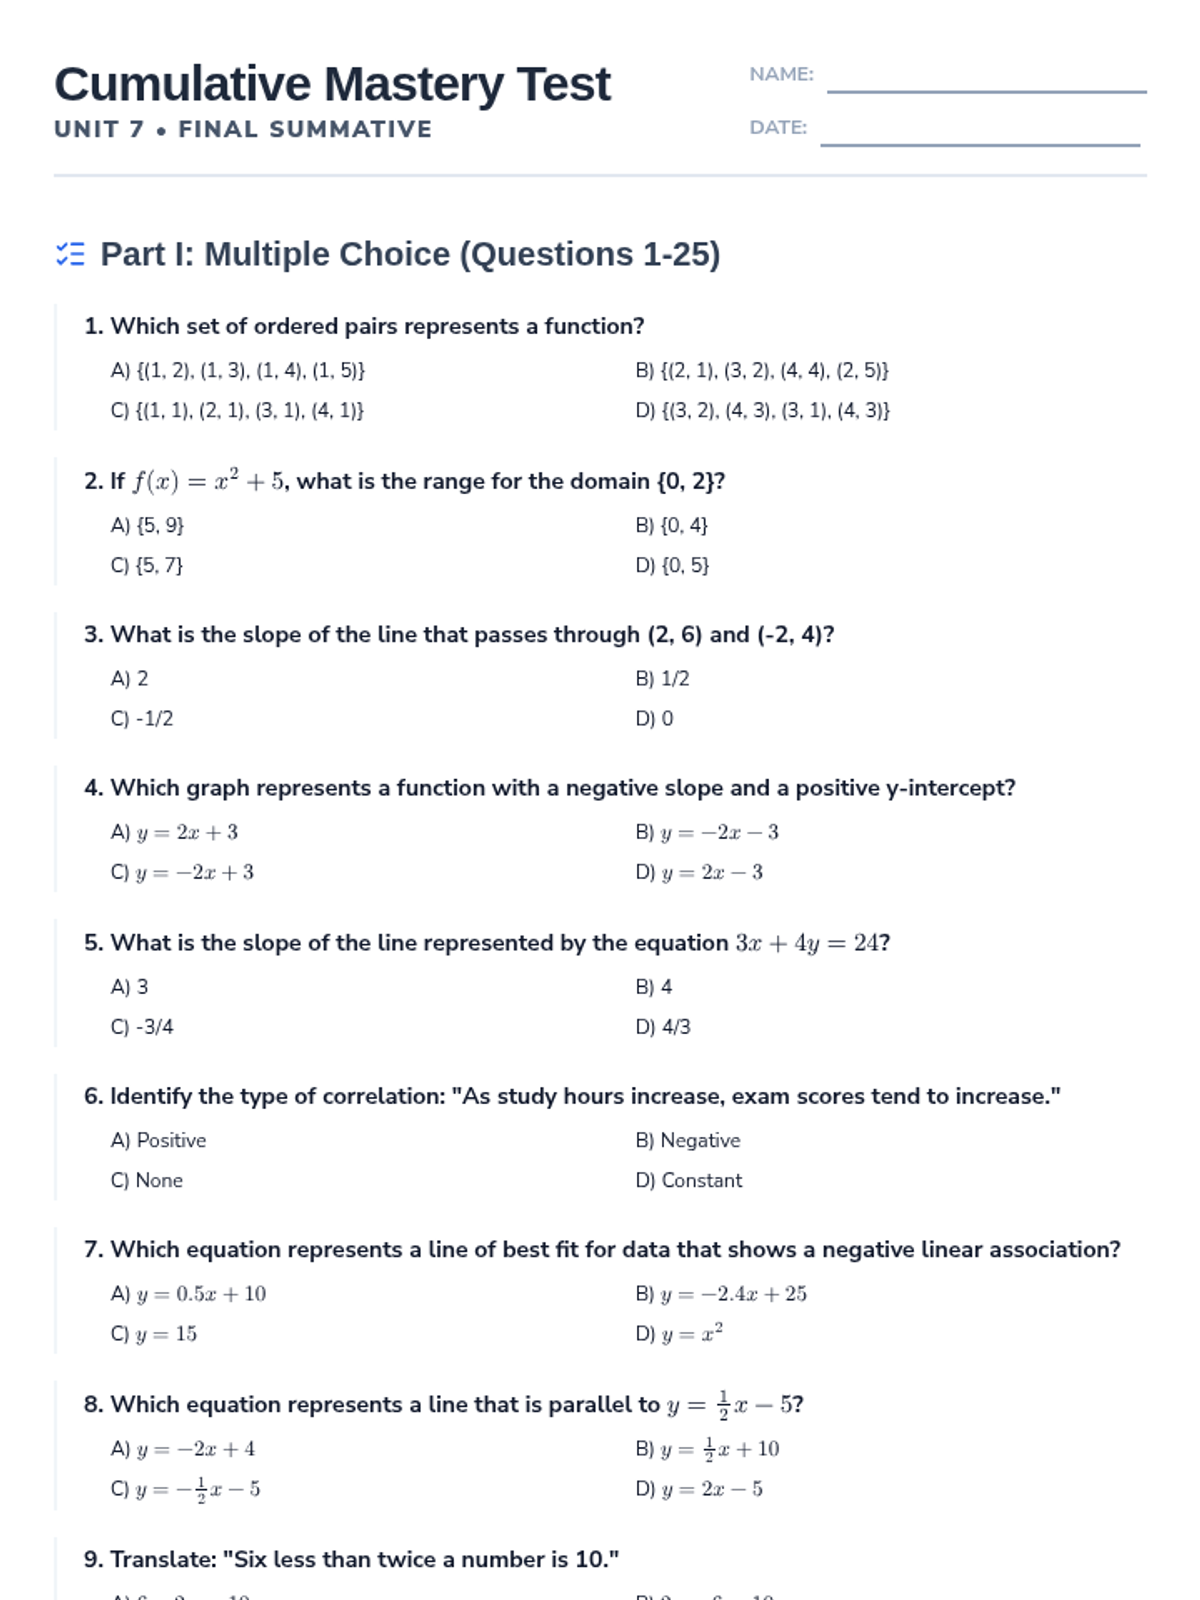
A comprehensive sequence covering the mastery of linear functions, equations, and inequalities. This progression takes students from identifying functions and solving basic equations to complex modeling with lines of best fit and inequality systems.
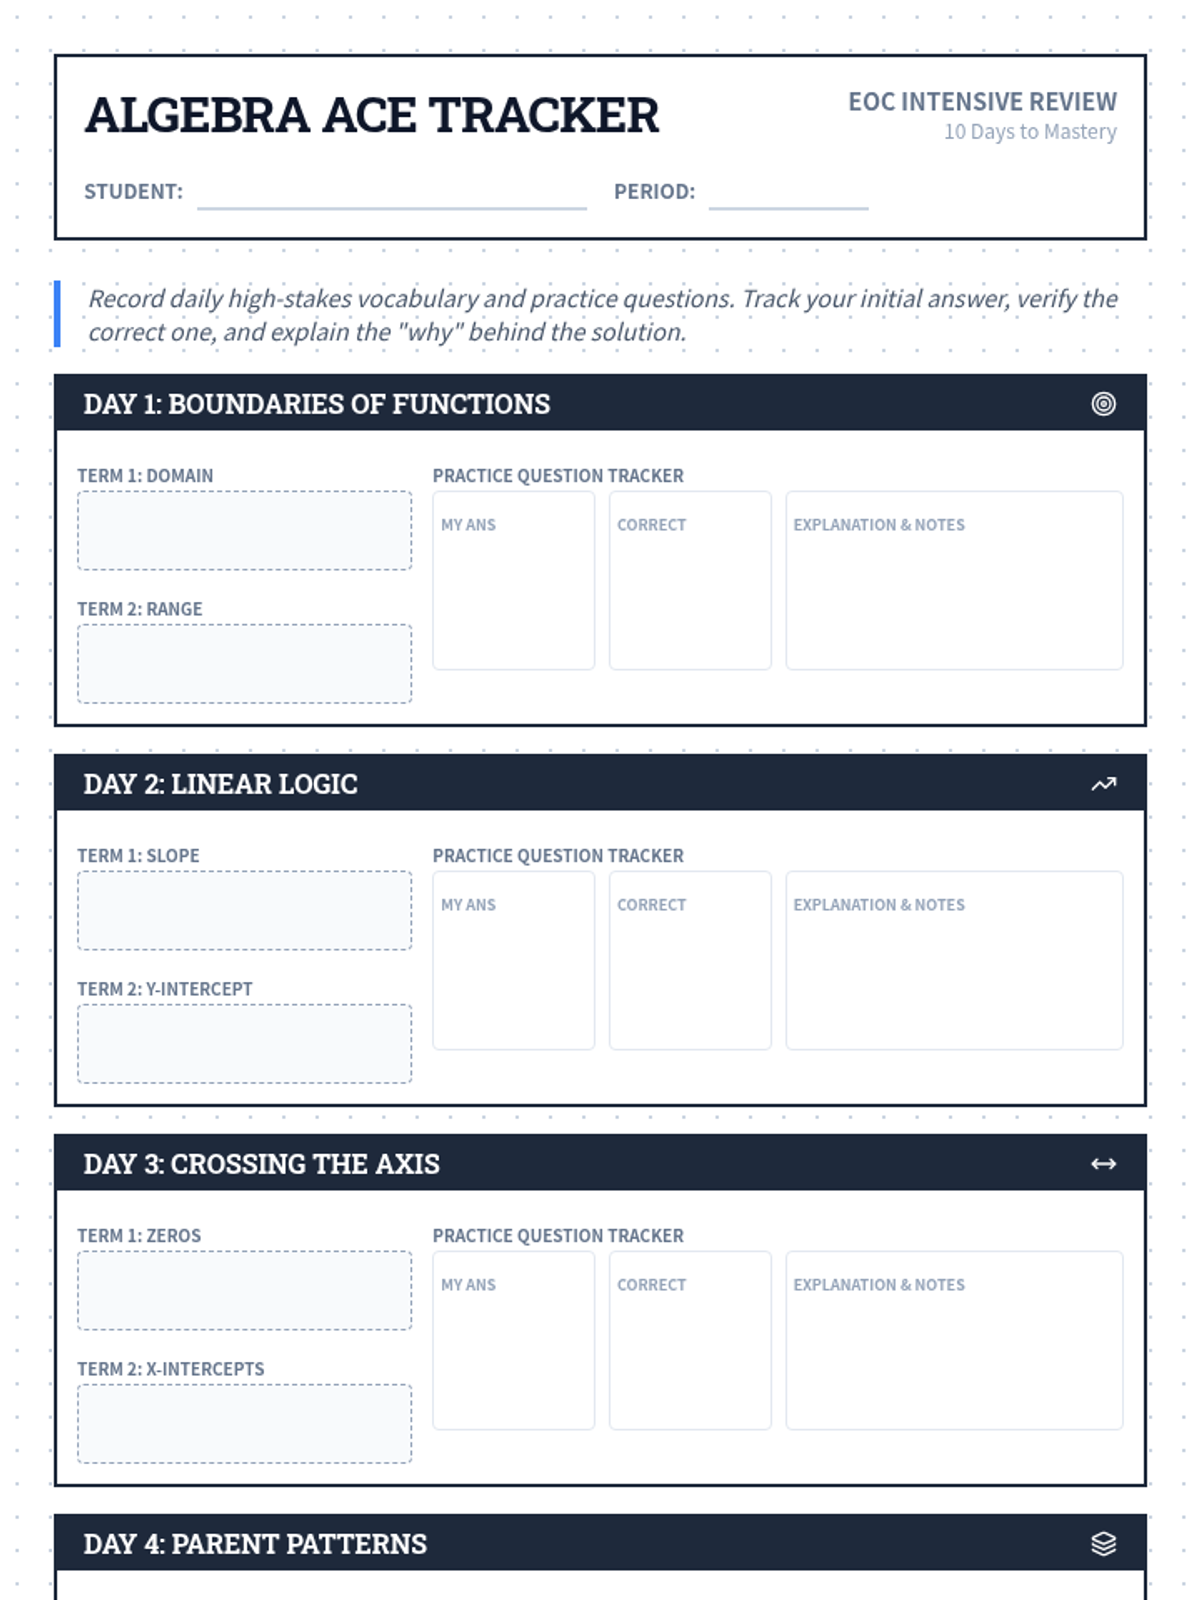
A 10-day intensive review sequence for the Texas Algebra I EOC exam, focusing on two high-stakes vocabulary terms each day with definitions, visual samples, and practice problems.
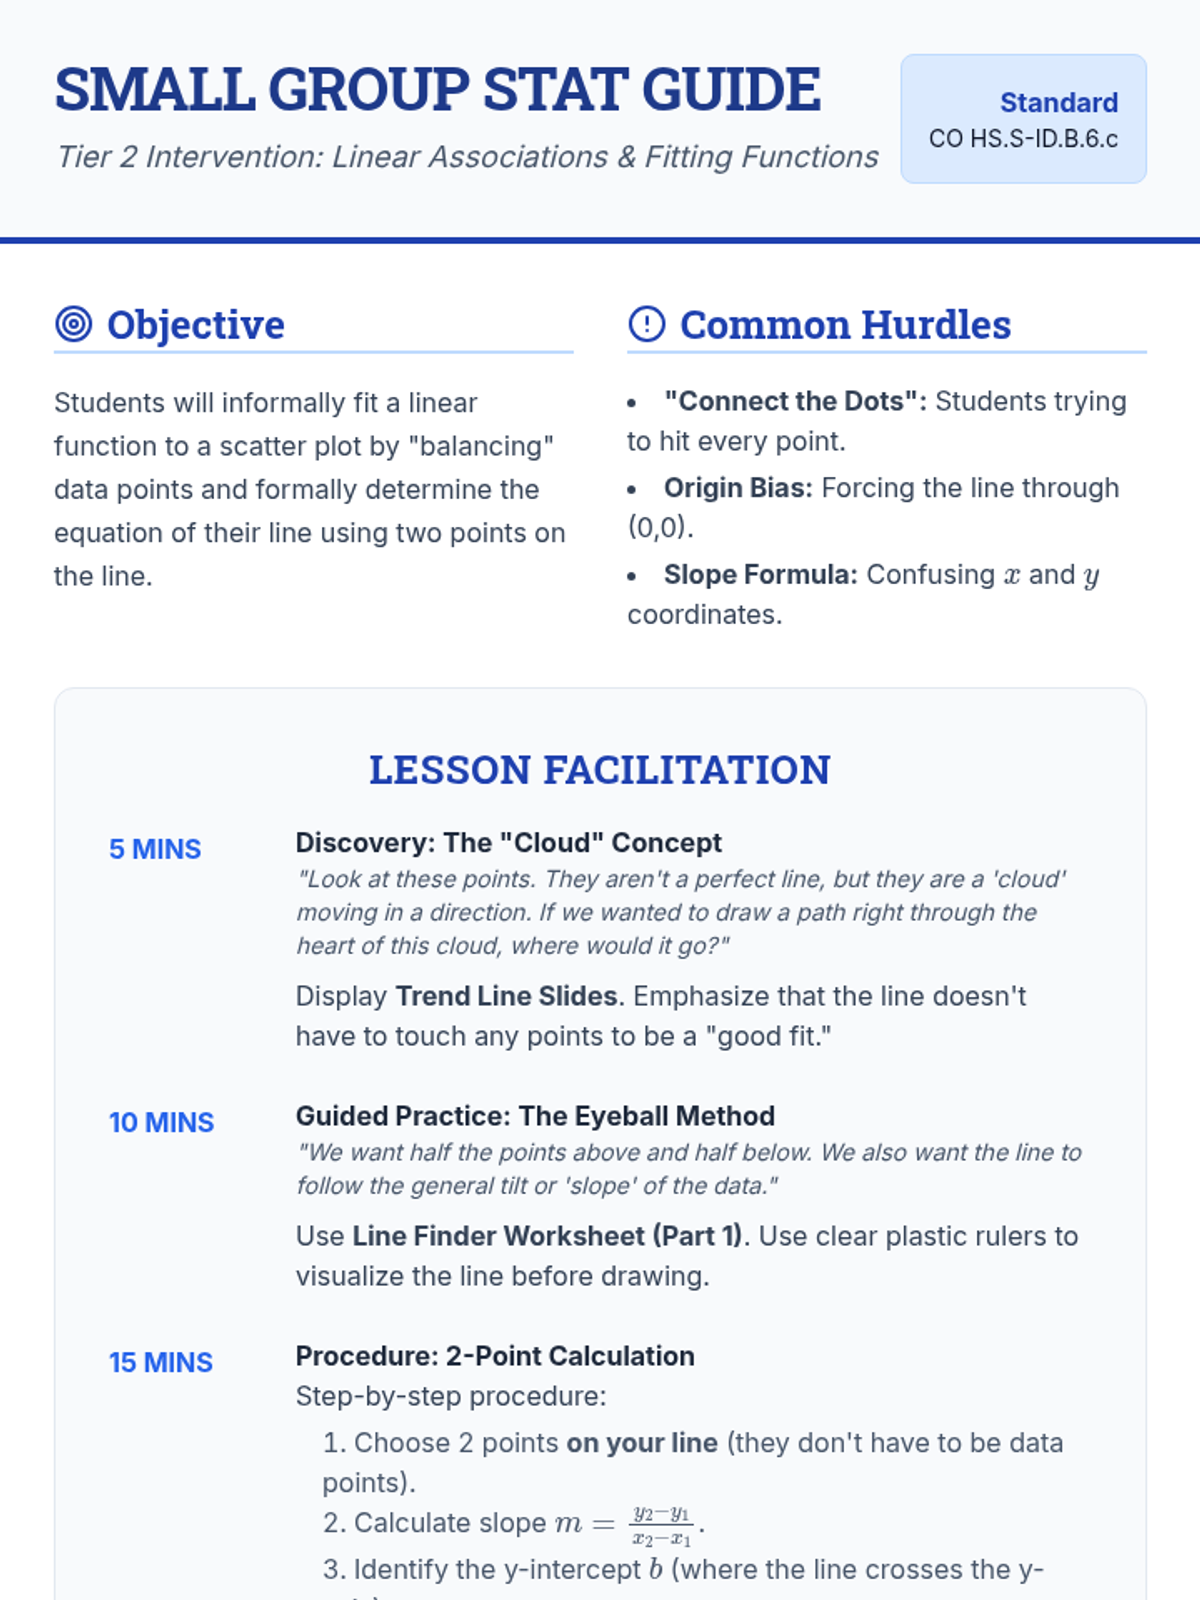
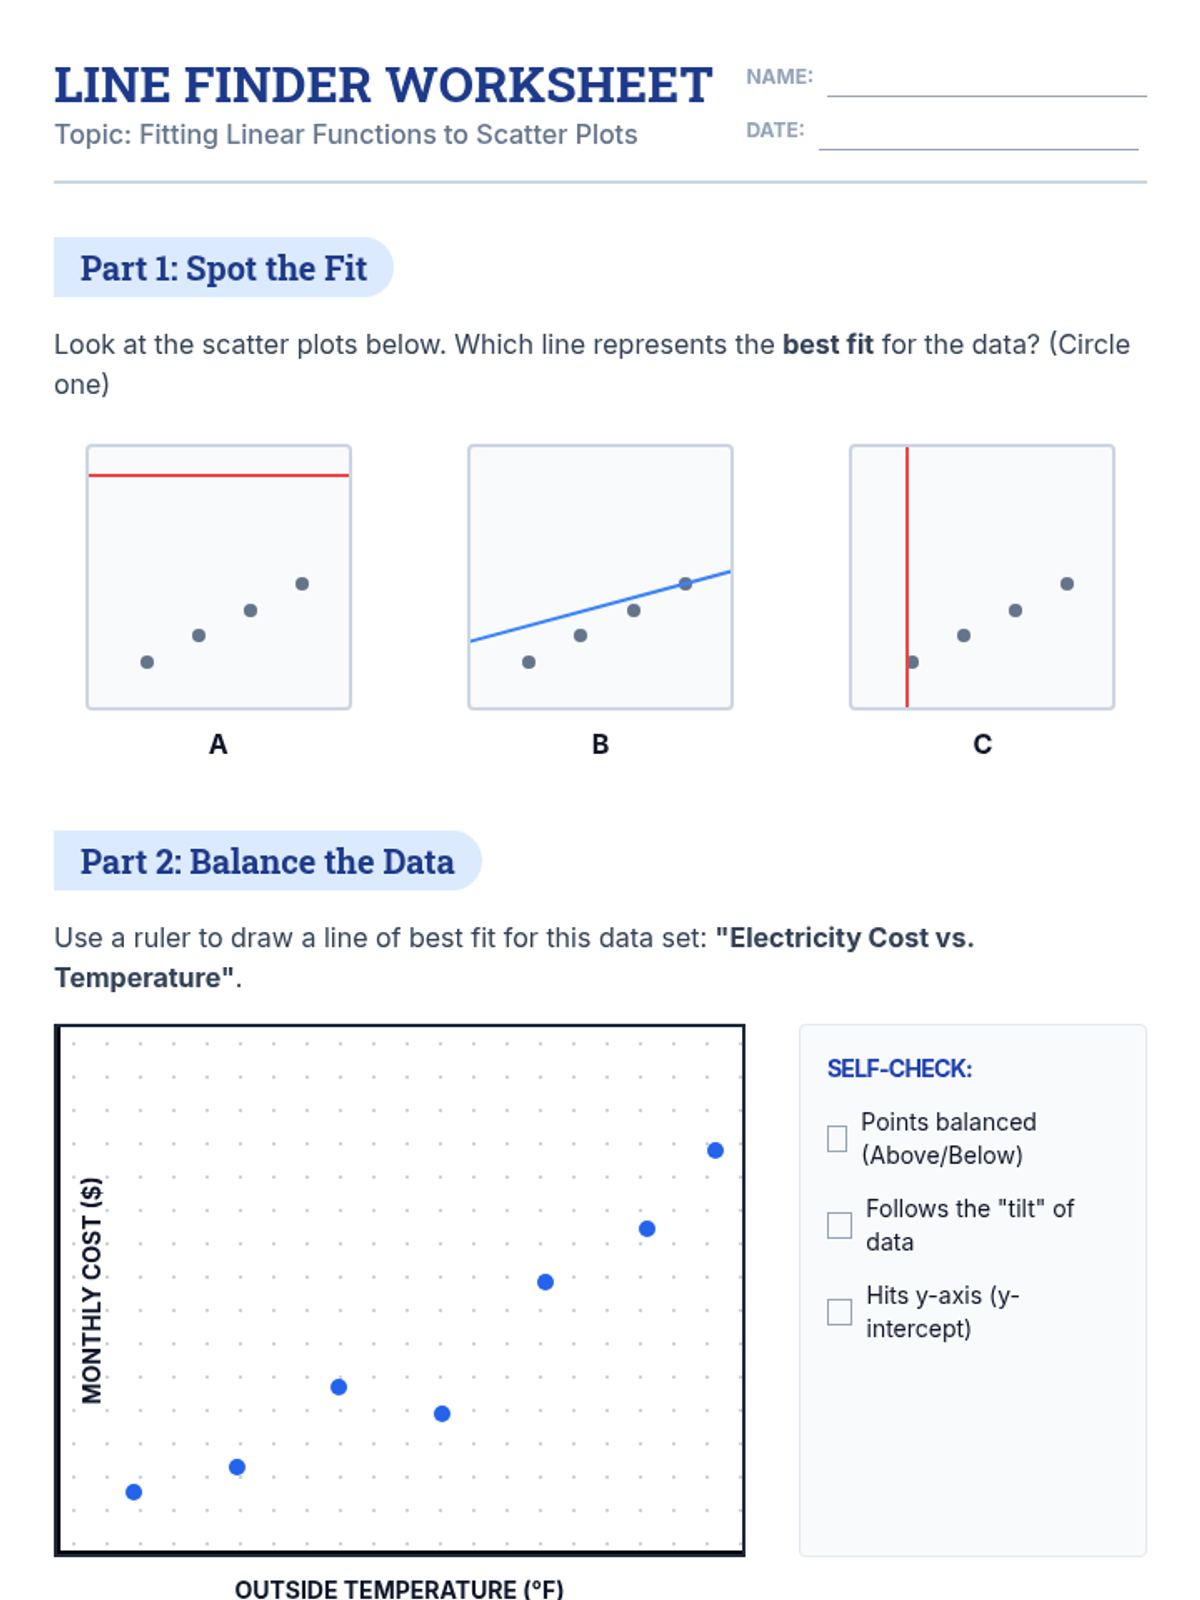
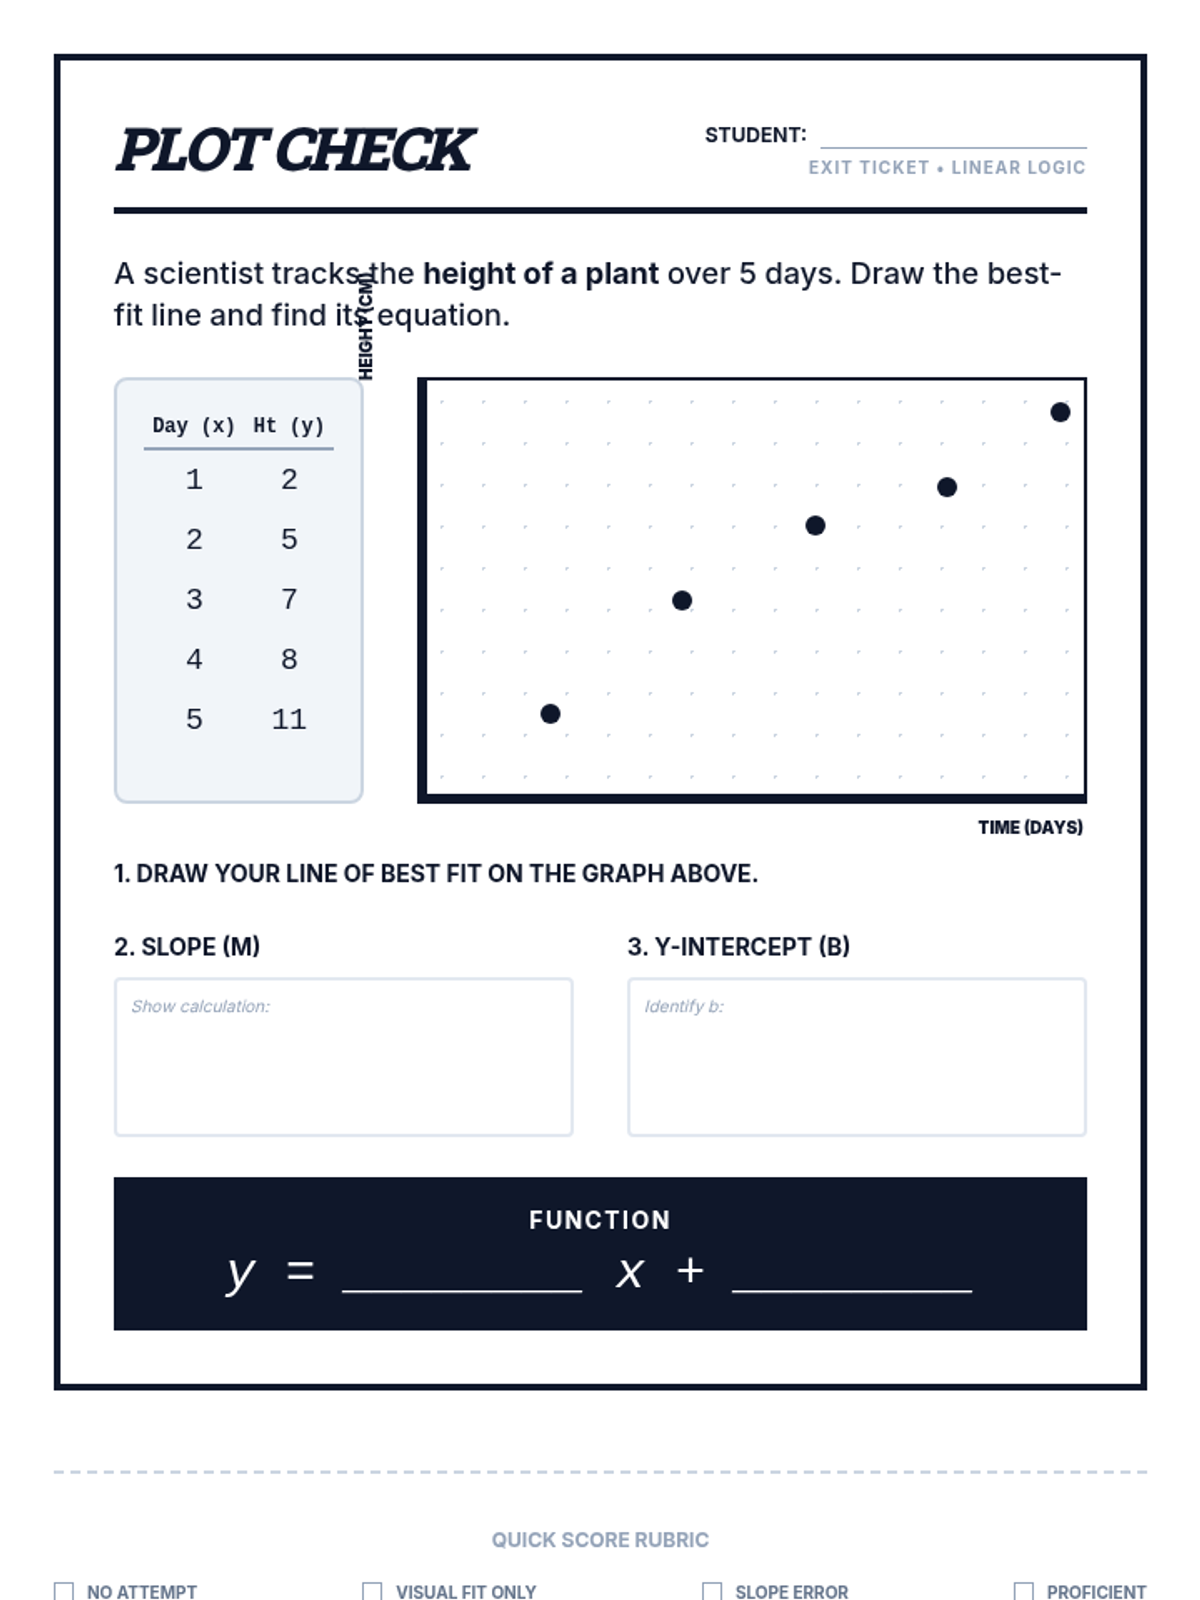
A targeted intervention sequence for high school statistics students focusing on fitting linear functions to scatter plots. It moves from conceptual understanding of 'balance' in data to the procedural steps of calculating lines of best fit.
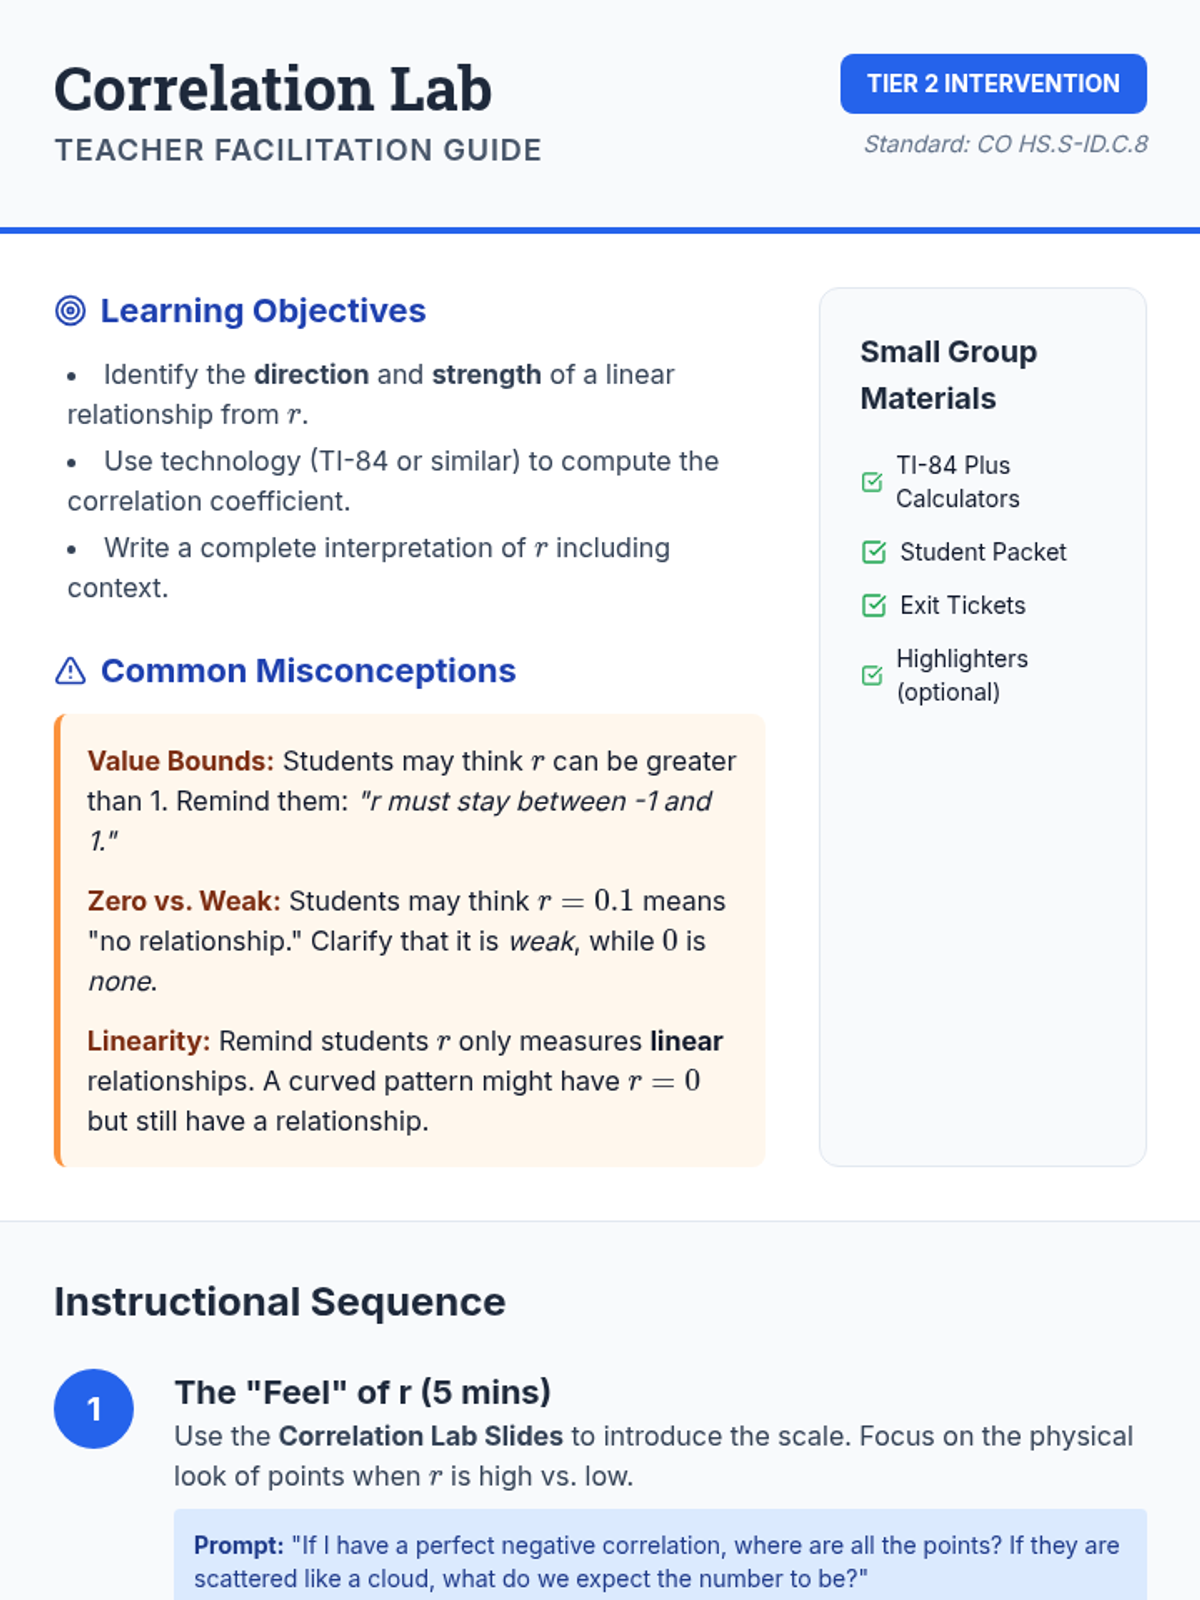
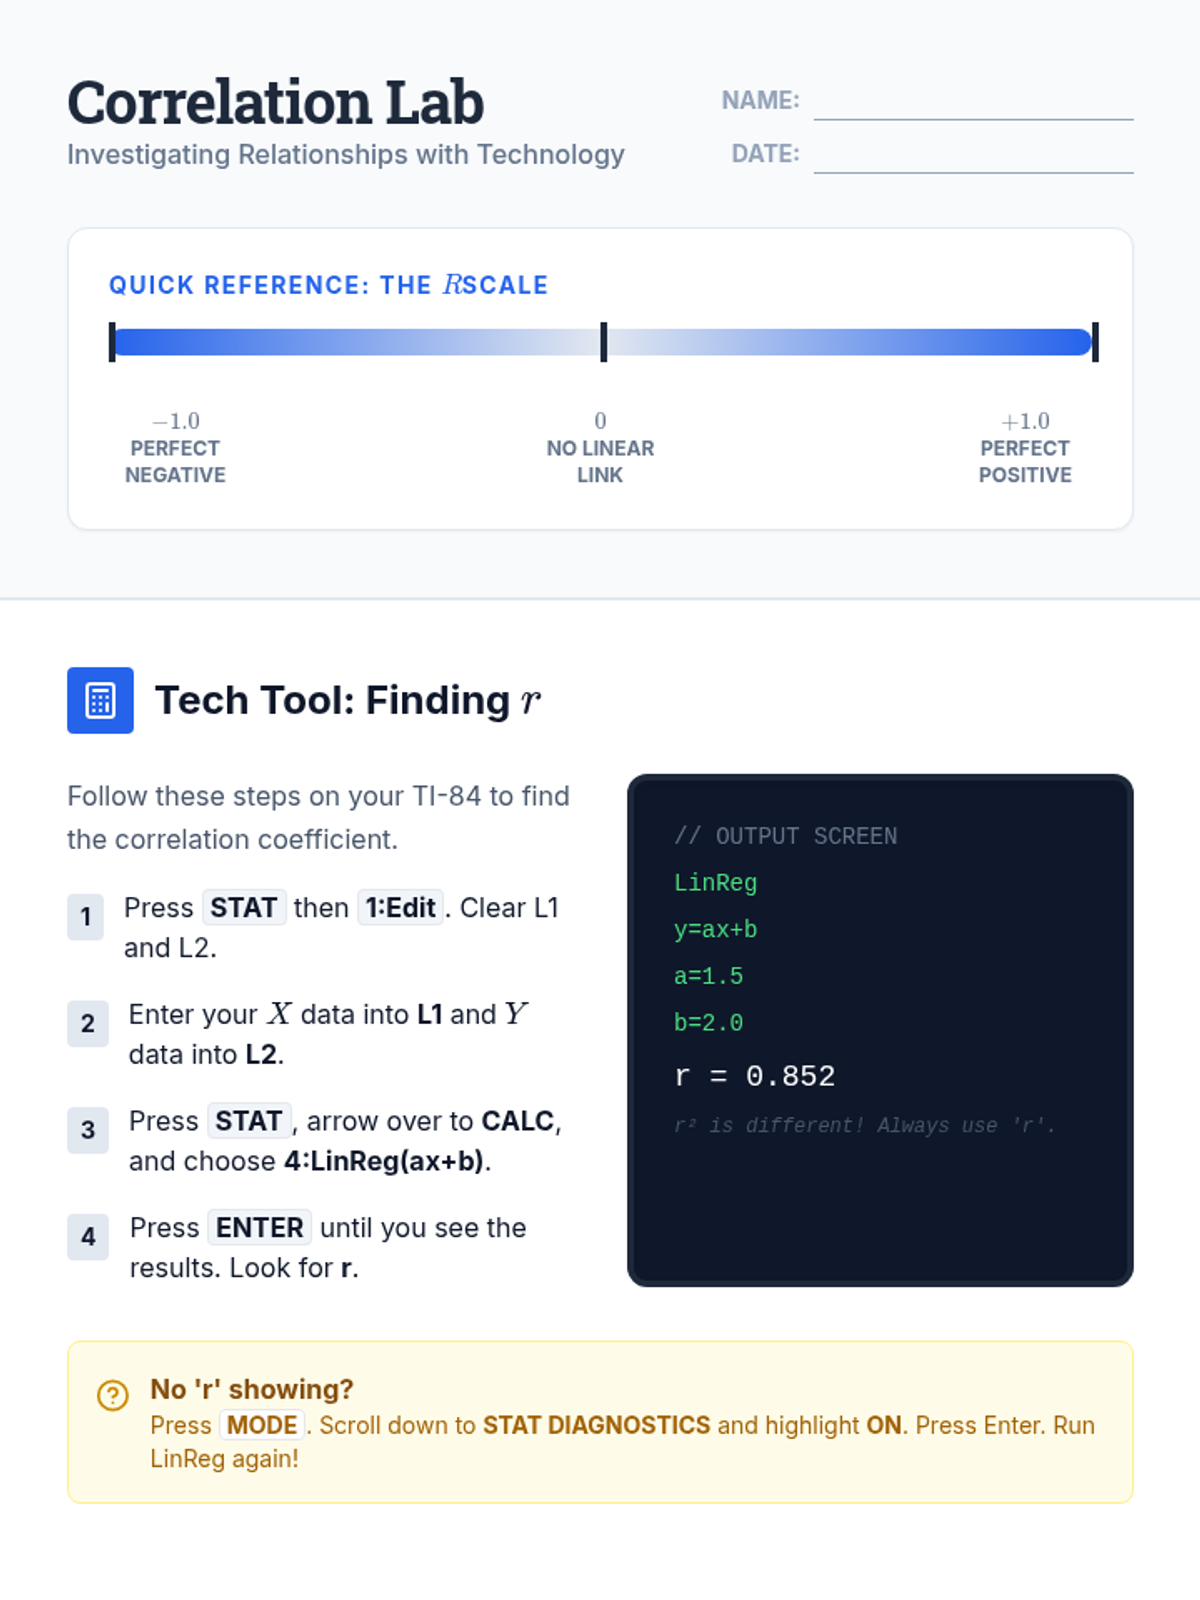
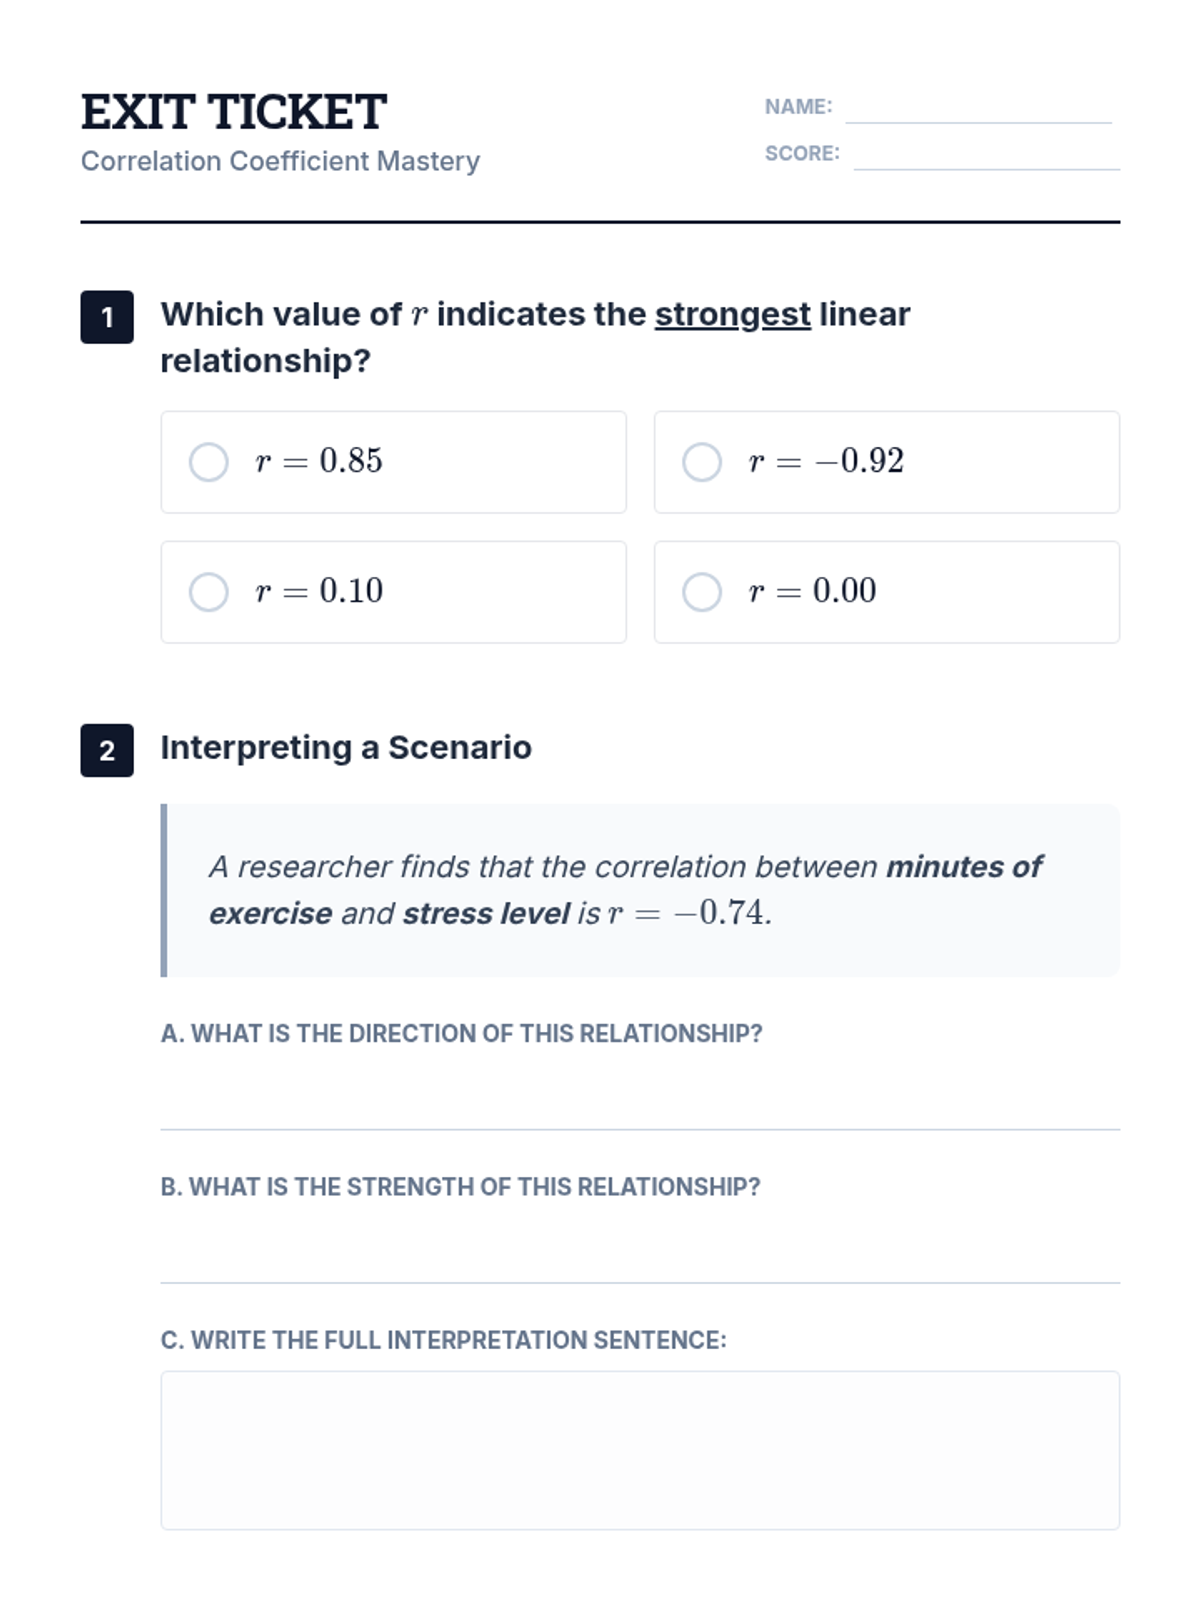
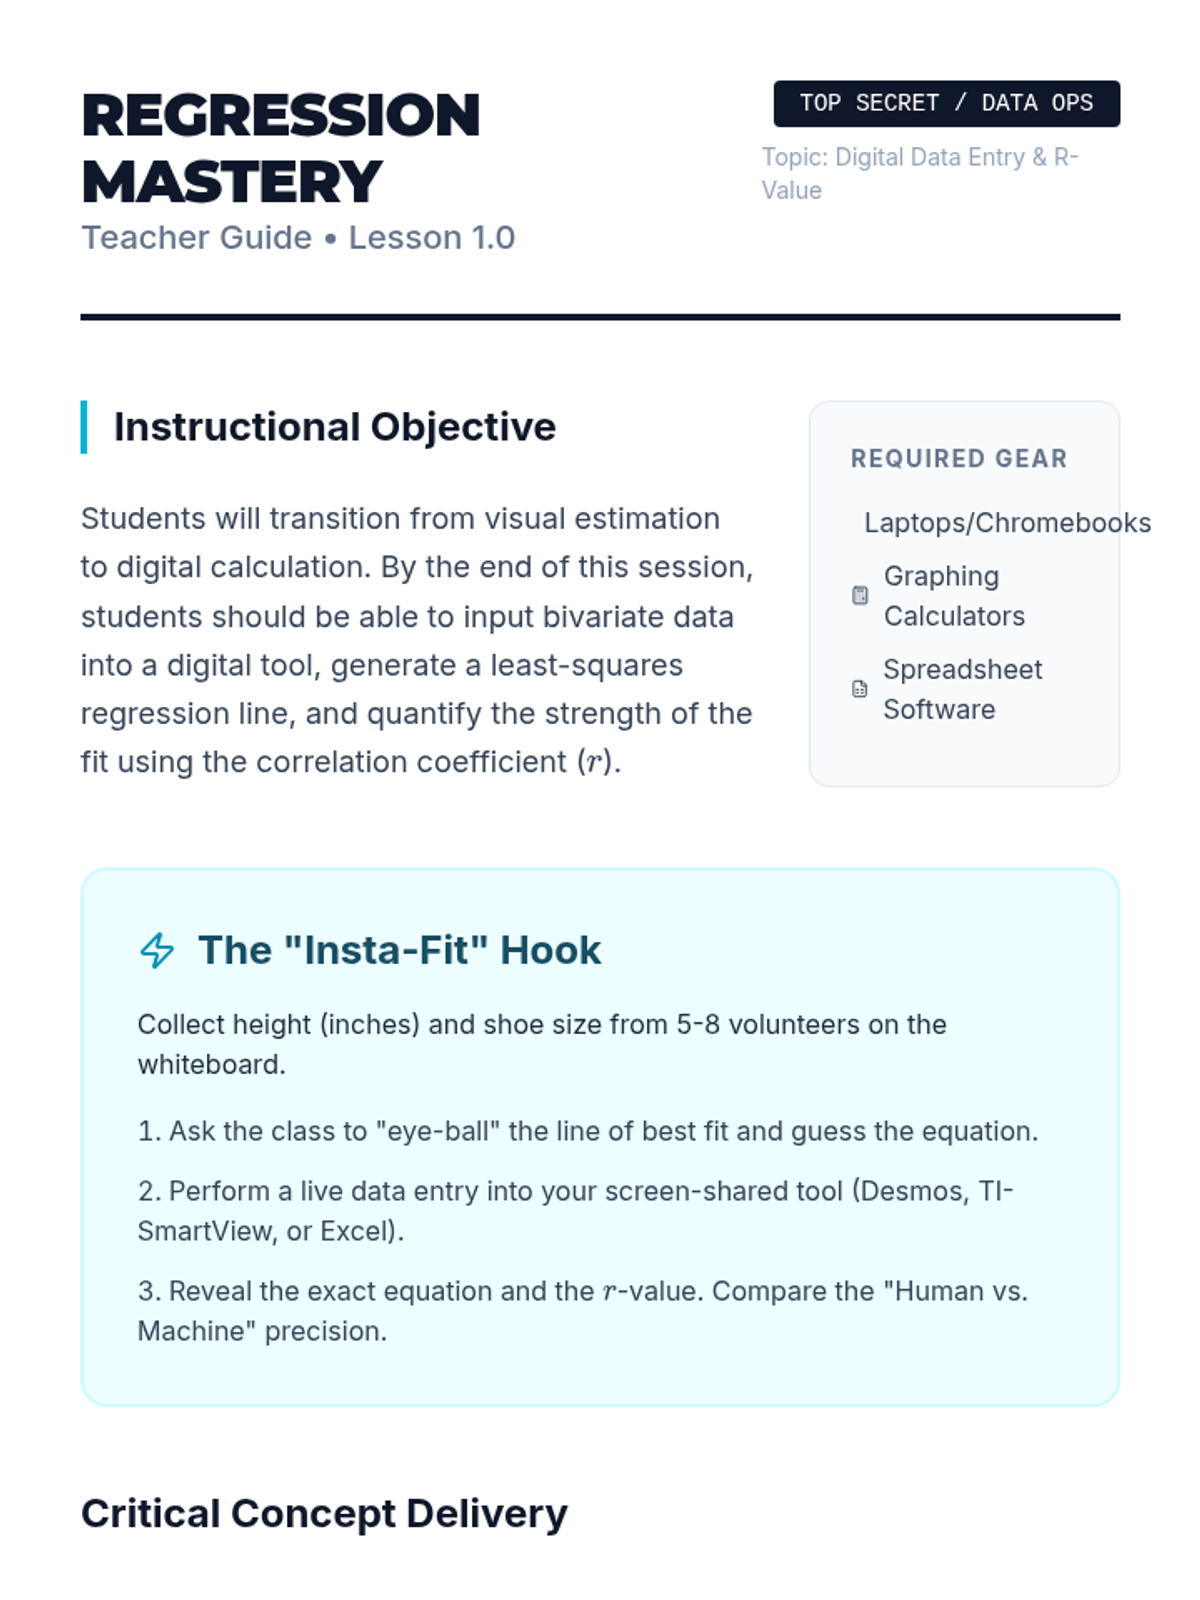
A Tier 2 intervention sequence focused on computing and interpreting the correlation coefficient (r) using technology, designed for high school statistics students needing targeted support.
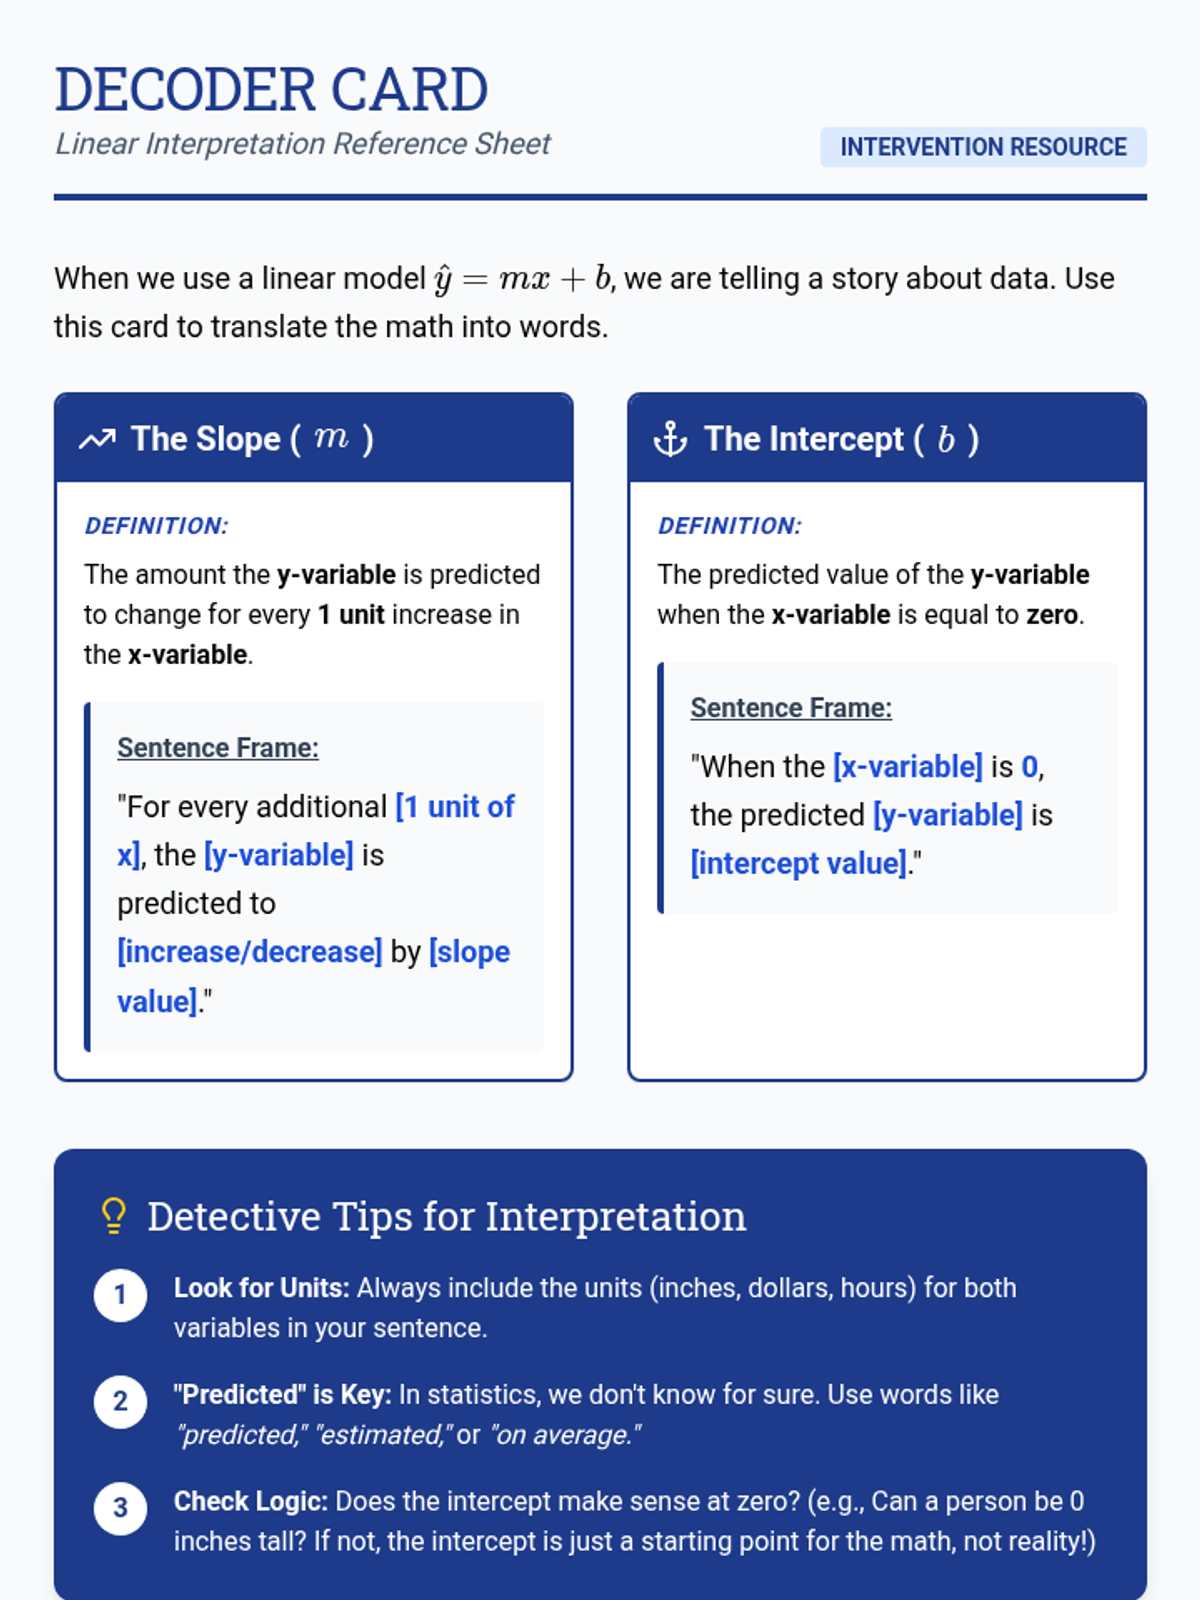
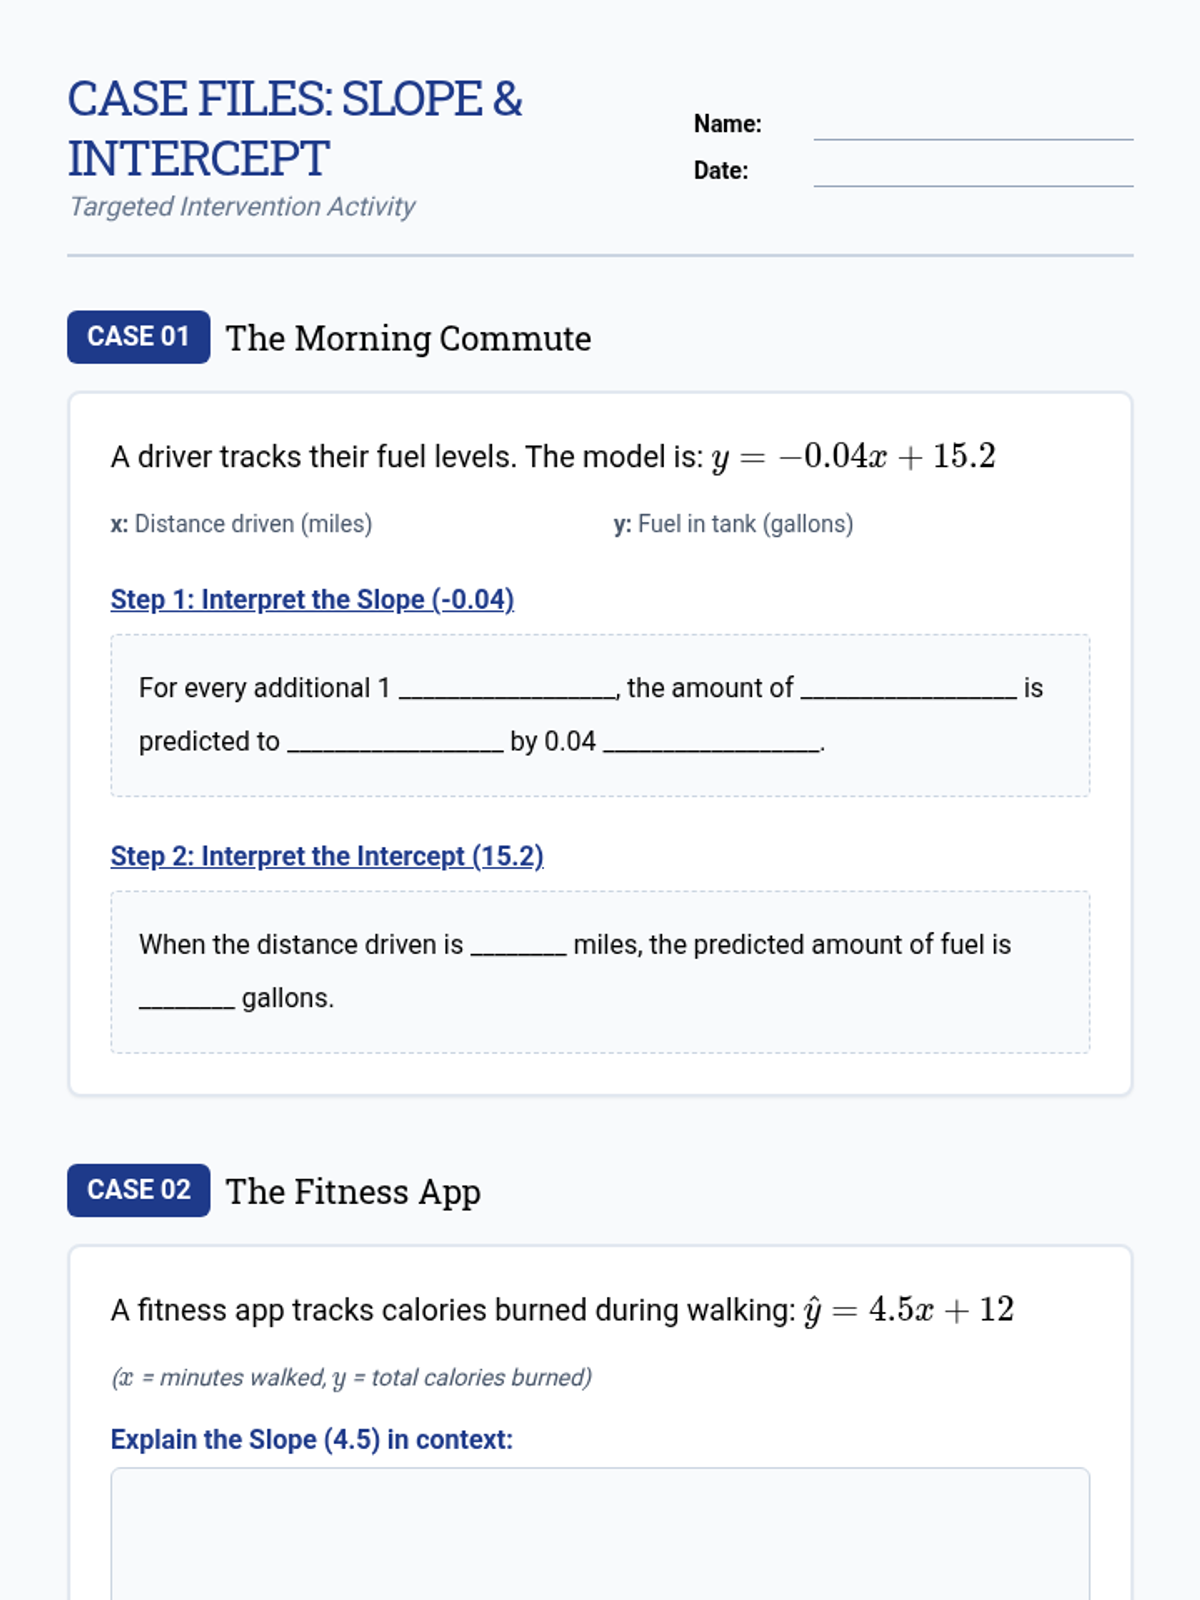
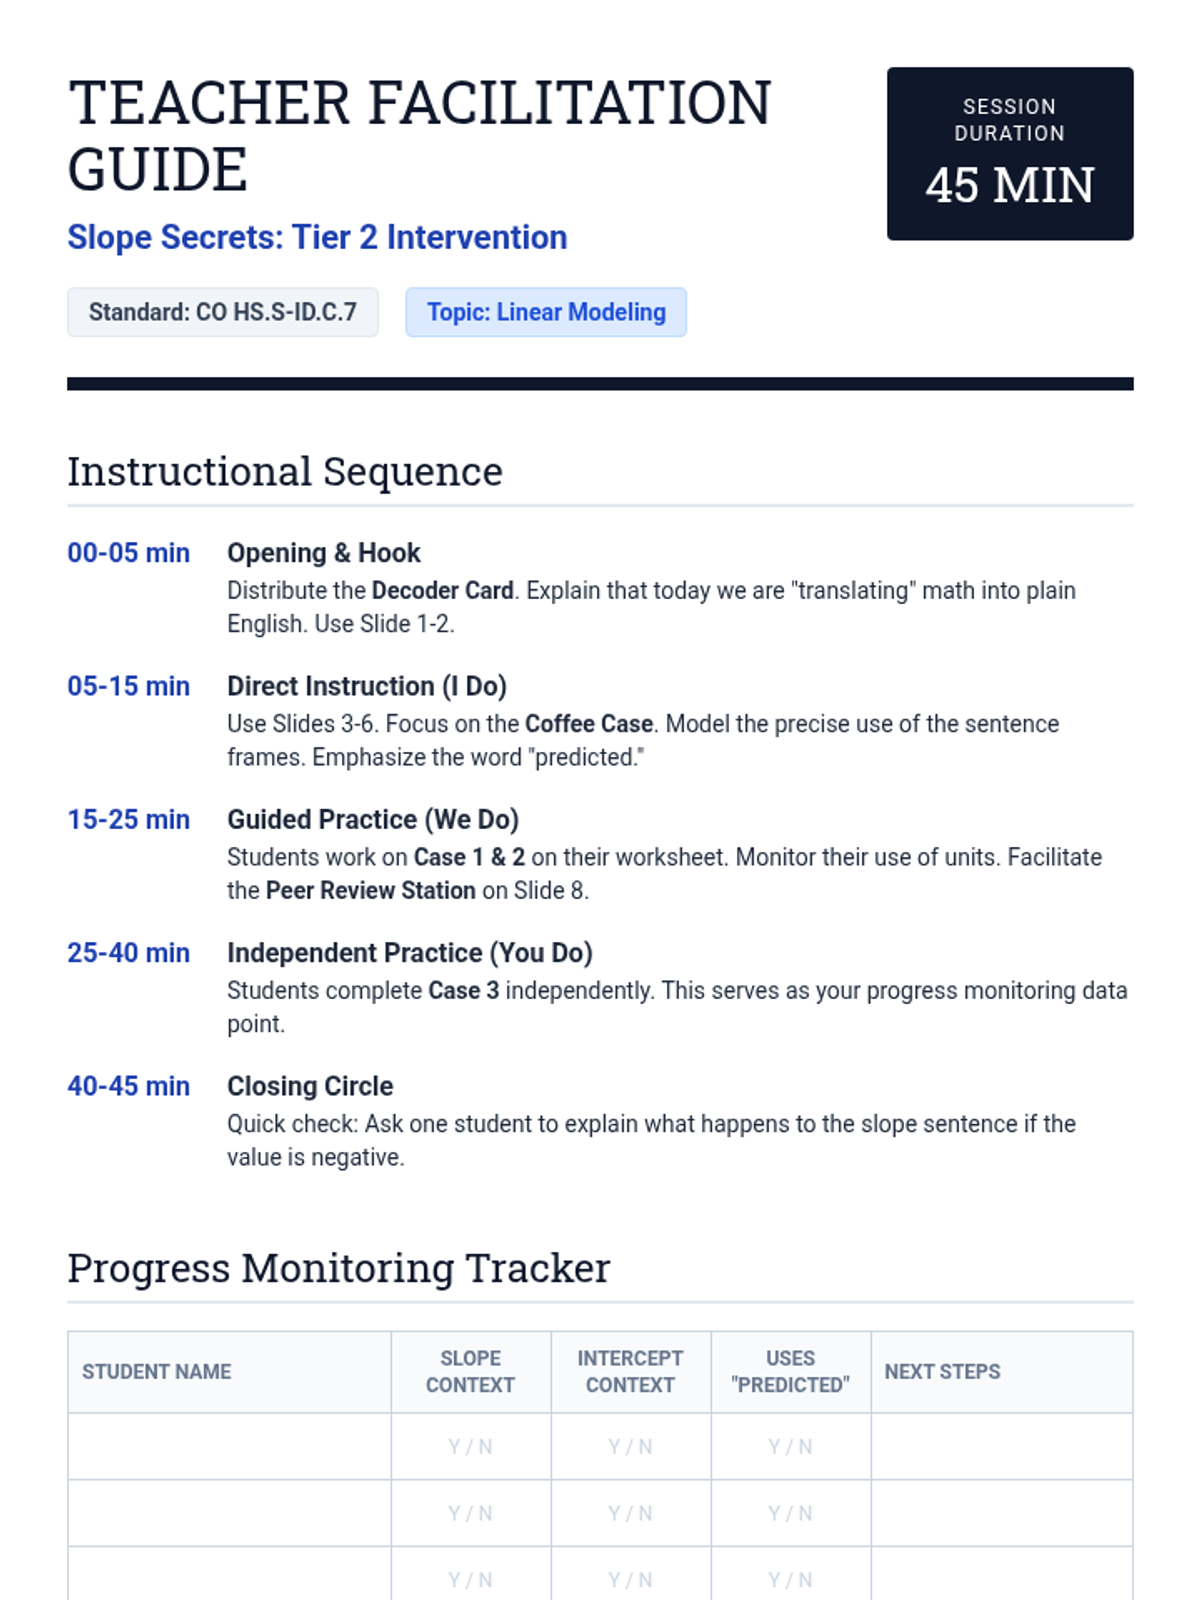
A specialized intervention sequence focusing on the foundational skills of linear modeling in statistics, specifically interpreting slope and intercept in real-world contexts. Designed for small groups requiring Tier 2 support.
A 5-lesson sequence where students act as data analysts to explore, construct, and interpret linear models. Students progress from basic scatter plots to making predictions and critiquing the validity of linear models in real-world contexts.
This sequence guides 9th-grade students through the process of interpreting linear models, moving from qualitative observations of scatter plots to quantitative interpretations of slope and y-intercept in real-world contexts. Students will learn to construct trend lines, write equations, and use those models to make informed predictions.
A project-based unit for 9th-grade students focusing on the reliability of linear models, technology-based regression, residual analysis, and the critical distinction between correlation and causation. Students transition from manual calculations to digital tools to defend data-driven predictions.
A project-based unit where students apply polynomial calculus concepts to real-world scenarios like business profits, projectile motion, and engineering design. Students transition from abstract solving to modeling data and optimizing outcomes using regression, intercepts, and extrema.
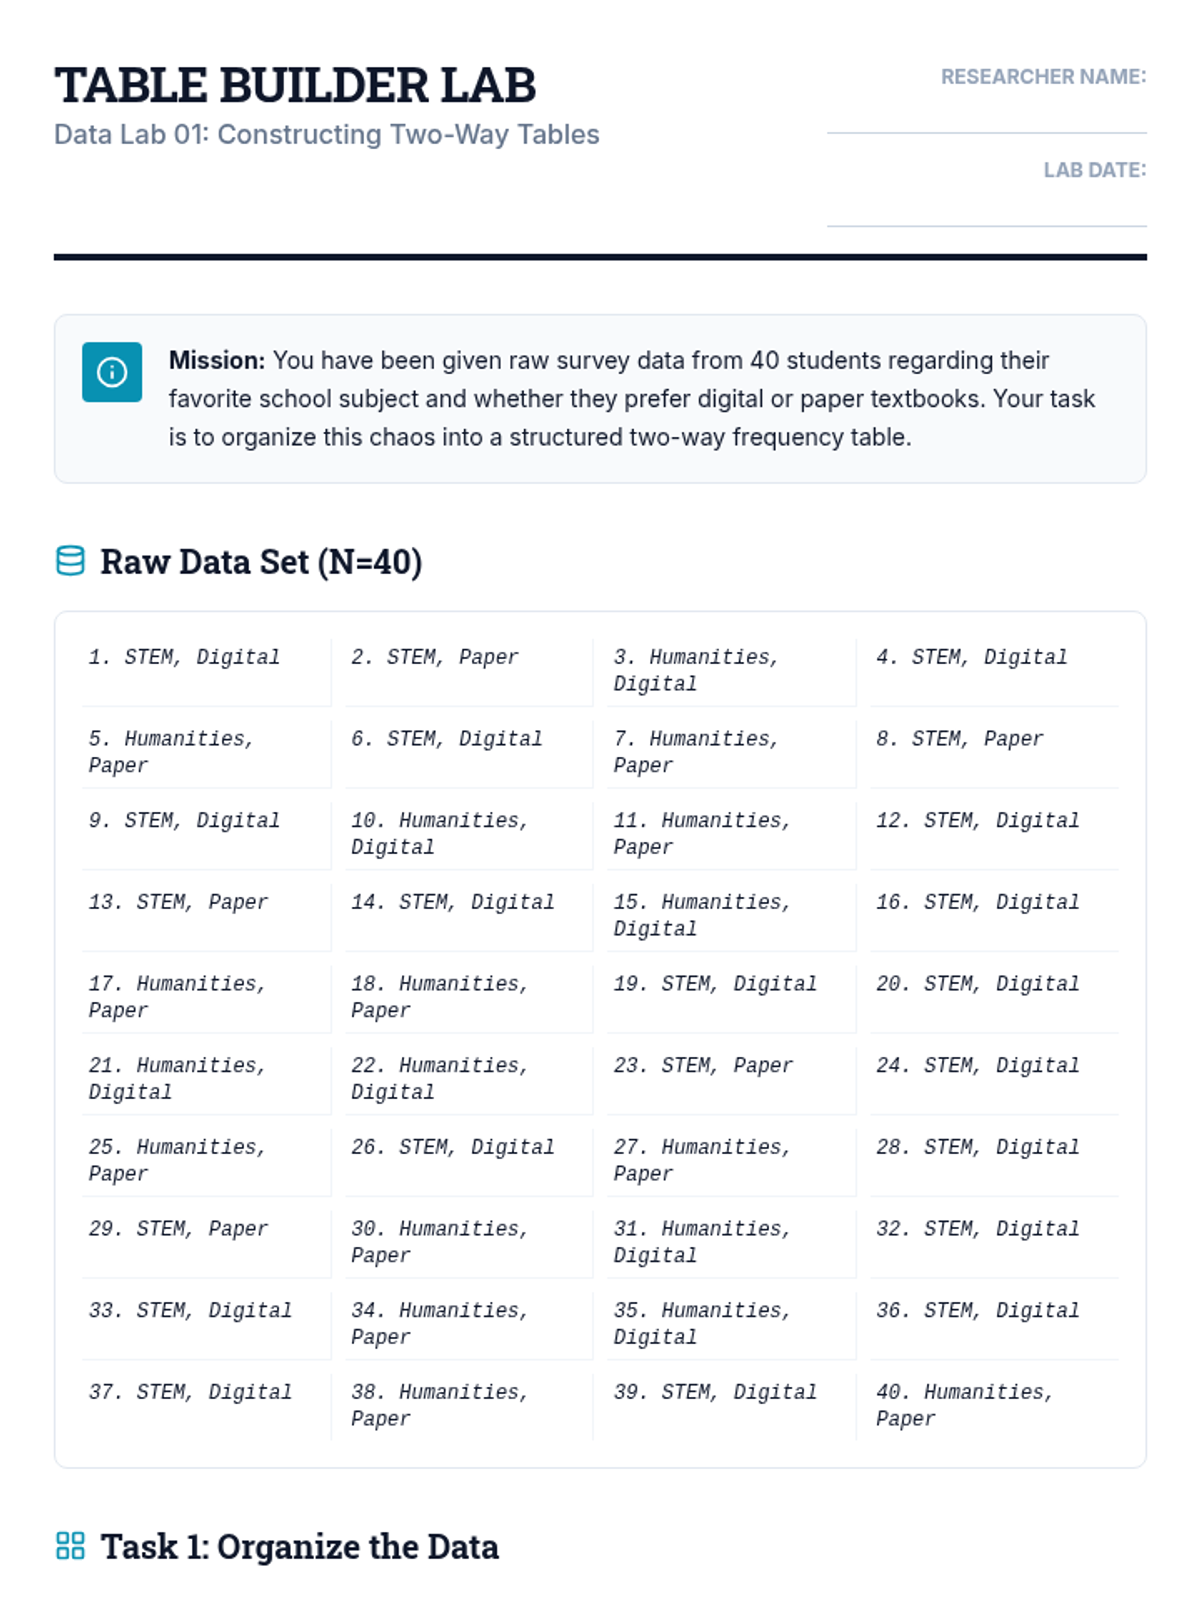
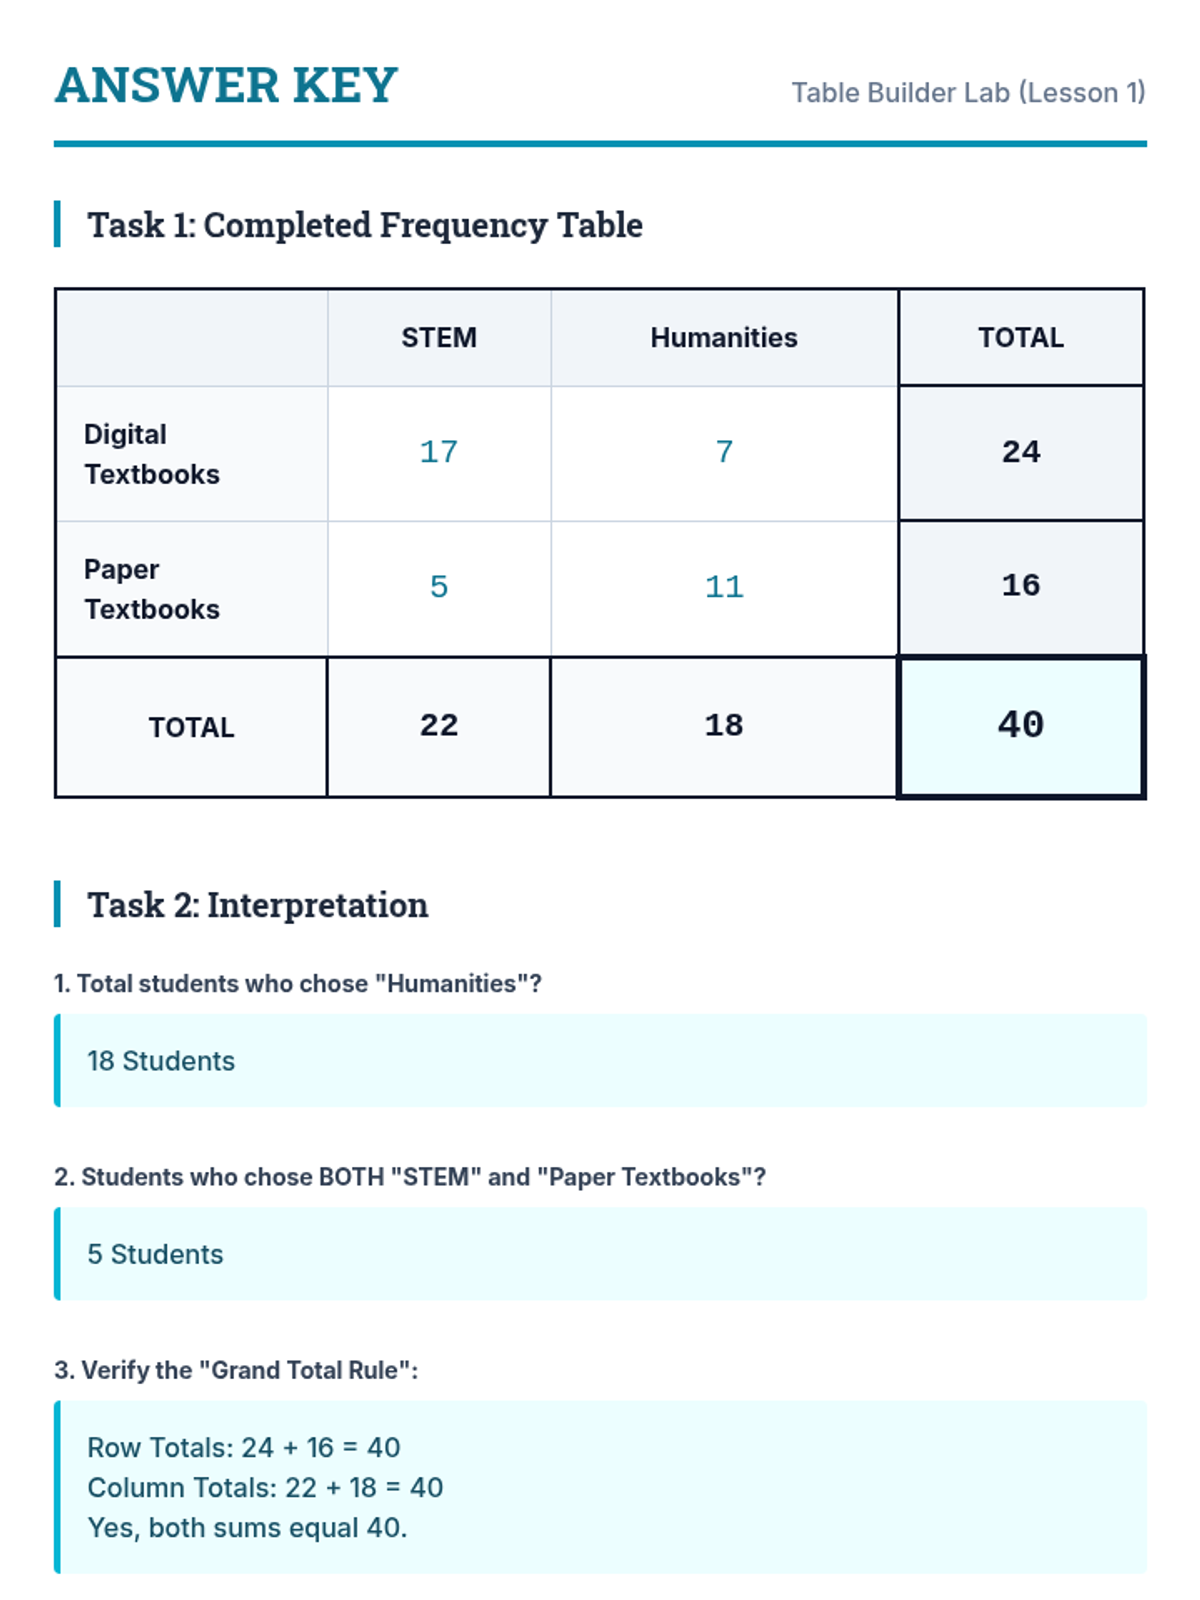
A comprehensive unit on two-way frequency tables, moving from data organization to complex probability analysis and independence testing. Students will bridge the gap between categorical counts and real-world statistical claims.