Data representation, distributions, and statistical variability using sampling and inference techniques. Integrates probability models, compound events, bivariate patterns, and linear models to guide data-driven decision making.
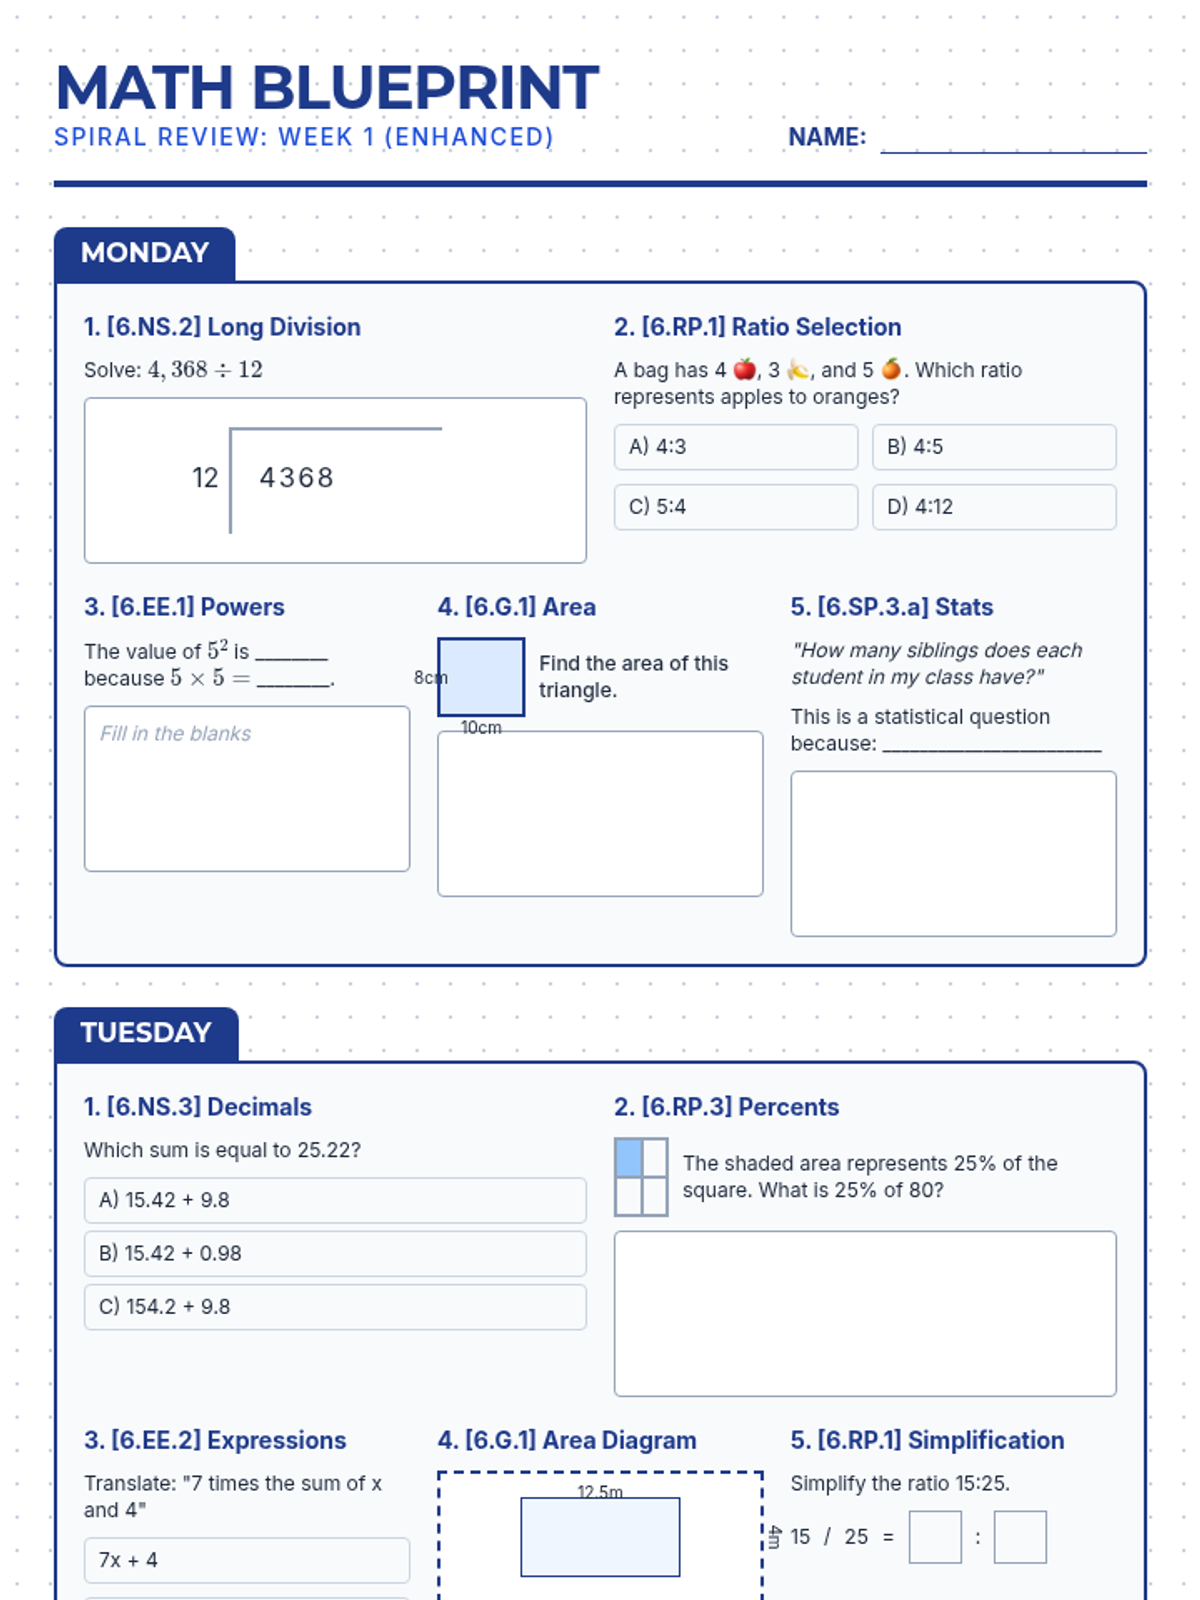
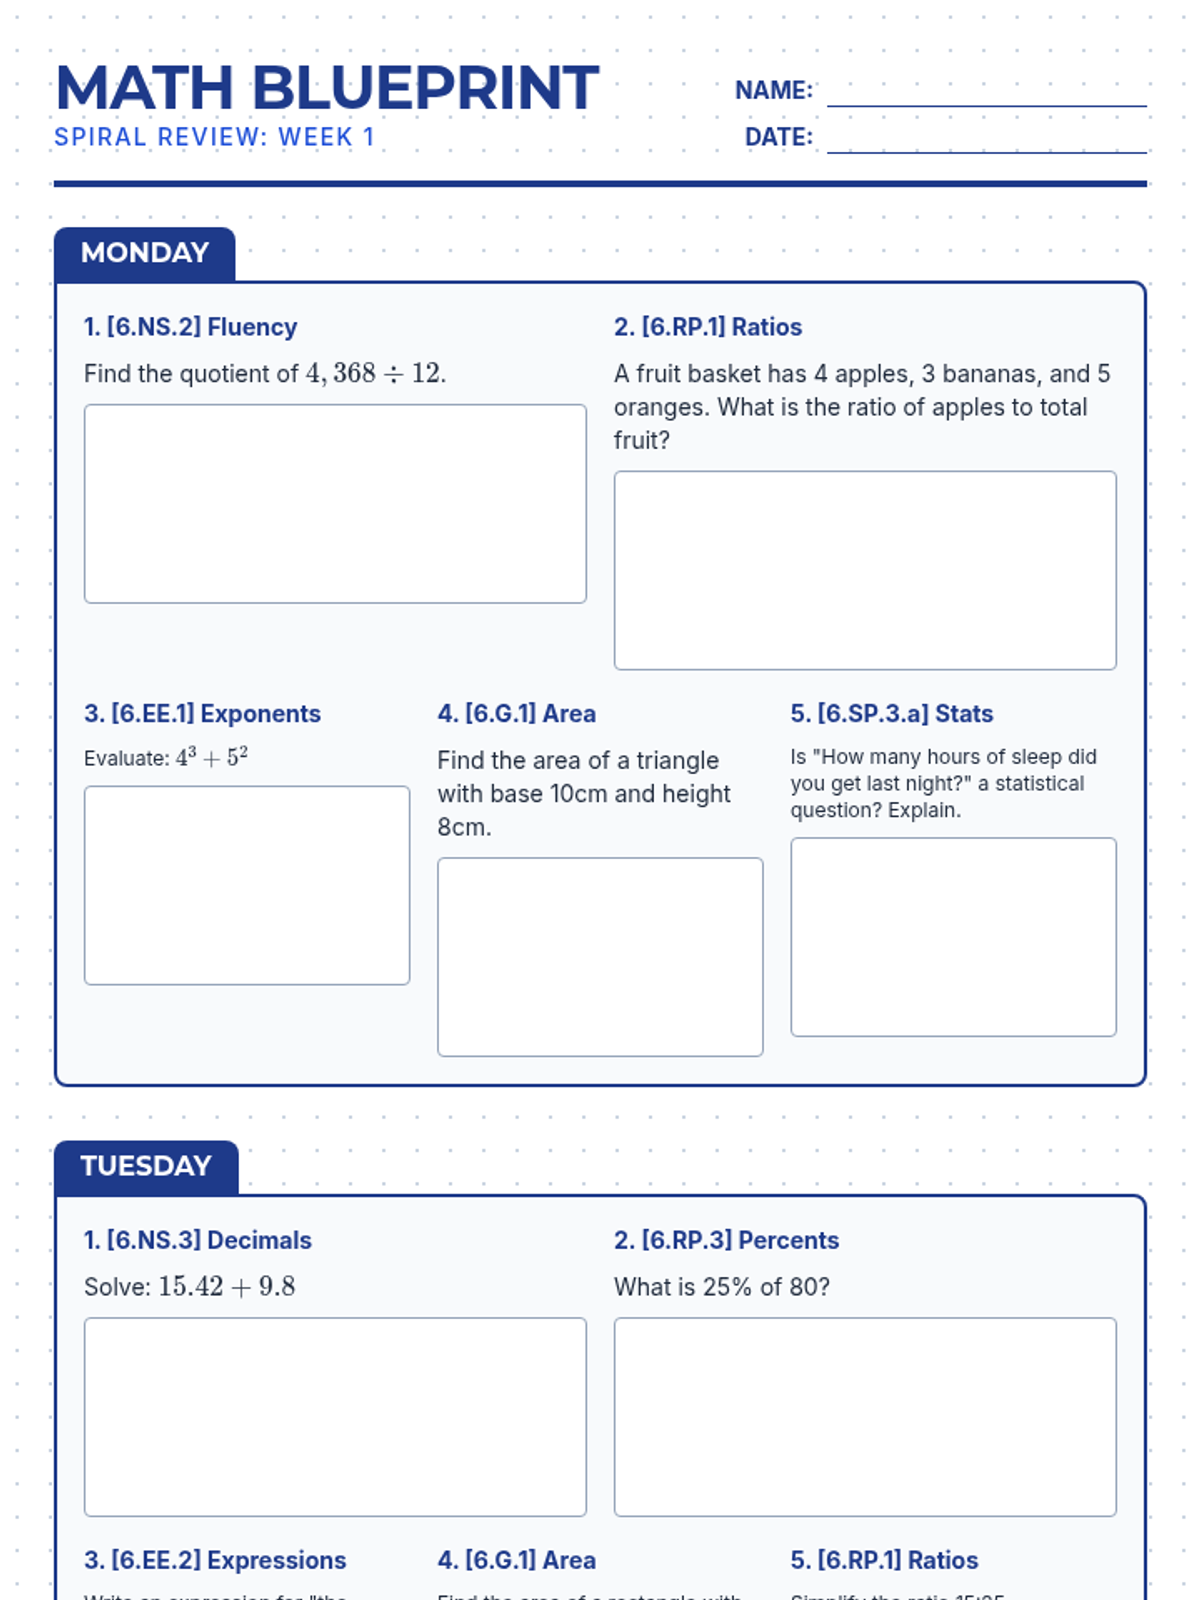
A 7-week comprehensive math review sequence designed to prepare 6th-grade students for the New York State (NYS) Math Assessment, aligned with the Next Generation Learning Standards. Covers Ratios, The Number System, Expressions & Equations, Geometry, and Statistics.
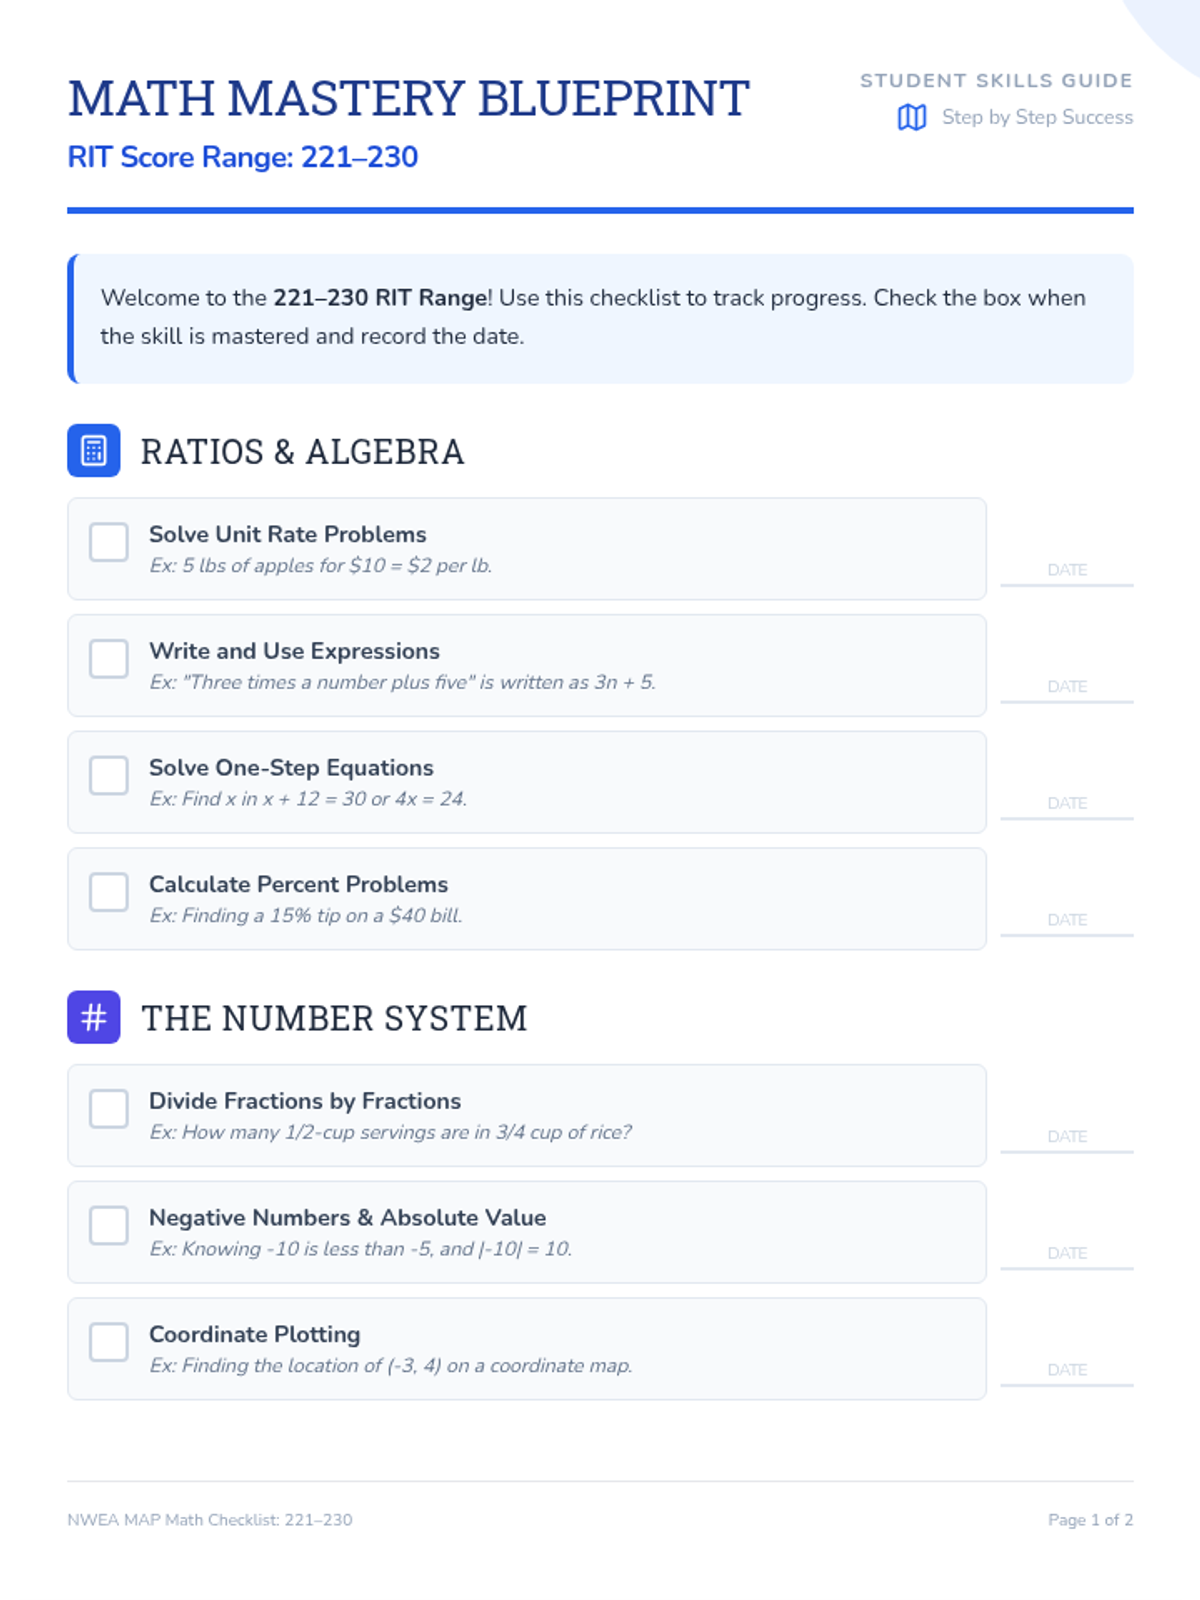
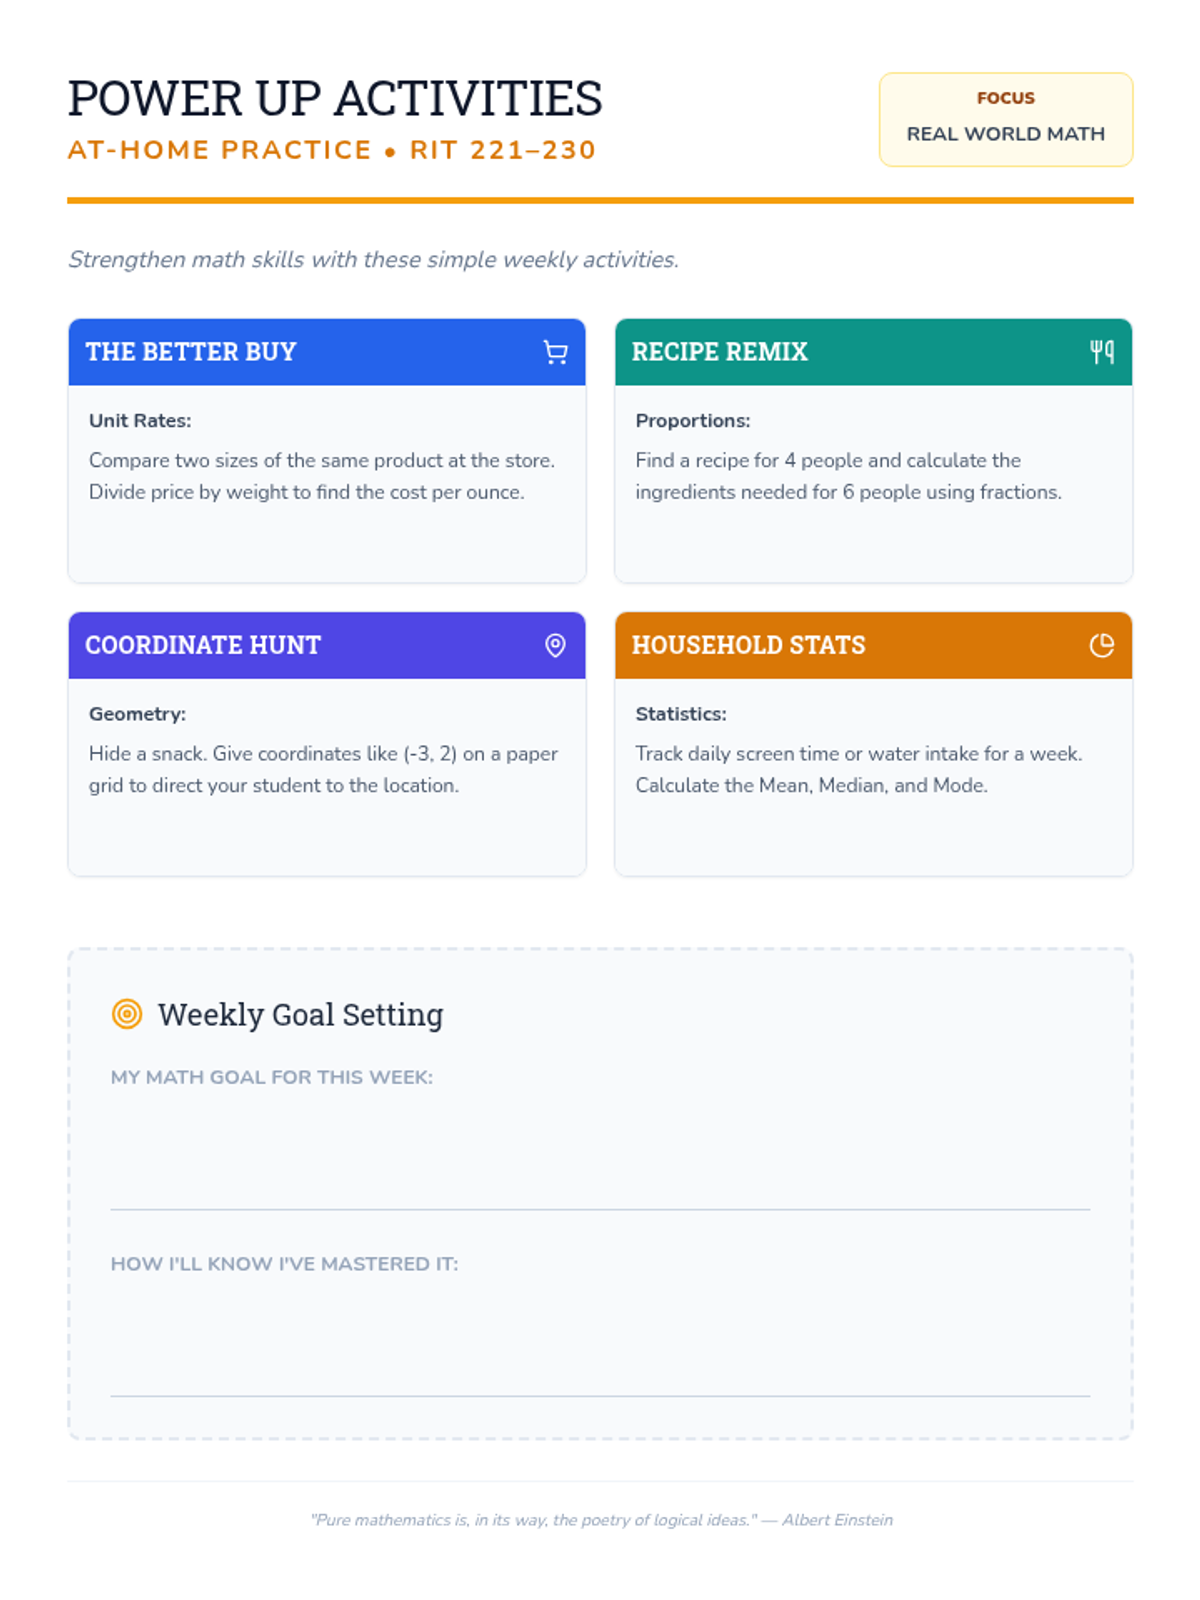
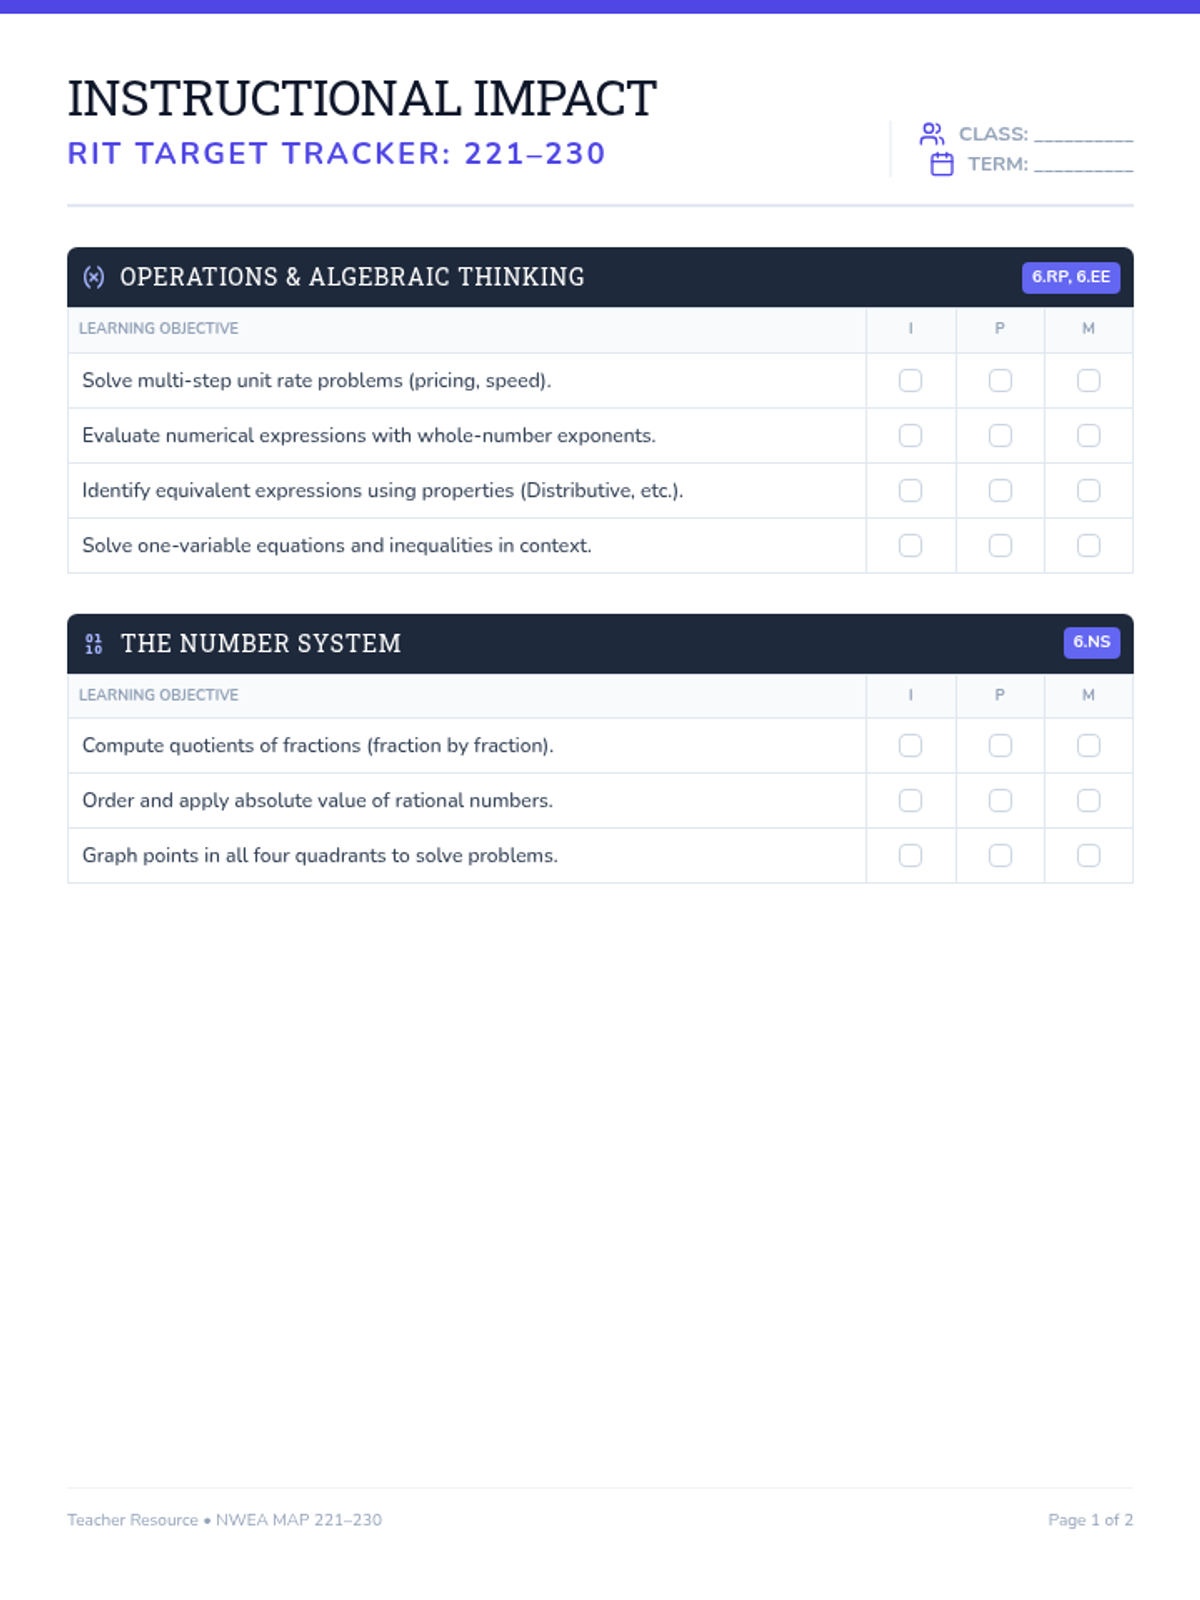
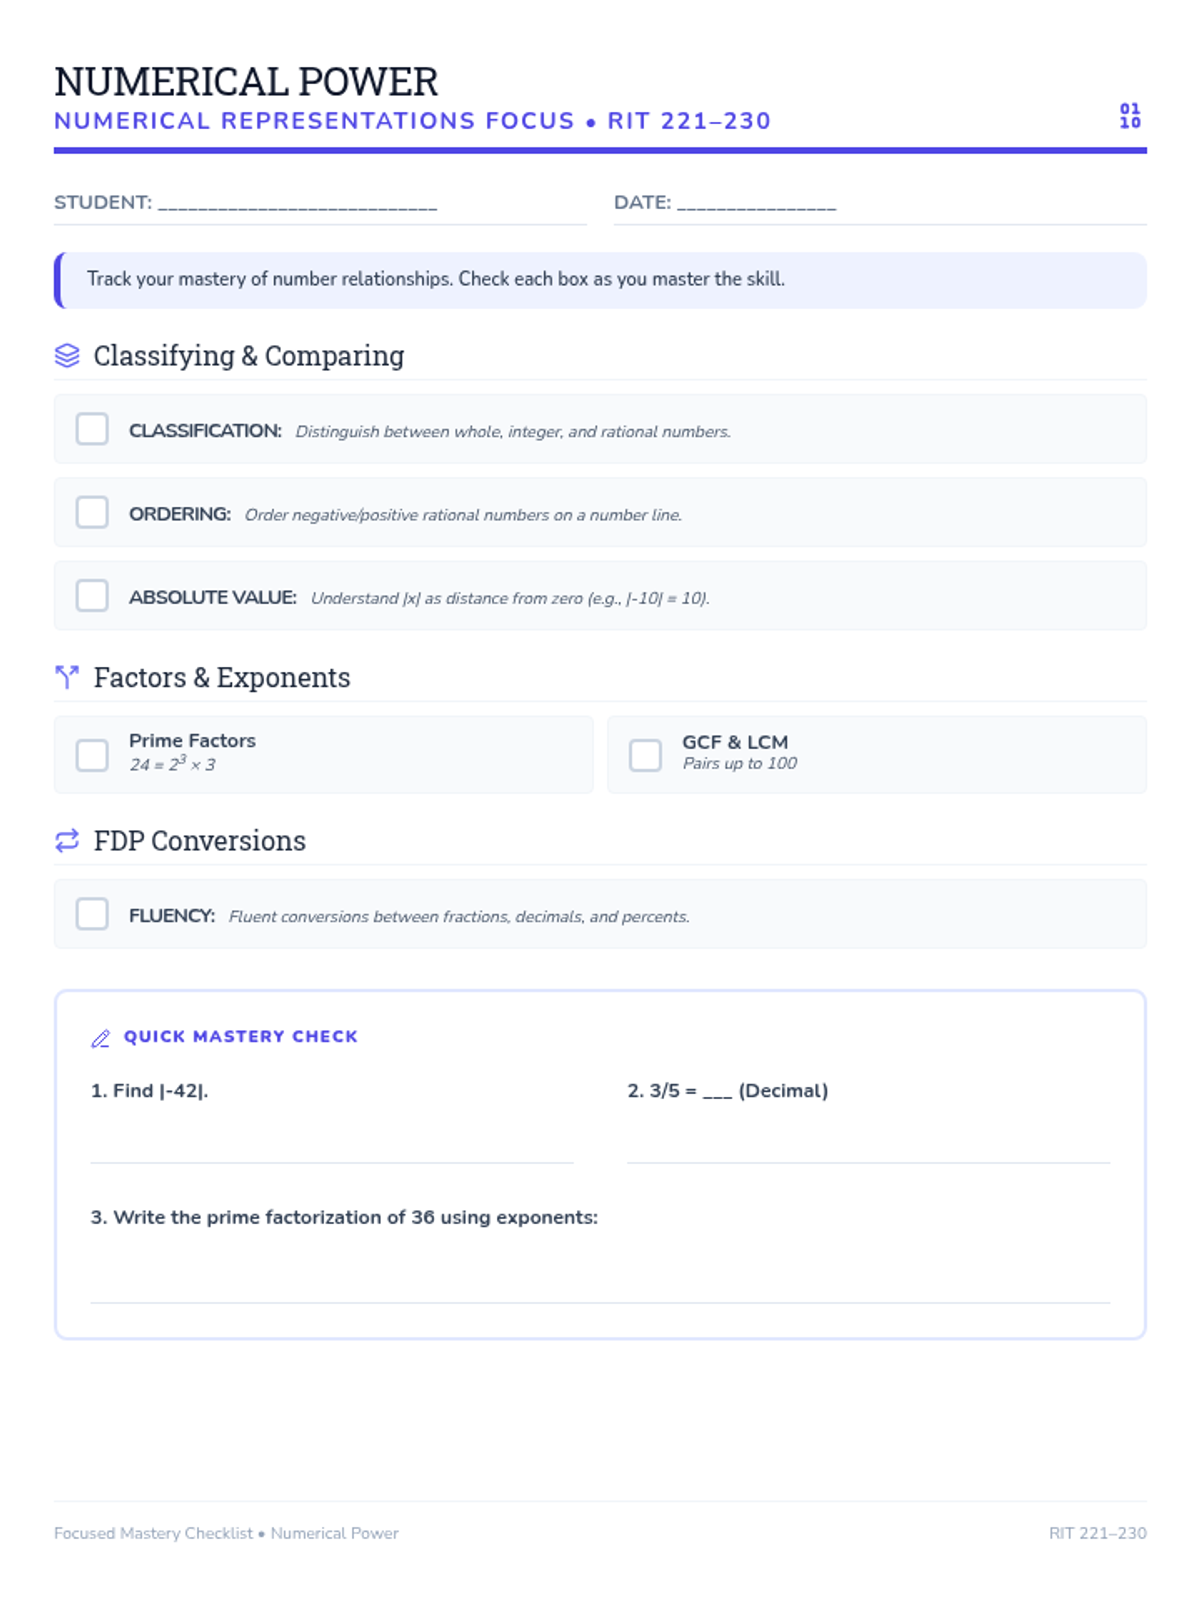
A comprehensive collection of RIT-aligned math mastery resources for student and teacher tracking across key mathematical development ranges.
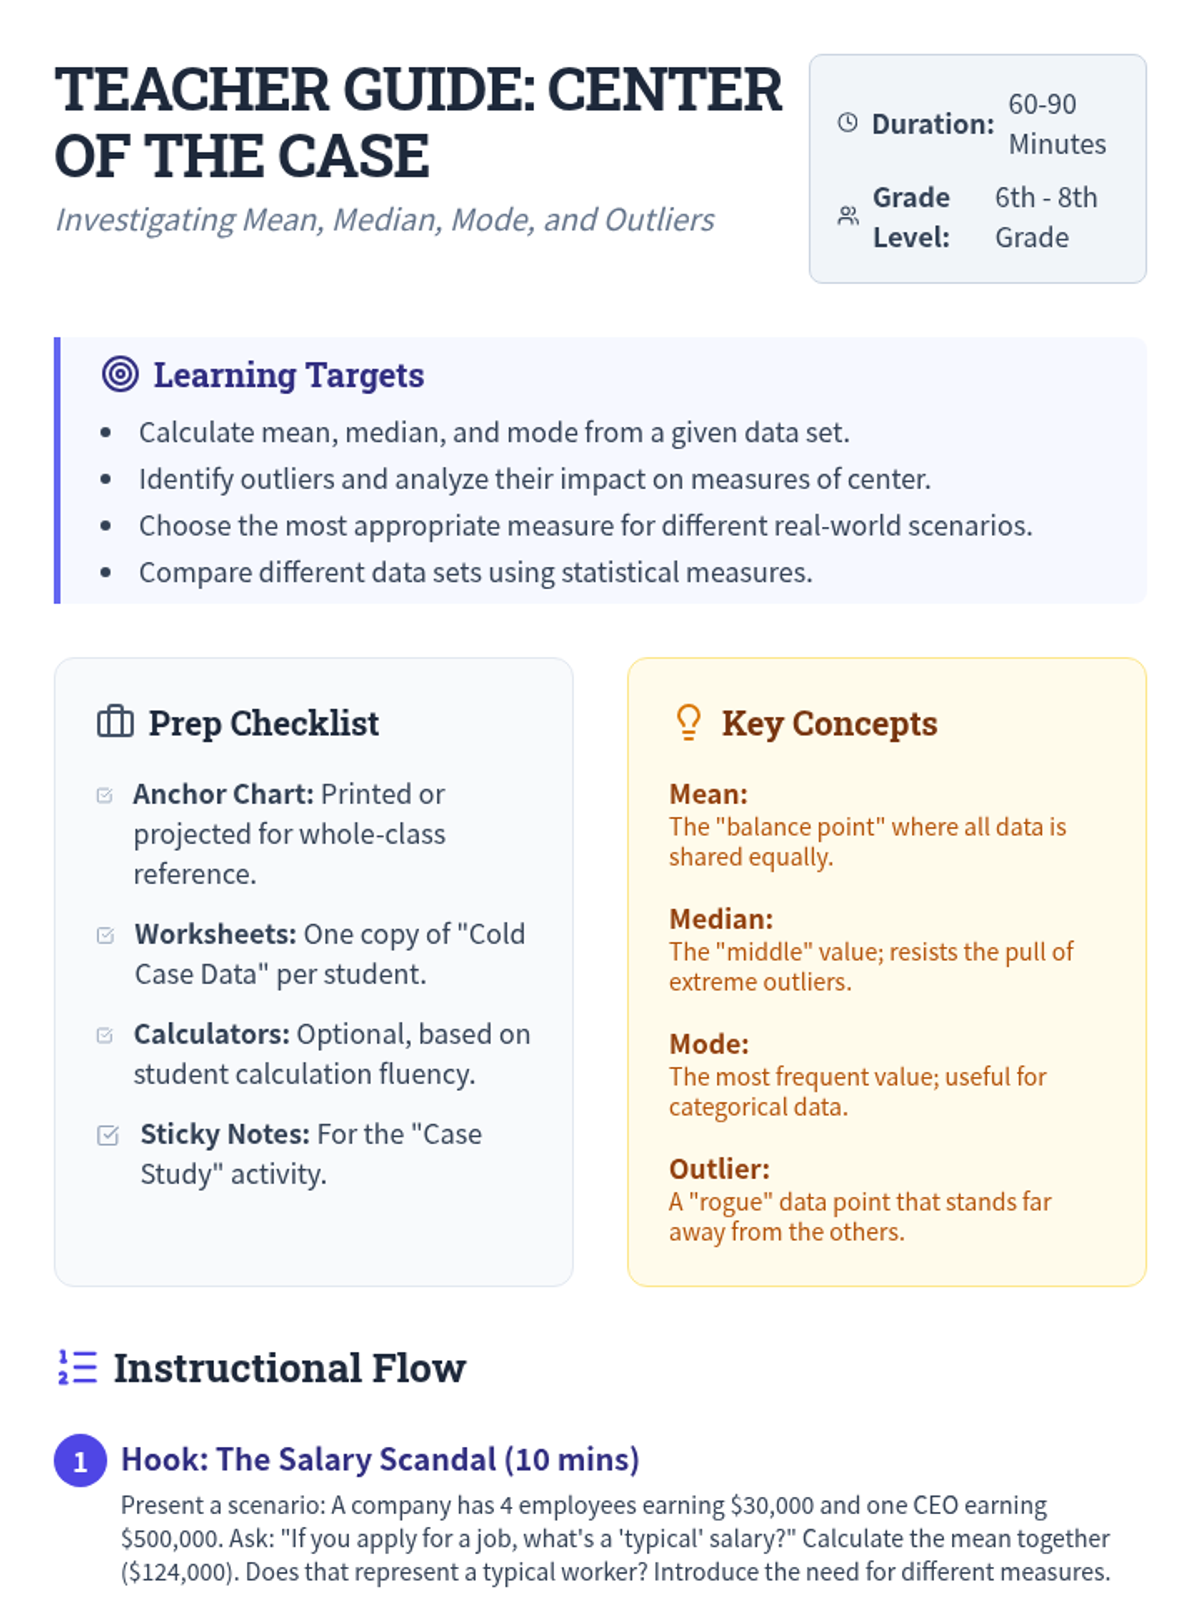
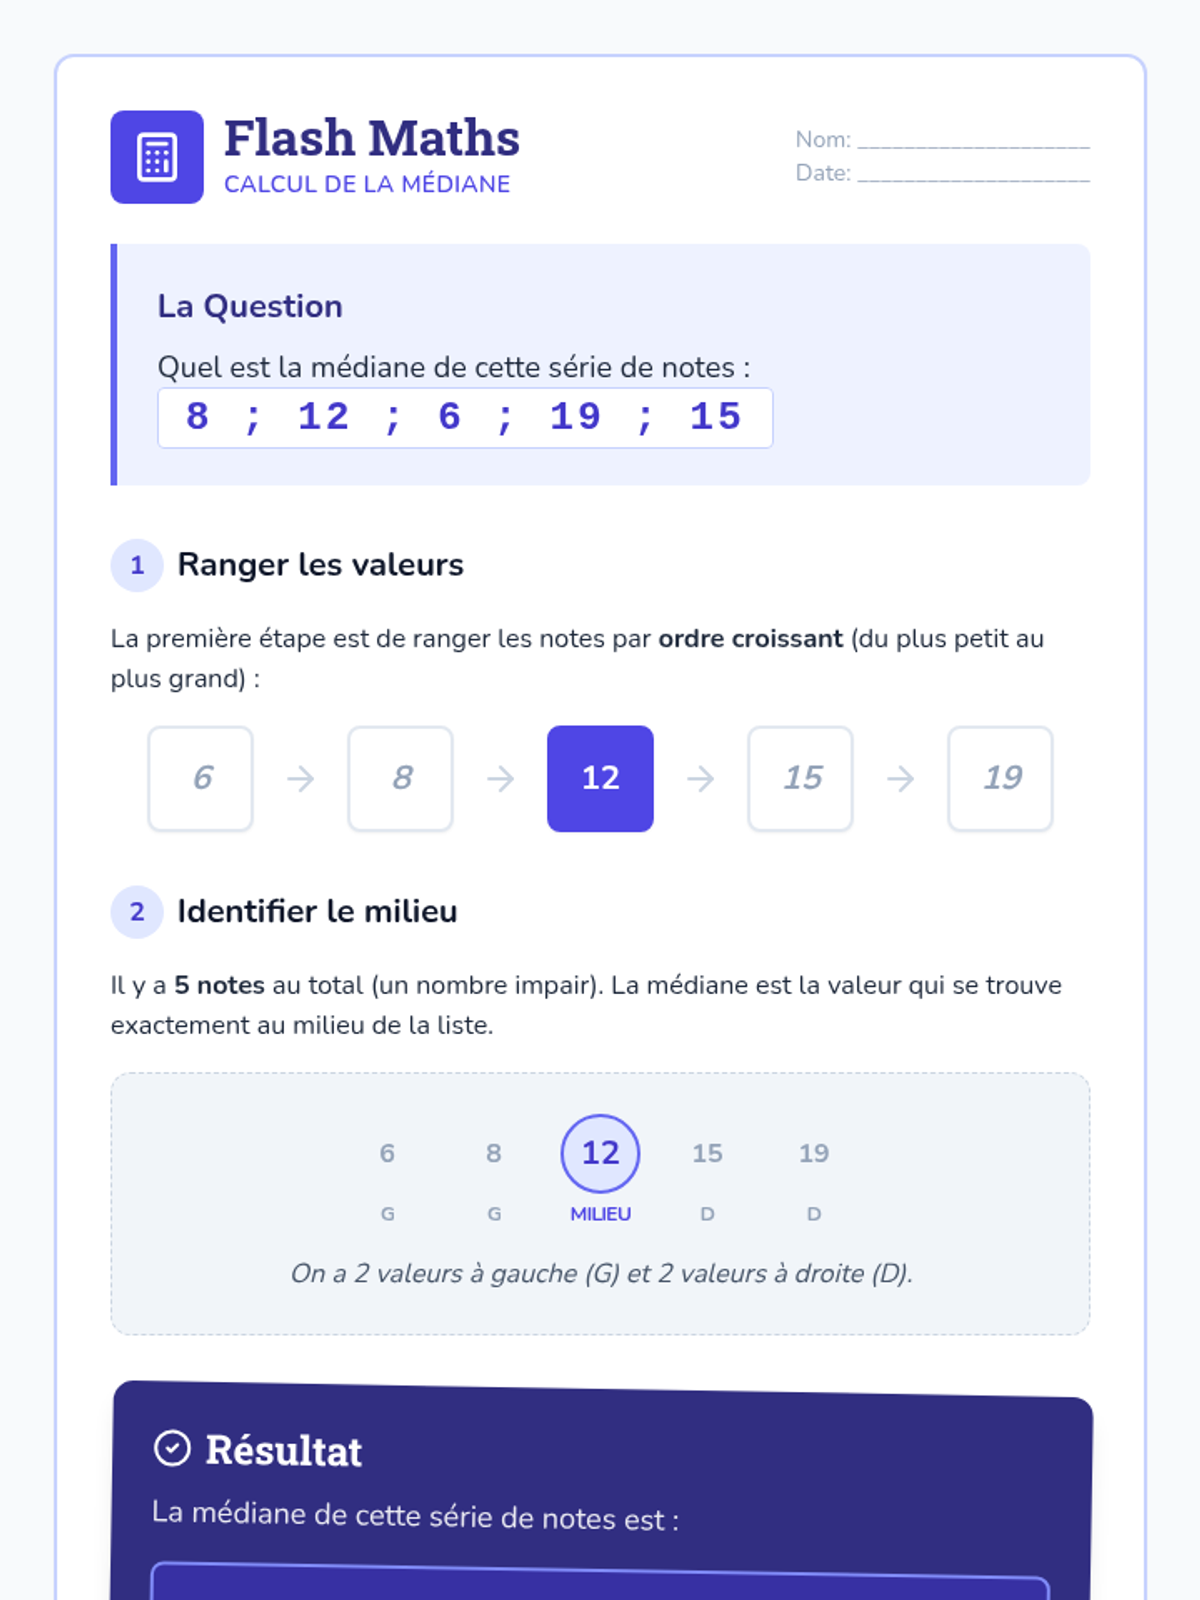
A comprehensive progression through descriptive statistics, from foundational calculations to high-school level analytical applications, including outlier effects and algebraic problem-solving.
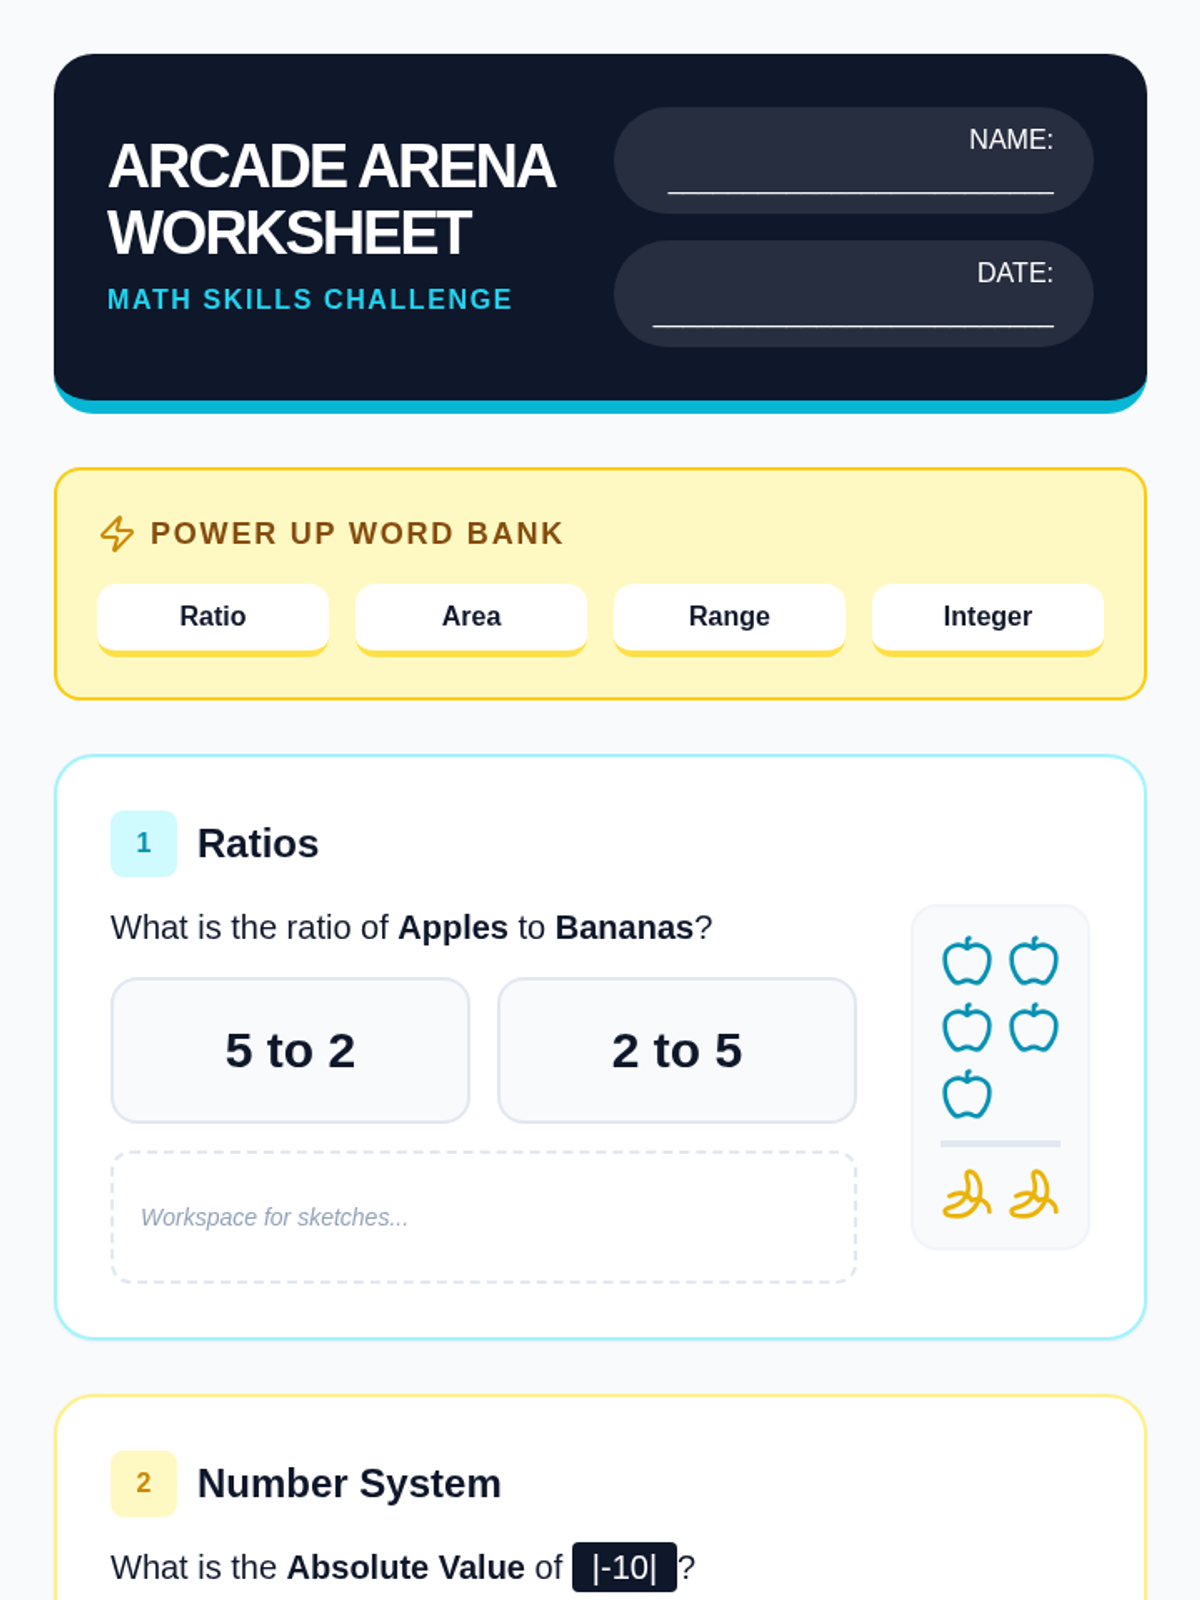
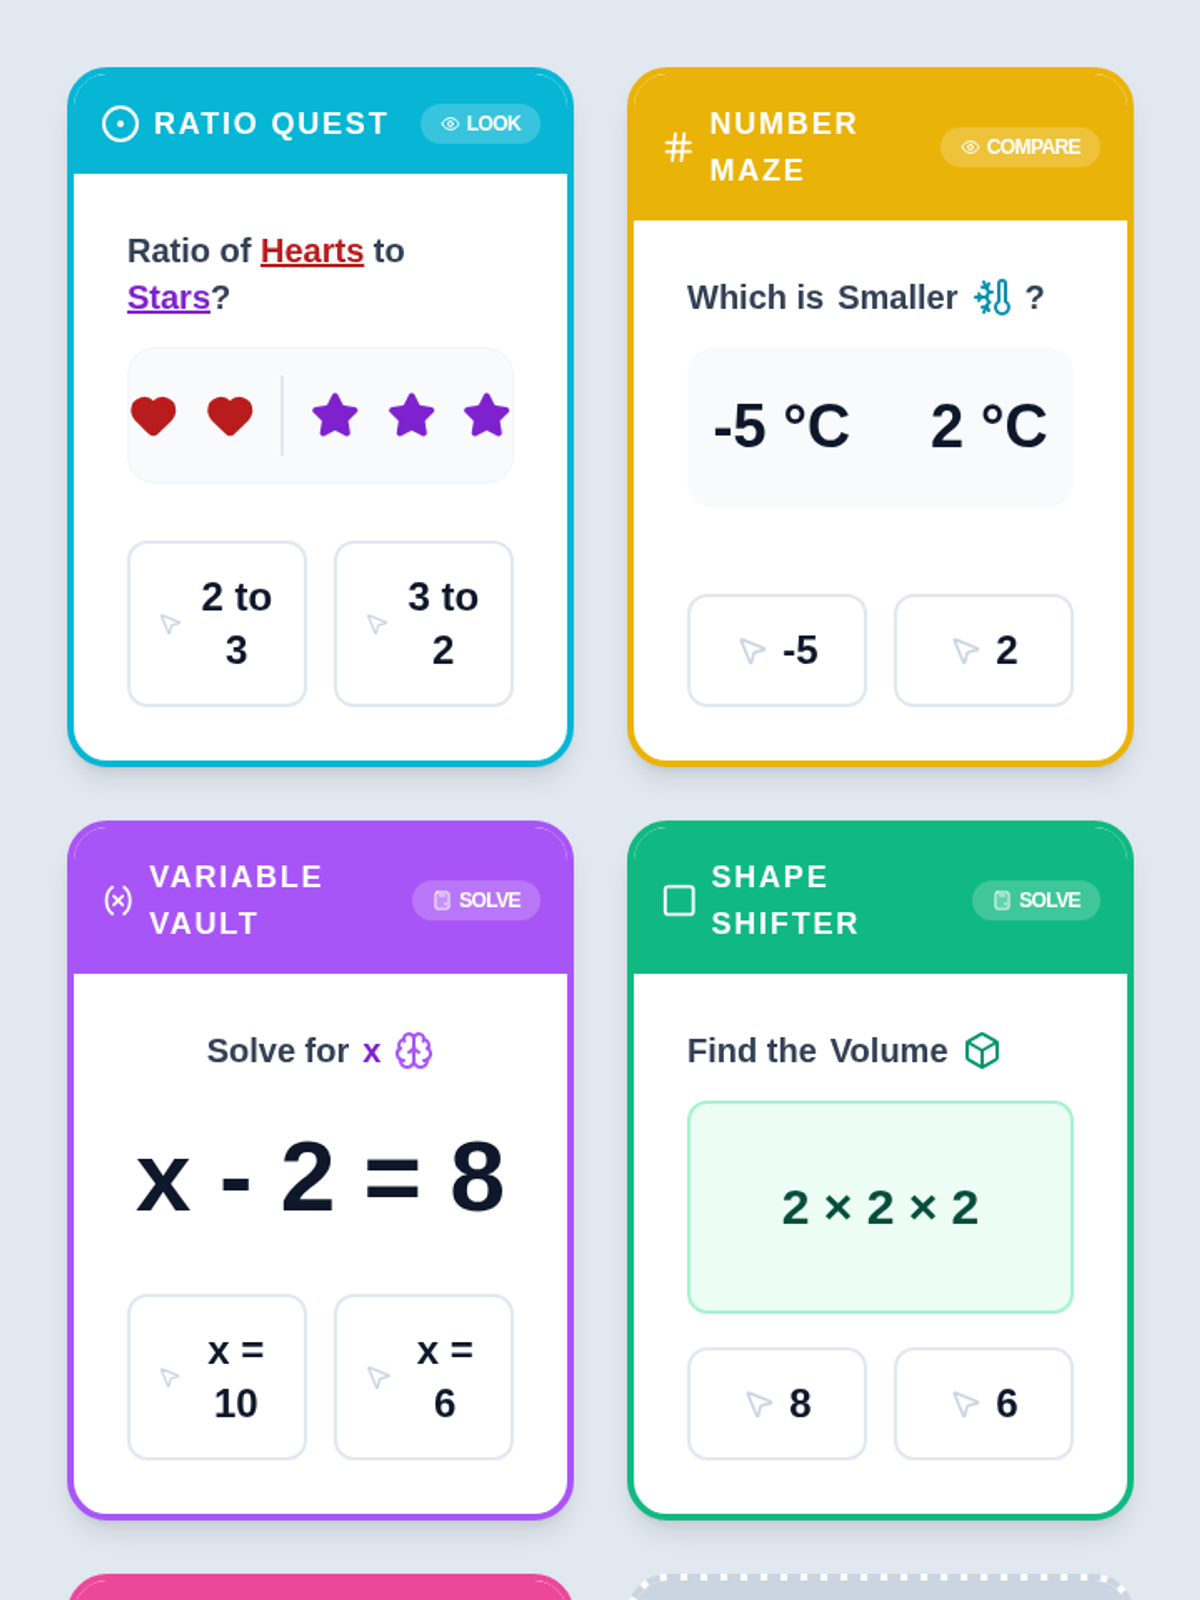
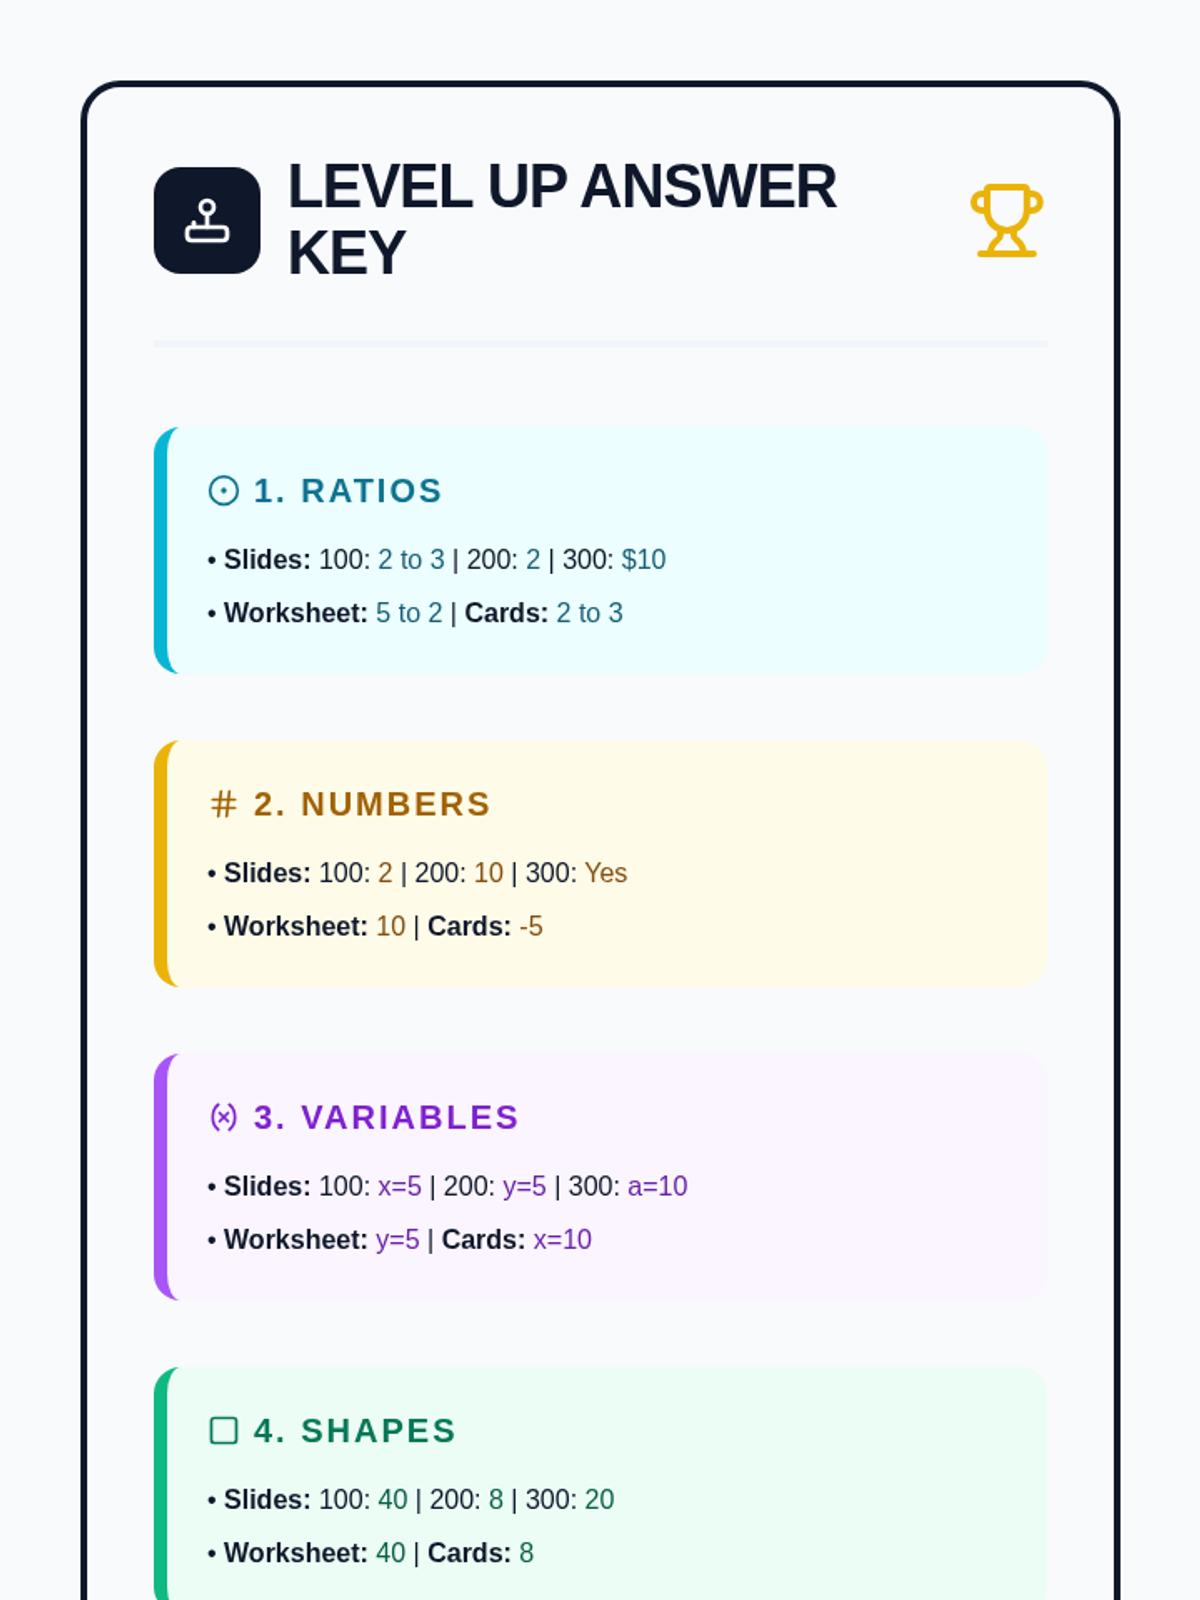
A comprehensive math review sequence designed for students with IEPs, featuring simplified numbers, visual aids, and a gamified arcade theme. Covers Ratios, The Number System, Expressions, Geometry, and Statistics through interactive slides and printable activities.
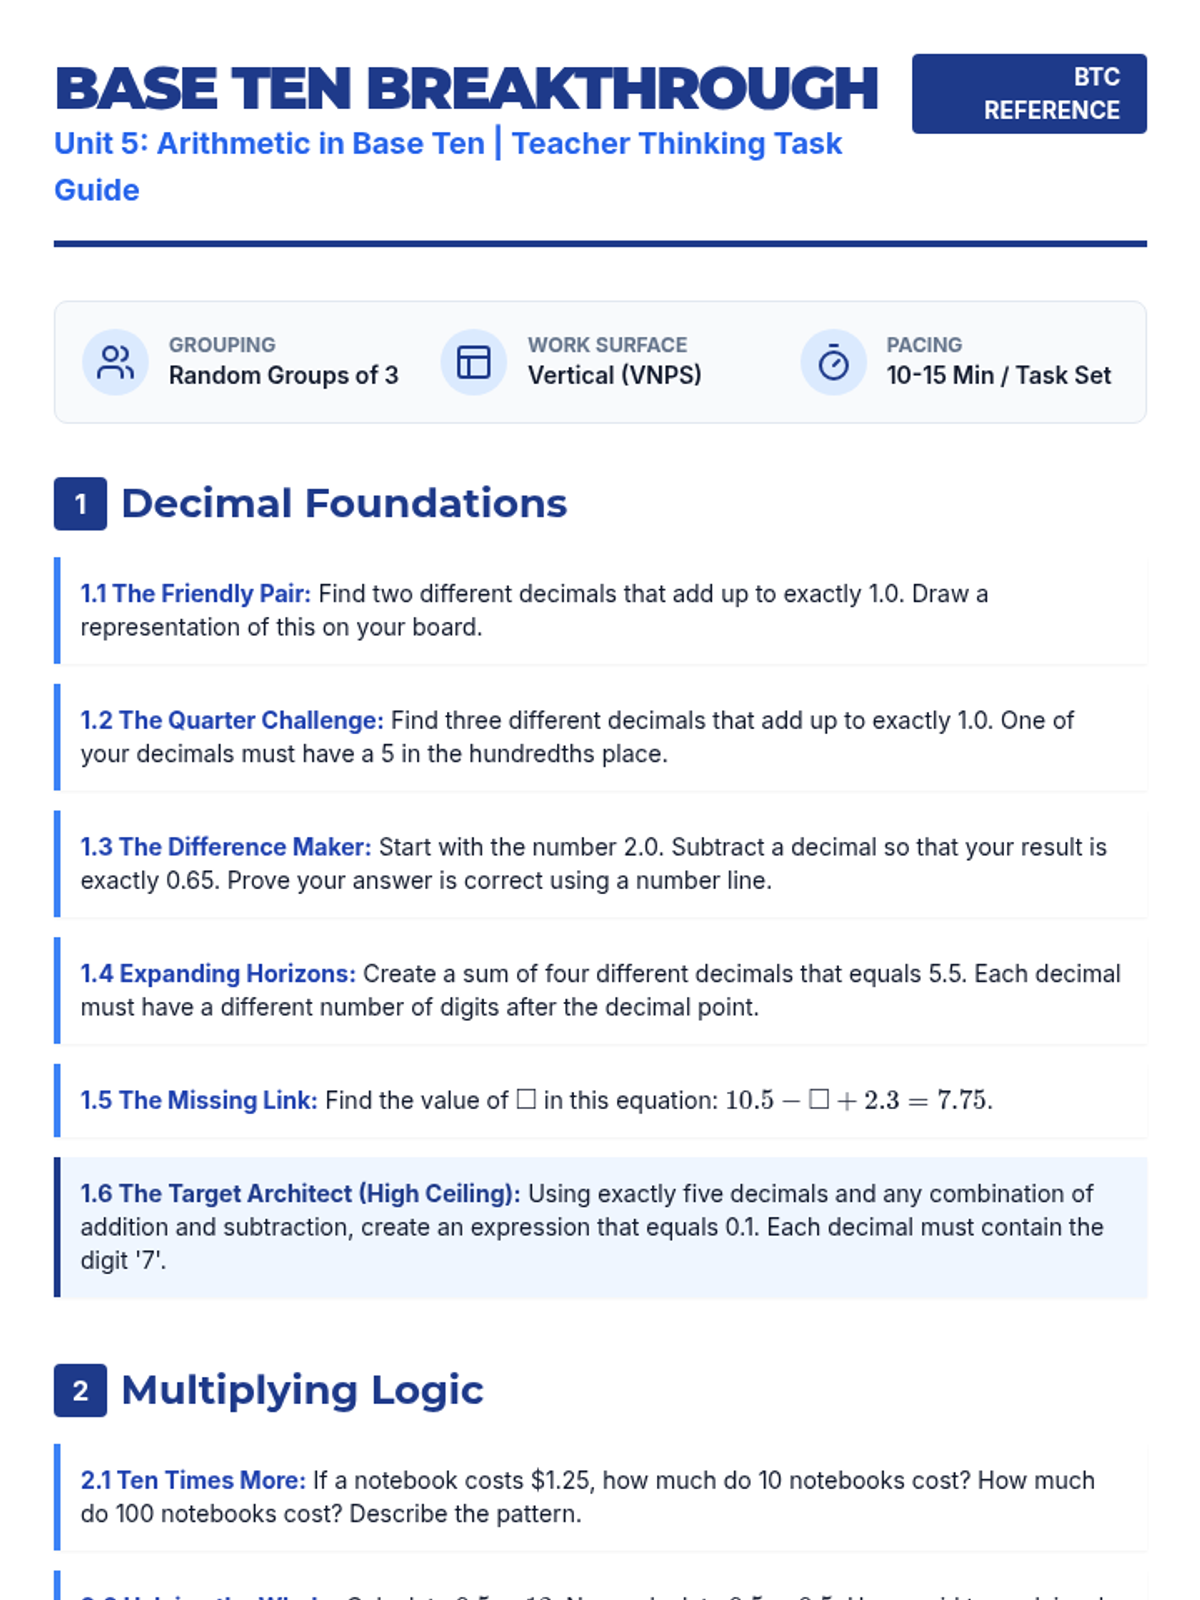
A comprehensive collection of "Building Thinking Classrooms" (BTC) tasks for Grade 6 Mathematics, Units 5-8. Each unit contains thin-sliced, low-floor high-ceiling tasks designed for collaborative problem-solving on vertical surfaces.
A 7-week comprehensive math review sequence designed to prepare 6th-grade students for North Carolina state testing, covering Number Systems, Ratios, Expressions, Geometry, and Statistics.
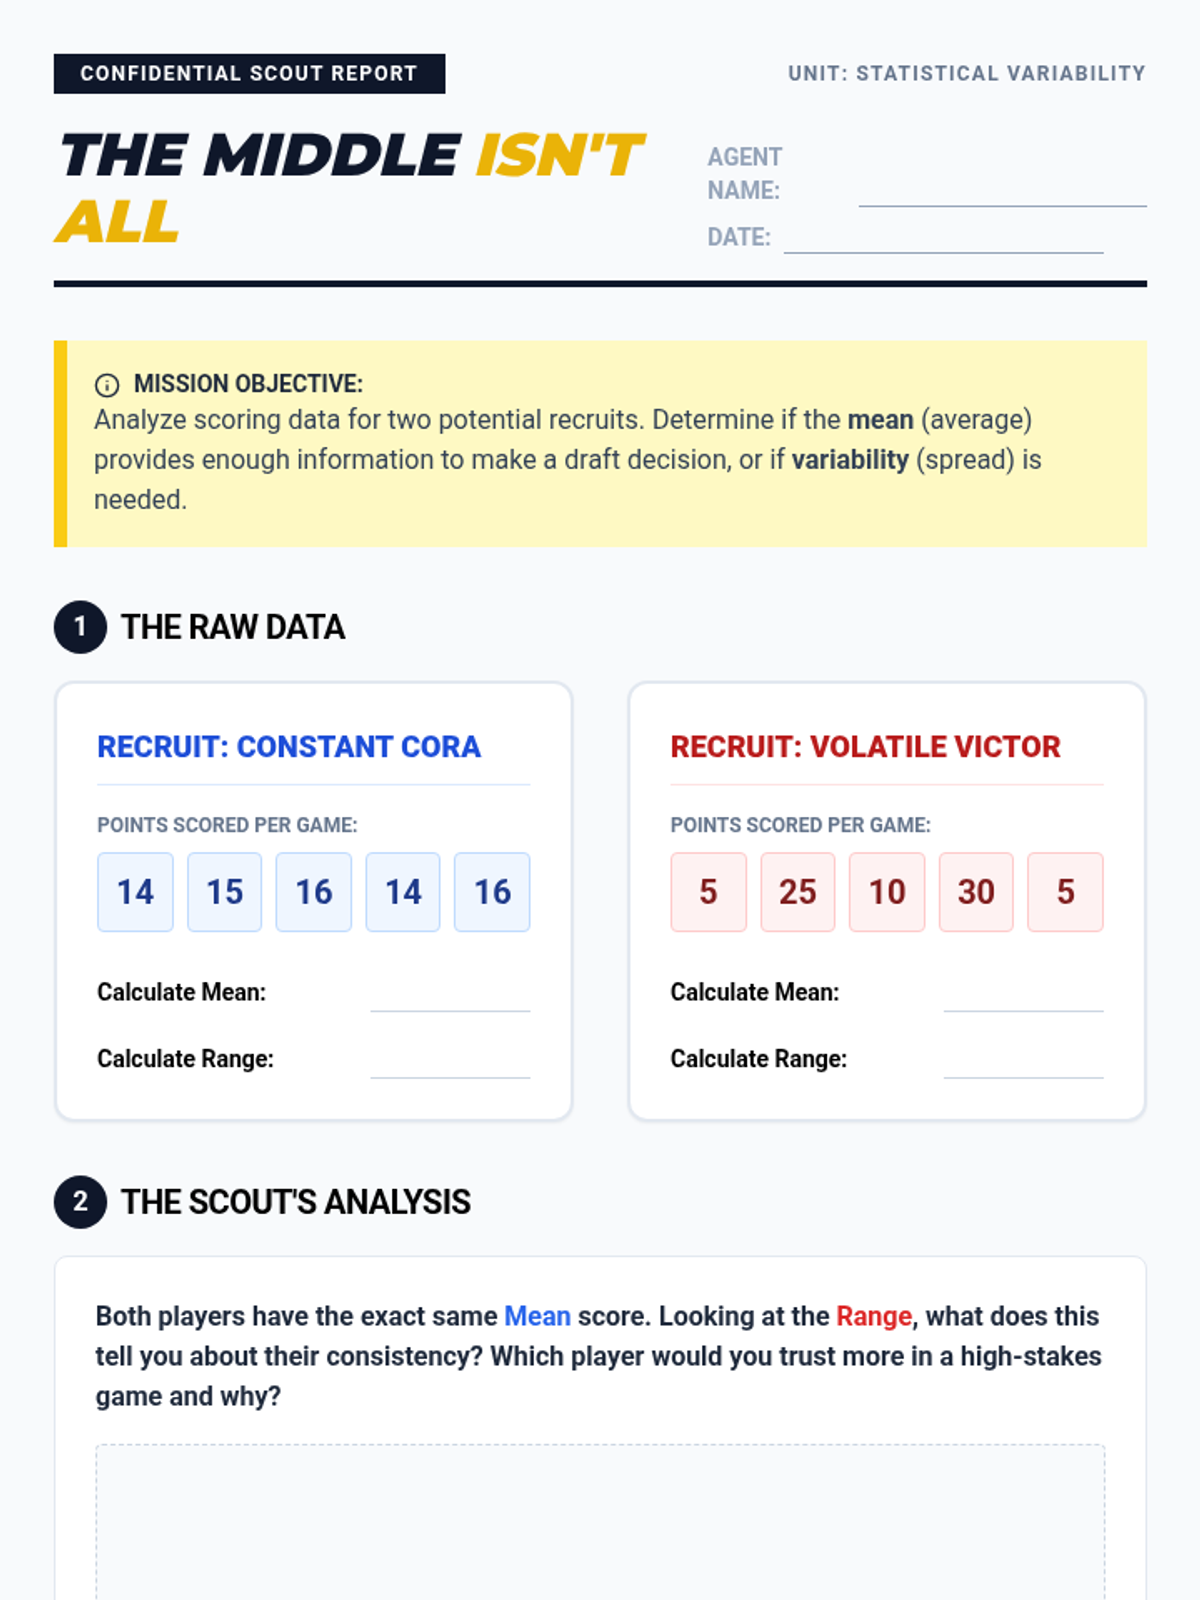
A unit focused on statistics and data analysis, teaching students how to interpret, compare, and draw conclusions from various data sets.
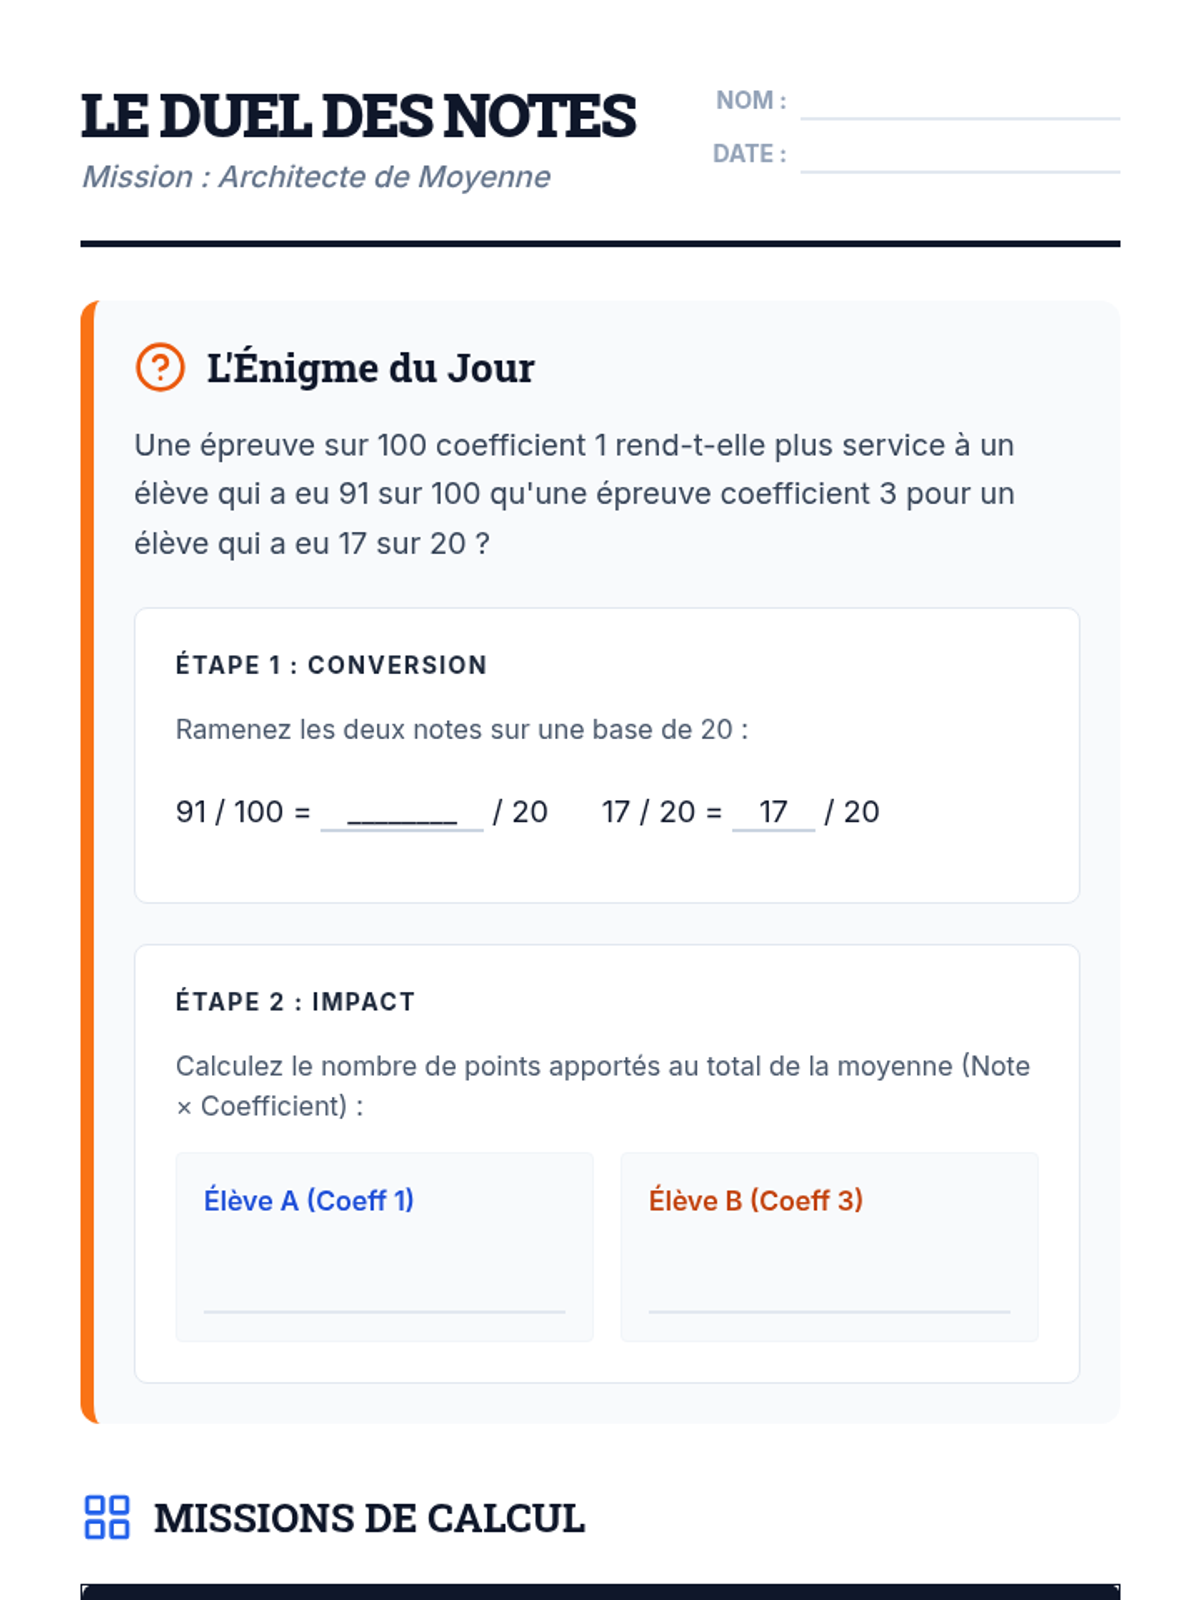
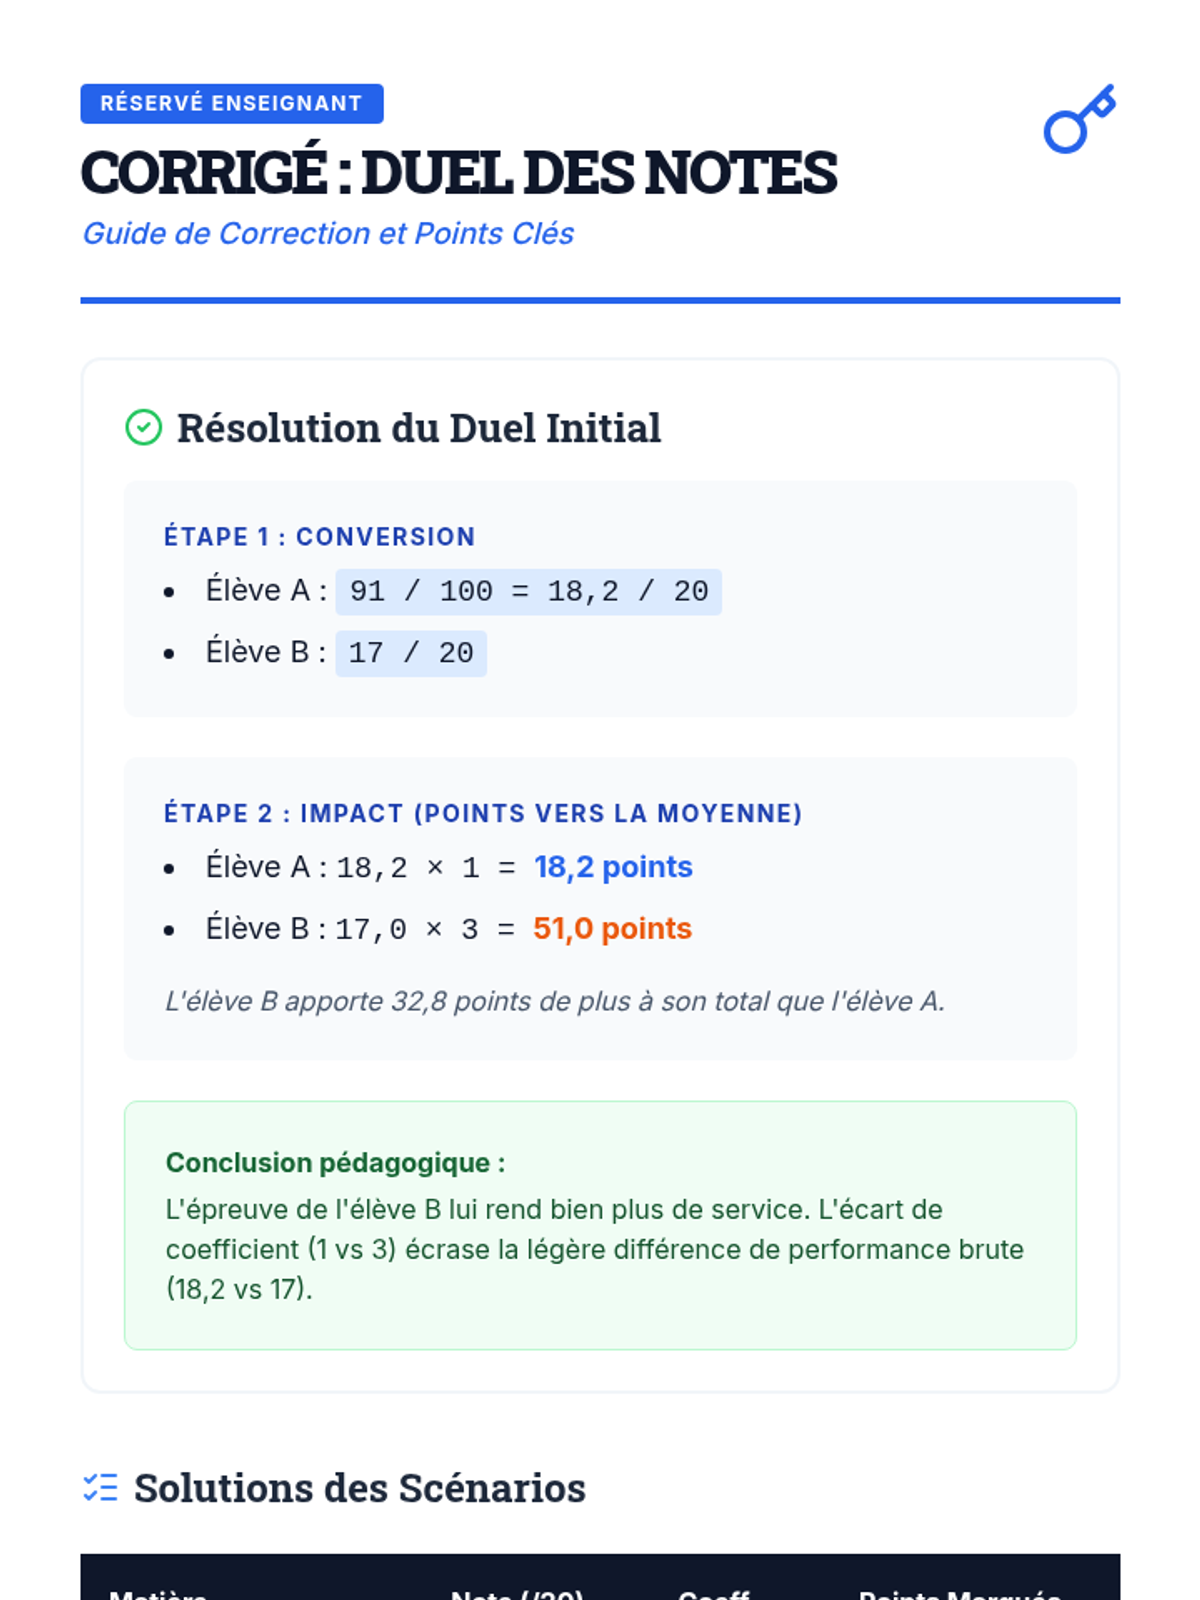
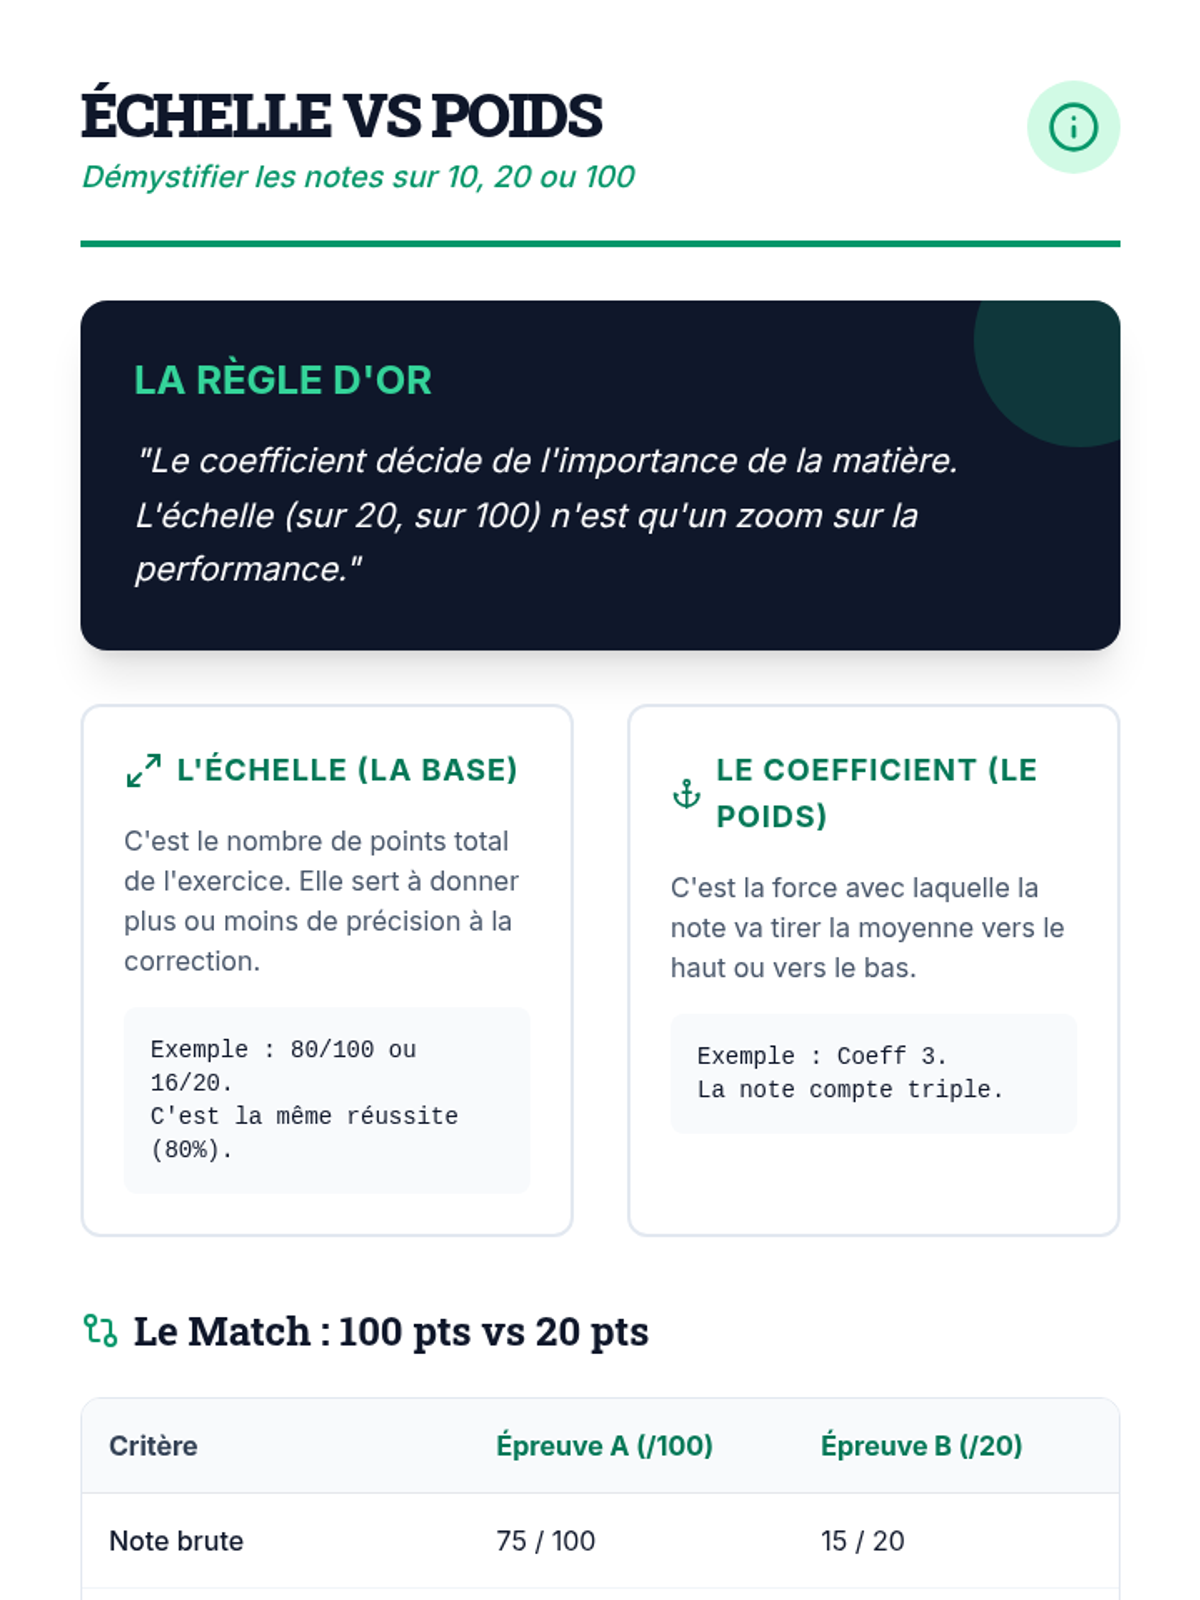
Une exploration mathématique de l'impact des coefficients sur les moyennes, utilisant des cas pratiques concrets pour comprendre la pondération et les moyennes pondérées.
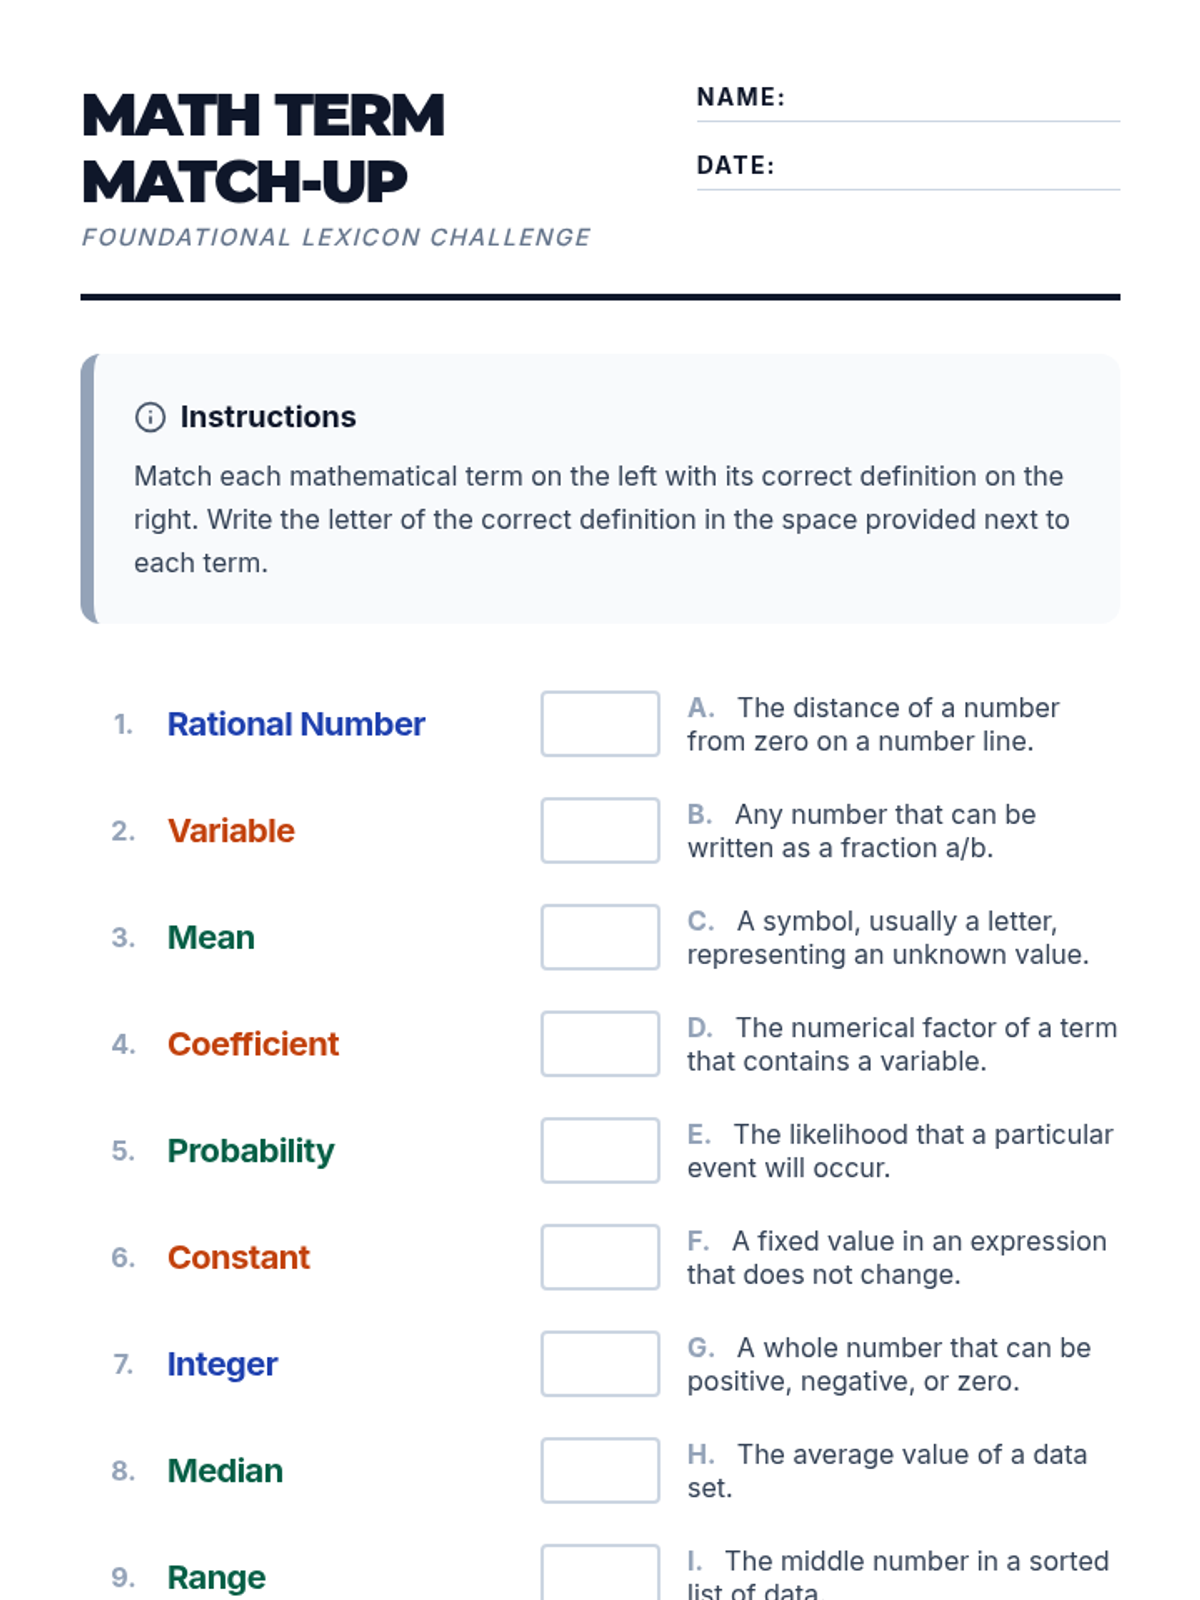
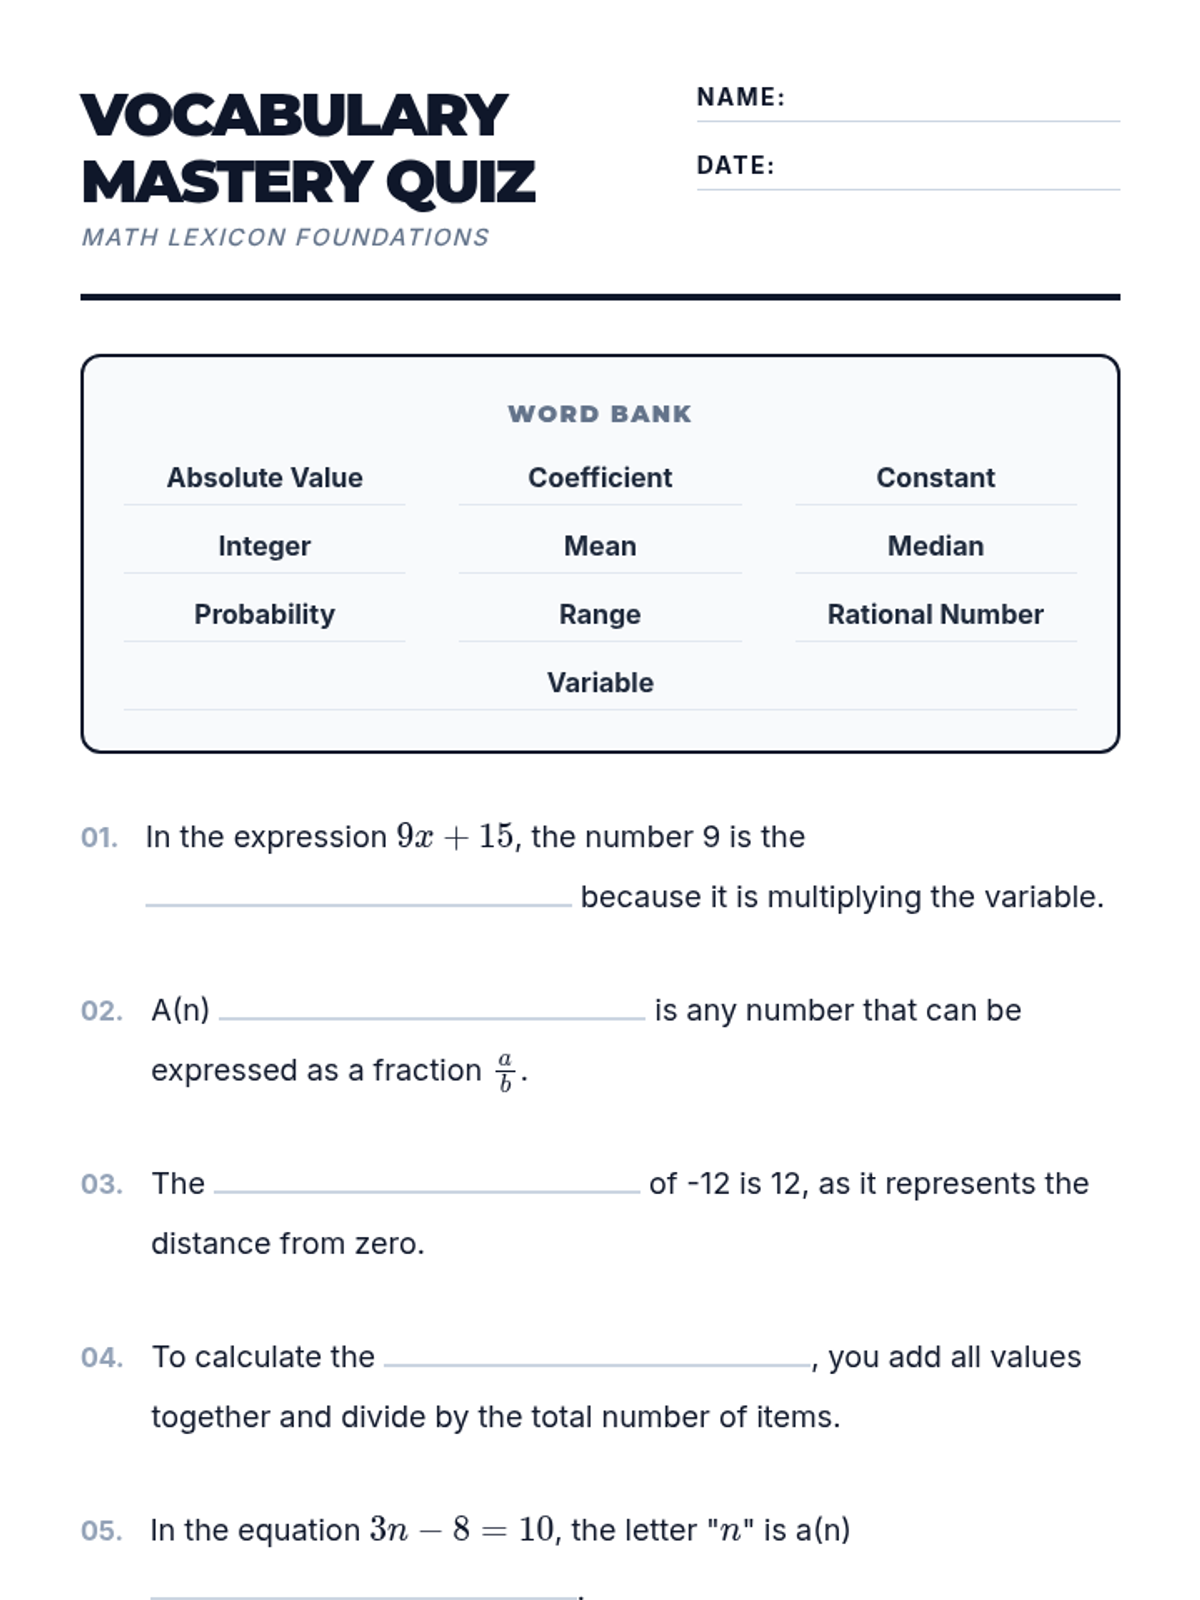
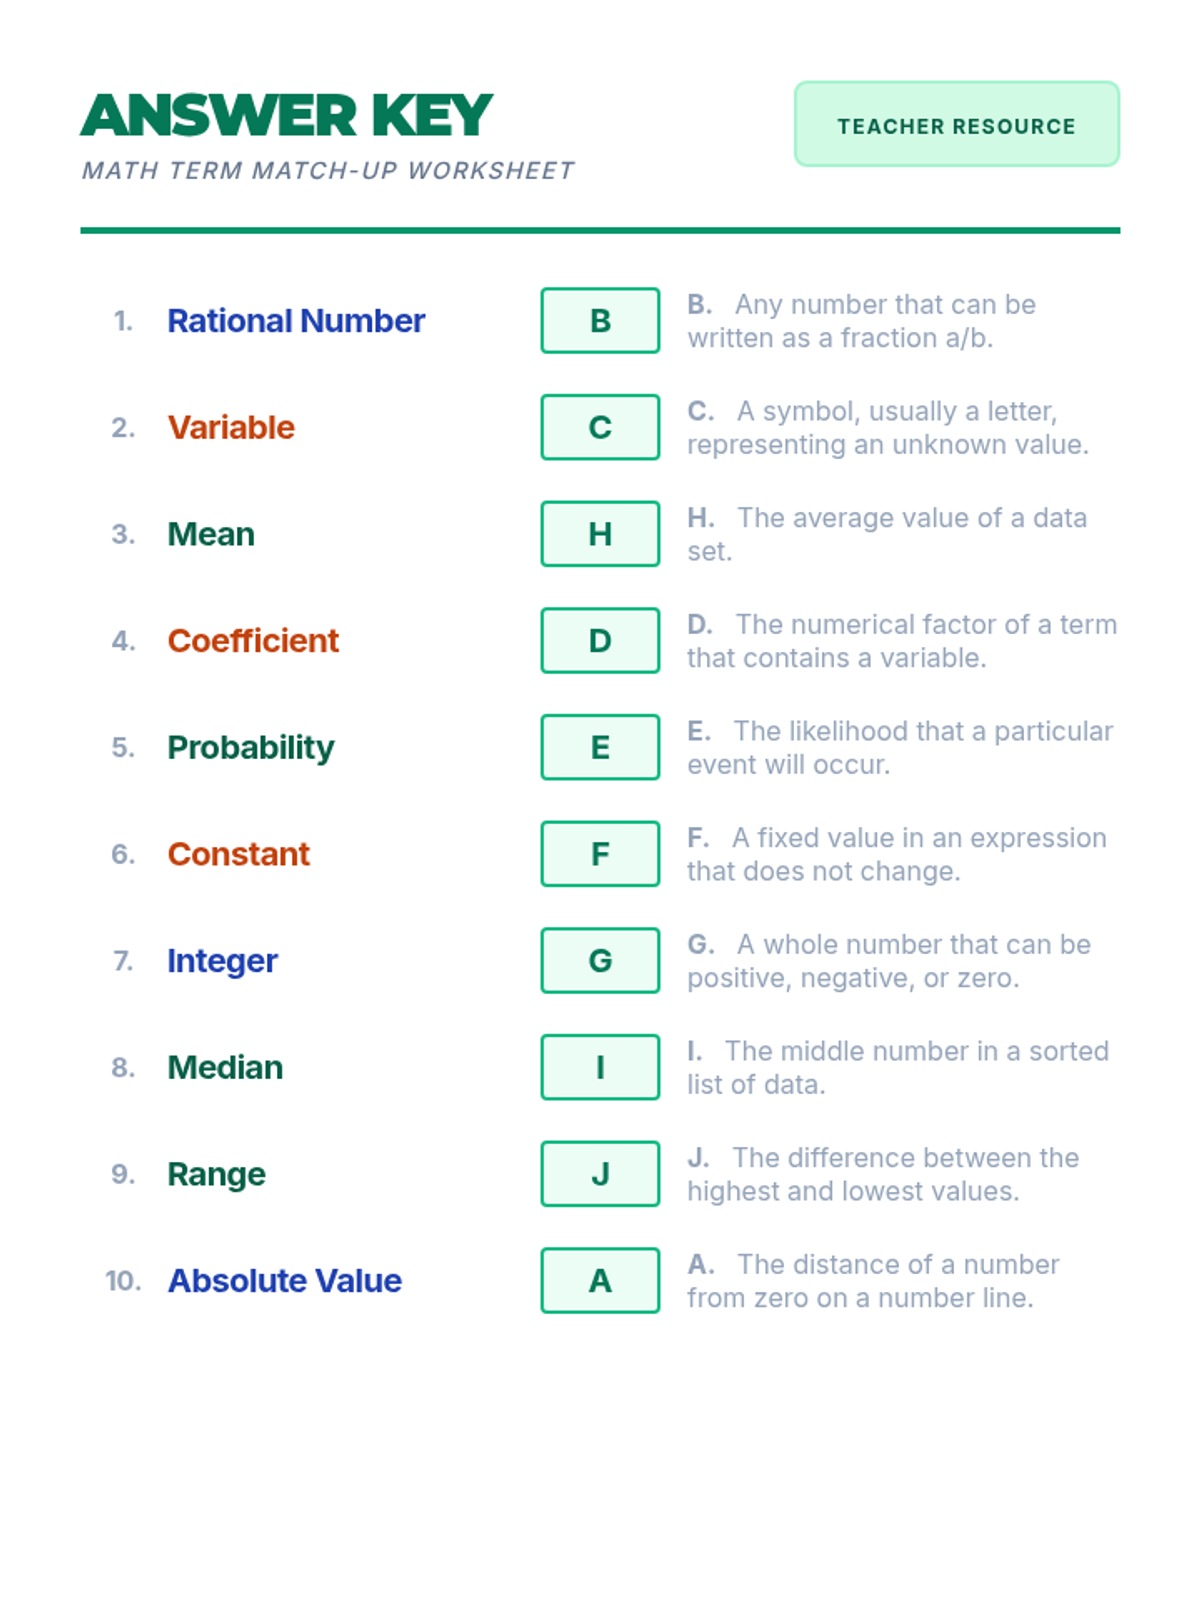
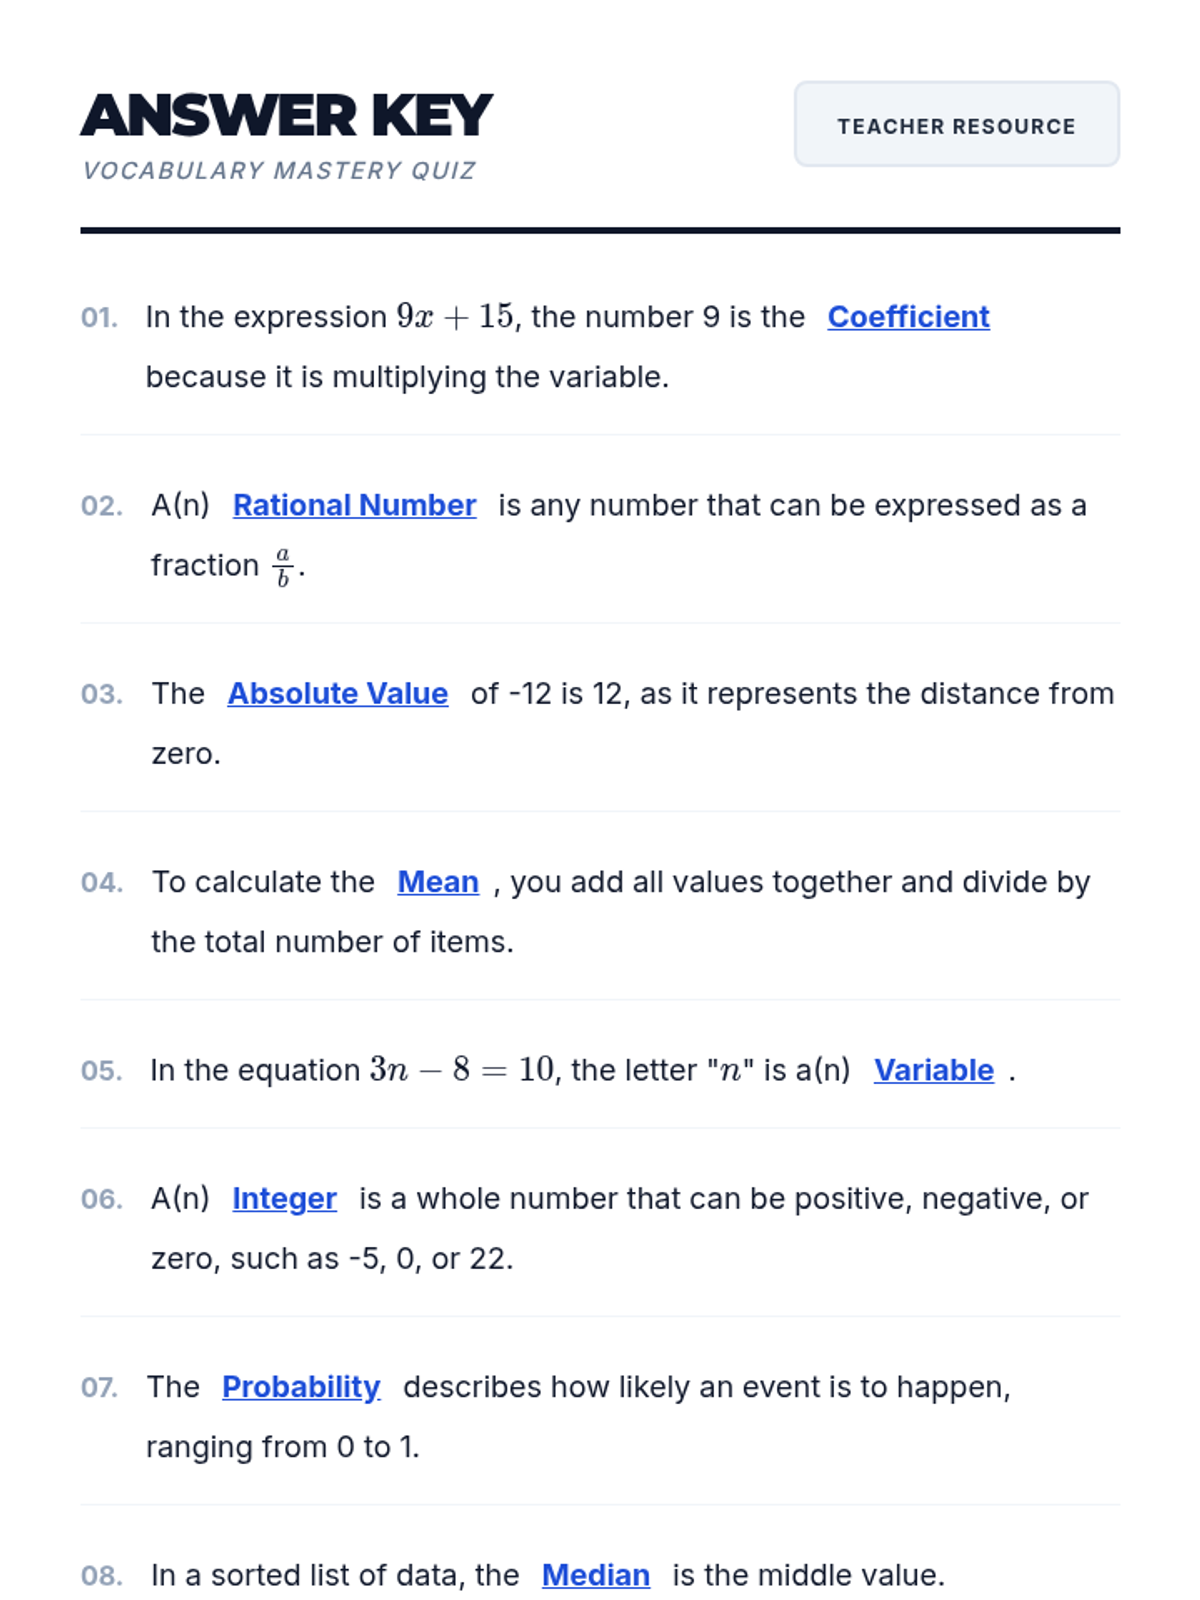
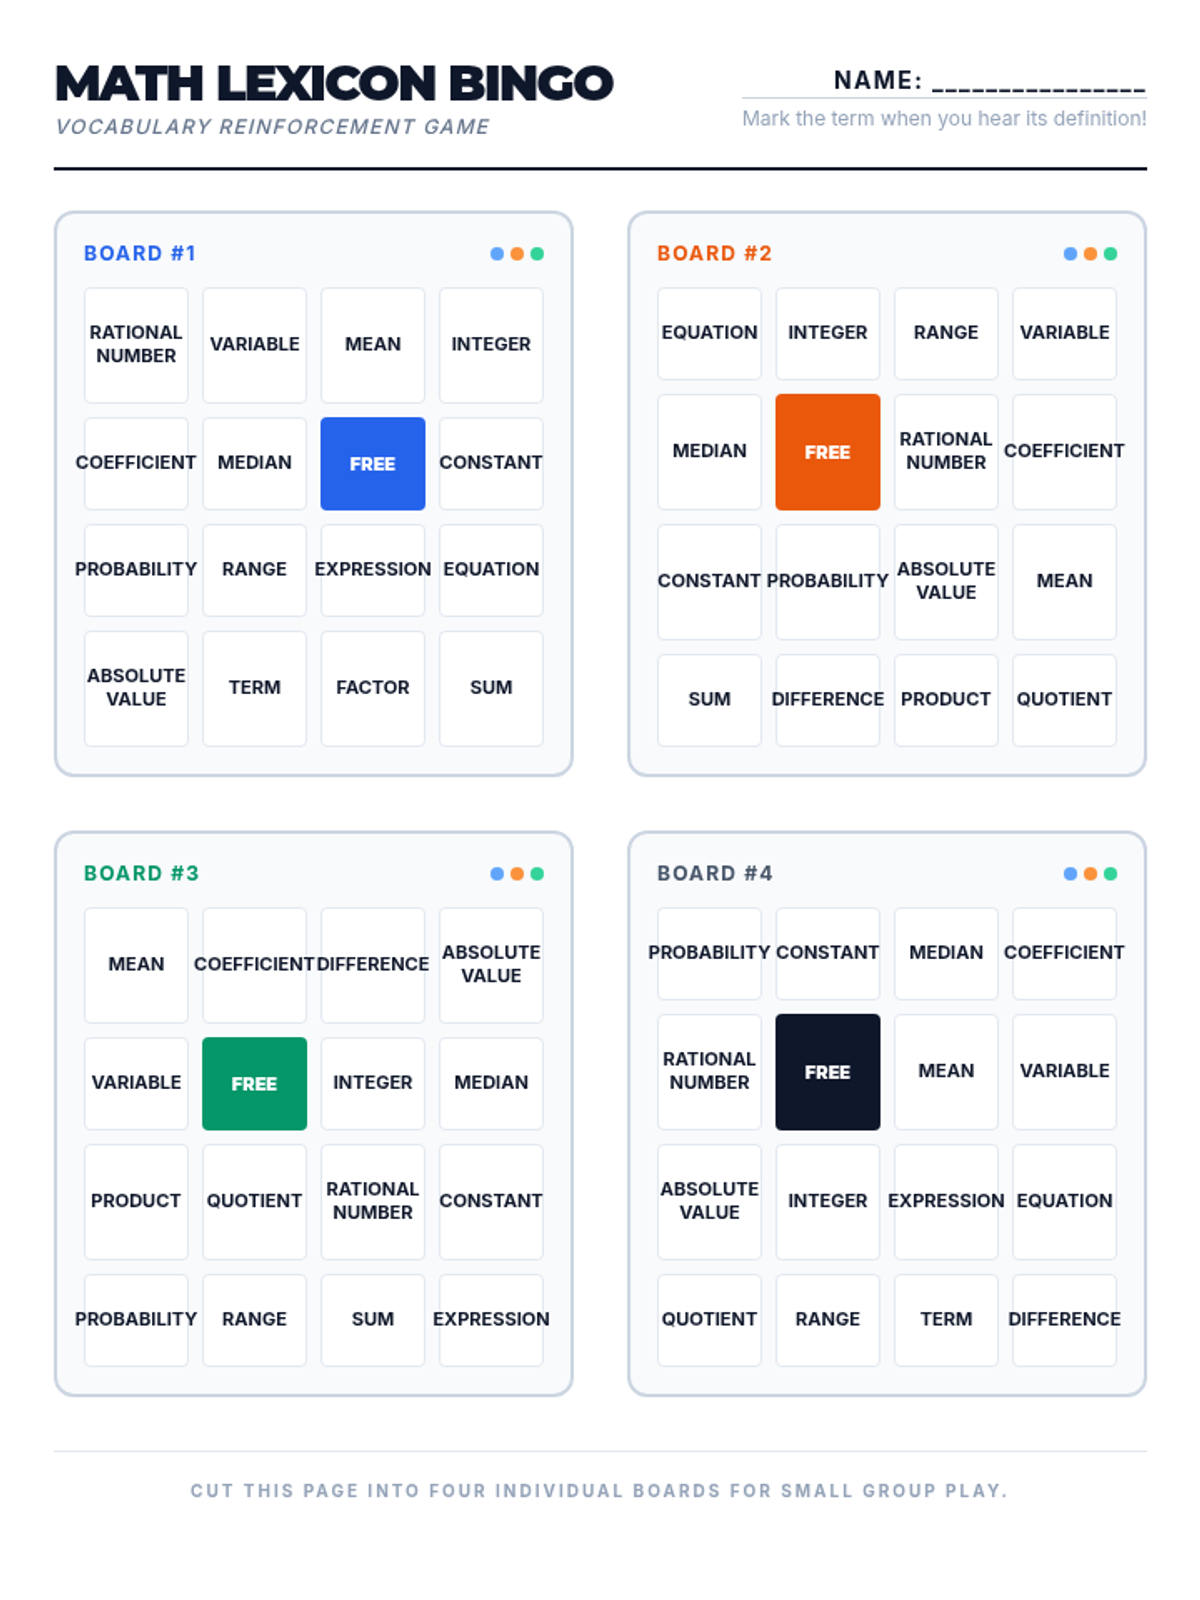
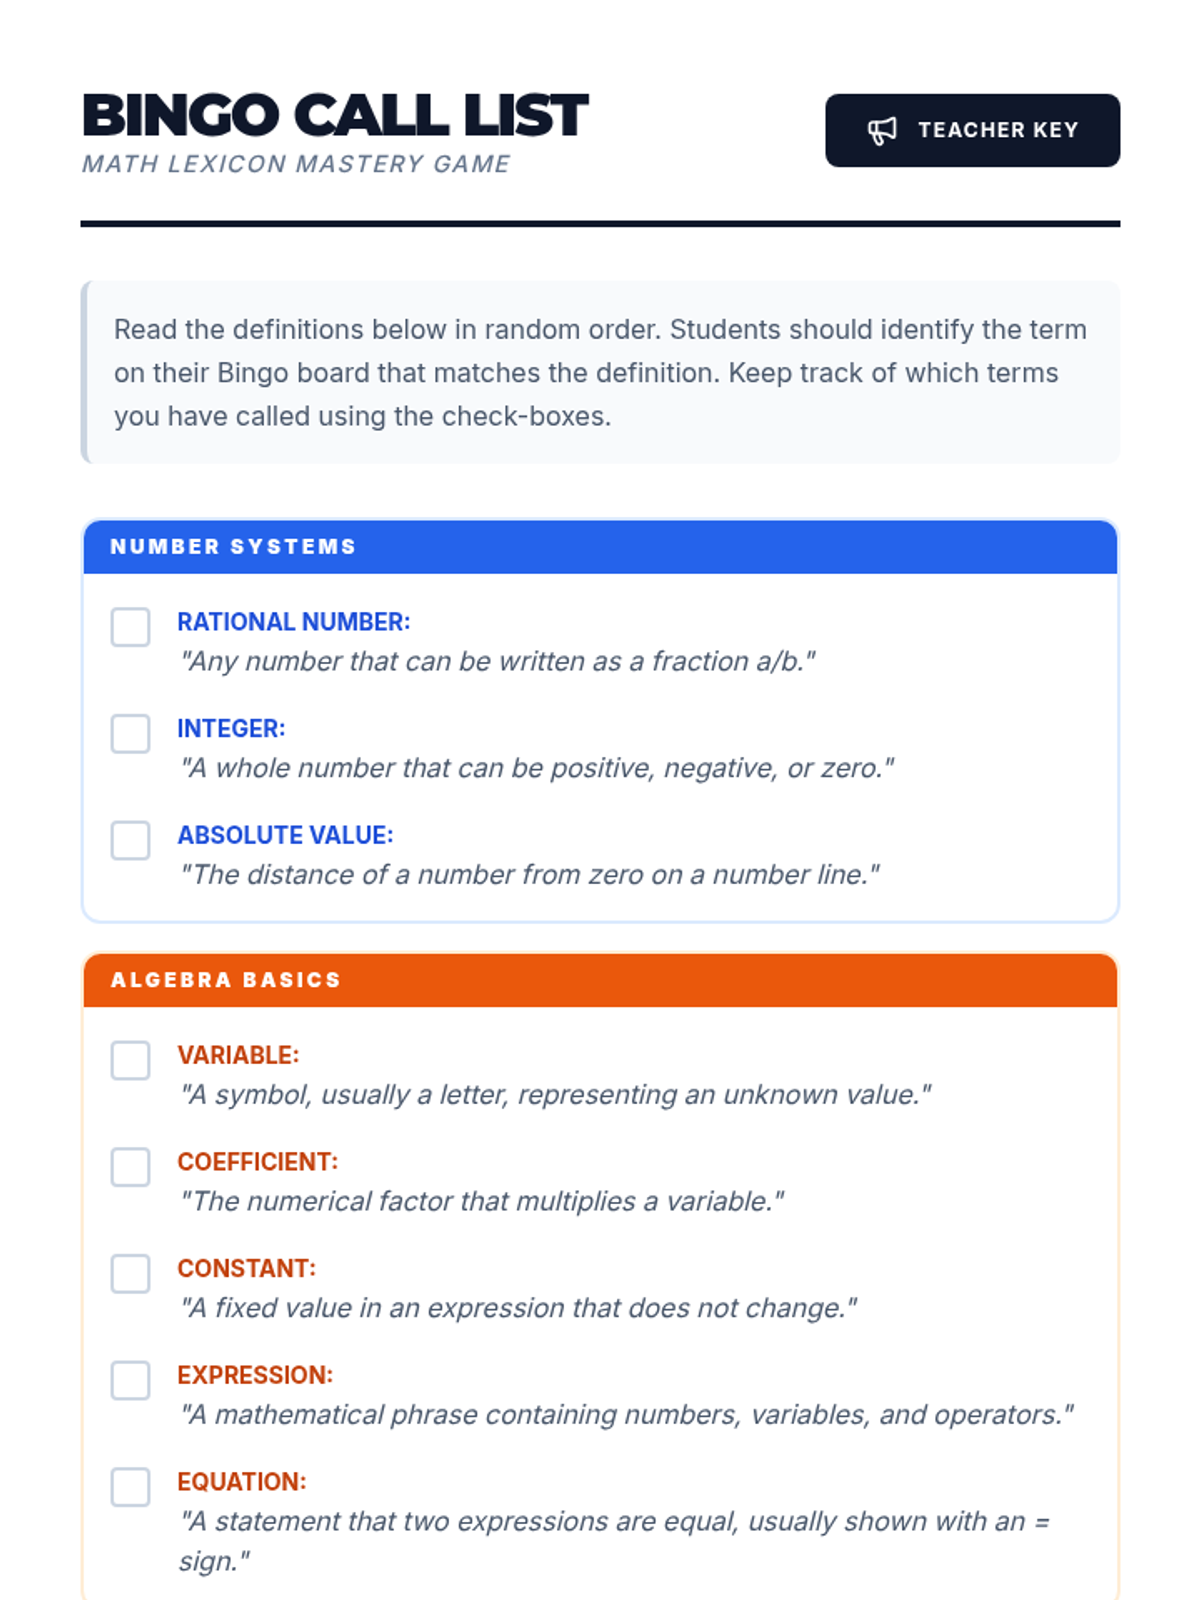
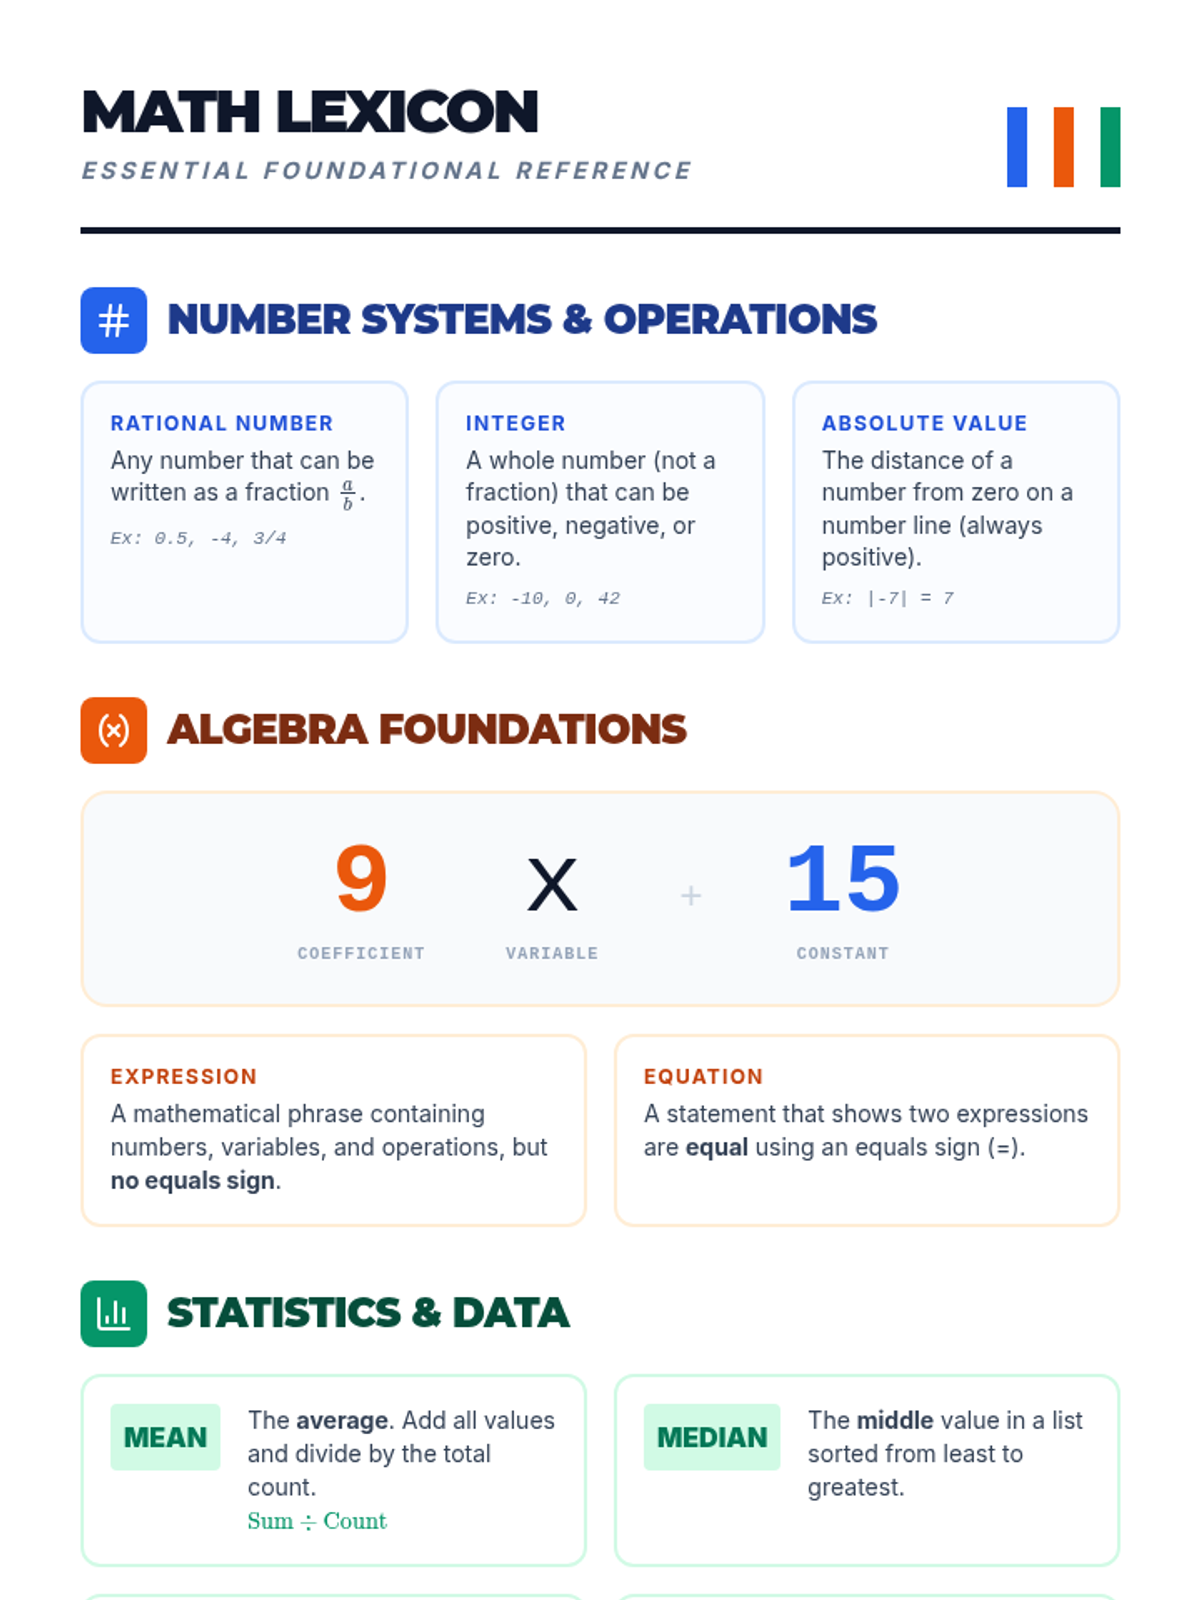
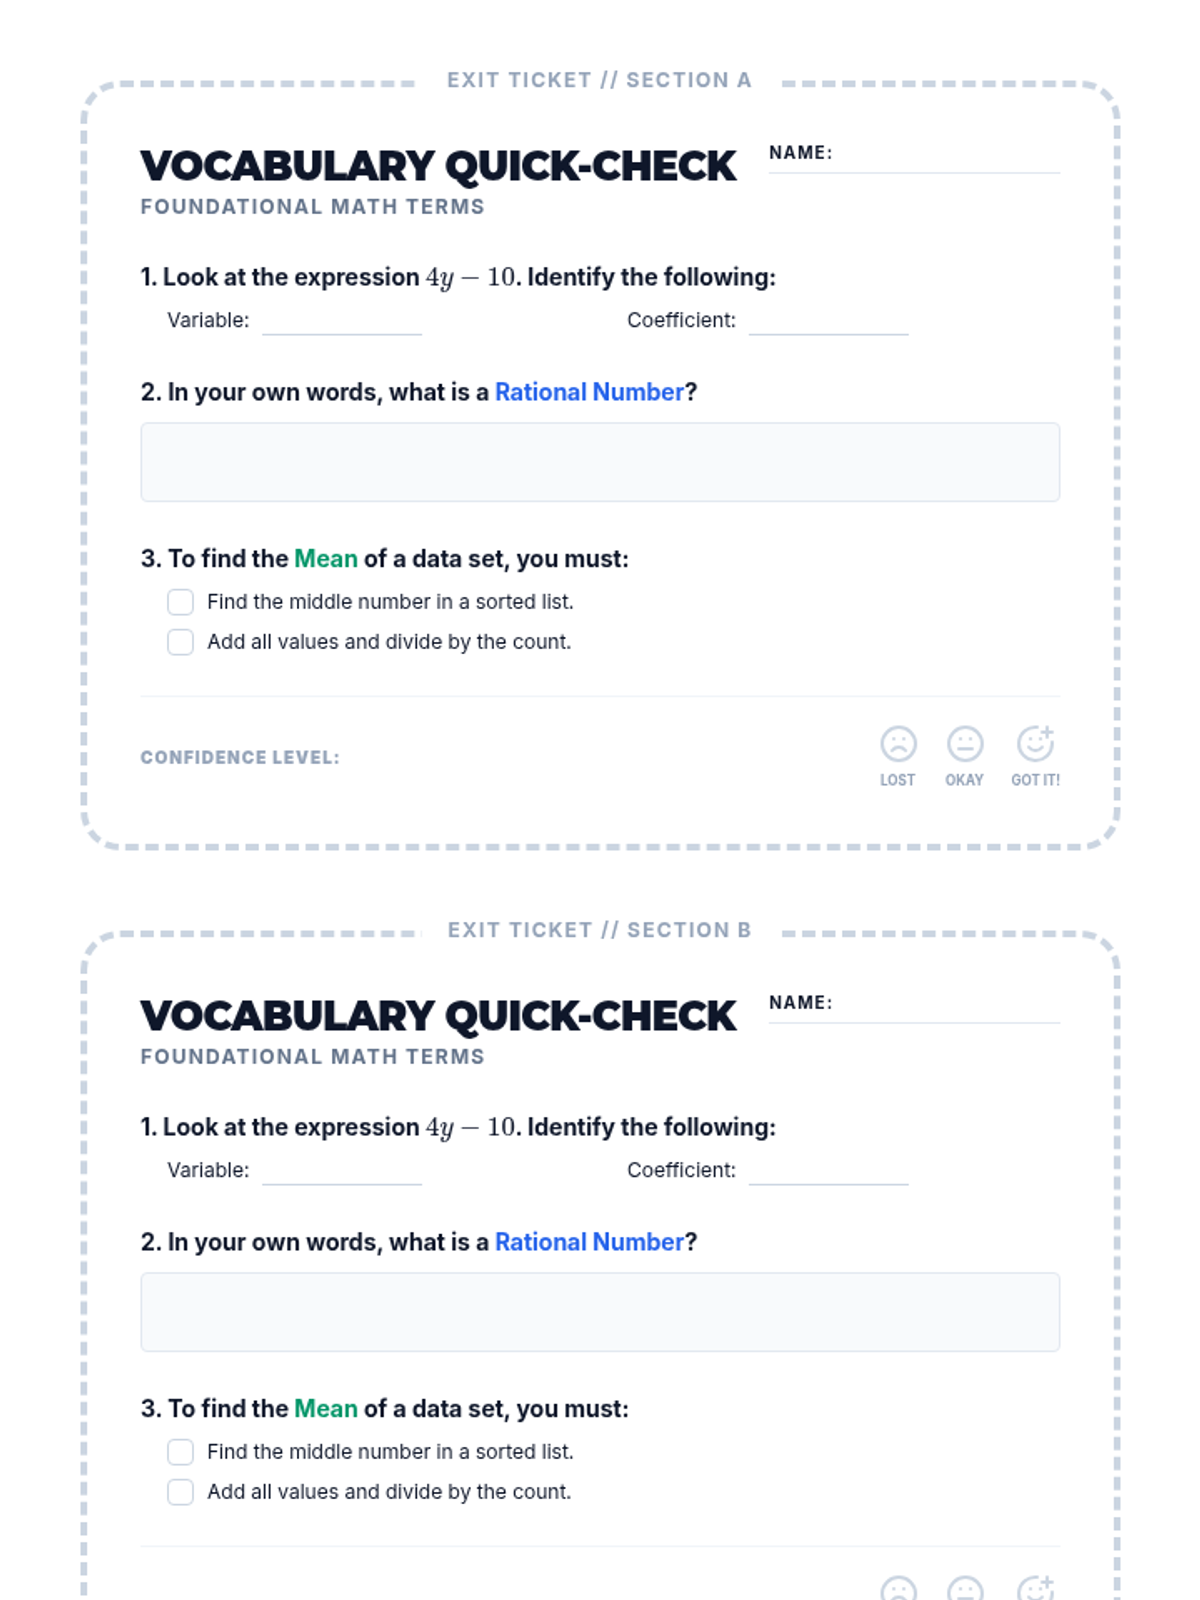
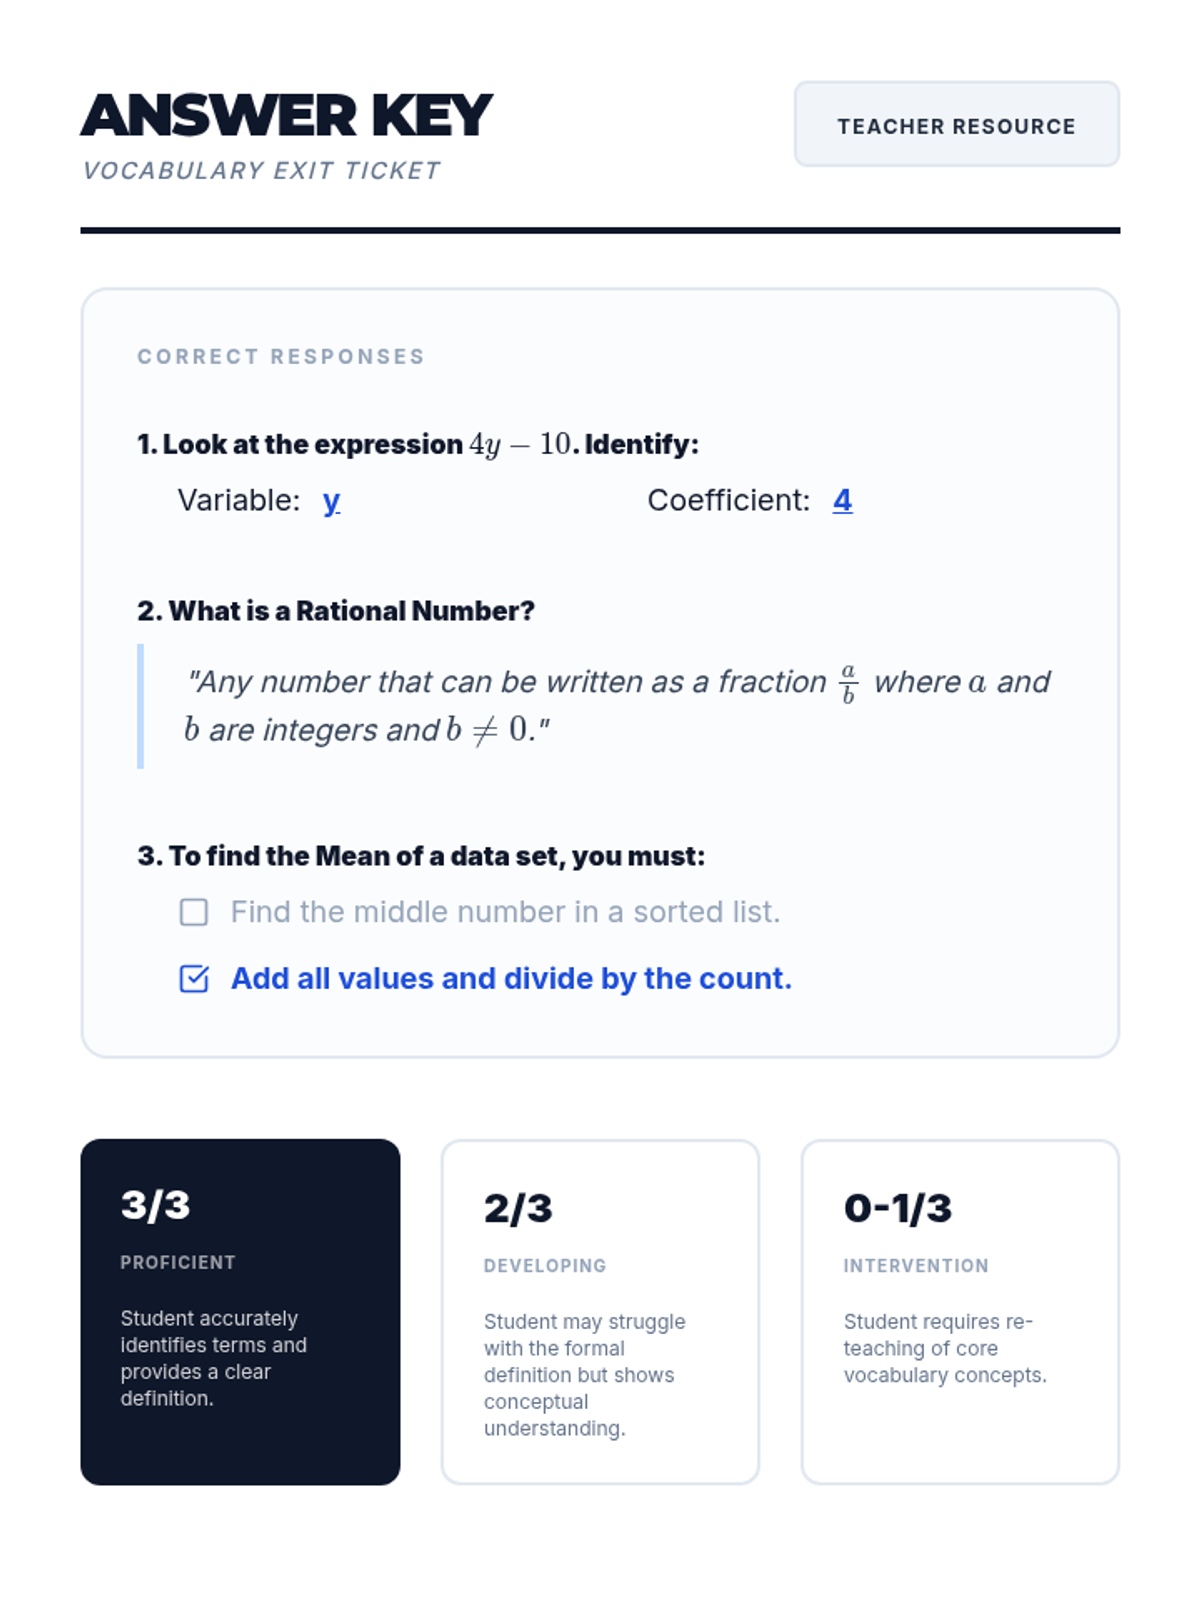
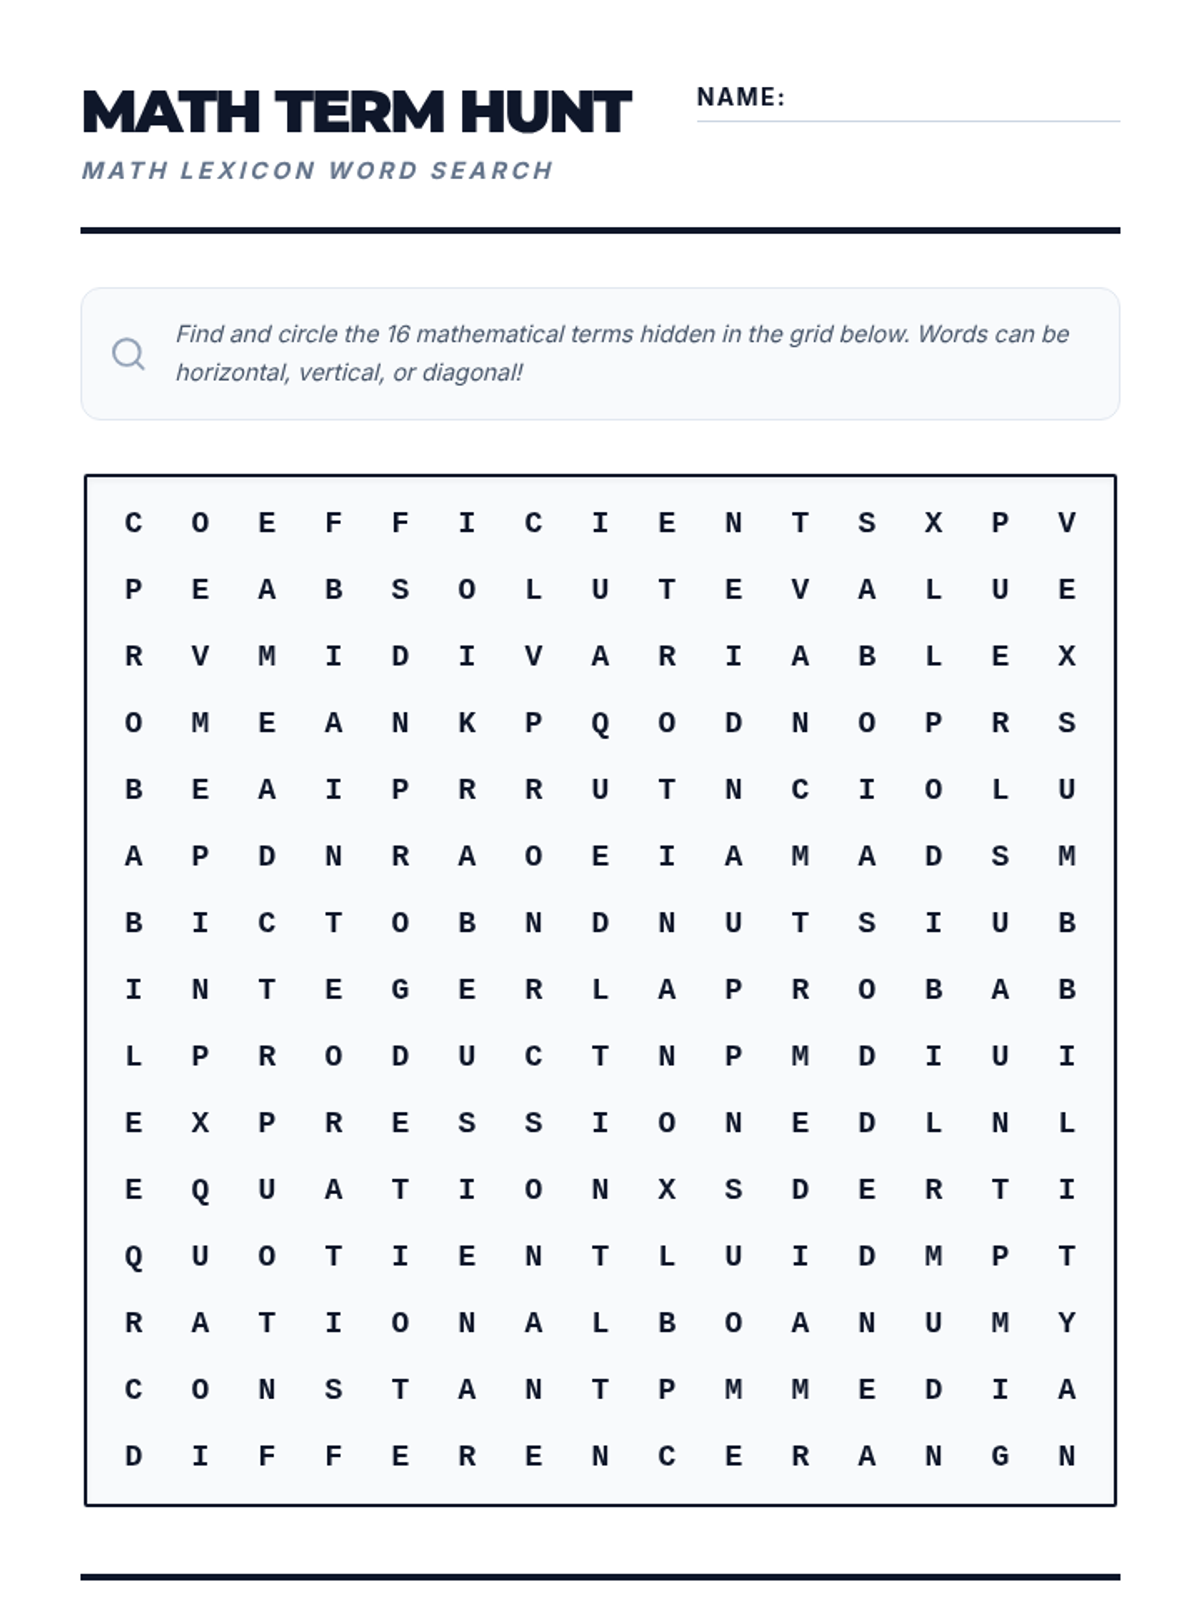
A comprehensive collection of mathematical vocabulary resources covering number systems, algebraic expressions, and statistical analysis. This unit focuses on building precise mathematical language for foundational concepts.
Une série de ressources éducatives couvrant divers concepts mathématiques essentiels comme les statistiques et la trigonométrie.
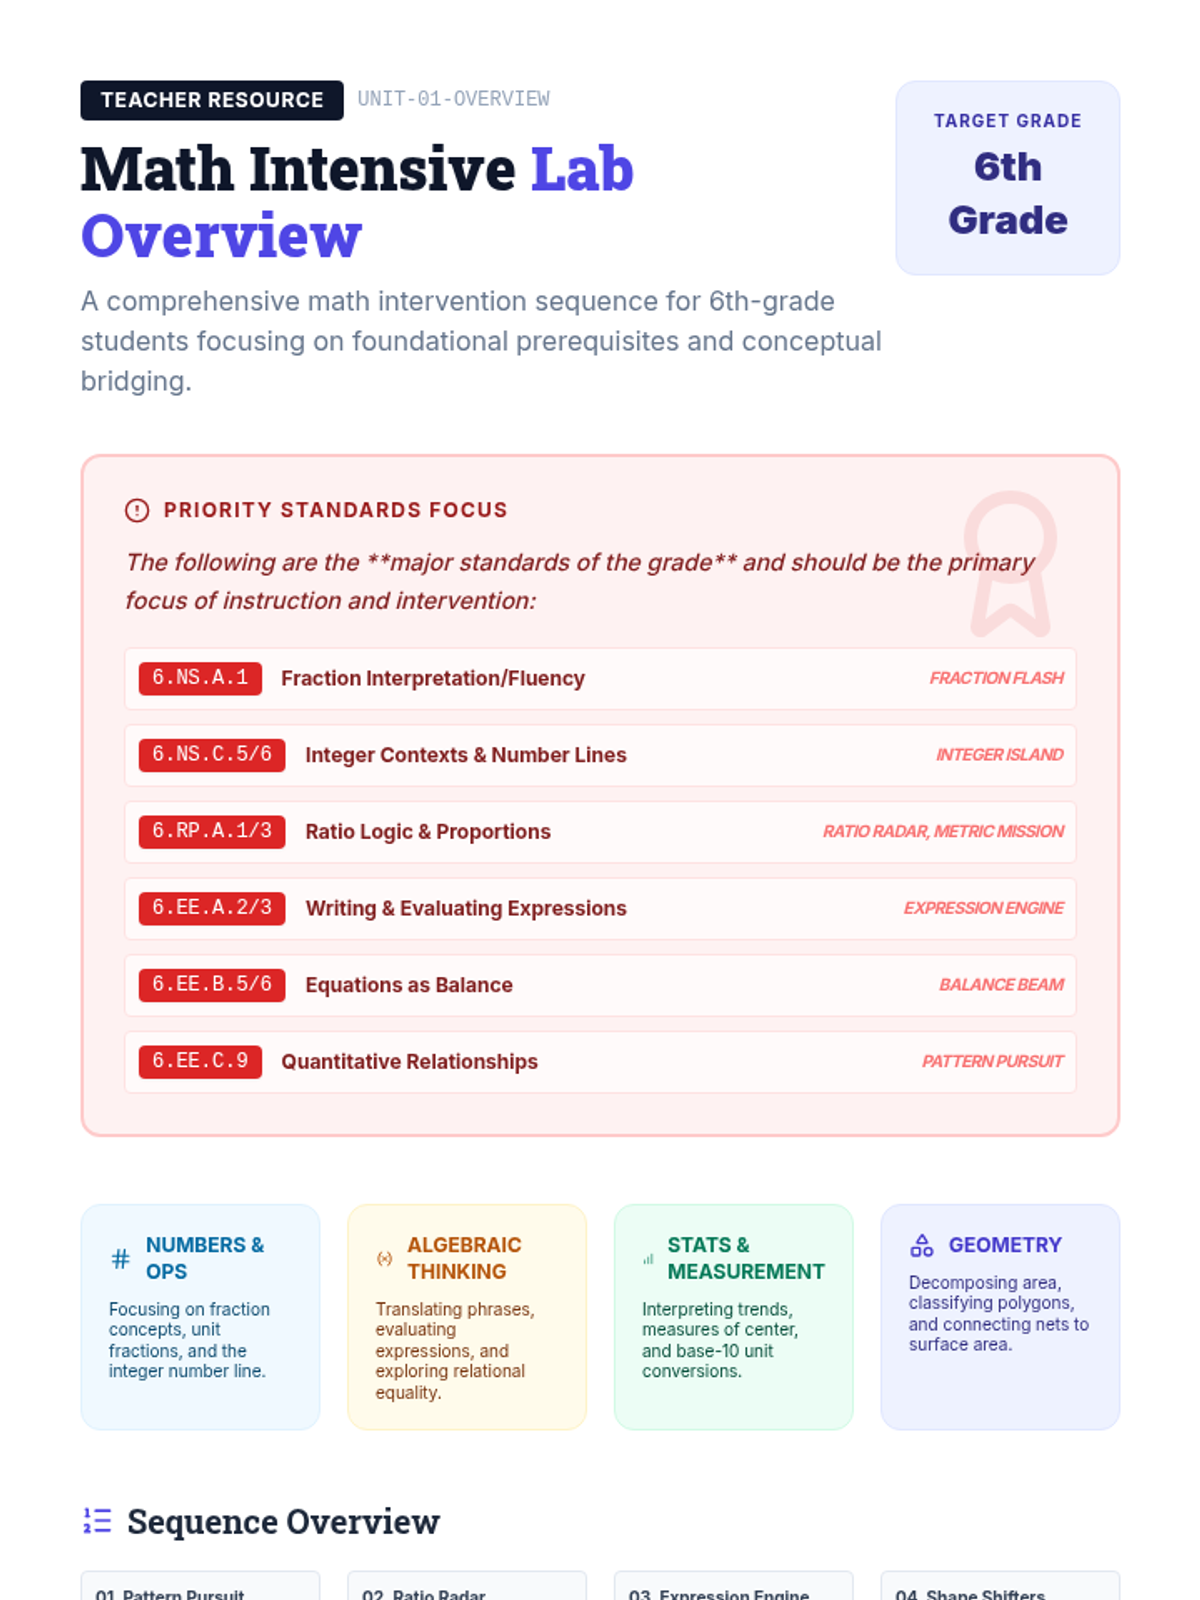
A comprehensive math intervention sequence for 6th-grade students, focusing on four key domains: Numbers & Operations, Algebraic Thinking, Measurement & Data, and Geometry. This sequence uses high-leverage strategies from the All Learners Network (ALN) and aligns with i-Ready prerequisite modules to bridge conceptual gaps.
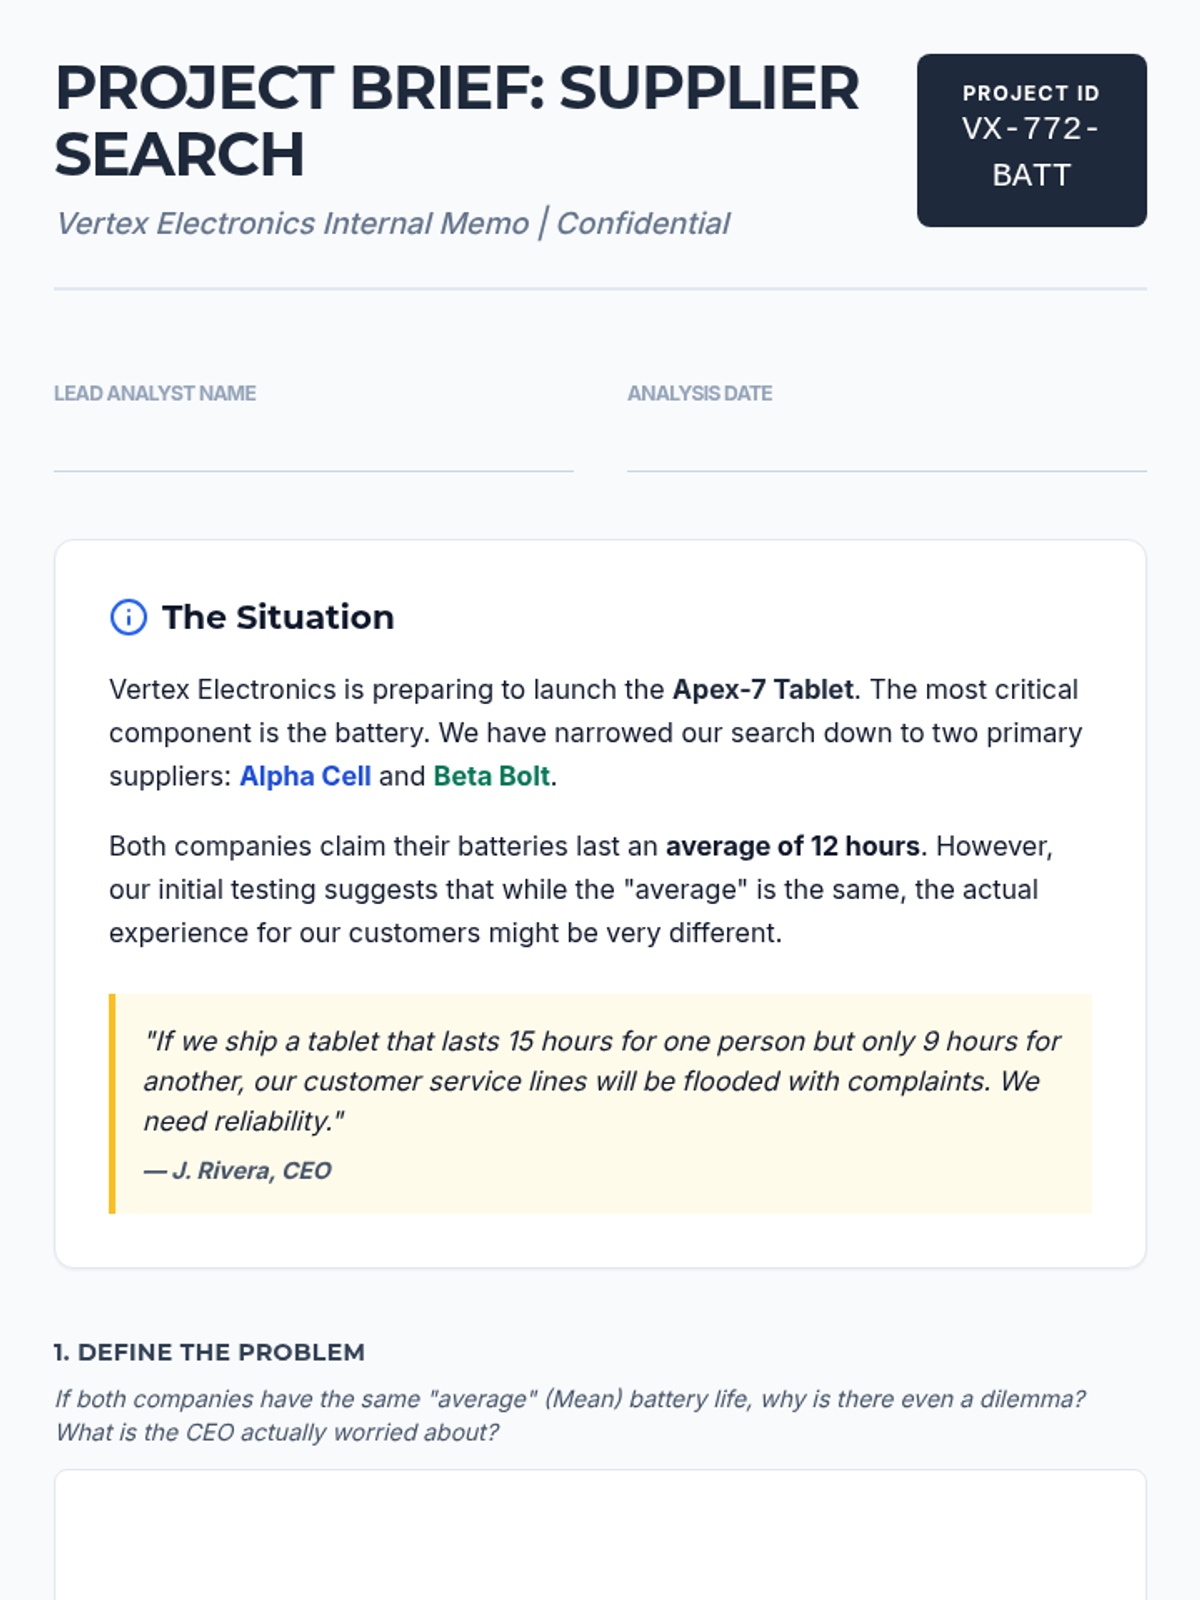
Students act as data analysts for a tech company to decide between two suppliers. They learn that averages don't tell the whole story, using Mean Absolute Deviation (MAD) and Interquartile Range (IQR) to assess risk and consistency in real-world decision making.
A comprehensive sequence on statistical variability focusing on Mean Absolute Deviation (MAD). Students progress from conceptual understanding of spread to algorithmic calculation and comparative analysis of data distributions.
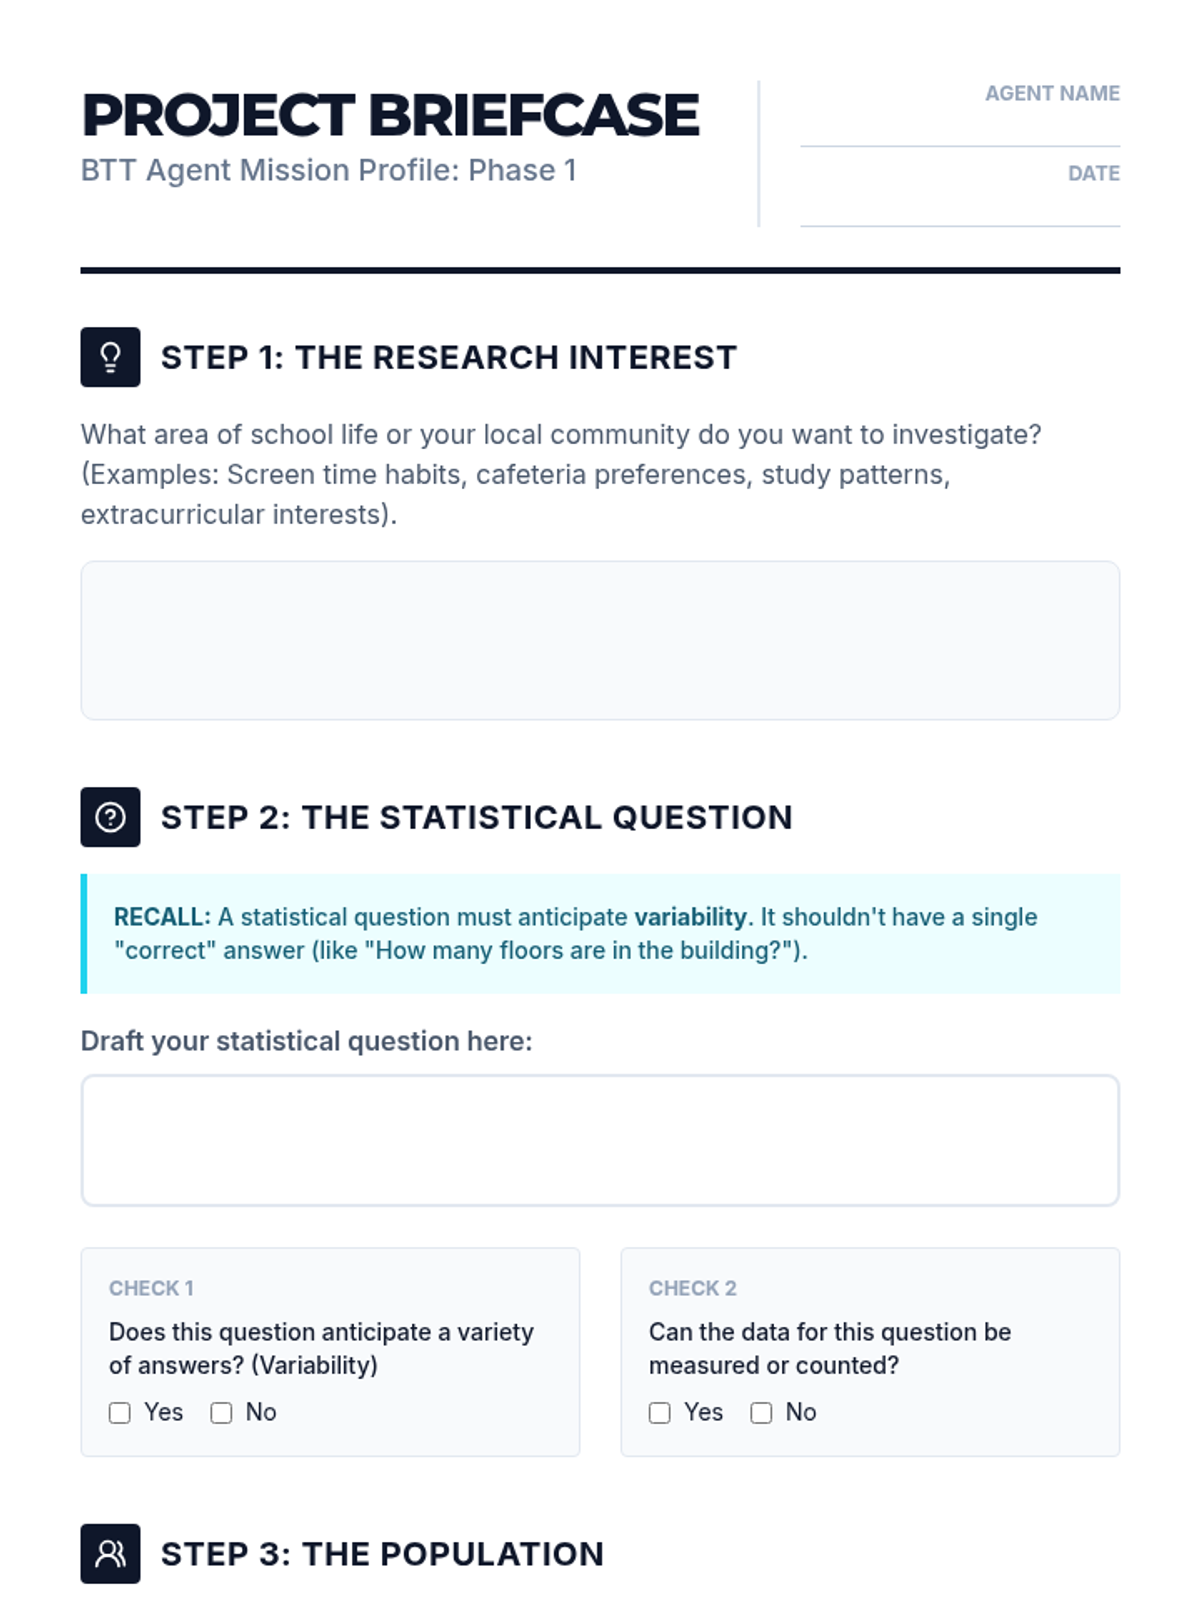
A project-based unit where students act as lead researchers, designing and executing a statistical study from question formulation to final validity reporting. Students learn to navigate population definitions, sampling methods, and question bias to ensure their data accurately reflects reality.
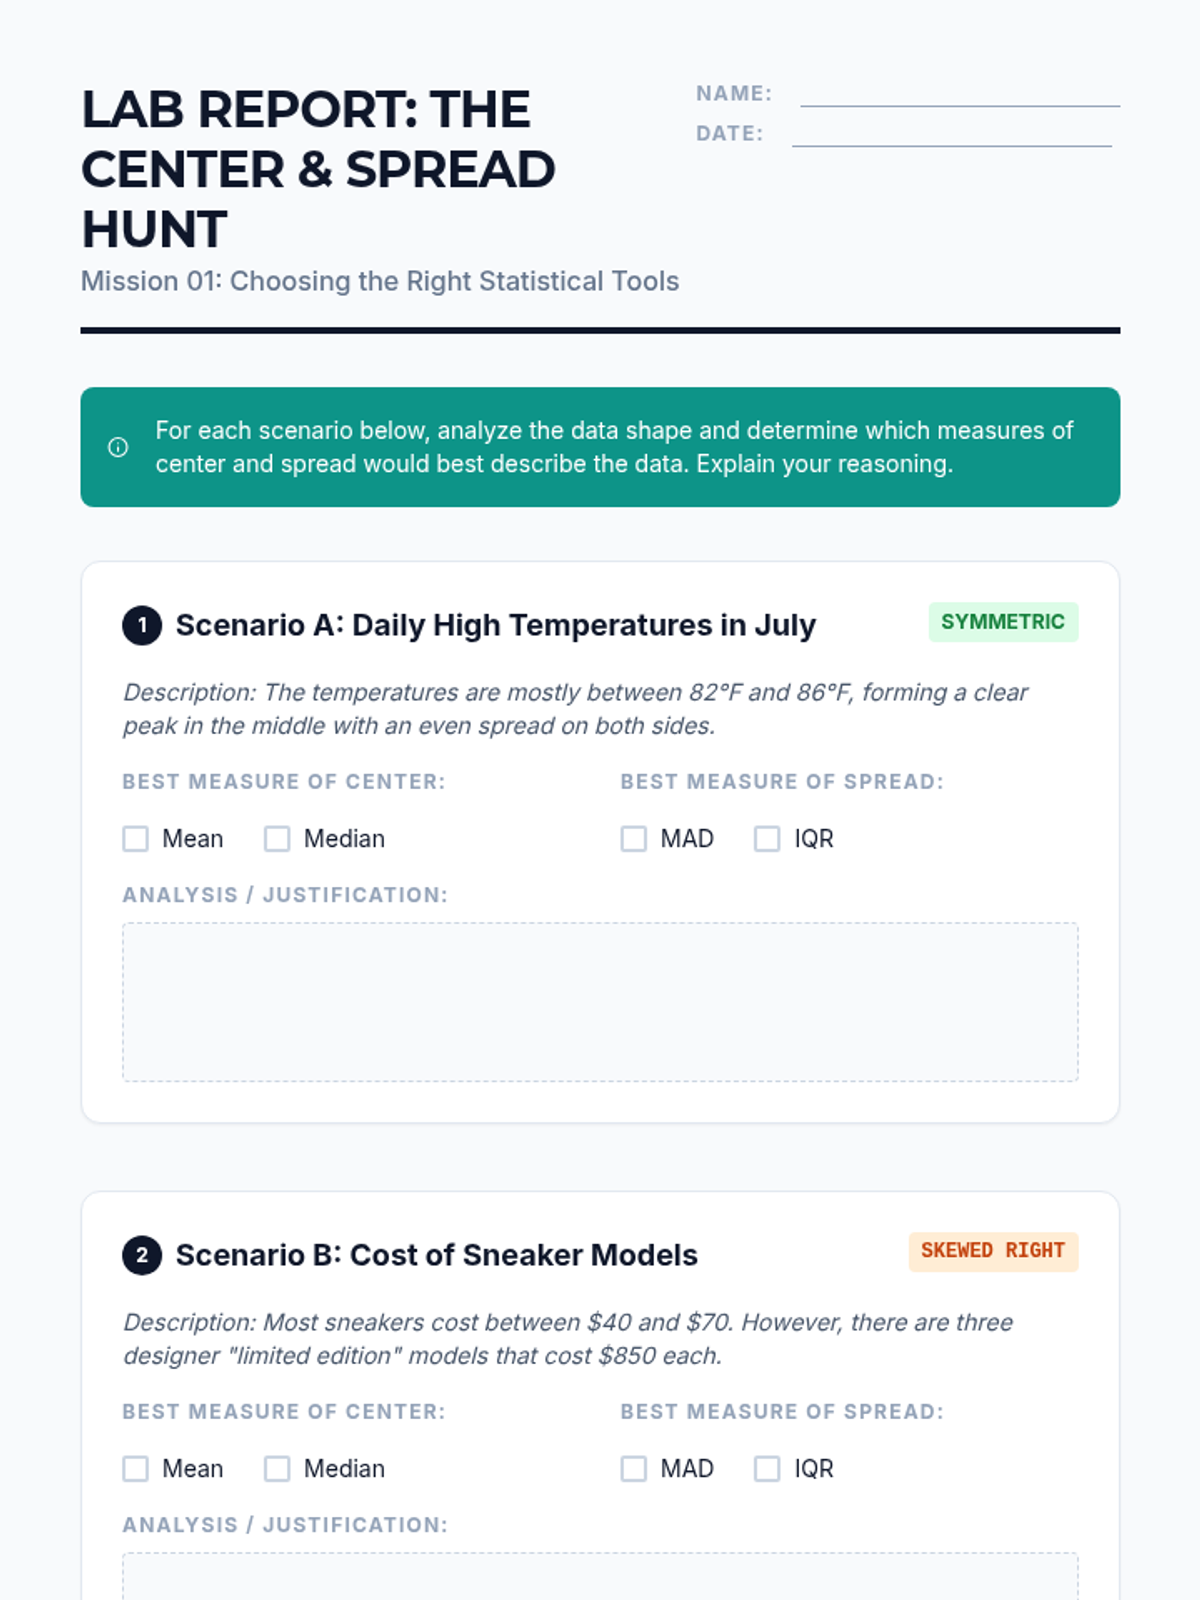
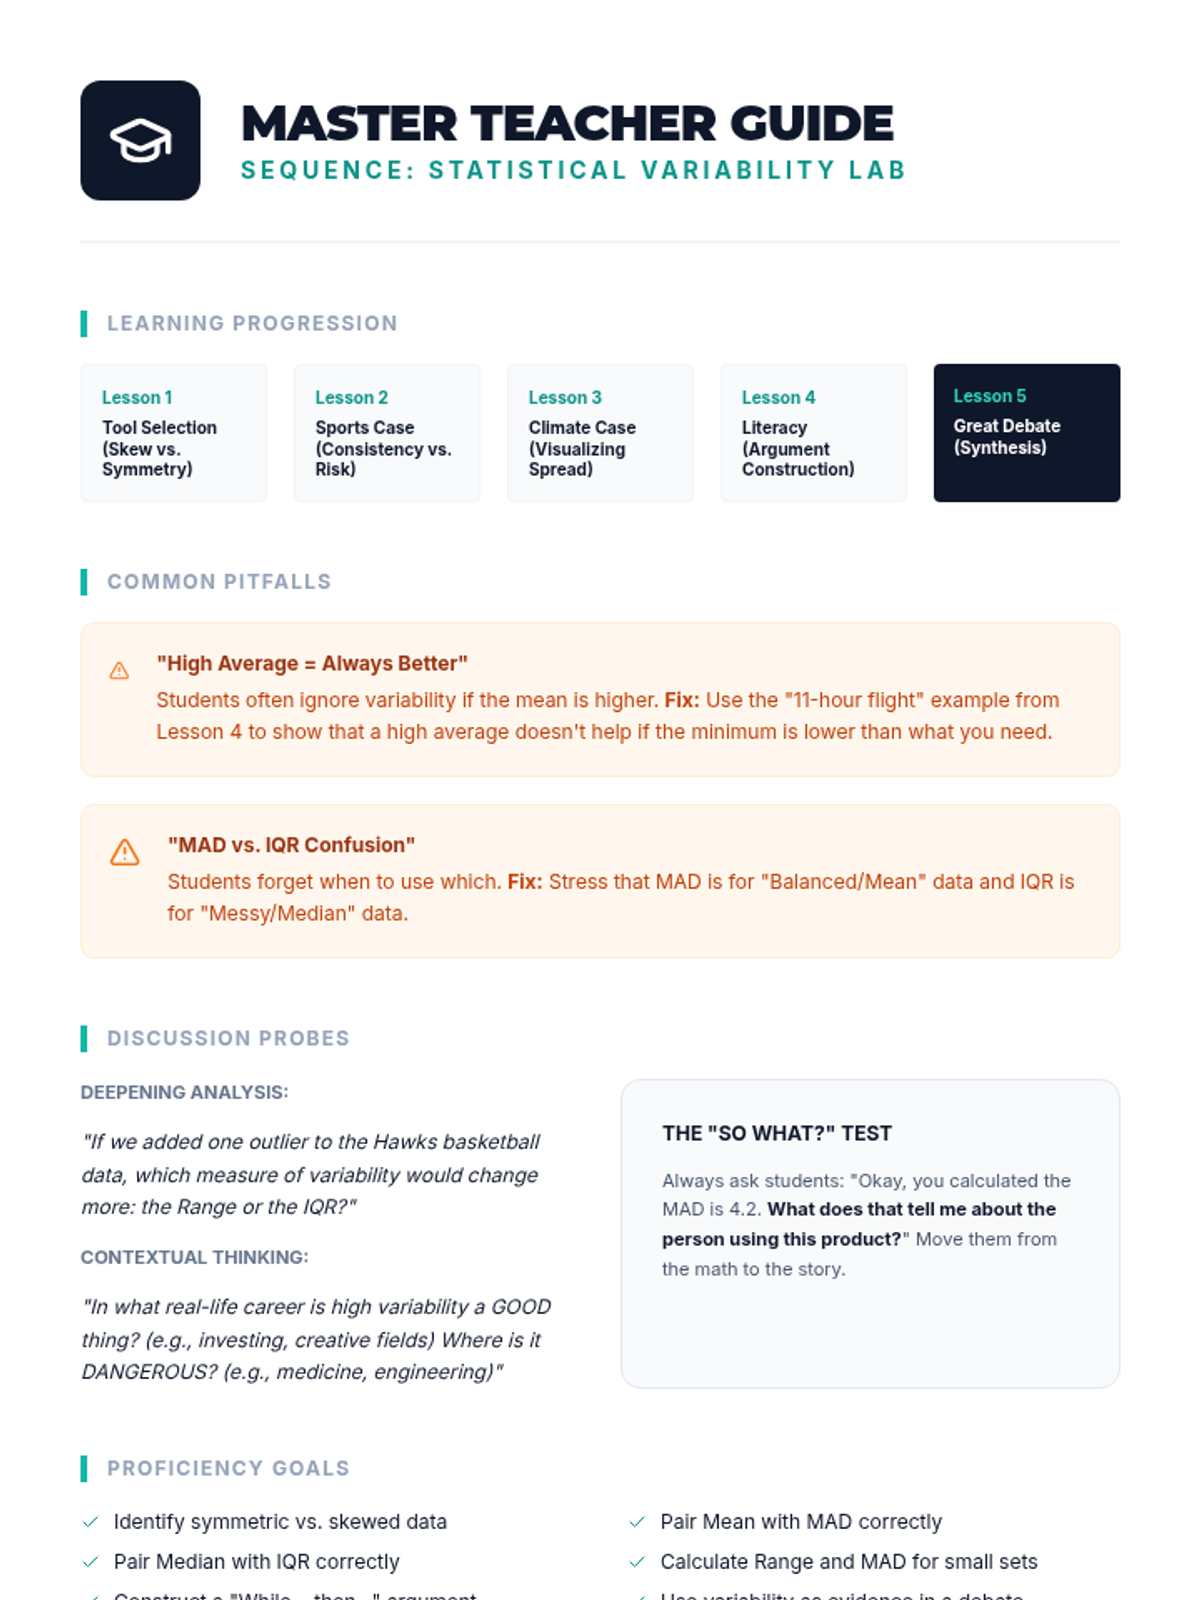
A 5-lesson sequence for 6th-grade students focused on using measures of variability (Range, IQR, MAD) to compare populations and make evidence-based arguments. Students transition from calculation to analysis using real-world case studies in sports, meteorology, and consumer products.
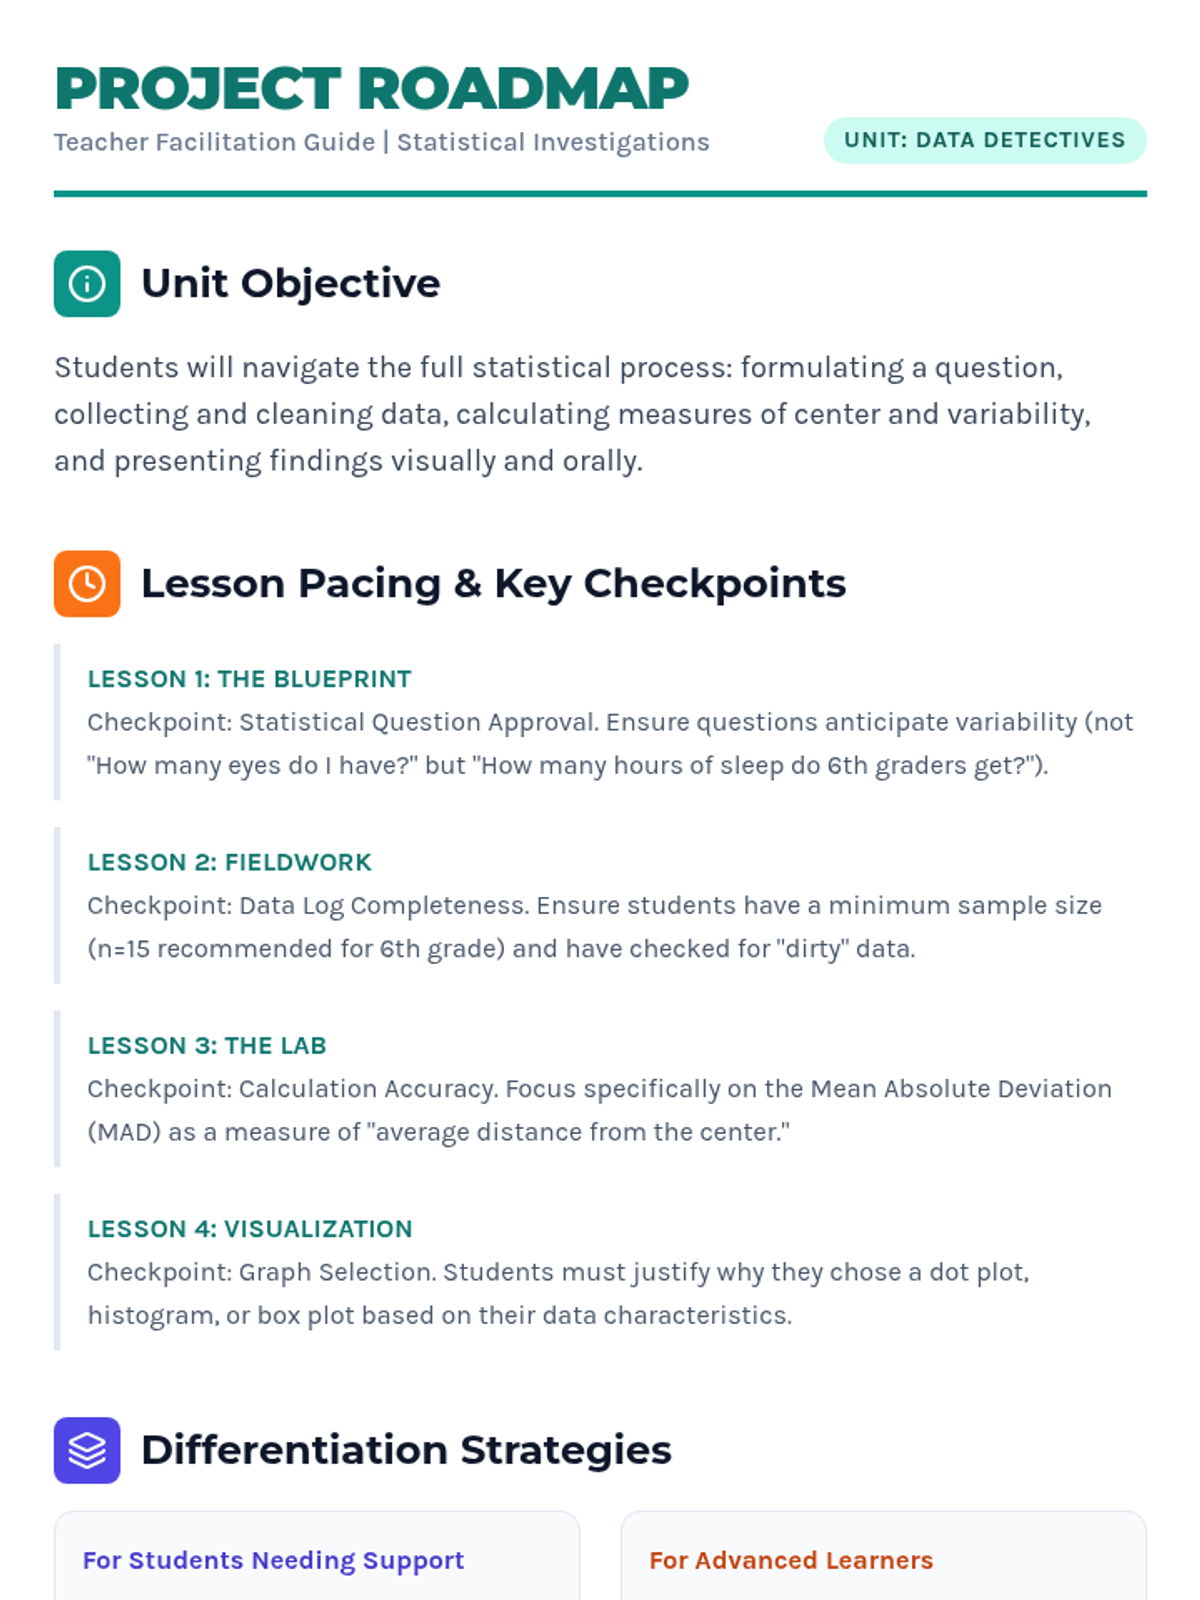
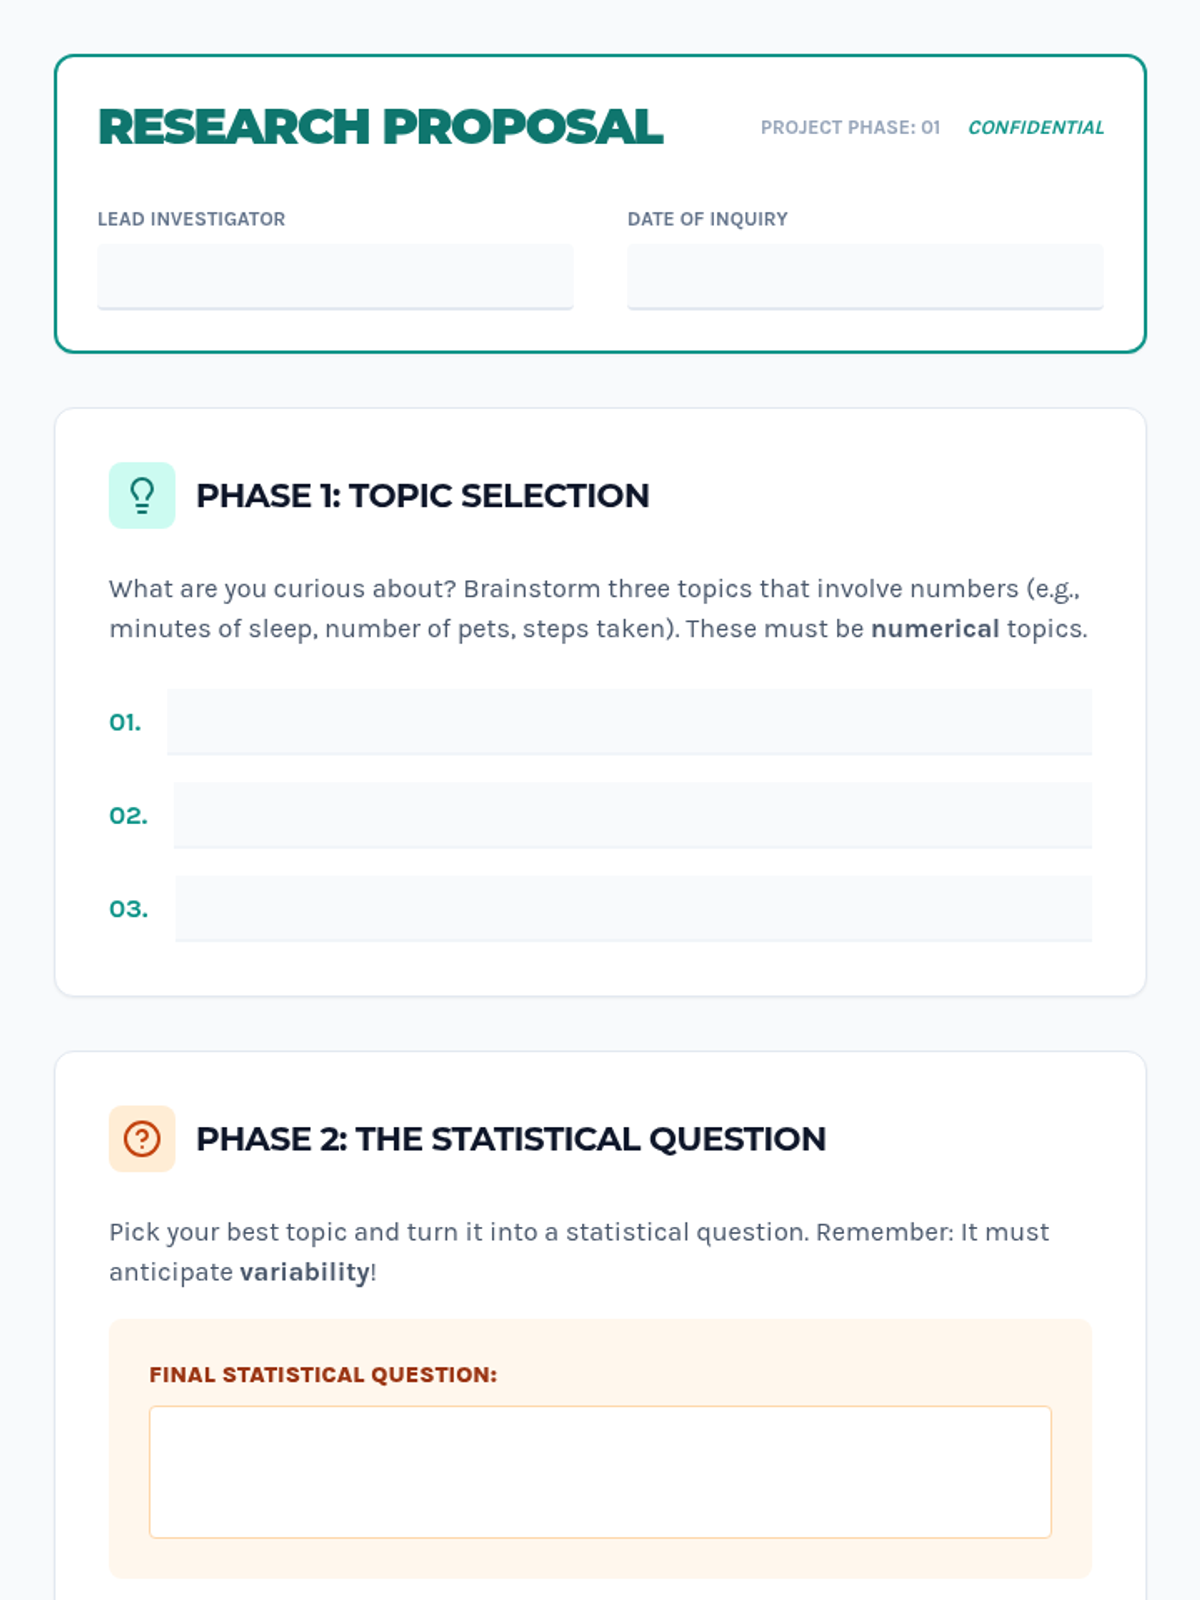
A project-based unit where 6th-grade students act as researchers, conducting a full statistical investigation from question formulation to final presentation. Students identify a topic, collect peer data, and analyze variability to answer their own statistical questions.
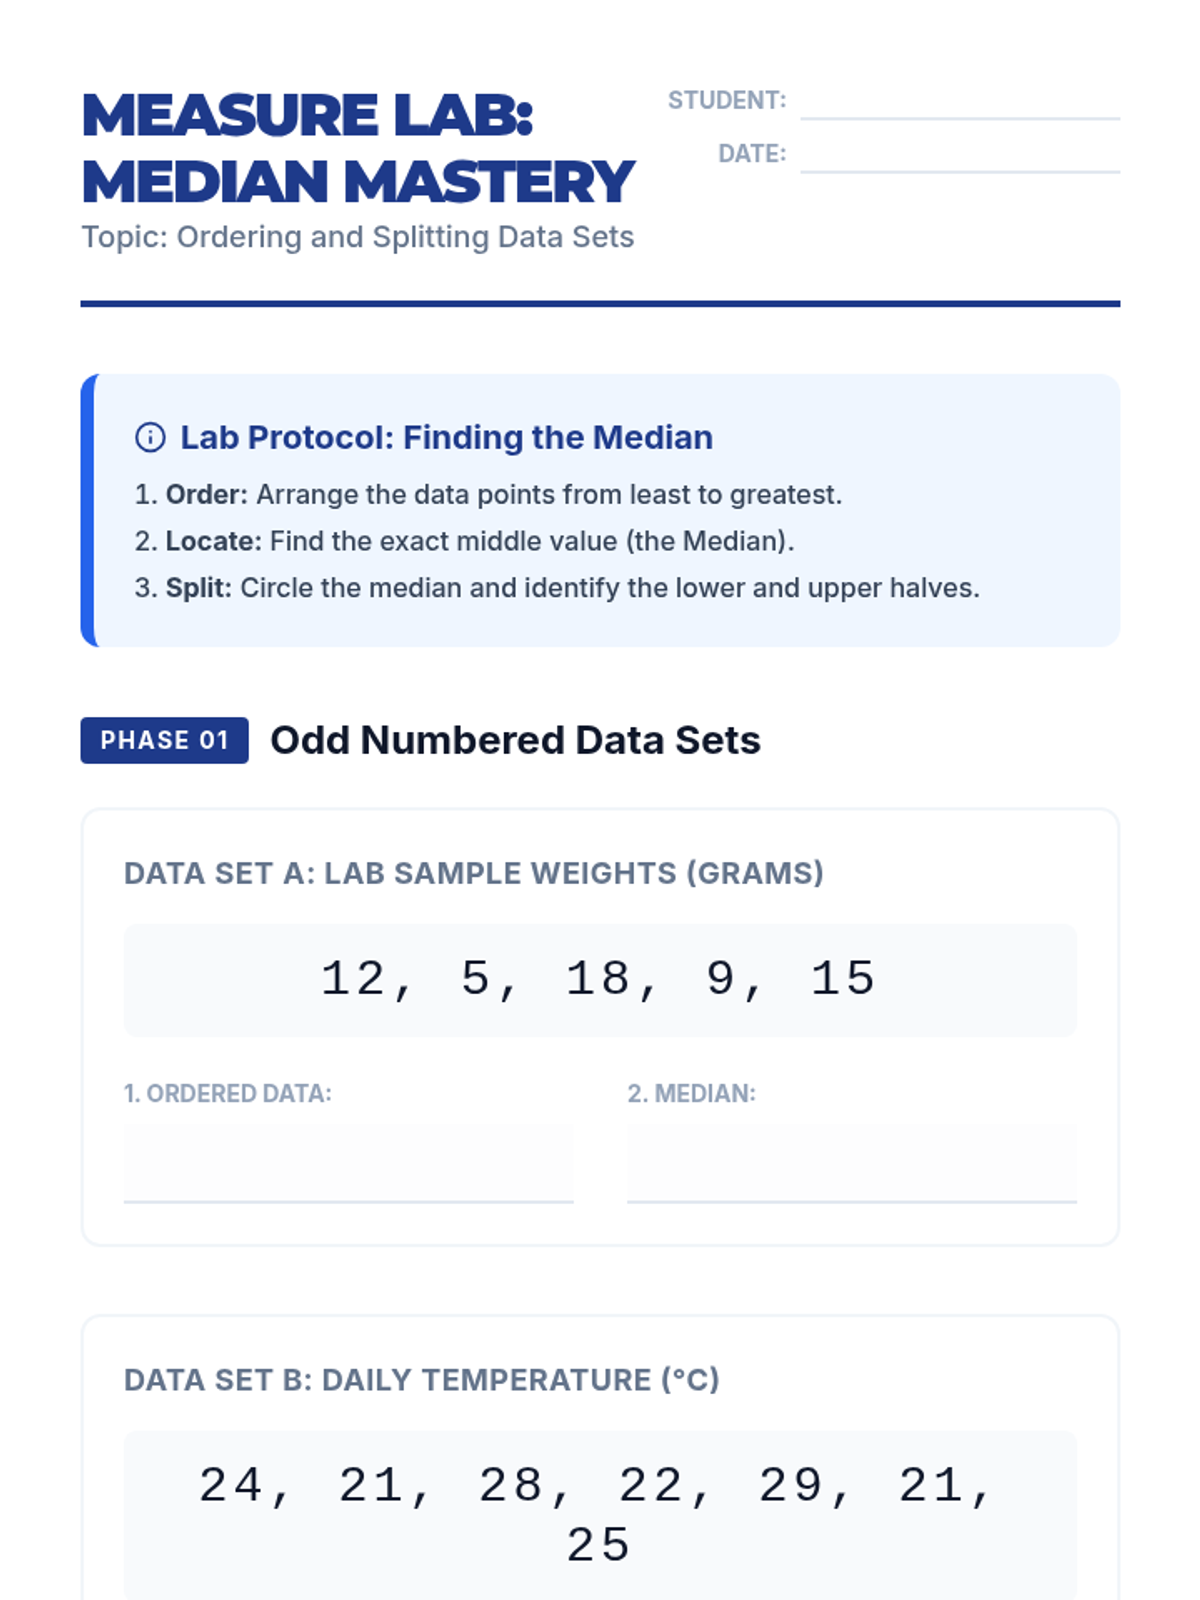
A comprehensive unit for 6th-grade students on statistical variability, focusing on quartiles, Interquartile Range (IQR), and the construction and interpretation of box plots. Students move from basic median splitting to complex data visualization and comparison.
This sequence guides 6th-grade students through the conceptual and procedural steps of calculating and interpreting Mean Absolute Deviation (MAD). Students move from understanding mean as a balance point to visualizing deviation as distance, eventually mastering the multi-step calculation and applying it to evaluate data consistency in real-world contexts.
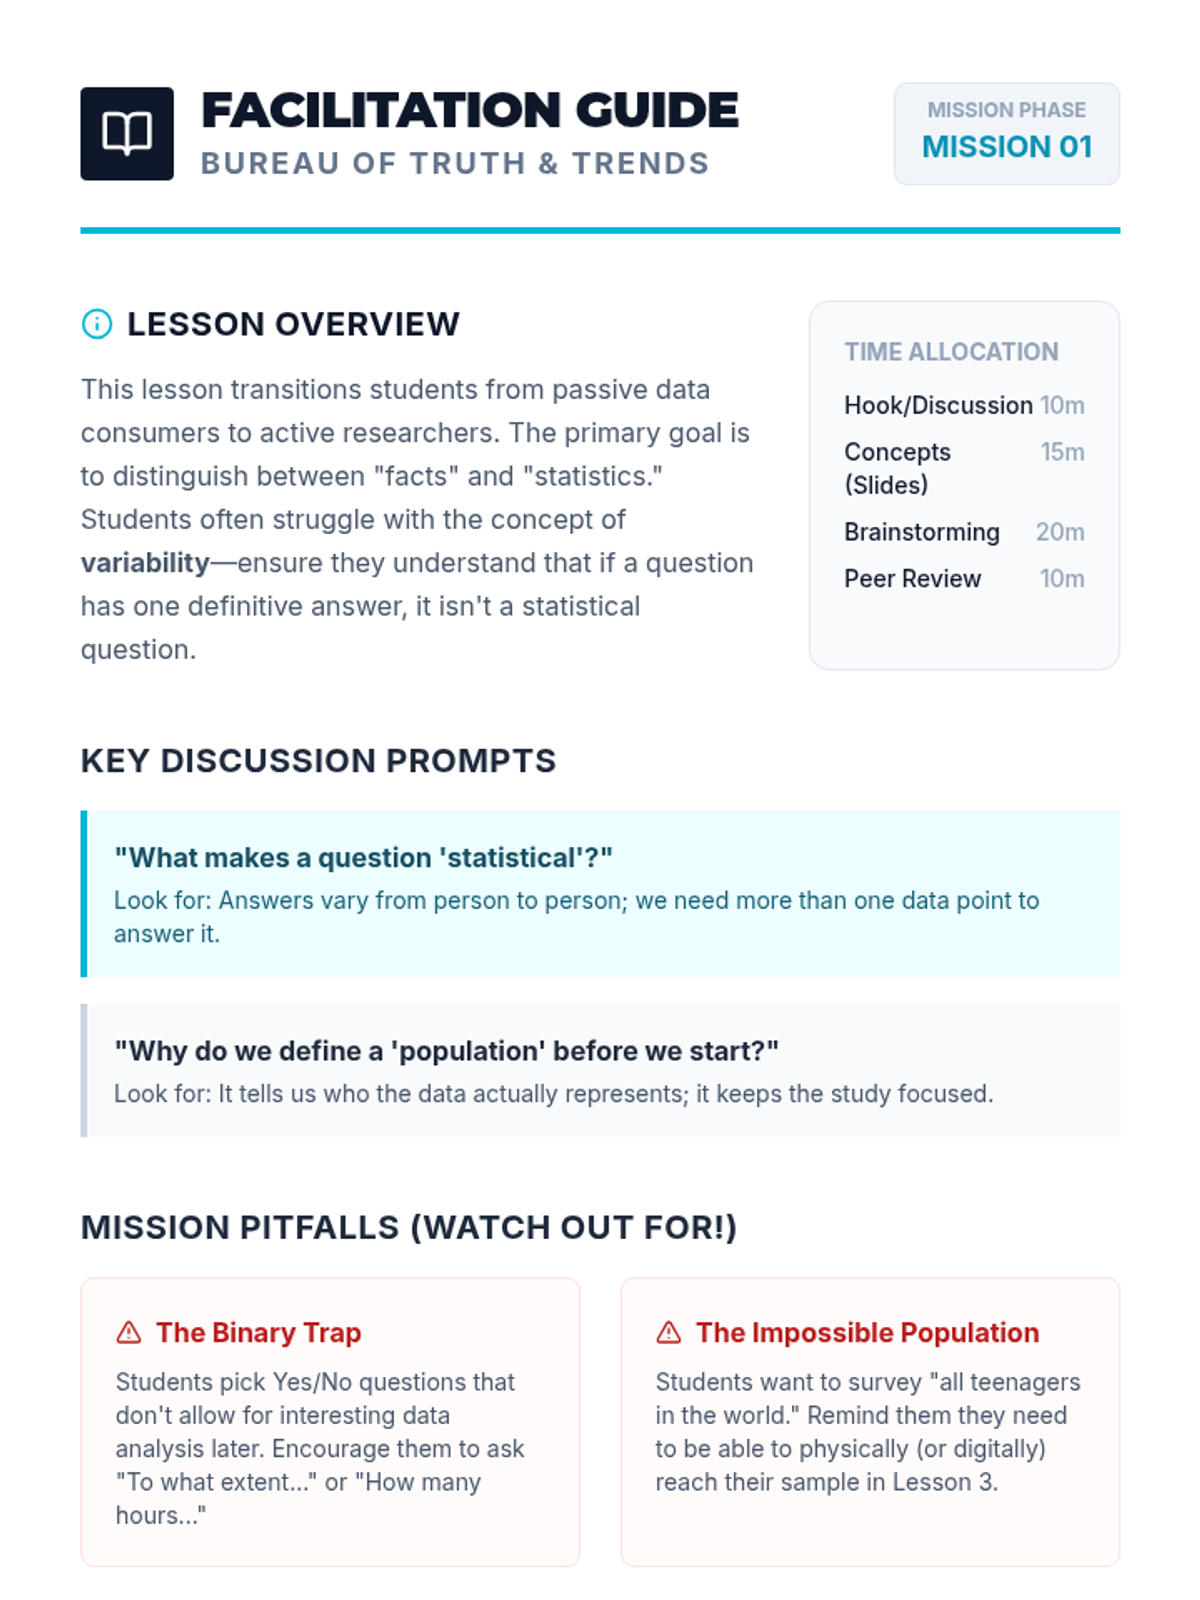
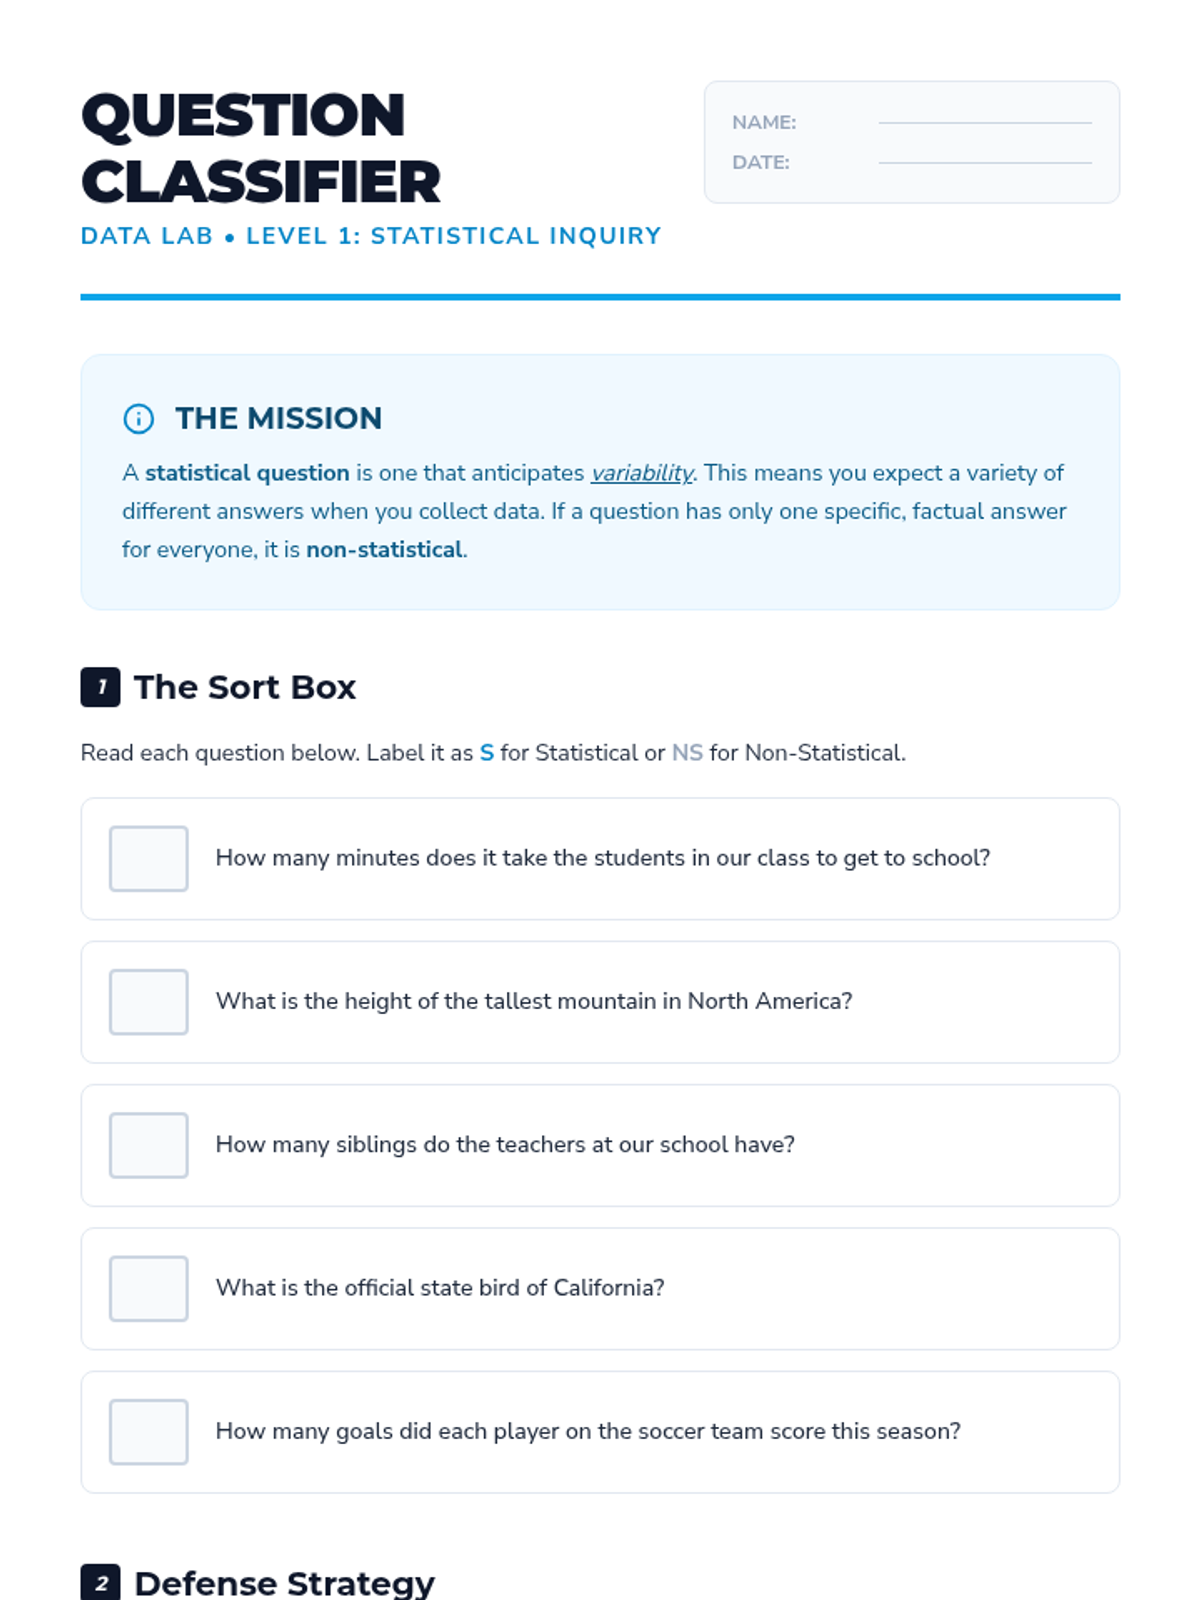
This inquiry-based sequence introduces 6th grade students to statistical variability, starting with distinguishing question types and progressing to visualizing data on dot plots and quantifying spread using range.
An inquiry-based exploration of statistical variability, focusing on how data spread reveals truths about inequality, climate instability, and diversity that averages often hide. Students transition from visual distribution analysis to quantifying disparity using IQR and MAD, culminating in an independent investigation.
A comprehensive 7-week NYS Math Assessment preparation sequence for 8th grade, covering major clusters including algebra, functions, geometry, and statistics.
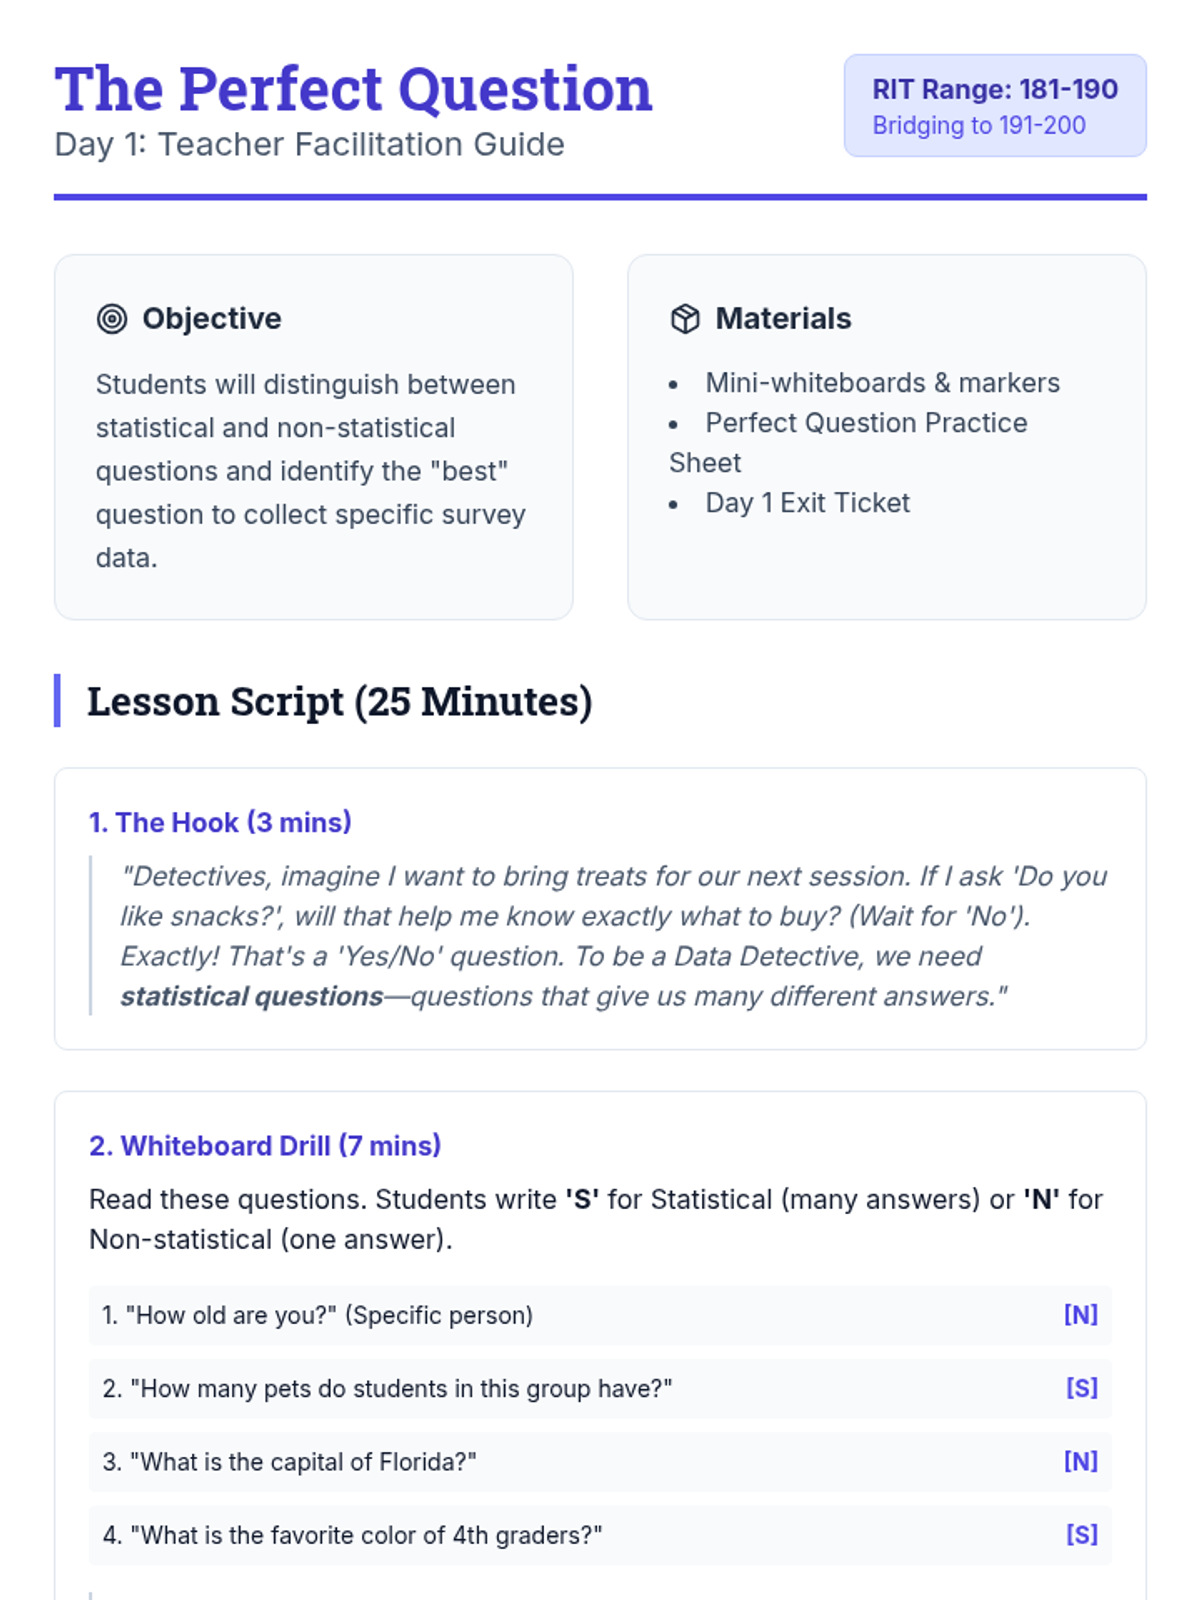
A 3-day small group math sequence designed to move students from RIT 181-190 to 191-200 in the Data Analysis domain, focusing on statistical questions and circle graph interpretation.
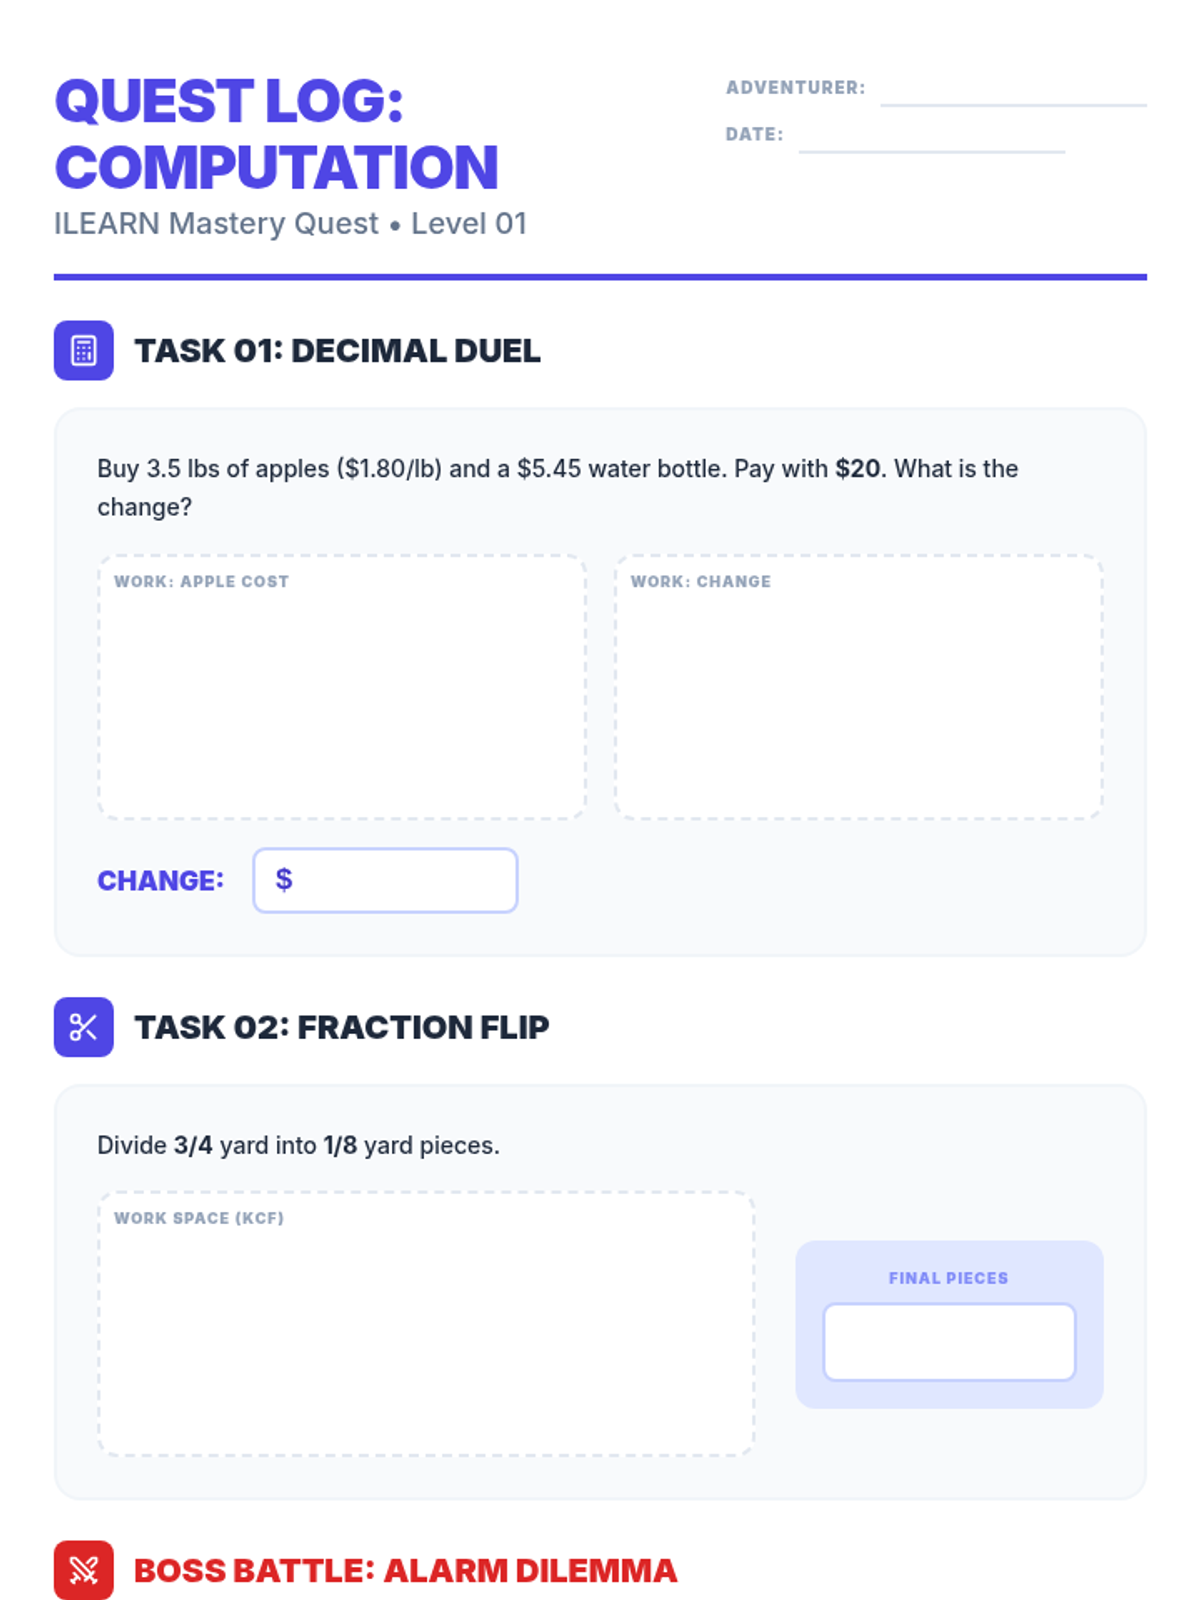
A comprehensive 4-part review sequence designed to prepare 6th-grade students for the ILEARN math assessment. Each stage focuses on a major domain of the Indiana academic standards, using a 'Quest' theme to engage students in digital practice.
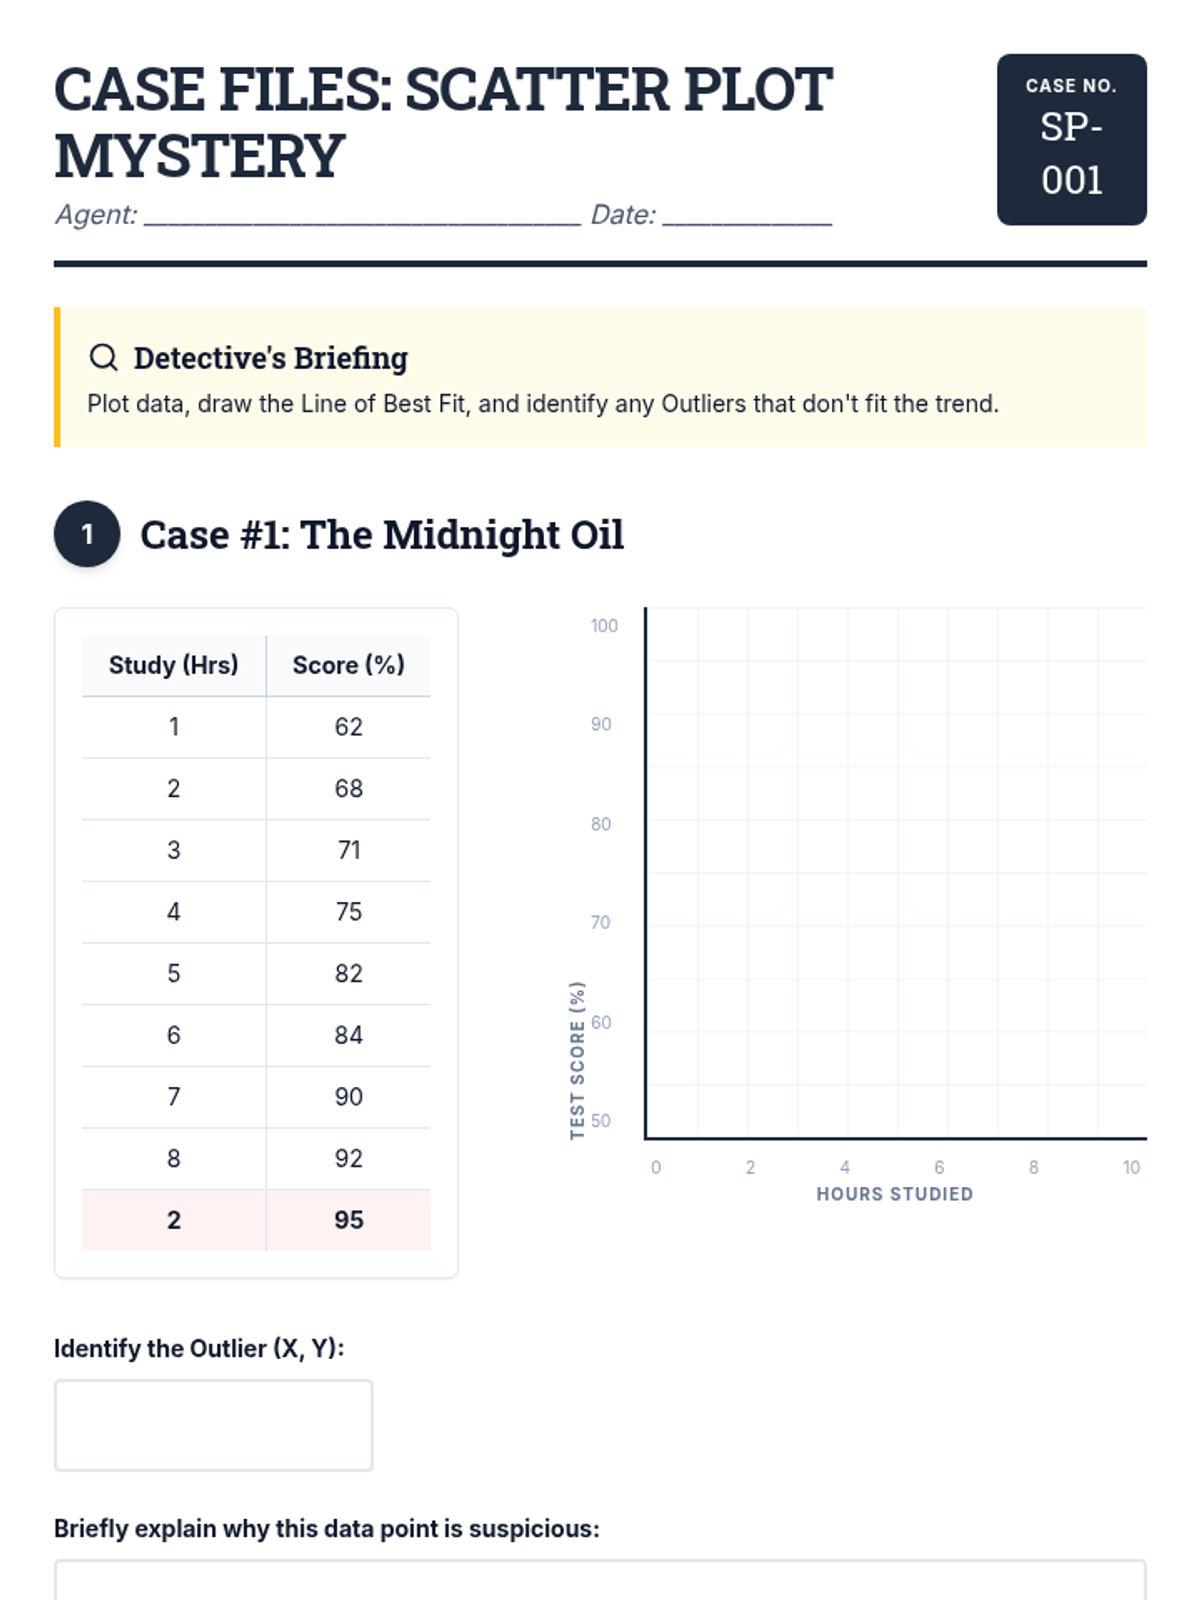
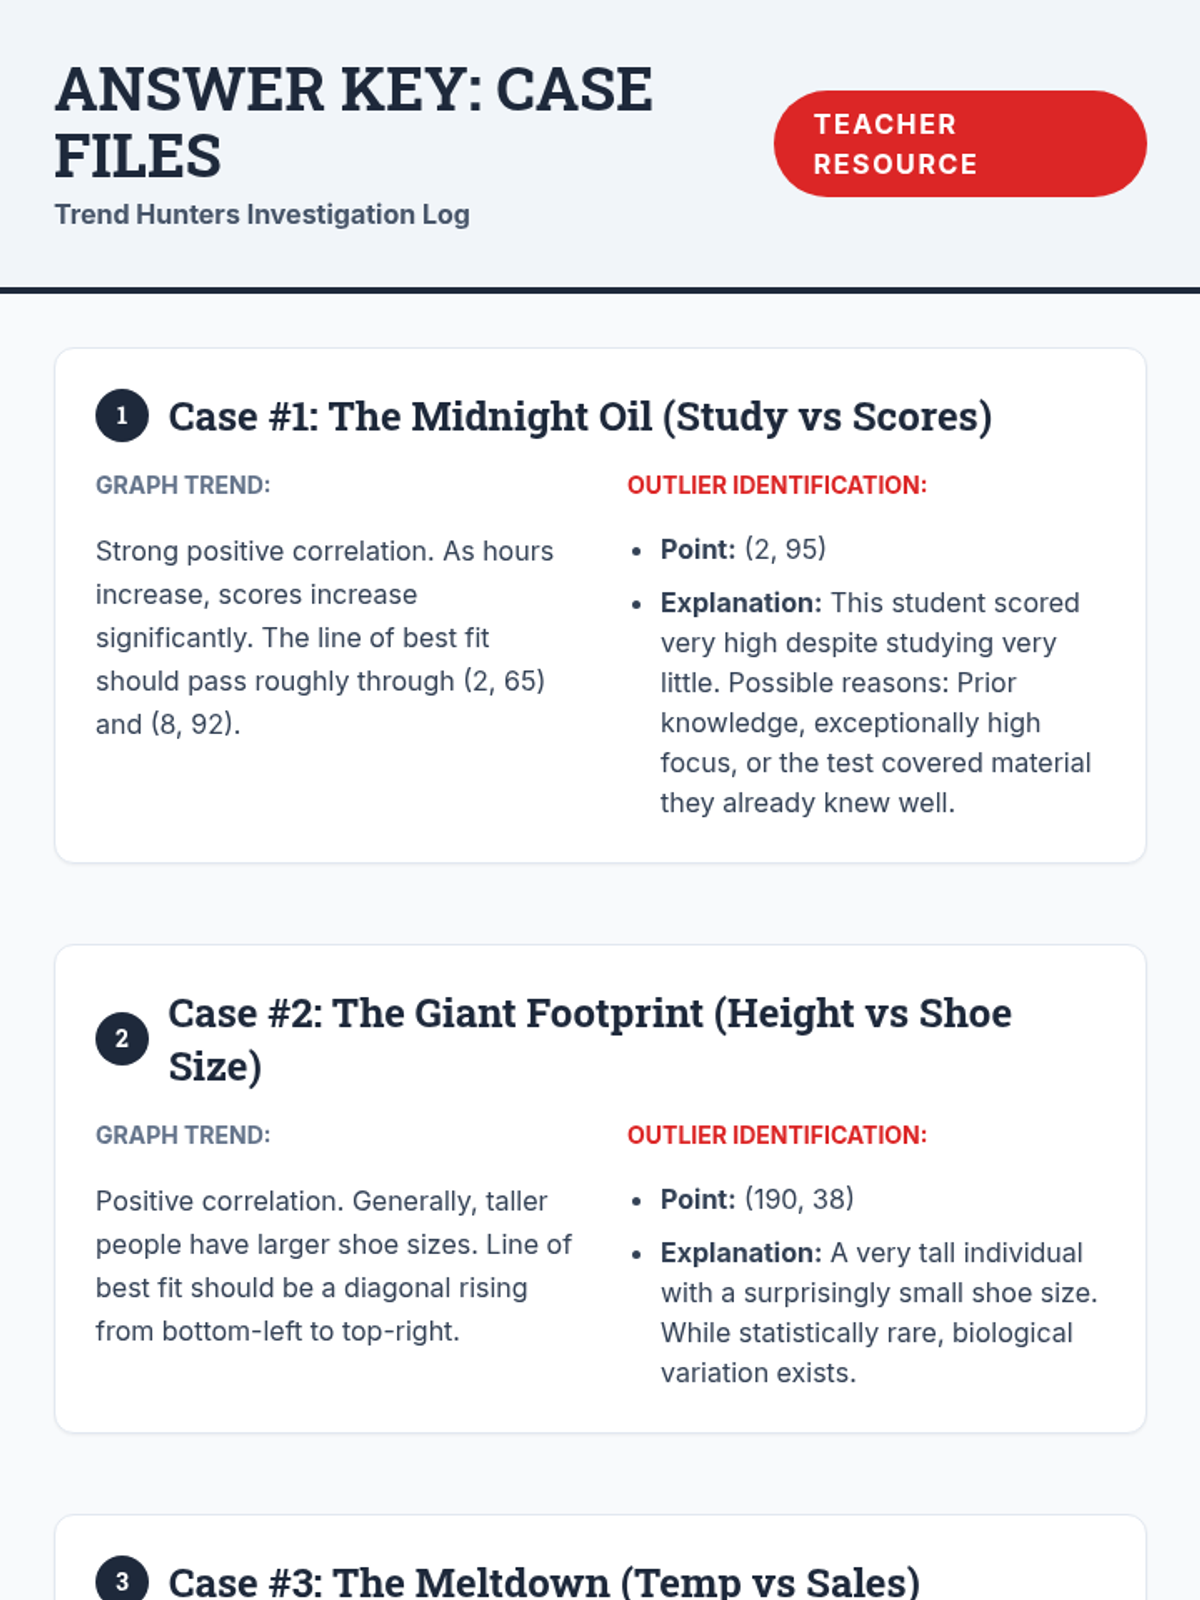
Mastering data visualization and interpretation through scatter plots and trend analysis.
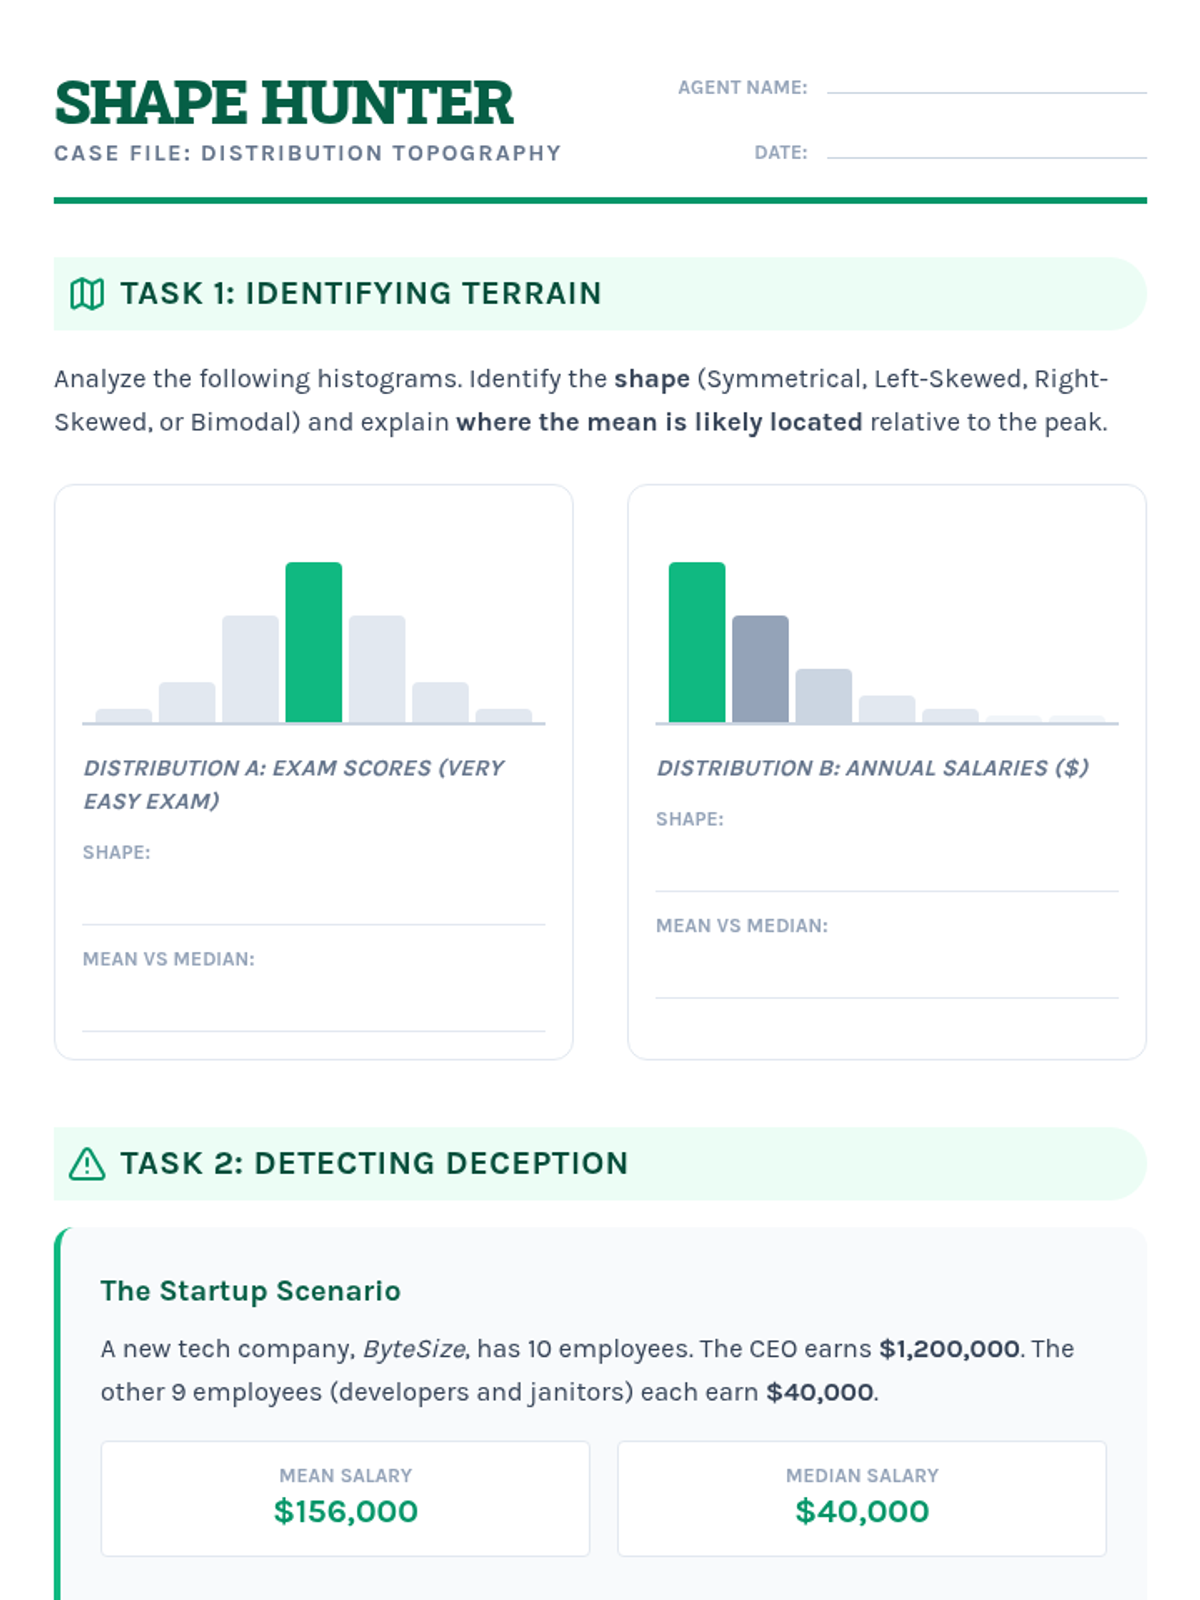
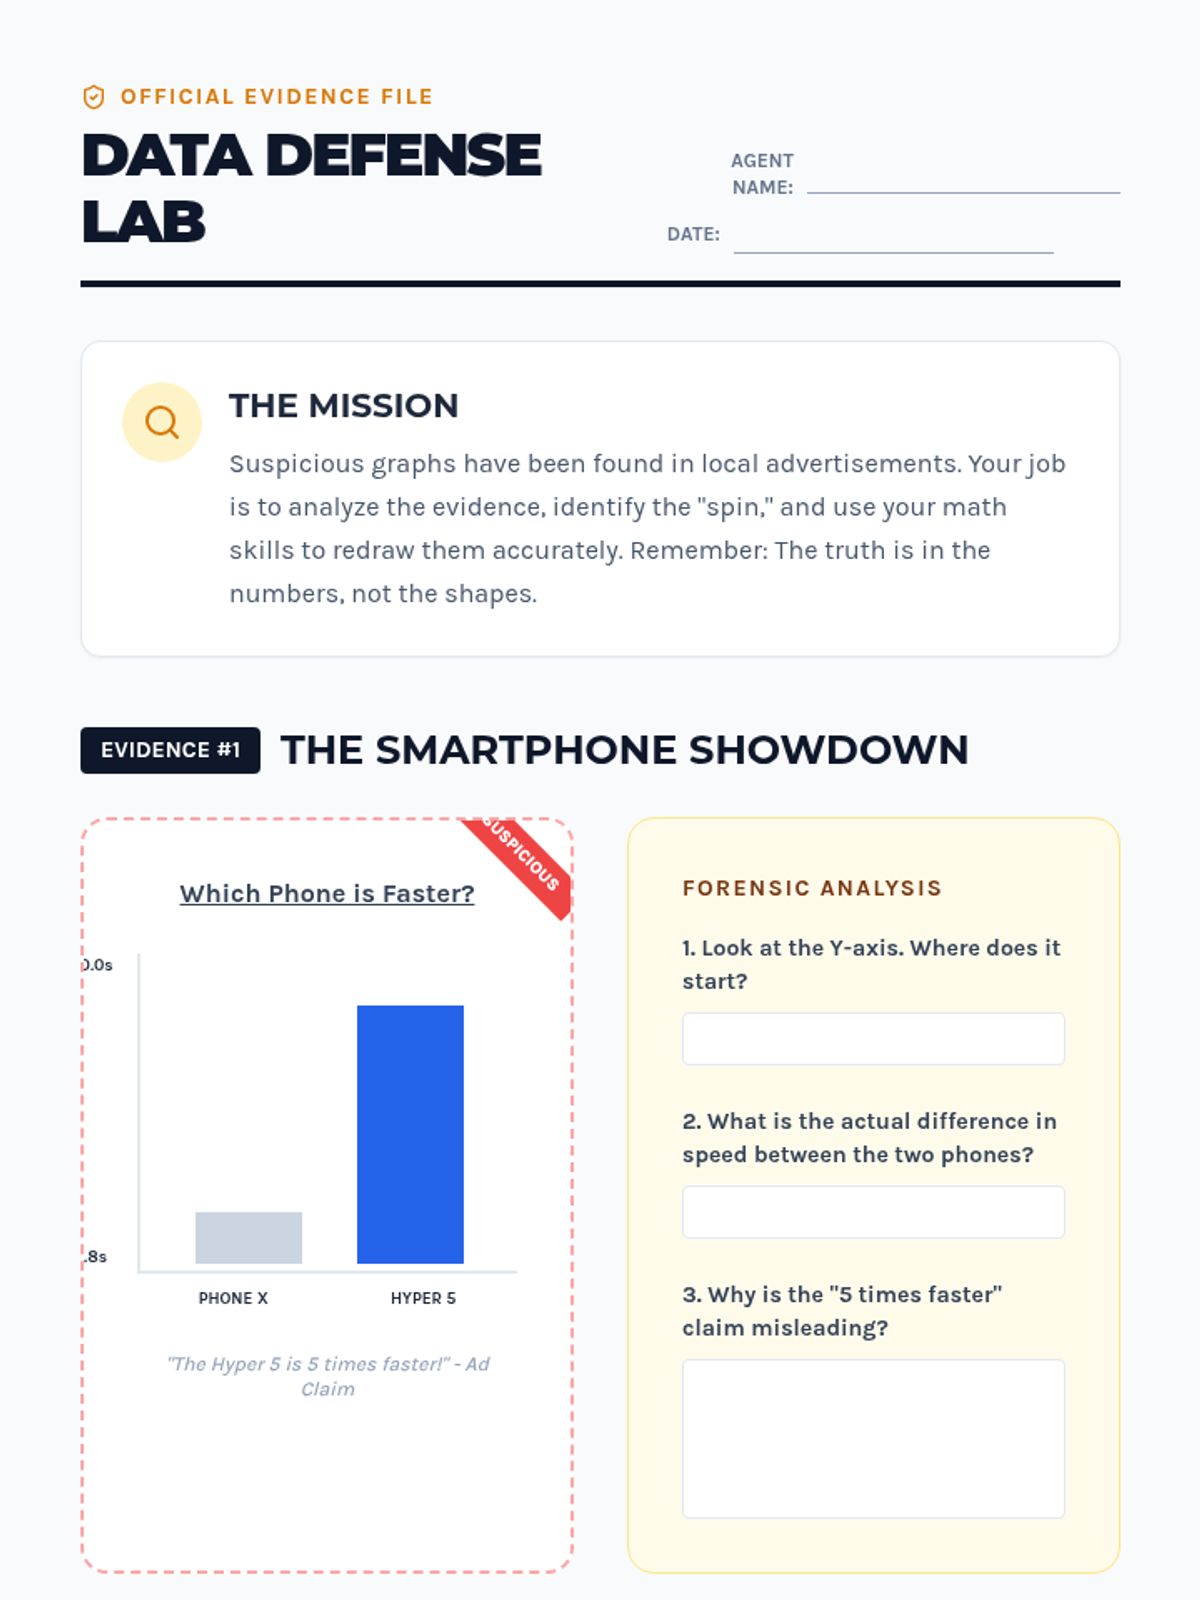
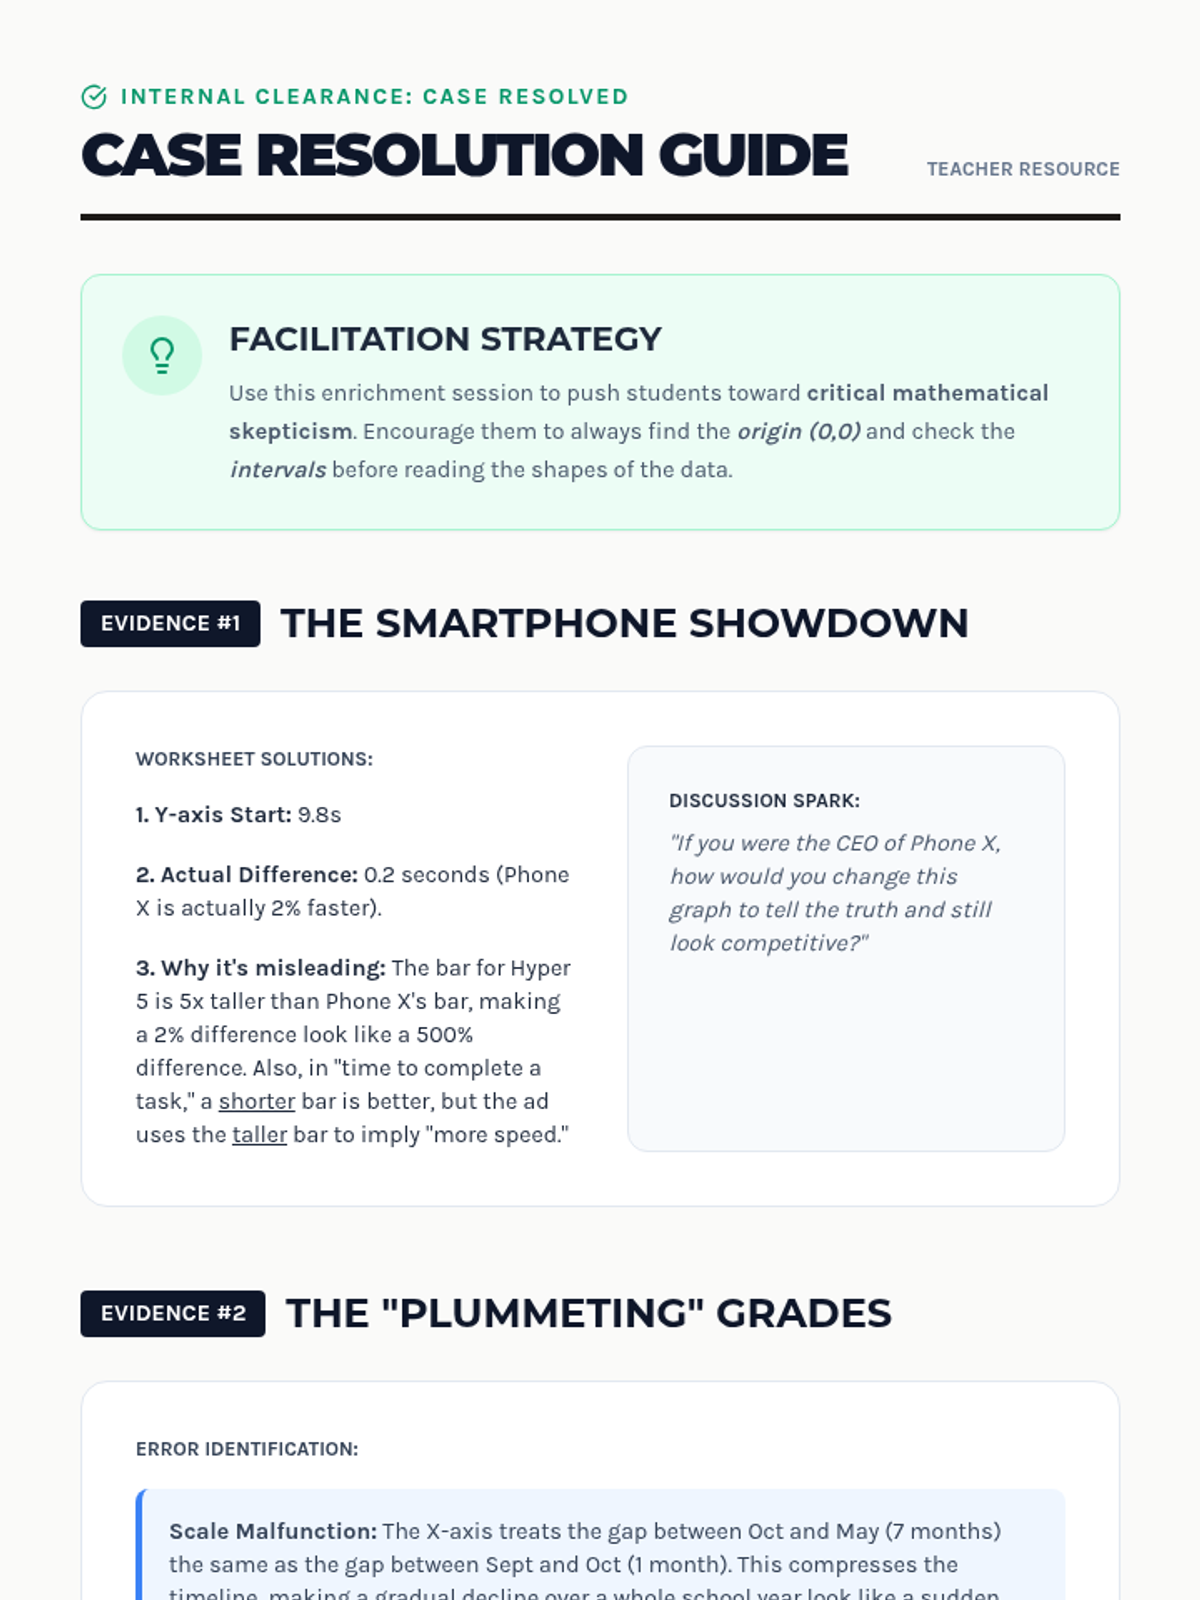
A deep dive into data literacy, focusing on how data can be manipulated and how to interpret it with a critical, mathematical eye. Students move beyond simple reading to evaluation and analysis.
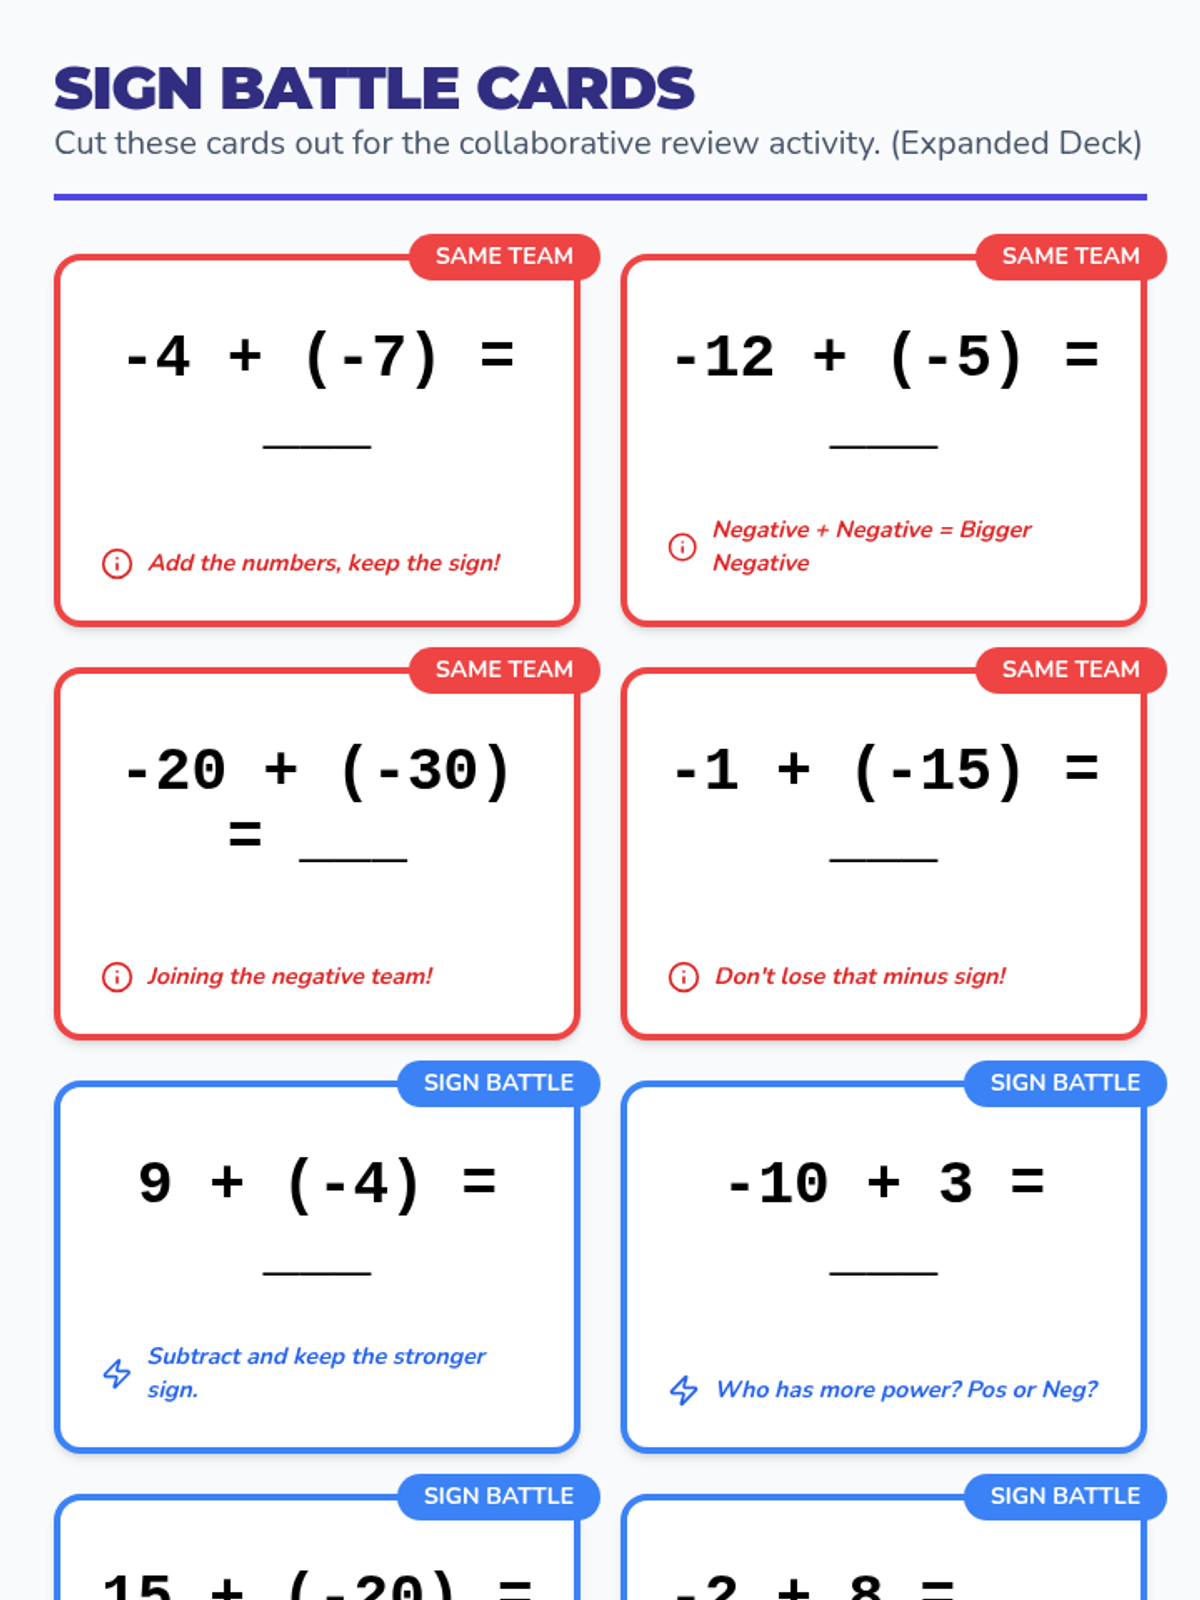
A comprehensive unit on adding and subtracting integers for grades 5-7, focusing on visual supports, mnemonic rules, and scaffolded practice for students with diverse learning needs.
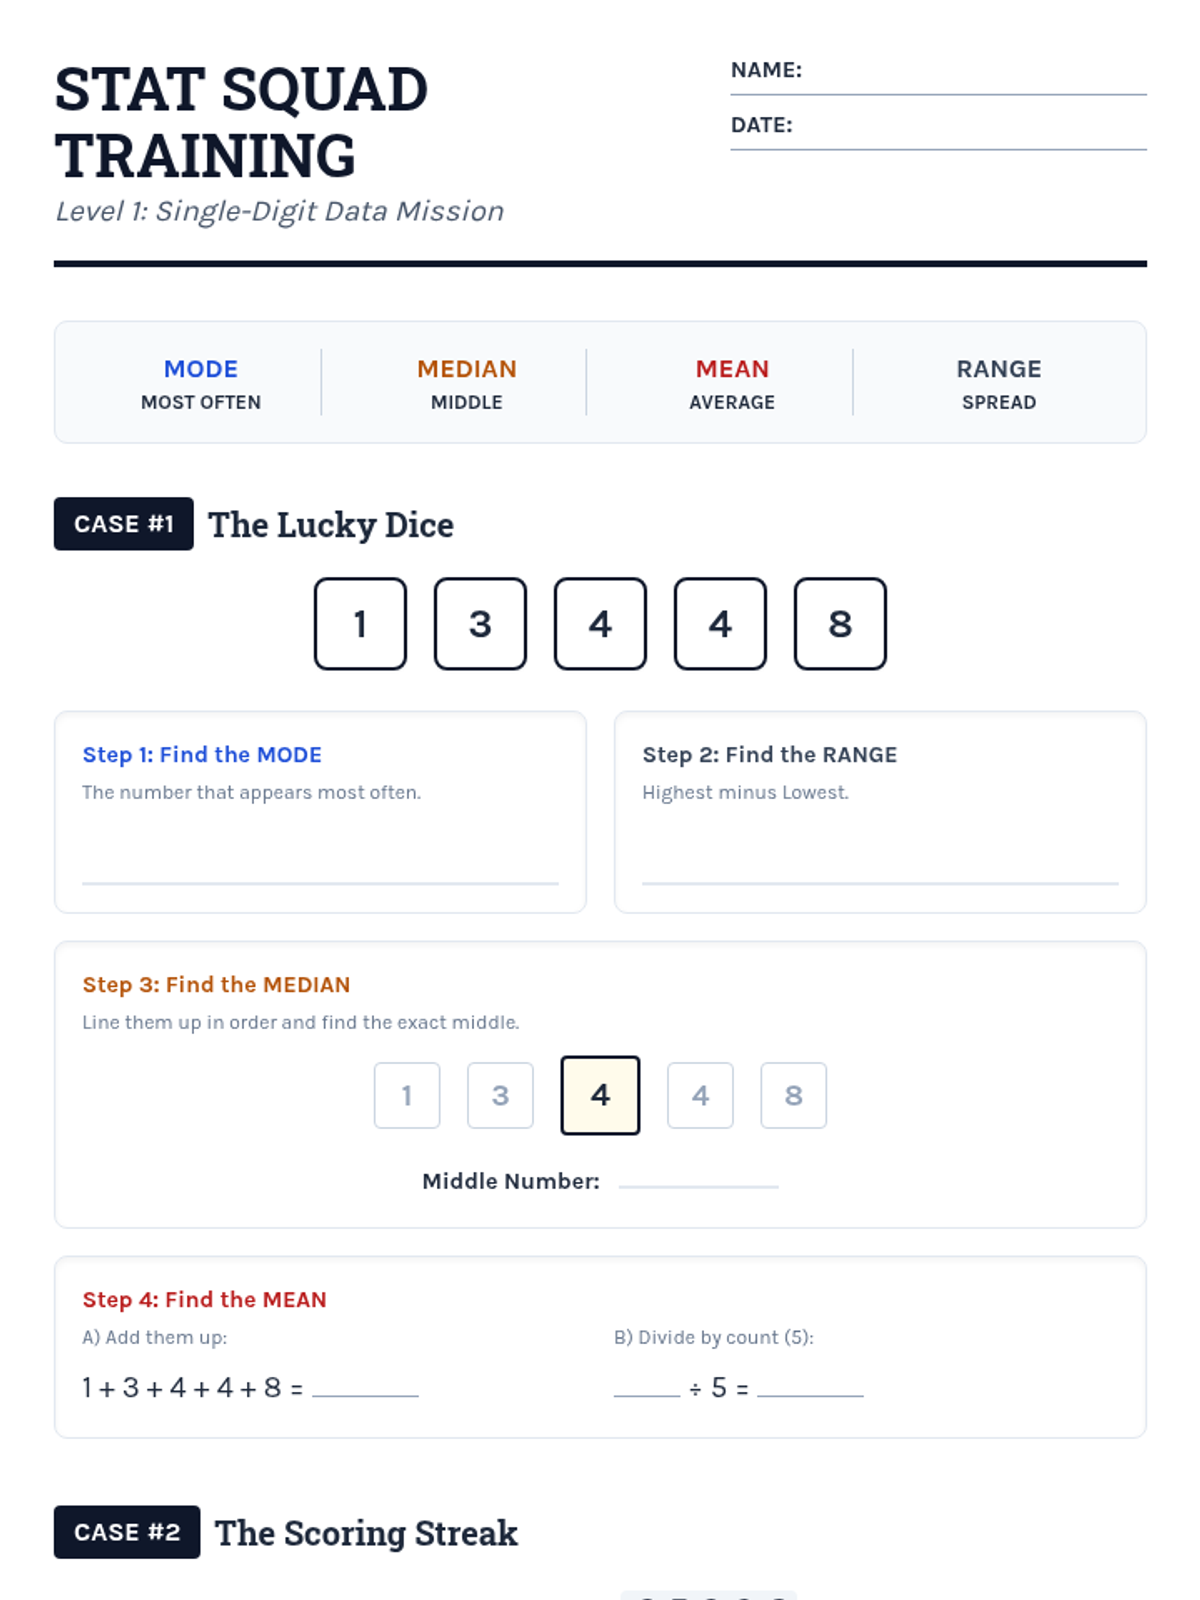
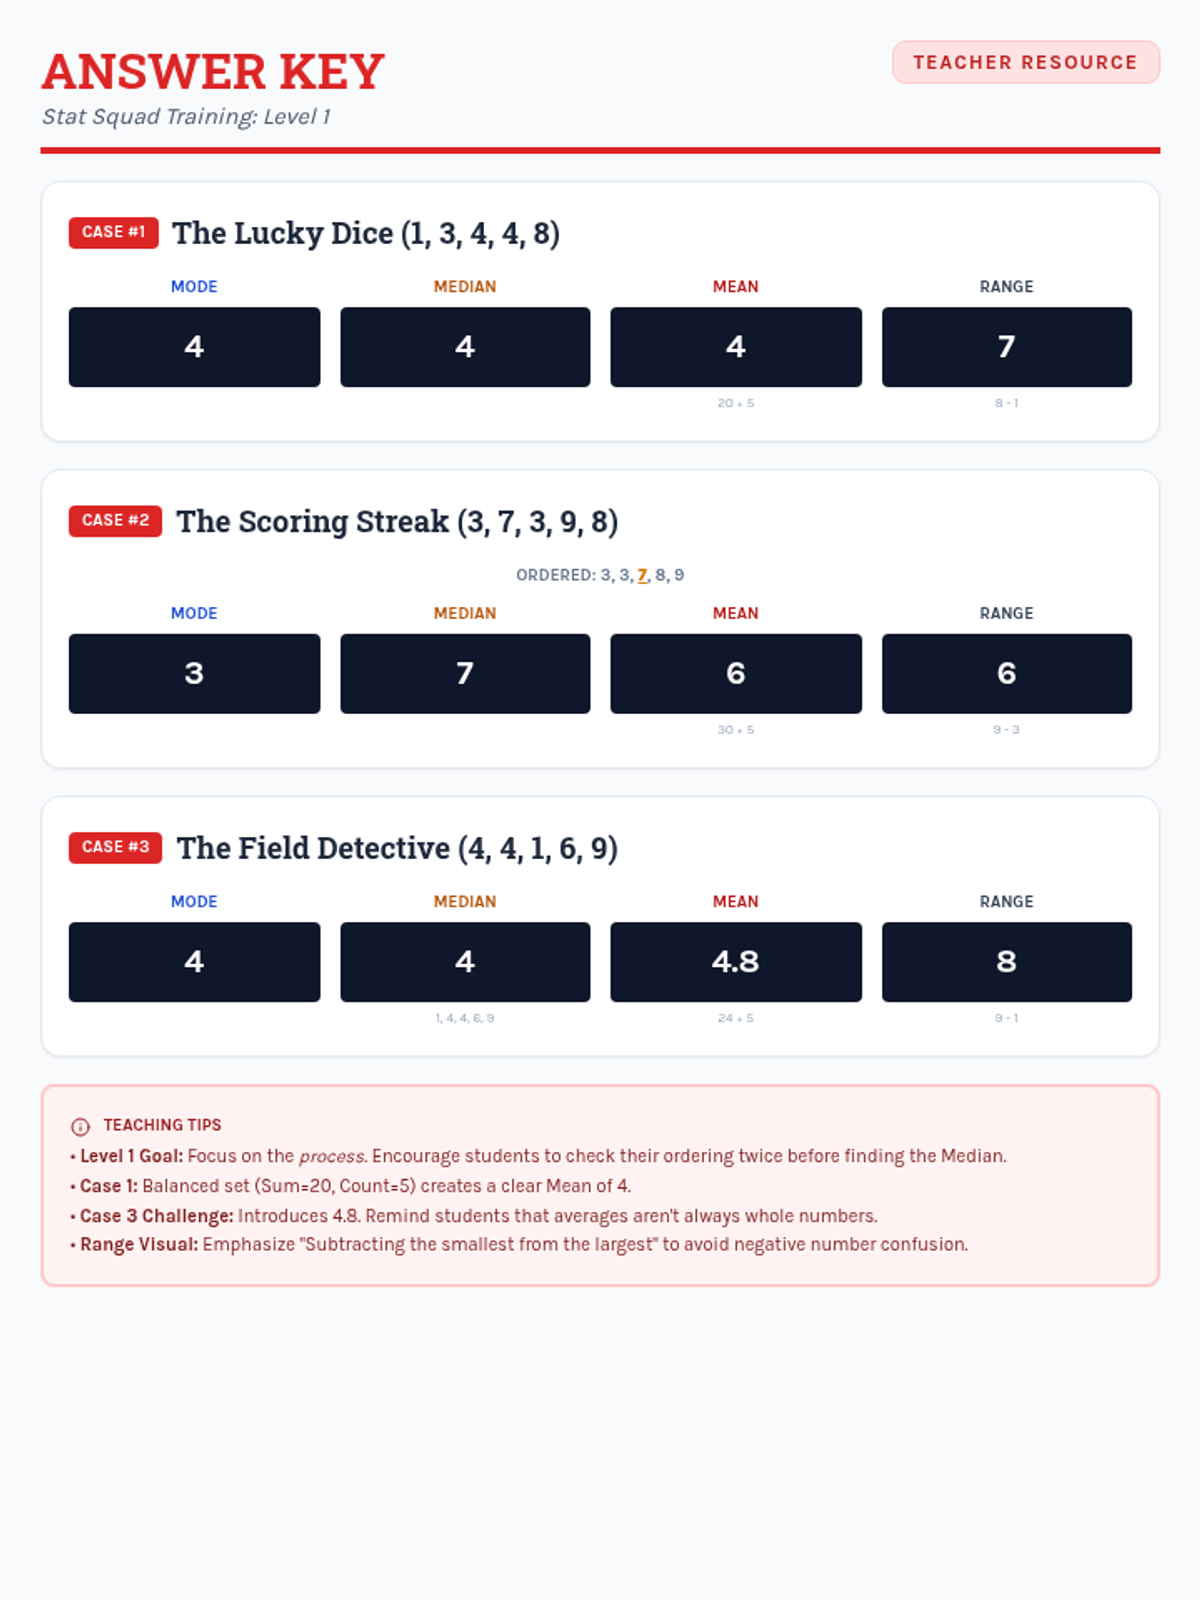
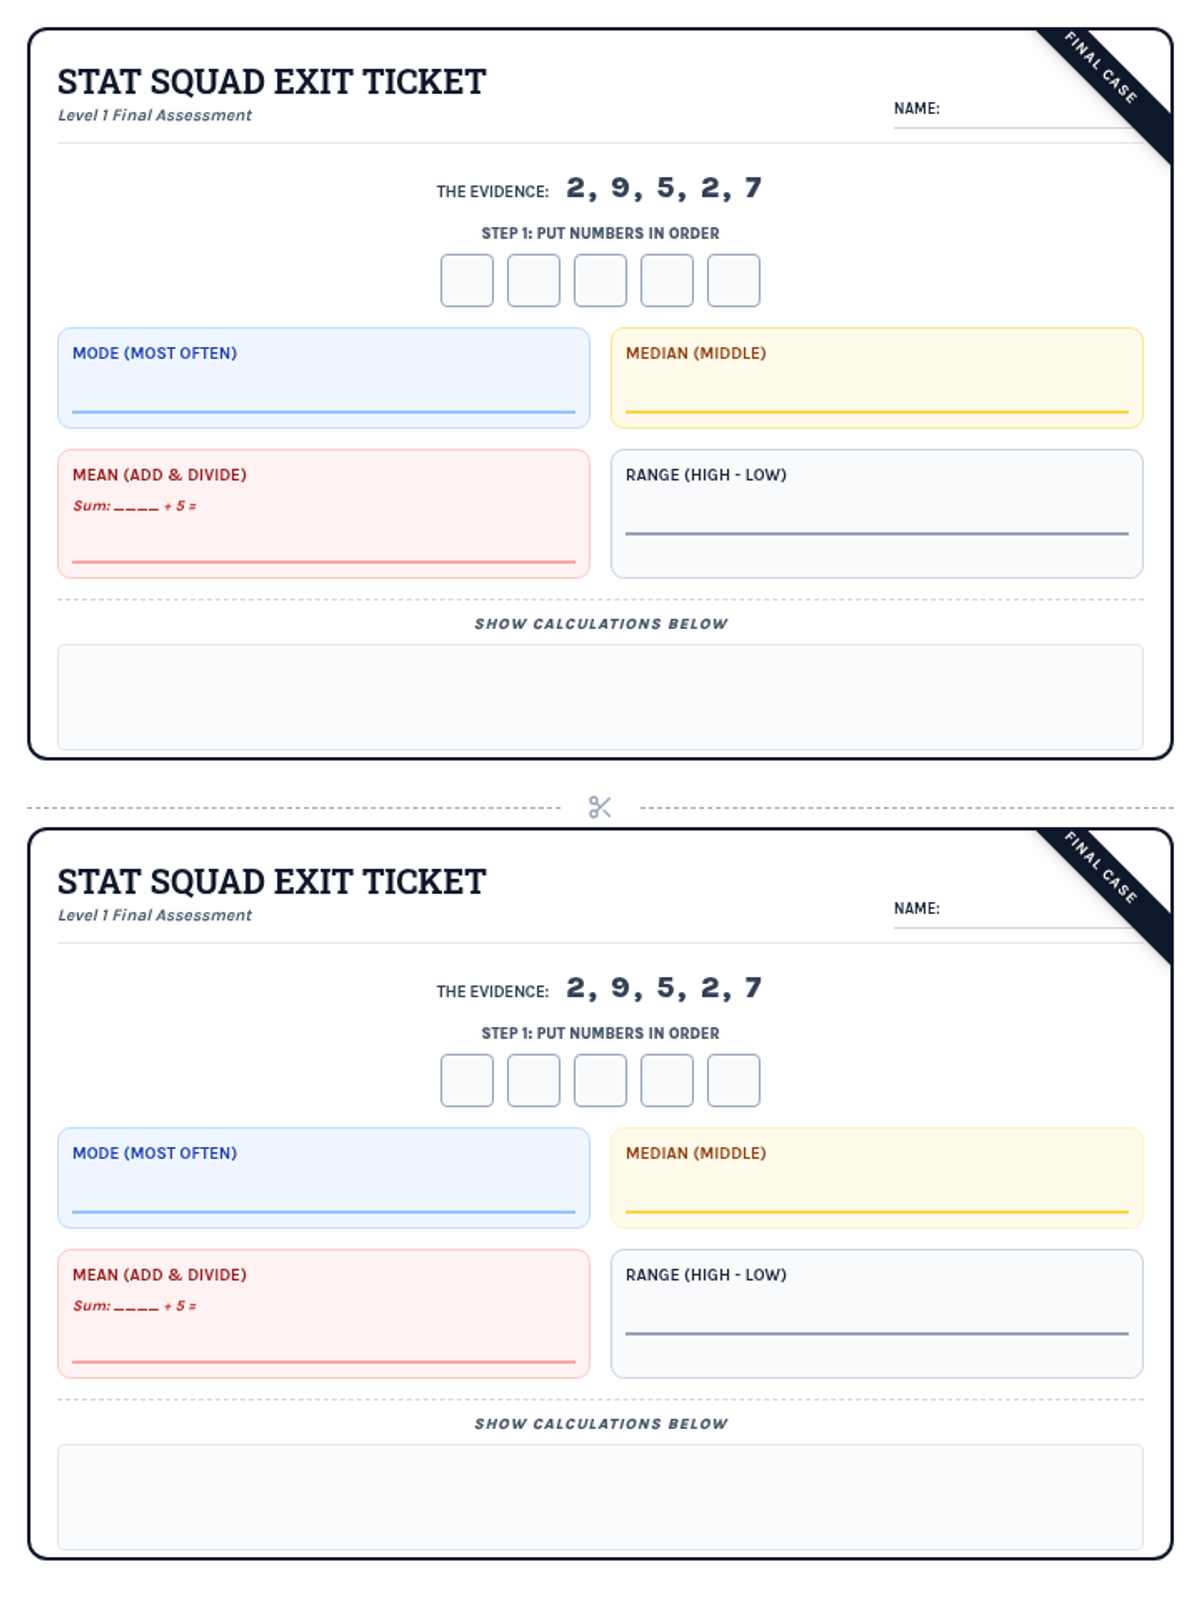
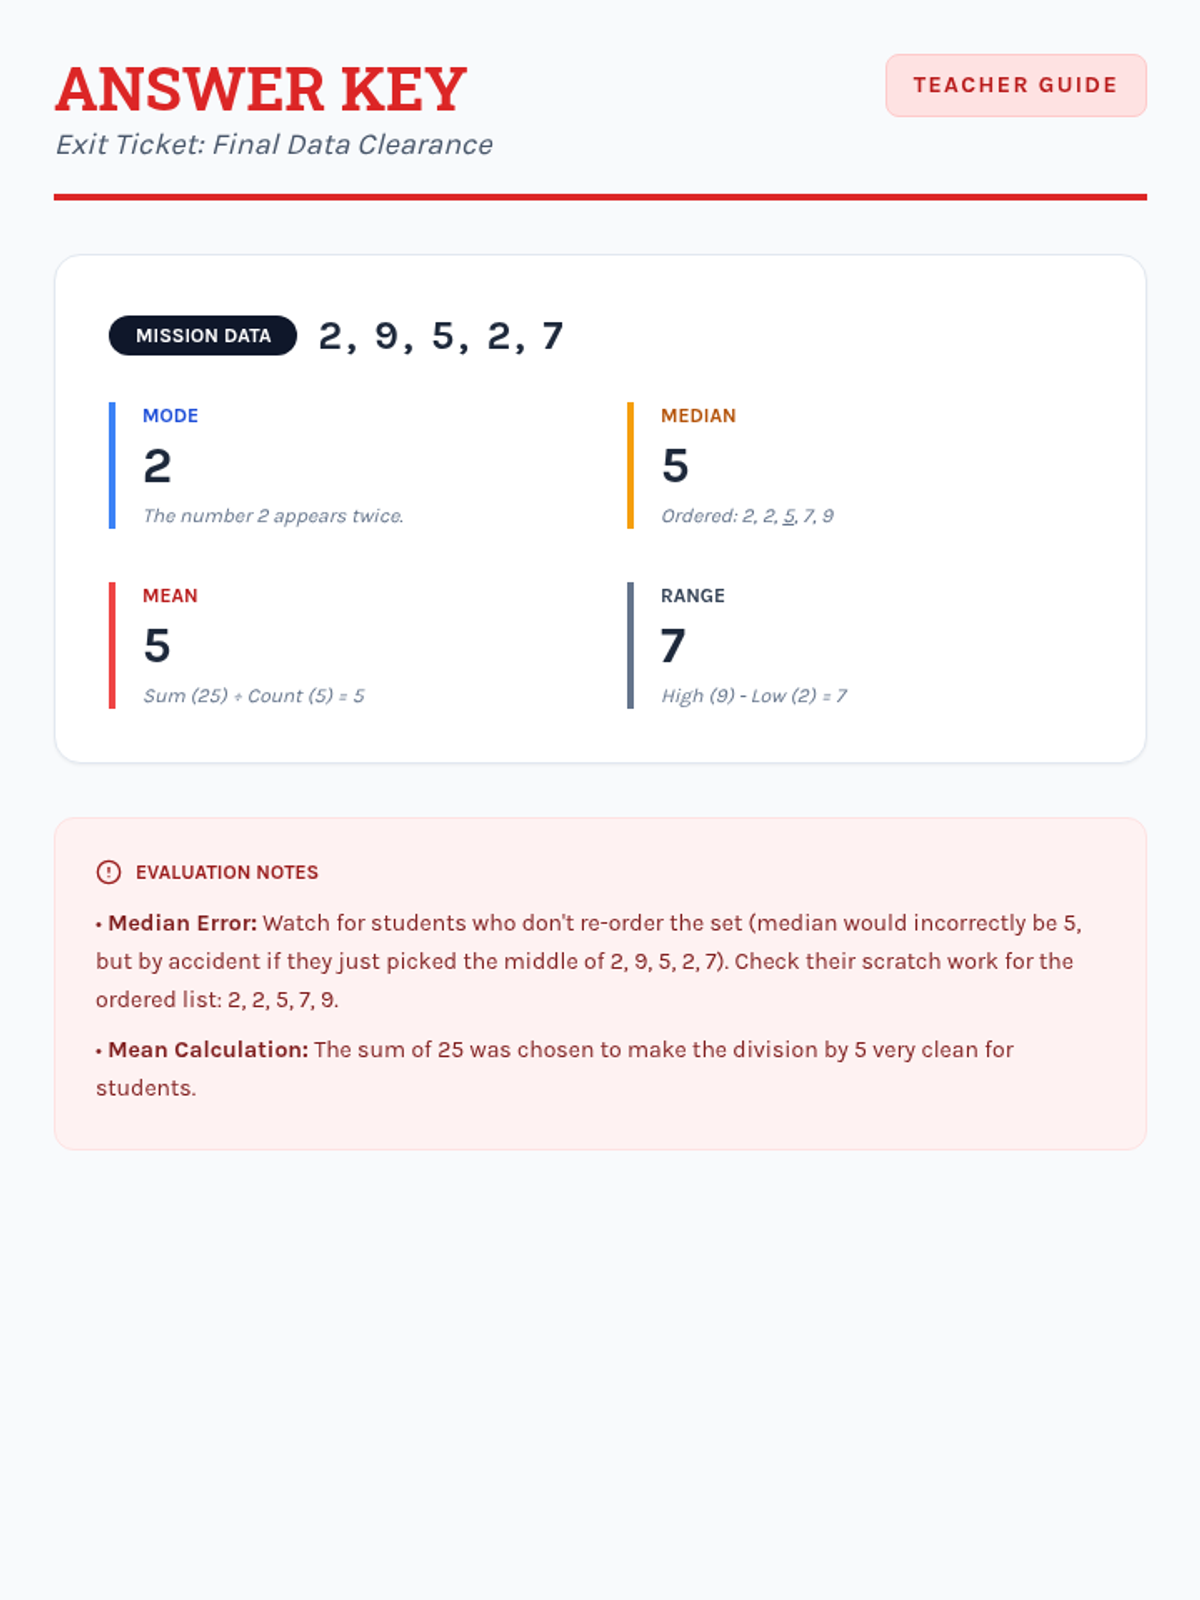
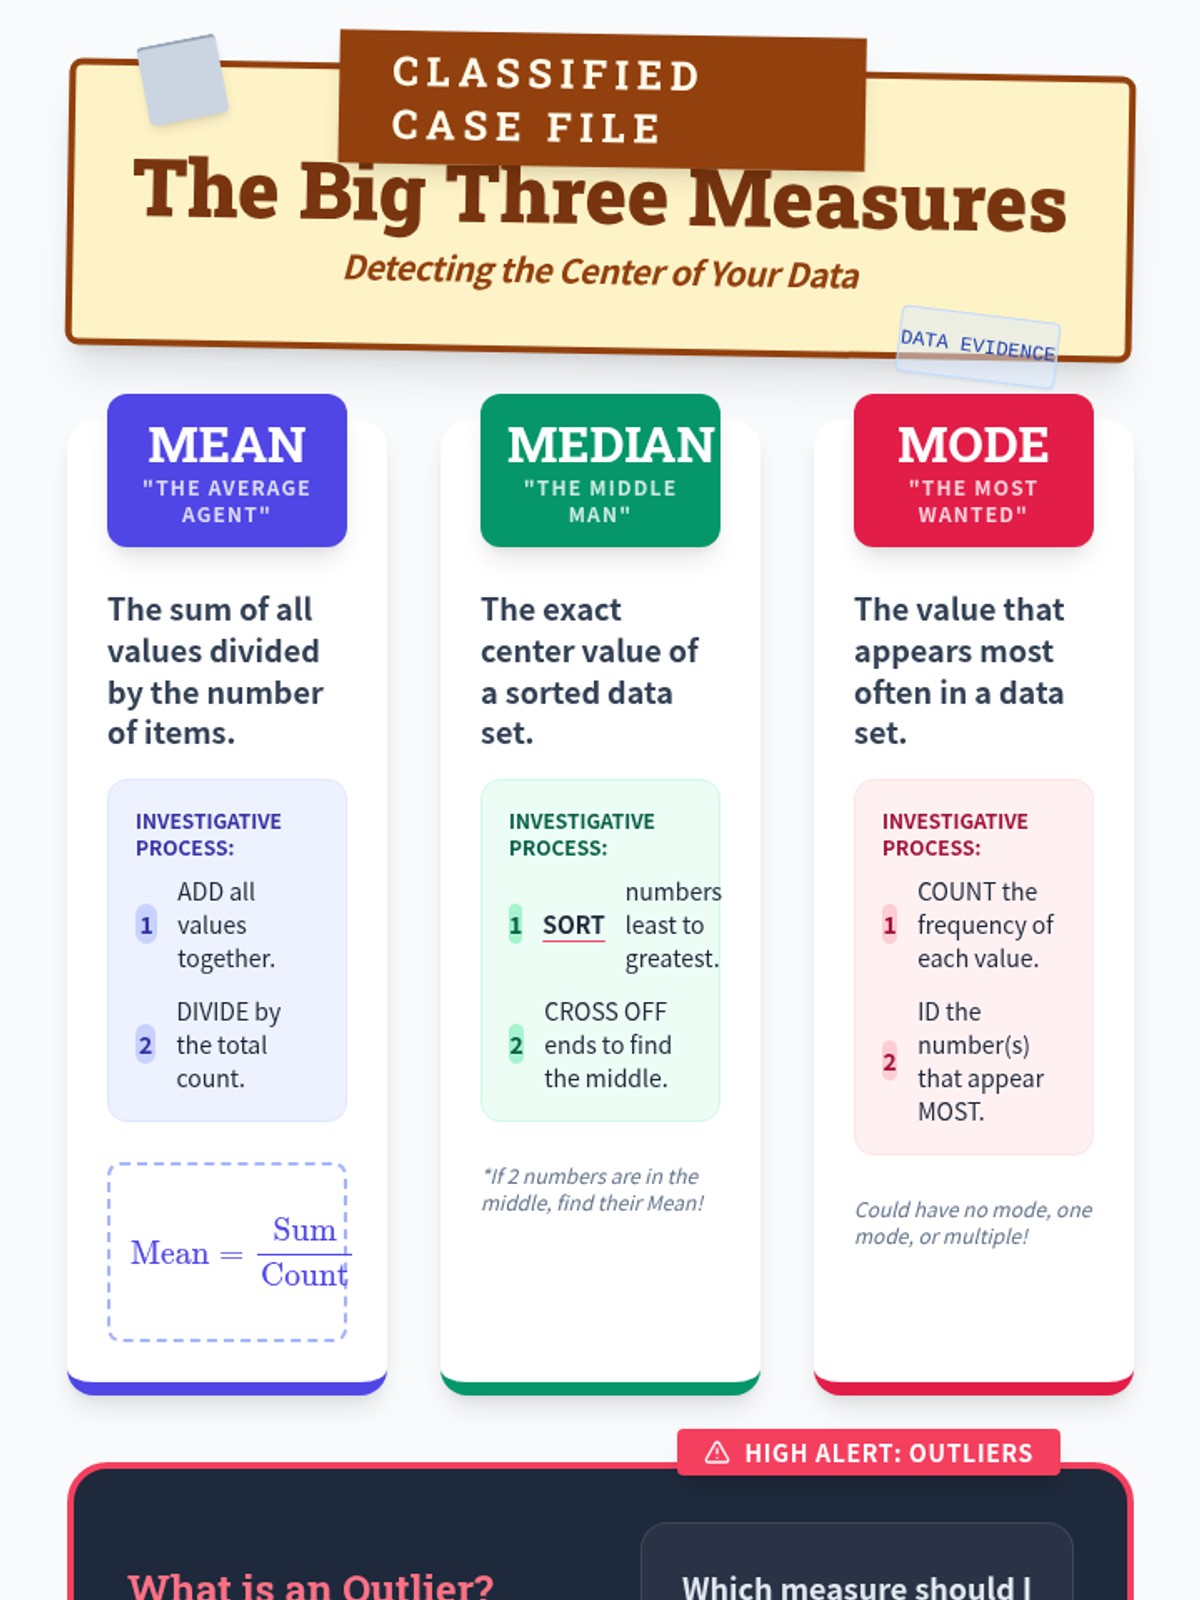
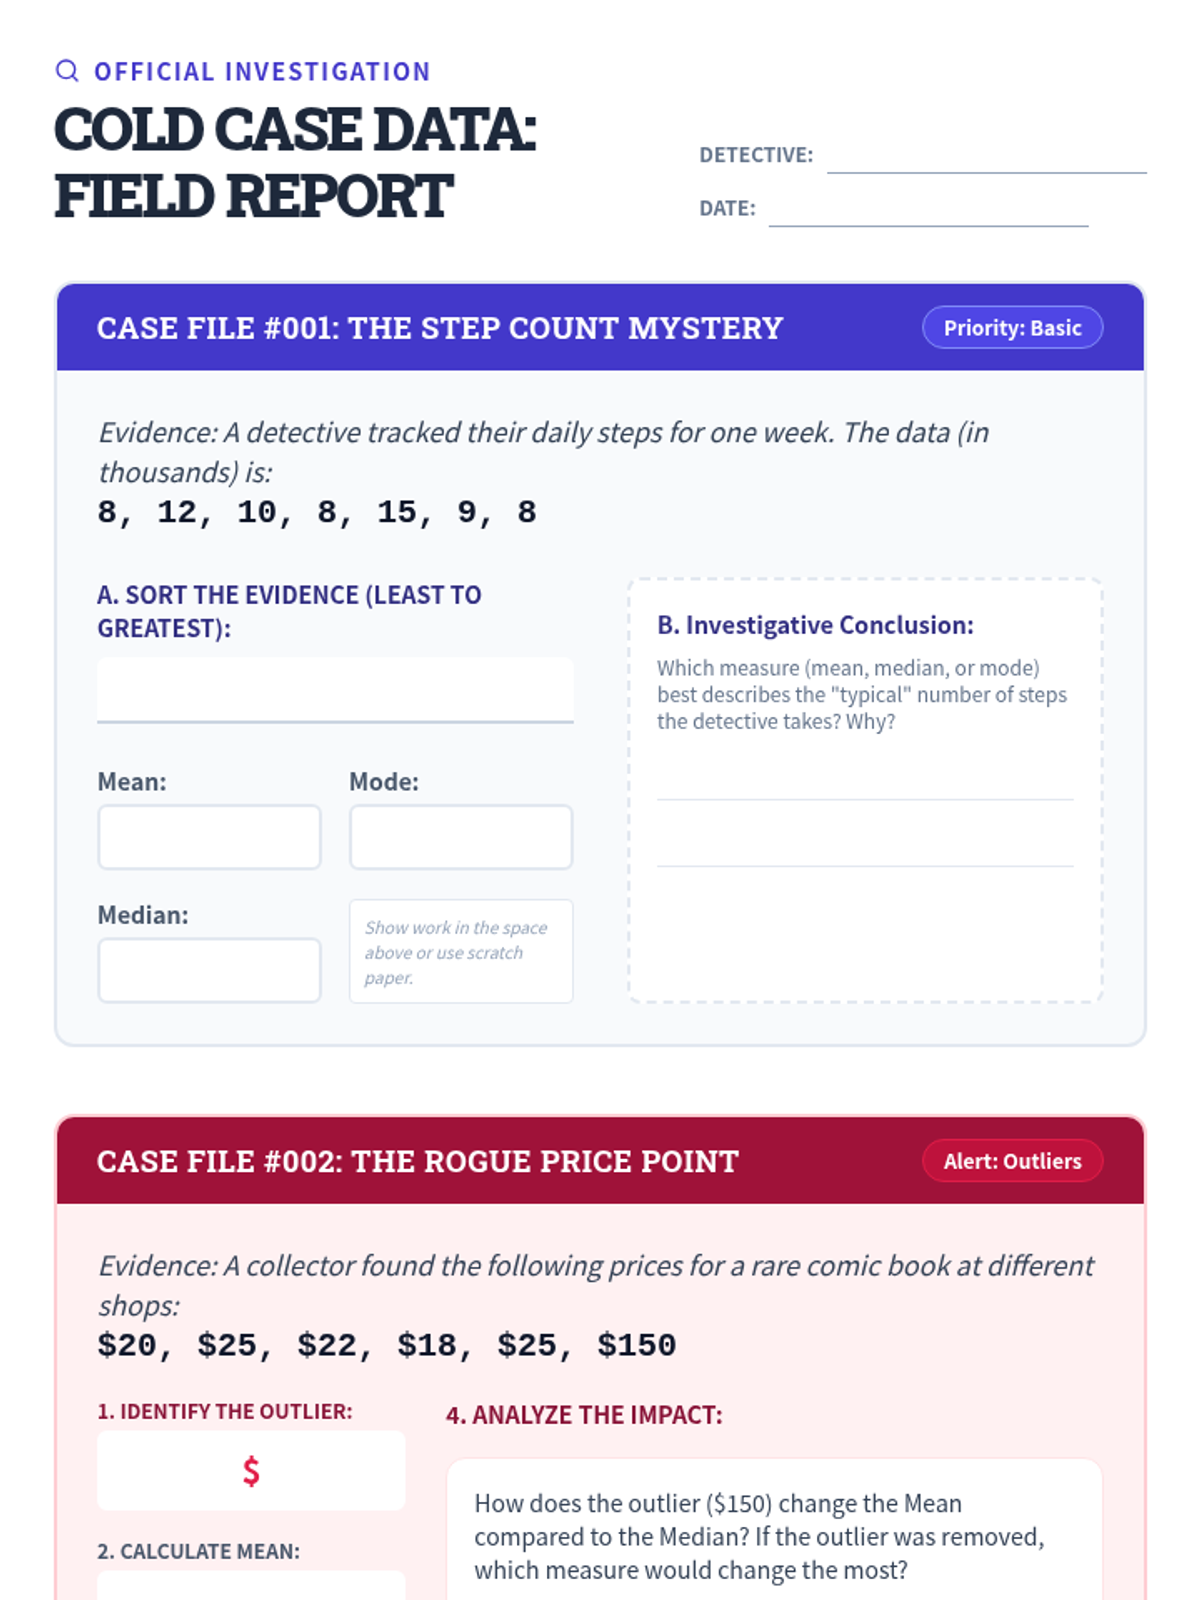
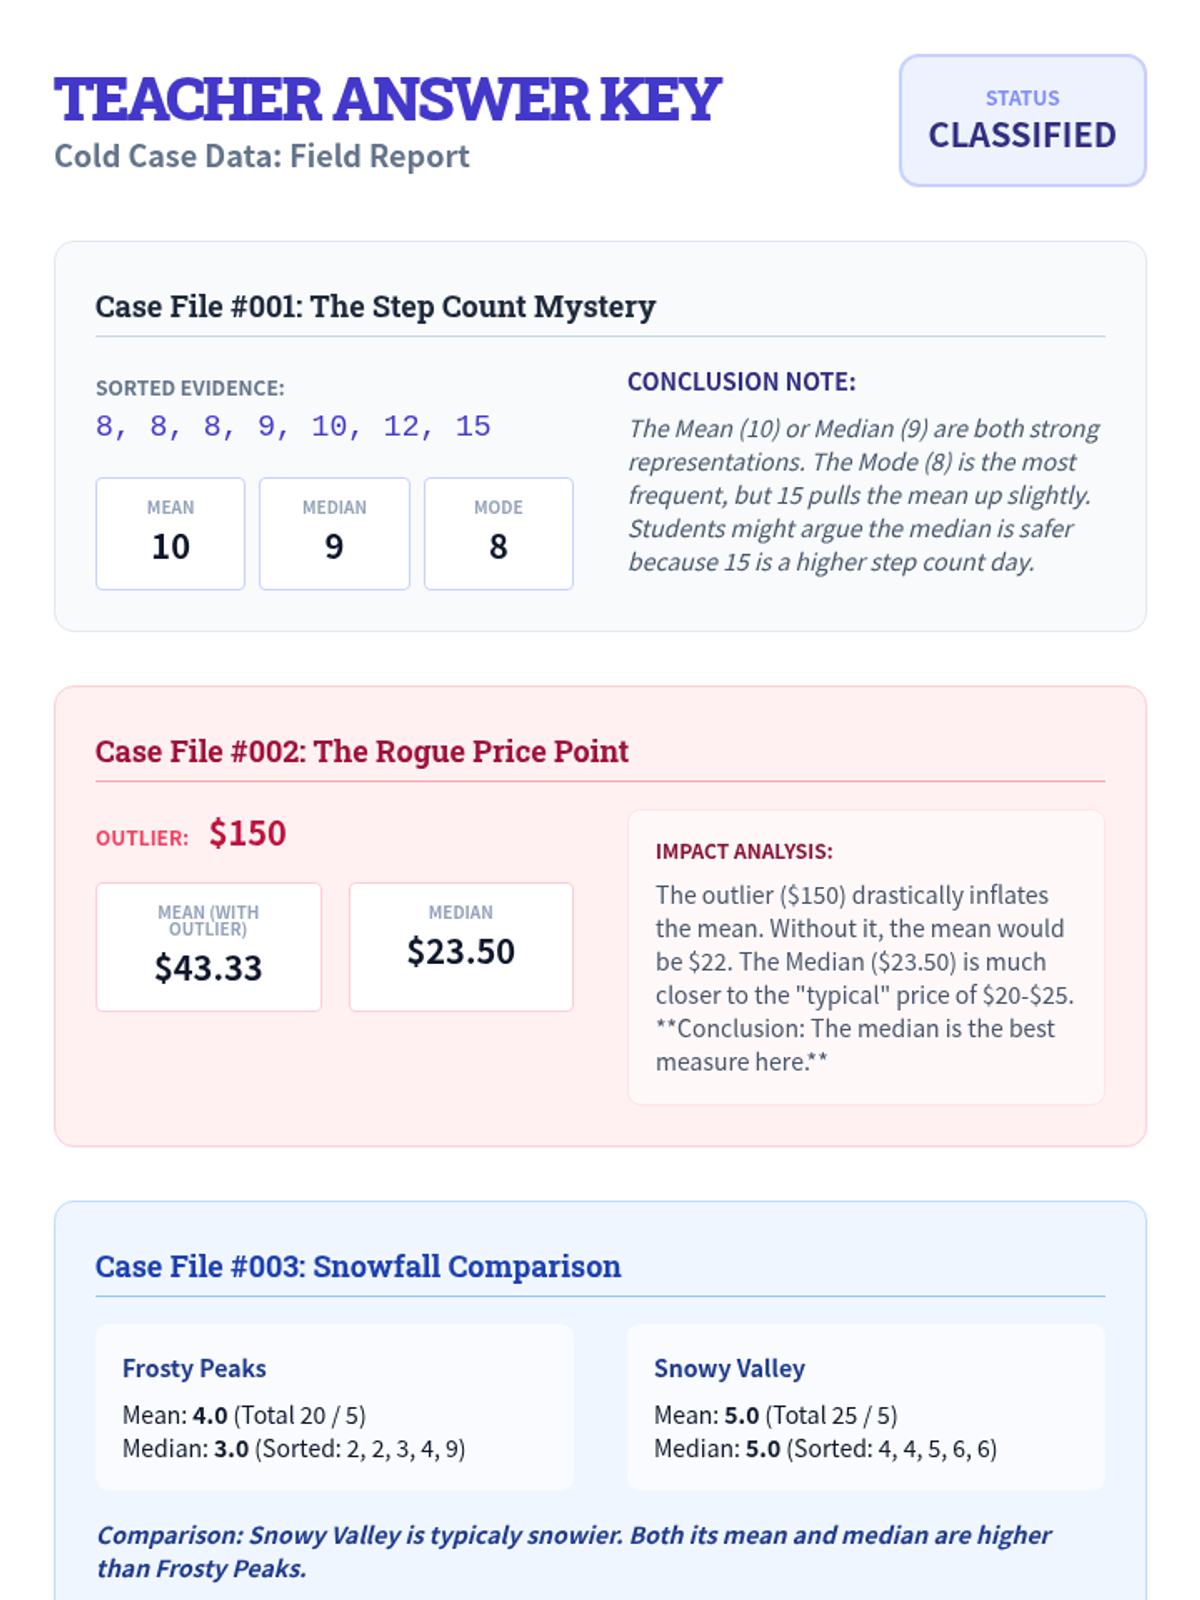
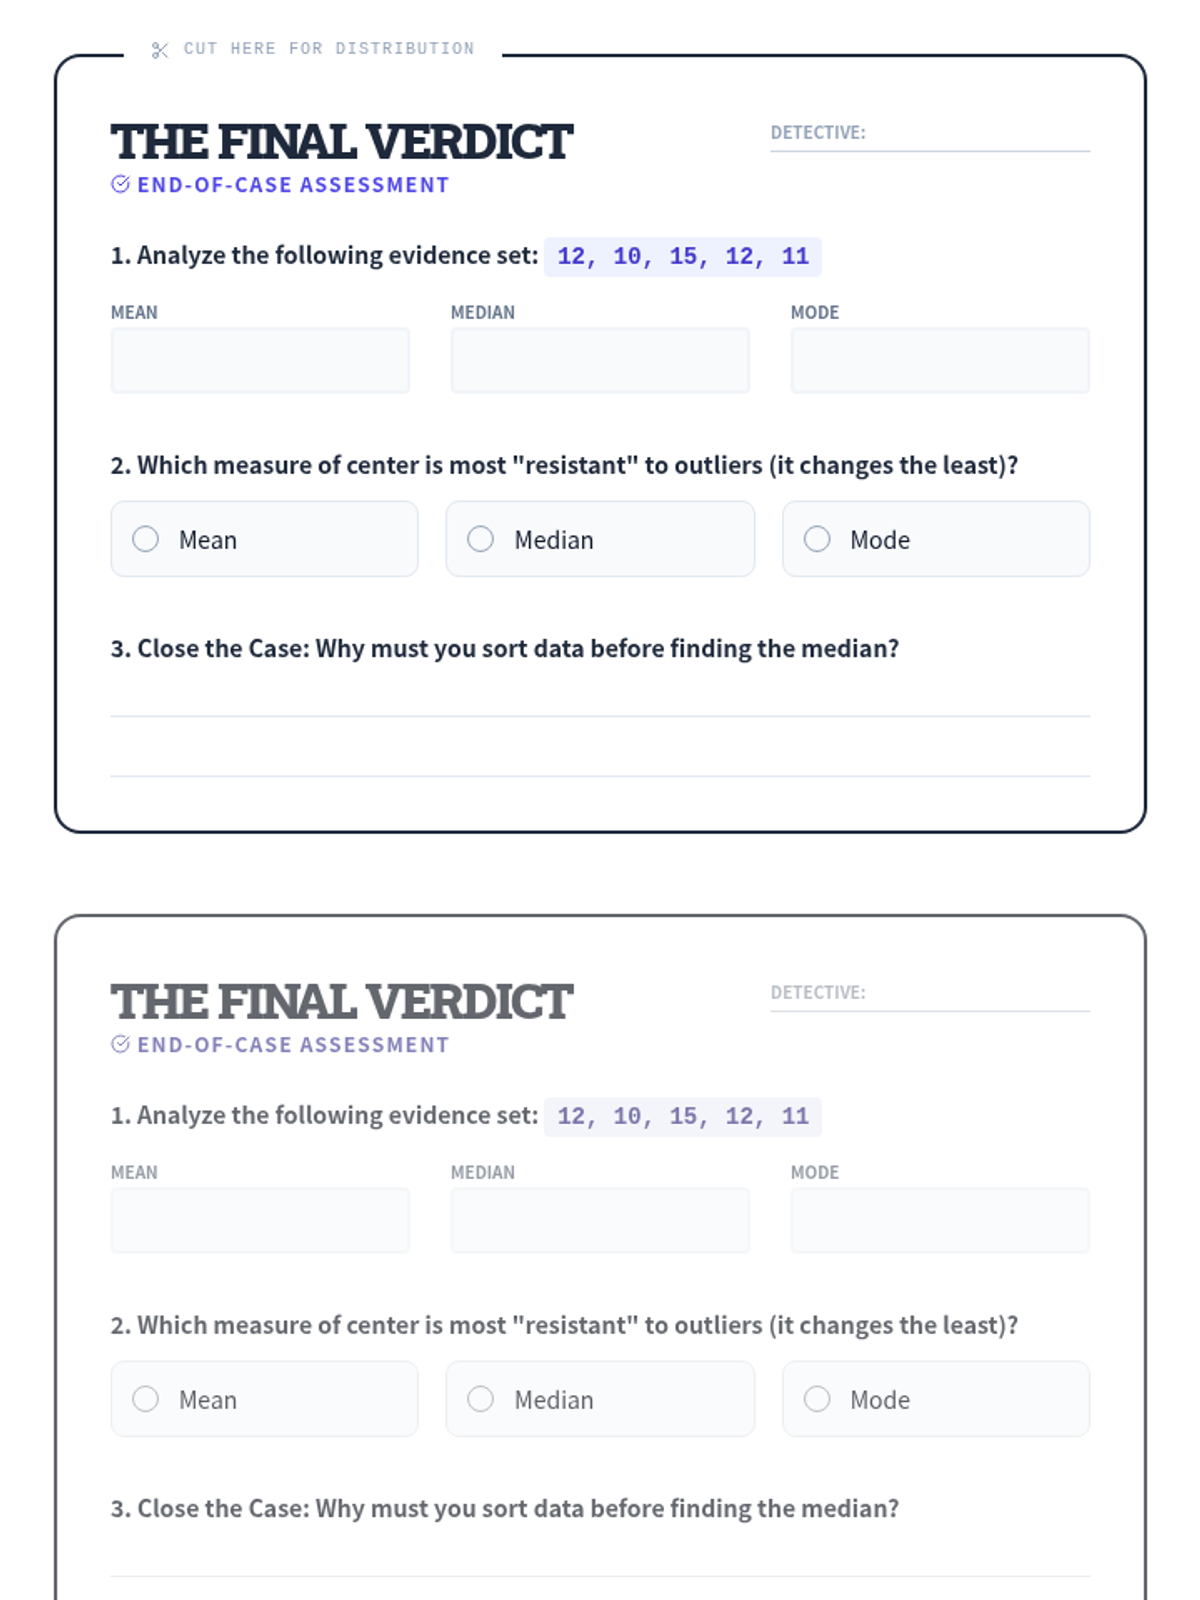
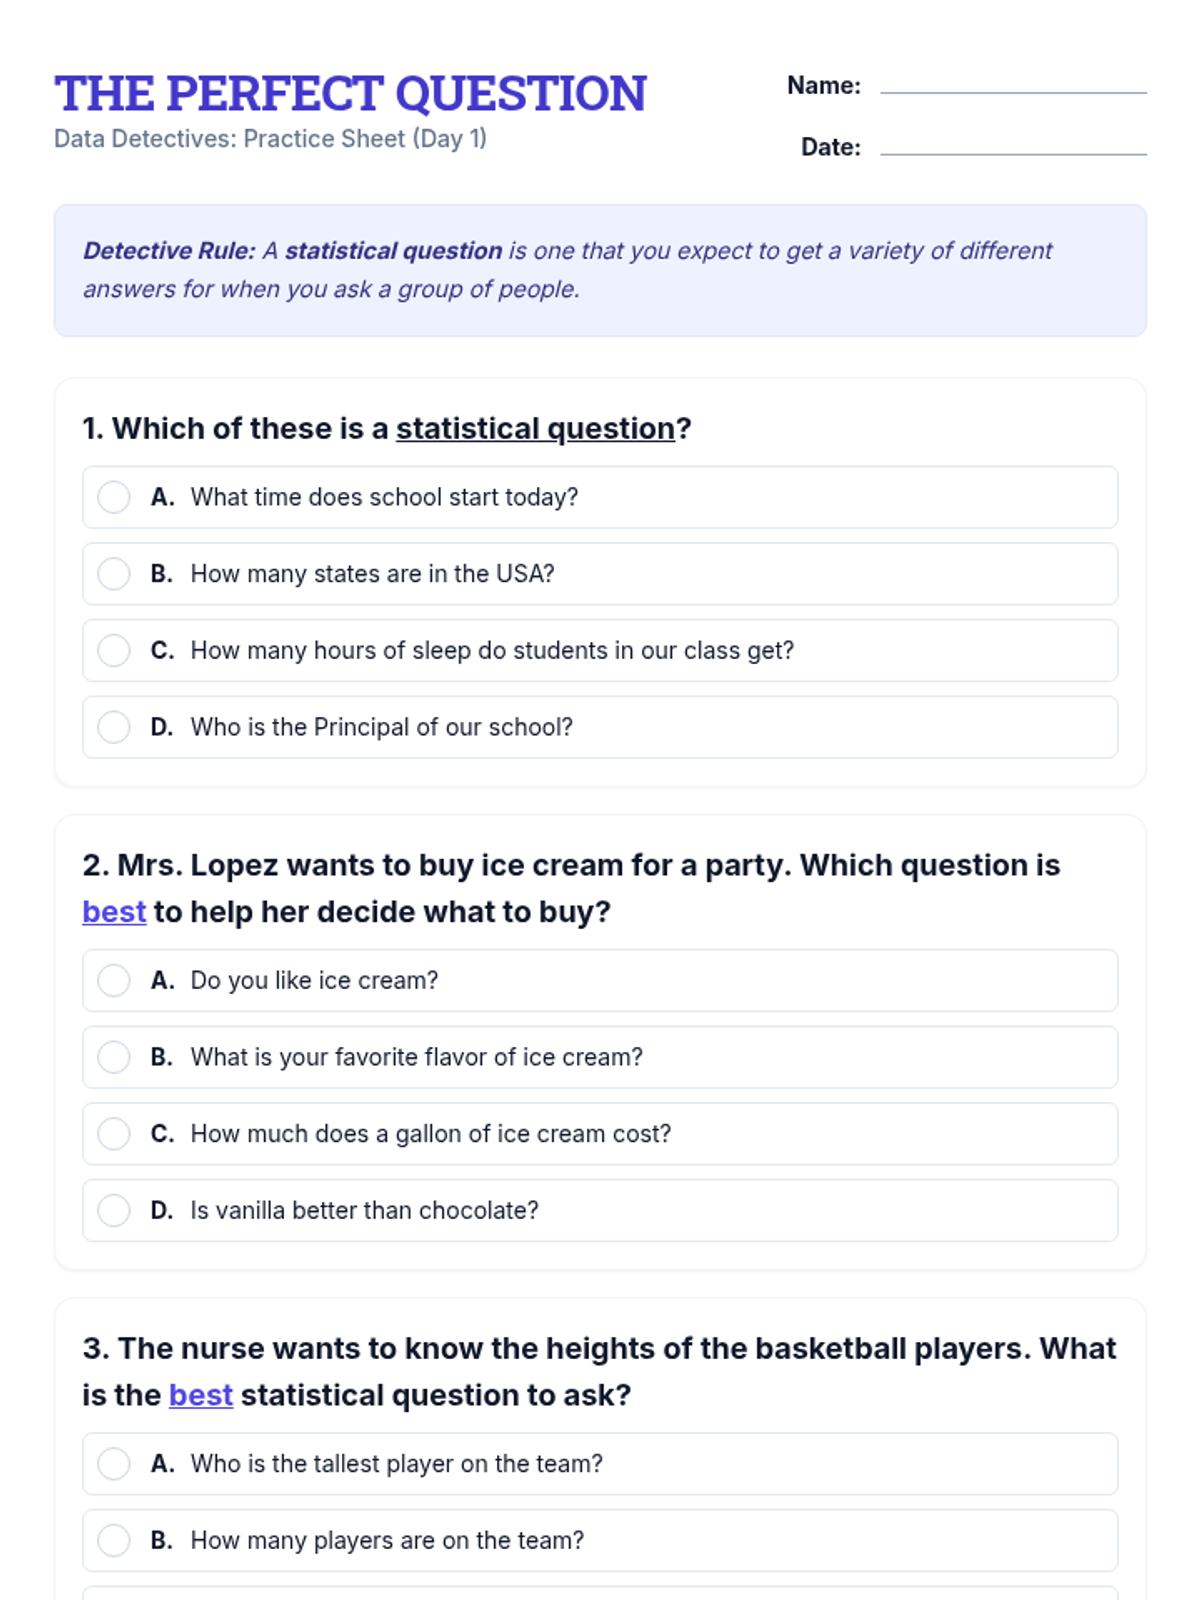
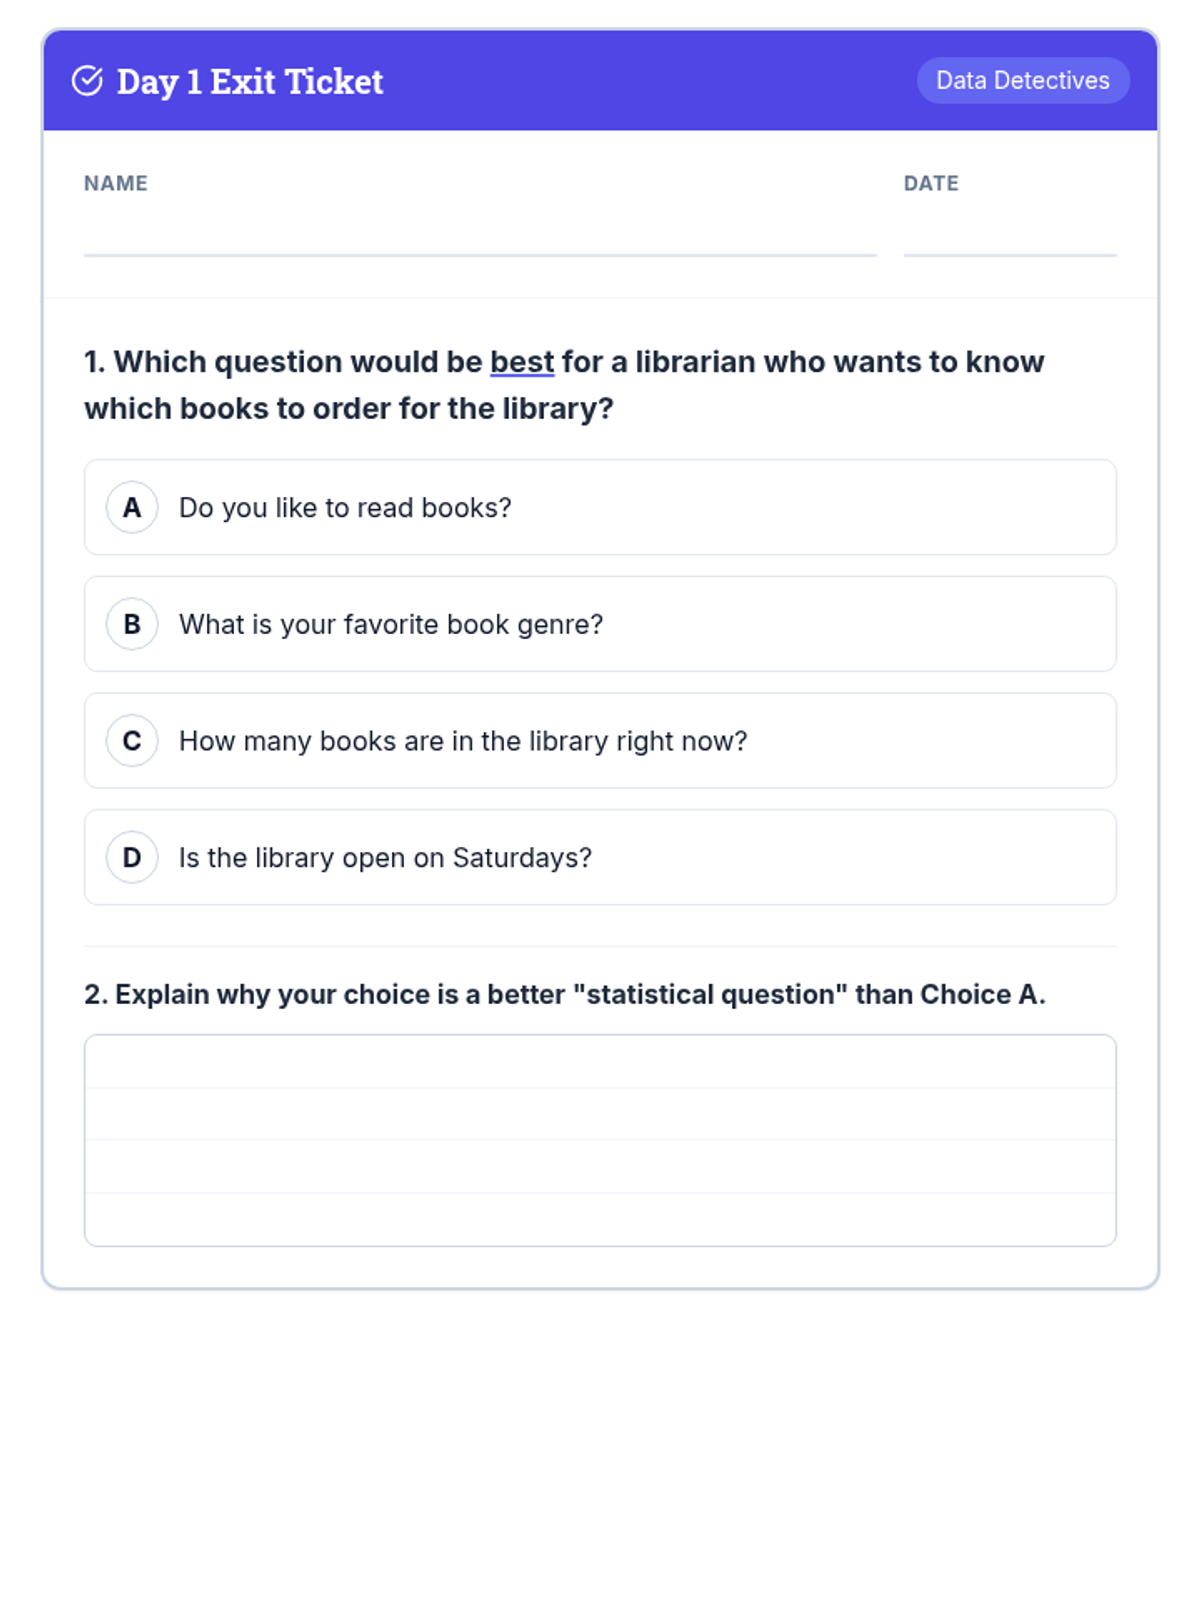
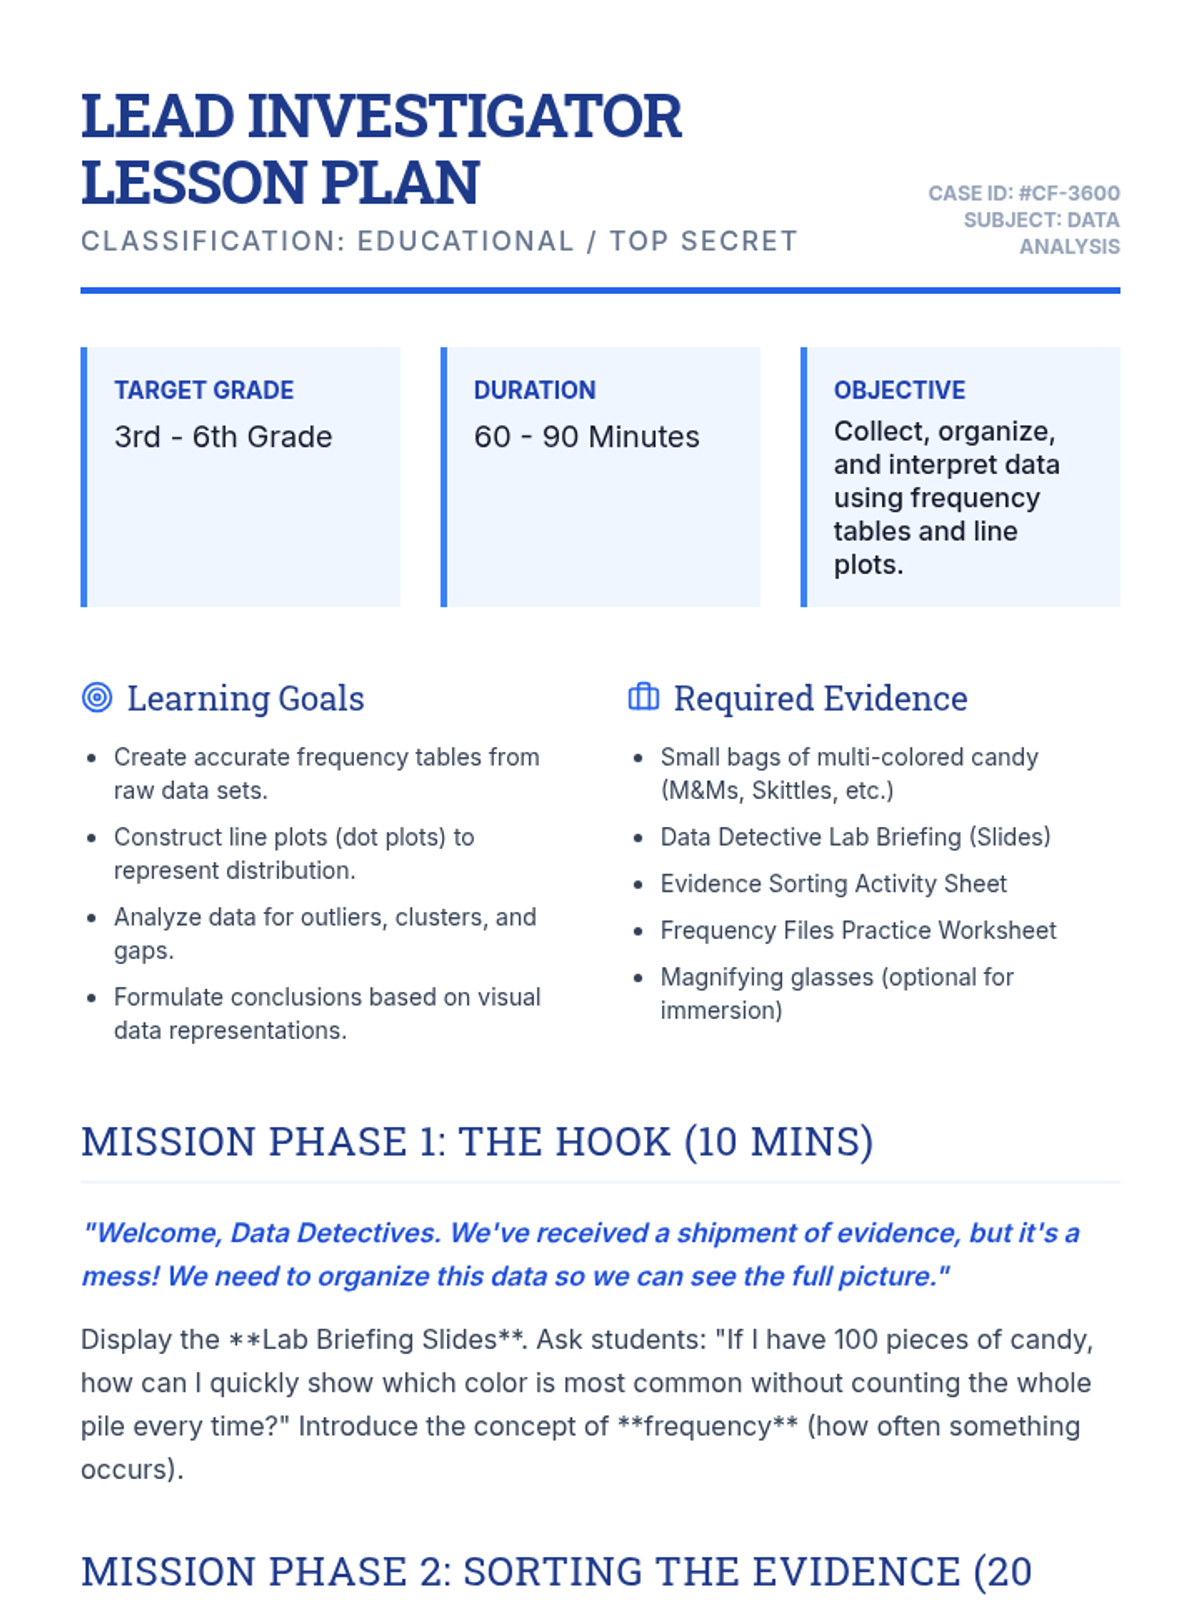
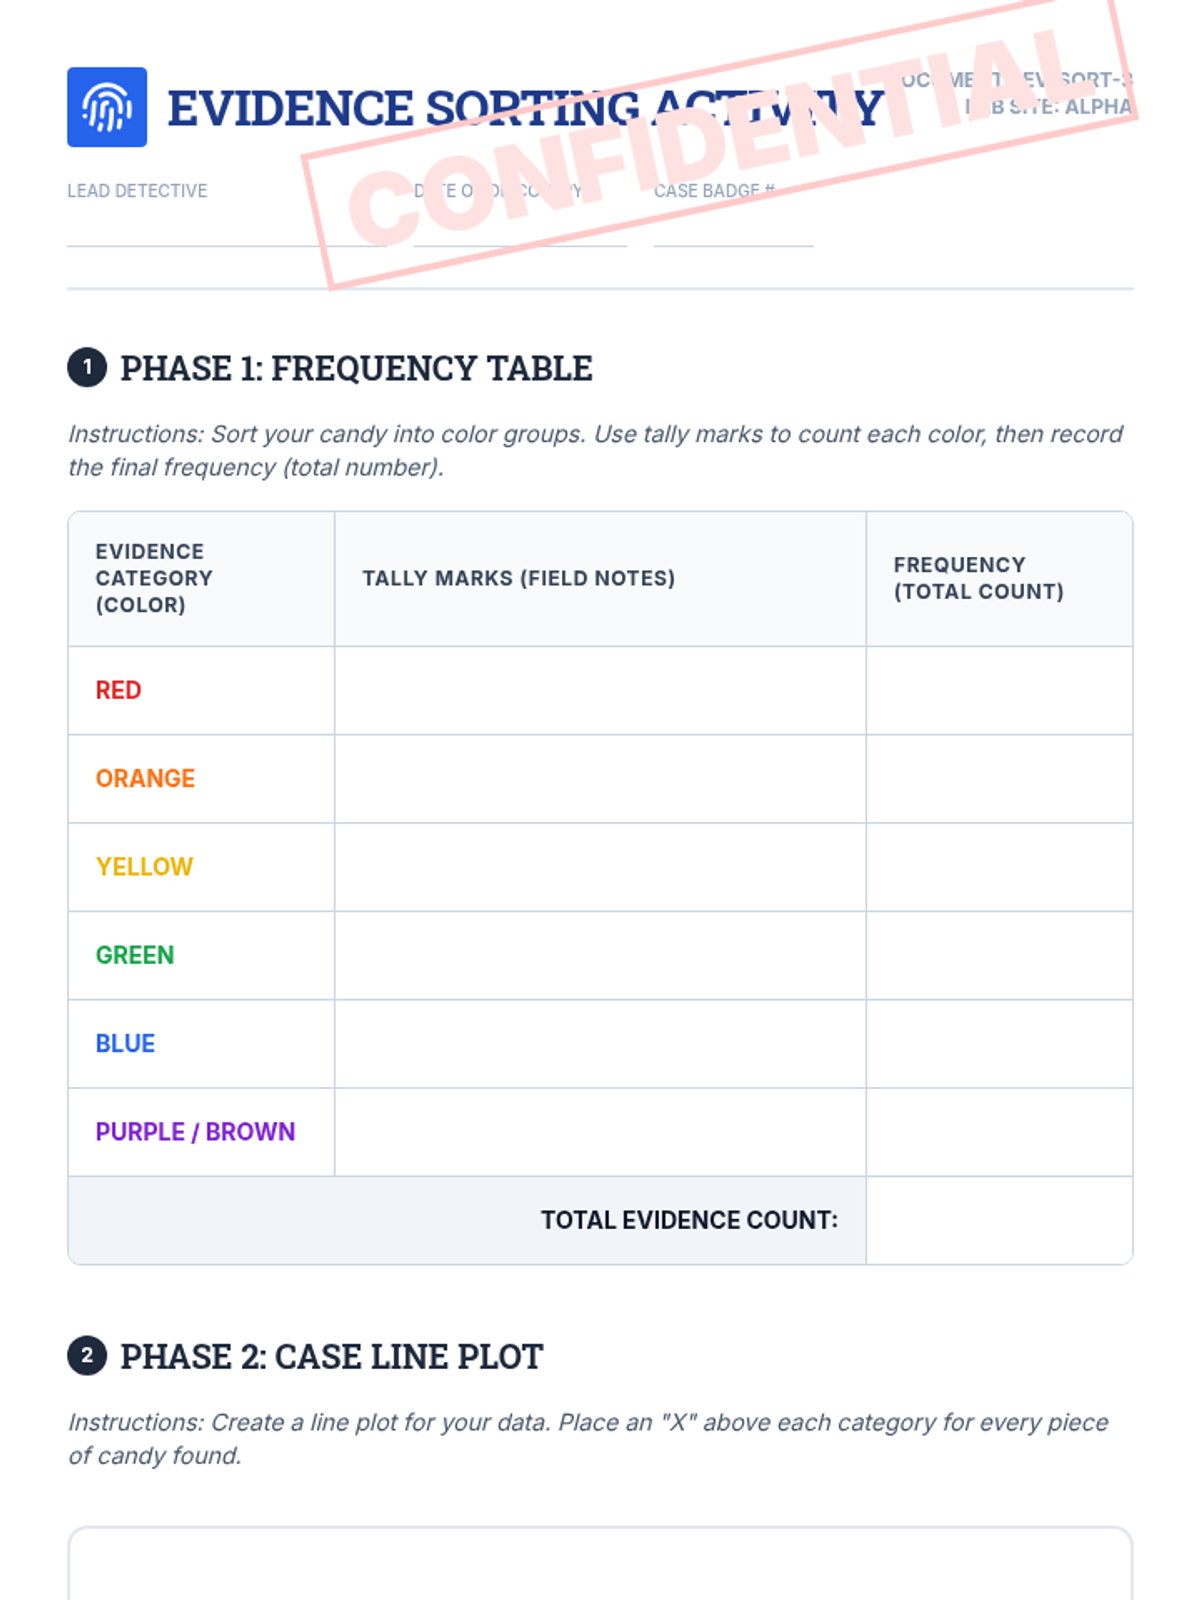
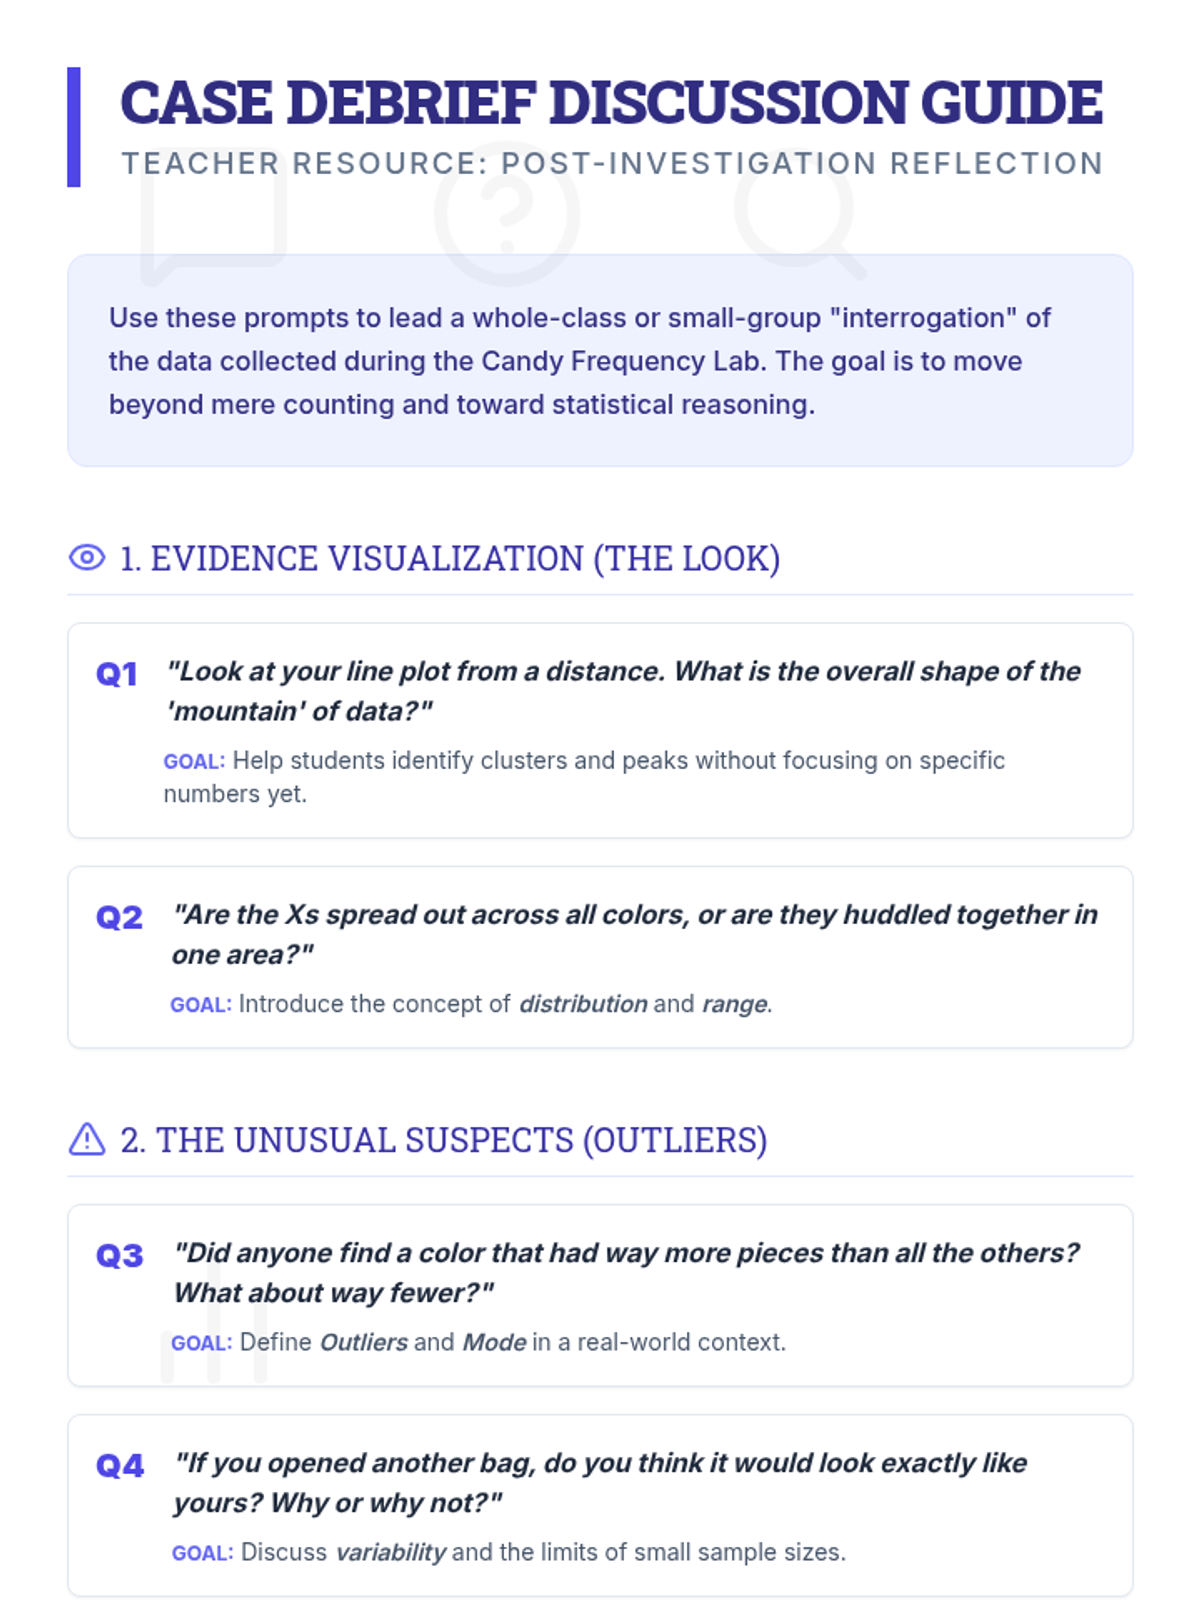
A math sequence focused on statistical analysis, data collection, and visualization through the lens of a detective agency. Students learn to create frequency tables and line plots using real-world data.
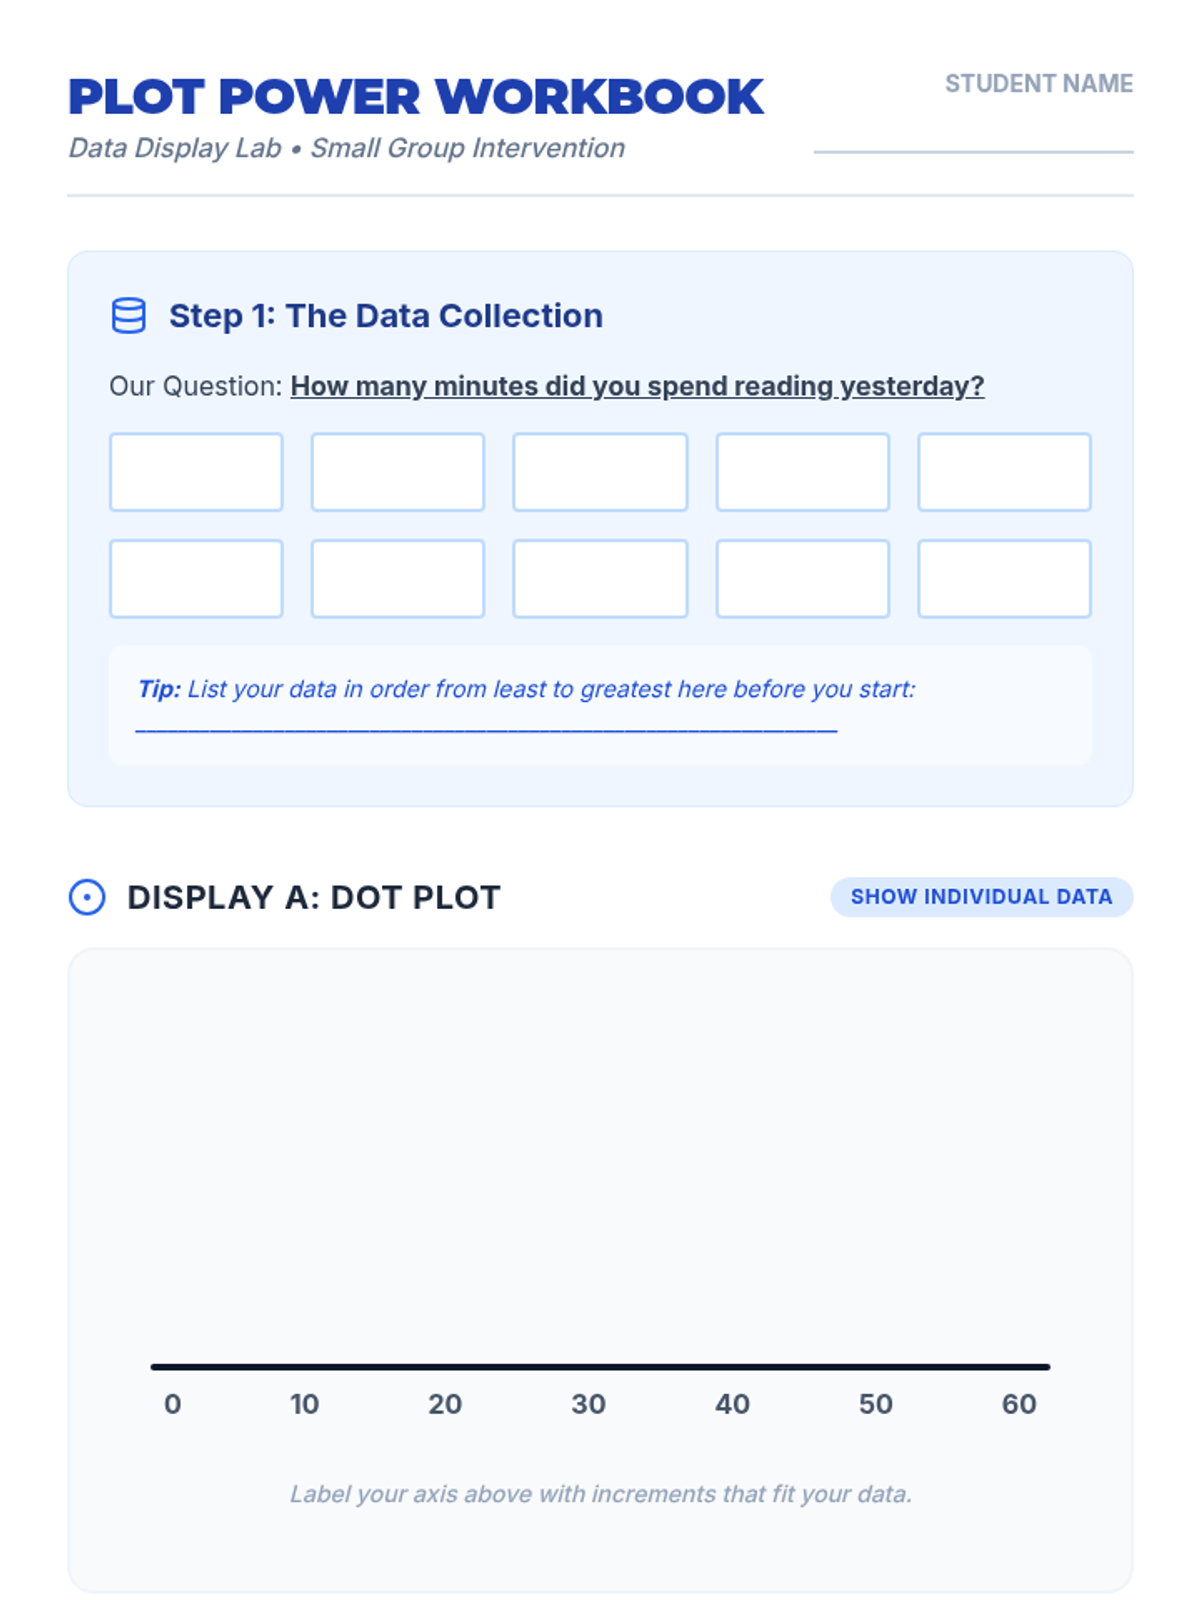
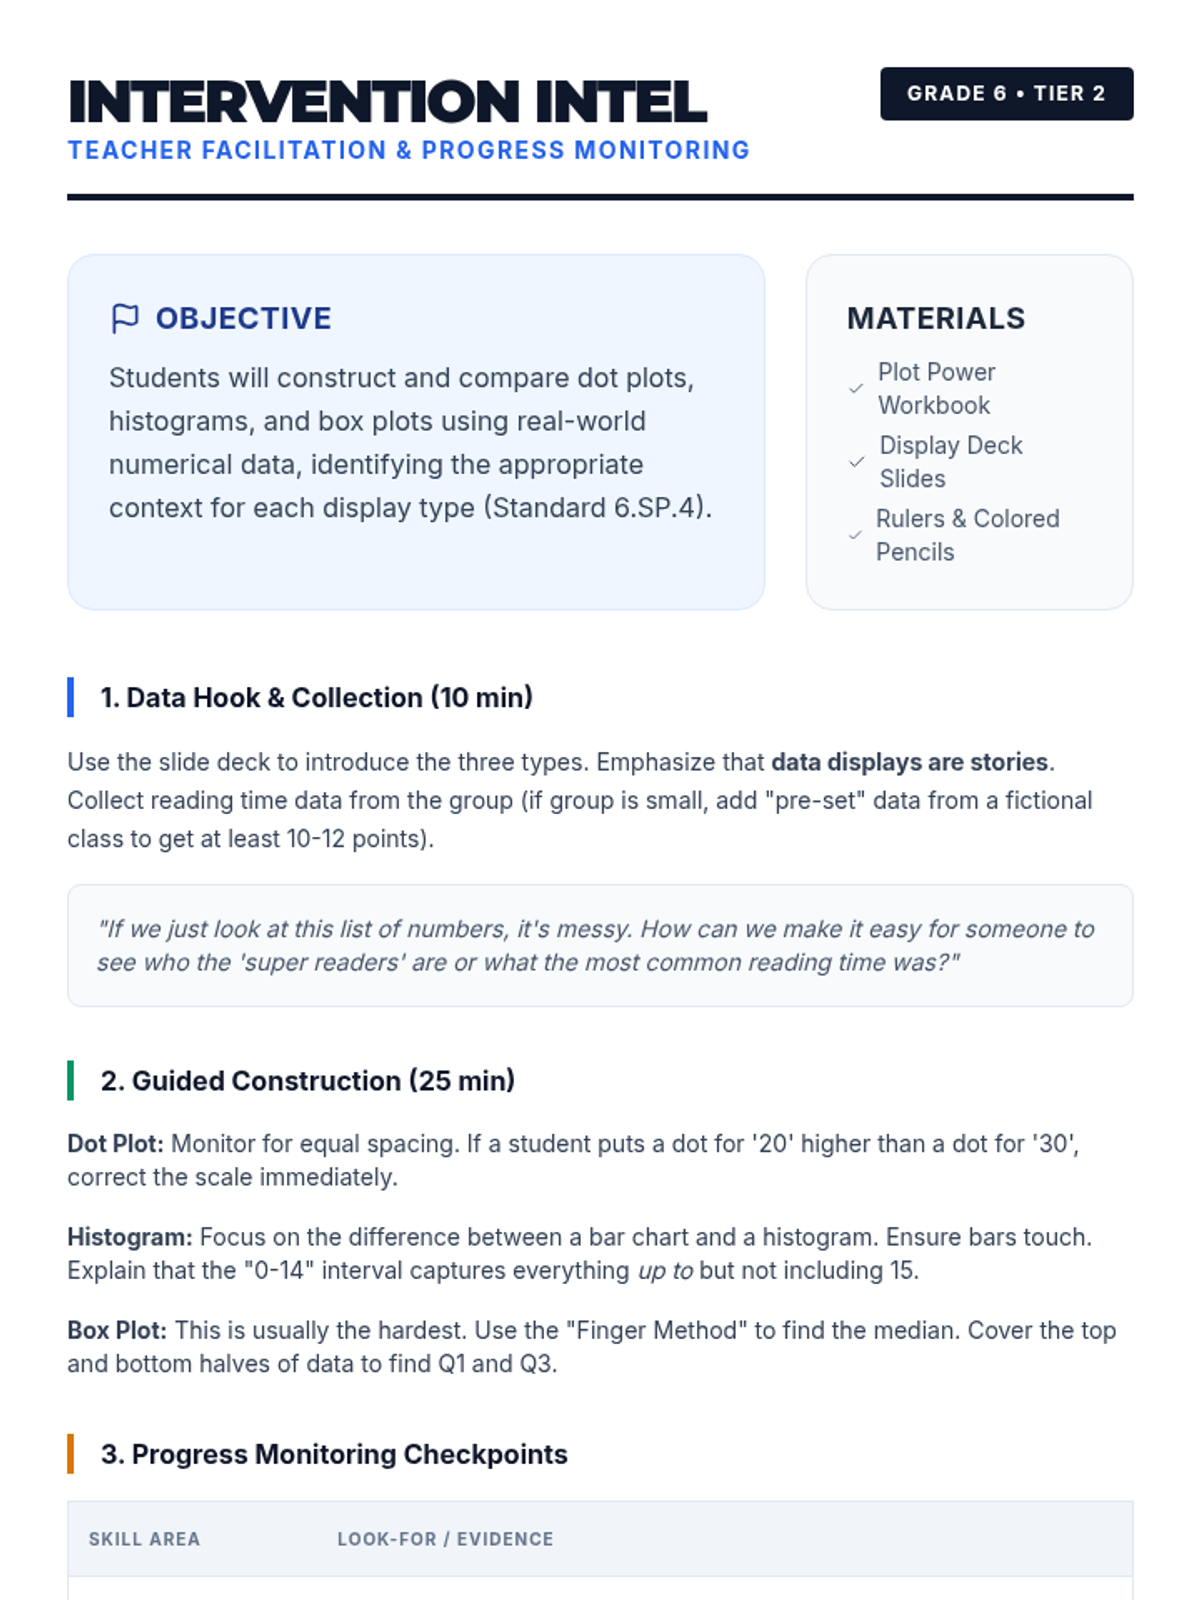
A targeted intervention sequence for 6th-grade students to master the construction and interpretation of dot plots, histograms, and box plots through hands-on data collection and analysis.
A collection of sports-themed instructional materials that use real-world events to teach logic, statistics, and organizational skills.
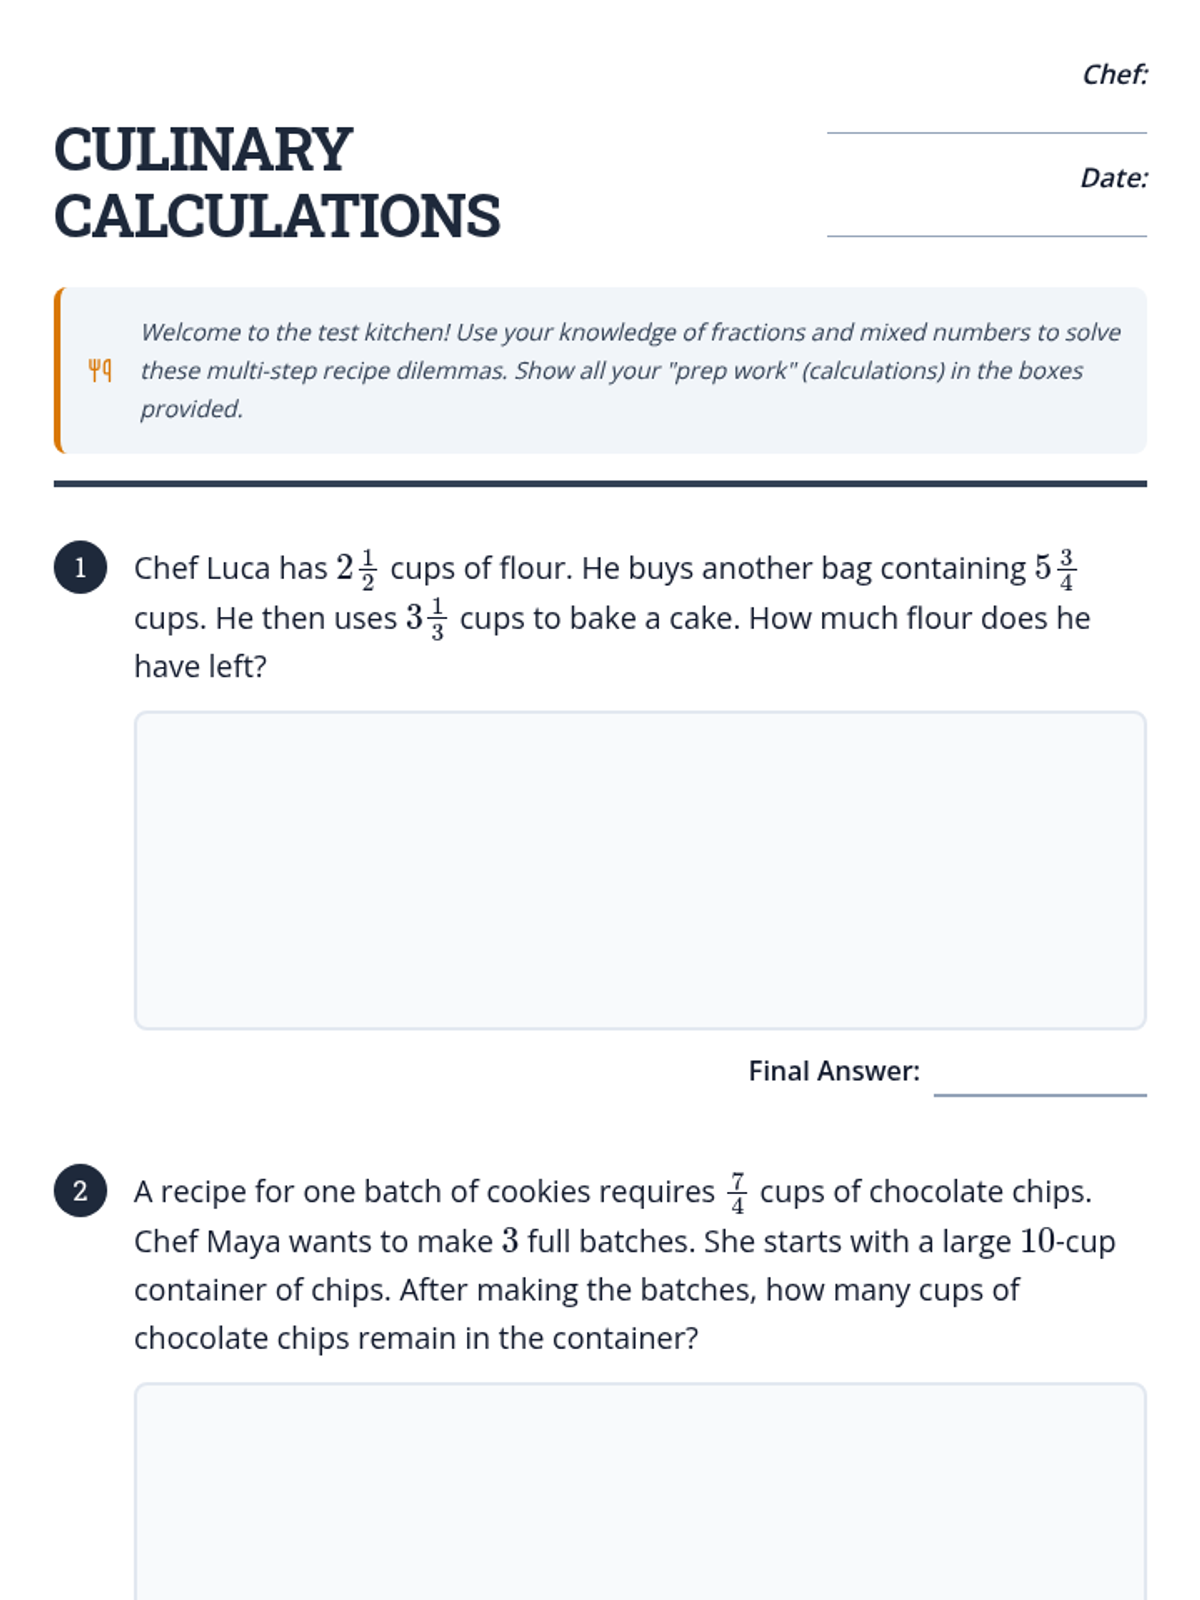
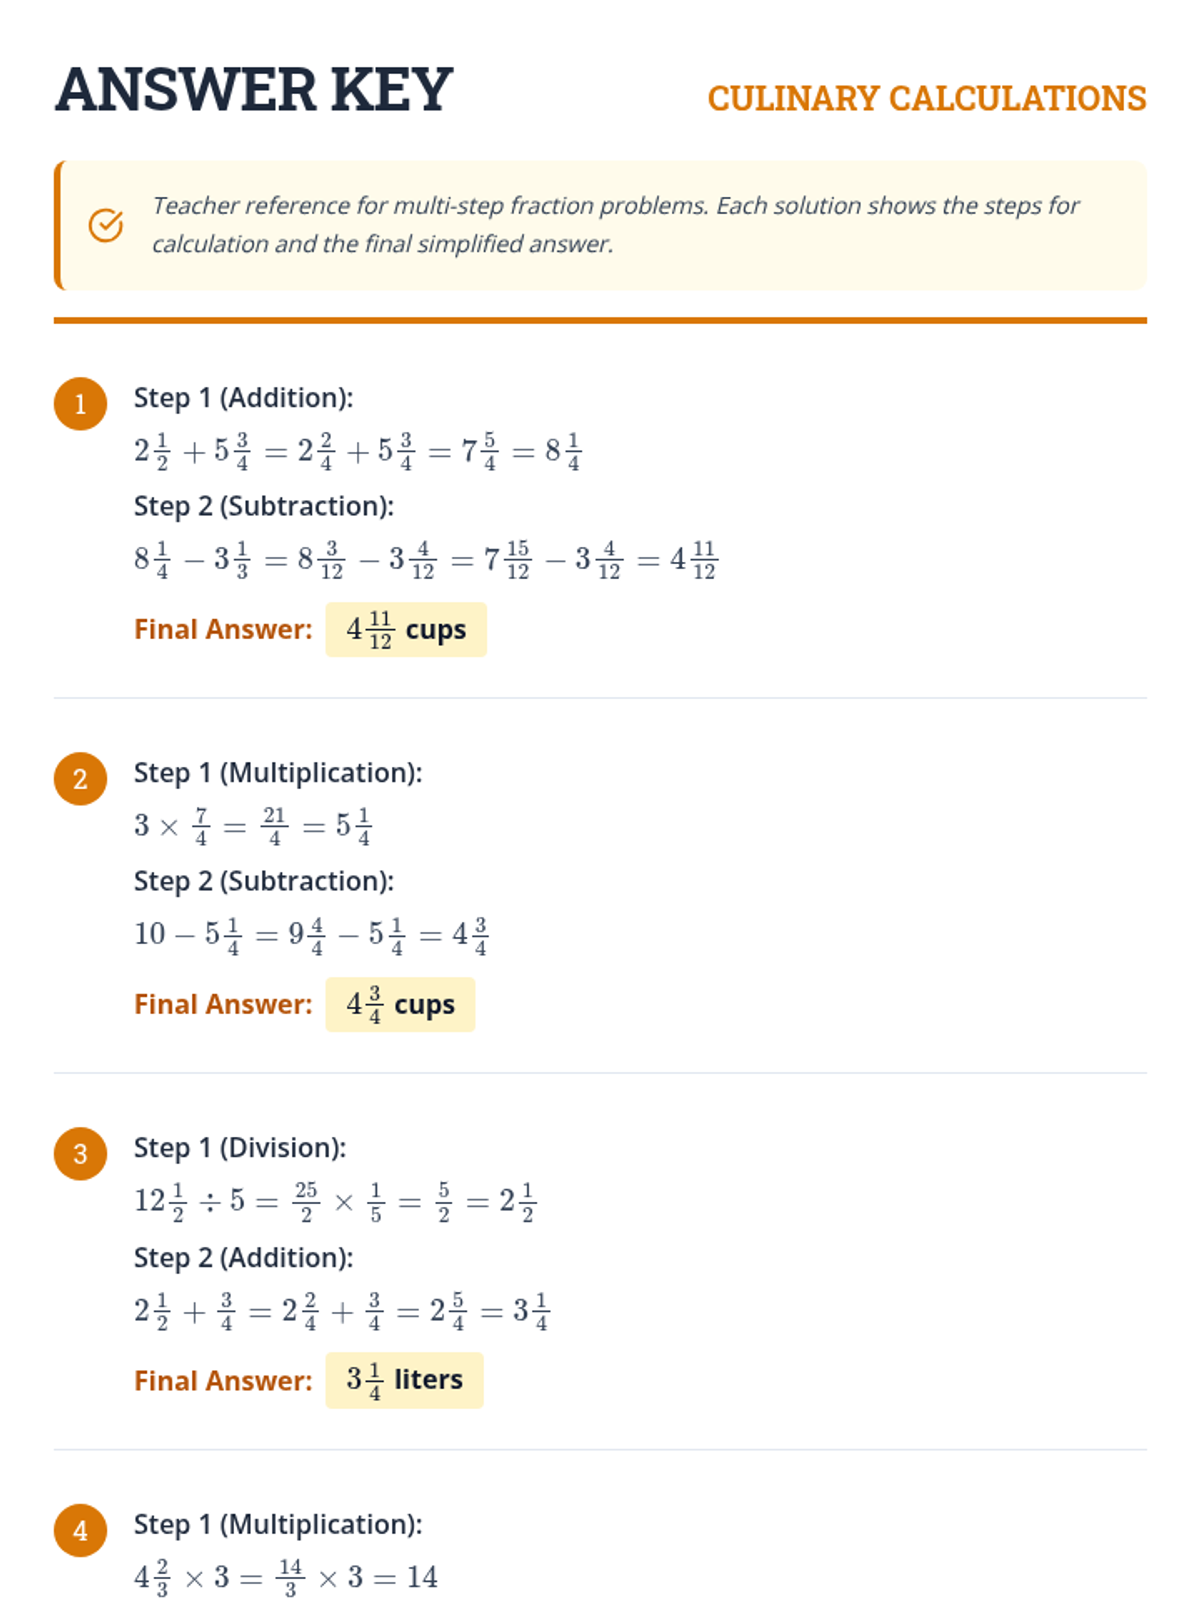
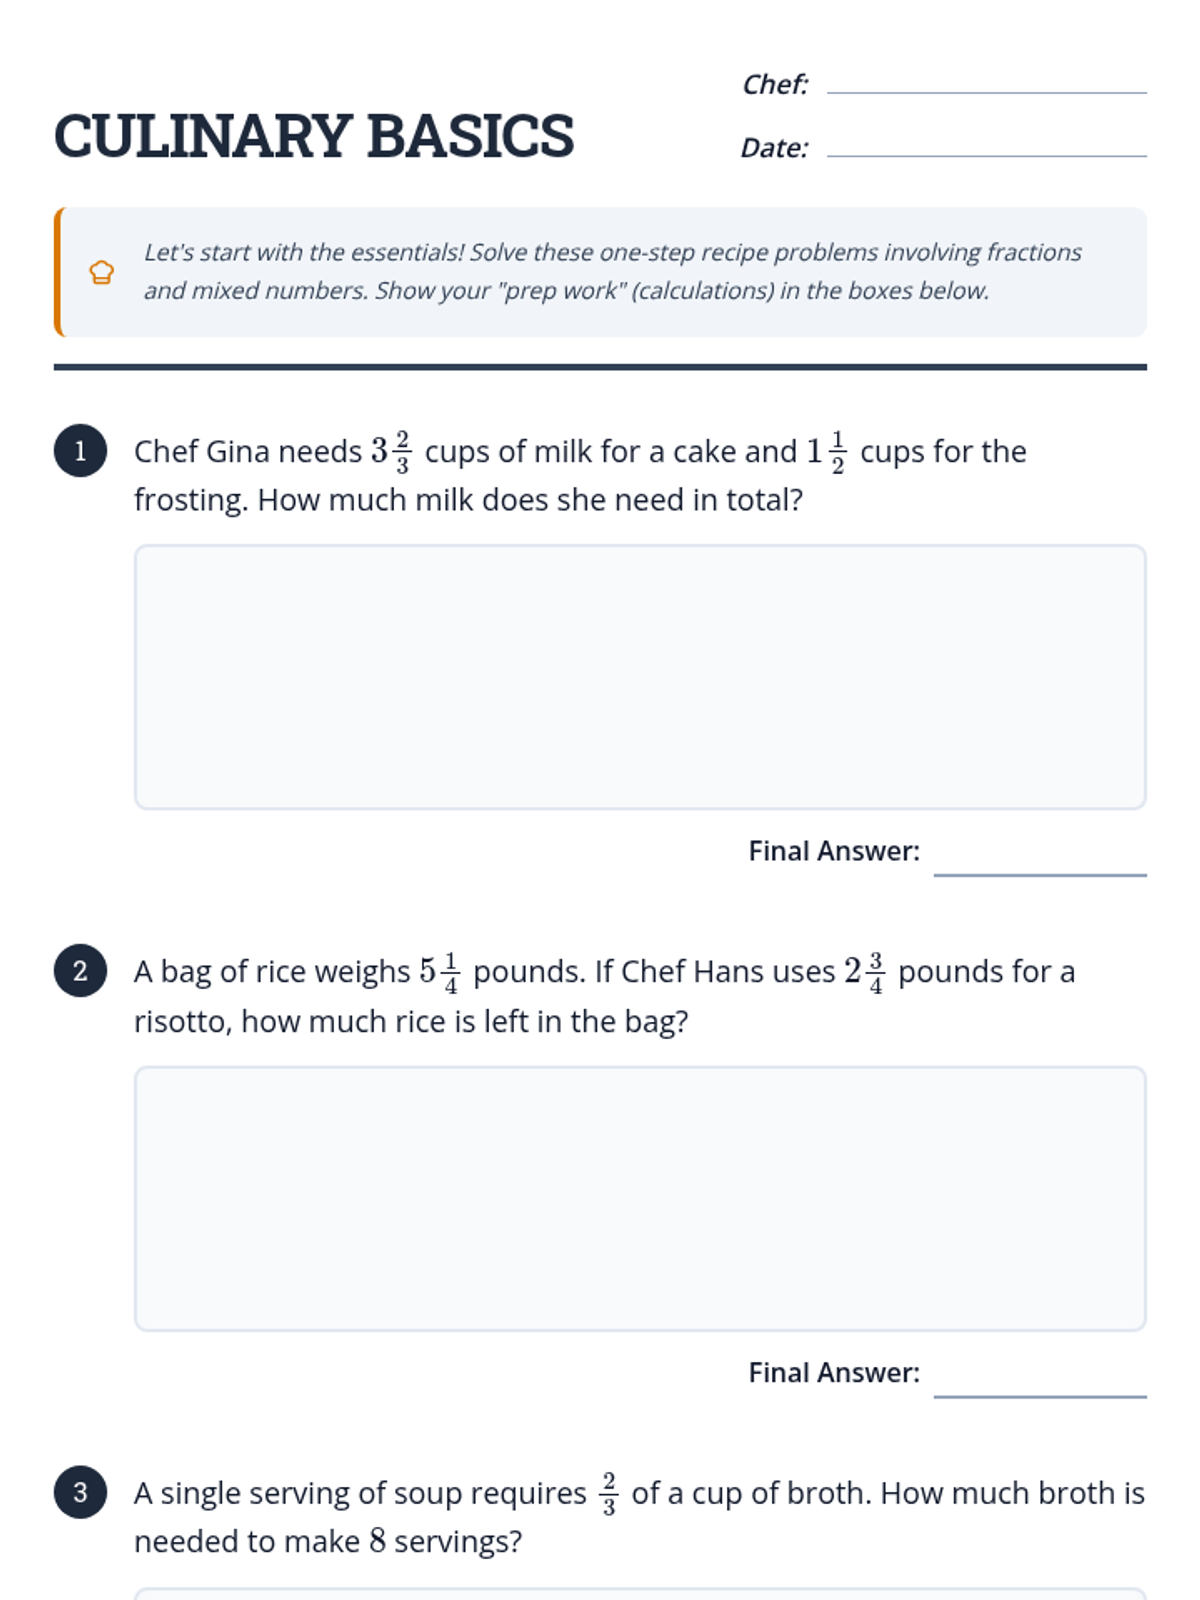
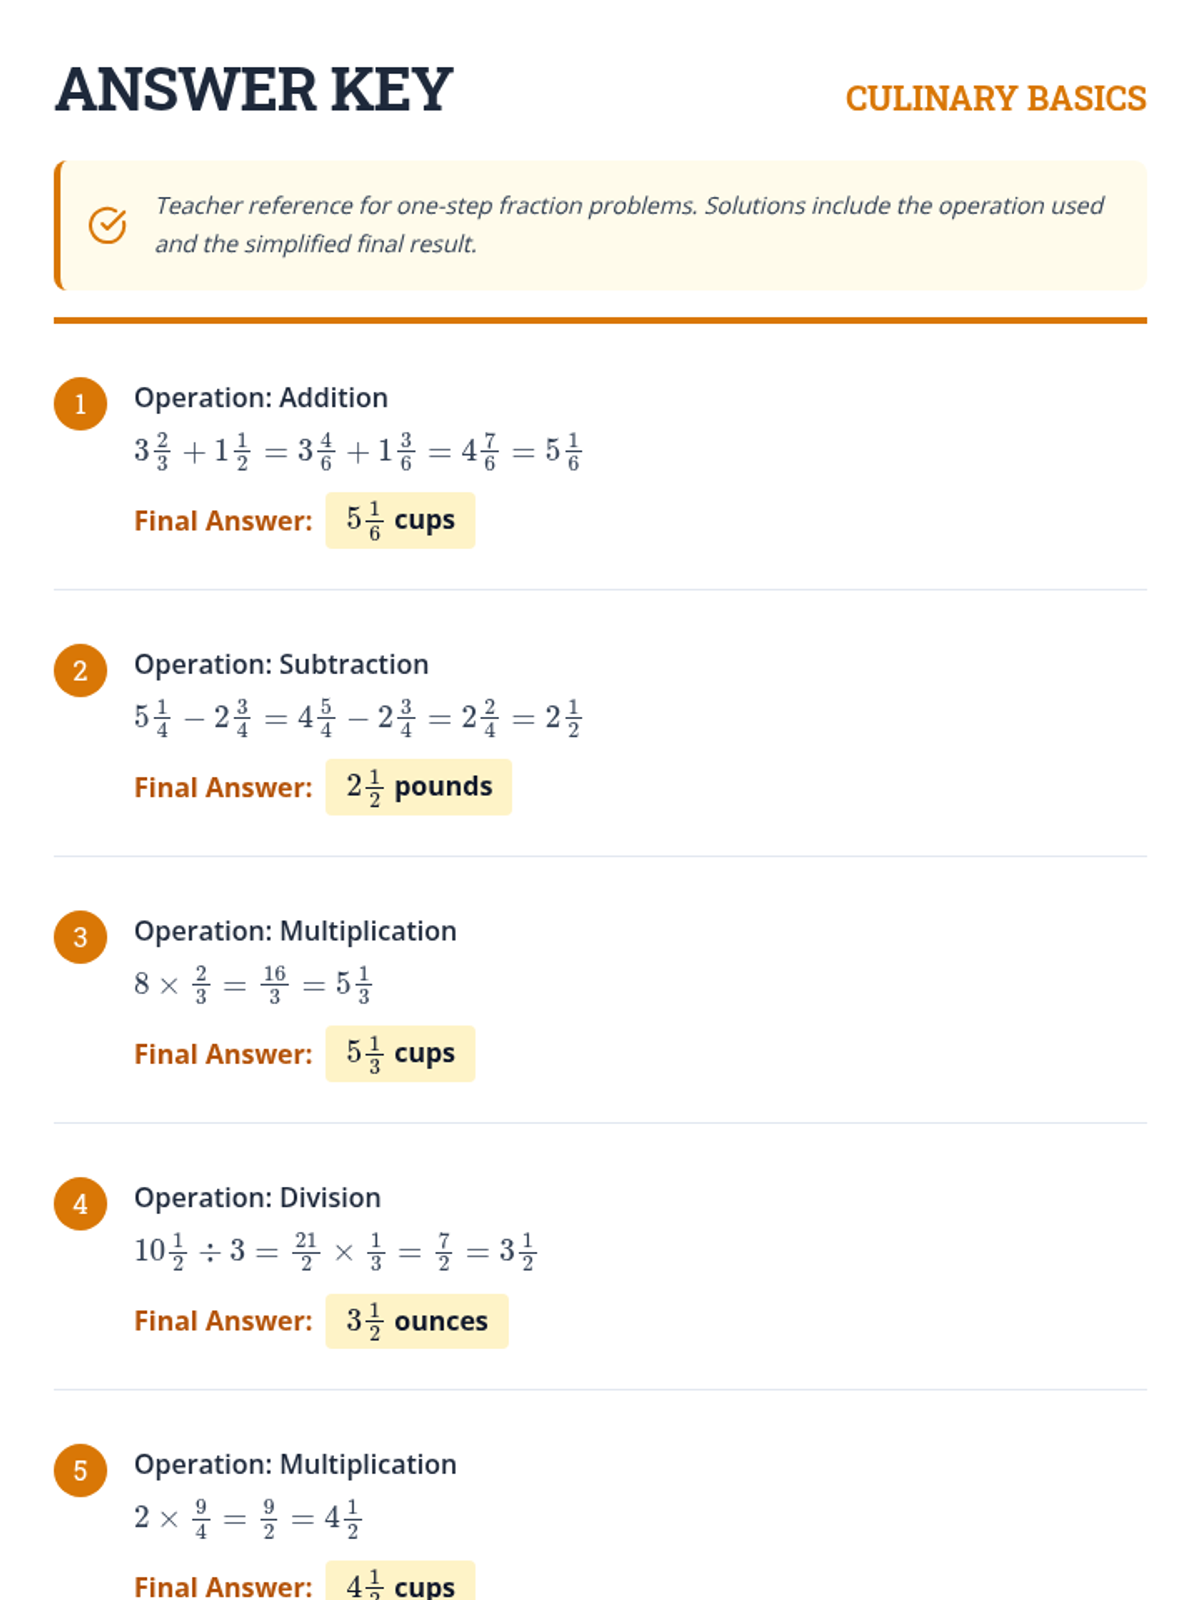
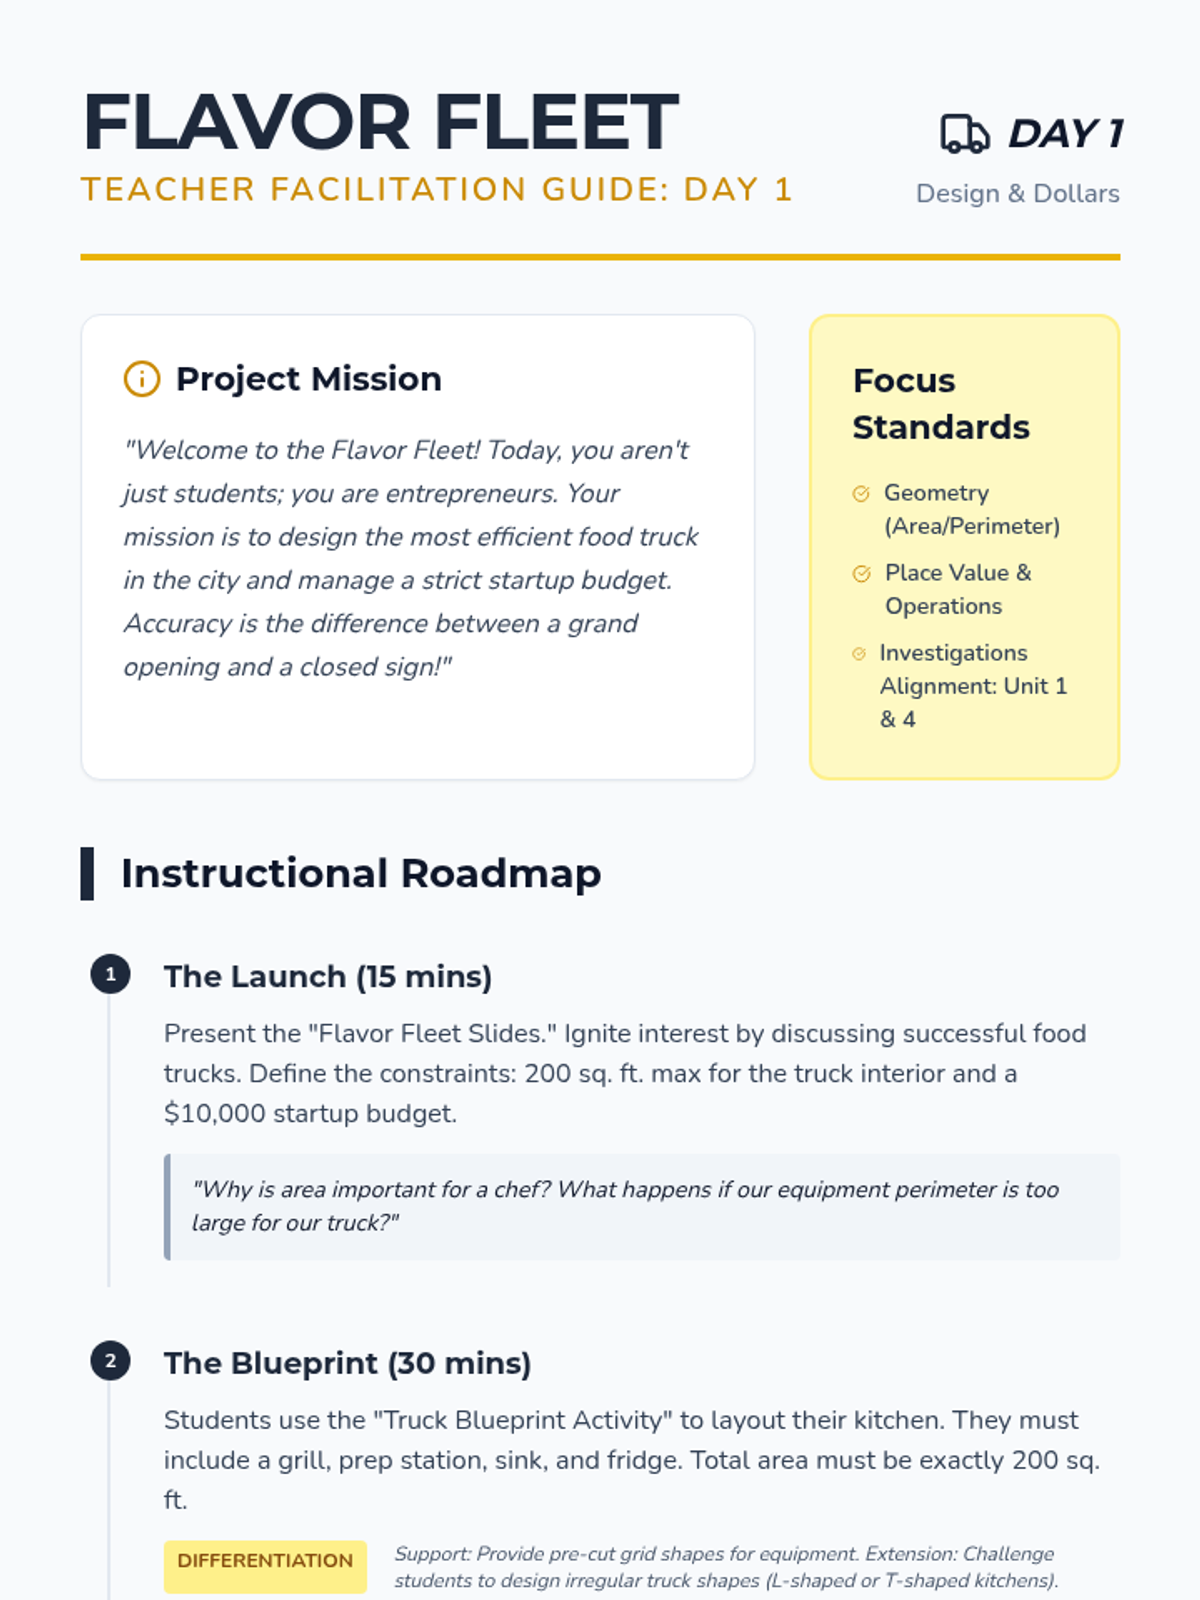
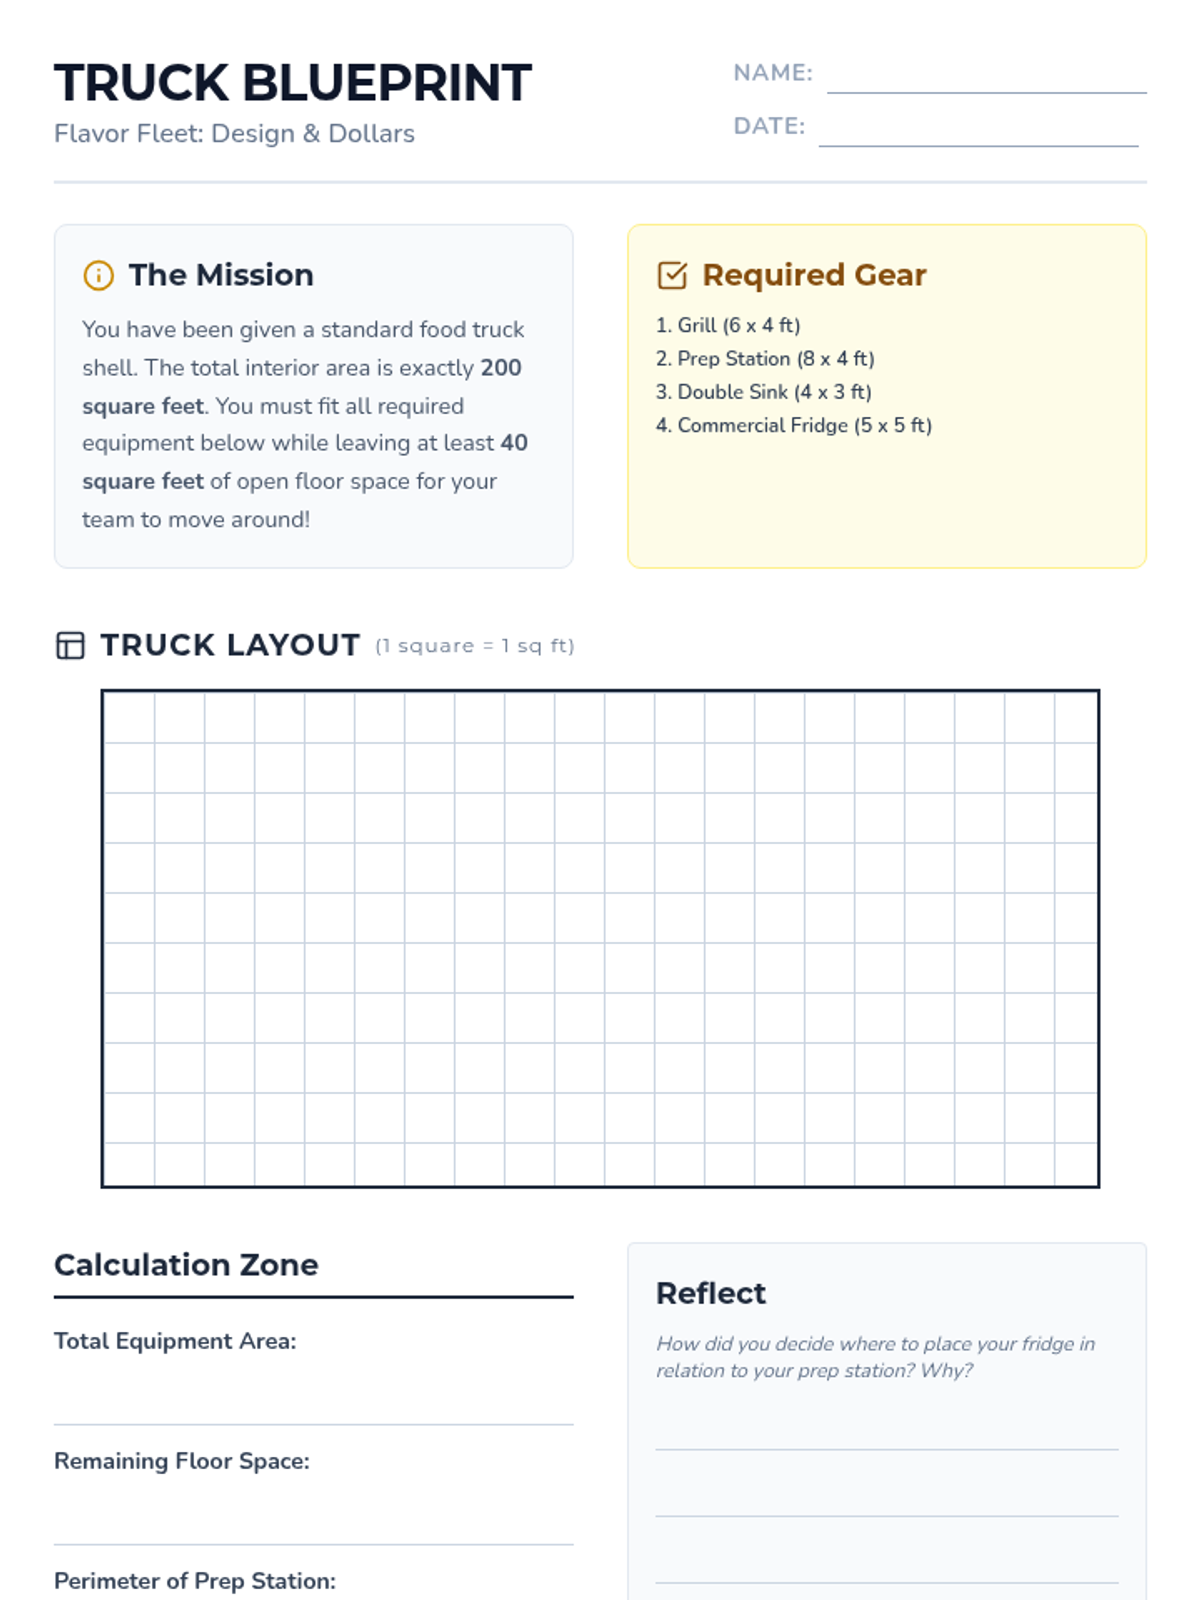
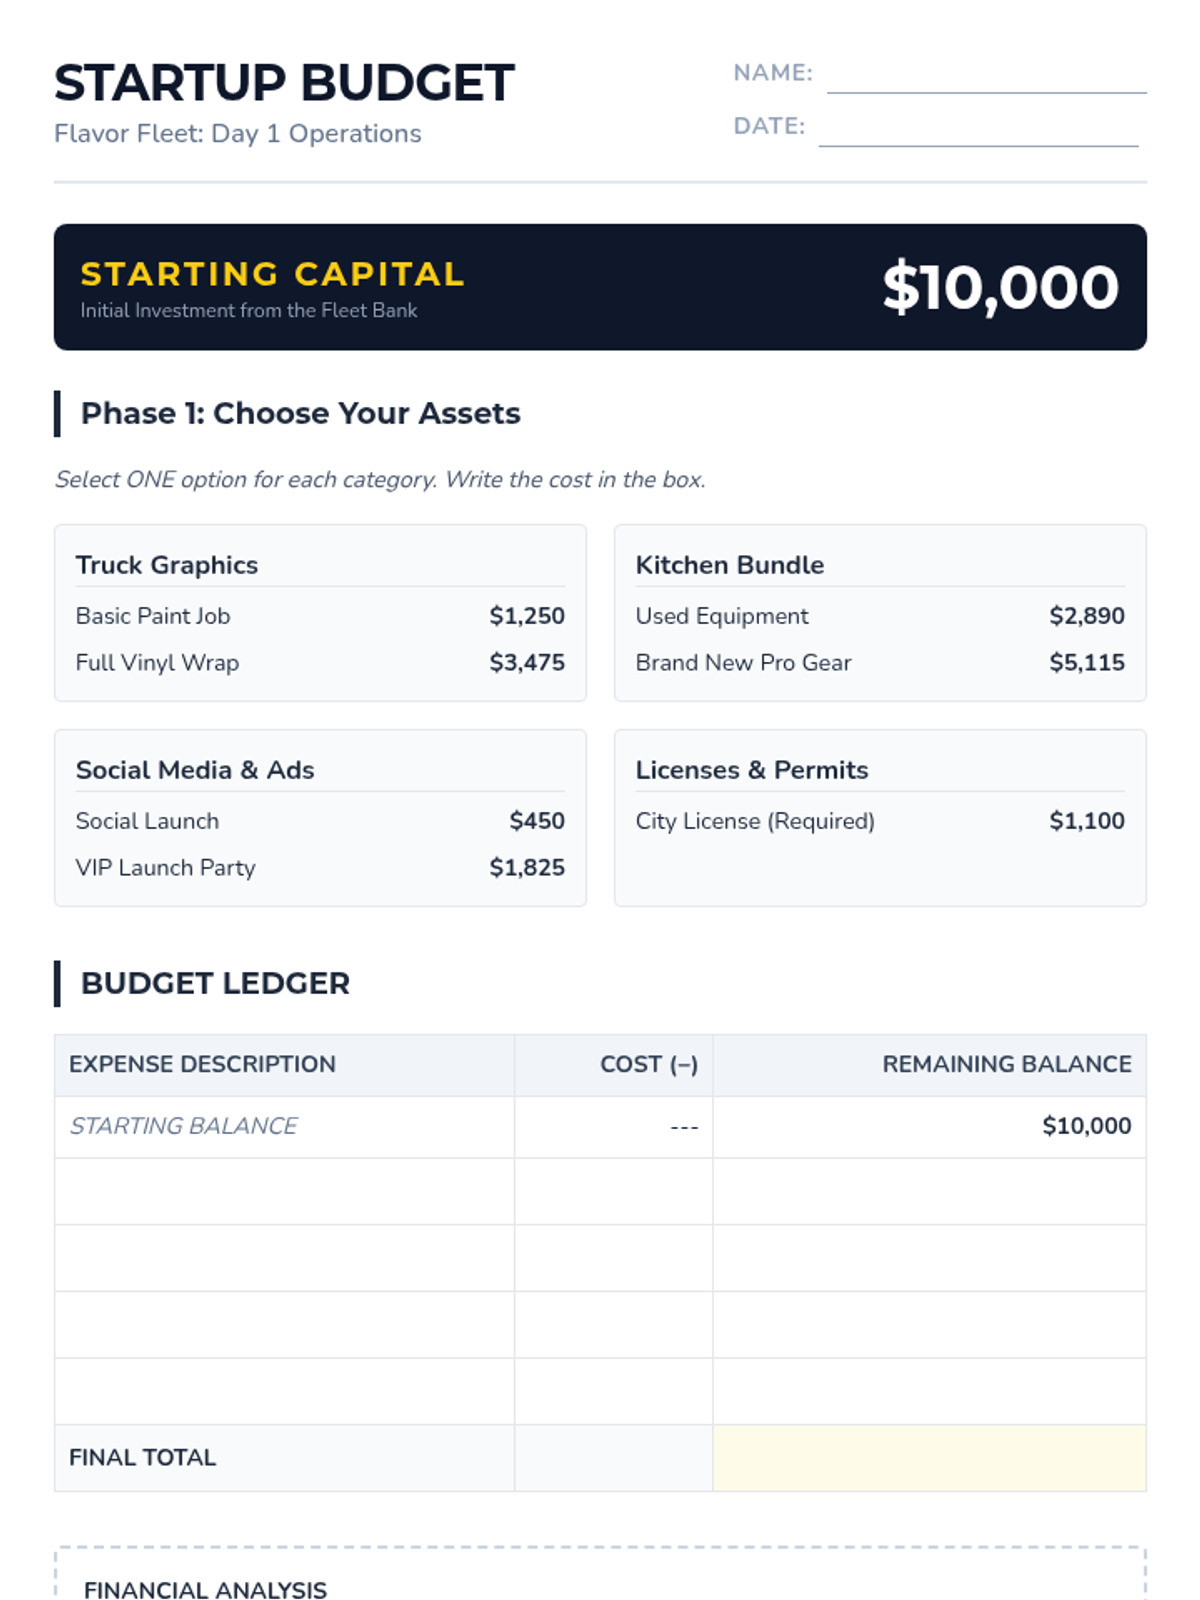
A 3-day project-based learning experience where students design, budget, and run their own food truck business, integrating fractions, geometry, operations, and data analysis.