Data representation, distributions, and statistical variability using sampling and inference techniques. Integrates probability models, compound events, bivariate patterns, and linear models to guide data-driven decision making.
Final 5-day answer key for Week 7 math review. Aligned with NYS standards.
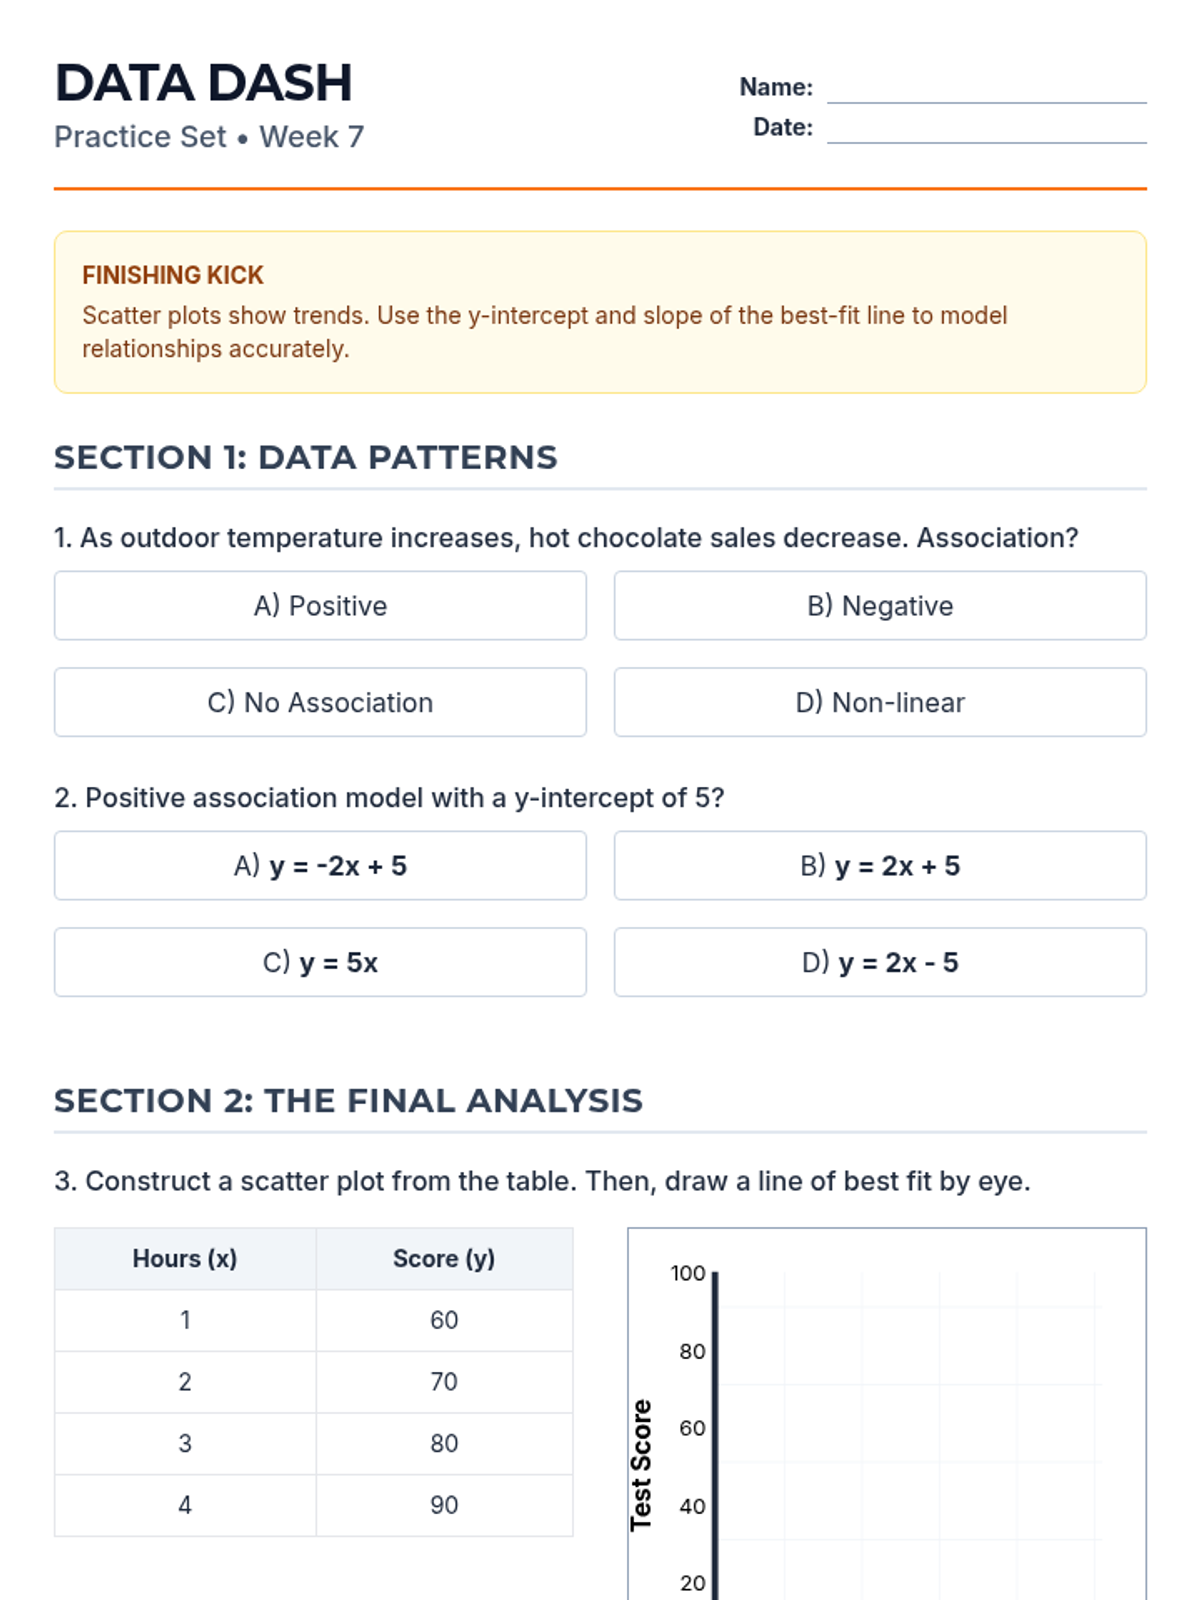
Final 5-day student review booklet for Week 7. Comprehensive final review. Aligned with NYS standards. 1 day per page.
Final 5-day answer key for Week 6 math review. Aligned with NYS standards.
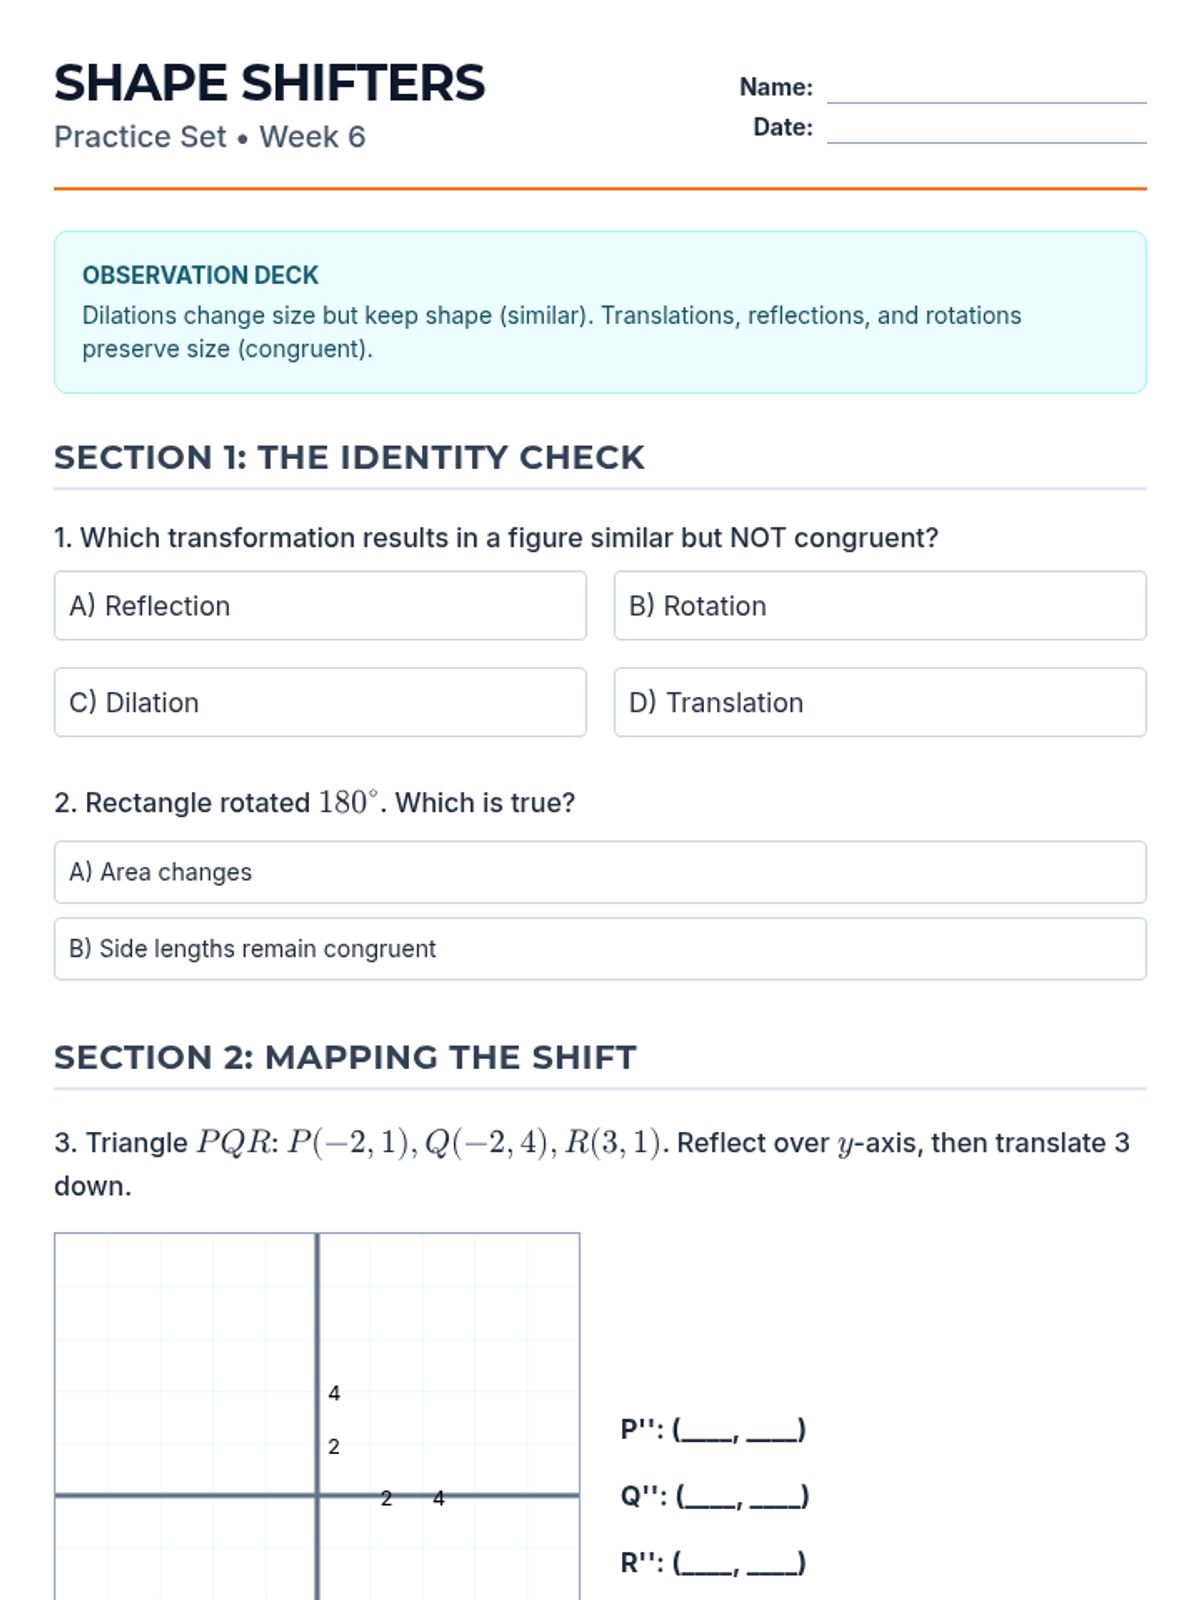
Final 5-day student review booklet for Week 6. Covers multi-step word problems. Aligned with NYS standards. 1 day per page.
Final 5-day answer key for Week 2 math review. Aligned with NYS standards.
Final 5-day student review booklet for Week 2. Covers Coordinate Planes, Inequalities, and Composite Area. Aligned with NYS standards. 1 day per page.
Final 5-day answer key for Week 5 math review. Aligned with NYS standards.
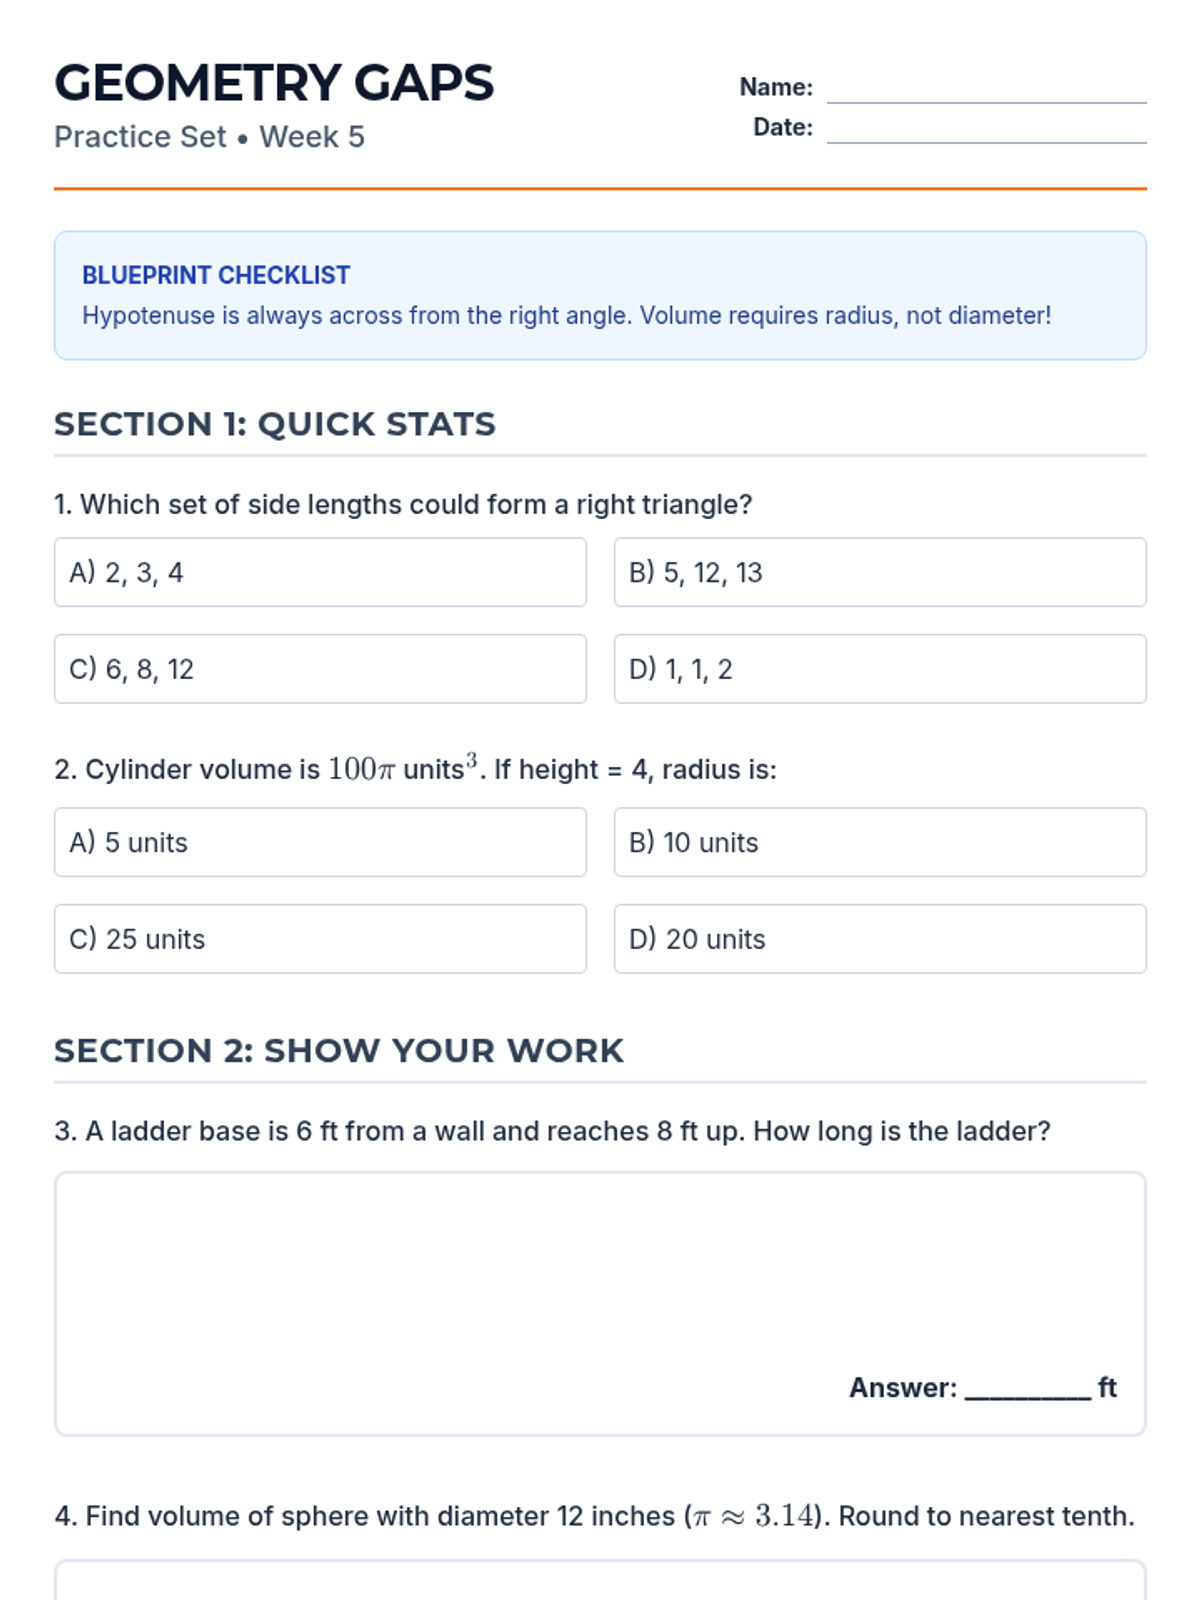
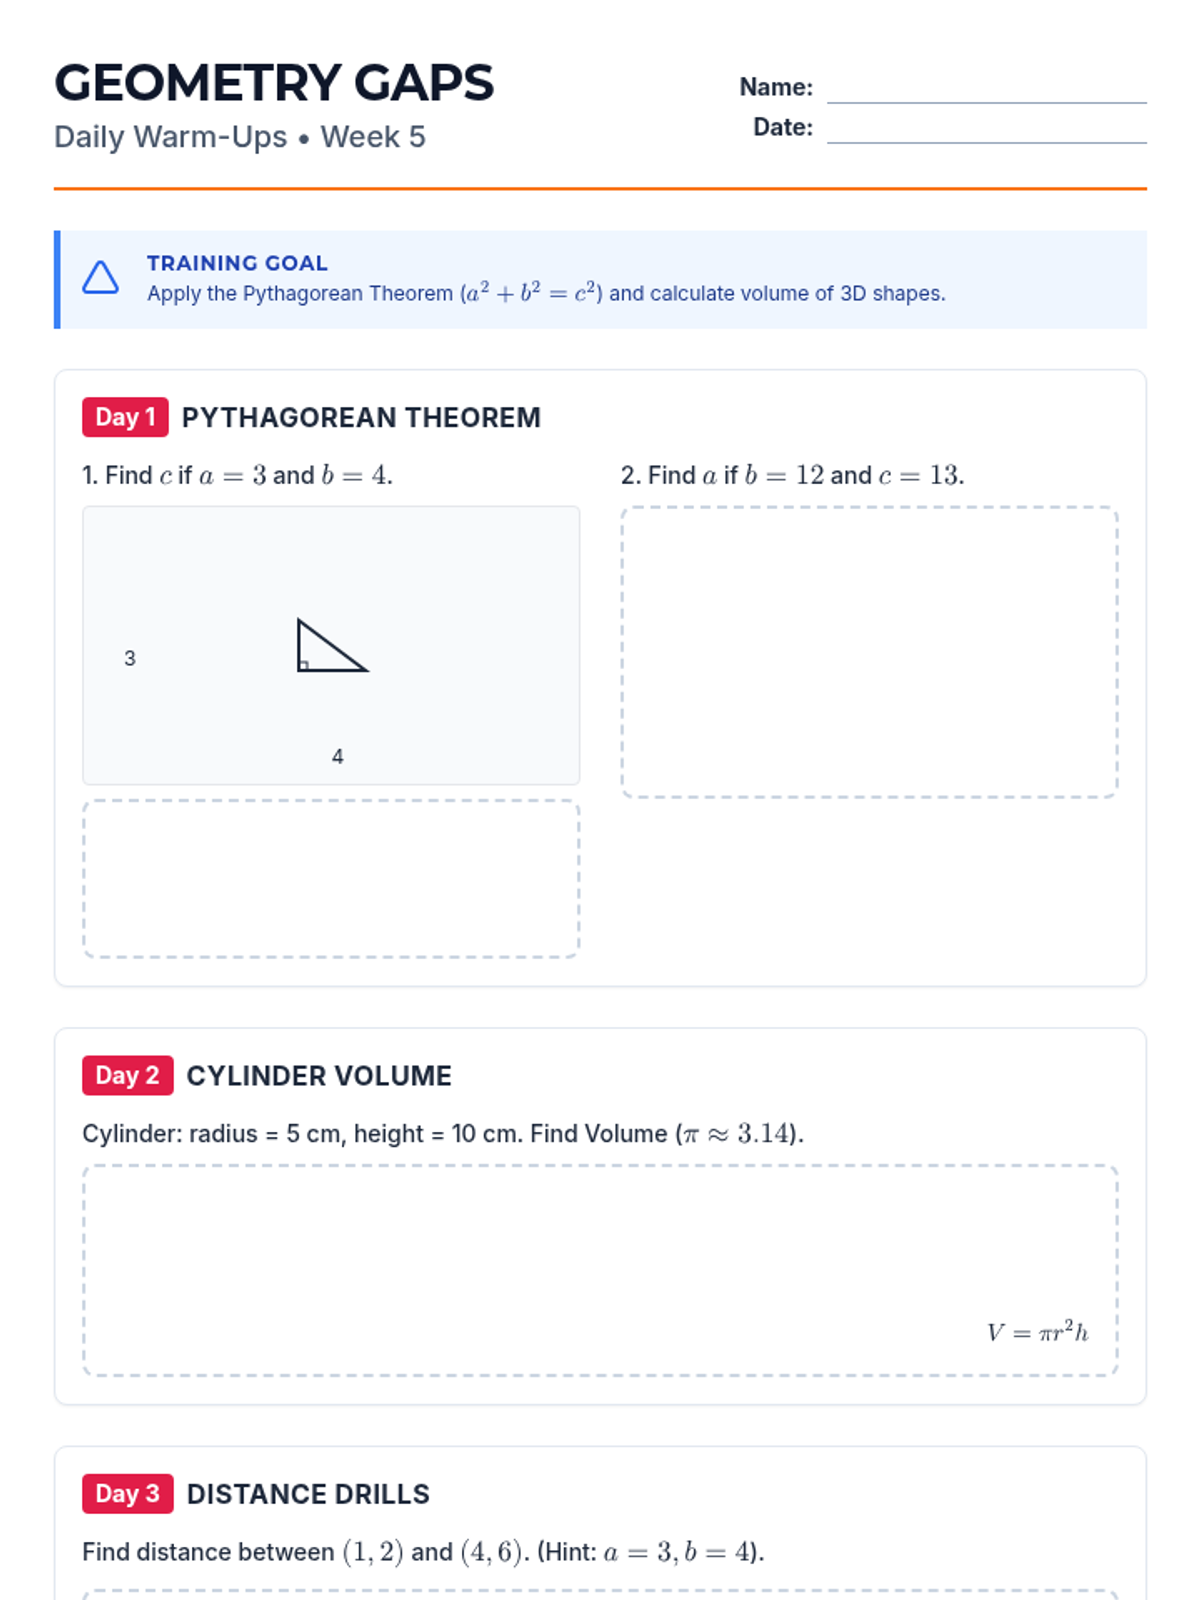
Final 5-day student review booklet for Week 5. Covers Percents and Coordinate Geometry. Aligned with NYS standards. 1 day per page.
Final 5-day answer key for Week 4 math review. Aligned with NYS standards.
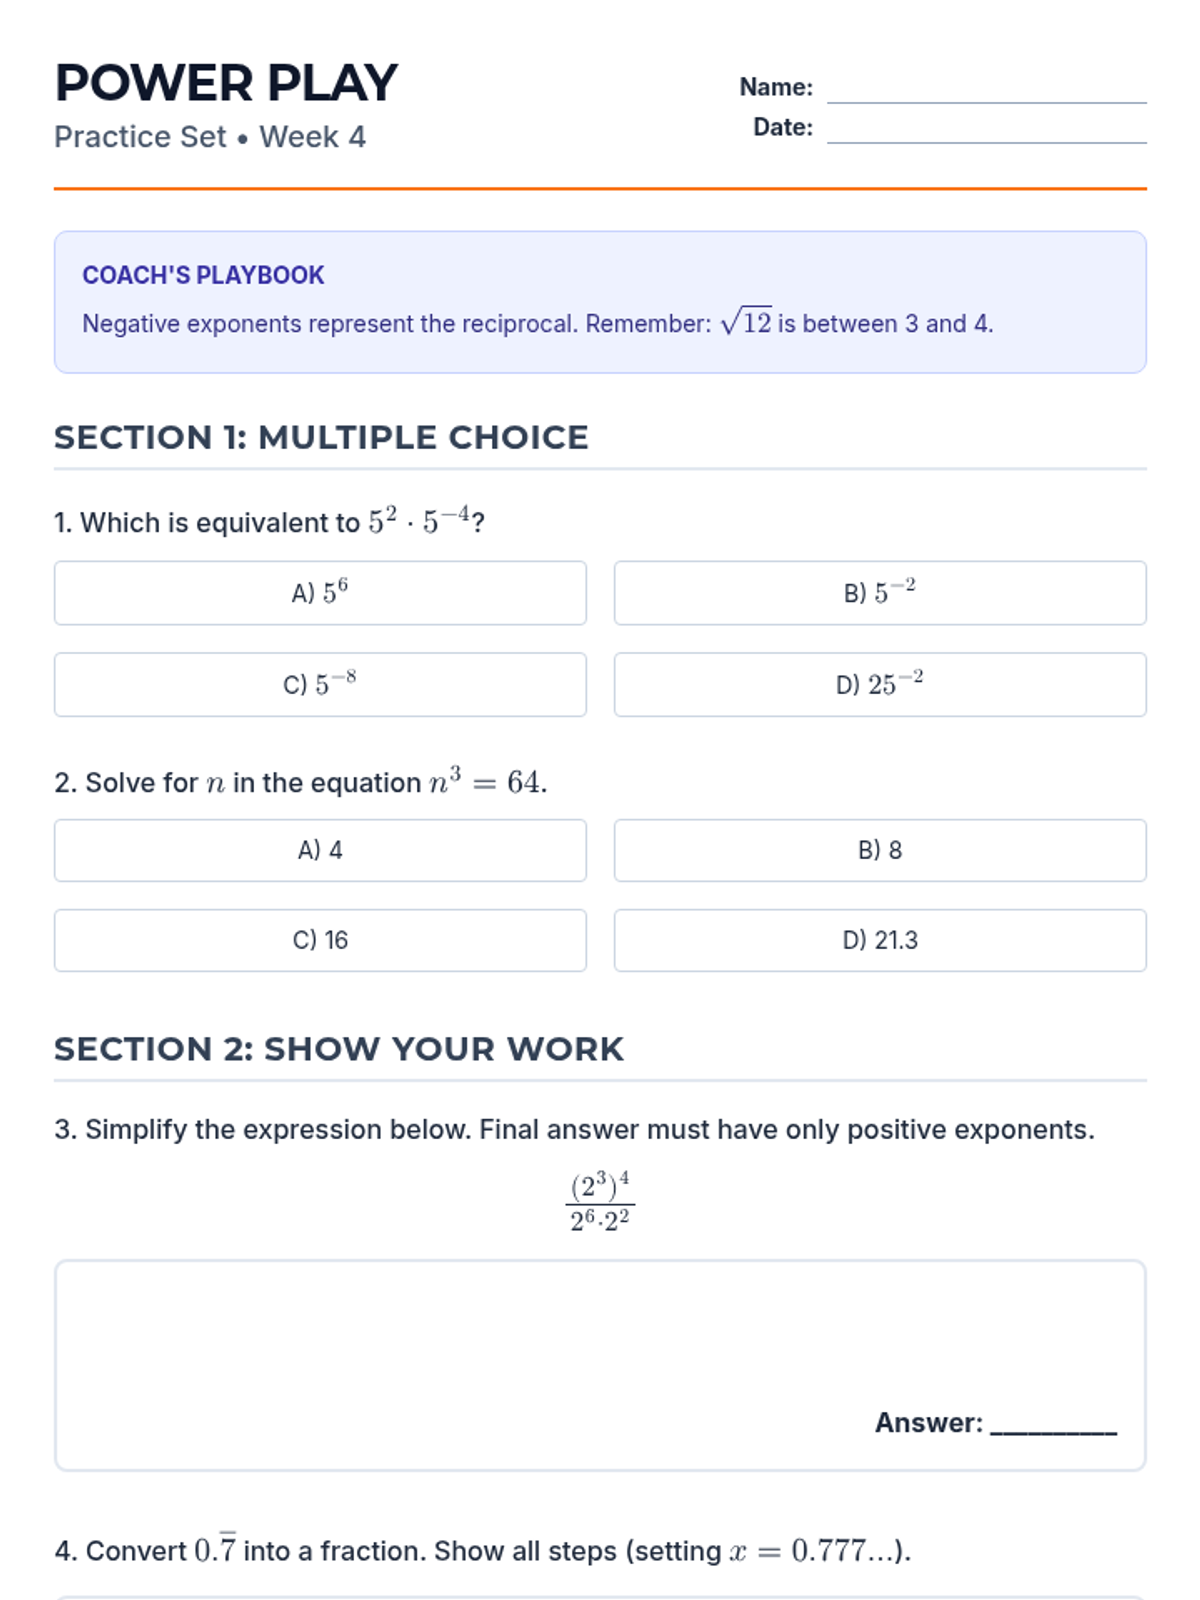
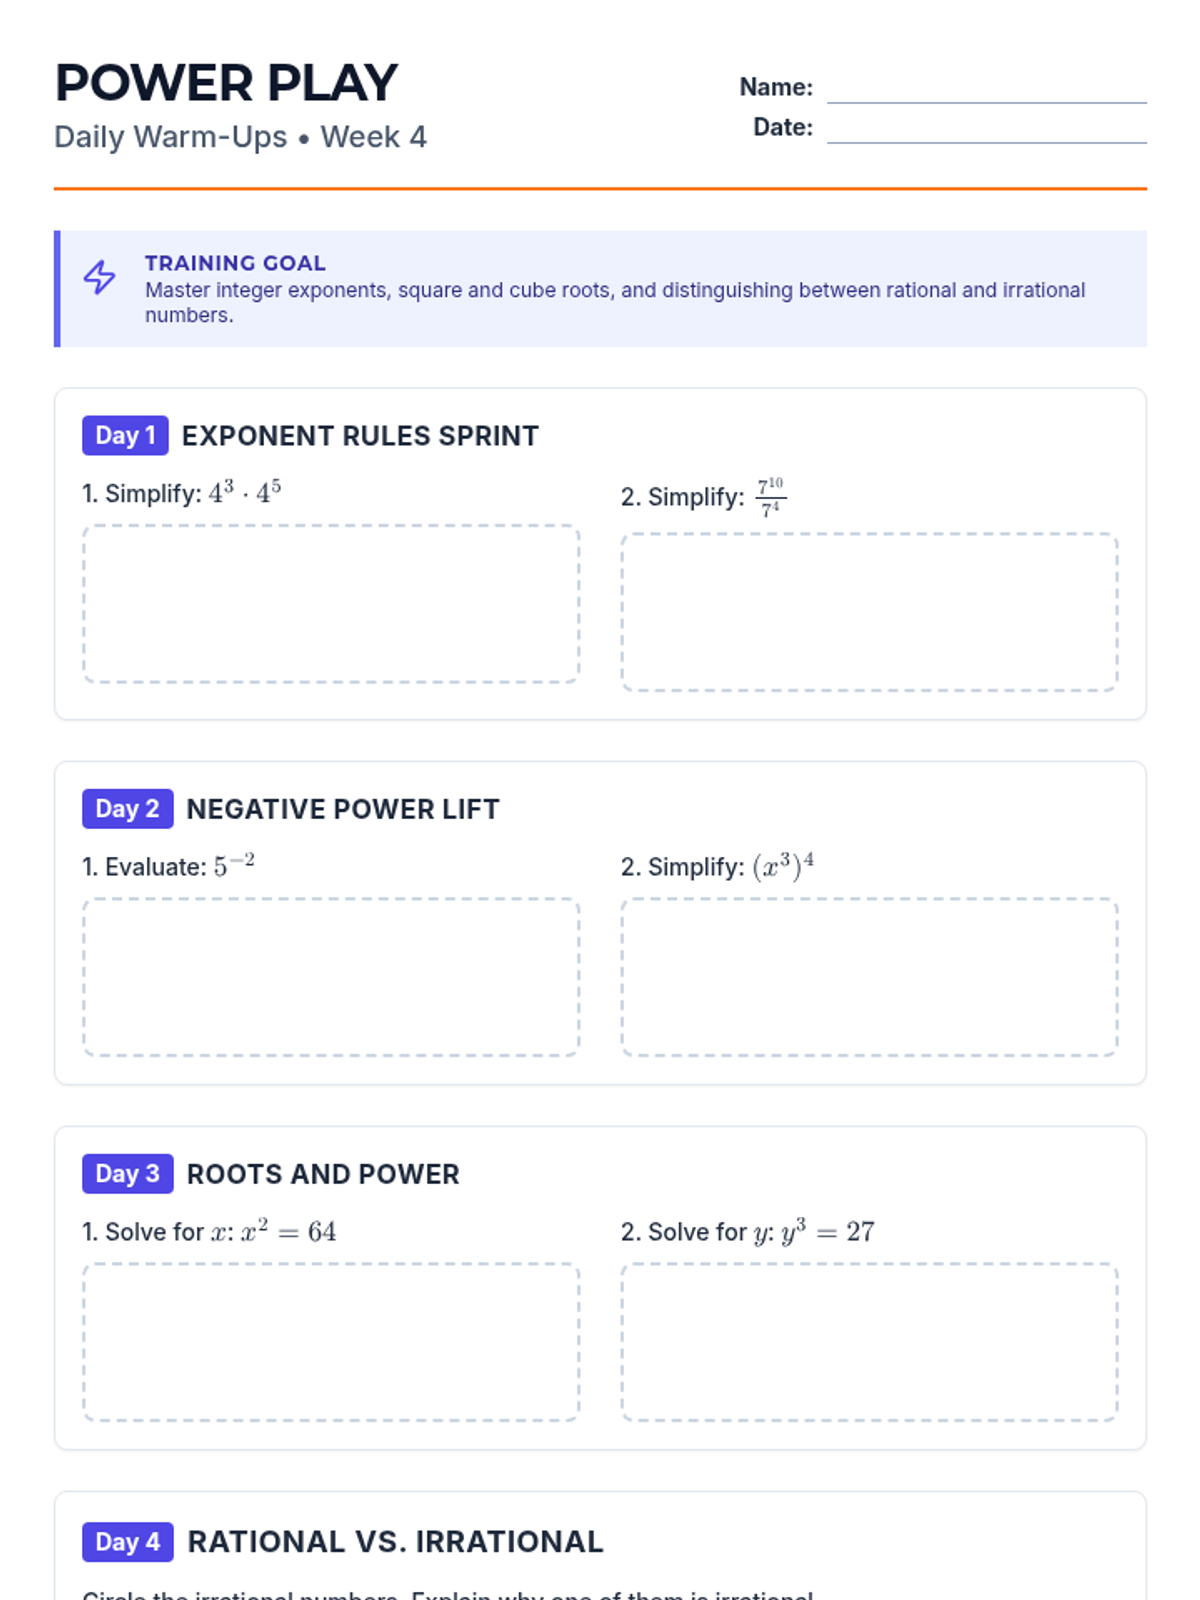
Final 5-day student review booklet for Week 4. Covers Decimals, Percents, and Volume. Aligned with NYS standards. 1 day per page.
Final 5-day answer key for Week 3 math review. Aligned with NYS standards.
Final 5-day student review booklet for Week 3. Covers Surface Area, GCF/LCM, and Variables. Aligned with NYS standards. 1 day per page.
Final 5-day answer key for Week 1 math review. Aligned with NYS standards.
Final 5-day student review booklet for Week 1. Aligned with NYS standards. Covers division, ratios, and area.
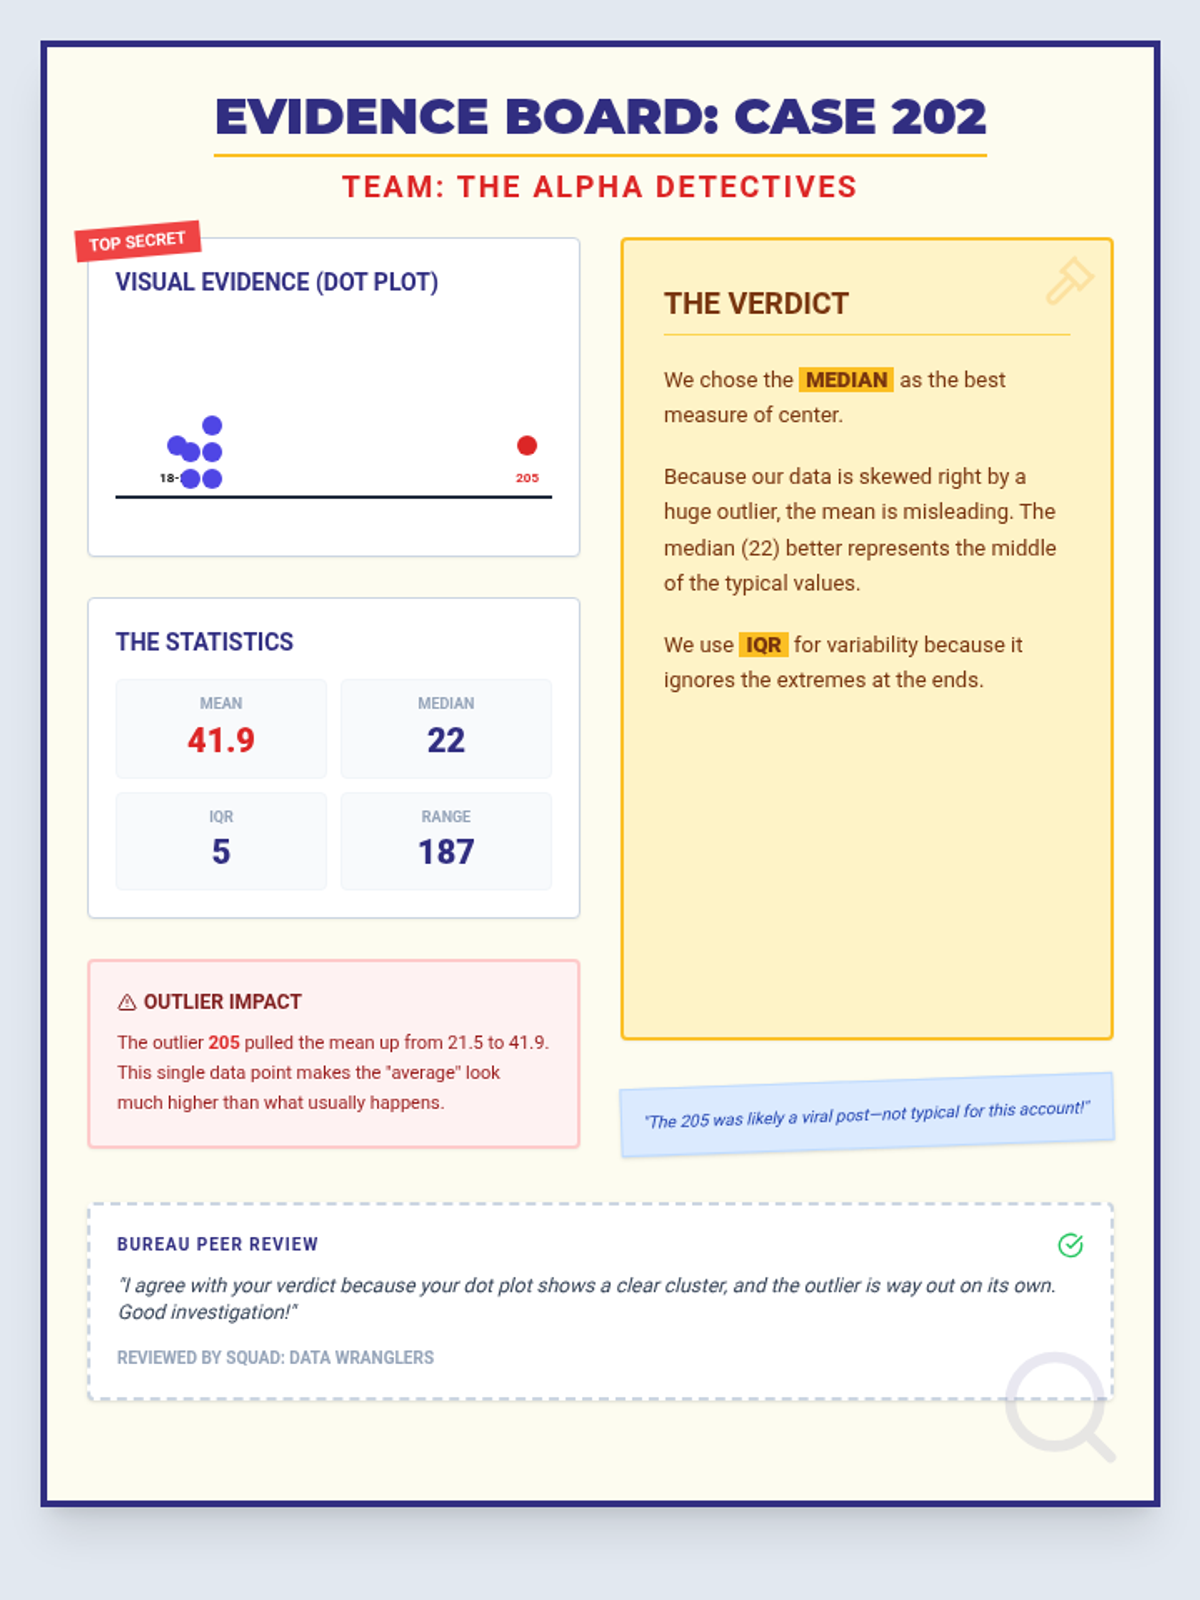
A visual example and mockup of a completed 'Evidence Board' poster for Case 202, demonstrating how students should present their visual plot, statistics, verdict, and outlier analysis. Revised for single-page layout.
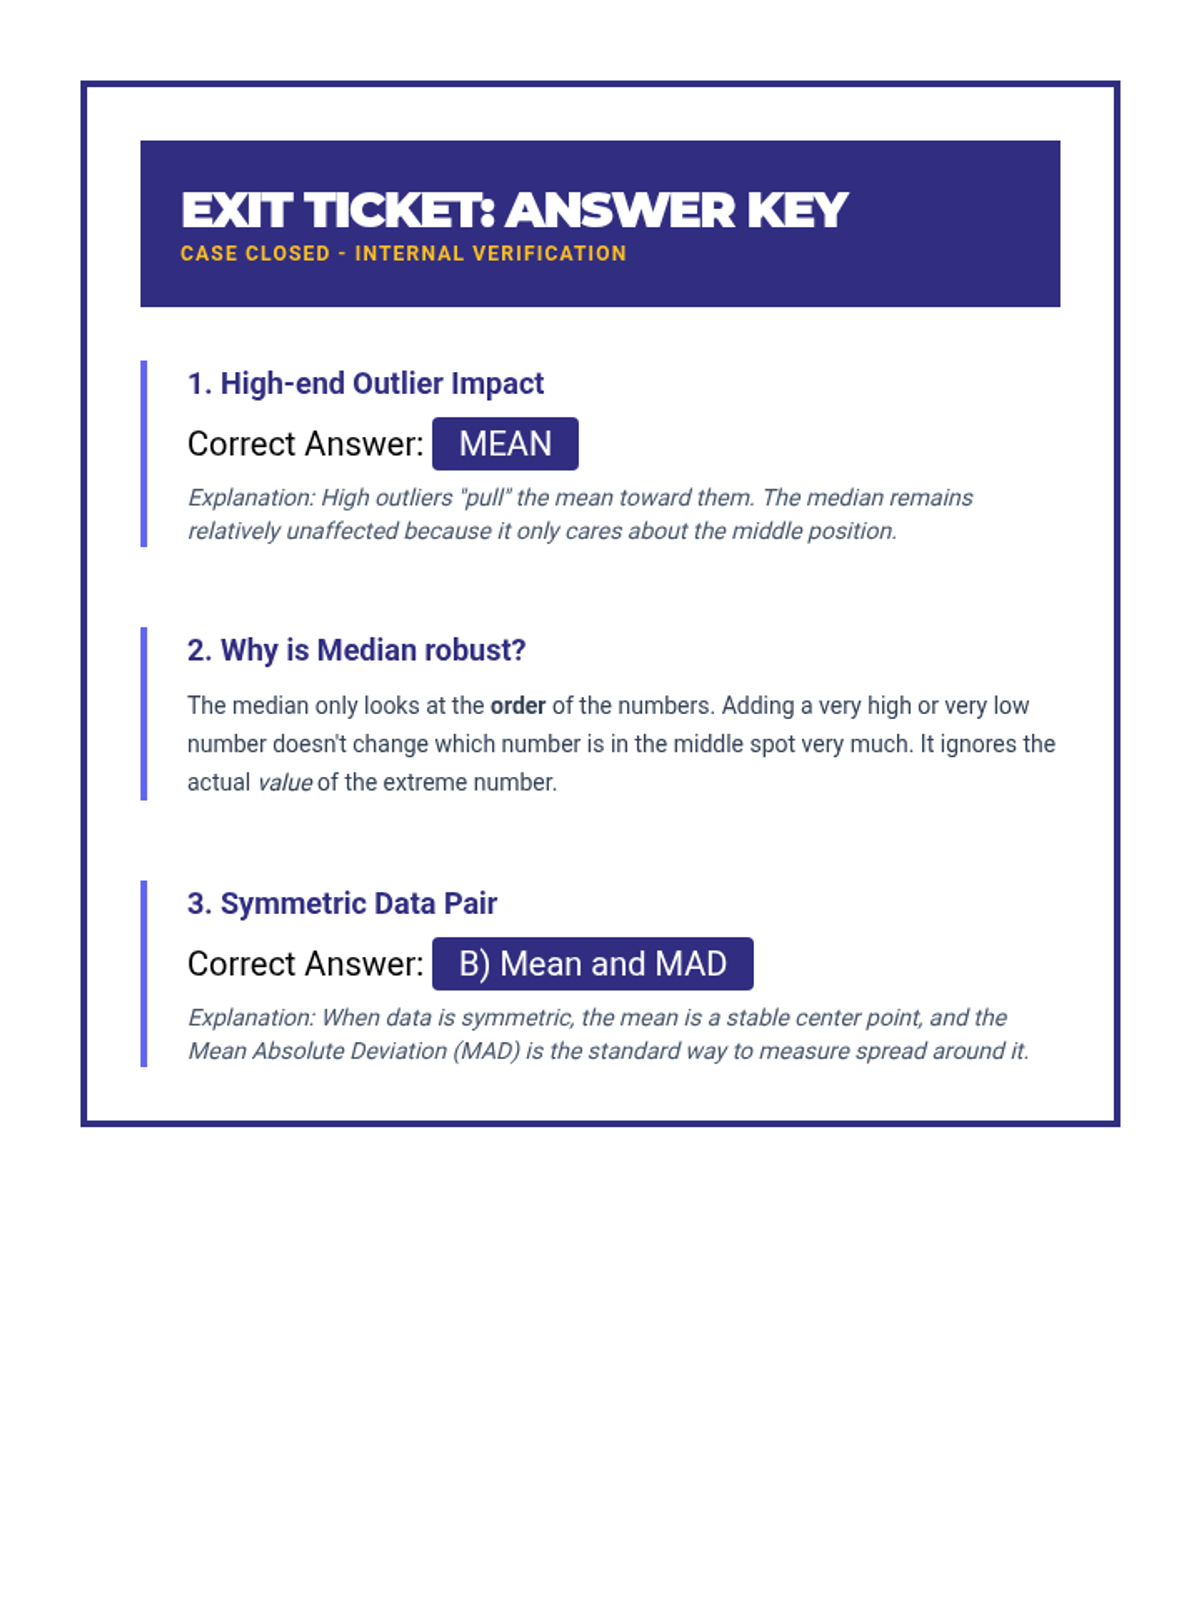
An answer key for the Distribution Debrief Exit Ticket, providing correct answers and brief pedagogical explanations.
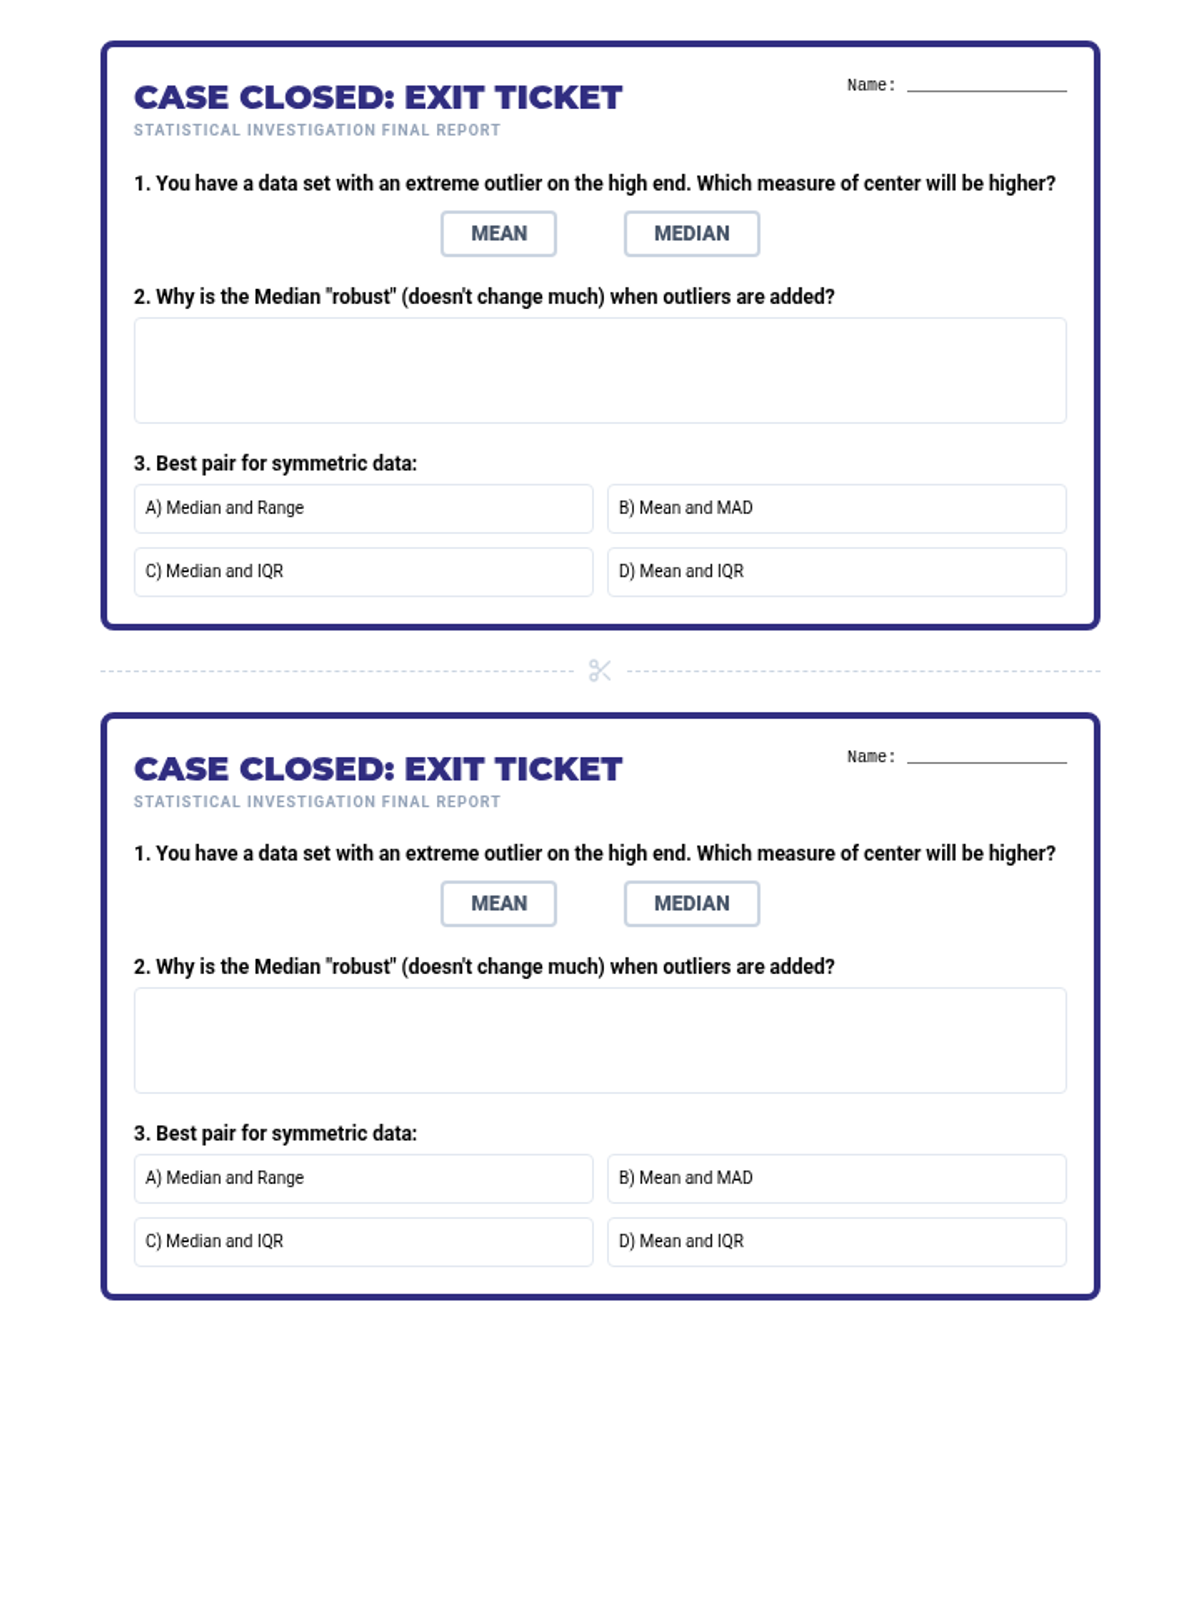
A brief end-of-lesson assessment checking student understanding of how outliers affect mean vs median and when to use specific statistical measures. Two tickets per page for efficient printing. Revised for layout and uniform answer choices.
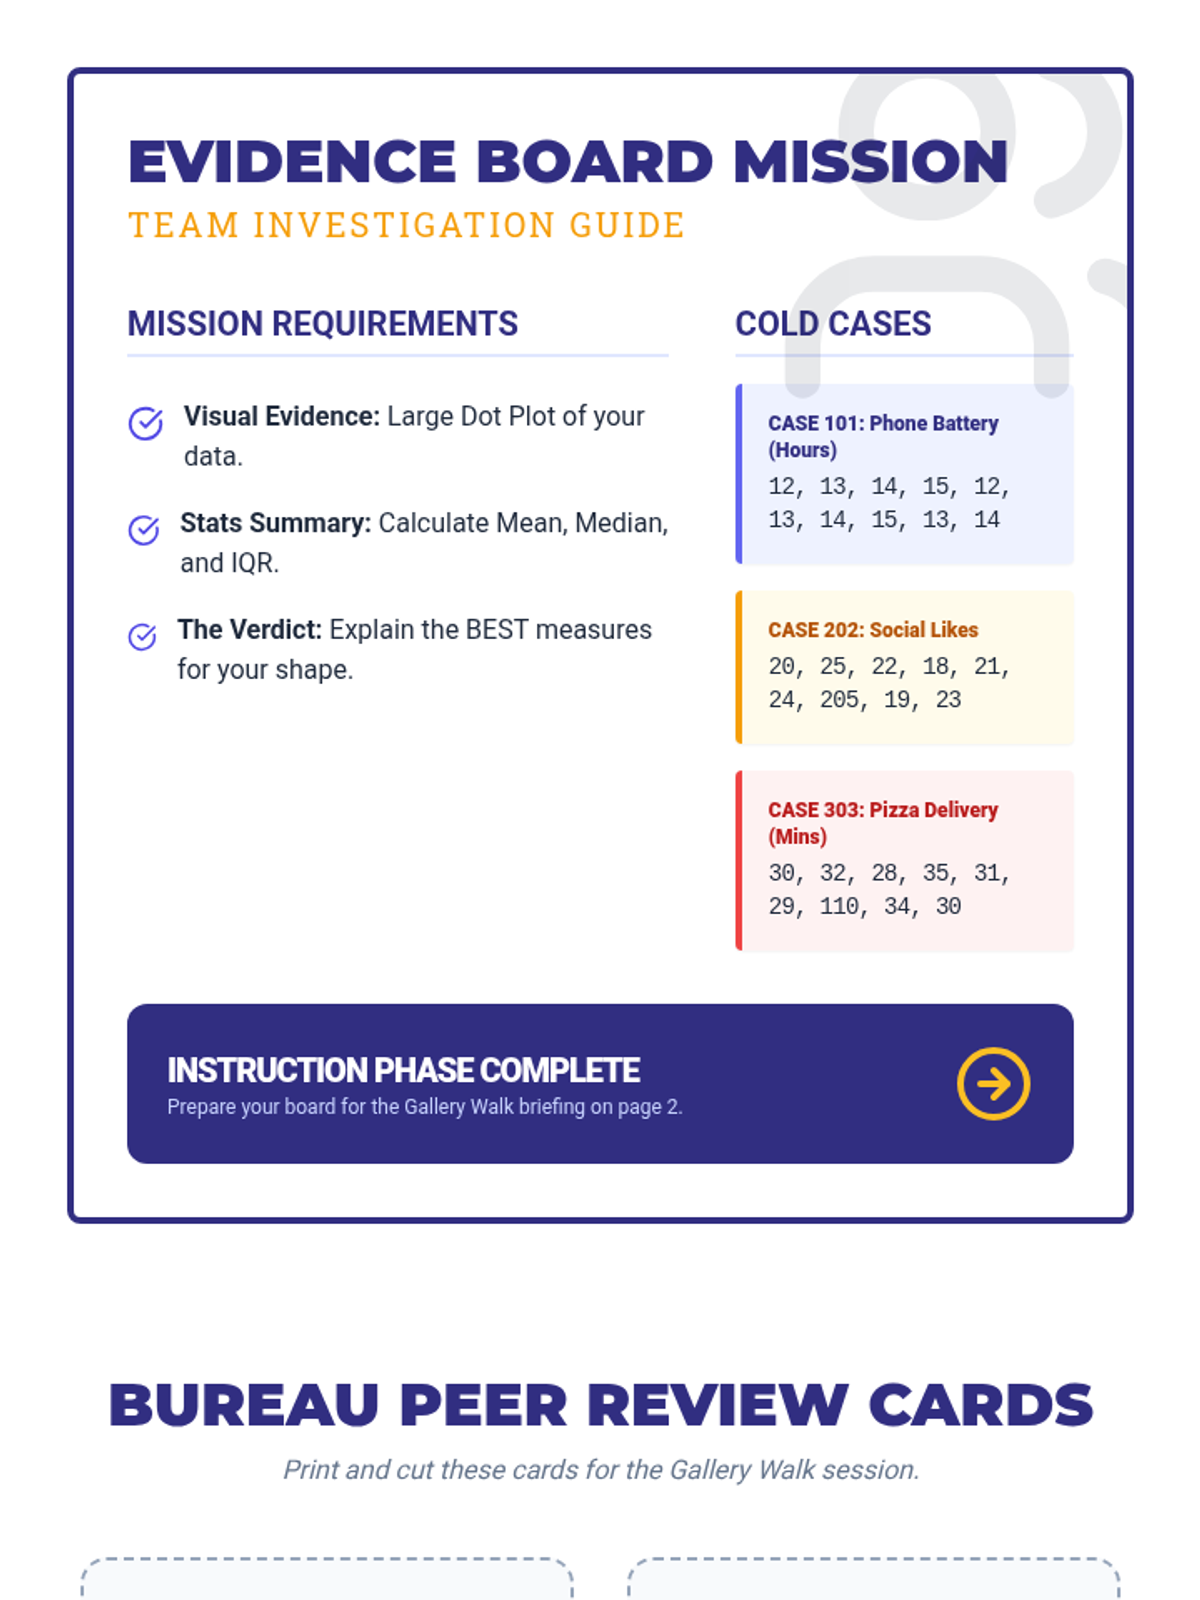
A guide for the collaborative poster activity featuring specific case studies for students to analyze and 'peer review' cards for a gallery walk. Revised with larger peer review cards and better layout.
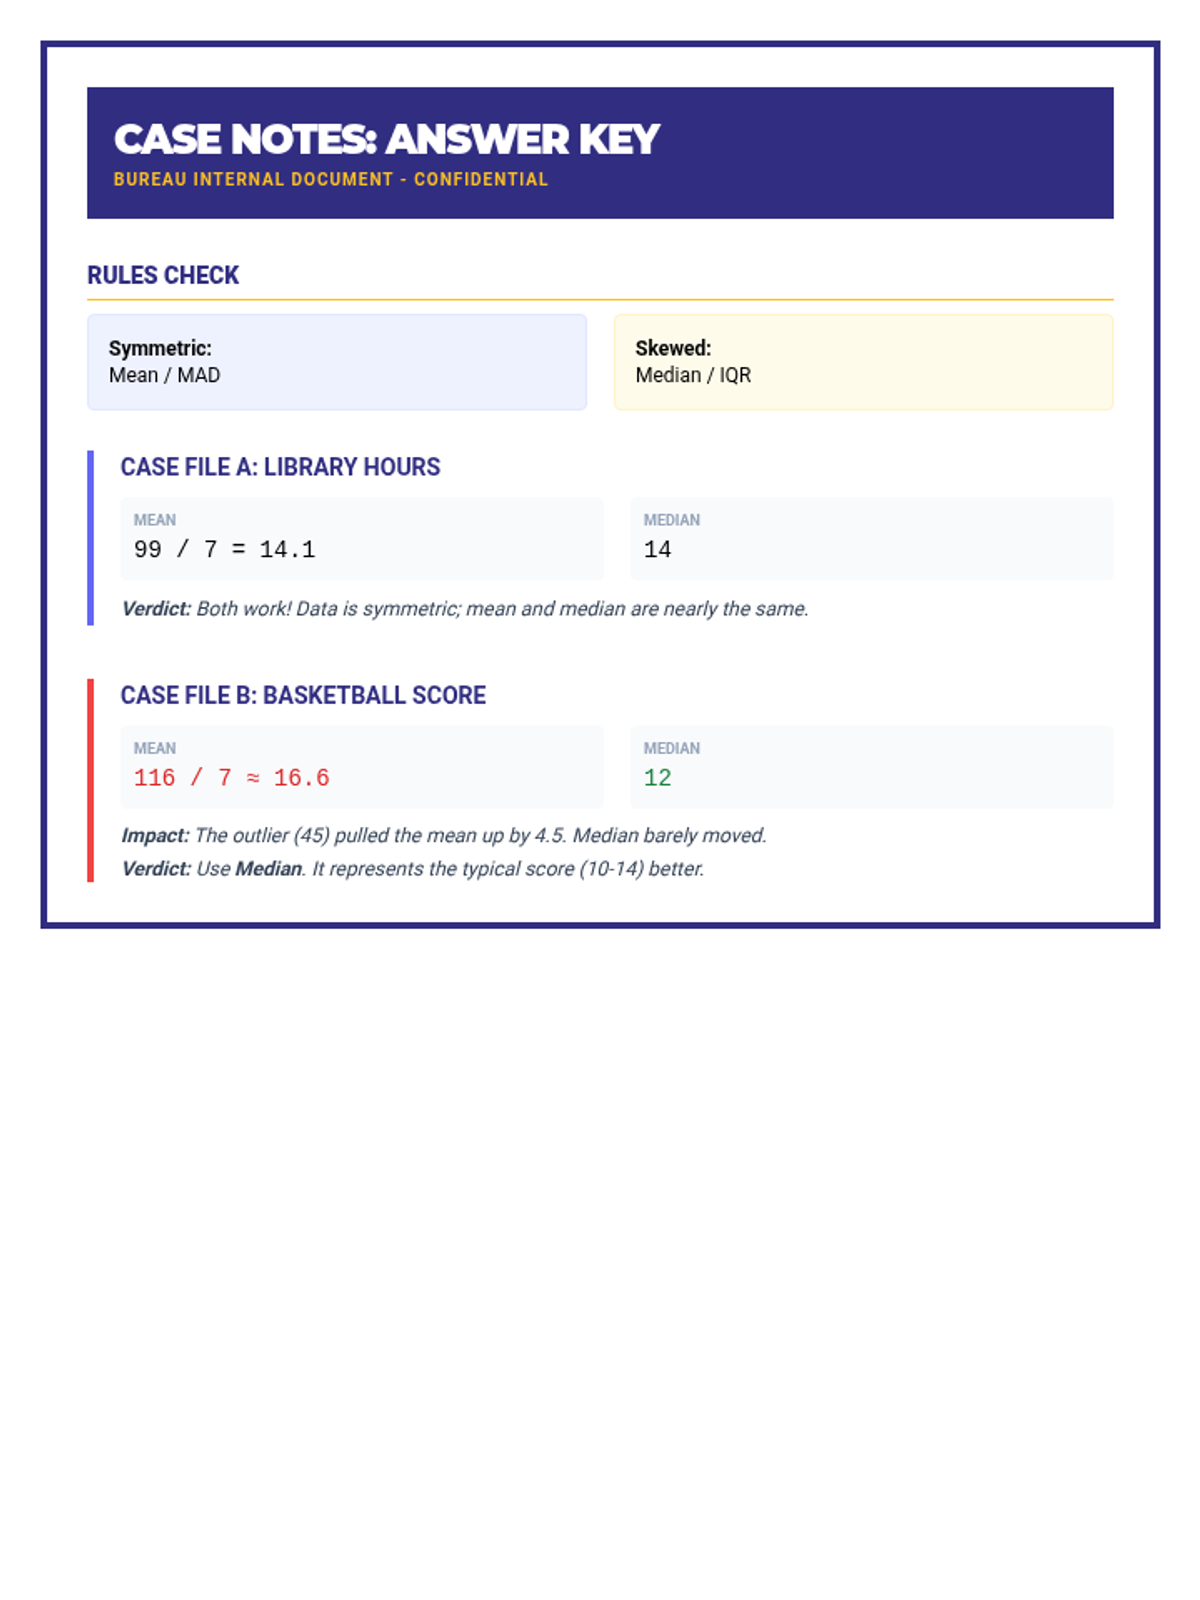
An answer key for the Case Notes handout, providing calculations for mean and median and clear explanations of why certain measures are preferred in symmetric vs skewed data. Revised for layout and clarity.
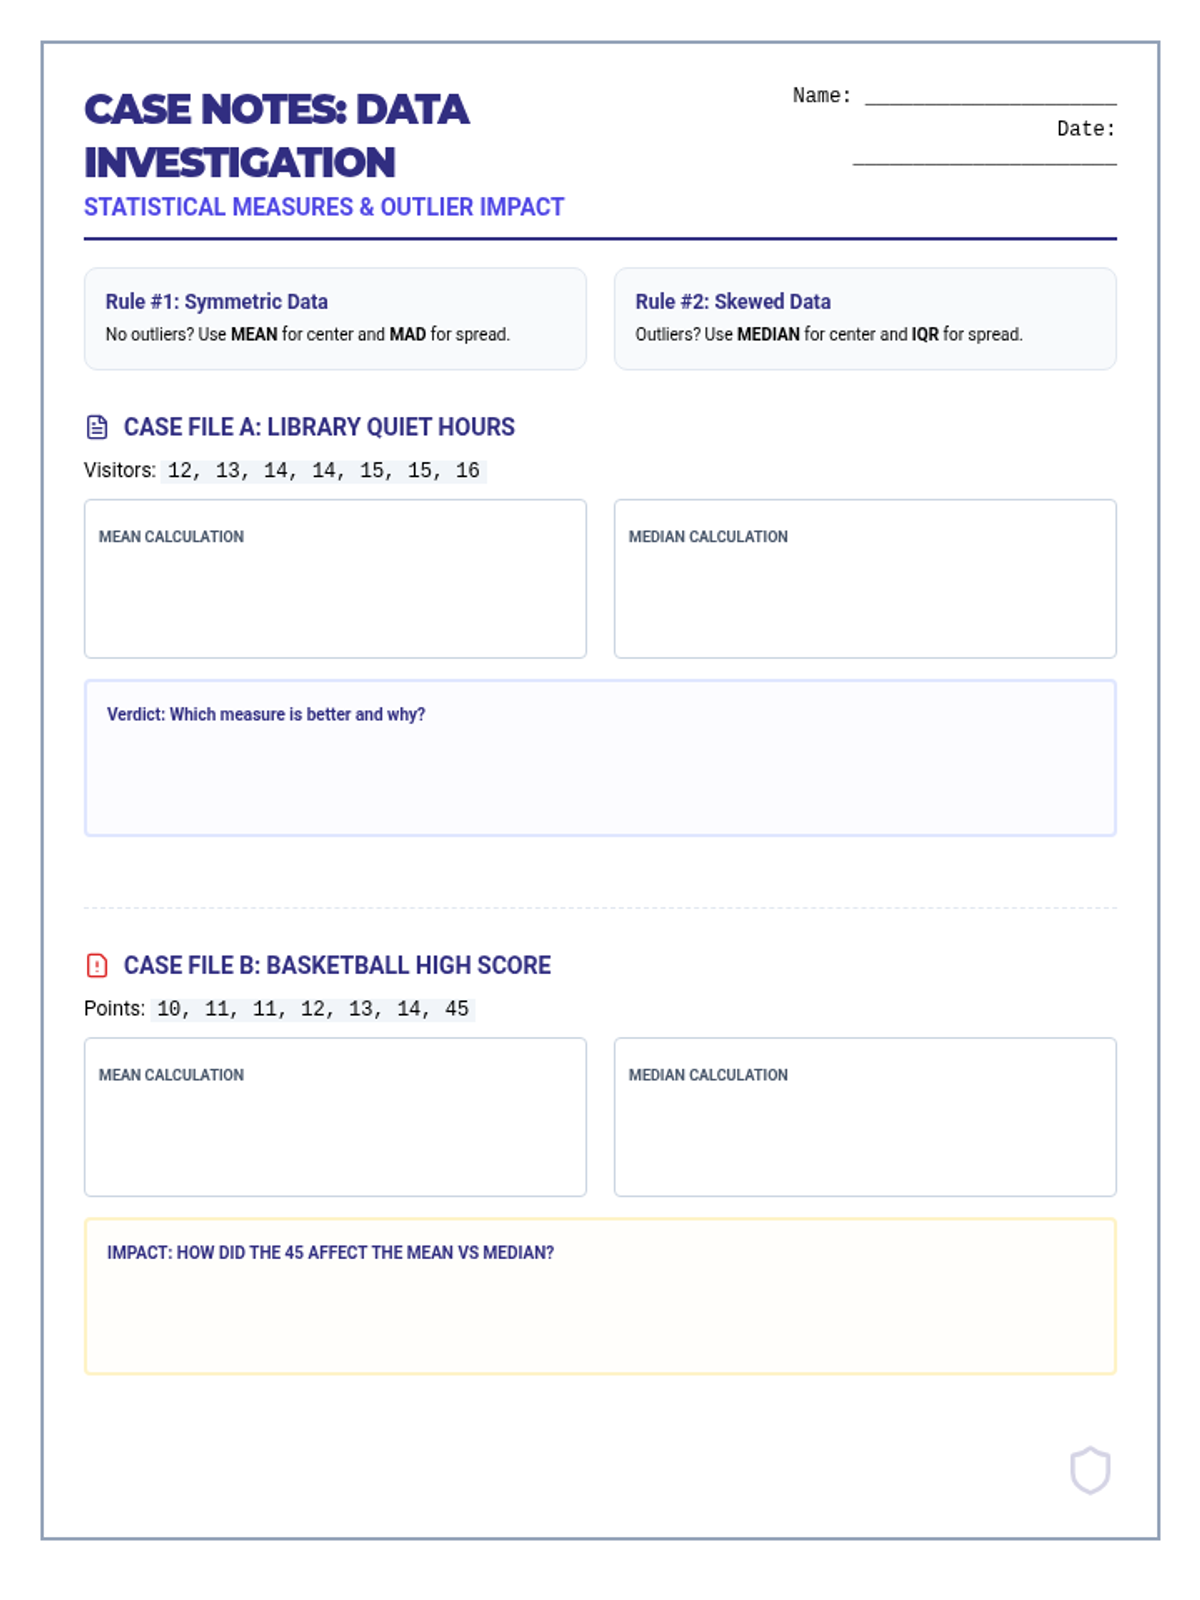
A student practice worksheet with two real-world scenarios comparing symmetric data to data with an outlier, requiring students to calculate measures and justify their selection. Layout optimized for 8.5x11 printing. Revised for single-page fit.
Revised 2-page practice set for Week 7. Fixed scatter plot grid Y-axis labels and tick alignment. Darkened handwriting guides and corrected table variable text for better PDF rendering.
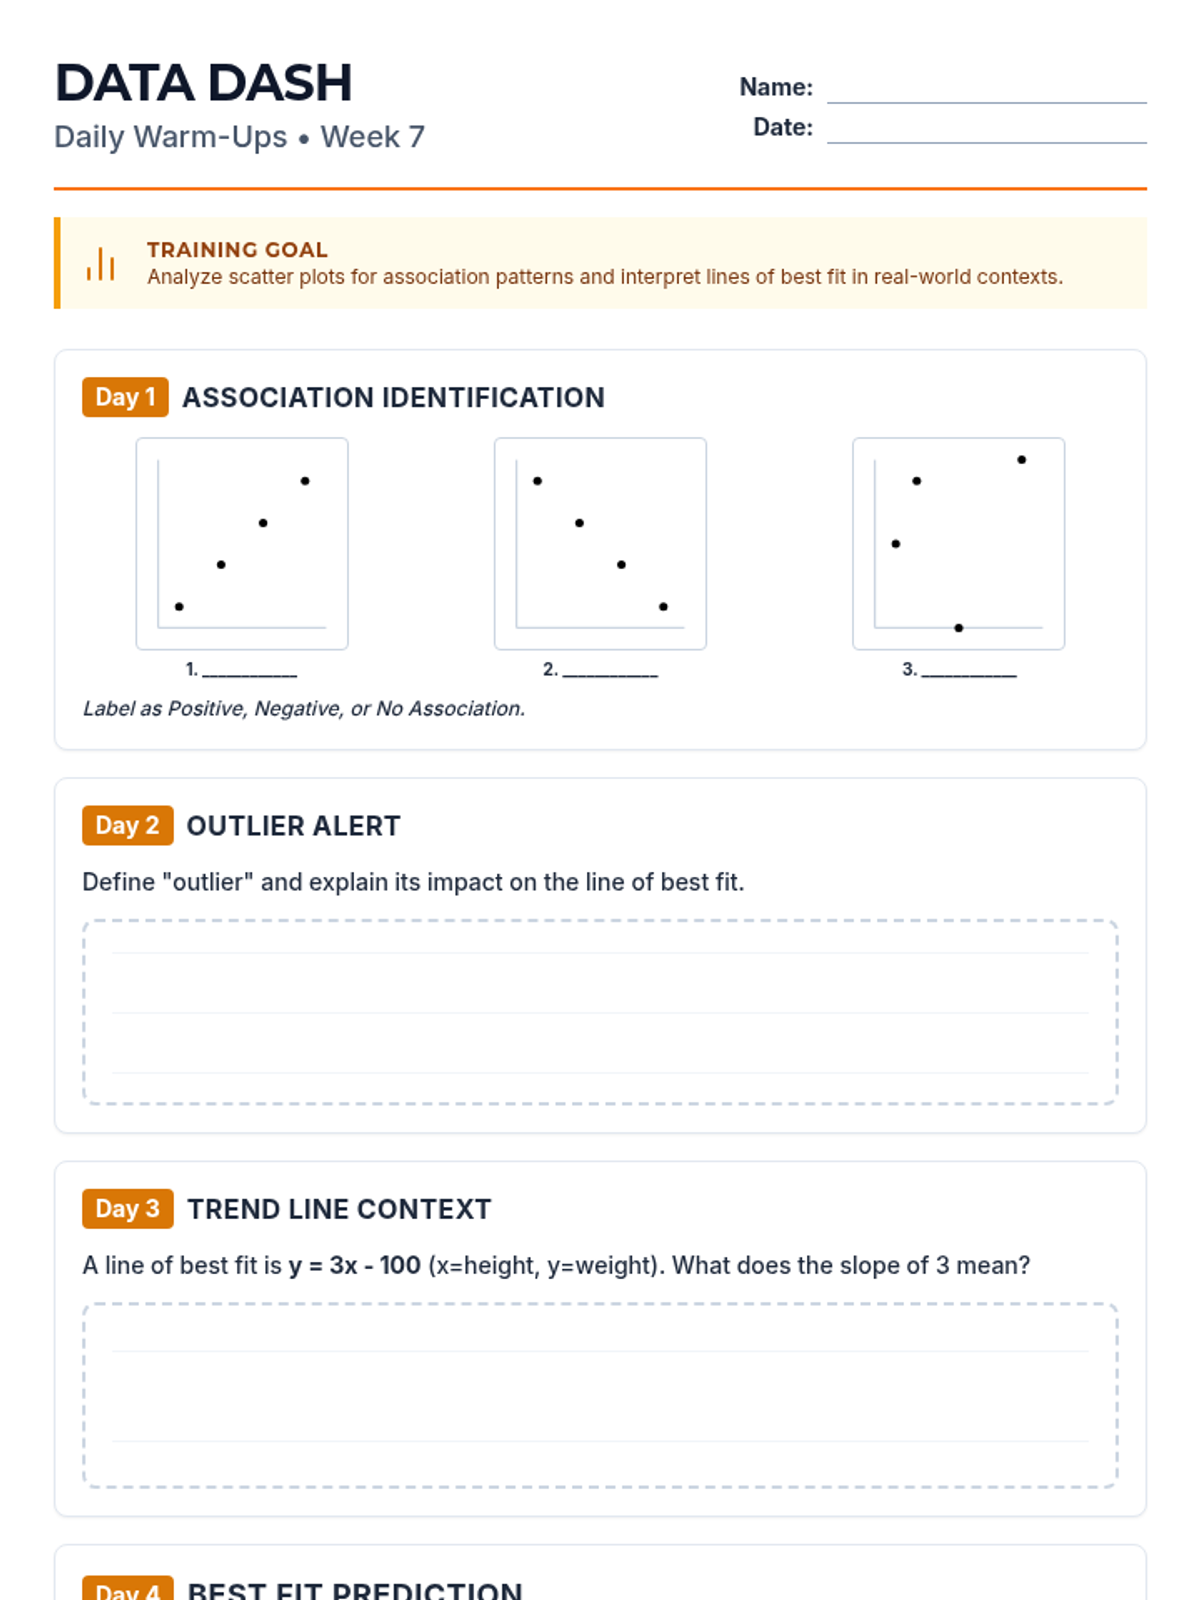
Polished 2-page Warm-Up for Week 7. Replaced MathJax in body text with standard bold for better PDF compatibility, consolidated layout to fit on two pages, and added guided handwriting lines.
Revised 2-page practice set for Week 6. Added grid and numerical labels to coordinate planes, consolidated layout to avoid orphaned headers, and improved shape comparison workspace.
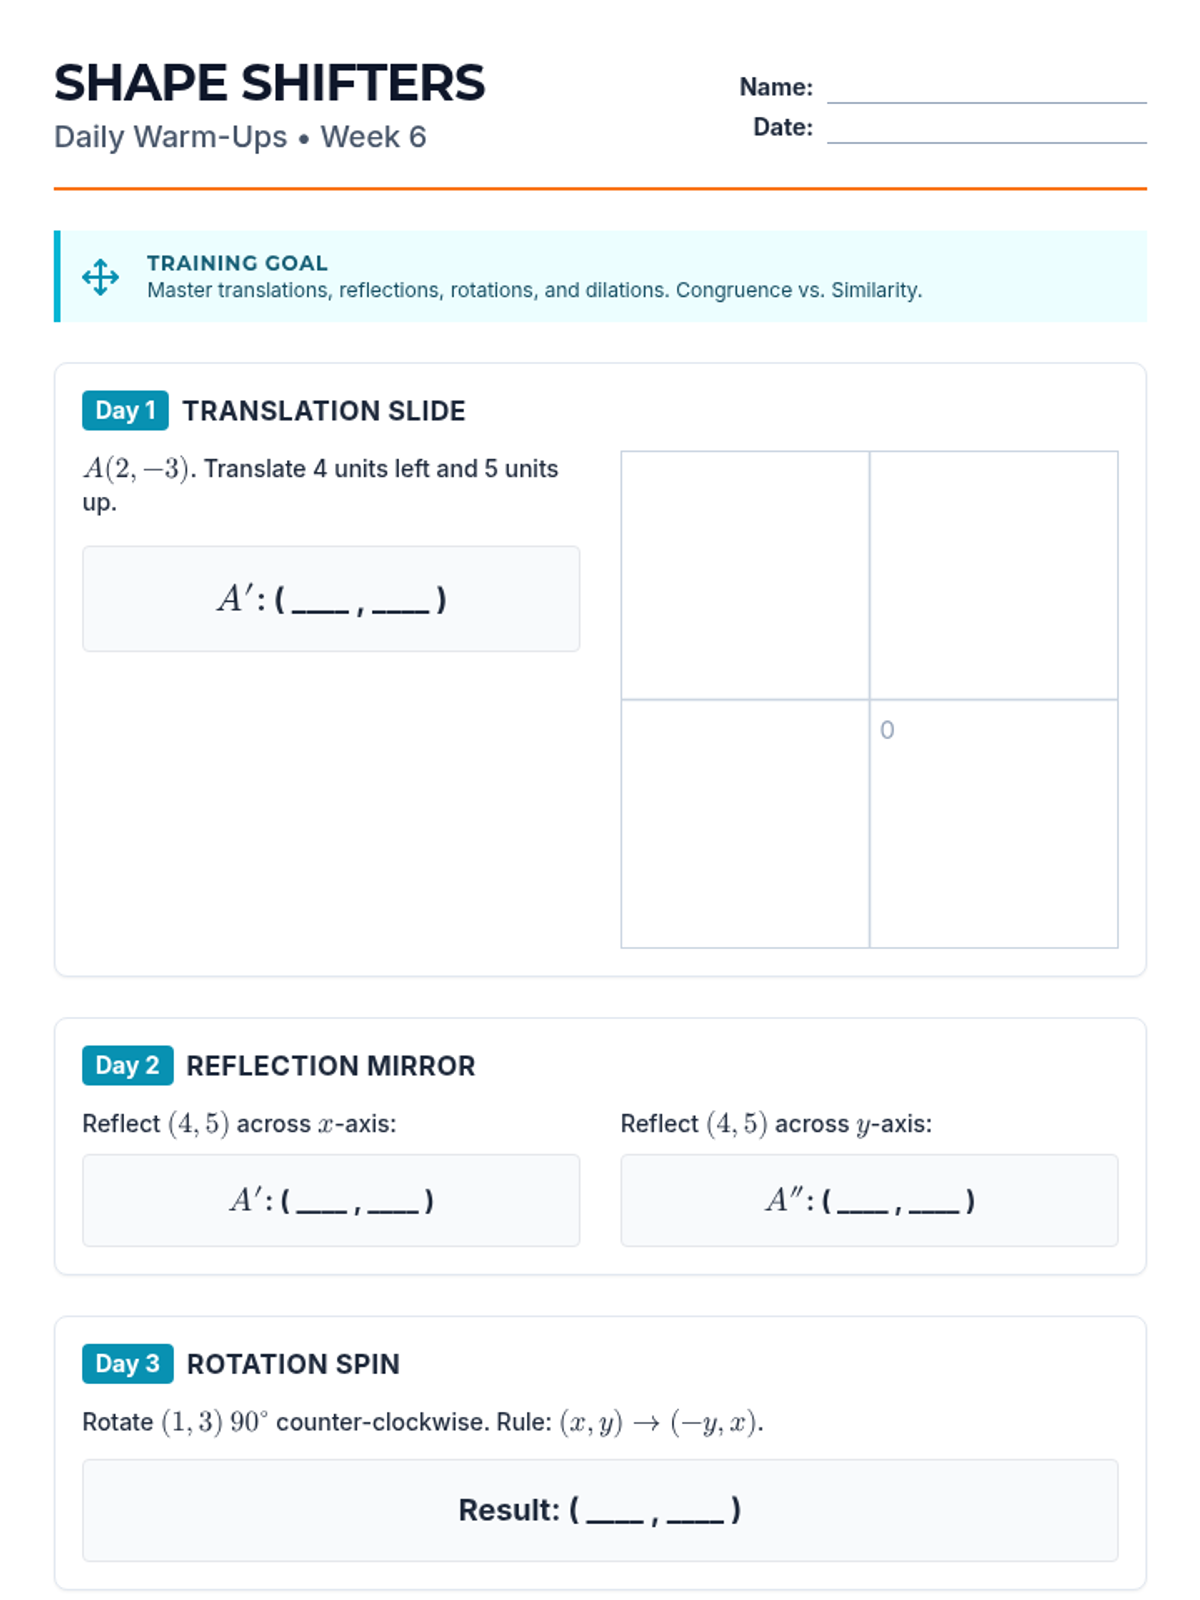
Revised 2-page Warm-Up for Week 6. Fixed overlapping coordinate plane, removed raw markdown asterisks, and consolidated all 5 days onto two pages.
Revised 2-page practice set for Week 5. Corrected LaTeX rendering for exponents, improved shape comparison workspace, and consolidated Section 2 layout.
Revised 2-page Warm-Up for Week 5. Fixed LaTeX rendering issues, consolidated layout to fit all days efficiently, and standardized work area heights.
Optimized 2-page practice set for Week 4. Standardized work area heights to fit all content on two pages and improved SVG number line scale and labels.
Revised 2-page Warm-Up for Week 4. Replaced scientific notation with square/cube roots and repeating decimal conversions. Improved pagination and font consistency.
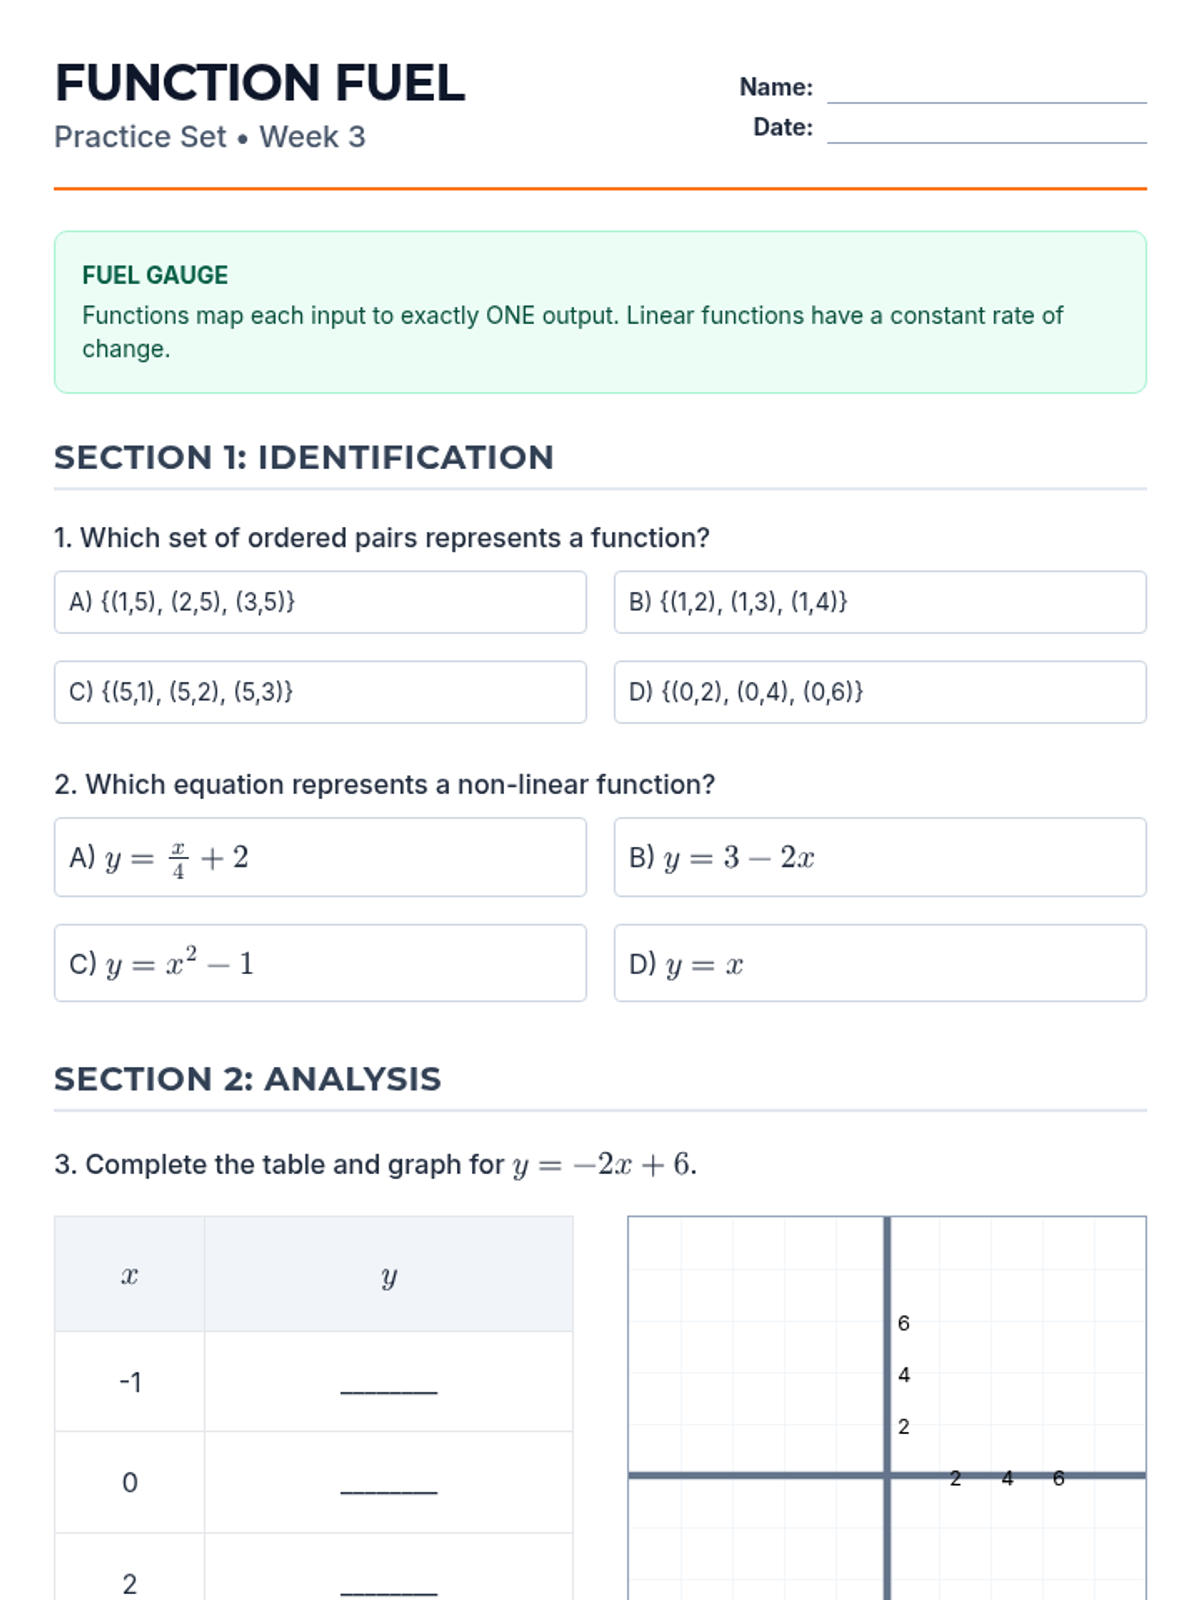
Revised 2-page practice set for Week 3. Improved coordinate plane with numerical labels, corrected font sizes, and consolidated layout.
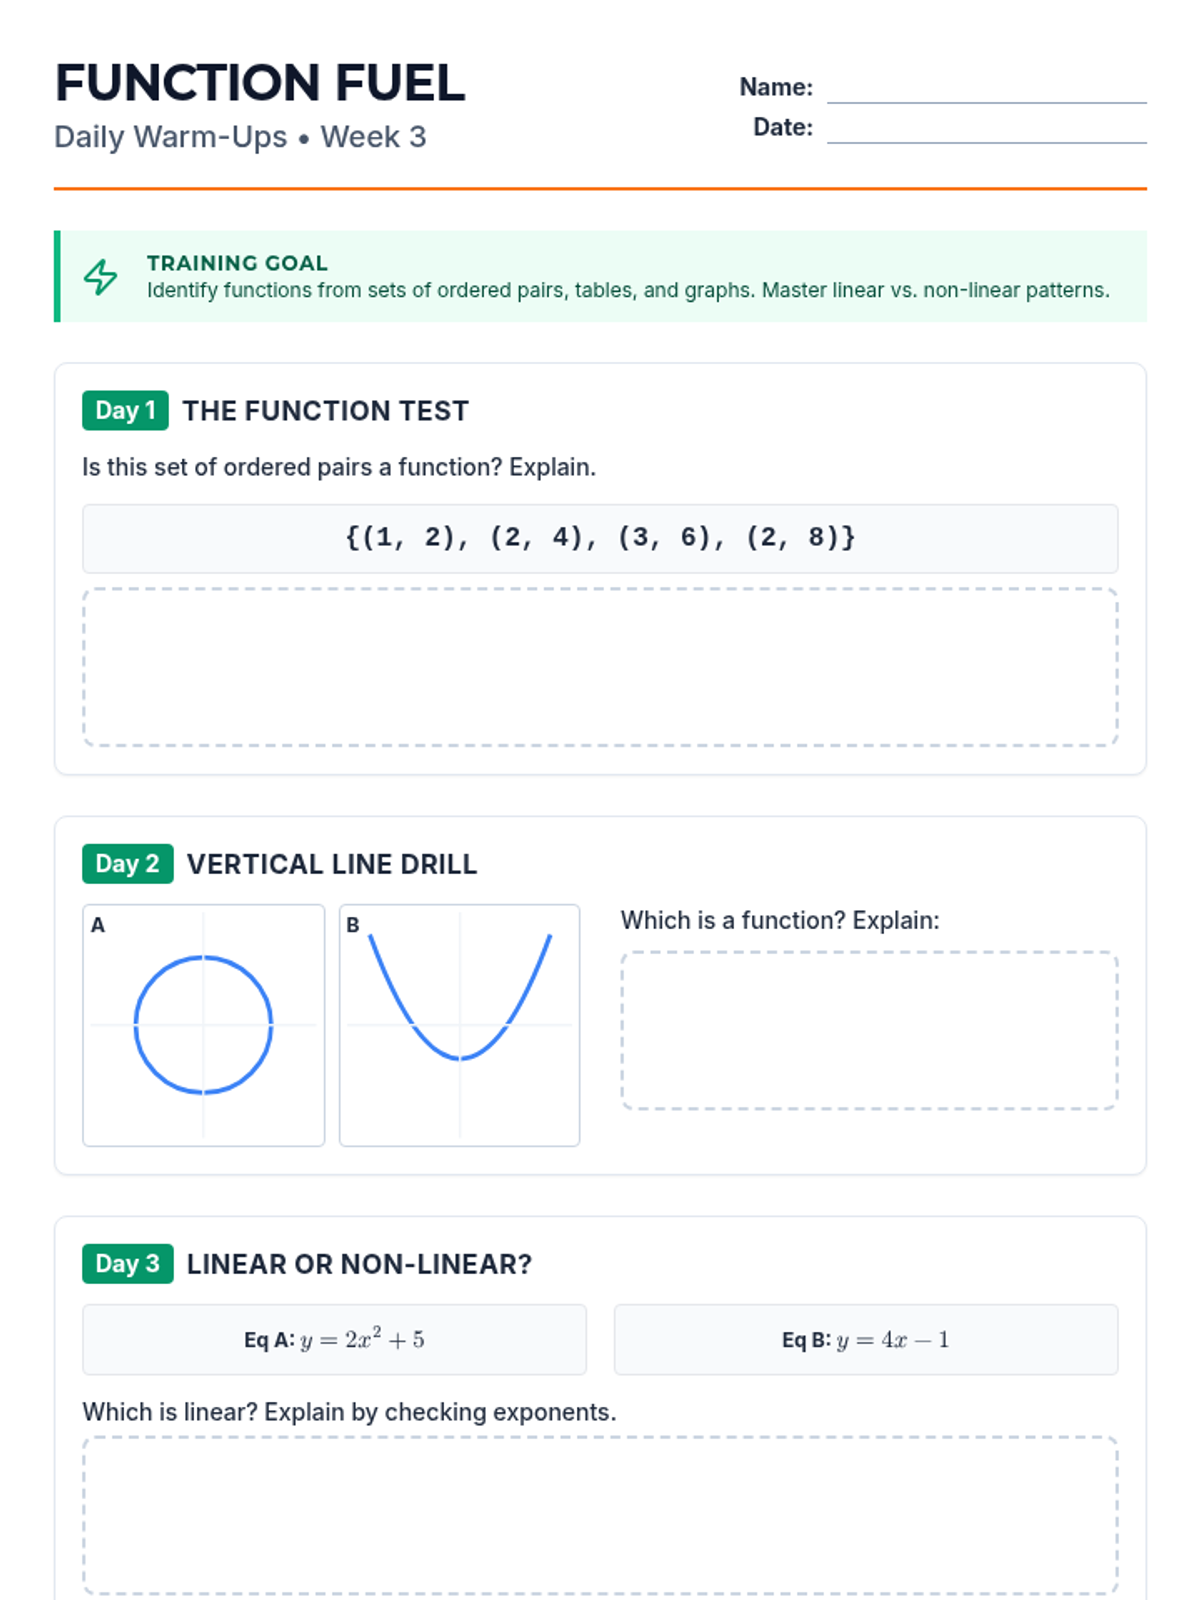
Revised 2-page Warm-Up for Week 3. Consolidated layout, fixed overlapping Day 2 elements, and improved work area contrast for better printing.
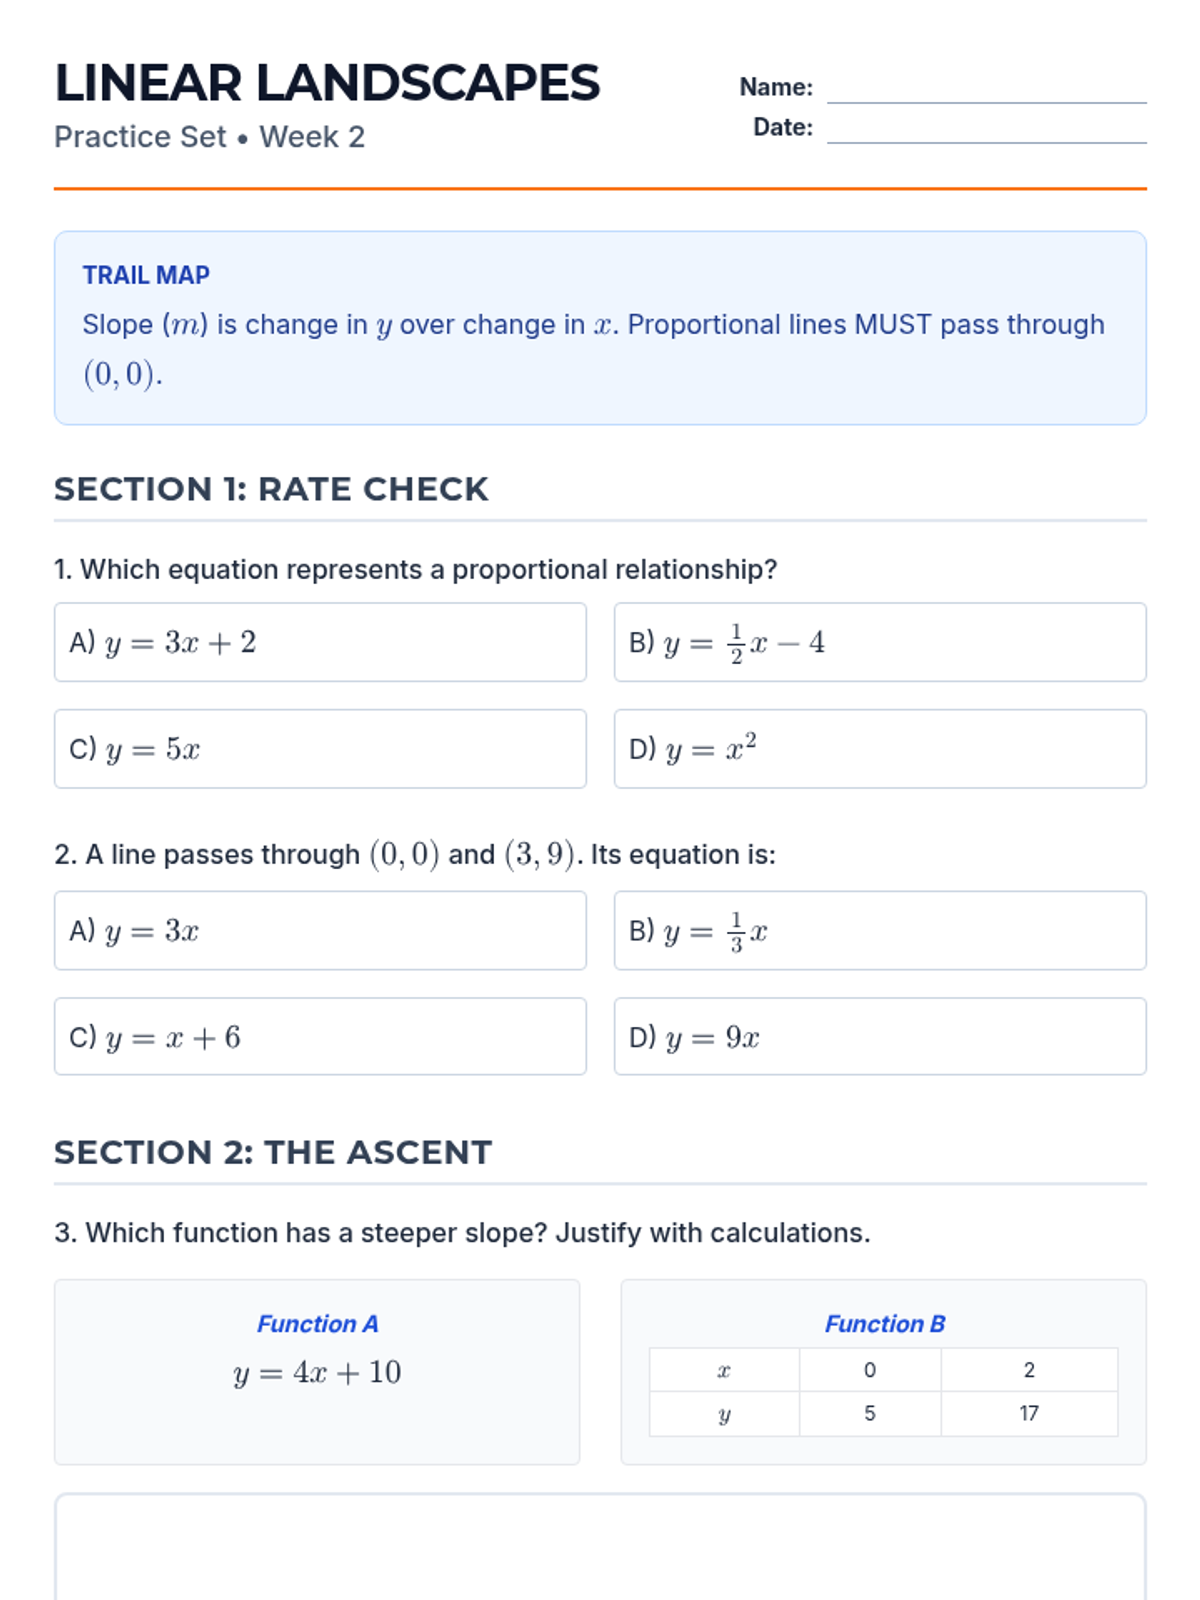
Revised 2-page practice set for Week 2. Fixed pagination, added numerical scale to coordinate plane, and improved the layout of word problems.
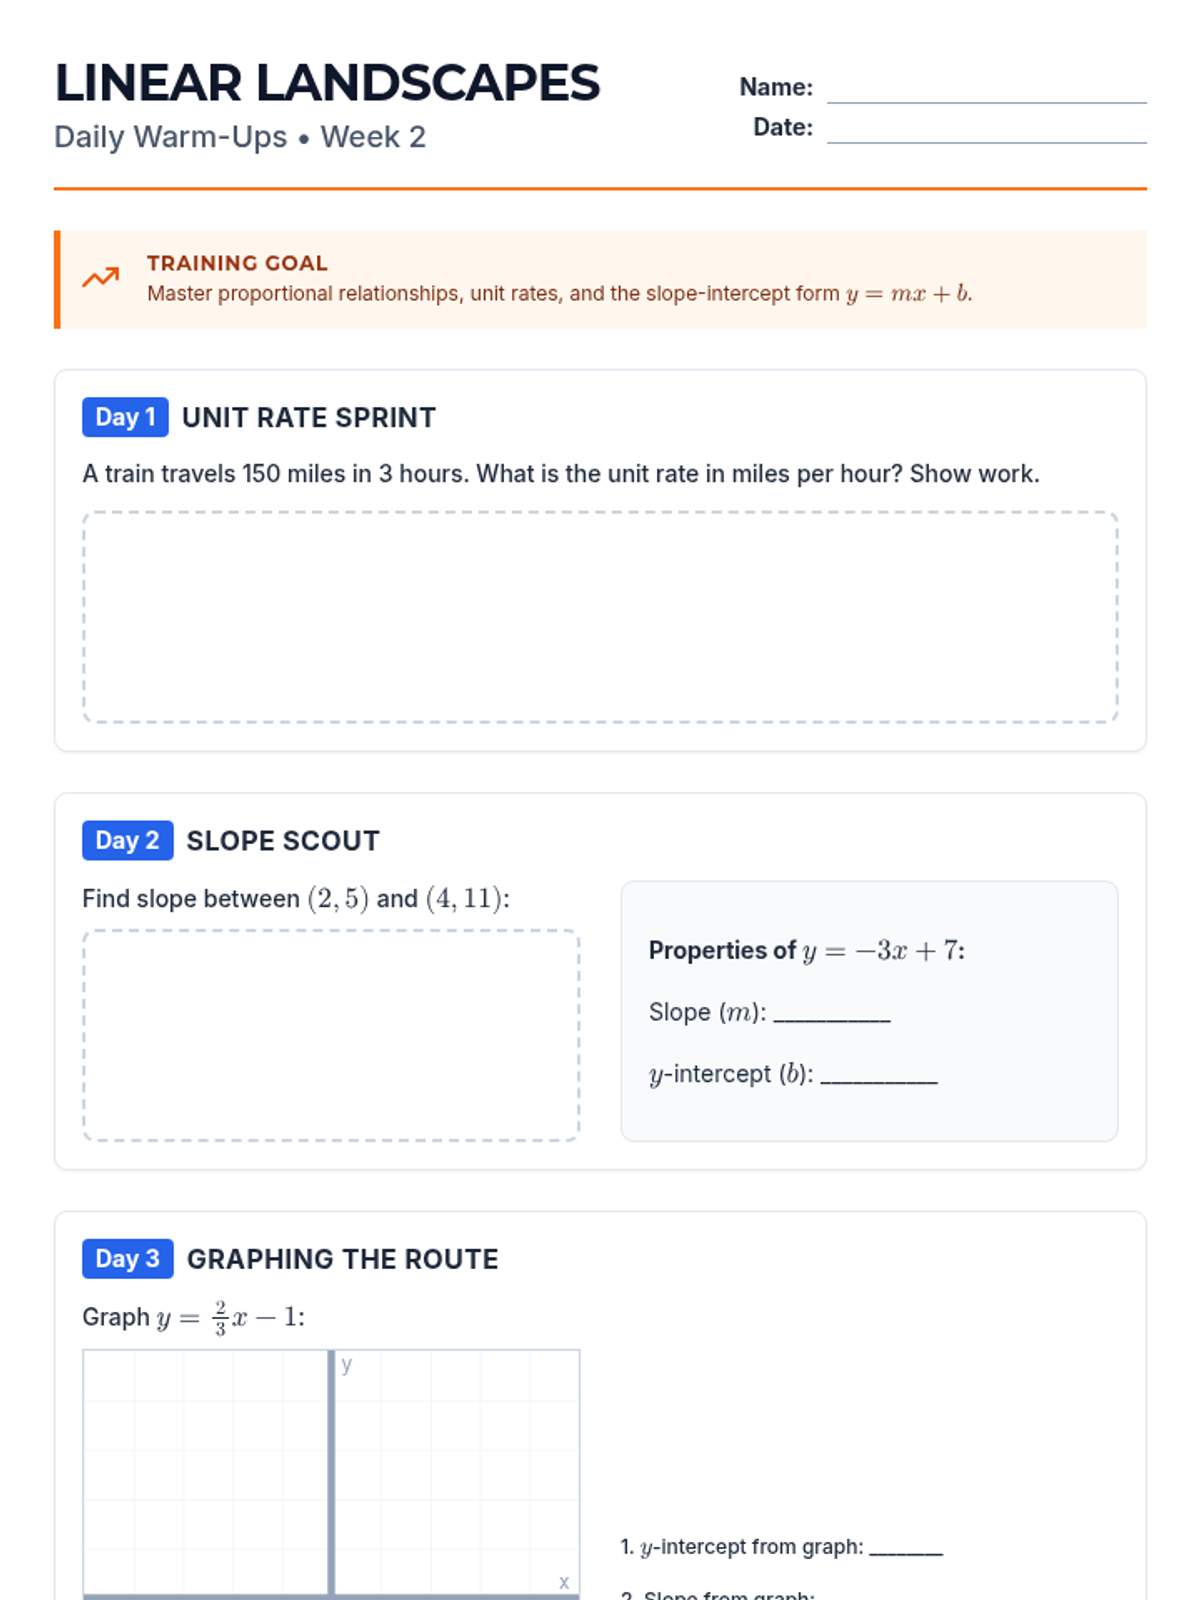
Revised 2-page Warm-Up for Week 2. Fixed pagination, added scale to coordinate plane, and improved the response area for slope identification.
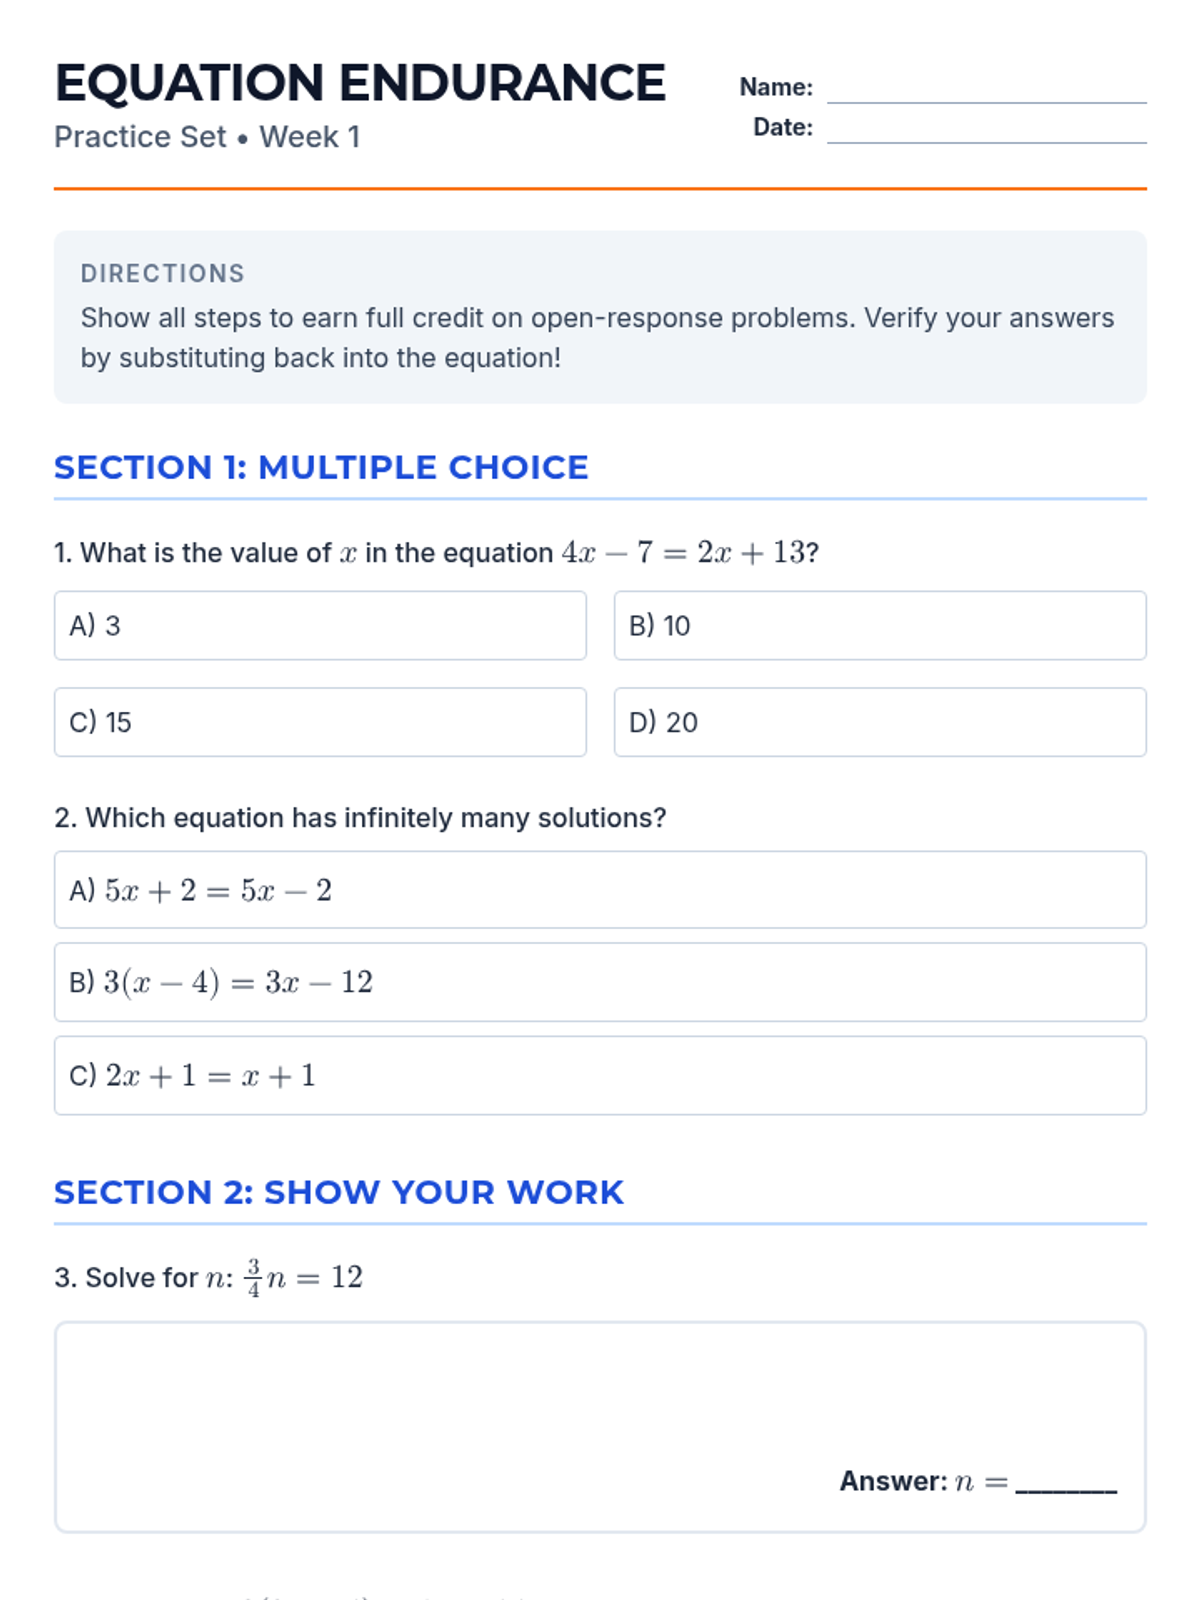
Revised 2-page practice set for Week 1. Consolidated layout to avoid orphaned headers and added specific answer lines.
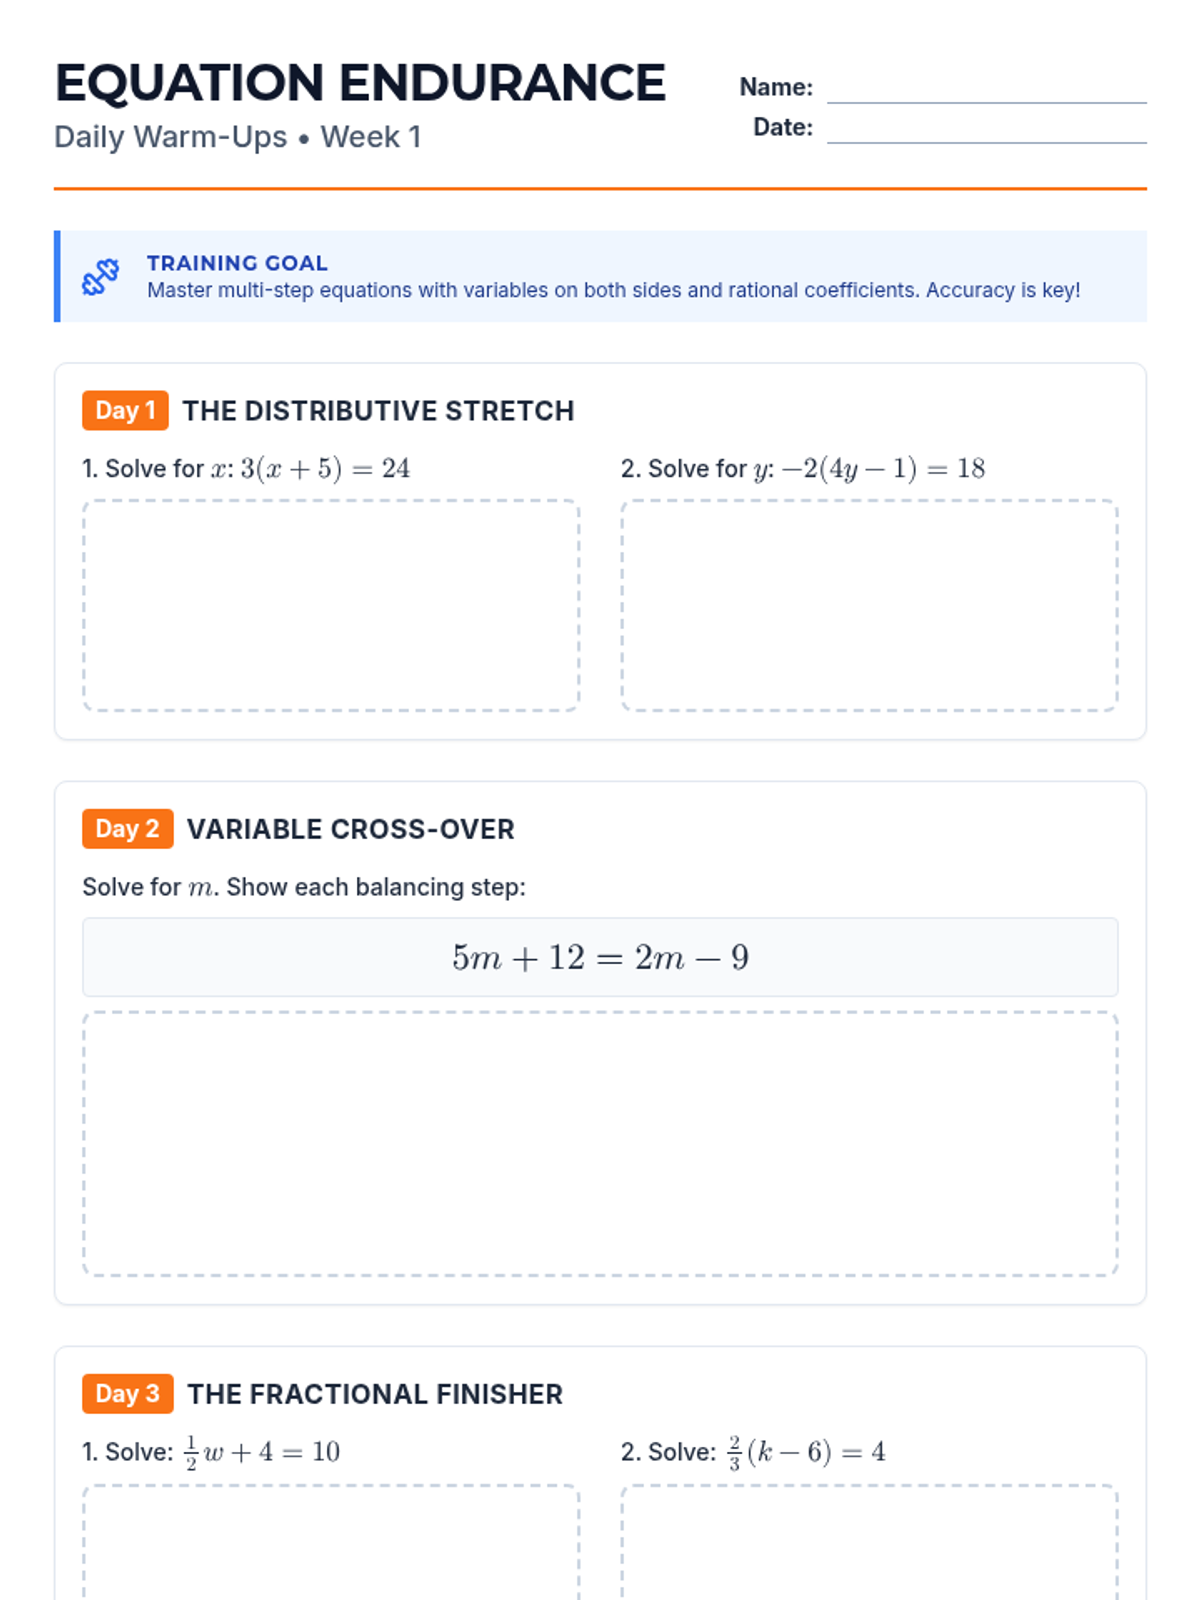
Condensed and polished 2-page Warm-Up for Week 1. Fixed pagination issues and improved work area contrast for printing.