Lenny LearningLenny
Create
Explore
Workspace
LoginSign up
MathEnglish Language ArtsScience & EngineeringSocial StudiesGlobal LanguagesHealth & Physical EducationSpecial EducationCounseling & Life SkillsArts & CreativityESL
Lenny LearningLenny
Lenny Learning
About
Training
Pricing
Support
Contact
© 2026 Lenny Learning Inc.
MathNumbers & CountingCounting ObjectsNumber NamesComparing NumbersNumber OperationsCounting SequenceNumbers 0-10Place Value Understanding and SystemAdd and Subtract Within 20Addition and Subtraction ConceptsAddition and Subtraction EquationsAddition and Subtraction ProblemsFoundations for MultiplicationMultiplication and Division PropertiesMultiply and Divide Within 100Multiplication and Division ProblemsFactors and MultiplesProperties of OperationsPatterns and RelationshipsGenerate and Analyze PatternsMulti-Digit ArithmeticPlace Value OperationsMulti-Digit and Decimal OperationsNumerical ExpressionsFour Operations and PatternsFour Operations Problem SolvingMeasurement & DataMeasurable AttributesMeasuring LengthsMeasure and Estimate Lengths in Standard UnitsRelate Addition and Subtraction to LengthClassifying and Counting ObjectsTime and MoneyArea Concepts and MeasurementPerimeter and Area MeasuresAngle Concepts and MeasurementTime, Volume, and MassMeasurement Unit ConversionsGeometryIdentifying ShapesShapes and AttributesShape Attributes and ReasoningShapes and CompositionClassifying 2D FiguresGeometric Figures and RelationshipsLines, Angles, and ShapesAngle, Area, and VolumeGeometric MeasurementVolume of 3D ShapesCoordinate Plane ApplicationsTransformations in the PlaneCongruence and SimilarityUnderstand congruence in terms of rigid motionsSimilarity and TransformationsProve Theorems Involving SimilarityPythagorean TheoremTrigonometry for General TrianglesMake Geometric ConstructionsProve Geometric TheoremsTheorems About CirclesFind Arc Lengths And Areas of Sectors of CirclesVolume FormulasRelationships Between Two-Dimensional and Three-Dimensional ObjectsProve Simple Geometric Theorems AlgebraicallyTranslate Between Geometric Description and Equation for Conic SectionApply Geometric Concepts in Modeling SituationsFractions & DecimalsFractions as NumbersBuilding FractionsFraction Equivalence and OrderingAdding and Subtracting FractionsMultiplying and Dividing FractionsDividing FractionsDecimal FractionsMulti-Digit Computation and FactorsAdd, Subtract, Multiply, and Divide Rational NumbersRational Number SystemIrrational Numbers and ApproximationsRatiosRatios and ProportionsProportional RelationshipsUnit RateAlgebraAlgebraic ExpressionsGenerate Equivalent ExpressionsQuantitative RelationshipsProportional Relationships and Linear EquationsEquations and InequalitiesEquation Solving and ReasoningLinear Equations and SystemsGraph Equations and InequalitiesSystems of EquationsReal-World Algebraic ProblemsQuantitative Reasoning with UnitsExpression StructureEquivalent Expression FormsRadicals and Integer ExponentsRational ExponentsRational and Irrational NumbersPolynomial OperationsPolynomial IdentitiesPolynomial Zeros and FactorsRational ExpressionsComplex Number OperationsComplex Numbers in PolynomialsComplex Numbers on PlaneStatistics & ProbabilityRepresent and Interpret DataData DistributionsStatistical VariabilityProbability ModelsCompound Event ProbabilitiesStatistical SamplingInterpret Categorical and Quantitative DataBivariate Data PatternsInterpret Linear ModelsComparing Two PopulationsRandom Processes in StatisticsIndependence and Conditional ProbabilityExpected ValuesProbability-Based Decision MakingStatistical Inference and ConclusionsFunctionsFunction Concepts and NotationDefine and Compare FunctionsInterpret Functions in ContextAnalyze Function RepresentationsModel Relationships with FunctionsIdentify Linear vs Exponential GrowthDistinguish Between Function TypesCompare Growth RatesInterpret Function ExpressionsBuild Functions from RelationshipsConstruct and Model FunctionsTransform and Combine FunctionsModel Comparison and SelectionSolve Exponential EquationsTrigonometryTrigonometric Ratios Involving Right TrianglesTrigonometric Functions and Unit CircleModel with Trigonometric FunctionsTrigonometric IdentitiesVectors & MatricesIntroduction to Vectors and MatricesVector QuantitiesVector OperationsMatrix OperationsCalculusLimits and ContinuityDerivative Concepts and NotationDerivative Rules and TechniquesApplications of DerivativesOptimization ProblemsRelated RatesCurve Sketching and AnalysisIntegration Concepts and NotationAntiderivatives and Indefinite IntegralsDefinite Integrals and AreaFundamental Theorem of CalculusIntegration TechniquesApplications of IntegrationDifferential EquationsSequences and SeriesParametric and Polar FunctionsVector-Valued Functions

Statistics & Probability

SequencesLessonsMaterialsVideos
  1. Math

Statistics & Probability

SequencesLessonsMaterialsVideos

Data representation, distributions, and statistical variability using sampling and inference techniques. Integrates probability models, compound events, bivariate patterns, and linear models to guide data-driven decision making.

Data DistributionsAnalyzes the shape, center, and spread of numerical datasets using histograms, box plots, and dot plots. Examines measures of central tendency and variability to interpret data consistency and skewness.
Statistical VariabilityAnalysis of data spread using range, interquartile range, and mean absolute deviation. Examines how individual data points differ from the center and from each other within a distribution.
Interpret Categorical and Quantitative DataStatistical analysis techniques for summarizing and visualizing numerical and non-numerical data sets. Emphasizes shape, center, spread, and the impact of outliers on data interpretation through dot plots, histograms, and box plots.
Lesson
Data Dash Warm-Ups
Data Dash Practice Set
Data Dash Warm-Ups Answer Key
Data Dash Practice Set Answer Key

Data Dash

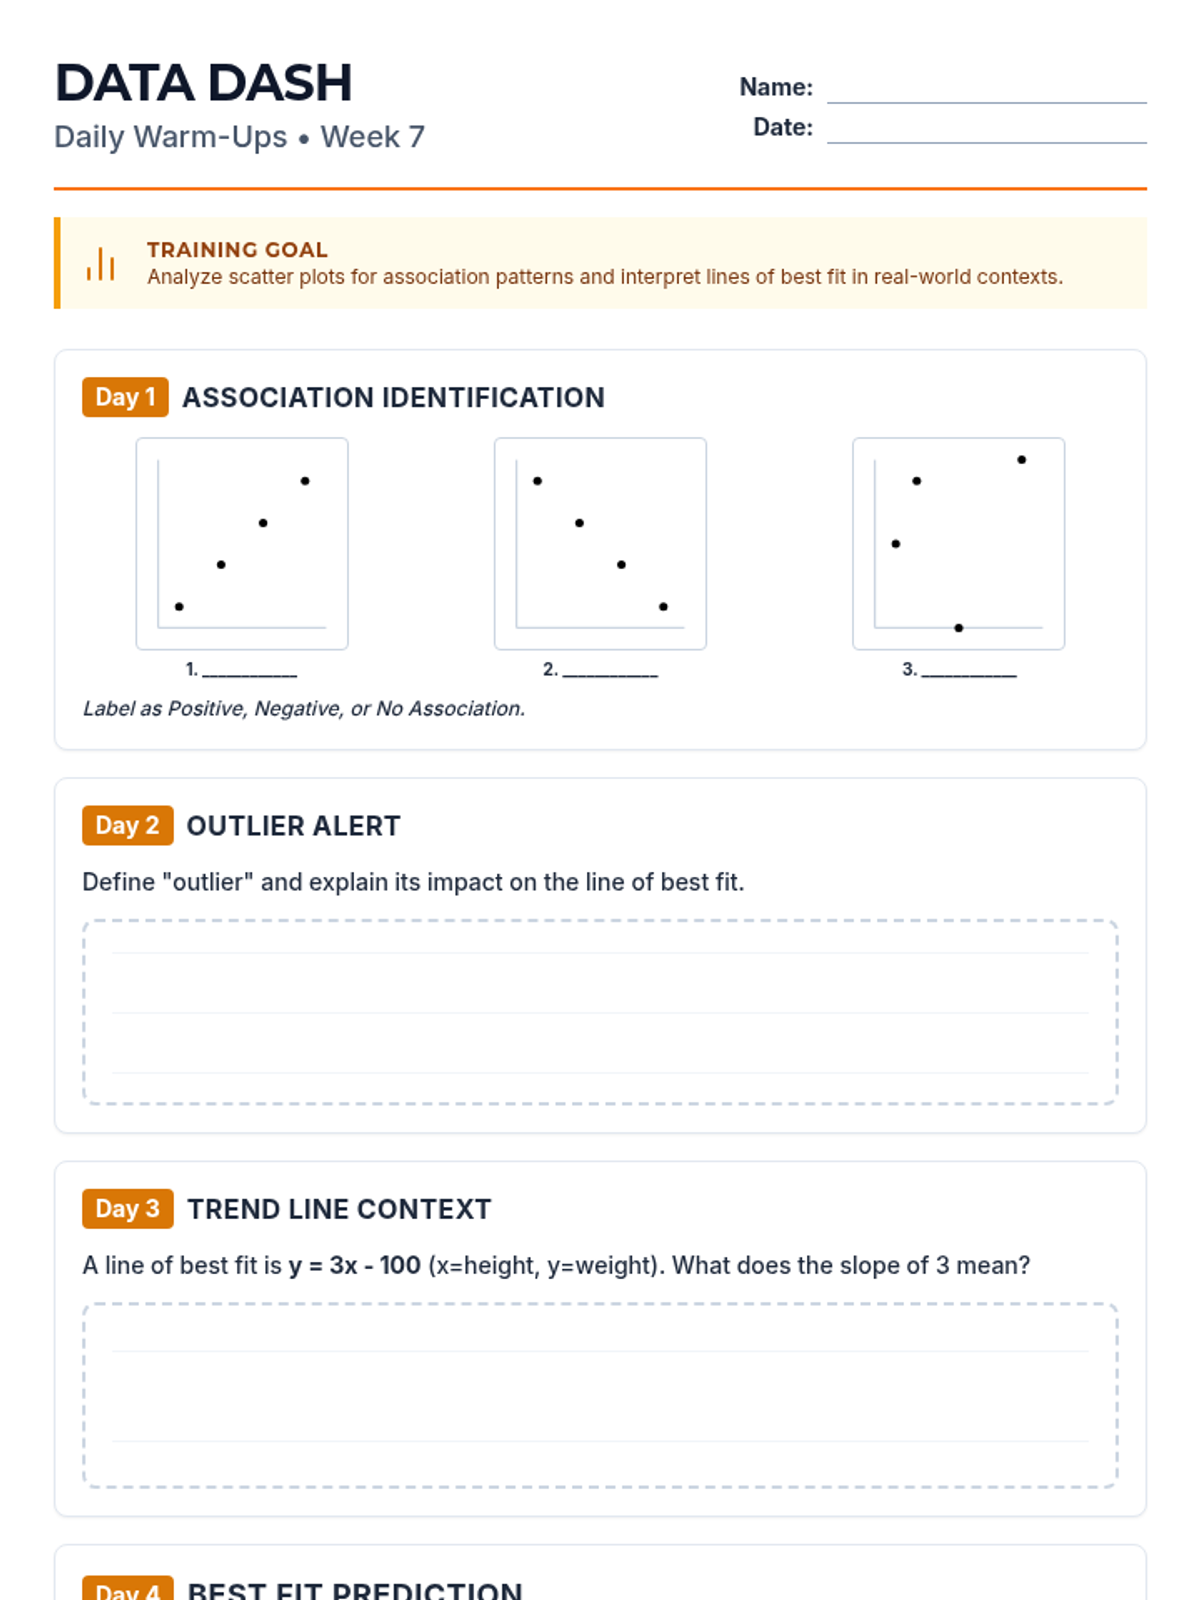
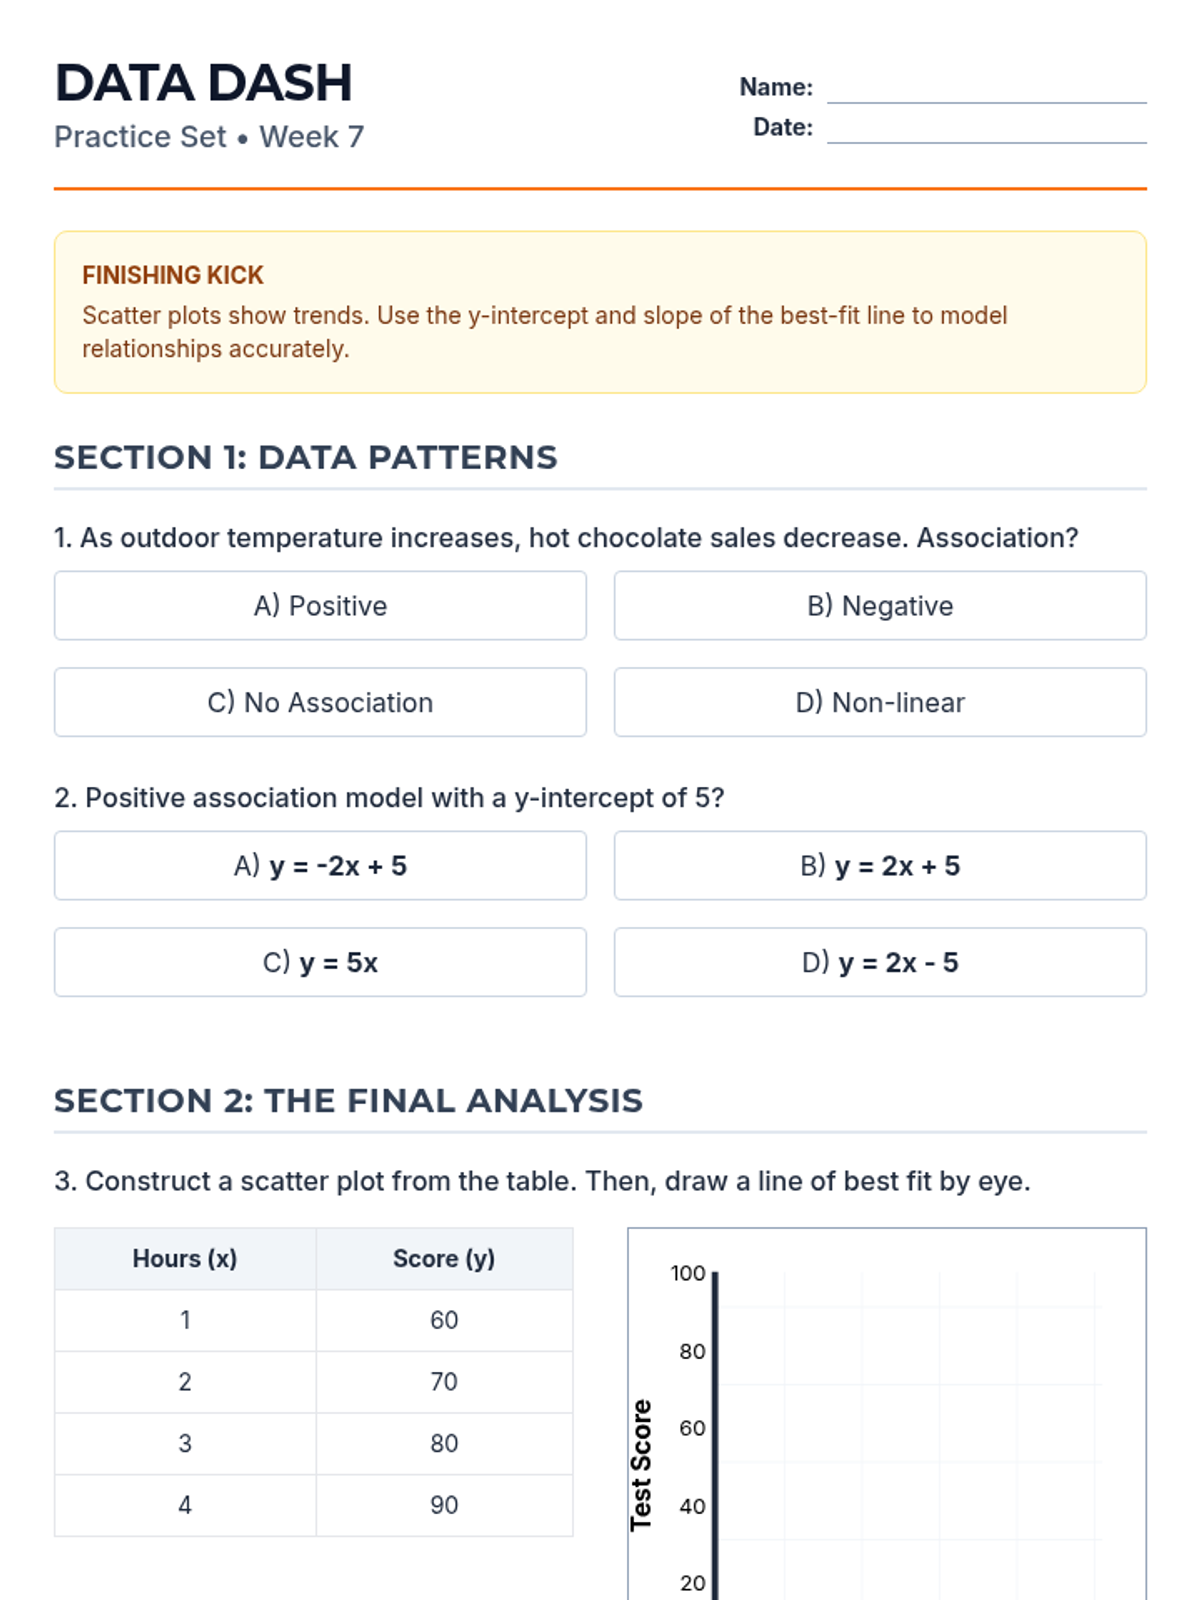
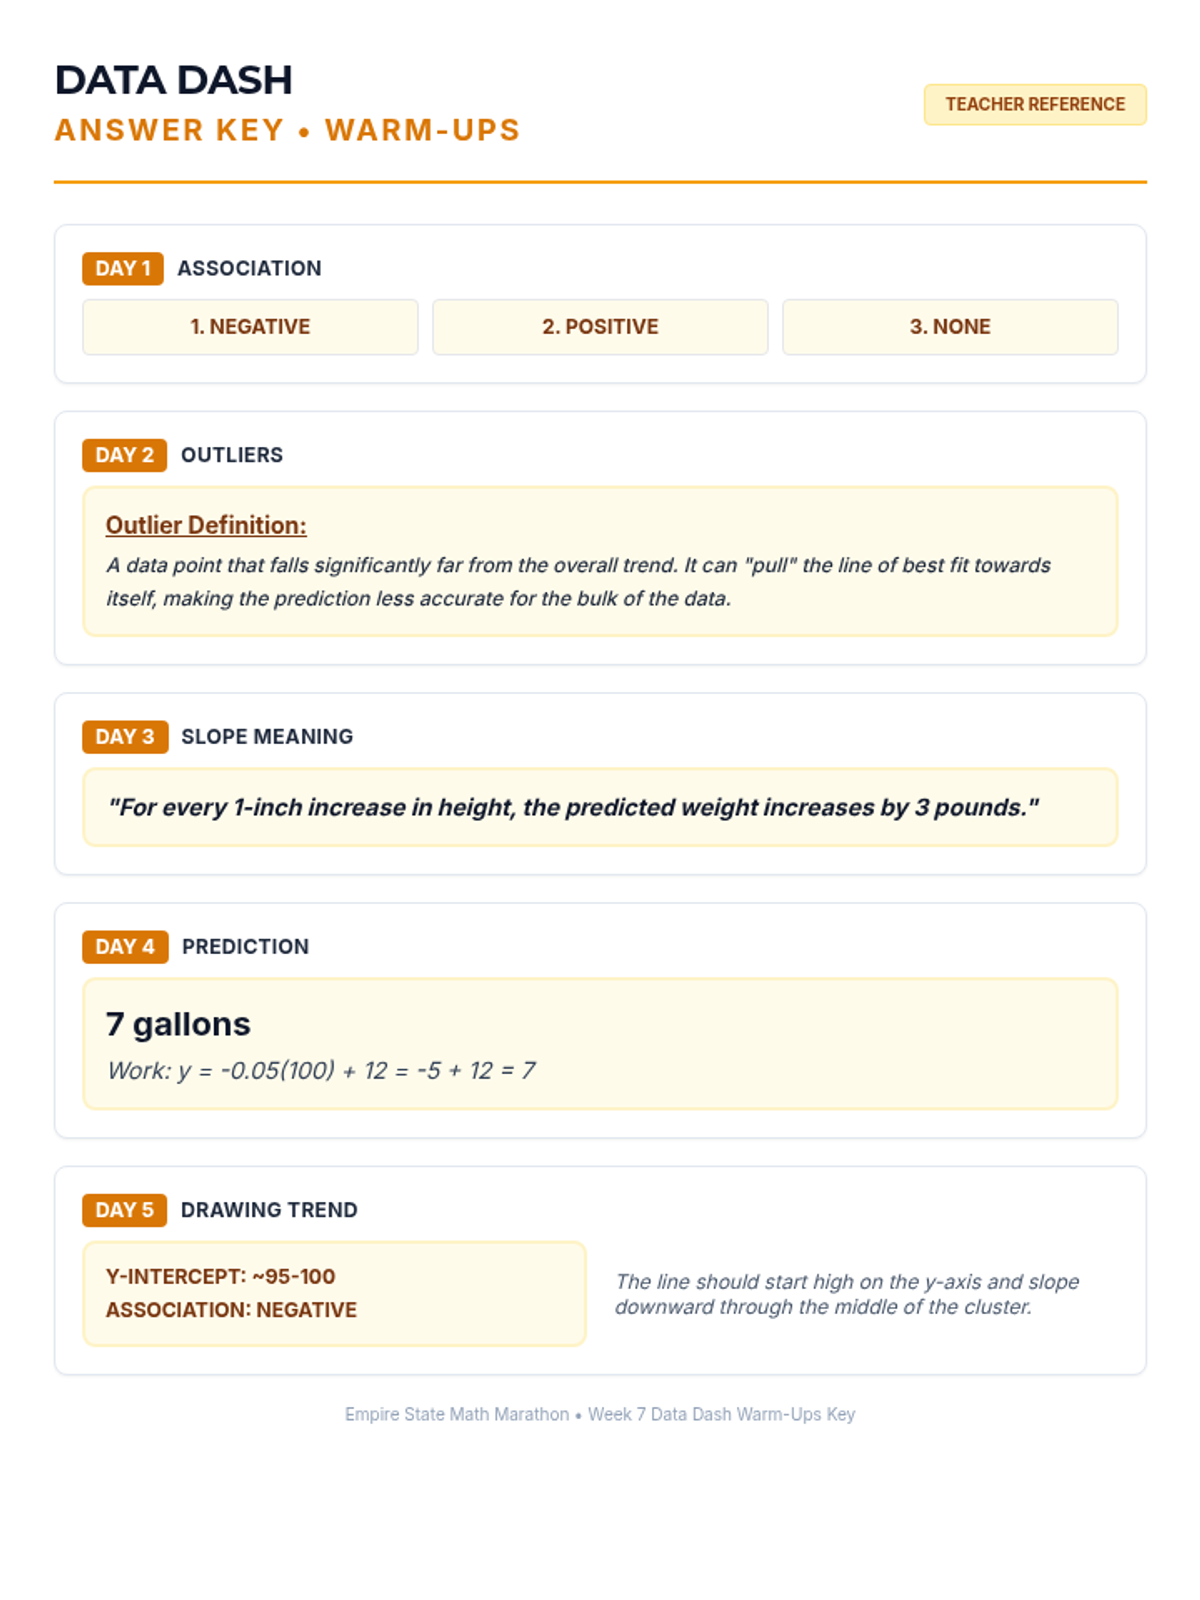
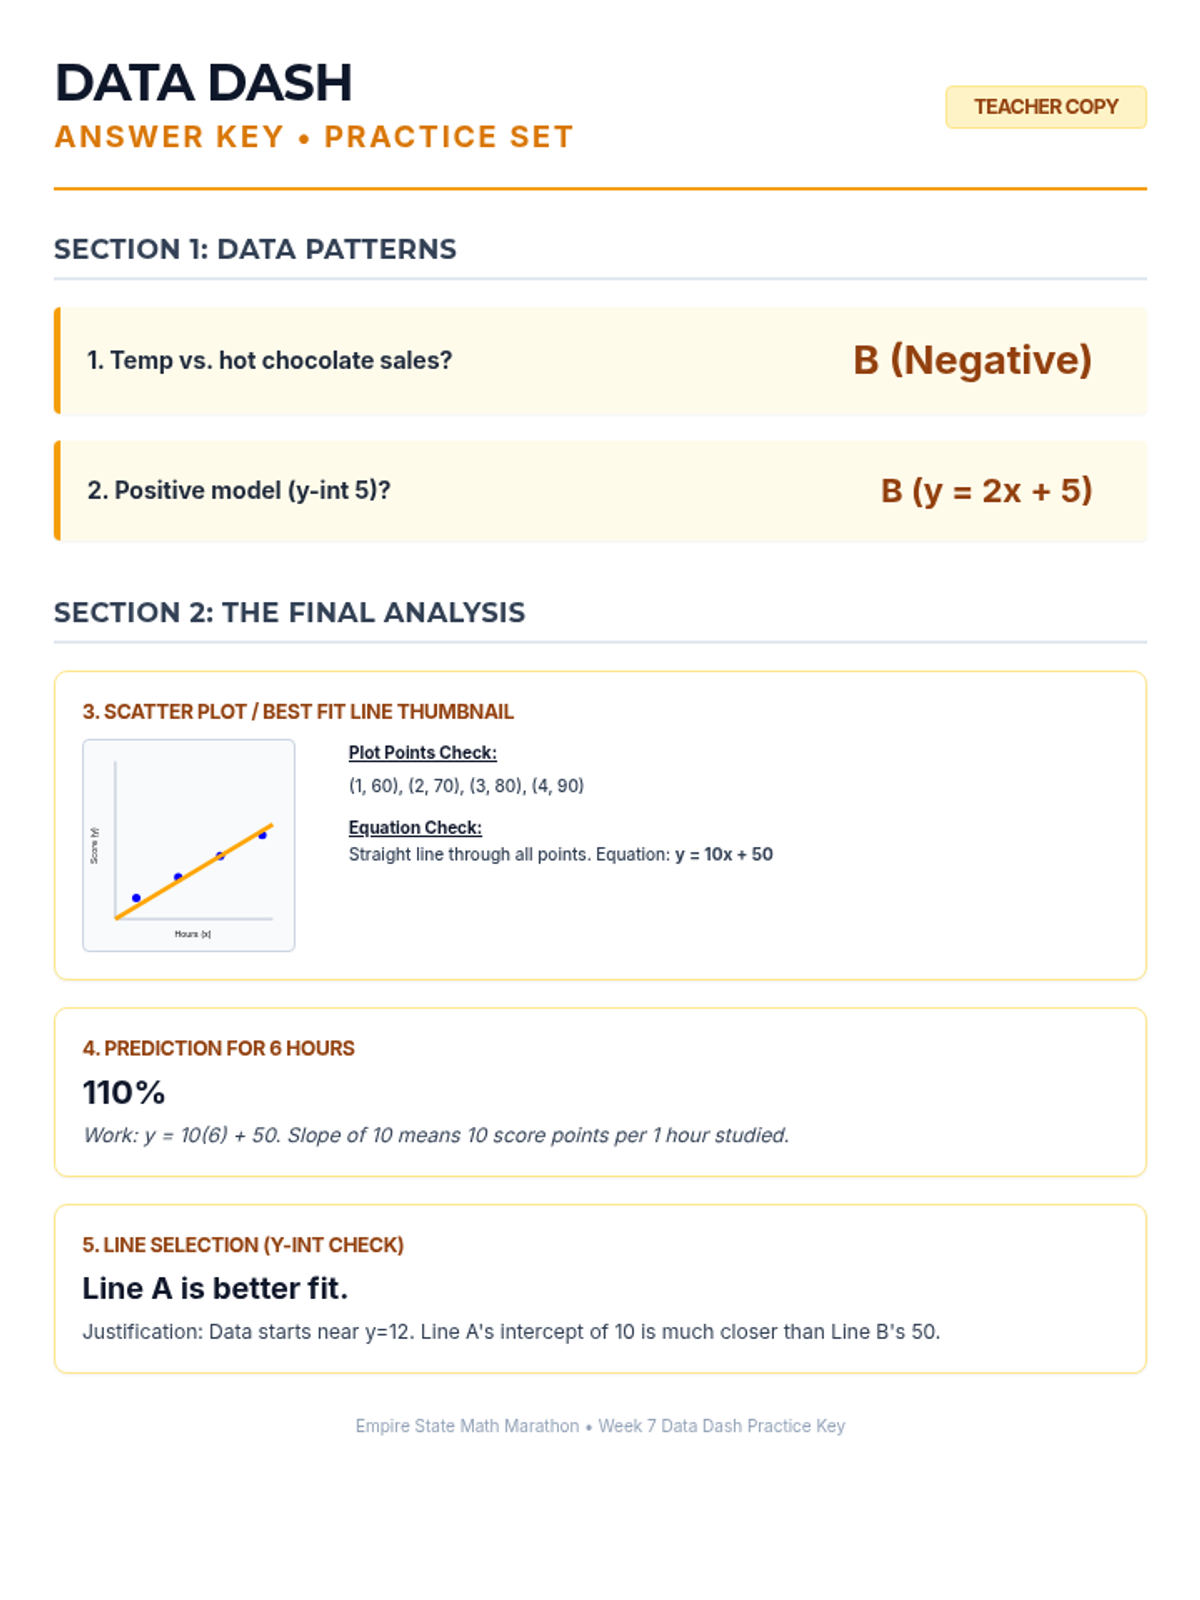
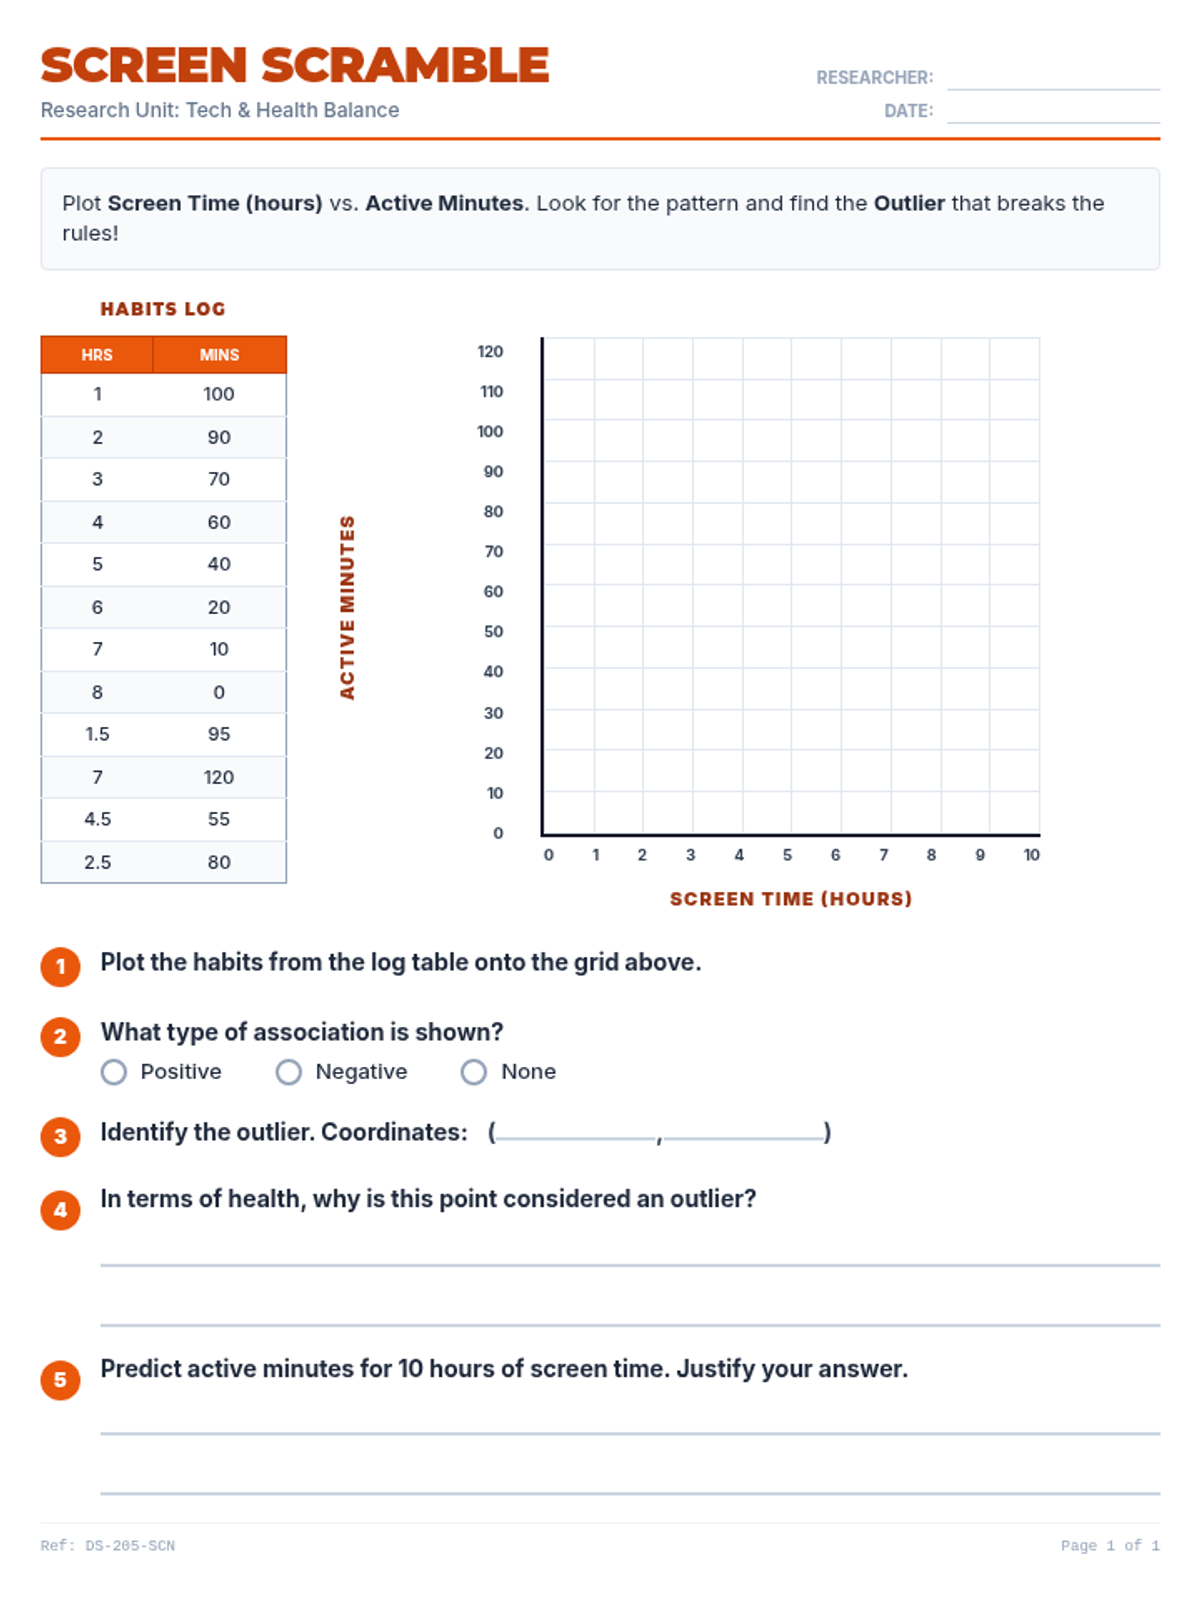
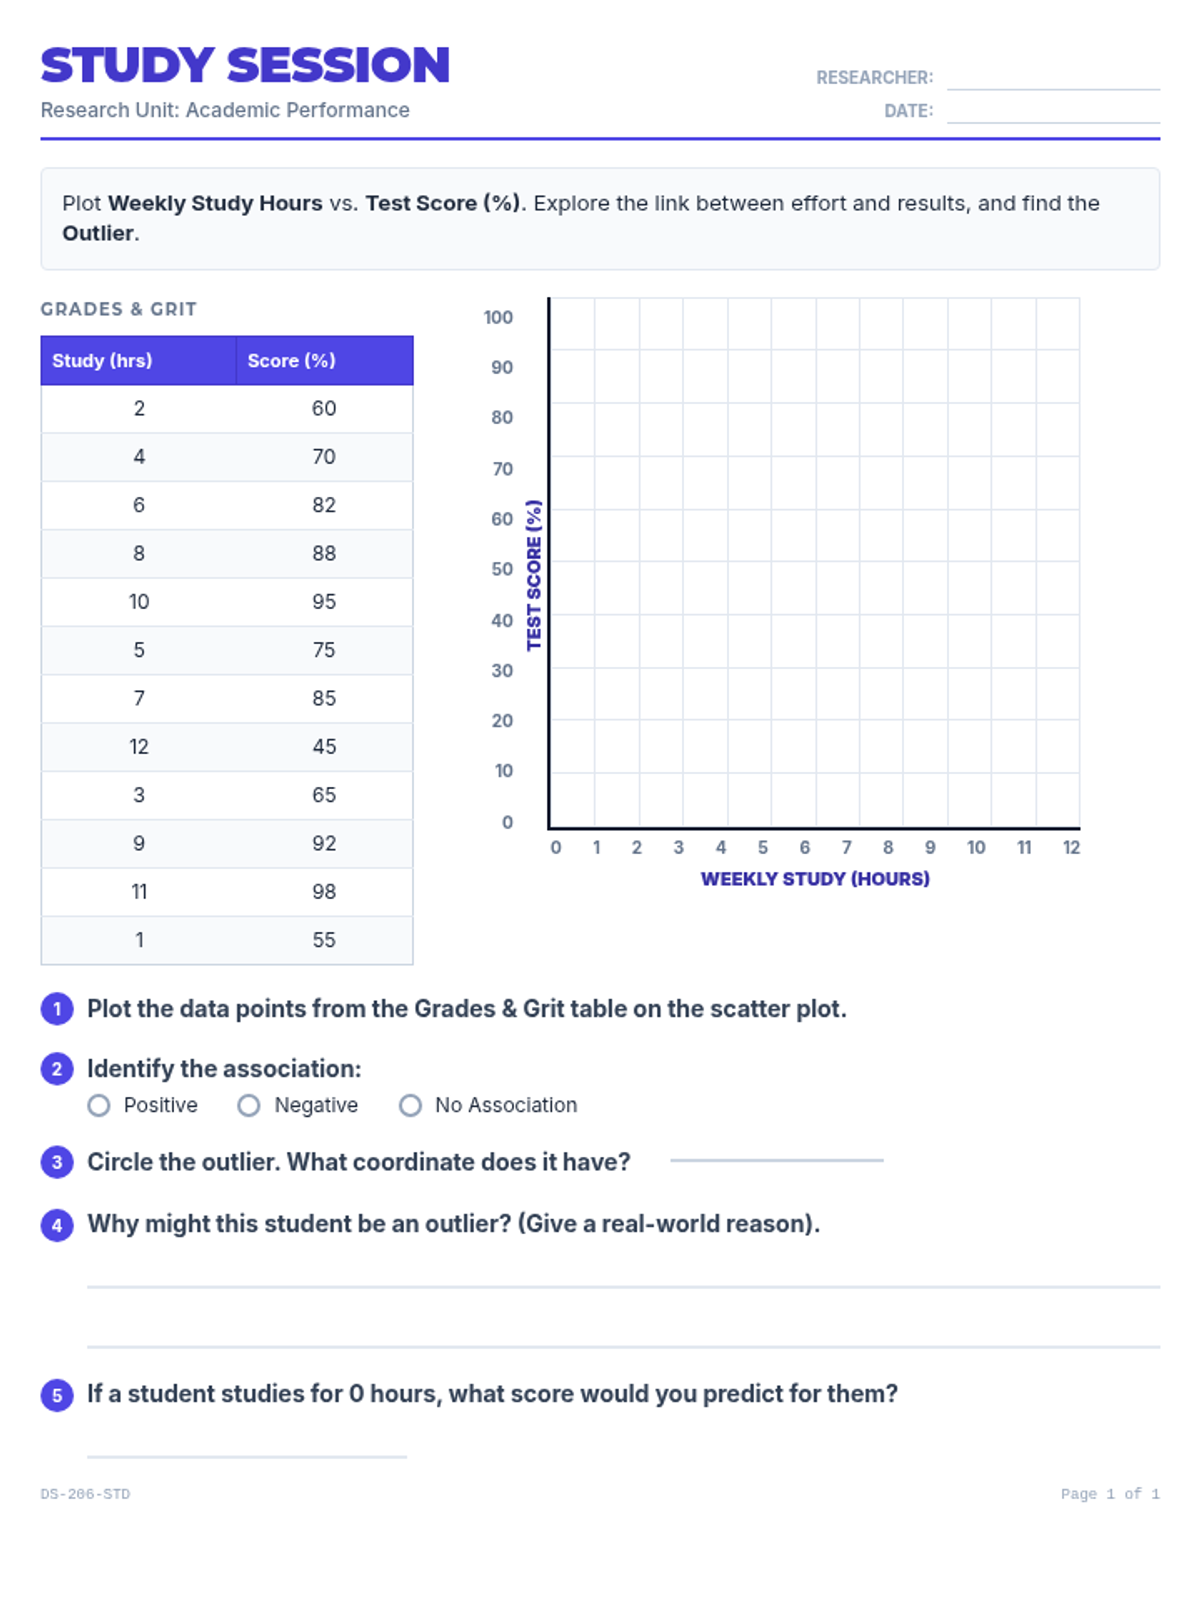
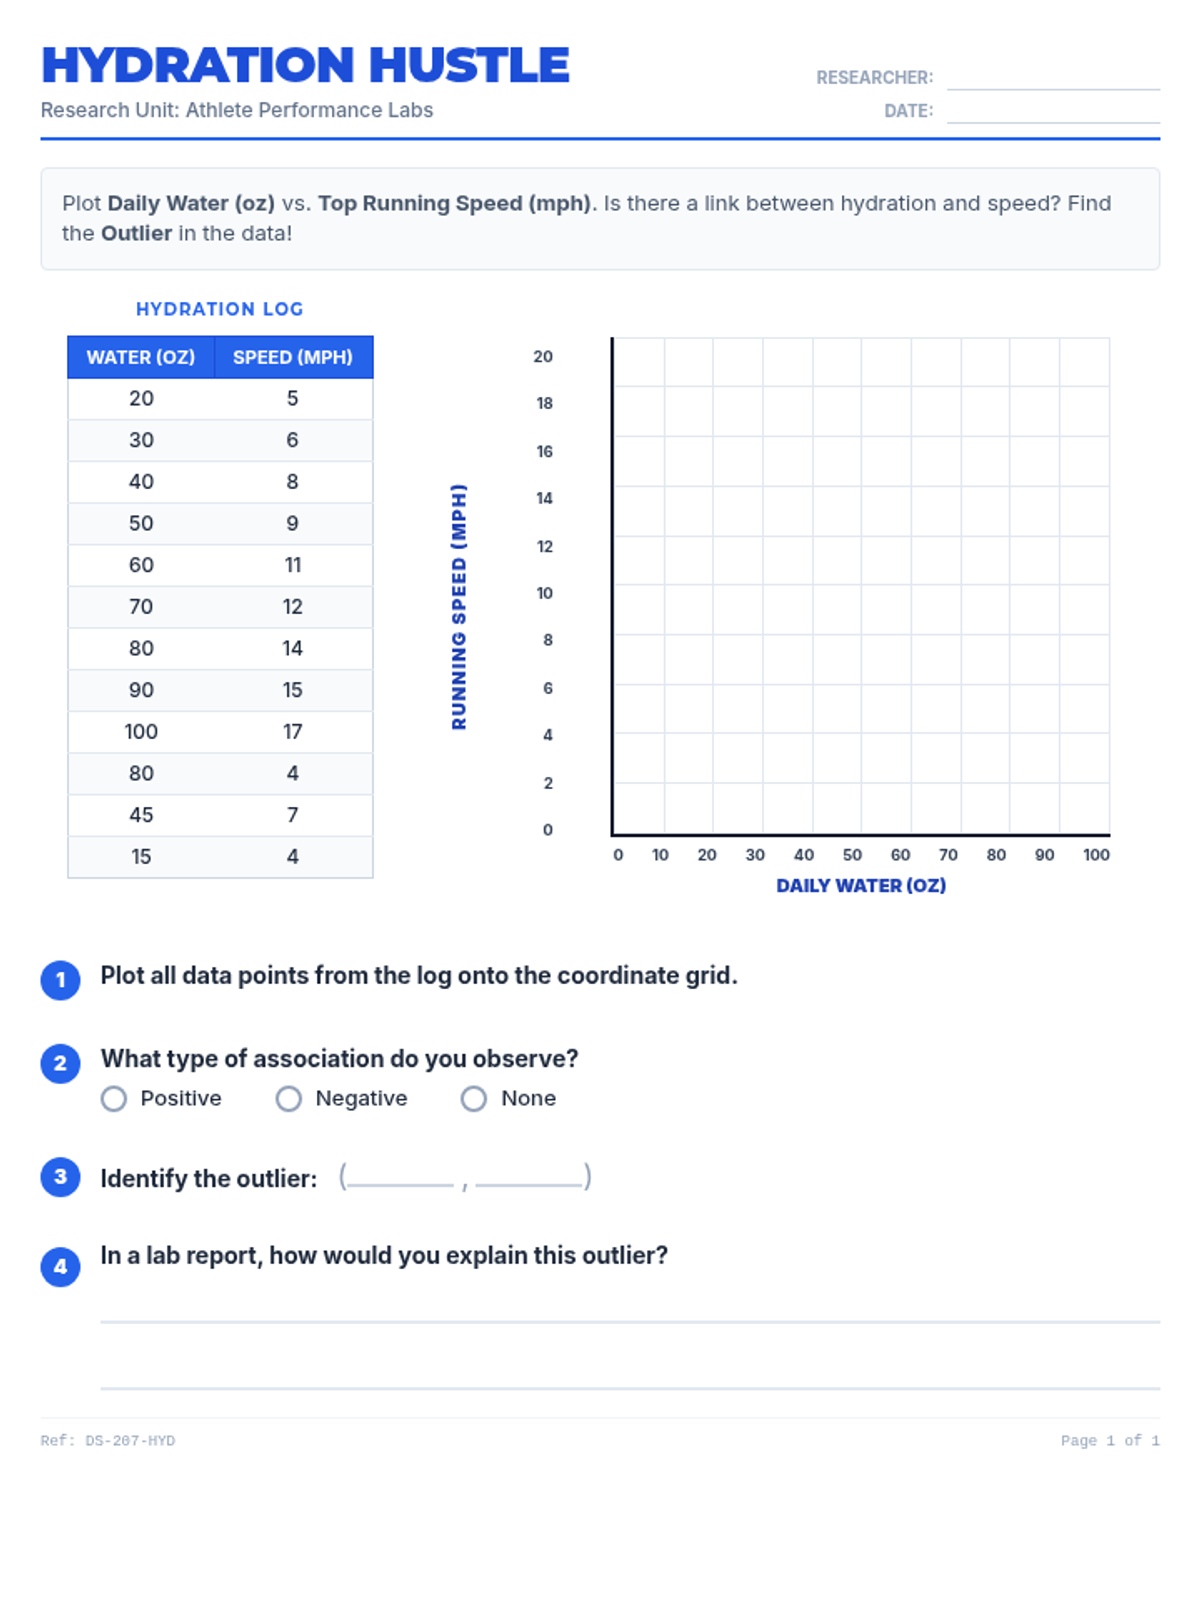
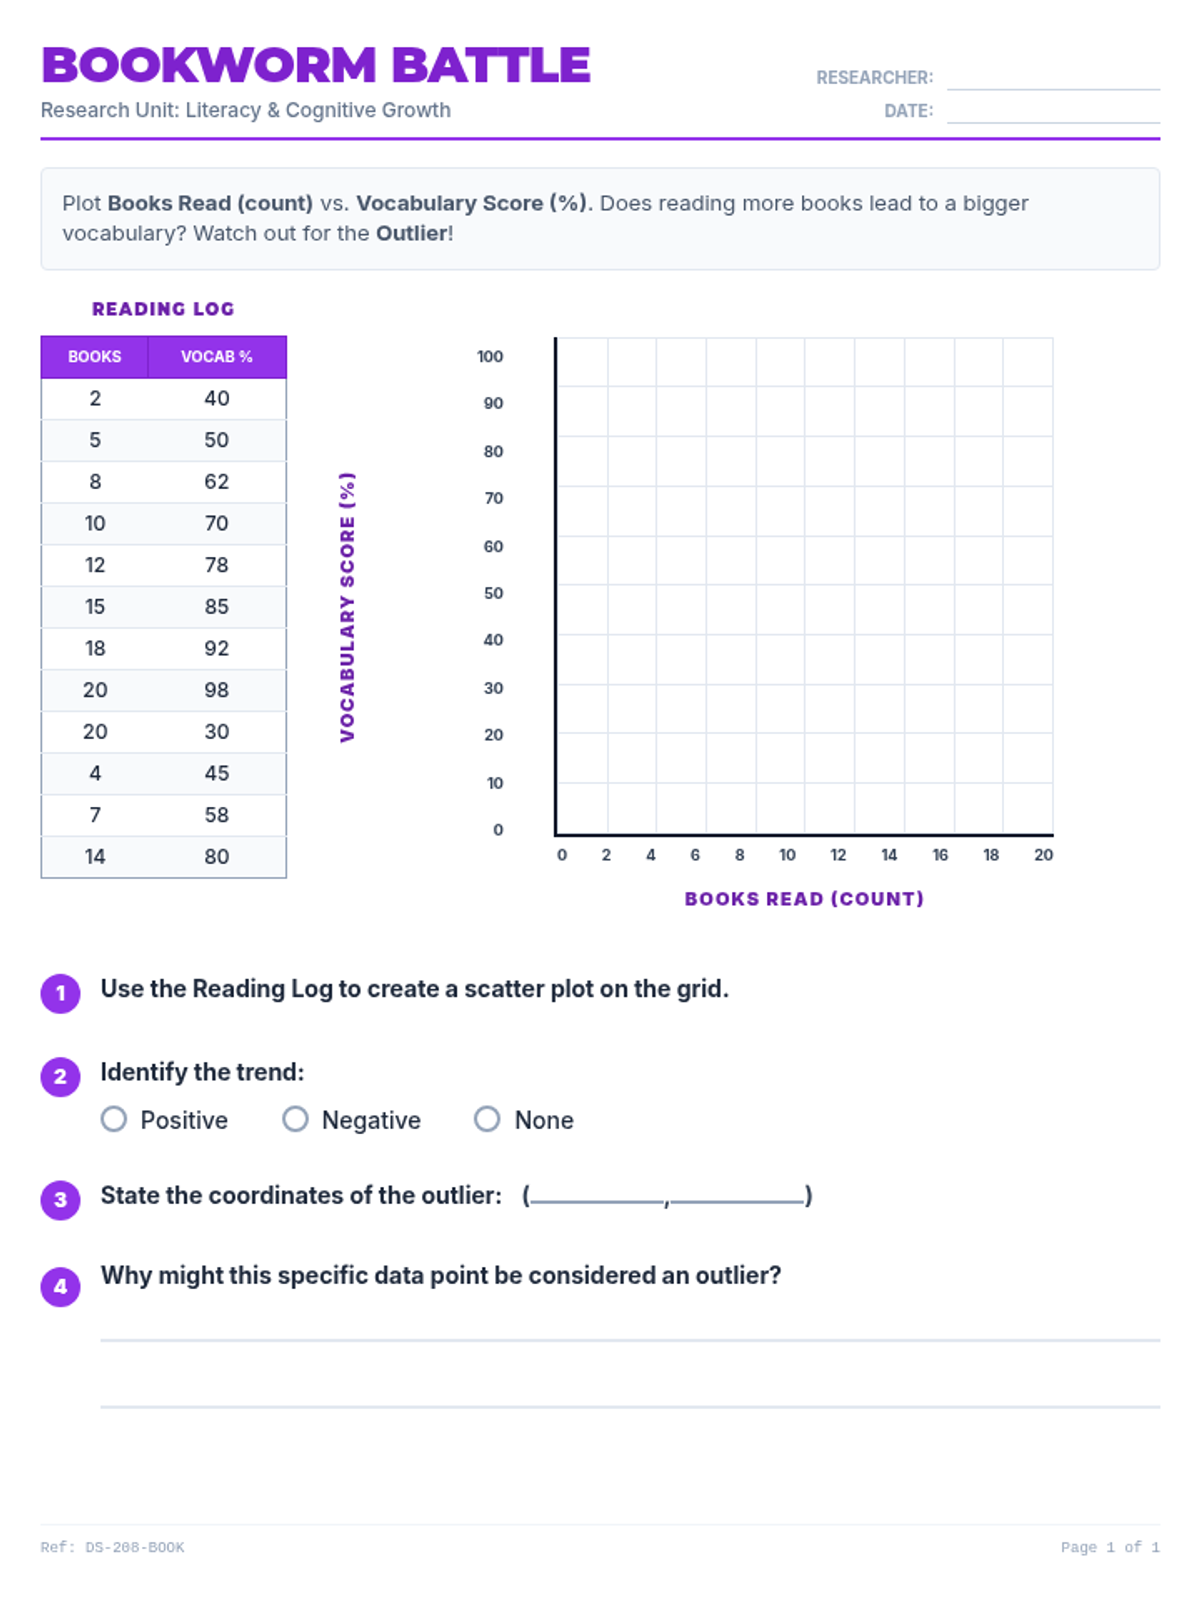
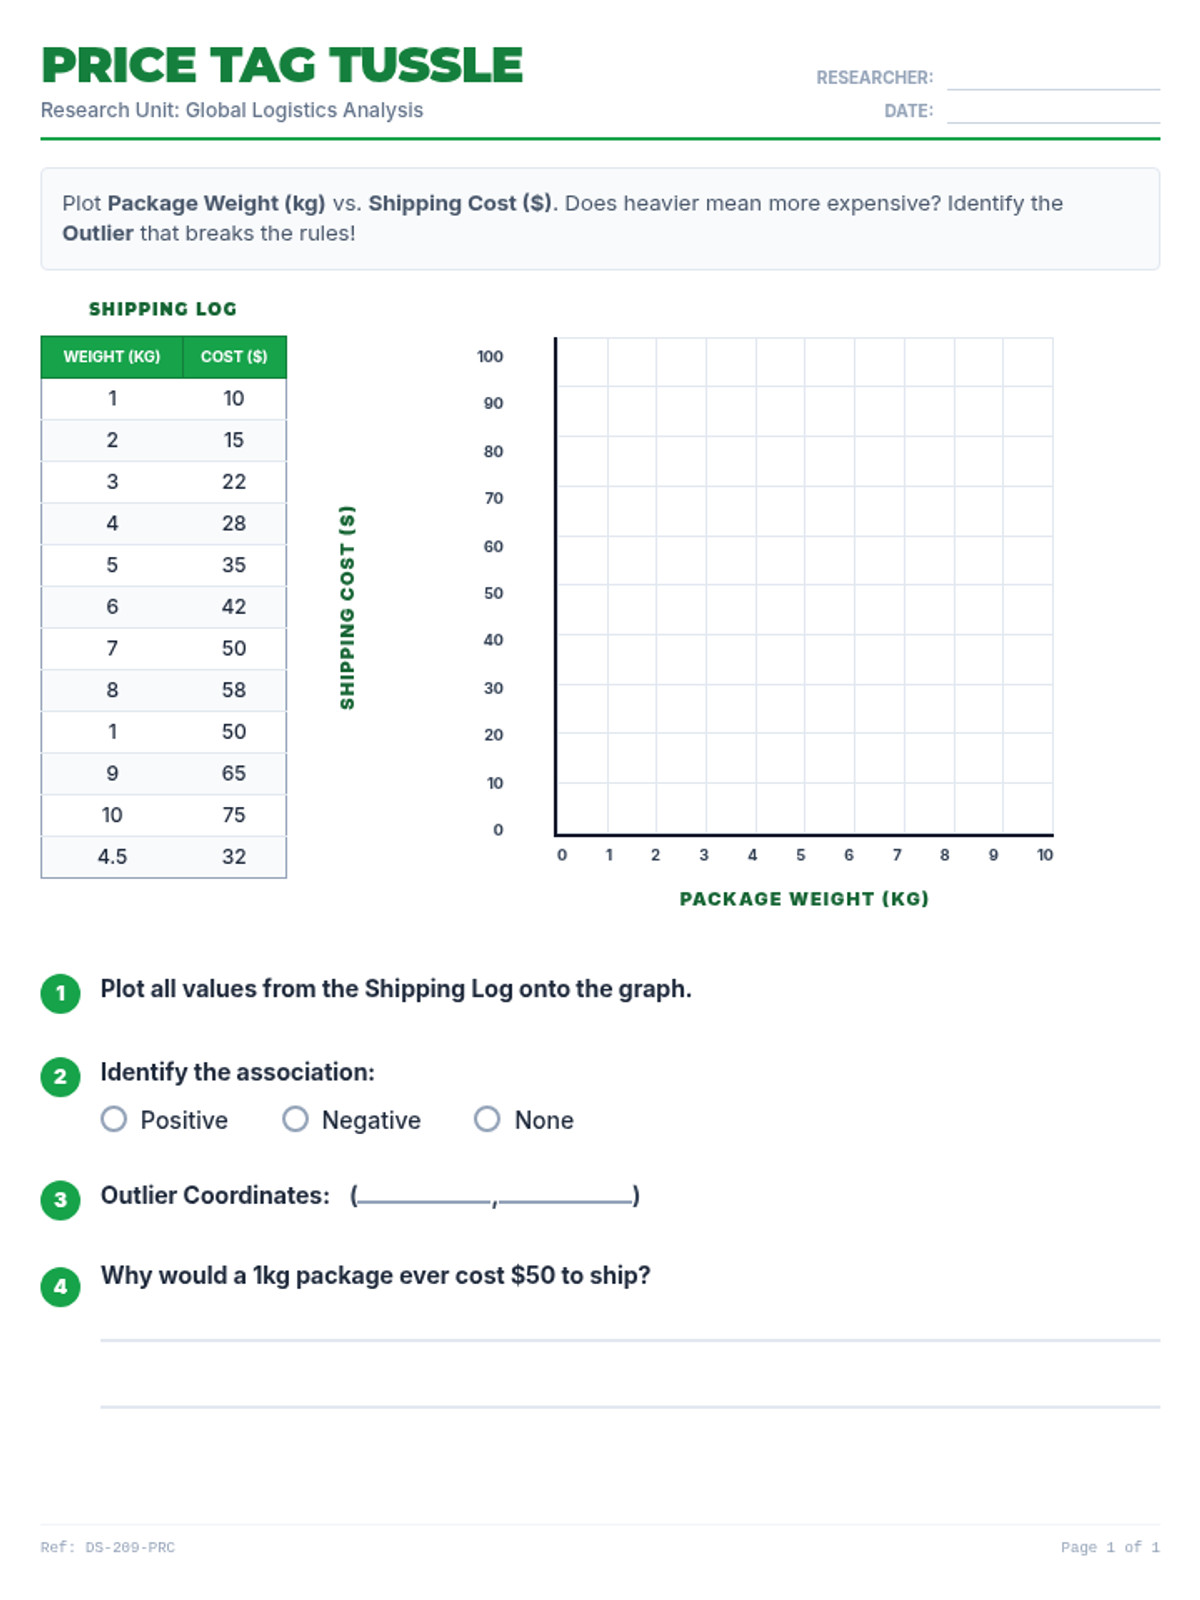
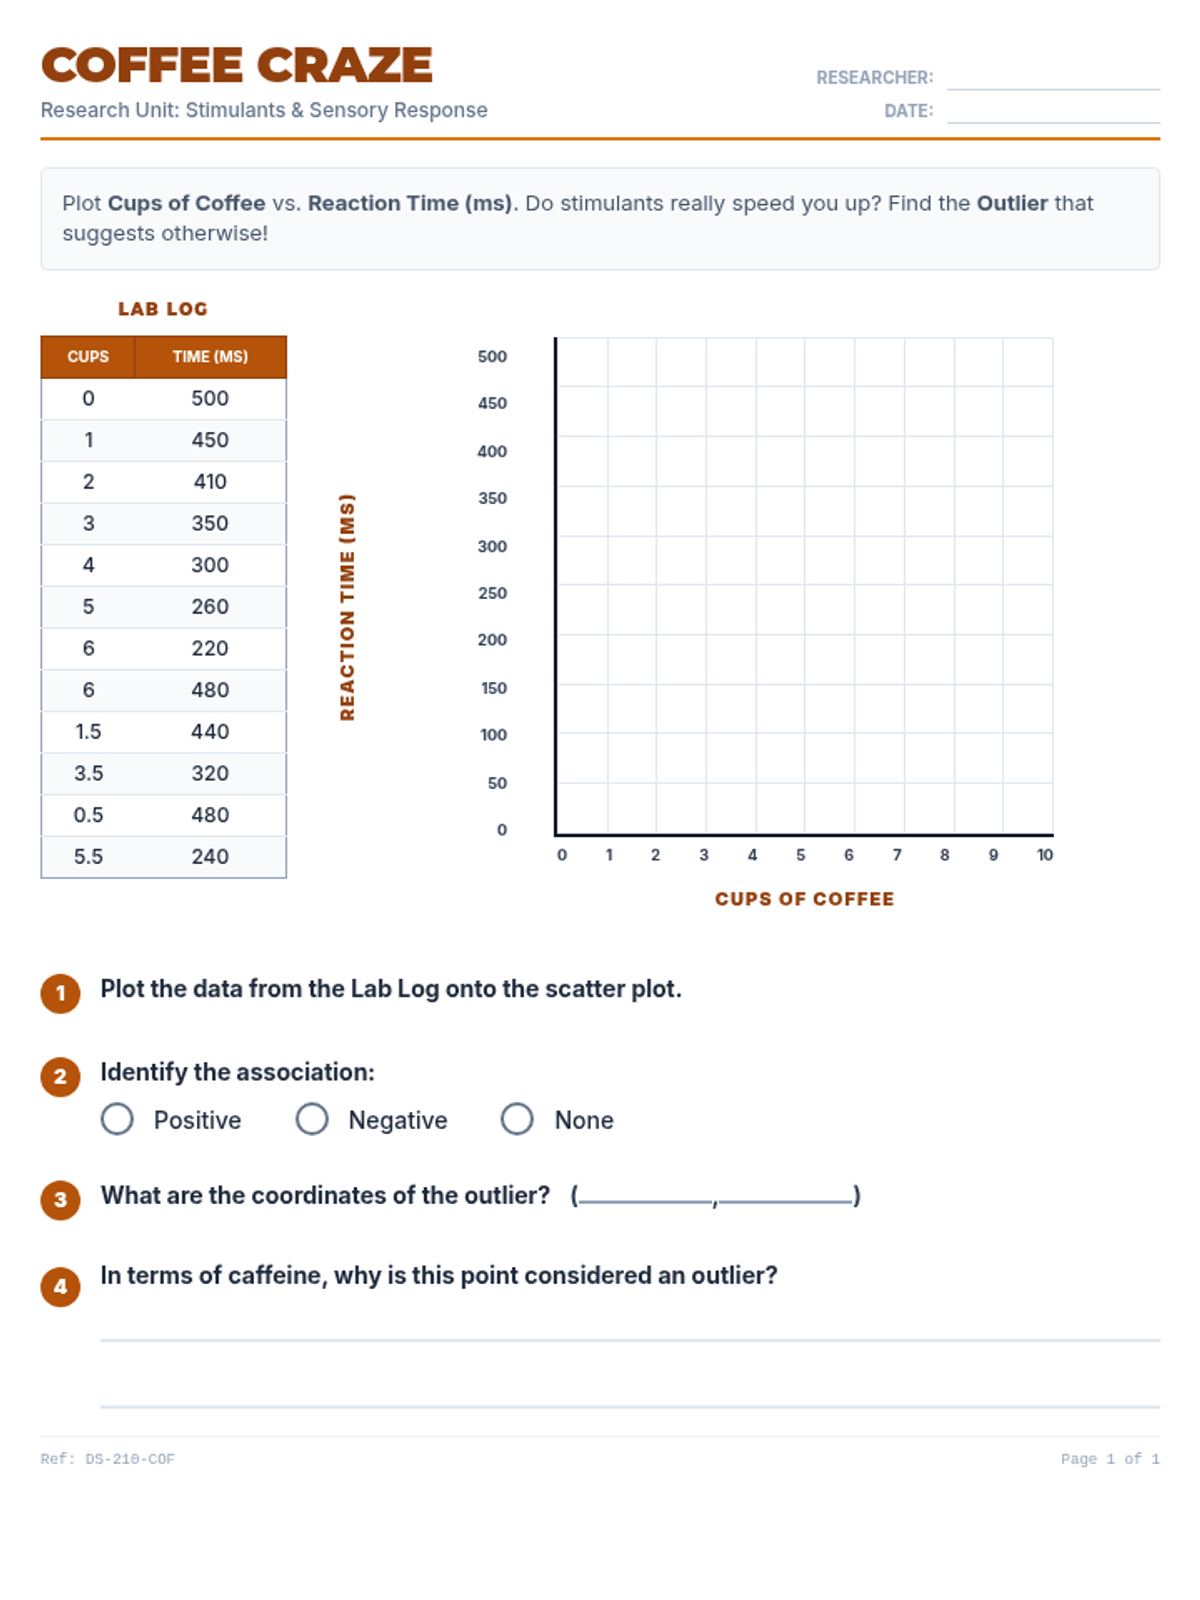
Week 7 analyzes bivariate data through scatter plots, interpreting lines of best fit, and using linear models to make predictions.

AG

Anna Gomez

Other
4/28
Lesson
Shape Shifters Warm-Ups
Shape Shifters Practice Set
Shape Shifters Warm-Ups Answer Key
Shape Shifters Practice Set Answer Key

Shape Shifters

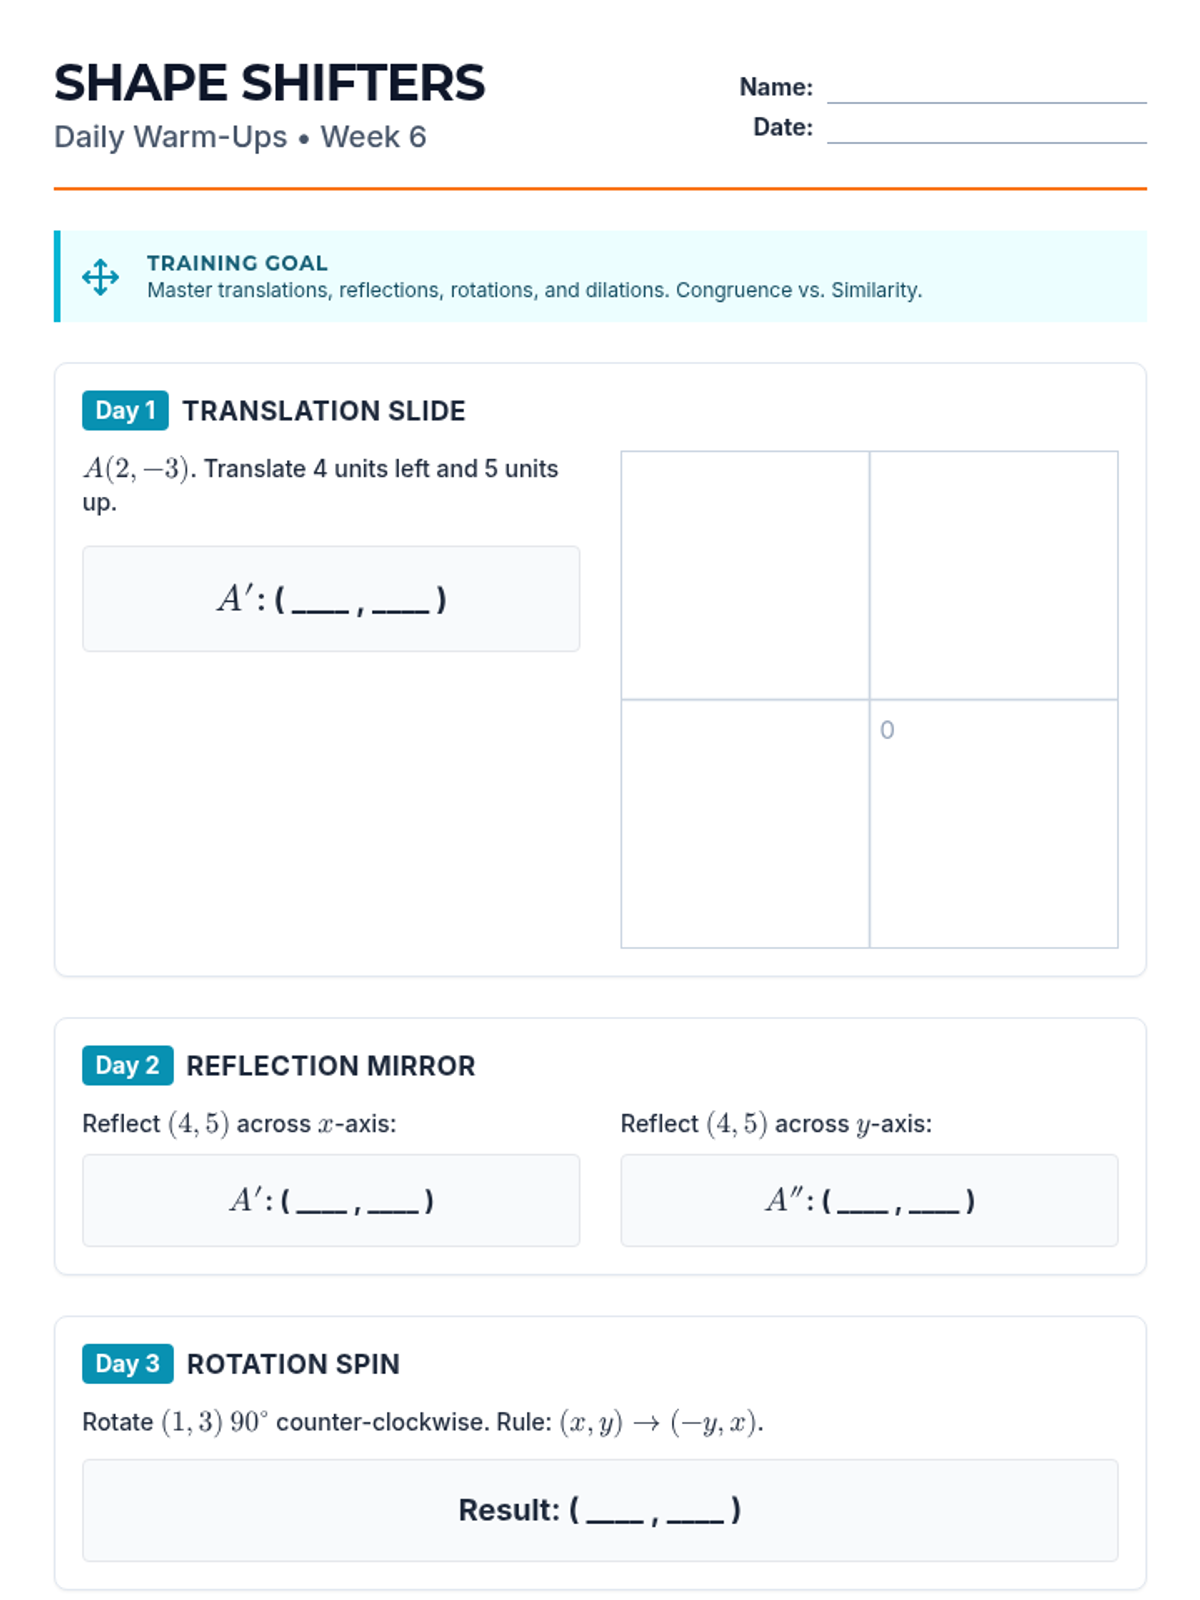
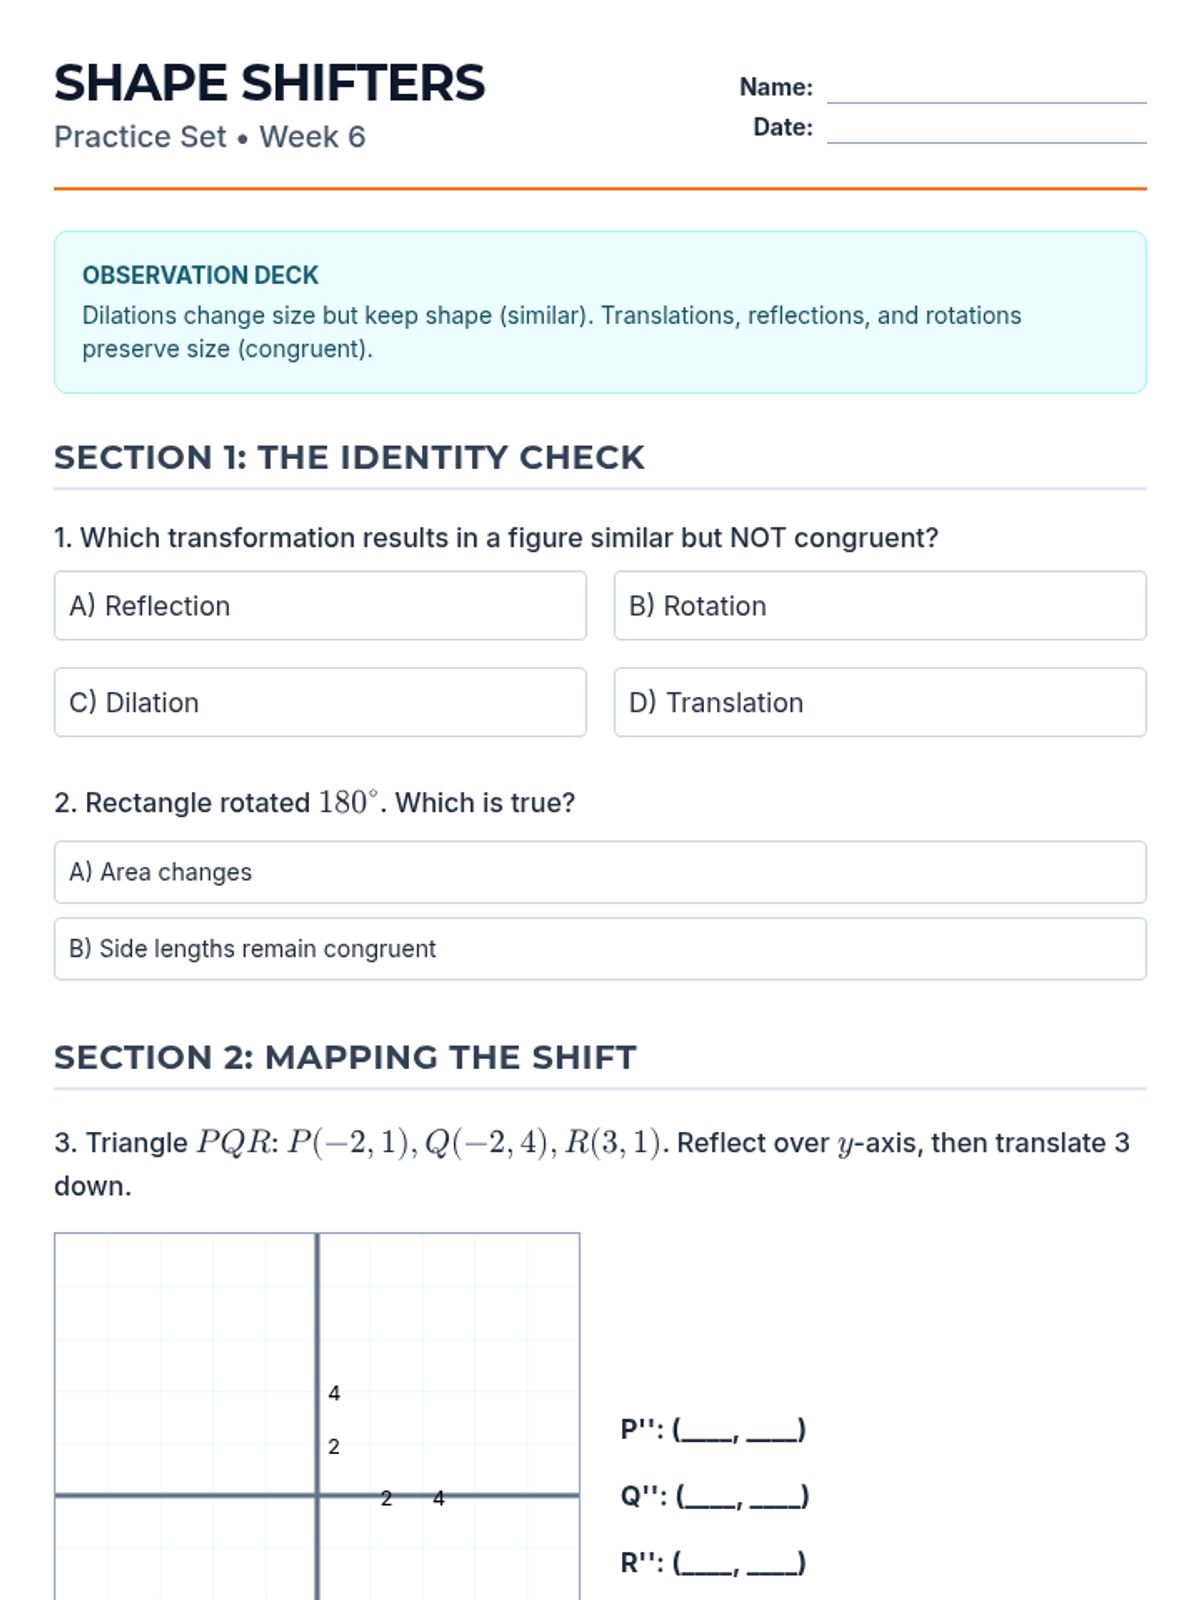
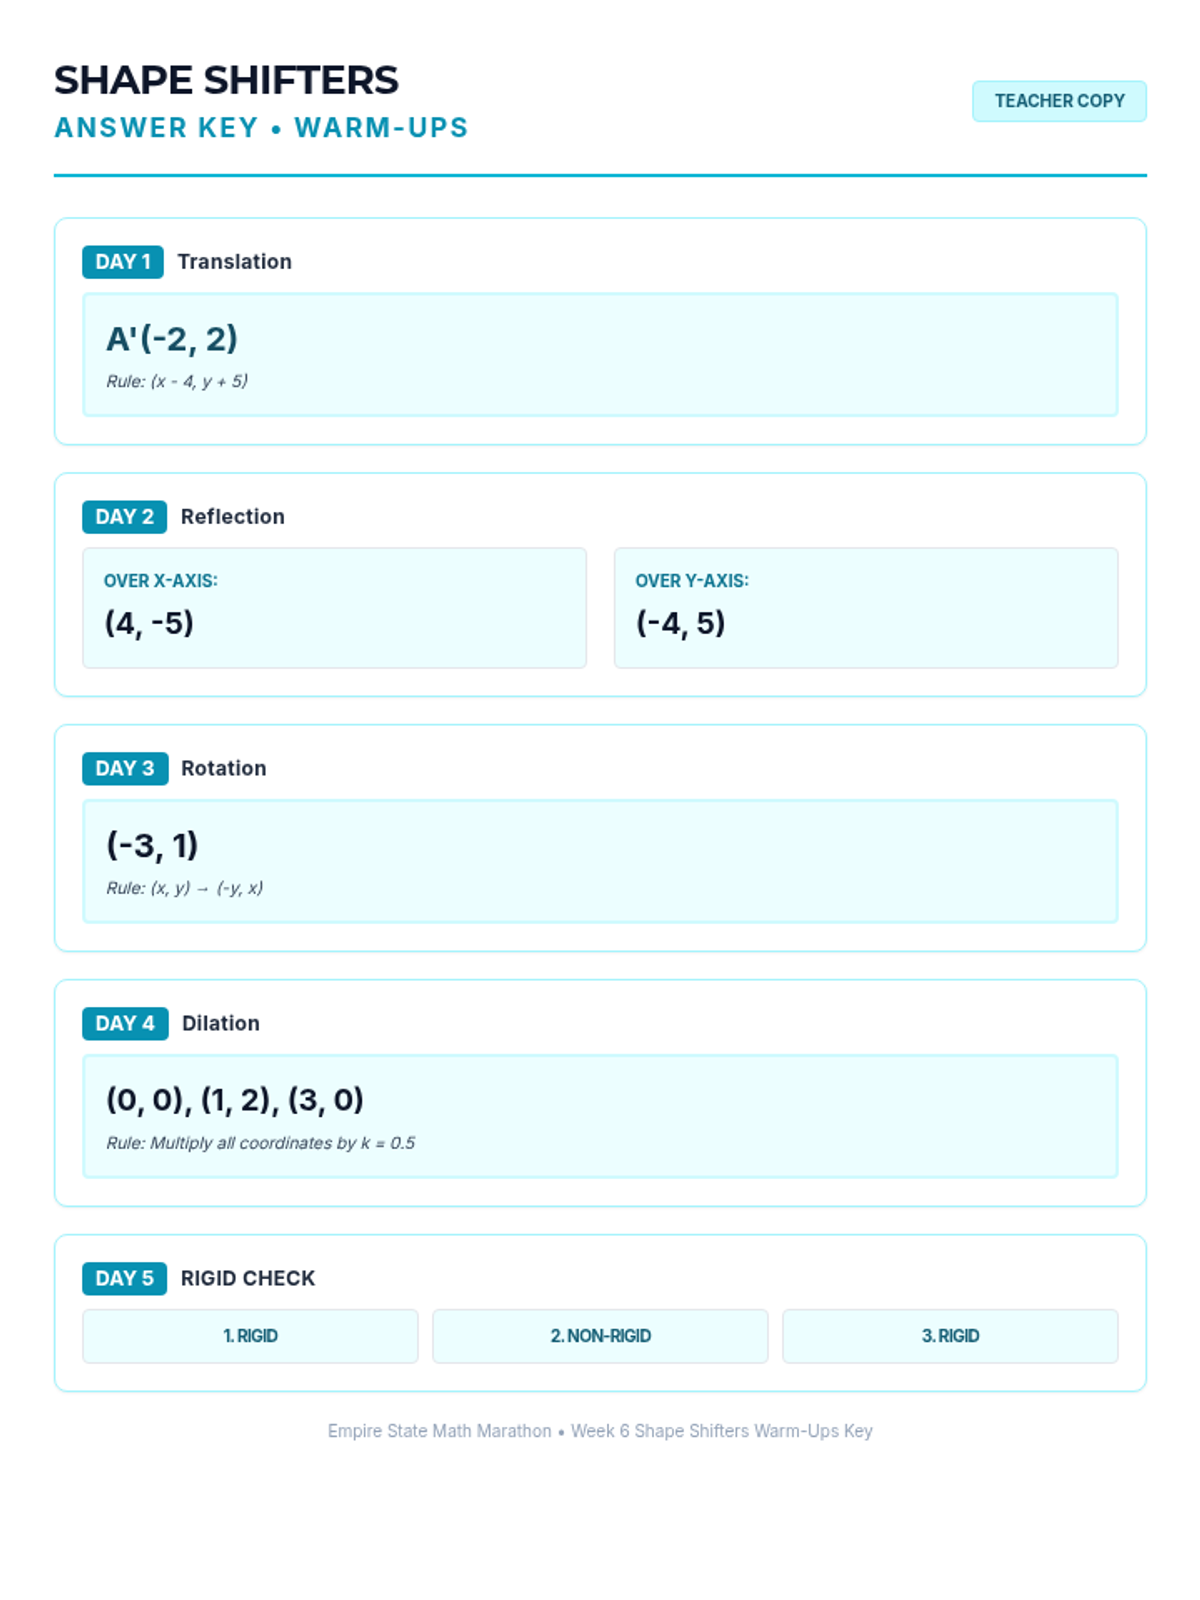
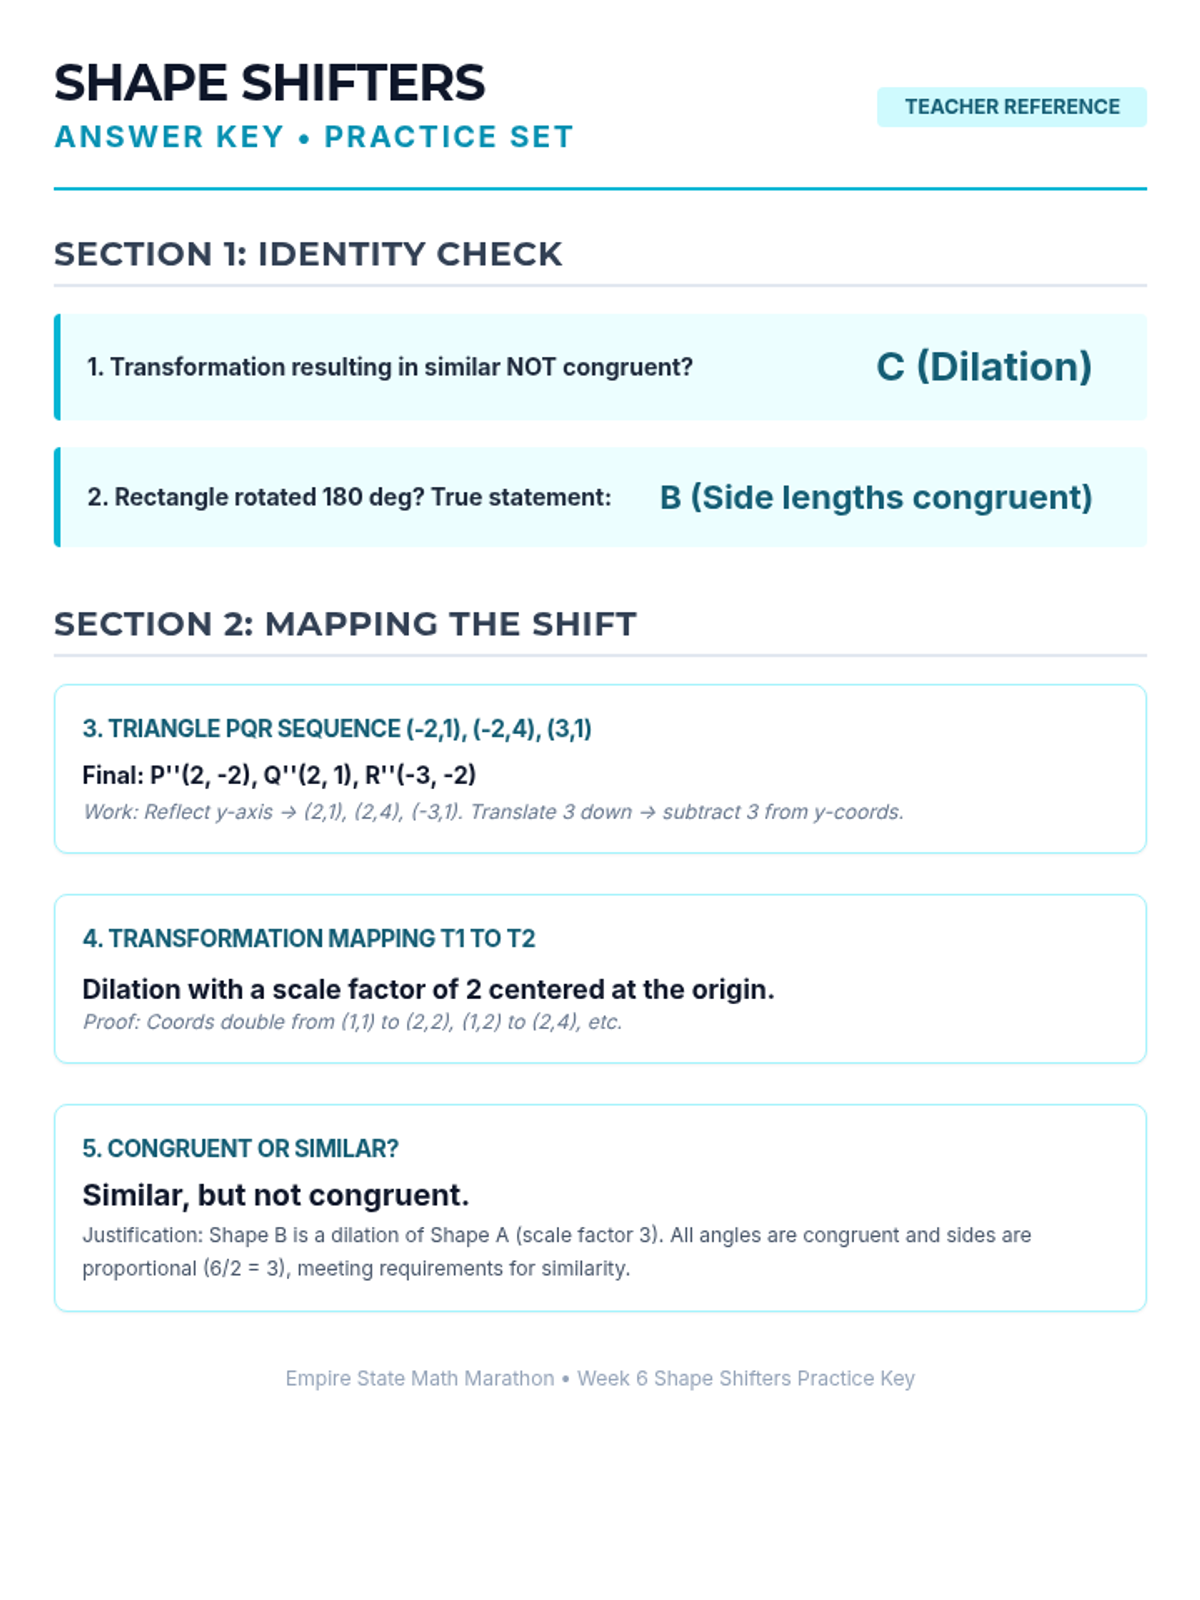
Week 6 focuses on rigid transformations (translations, reflections, rotations) and similarity transformations (dilations).

AG

Anna Gomez

Other
4/28
Lesson
Geometry Gaps Warm-Ups
Geometry Gaps Practice Set
Geometry Gaps Warm-Ups Answer Key
Geometry Gaps Practice Set Answer Key

Geometry Gaps

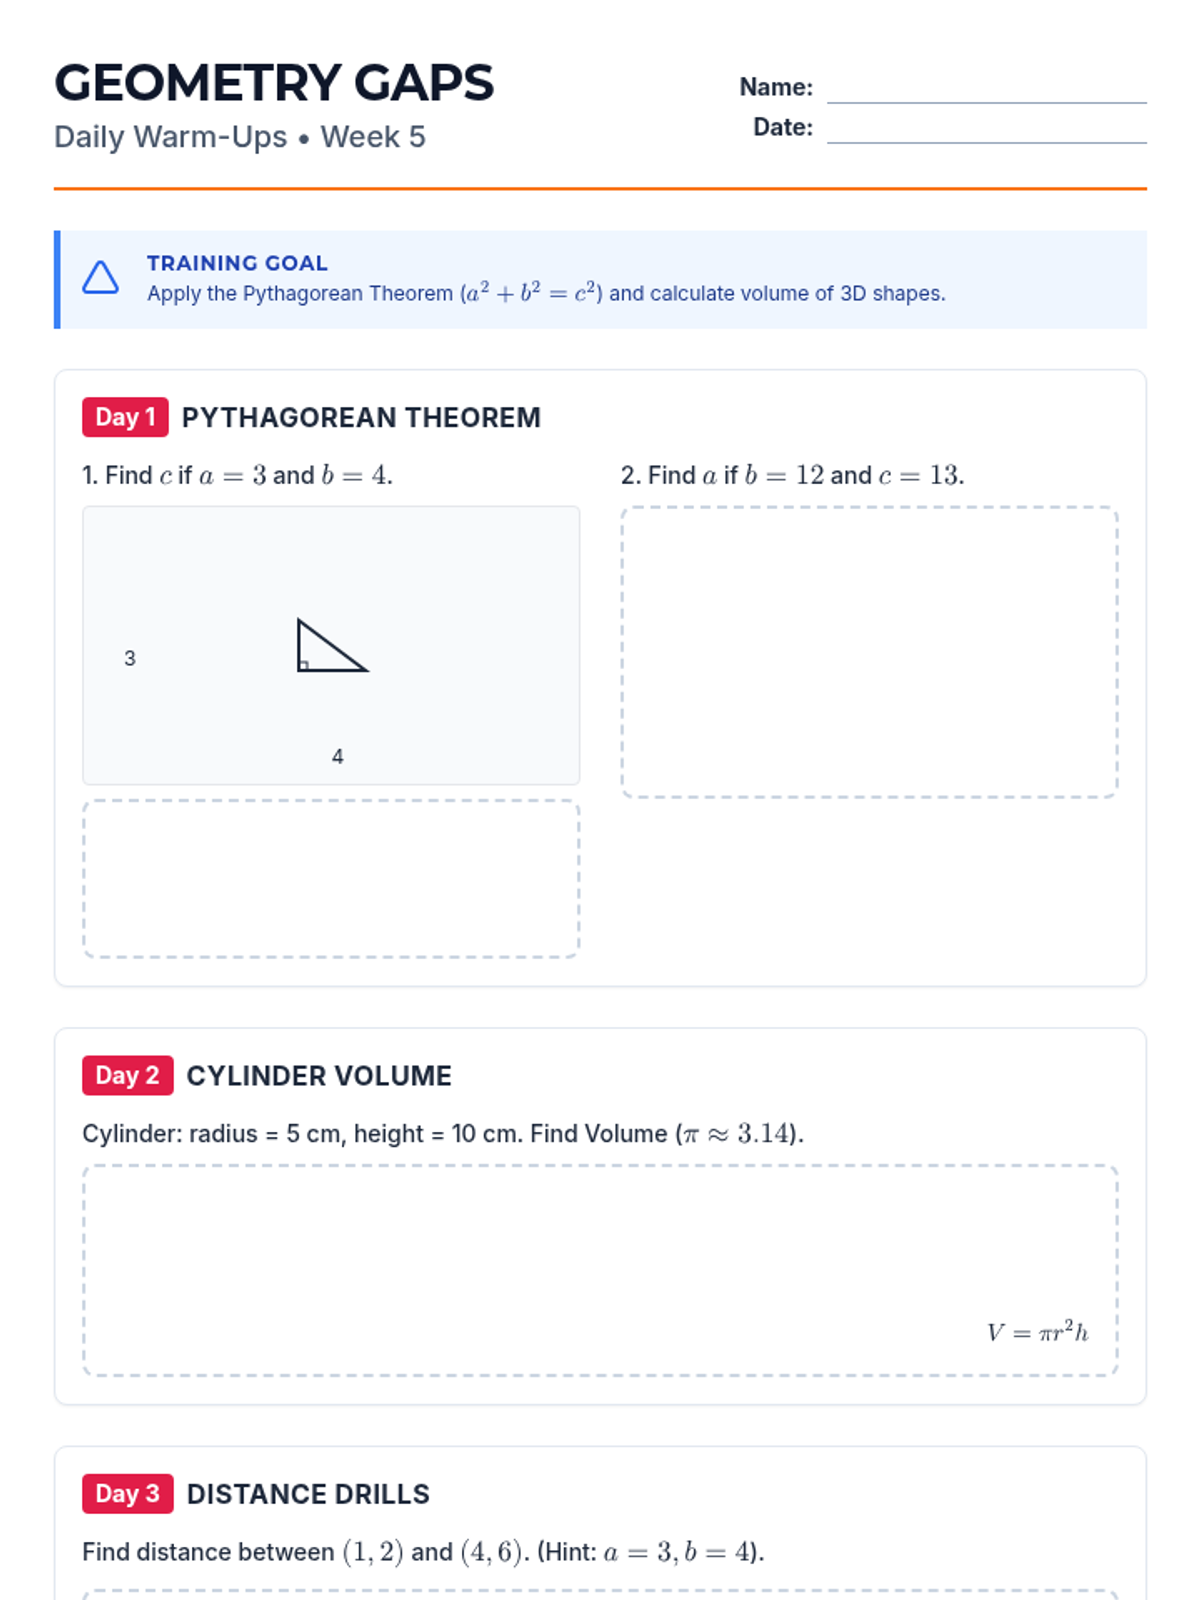
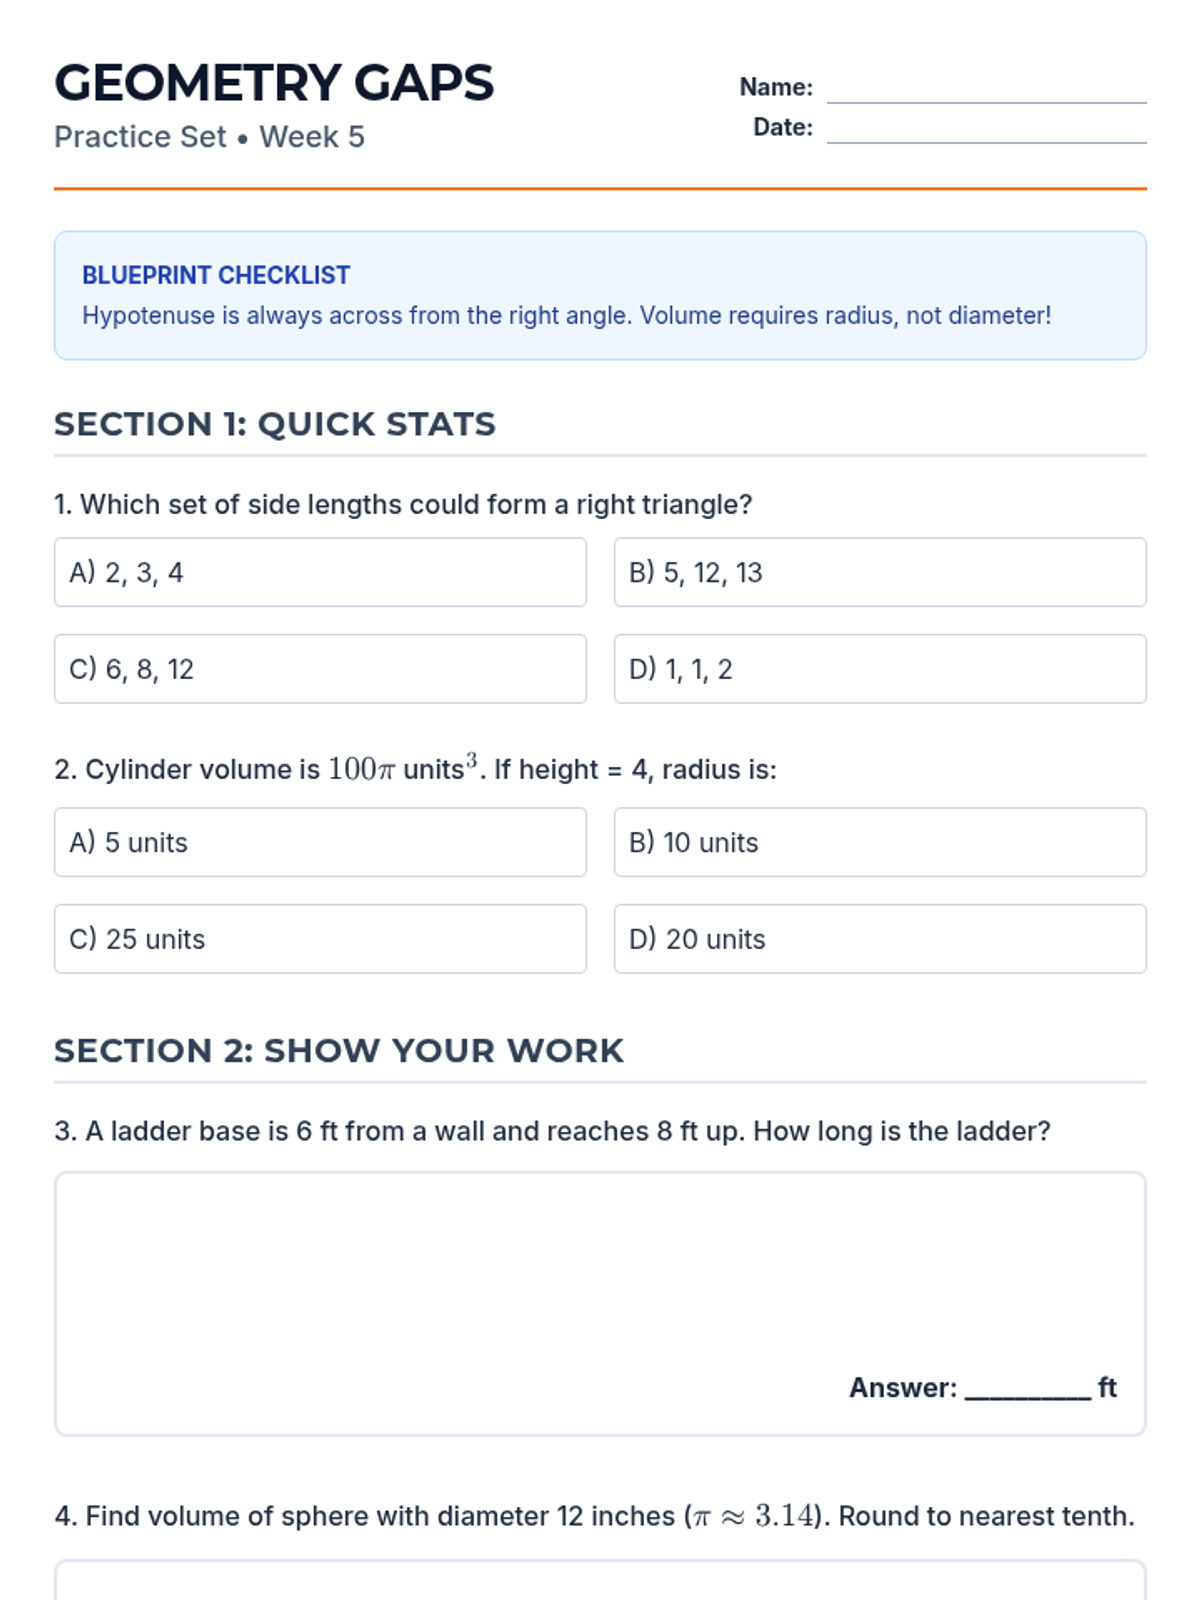
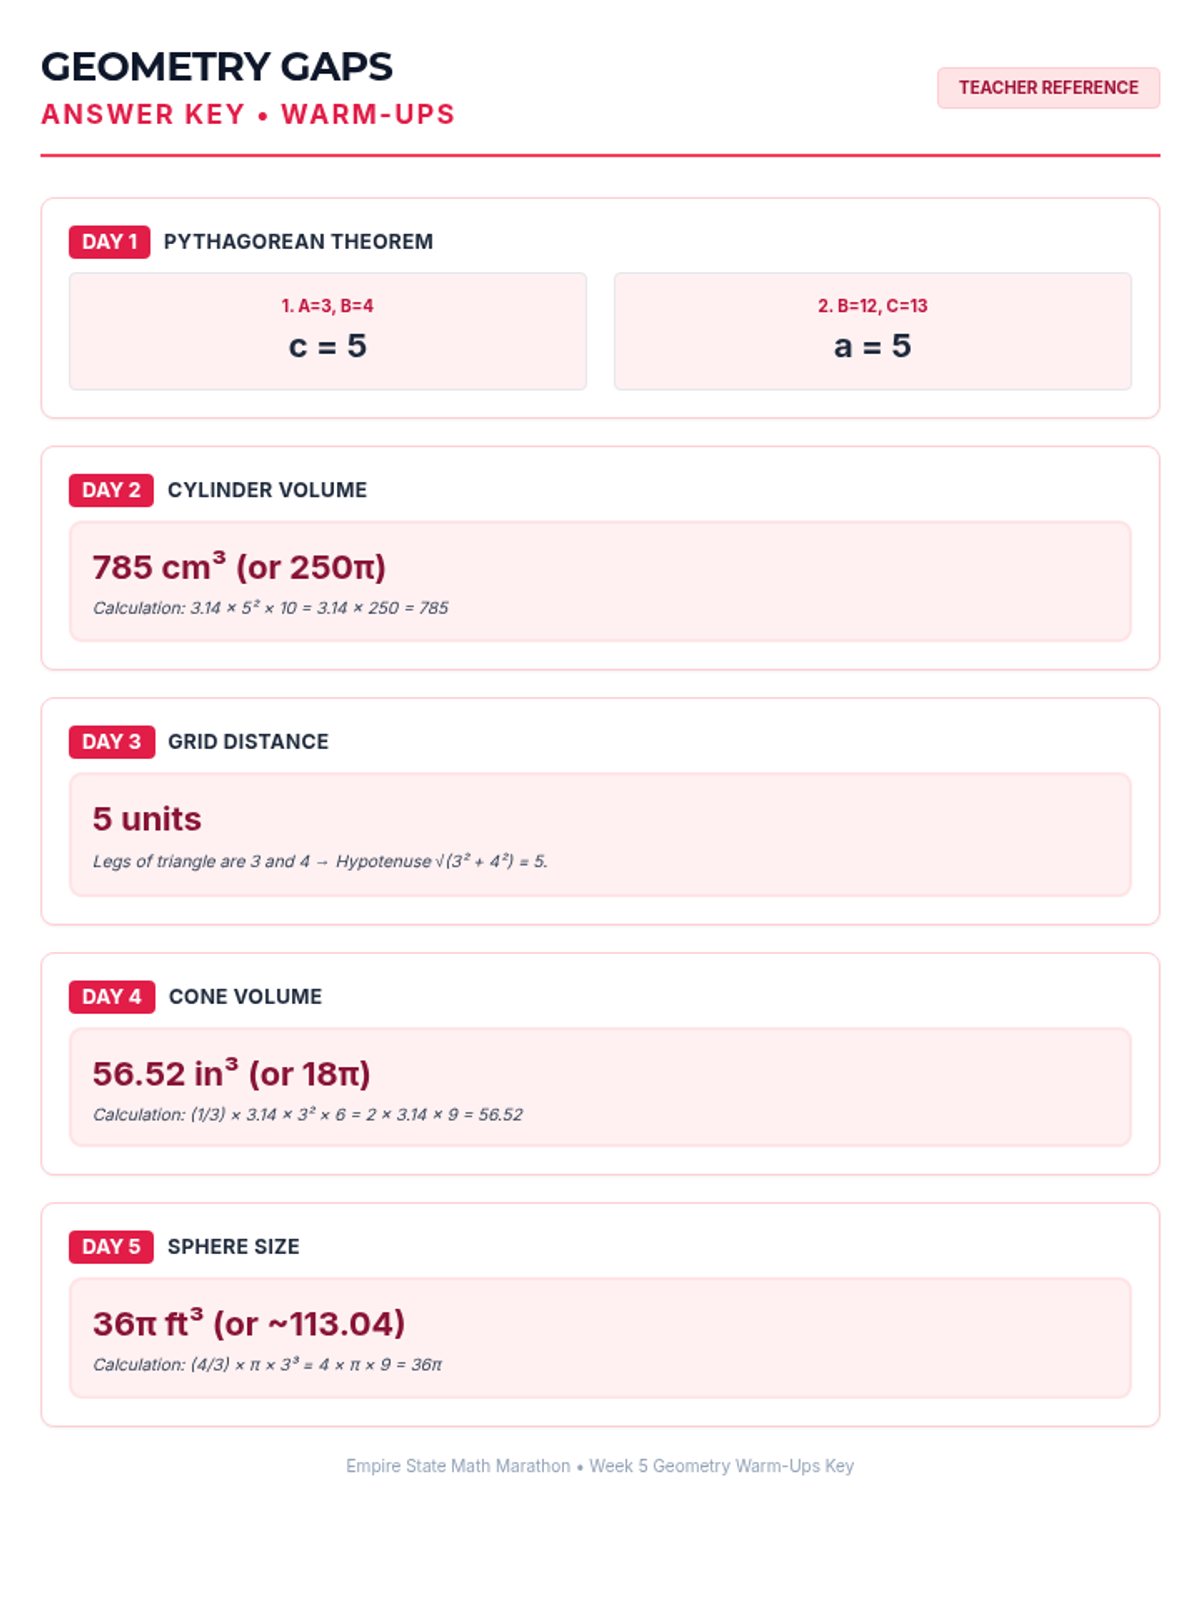
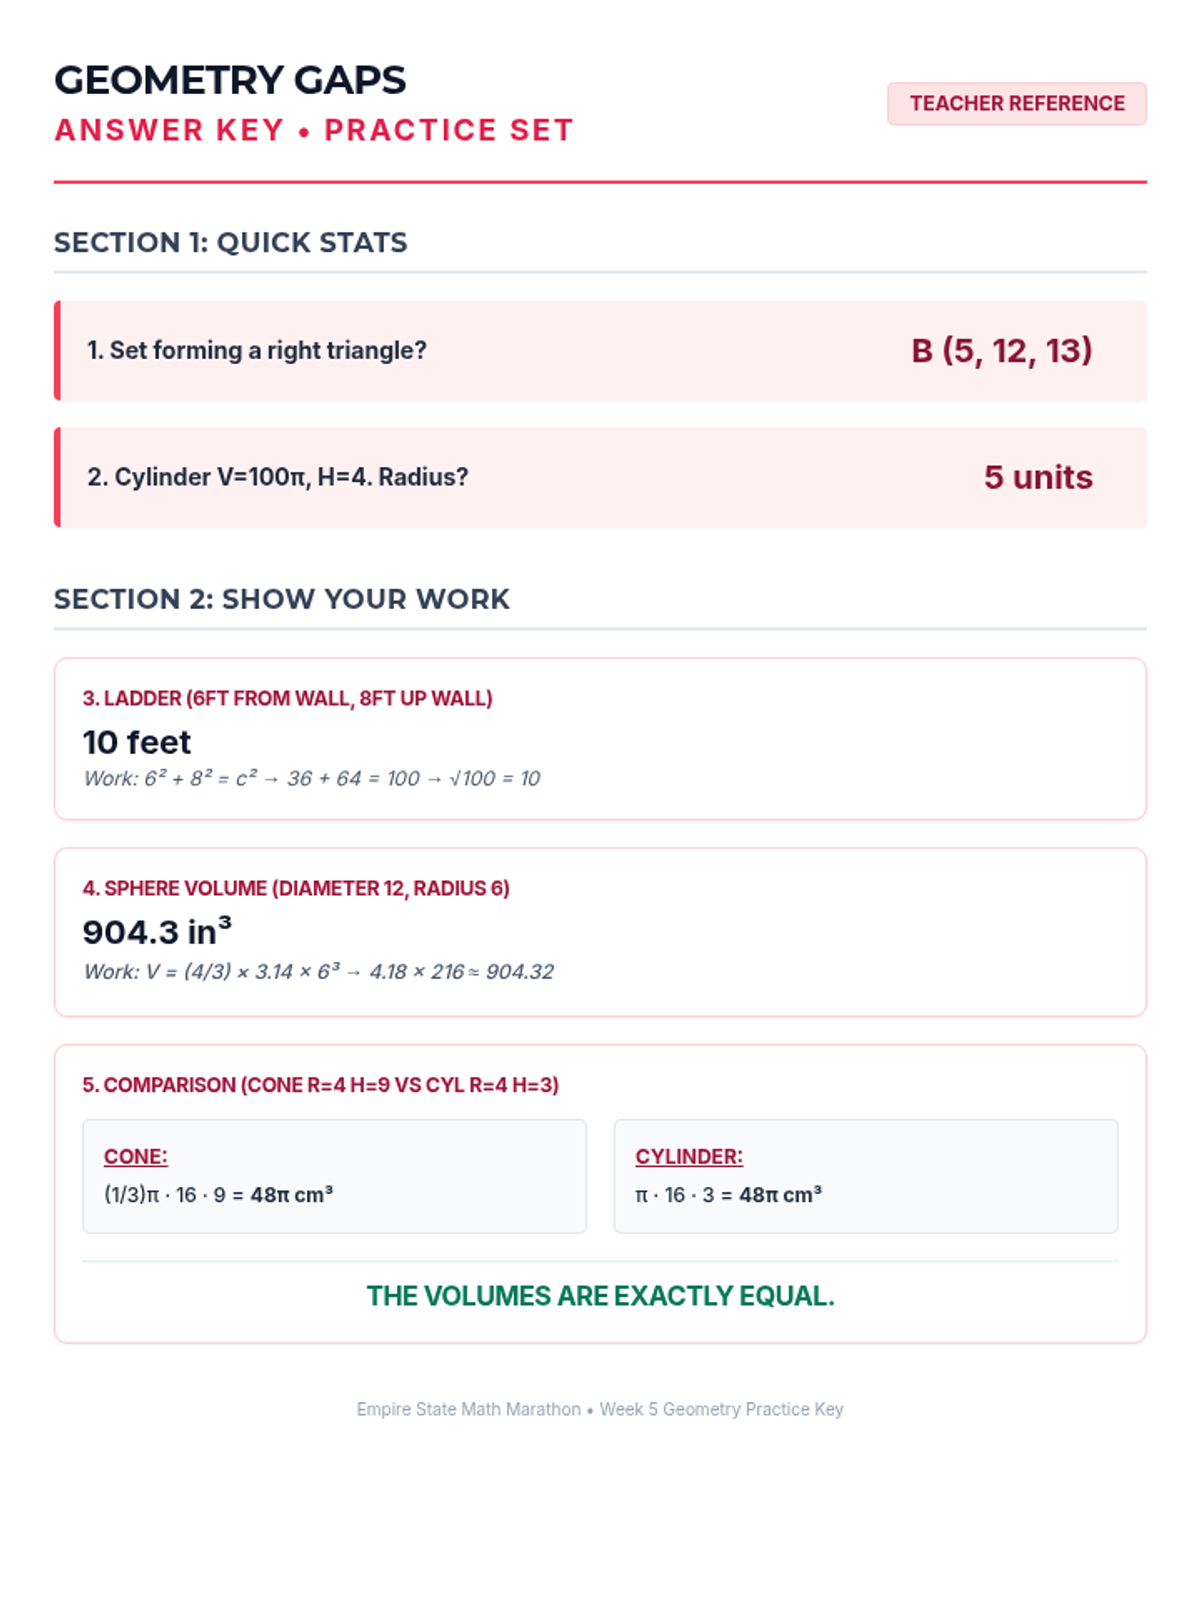
Week 5 reviews the Pythagorean Theorem and volume formulas for cylinders, cones, and spheres.

AG

Anna Gomez

Other
4/28
Lesson
Power Play Warm-Ups
Power Play Practice Set
Power Play Warm-Ups Answer Key
Power Play Practice Set Answer Key

Power Play

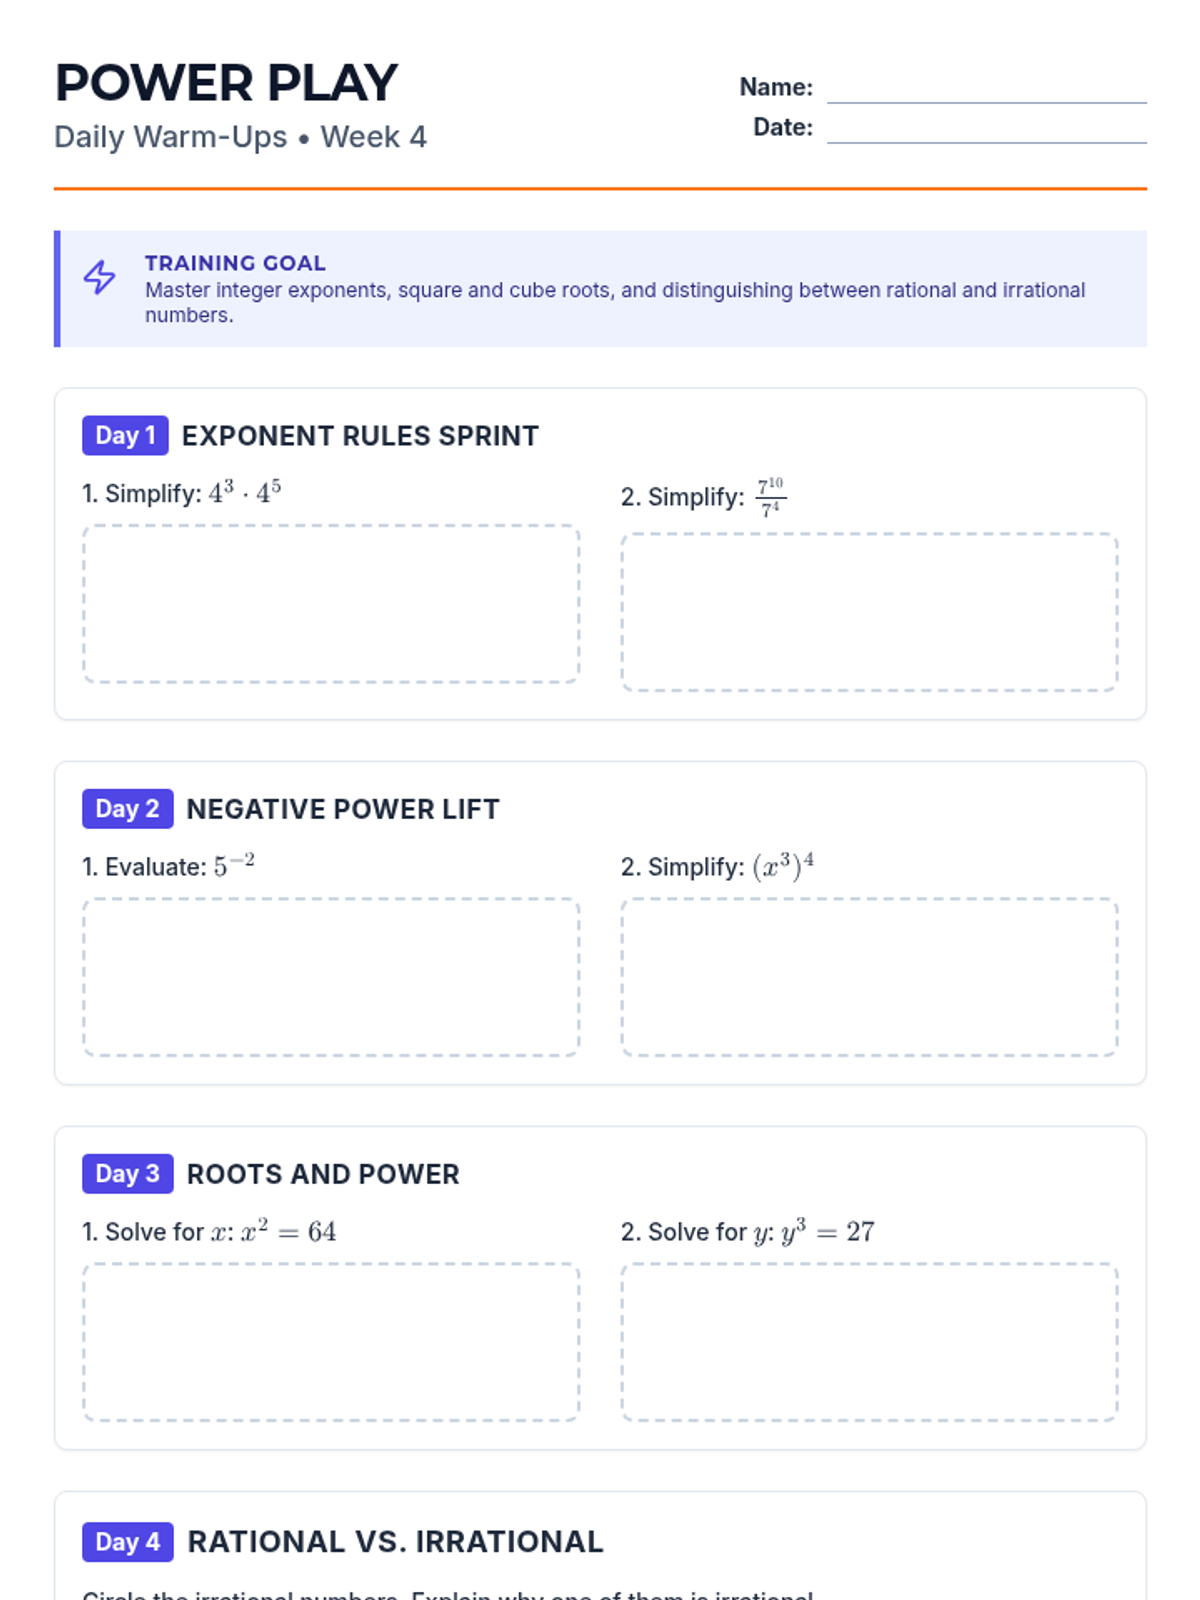
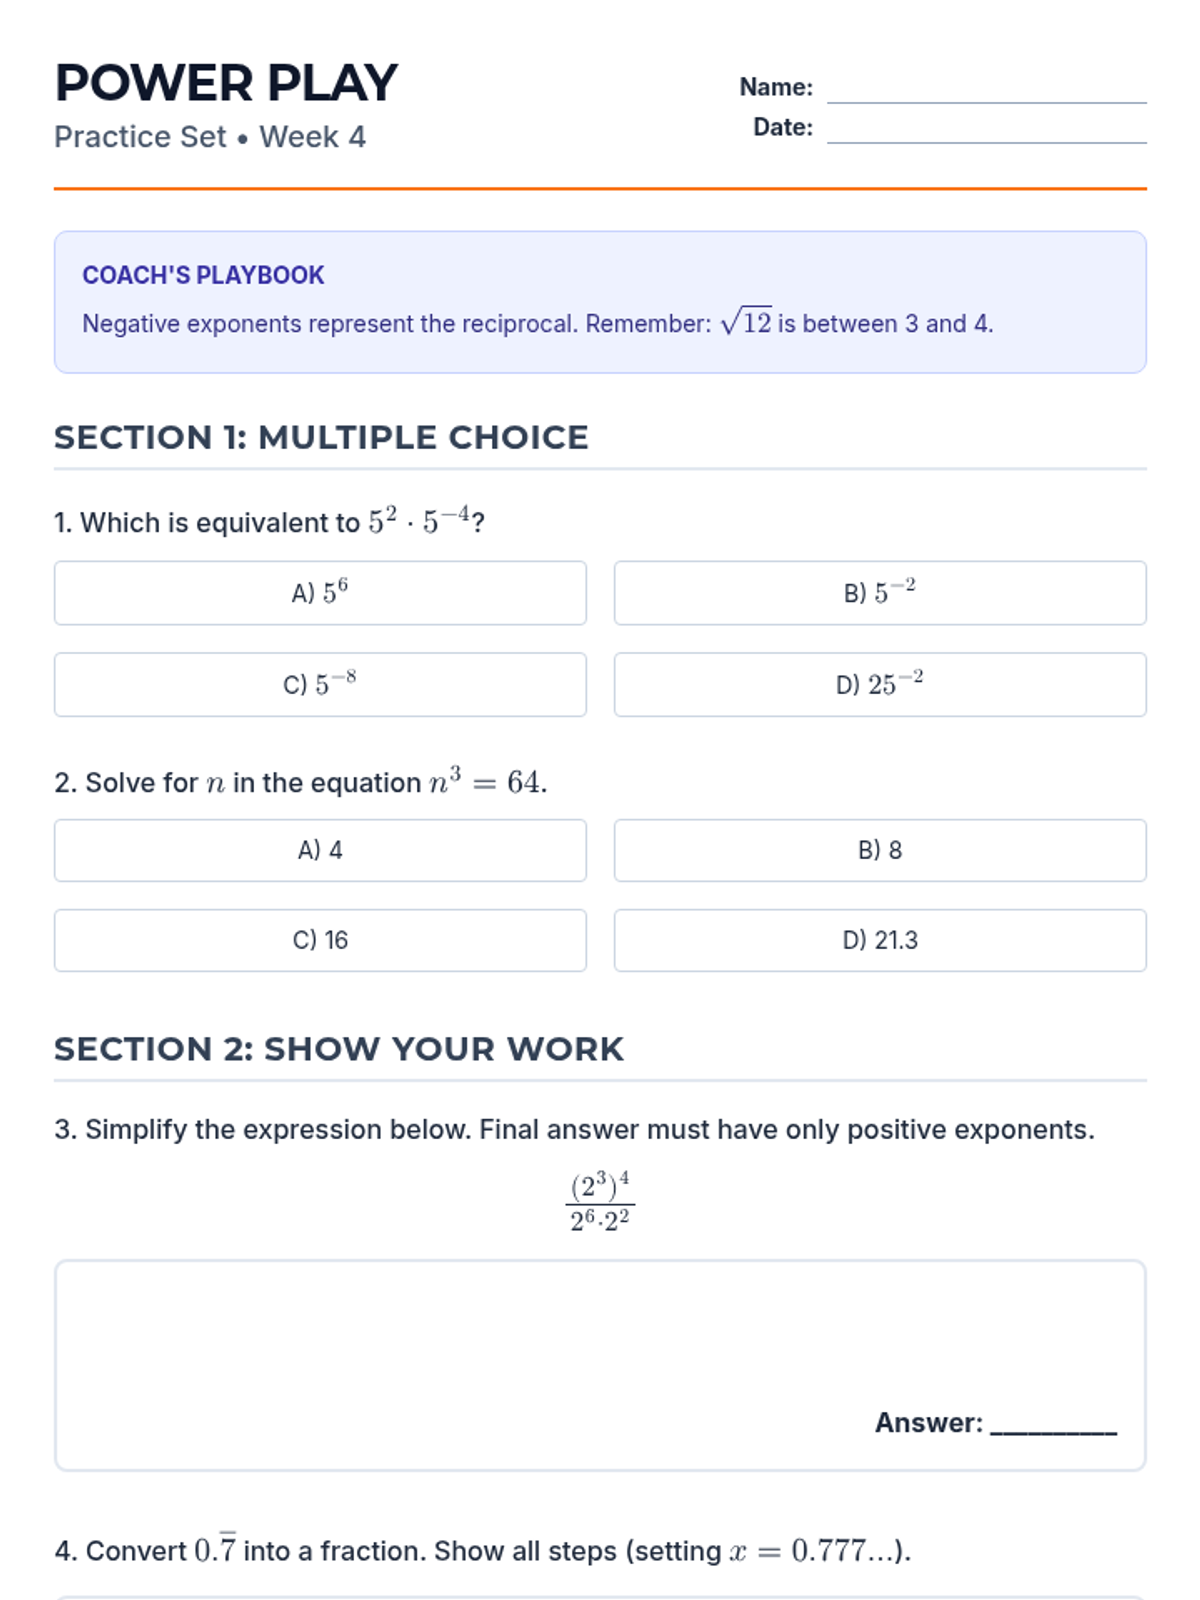
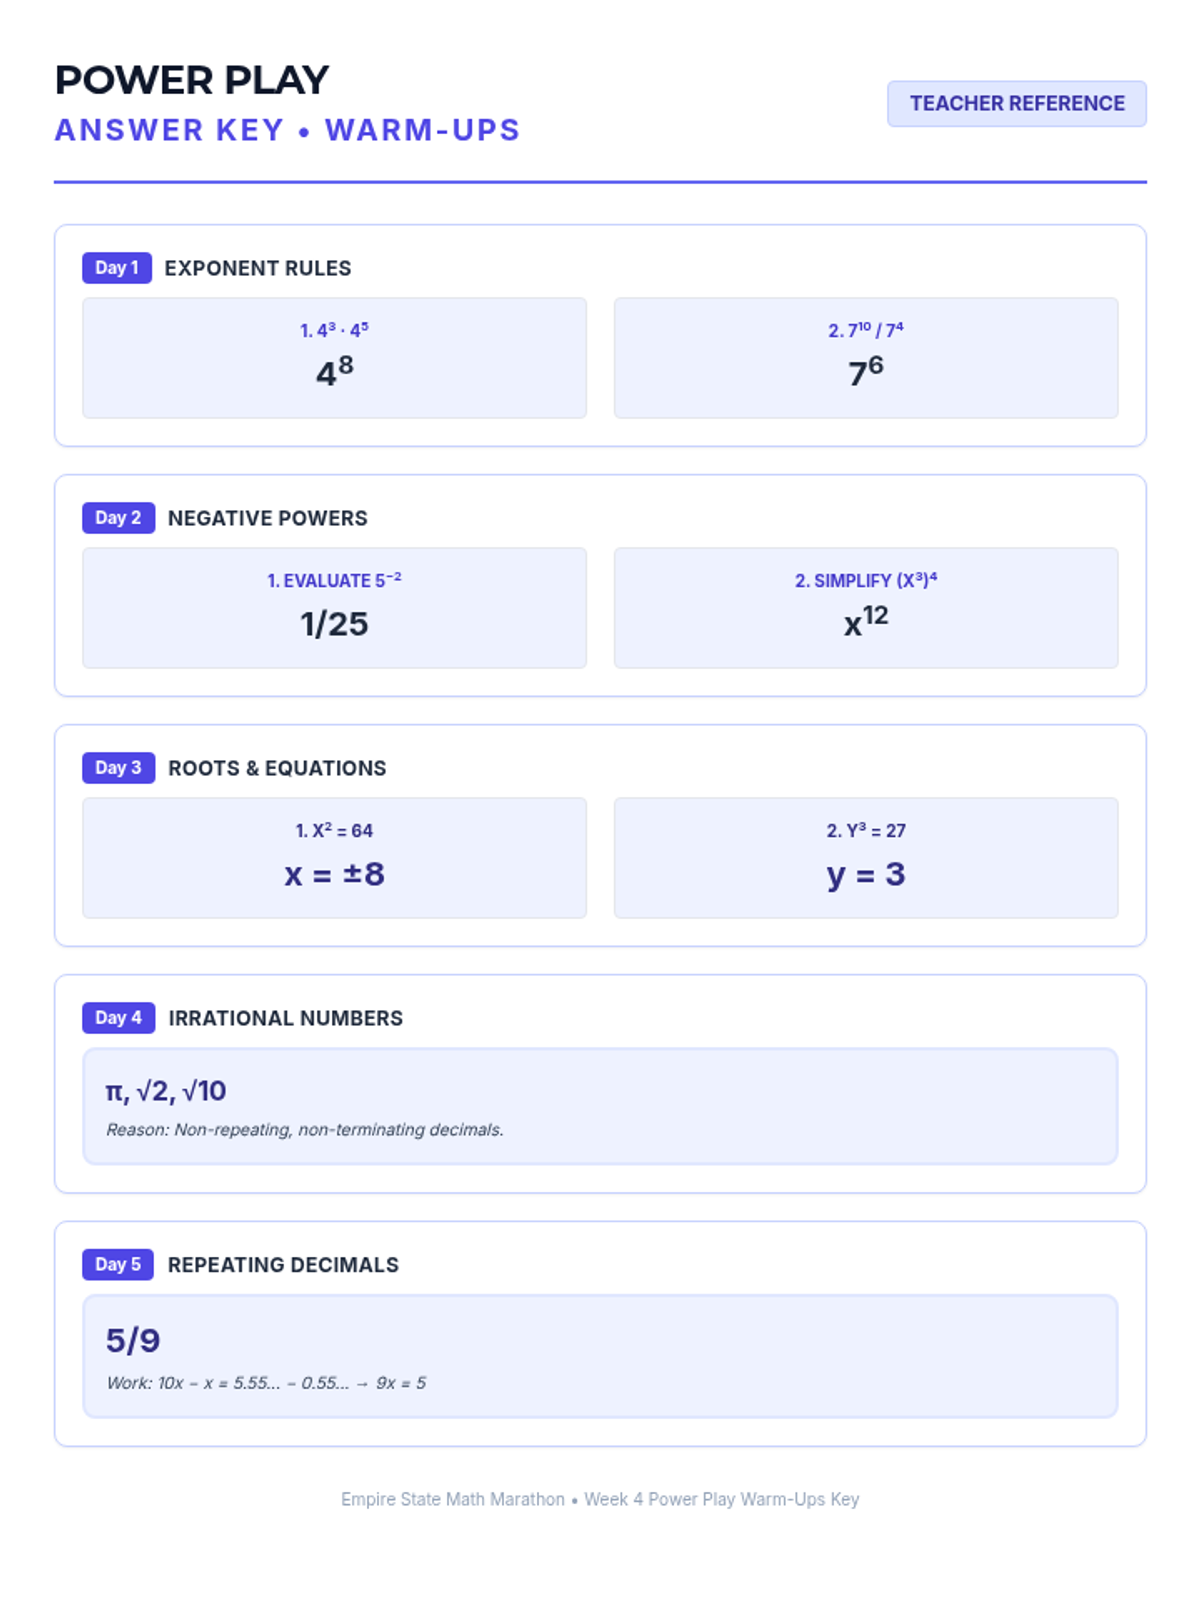
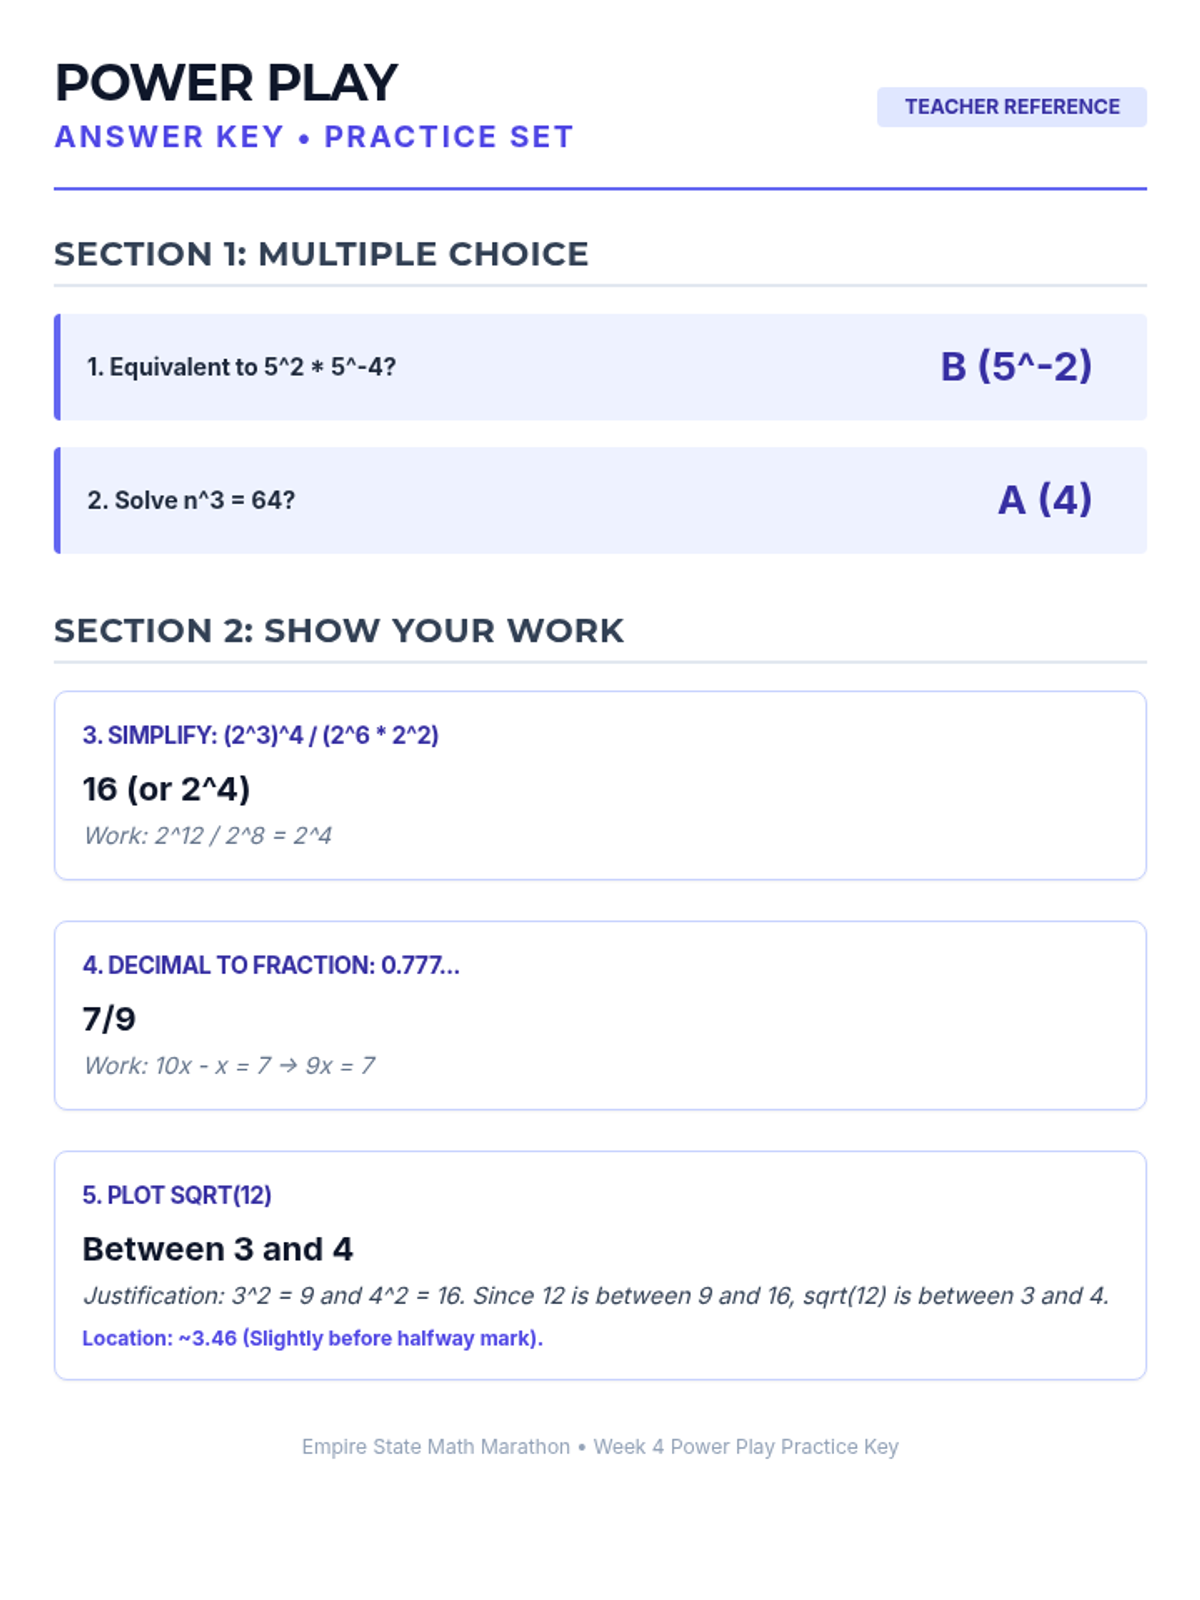
Week 4 explores integer exponent rules, perfect squares and cubes, and distinguishing between rational and irrational numbers.

AG

Anna Gomez

Other
4/28
Lesson
Function Fuel Warm-Ups
Function Fuel Practice Set
Function Fuel Warm-Ups Answer Key
Function Fuel Practice Set Answer Key

Function Fuel

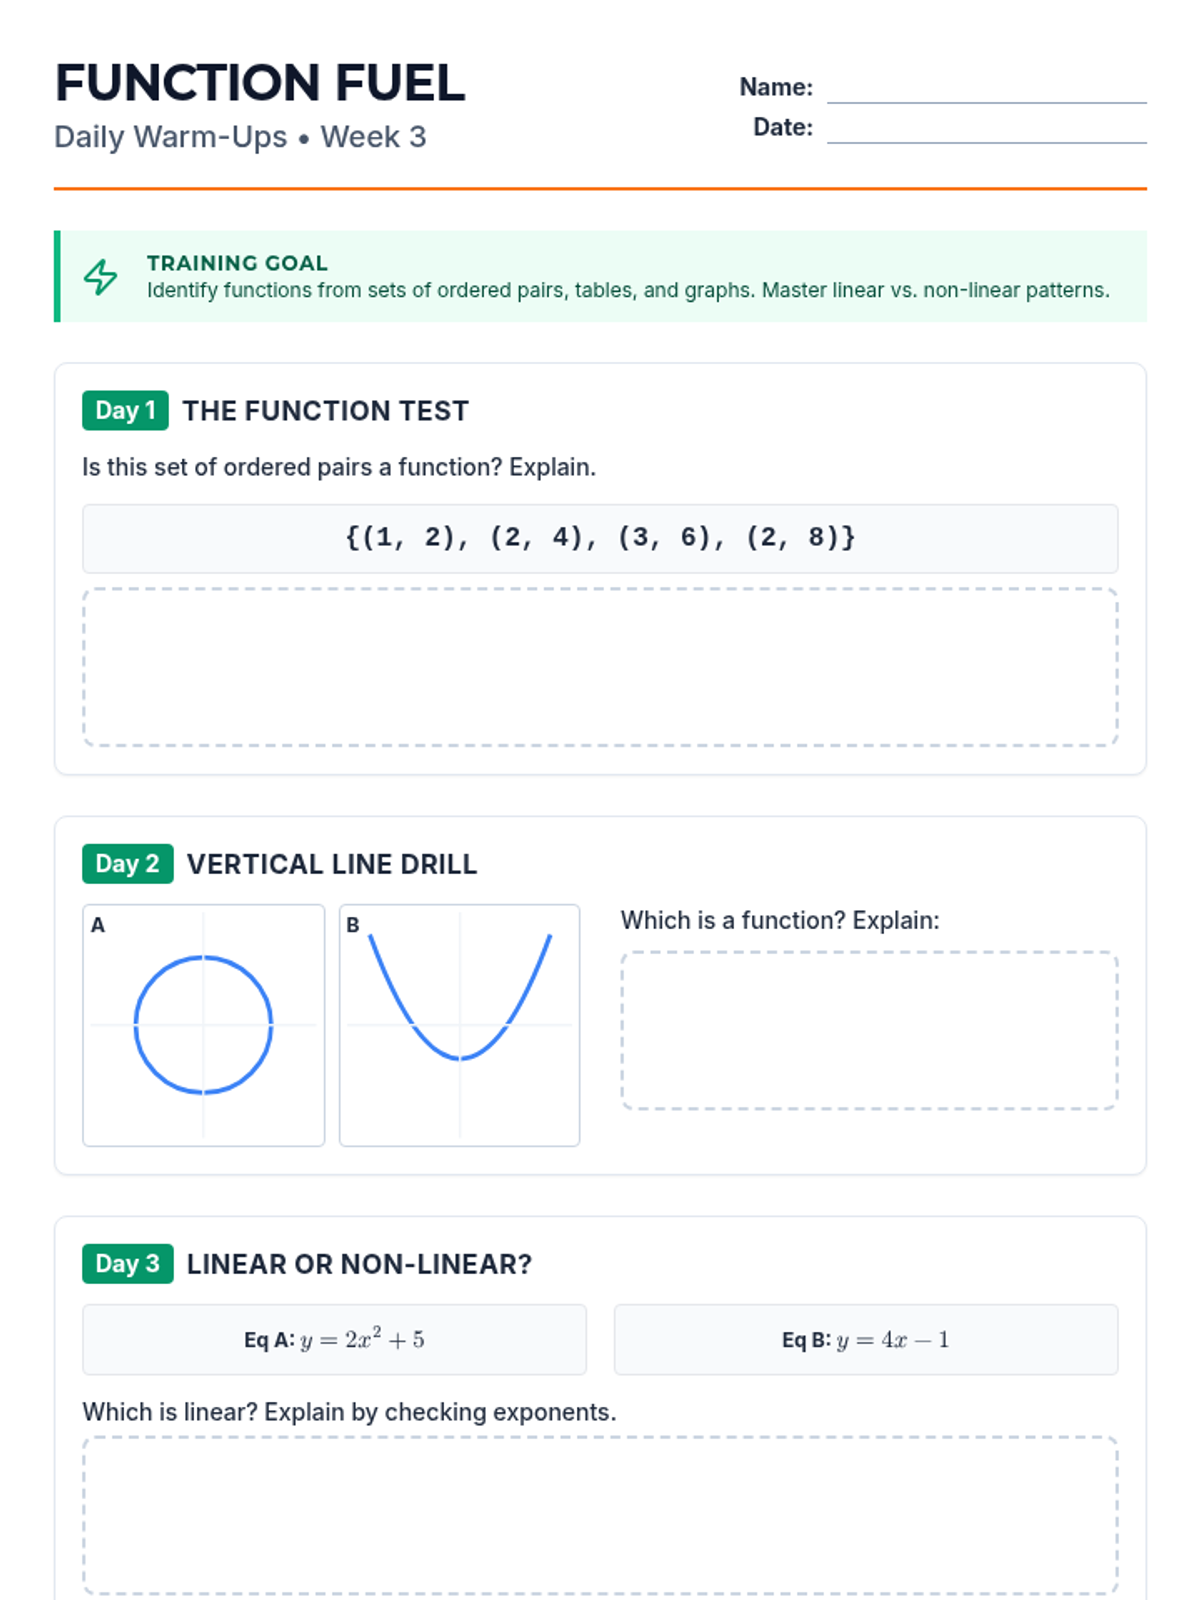
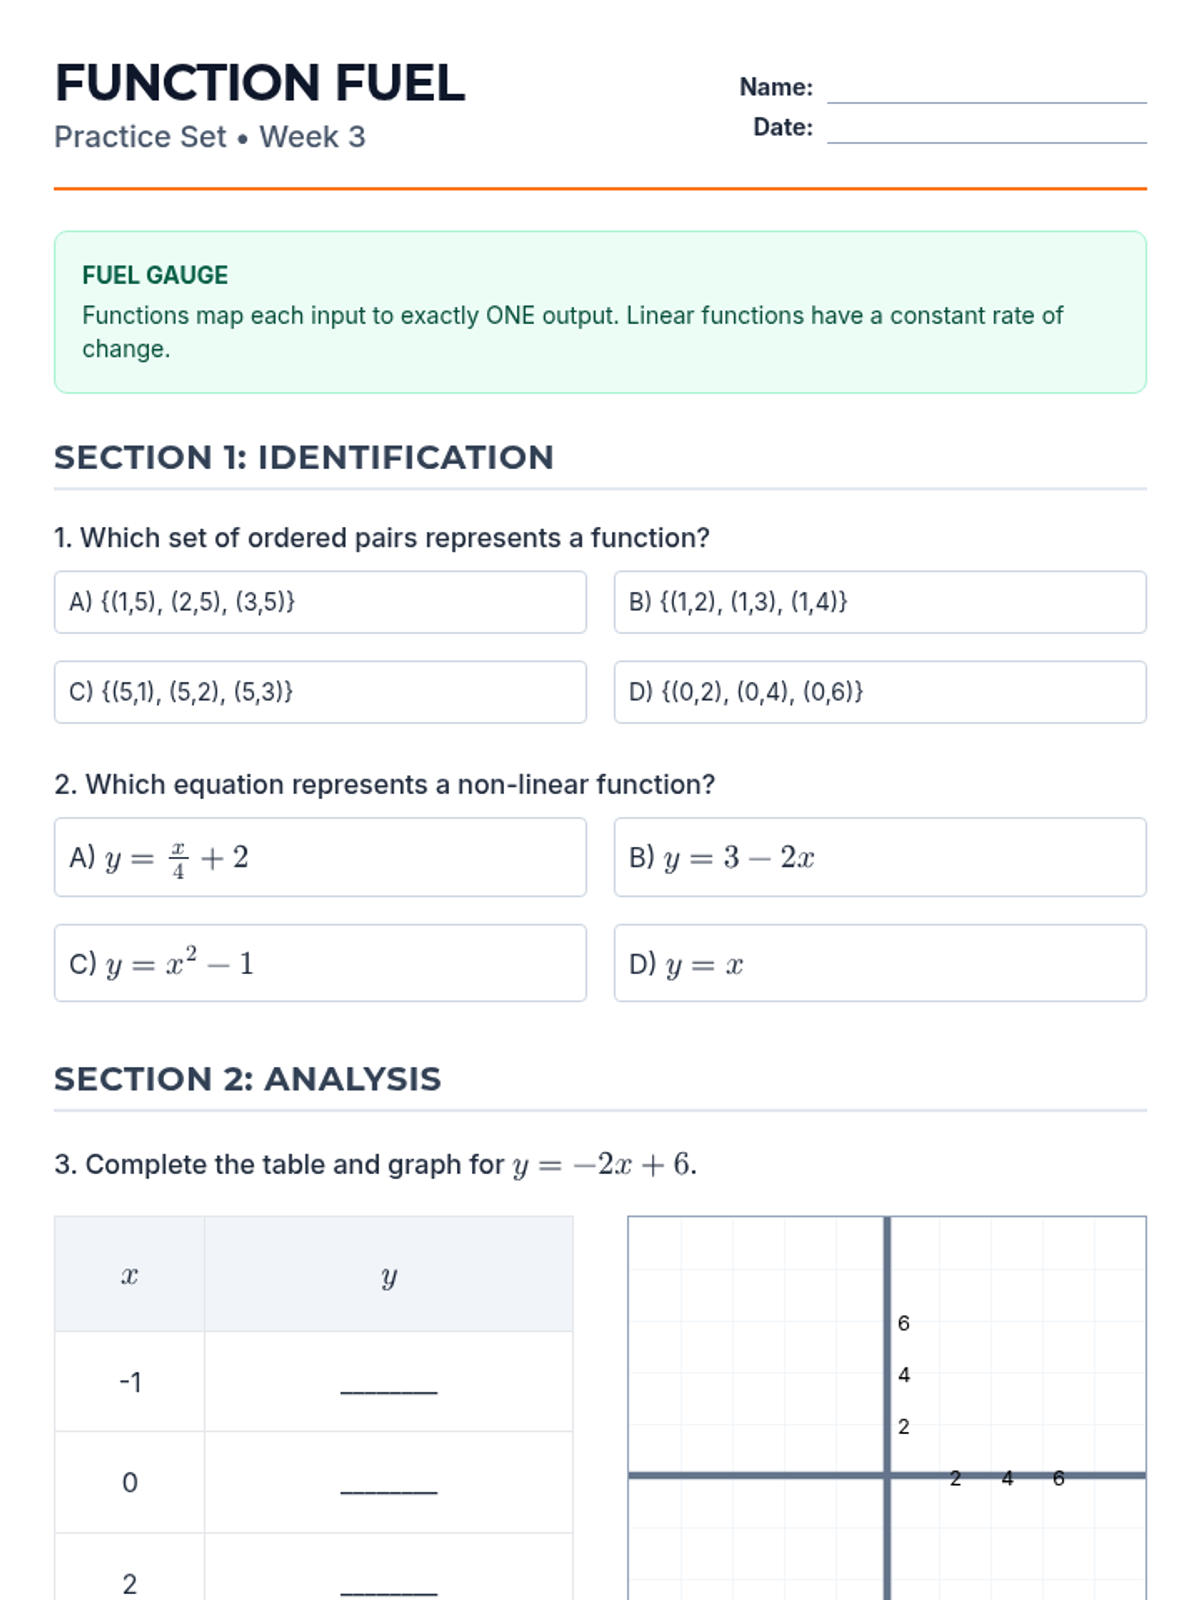
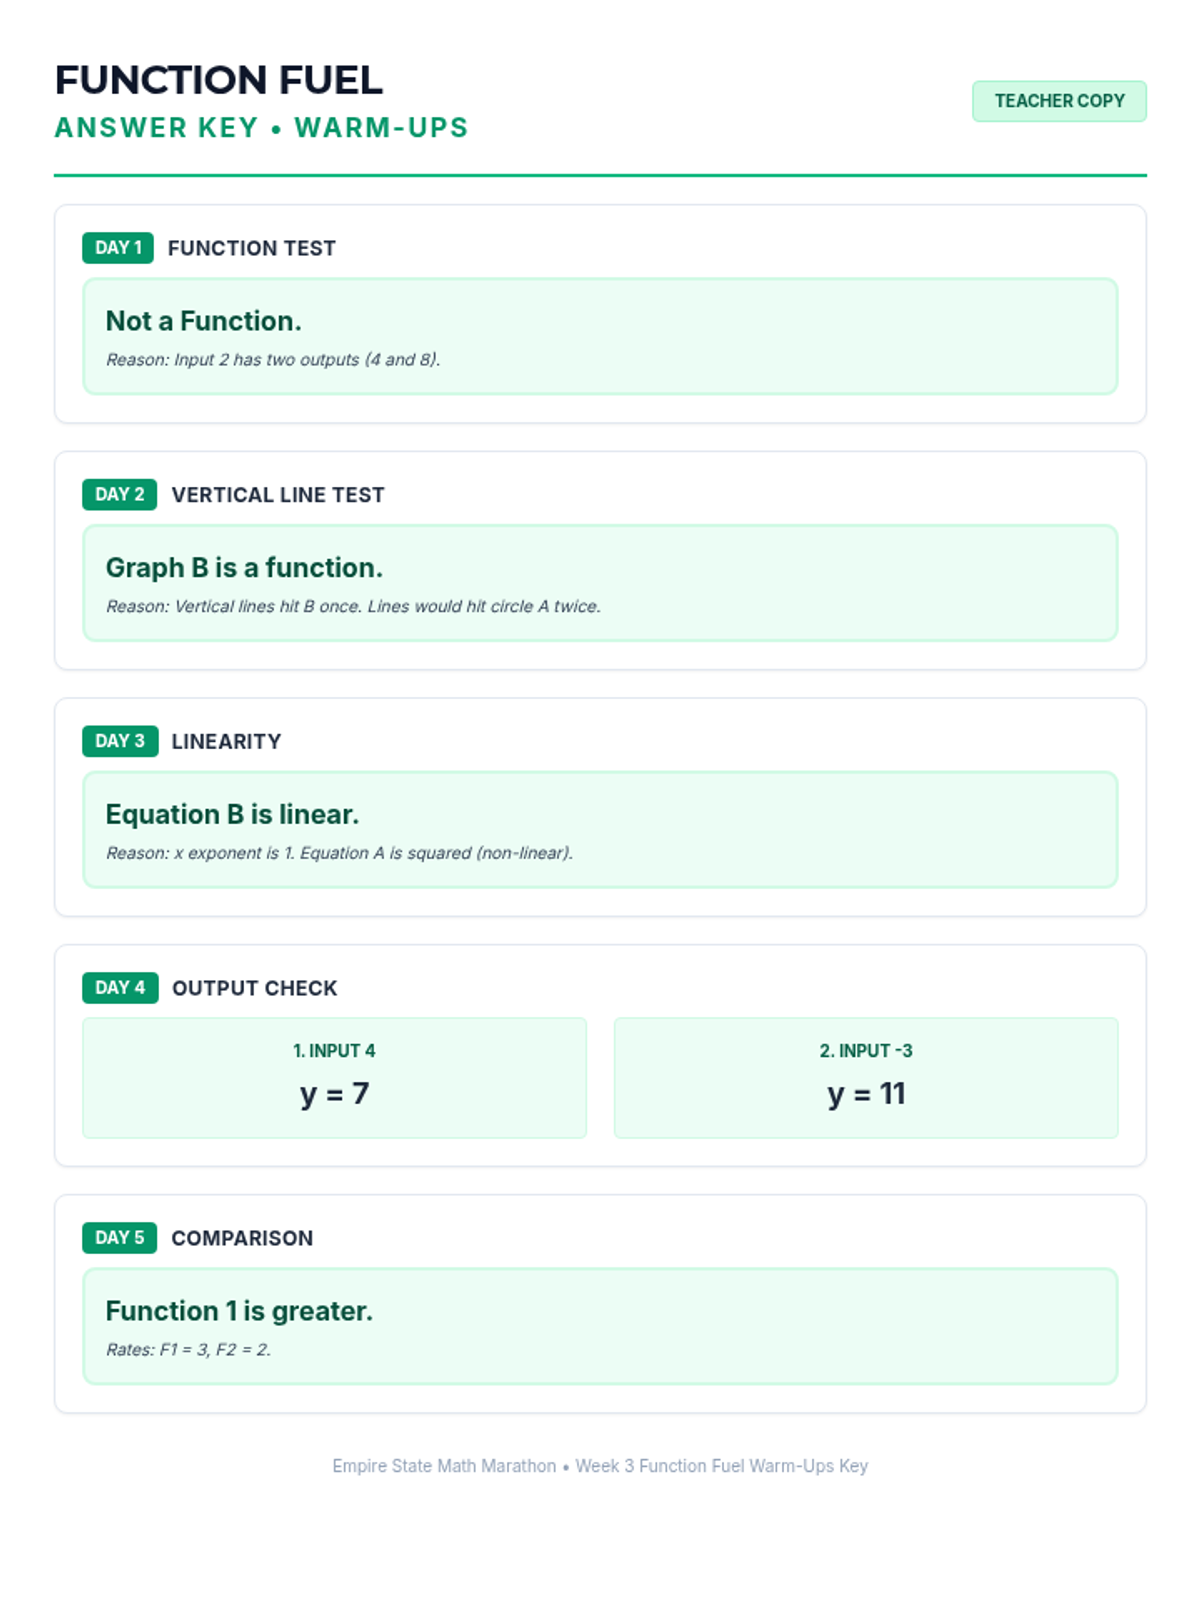
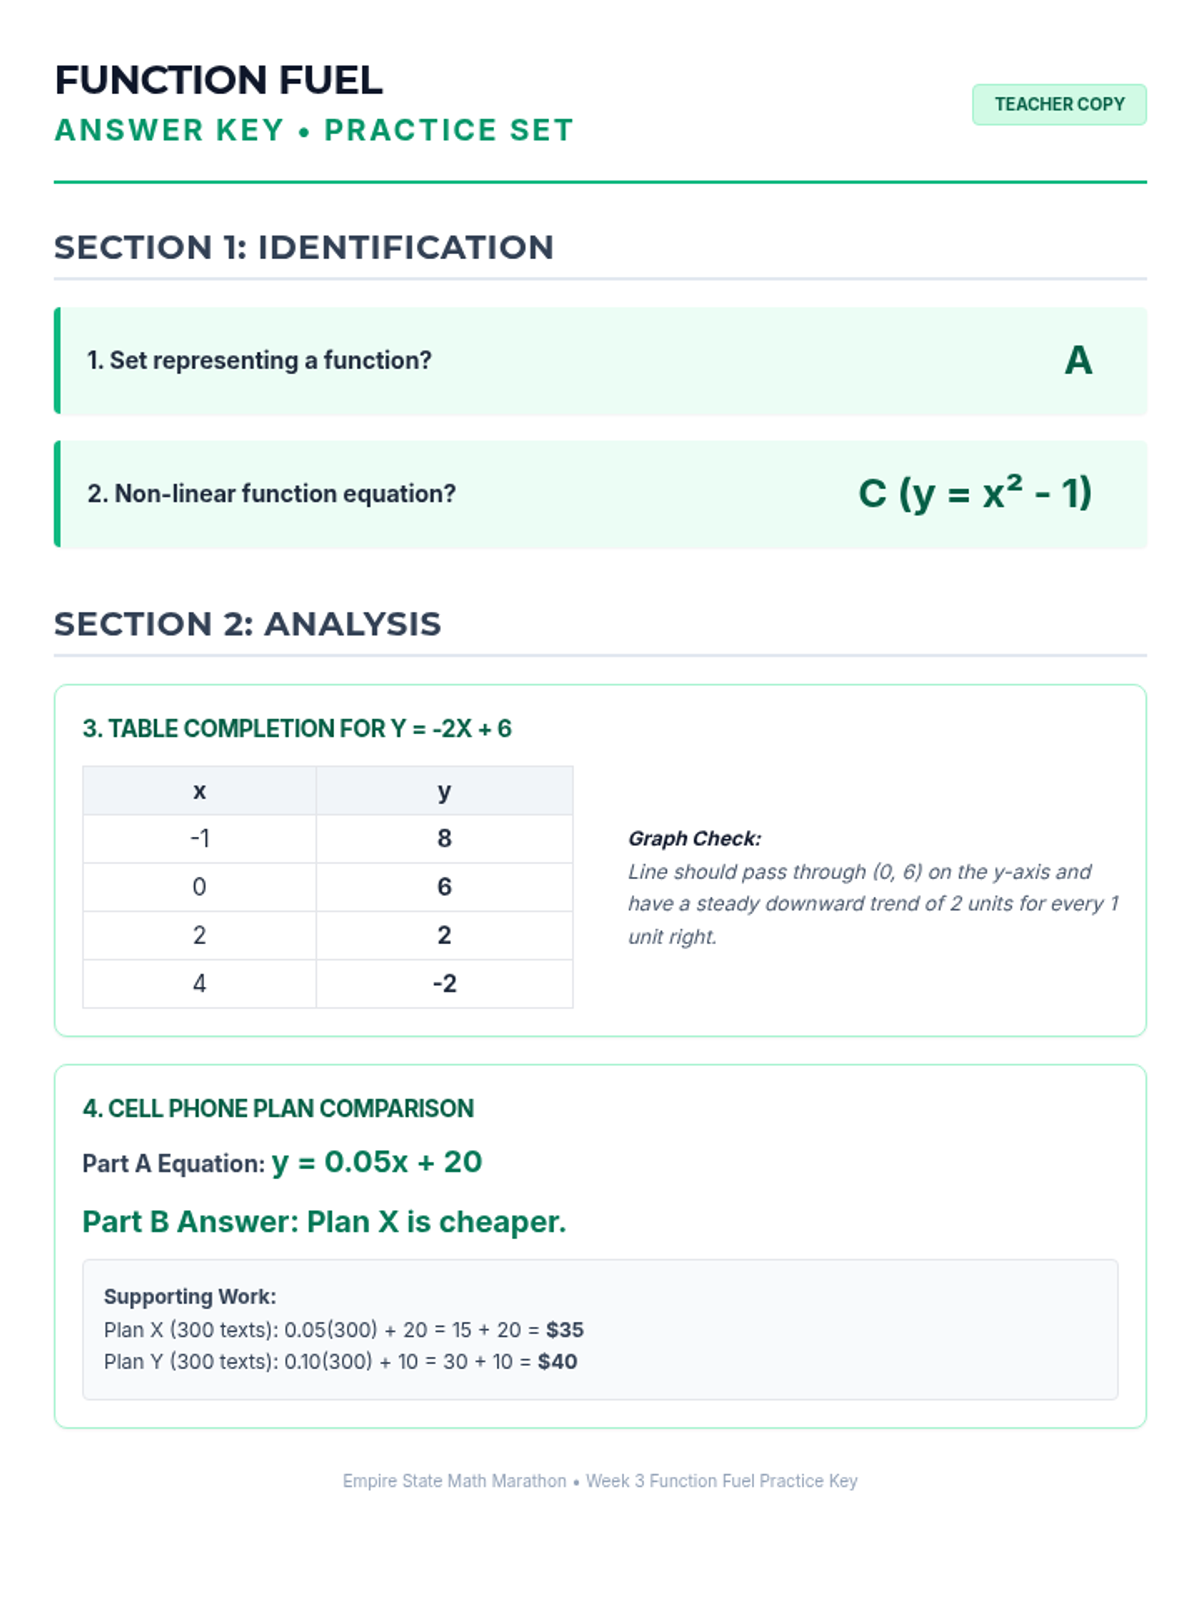
Week 3 defines, evaluates, and compares functions represented in different ways (tables, graphs, equations).

AG

Anna Gomez

Other
4/28
Lesson
Linear Landscapes Warm-Ups
Linear Landscapes Practice Set
Linear Landscapes Warm-Ups Answer Key
Linear Landscapes Practice Set Answer Key

Linear Landscapes

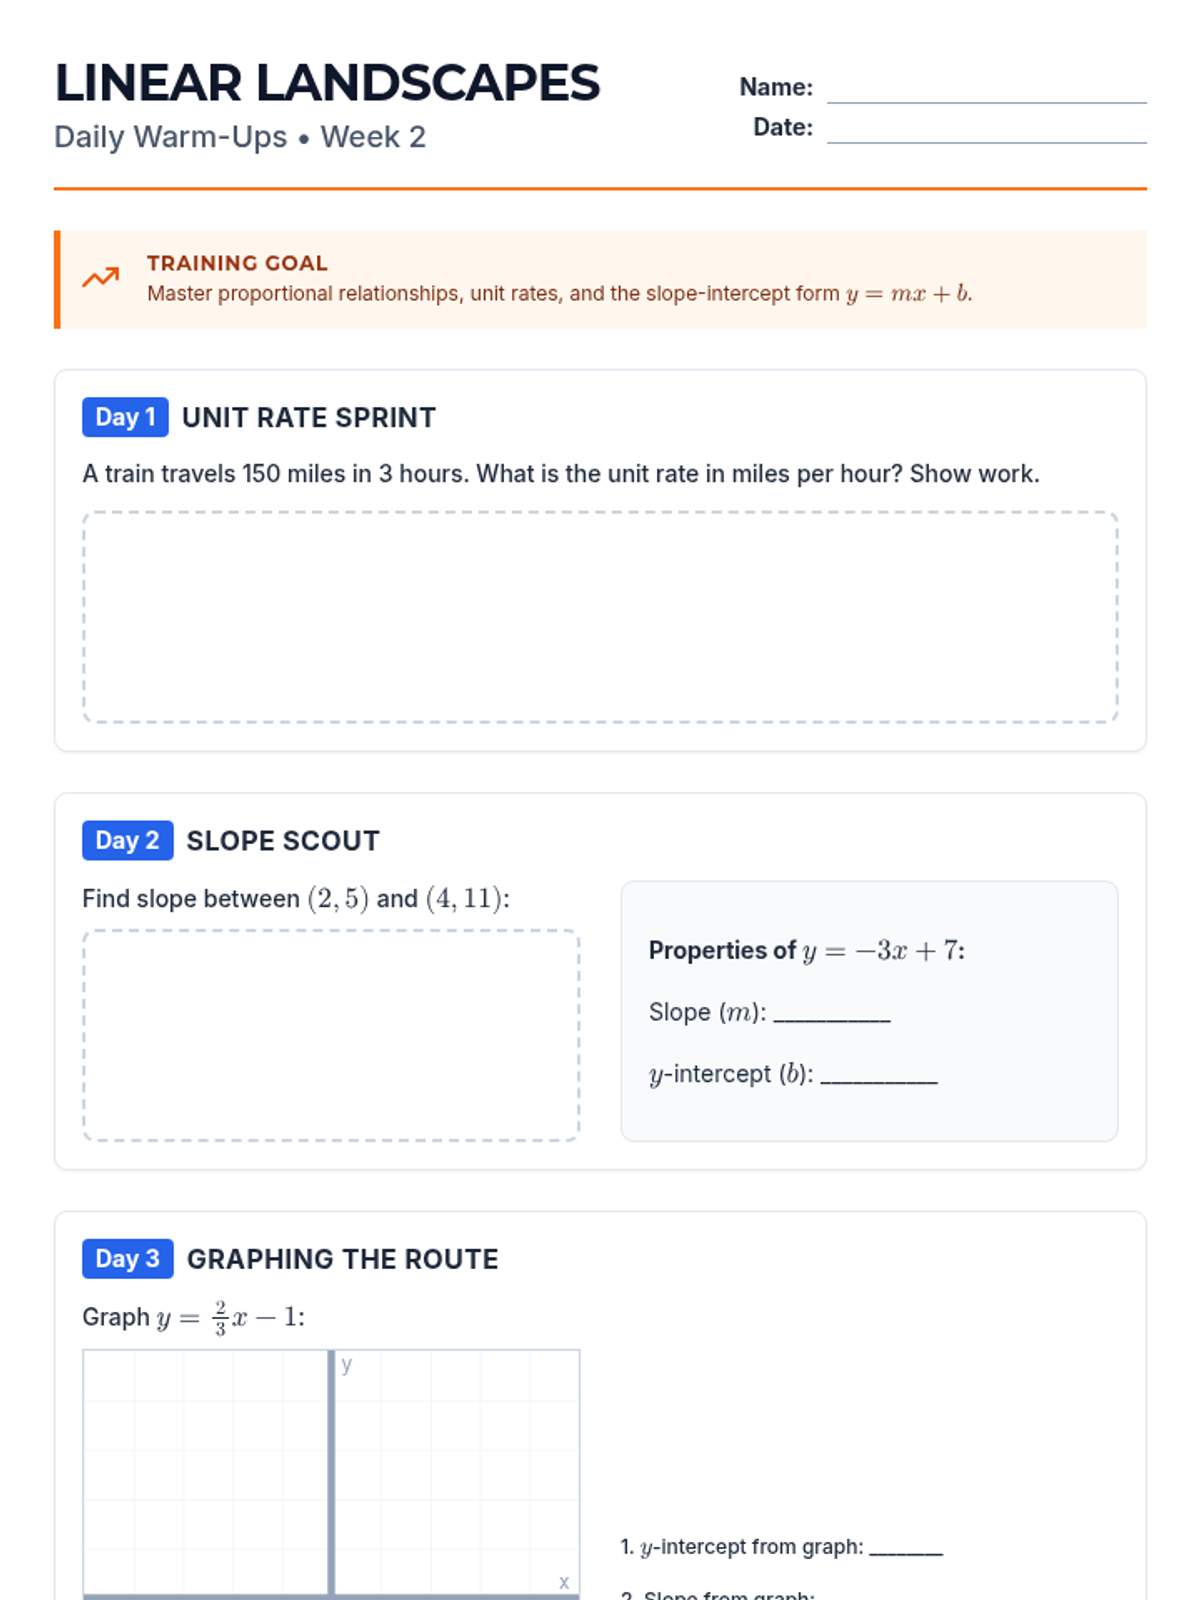
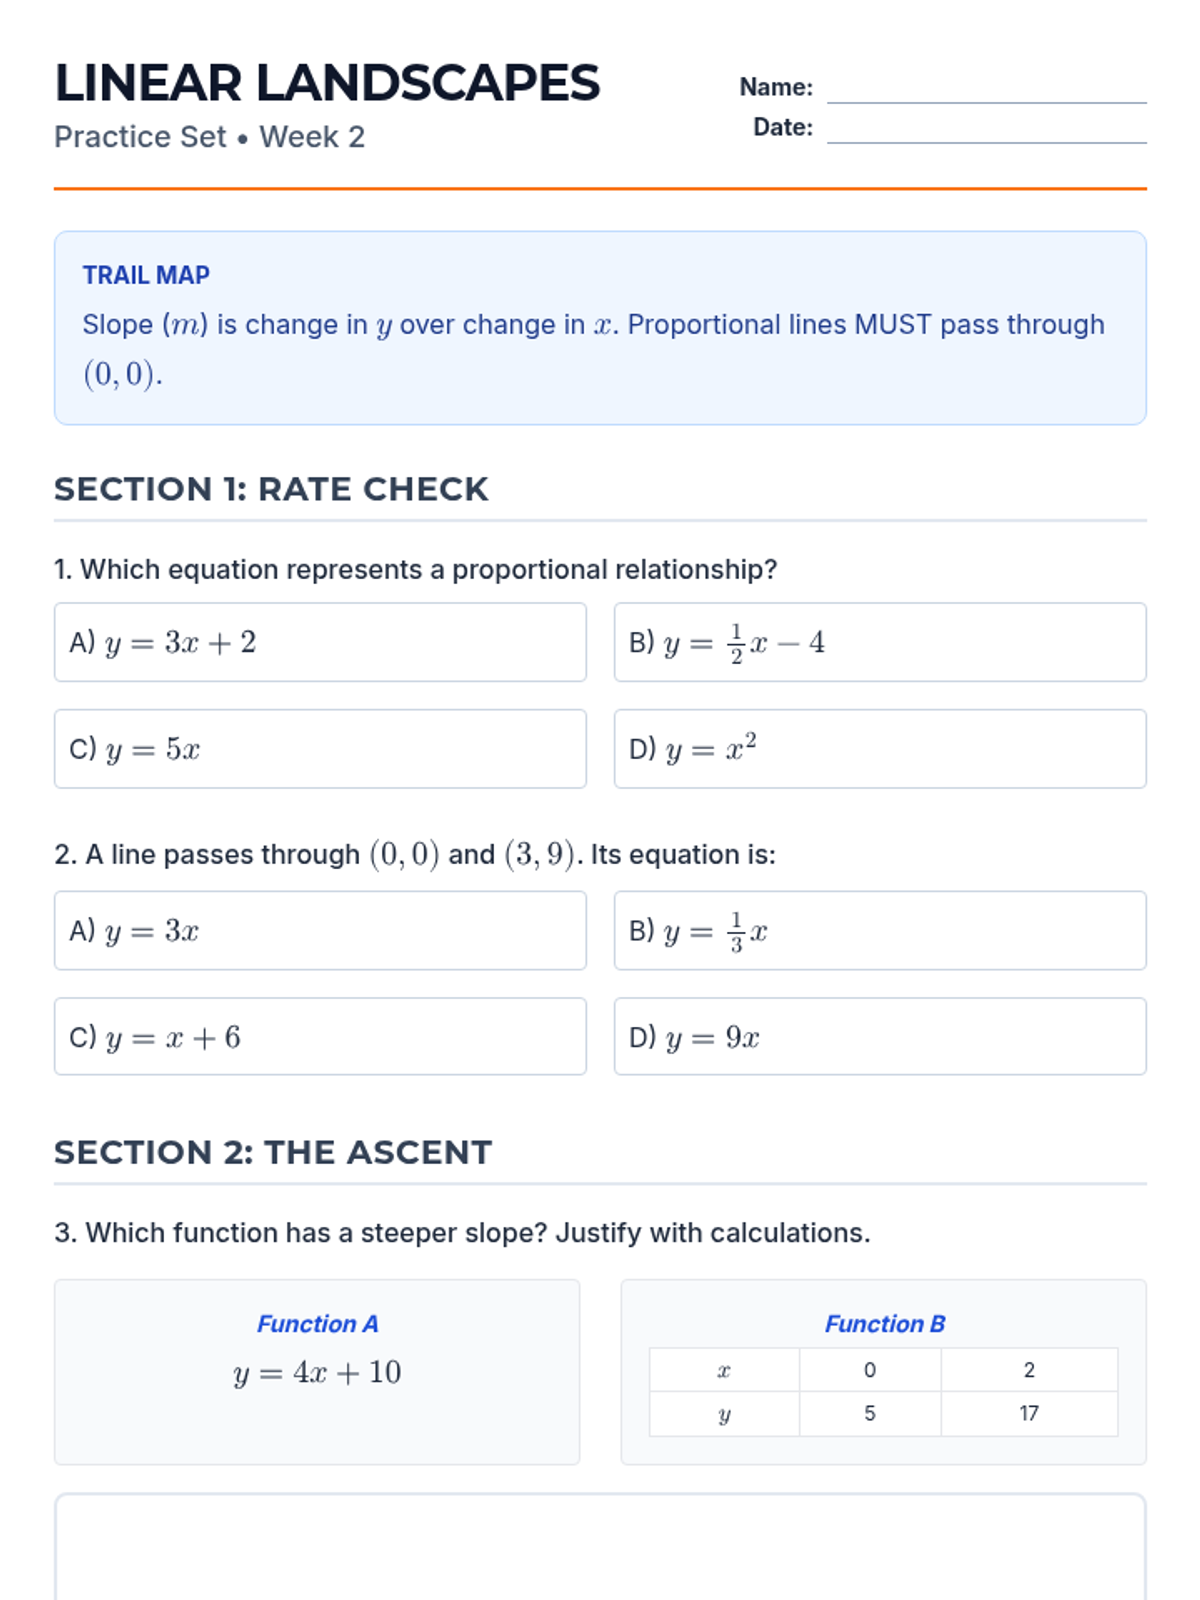
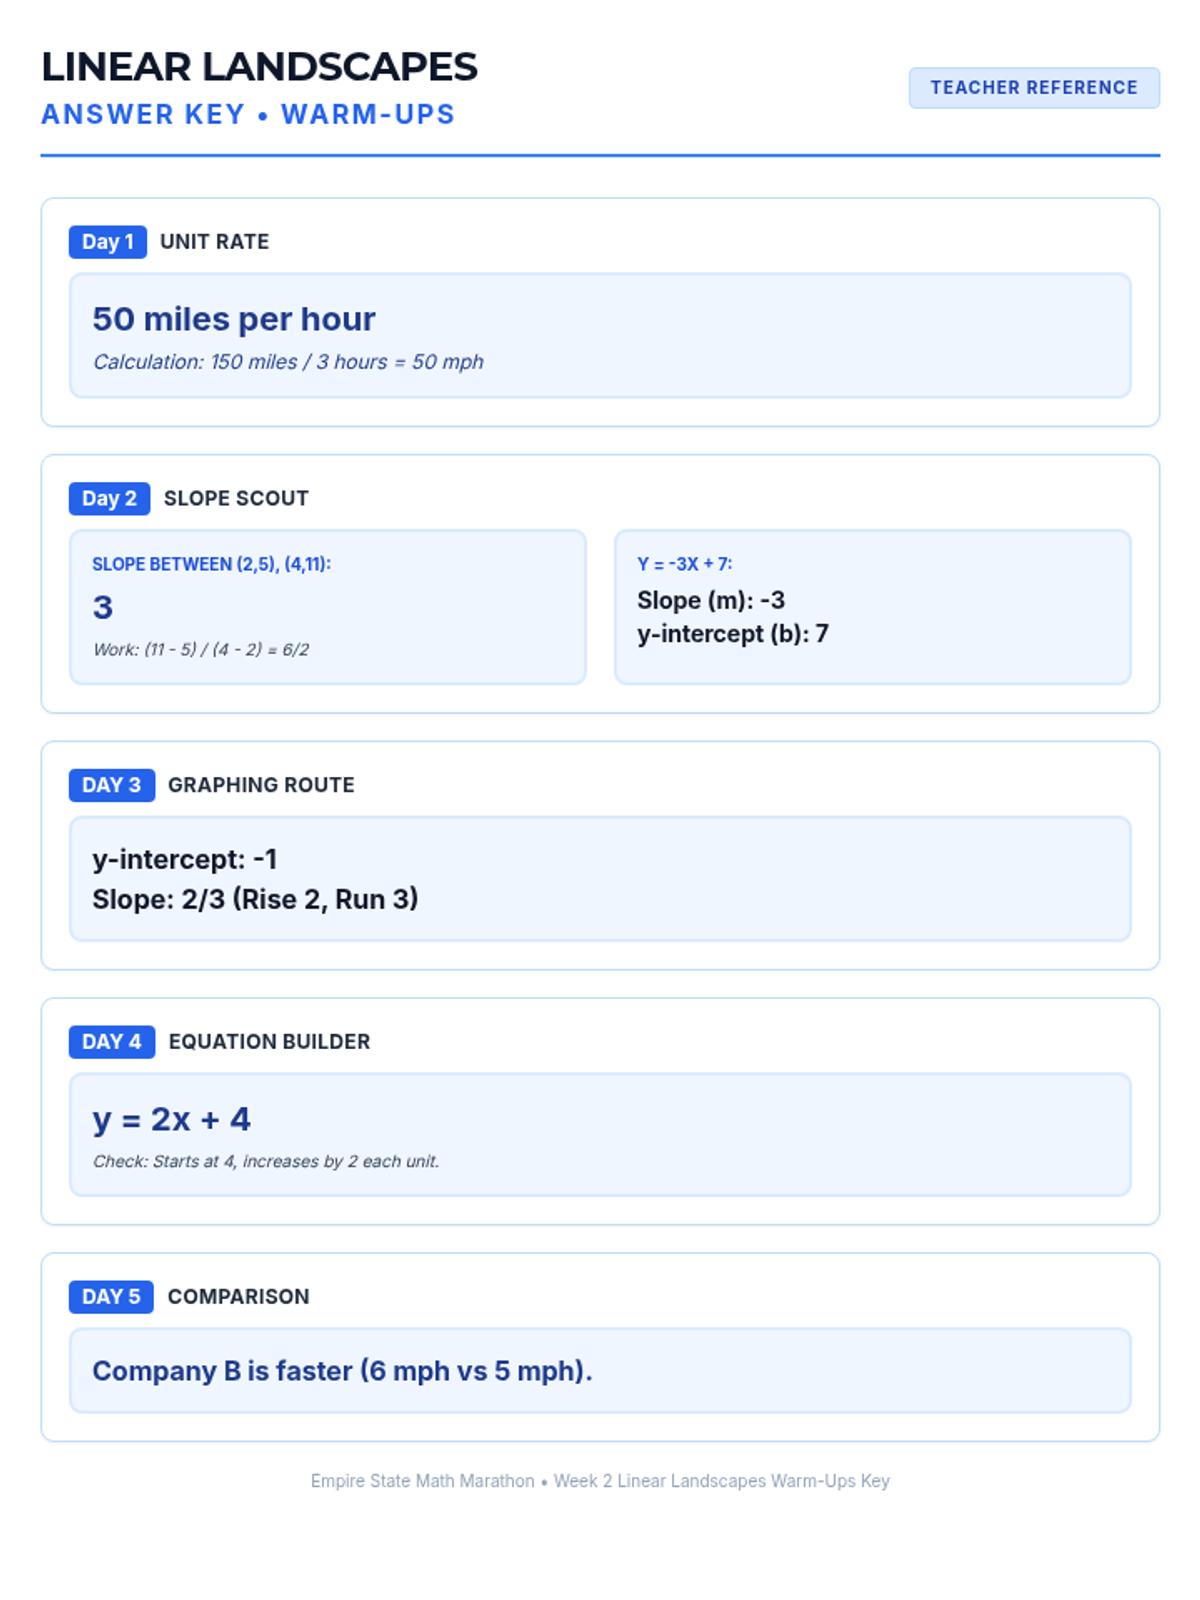
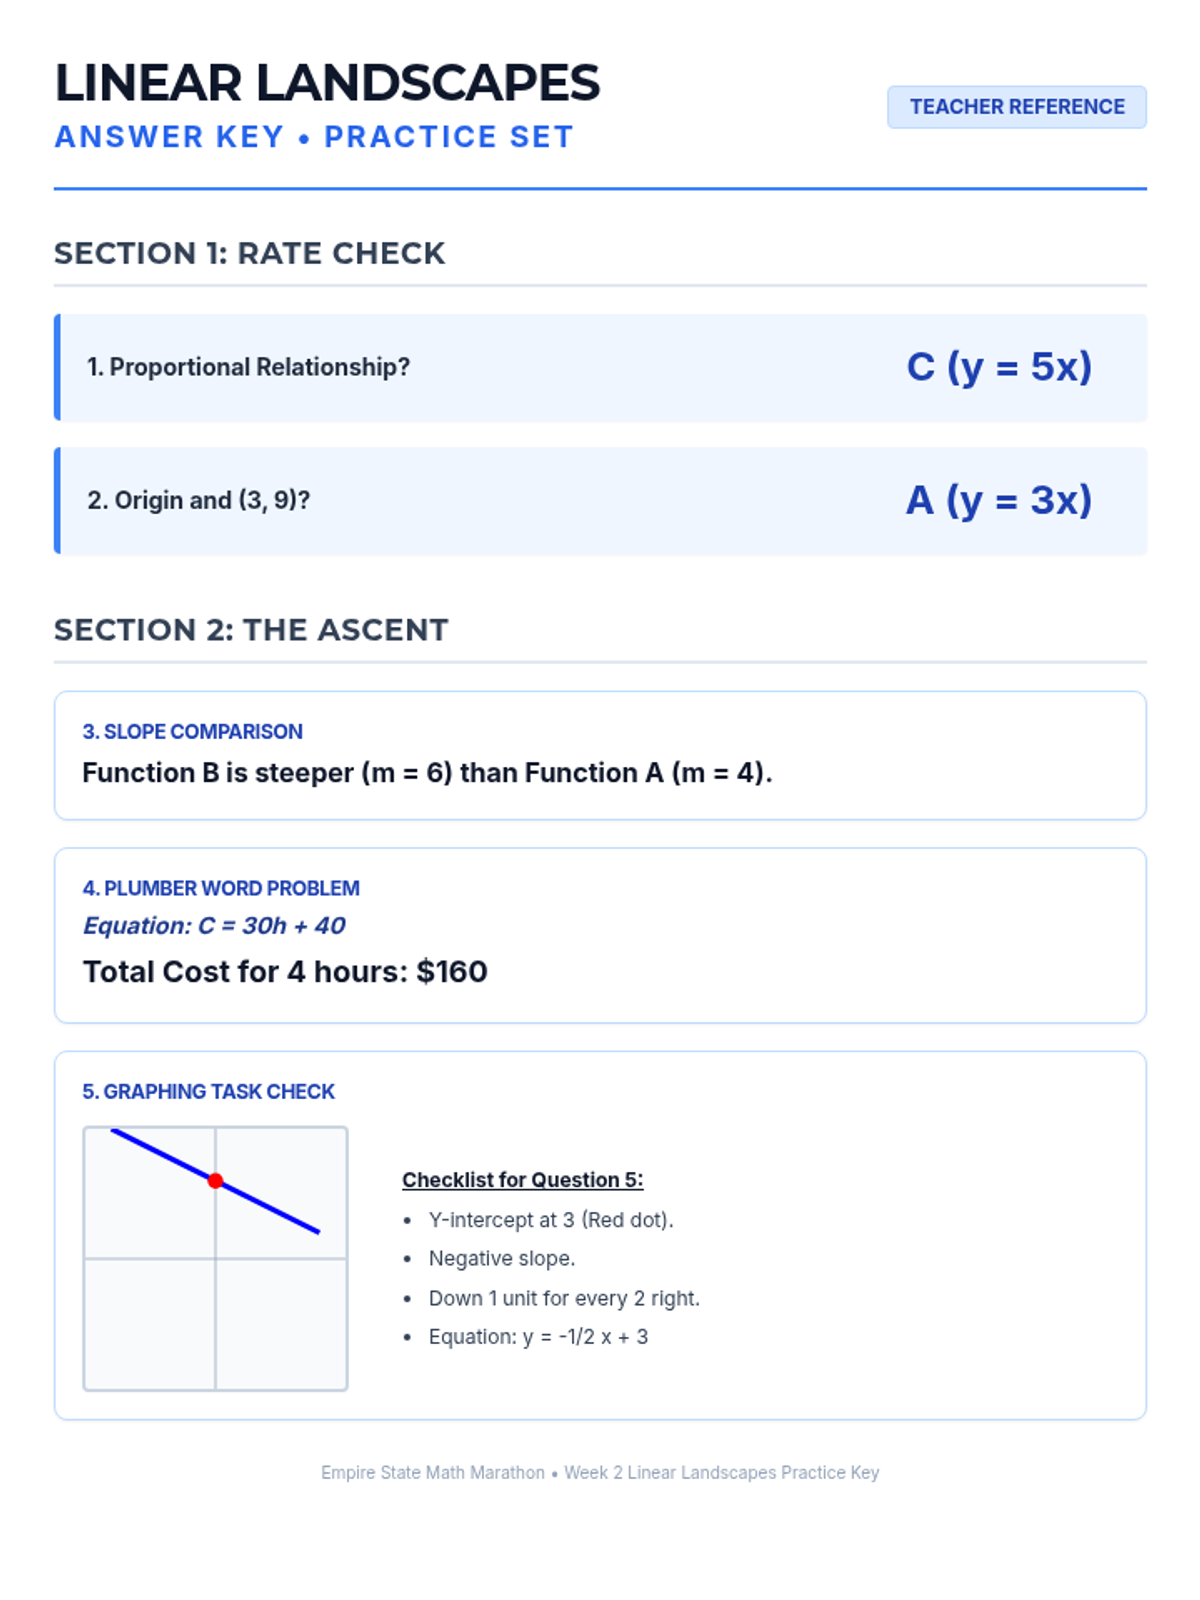
Week 2 covers proportional relationships, unit rates, and the slope-intercept form of linear equations.

AG

Anna Gomez

Other
4/28
Lesson
Equation Endurance Warm-Ups
Equation Endurance Practice Set
Equation Endurance Warm-Ups Answer Key
Equation Endurance Practice Set Answer Key

Equation Endurance

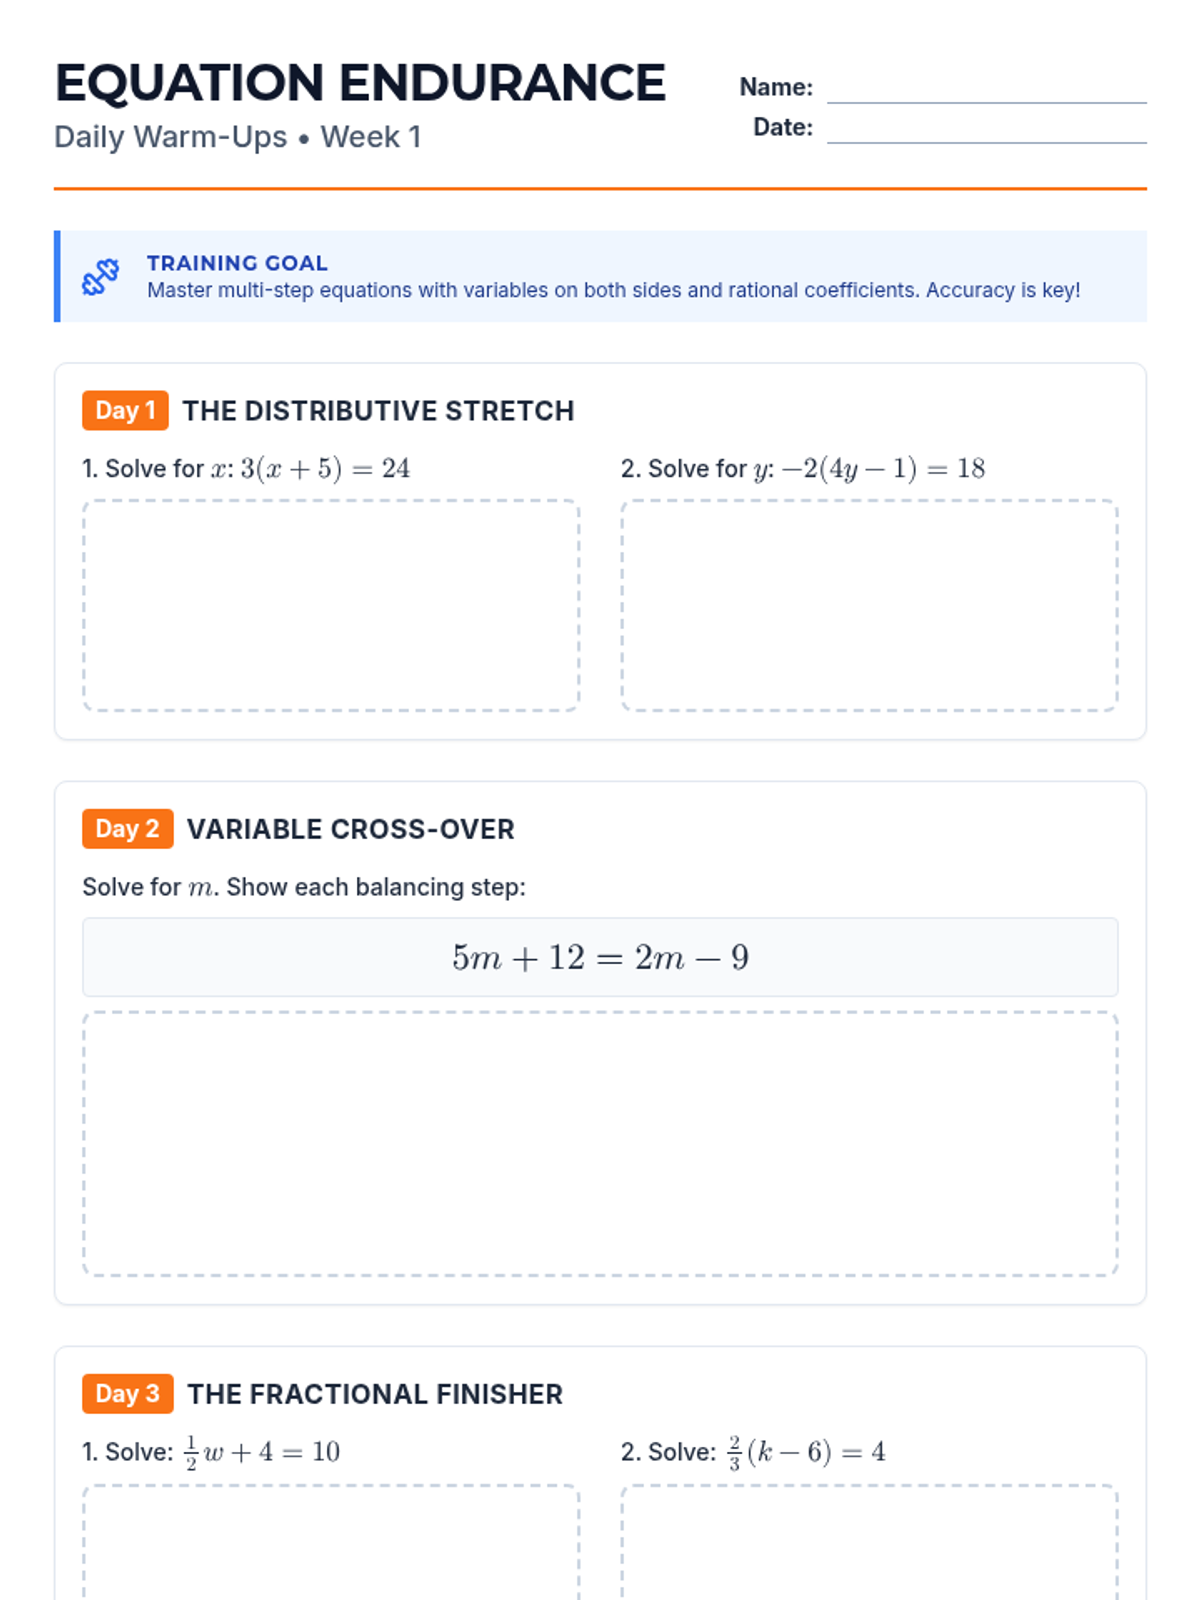
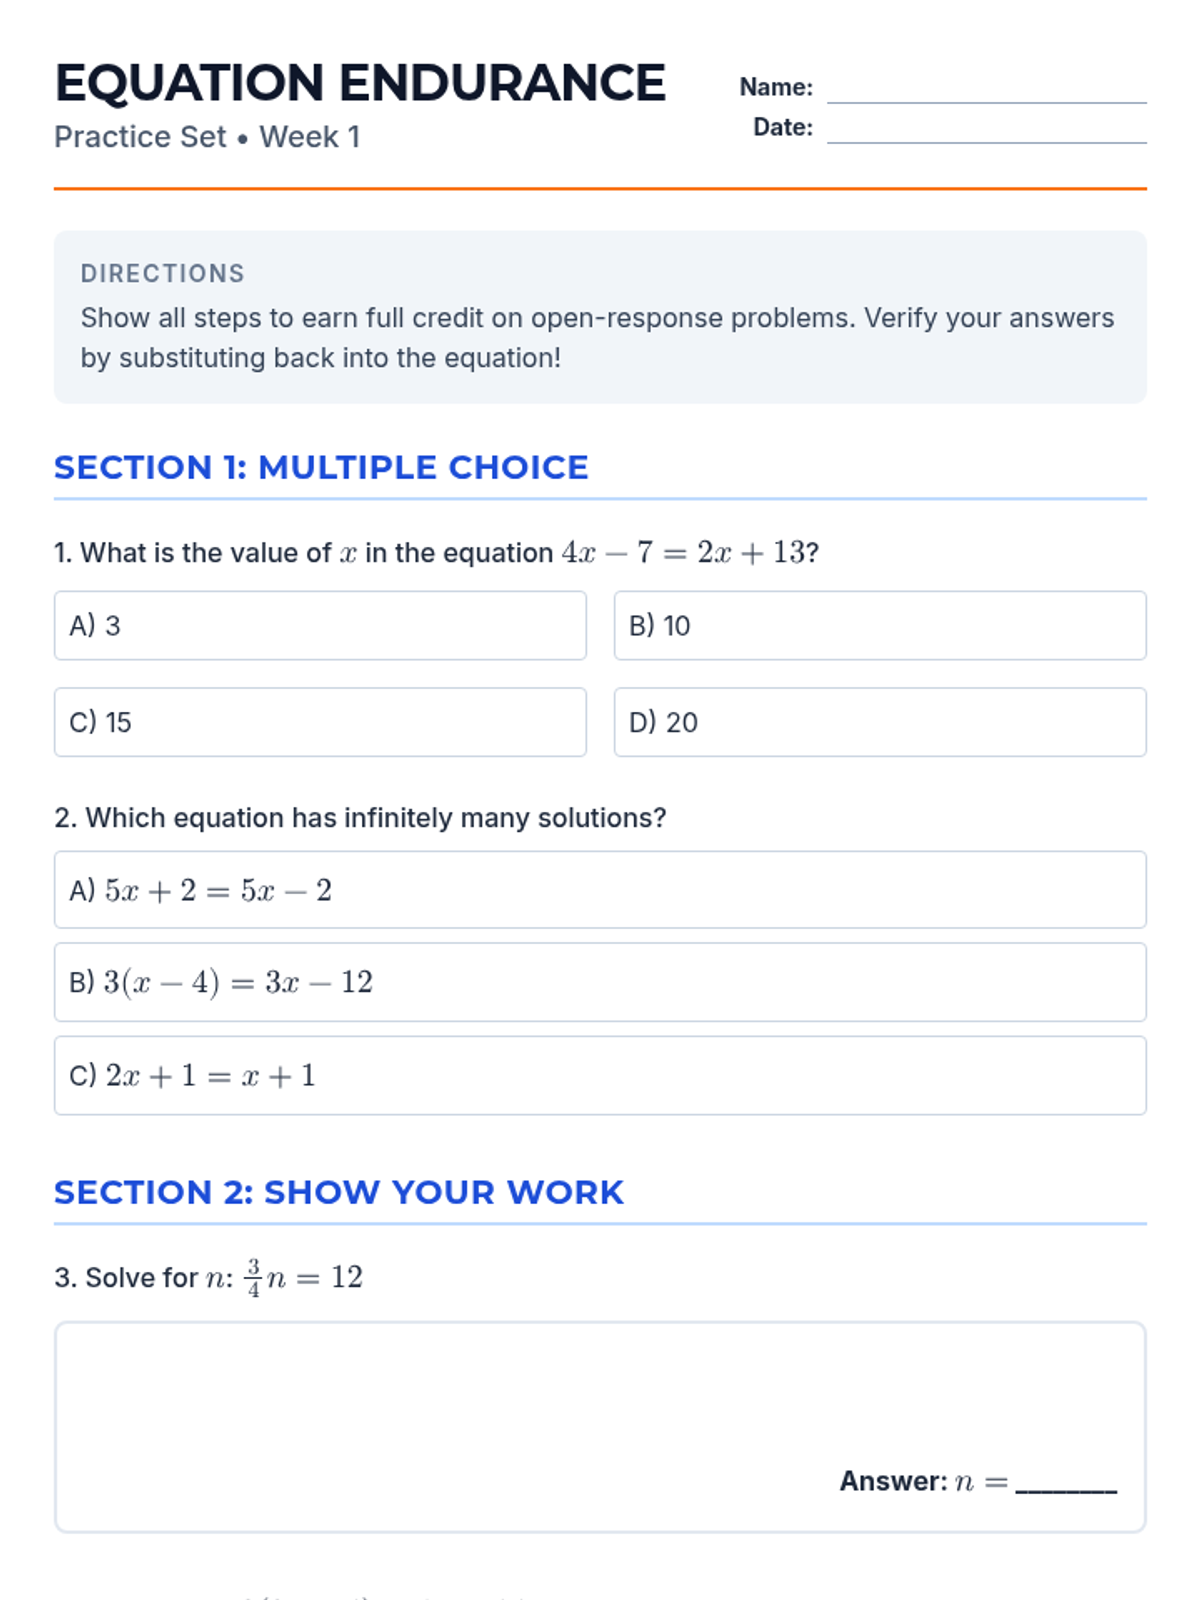
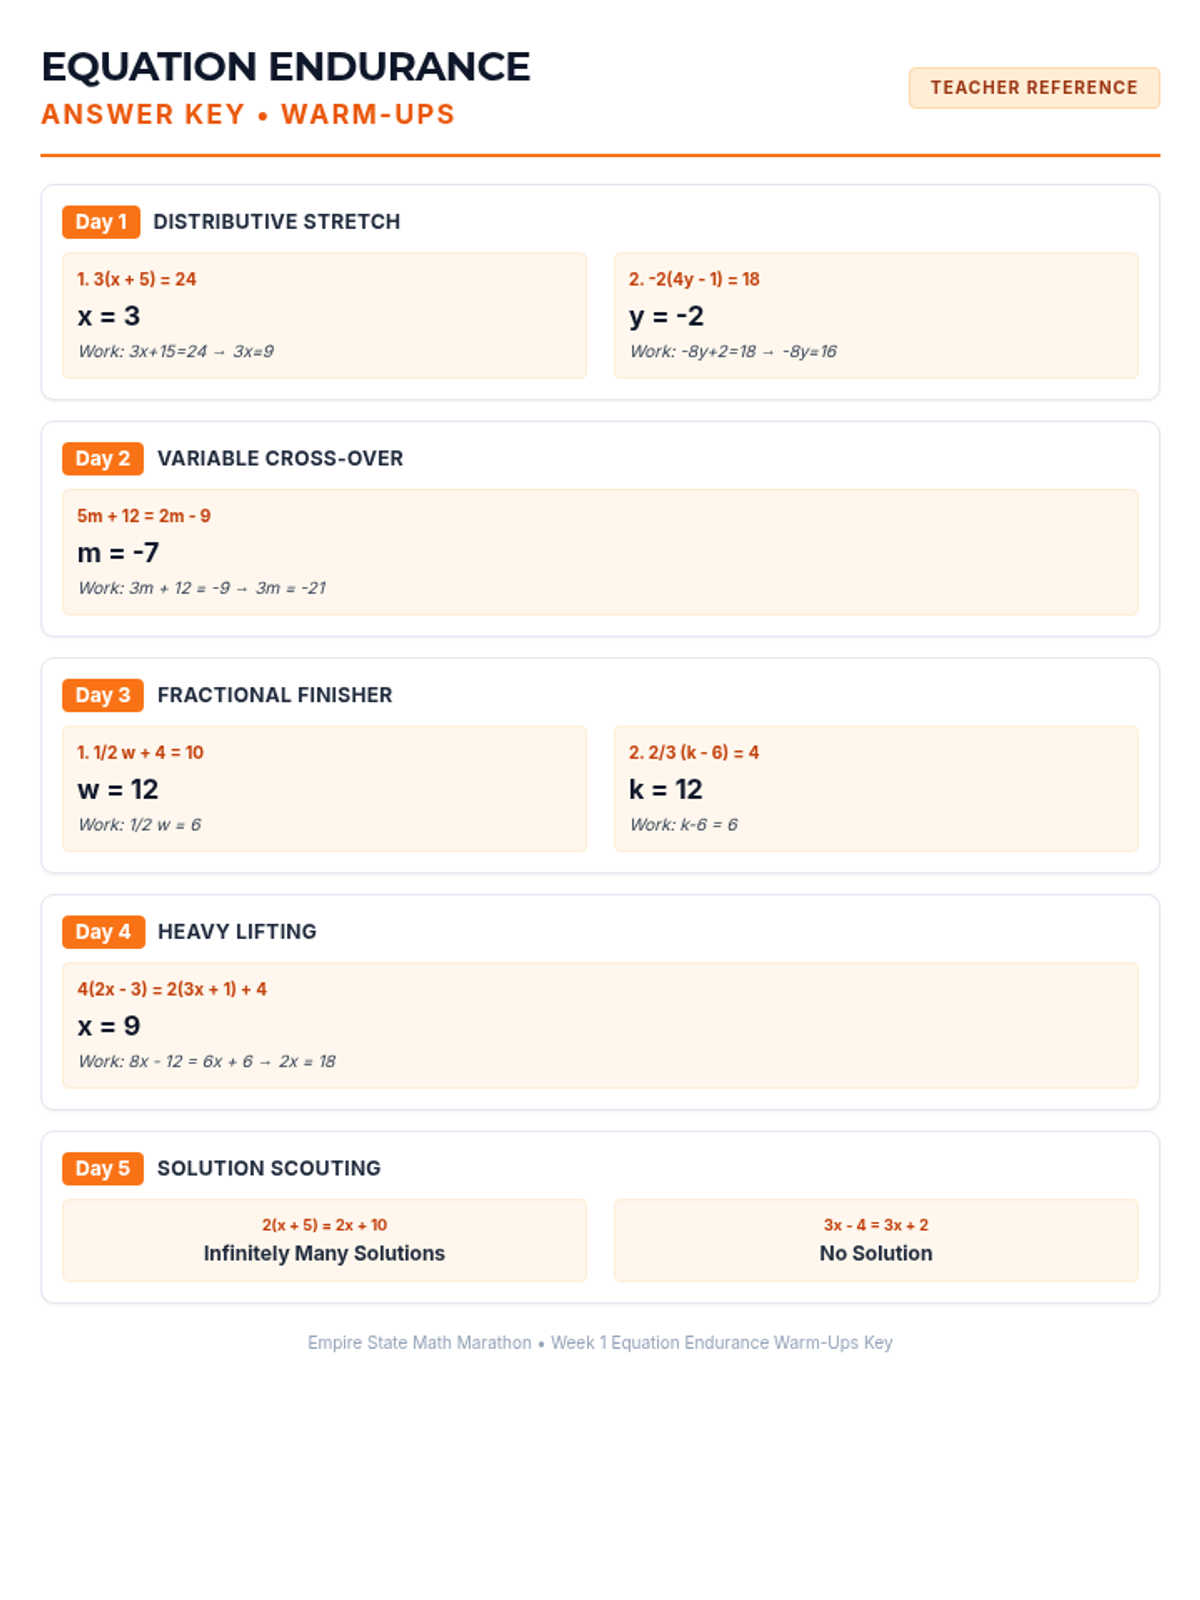
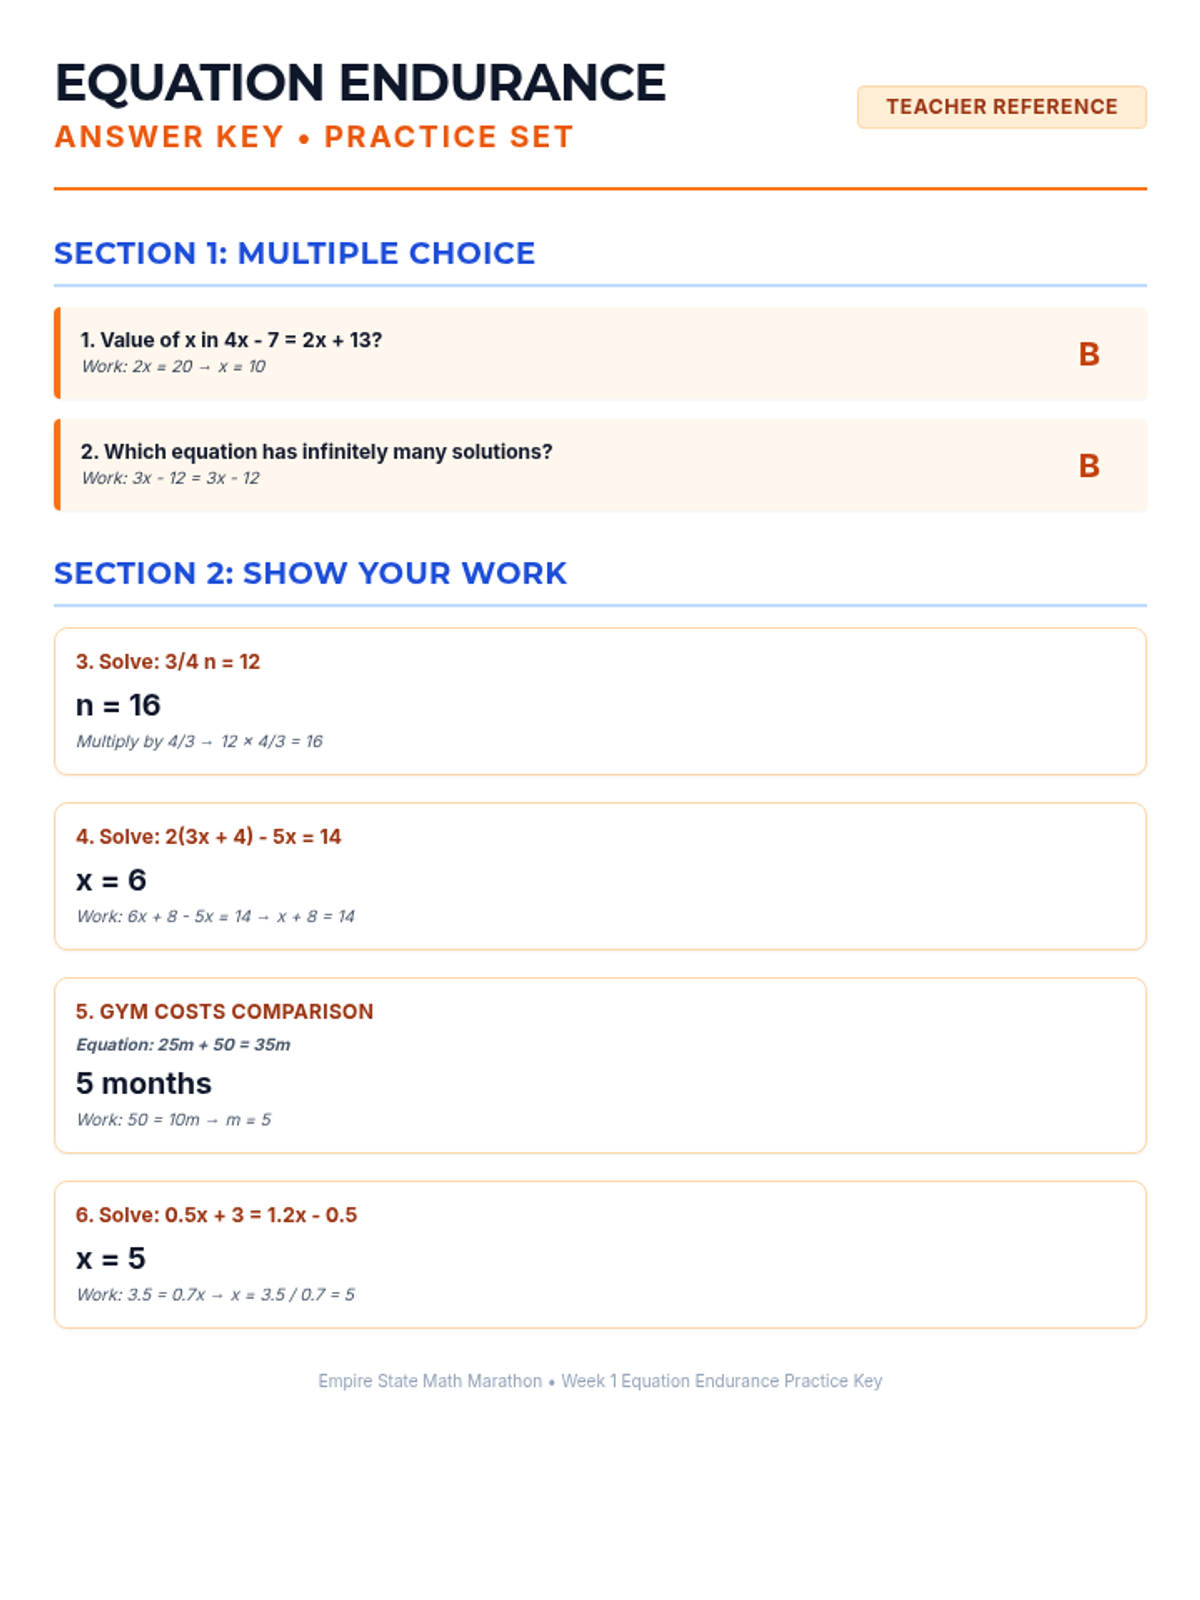
Week 1 focuses on solving multi-step equations, including those with variables on both sides, rational coefficients, and checking solutions.

AG

Anna Gomez

Other
4/28
Lesson
Data Detective Lesson Plan
Outlier Investigation Slides
Case Notes Handout
Case Notes Key
Poster Session Guide
Distribution Debrief Exit Ticket
Exit Ticket Key
Poster Example Visual

Data Detectives Case File

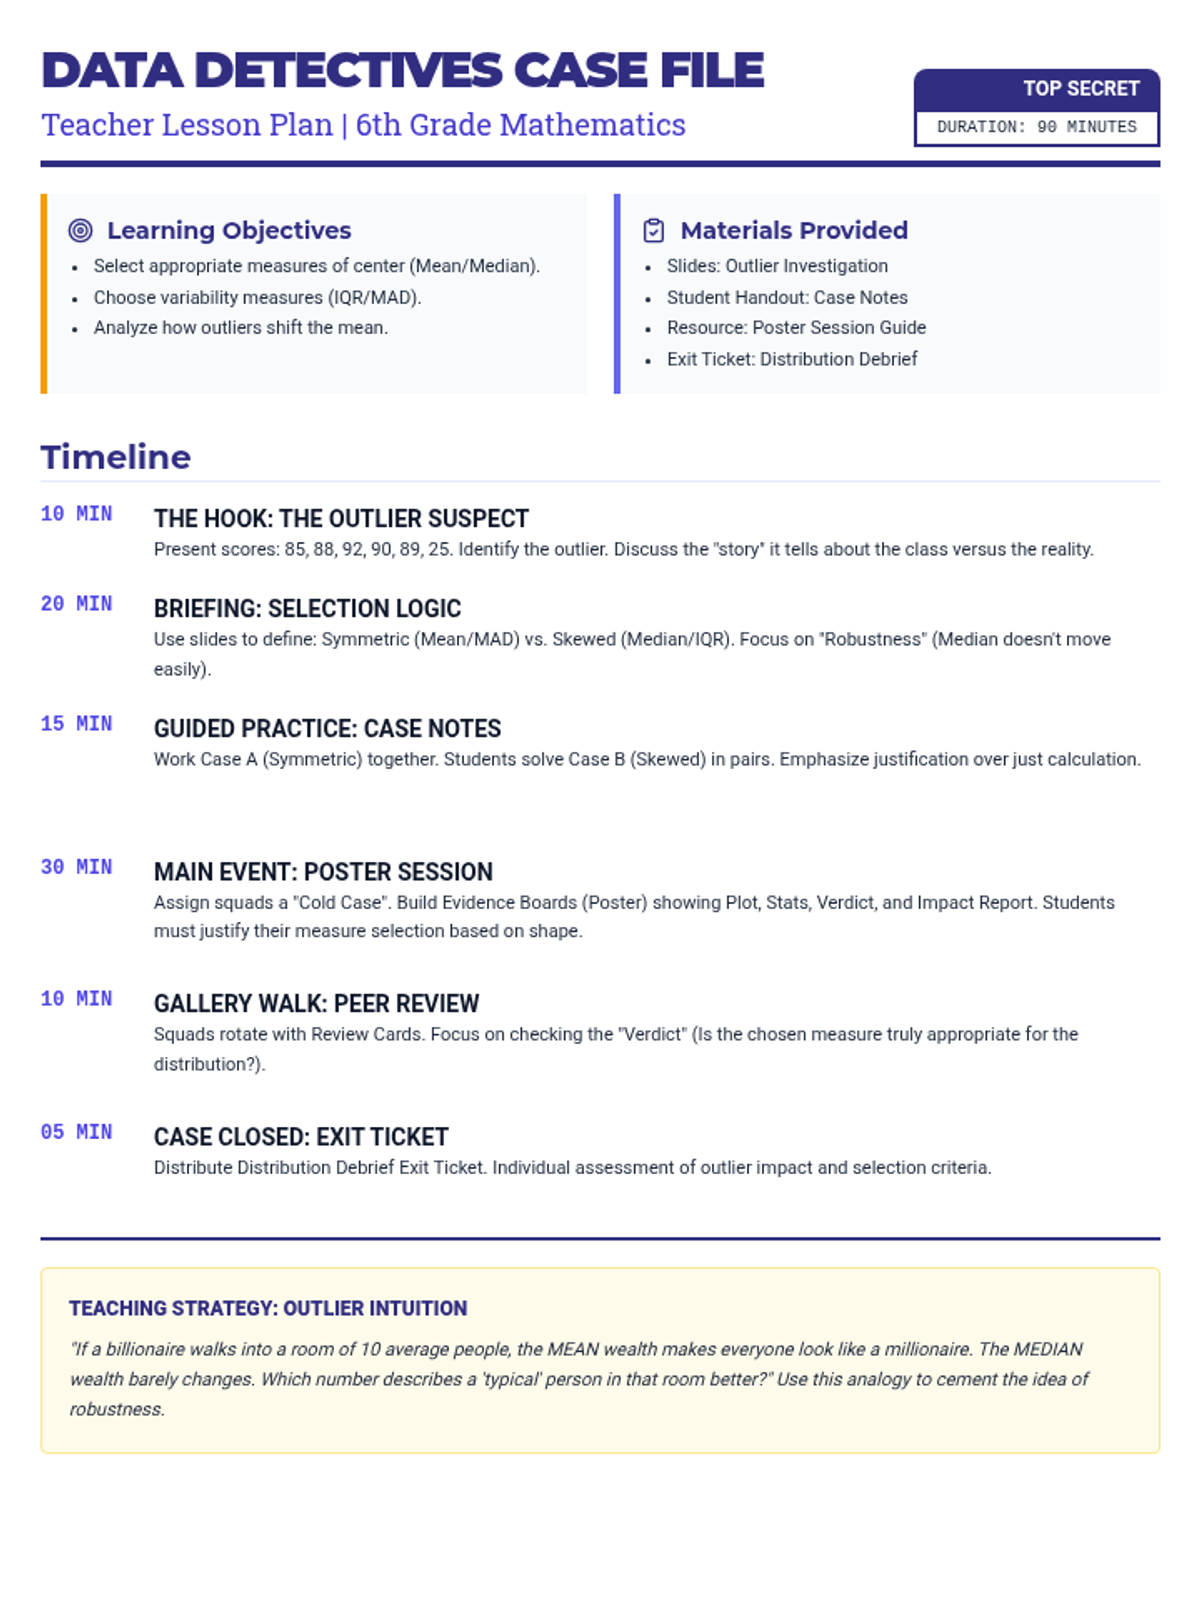
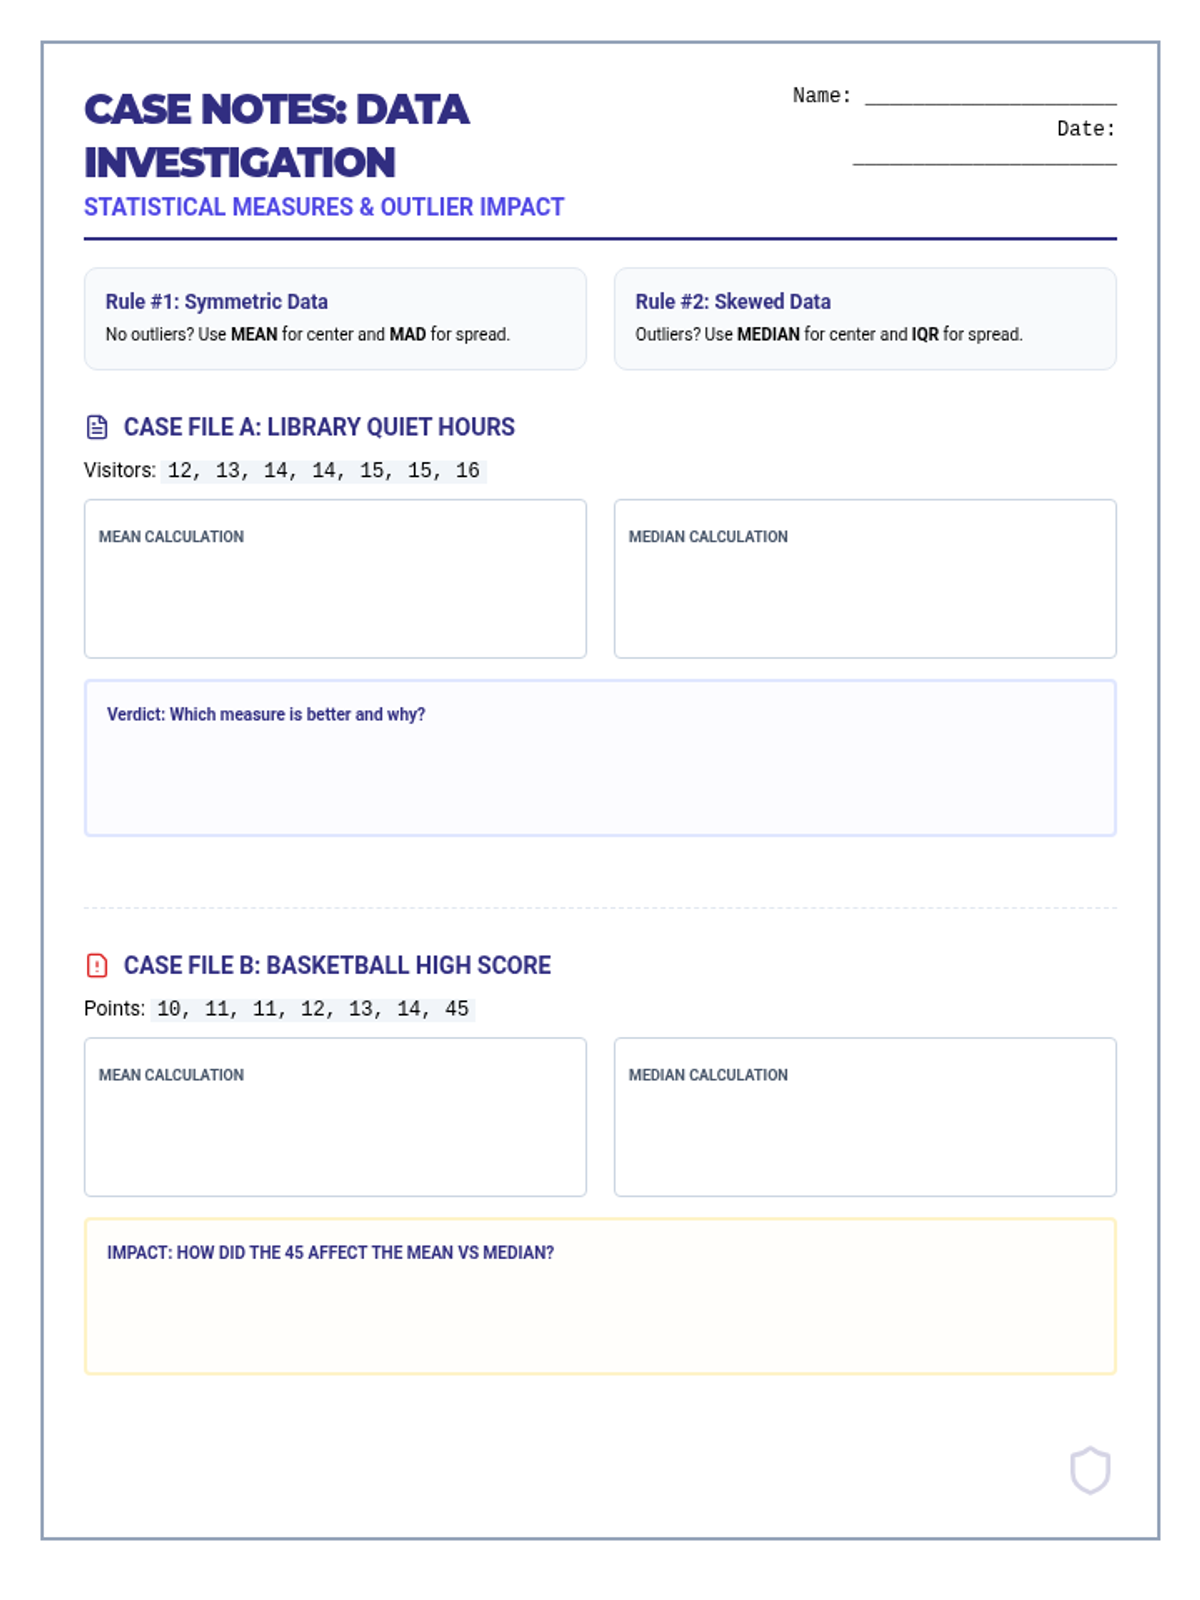
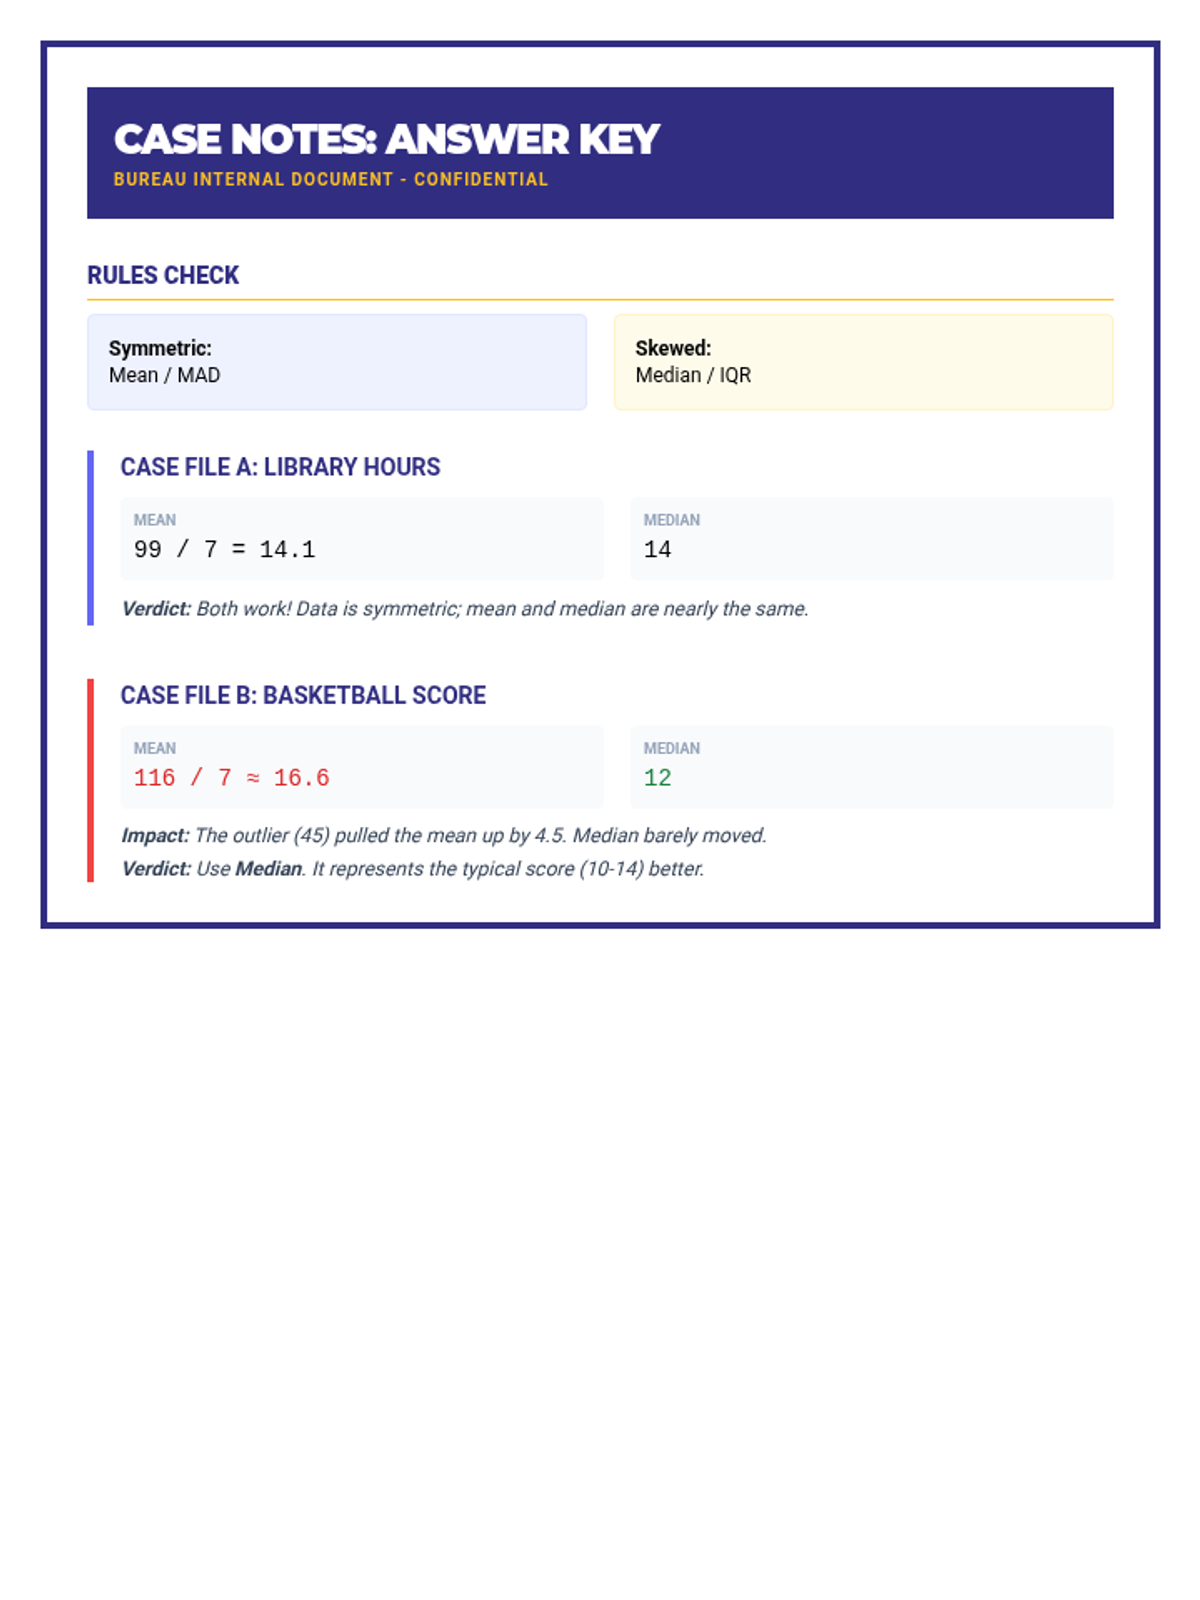
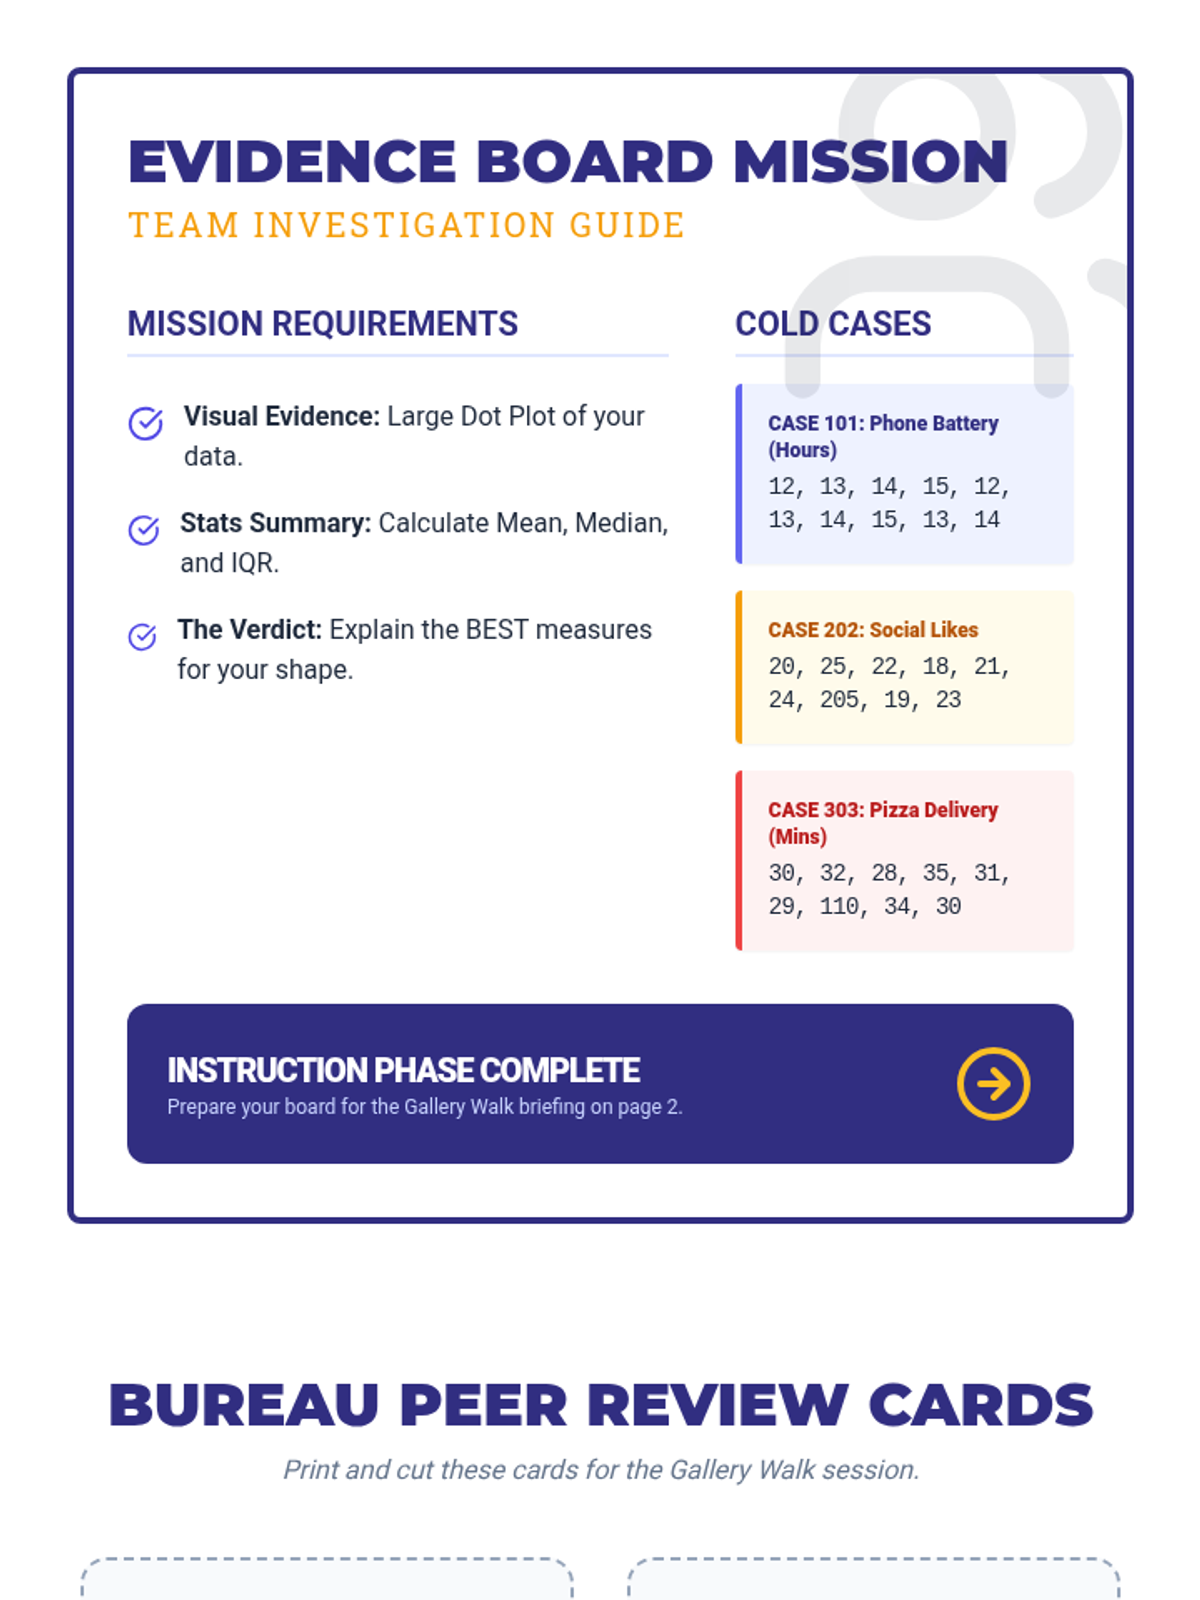
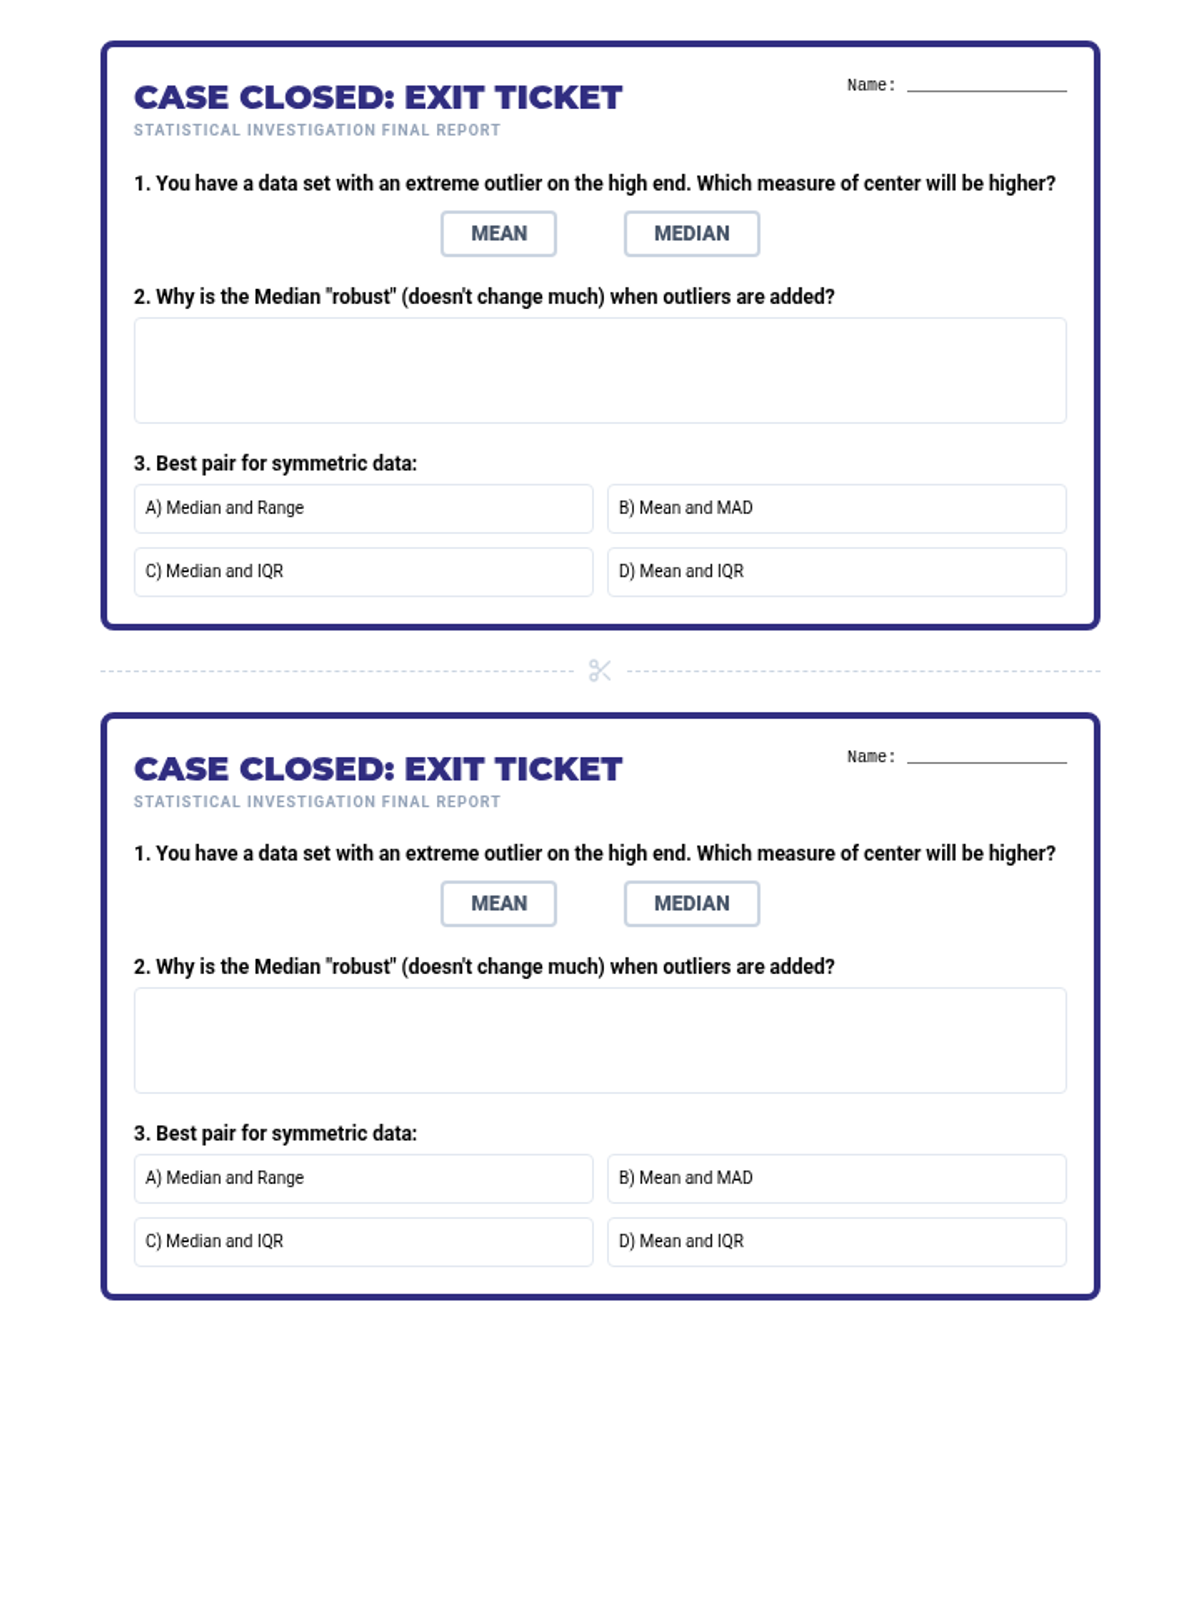
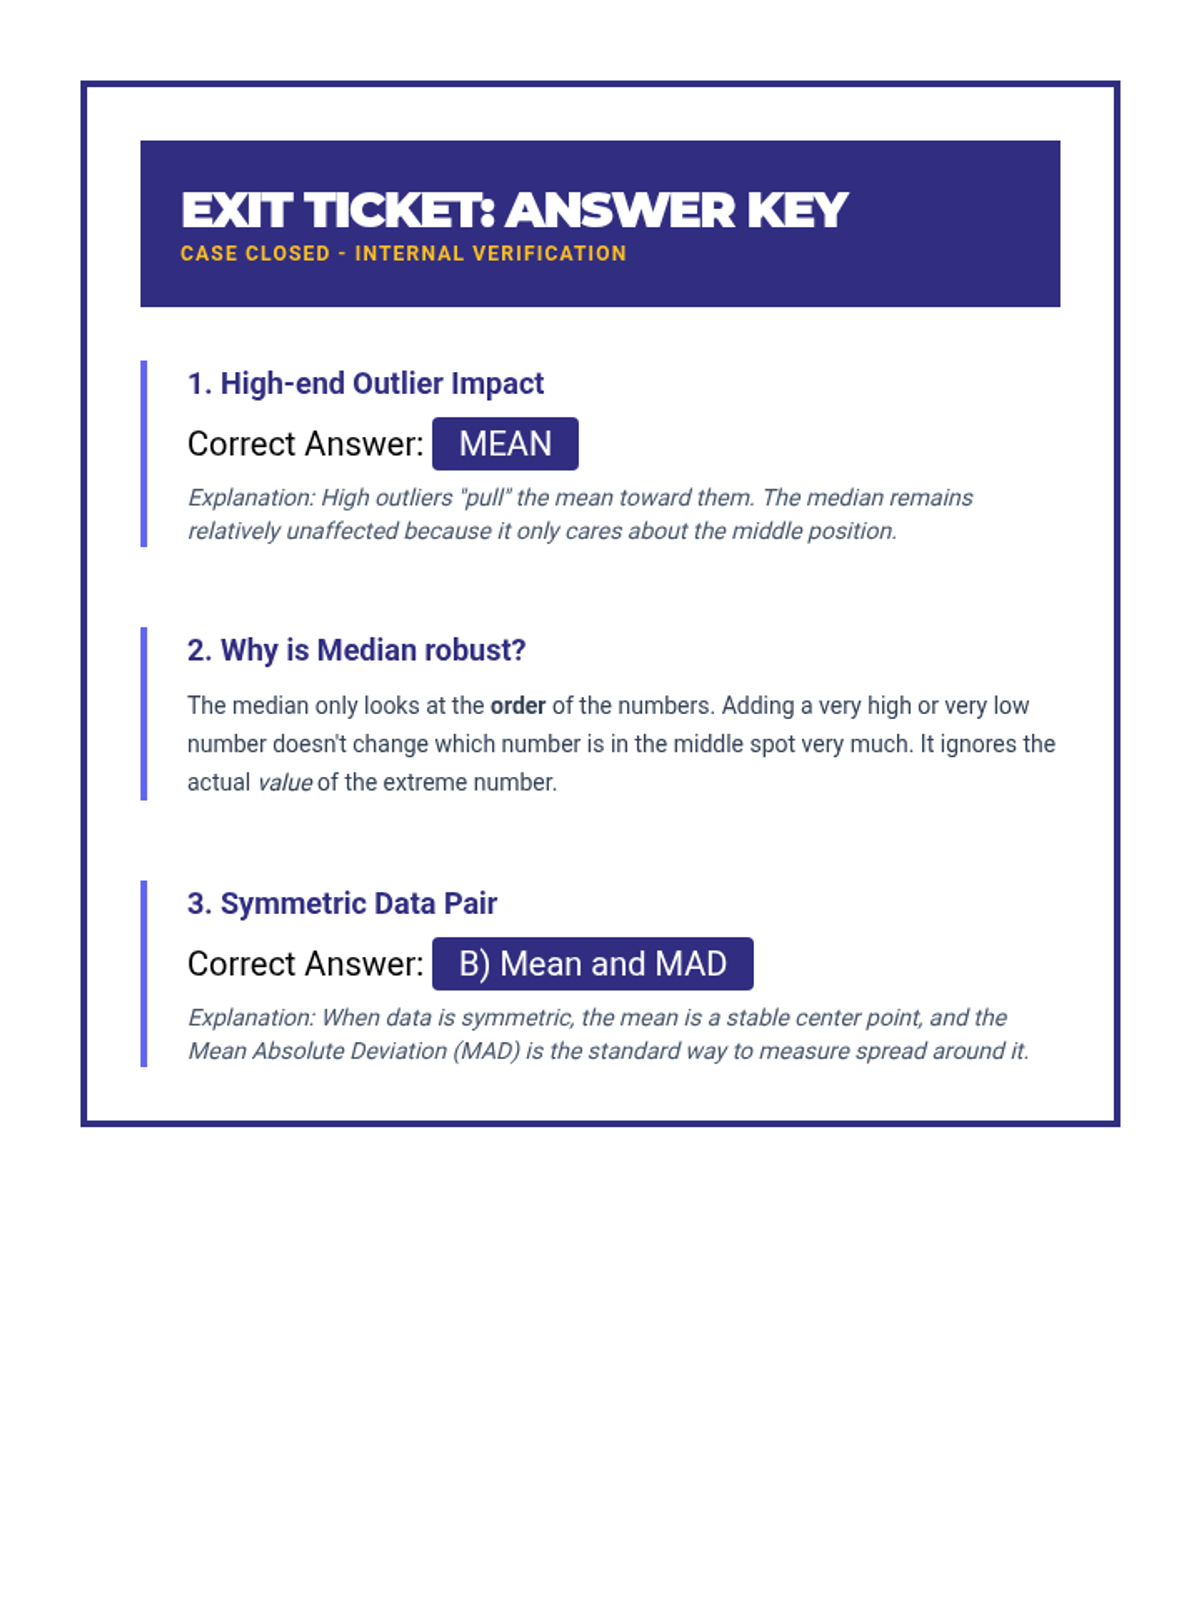
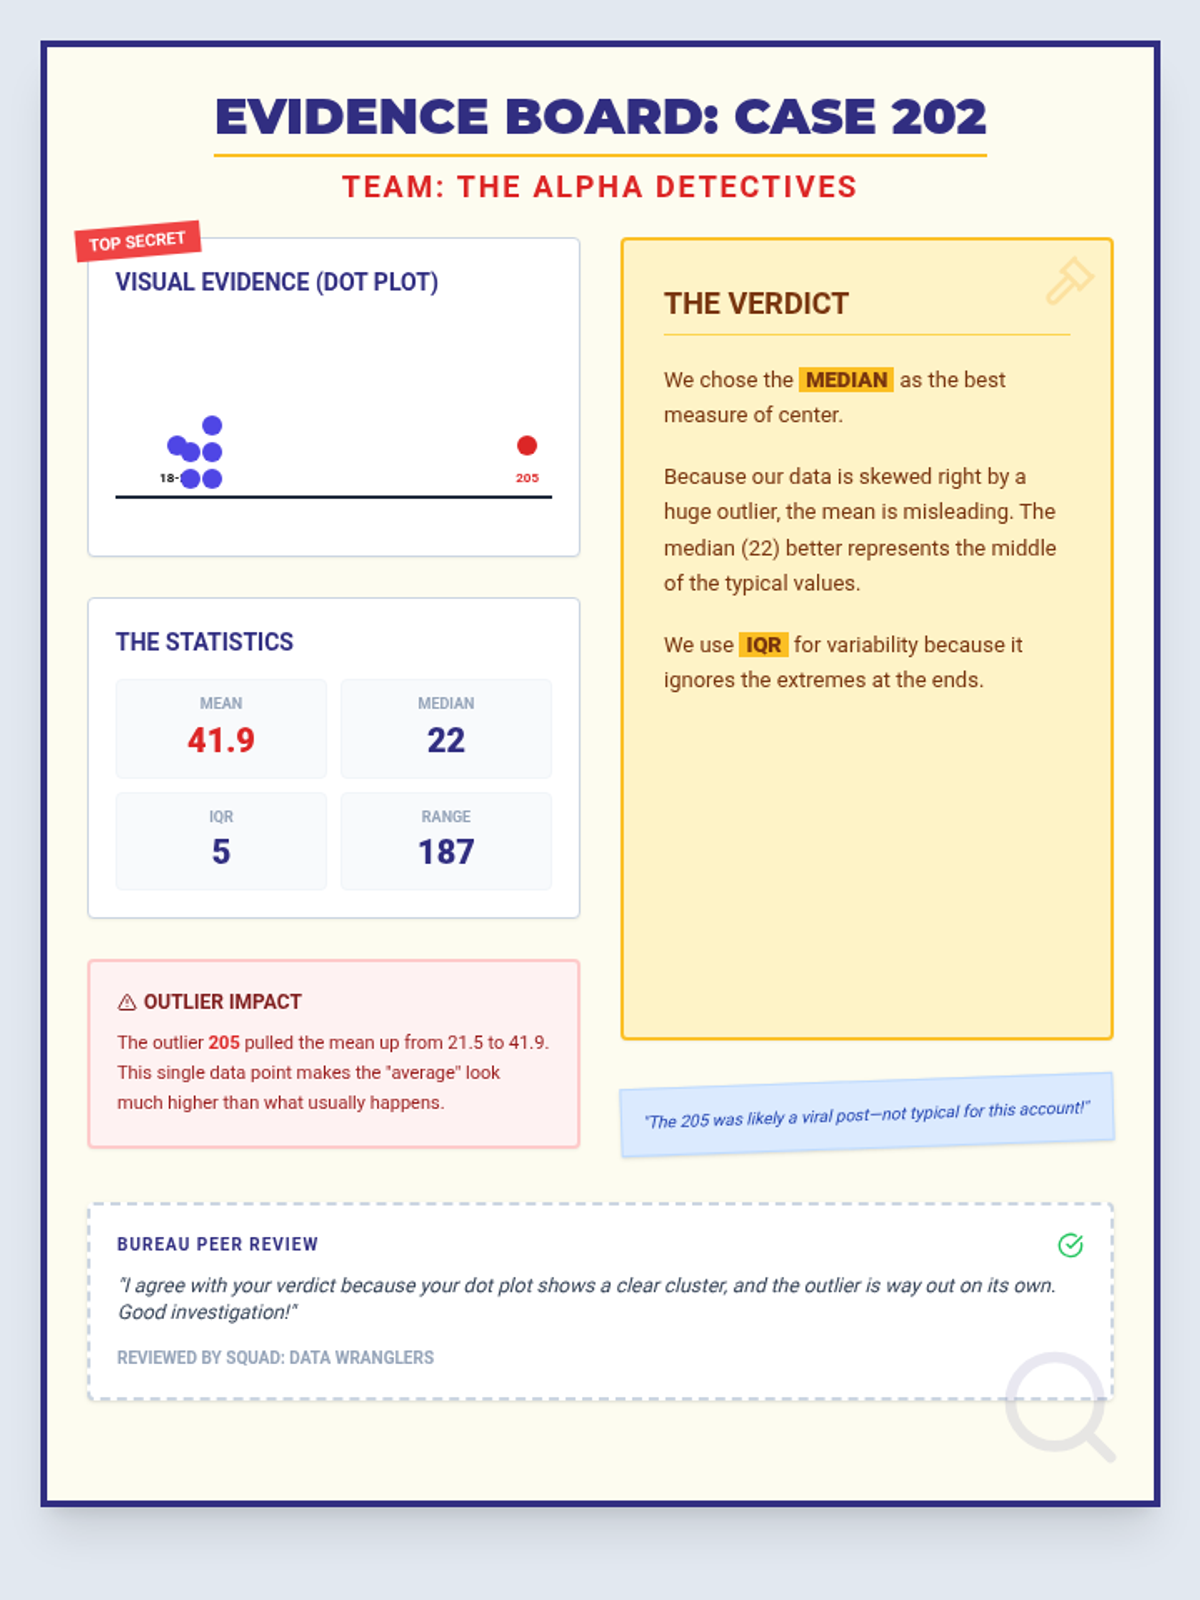
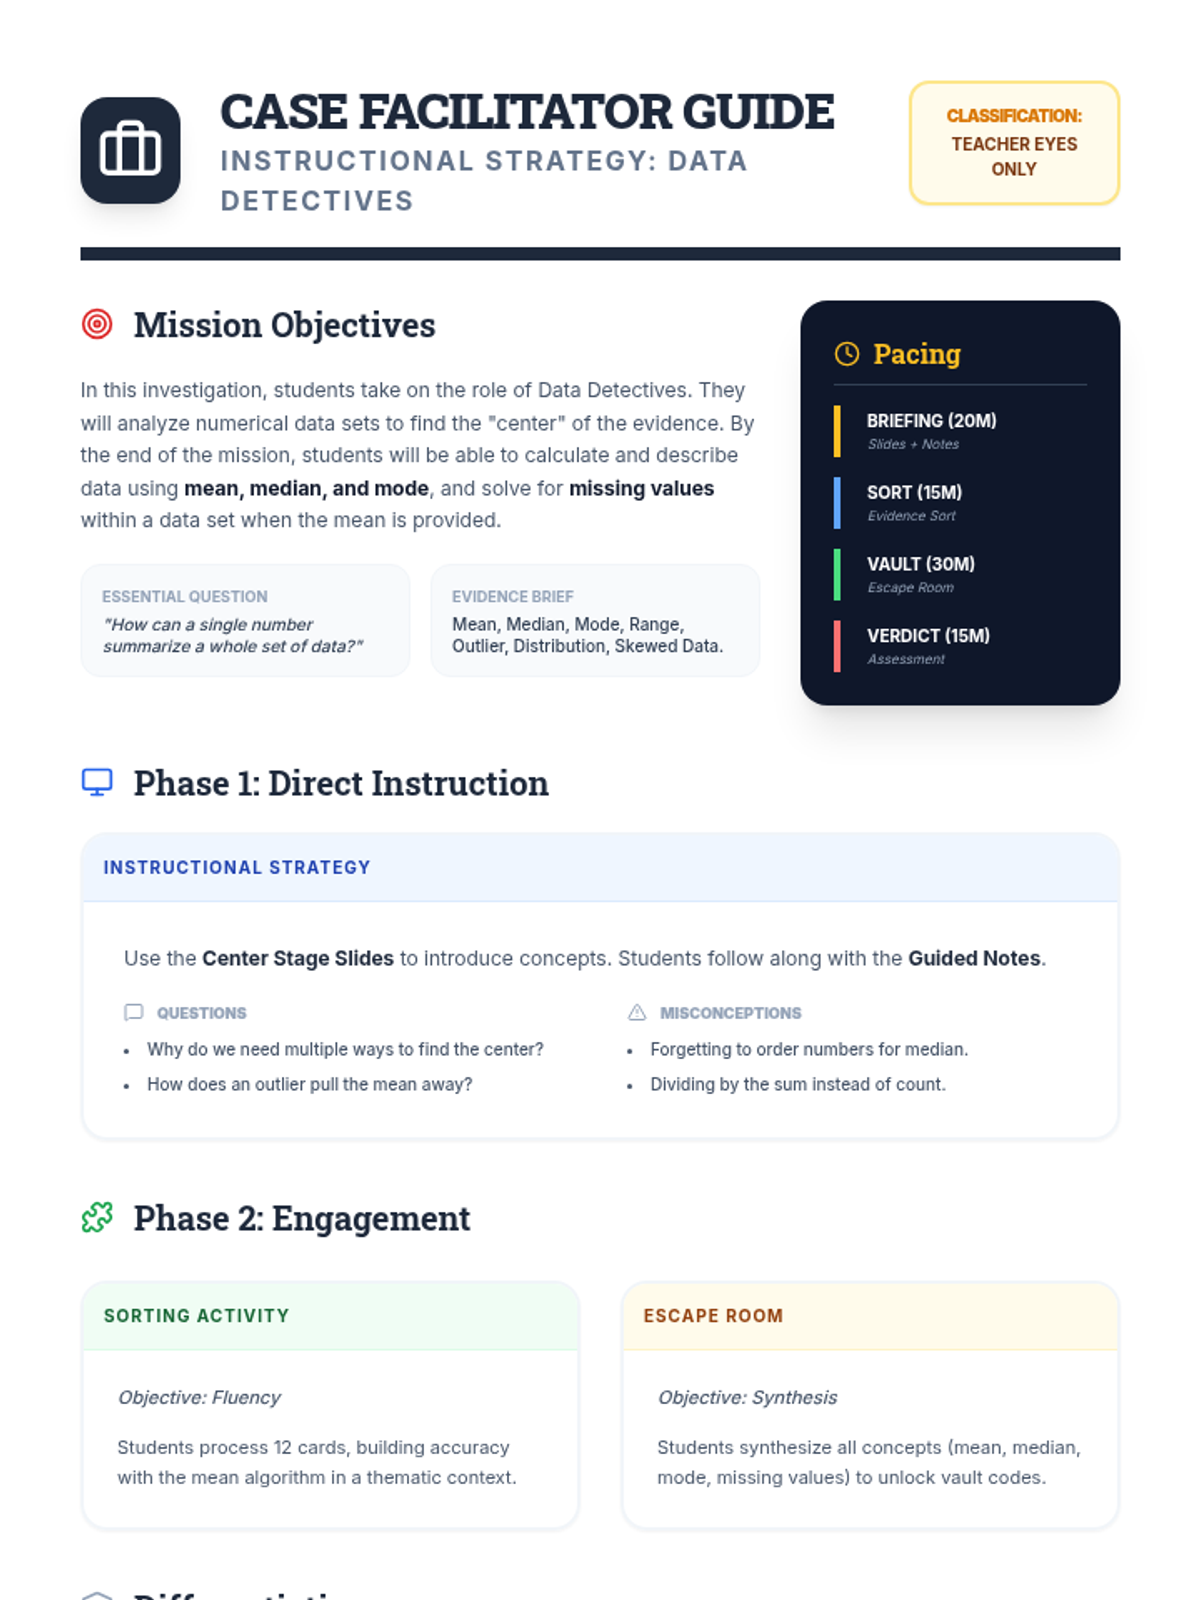
A comprehensive 90-minute lesson where students become 'Data Detectives' to investigate how outliers influence measures of center and variability, culminating in a collaborative poster session.

MK

Michell Kisler

Math Teacher
4/28
Lesson
Variability Vitals Lesson Plan
Variability Vitals Slides
Variability Vitals Worksheet
Variability Vitals Answer Key
Stat Squad Bingo Guide
Stat Squad Bingo Slides
Stat Squad Bingo Cards

Variability Vitals

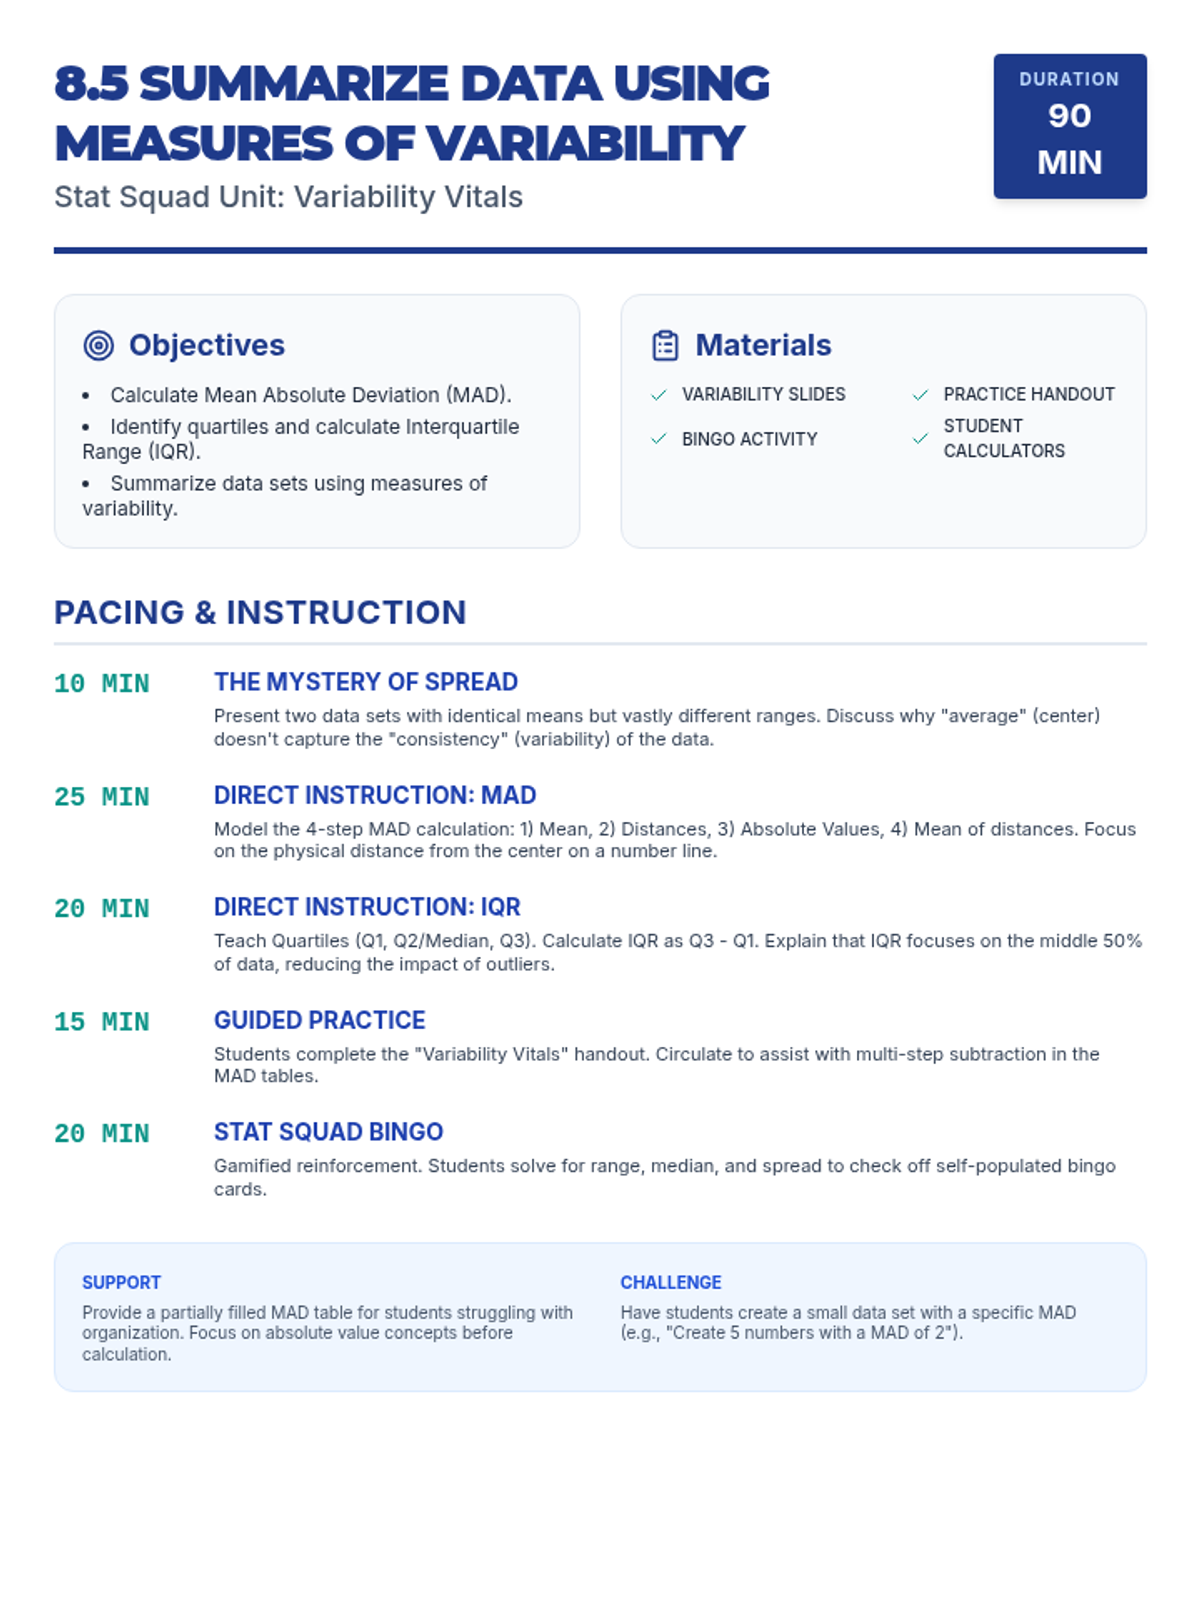
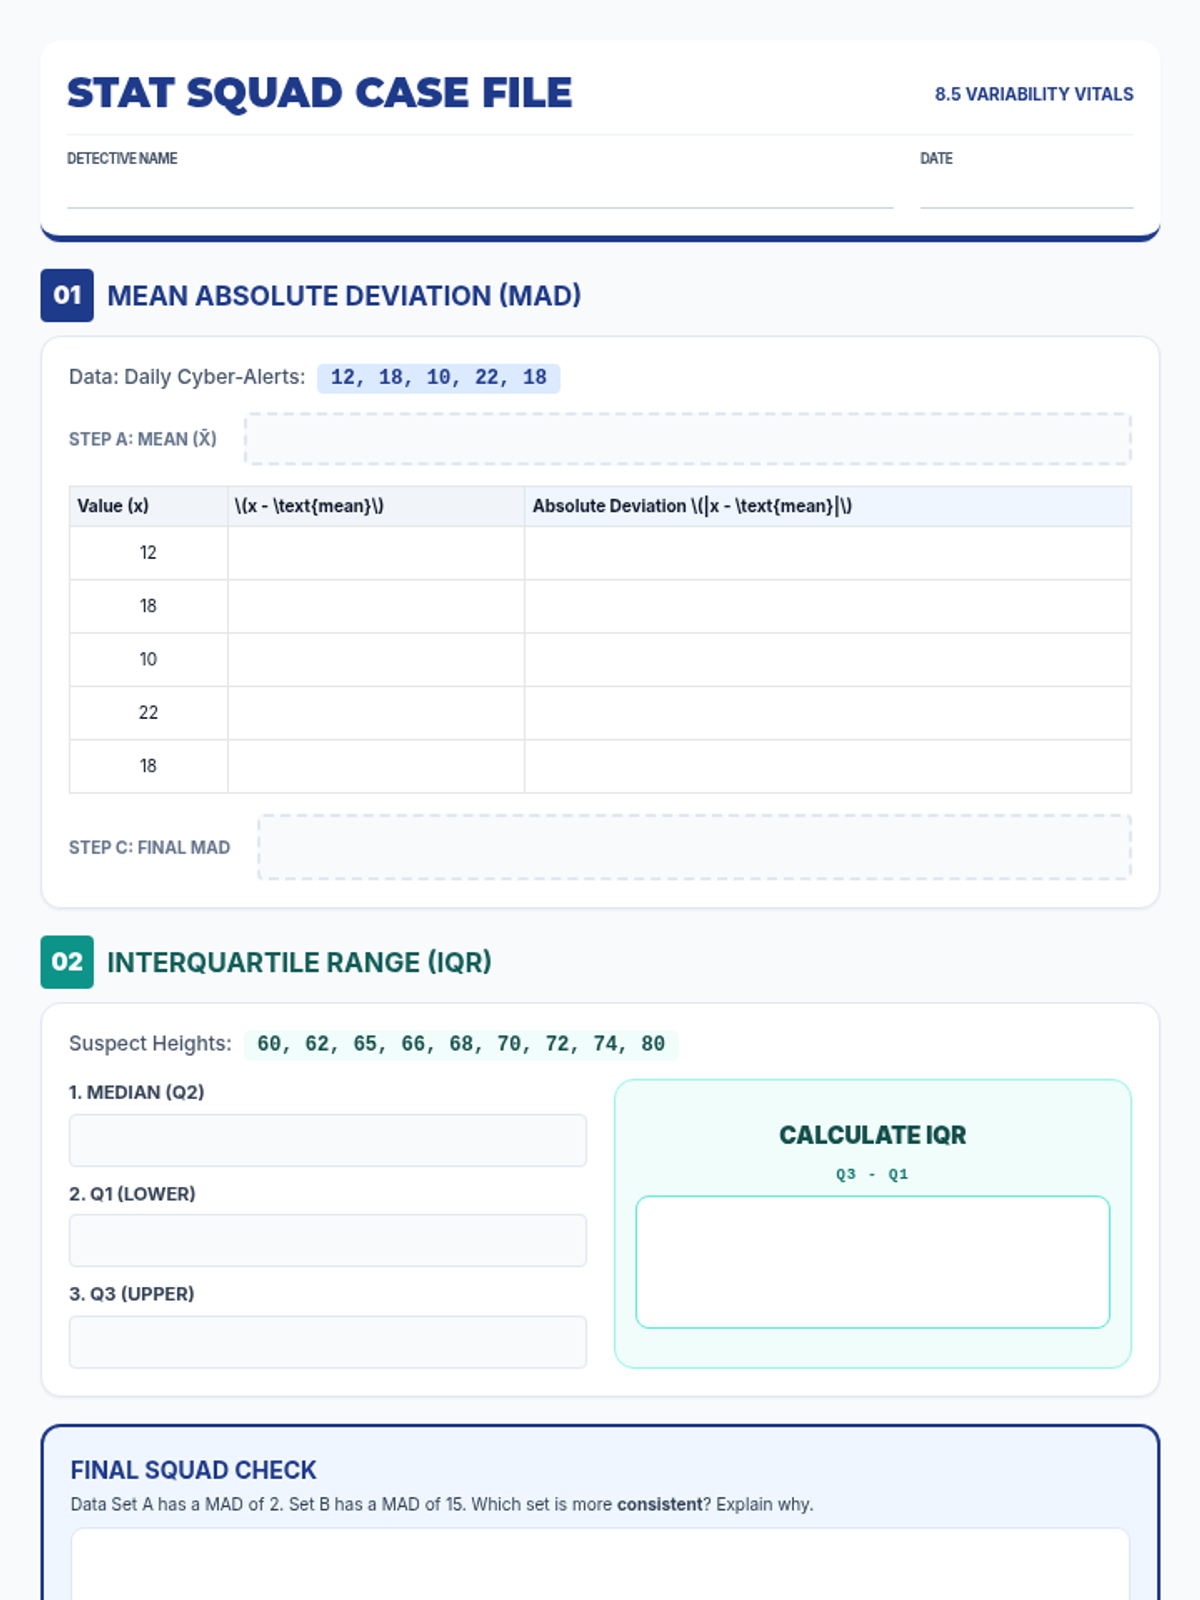
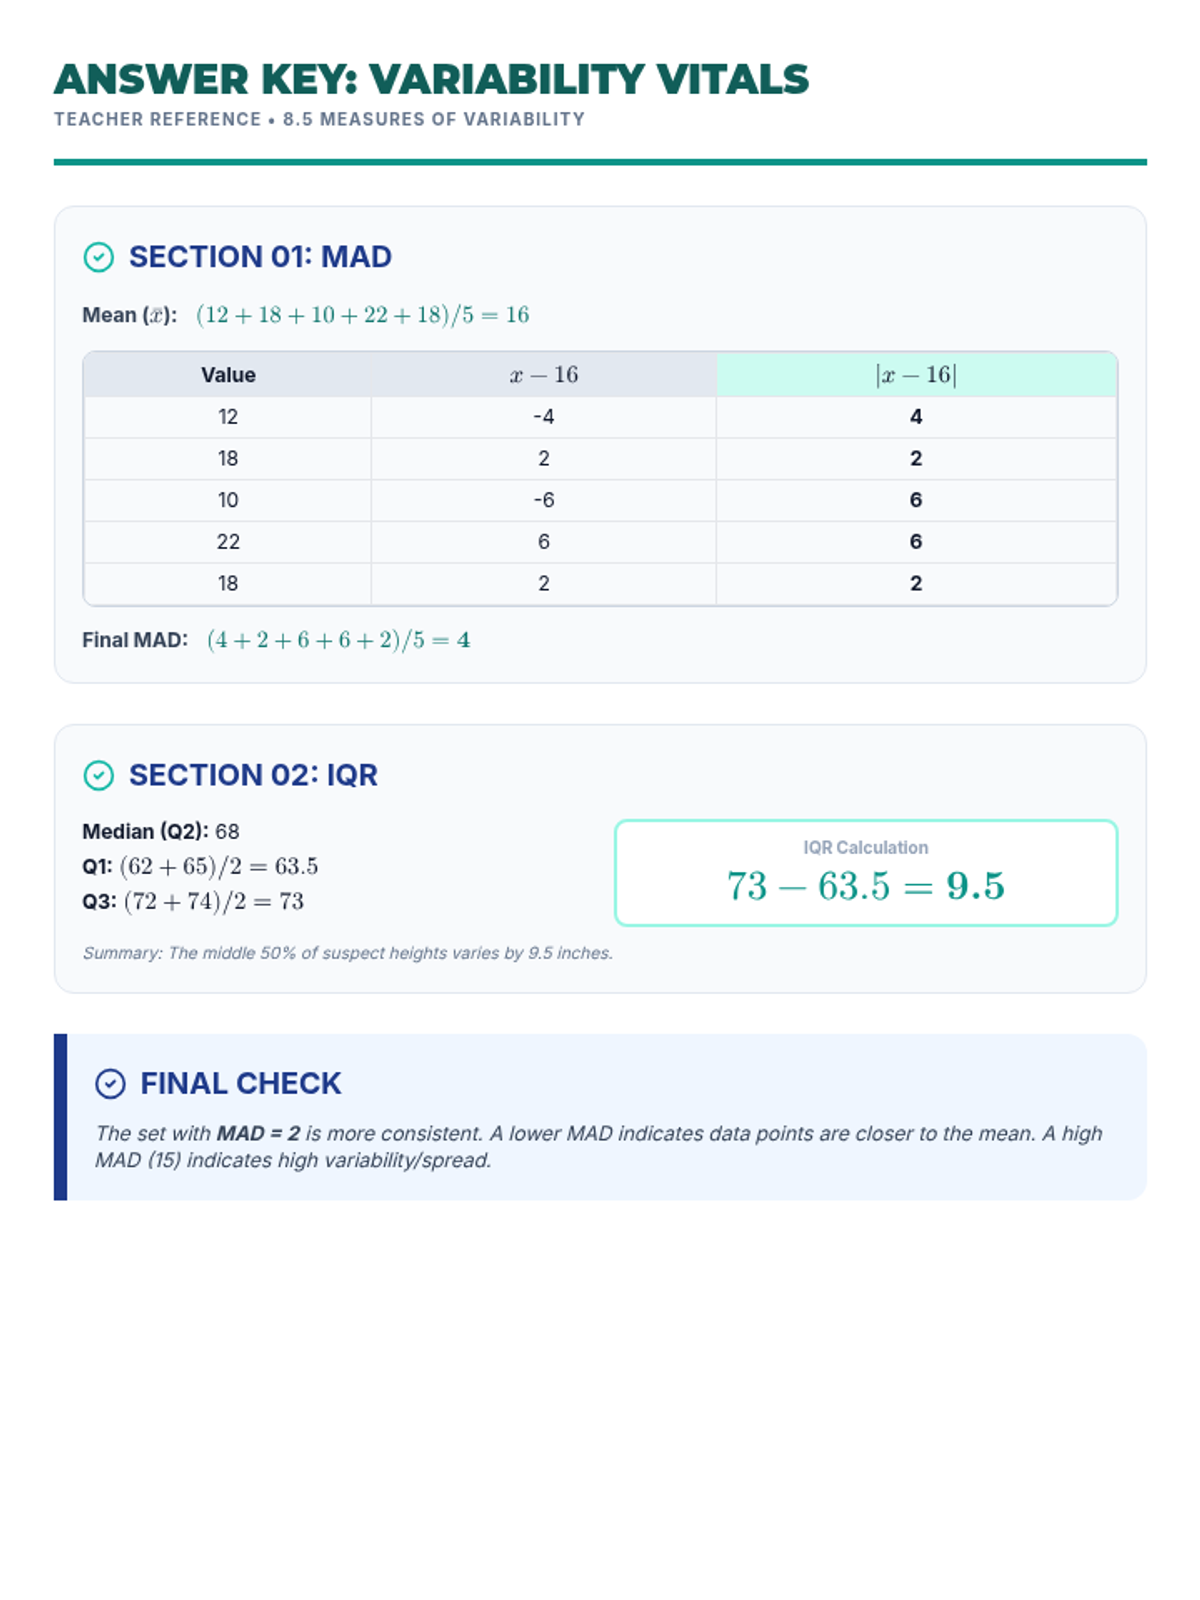
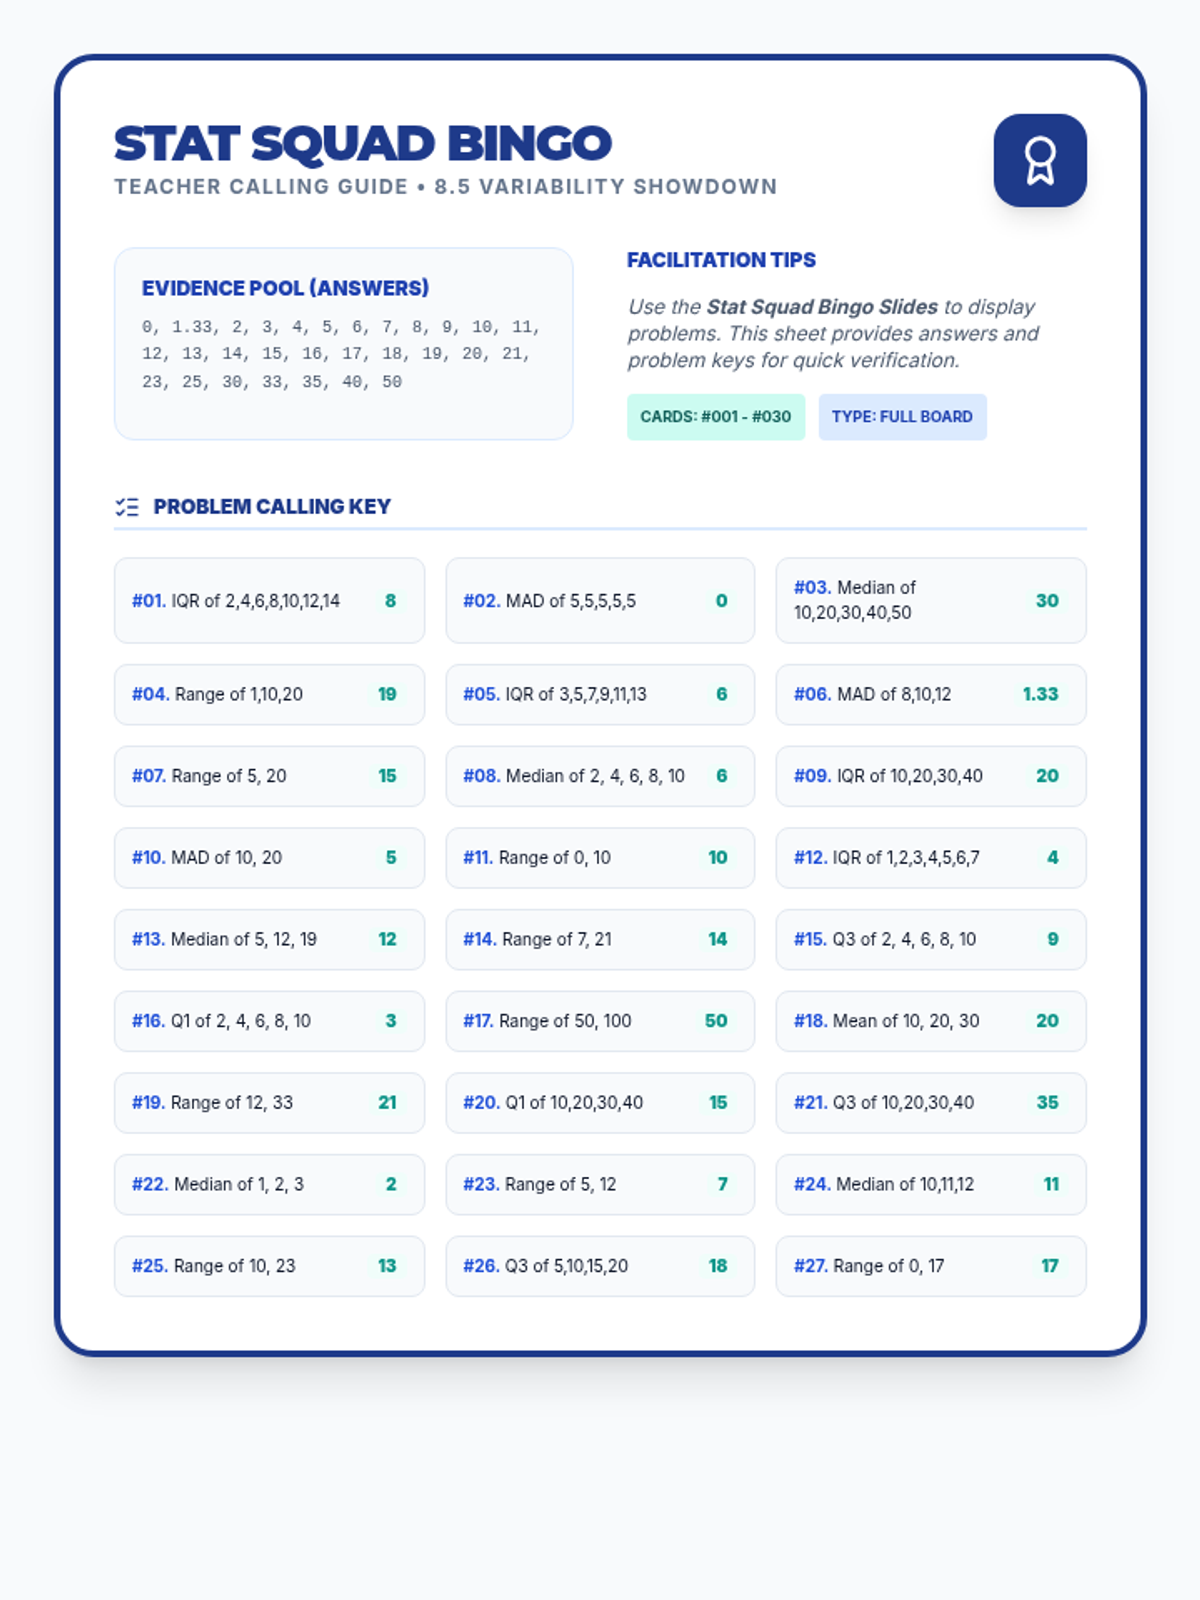
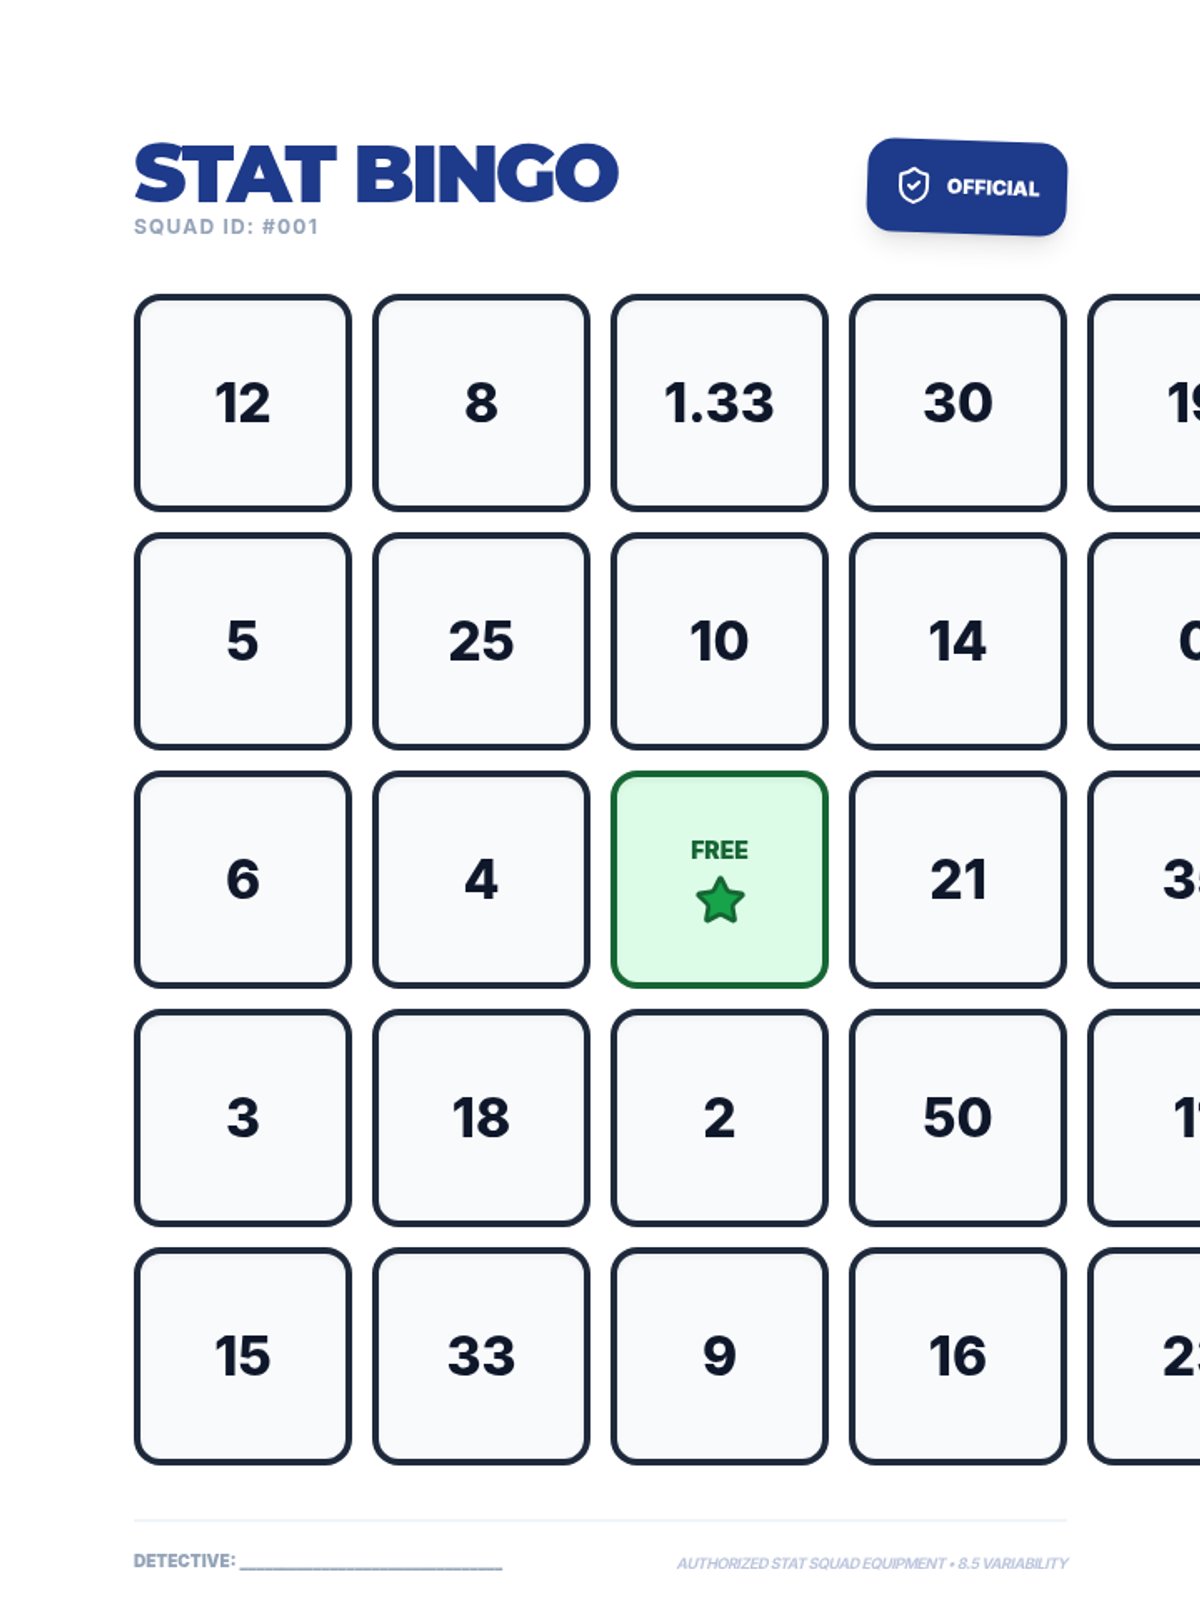
A comprehensive 90-minute lesson where students investigate data spread by calculating Mean Absolute Deviation (MAD) and Interquartile Range (IQR) through a "Stat Squad" forensic lens.

MK

Michell Kisler

Math Teacher
4/27
Lesson
Numerical Power Checklist 211-220
Milestone Assessment Worksheet
Milestone Assessment Answer Key

Math Mastery 211-220

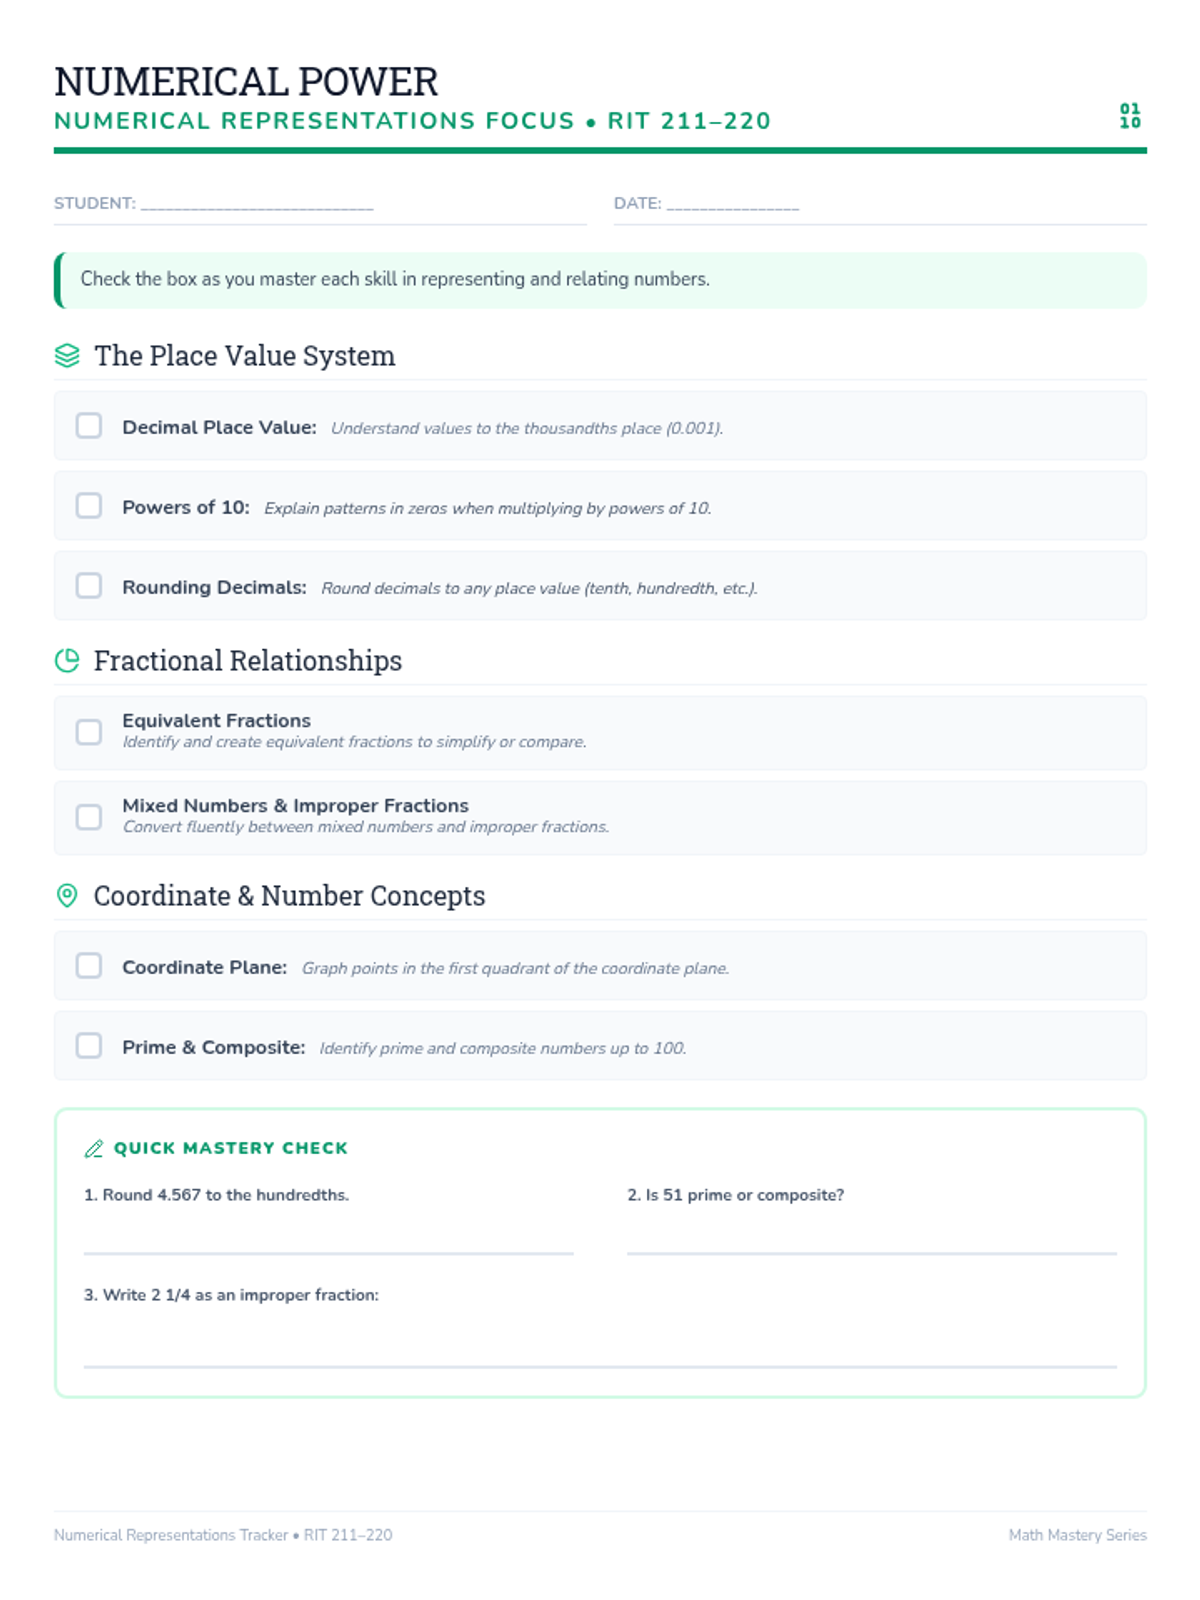
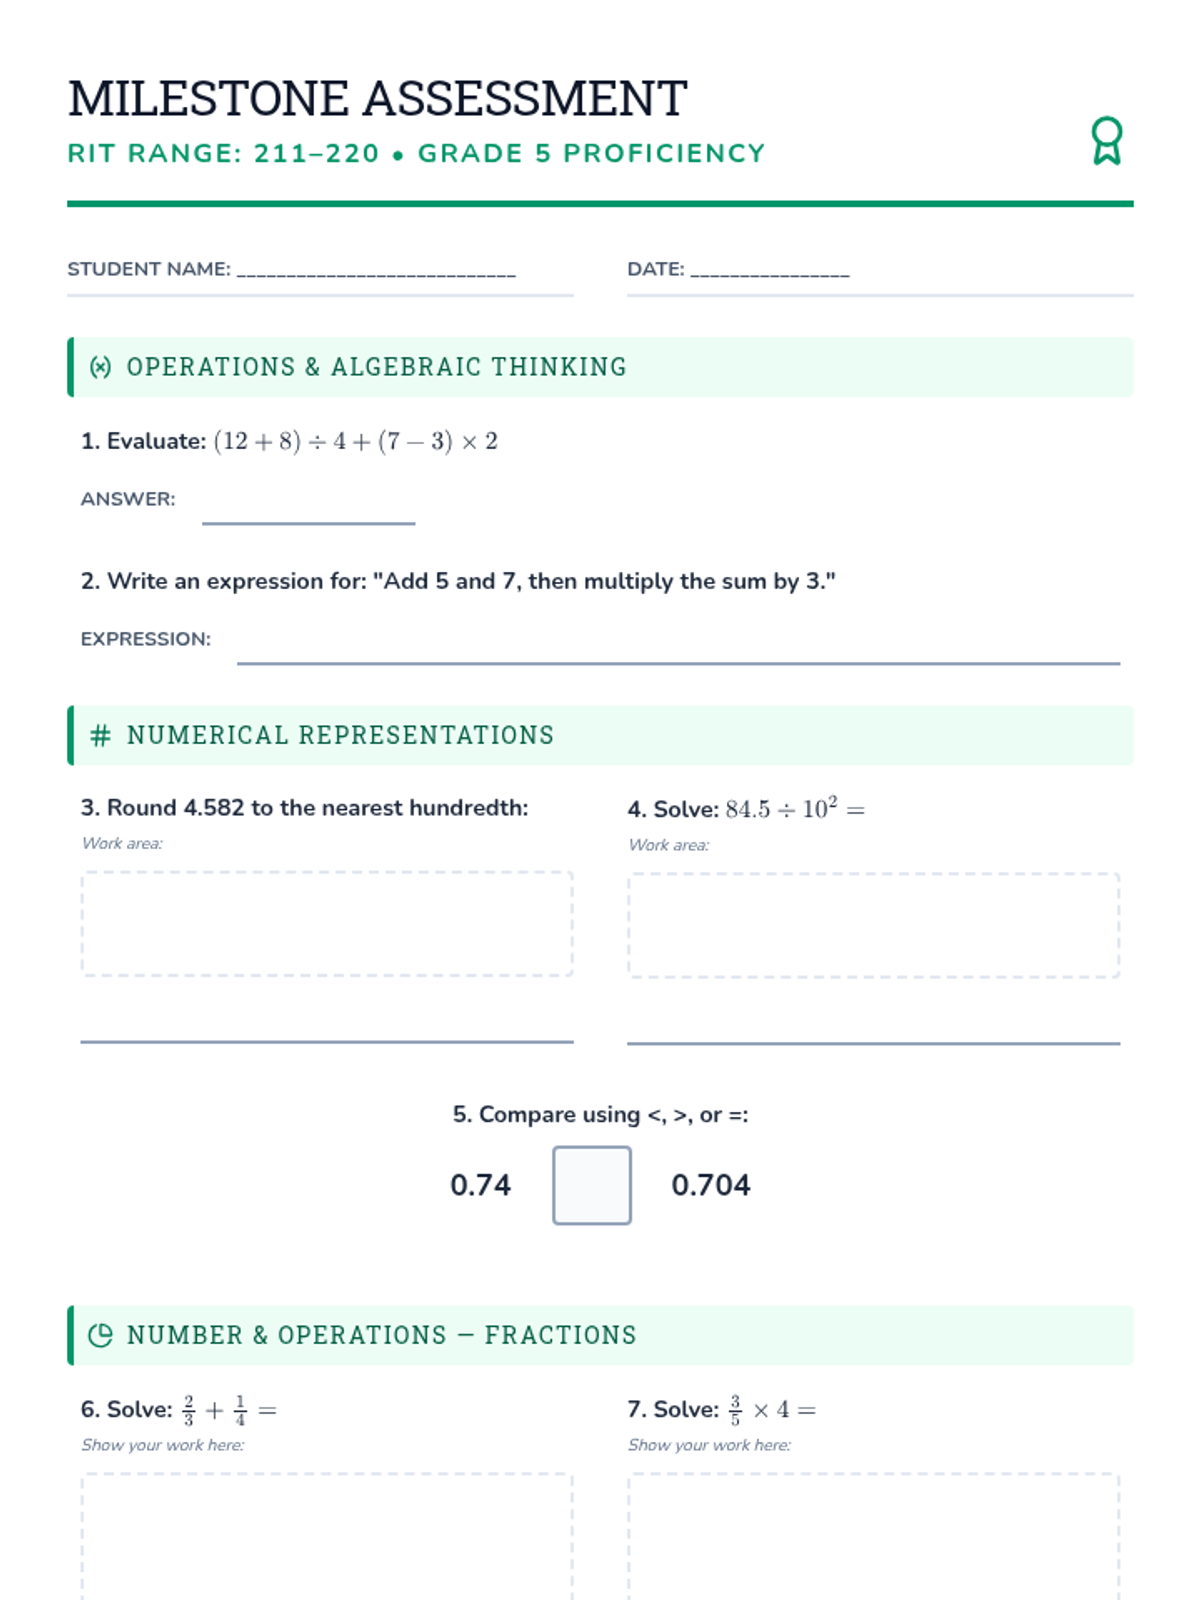
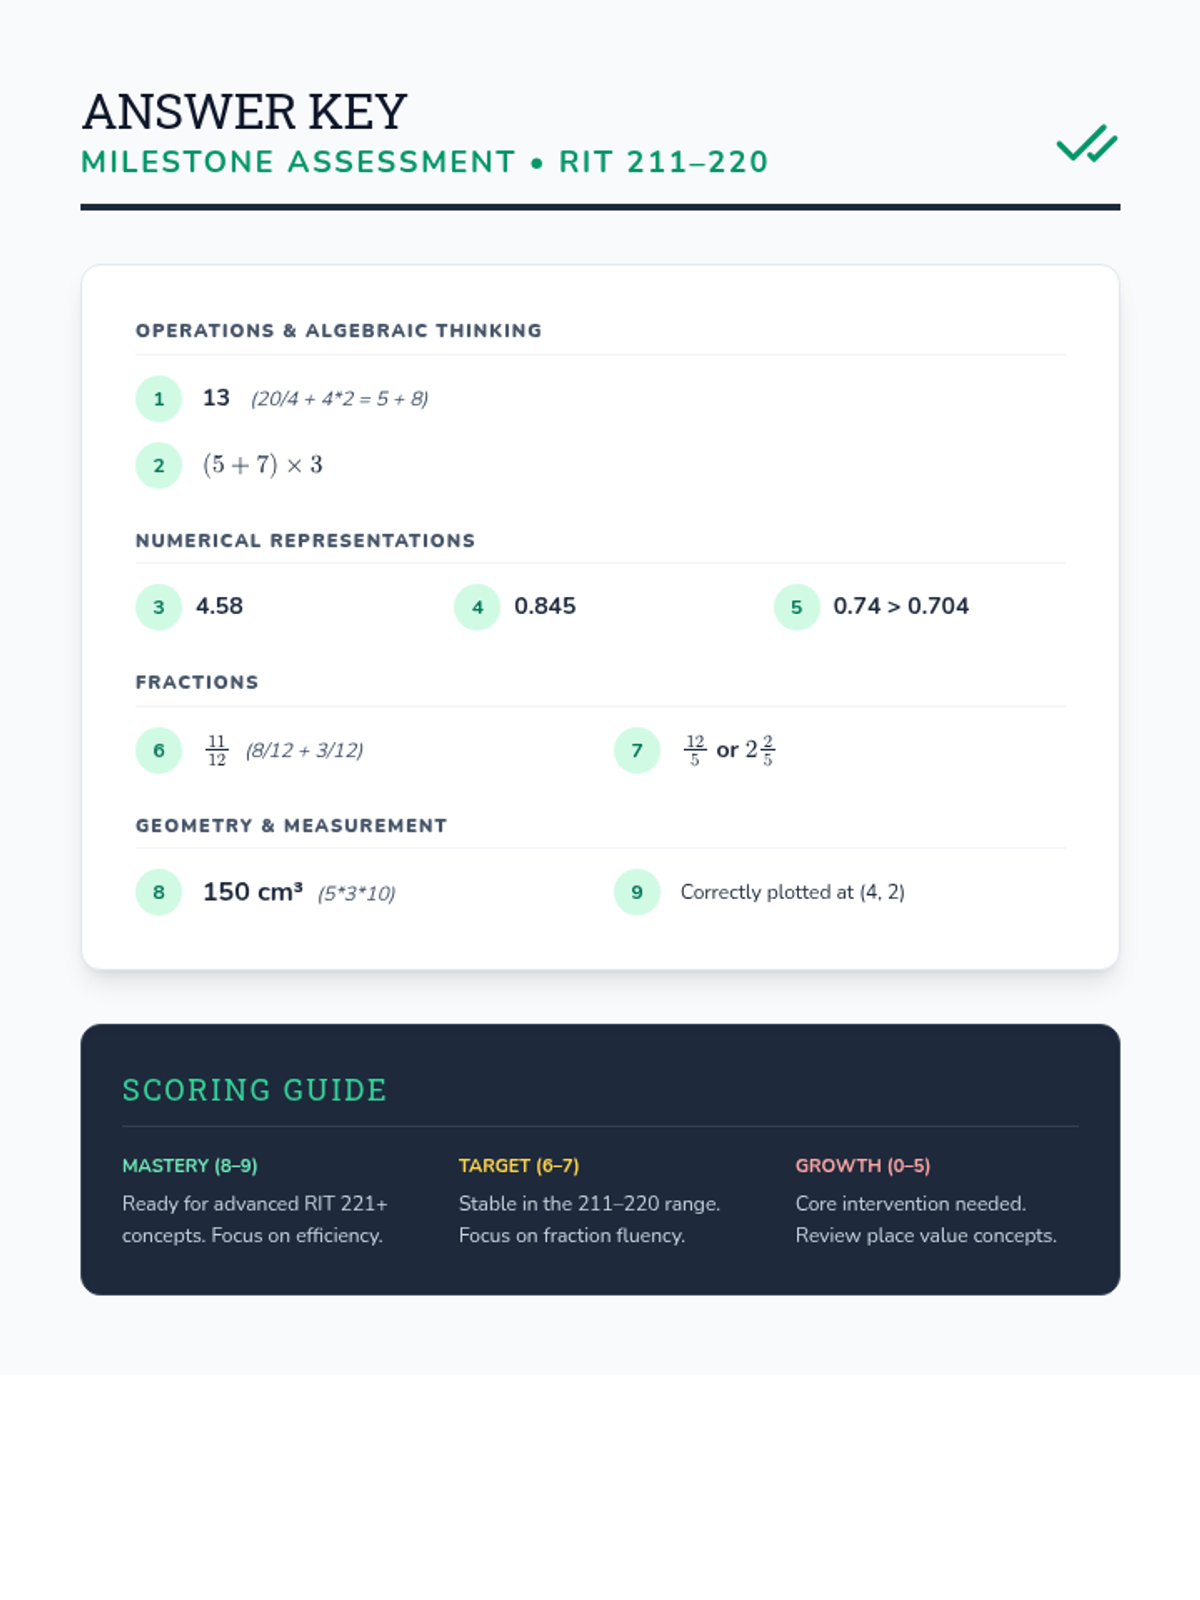
A specialized toolkit for navigating mathematical skills in the 211-220 RIT range, with a focus on foundational decimals, fractions, and place value relationships.

L

llocascio

Math Teacher
4/27
Lesson
Math Mastery Blueprint Checklist
Power Up Activities Worksheet
Instructional Impact Checklist
Numerical Power Checklist

Math Mastery 221-230

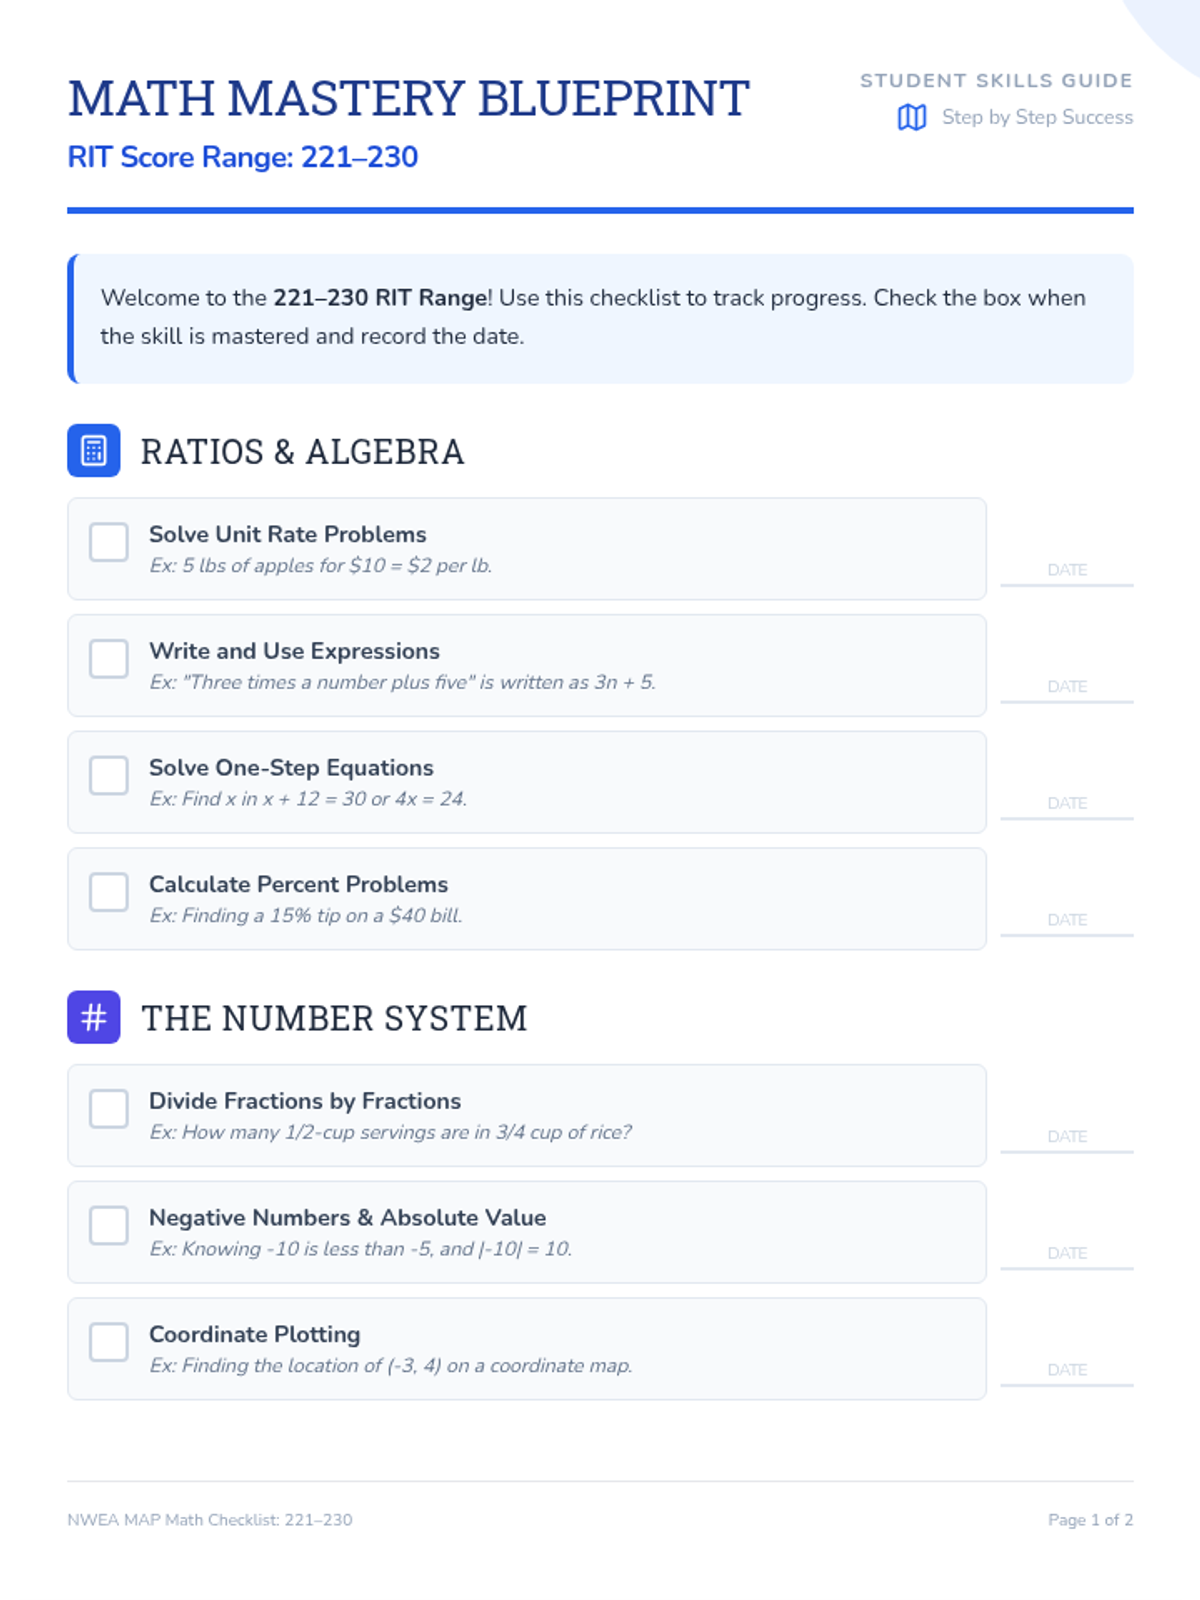
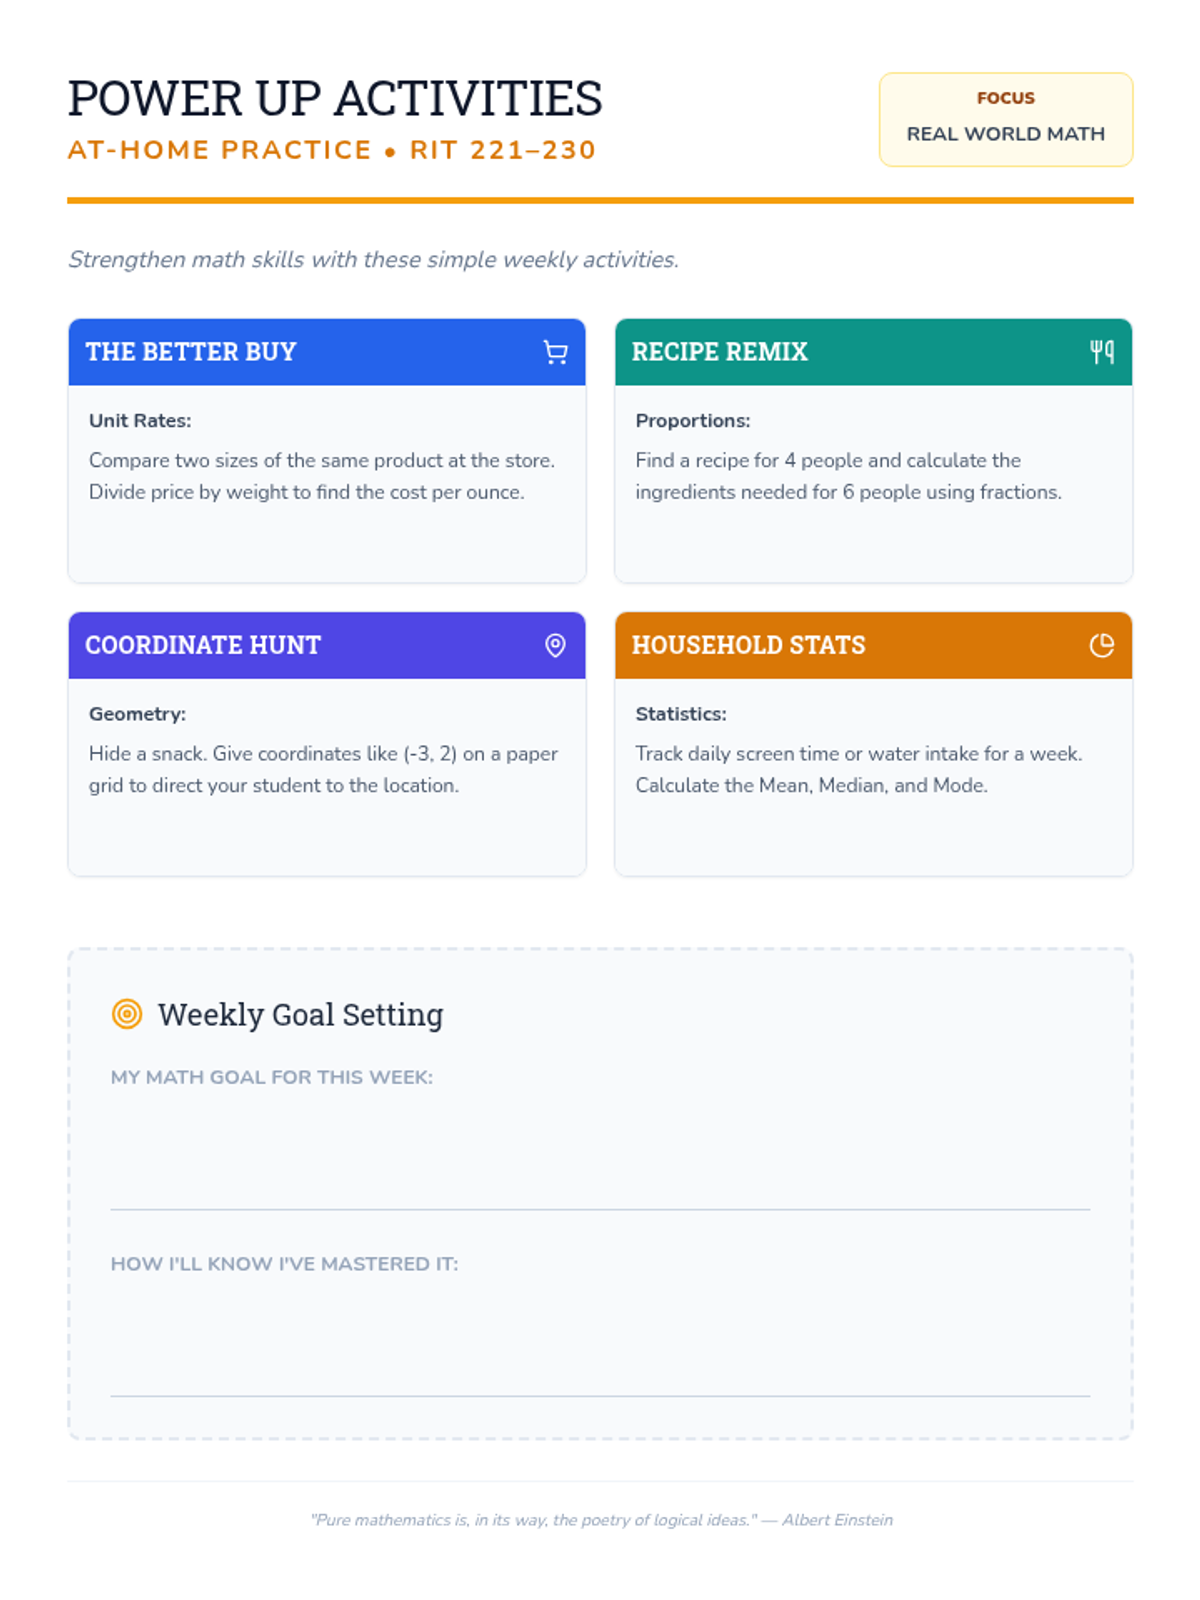
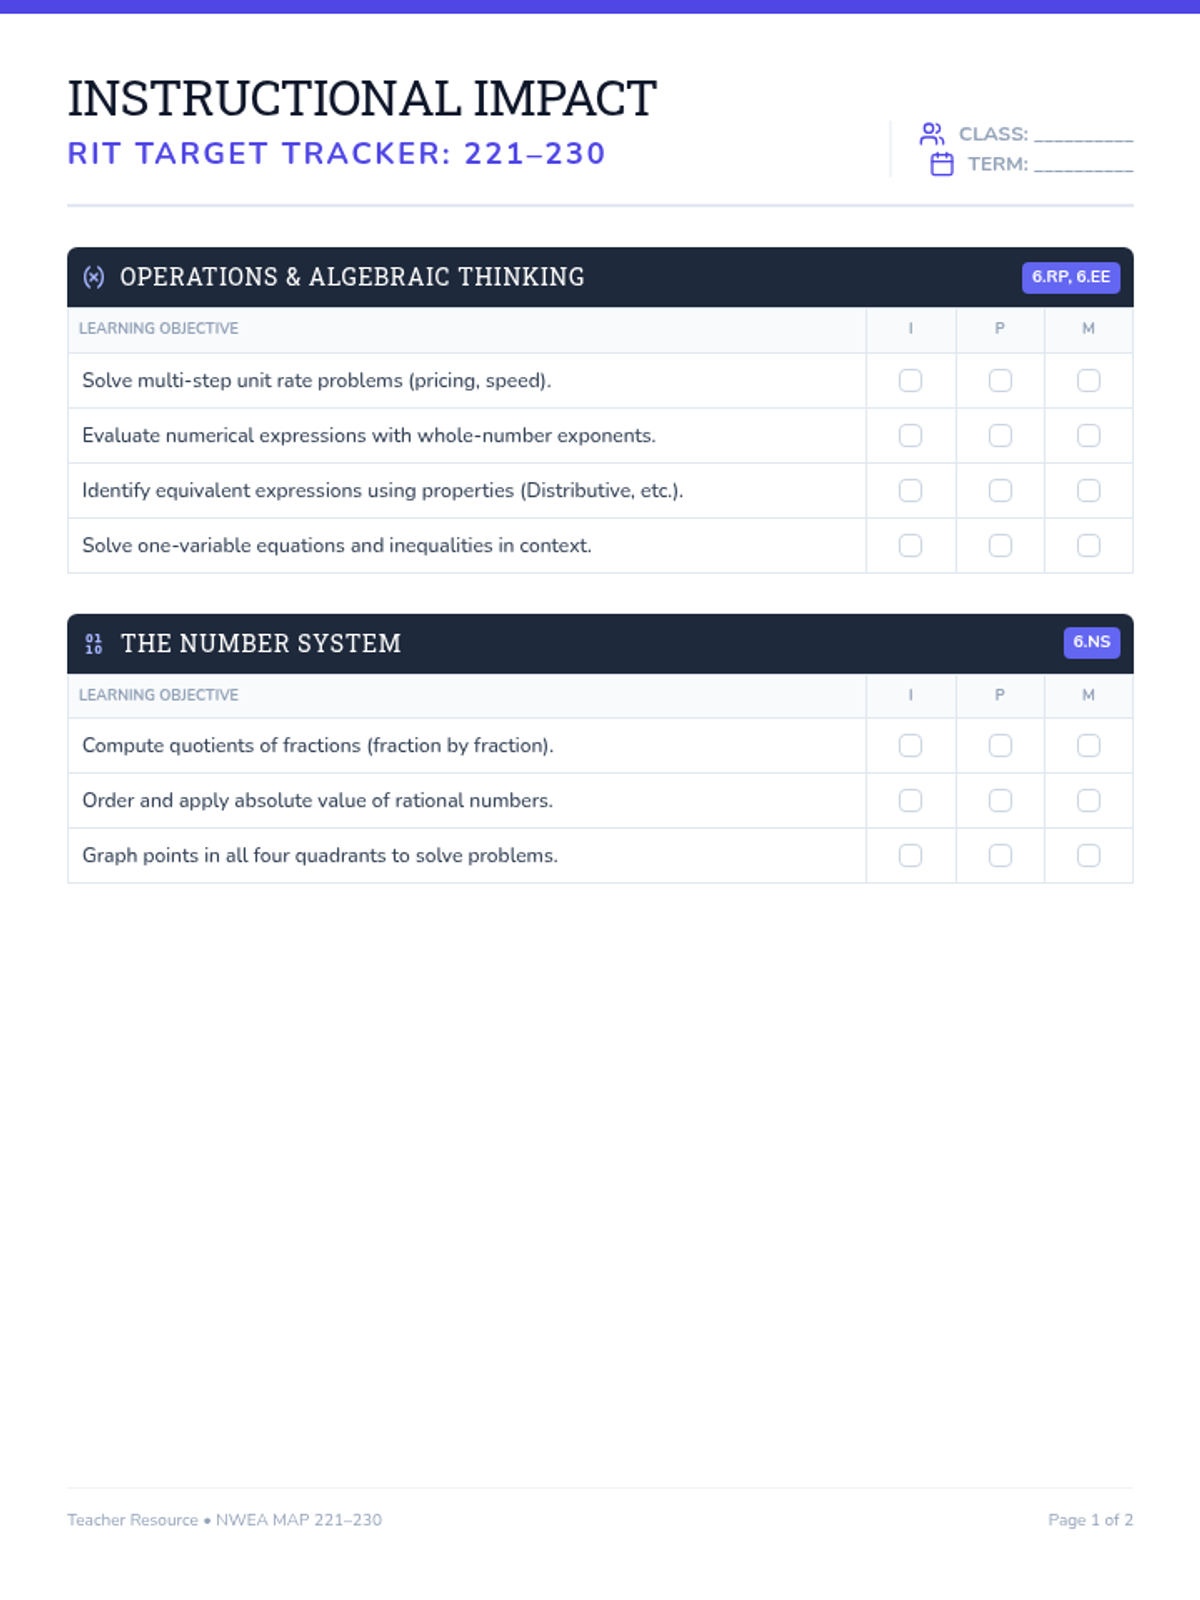
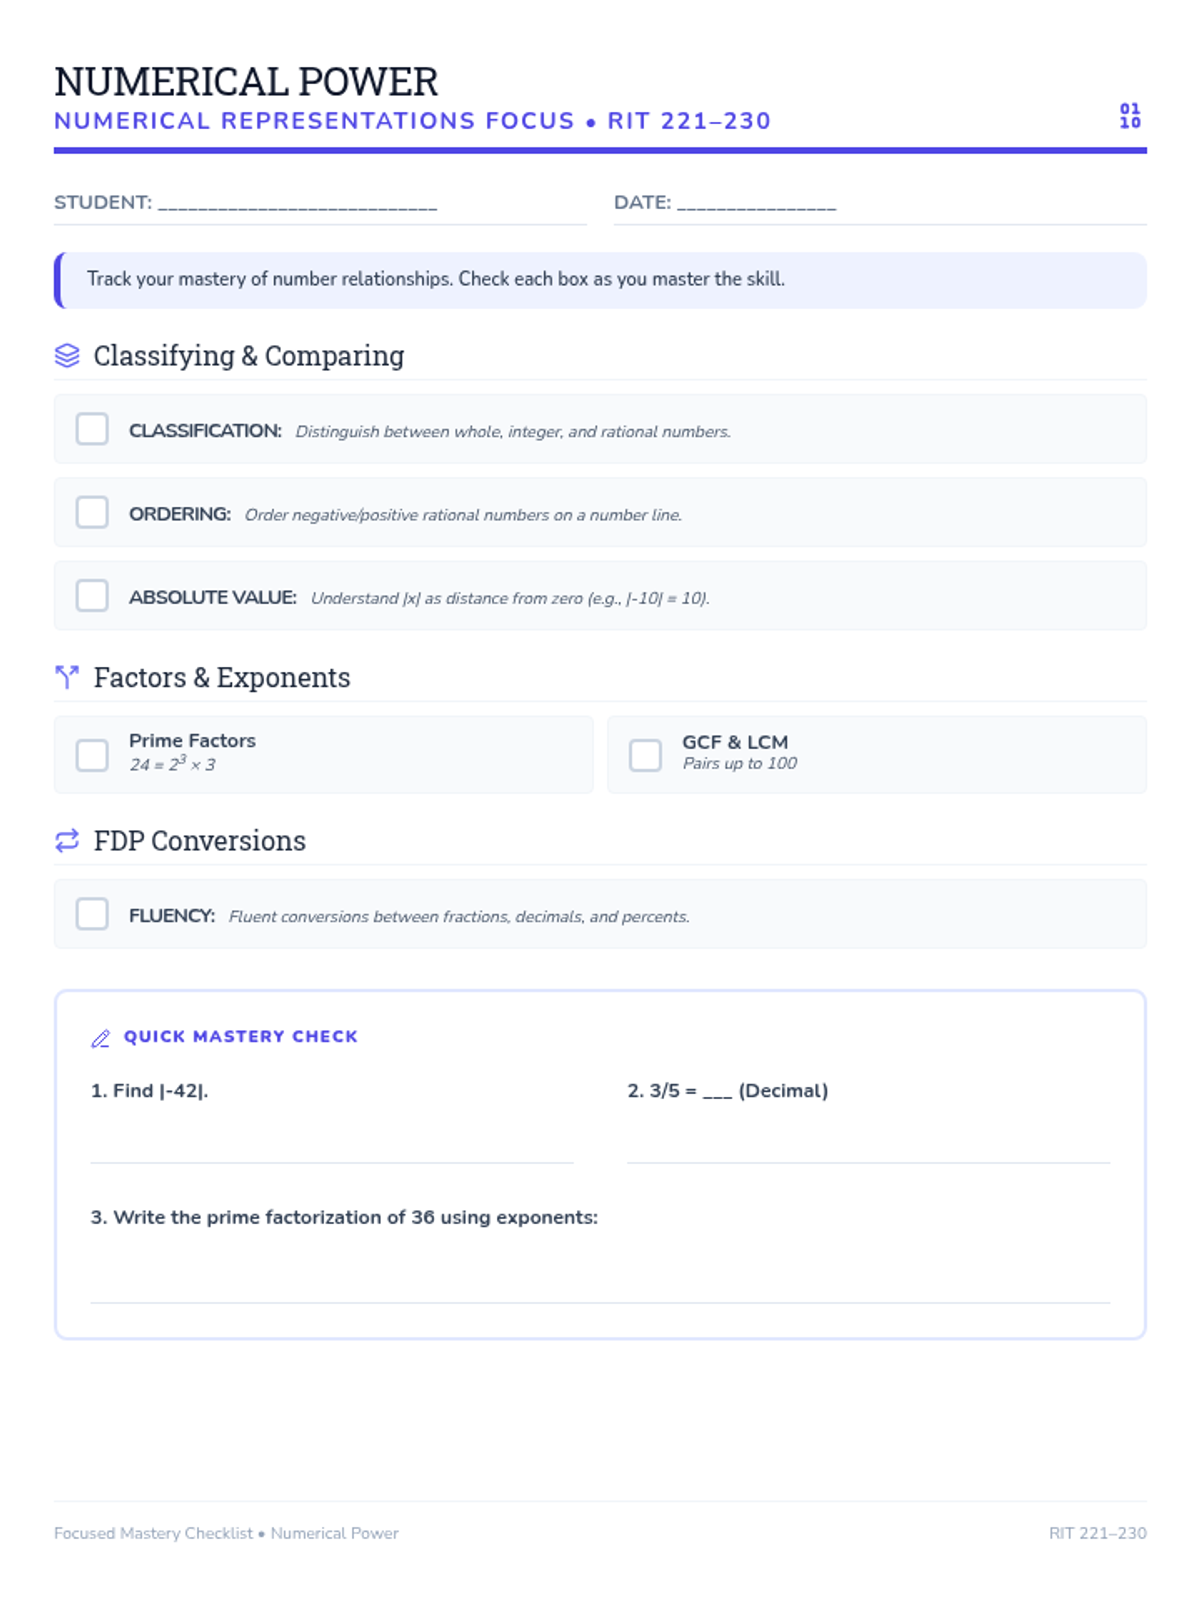
A comprehensive guide for parents and students to navigate the mathematical skills expected in the 221-230 NWEA MAP RIT range, featuring actionable checklists and home-based practice ideas.

L

llocascio

Math Teacher
4/27
Lesson
Mood Map Worksheet
Mood Map Answer Key
Screen Scramble Worksheet
Screen Scramble Answer Key
Study Session Worksheet
Study Session Answer Key
Hydration Hustle Worksheet
Hydration Hustle Answer Key
Bookworm Battle Worksheet
Bookworm Battle Answer Key
Price Tag Tussle Worksheet
Price Tag Tussle Answer Key
Coffee Craze Worksheet
Coffee Craze Answer Key
Temperature Trek Worksheet
Temperature Trek Answer Key

Data Detectives

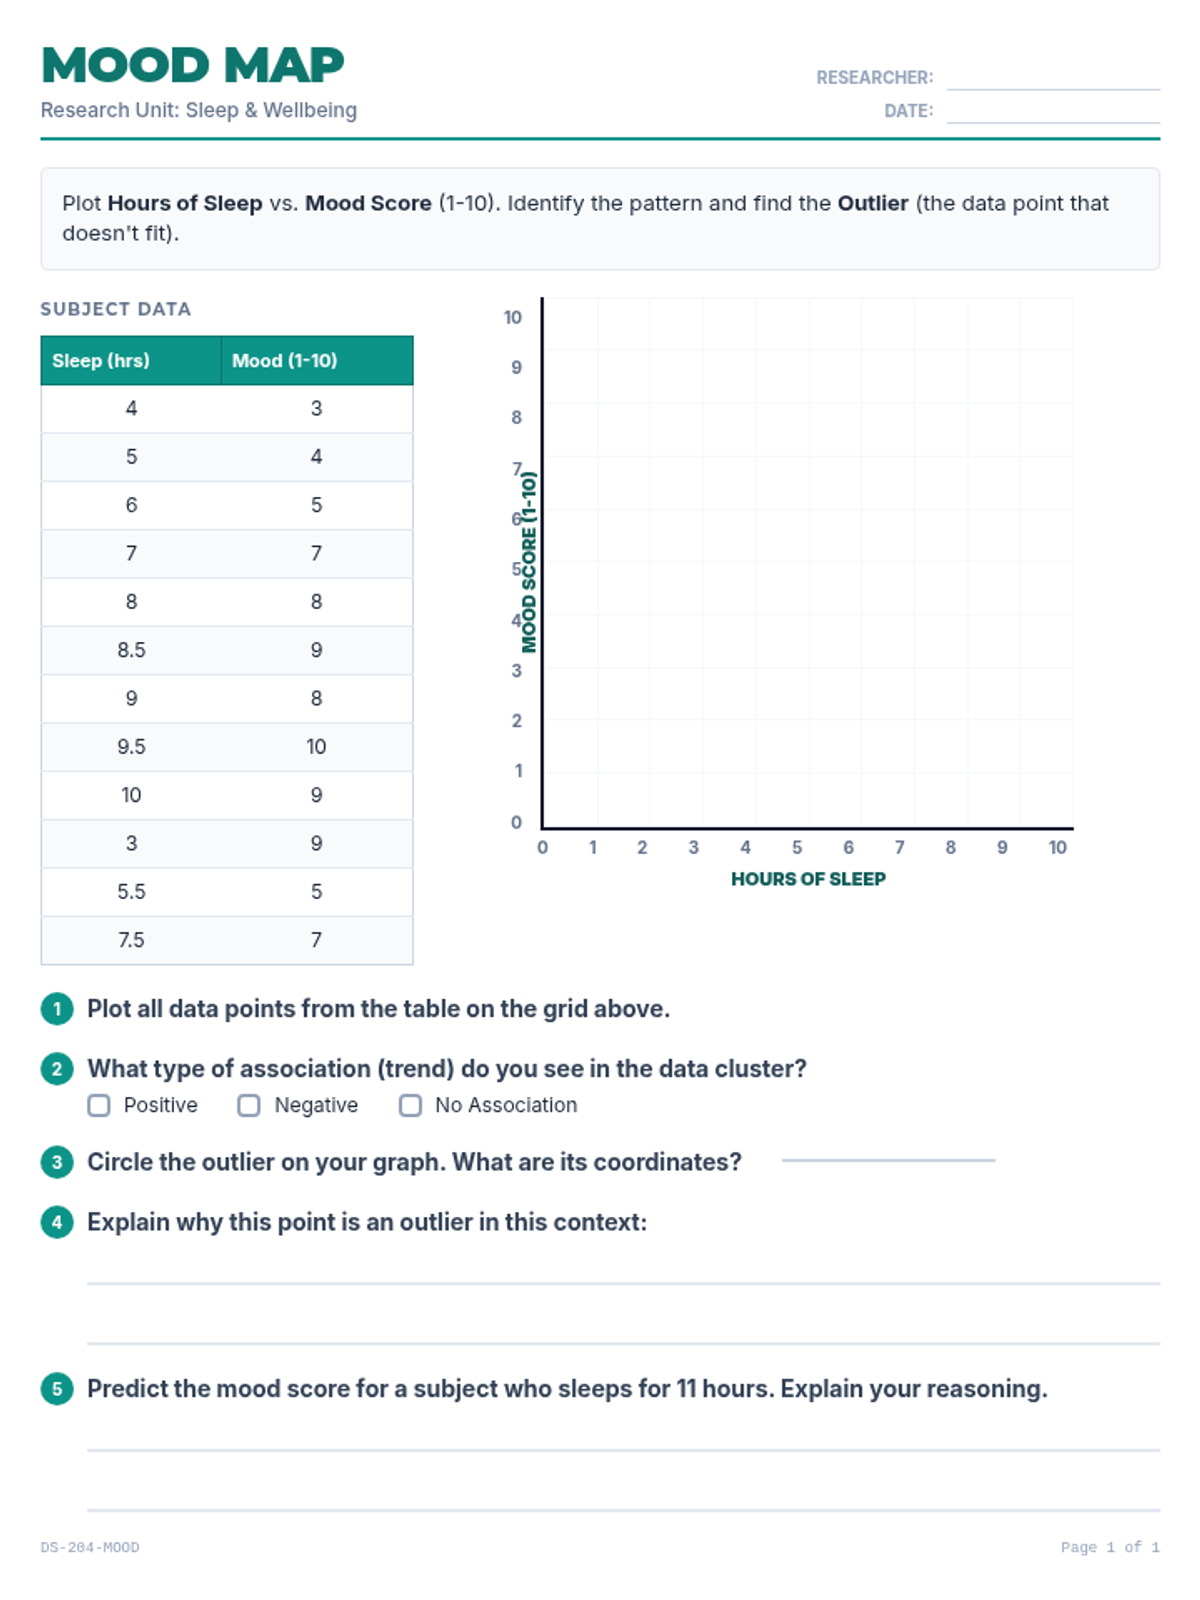
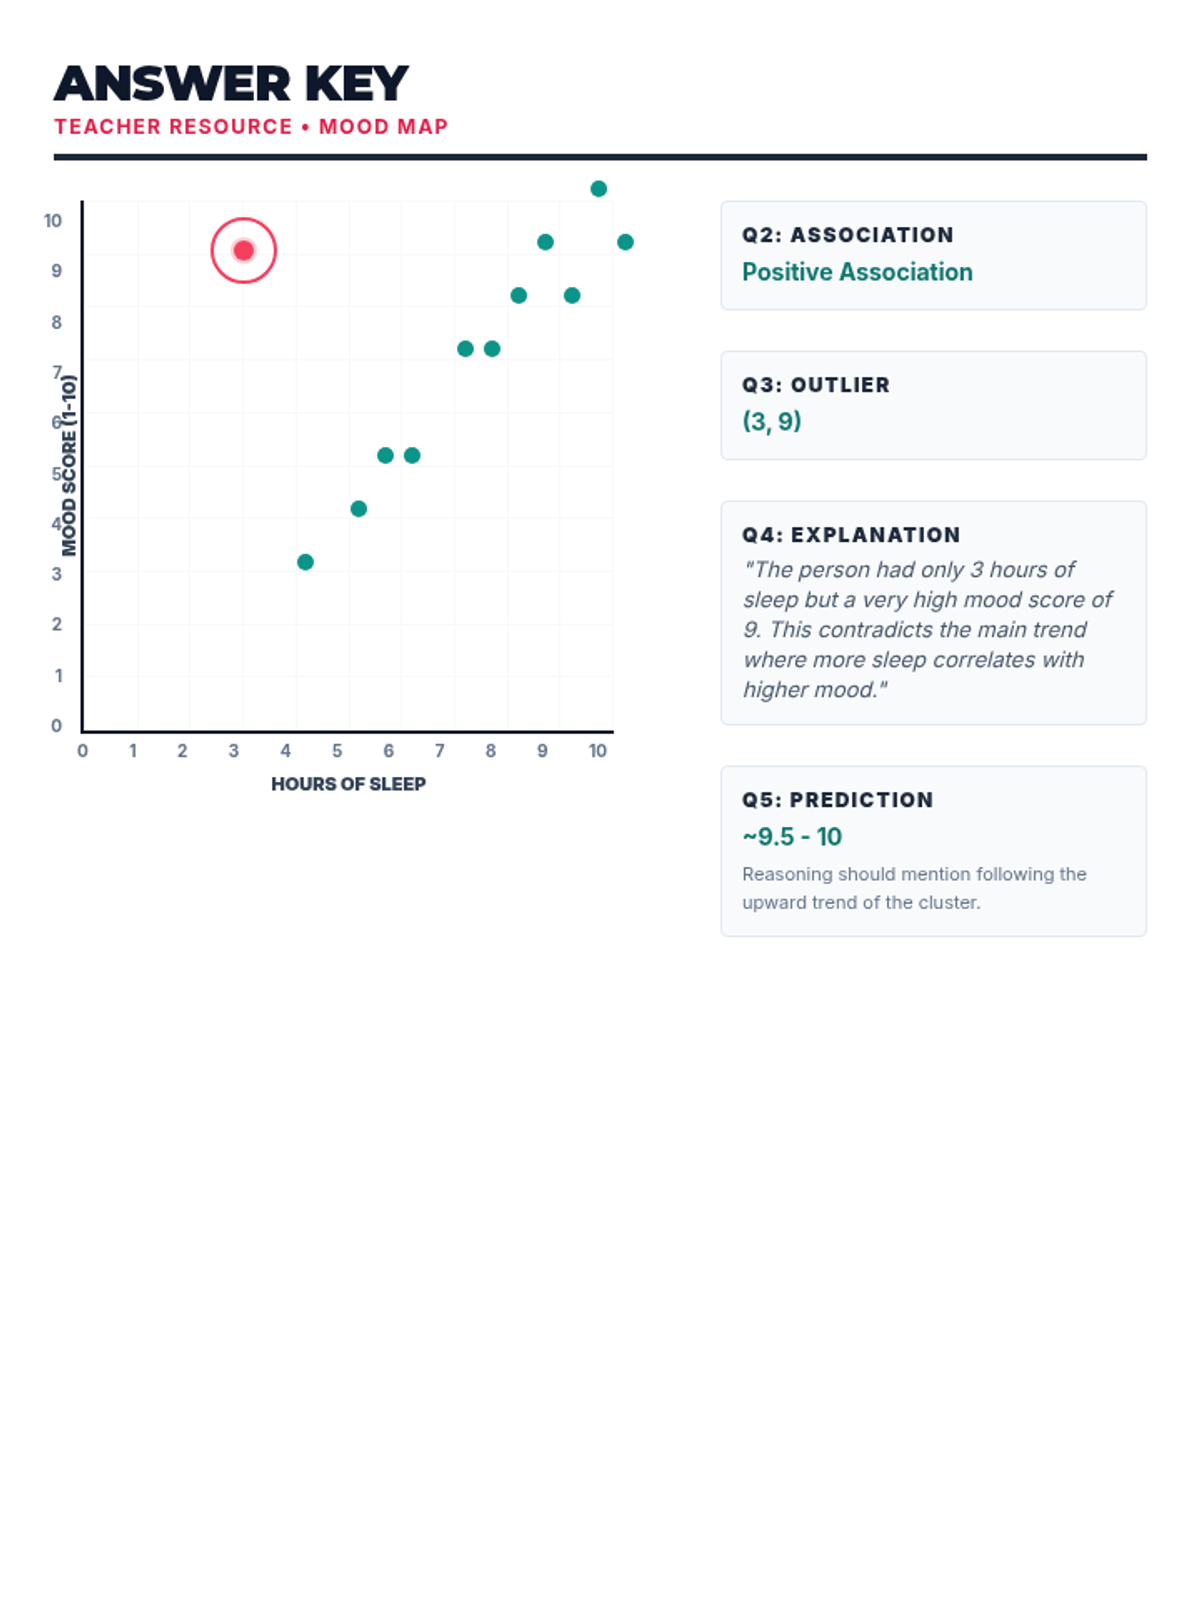
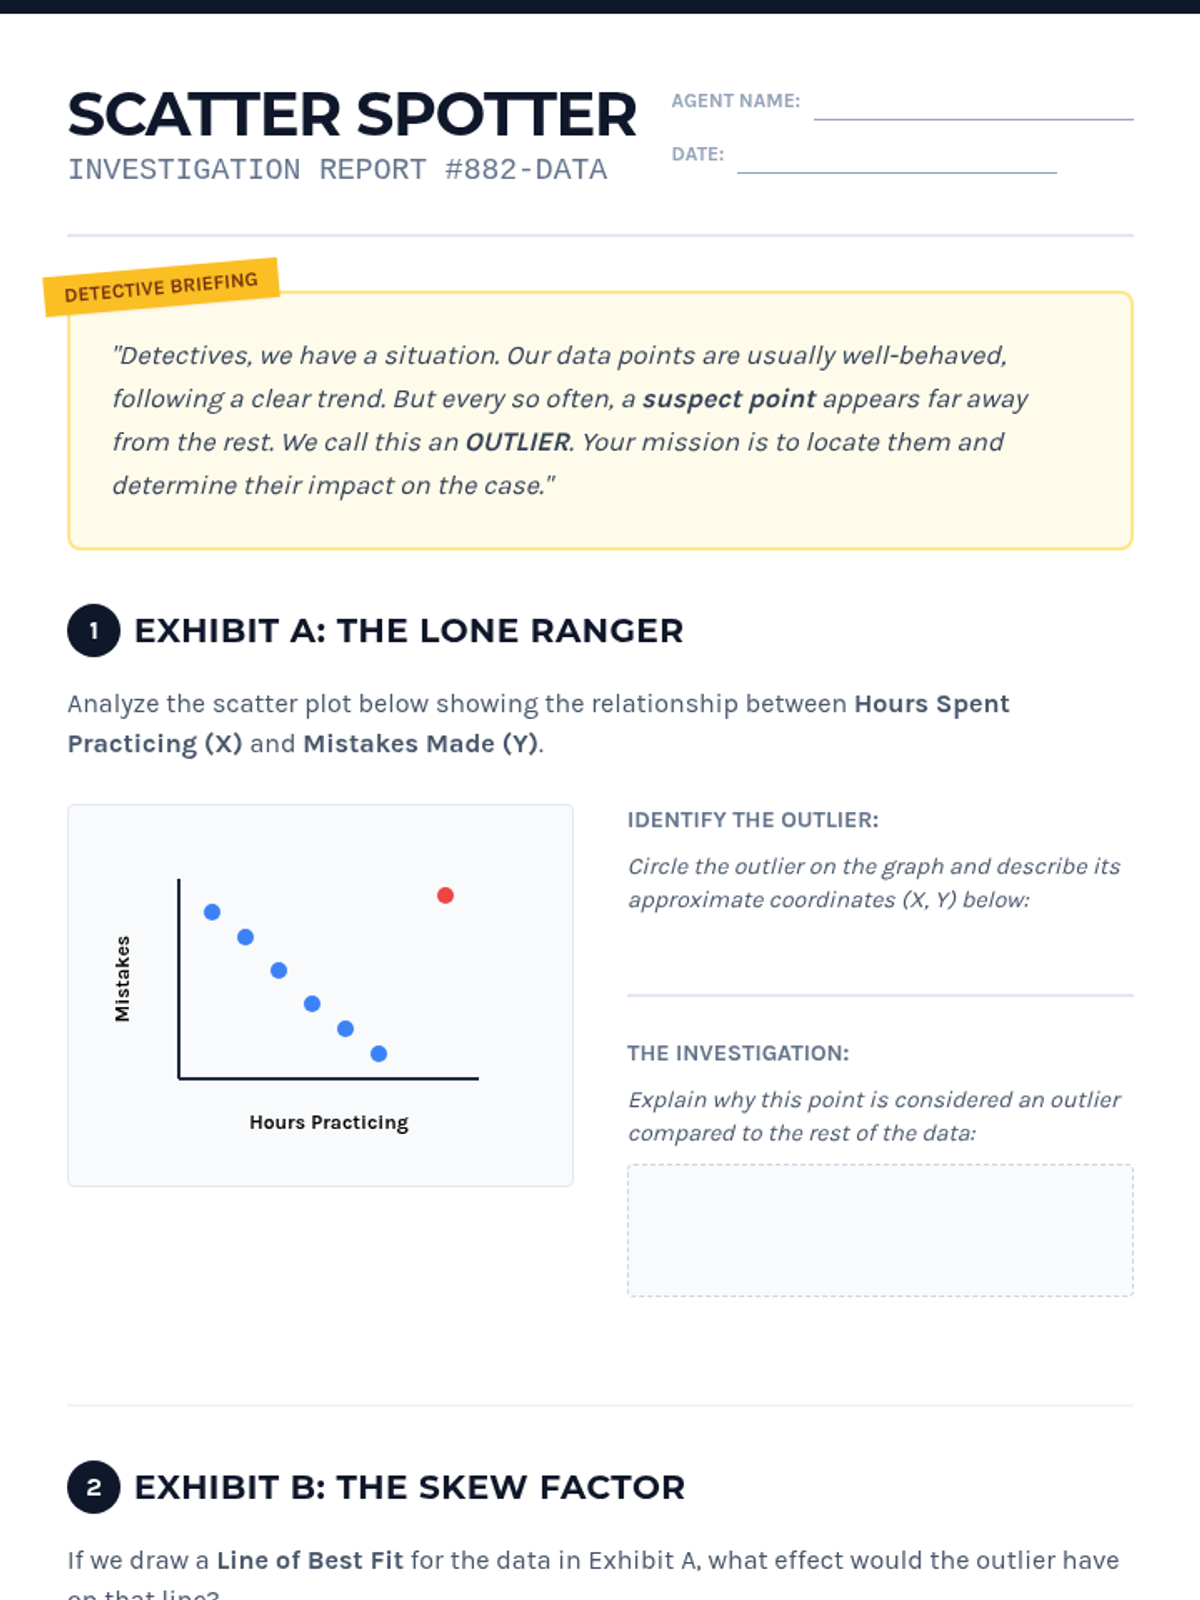
Students learn to plot bivariate data, identify trends, and spot outliers using a real-world scenario of sleep and mood.

SB

Stephanie Bizeur

Special Education Teacher
4/27
Lesson
Center Stage Slides
Evidence Logs Guided Notes
Case Closed Escape Room
Final Verdict Quiz
Final Verdict Answer Key
Detective Glossary Handbook
Evidence Sorting Activity
Data Detectives Teacher Guide

Data Detectives

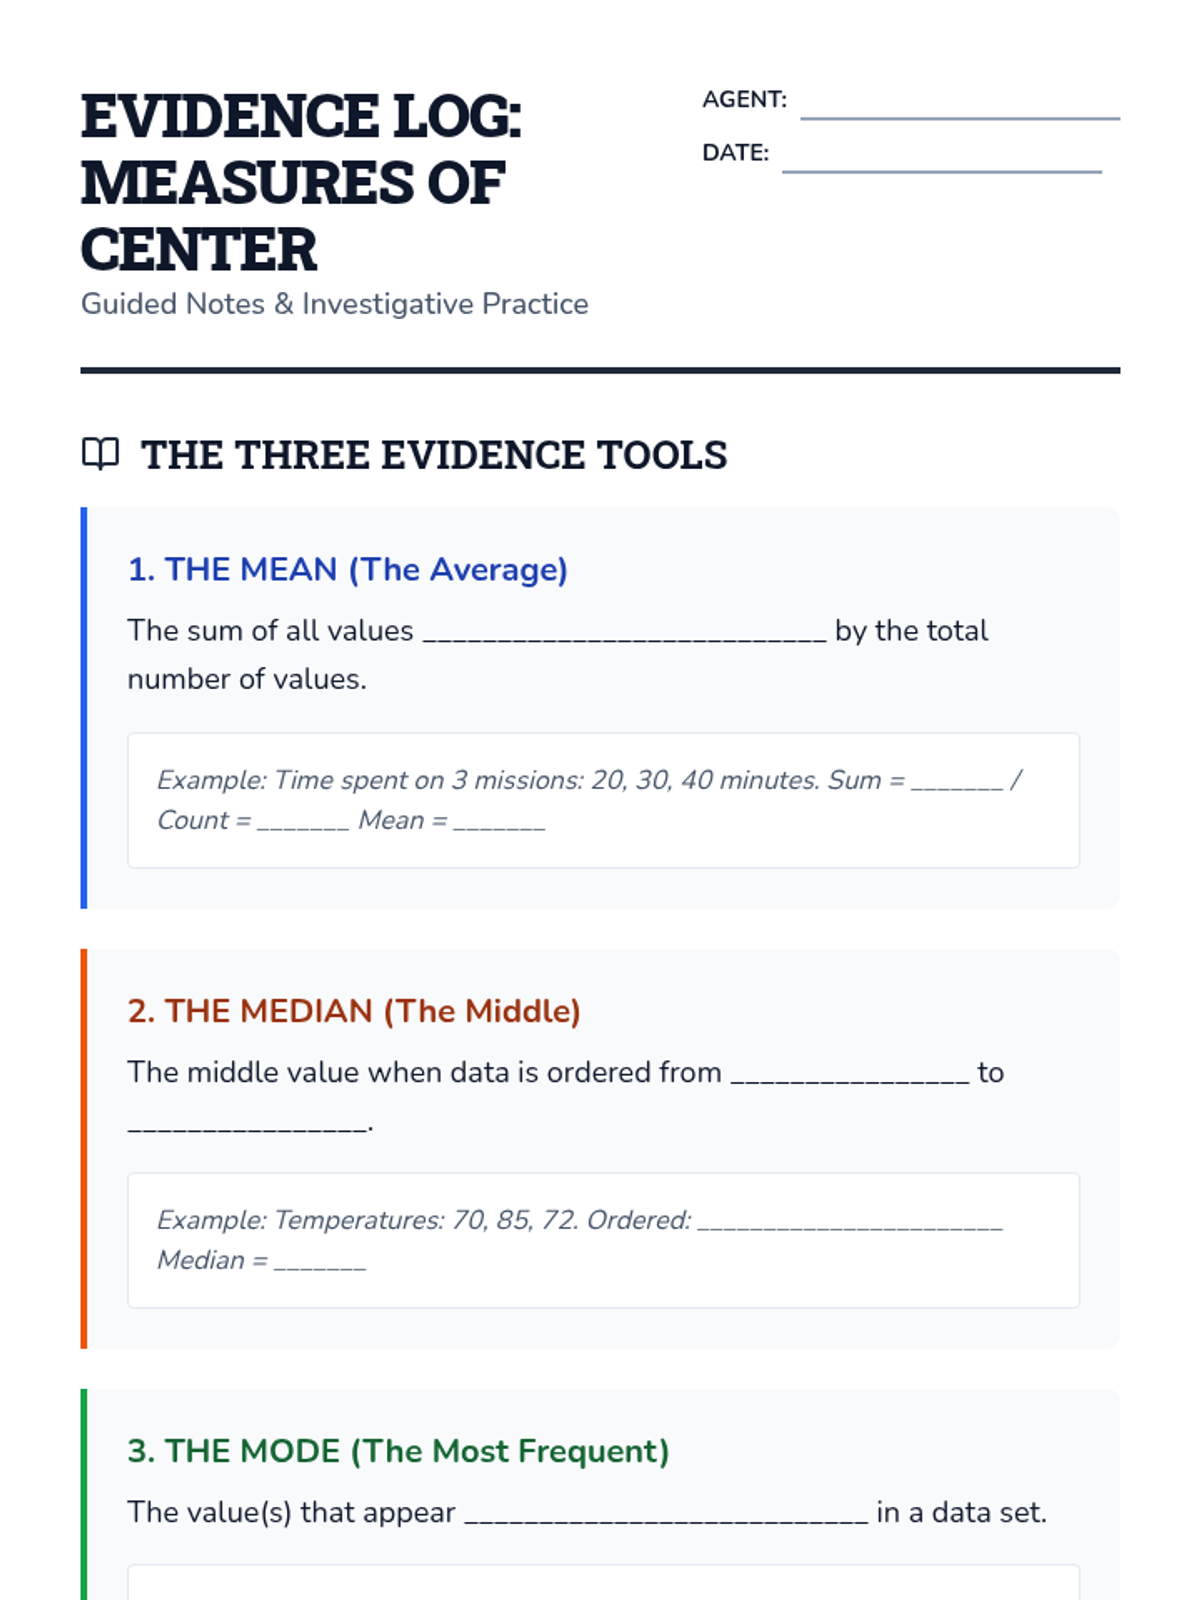
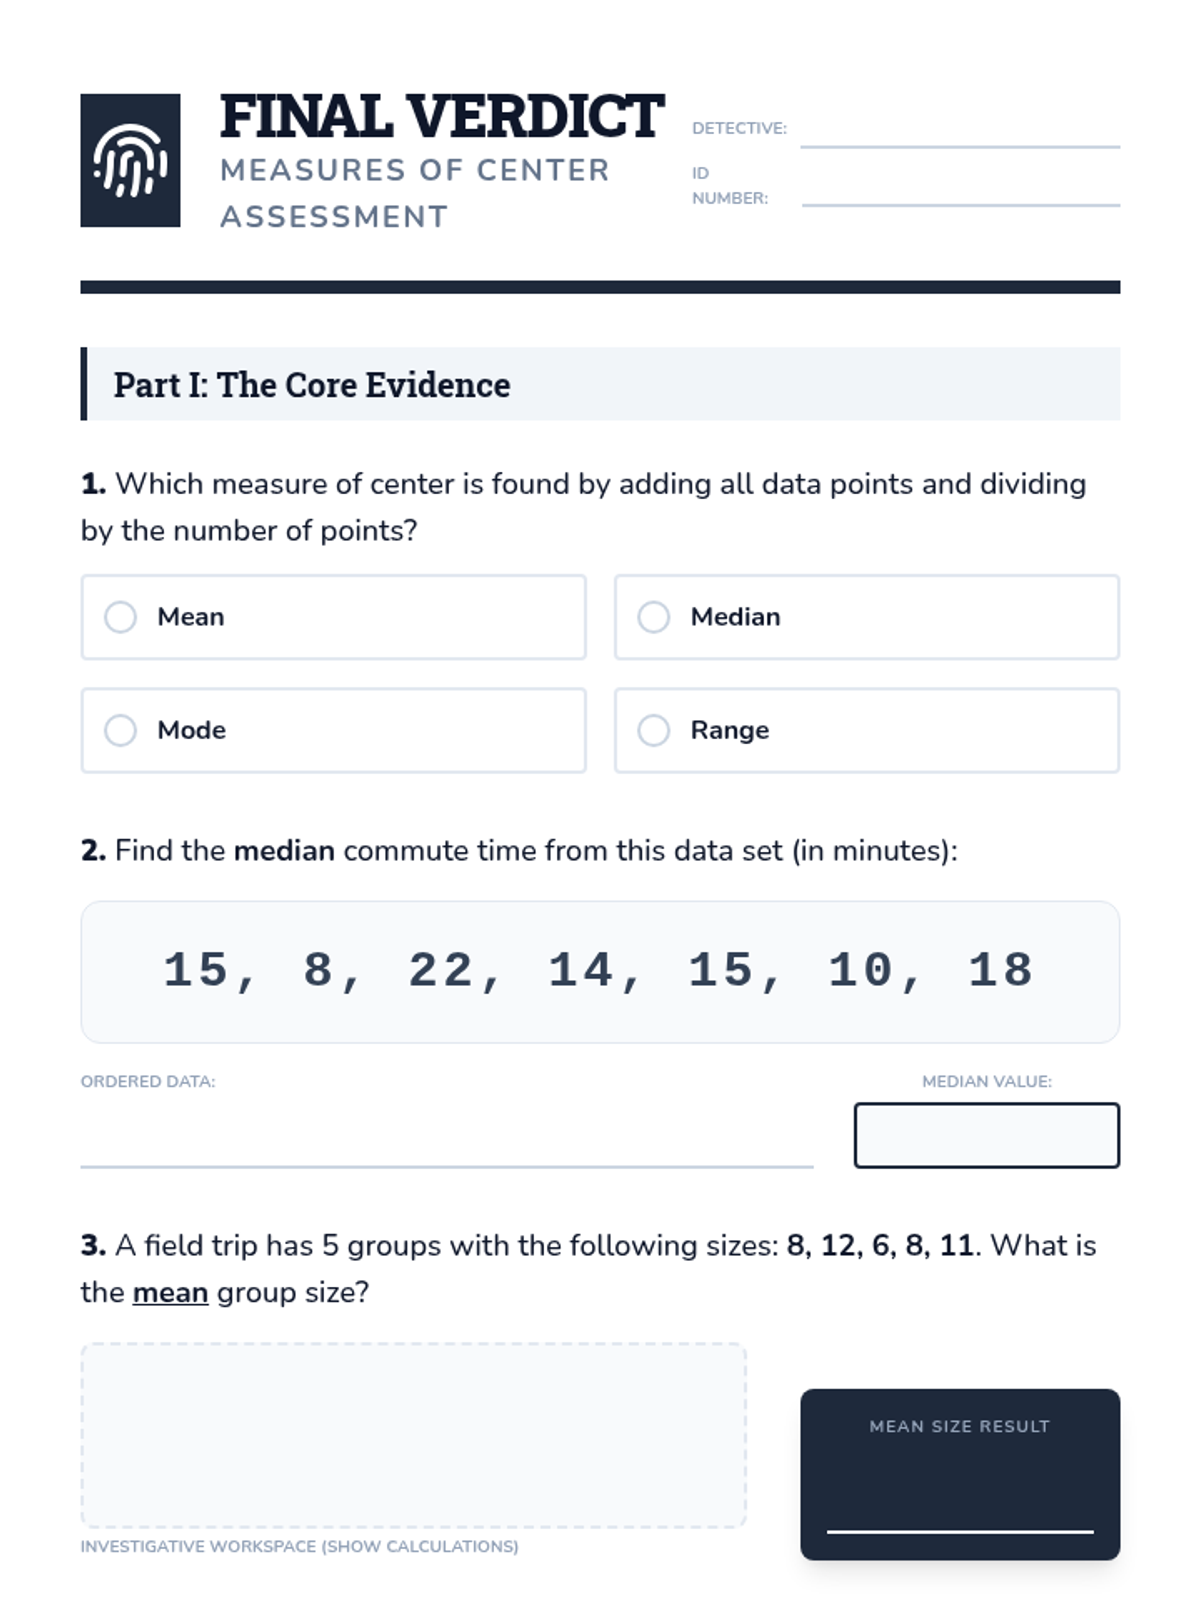
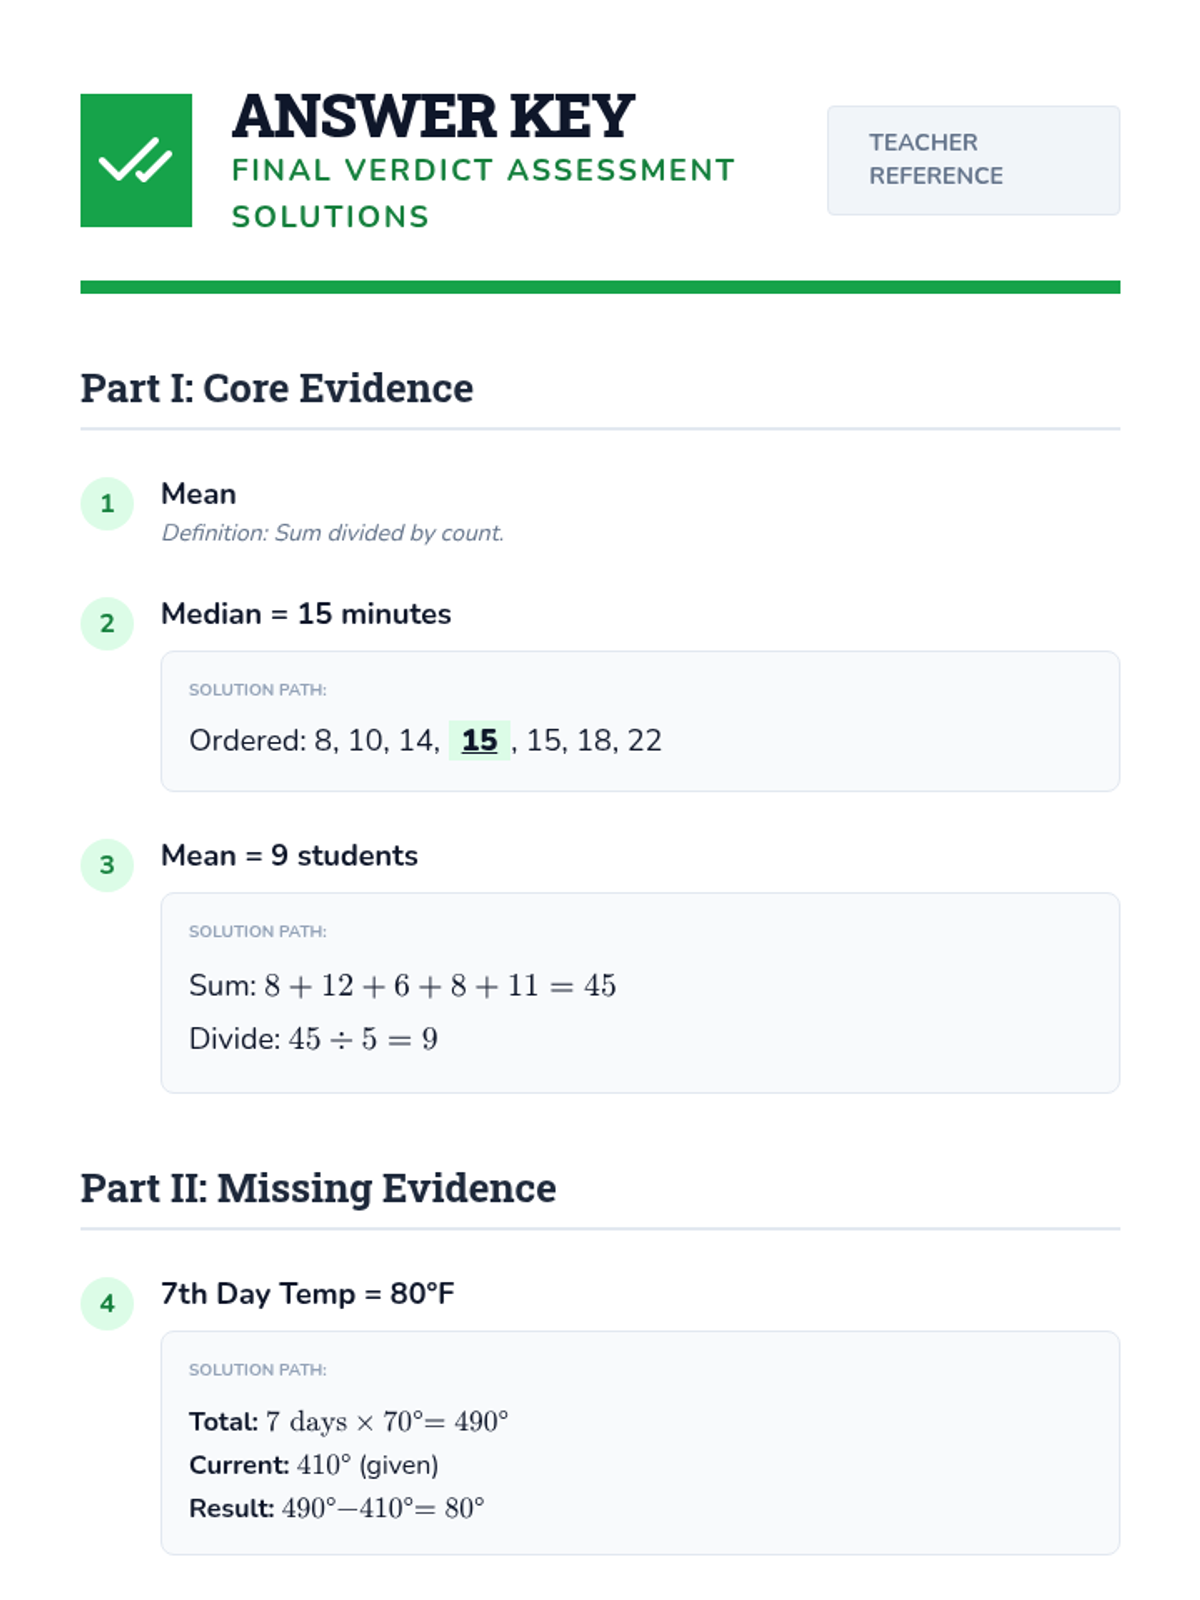
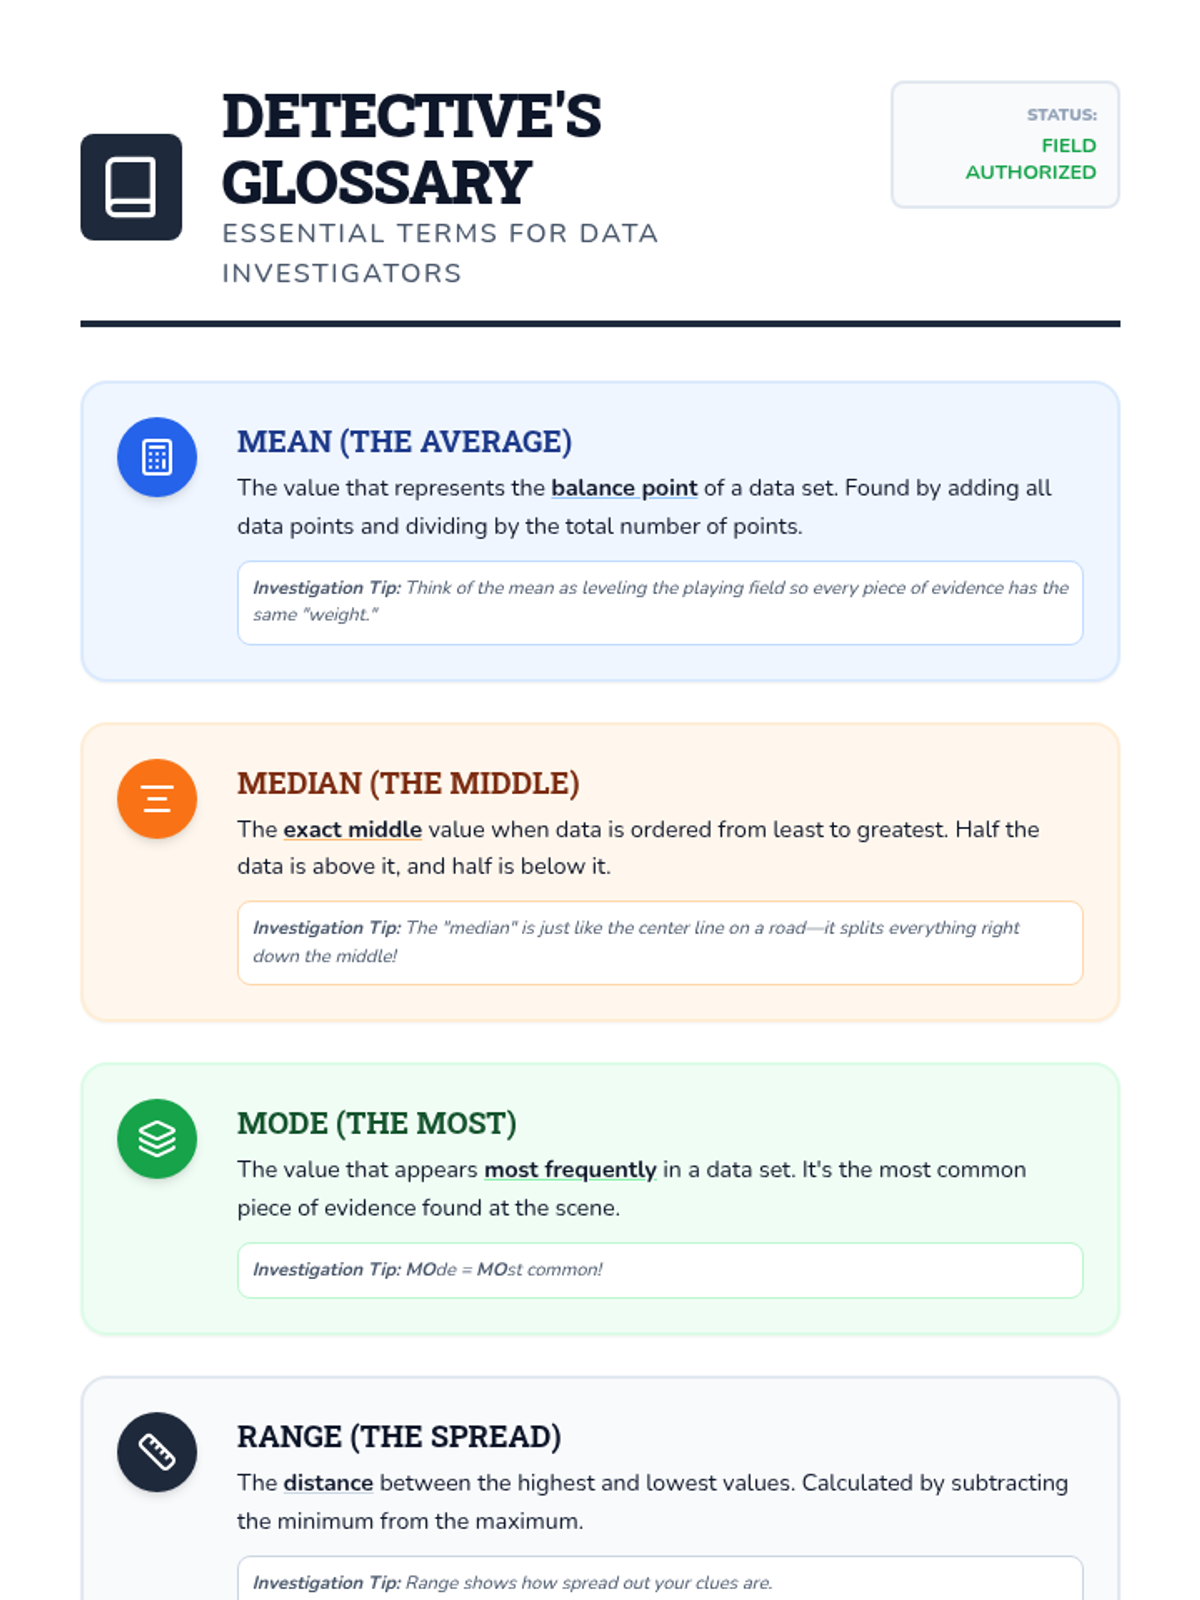
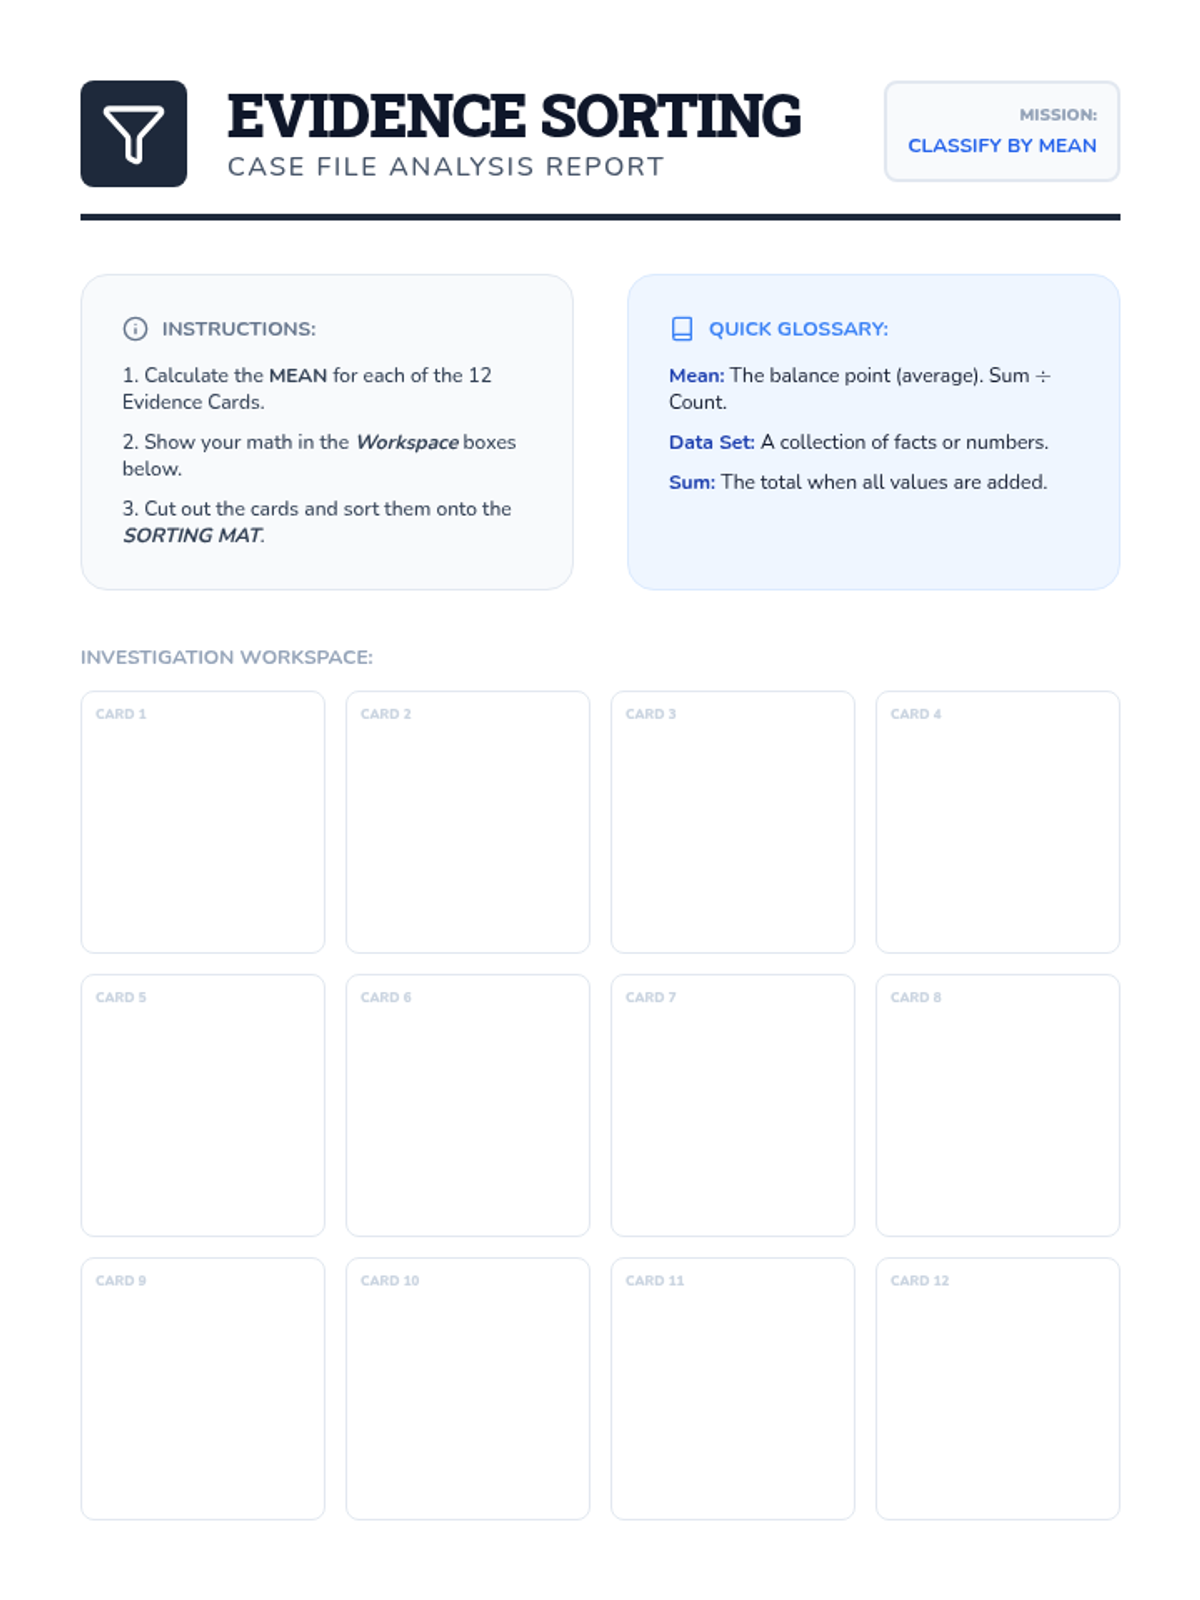
A comprehensive lesson on measures of center (mean, median, mode) where students learn to summarize numerical data and find missing values using time, temperature, and group size data.

CS

Crysta Schwartz

Elementary Teacher
4/27
Lesson
Price Tag Patrol Slides
Price Tag Patrol Guided Notes
Shopping Spree Practice Worksheet
Market Research Task Cards
Checkout Quiz Assessment
Checkout Quiz Answer Key

Price Tag Patrol

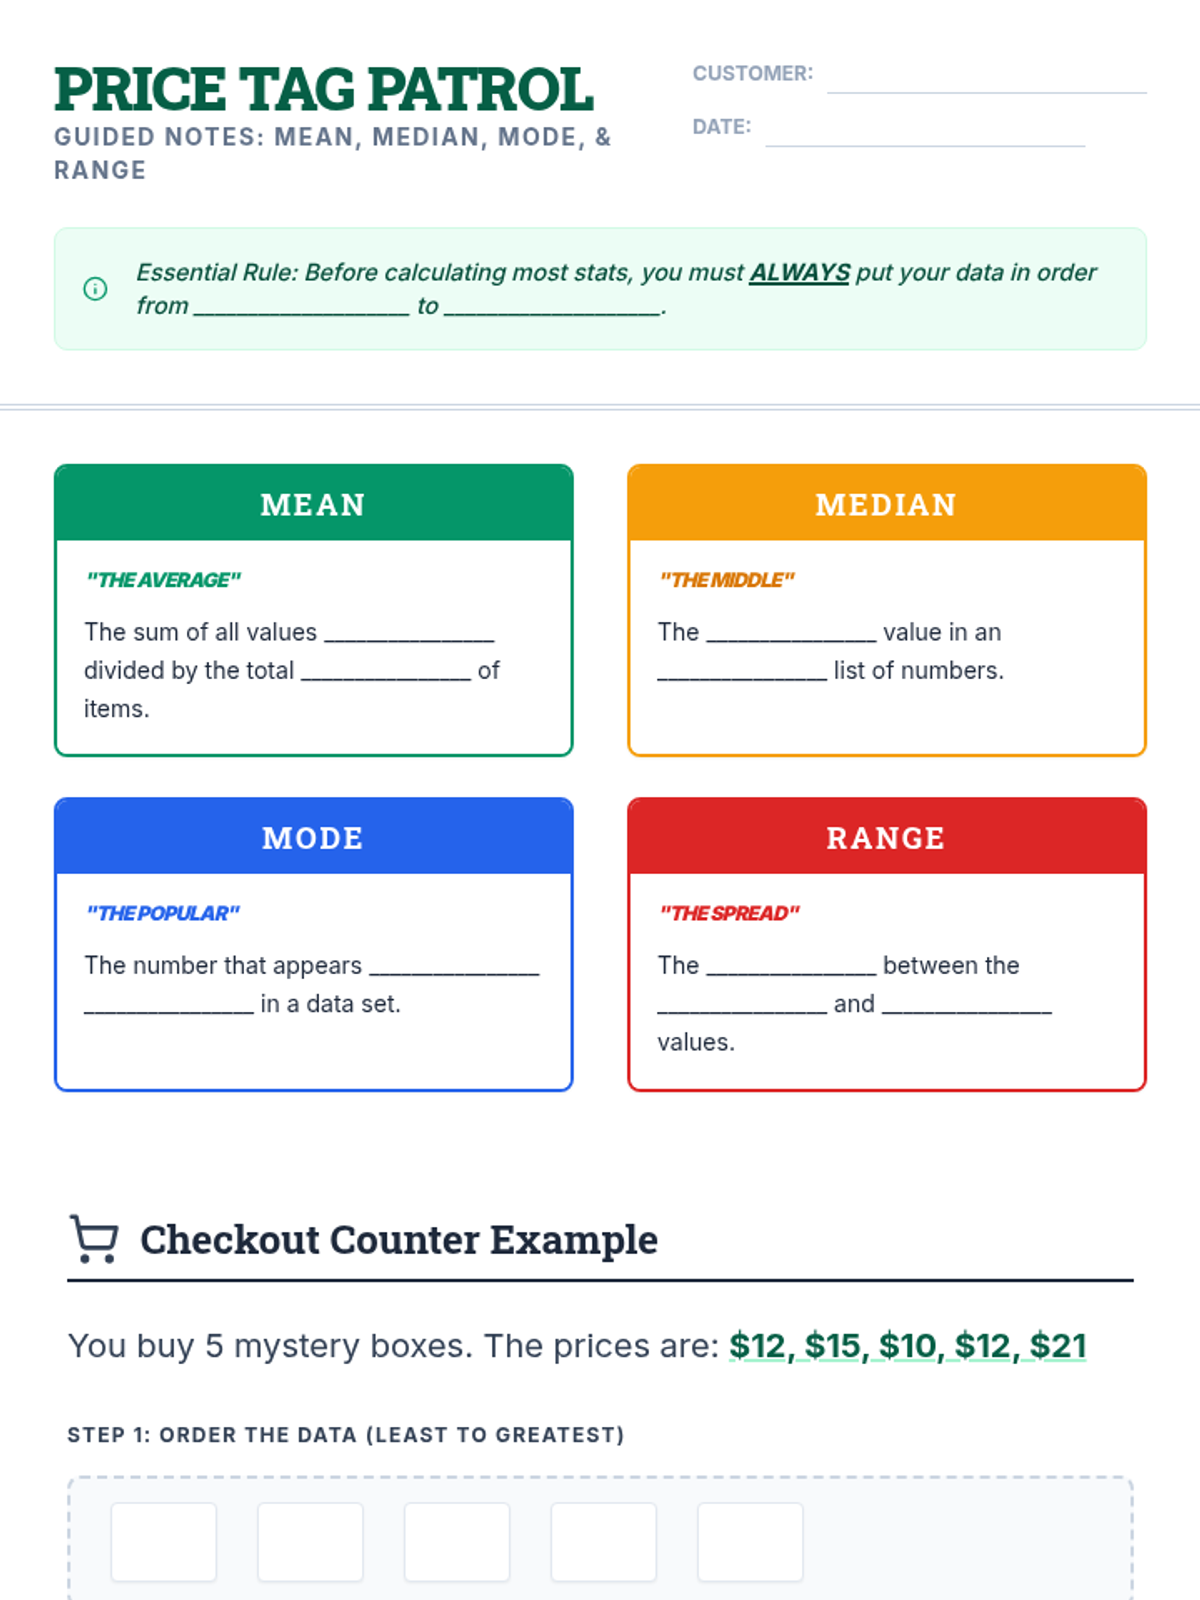
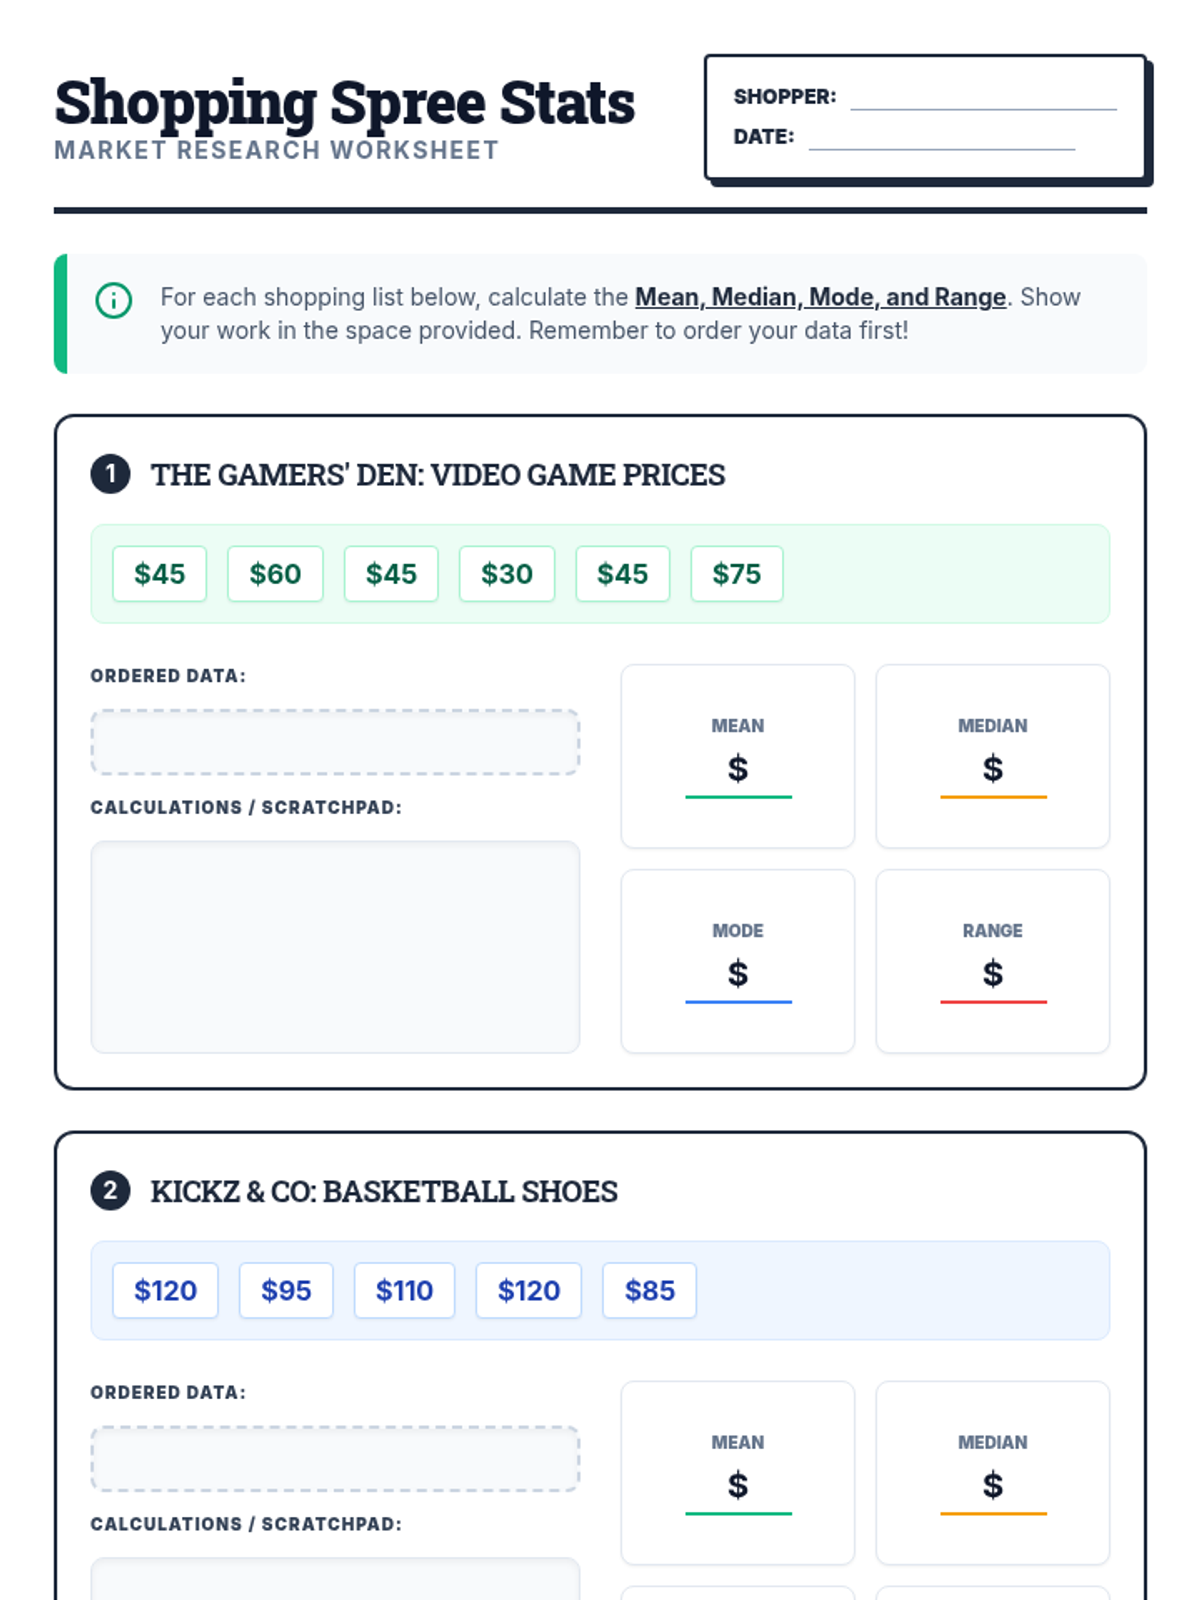
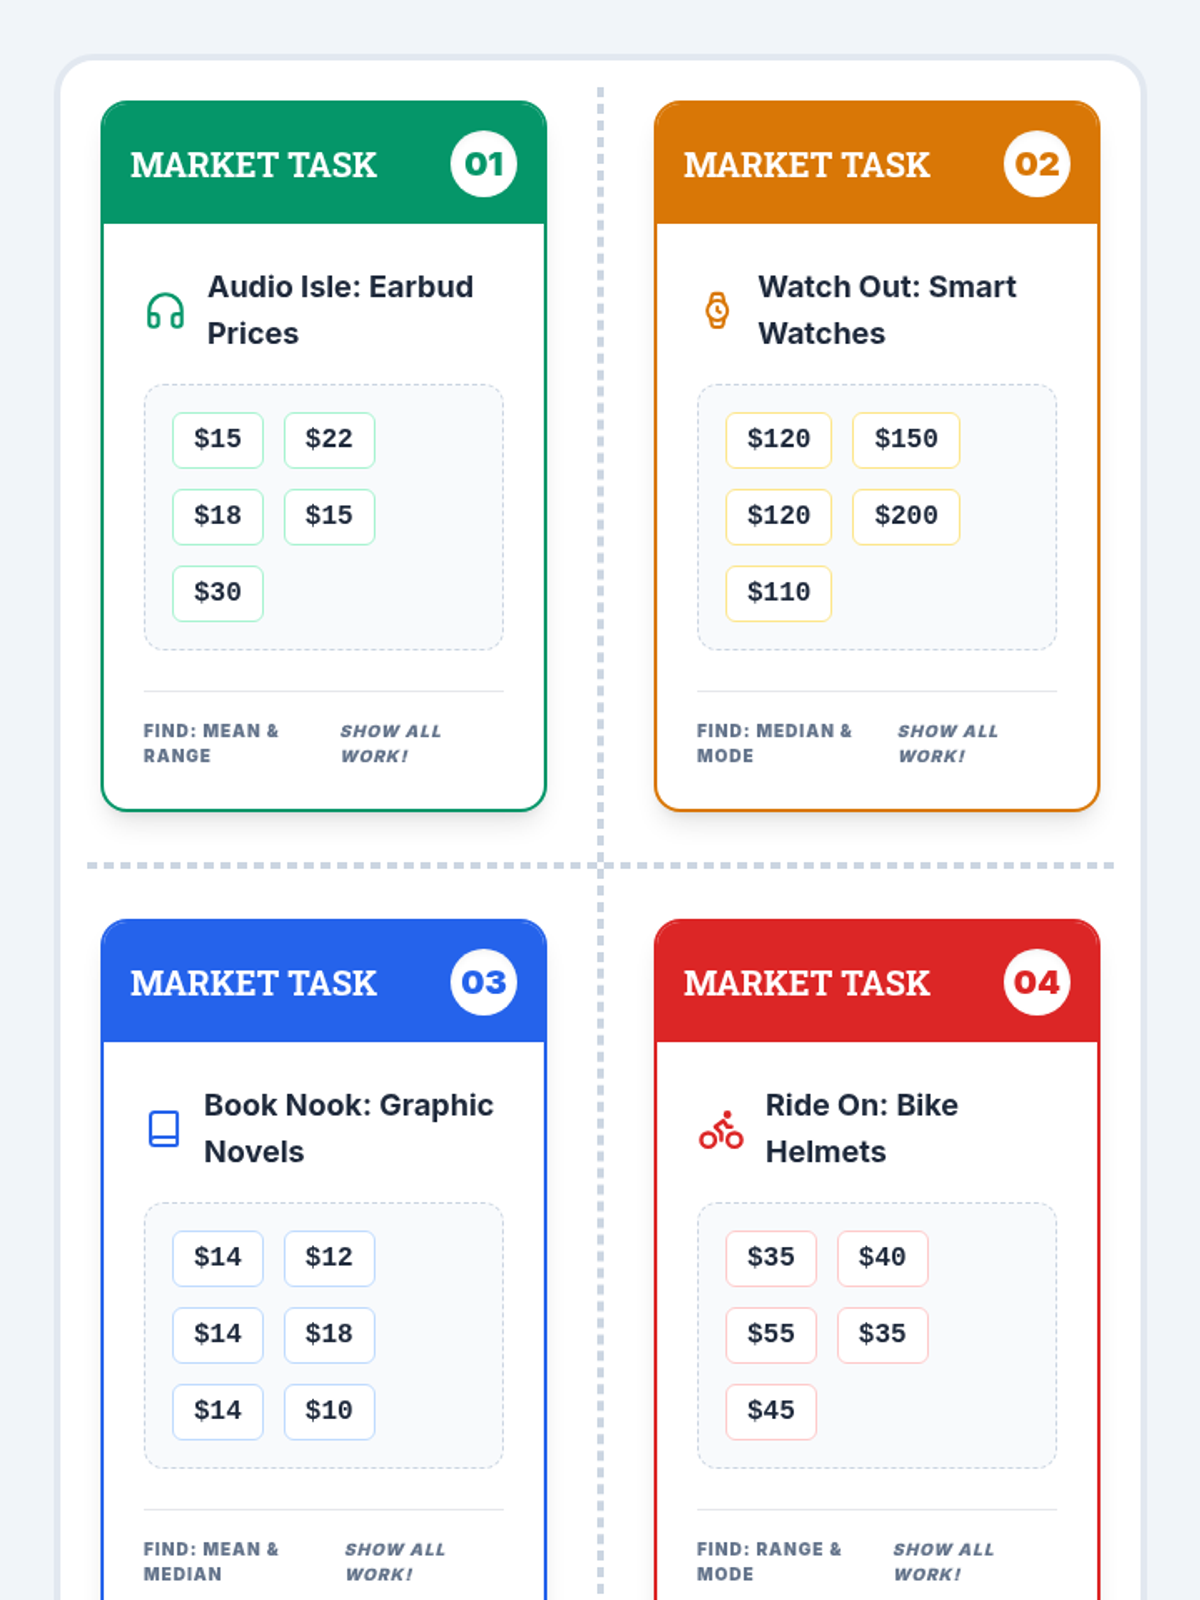
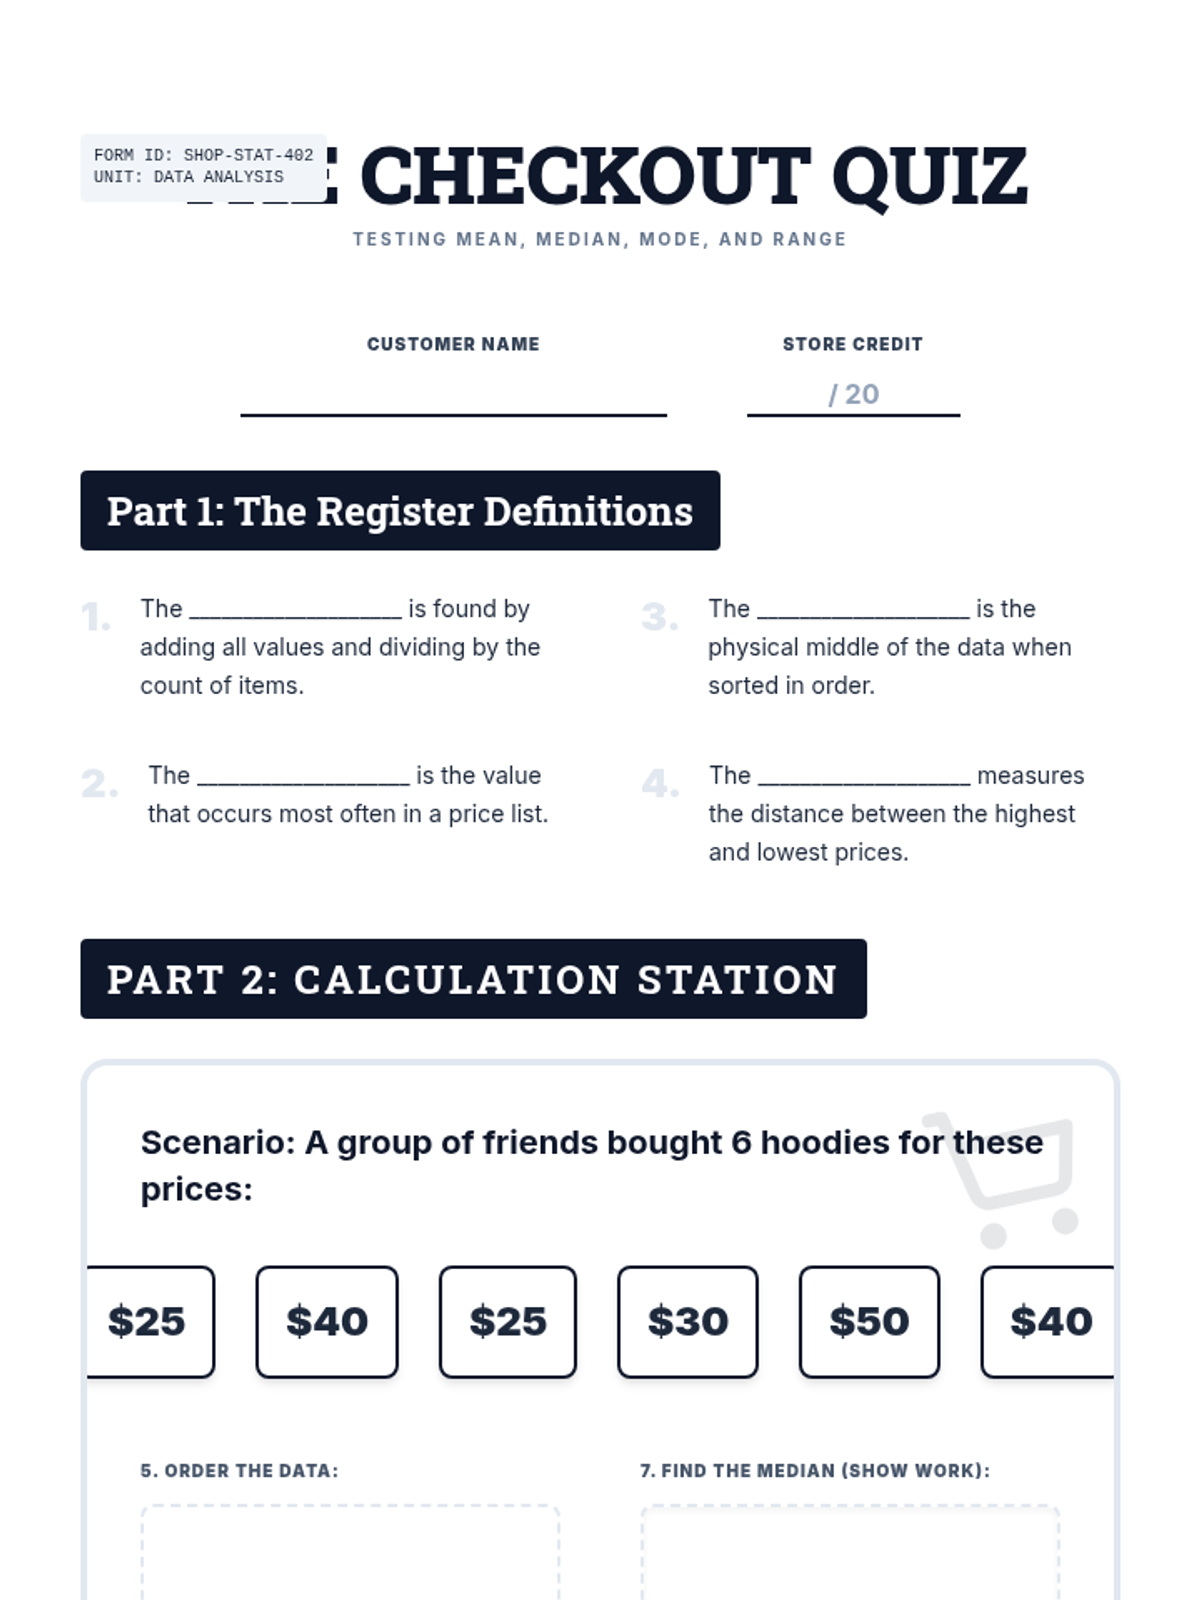
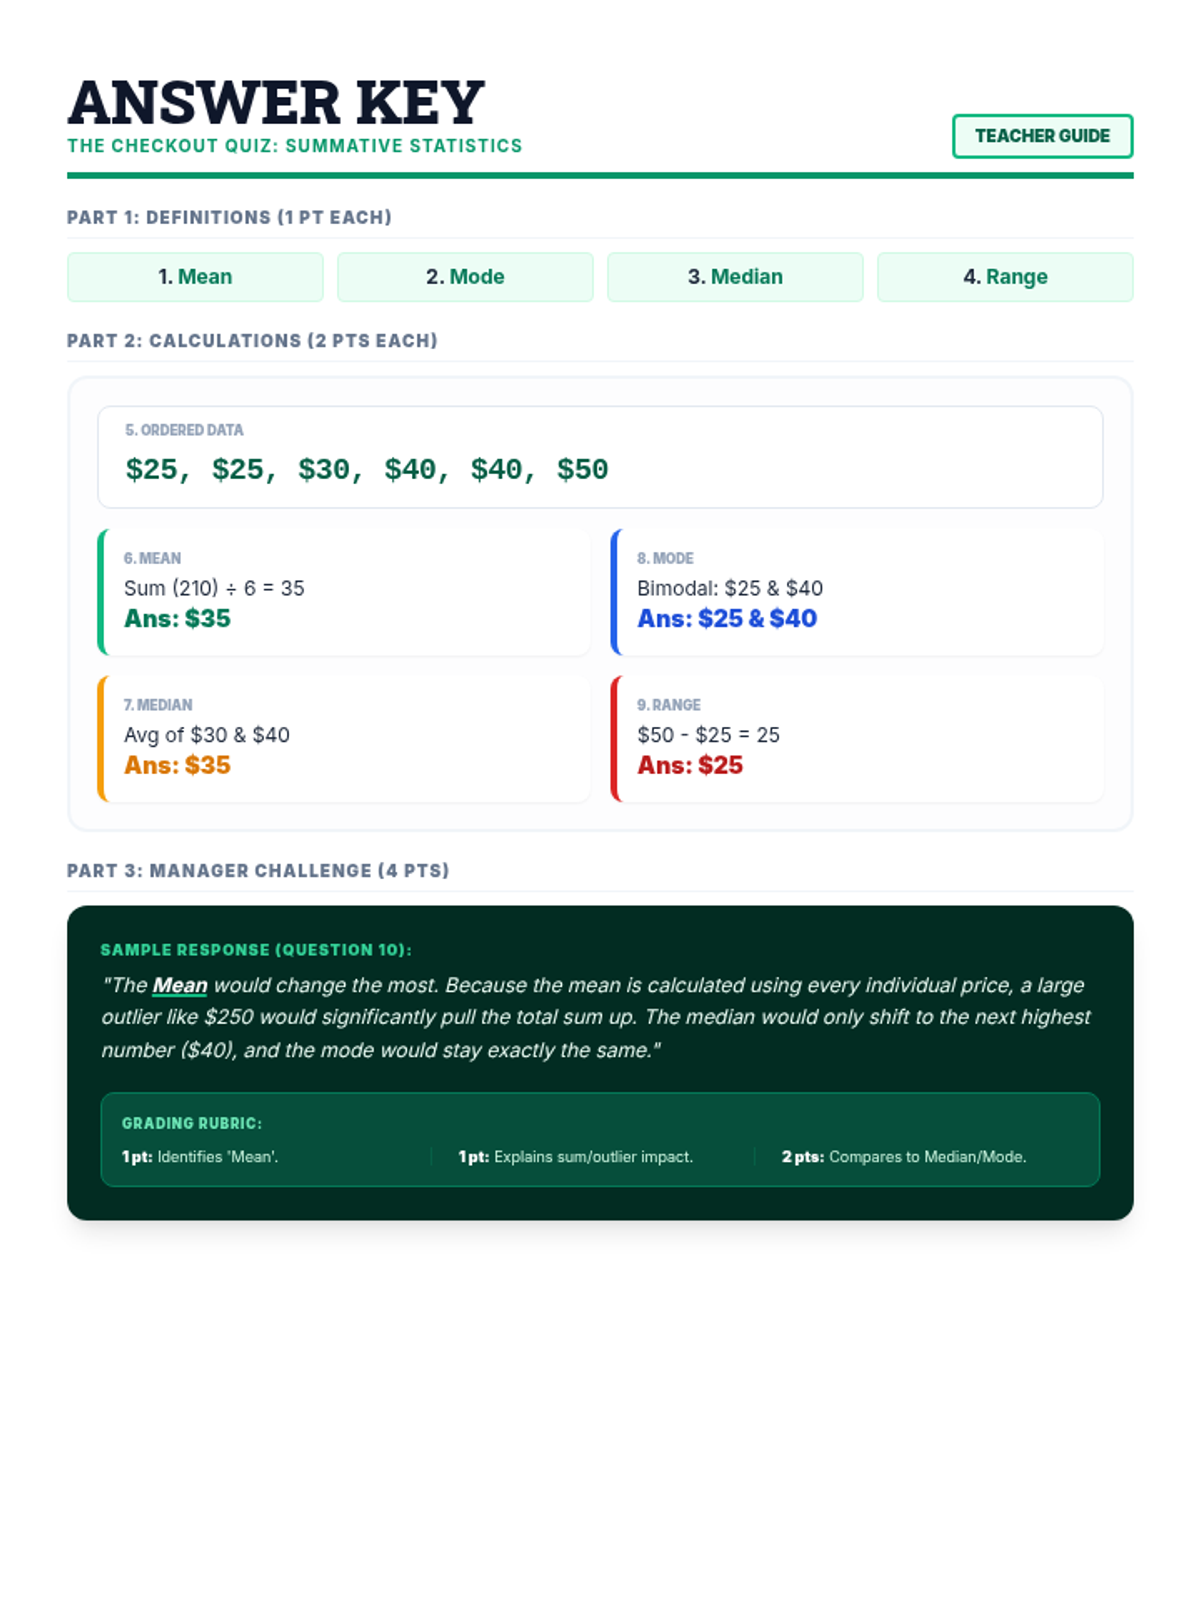
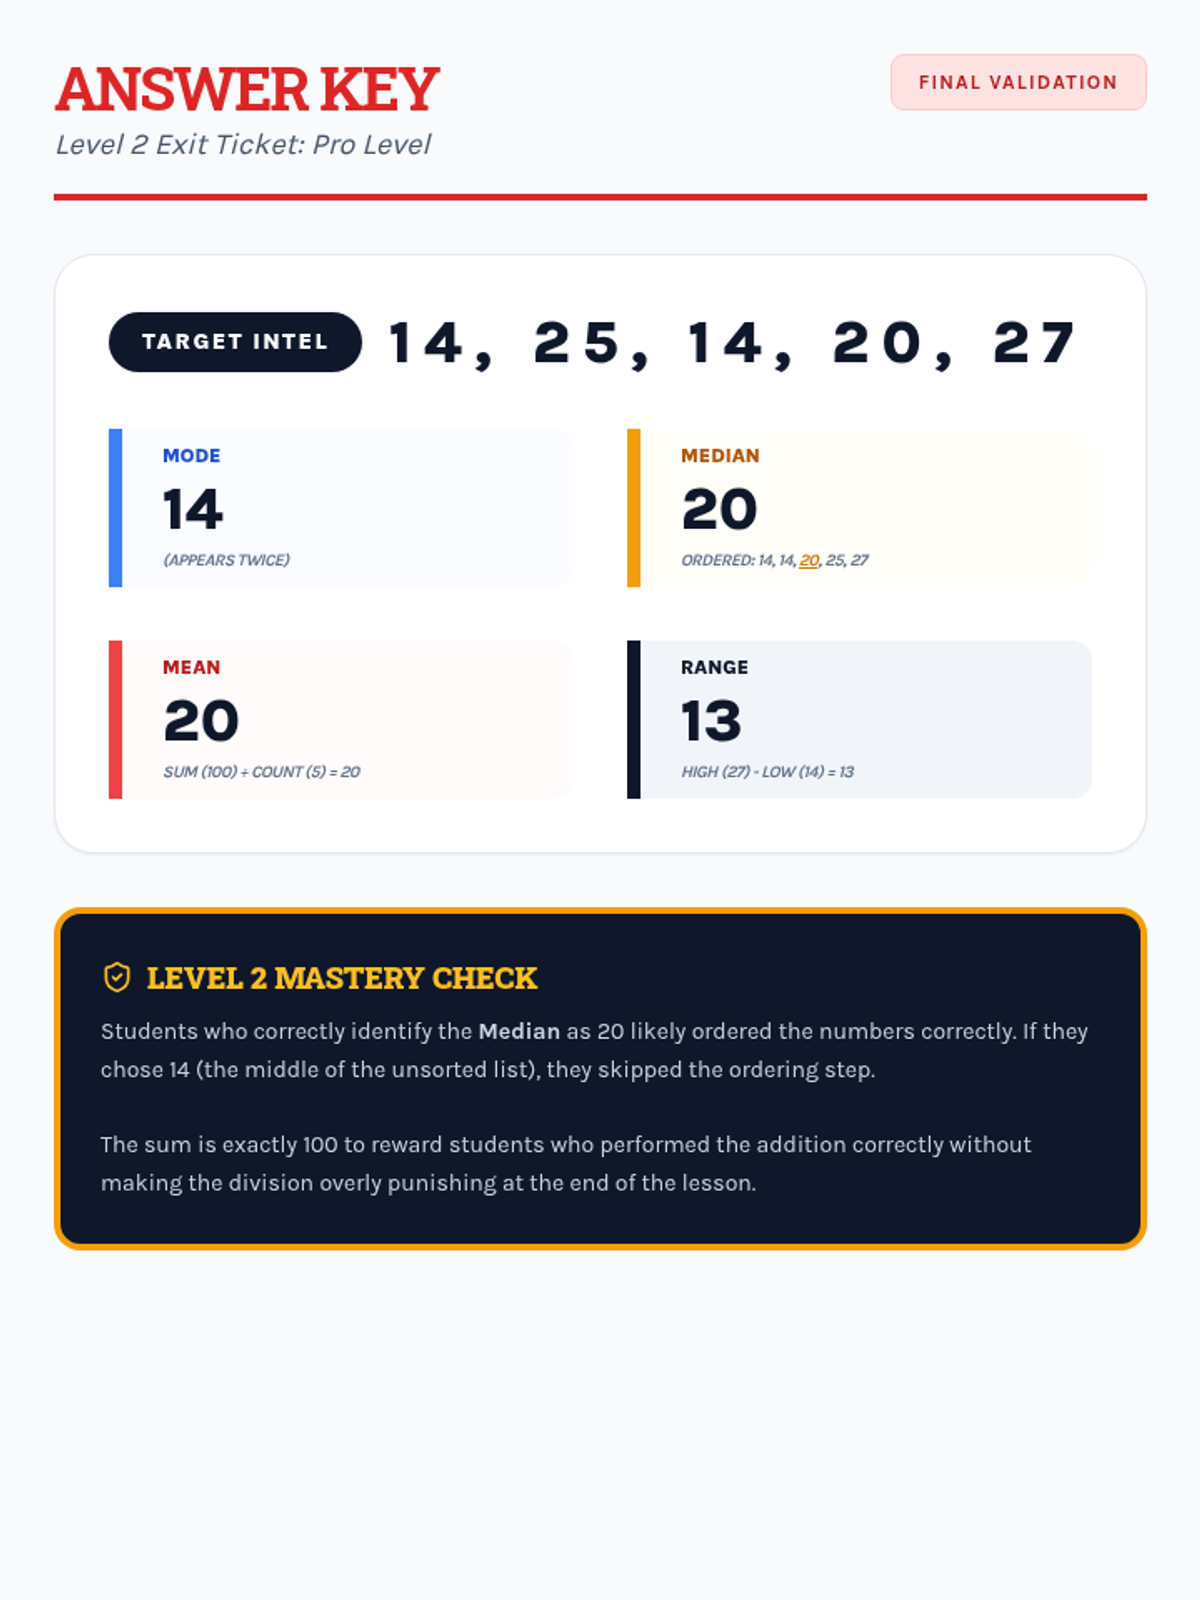
A comprehensive lesson on calculating and interpreting mean, median, mode, and range using real-world shopping and pricing data. Students will analyze price lists for various items to master basic statistics.

CS

Crysta Schwartz

Elementary Teacher
4/27
Lesson
High School Statistics Test Assessment
High School Statistics Answer Key

High School Statistical Mastery

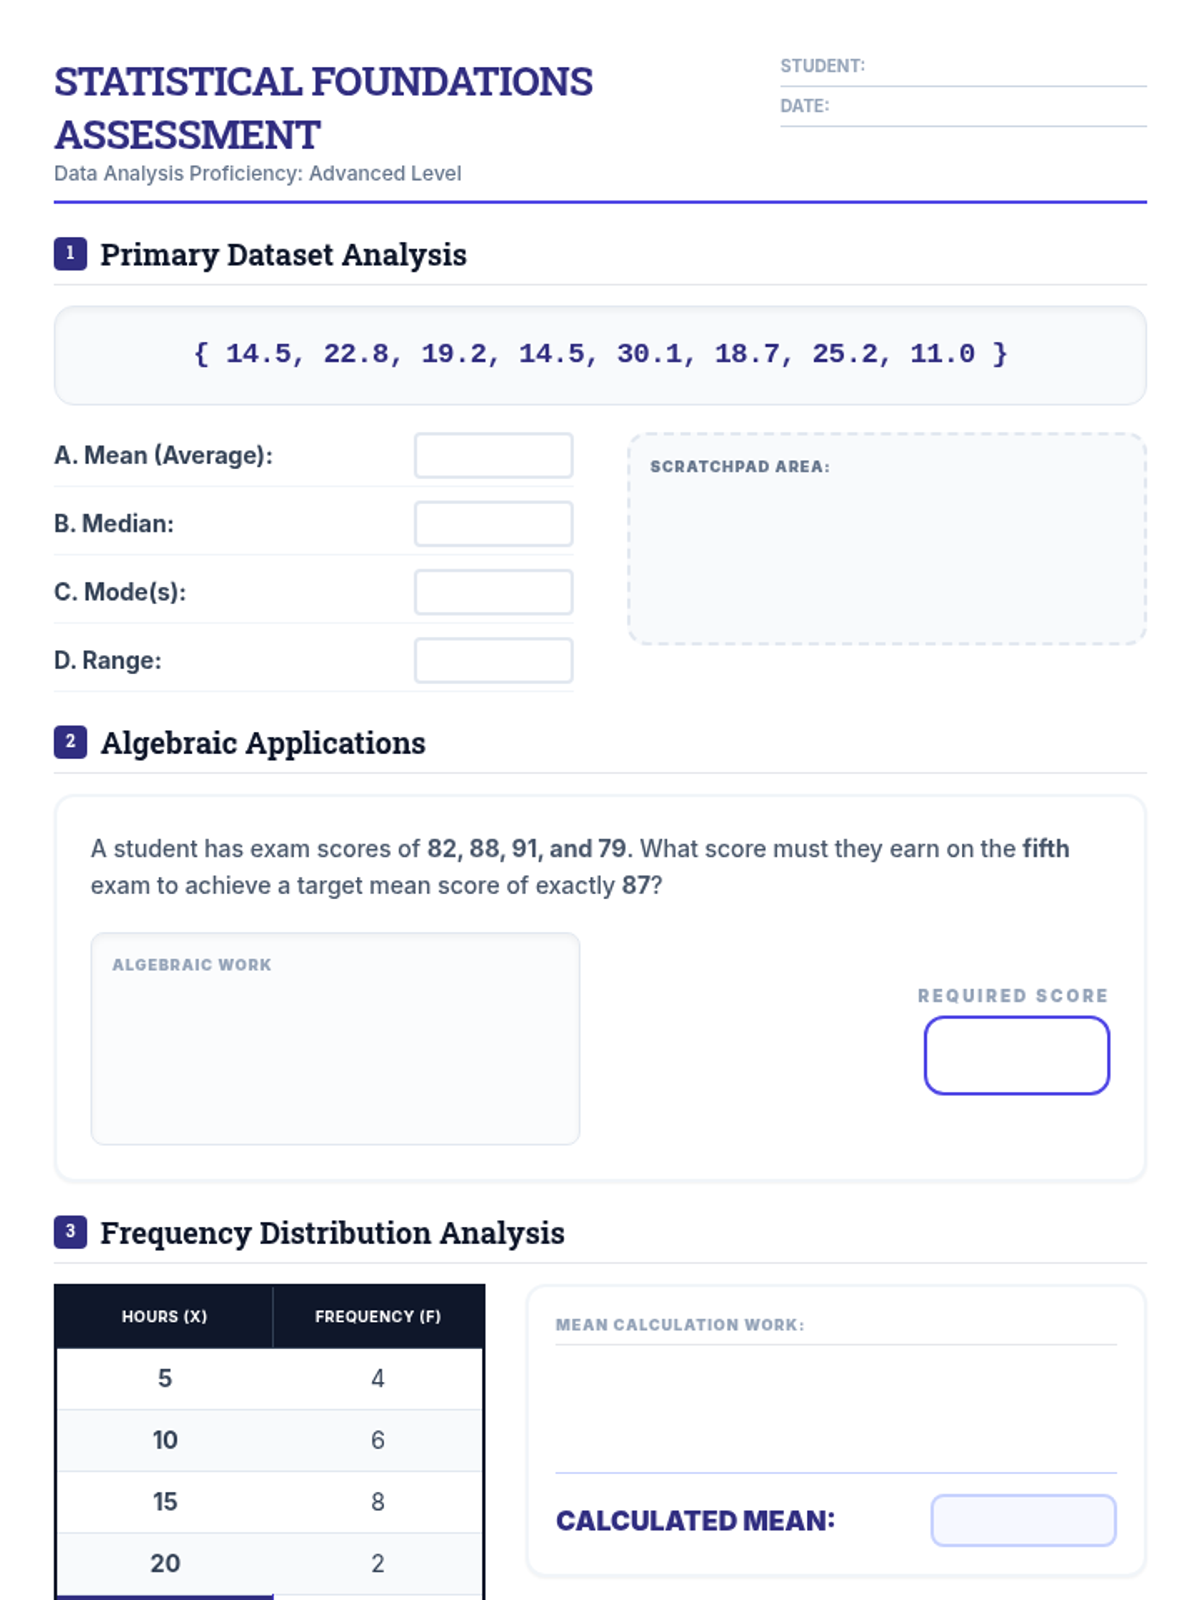
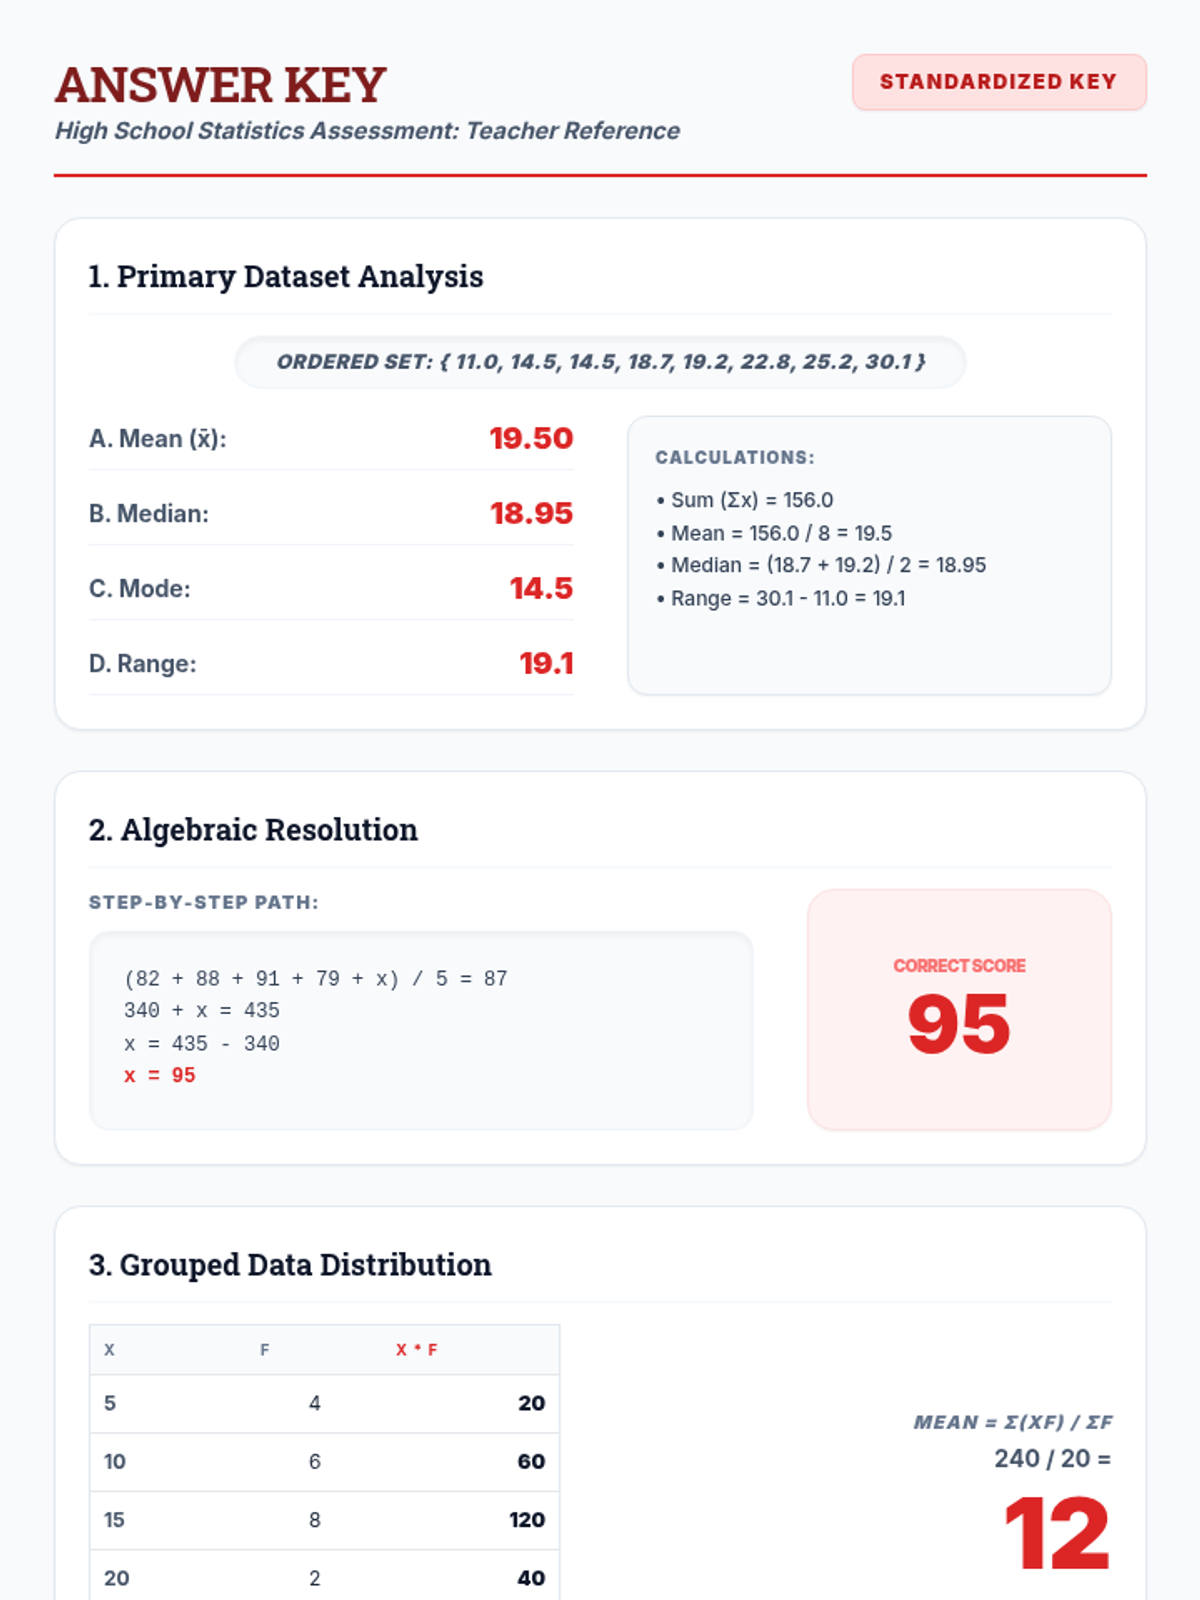
Advanced applications of central tendency and spread, including algebraic problem-solving, weighted means, and the mathematical impact of outliers for high school students.

K

Karen.Ford

Special Education Teacher
4/27
Lesson
Academy Final Evaluation Test
Academy Final Evaluation Answer Key

Academy Final Evaluation

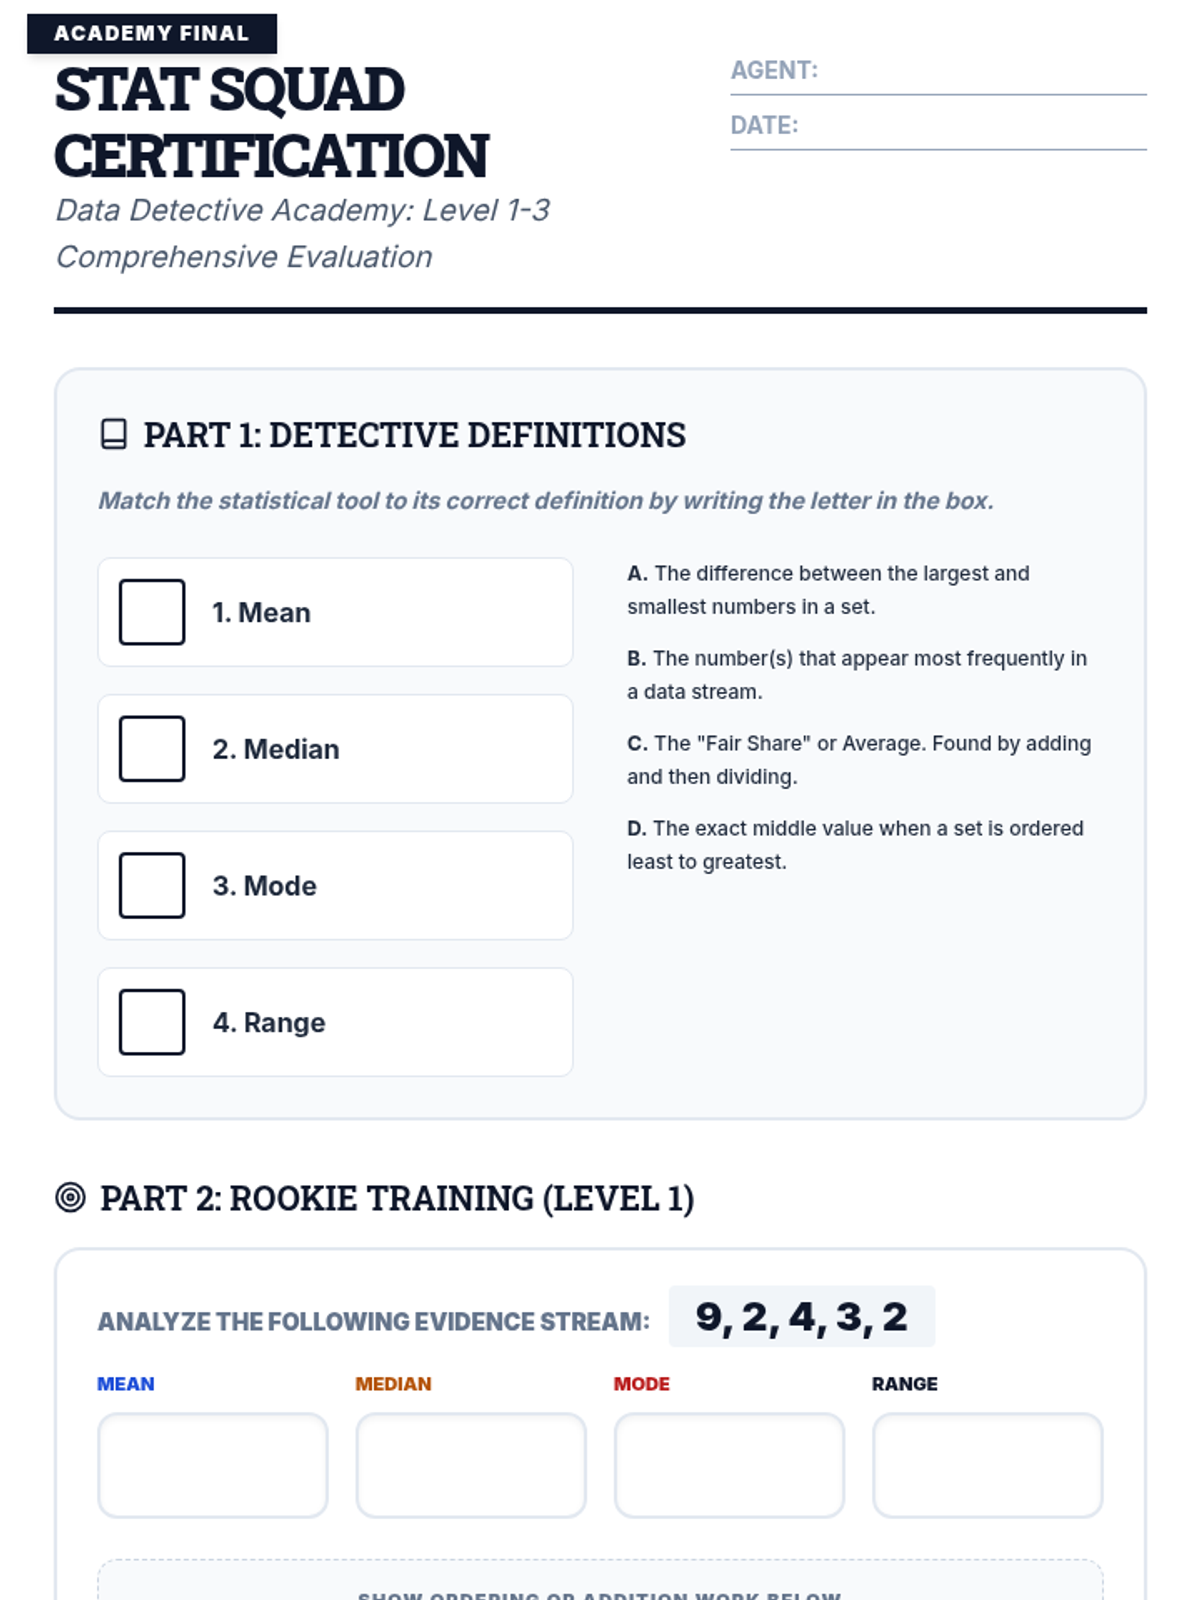
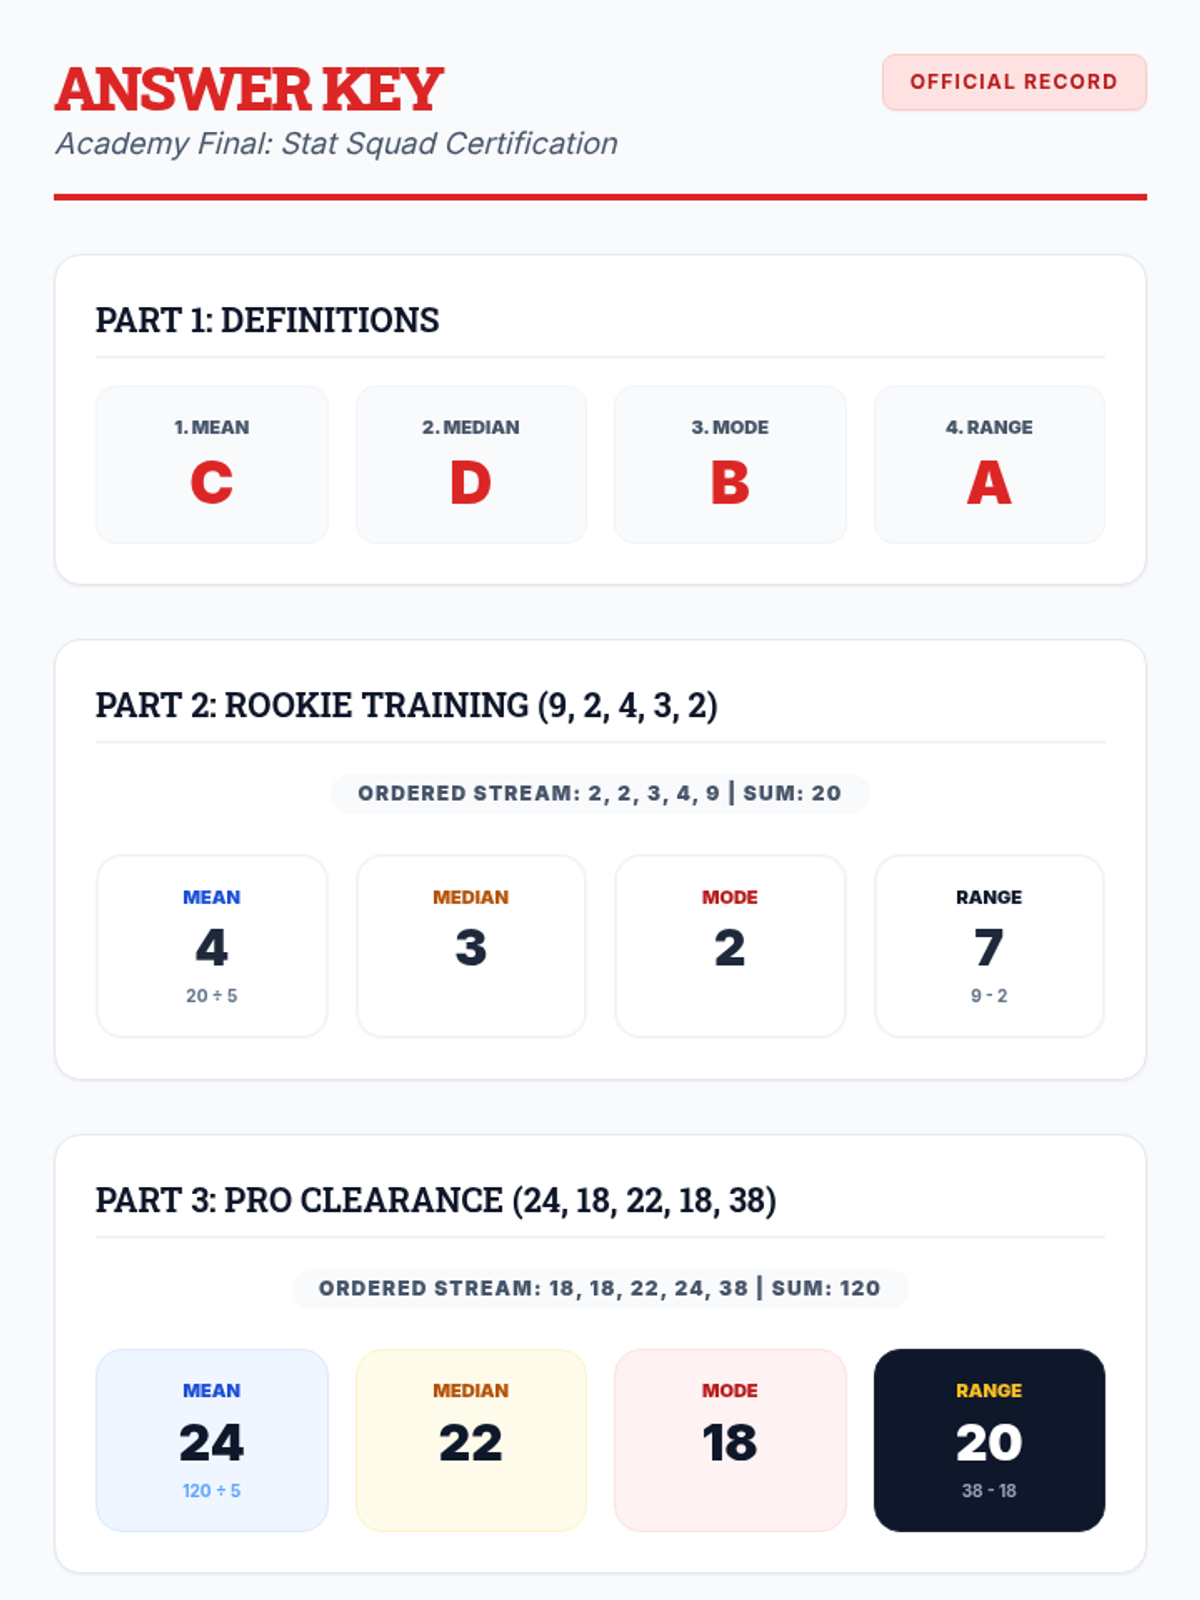
A comprehensive assessment covering Level 1, Level 2, and Level 3 data analysis, designed to evaluate mastery of mean, median, mode, and range in both numerical and narrative contexts.

K

Karen.Ford

Special Education Teacher
4/27
Lesson
Mystery extraction Slides
Mystery Logs Worksheet
Mystery Logs Answer Key

Word Problem Mysteries

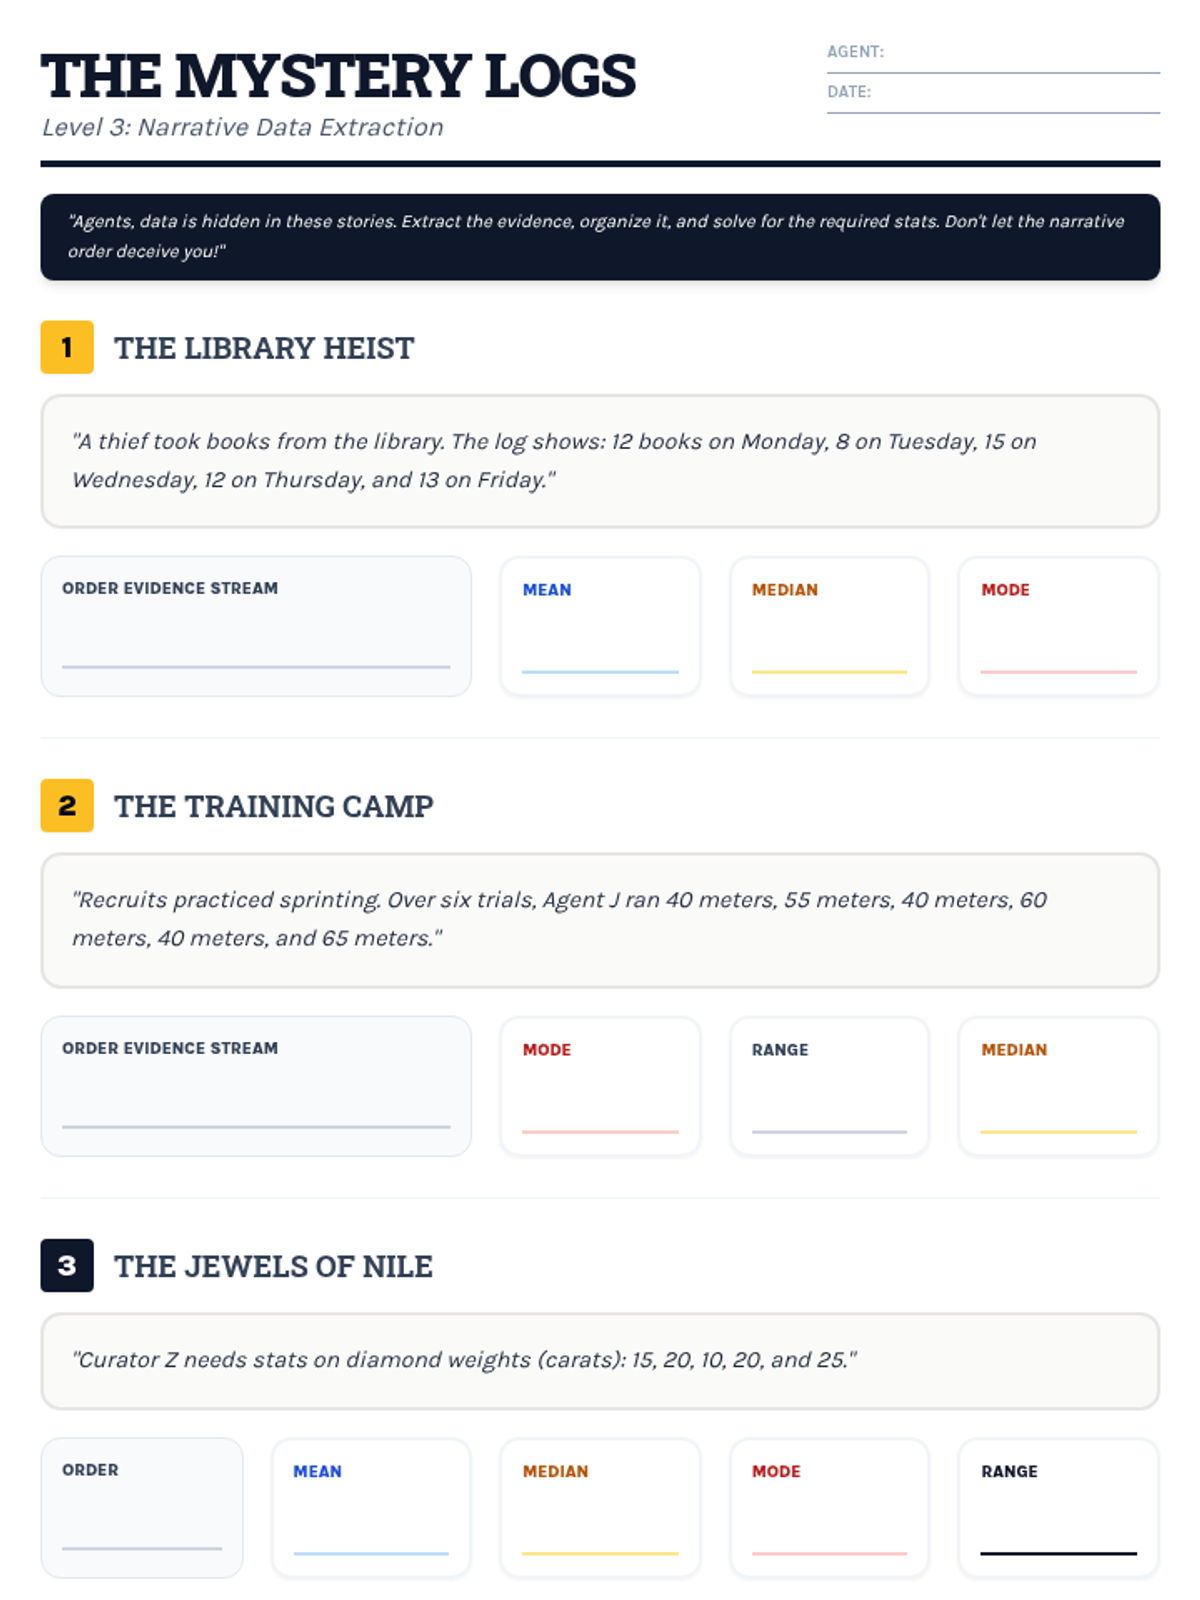
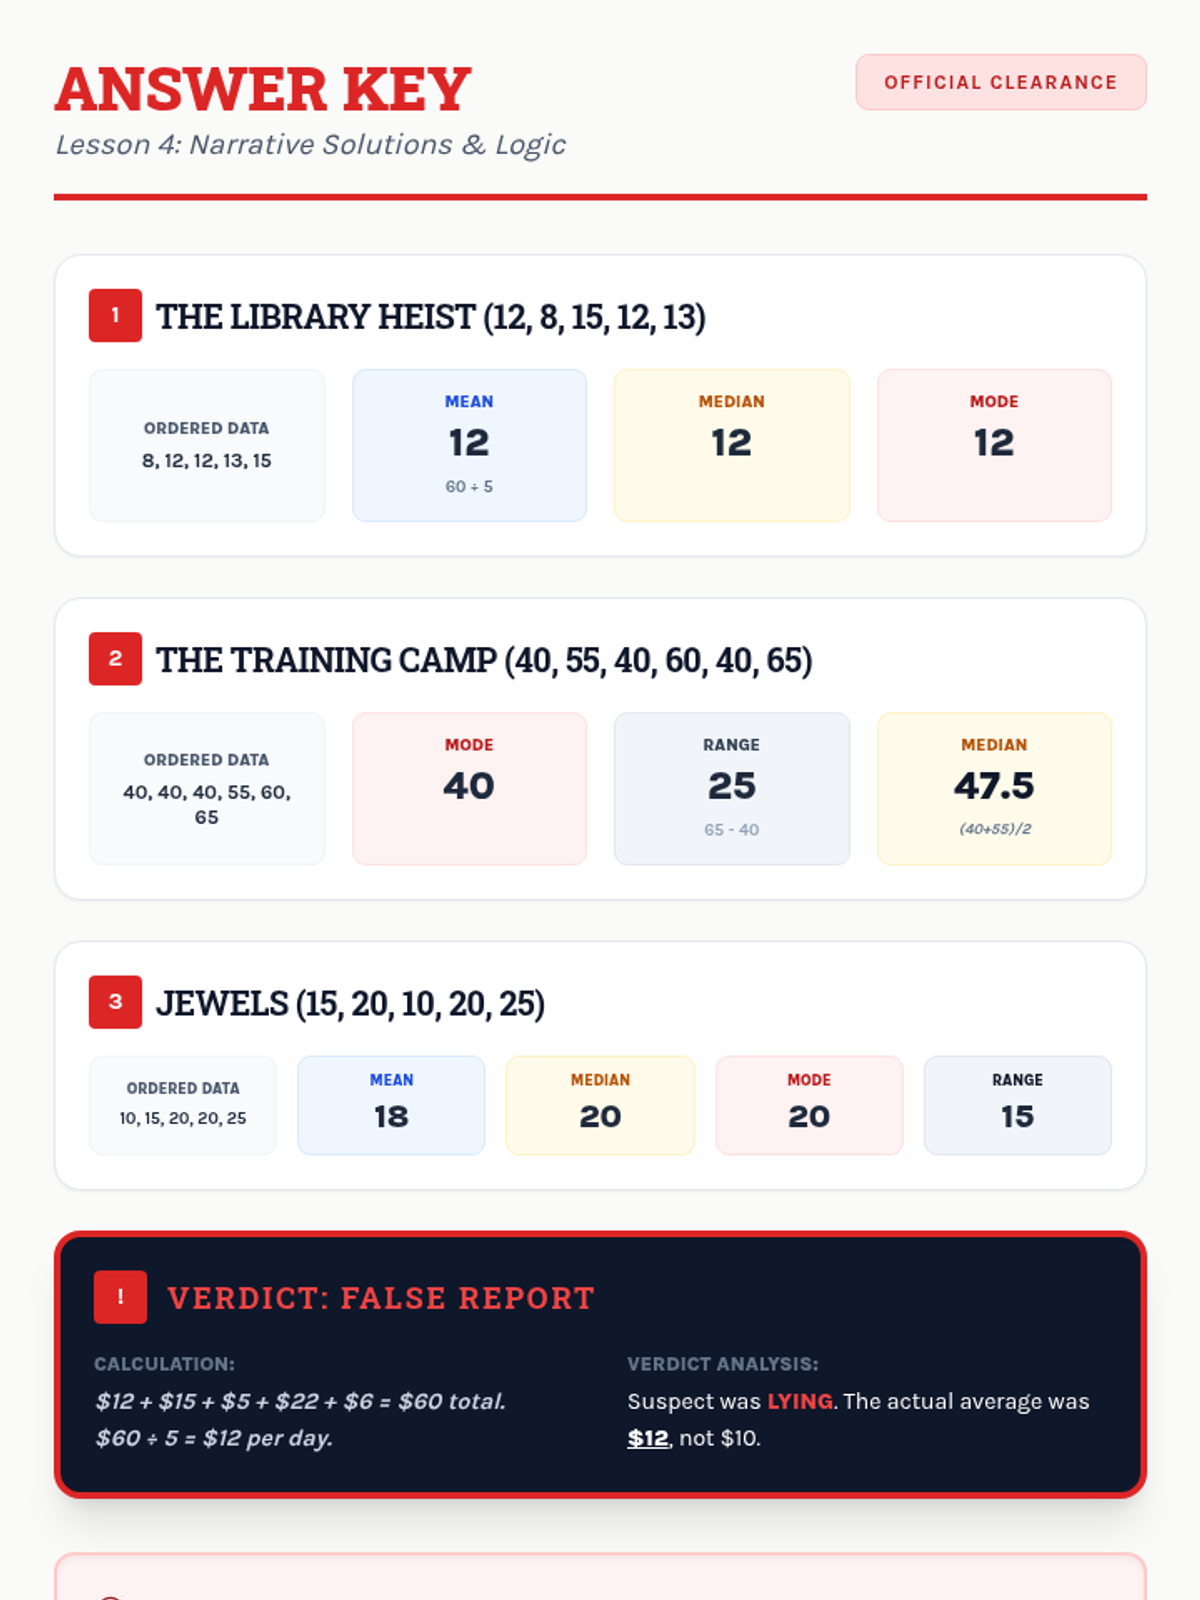
Students interpret and solve word problems involving mean, median, mode, and range, focusing on extracting data from narrative contexts and real-world scenarios.

K

Karen.Ford

Special Education Teacher
4/27
Lesson
Case Files Practice Pack
Case Files Answer Key

Case Files Practice

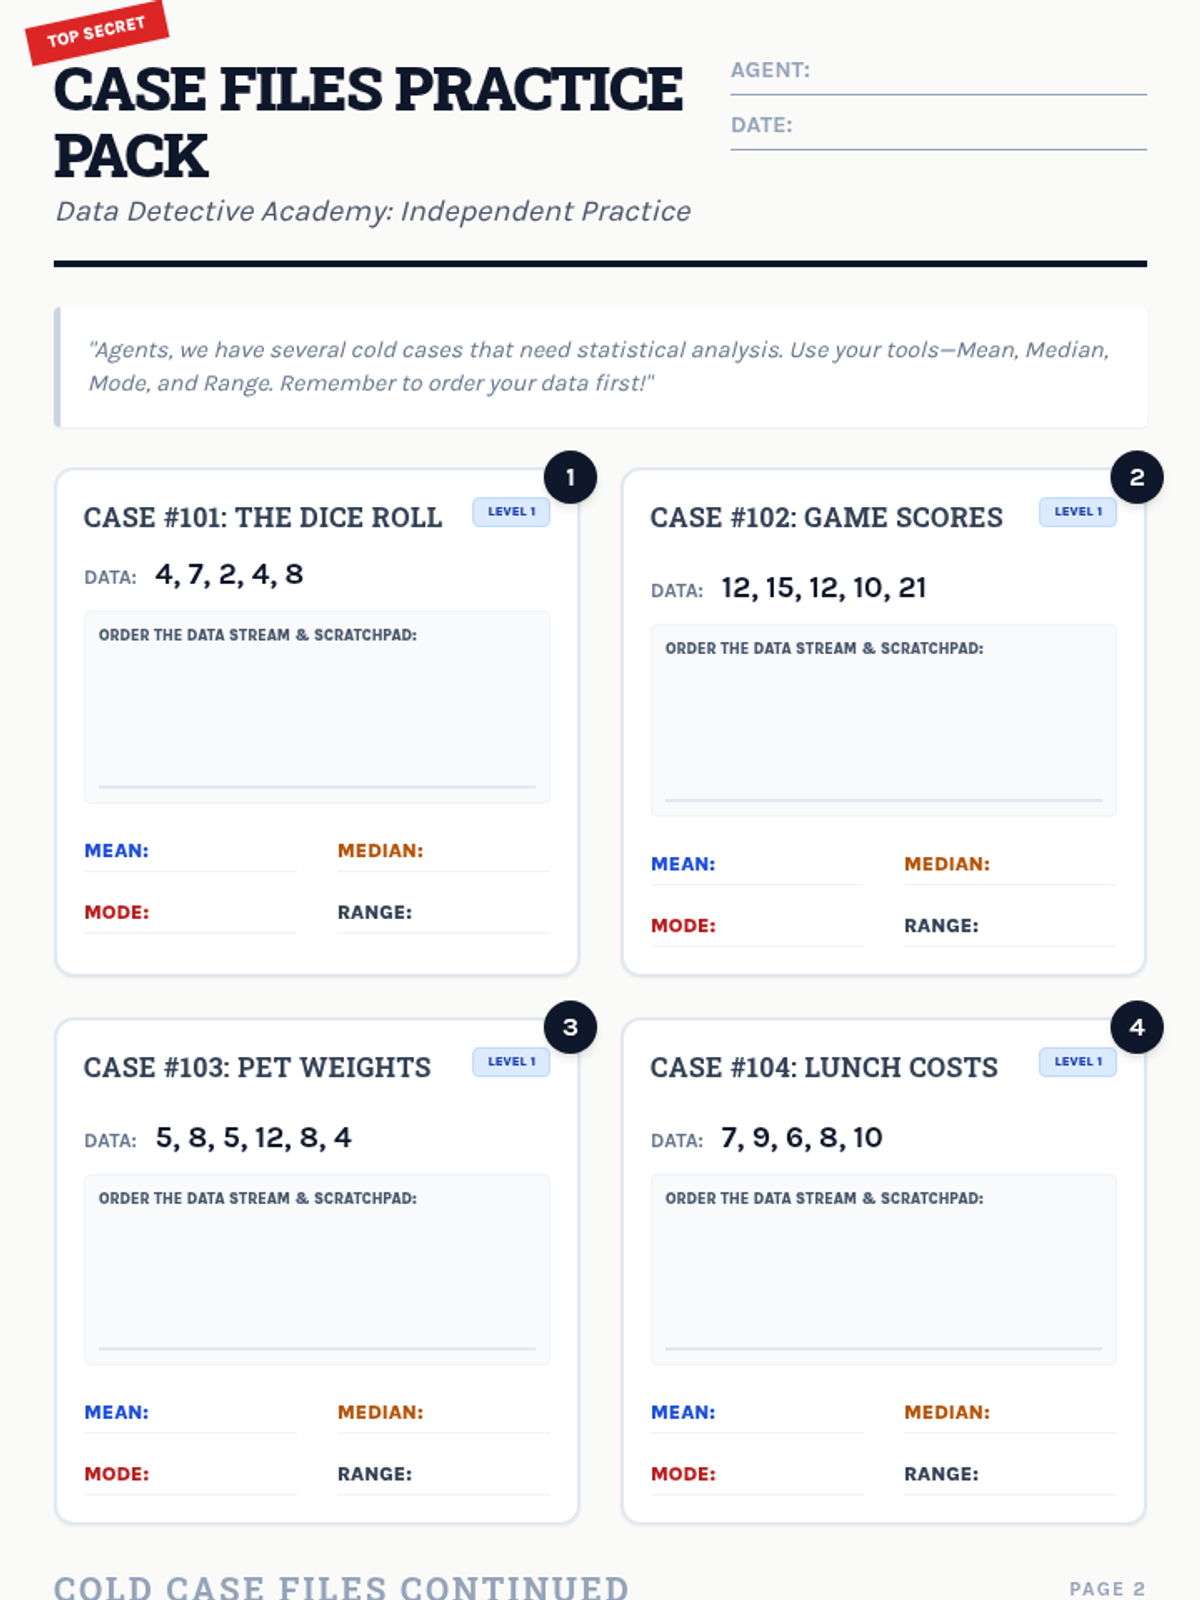
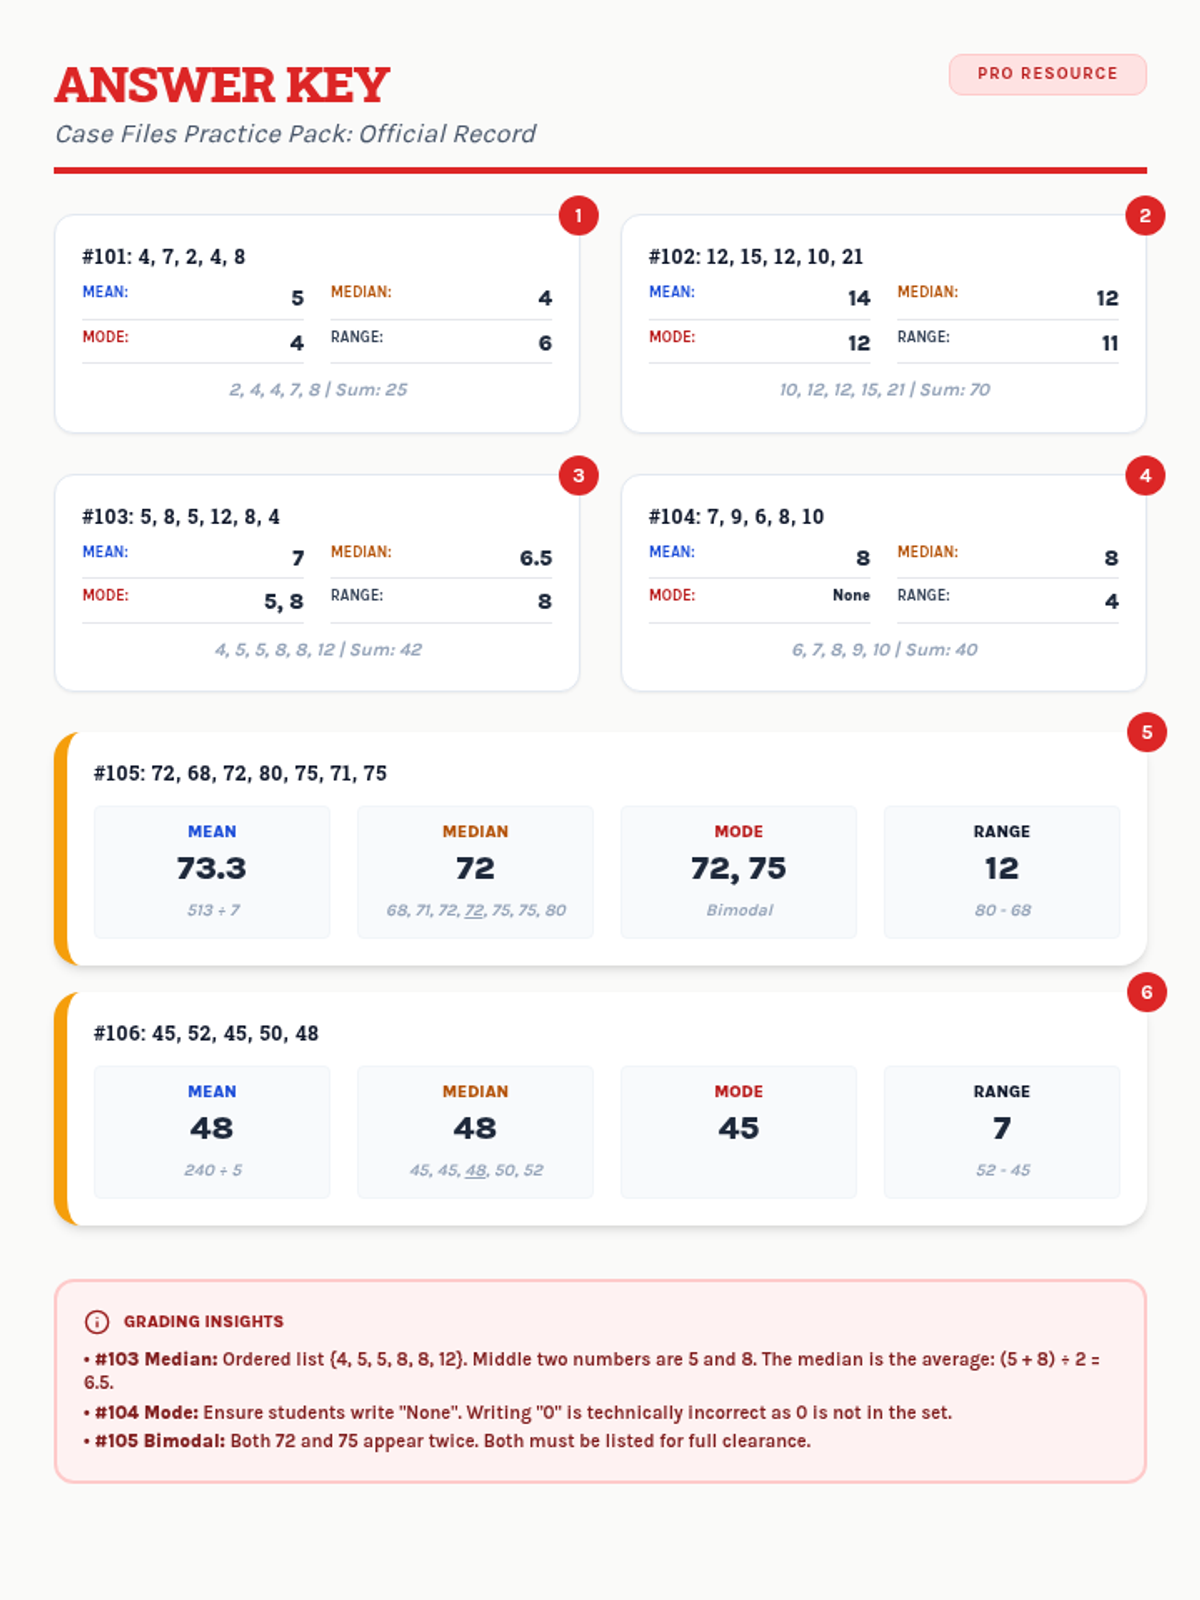
A collection of extra practice cases for mean, median, mode, and range, ranging from single-digit warmups to double-digit challenges, themed as unsolved detective files.

K

Karen.Ford

Special Education Teacher
4/27
Lesson
Stat Squad Pro Slides
Double Digit Data Worksheet
Double Digit Answer Key
Level 2 Exit Ticket
Level 2 Exit Ticket Key

Double Digit Detectives

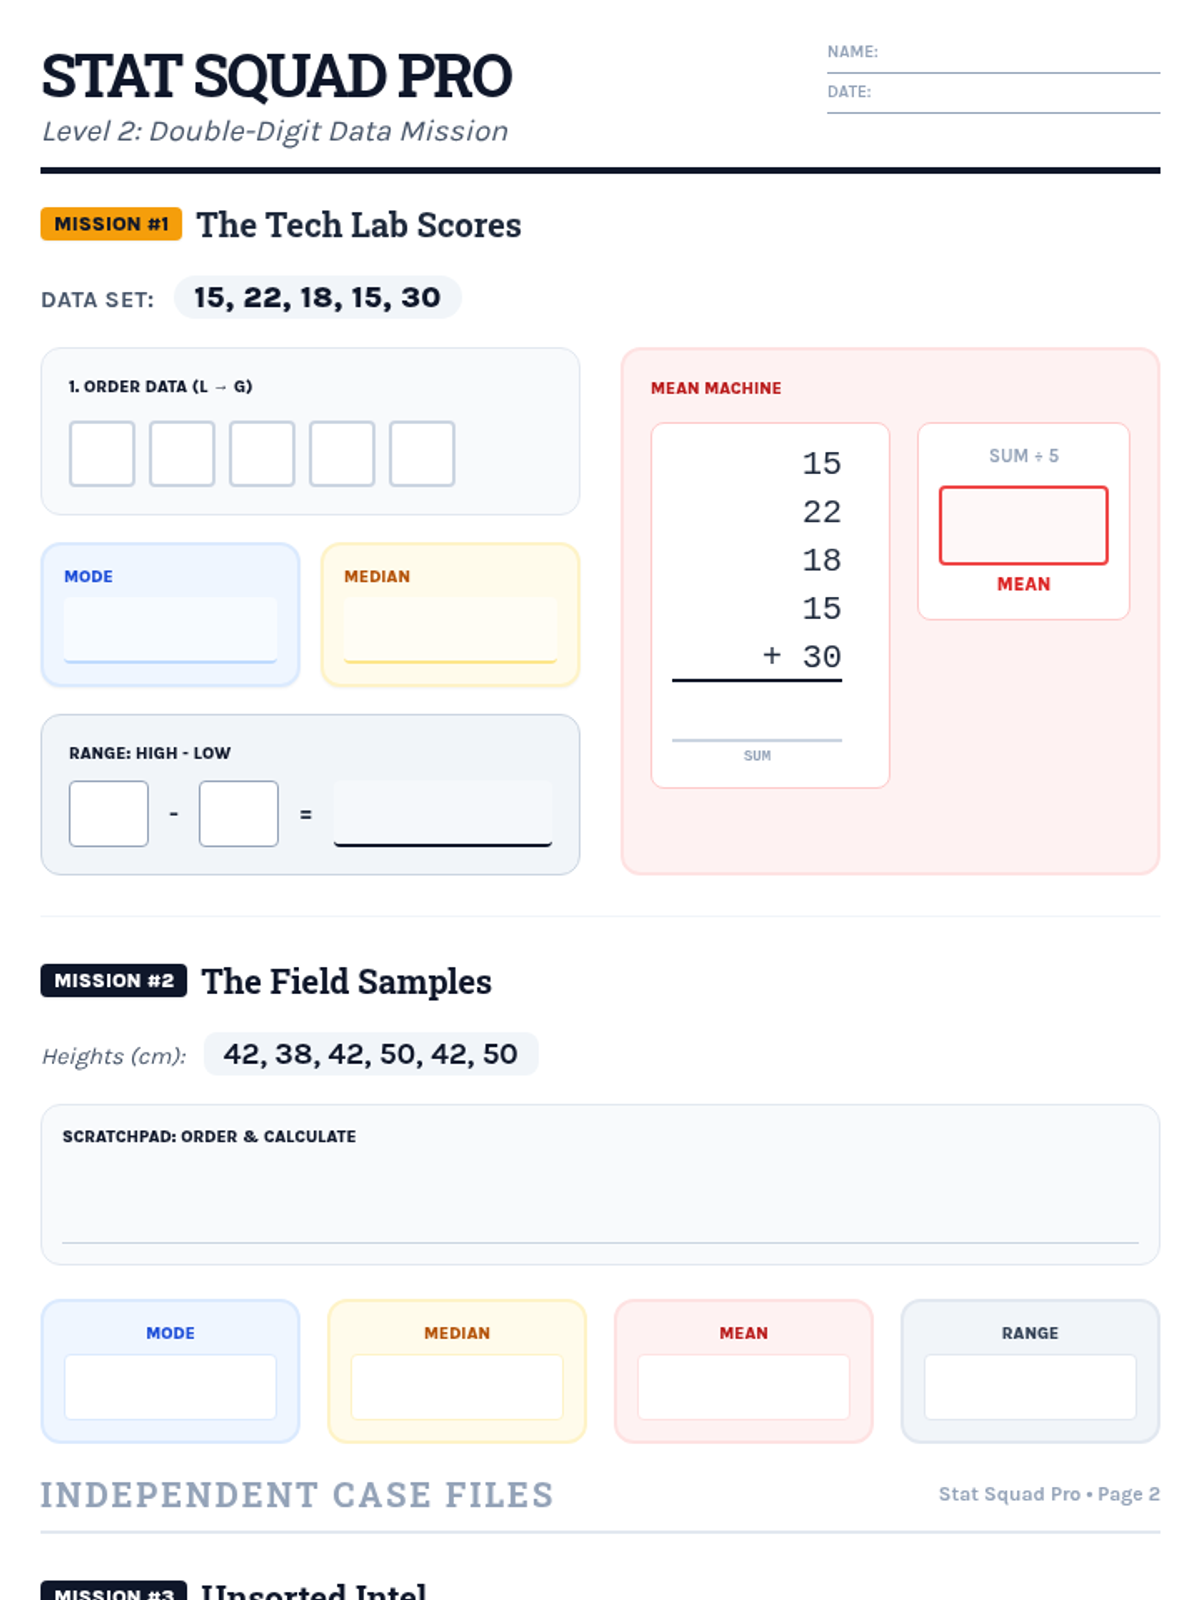
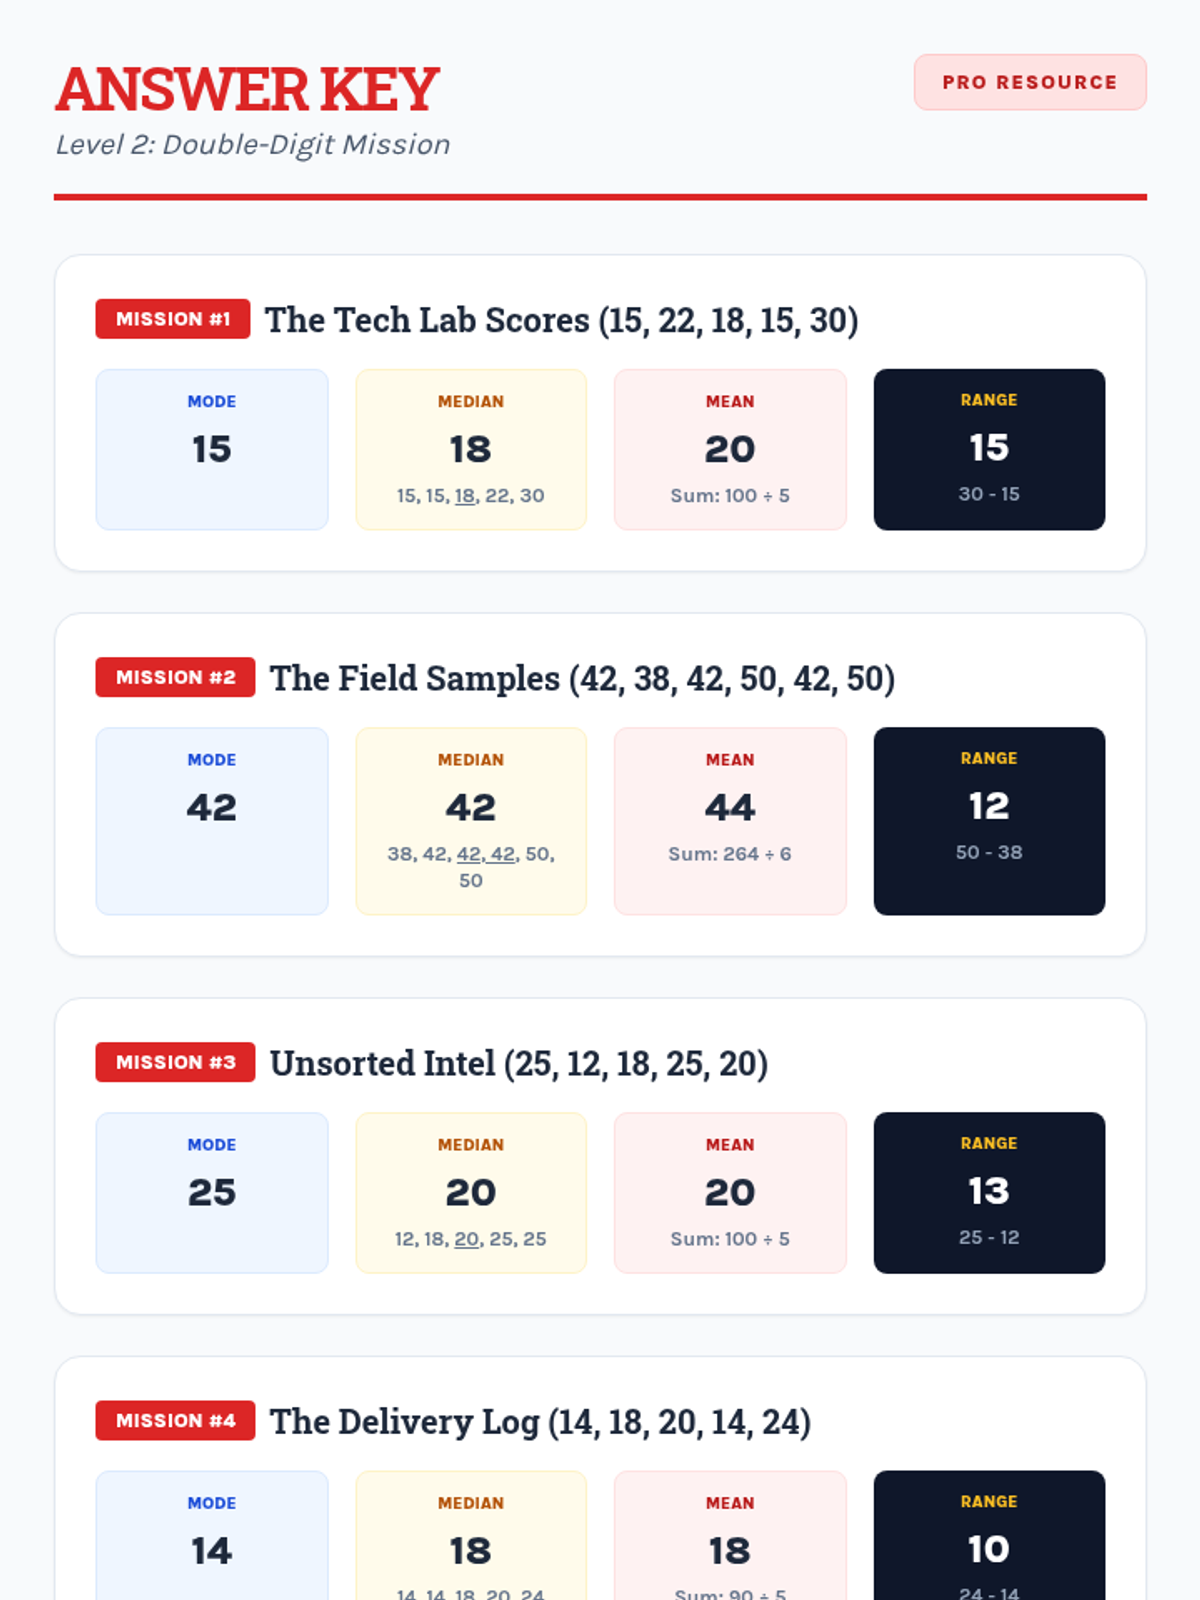
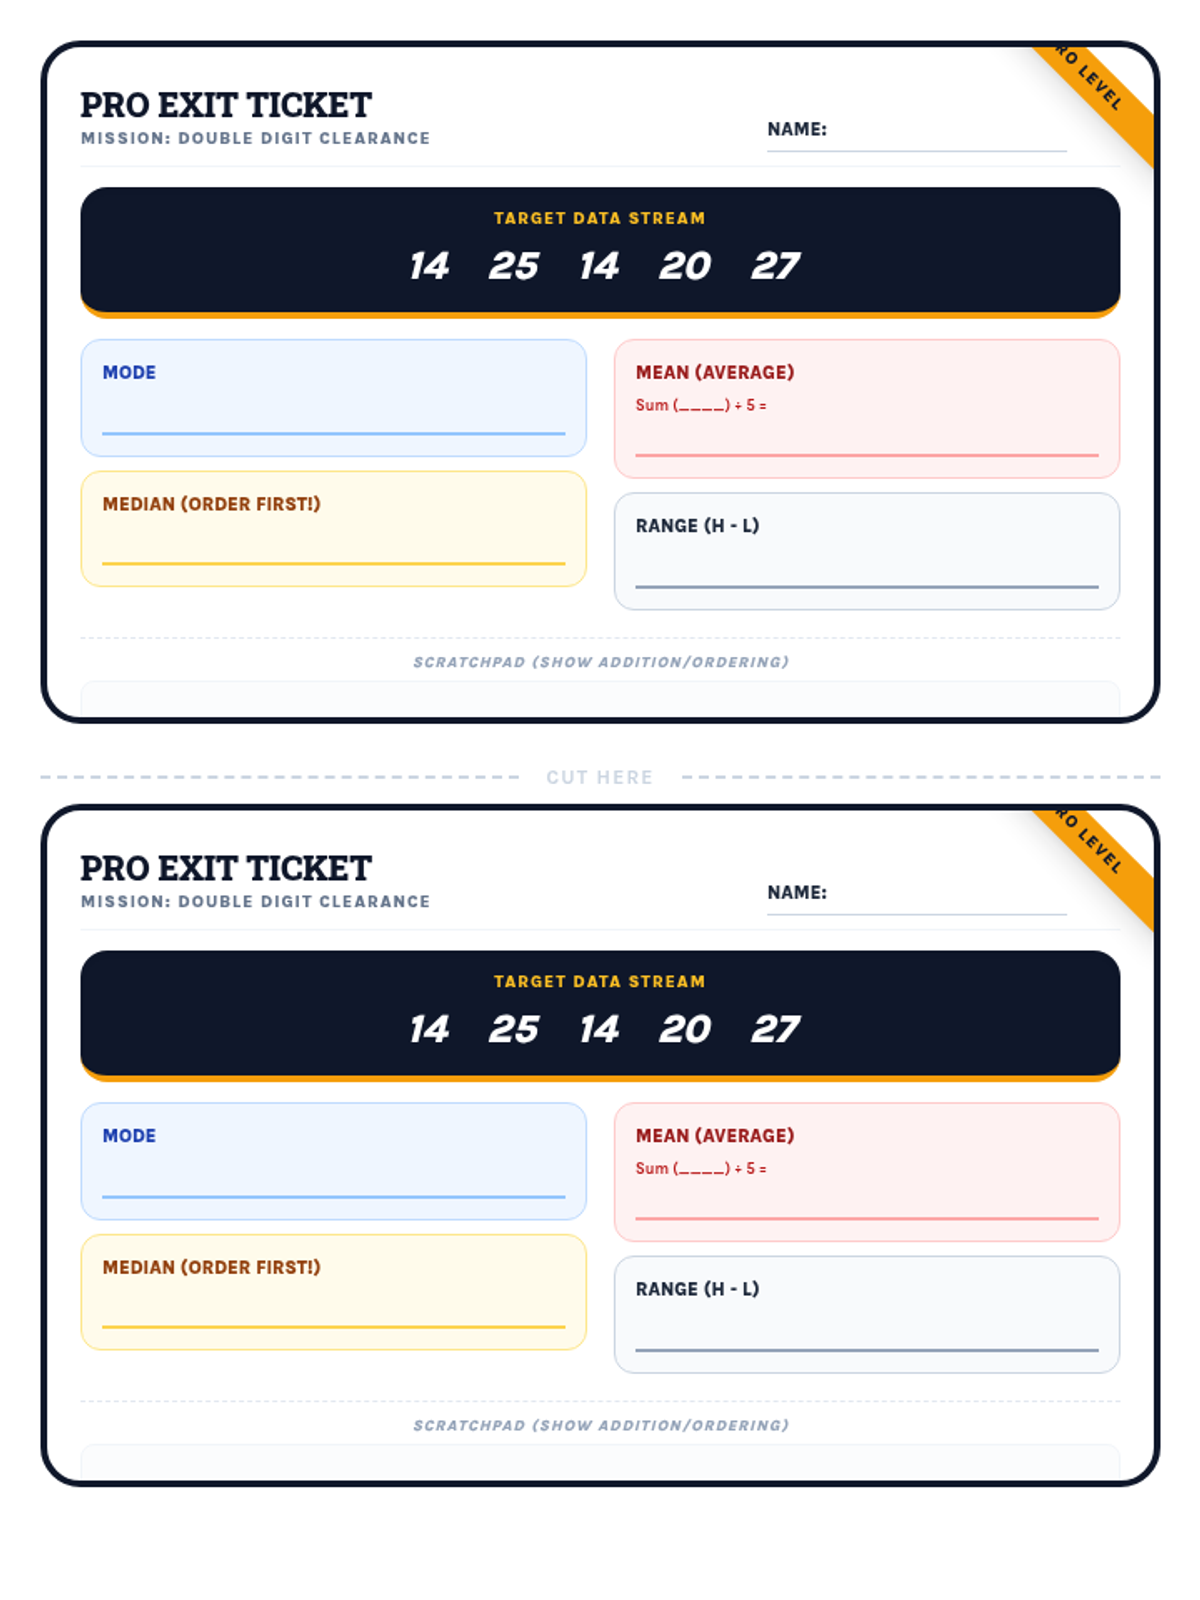
Students apply their knowledge of mean, median, mode, and range to data sets featuring two-digit numbers, focusing on multi-digit addition and division.

K

Karen.Ford

Special Education Teacher
4/27
Lesson
Scatter Spotter Slides
Scatter Spotter Worksheet
Scatter Spotter Answer Key

Scatter Spotter Case

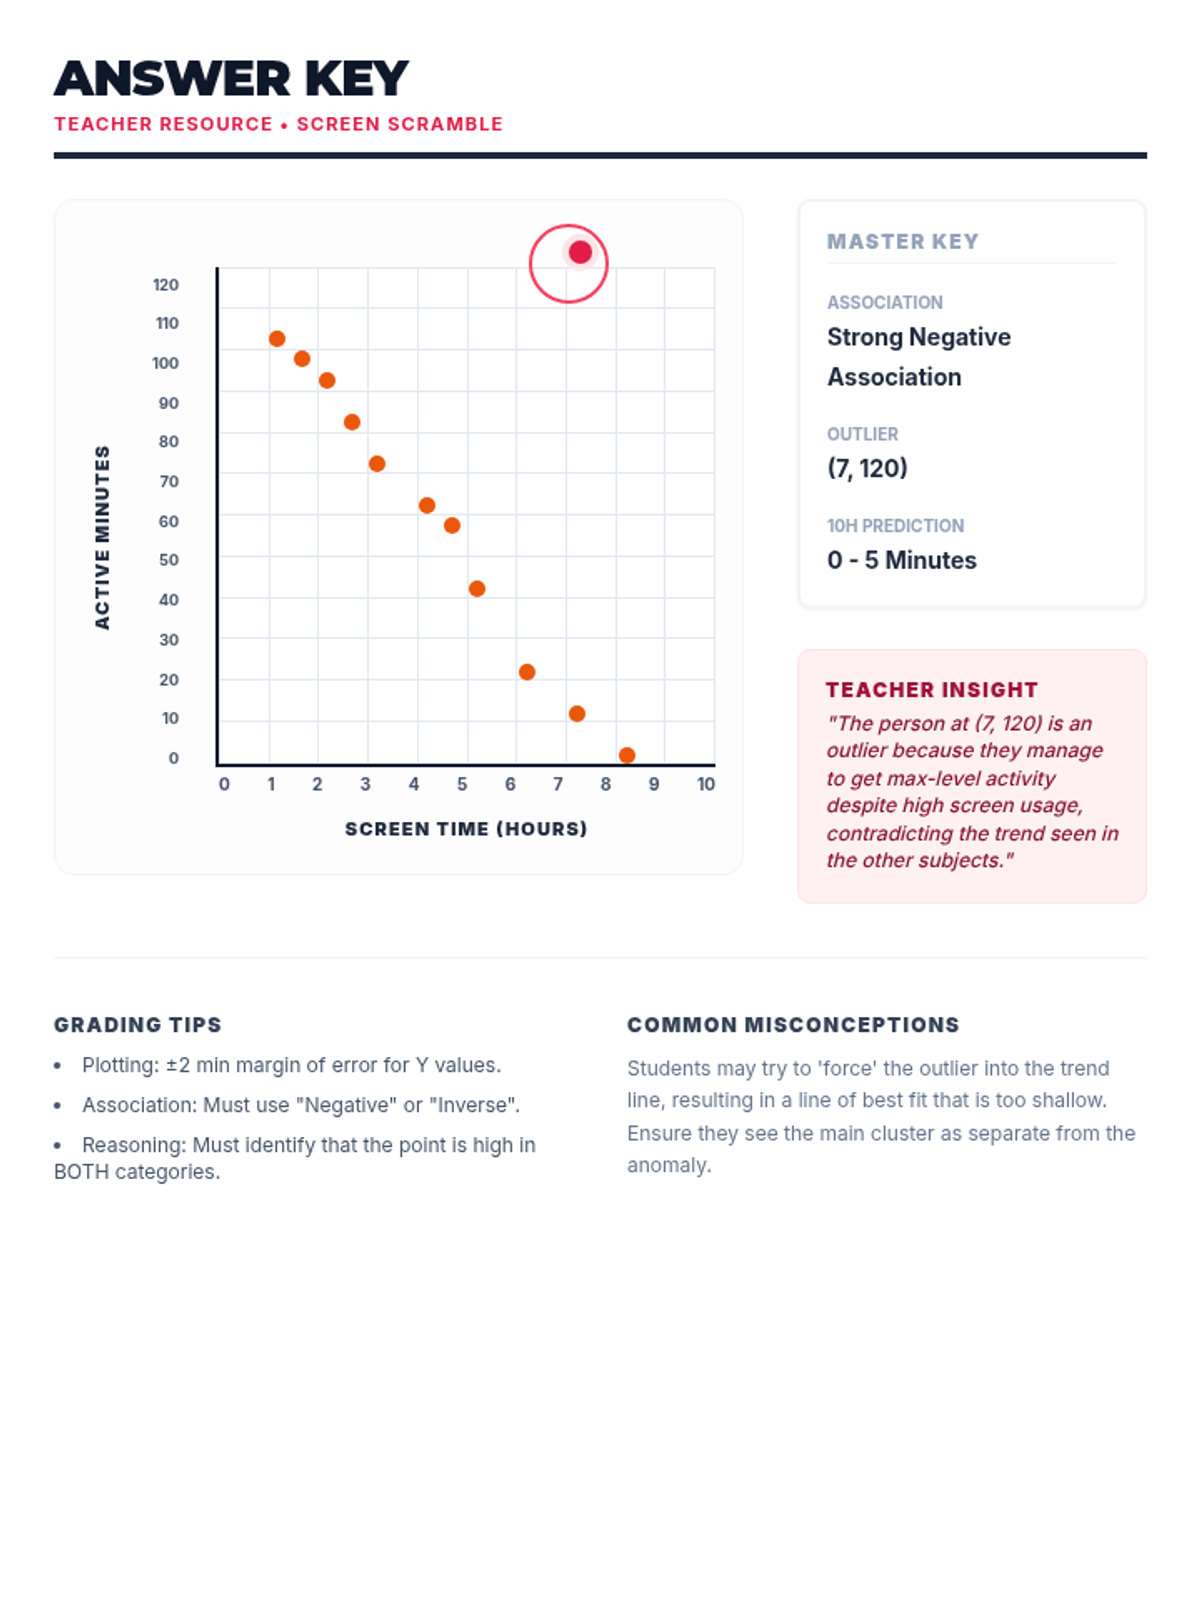
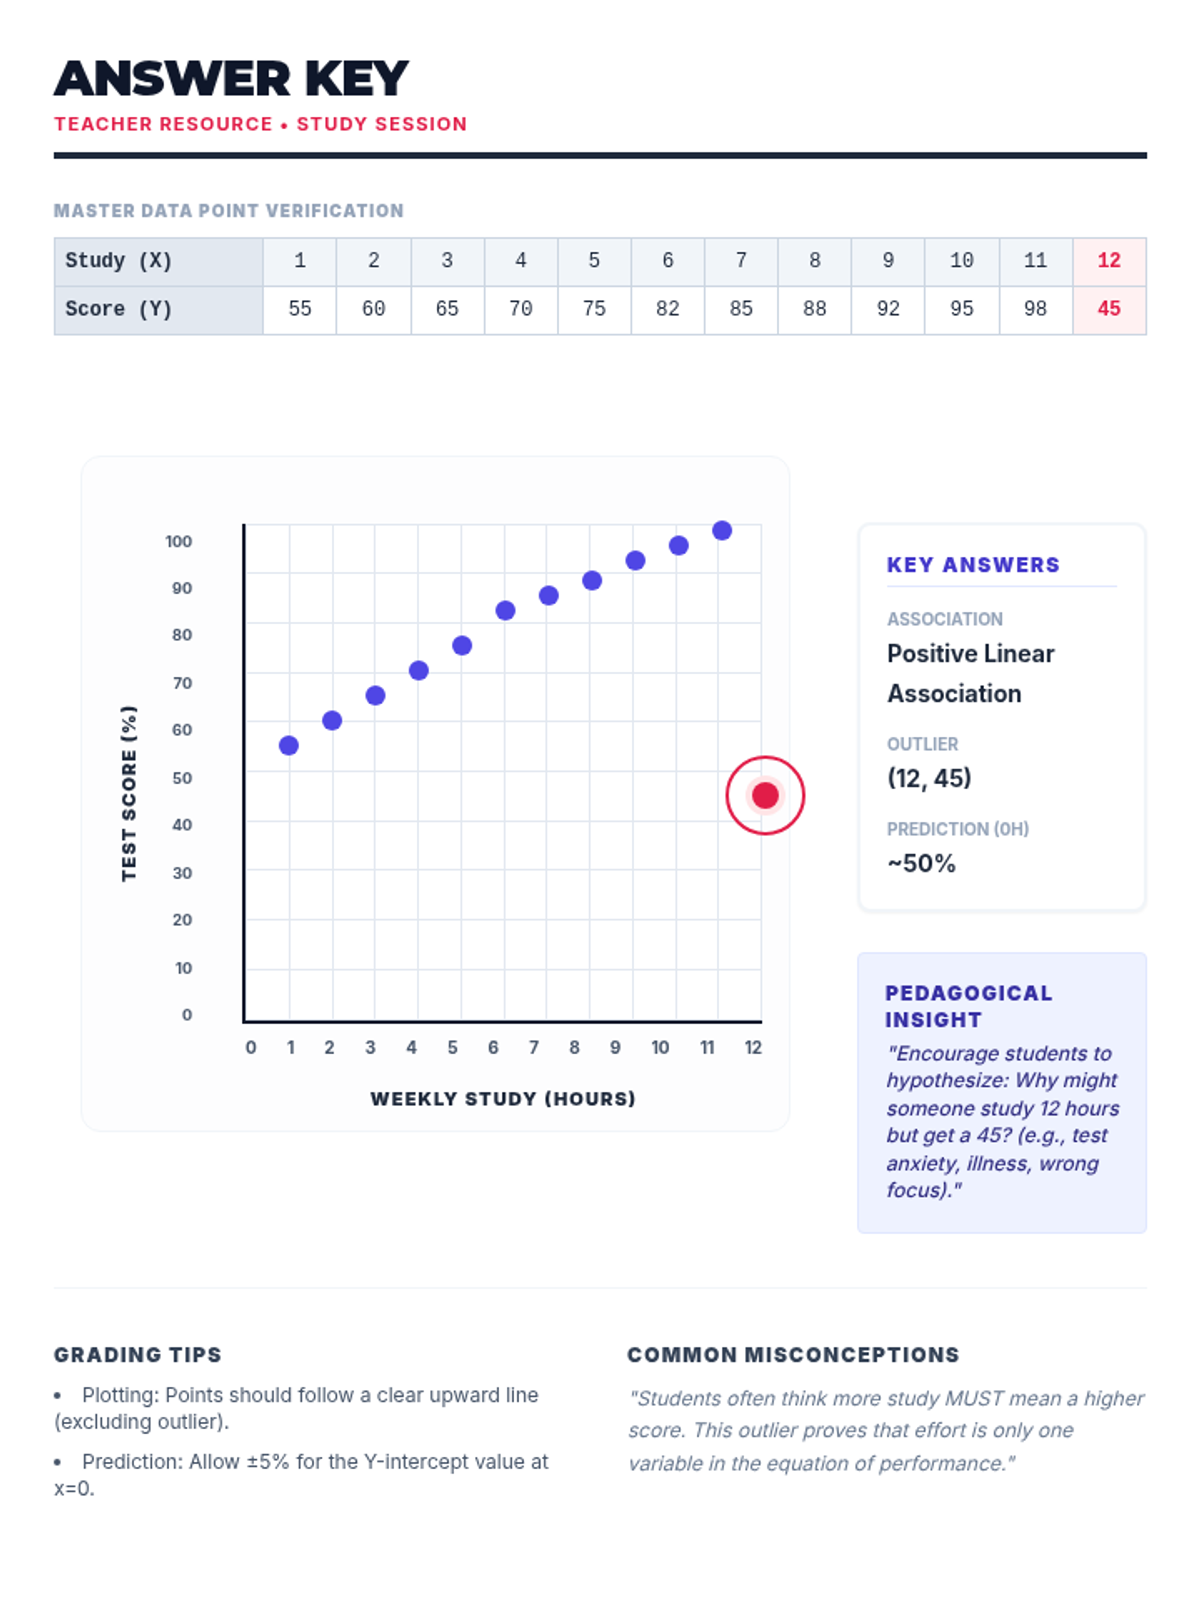
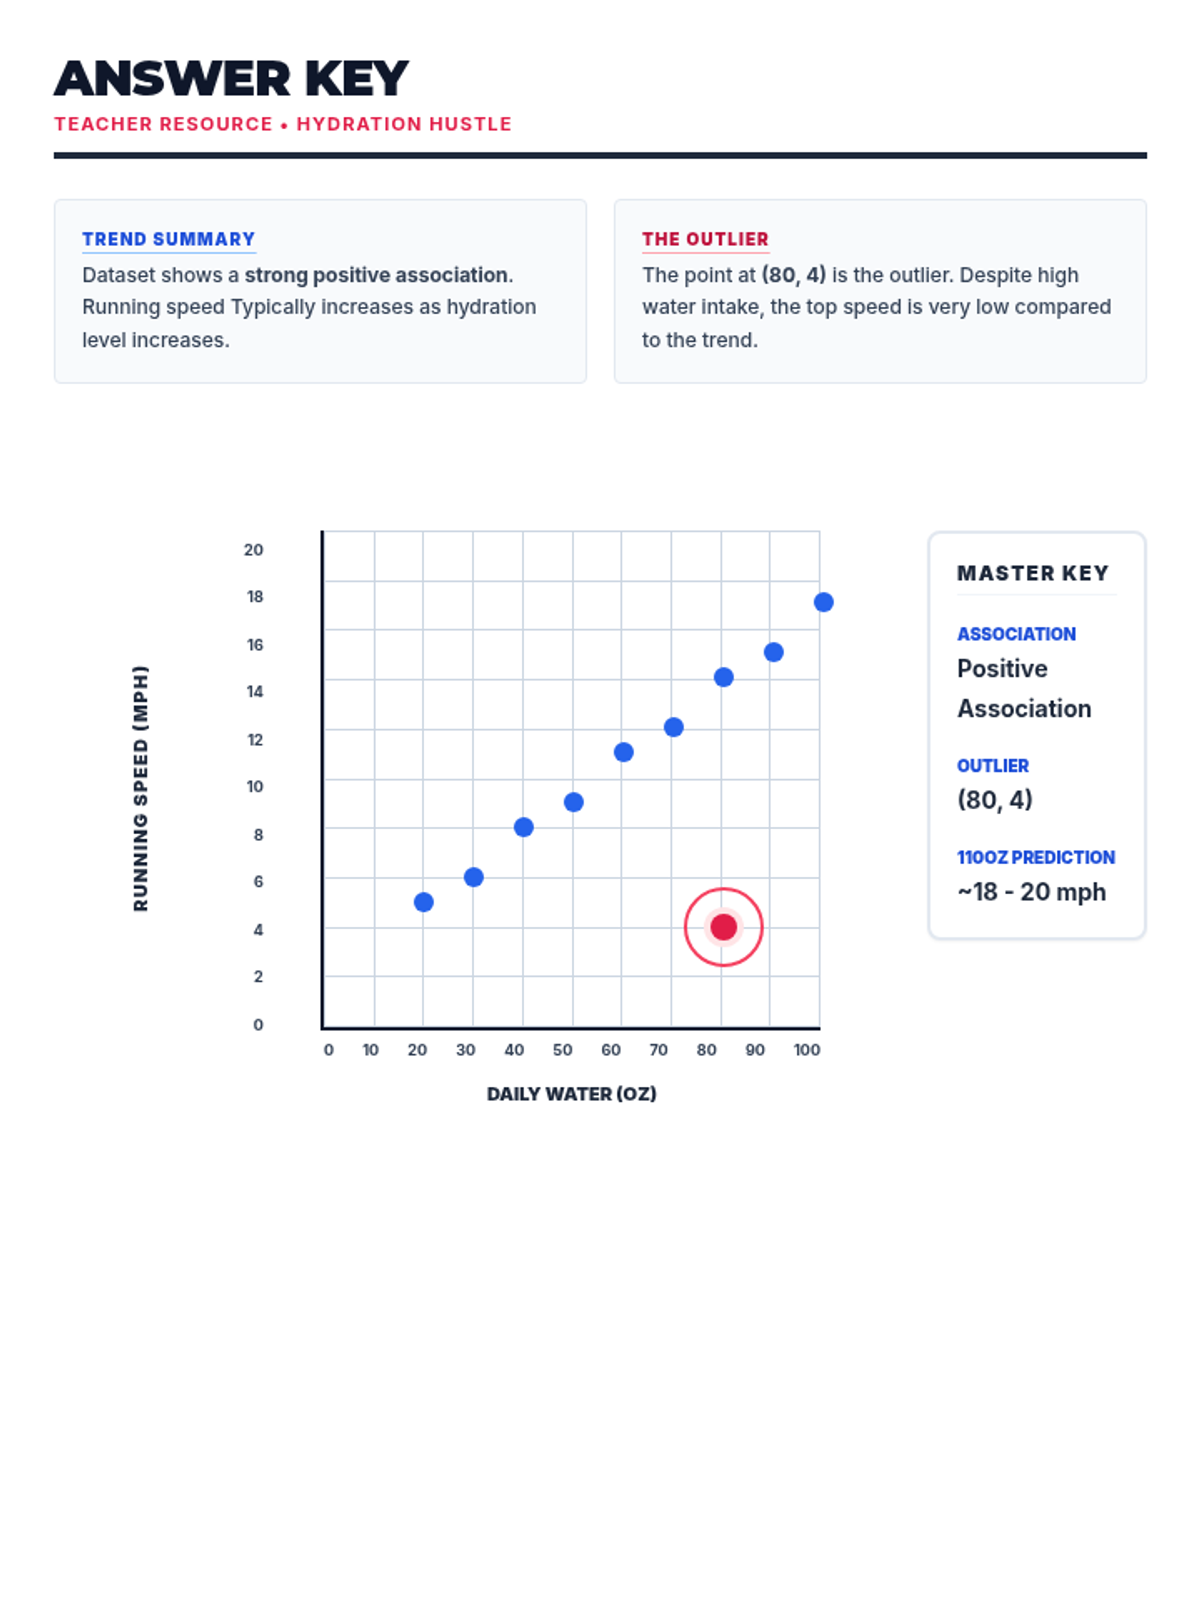
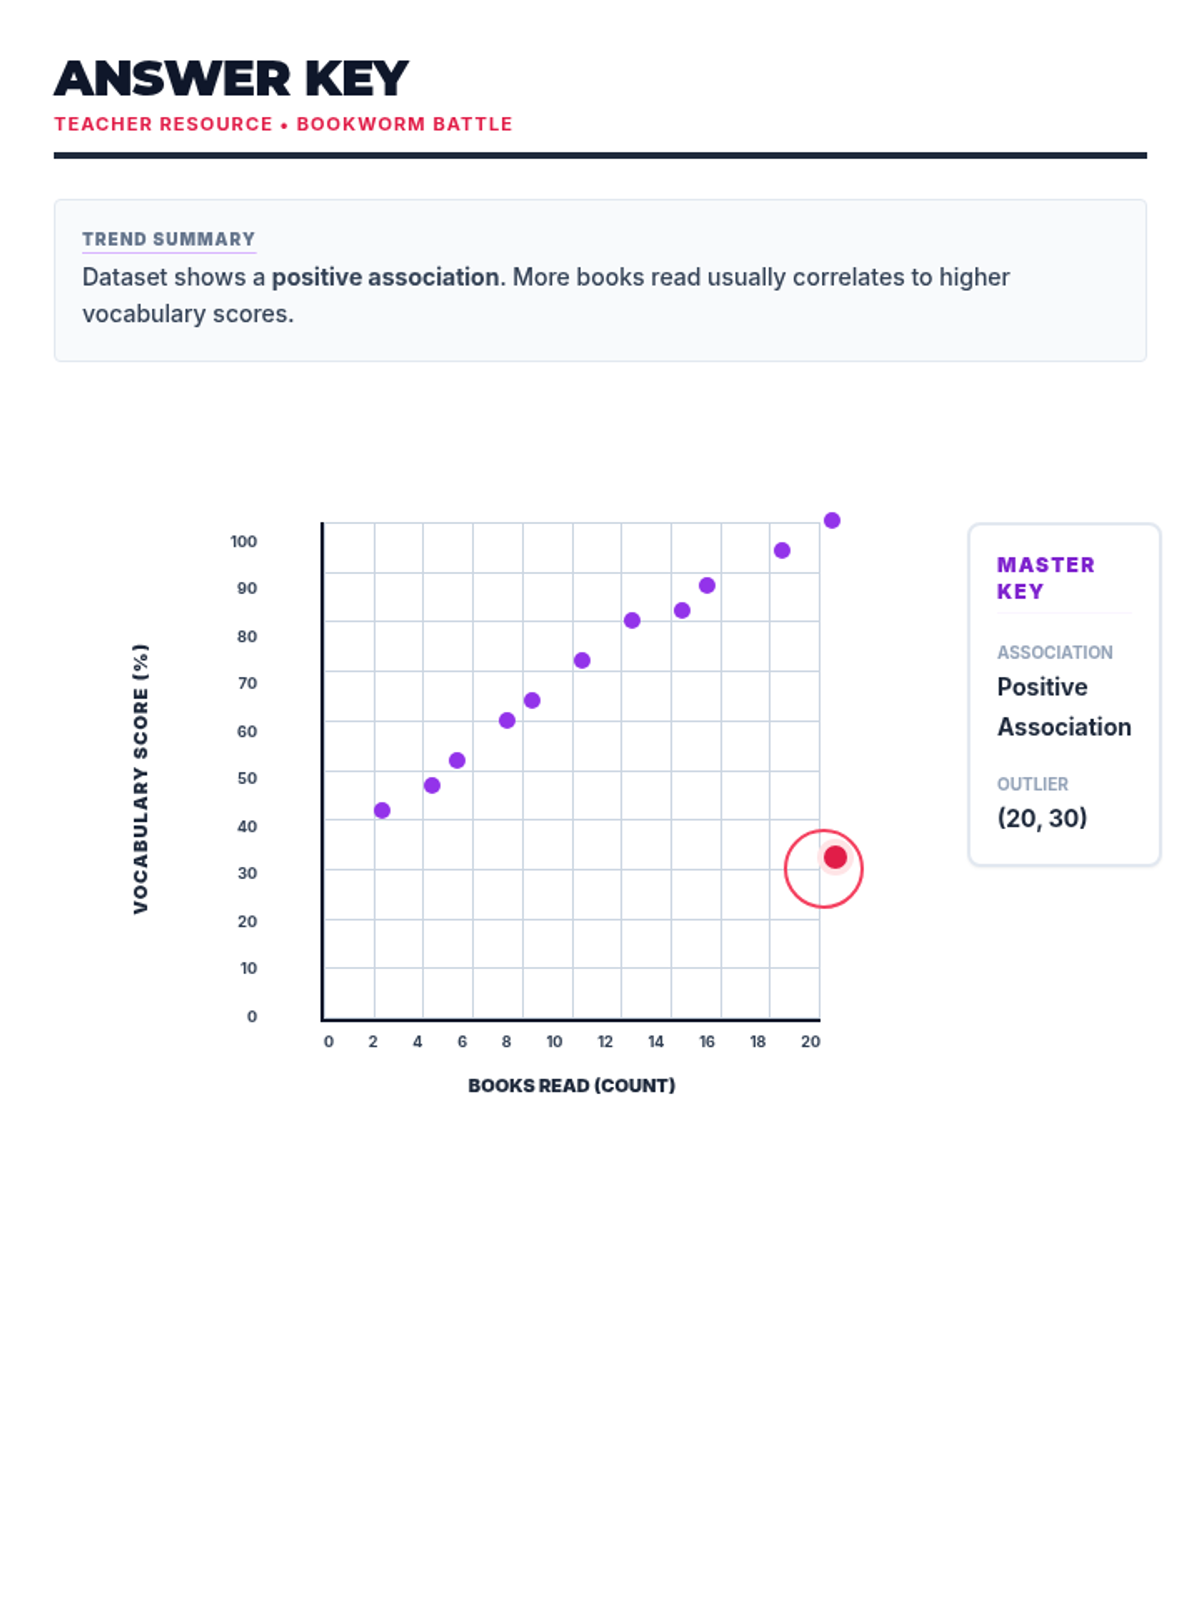
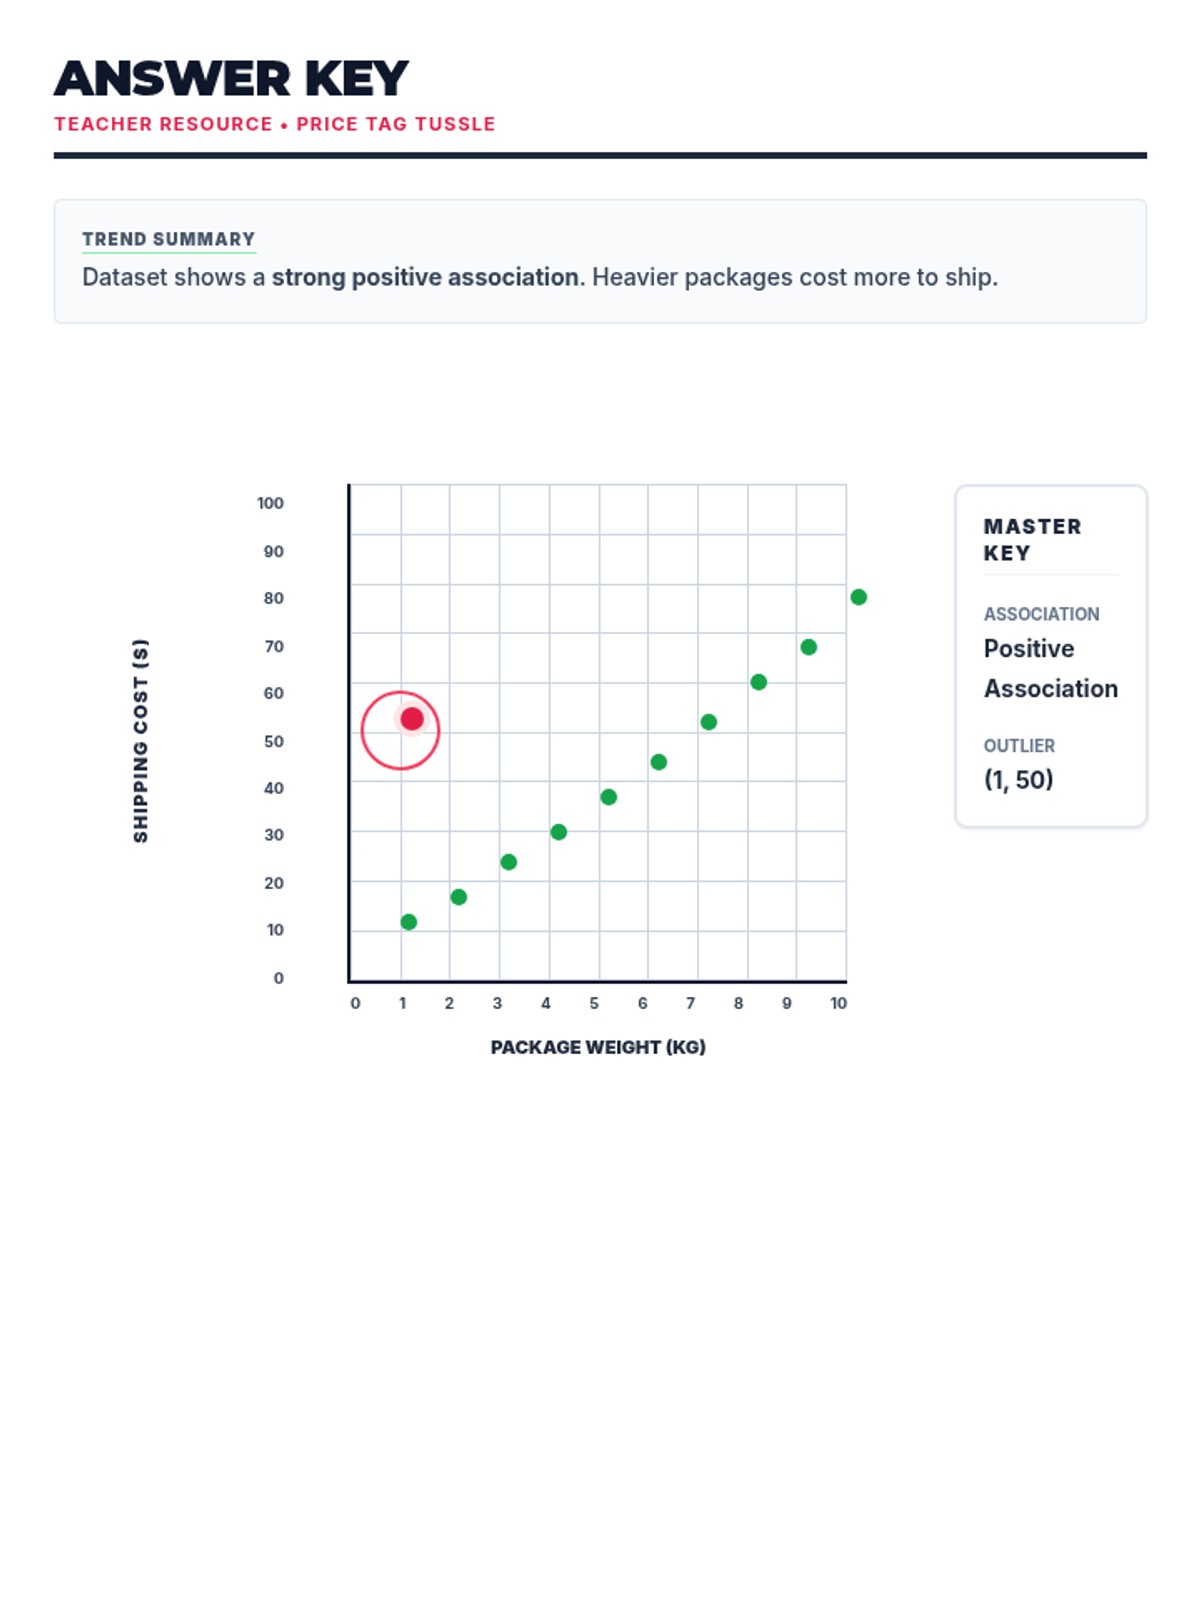
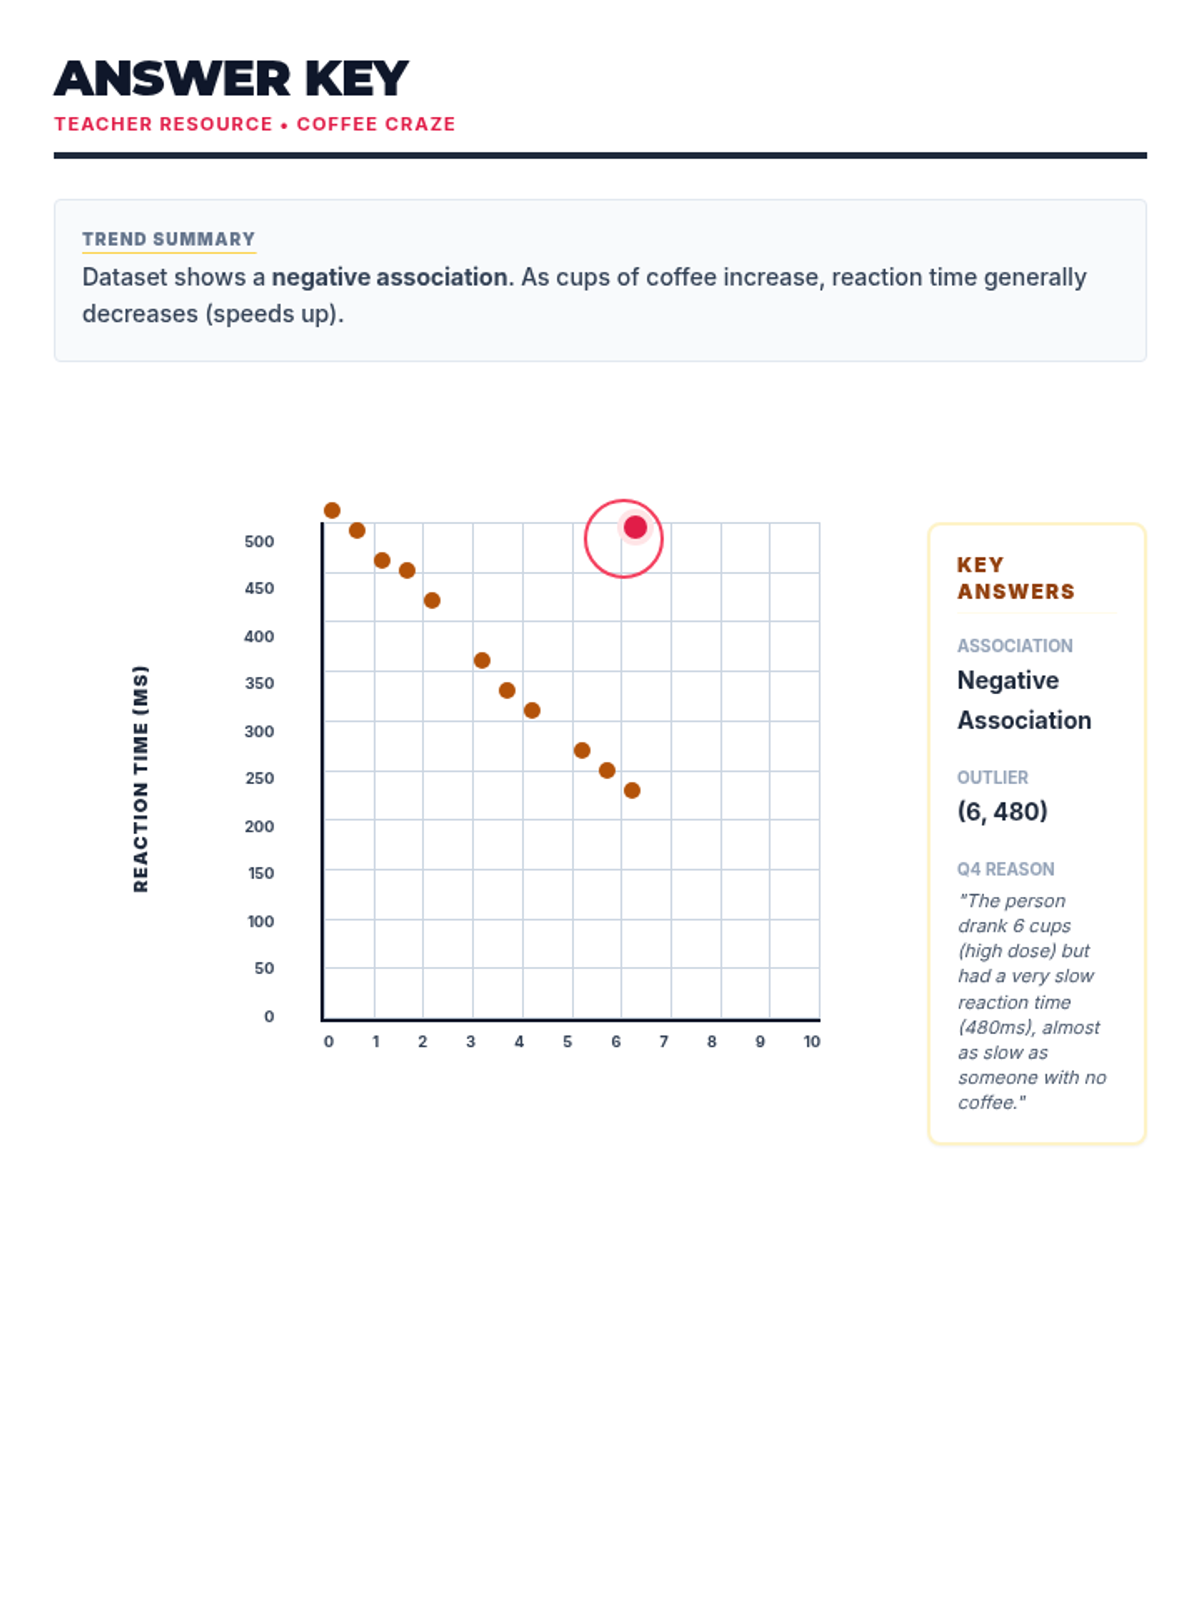
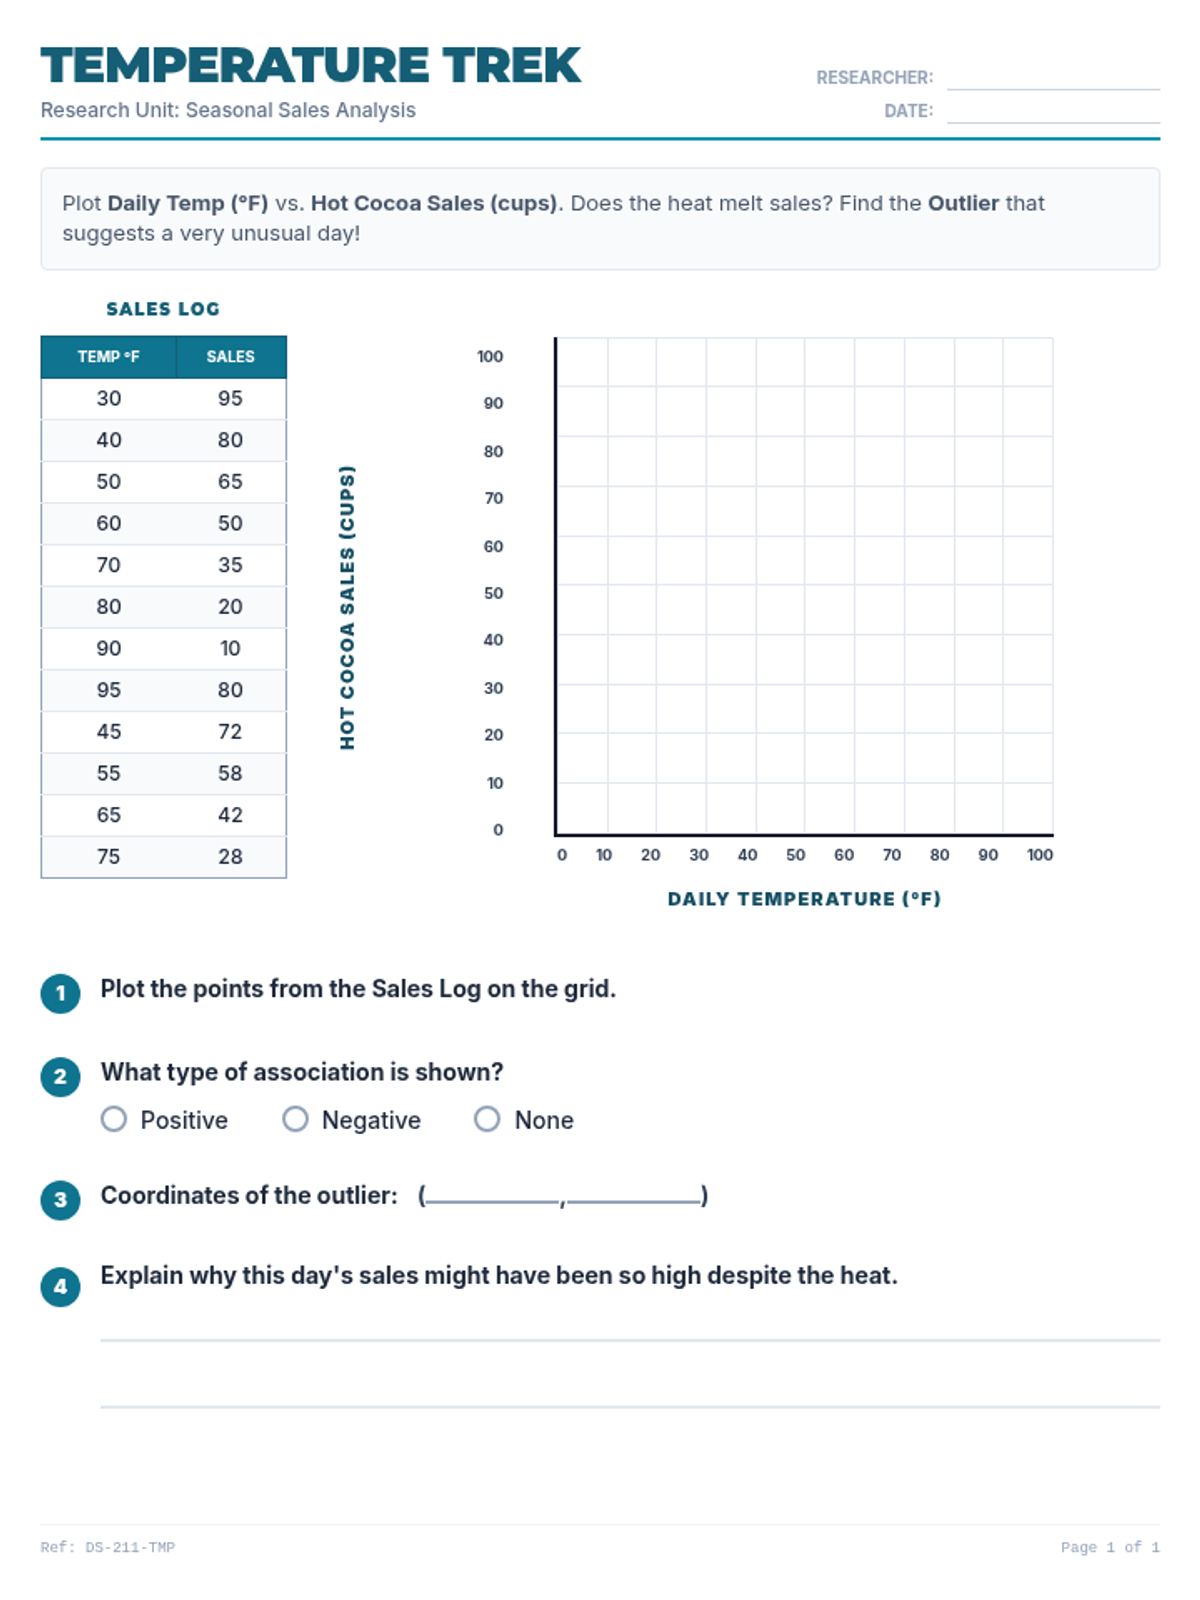
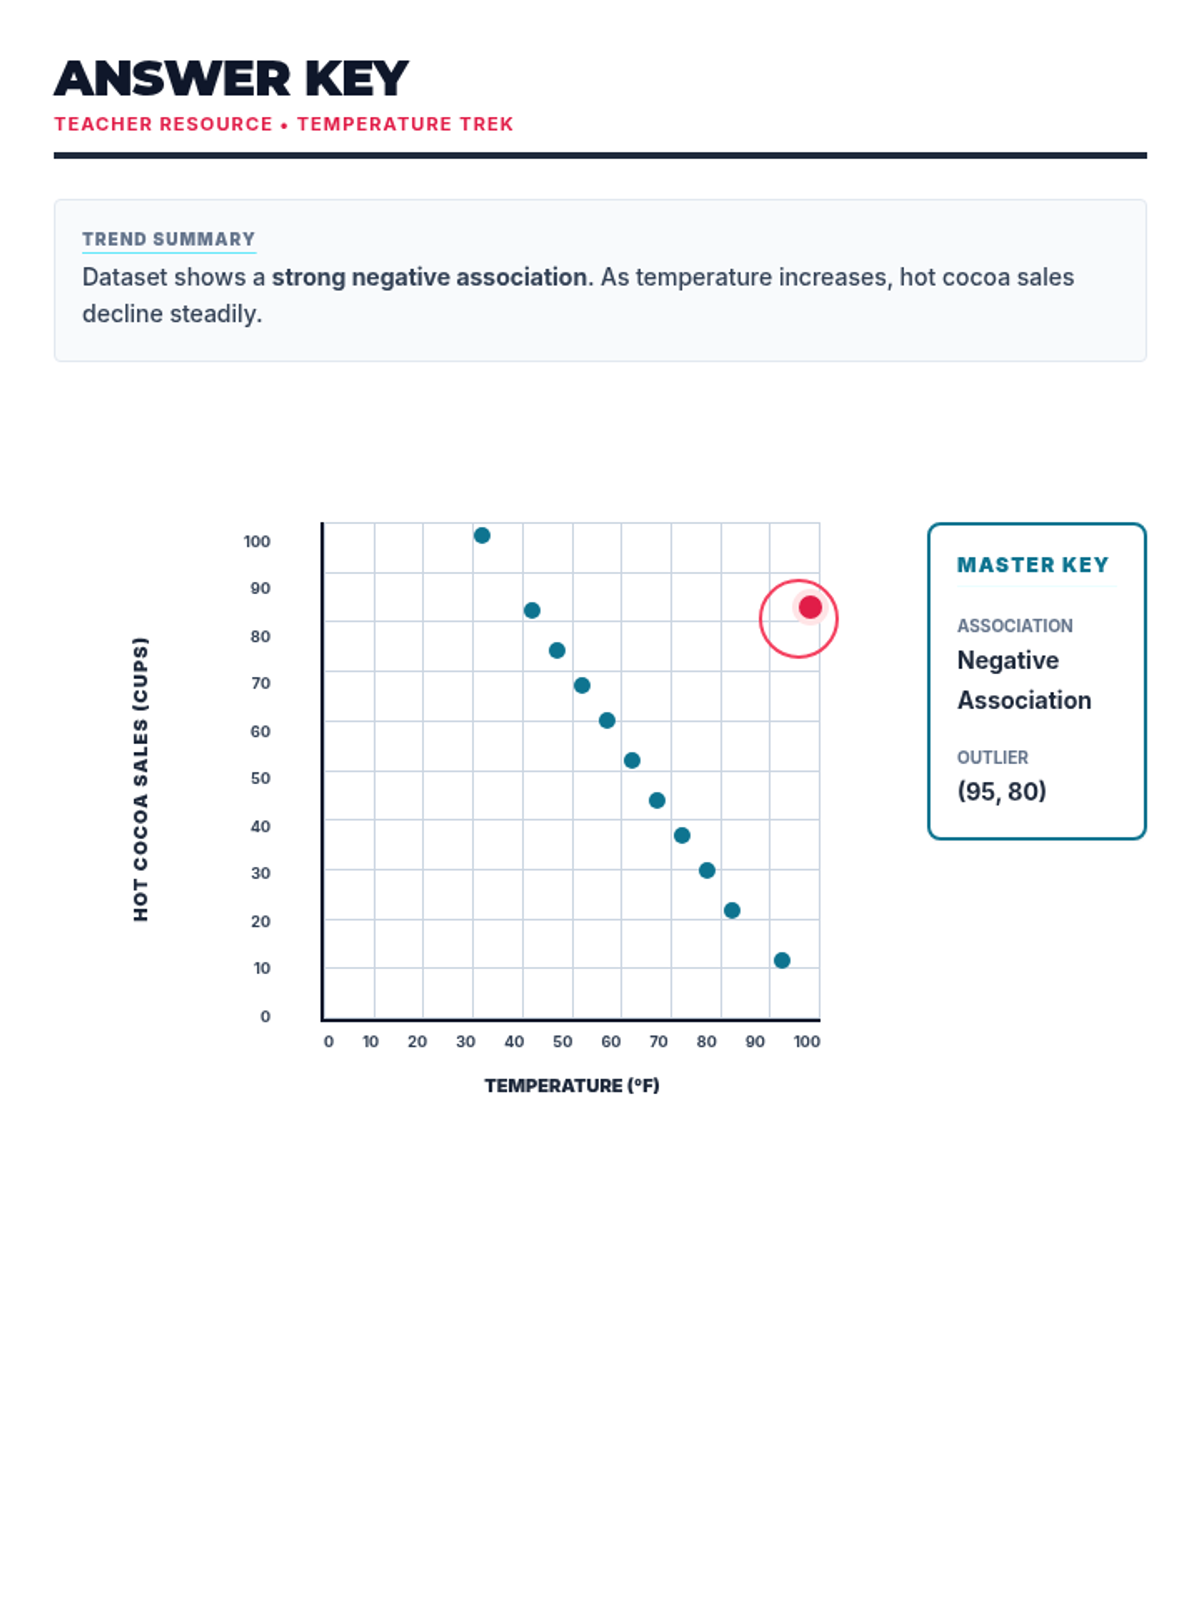
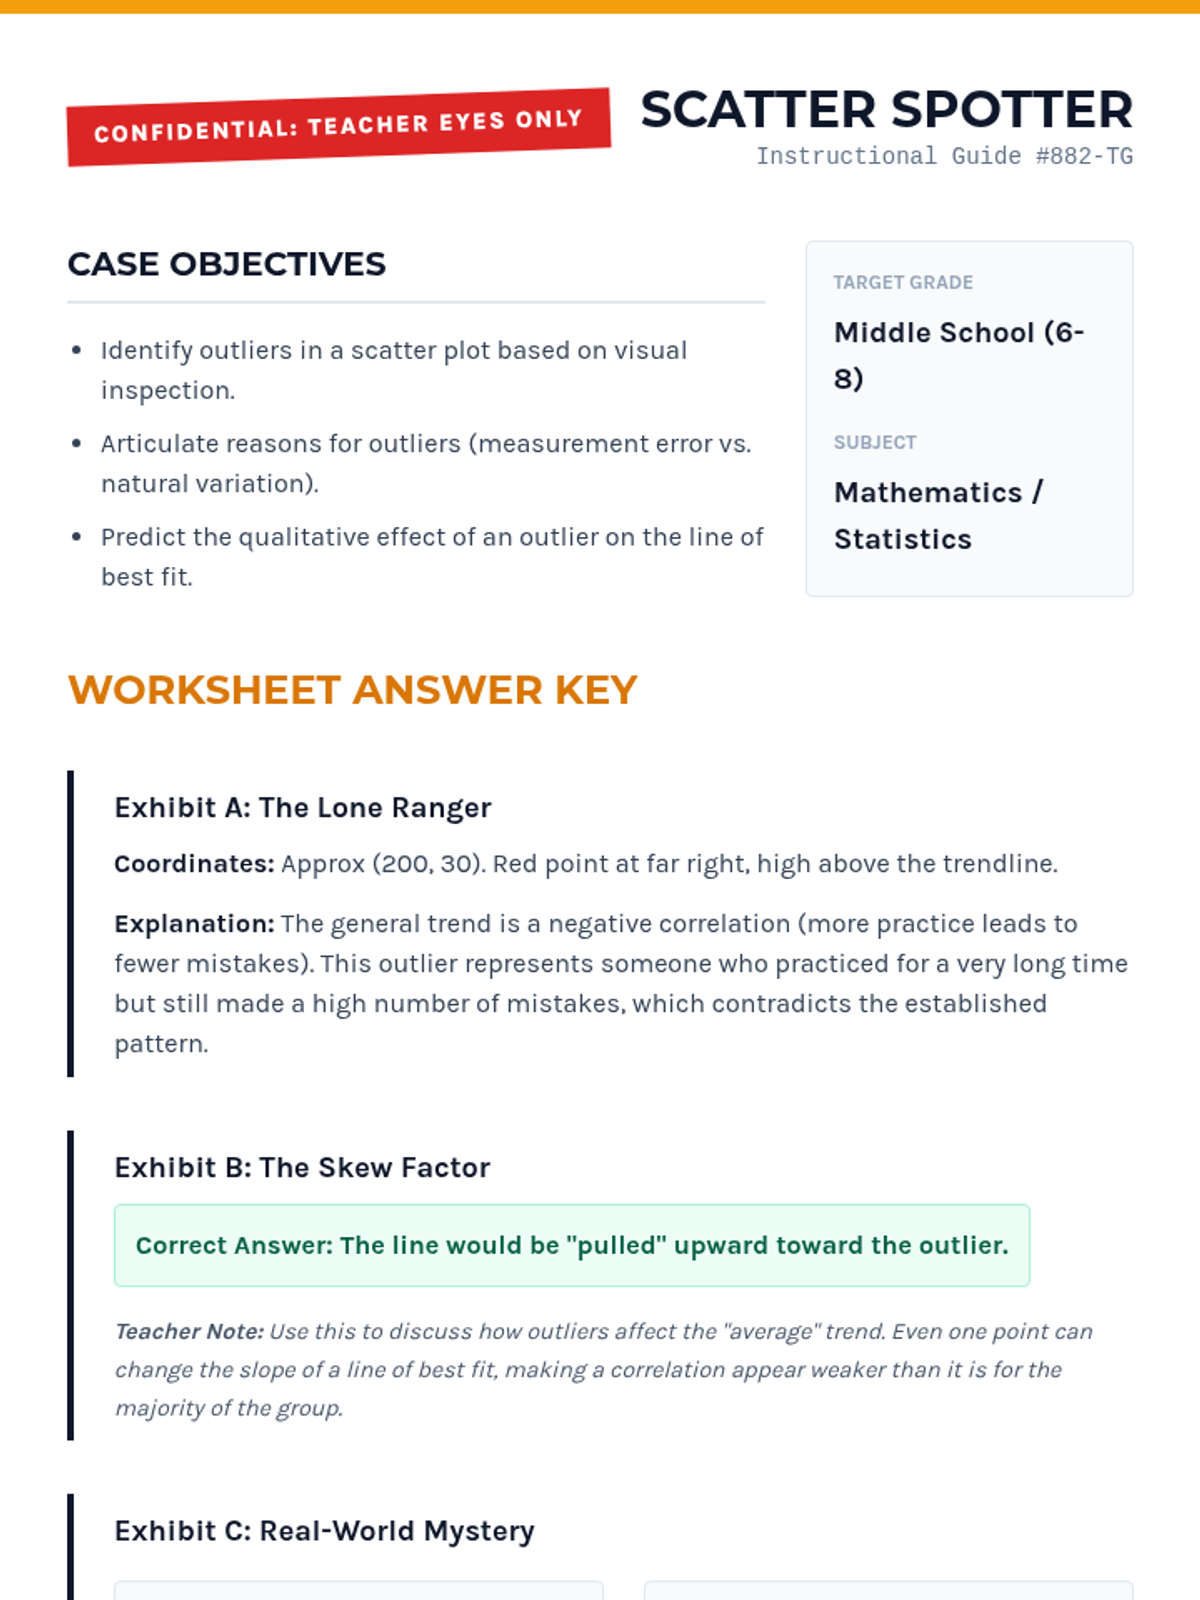
A comprehensive lesson on identifying and analyzing outliers within scatter plots using a 'Data Detective' theme. Students will learn to spot anomalous data points and understand their impact on trends.

SB

Stephanie Bizeur

Special Education Teacher
4/27