Data representation, distributions, and statistical variability using sampling and inference techniques. Integrates probability models, compound events, bivariate patterns, and linear models to guide data-driven decision making.
A 3-day small group intervention sequence focused on data interpretation, coin values, and probability predictions for students moving toward the NWEA RIT 171-180 range.
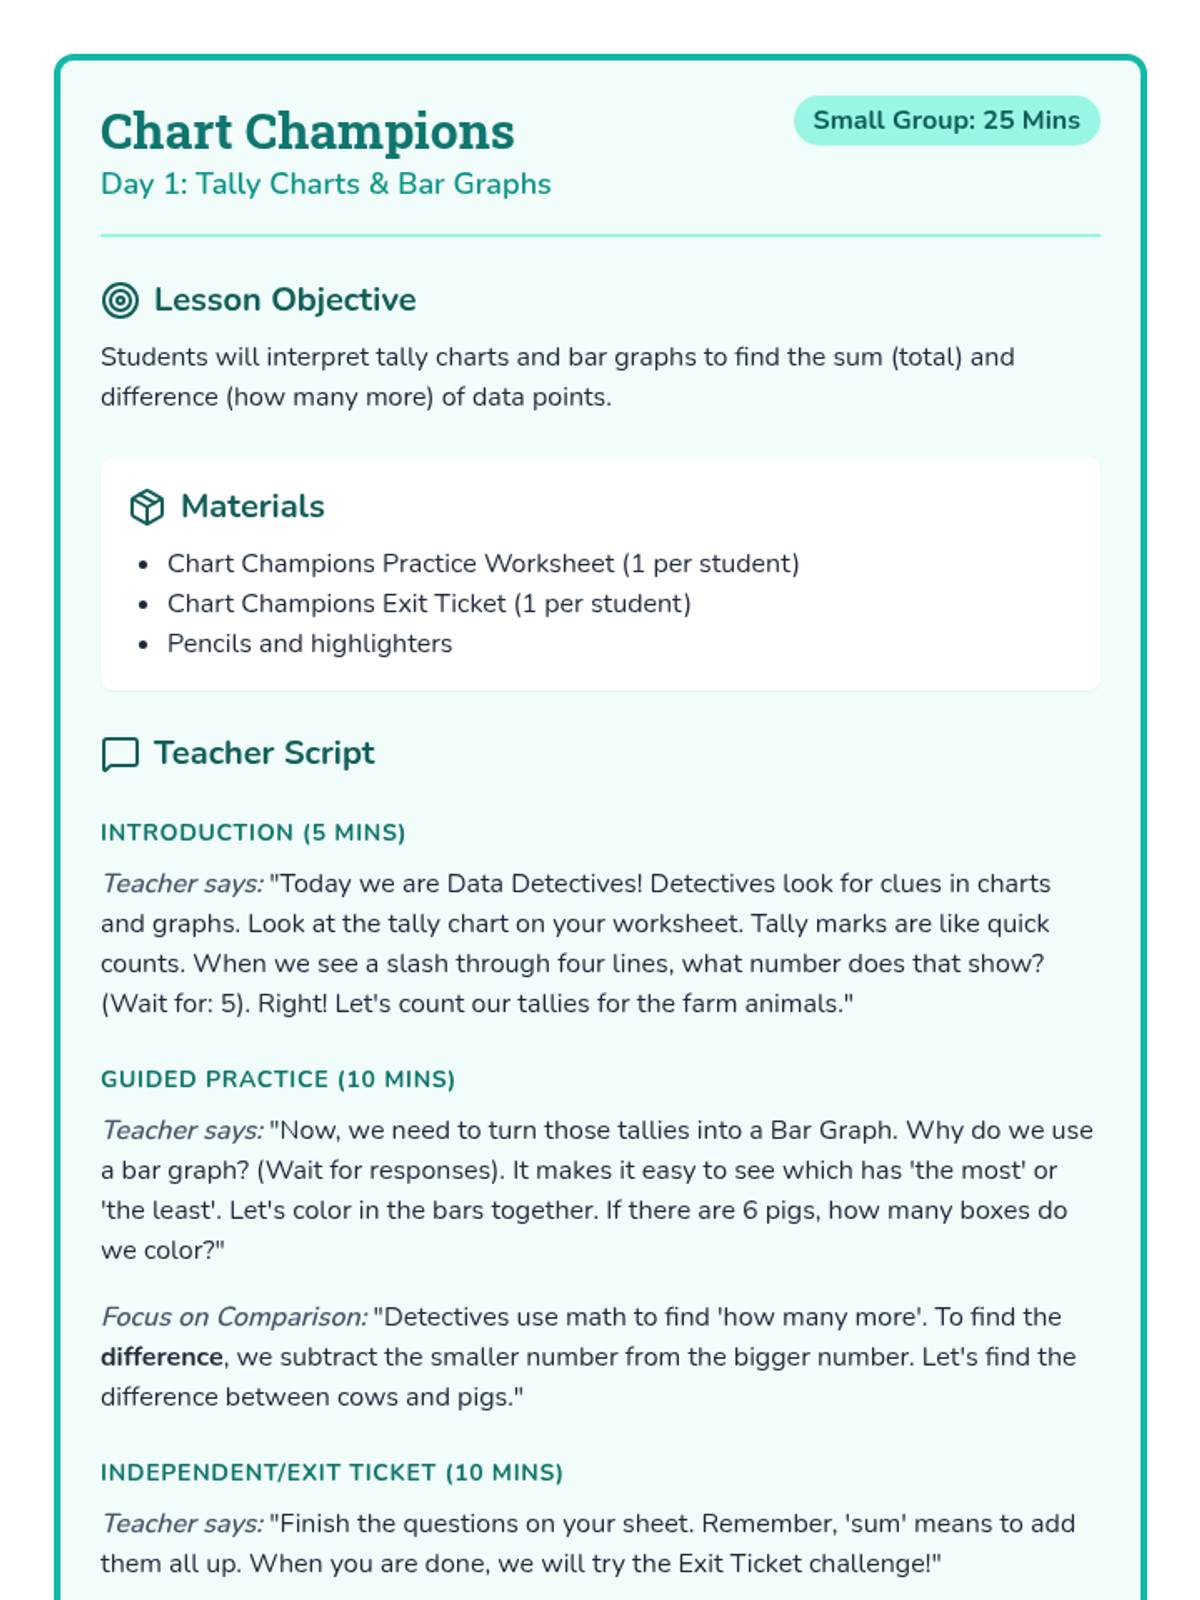
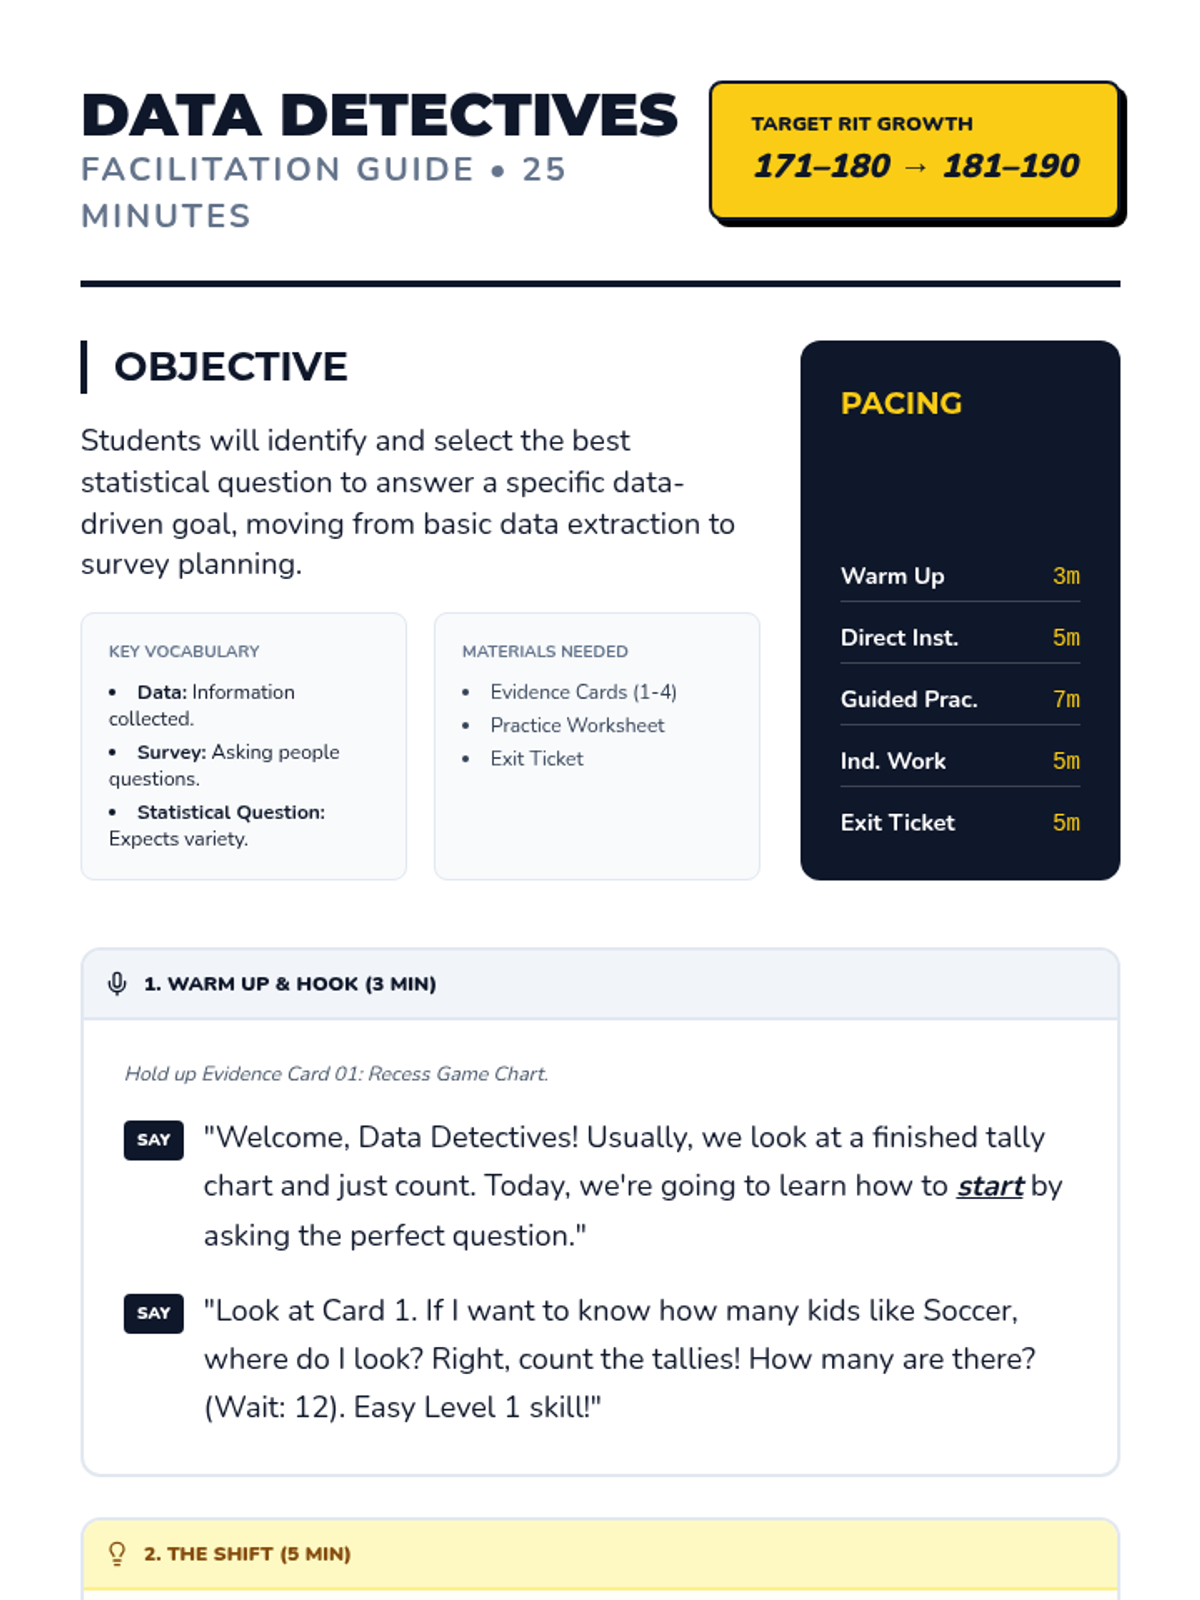
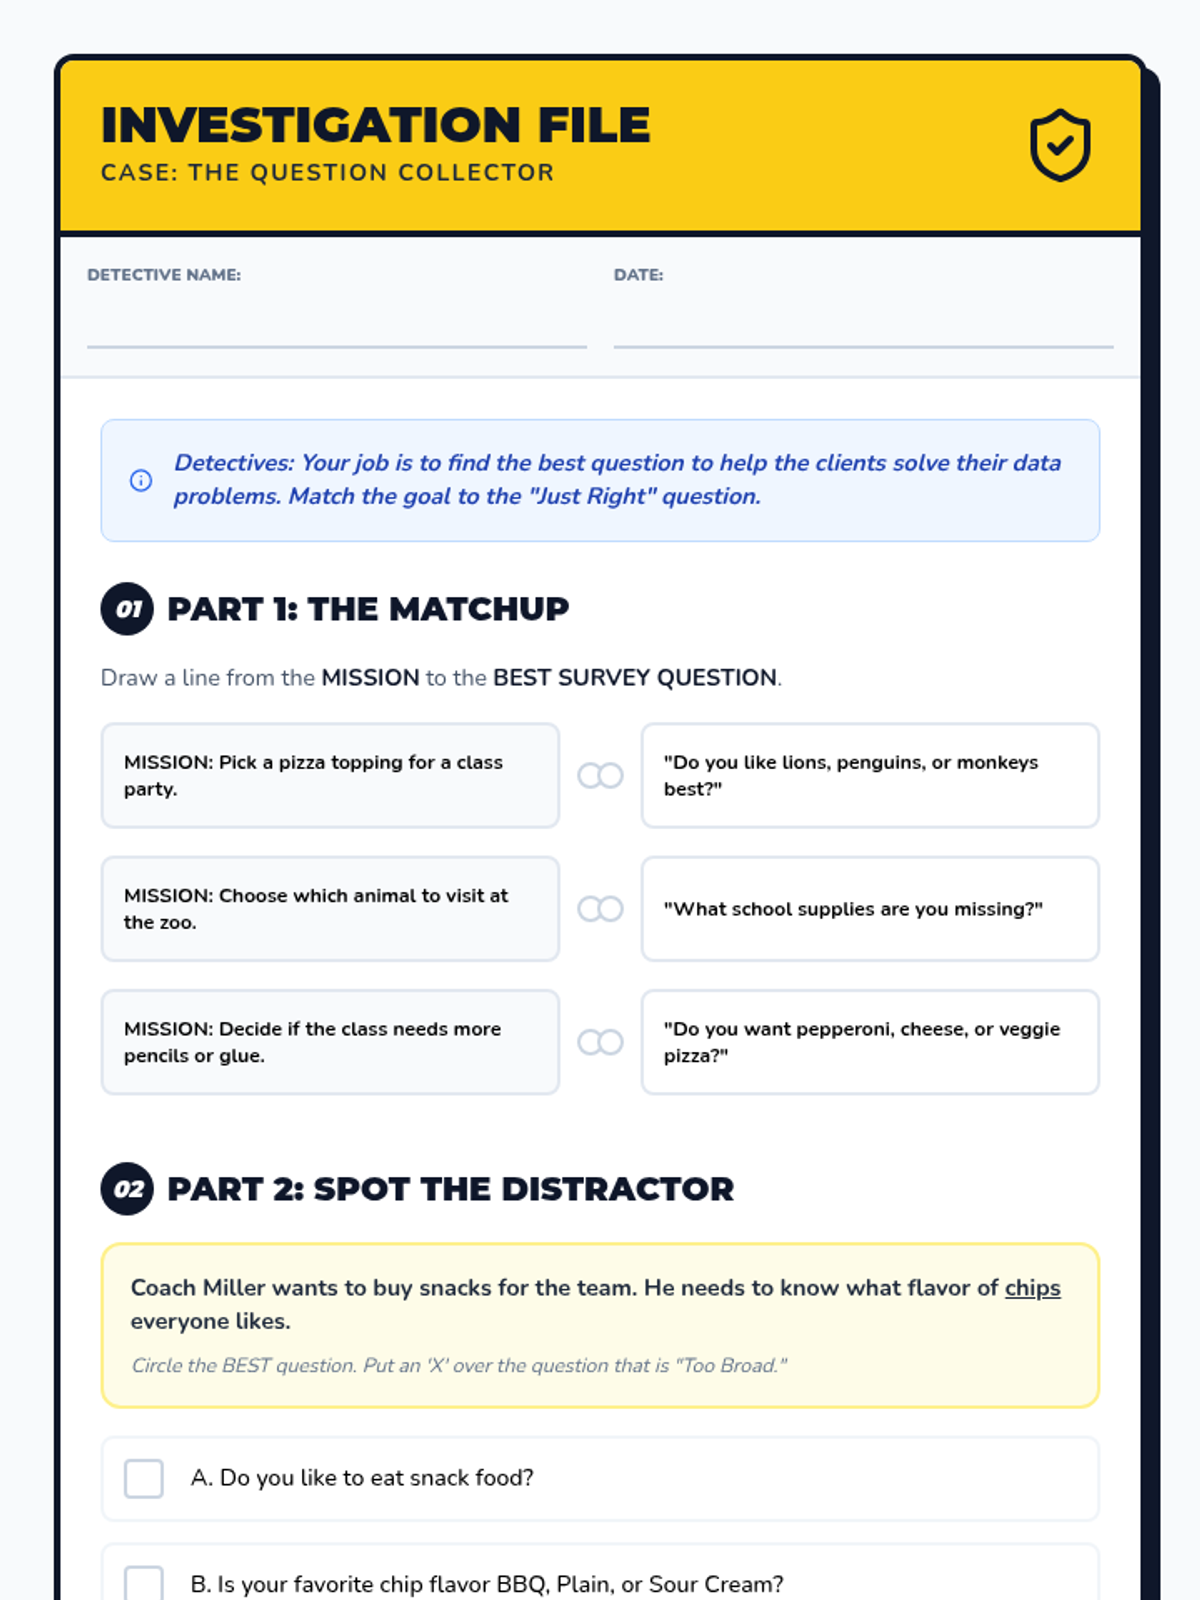
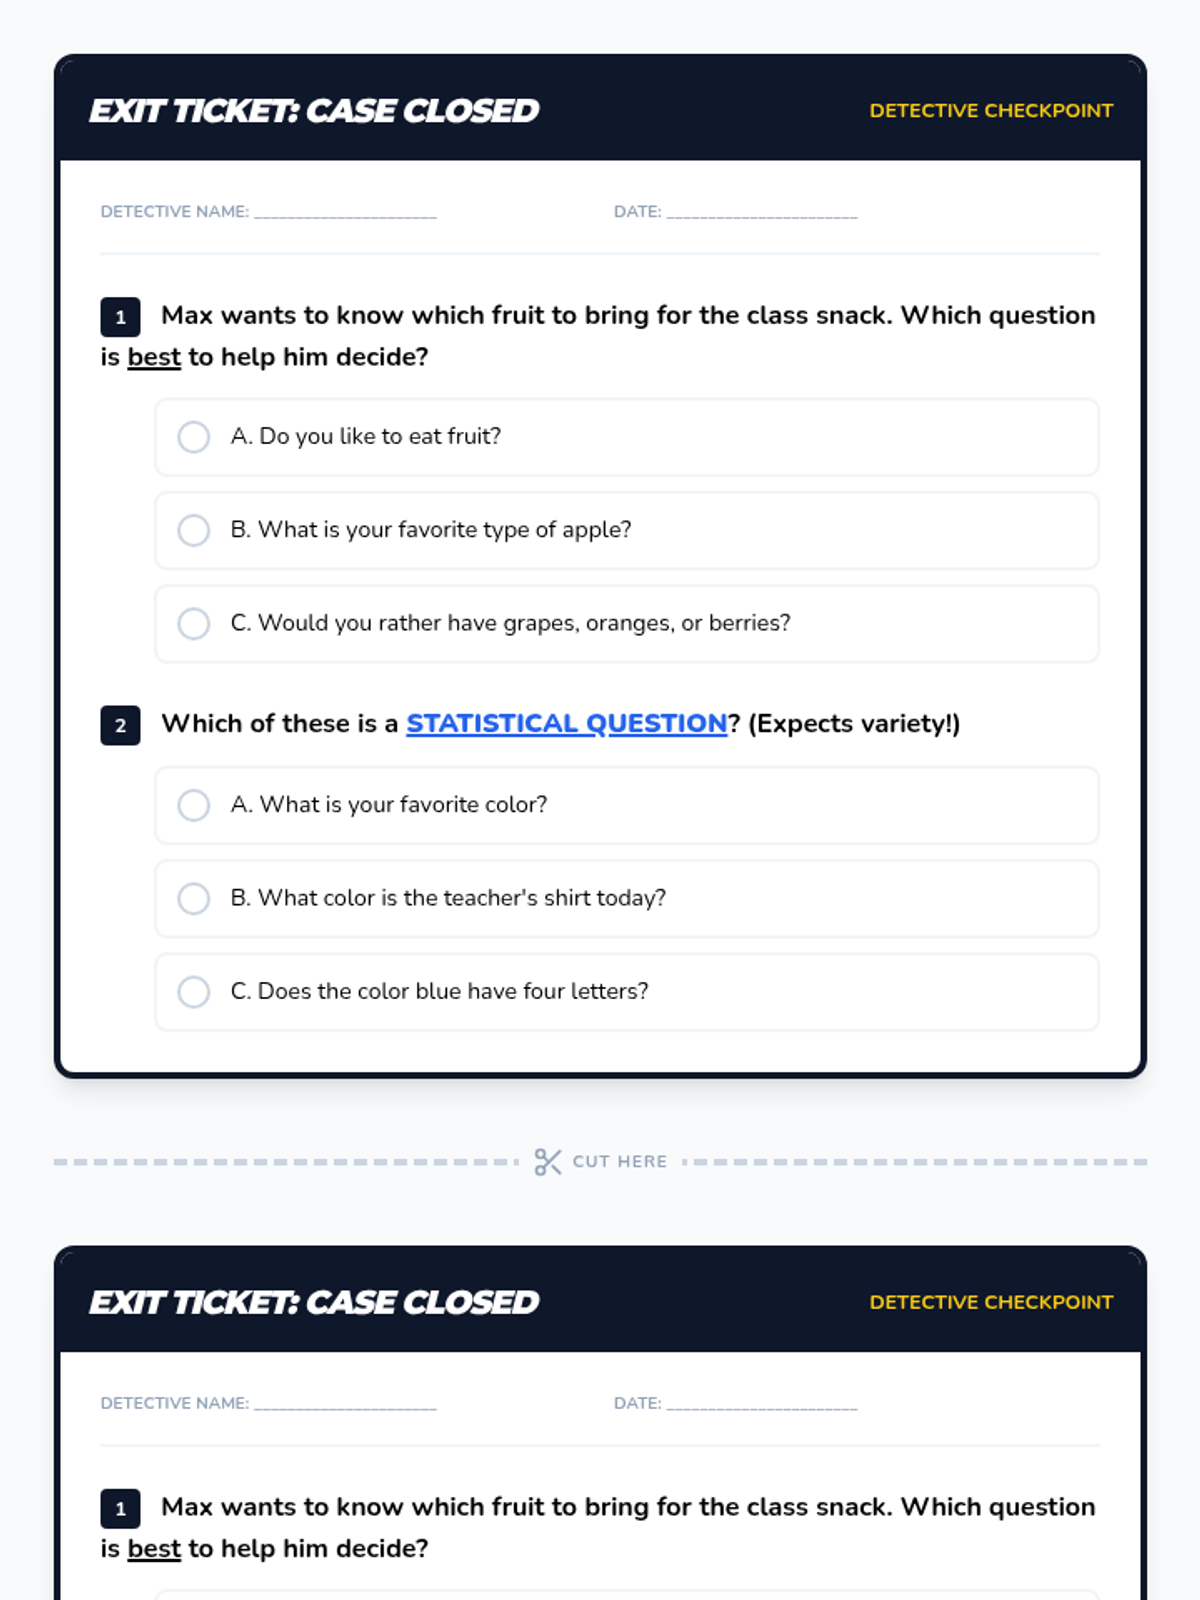
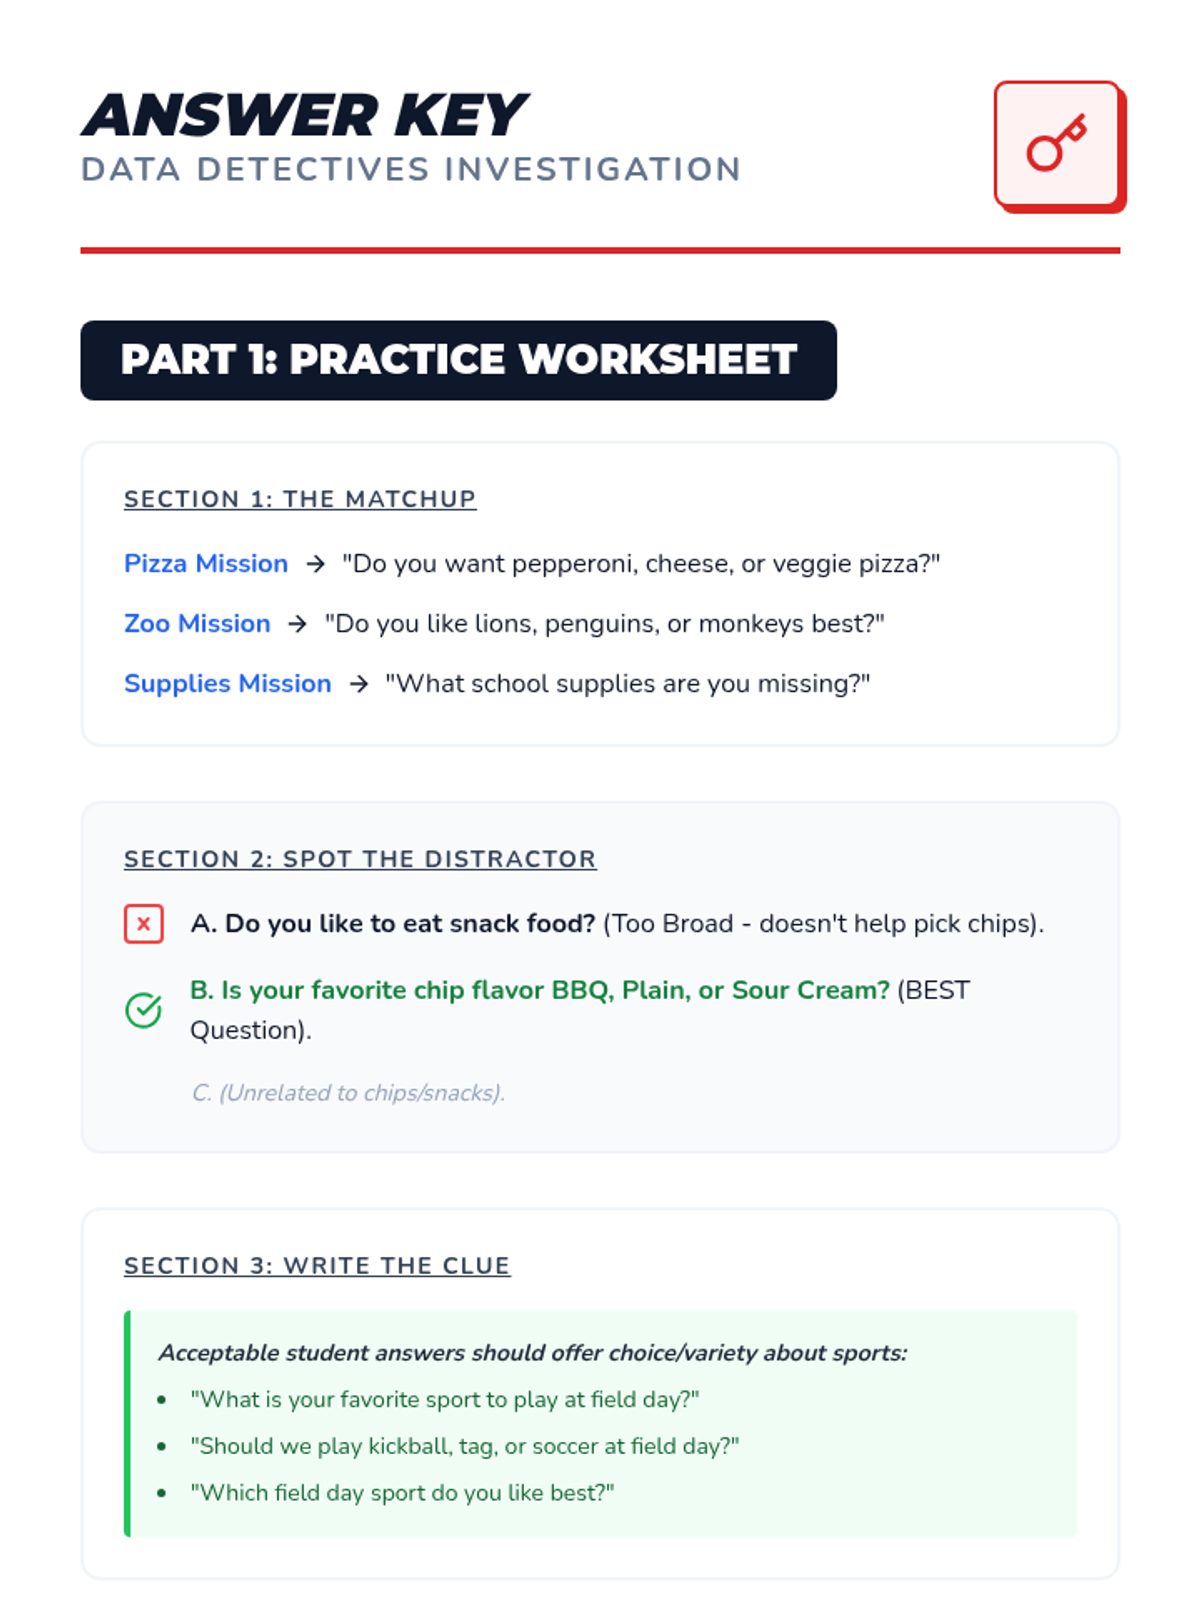
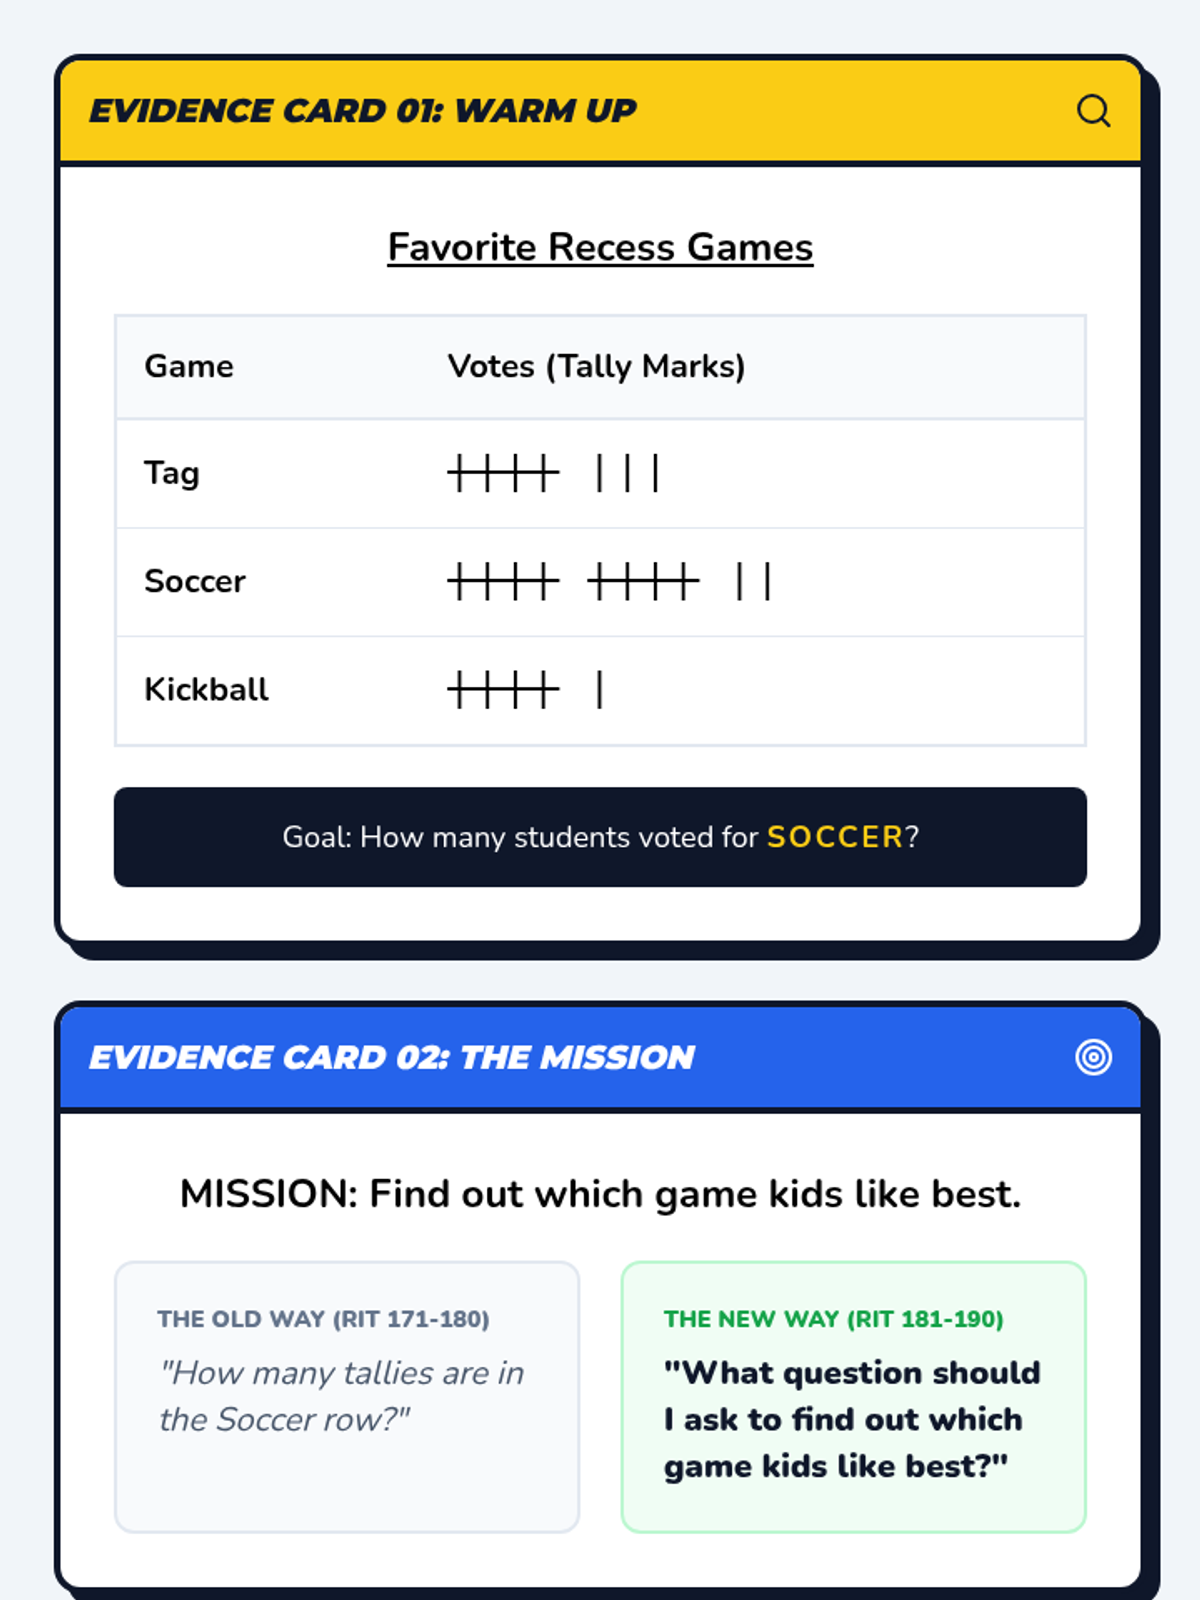
A 3-day small group intervention sequence designed to move students from RIT 171-180 to 181-190 in Data Analysis. Students progress from selecting appropriate survey questions to formulating their own and evaluating the effectiveness of data collection methods.
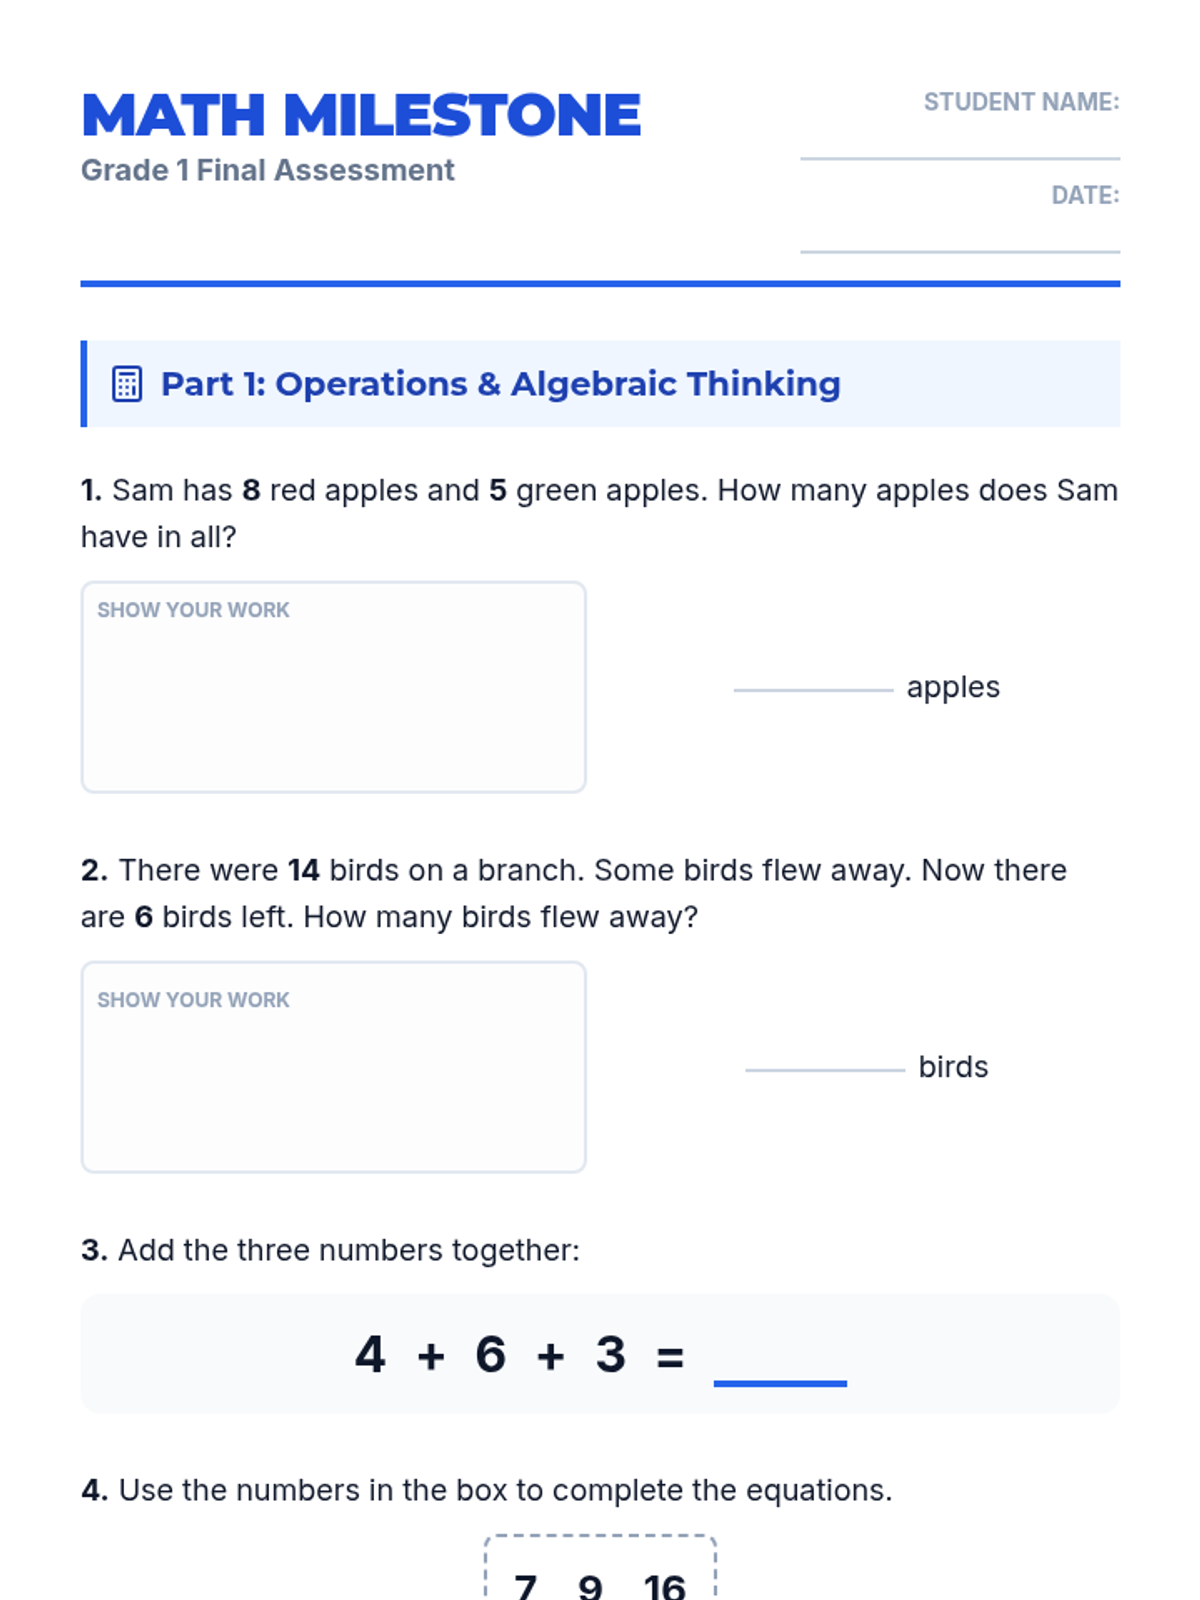
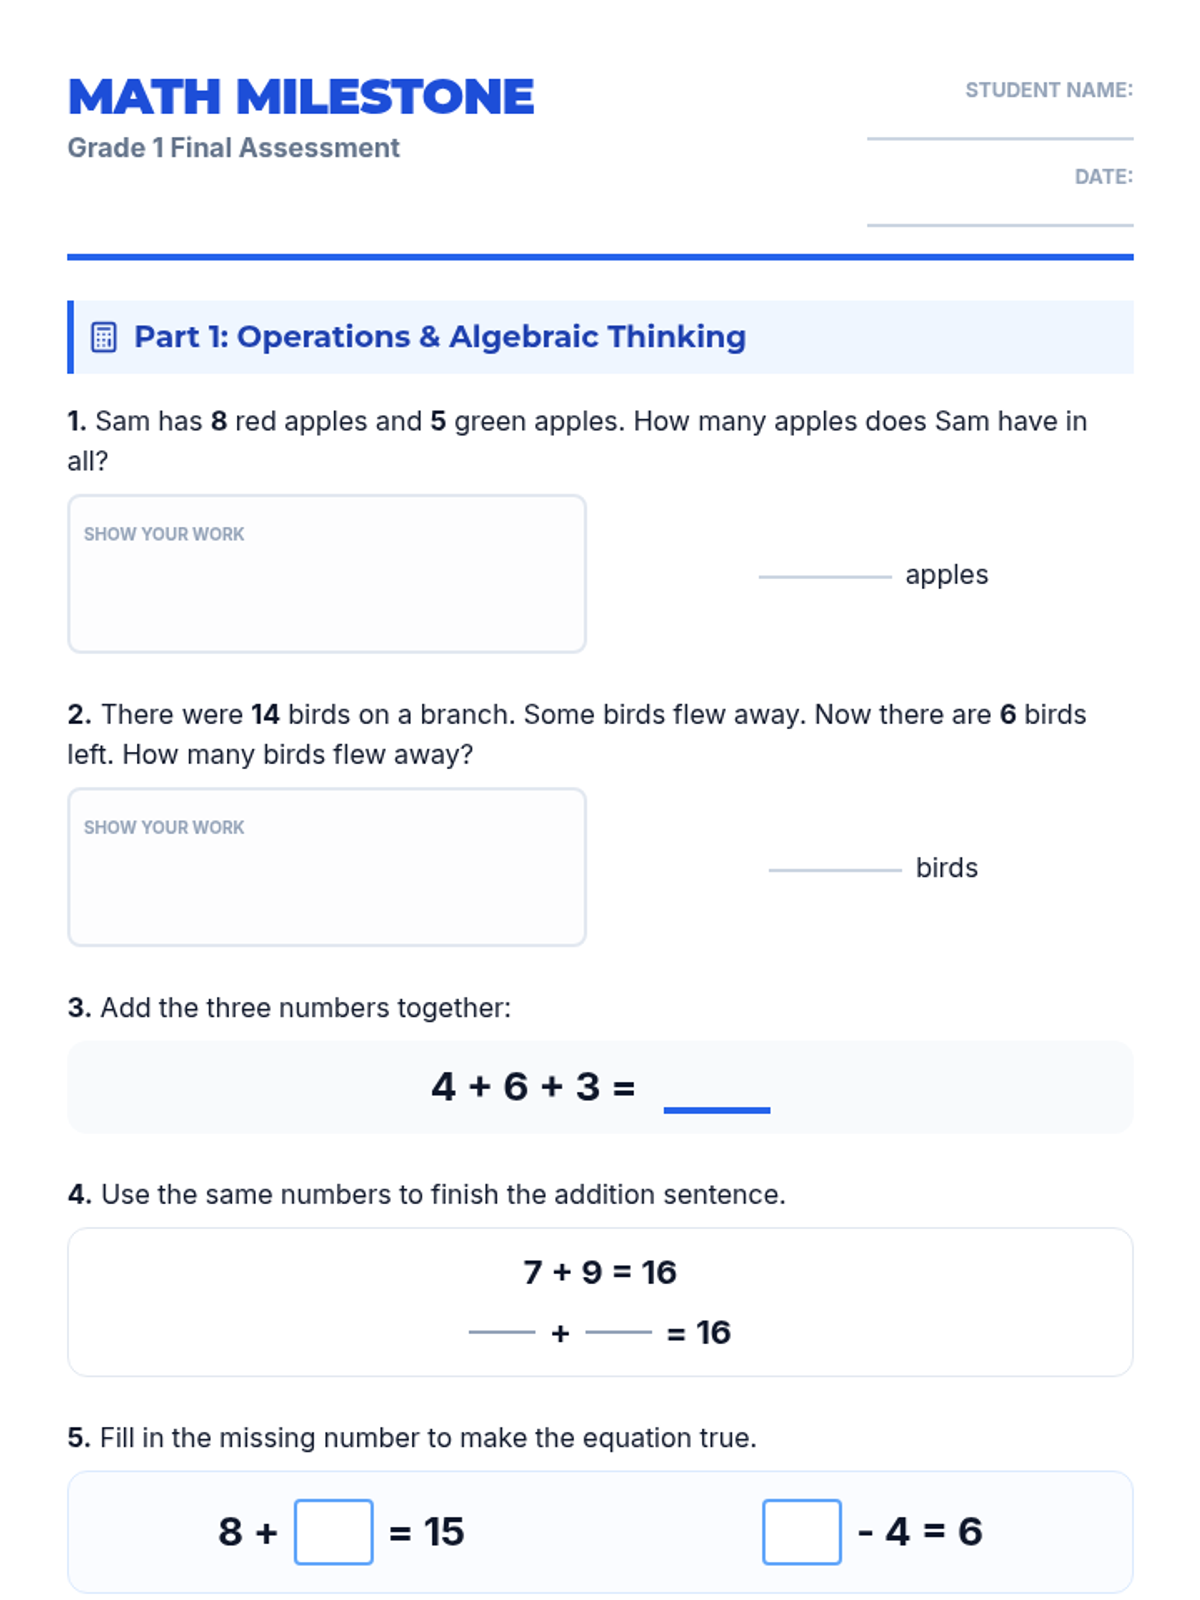
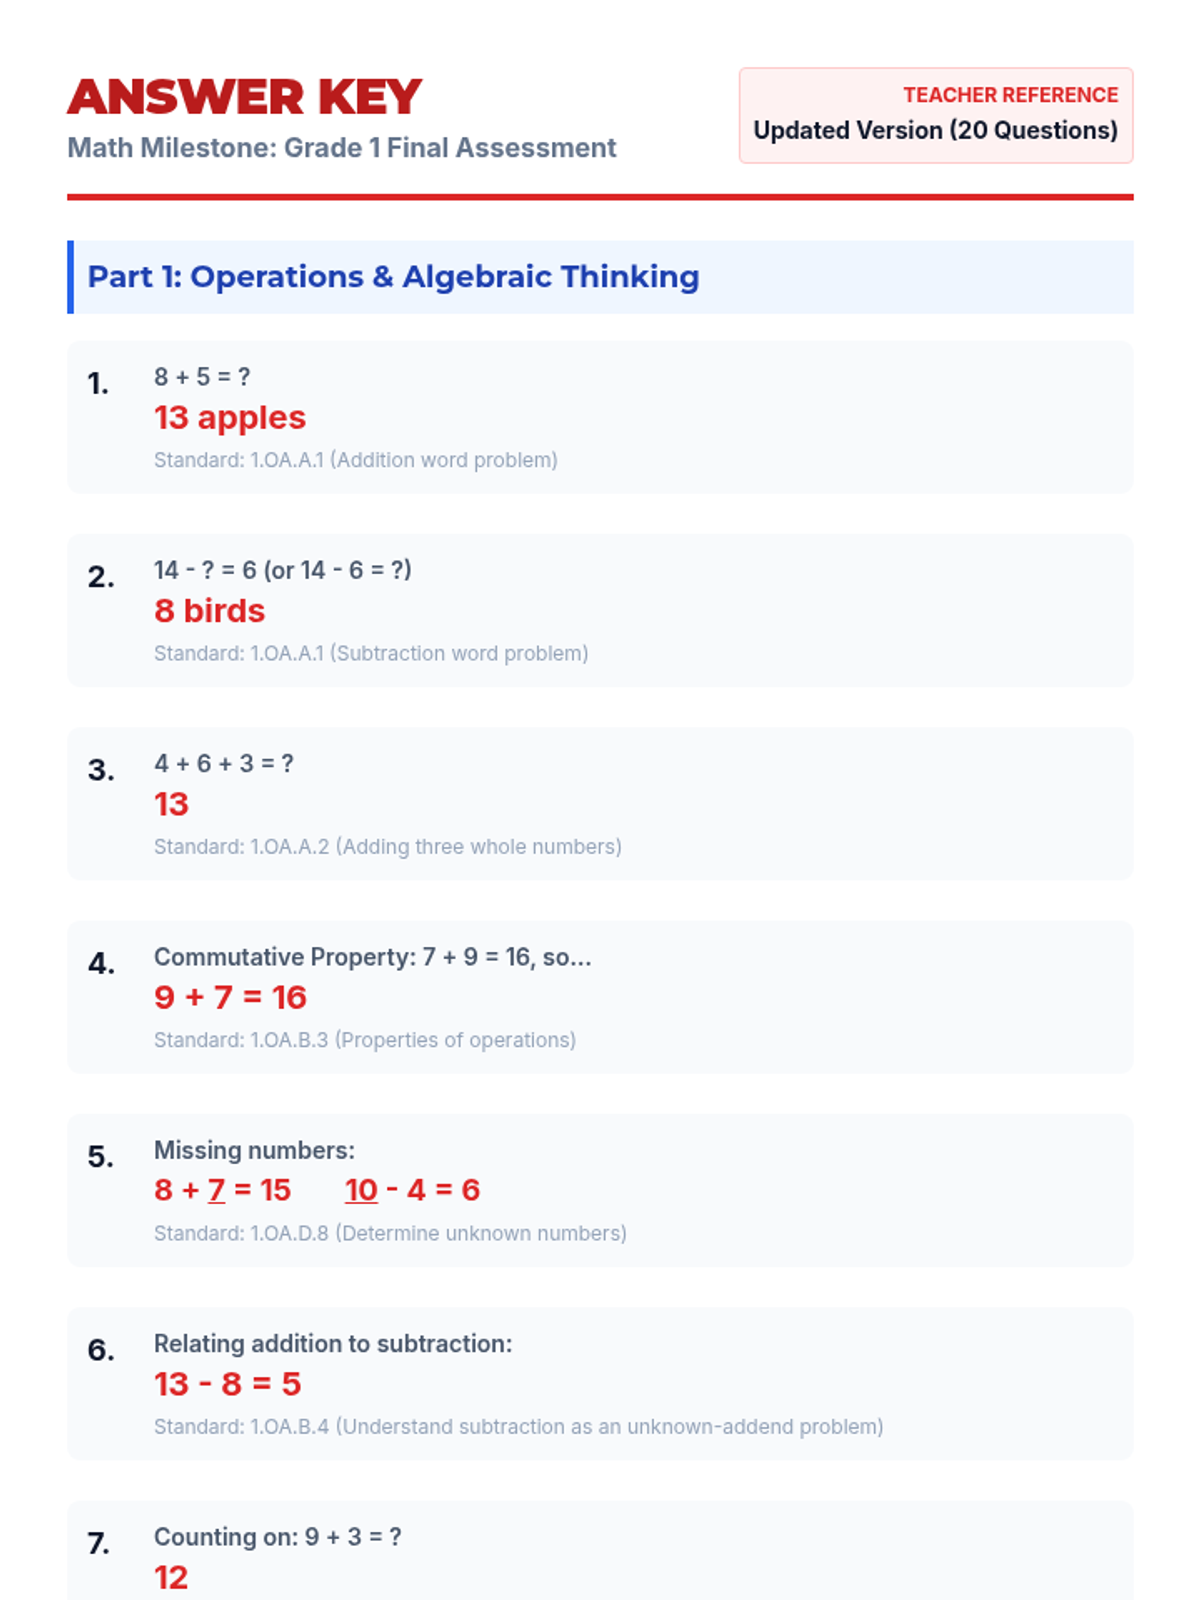
A series of materials designed to evaluate and document first-grade students' mastery of year-long mathematical standards in preparation for second grade.
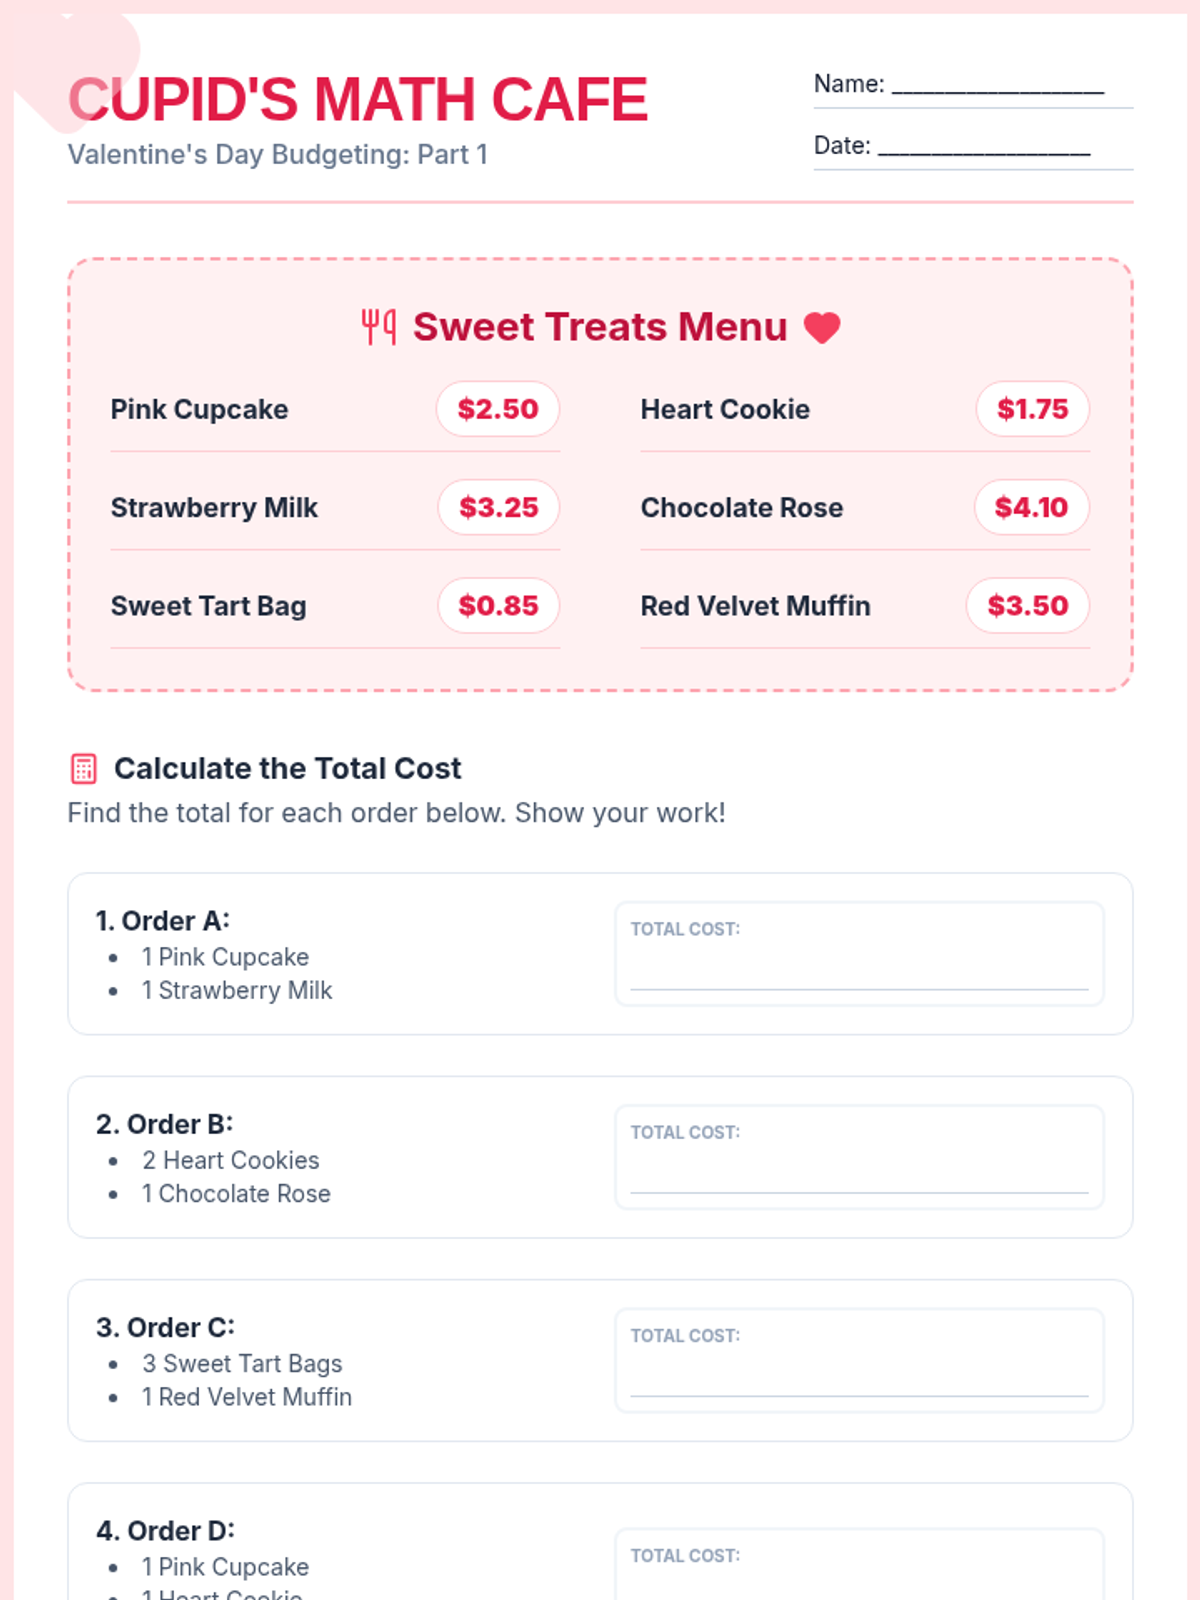
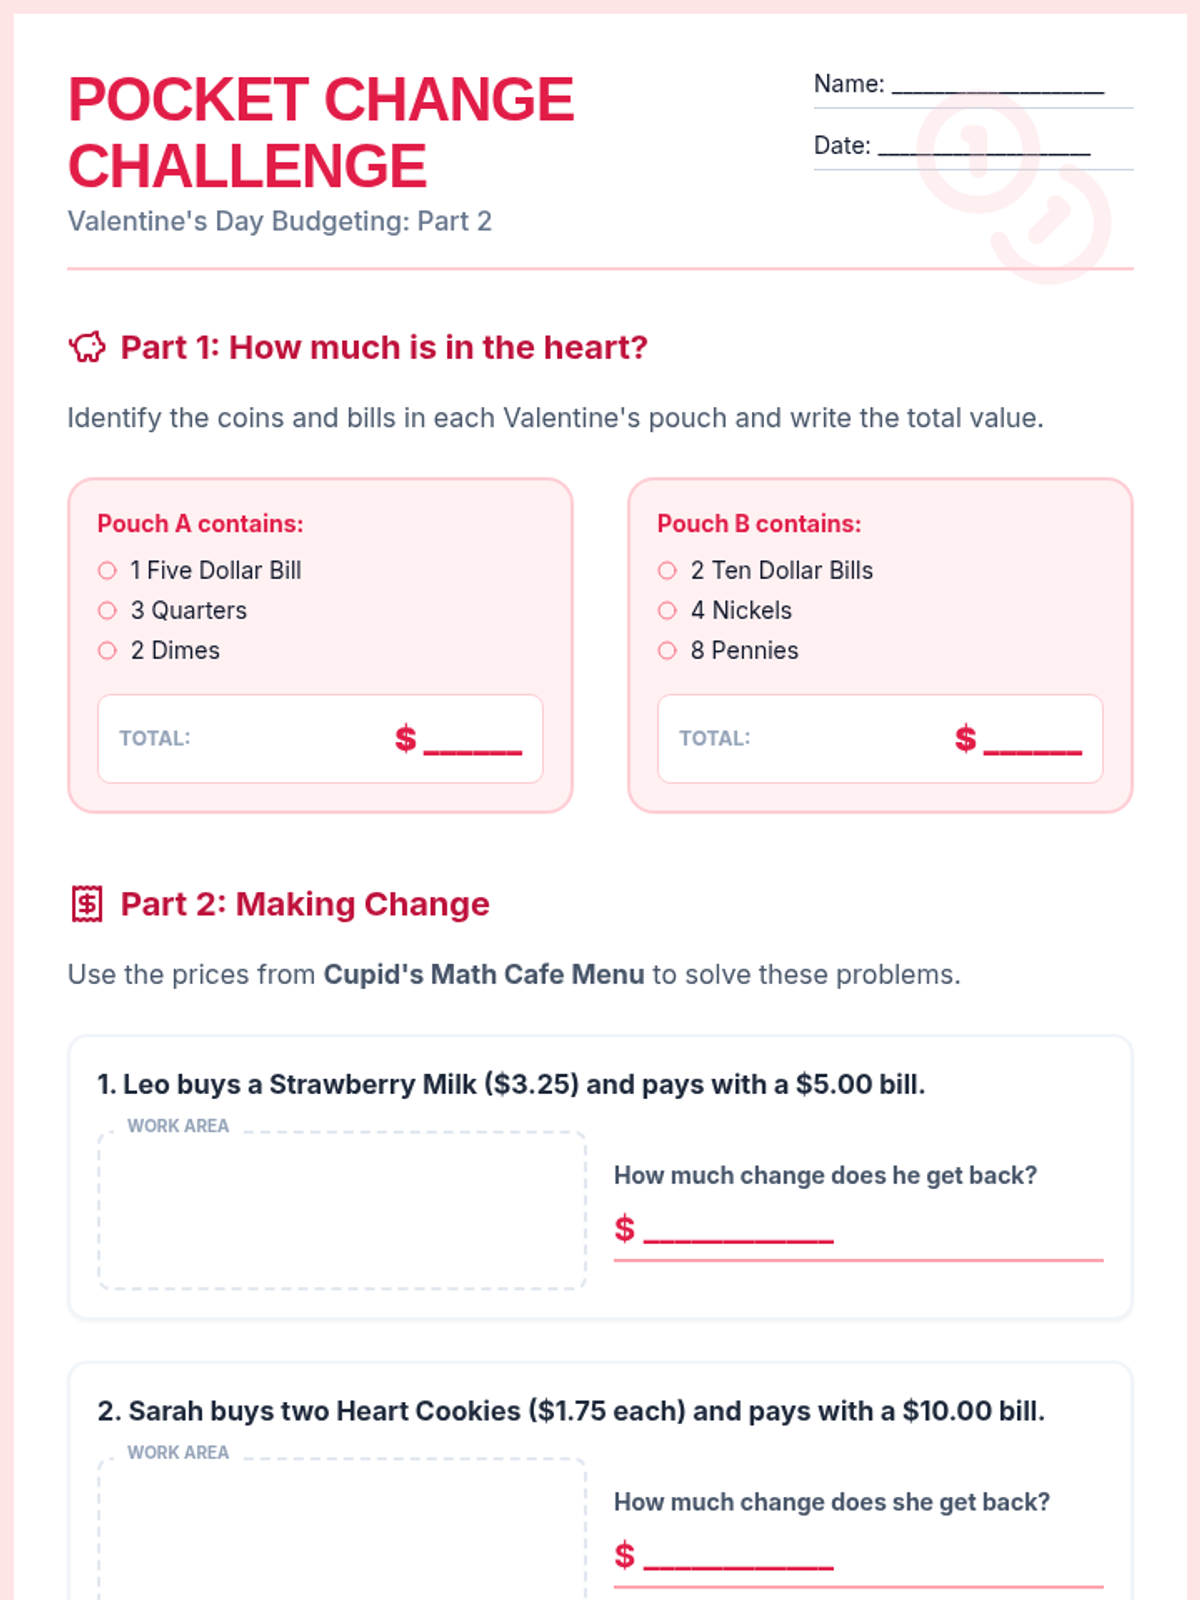
A collection of Valentine's Day math packets at two different levels (Level 1 and Quest), covering budgeting, graphing, measurement, time, and word problems.
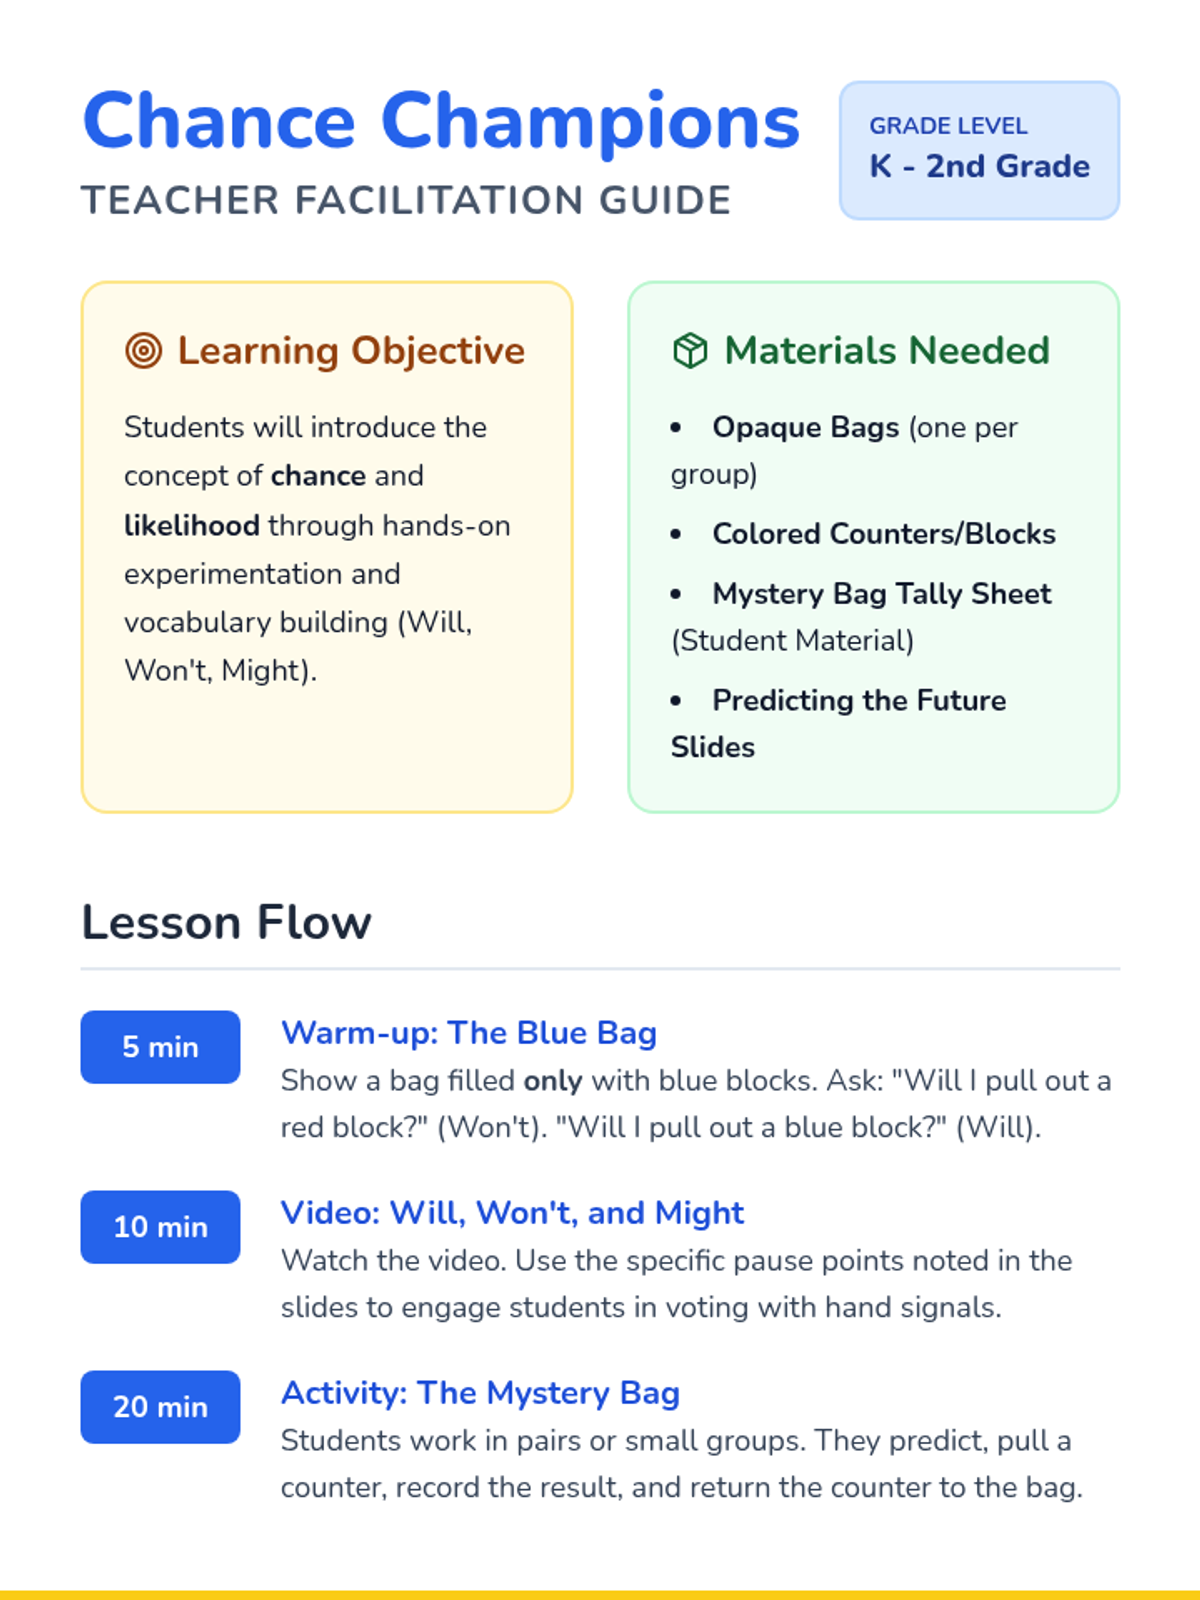
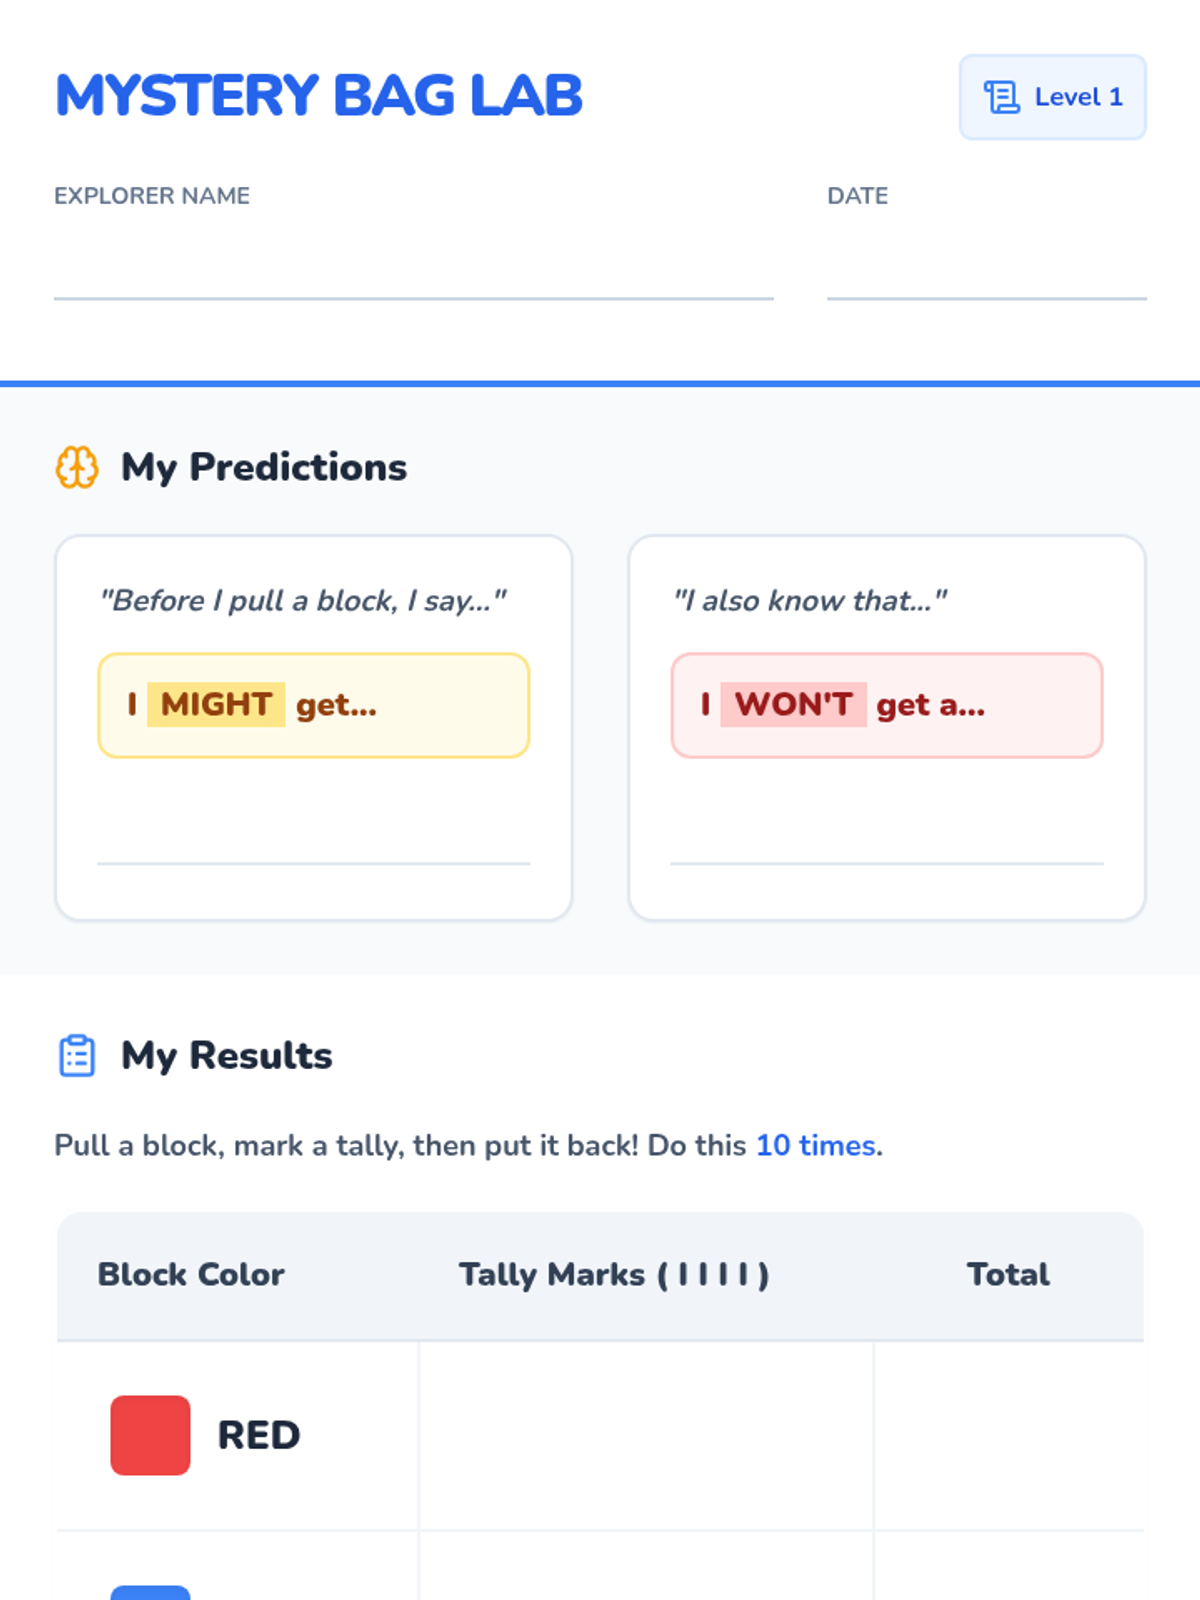
A hands-on introduction to probability and chance for early elementary students using the concepts of will, won't, and might.
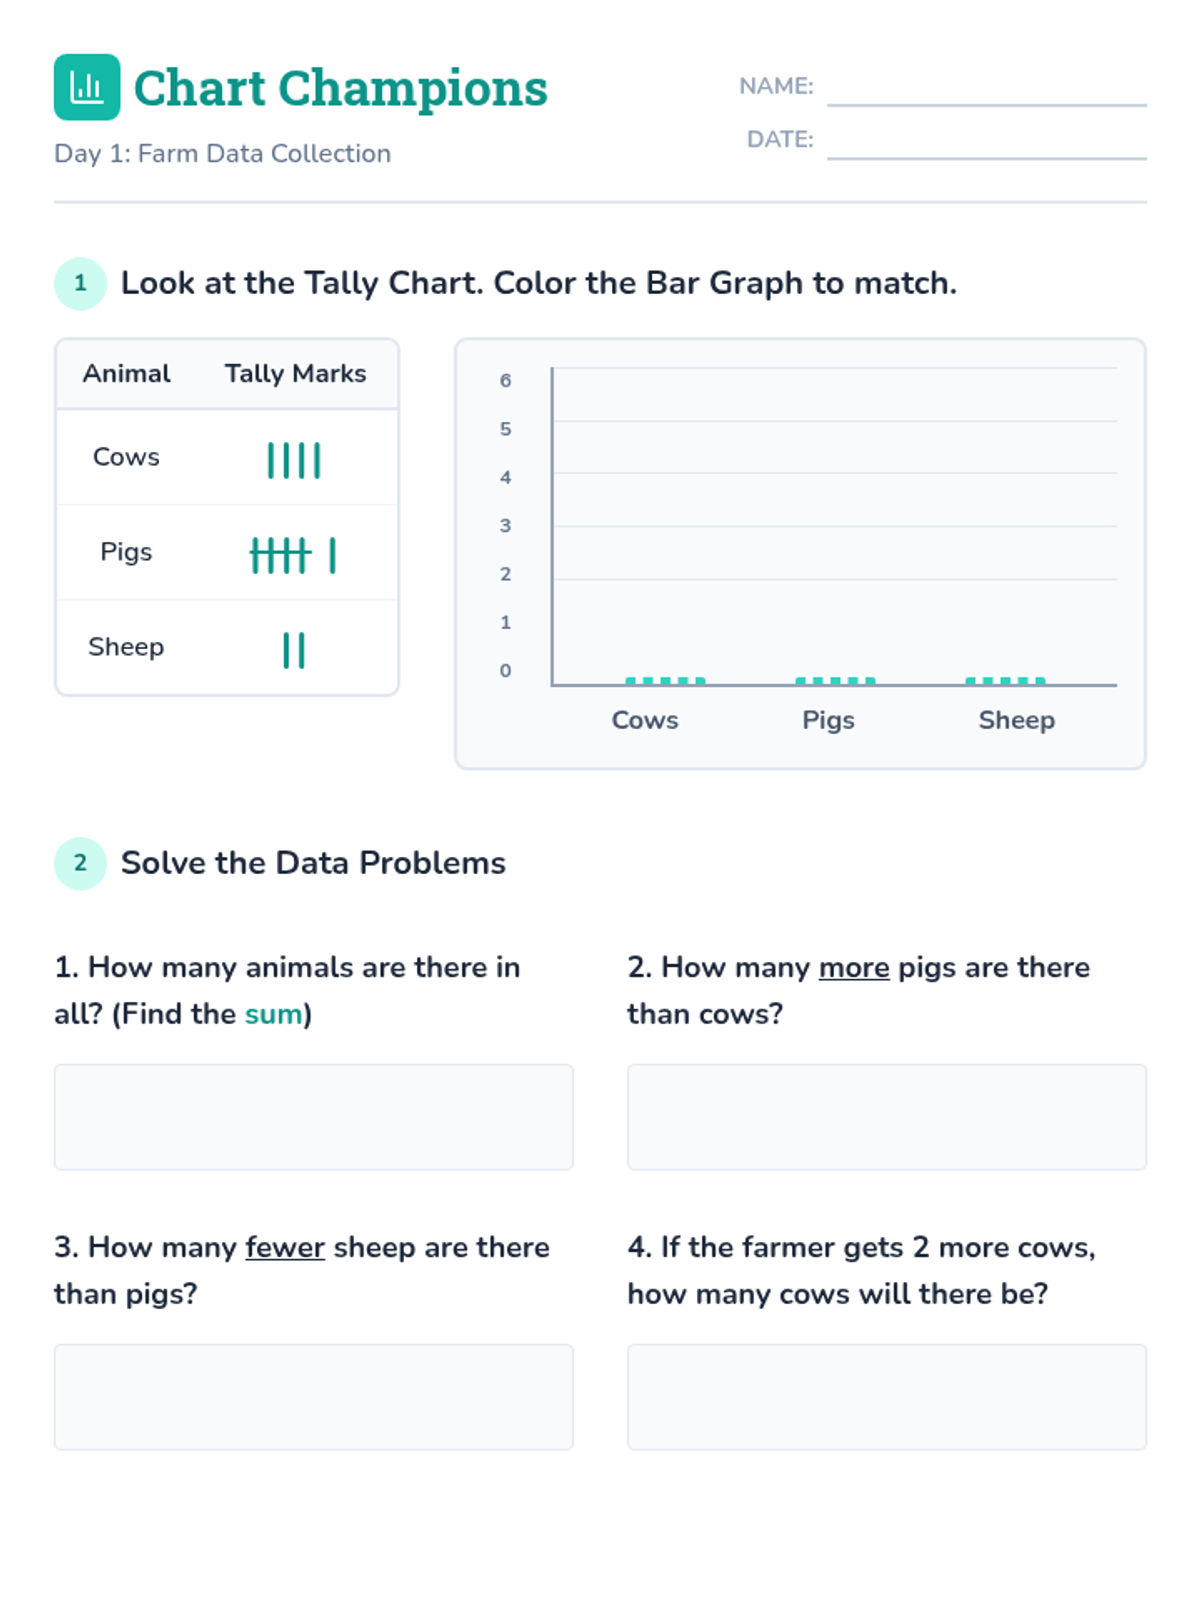
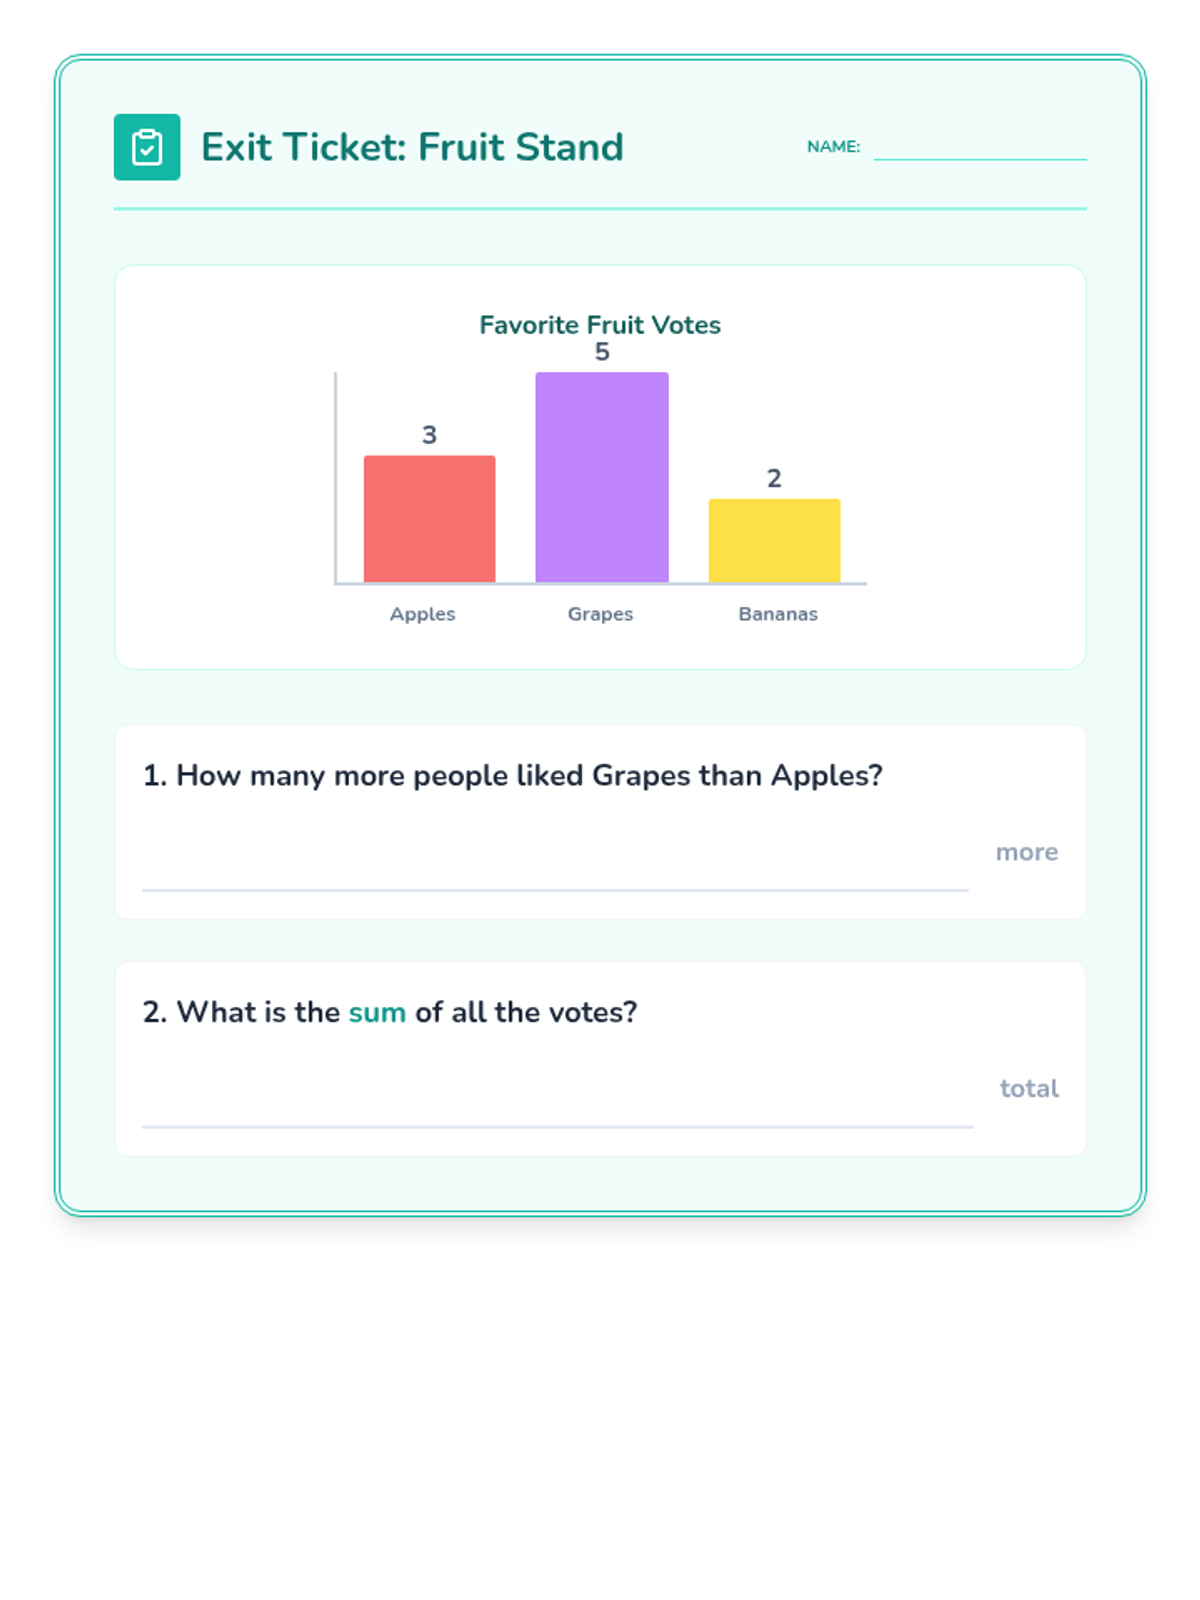
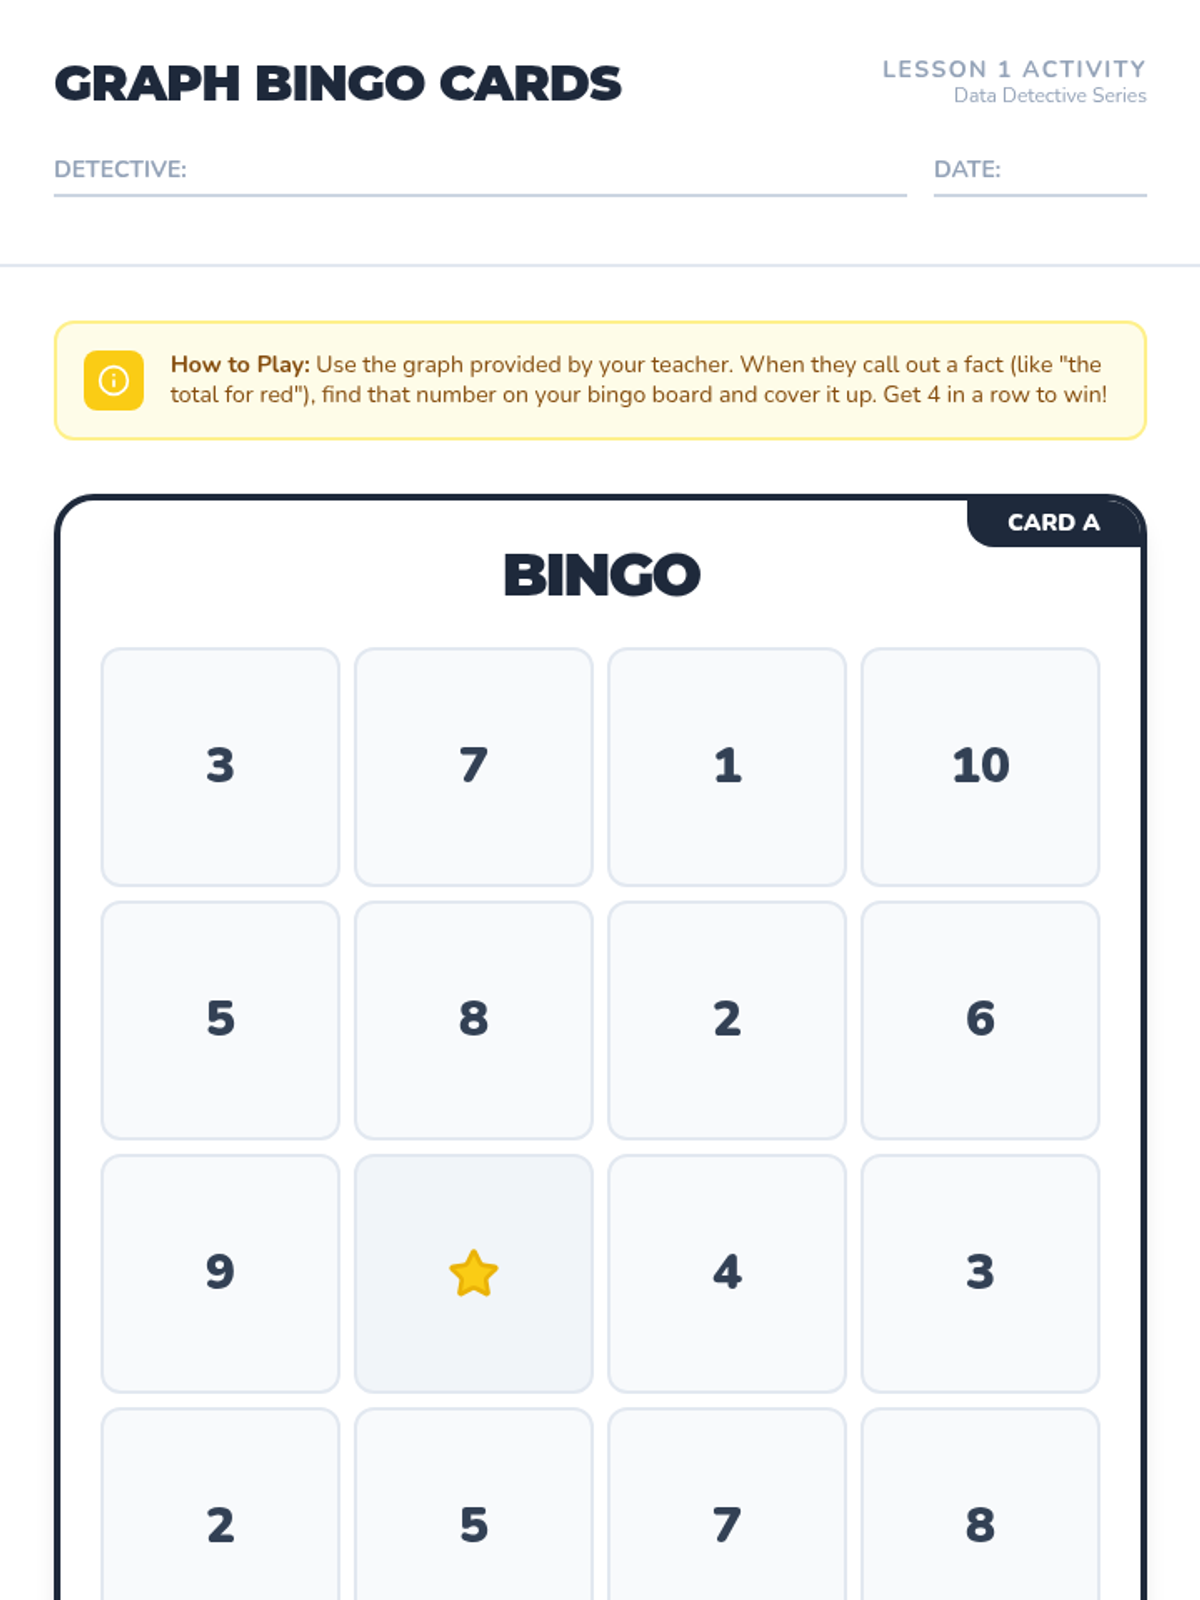
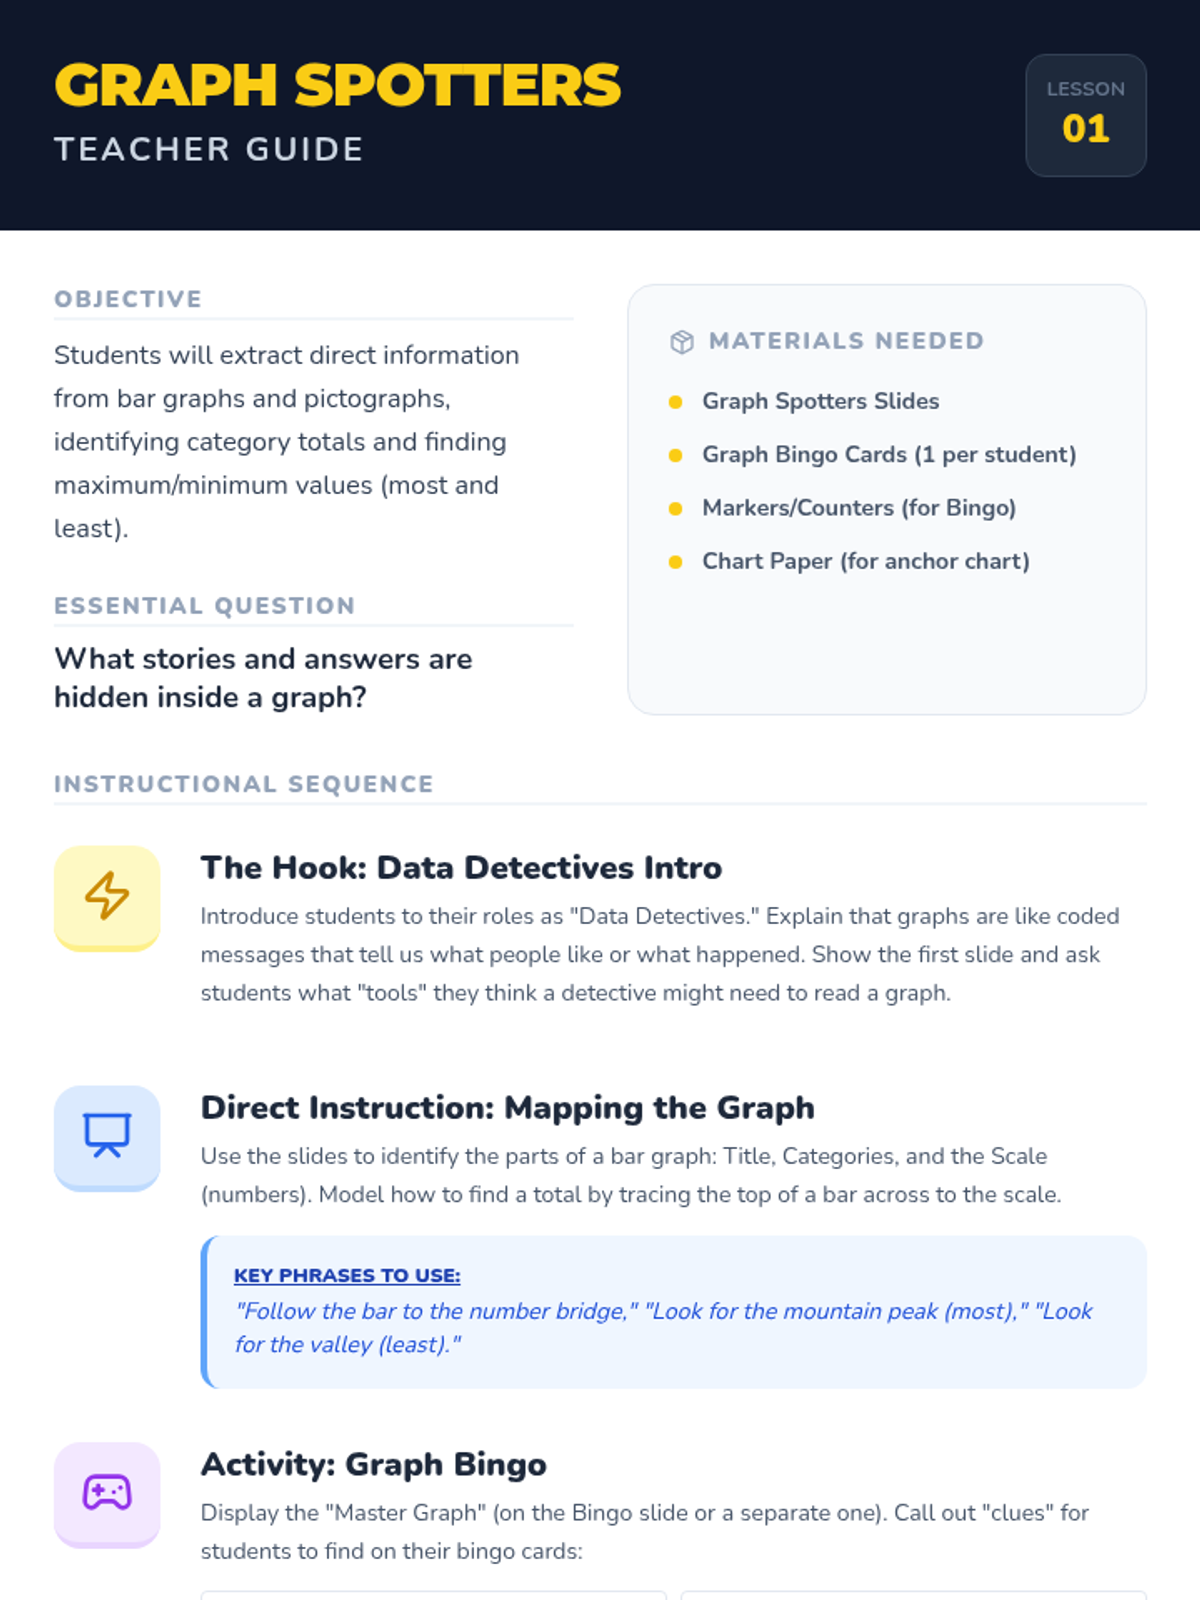
Students move beyond data creation to analysis and interpretation, practicing reading graphs to determine totals, combine categories, and make comparisons using 'how many more' and 'how many less'. The sequence culminates in a decision-making project where students use data evidence to recommend school playground improvements.
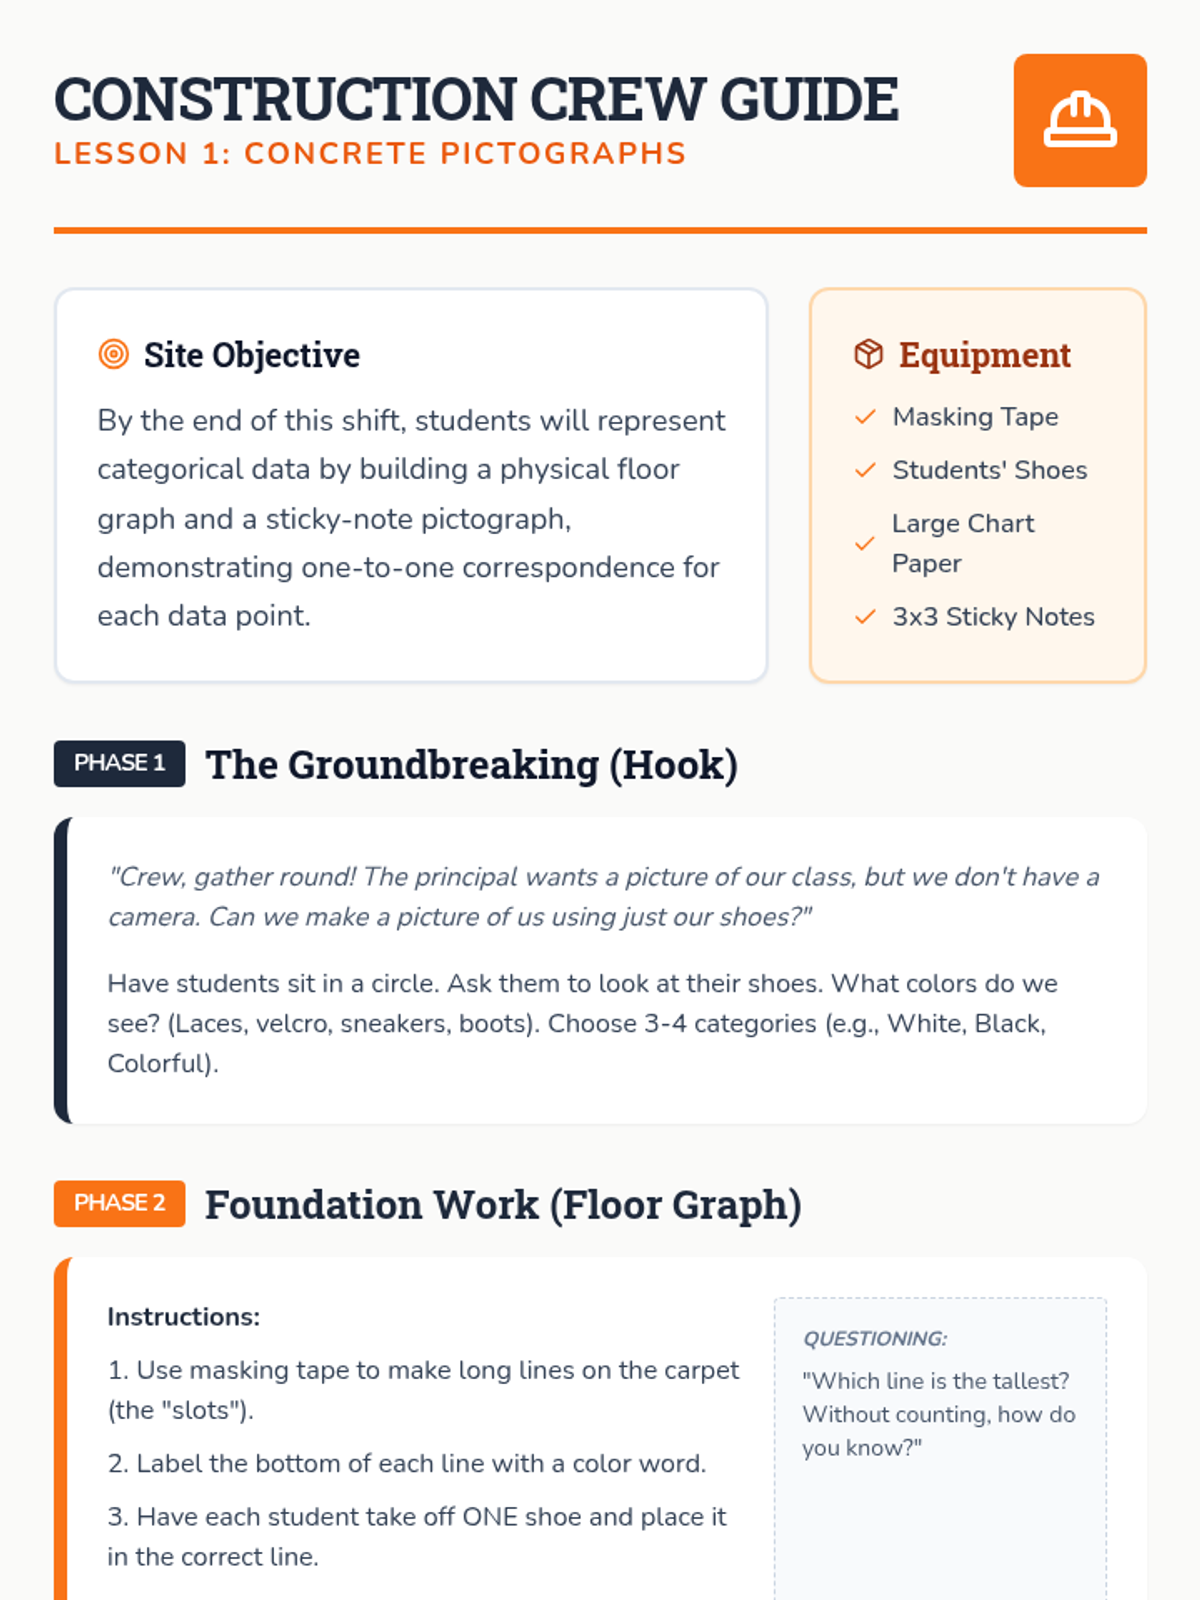
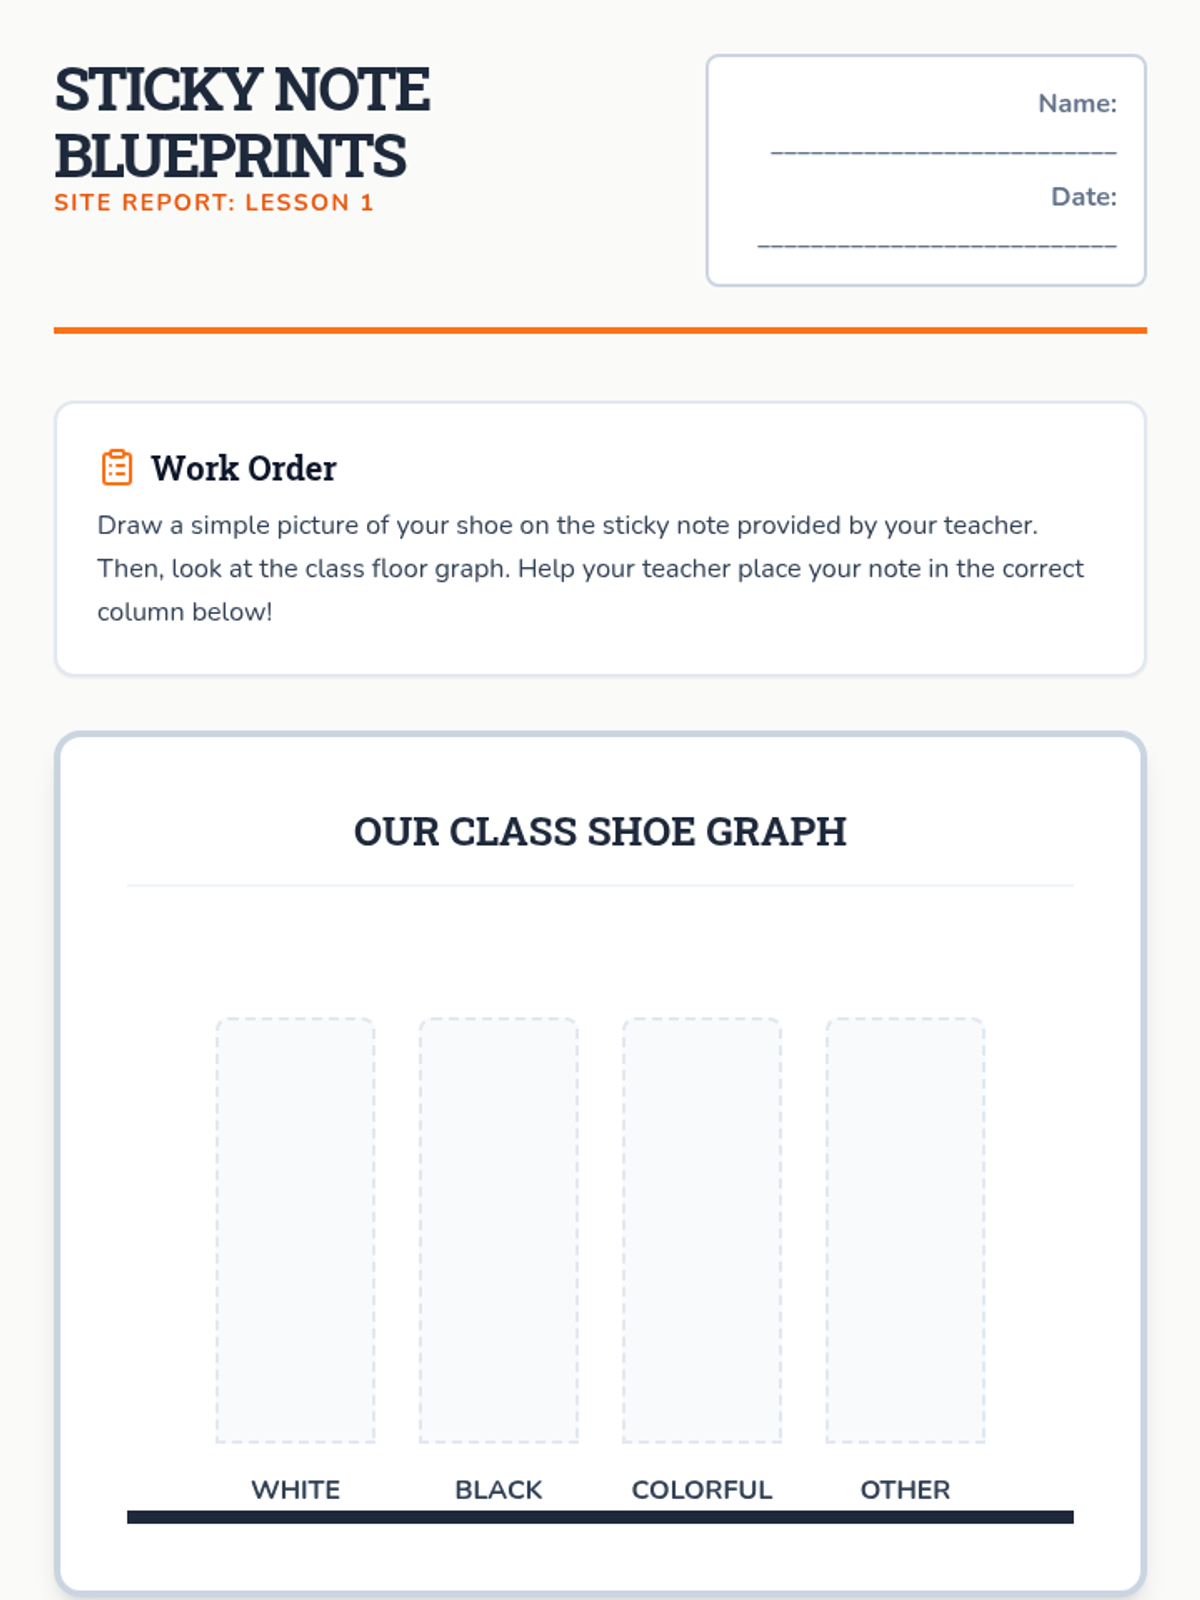
A construction-themed sequence where 1st graders learn to build and interpret pictographs and bar graphs through hands-on activities and visual representations.