Data representation, distributions, and statistical variability using sampling and inference techniques. Integrates probability models, compound events, bivariate patterns, and linear models to guide data-driven decision making.
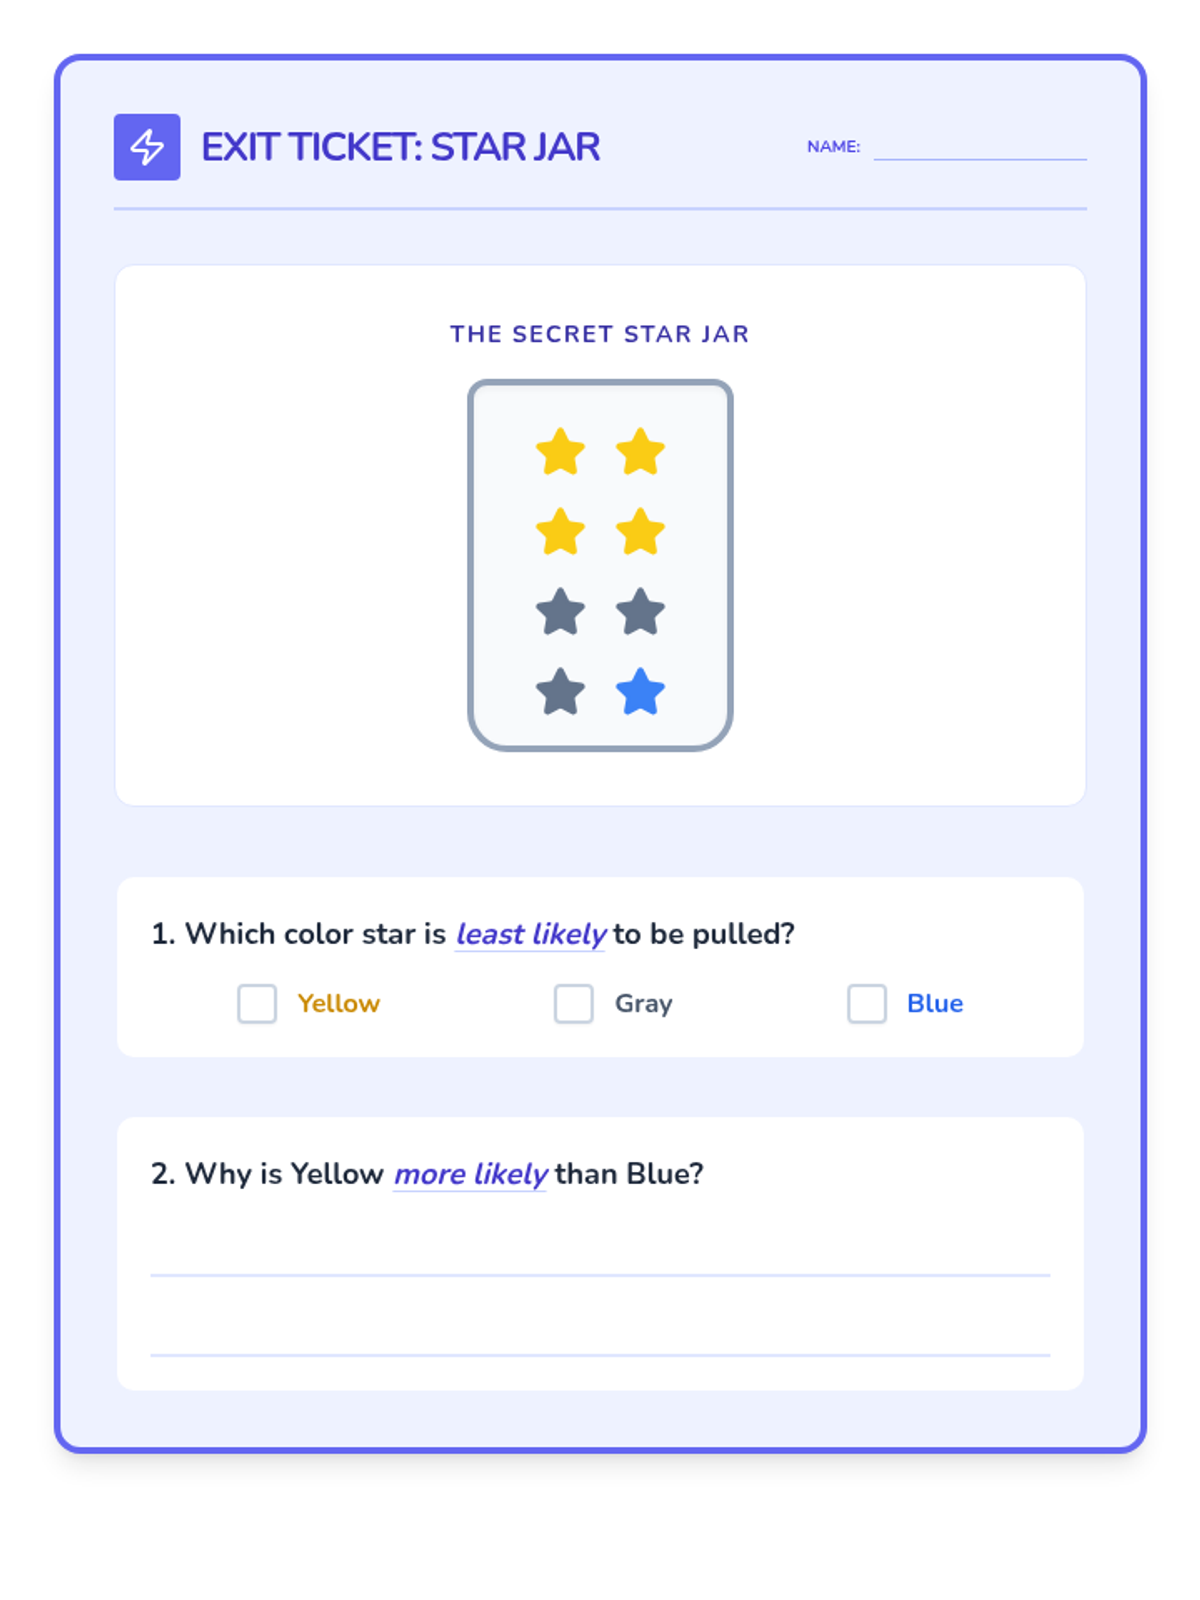
Day 3 Exit Ticket. Improved contrast for "Gray" options, added multiple writing lines for explanations, and used break-inside-avoid for better printing.
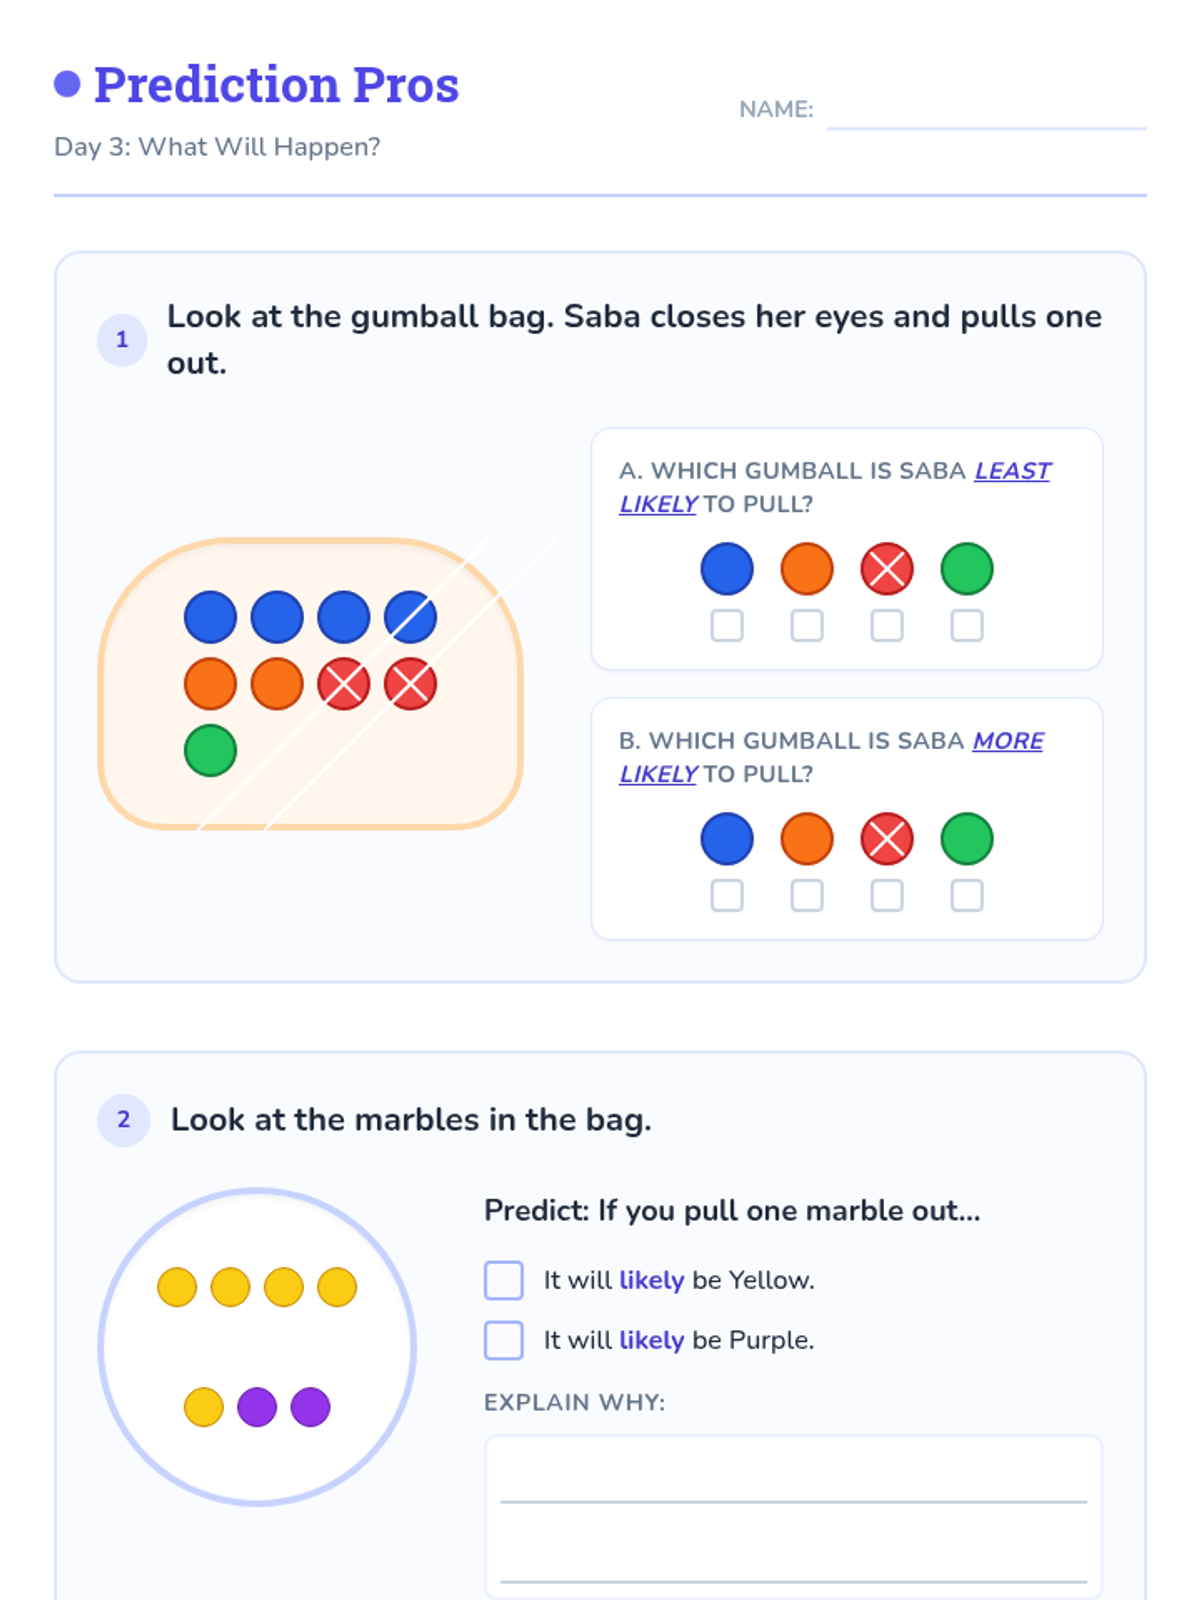
Day 3 student worksheet for probability. Fixed answer choices in Problem 1 to include all colors, removed background glitches, and darkened explanation lines.
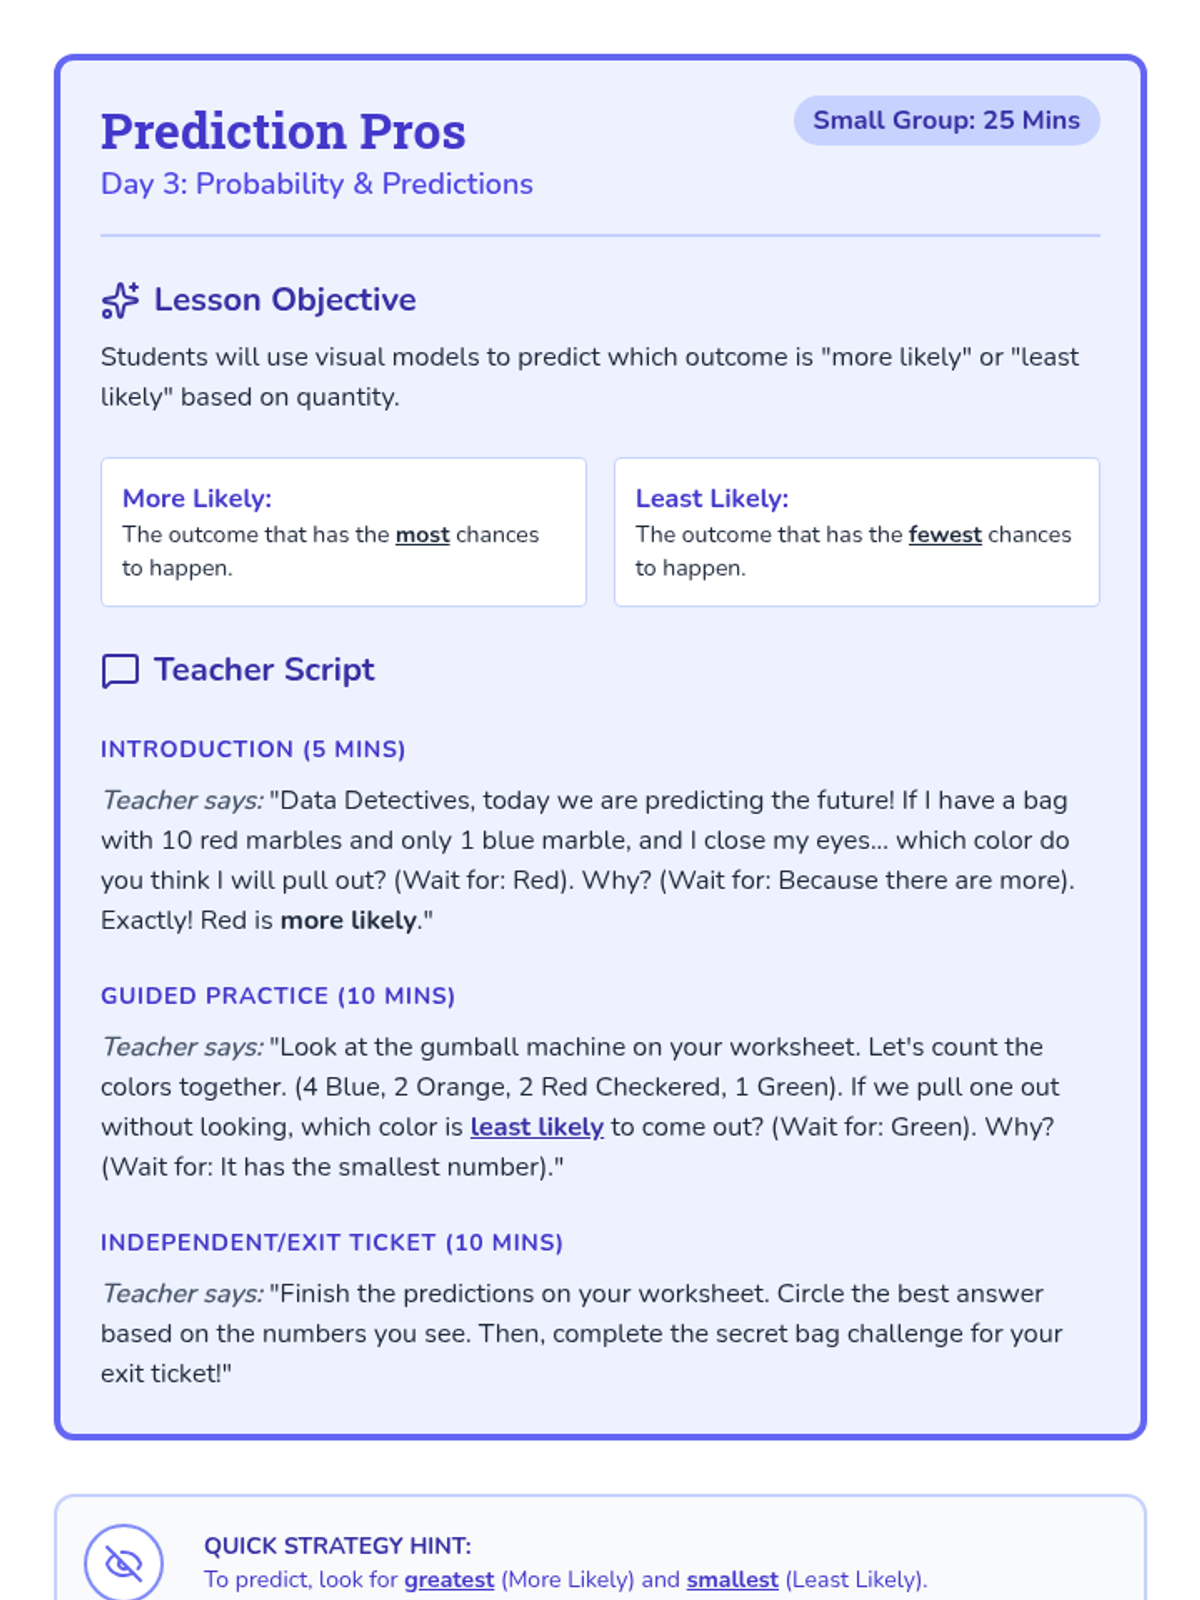
Teacher guide for Day 3 of the Data Detectives sequence. Fixed page break issue and added quick reference thumbnail for the teacher.
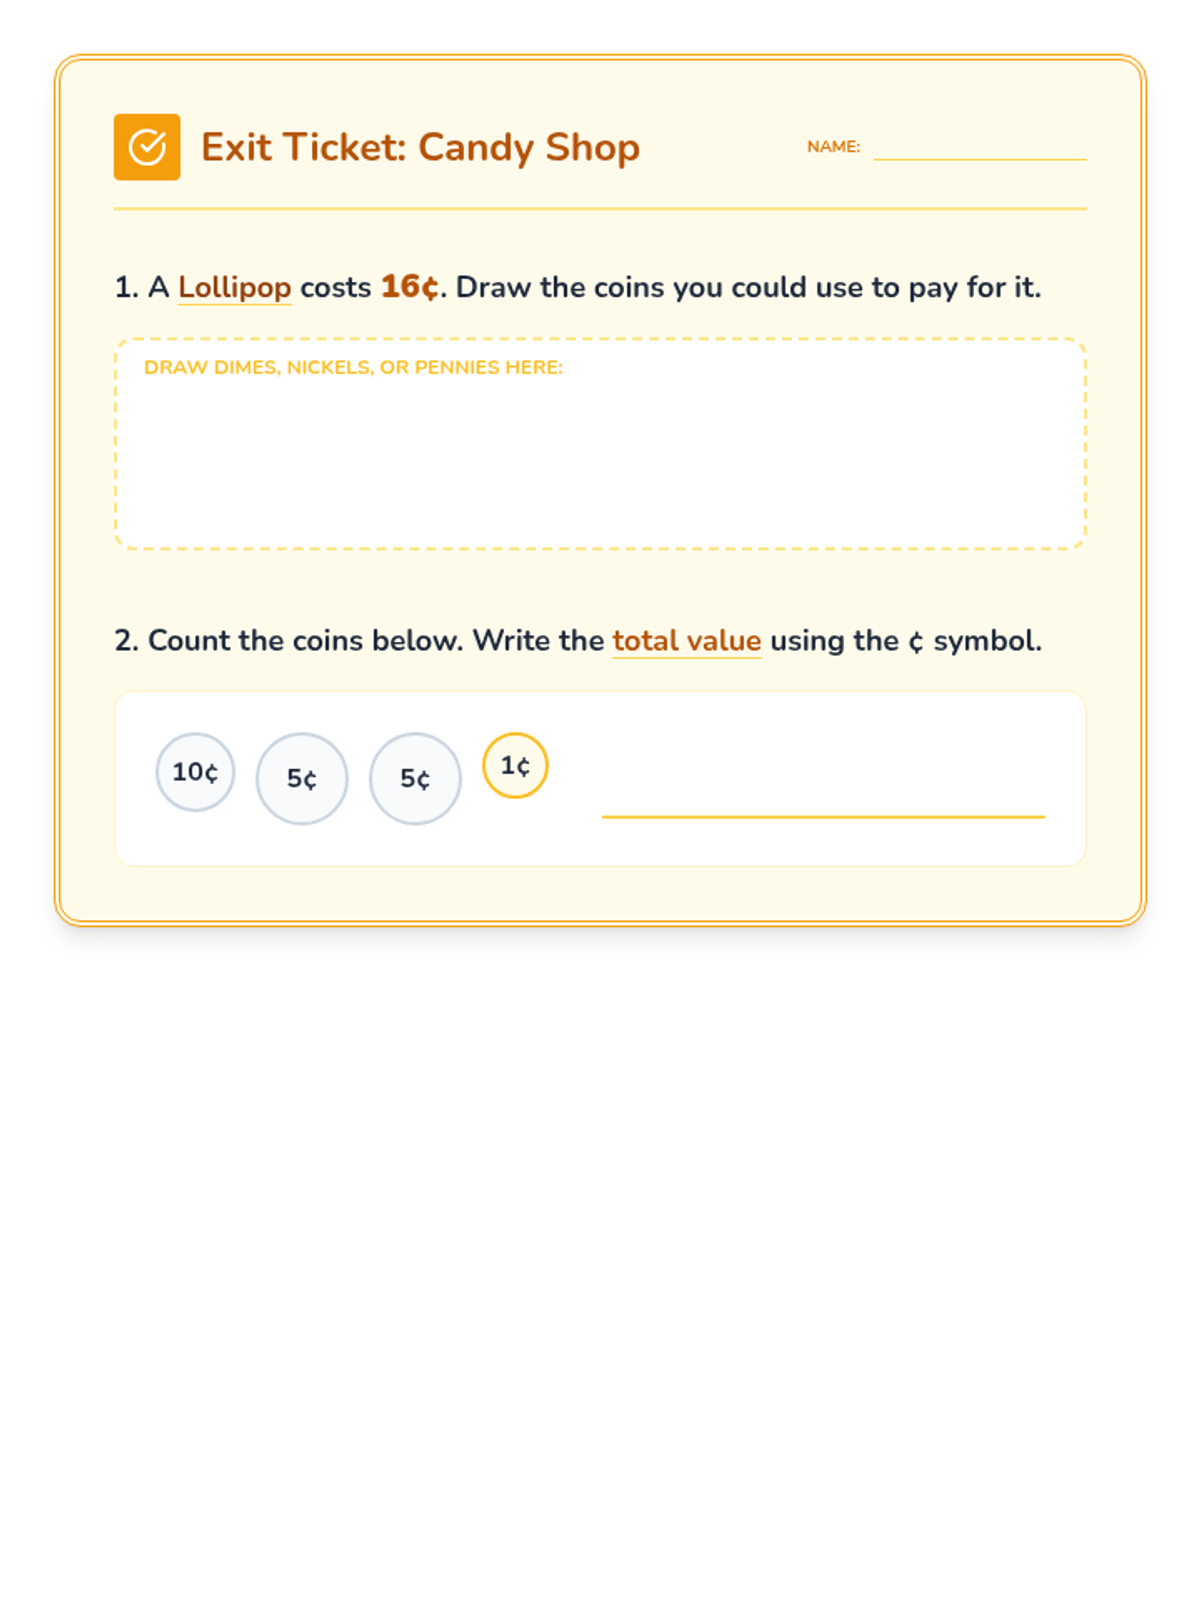
Day 2 Exit Ticket for the Candy Shop theme. Fixed theme mismatch, improved drawing area instructions, and corrected cent symbol rendering.
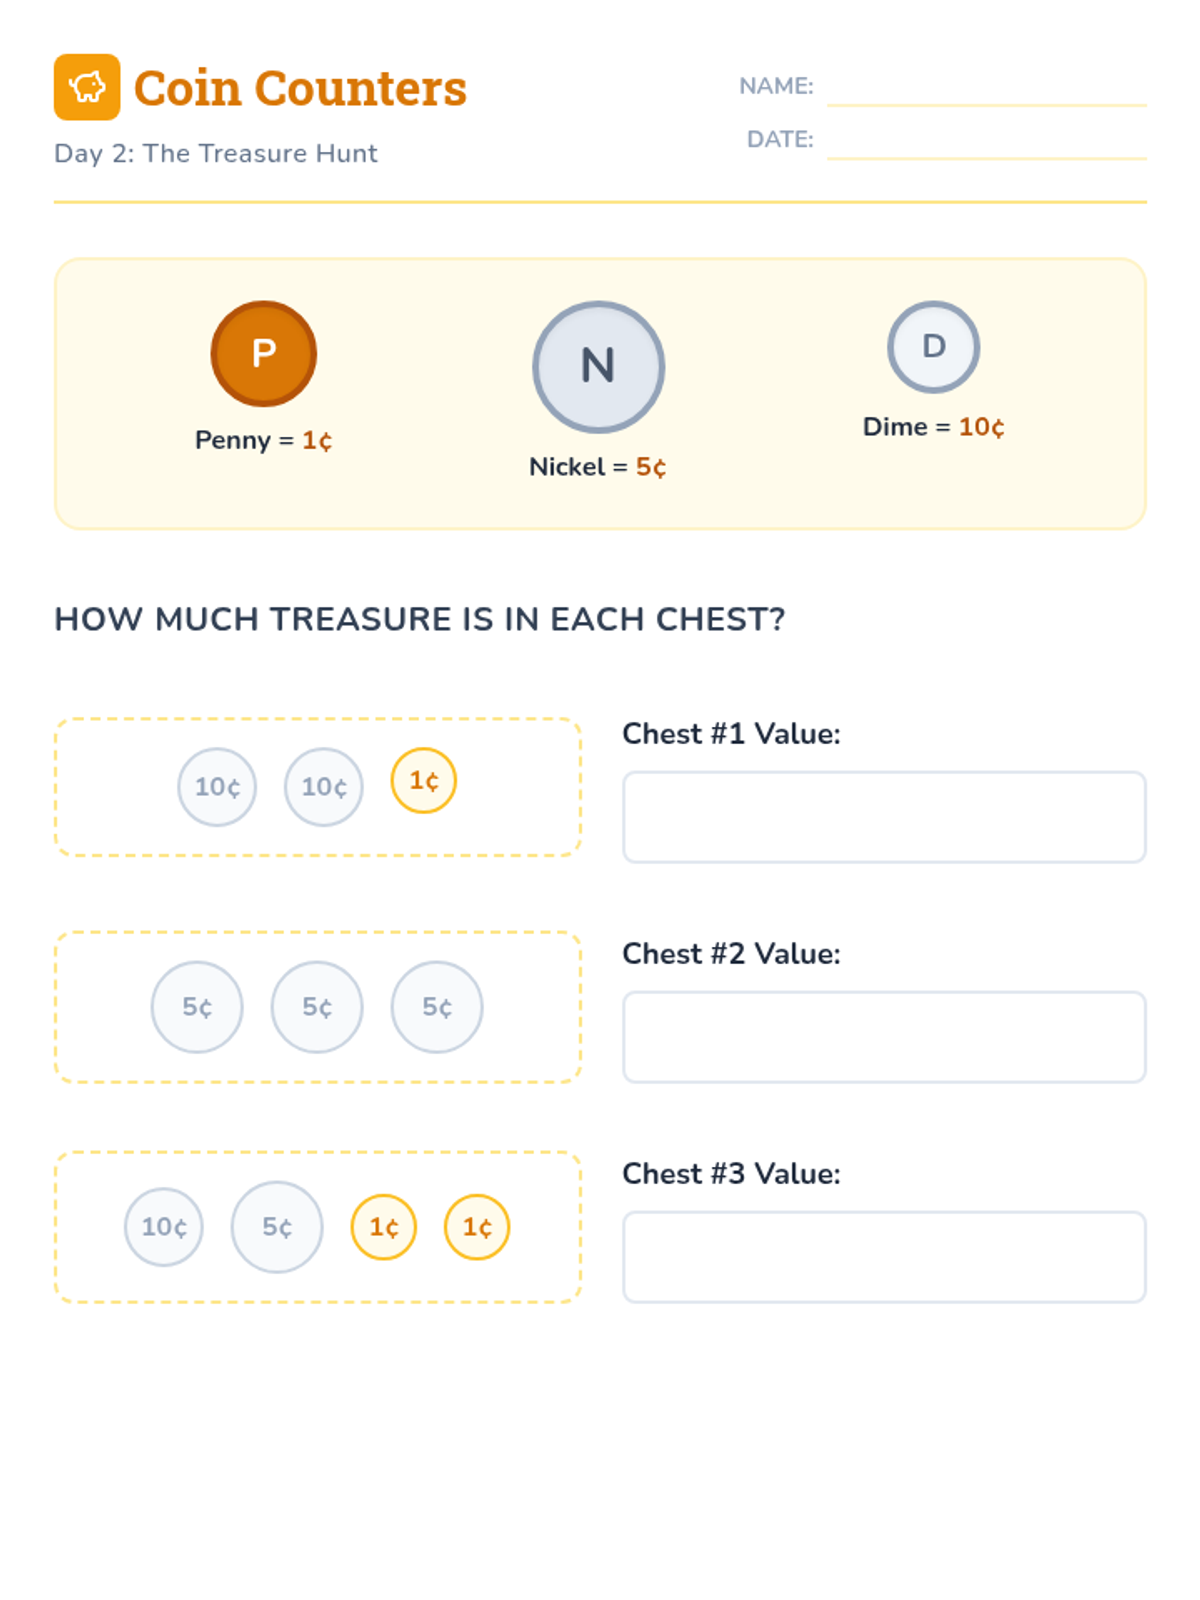
Day 2 student worksheet for identifying and counting pennies, nickels, and dimes. Fixed coin values from dollars to cents and corrected cent symbol rendering.
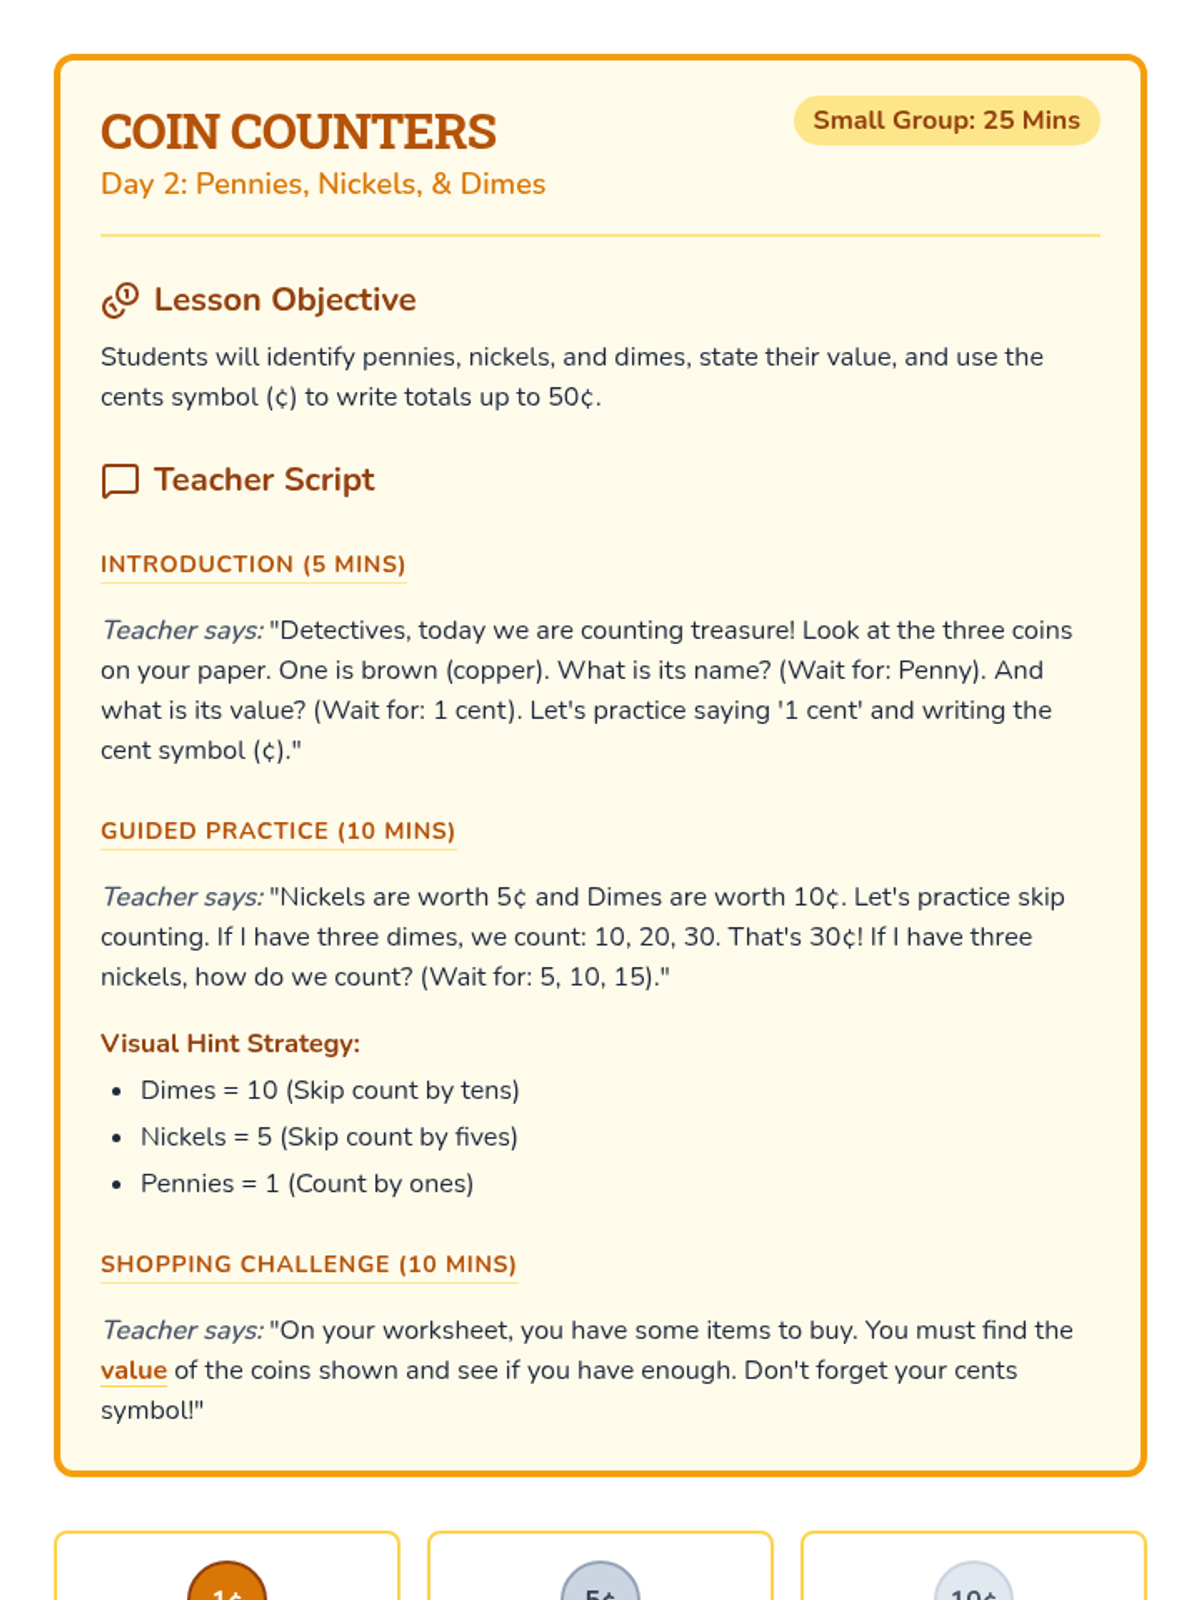
Teacher guide for Day 2 of the Data Detectives sequence. Fixed cent symbol rendering and page break layout.
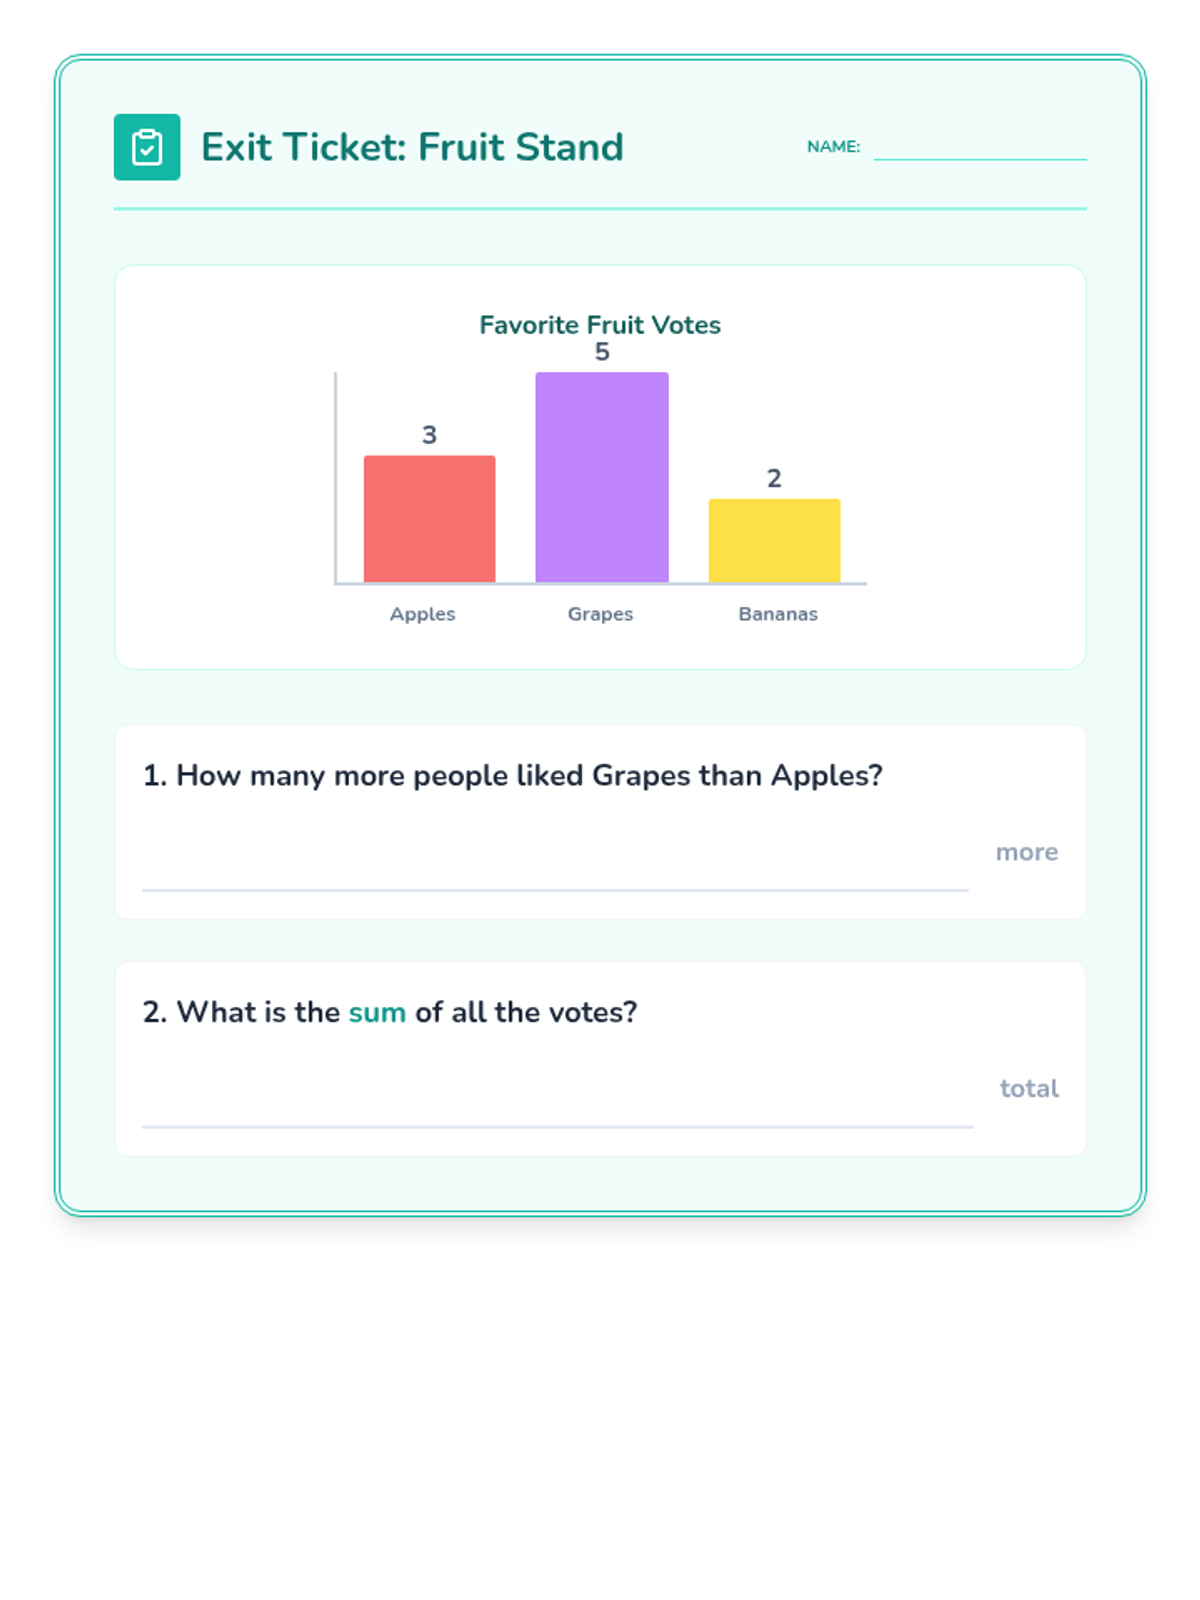
Day 1 Exit Ticket assessing the ability to compare data and calculate totals from a simple bar graph.
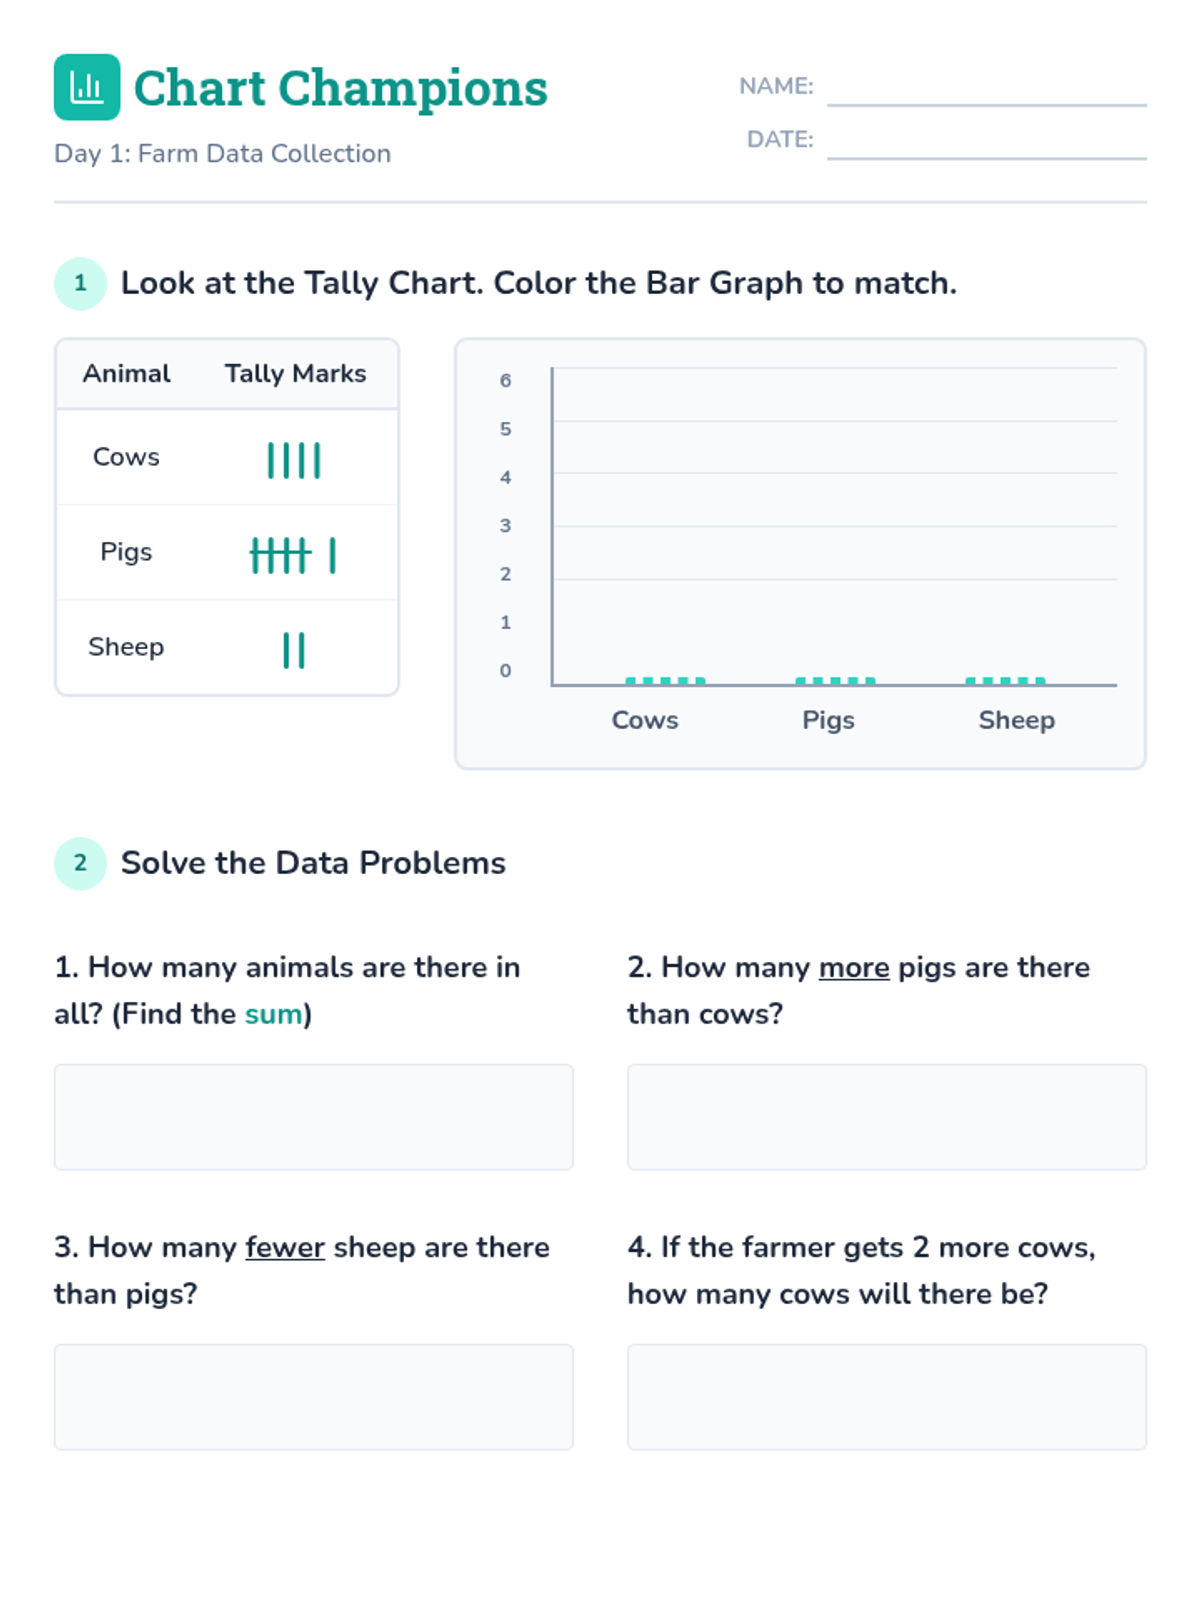
Day 1 student worksheet for tally charts and bar graphs. Fixed bar graph scale, added Y-axis labels and a graph title. Optimized to fit on a single page.
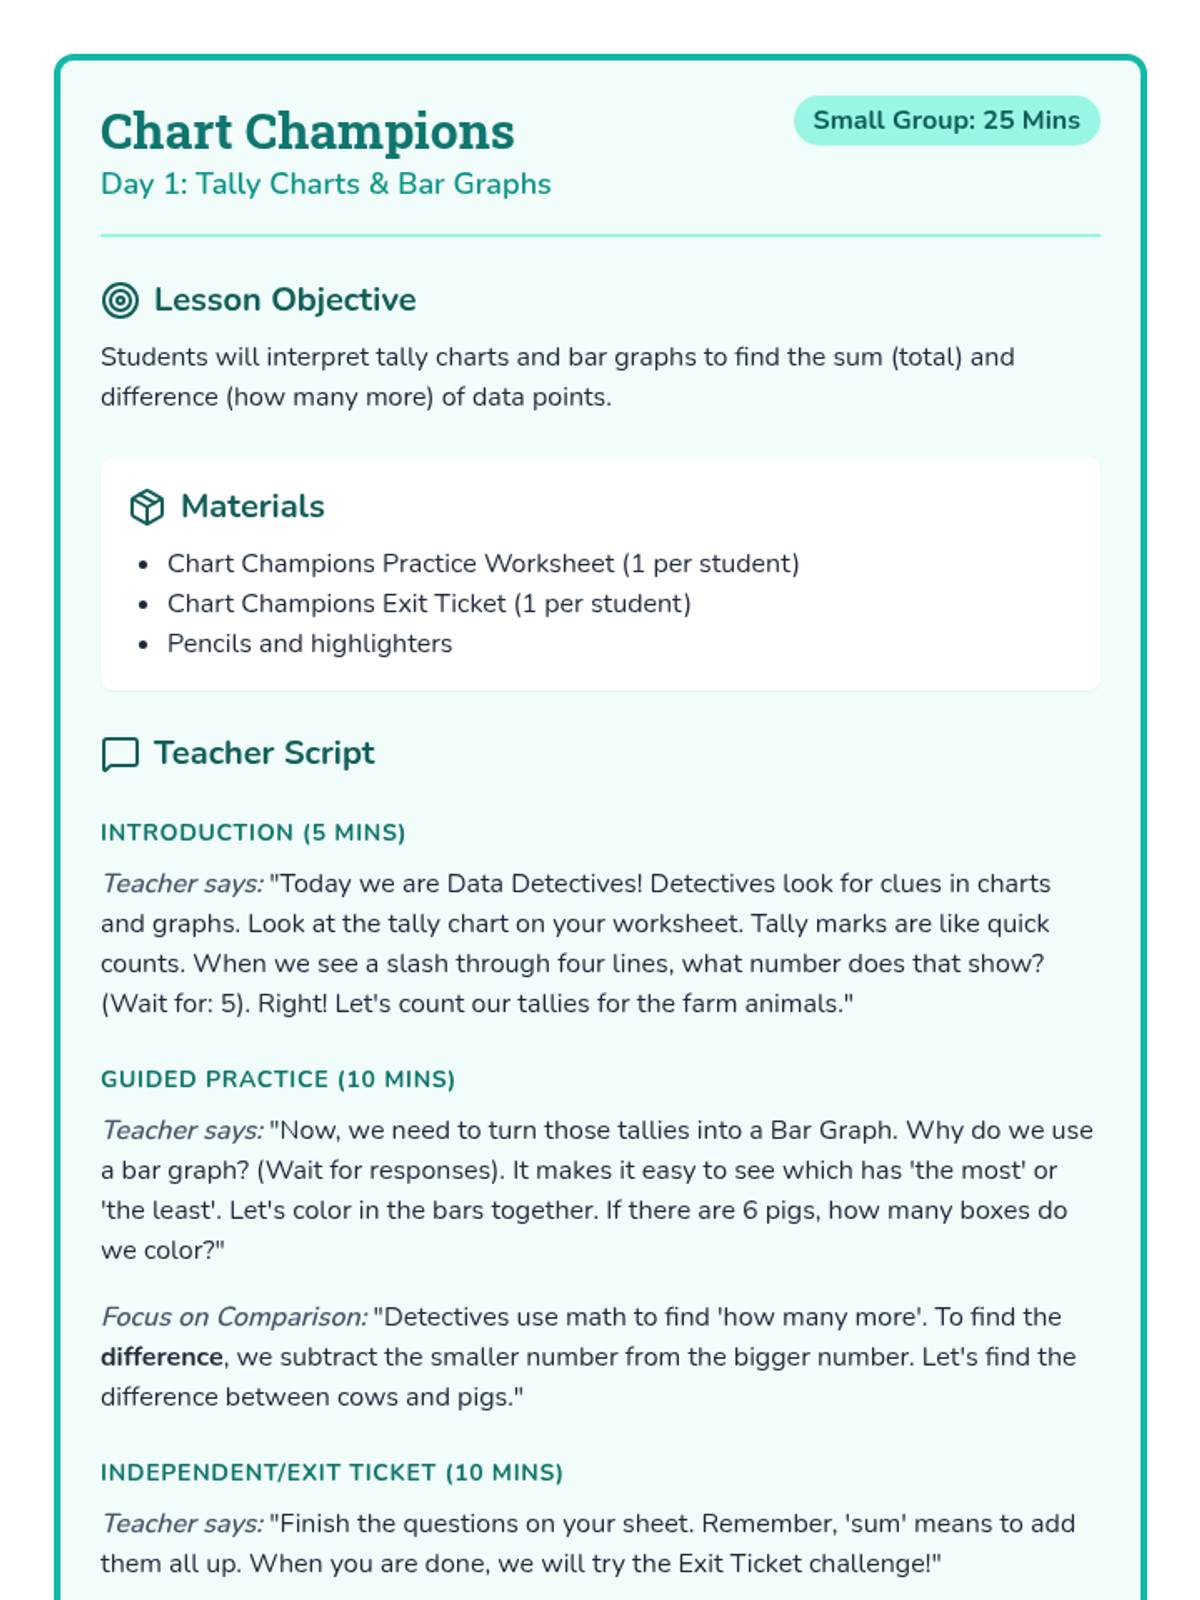
Teacher guide for Day 1 of the Data Detectives sequence, covering tally charts and bar graphs with a full script and procedure. Adjusted for page break safety.
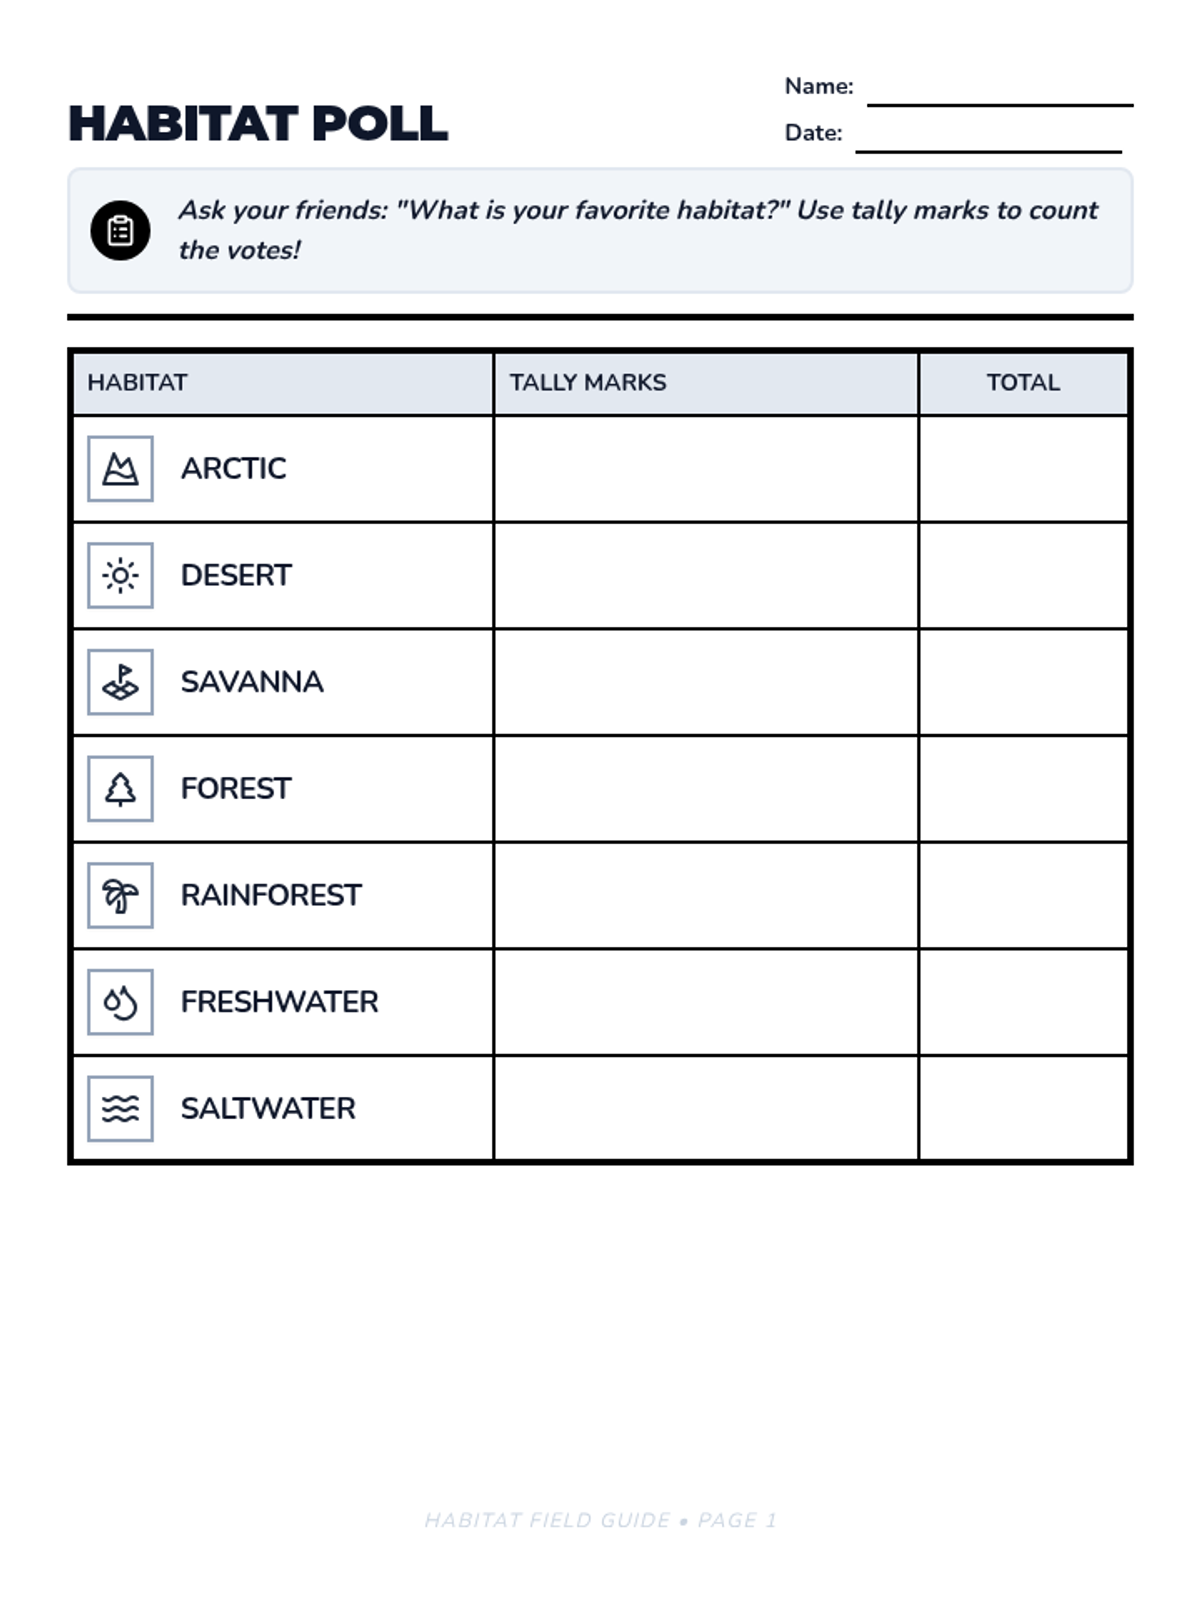
A 3-page habitat data collection and analysis resource for first graders. includes a tally chart with icons, a bar graph, and interpretative questions where students can customize their own comparisons for "how many more" and "how many fewer".
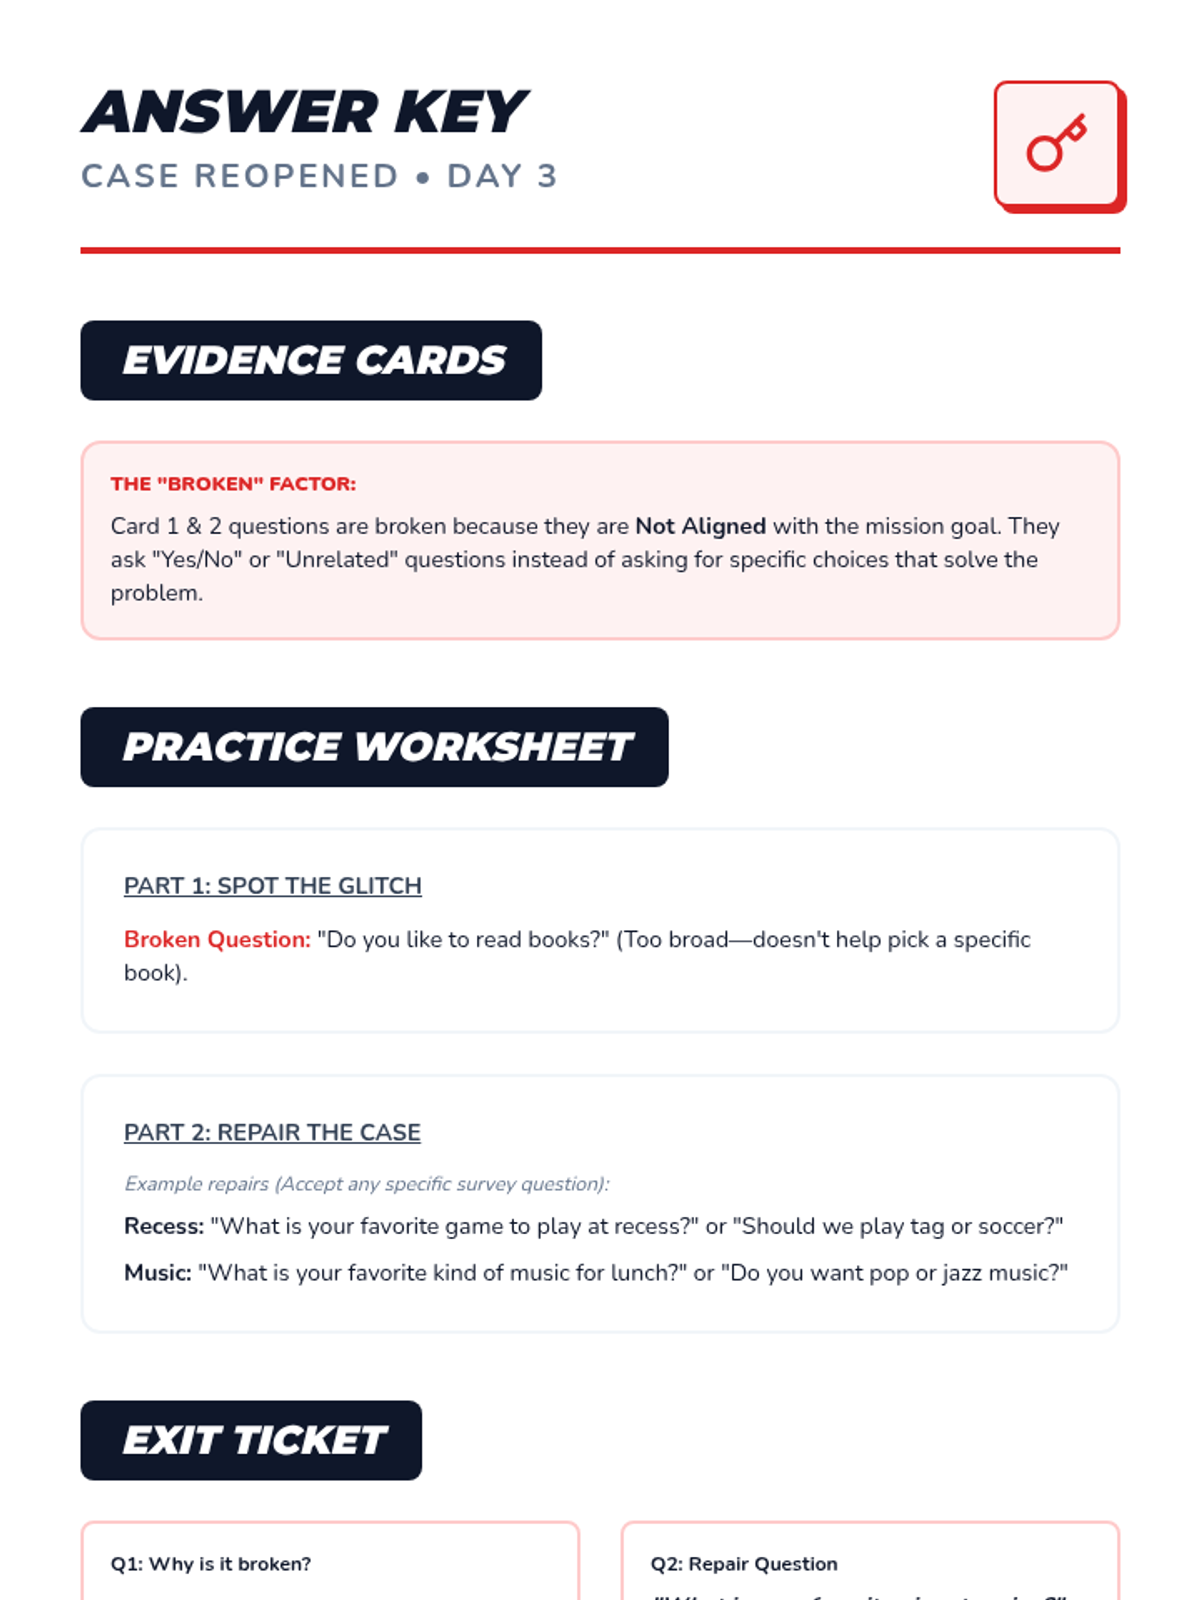
Day 3 Answer Key for the Case Reopened session. Provides correct responses for the practice worksheet and exit ticket, focusing on evaluation and repair. Explicitly branded "Day 3".
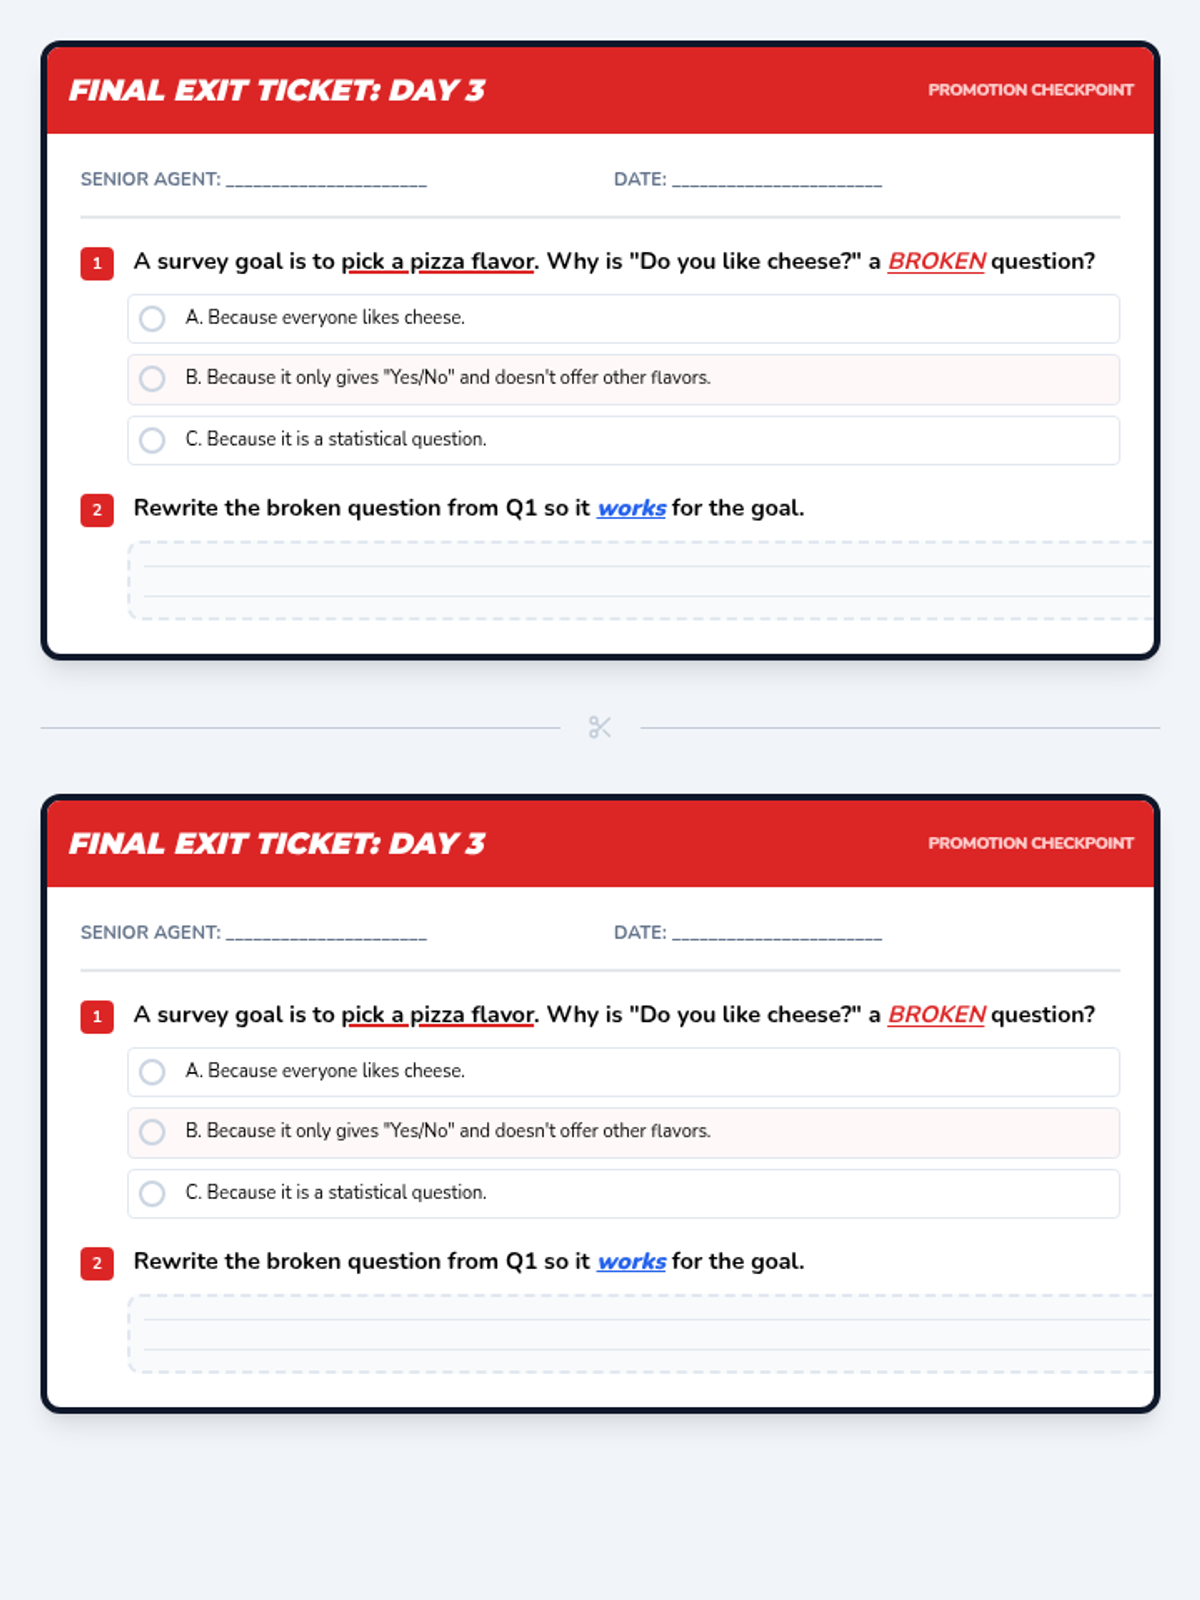
Day 3 Exit Ticket for the Case Reopened lesson. Final progress monitoring check for evaluating and rewriting survey questions for goal alignment. Revised with print-safe page breaks and improved tally rendering. Bumbed font size and darkened labels. Improved writing space.
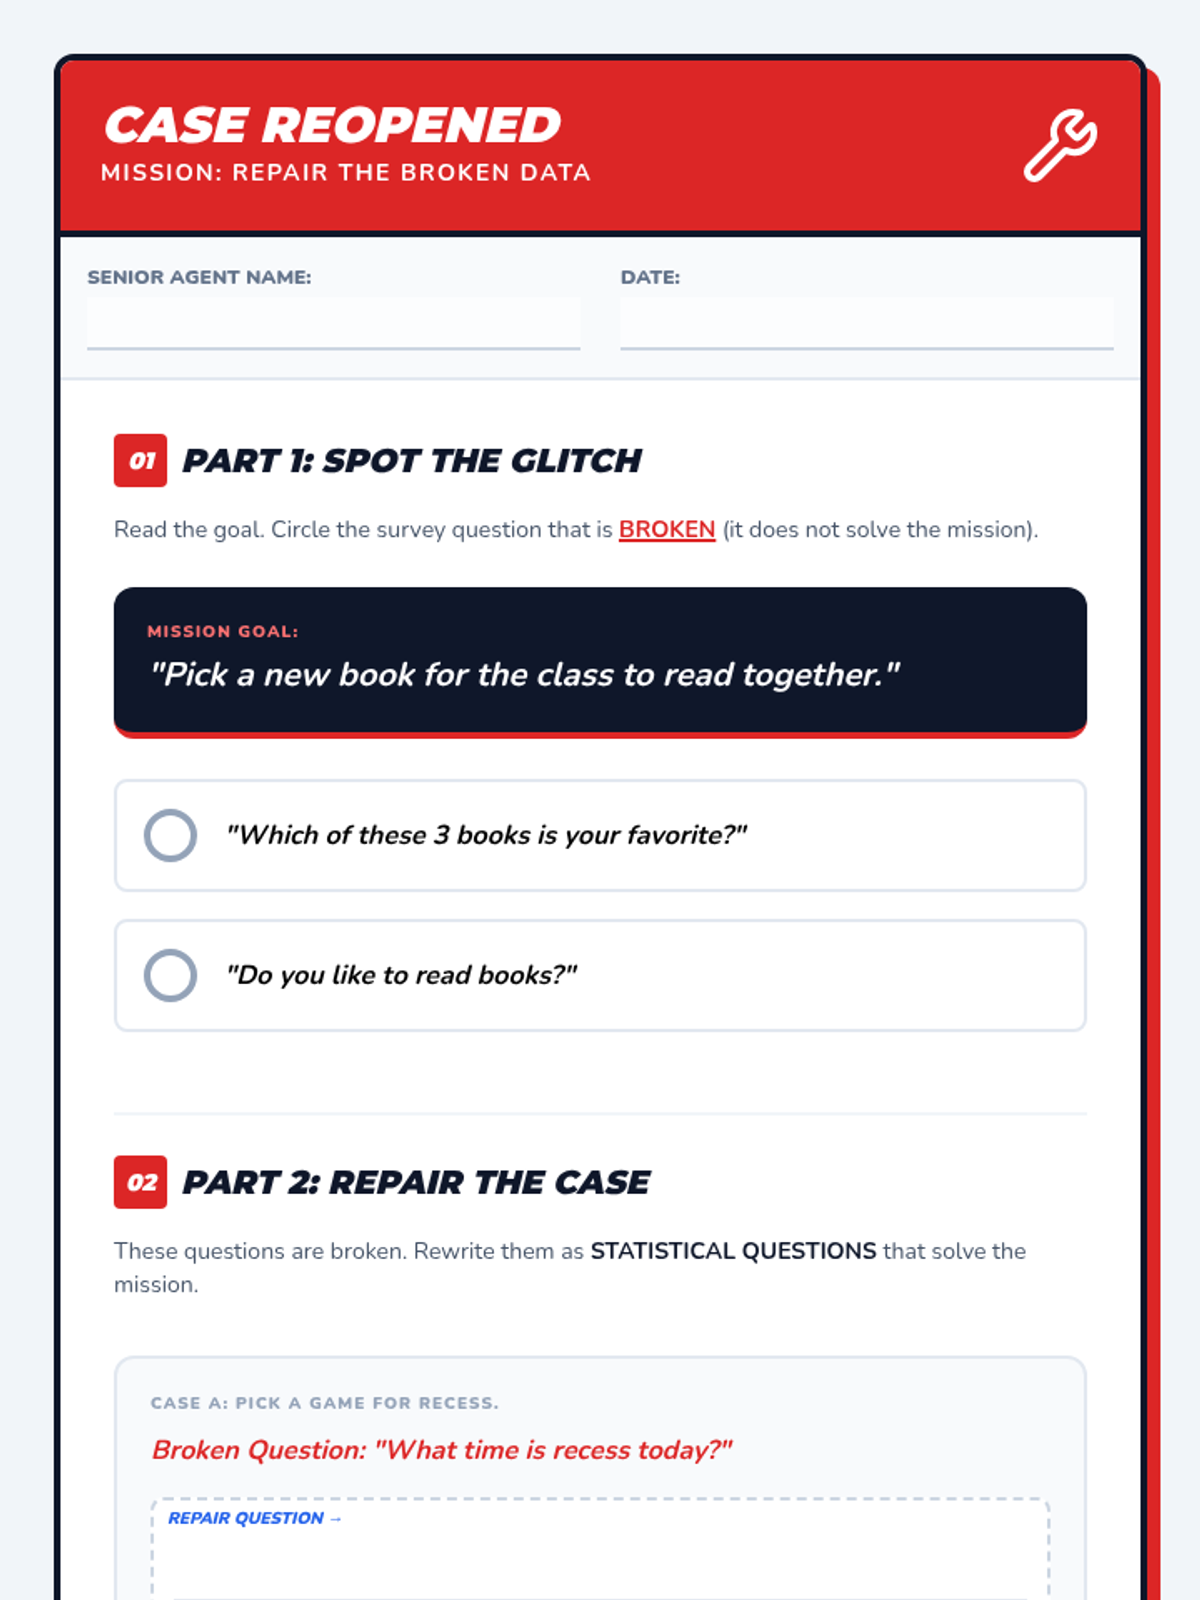
Day 3 Practice Worksheet for the Case Reopened session. Students evaluate survey misalignment and rewrite questions. Highly compacted layout with side-by-side containers to ensure it fits on a single letter-sized page (720x960 pixels). Revised with legible font sizes and optimized vertical space.
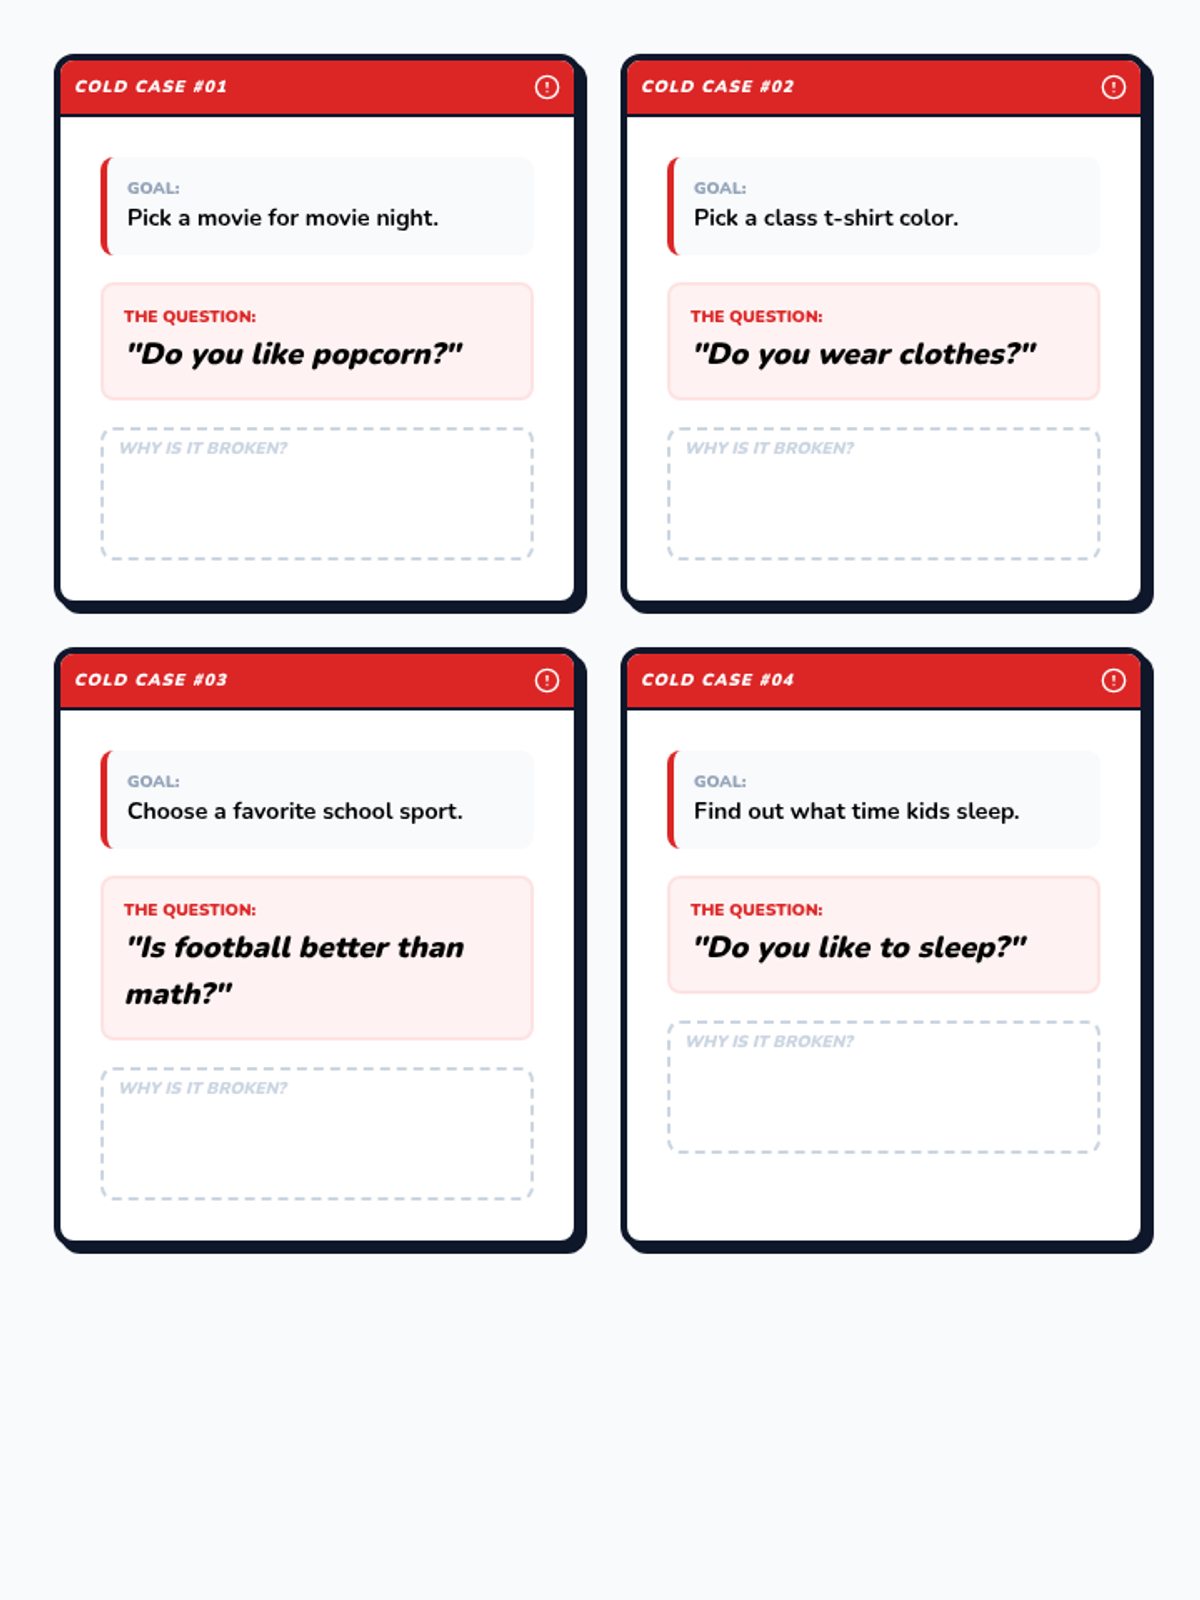
Day 3 Evidence Cards for the Case Reopened session. Printable visual aids with "Broken Survey" examples for evaluation practice. Explicitly branded "Day 3".
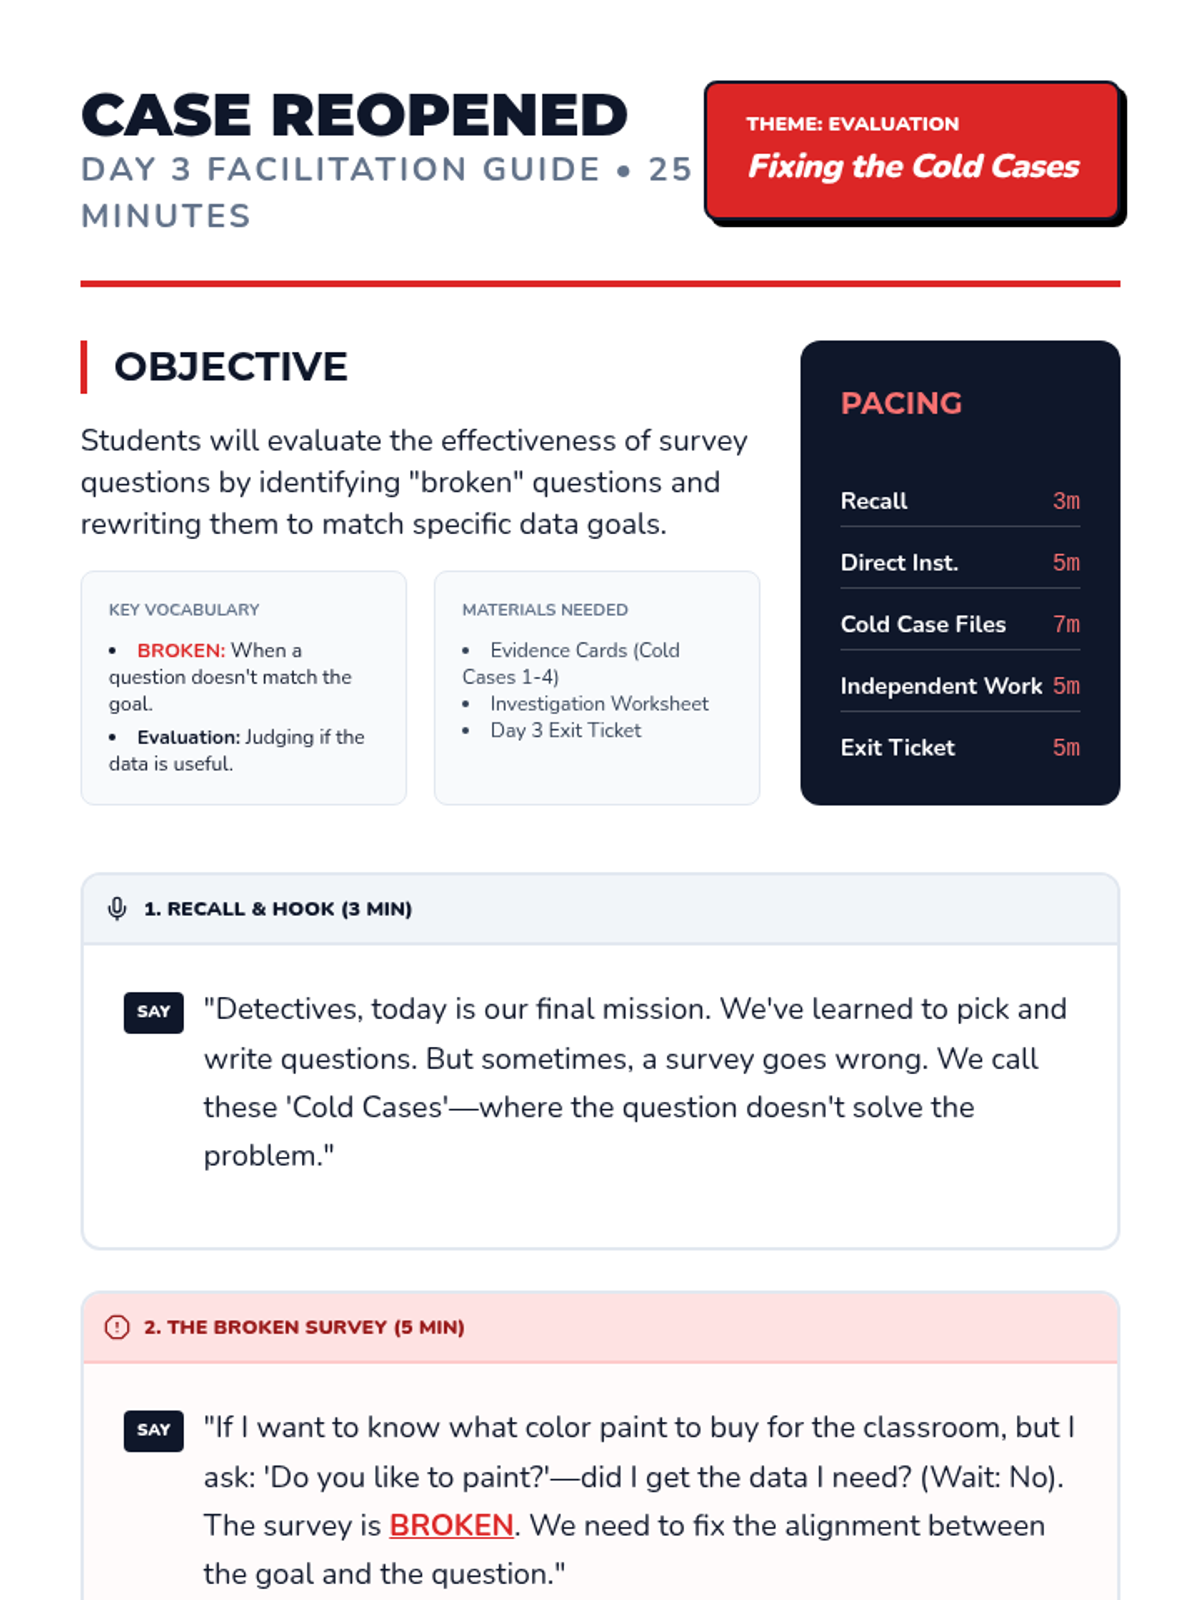
Day 3 Facilitation Guide for the Case Reopened session. Focuses on evaluating survey effectiveness and goal alignment. Explicitly branded "Day 3".
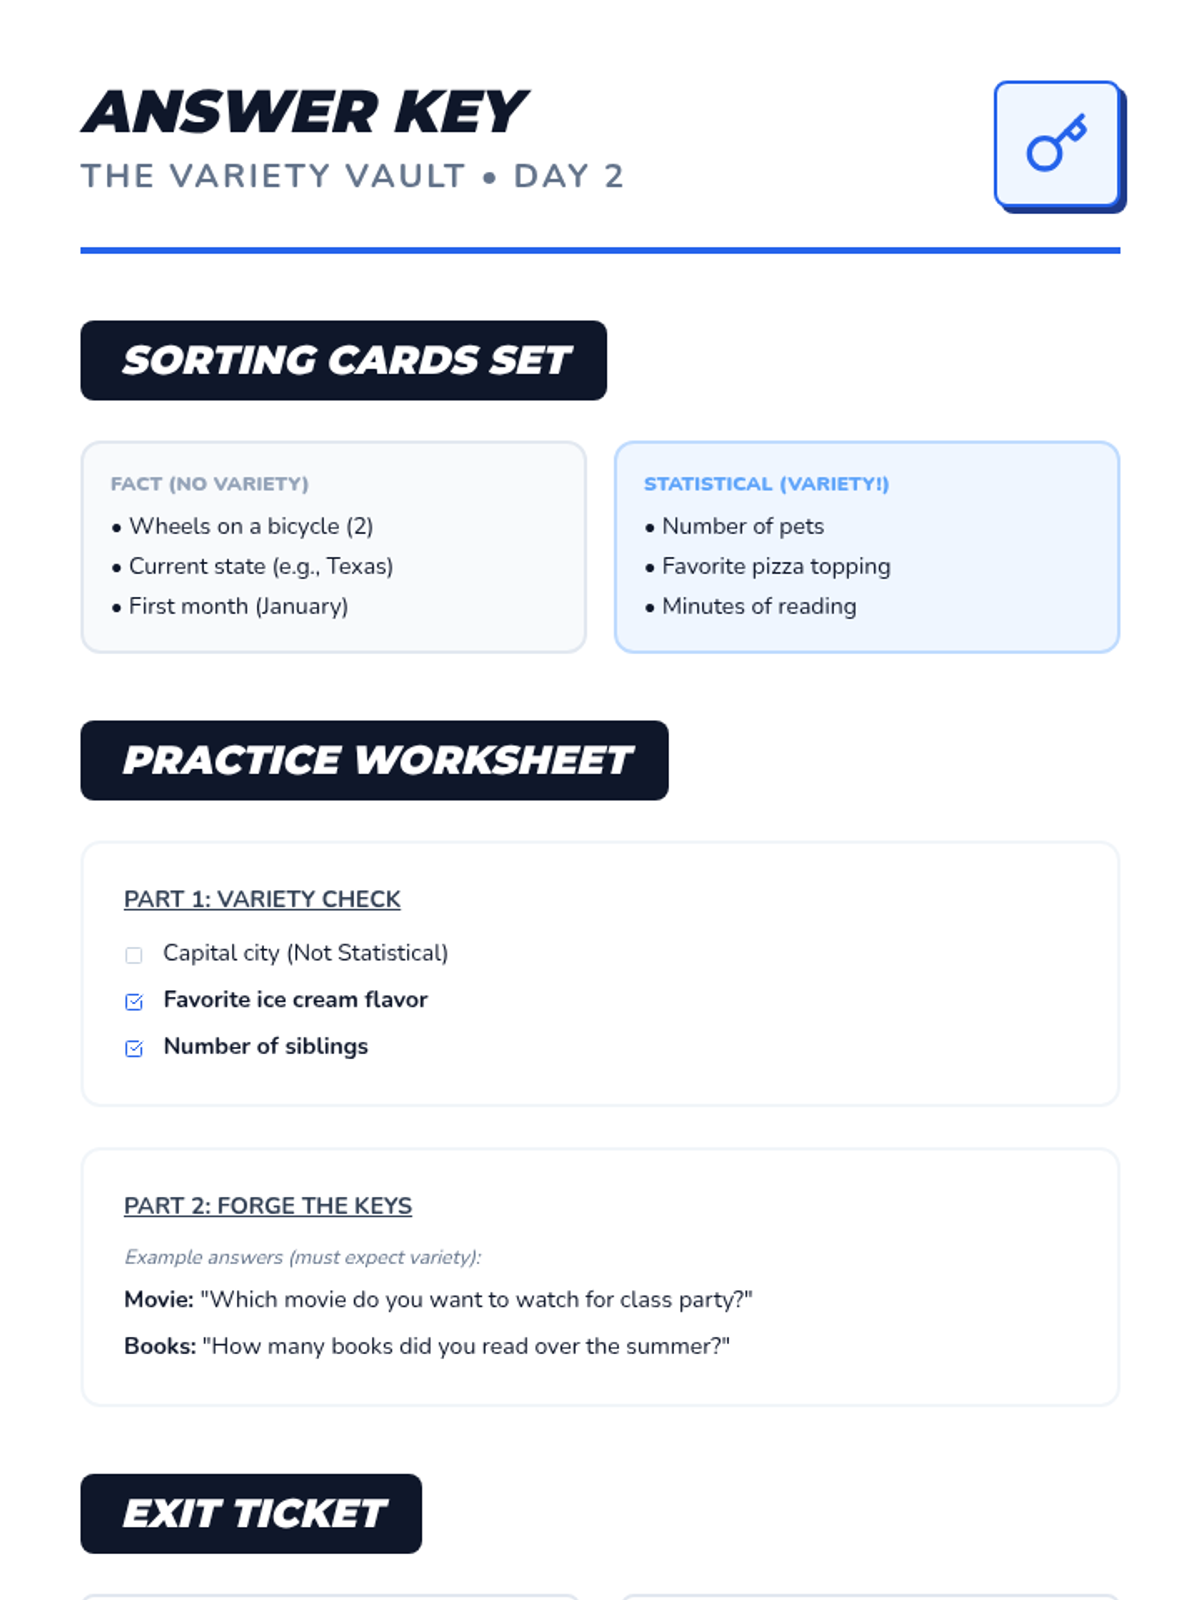
Day 2 Answer Key for the Variety Vault session. Provides correct responses for the practice worksheet and exit ticket, focusing on statistical variety. Explicitly branded "Day 2".
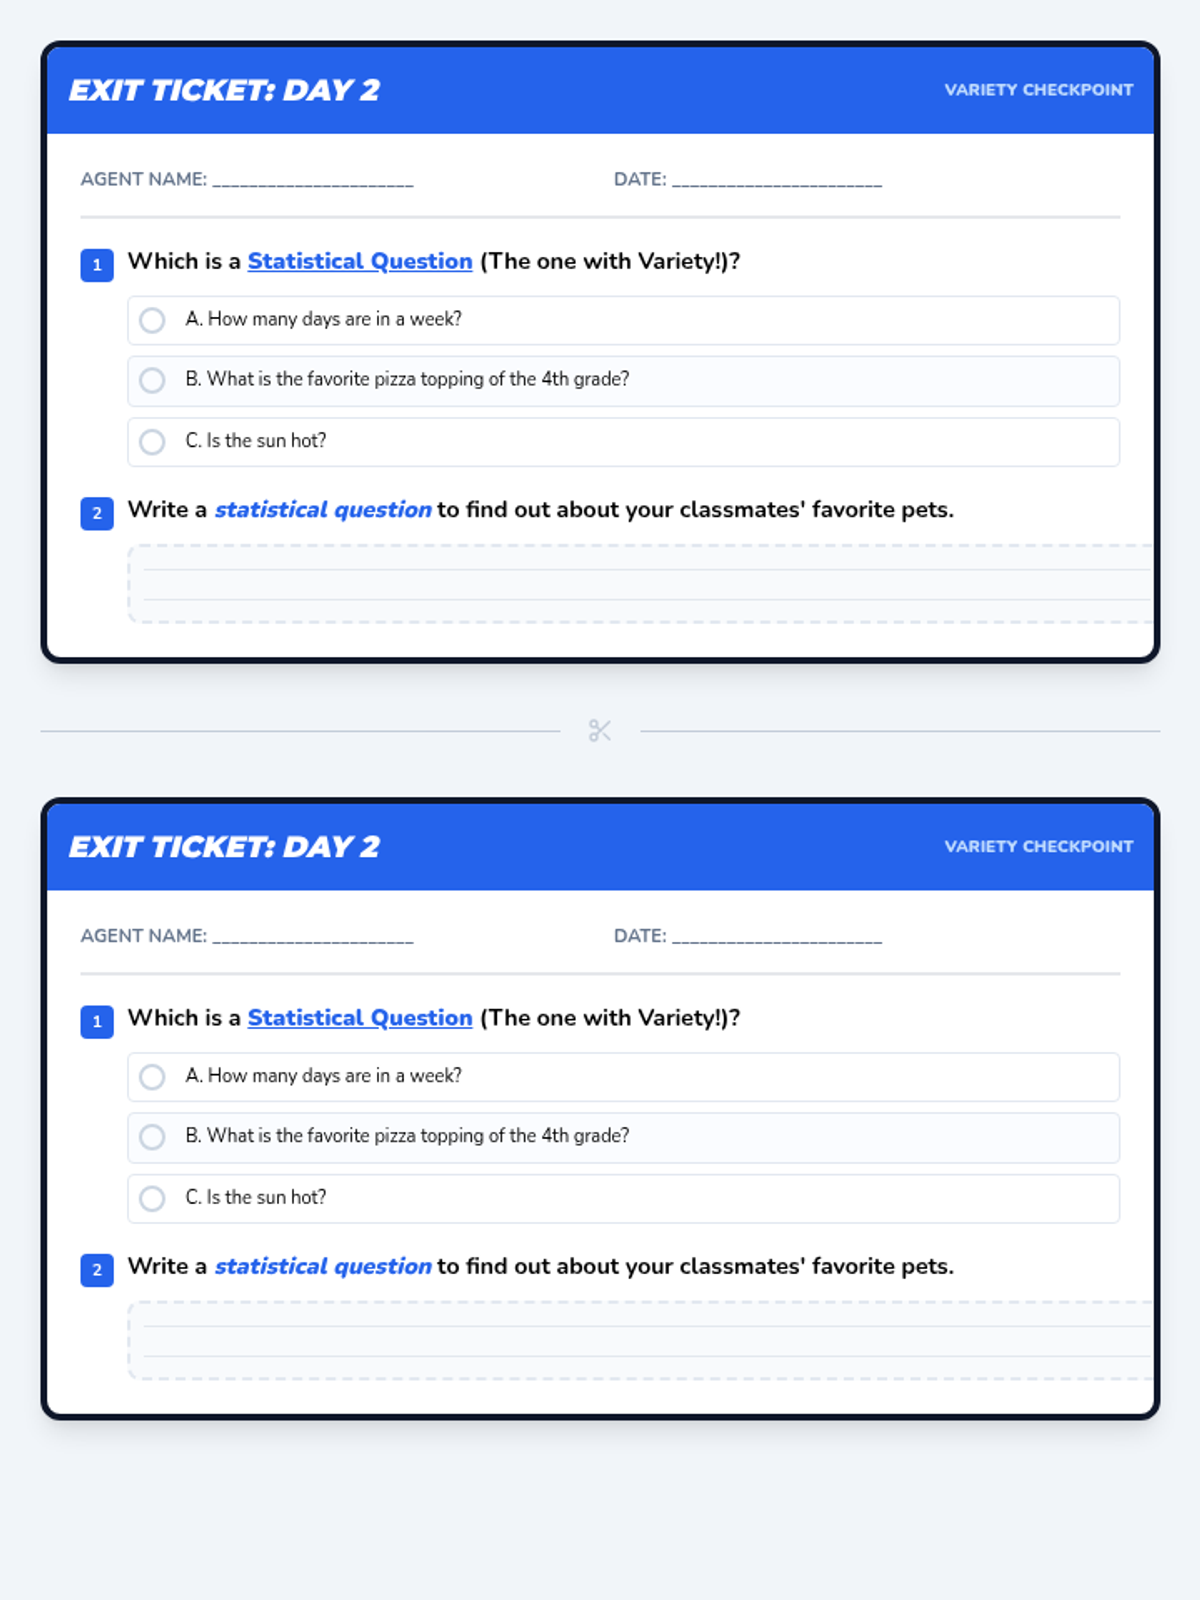
Day 2 Exit Ticket for the Variety Vault session. Assesses student ability to interpret data with variety and identify the underlying statistical question. Revised with print-safe page breaks and improved tally rendering. Darkened labels and corrected font sizing.
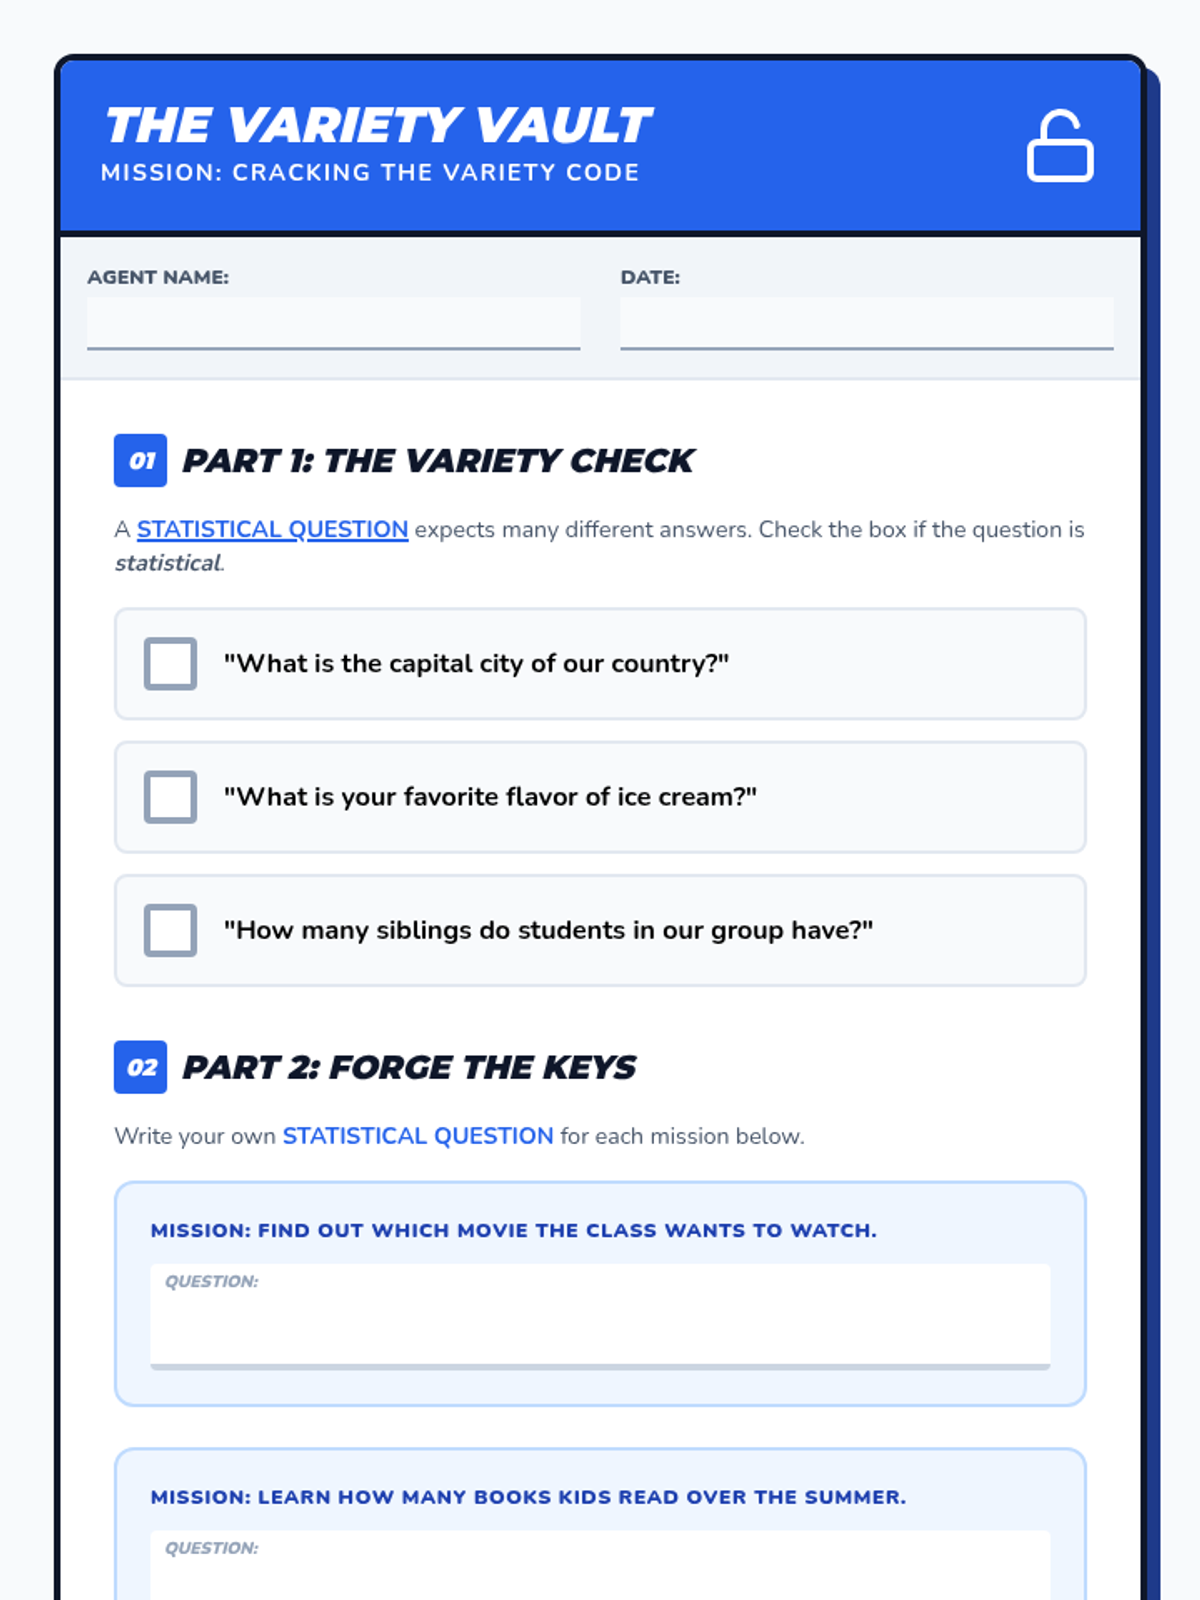
Day 2 Practice Worksheet for the Variety Vault session. Students analyze data sets for variety and identify statistical questions. Revised with print-safe page breaks, improved tally marks (|||| \), and darkened labels. Added a student work area.
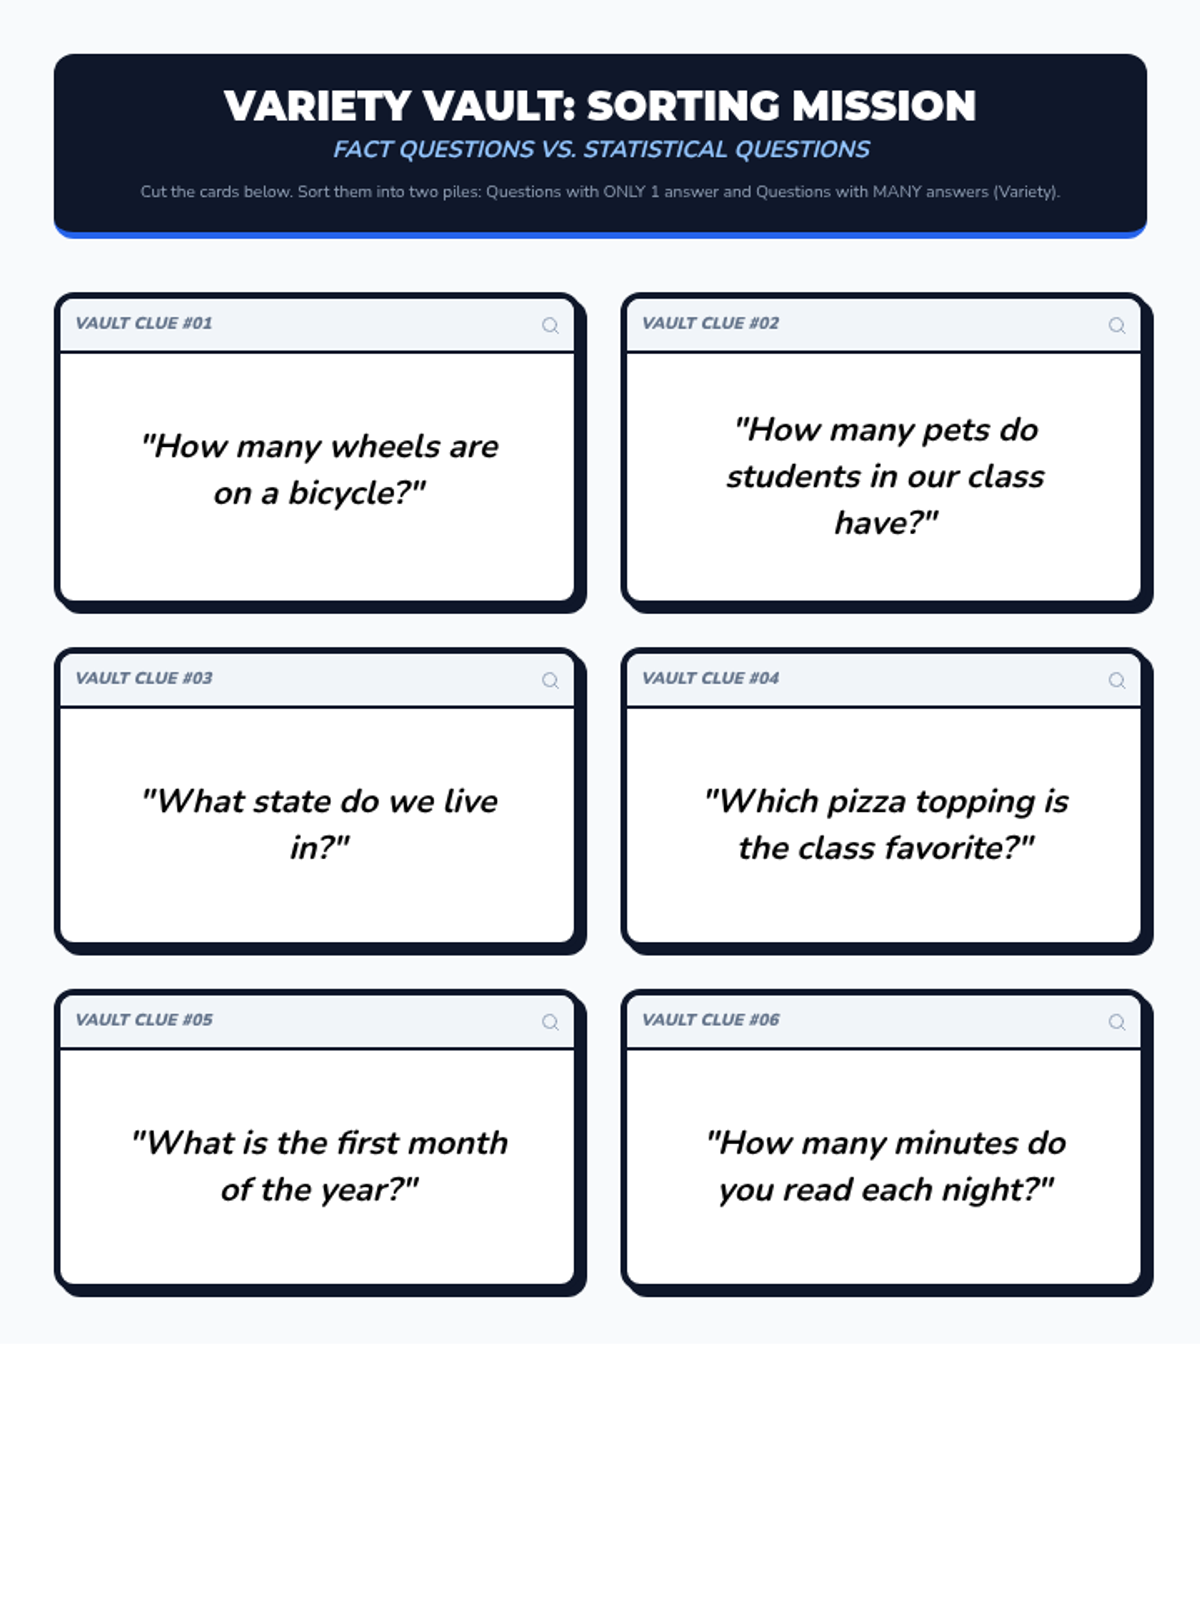
Day 2 Sorting Cards for the Variety Vault session. Students sort questions into 'Fact' and 'Statistical' categories. Revised for explicit branding and visual uniformity.
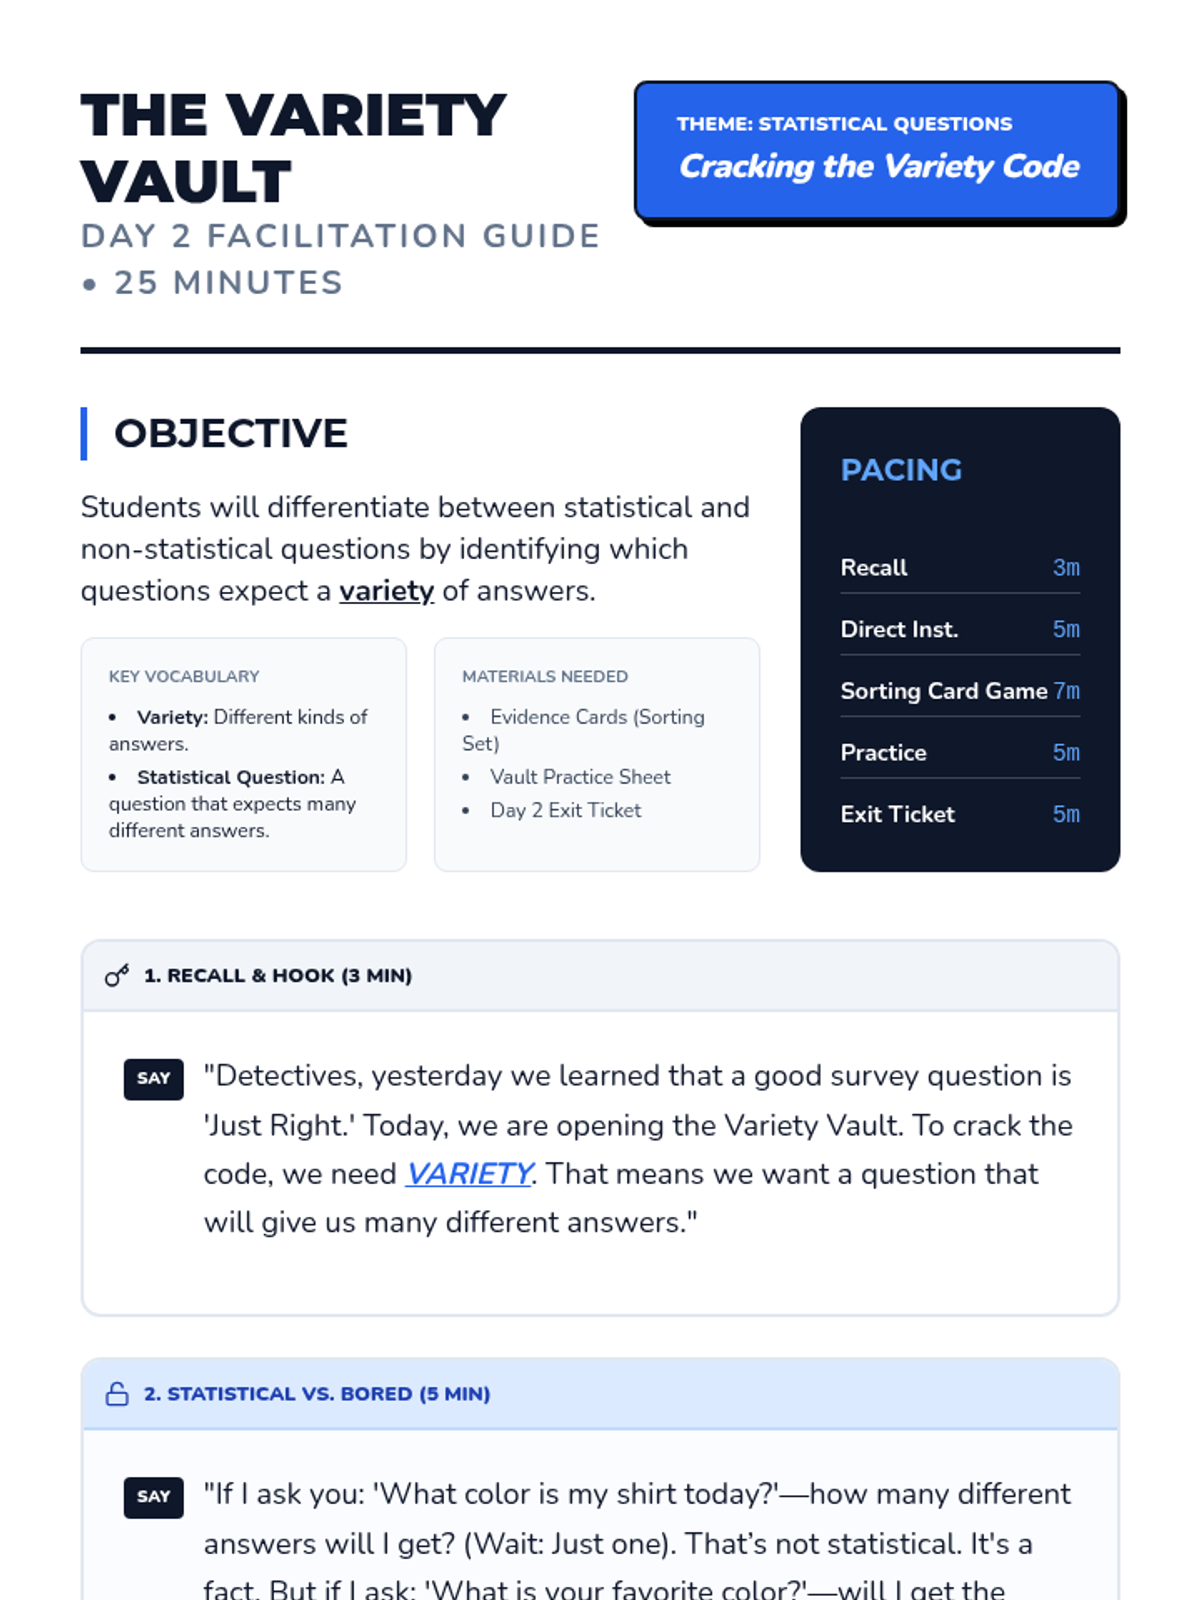
Day 2 Facilitation Guide for the Variety Vault session. Focuses on teaching students to distinguish between statistical questions (variety) and fact-based questions (single answer). Explicitly branded "Day 2".