Data representation, distributions, and statistical variability using sampling and inference techniques. Integrates probability models, compound events, bivariate patterns, and linear models to guide data-driven decision making.
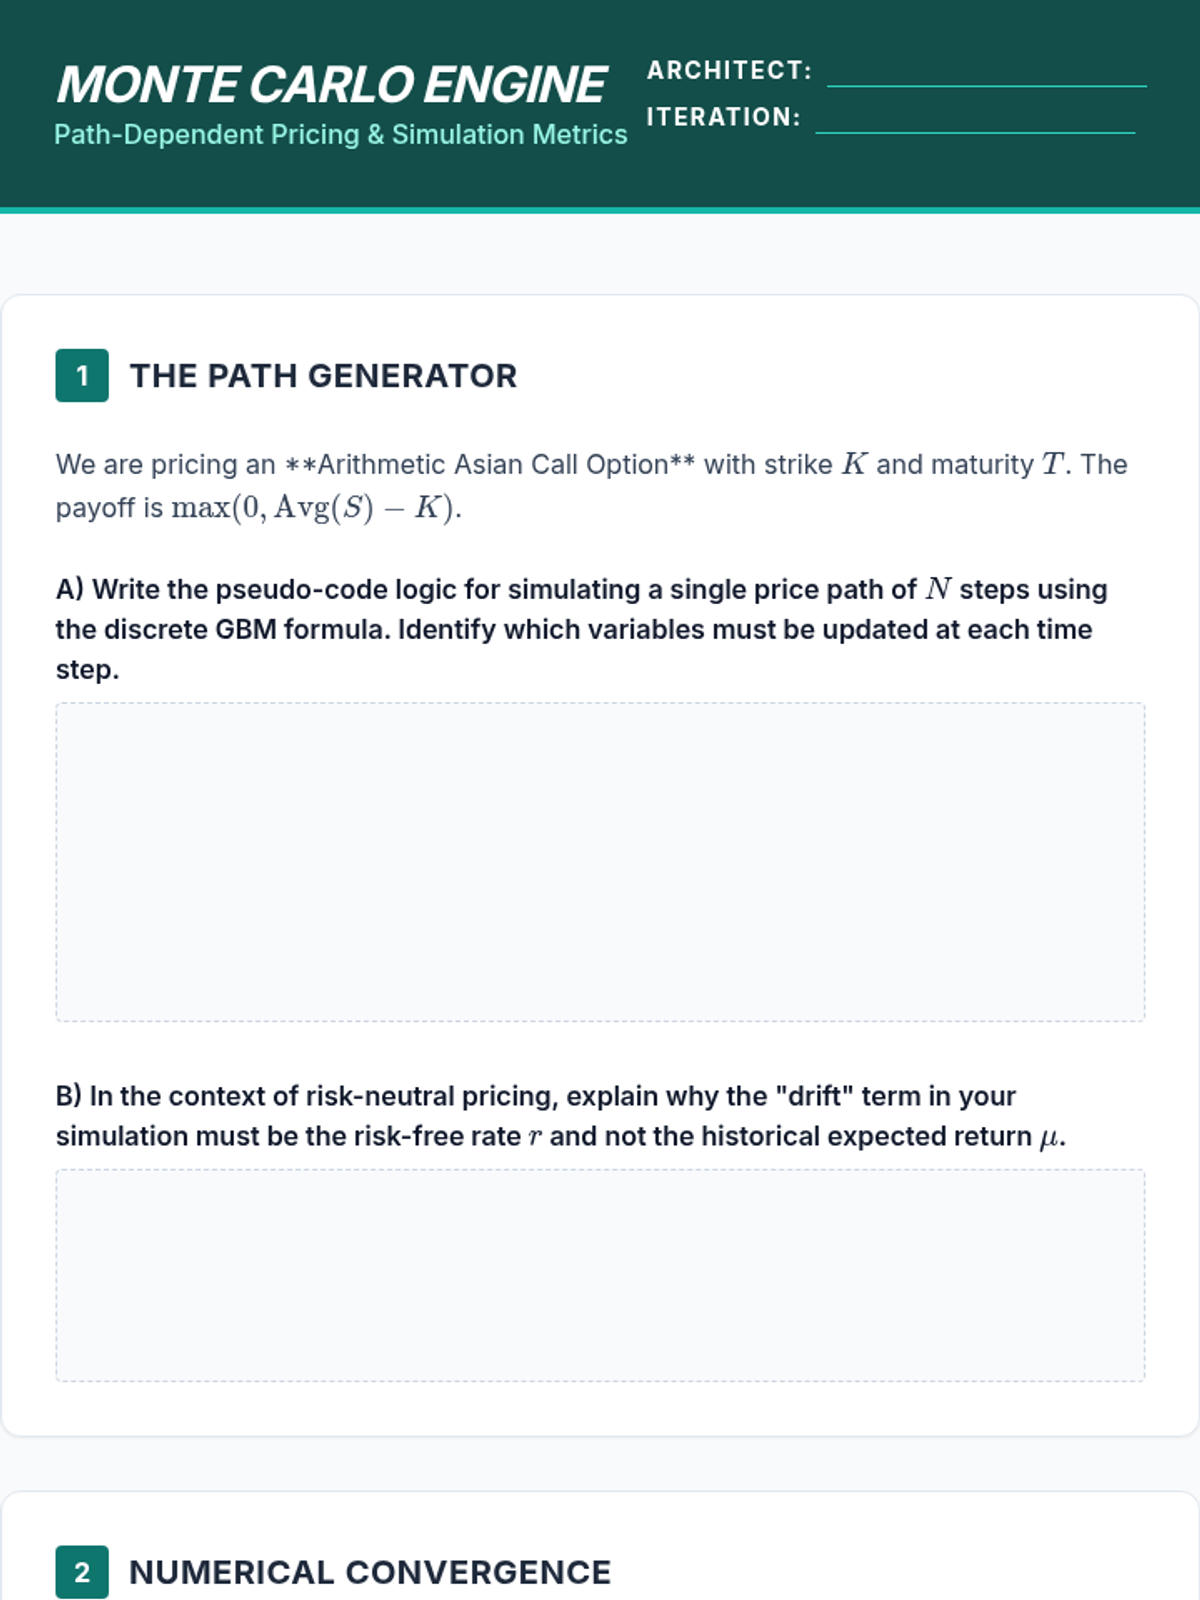
Problem set for graduate students to practice implementing Monte Carlo simulations, calculating standard error, and understanding variance reduction techniques.
Graduate-level slides covering Monte Carlo methods, Geometric Brownian Motion paths, and the Law of Large Numbers applied to derivative pricing.
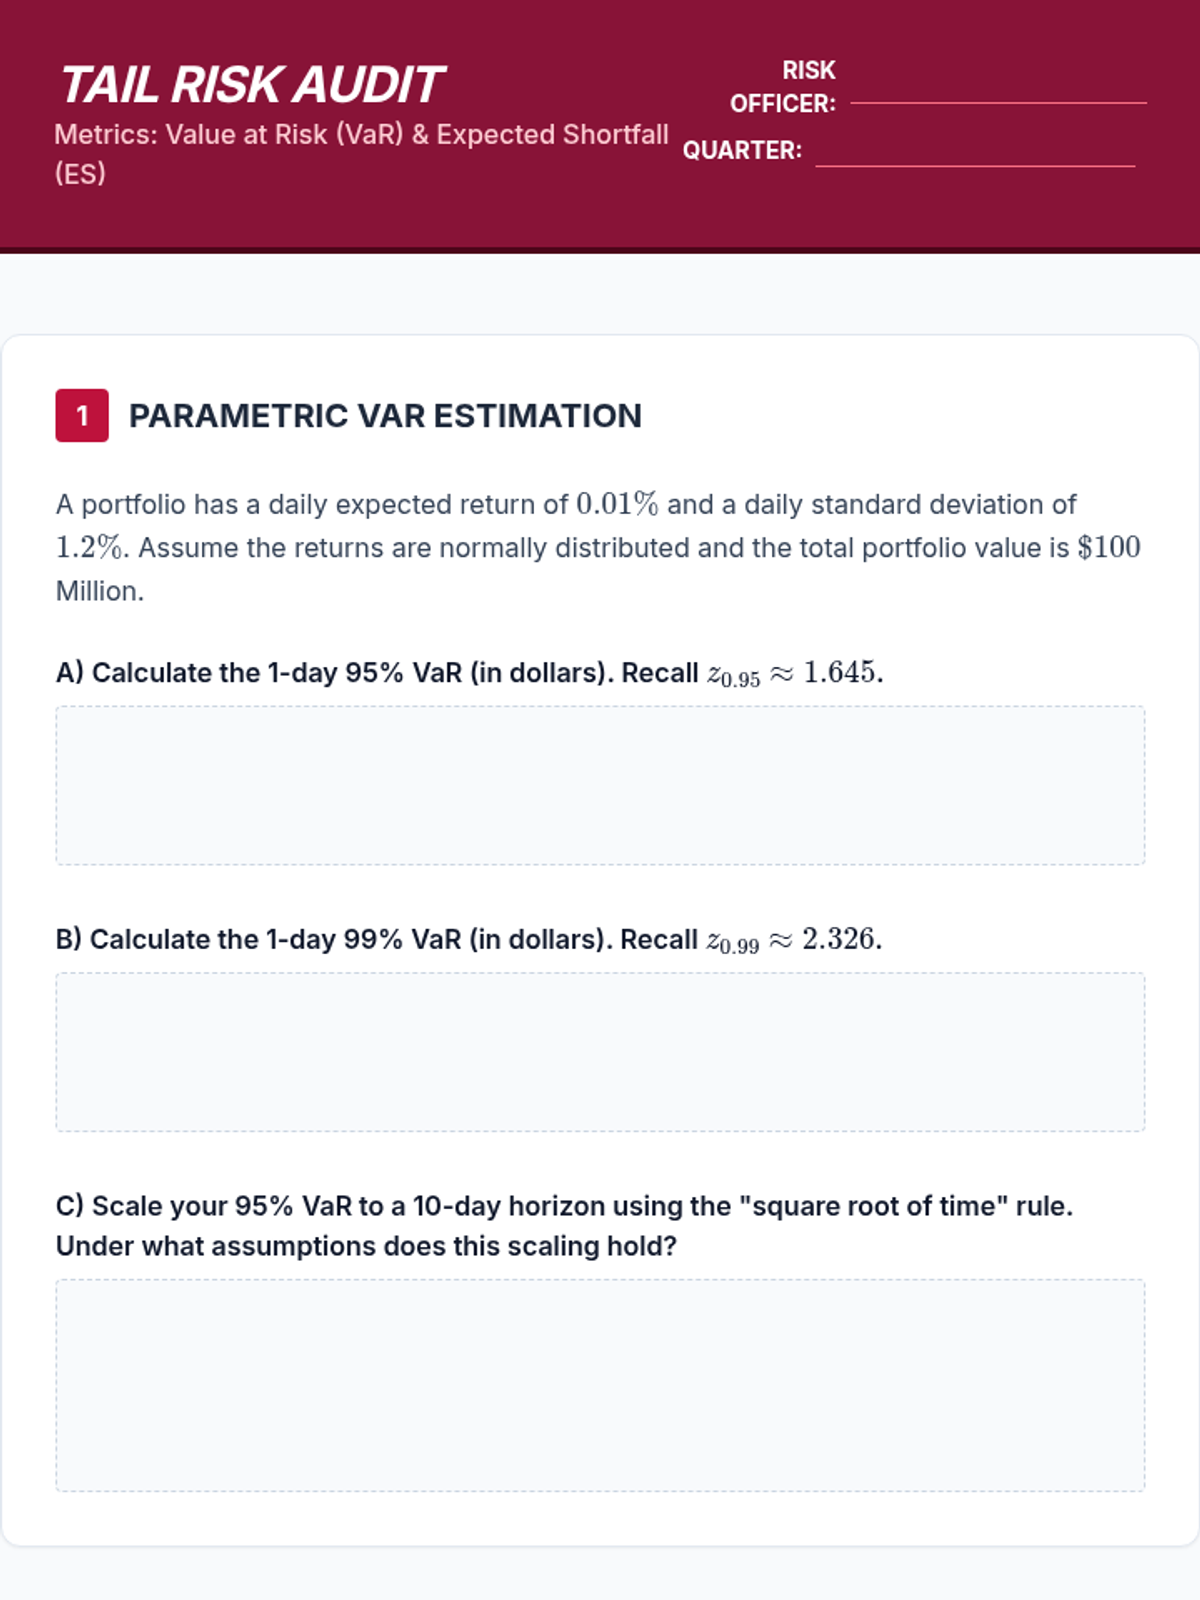
Problem set for graduate students to practice calculating VaR and Expected Shortfall, analyzing the impact of non-normal distributions on risk metrics.
Graduate-level slides covering VaR, Expected Shortfall, tail risk metrics, and the limitations of normal distributions.
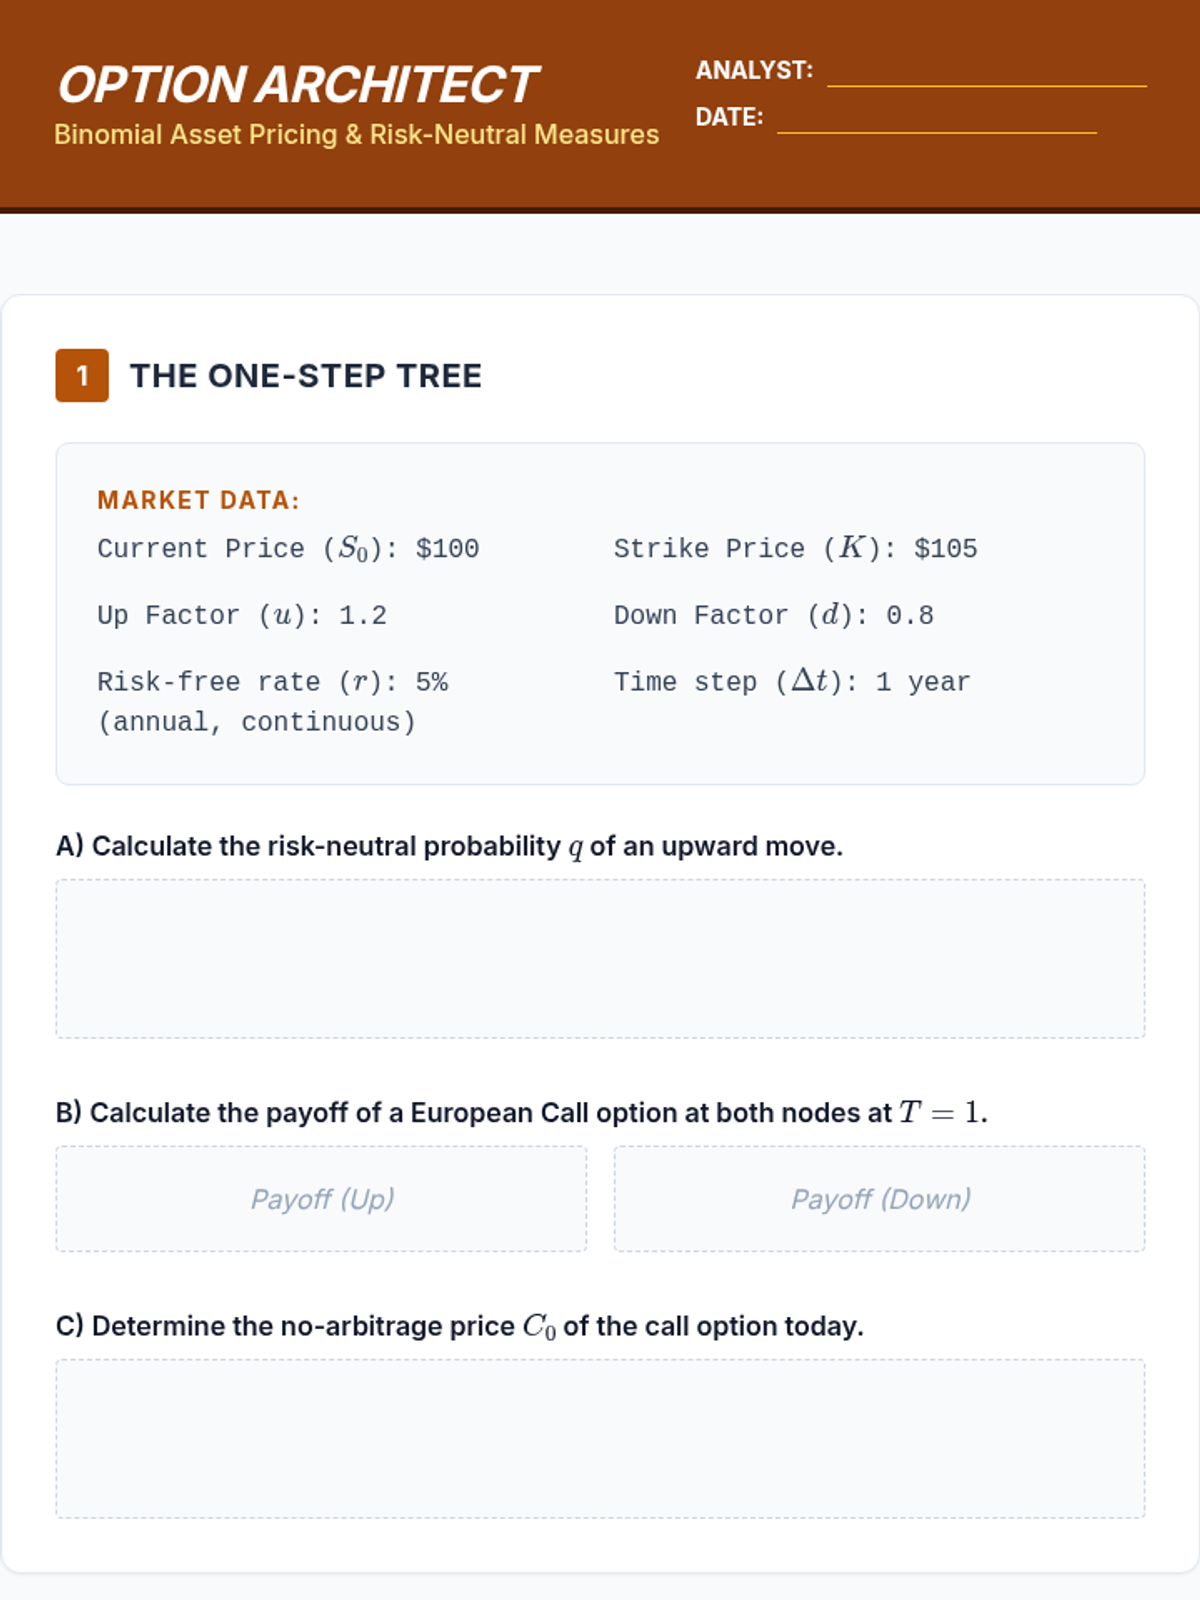
Problem set for graduate students to price European options using the binomial model and calculate delta-hedging portfolios.
Graduate-level slides covering risk-neutral measures, the fundamental theorem of asset pricing, and the derivation of the binomial model.
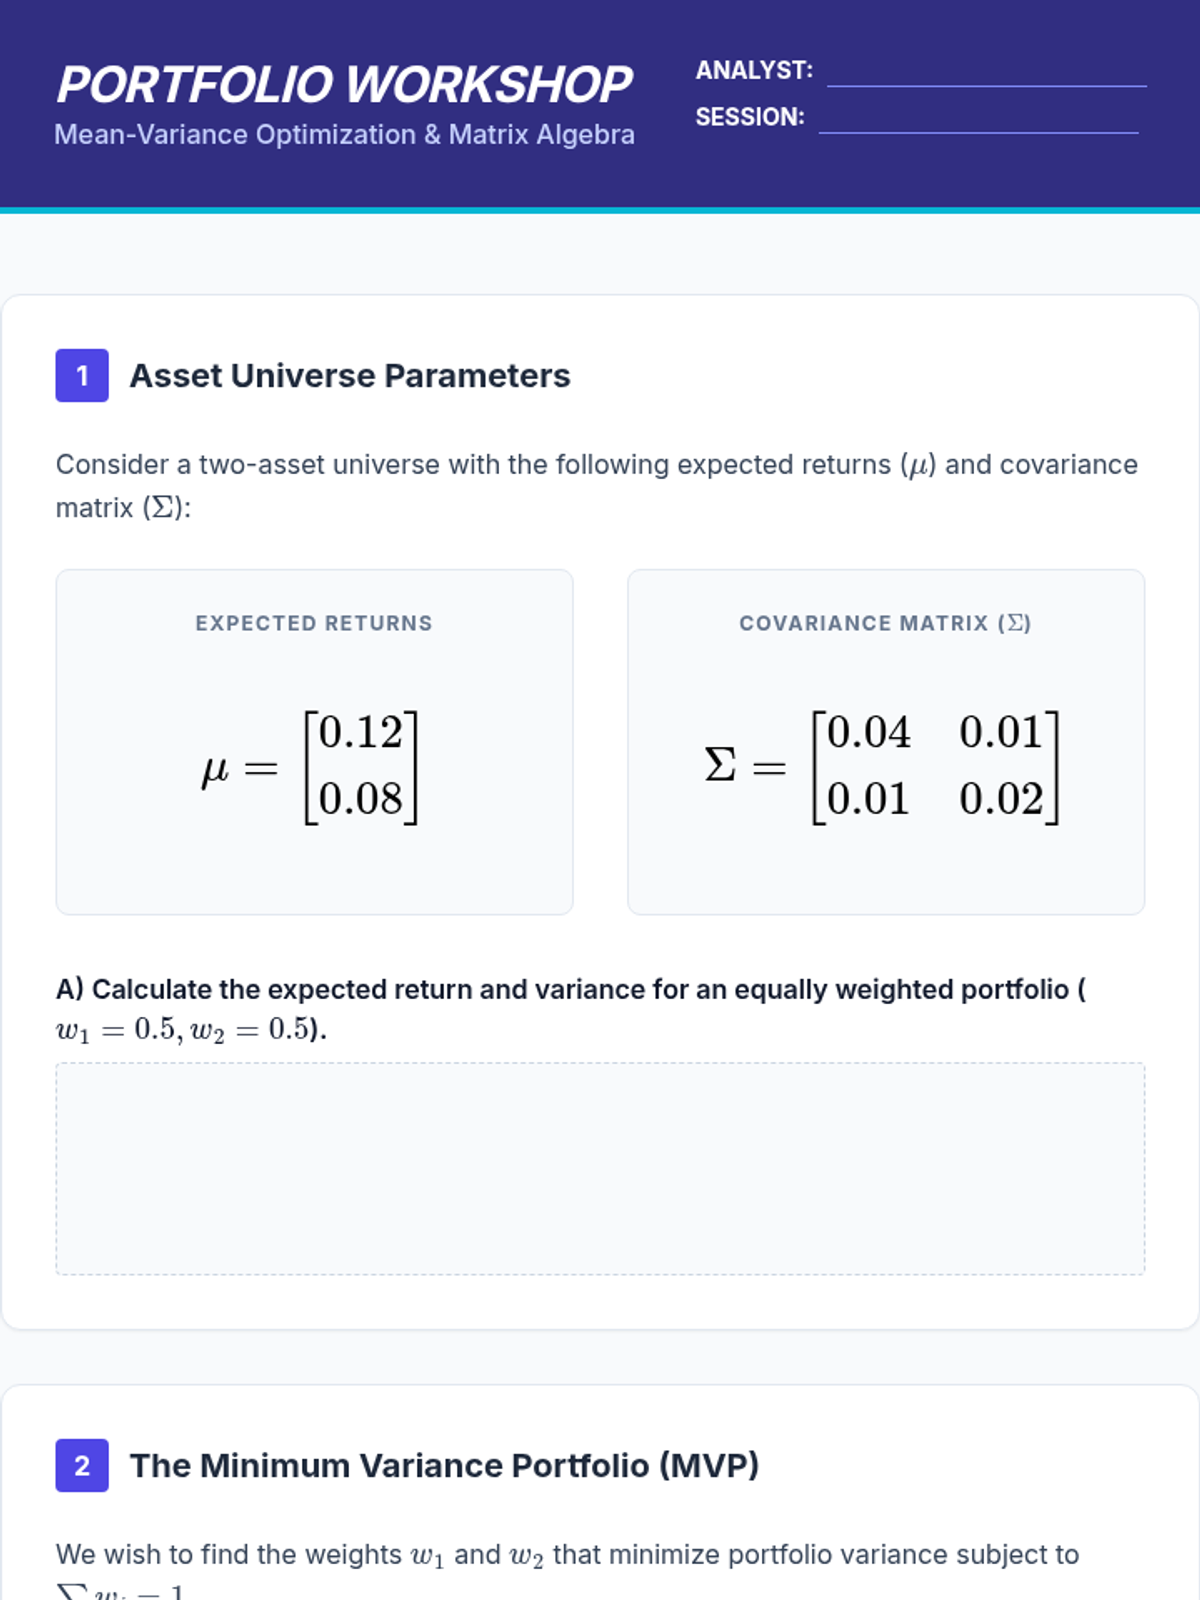
Problem set for graduate students to compute portfolio expected returns and variance using matrix algebra, and derive the Minimum Variance Portfolio.
Graduate-level slides covering portfolio expected returns, covariance matrices, and the formulation of the Markowitz mean-variance optimization problem.
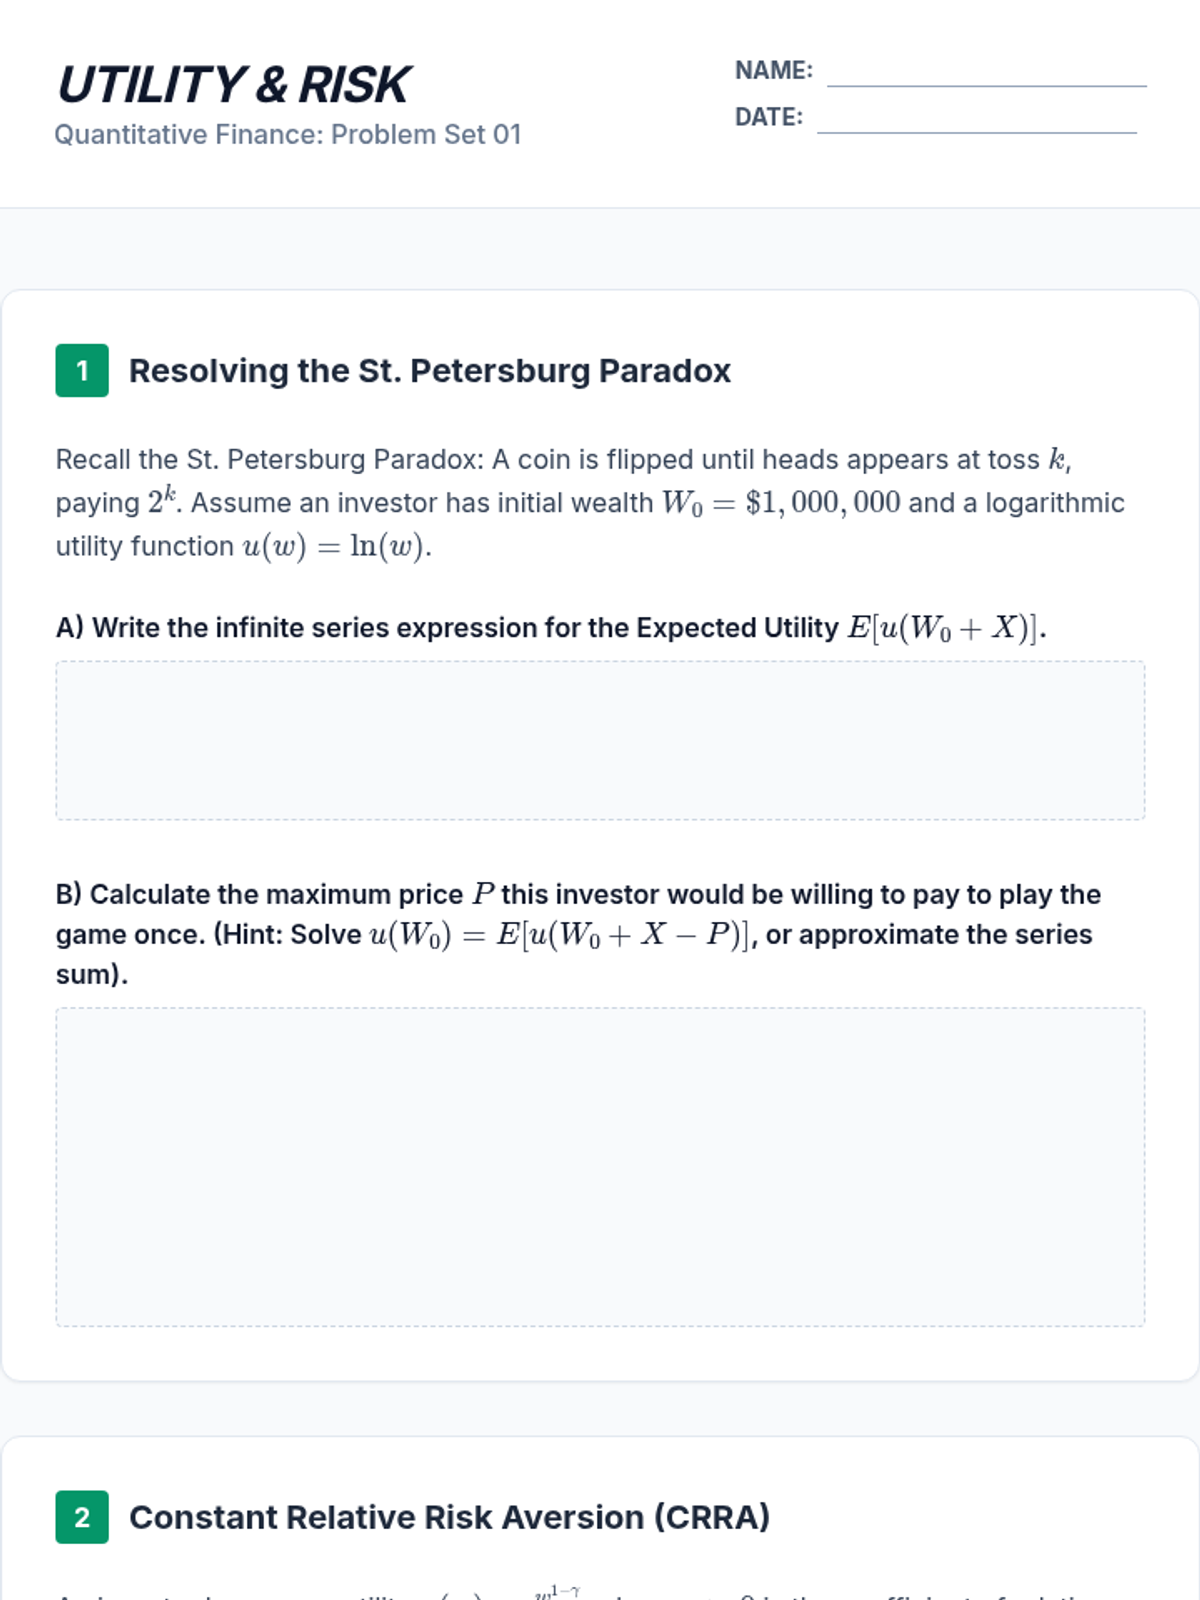
Problem set for graduate students to practice calculating expected utility, risk premiums, and deriving risk aversion measures.
Graduate-level slides covering the St. Petersburg Paradox, vNM Utility functions, and risk premiums in quantitative finance.
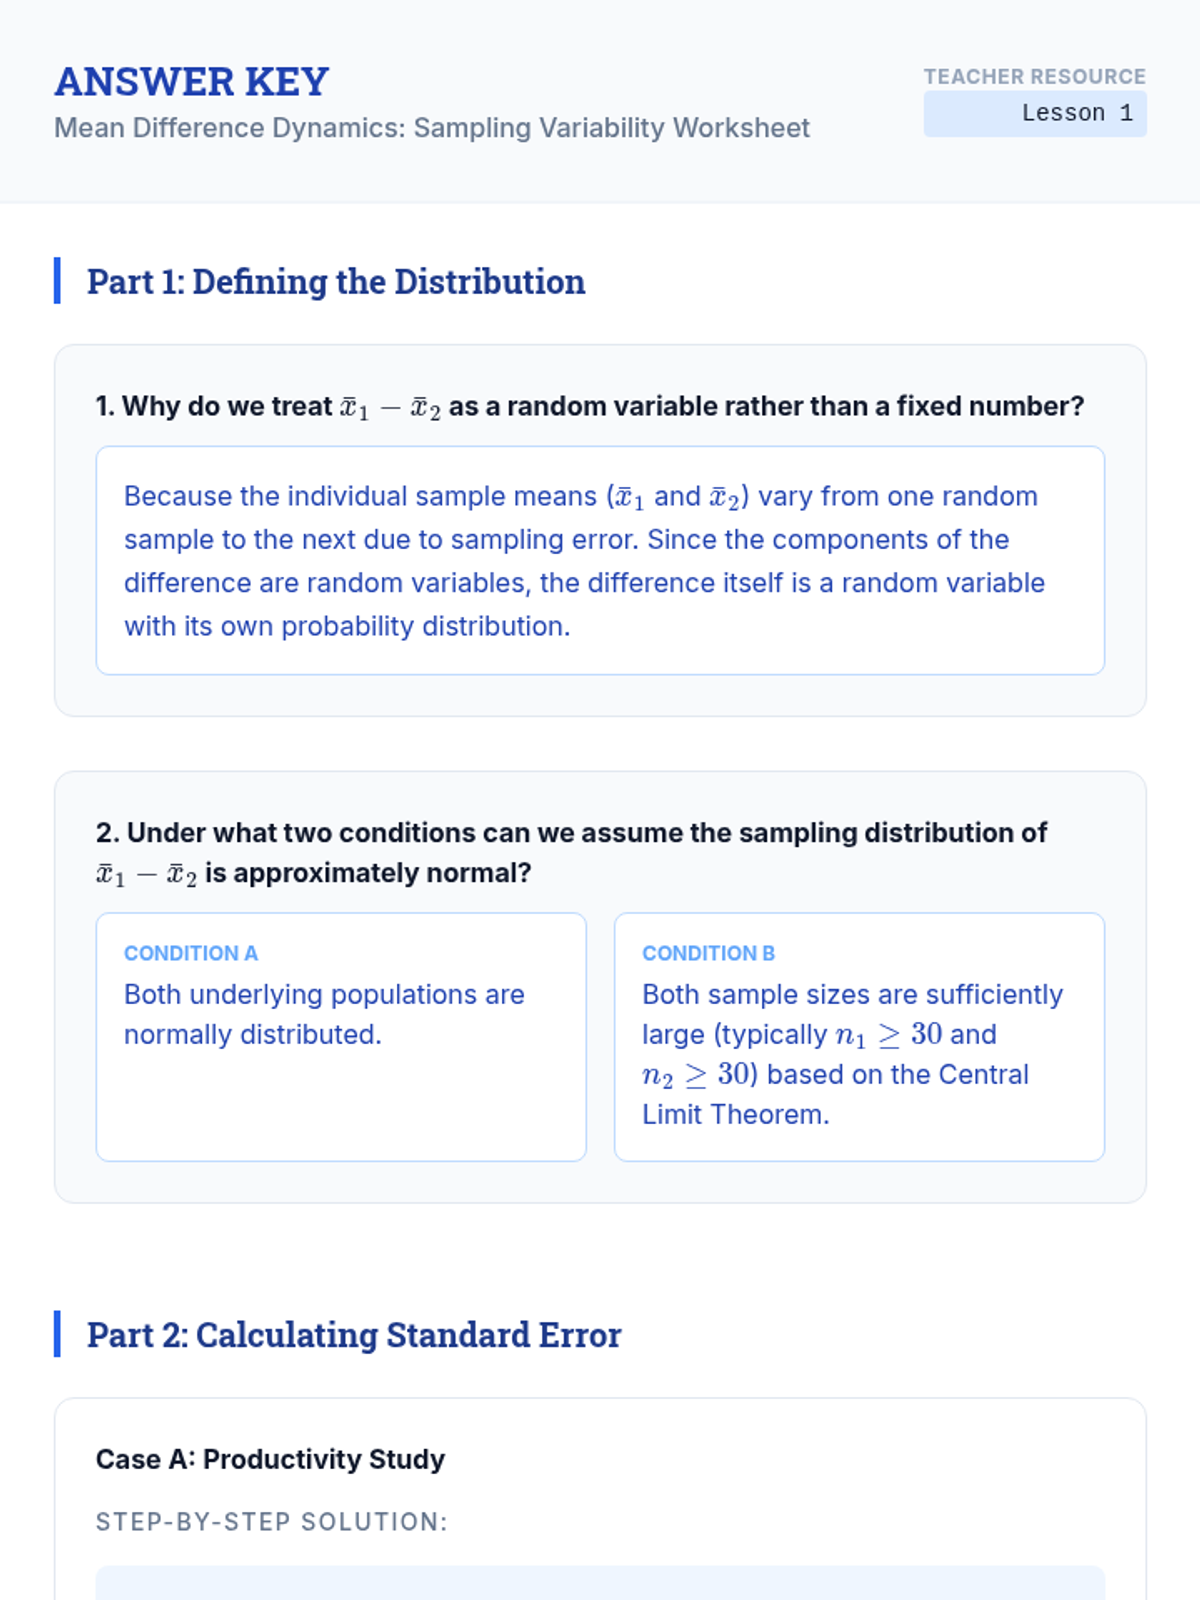
Answer key for Lesson 1 worksheet, providing detailed step-by-step solutions for standard error calculations and conceptual explanations.
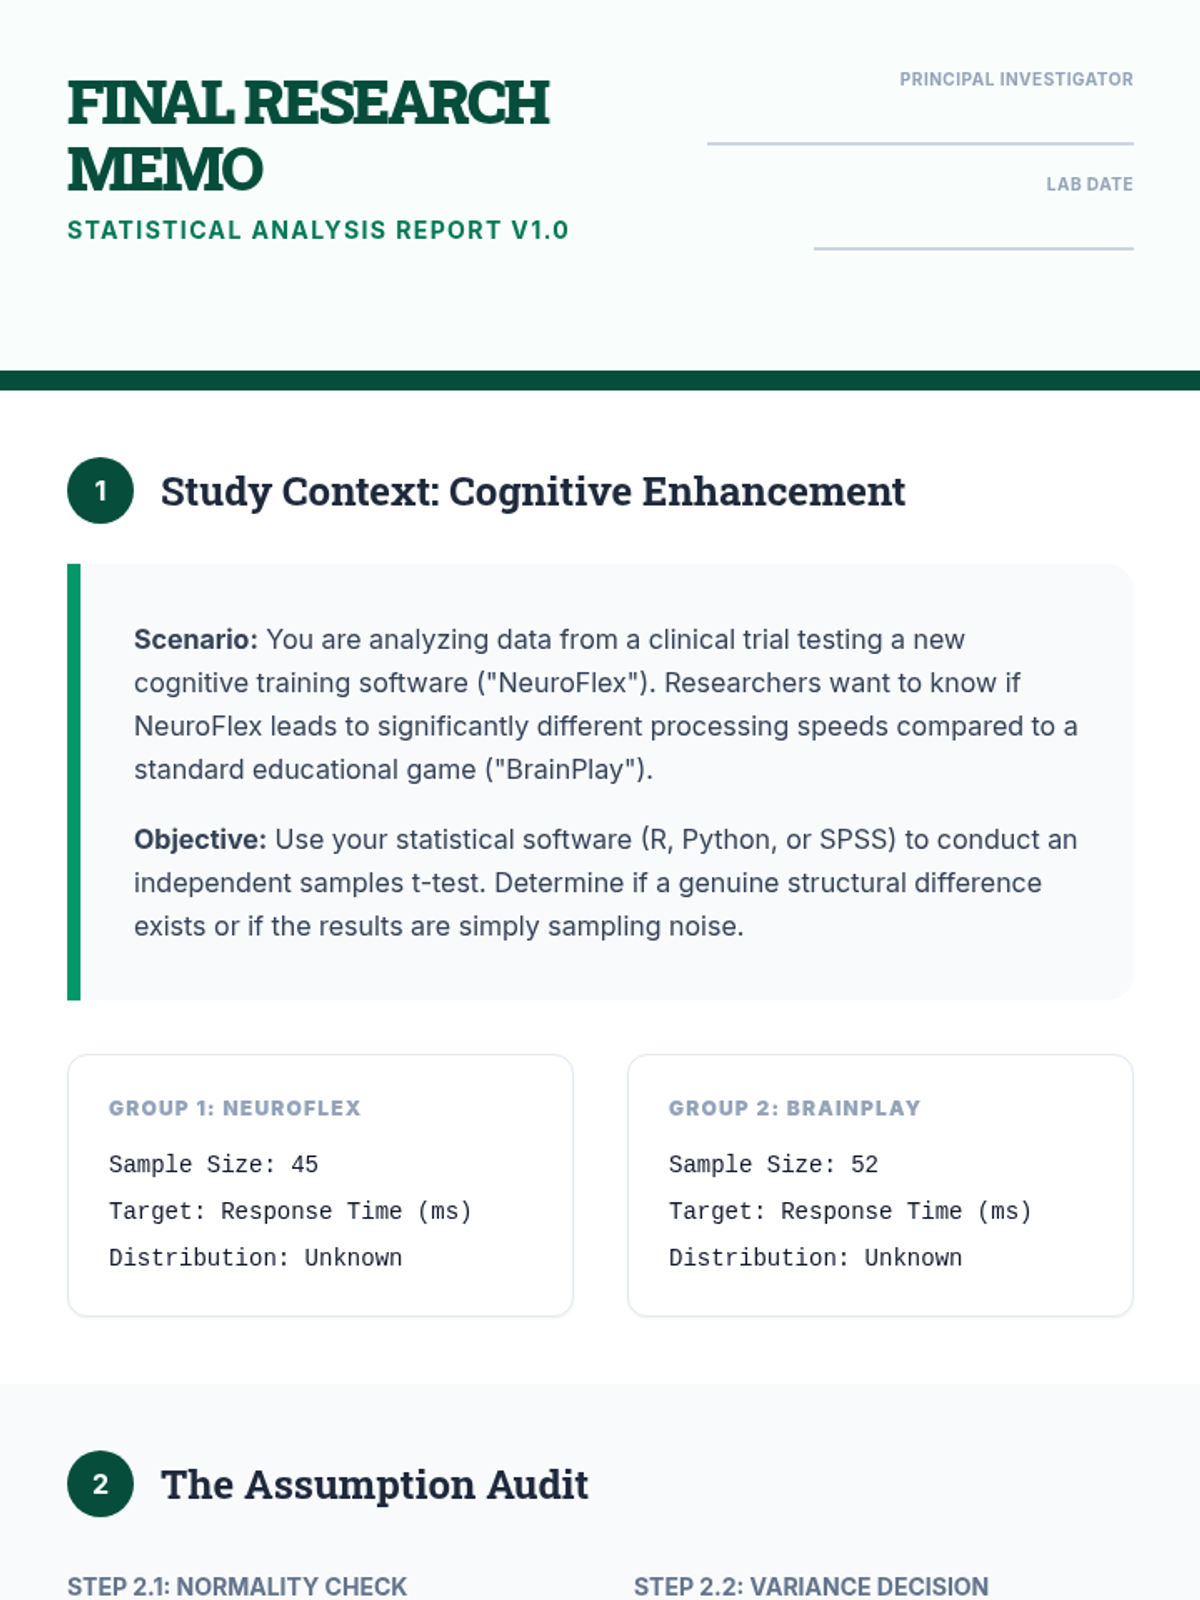
Final project guide for Lesson 5, where students analyze a cognitive training dataset using statistical software and write a formal APA-style scientific report.
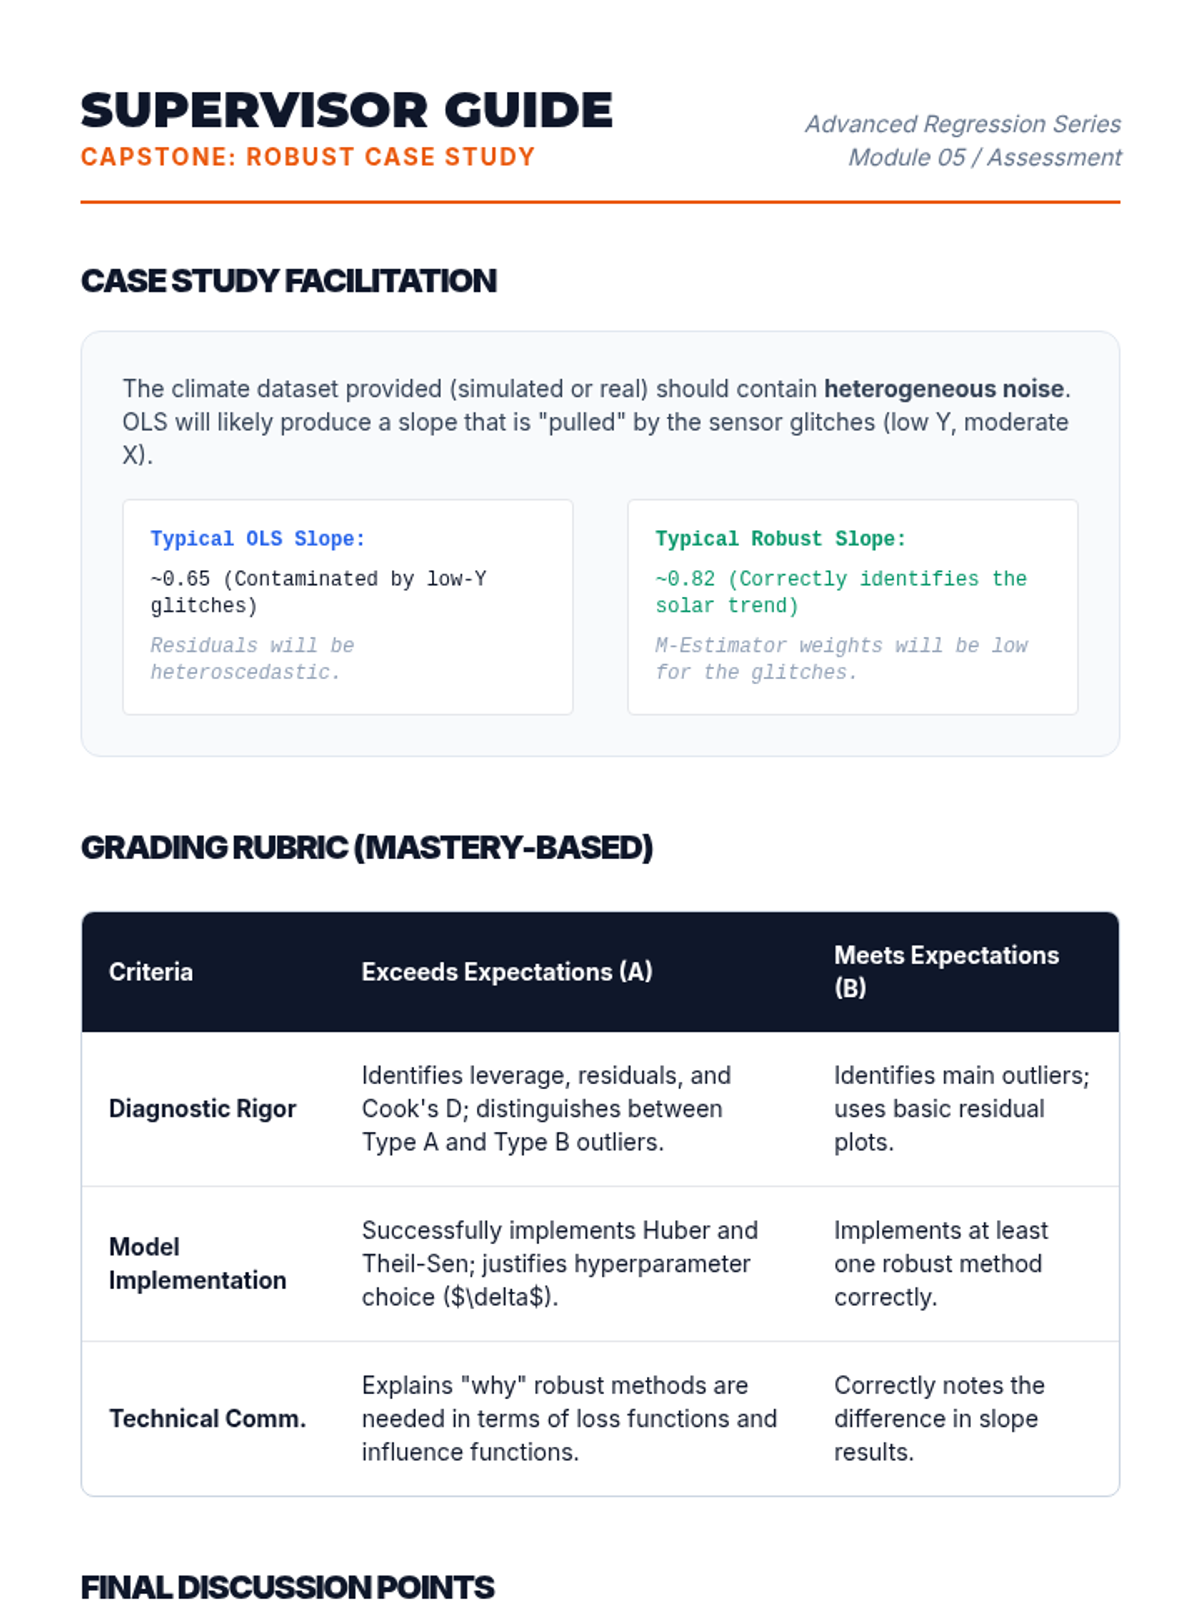
A facilitation guide for Lesson 5, including grading criteria and discussion prompts for the climate data case study.
Introductory slides for Lesson 5, focusing on performing t-tests using statistical software and formatting the output according to APA reporting standards.
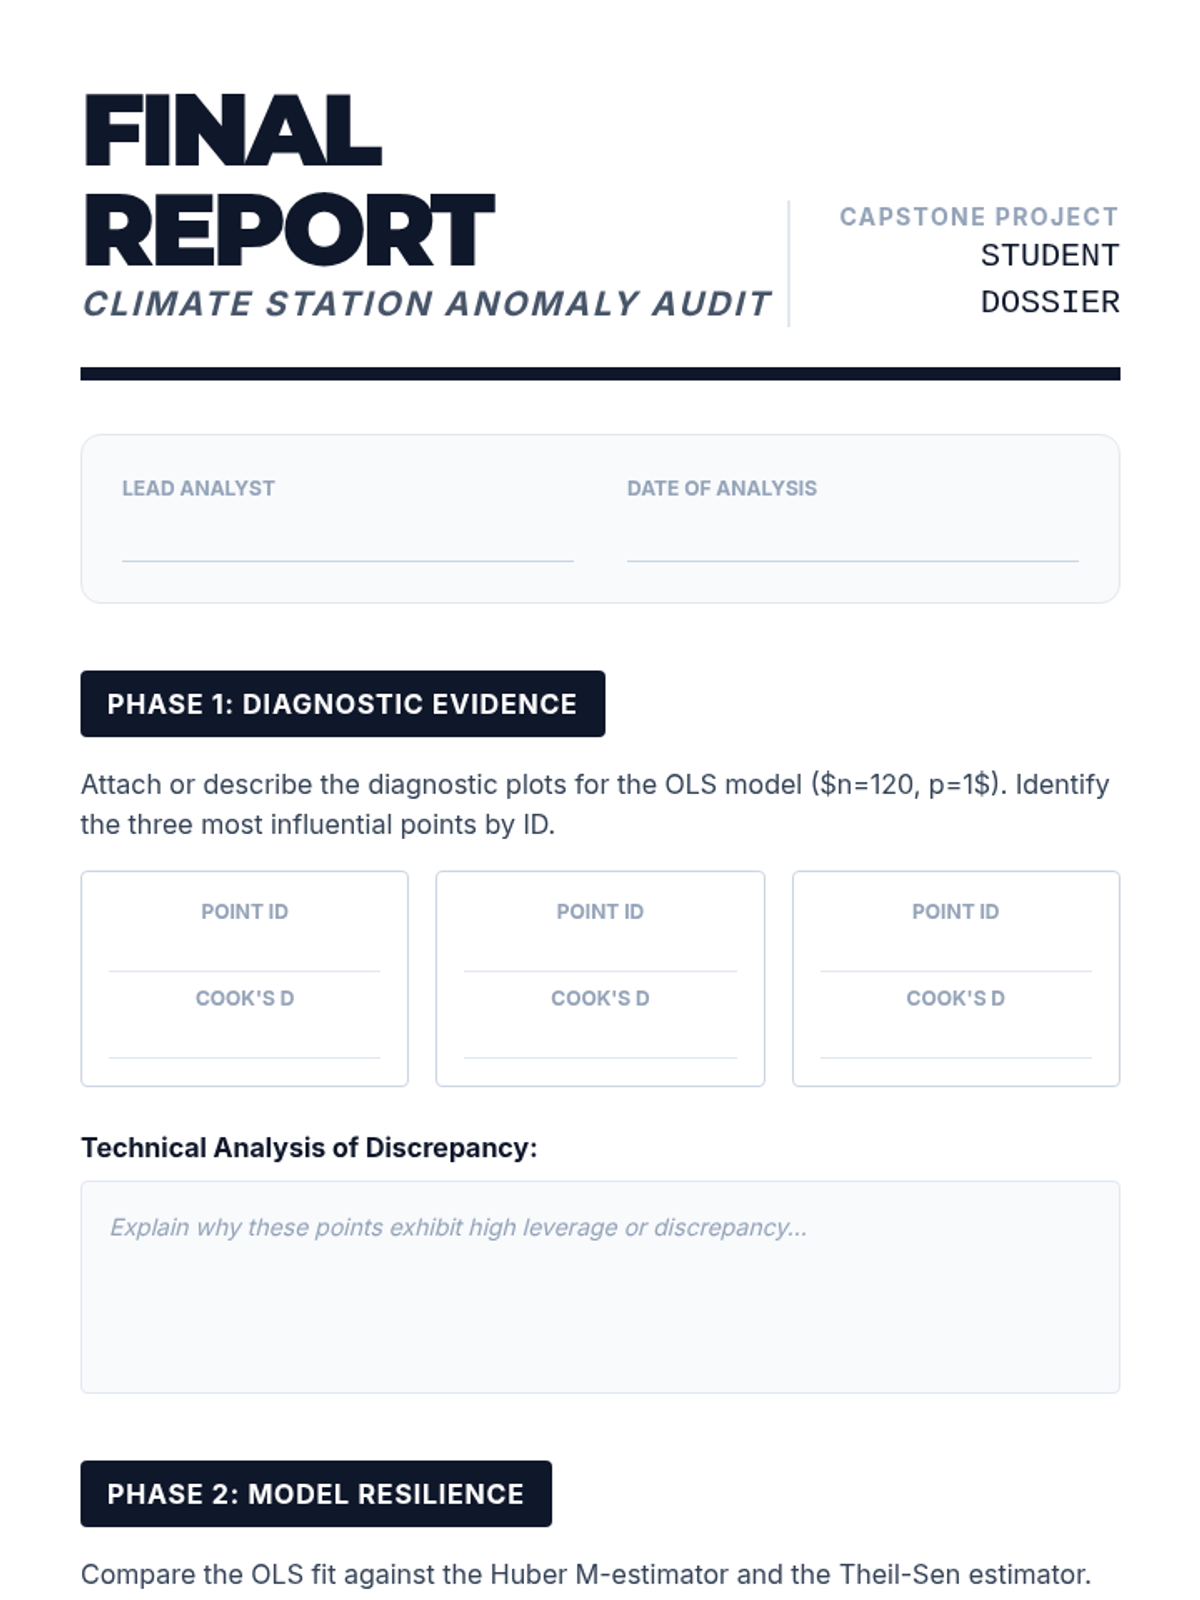
A structured report template for students to present their comparative analysis of OLS vs robust regression on a contaminated climate dataset.
A slide deck for the final case study lesson, summarizing the forensic workflow and the distinction between statistical evidence and scientific justification.
Student worksheet for Lesson 4, practicing visual diagnosis of normality using Q-Q plots, evaluating independence in scenarios, and applying failure protocols when assumptions are violated.
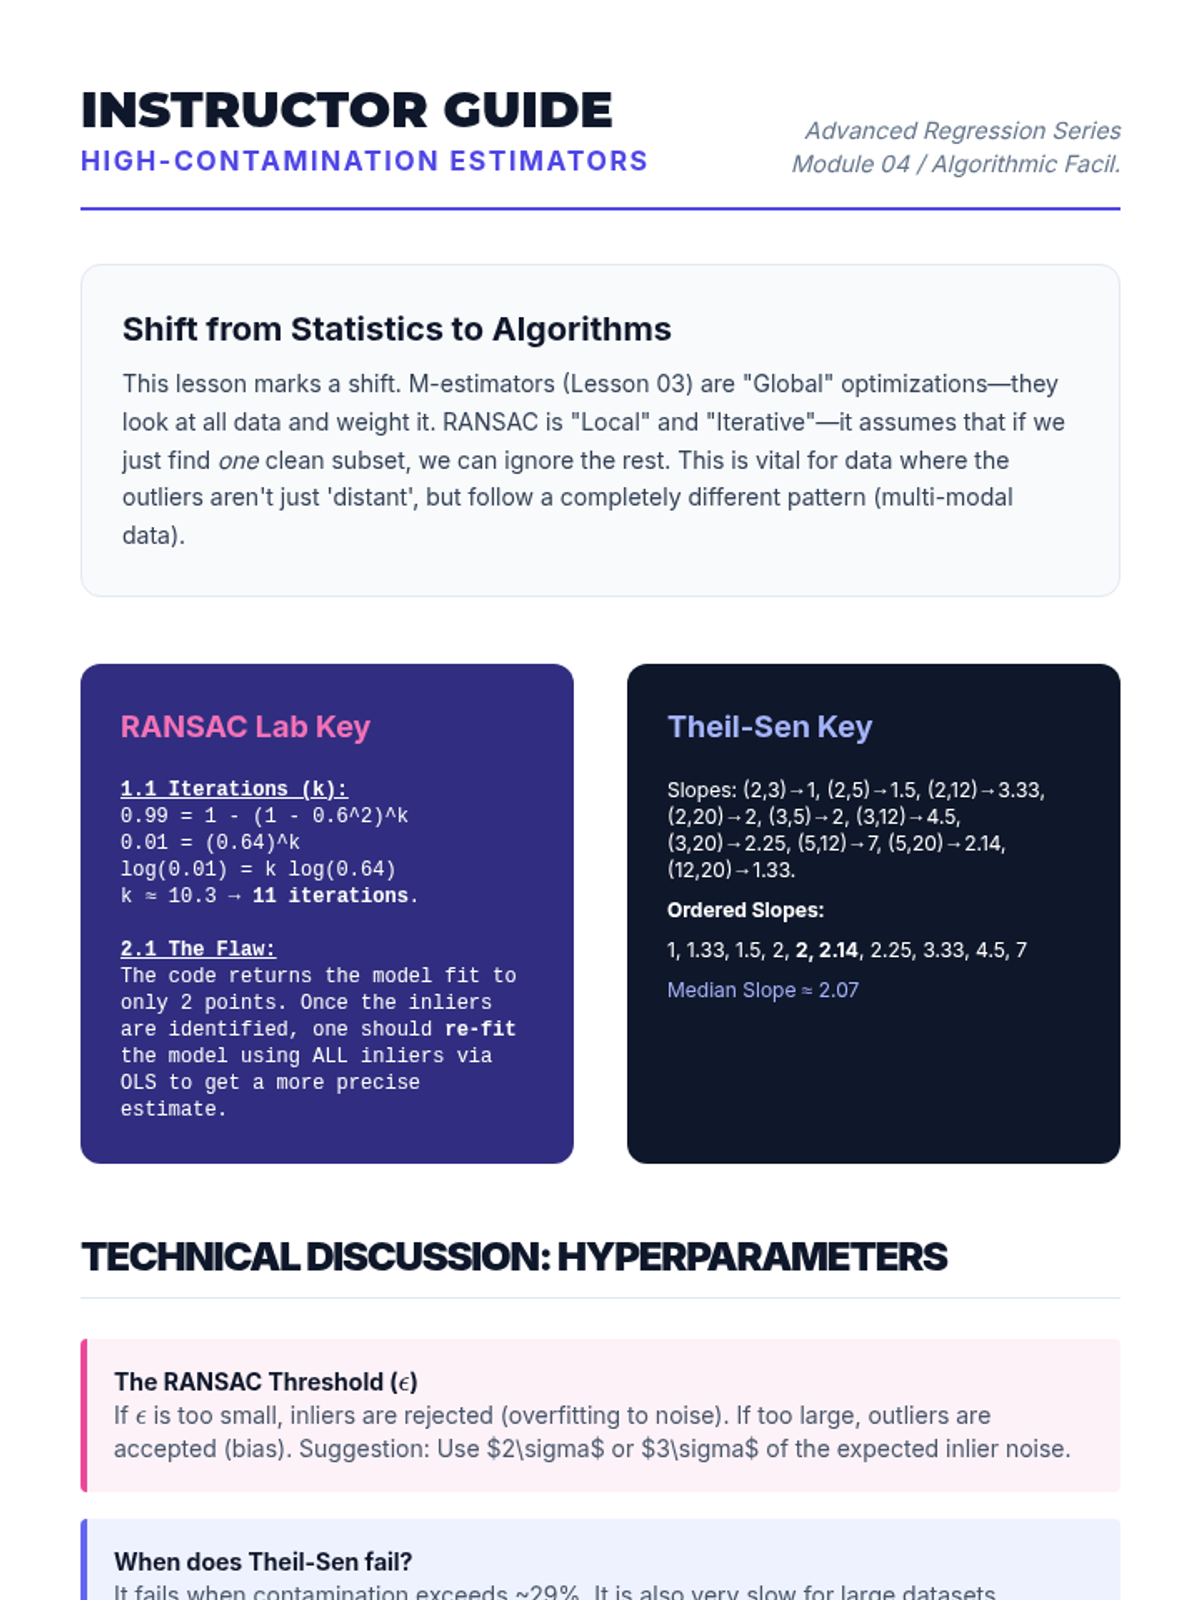
A facilitation guide for Lesson 4, including answer keys for the RANSAC probability calculations and Theil-Sen slope median.
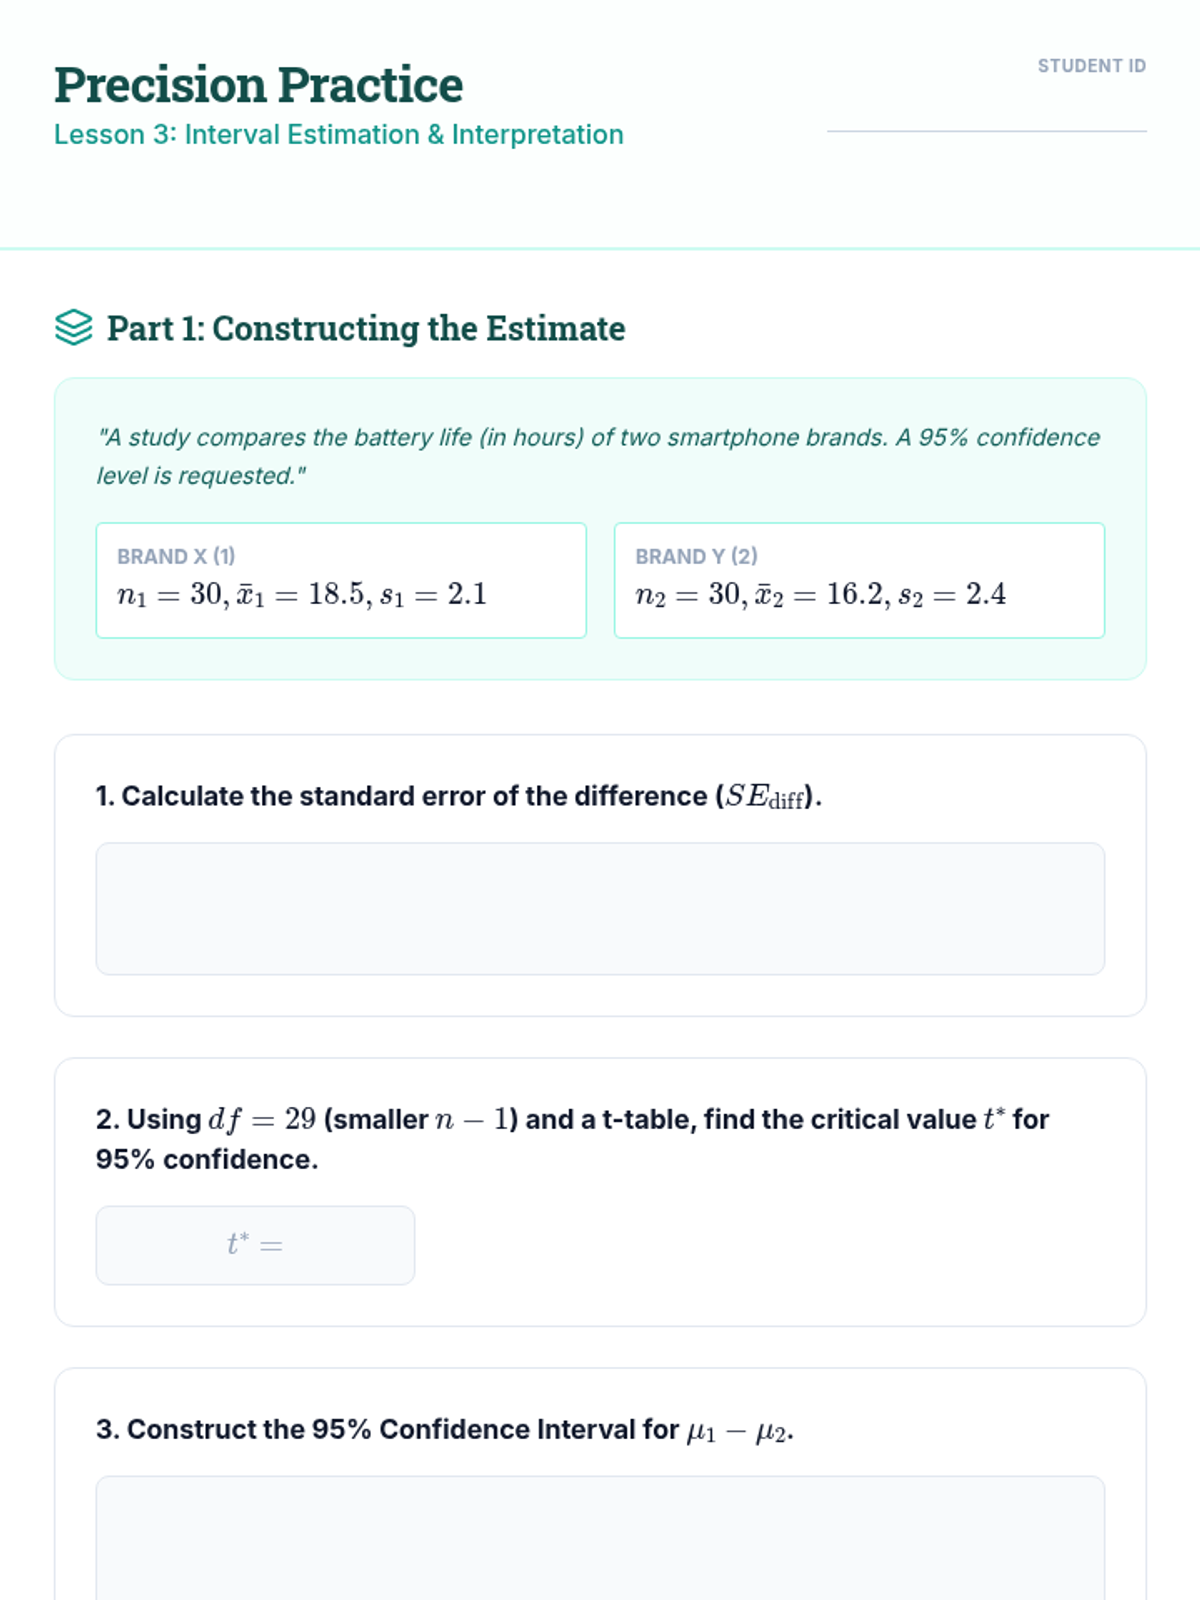
Student worksheet for Lesson 3, focusing on manual construction of confidence intervals and the conceptual trade-offs between confidence levels and precision.
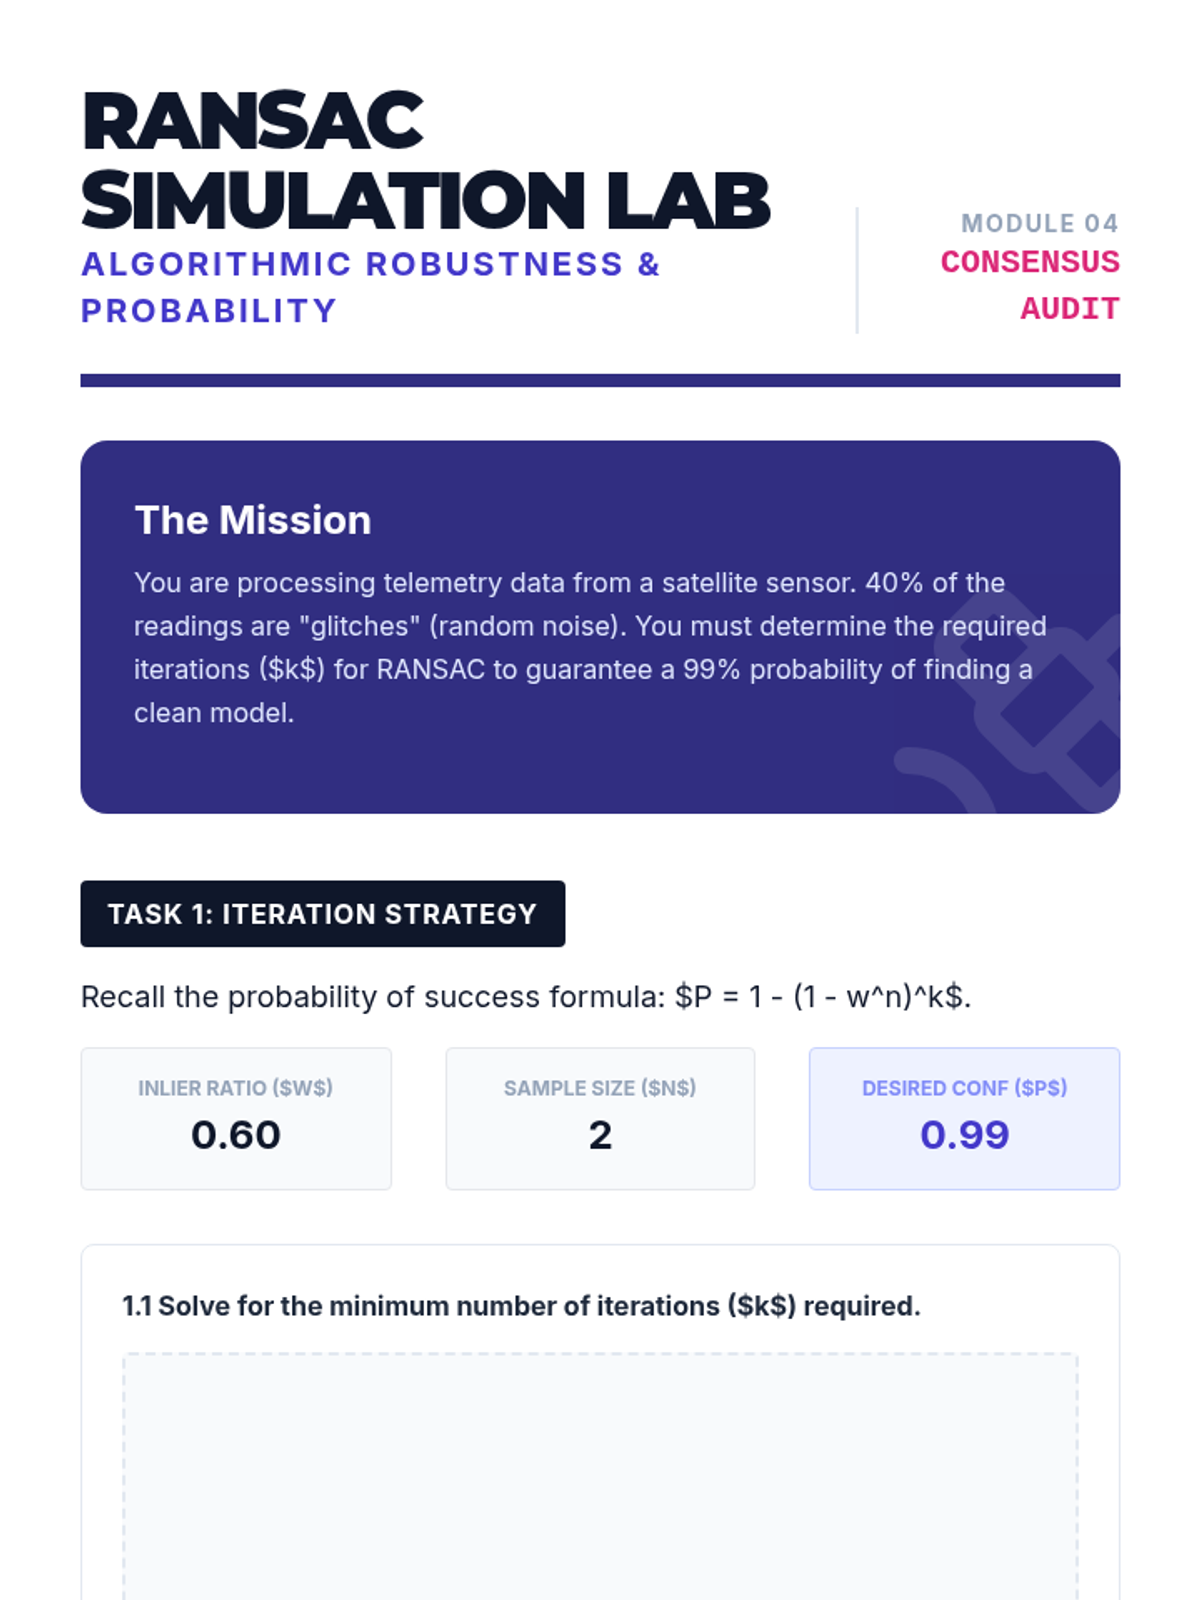
A worksheet for calculating RANSAC success probabilities and identifying algorithmic inefficiencies, plus a manual Theil-Sen slope calculation.
A slide deck introducing iterative robust methods like RANSAC and the non-parametric Theil-Sen estimator for high-contamination datasets.
Introductory slides for Lesson 4, covering the critical assumptions of independent samples, normality, and variance equality, including the use of Q-Q plots.
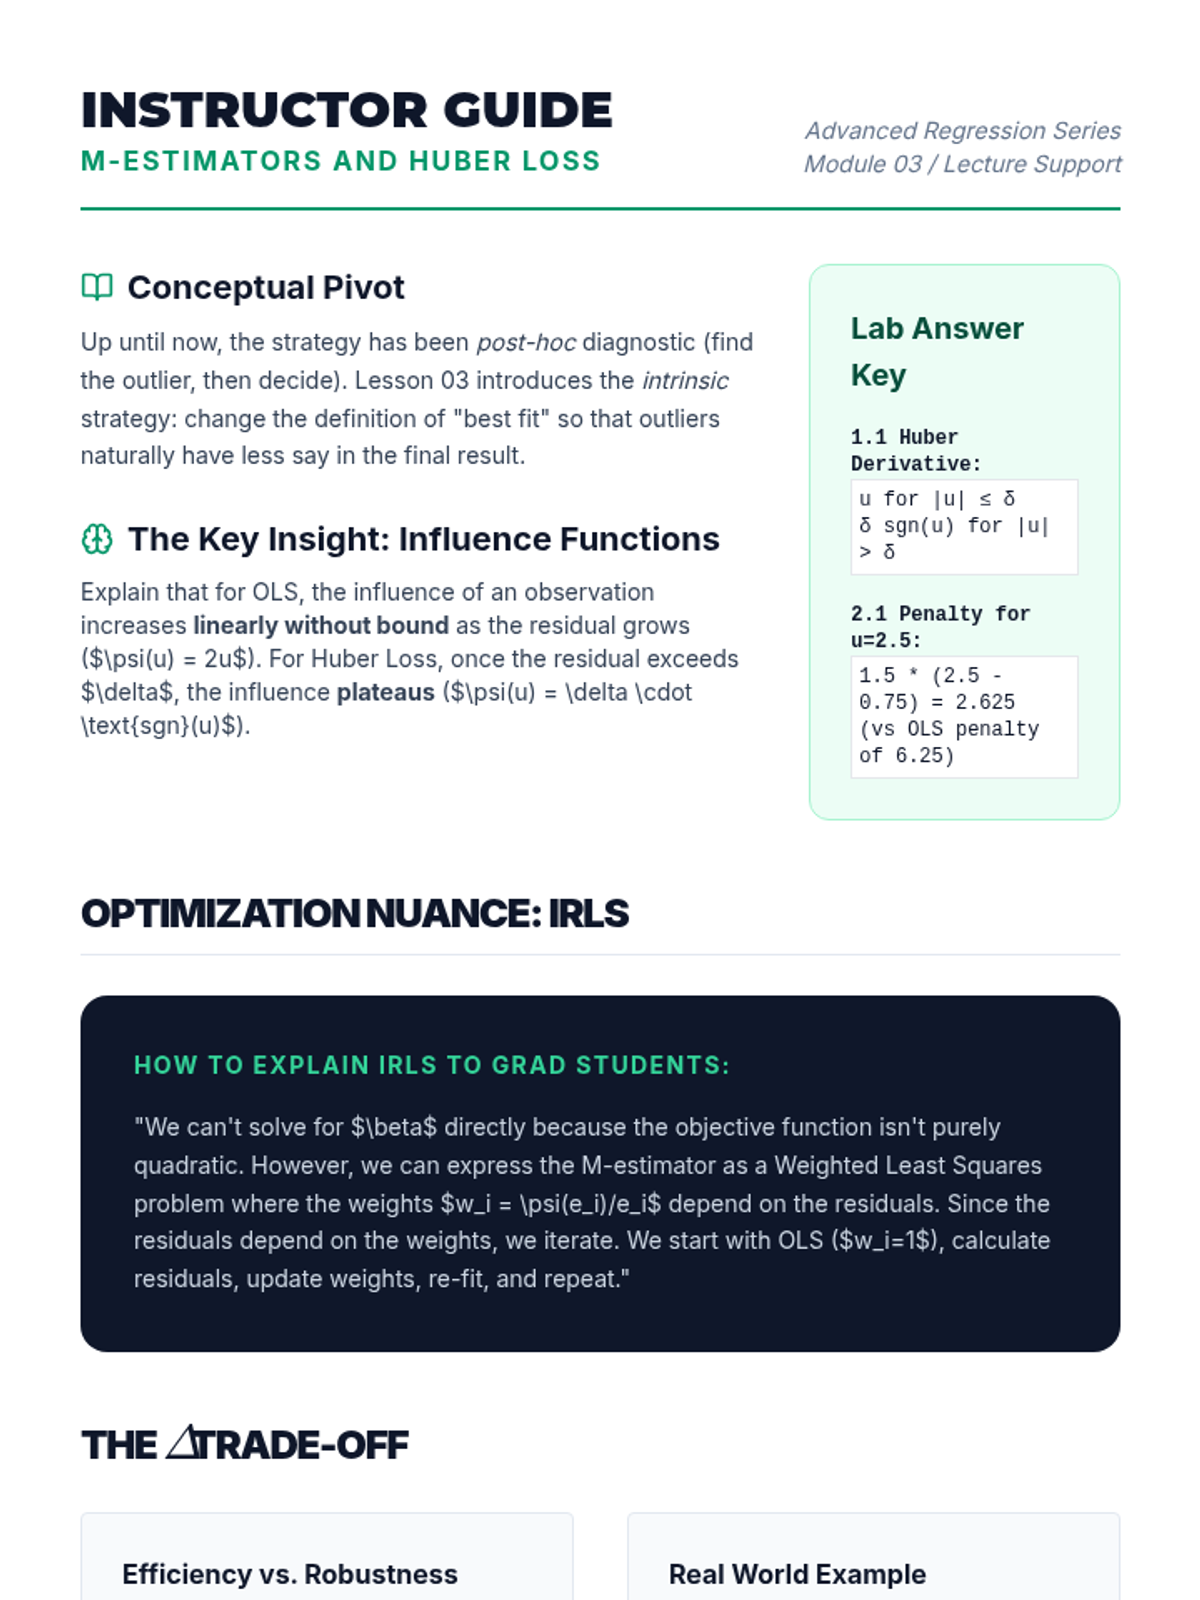
A facilitation guide for Lesson 3, providing pedagogical strategies for teaching M-estimators and objective functions.
Introductory slides for Lesson 3, covering the construction, components, and interpretation of confidence intervals for independent means.
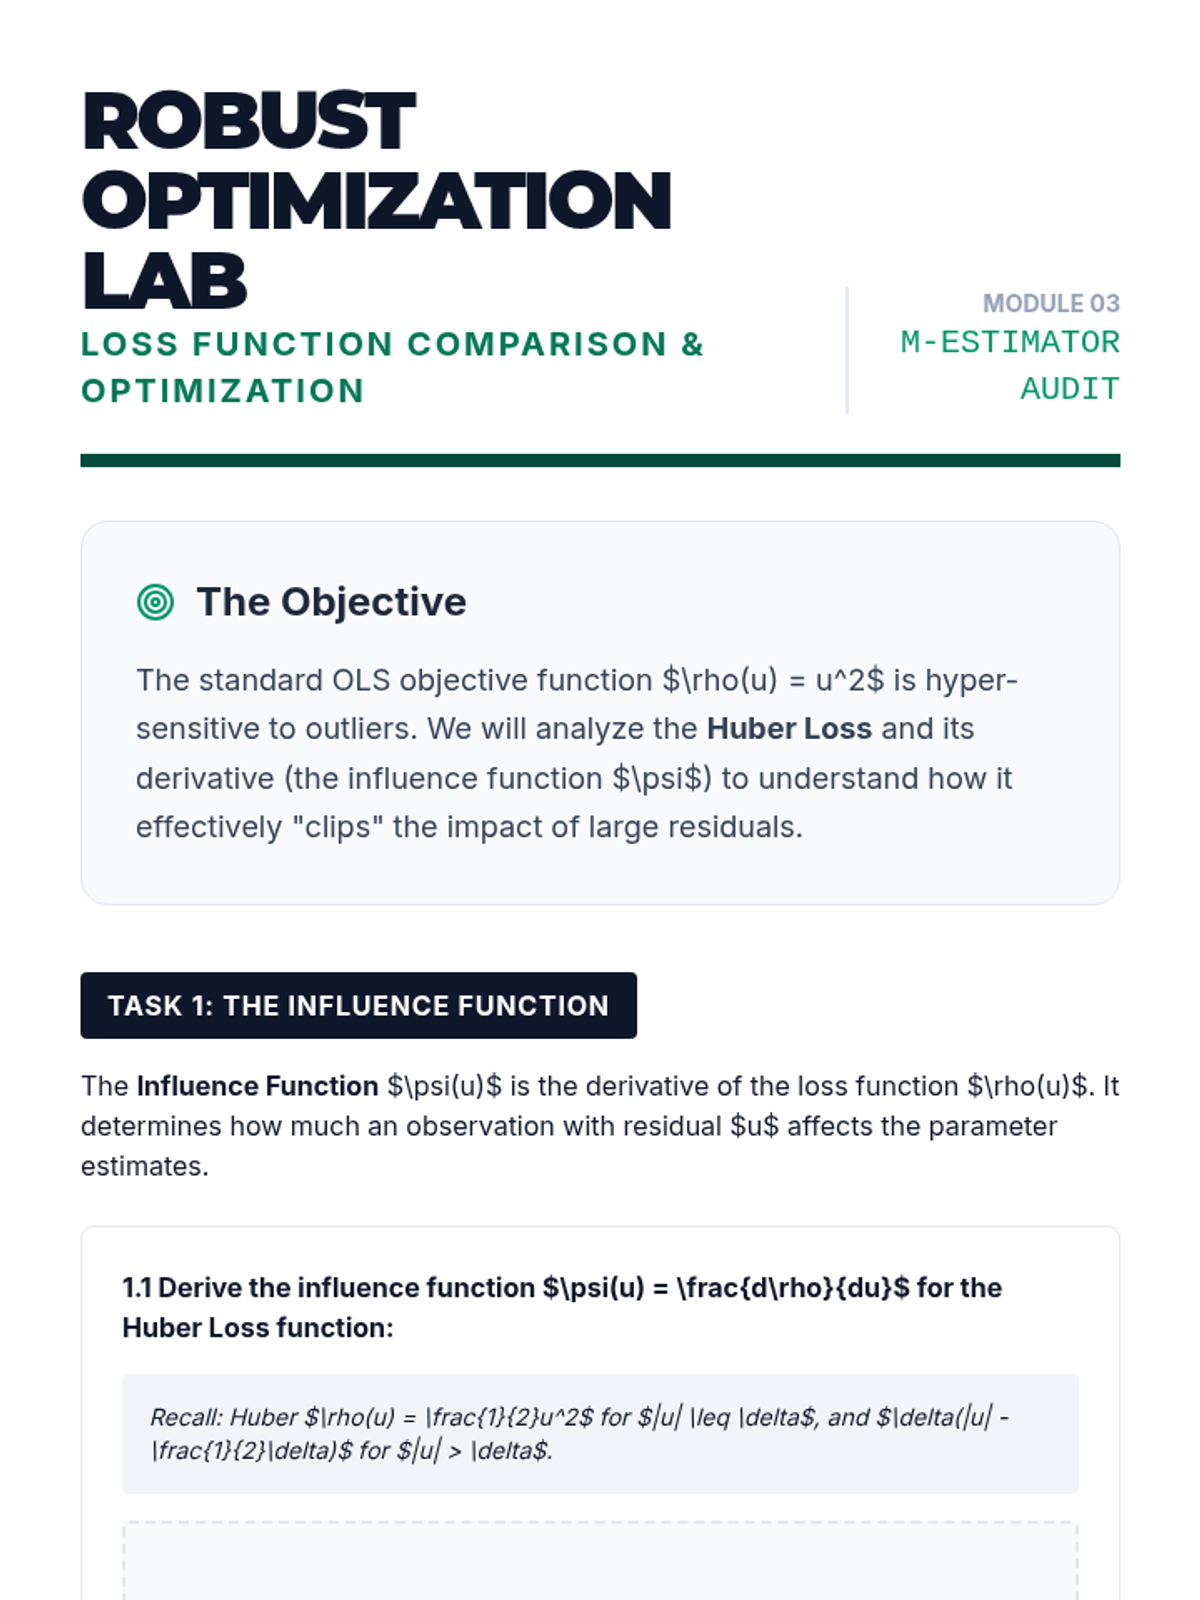
A graduate-level problem set comparing L2, L1, and Huber loss functions, including mathematical derivations and empirical calculations.
A slide deck introducing robust regression techniques, focusing on M-estimators and the Huber loss function.
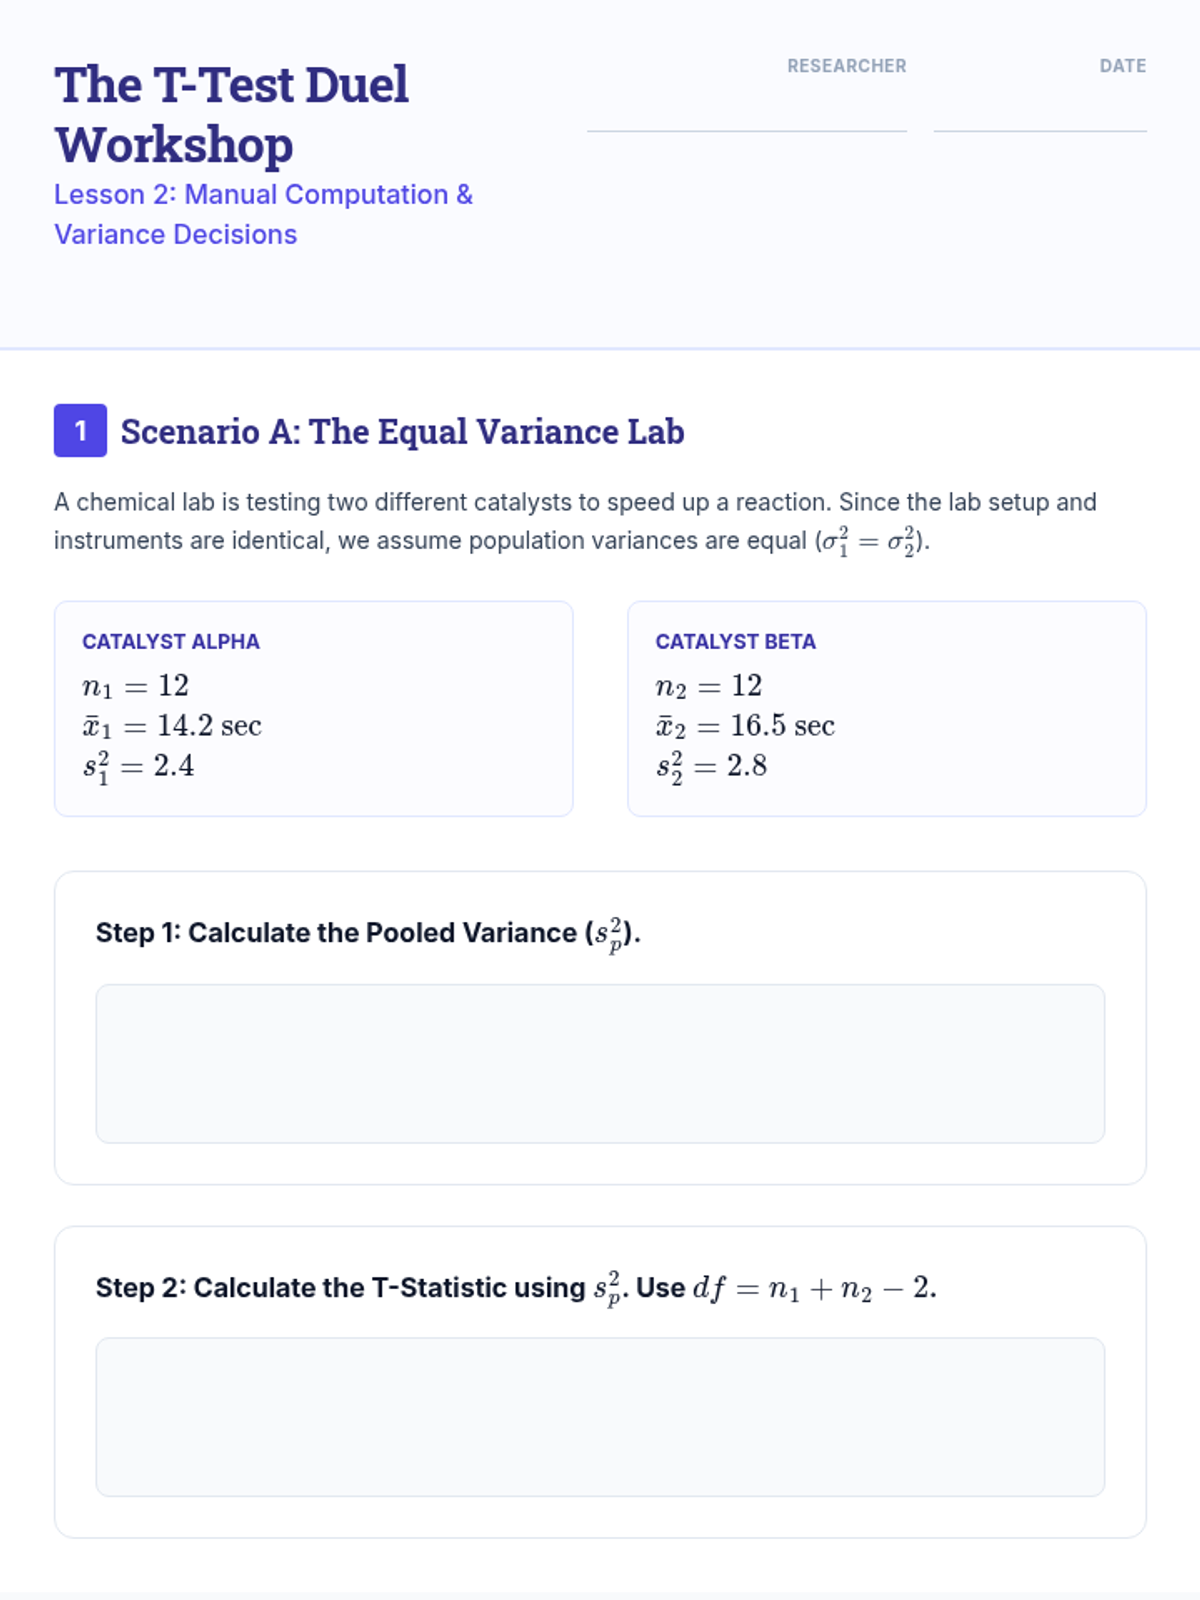
Manual calculation workshop for Lesson 2, distinguishing between Student’s pooled t-test and Welch’s unpooled t-test through step-by-step problem solving.
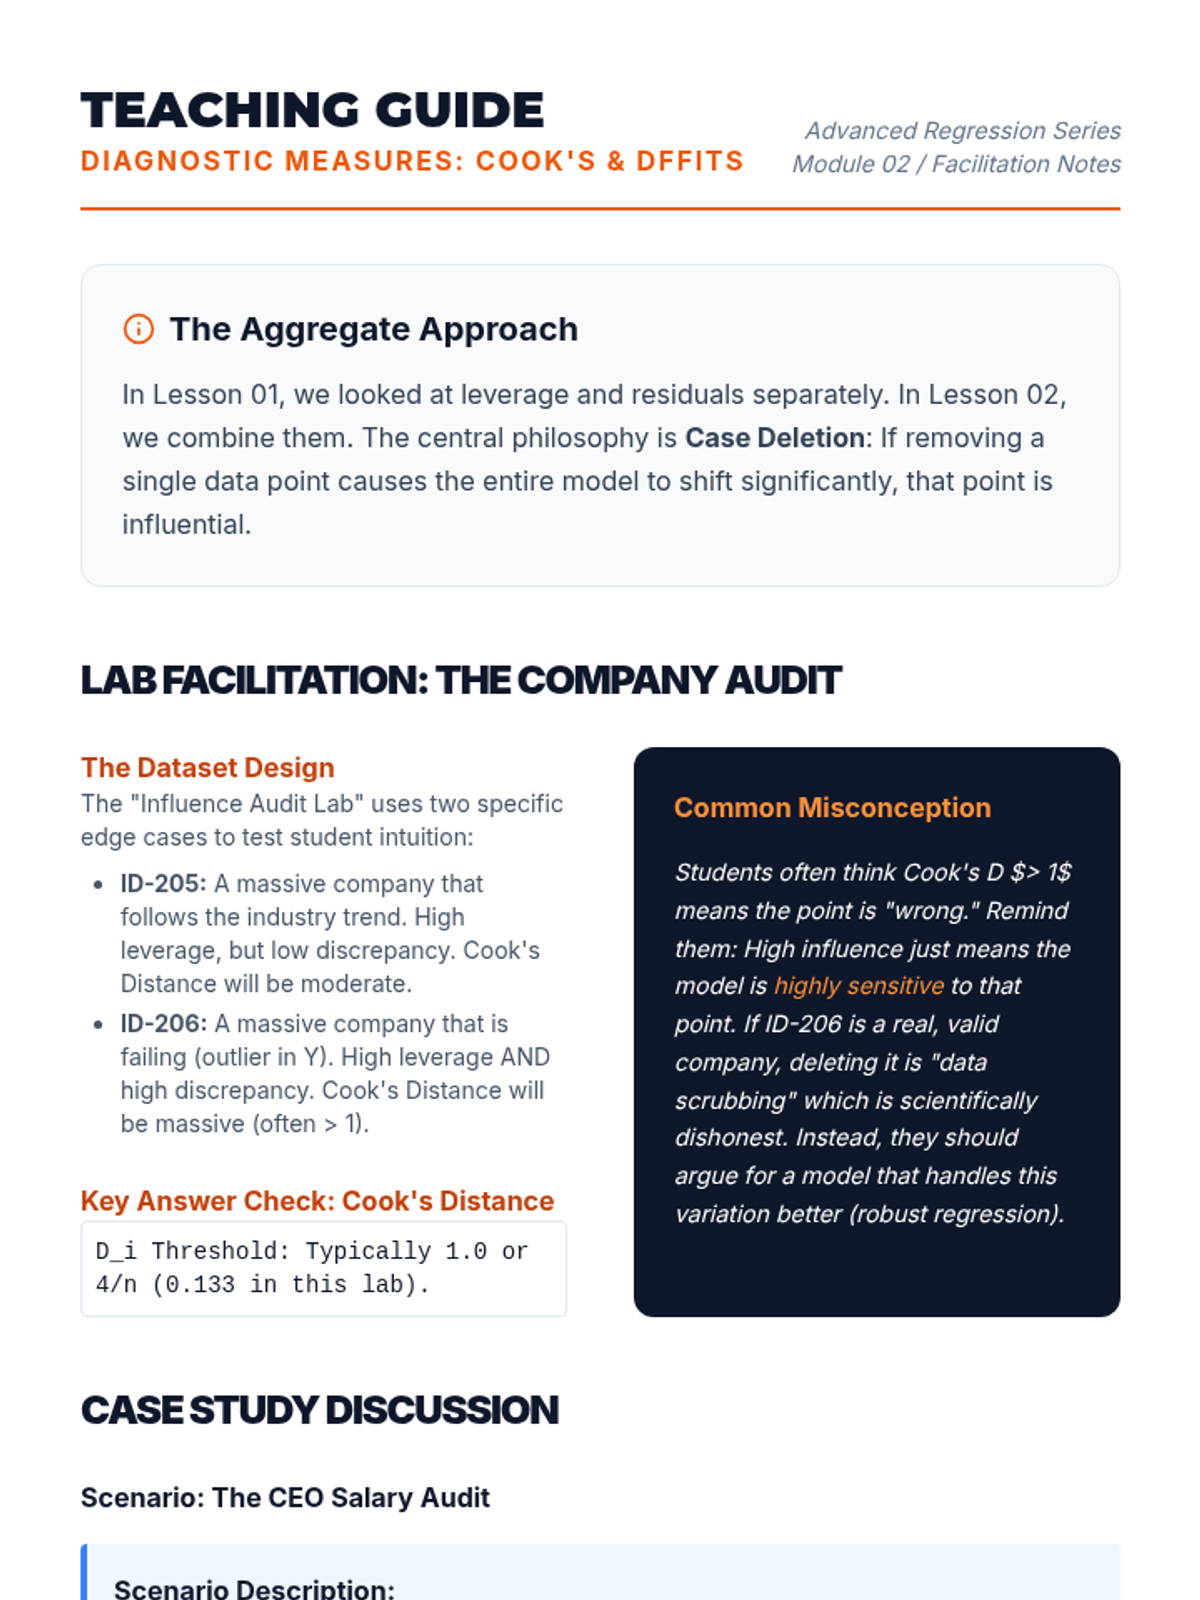
A facilitation guide for Lesson 2, including answer keys for the audit lab and discussion prompts on the ethics of data deletion.
Introductory slides for Lesson 2, distinguishing between Student’s pooled t-test and Welch’s unpooled t-test, including formulas and modern best practices.
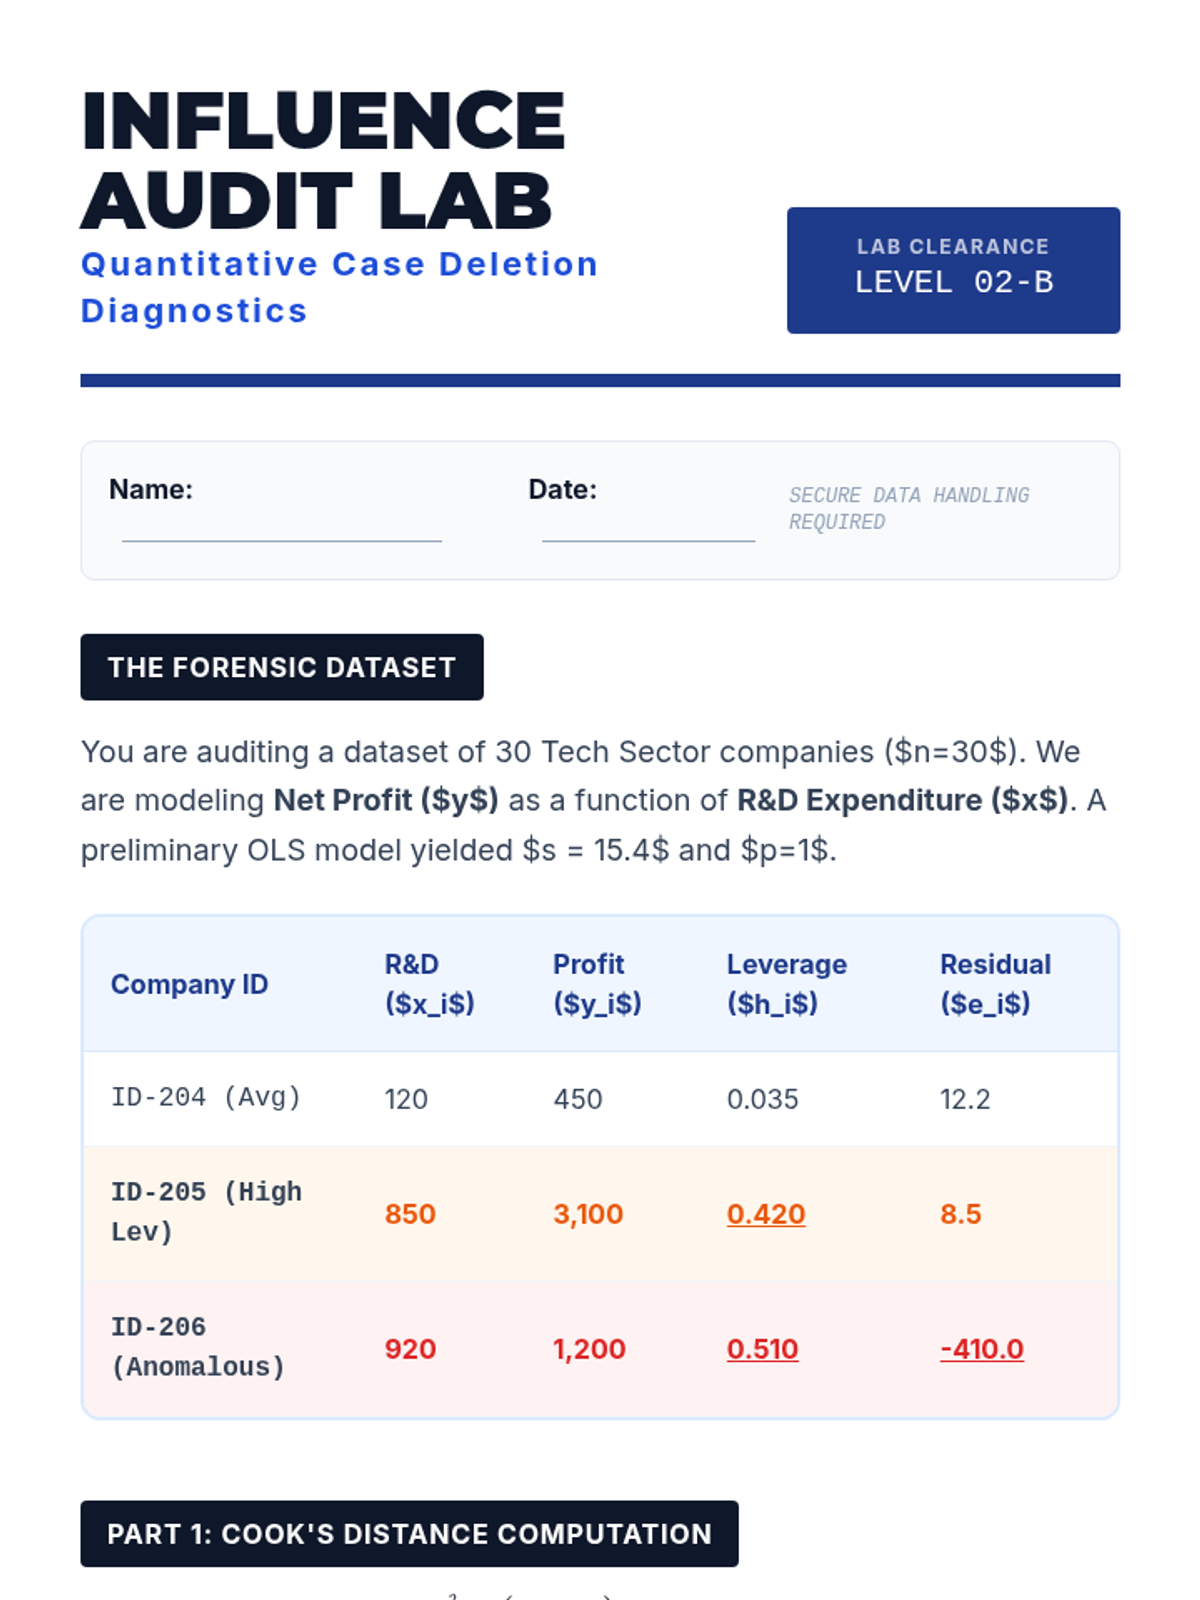
A graduate-level lab worksheet for calculating and interpreting Cook's Distance and DFFITS for a dataset of company financials.
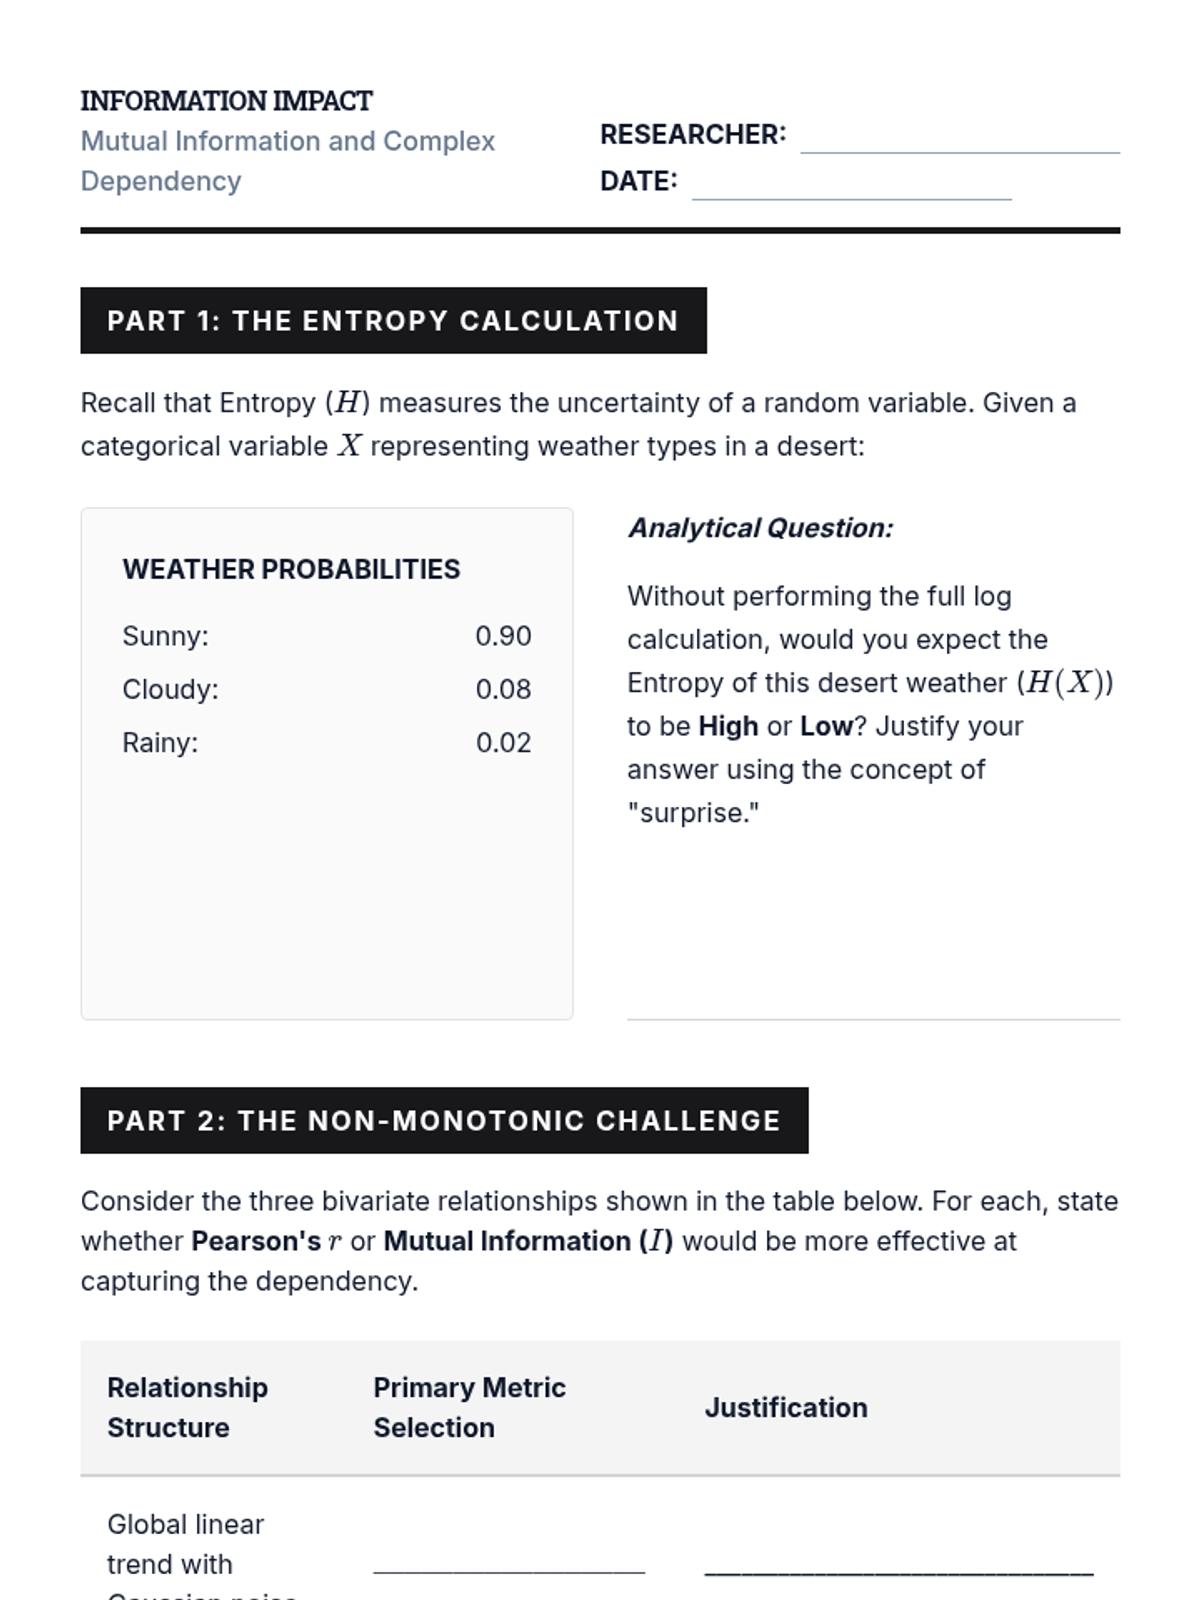
Final student worksheet for Lesson 5, focusing on entropy calculations, metric selection for non-monotonic structures, and sequence reflection.
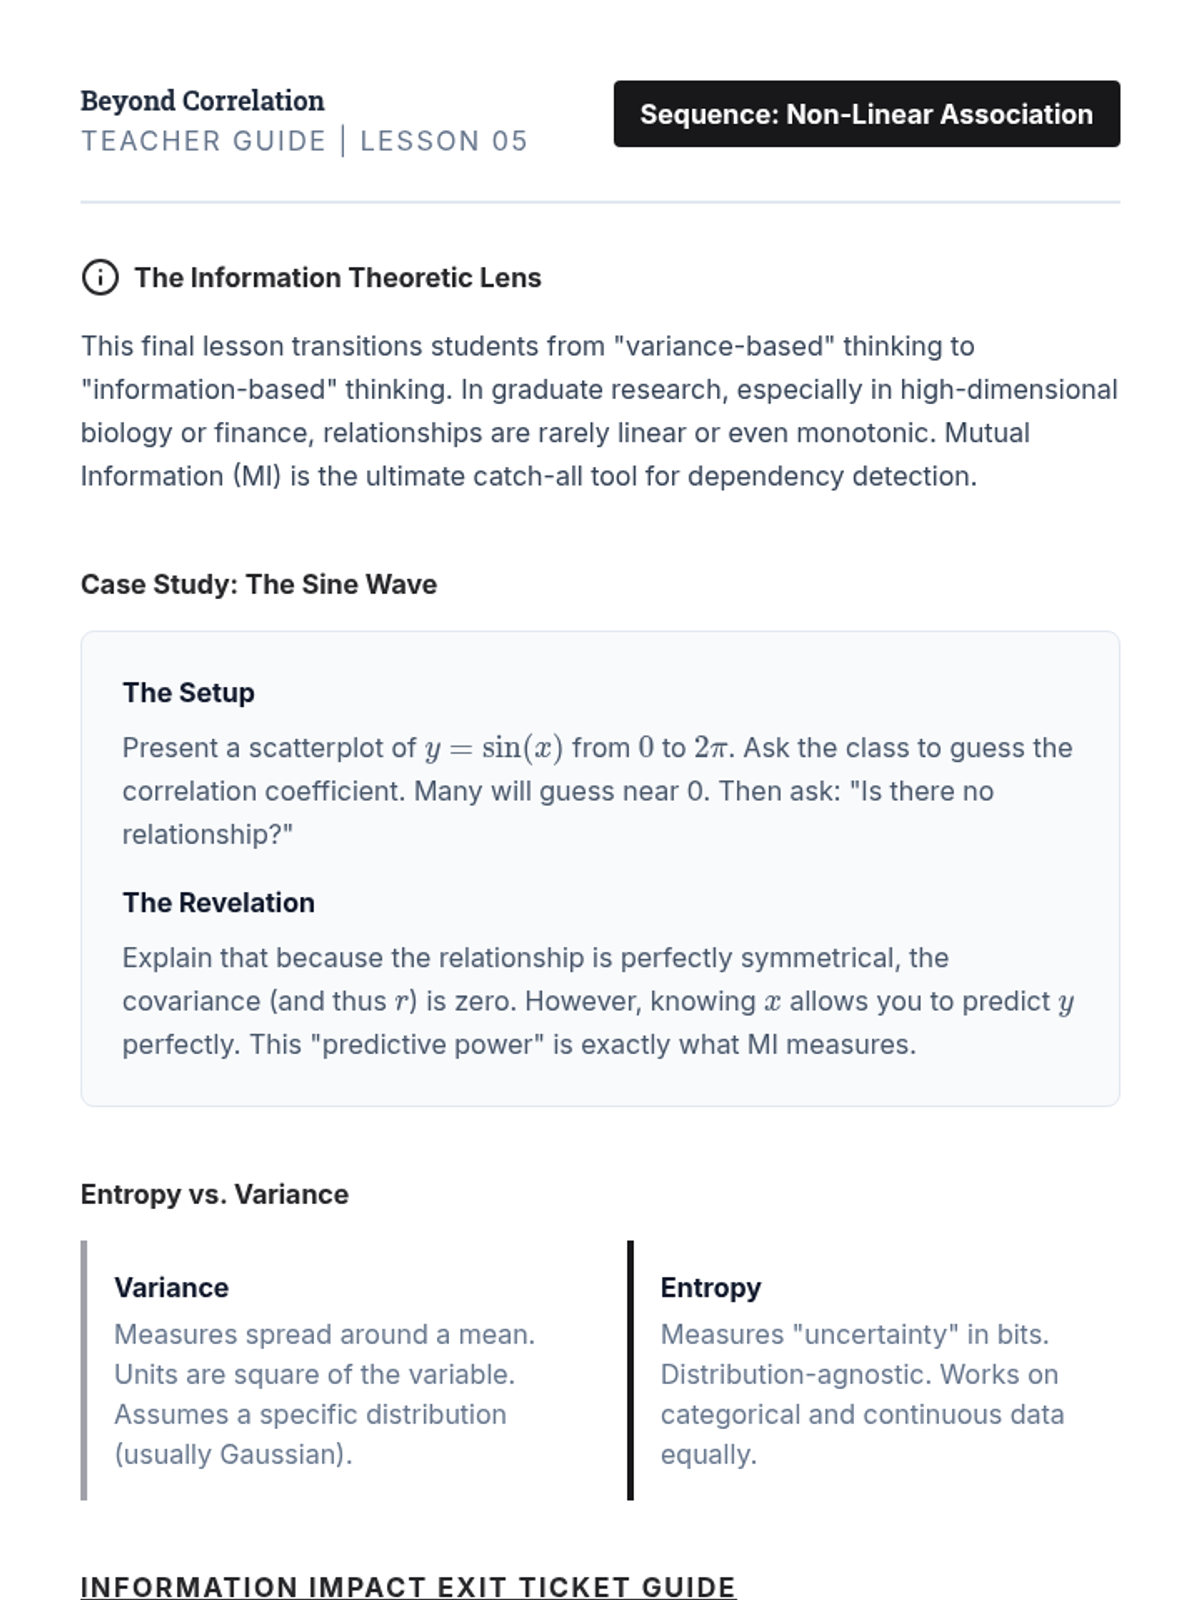
Teacher guide for Lesson 5 focusing on Mutual Information application, entropy concepts, and final sequence debrief.
Final slide deck for Lesson 5 introducing Mutual Information and Entropy, focusing on detecting complex, non-monotonic relationships.
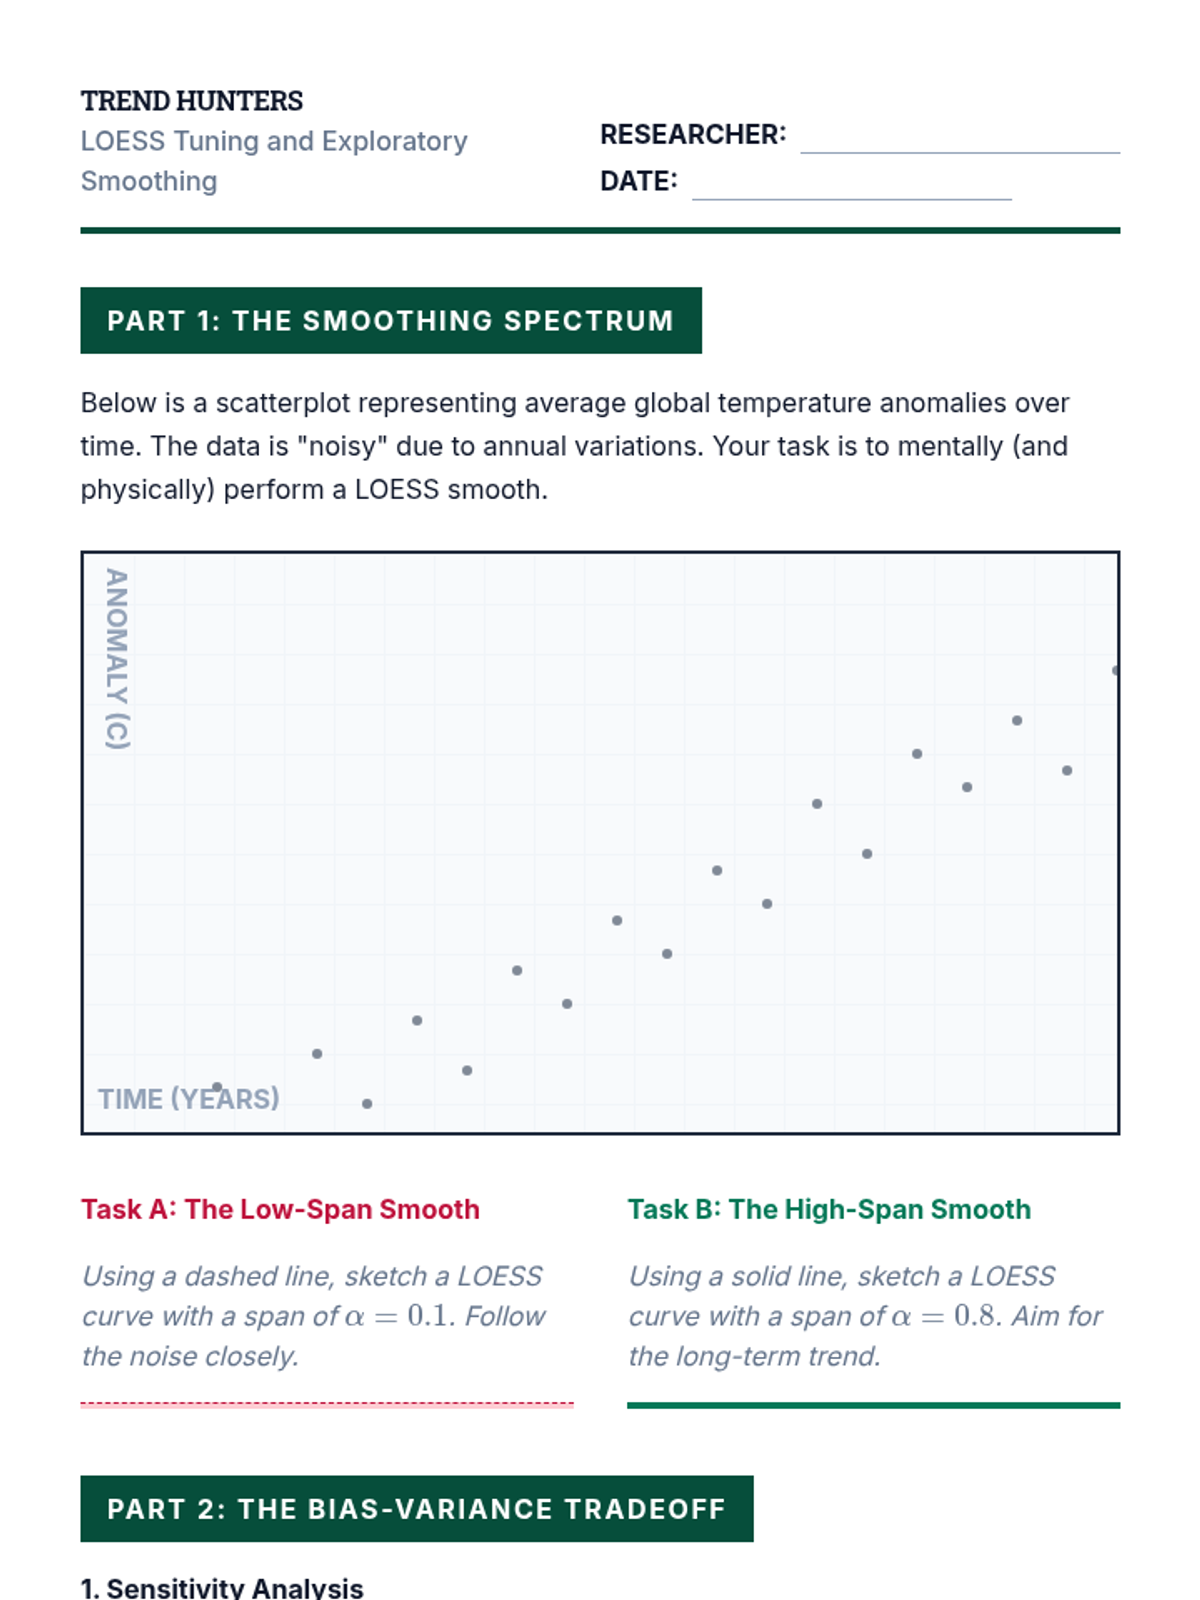
Student worksheet for Lesson 4 where students sketch LOESS curves with different spans and reason about the effect of hyperparameters on model bias and variance.
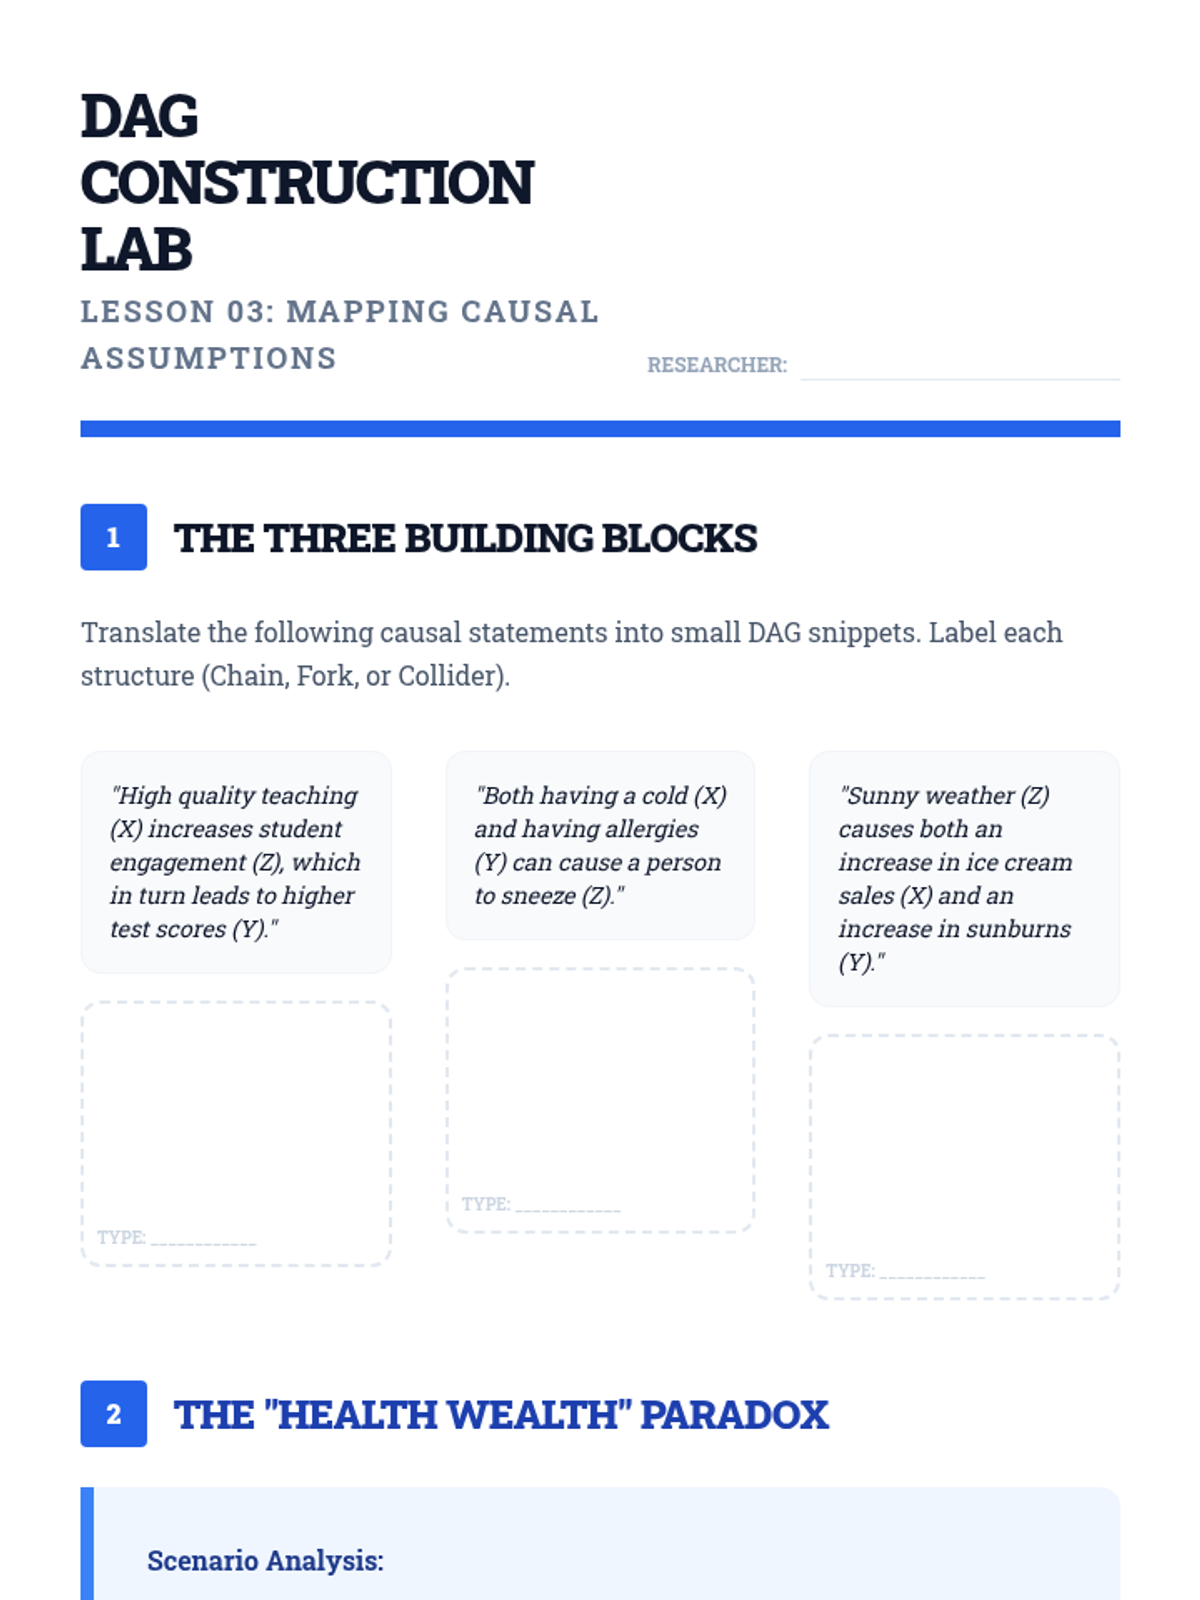
A graduate-level skill-building workshop where students practice drawing and interpreting Directed Acyclic Graphs (DAGs) and identifying backdoor paths.
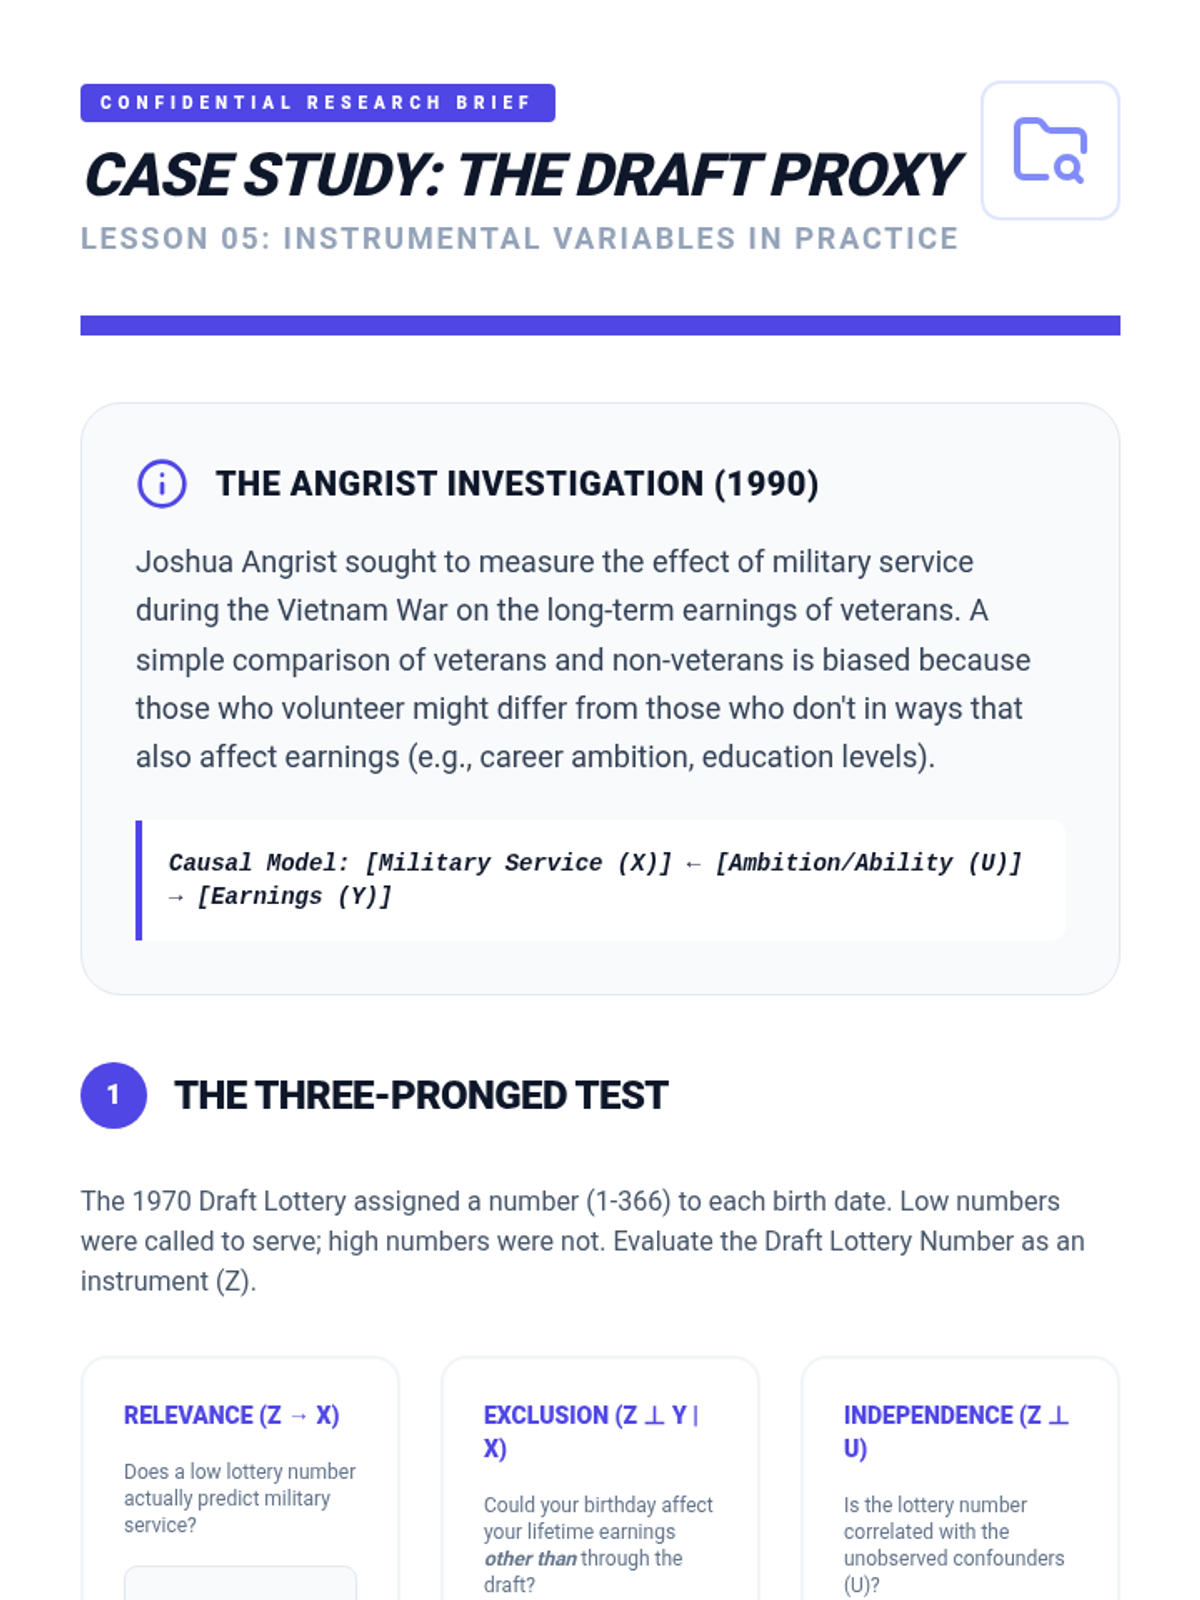
A graduate activity analyzing the Vietnam War draft lottery as a classic case of Instrumental Variables, requiring students to validate IV conditions and discuss LATE.
A graduate-level slide deck for Lesson 5, introducing Instrumental Variables (IV) and the logic of using random proxies to estimate causal effects, featuring the Vietnam Draft case study.
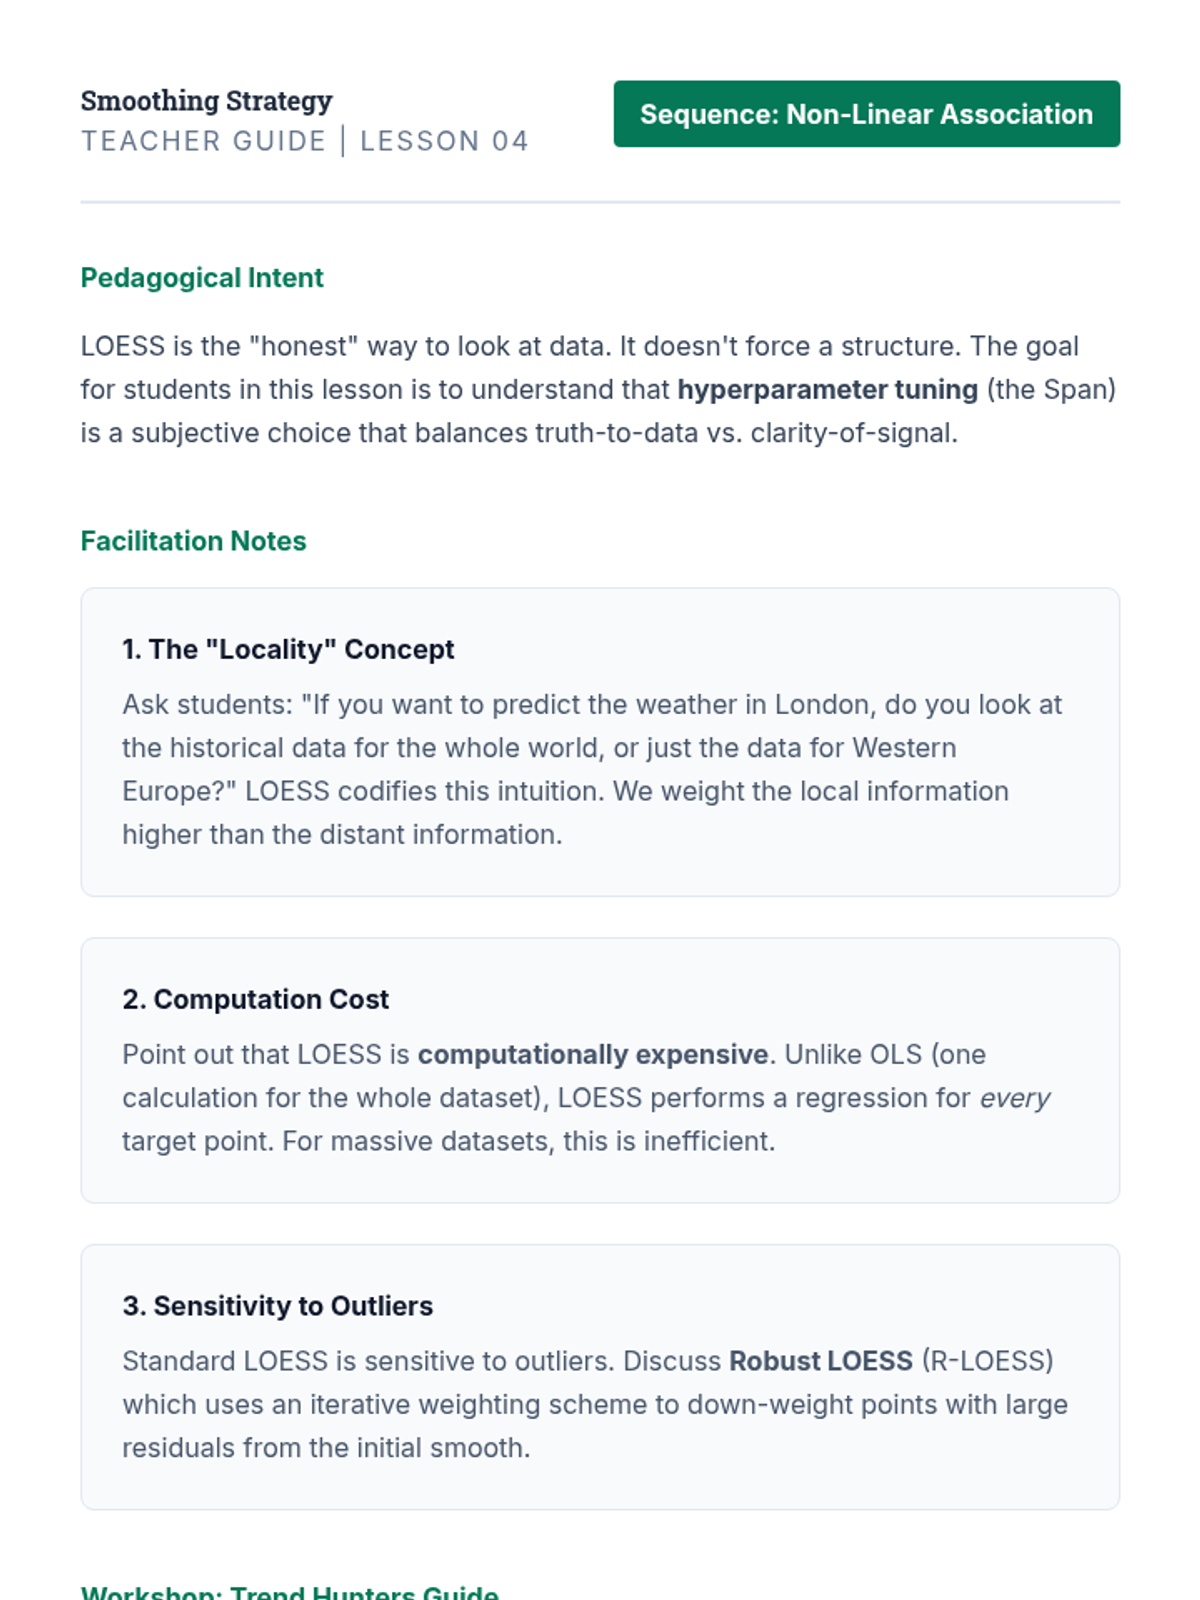
Teacher guide for Lesson 4 focusing on LOESS application, bandwidth tuning, and computational considerations.
Slide deck for Lesson 4 focusing on locally weighted scatterplot smoothing (LOESS), its algorithmic steps, and the effect of the span parameter.
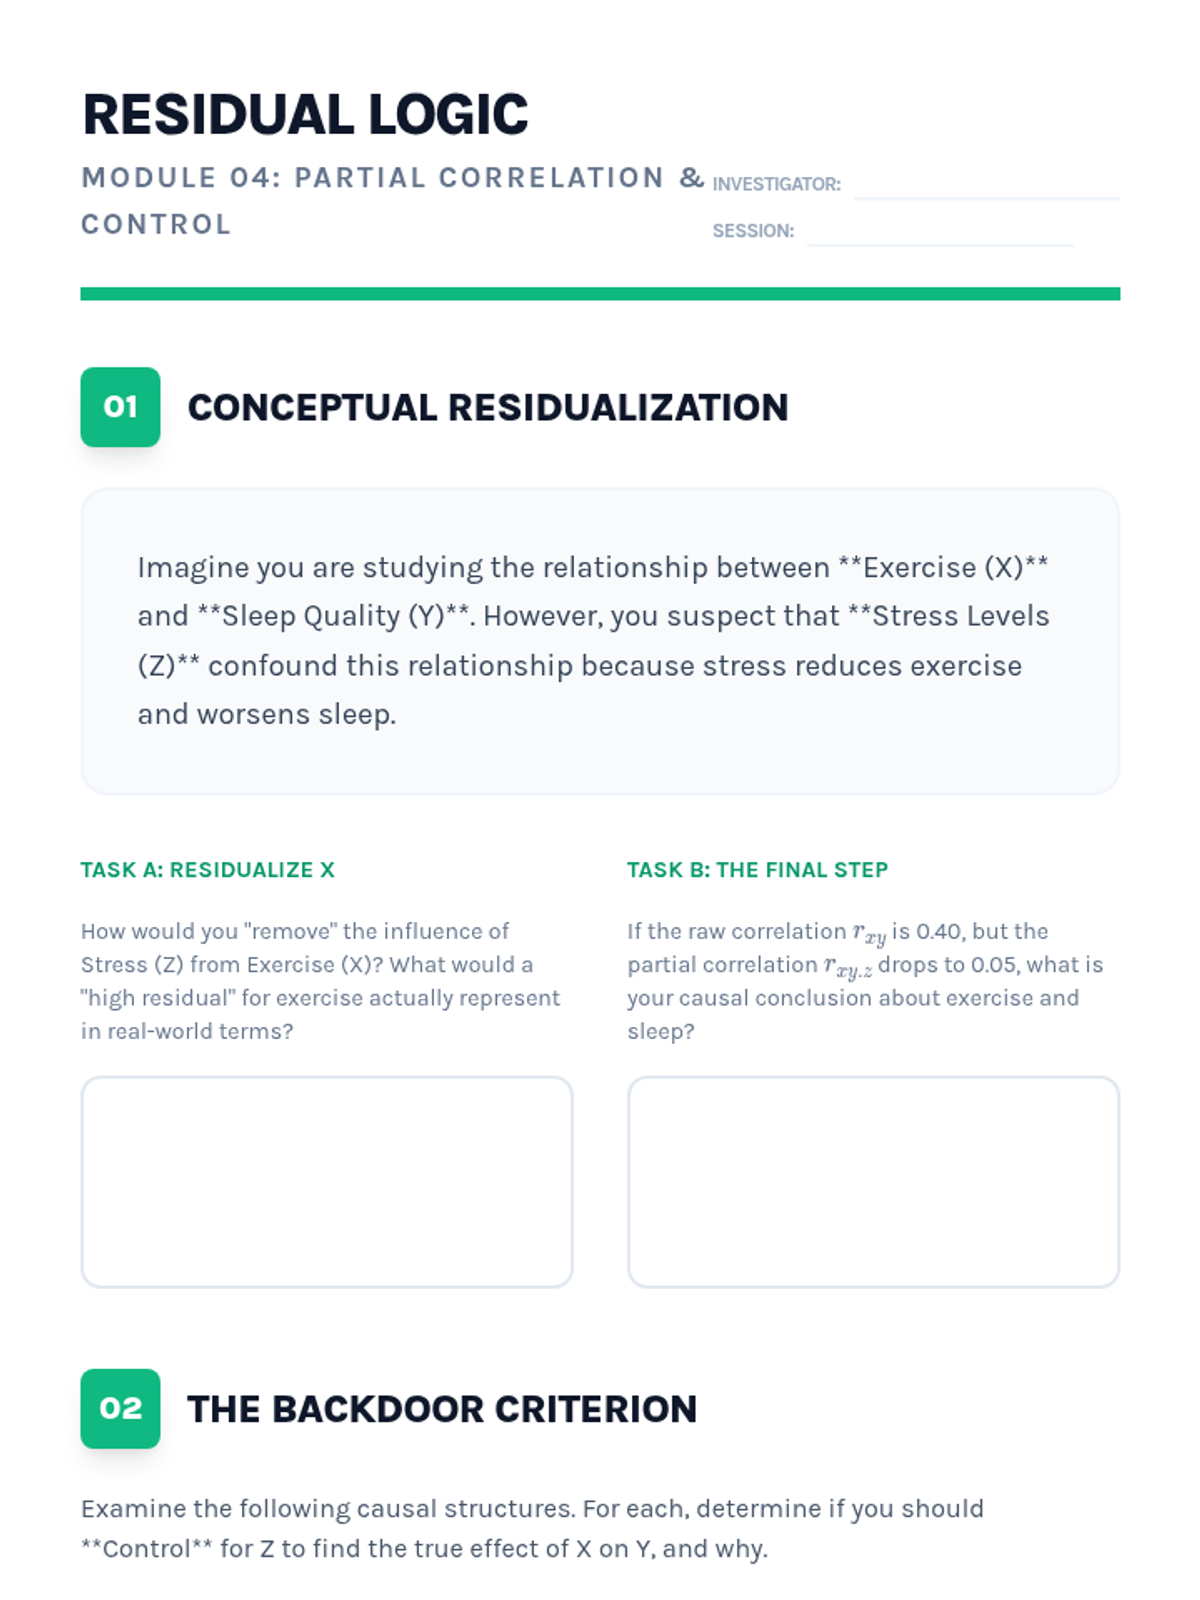
A graduate-level worksheet for Lesson 4, focusing on identifying confounders, choosing control variables based on DAGs, and calculating partial correlation.
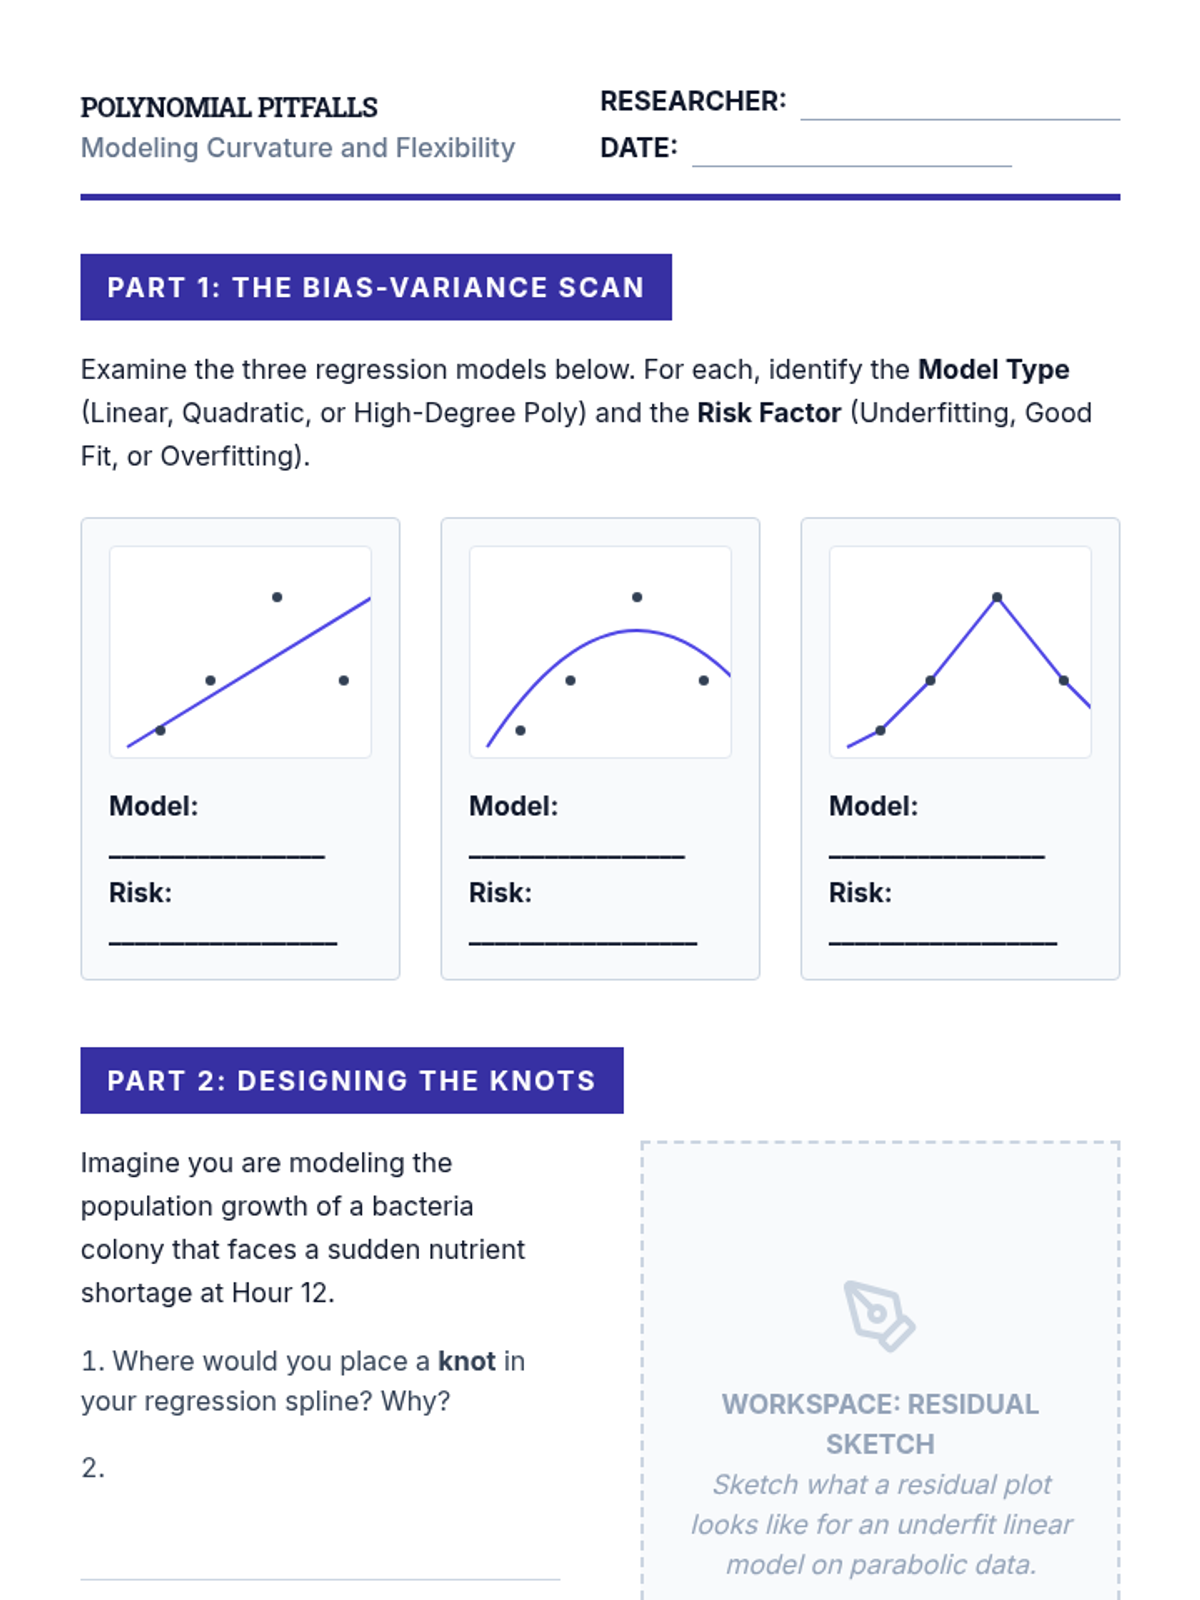
Student worksheet for Lesson 3 focusing on bias-variance tradeoffs and the conceptual requirements of cubic splines.
A graduate-level slide deck for Lesson 4, exploring the concept of partial correlation and the use of control variables to neutralize confounders in bivariate relationships.
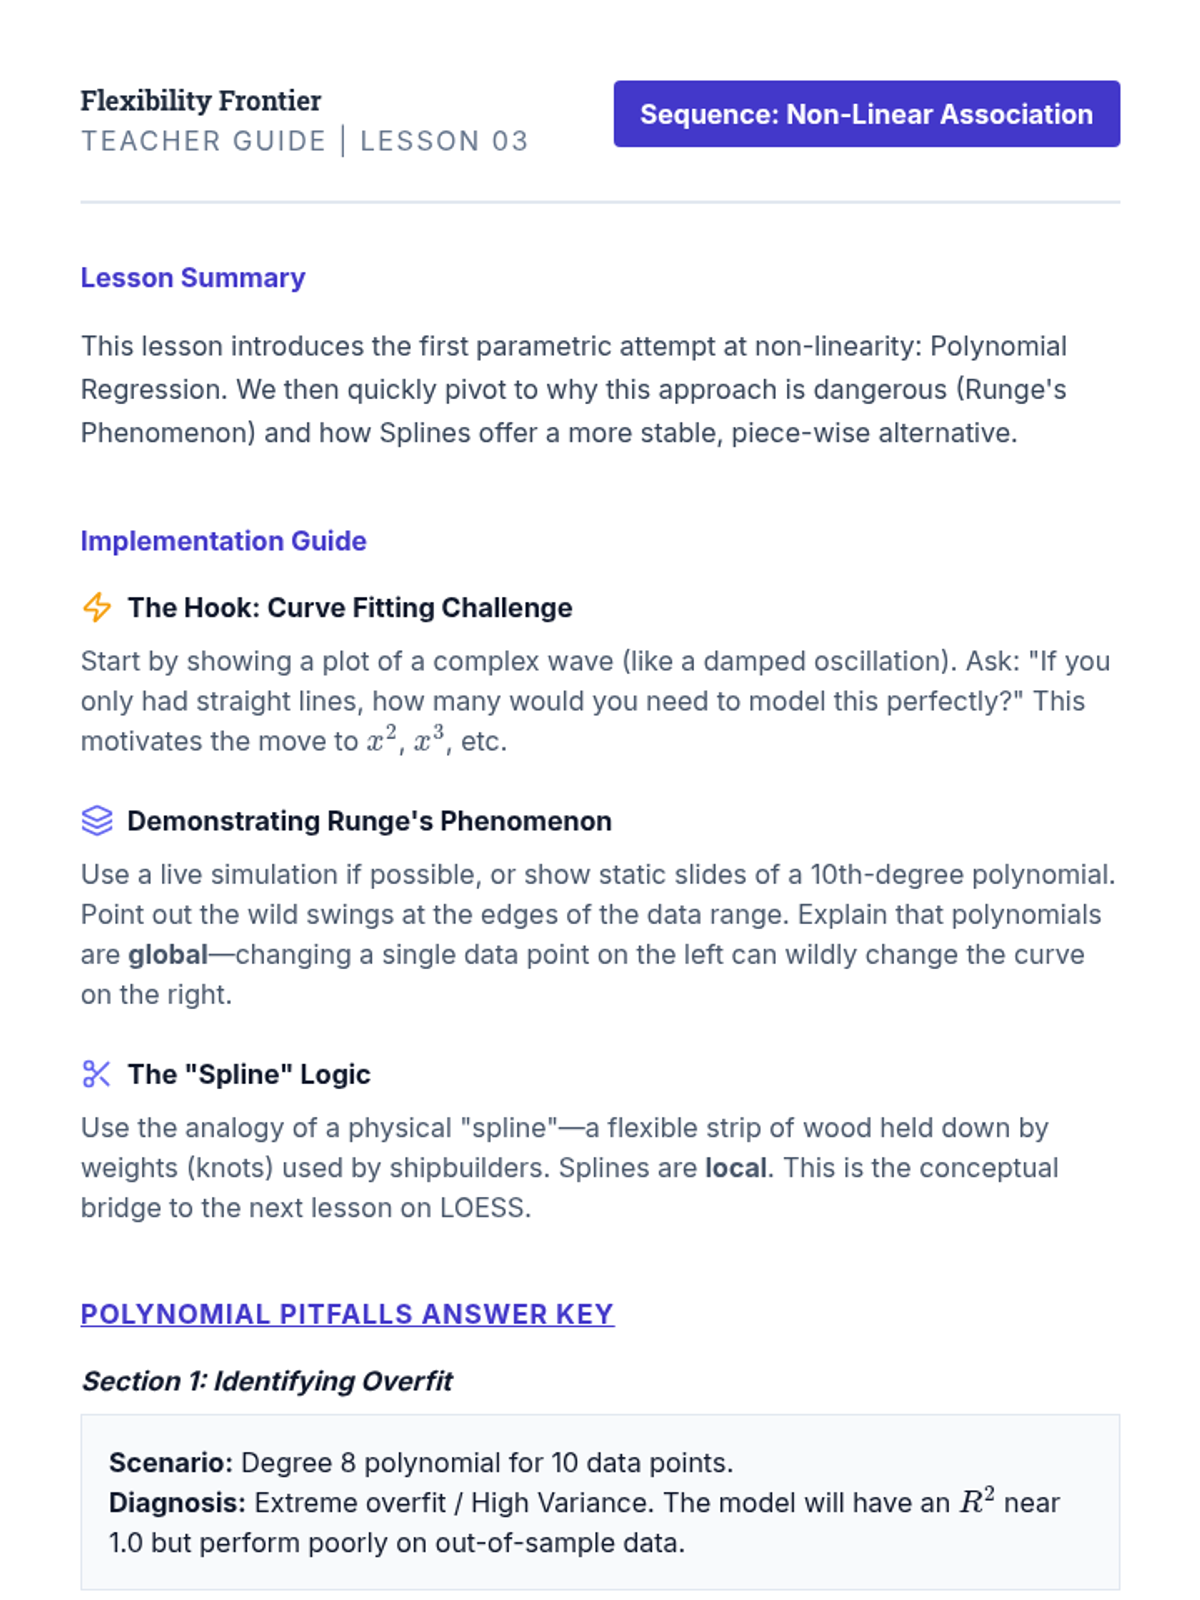
Teacher guide for Lesson 3 focusing on polynomial regression risks and spline continuity requirements.
A student-facing discussion guide for the final seminar on the replication crisis. It includes reflective prompts on p-value culture, the ethics of underpowered research, and peer-review simulation.
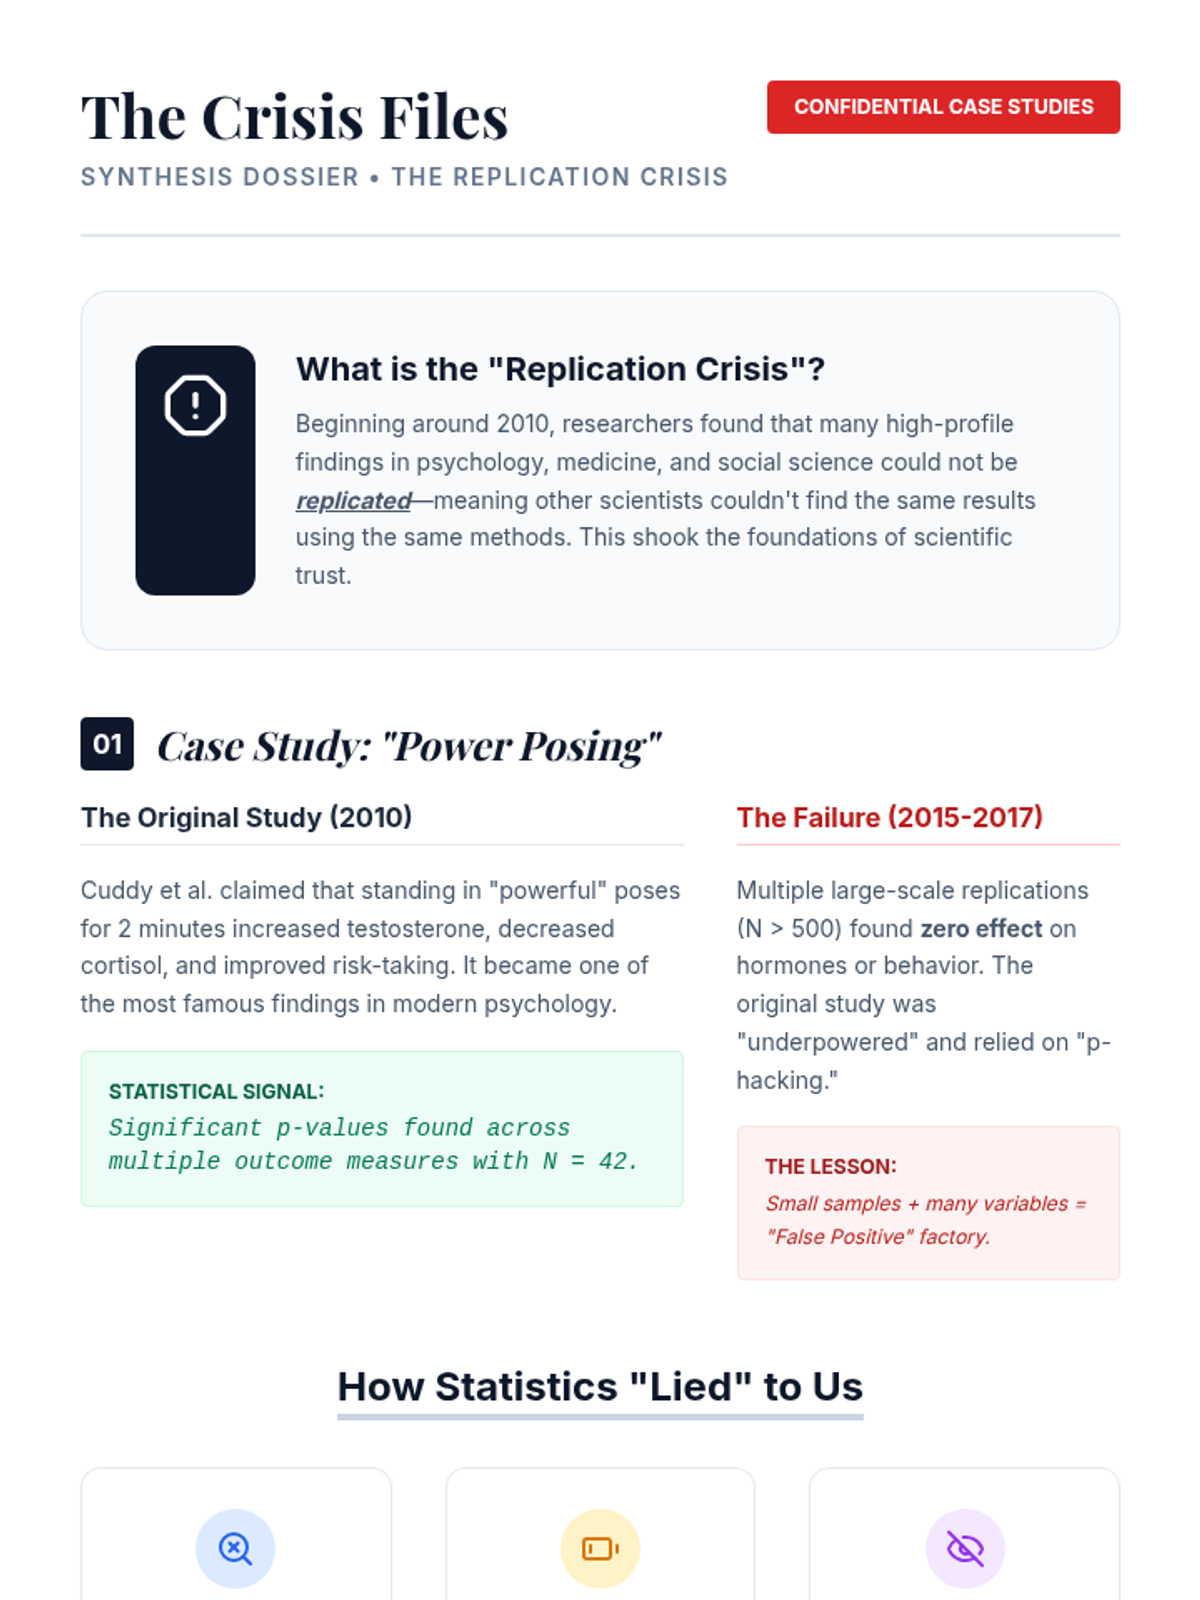
A case study dossier for undergraduate students summarizing the causes of the replication crisis, including low power, p-hacking, and publication bias. It highlights the "Power Posing" case study as a key example.
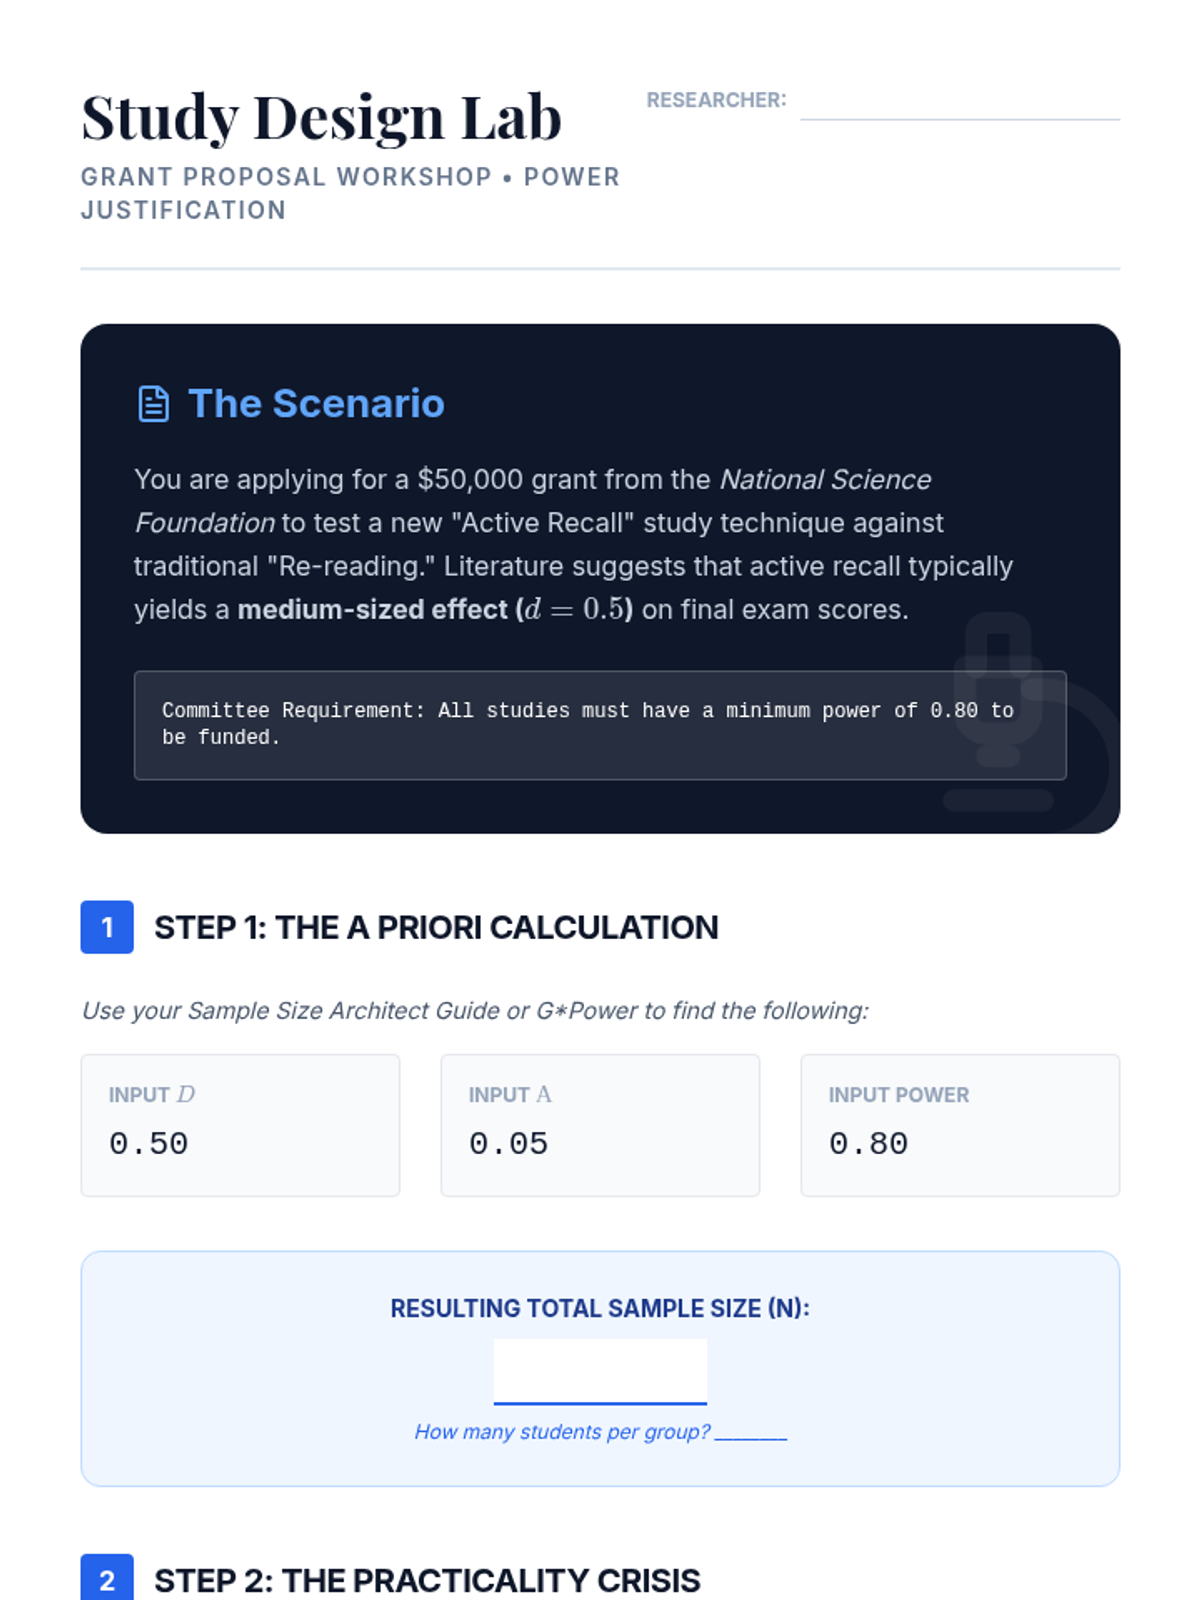
A study design worksheet where undergraduate students apply power analysis to a hypothetical grant proposal. It requires calculating required sample size and evaluating the impact of budget constraints on statistical power.
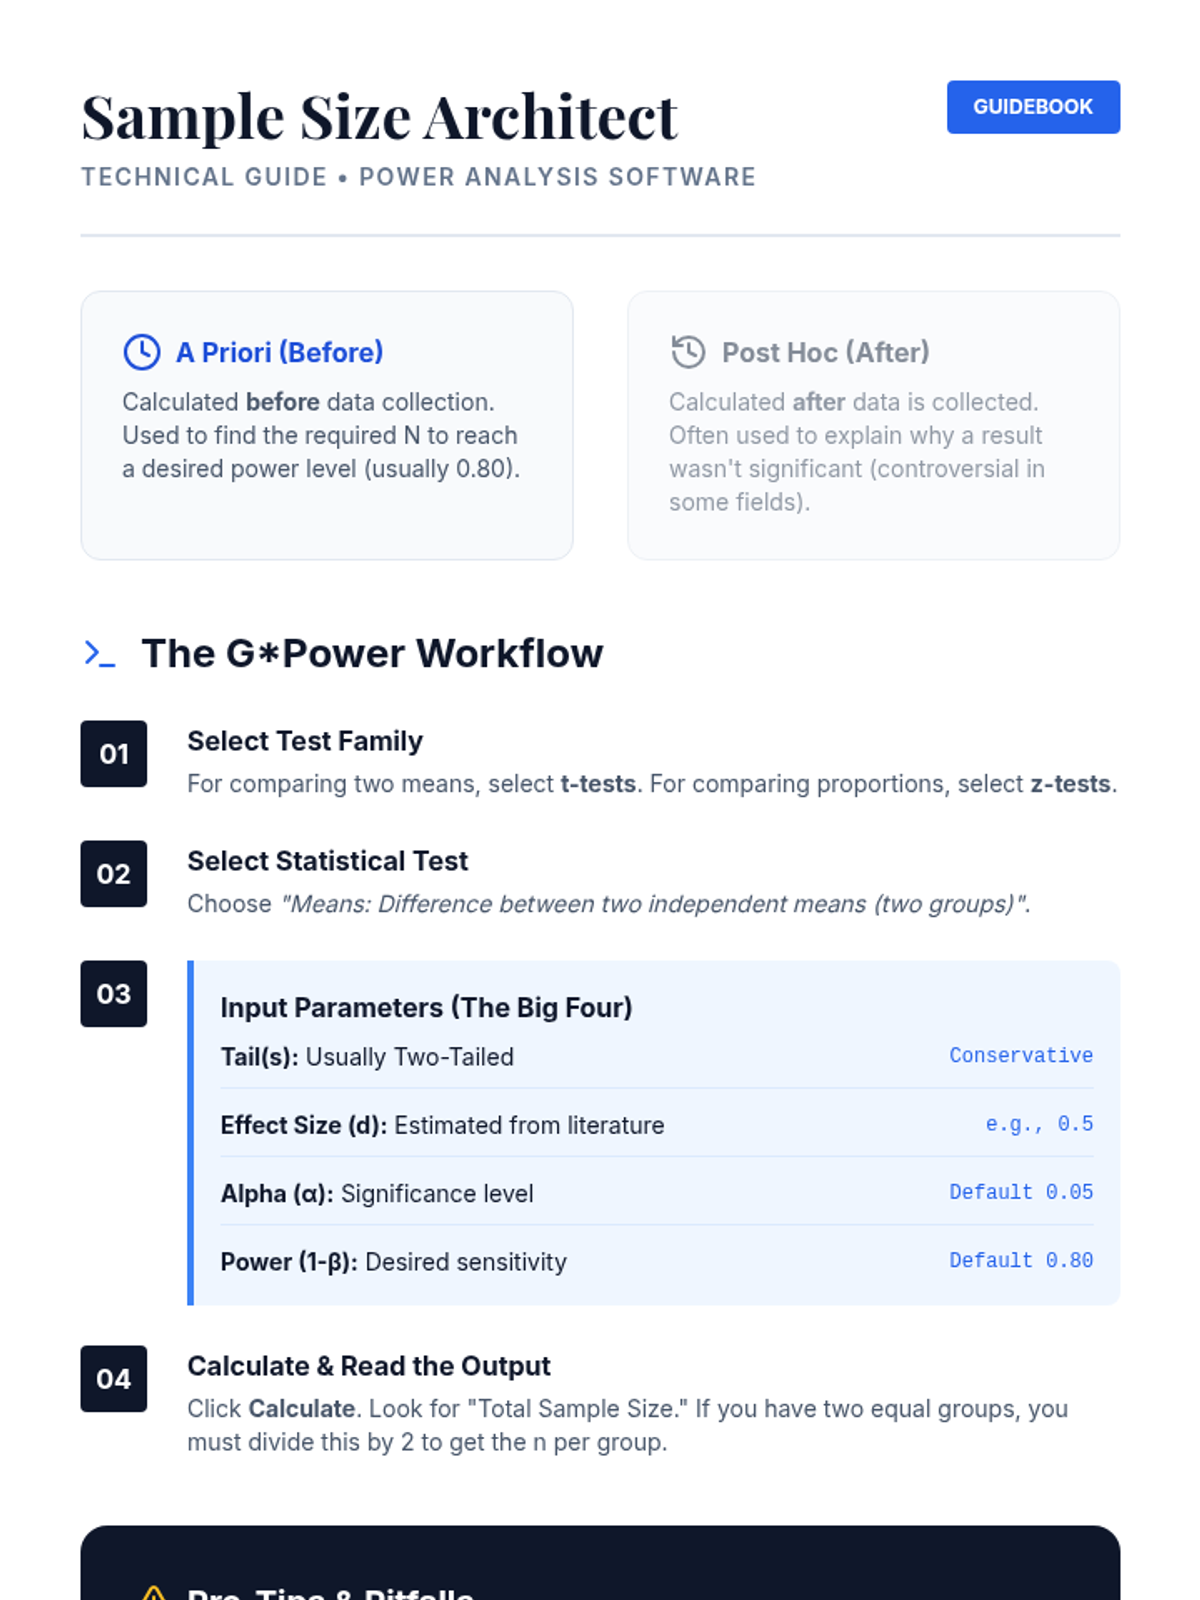
A technical reference guide for undergraduate students on performing a priori sample size determination using software like G*Power. Includes a step-by-step workflow and a reference table for standard power levels.
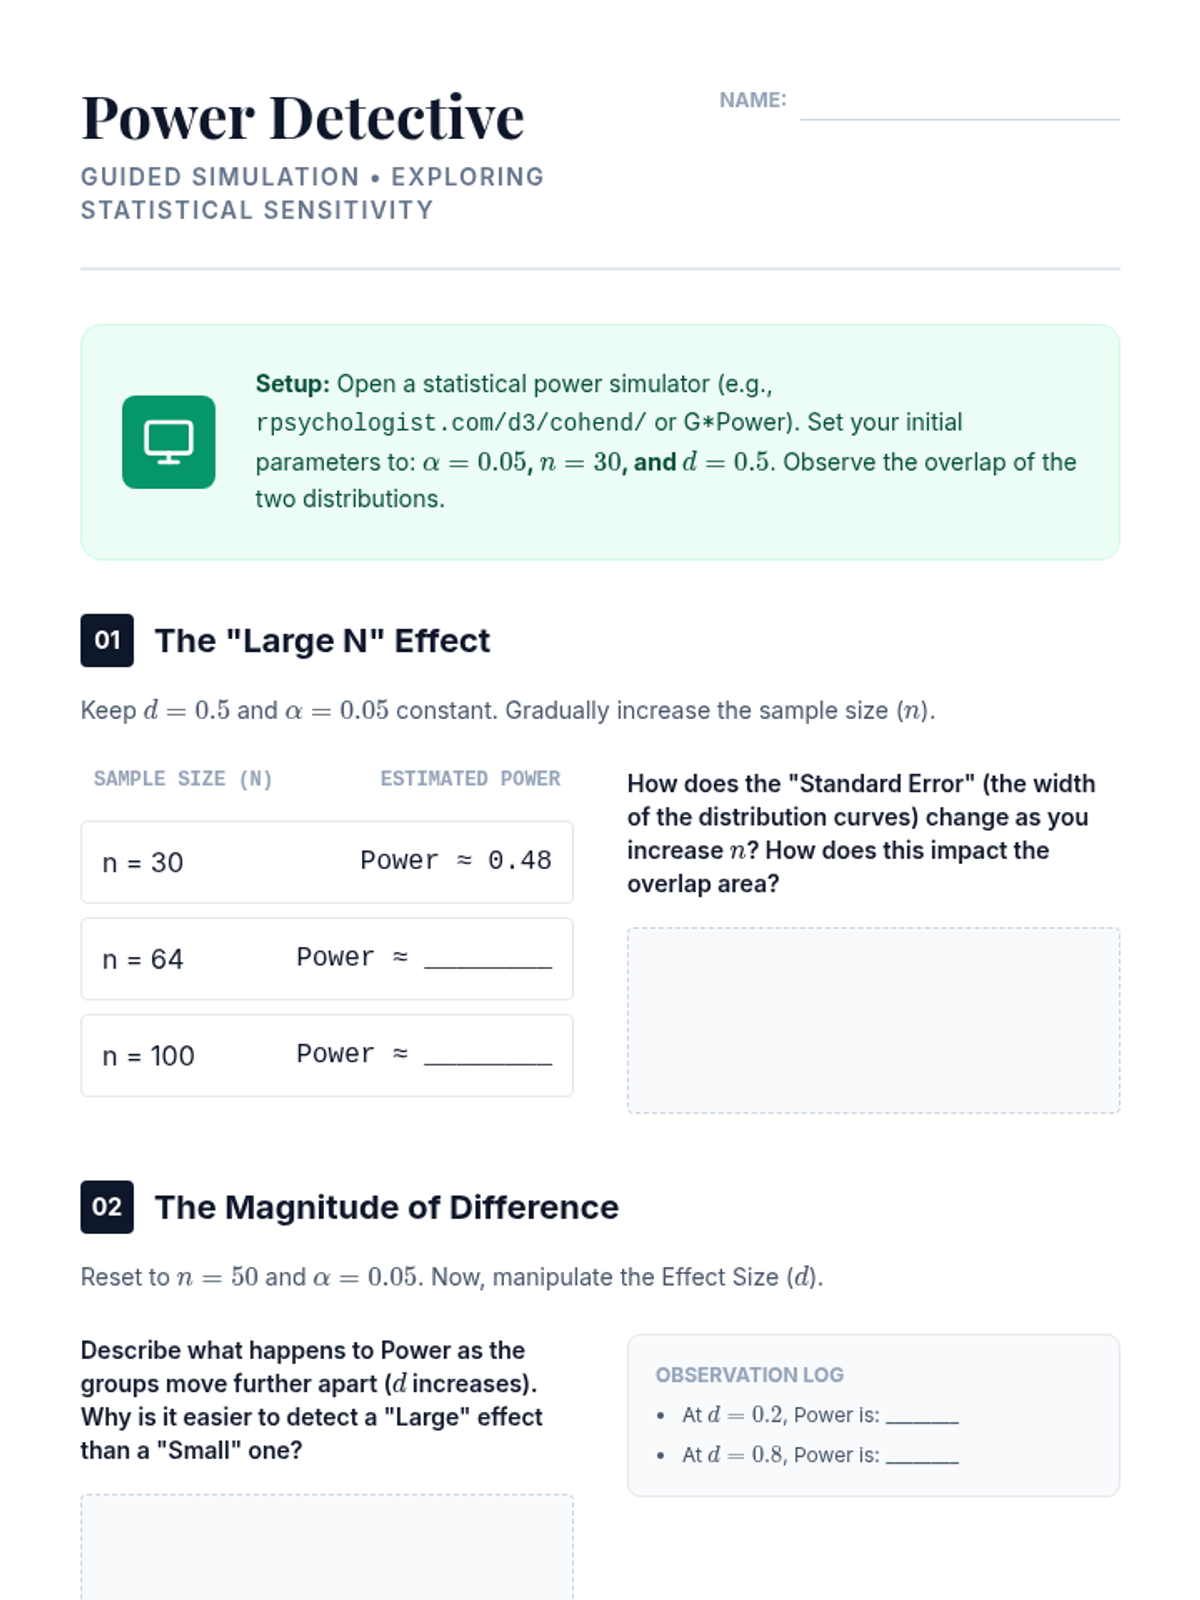
A guided simulation activity where undergraduate students manipulate variables (n, alpha, d) in a power calculator to observe real-time changes in statistical power and Type II error risk.
A visual presentation for undergraduate students defining statistical power, Type I and Type II errors, and the four main factors that influence power levels in research.
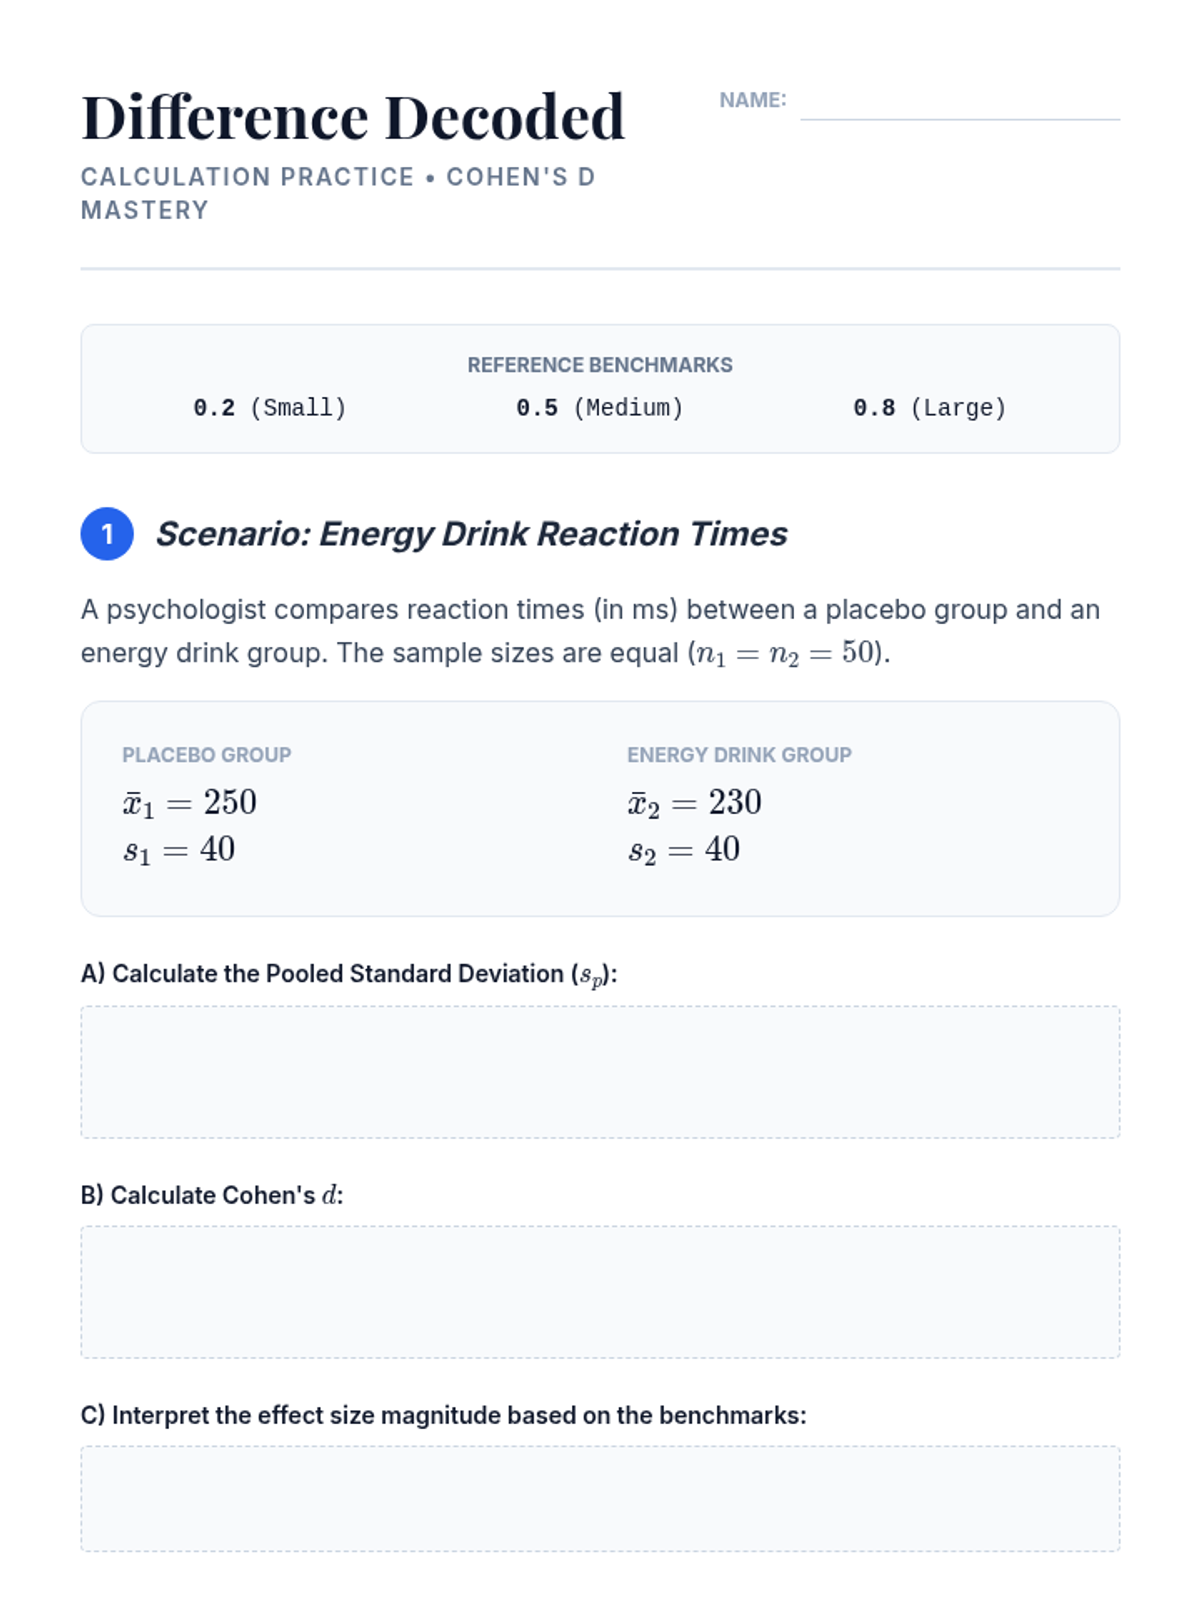
A practice worksheet for undergraduate students to calculate Cohen's d using both equal and unequal sample sizes. It includes interpretive questions to reinforce the concept of effect magnitude.
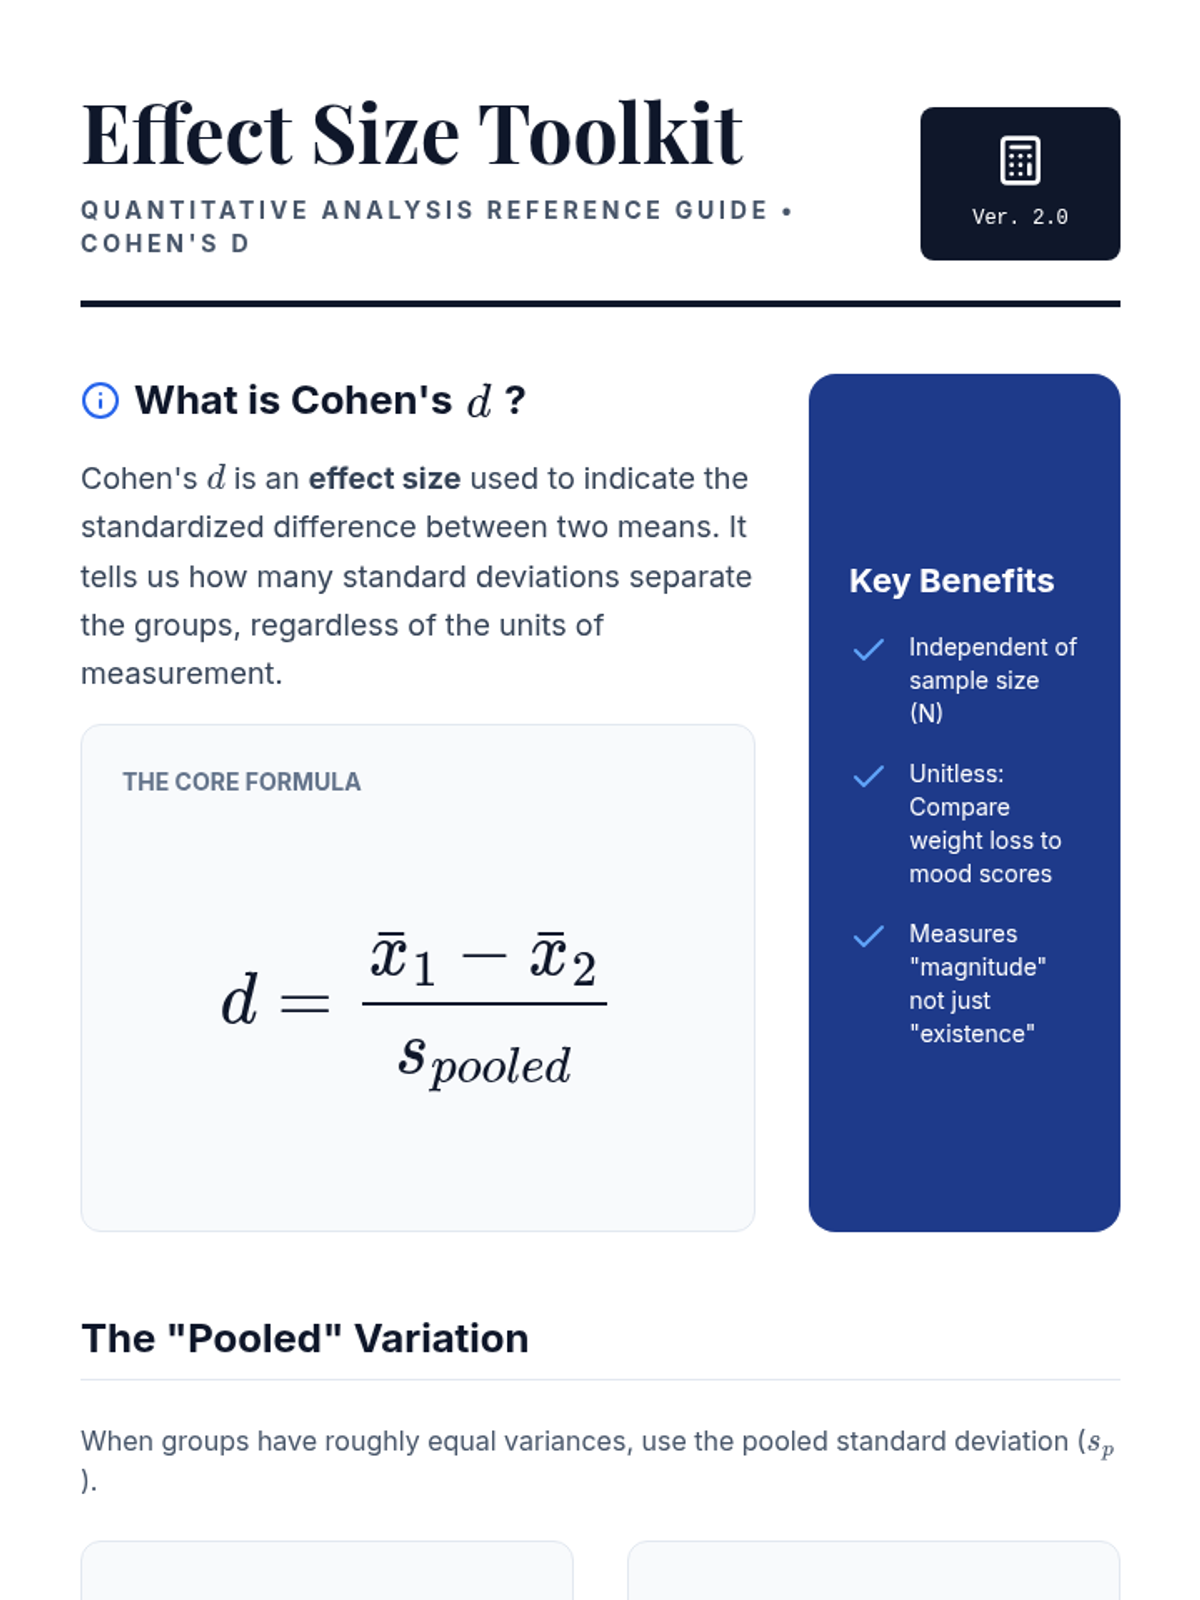
A comprehensive reference sheet for undergraduate students detailing the formulas for Cohen's d (including pooled standard deviation) and the standard benchmarks for interpreting effect magnitude.
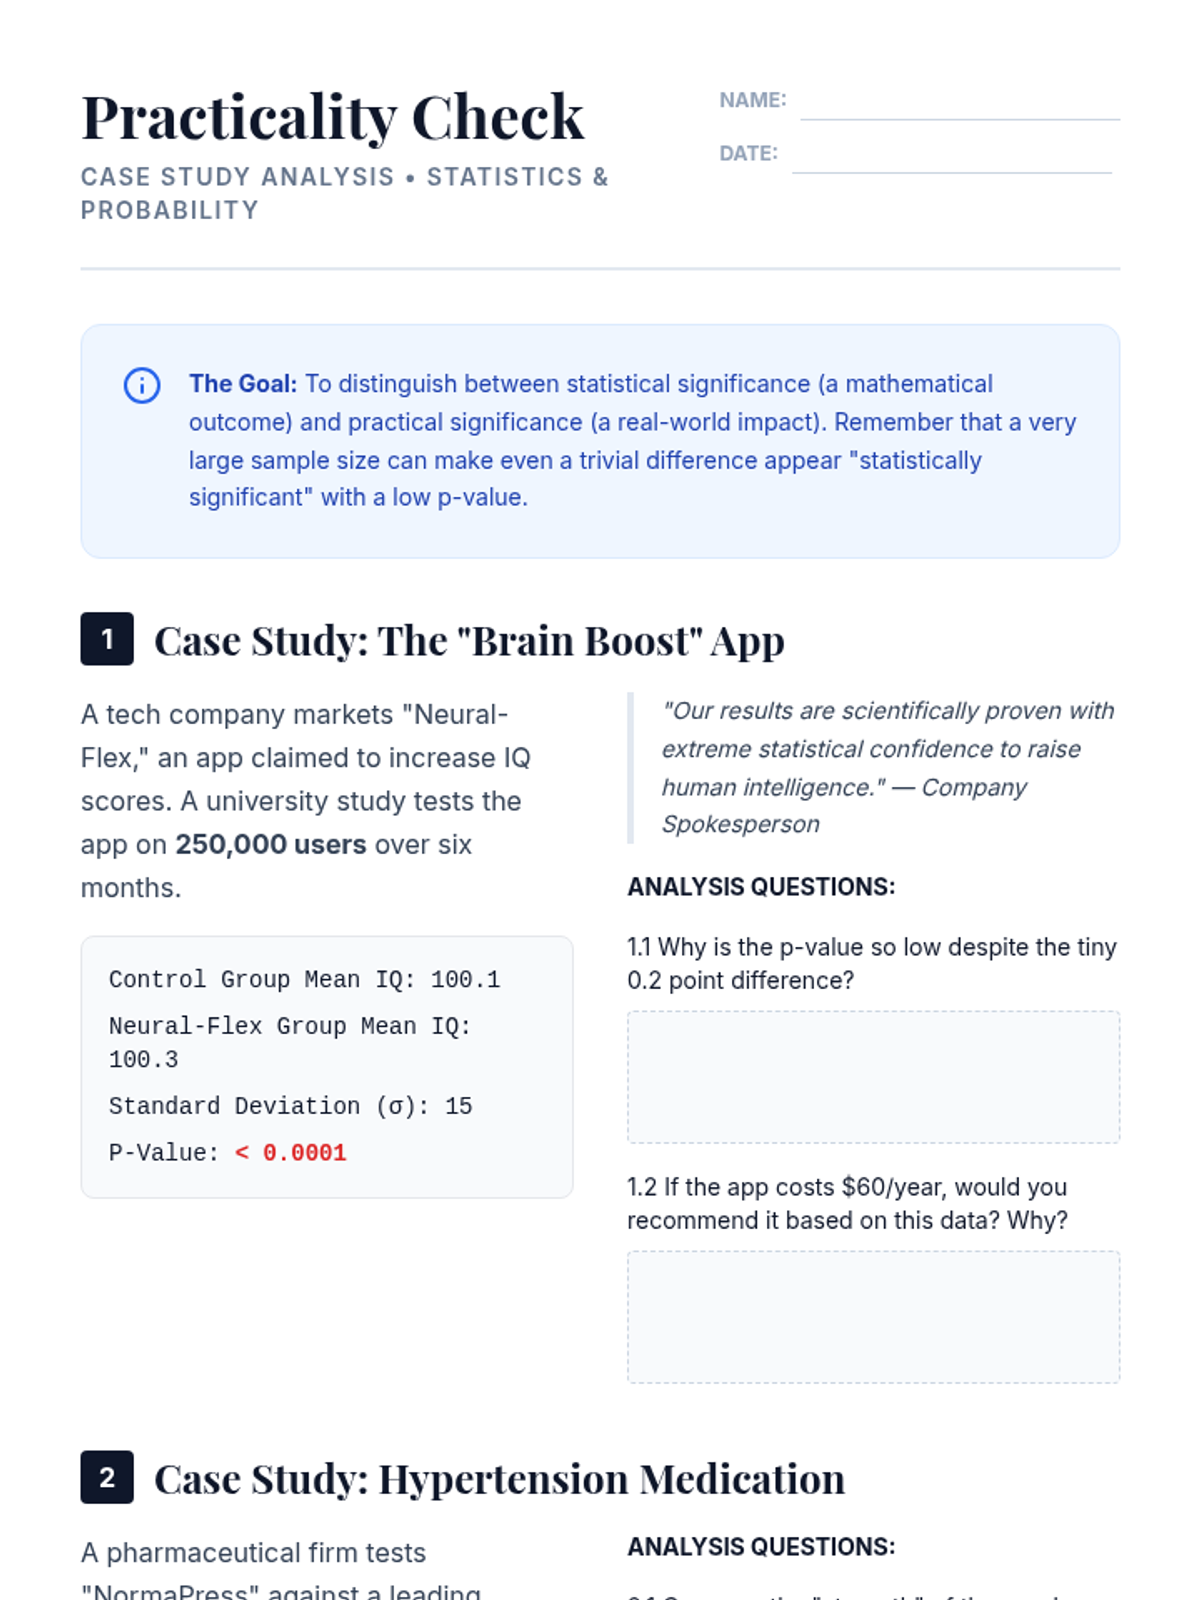
A case study worksheet for undergraduate students to practice distinguishing between statistical and practical significance. It features two scenarios (a technology app and a medical study) with varying sample sizes and p-values.
An introductory slide deck for undergraduate statistics students exploring the limitations of p-values in large datasets and the necessity of measuring effect size (Cohen's d). It visually distinguishes between statistical and practical significance using a real-world case study.
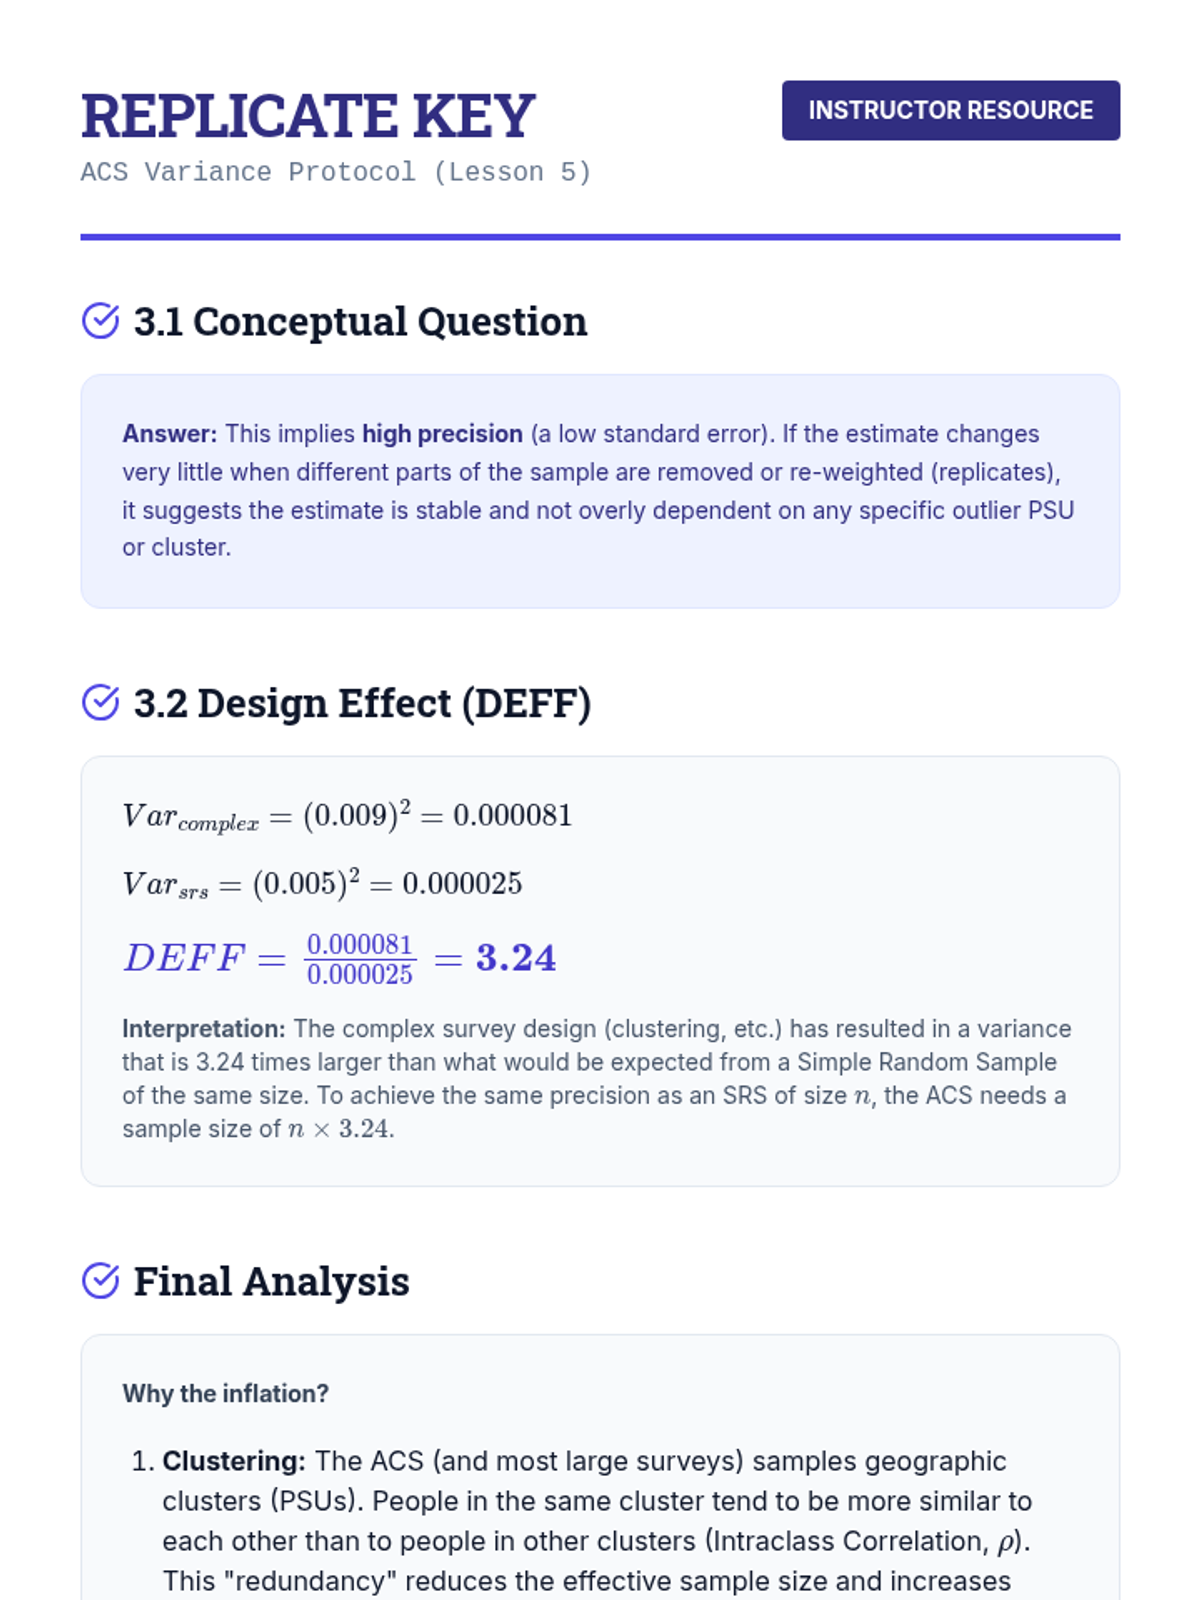
Instructor's answer key for the Replication Protocol activity, including Design Effect calculations and analysis of variance inflation in complex surveys.
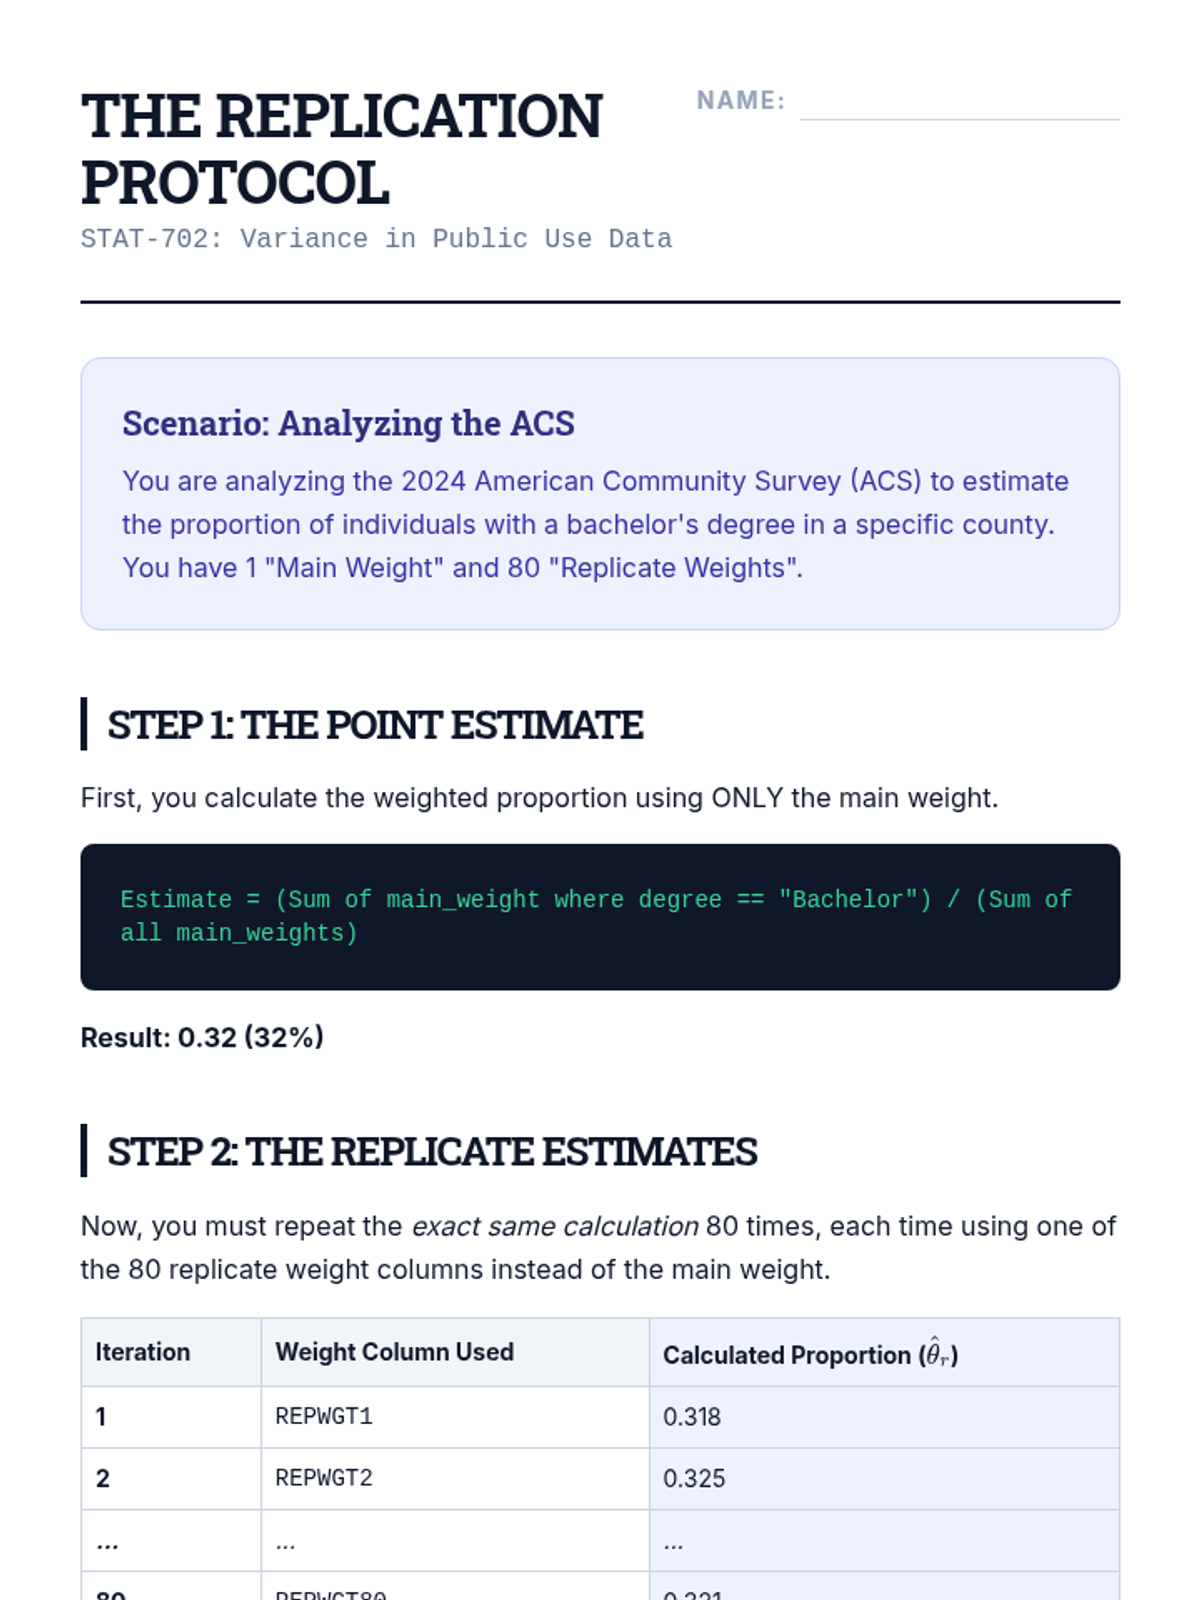
A technical guide for graduate students to practice implementing the replicate weights procedure for variance estimation using a hypothetical ACS dataset scenario.
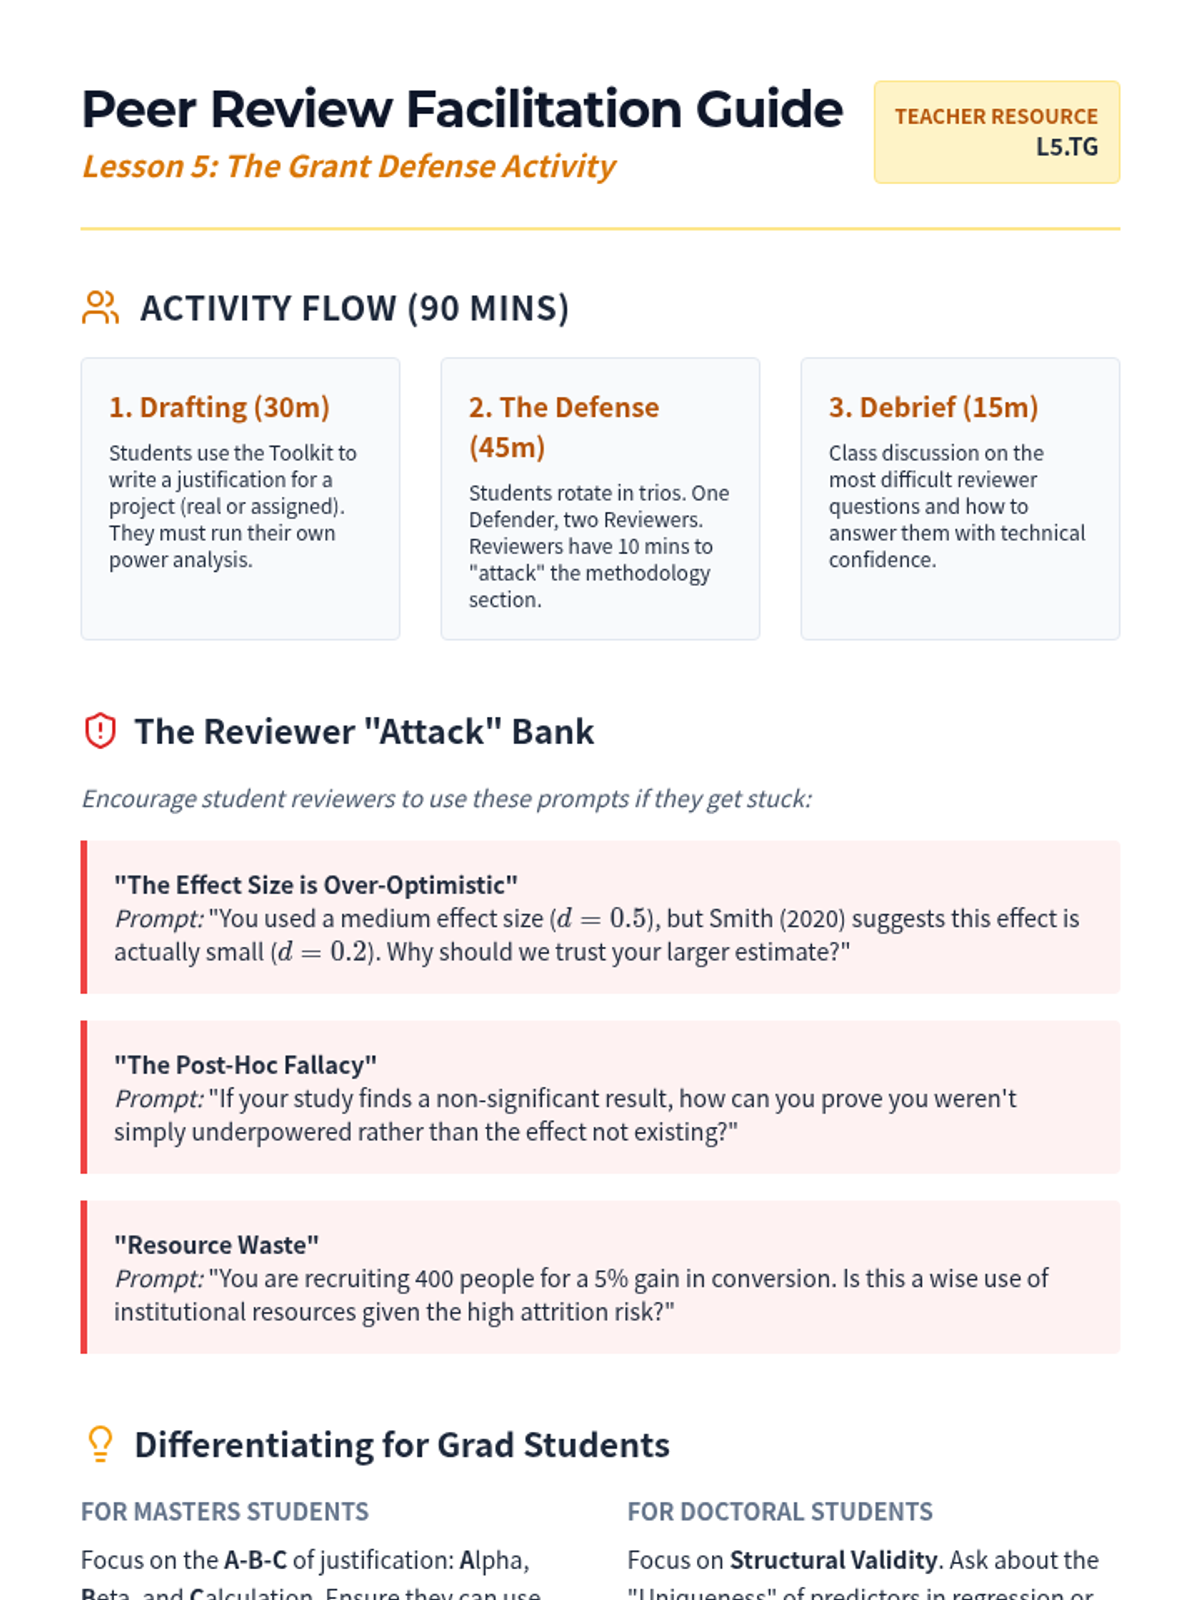
A facilitation guide for the Lesson 5 "Grant Defender" activity, featuring reviewer critique prompts, differentiation strategies, and an activity flow.
Graduate-level presentation slides covering the purpose and application of replicate weights (Jackknife, BRR) in complex survey variance estimation.
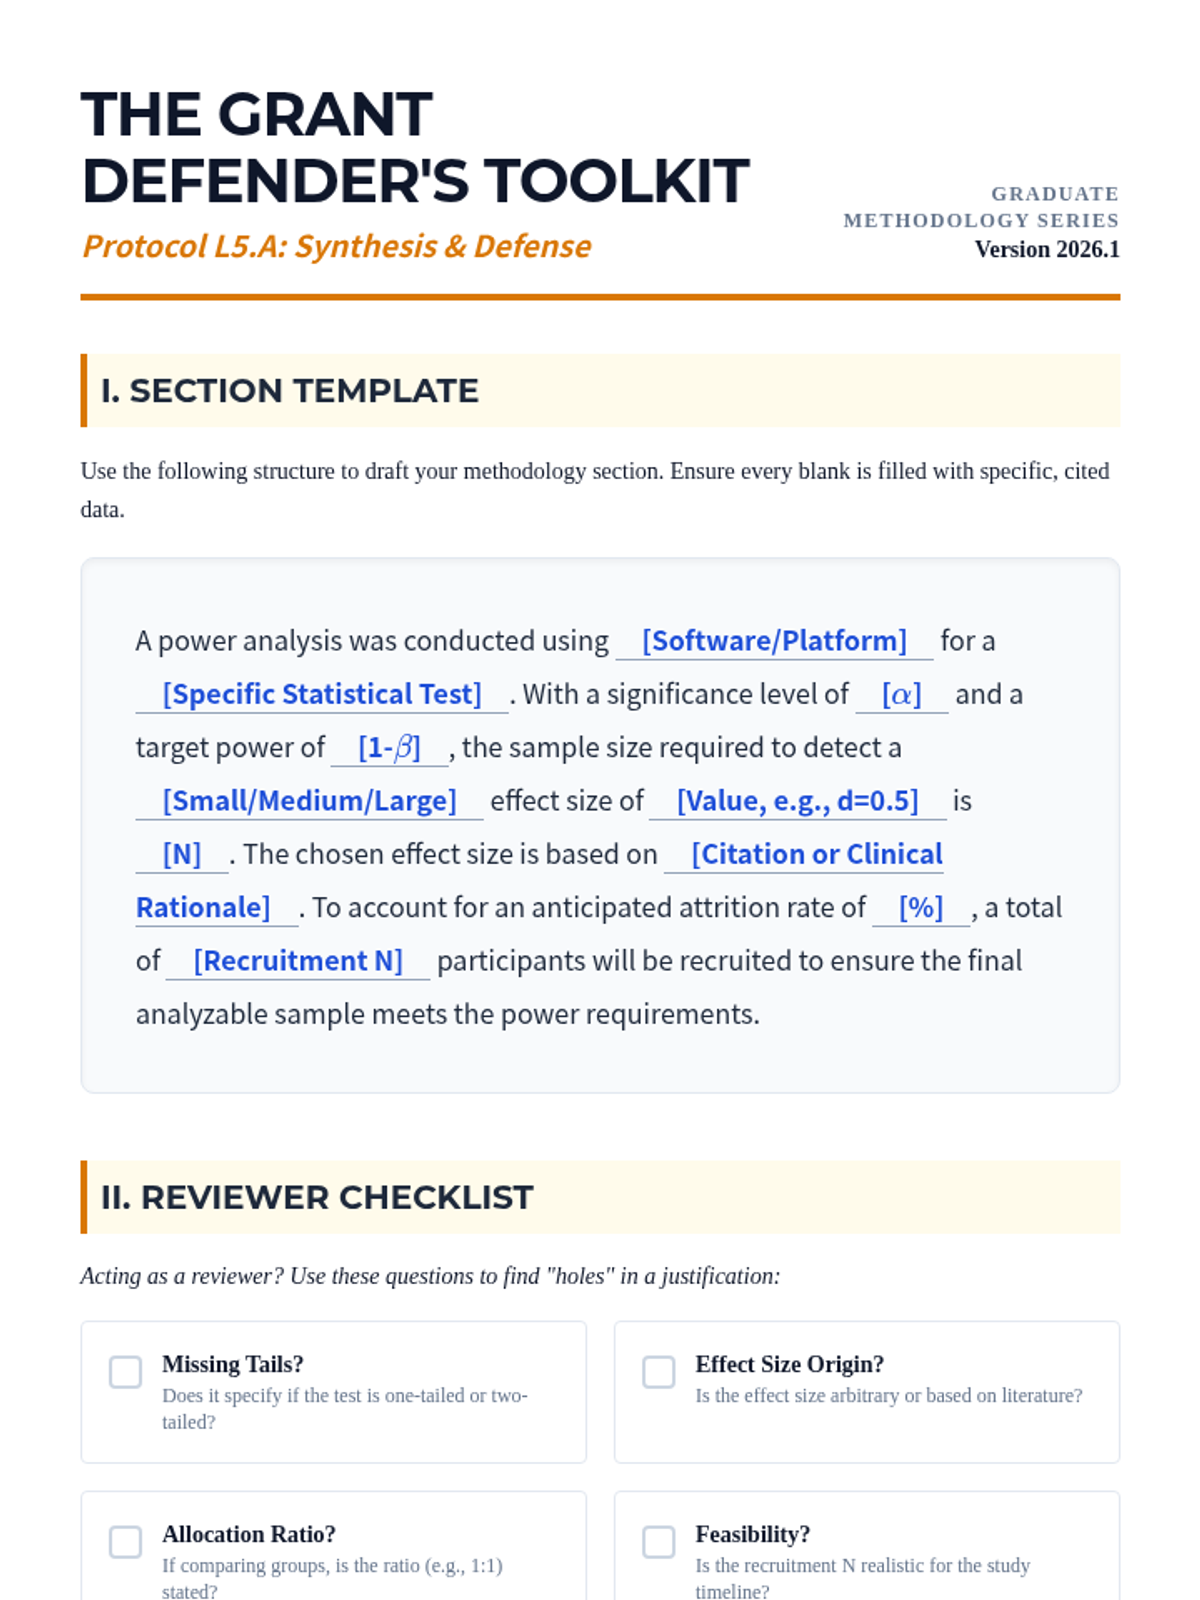
A comprehensive student toolkit for Lesson 5 including a justification paragraph template, reviewer checklist, and a peer defense rubric.
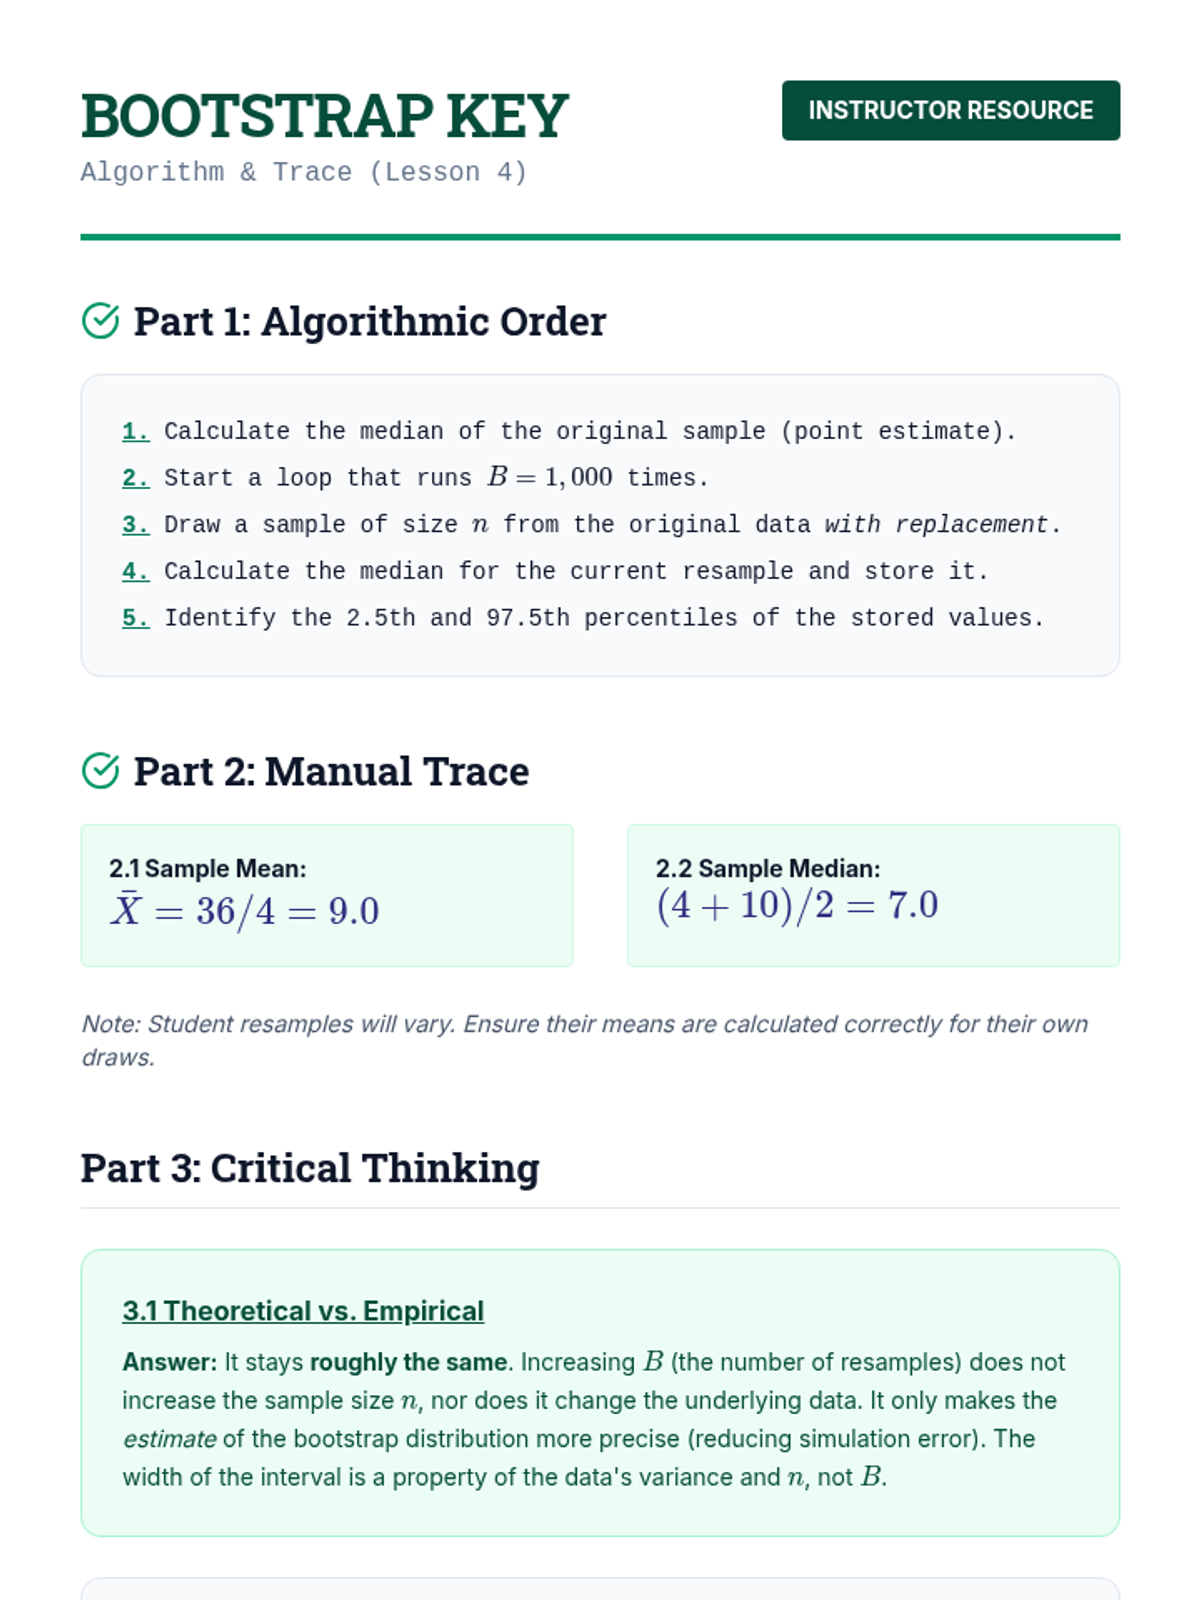
Instructor's answer key for the Bootstrap Builder worksheet, including algorithmic order, trace logic, and conceptual explanations.
Instructional slide deck for Lesson 5 on drafting and defending a sample size justification, including the core components of a professional methodology section and accounting for attrition.
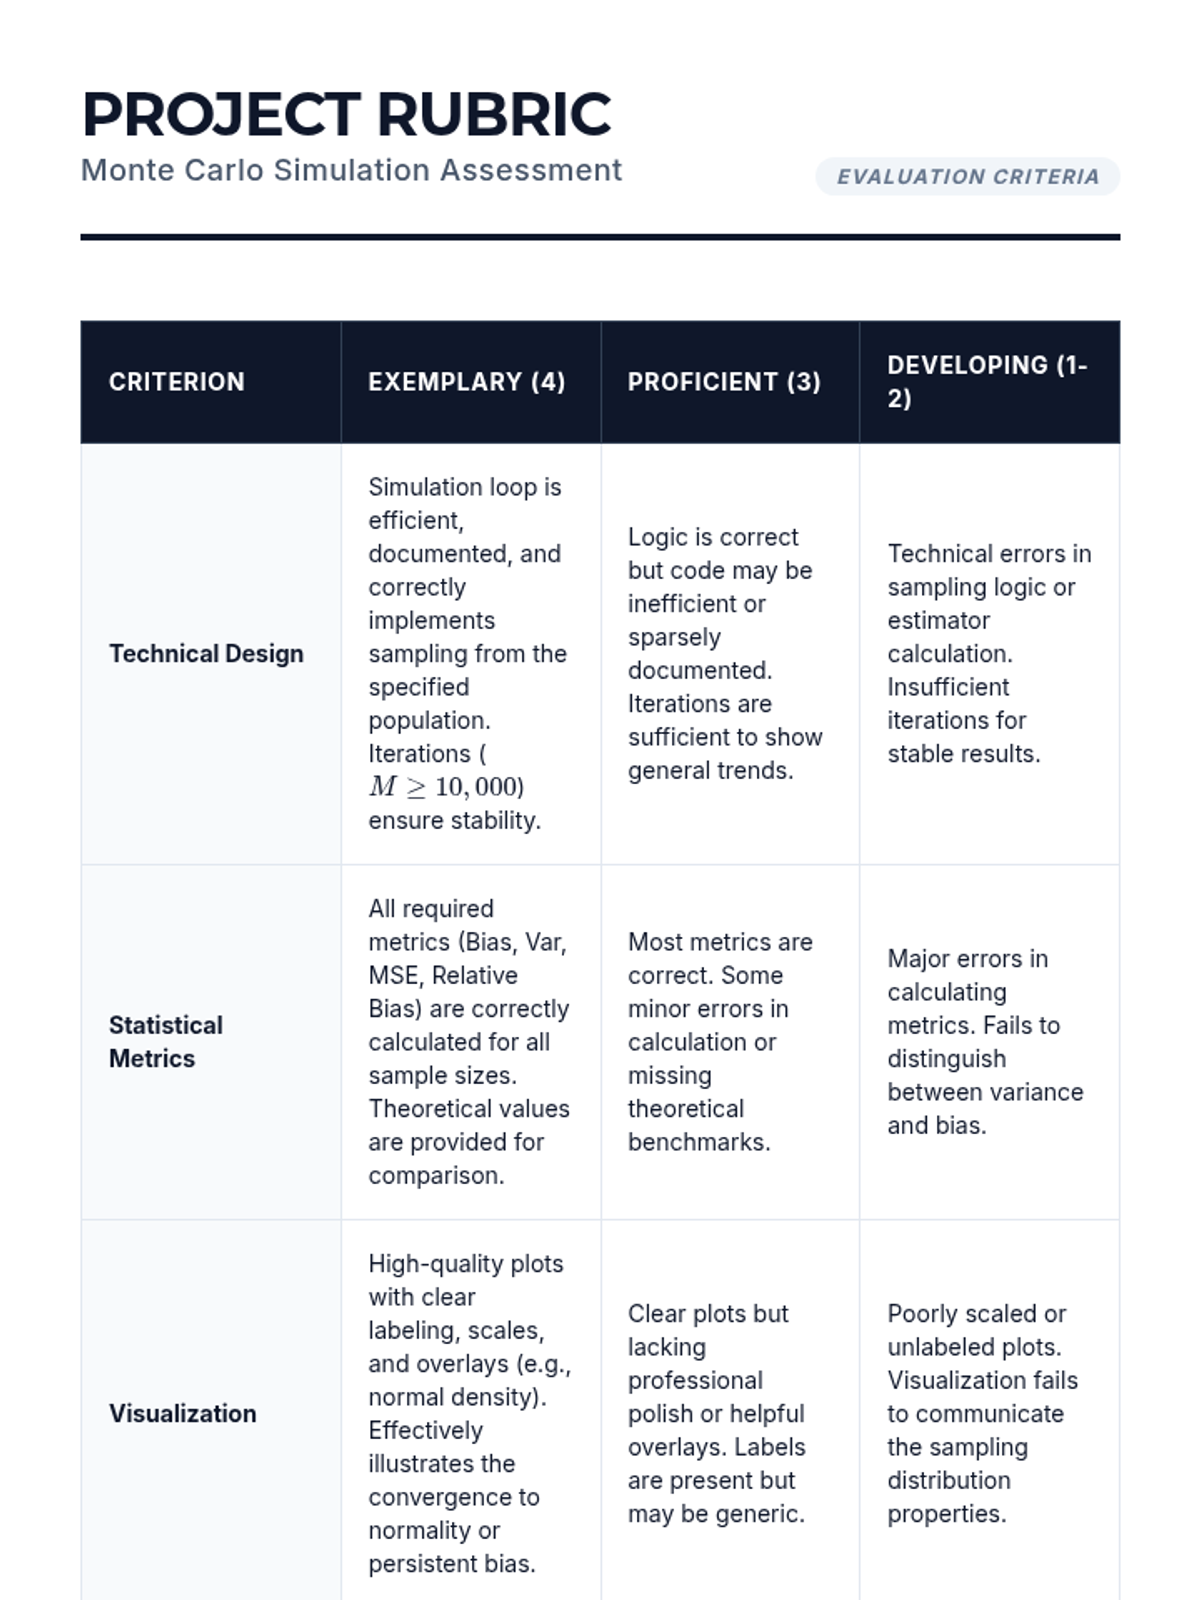
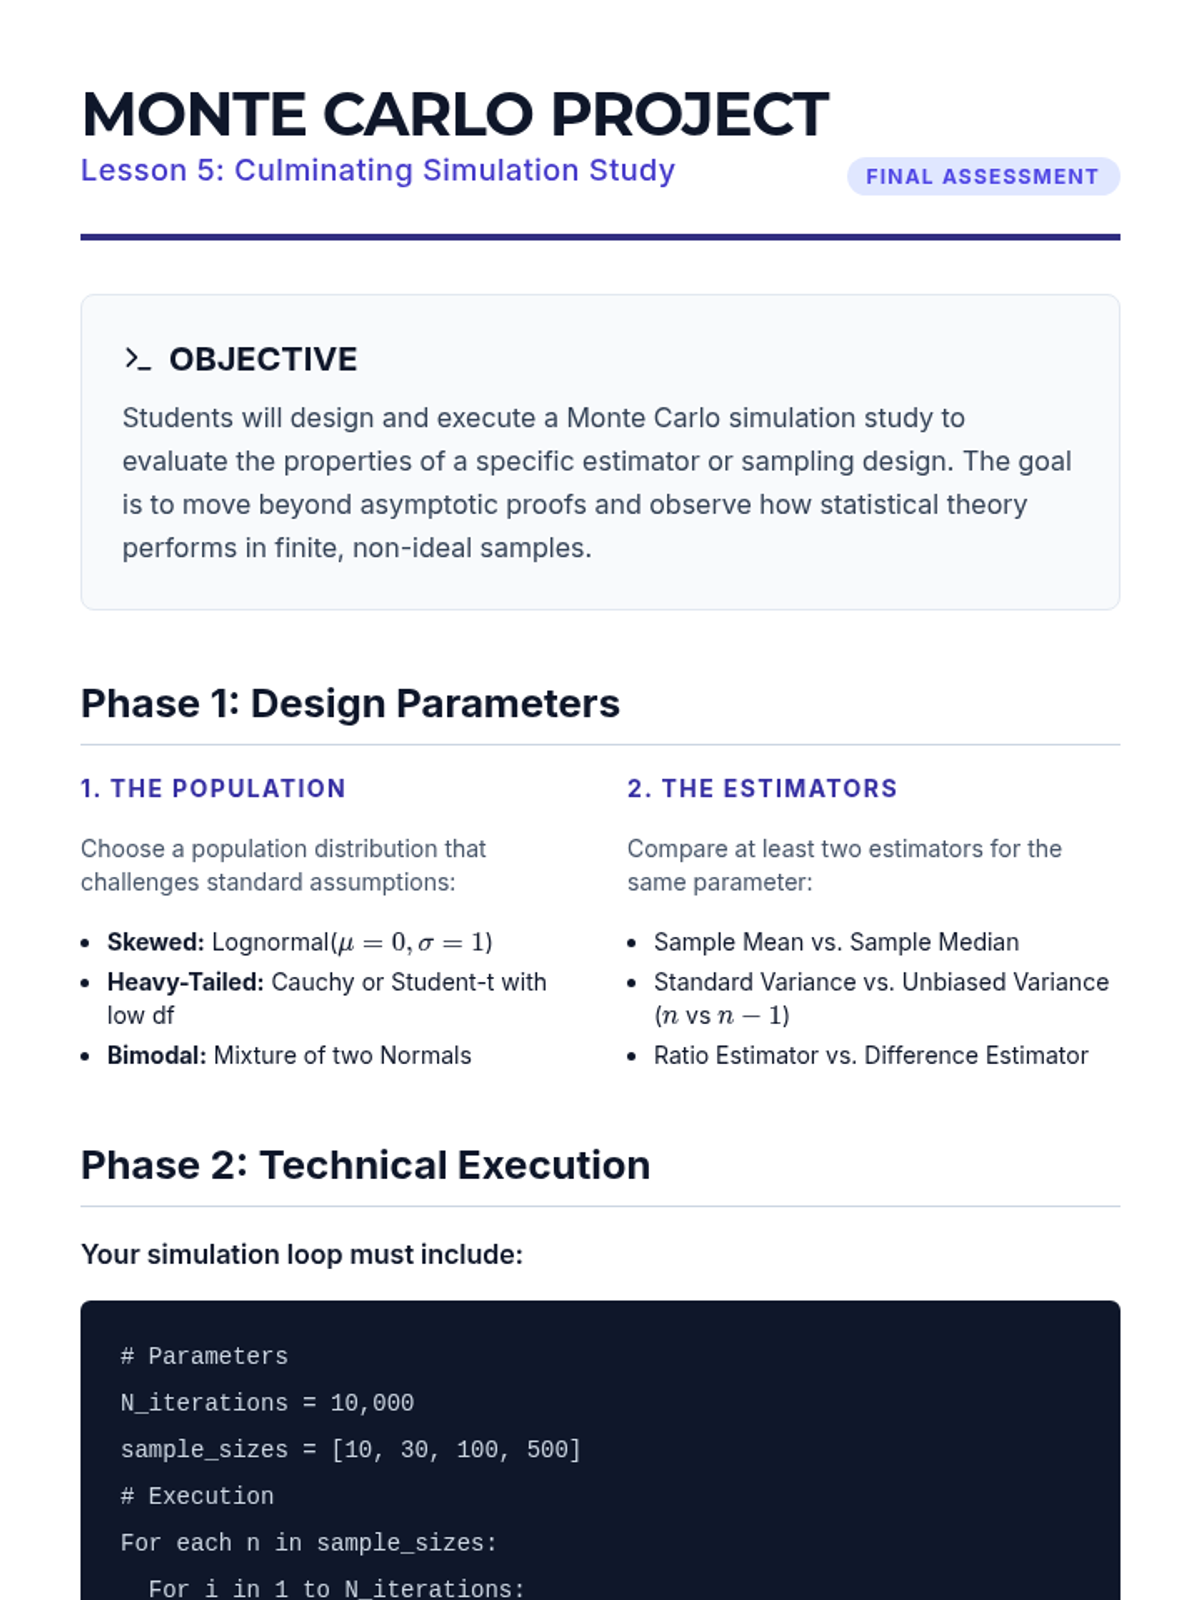
Assessment rubric for the Lesson 5 Monte Carlo simulation project, evaluating technical execution, statistical accuracy, visualization, and theoretical synthesis.
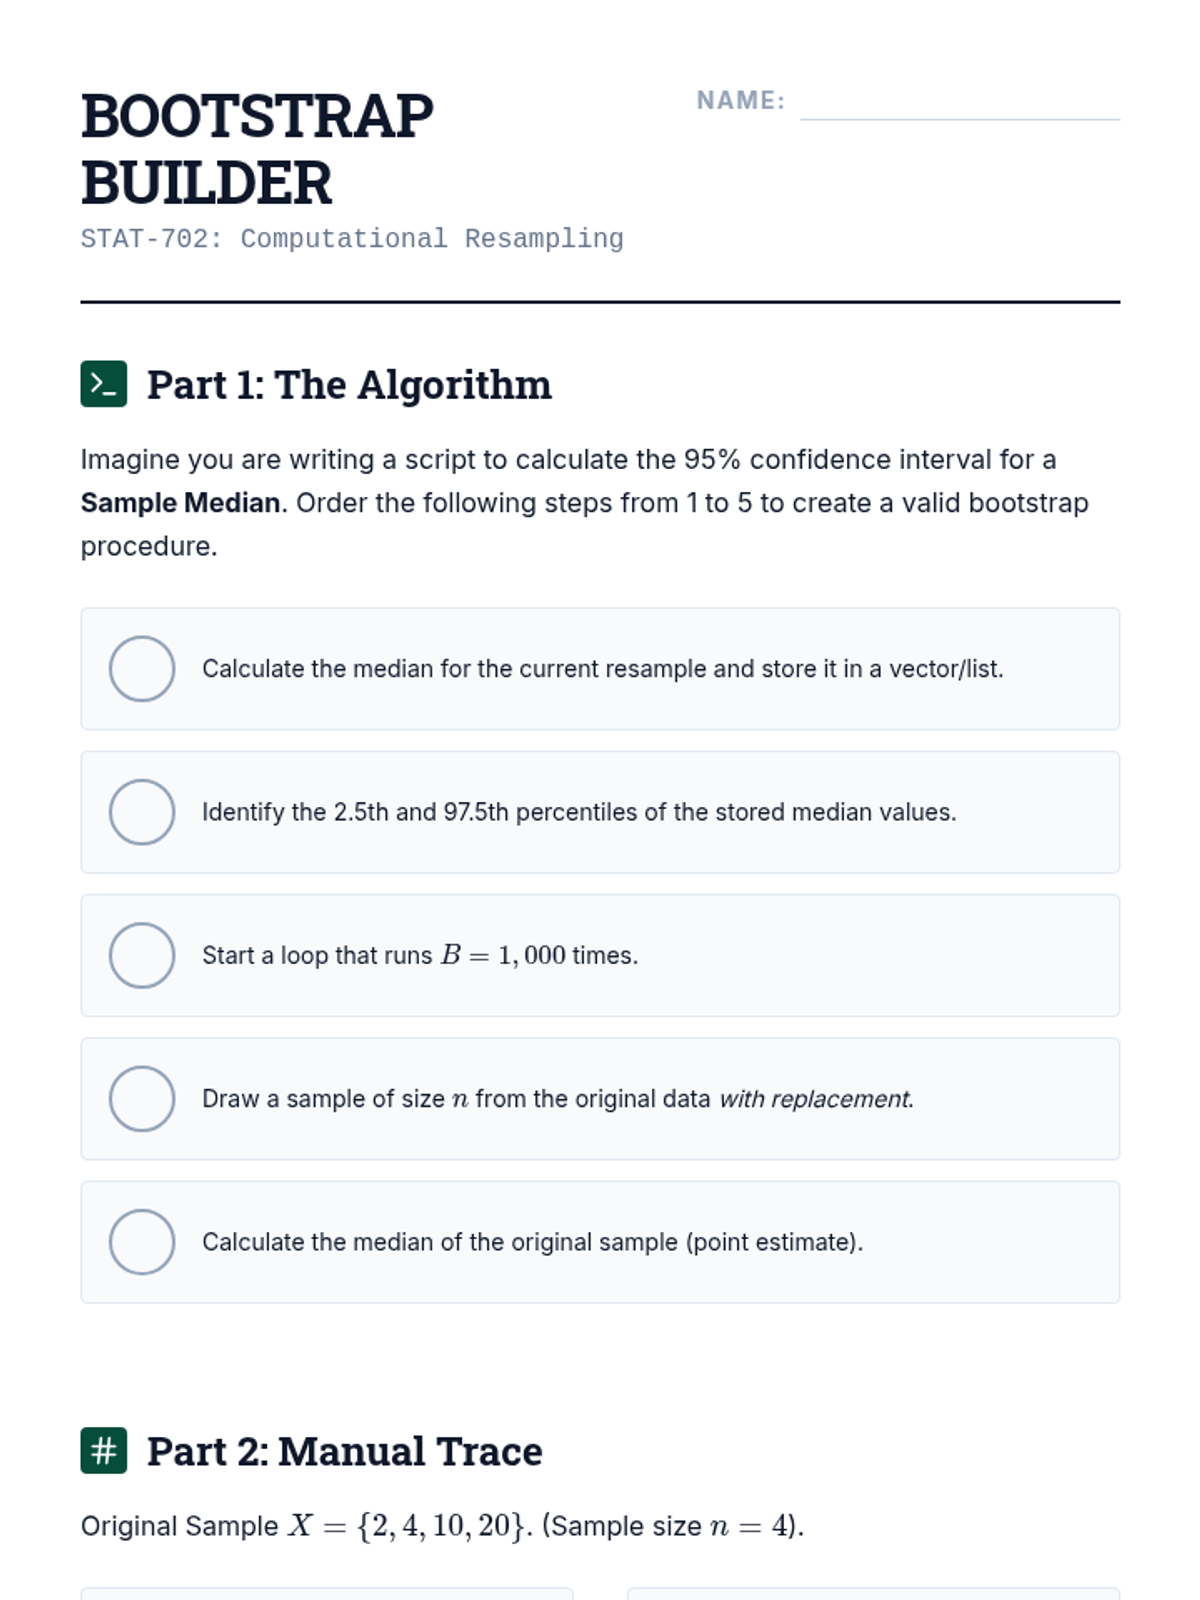
A step-by-step logic builder for implementing the Bootstrap method, including a manual trace exercise and theoretical reflection questions.
Project-based guide for Lesson 5, outlining the technical requirements, required metrics, and structure for the Monte Carlo simulation study.
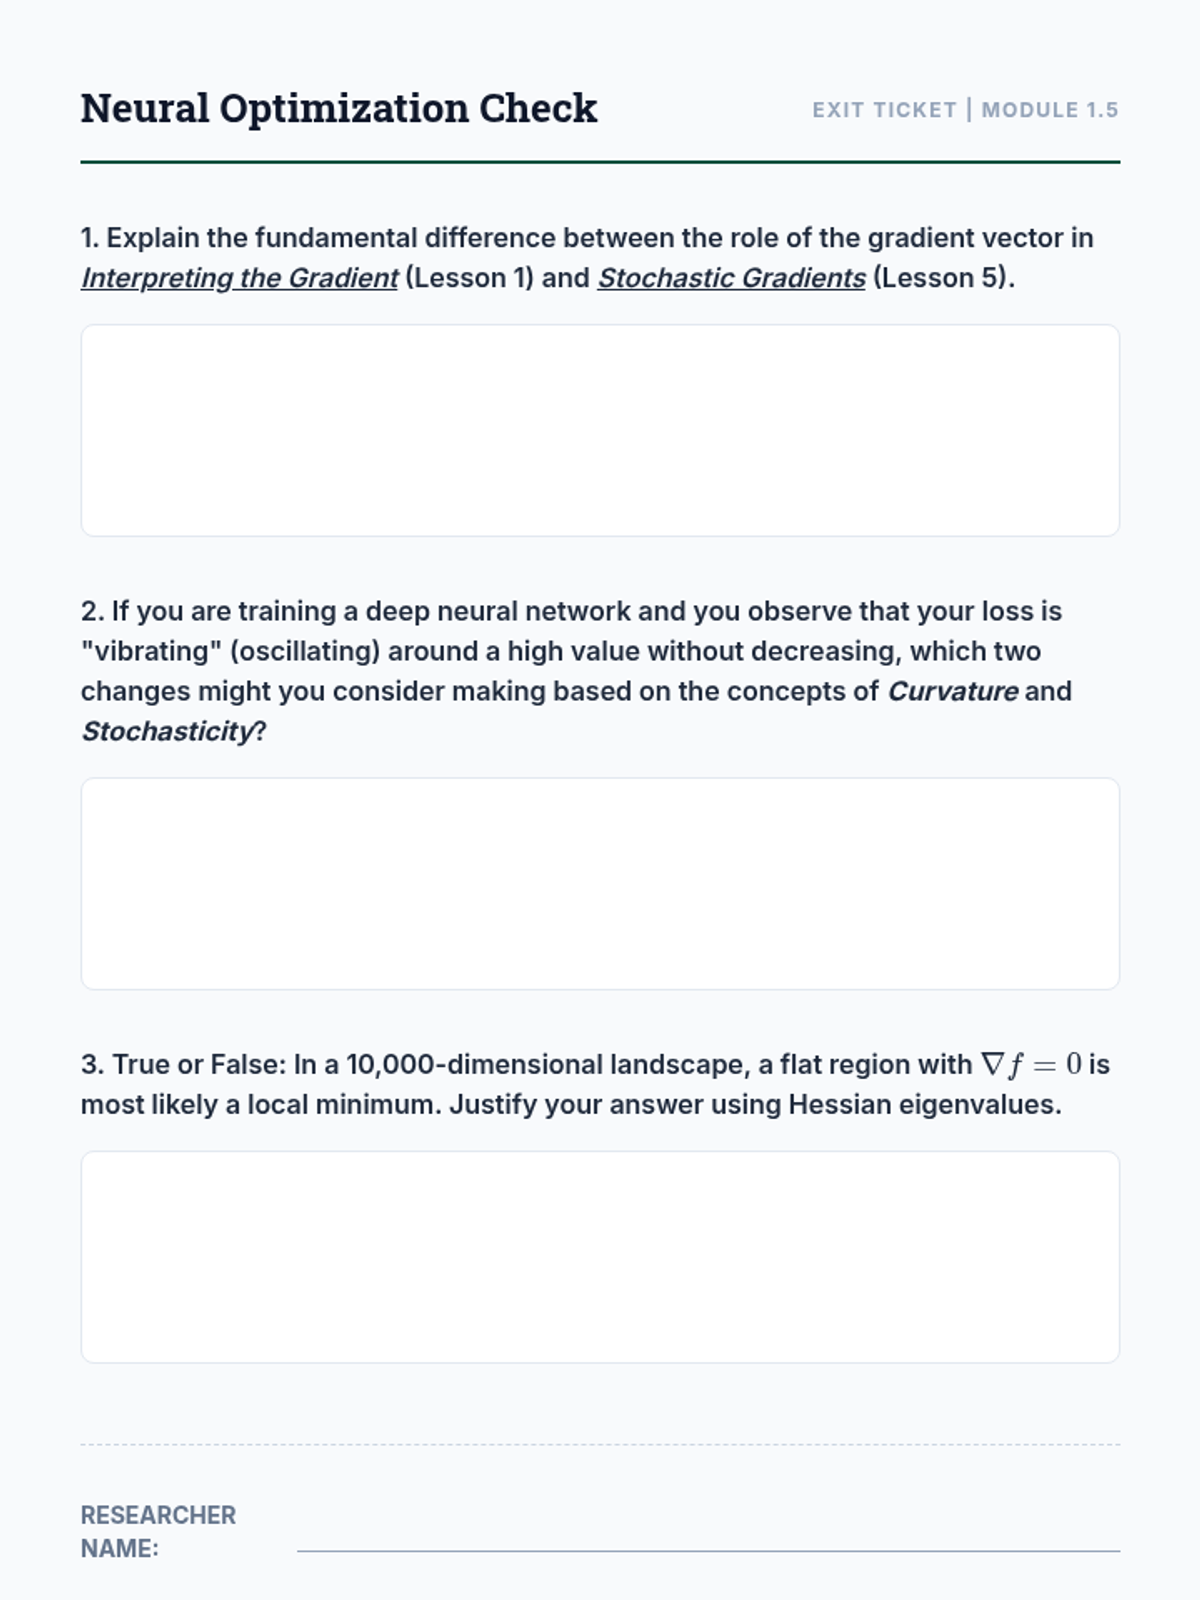
A conceptual exit ticket for graduate students to synthesize their learning across the entire sequence, focusing on the differences between analytical and stochastic optimization and the geometry of high-dimensional landscapes.
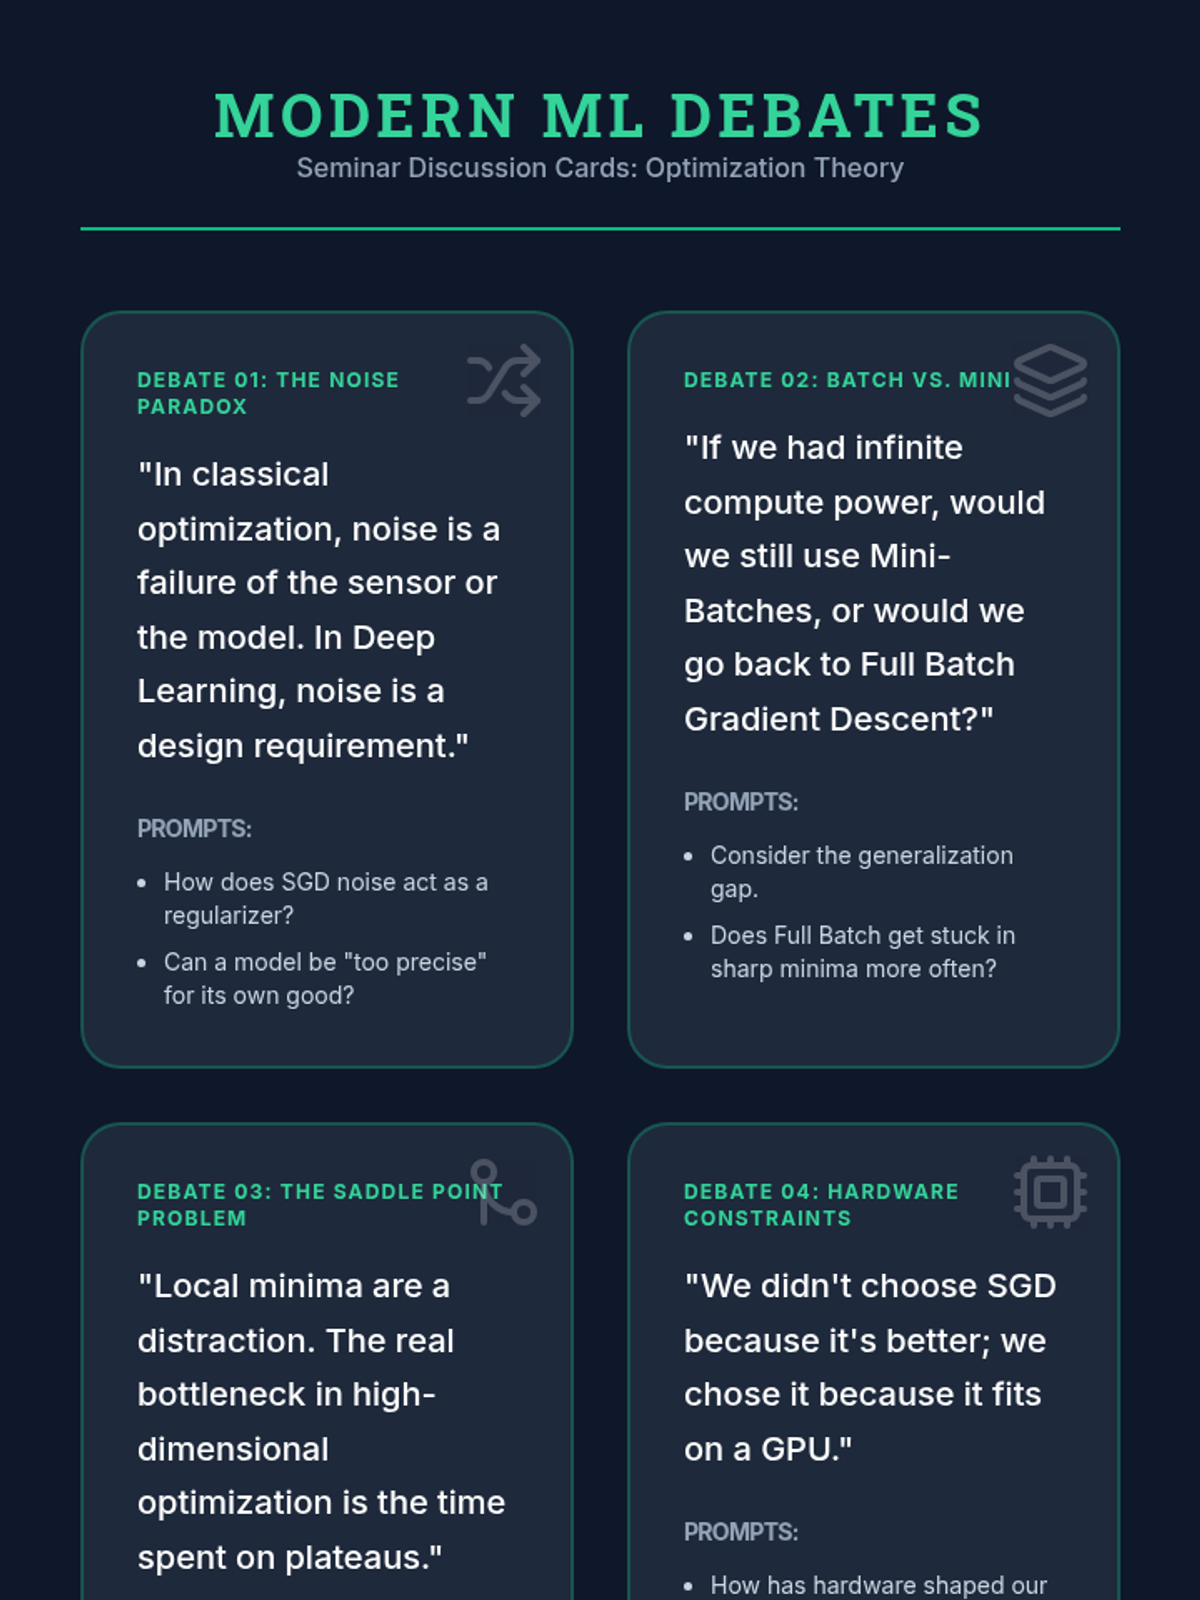
Seminar-style discussion cards for graduate students to explore the nuances of Stochastic Gradient Descent, the role of noise, and the geometric challenges of high-dimensional optimization.
A slide deck exploring Stochastic Gradient Descent (SGD) and its role in navigating high-dimensional, non-convex landscapes in machine learning. Covers mini-batching, noise, and convergence.
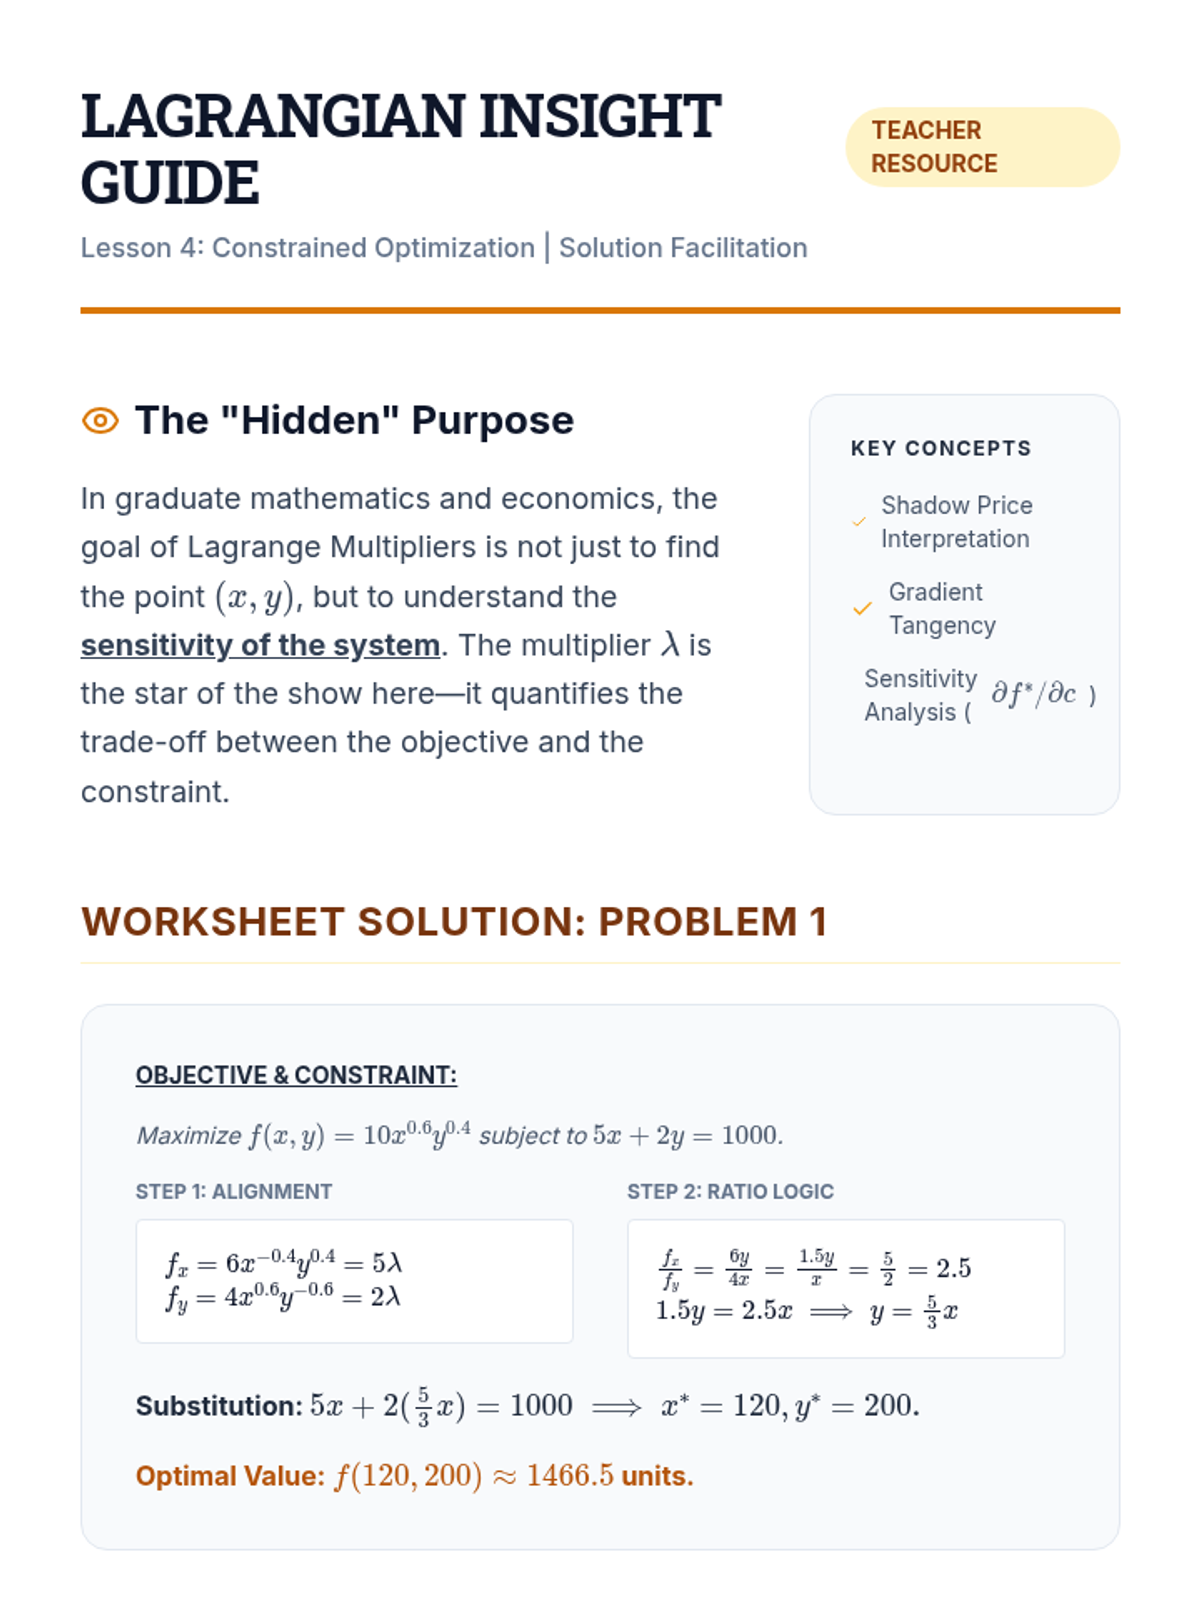
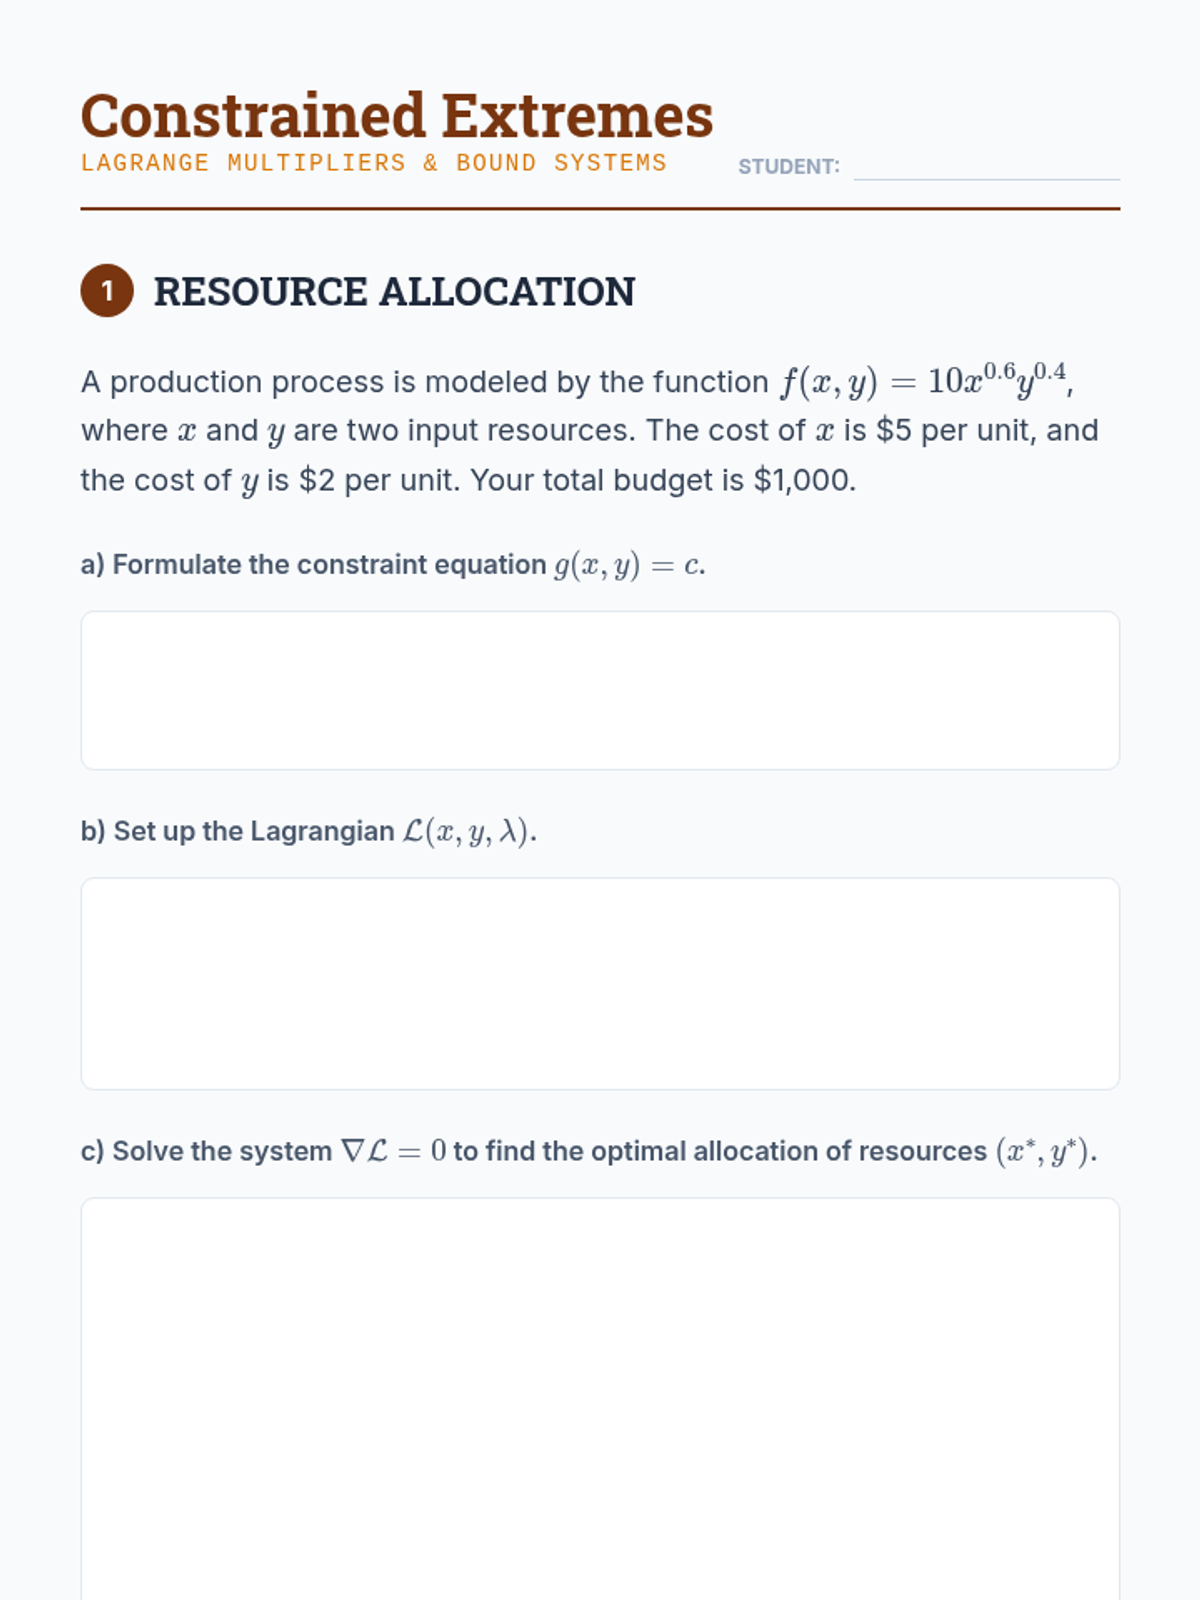
A teacher-facing guide for the lesson on Lagrange multipliers, including instructional goals, full solutions for the resource allocation problem, and notes on the interpretation of shadow prices.
A student worksheet for practicing constrained optimization using the method of Lagrange multipliers. Features a Cobb-Douglas production problem and questions on the interpretation of the multiplier.
A slide deck explaining constrained optimization using Lagrange multipliers. Covers the geometric interpretation of aligned gradients, the Lagrangian function, and the meaning of the multiplier lambda.
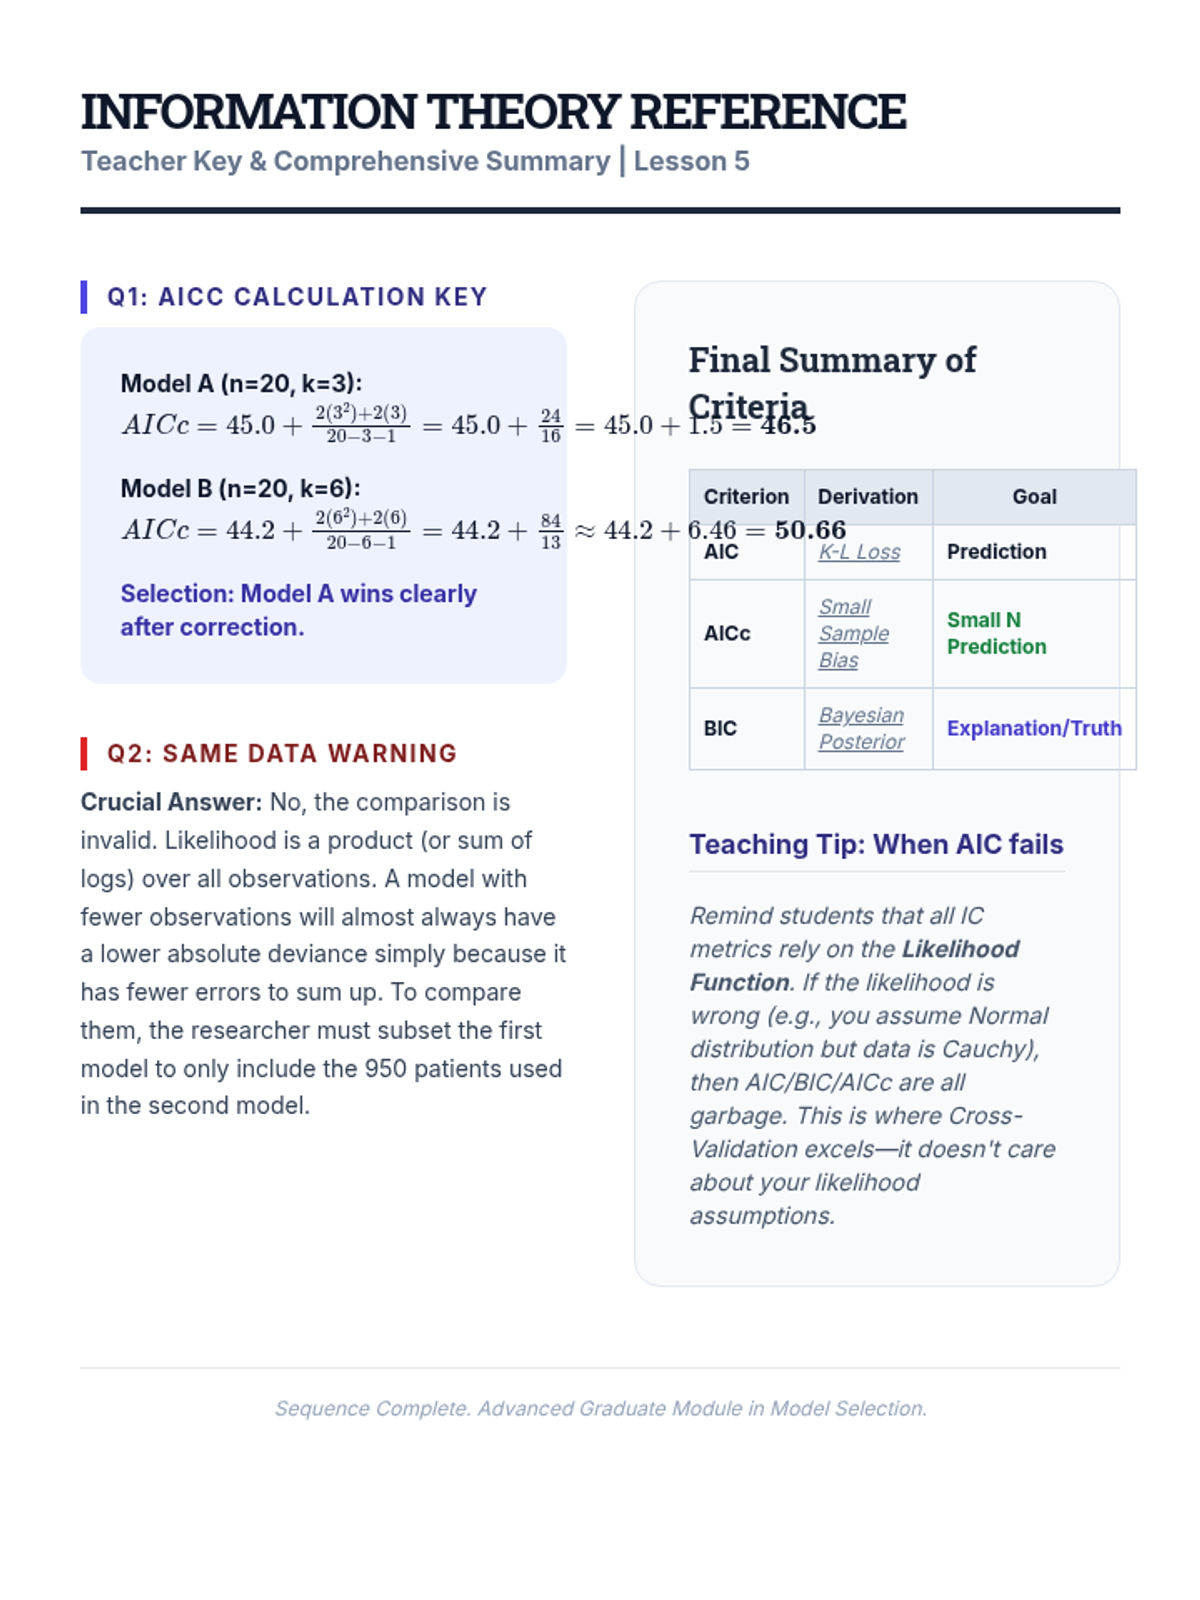
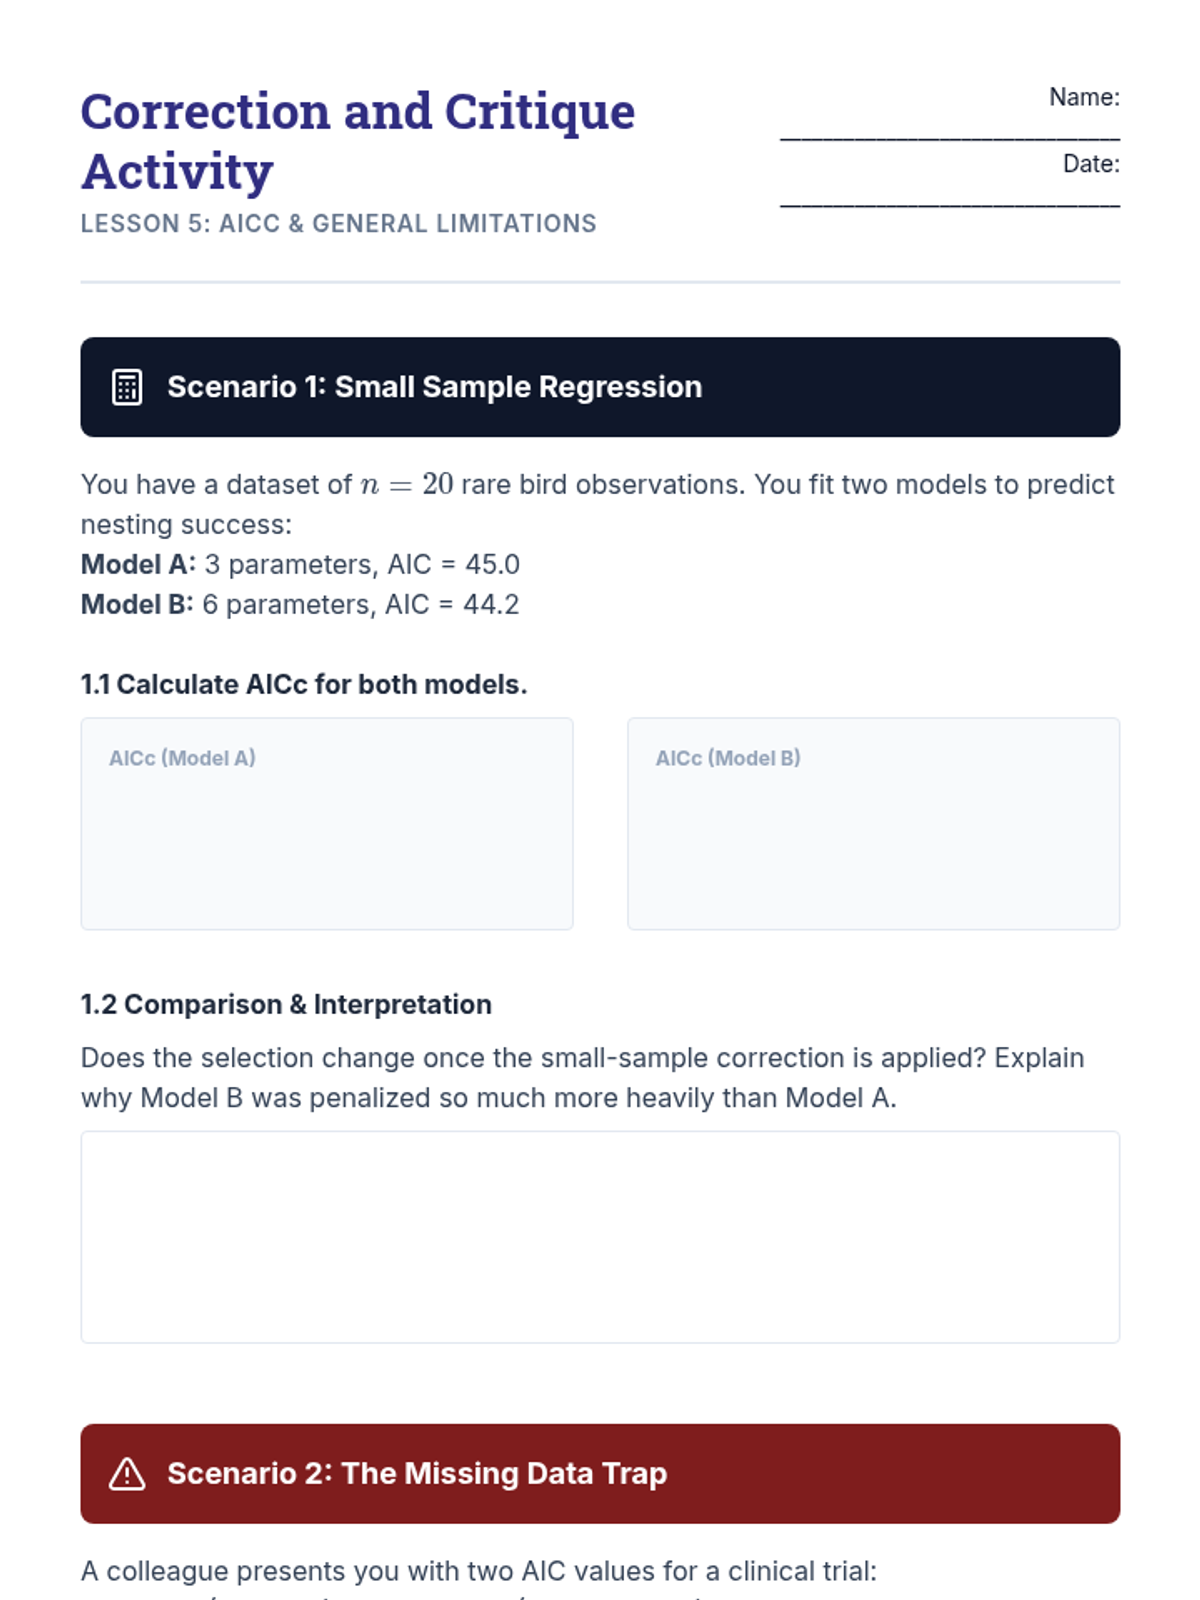
Teacher answer key and instructional guide for the small-sample challenge, providing the corrected AIC formulas and philosophical context.
The sequence concludes by addressing small-sample bias in AIC with the AICc correction and discussing the general limitations of information criteria compared to cross-validation.
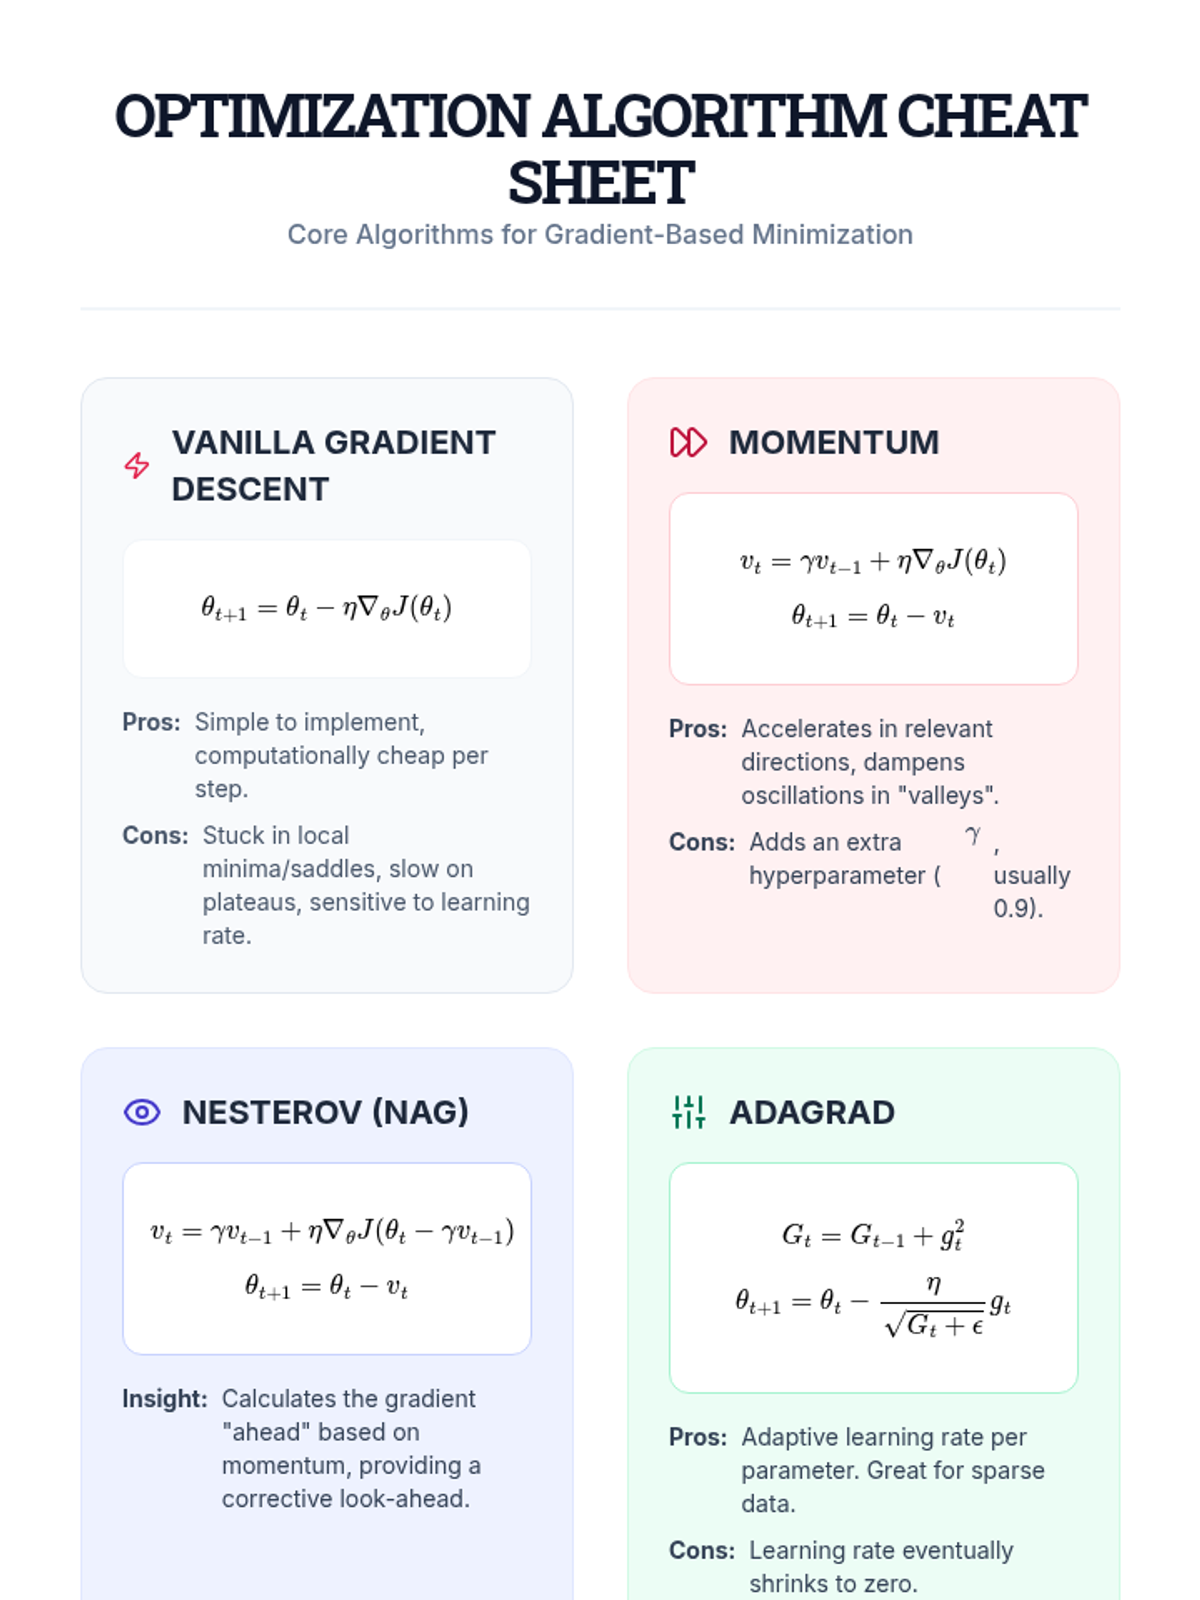
A comprehensive reference sheet for graduate students summarizing key optimization algorithms, including Vanilla Gradient Descent, Momentum, Nesterov Accelerated Gradient, and AdaGrad. Includes a troubleshooting table for common convergence issues.
A slide deck introducing the corrected AIC (AICc) for small samples and discussing the philosophical differences between information criteria and cross-validation.
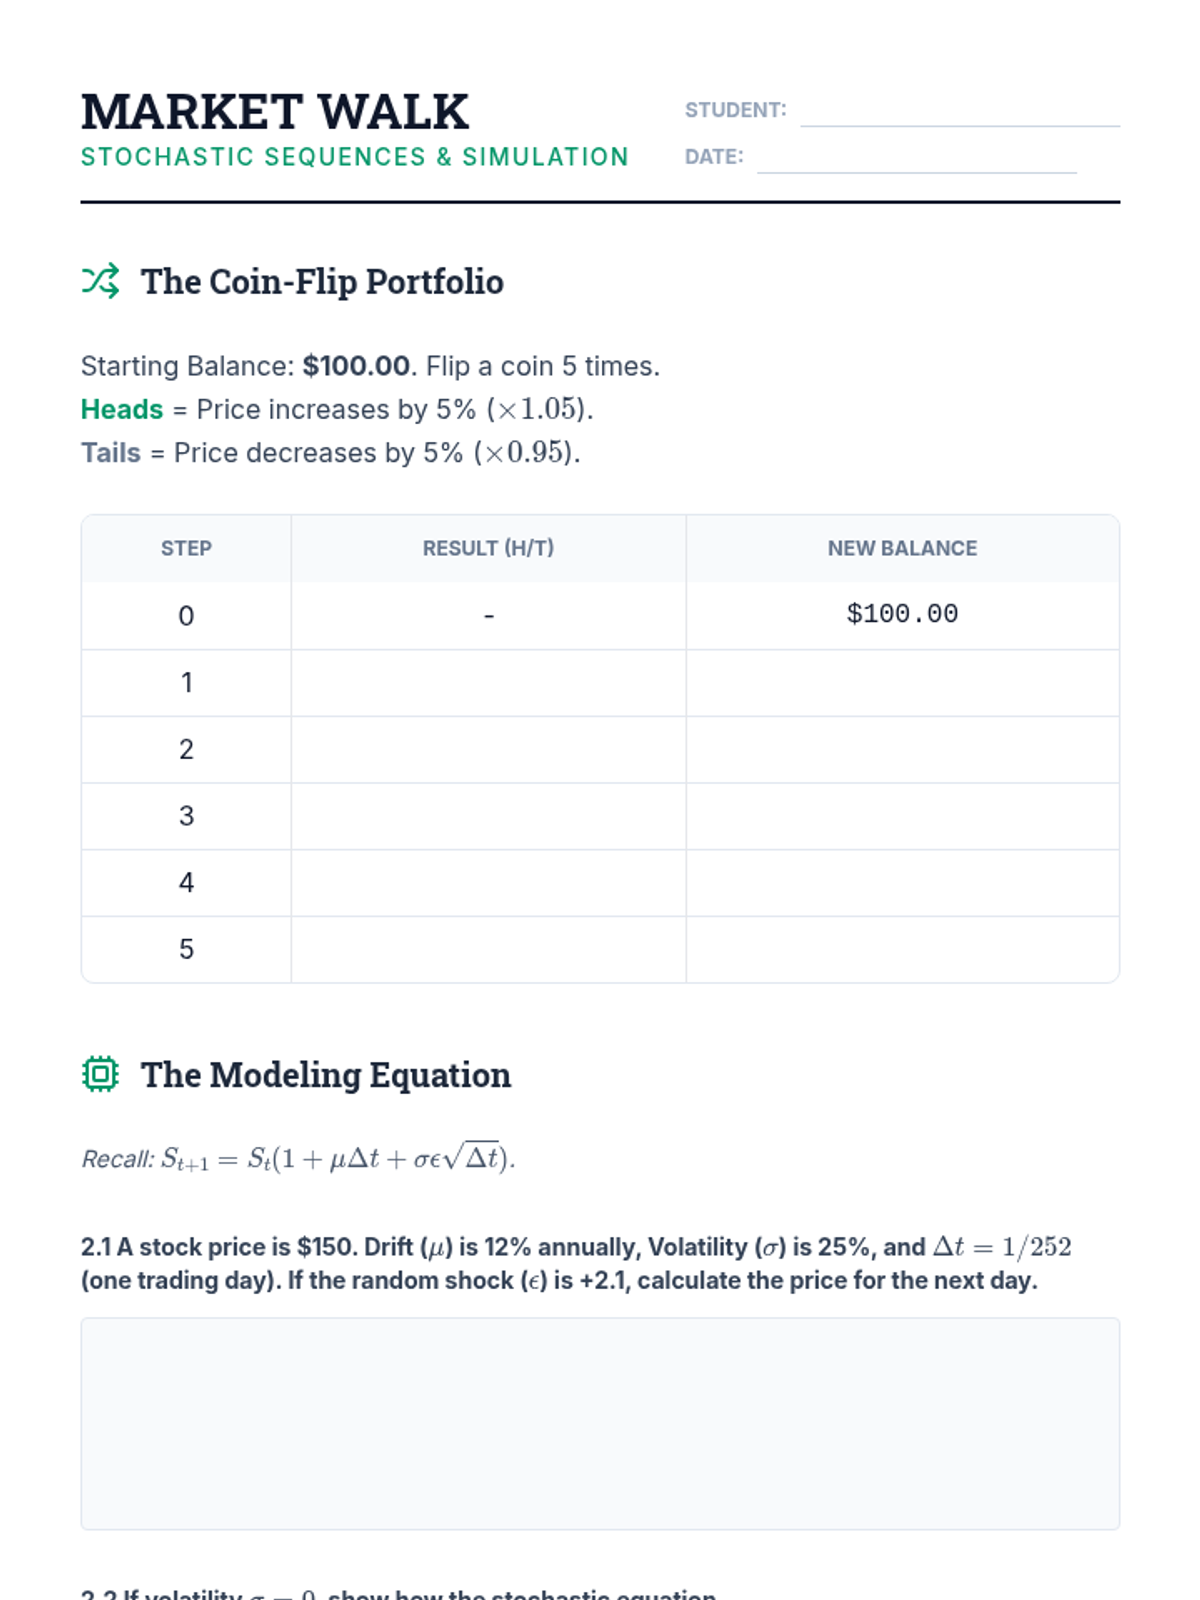
Student worksheet for Lesson 5, focusing on manual random walk simulations and the mathematical application of the stochastic price equation.
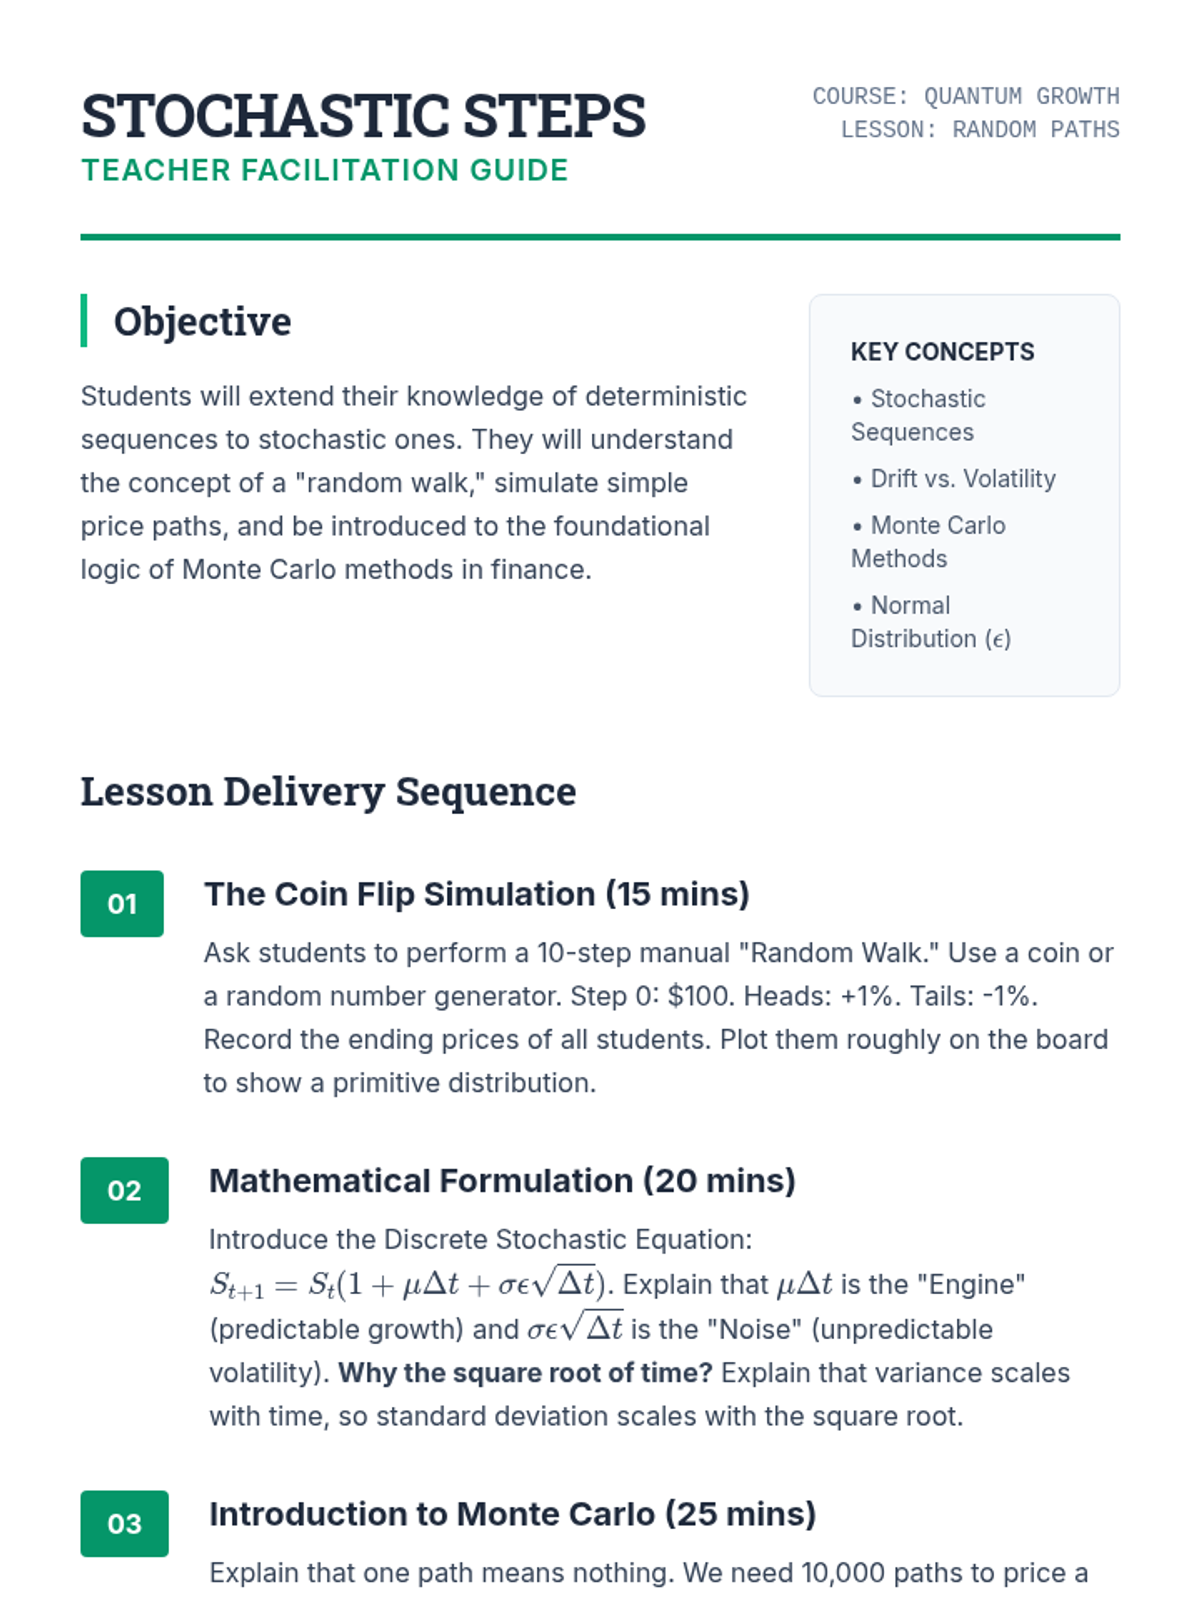
Teacher facilitation guide for Lesson 5, detailing the introduction to stochastic sequences, the drift/volatility model, and the concept of Monte Carlo simulations.
Slide deck for Lesson 5 introducing stochastic sequences, simulations of random walks, and their application to stock price modeling.
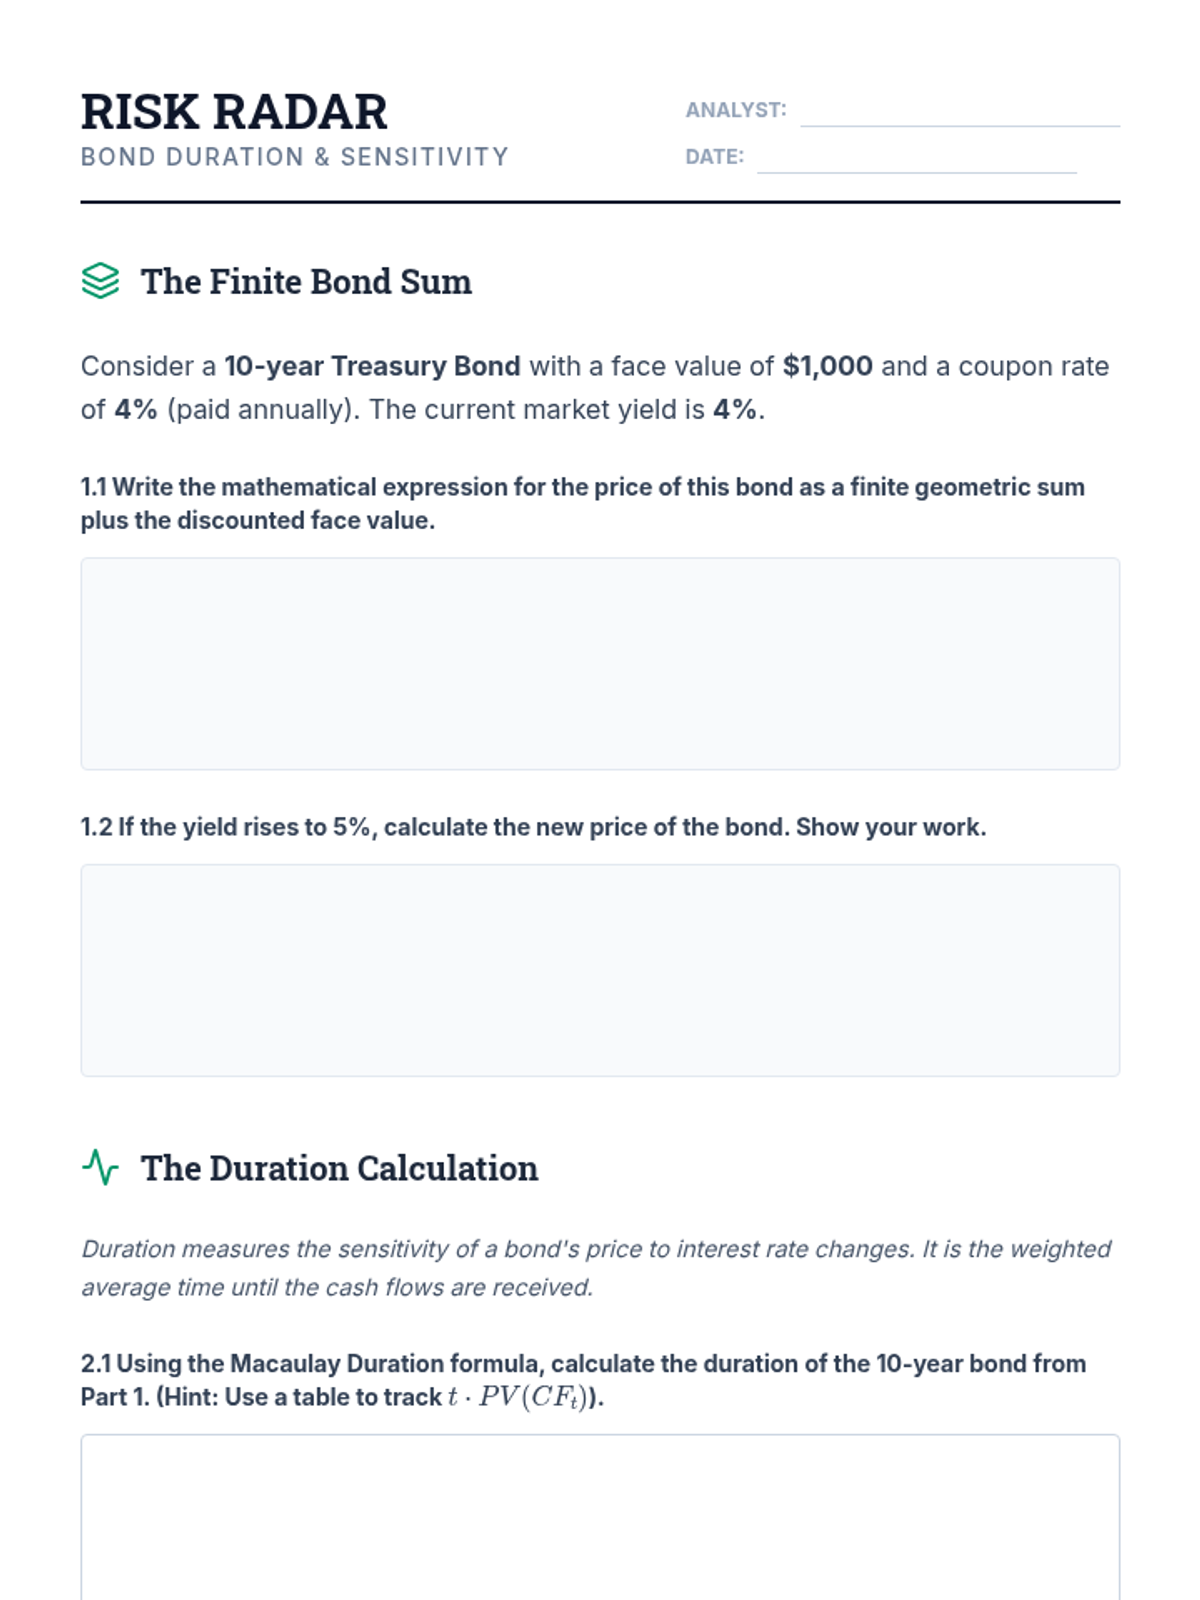
Student worksheet for Lesson 4, covering bond price calculations and the derivation of Macaulay and Modified duration to assess interest rate sensitivity.
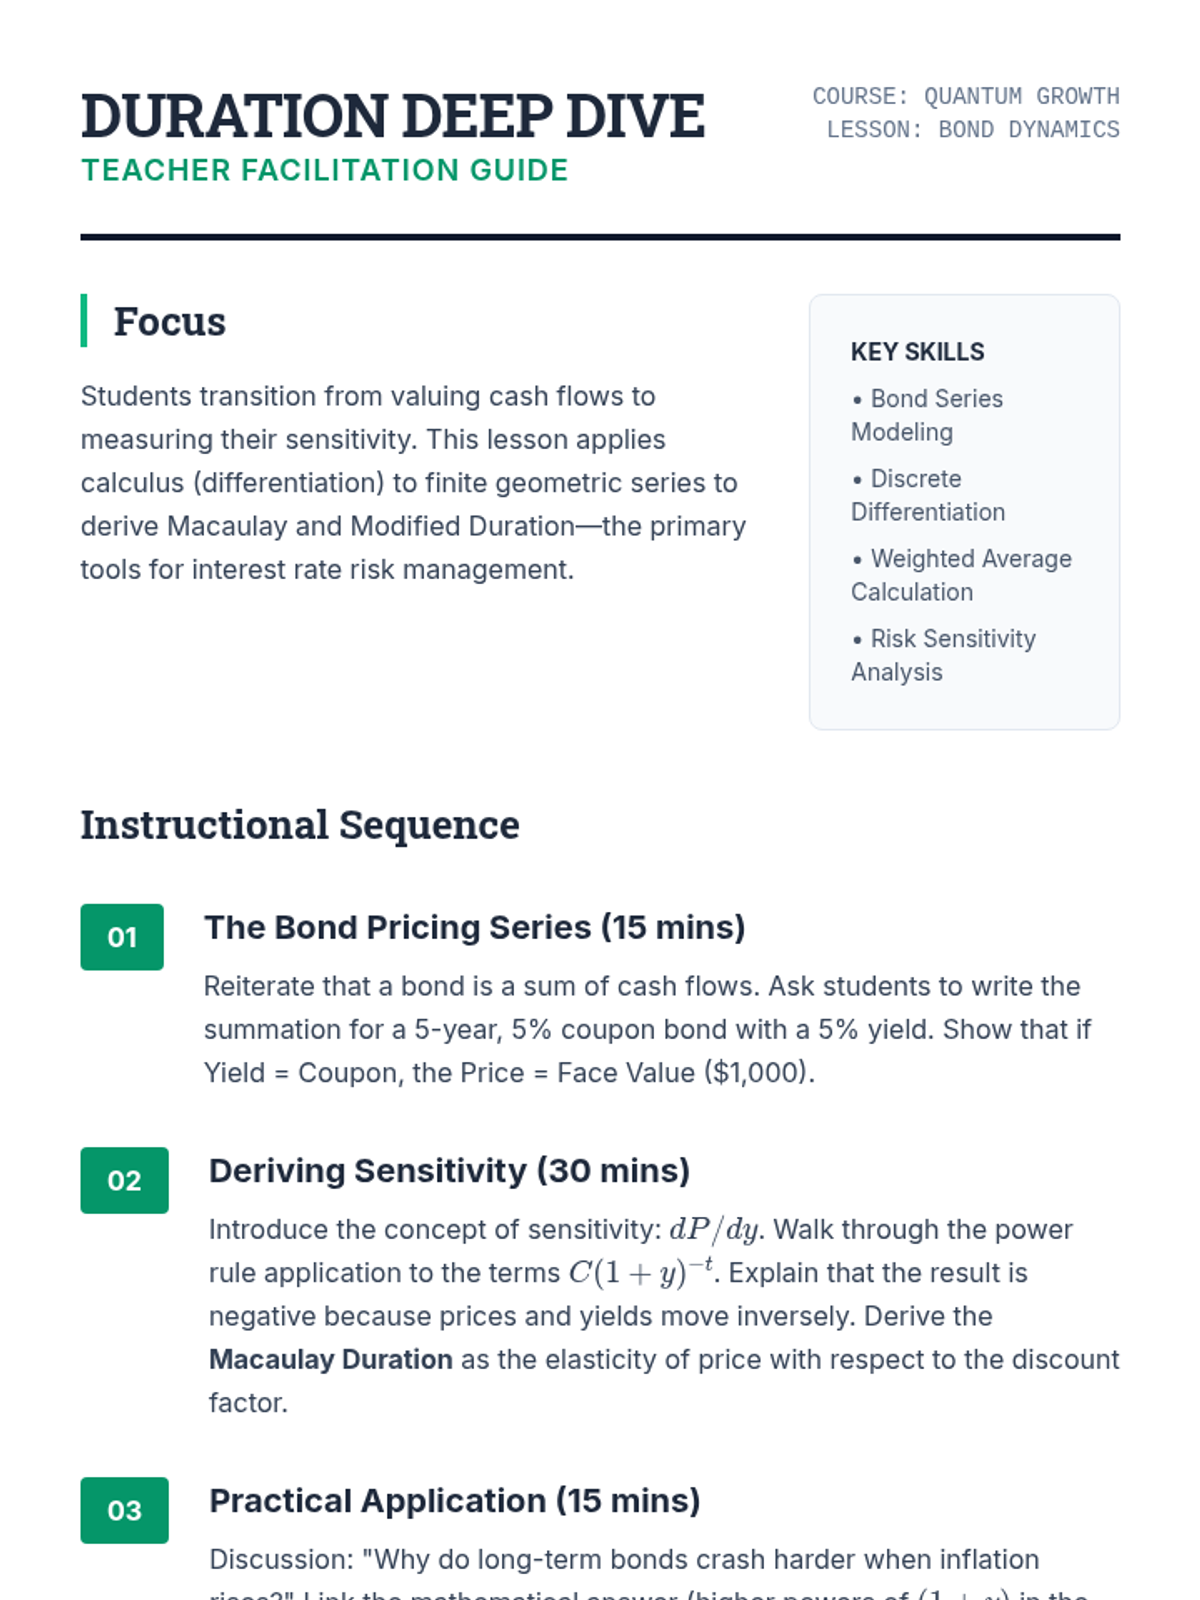
Teacher facilitation guide for Lesson 4, detailing the bond pricing series derivation and the calculus-based sensitivity analysis (duration).
Slide deck for Lesson 4 exploring bond pricing as a finite series and the derivation of Macaulay duration to measure interest rate risk.
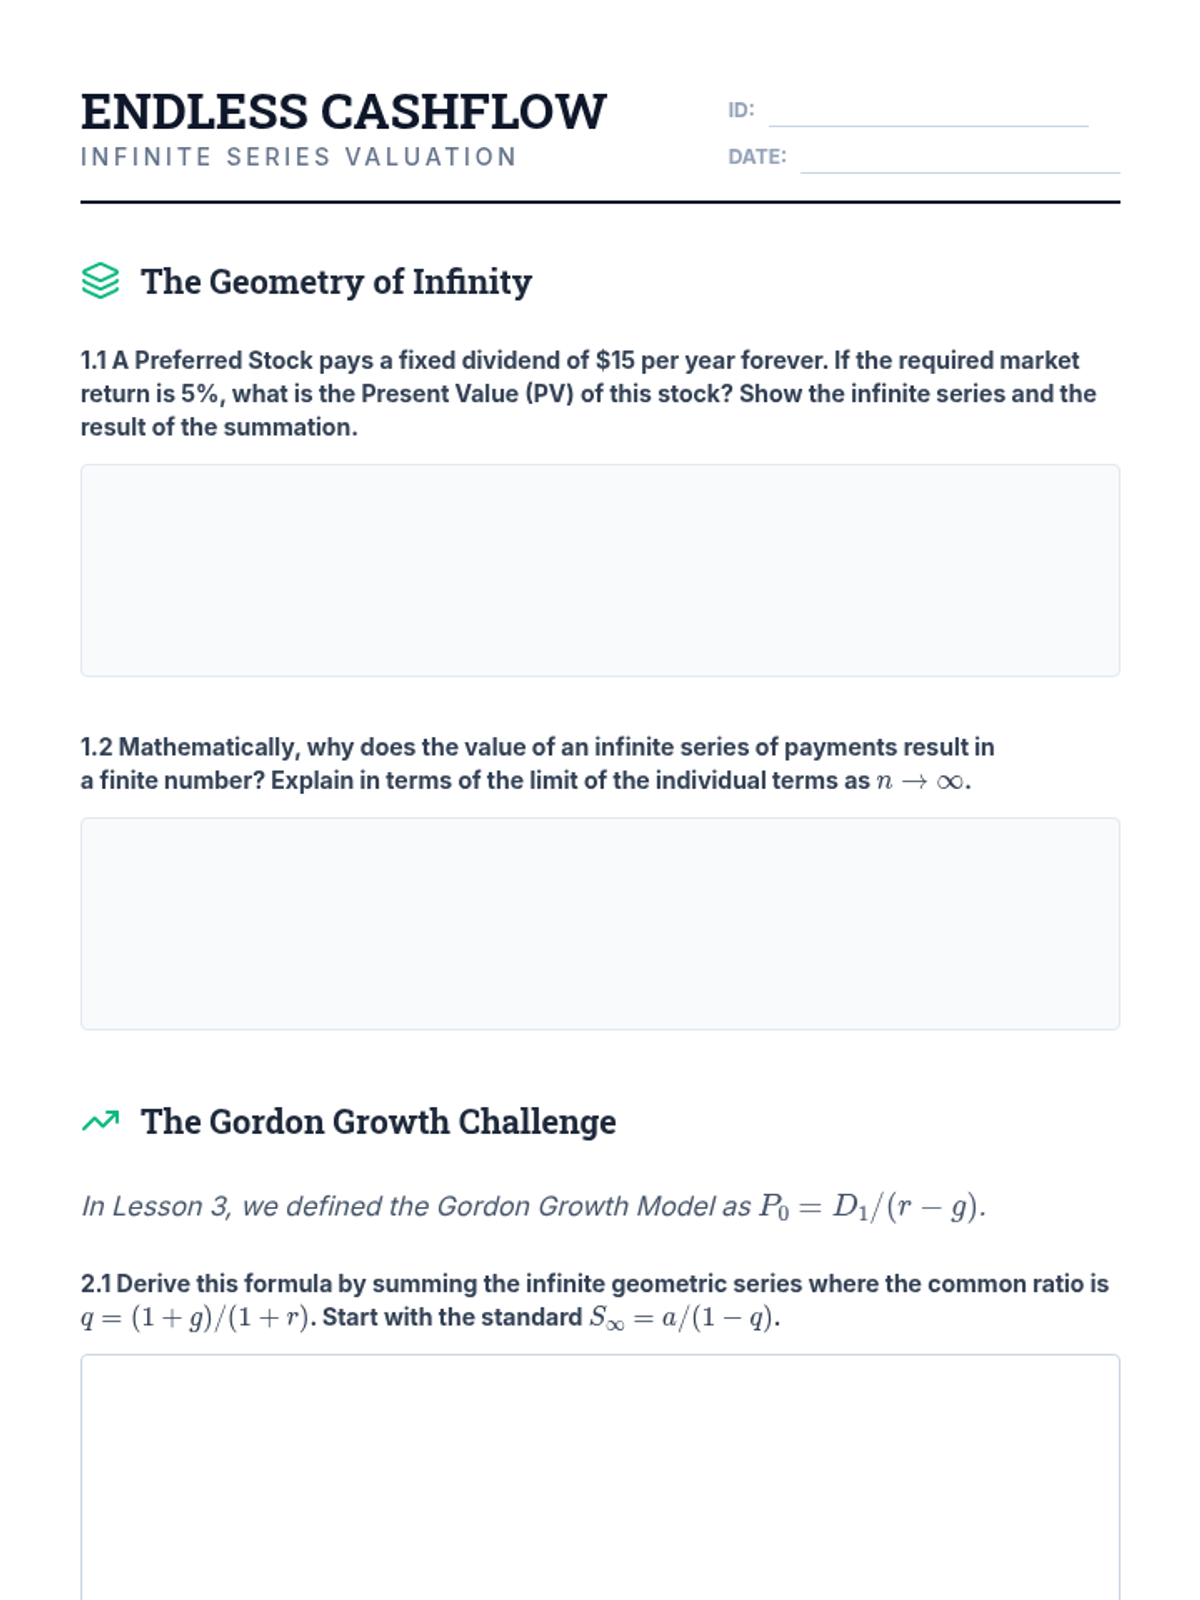
Student worksheet for Lesson 3, covering the pricing of perpetuities and the mathematical derivation/application of the Dividend Discount Model.
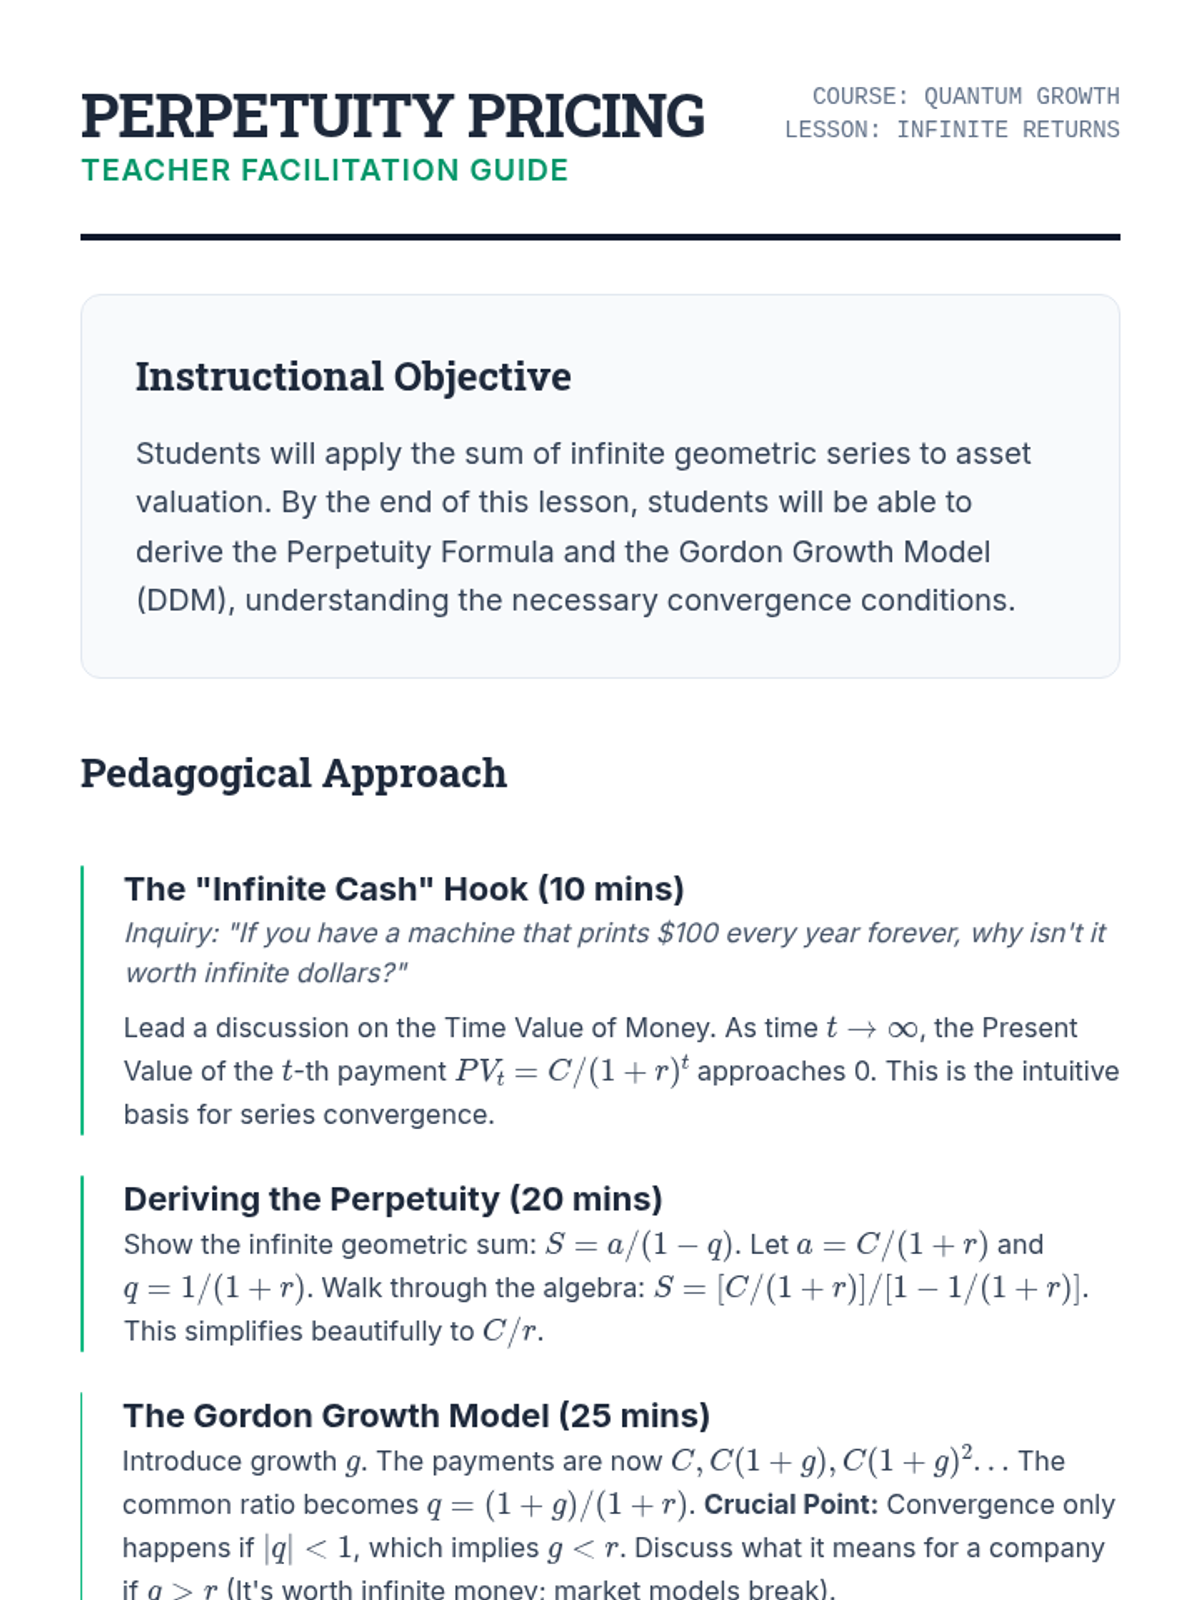
Teacher facilitation guide for Lesson 3, outlining the mathematical derivation of perpetuity valuation and the Dividend Discount Model convergence conditions.
Slide deck for Lesson 3 exploring the valuation of perpetuities and the Dividend Discount Model through the lens of infinite geometric series convergence.
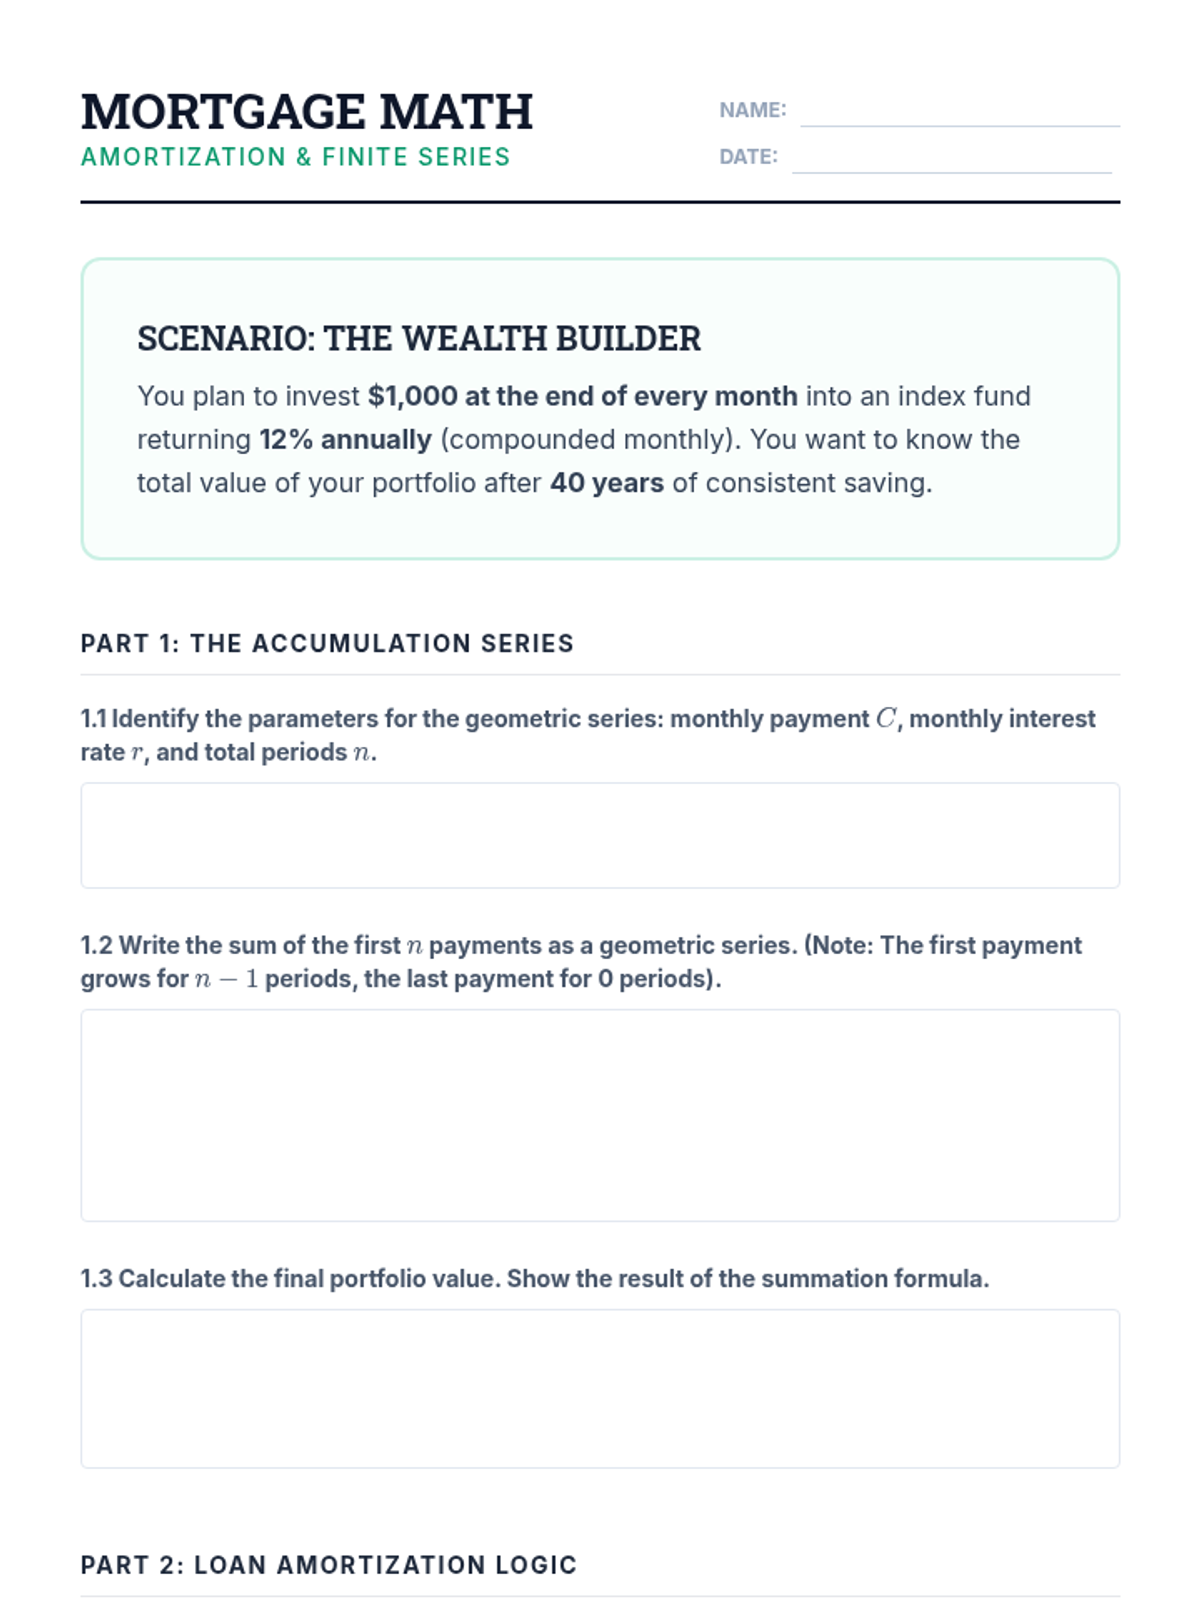
Student worksheet for Lesson 2, covering the calculation of future value for savings and the derivation of monthly mortgage payments using finite geometric sums.
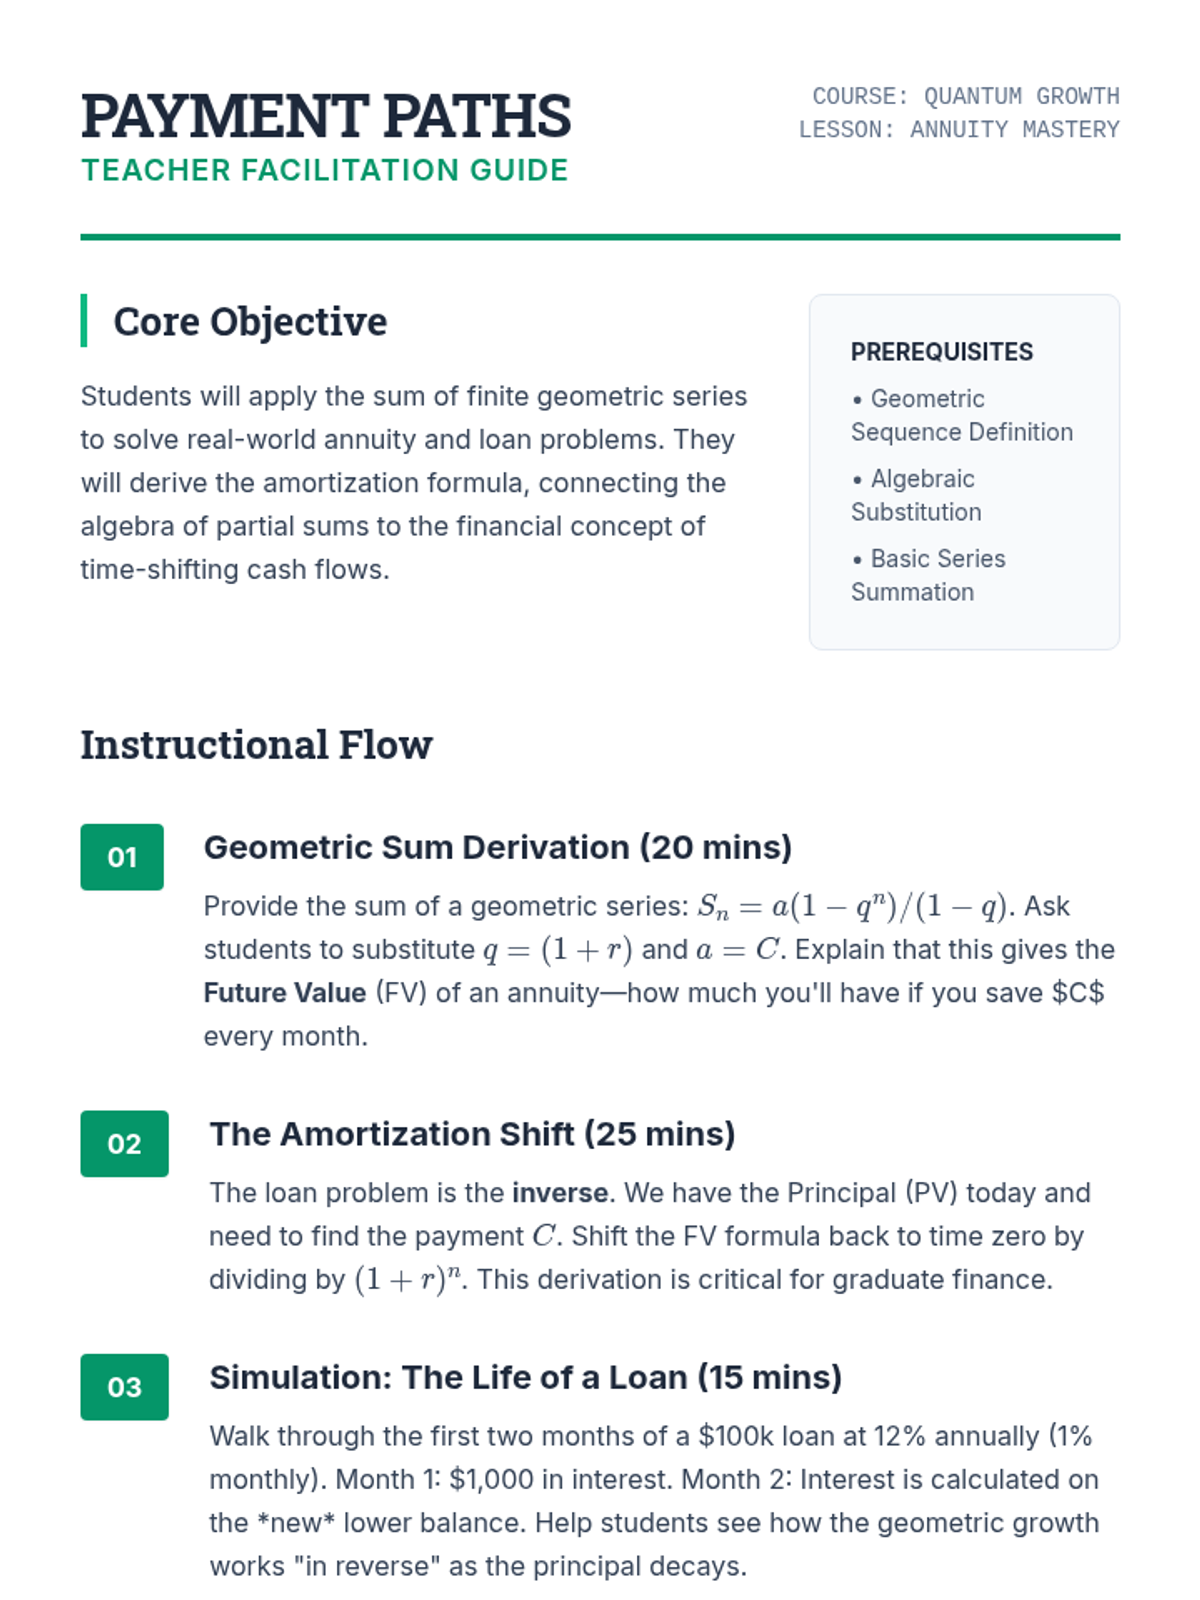
Teacher facilitation guide for Lesson 2, outlining the derivation of the annuity formula and providing guidance for the amortization simulation.
Slide deck for Lesson 2 focusing on finite geometric series and their application in calculating annuity values and loan amortization.
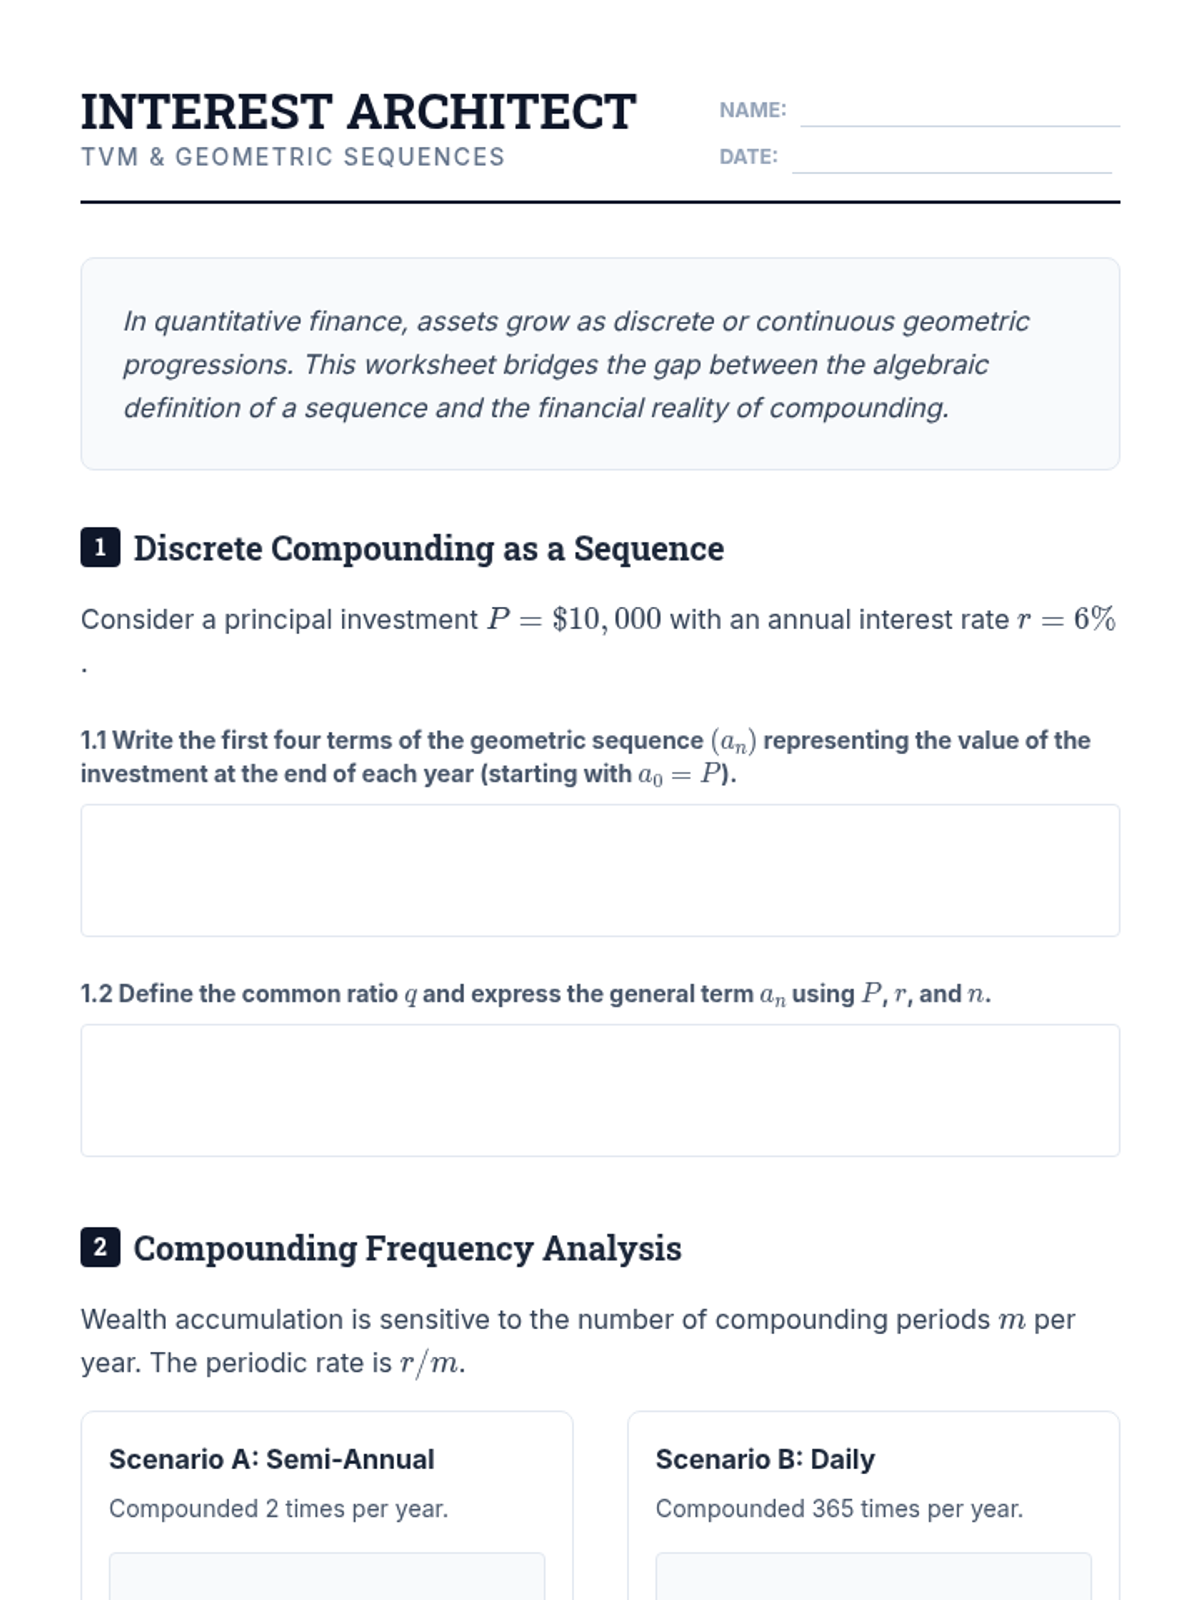
Student worksheet for Lesson 1, focusing on modeling interest as a geometric sequence and calculating the effects of different compounding frequencies.
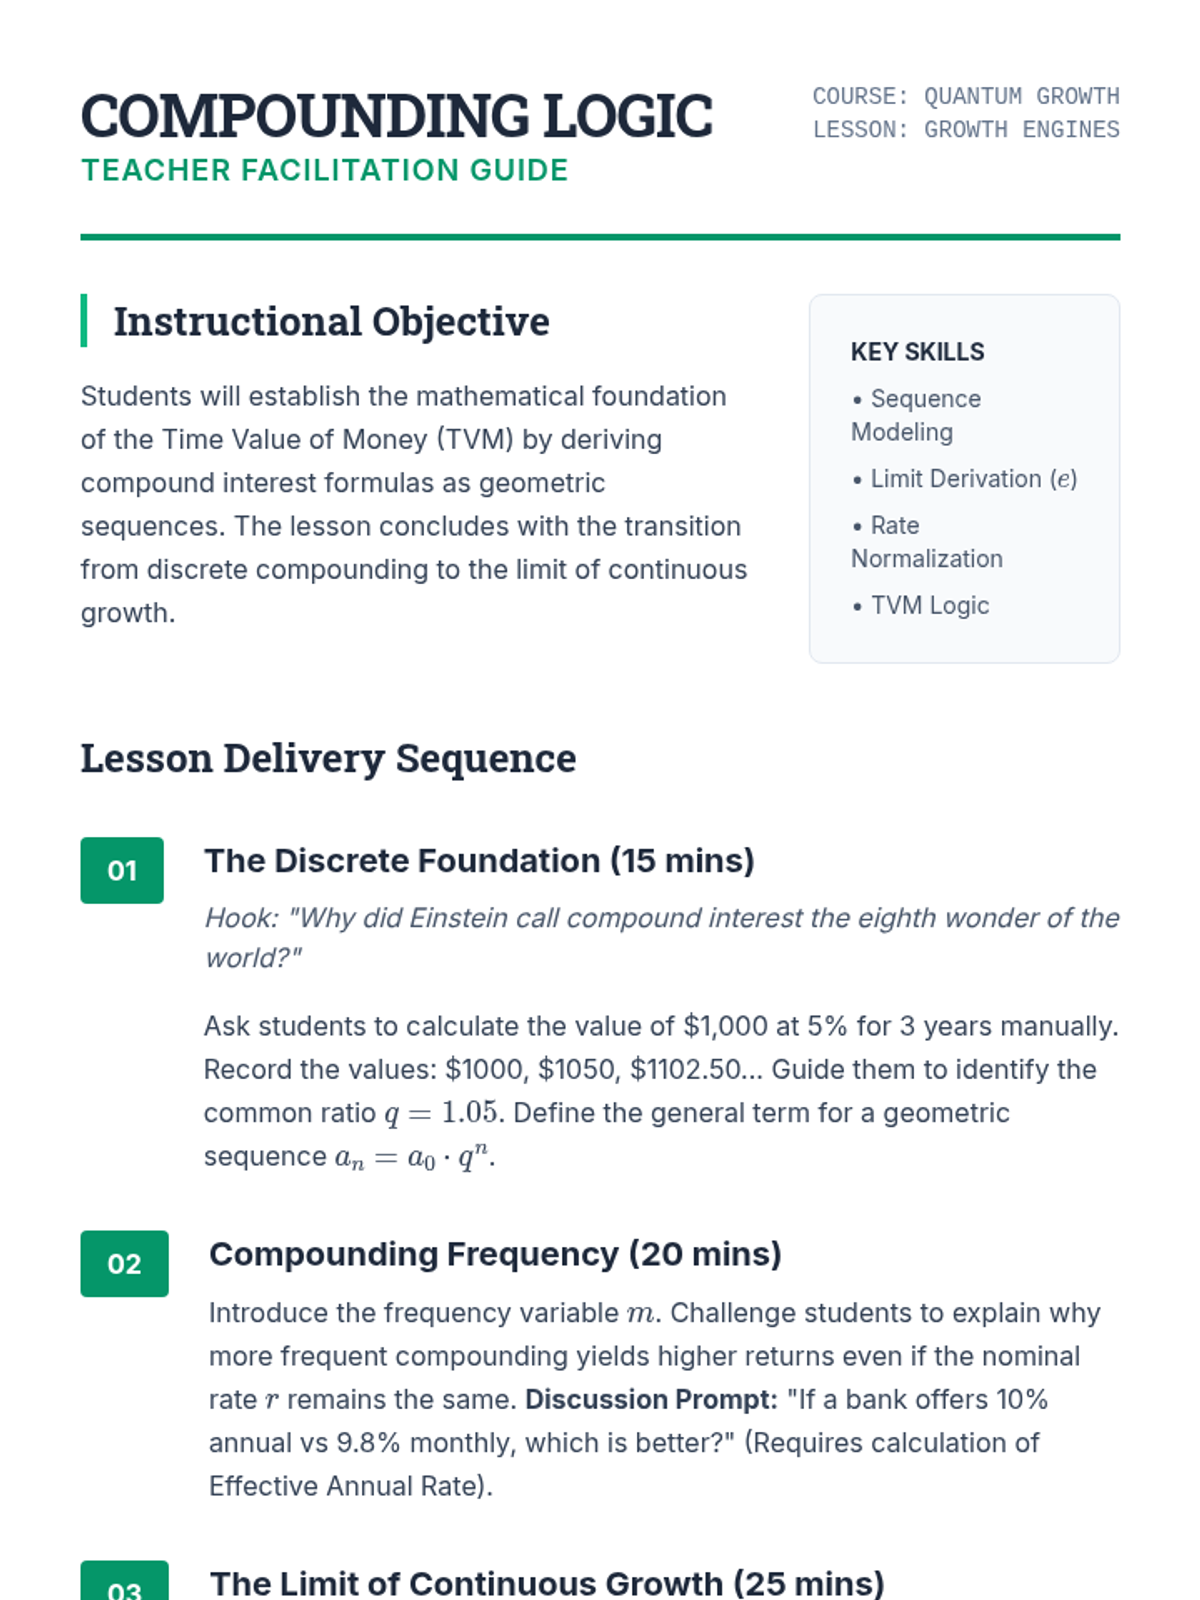
Teacher facilitation guide for Lesson 1, detailing the transition from discrete geometric growth to continuous compounding with lesson delivery steps and answer key highlights.
Introductory slide deck for Lesson 1 covering the derivation of compound interest as a geometric sequence and the limit definition of continuous compounding.
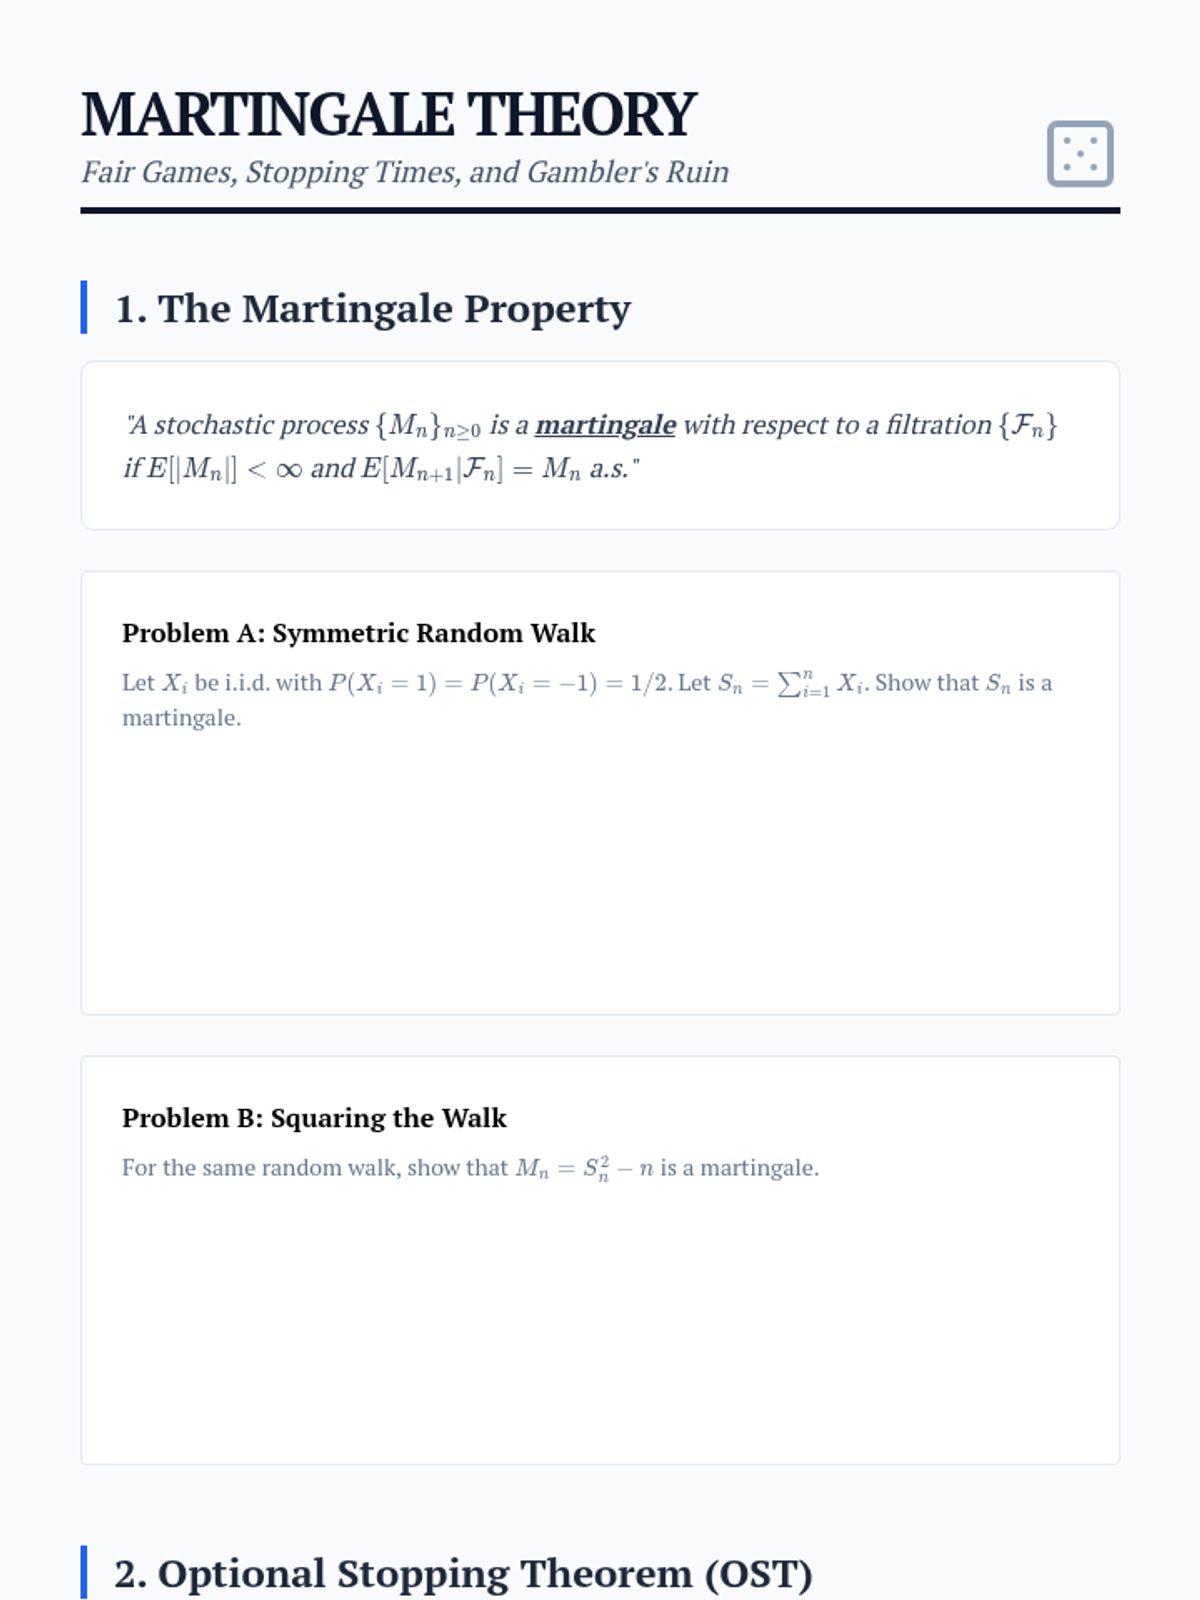
Graduate-level slides for Martingale theory, explaining the fair game concept, filtration, and the Optional Stopping Theorem.
A graduate worksheet on Martingale theory, focusing on the definition of martingales, the Optional Stopping Theorem, and its application to the Gambler's Ruin problem.
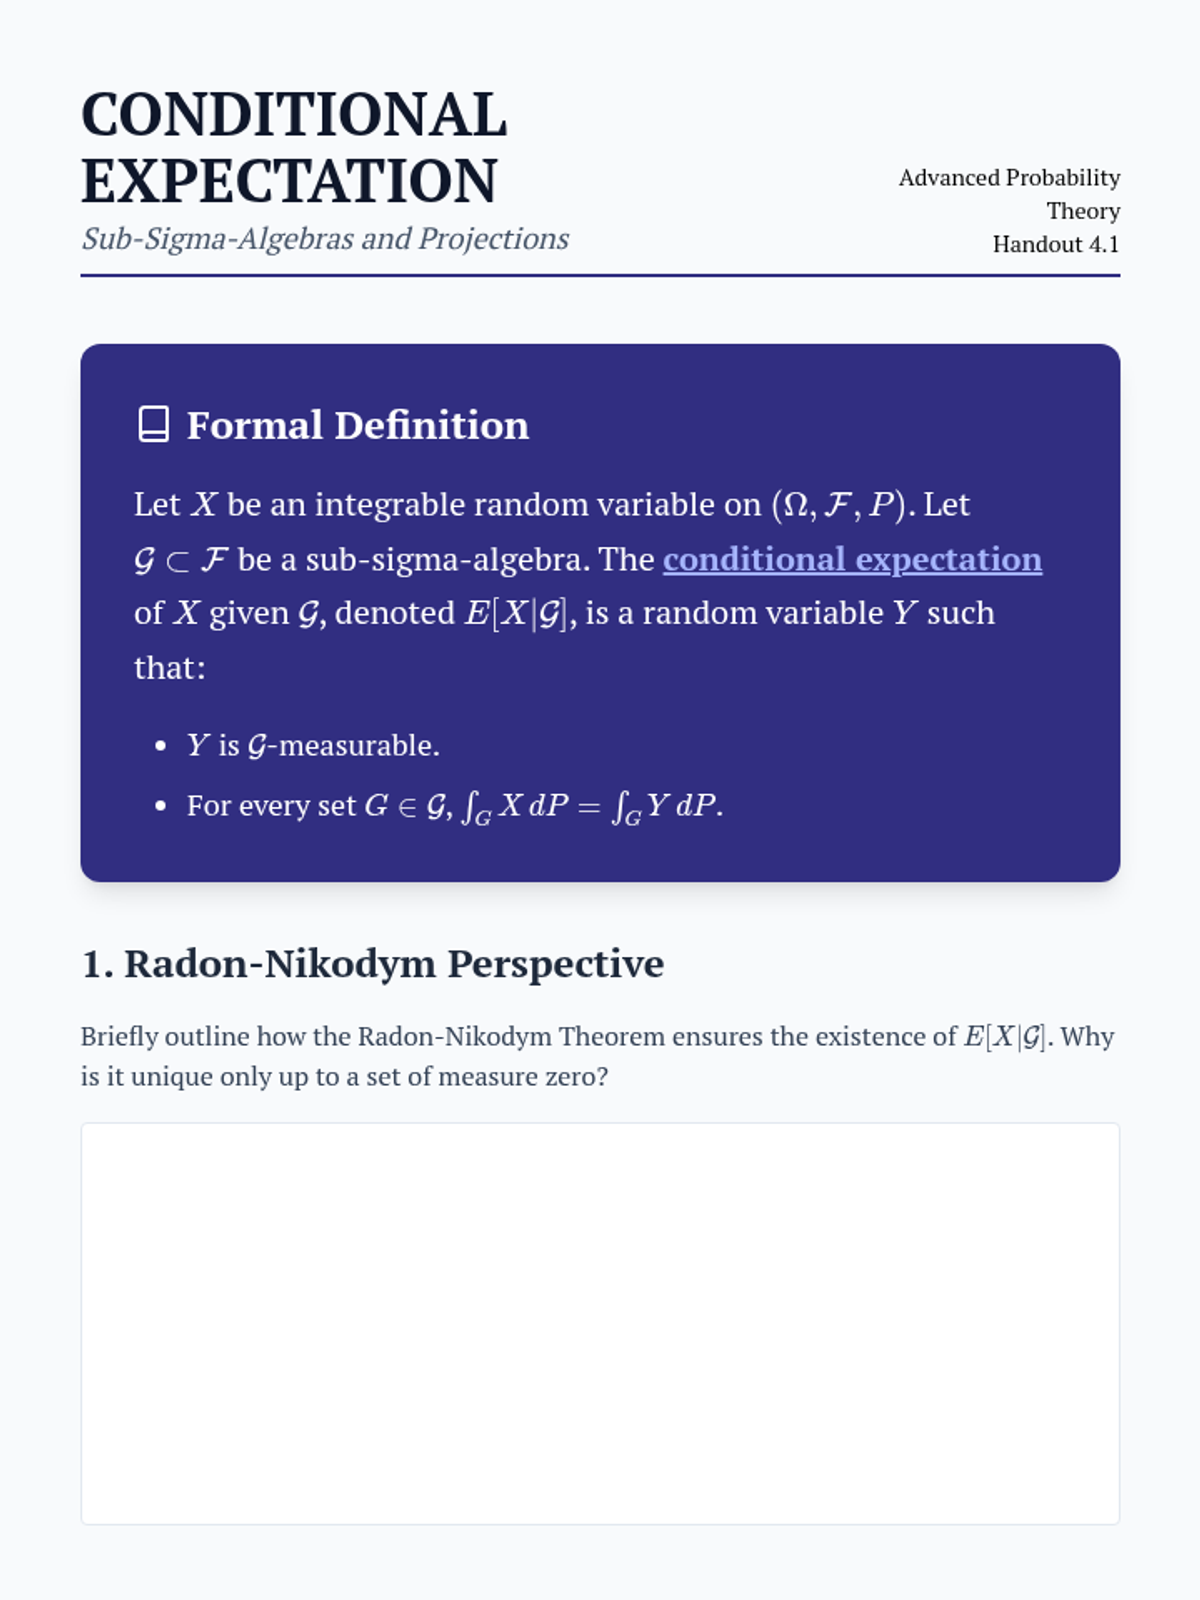
Graduate slides on conditional expectation as a projection in Hilbert space and its definition using sub-sigma-algebras.
A graduate worksheet on conditional expectation, covering its measure-theoretic definition, Radon-Nikodym foundation, and the projection property in Hilbert spaces.
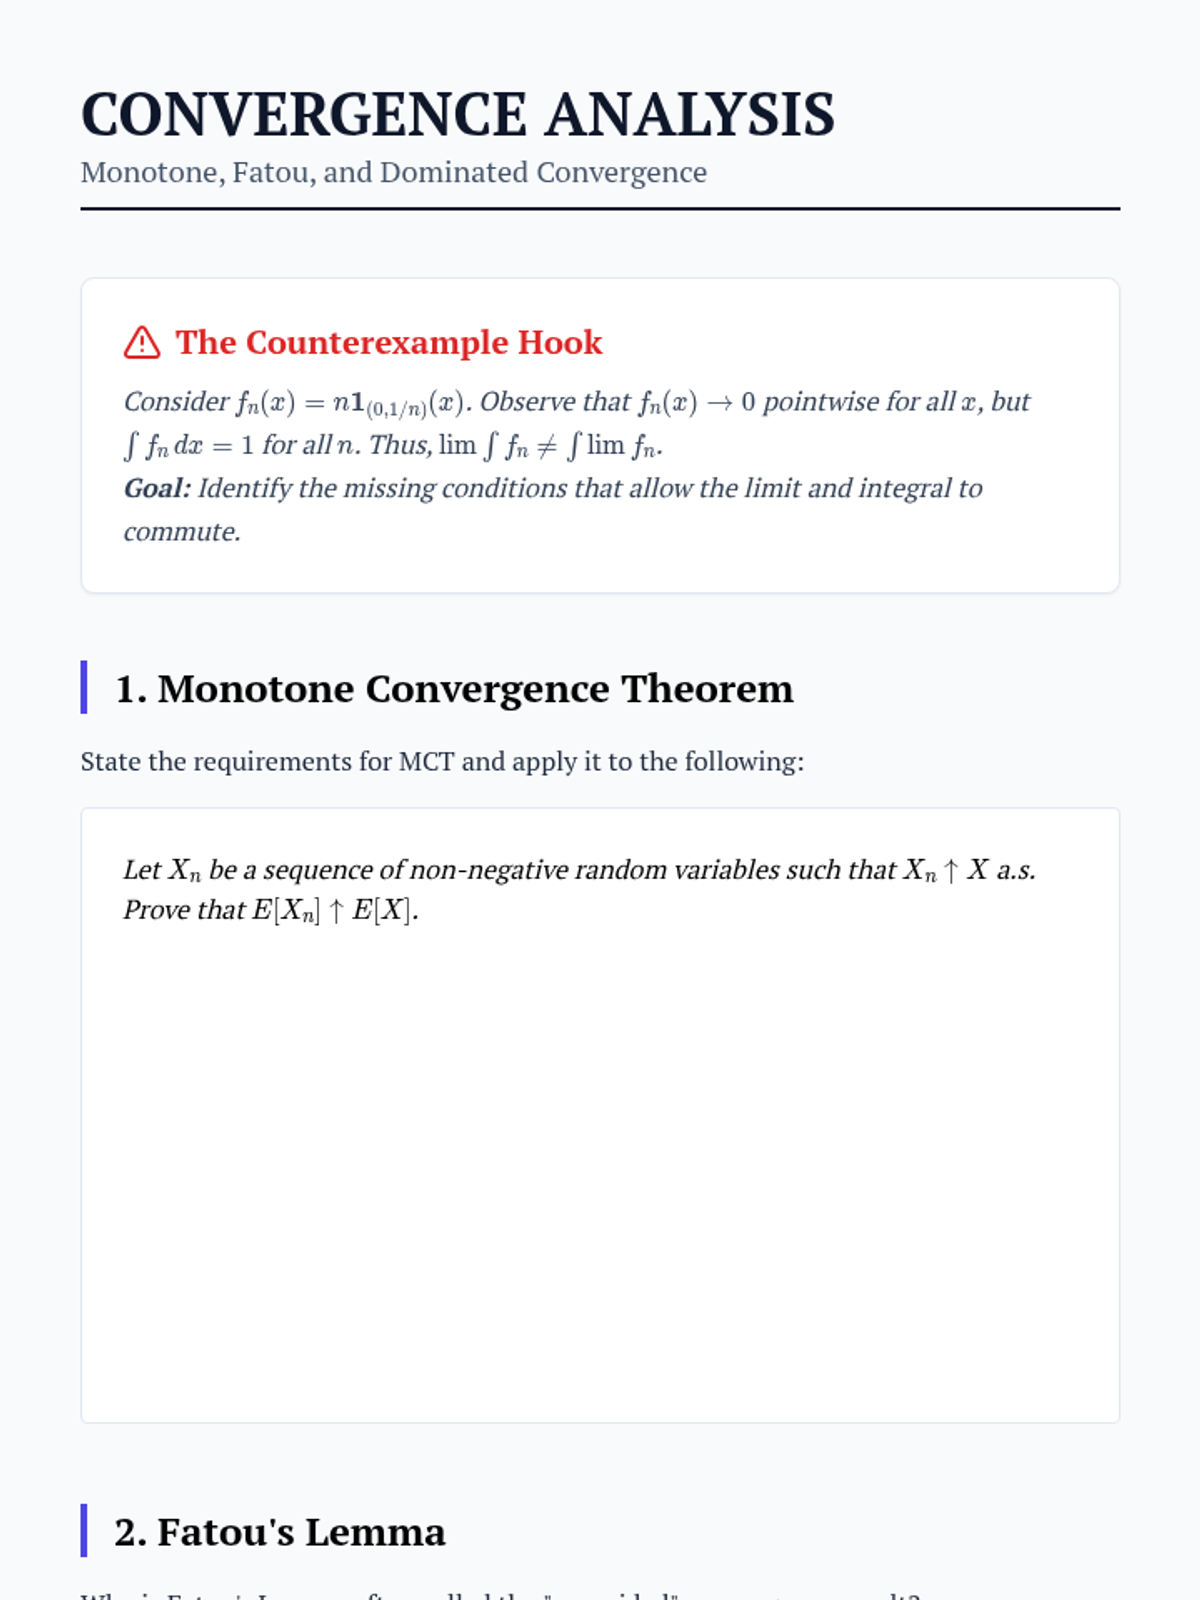
Graduate slides covering MCT, Fatou's Lemma, and DCT with visual representations of the convergence requirements.
A graduate worksheet focusing on Monotone Convergence, Fatou's Lemma, and Dominated Convergence Theorems through rigorous analysis and proof construction.
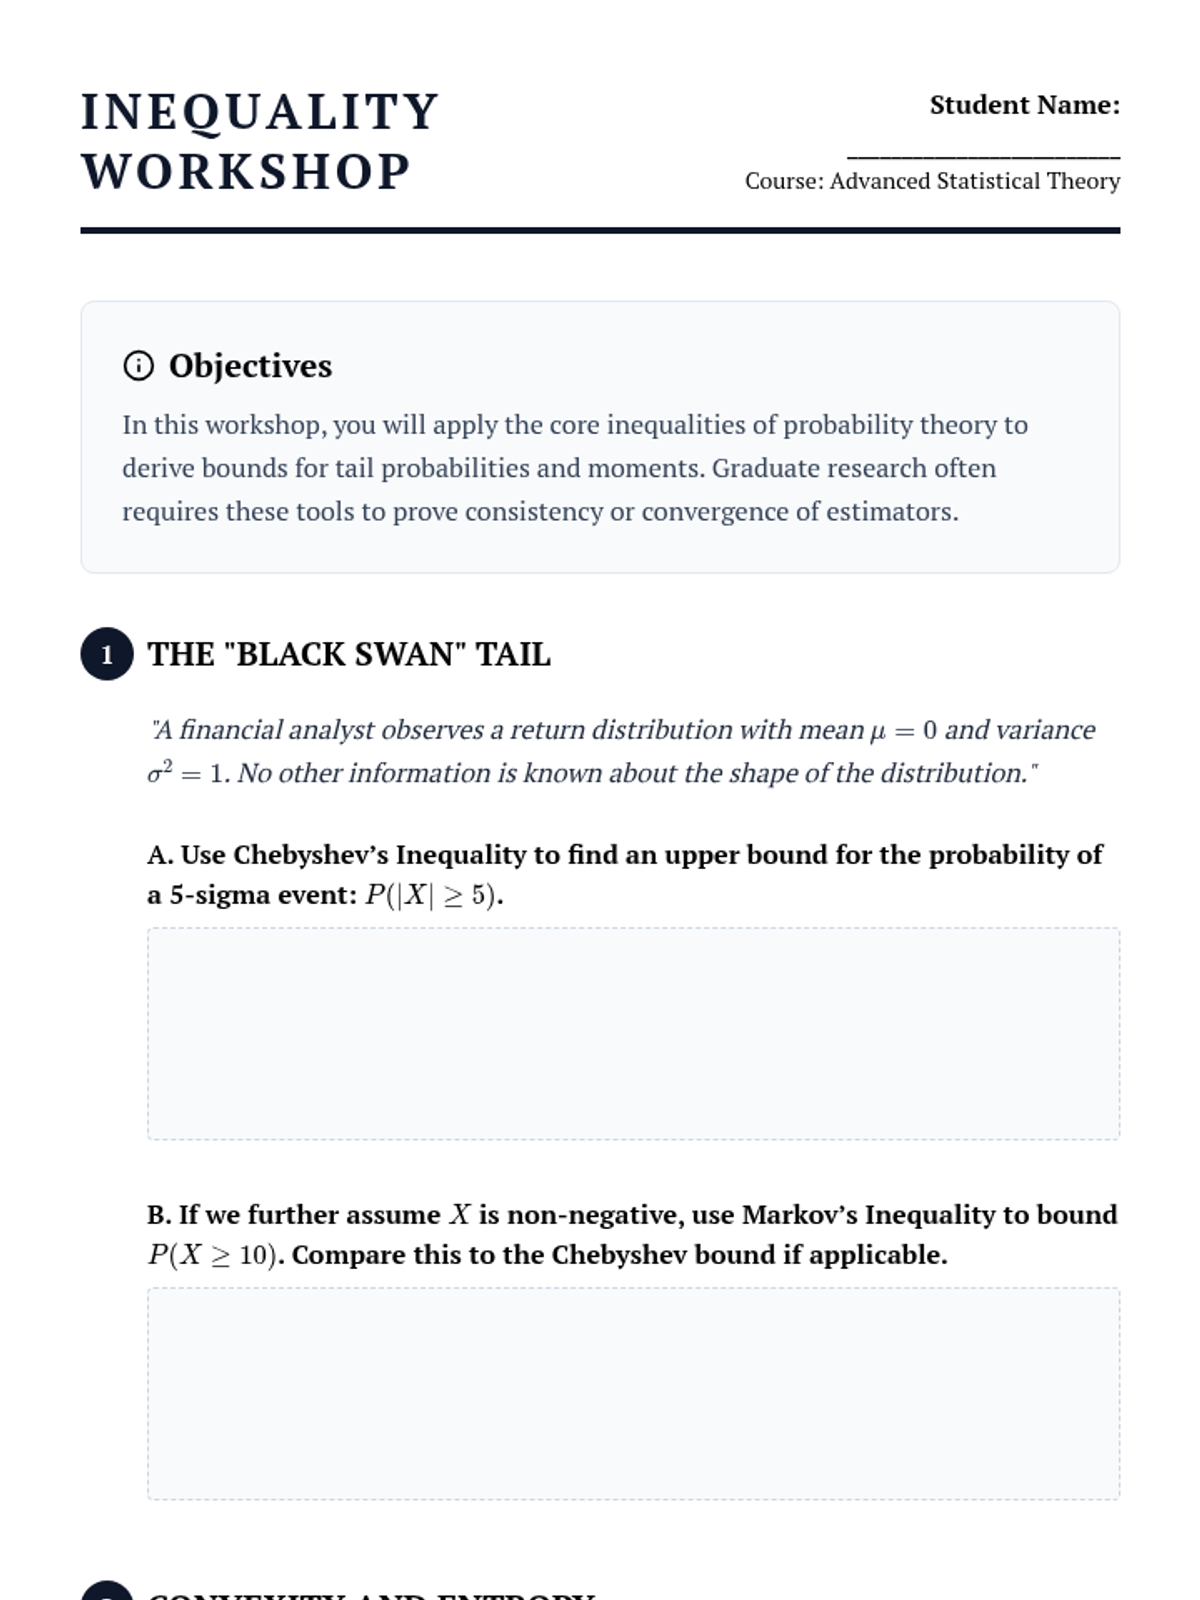
Slides for Graduate-level probability covering Markov, Chebyshev, Jensen, Hölder, and Minkowski inequalities with proofs and applications.
A workshop-style worksheet for graduate students to practice applying Markov, Chebyshev, Jensen, Hölder, and Minkowski inequalities.
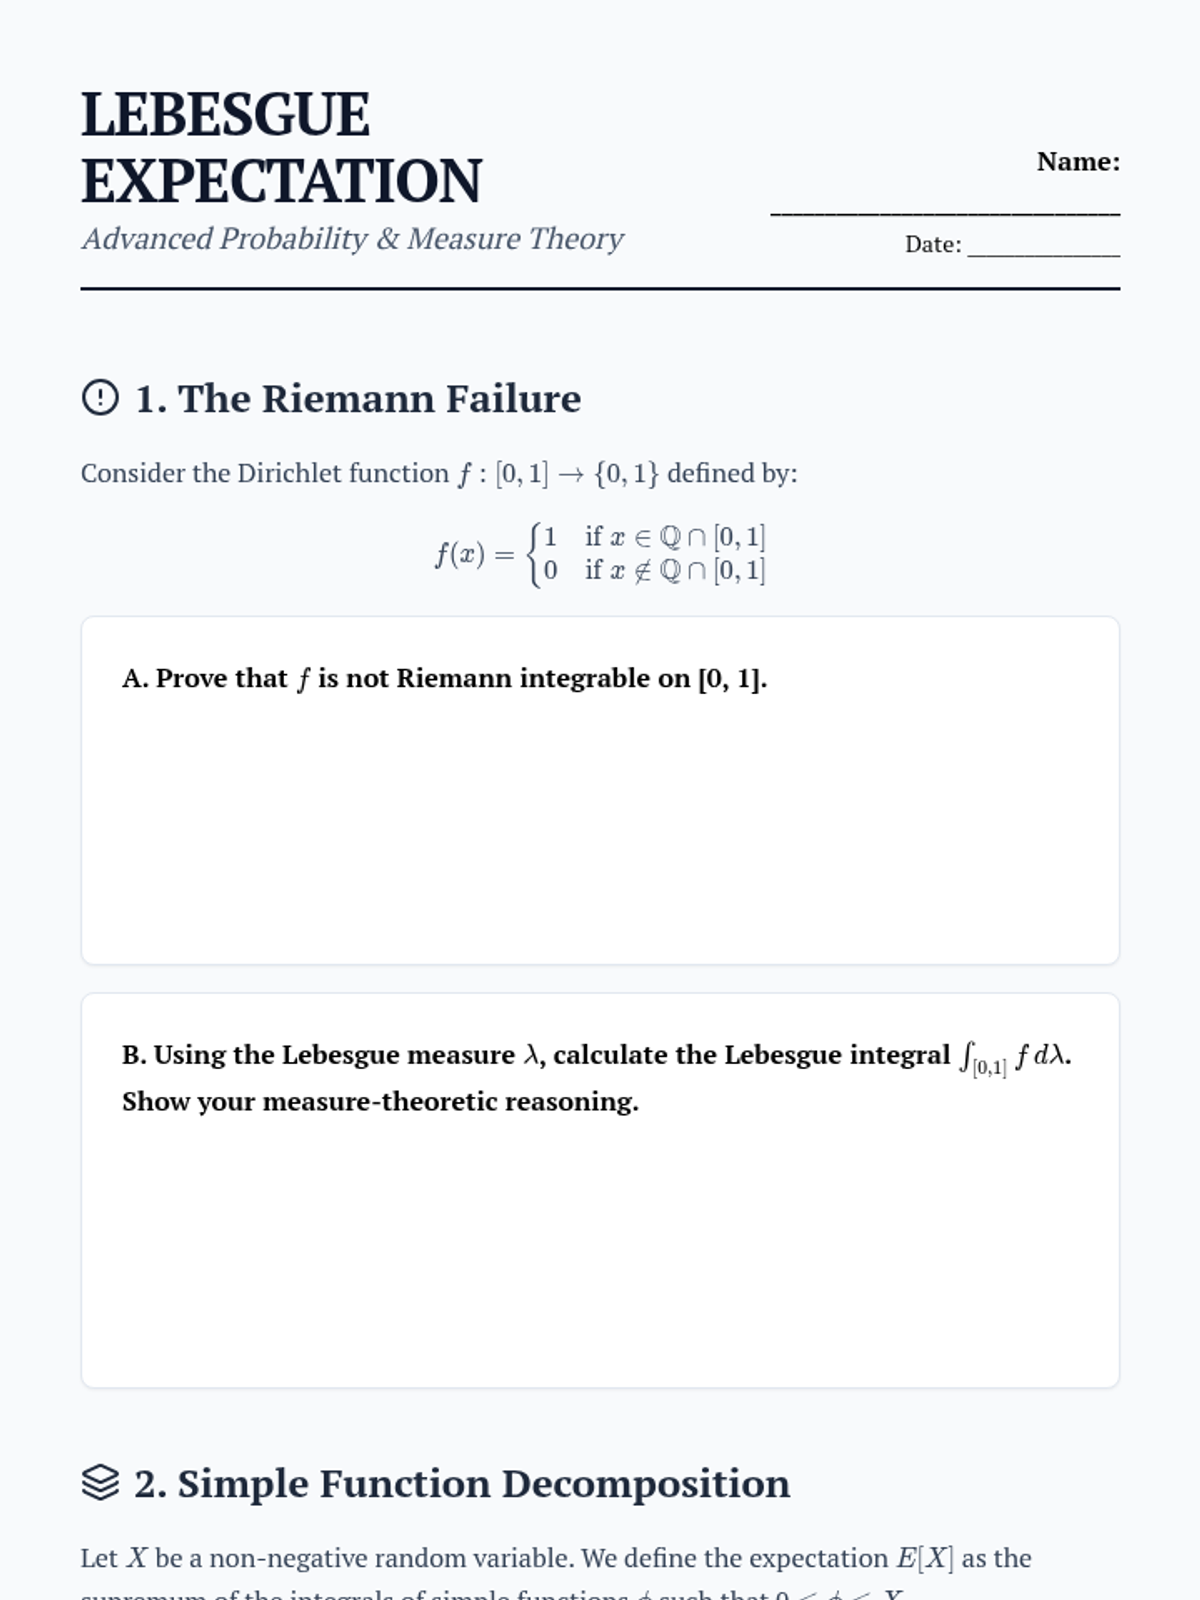
Introductory slides for Graduate-level probability focusing on the transition from Riemann to Lebesgue integration and the definition of expectation.
A graduate-level worksheet covering the measure-theoretic definition of expectation, comparing Riemann vs. Lebesgue integration and exploring simple function decomposition.
A graduate-level slide deck introducing Directed Acyclic Graphs (DAGs), focusing on the three fundamental causal structures: chains, forks, and colliders.