Mapping relationships through notation, algebraic representations, and growth rate comparisons. Equips learners to transform functions, model contextual data, and solve exponential equations.
Final student worksheet for Lesson 5, focusing on entropy calculations, metric selection for non-monotonic structures, and sequence reflection.
Teacher guide for Lesson 5 focusing on Mutual Information application, entropy concepts, and final sequence debrief.
Final slide deck for Lesson 5 introducing Mutual Information and Entropy, focusing on detecting complex, non-monotonic relationships.
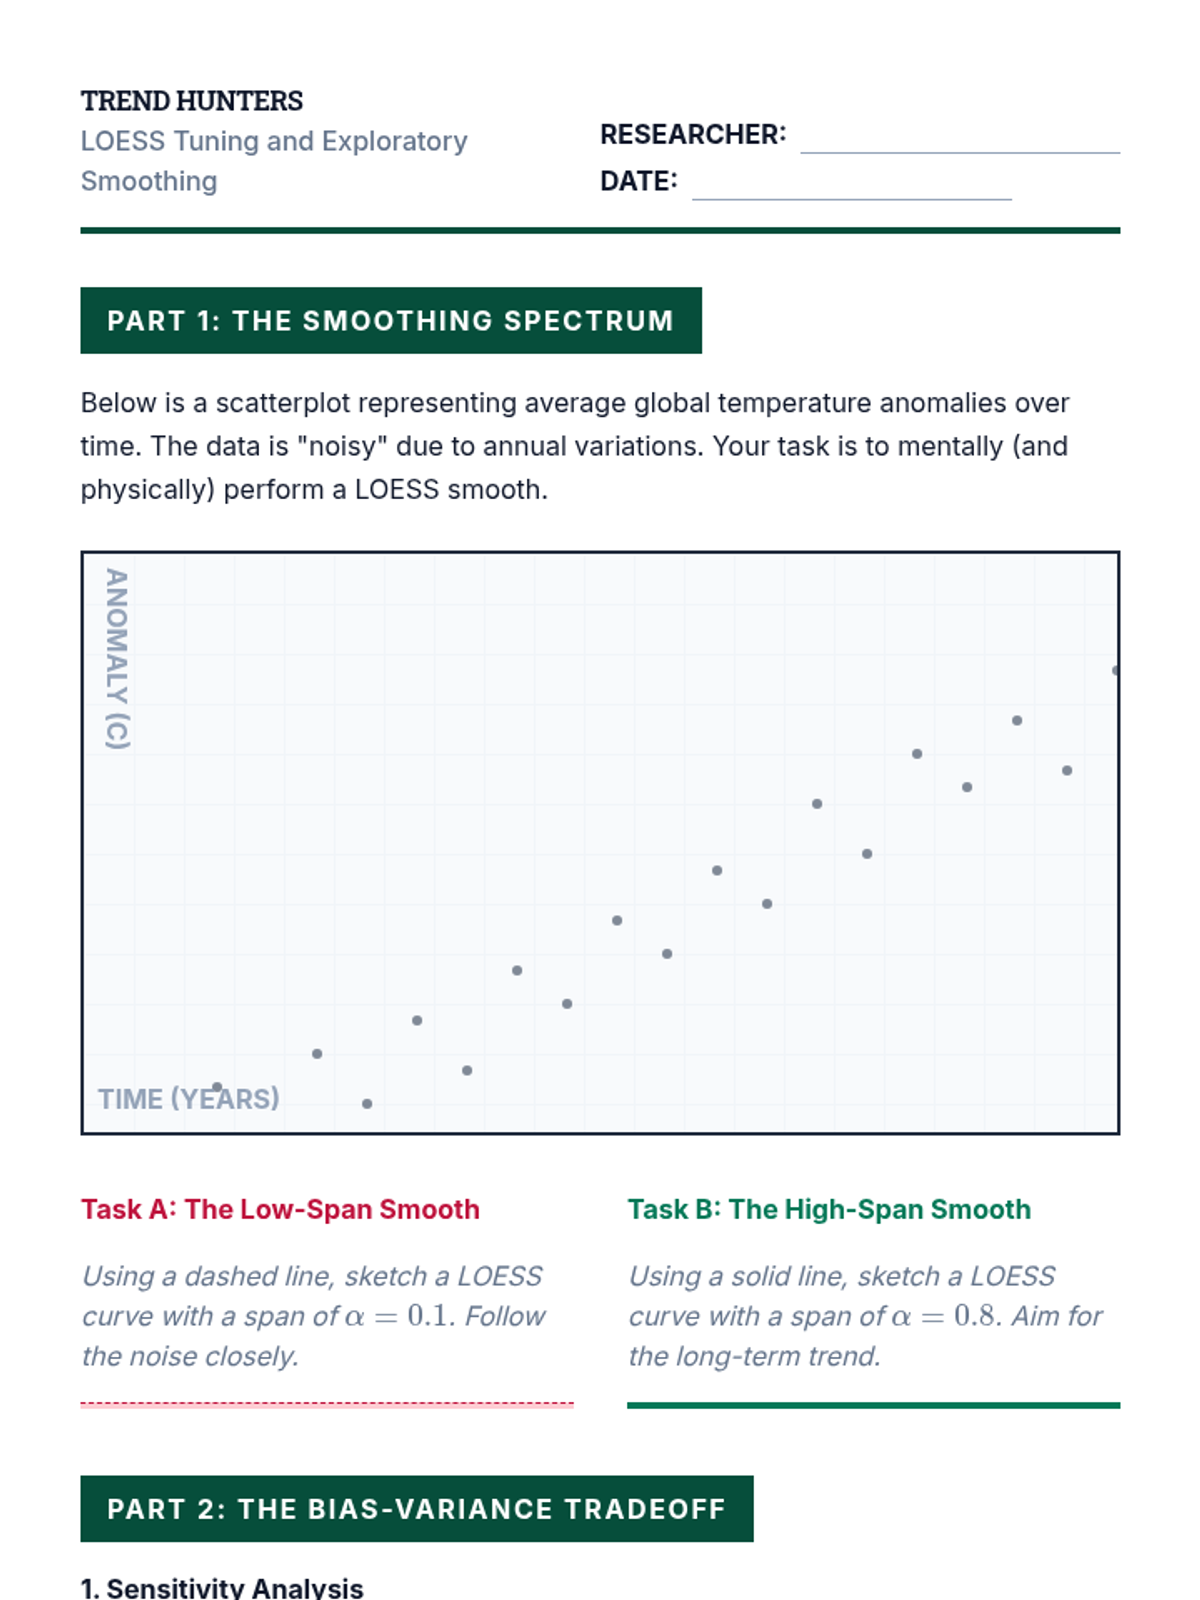
Student worksheet for Lesson 4 where students sketch LOESS curves with different spans and reason about the effect of hyperparameters on model bias and variance.
Teacher guide for Lesson 4 focusing on LOESS application, bandwidth tuning, and computational considerations.
Slide deck for Lesson 4 focusing on locally weighted scatterplot smoothing (LOESS), its algorithmic steps, and the effect of the span parameter.
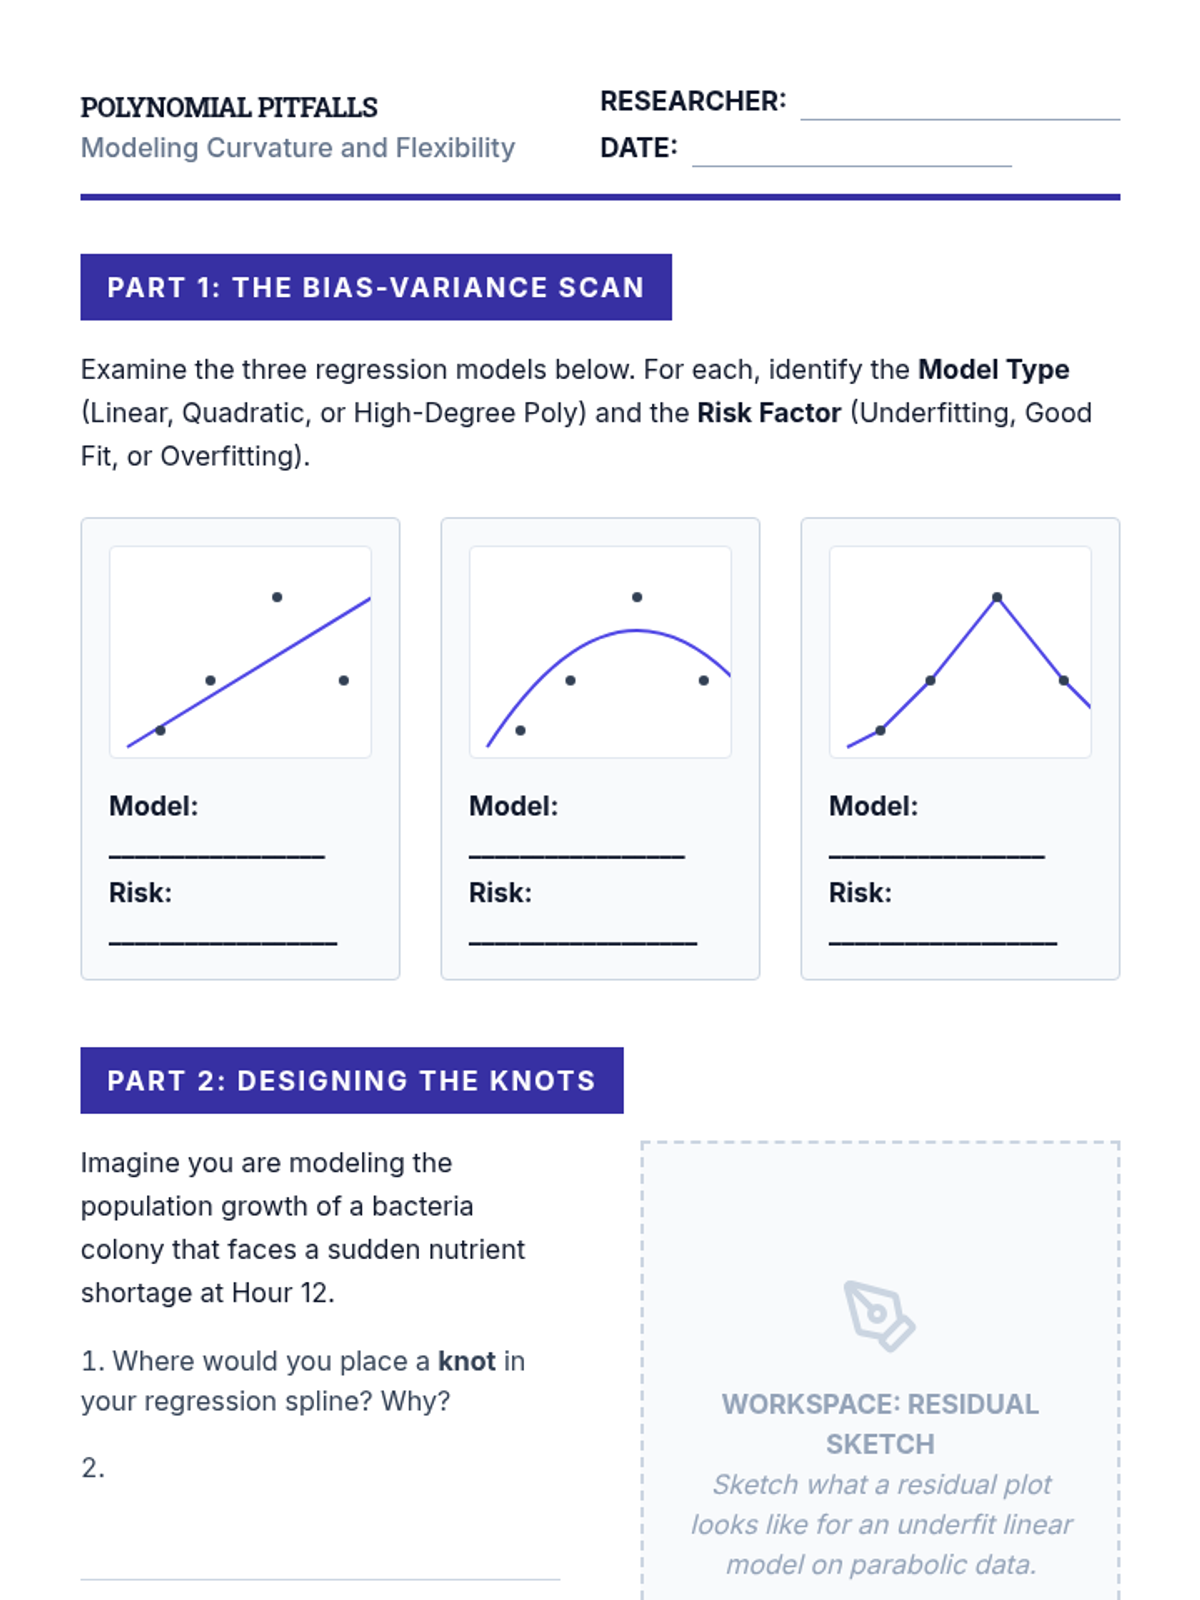
Student worksheet for Lesson 3 focusing on bias-variance tradeoffs and the conceptual requirements of cubic splines.
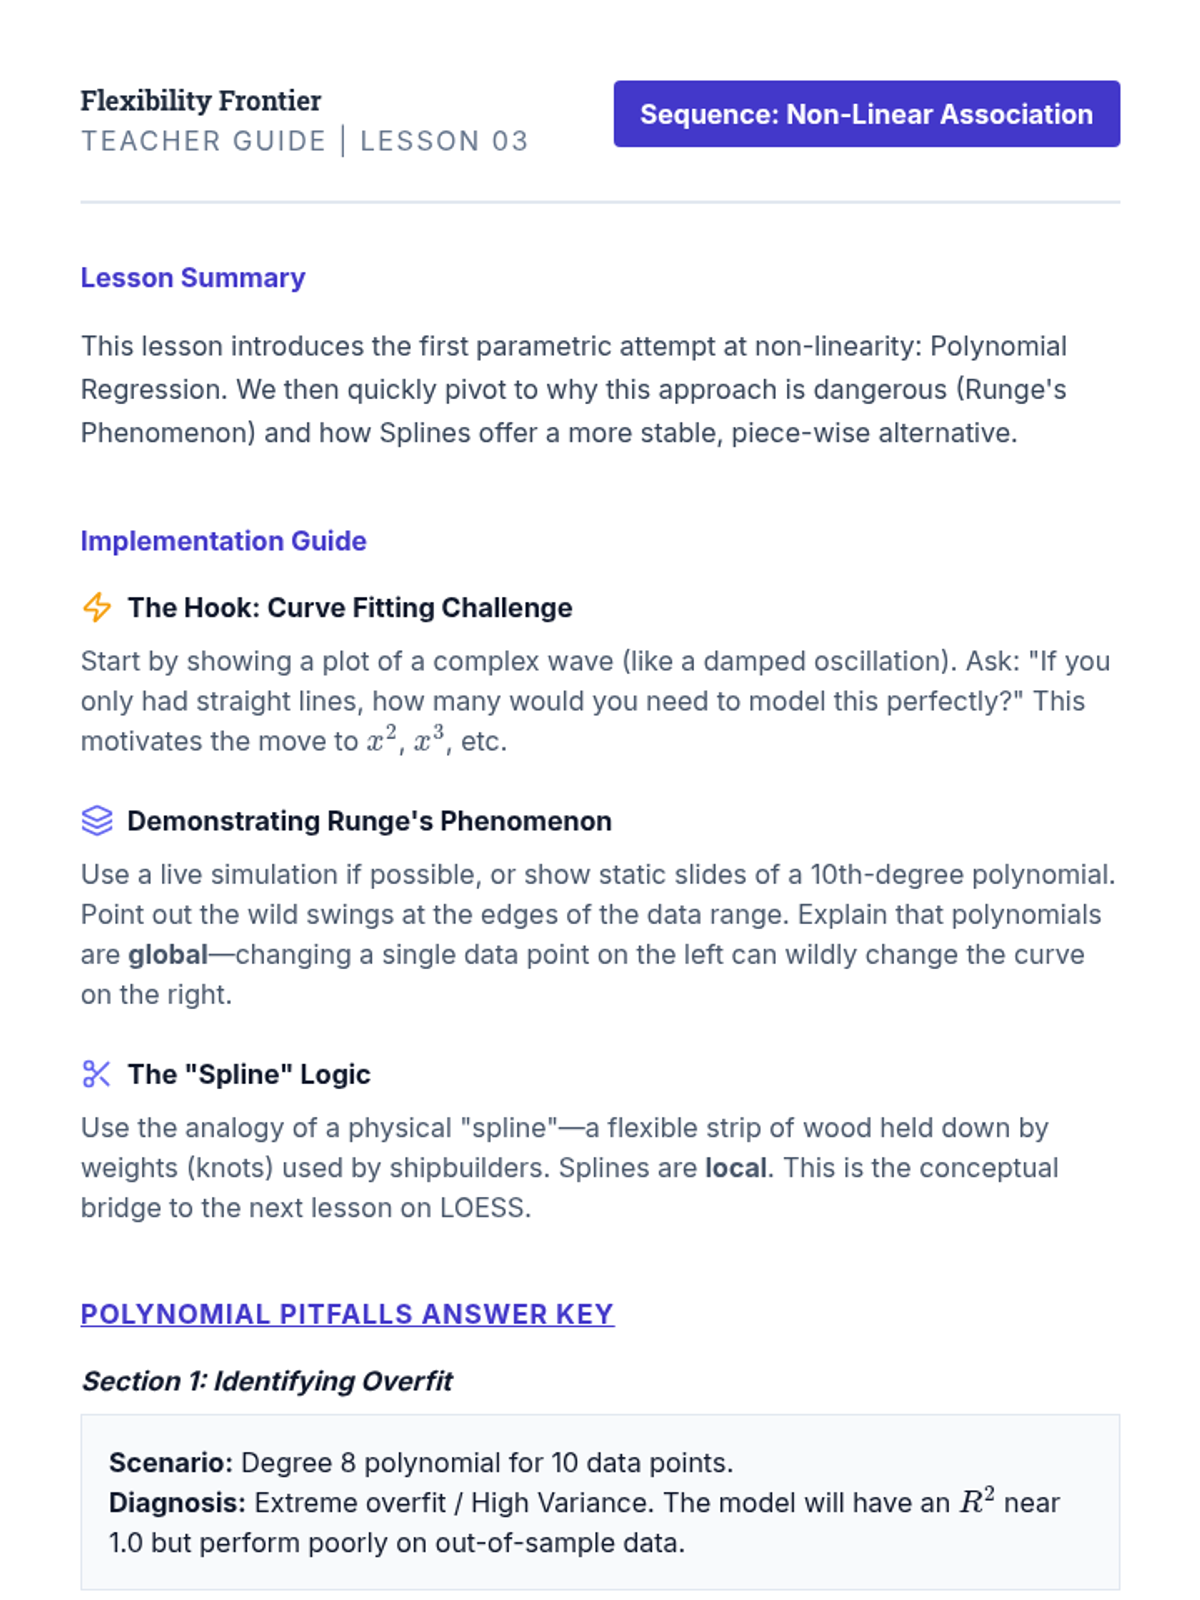
Teacher guide for Lesson 3 focusing on polynomial regression risks and spline continuity requirements.
Slide deck for Lesson 3 introducing modeling curvature with polynomial regression and splines, emphasizing the bias-variance tradeoff.
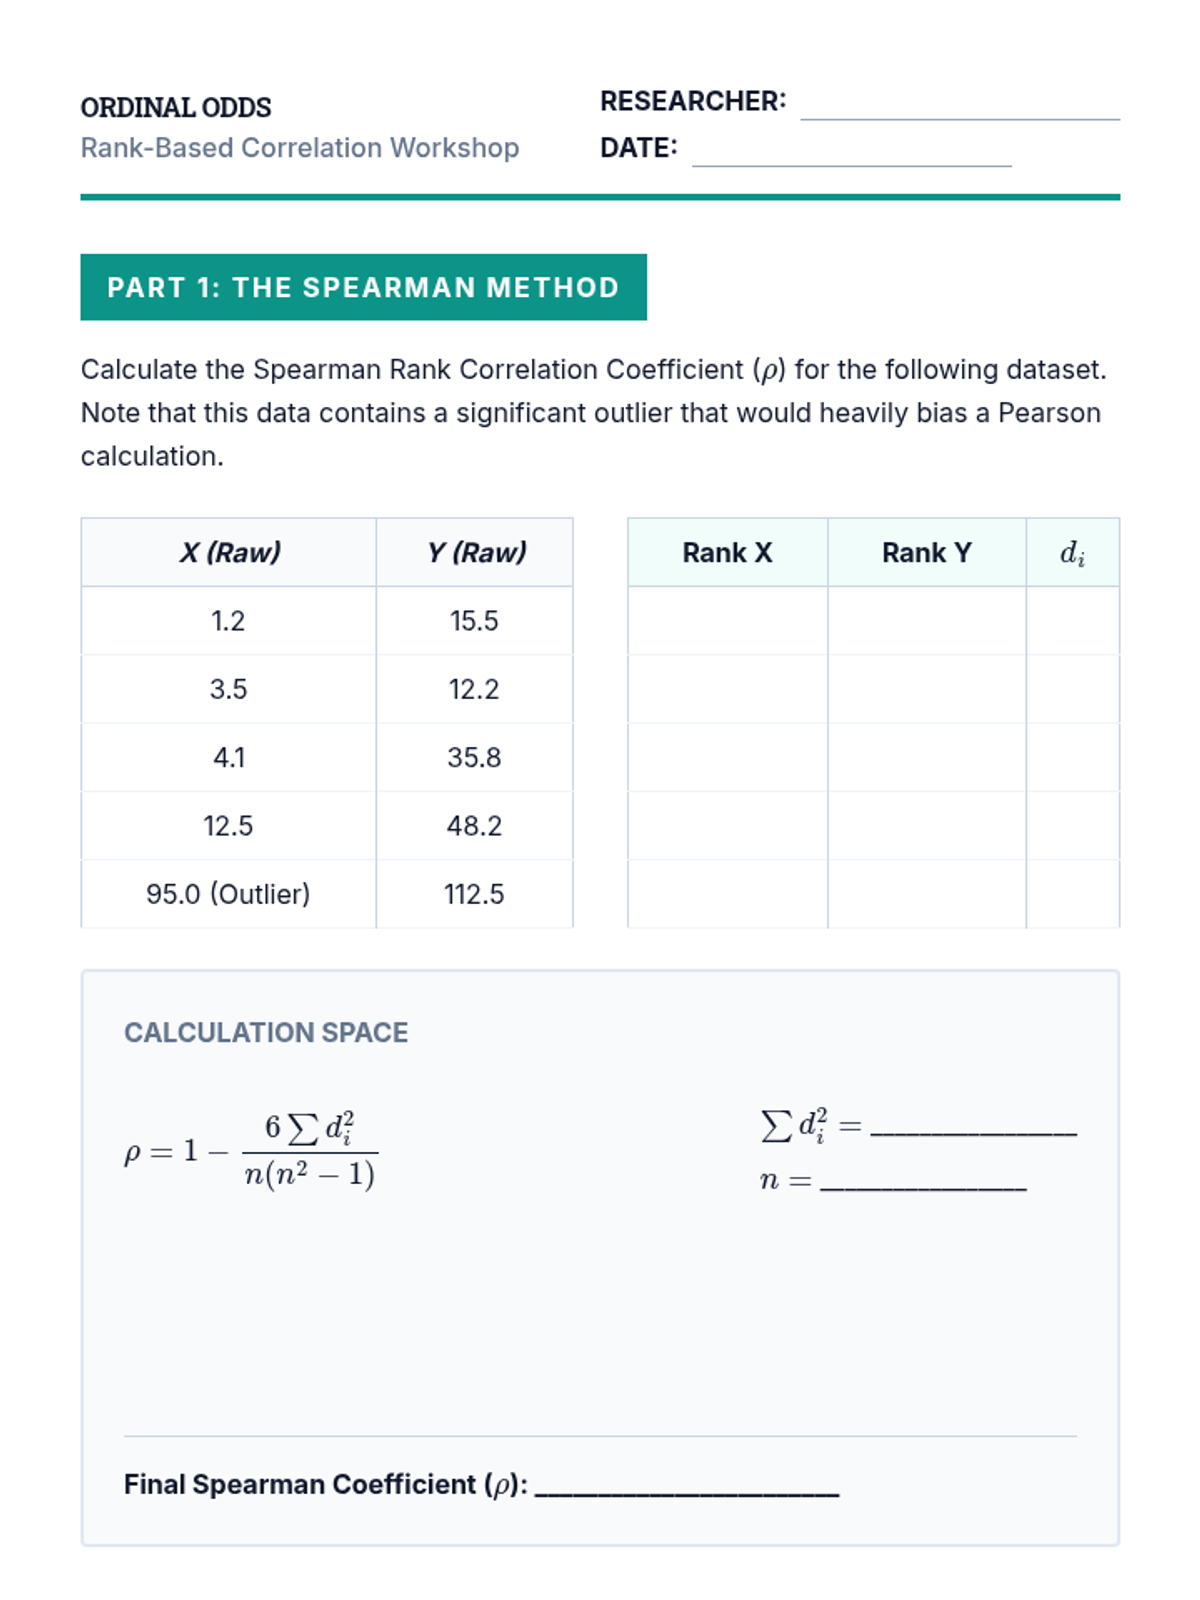
Student workshop material for Lesson 2, including hand-calculation of Spearman's rho and conceptual analysis of Kendall's tau.
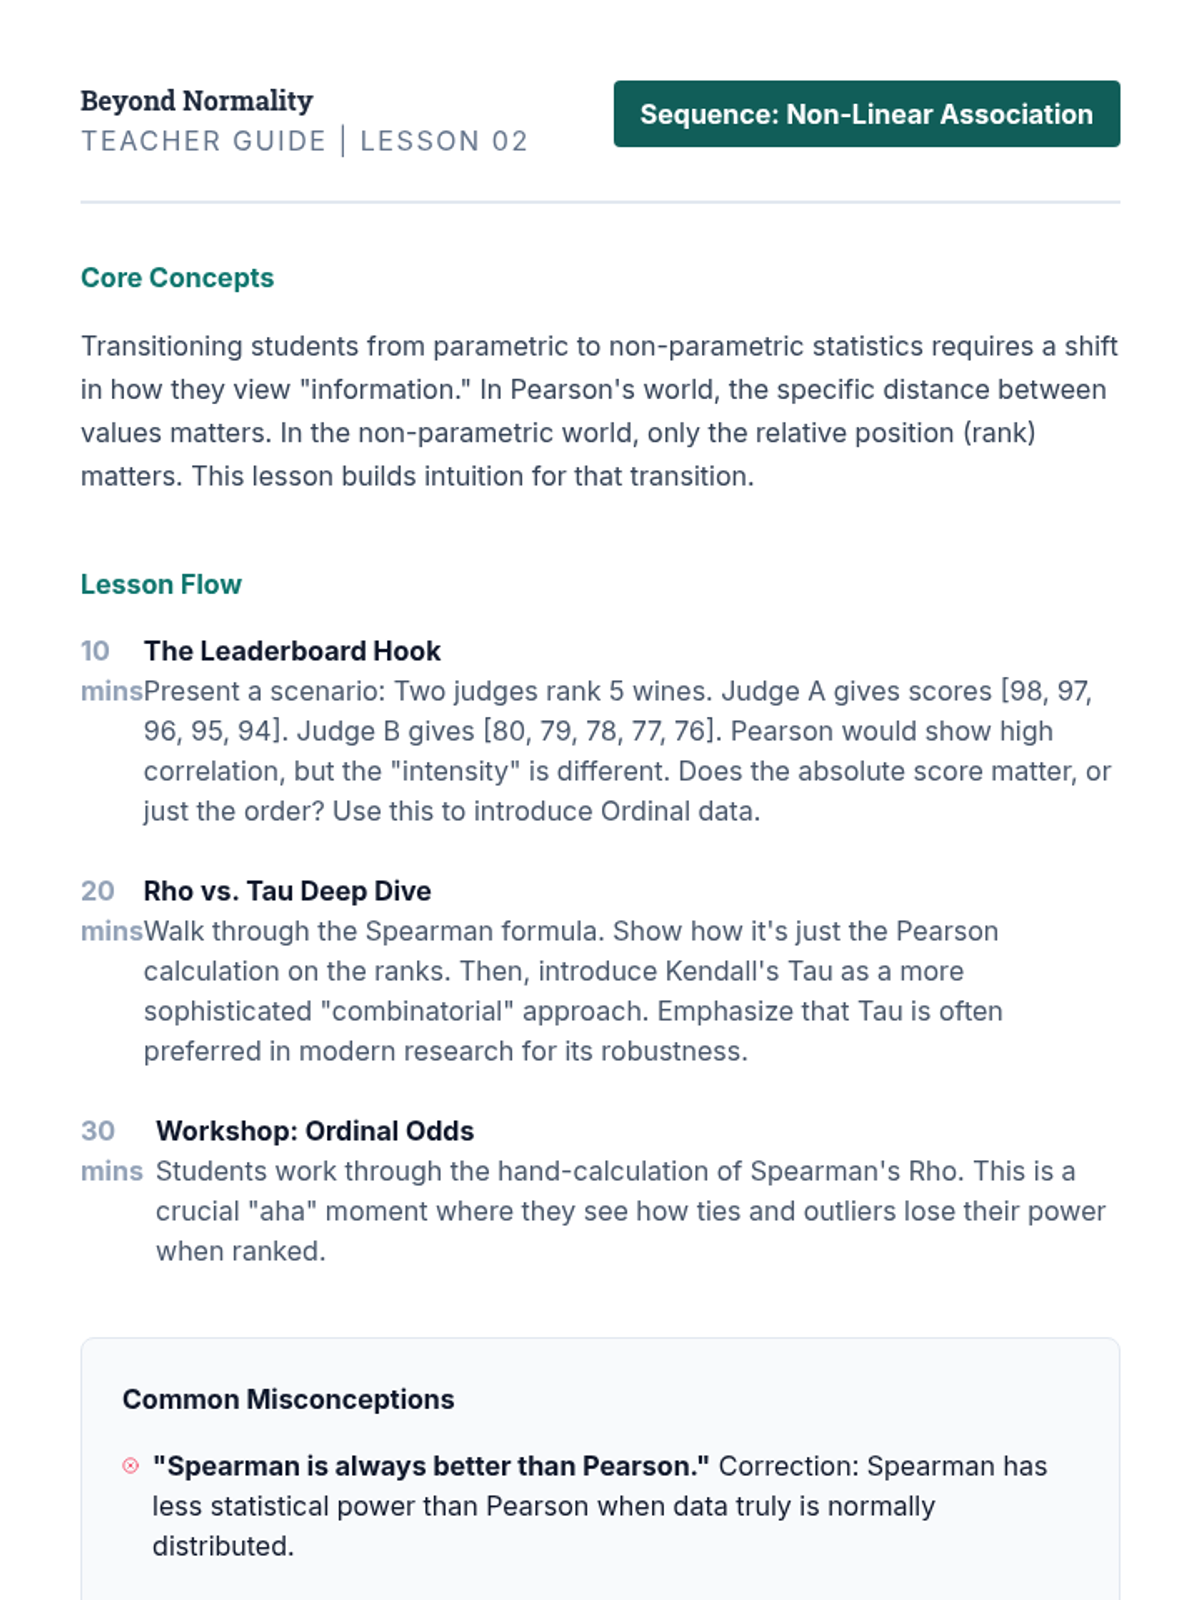
Teacher guide for Lesson 2 focusing on rank-based correlation instructional strategies, common misconceptions, and answer keys.
Slide deck for Lesson 2 introducing rank-based correlation methods like Spearman's rho and Kendall's tau, focusing on monotonicity and ordinal data.
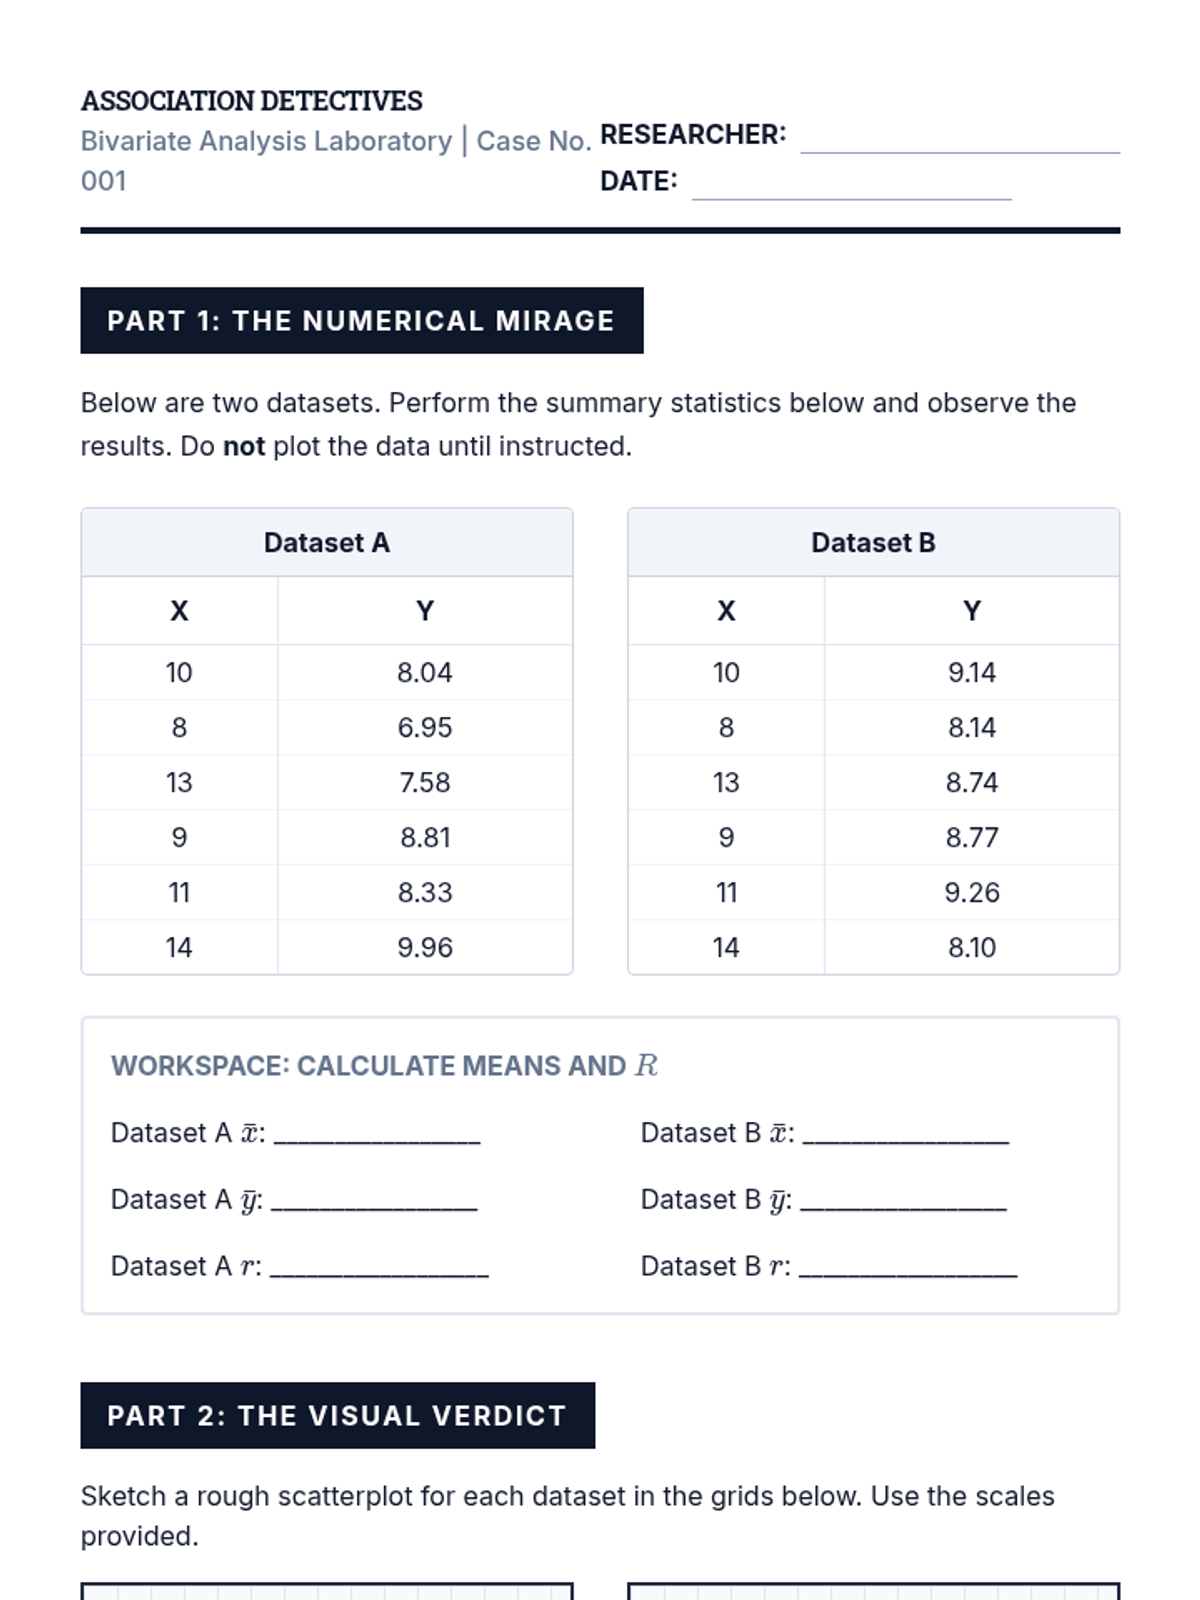
Student worksheet for Lesson 1 where students calculate summary statistics for two datasets that appear identical but reveal different structures when visualized.
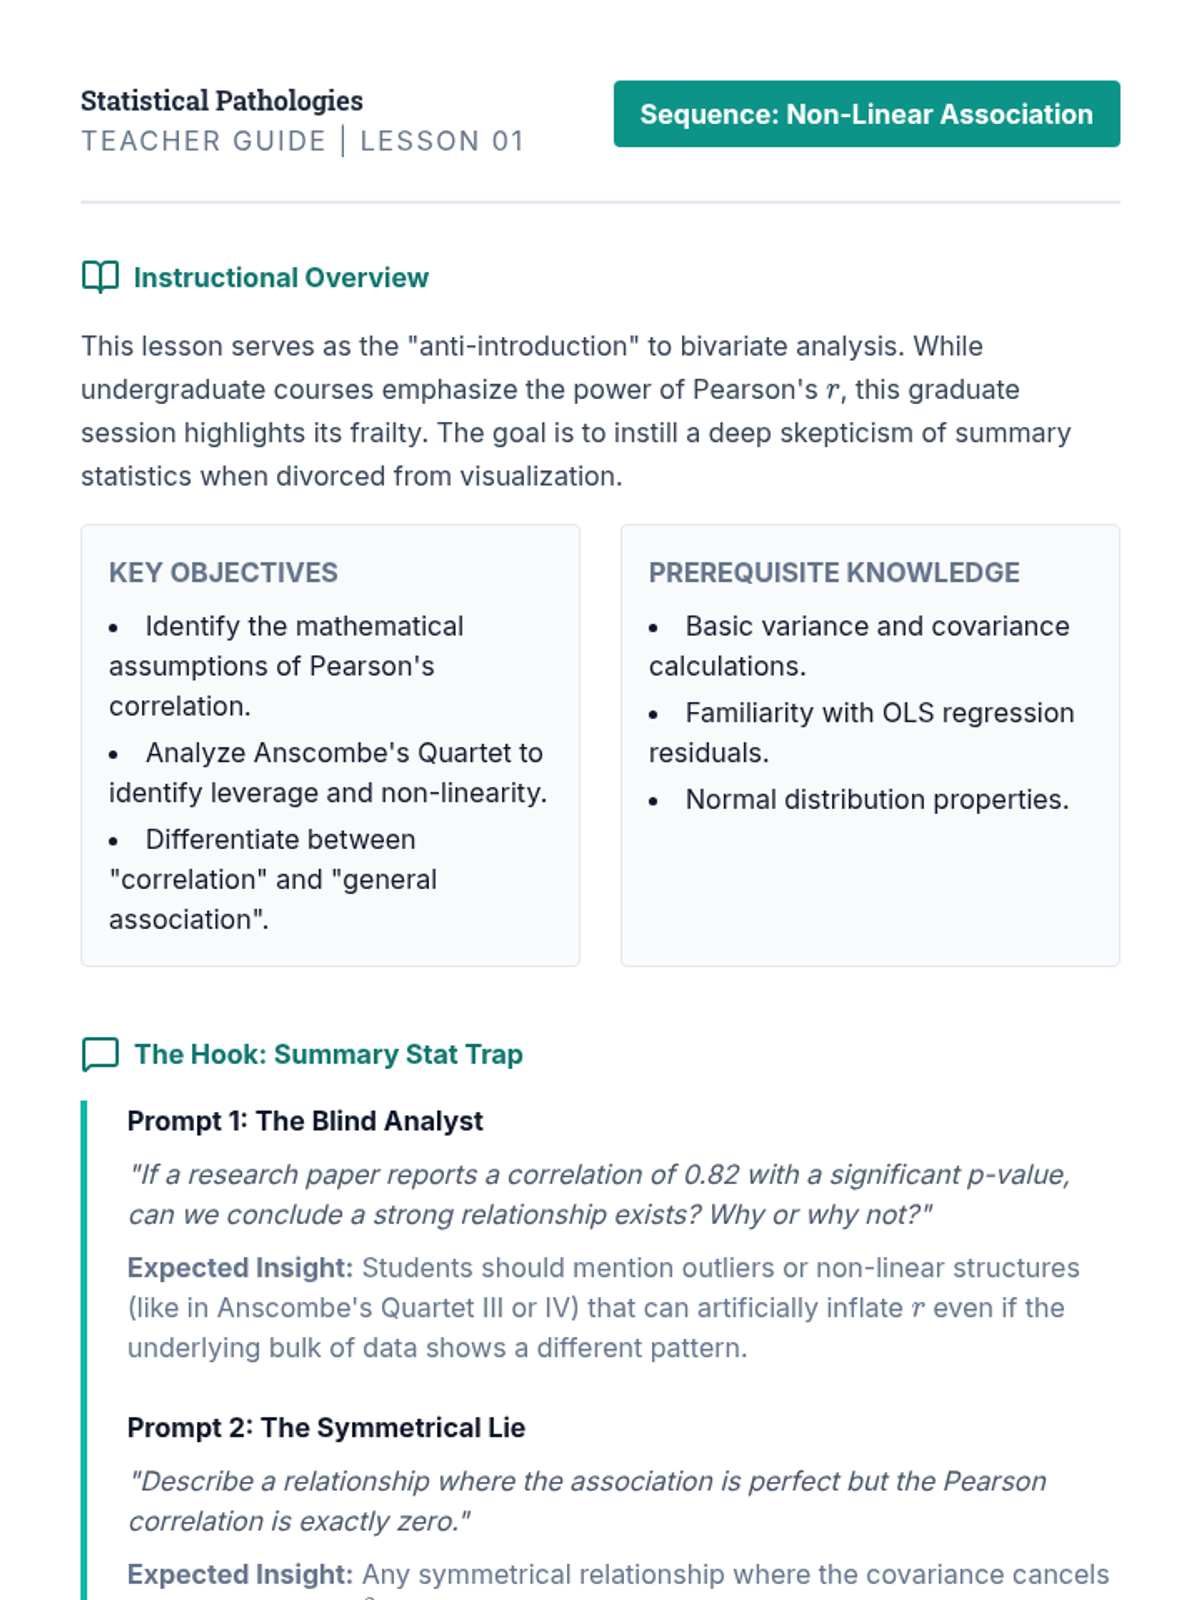
Teacher guide for Lesson 1 focusing on instructional strategies for discussing Pearson's limitations and Anscombe's Quartet.
Introductory slide deck for Lesson 1, visually demonstrating the pitfalls of Pearson's correlation using Anscombe's Quartet and discussing the distinction between linearity and association.
A professional slide deck for Lesson 5, focusing on synthesizing findings into a technical defense of the model selection process.
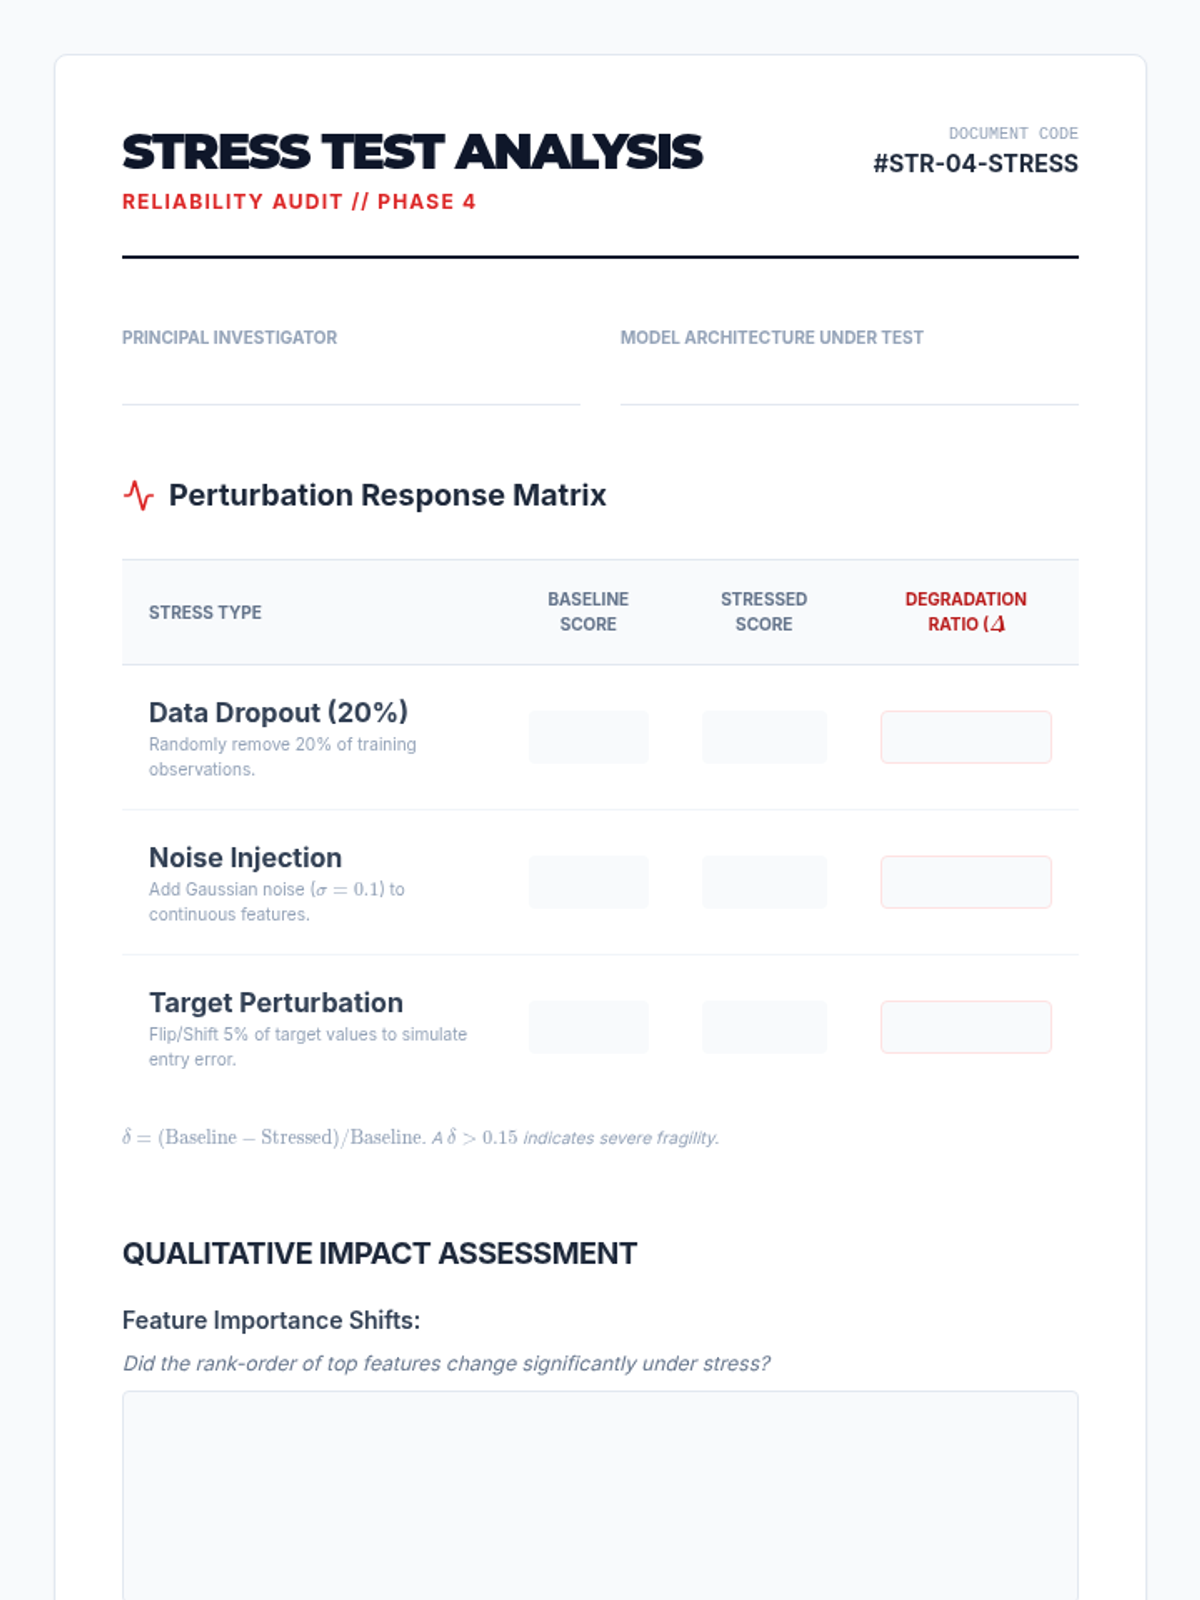
A student worksheet for documenting model performance and degradation under various data stress tests, including dropout, noise, and target perturbation.
A professional slide deck for Lesson 4, focusing on stability analysis and sensitivity testing to ensure model robustness under data perturbation.
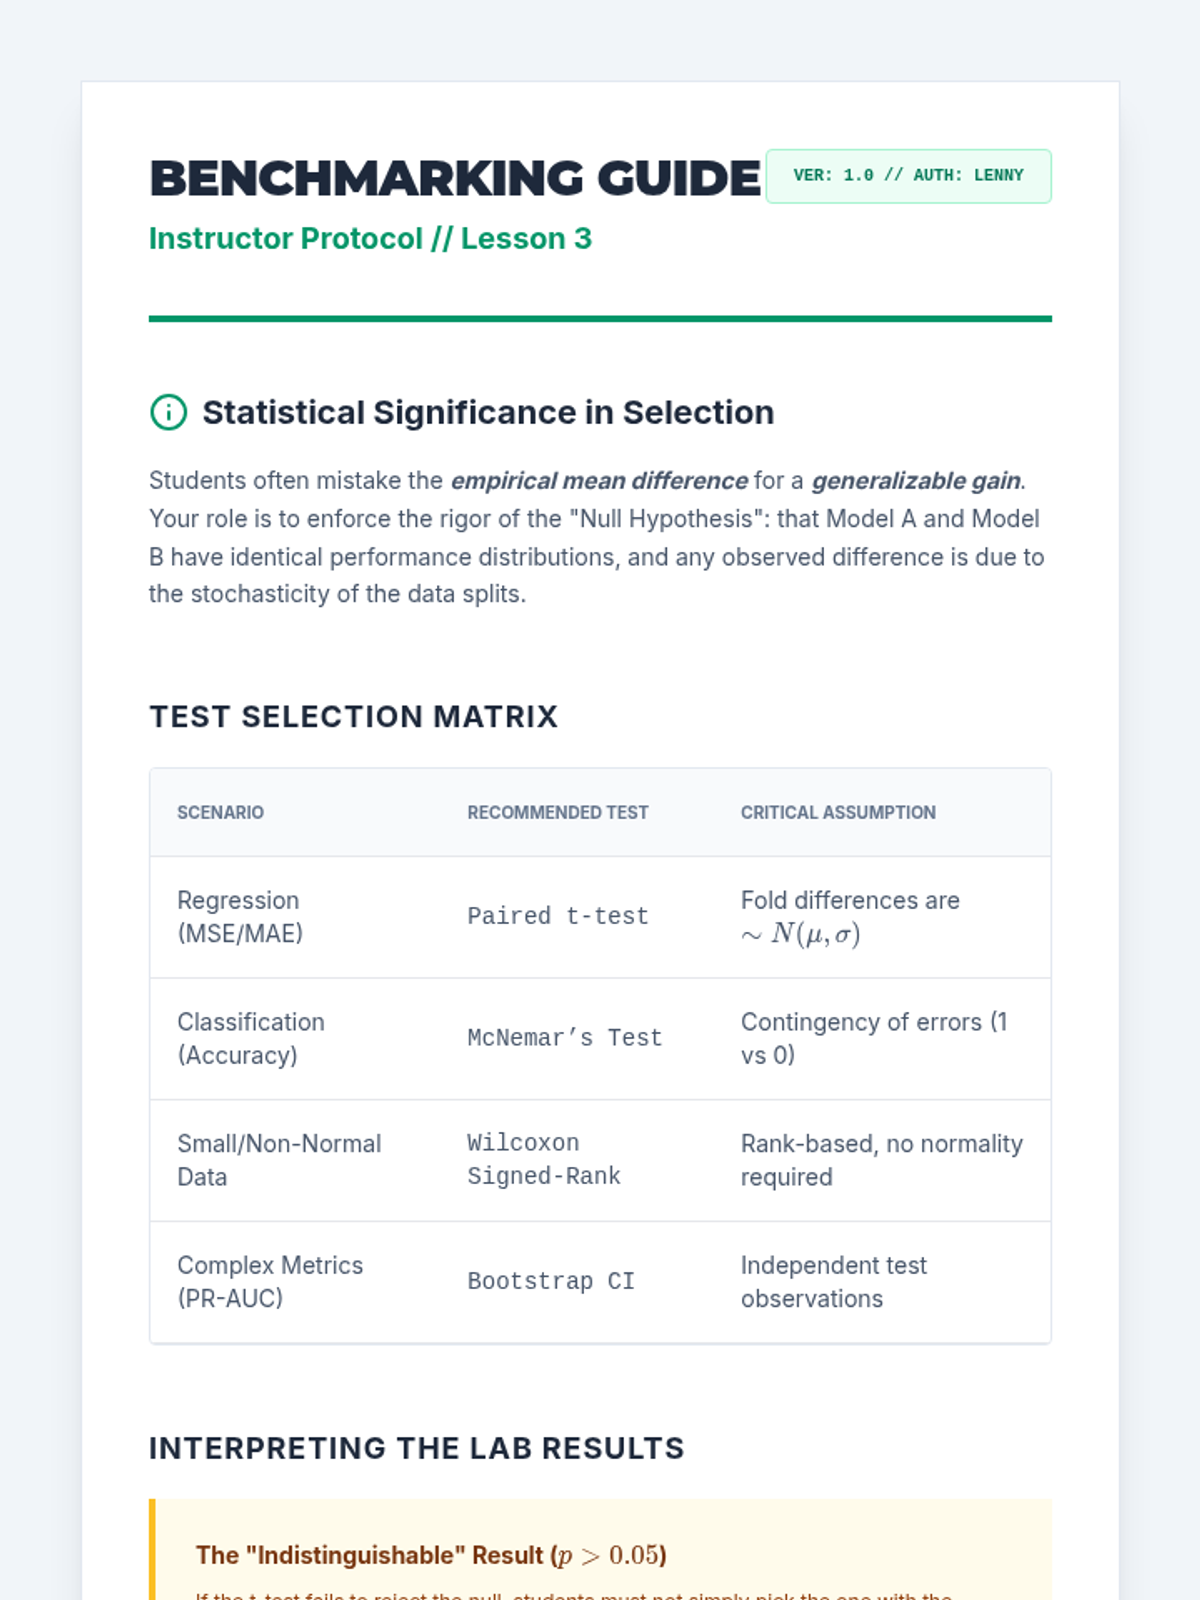
Detailed teacher guide and answer key for the Lesson 3 statistical benchmarking lab, providing guidance on test selection, result interpretation, and statistical pitfalls.
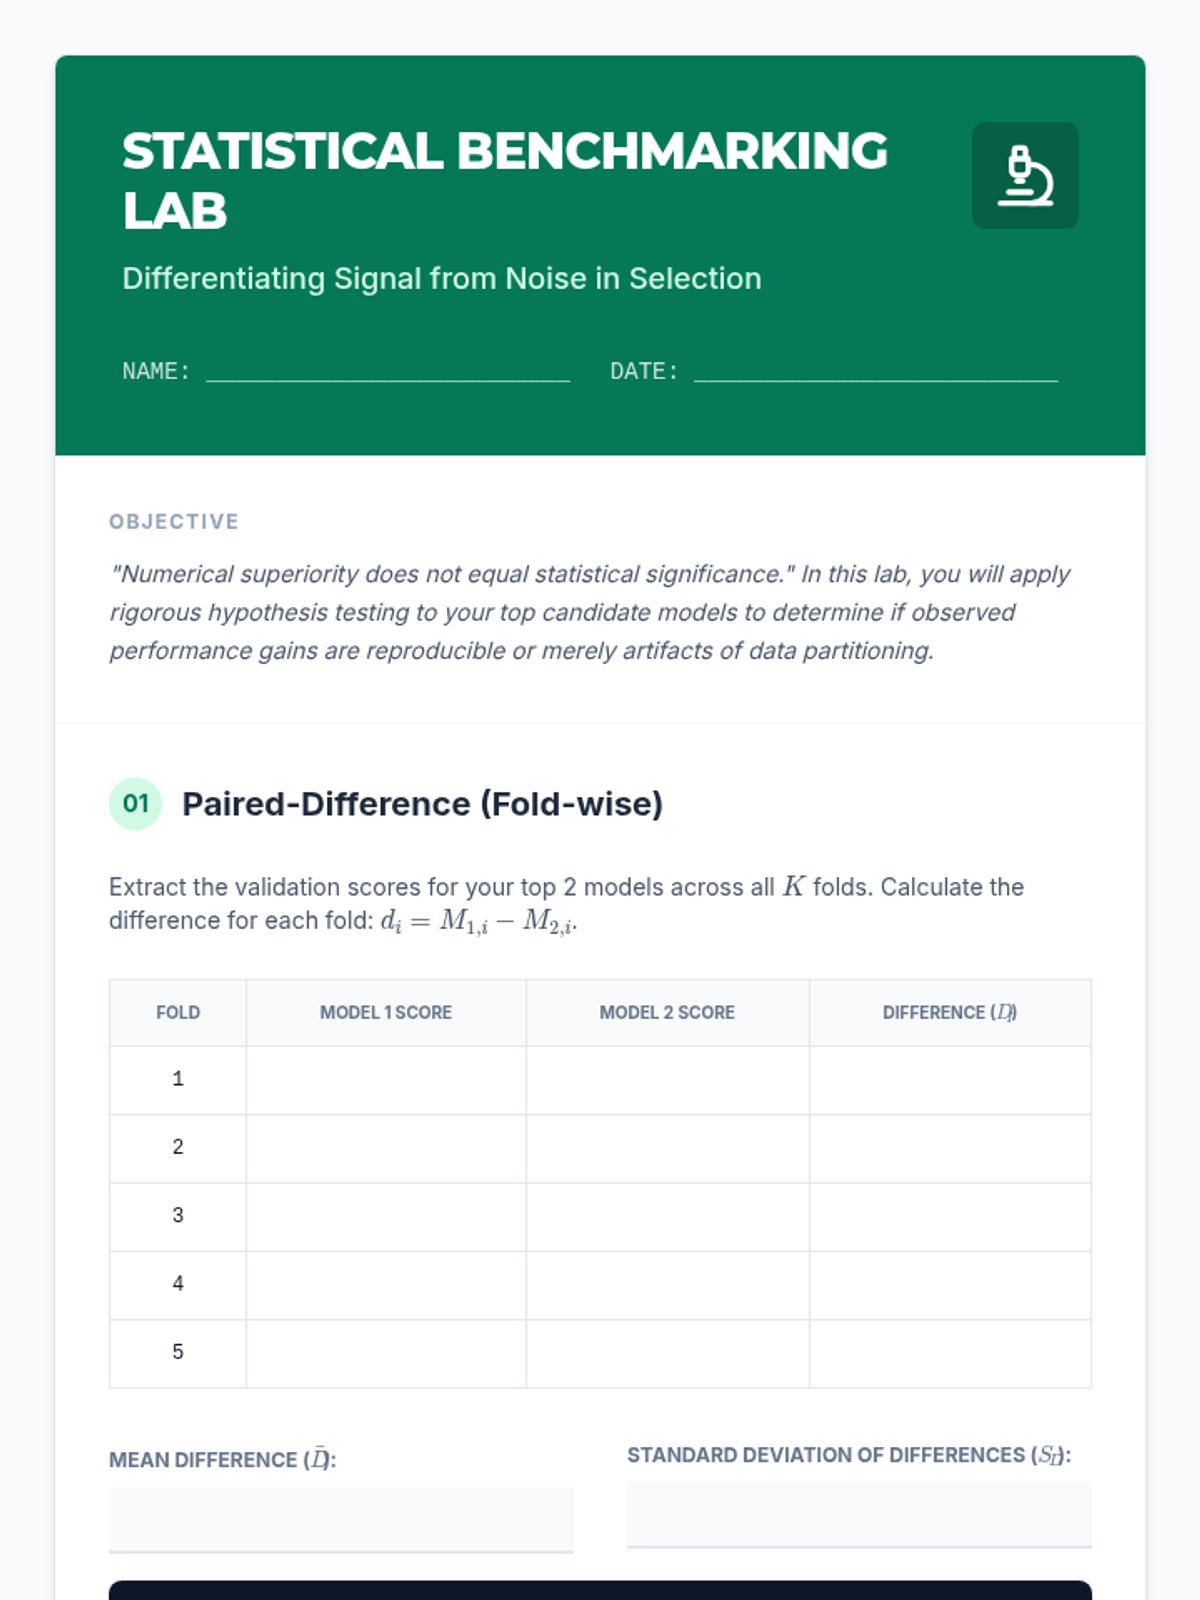
A structured lab worksheet for students to perform paired t-tests and bootstrap analysis to determine the statistical significance of model performance differences.