Data representation, distributions, and statistical variability using sampling and inference techniques. Integrates probability models, compound events, bivariate patterns, and linear models to guide data-driven decision making.
Computational estimation of expected payoffs for path-dependent derivatives using Geometric Brownian Motion and Monte Carlo simulations.
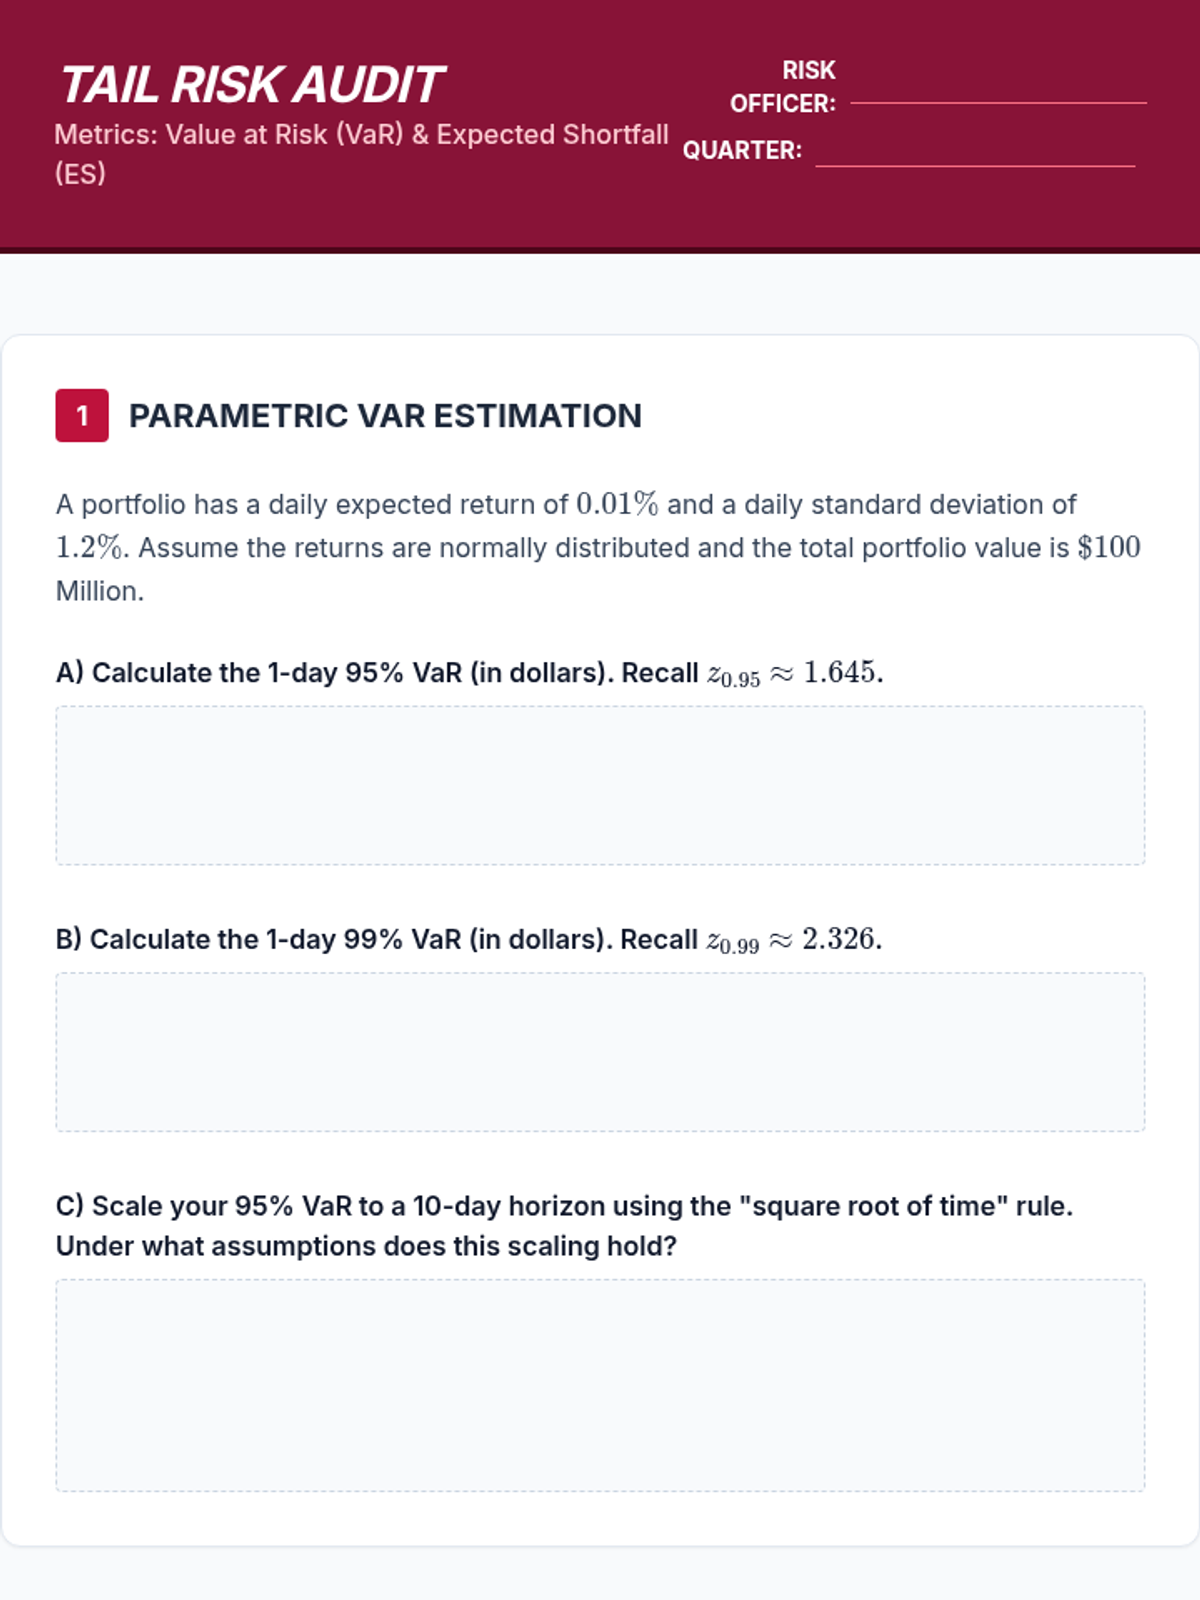
Analysis of tail risk through Value at Risk (VaR) and Expected Shortfall, focusing on the limitations of normal distributions.
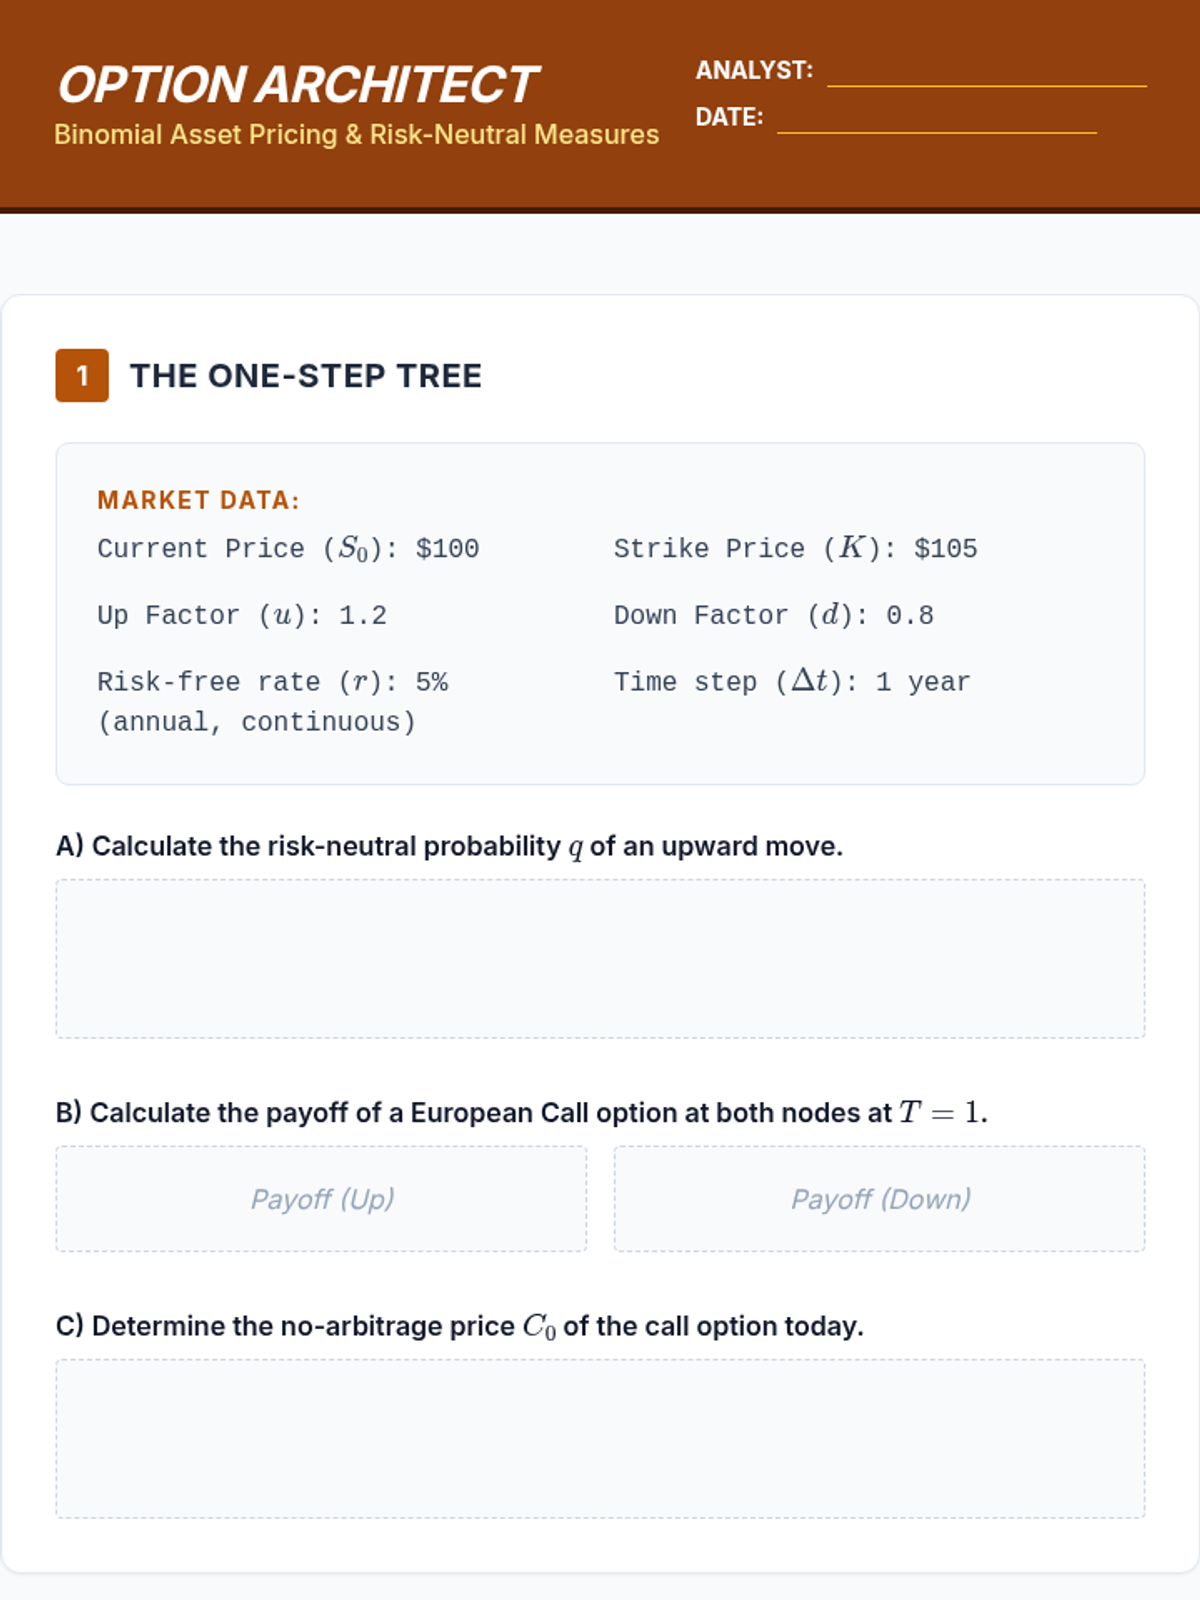
Introduction to risk-neutral measures and binomial pricing models, using expected values to price options without arbitrage.
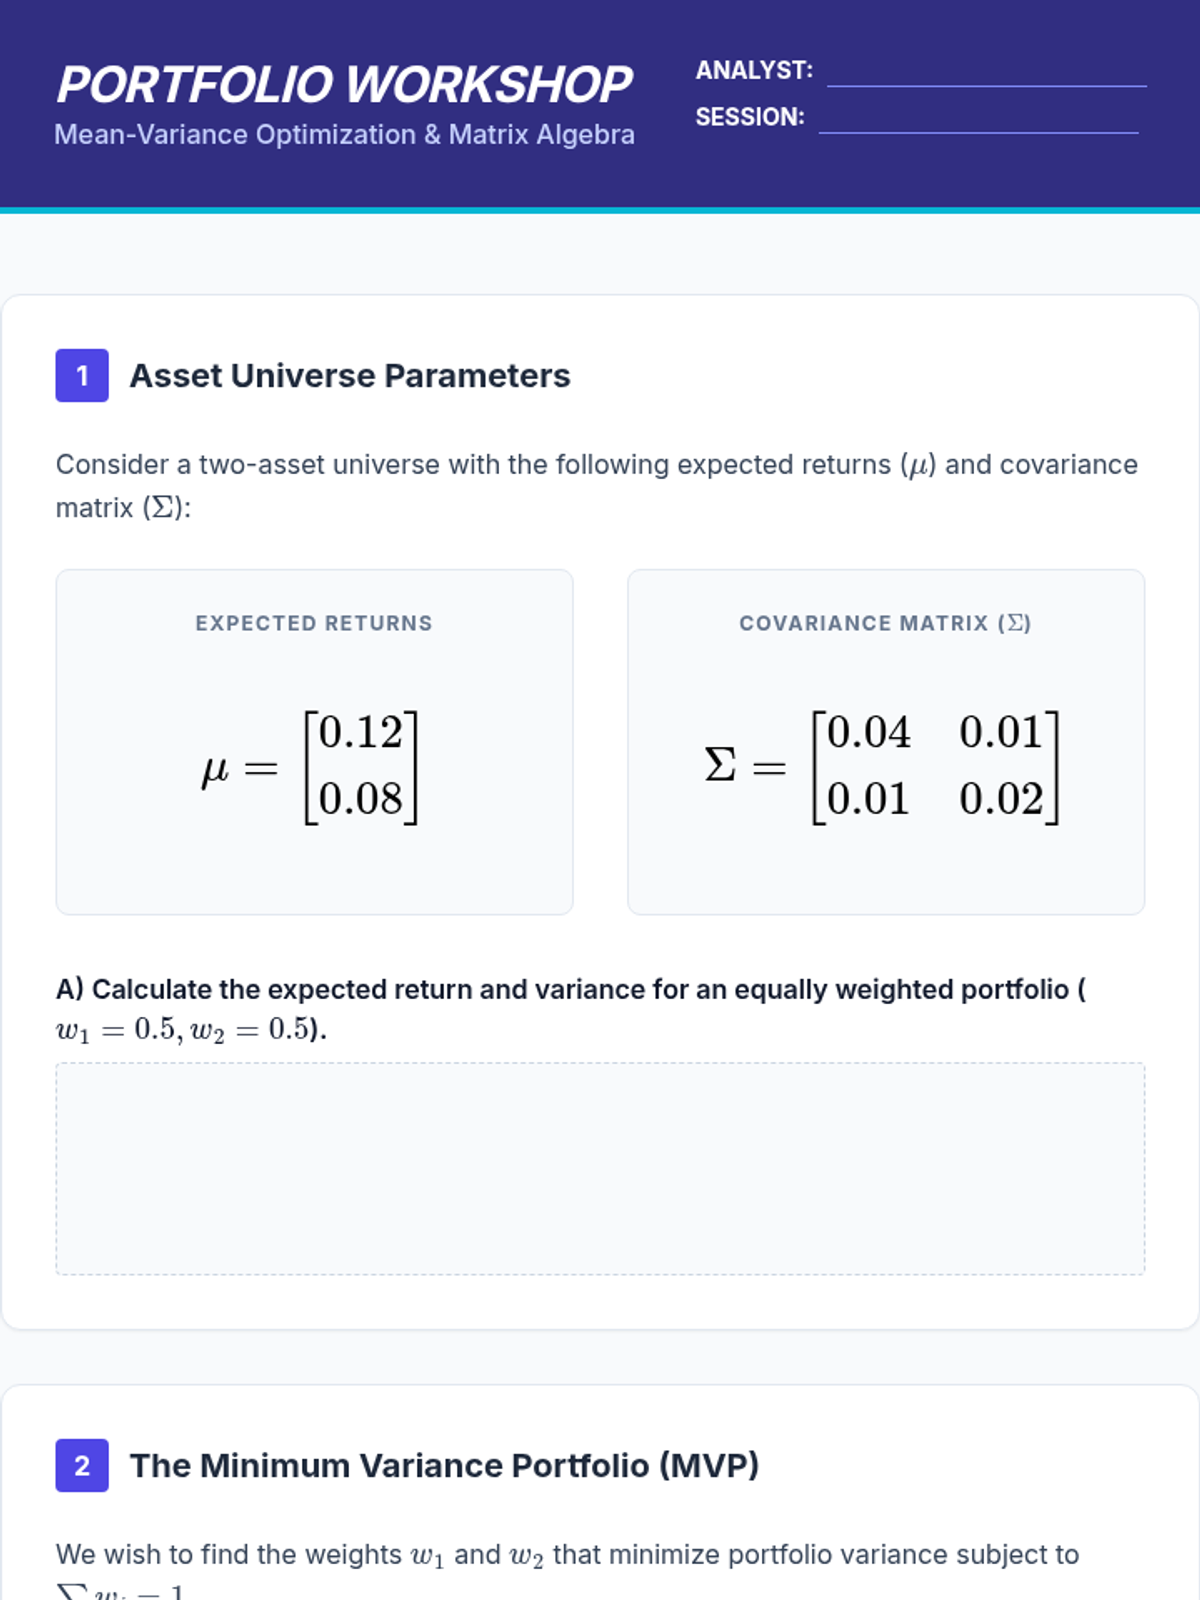
Application of expected value to asset returns using matrix algebra to derive the Efficient Frontier and optimize portfolios.
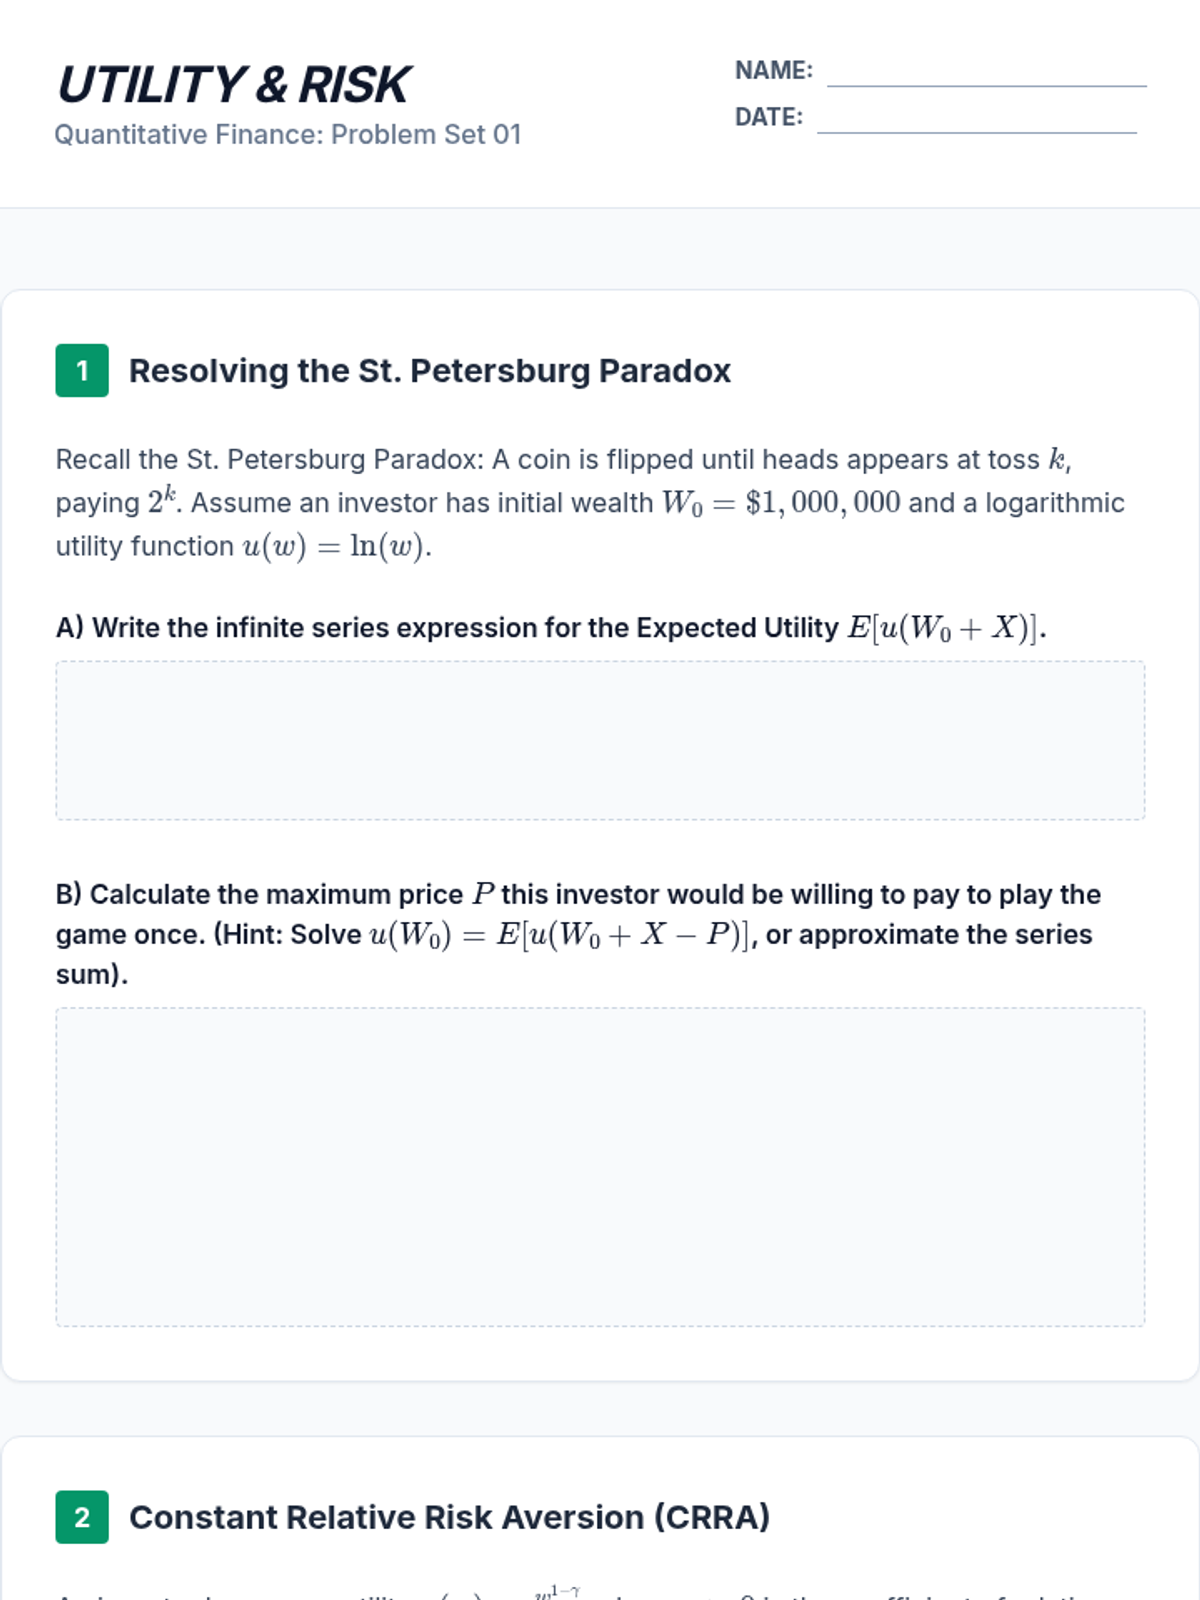
Students contrast mathematical expected value with expected utility to explain decision-making under uncertainty, analyzing different utility functions to model risk-averse behavior.
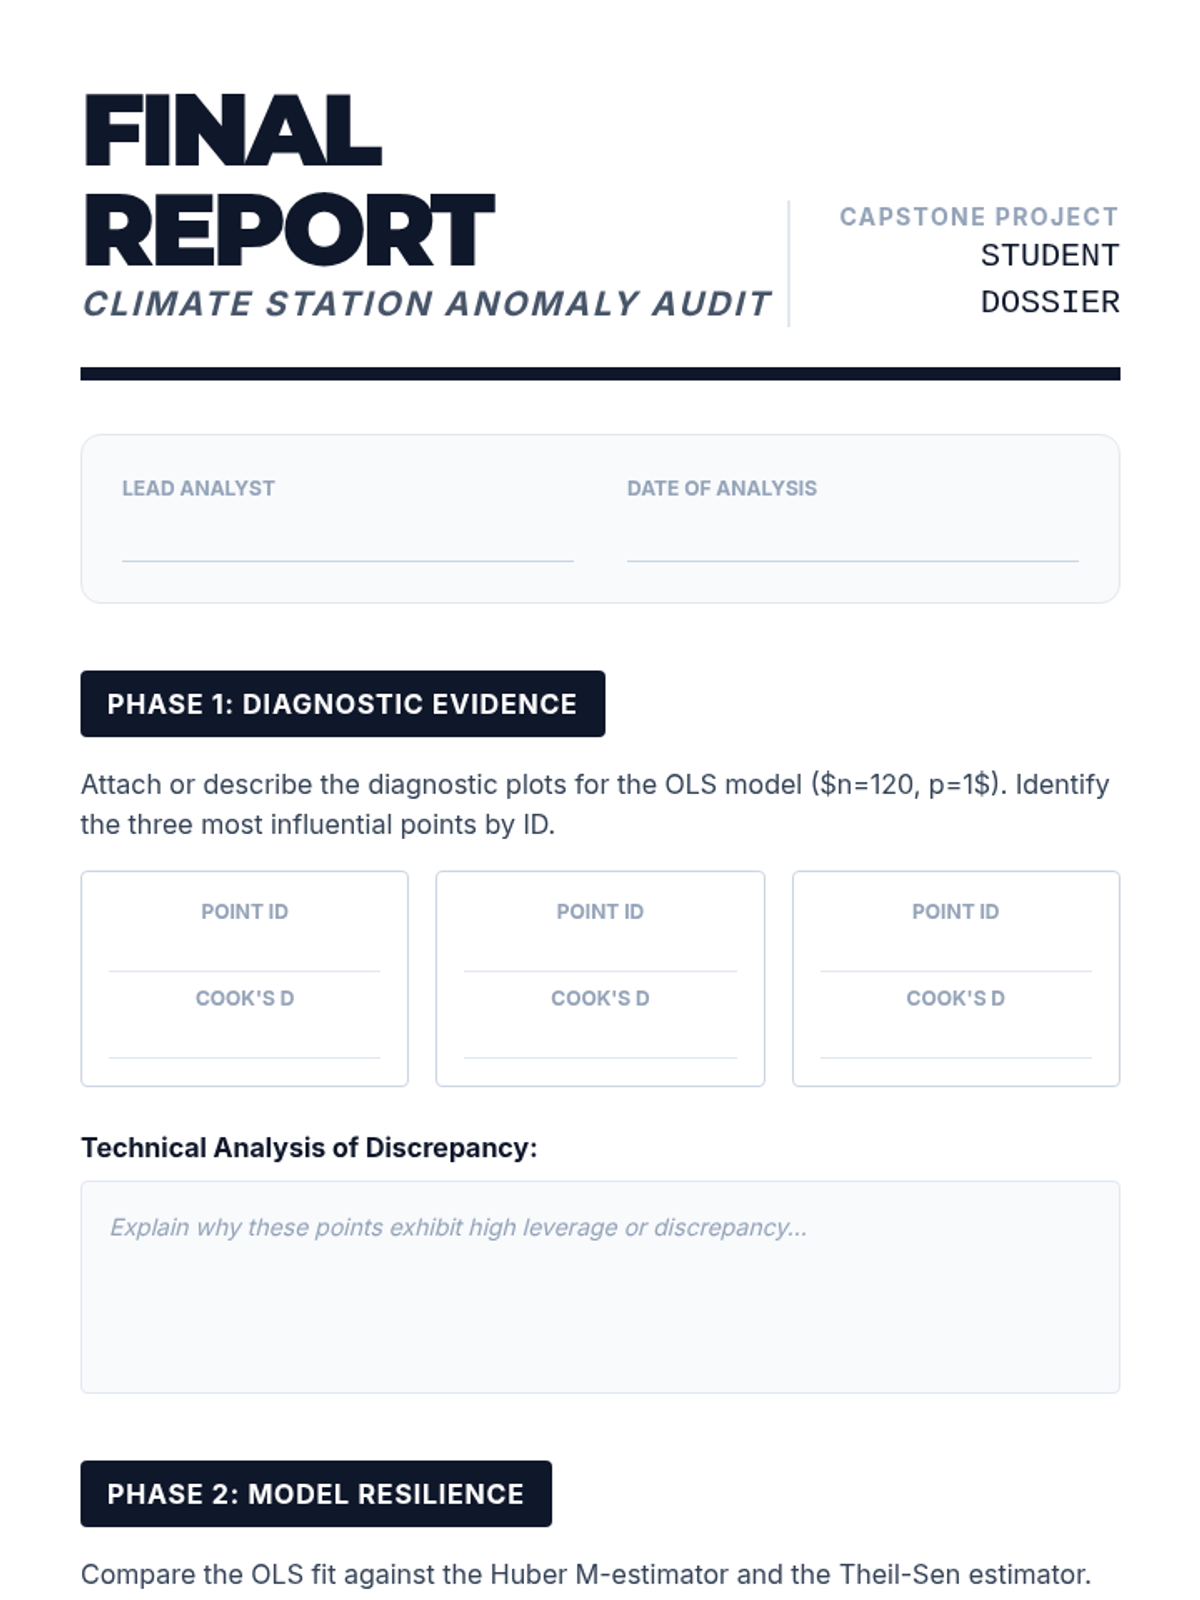
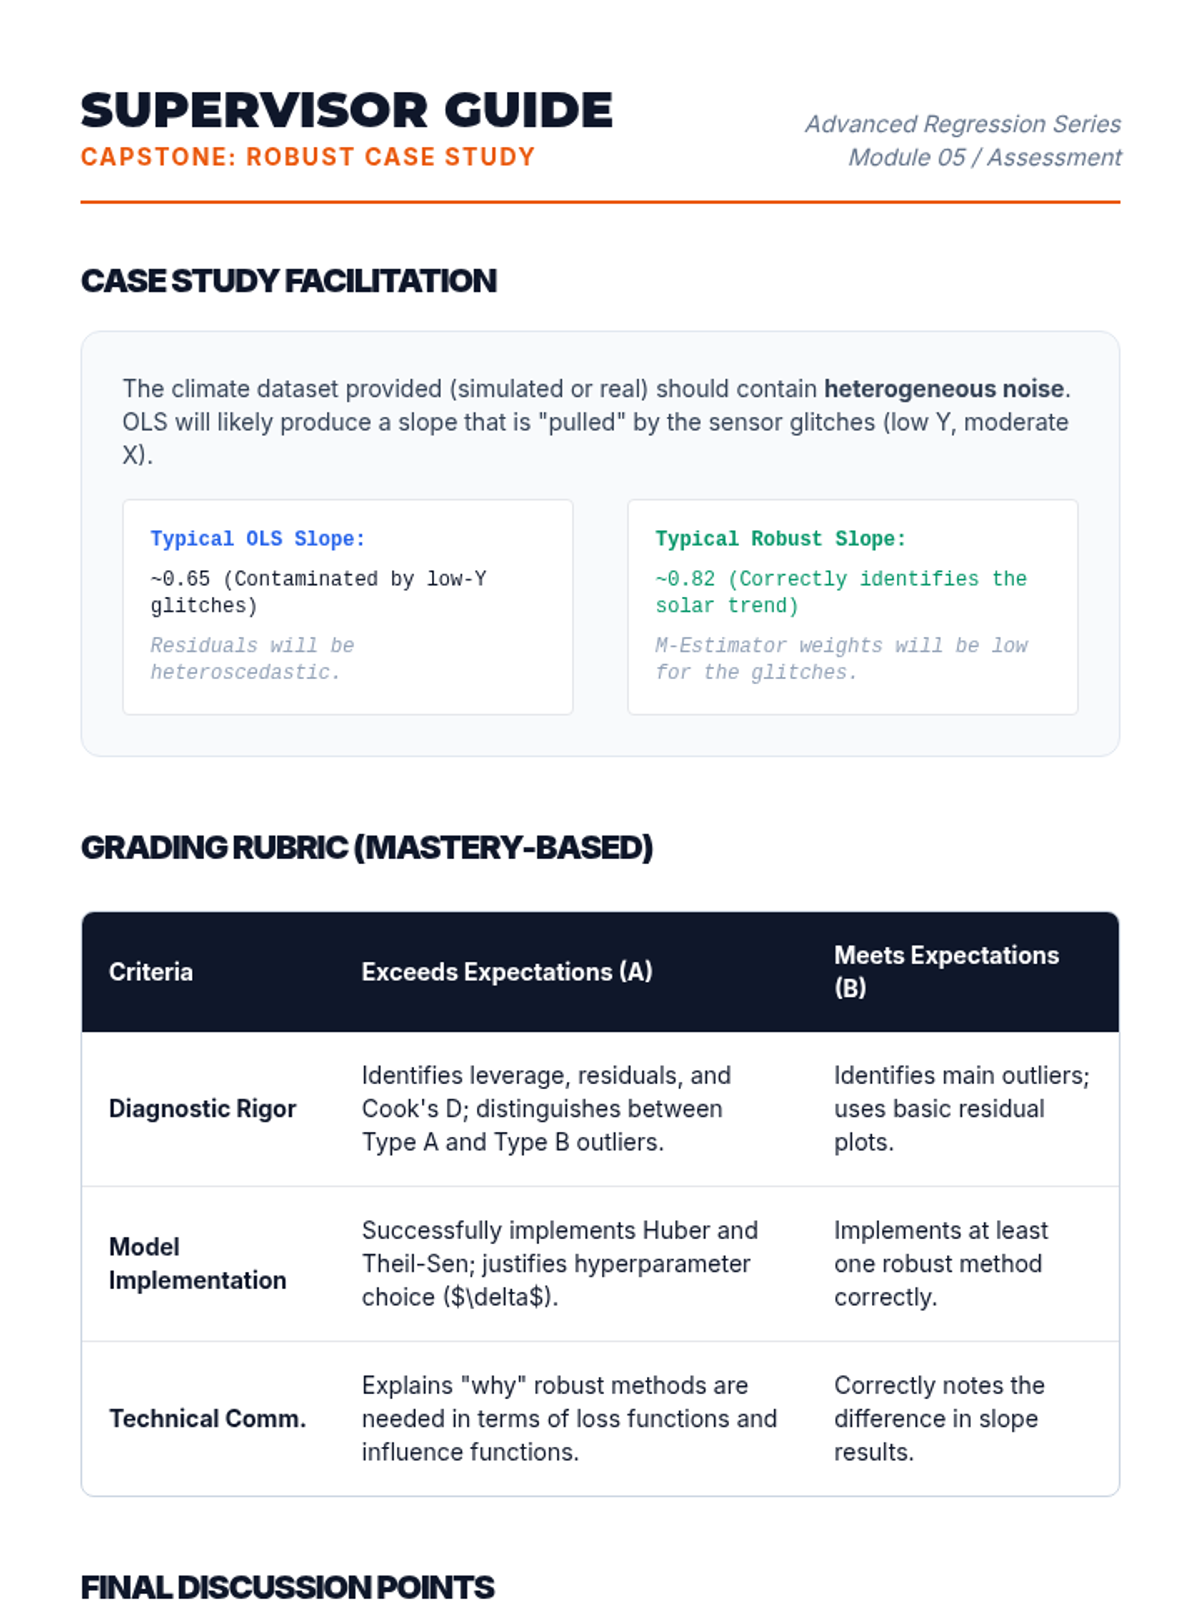
Students analyze a contaminated dataset (e.g., historical climate data with sensor errors) using both OLS and robust methods. They must justify their choice of model and explain the nature of the identified outliers.
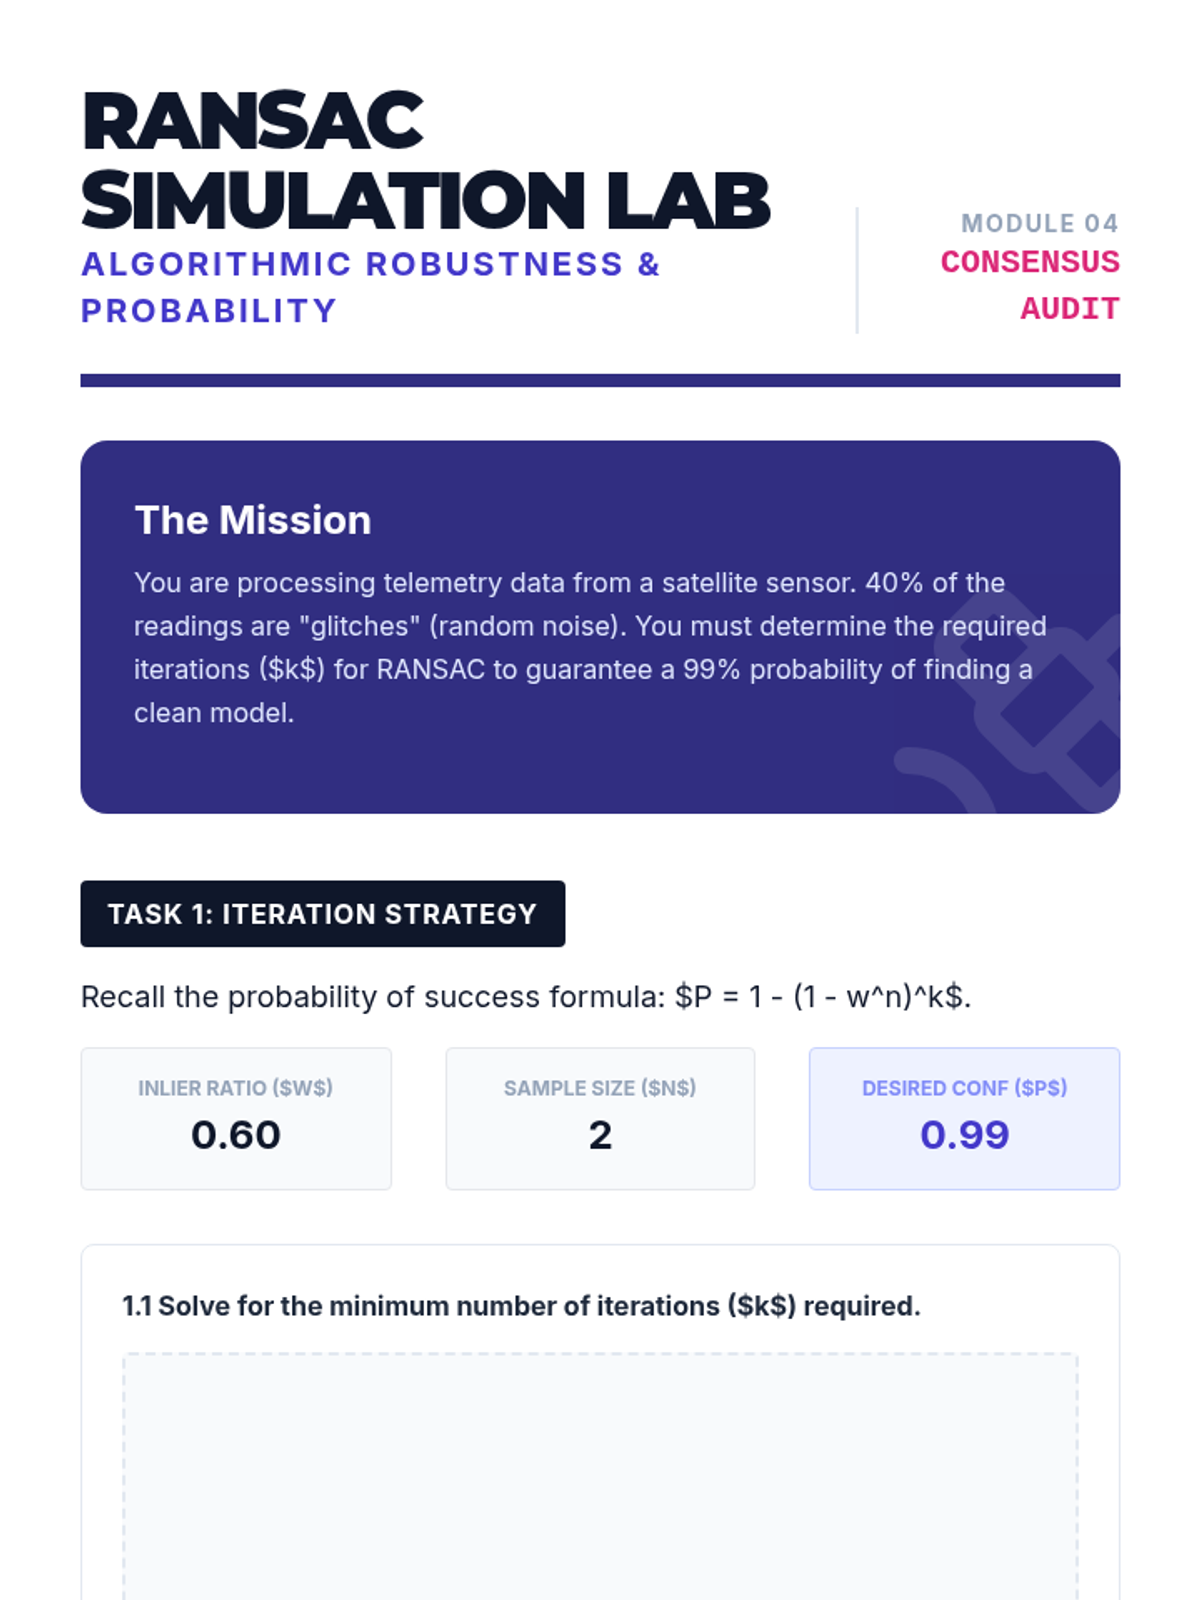
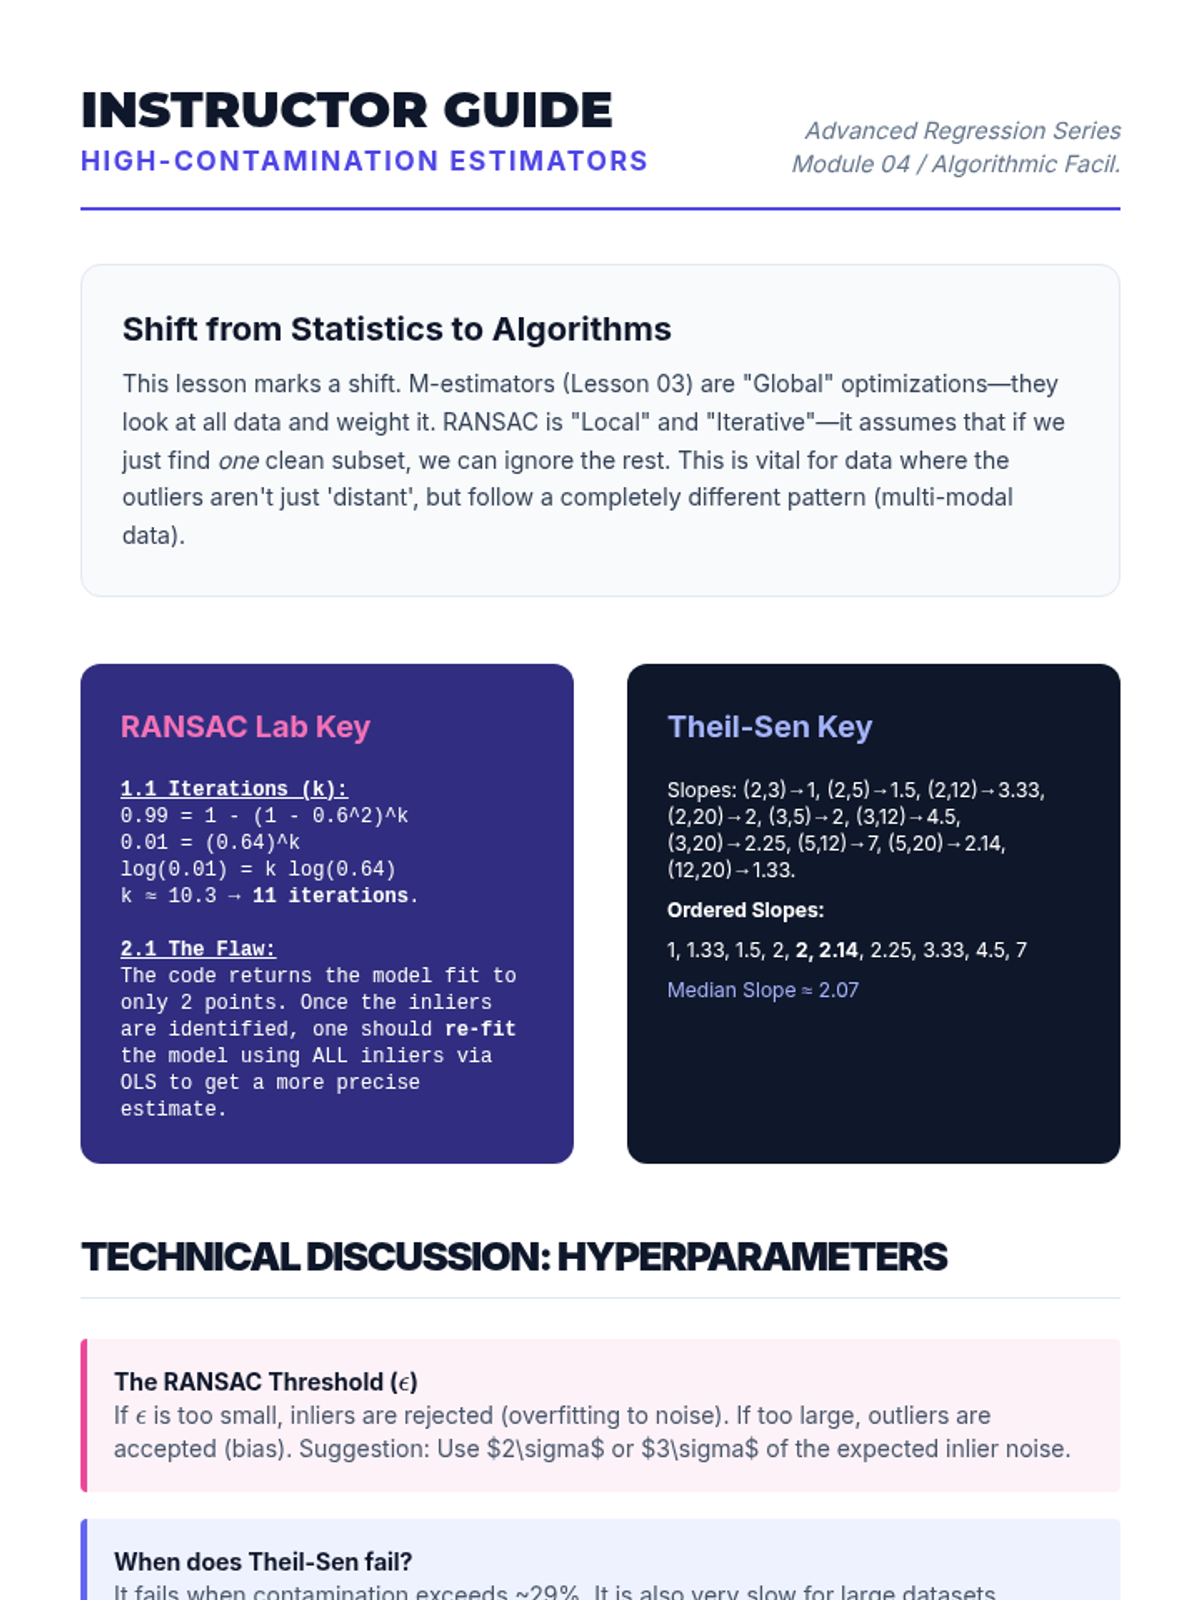
This lesson covers iterative robust methods used frequently in computer vision and engineering. Students implement RANSAC (Random Sample Consensus) to fit models to data with high contamination rates (up to 50% outliers).
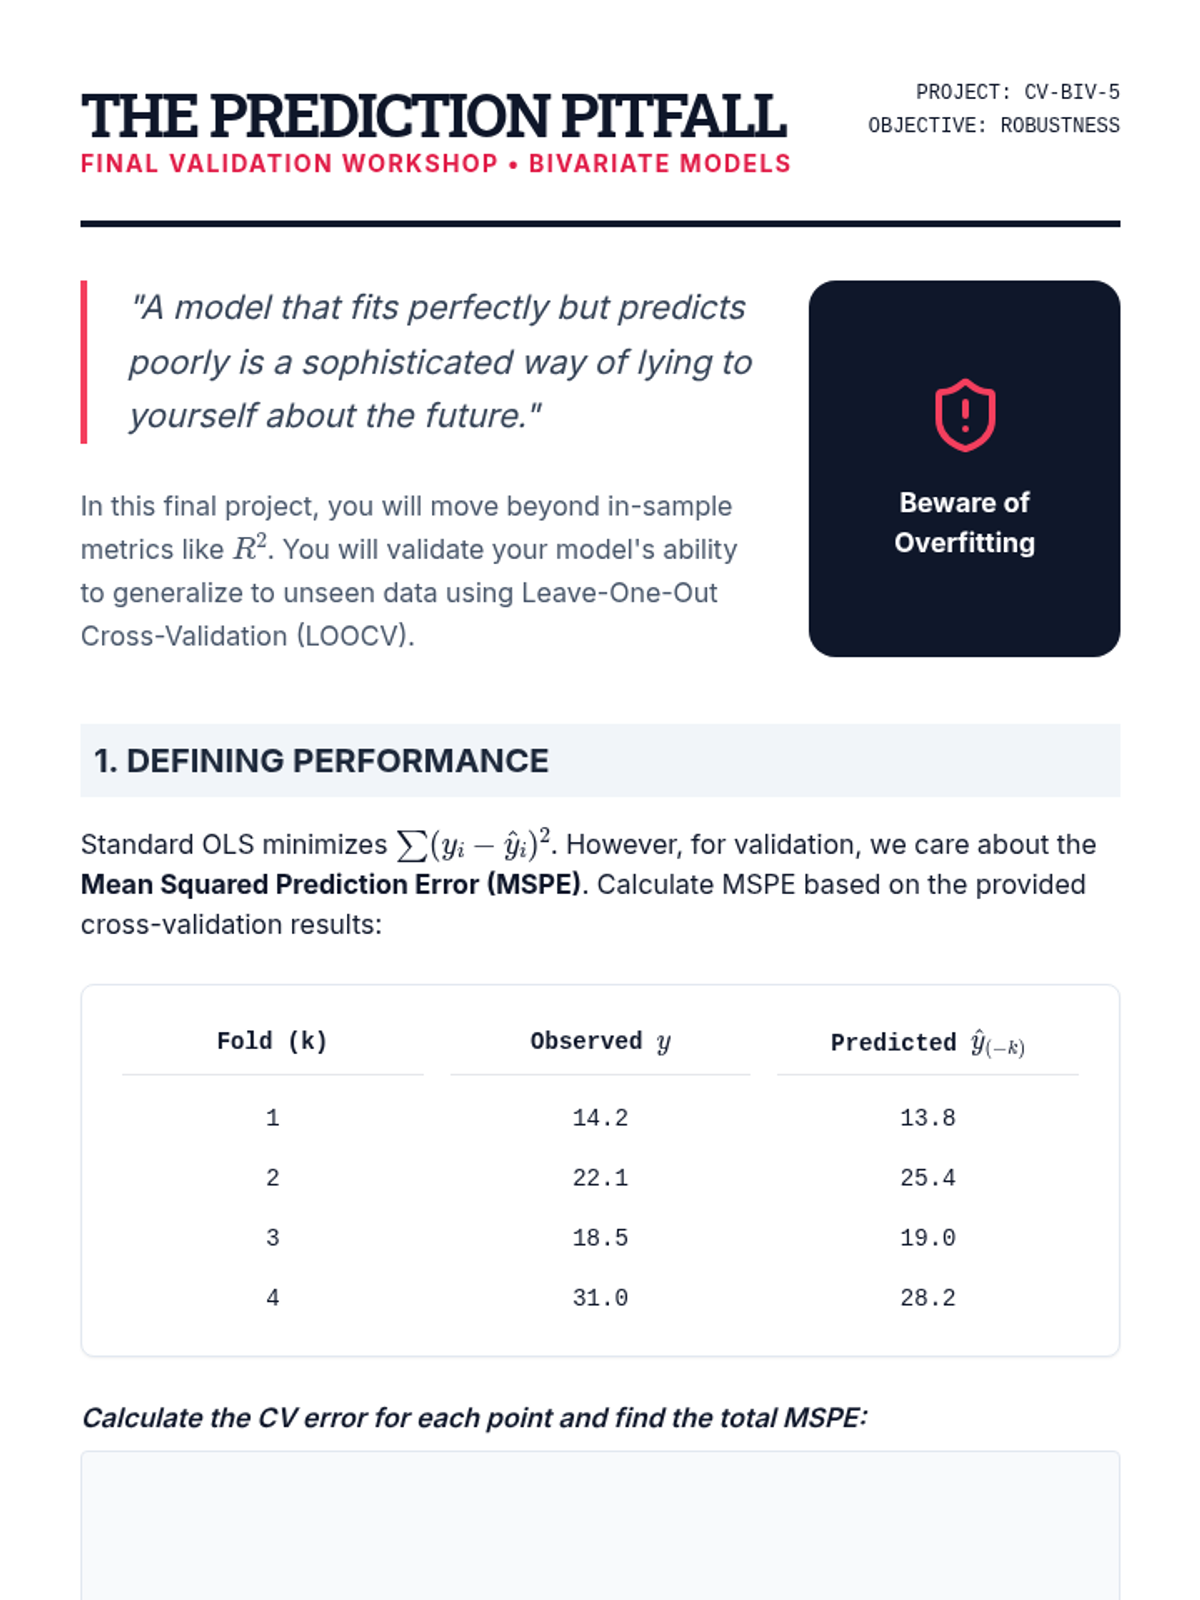
Students synthesize their diagnostic skills by implementing cross-validation frameworks to assess model generalizability and prevent overfitting.
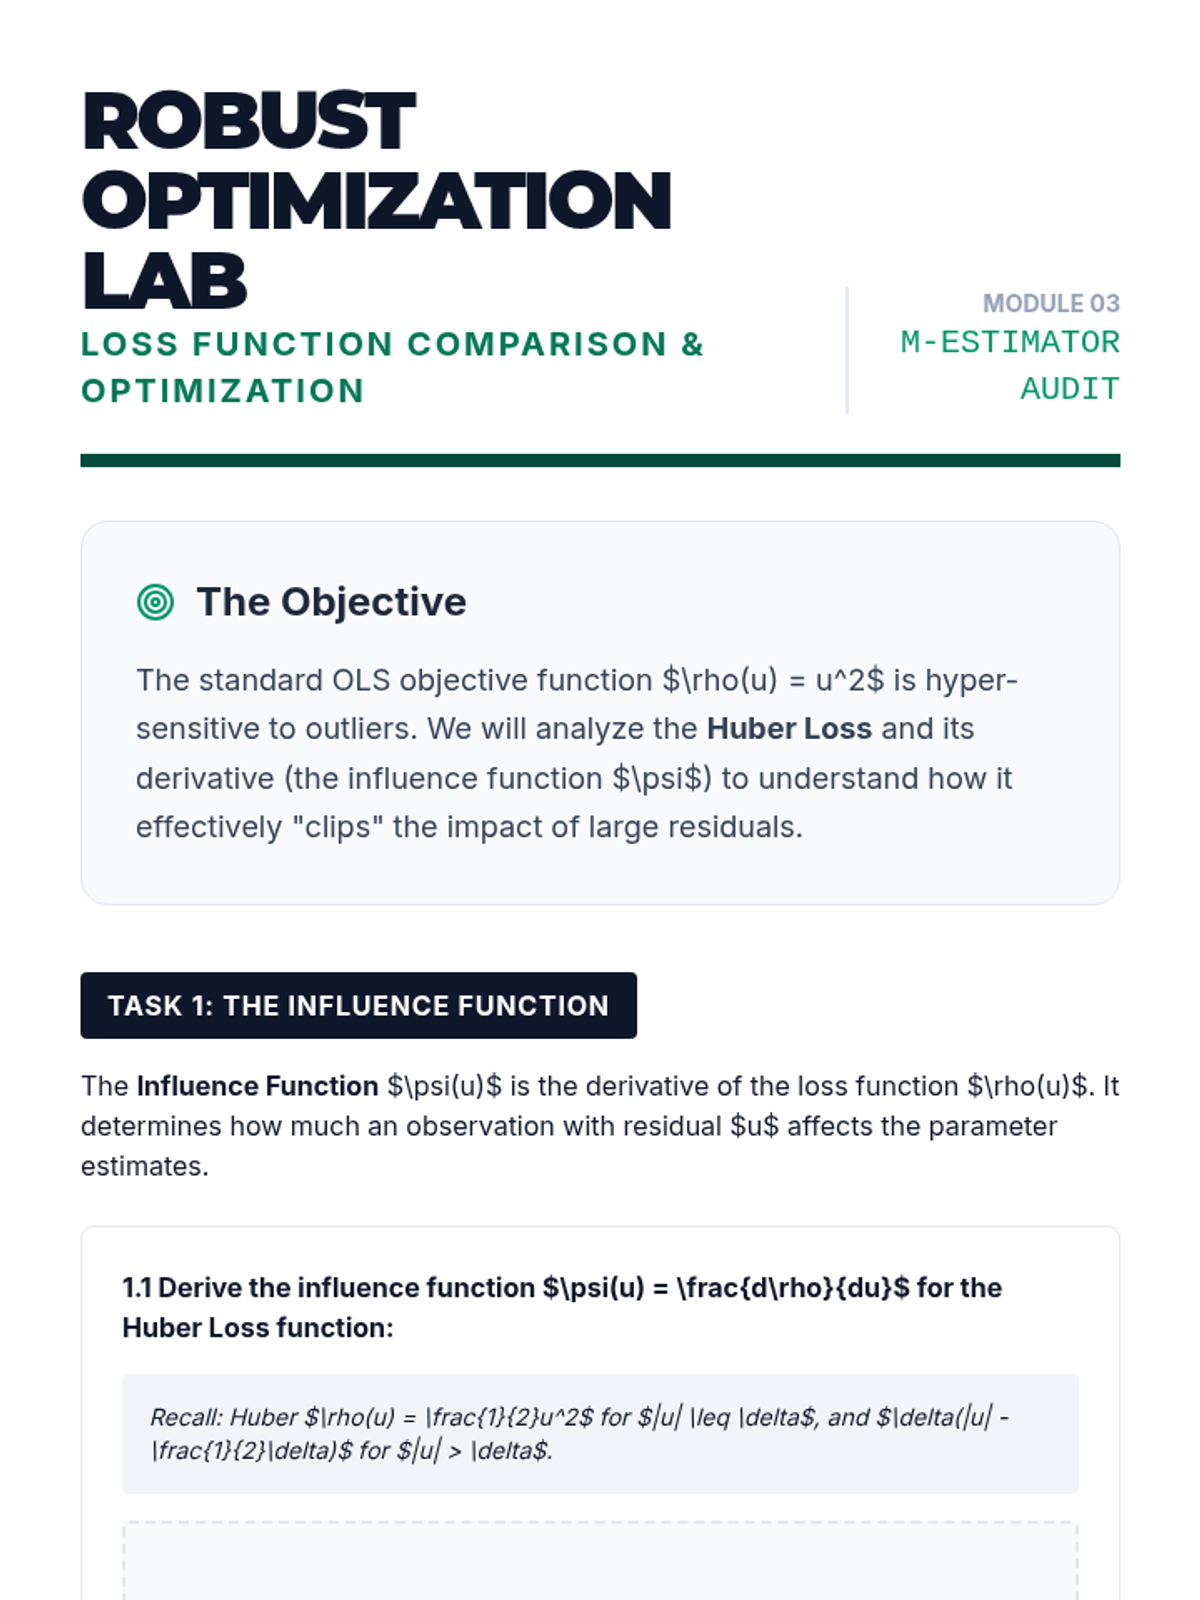
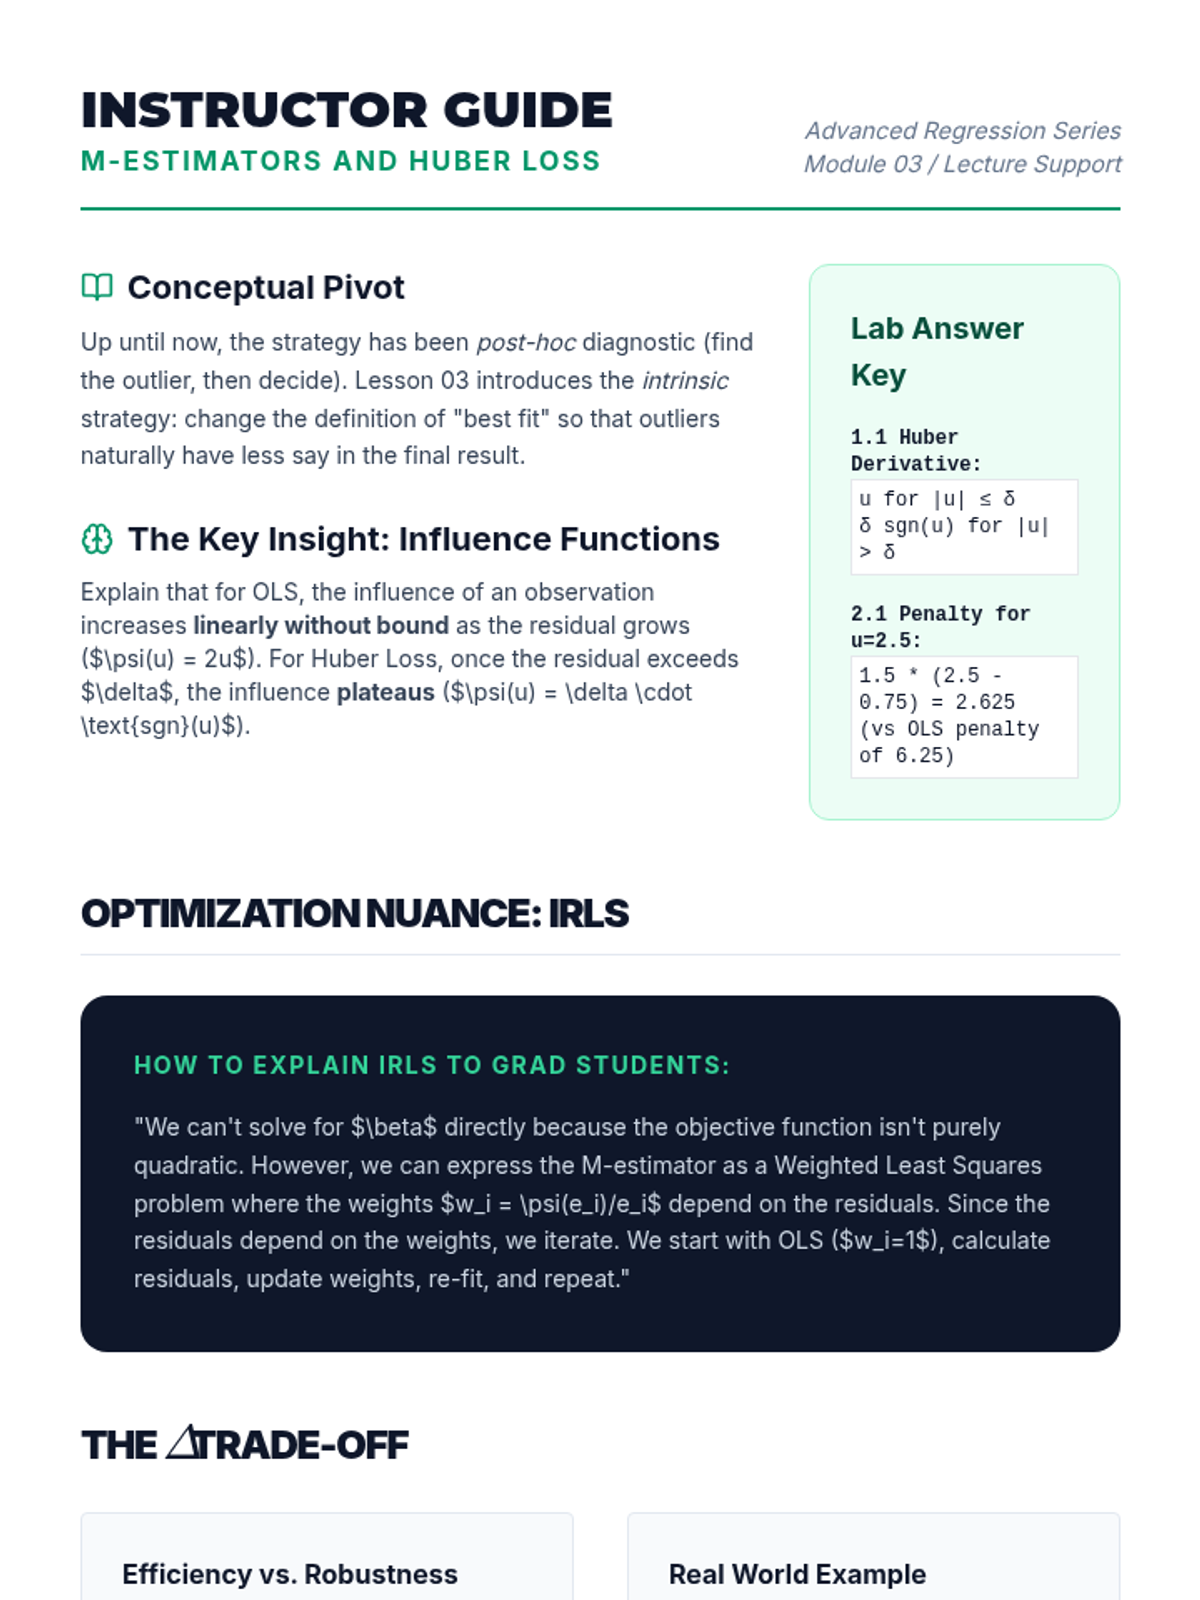
Students are introduced to robust regression techniques that modify the loss function. The lesson contrasts squared error loss (L2) with absolute error (L1) and Huber loss to reduce the impact of outliers.
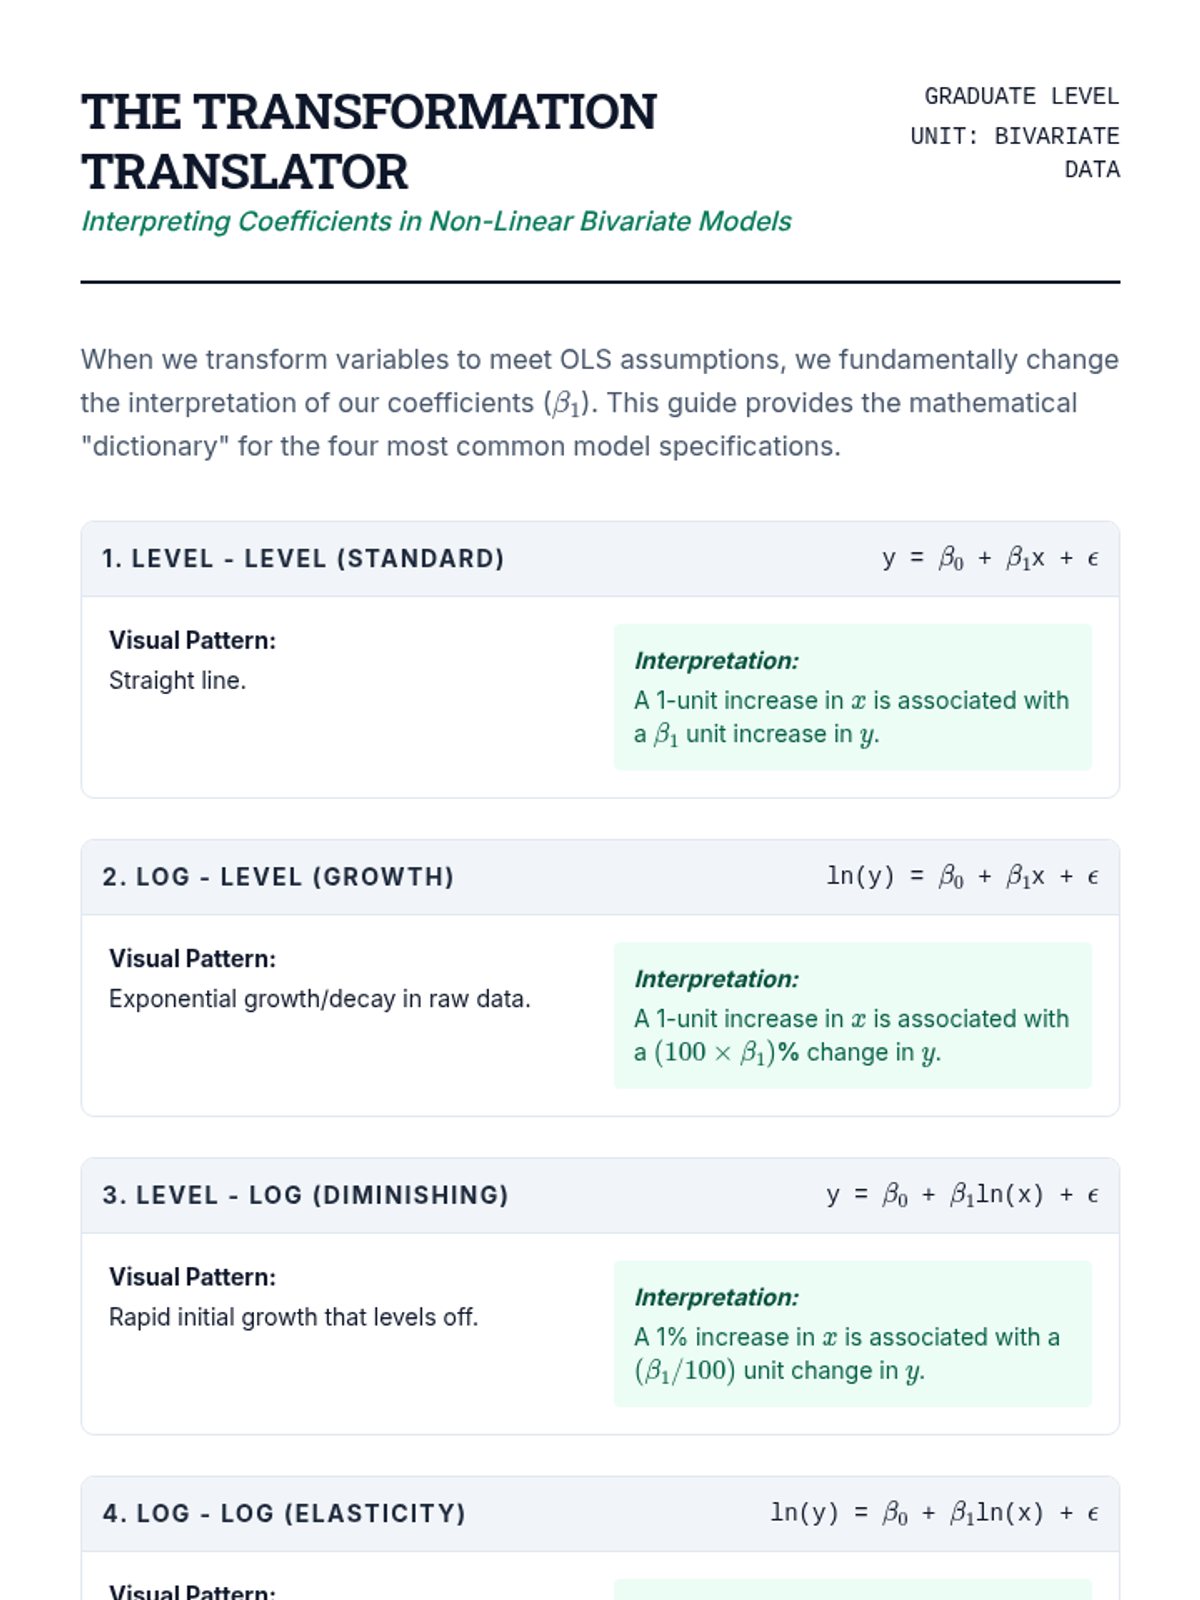
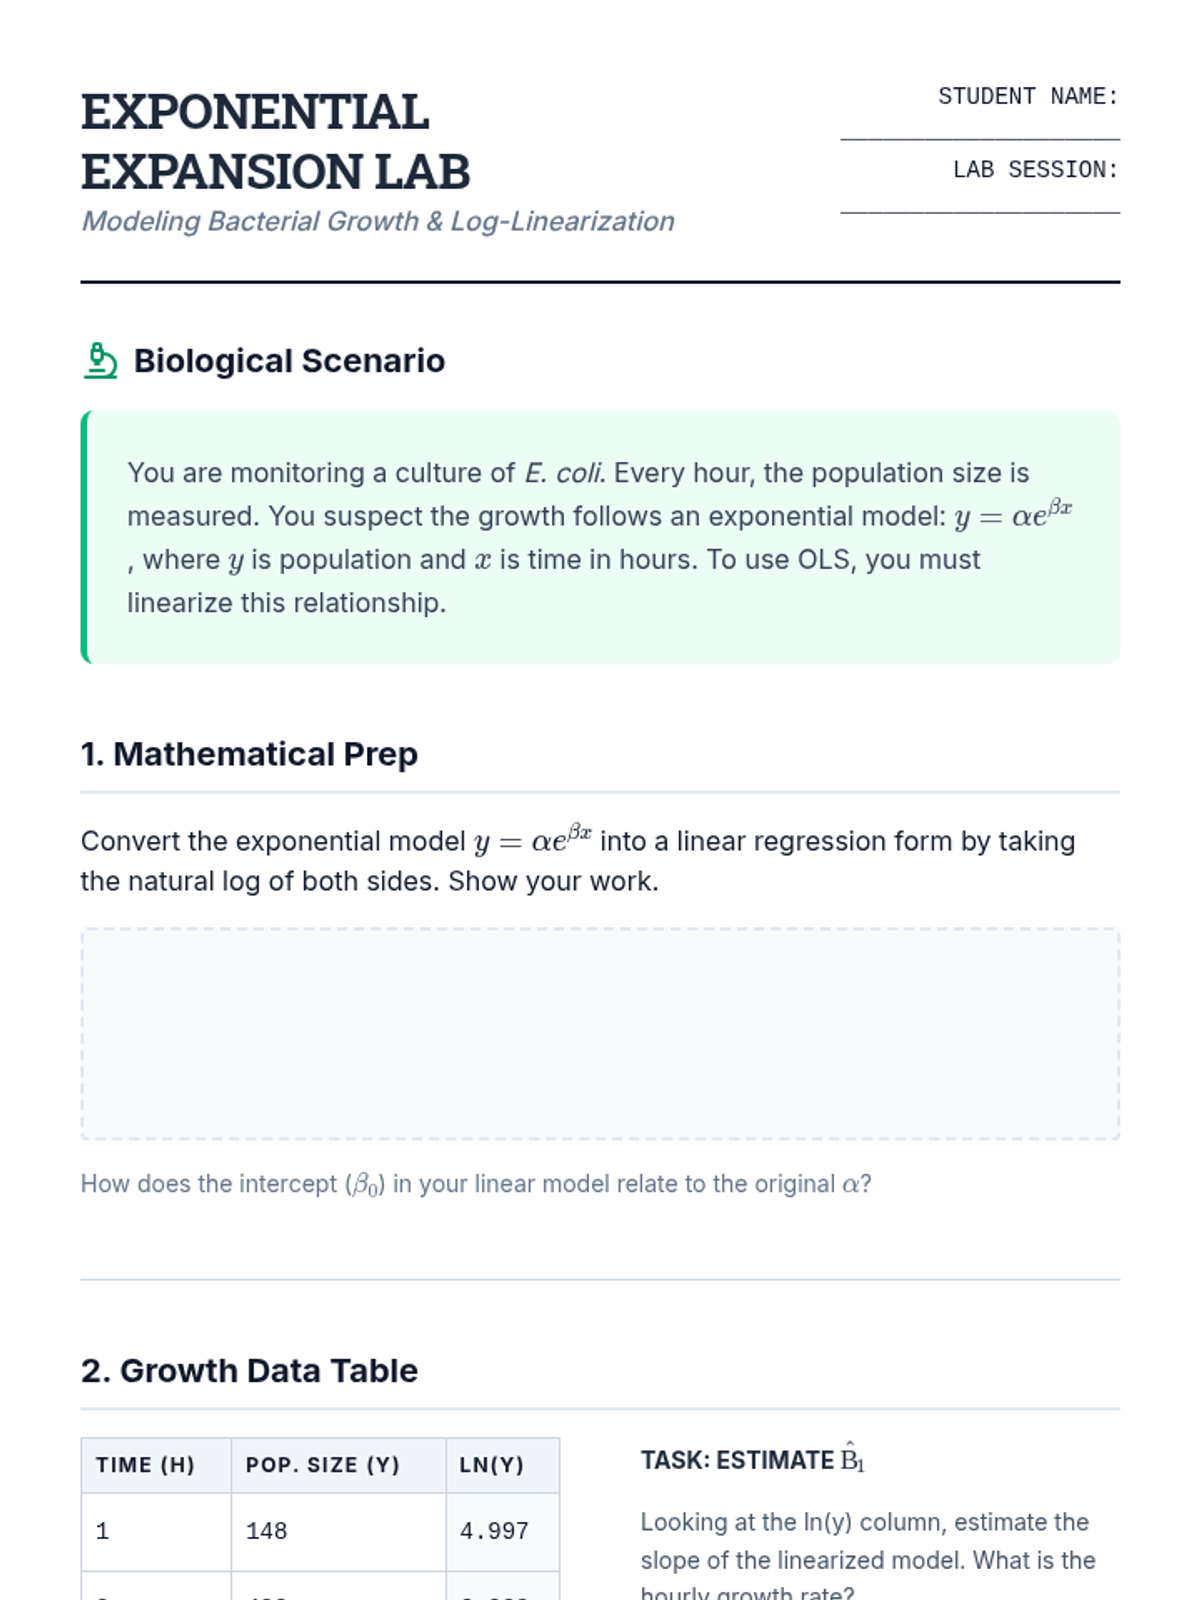
Students master data transformations to linearize relationships and stabilize variance, focusing on the interpretative shifts required for log-based models.
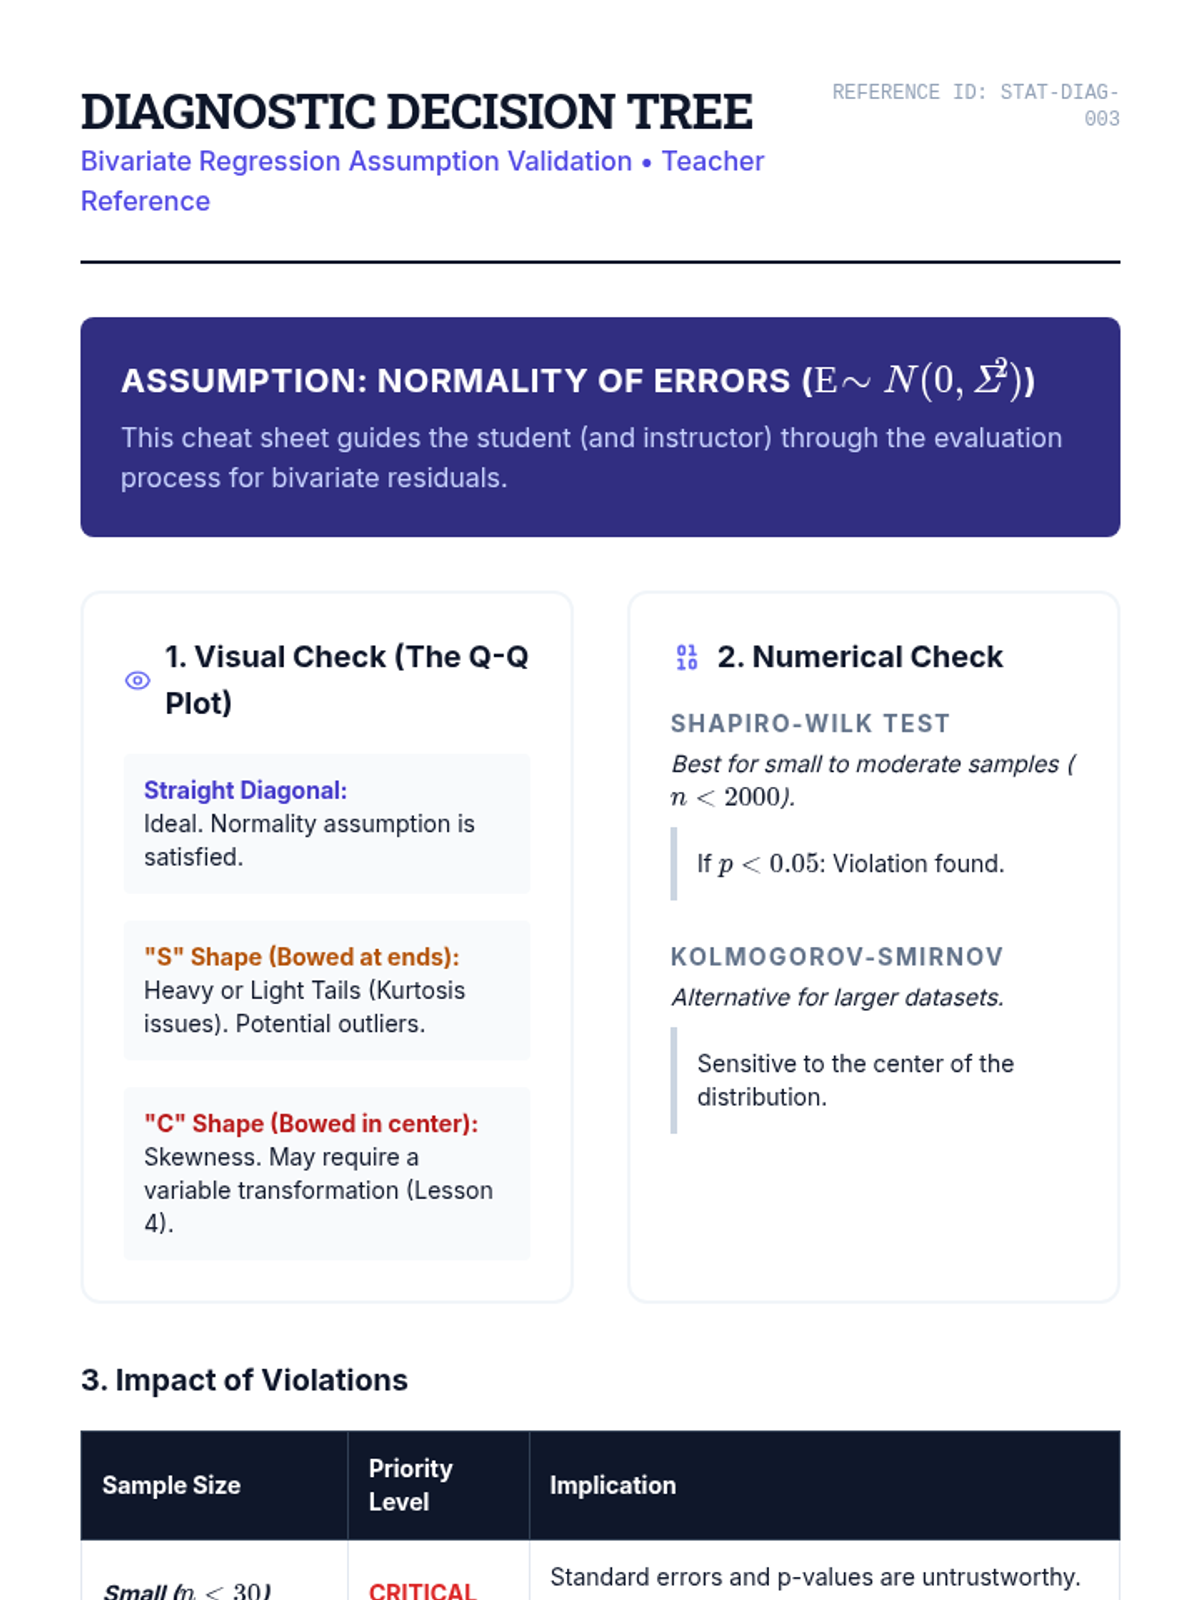
Students investigate the normality assumption of errors using Q-Q plots and statistical tests, understanding how departures from normality impact inference in small vs. large samples.
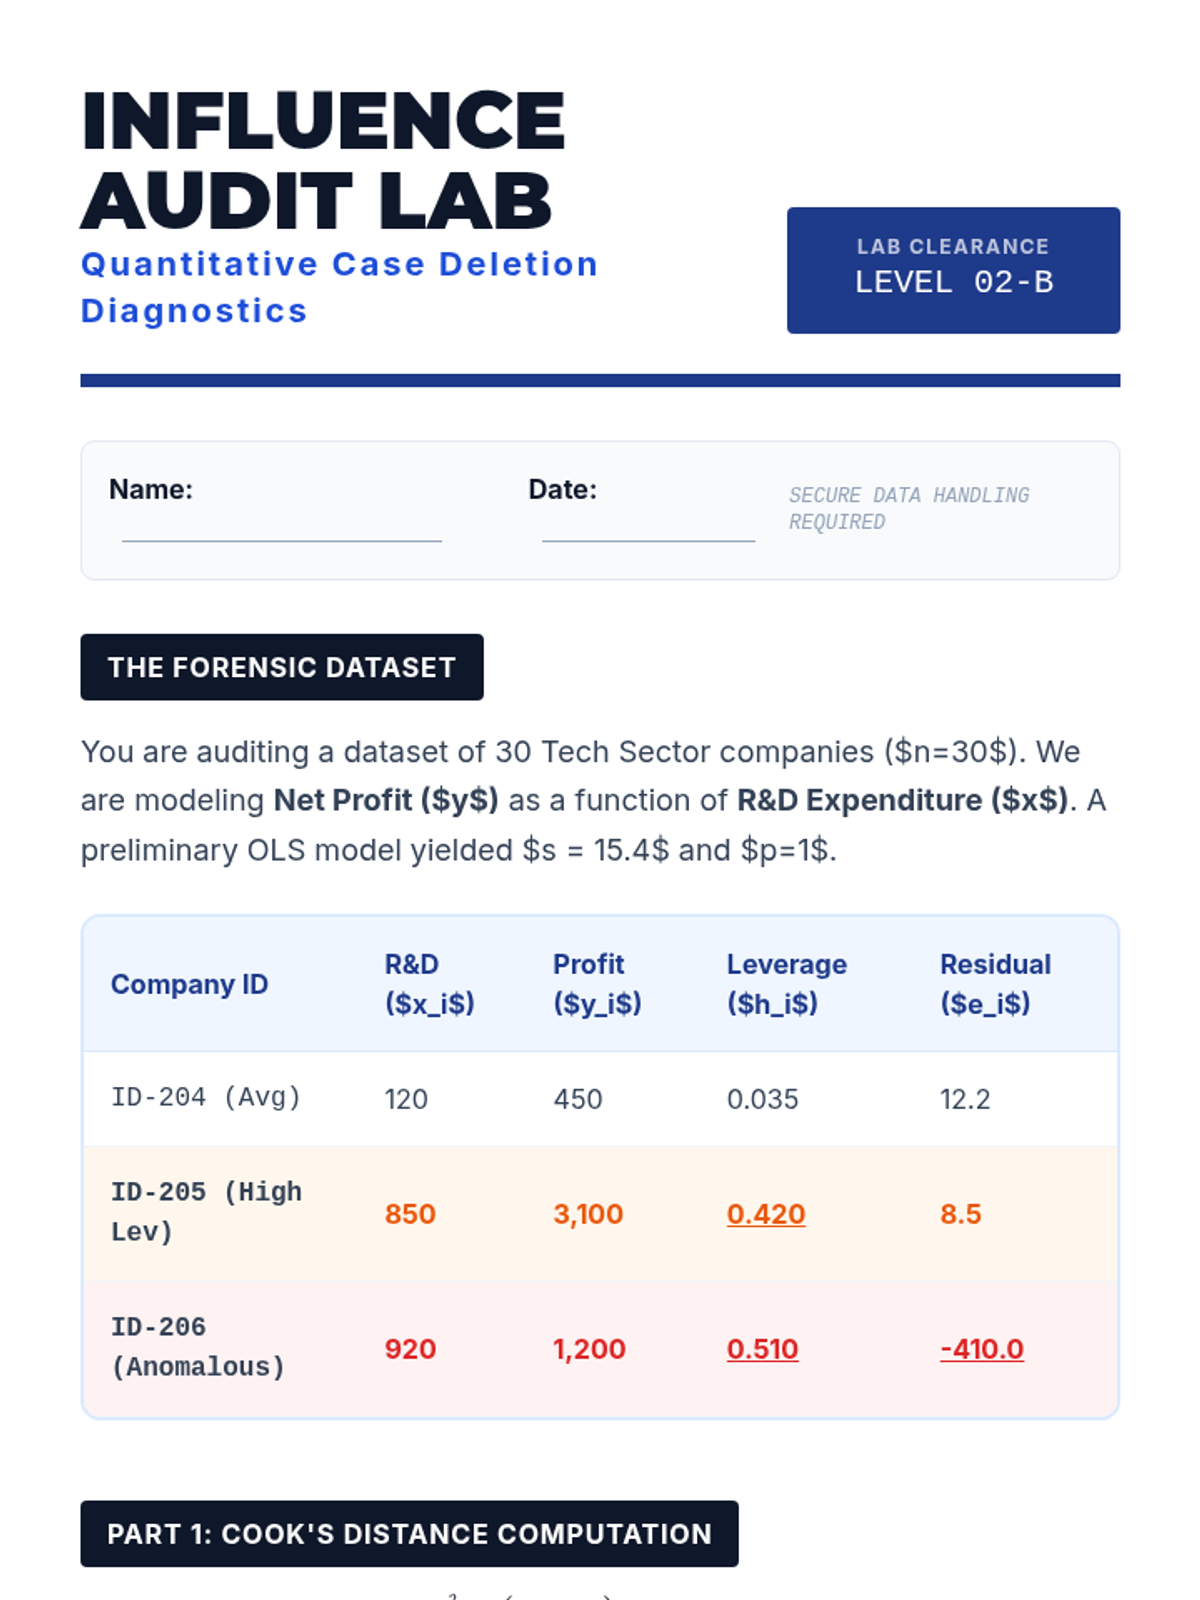
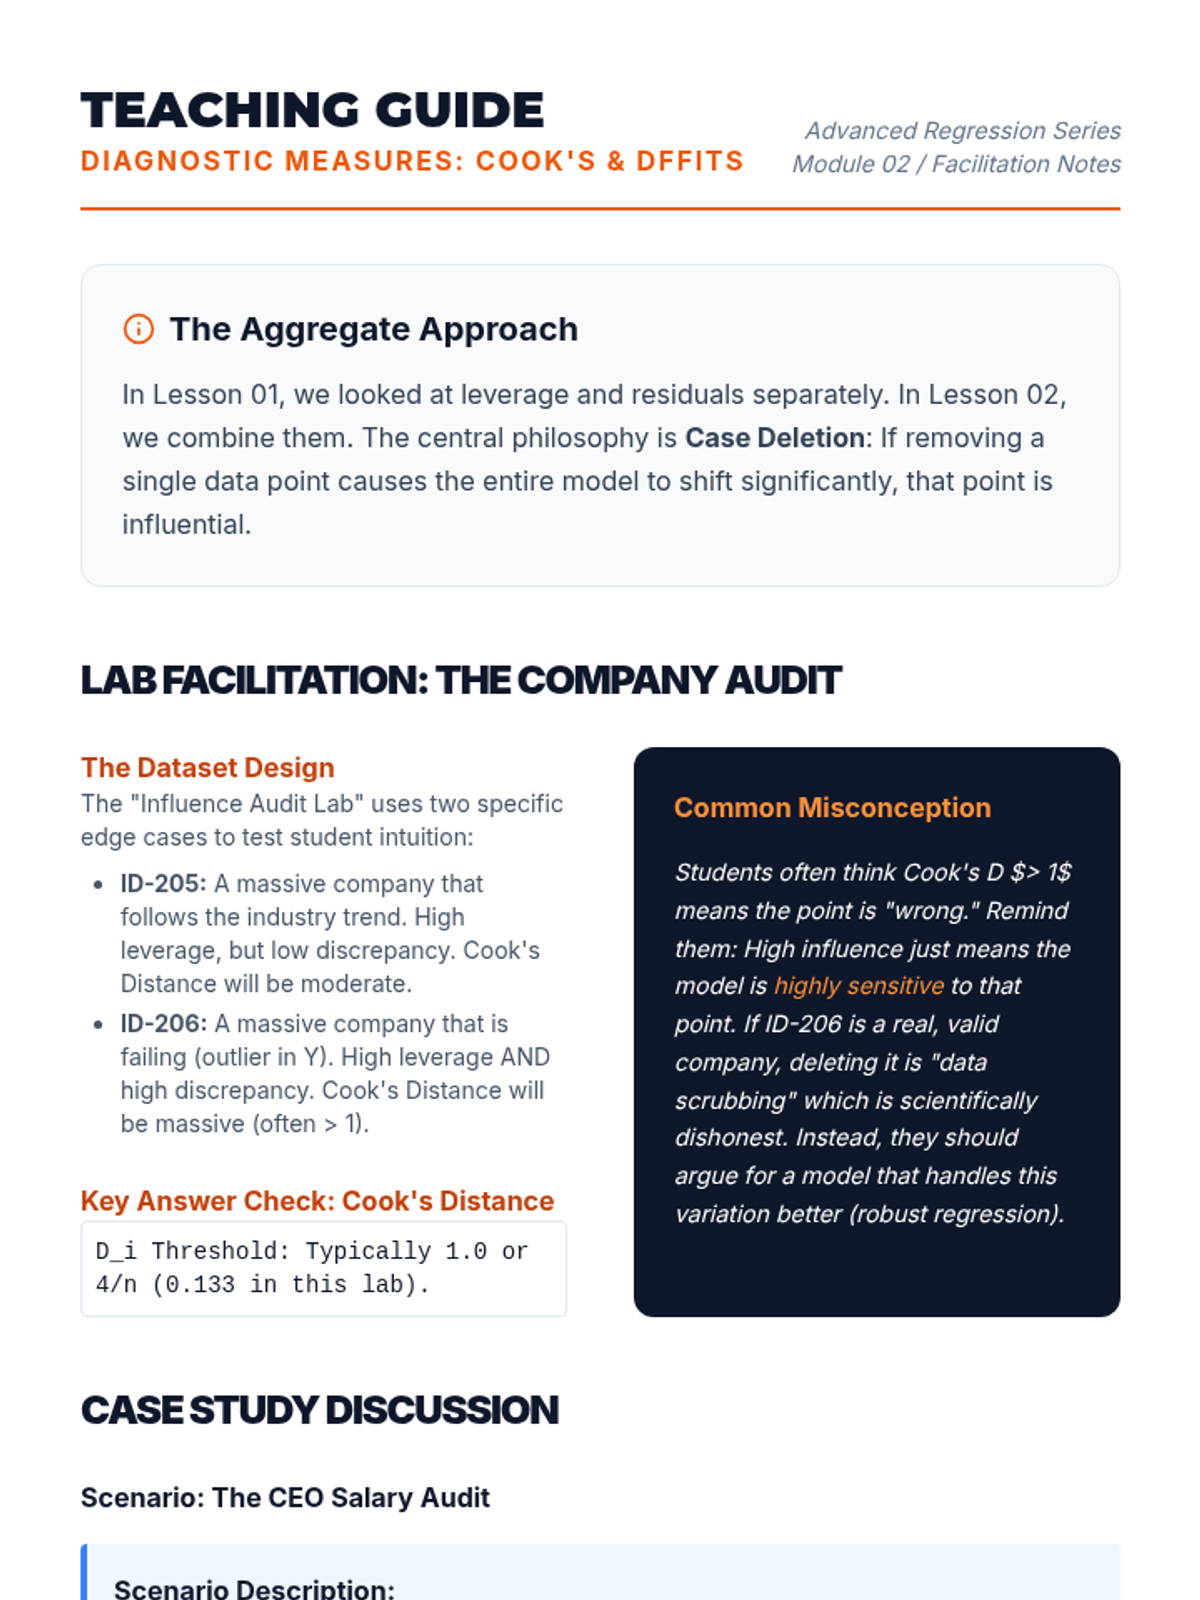
This lesson details specific aggregate measures of influence. Students calculate Cook's Distance and DFFITS to quantitatively identify points that justify exclusion or special handling in regression analysis.
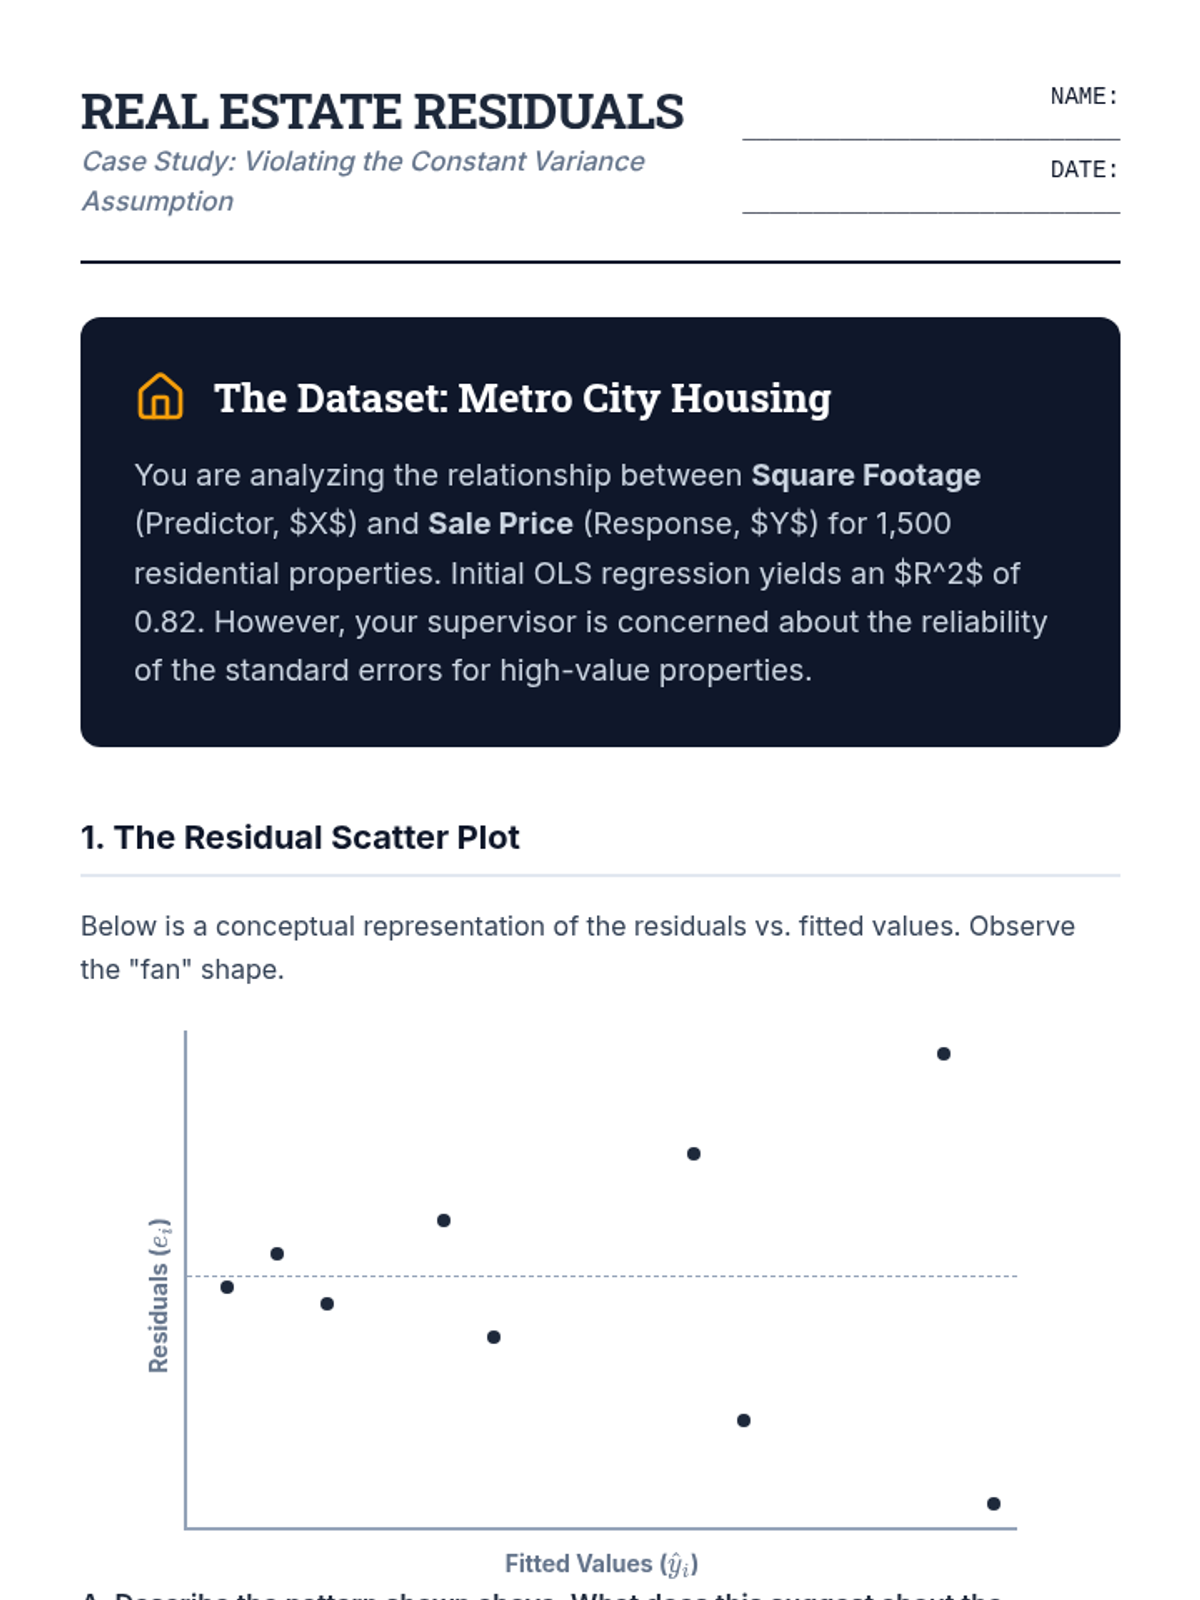
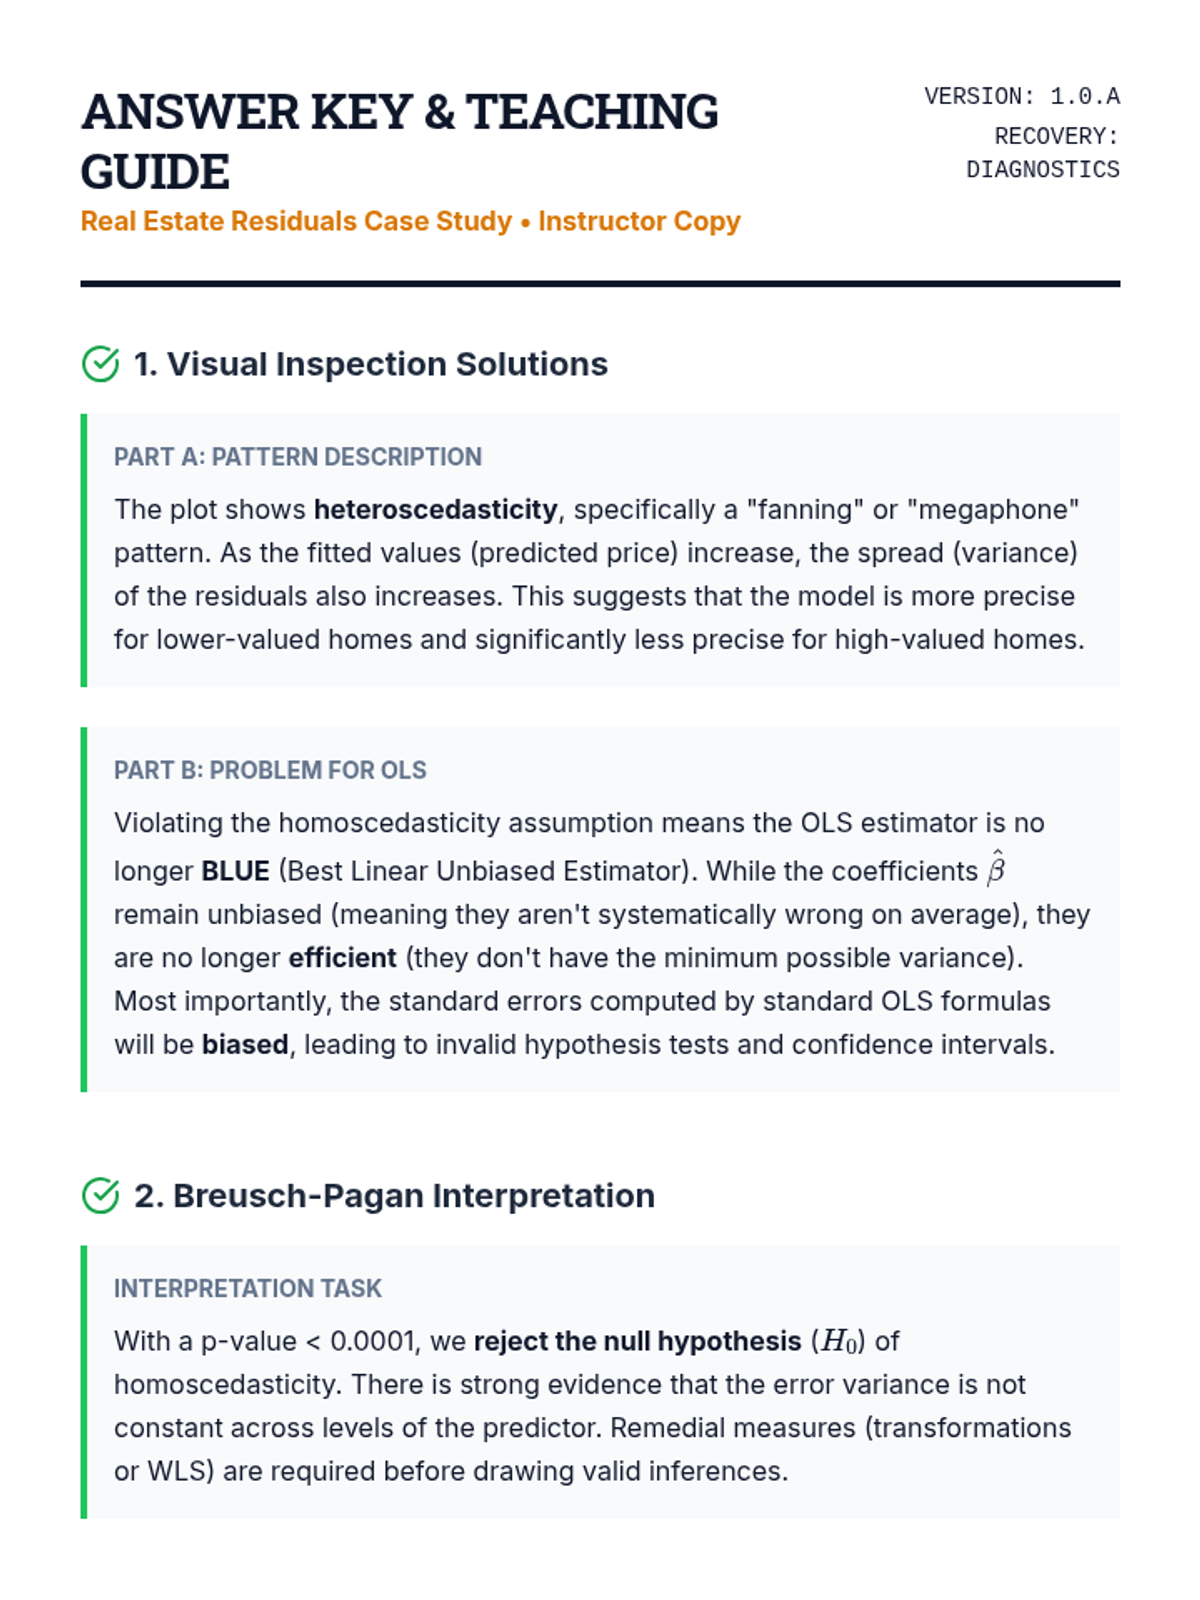
Students analyze residual plots and perform the Breusch-Pagan test to diagnose and understand the implications of heteroscedasticity in regression models.
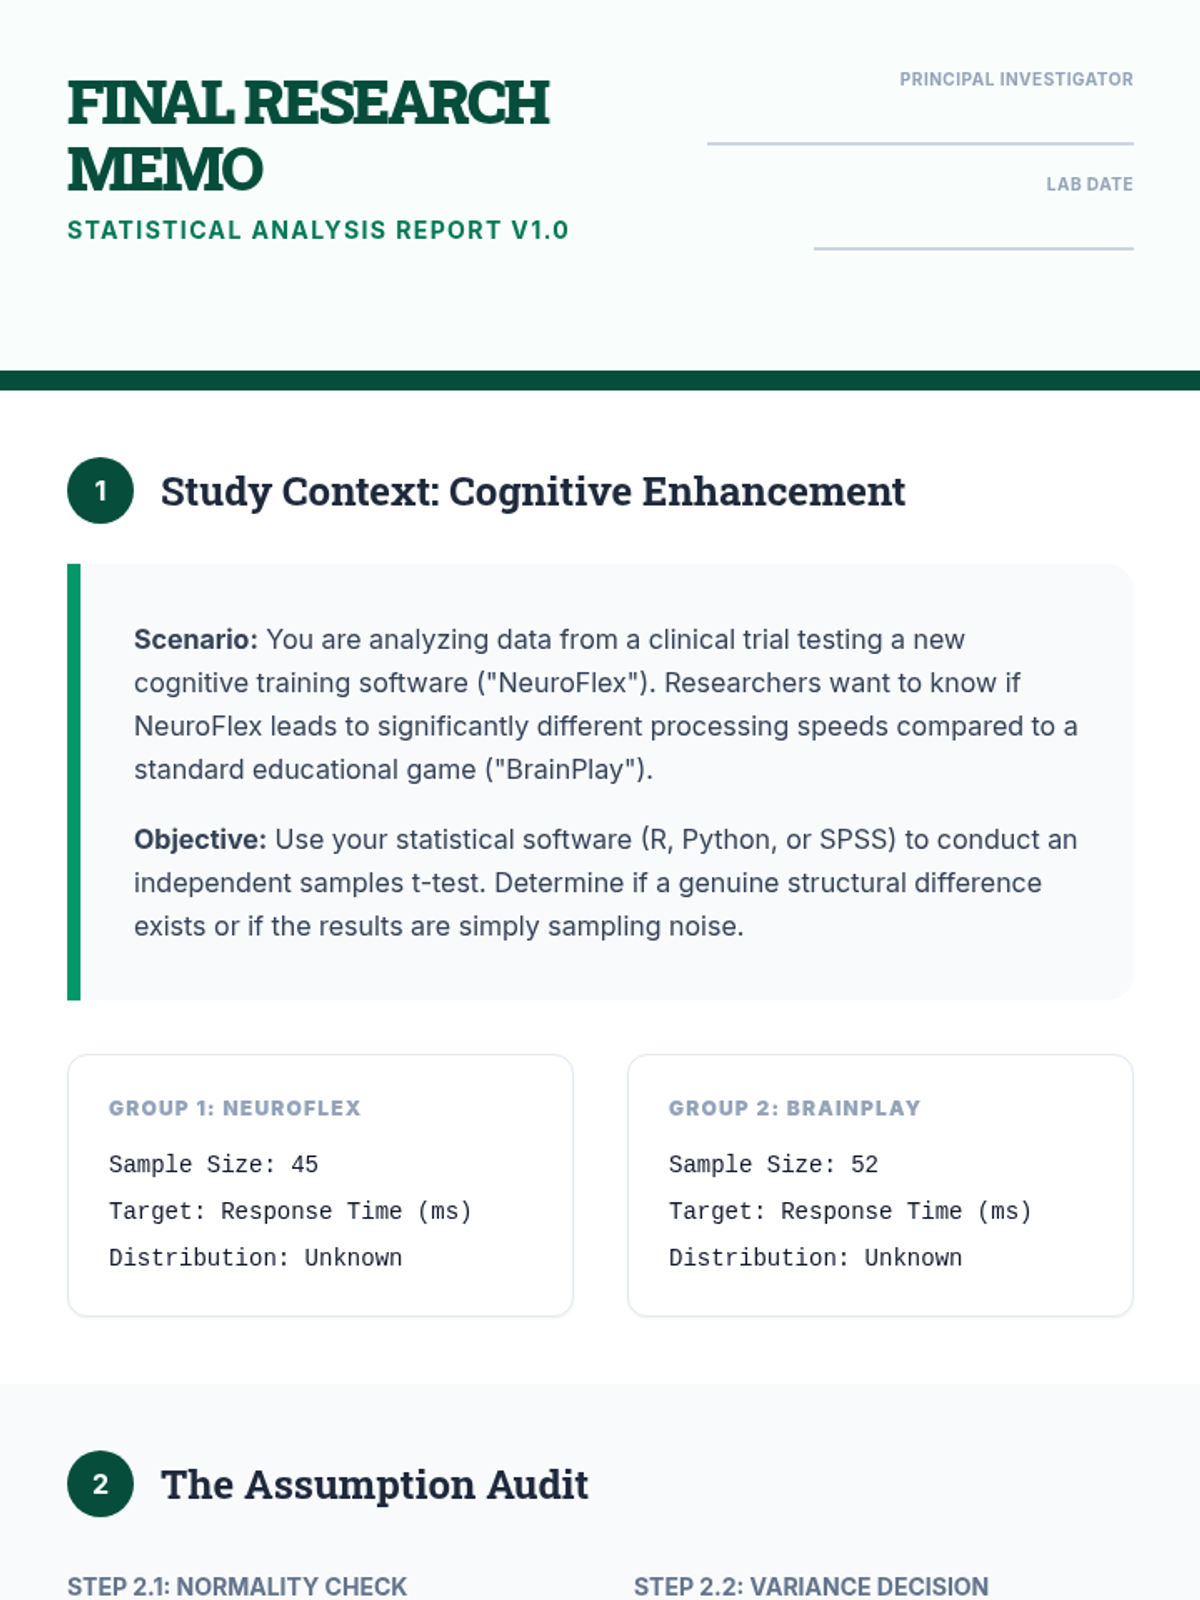
Students apply their knowledge using statistical software to analyze a raw dataset. The focus shifts to correctly formatting the output into a standard scientific report.
Students evaluate the critical assumptions of normality and independence required for valid t-tests. The lesson introduces diagnostic plots (Q-Q plots) and briefly touches upon non-parametric alternatives when assumptions fail.
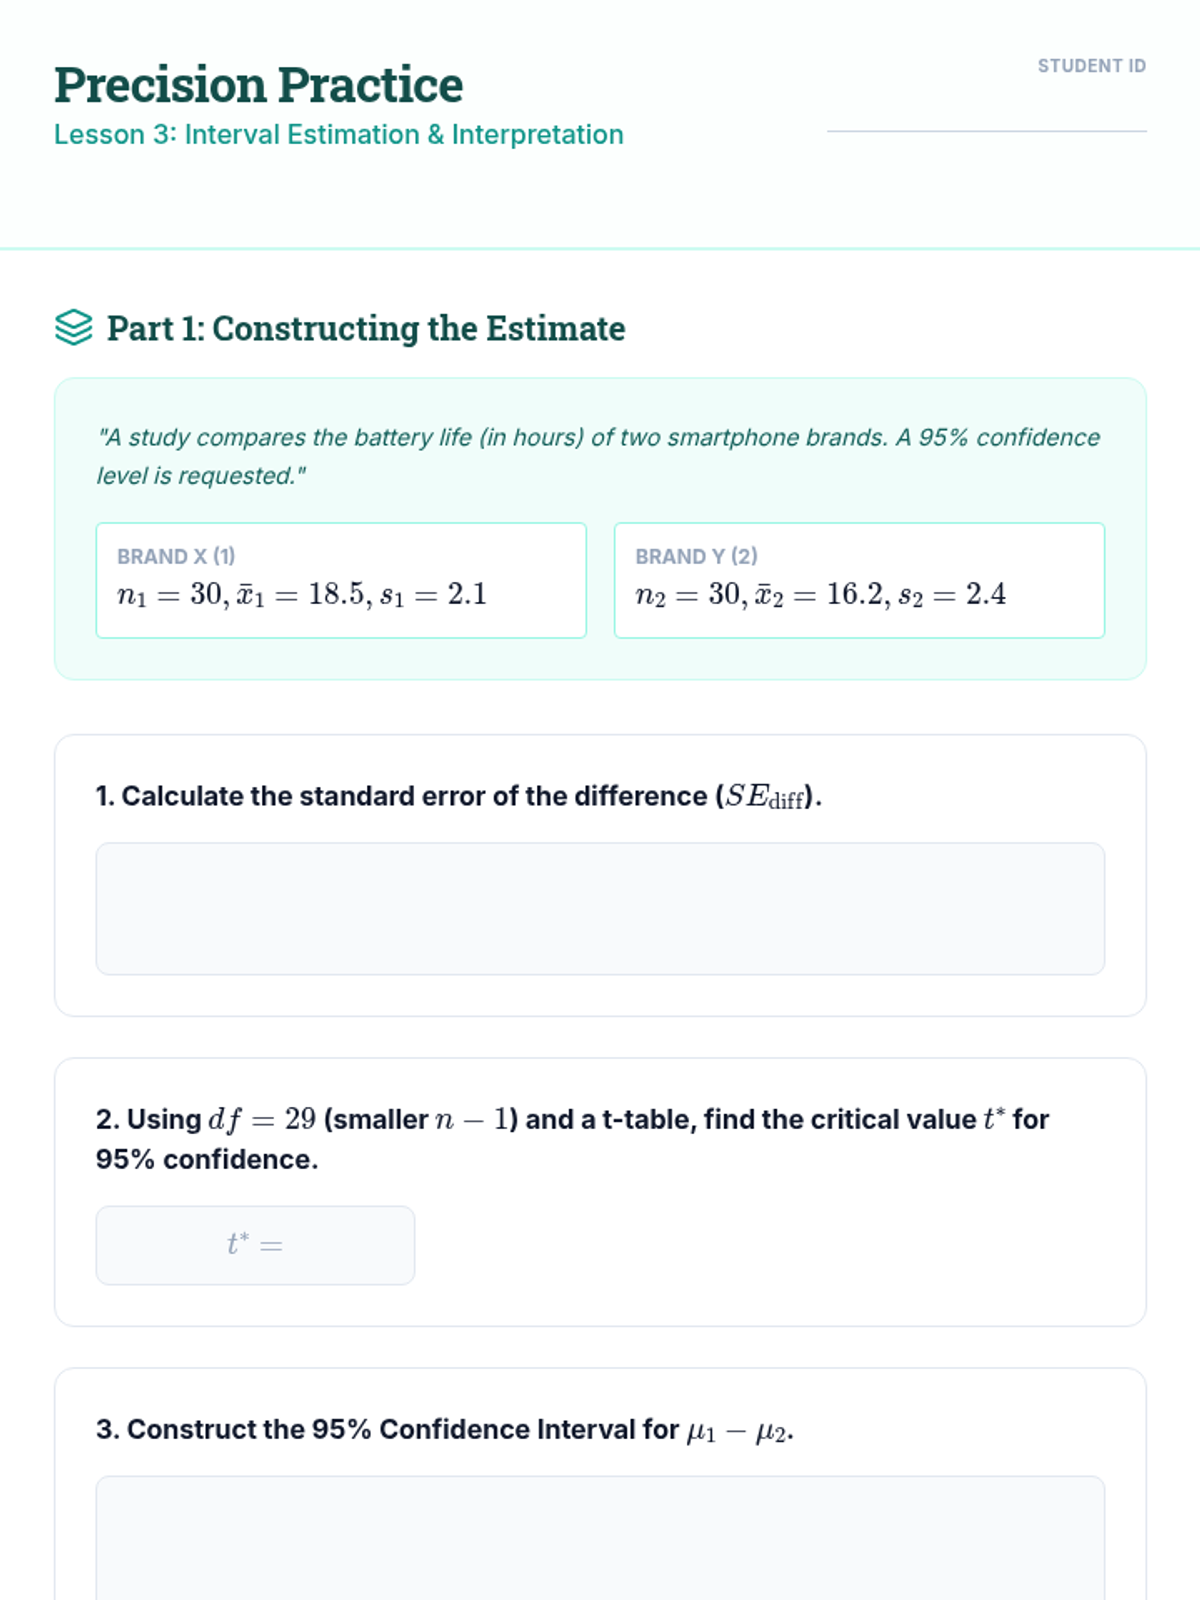
Students move beyond simple hypothesis testing to estimating the magnitude of the difference between populations. The lesson covers the construction and interpretation of confidence intervals for the difference in means.
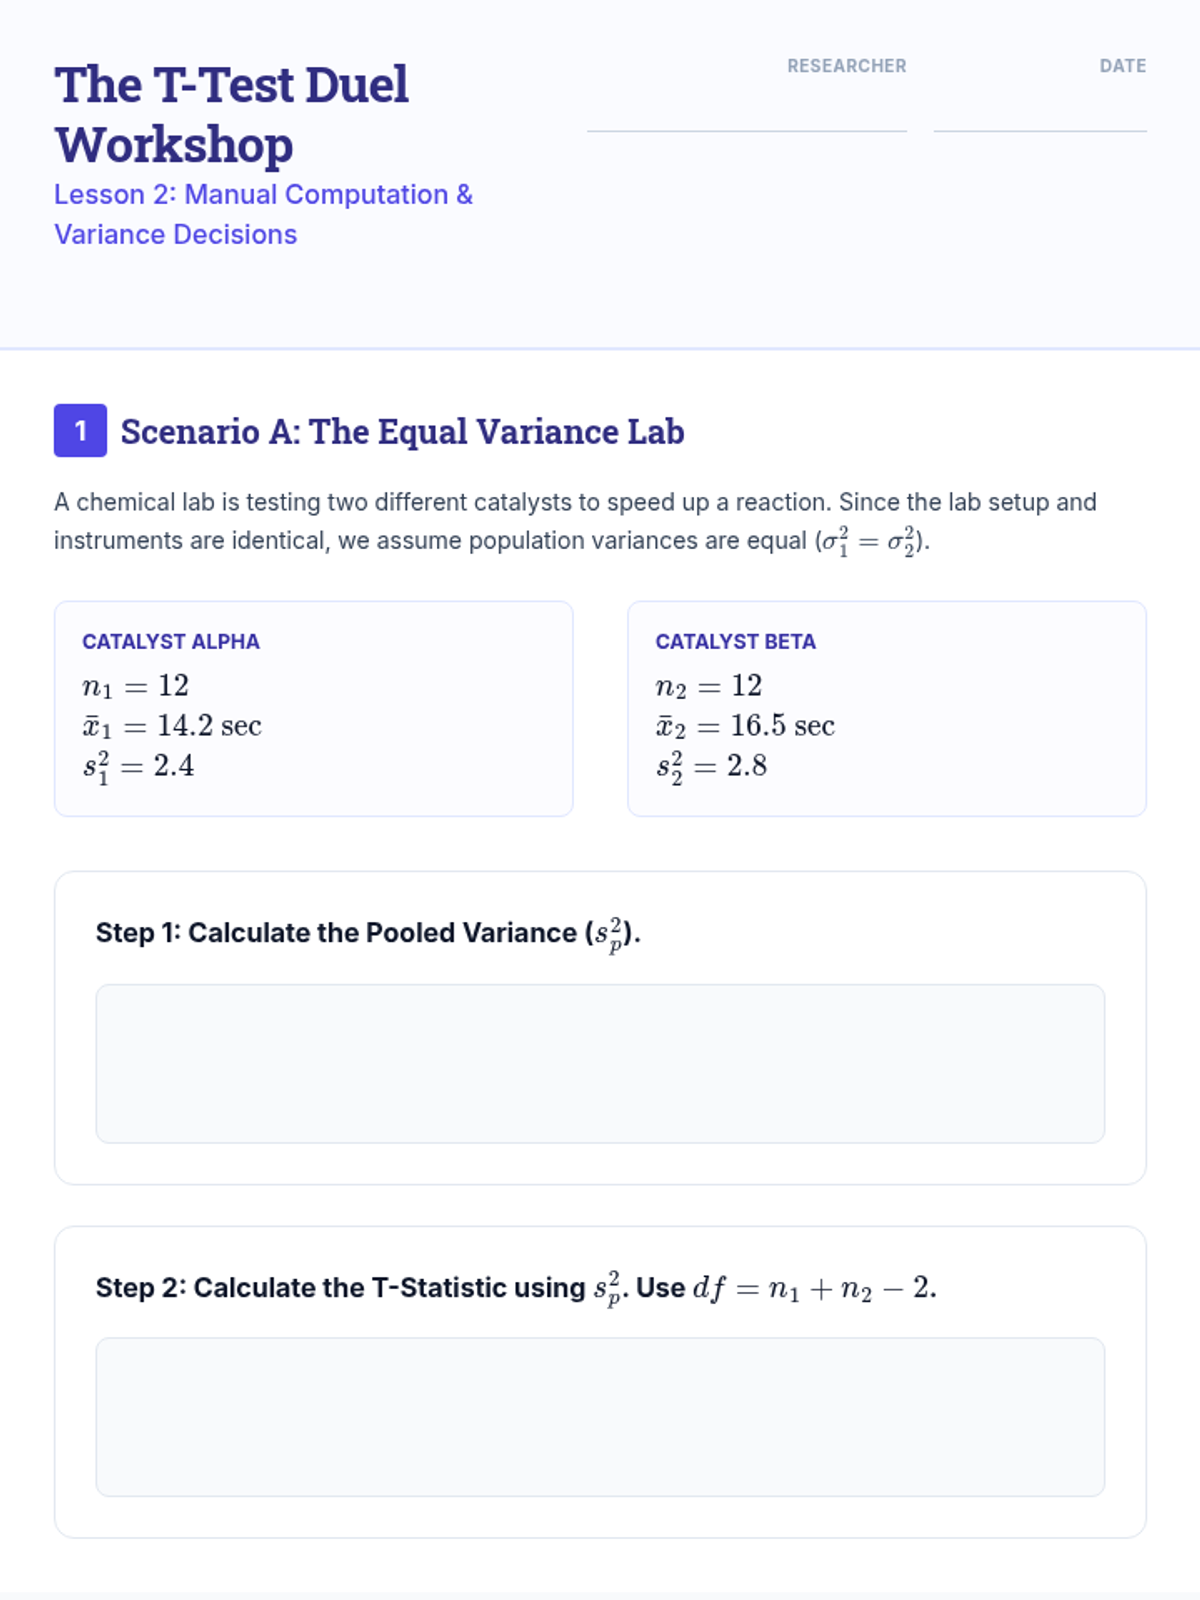
This lesson distinguishes between Student’s t-test (equal variances) and Welch’s t-test (unequal variances). Students perform calculations manually to understand the underlying mechanics before discussing when to assume homoscedasticity.
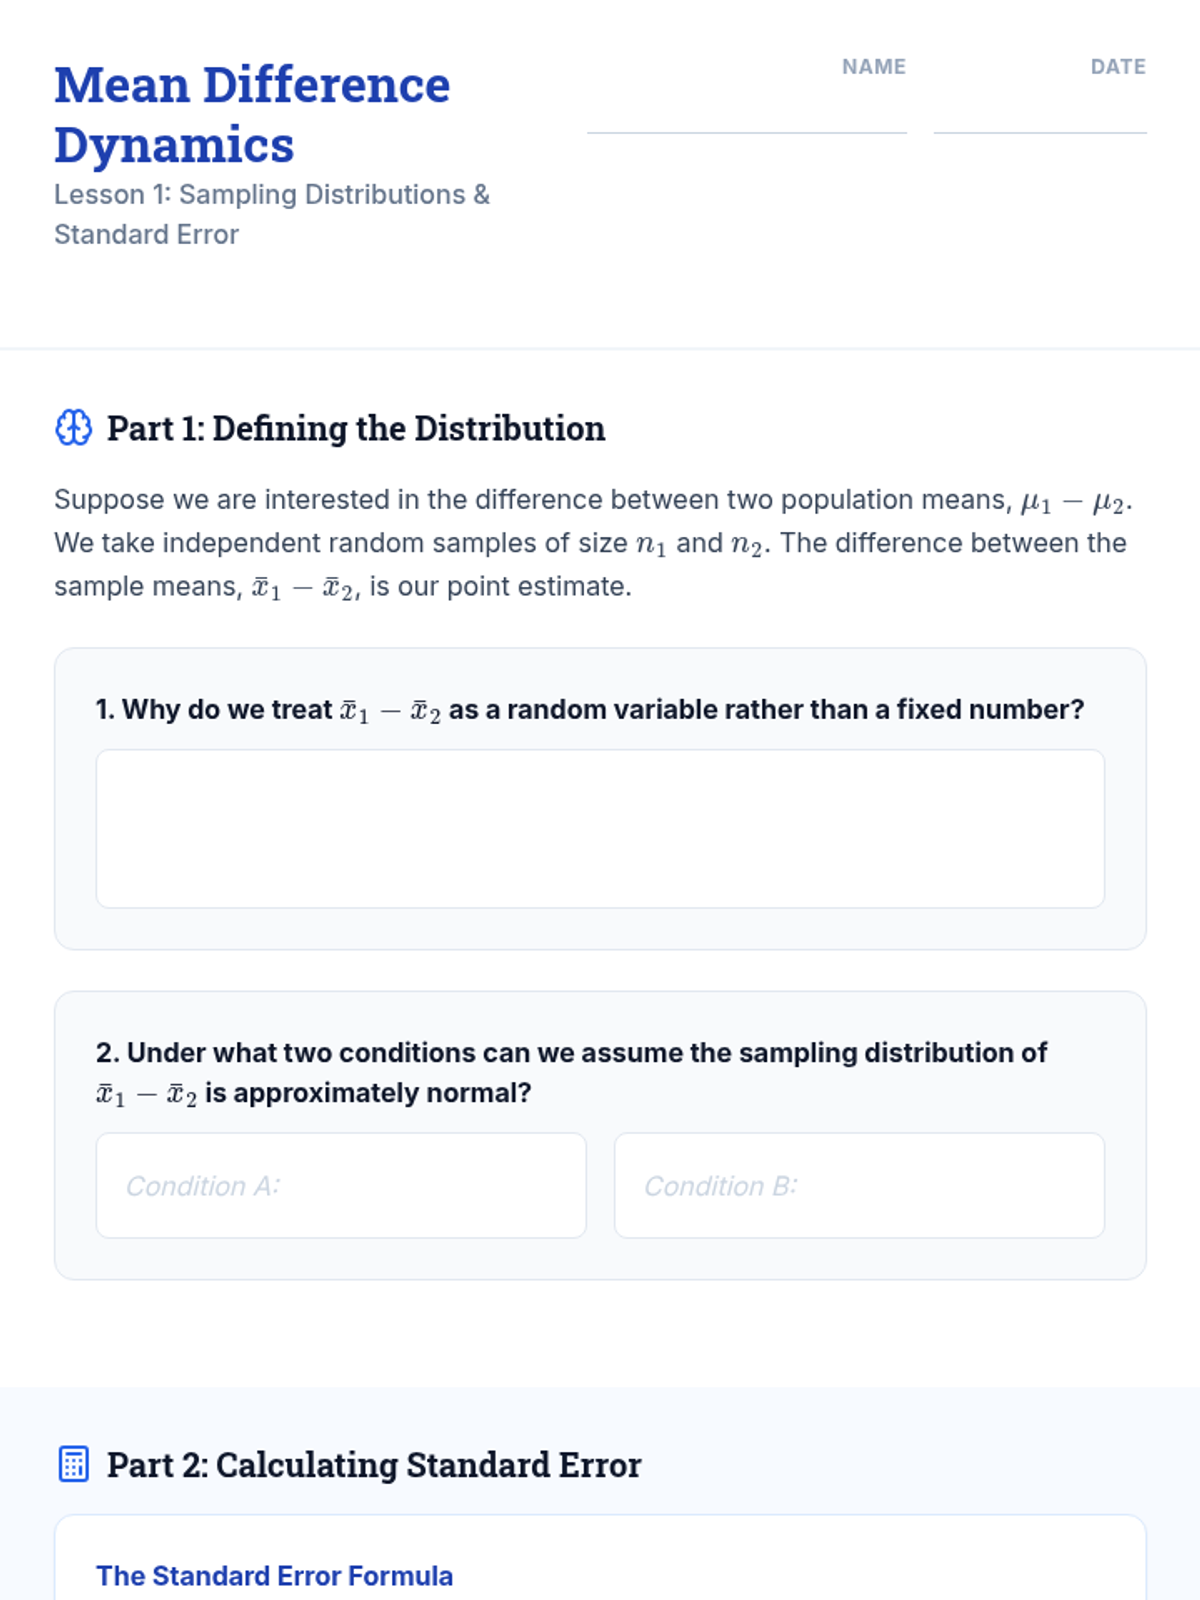
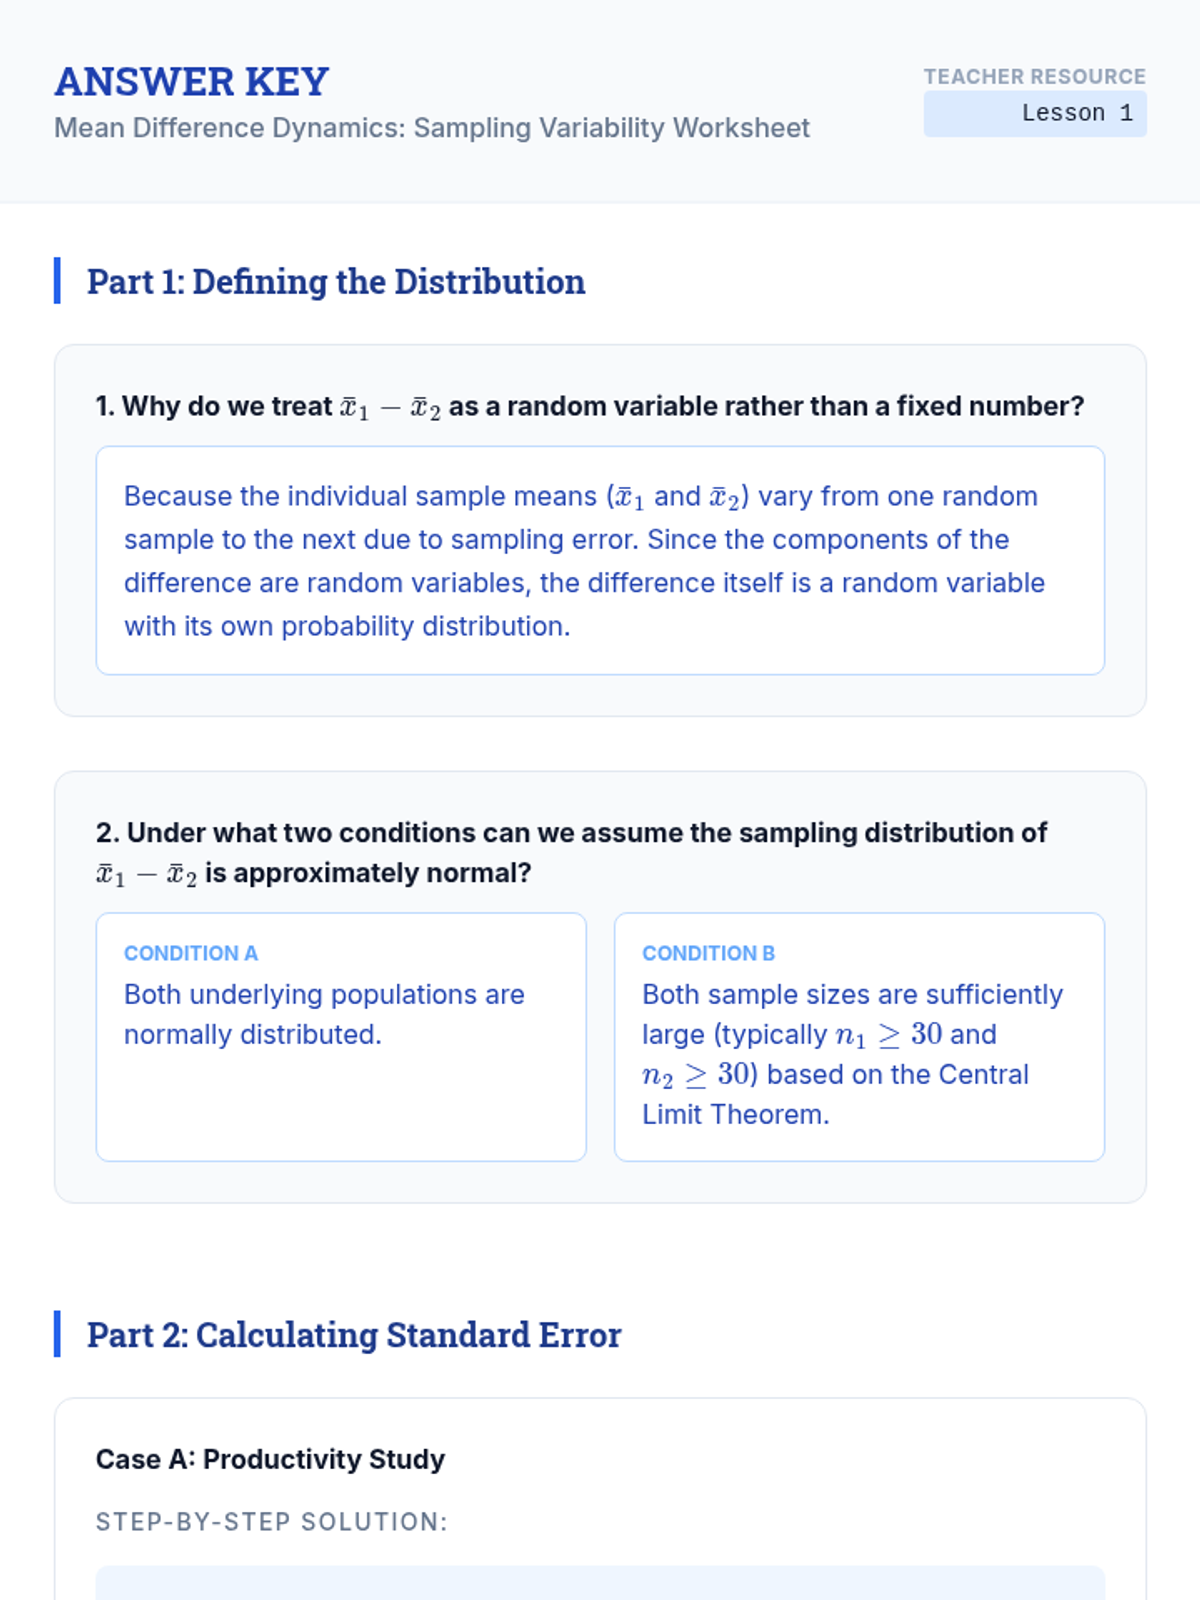
Students explore how the difference between two sample means behaves as a random variable. They derive the standard error for the difference and establish the foundation for the t-statistic using independent samples.
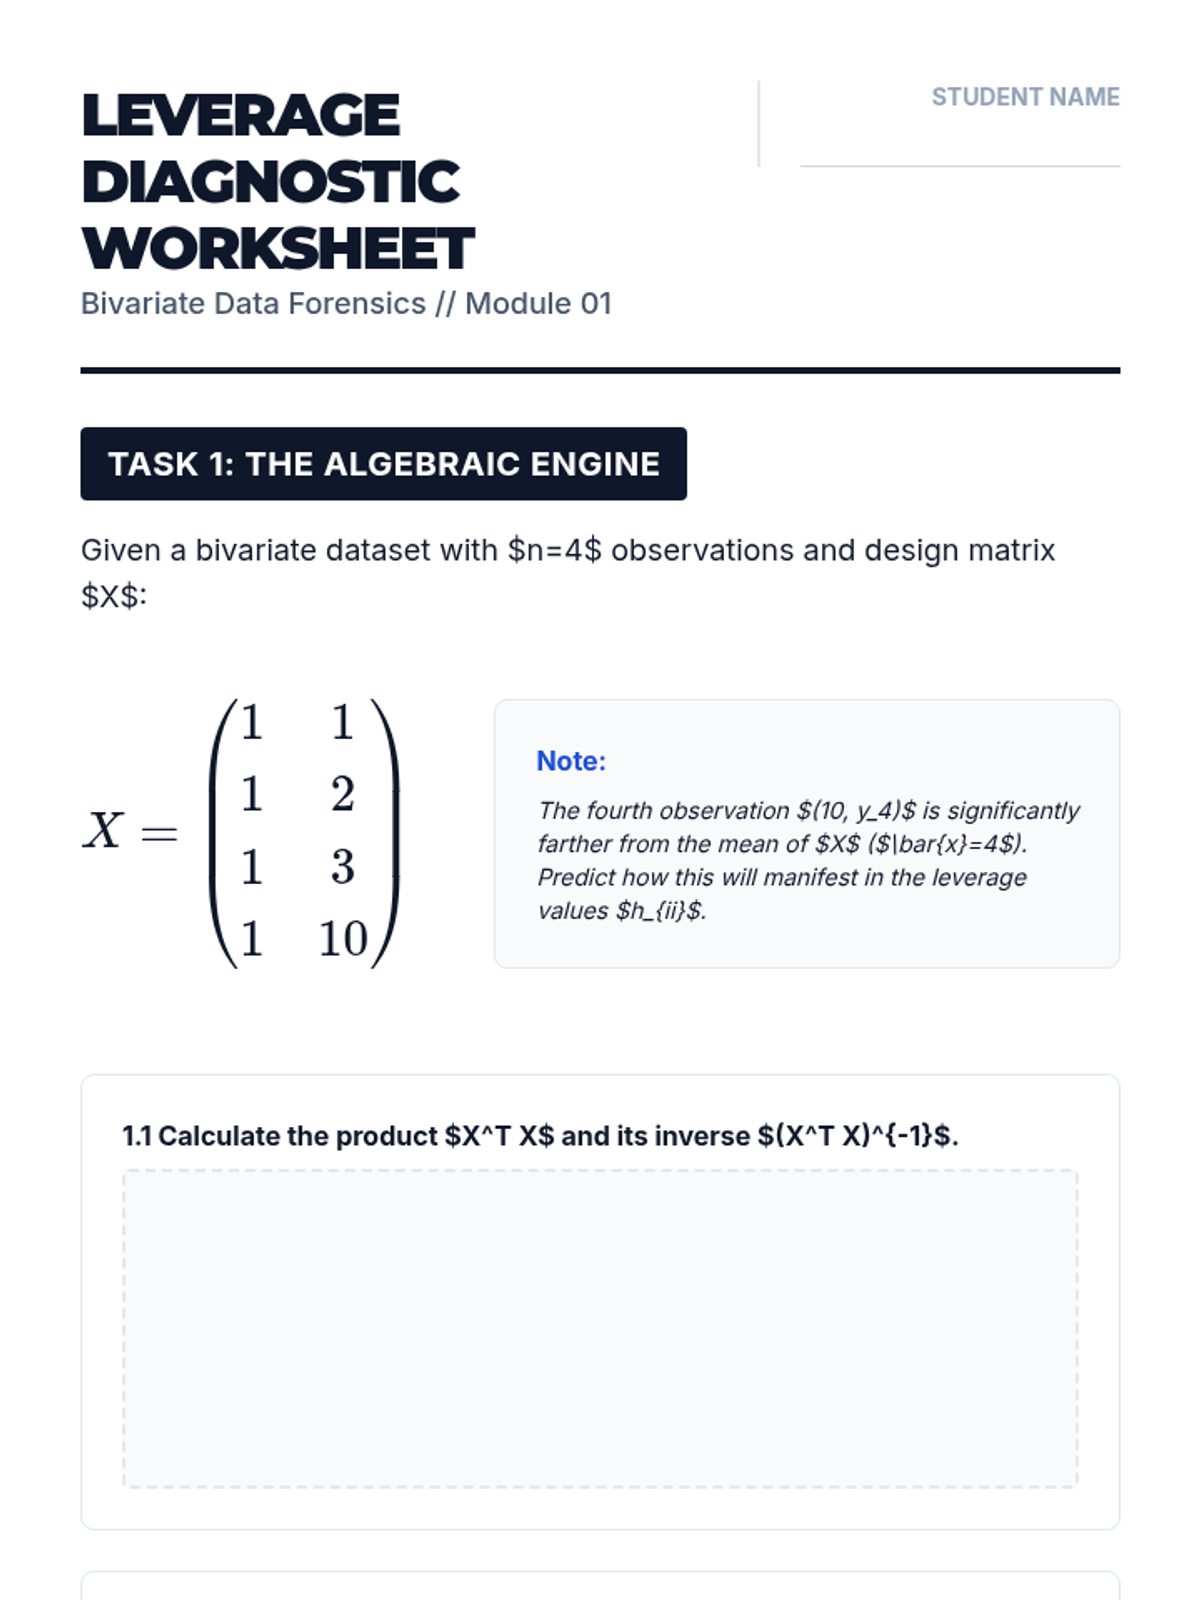
Students explore the geometric and algebraic foundations of influence in bivariate regression, distinguishing between leverage (extremity in X) and discrepancy (extremity in Y).
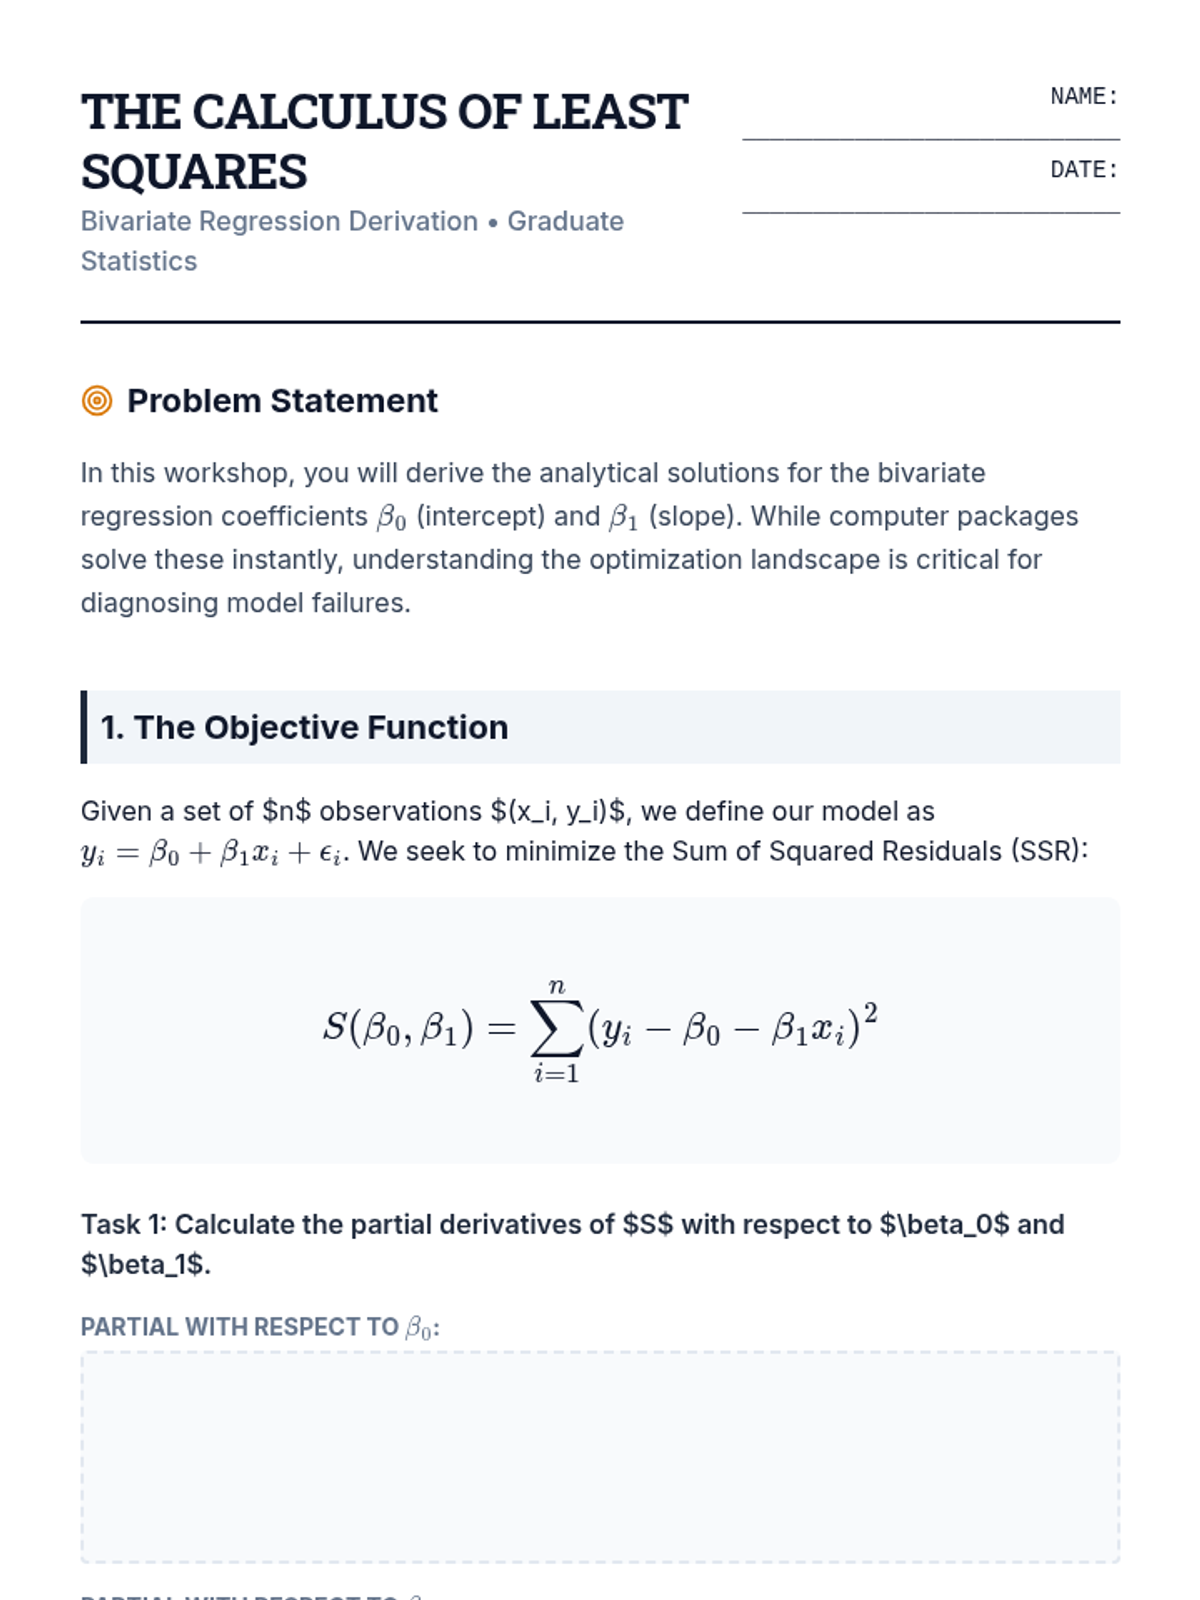
Students derive the OLS estimators for slope and intercept using matrix algebra and calculus, establishing the mathematical foundation for bivariate regression.
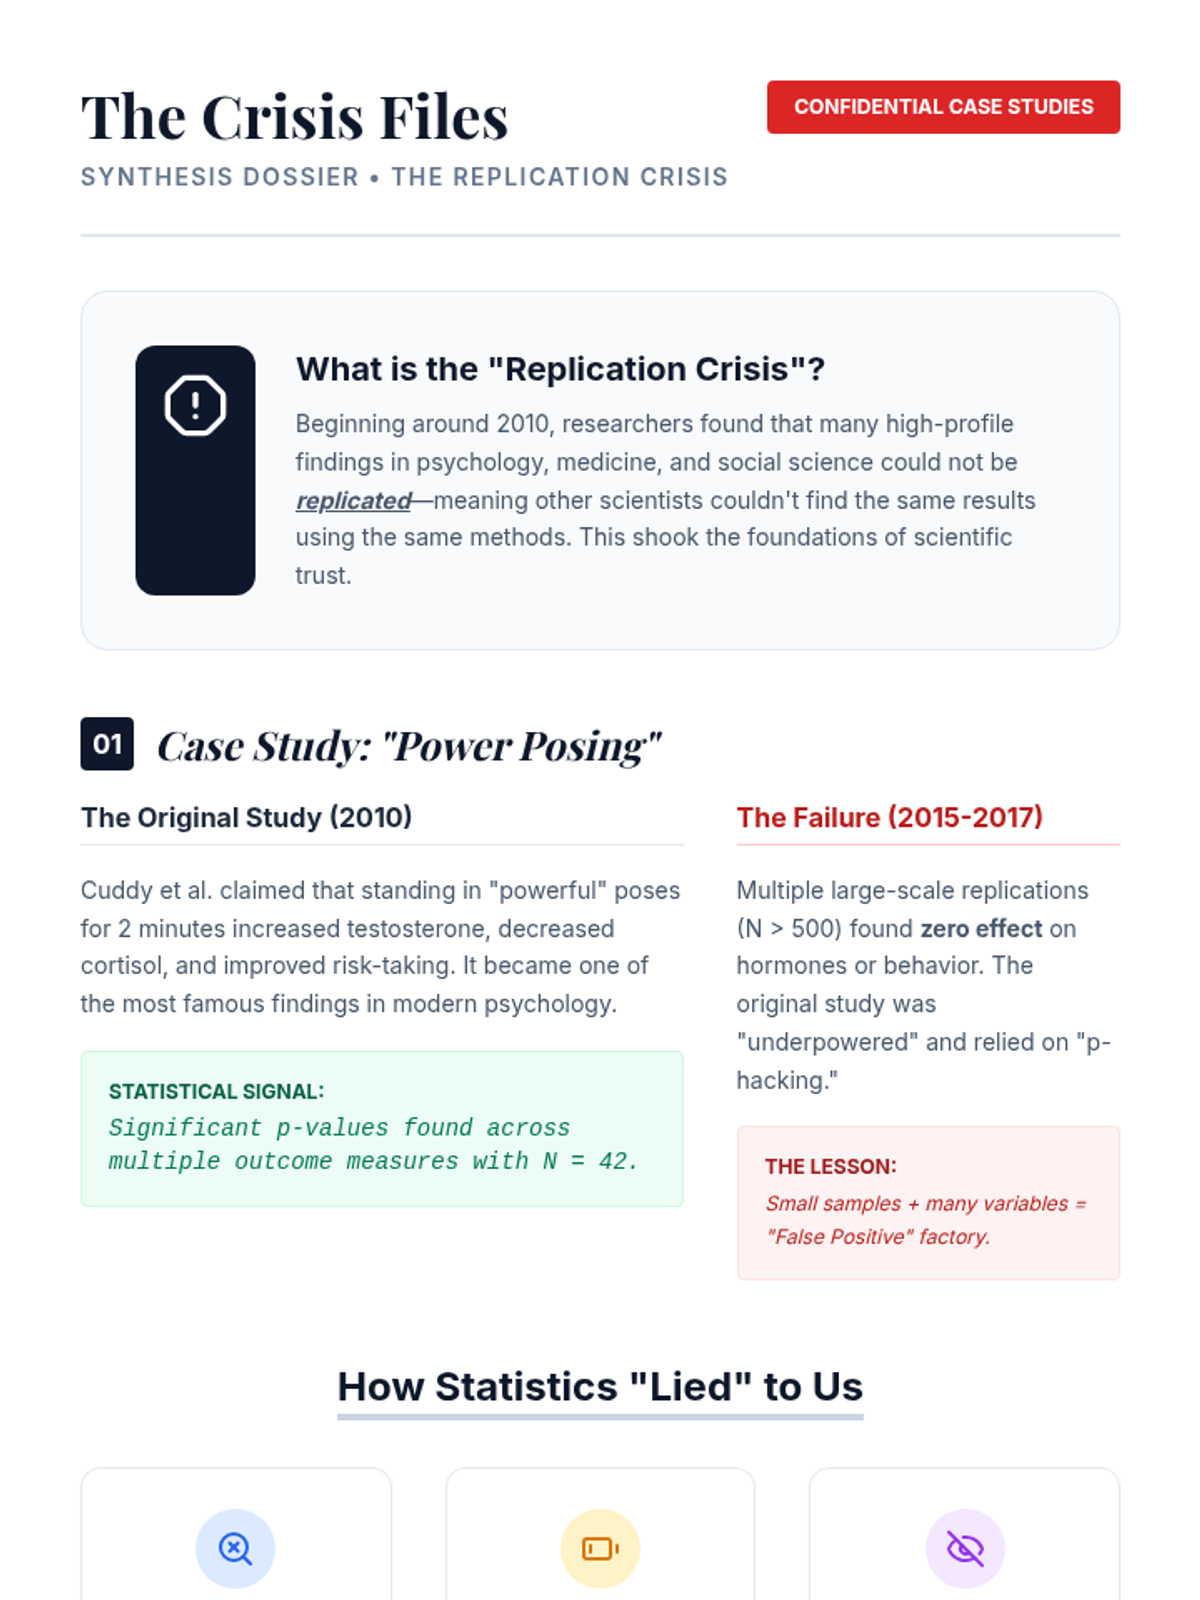
A culminating discussion on the replication crisis in science. Students synthesize their knowledge of power, effect size, and p-hacking to evaluate the credibility of published research and the importance of open science practices.
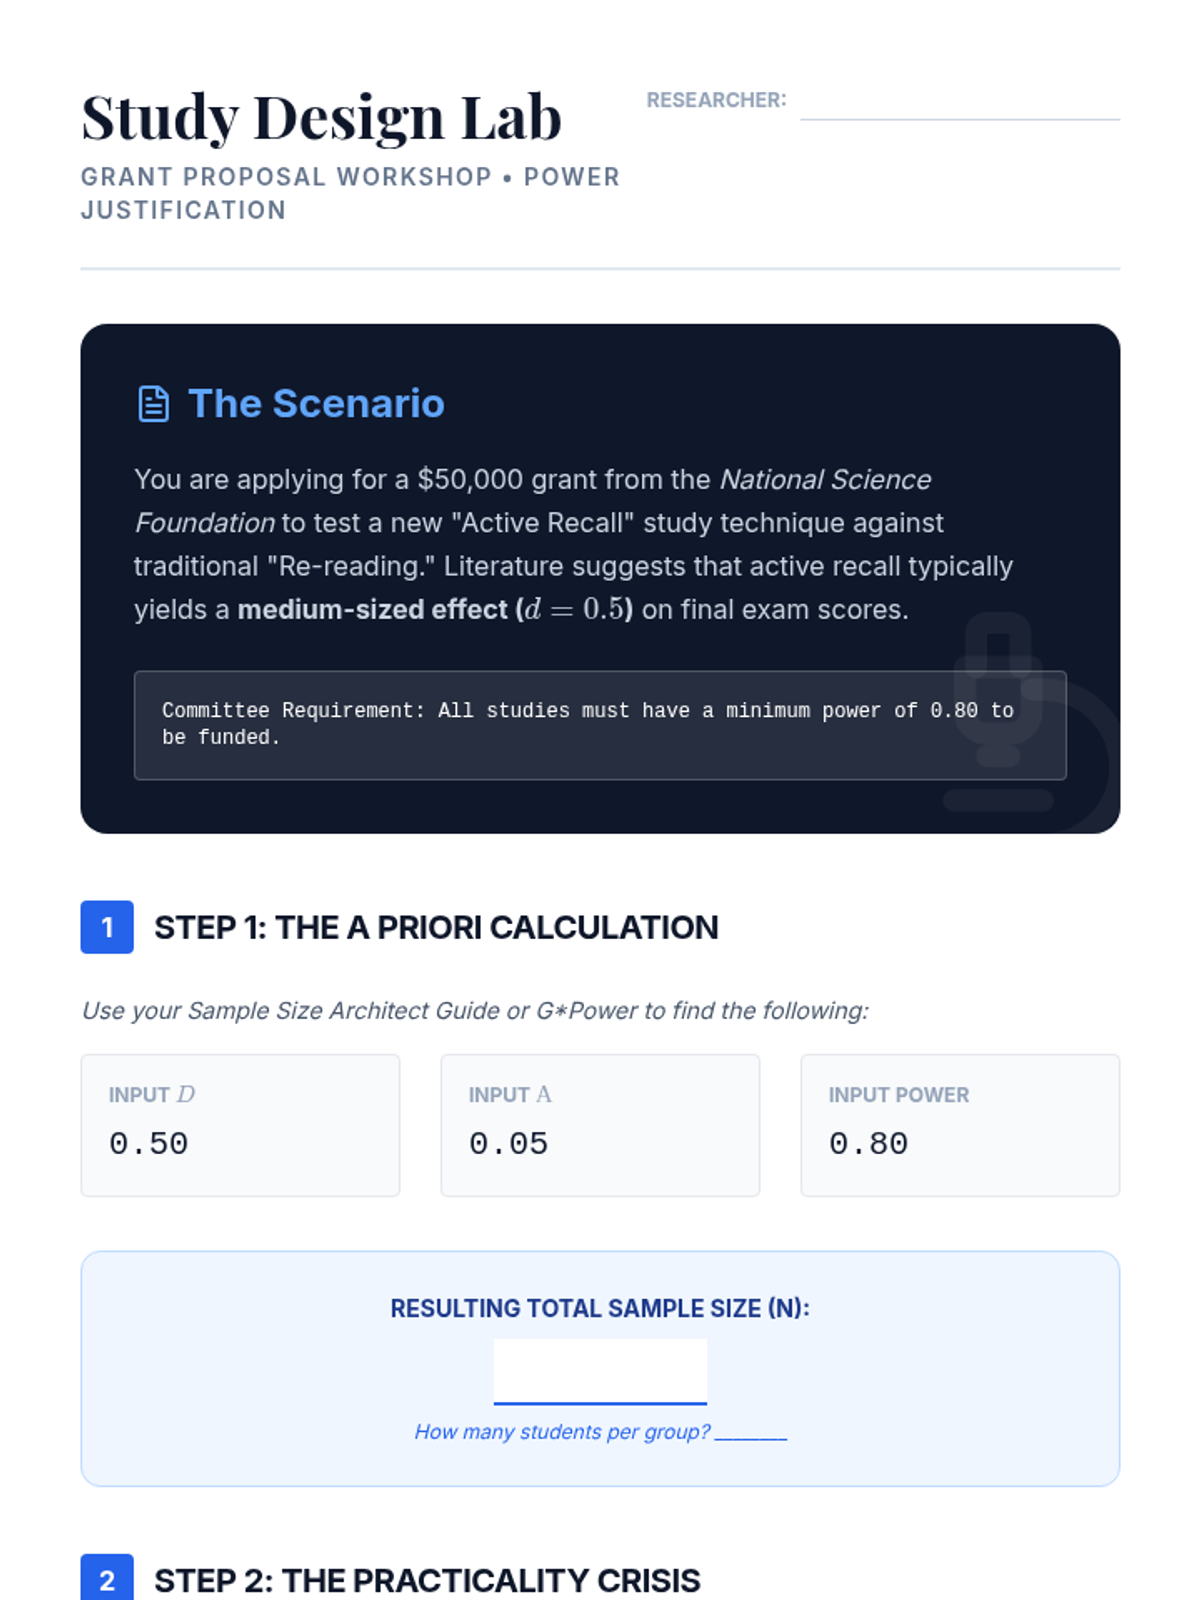
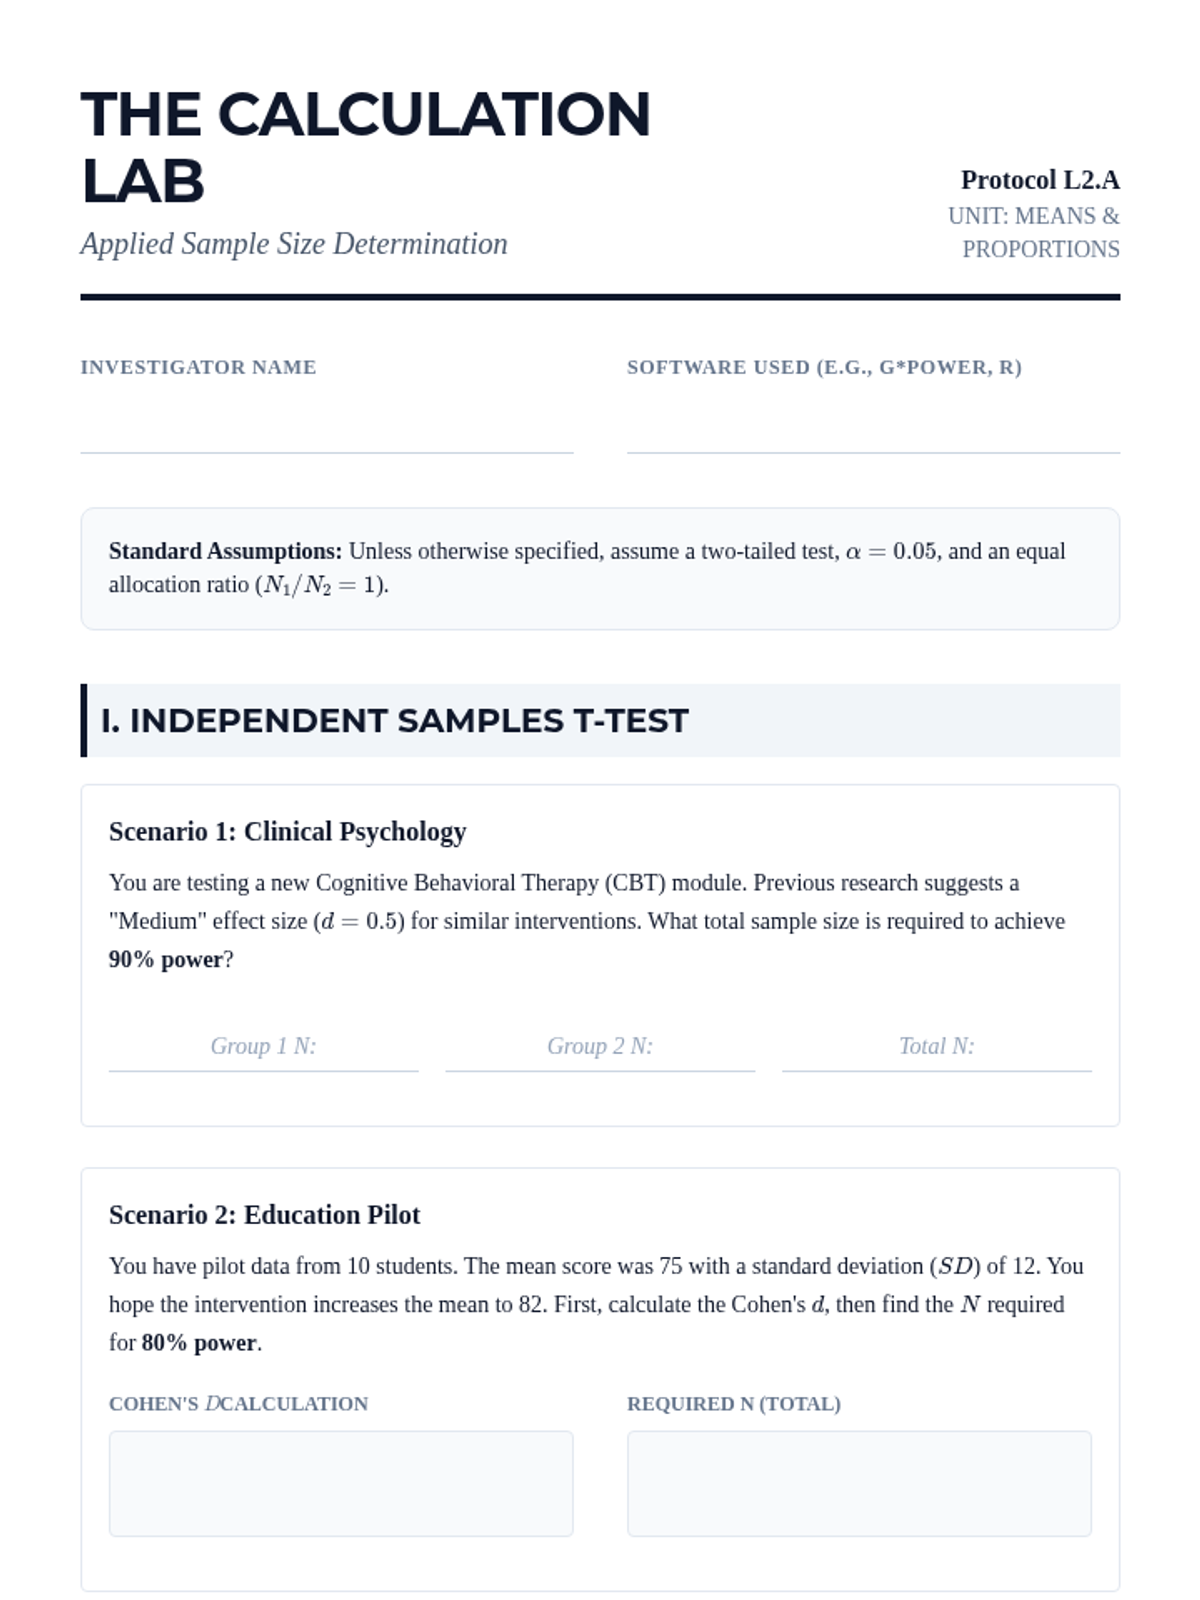
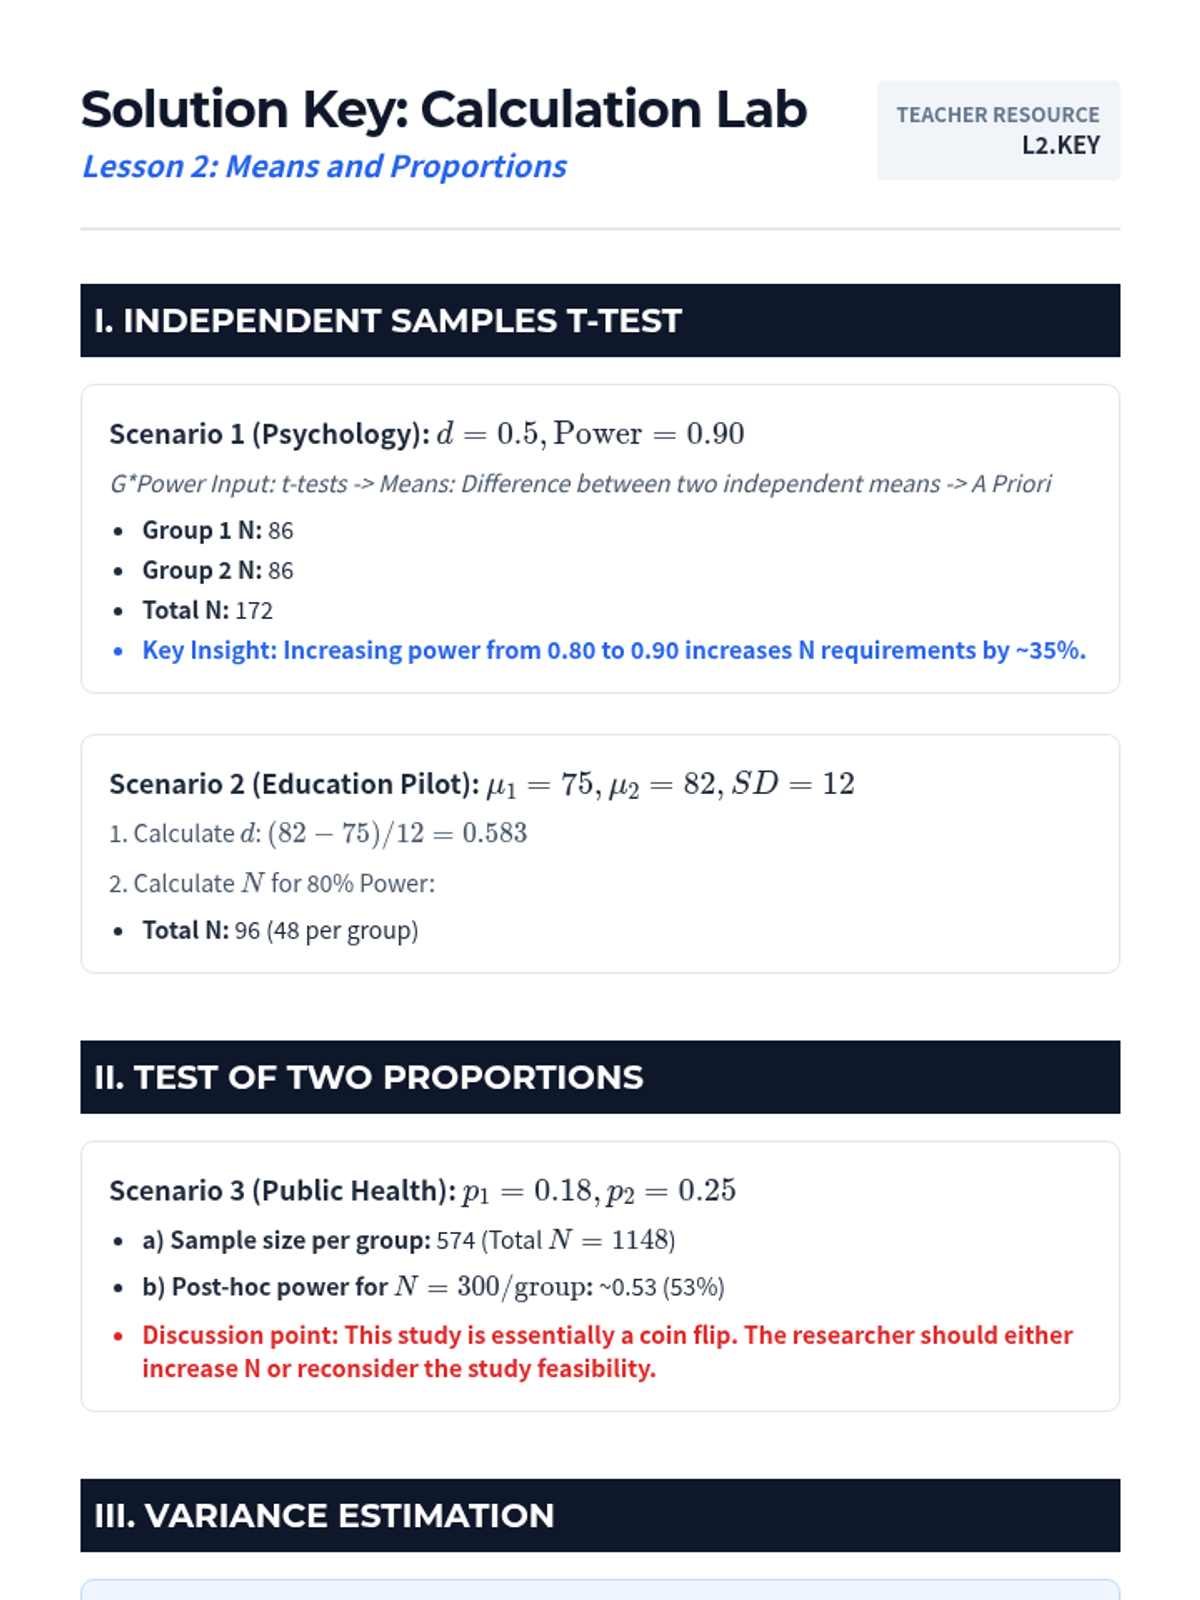
Applying power analysis to study design, students learn to determine required sample sizes before data collection. This lesson focuses on the practical use of power analysis software to justify research parameters in grant and project proposals.
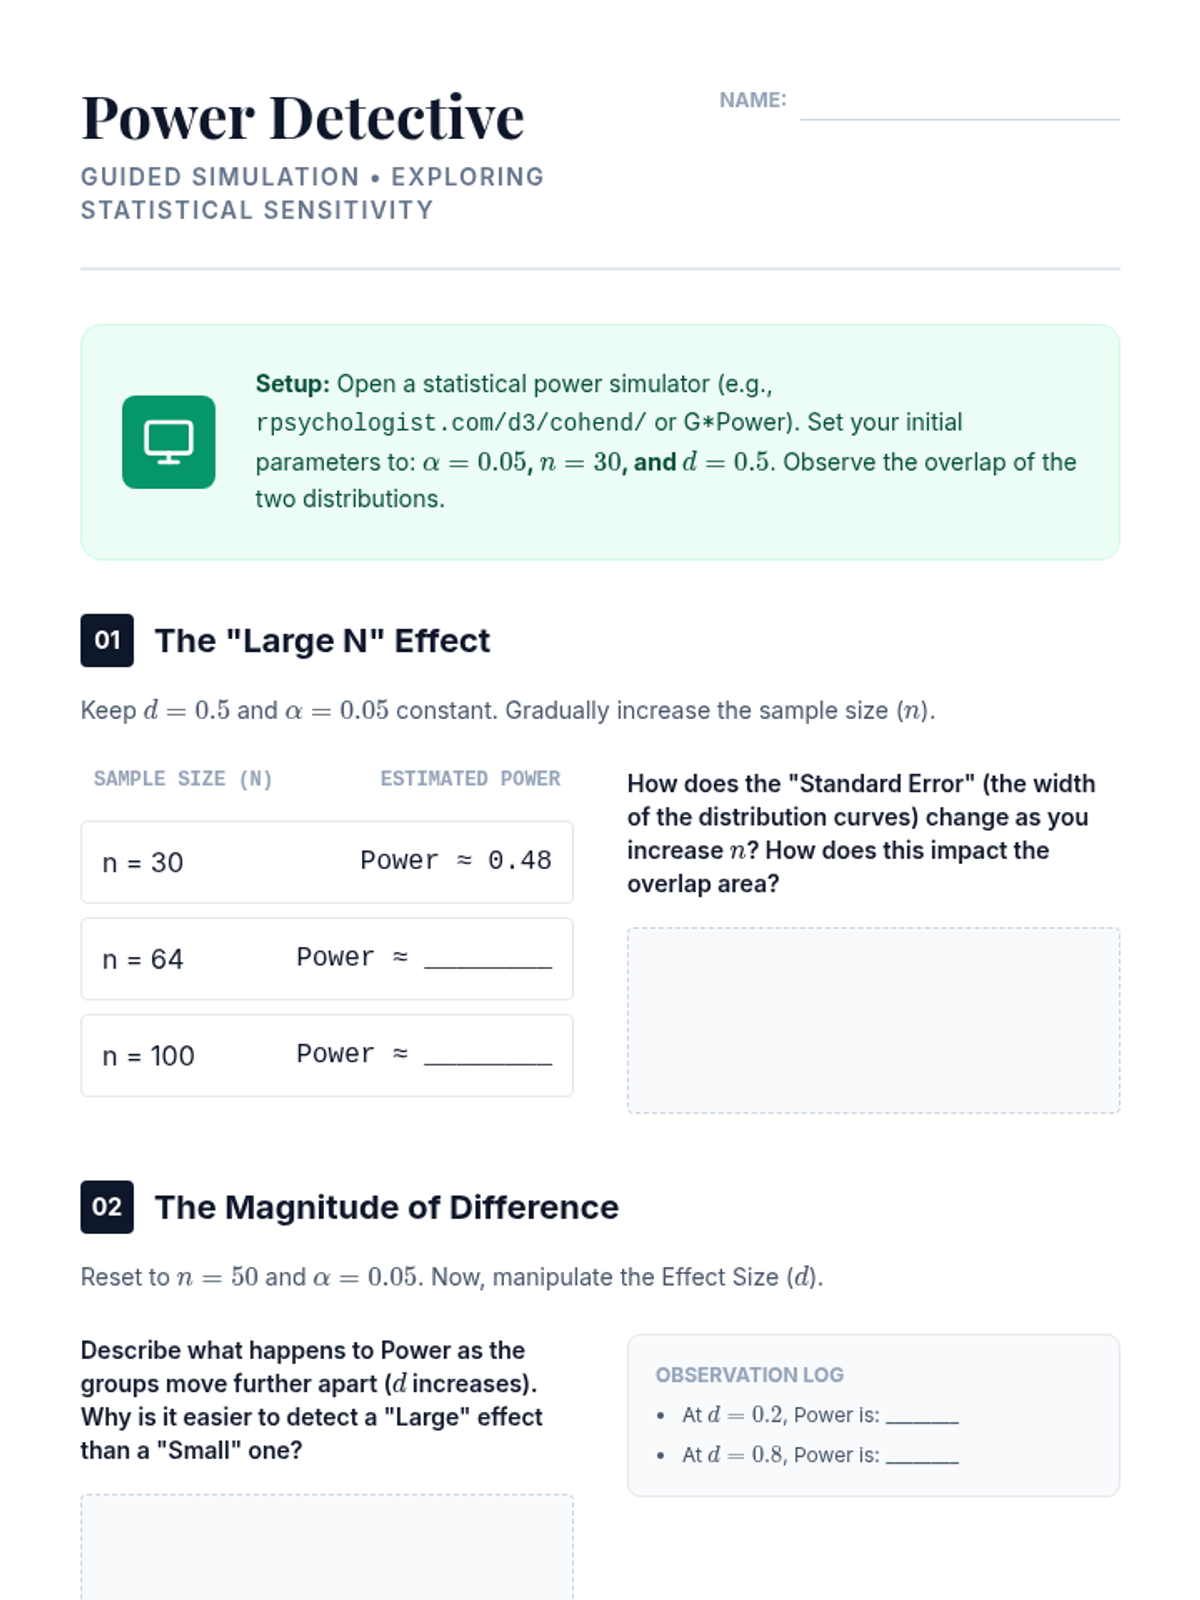
Students explore statistical power as the probability of detecting a real effect. Through visual simulations, they examine the dynamic relationships between sample size, effect size, alpha level, and the risk of Type II errors.
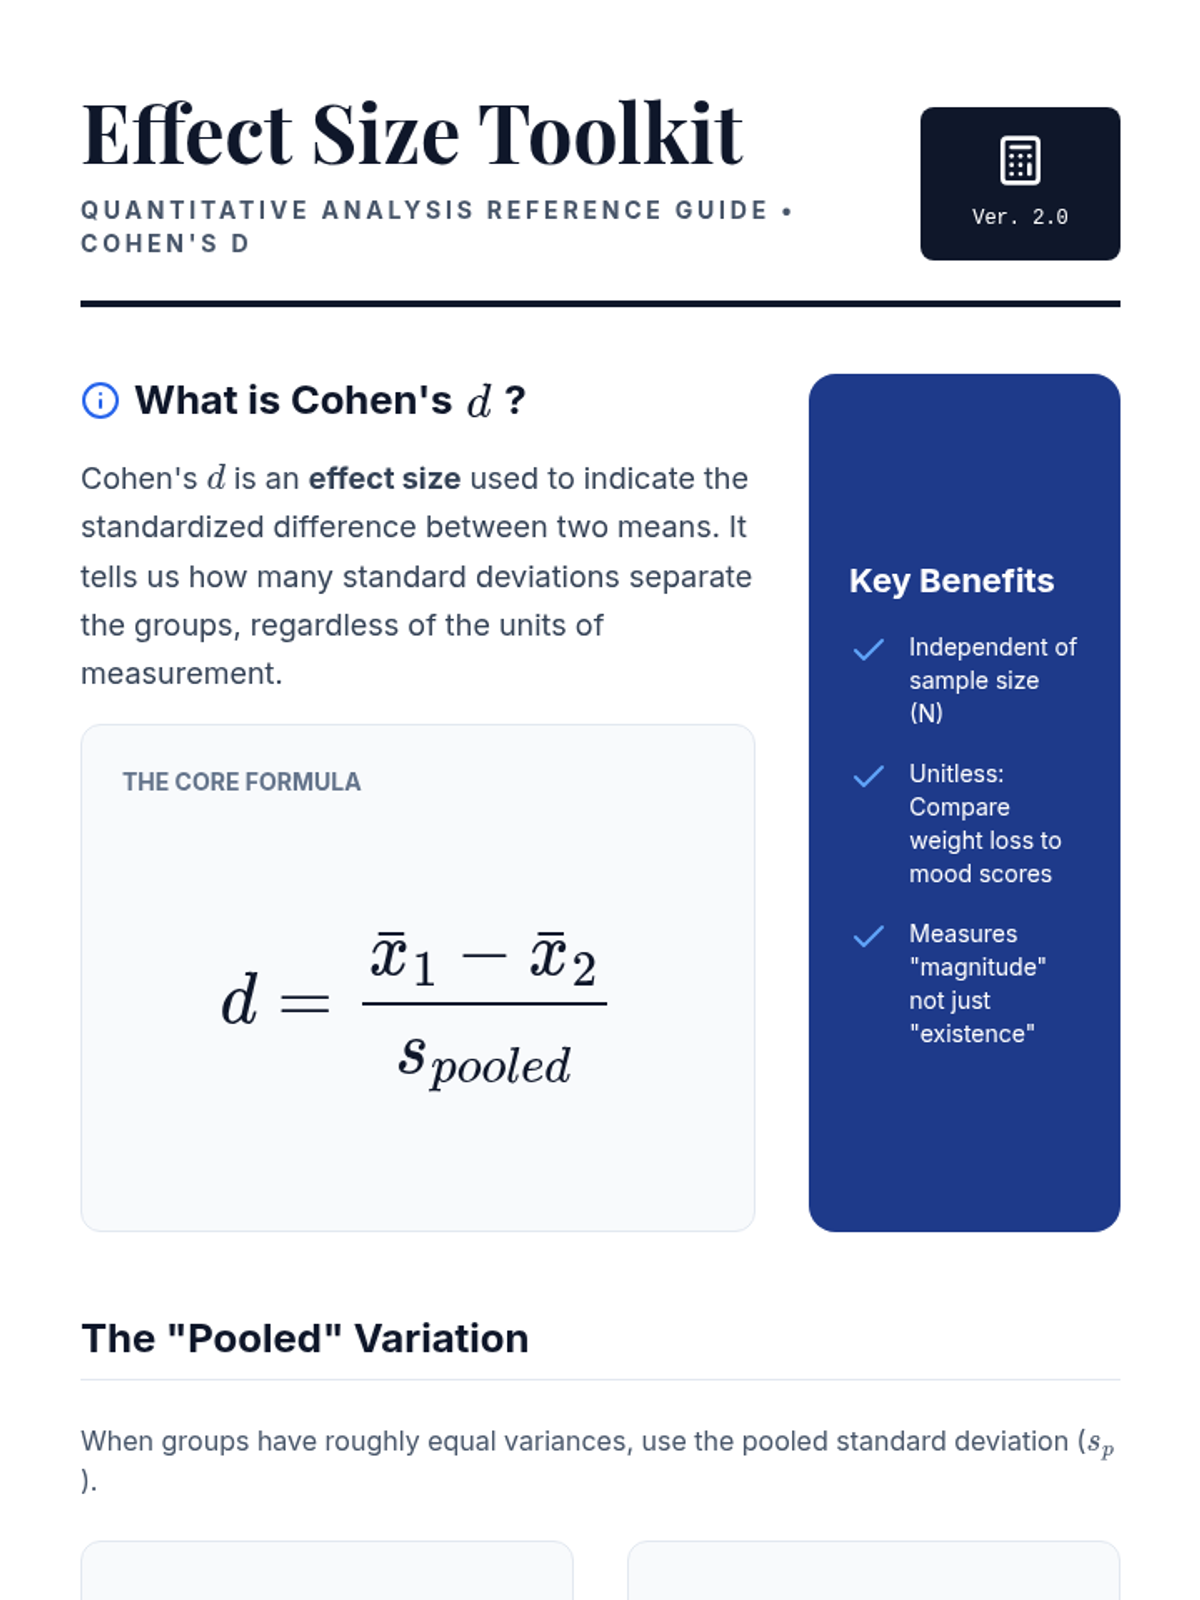
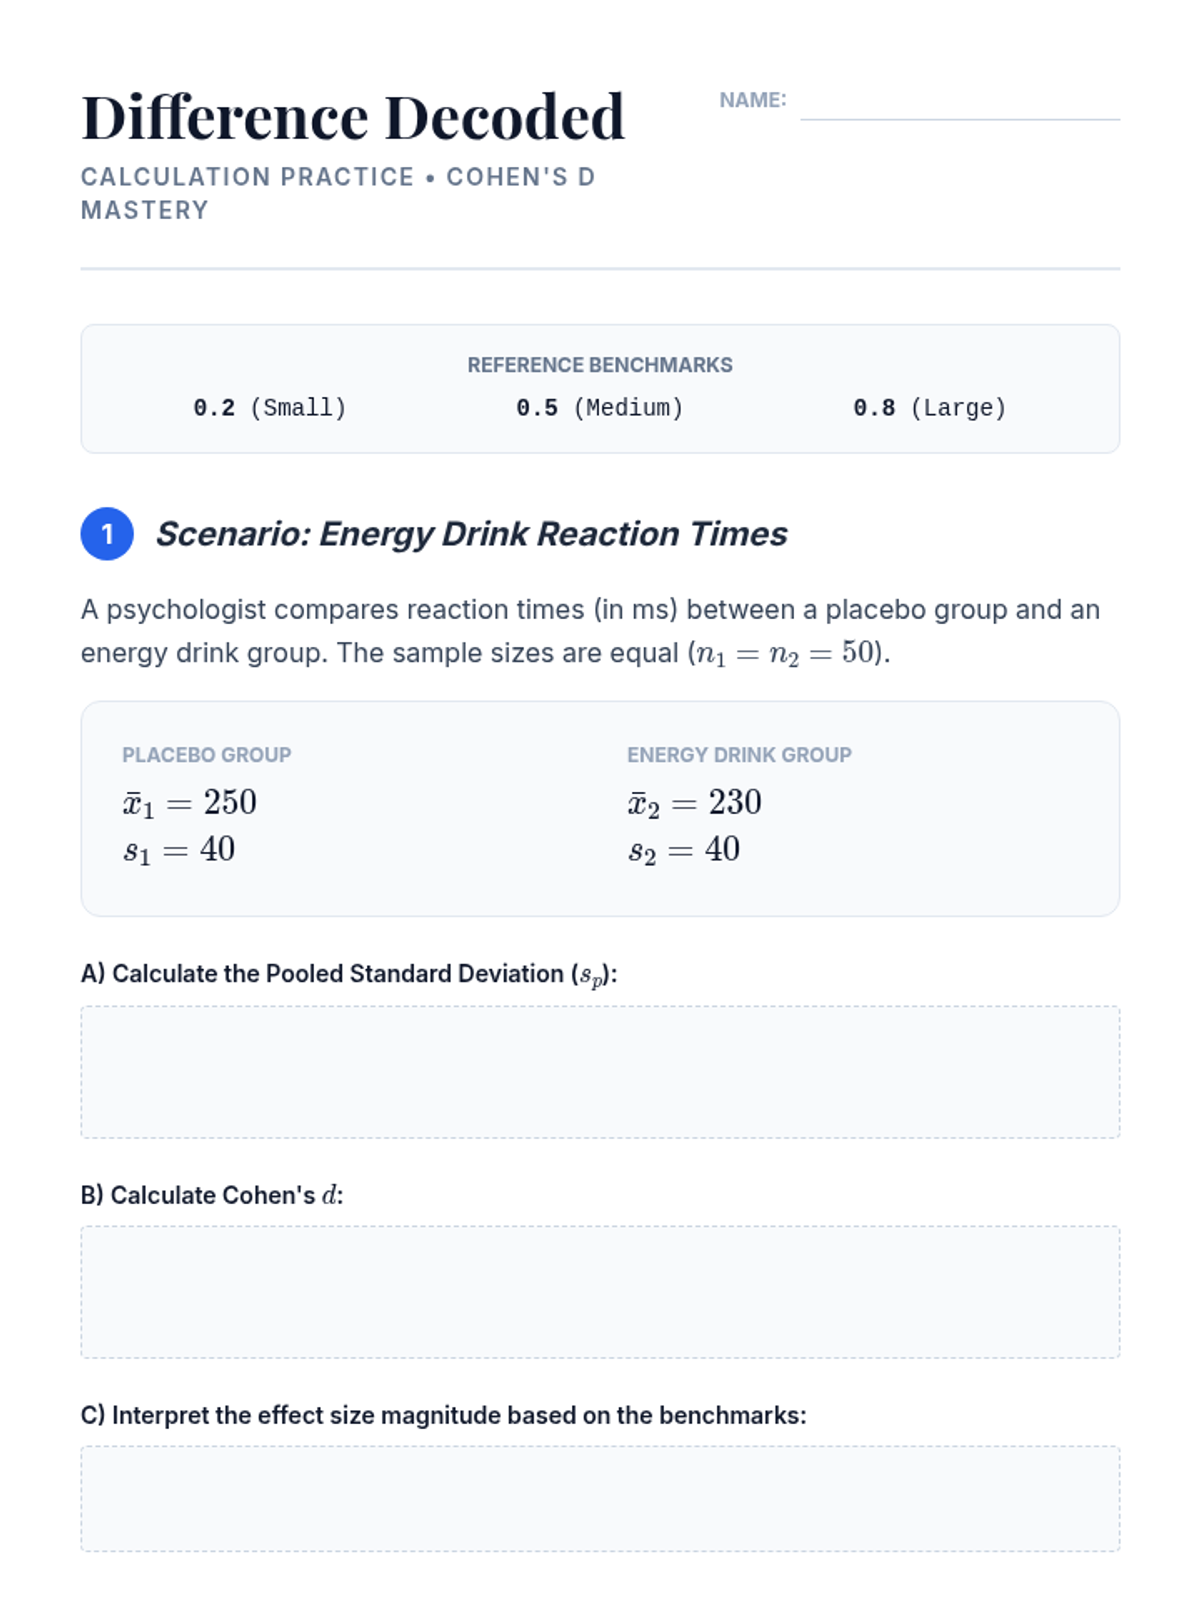
A technical session focused on calculating and interpreting Cohen's d for two-sample comparisons. Students learn to use benchmarks to evaluate effect magnitude and practice reporting these metrics alongside traditional inferential statistics.
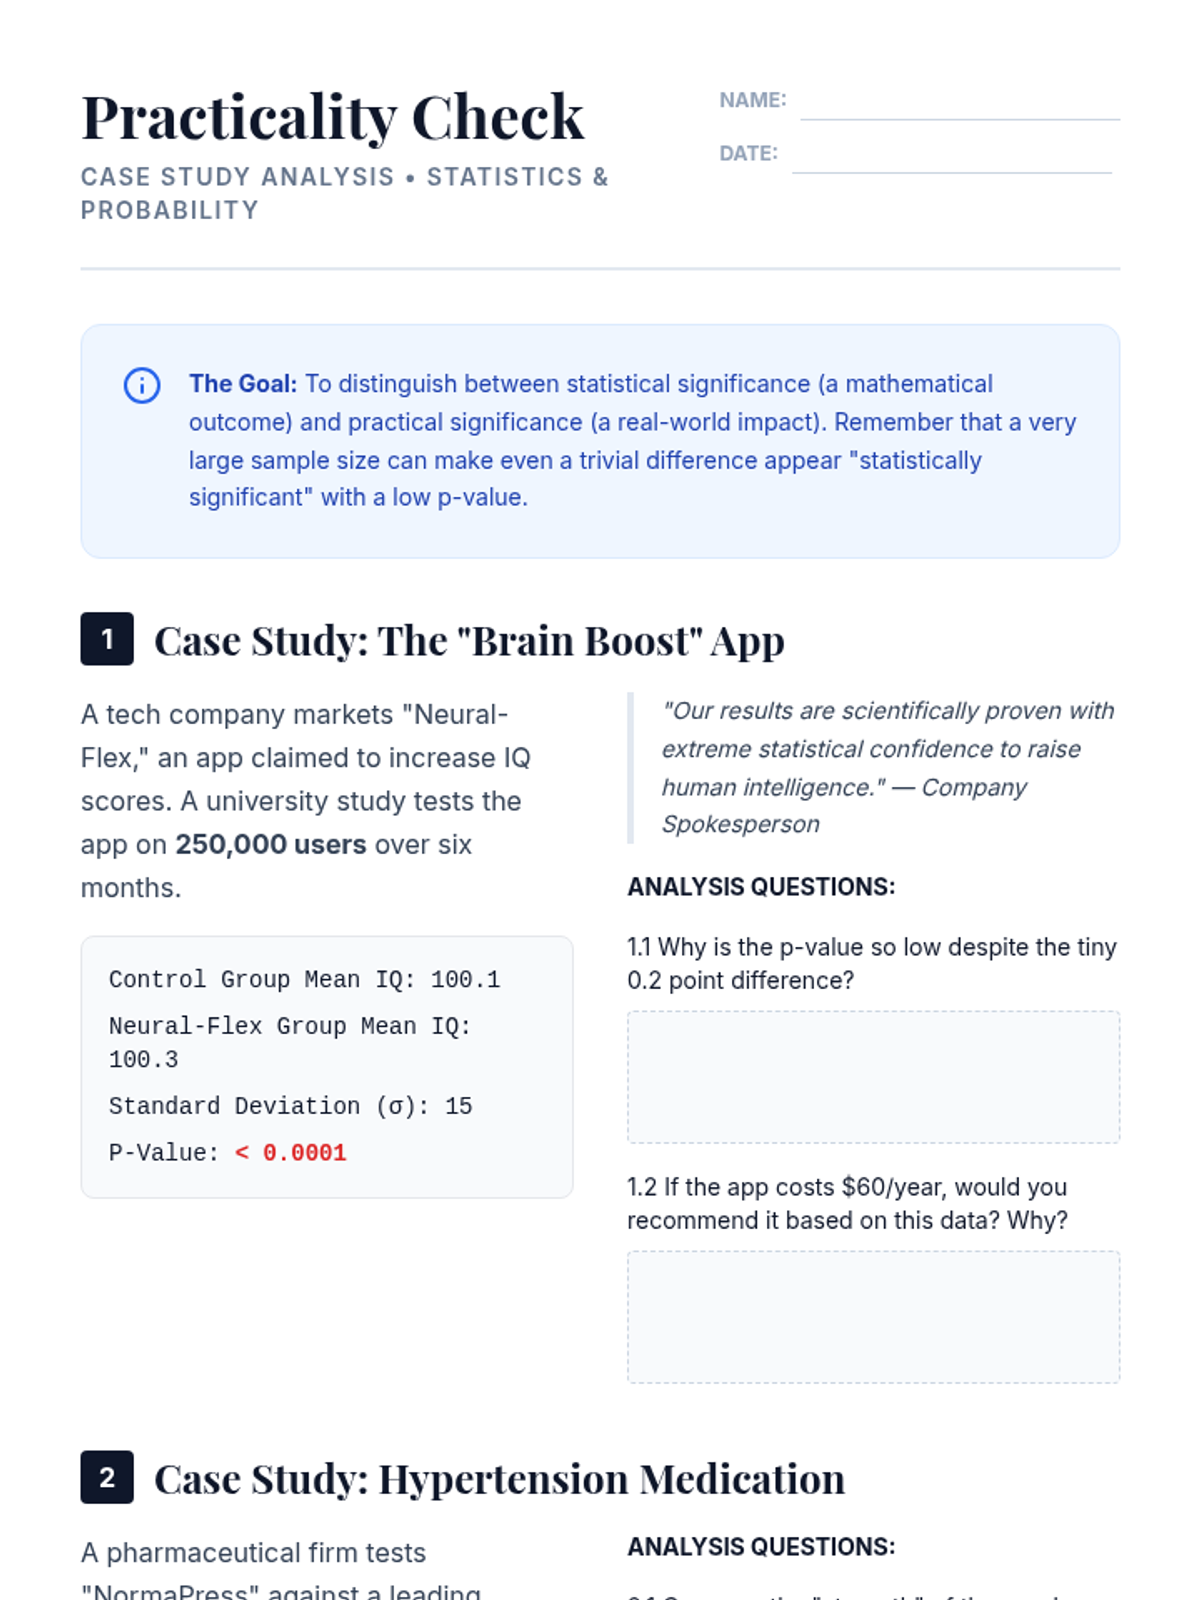
Students investigate the limitations of p-values, particularly in large samples, and are introduced to Cohen's d as a measure of practical significance. Through case studies, they analyze when a statistically significant result might be trivial in a real-world context.
An introduction to Instrumental Variables (IV) as a method for estimating causal effects when experiments are impossible, featuring the Vietnam War draft lottery case.
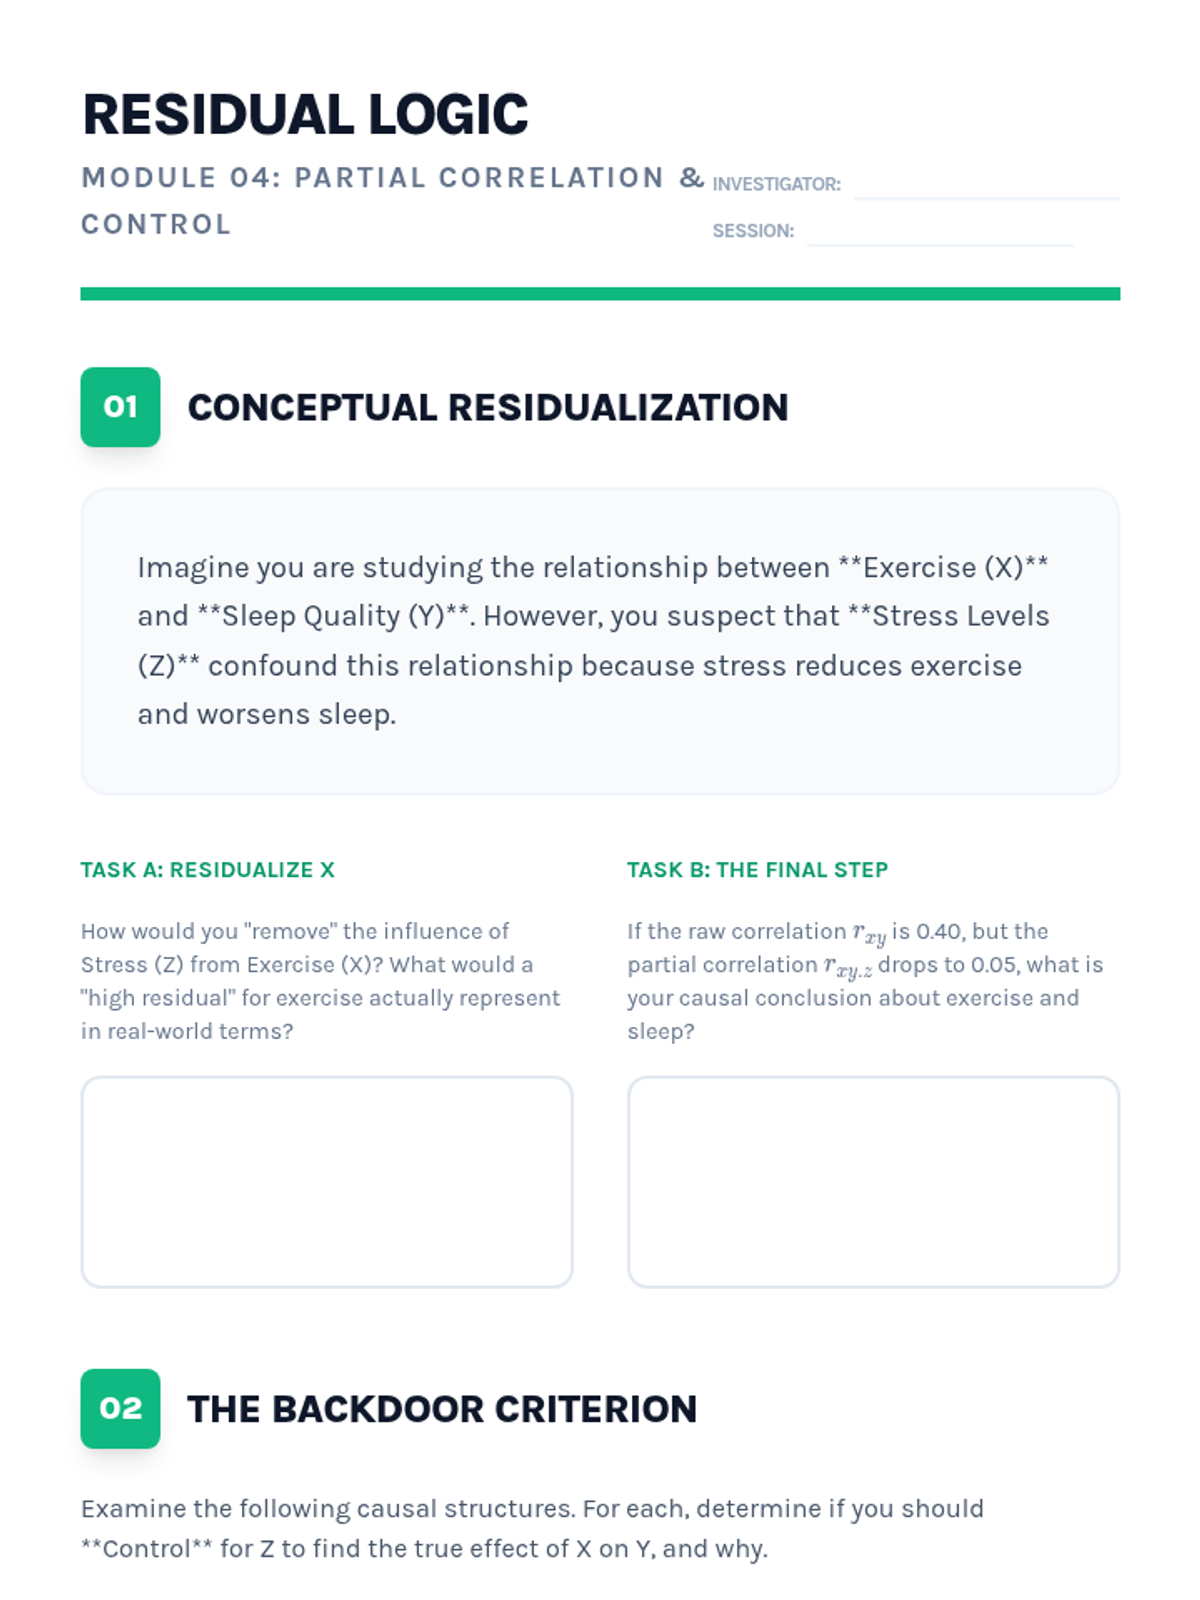
Practice identifying and adjusting for confounders. Students use partial correlation to 'control' for third variables and observe the impact on primary bivariate relationships.
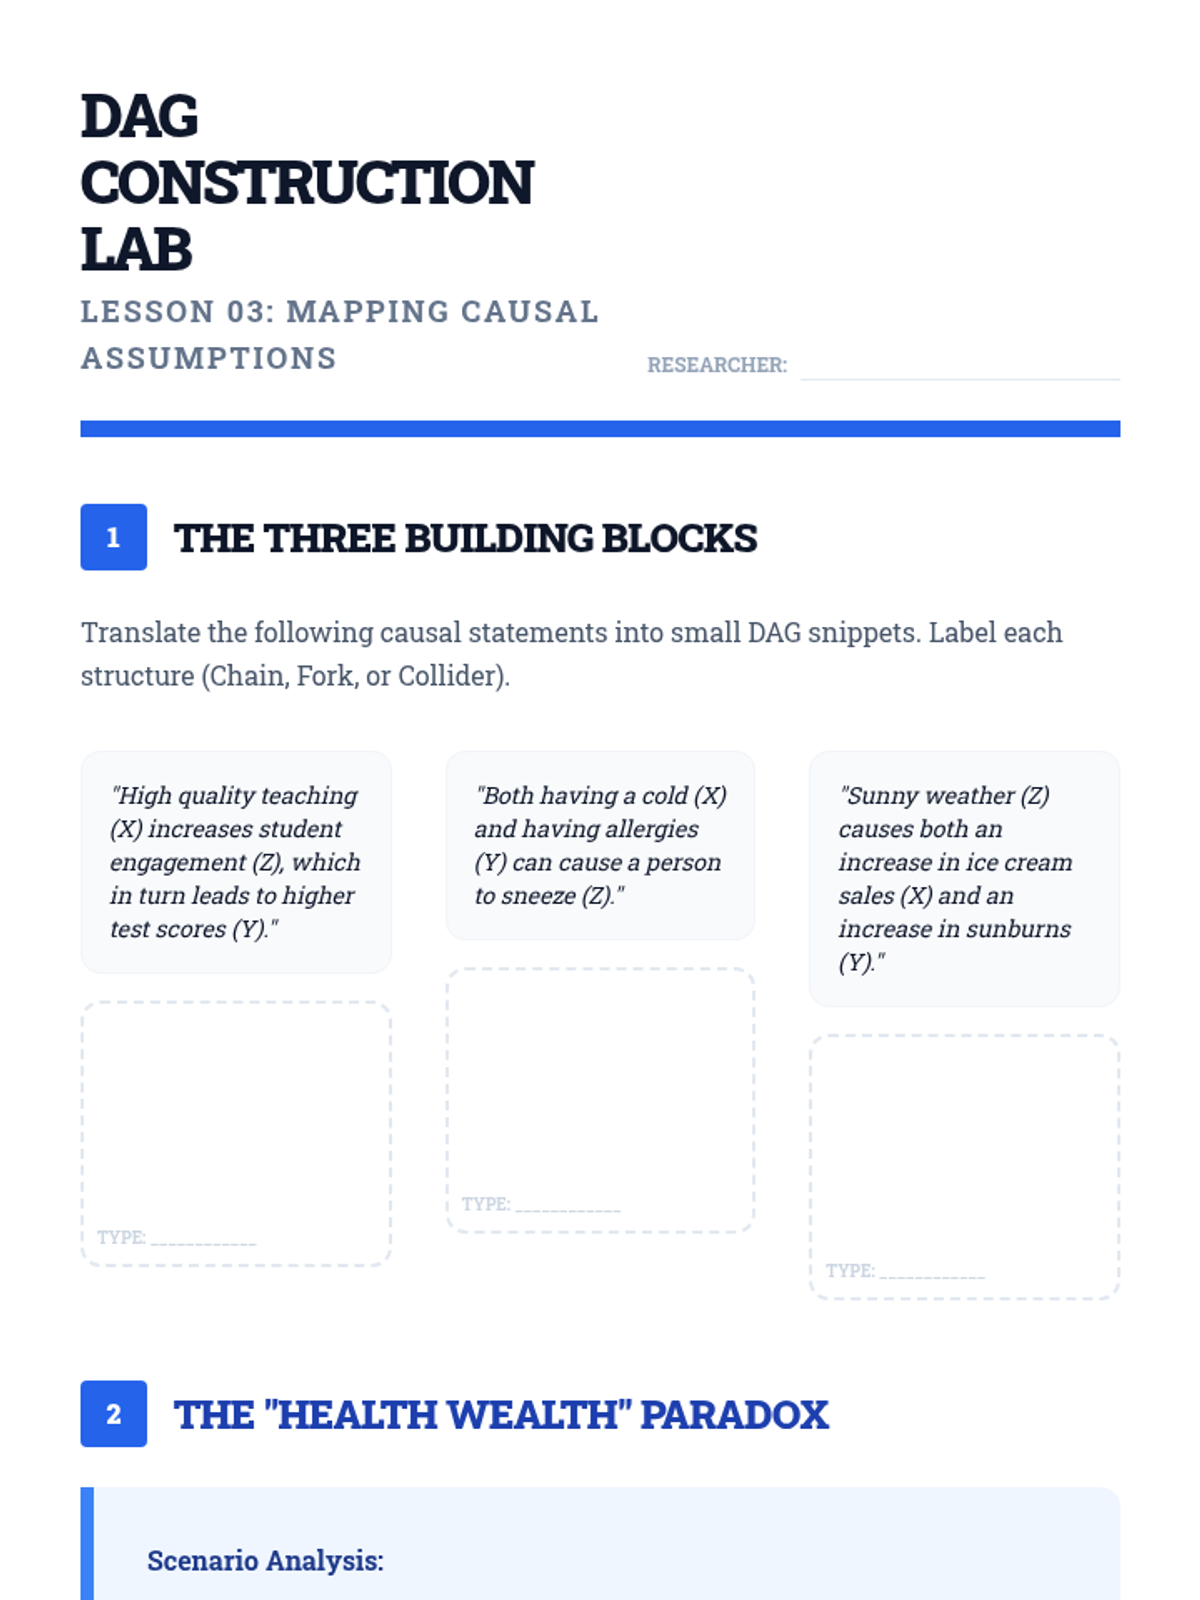
Learn to represent causal assumptions using Directed Acyclic Graphs (DAGs). Students master the structures of chains, forks, and colliders to determine when to control for variables.
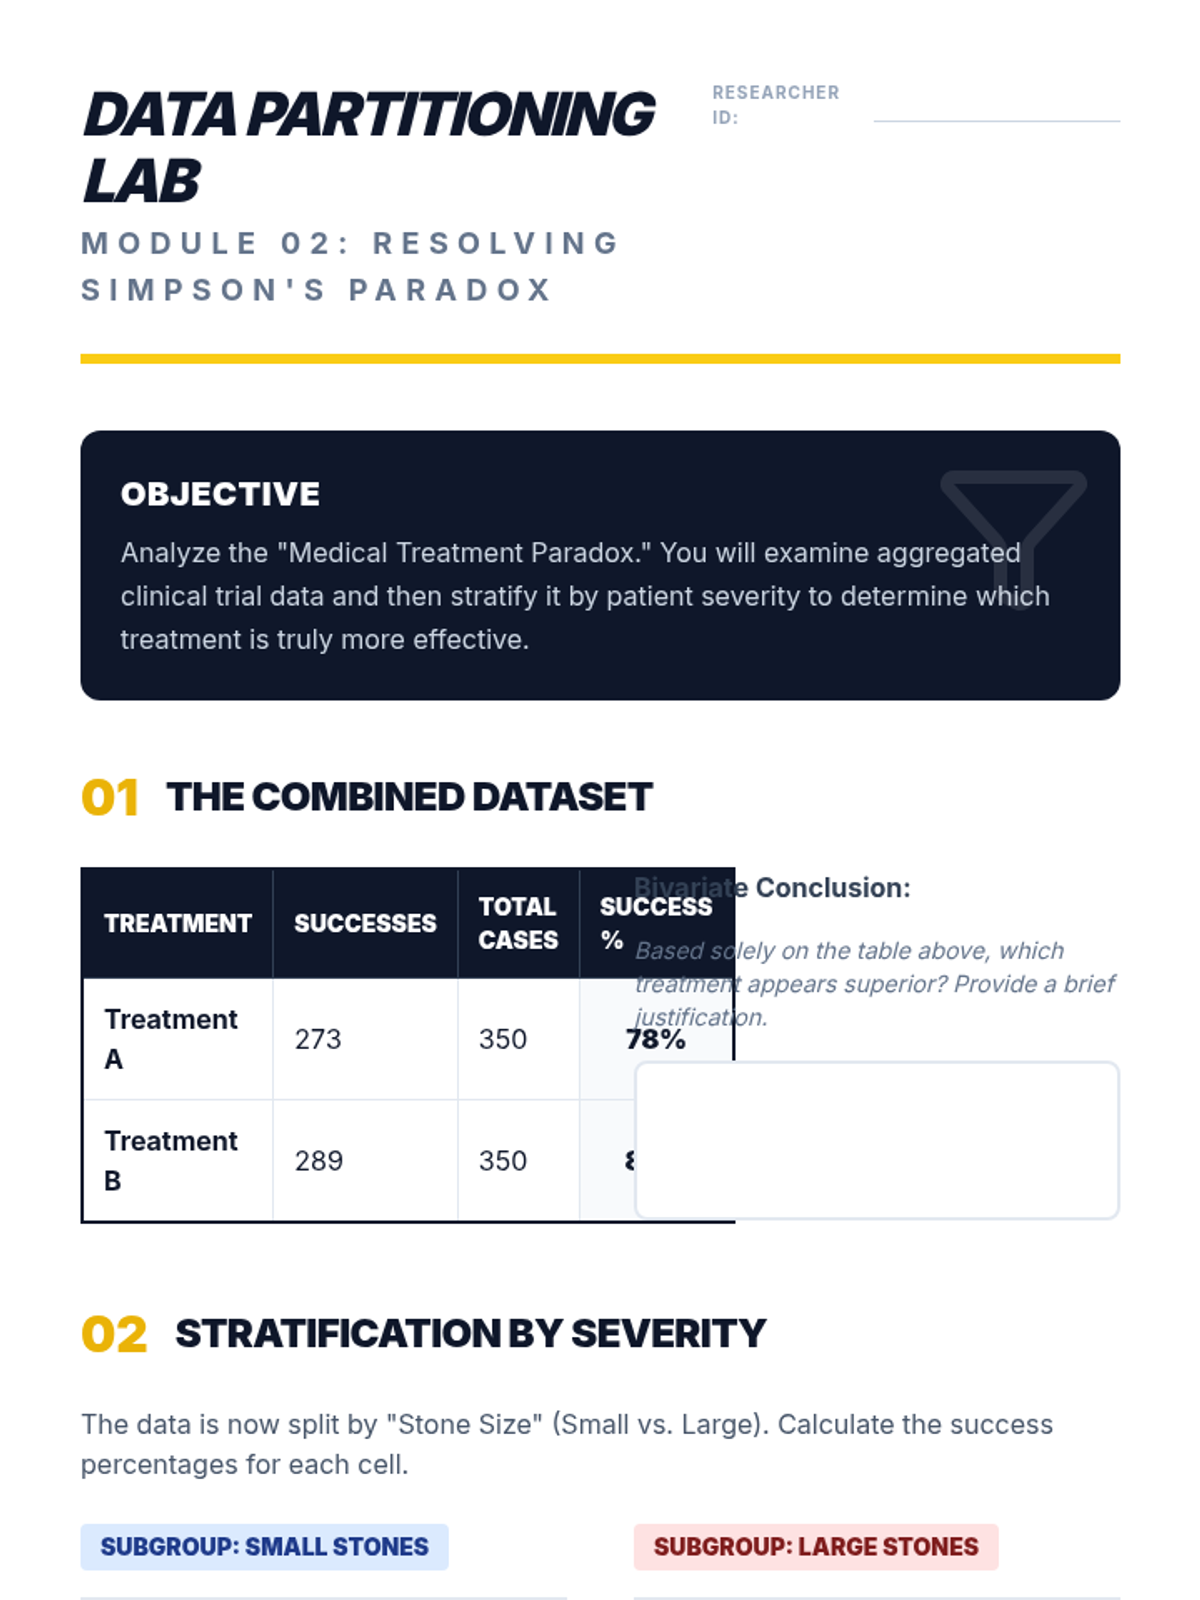
A deep dive into Simpson's Paradox where trends reverse upon aggregation. Students analyze the UC Berkeley admissions case to understand how data stratification reveals hidden truths.
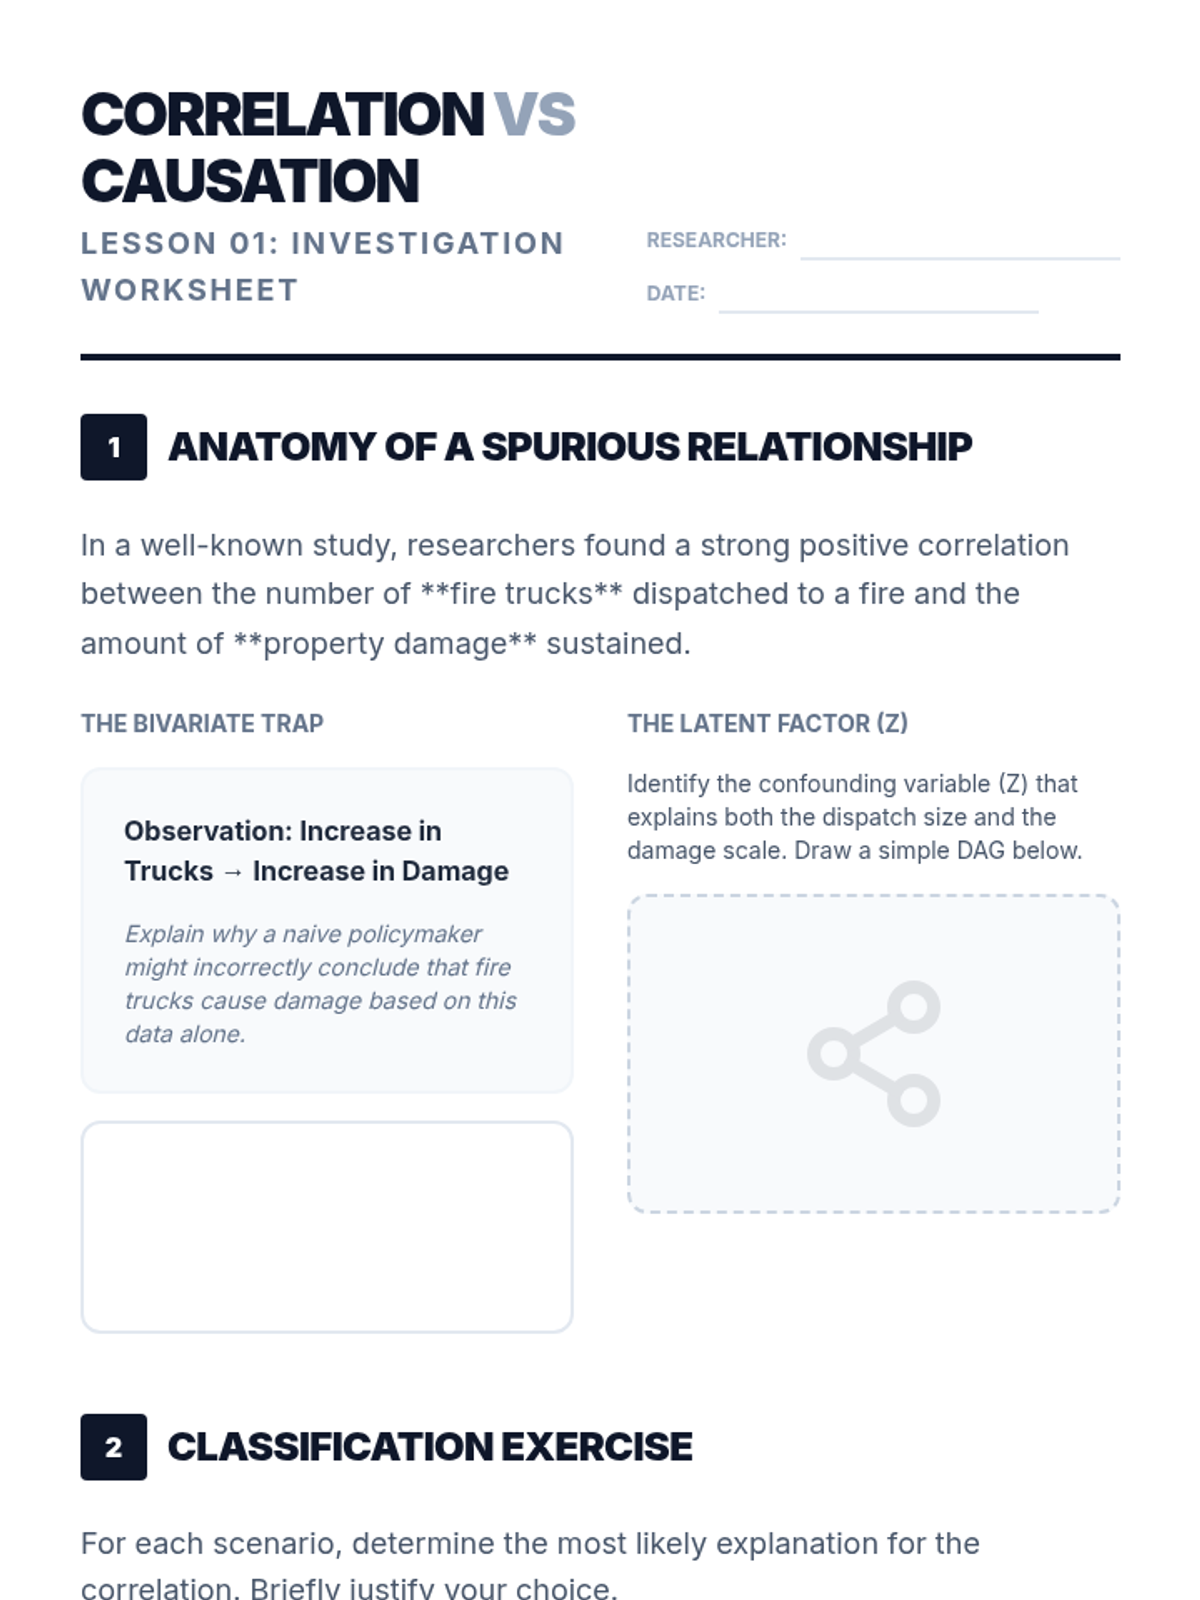
Explore spurious correlations and the 'third variable' problem using historical examples. Students learn to distinguish between coincidence, common causes, and direct causation.
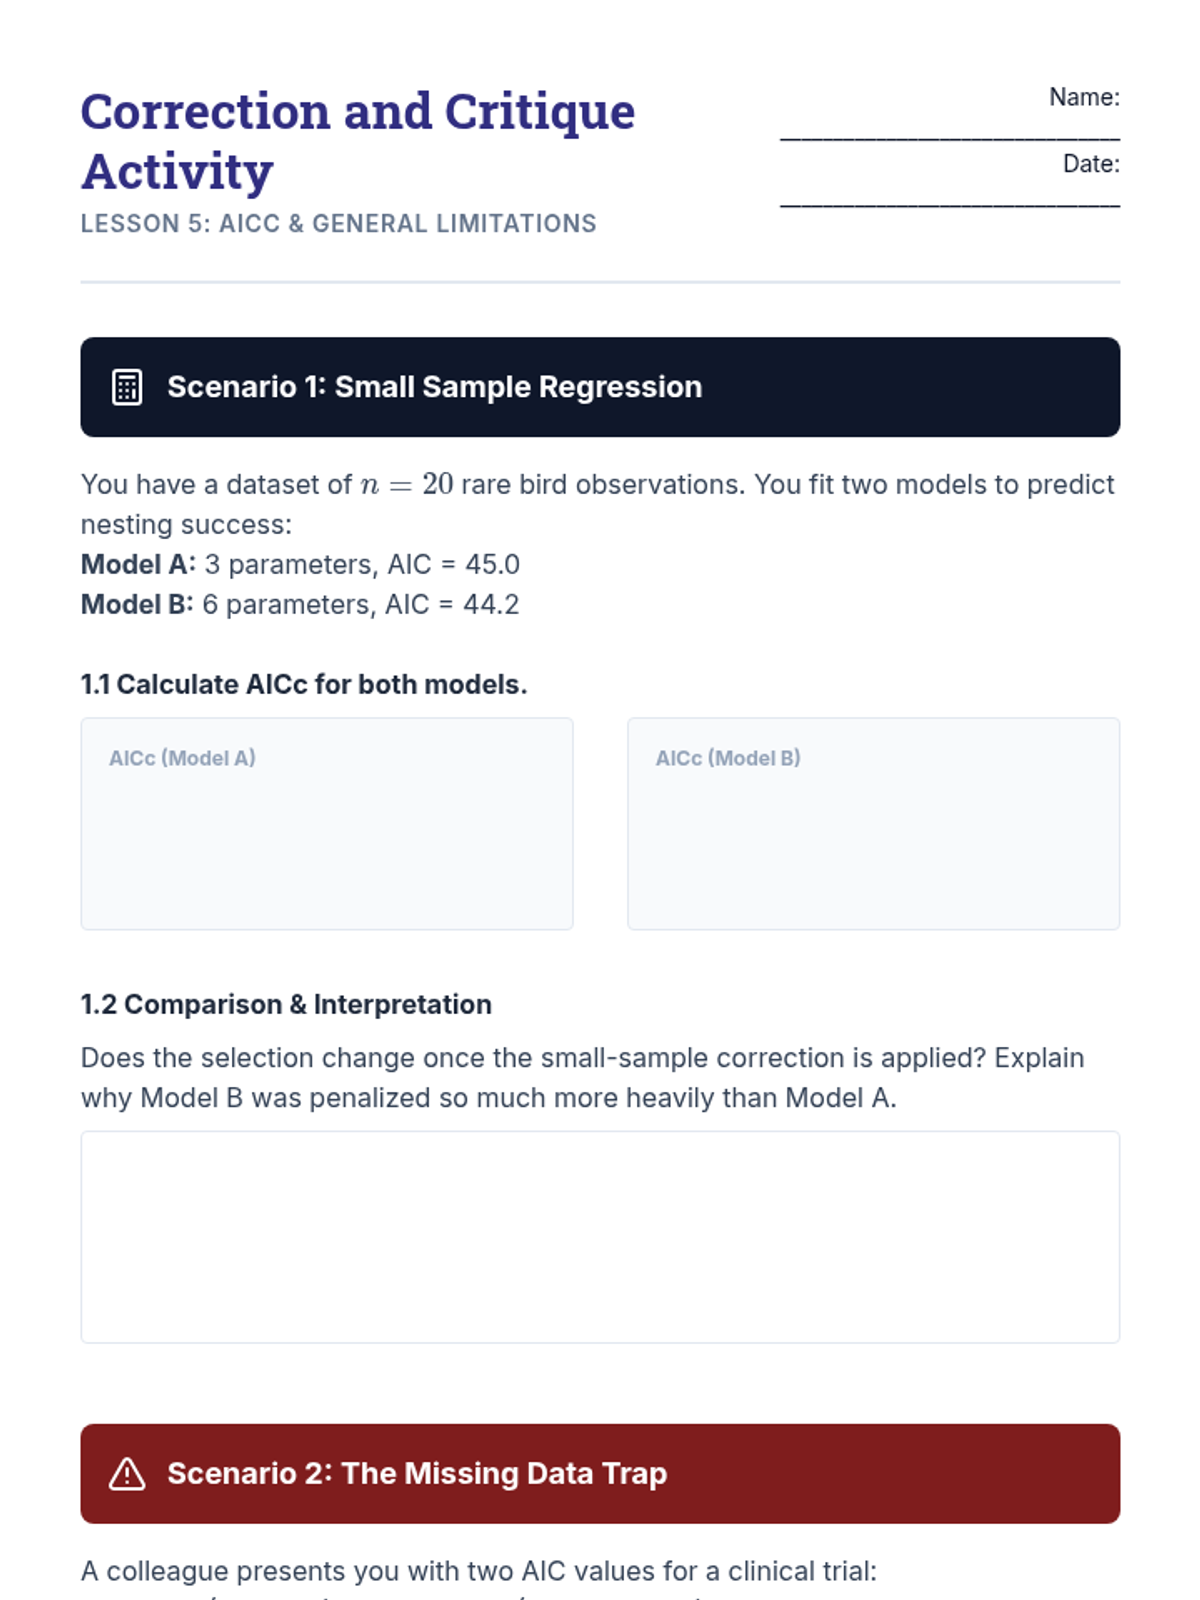
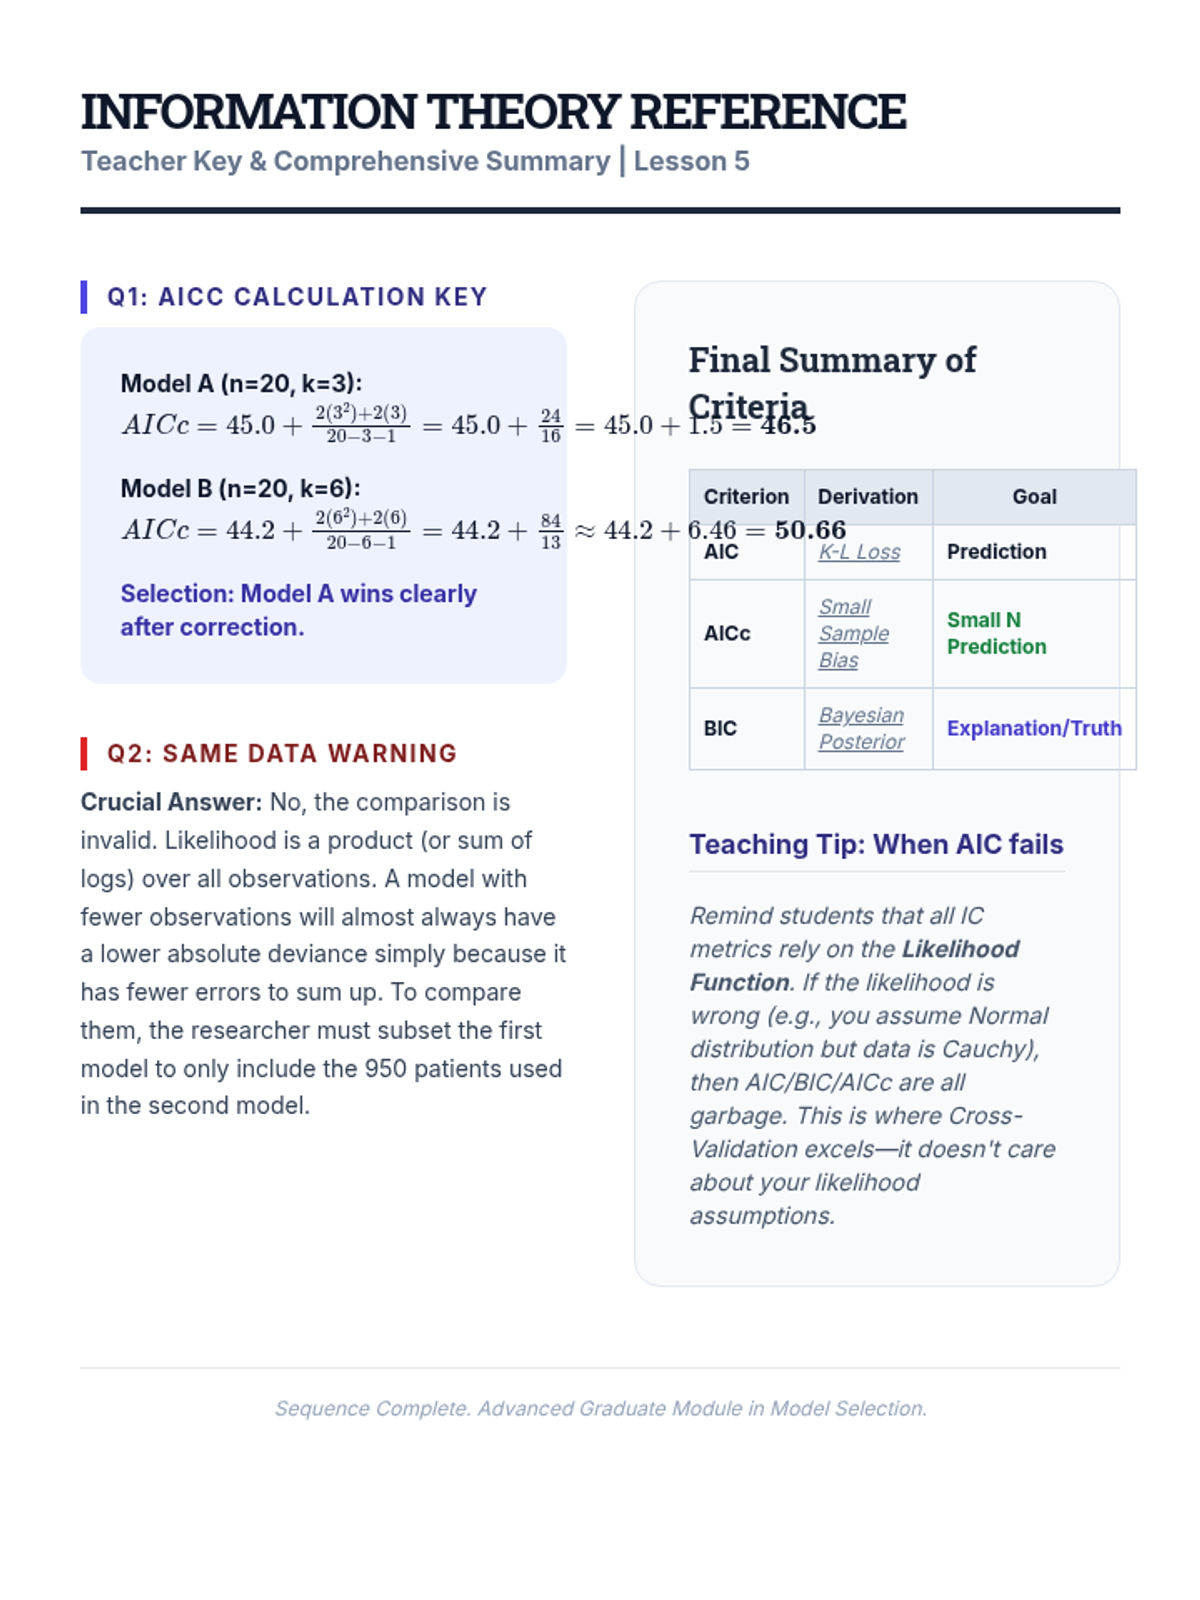
Address small-sample bias in AIC with the AICc correction and discuss the broader limitations of information criteria compared to cross-validation.
The culmination of the project where students synthesize their findings into a technical report and defend their model choice based on performance, trade-offs, and generalization expectations.
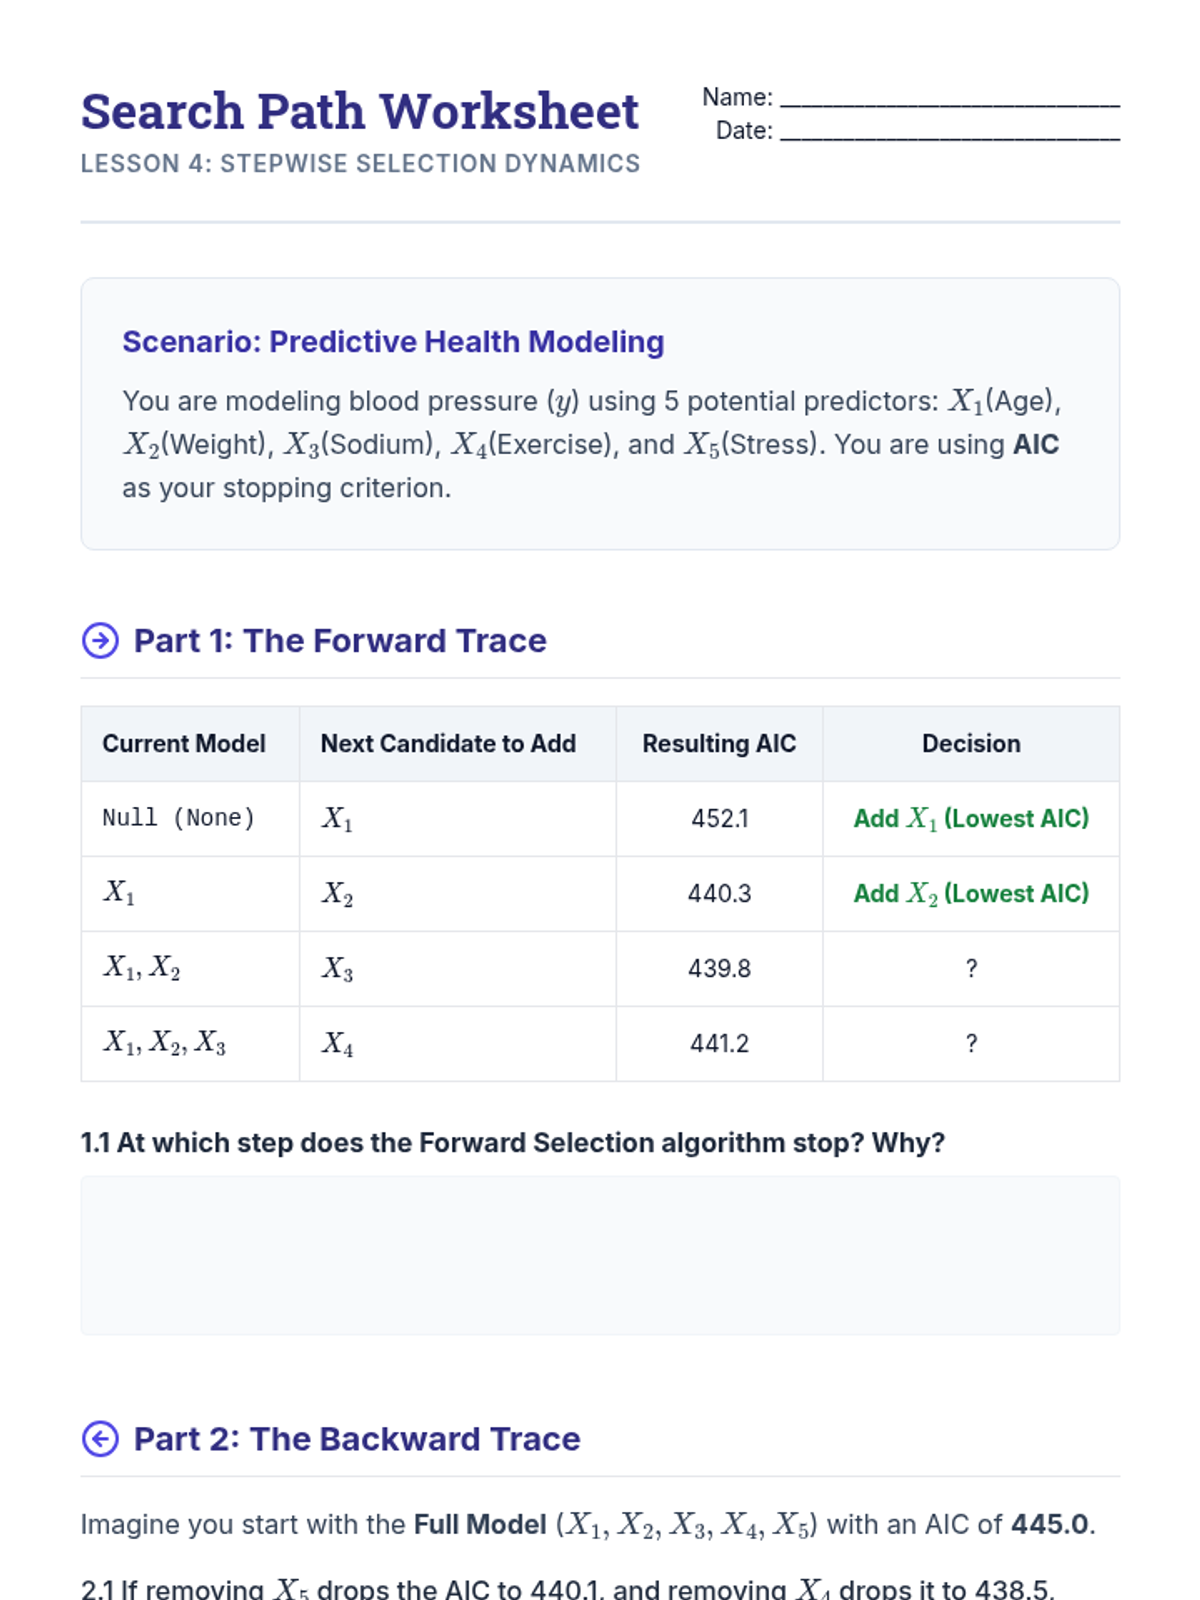
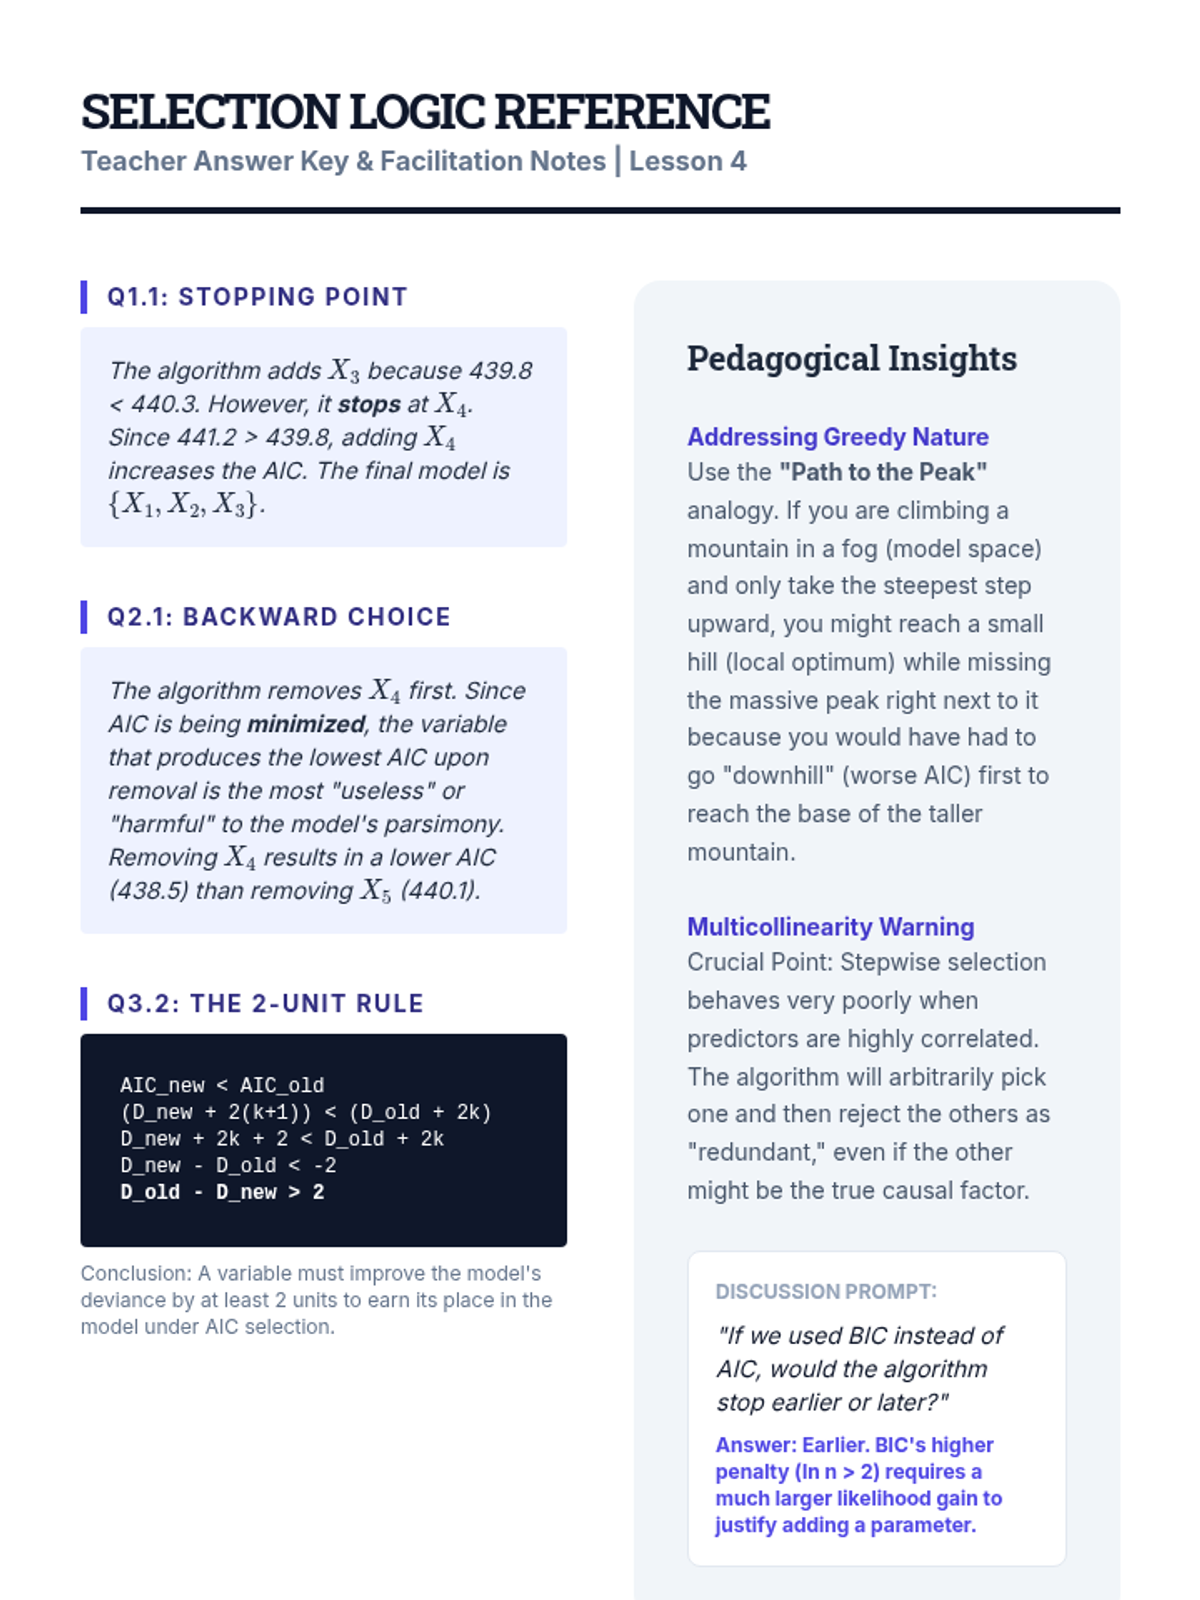
Implement and critique forward and backward stepwise selection algorithms using information criteria as stopping rules, discussing their greedy nature and instability.
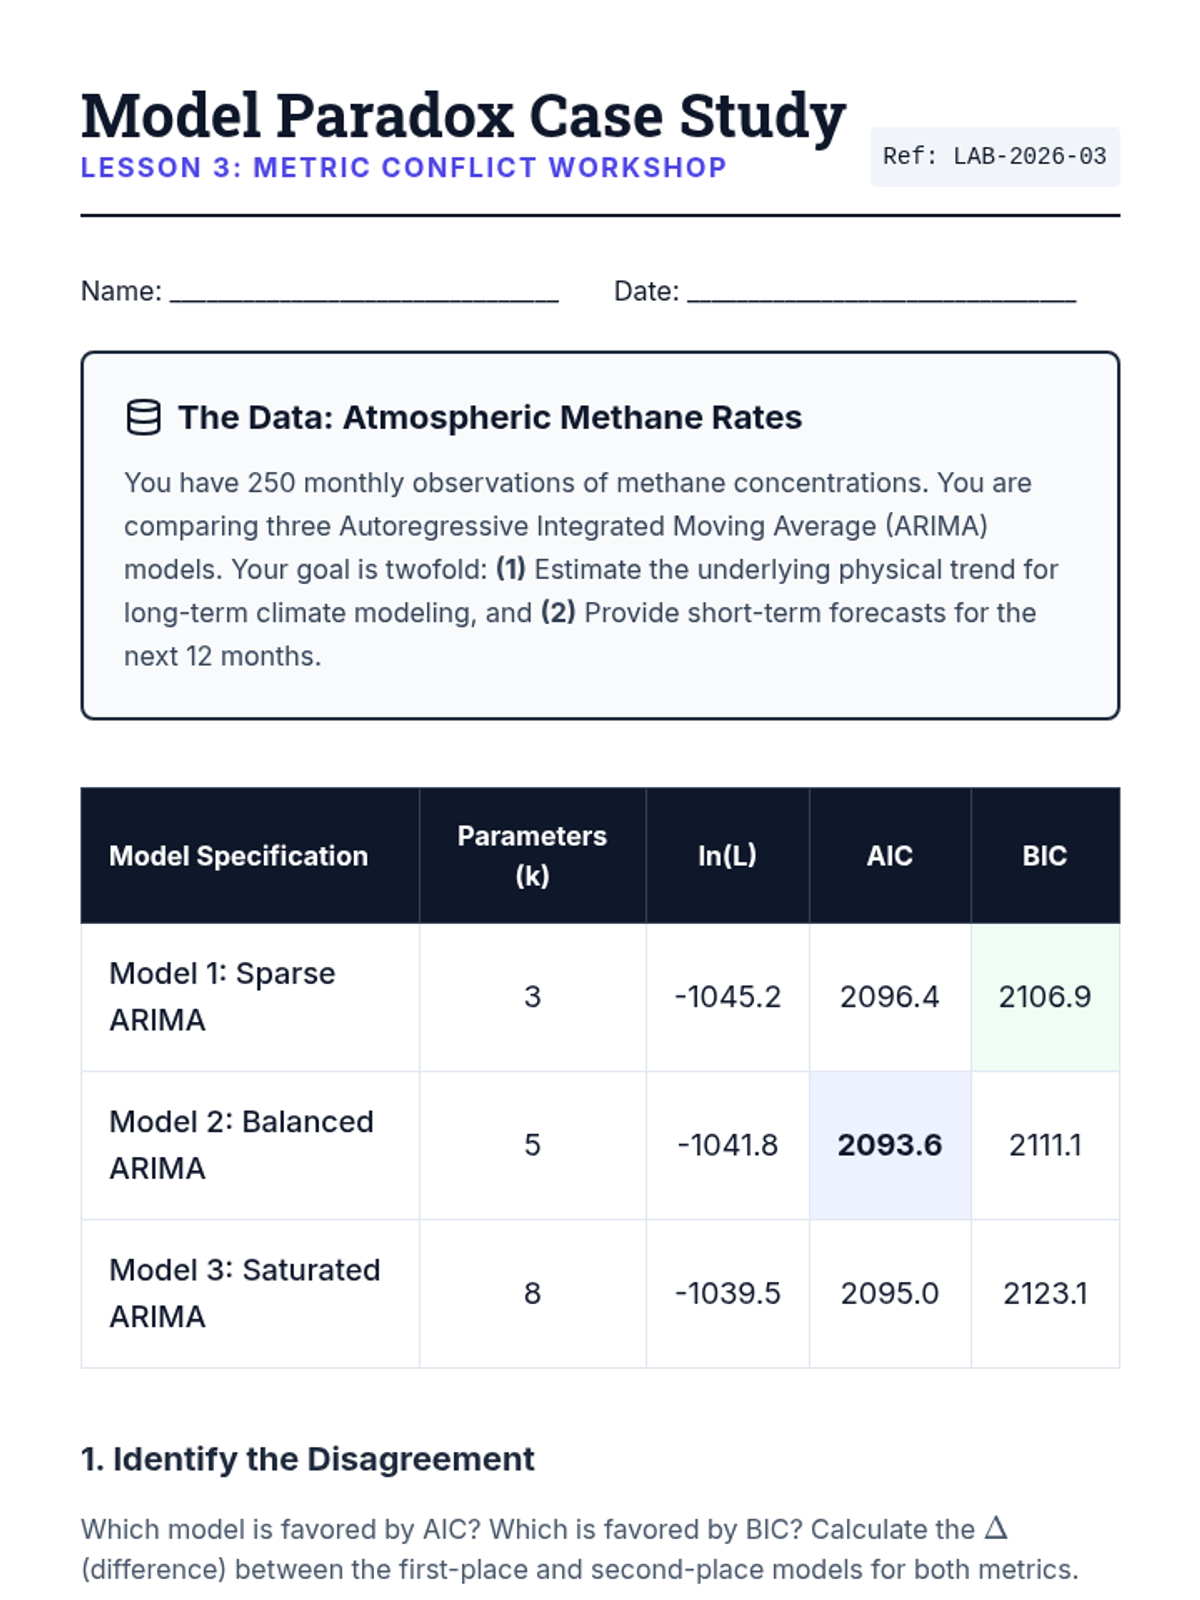
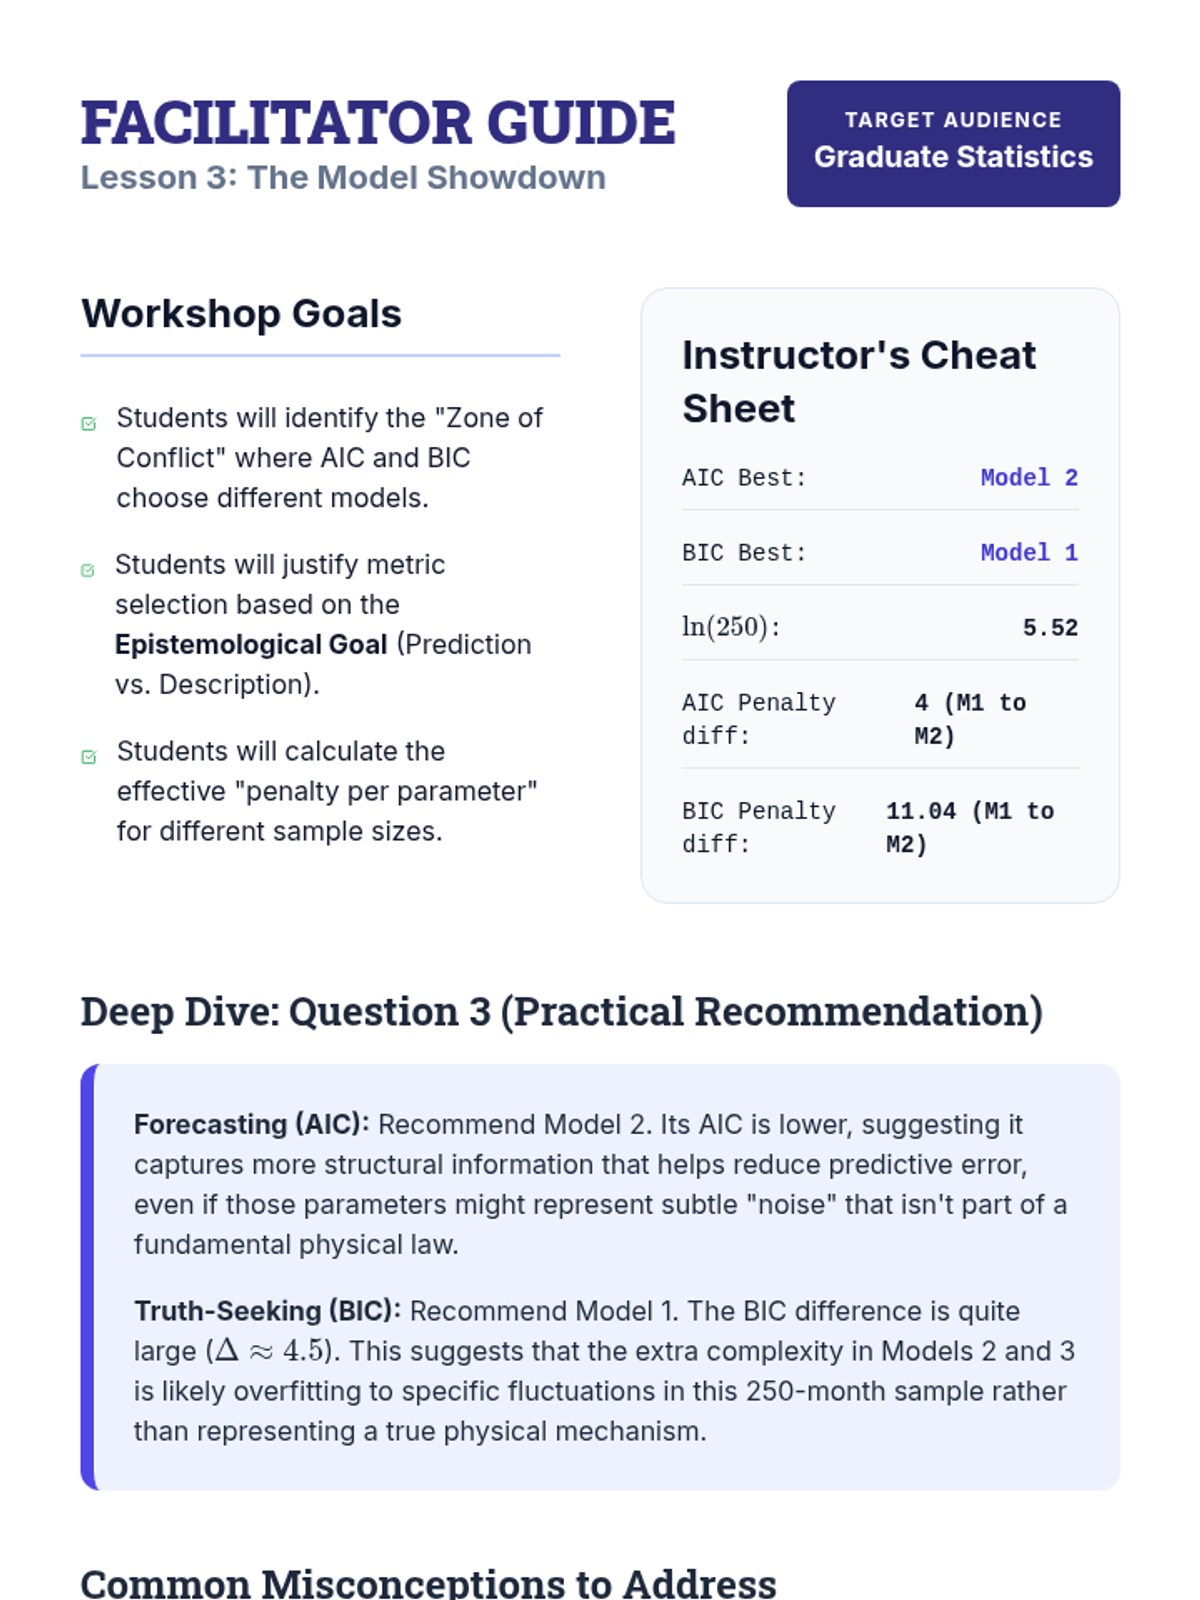
Analyze scenarios where AIC and BIC disagree, fitting multiple parametric models to datasets and determining the appropriate metric based on research goals.
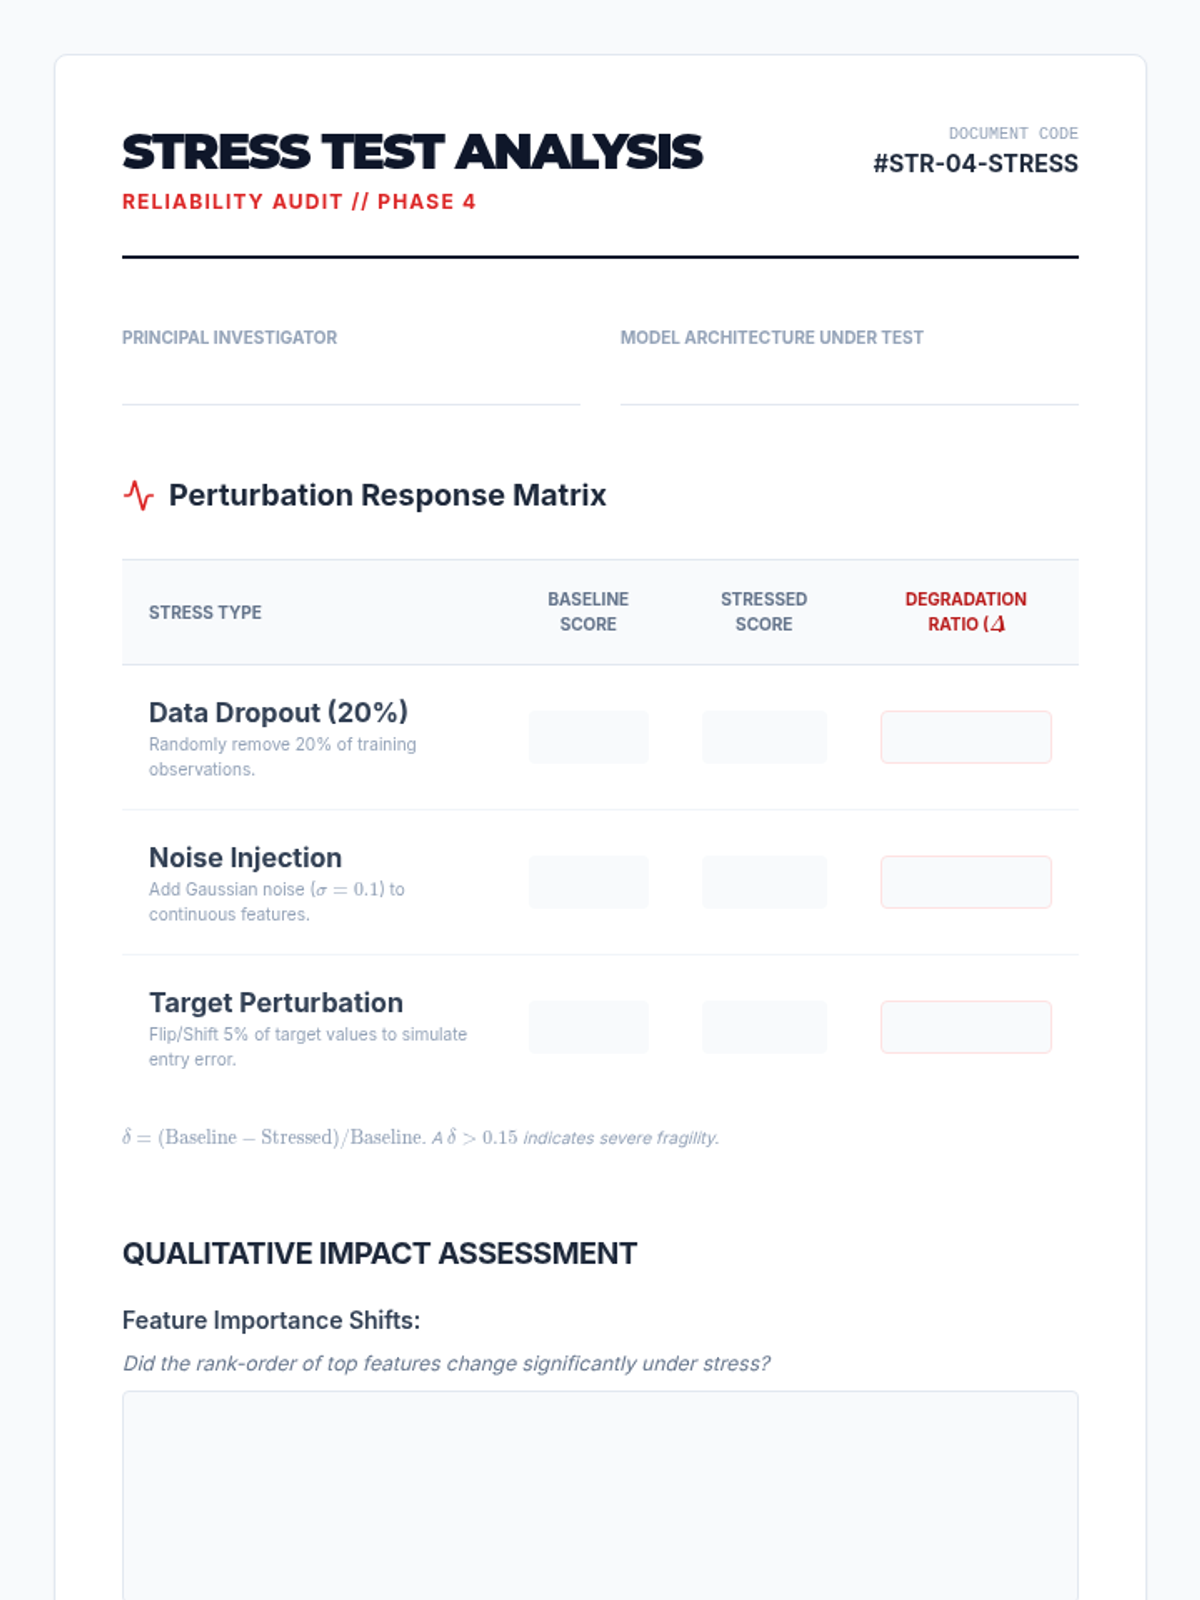
Students explore model sensitivity and selection bias through stability analysis and data perturbation to ensure the chosen model generalizes robustly across varying data distributions.
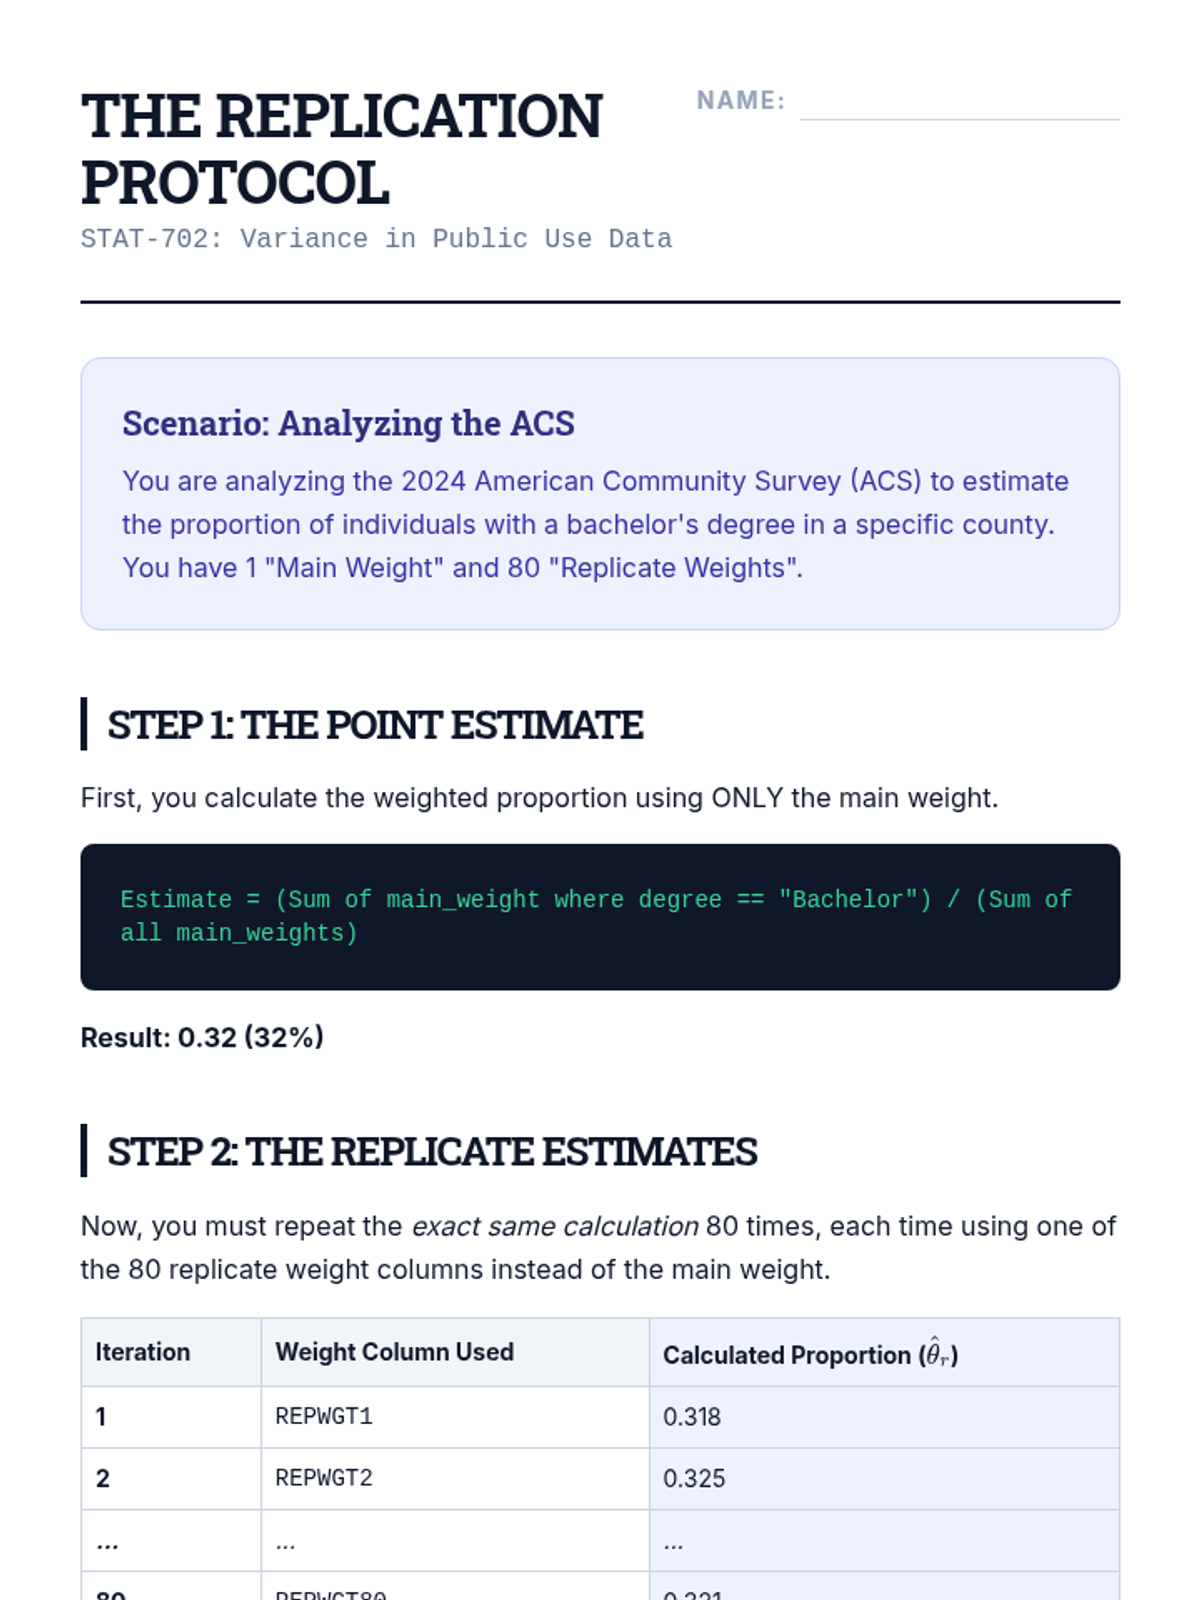
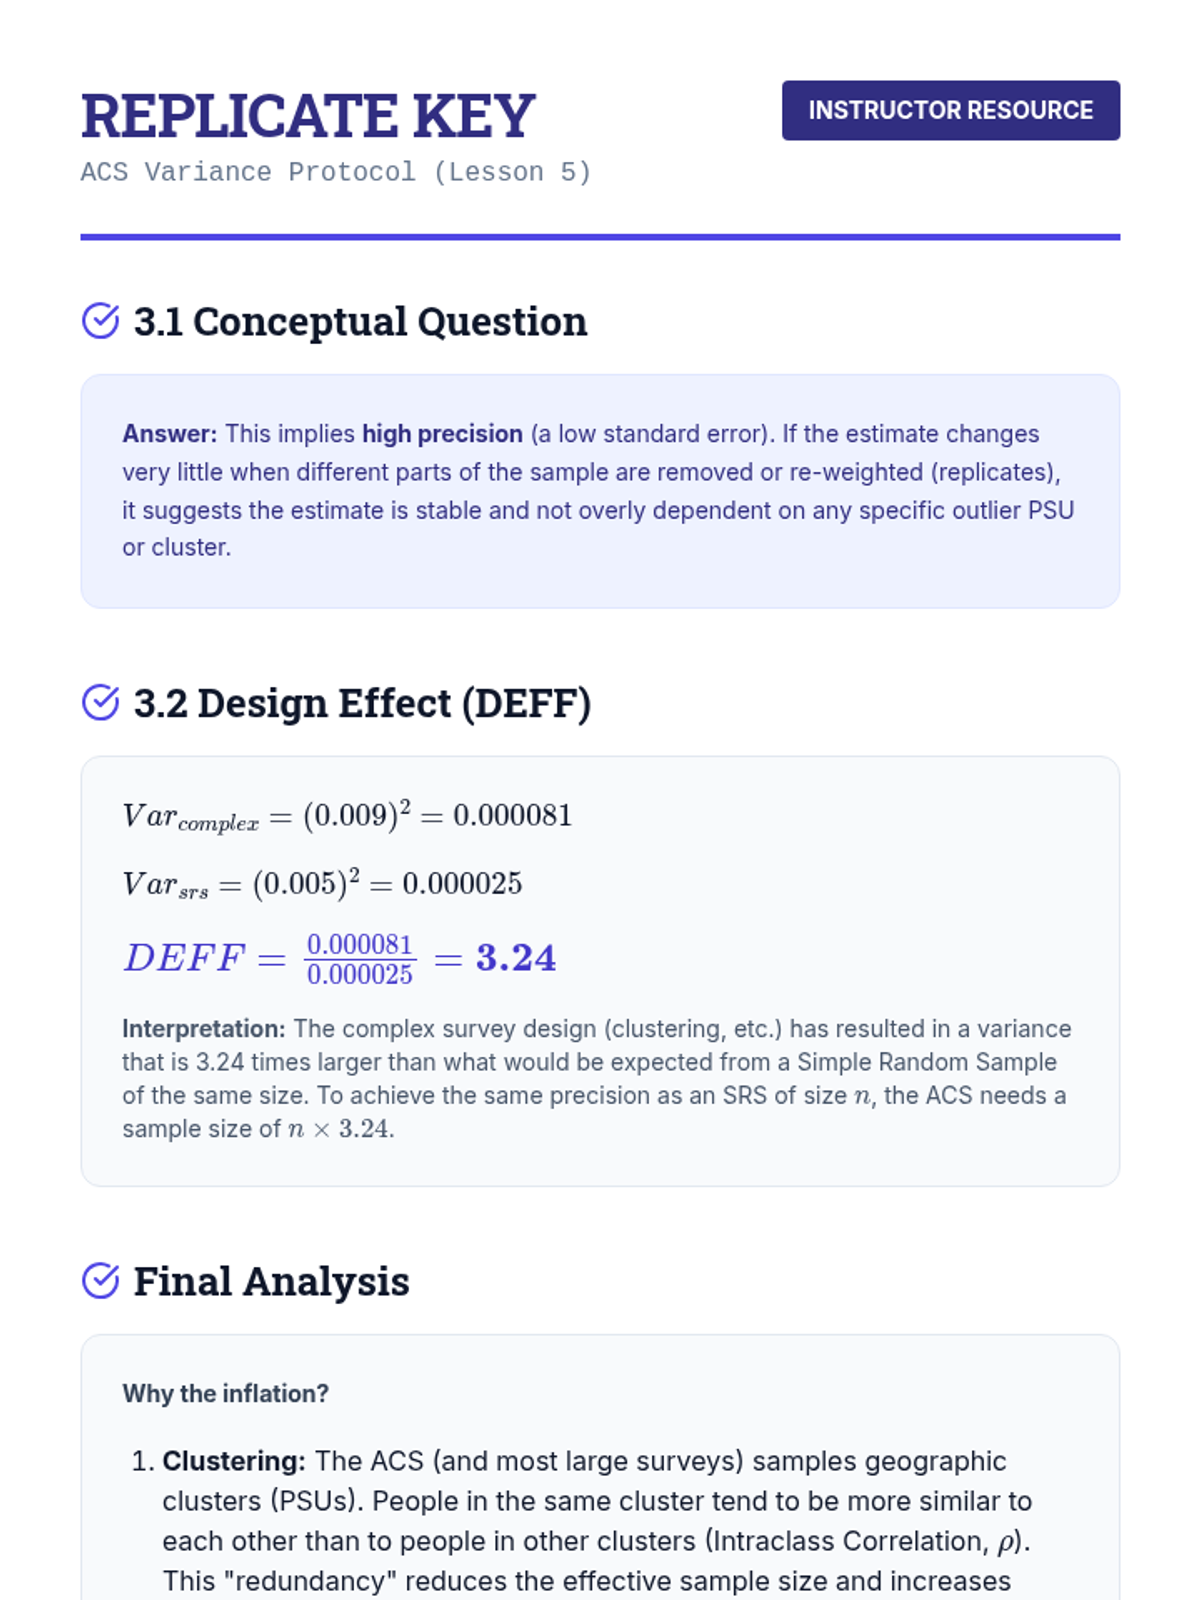
Covers variance estimation in complex surveys using replicate weights, focusing on the Jackknife and Balanced Repeated Replication (BRR) methods for public use datasets.
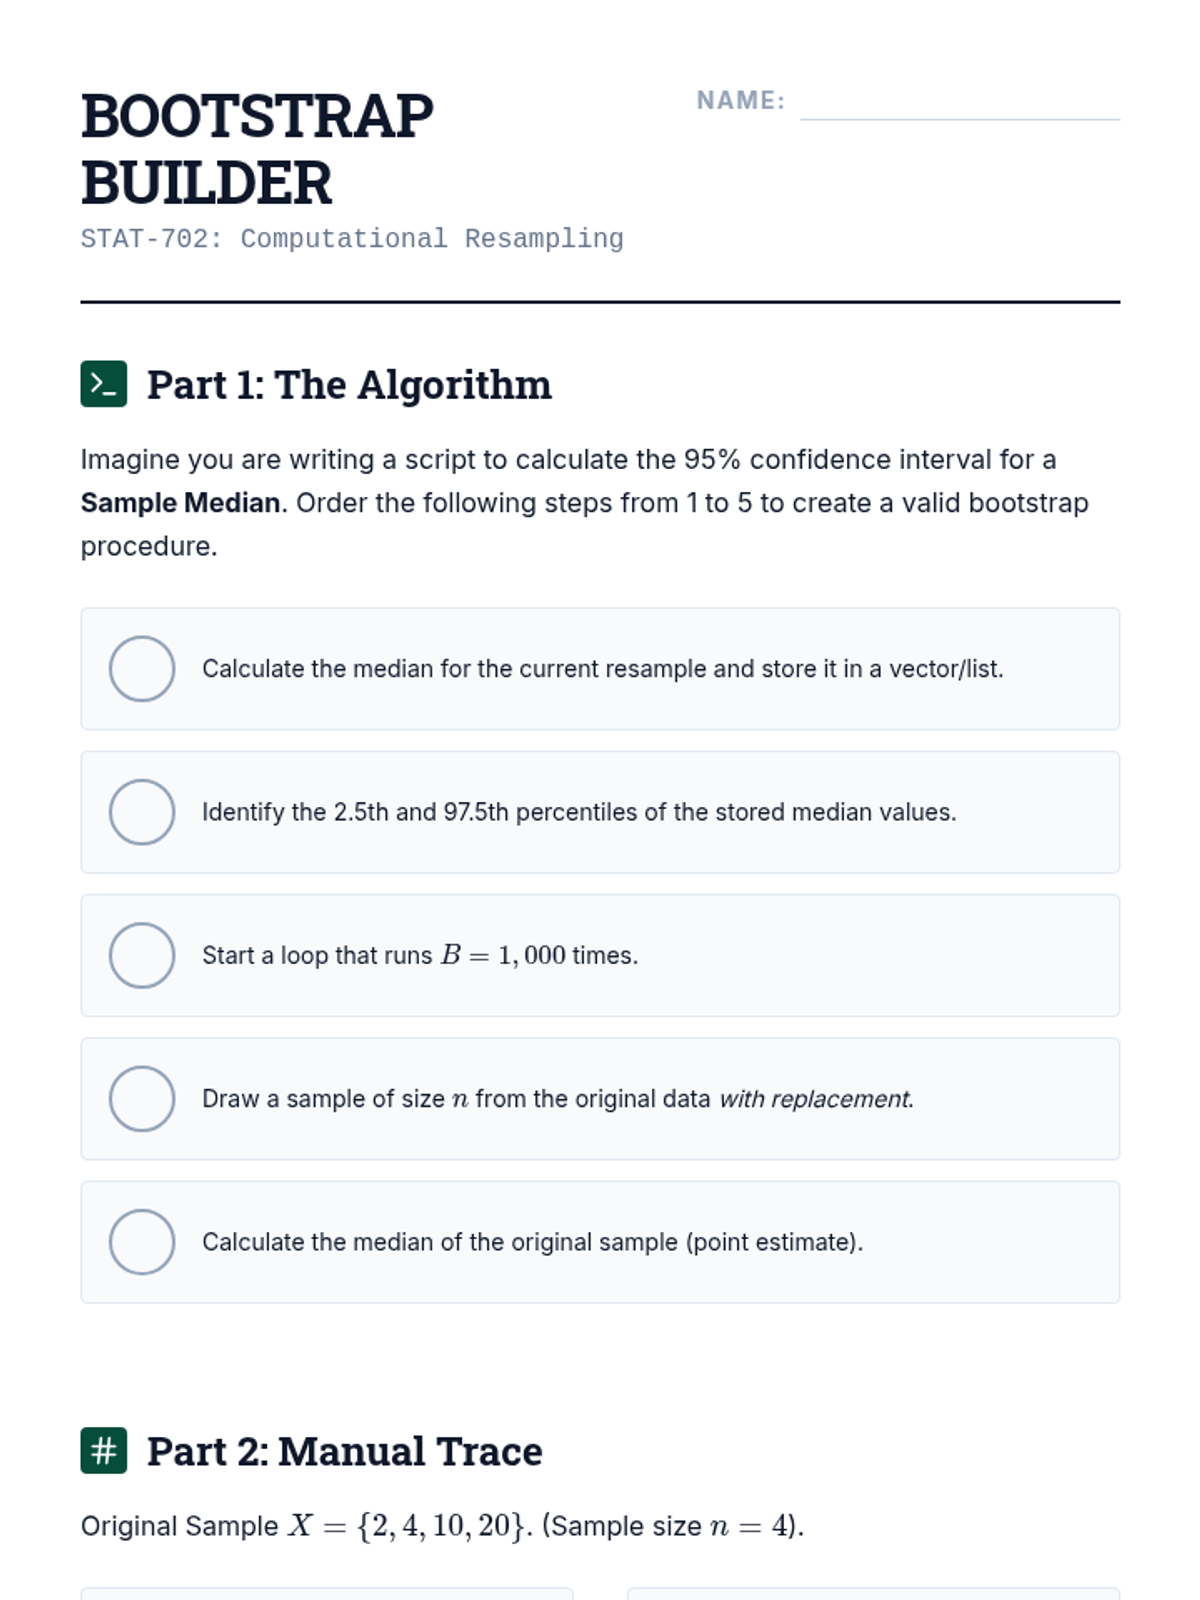
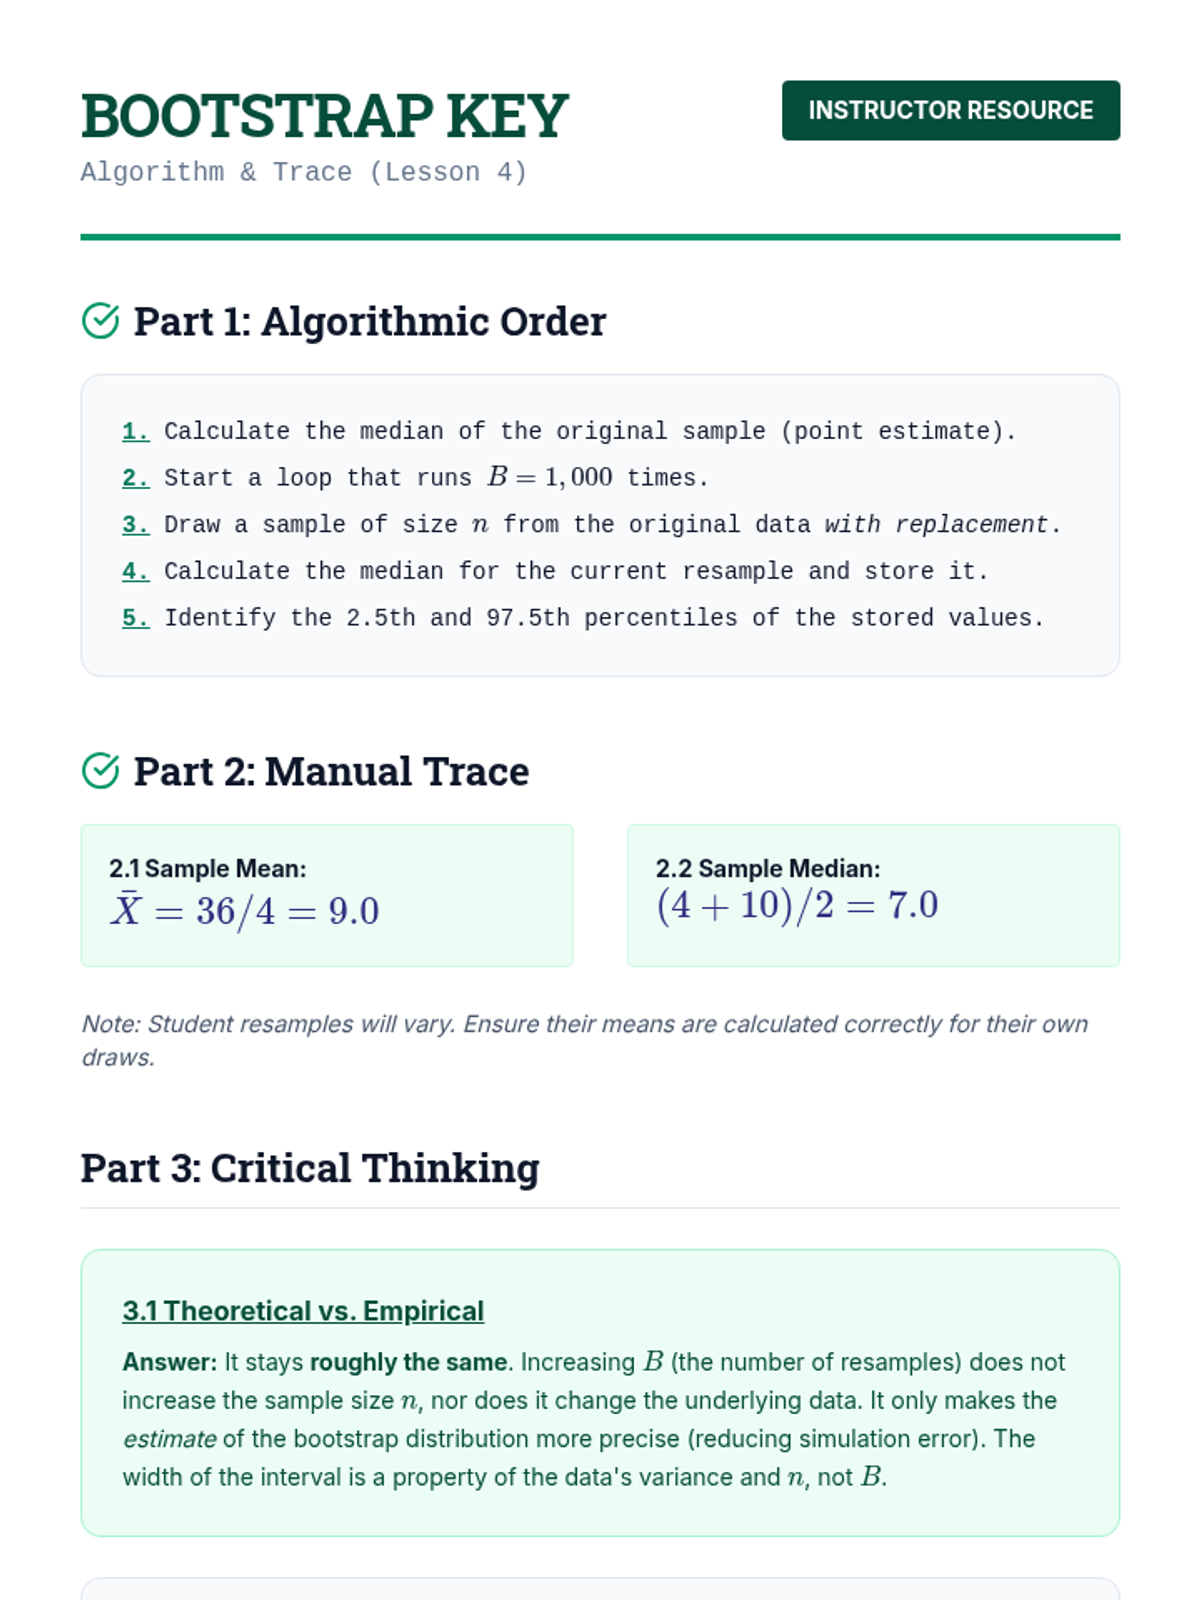
An introduction to computational resampling techniques for estimating sampling distributions and constructing confidence intervals for non-standard estimators.
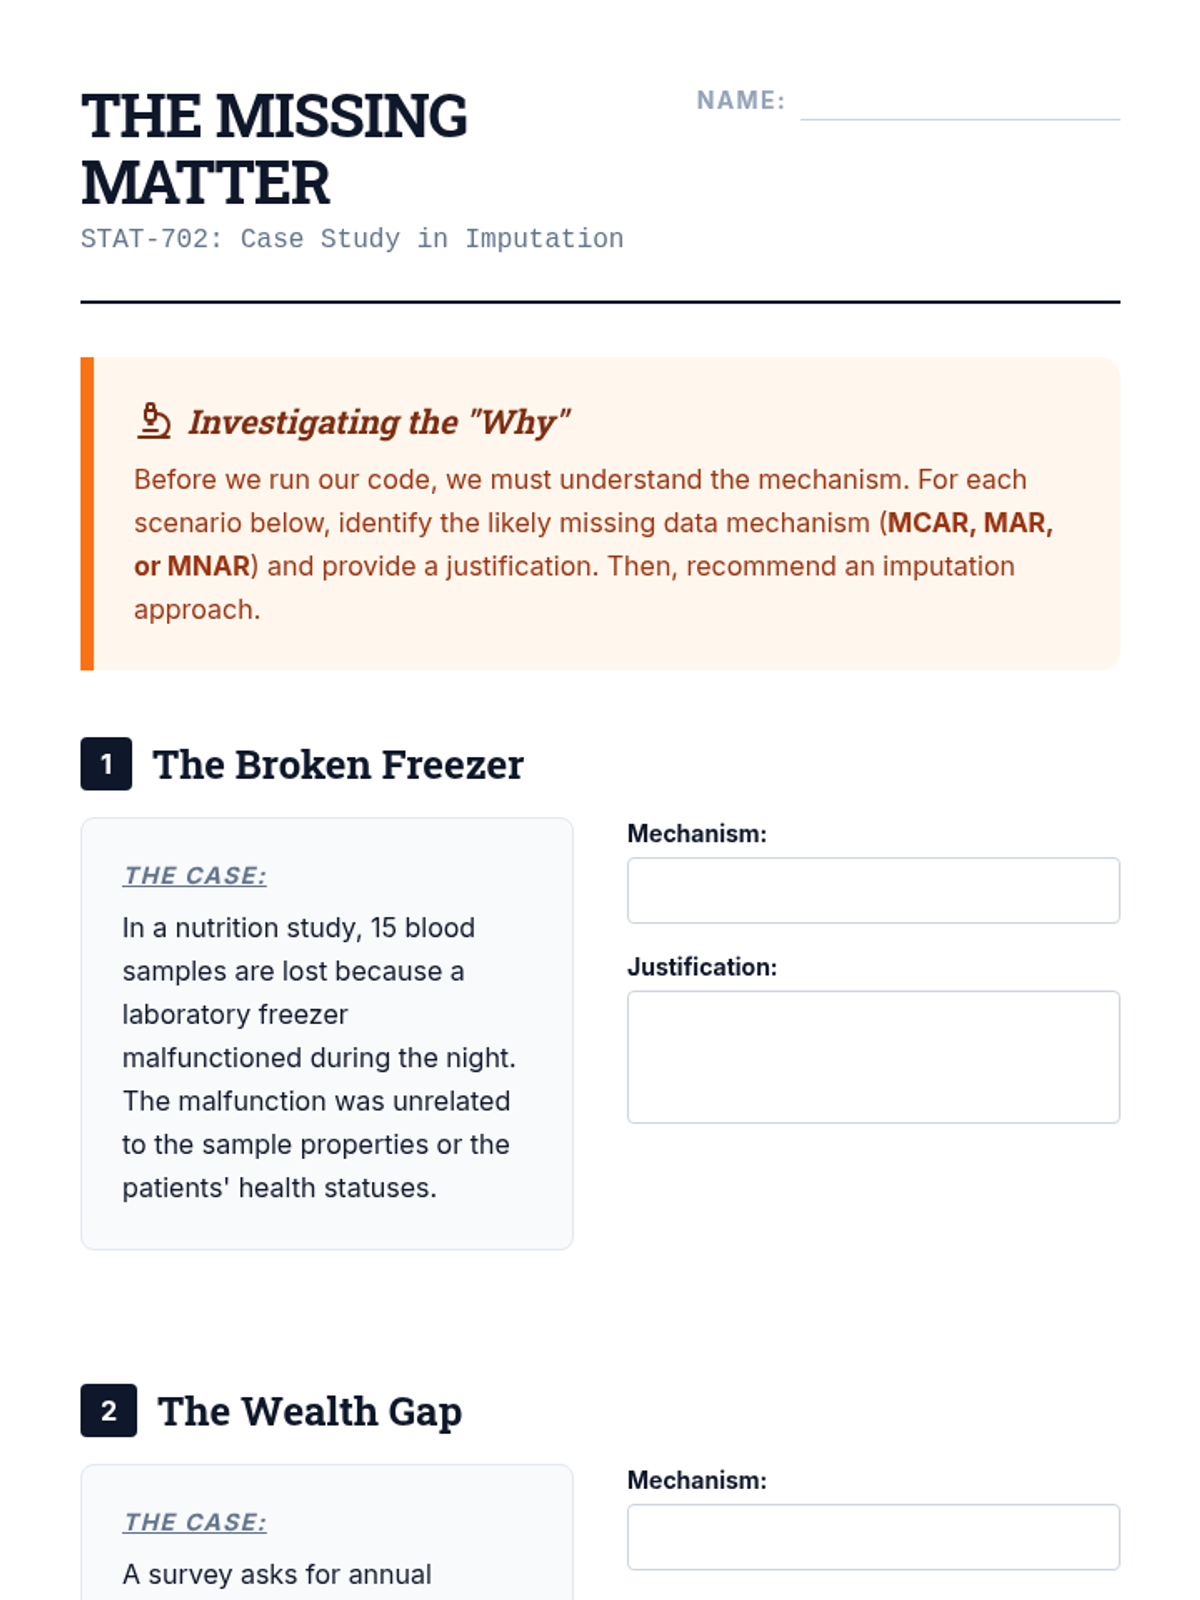
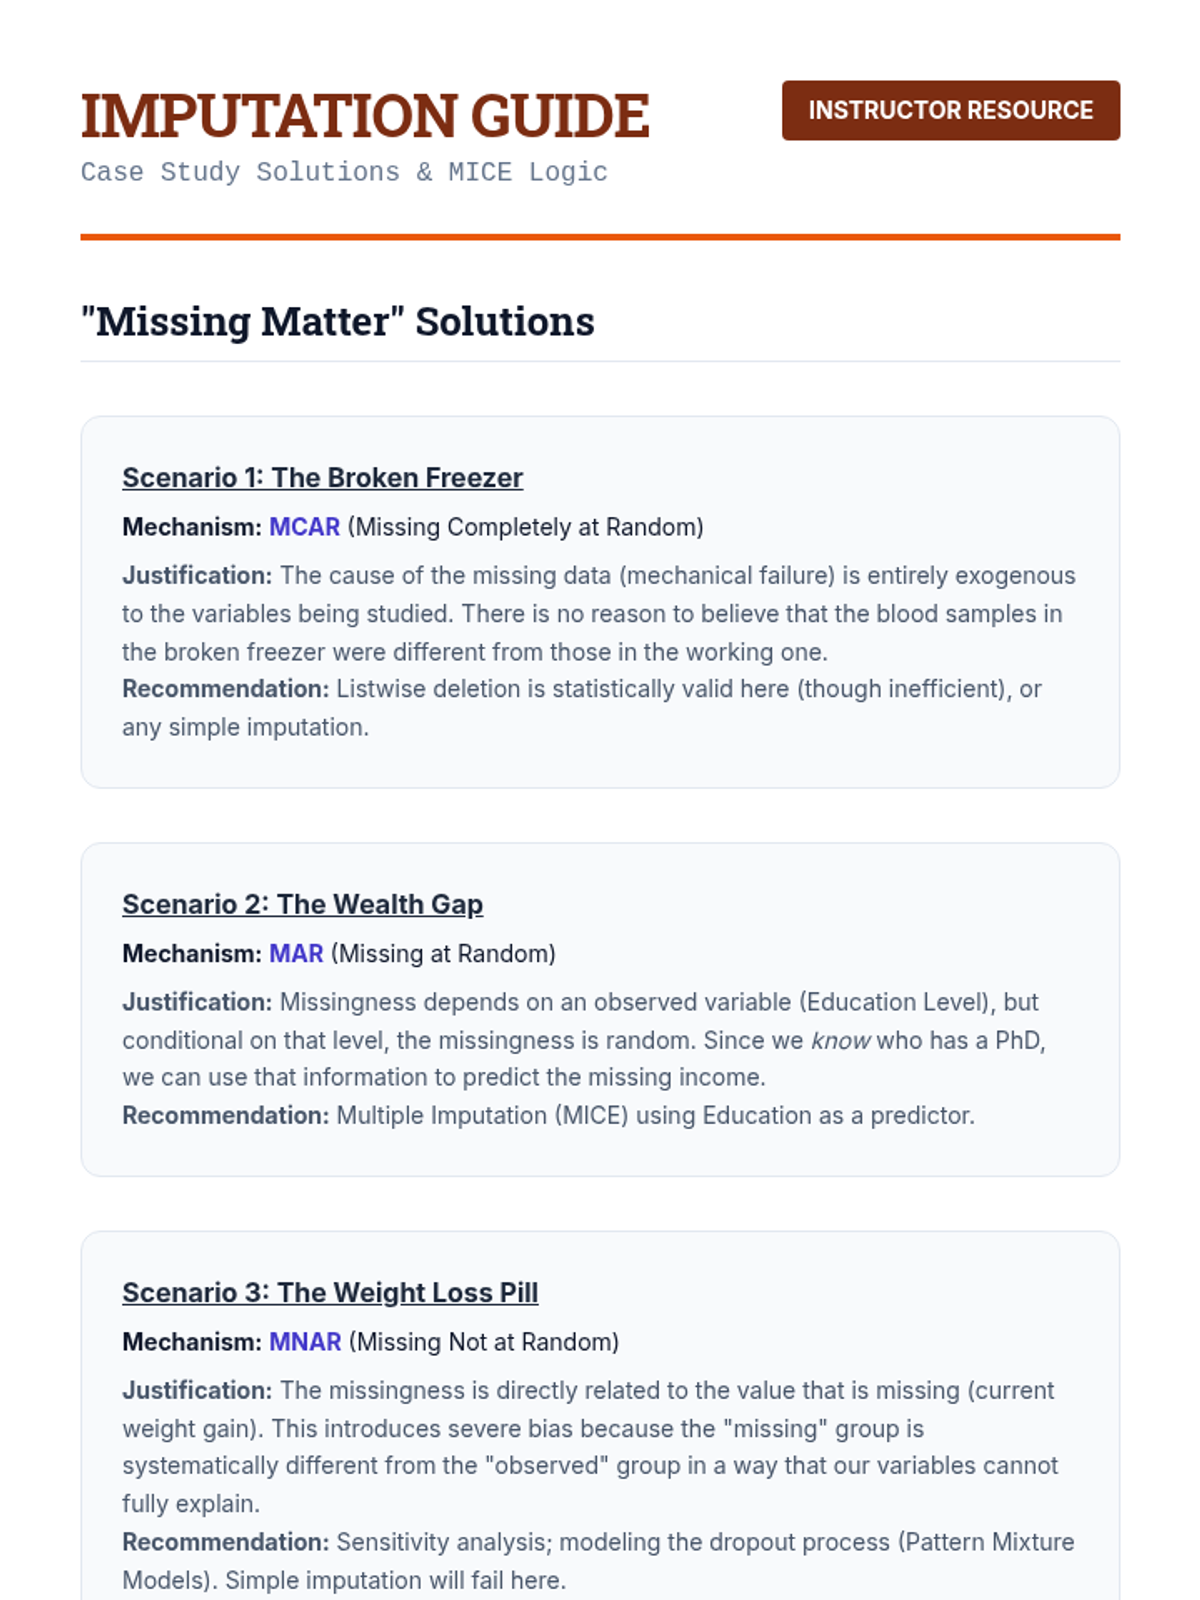
Explores the theory of missing data mechanisms (MCAR, MAR, MNAR) and the application of Multiple Imputation by Chained Equations (MICE) to preserve statistical validity.
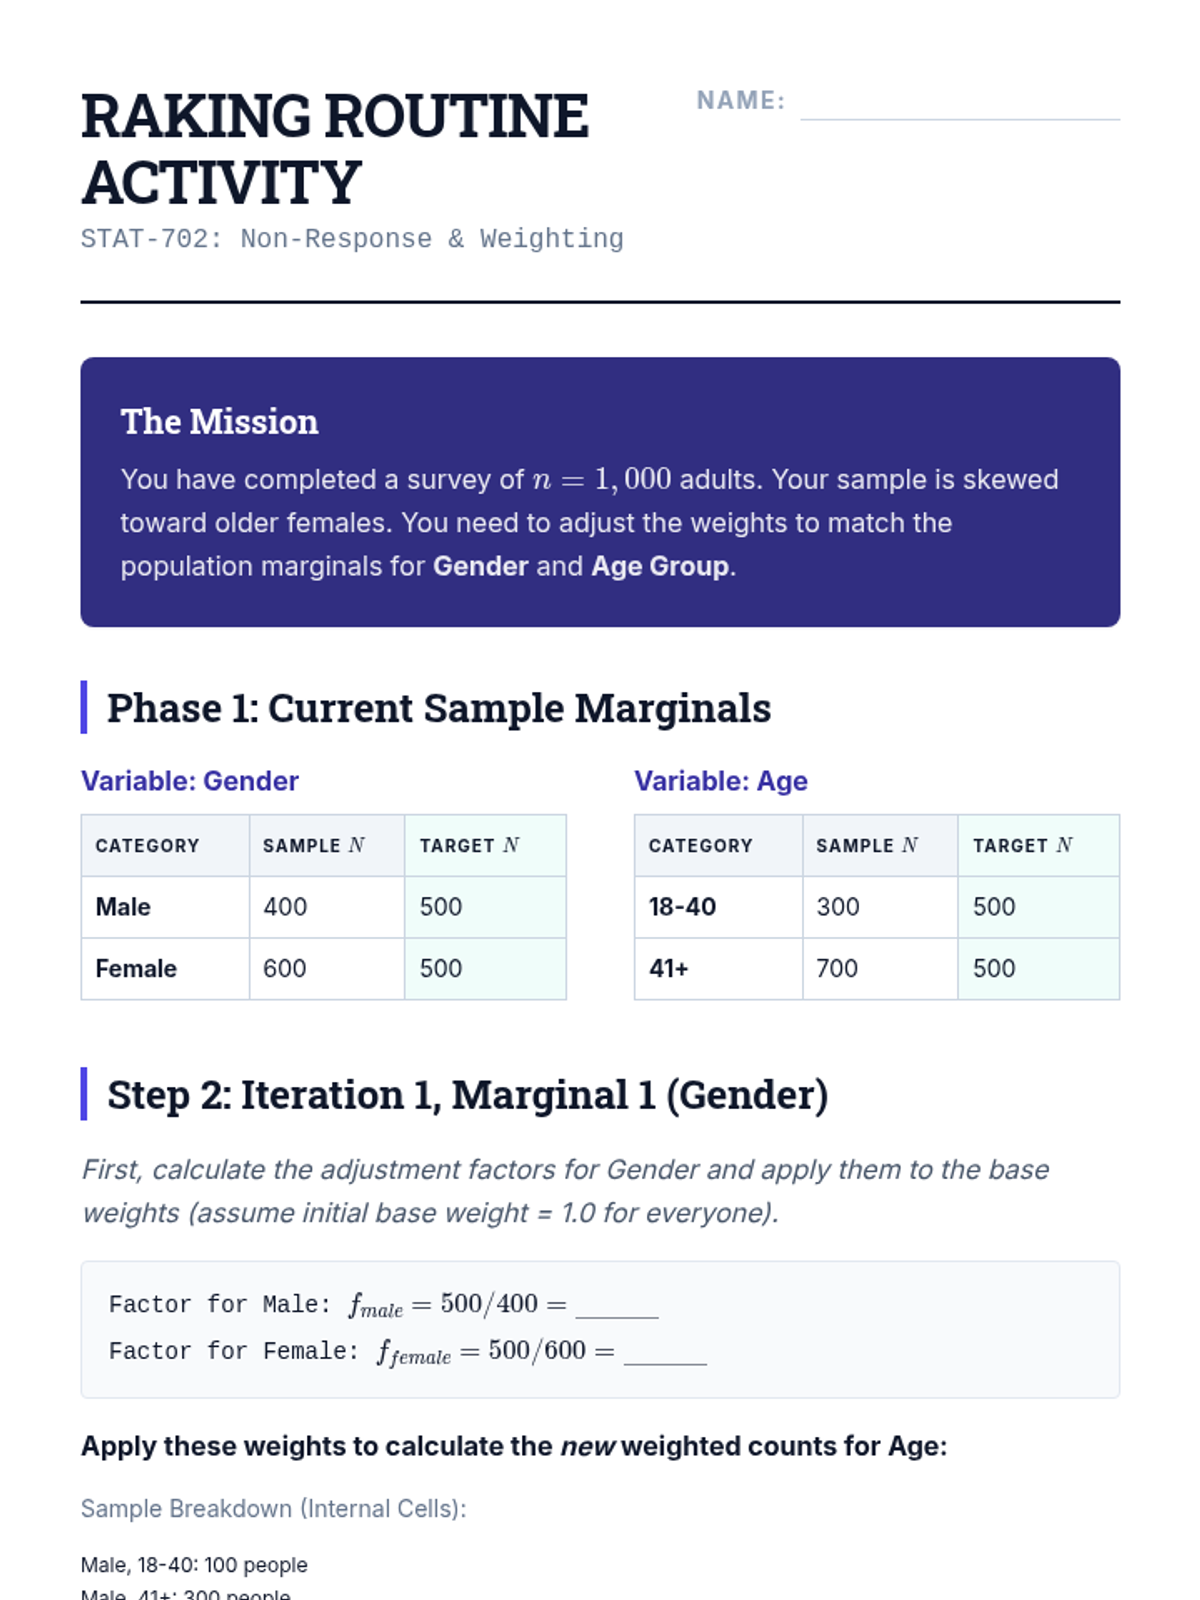
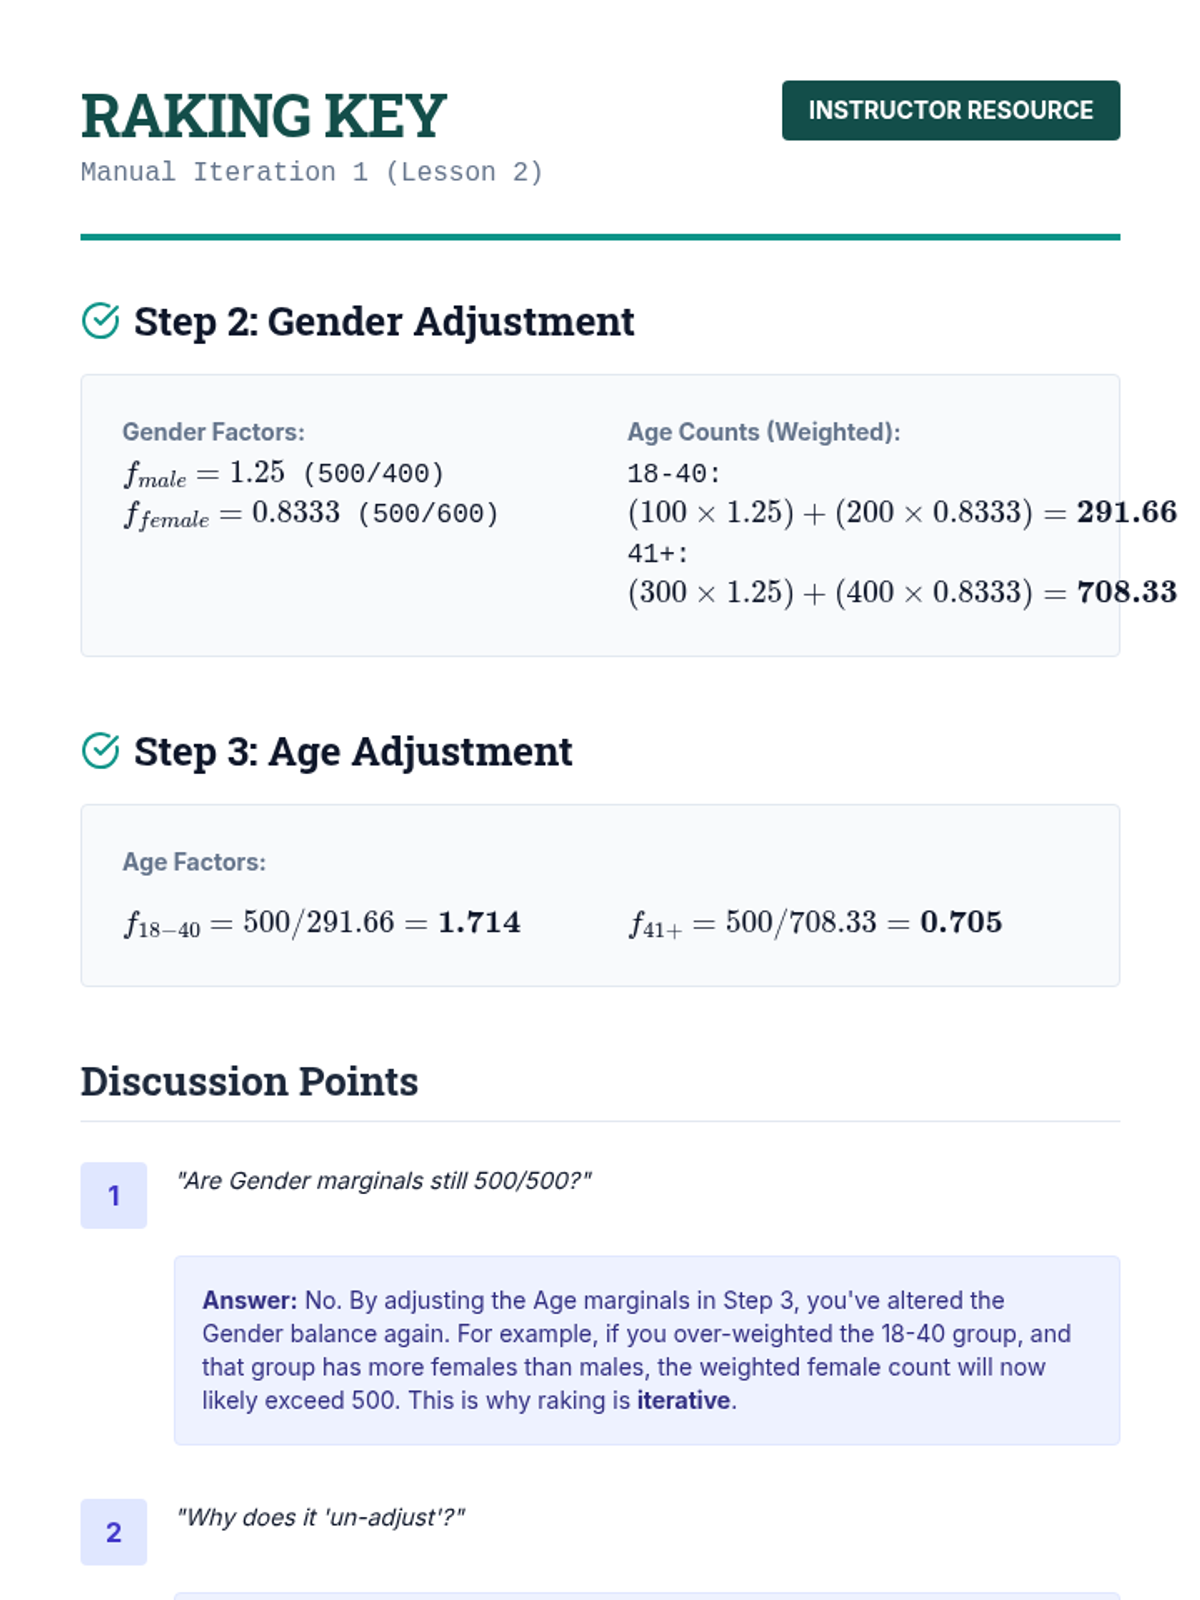
Covers techniques to handle unit non-response using post-stratification and iterative proportional fitting (raking) to align sample demographics with population totals.
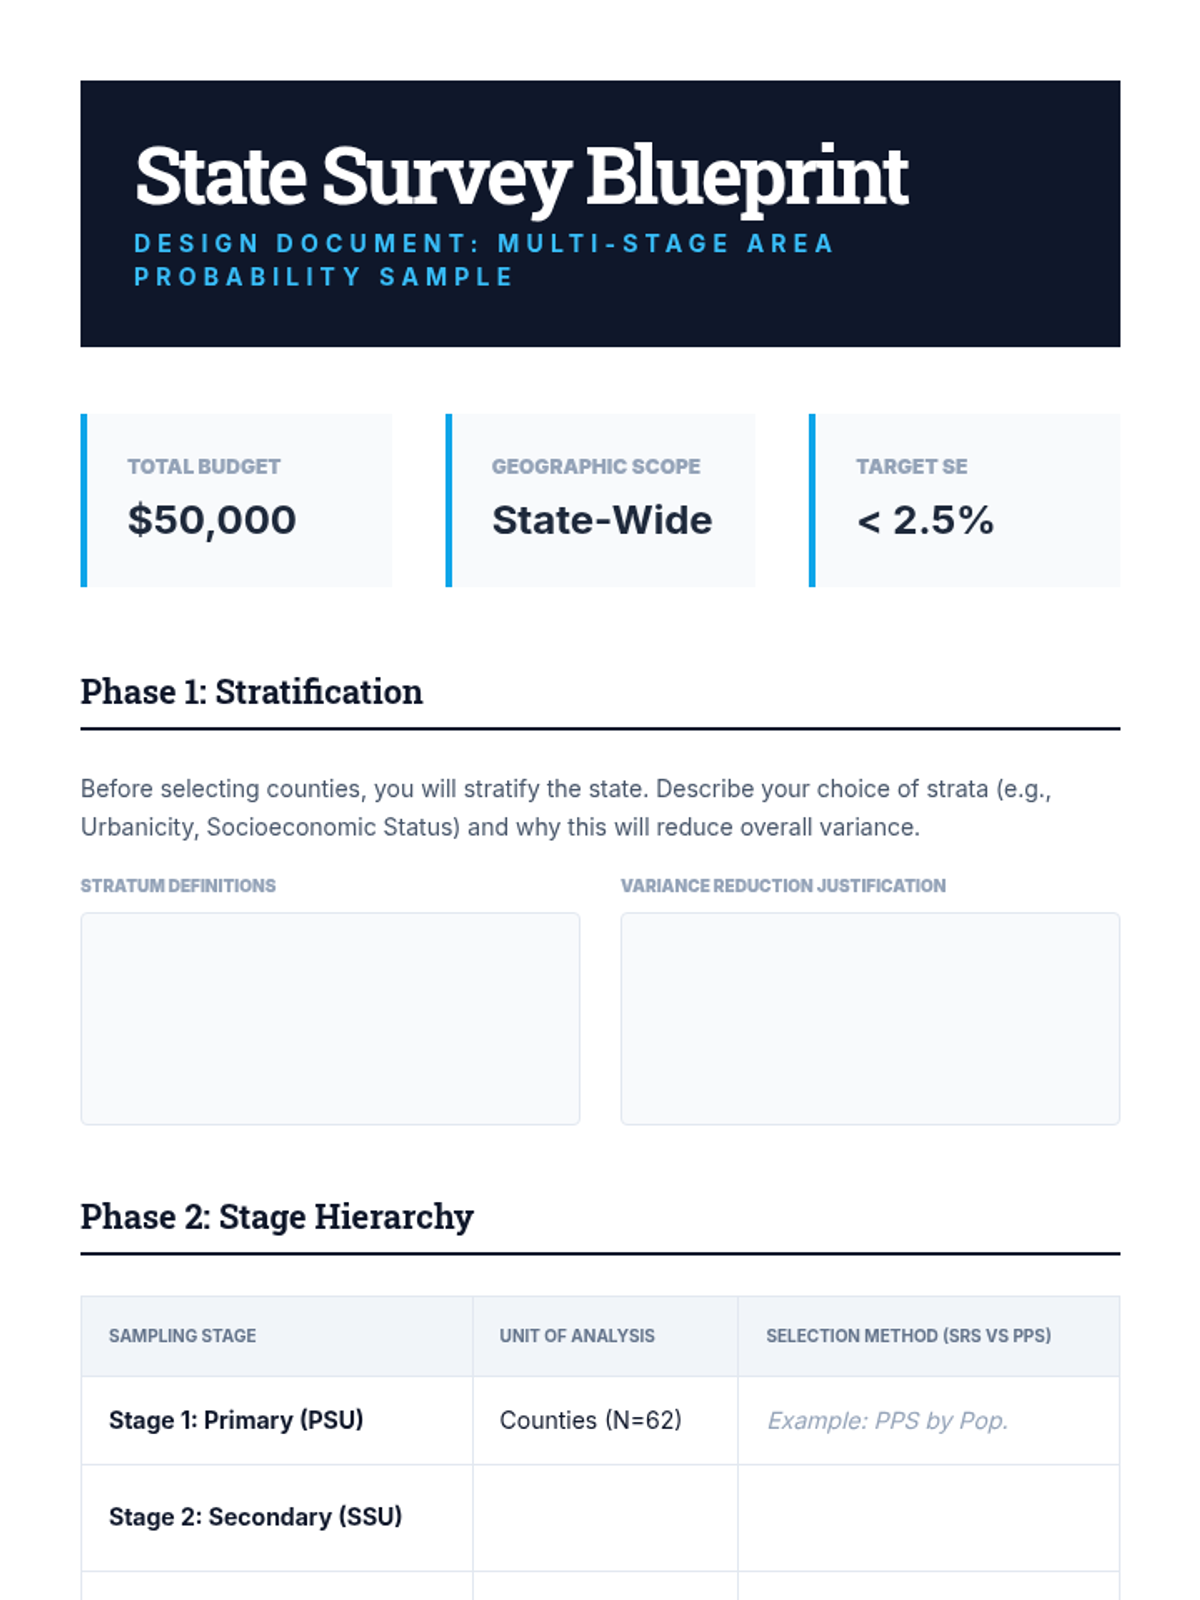
The capstone lesson where students integrate stratification, clustering, and Probability Proportional to Size (PPS) to design a comprehensive multi-stage area probability survey.
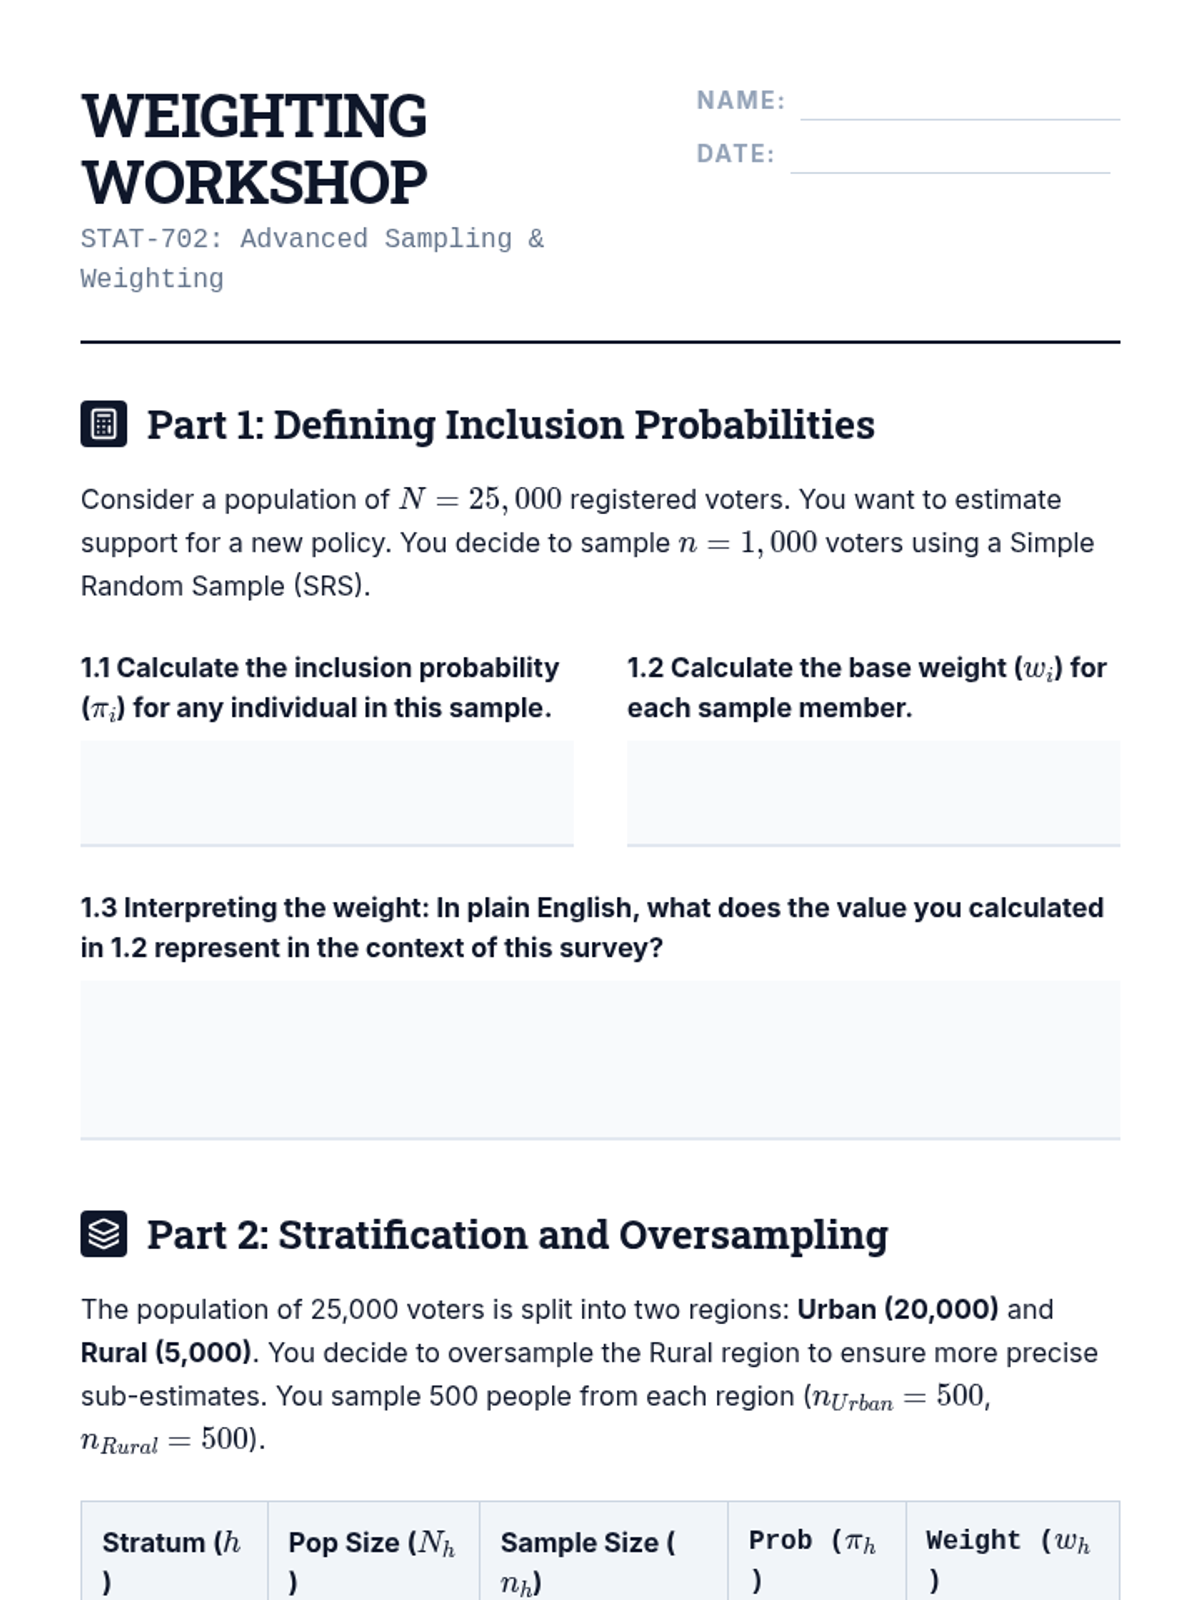
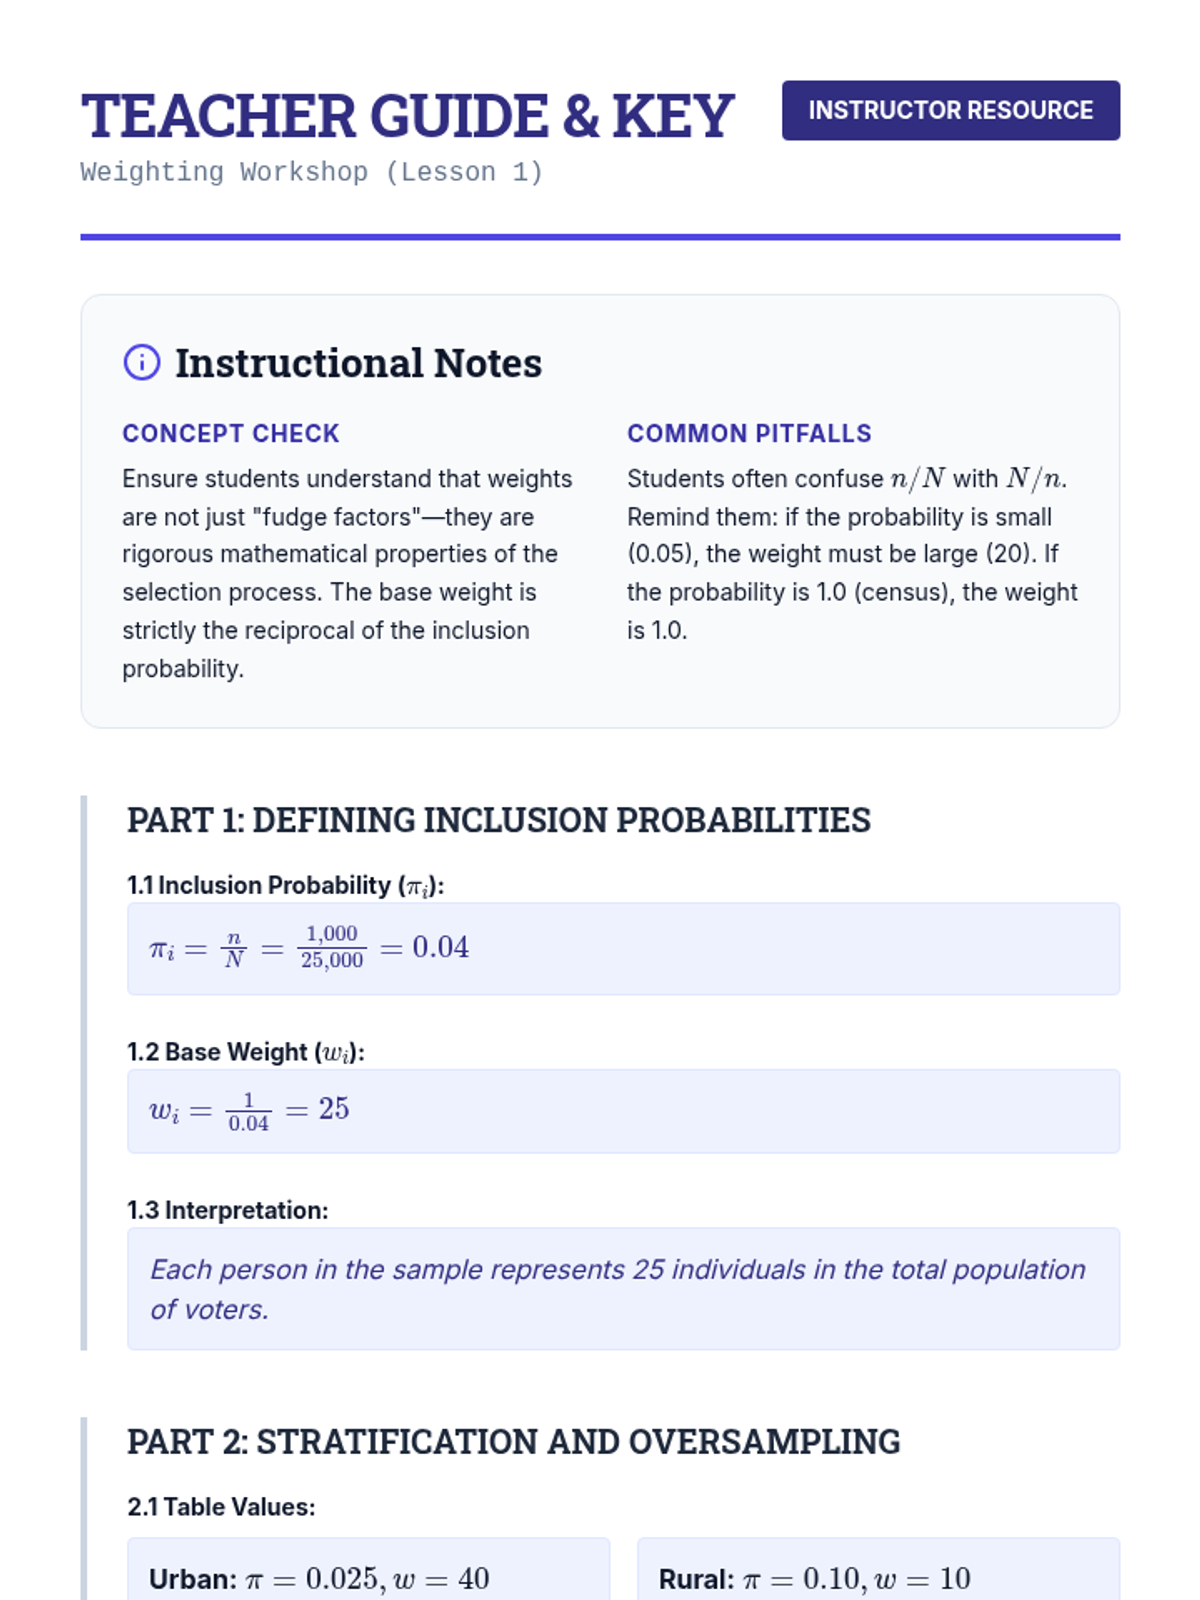
Students define and calculate base weights as the inverse of inclusion probabilities, with a focus on adjusting for complex survey designs and intentional oversampling.
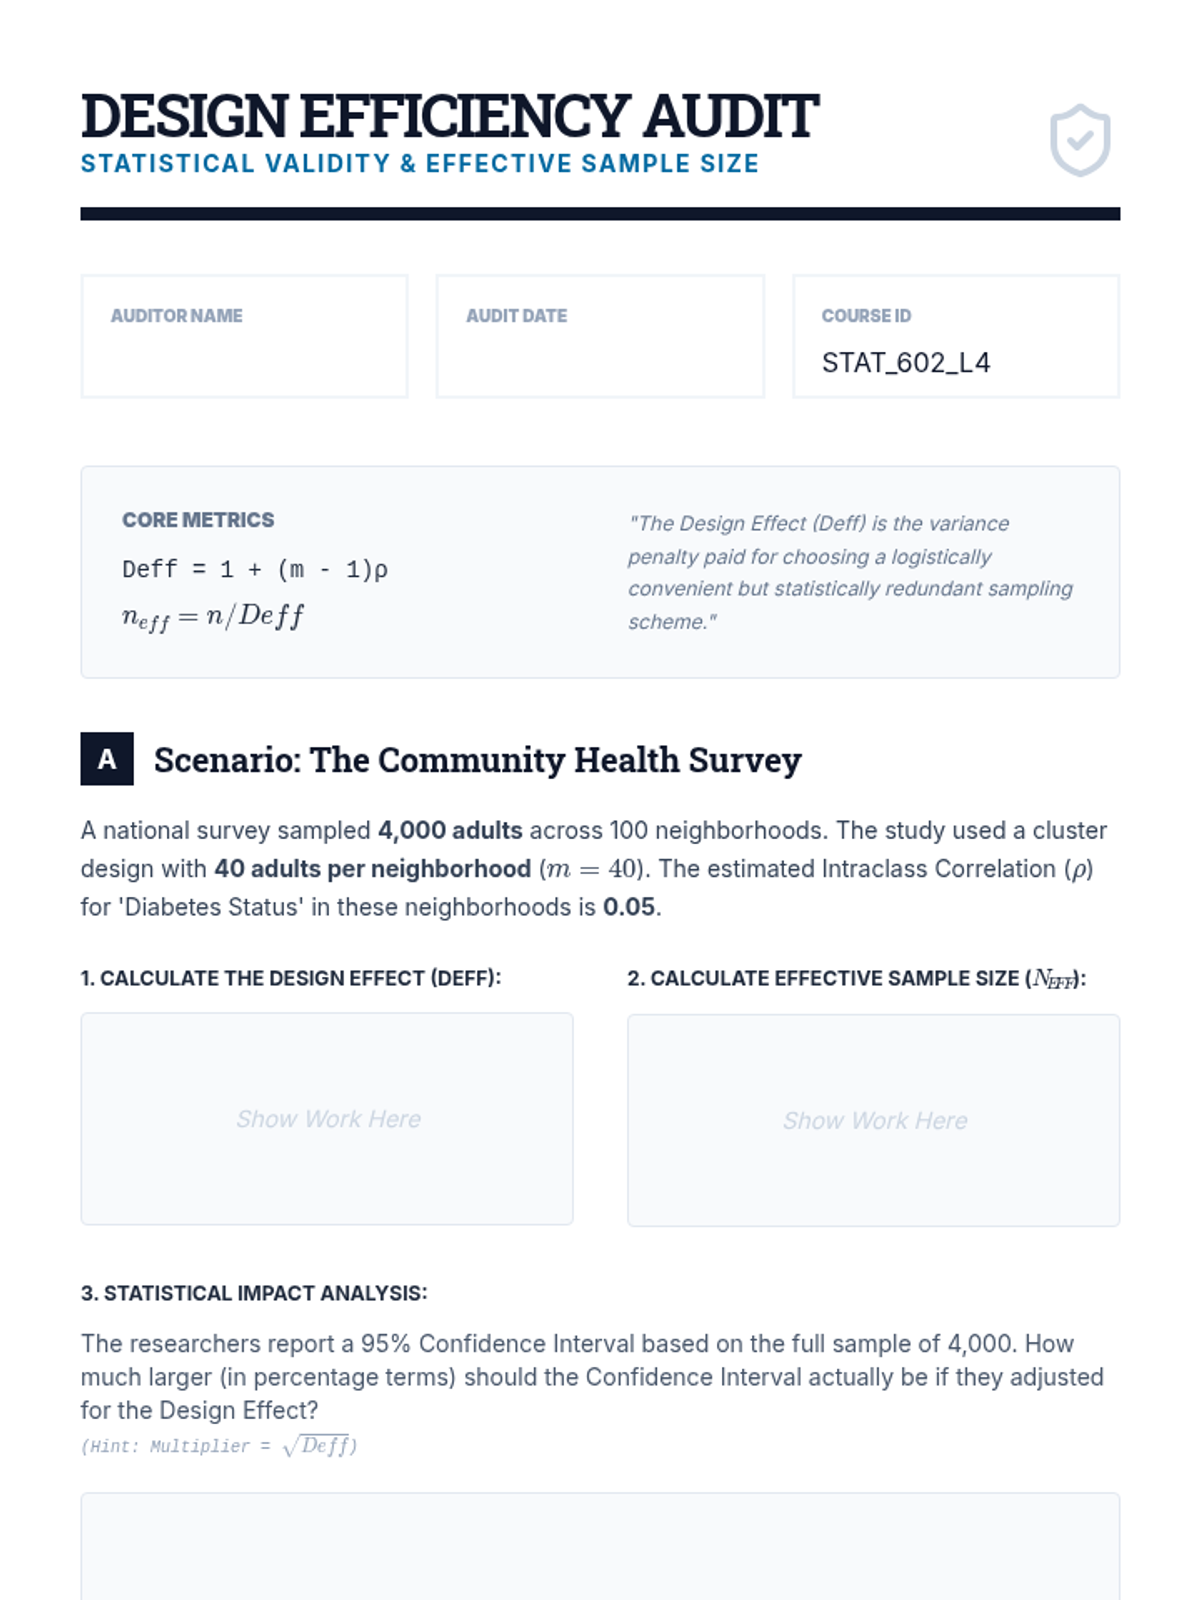
A technical dive into the Design Effect (Deff) and Effective Sample Size. Students learn to adjust standard errors for non-SRS designs and evaluate the efficiency of complex sampling schemes.
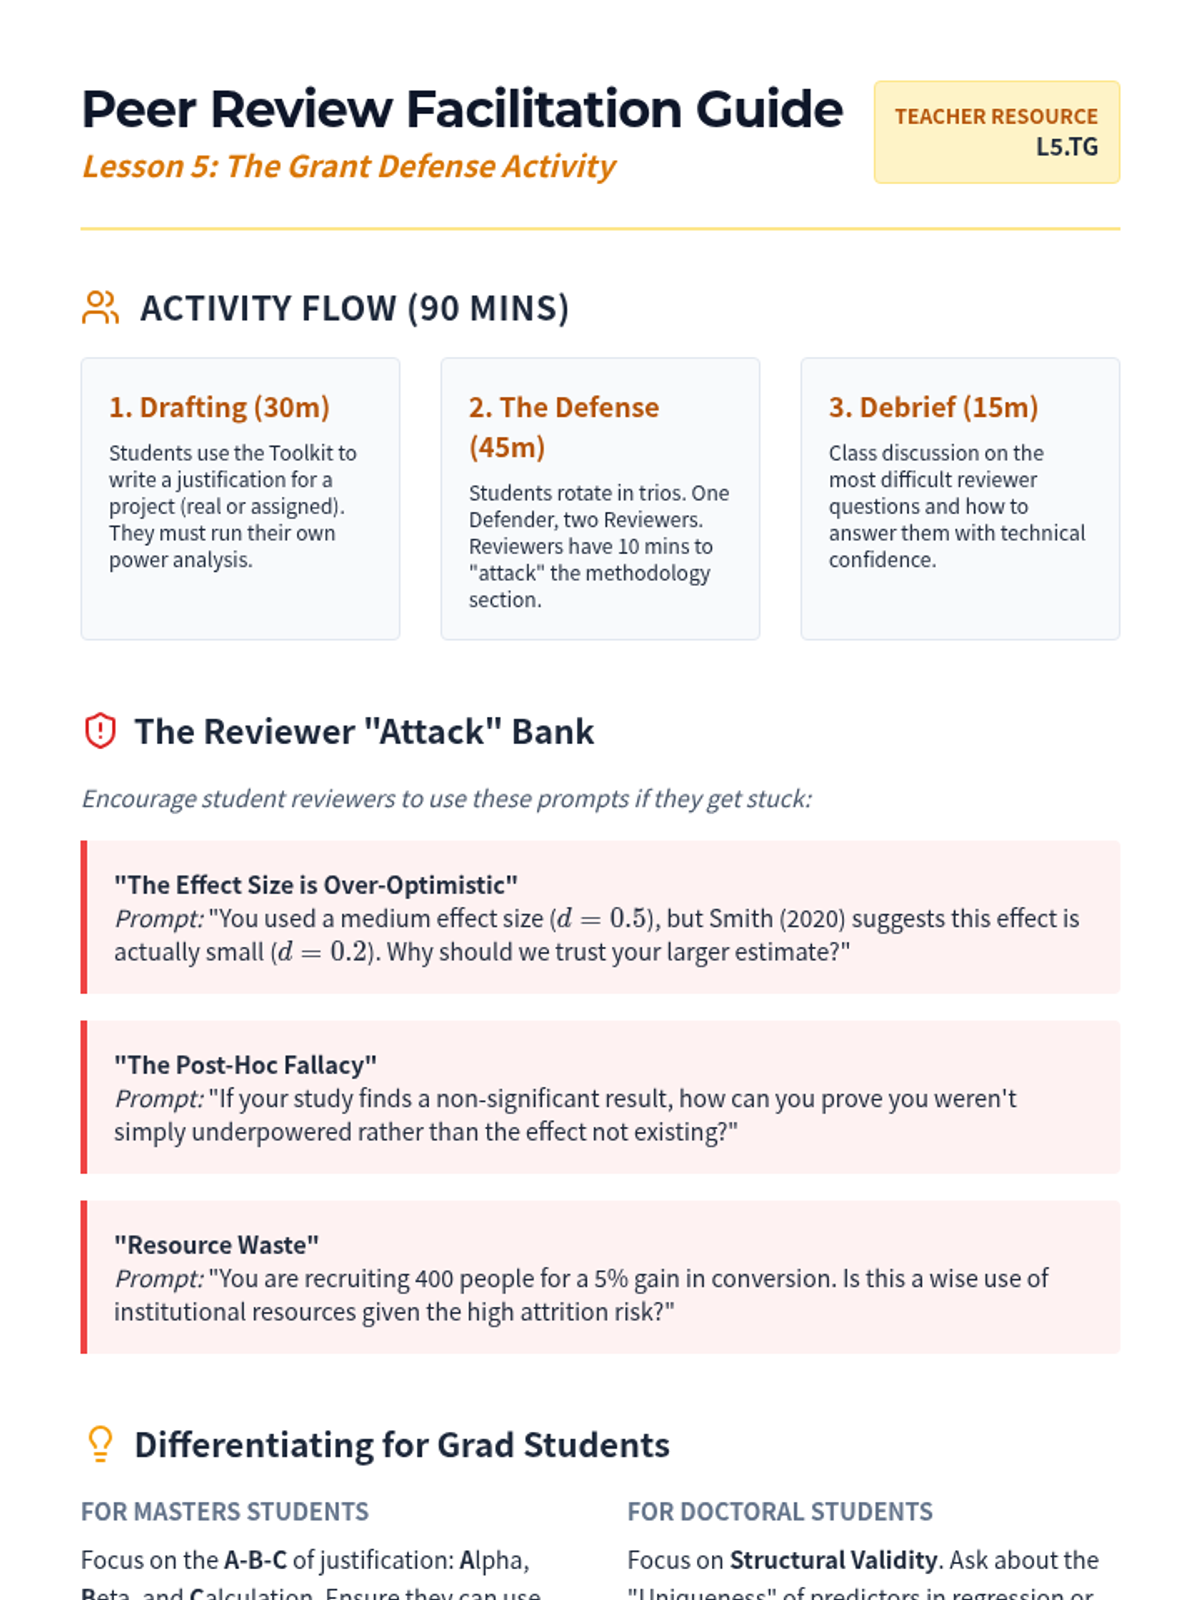
A synthesis lesson where students draft and defend a formal sample size justification for a research proposal, addressing potential reviewer critiques.
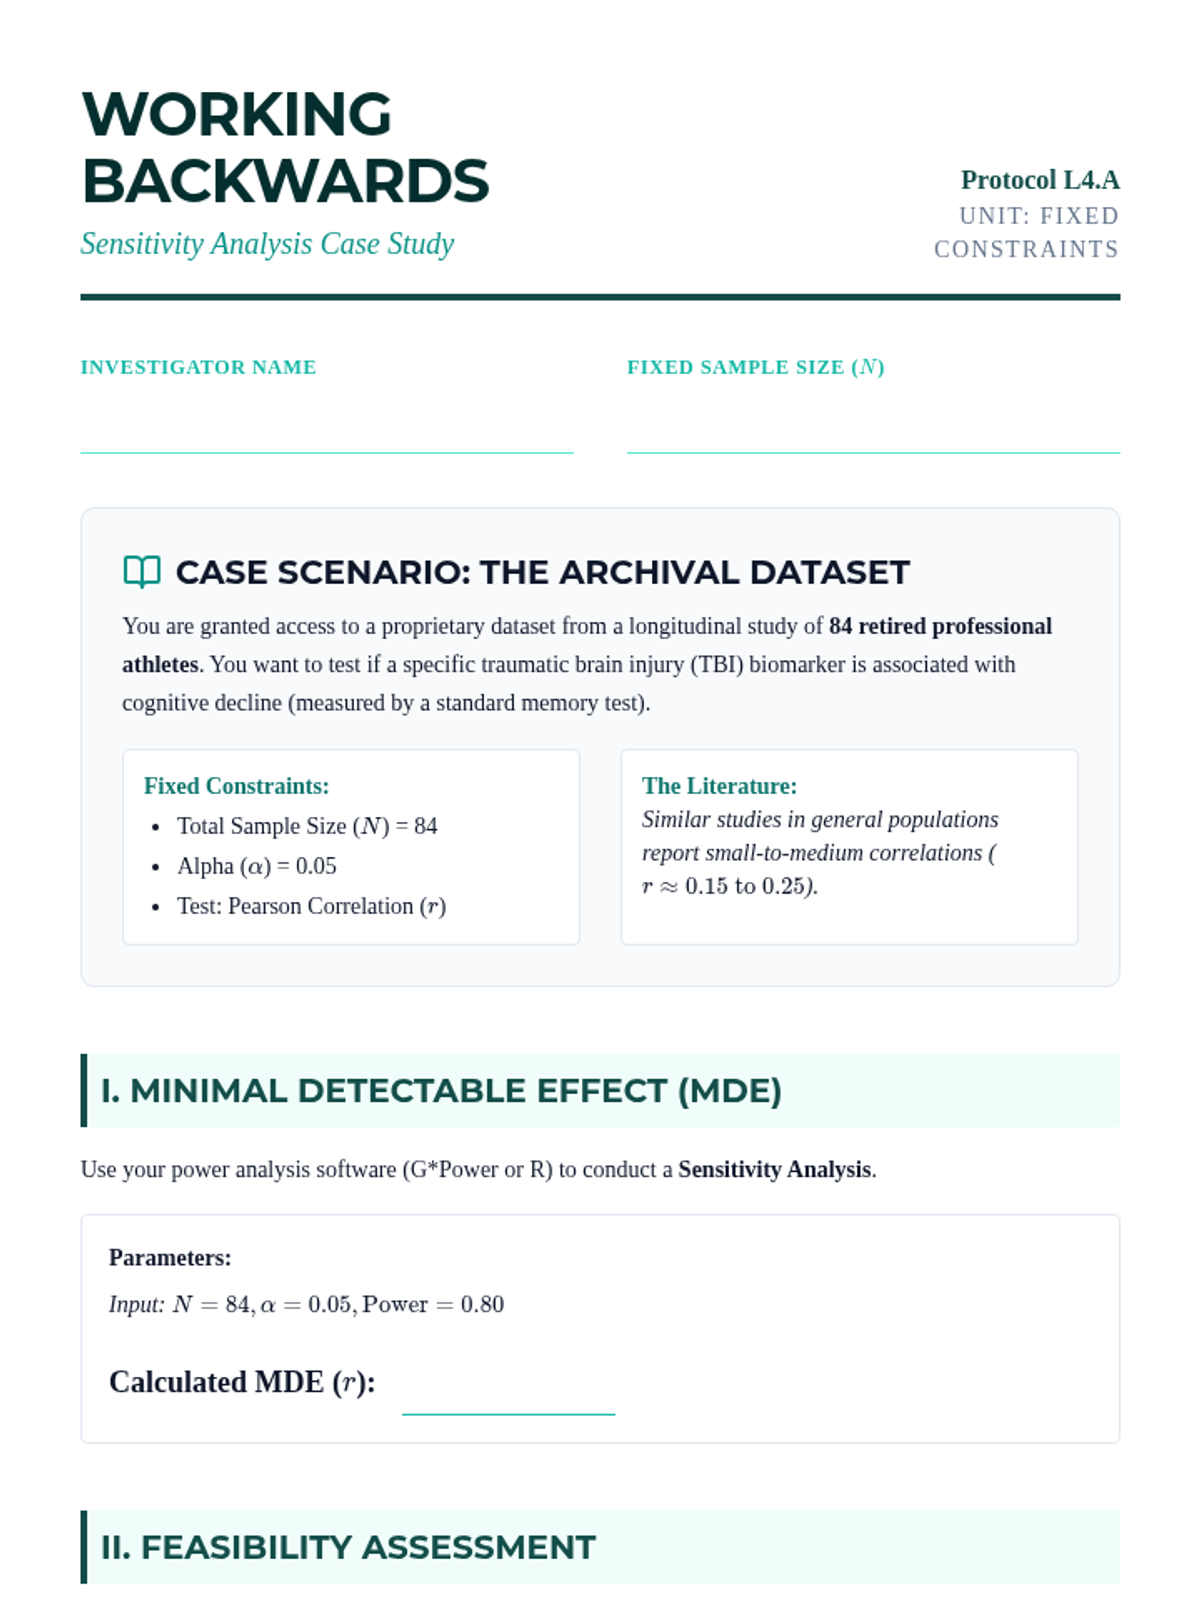
Instruction on conducting sensitivity analyses to determine the Minimal Detectable Effect (MDE) when sample size is fixed. Students learn to navigate the constraints of secondary data and limited budgets.
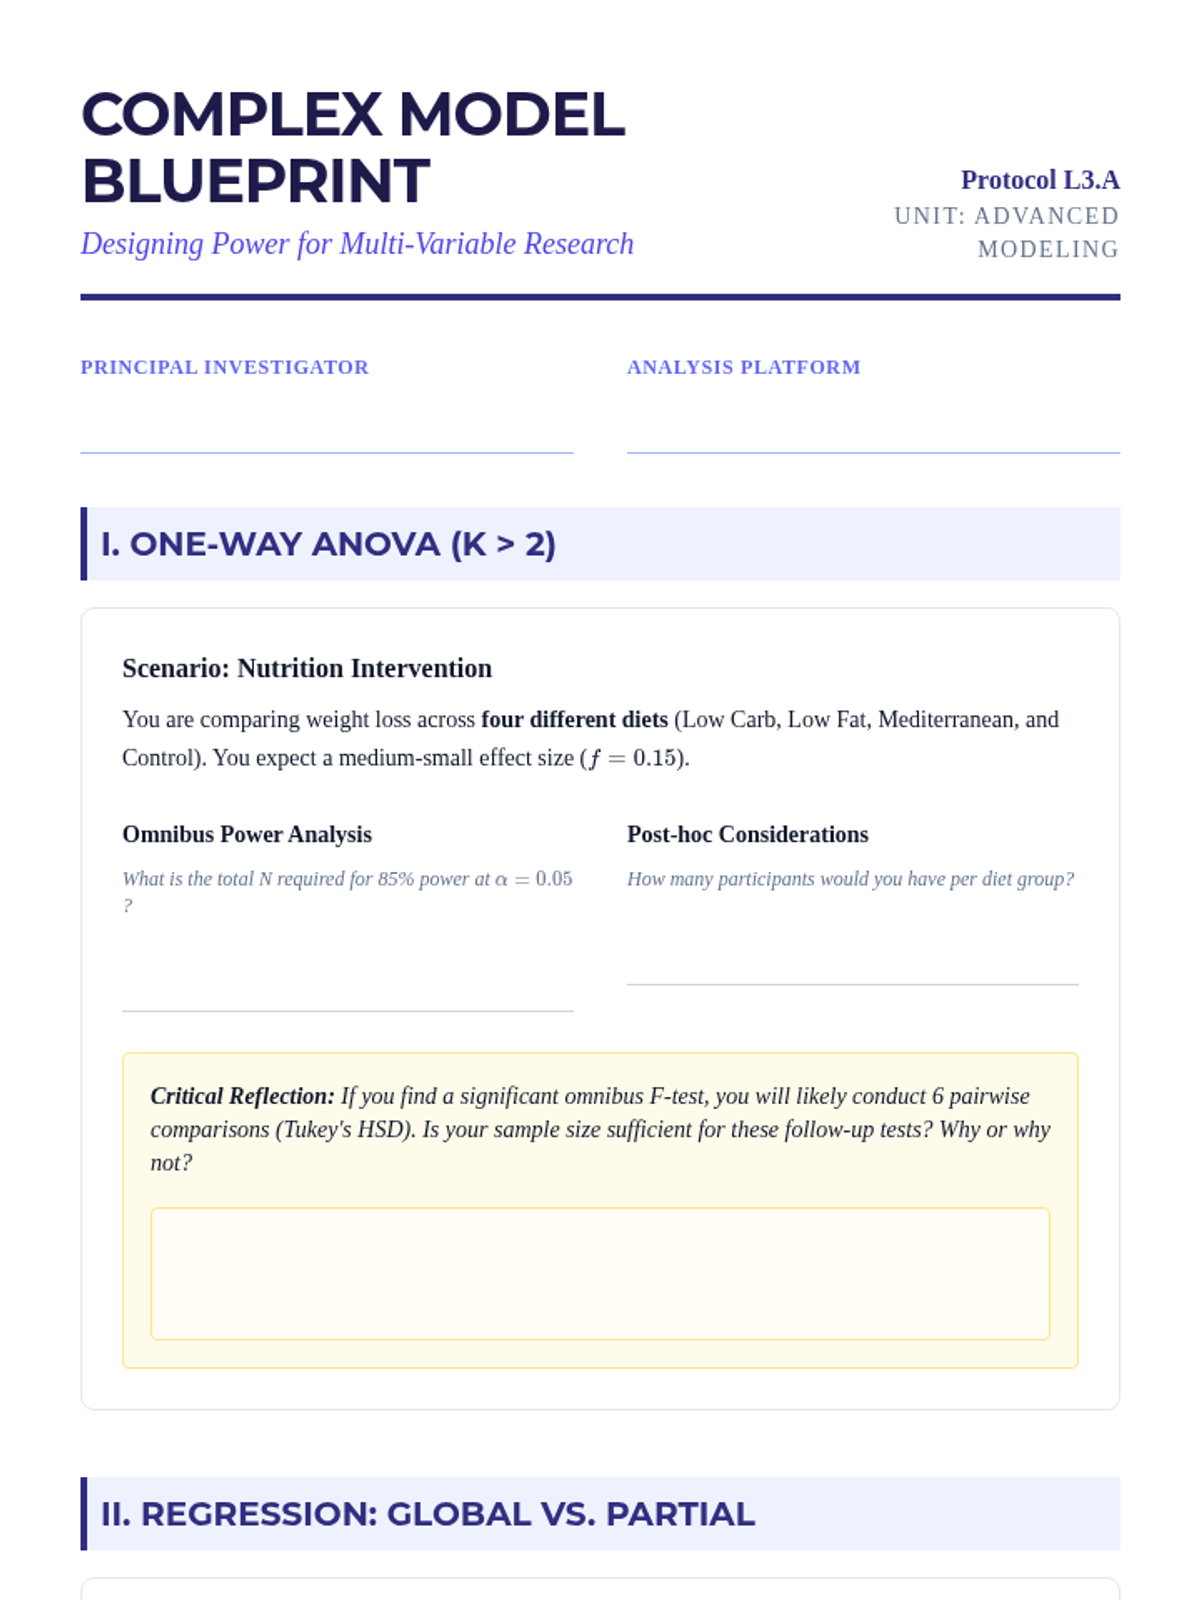
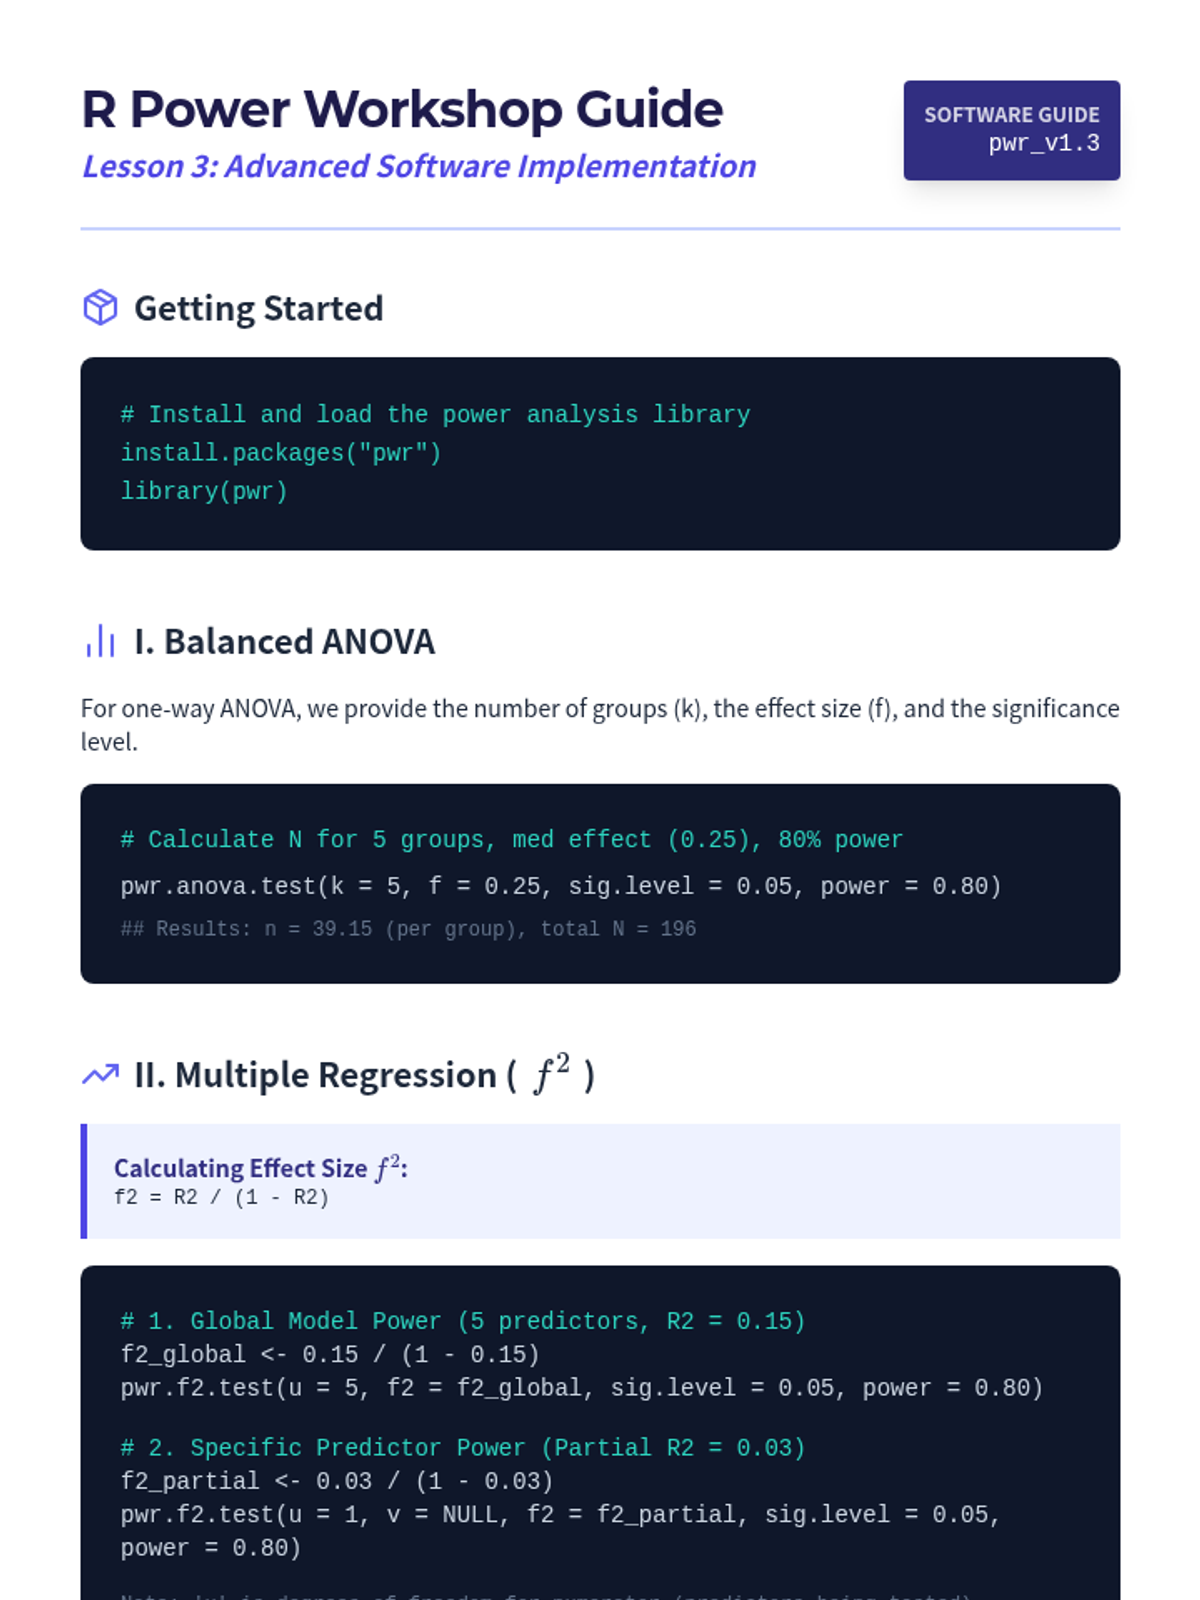
Advancing to complex statistical models including ANOVA and Multiple Regression. The lesson emphasizes the difference between global power and partial power for specific predictors.
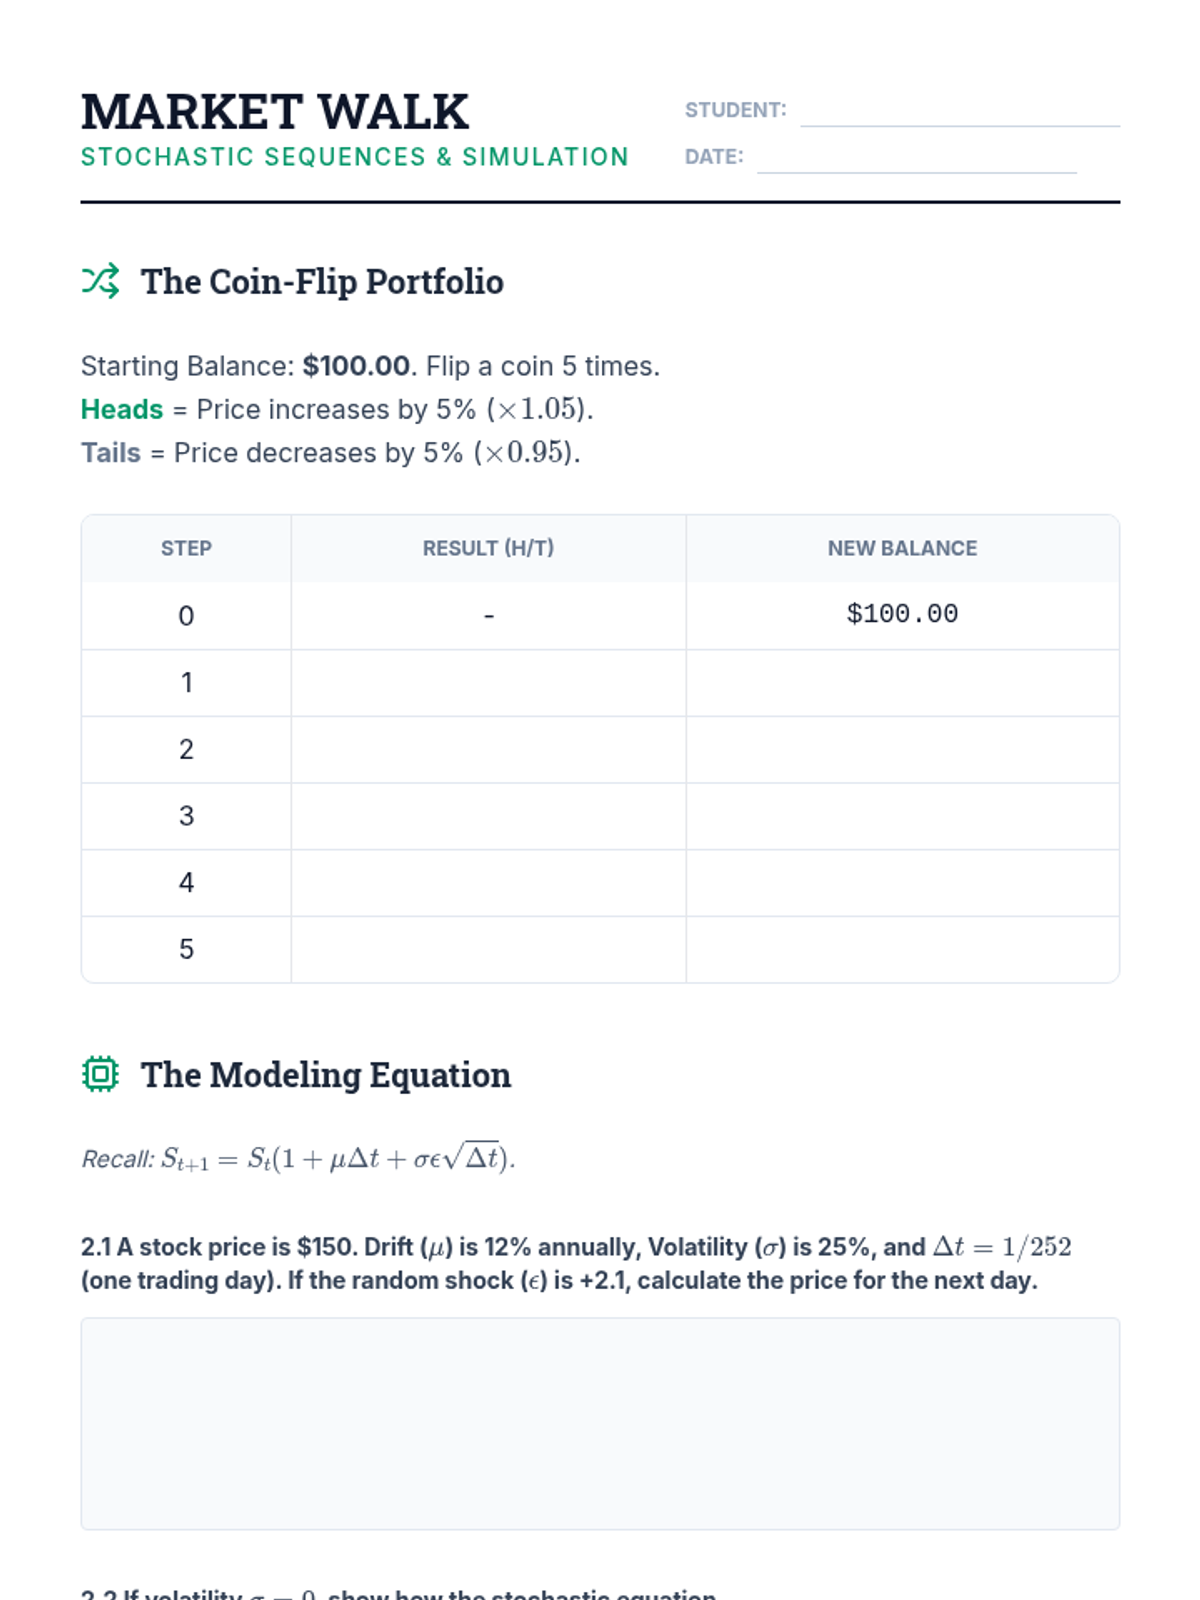
The sequence concludes with an introduction to stochastic sequences, simulating random walks to model stock price movements.
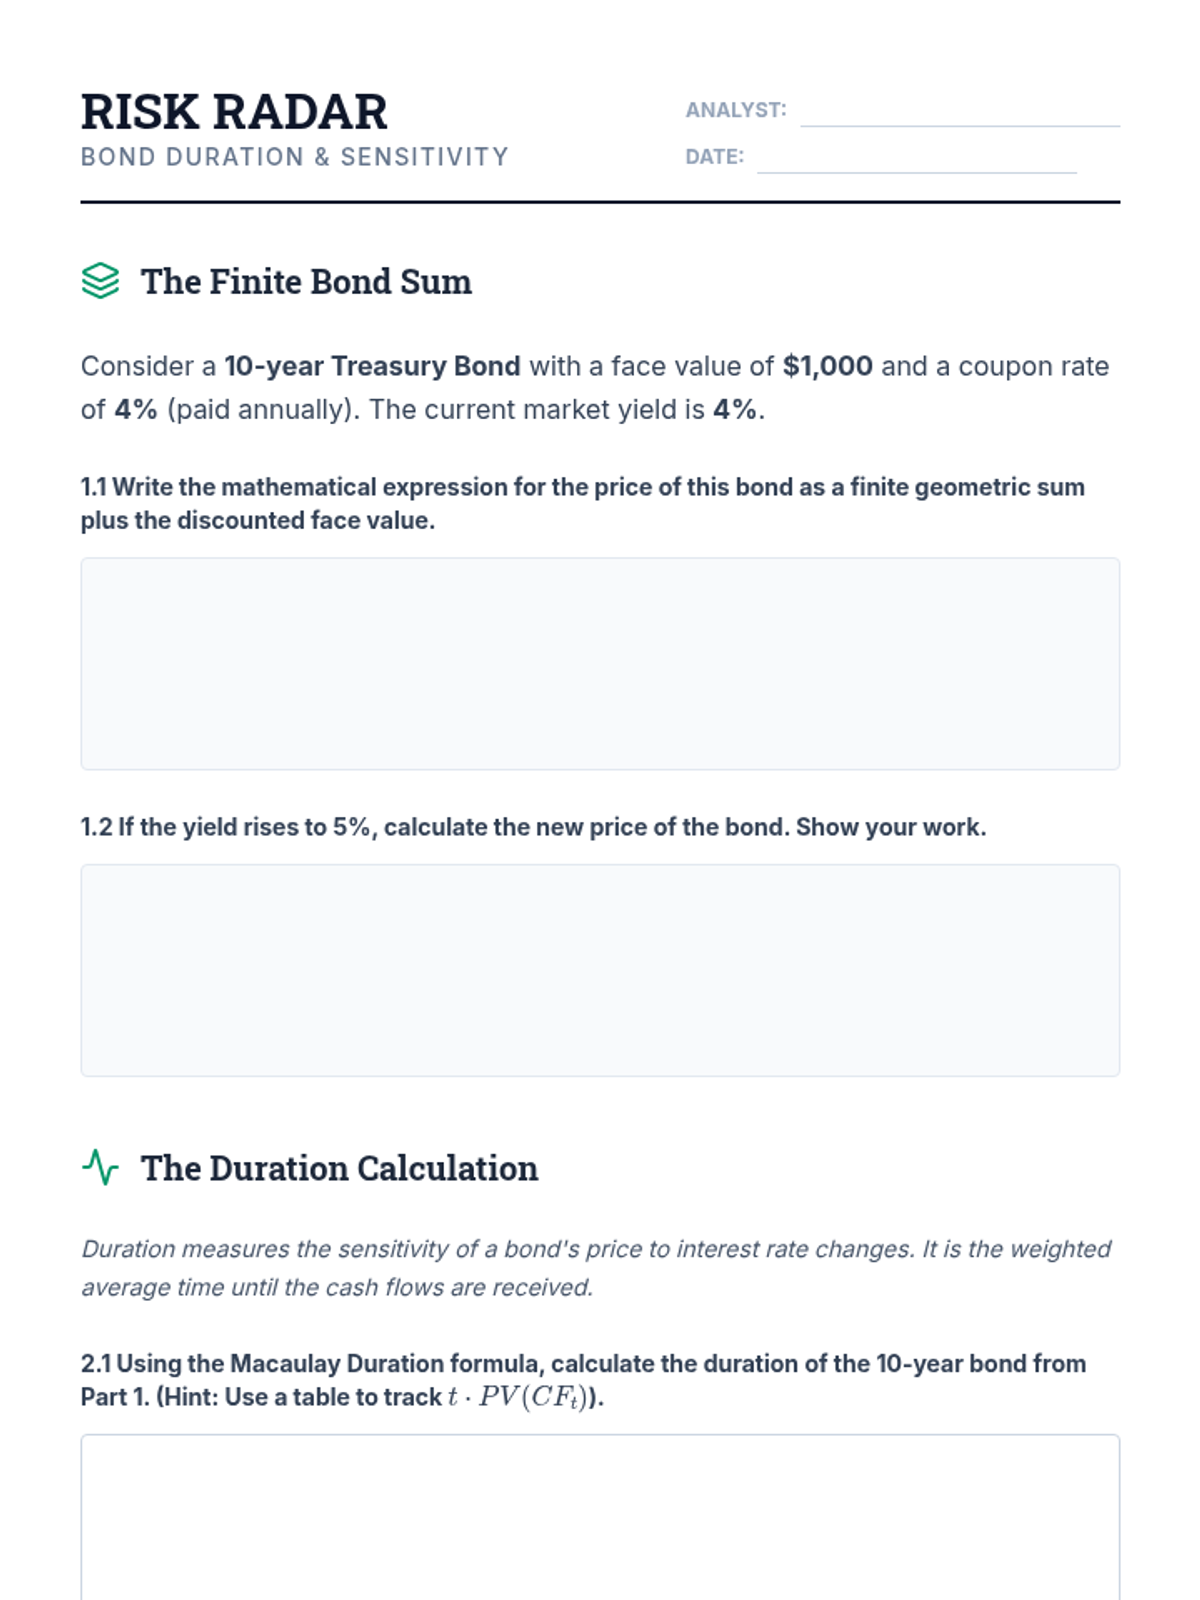
Students analyze bonds as series of cash flows, using differentiation to calculate Duration and assess interest rate risk.
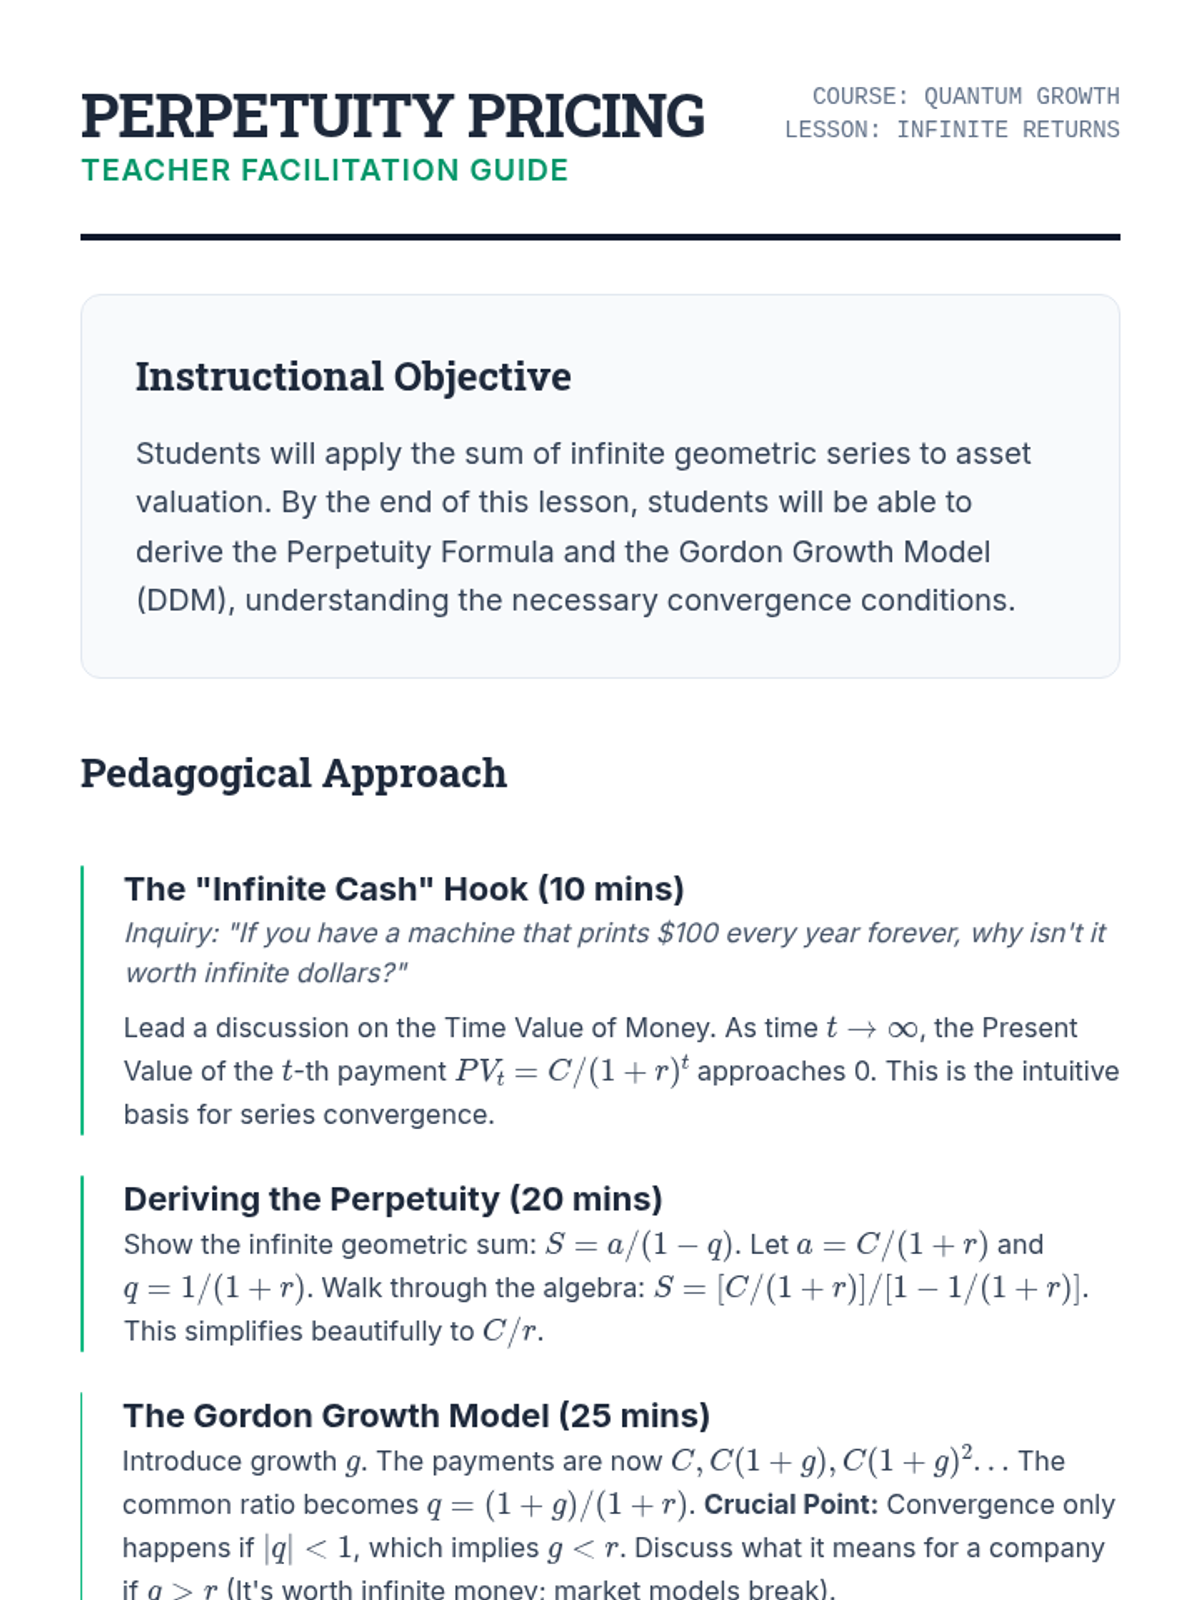
This lesson explores the valuation of infinite horizons, applying geometric series convergence to price perpetuities and the Dividend Discount Model.
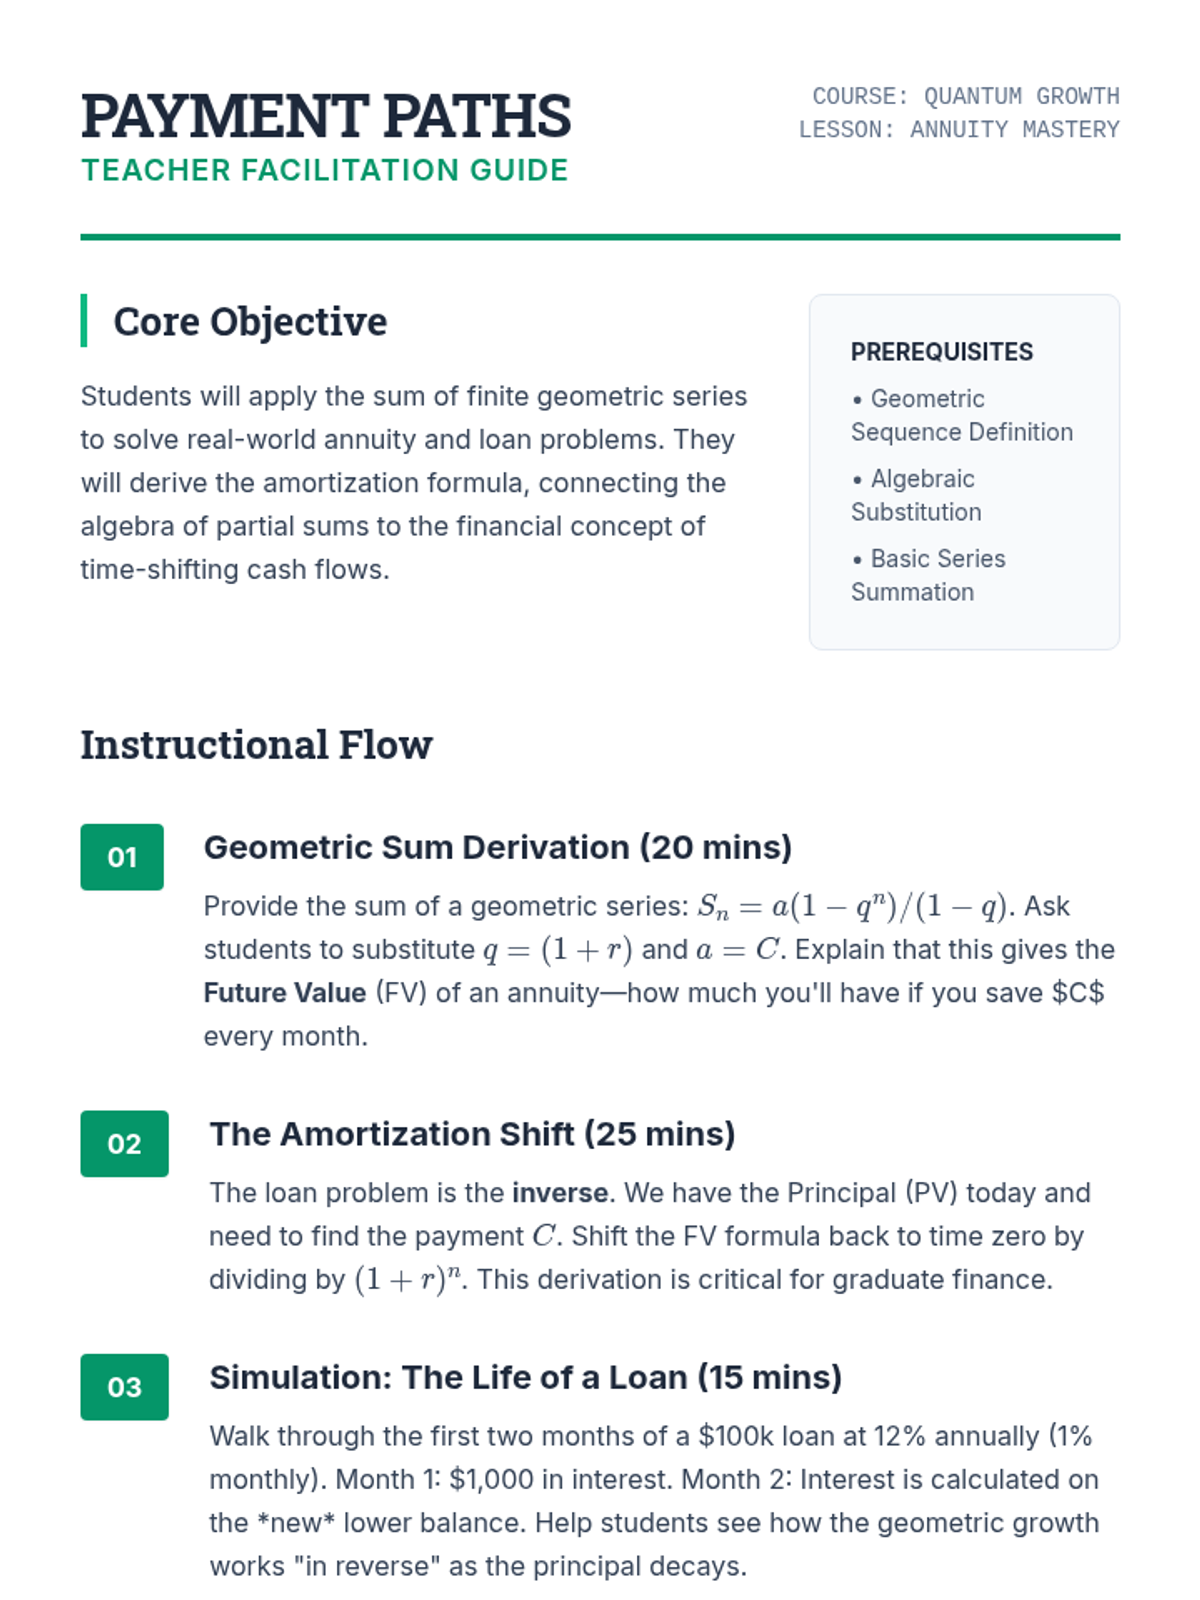
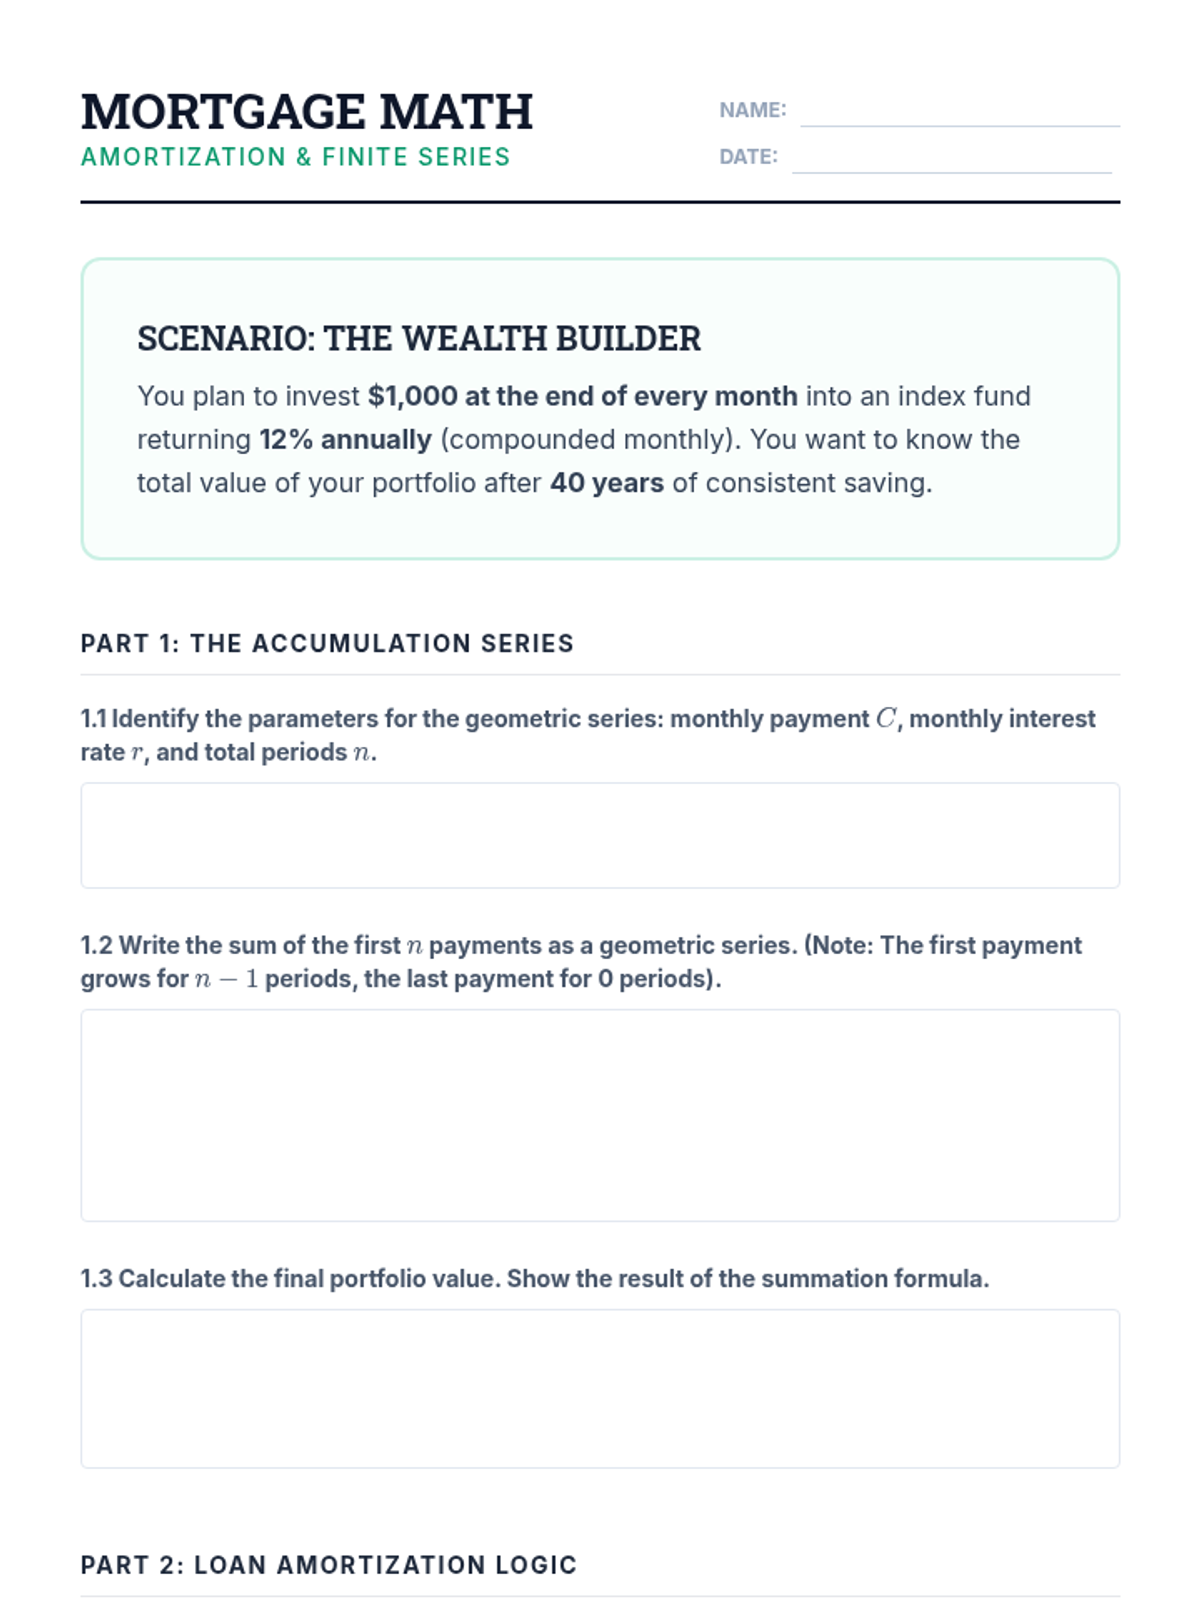
Learners model loan payments and savings plans using finite geometric series, deriving amortization formulas for mortgages and annuities.
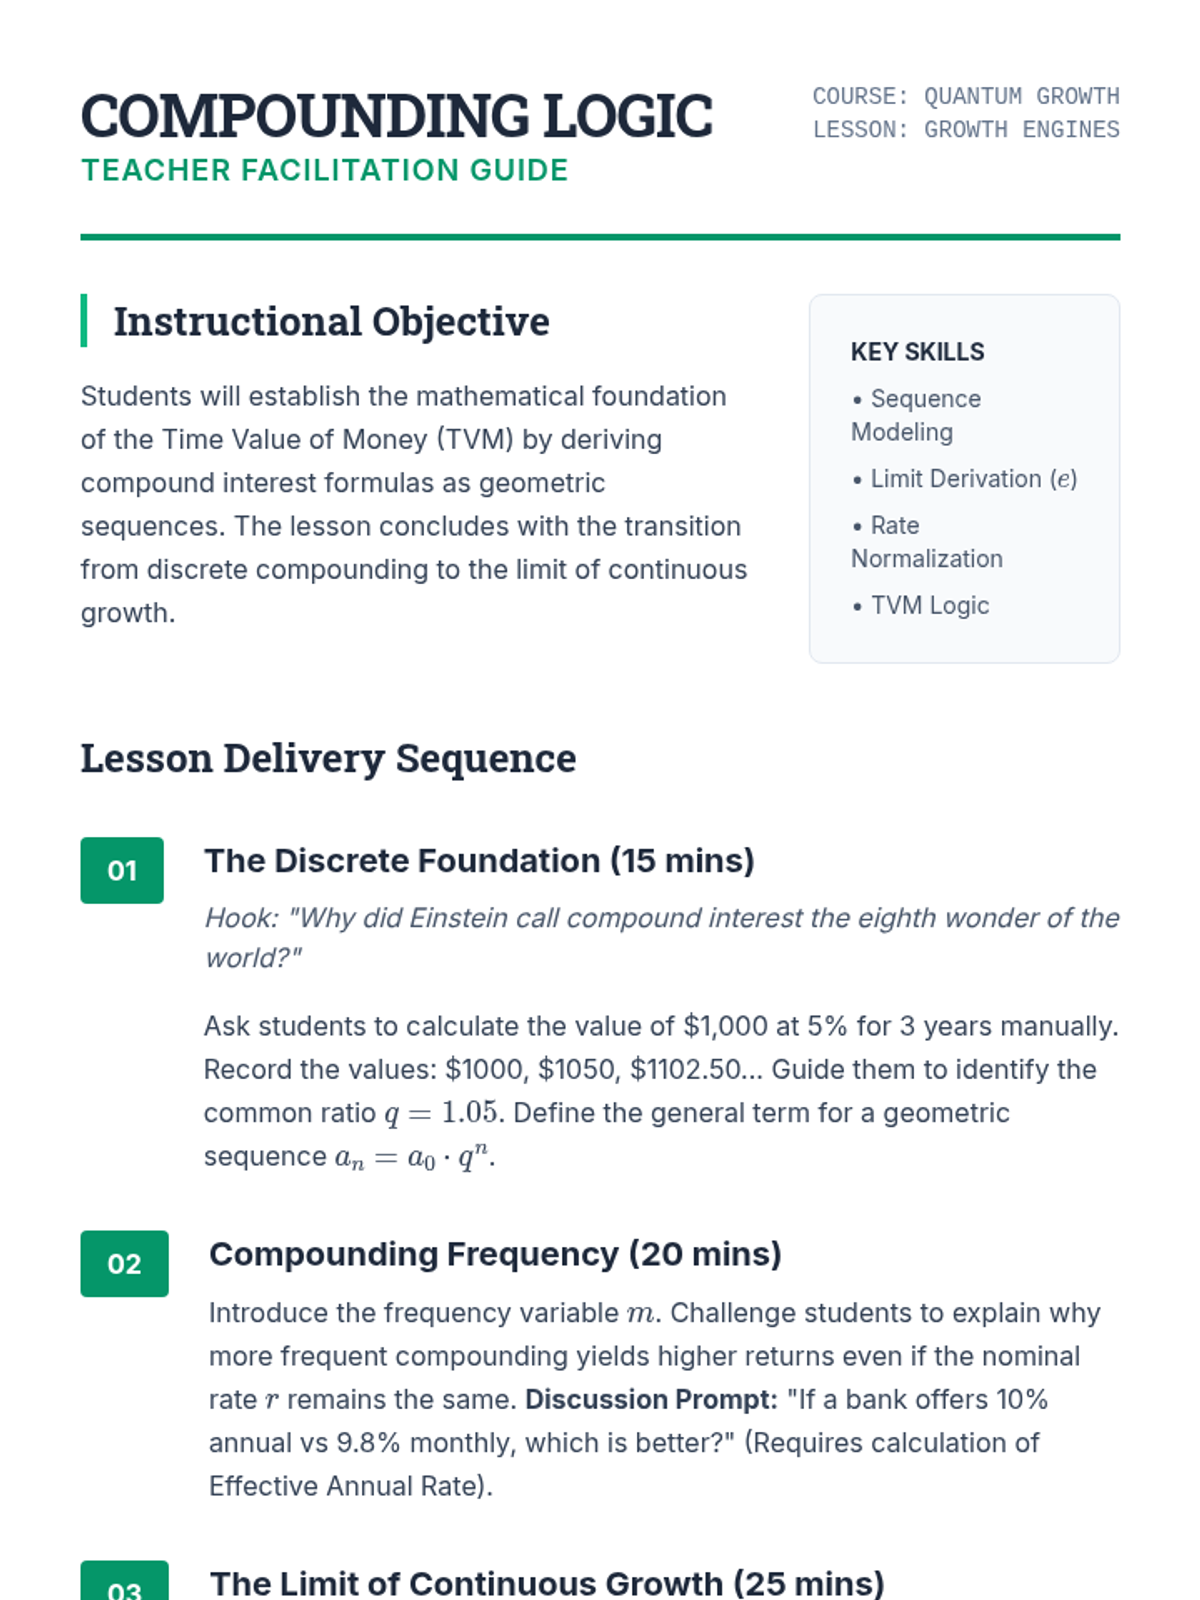
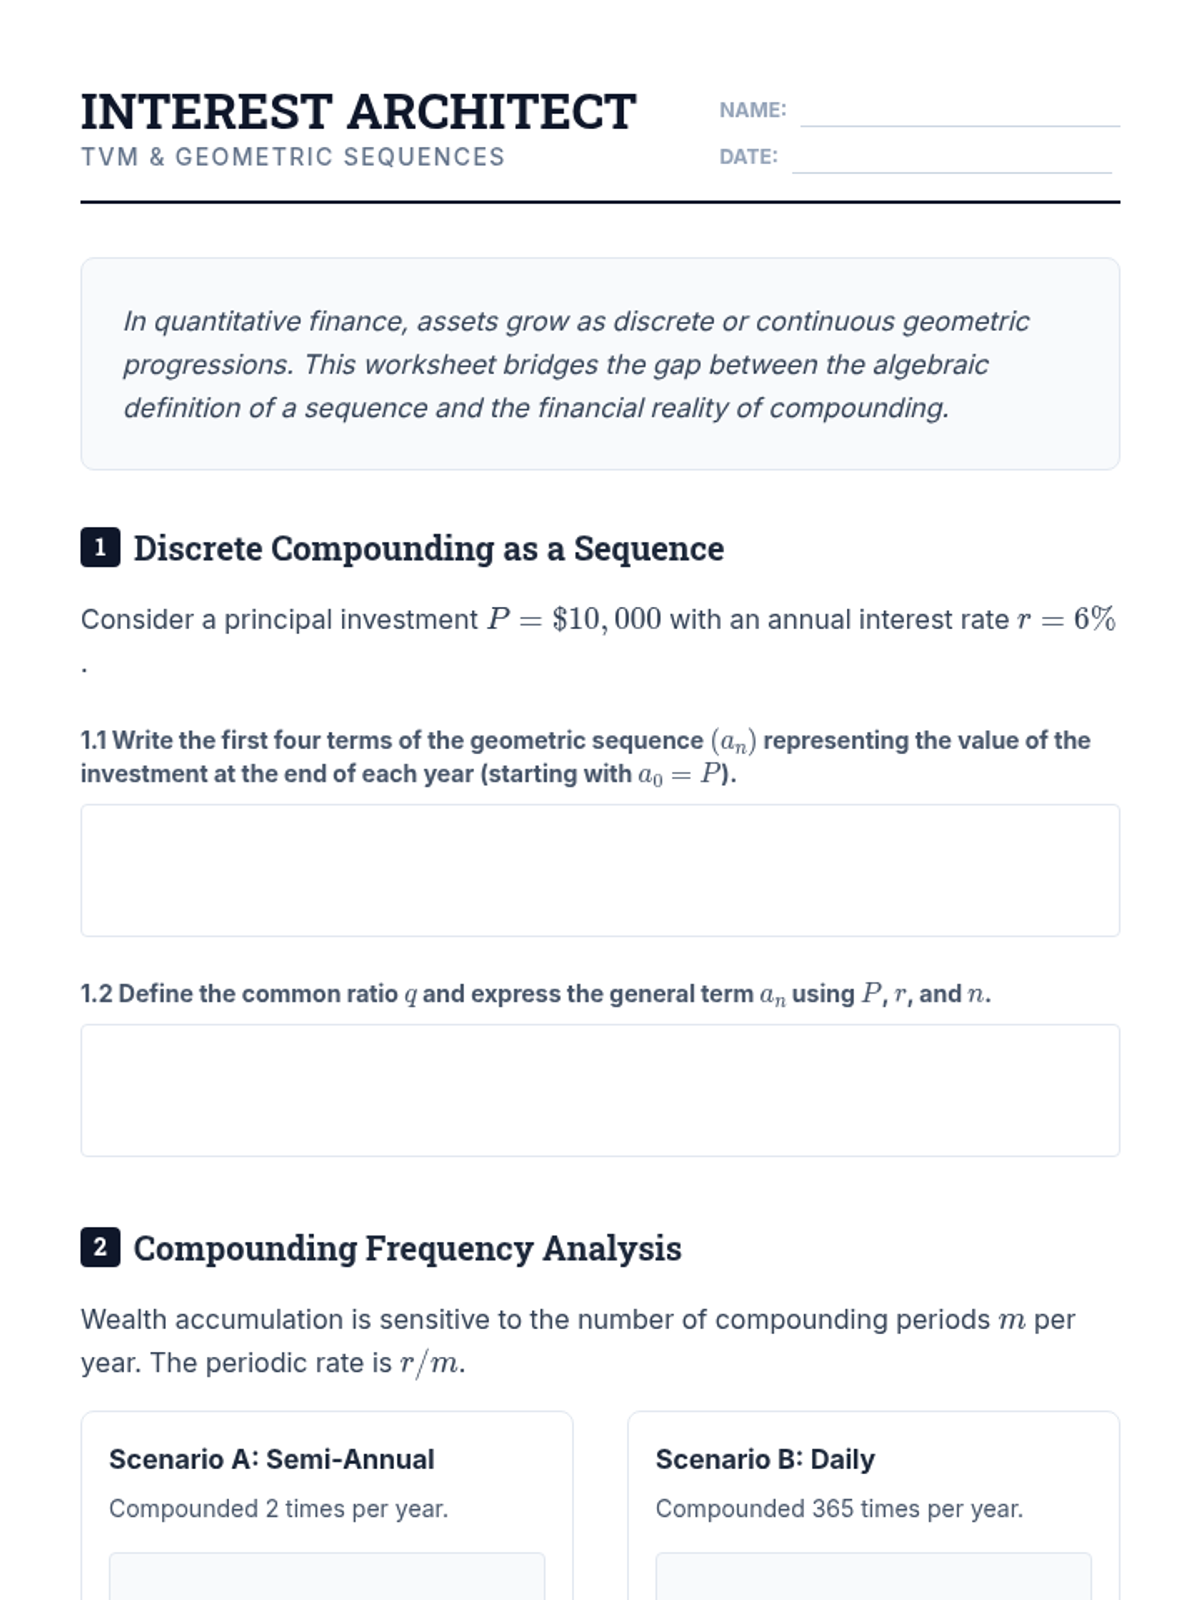
Students derive the compound interest formulas as geometric sequences, exploring the impact of compounding frequency and the limit as it approaches infinity (continuous compounding).
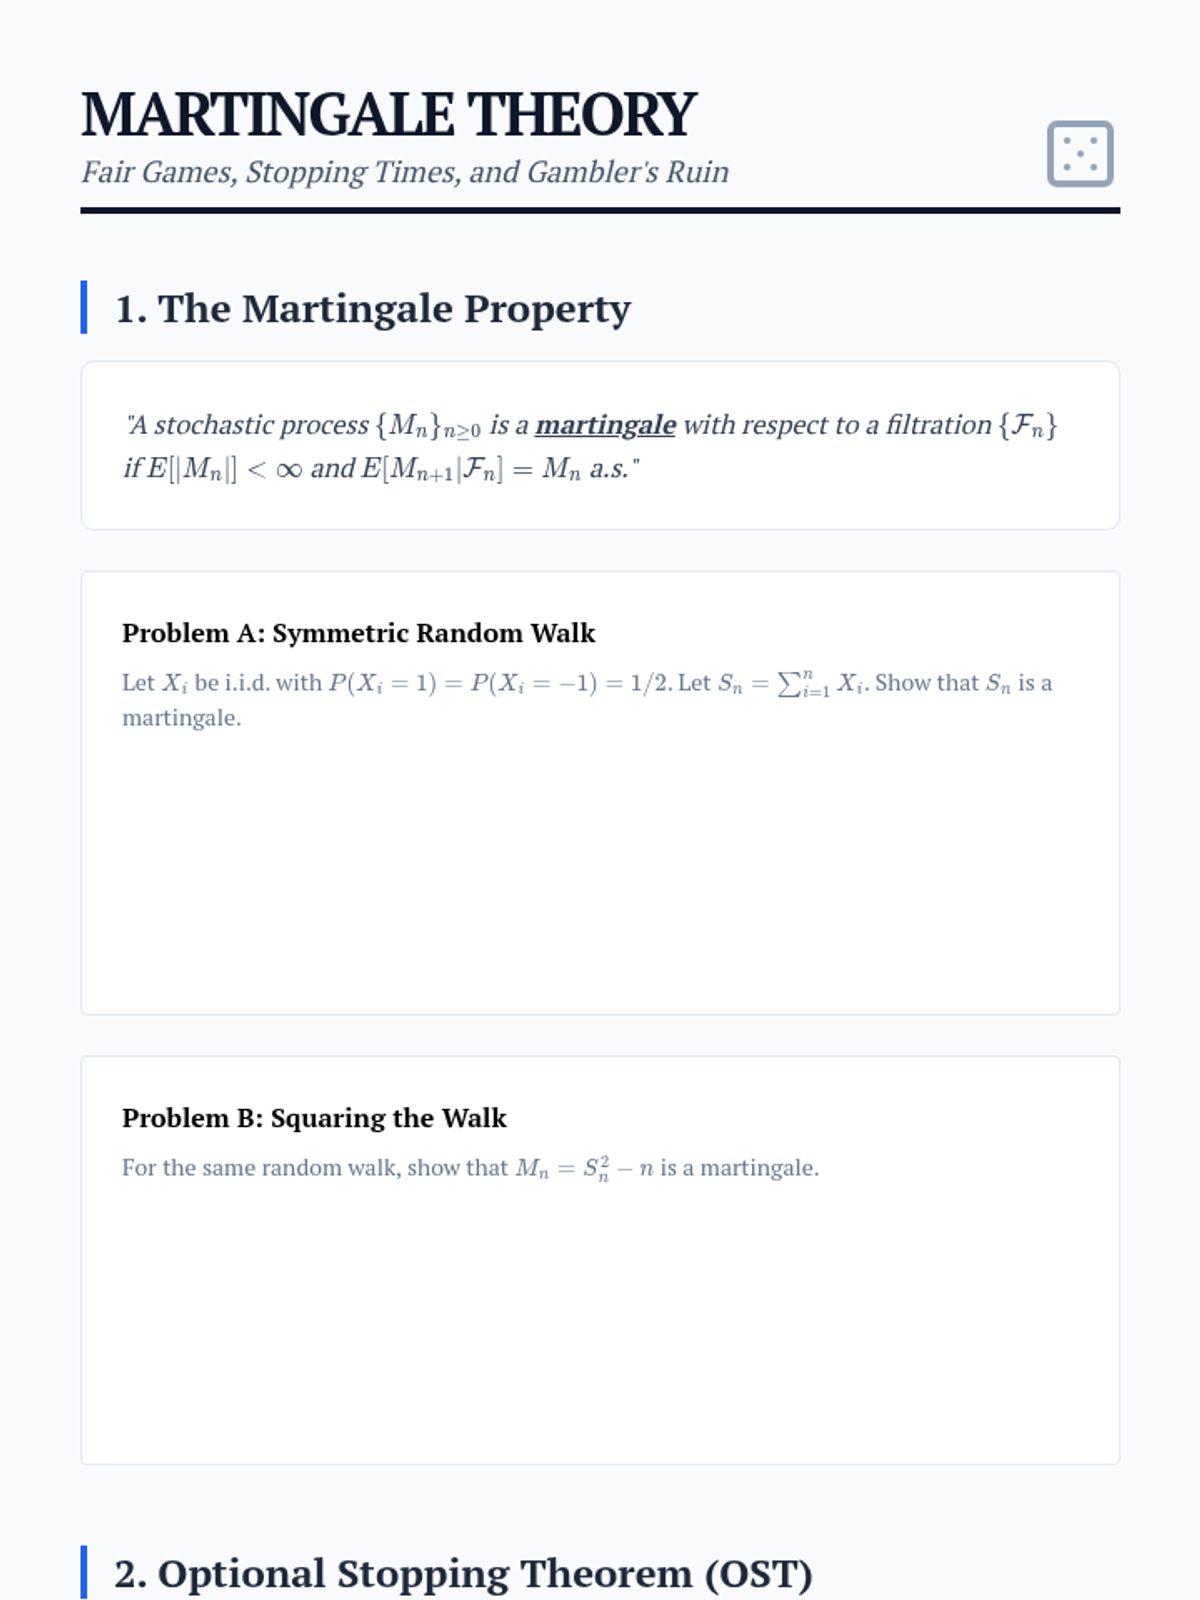
Introduction to Martingales and the Optional Stopping Theorem, applying these concepts to fair games and boundary crossing probabilities.
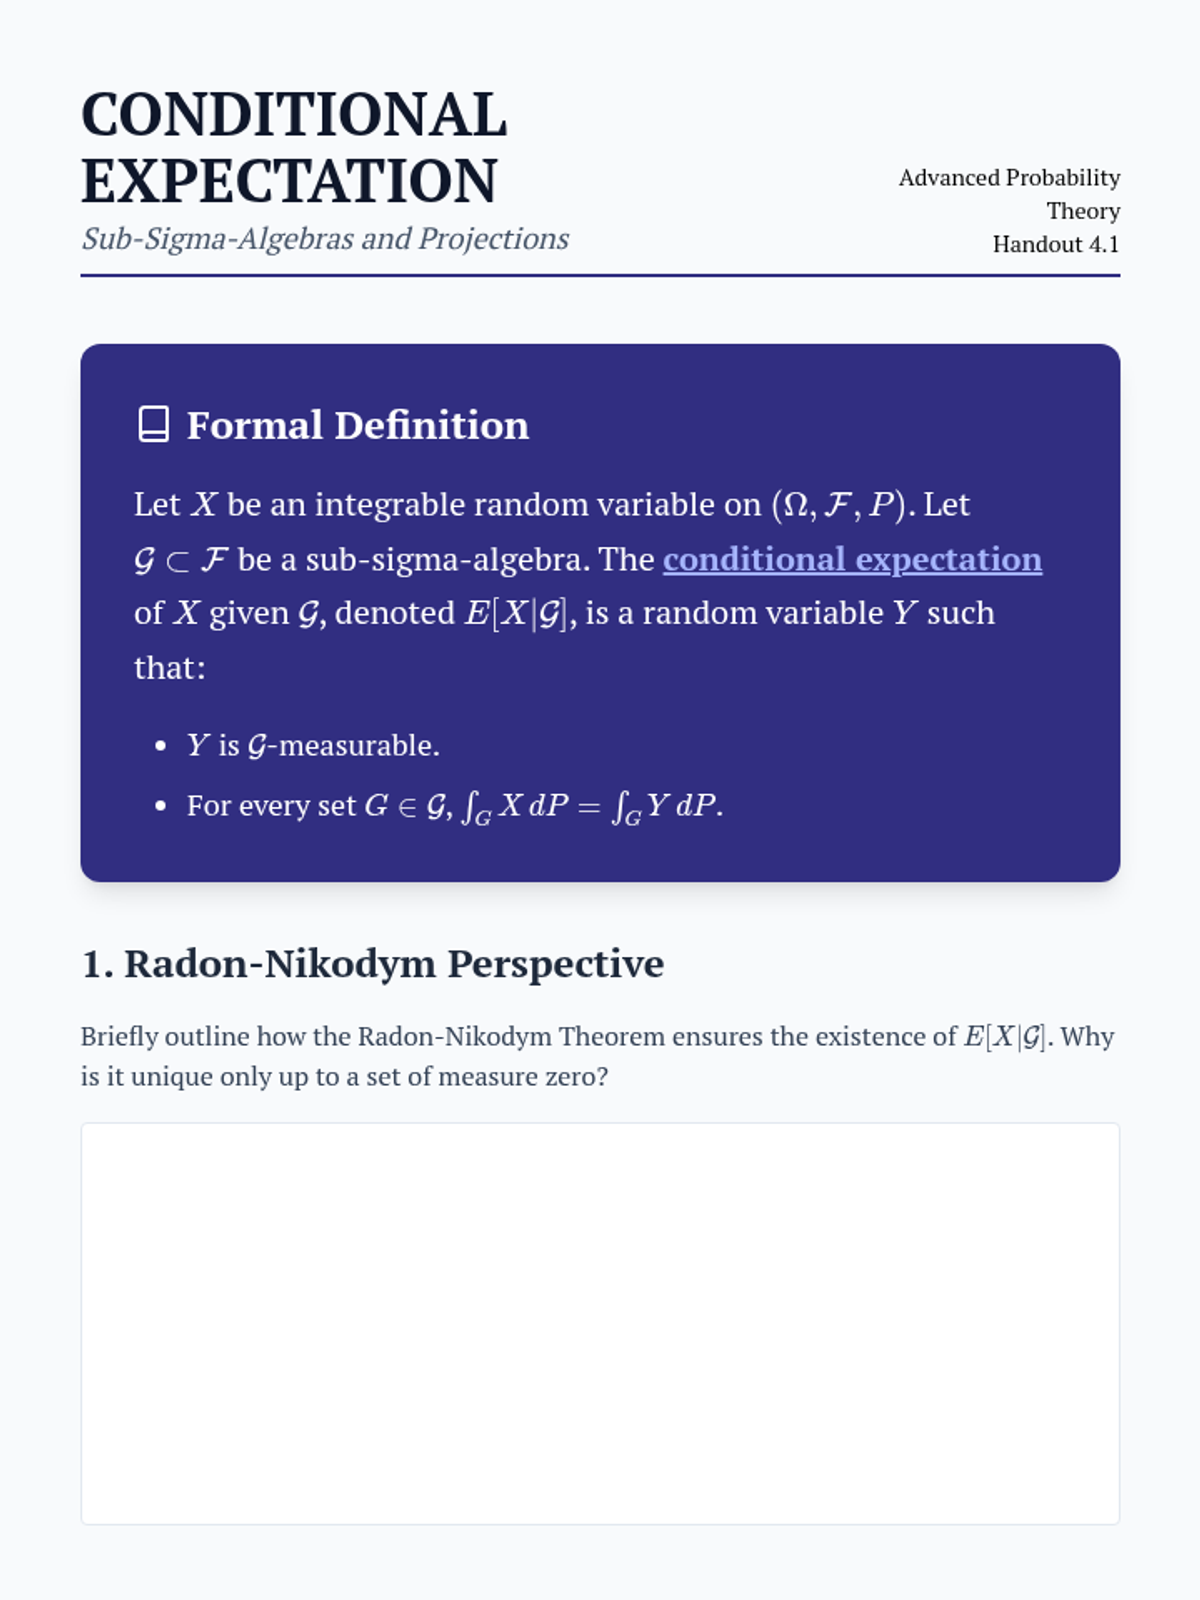
Defines conditional expectation as a random variable measurable with respect to a sub-sigma-algebra, utilizing the Radon-Nikodym theorem.
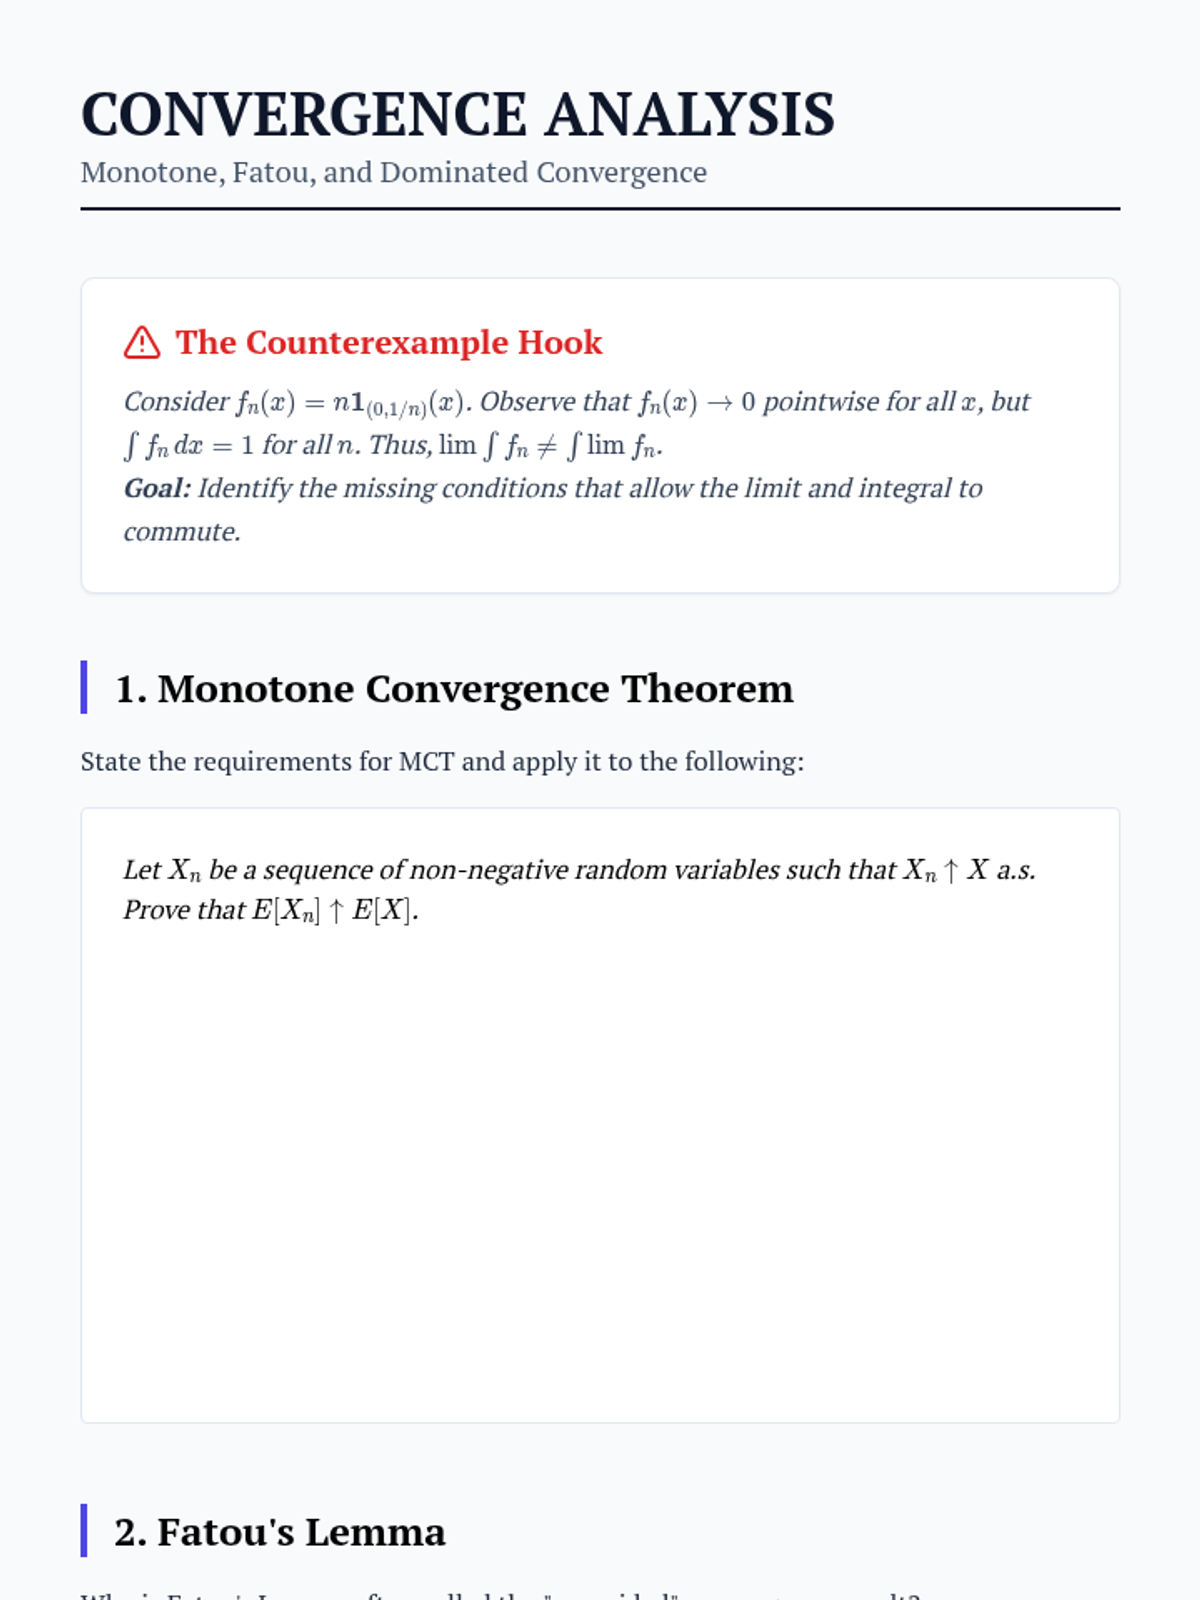
Analysis of Monotone Convergence, Fatou's Lemma, and Dominated Convergence Theorems to determine when limits and expectations commute.
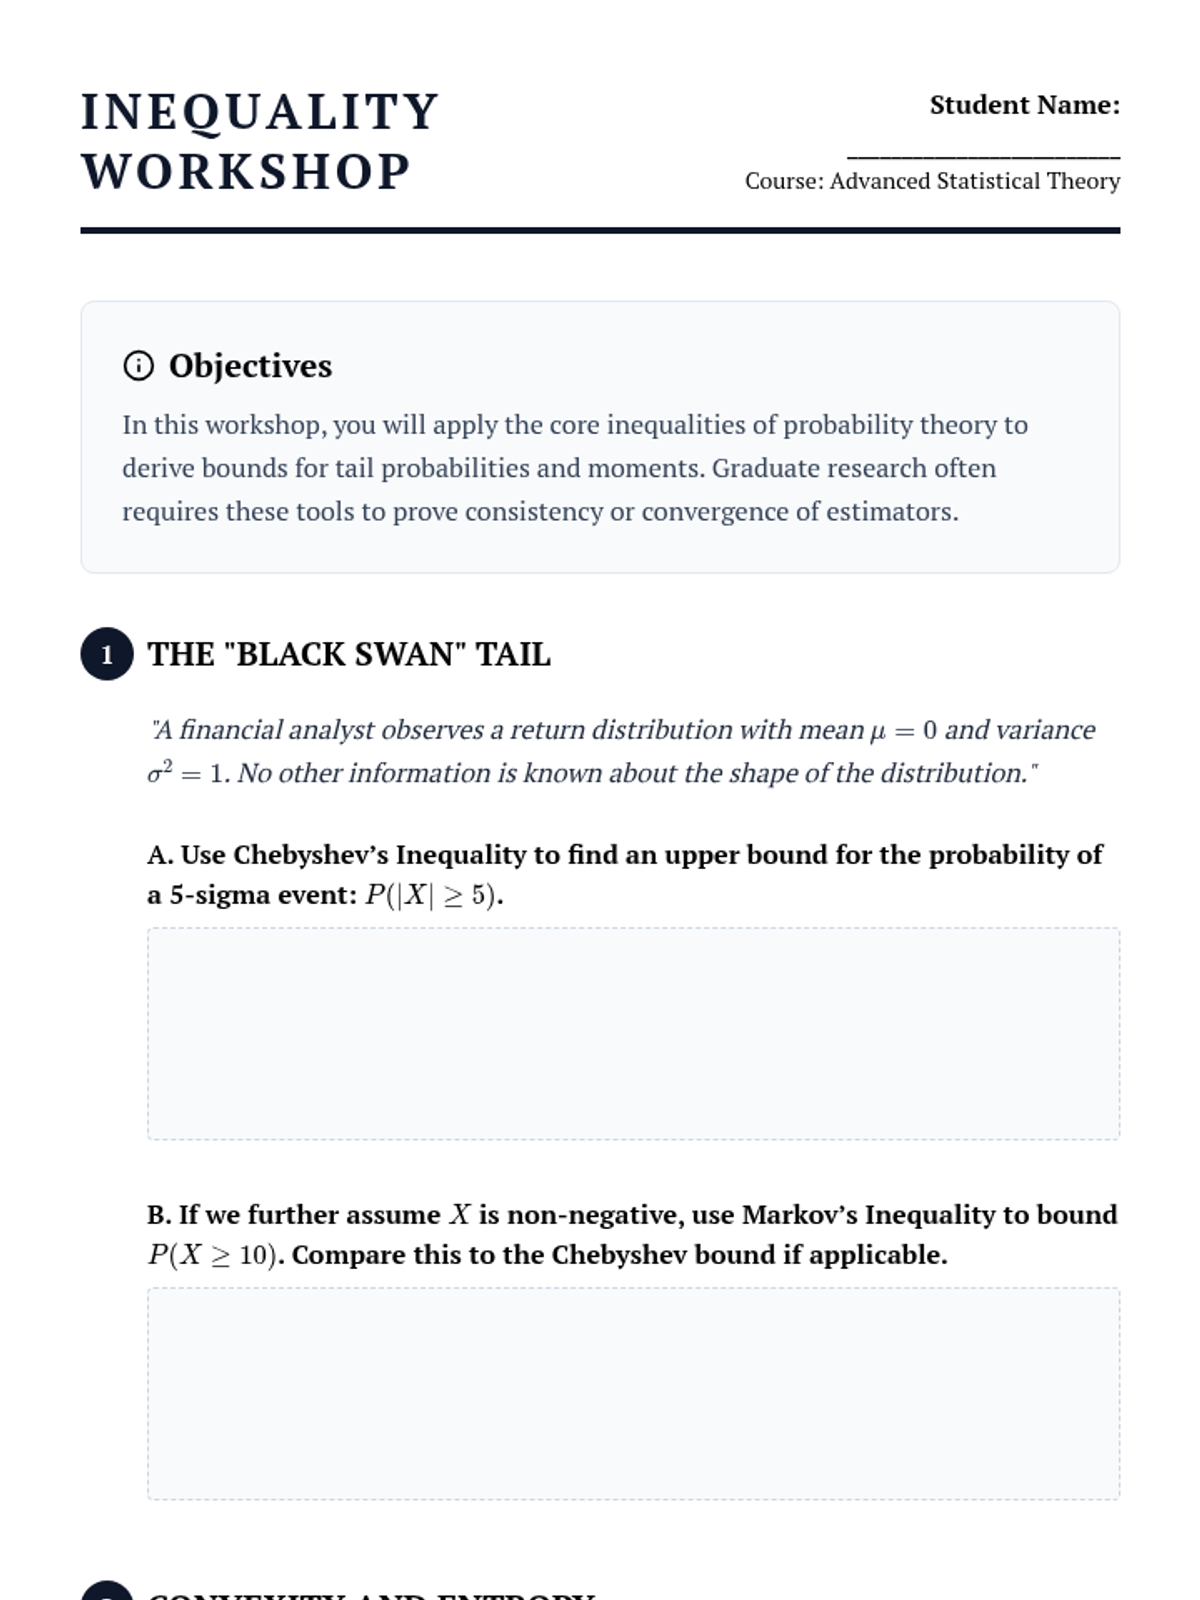
Focuses on the derivation and application of Markov, Chebyshev, Jensen, Hölder, and Minkowski inequalities to bound expected values.
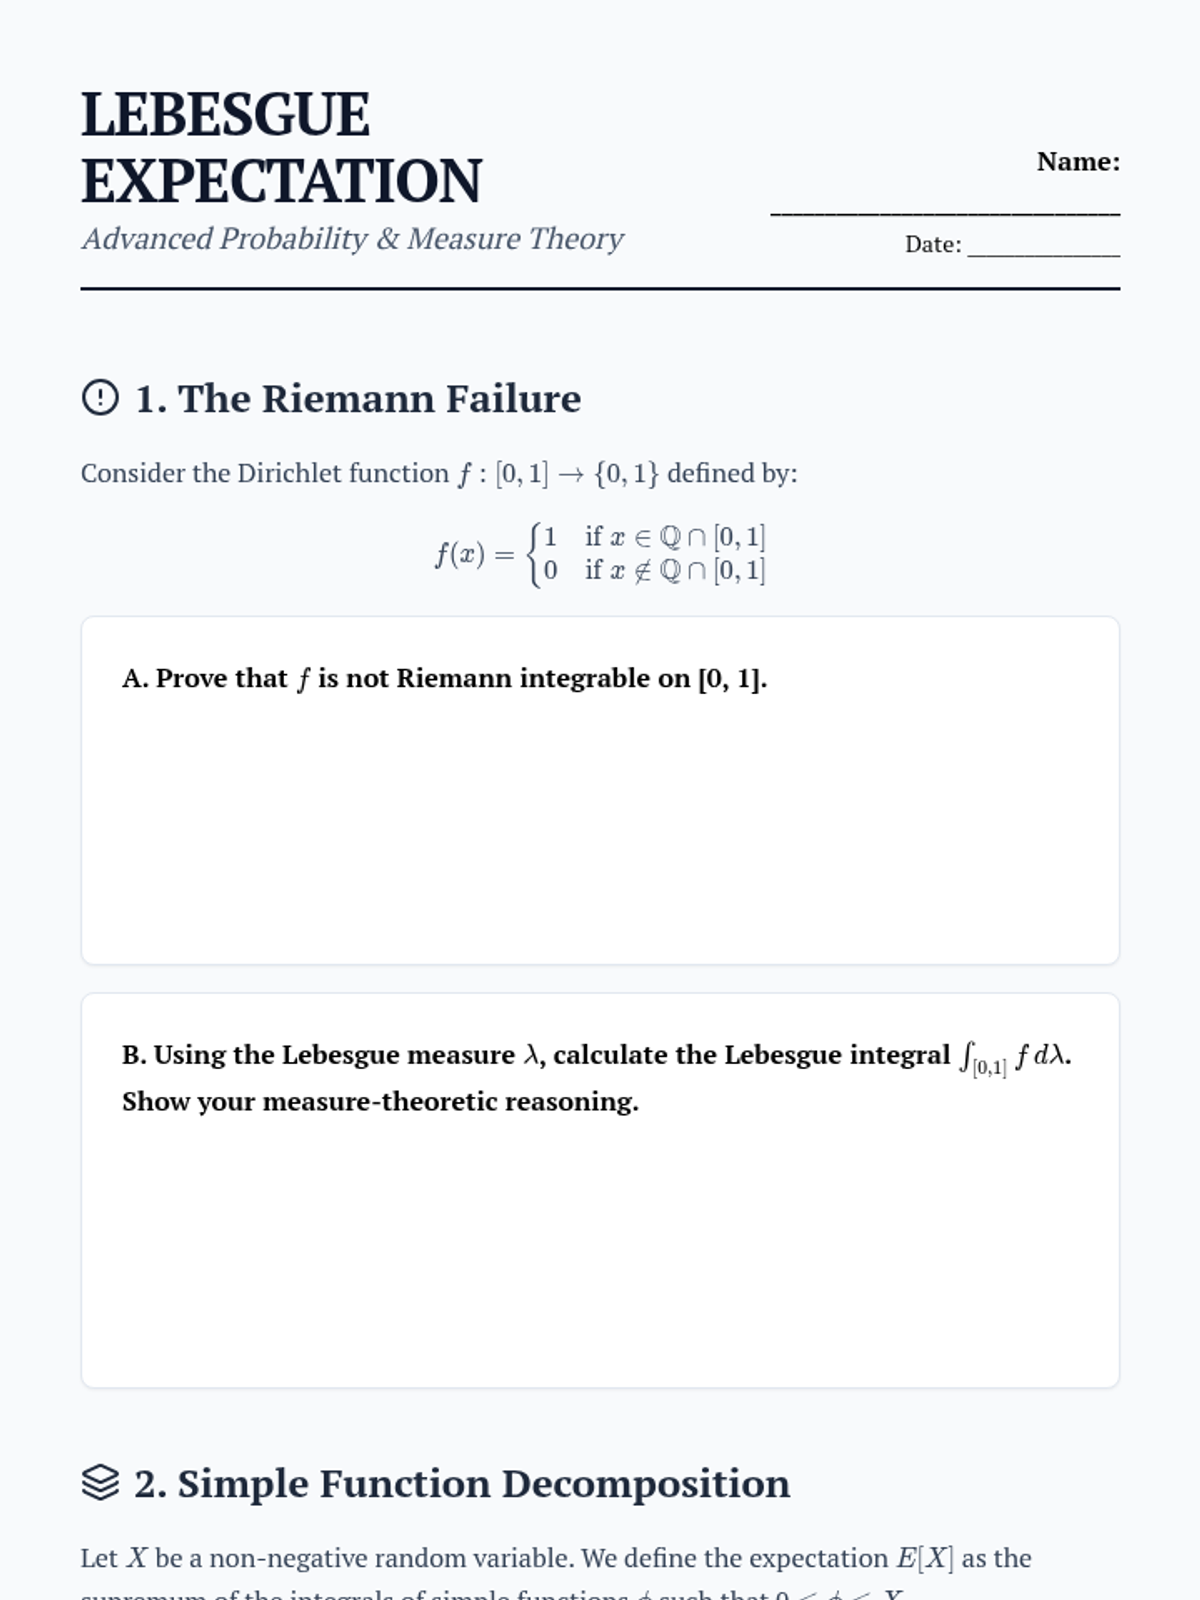
Students define expectation using the Lebesgue integral, moving from simple functions to non-negative random variables and addressing the limitations of Riemann integration.
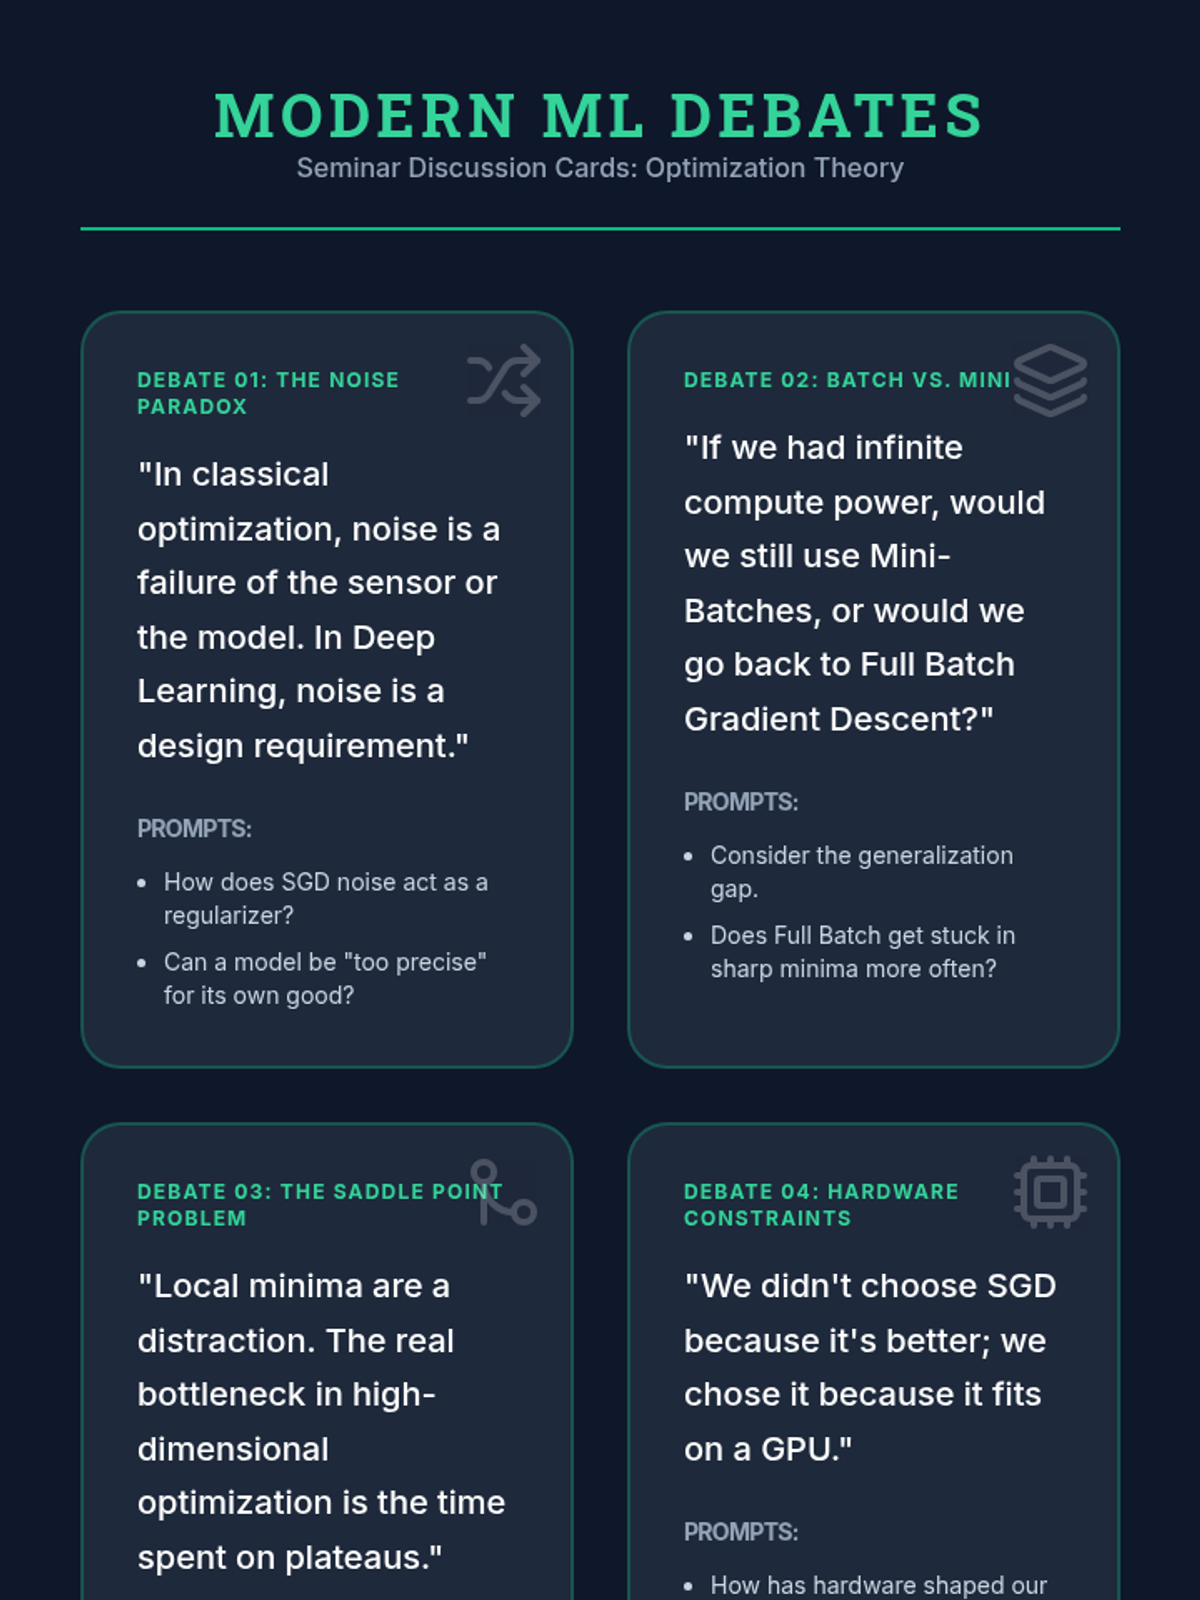
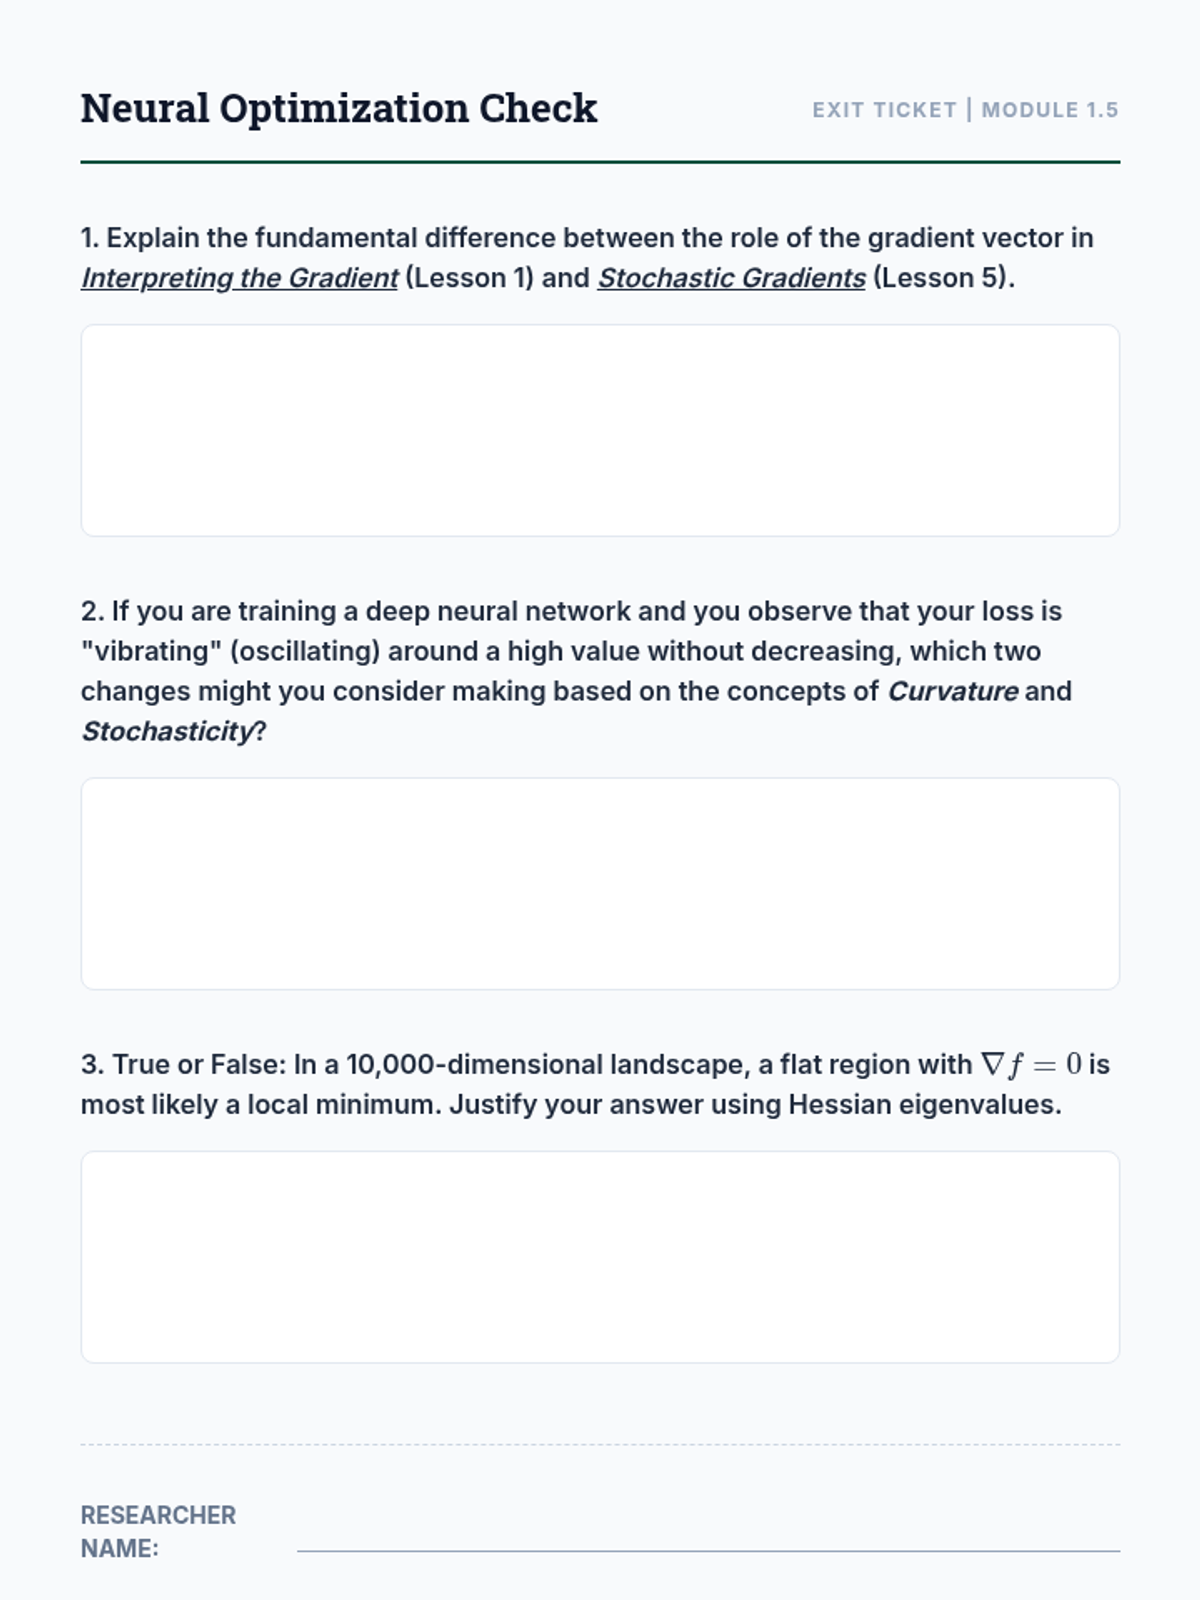
Exploring Stochastic Gradient Descent (SGD) and its role in navigating high-dimensional, non-convex landscapes in machine learning.
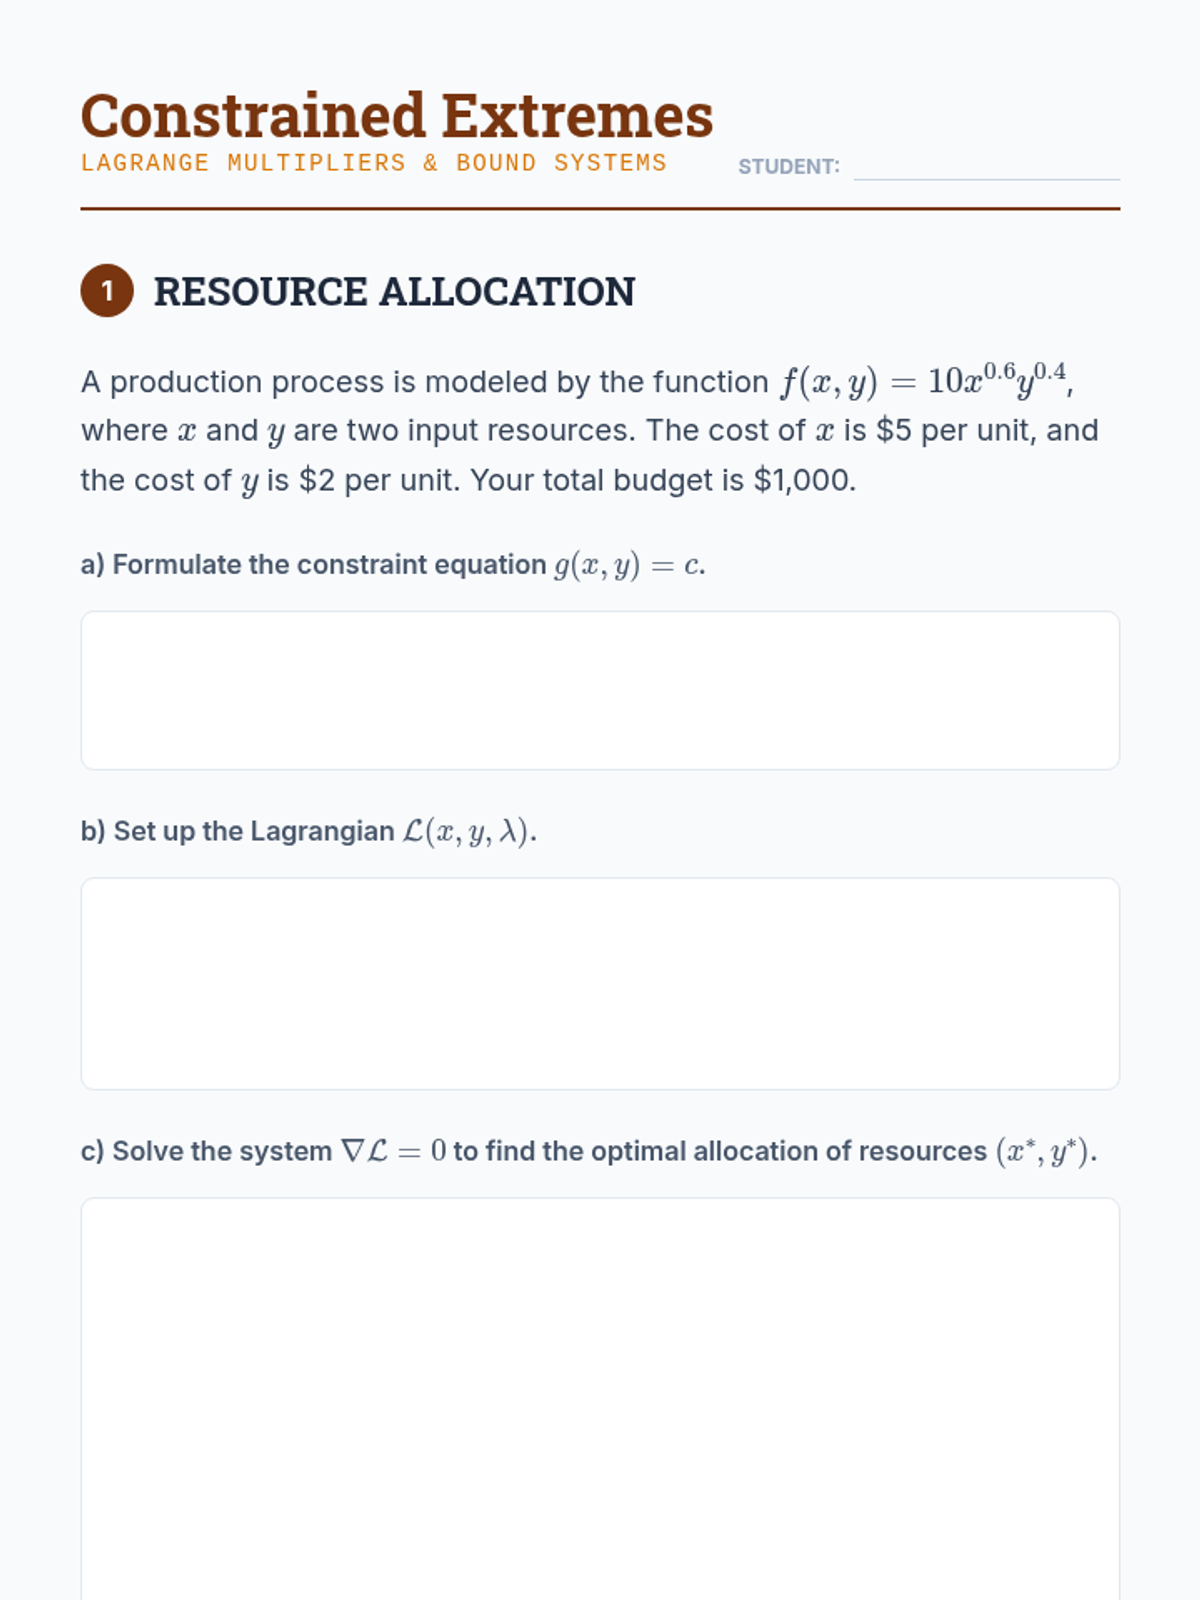
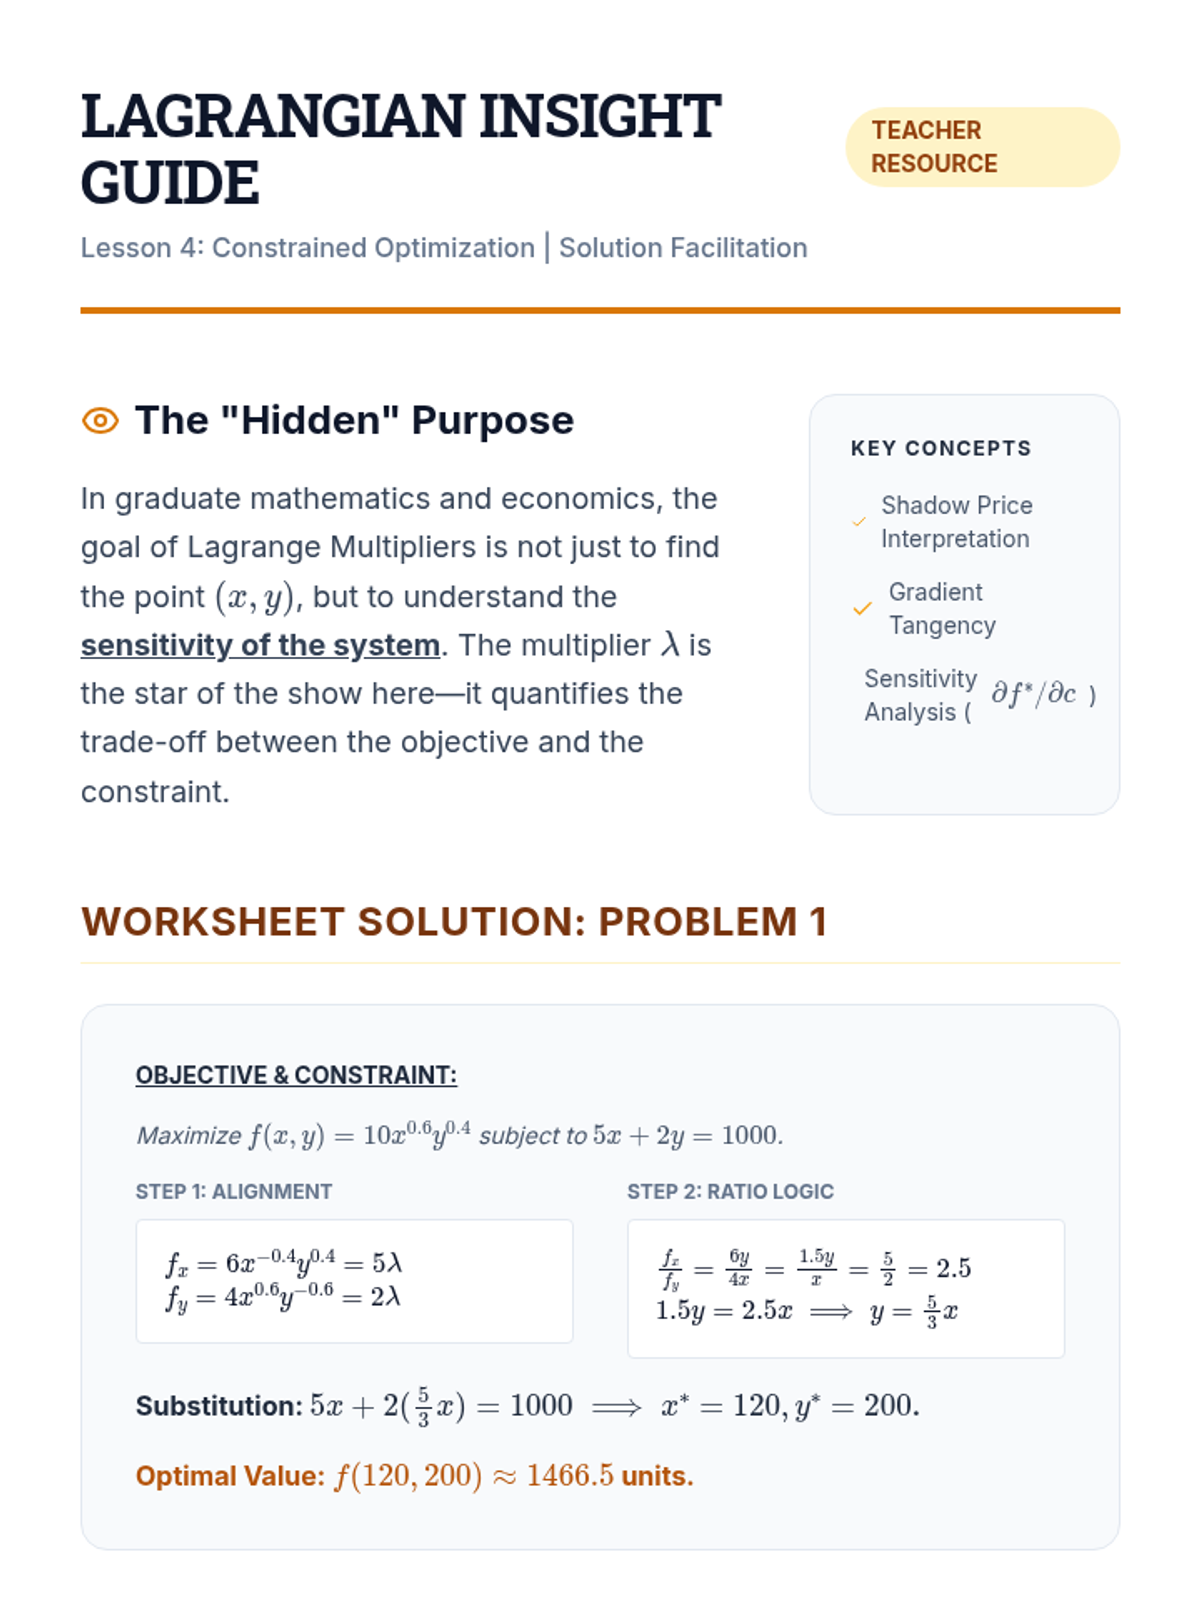
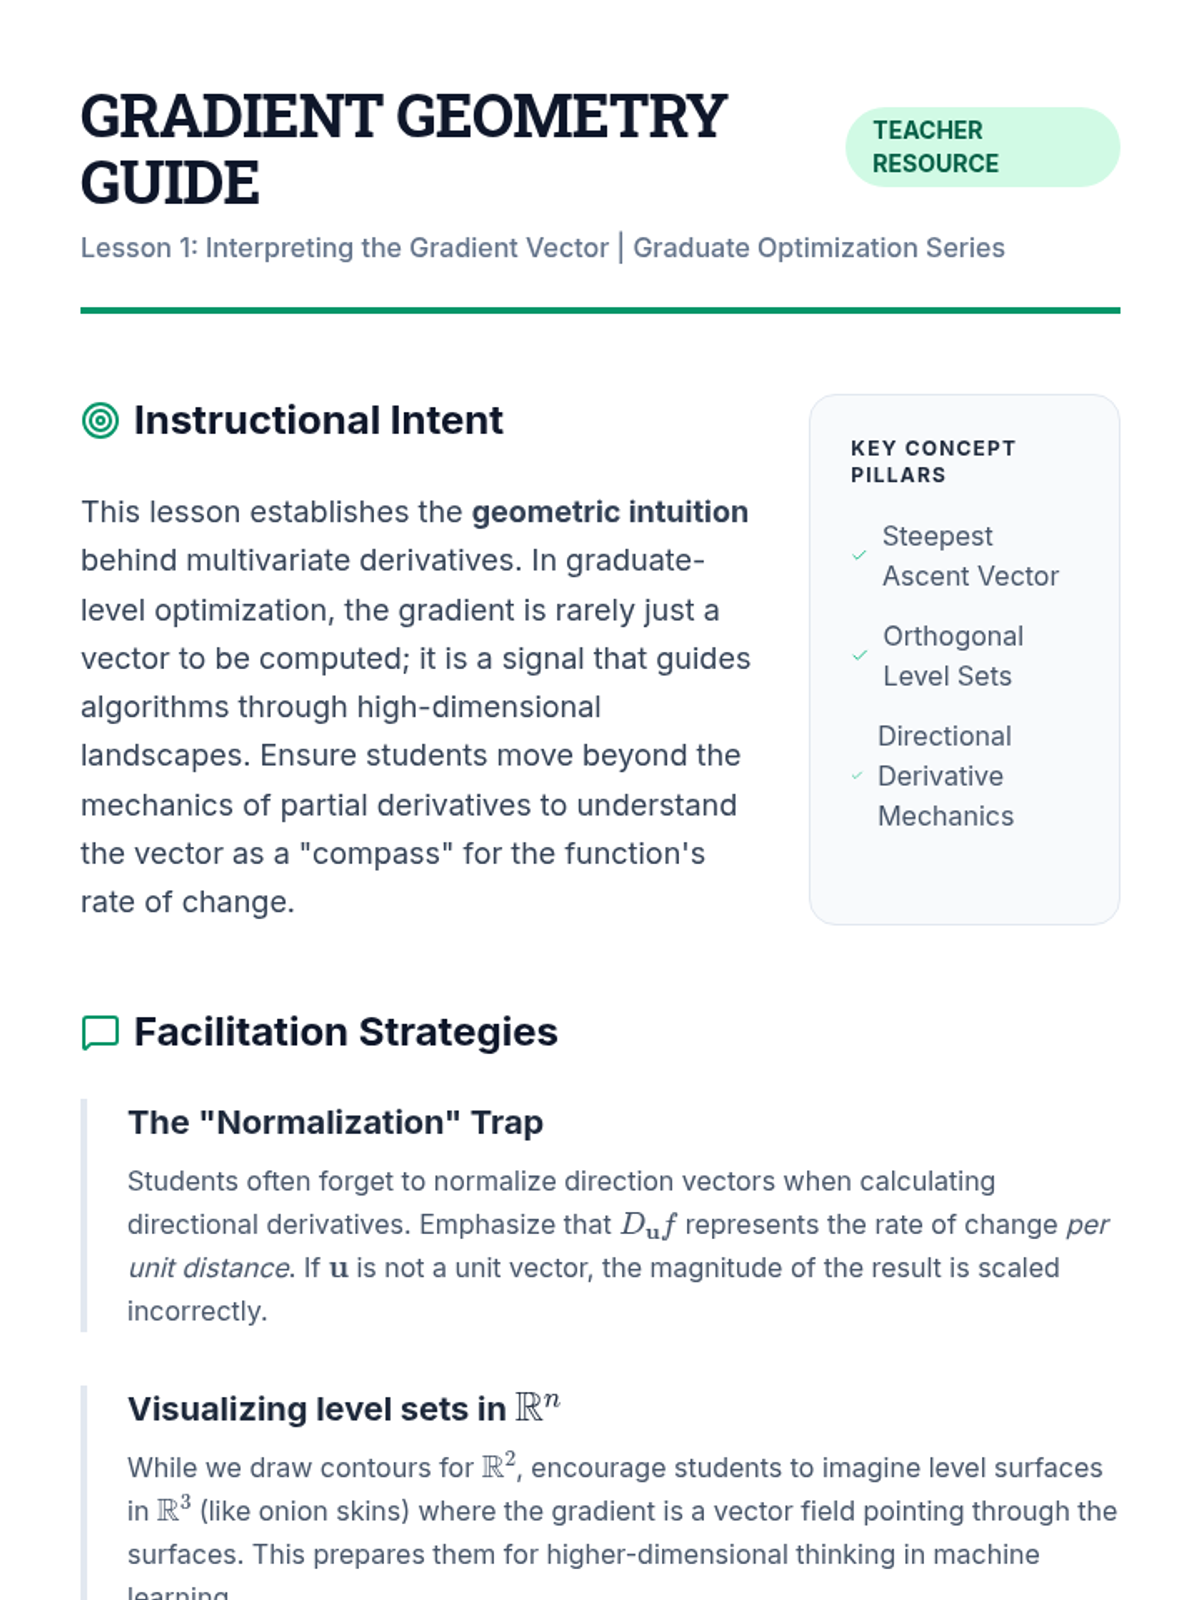
Solving optimization problems under constraints using the method of Lagrange multipliers, focusing on the alignment of gradient vectors.
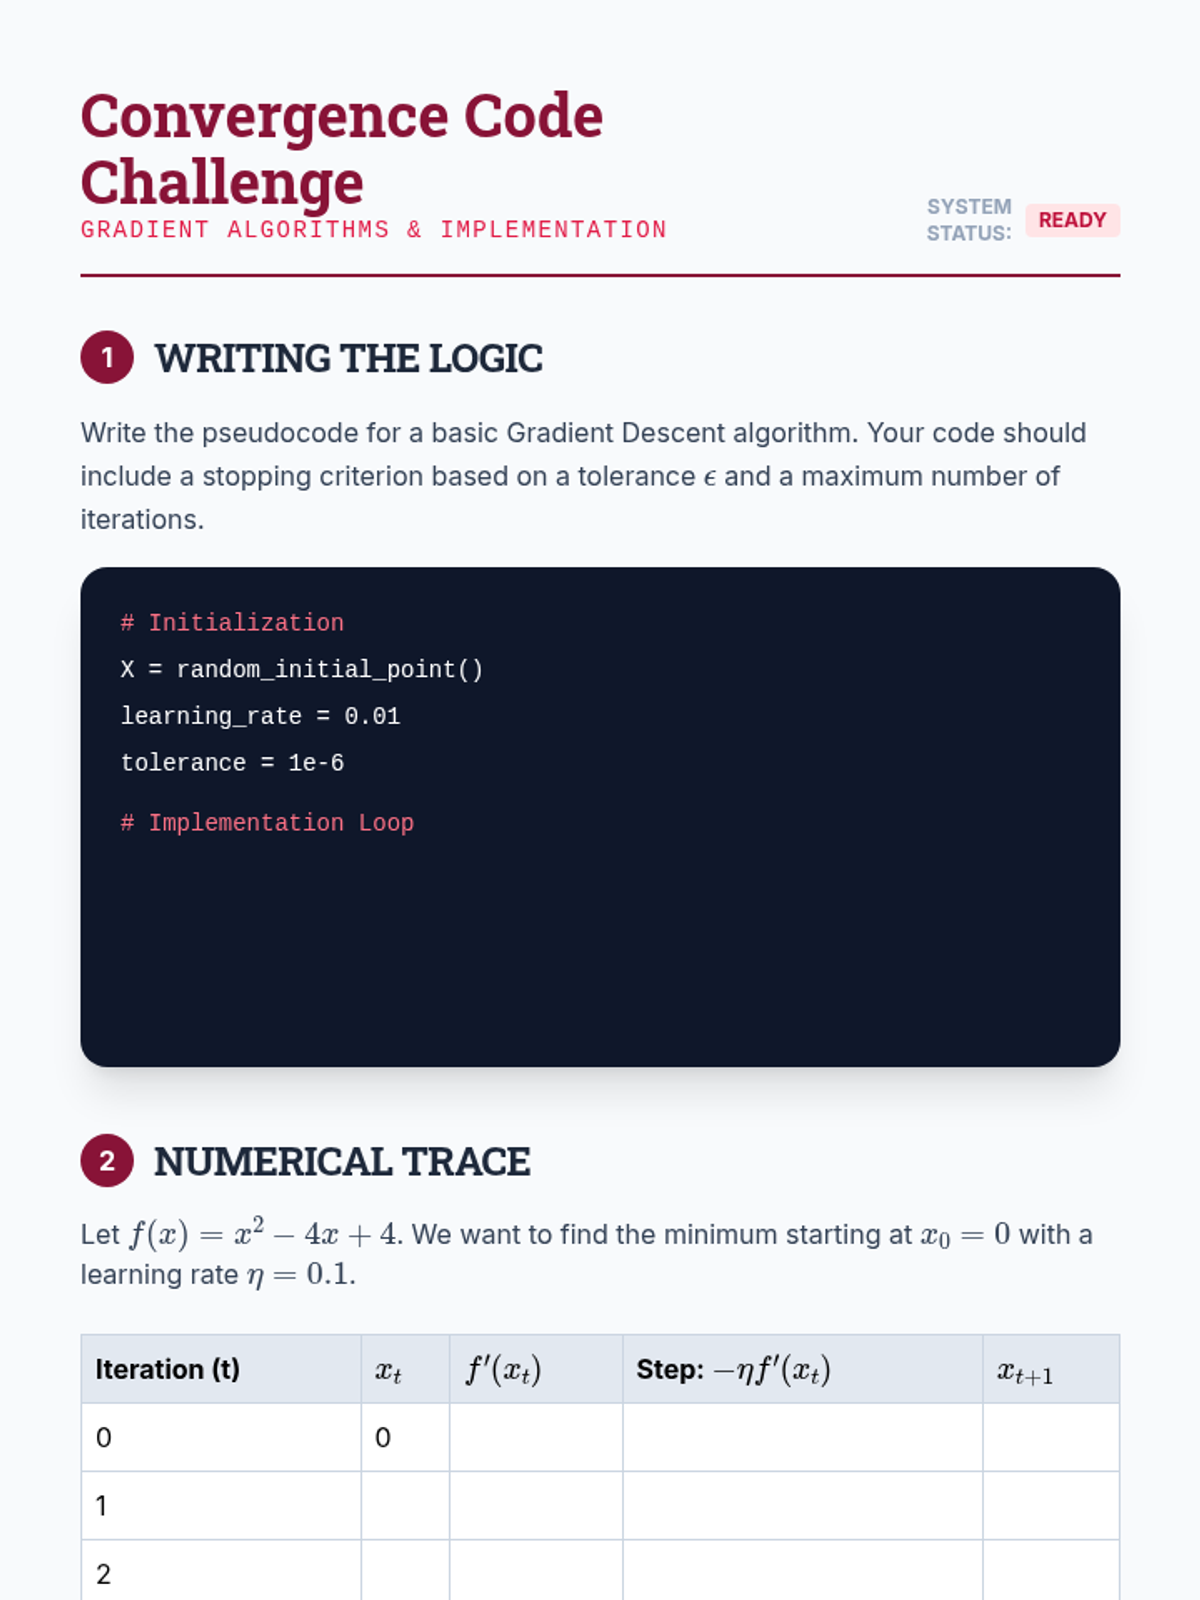
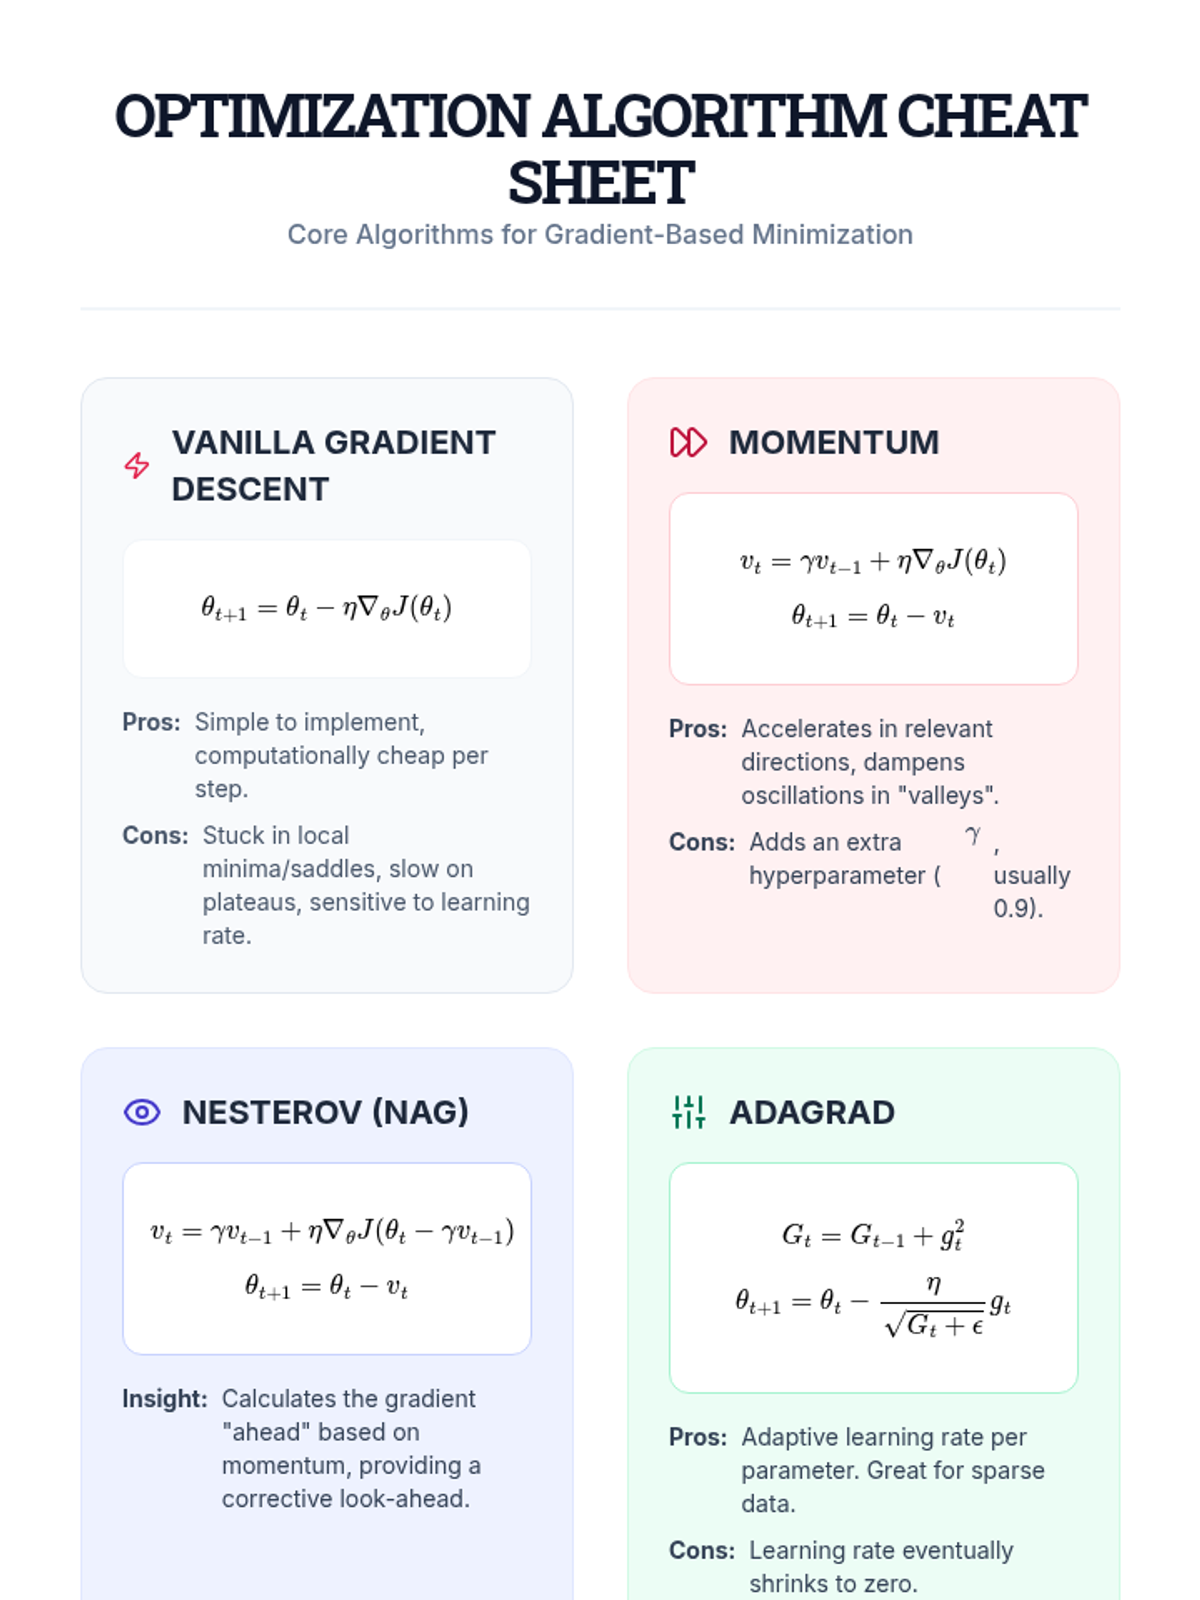
Implementation of iterative numerical methods, focusing on the geometry of convergence, learning rates, and momentum in gradient descent.
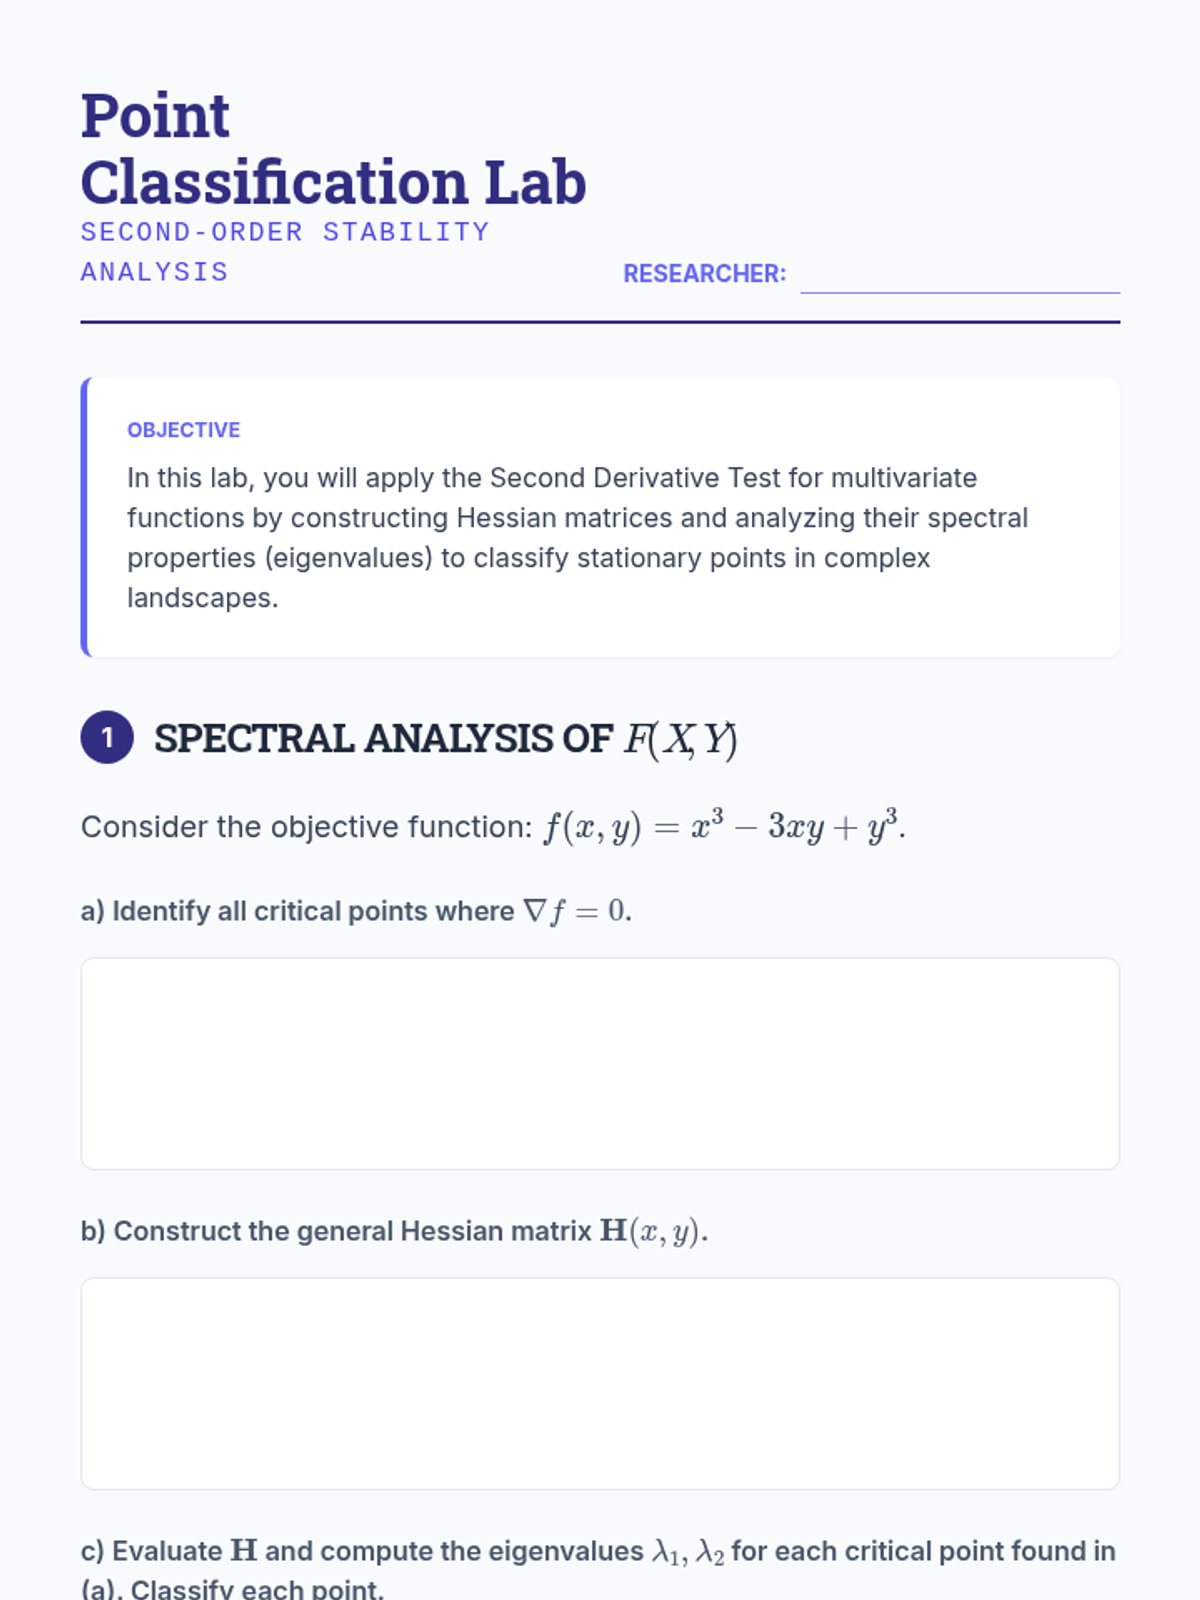
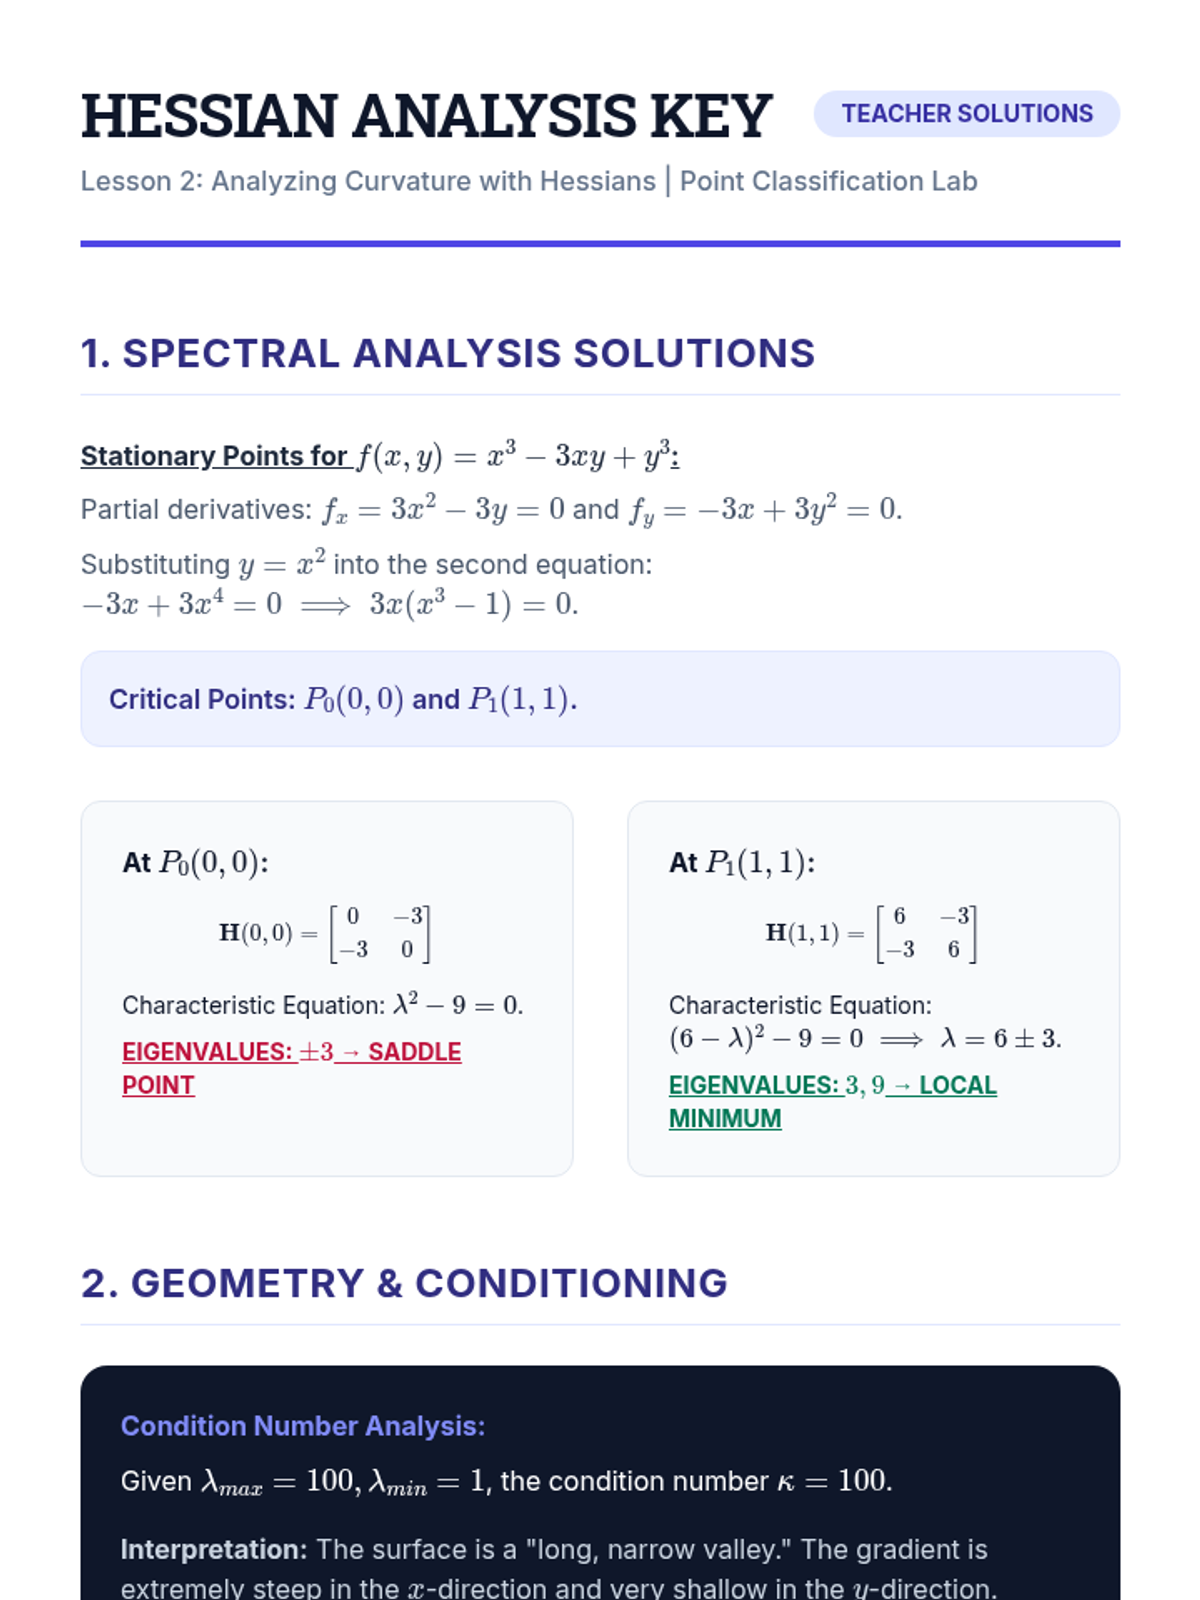
An examination of second-order derivatives via the Hessian matrix to understand surface curvature and classify critical points using eigenvalues.
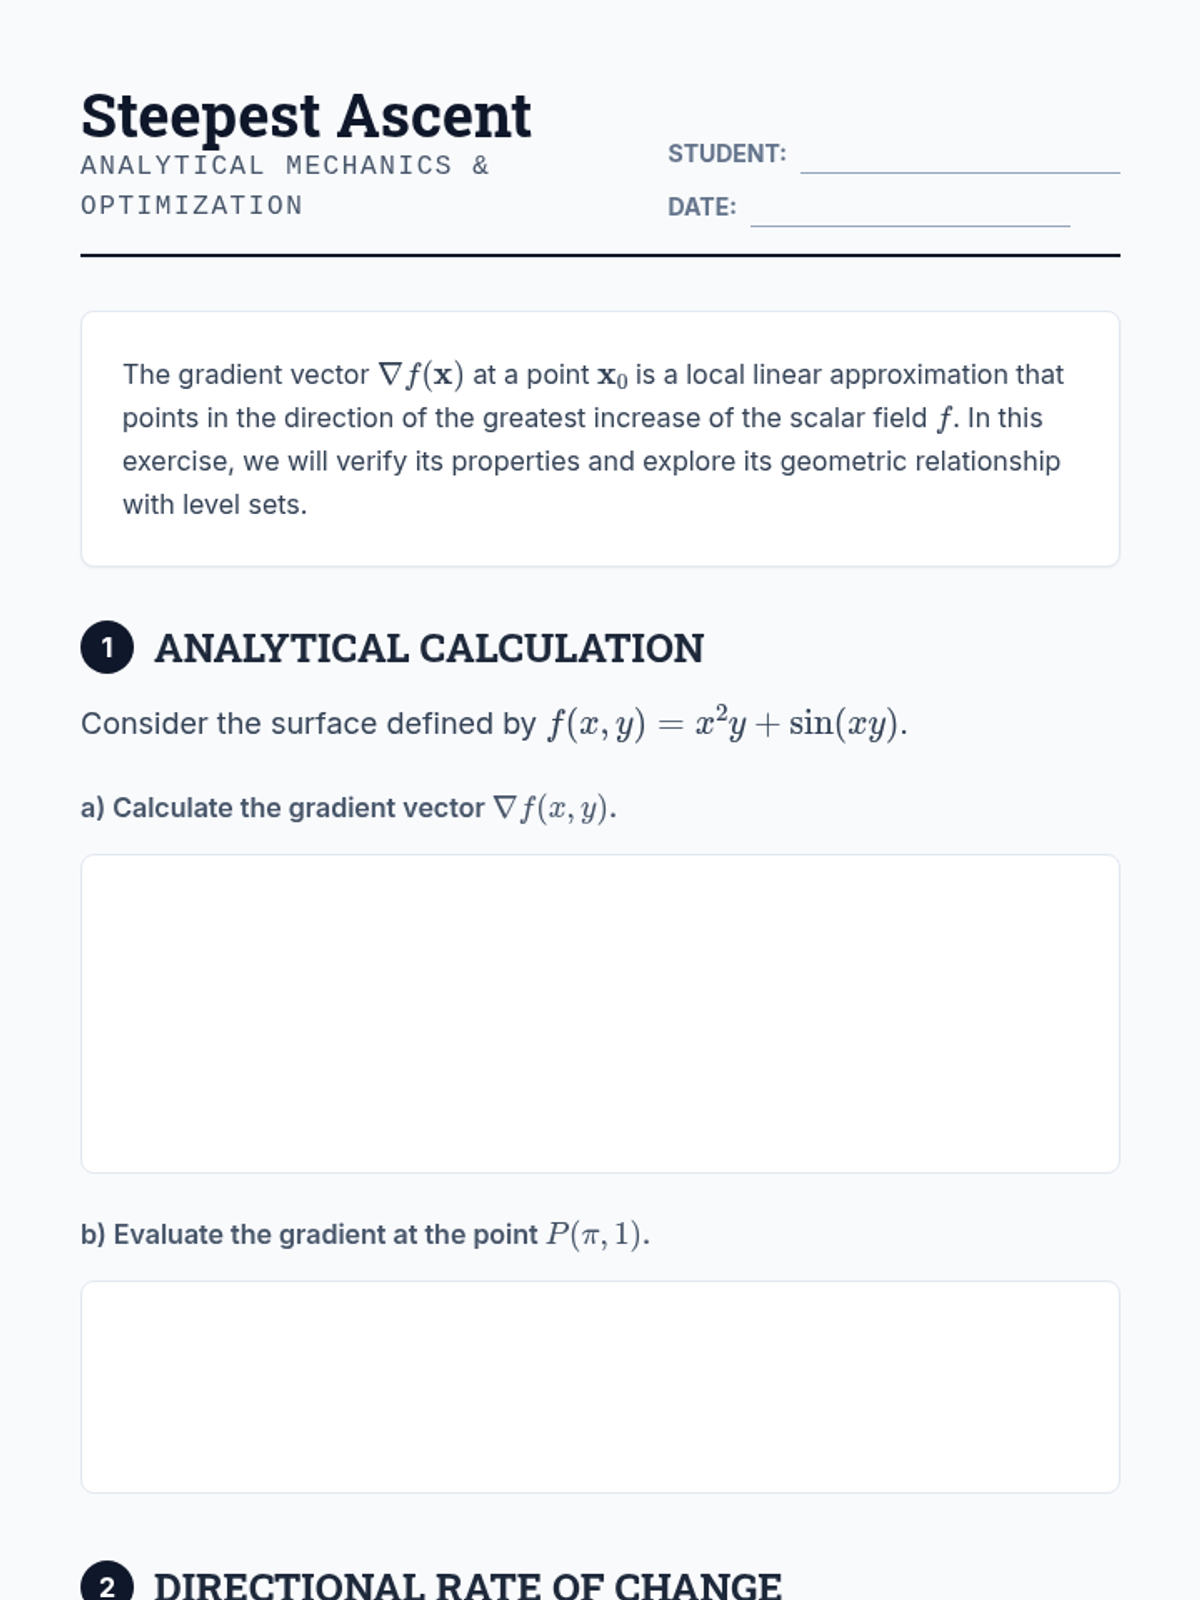
Students analyze the gradient vector as a directional quantity, establishing its geometric relationship with level sets and proving it indicates the steepest ascent.
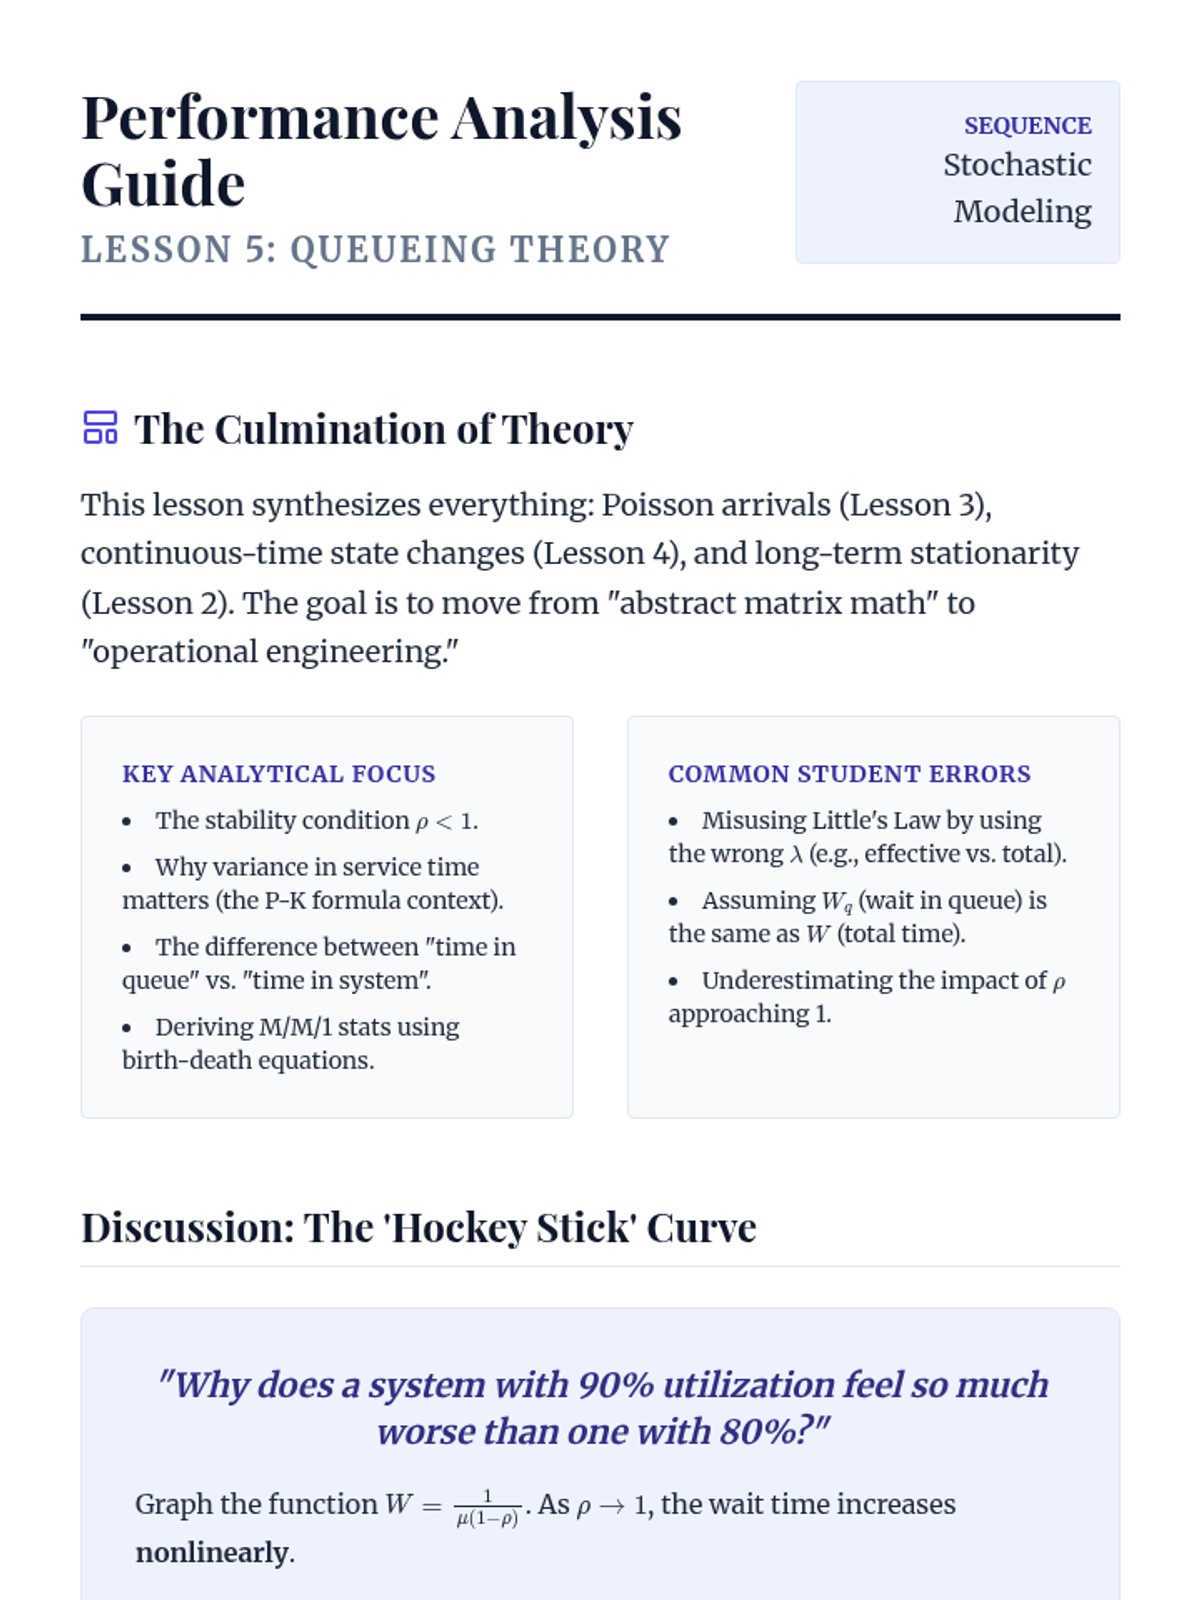
Application of stochastic modeling to queueing systems, using Little's Law and steady-state analysis to optimize performance in complex environments.
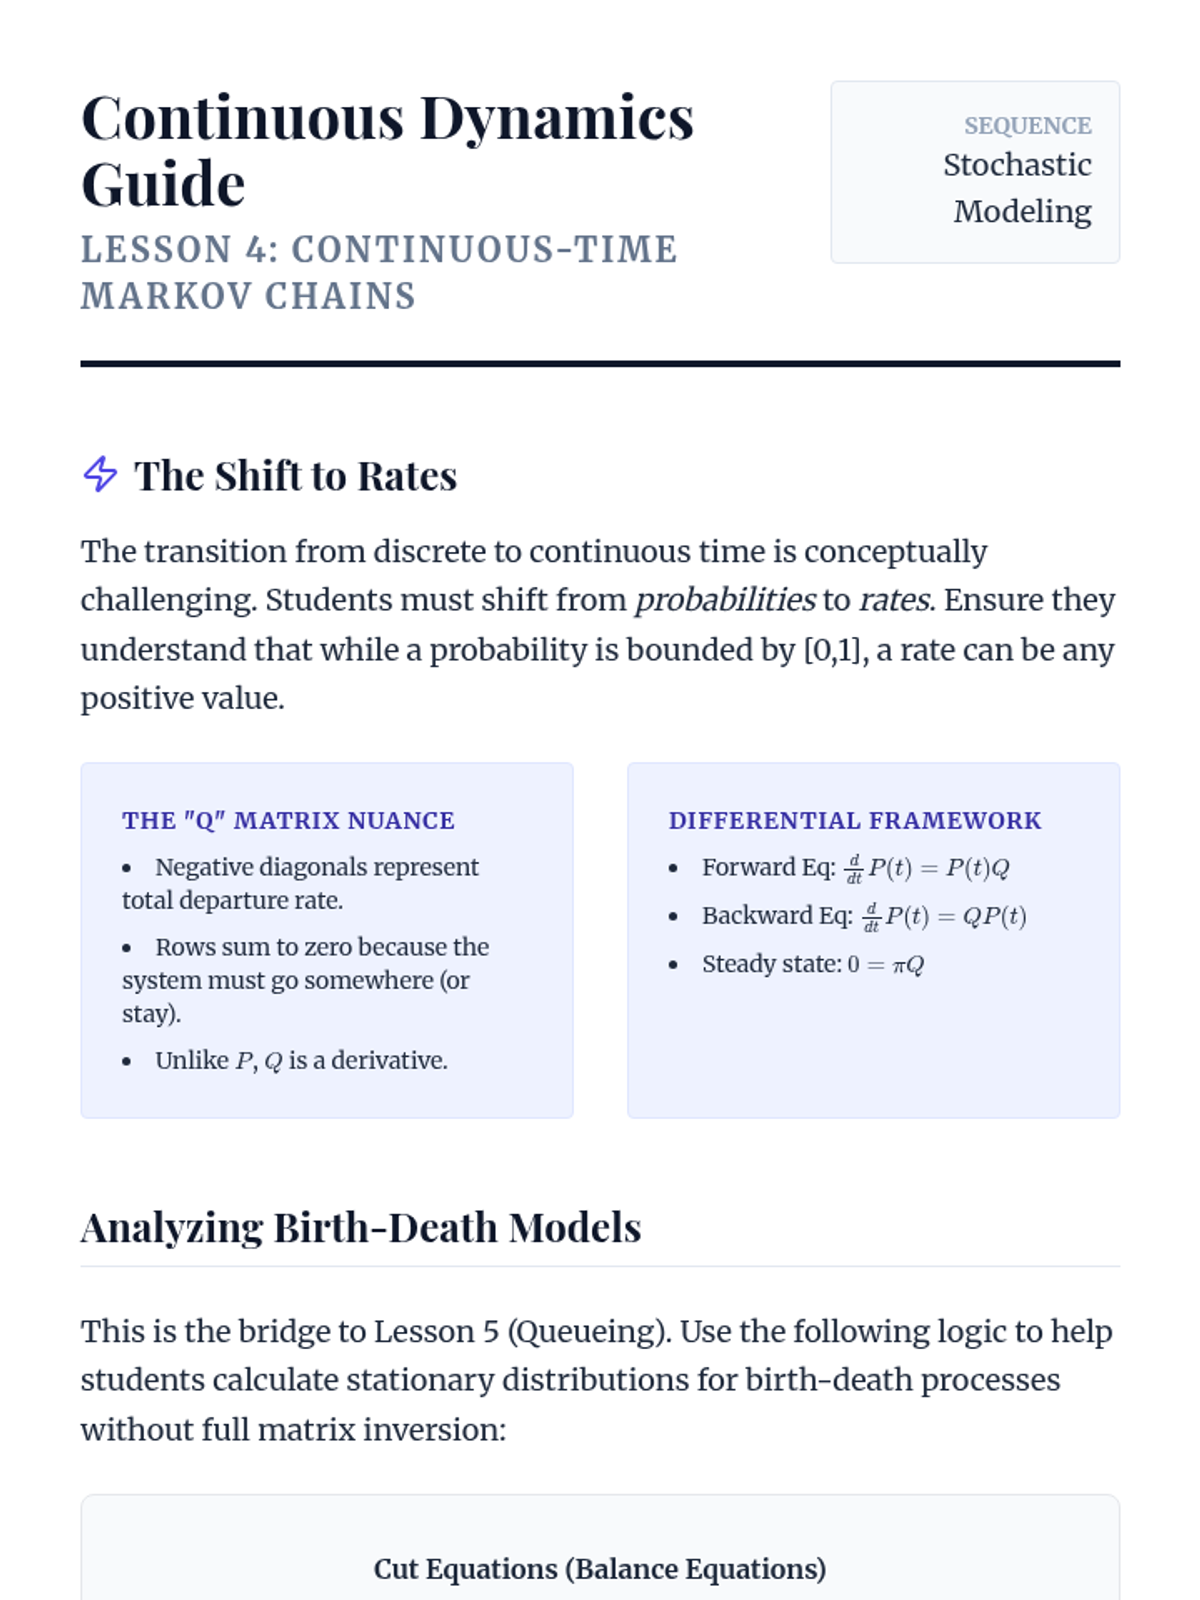
Transitioning to continuous-time Markov chains using generator matrices and solving Kolmogorov's differential equations for birth-death processes.
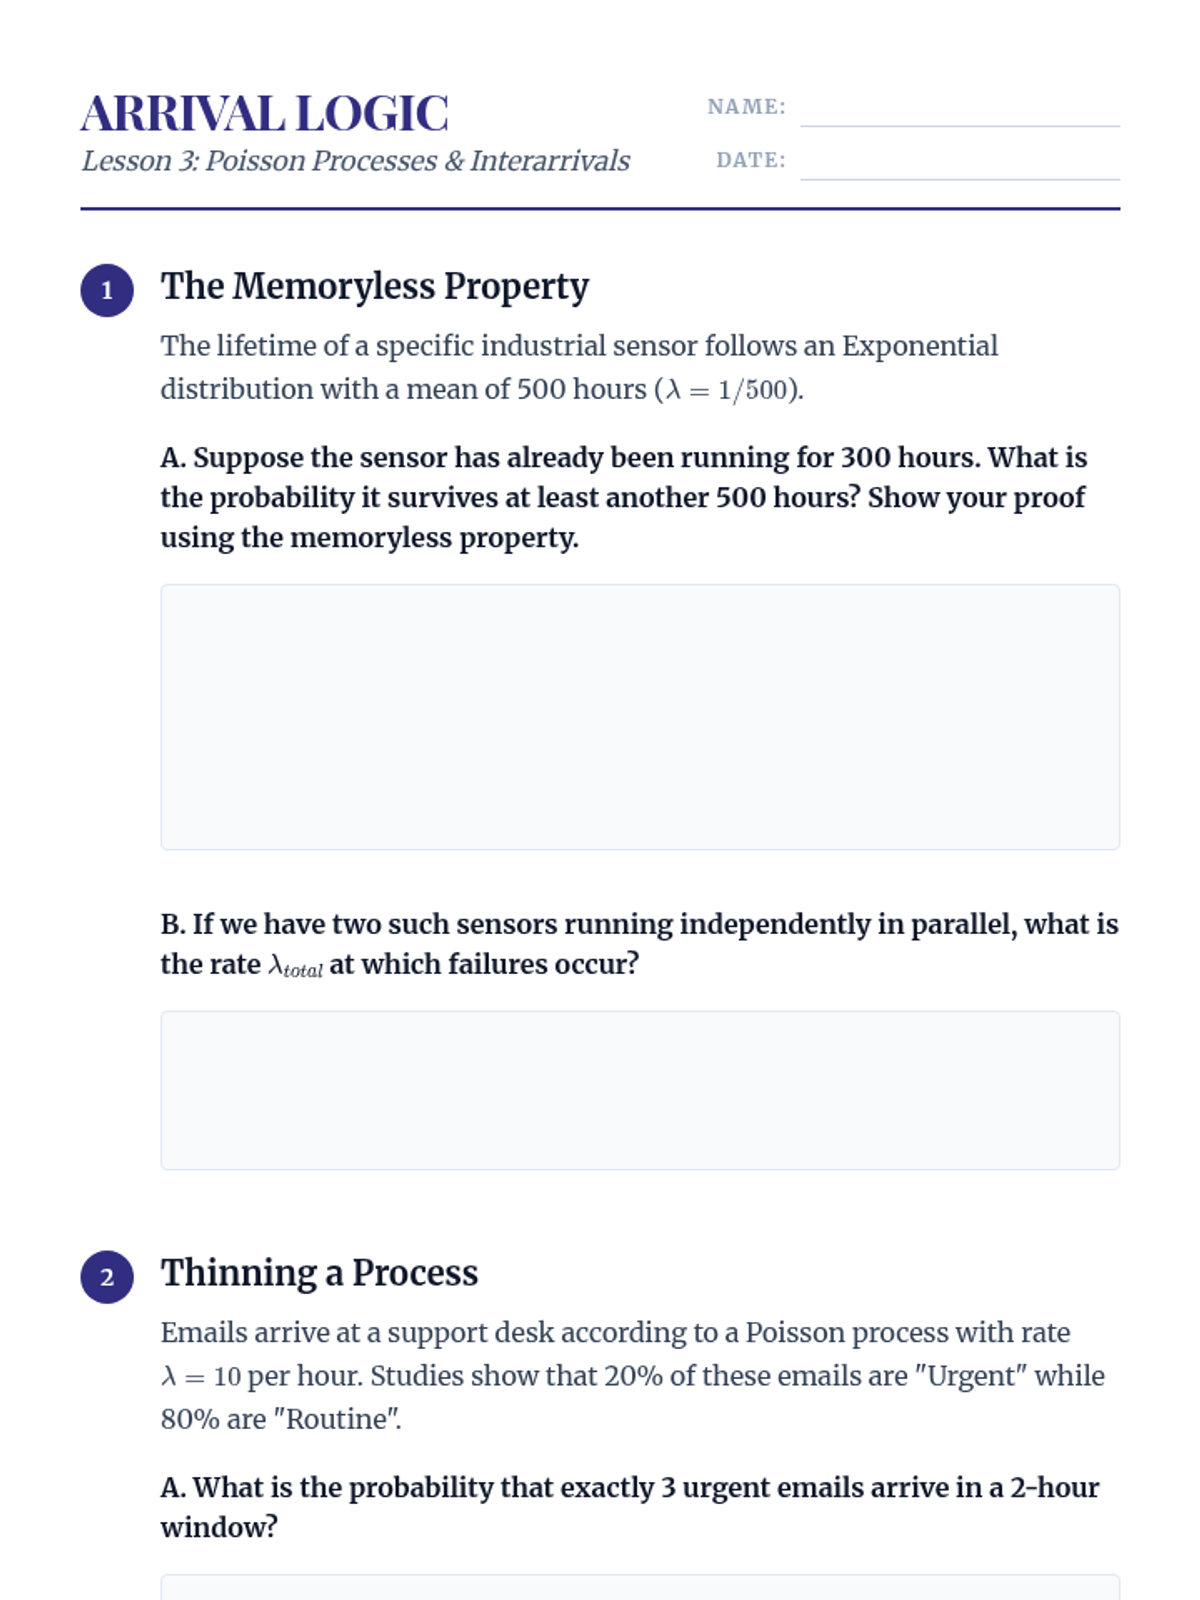
Investigation of the Poisson process, its relationship to the exponential distribution, and the implications of the memoryless property in continuous-time modeling.
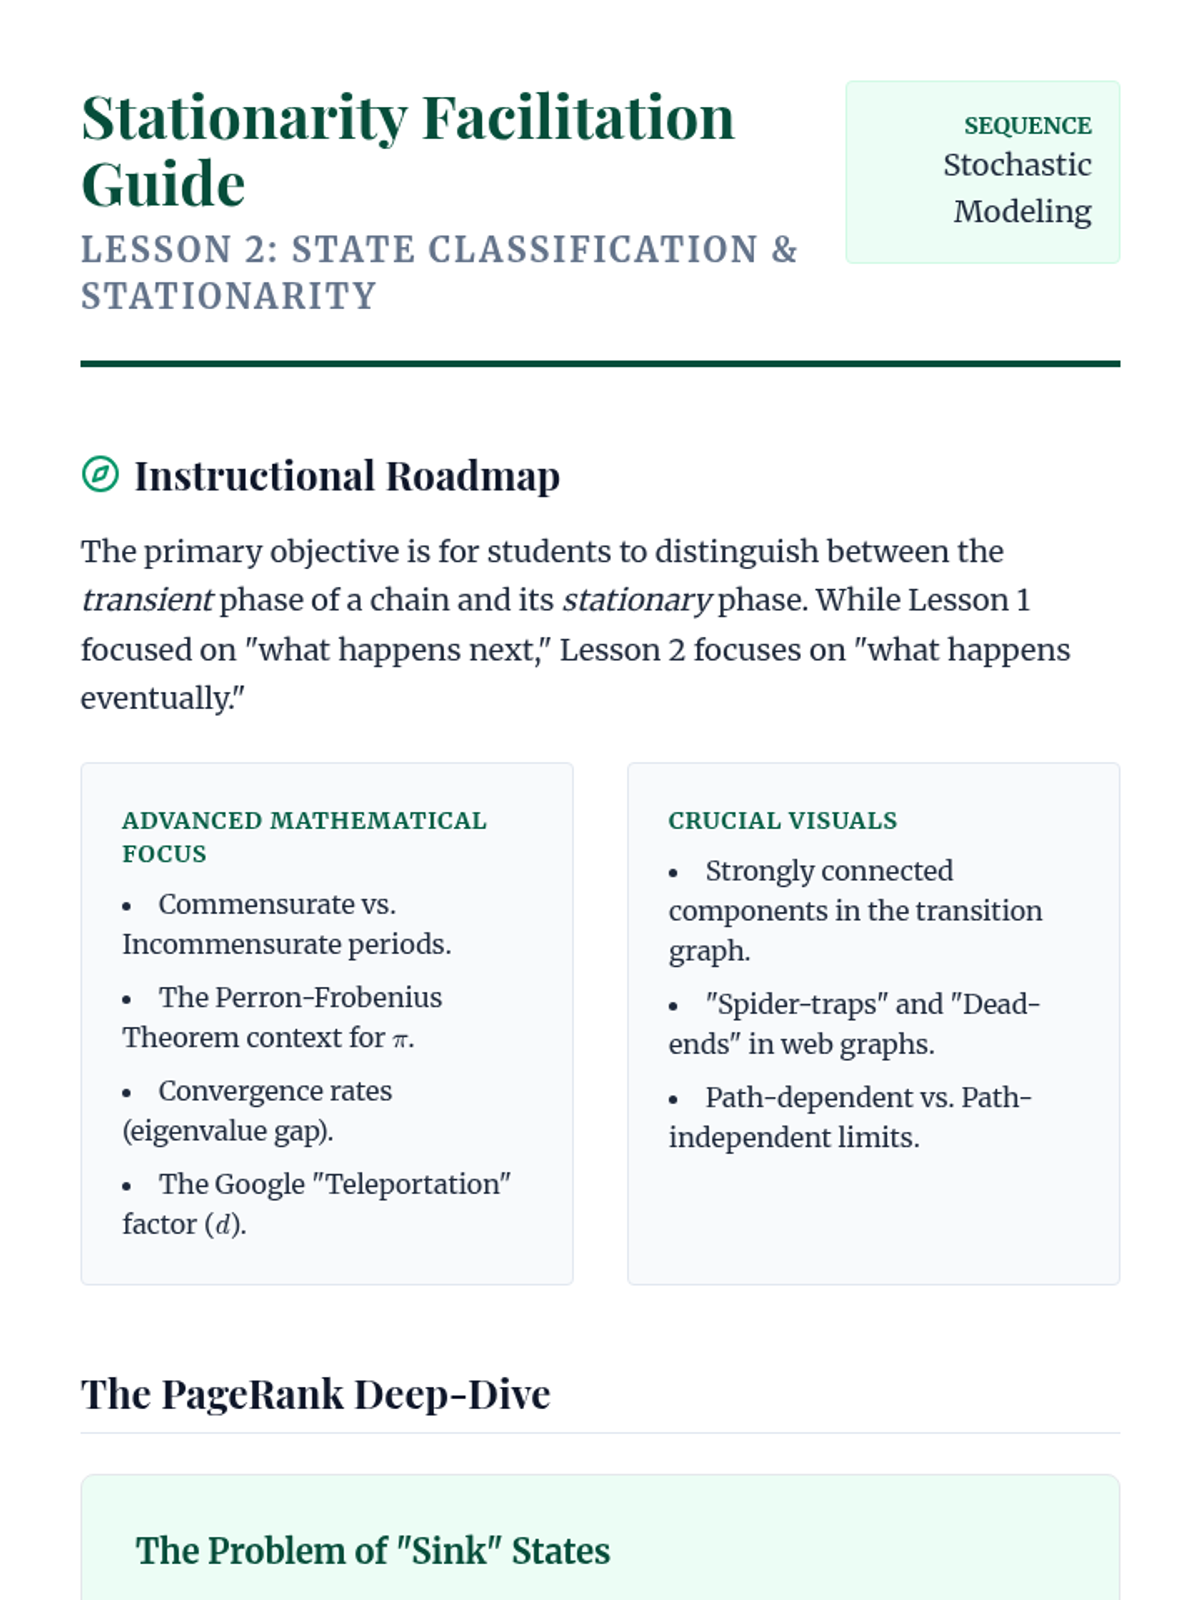
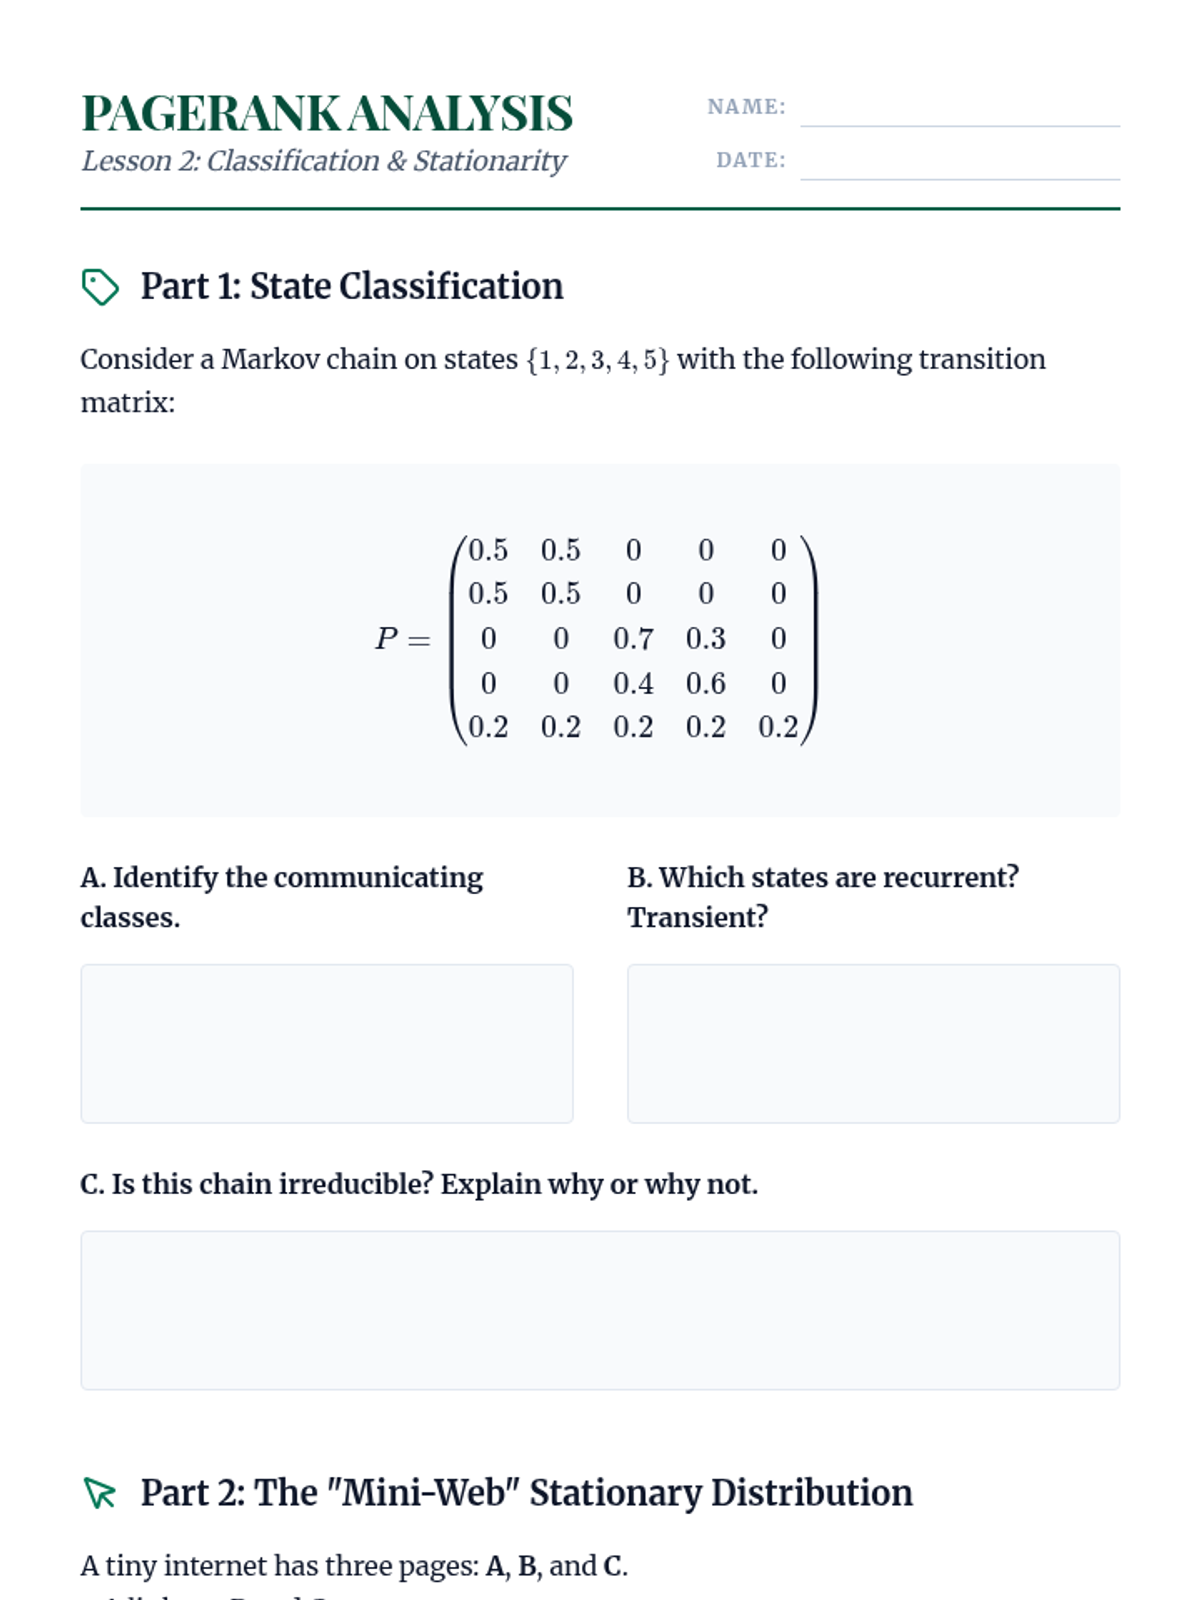
Analysis of the long-term behavior of Markov chains, focusing on state classification (recurrence, transience) and the computation of stationary distributions.
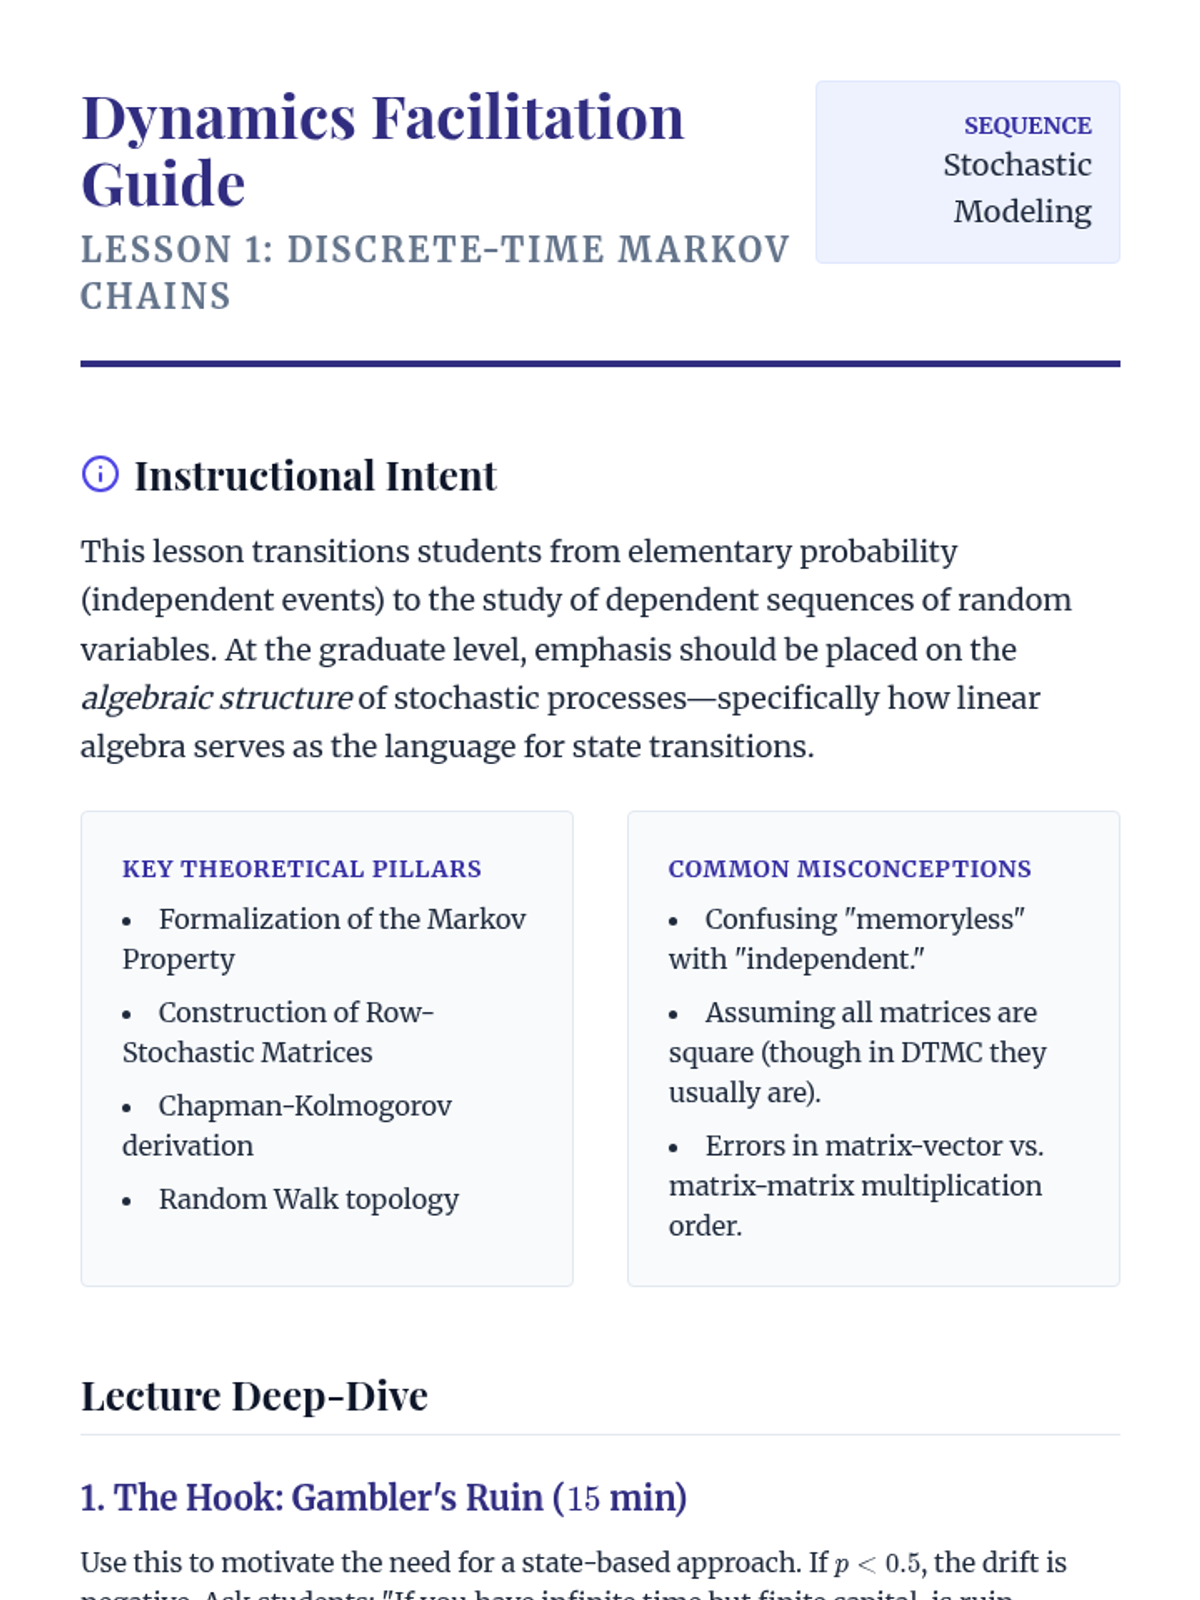
Foundational concepts of Markov processes, the Markov property, and the mathematical framework of transition matrices and Chapman-Kolmogorov equations.
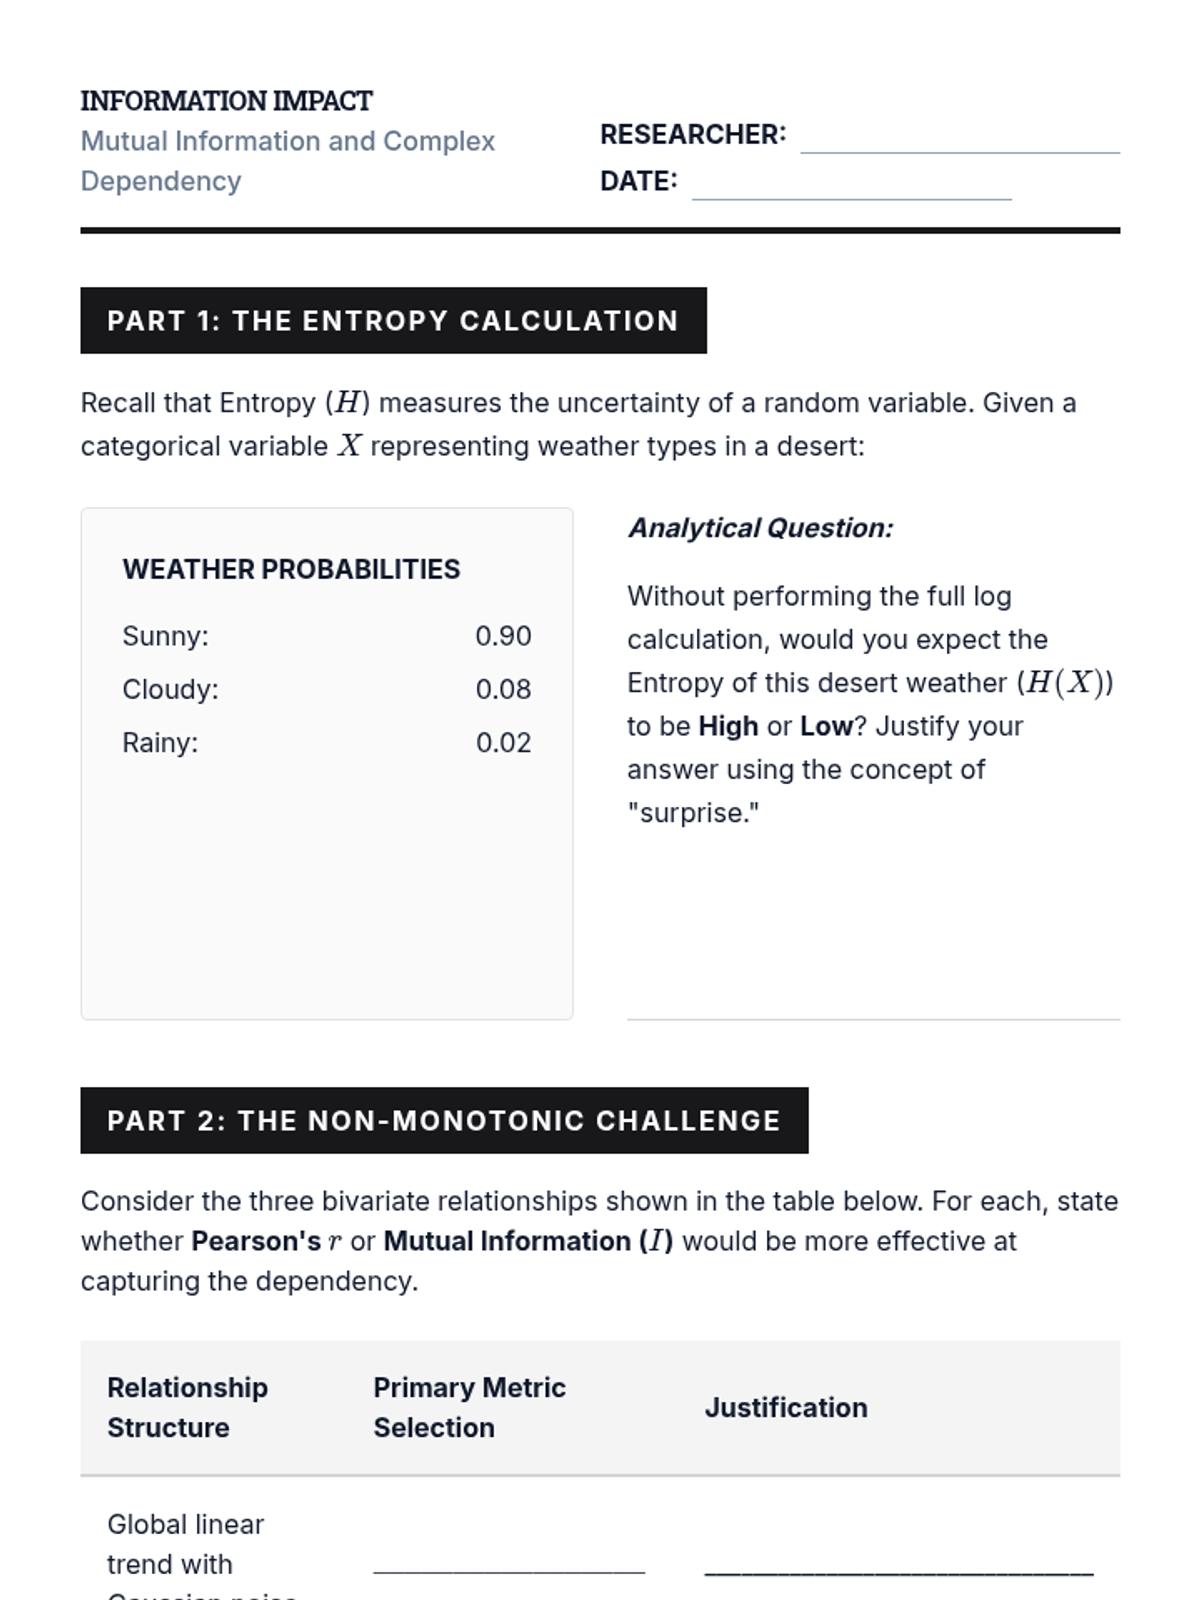
The sequence concludes with Information Theory metrics, using Mutual Information to detect non-monotonic, complex associations that correlation coefficients miss.
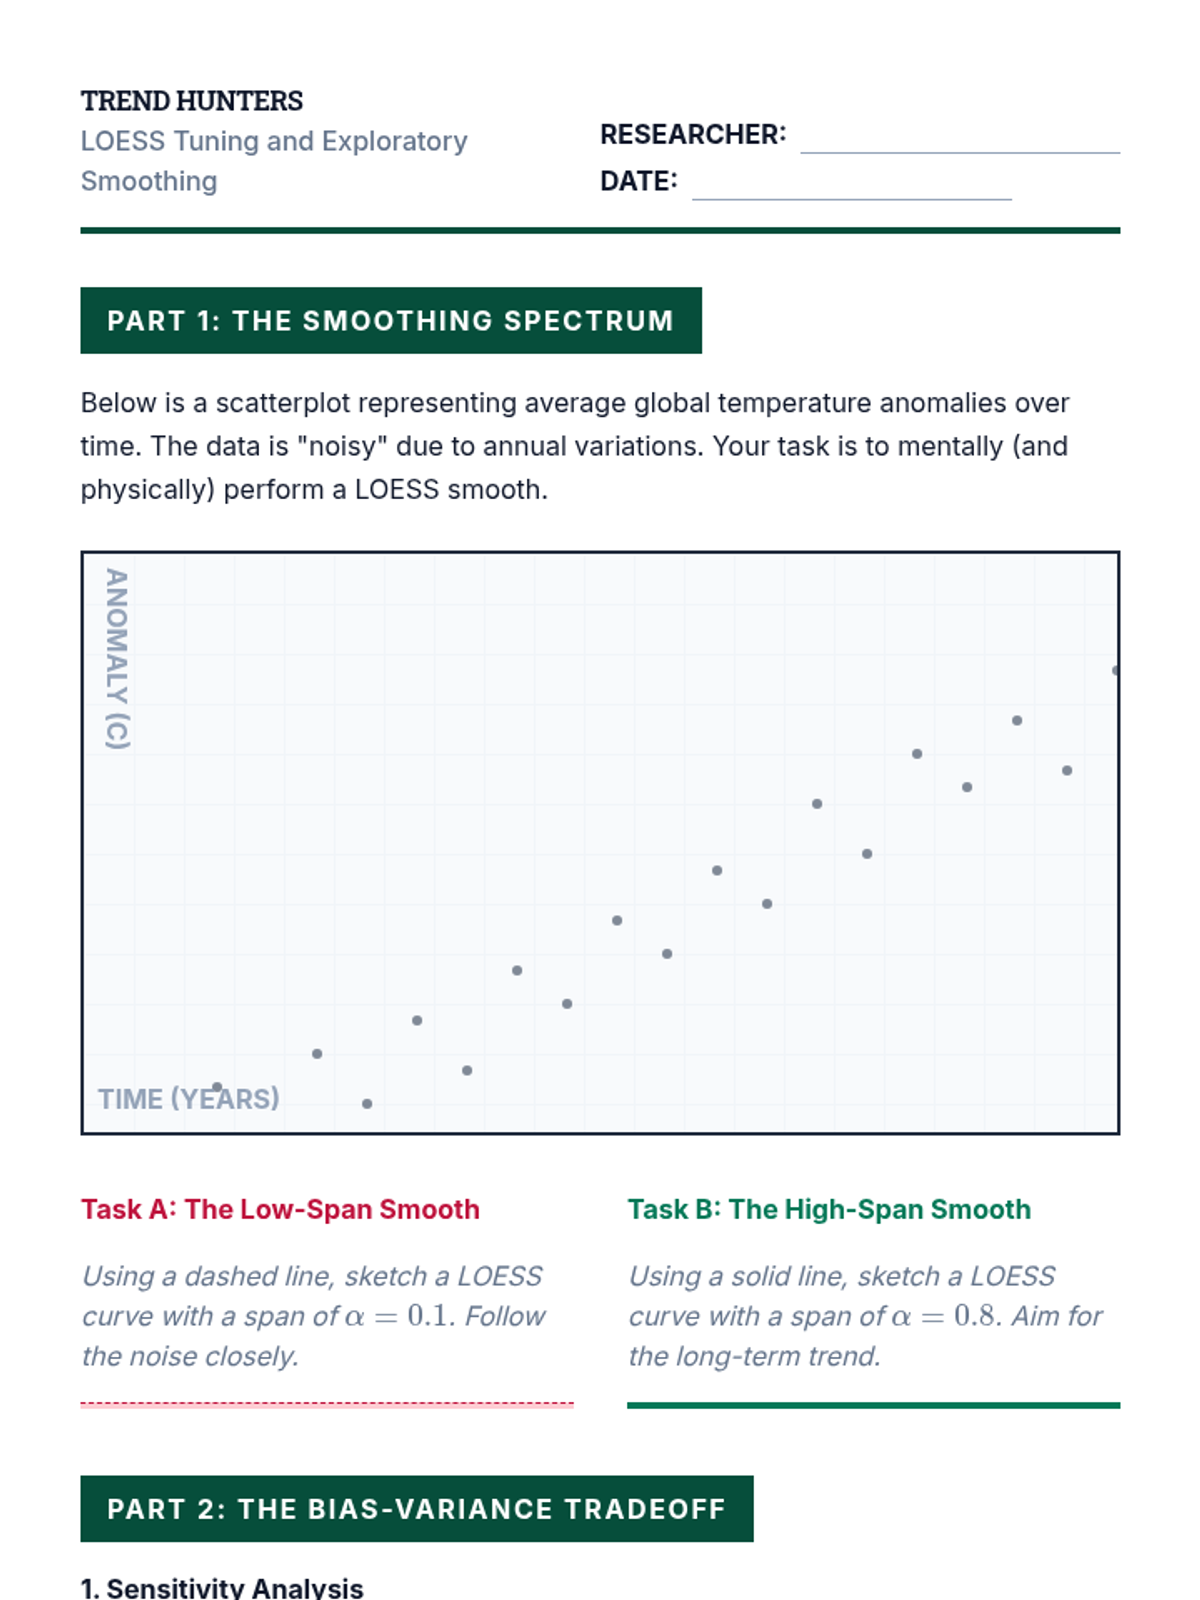
This lesson focuses on locally weighted scatterplot smoothing (LOESS) to visualize trends without pre-defined parametric functions, exploring bandwidth selection and smoothing.
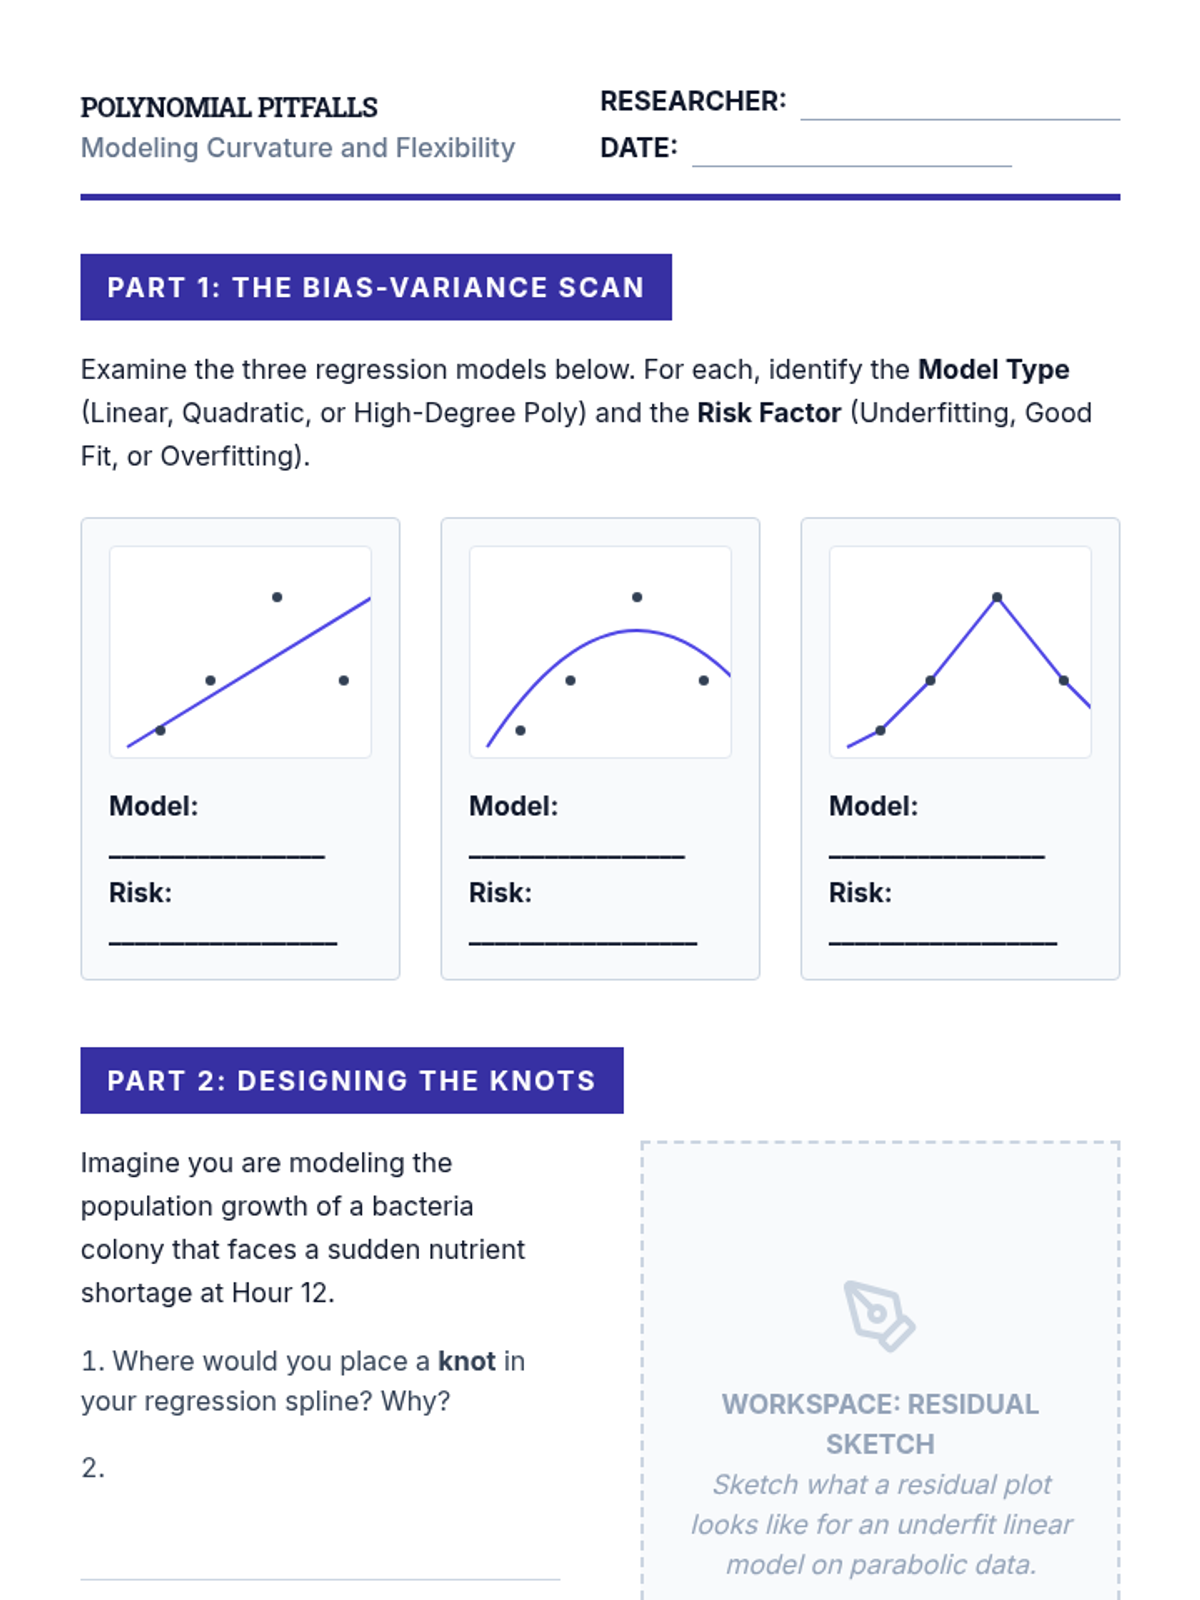
Students explore modeling curvature using polynomial terms and splines, while addressing the bias-variance tradeoff and the risks of overfitting.
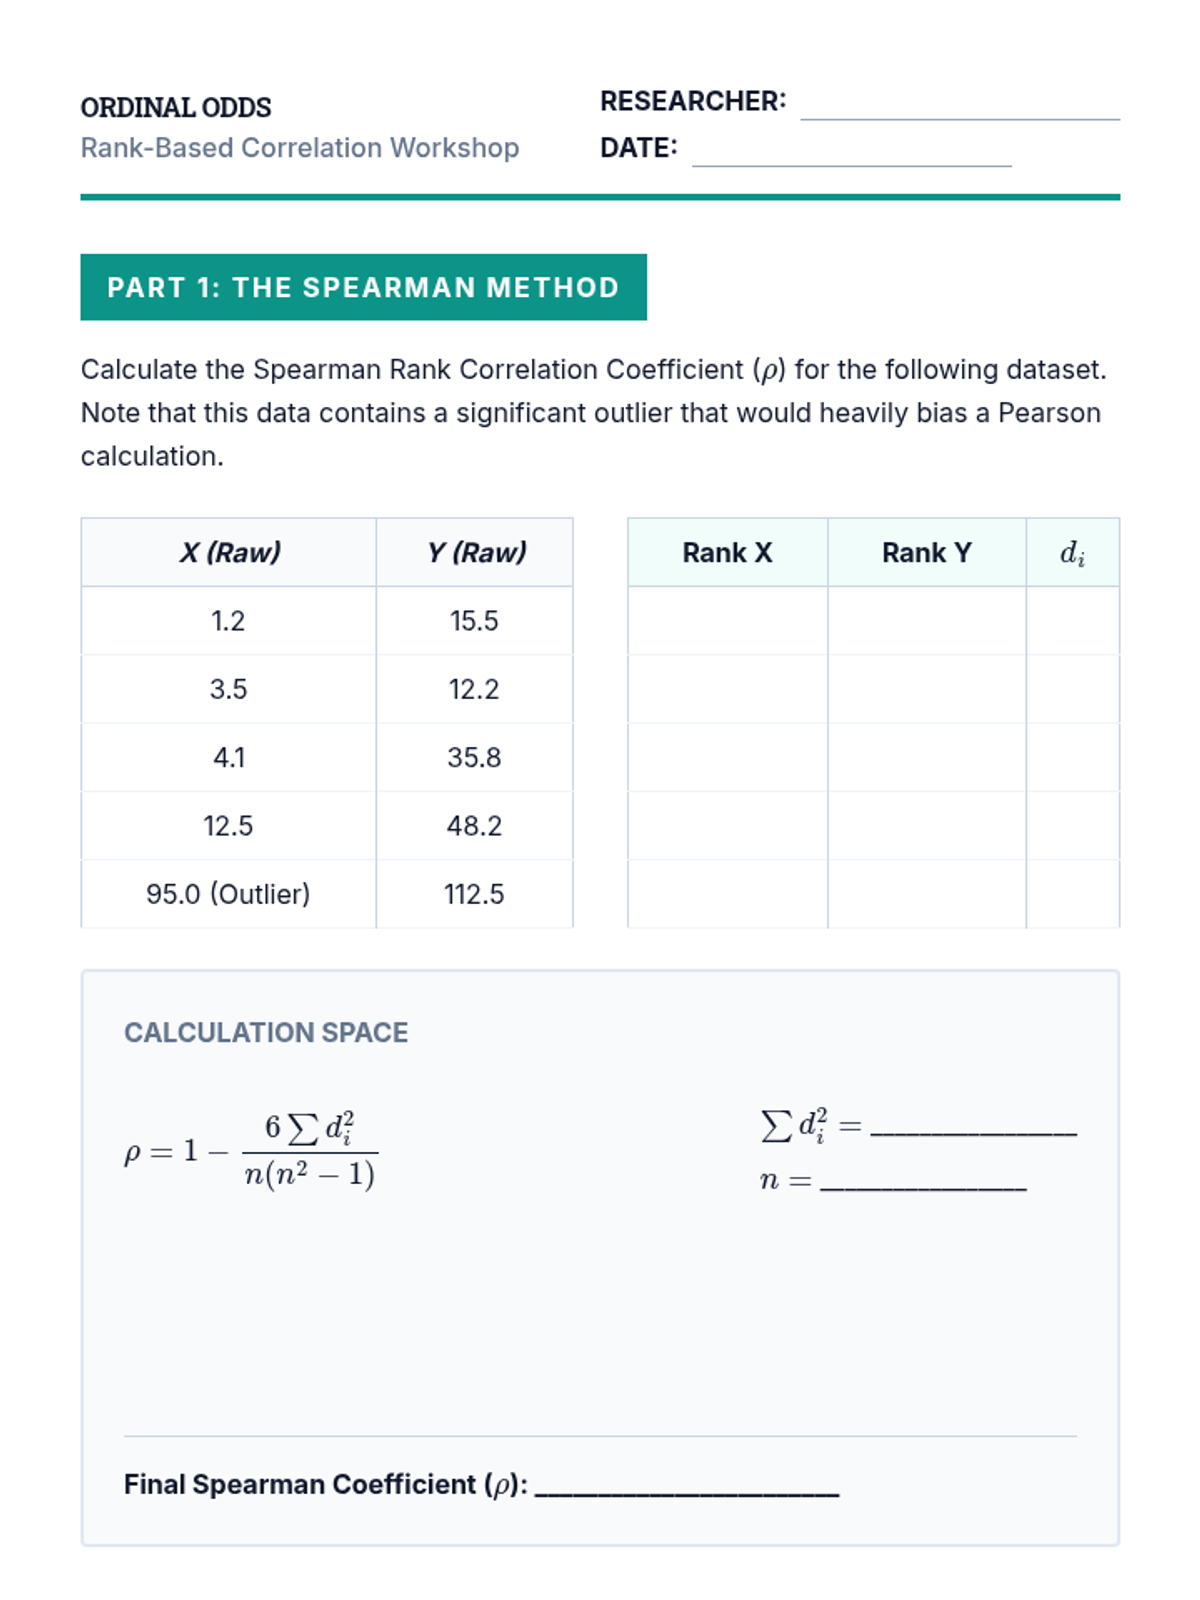
This lesson introduces Spearman’s rho and Kendall’s tau for assessing monotonic relationships in ordinal and non-normal continuous data.
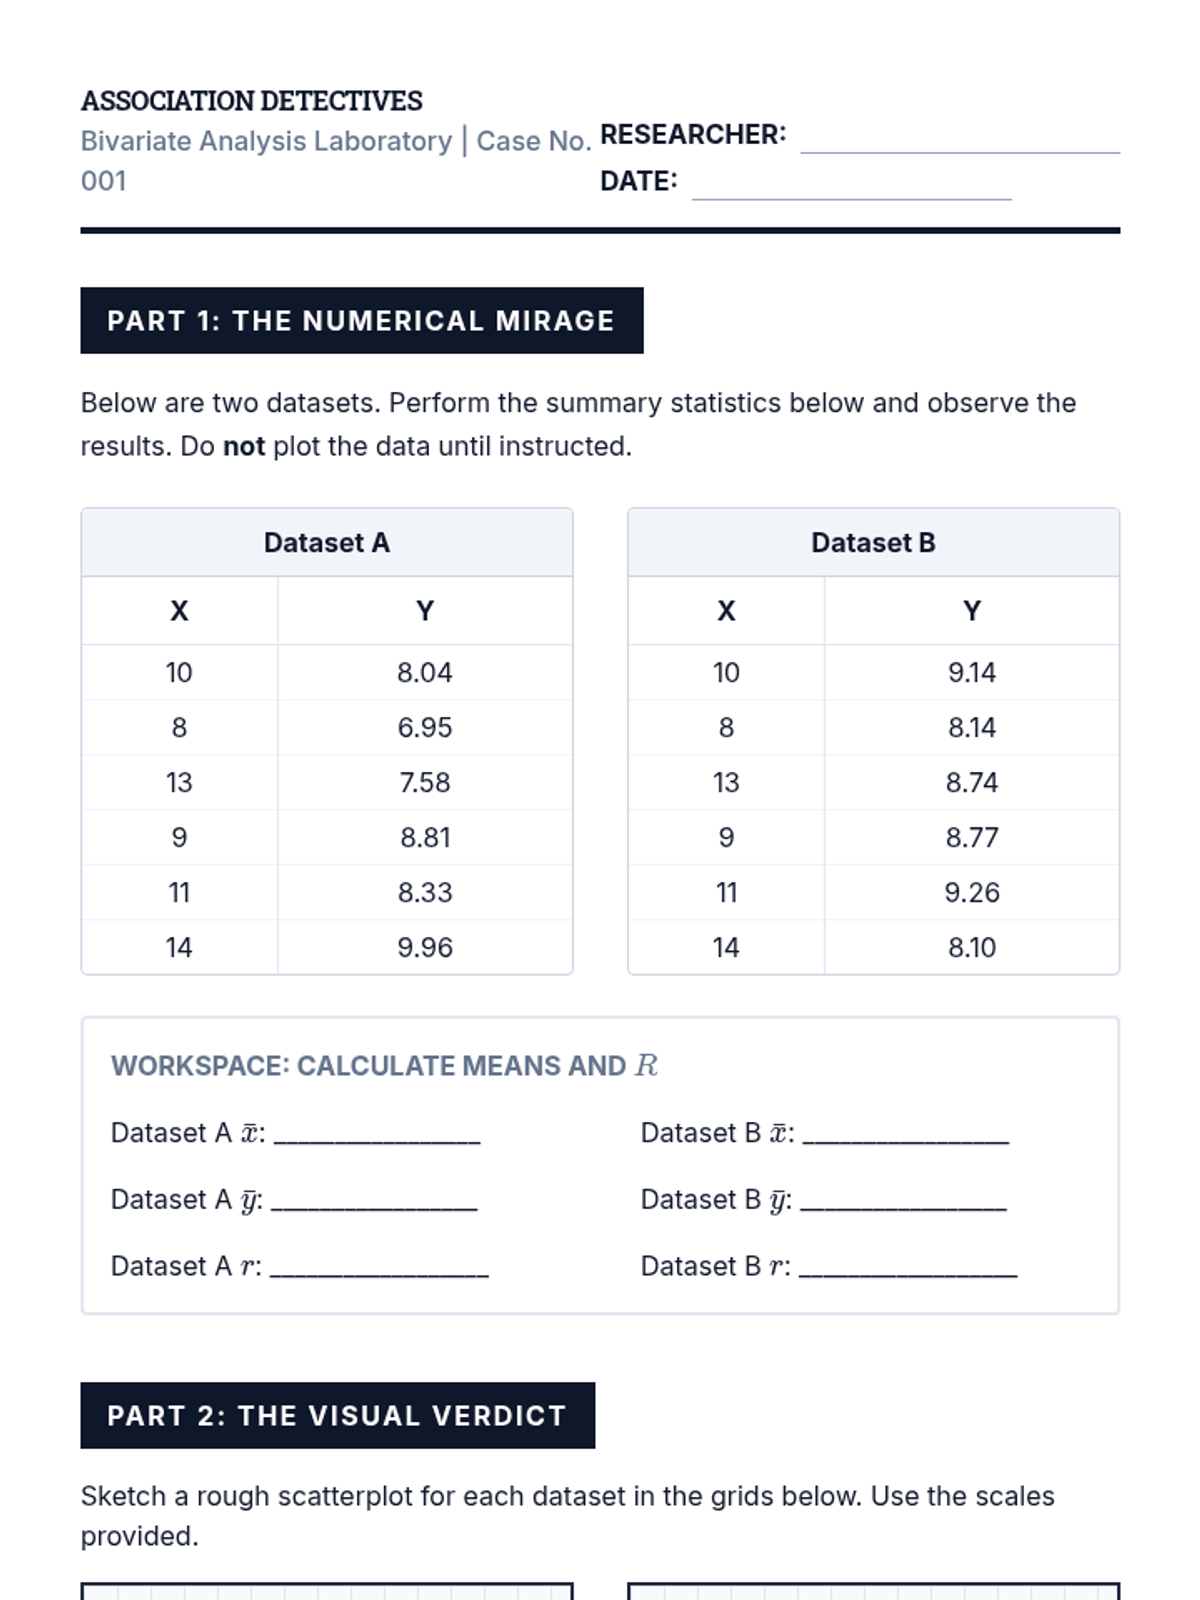
Students analyze Anscombe's Quartet and other pathological datasets to demonstrate where Pearson’s r fails, focusing on the distinction between linearity and general association.
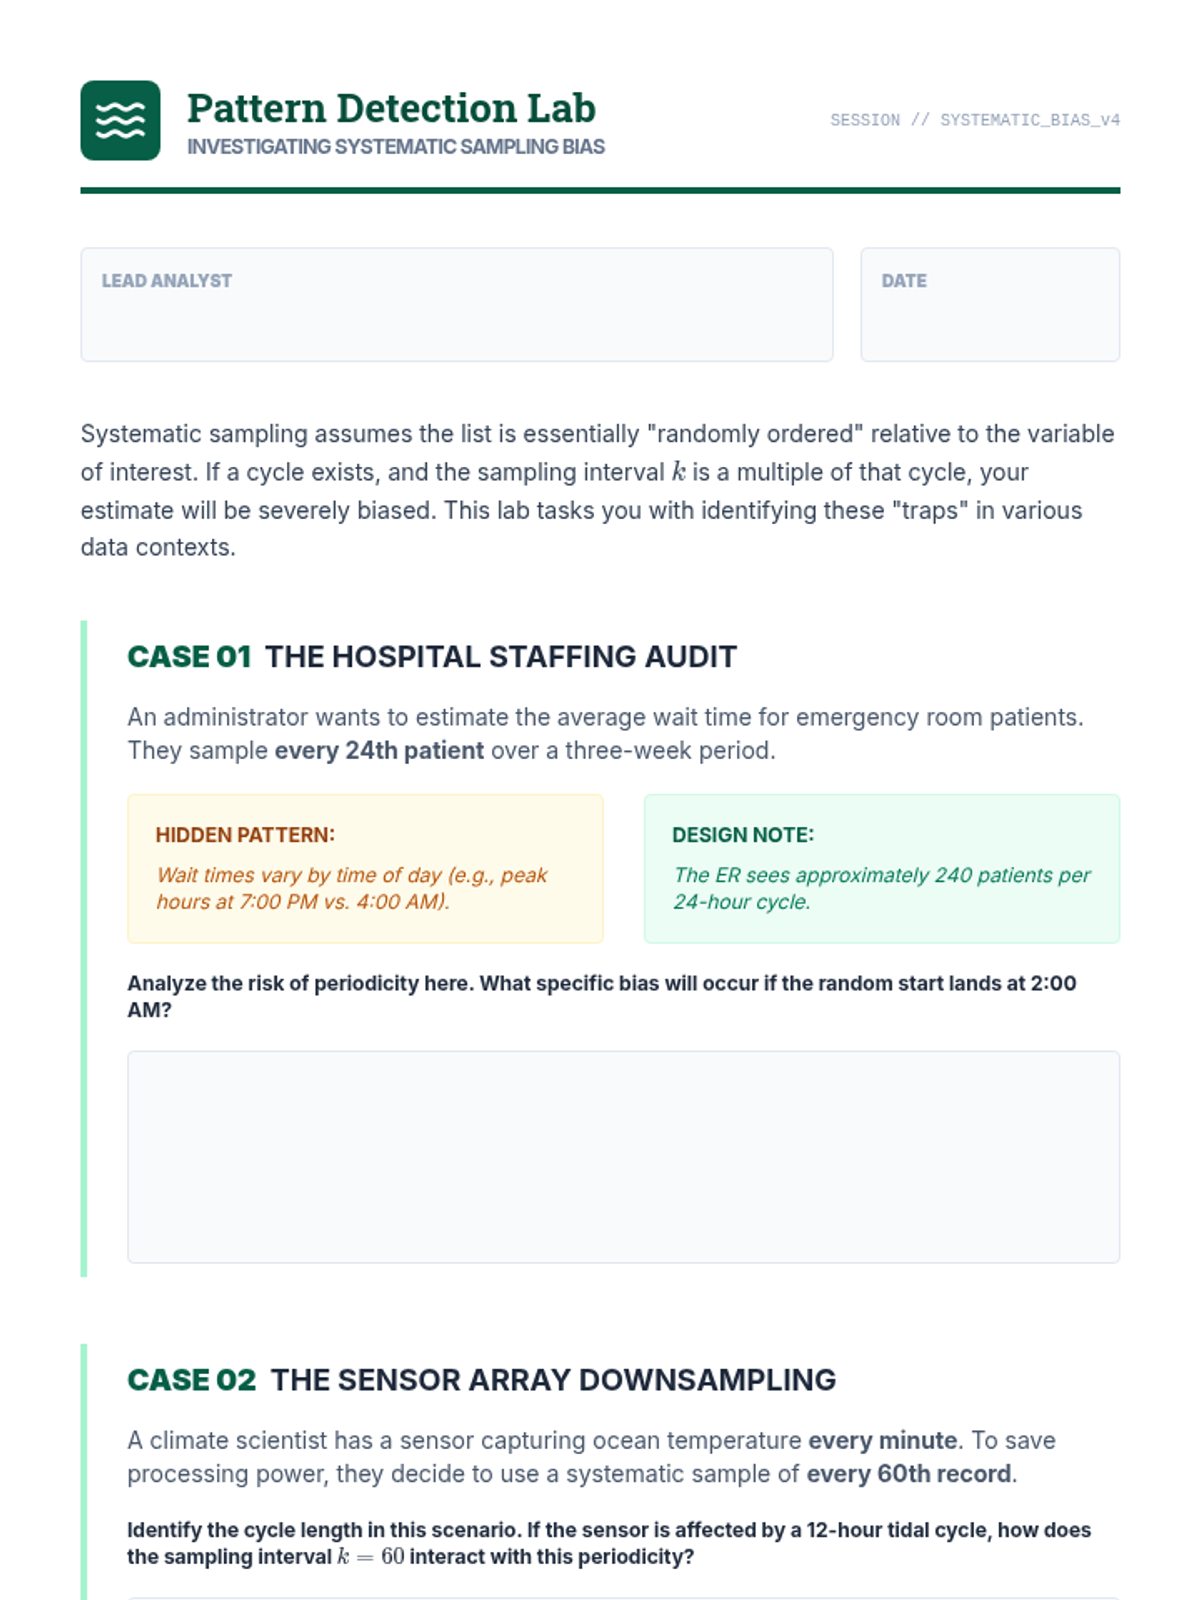
Examination of systematic sampling as a logistical proxy for random sampling. The lesson focuses on identifying periodicity and cyclical patterns in datasets that can lead to significant sampling bias.
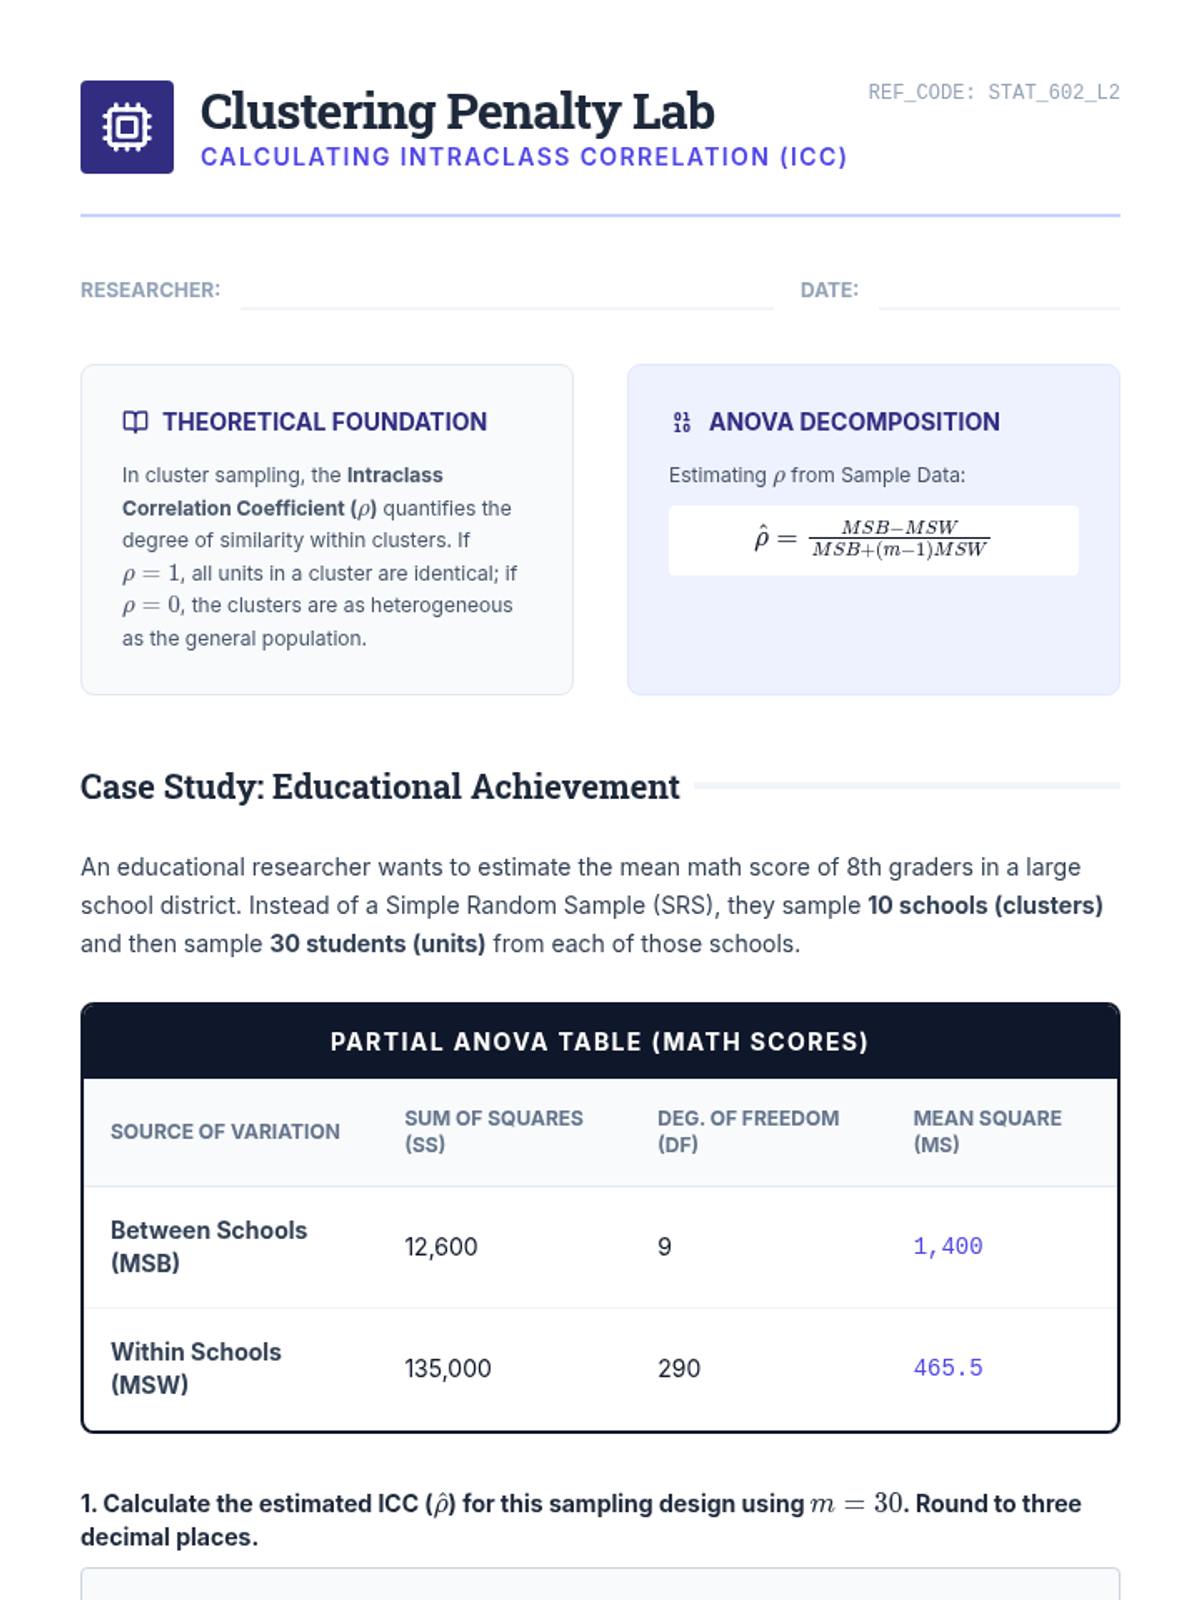
Introduction to cluster sampling and the Intraclass Correlation Coefficient (ICC). Students analyze how within-cluster homogeneity inflates standard errors and learn to quantify the 'clustering penalty' in research design.
A technical session focusing on calculating sample sizes for basic tests of means and proportions. Students will learn to estimate population parameters and use software tools for sample size determination.
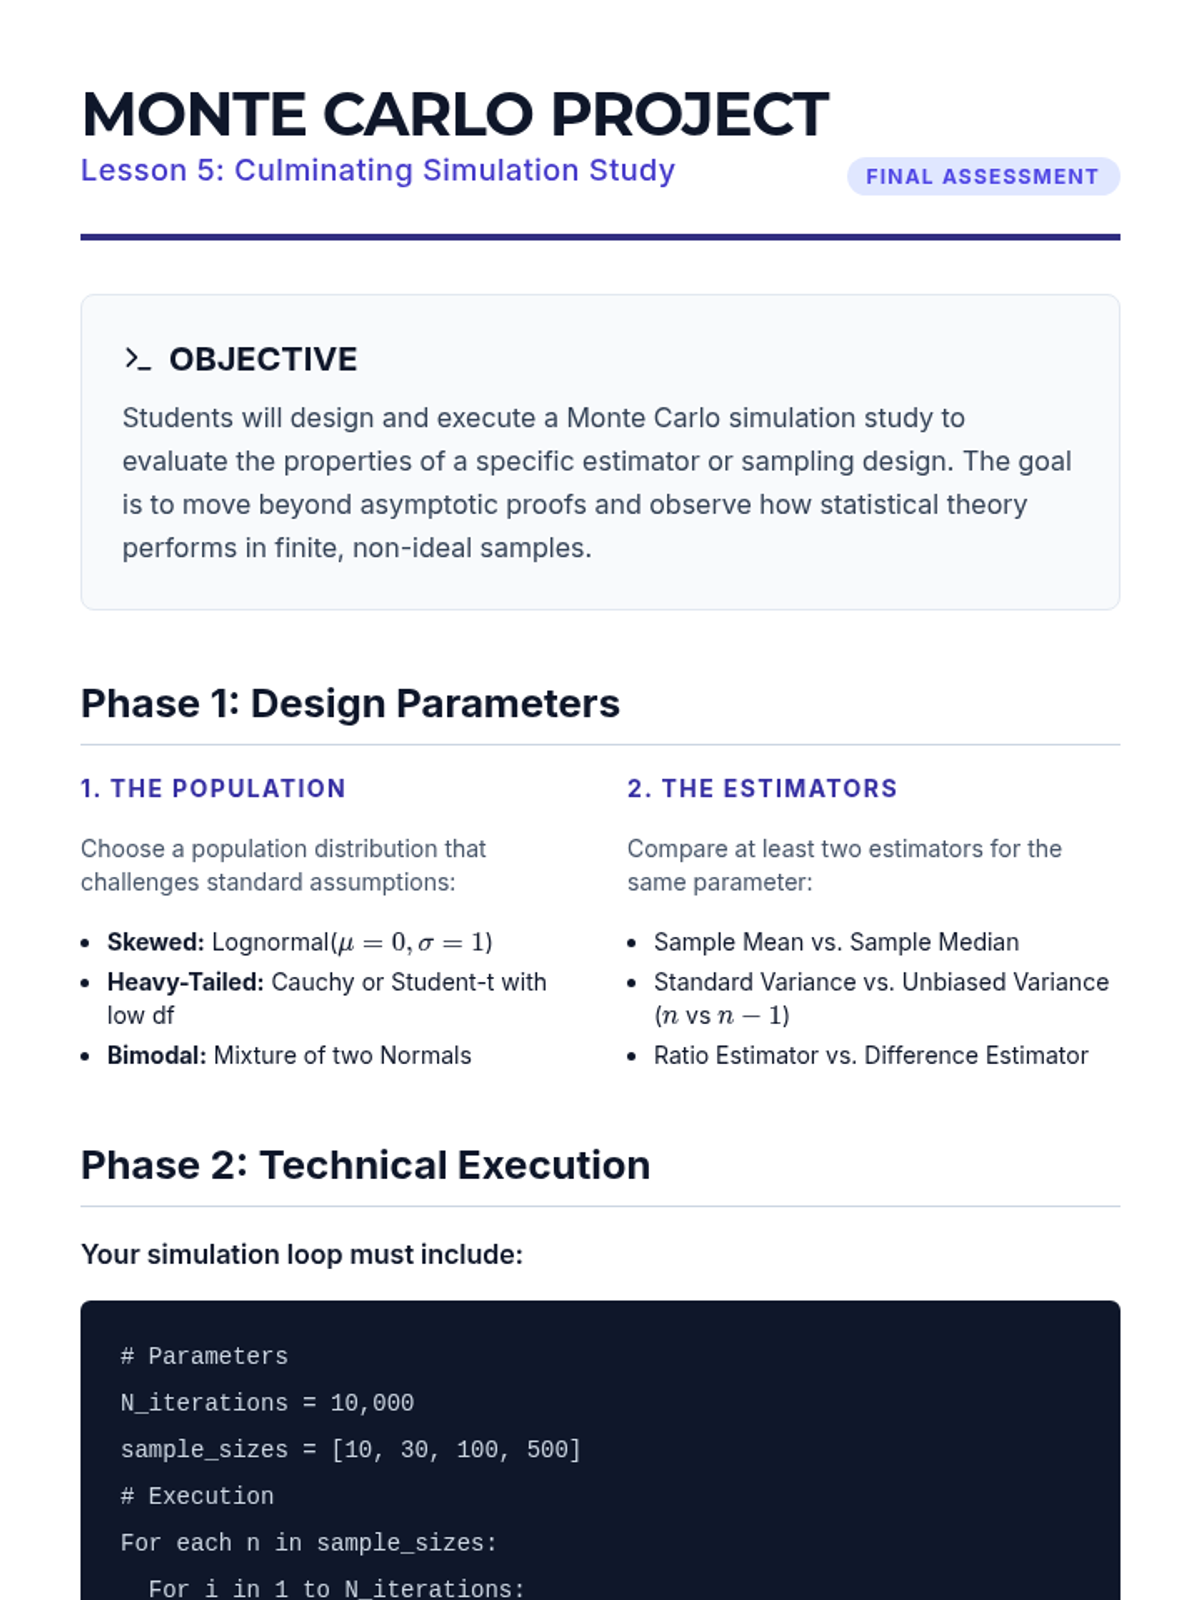
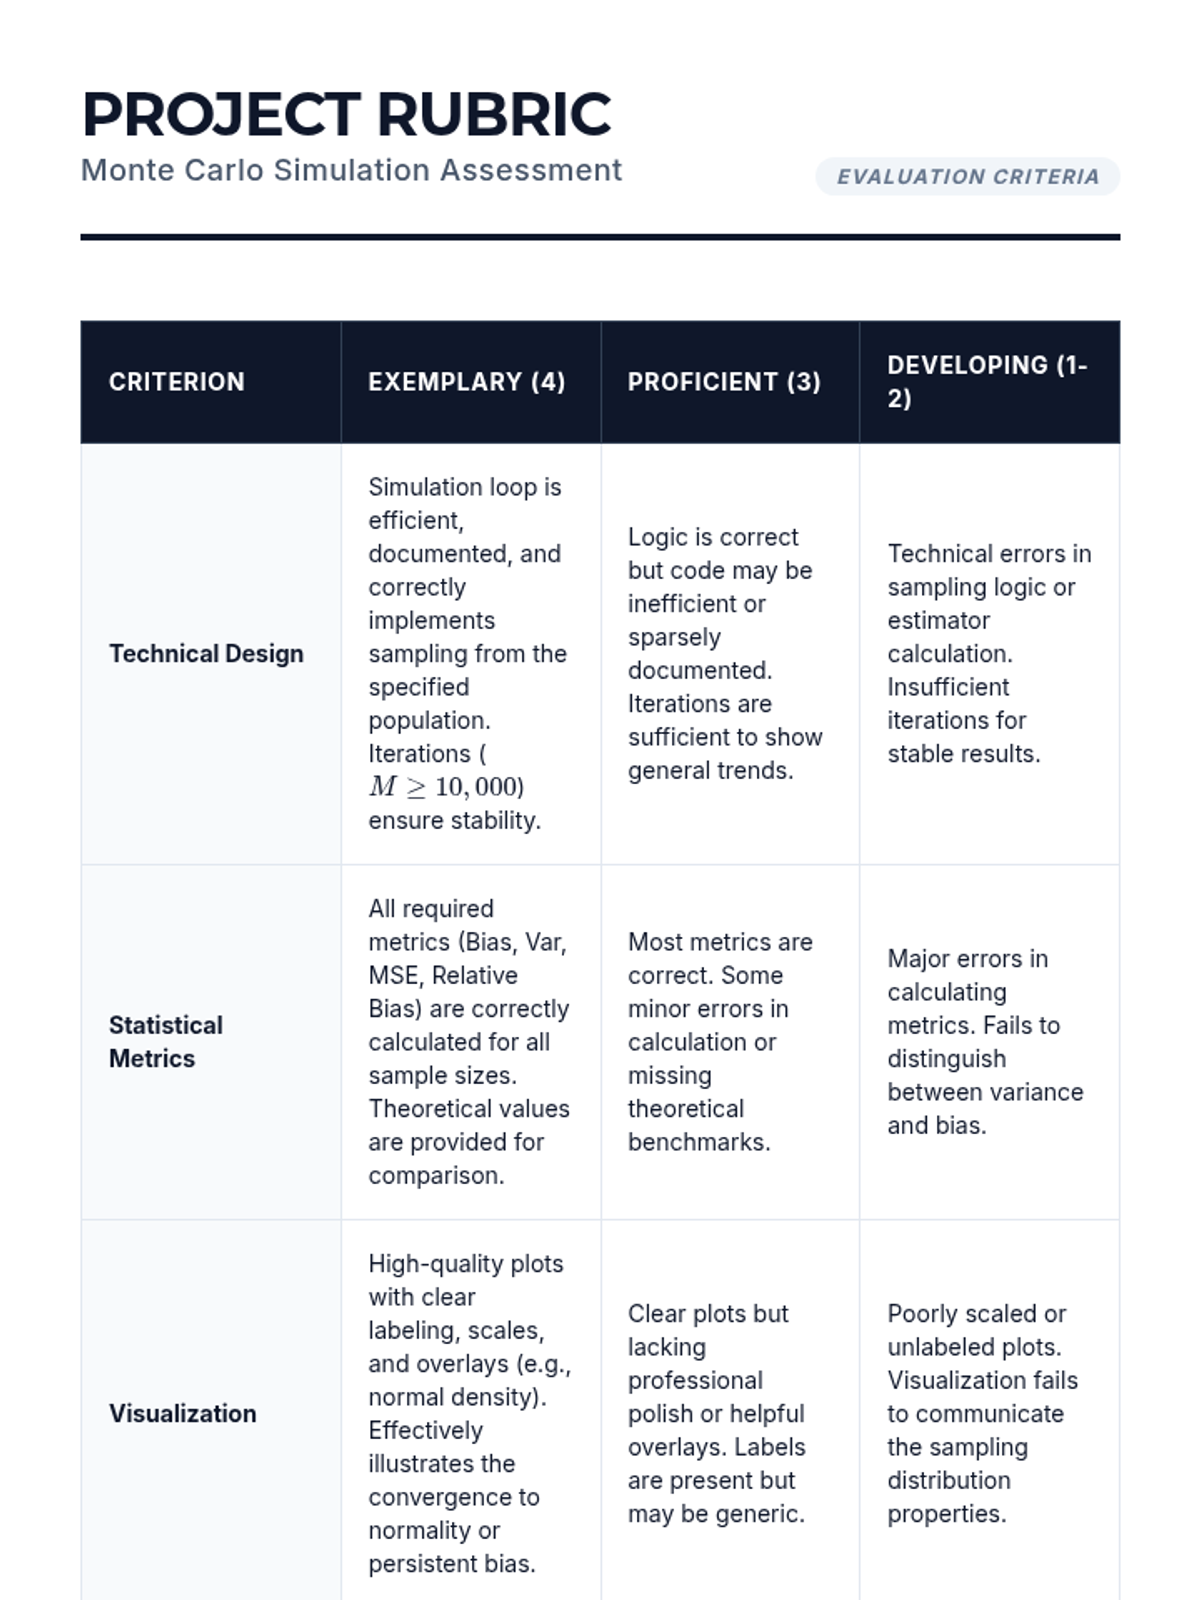
Design and implement a Monte Carlo simulation study to test estimator robustness under finite sample constraints and non-normal population distributions.
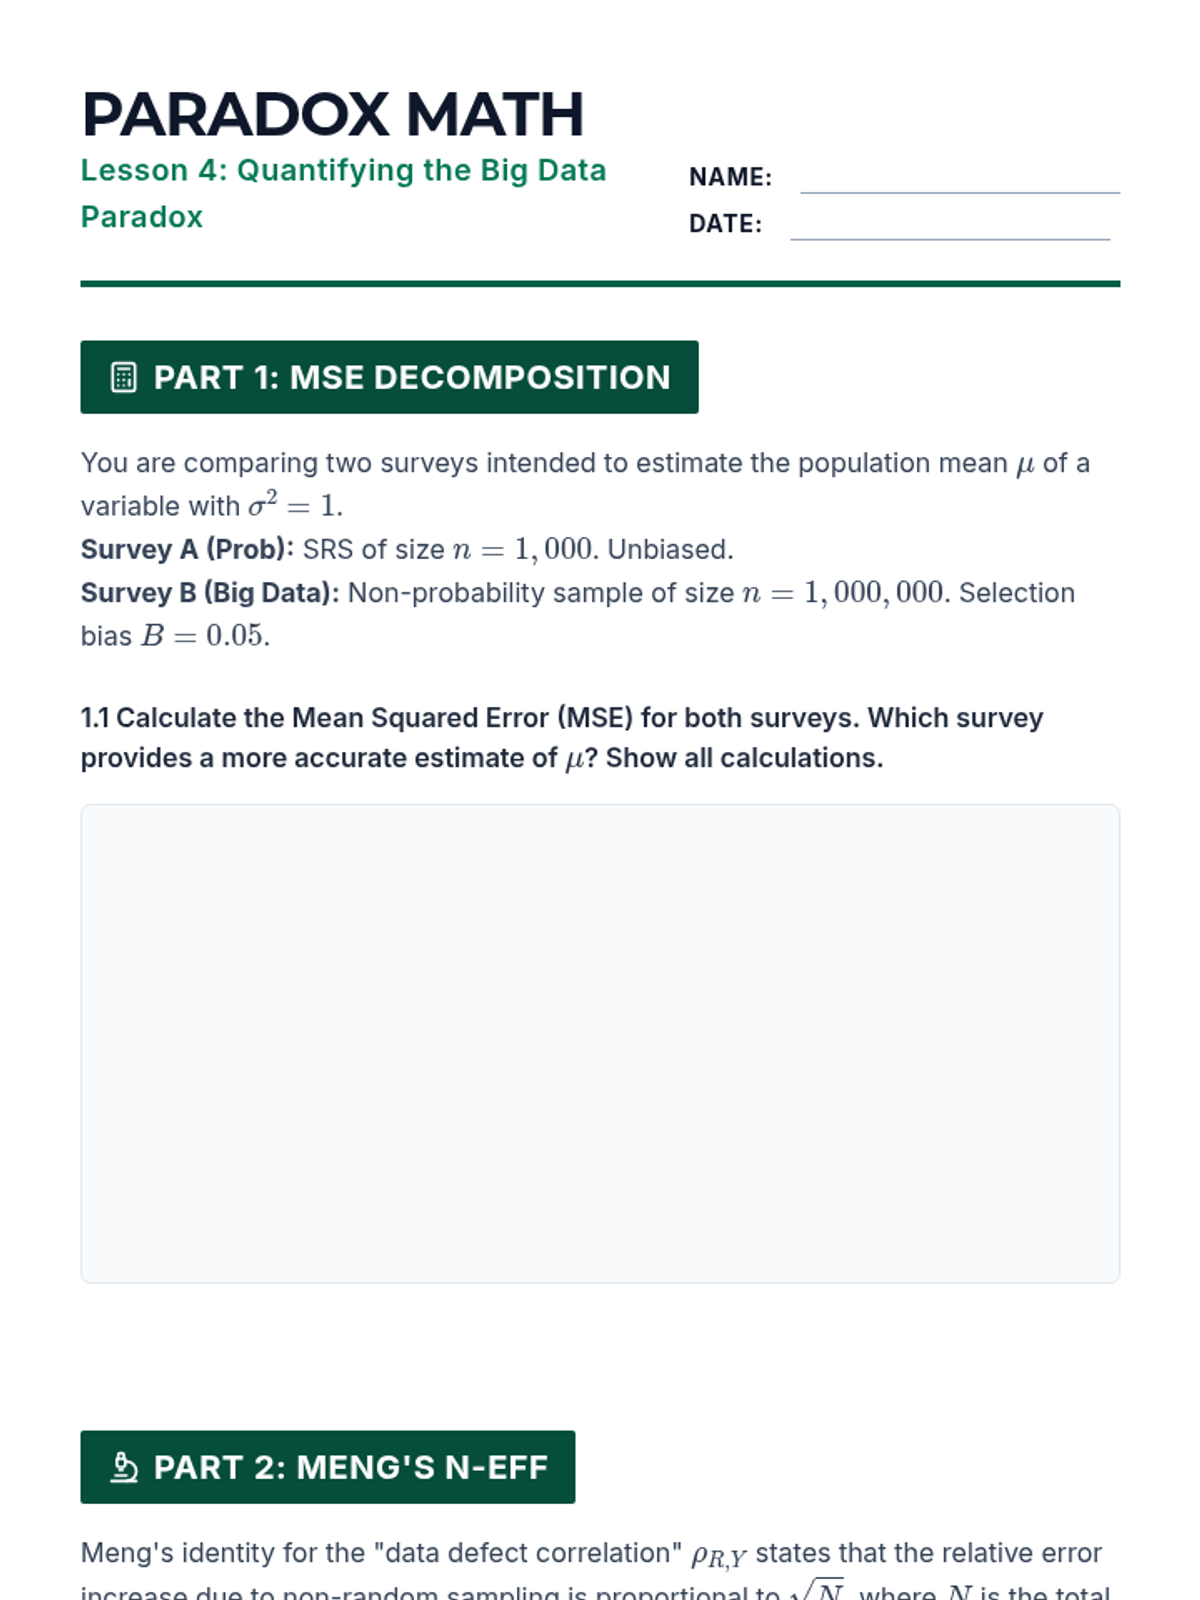
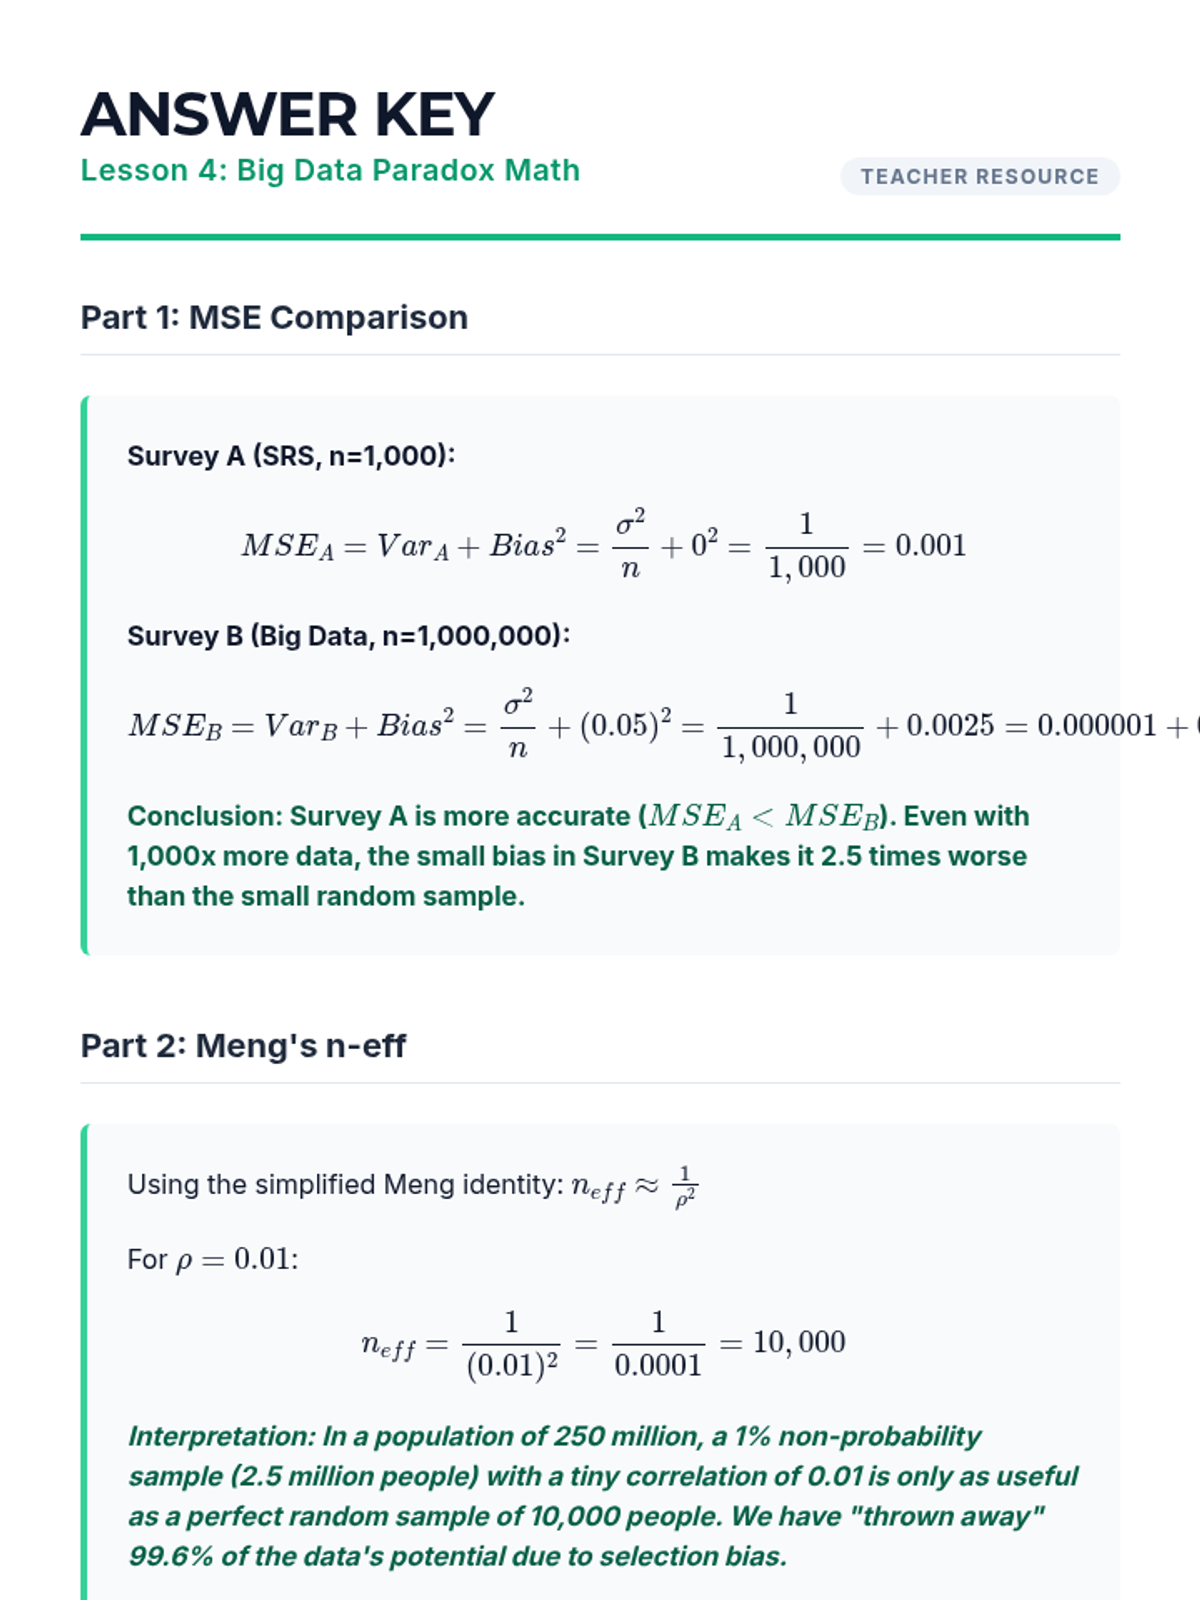
Critically assess non-probability sampling and the 'Big Data Paradox' by comparing Mean Squared Error (MSE) across different sampling regimes.
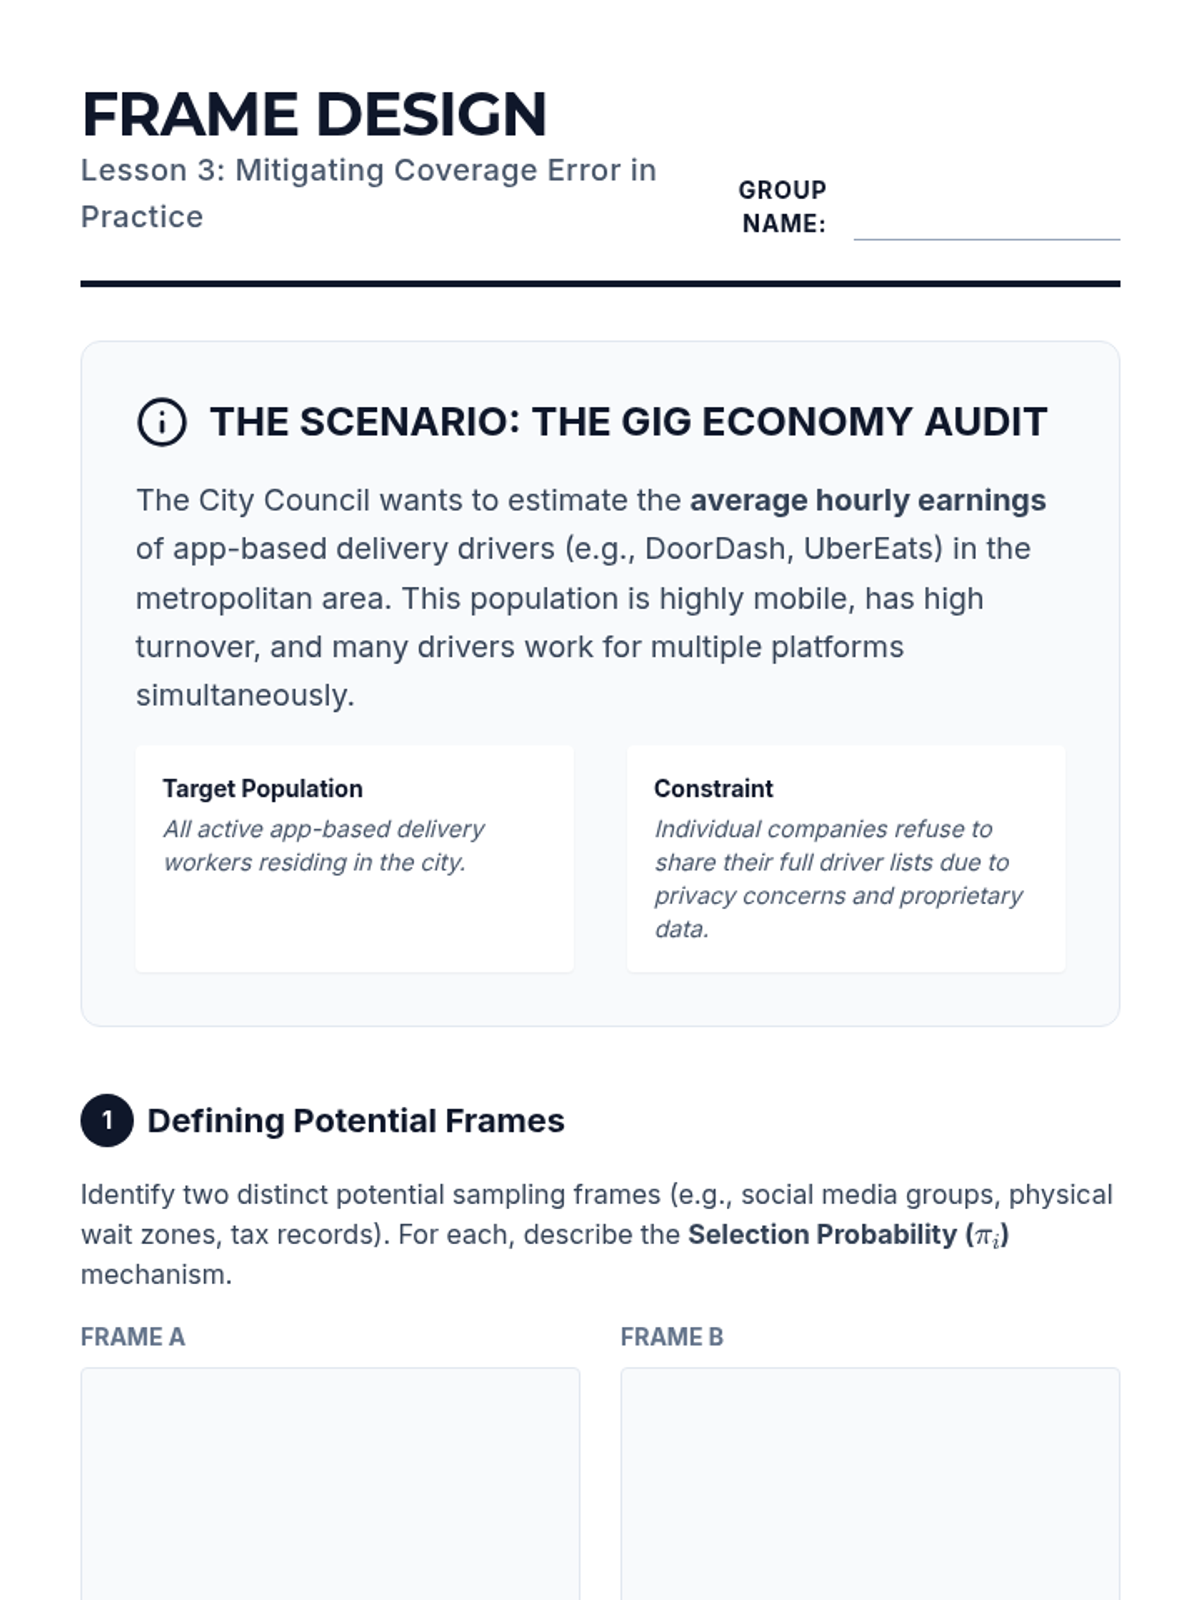
Analyze the gap between target populations and sampling frames, focusing on the mathematical impacts of undercoverage and overcoverage on estimator variance.
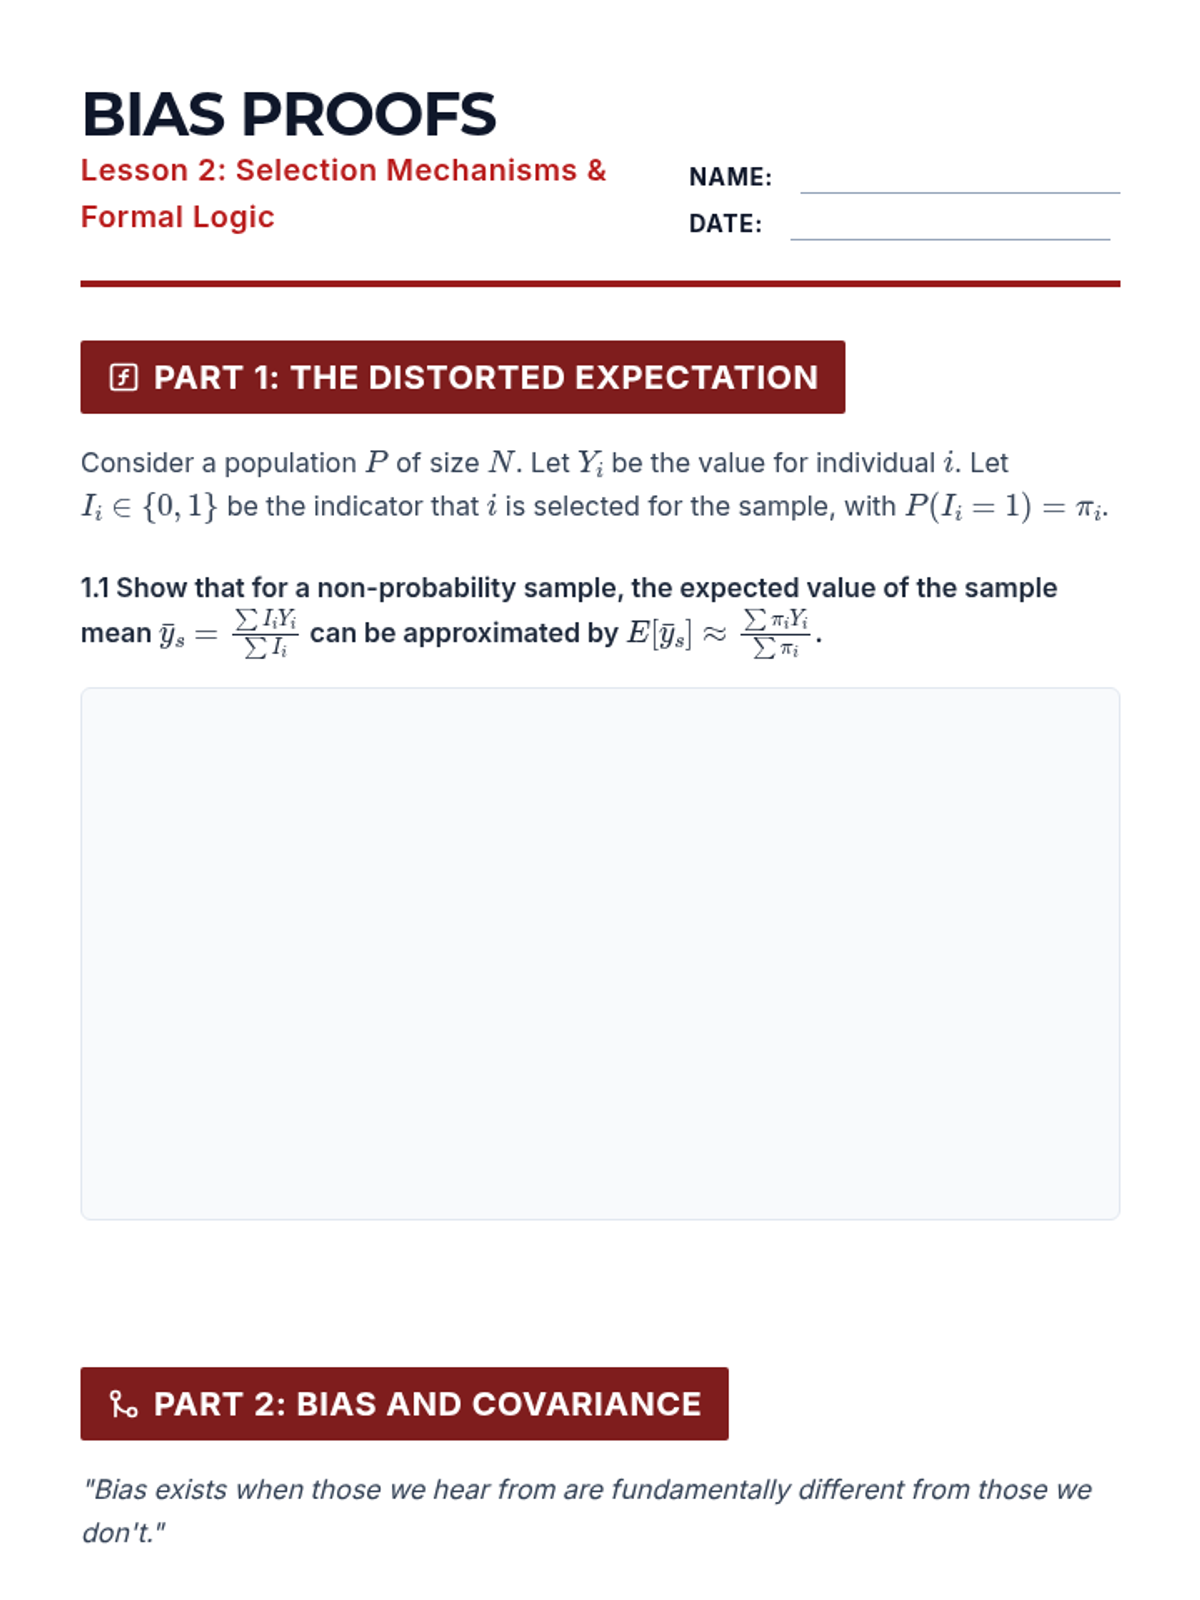
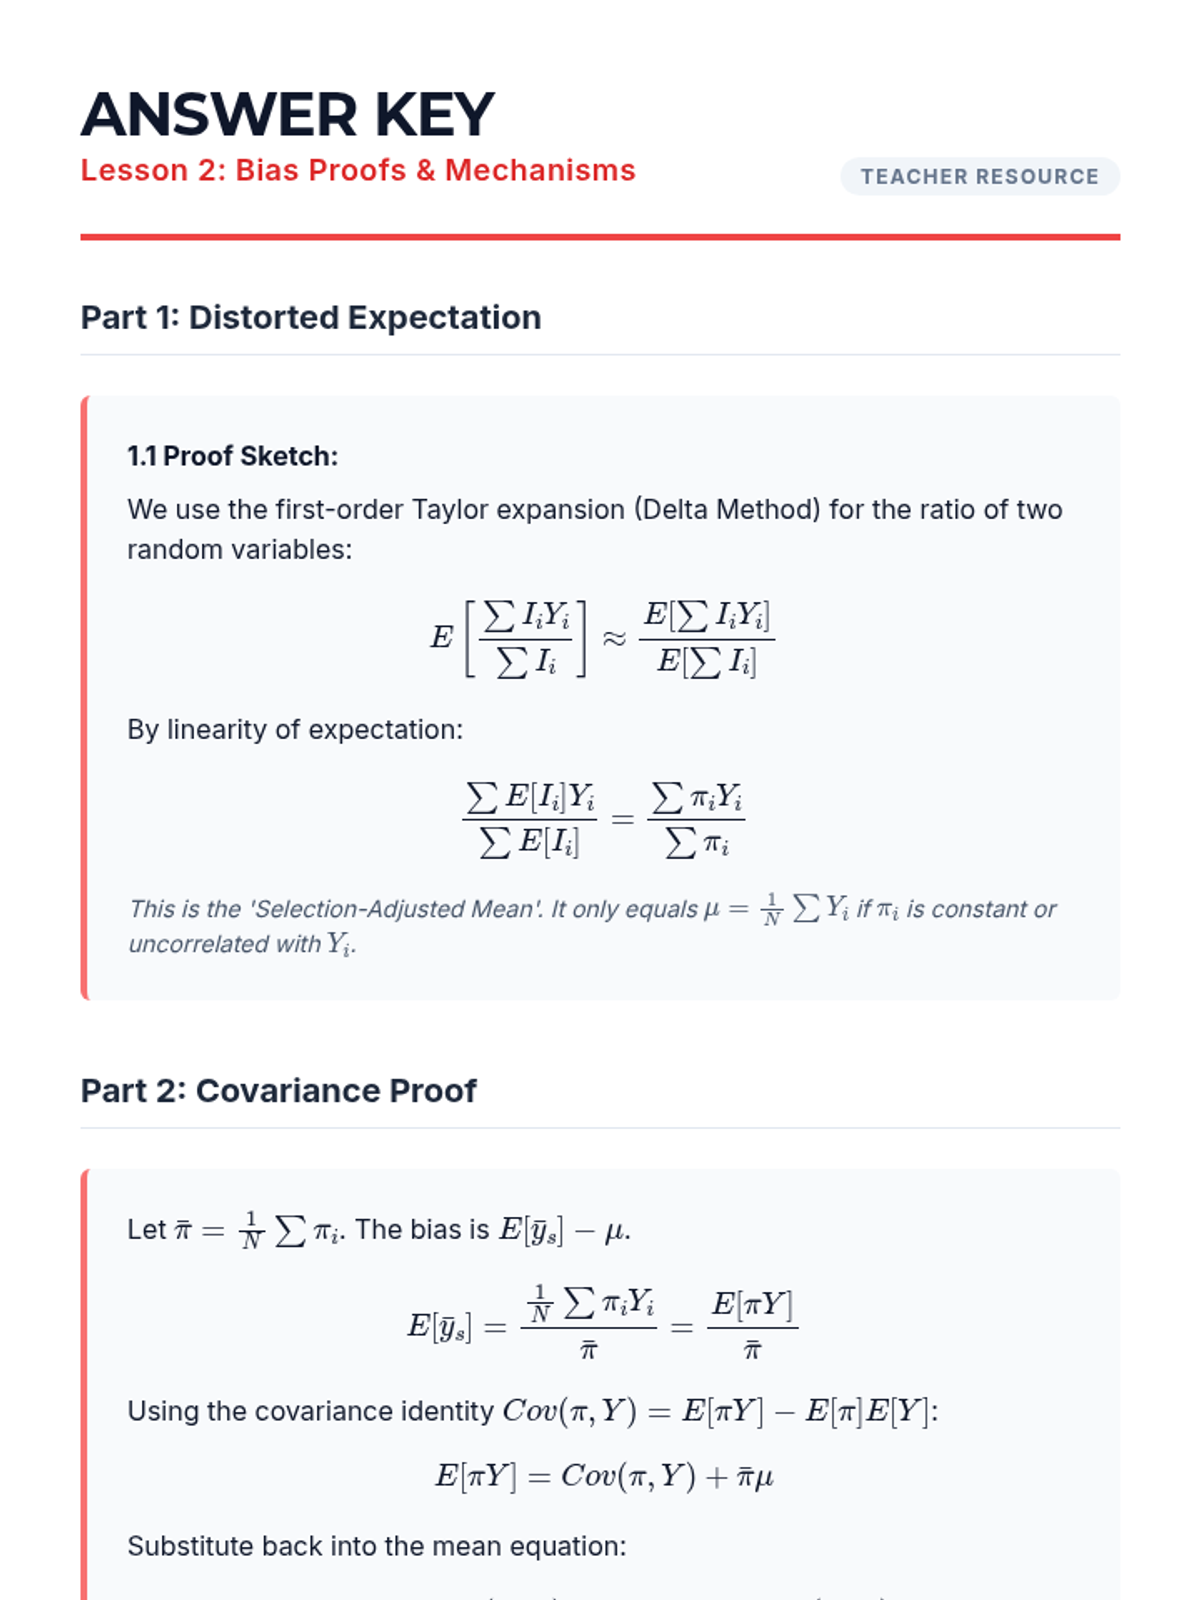
Deconstruct selection bias through mathematical proofs and the historical lens of the 1936 Literary Digest poll, exploring how non-random exclusion alters conditional probabilities.
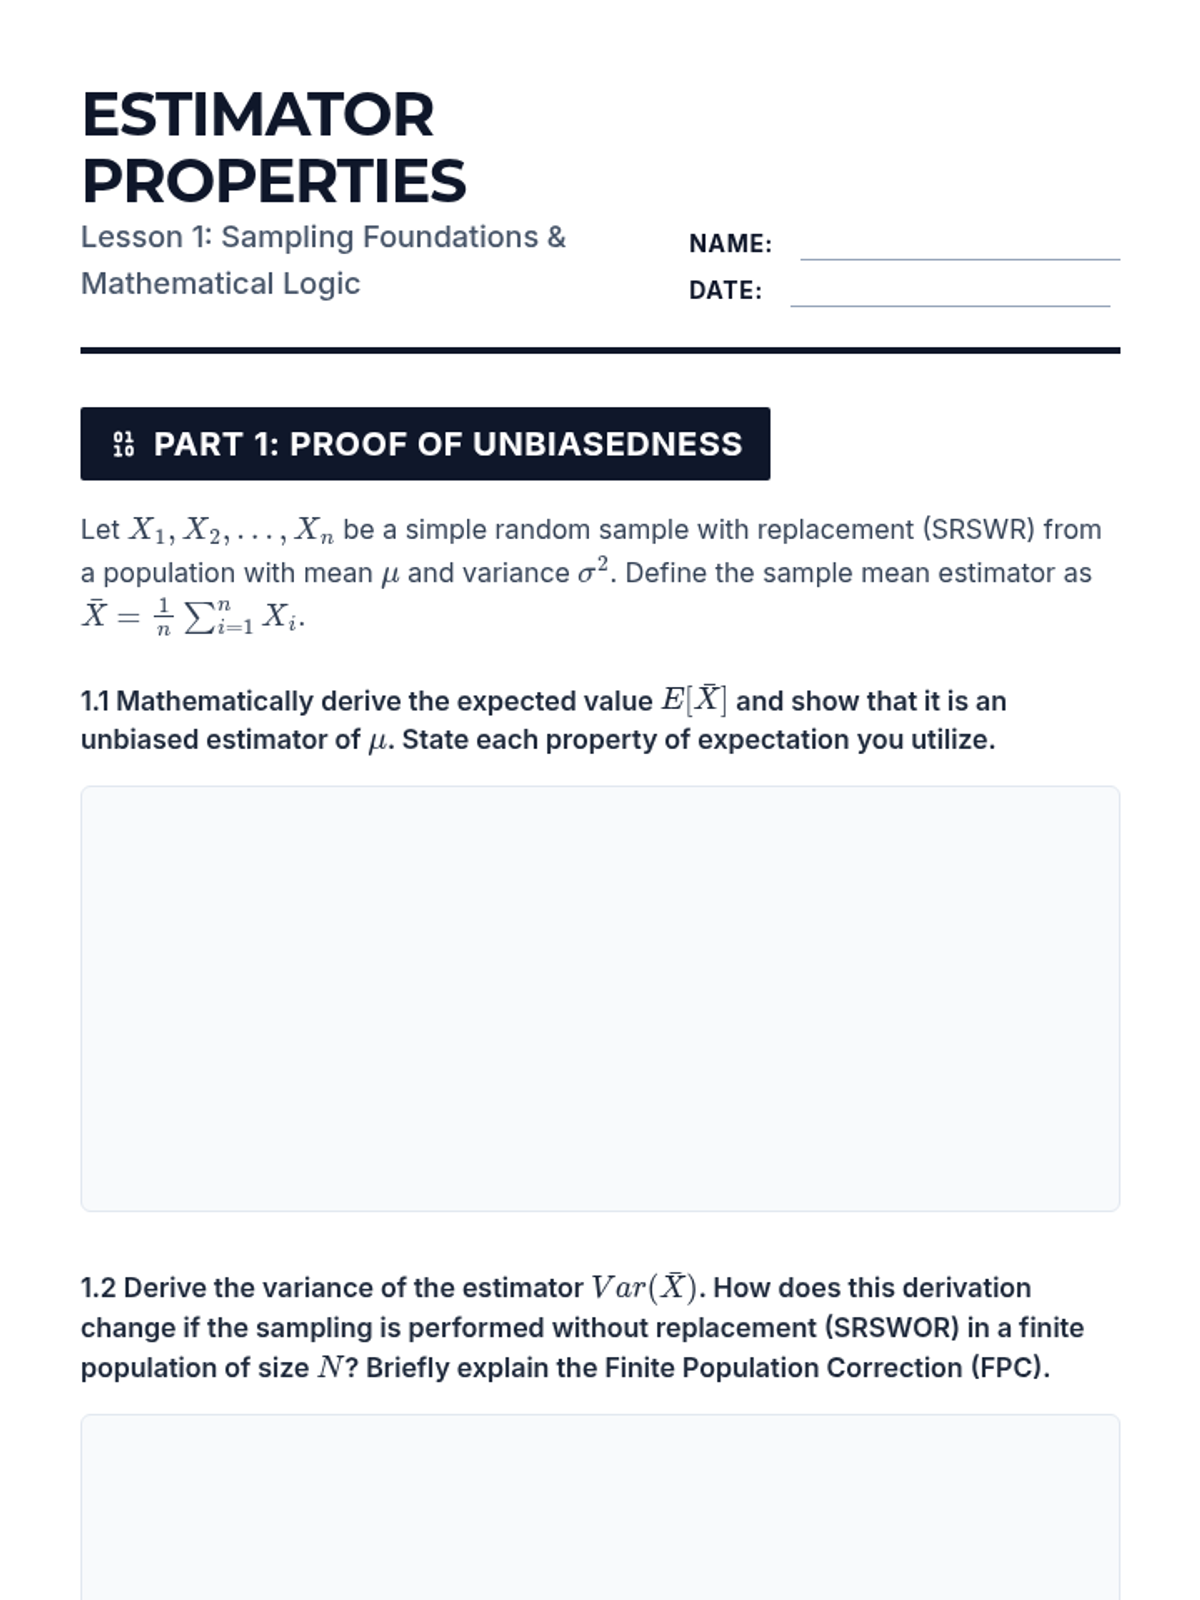
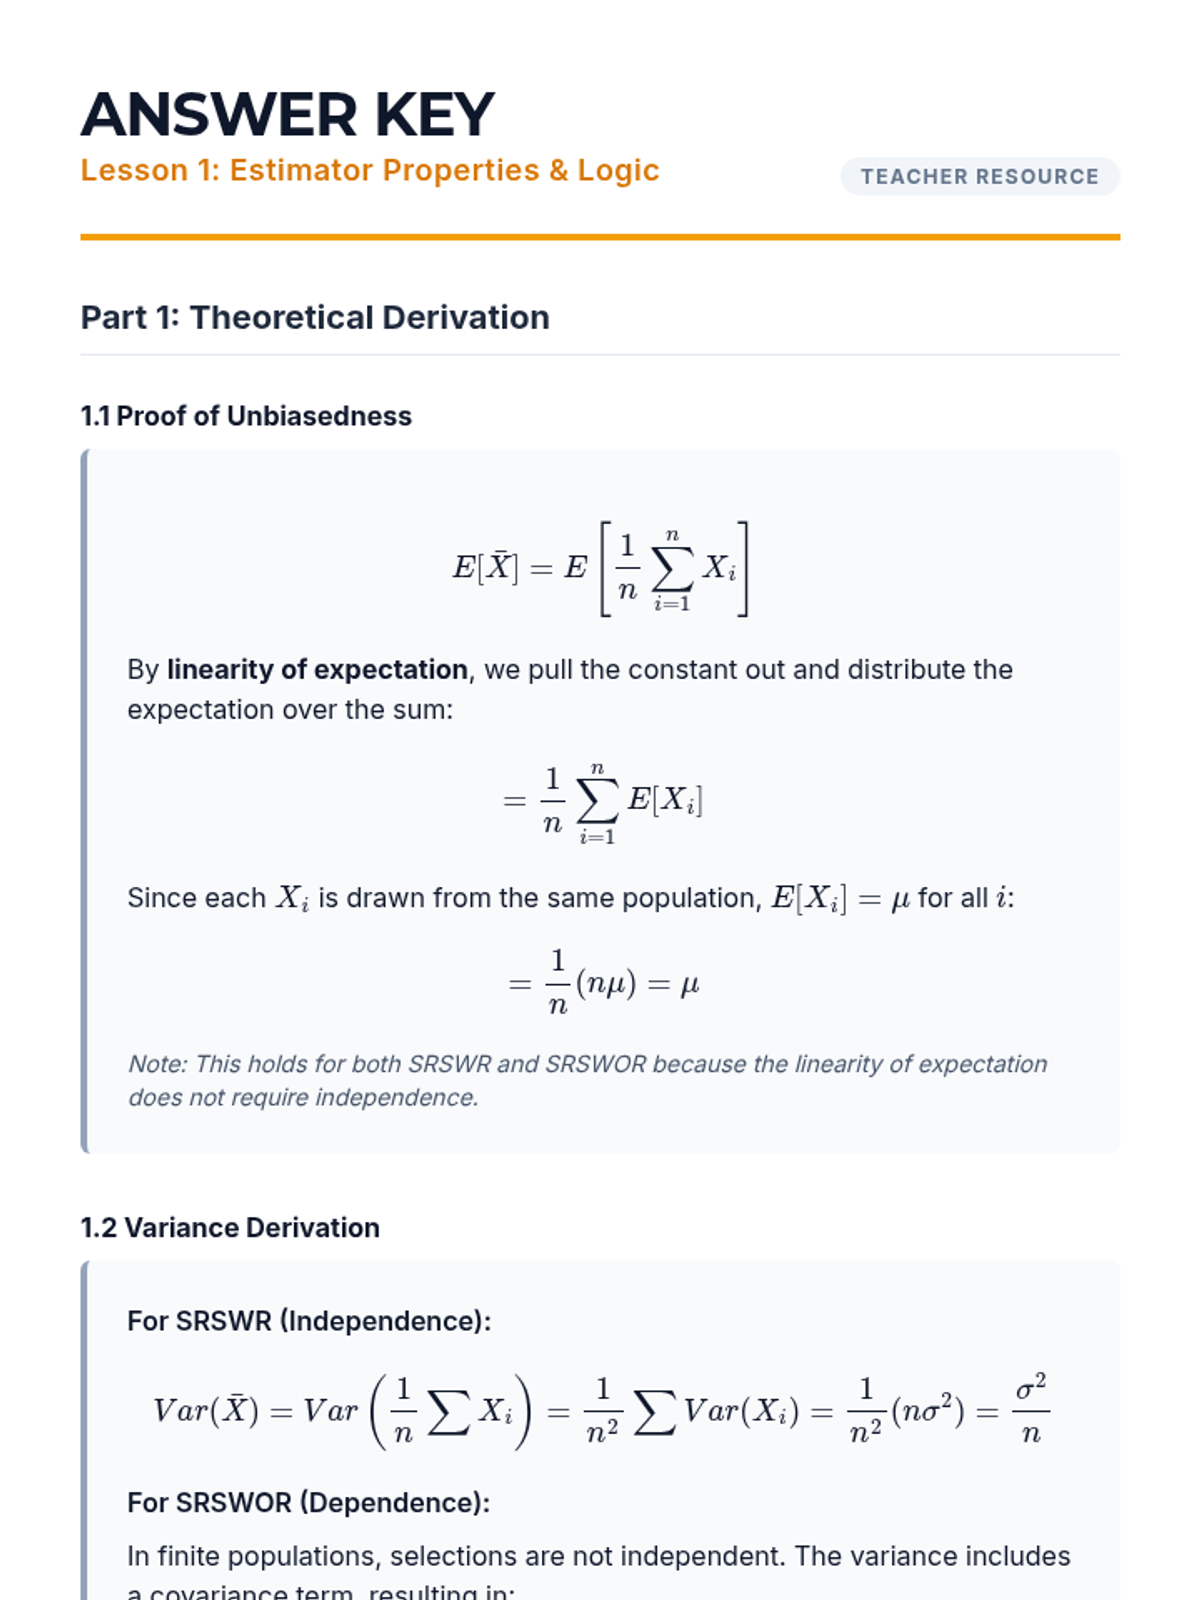
Examine the mathematical properties of estimators under simple random sampling (SRS), focusing on unbiasedness, consistency, and the Central Limit Theorem's role in sampling distributions.
Using computational simulations to verify theoretical probability models and observe the Law of Large Numbers.
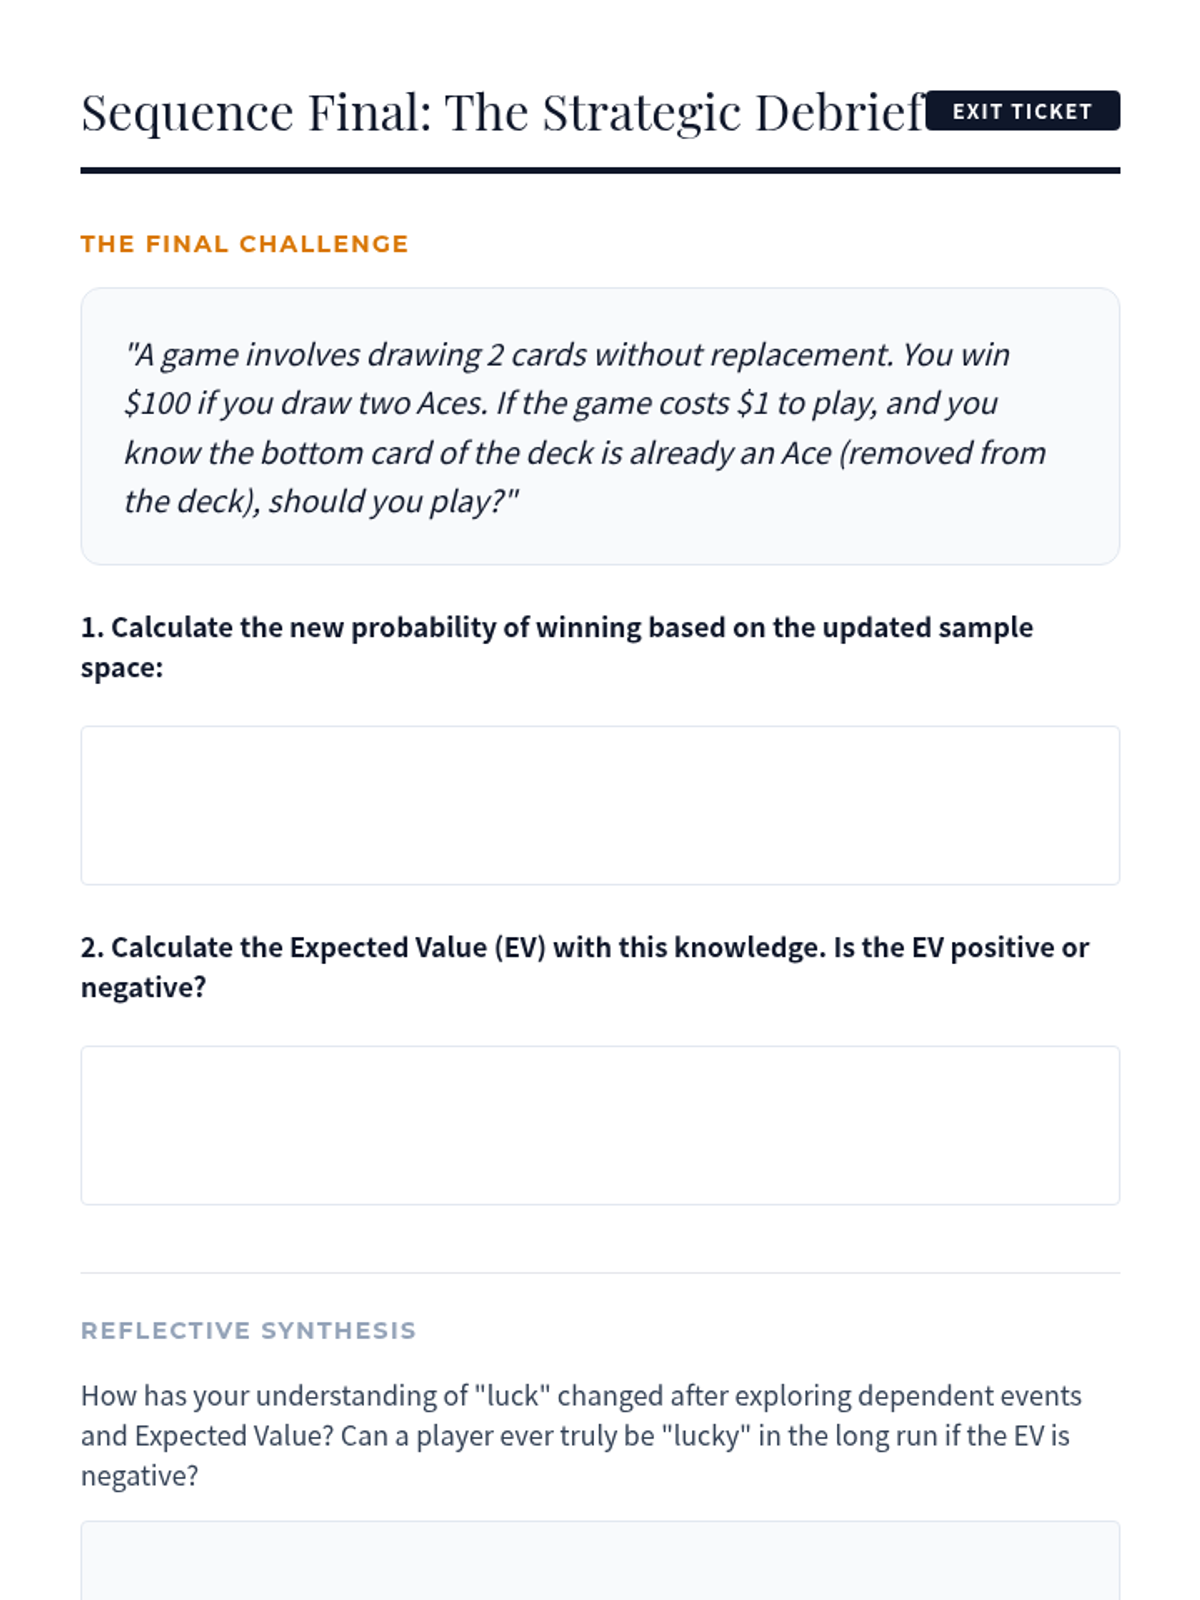
Combining probability with payoffs to calculate Expected Value and analyze house edges in gambling.
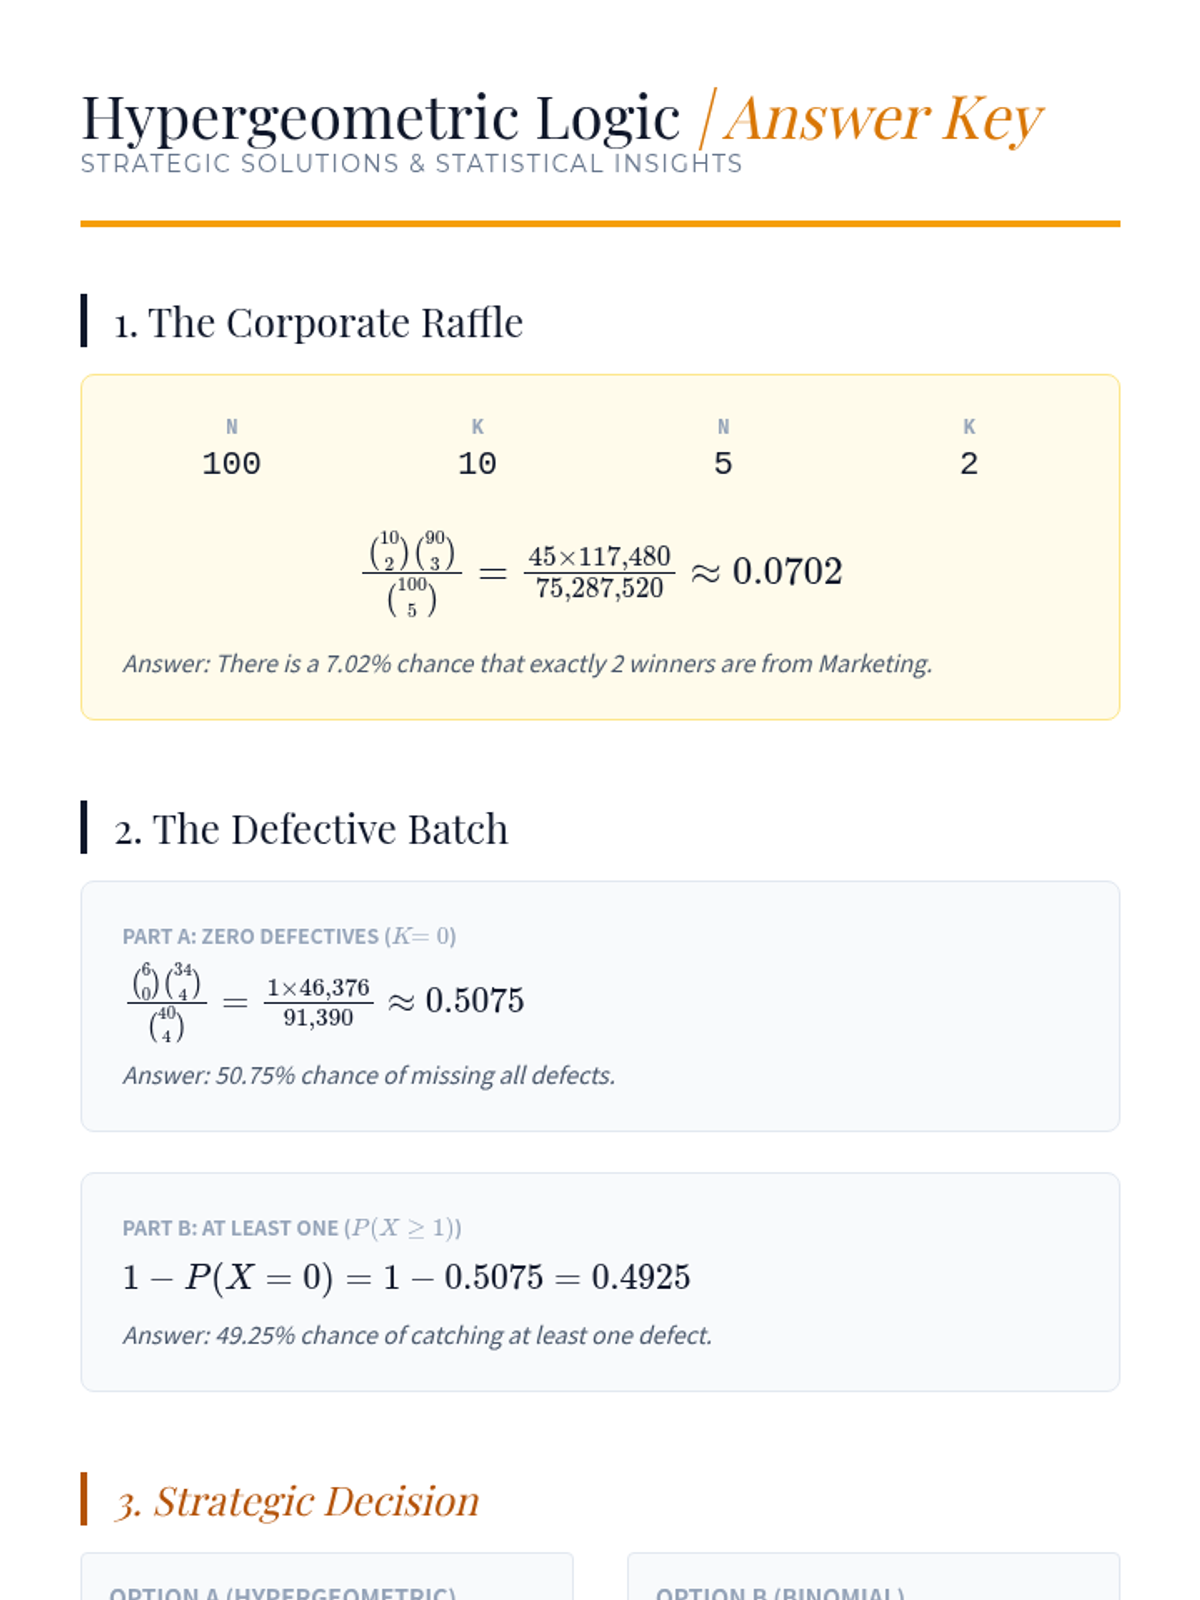
Formalizing the logic of drawing without replacement using the Hypergeometric distribution.
Applying combinatorics and the multiplication rule to calculate the probability of complex poker hands.
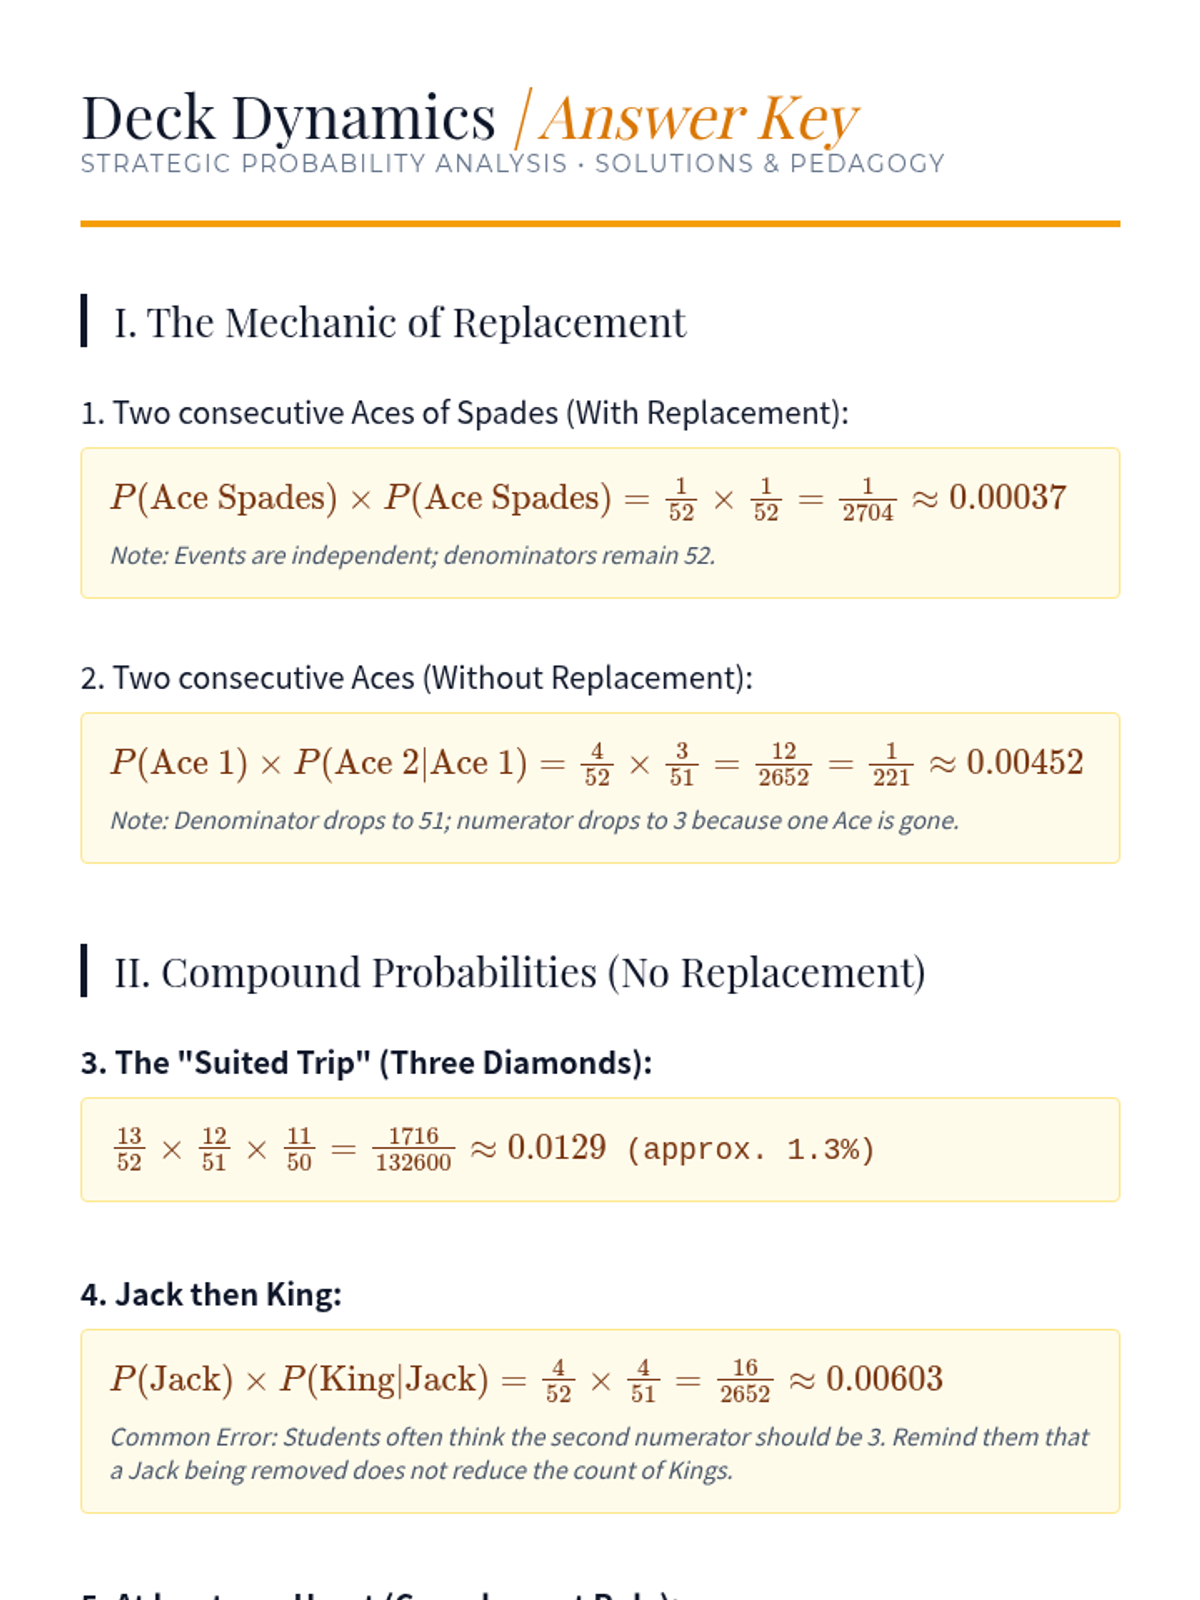
Establishing the standard 52-card deck as a sample space and differentiating between independent and dependent compound events.
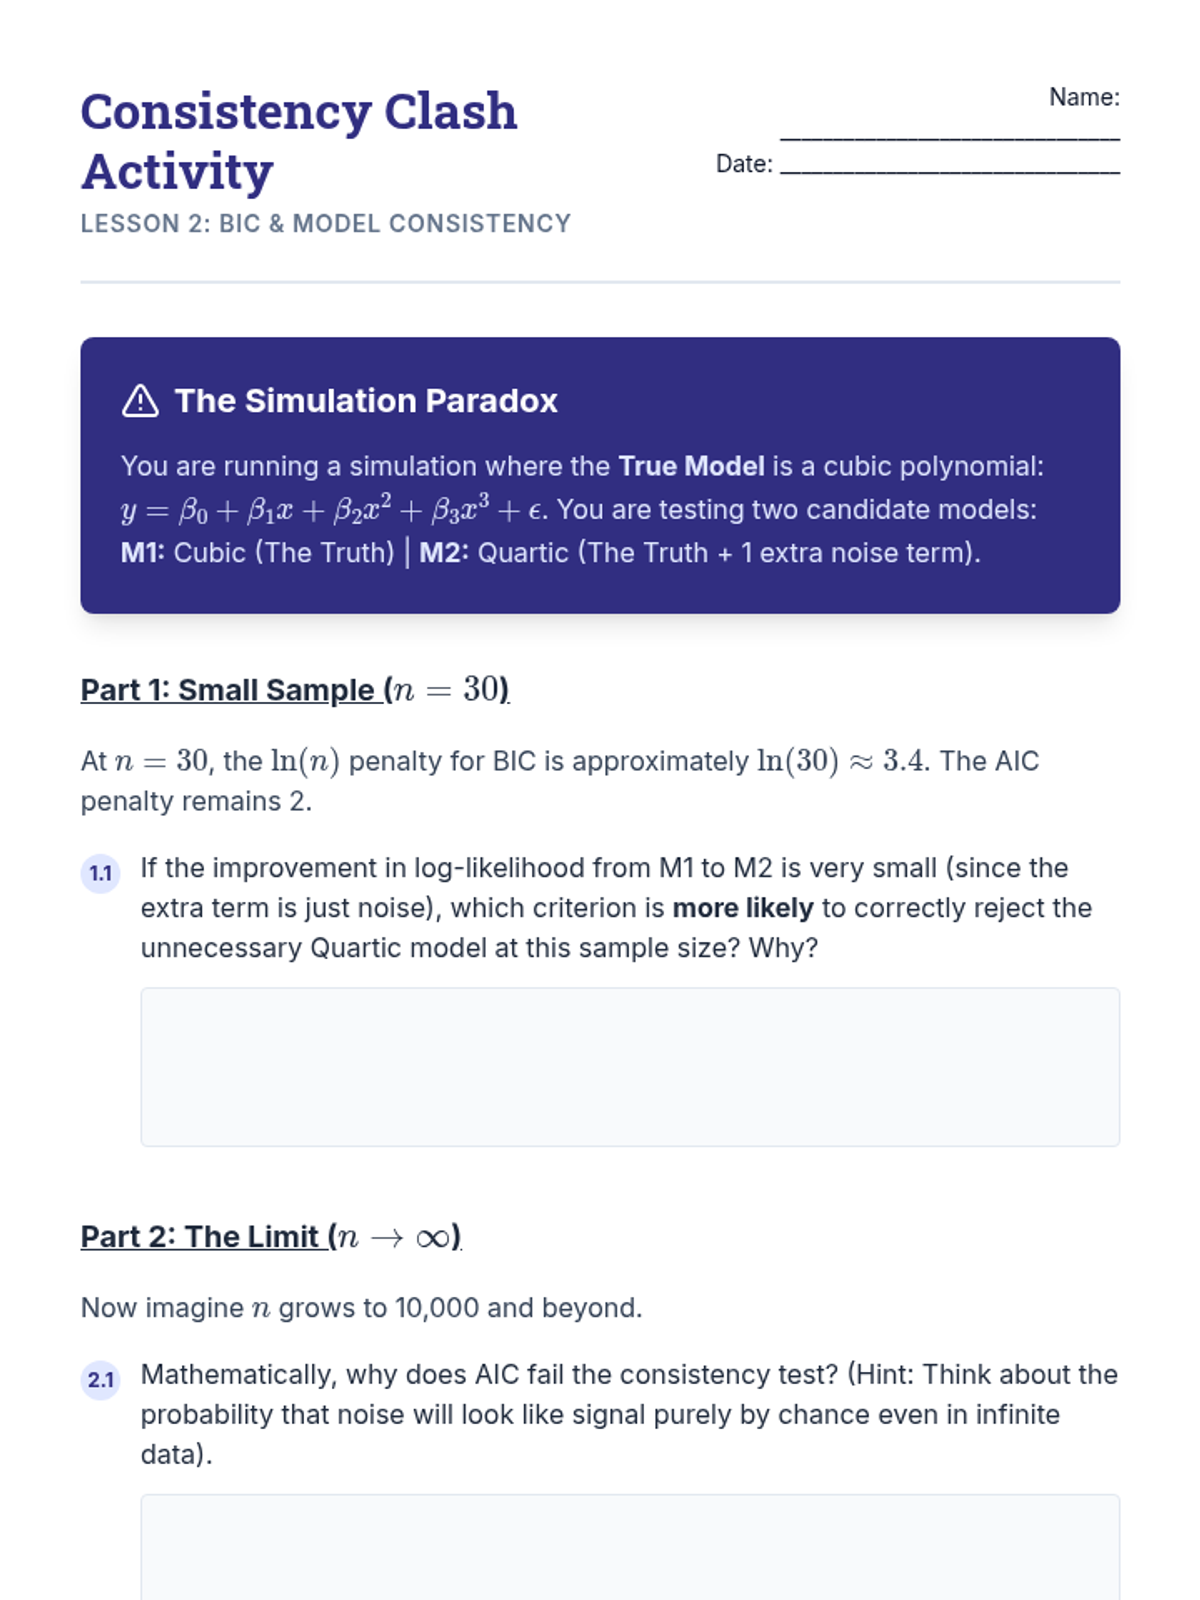
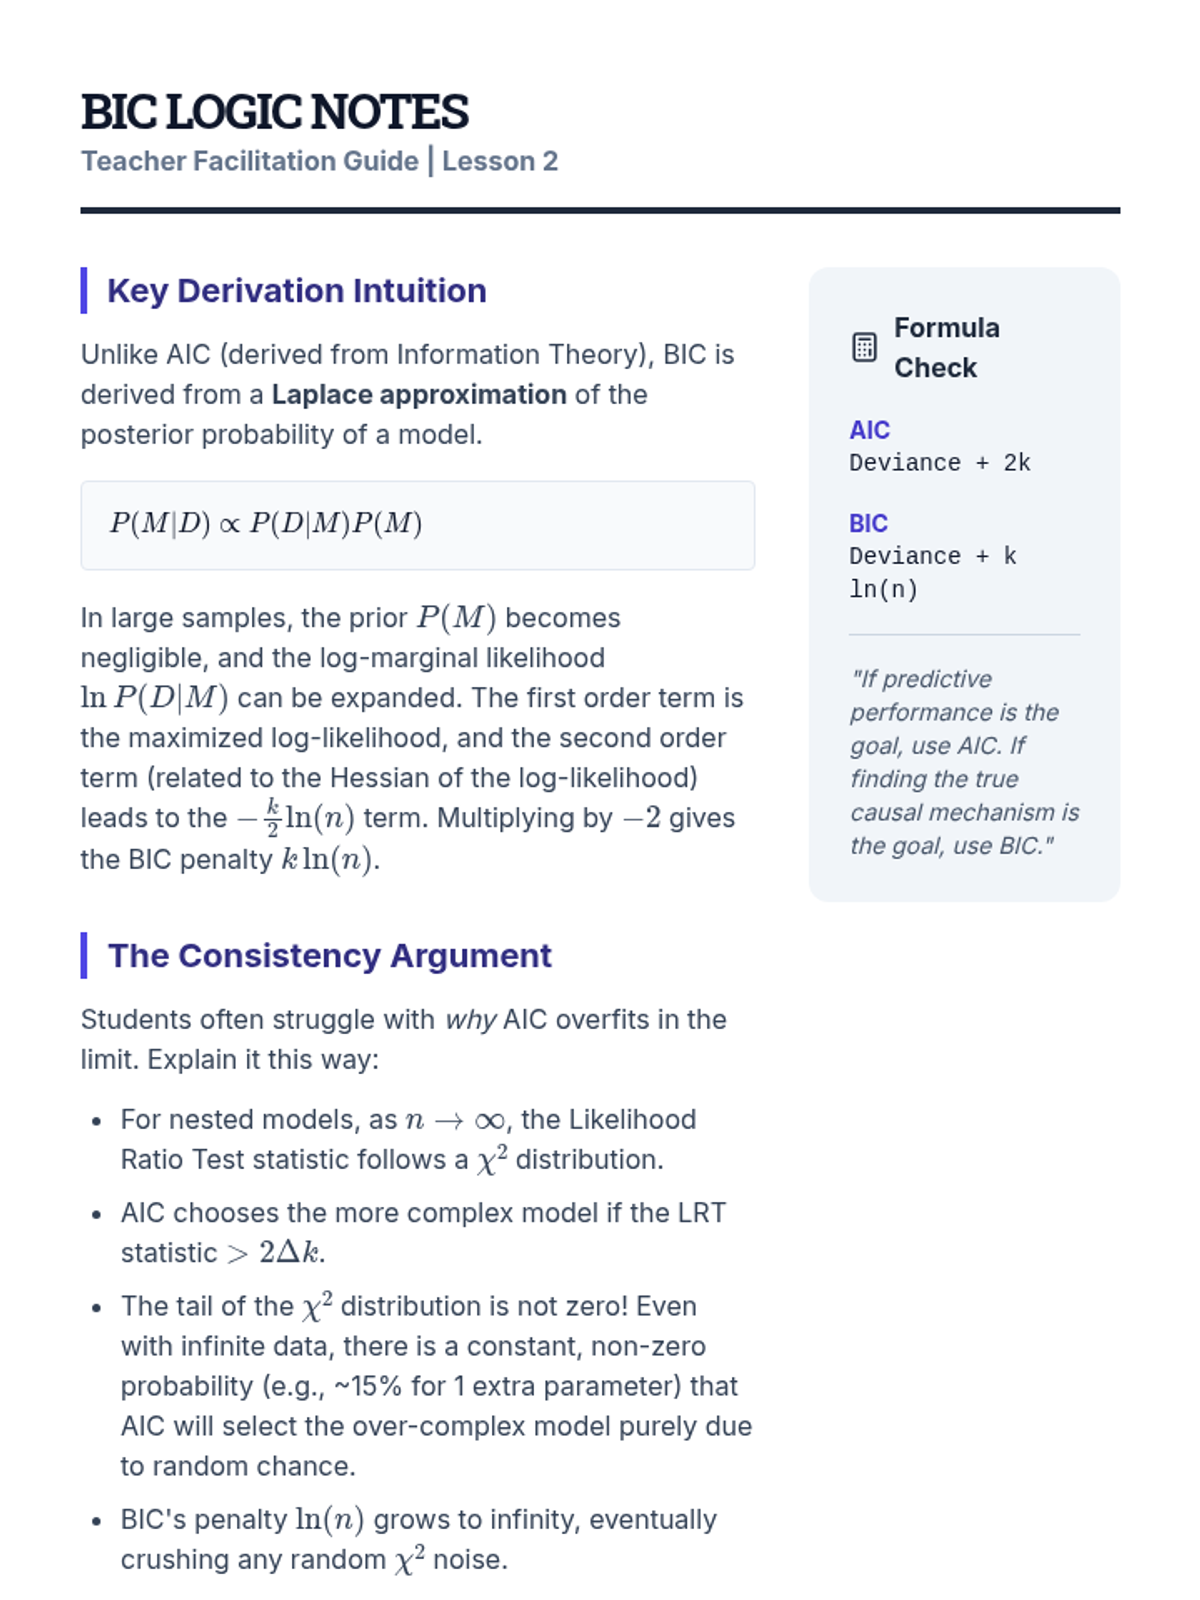
Introduce BIC as a Bayesian approximation for model selection, focusing on its stronger penalty term and the property of consistency in large samples.
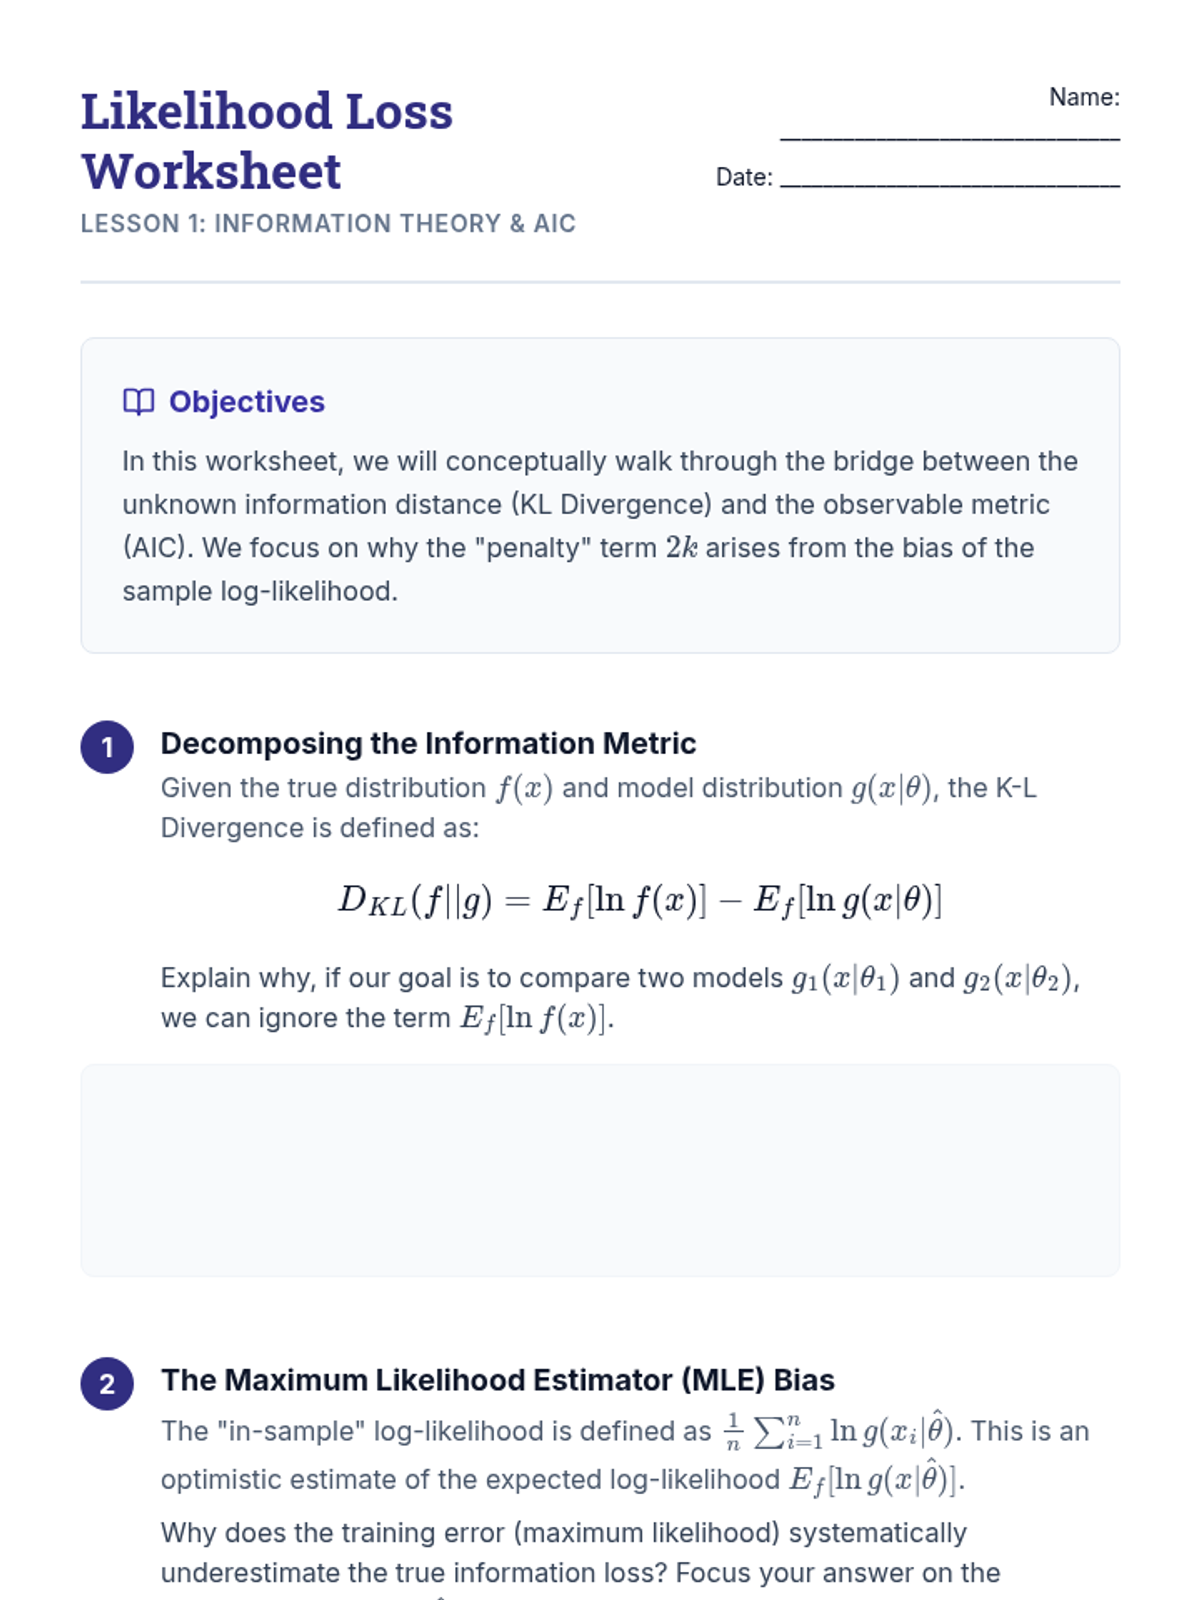
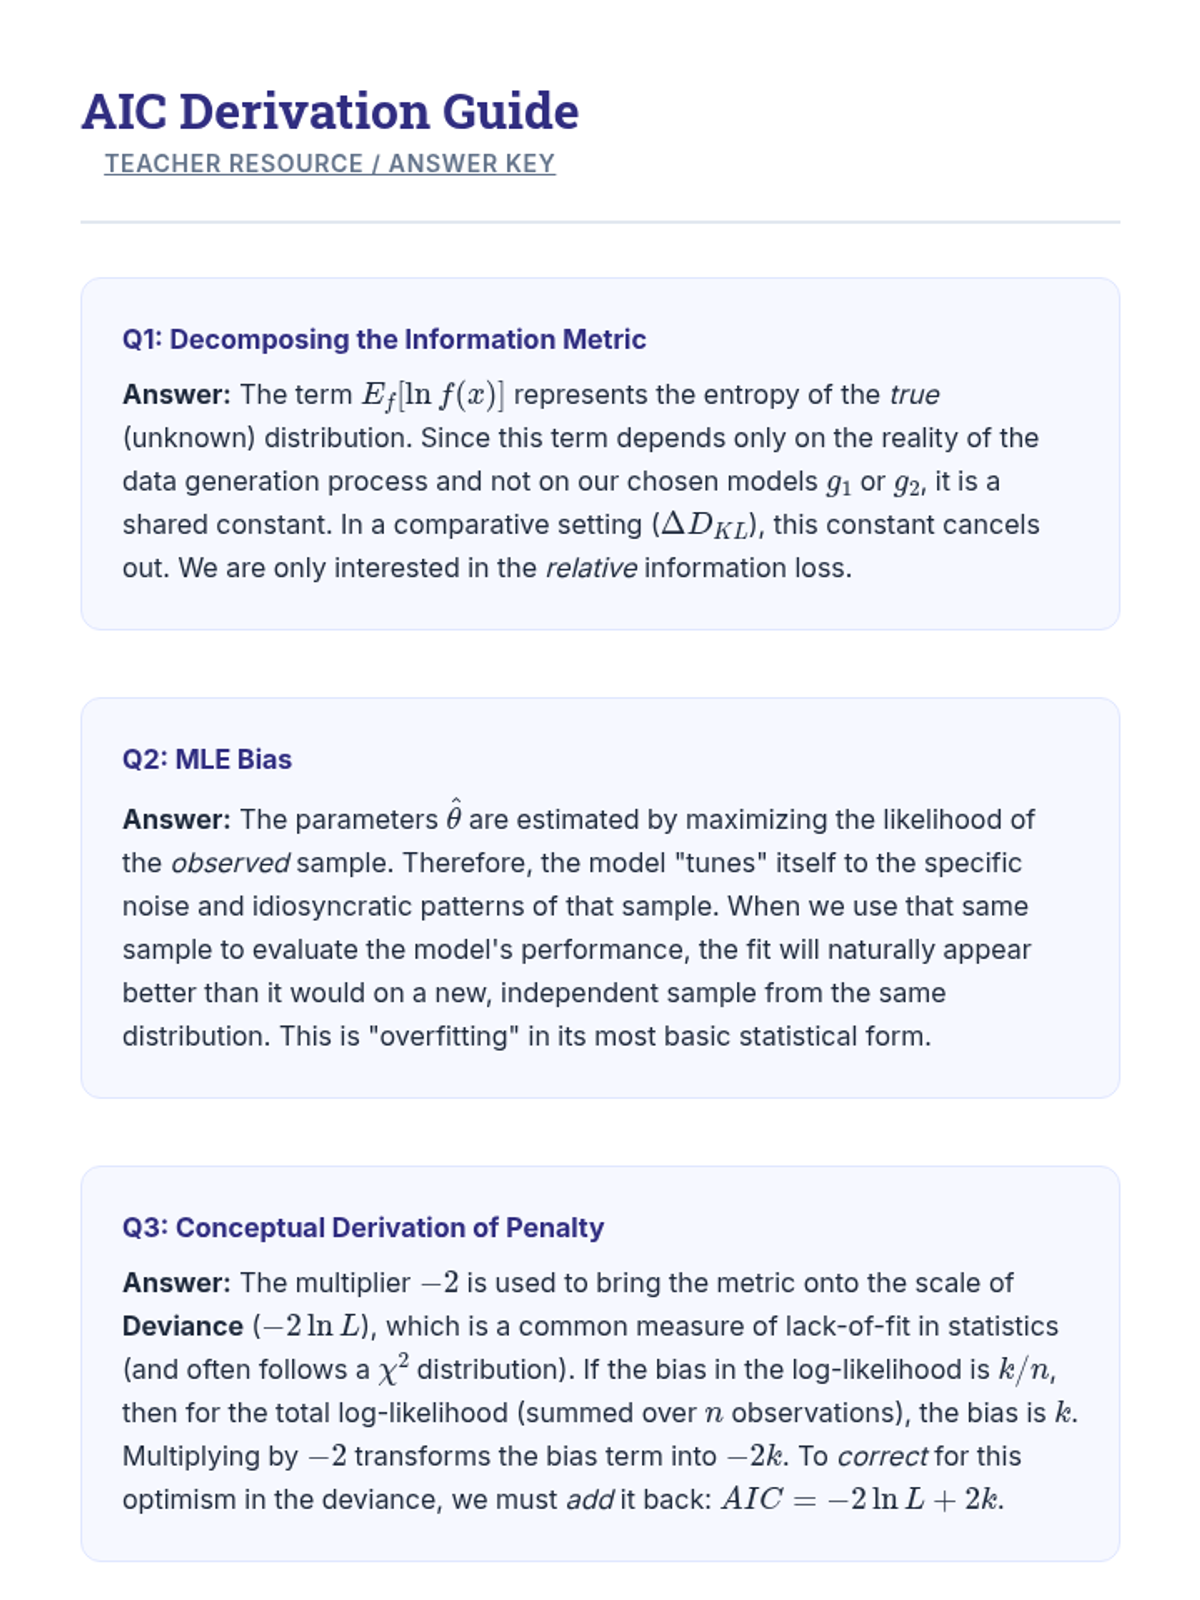
Explore the theoretical link between maximum likelihood estimation and information loss, conceptually deriving AIC as an estimator of relative expected K-L divergence.
An exploration of the four interdependent parameters of power analysis: alpha, beta, effect size, and sample size. Students will understand the trade-offs between Type I and Type II errors and the ethical implications of underpowered research.