Data representation, distributions, and statistical variability using sampling and inference techniques. Integrates probability models, compound events, bivariate patterns, and linear models to guide data-driven decision making.
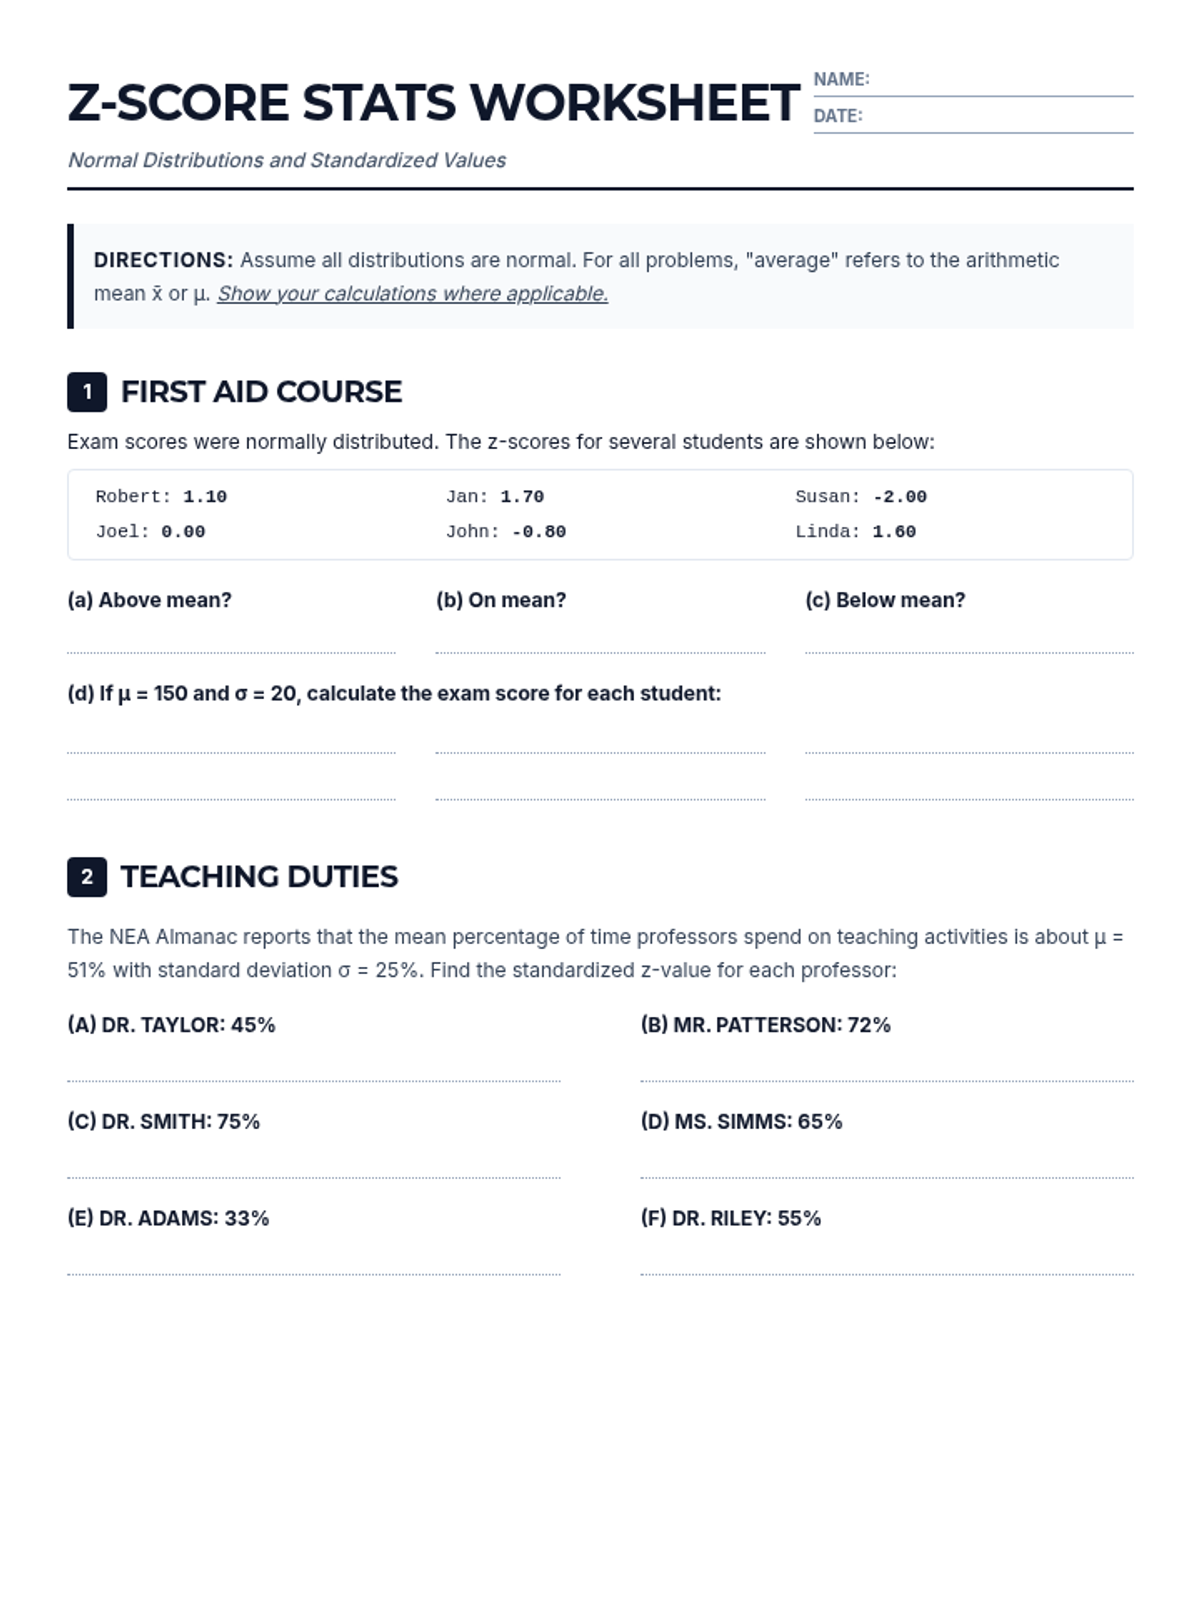
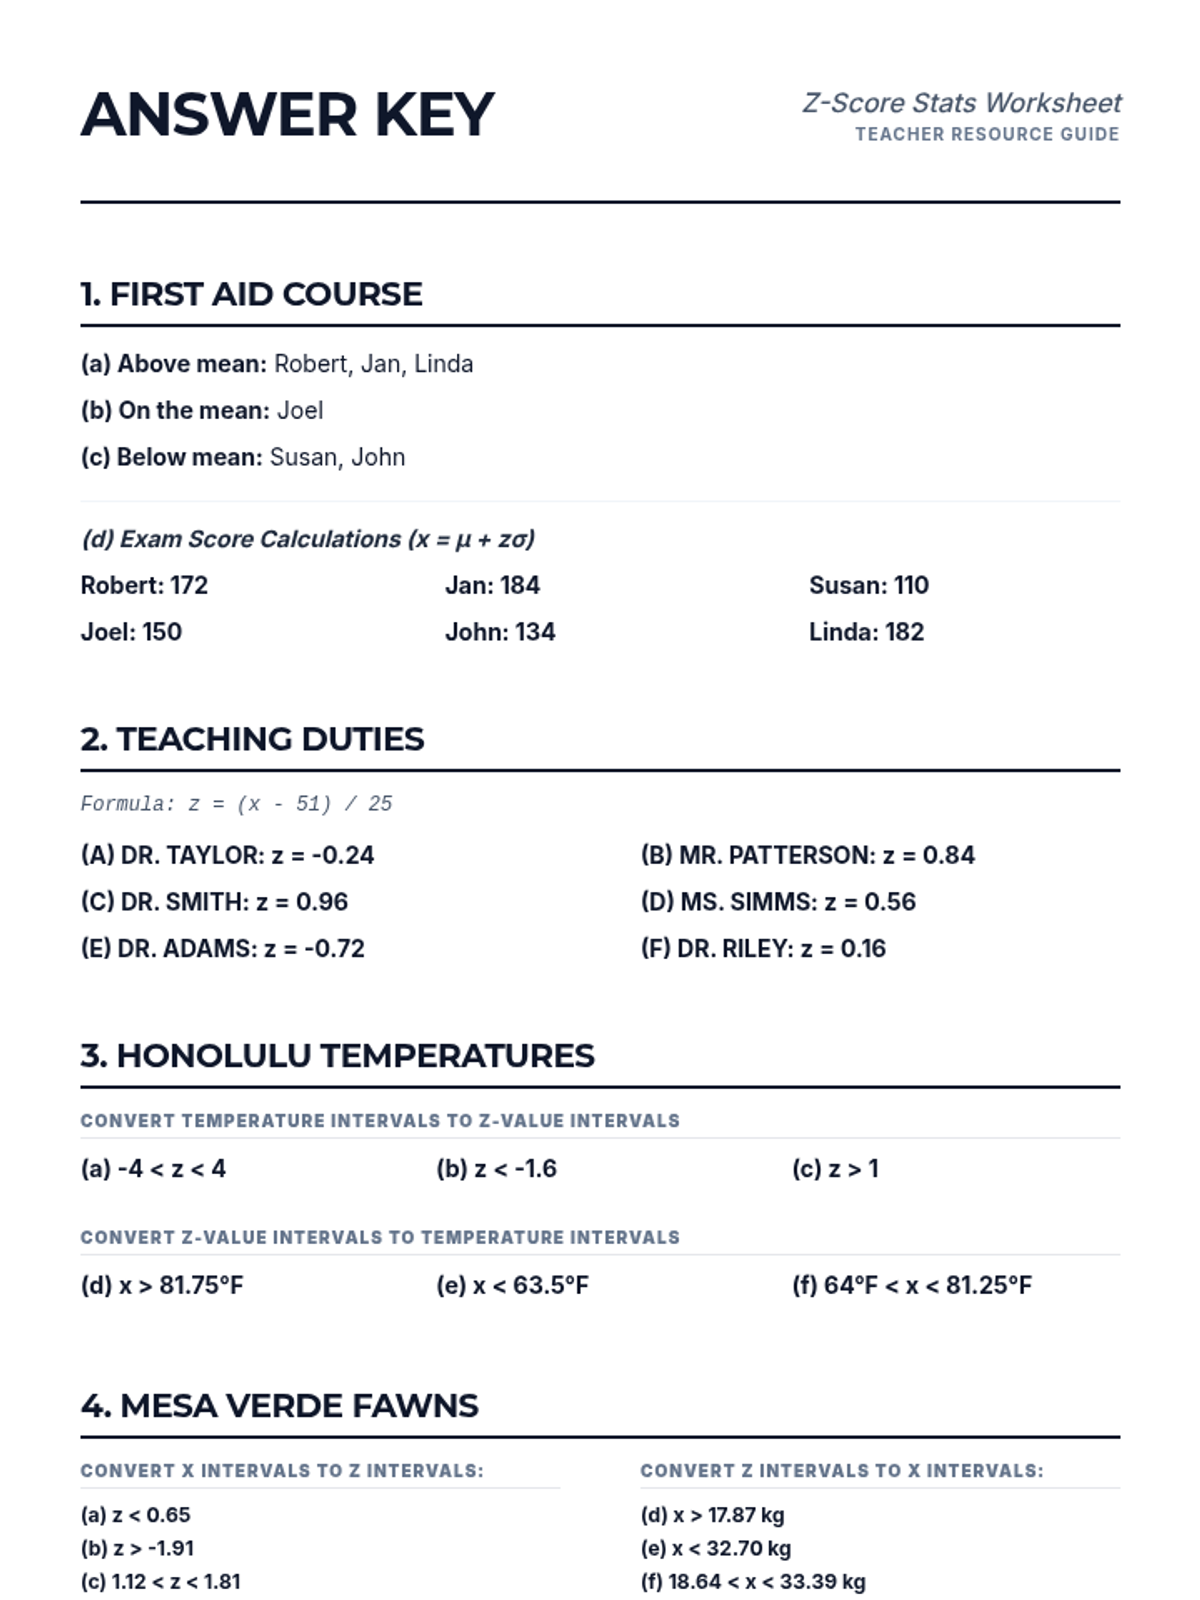
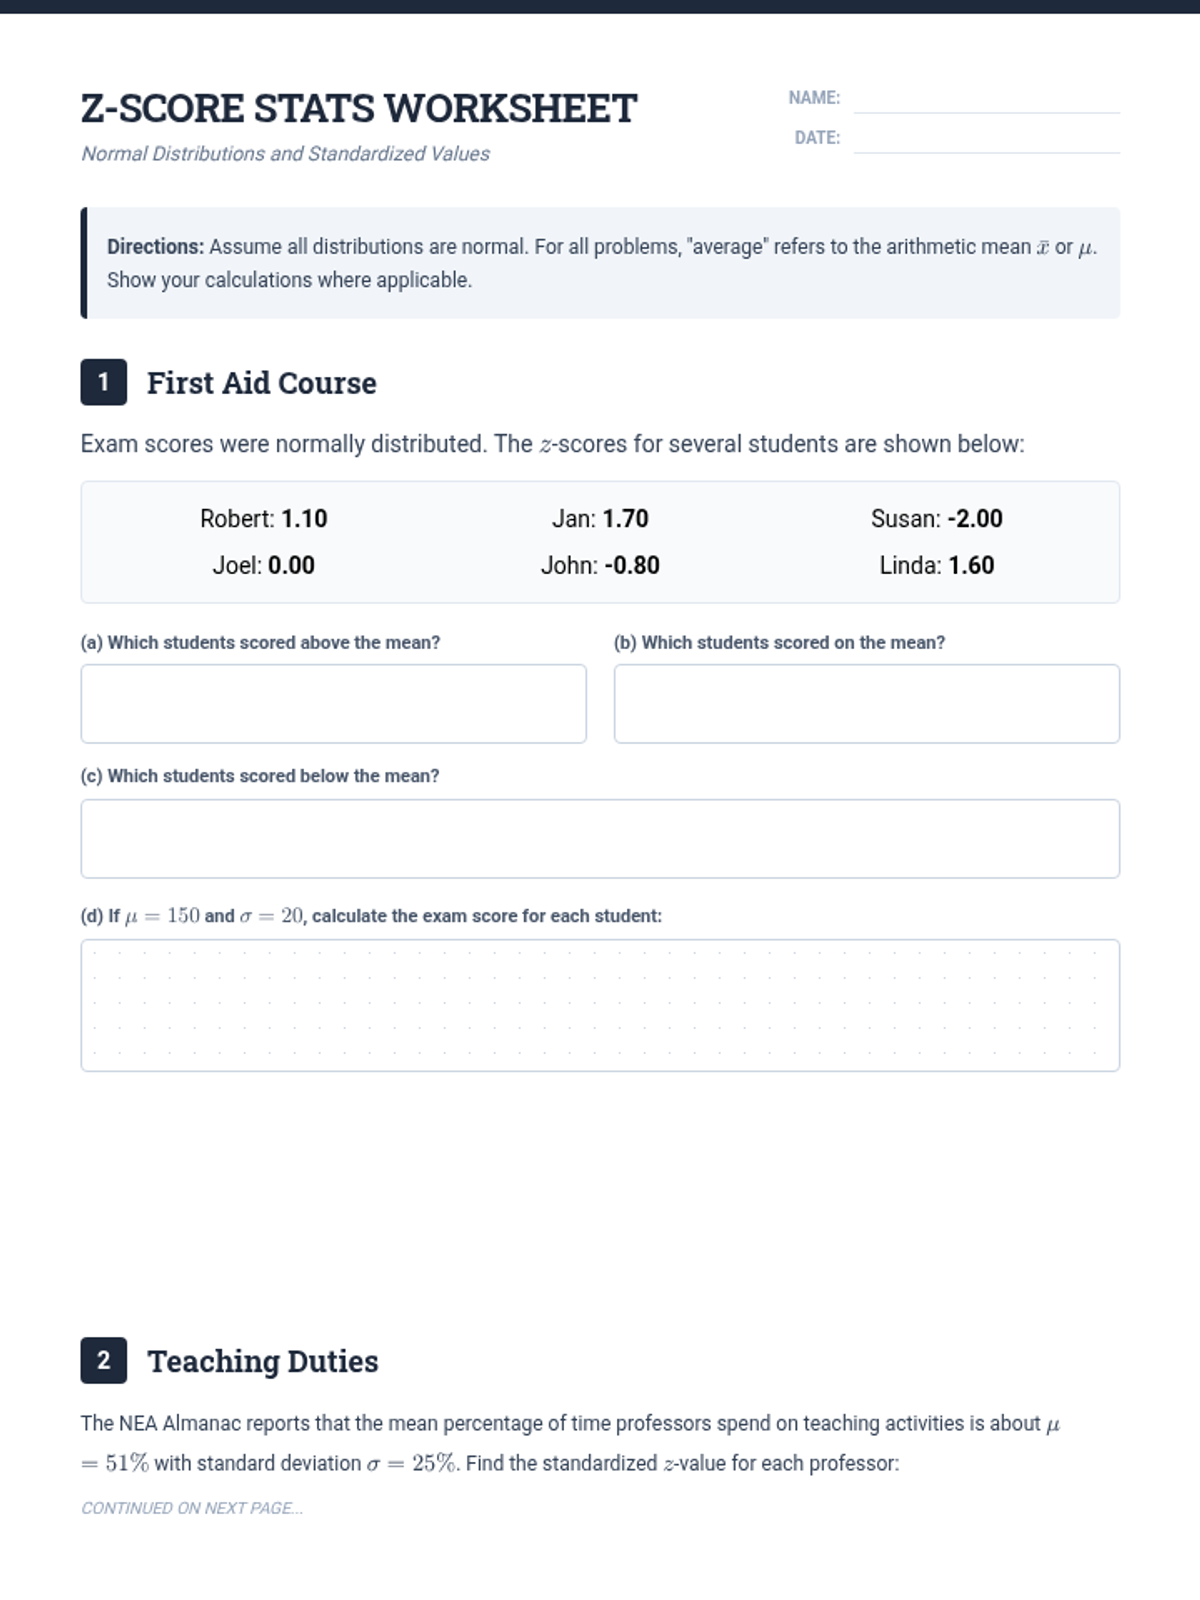
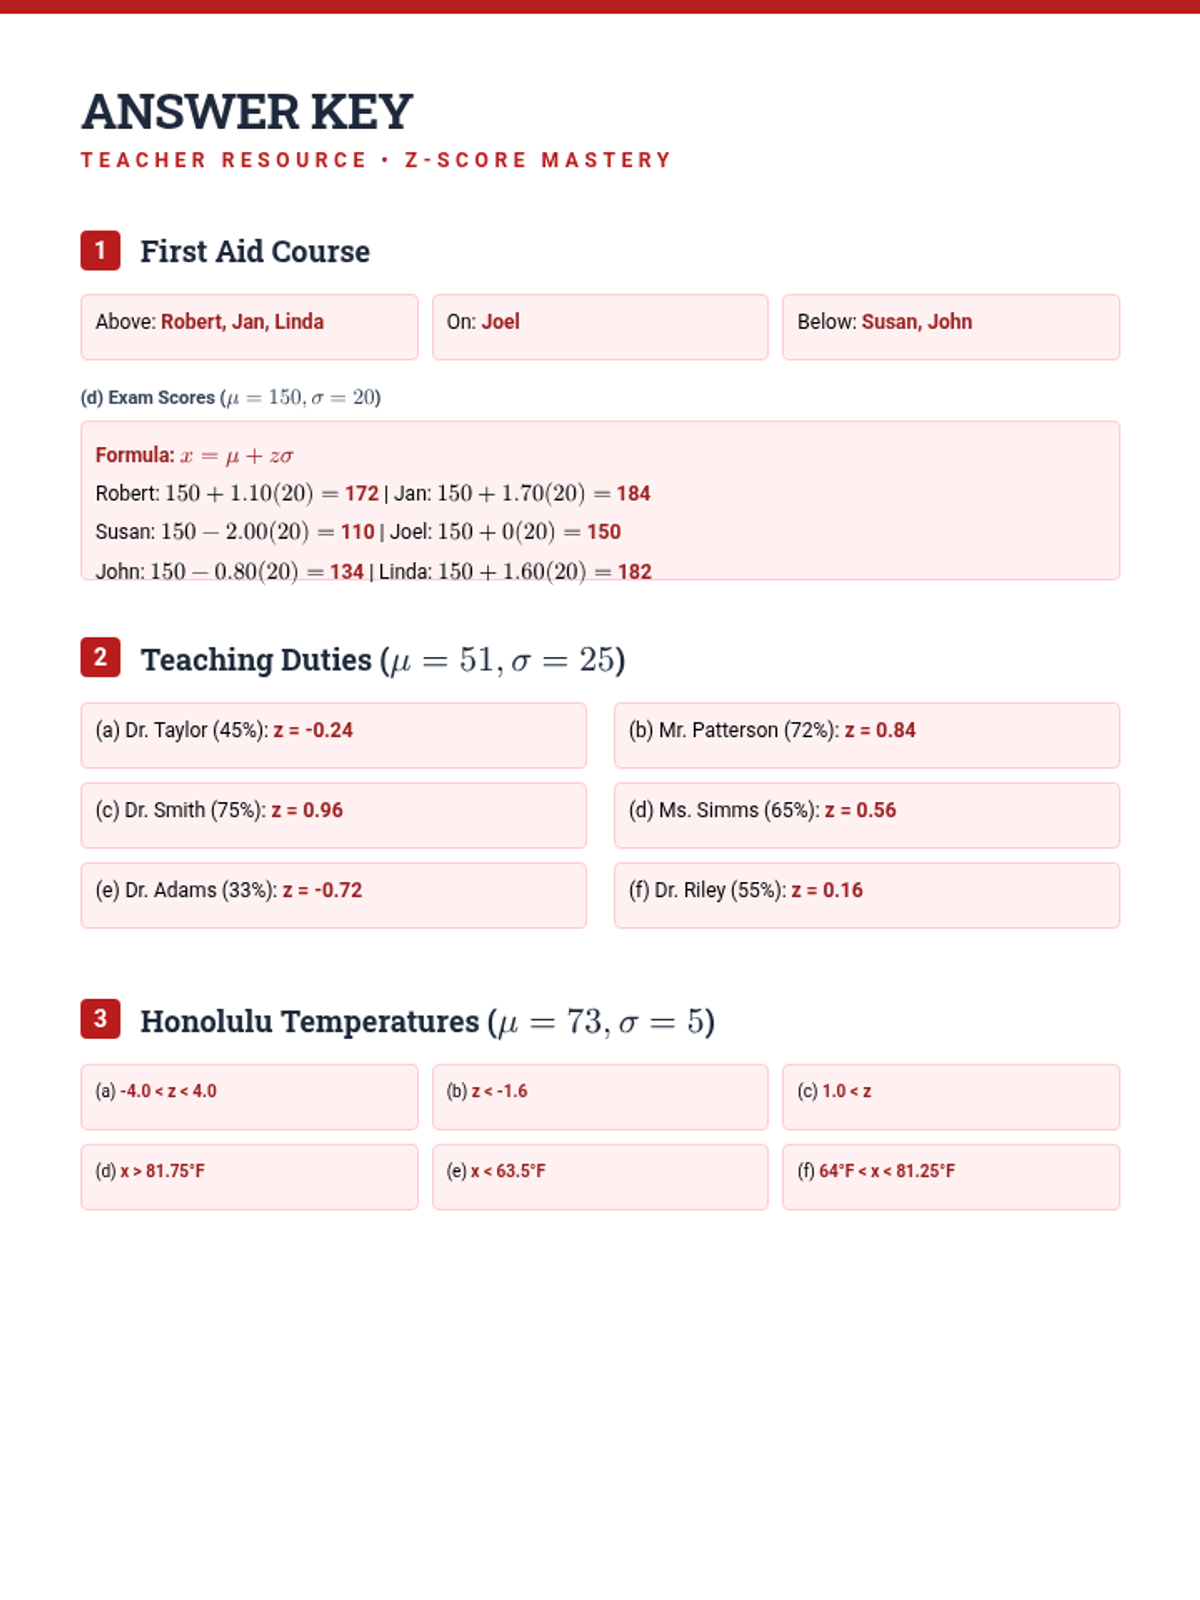
A lesson focused on understanding and applying z-scores to compare values from different normal distributions and interpret real-world statistical data.
A lesson focused on calculating and interpreting z-scores within the context of normal distributions, featuring real-world data from ecology to education.
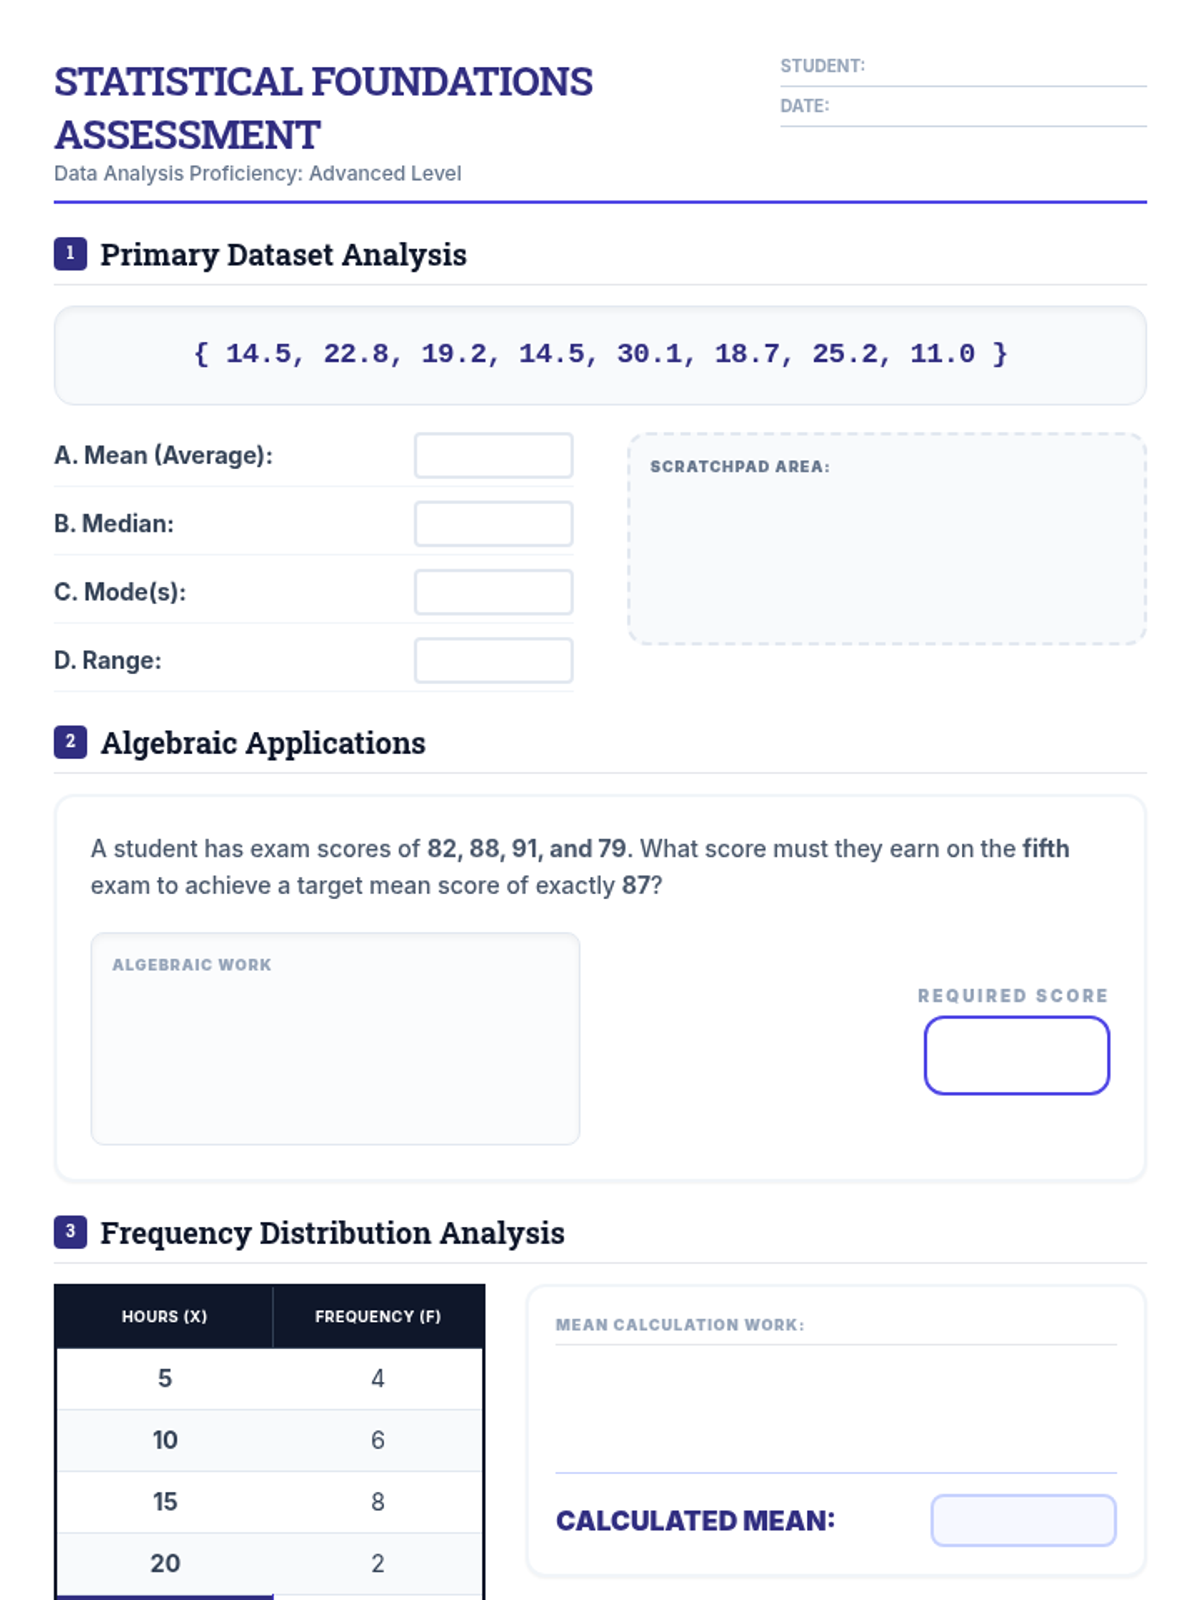
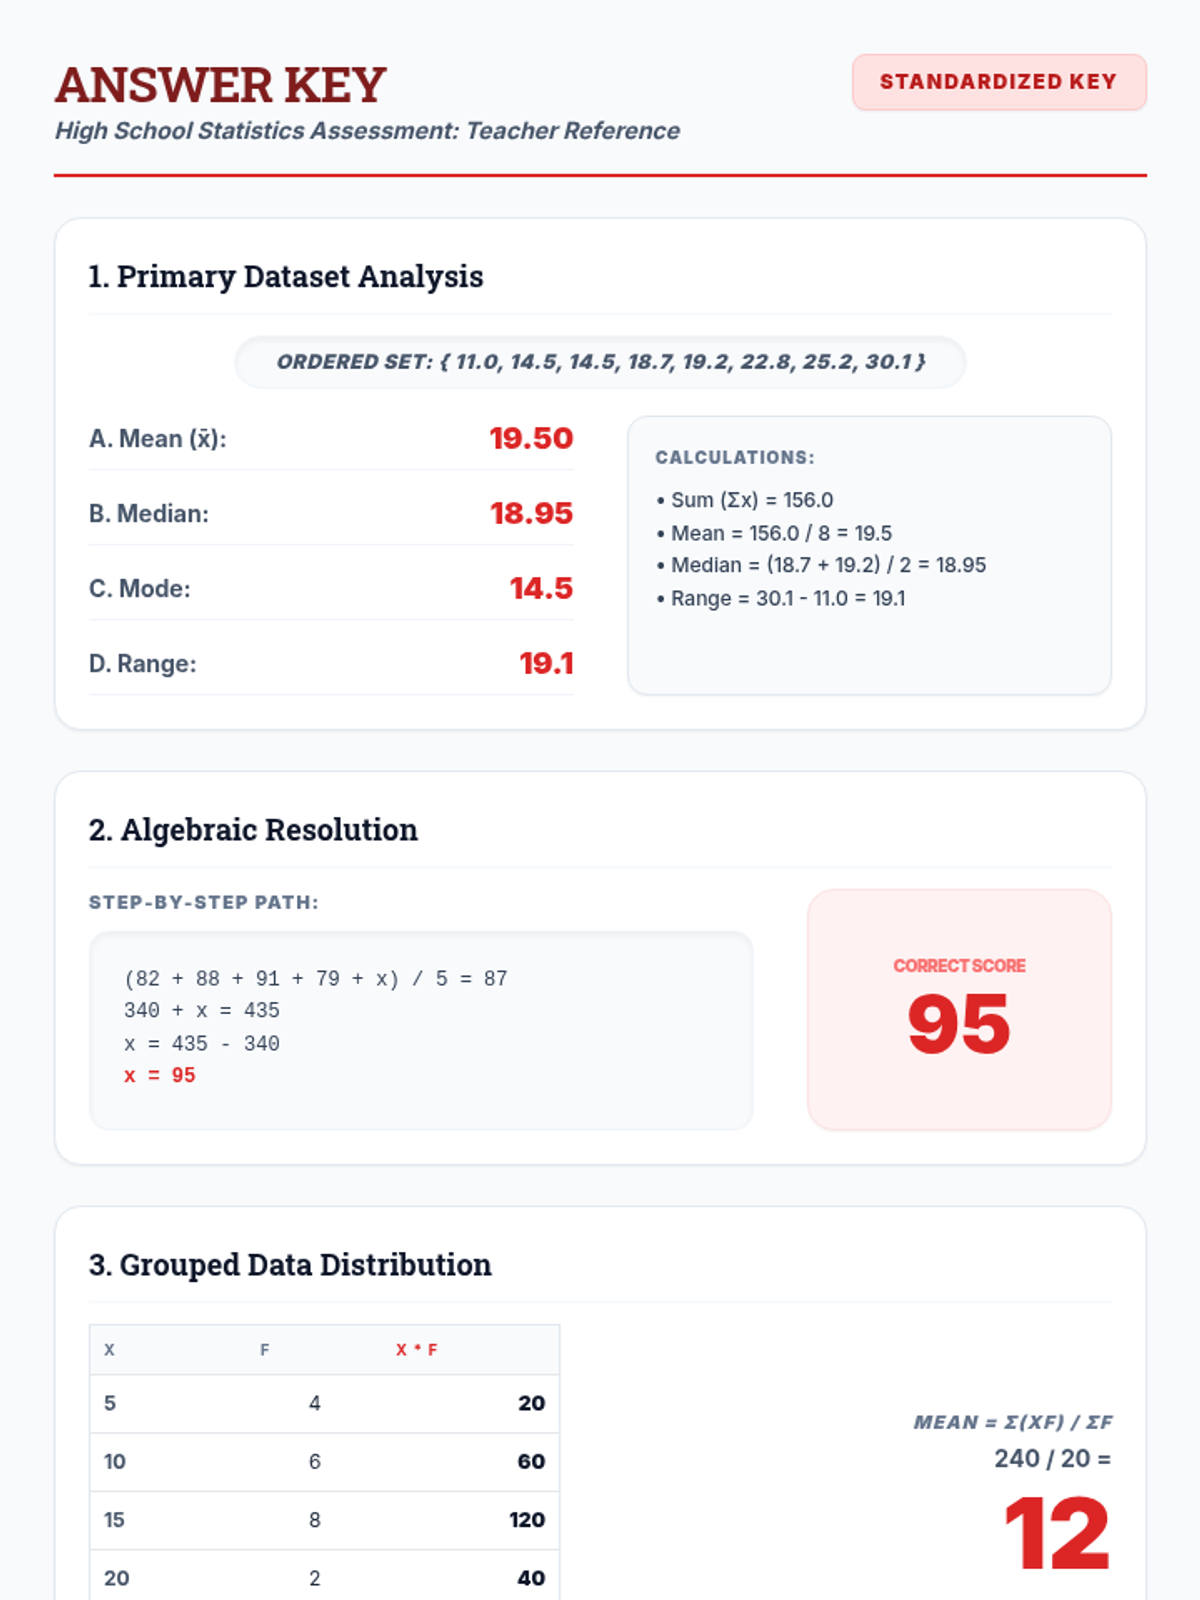
Advanced applications of central tendency and spread, including algebraic problem-solving, weighted means, and the mathematical impact of outliers for high school students.
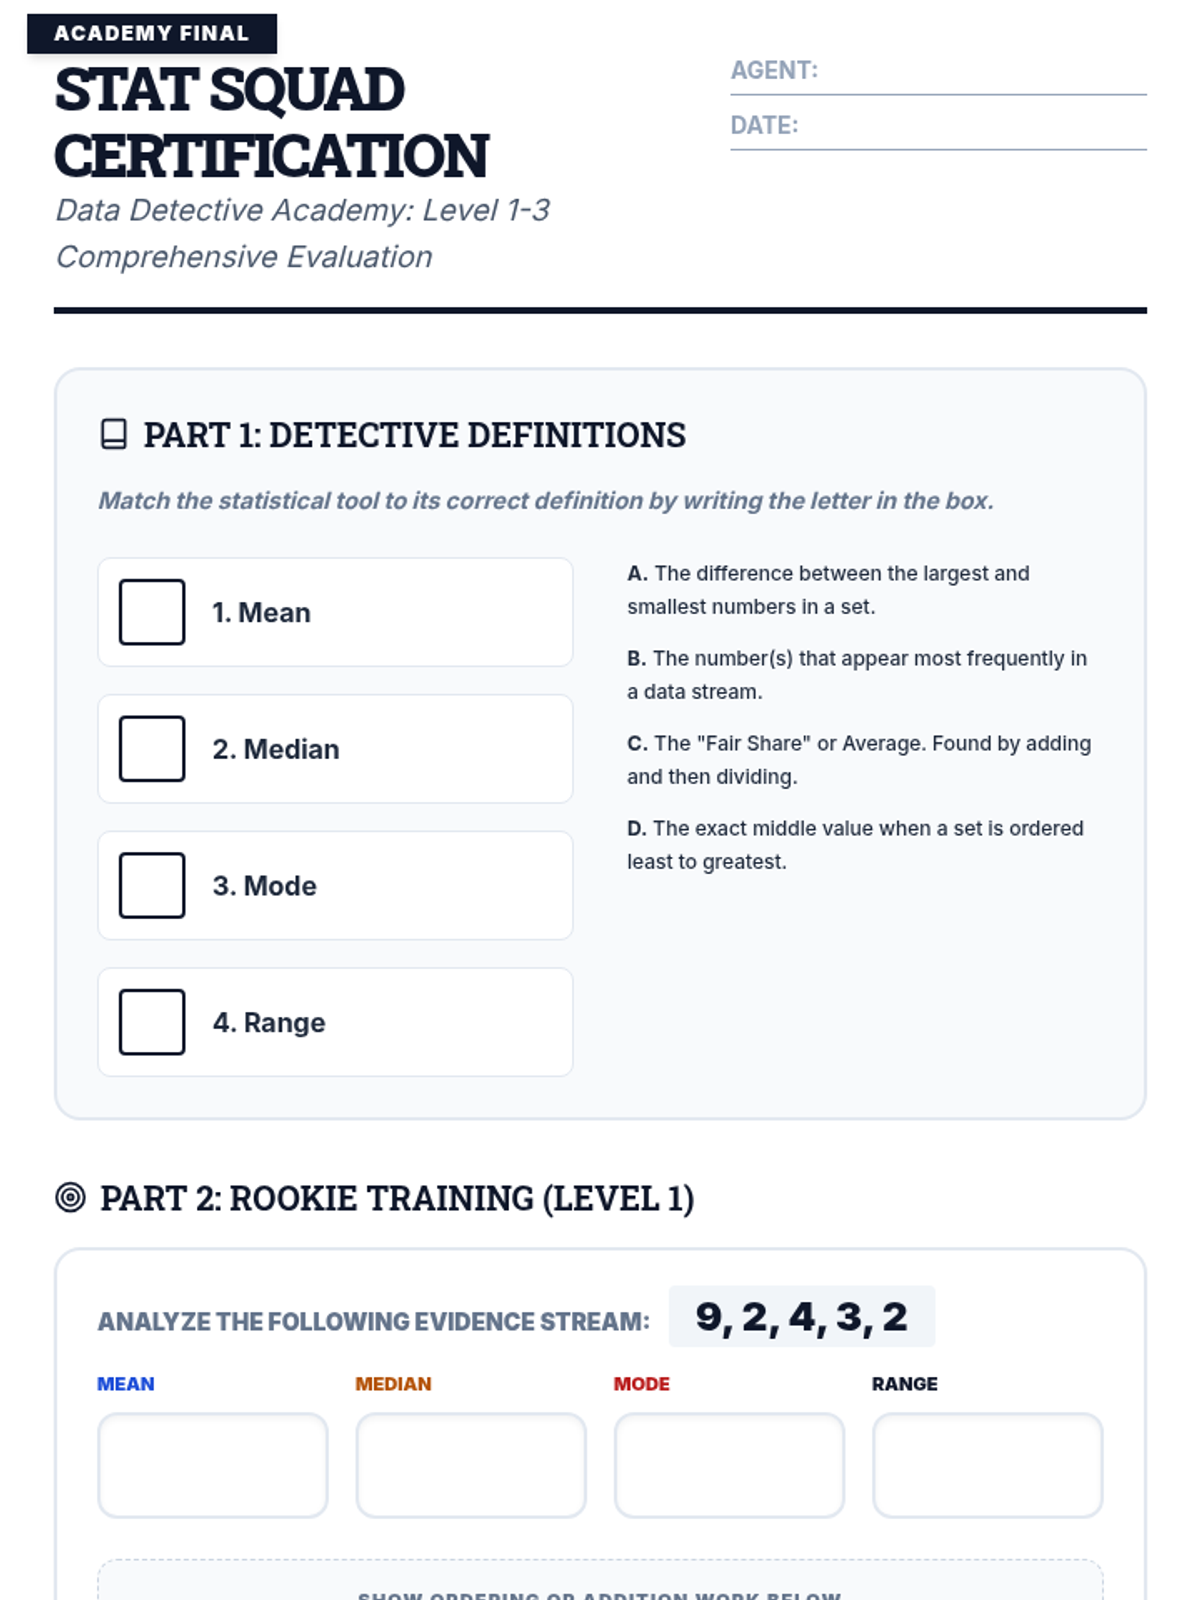
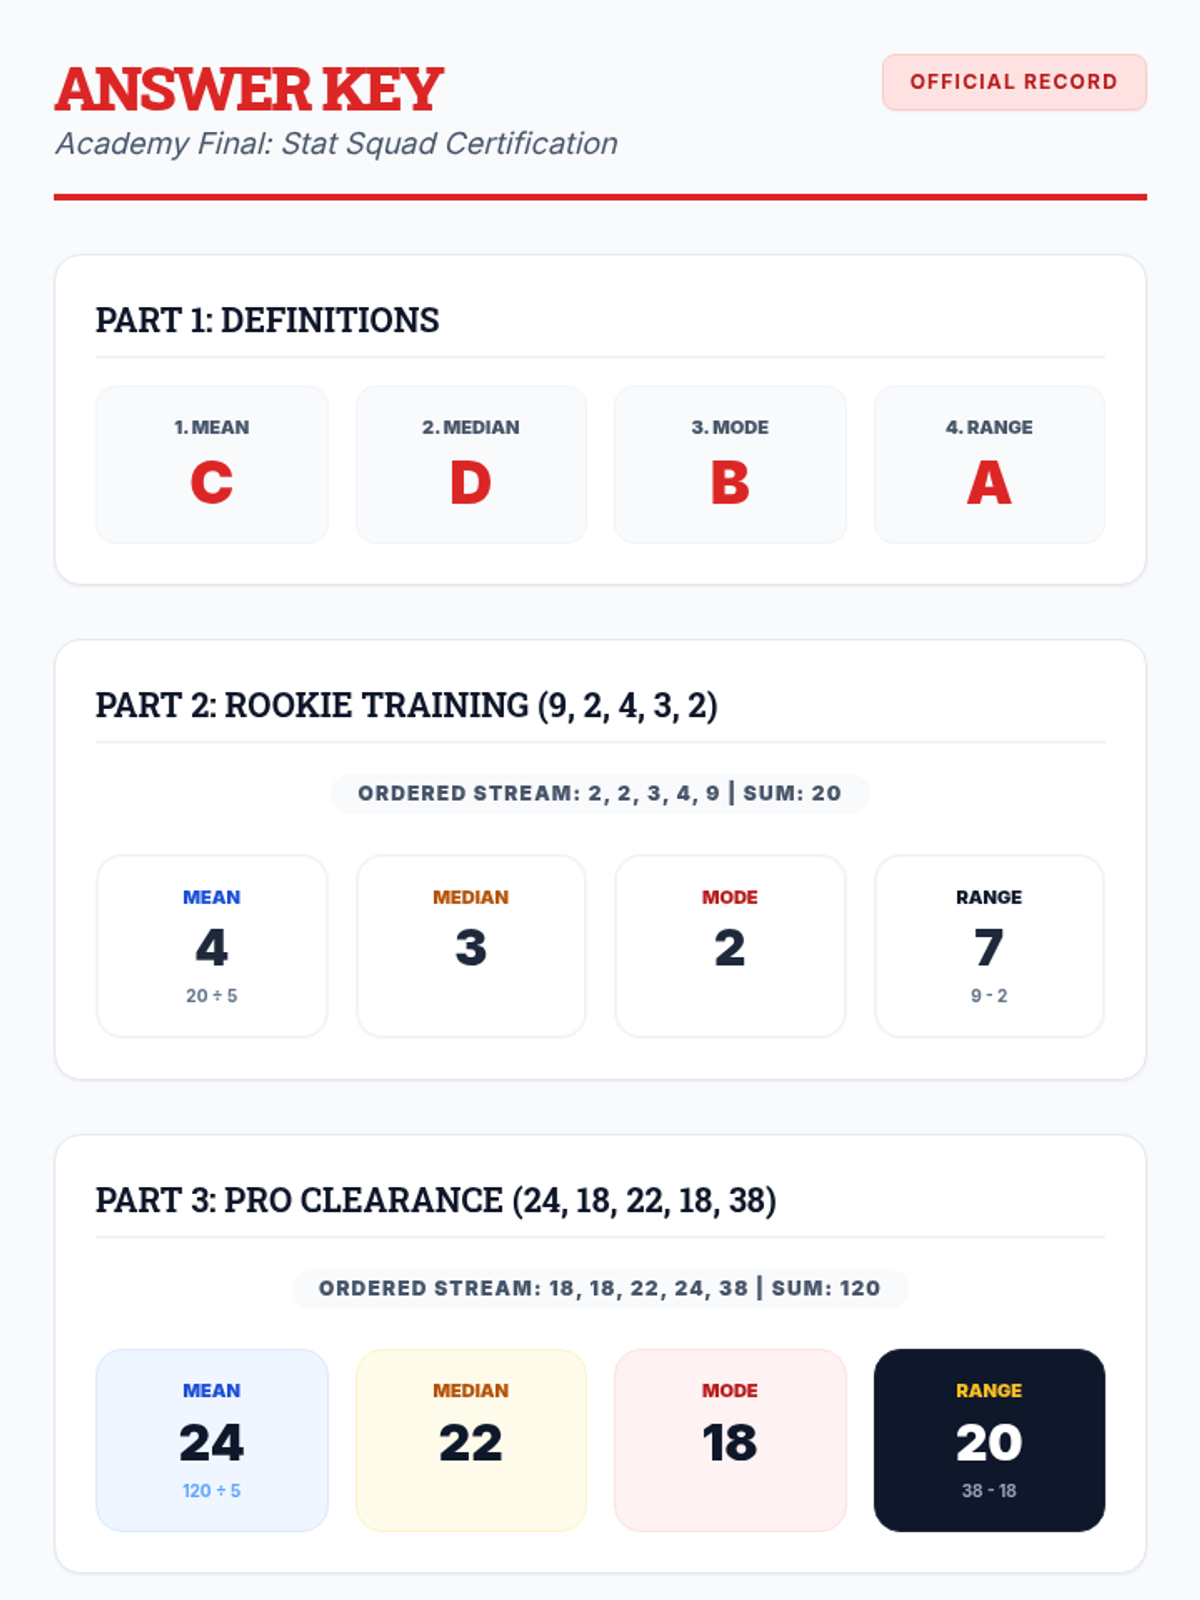
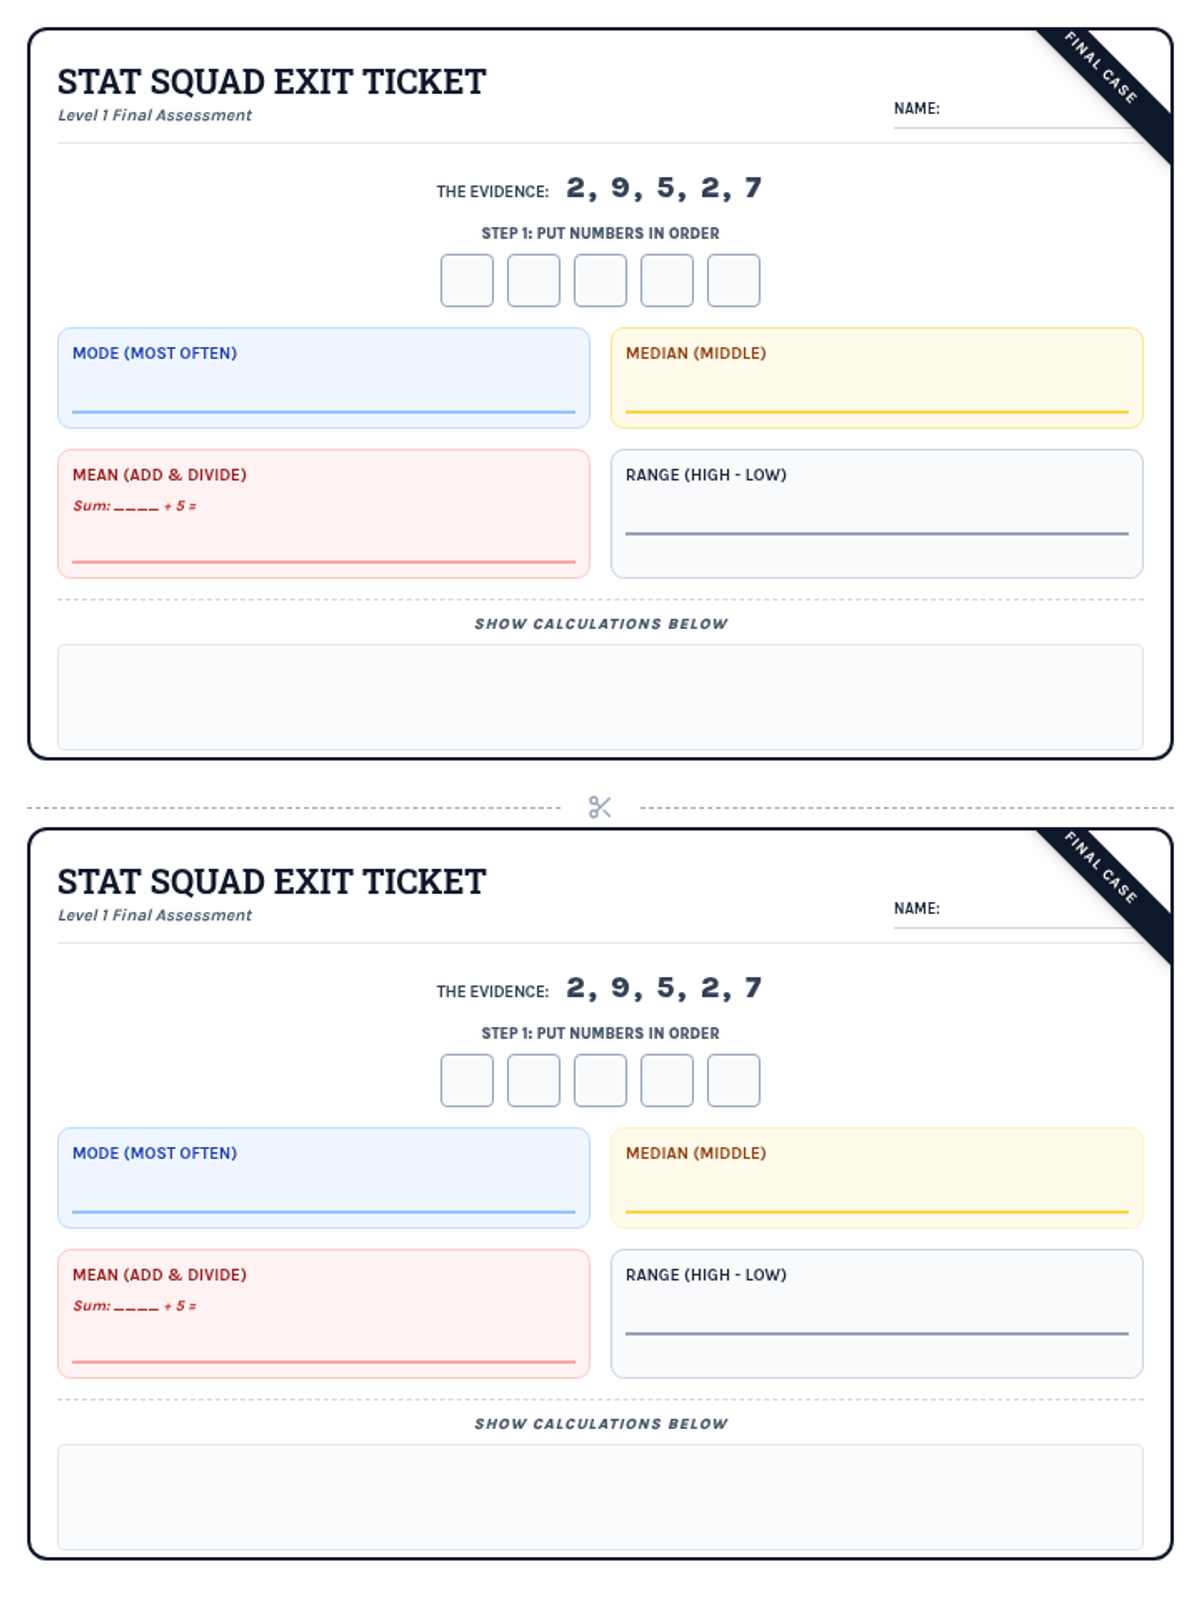
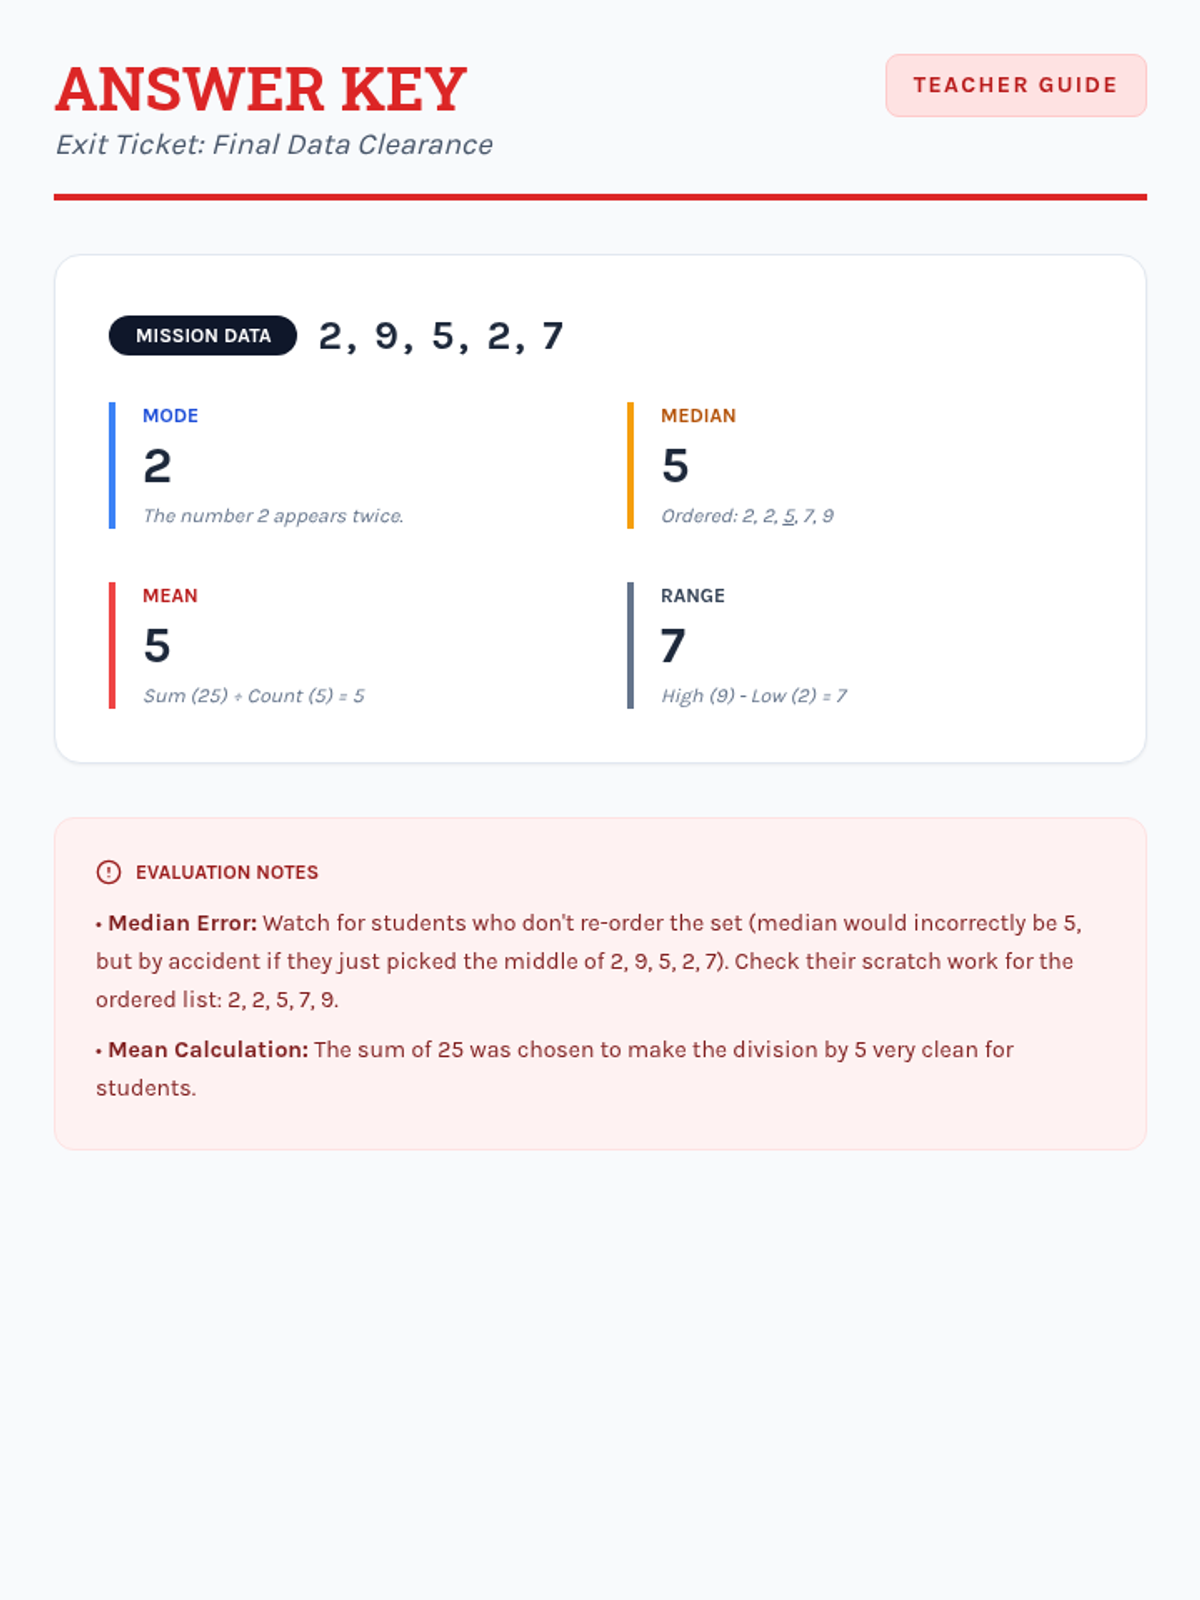
A comprehensive assessment covering Level 1, Level 2, and Level 3 data analysis, designed to evaluate mastery of mean, median, mode, and range in both numerical and narrative contexts.
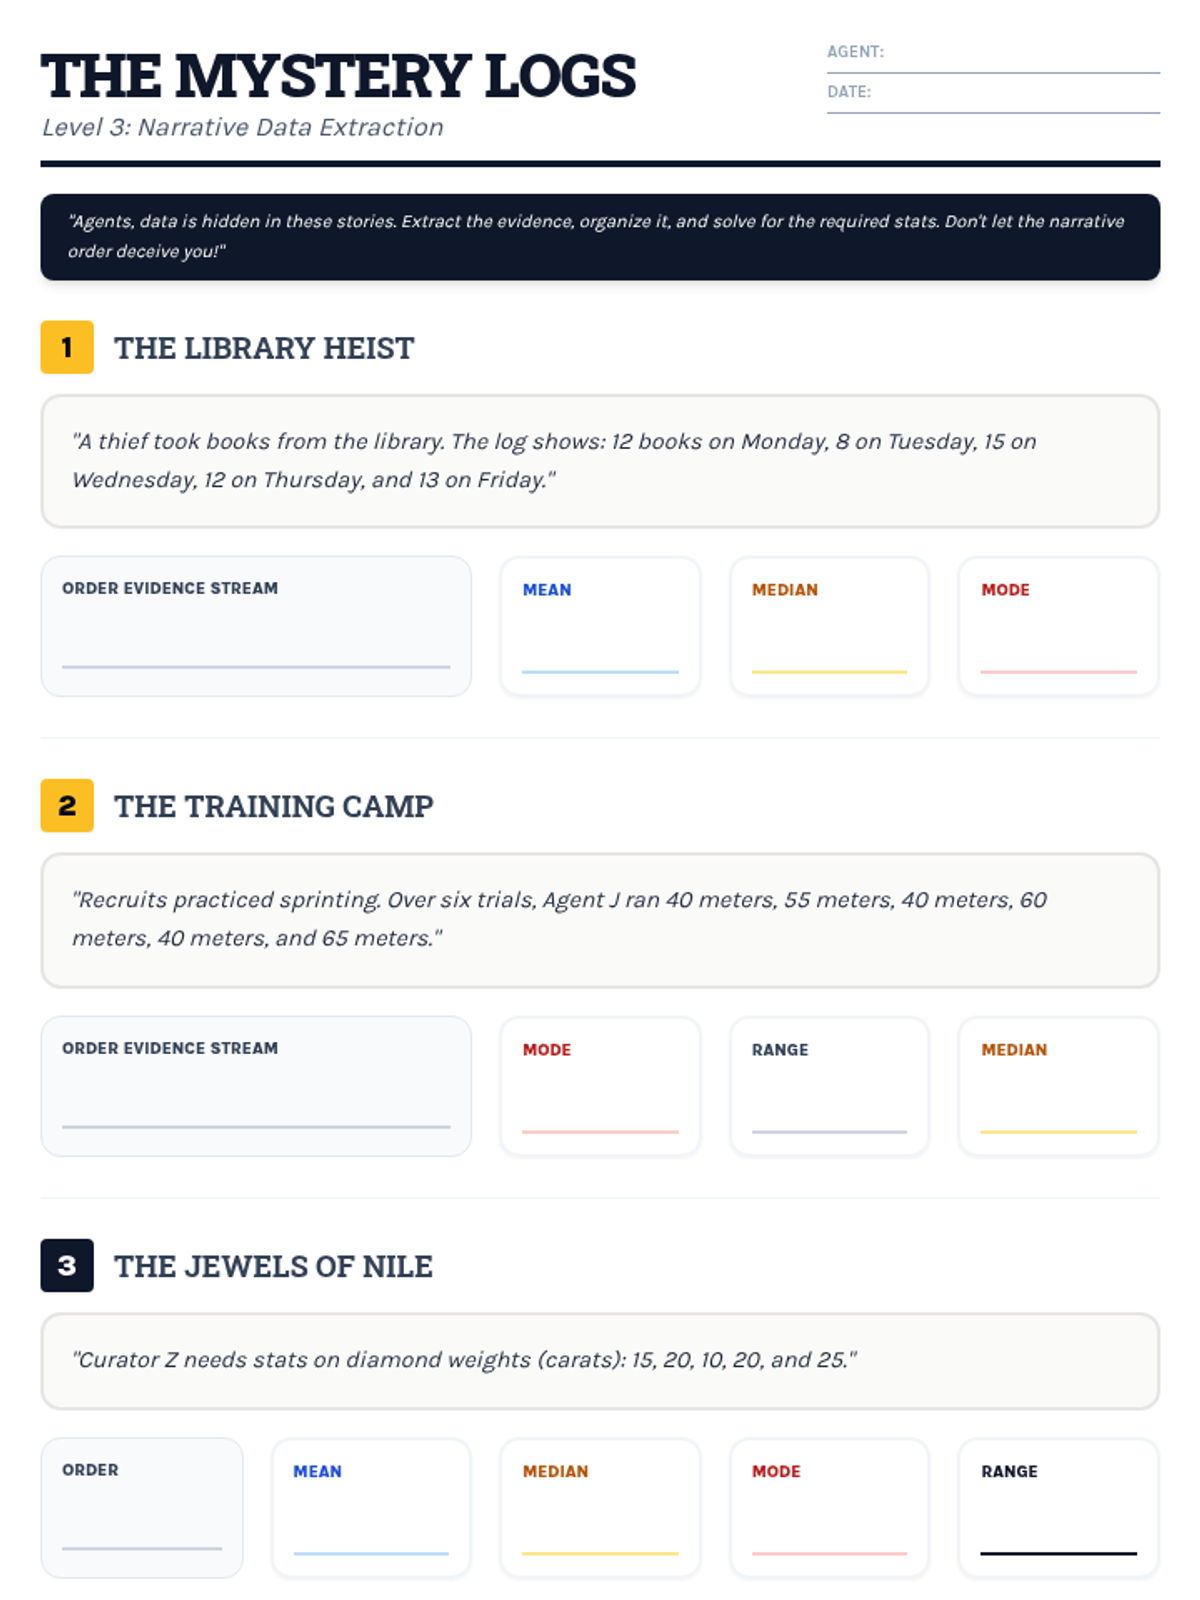
Students interpret and solve word problems involving mean, median, mode, and range, focusing on extracting data from narrative contexts and real-world scenarios.
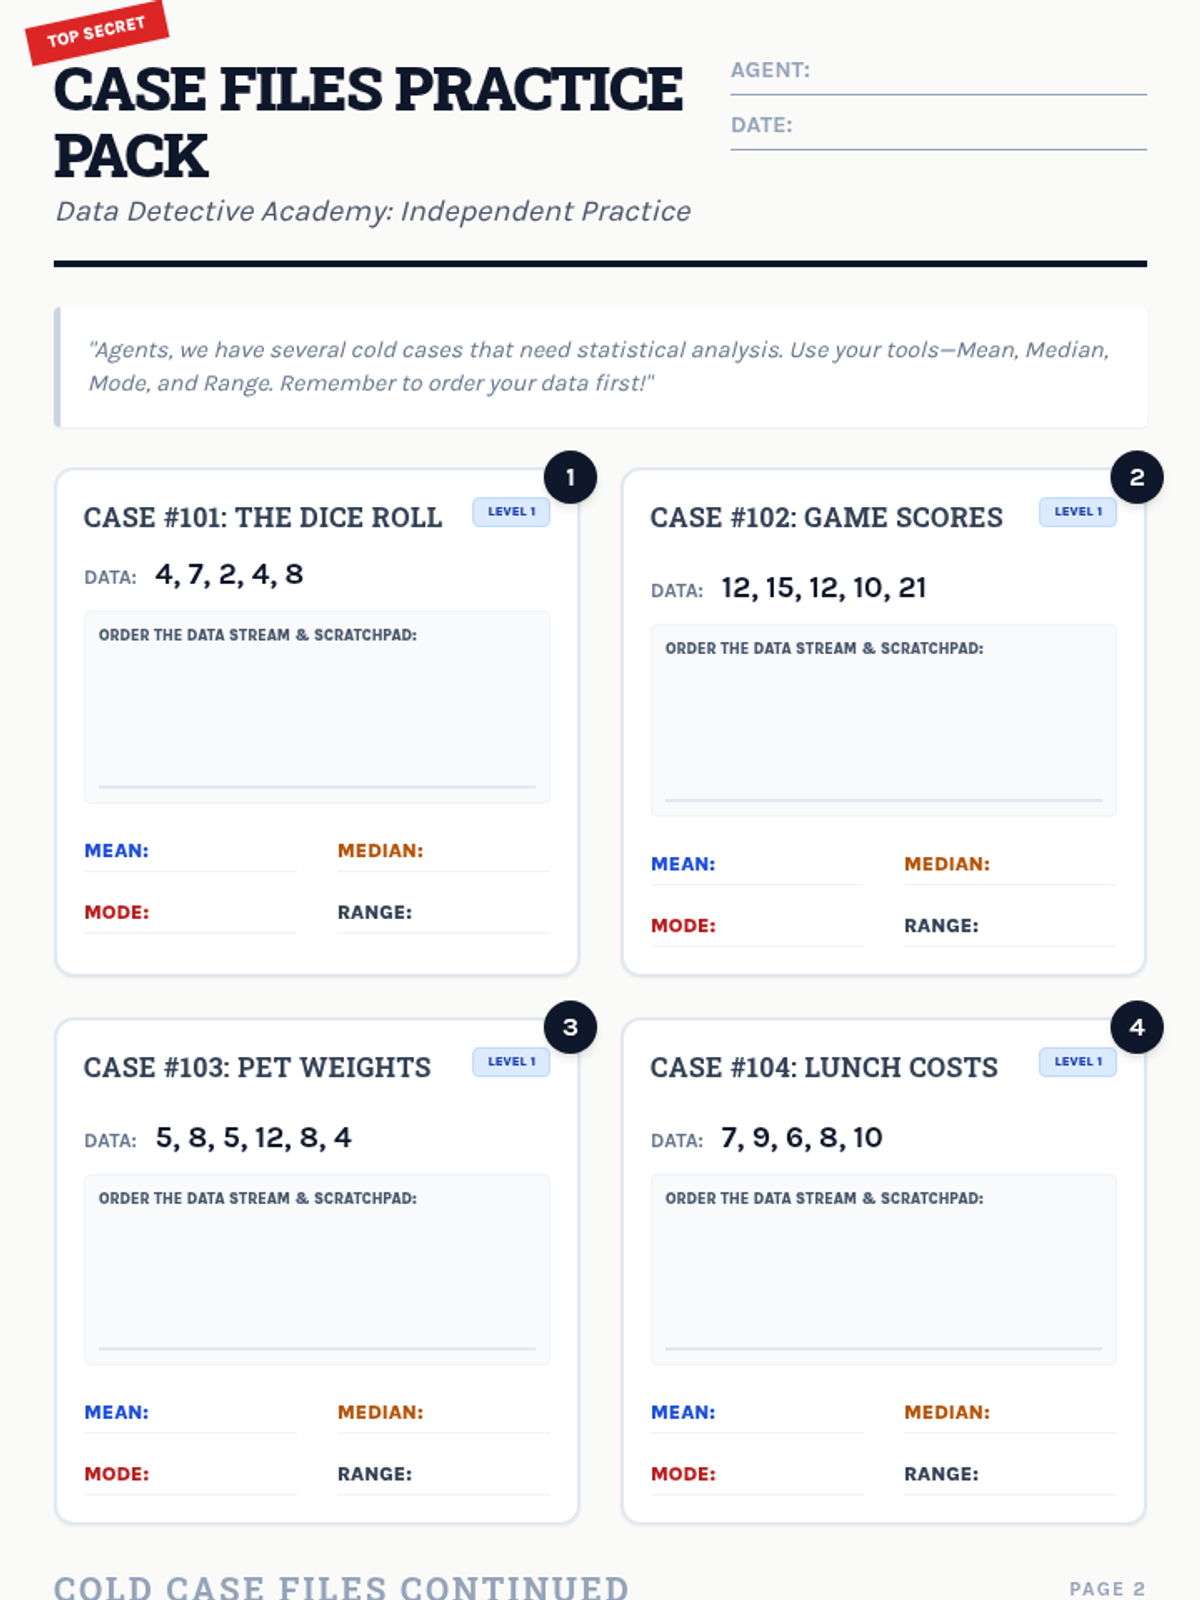
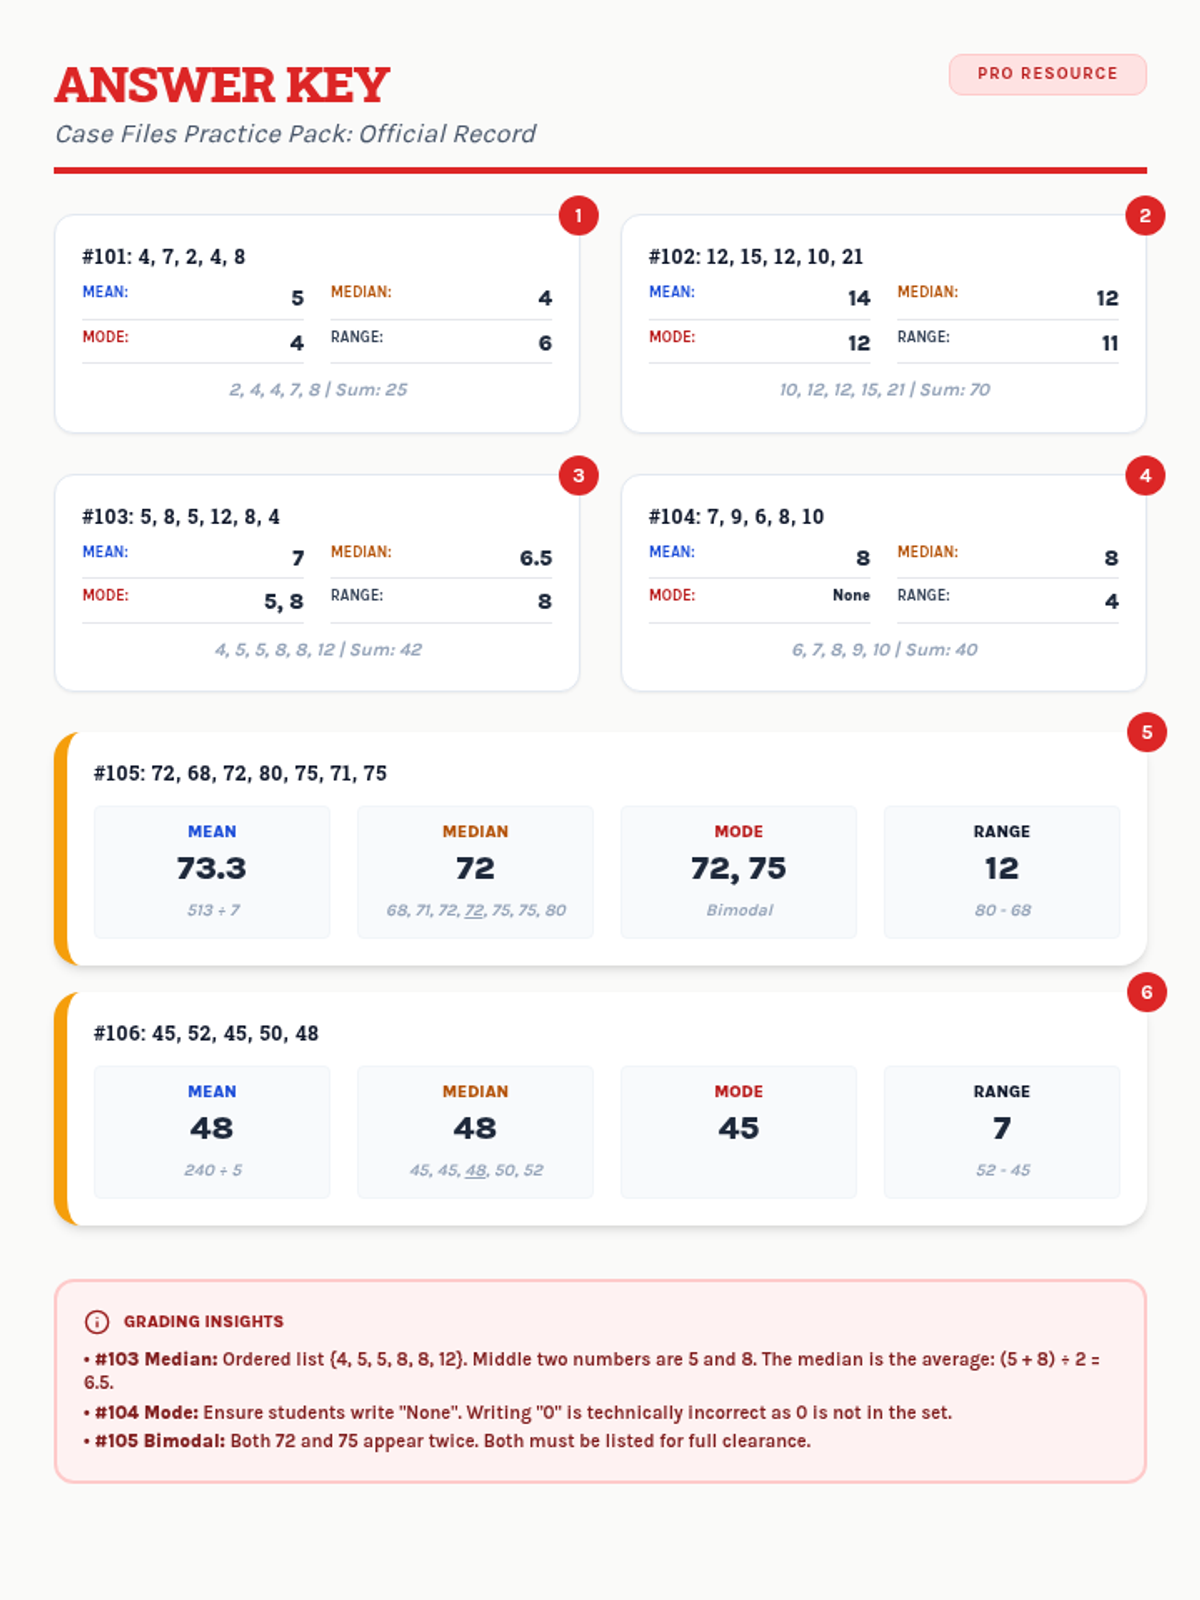
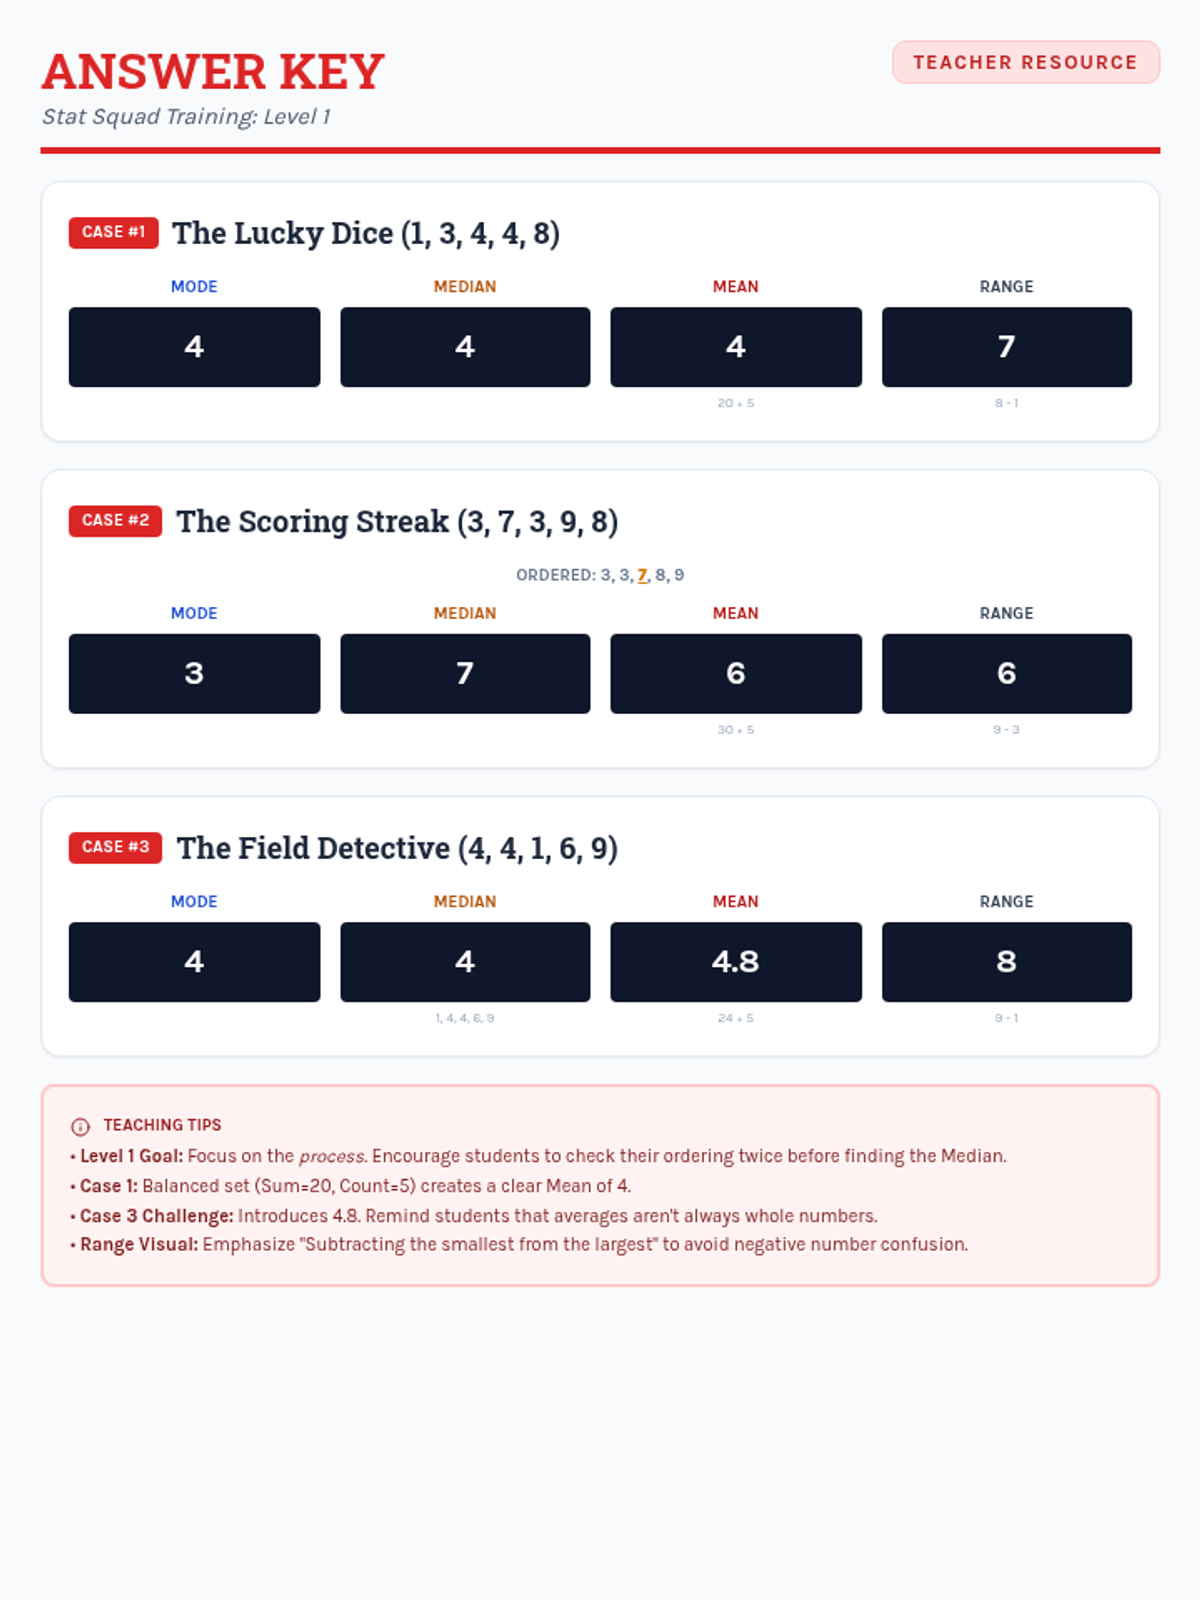
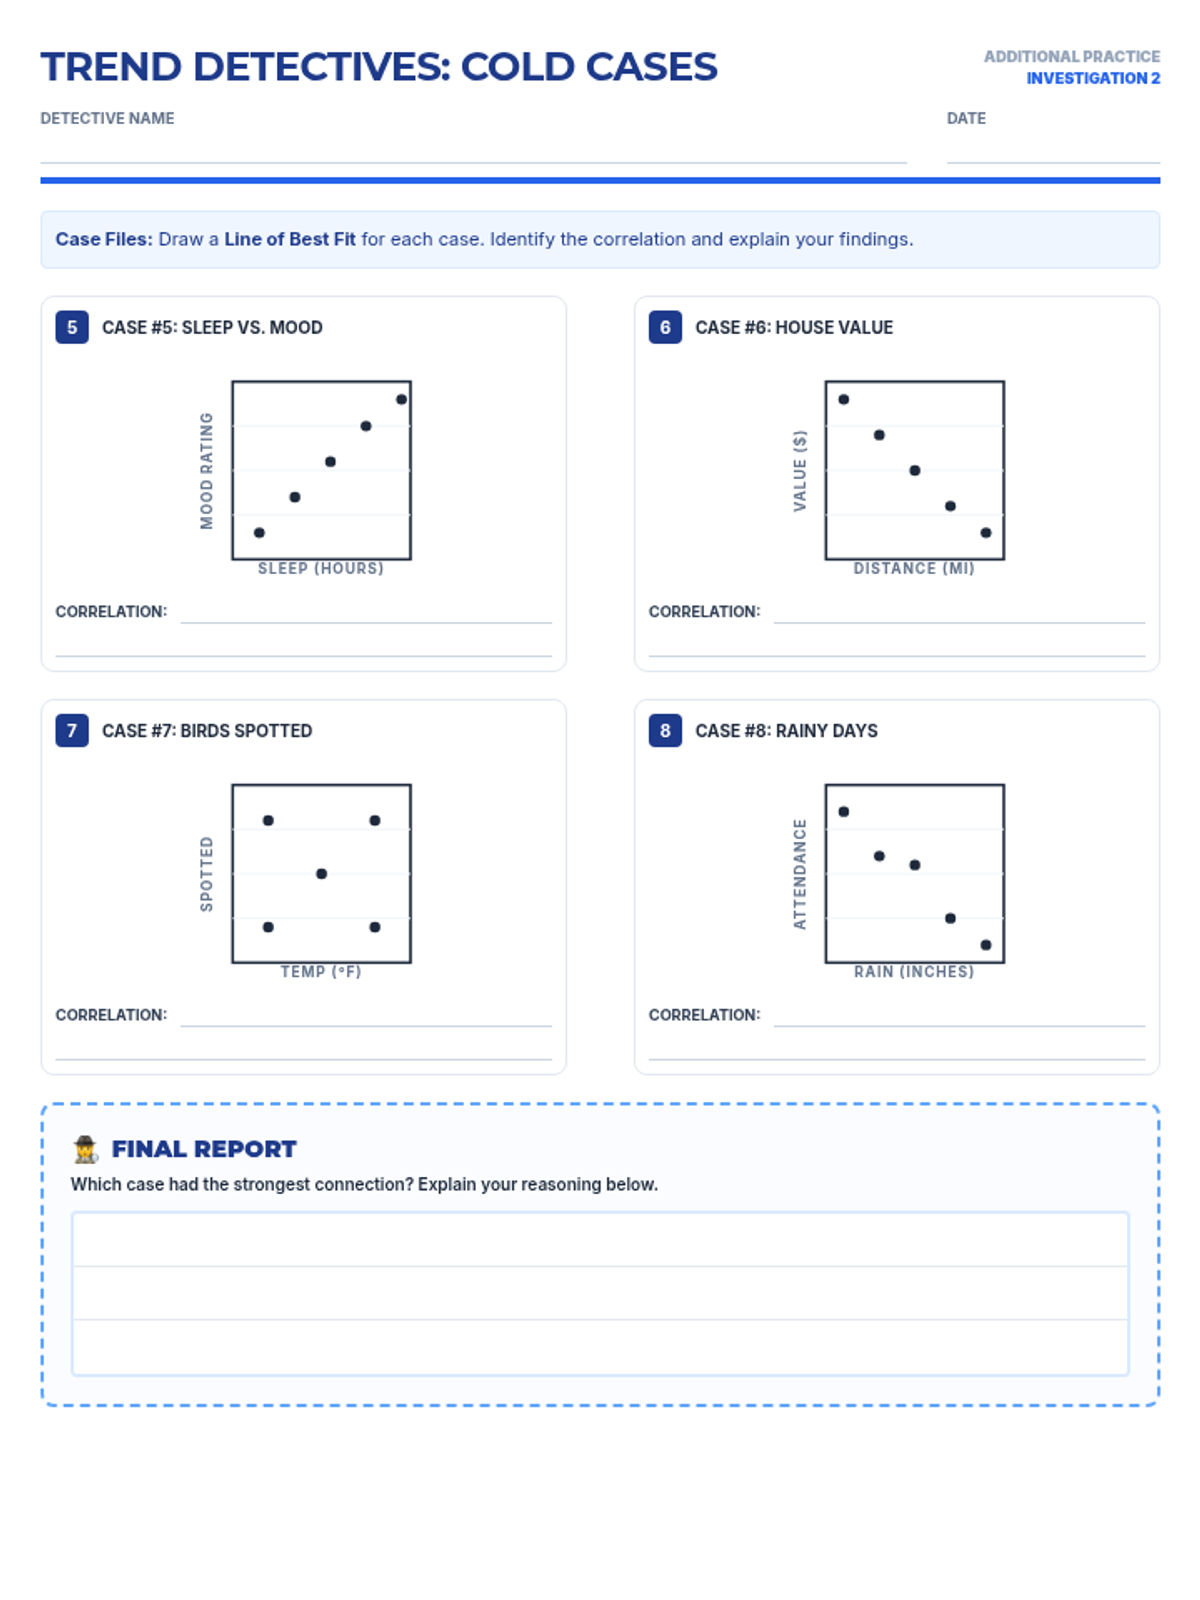
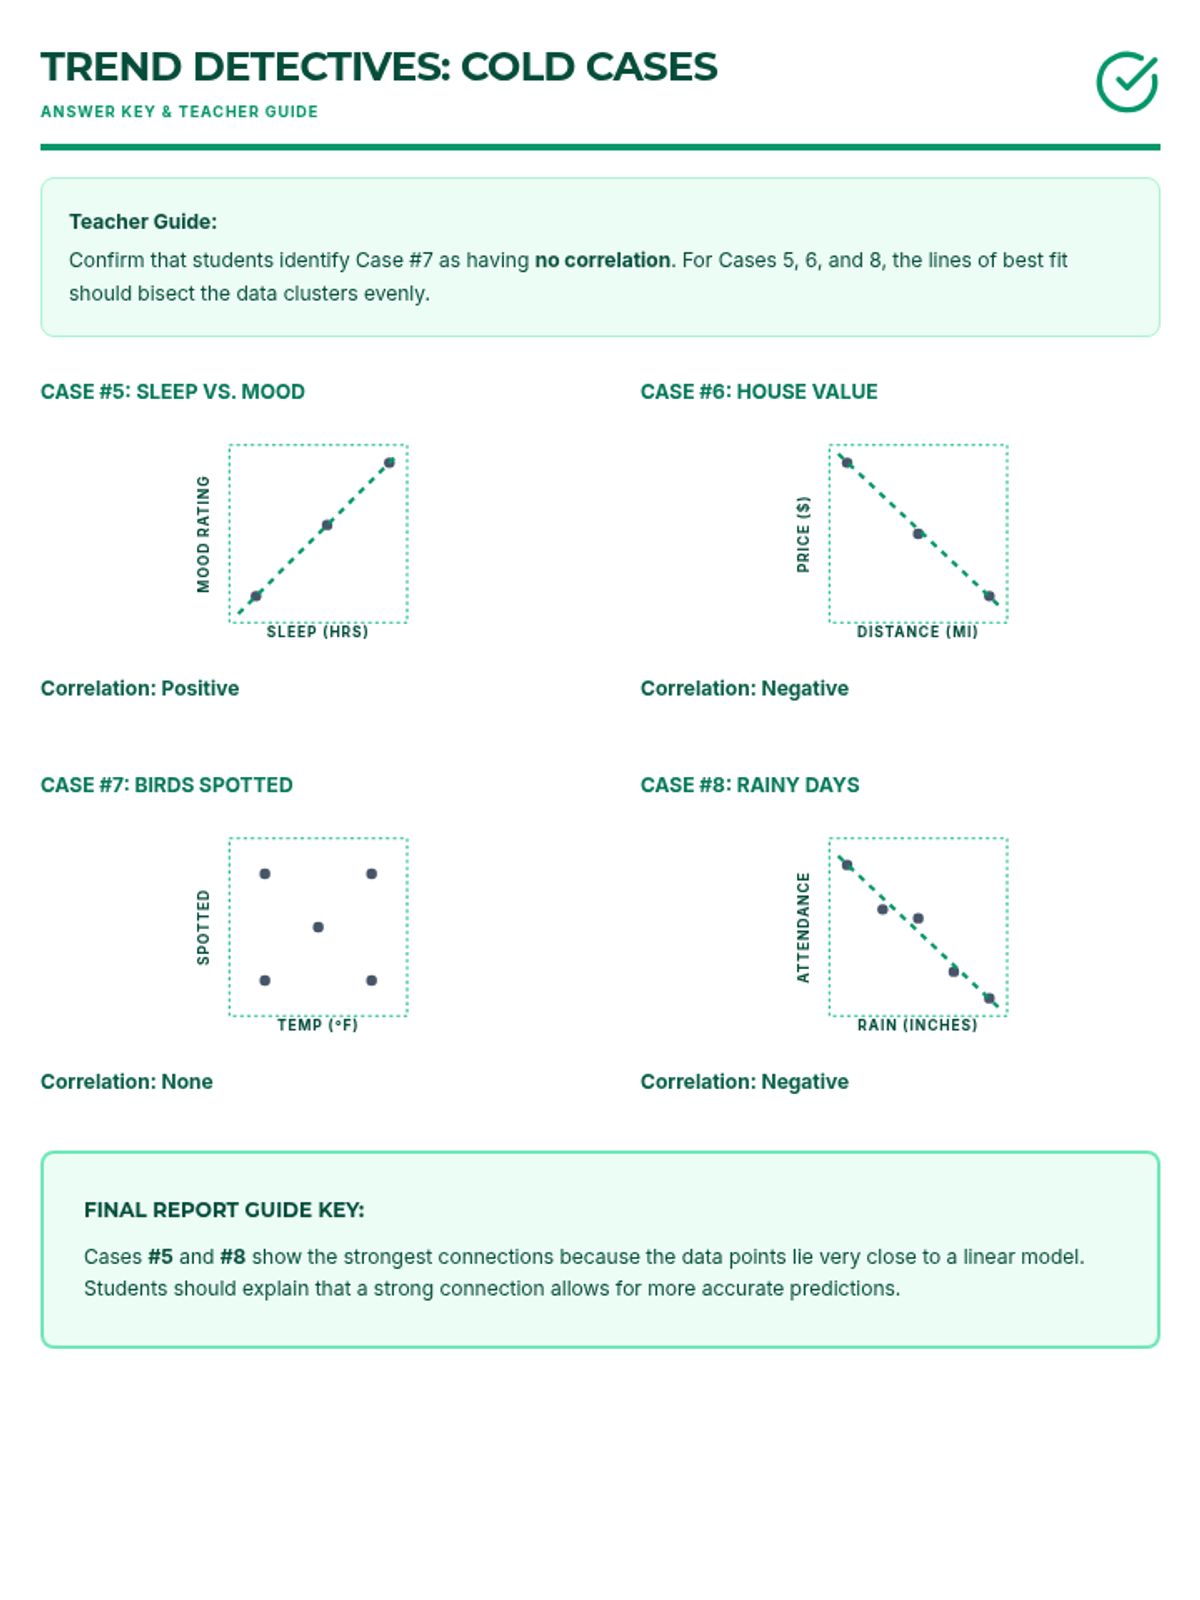
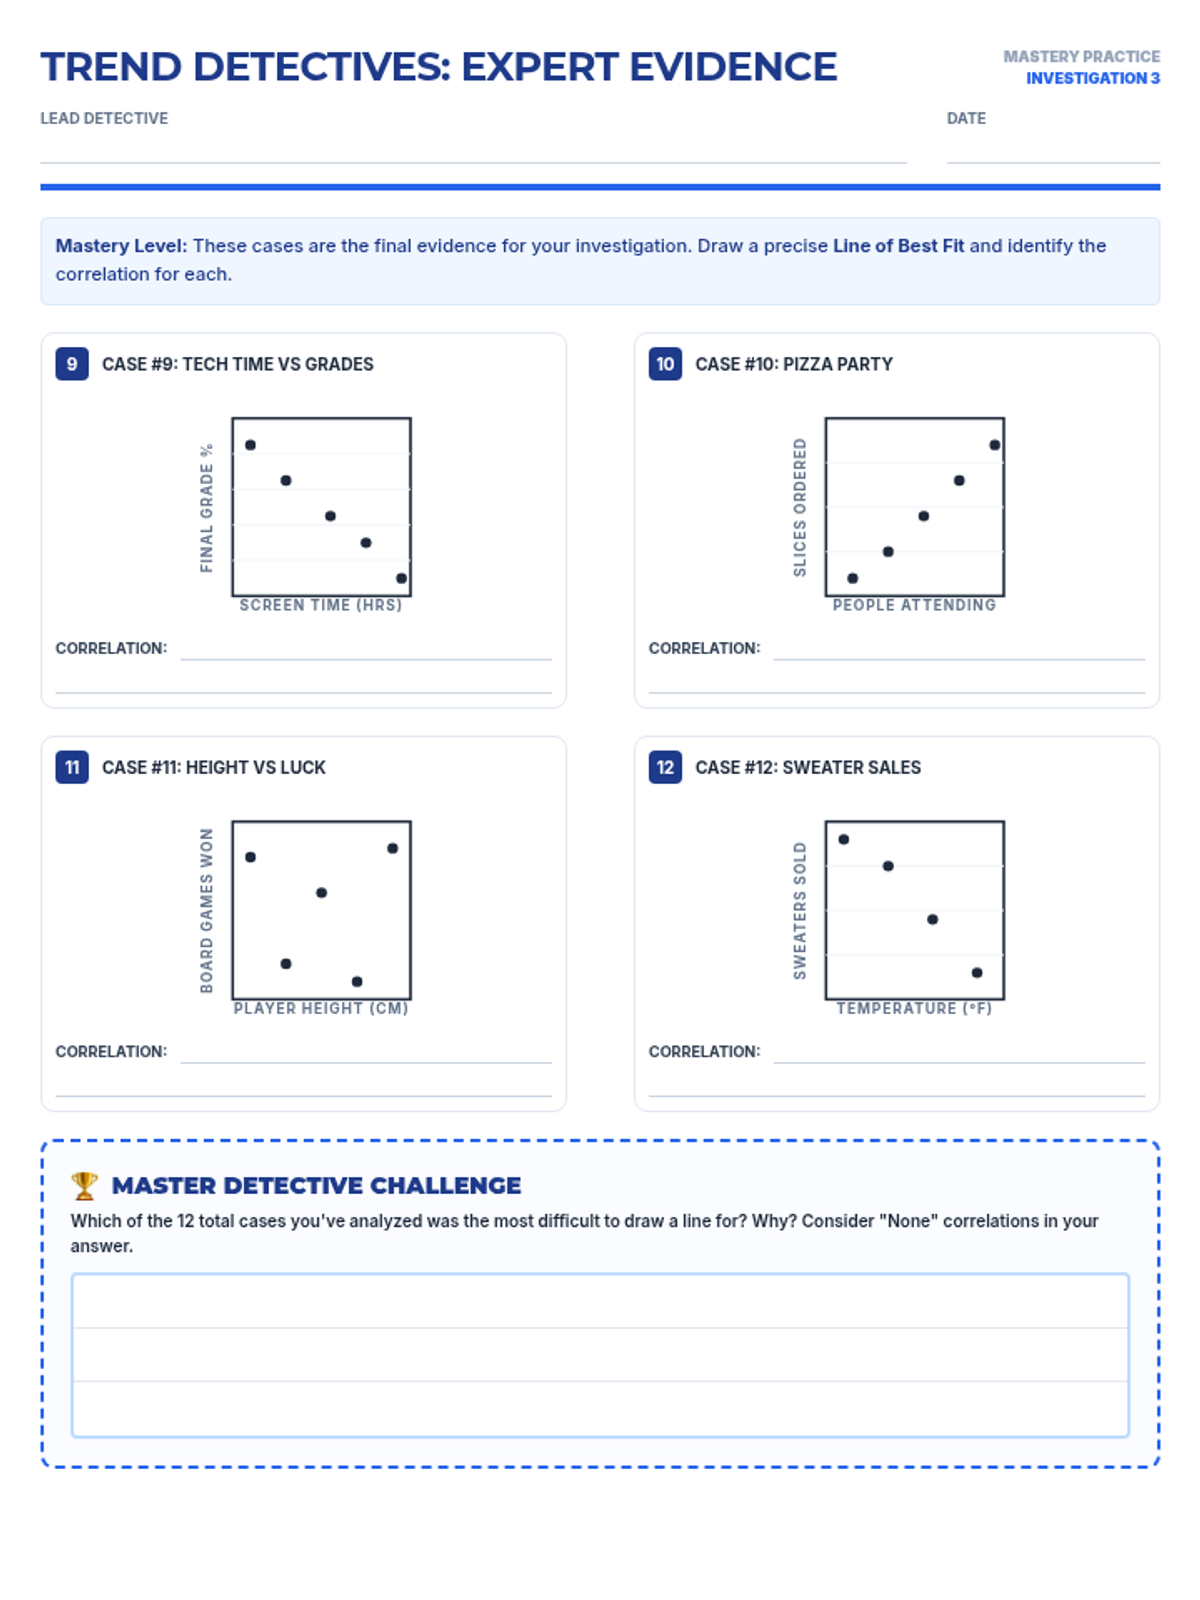
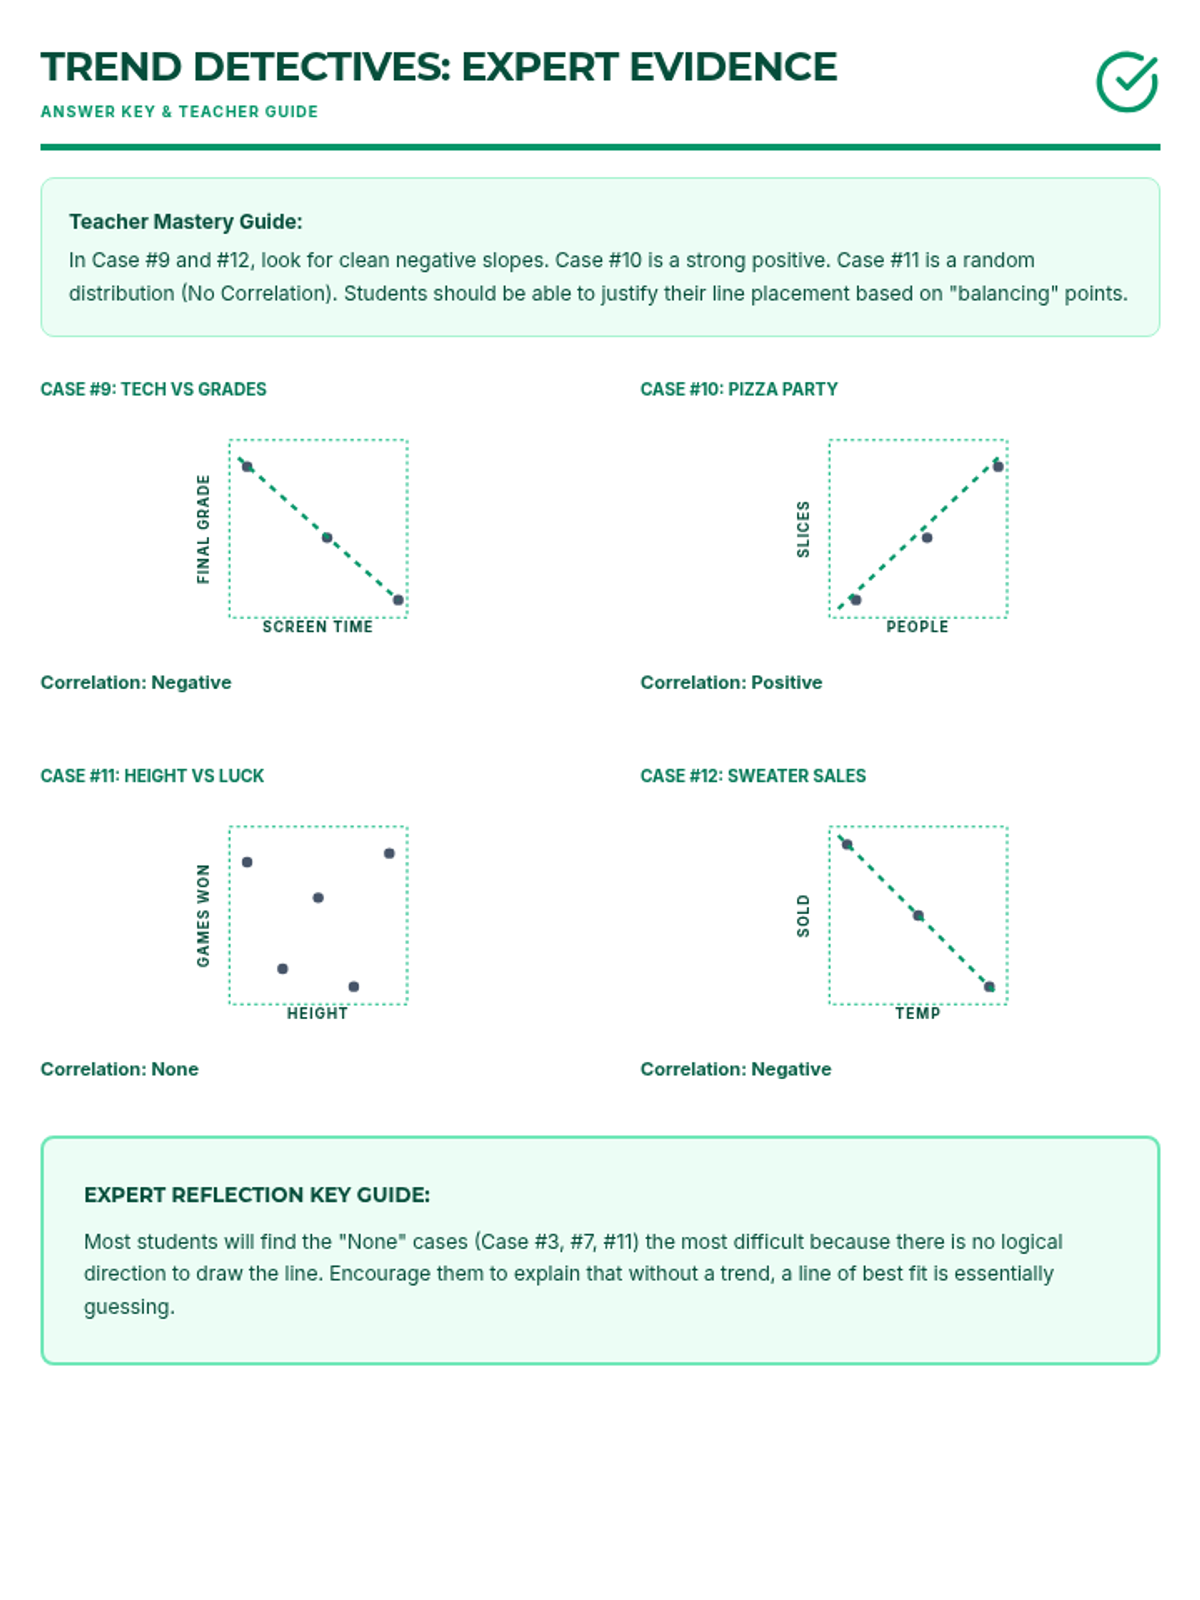
A collection of extra practice cases for mean, median, mode, and range, ranging from single-digit warmups to double-digit challenges, themed as unsolved detective files.
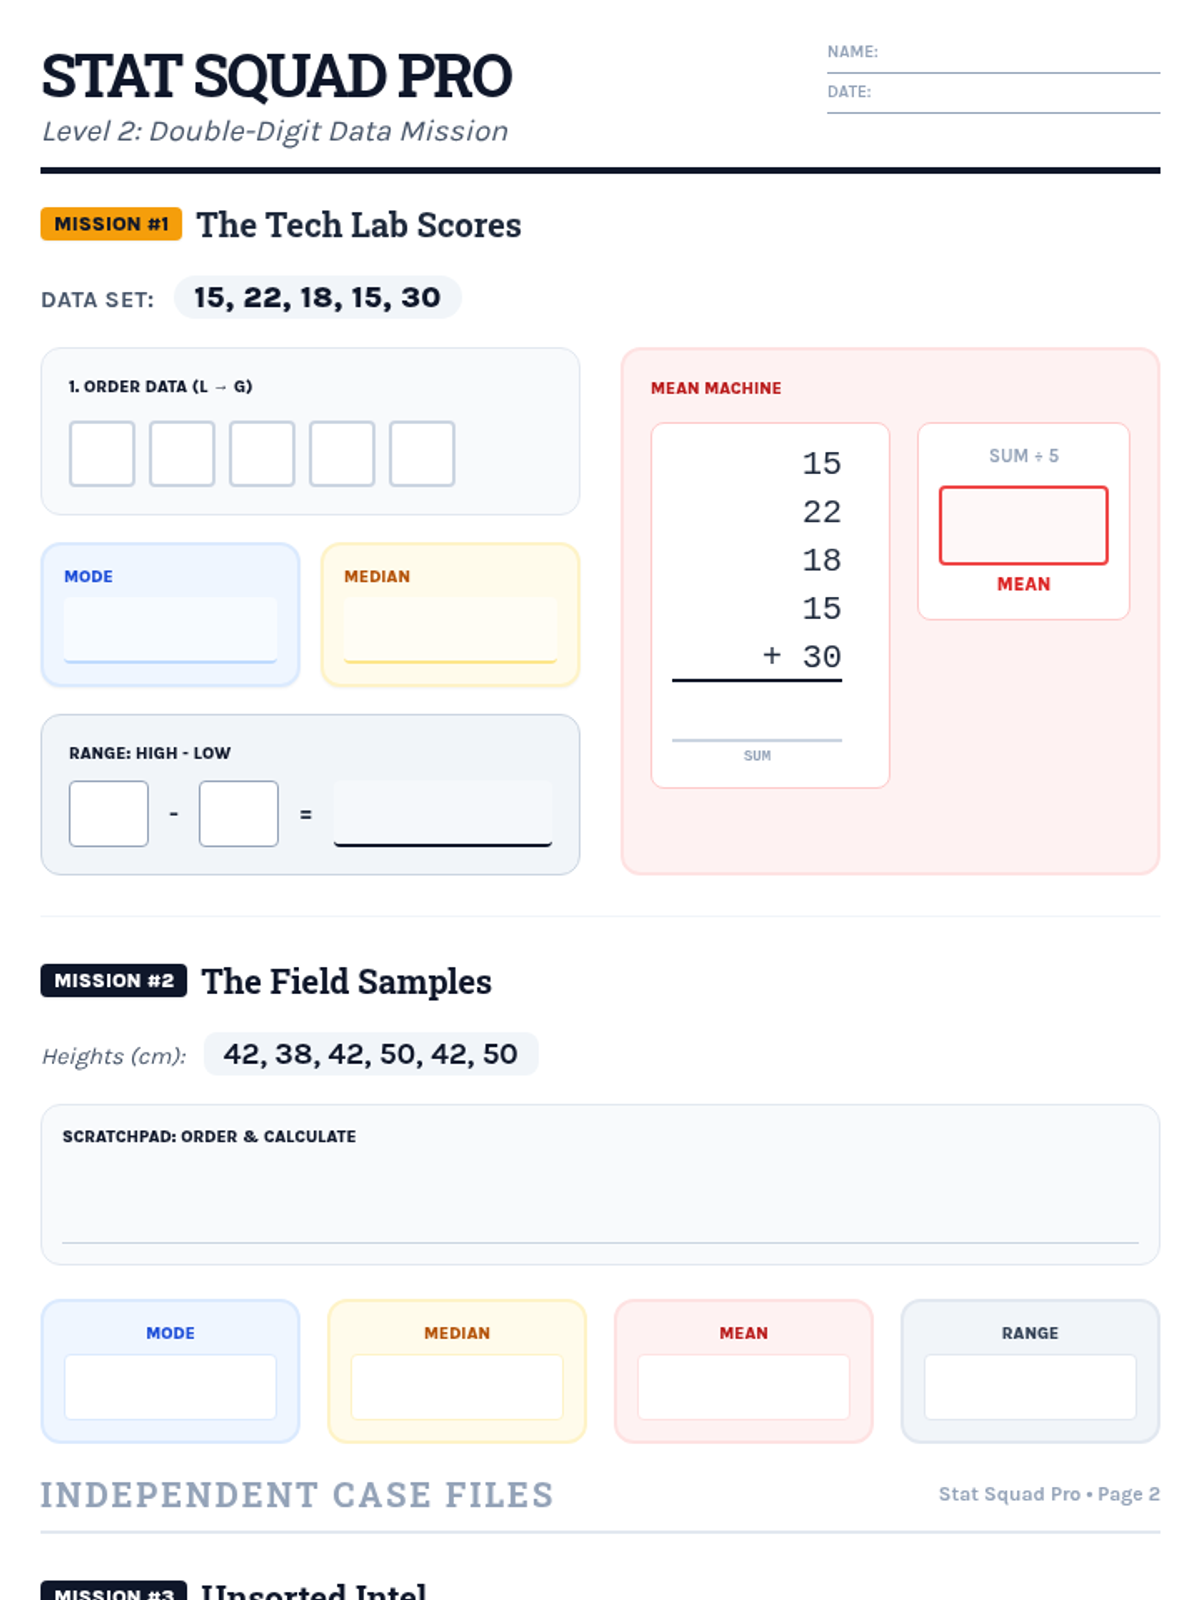
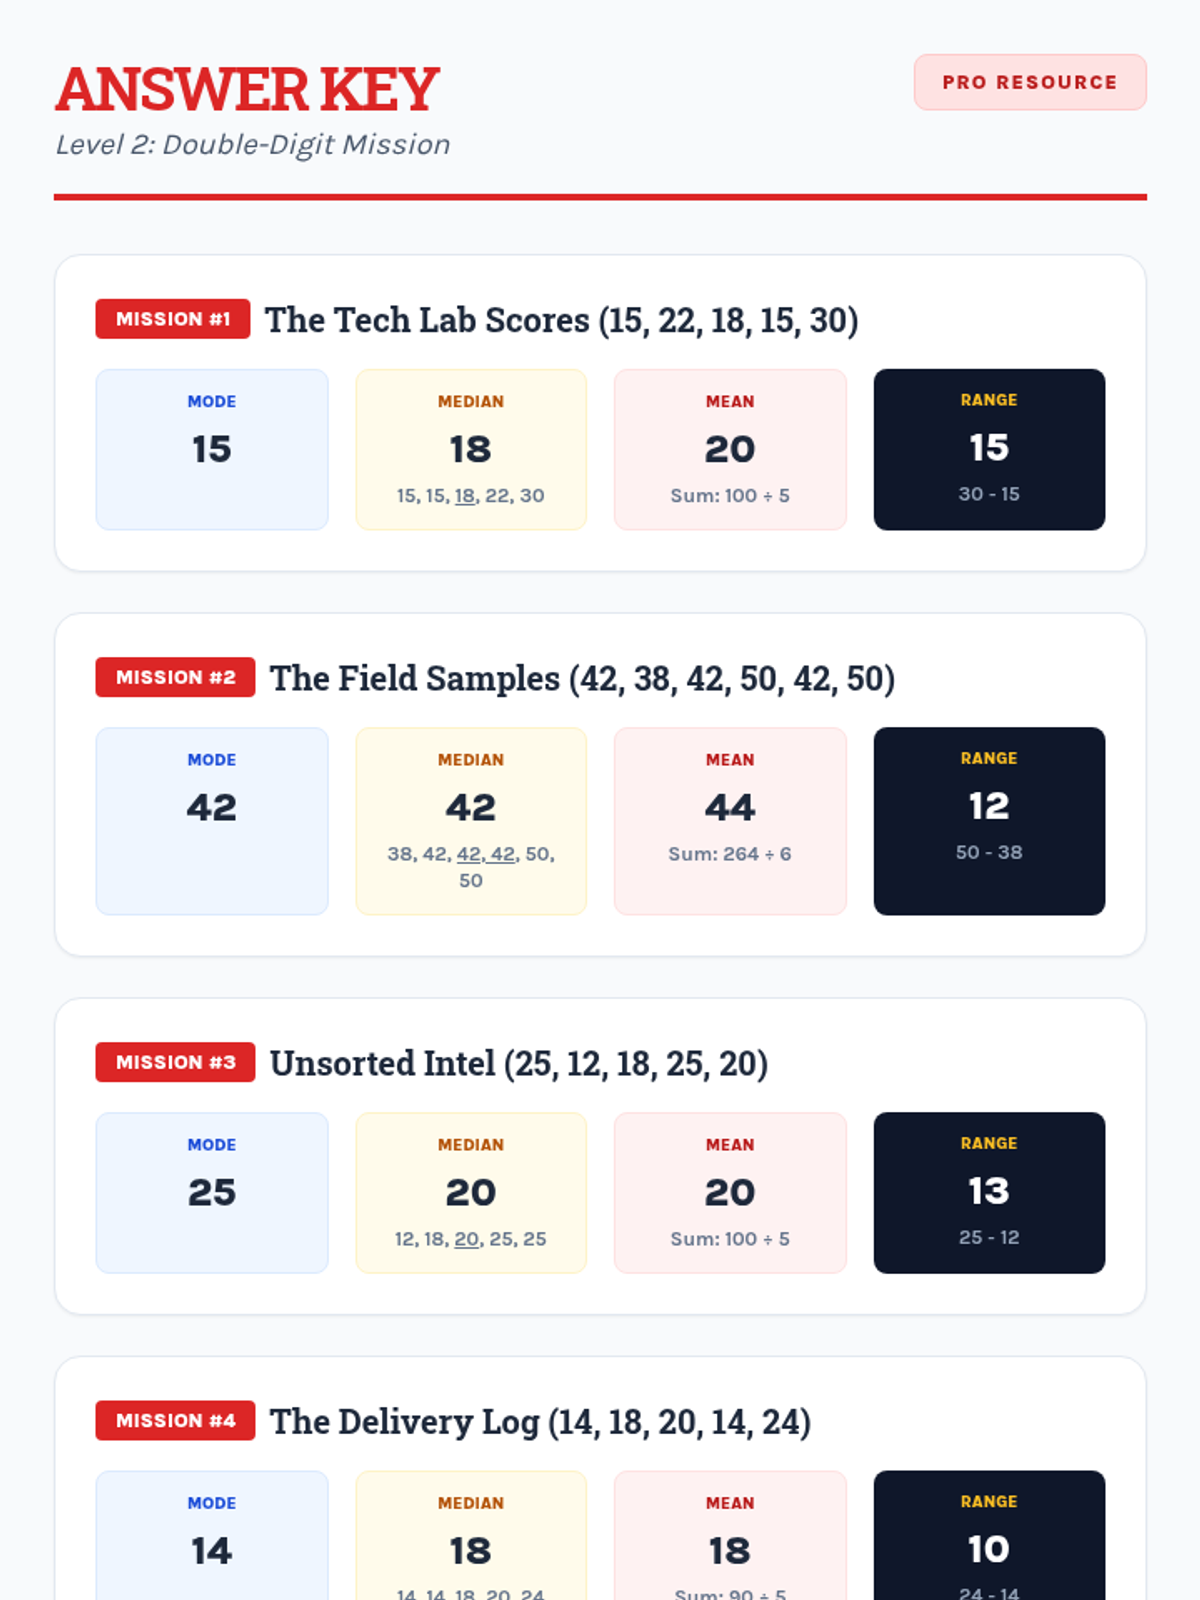
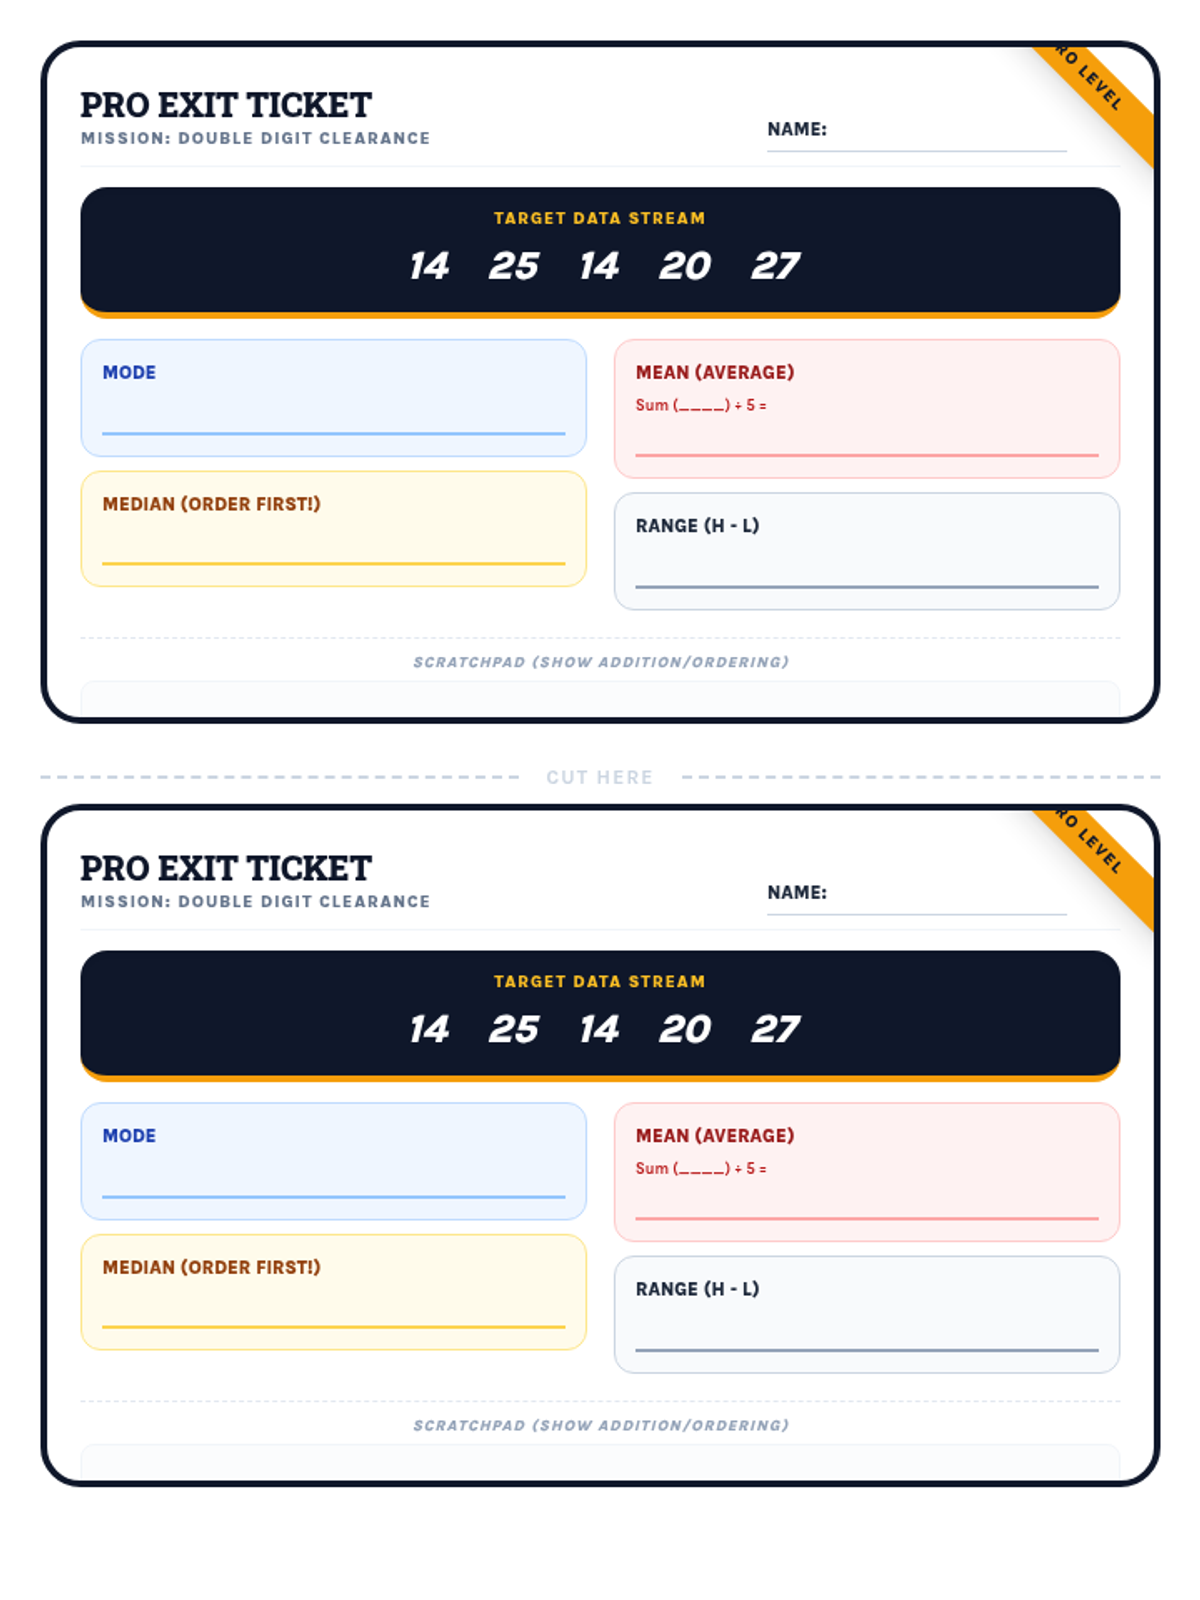
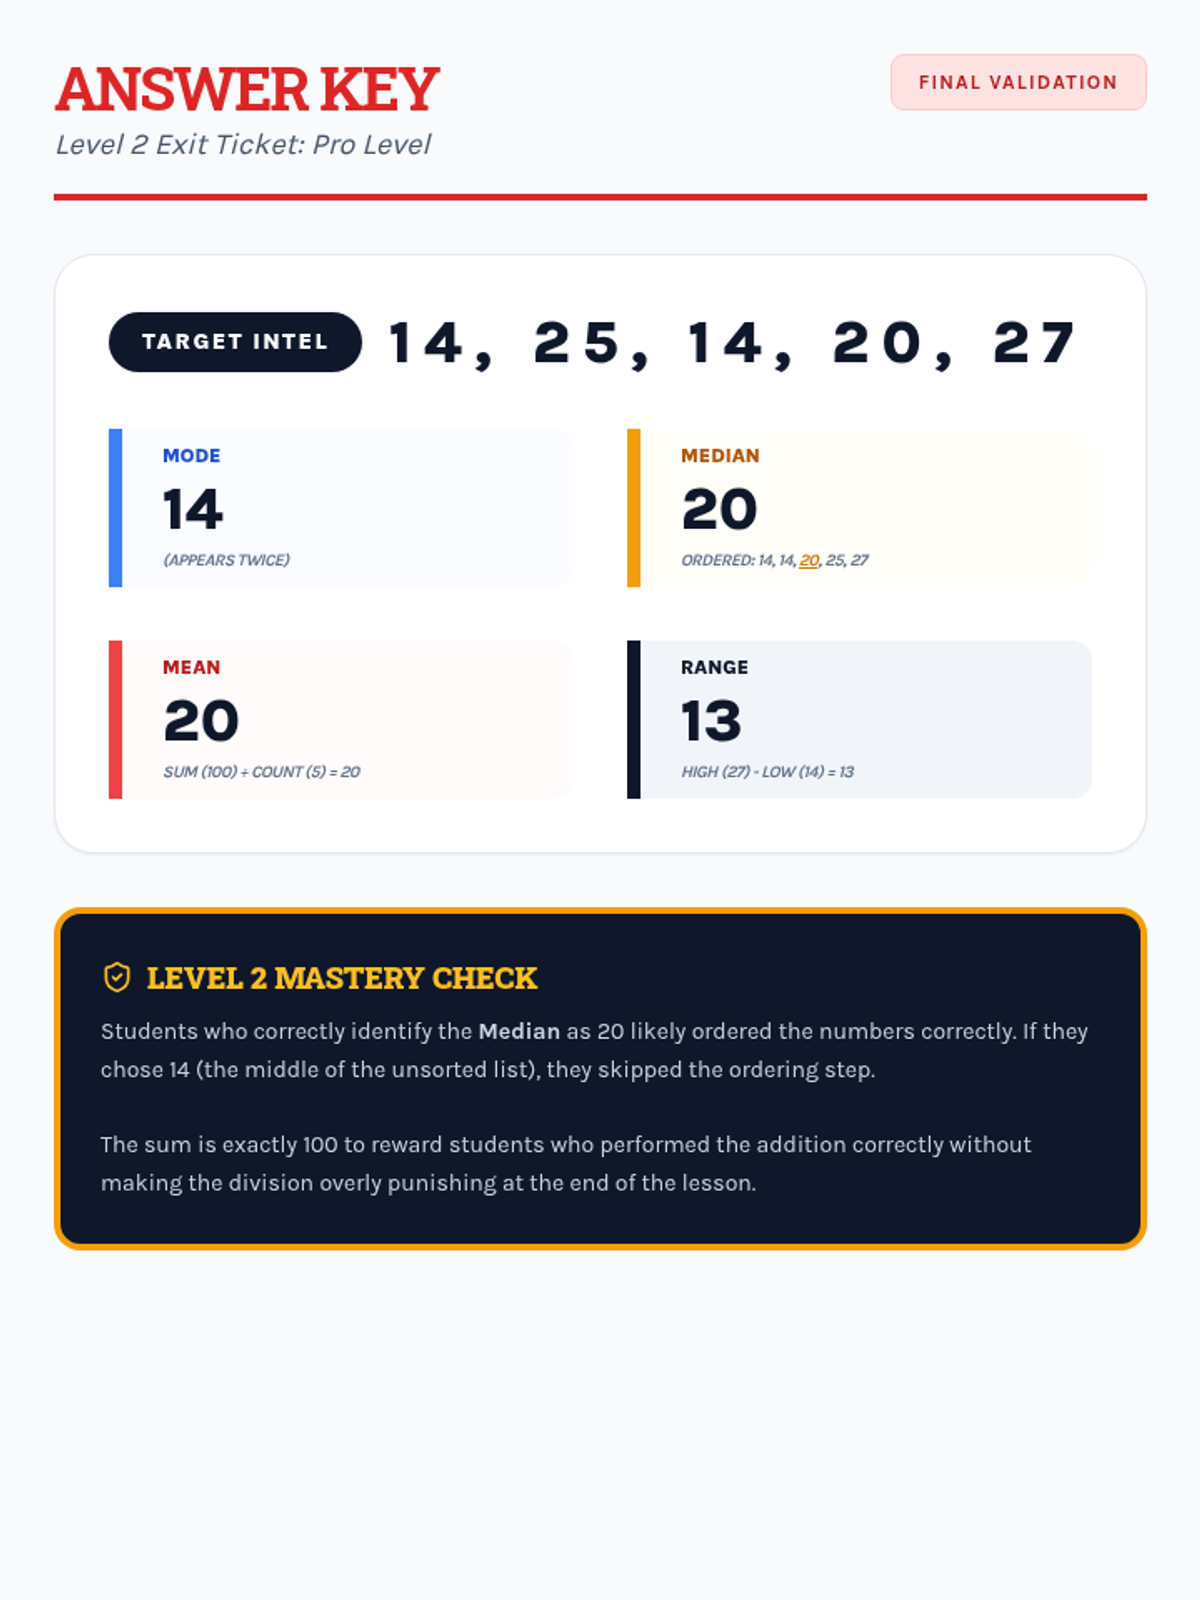
Students apply their knowledge of mean, median, mode, and range to data sets featuring two-digit numbers, focusing on multi-digit addition and division.
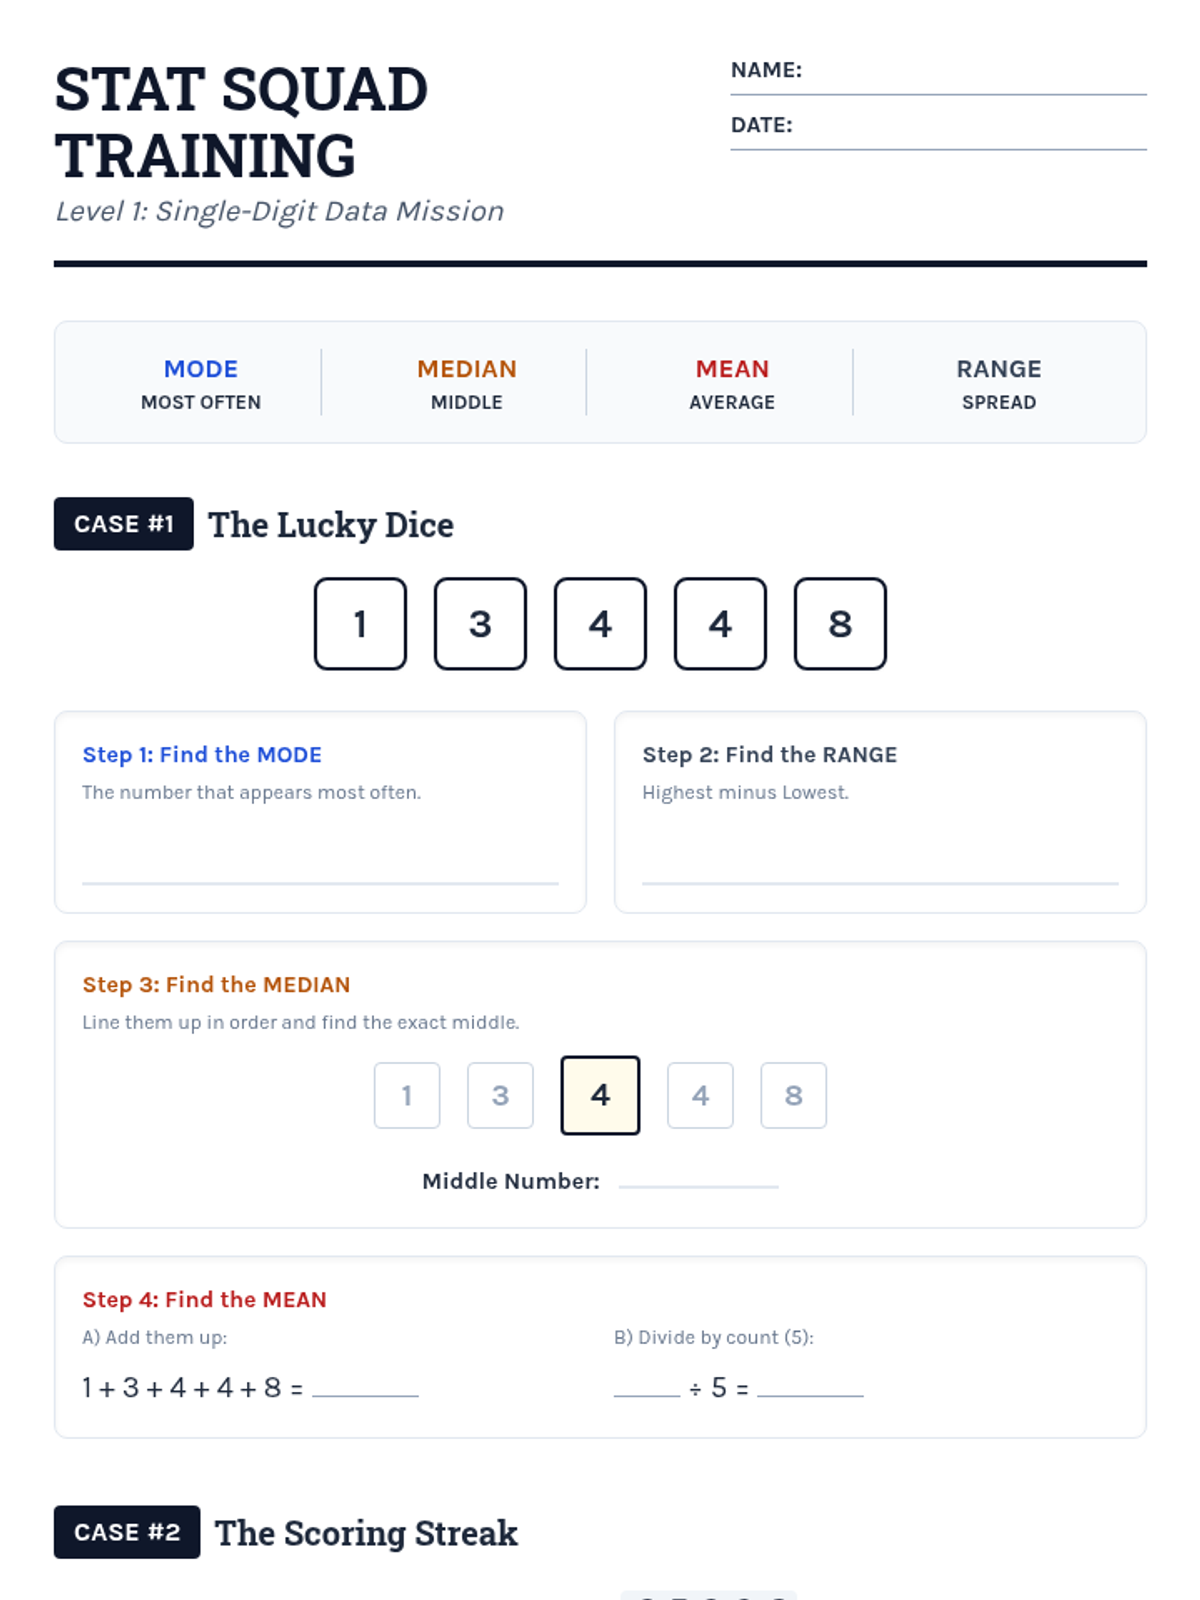
Students learn to calculate mean, median, mode, and range using single-digit data sets through structured, step-by-step guided practice and visual aids.
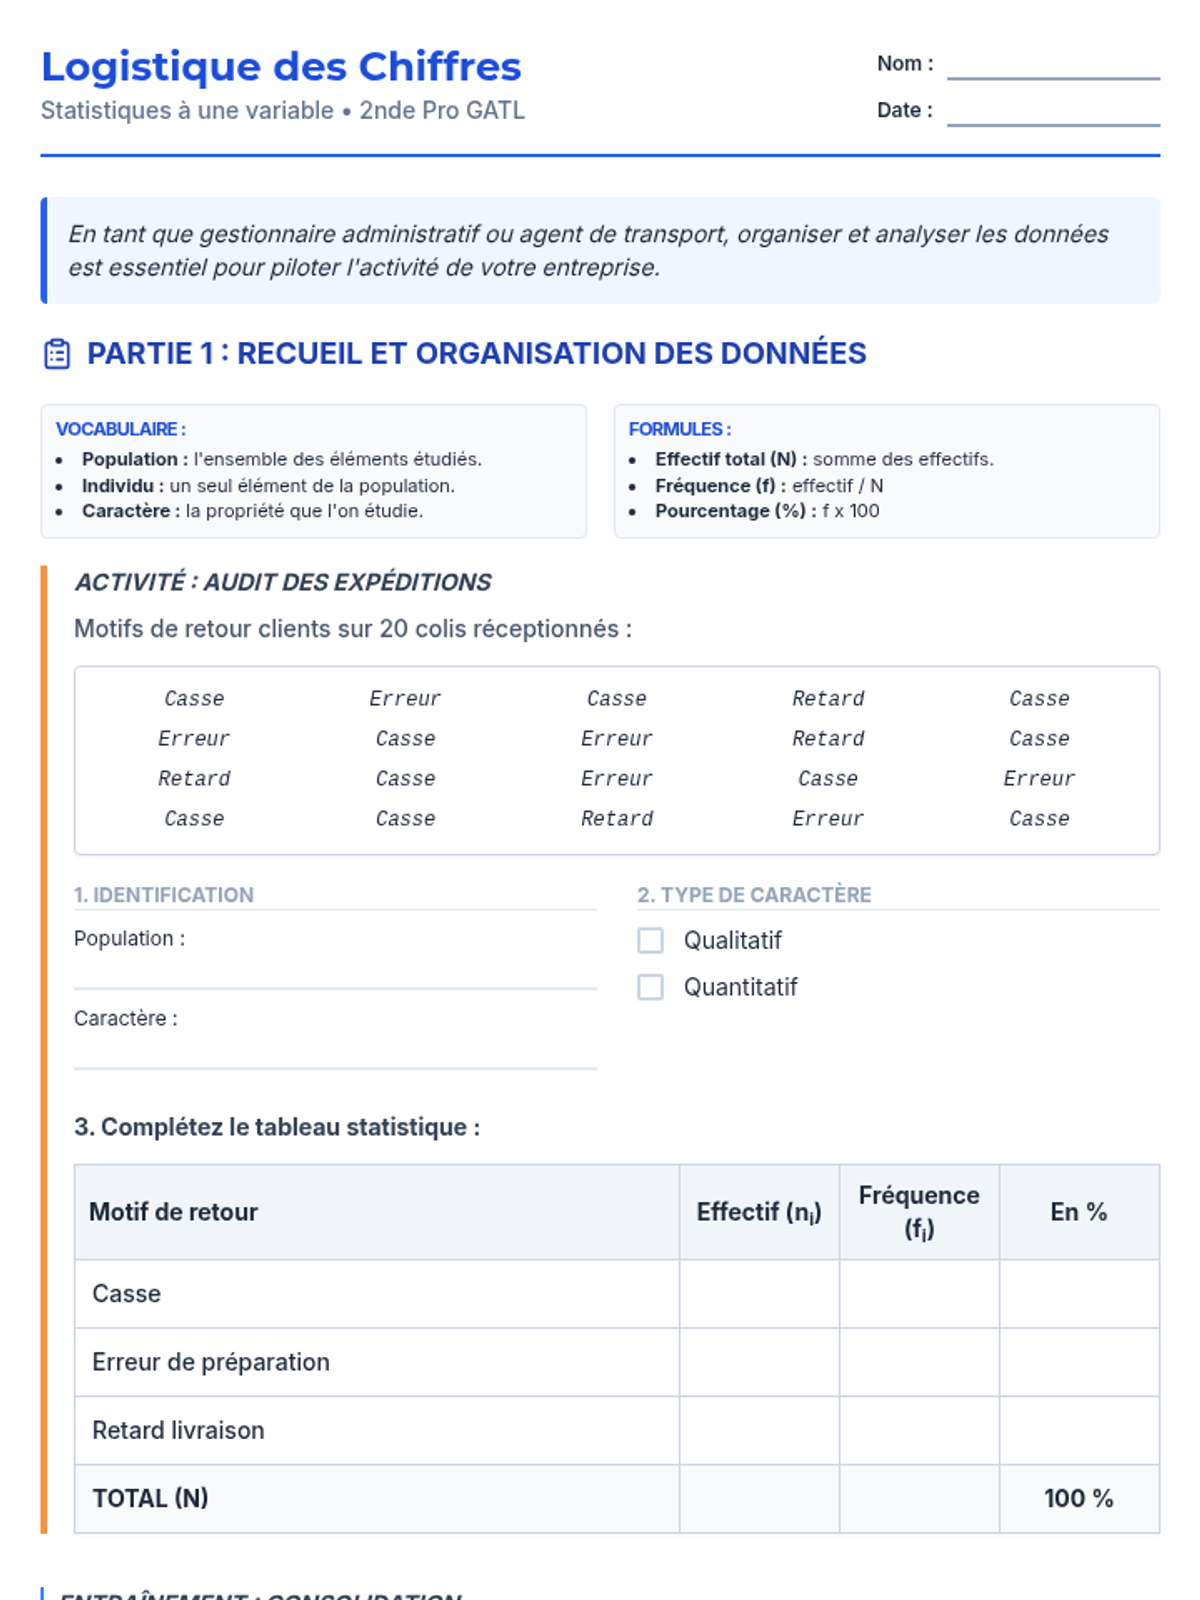
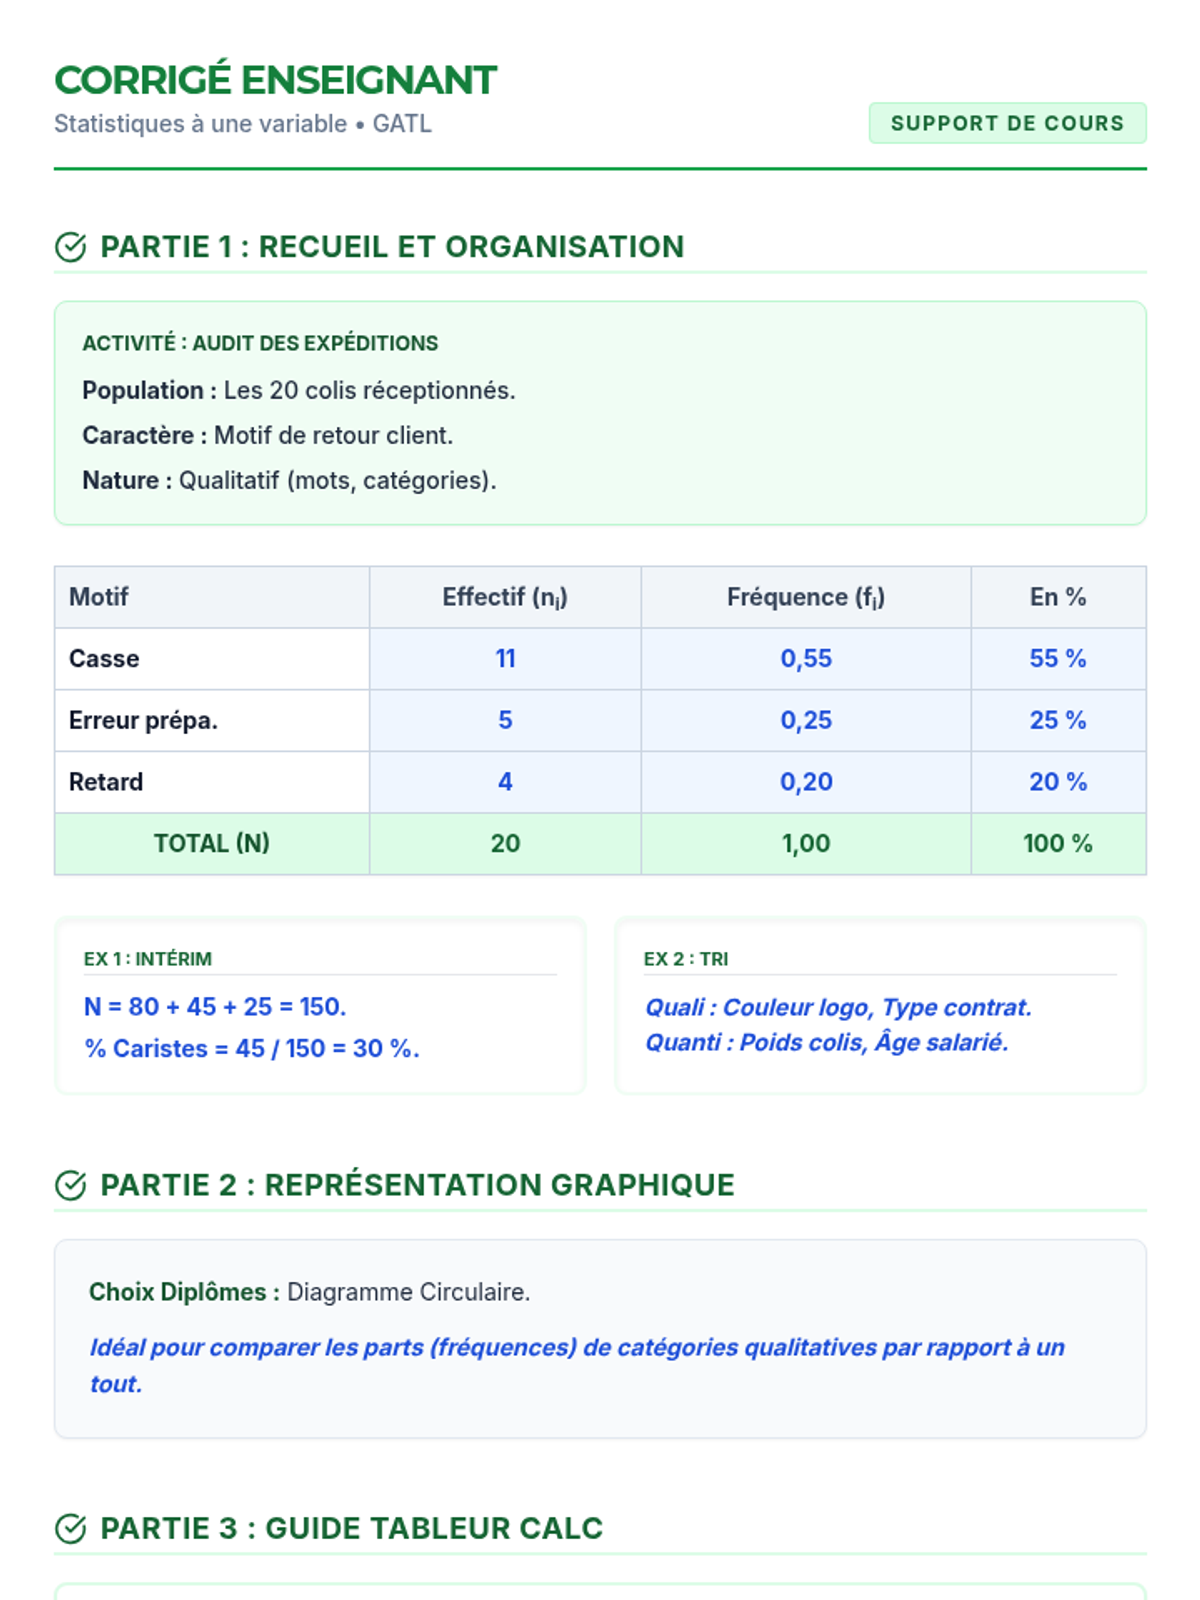
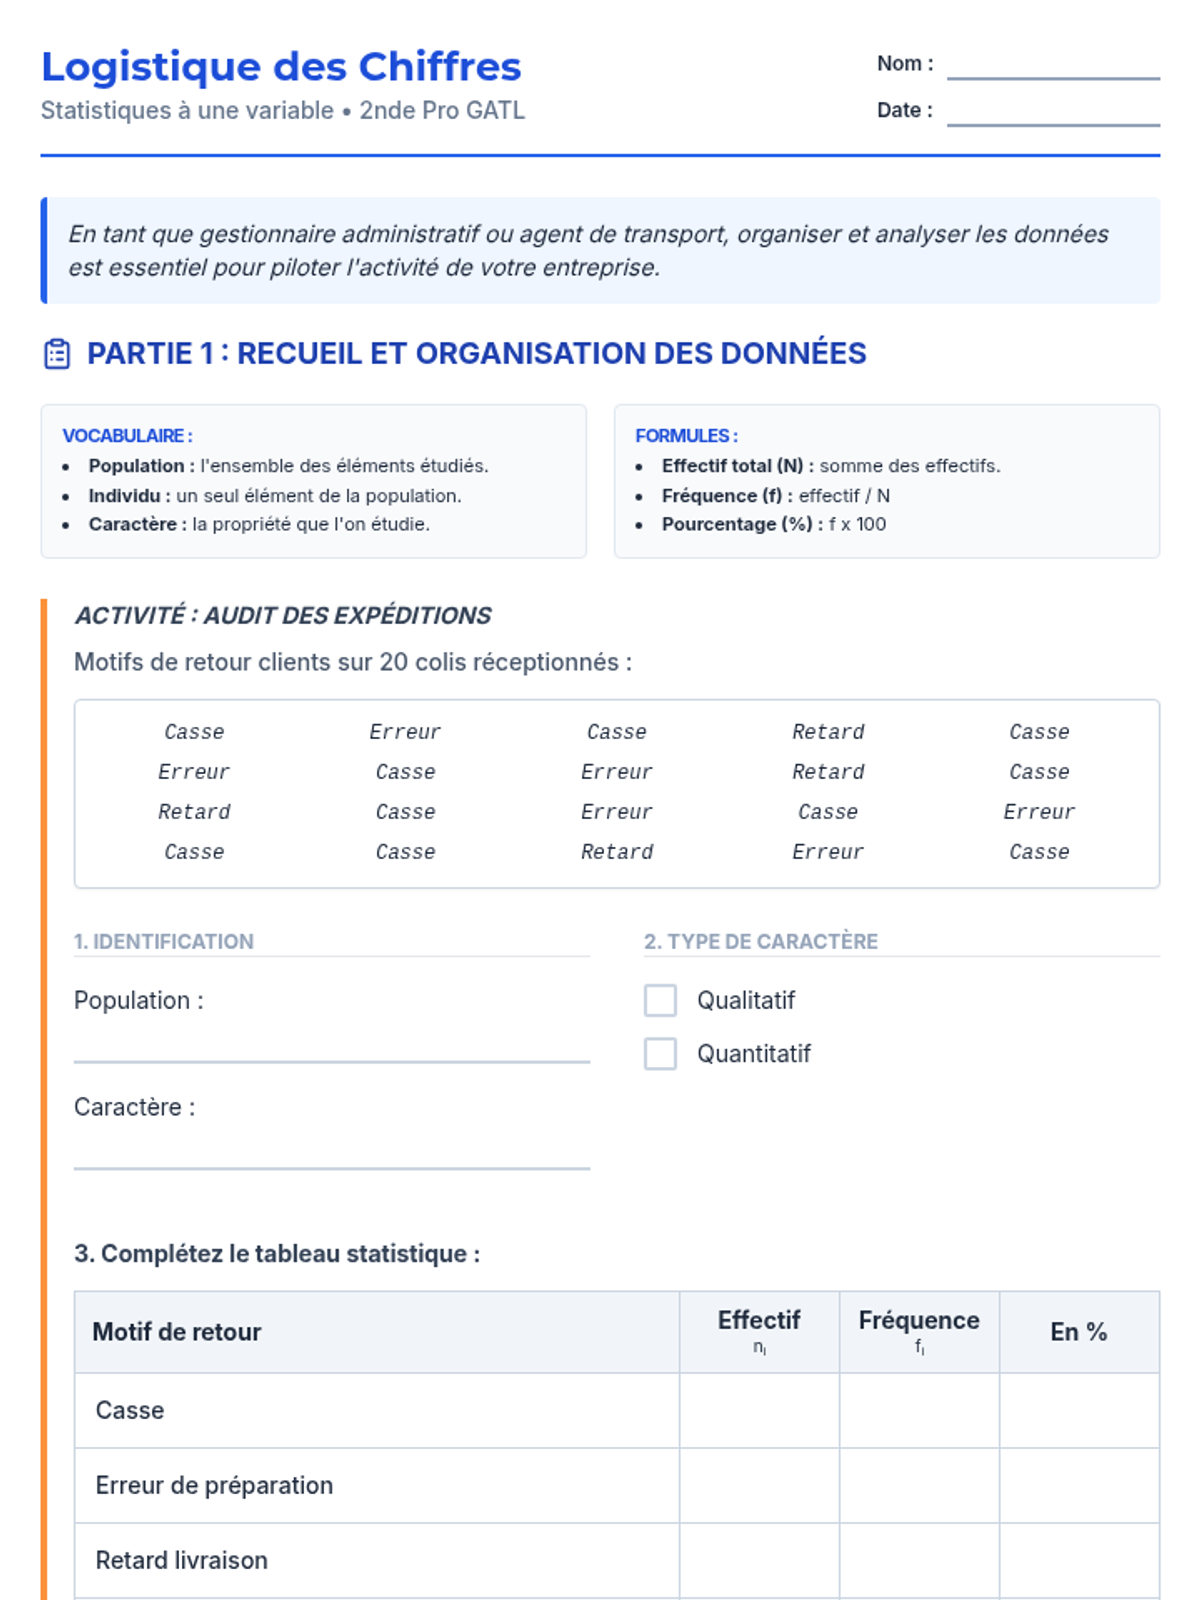
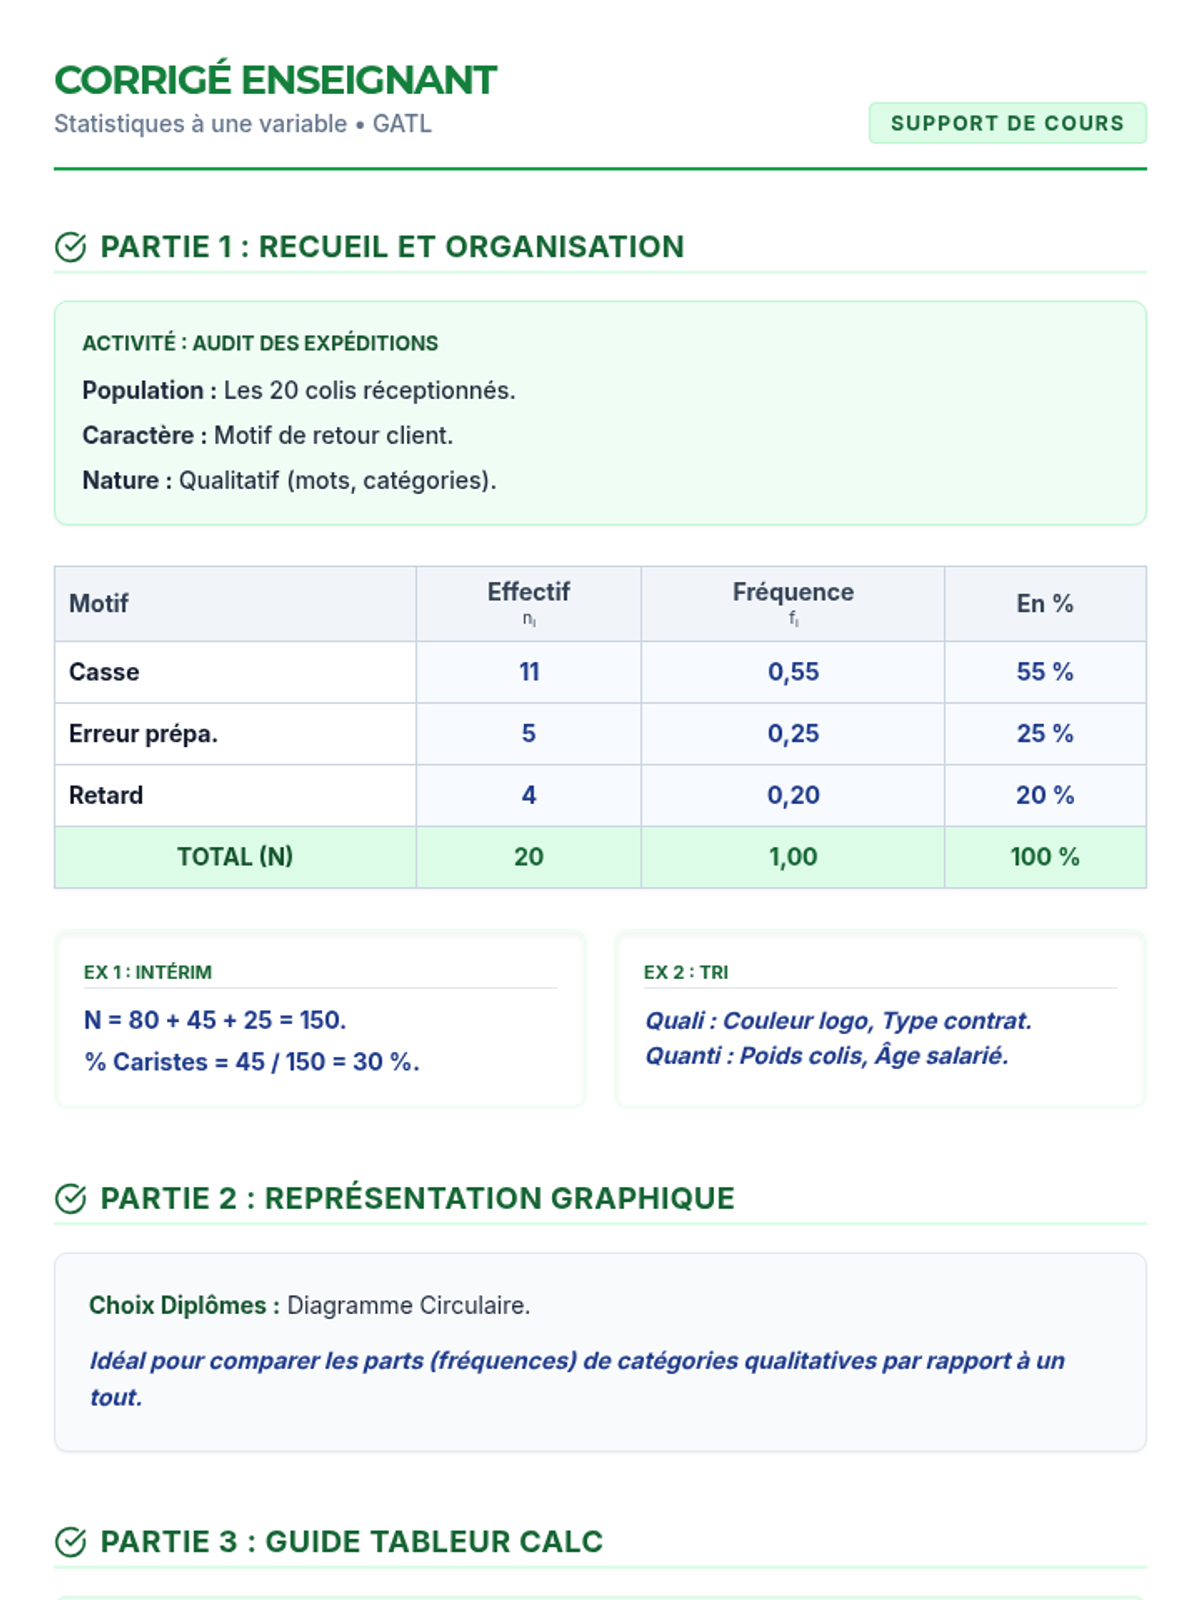
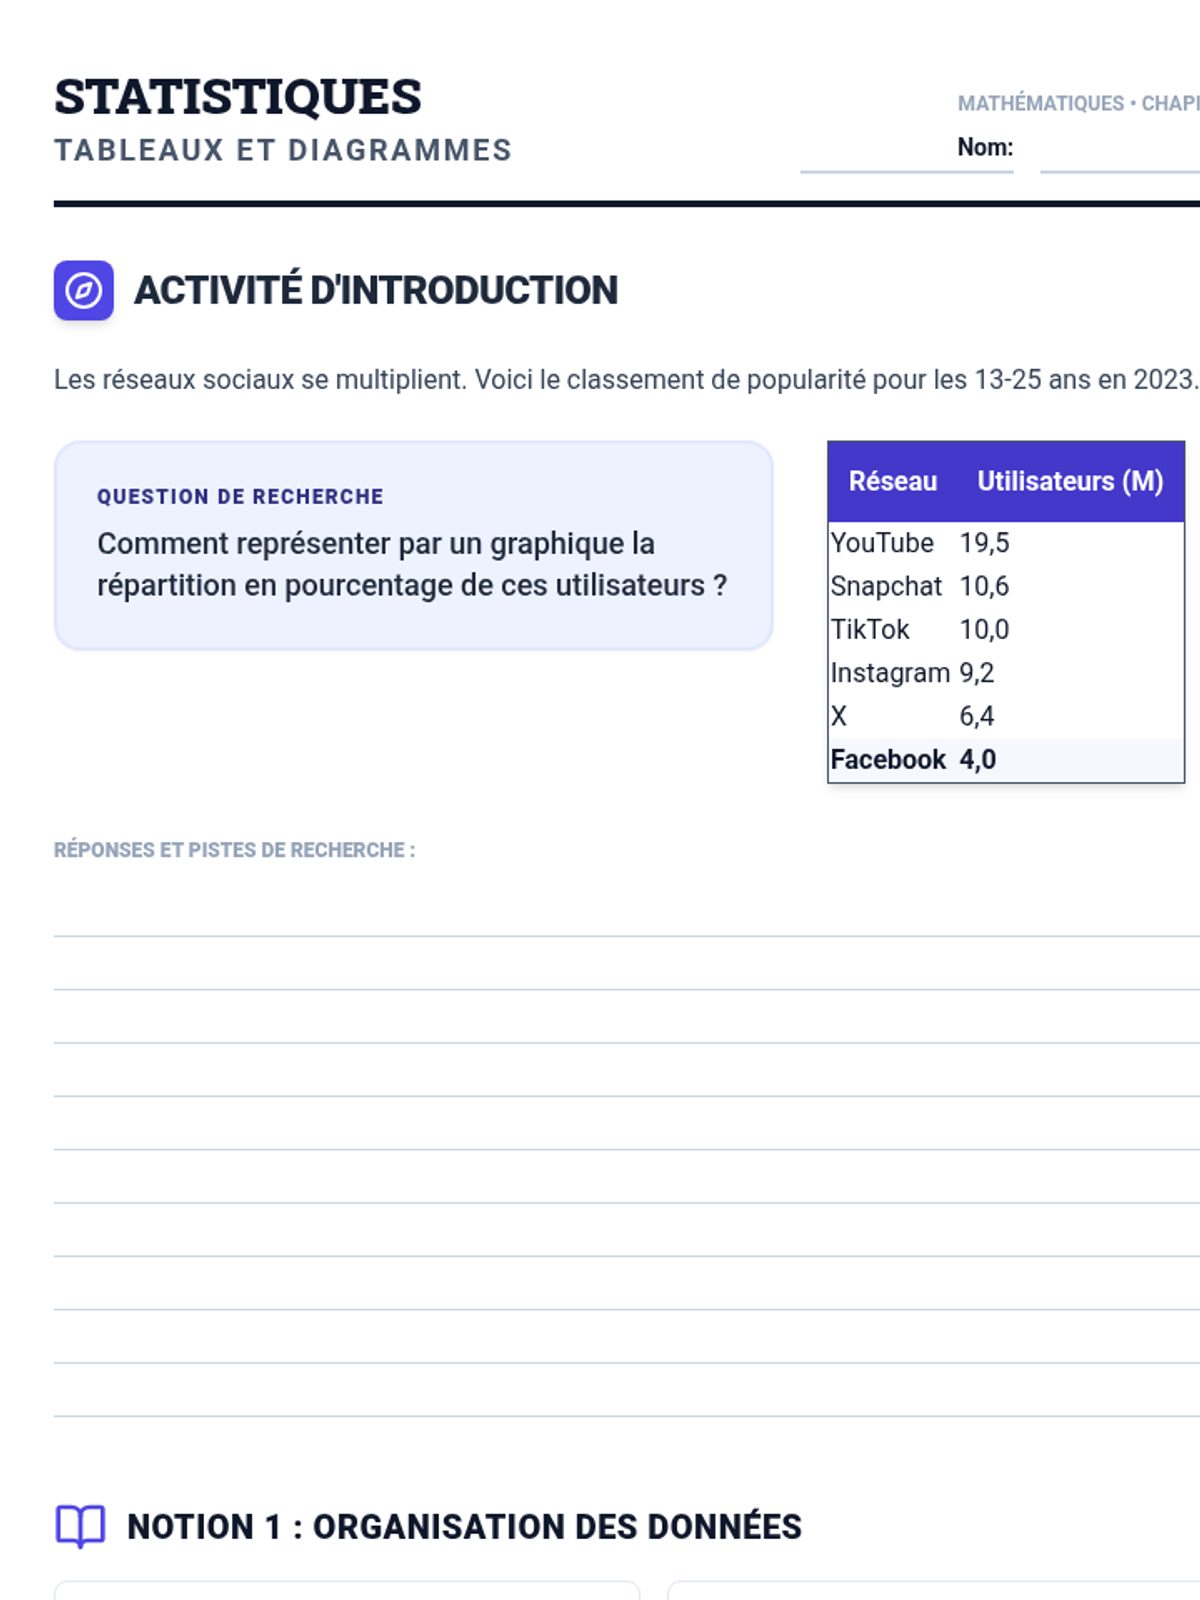
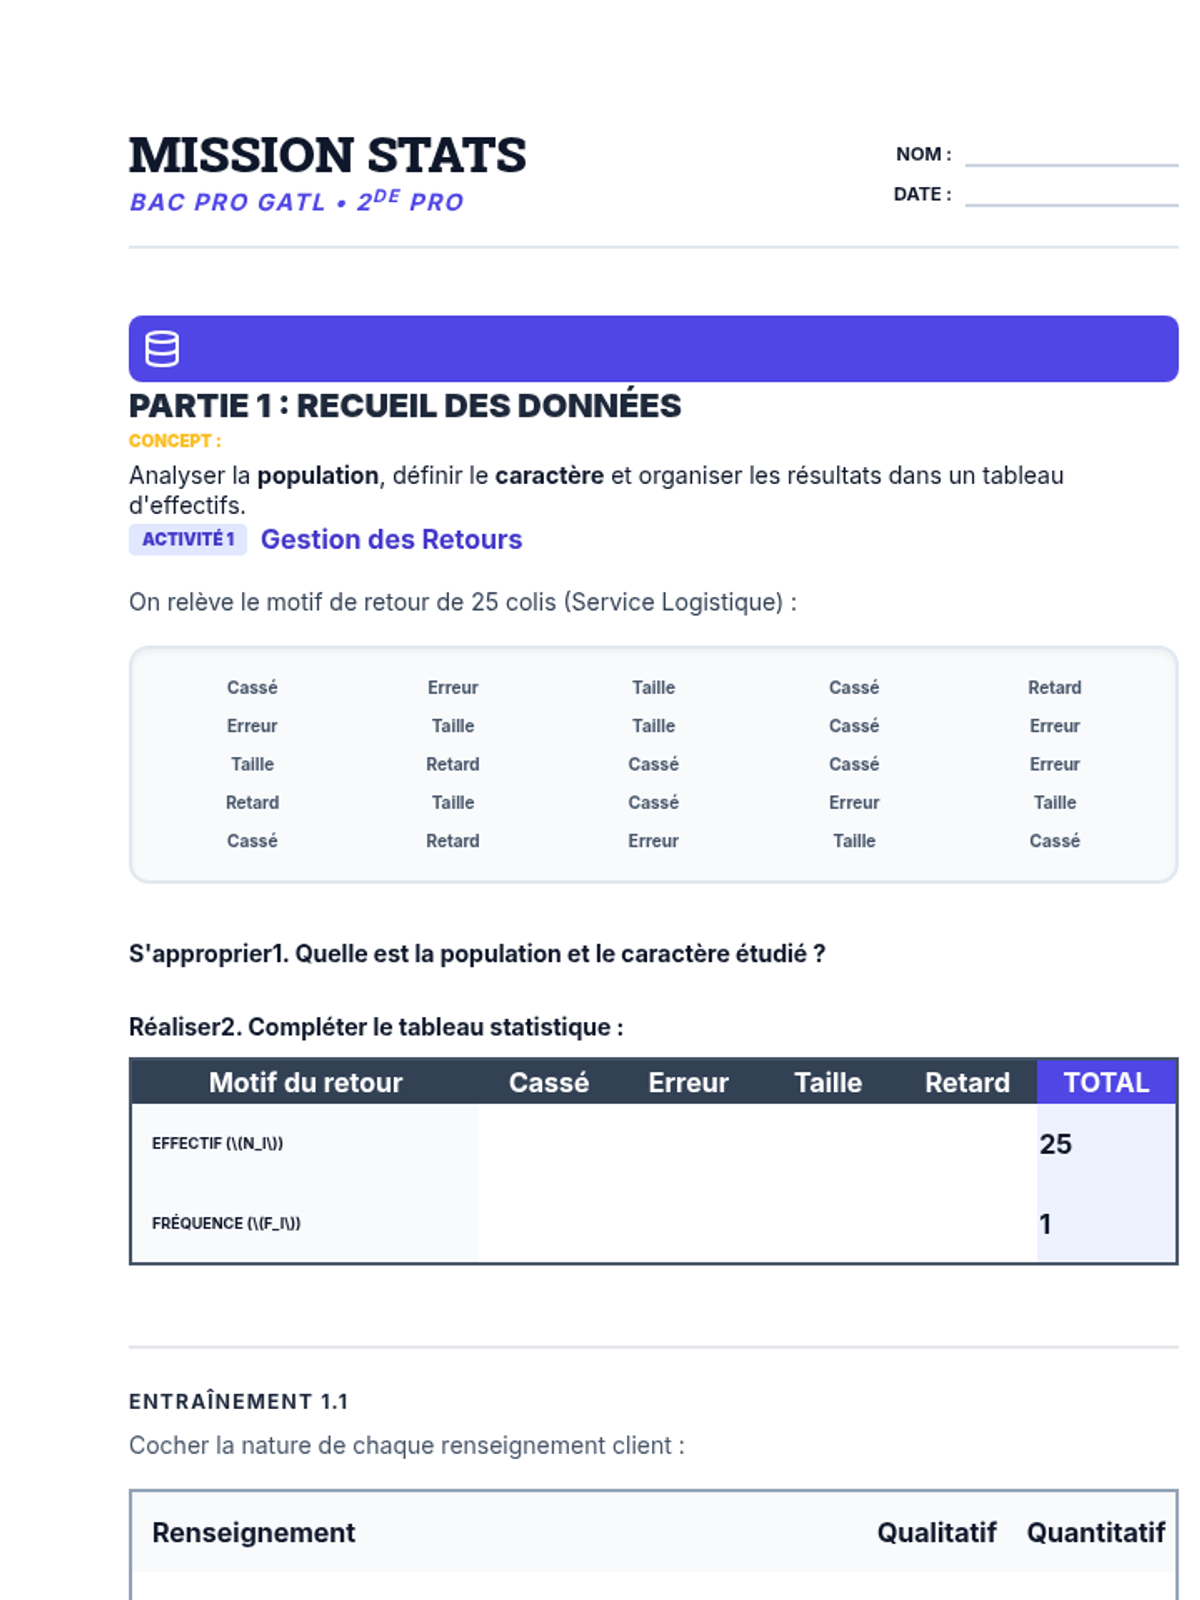
Leçon focalisée sur les bases des statistiques à une variable : du recueil de données brutes à leur analyse graphique, avec un focus sur l'utilisation de LibreOffice Calc.
Une leçon complète sur les statistiques à une variable, couvrant la collecte de données, l'organisation en tableaux et la représentation graphique à travers divers exercices pratiques et activités d'introduction.
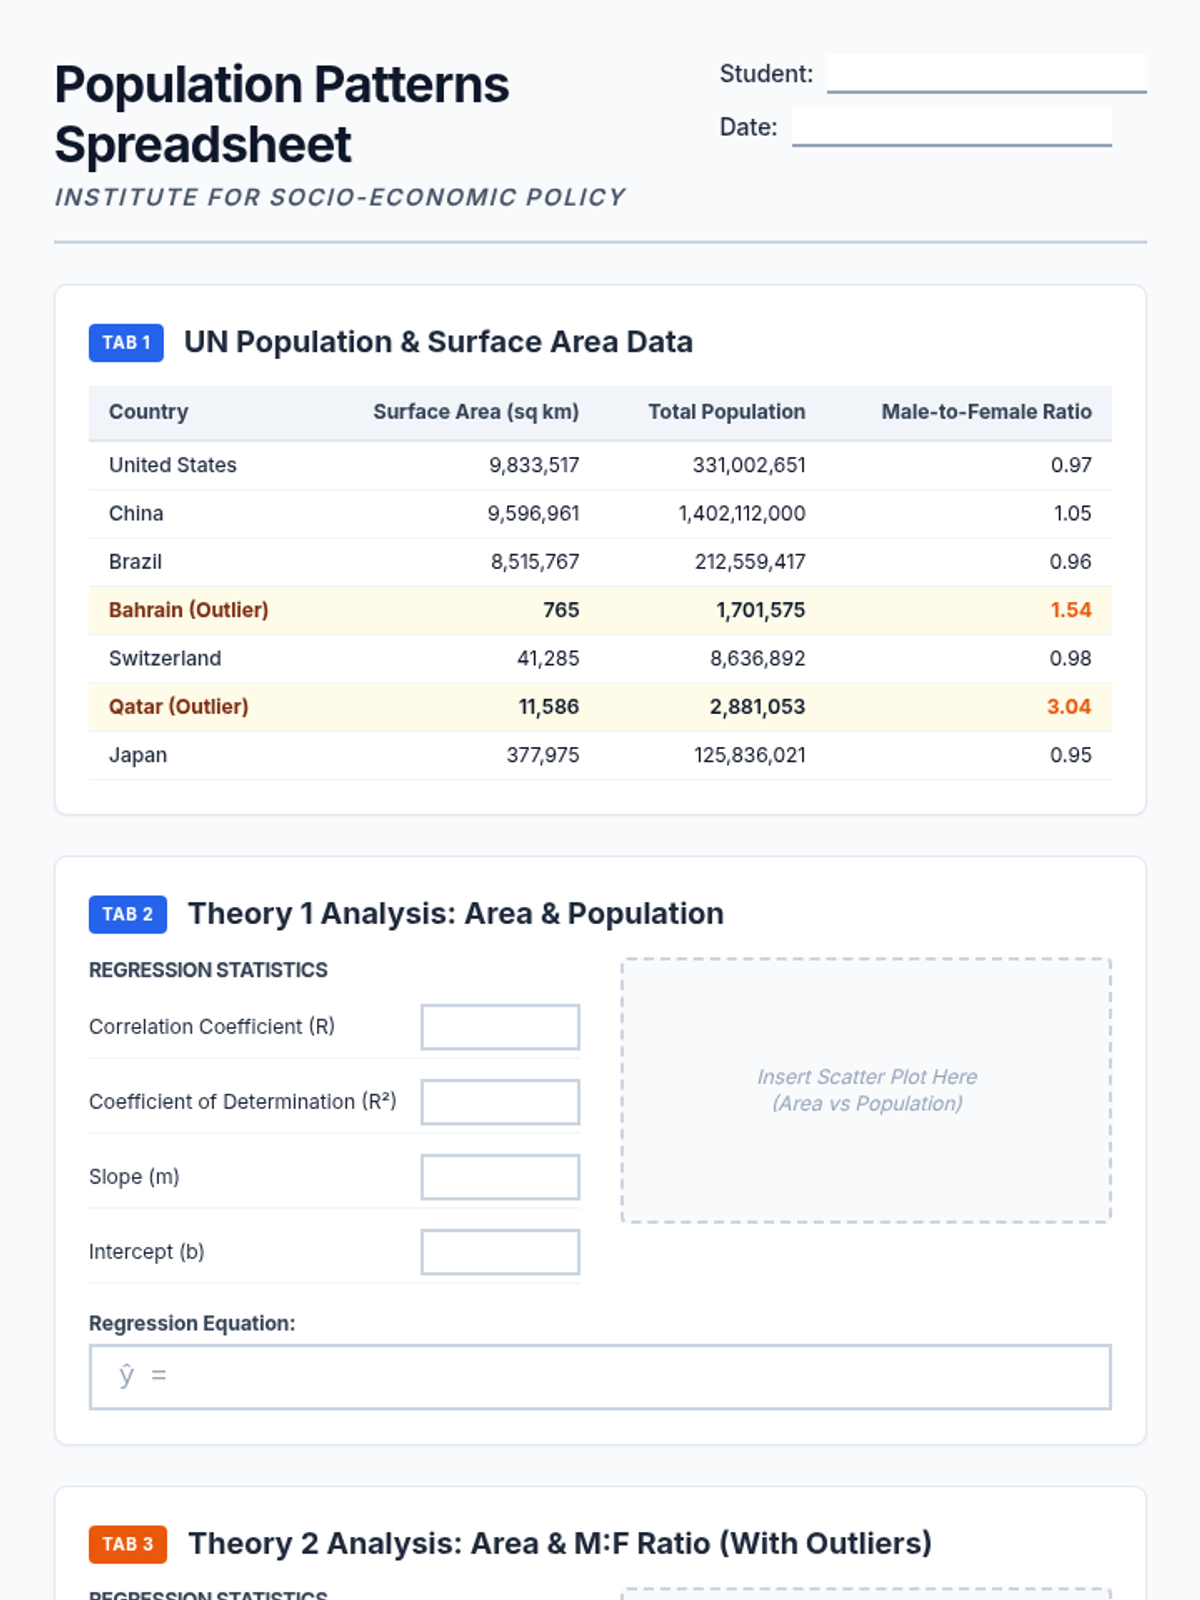
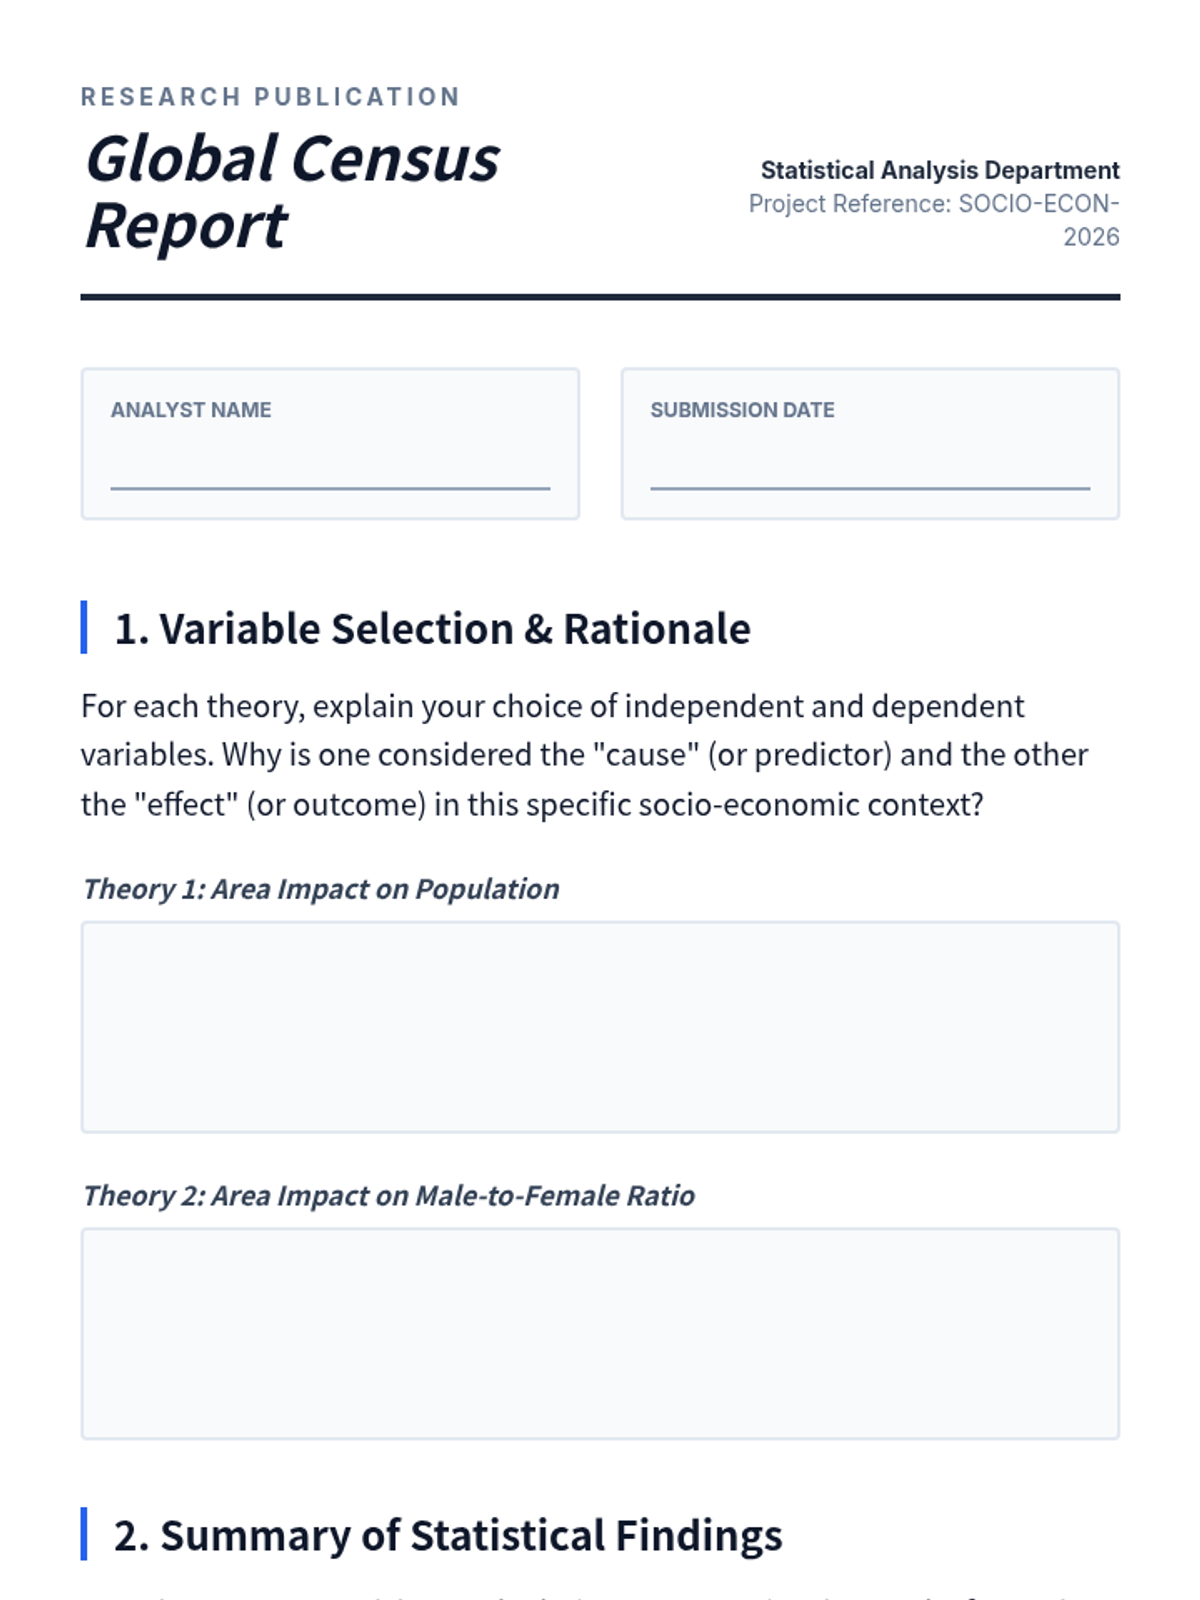
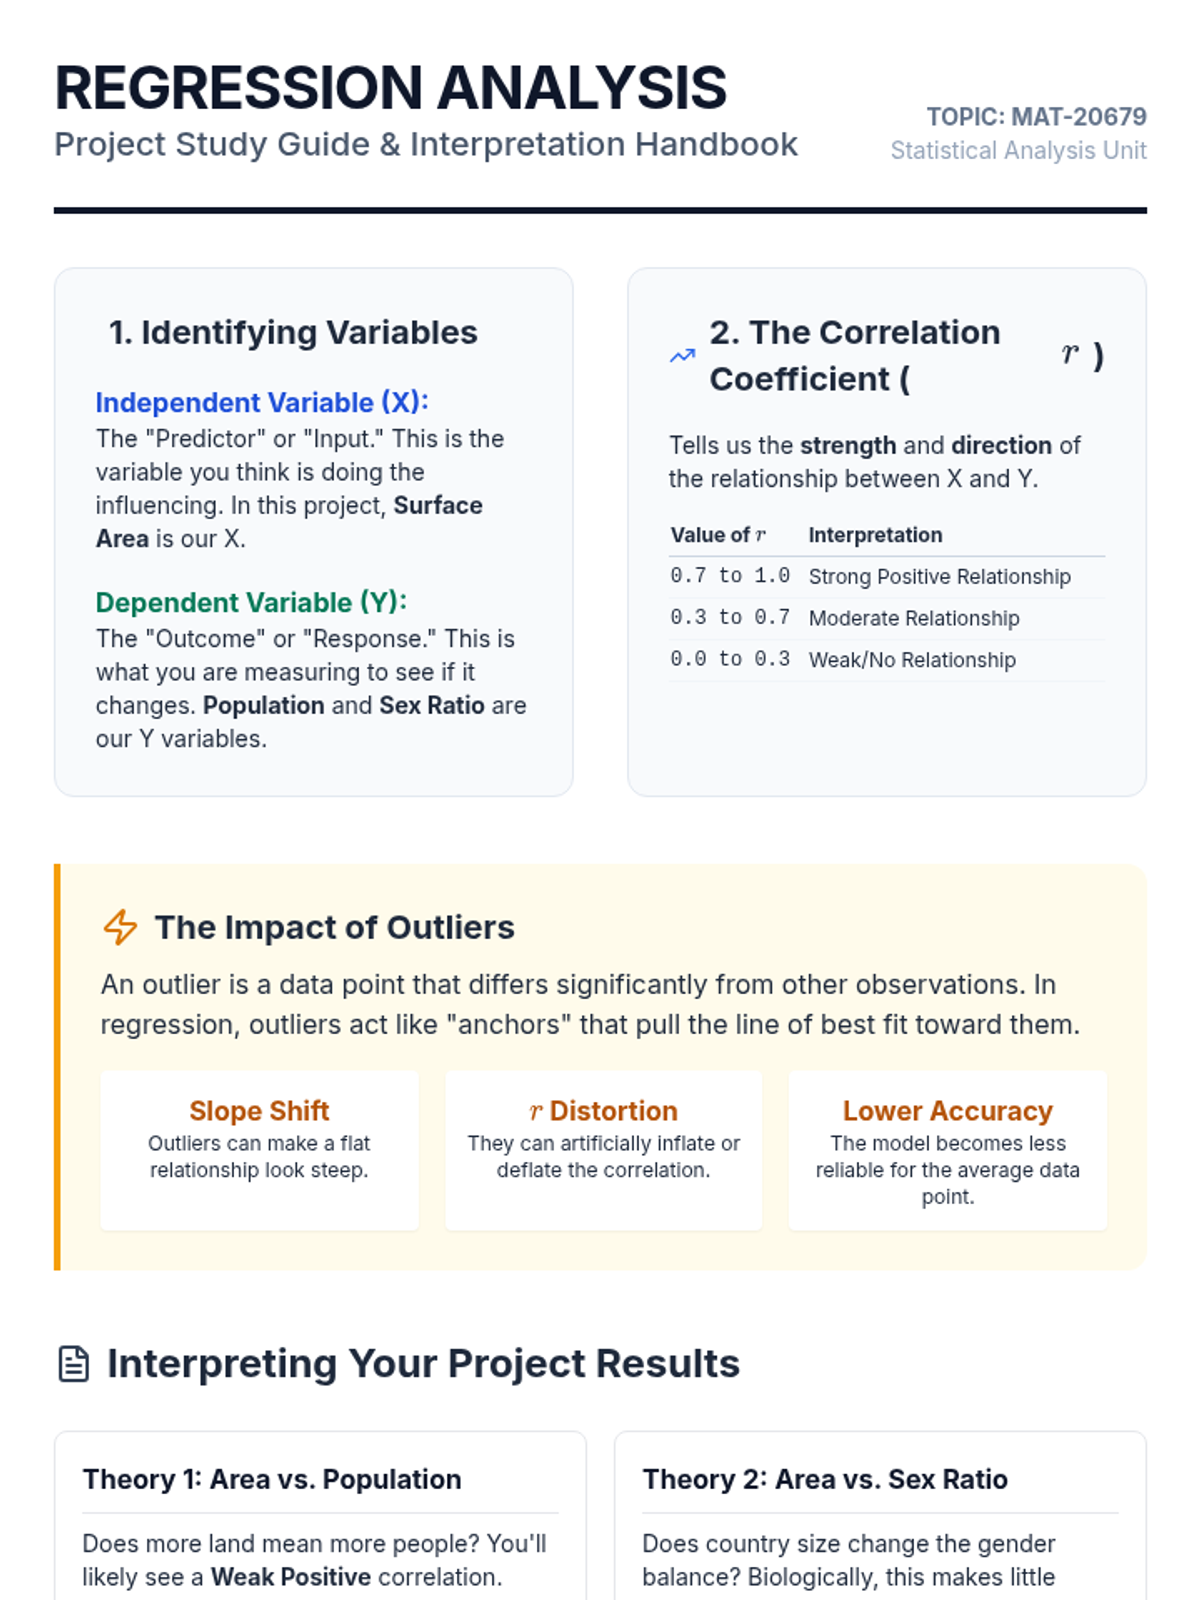
A project-based lesson on performing linear regression analysis using United Nations population and surface area data to test socio-economic theories.
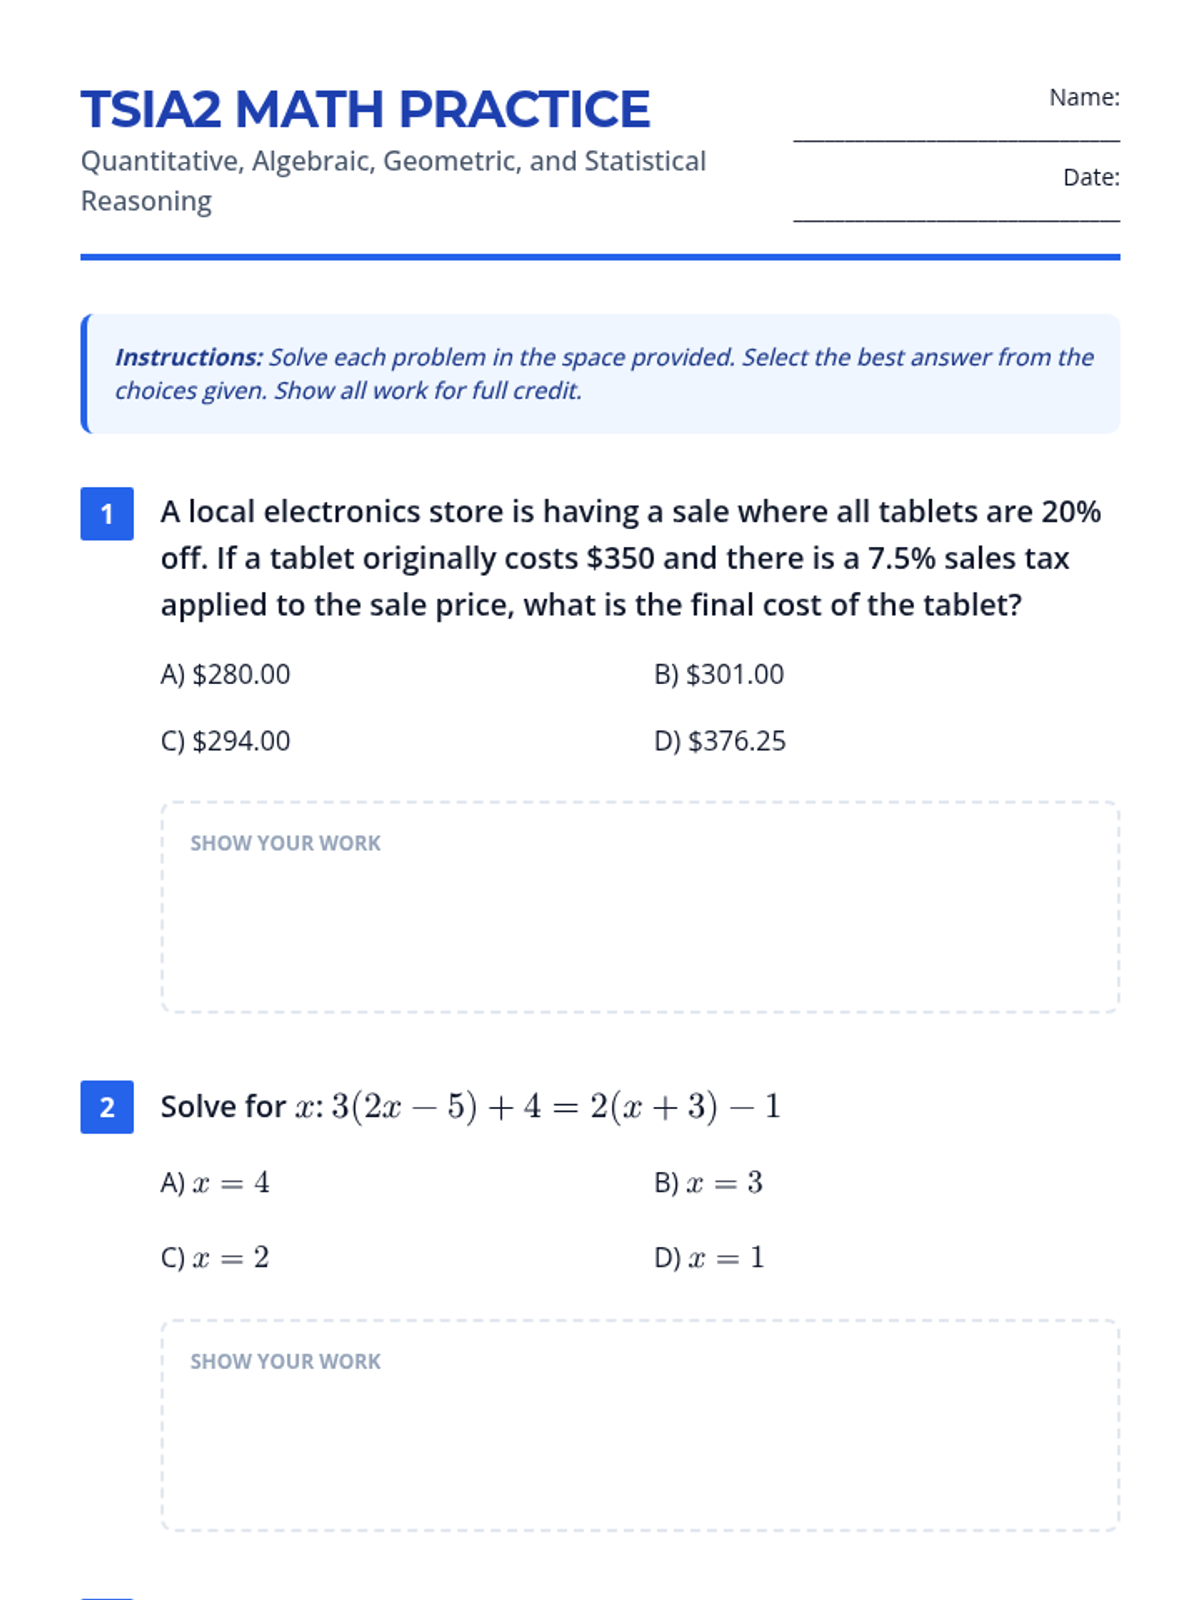
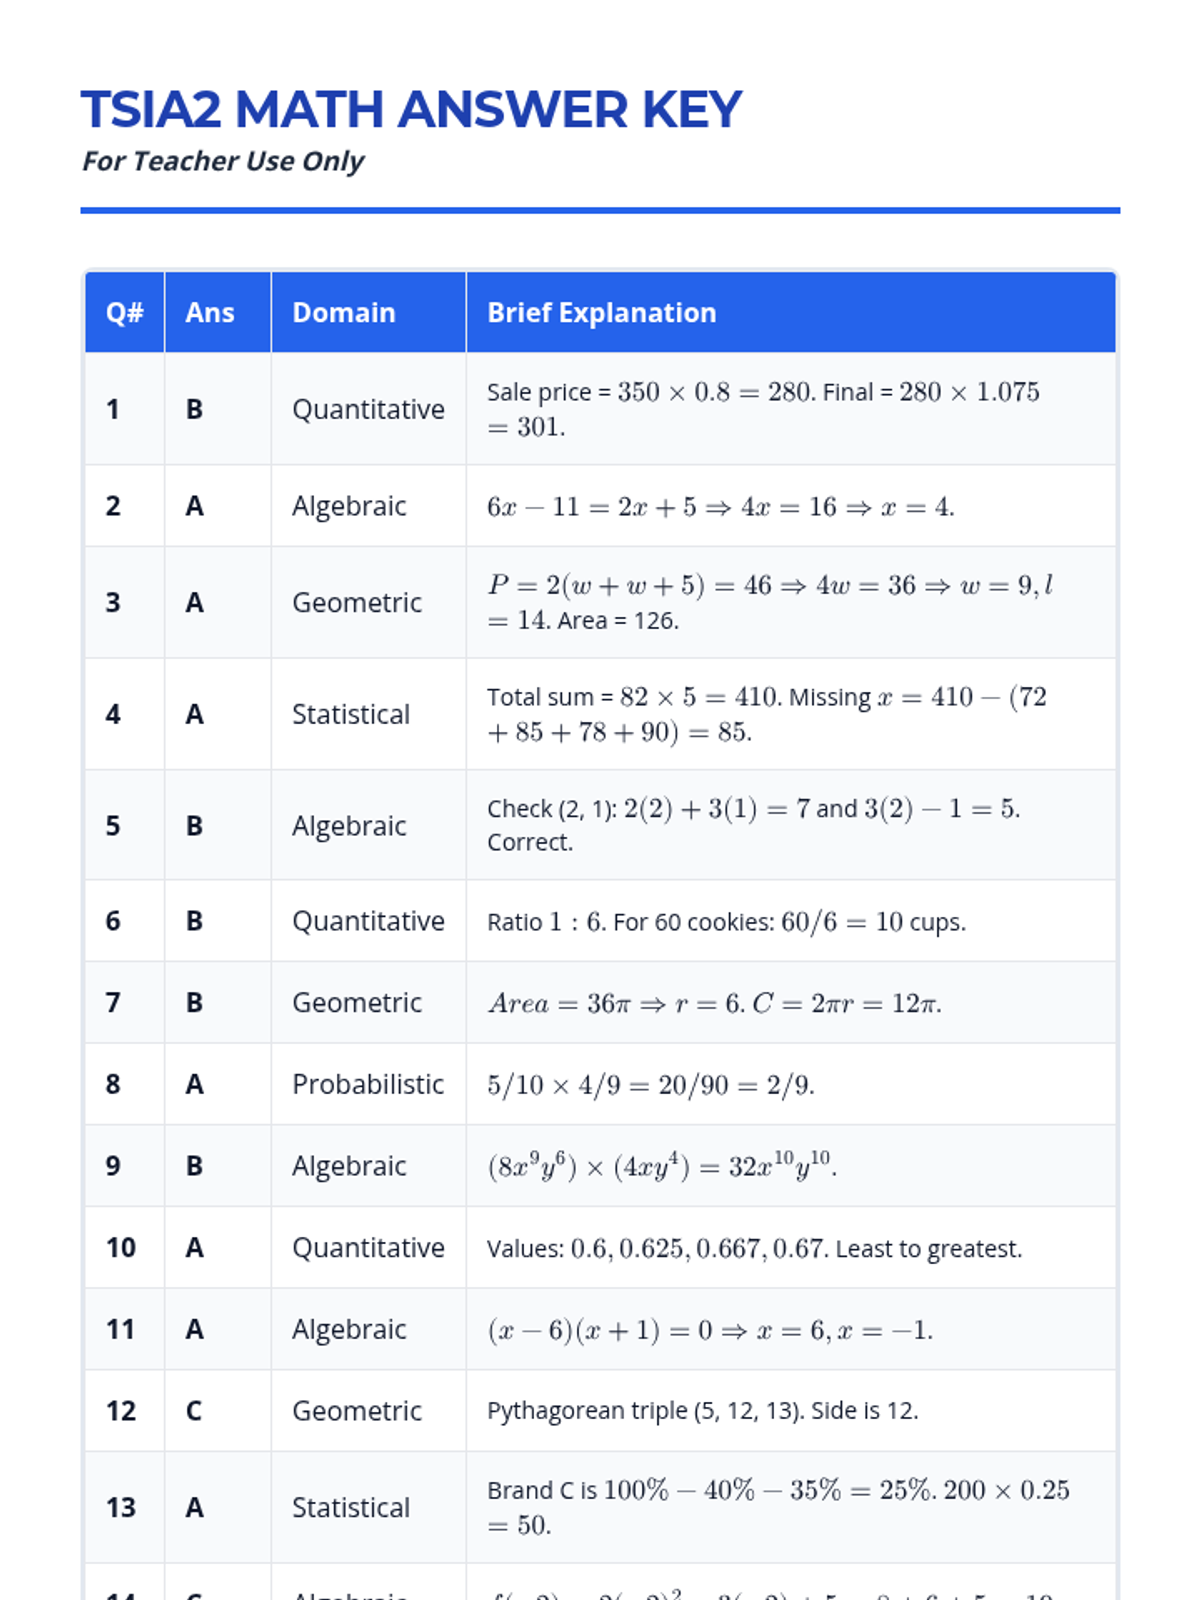
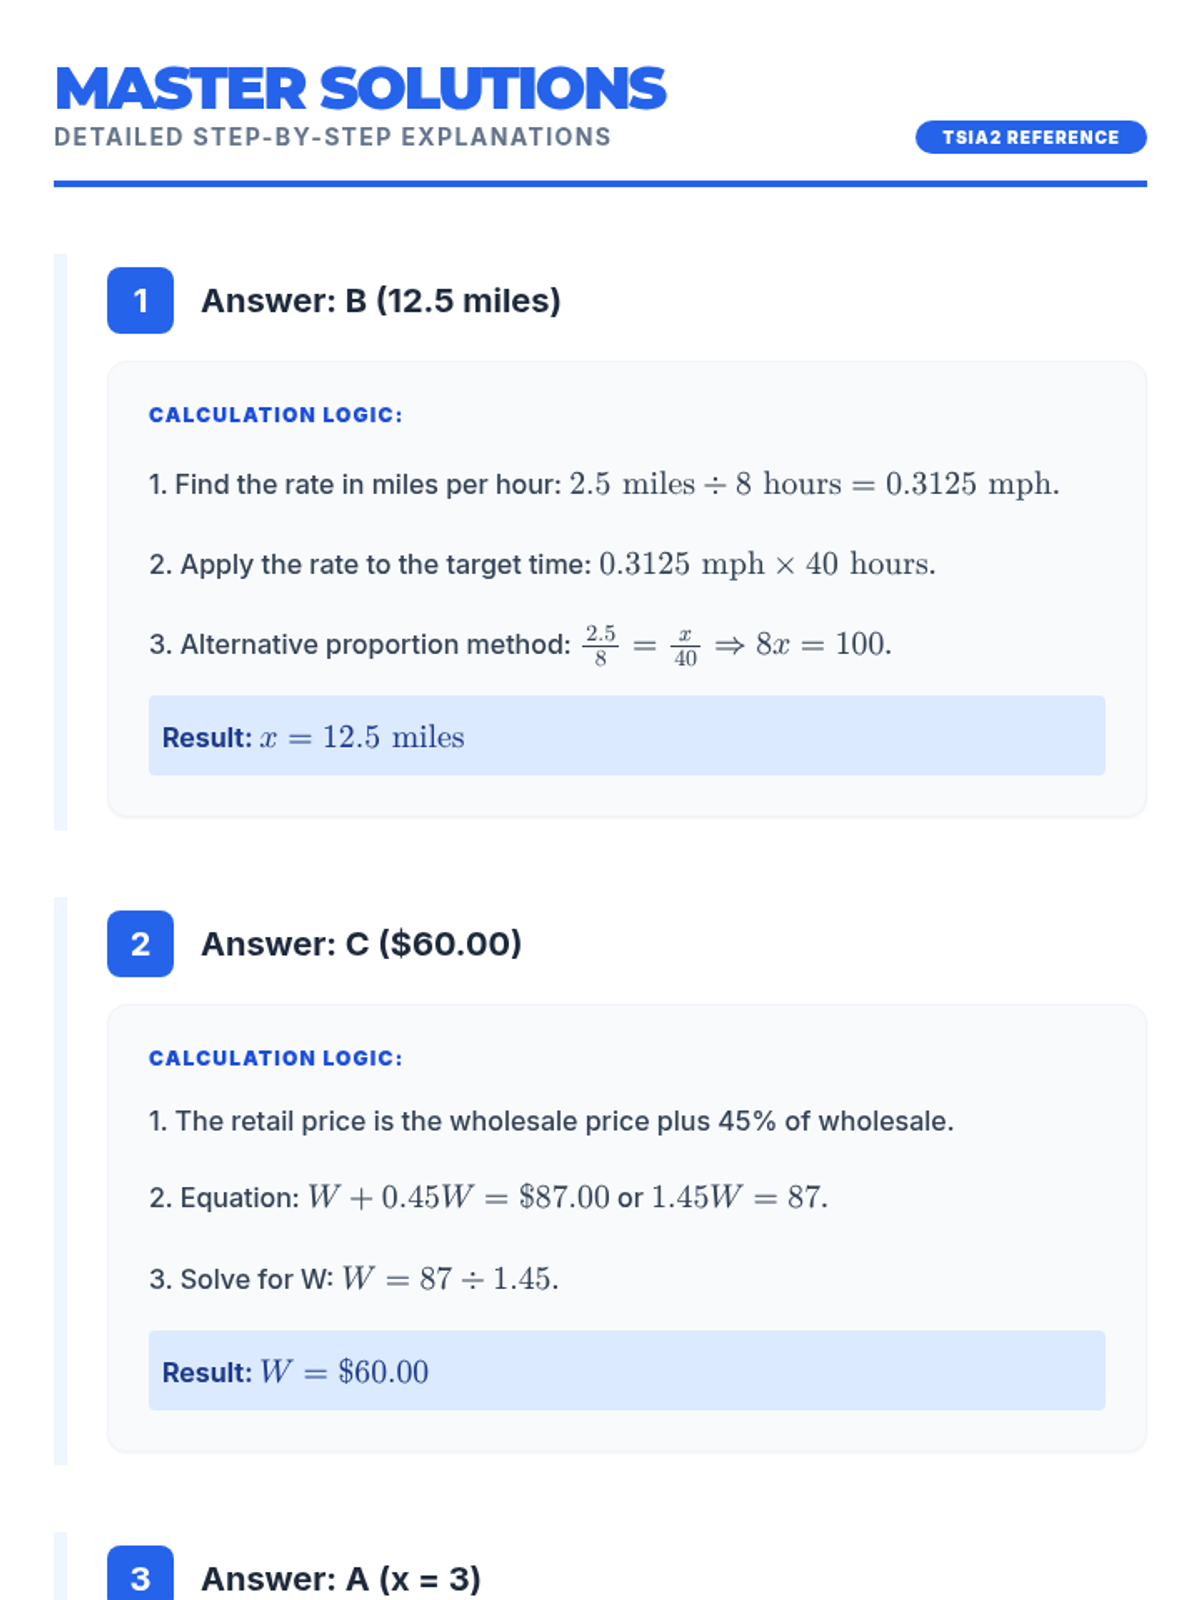
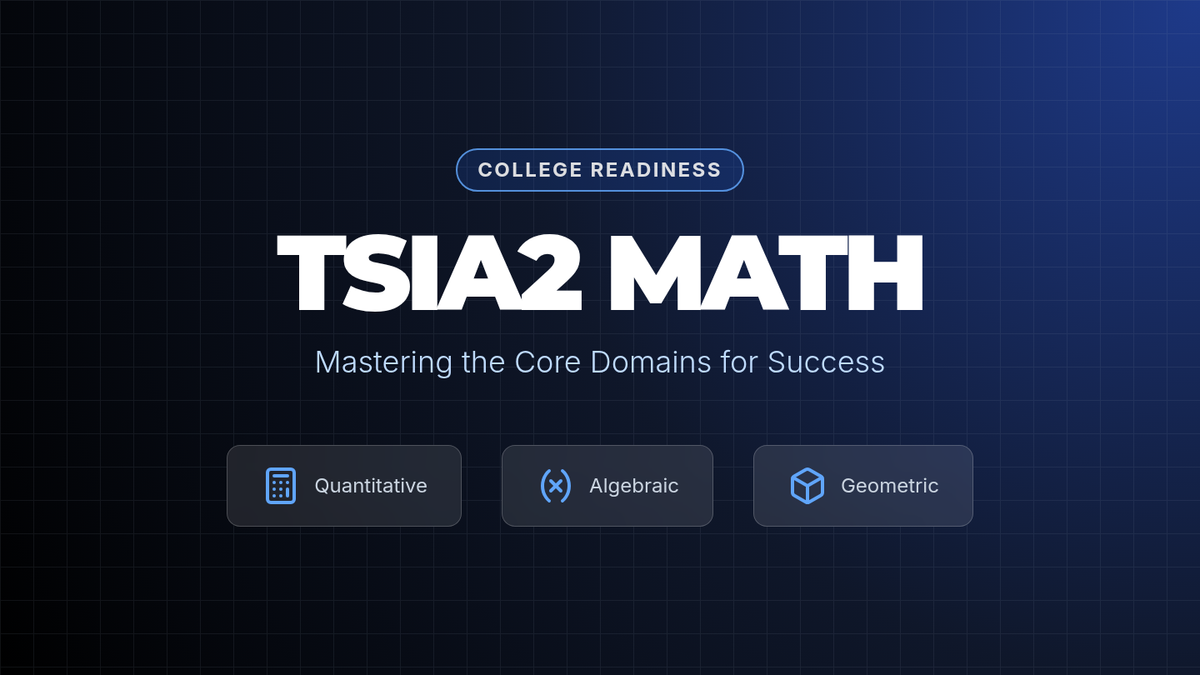
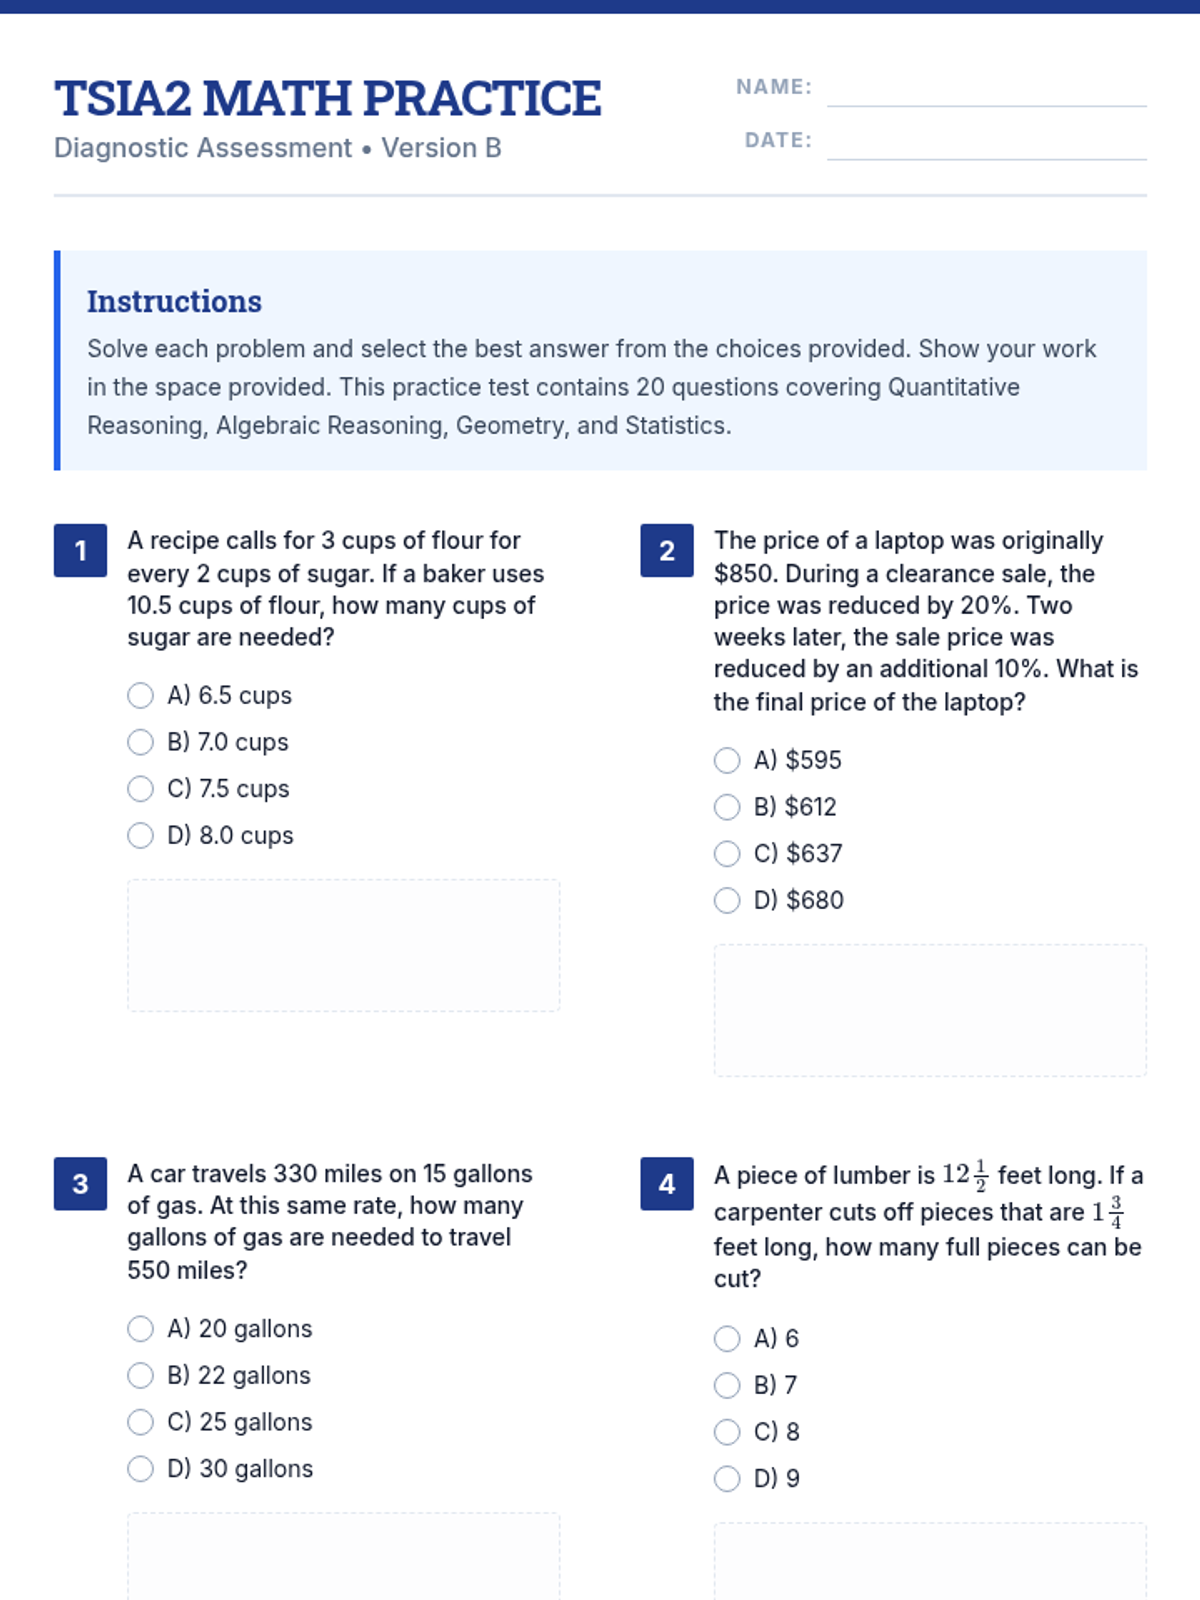
A comprehensive practice set and review presentation for the TSIA2 Math exam, covering Quantitative, Algebraic, Geometric, and Statistical reasoning.
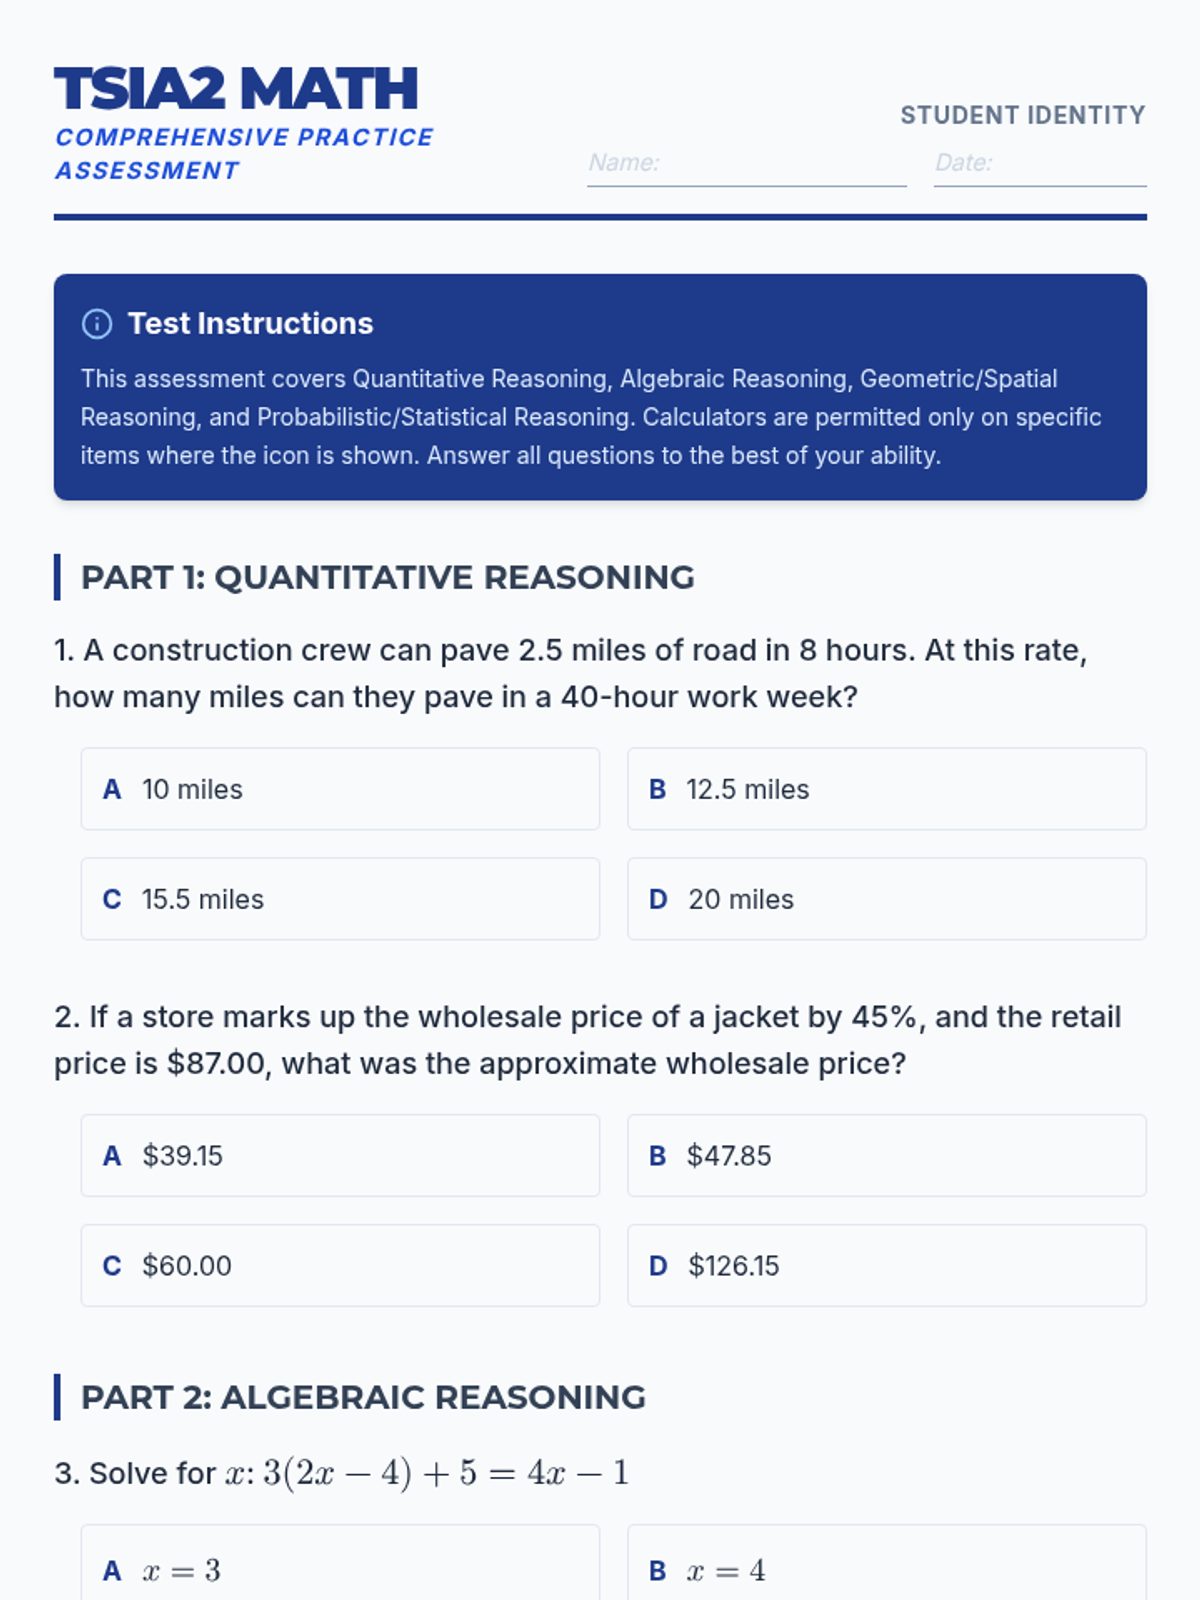
A comprehensive preparation set for the TSIA2 Mathematics assessment, featuring a full-length practice test, detailed step-by-step solutions, and a strategic review presentation.
The final week of the TSIA2 Math Marathon, reviewing complex problems and multi-step reasoning.
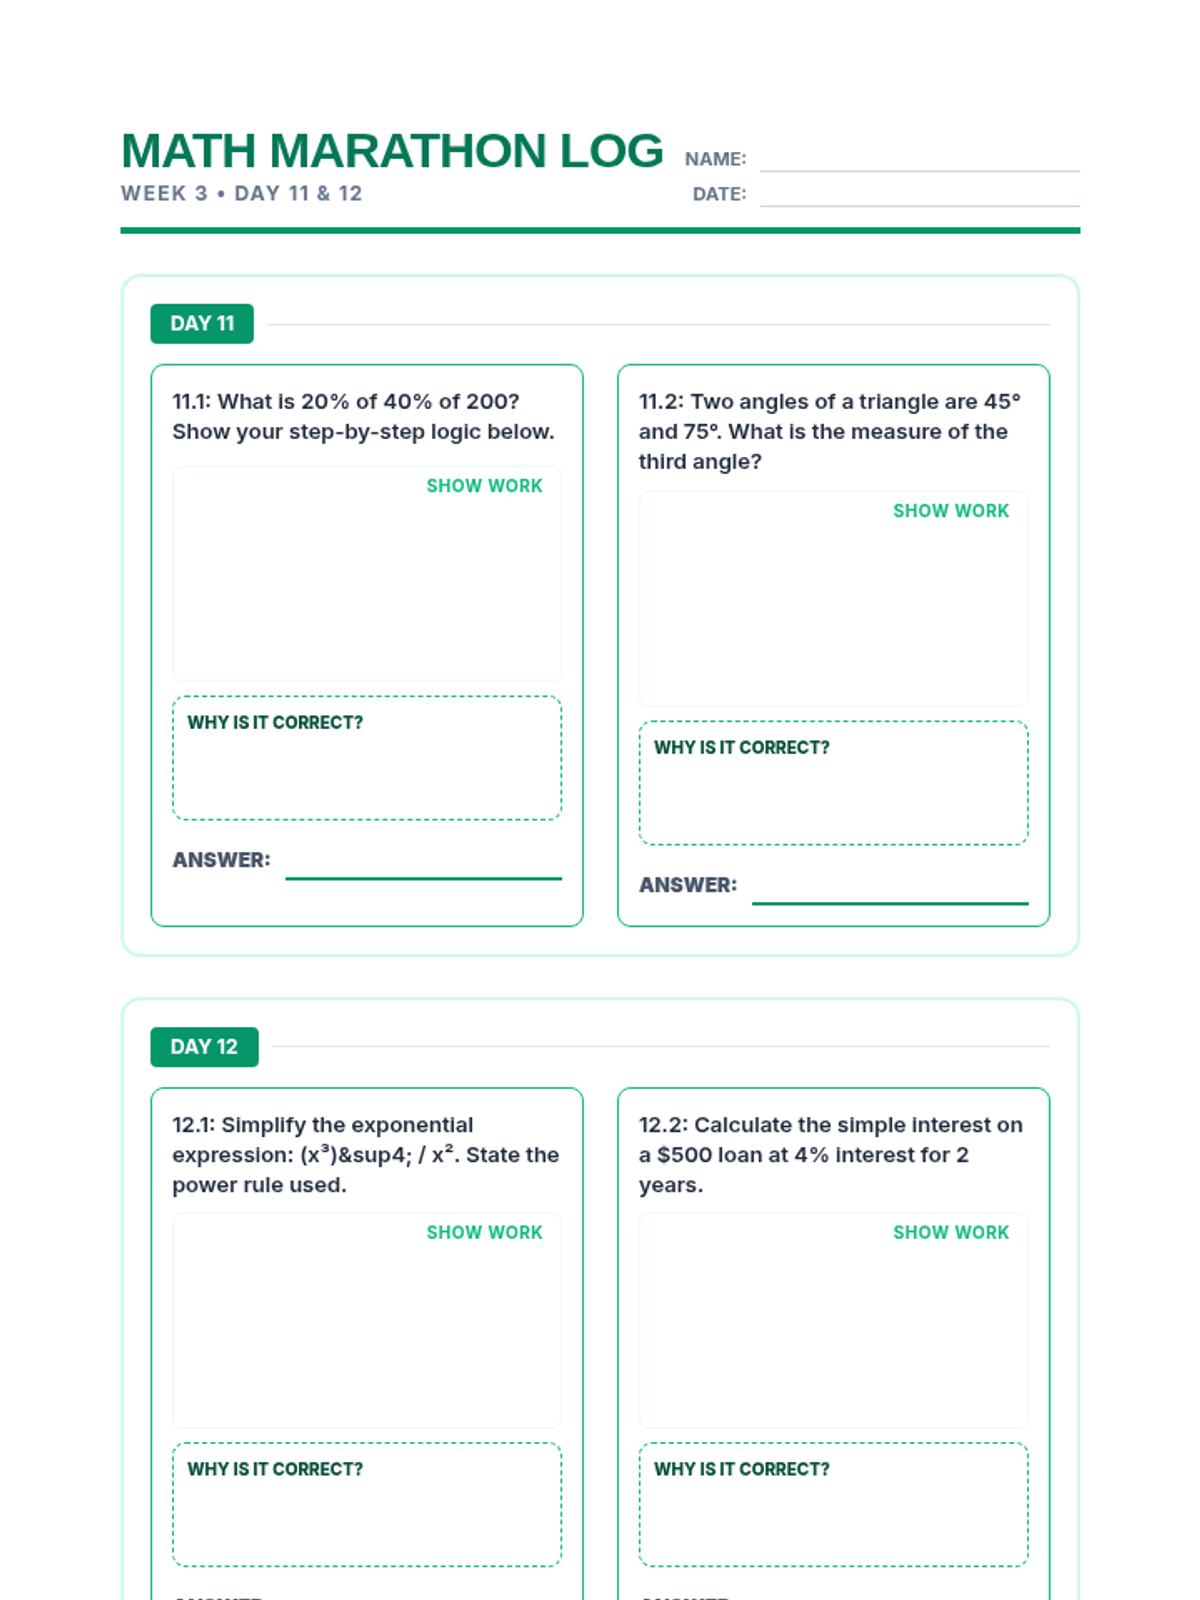
The second week of the TSIA2 Math Marathon, expanding into geometric and statistical reasoning.
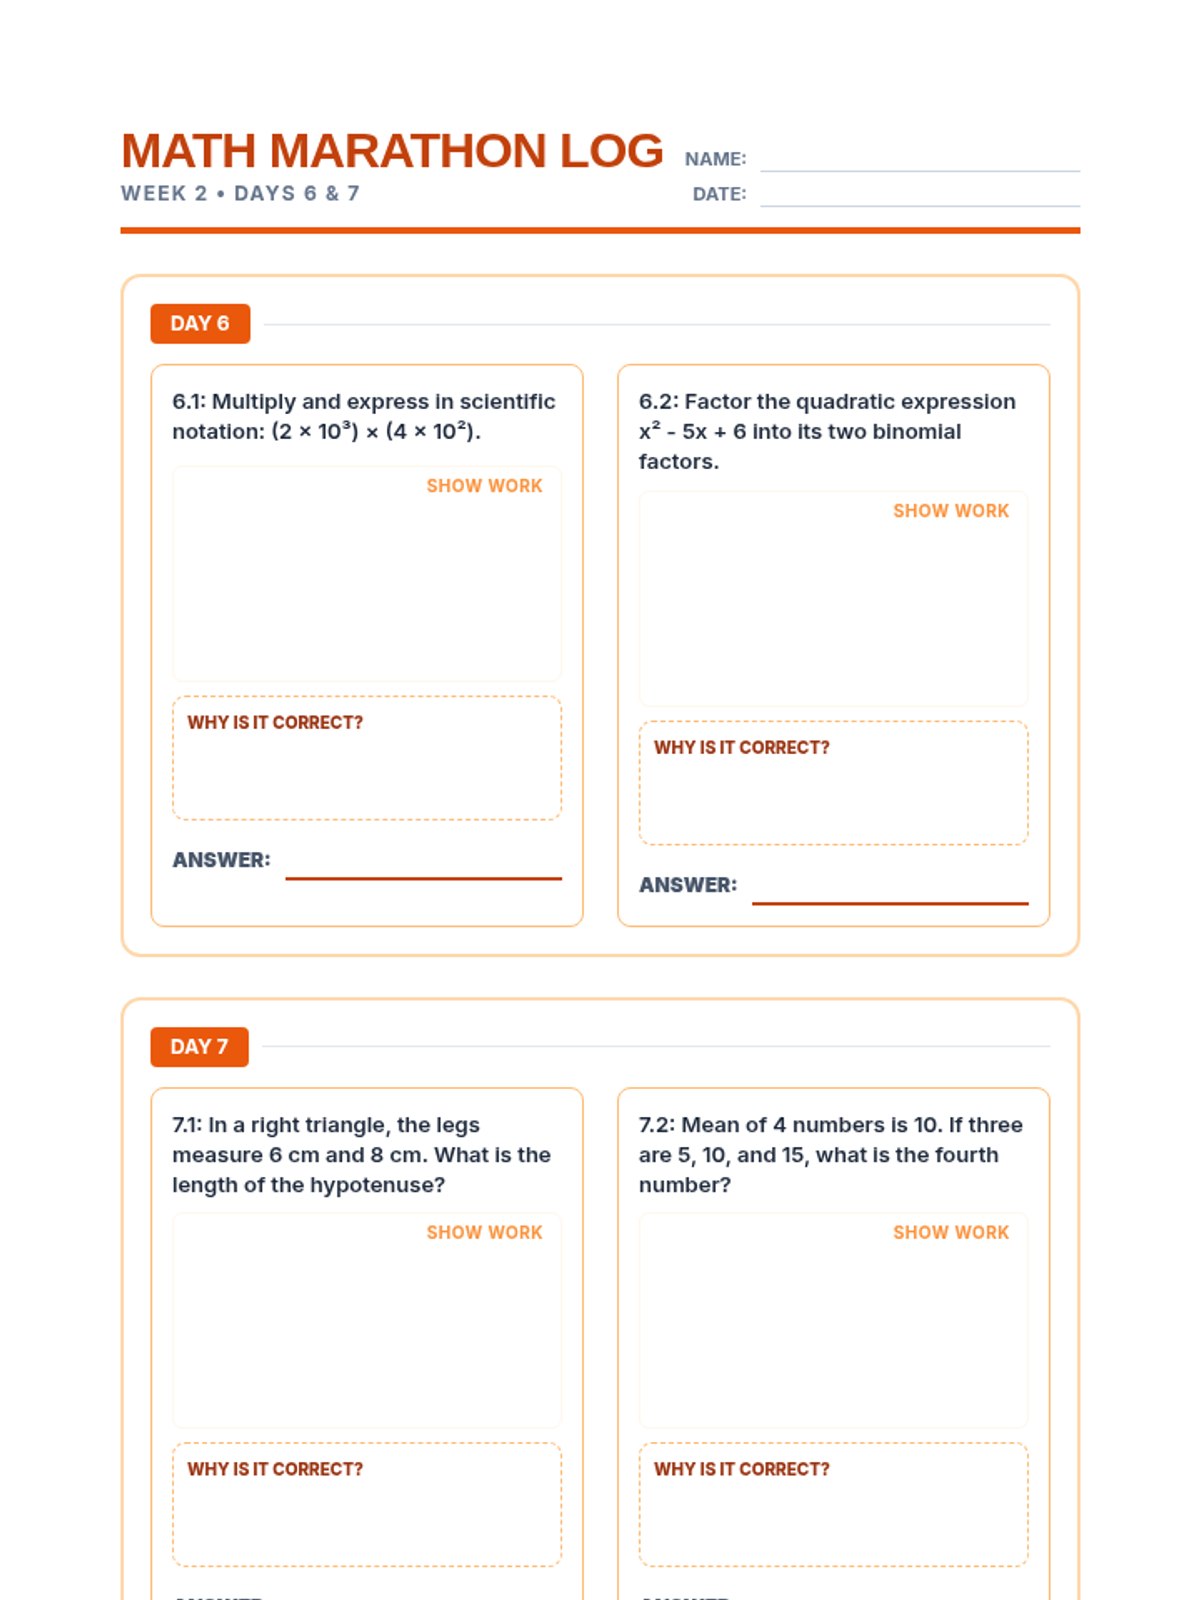
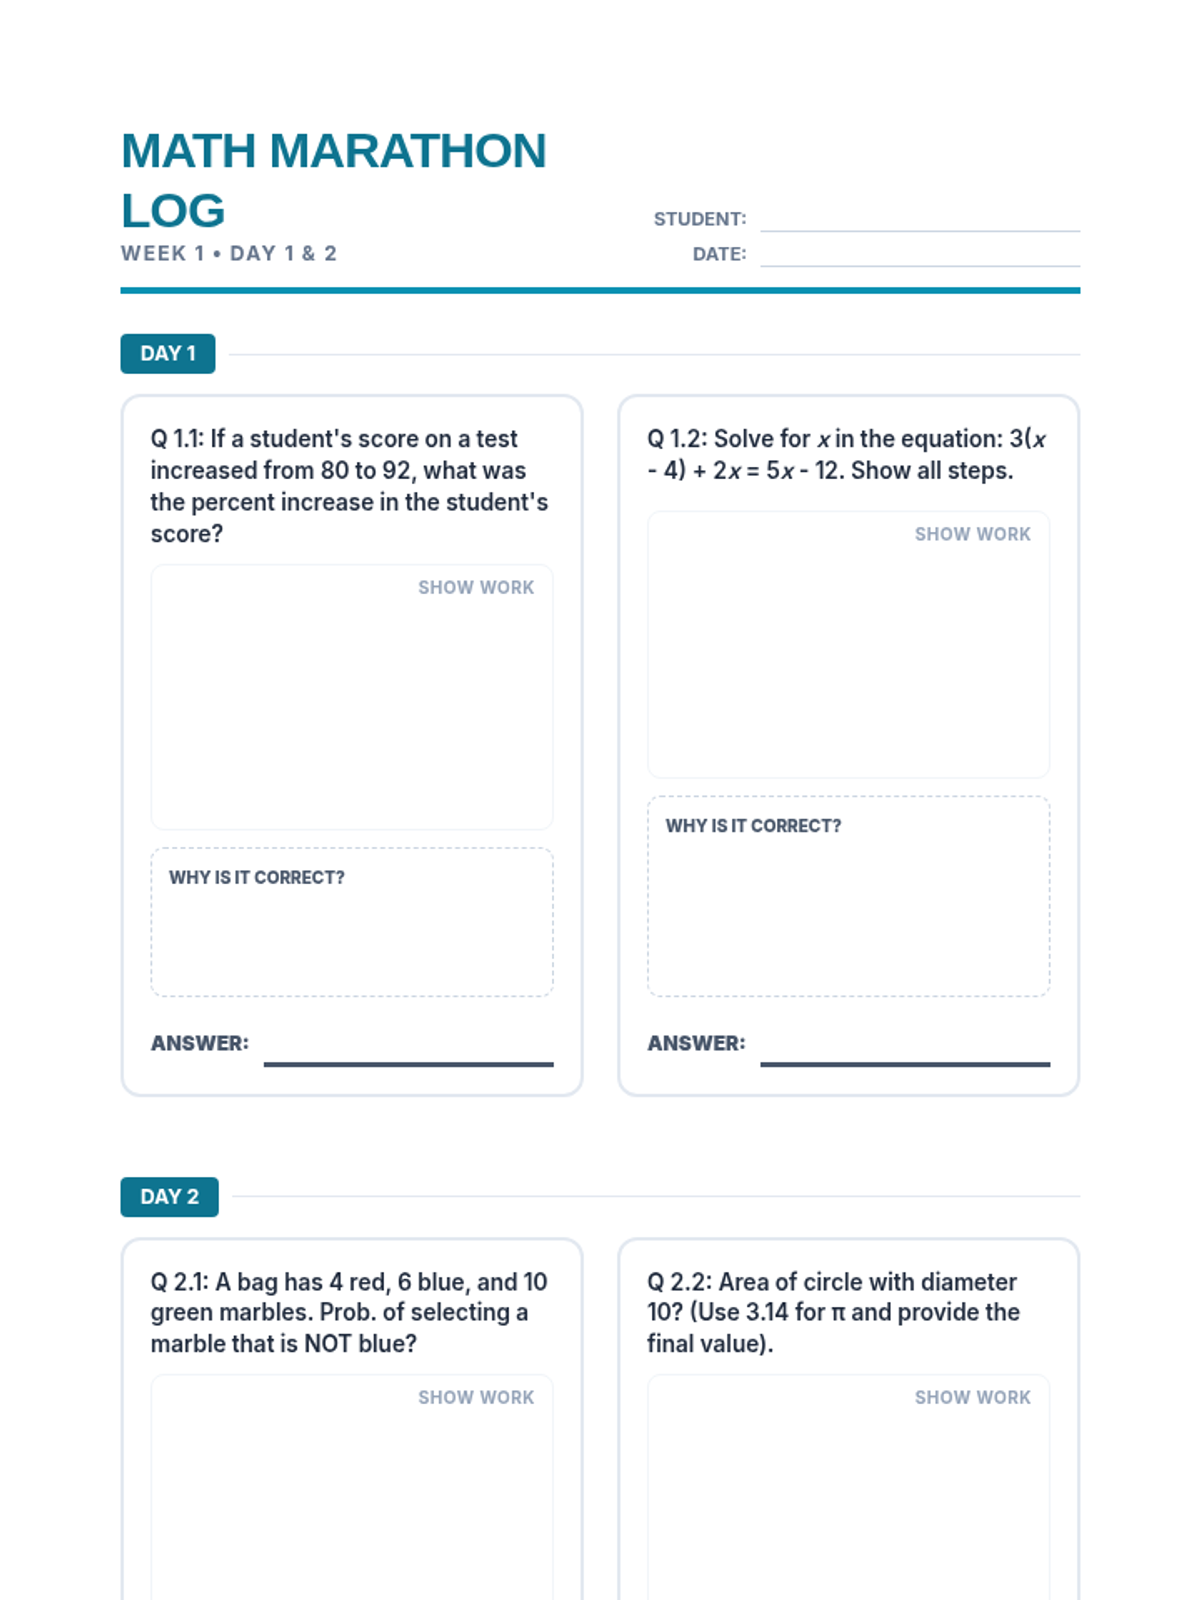
The first week of the TSIA2 Math Marathon, focusing on foundational algebraic and quantitative reasoning.
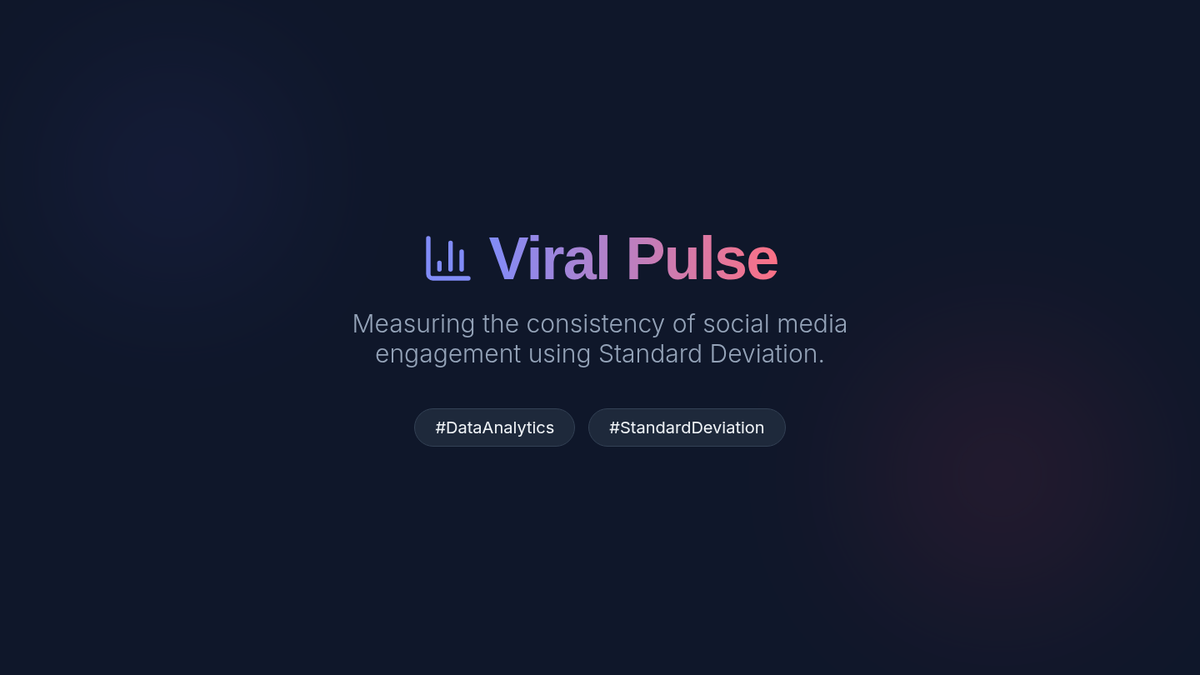
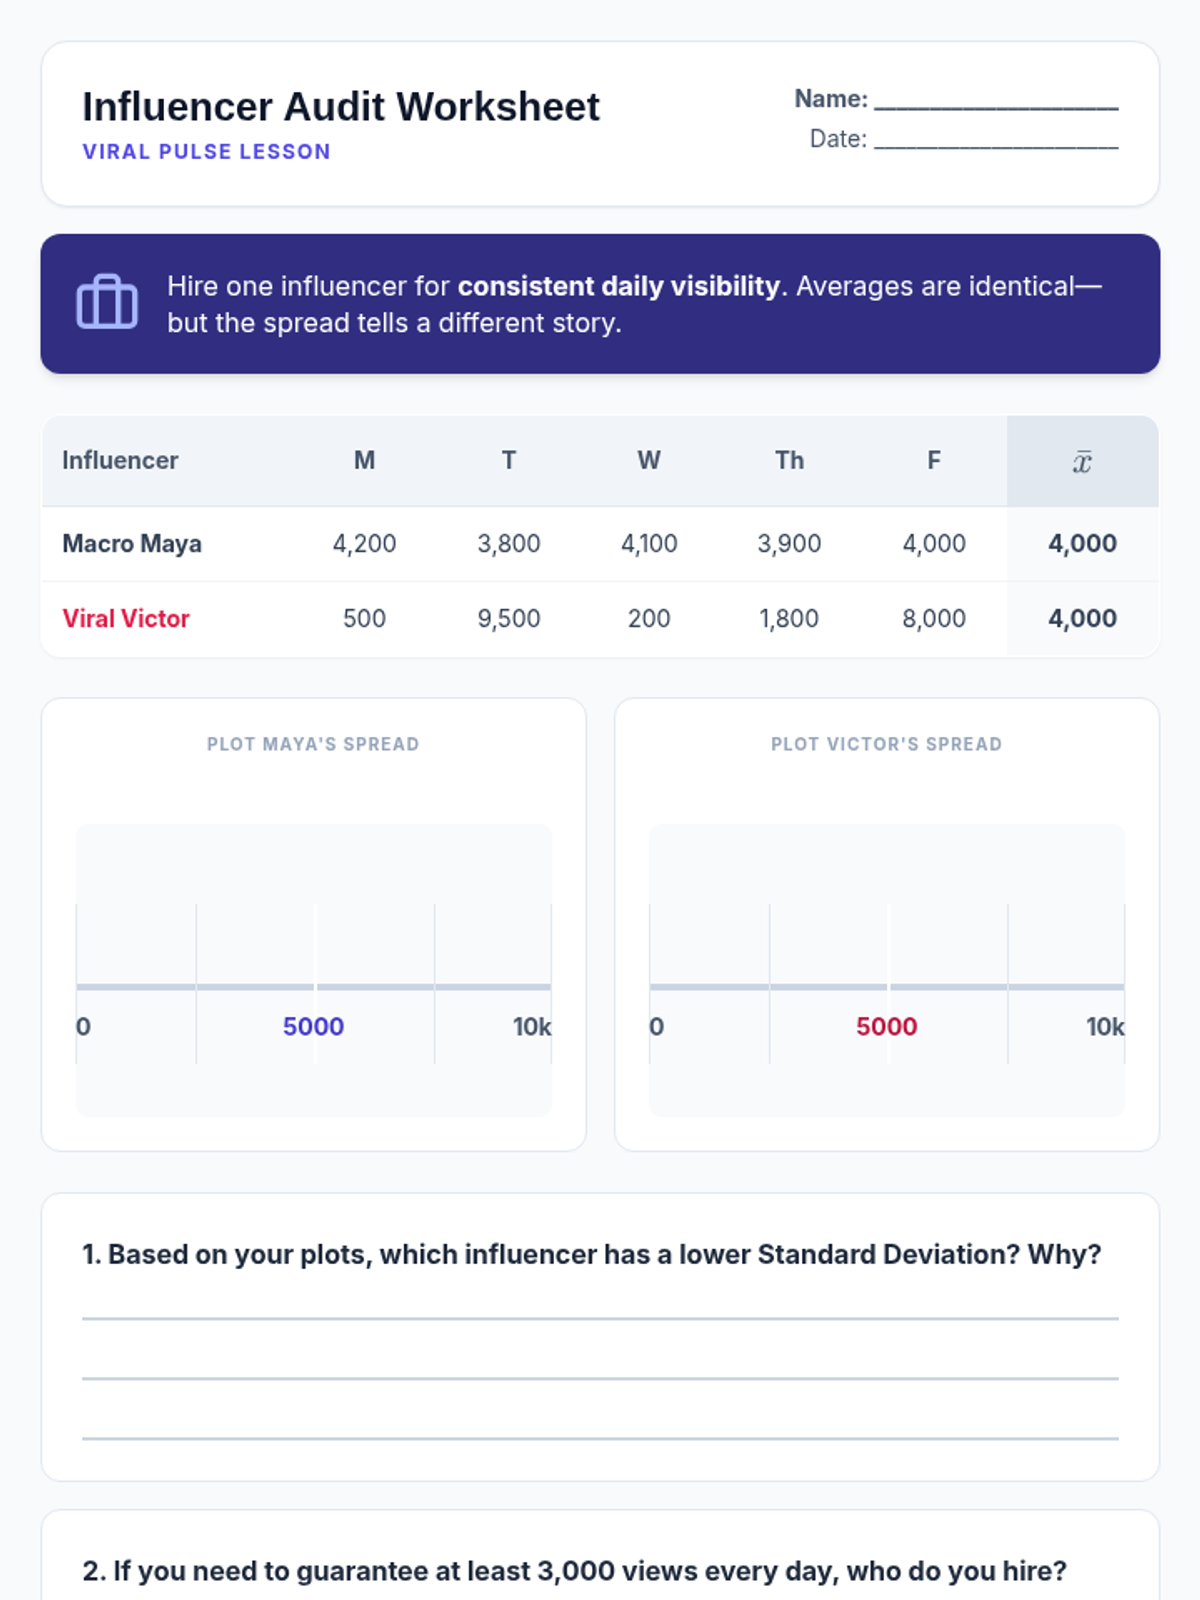
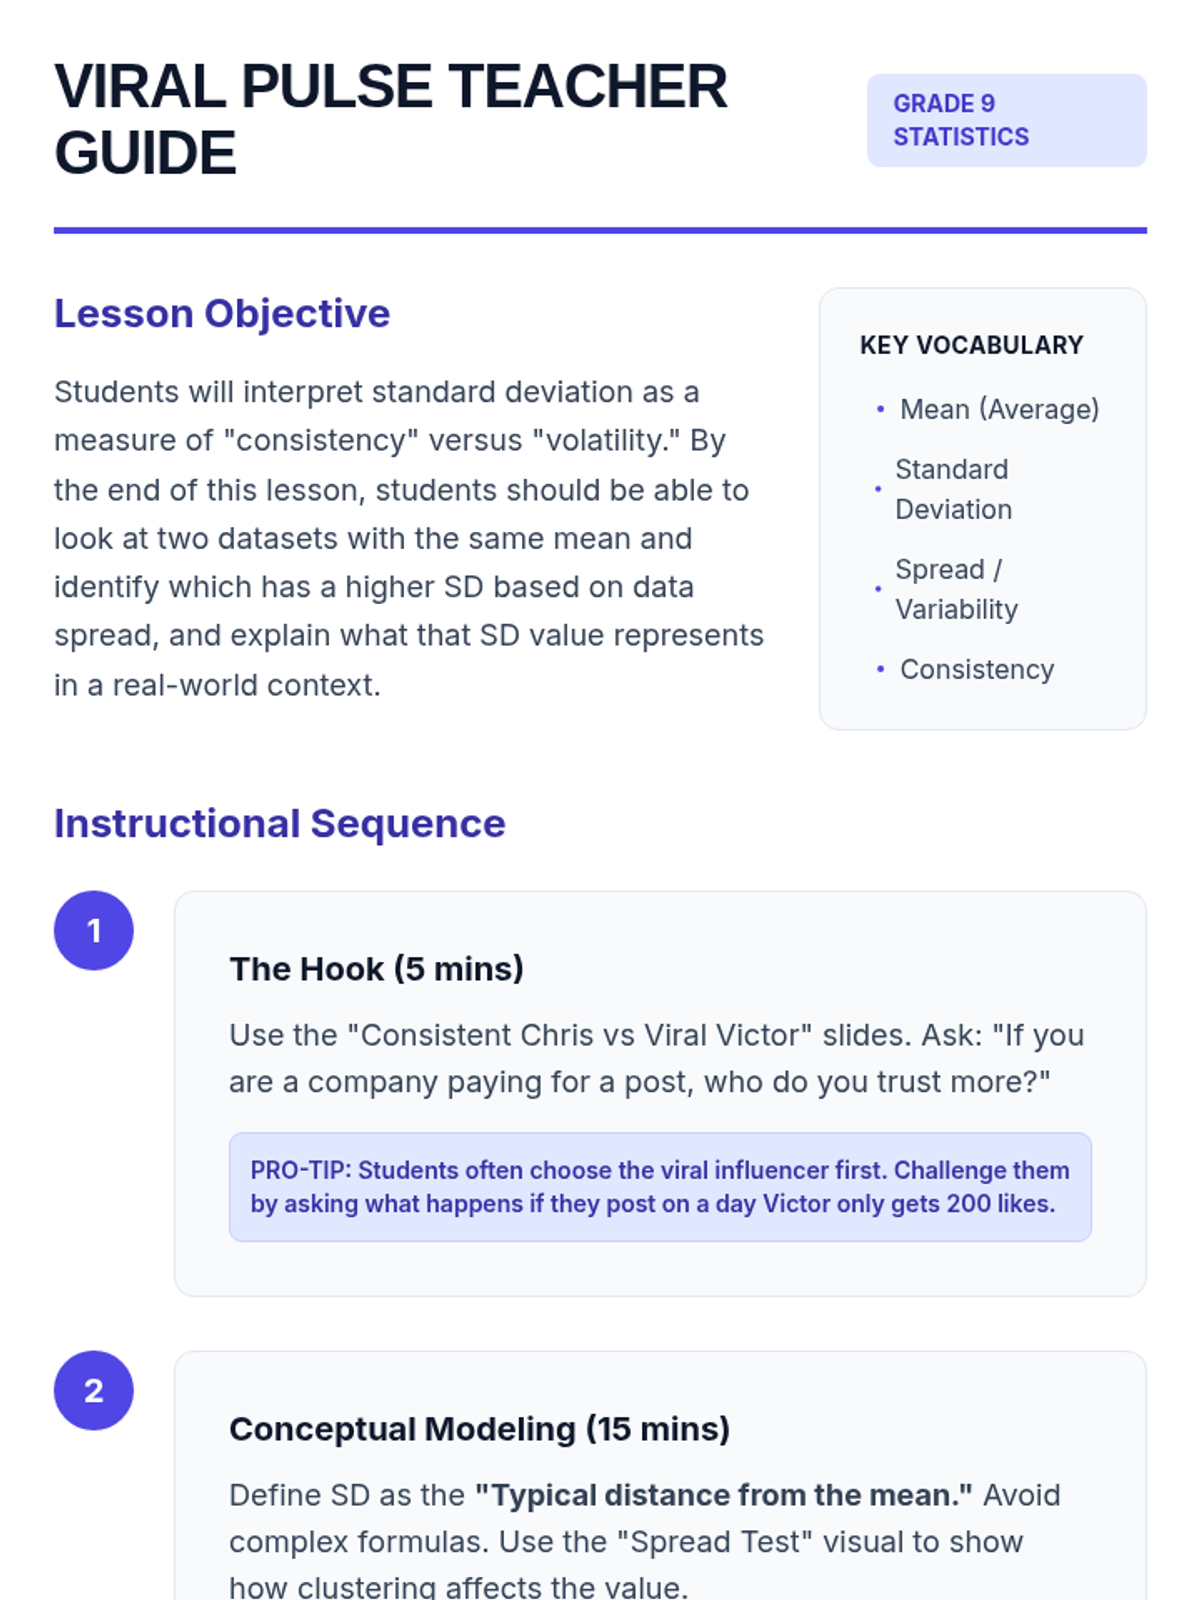
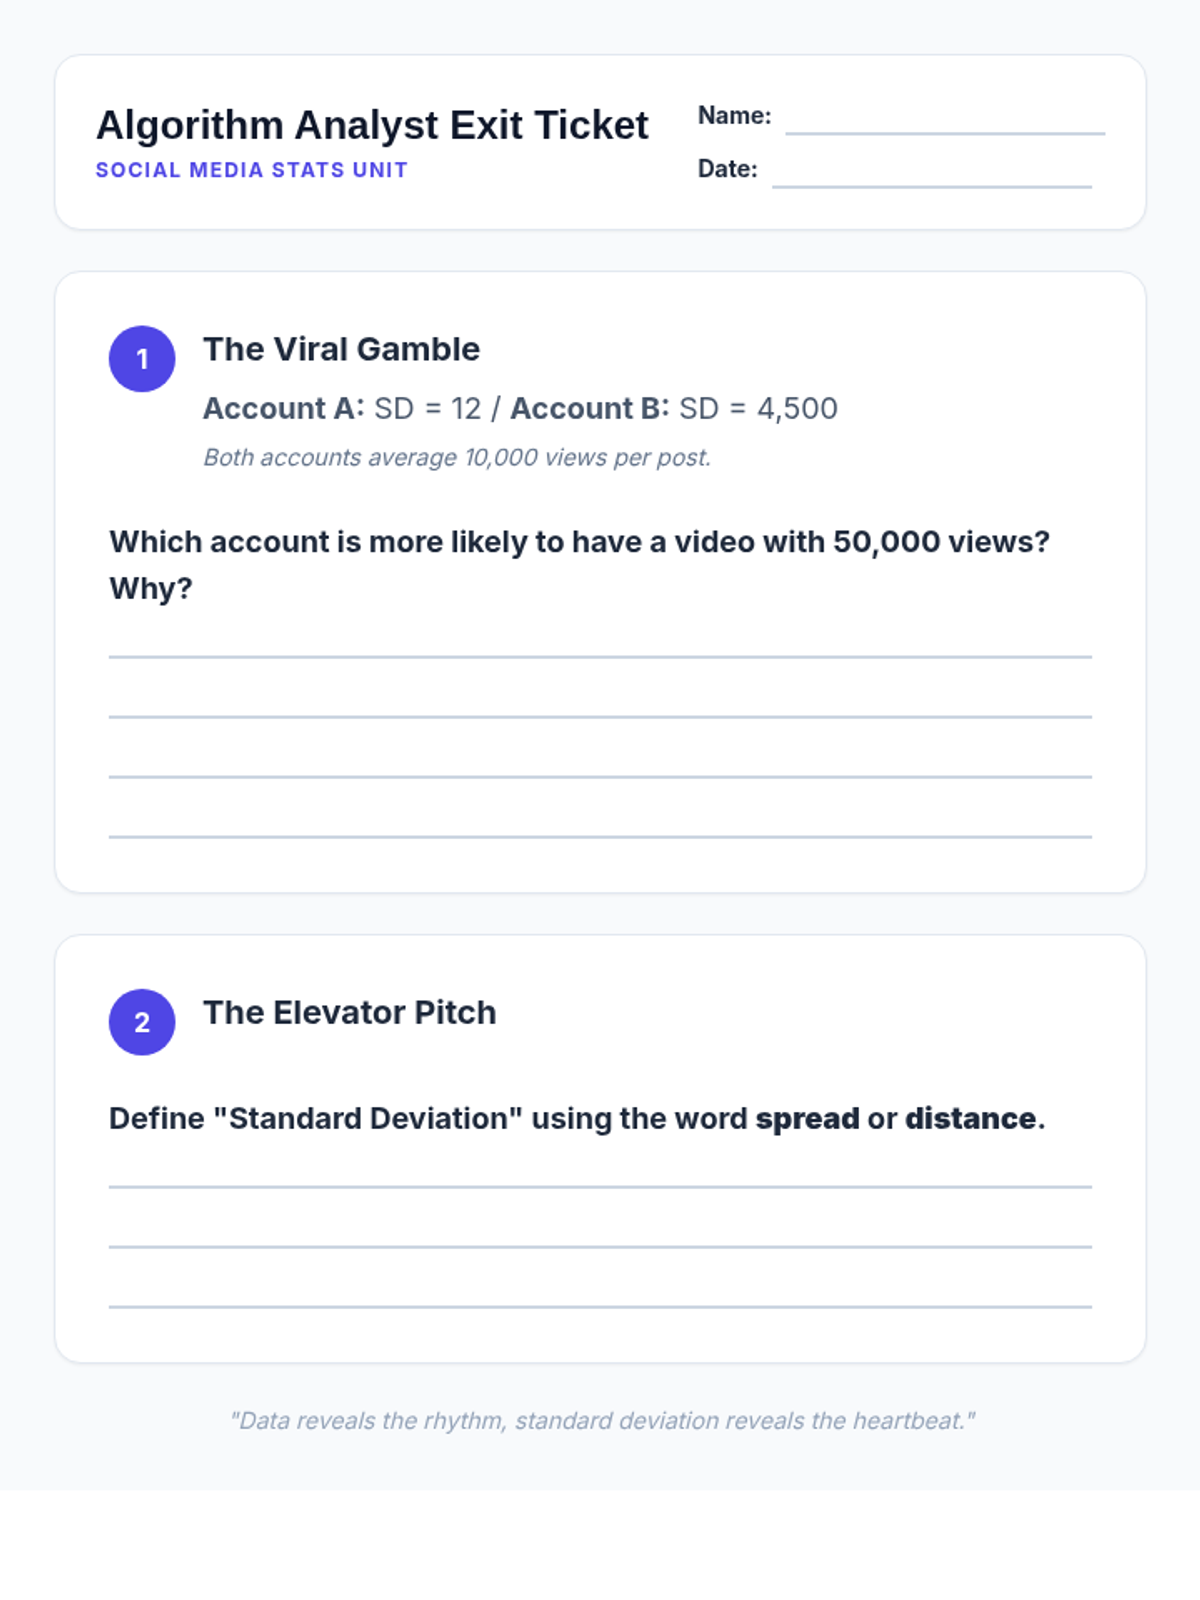
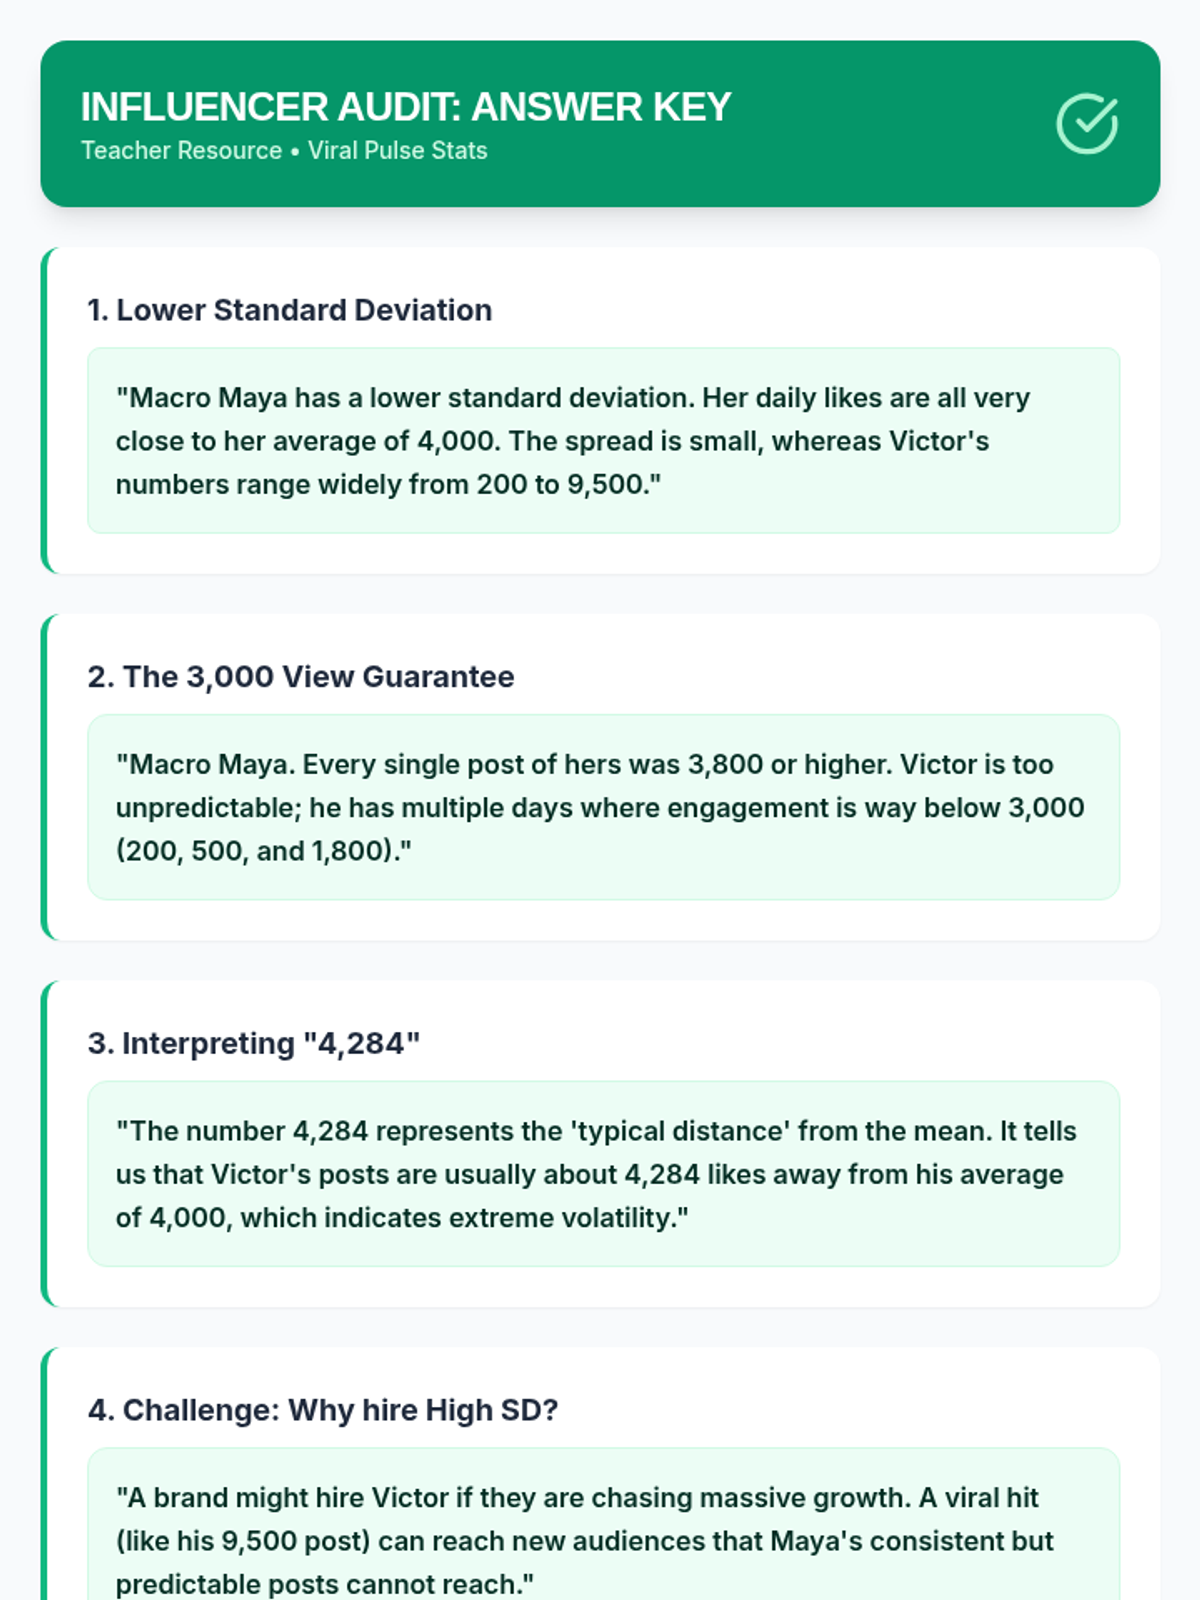
A lesson exploring standard deviation through social media analytics, focusing on how 'consistency' and 'volatility' are measured in the digital world. Students will interpret data spread to make marketing decisions without complex manual calculations.
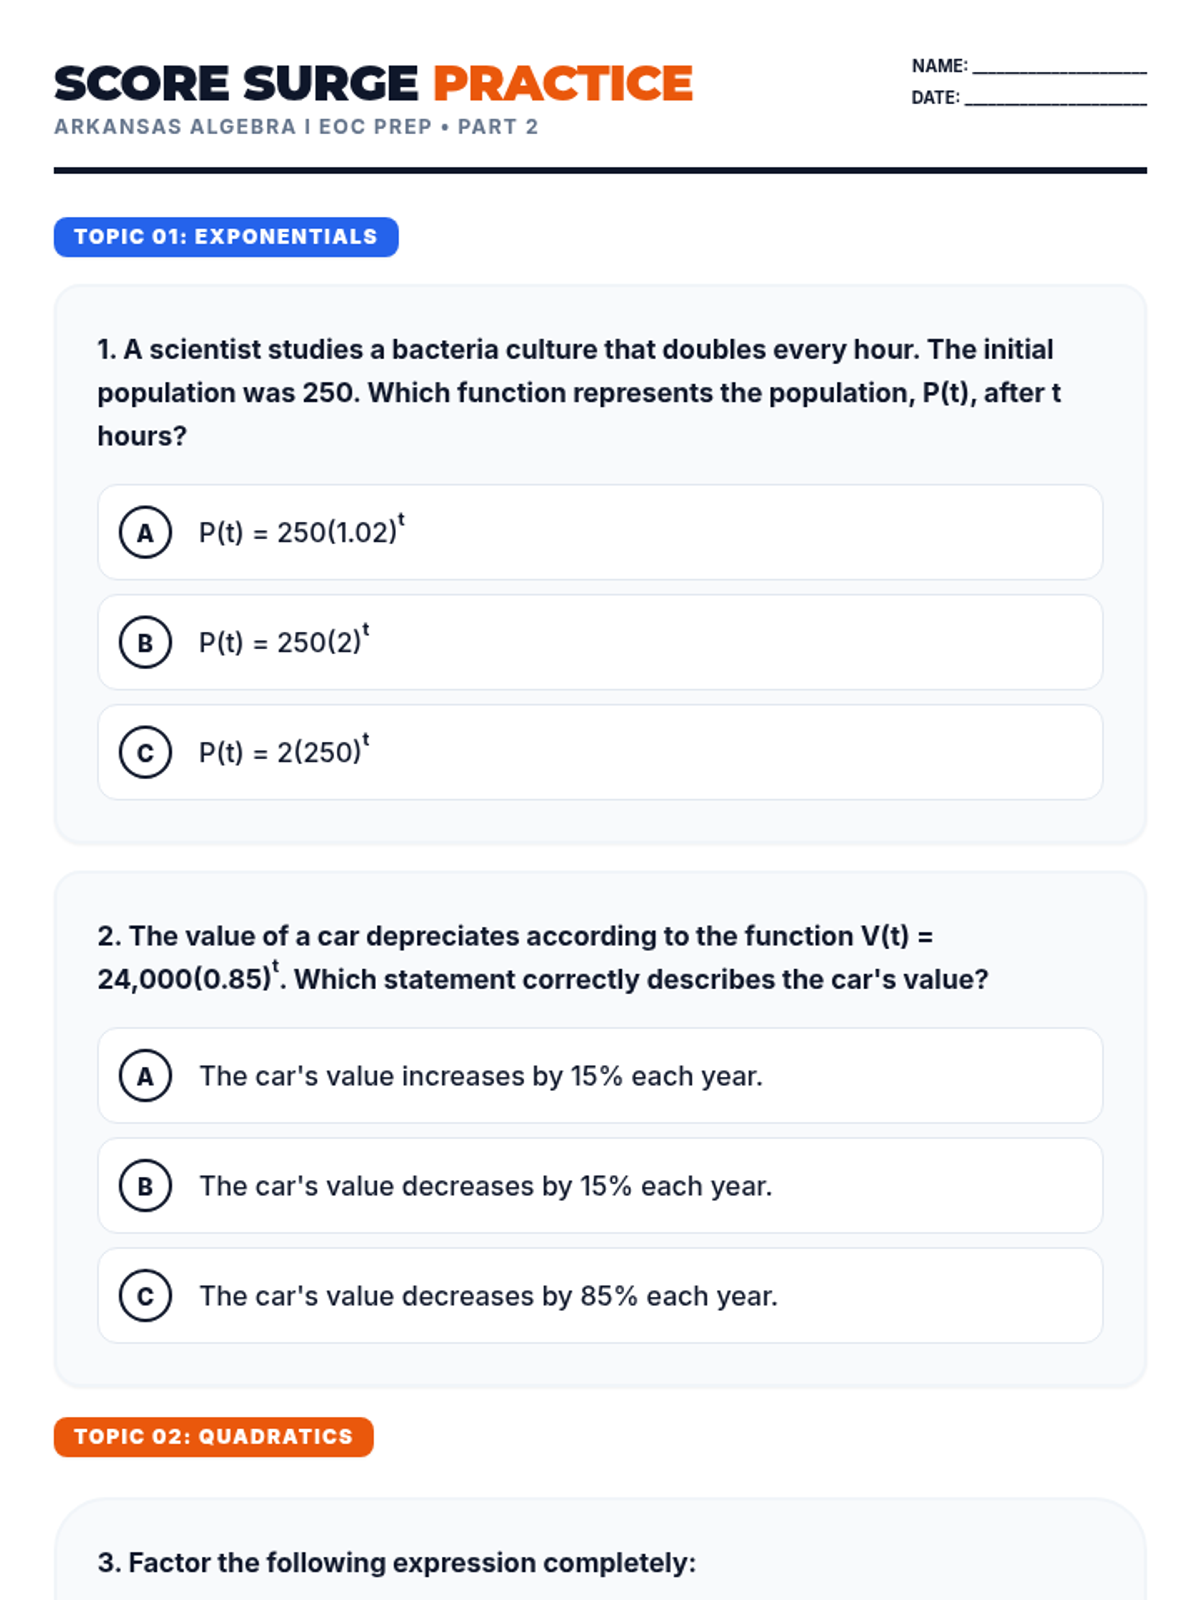
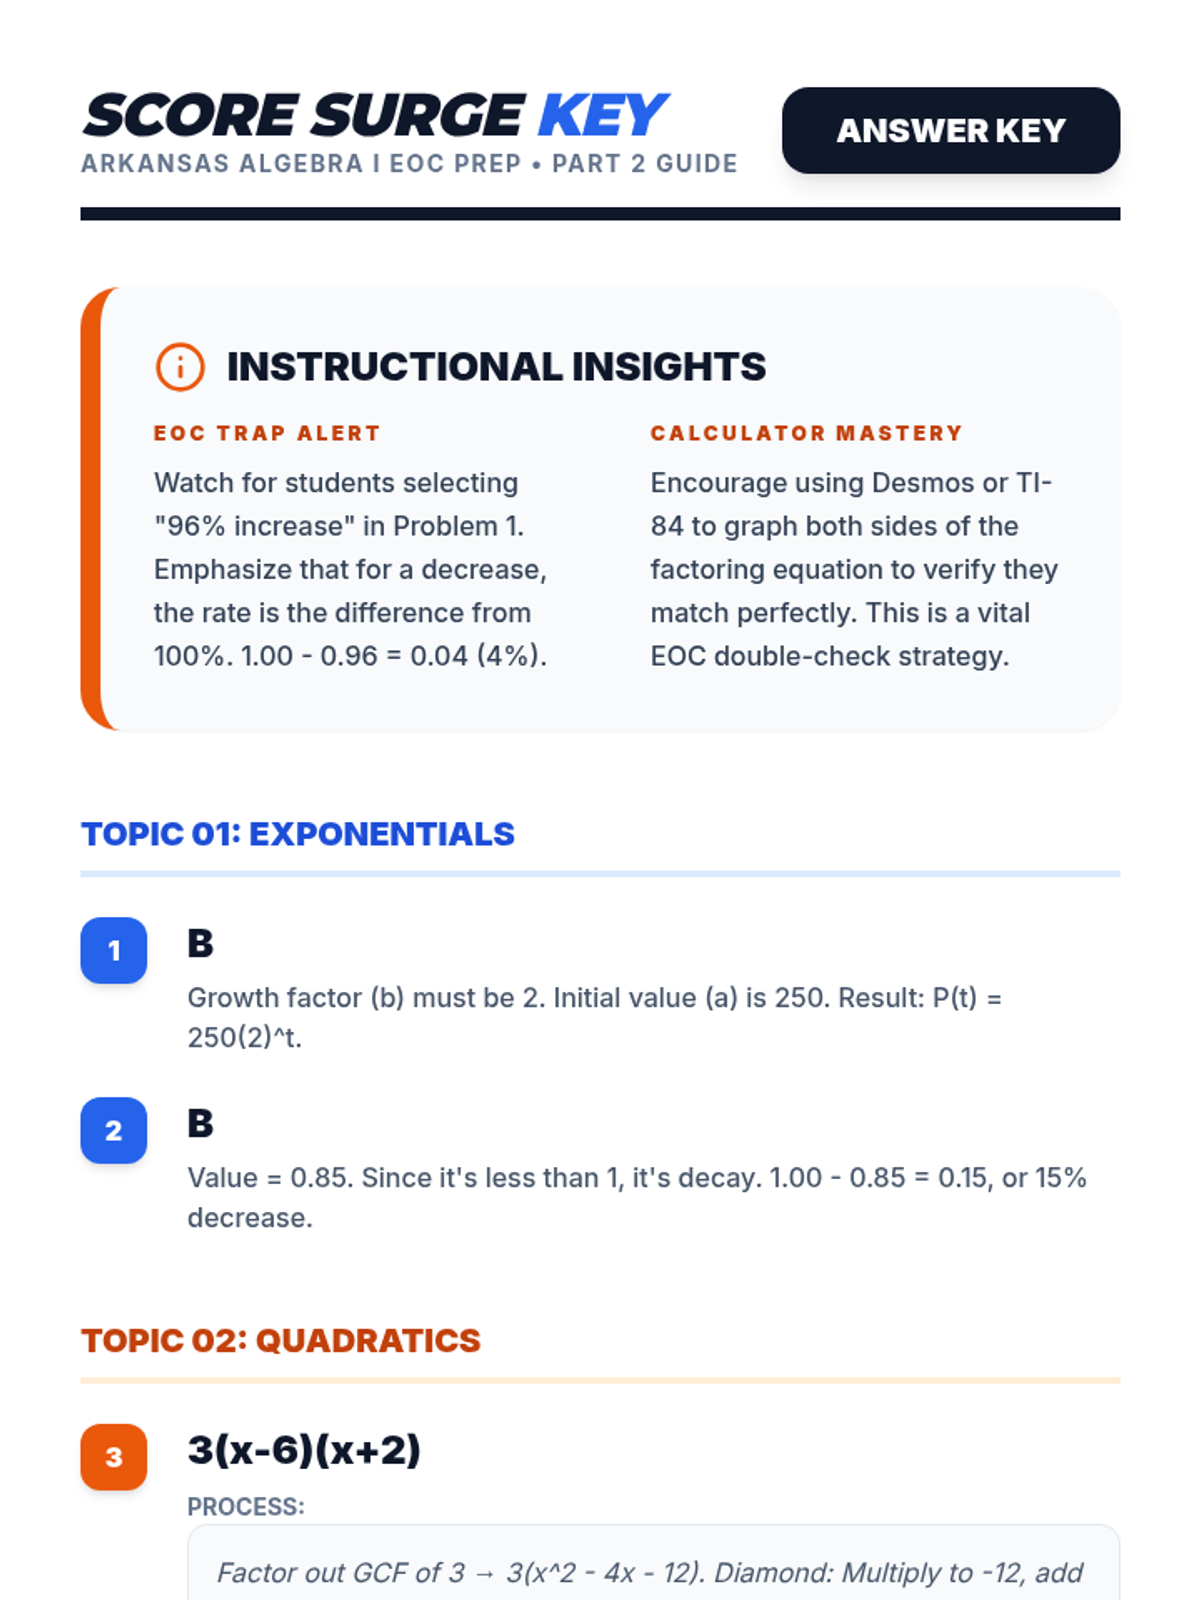
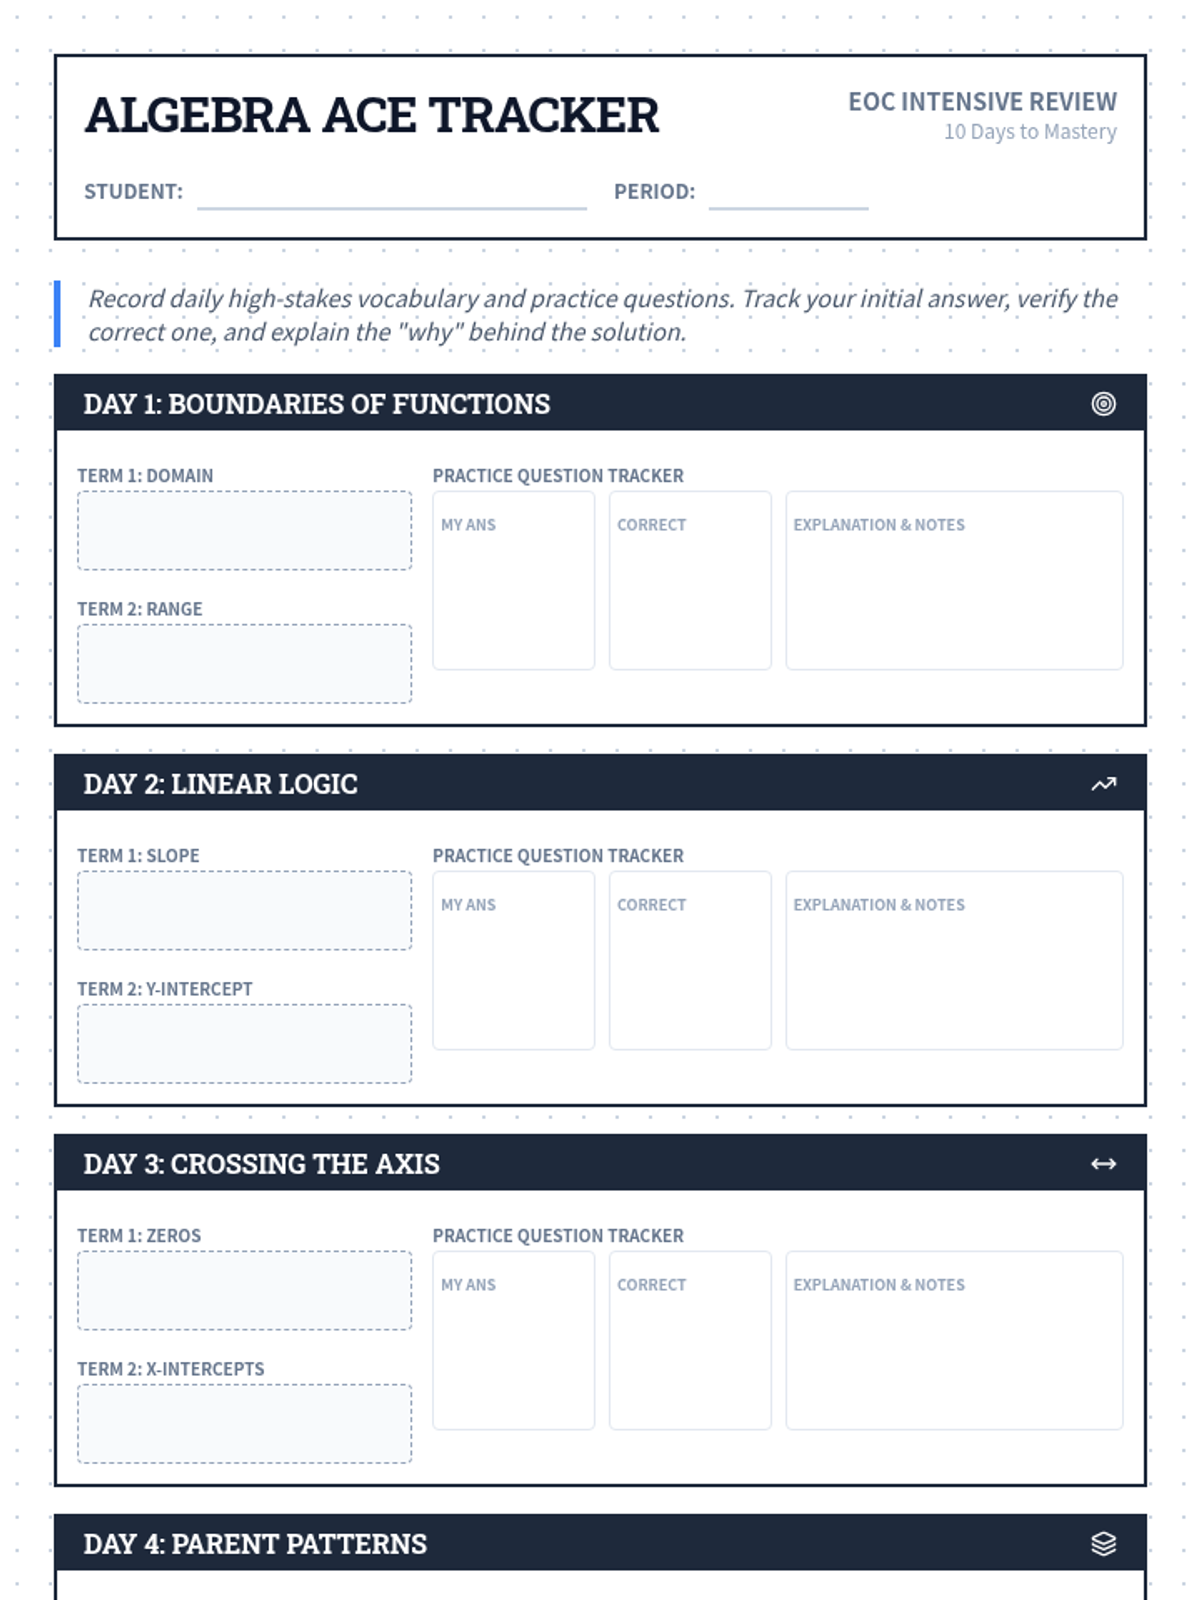
A high-intensity EOC preparation lesson focused on mastering exponential functions, quadratic expressions, and data statistics for the Arkansas Algebra I state exam.
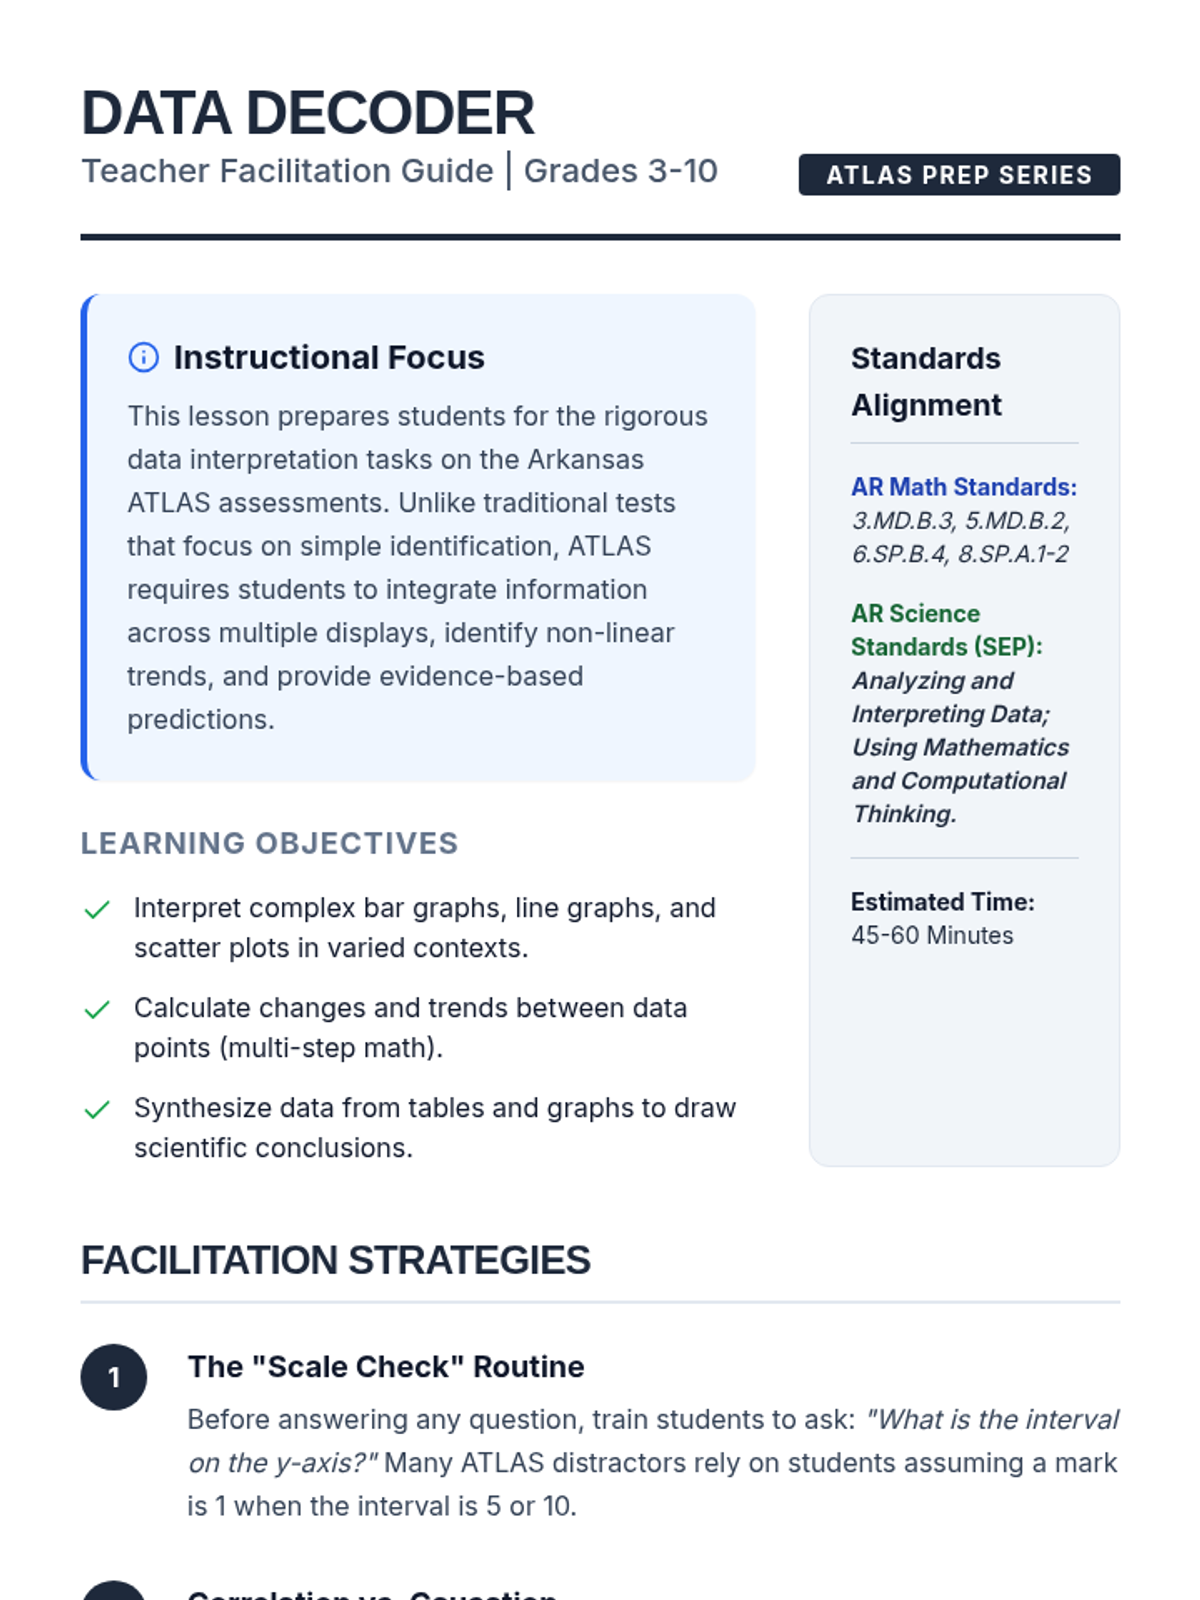
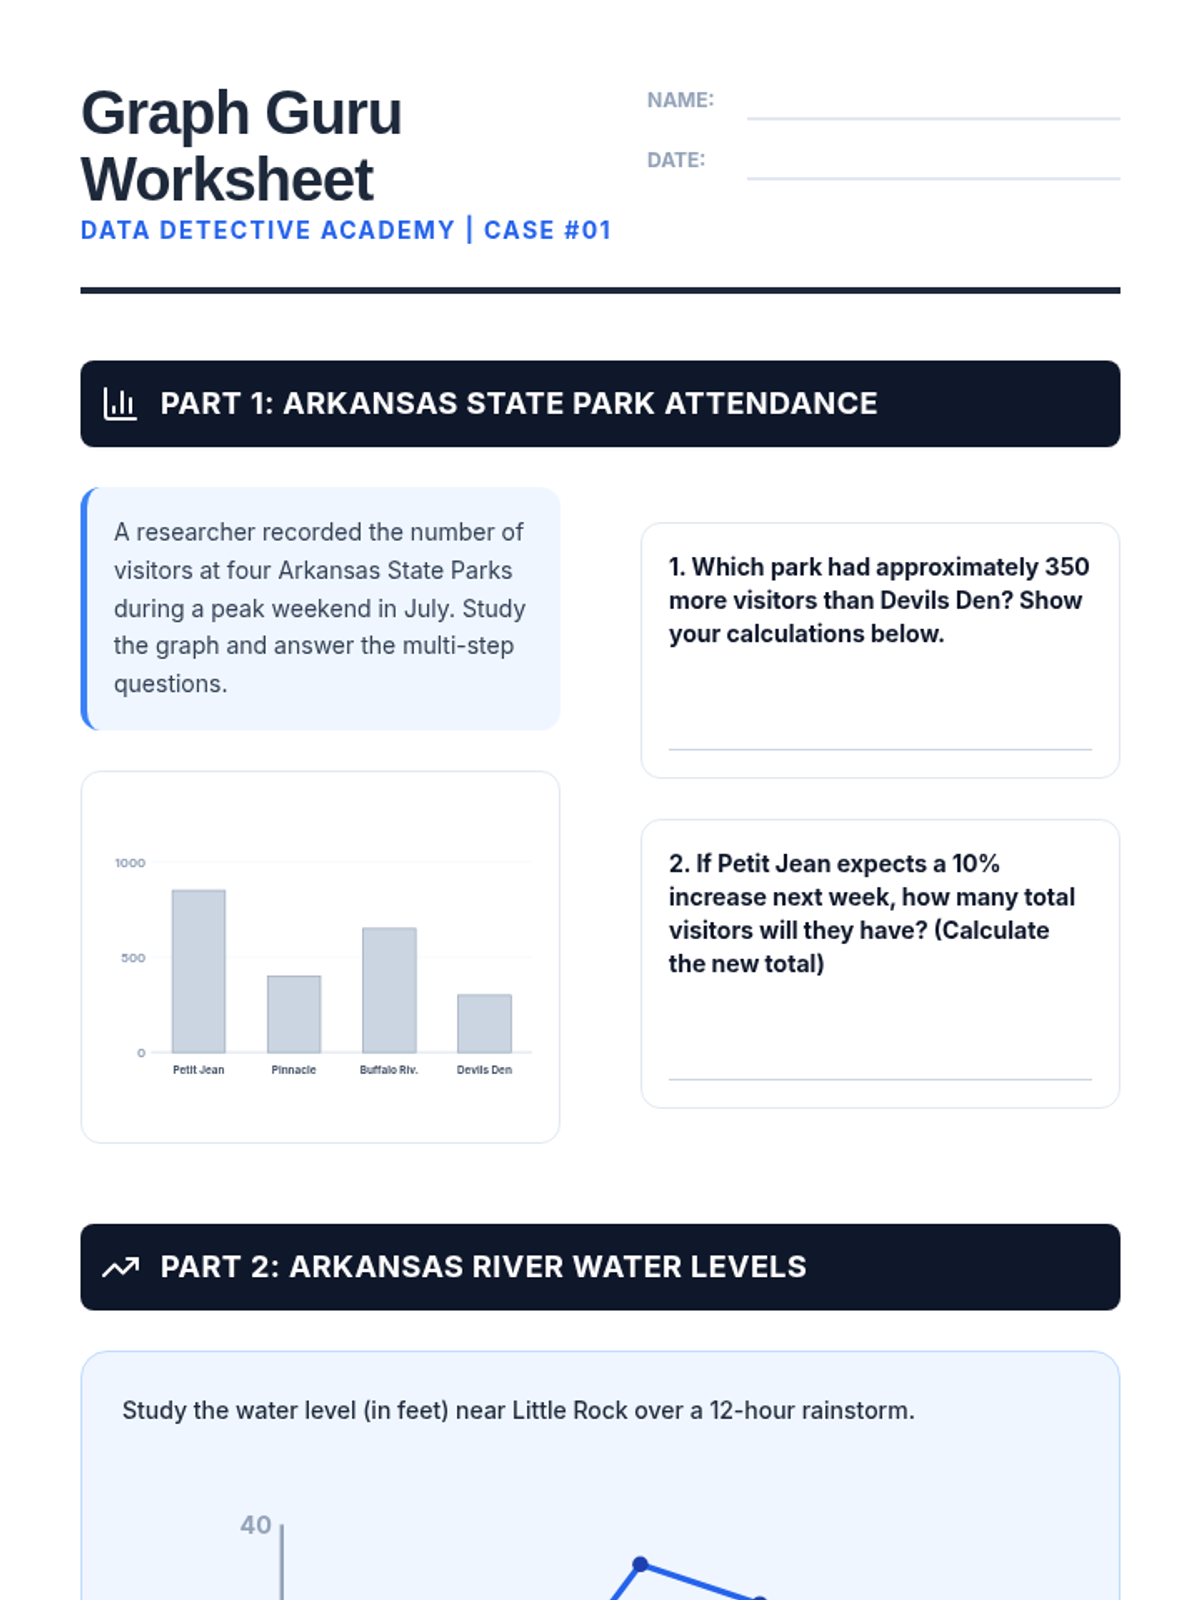
A comprehensive guide to mastering data interpretation for Arkansas ATLAS assessments, covering bar graphs, line graphs, scatter plots, and tables in math and science contexts. Students learn to decode complex visuals and draw evidence-based conclusions.
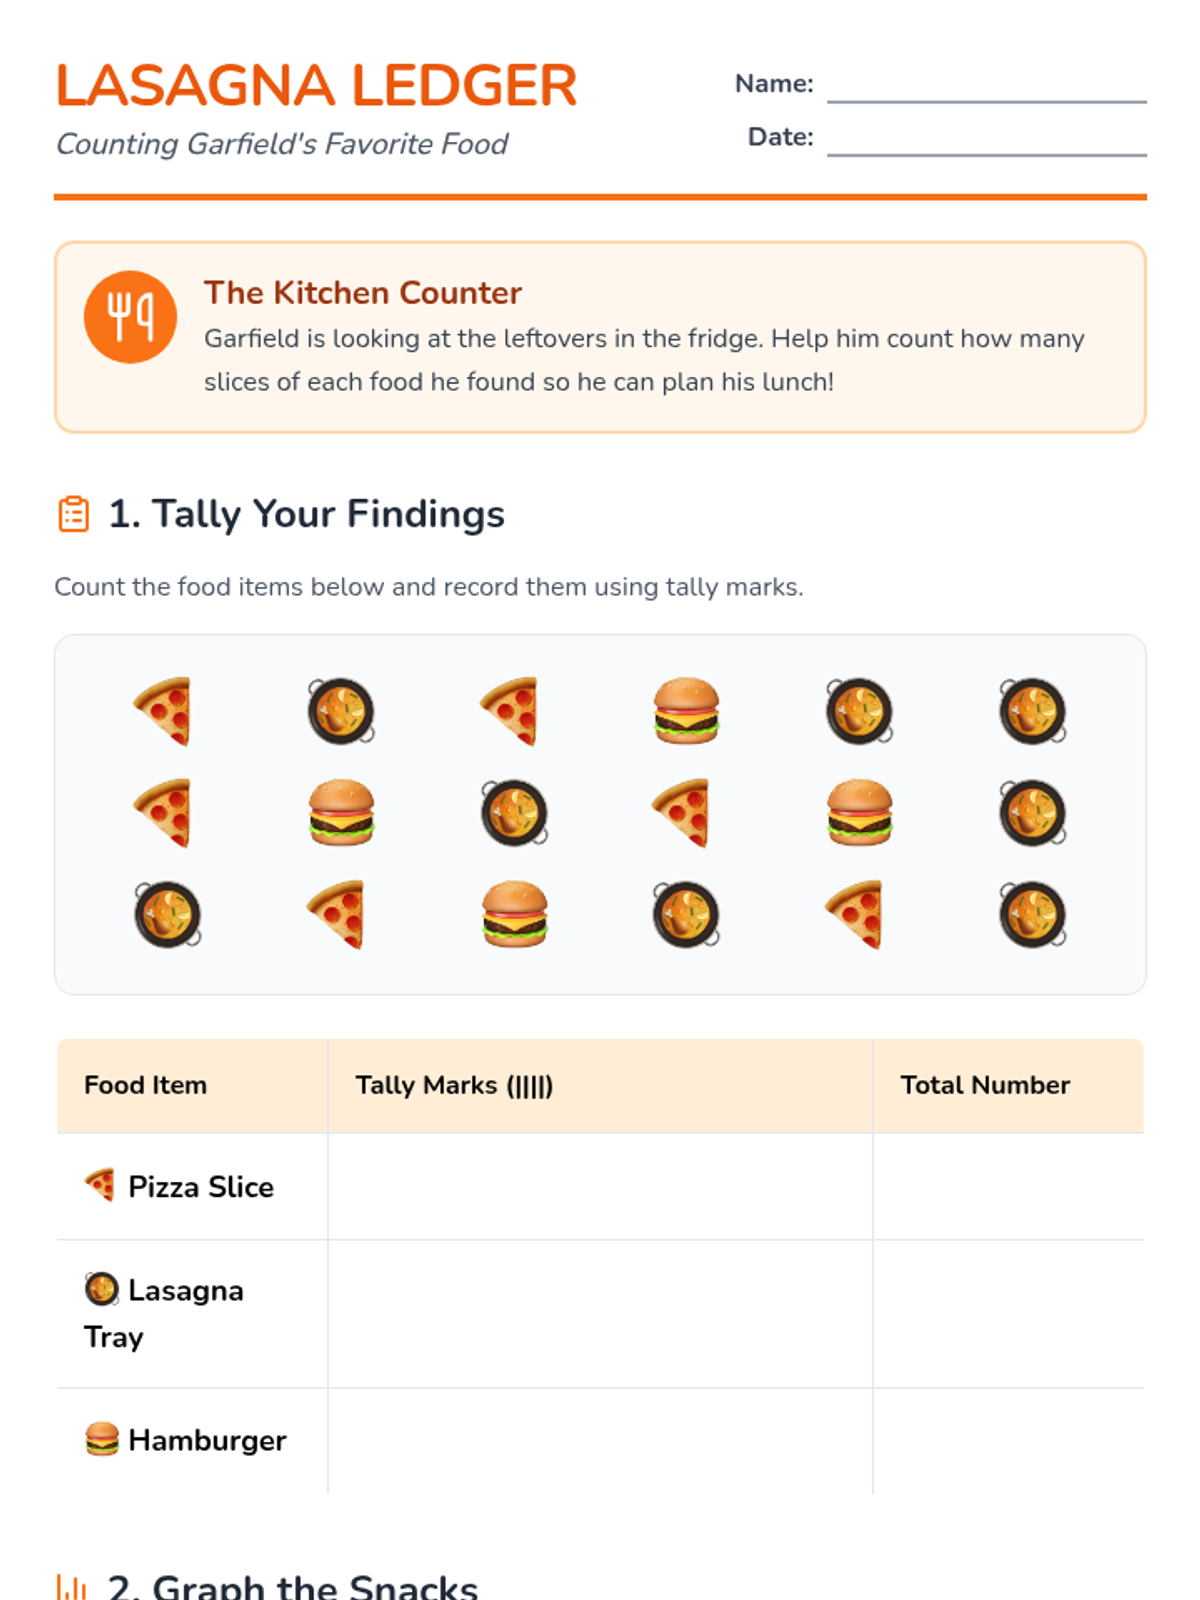
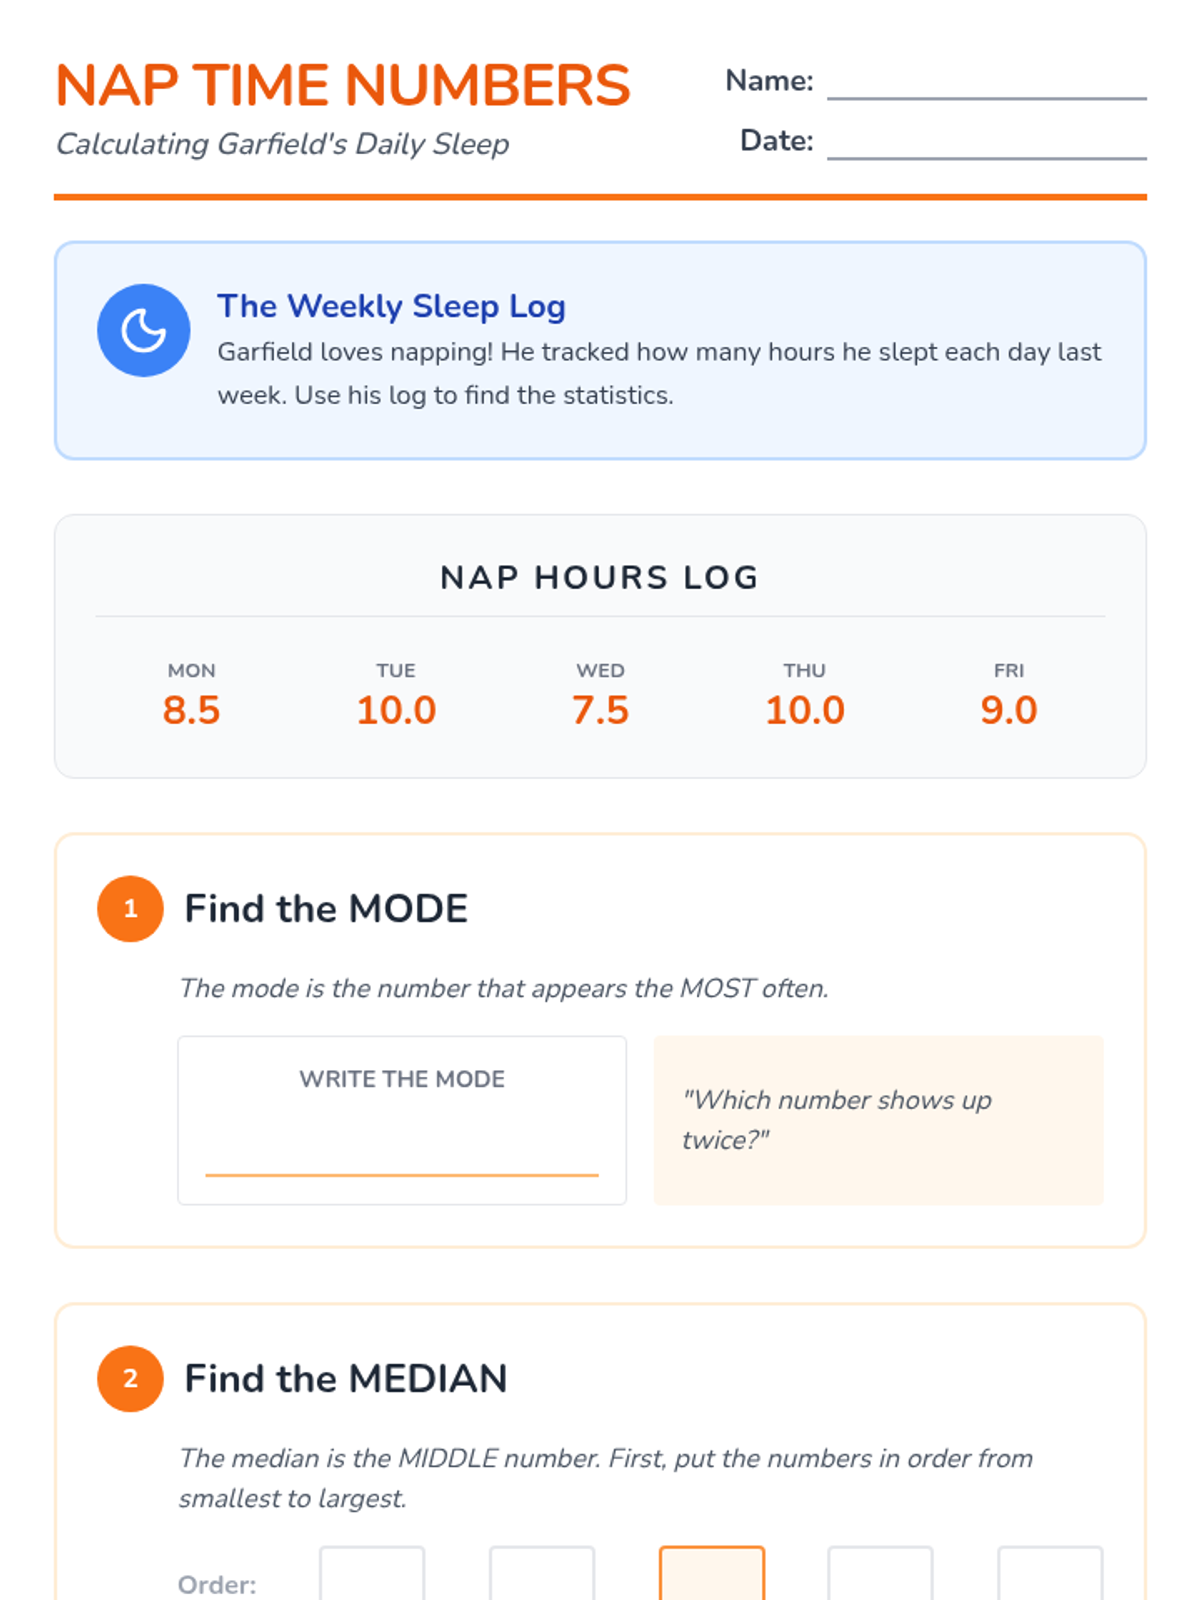
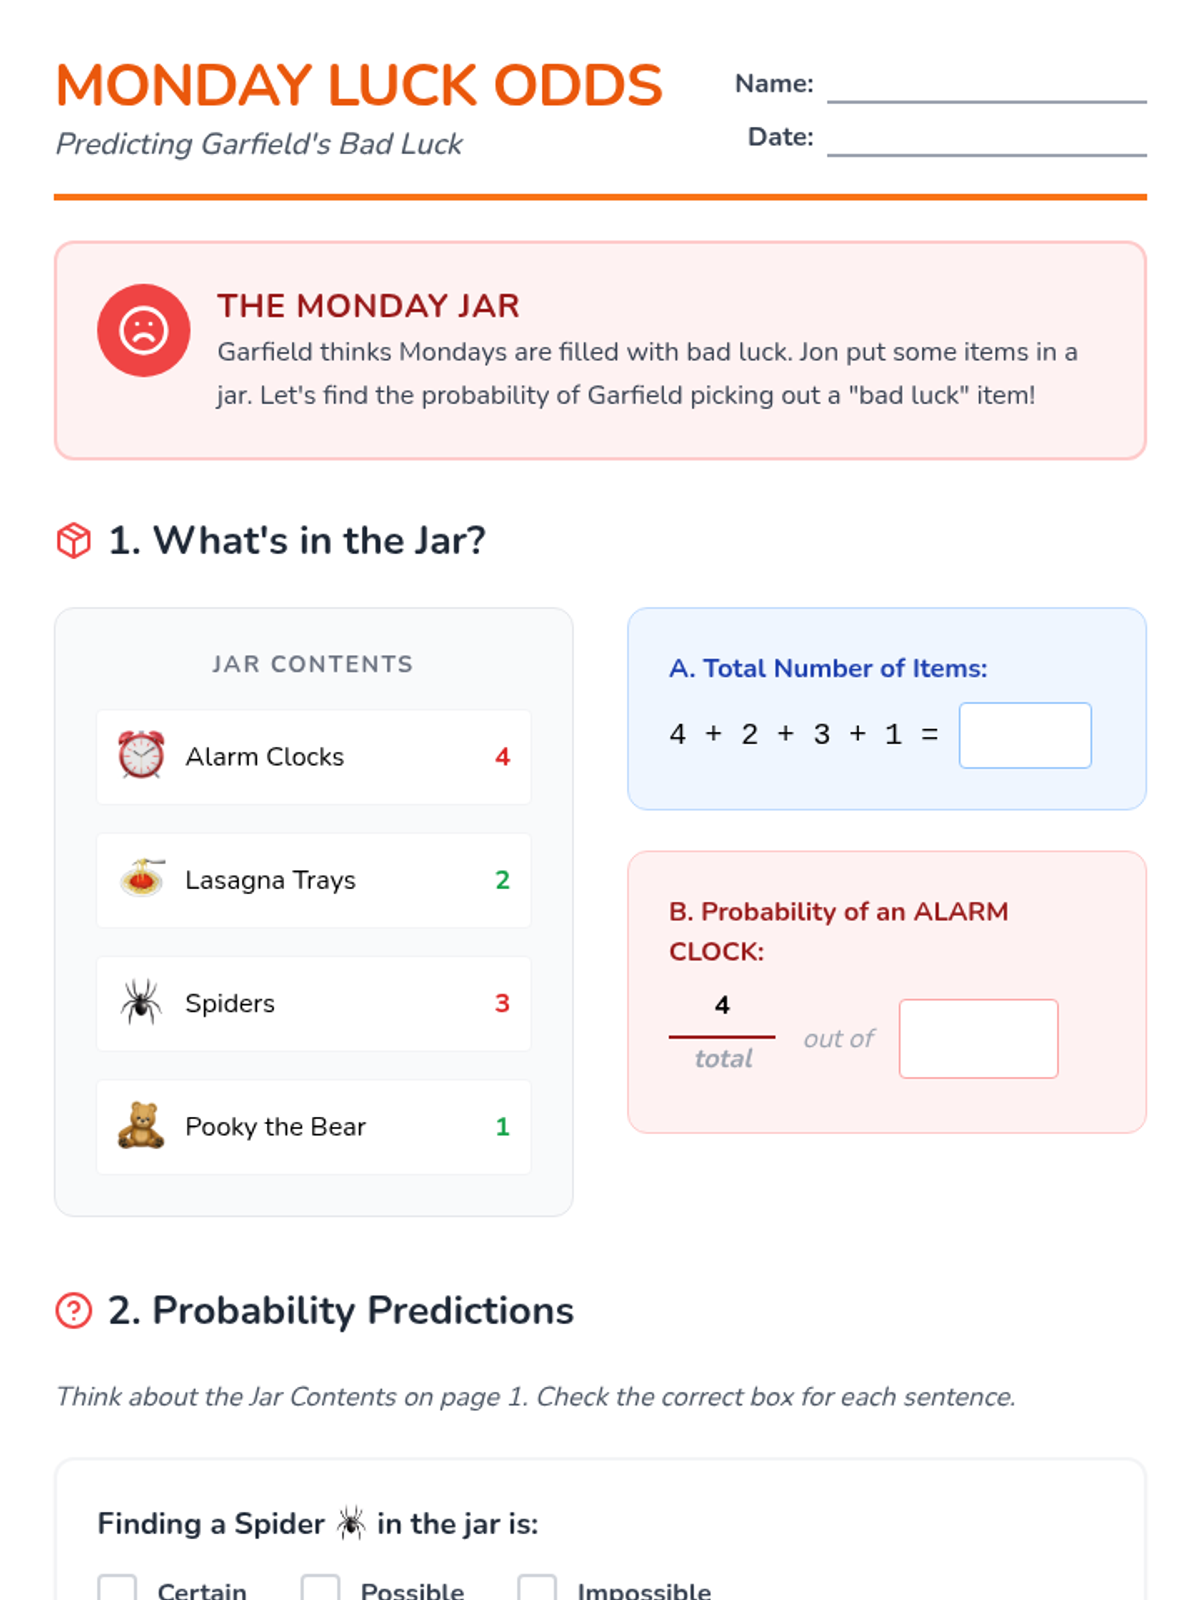
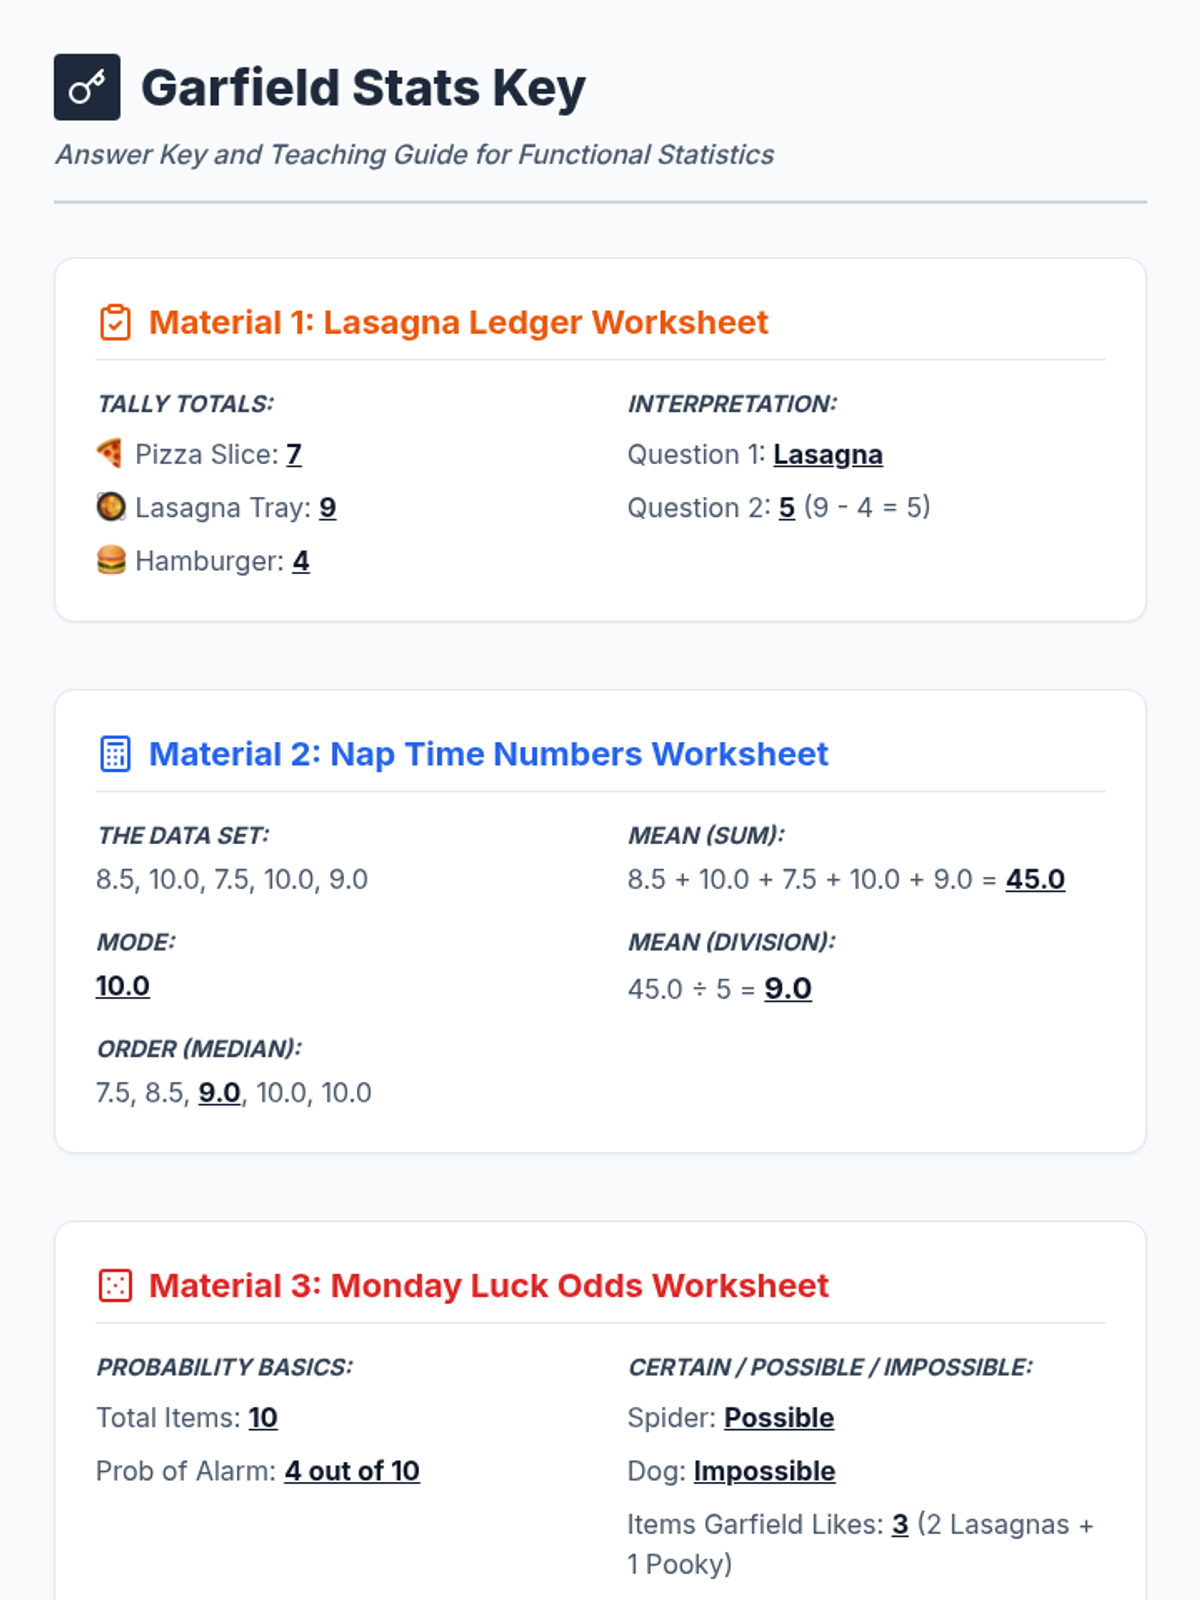
A collection of statistics activities themed around Garfield the cat, covering data collection, central tendency, and probability for students working with functional math and decimals.
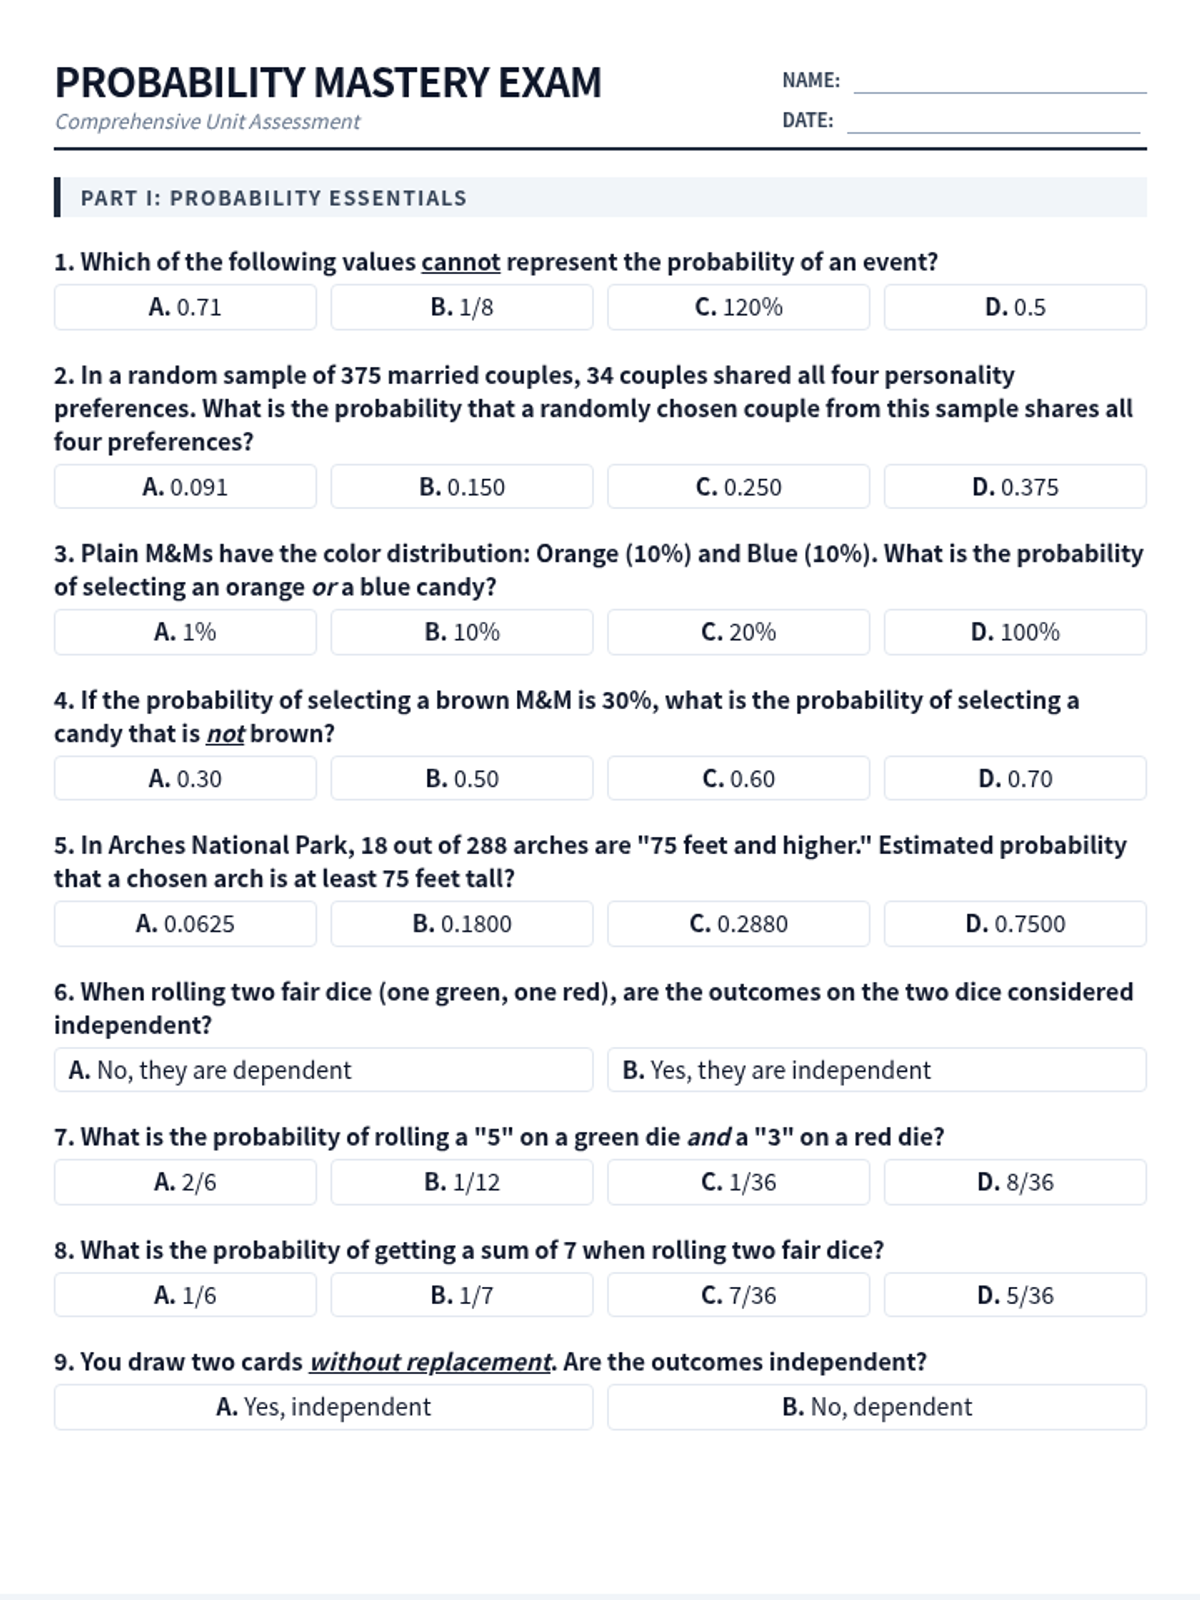
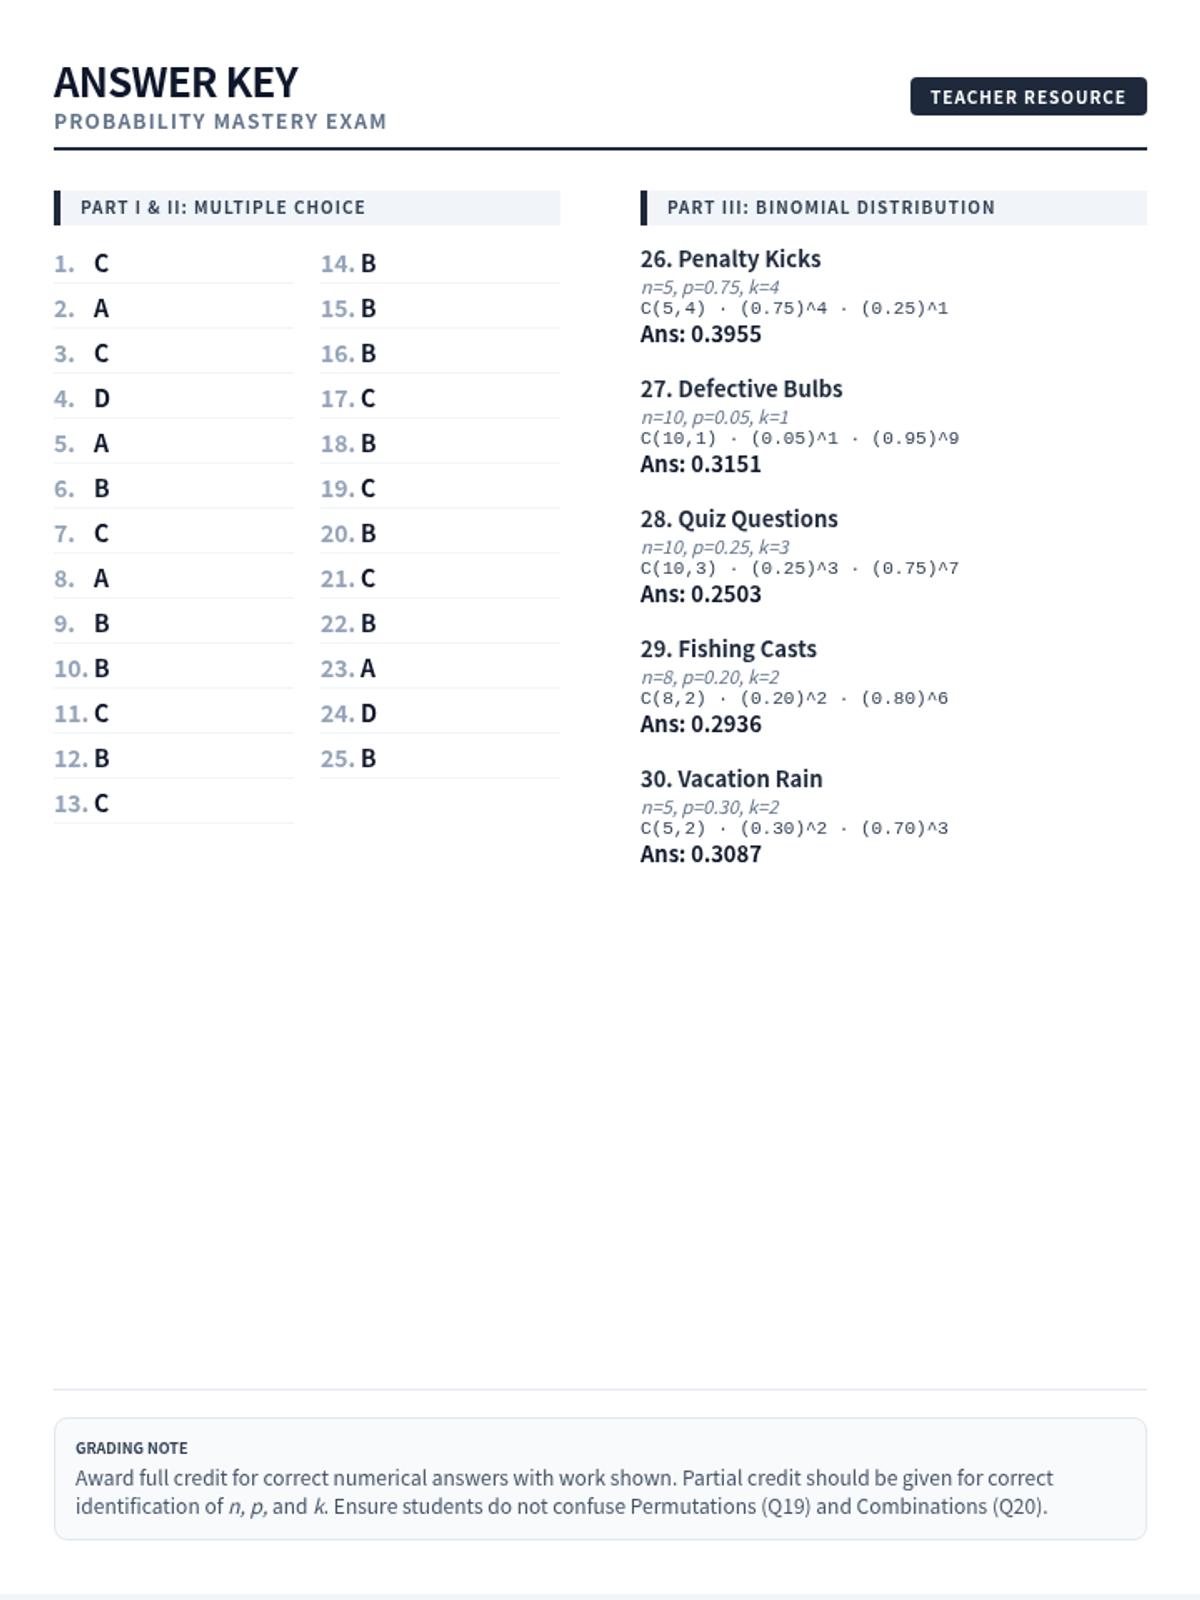
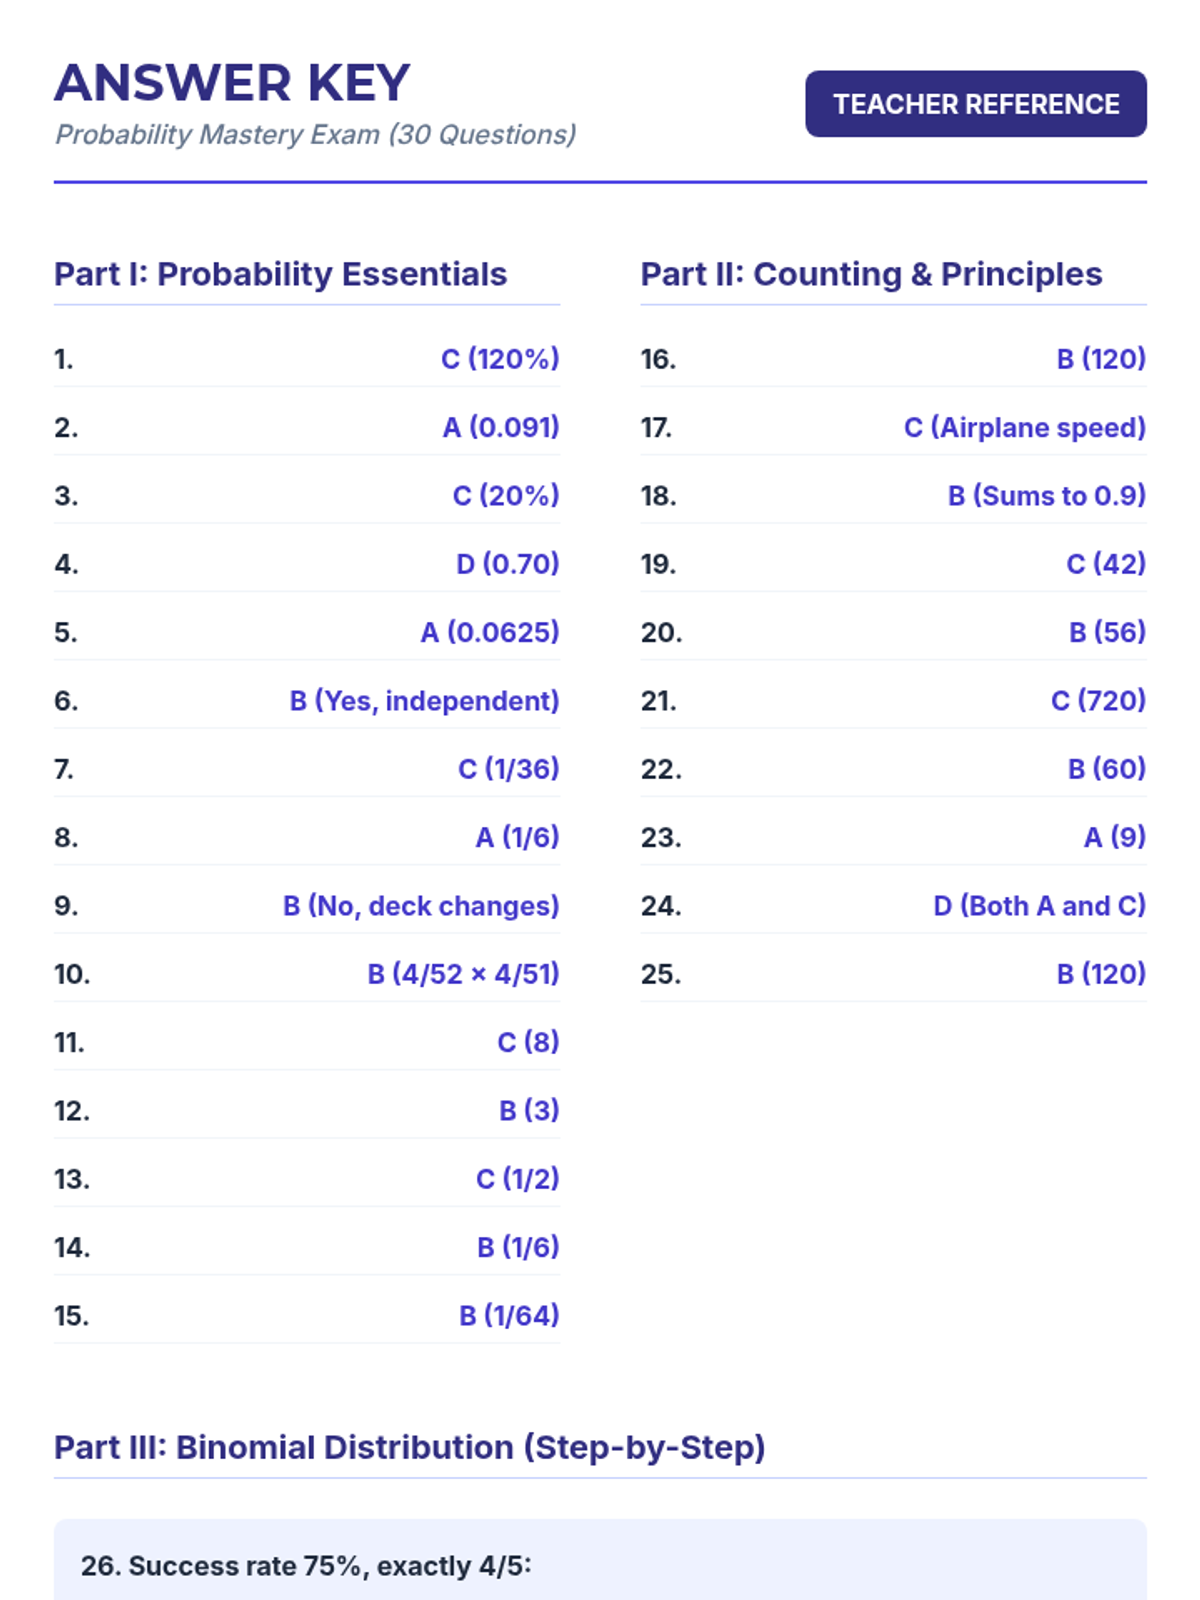
A comprehensive lesson covering probability basics, counting principles, and the binomial distribution, concluding with a summative 30-question mastery exam.
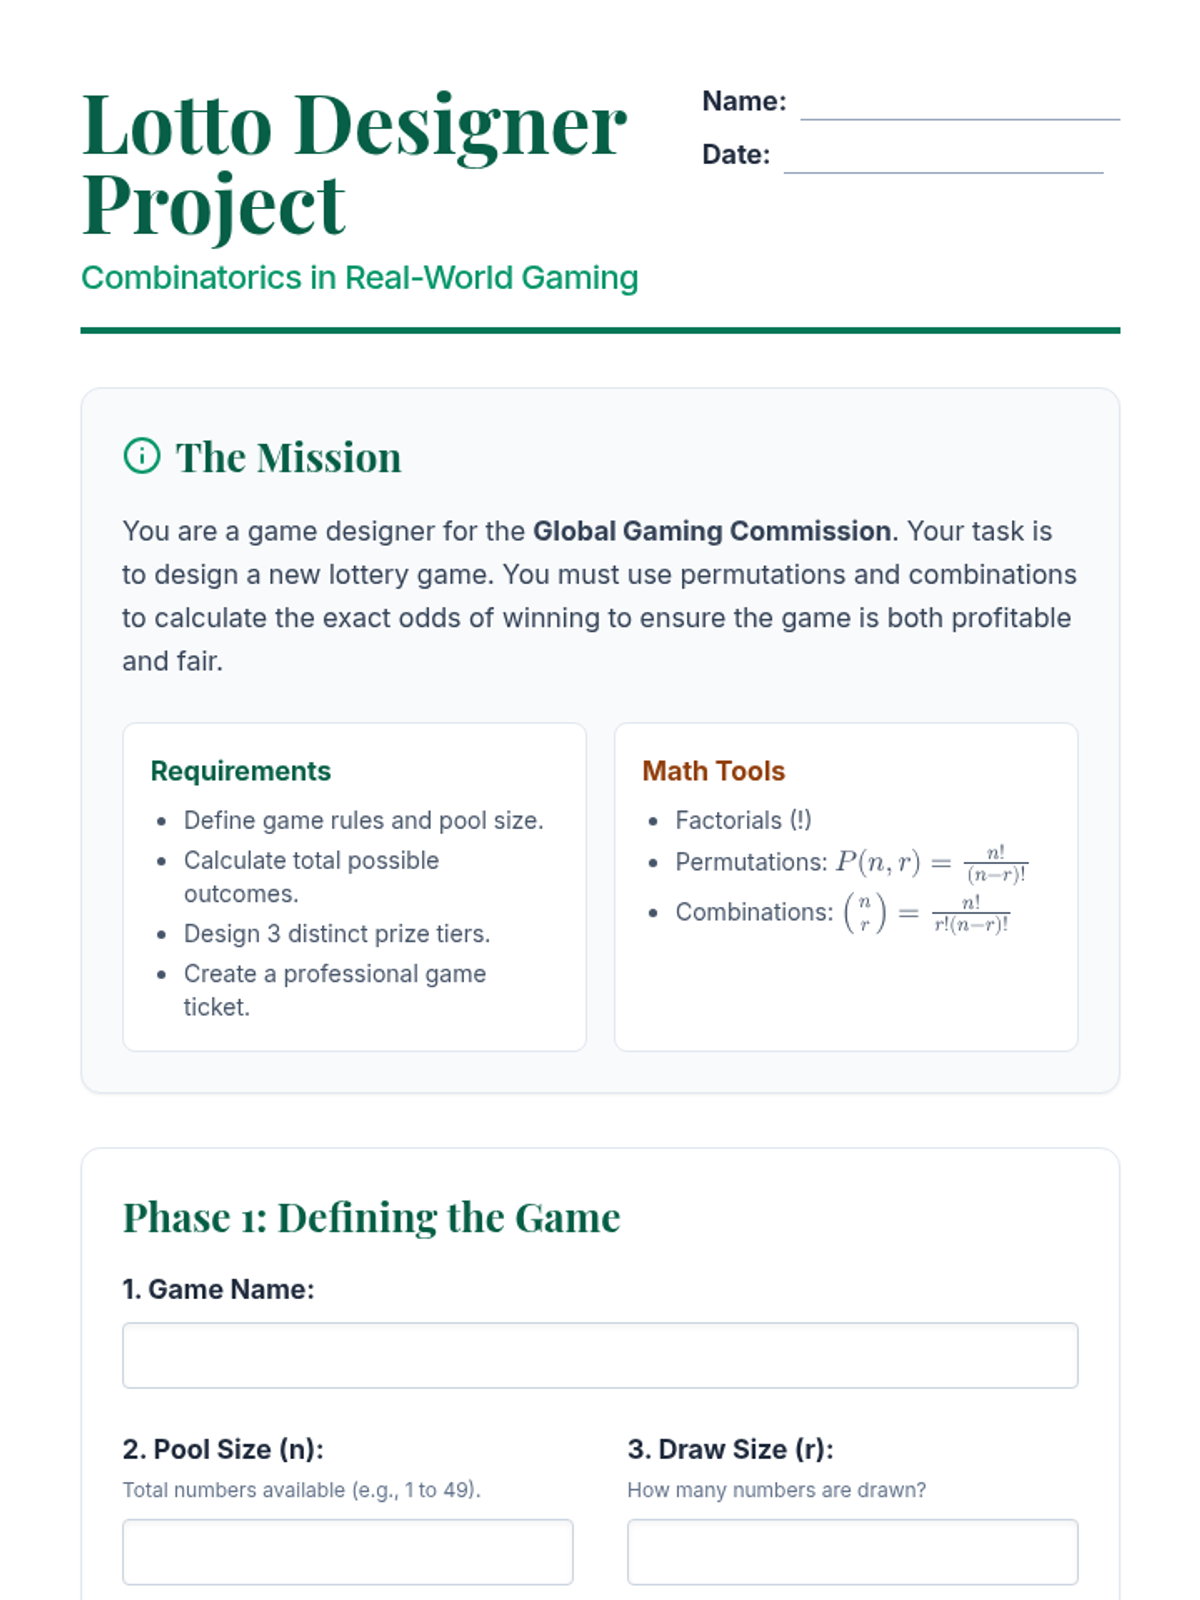
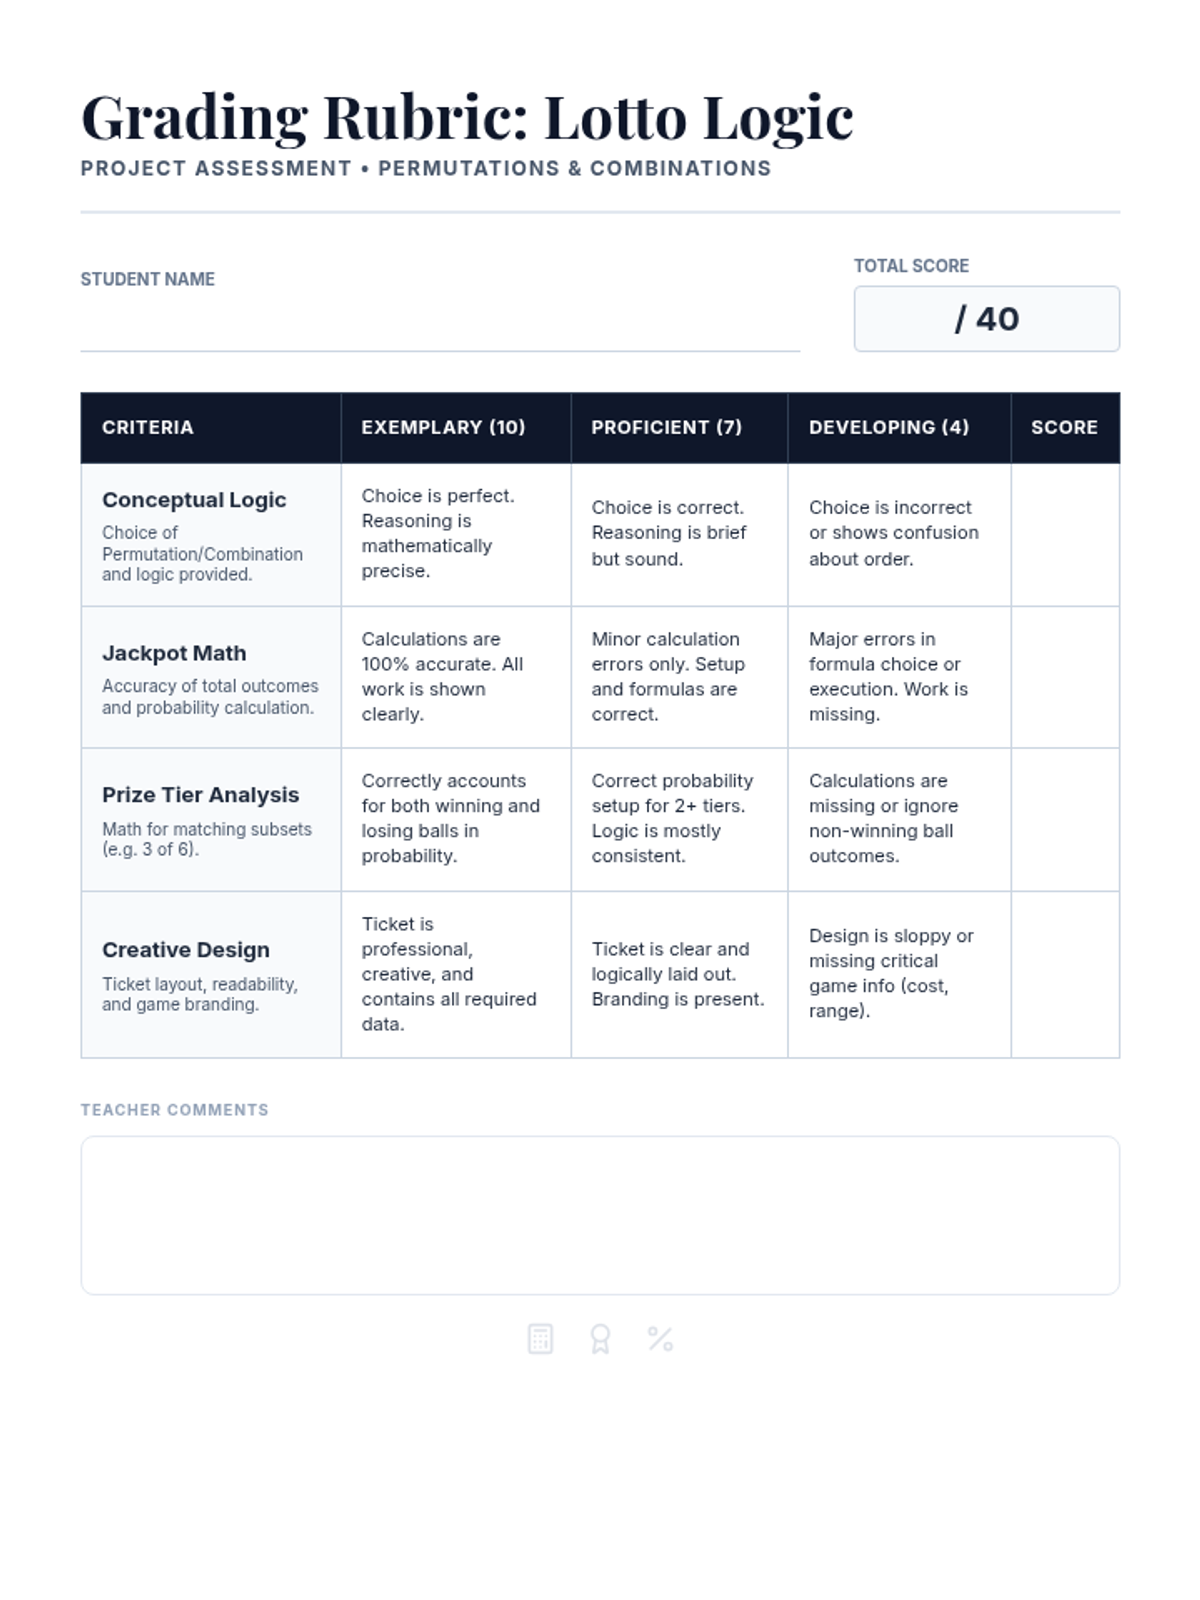
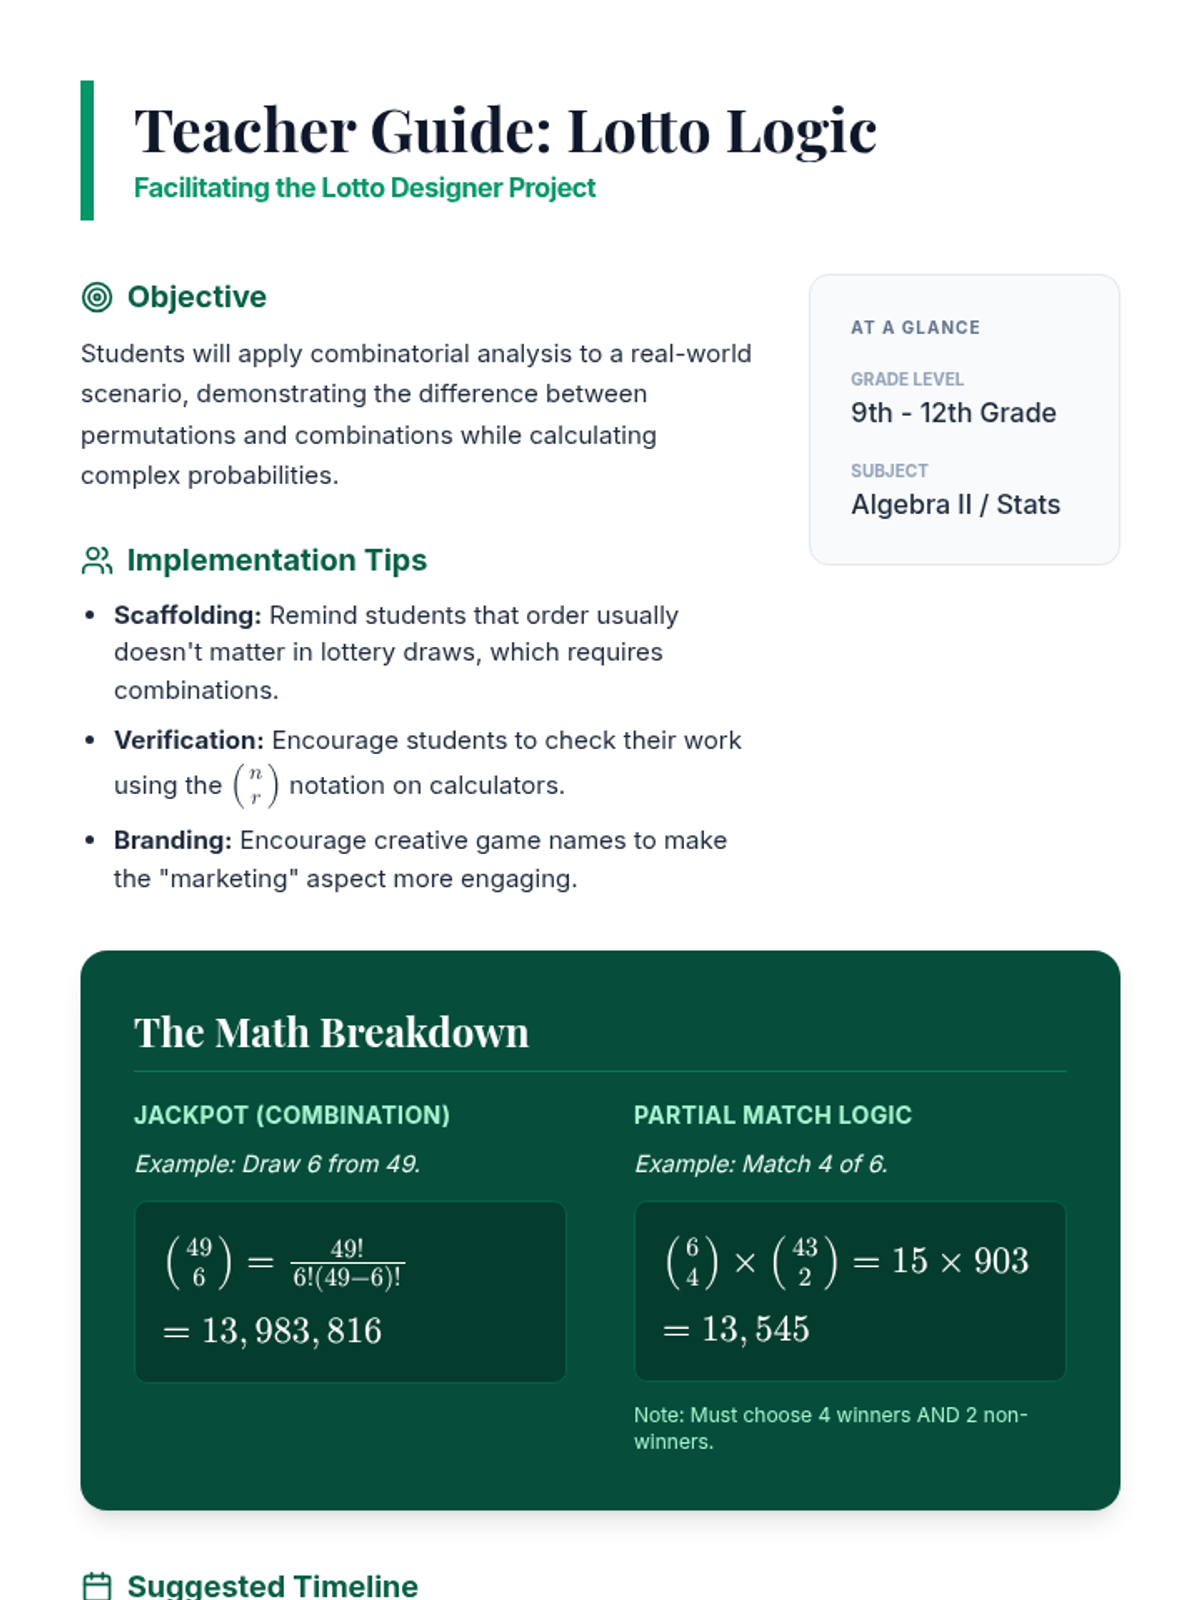
Students apply their knowledge of permutations and combinations to design their own lottery game, calculating the odds of winning and presenting their mathematical findings in a professional format.
A comprehensive examination combining elementary probability theory, counting principles, and binomial distribution problems into a single rigorous assessment.
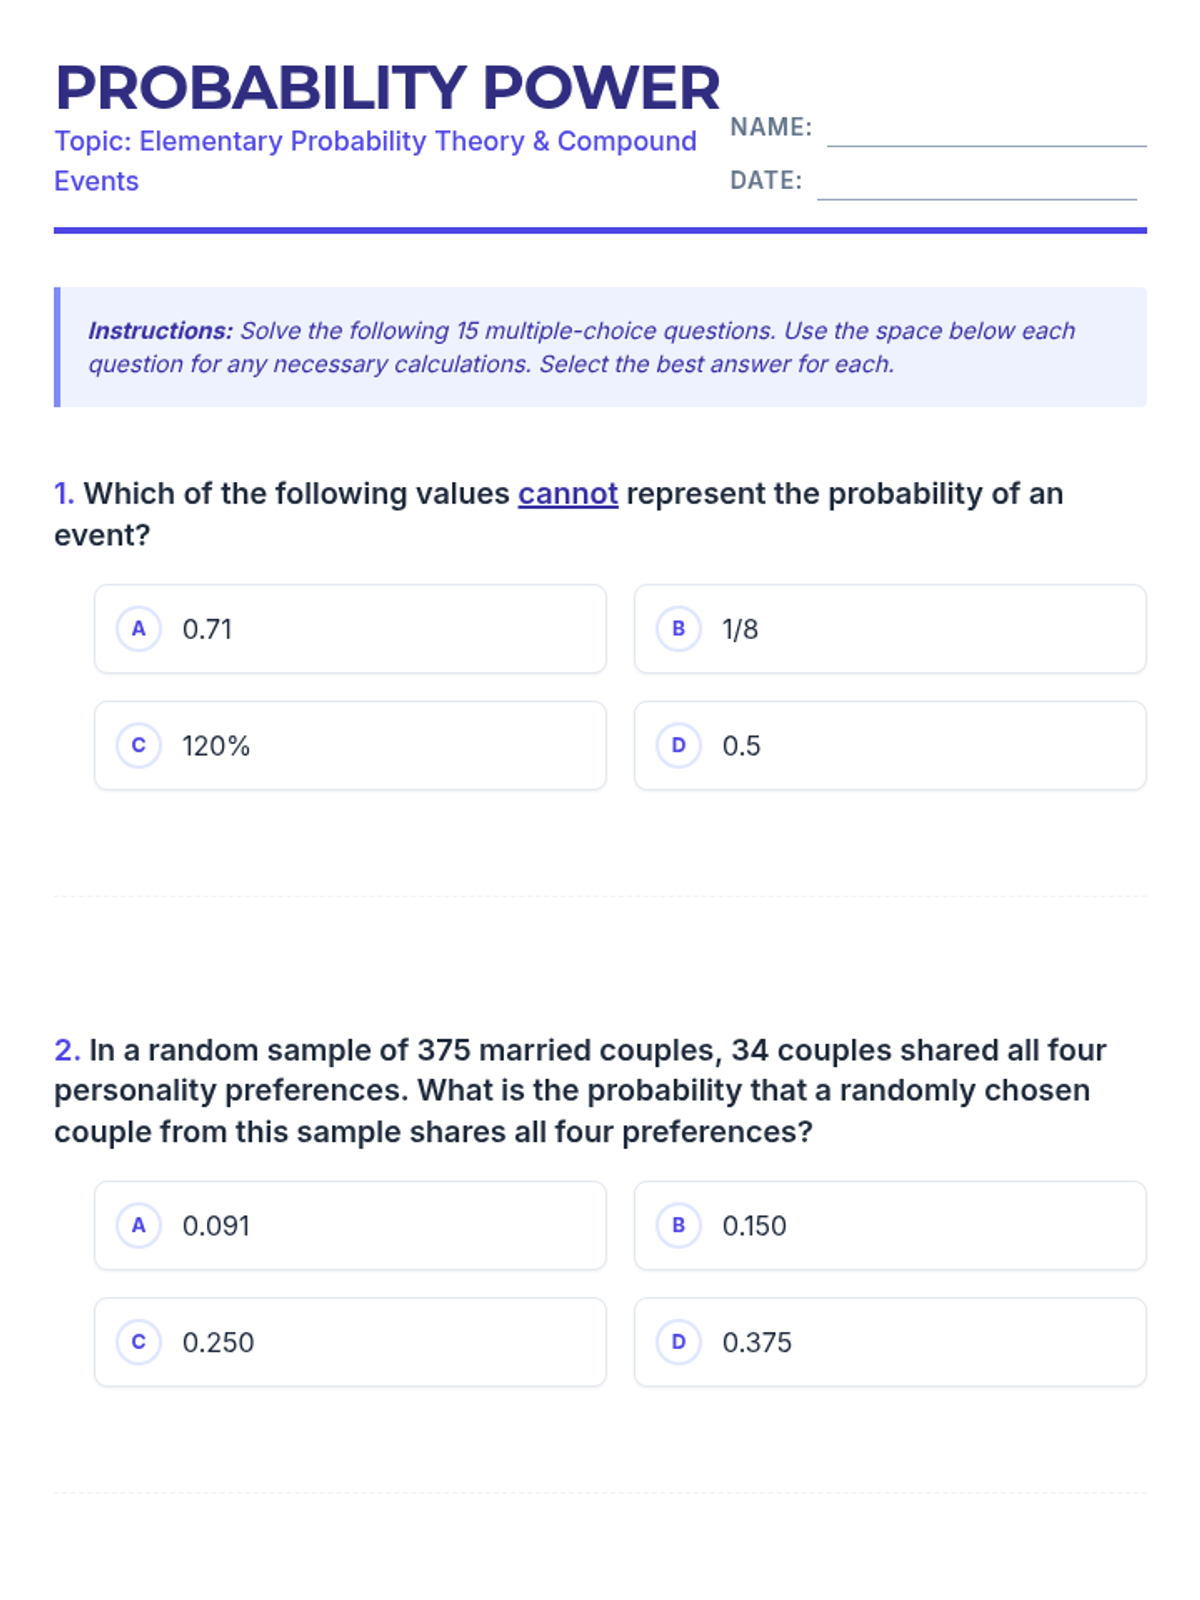
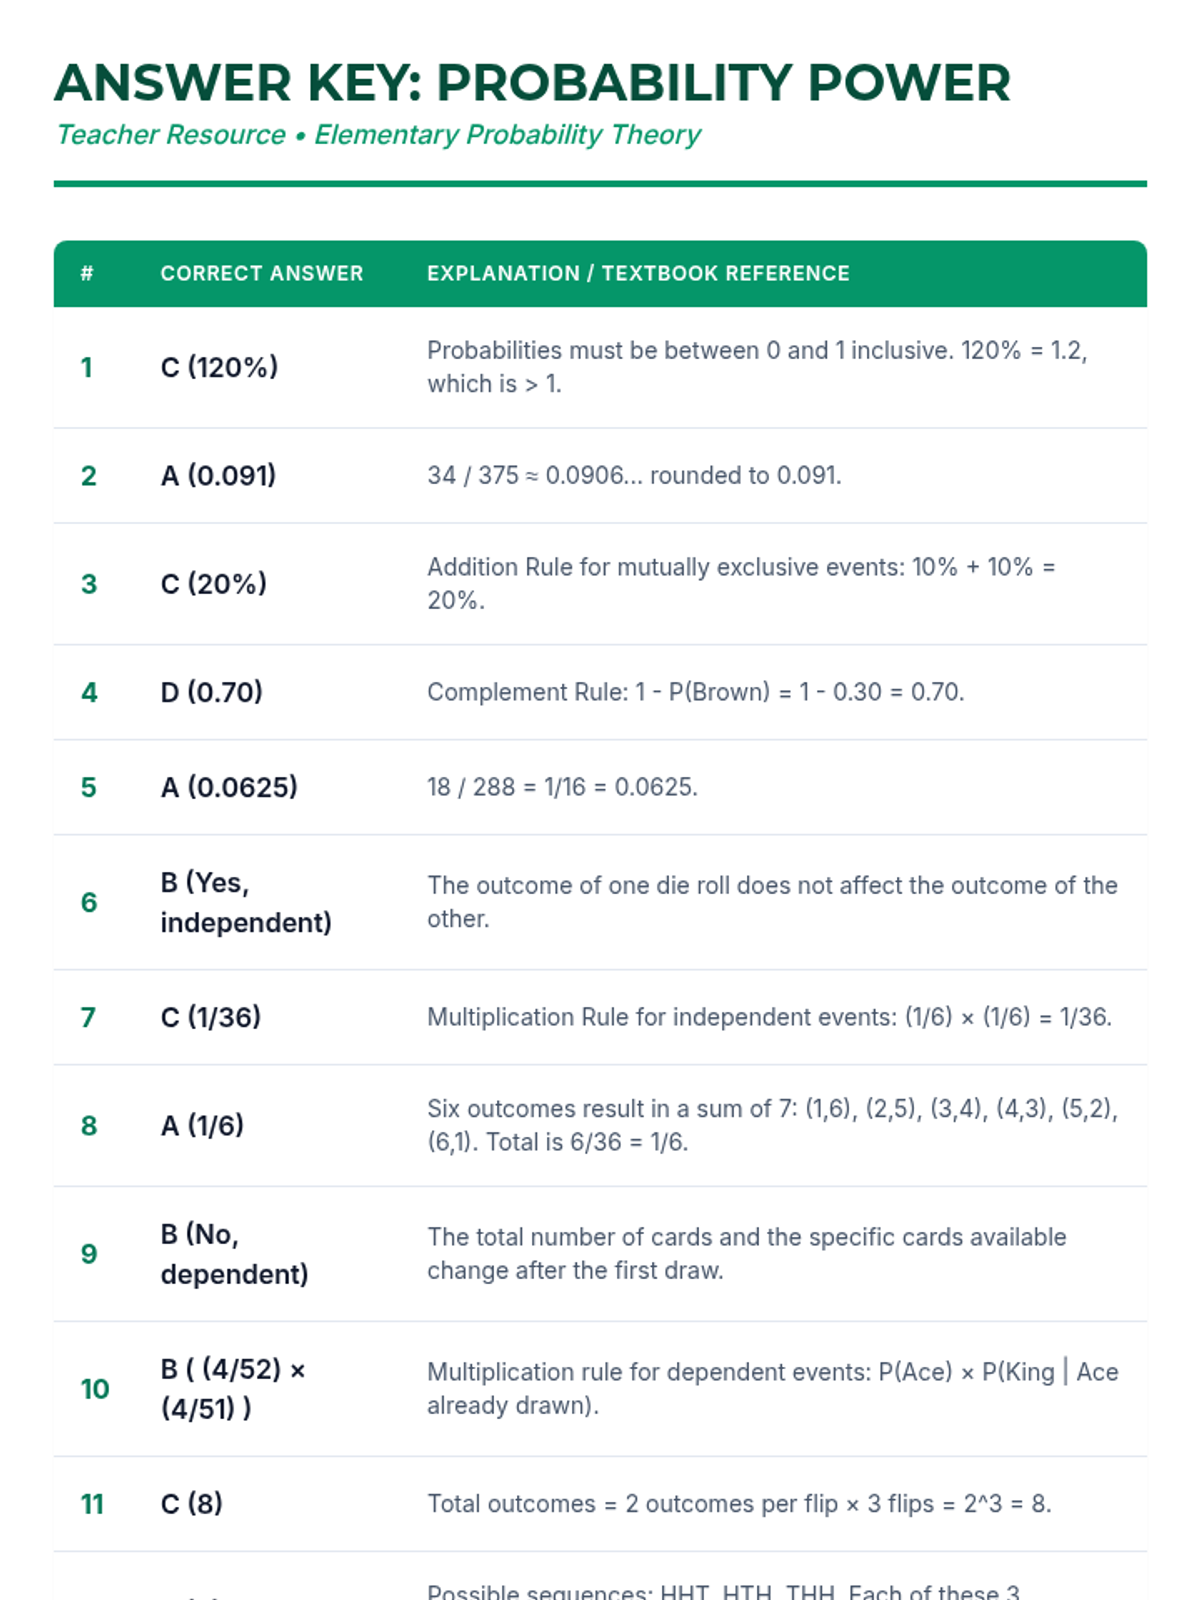
A comprehensive lesson on elementary probability theory covering valid probability ranges, compound events, independent and dependent outcomes, and tree diagrams based on textbook problems.
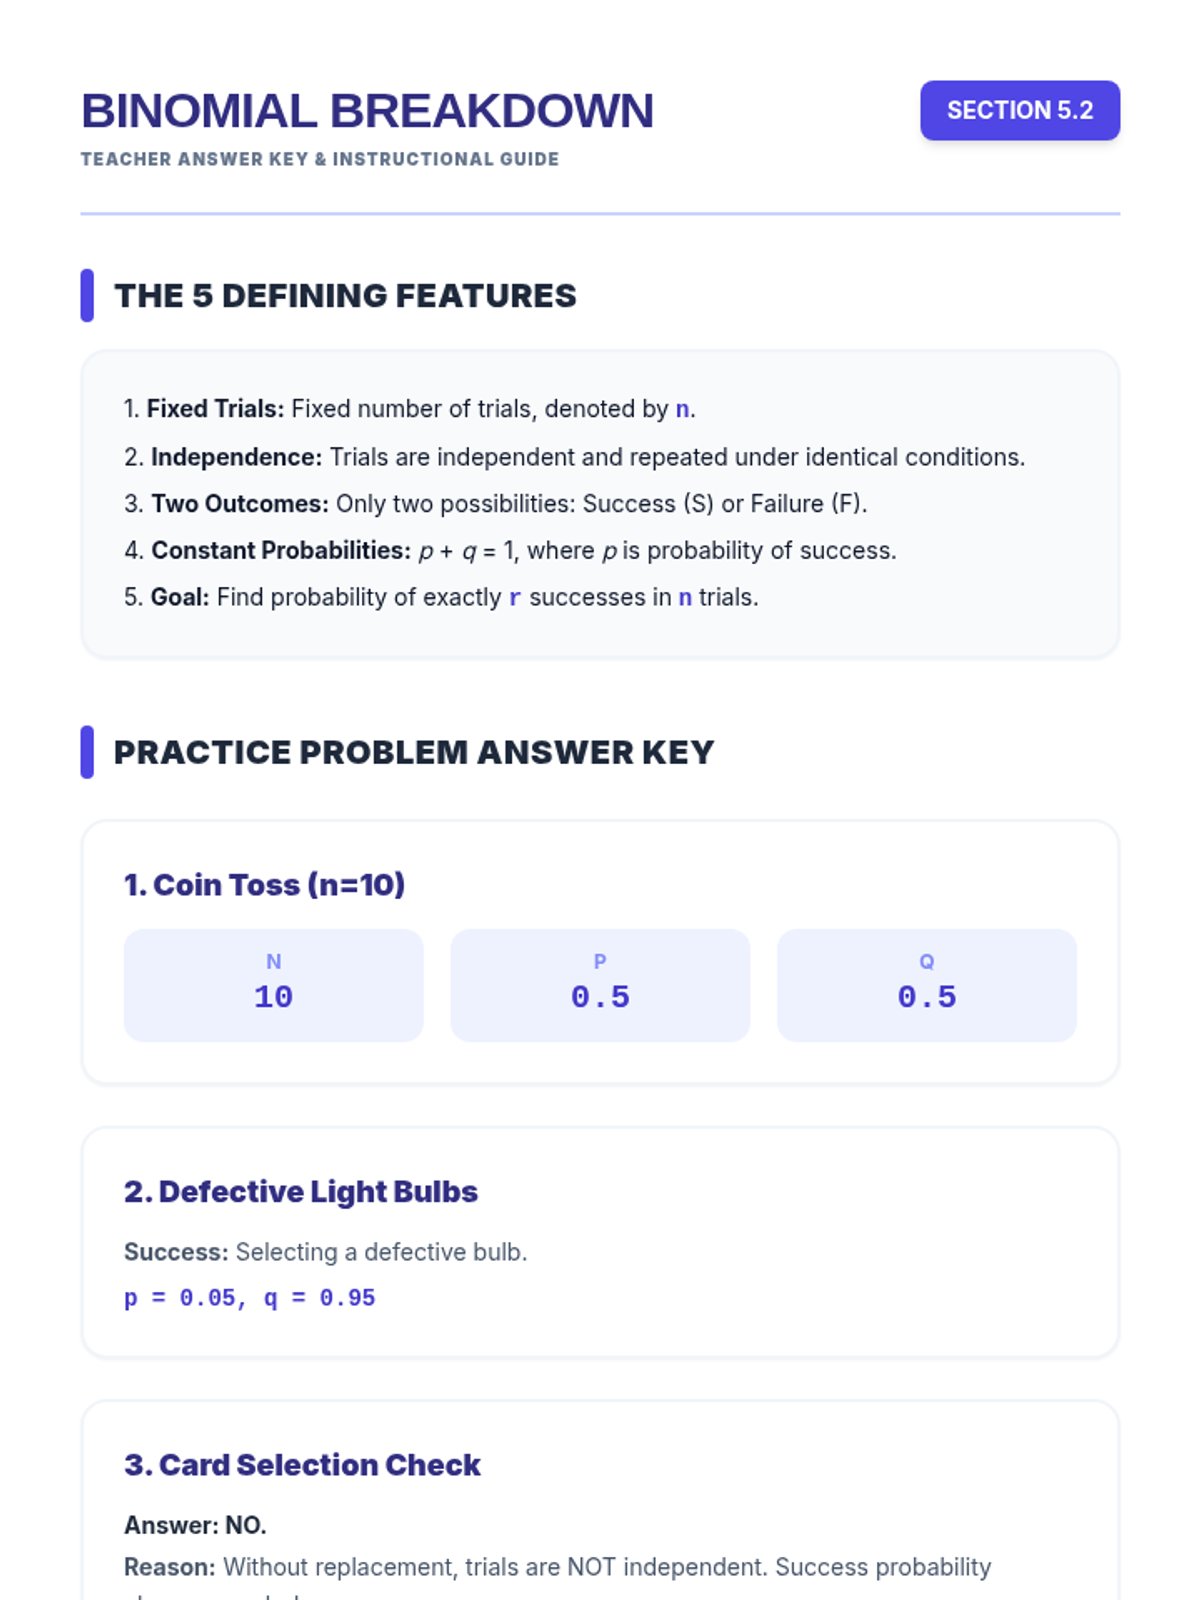
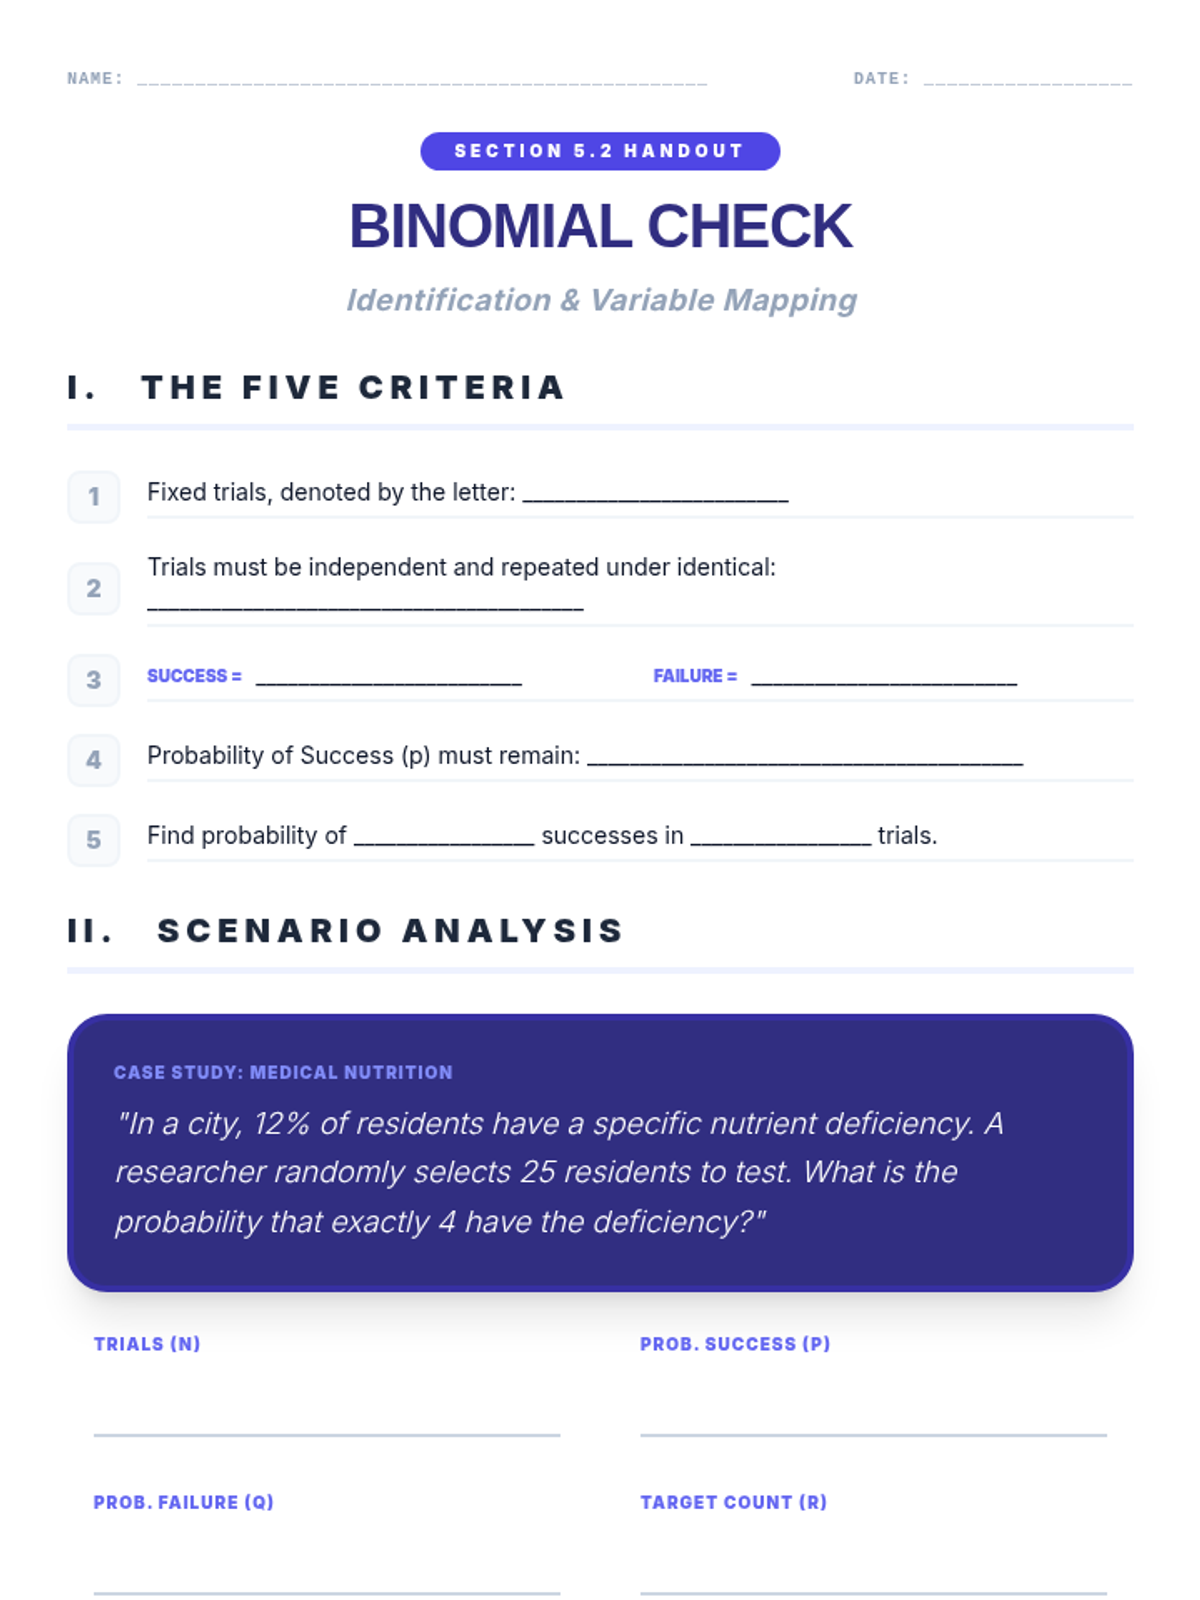
A comprehensive introduction to binomial experiments, covering the five core criteria, Bernoulli trials, and practical probability examples.
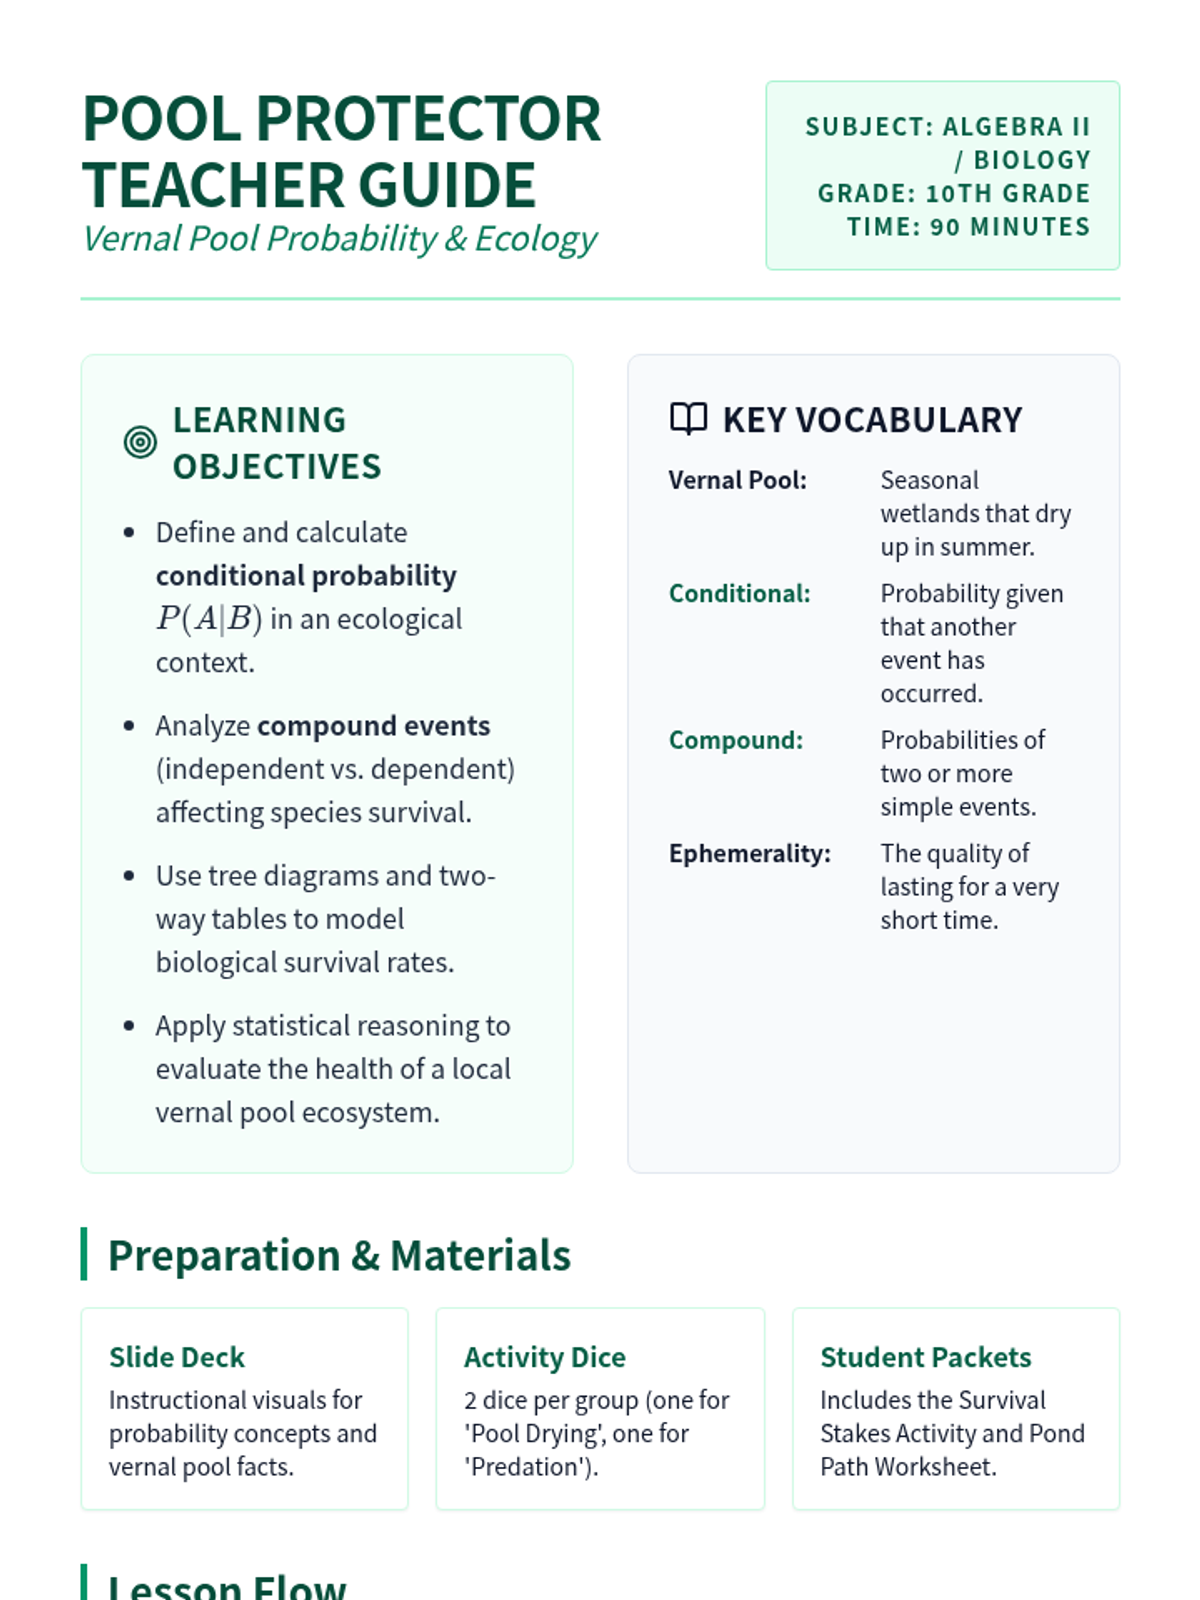
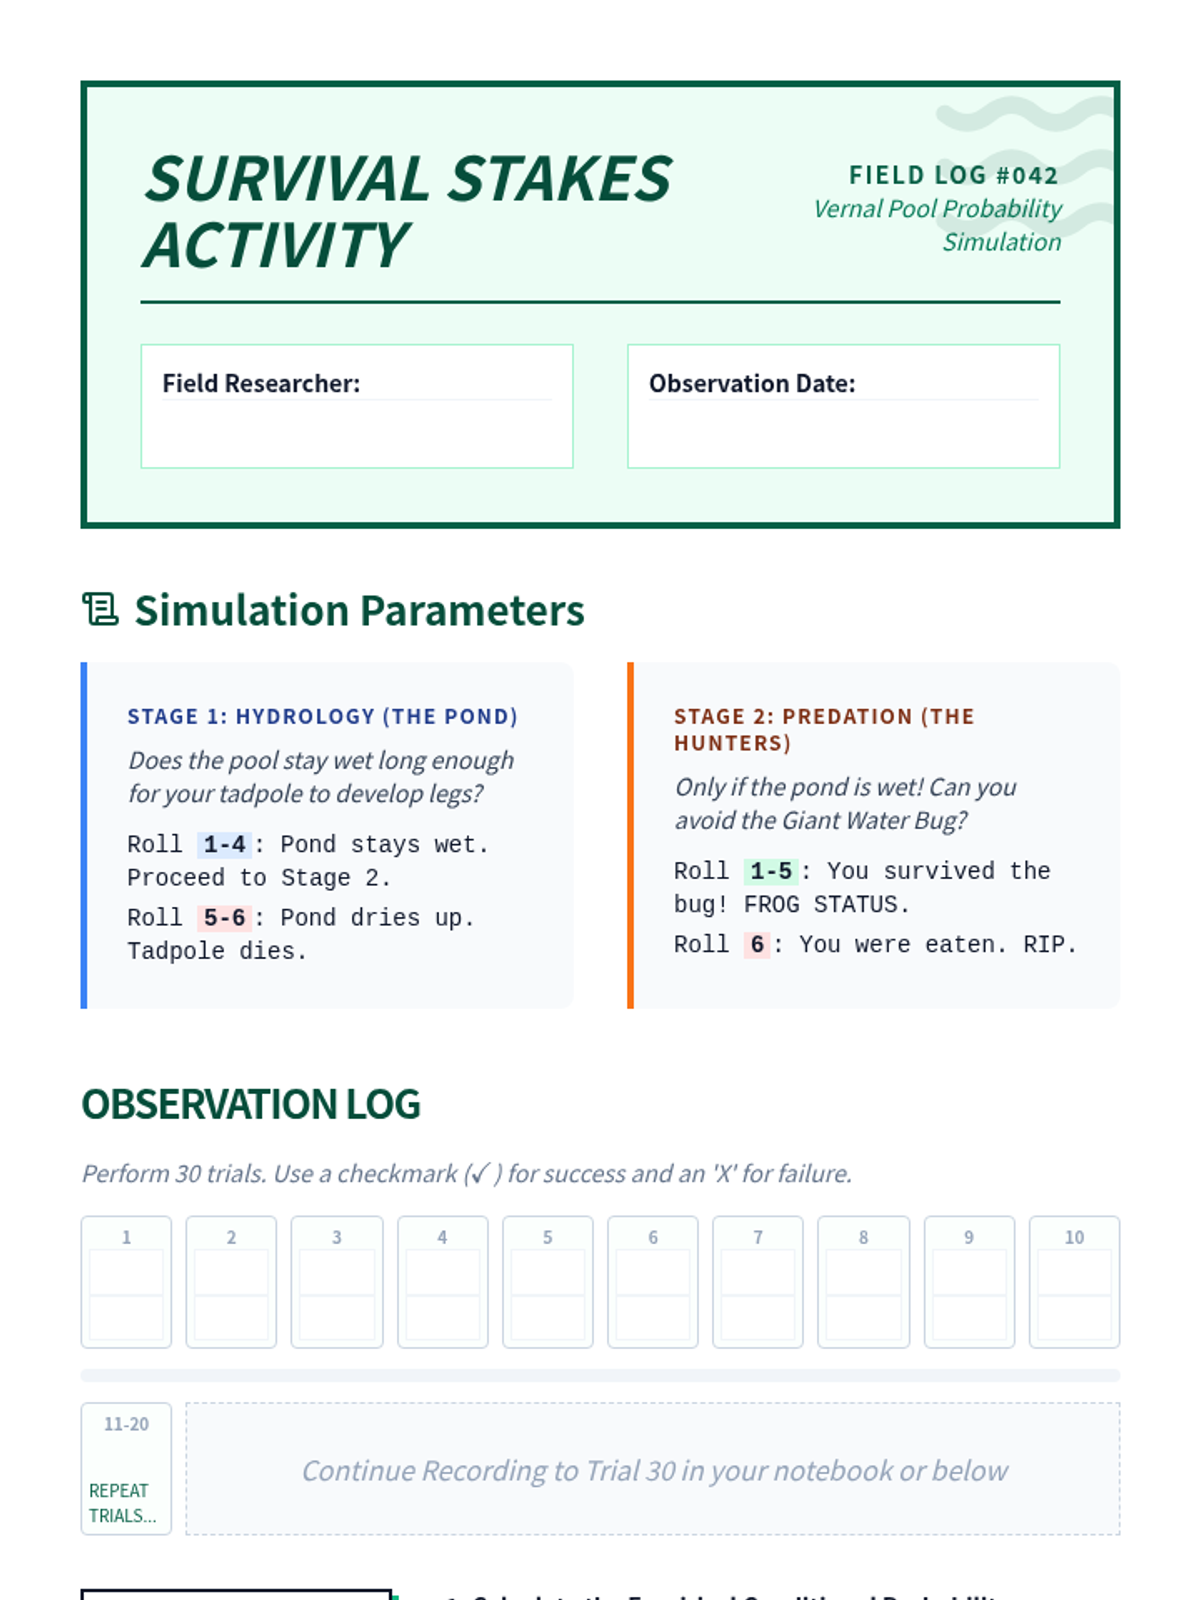
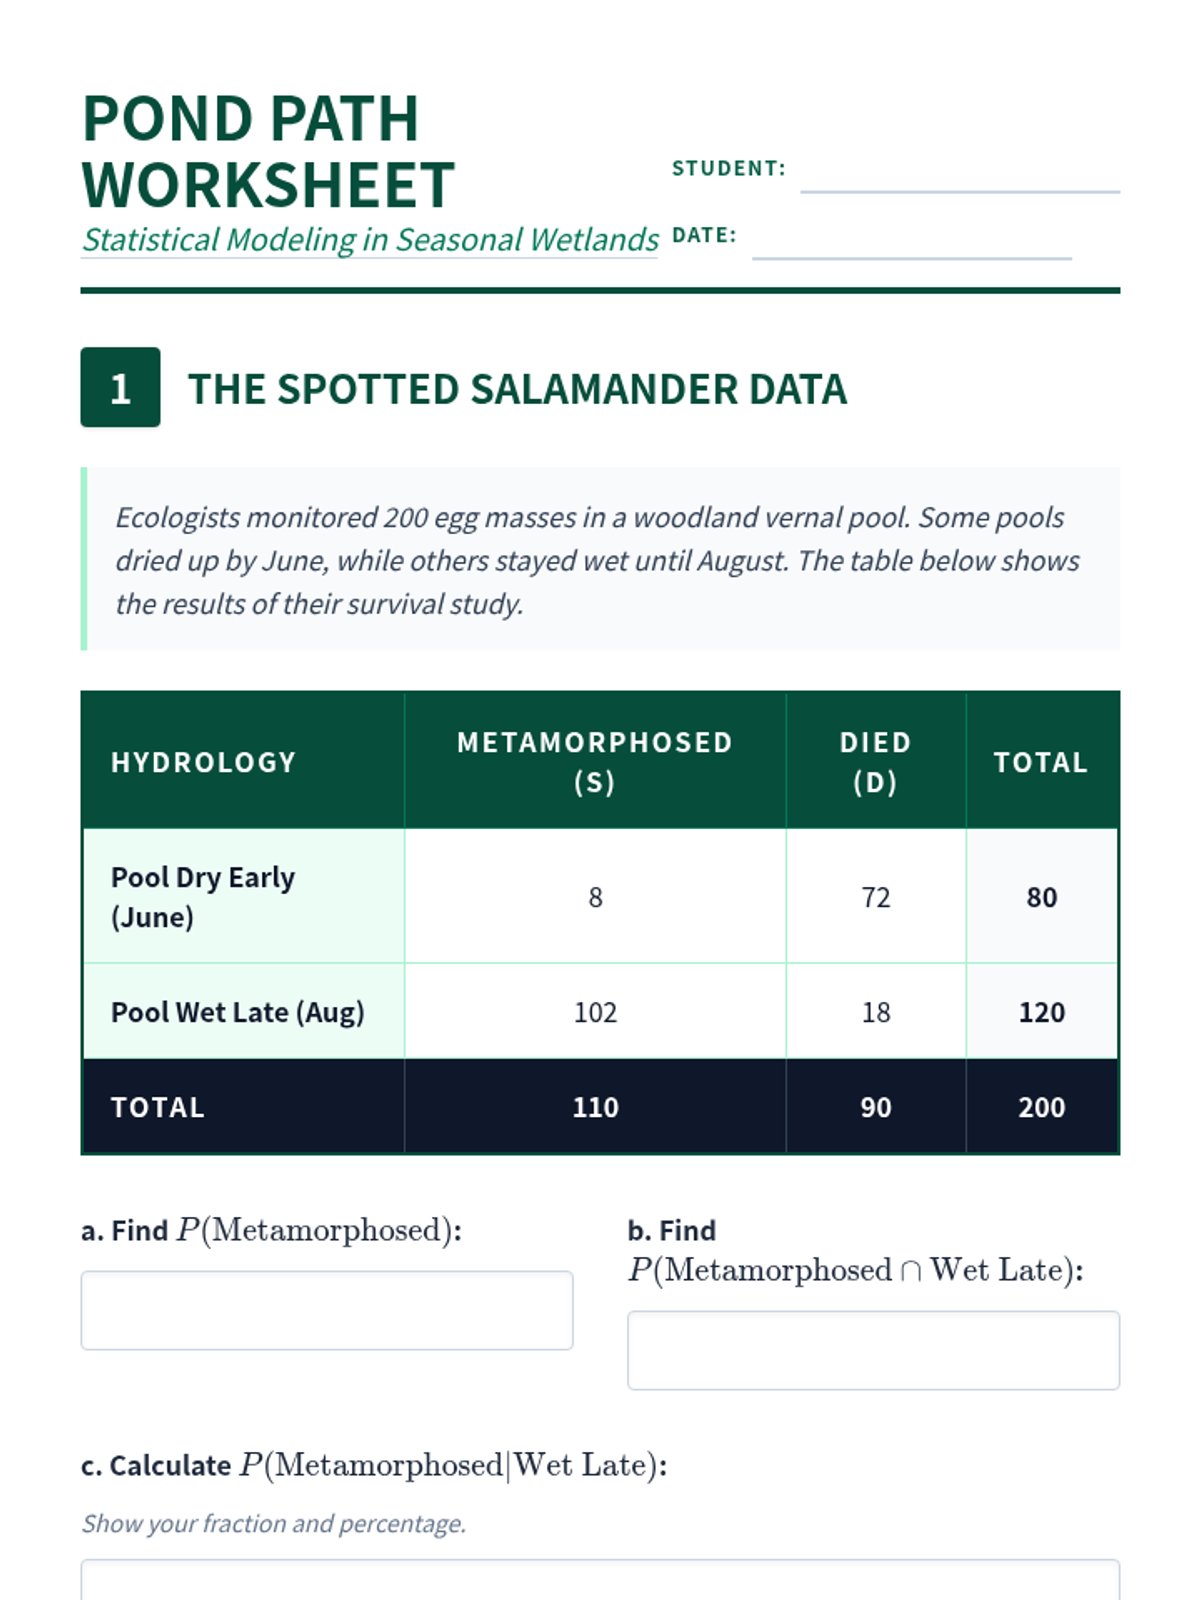
Students apply conditional probability and compound event analysis to understand the survival dynamics of species in vernal pools, bridging biology and statistical reasoning.
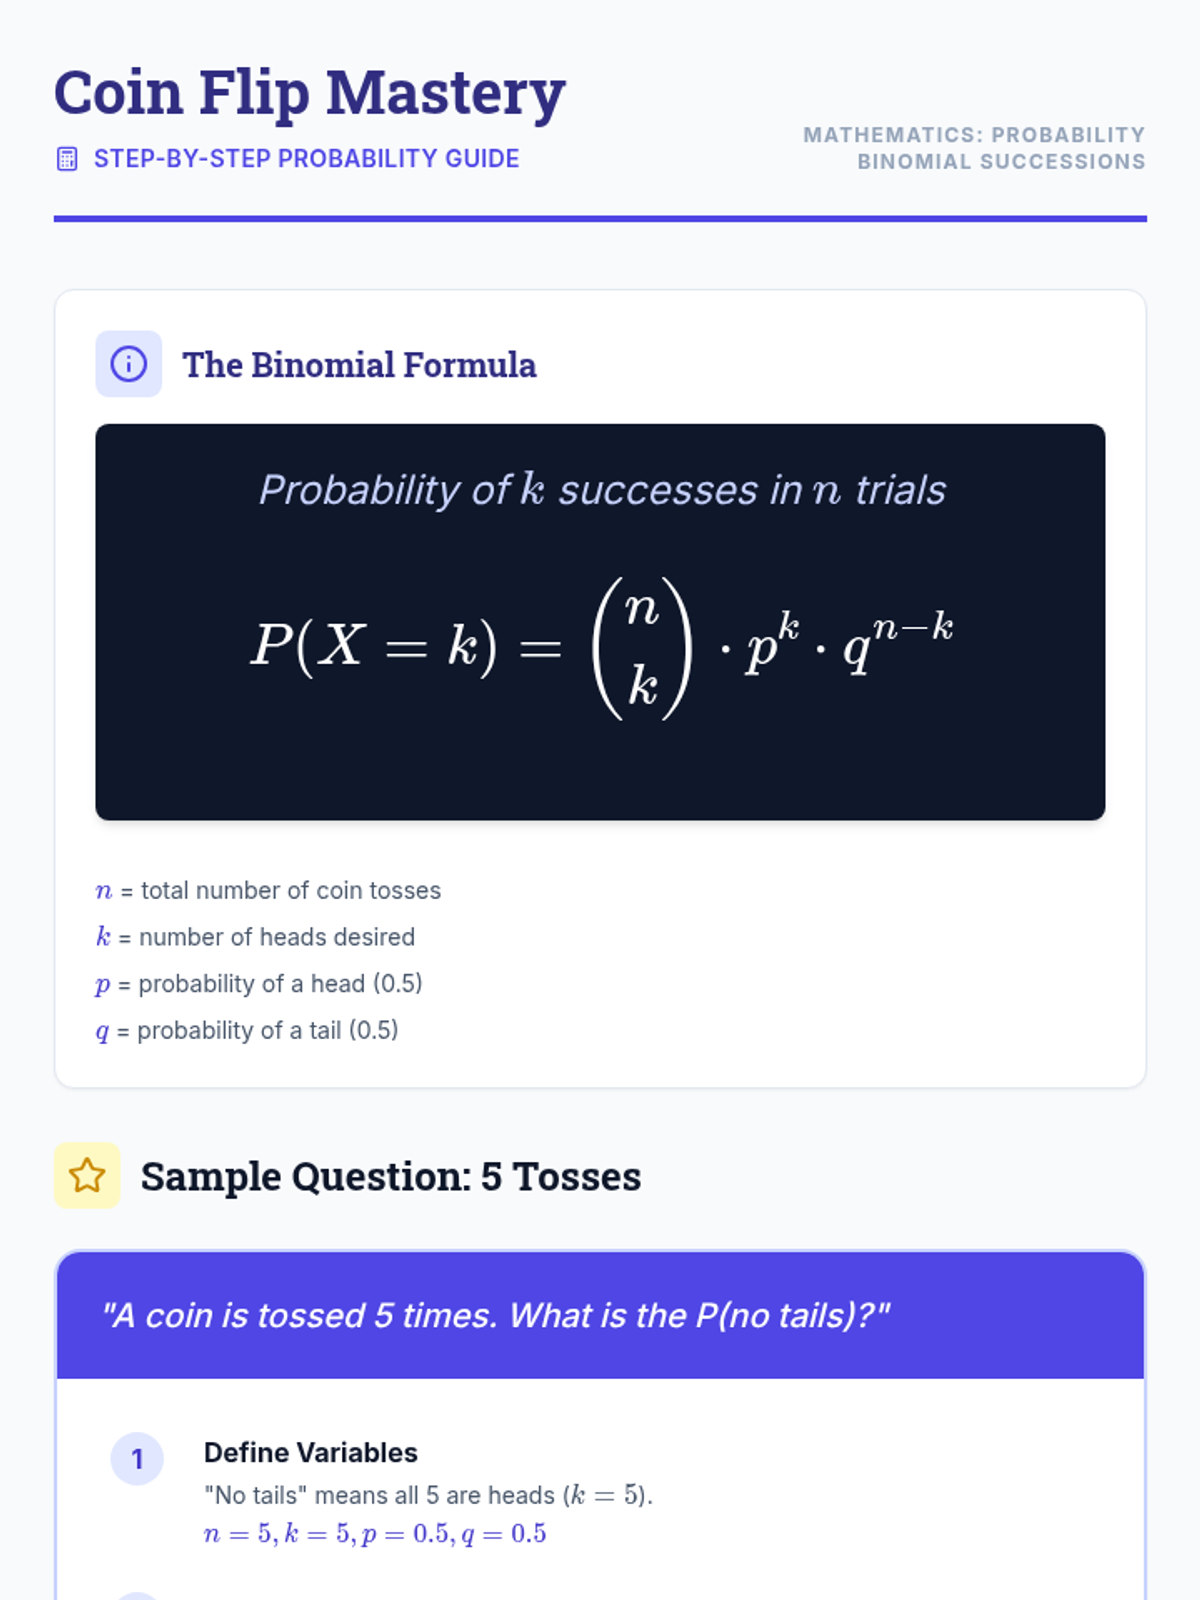
A focused lesson on calculating binomial probabilities for independent coin toss events, specifically focusing on 'all-or-nothing' outcomes.
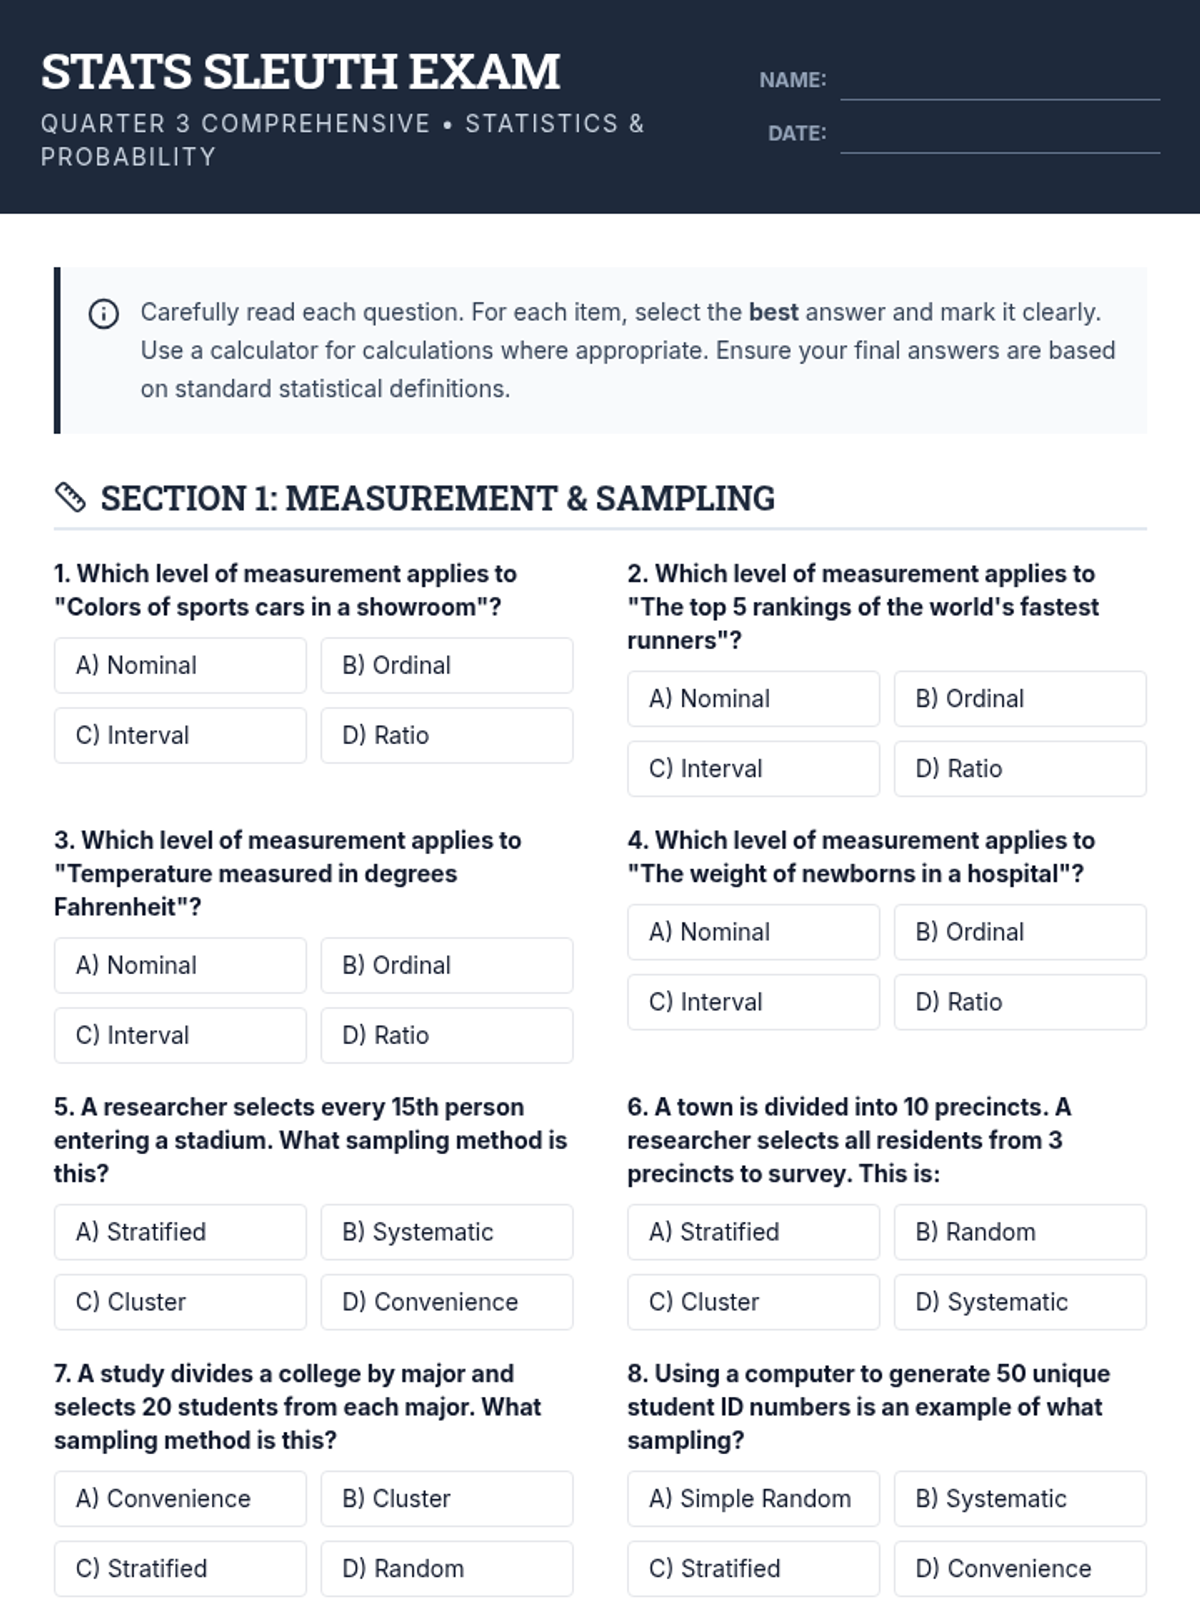
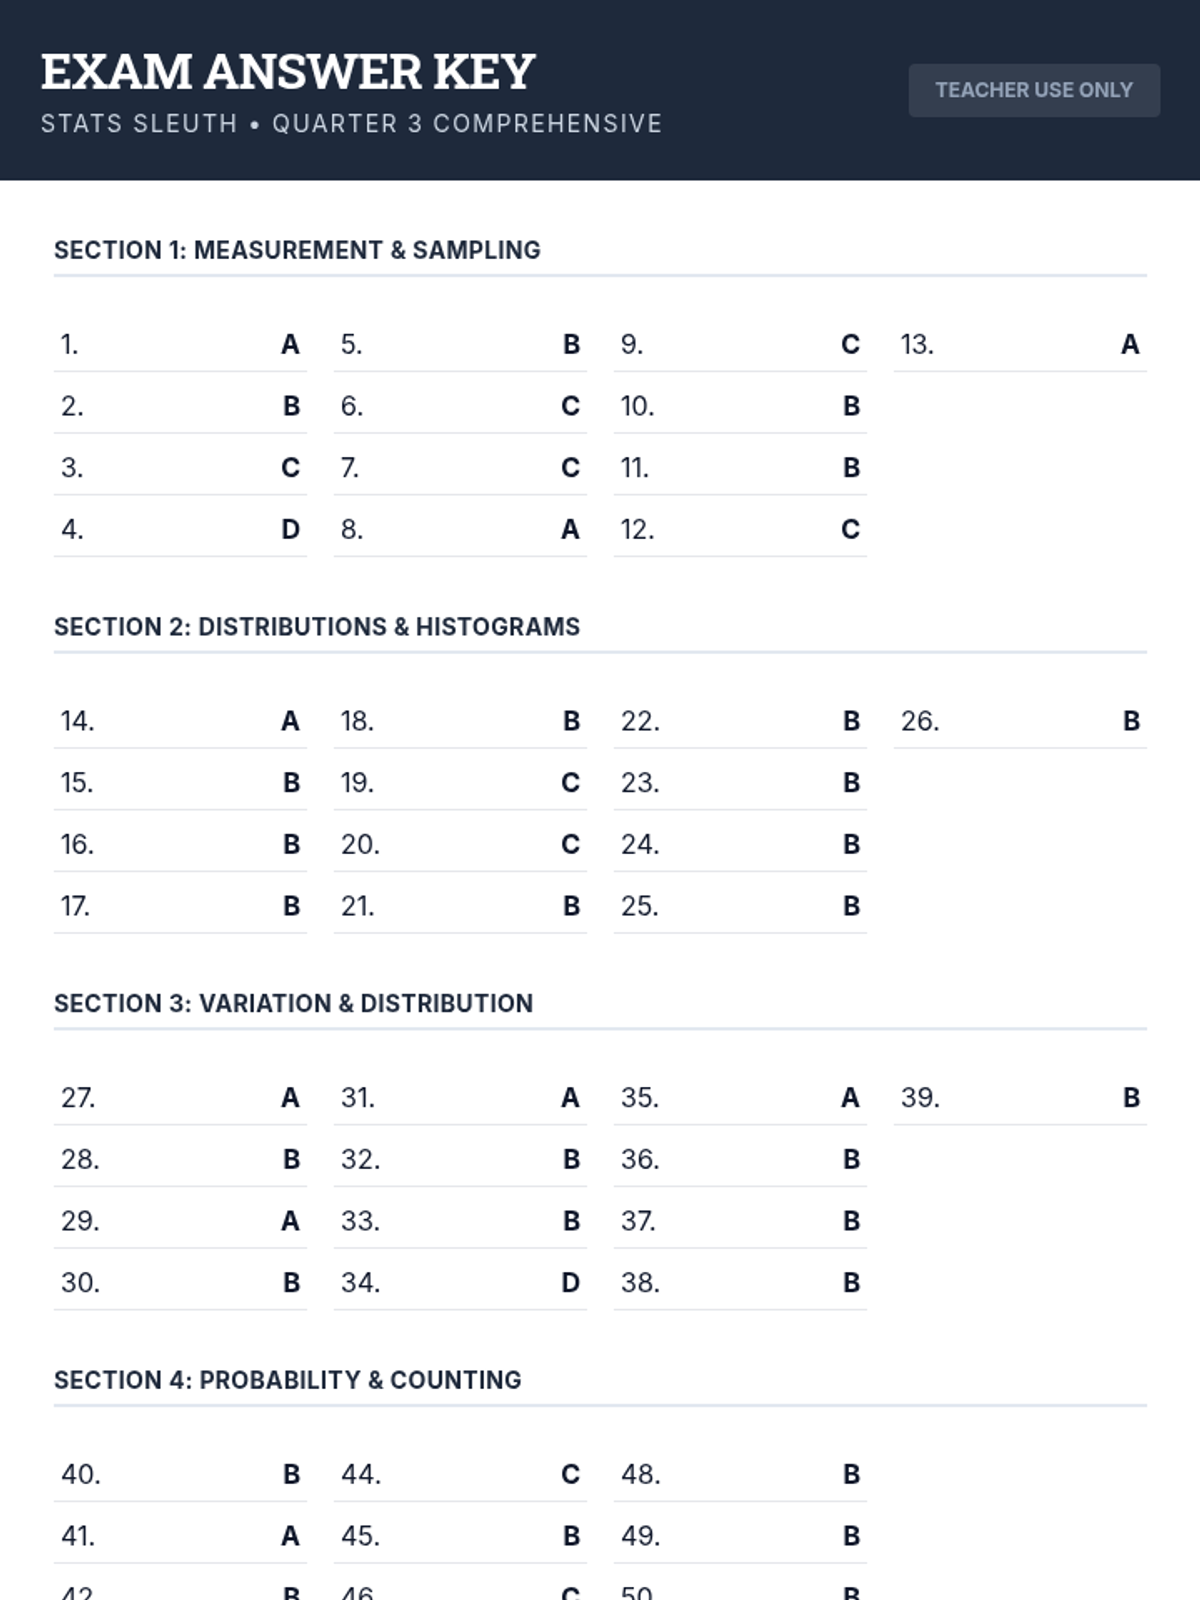
A comprehensive 3rd-quarter statistics assessment combining data interpretation, central tendency, variation, probability, and counting techniques. Students analyze real-world scenarios including justice system data, tax polls, and probability models.
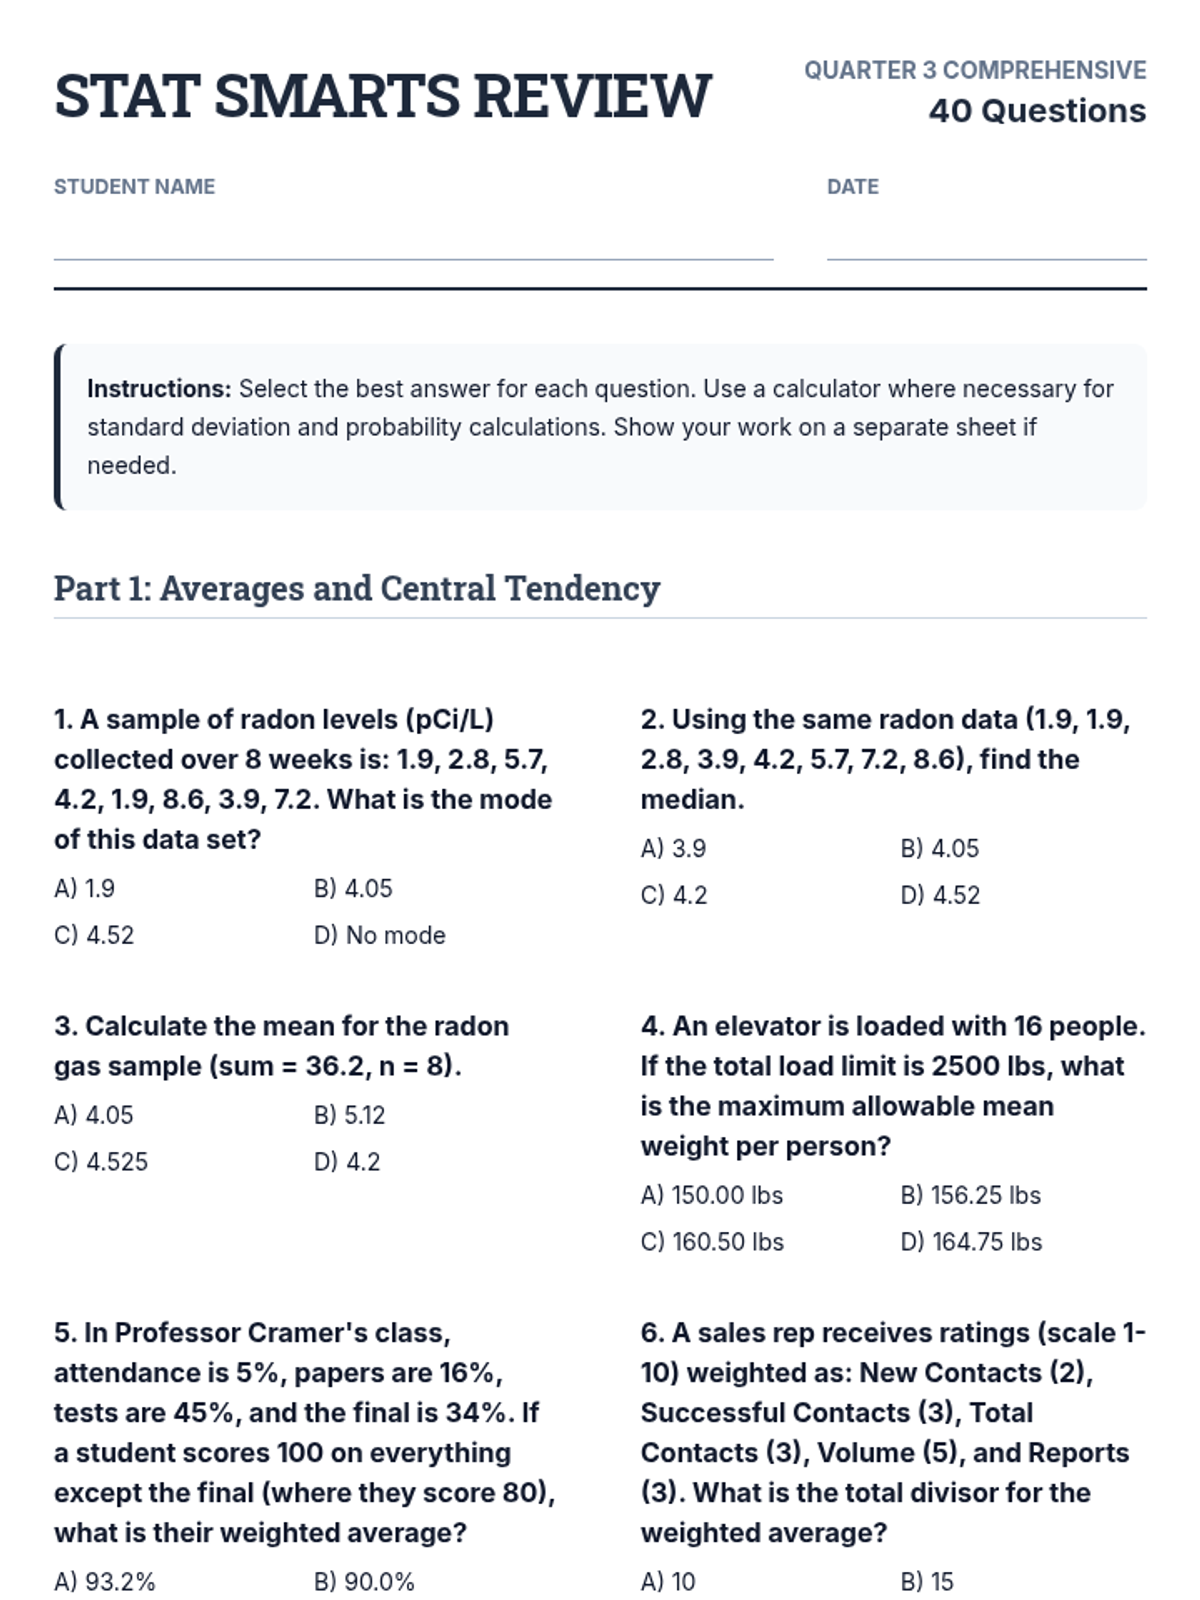
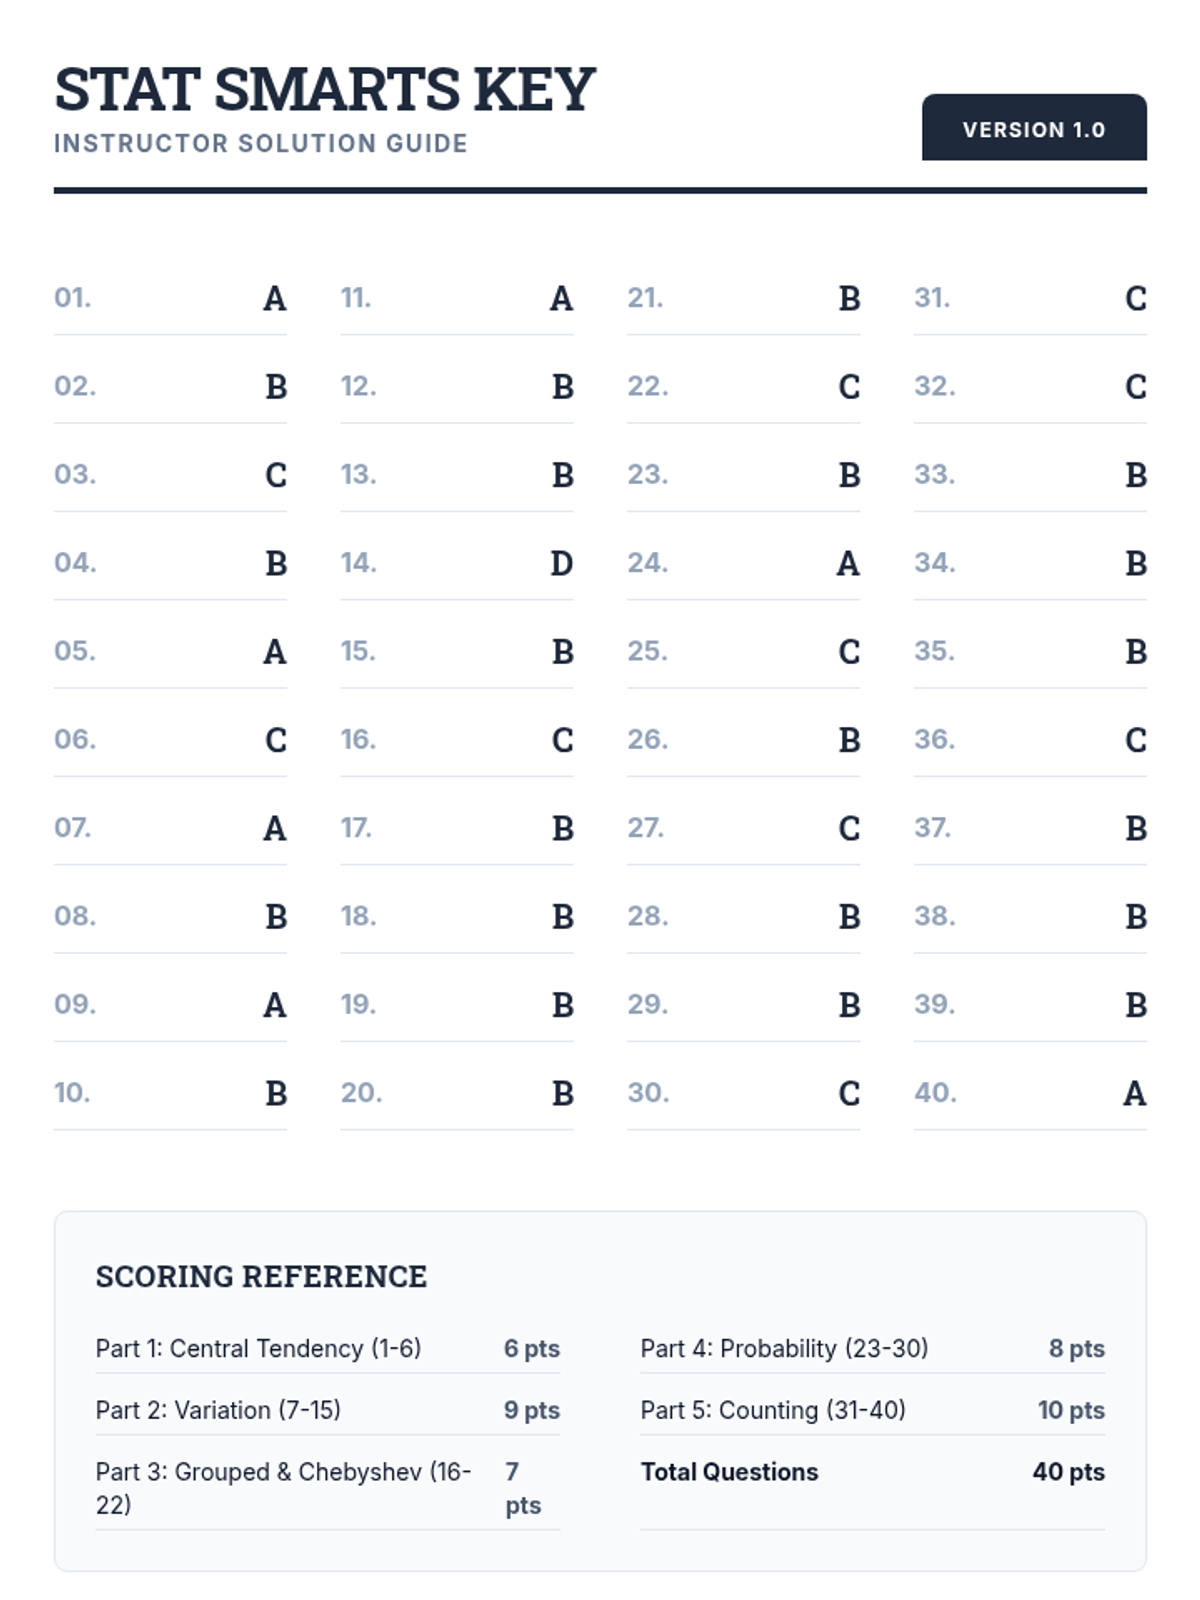
A comprehensive 40-question review covering descriptive statistics, elementary probability, and counting techniques based on Algebra 1 and Statistics curriculum.
A comprehensive practice session for the TSIA2 Math exam, focusing on quantitative reasoning, algebraic reasoning, geometry, and statistics.
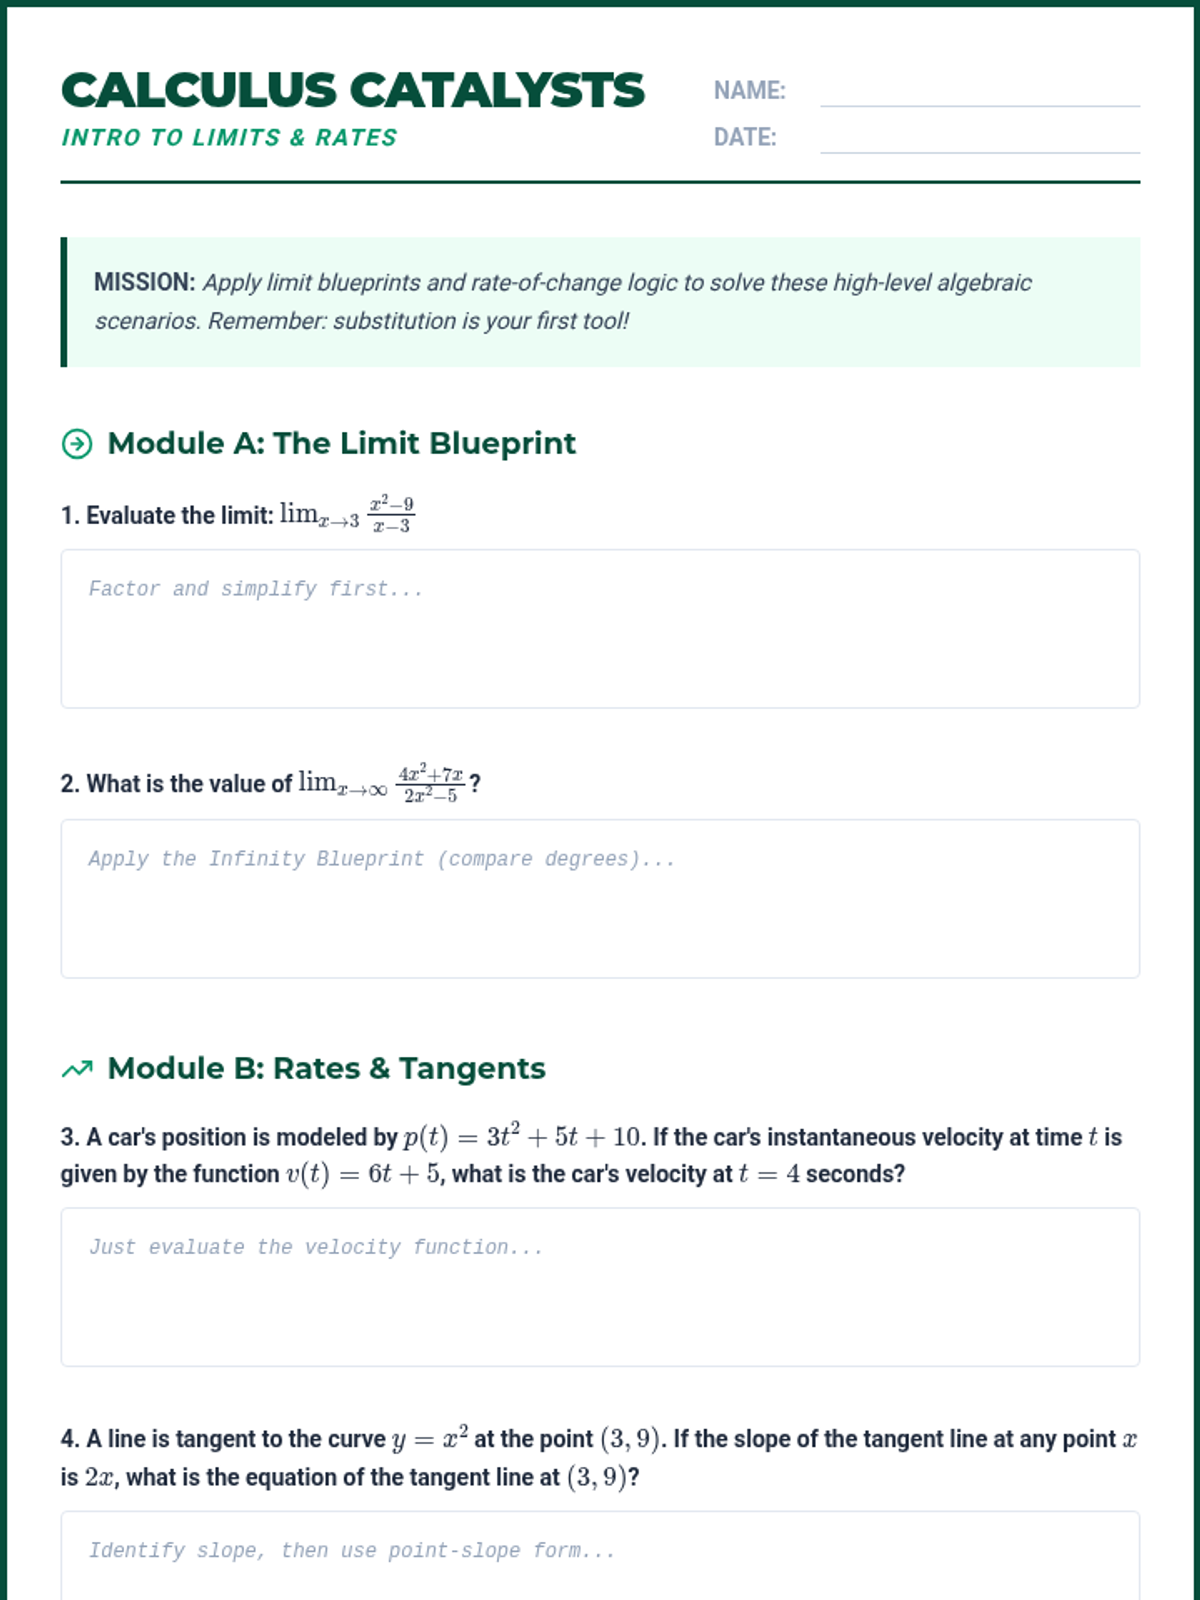
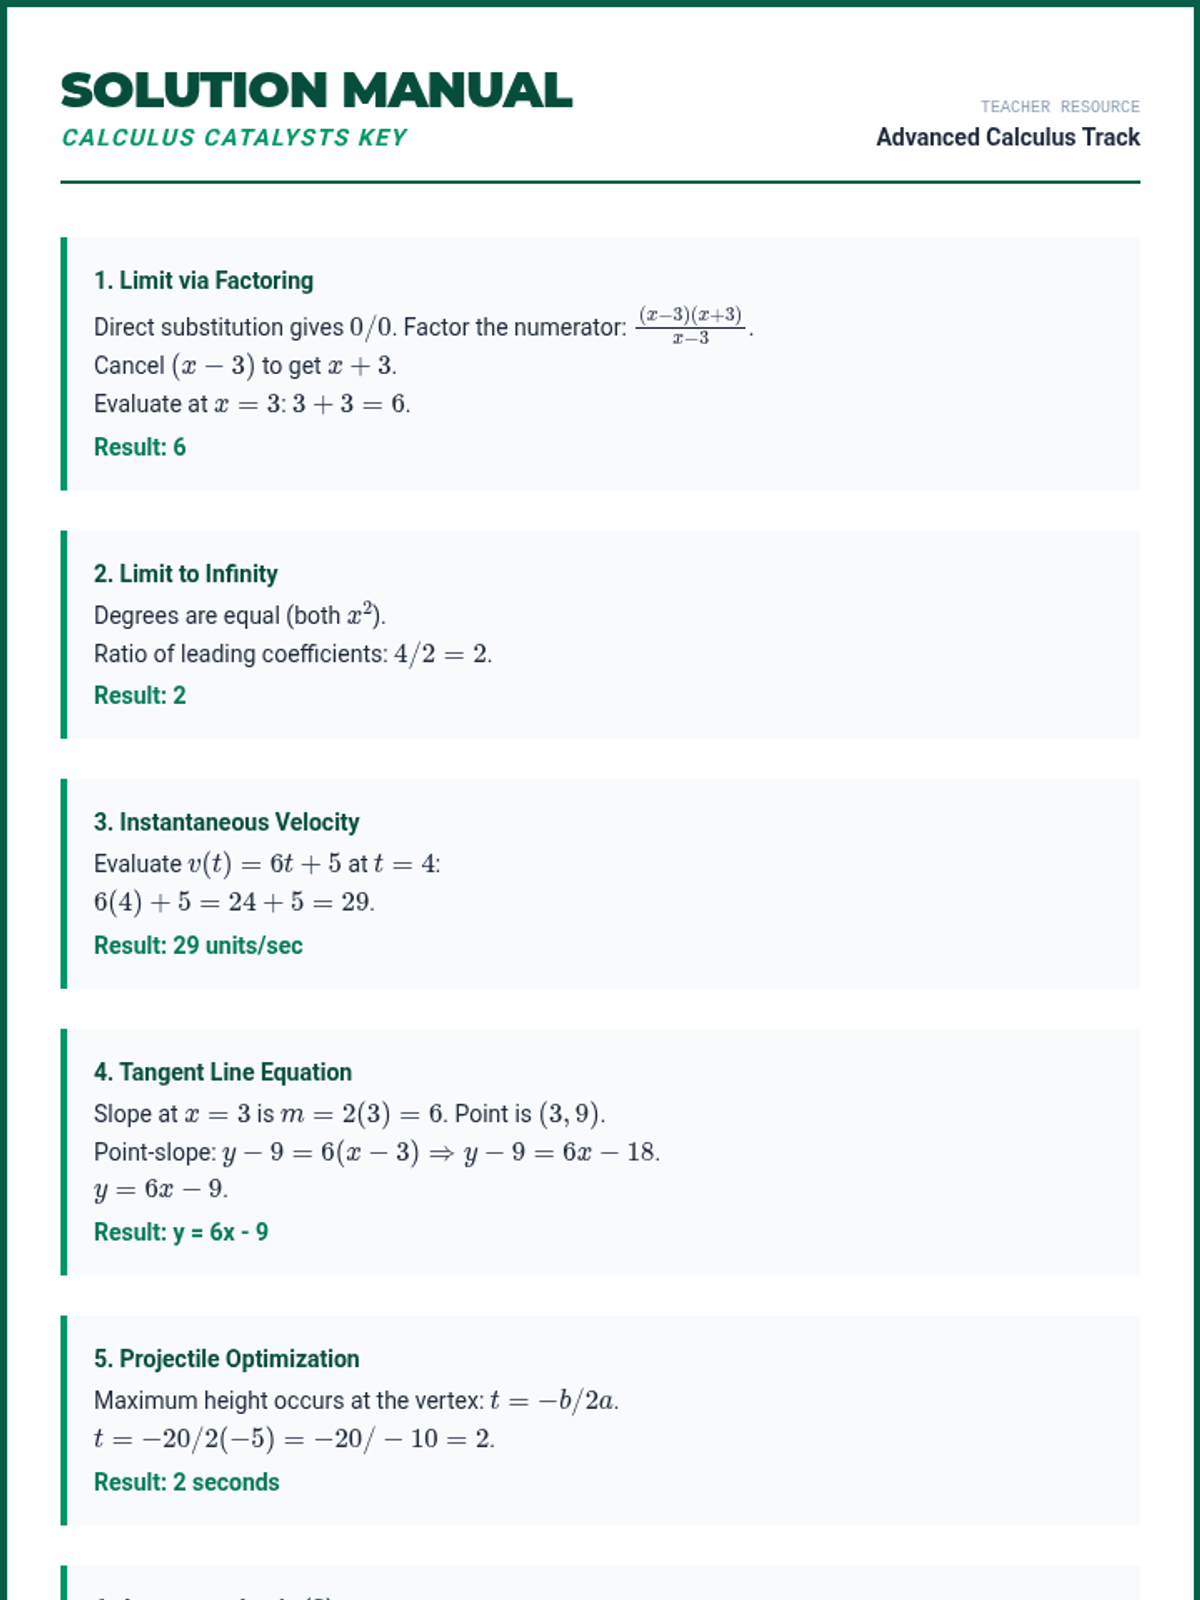
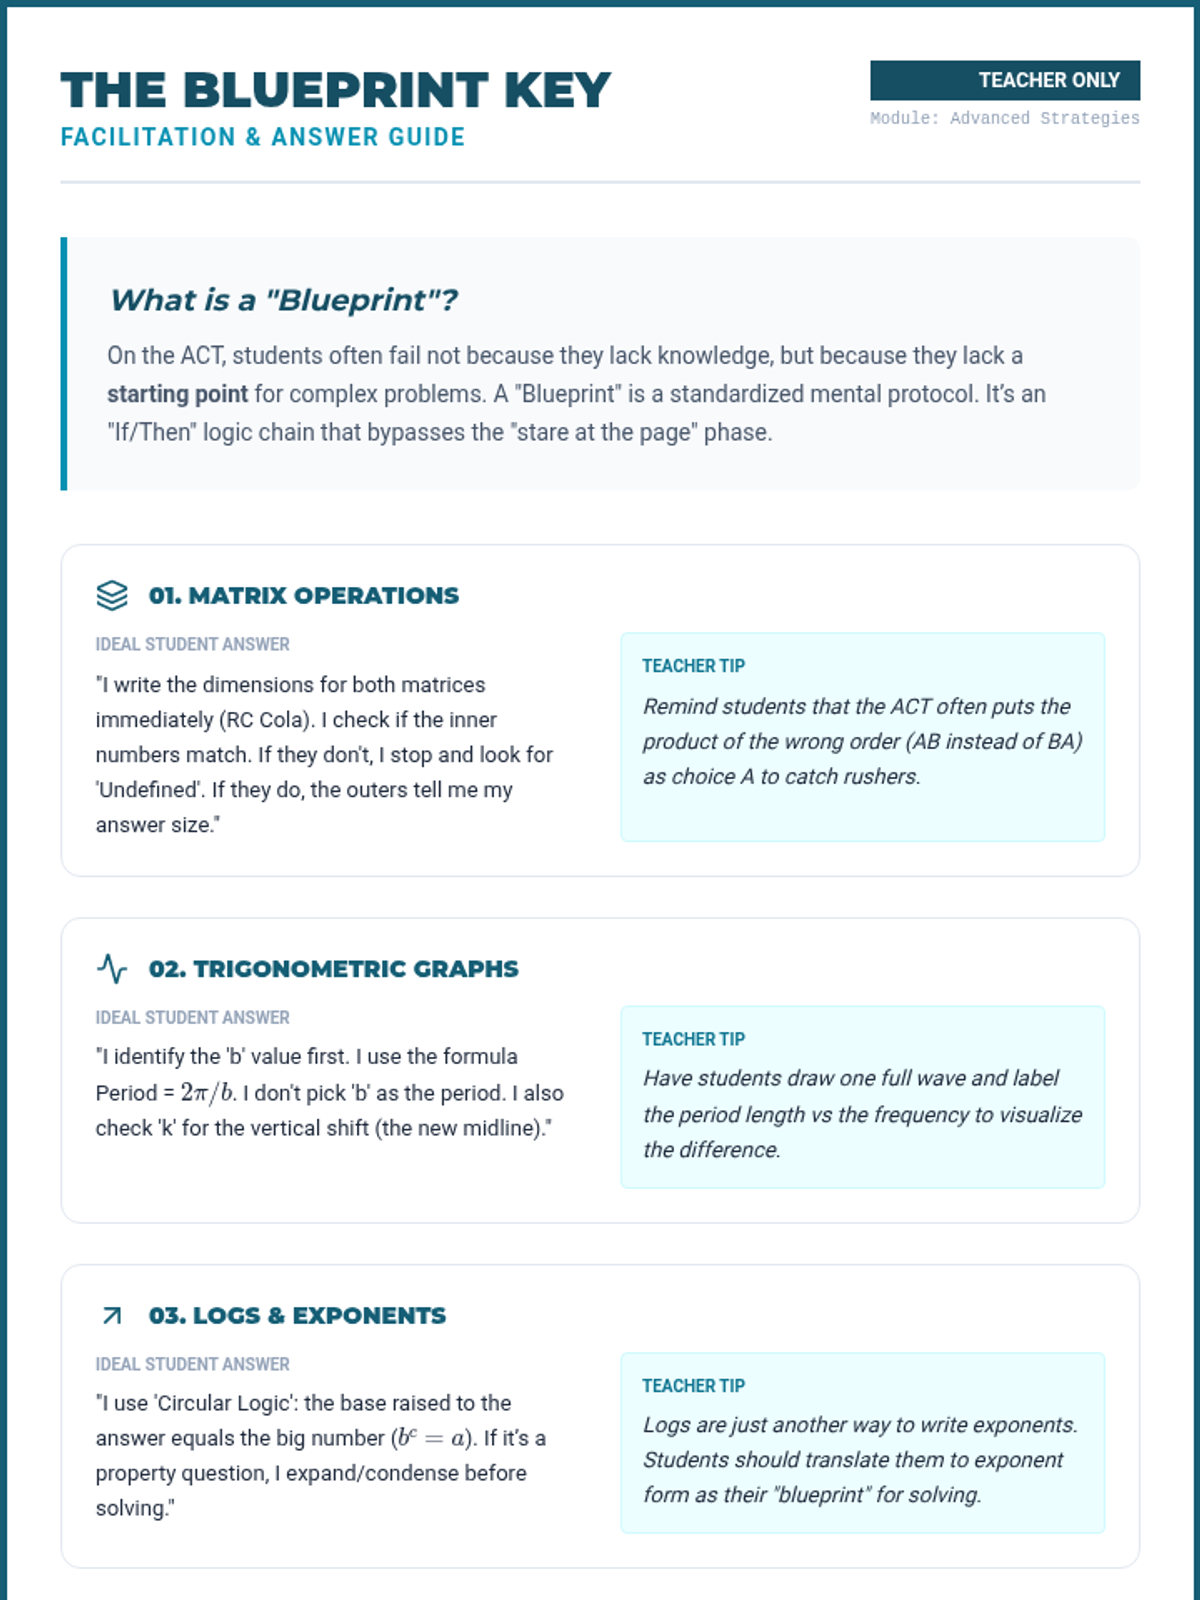
An introductory exploration of calculus-adjacent concepts tested on the ACT, focusing on limits, instantaneous rates of change, and function optimization. Students will master the Limit Blueprint and apply rate-of-change logic to complex algebraic scenarios.
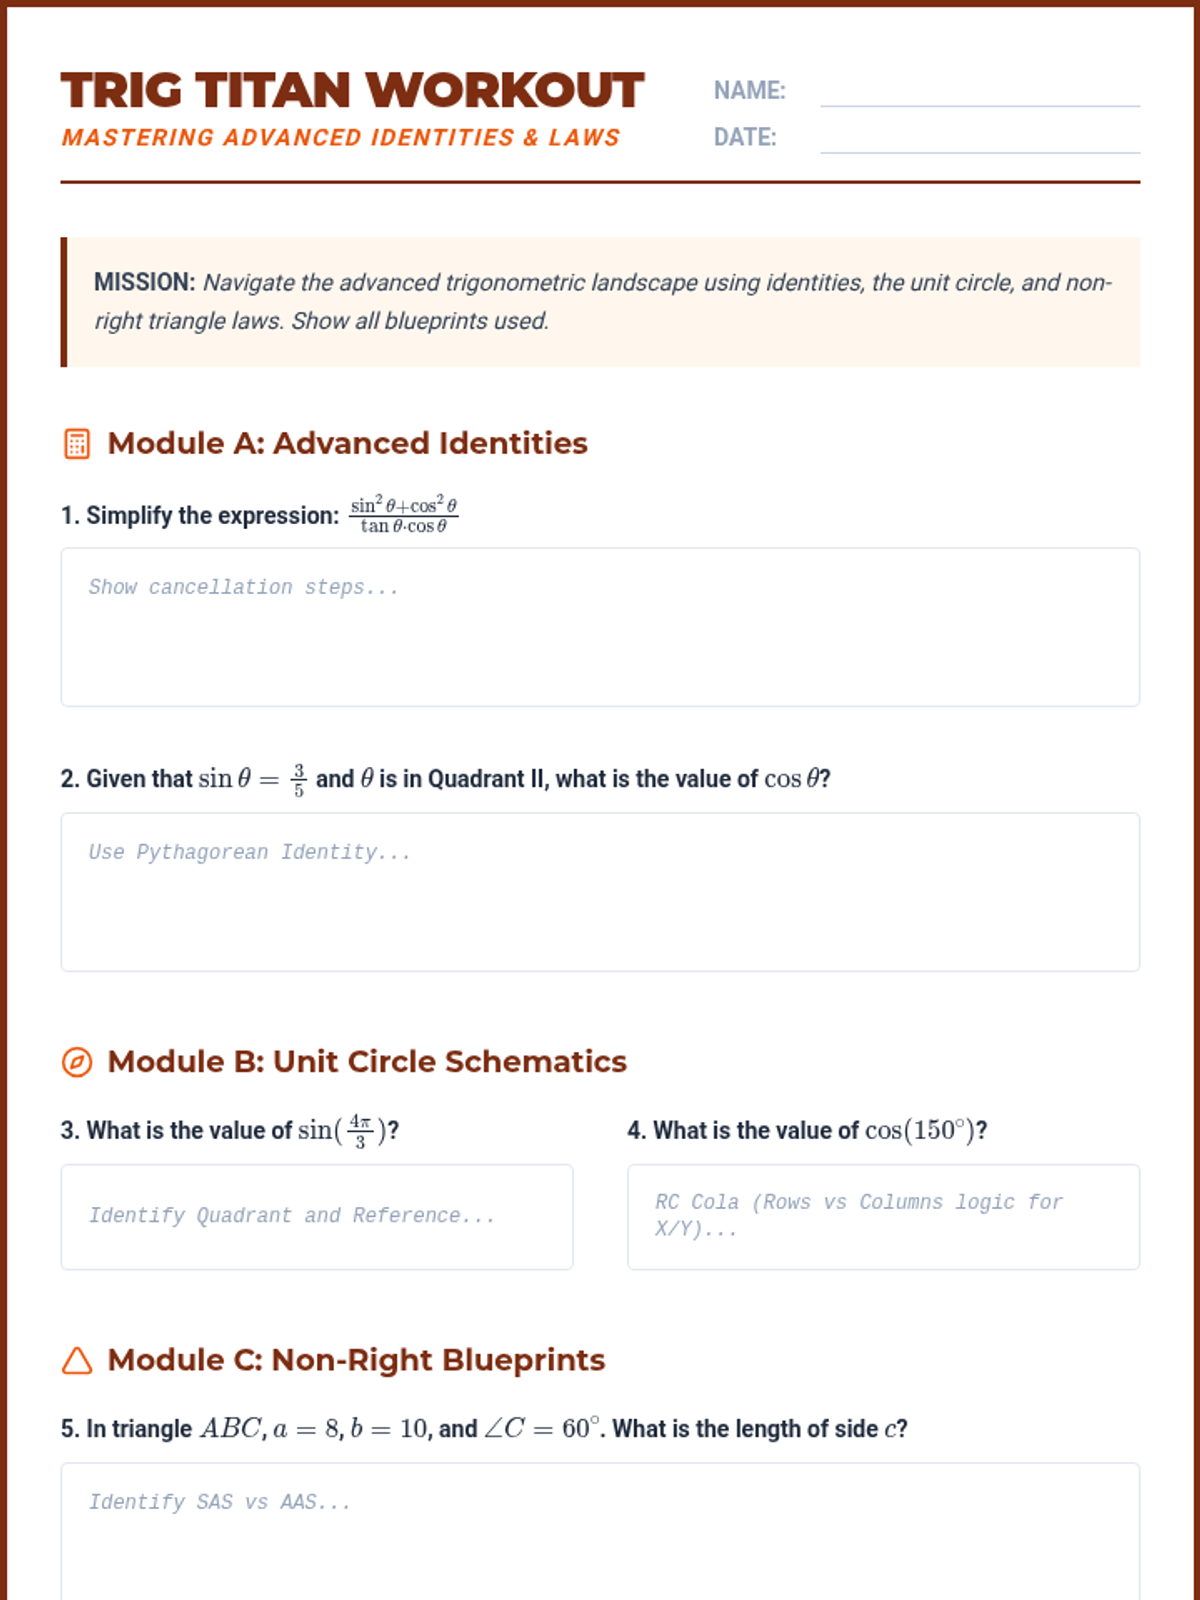
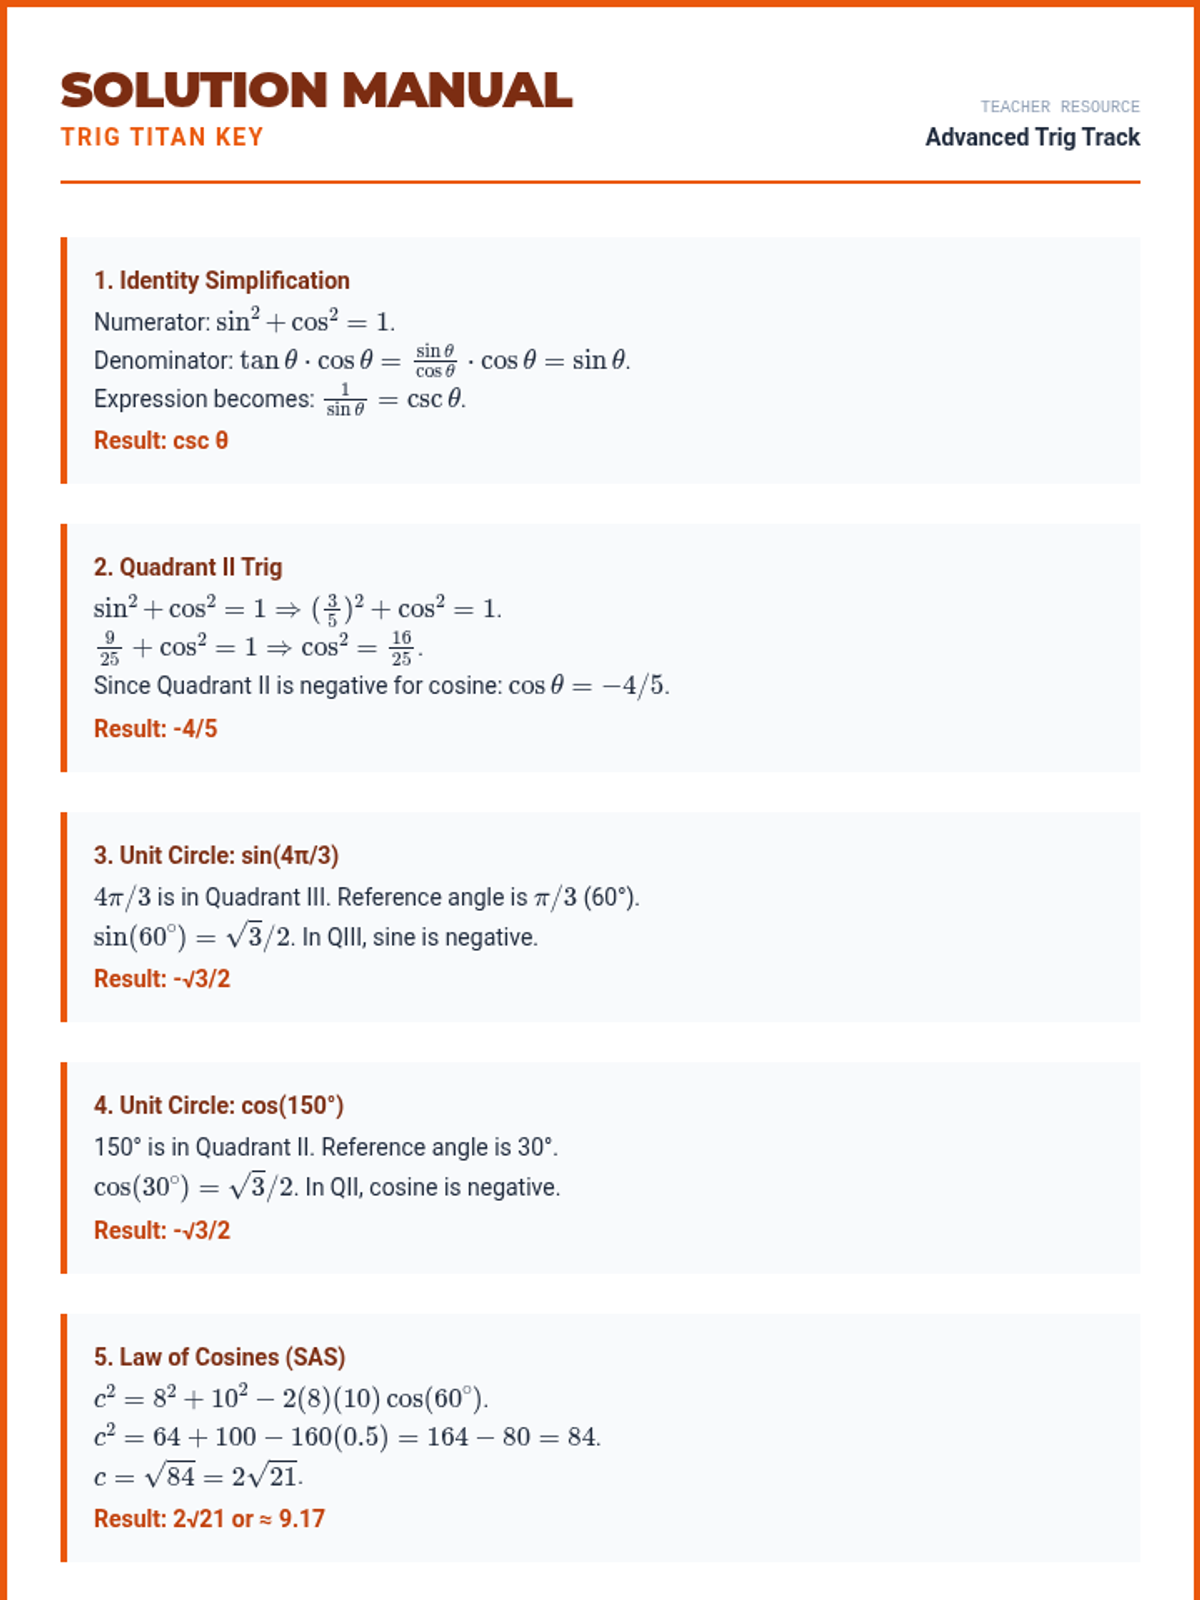
An intensive masterclass on advanced trigonometric identities, the unit circle, and non-right triangle laws. Students will master the Pythagorean identities, Law of Sines/Cosines, and the specific ACT-style unit circle coordinates required for top-tier scores.
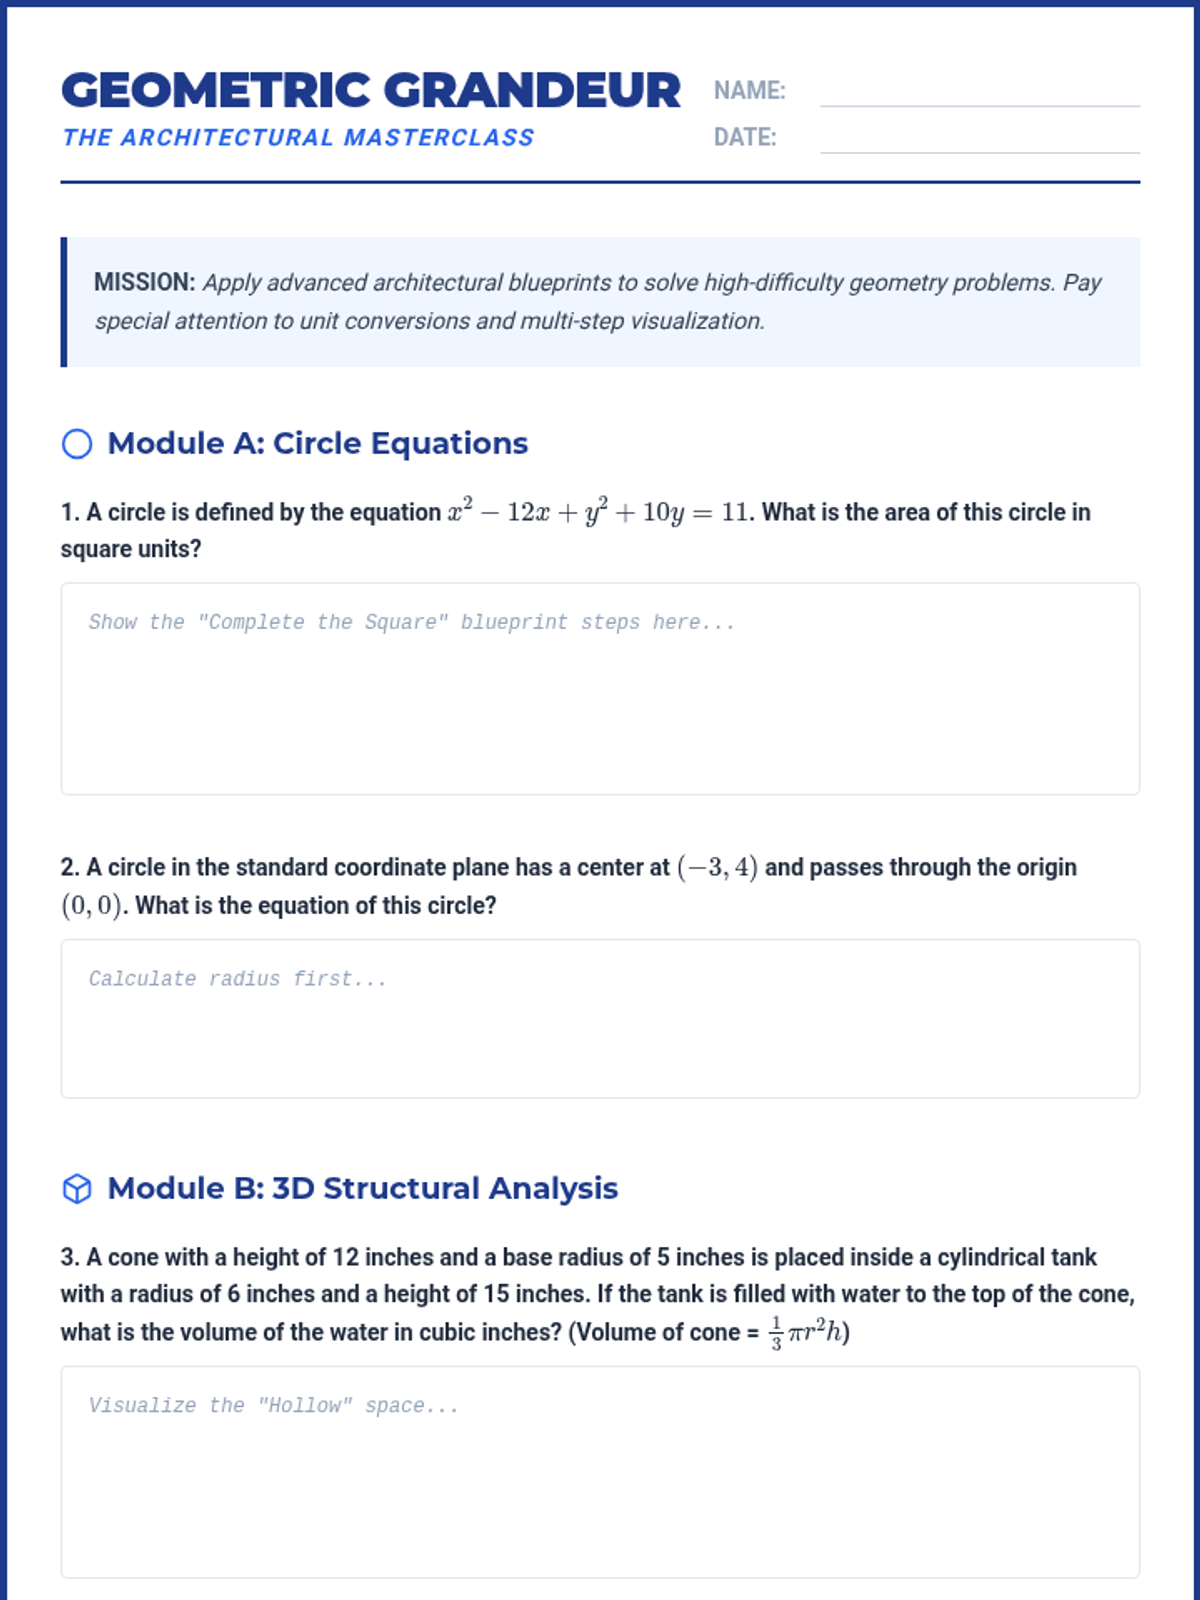
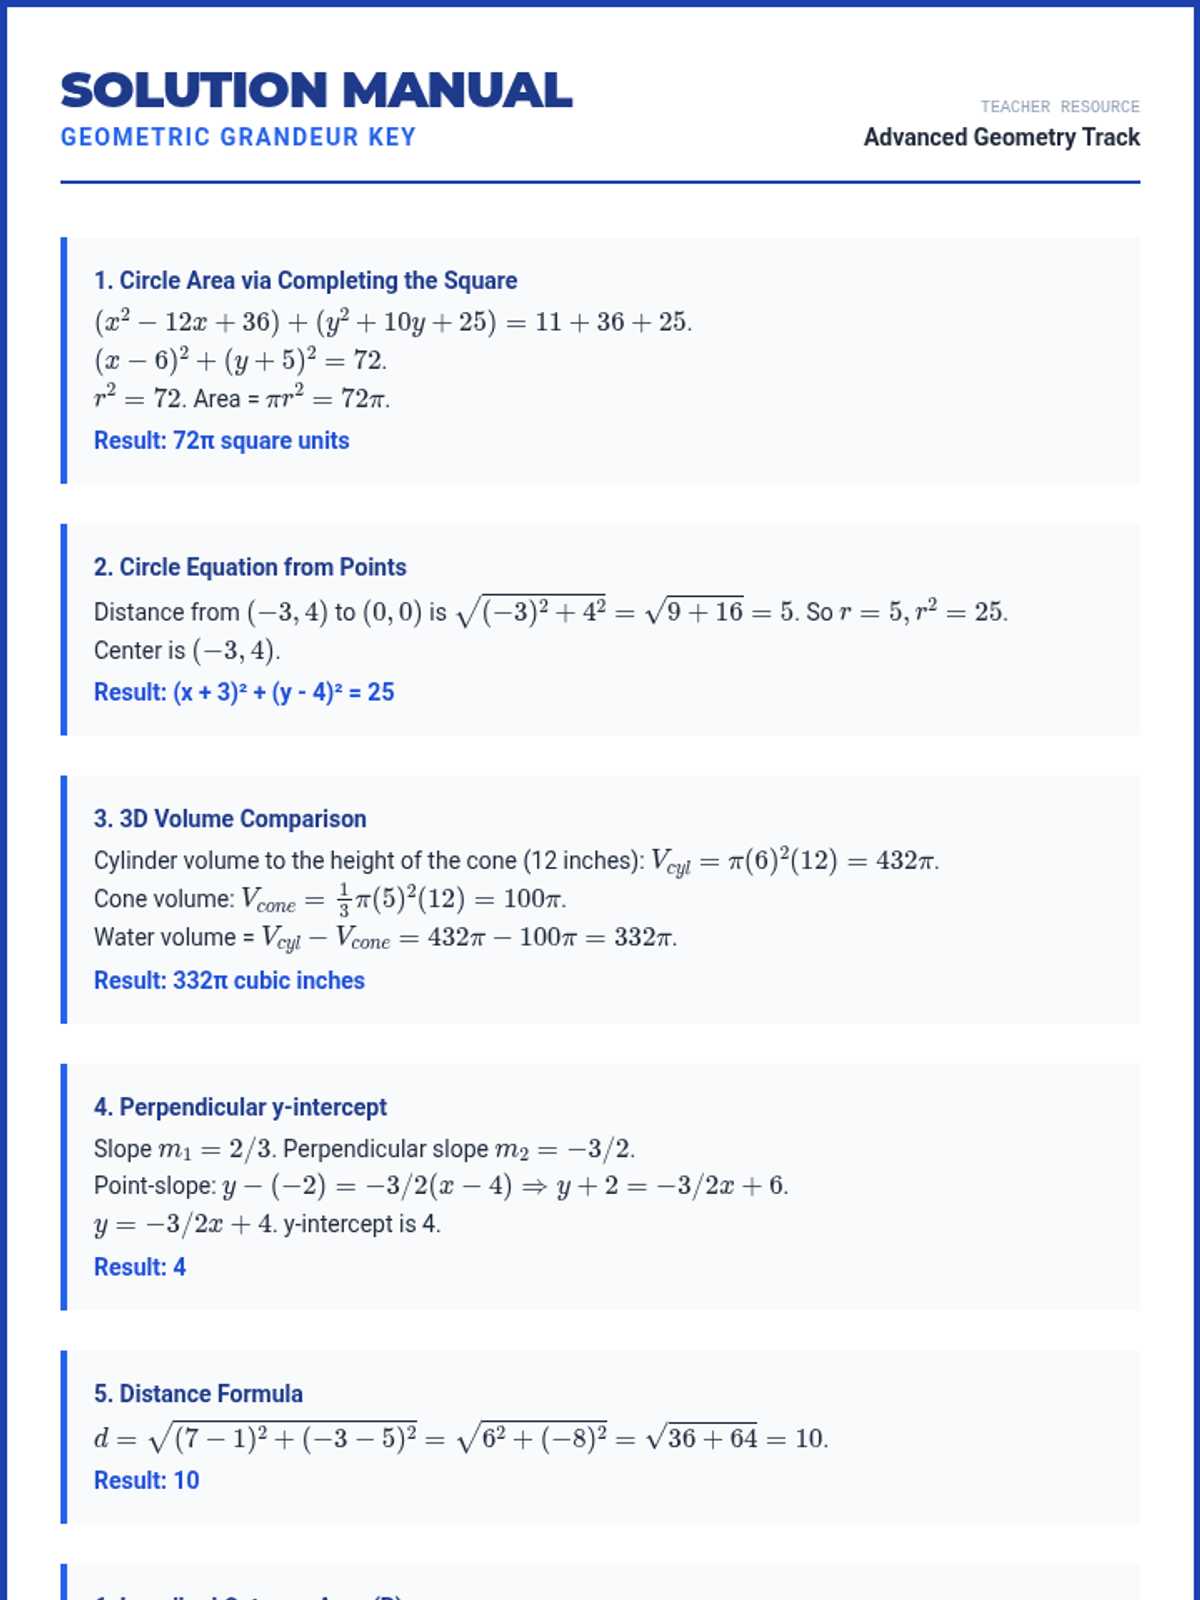
A specialized deep dive into advanced geometry concepts including circle equations, 3D volume/surface area of complex shapes, and coordinate geometry involving perpendicularity and distance. Students will master completing the square for circles and visualizing 3D cross-sections.
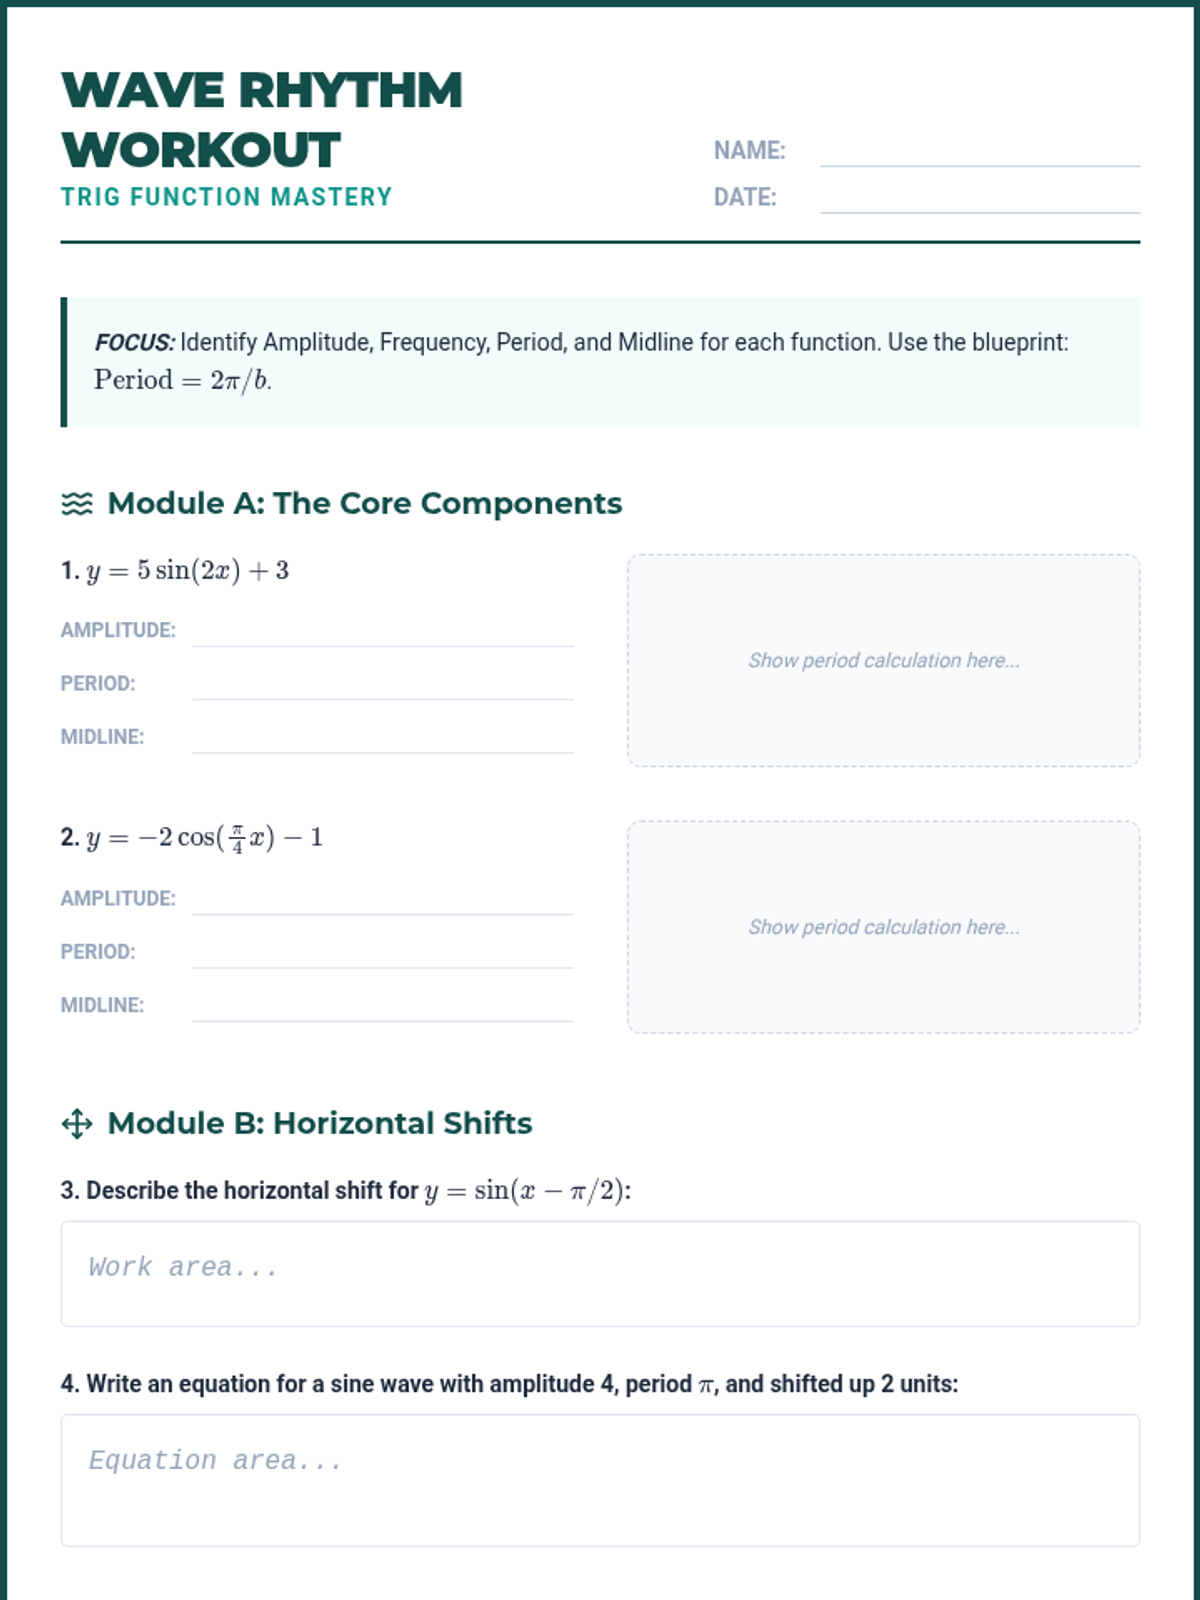
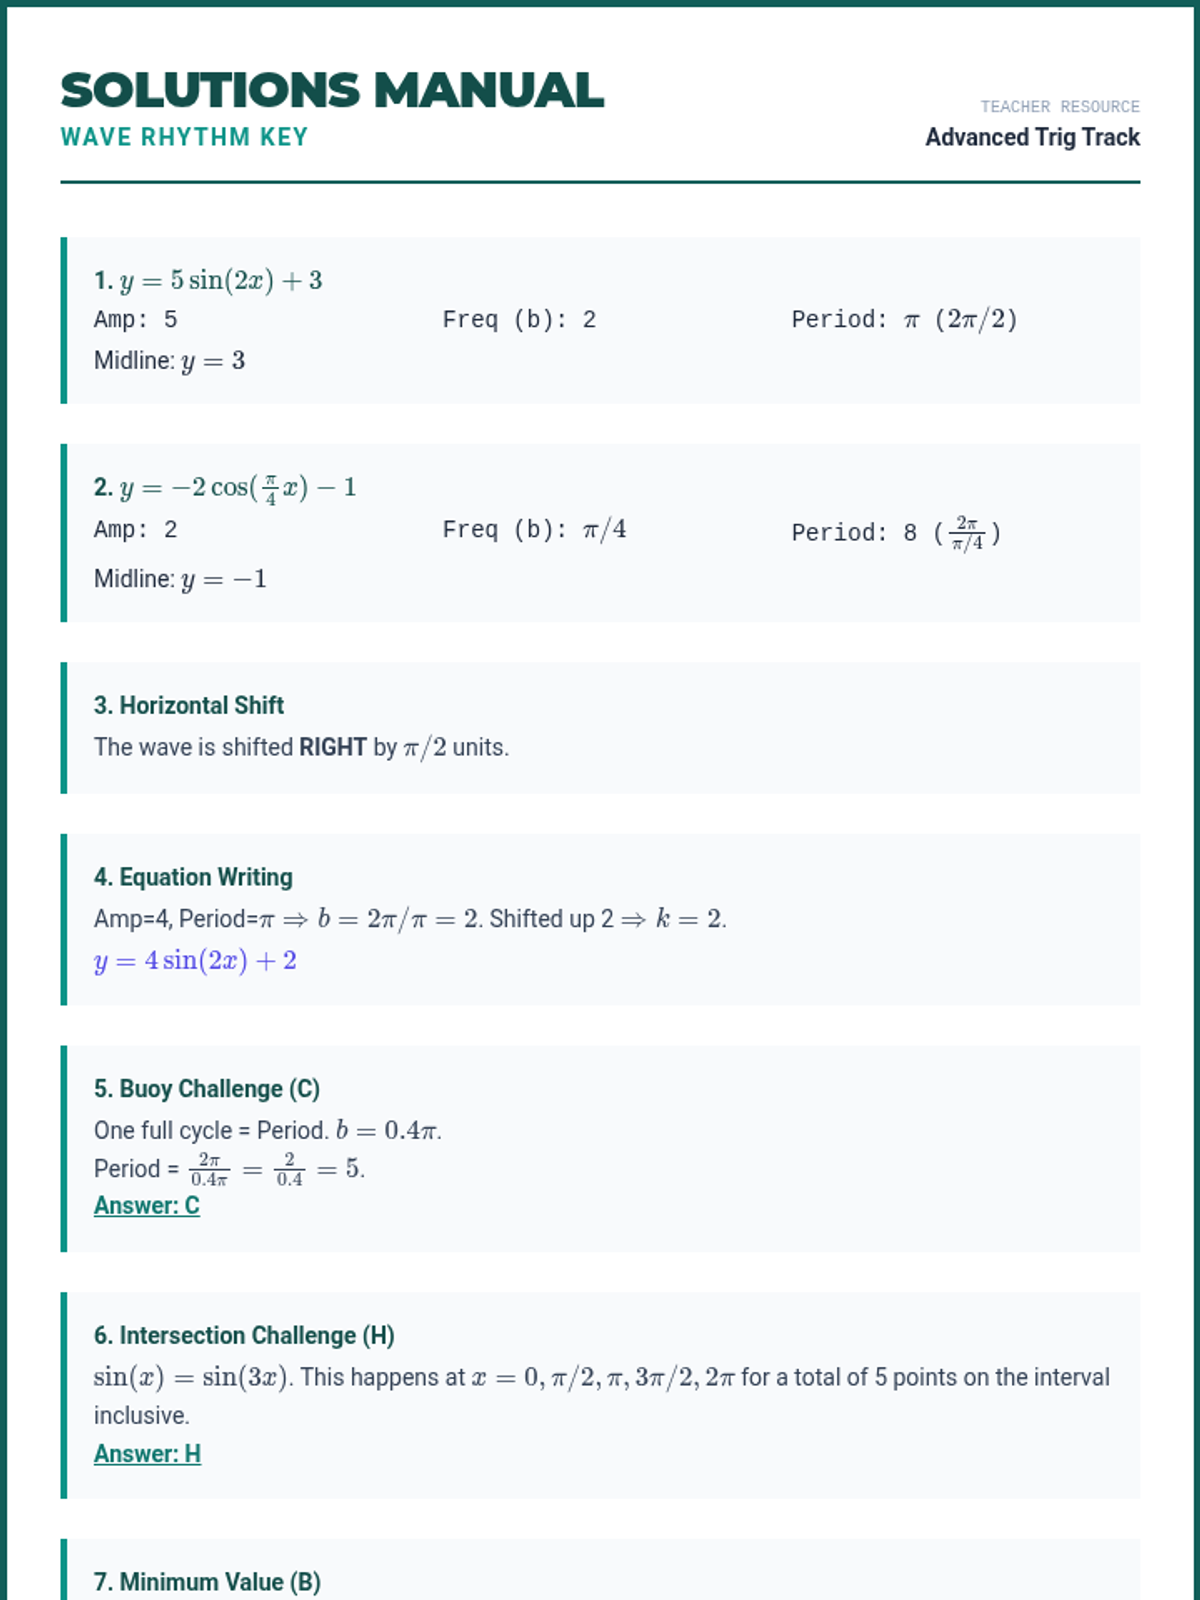
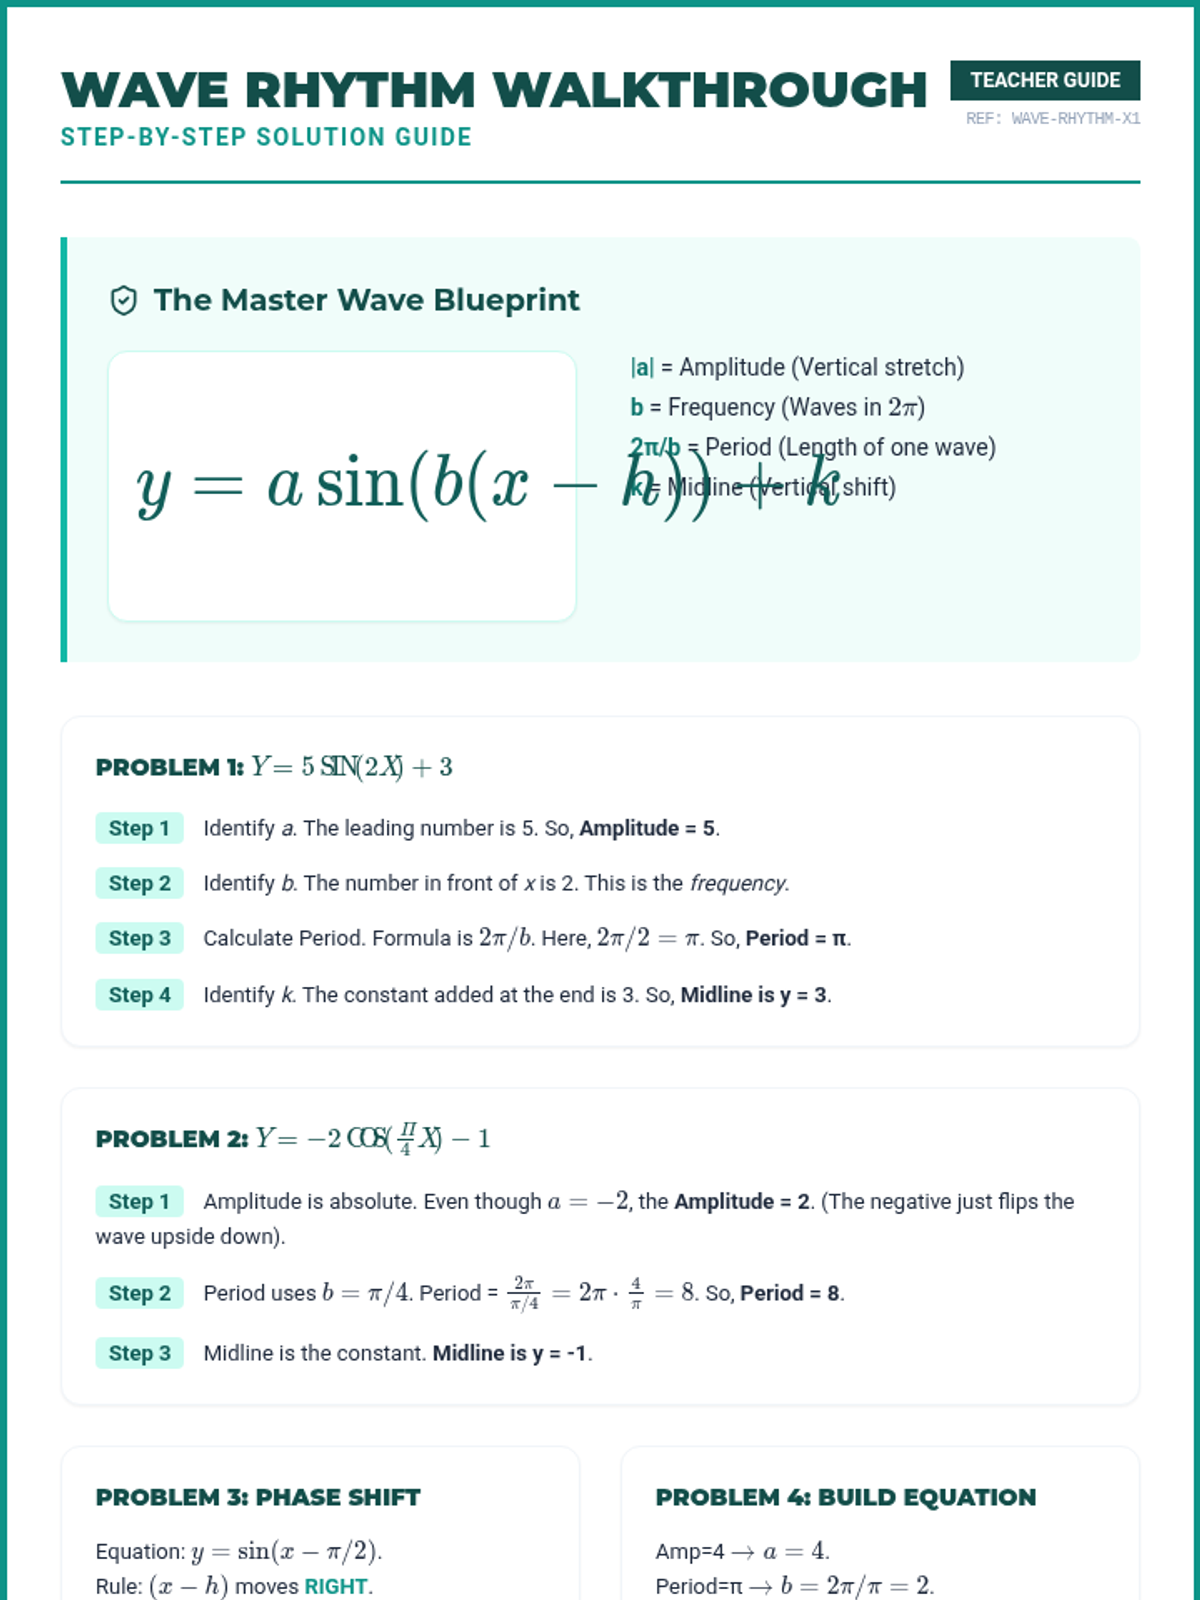
A specialized deep dive into trigonometric functions, mastering the critical distinction between period and frequency. Students will apply the 2π/b blueprint to decode sine and cosine graphs and solve high-difficulty periodic motion problems.
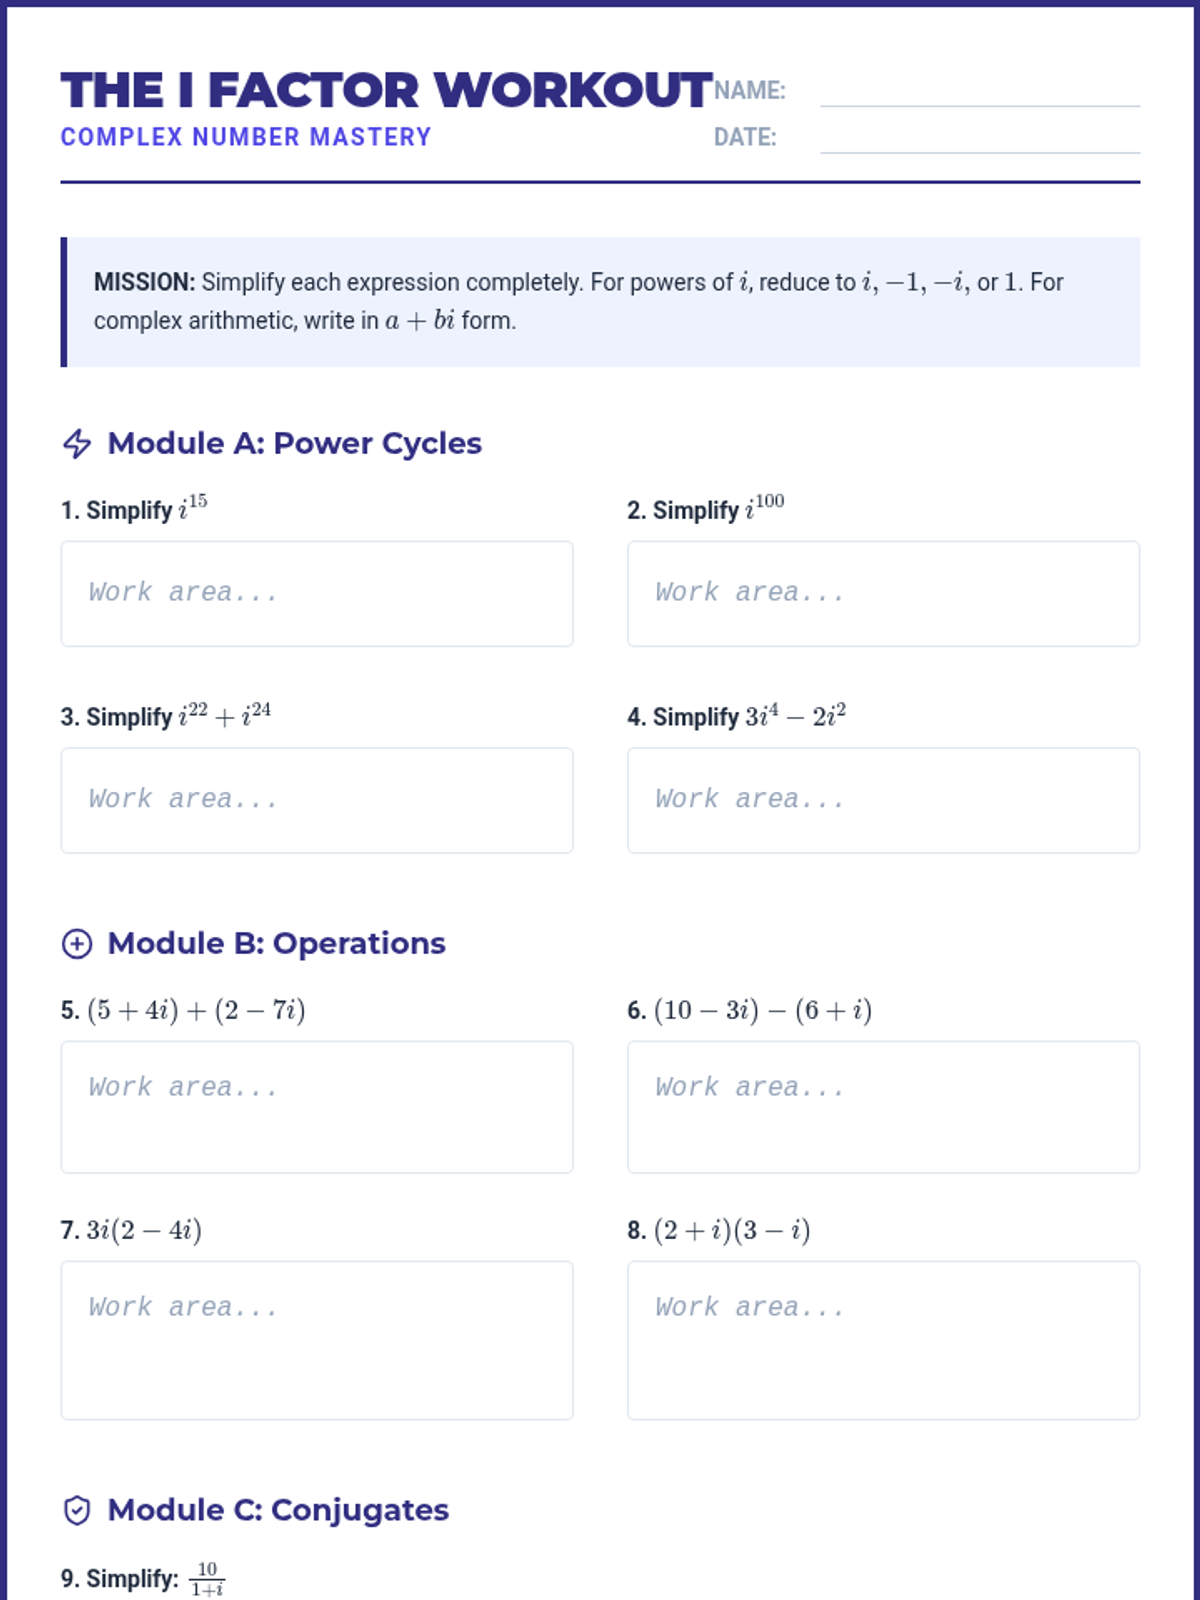
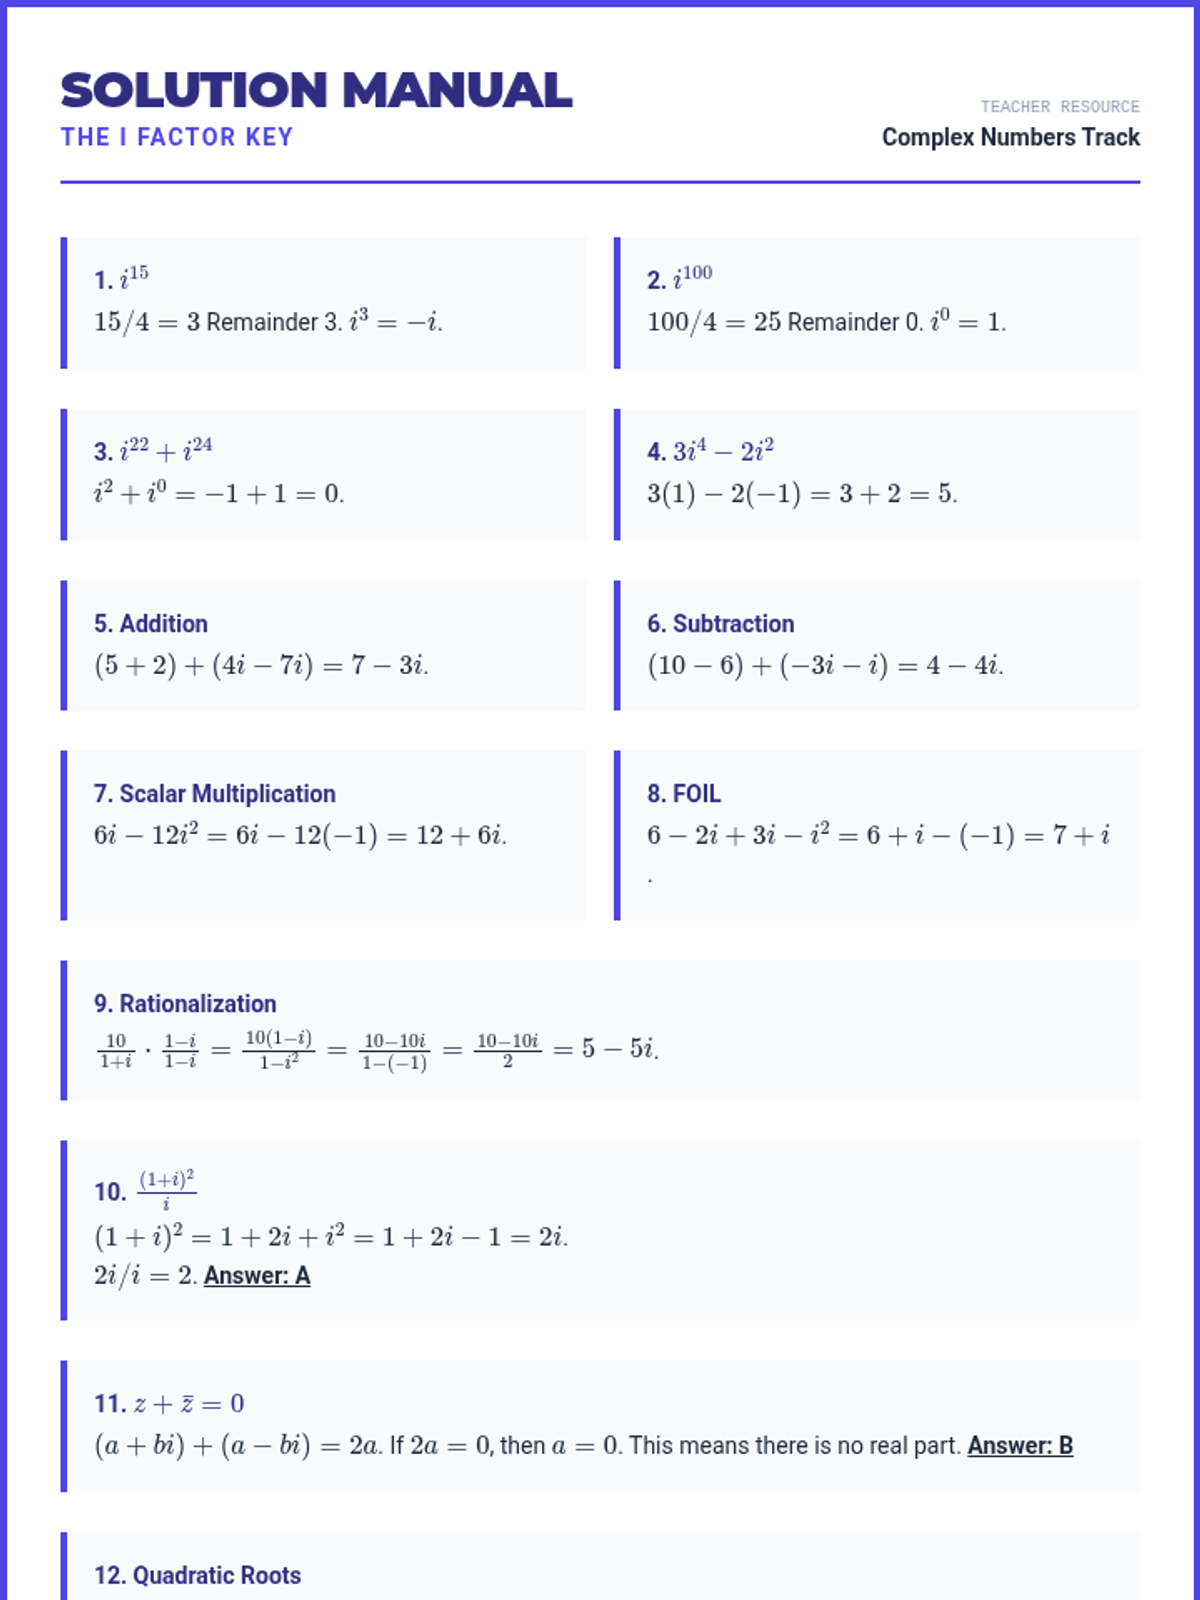
A focused deep dive into imaginary and complex numbers. Students will master powers of i, arithmetic with complex conjugates, and solving quadratic equations with complex roots—all through the lens of ACT-style 'Final Ten' questions.
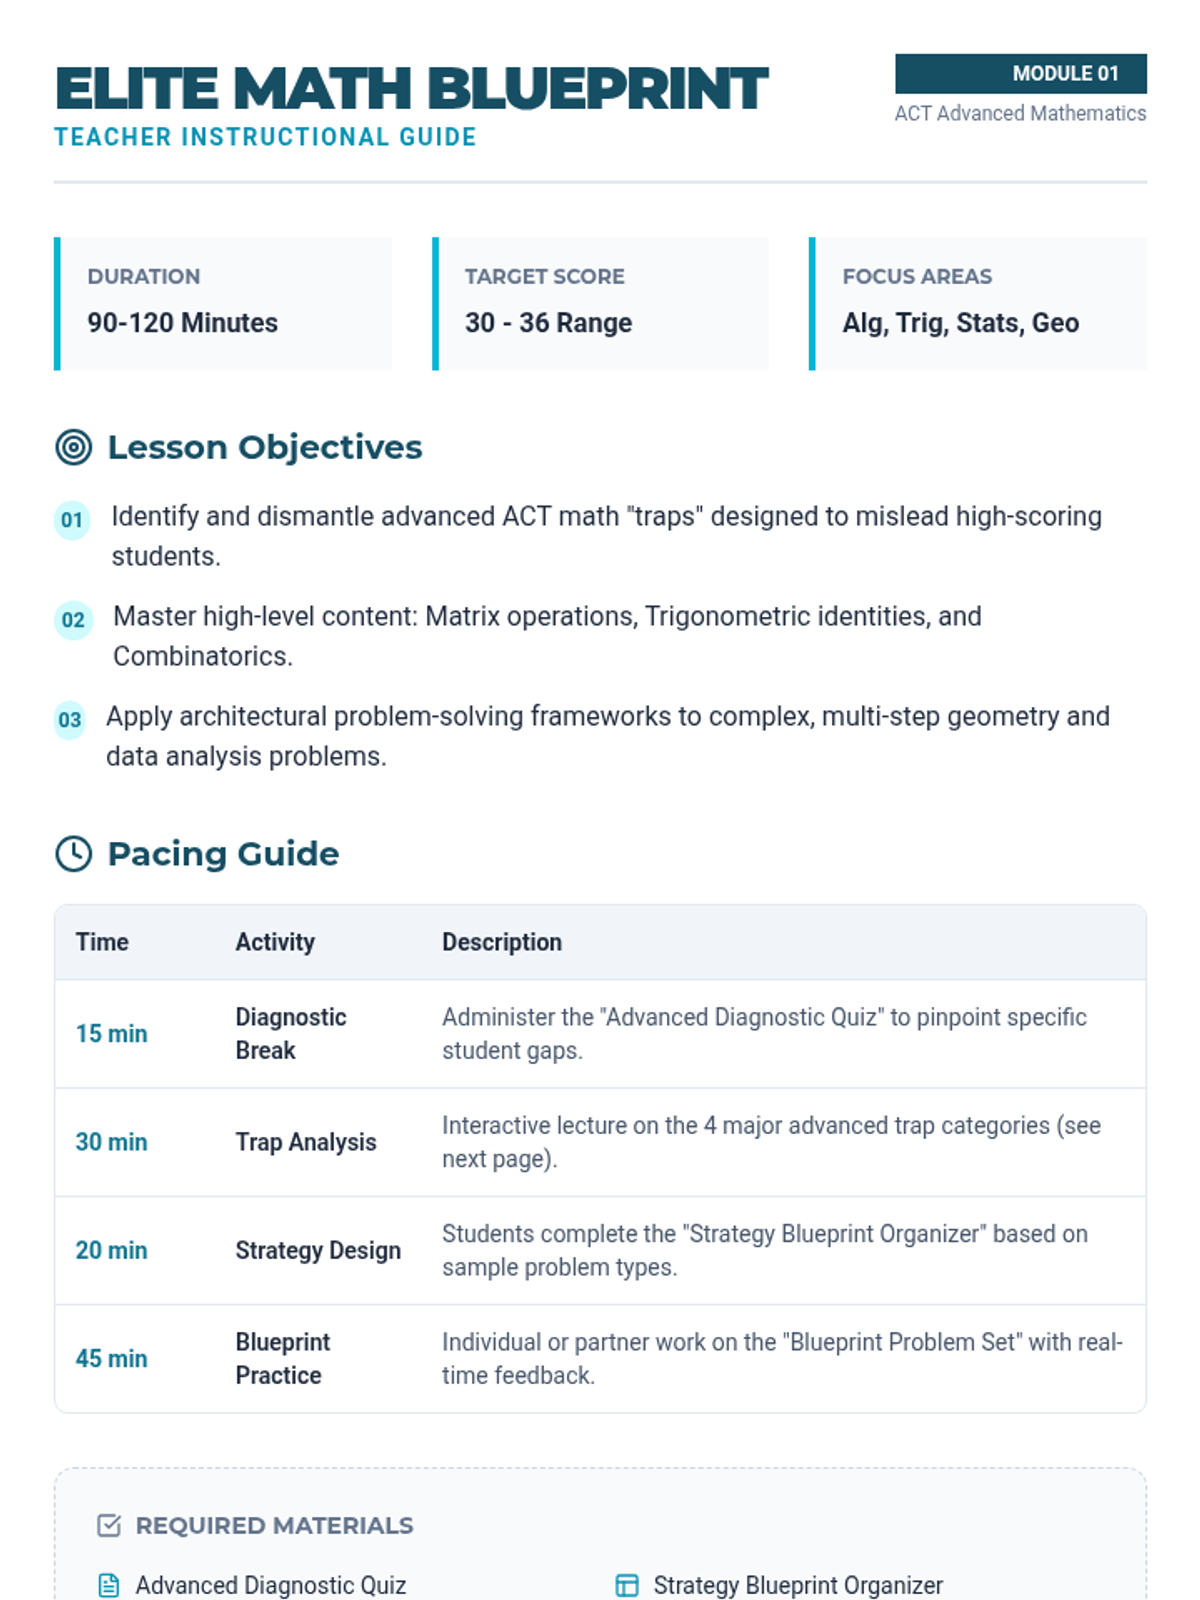
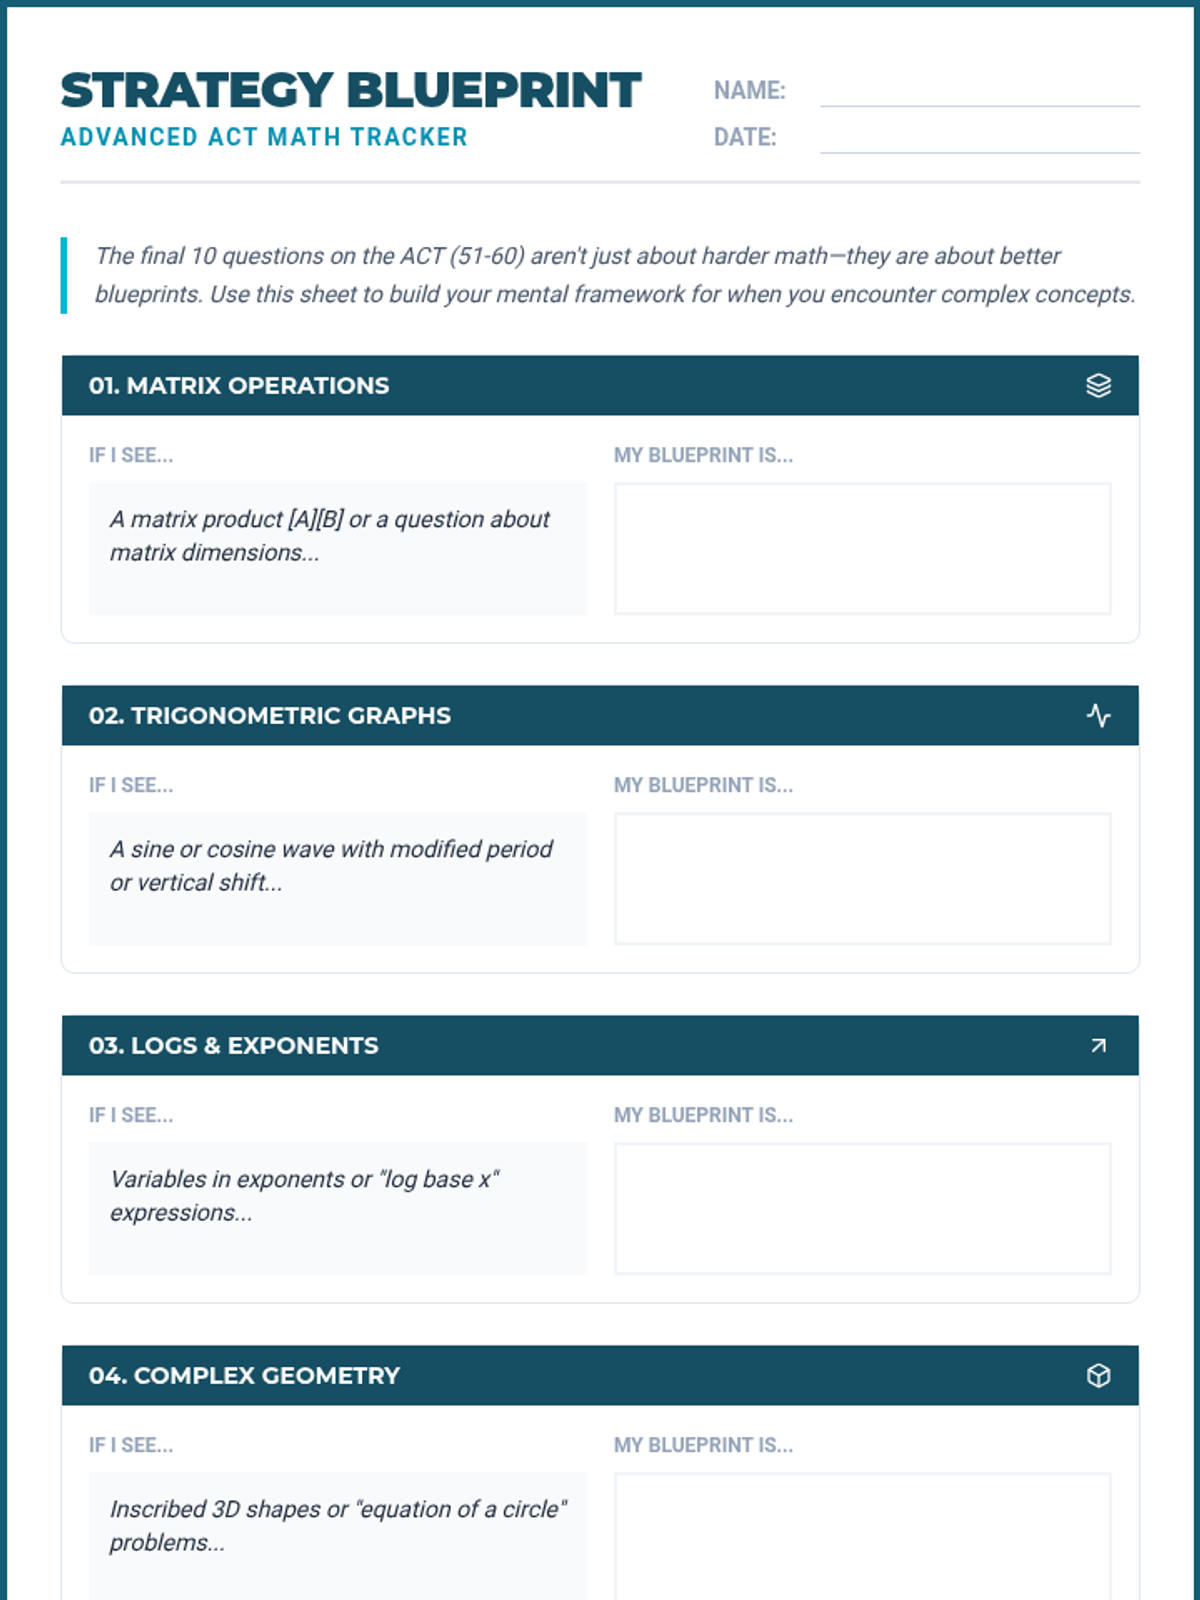
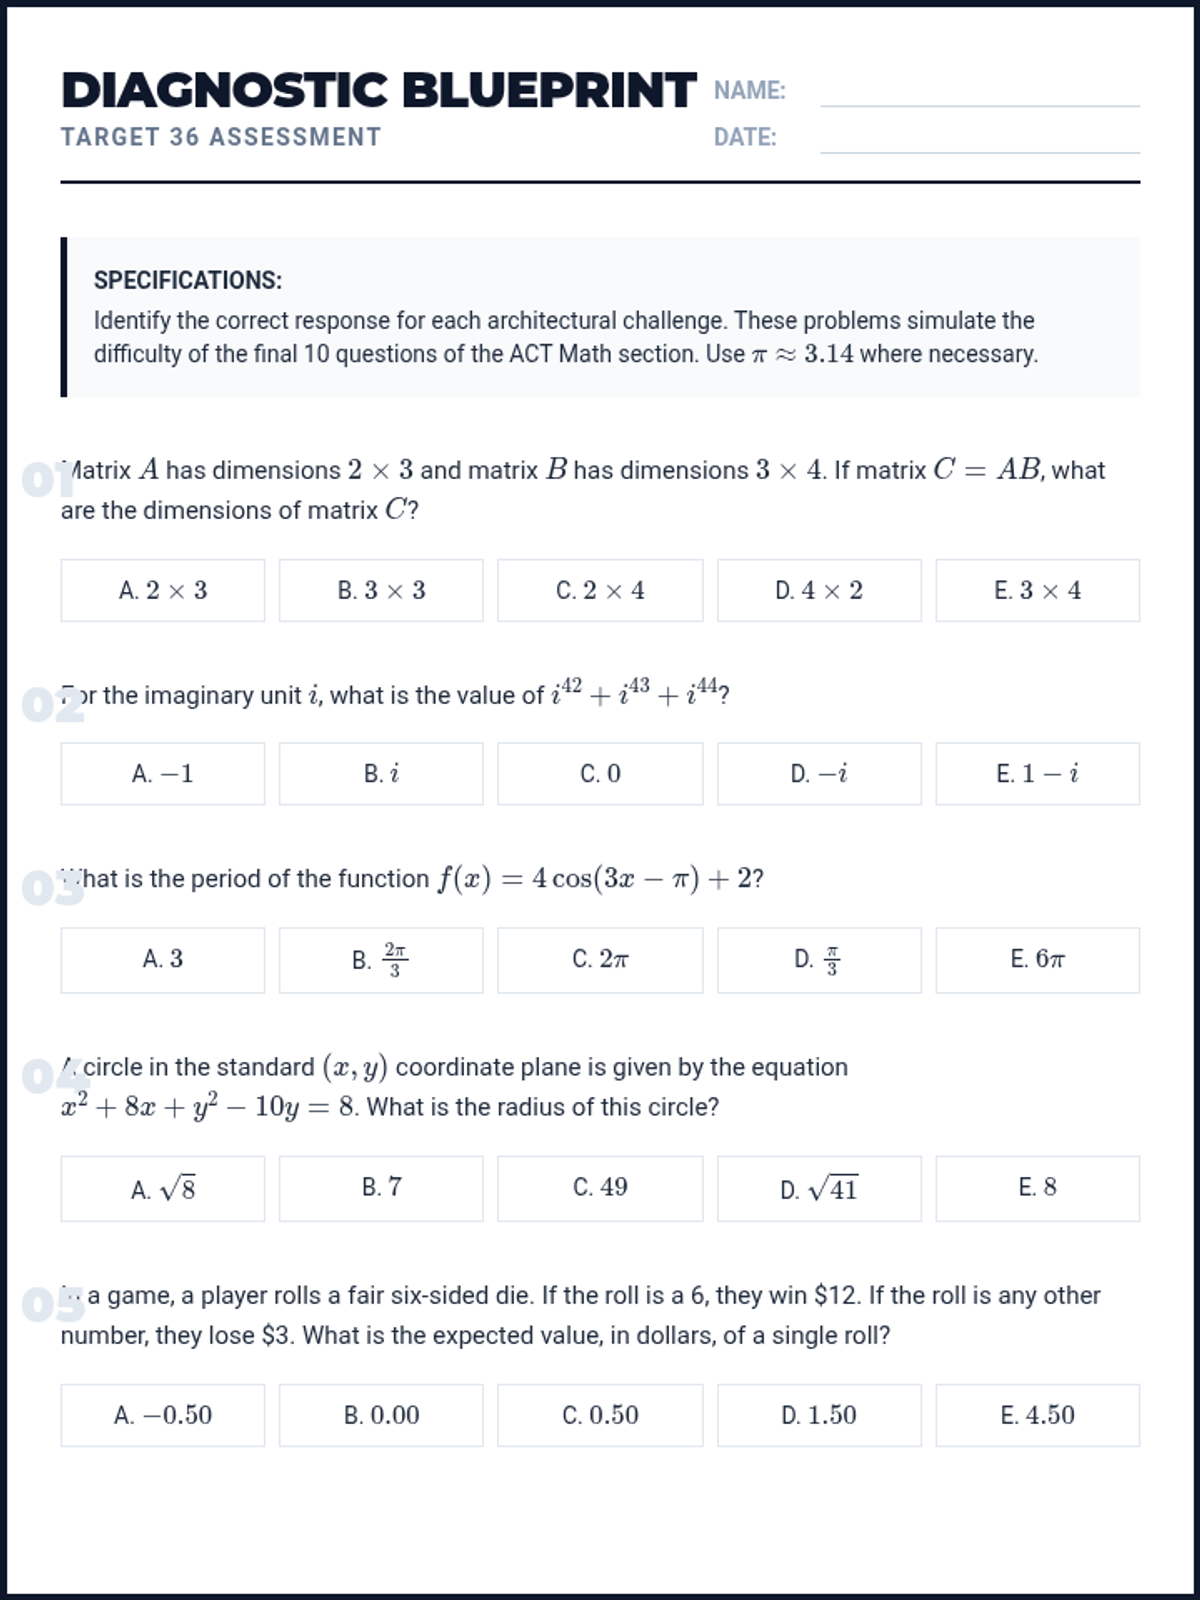
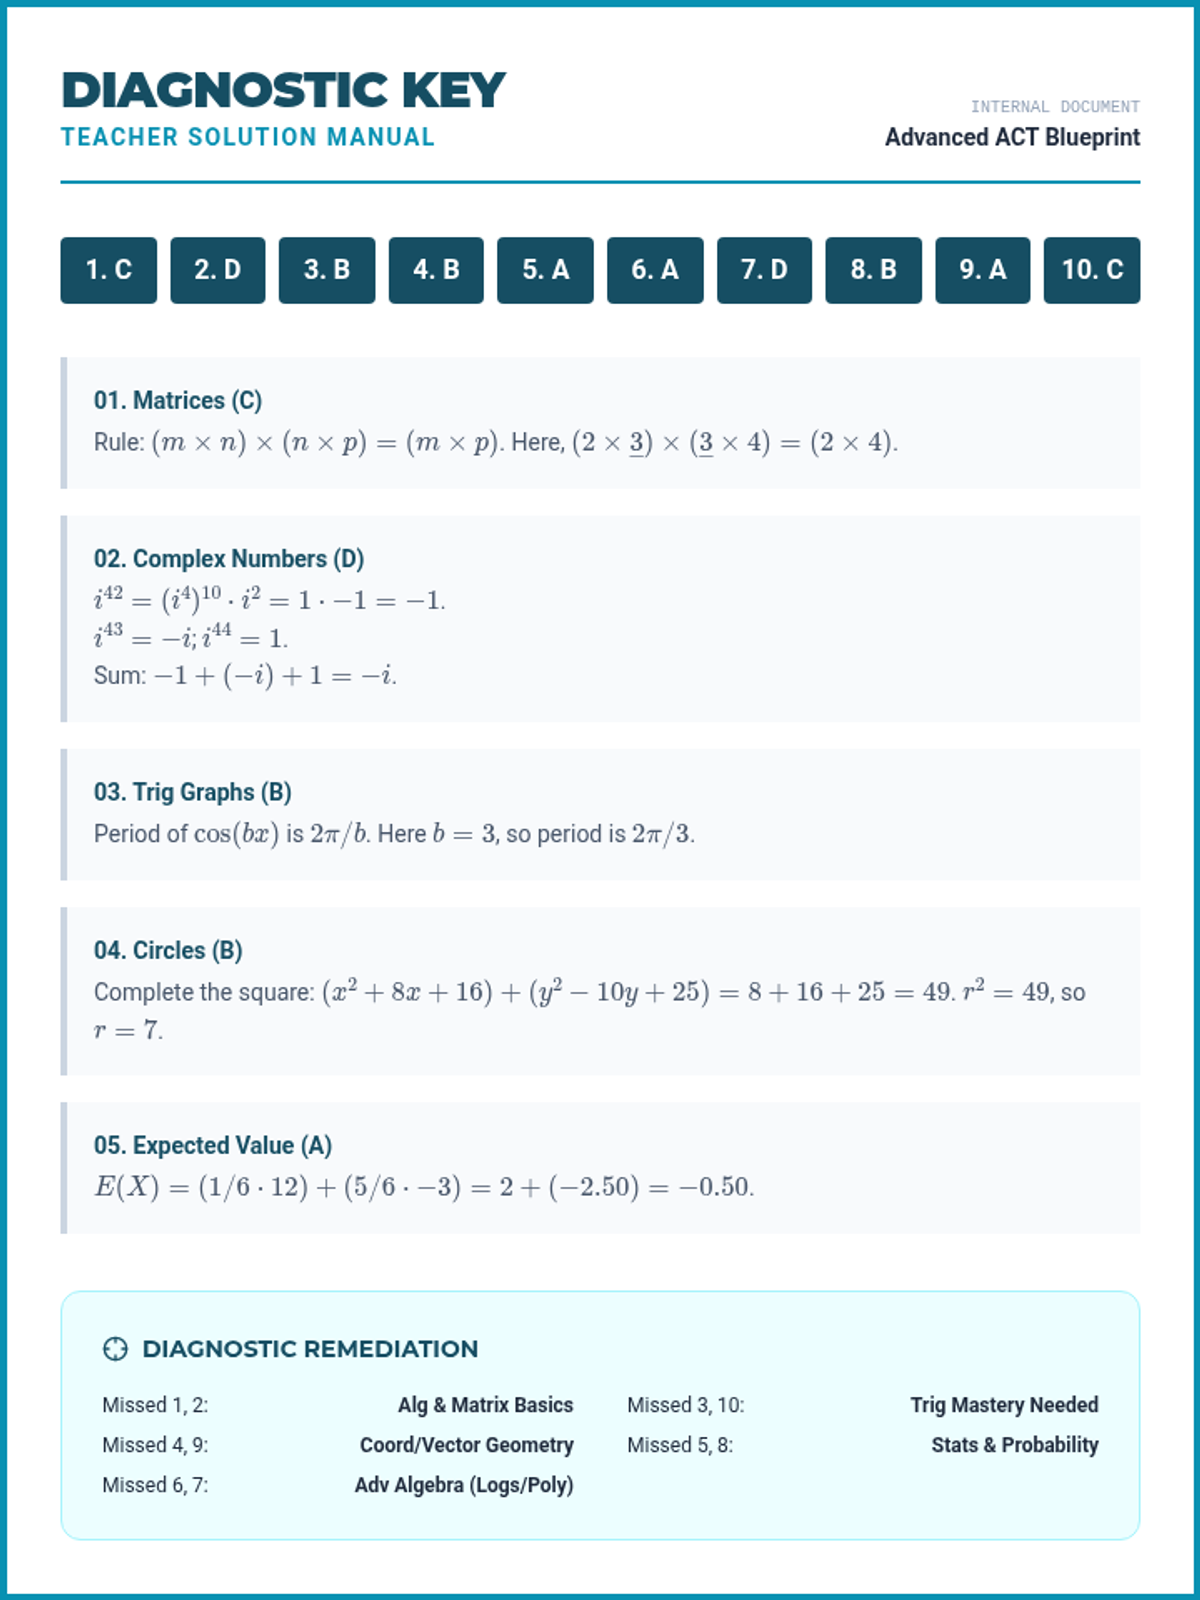
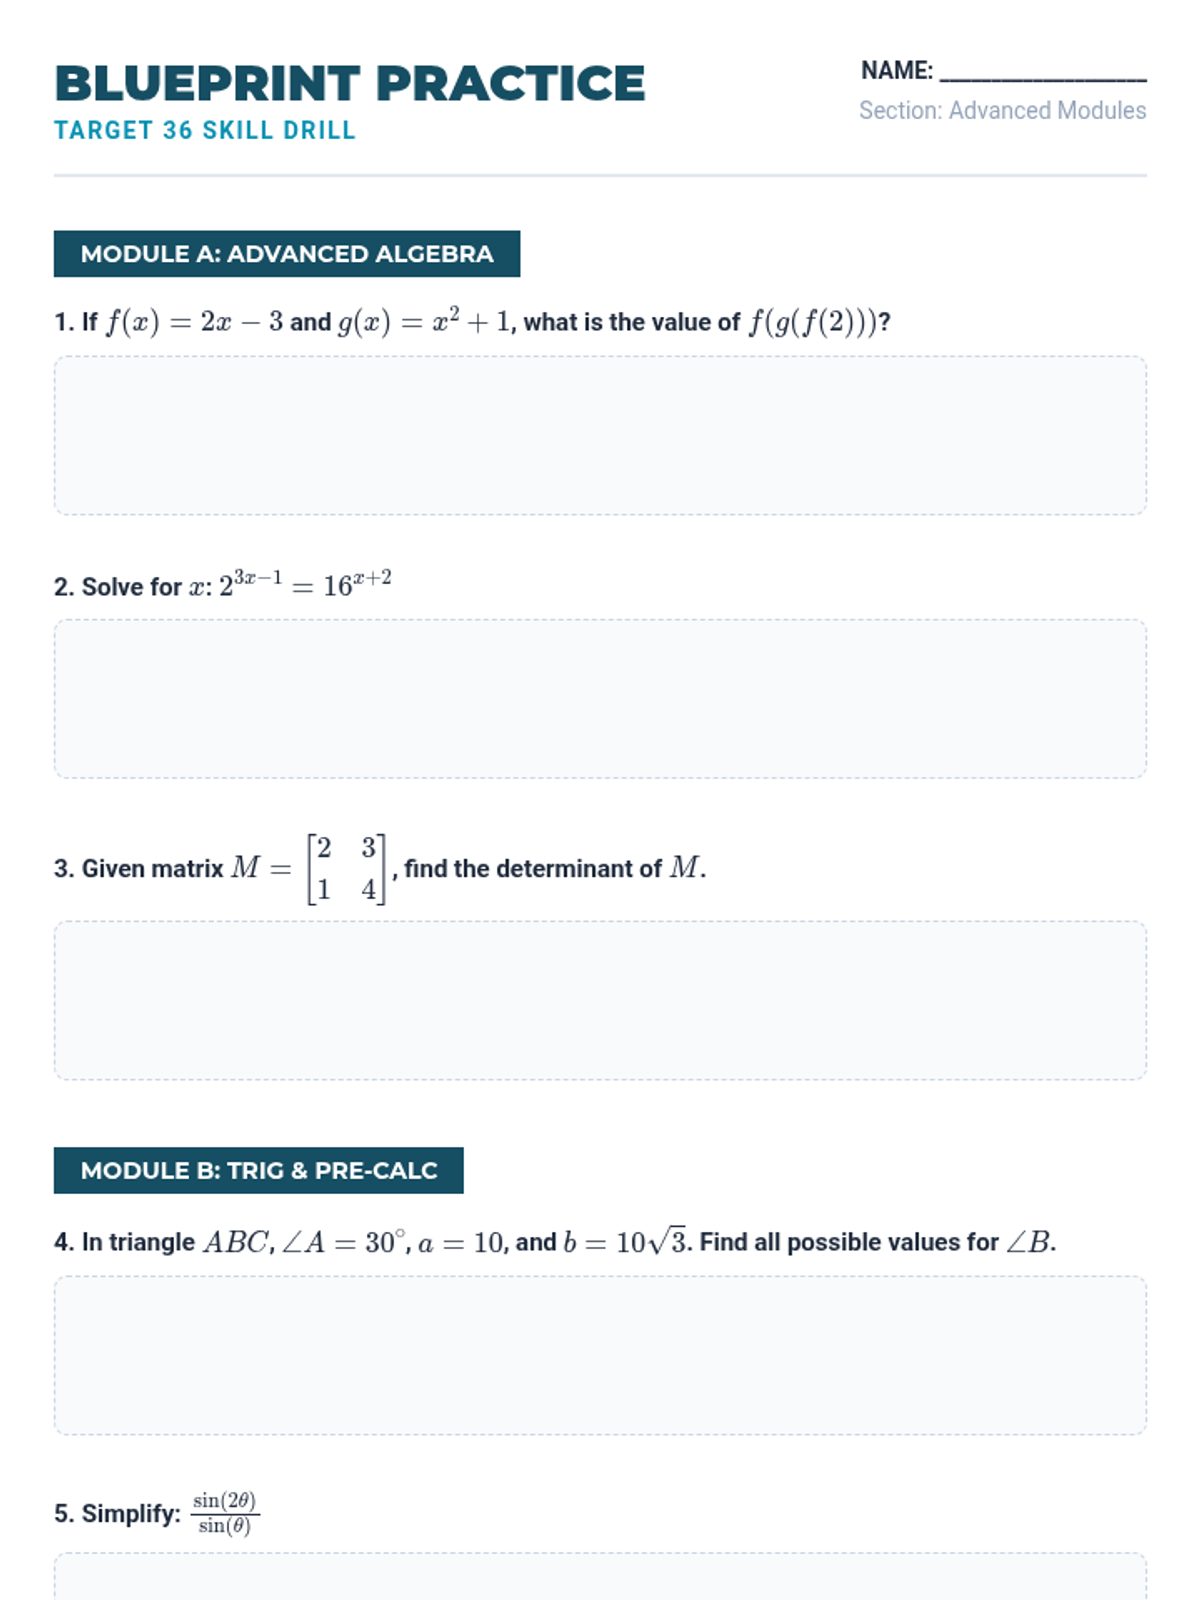
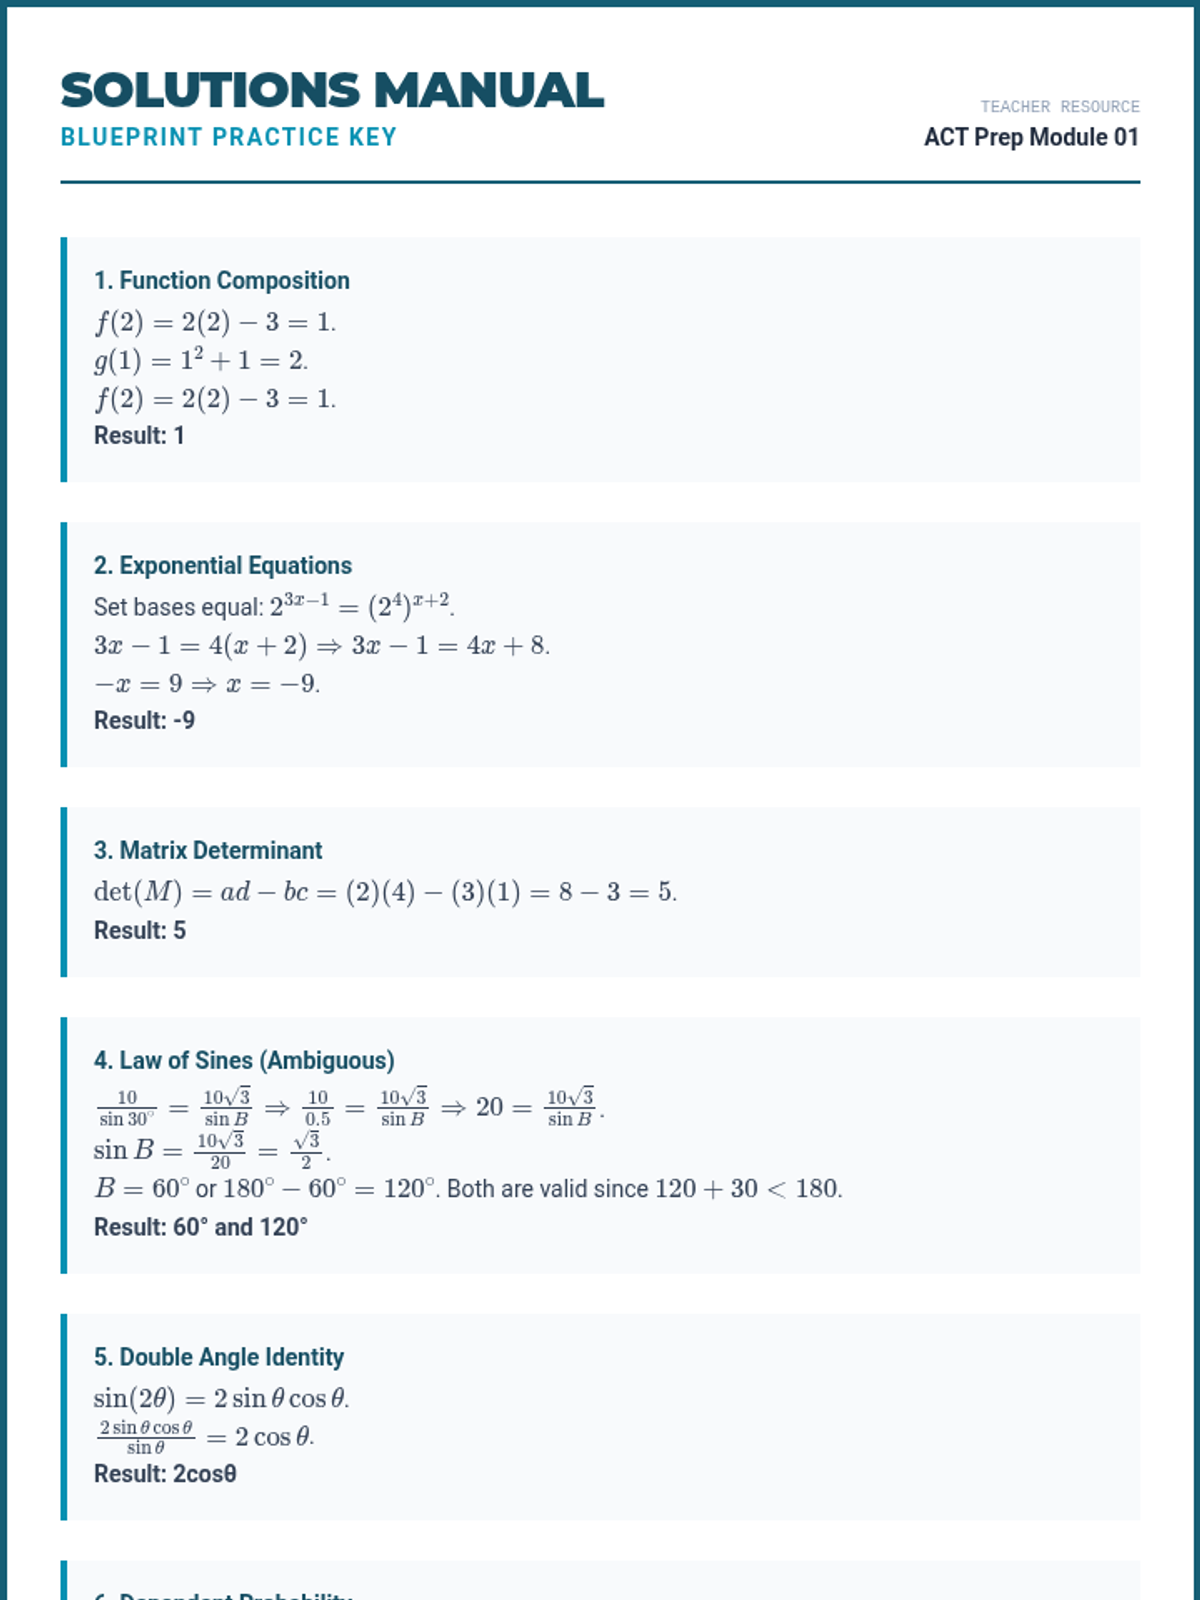
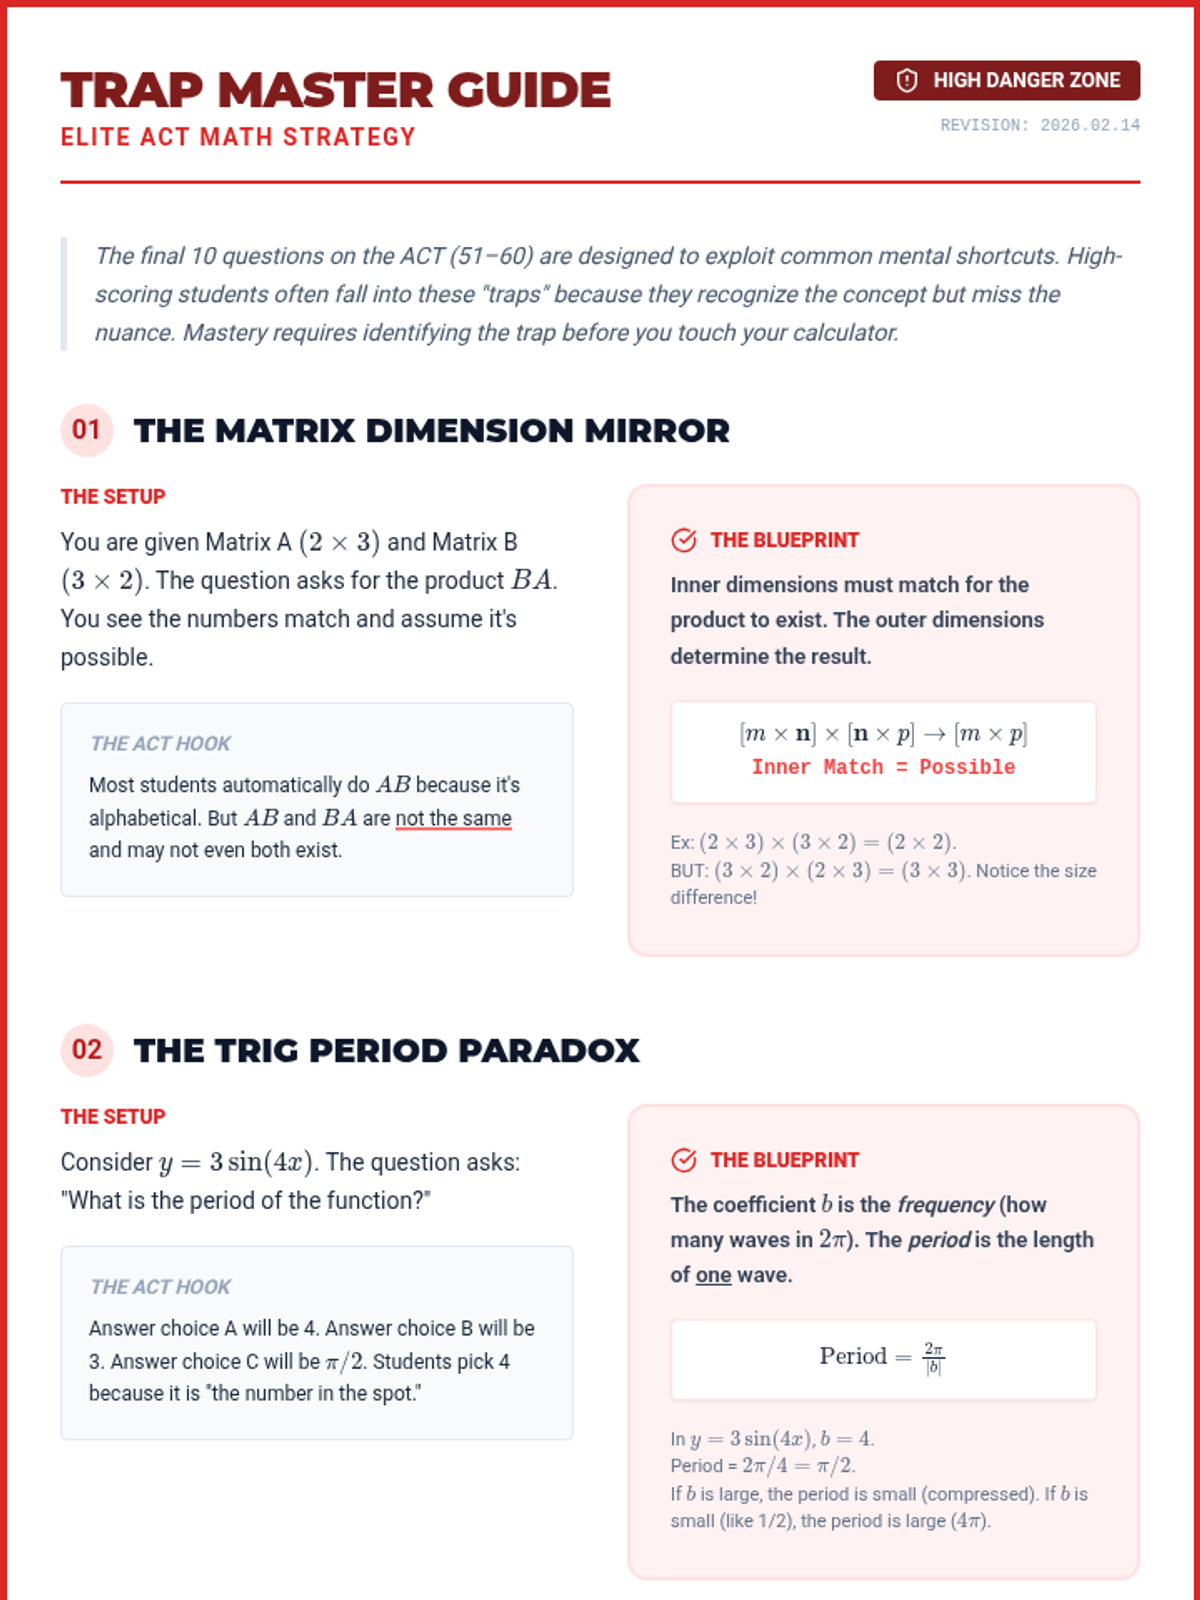
A comprehensive lesson focused on high-level ACT Math topics including matrices, complex functions, trigonometry, and advanced statistics. The lesson emphasizes identifying common 'traps' and applying architectural-style problem-solving strategies.
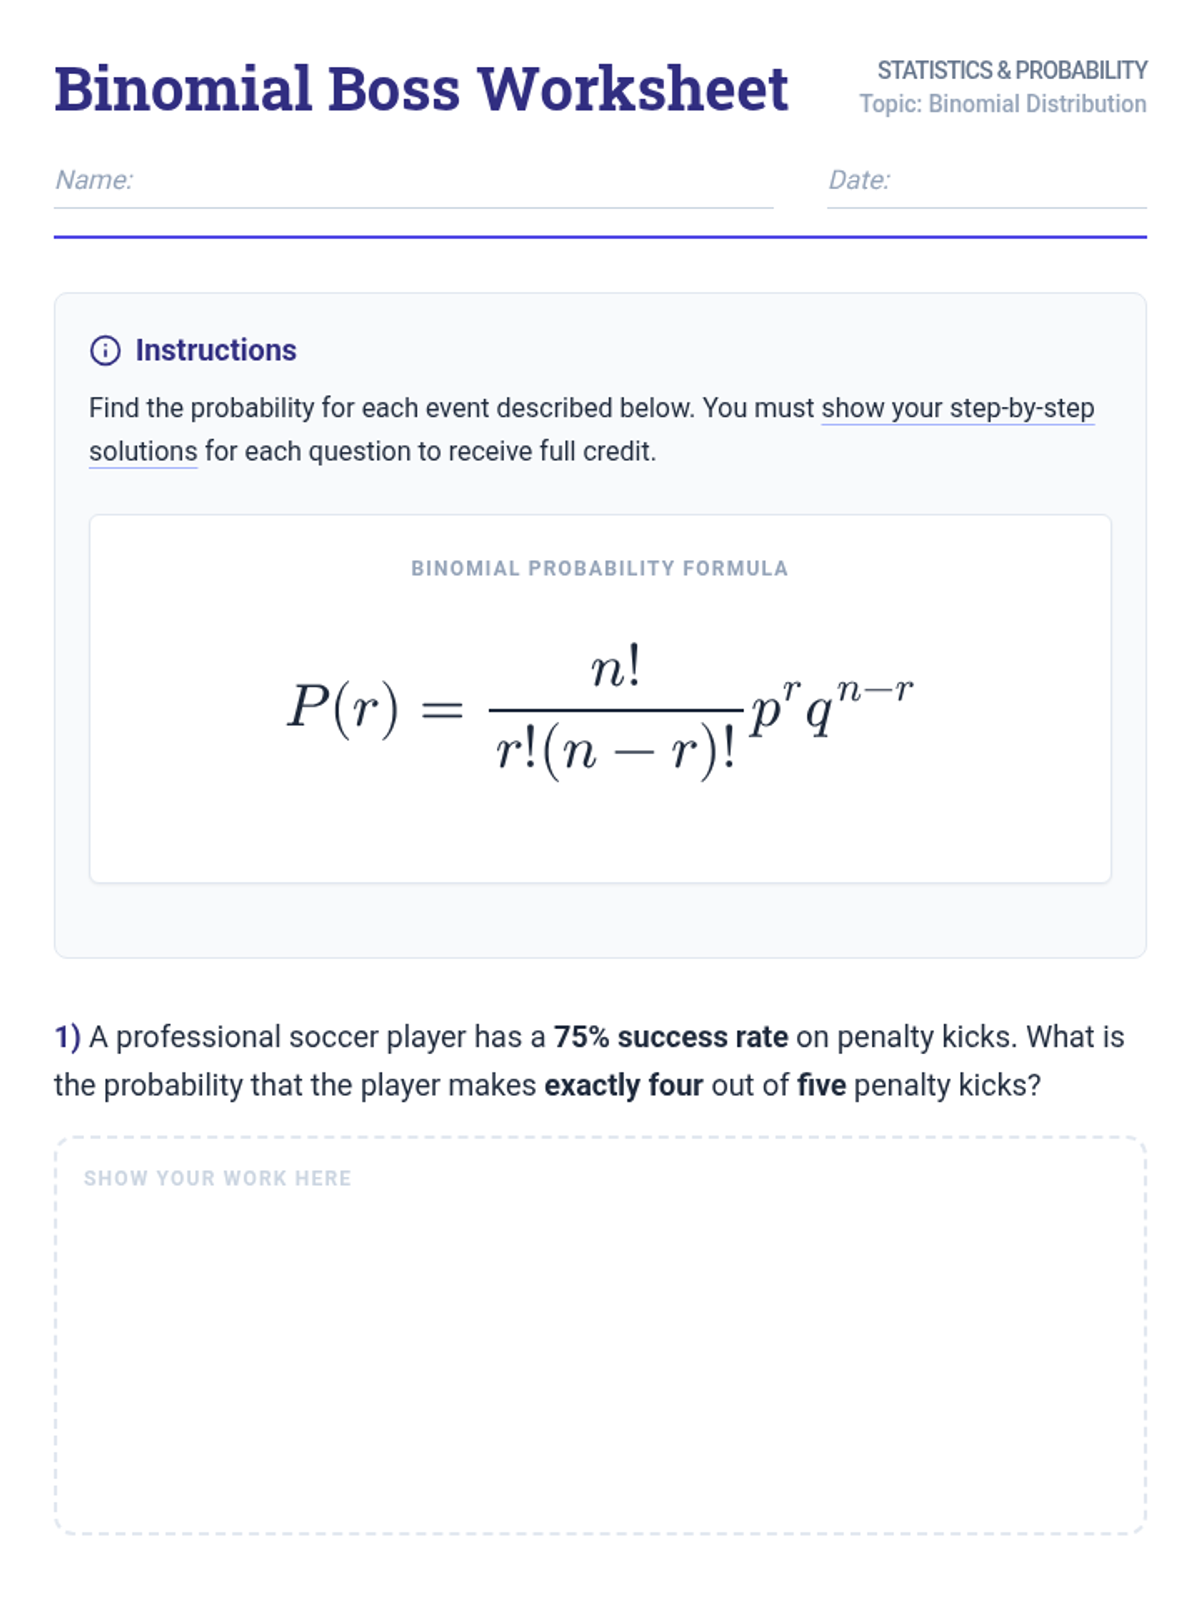
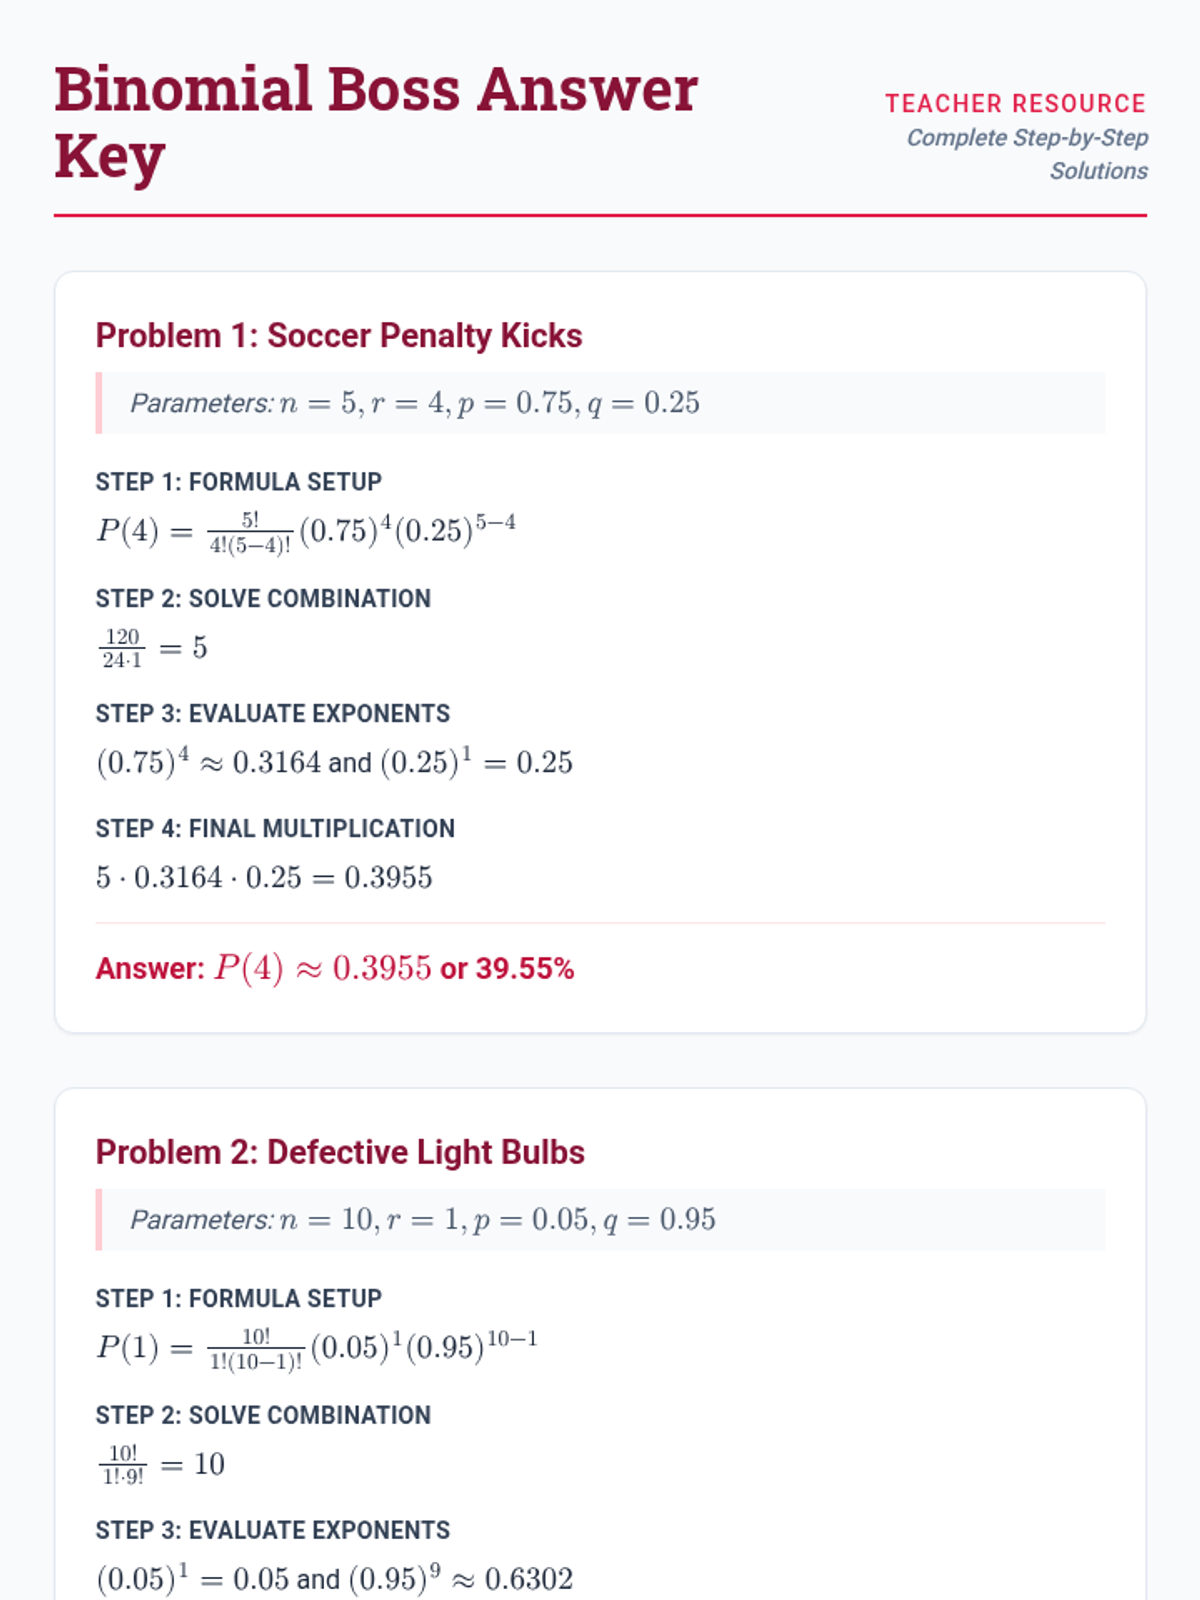
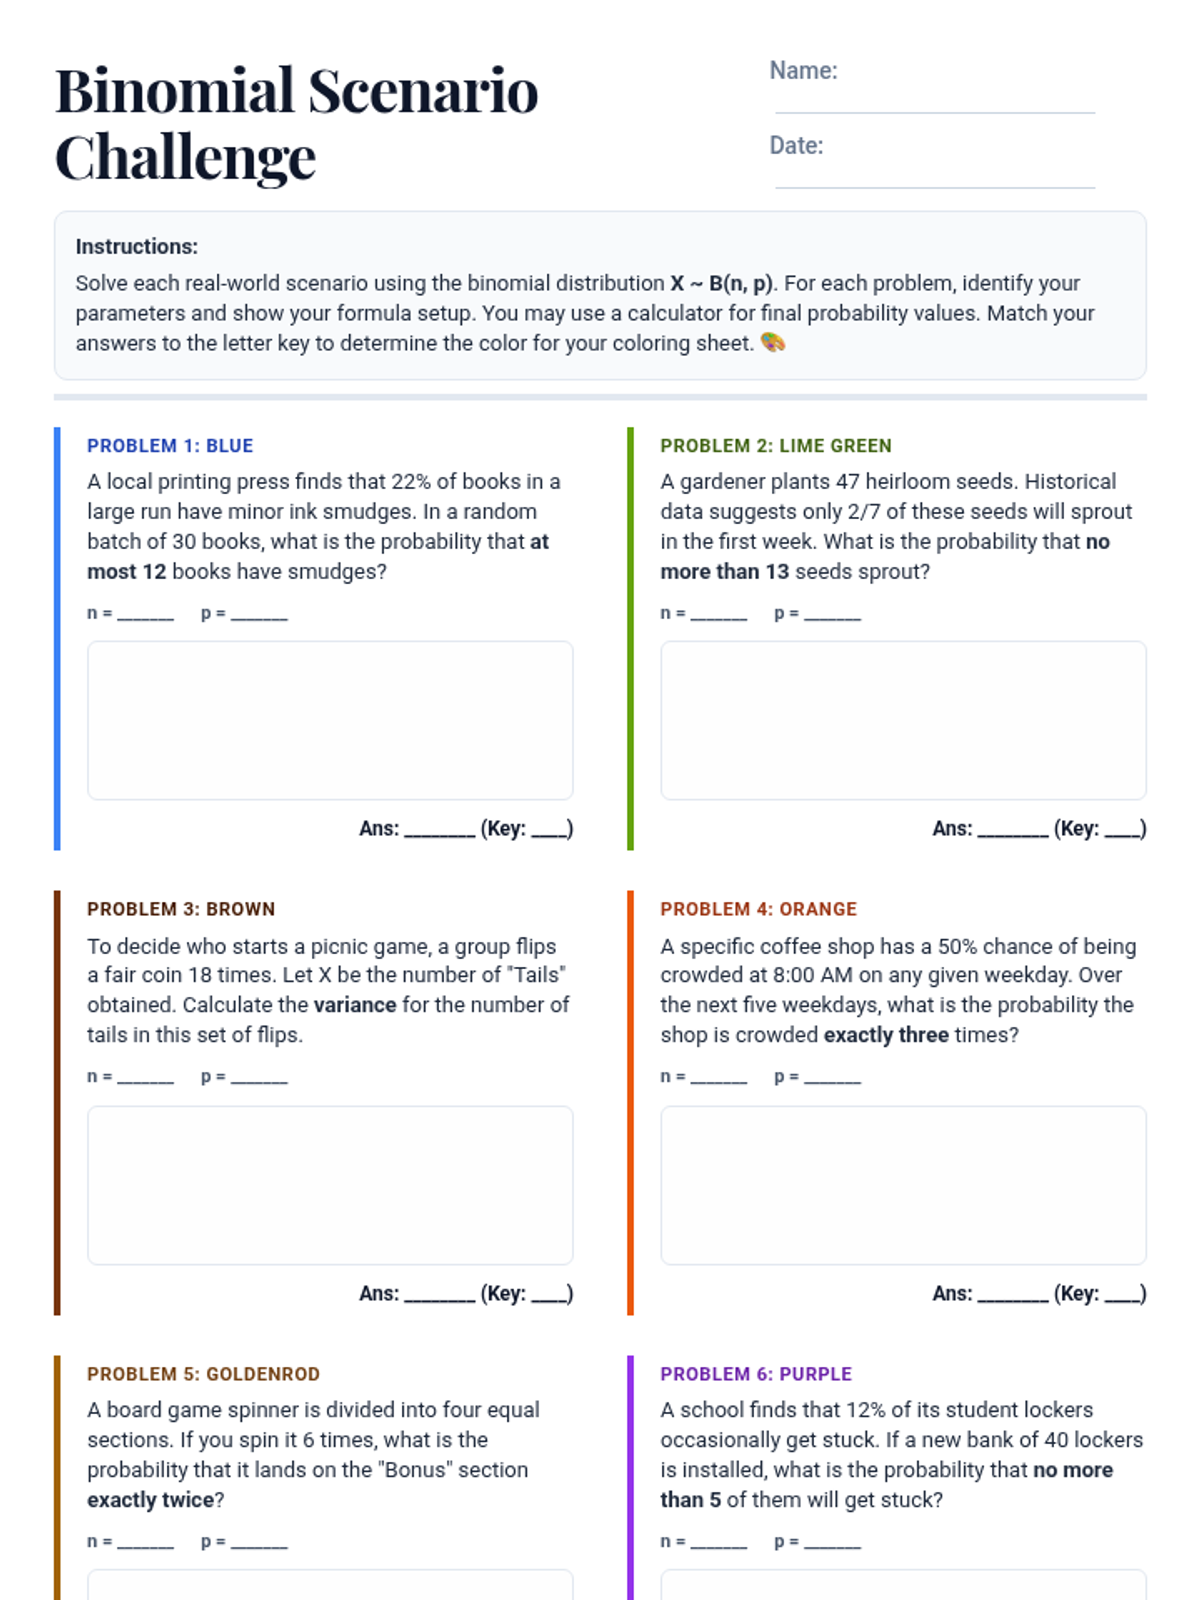
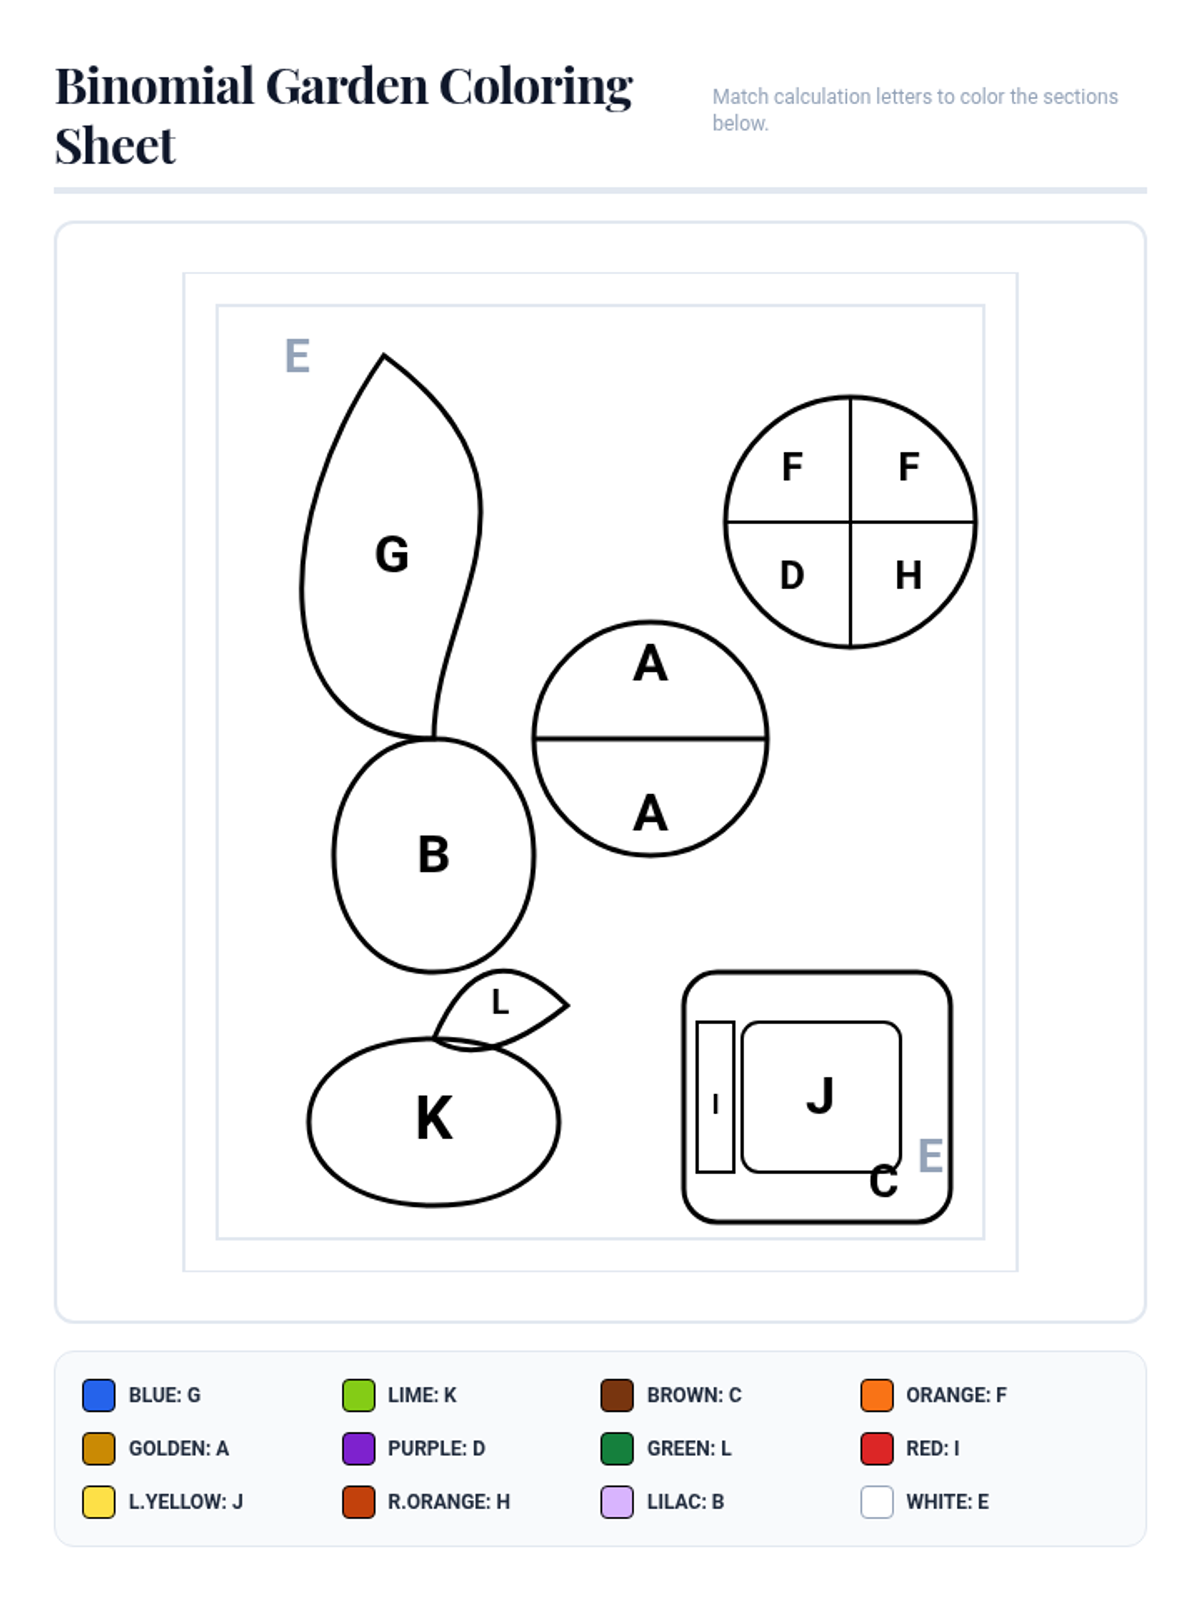
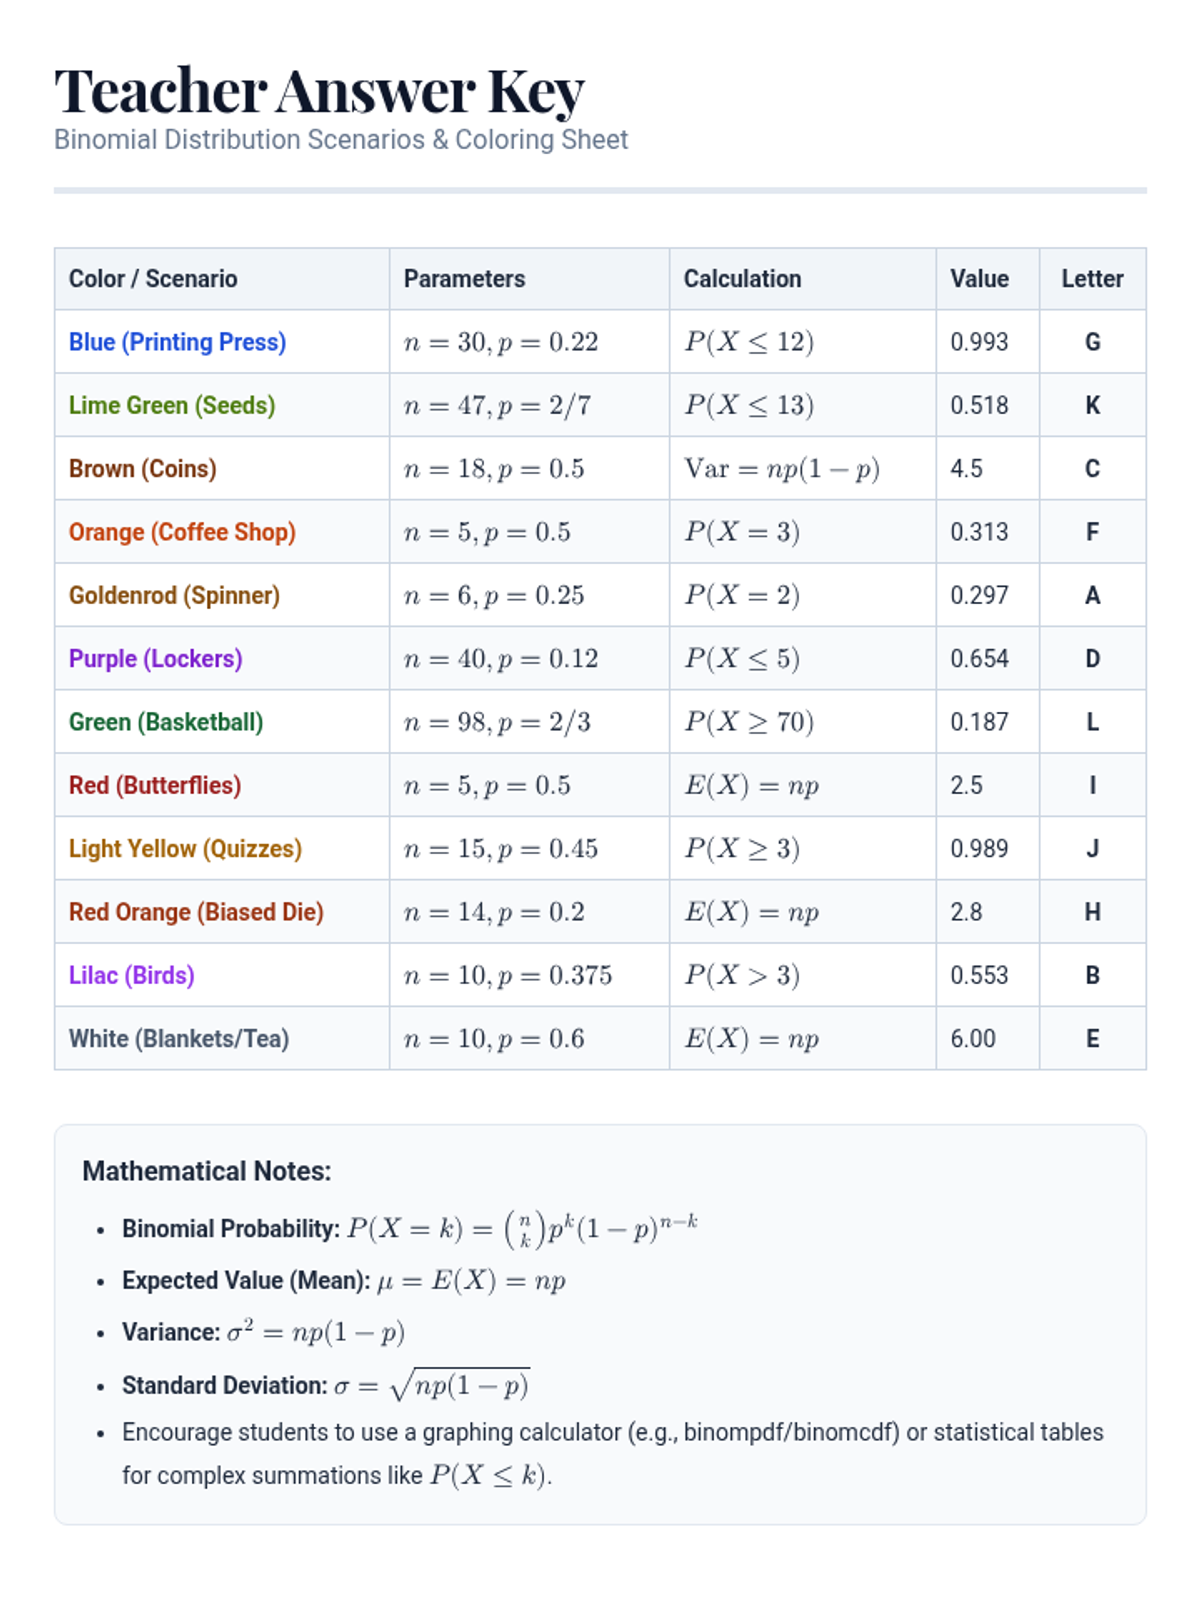
A lesson focused on solving word problems using the binomial probability distribution formula, featuring real-world scenarios and step-by-step calculations.
A lesson focused on applying binomial distribution concepts to real-world scenarios through a creative coloring activity. Students translate narrative word problems into mathematical models to calculate probabilities, means, and variances.
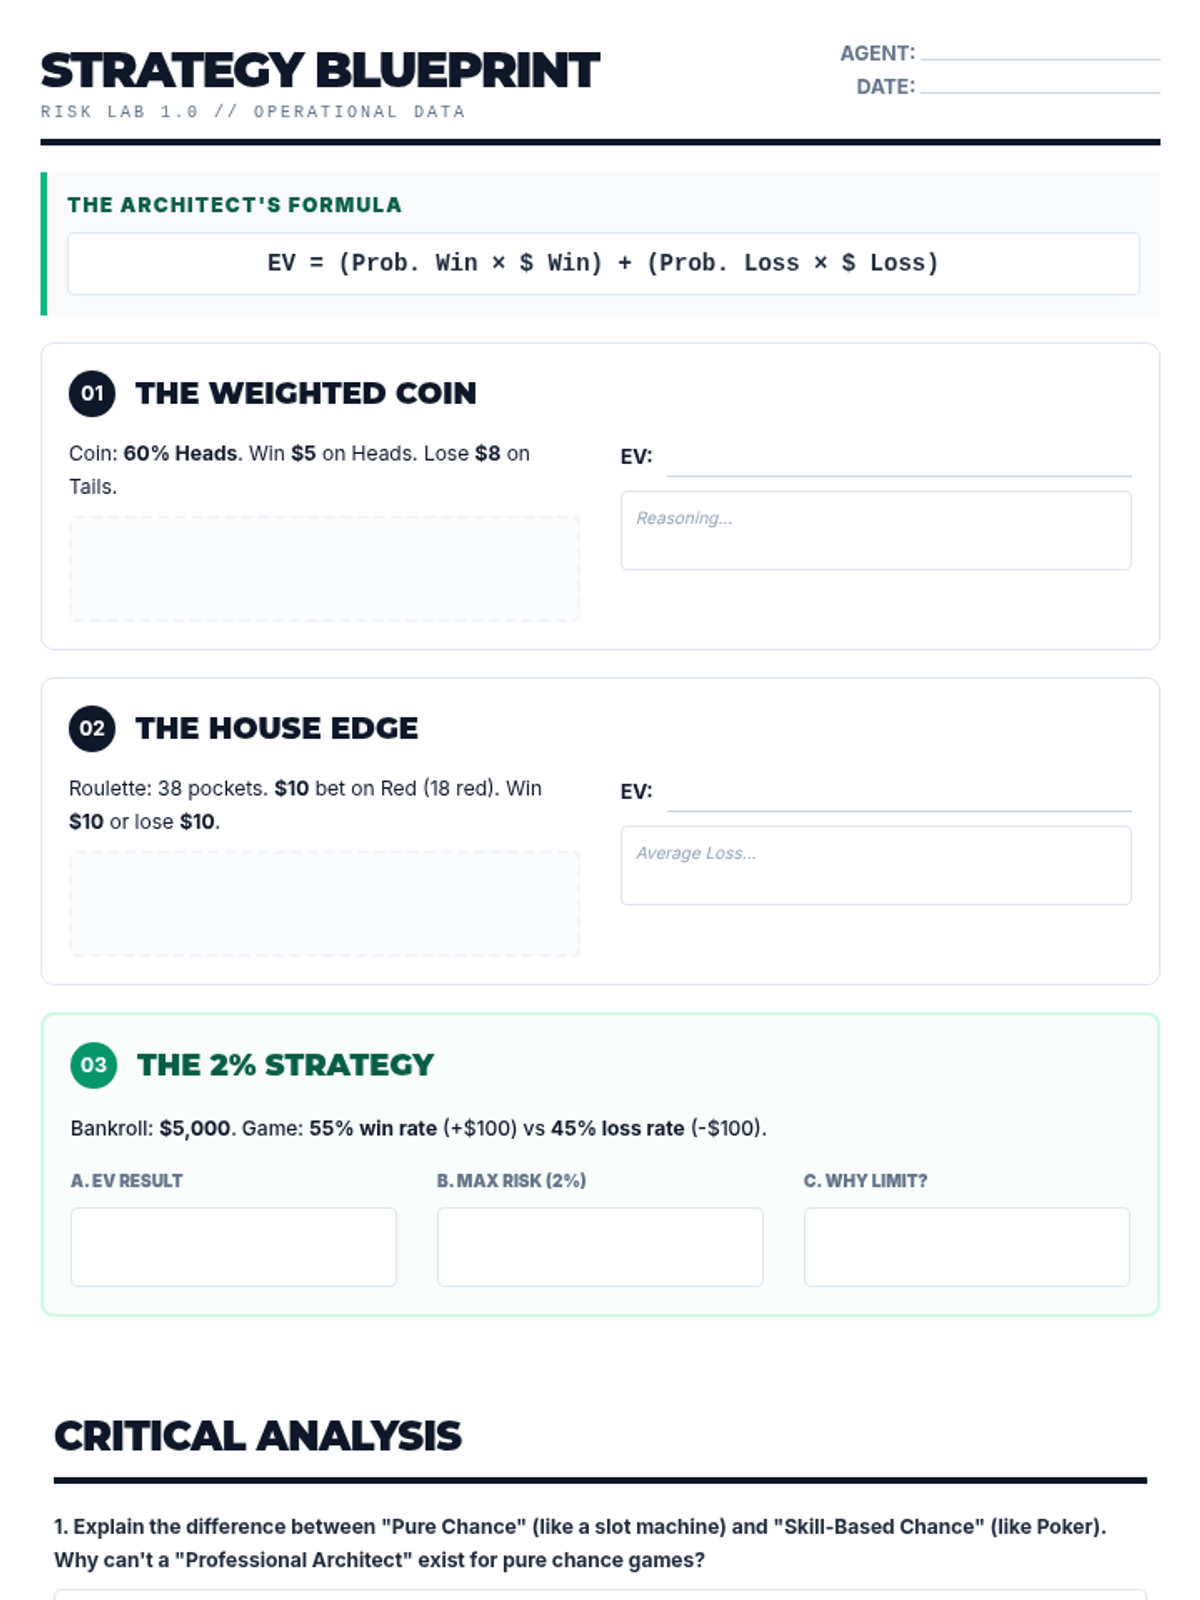
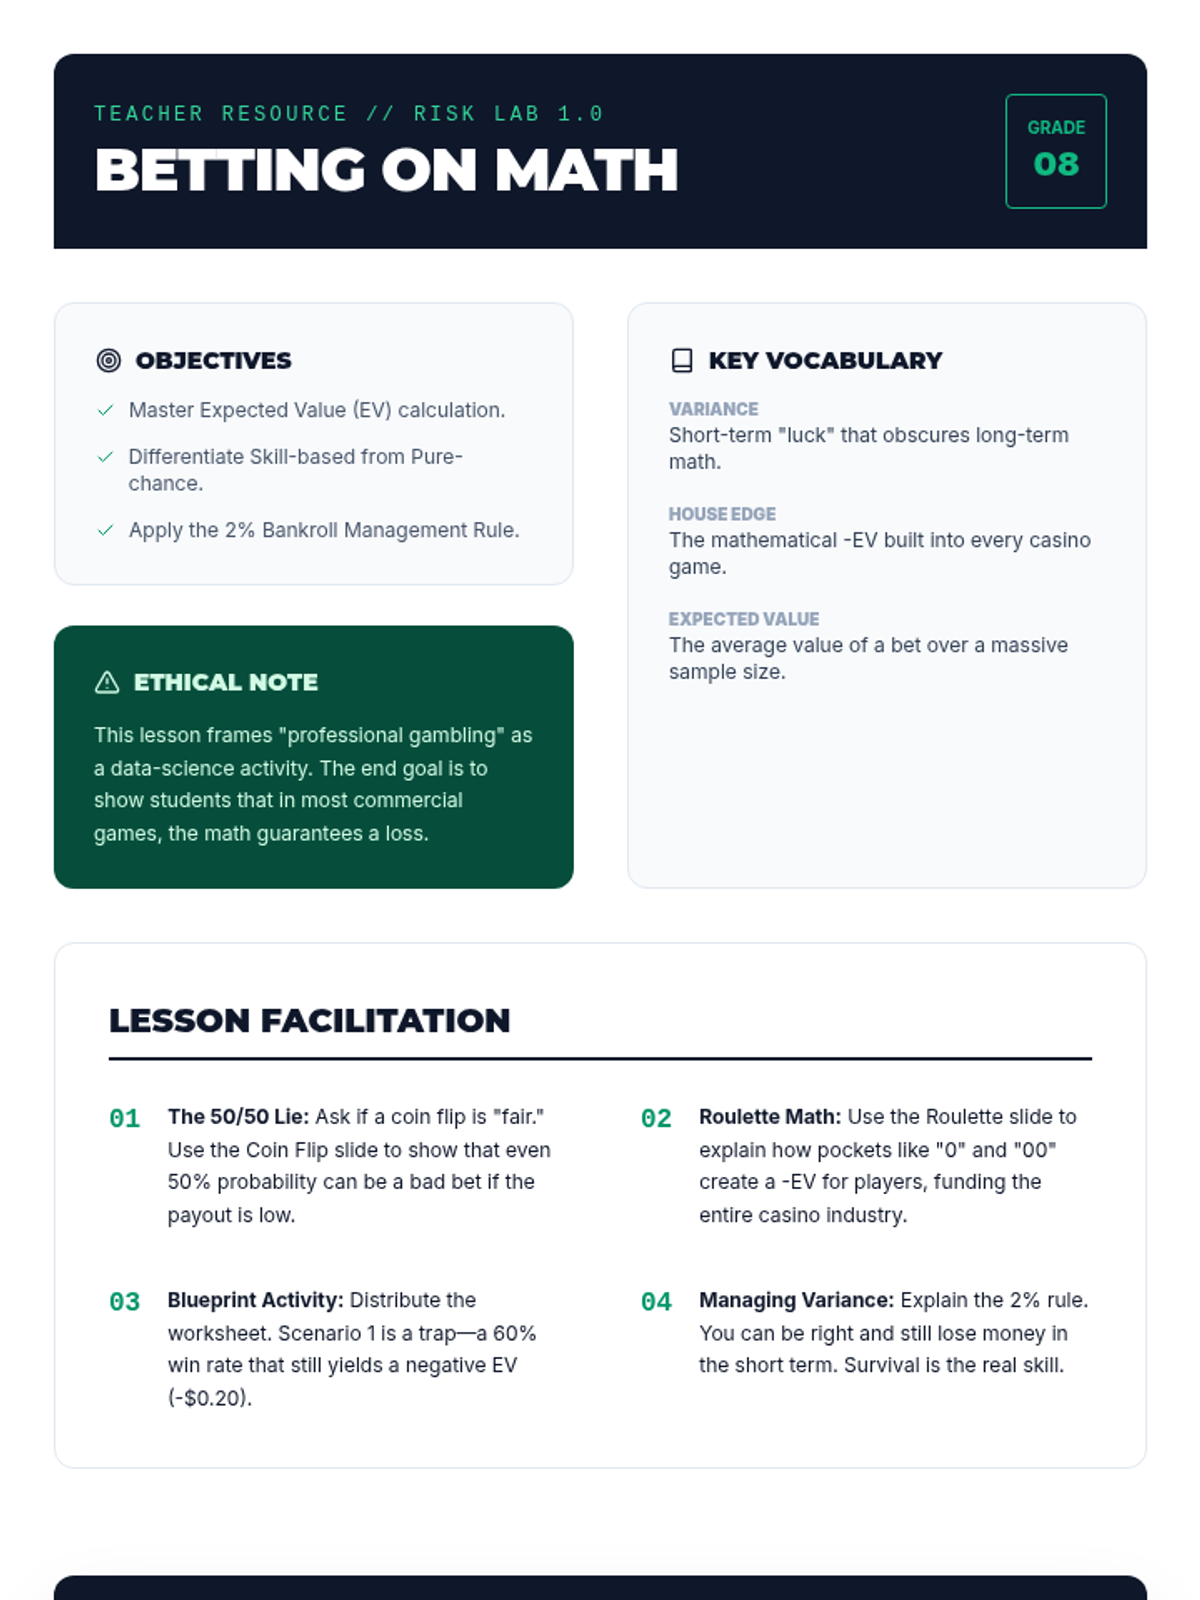
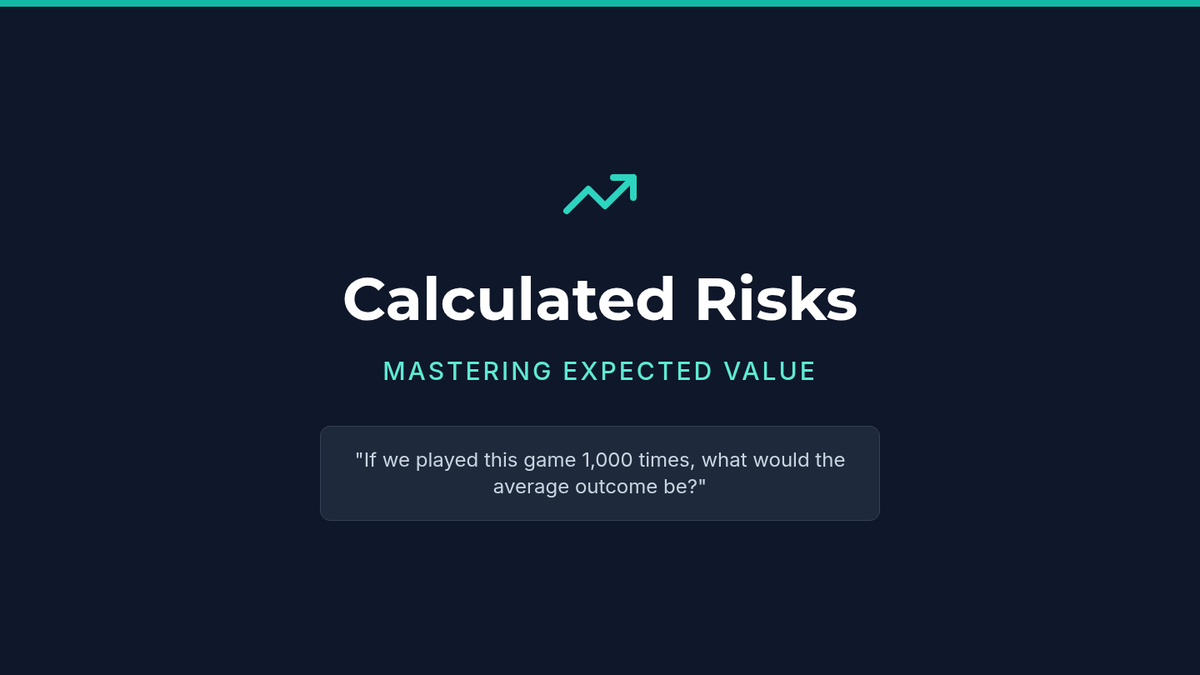
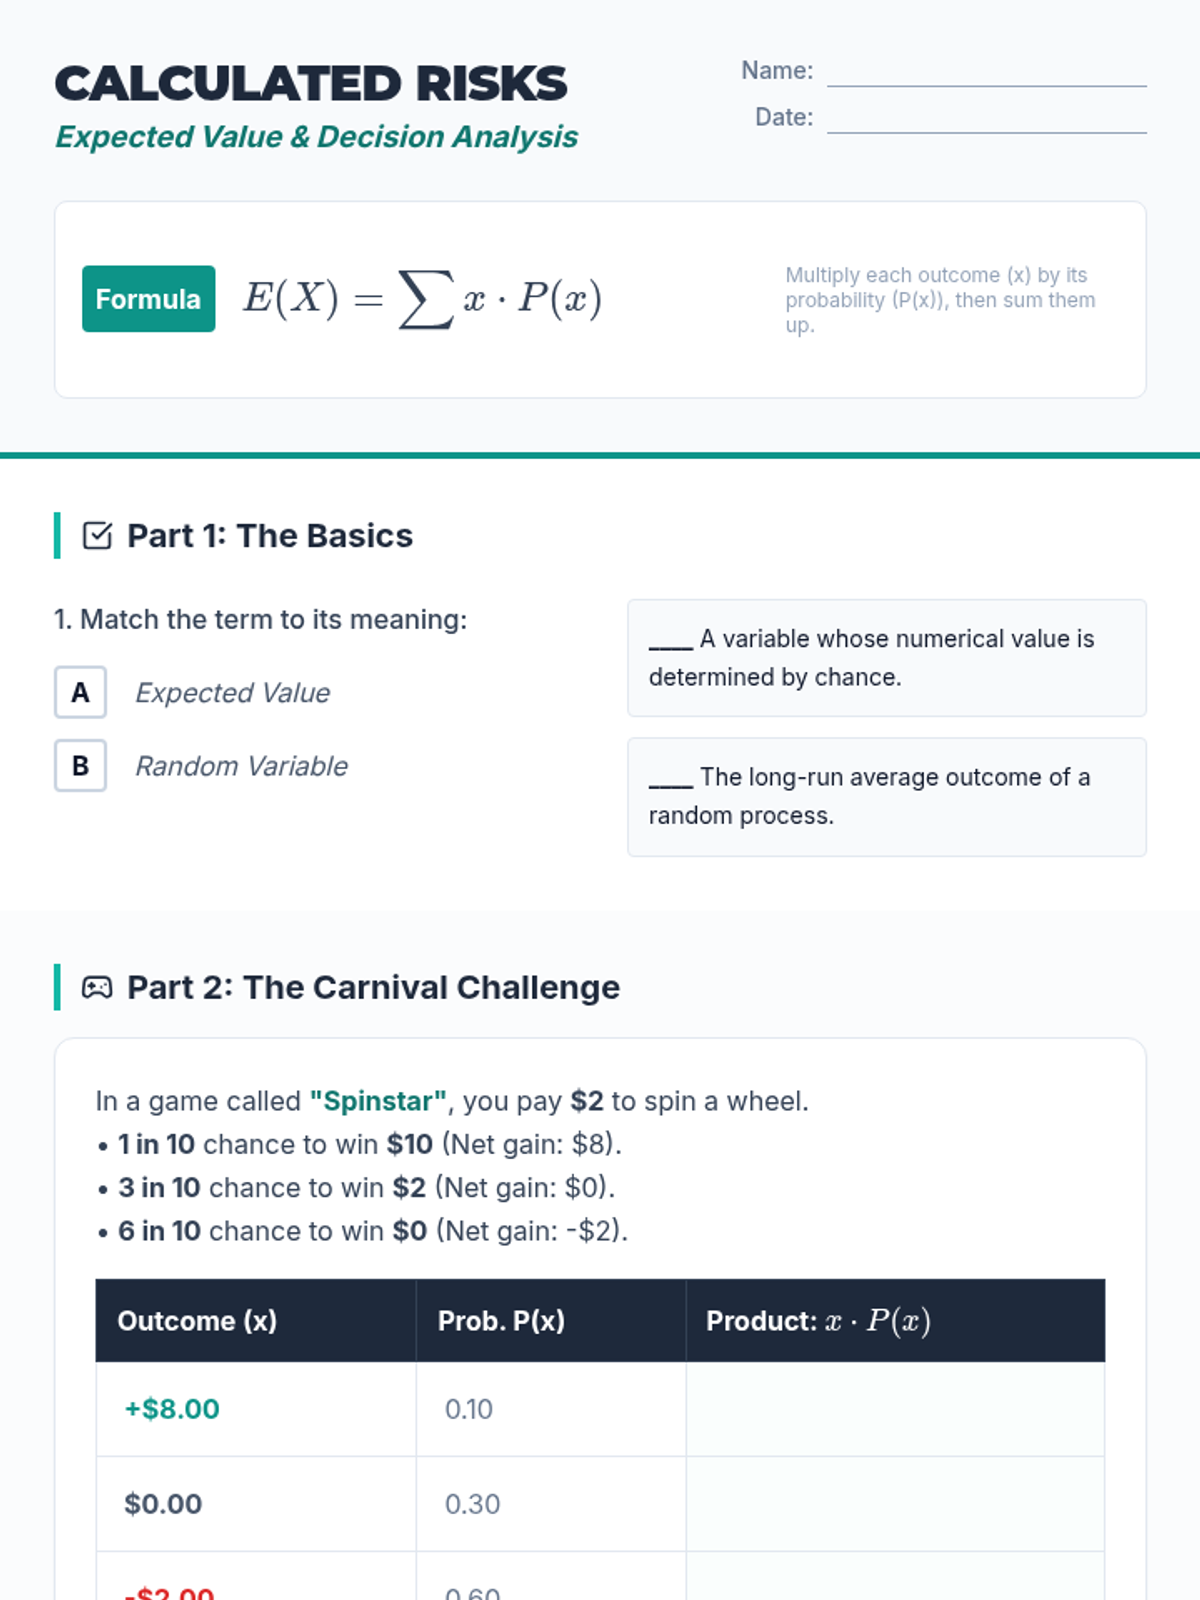
Students explore the concept of expected value and house edge to understand why certain strategies succeed while others are designed to fail.
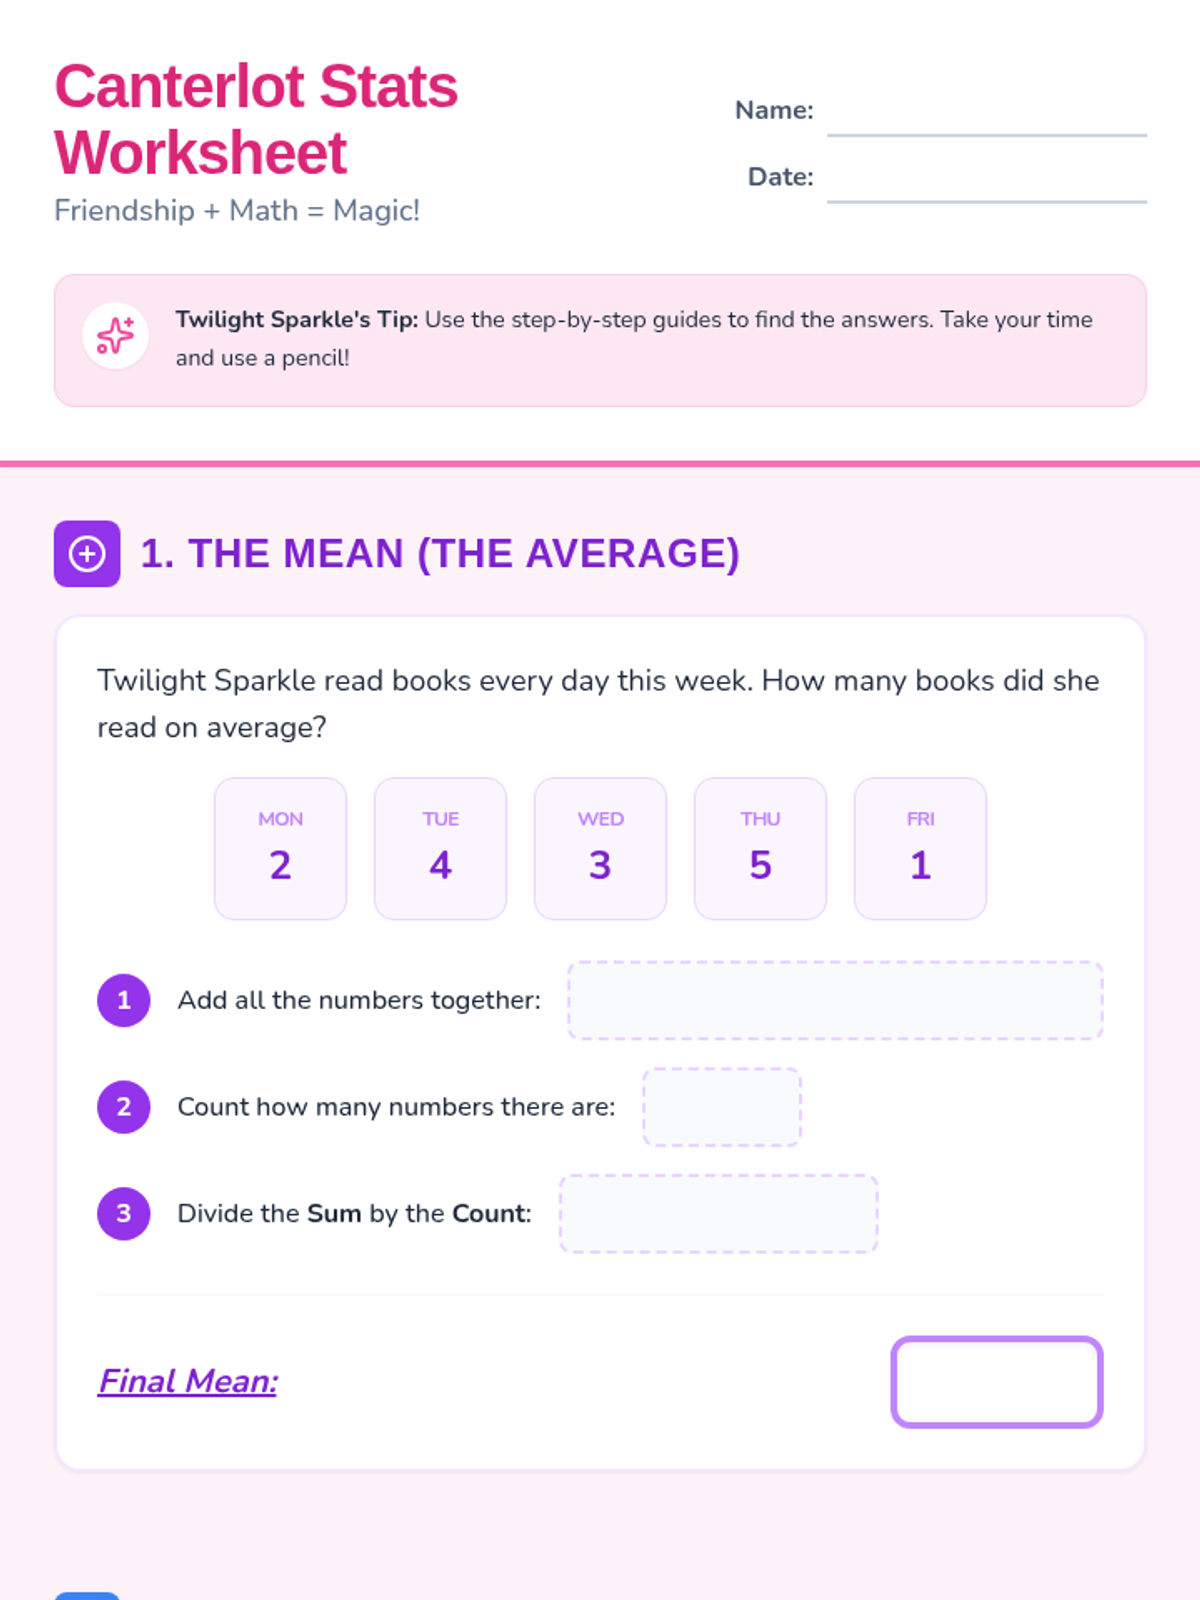
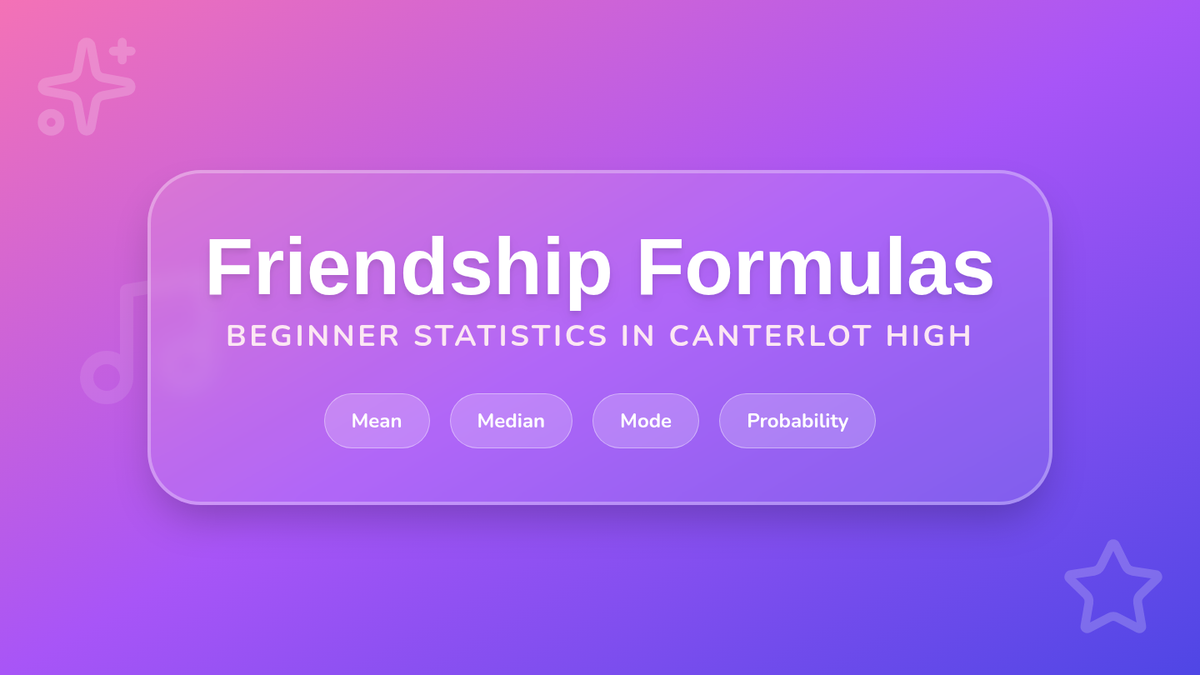
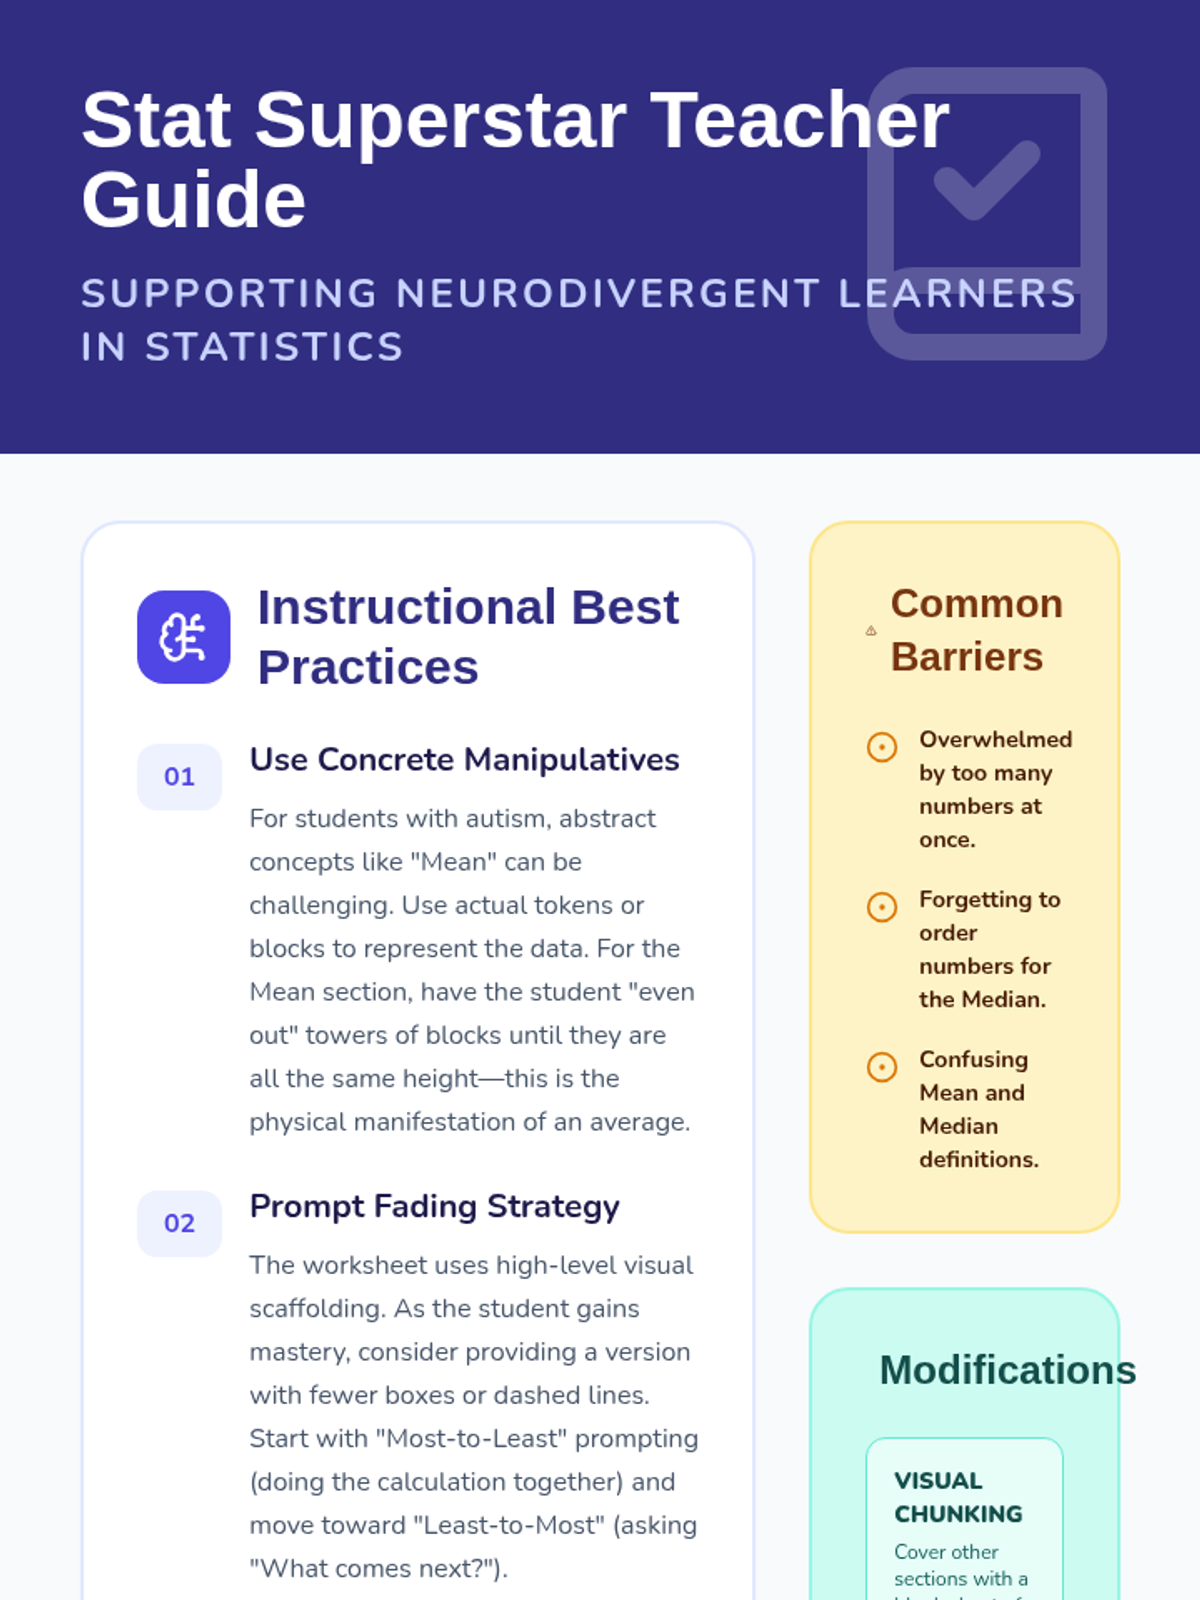
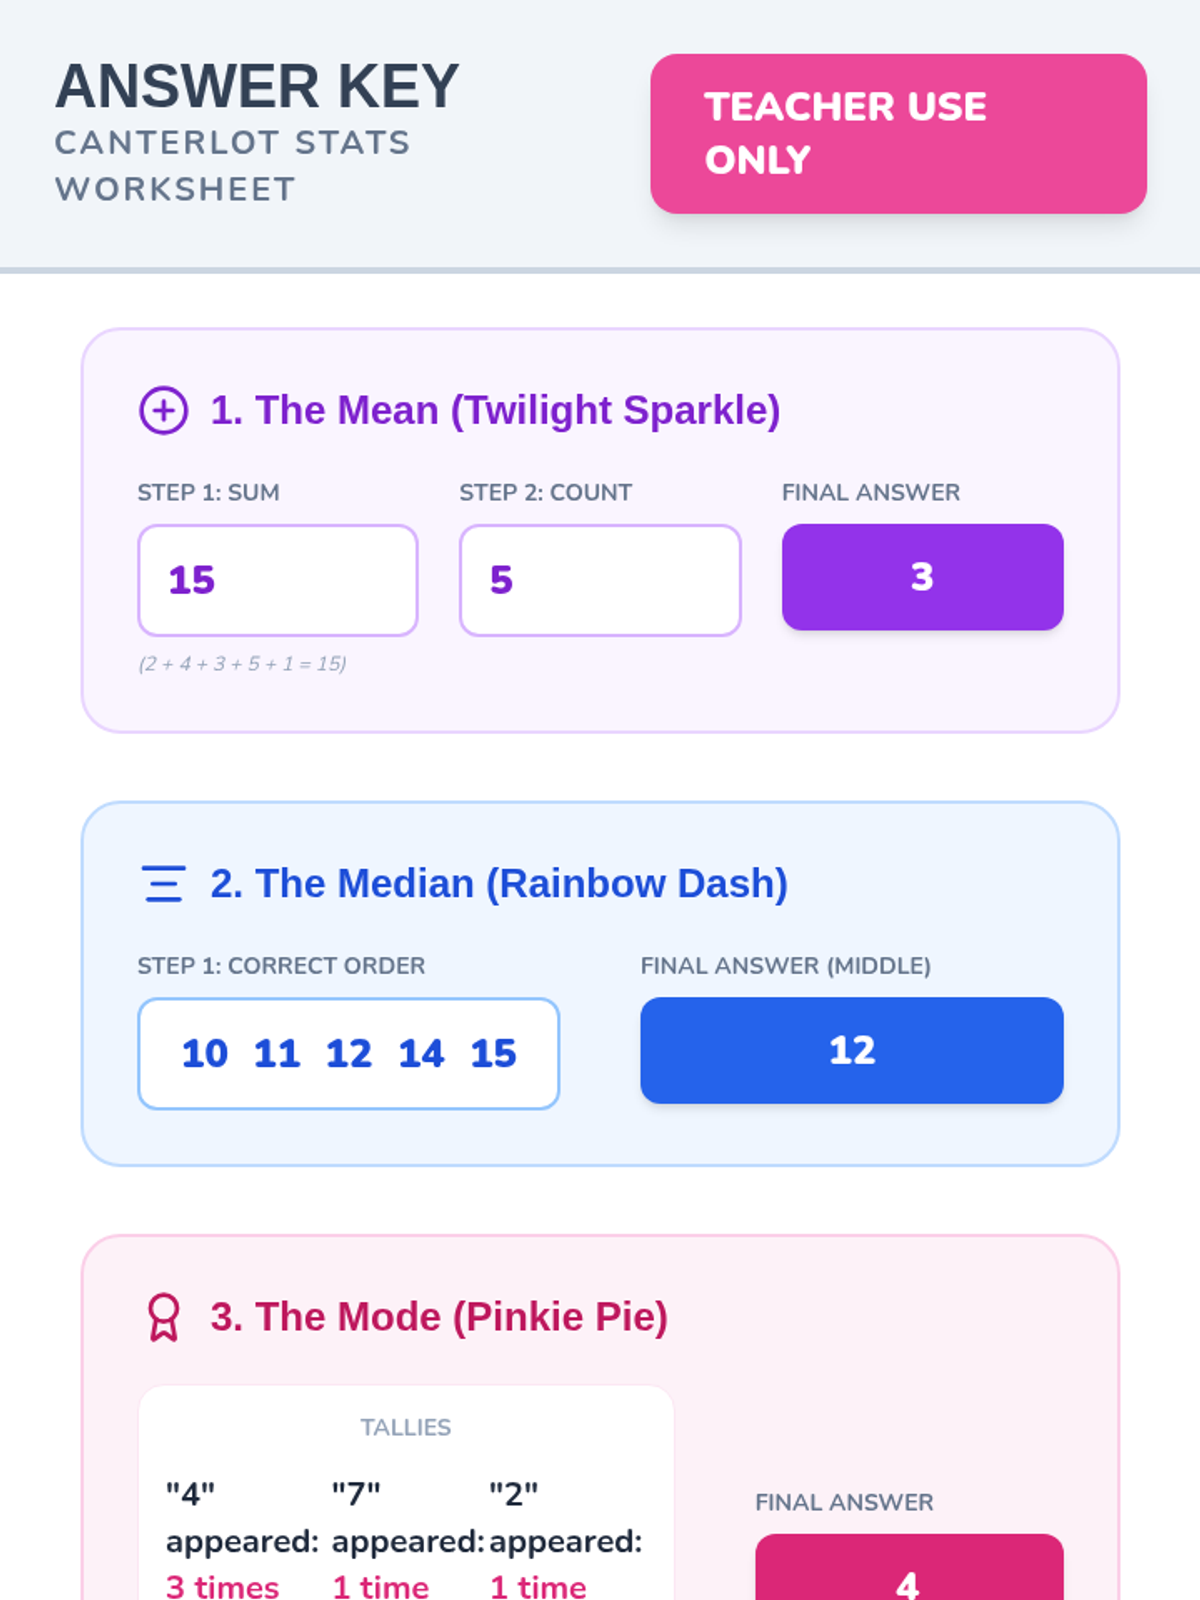
A beginner statistics lesson themed around Equestria Girls, focusing on mean, median, mode, range, and basic probability with highly visual step-by-step guides.
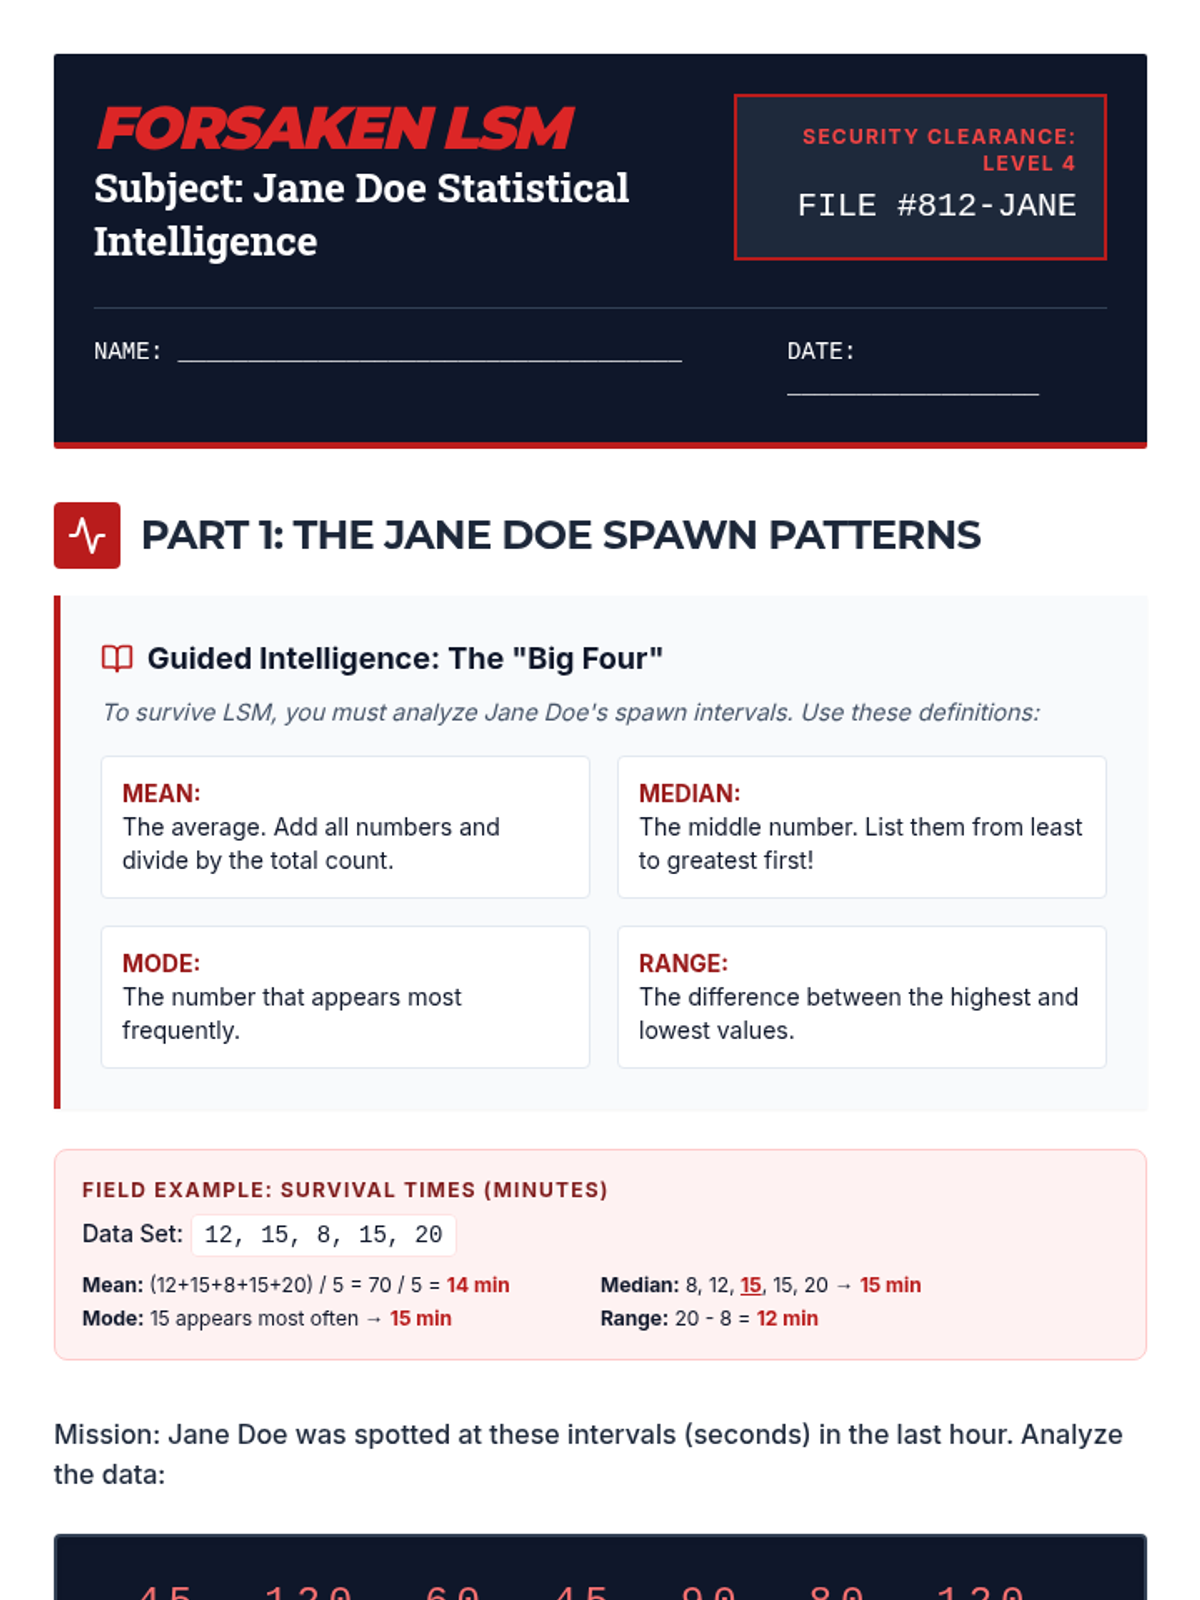
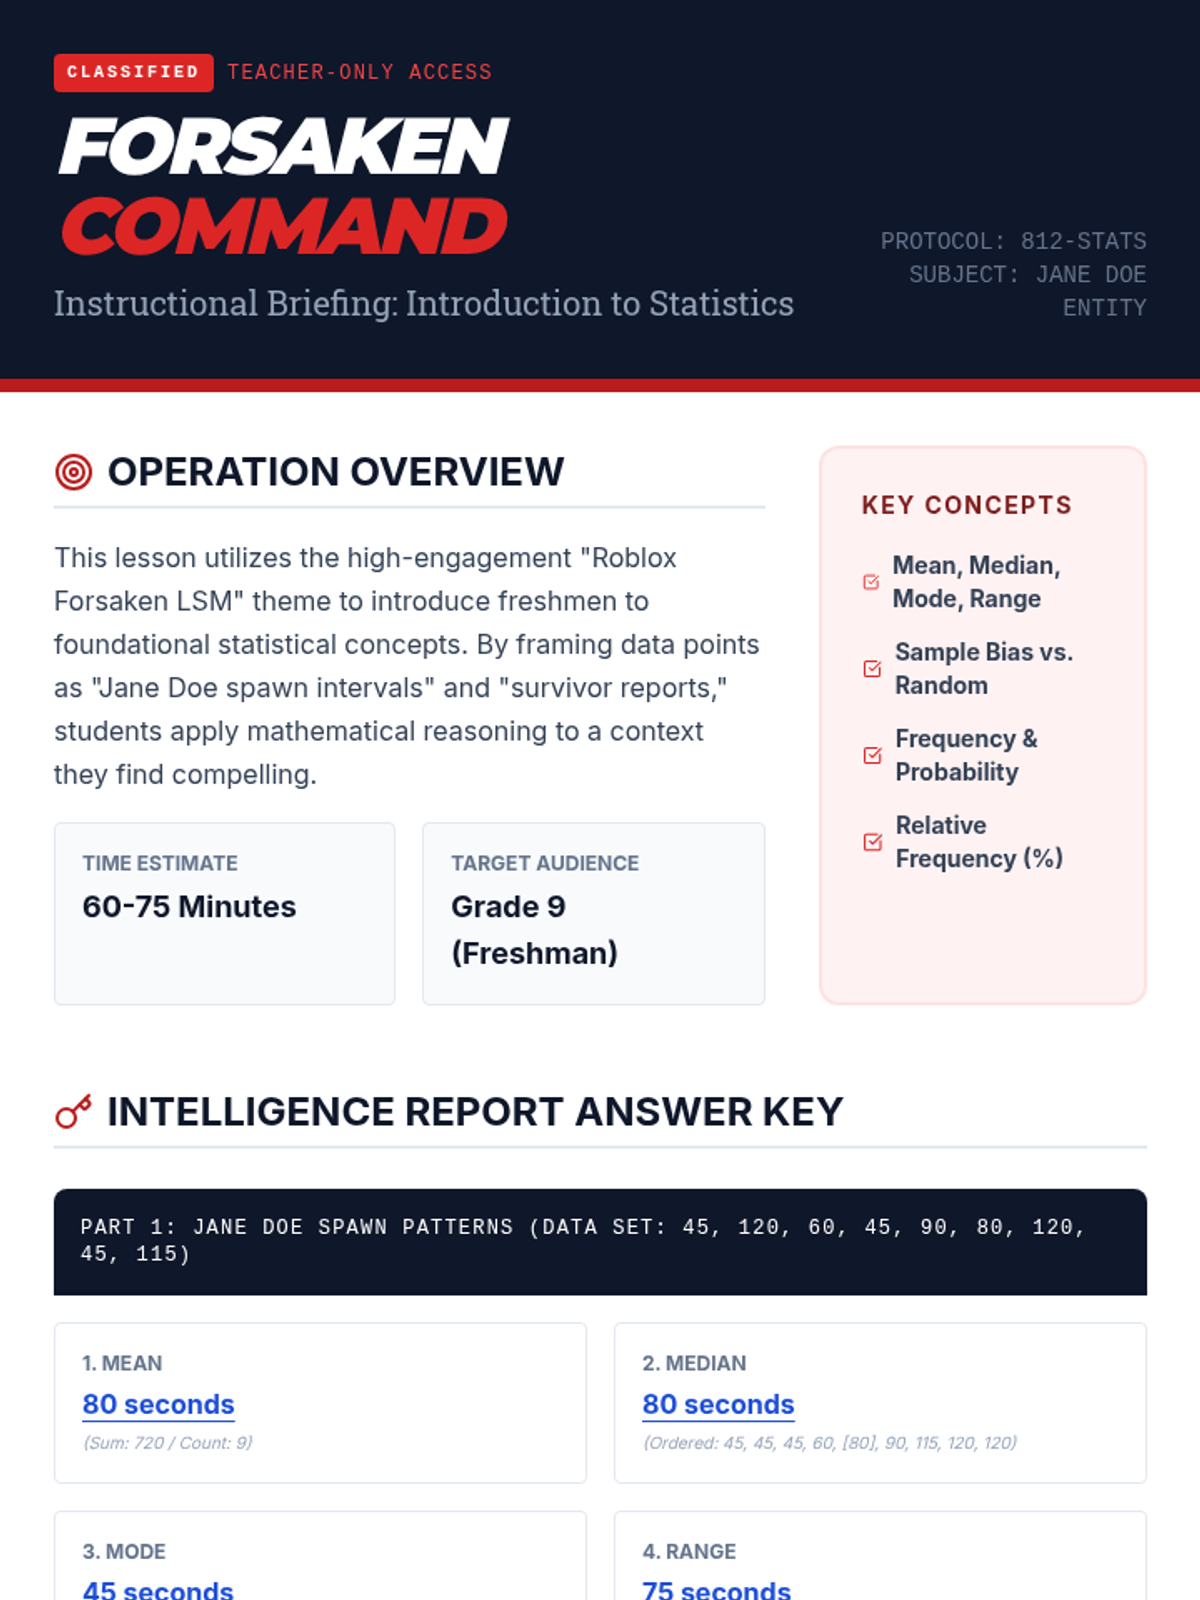
An introductory statistics lesson themed around Roblox Forsaken LSM and the Jane Doe entity, covering central tendency, data collection, and probability.
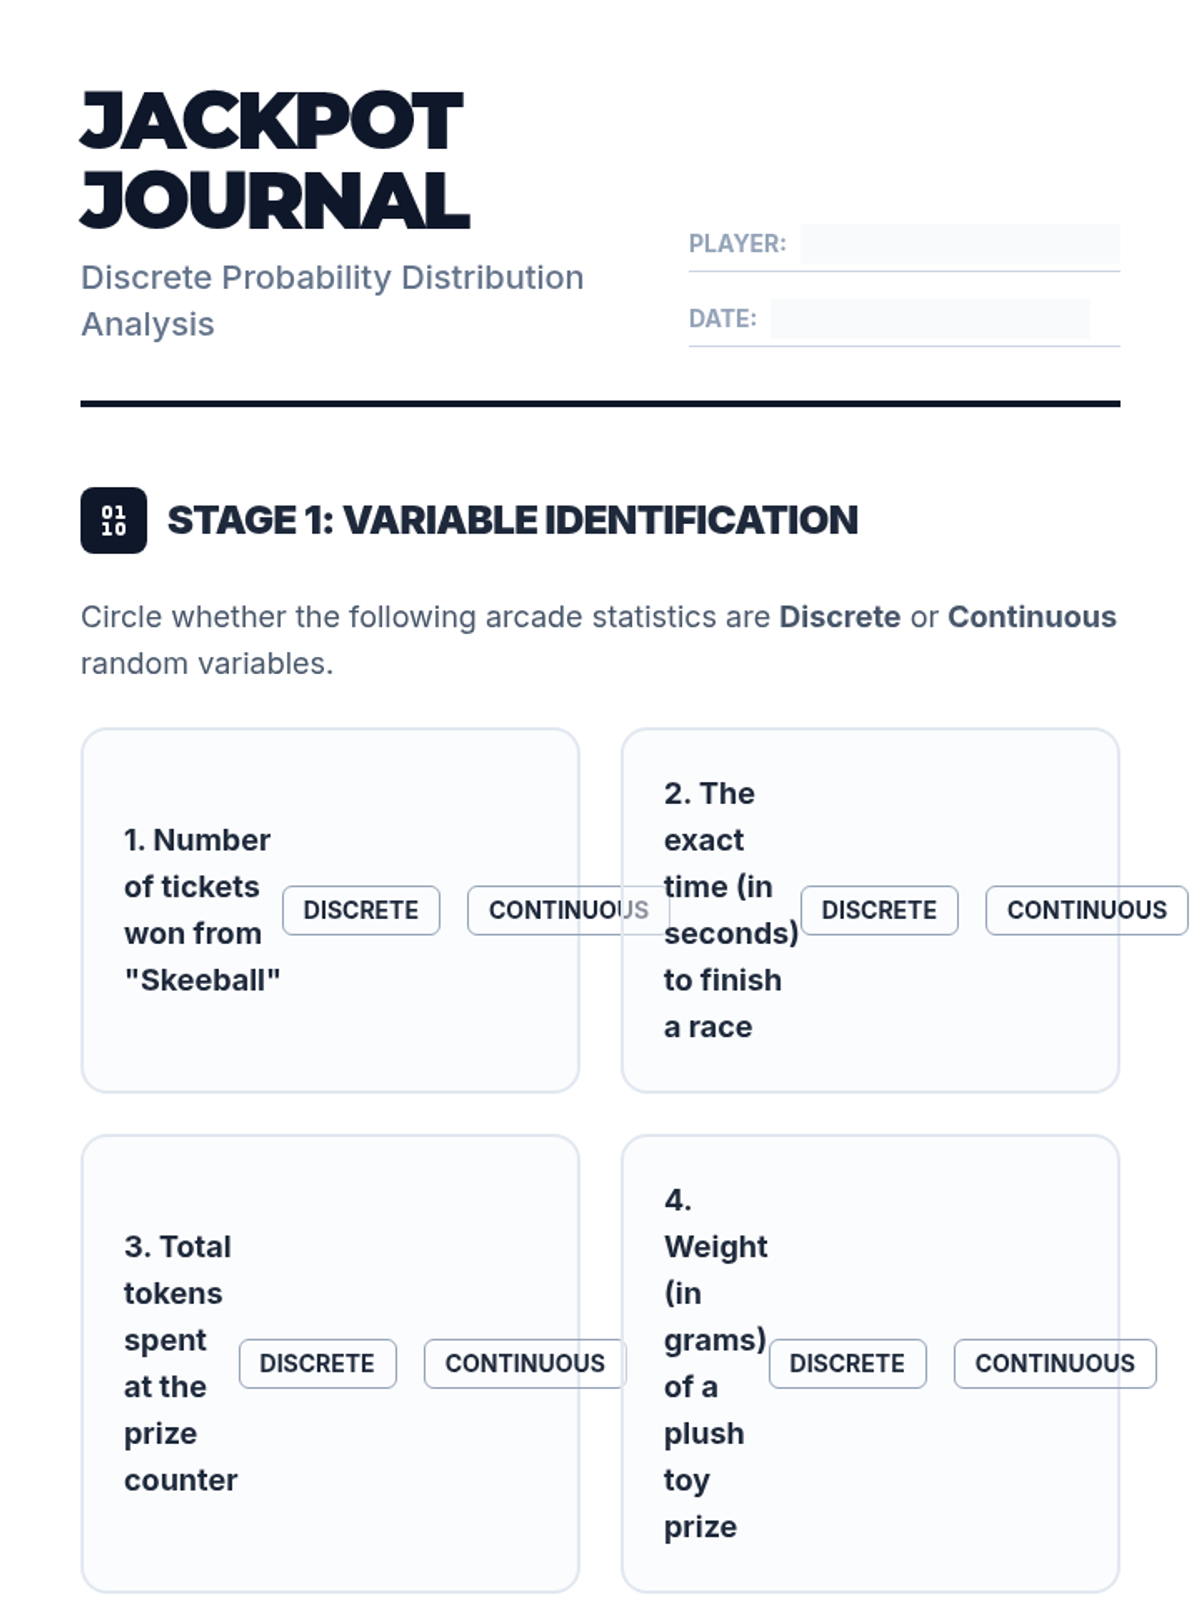
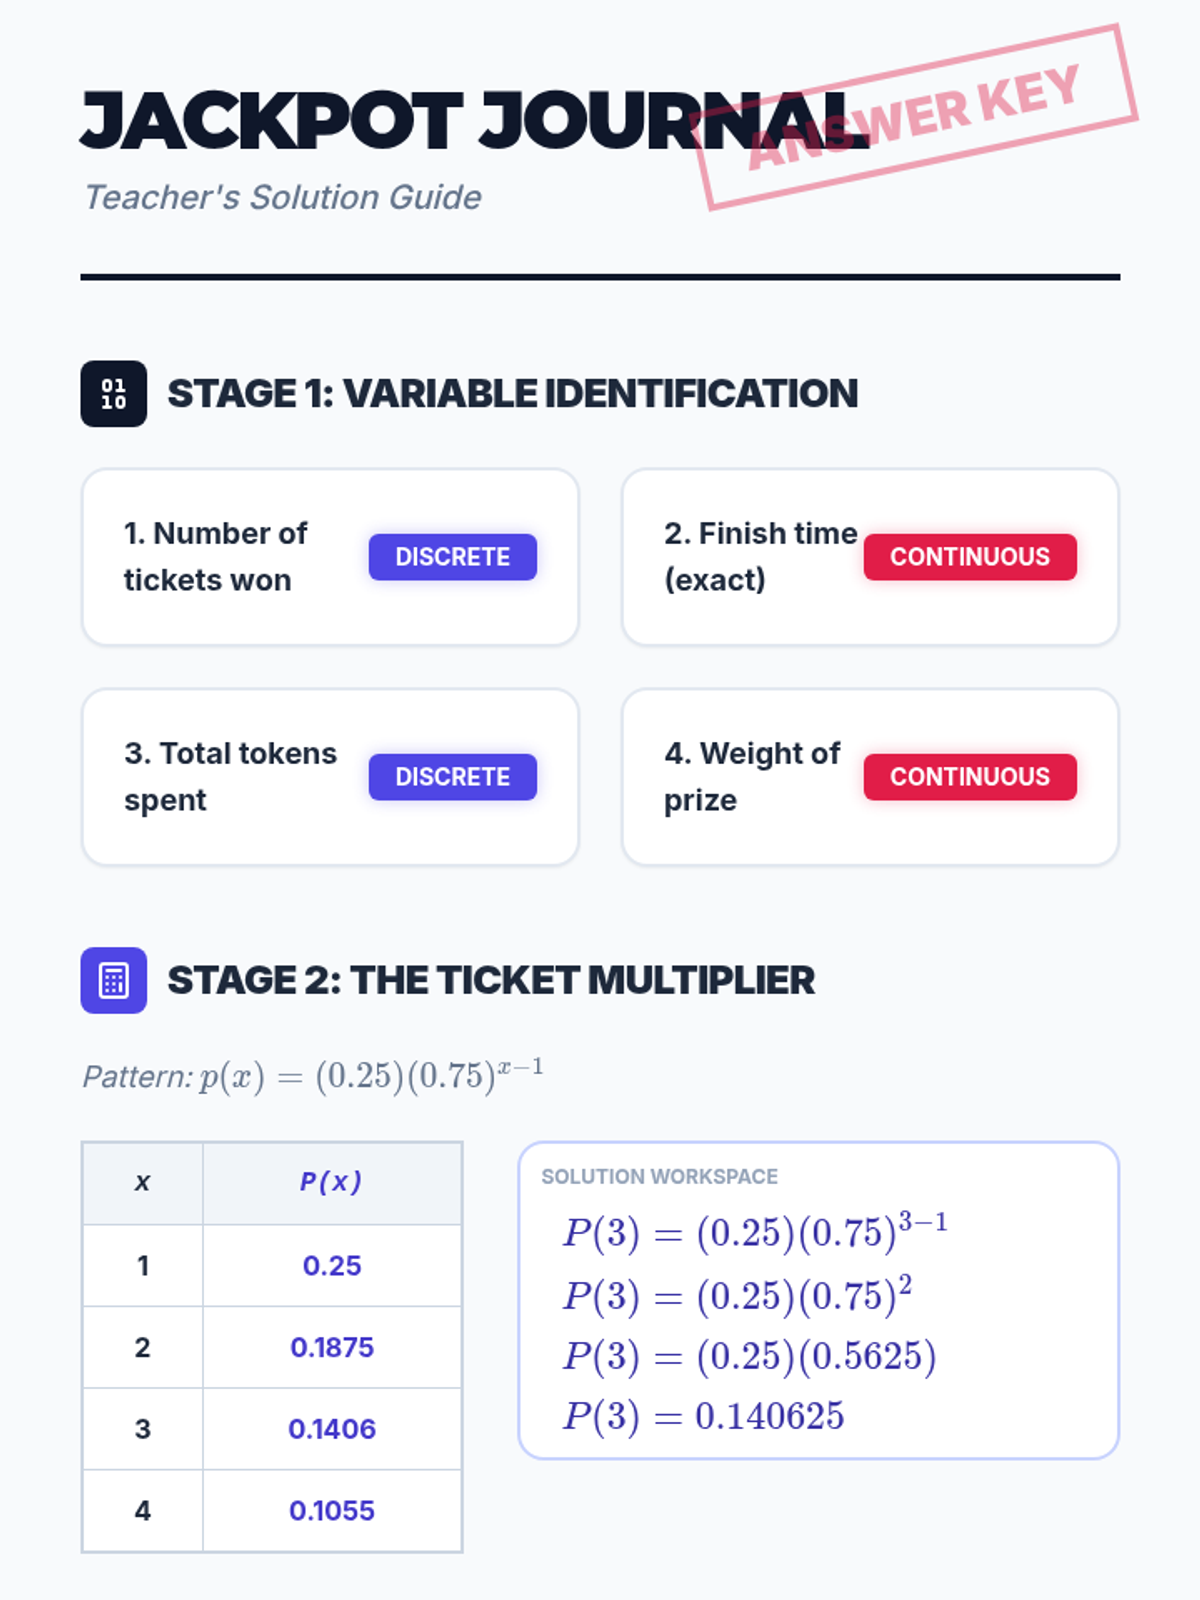
Students explore discrete probability distributions through the lens of arcade games and challenges, learning to model random events and calculate probabilities.
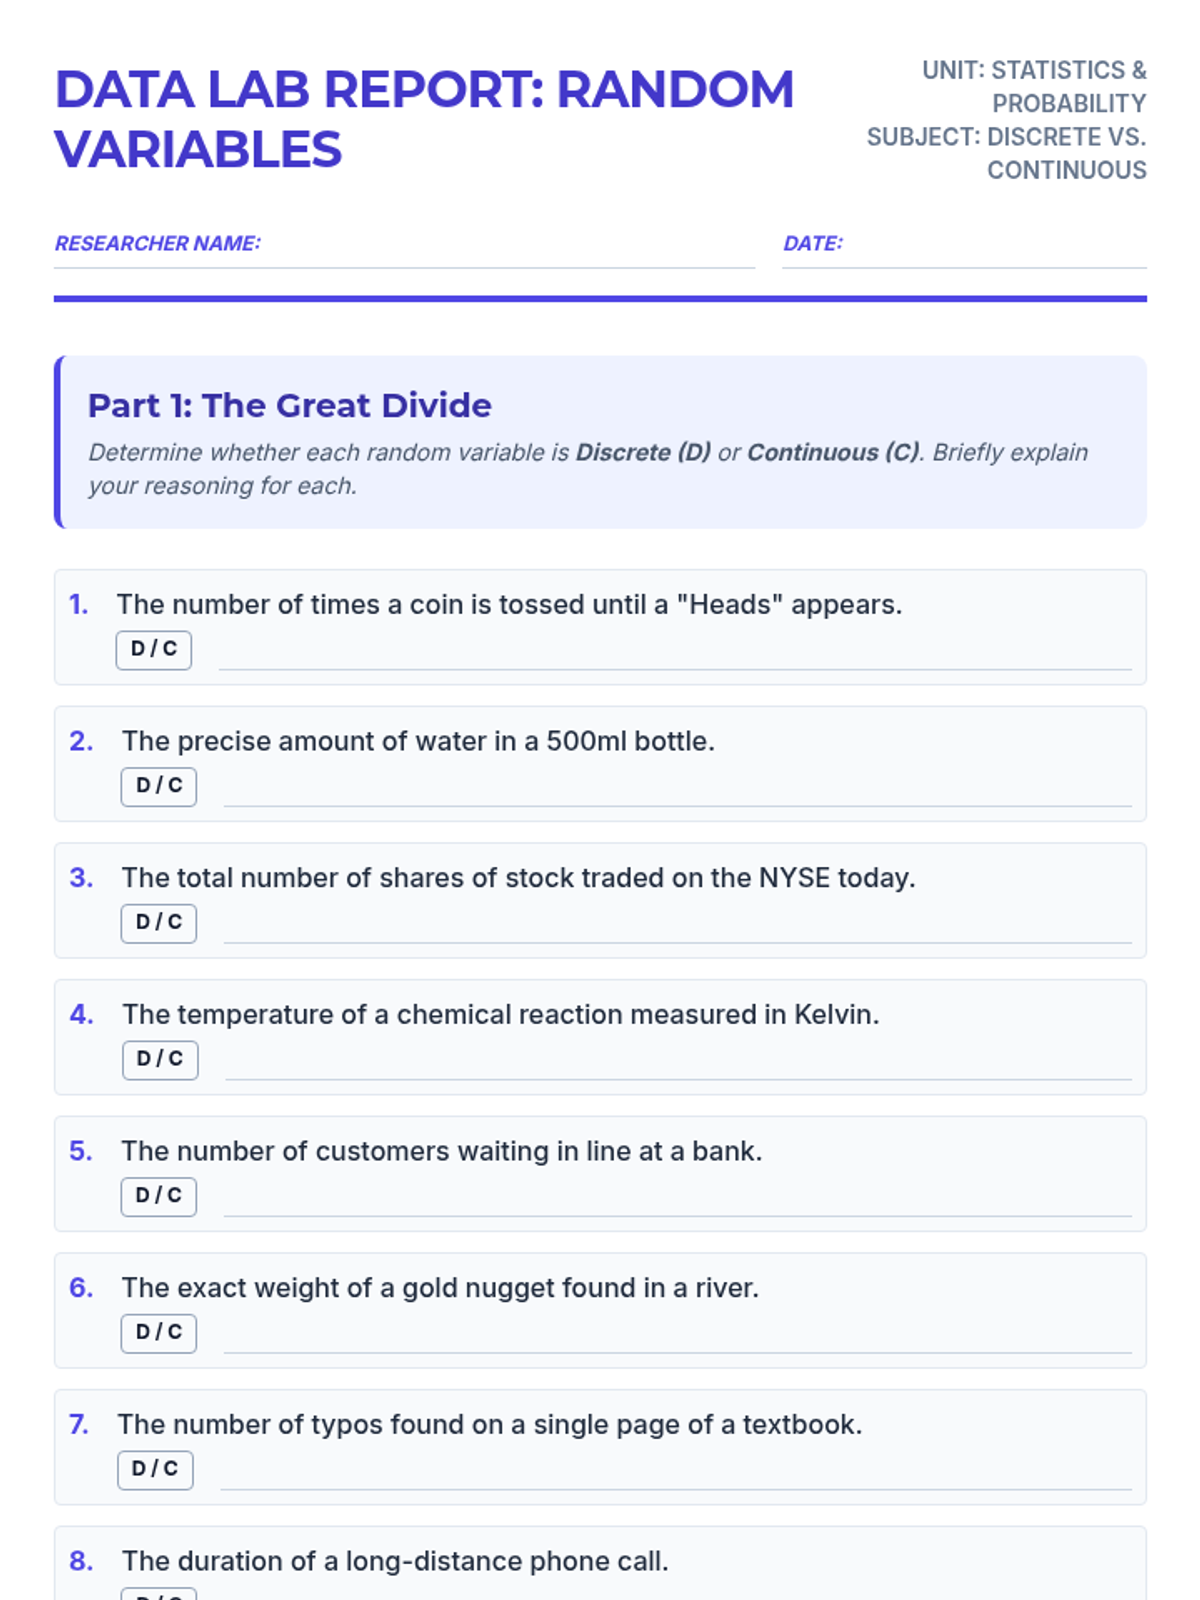
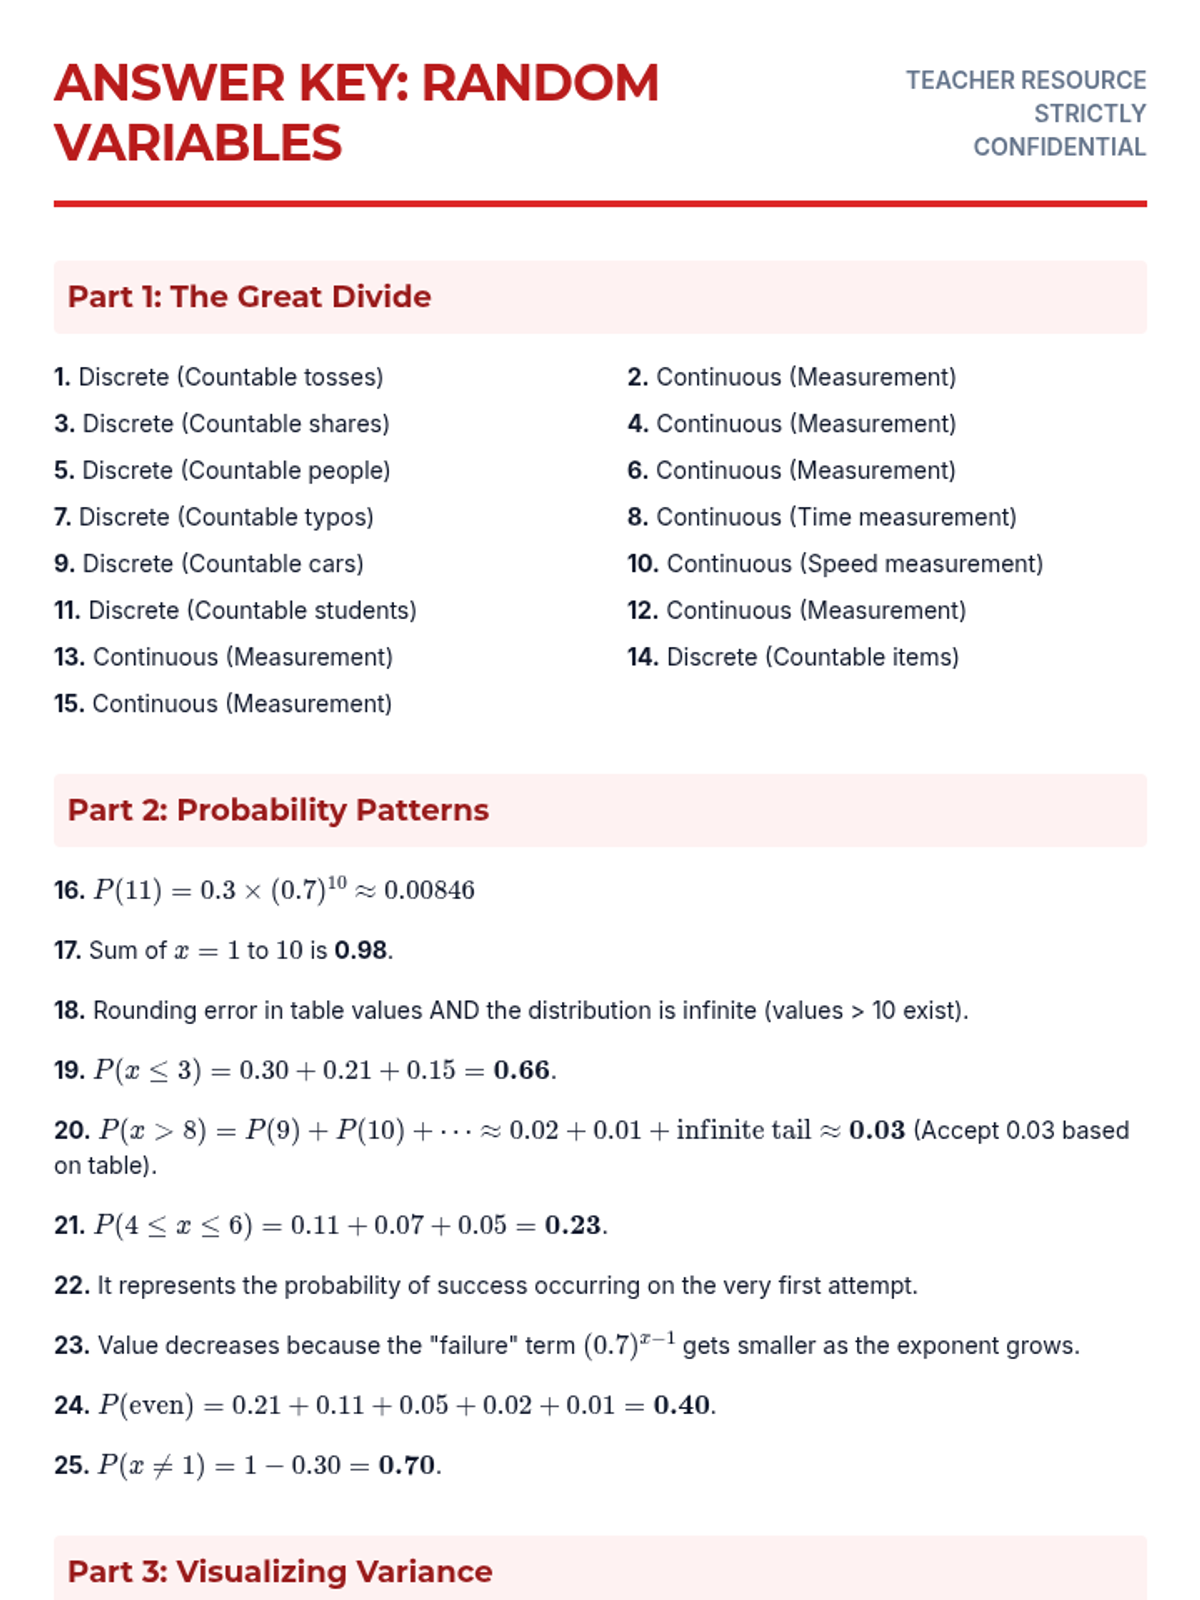
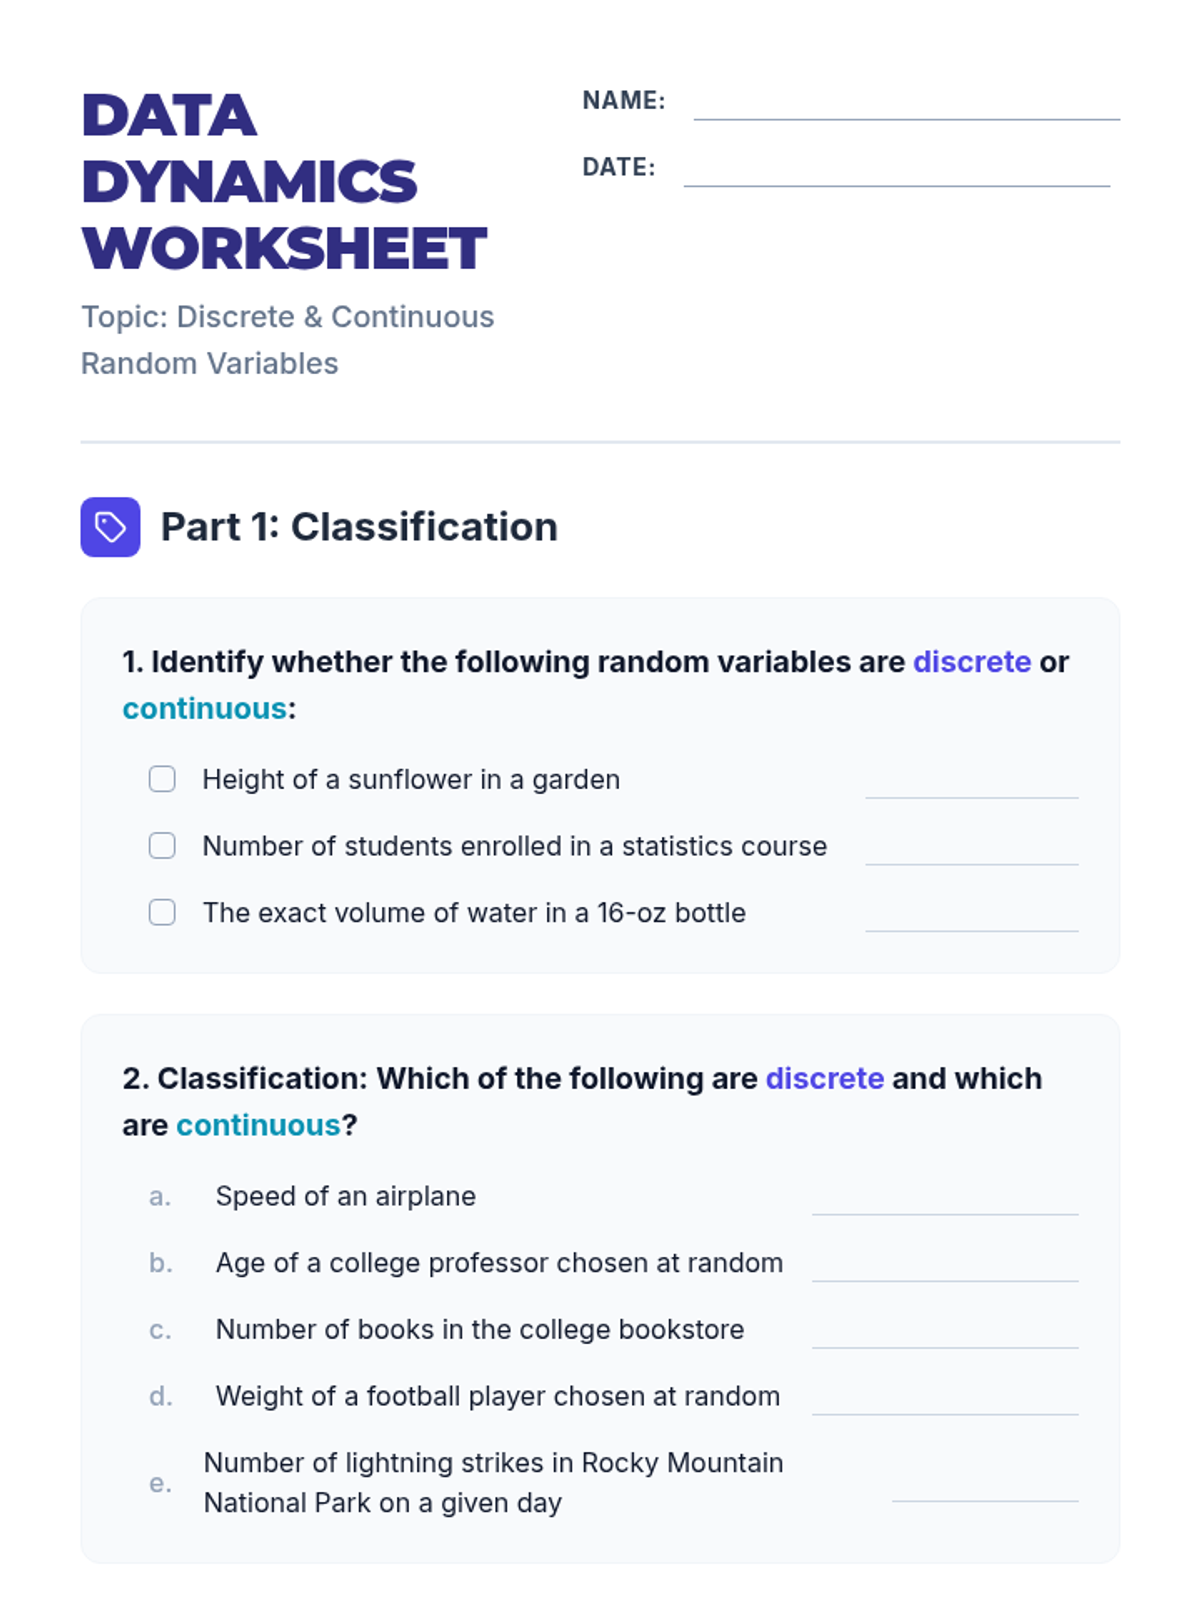
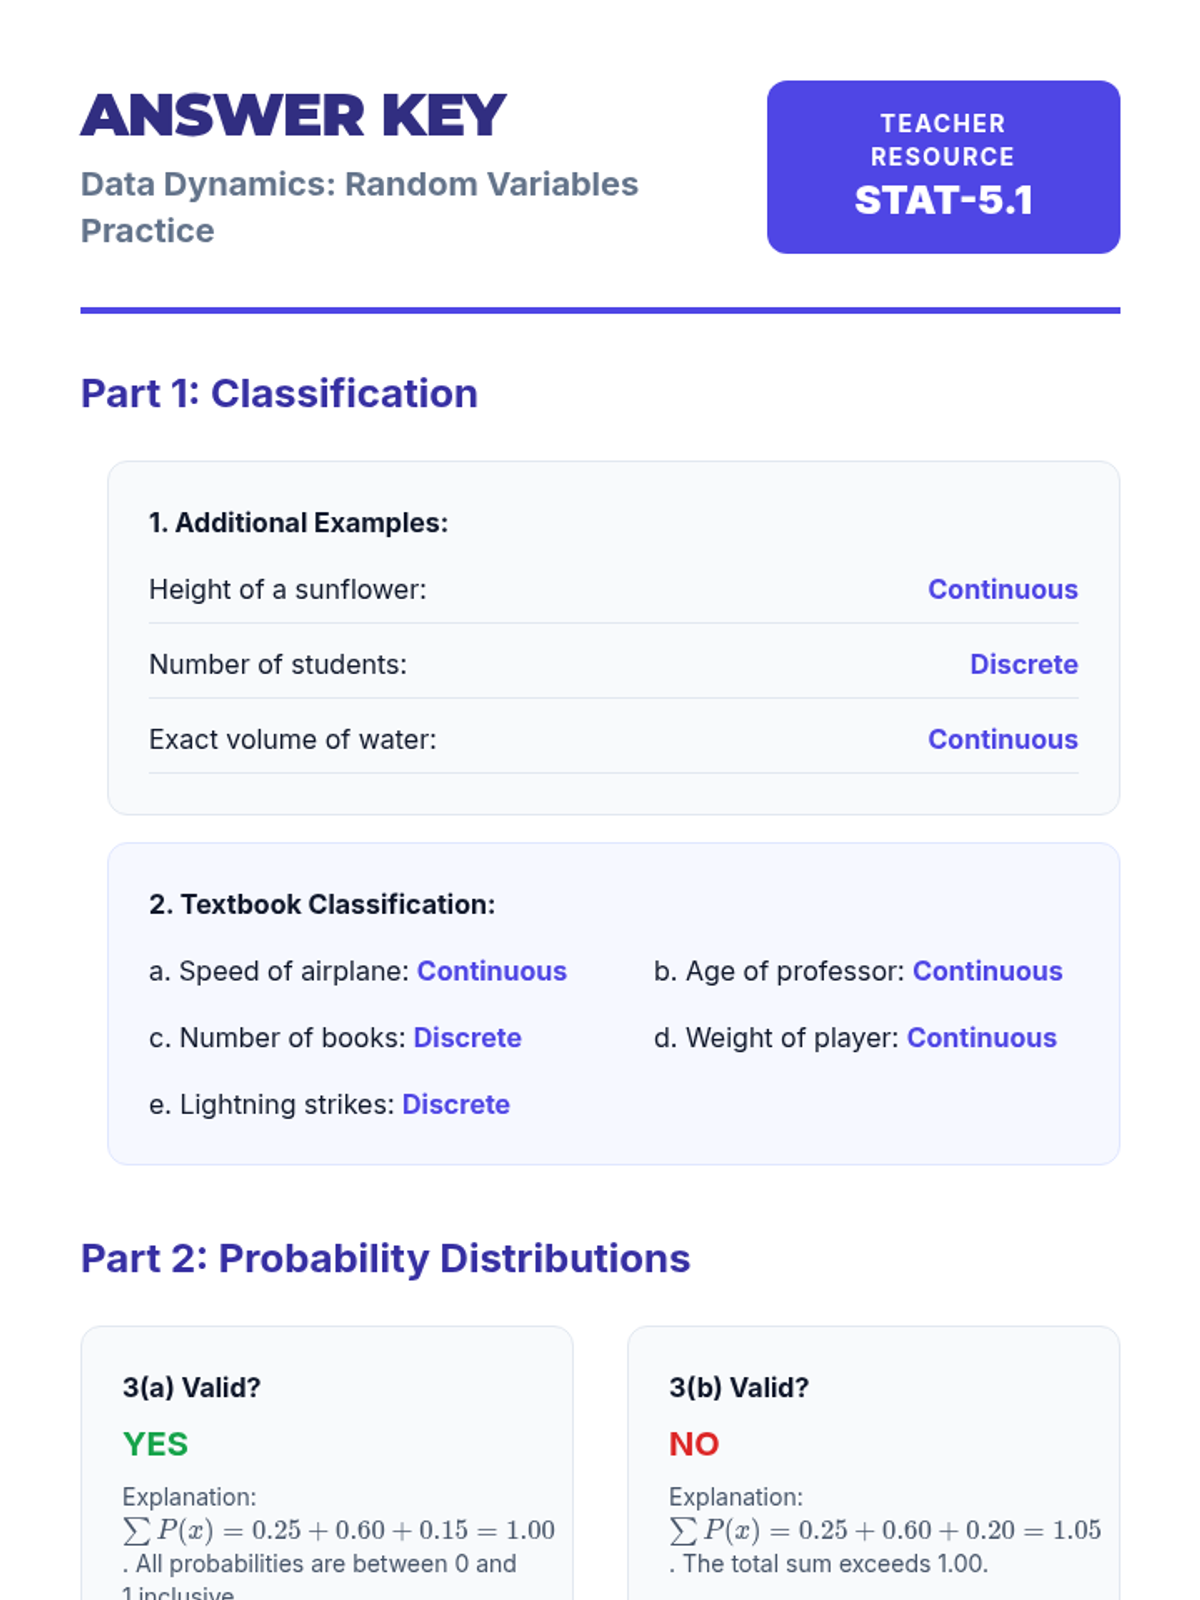
A comprehensive lesson on identifying random variable types, working with discrete probability distributions, and visualizing data through histograms.
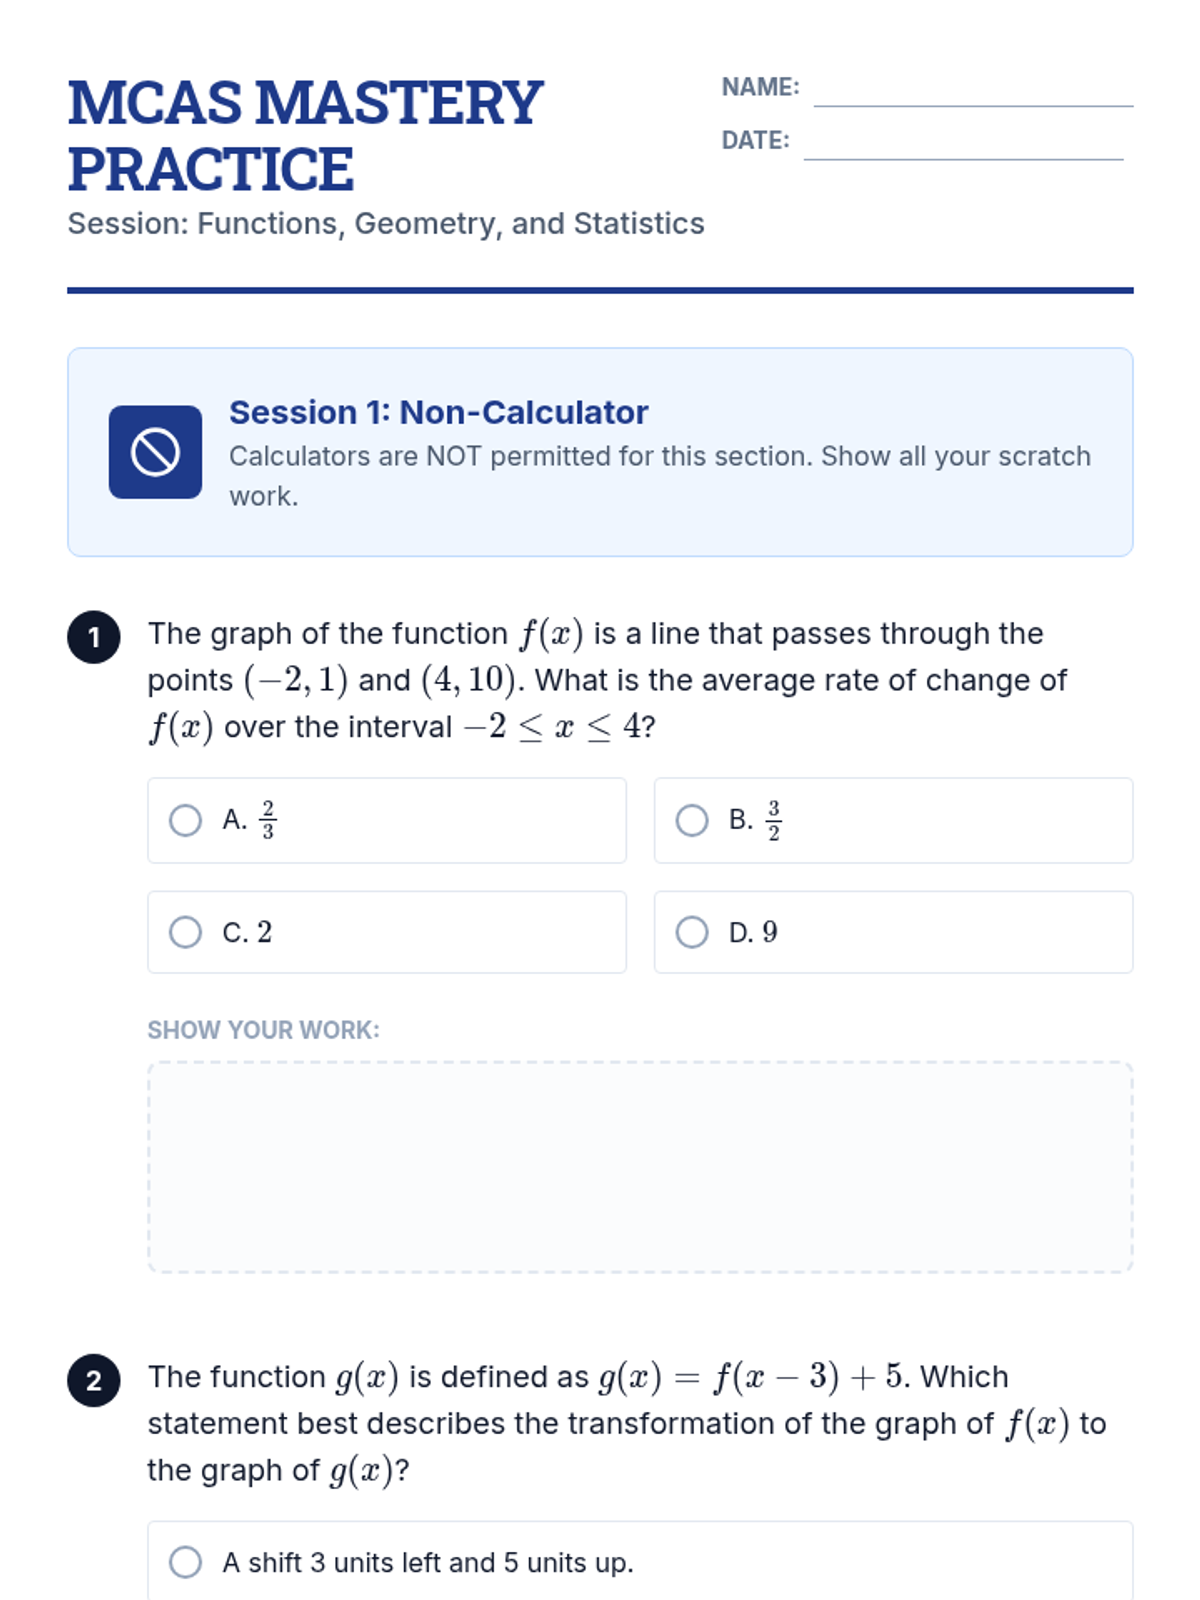
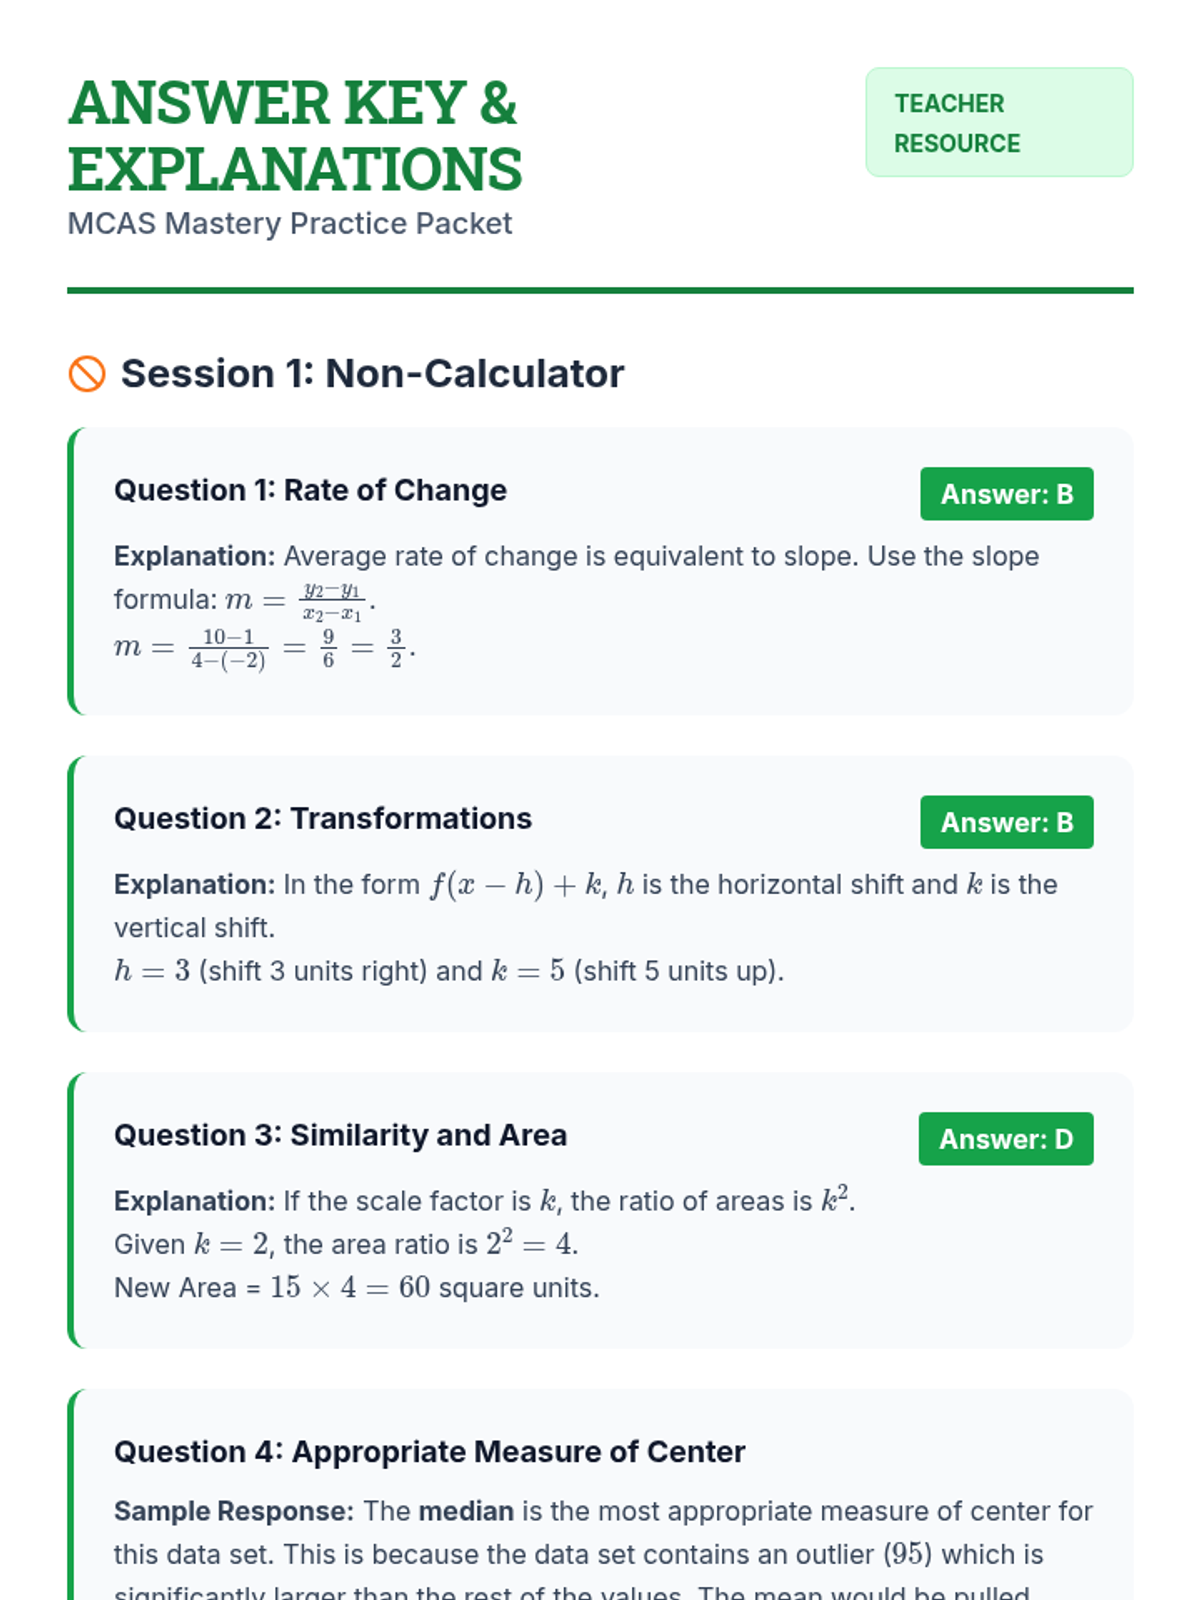
A comprehensive MCAS prep lesson focusing on high-frequency 10th-grade topics in Functions, Geometry, and Statistics. Includes test-taking strategies for both calculator and non-calculator sections aligned to Massachusetts Mathematics Curriculum Frameworks.
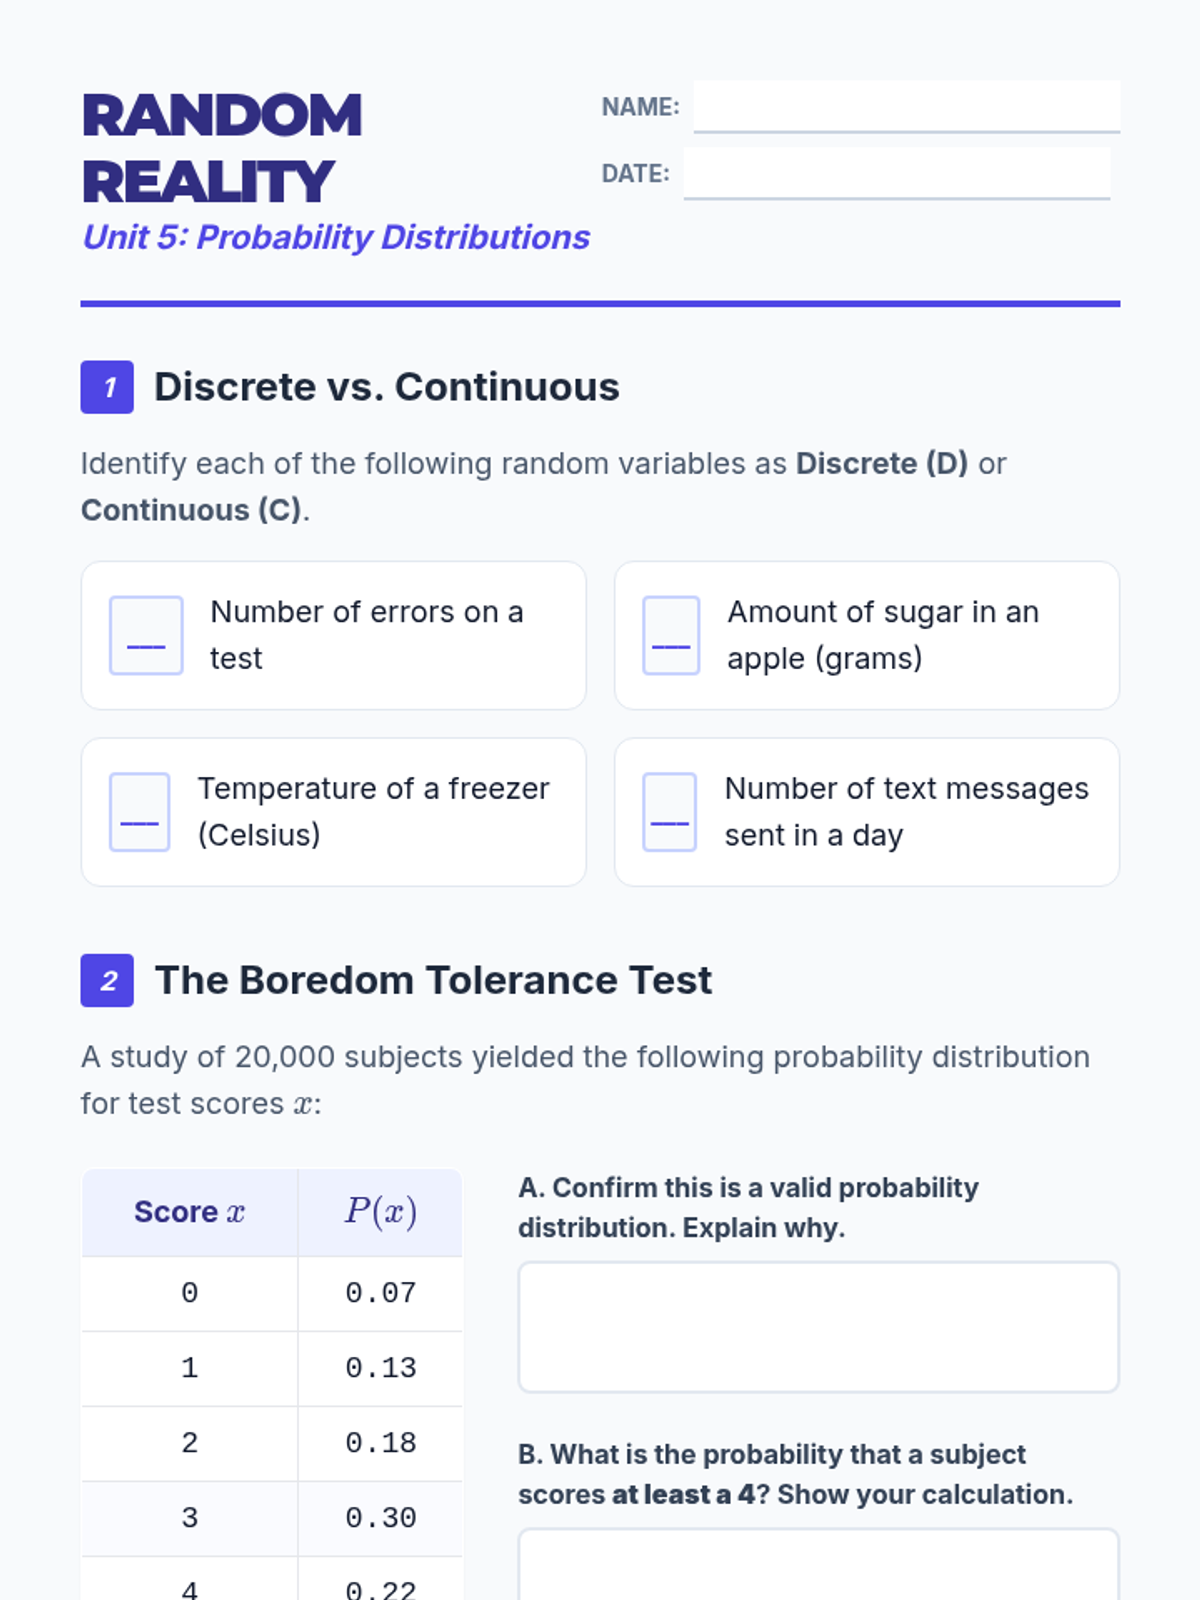
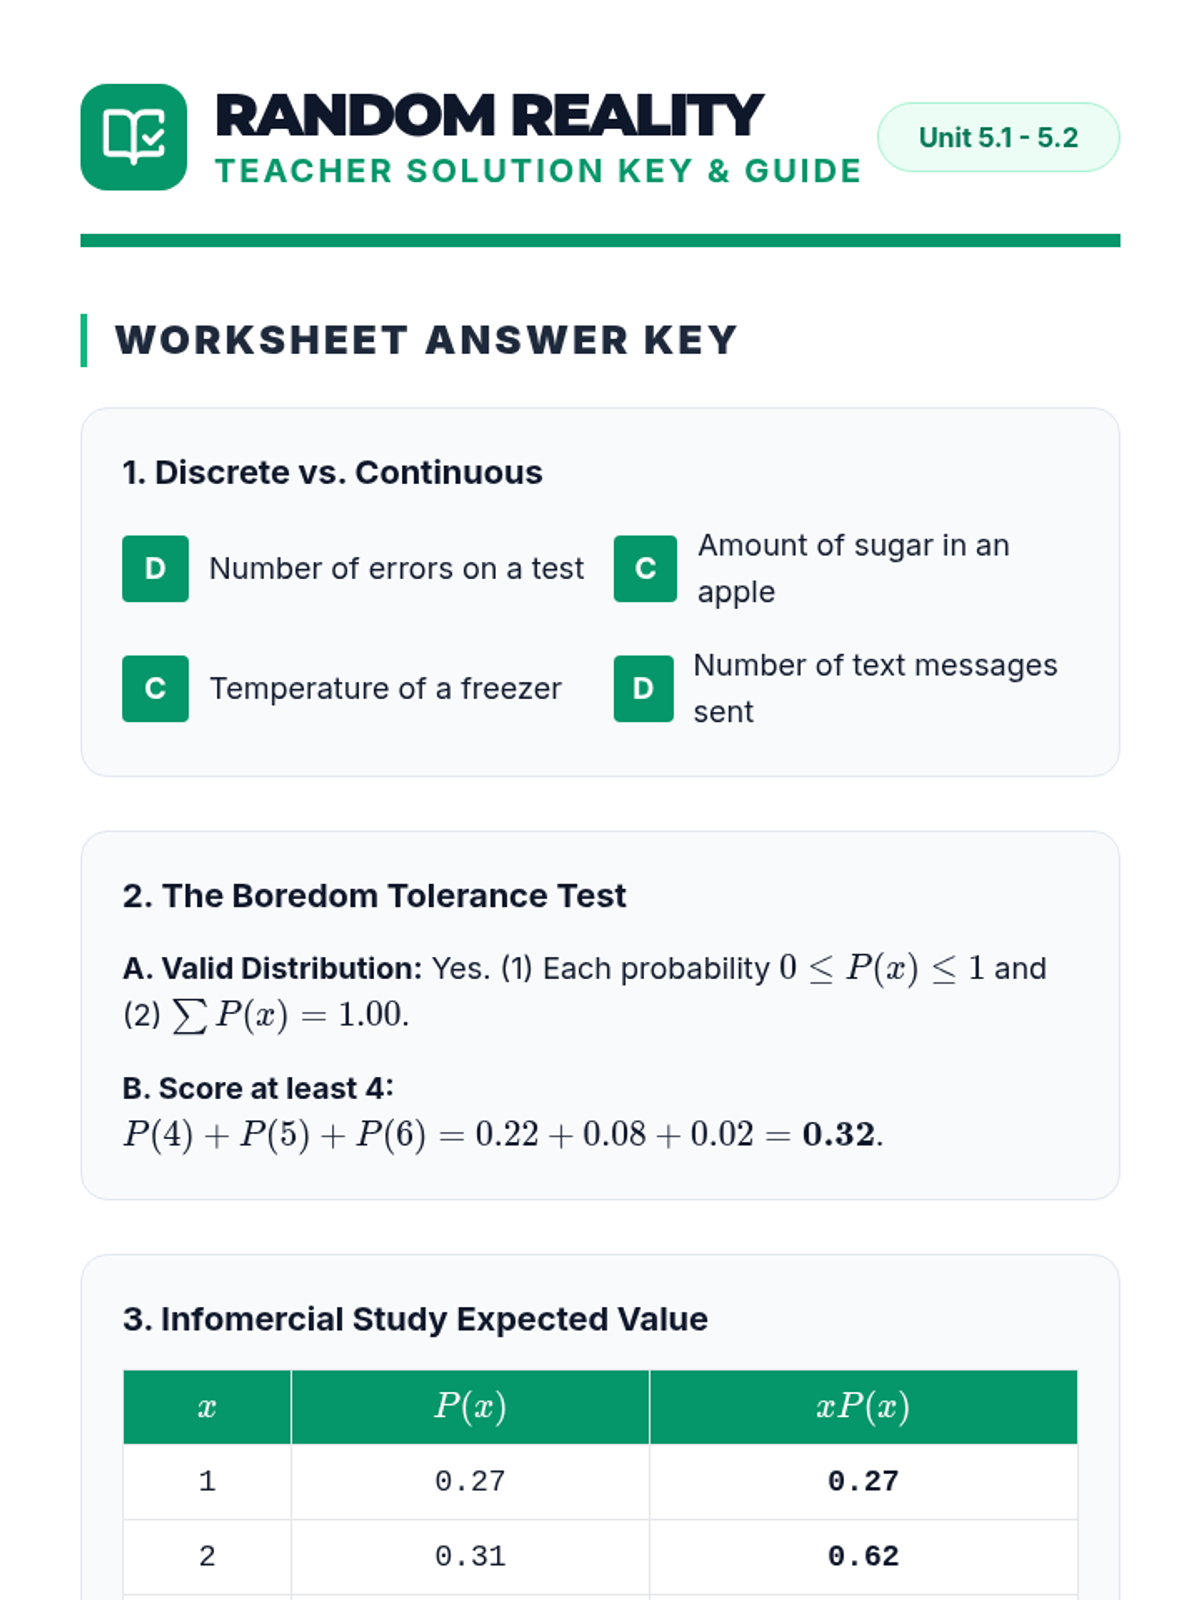
An introduction to random variables, distinguishing between discrete and continuous types, graphing probability distributions, and calculating mean and standard deviation.
Comprehensive review of high-frequency question types and unit conversions.
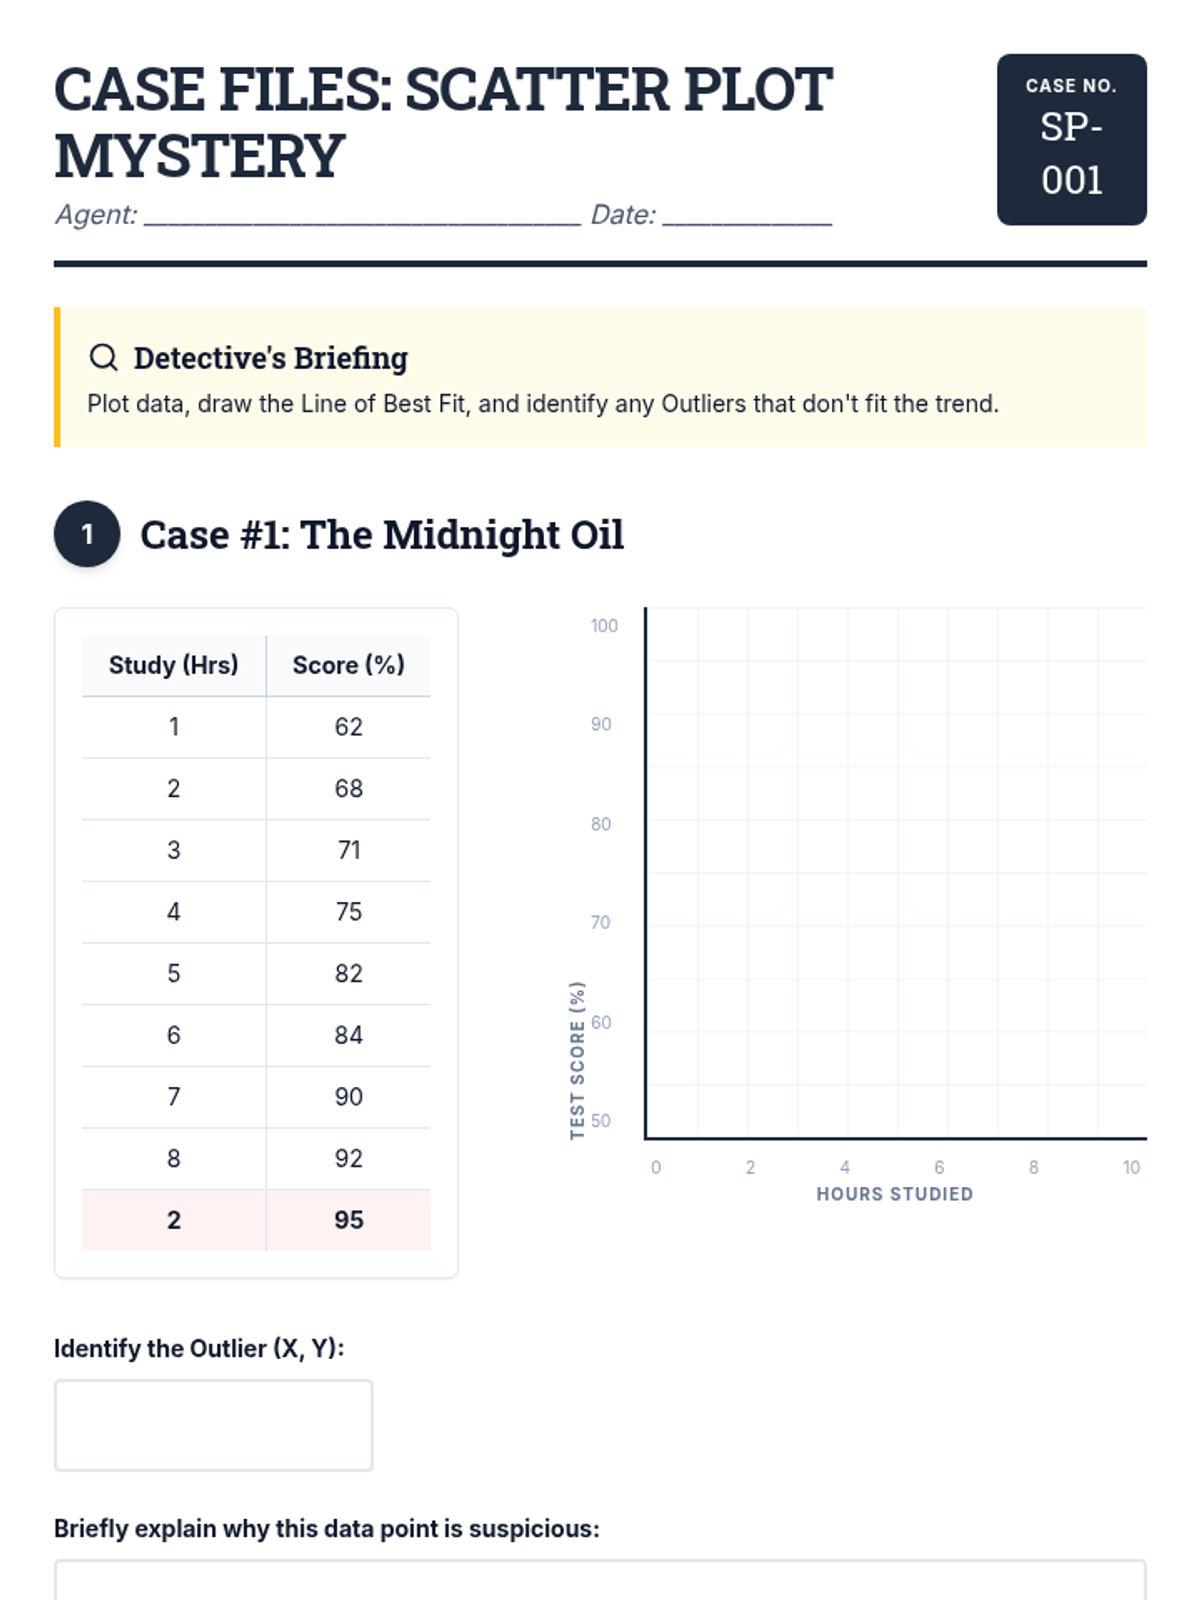
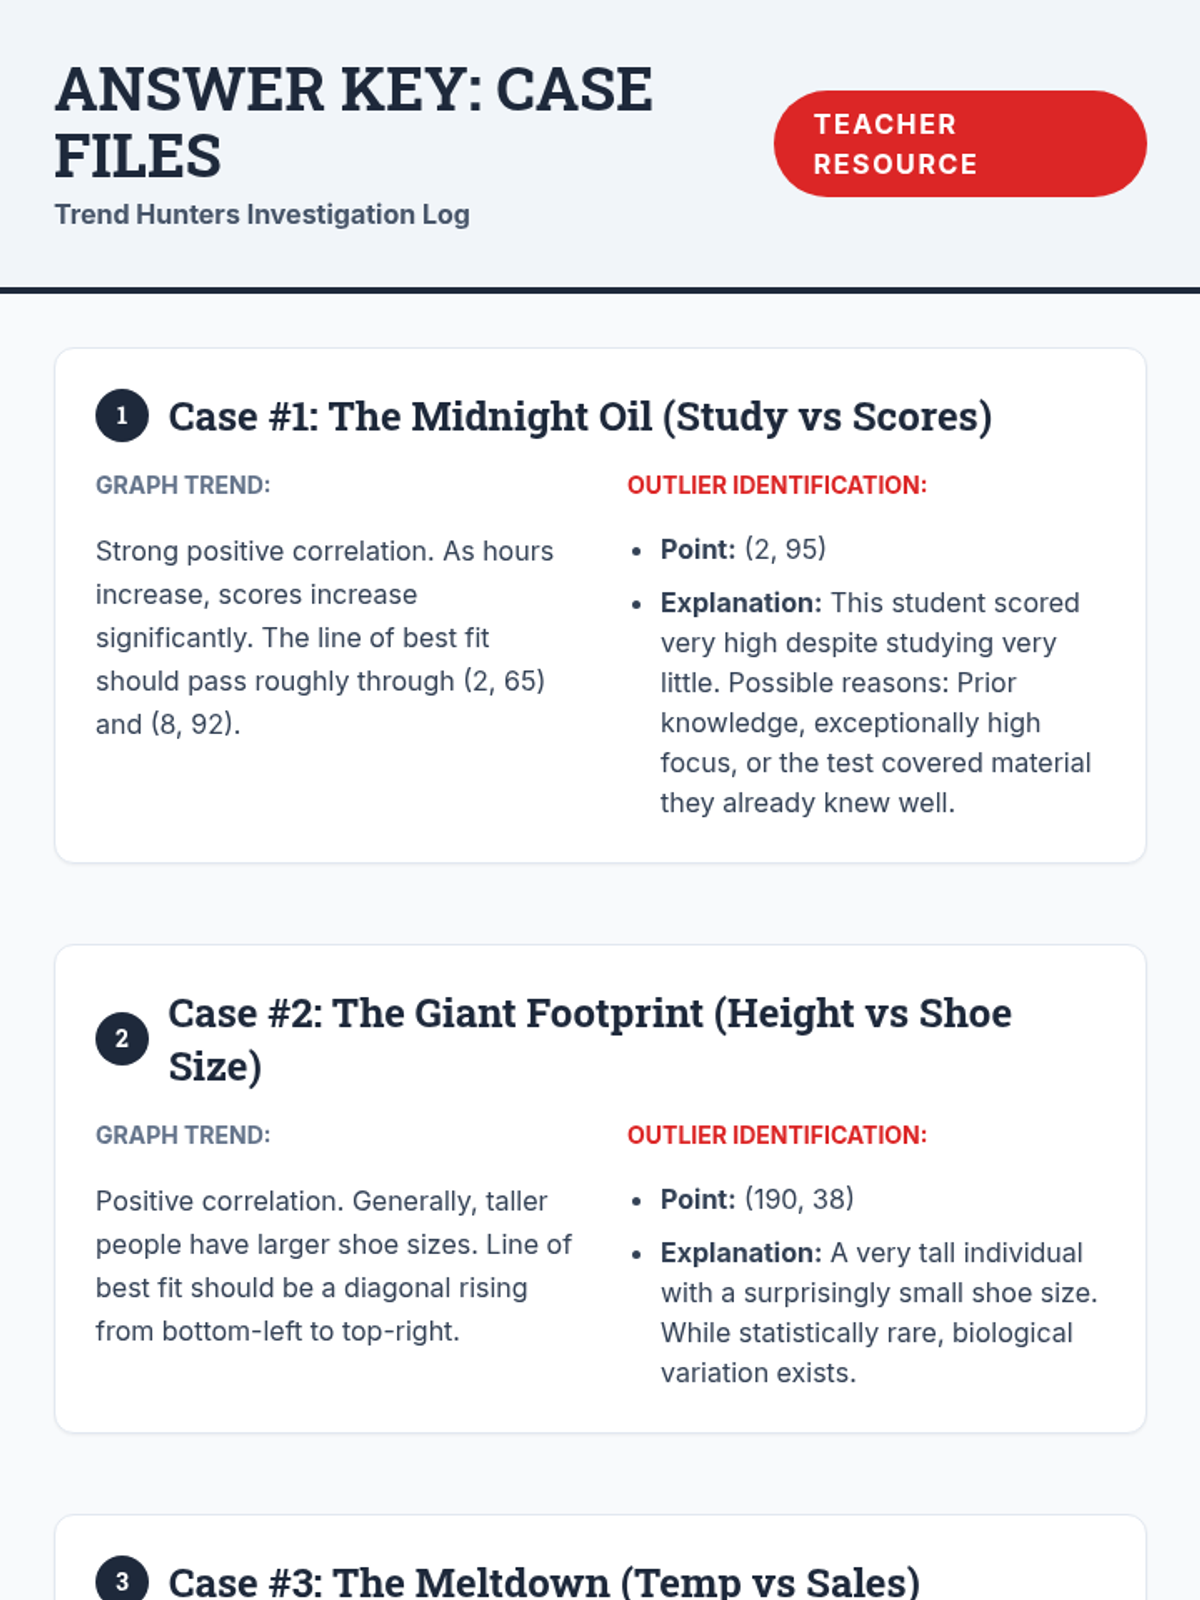
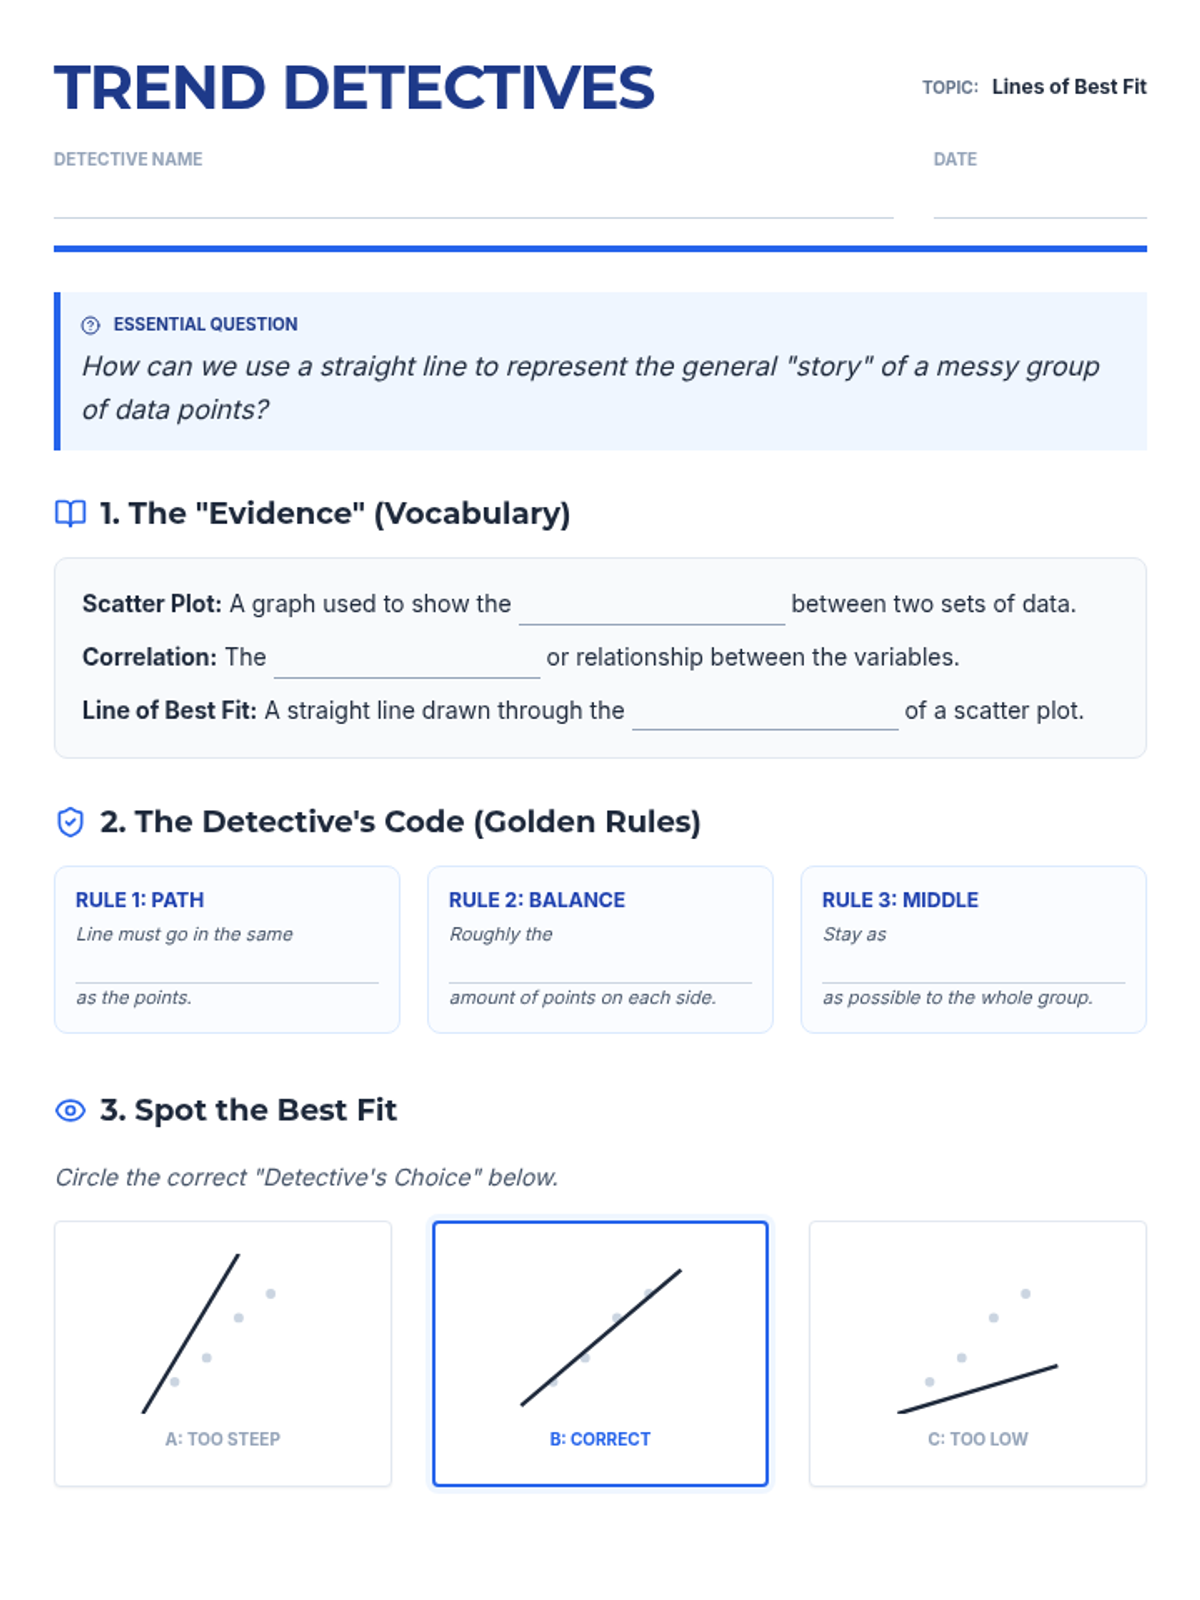
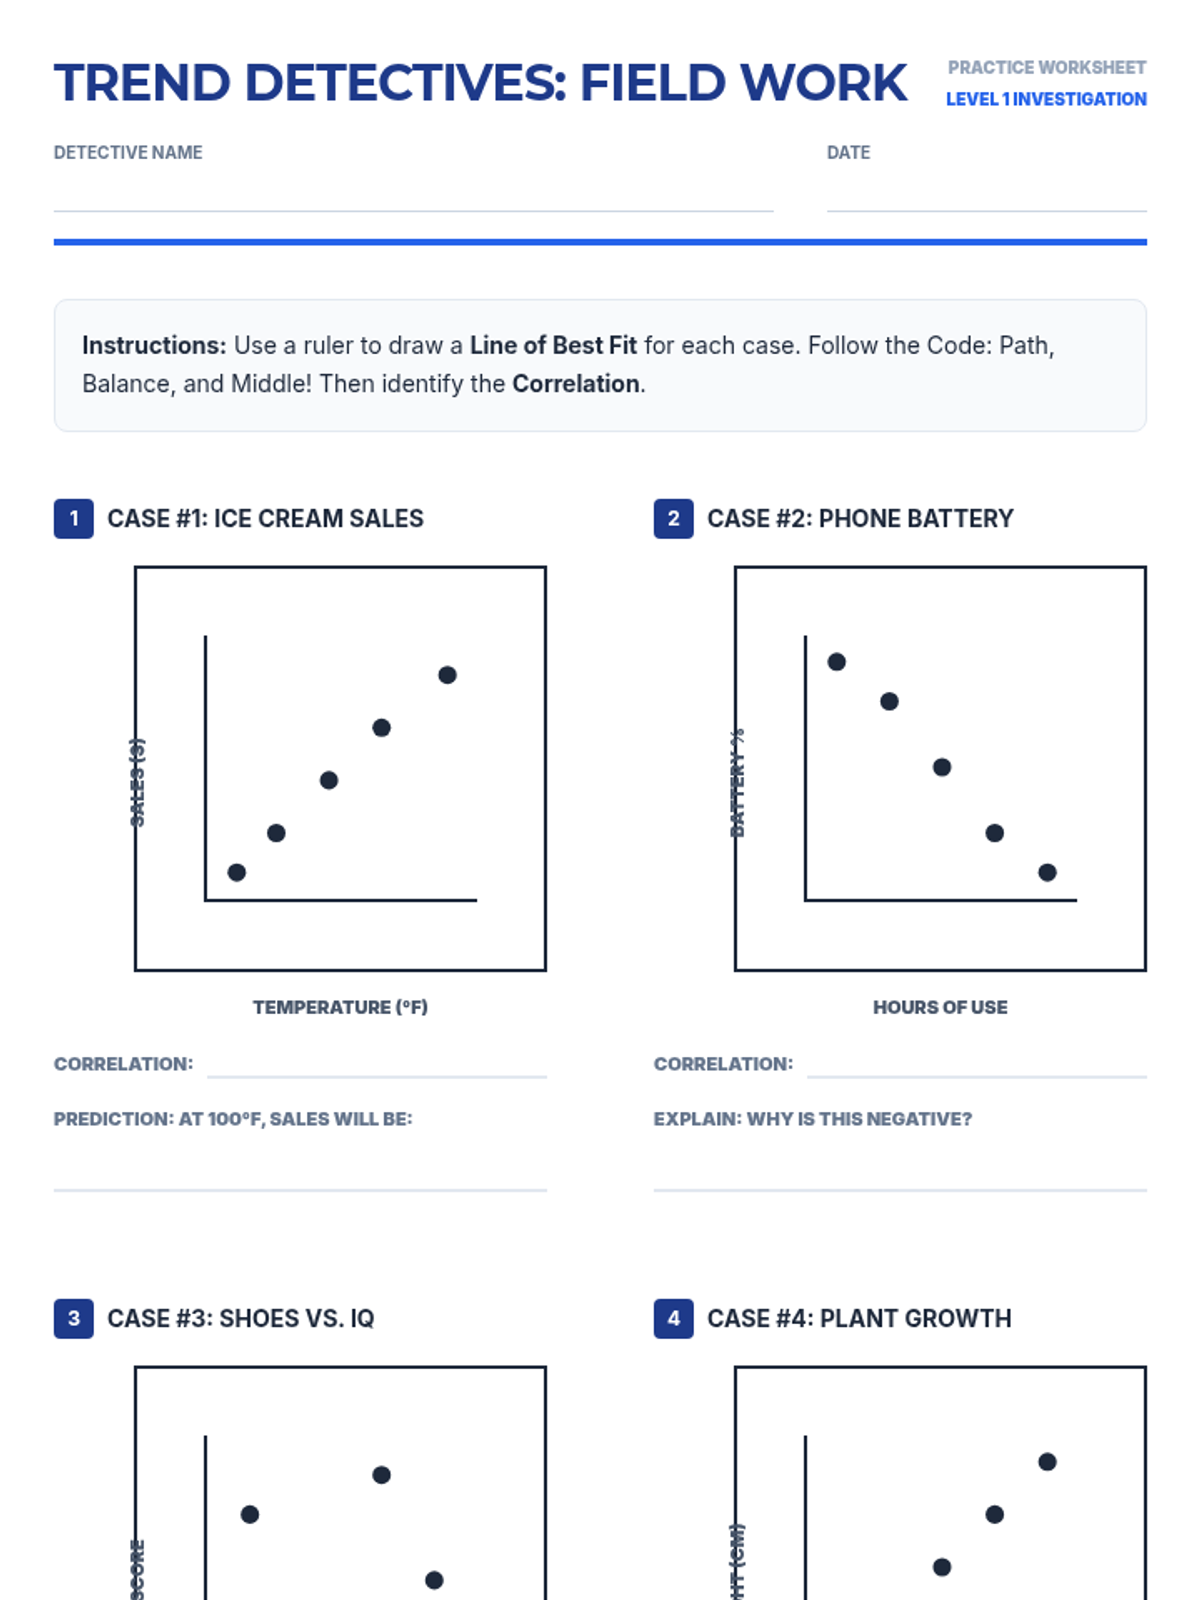
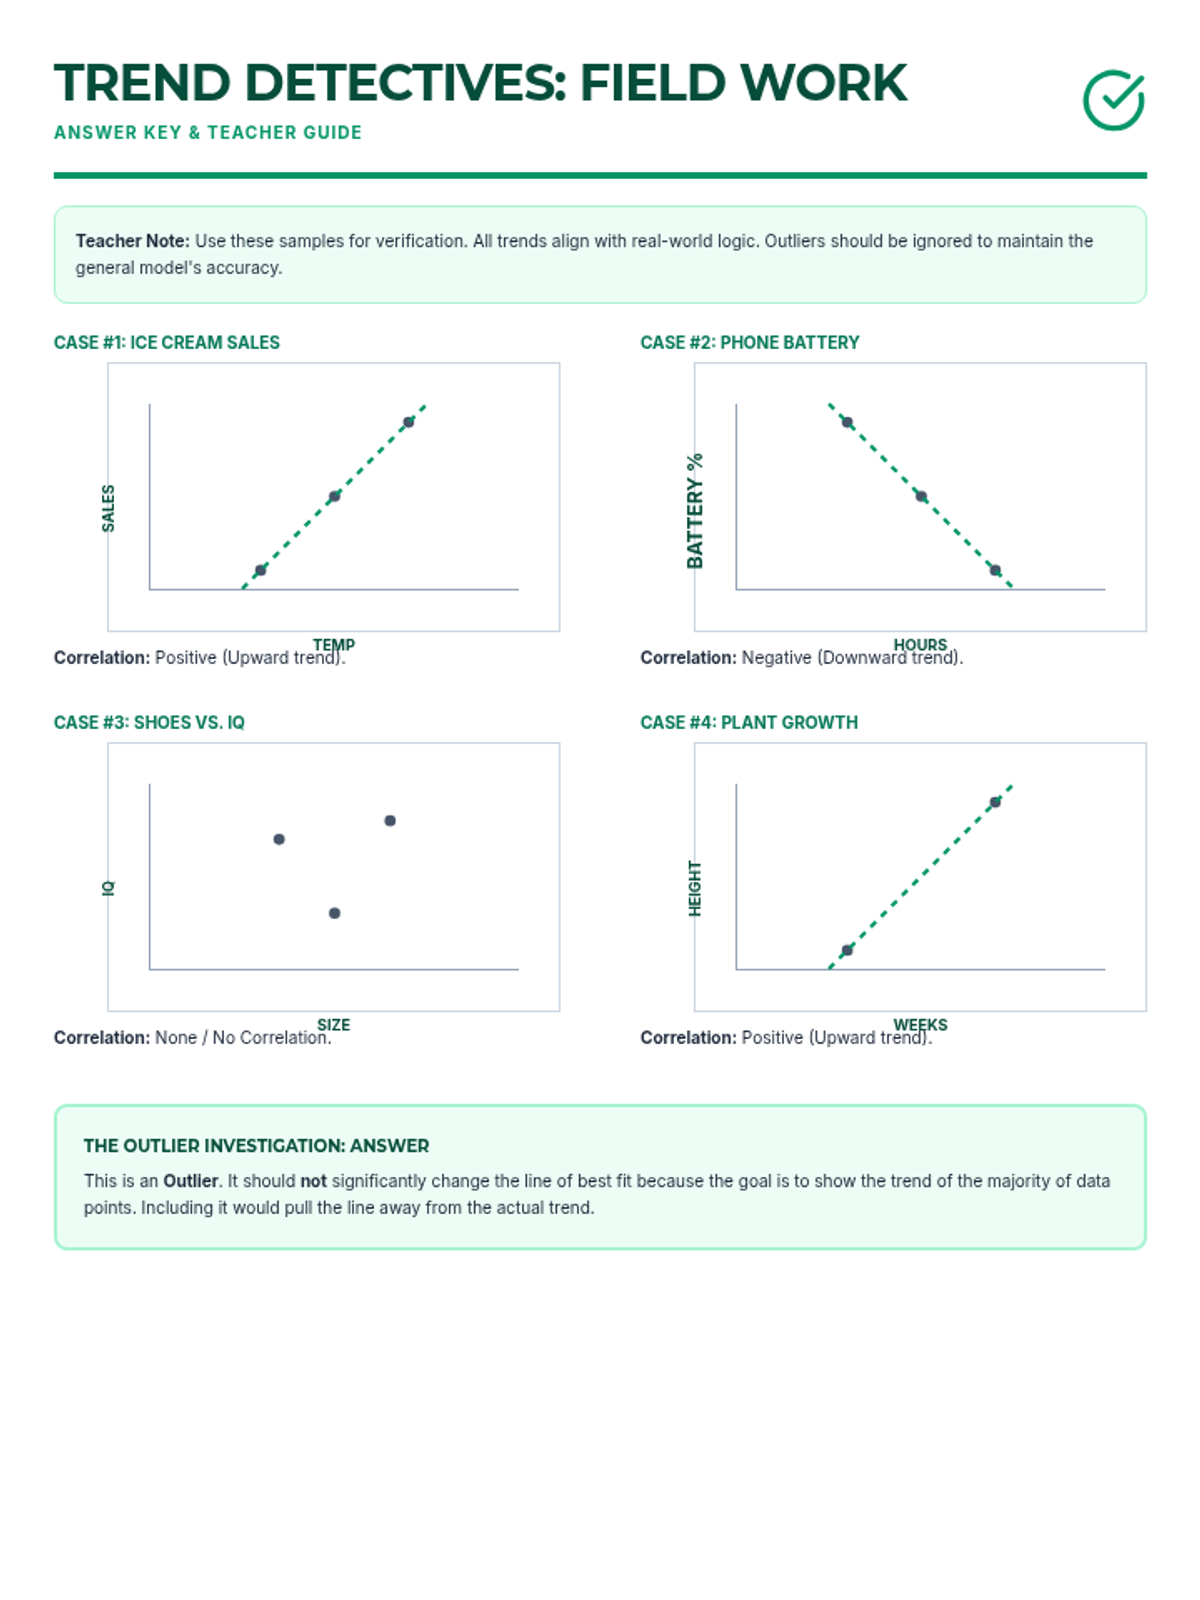
A hands-on investigation into scatter plots, lines of best fit, and identifying outliers using real-world scenarios like test scores and plant growth.
A lesson on understanding and drawing lines of best fit (trend lines) on scatter plots to identify data patterns and make predictions.
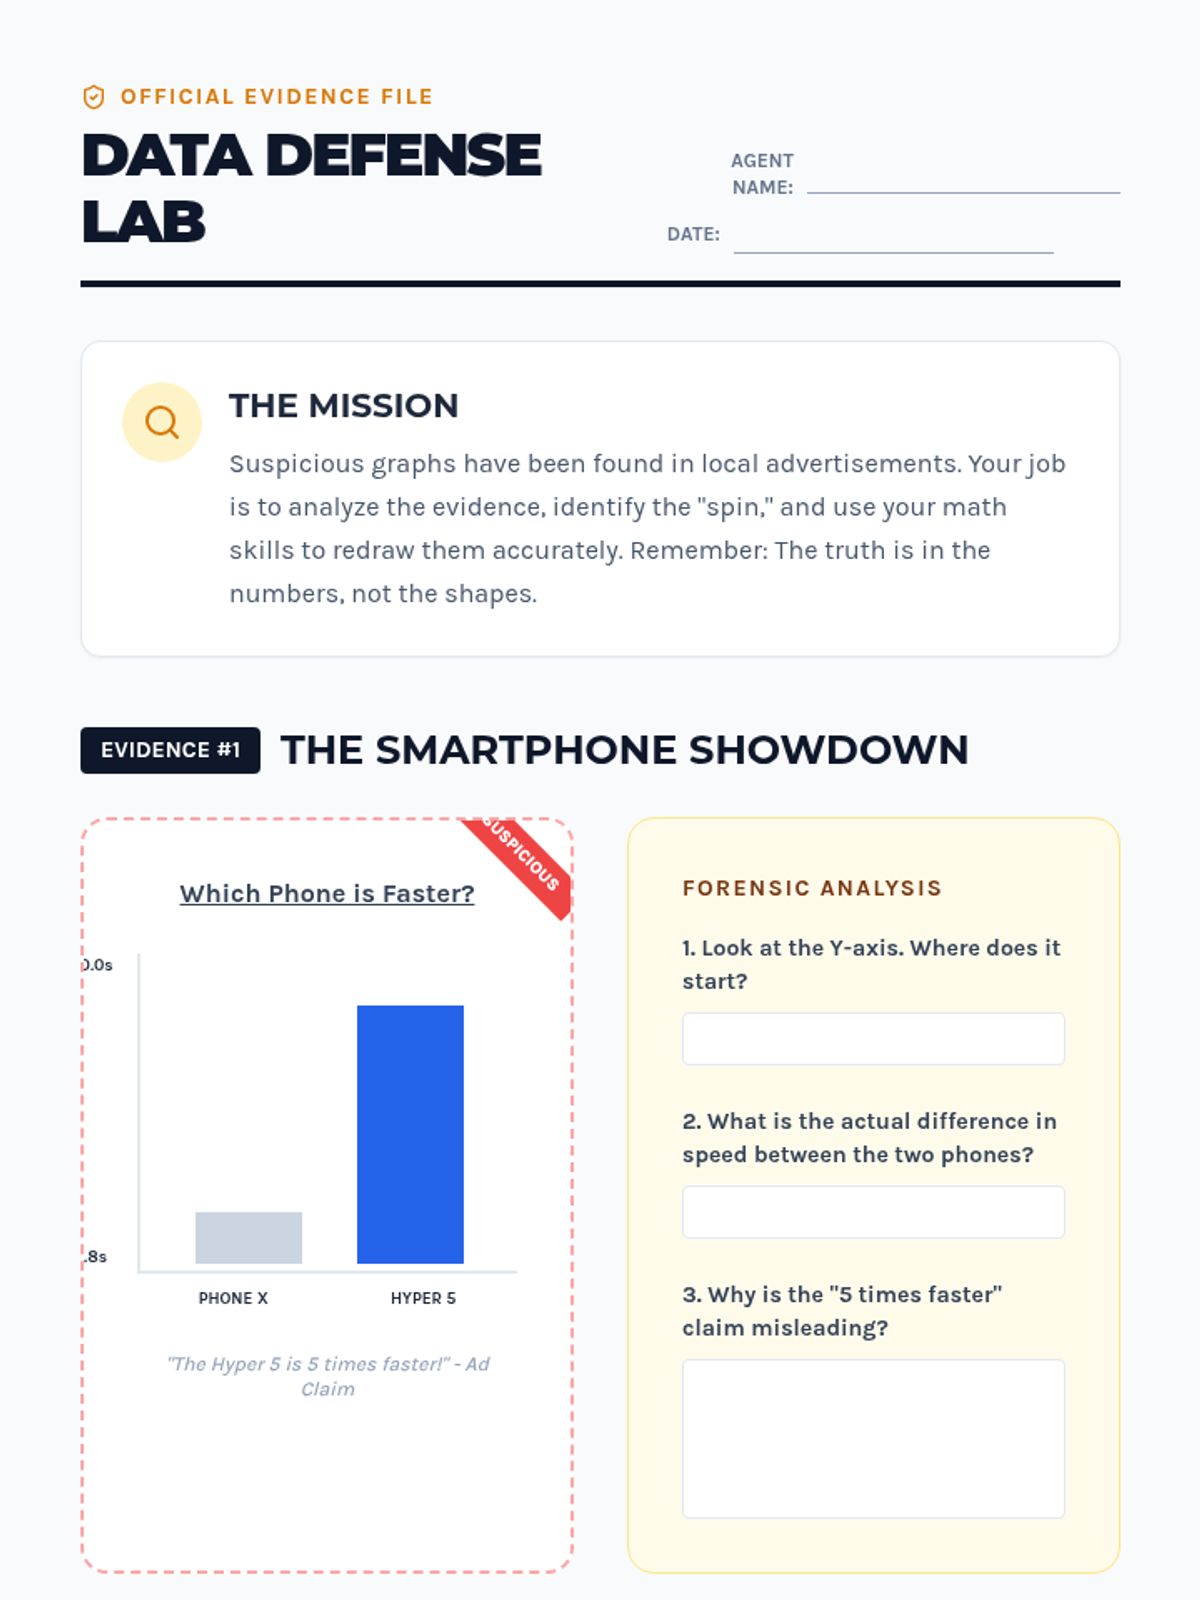
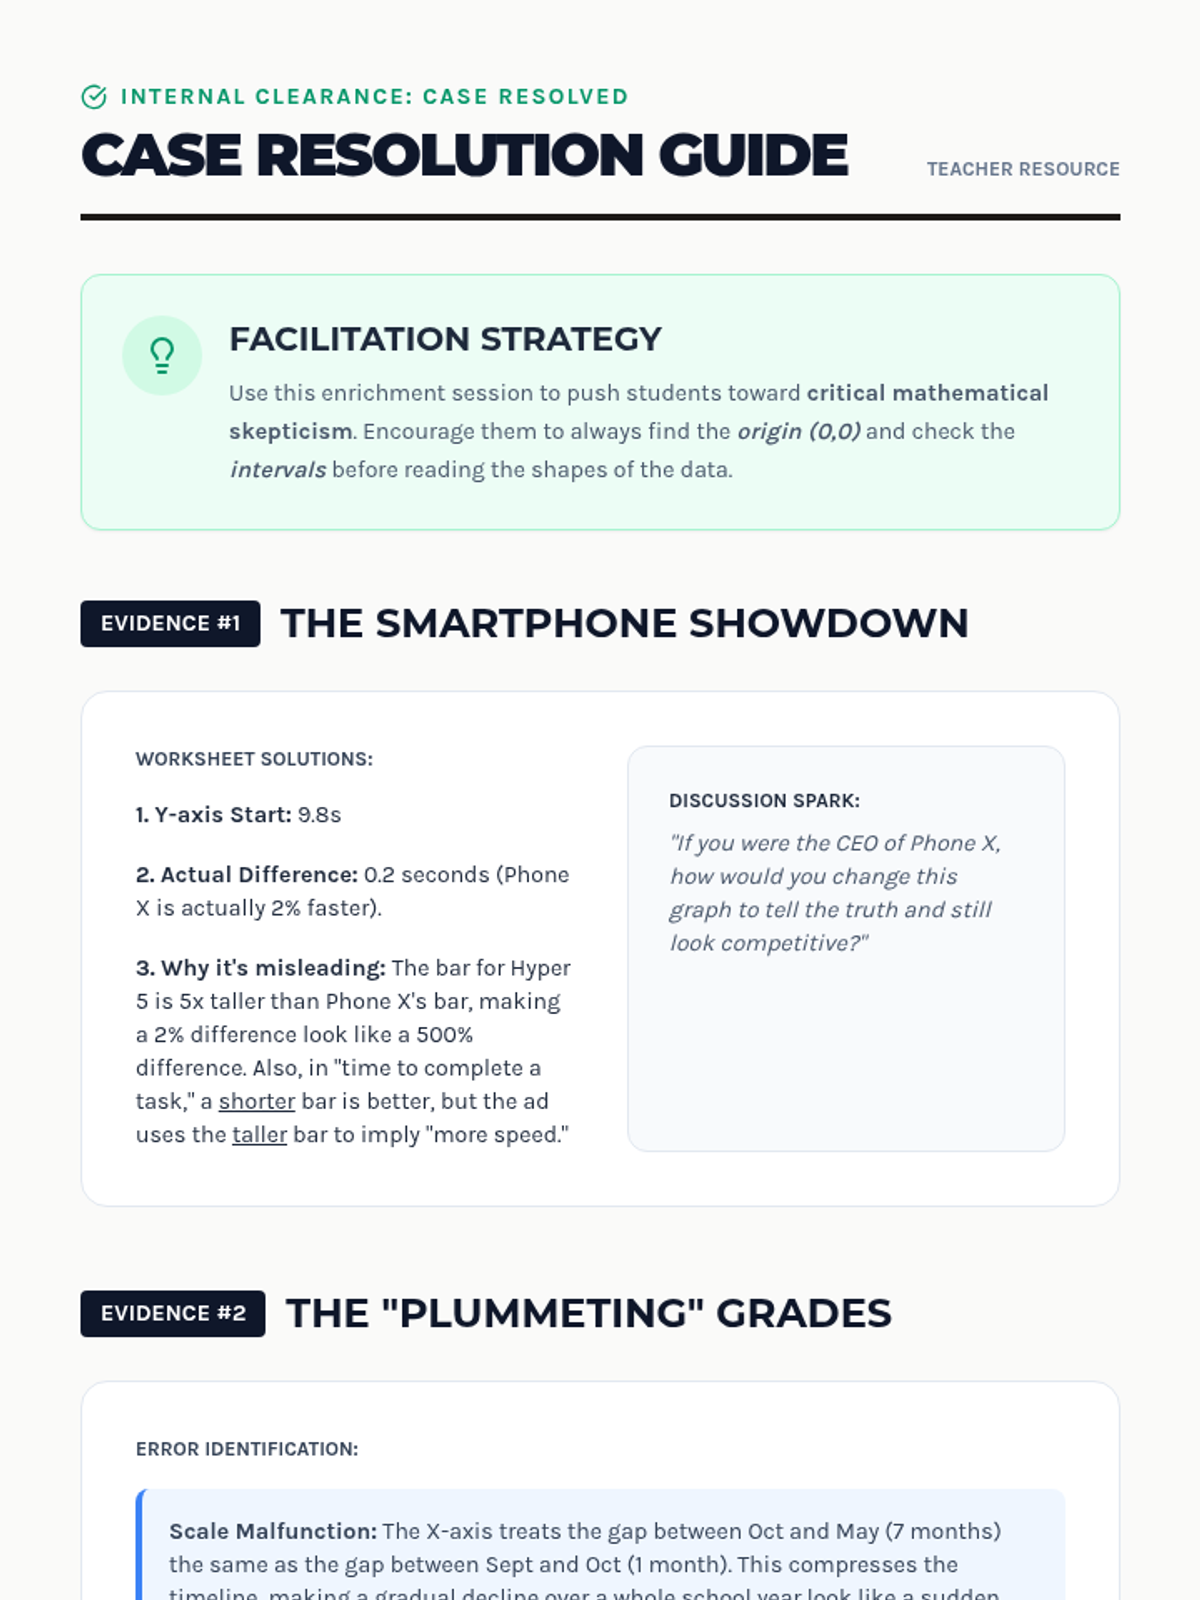
Students learn to identify common techniques used to create misleading graphs, such as truncated axes and inconsistent scales, and learn how to redraw them for accuracy.
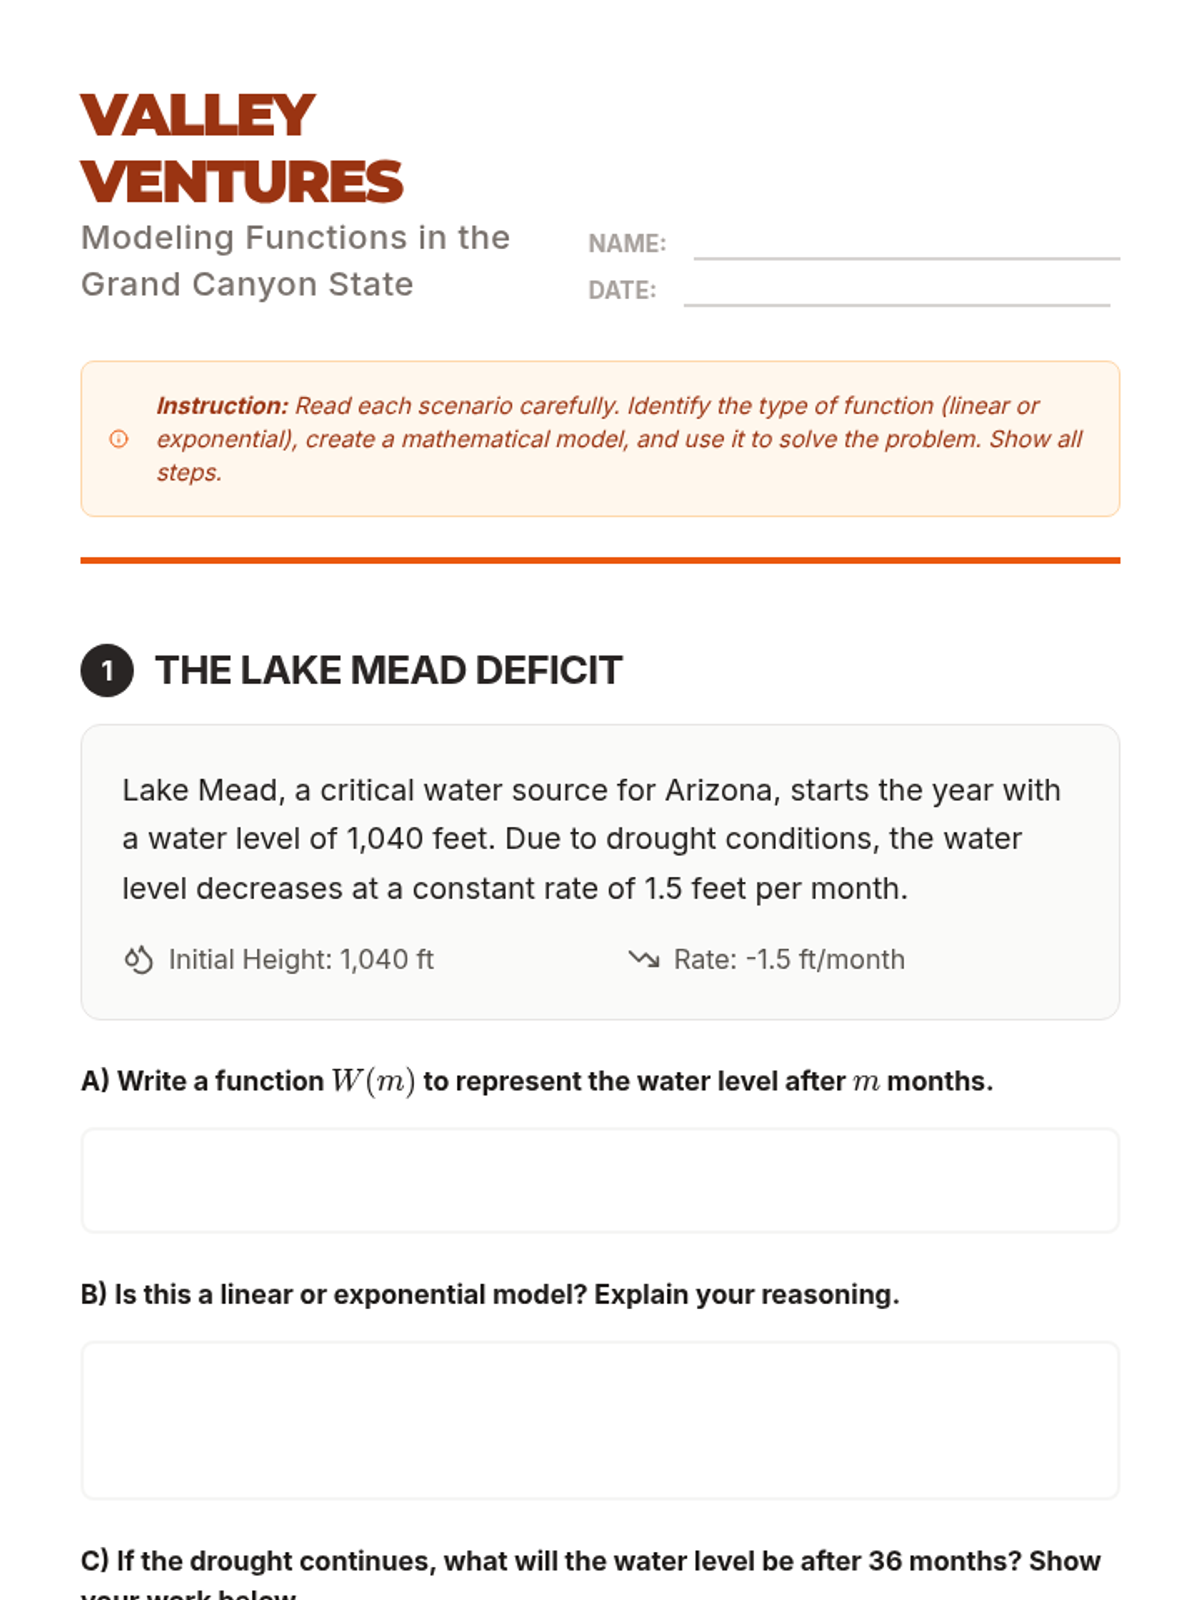
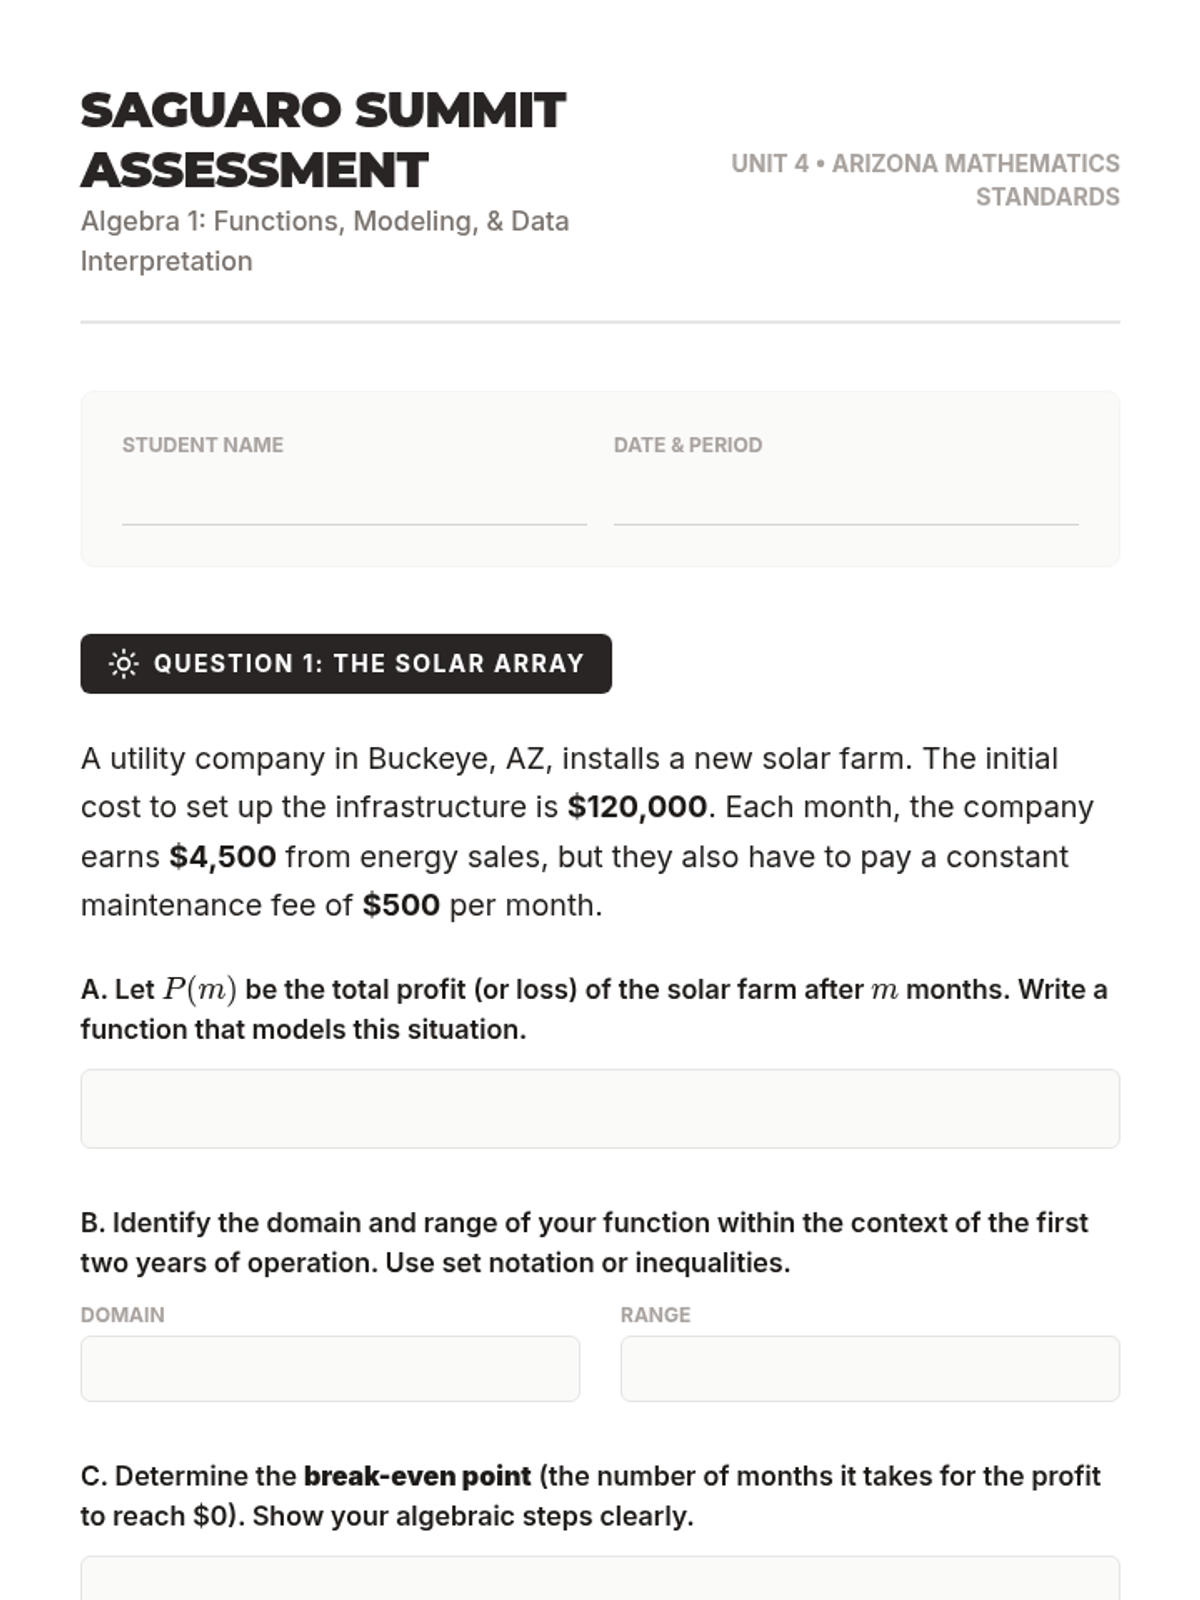
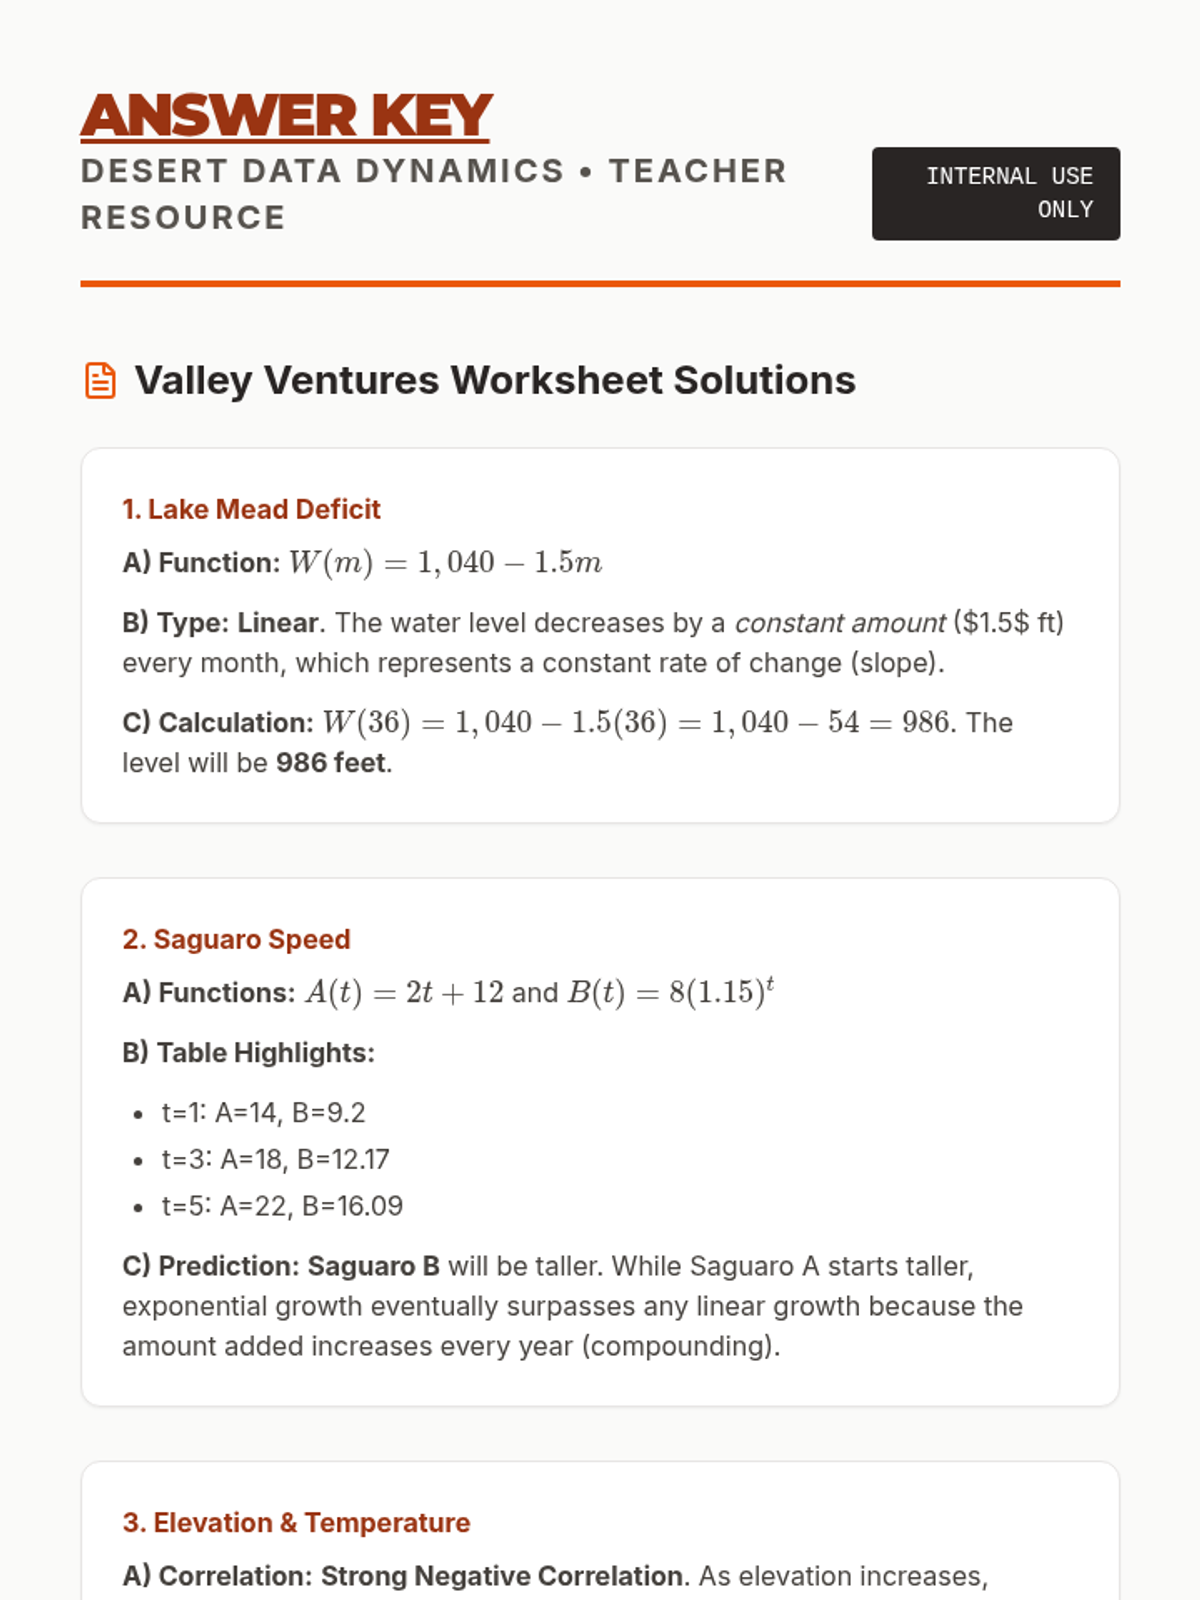
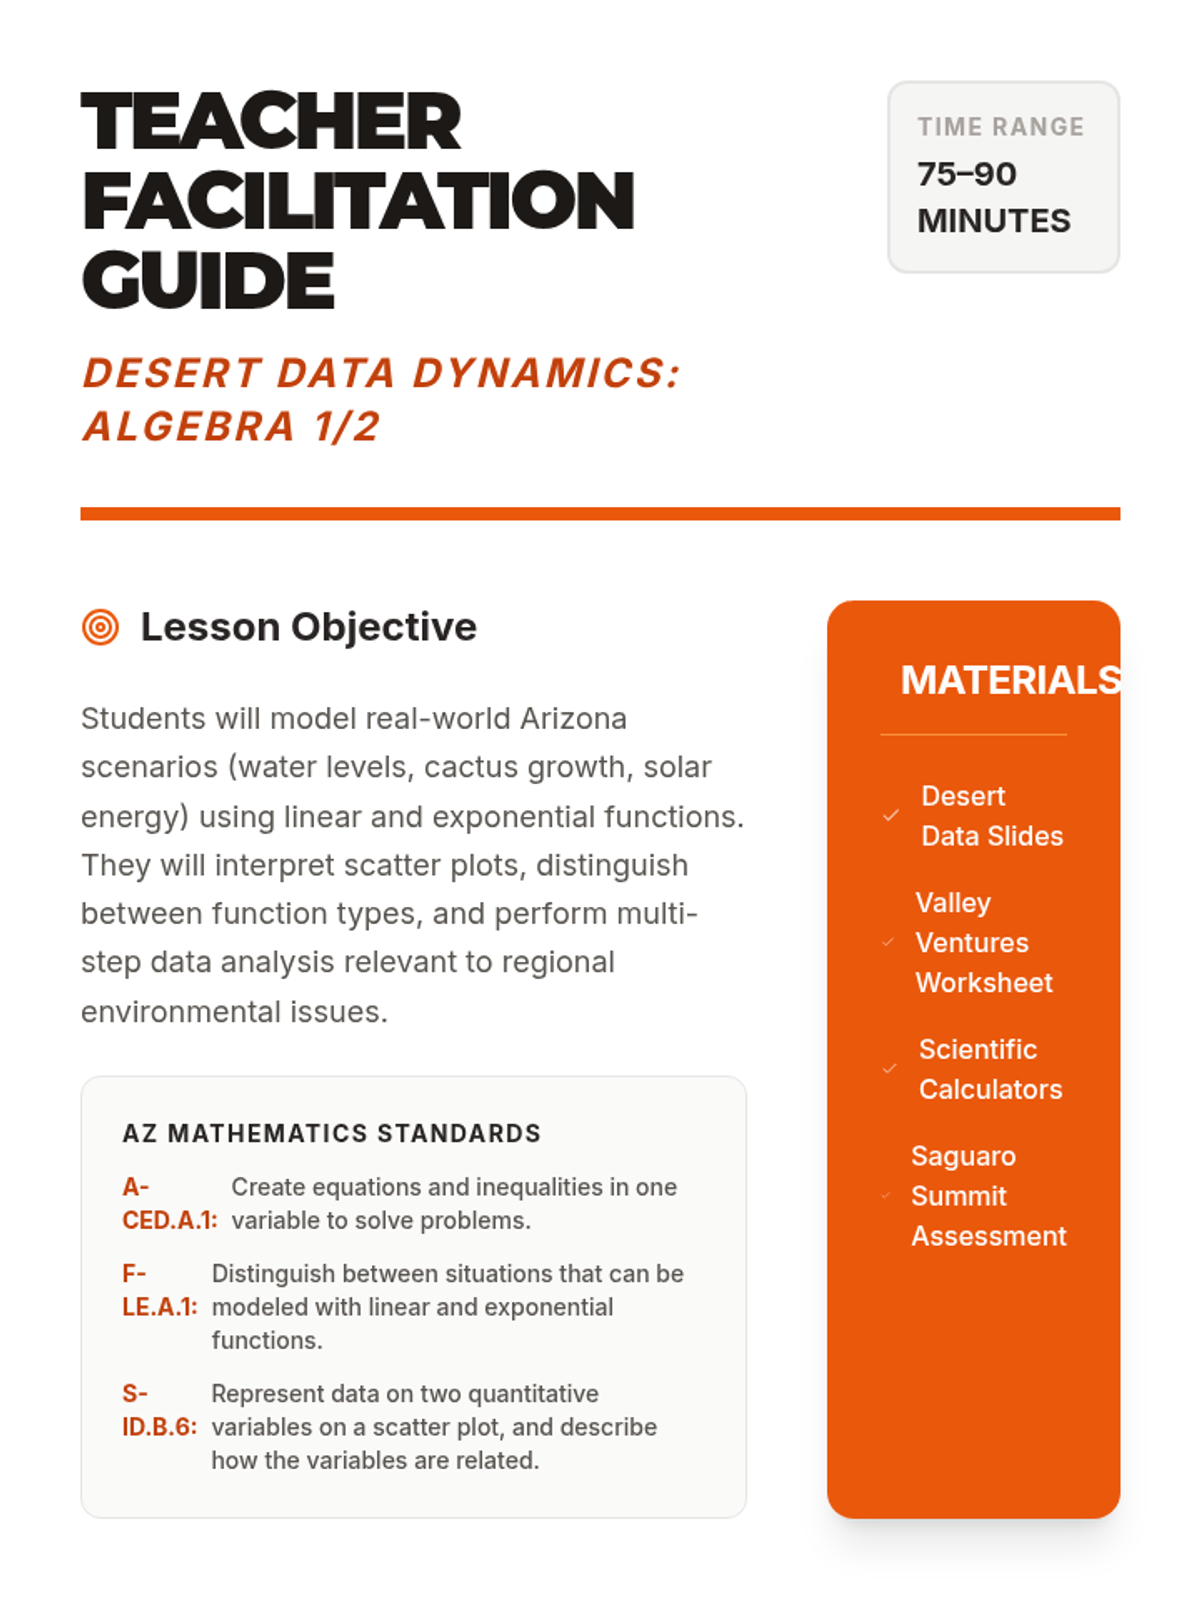
A comprehensive Algebra lesson focusing on modeling real-world Arizona scenarios using functions and data interpretation. Students will master identifying function types, constructing equations, and analyzing statistical trends.
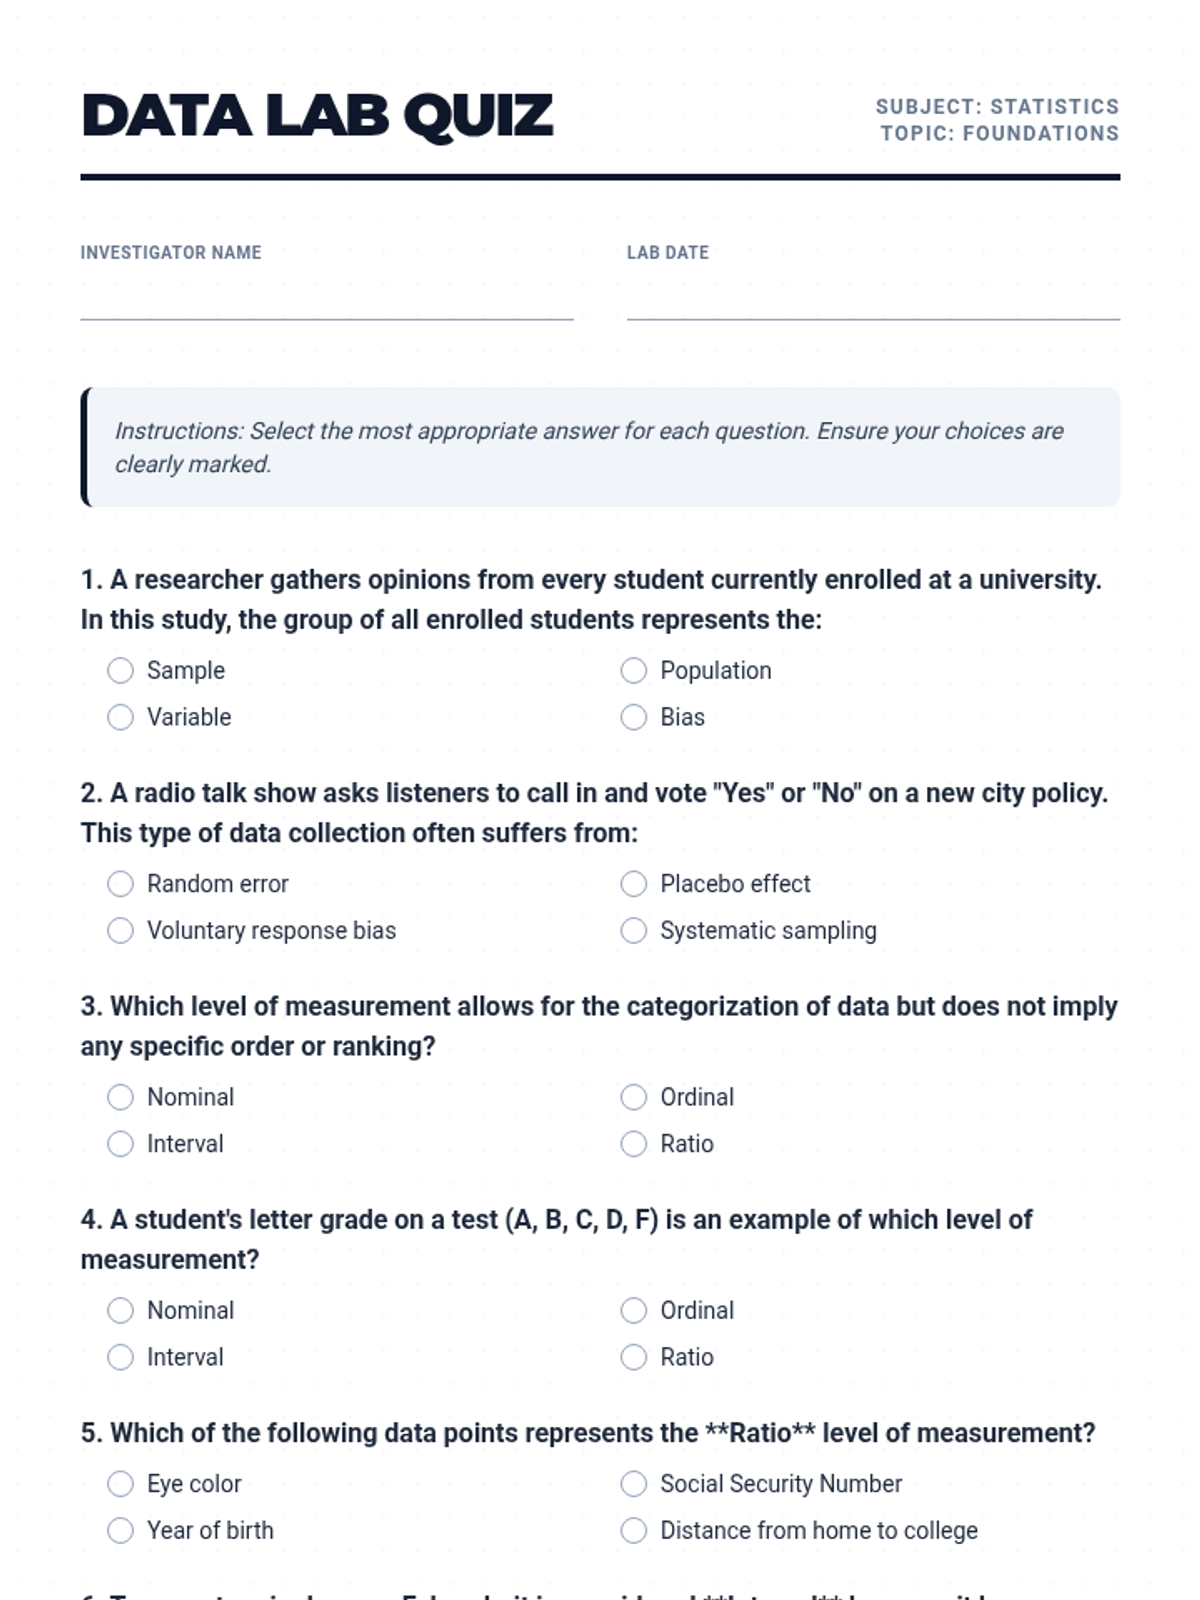
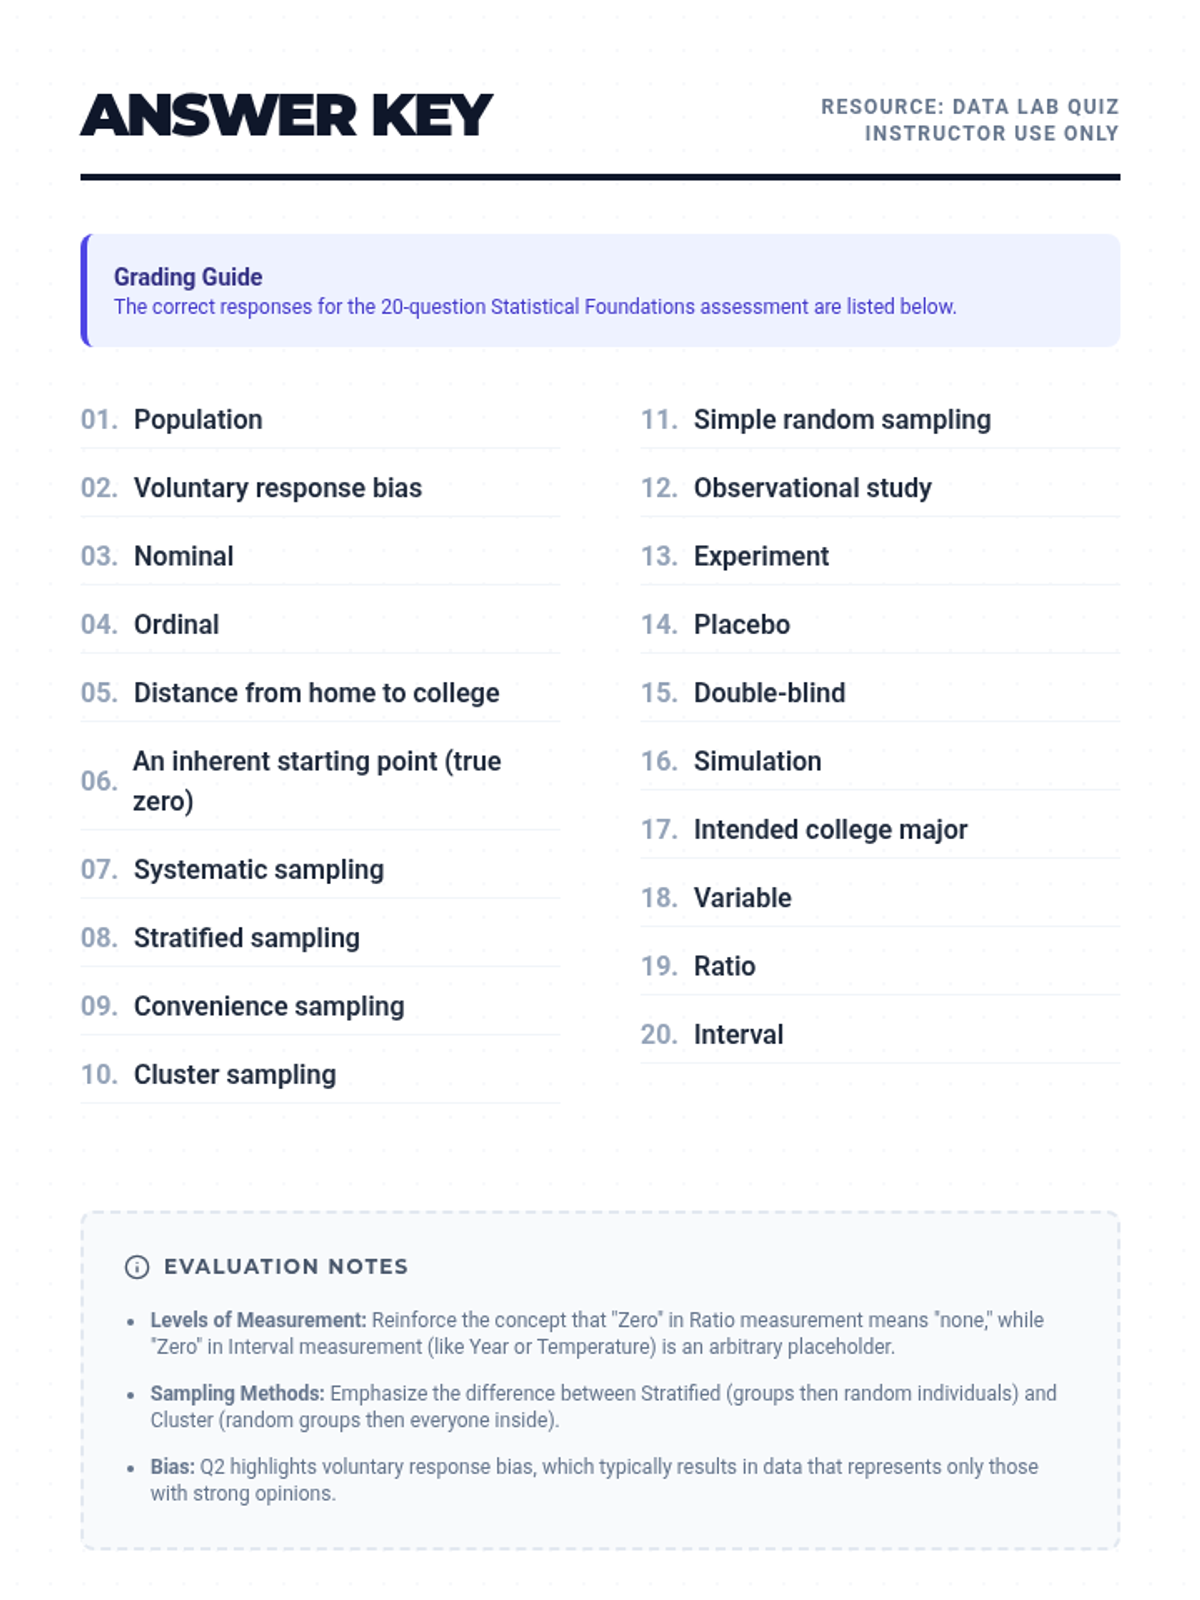
A comprehensive introduction to the fundamental concepts of statistics, including data classification, sampling methods, and experimental design.
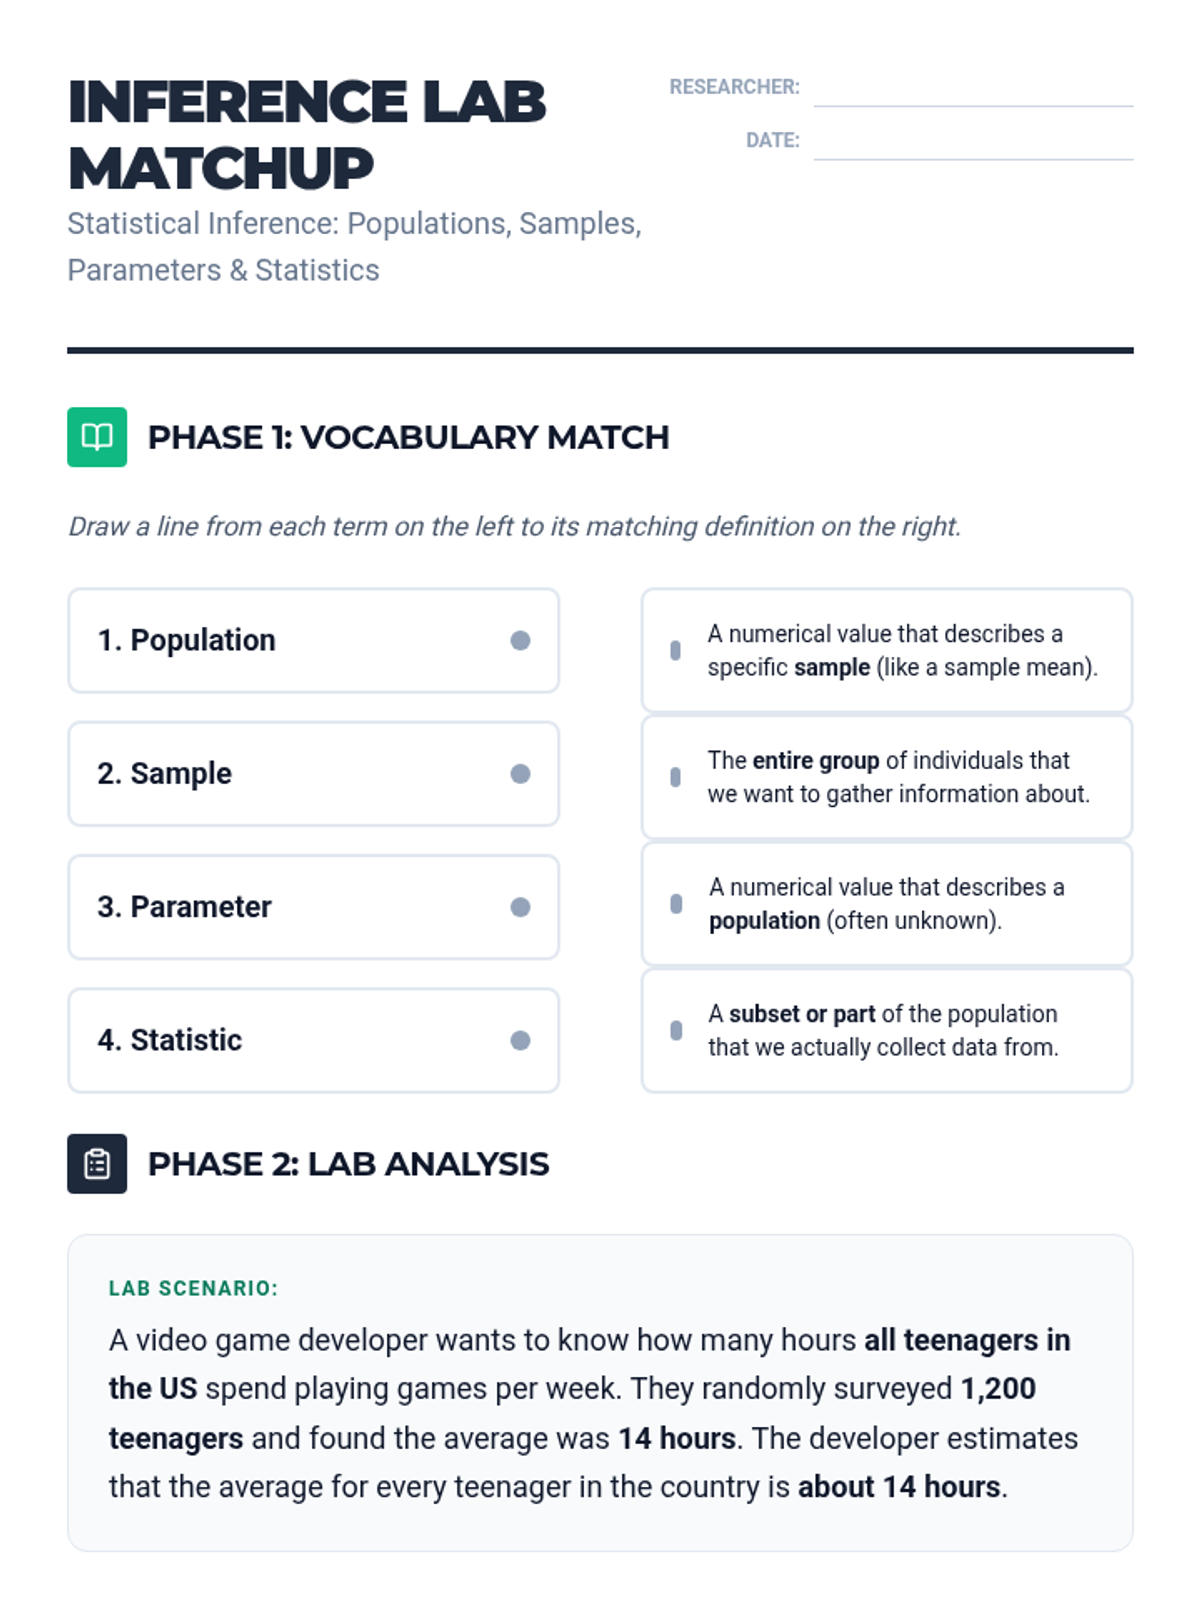
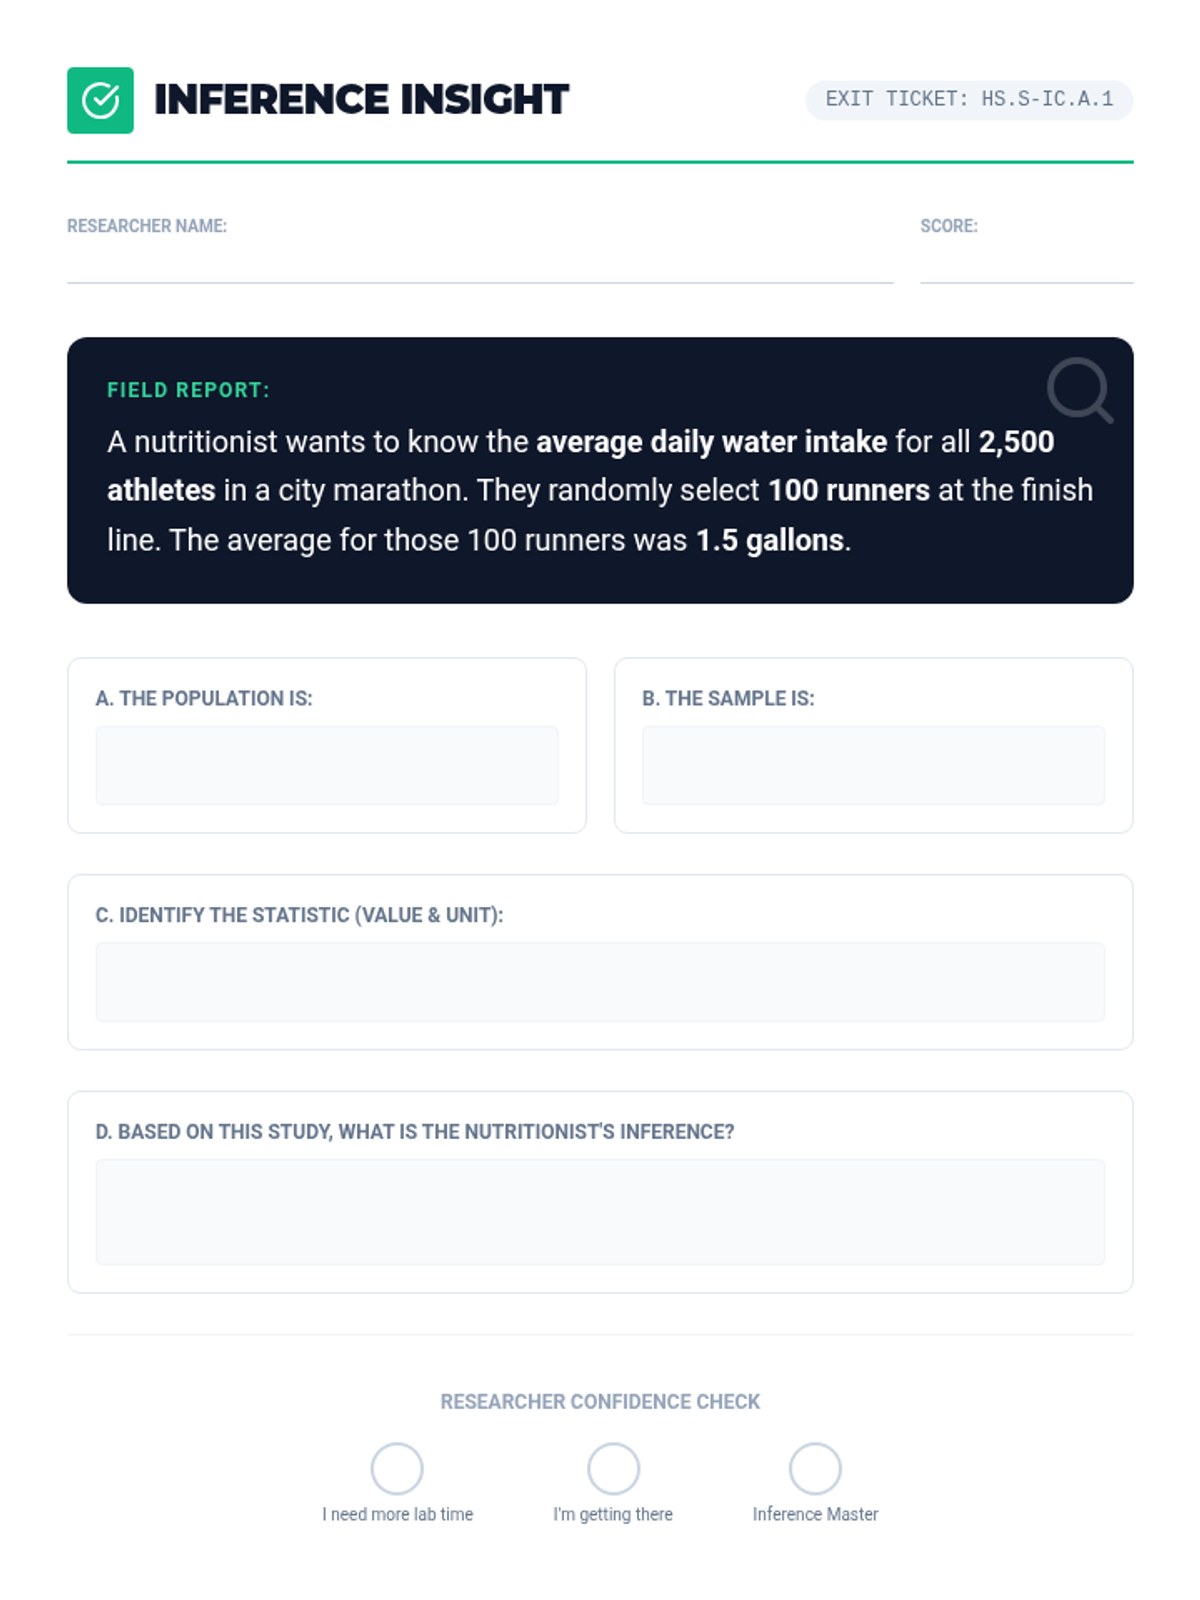
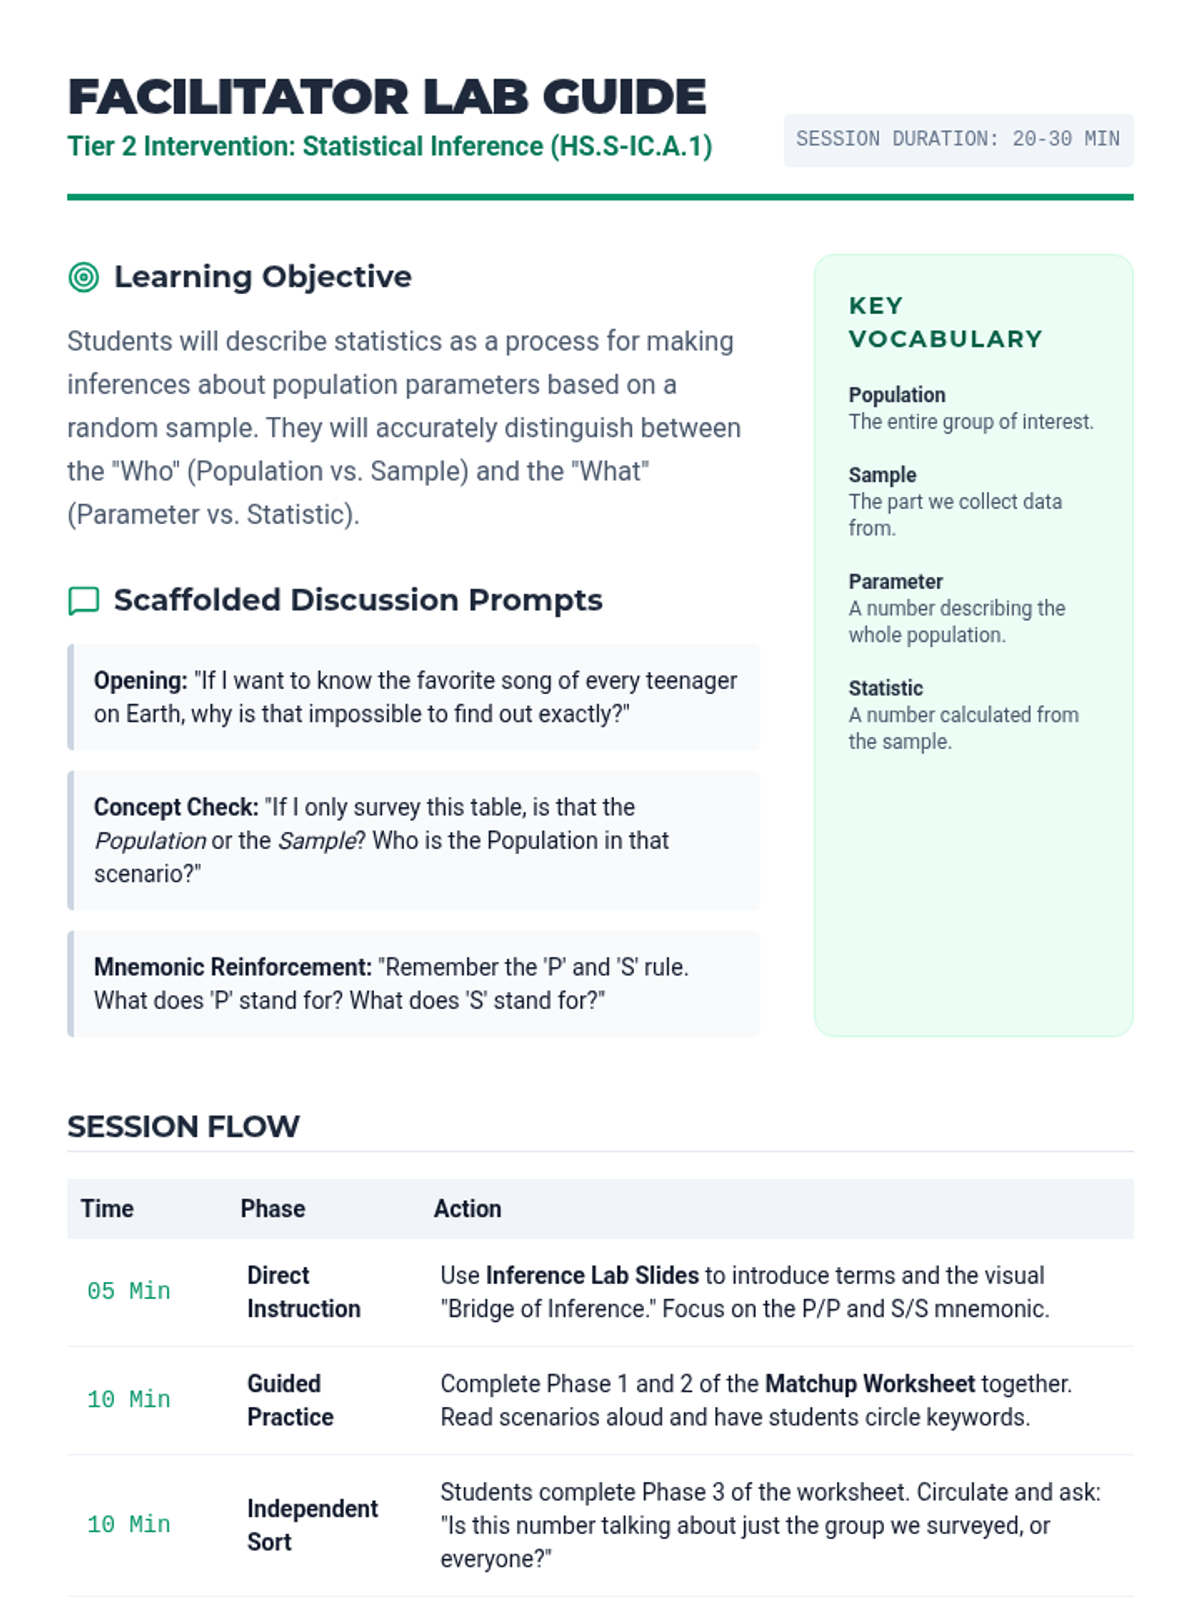
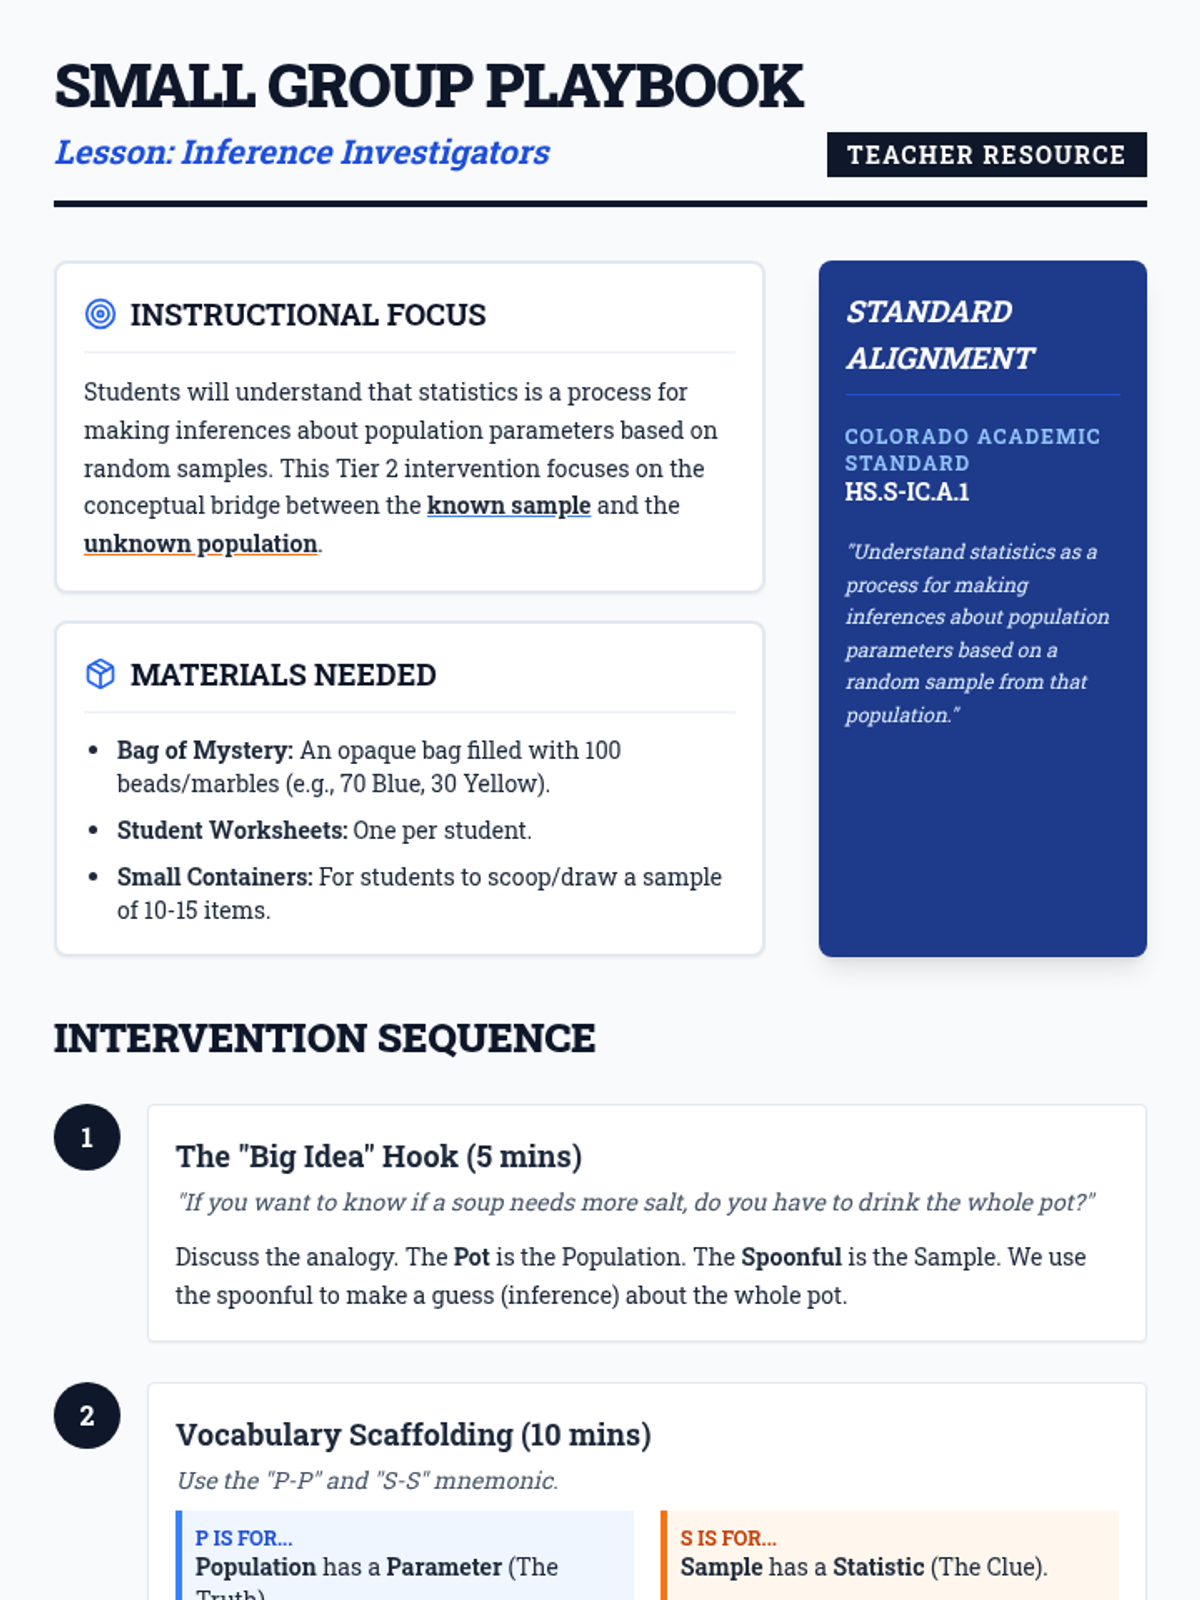
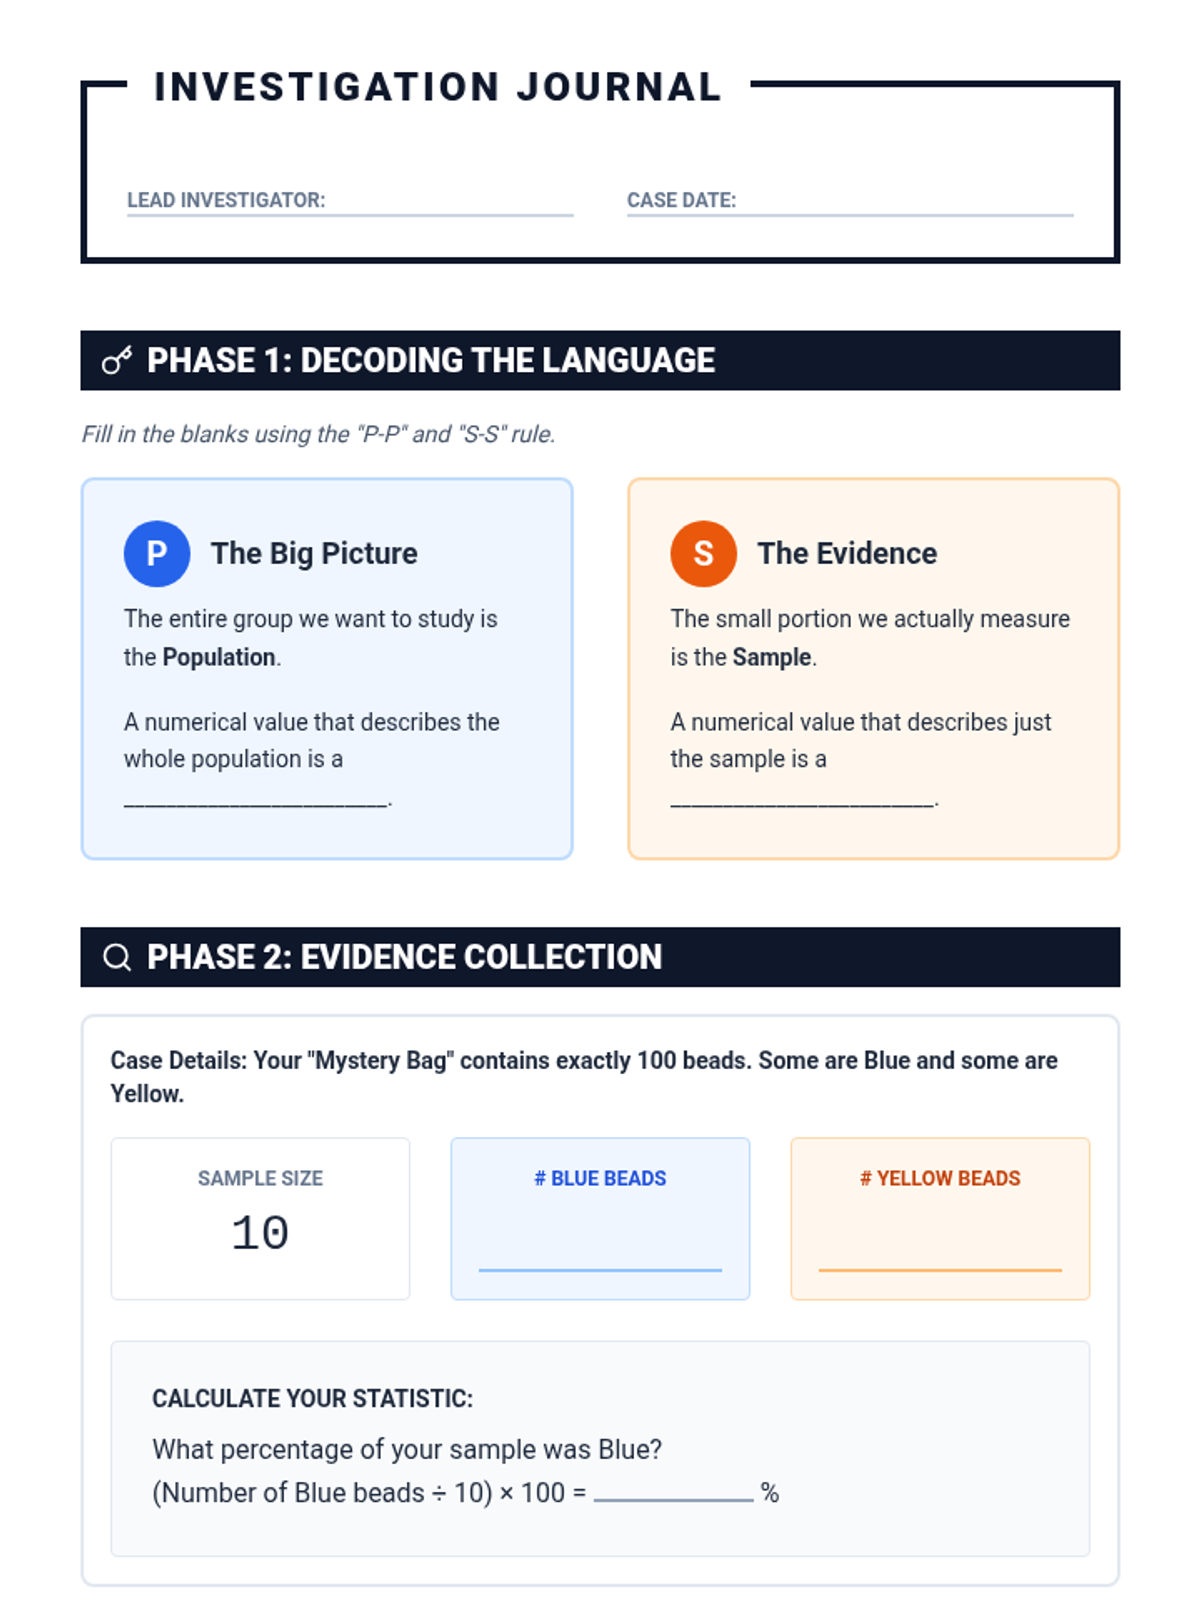
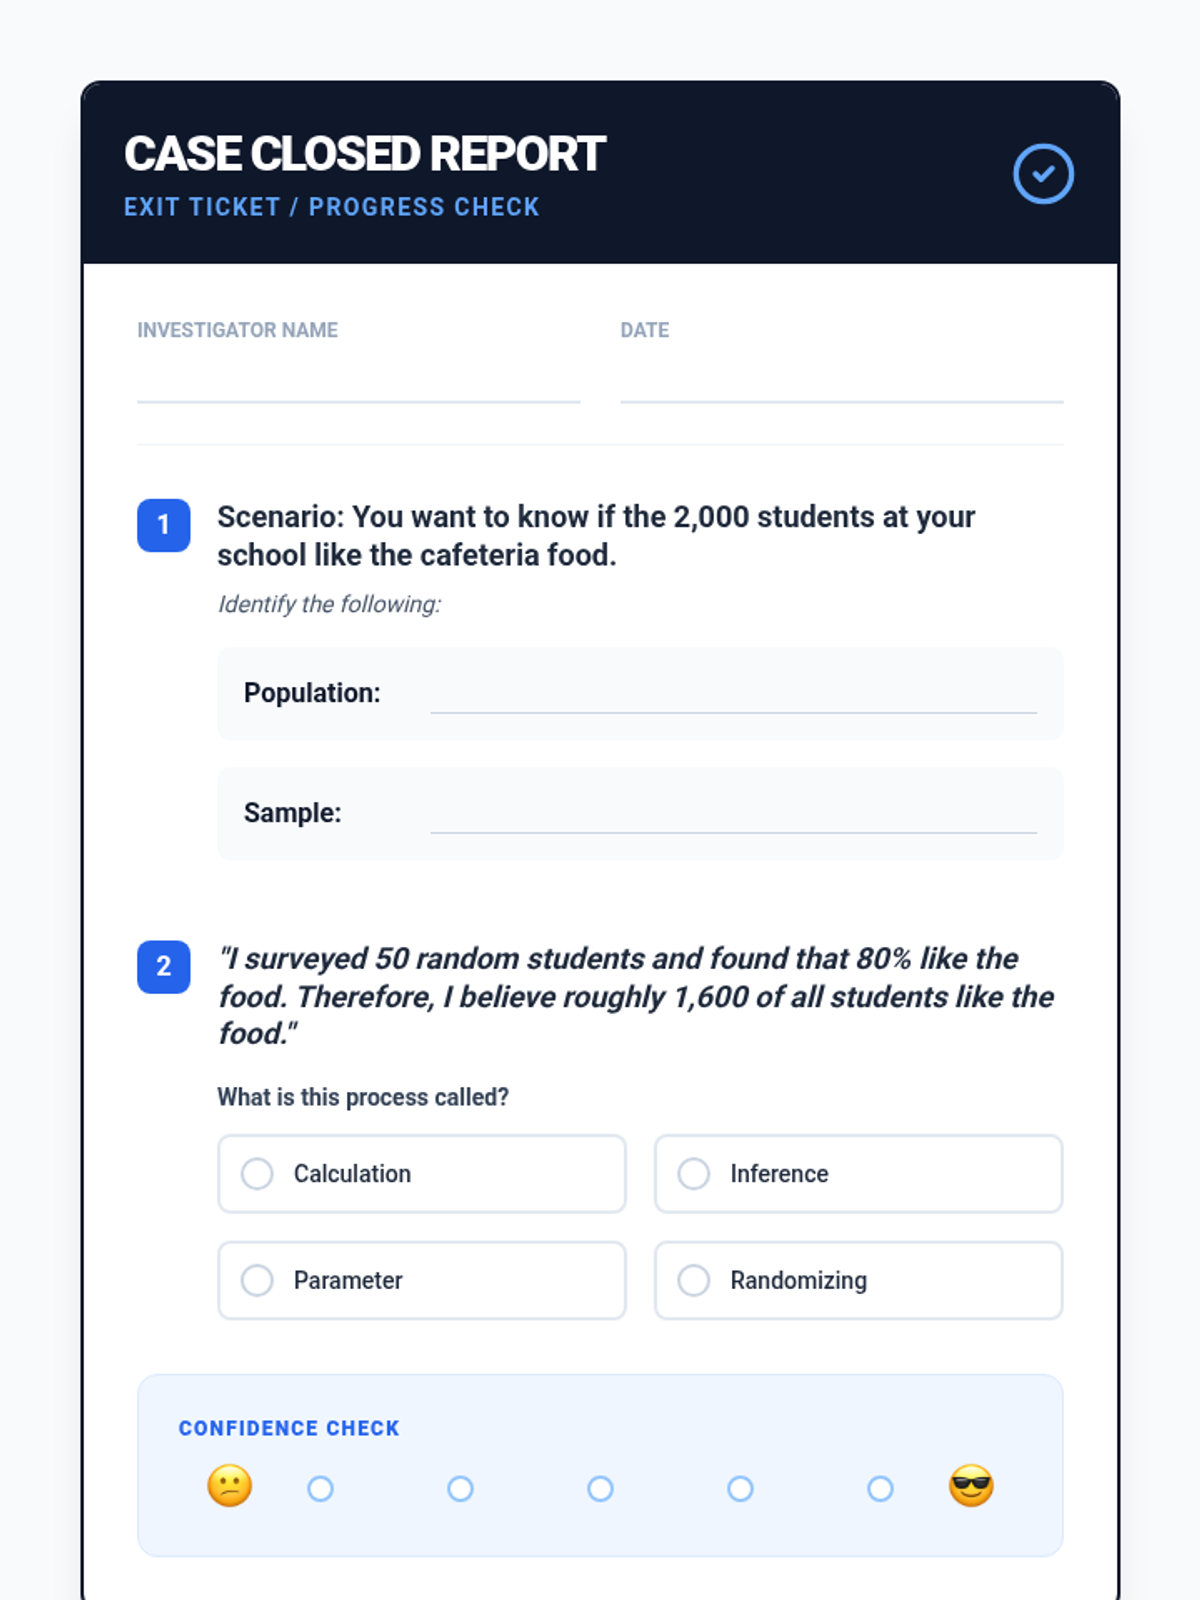
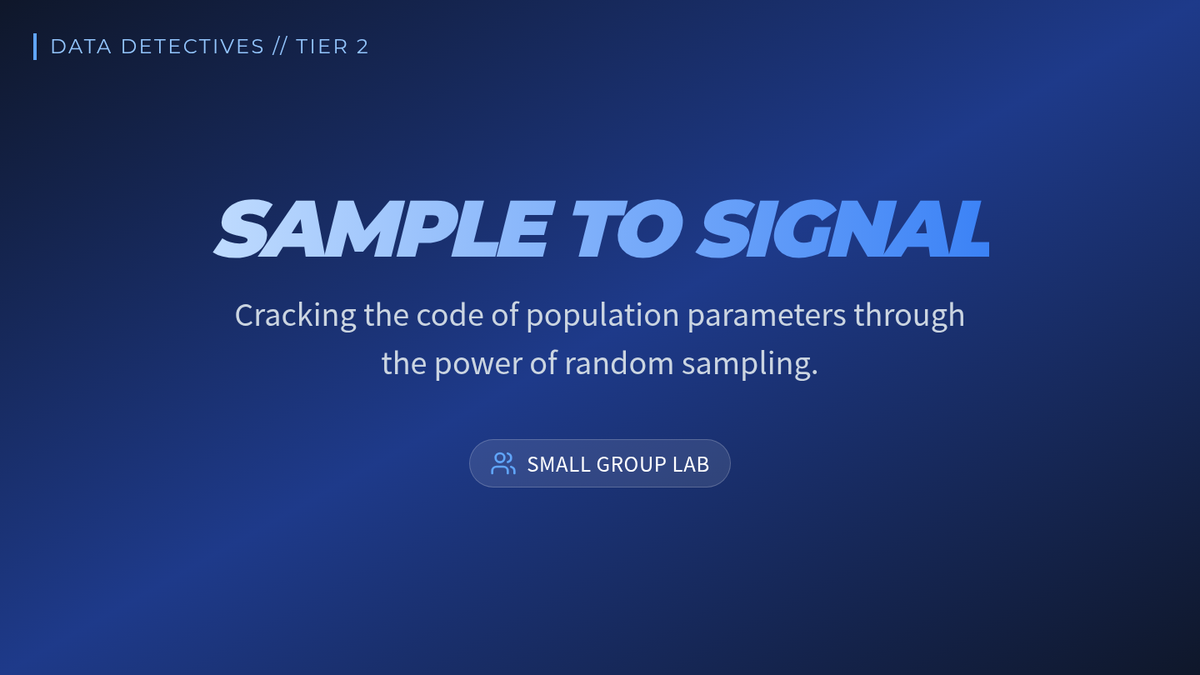
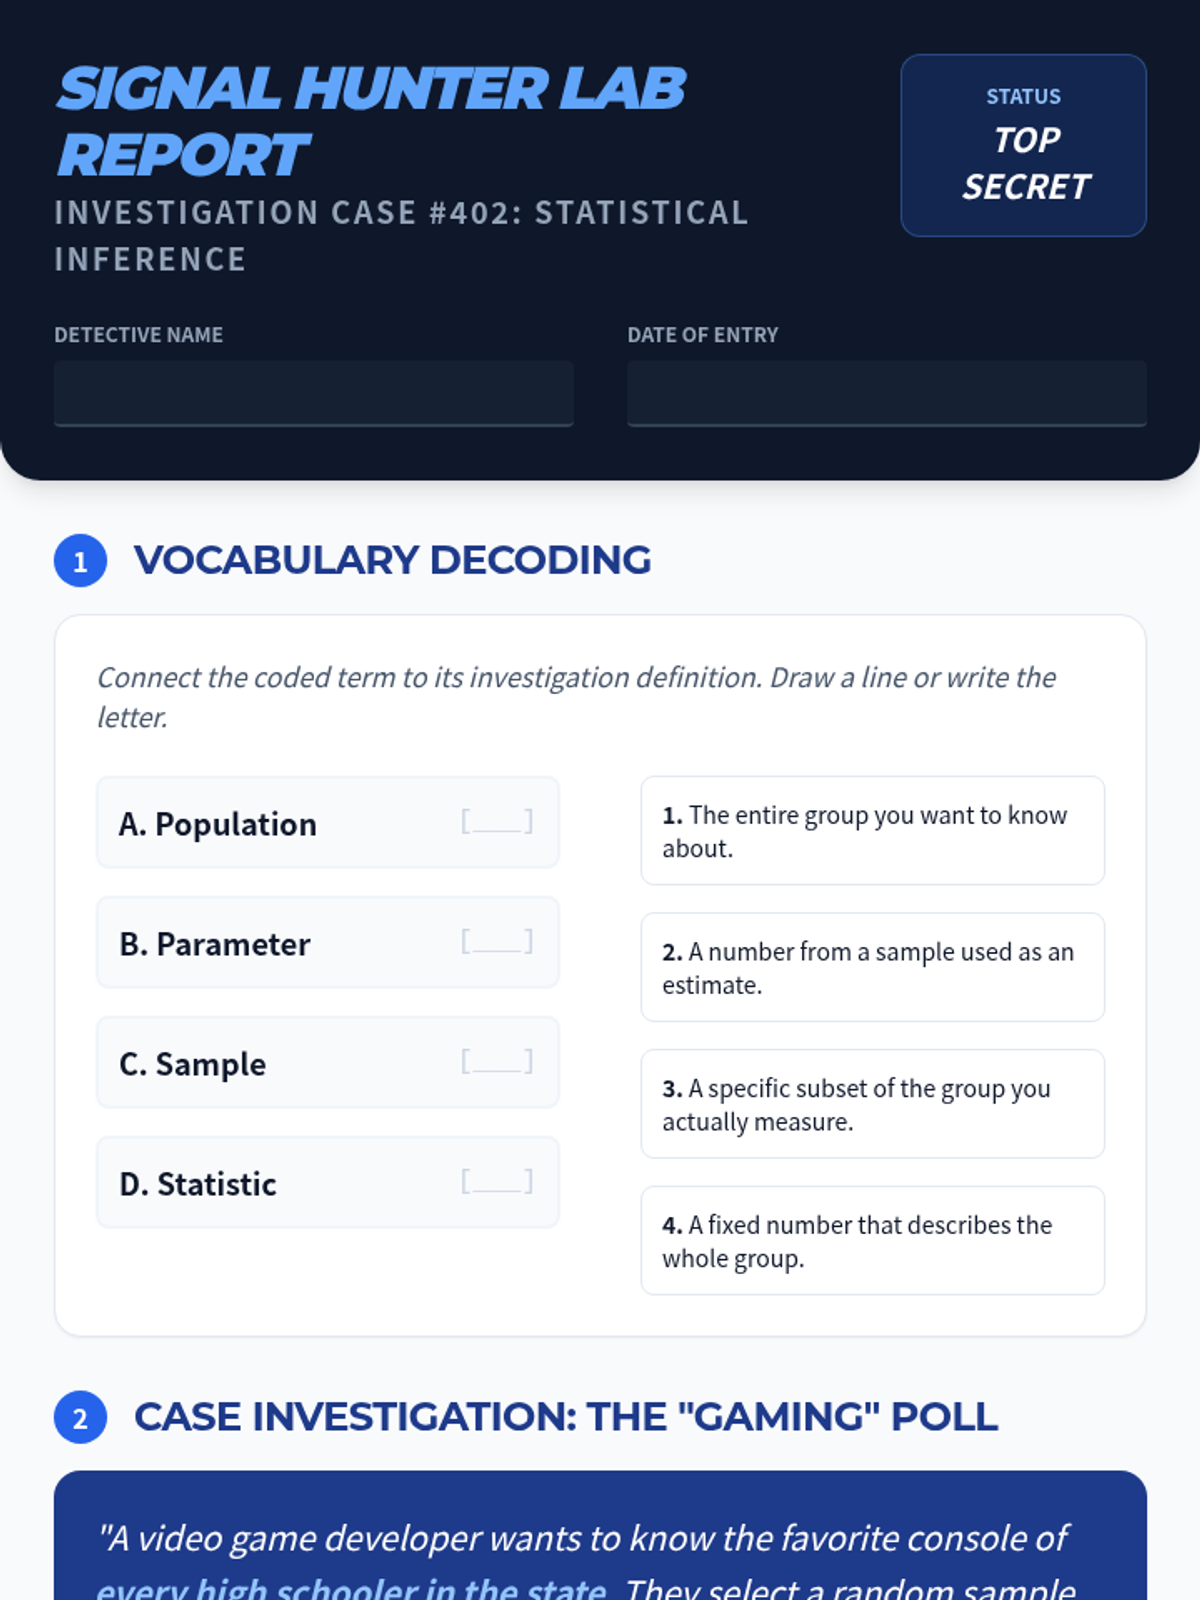
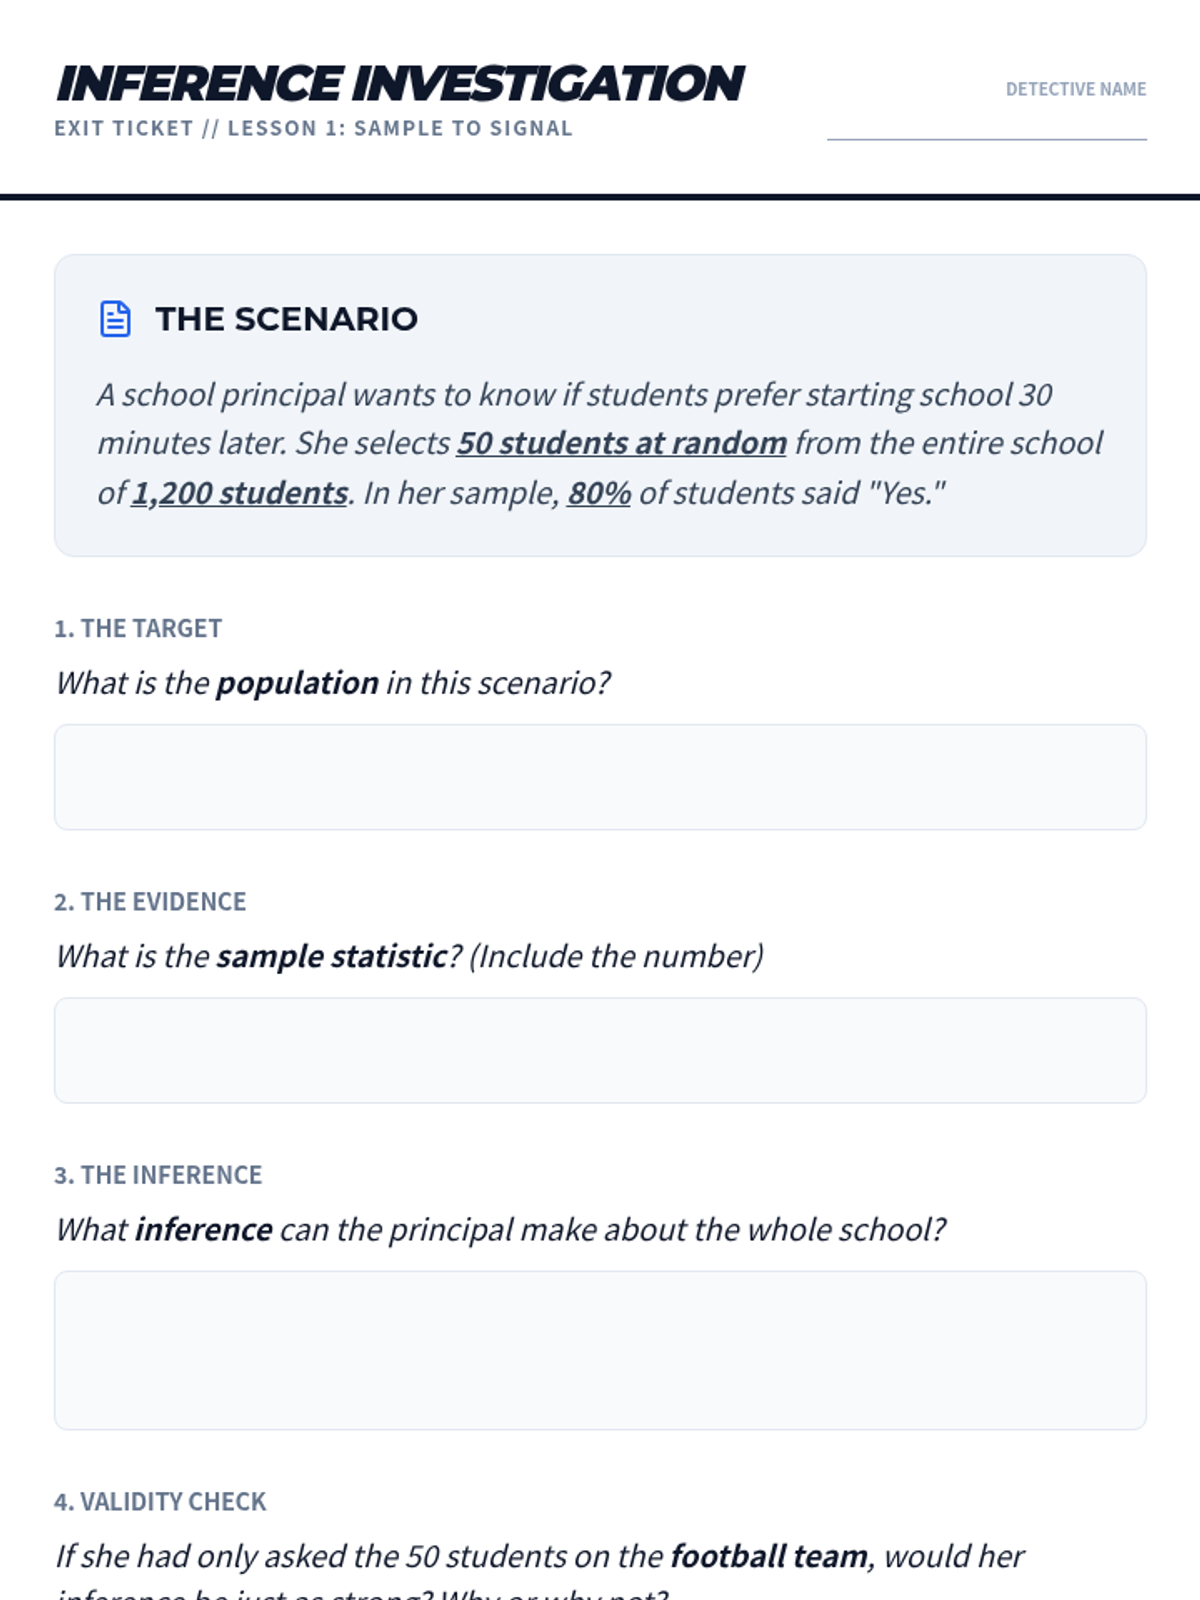
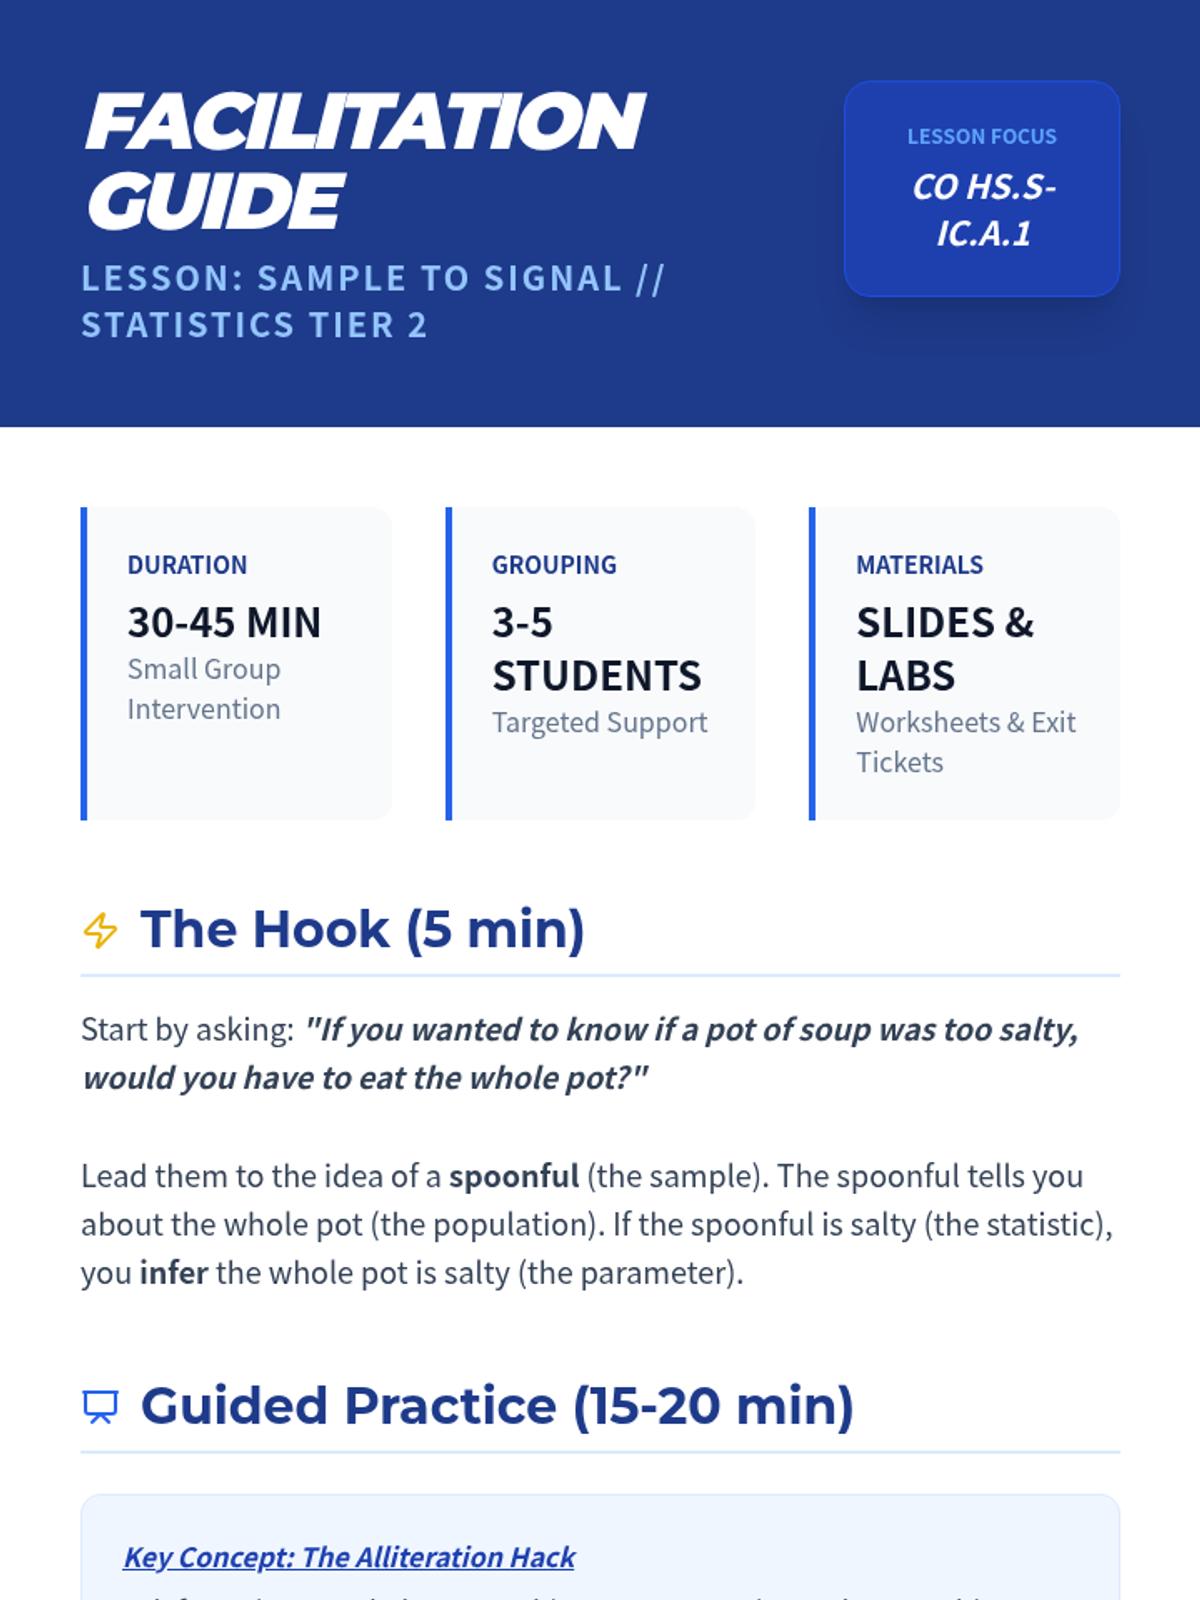
This lesson focuses on the statistical inference process, helping students distinguish between populations and samples, and parameters and statistics. It is designed for Tier 2 intervention, utilizing scaffolded vocabulary activities and scenario-based sorting to build conceptual understanding.
A Tier 2 intervention lesson focusing on the core logic of statistical inference. Students move from physical sampling to conceptual understanding of how samples represent populations.
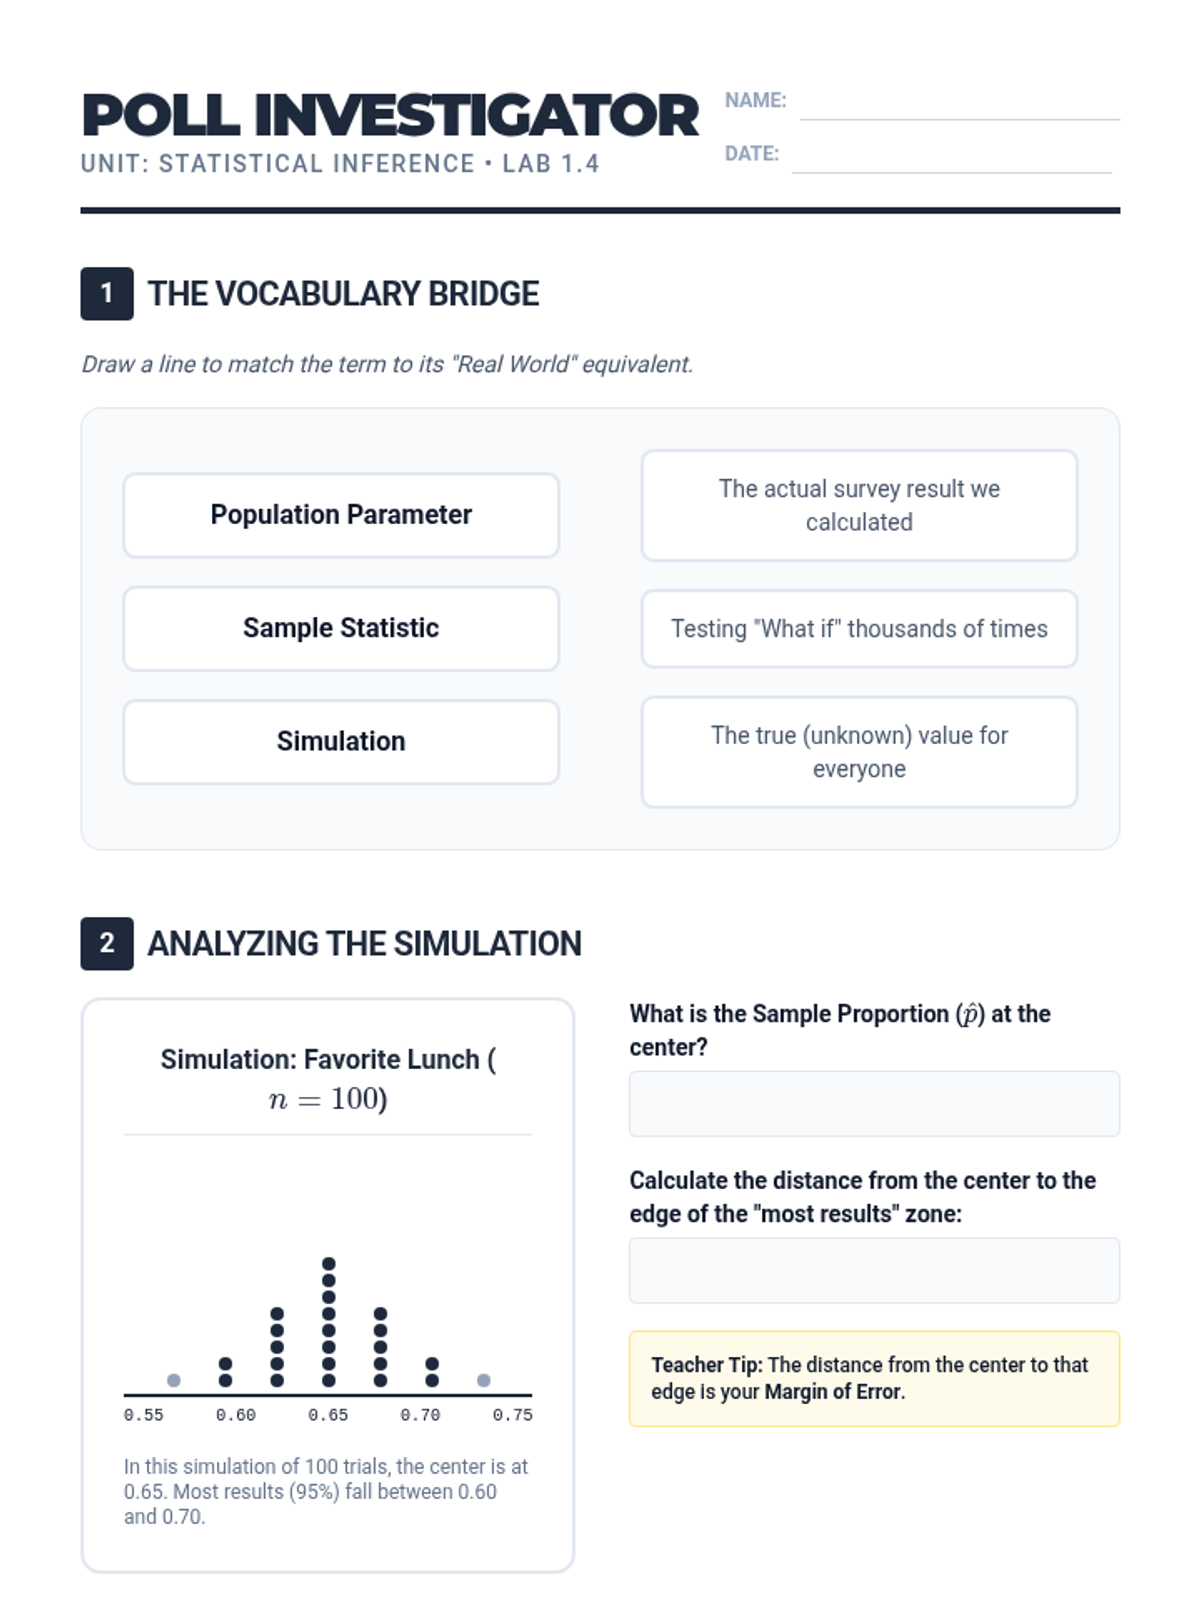
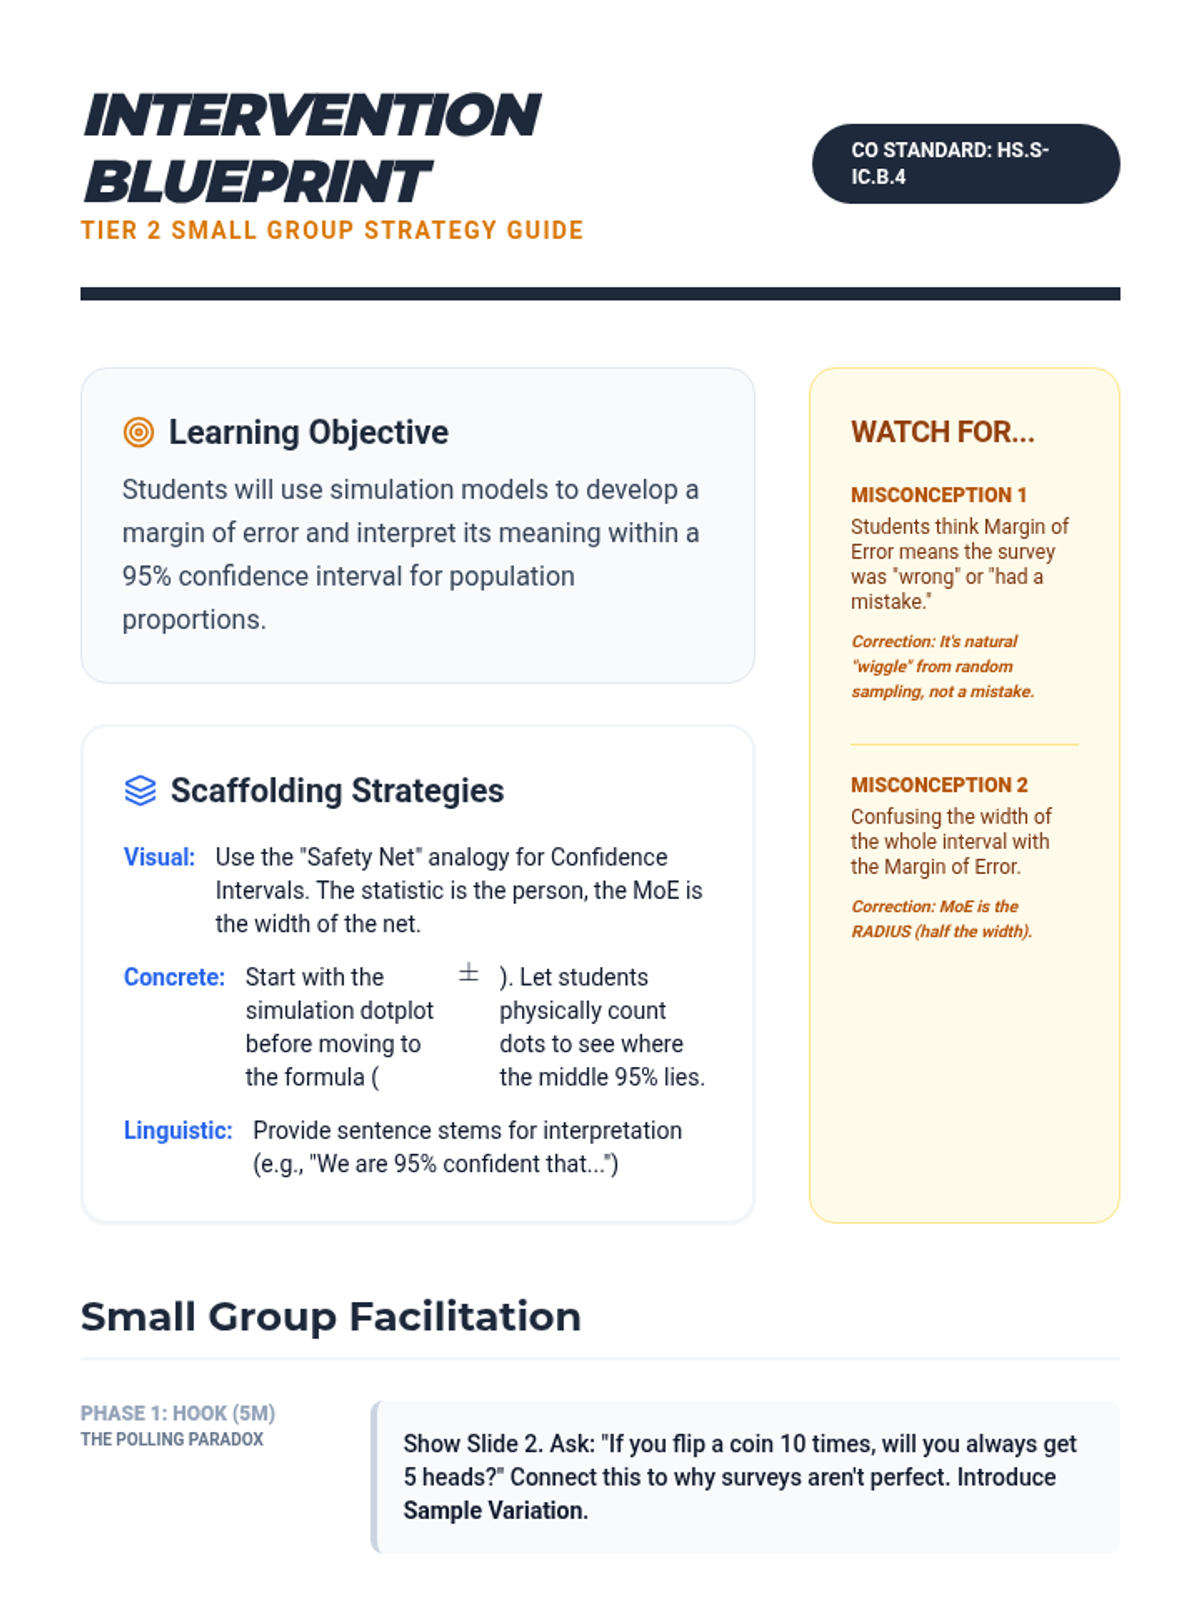
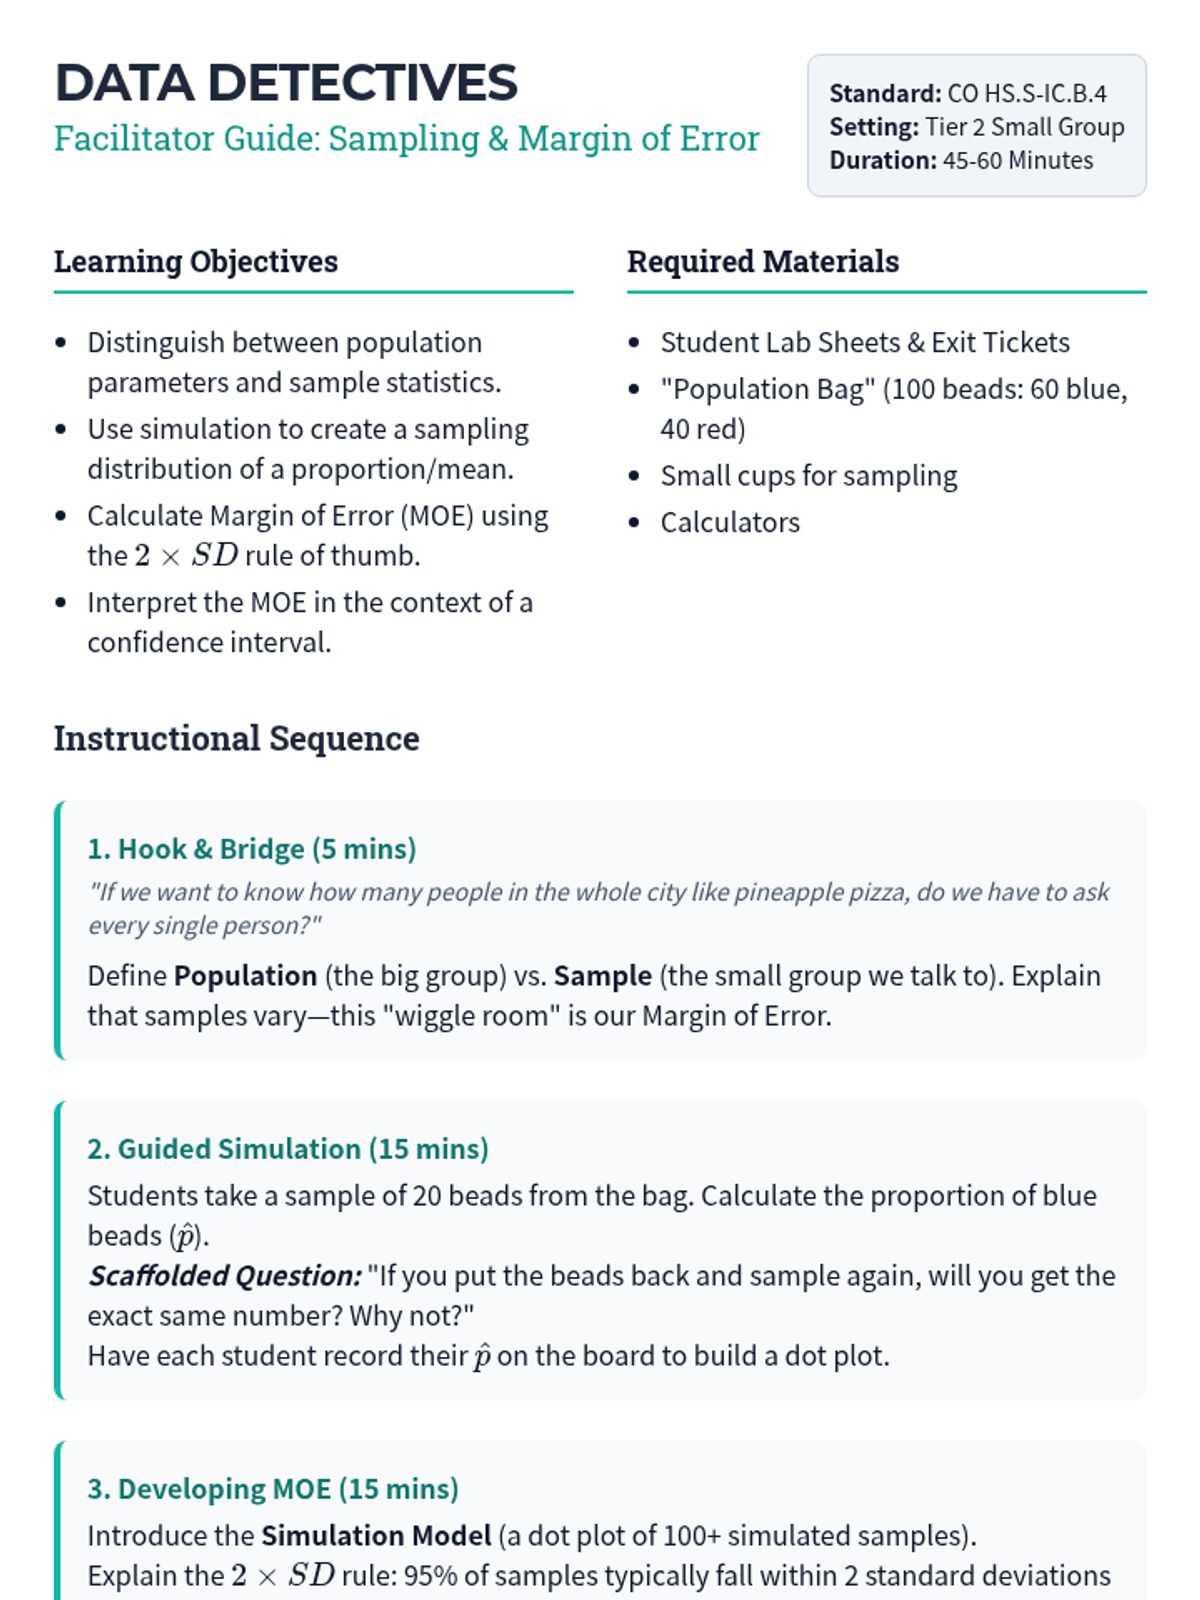
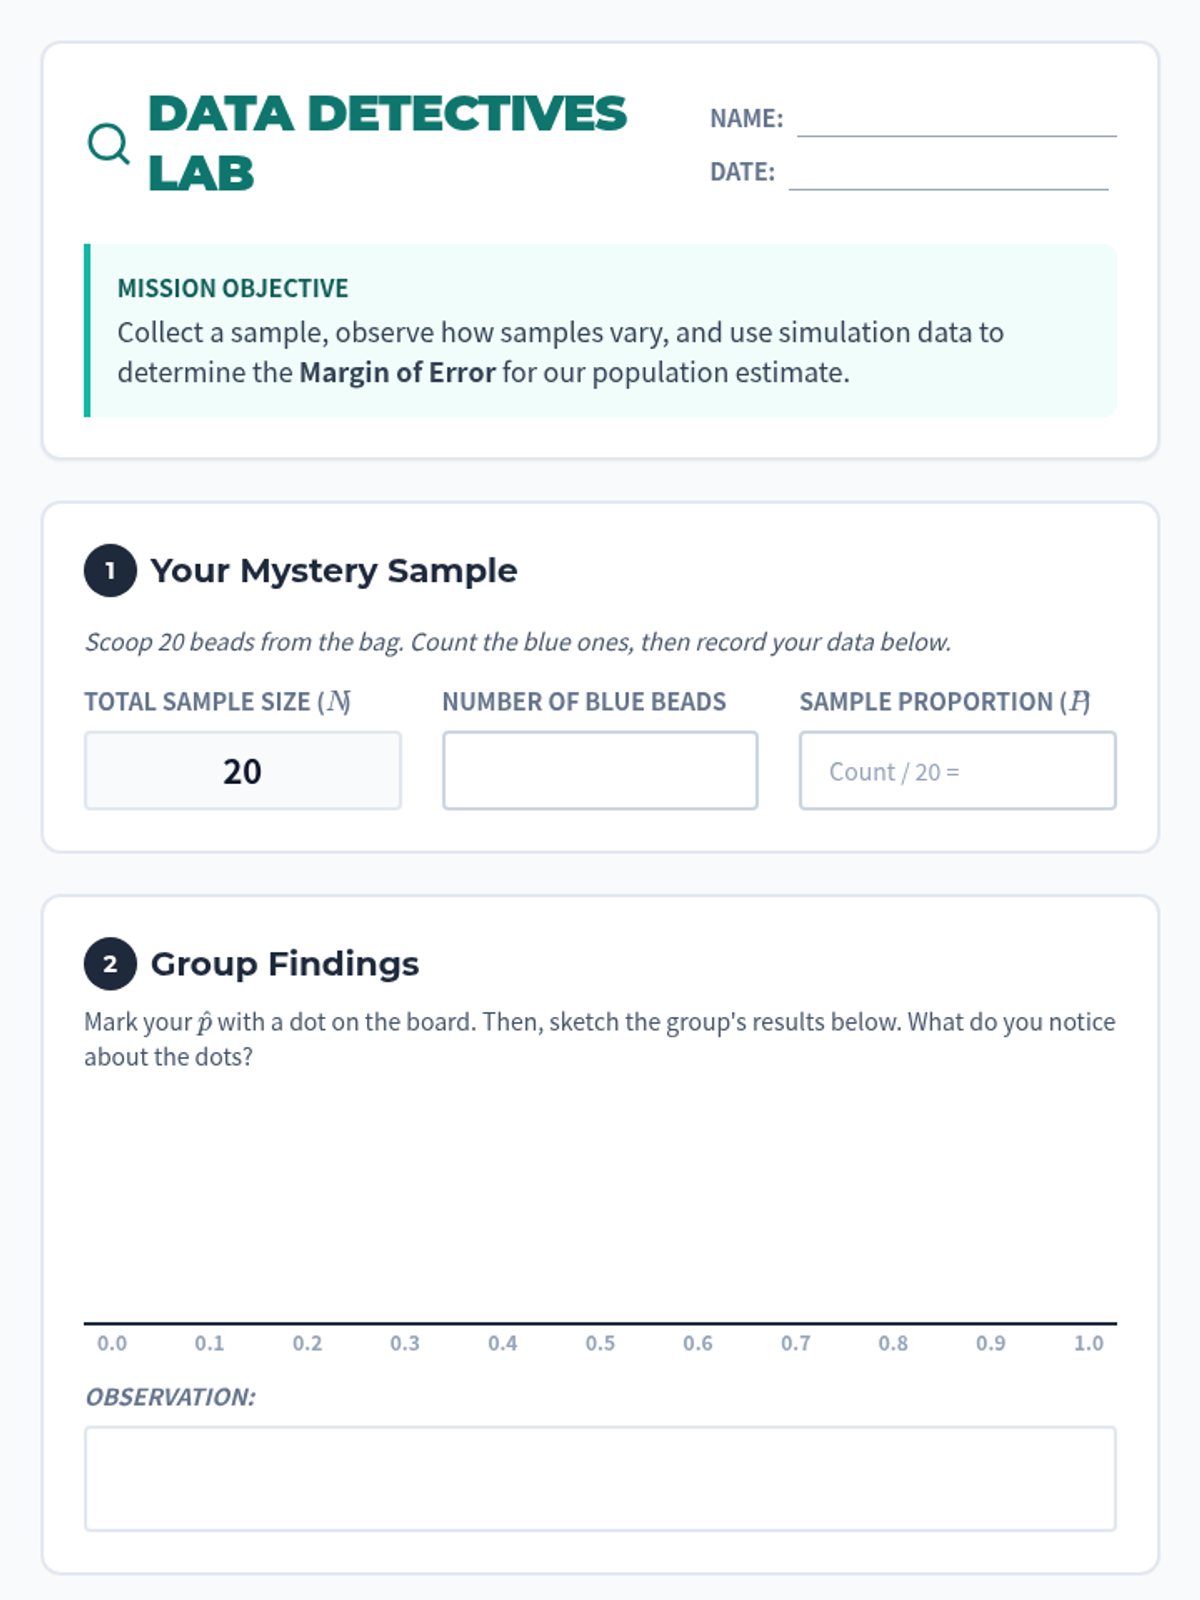
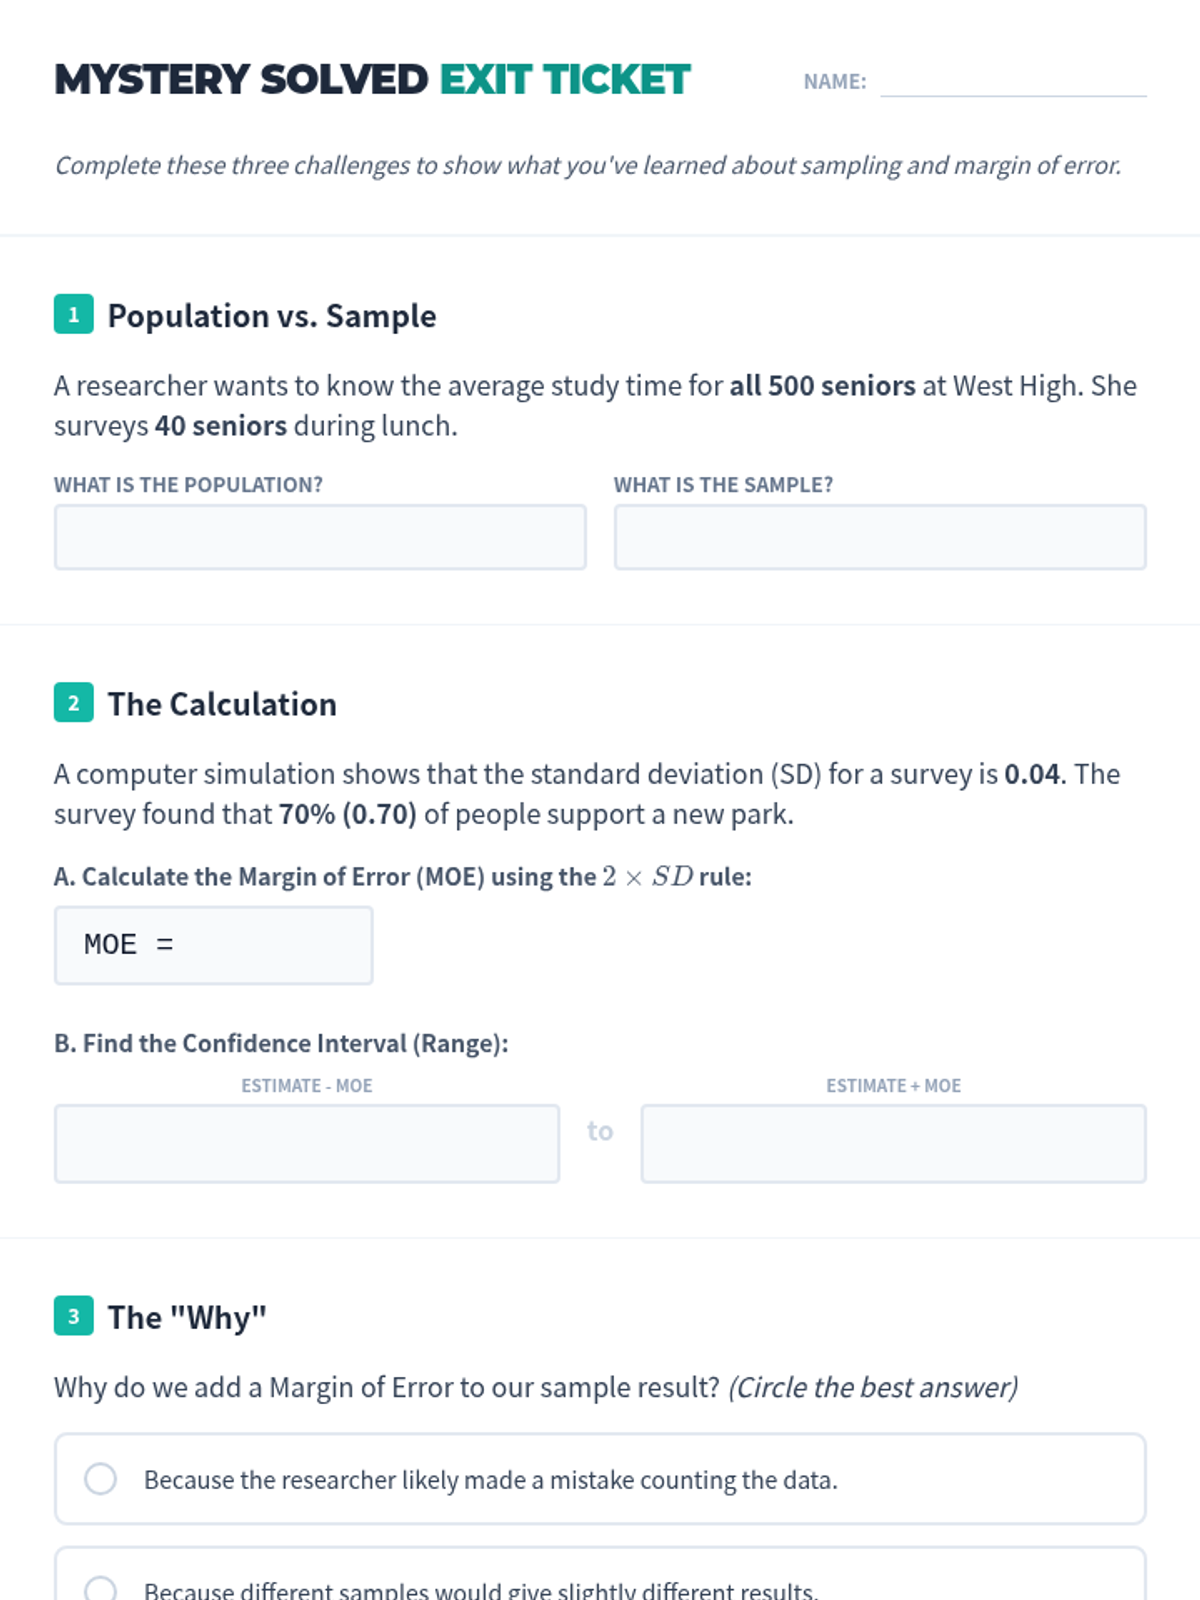
A Tier 2 intervention lesson focusing on using sample data to estimate population parameters. Students use simulations to develop and interpret margin of error in real-world polling contexts.
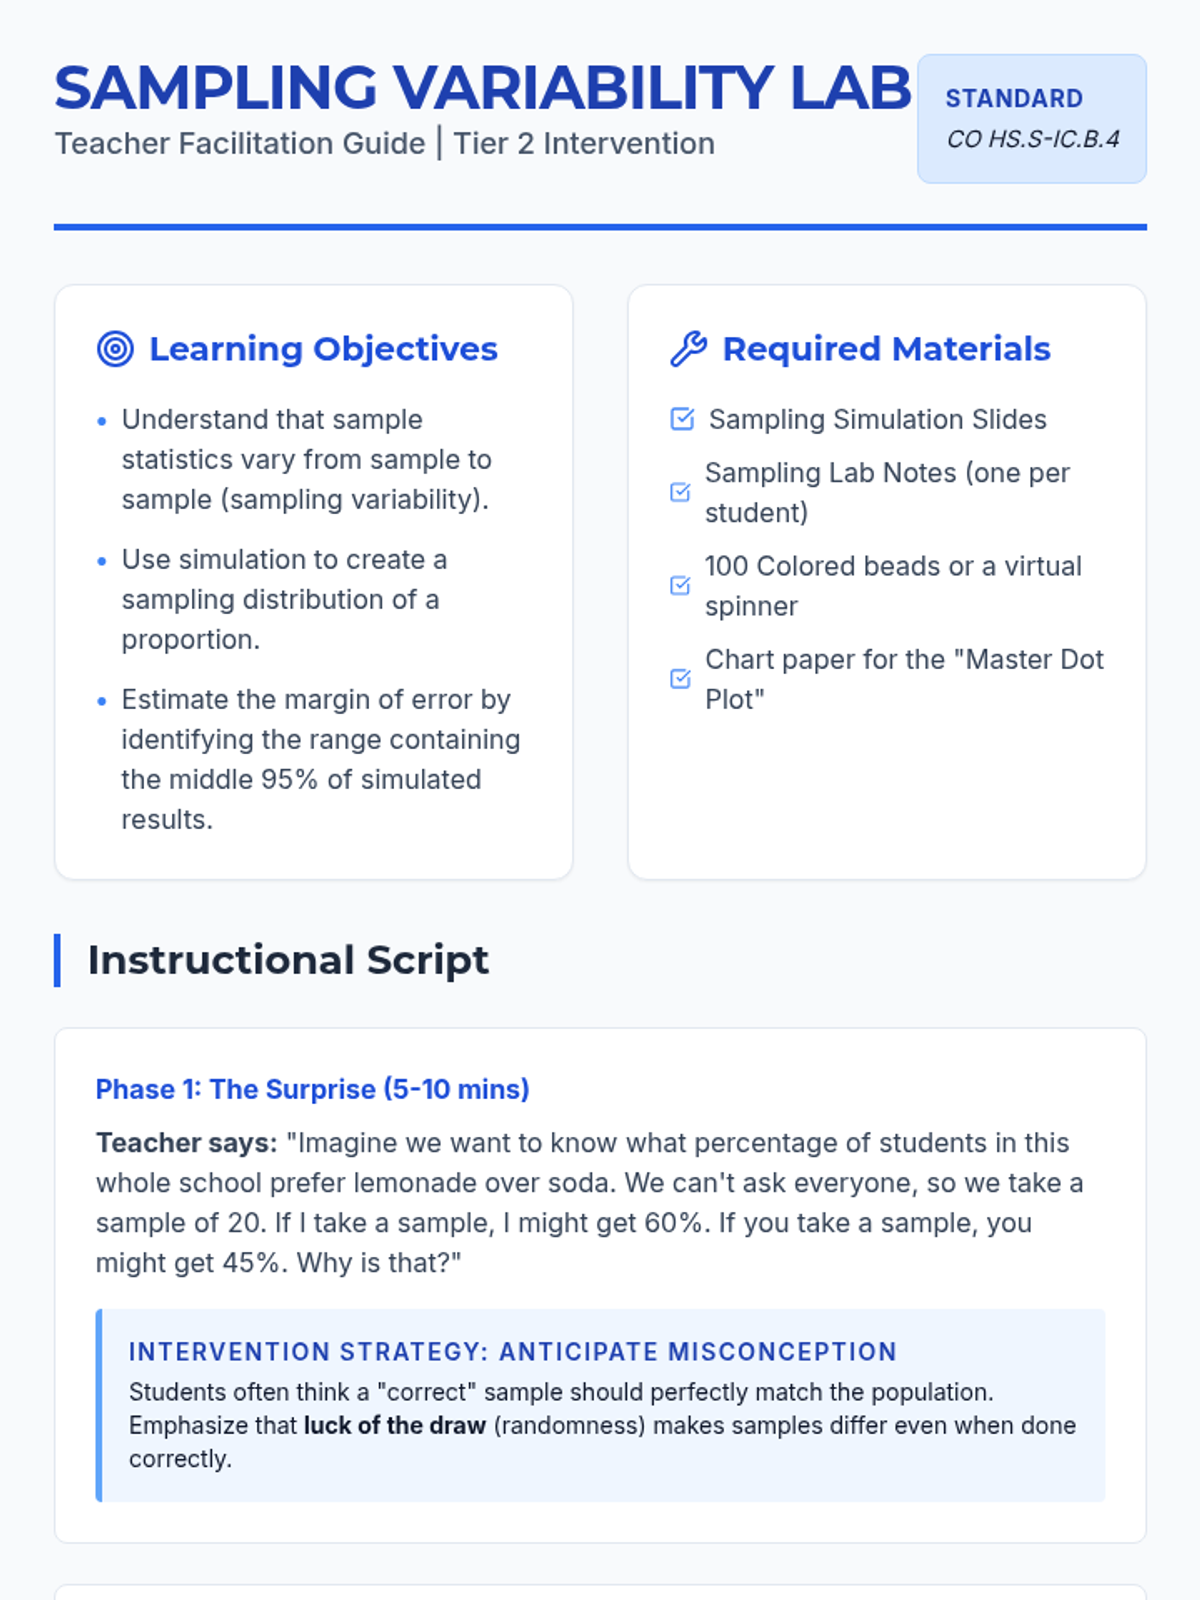
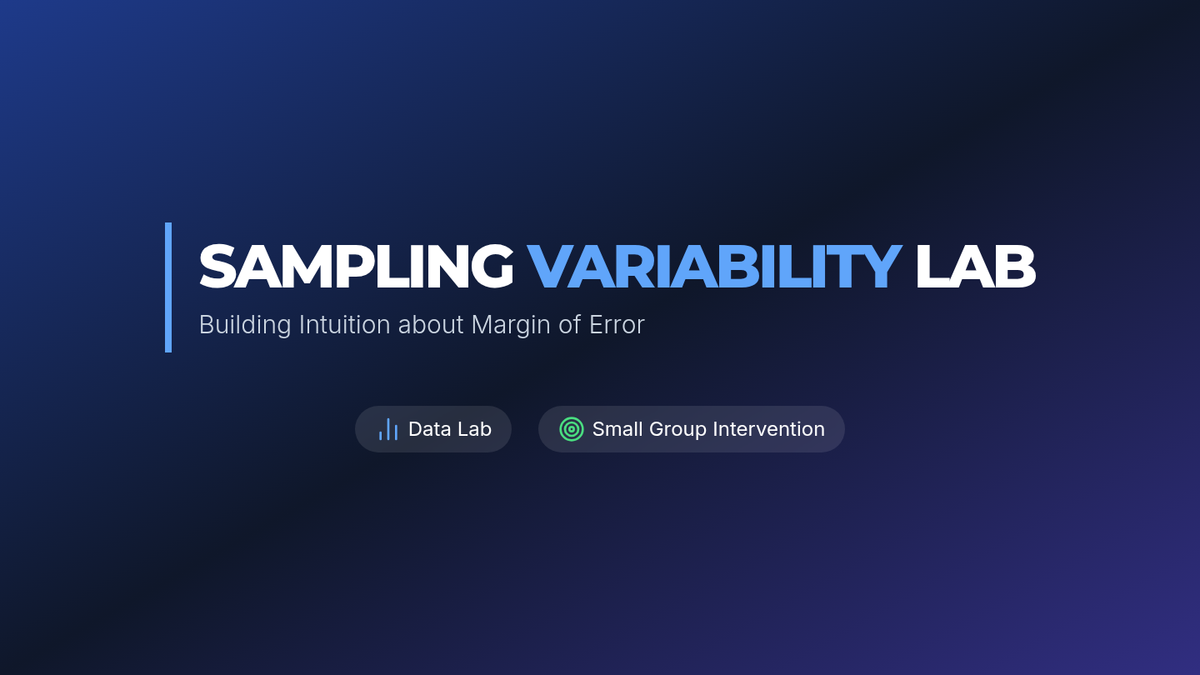
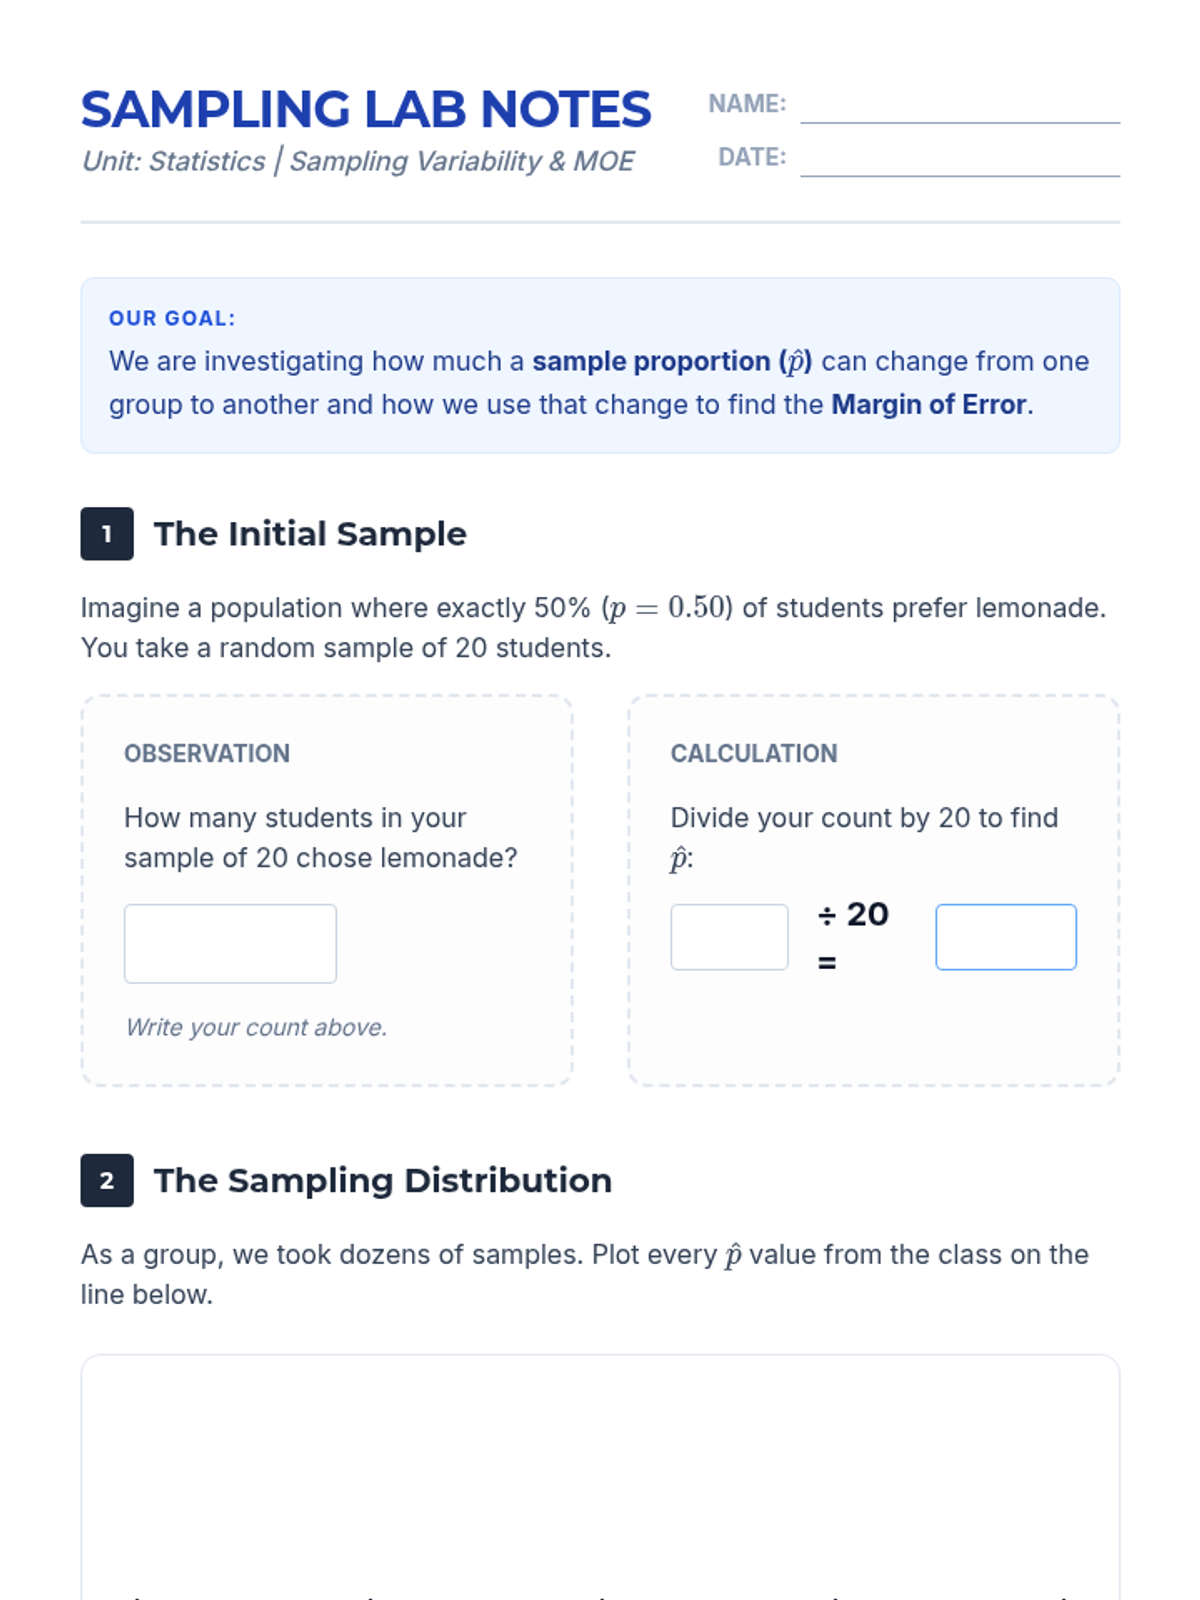
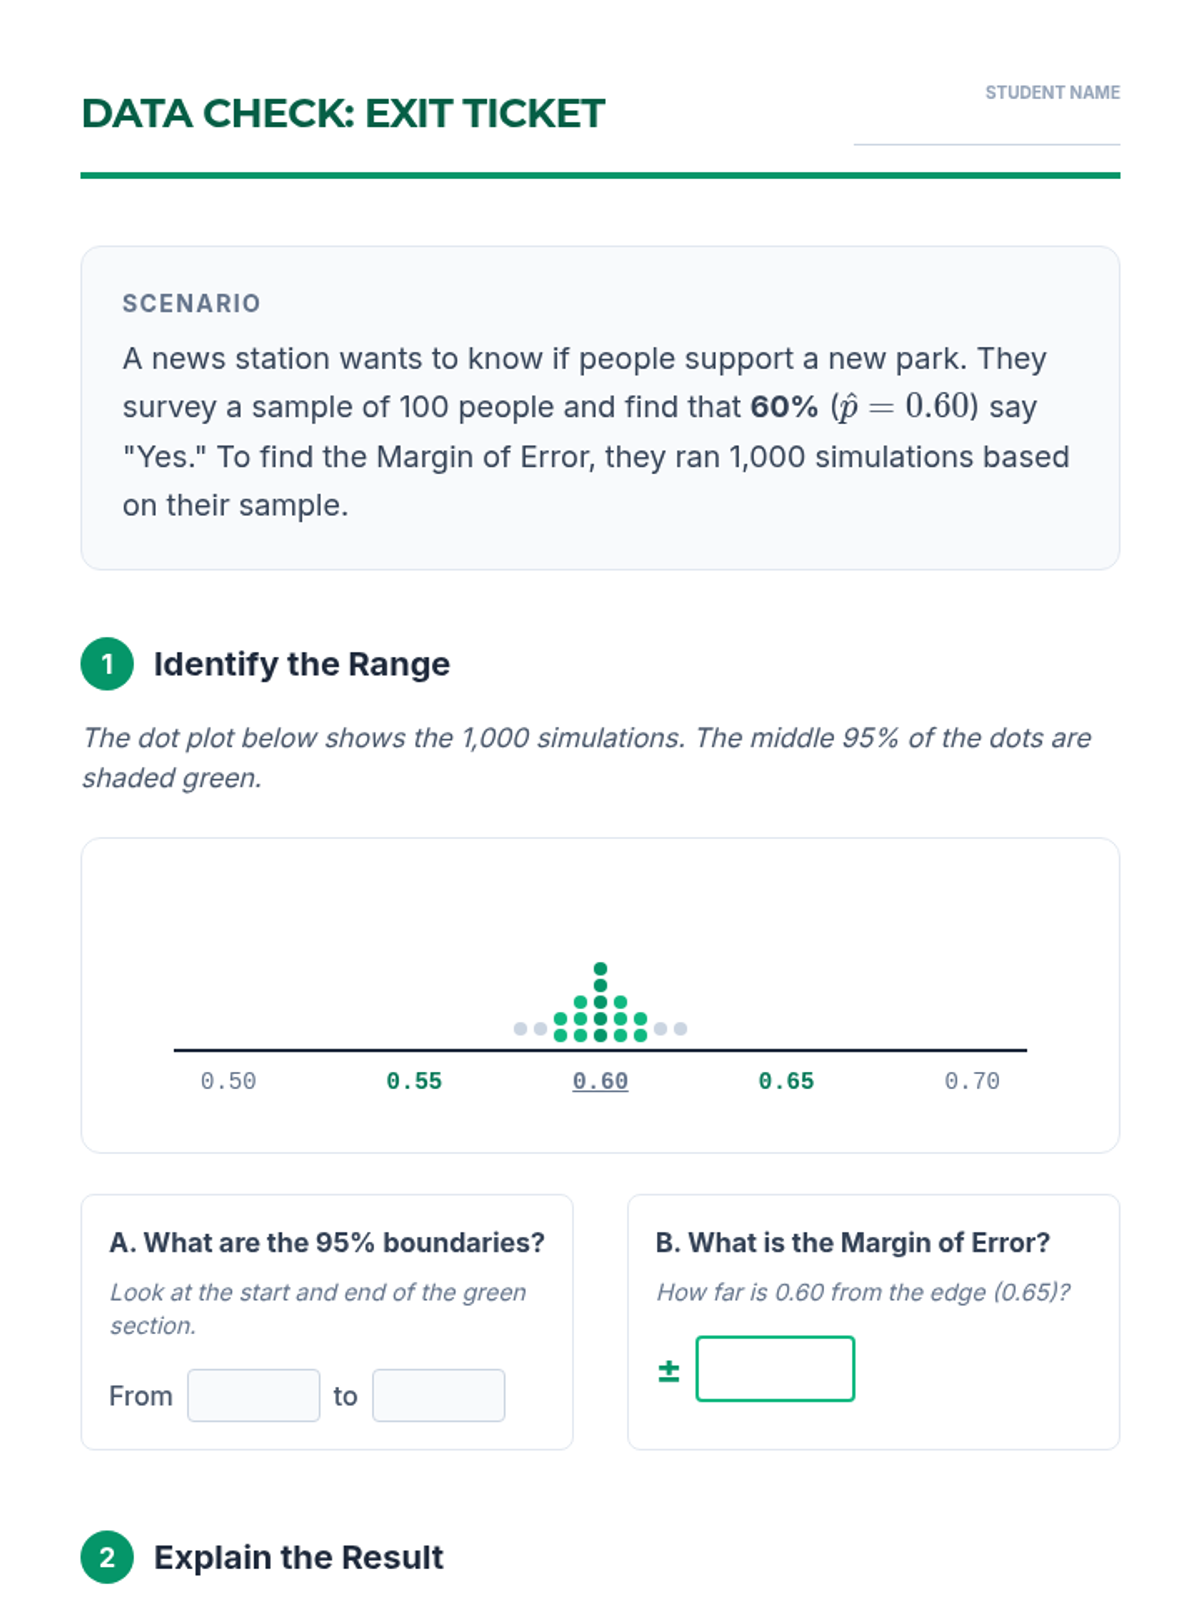
A Tier 2 intervention lesson focused on using simulation to estimate population parameters and determine the margin of error, aligned with Colorado standard HS.S-IC.B.4. Students engage in hands-on data collection and visual analysis of sampling distributions.
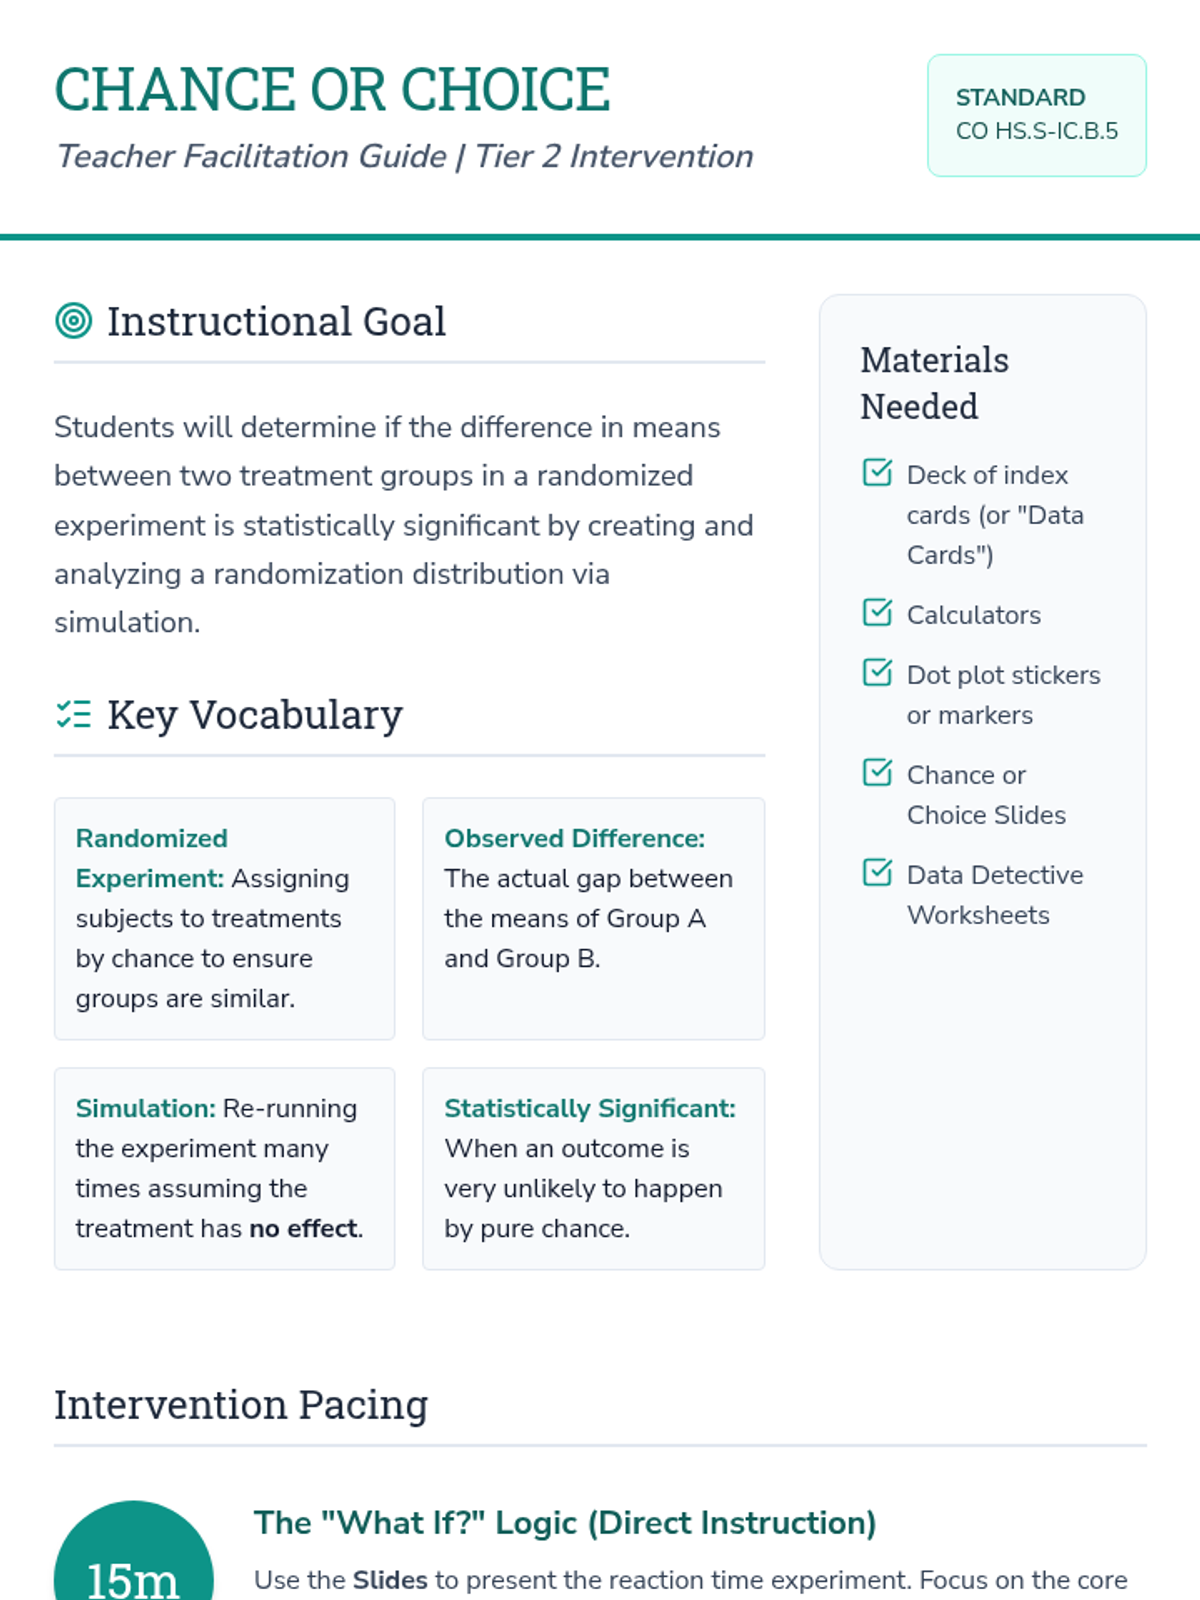
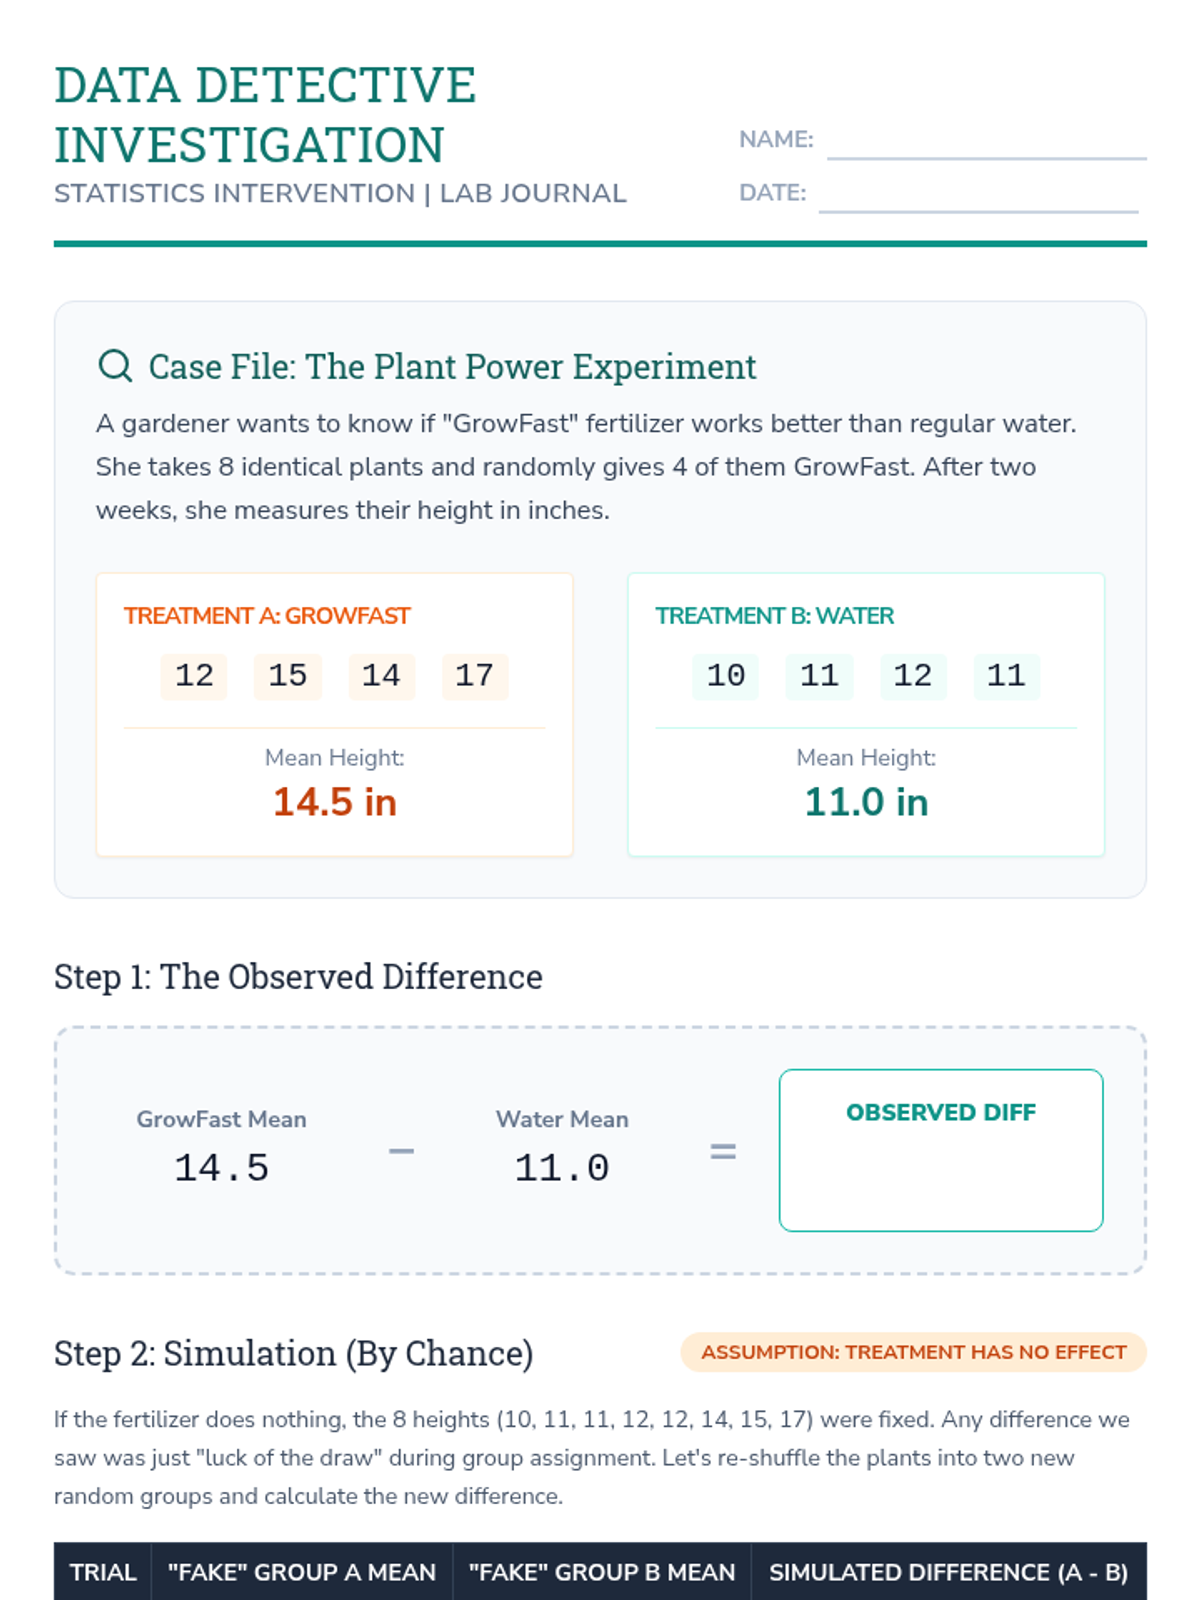
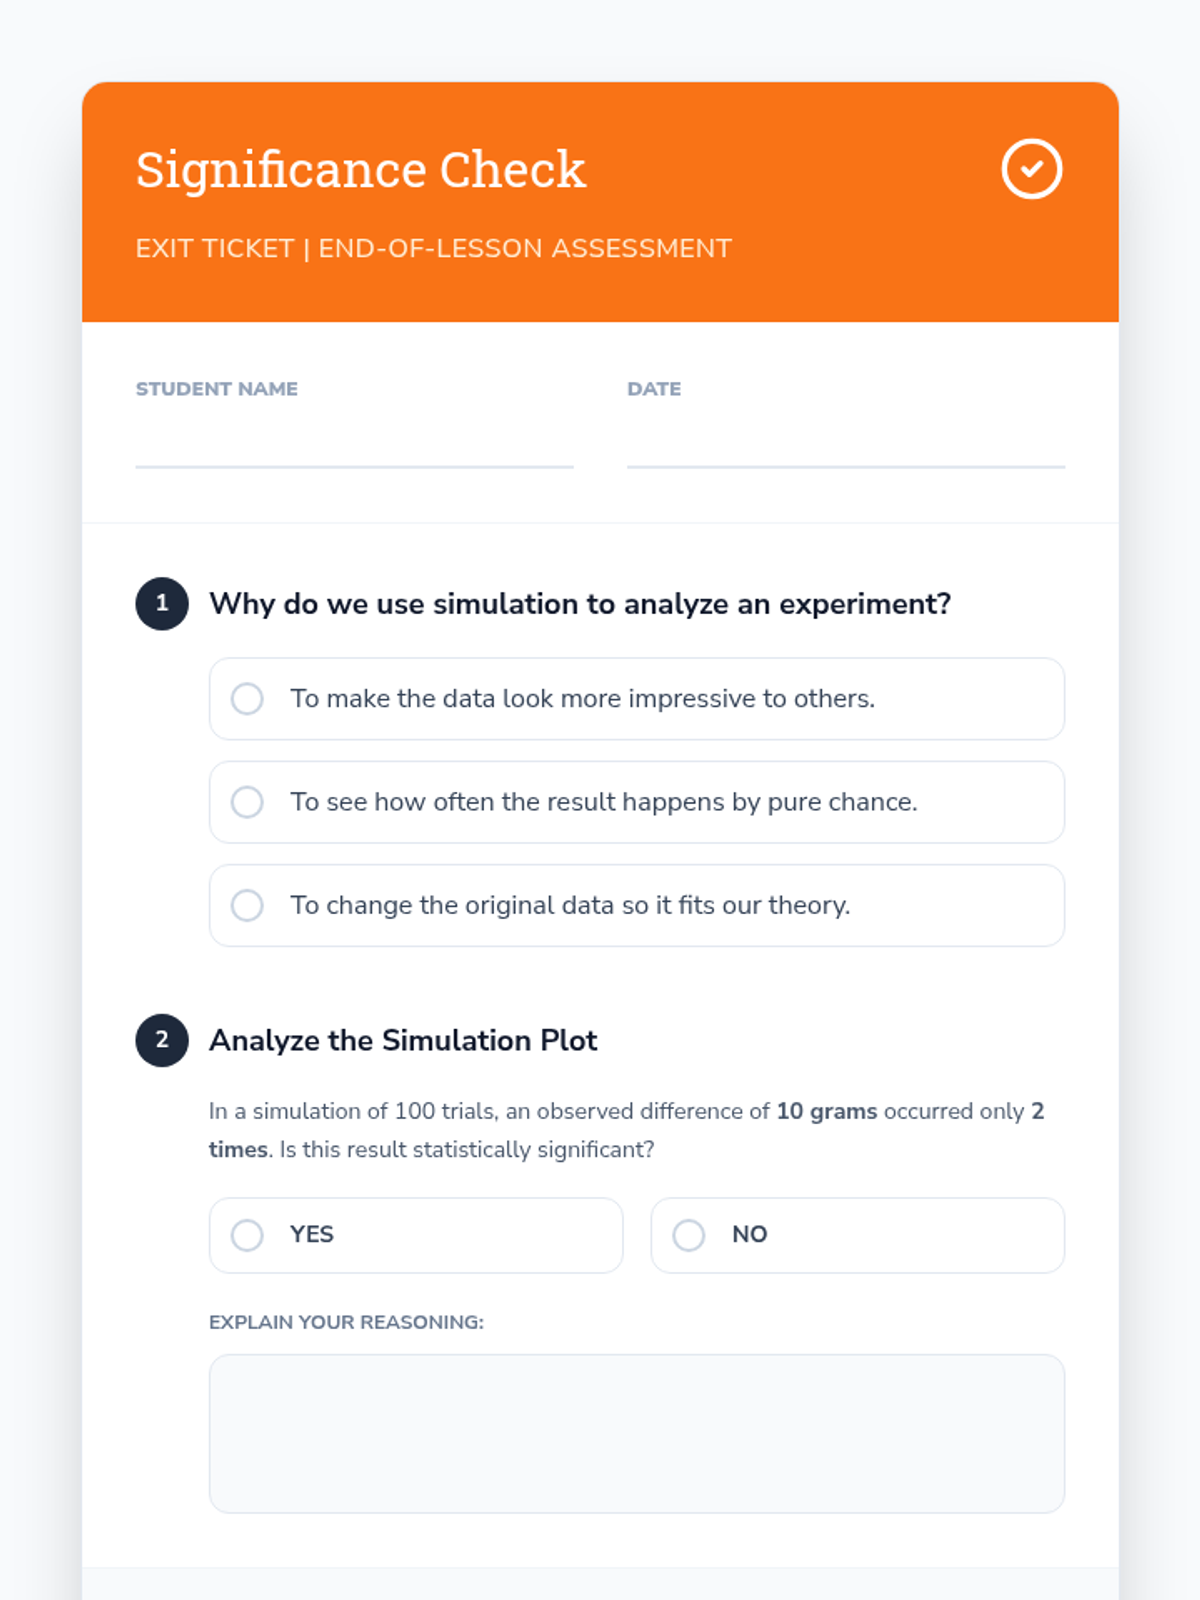
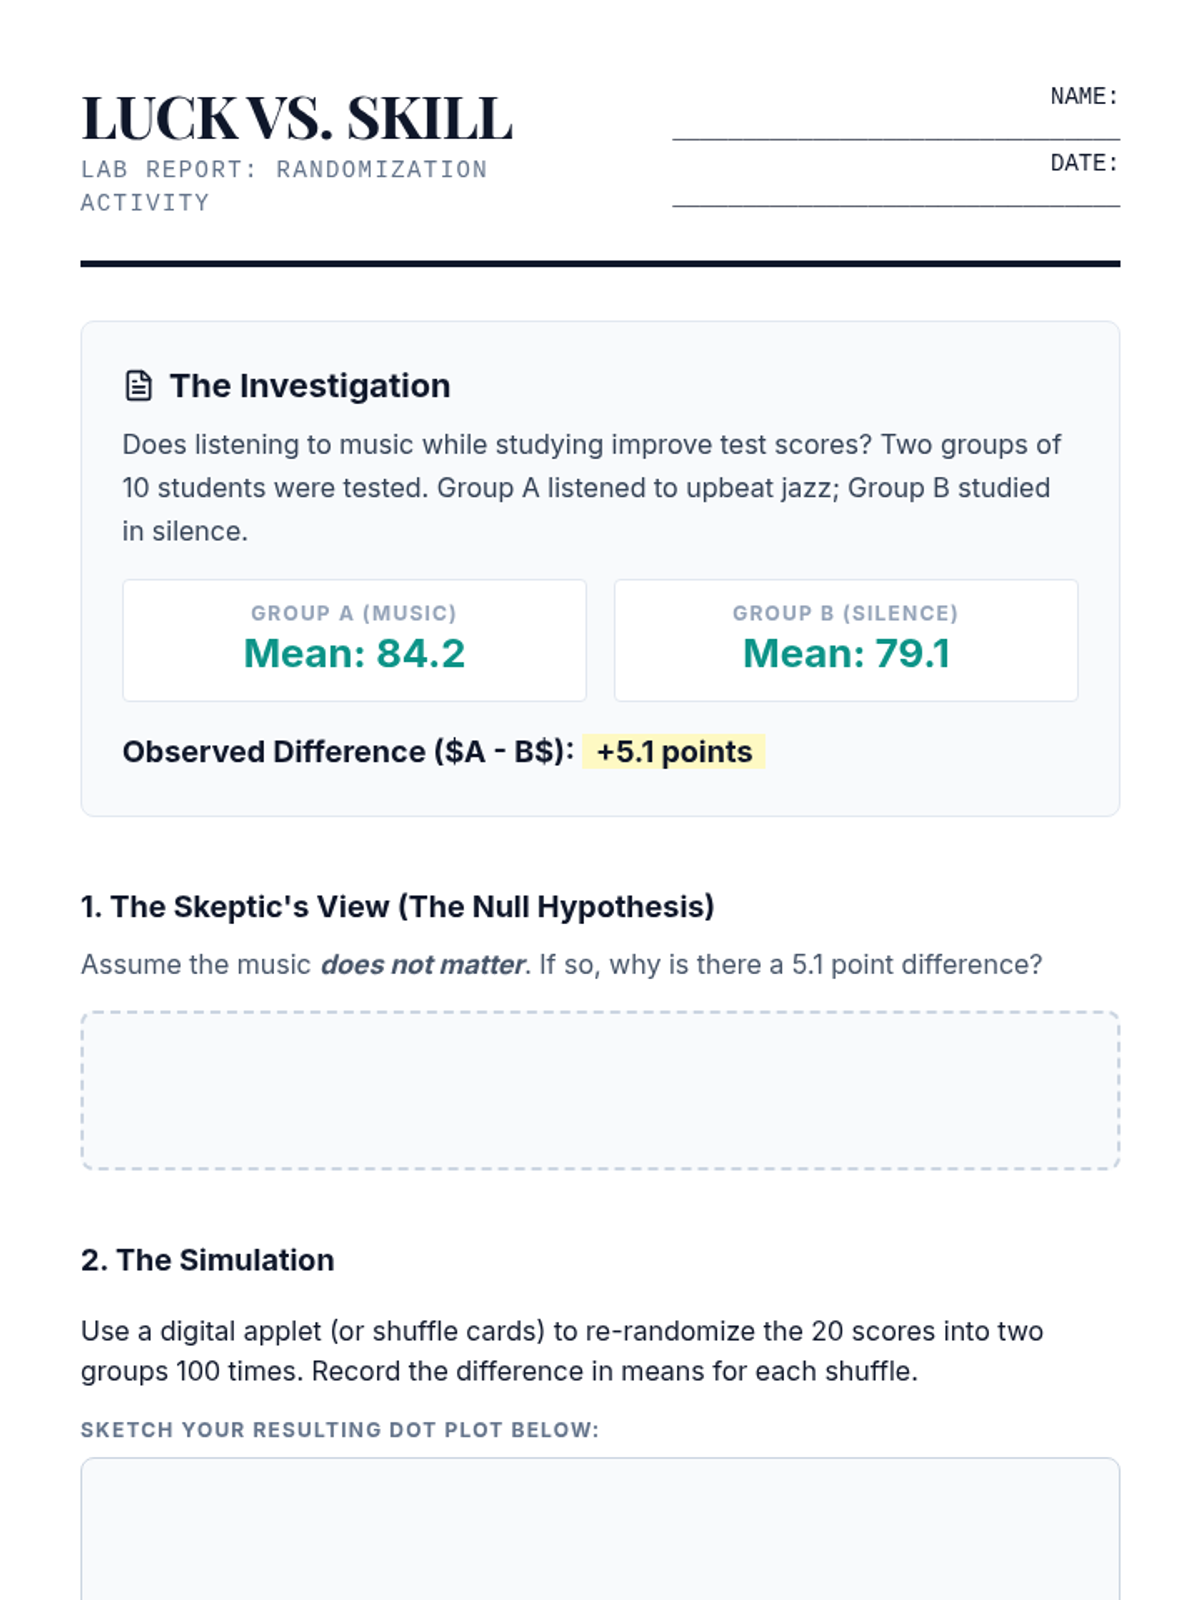
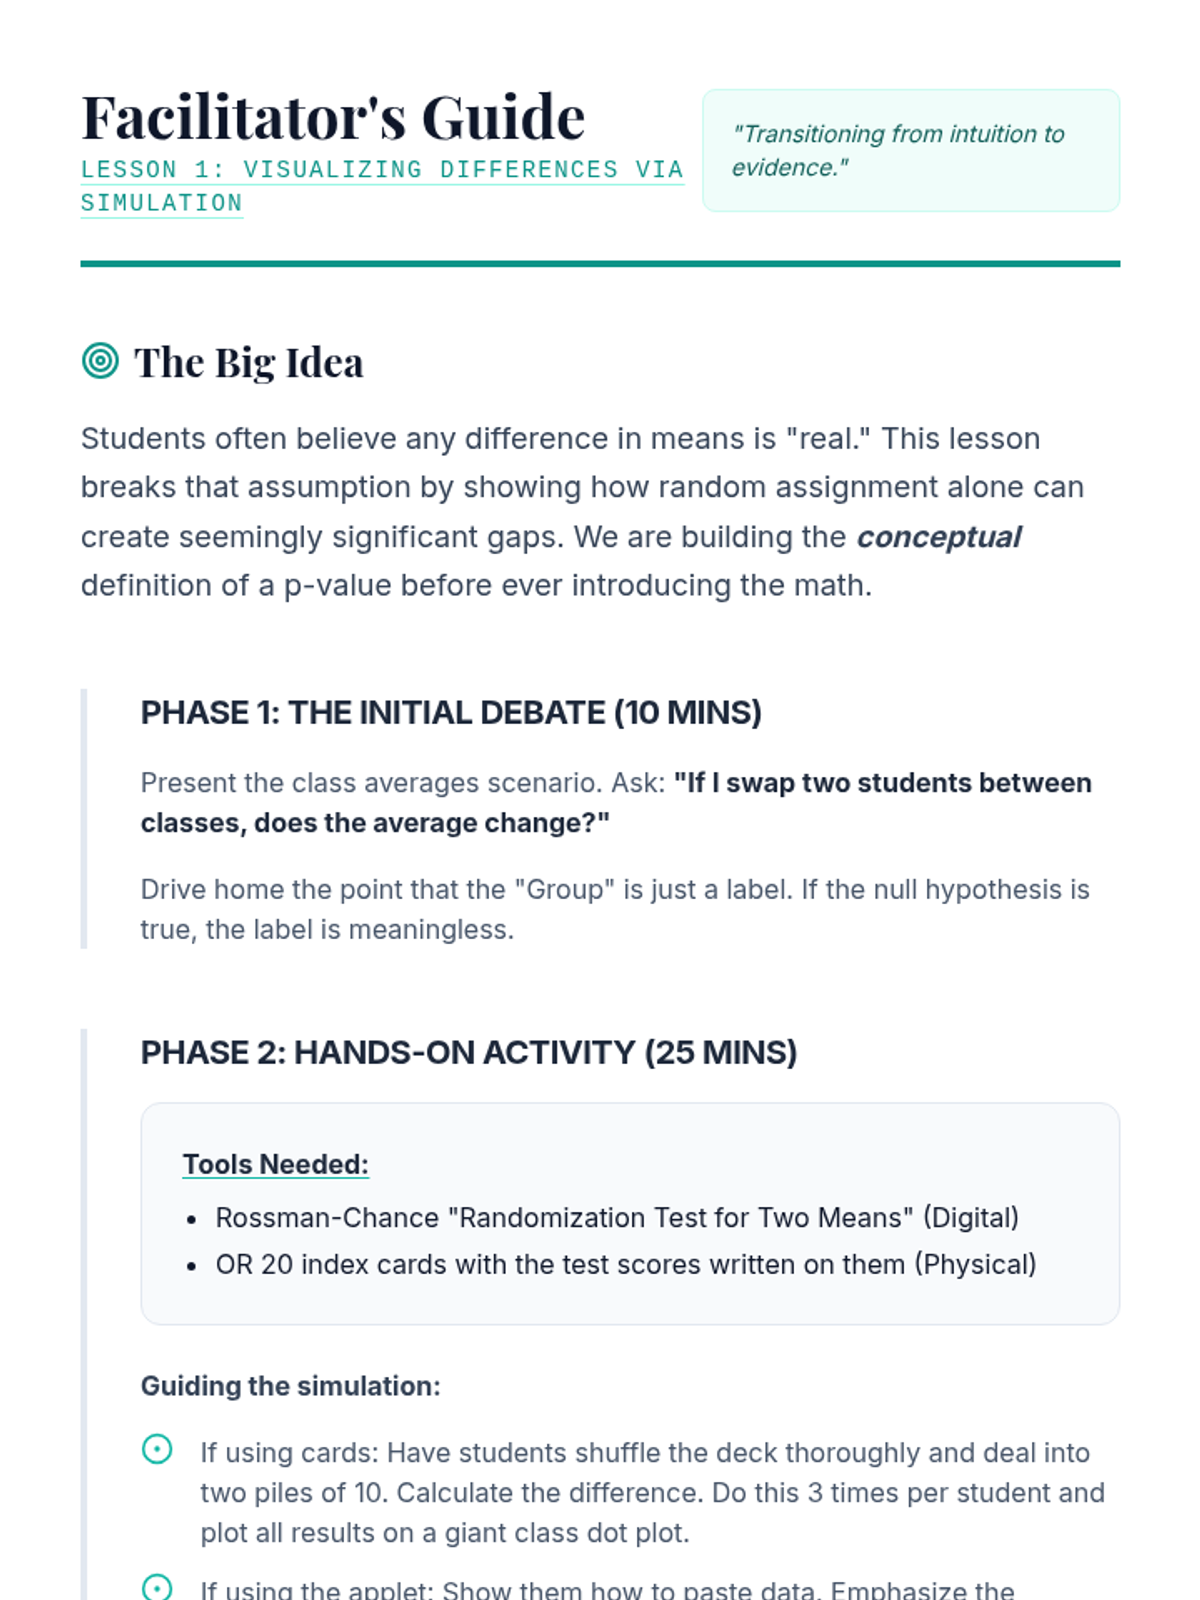
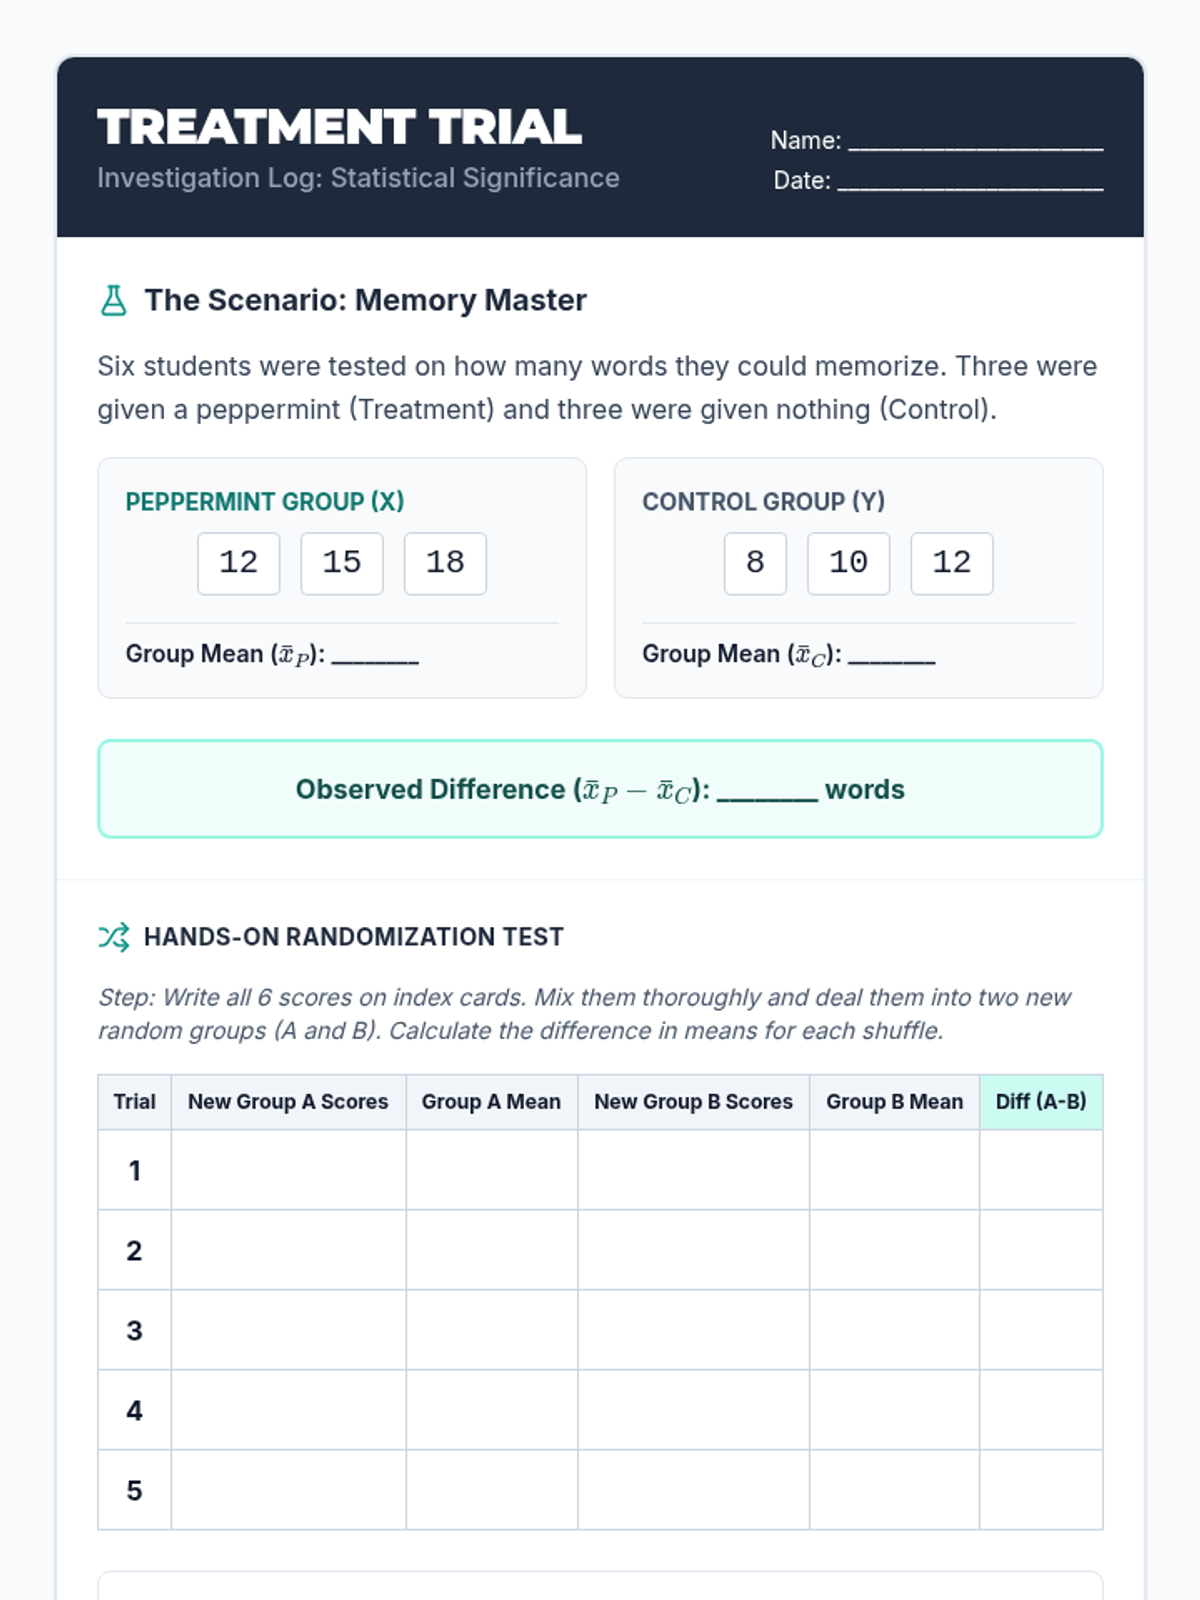
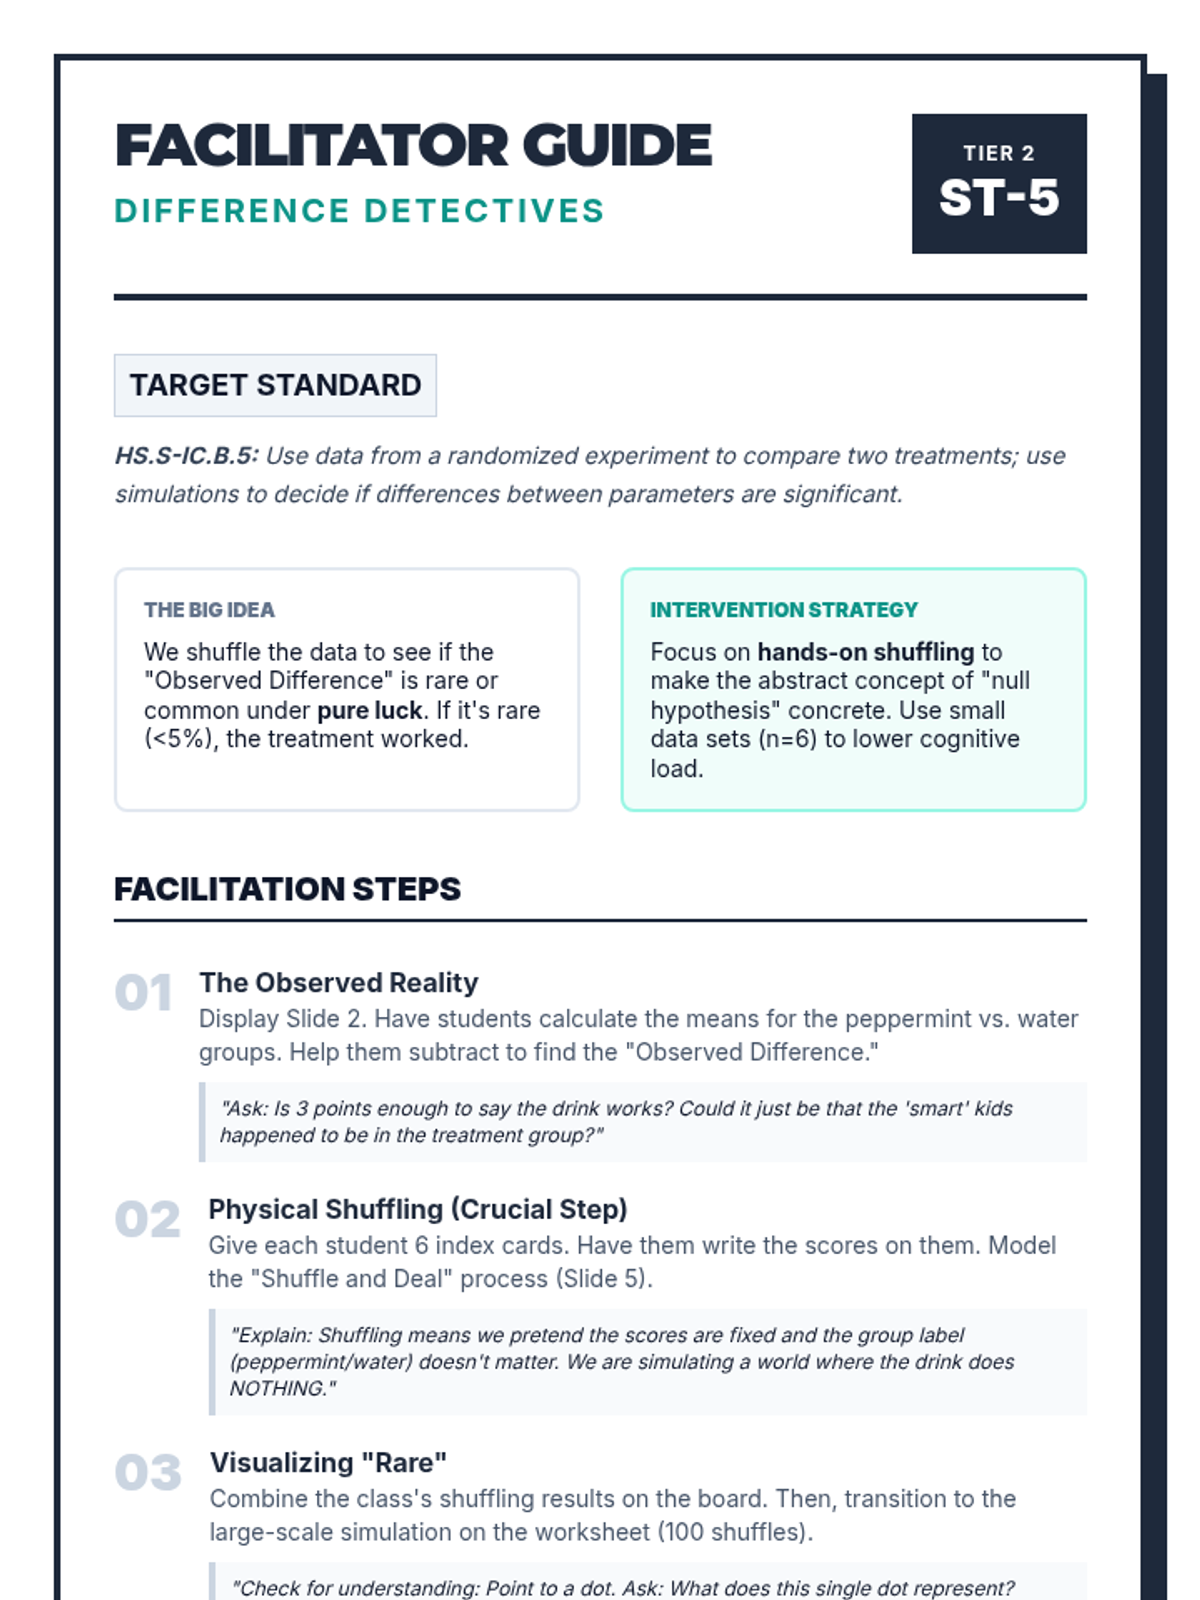
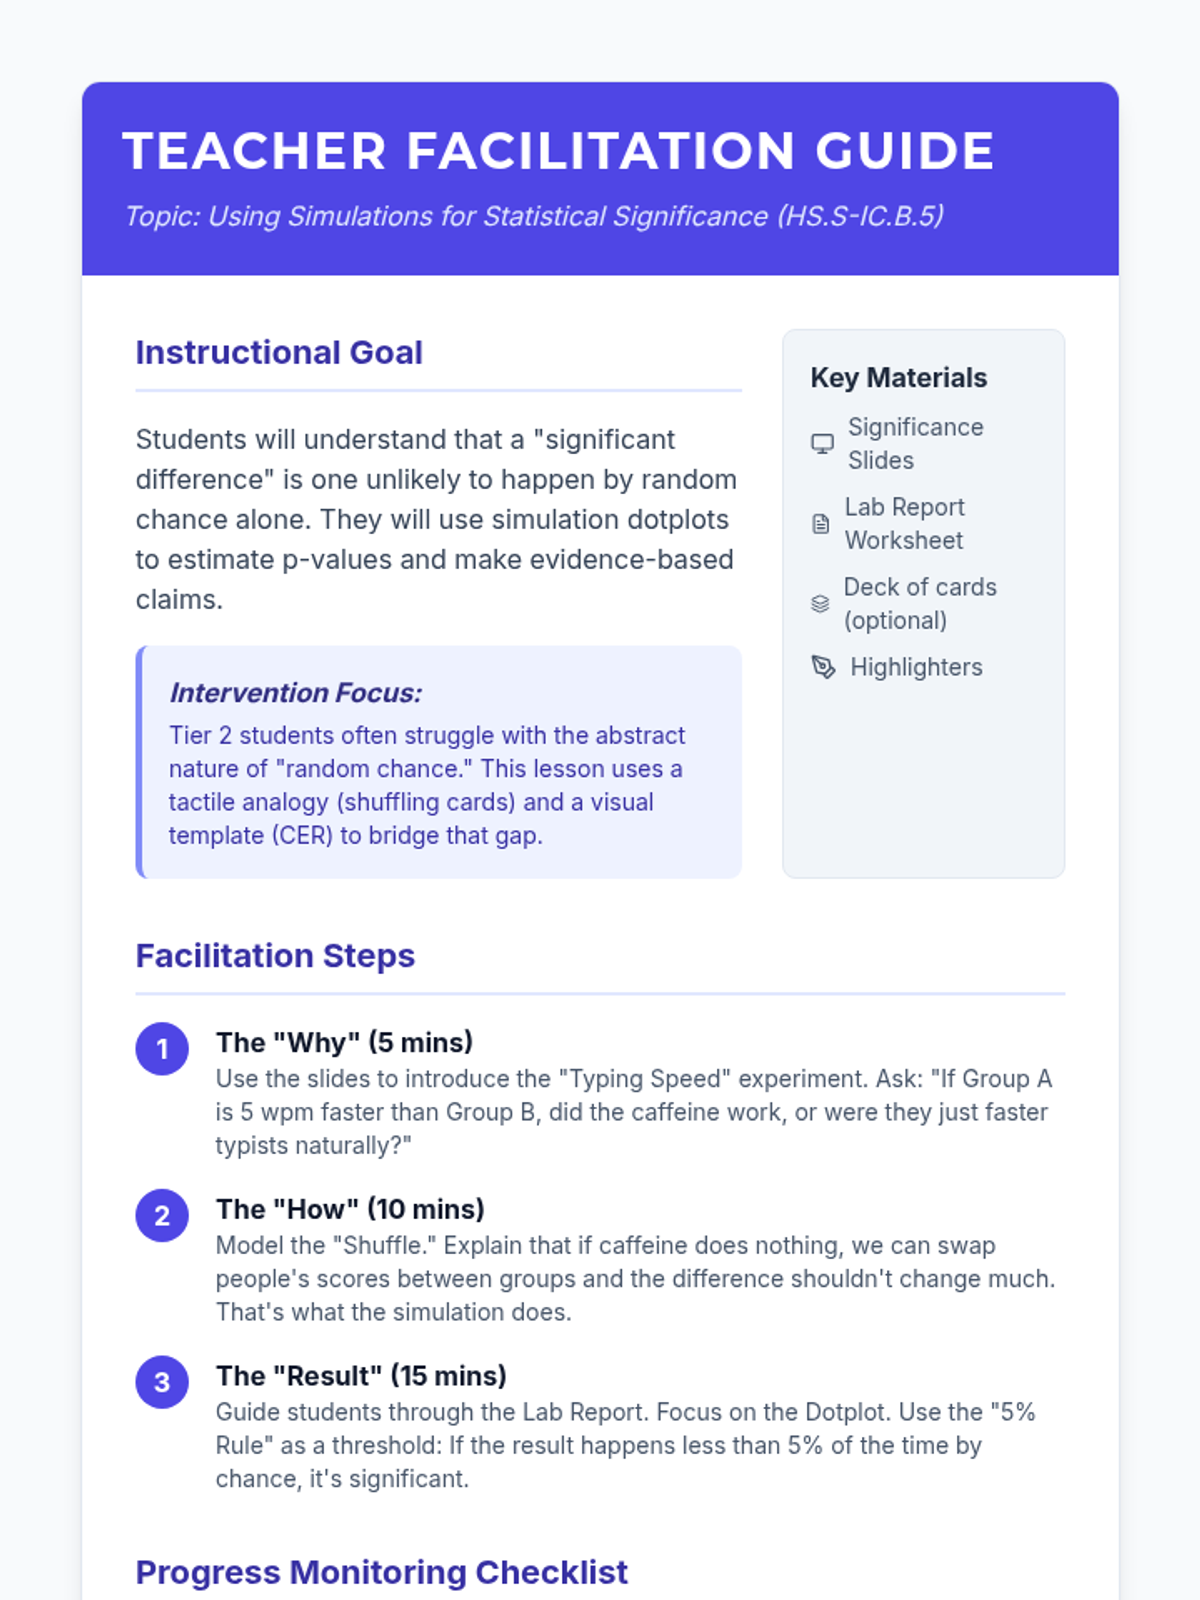
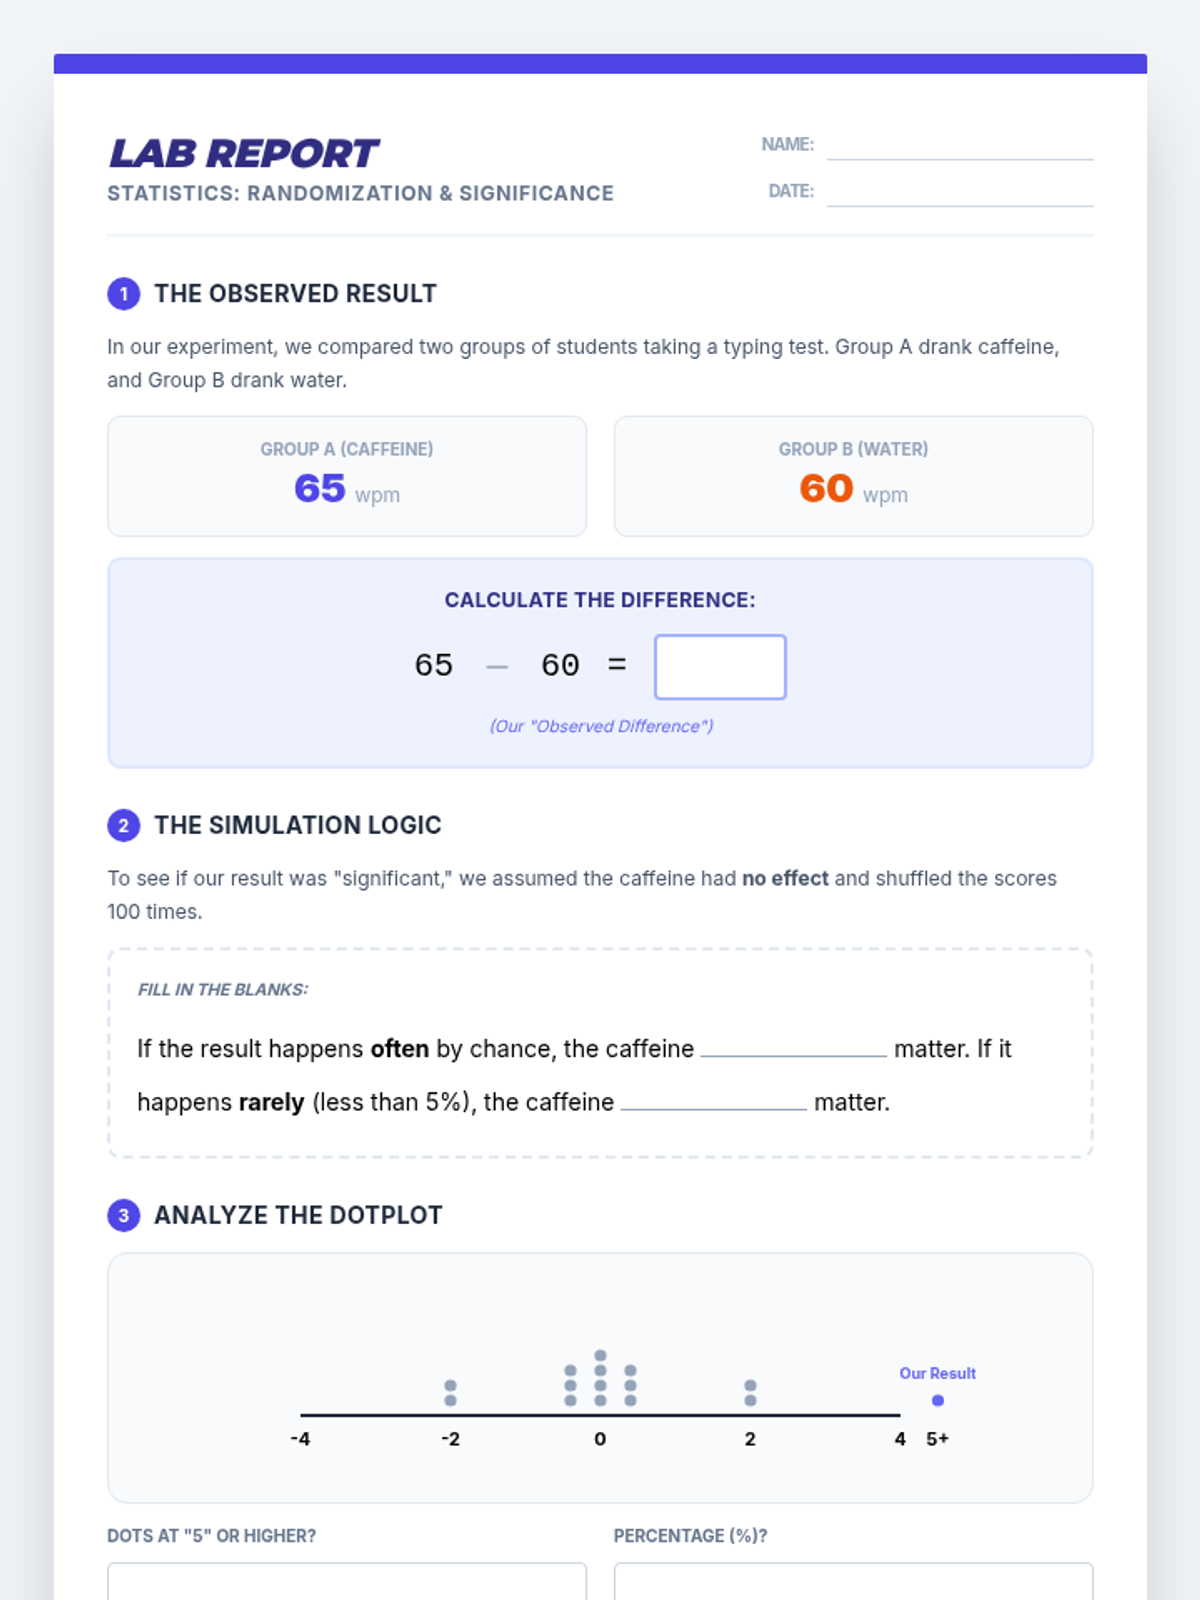
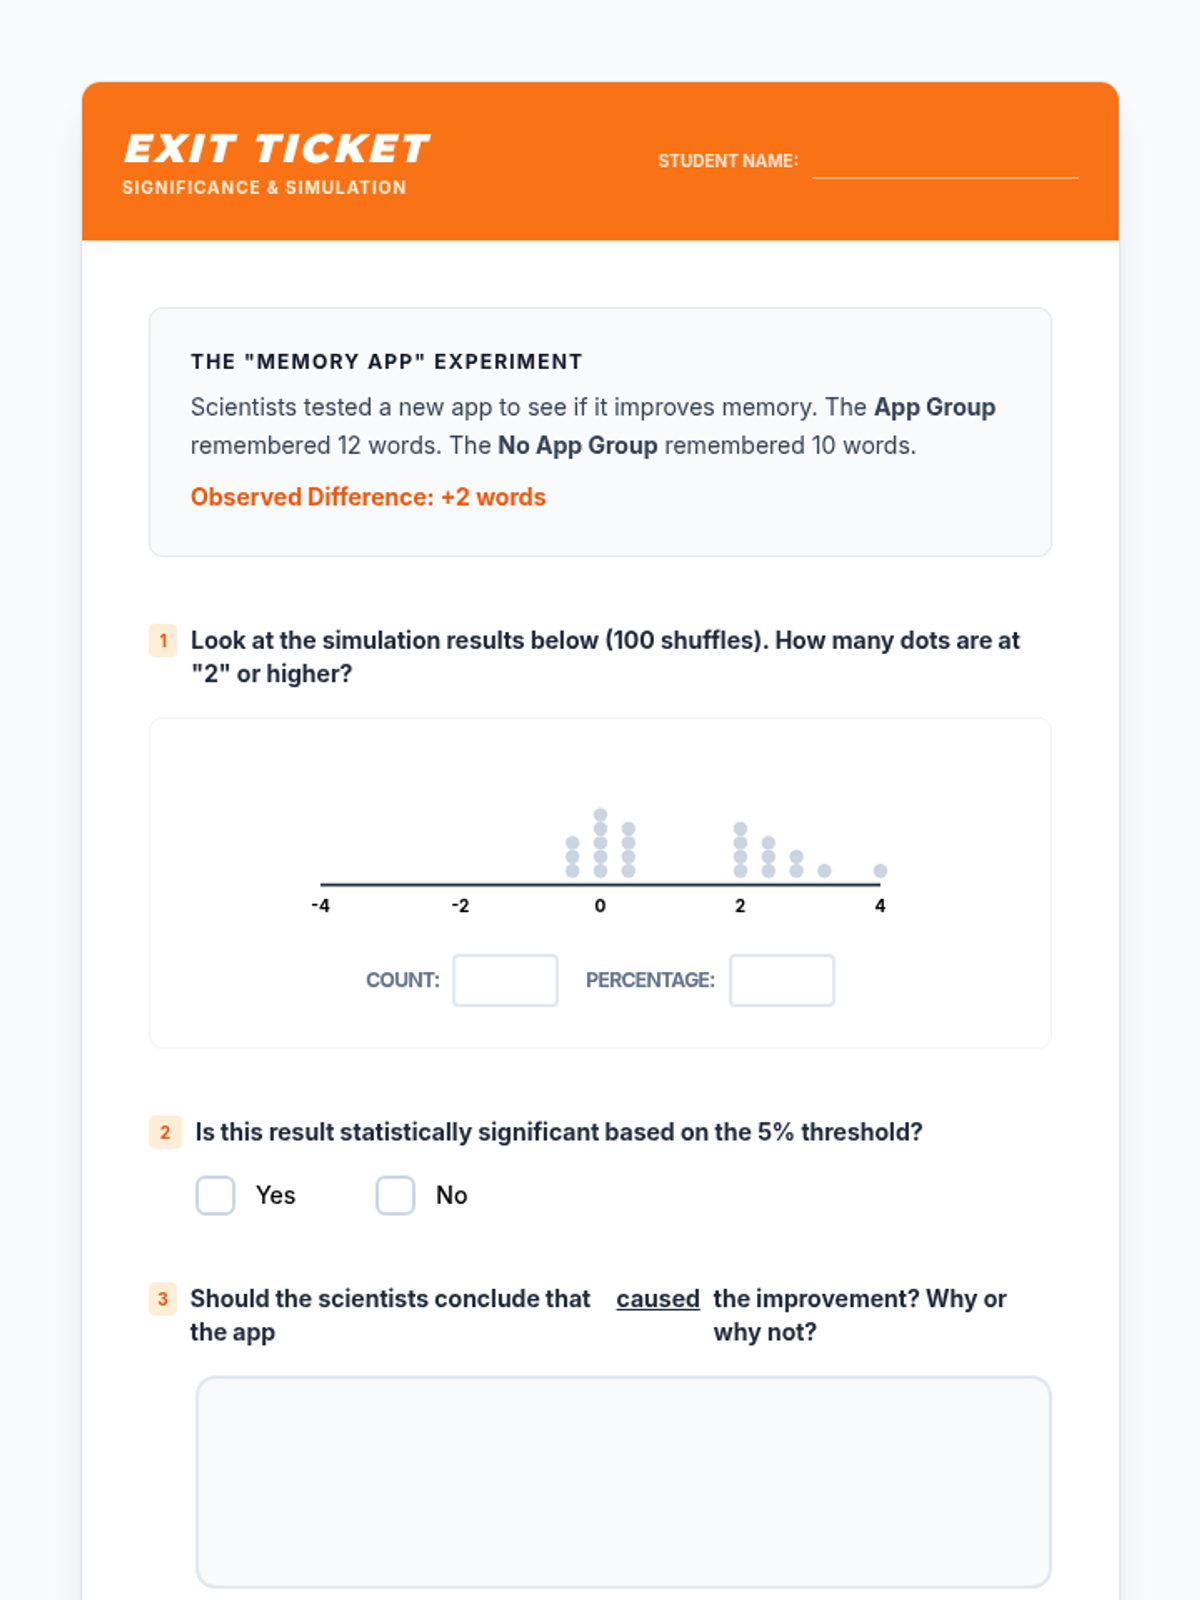
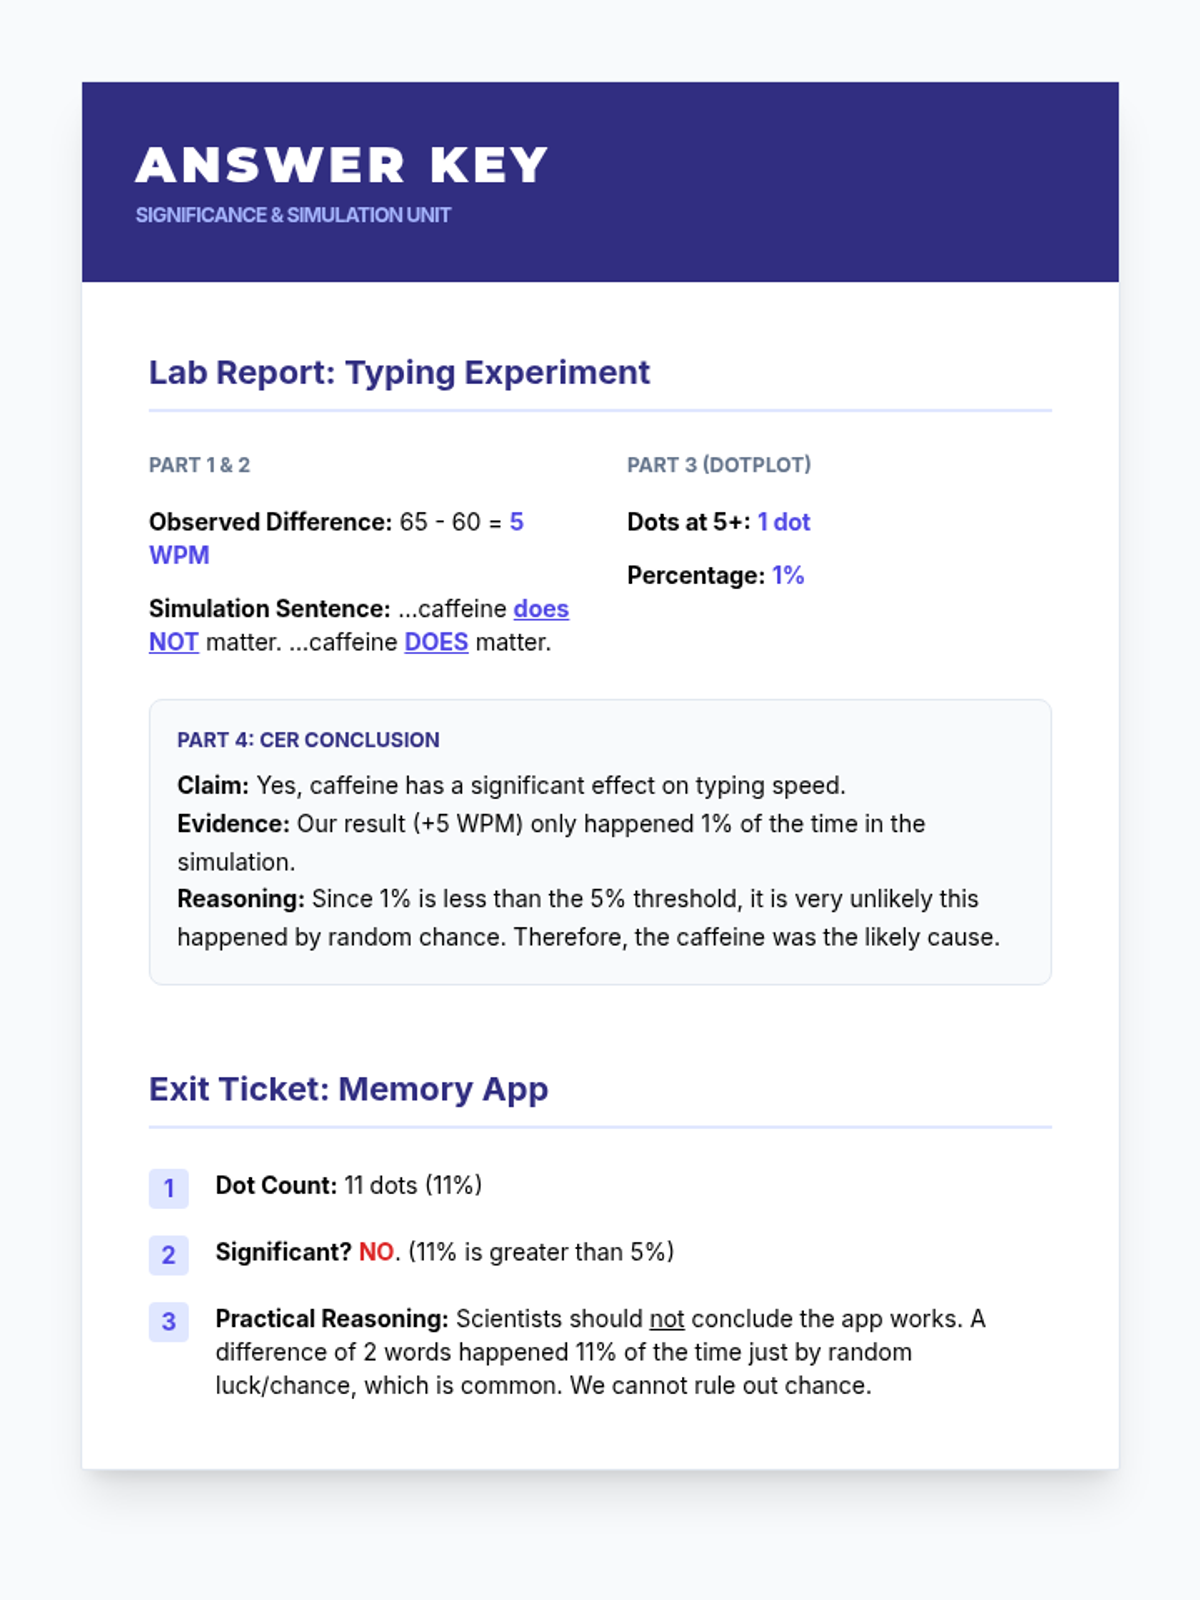
A Tier 2 intervention lesson focusing on randomized experiments and simulation-based significance testing. Students learn to determine if observed differences between two treatments are statistically significant using a hands-on shuffling simulation approach.
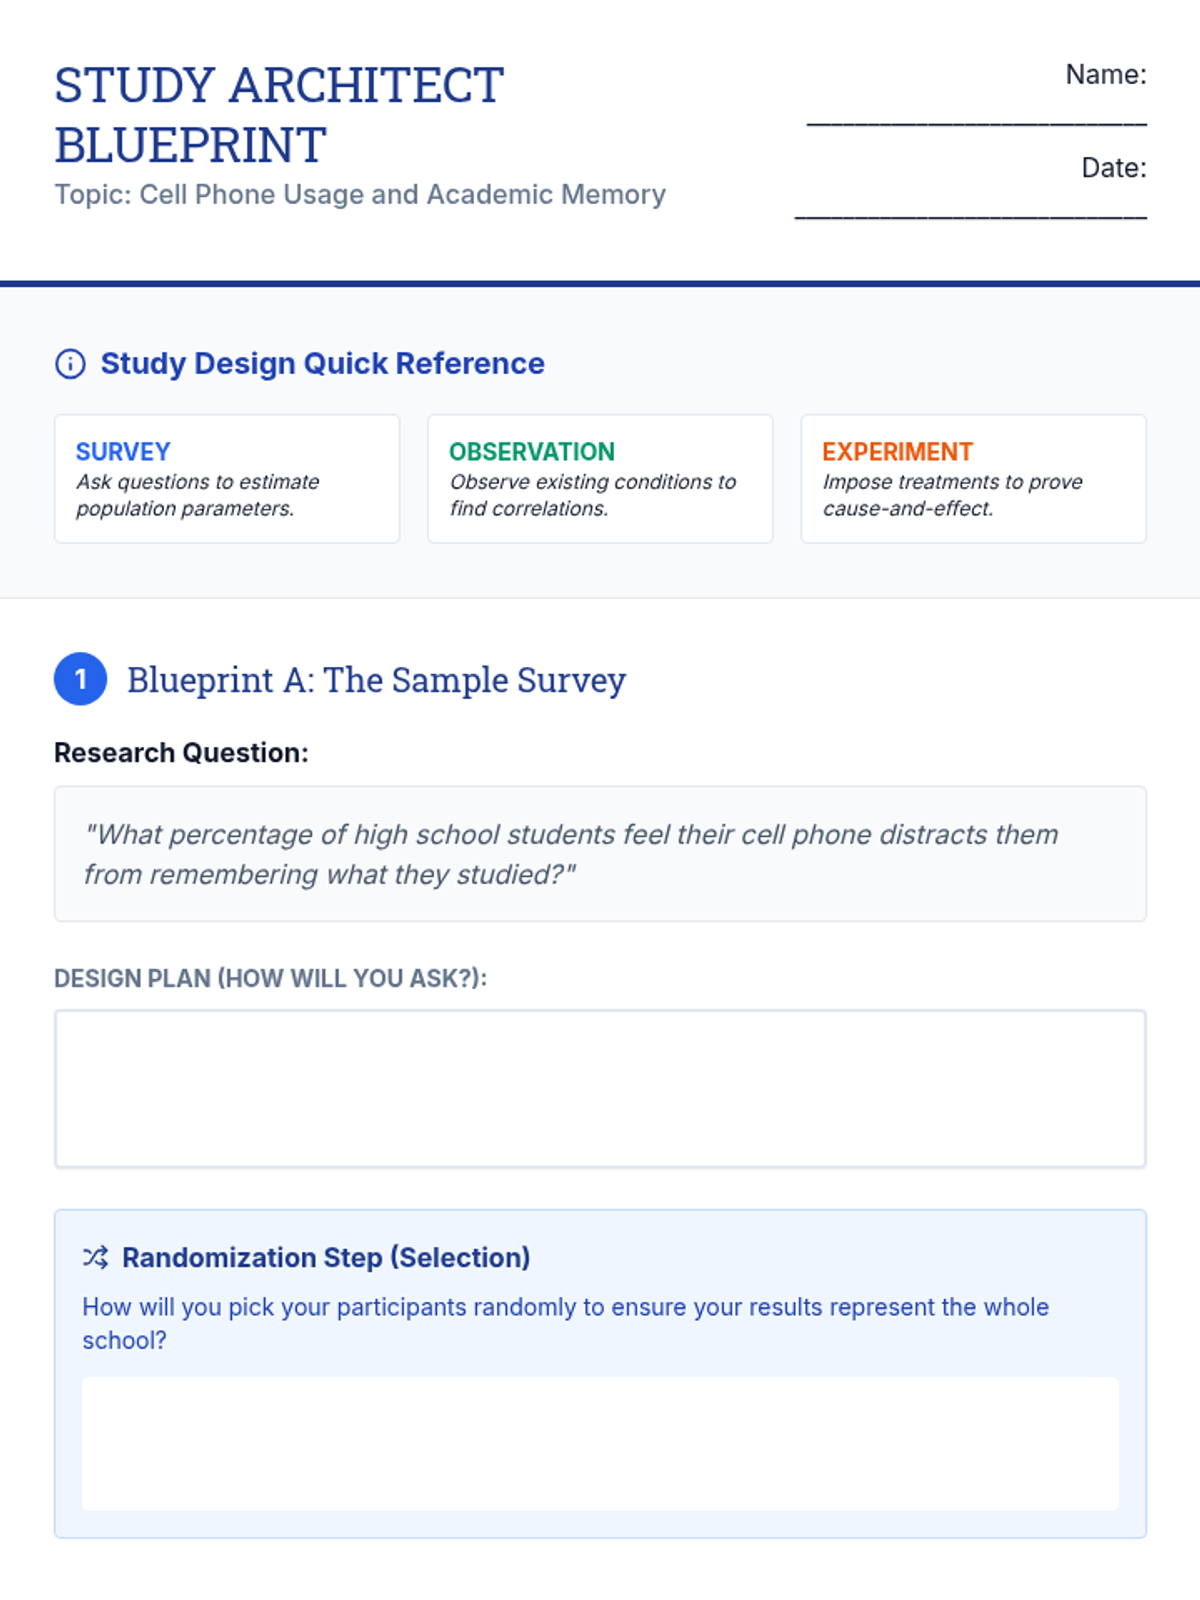
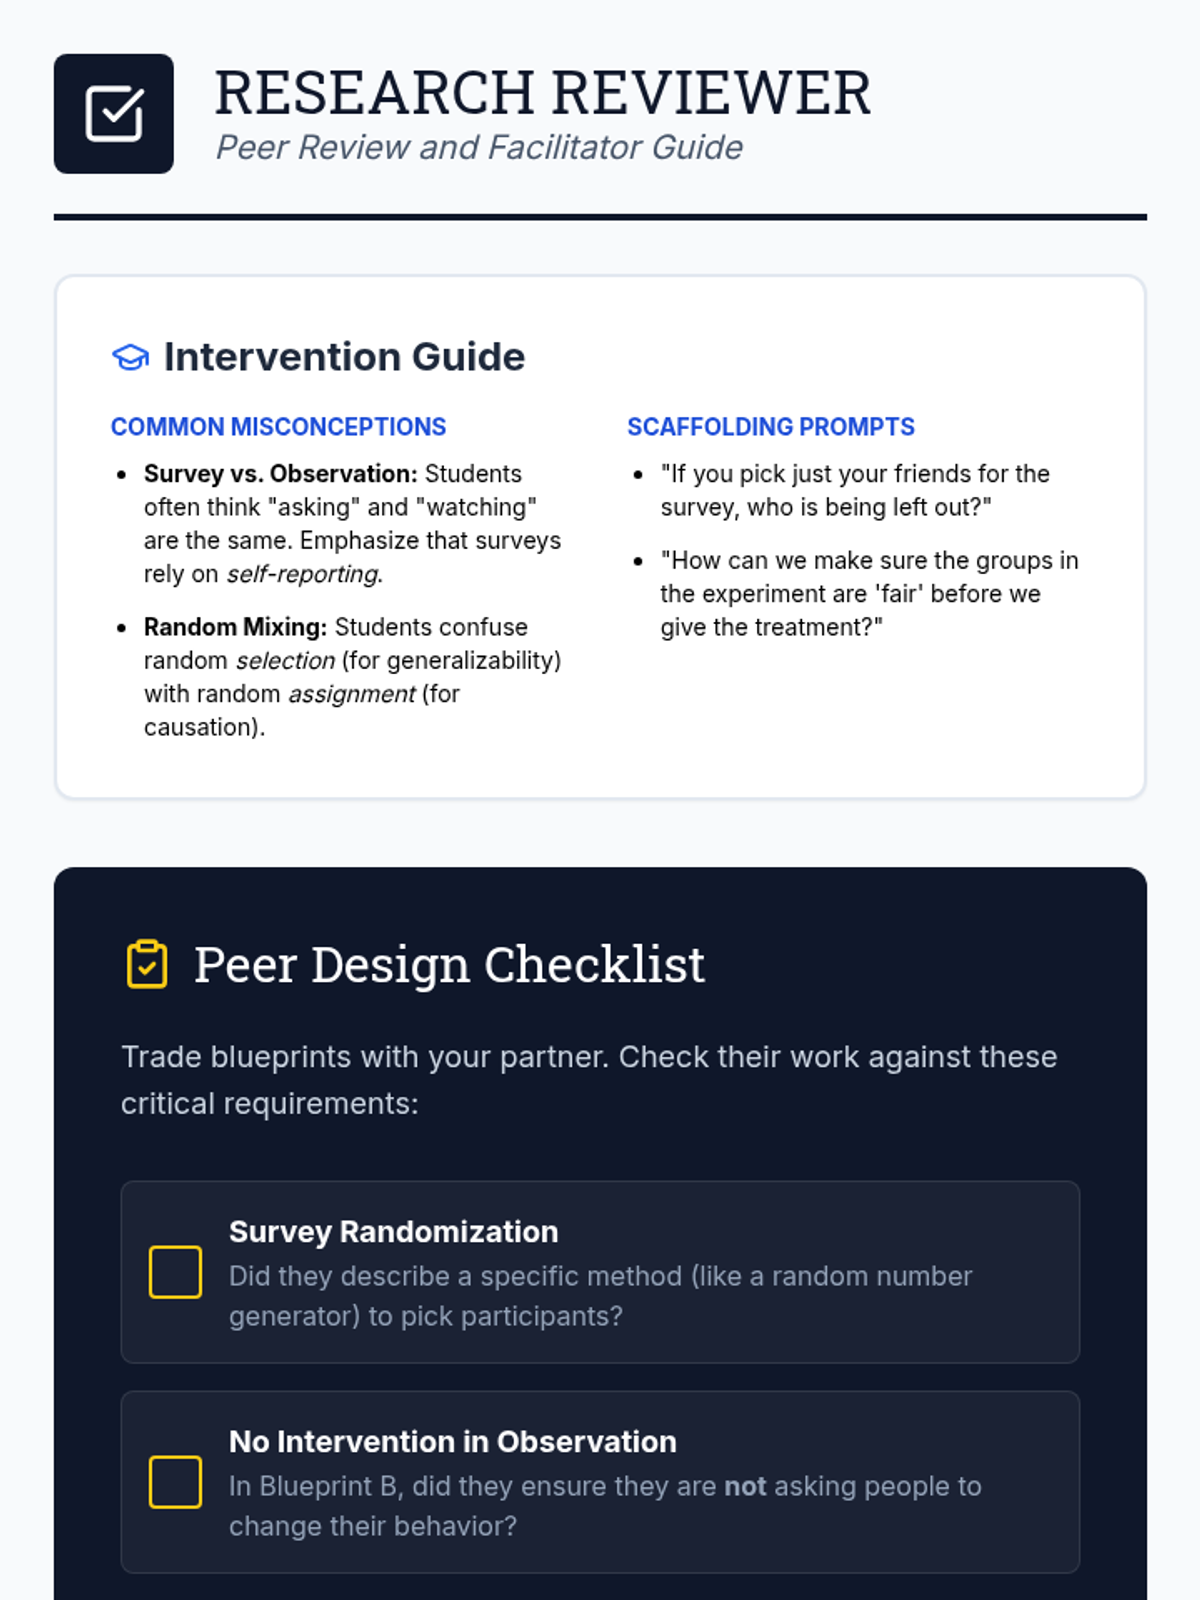
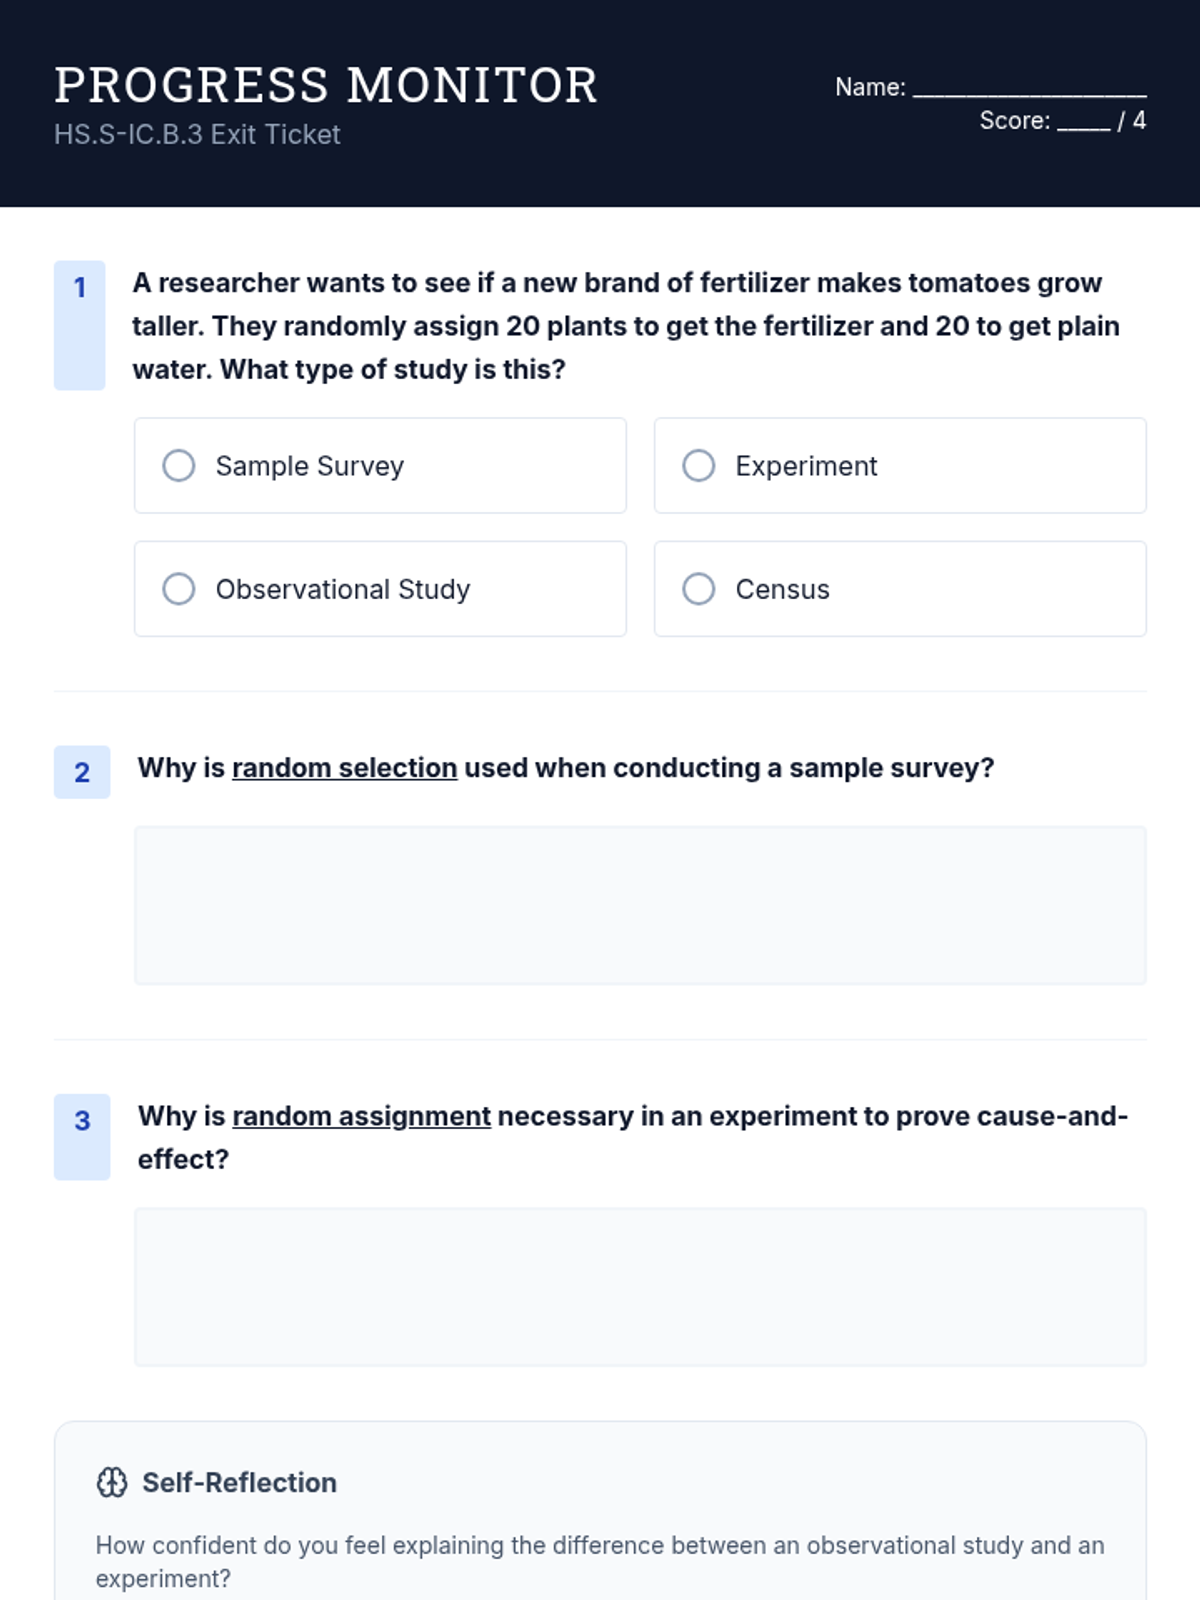
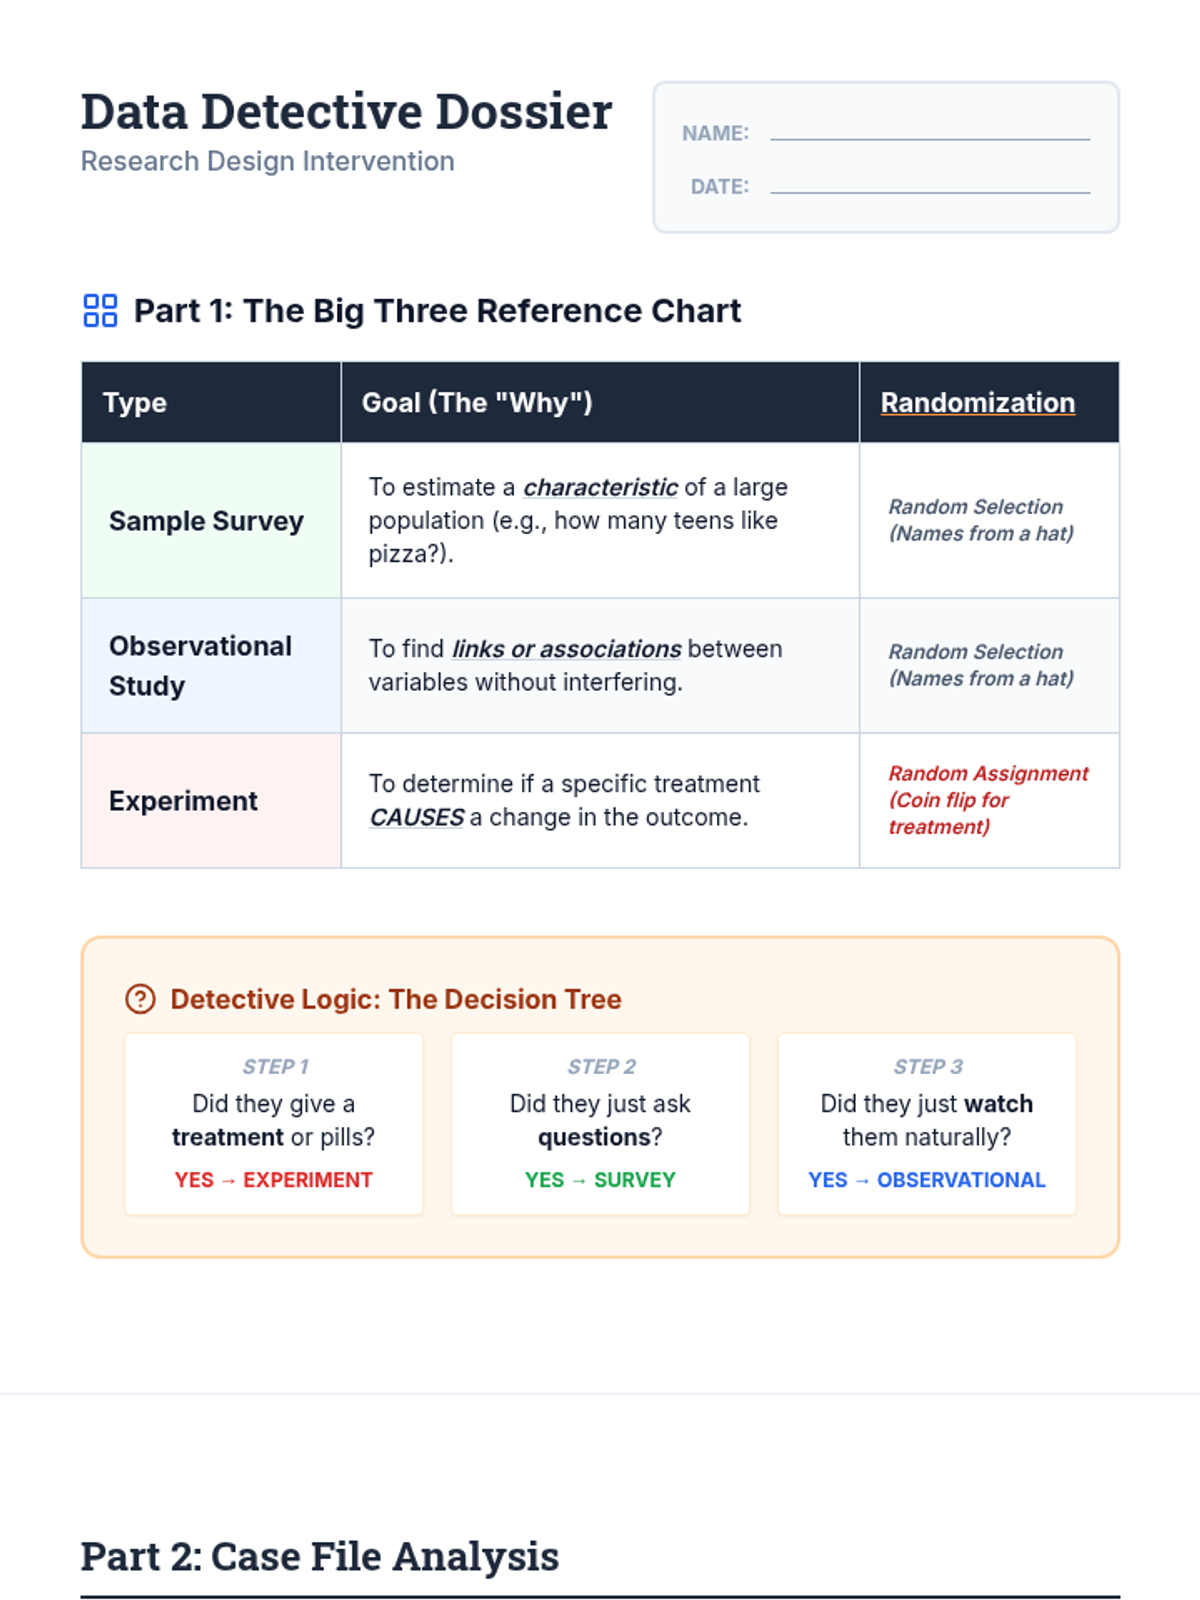
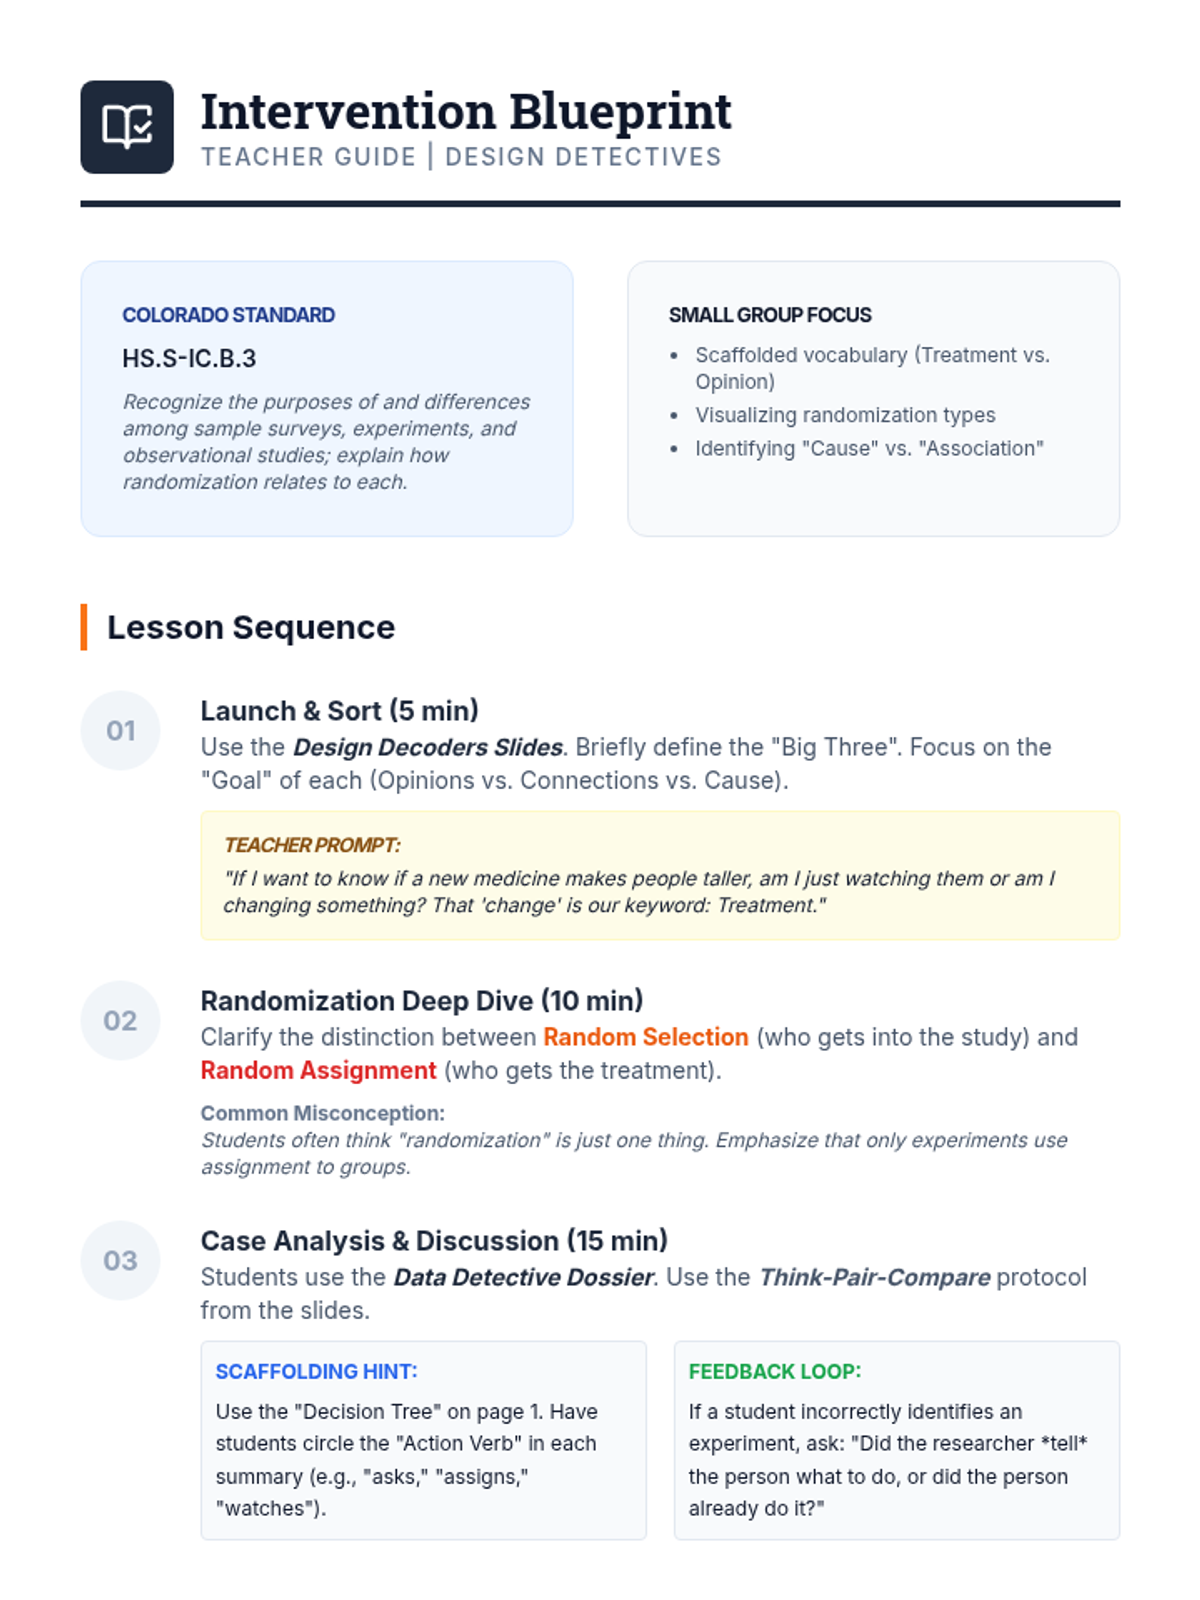
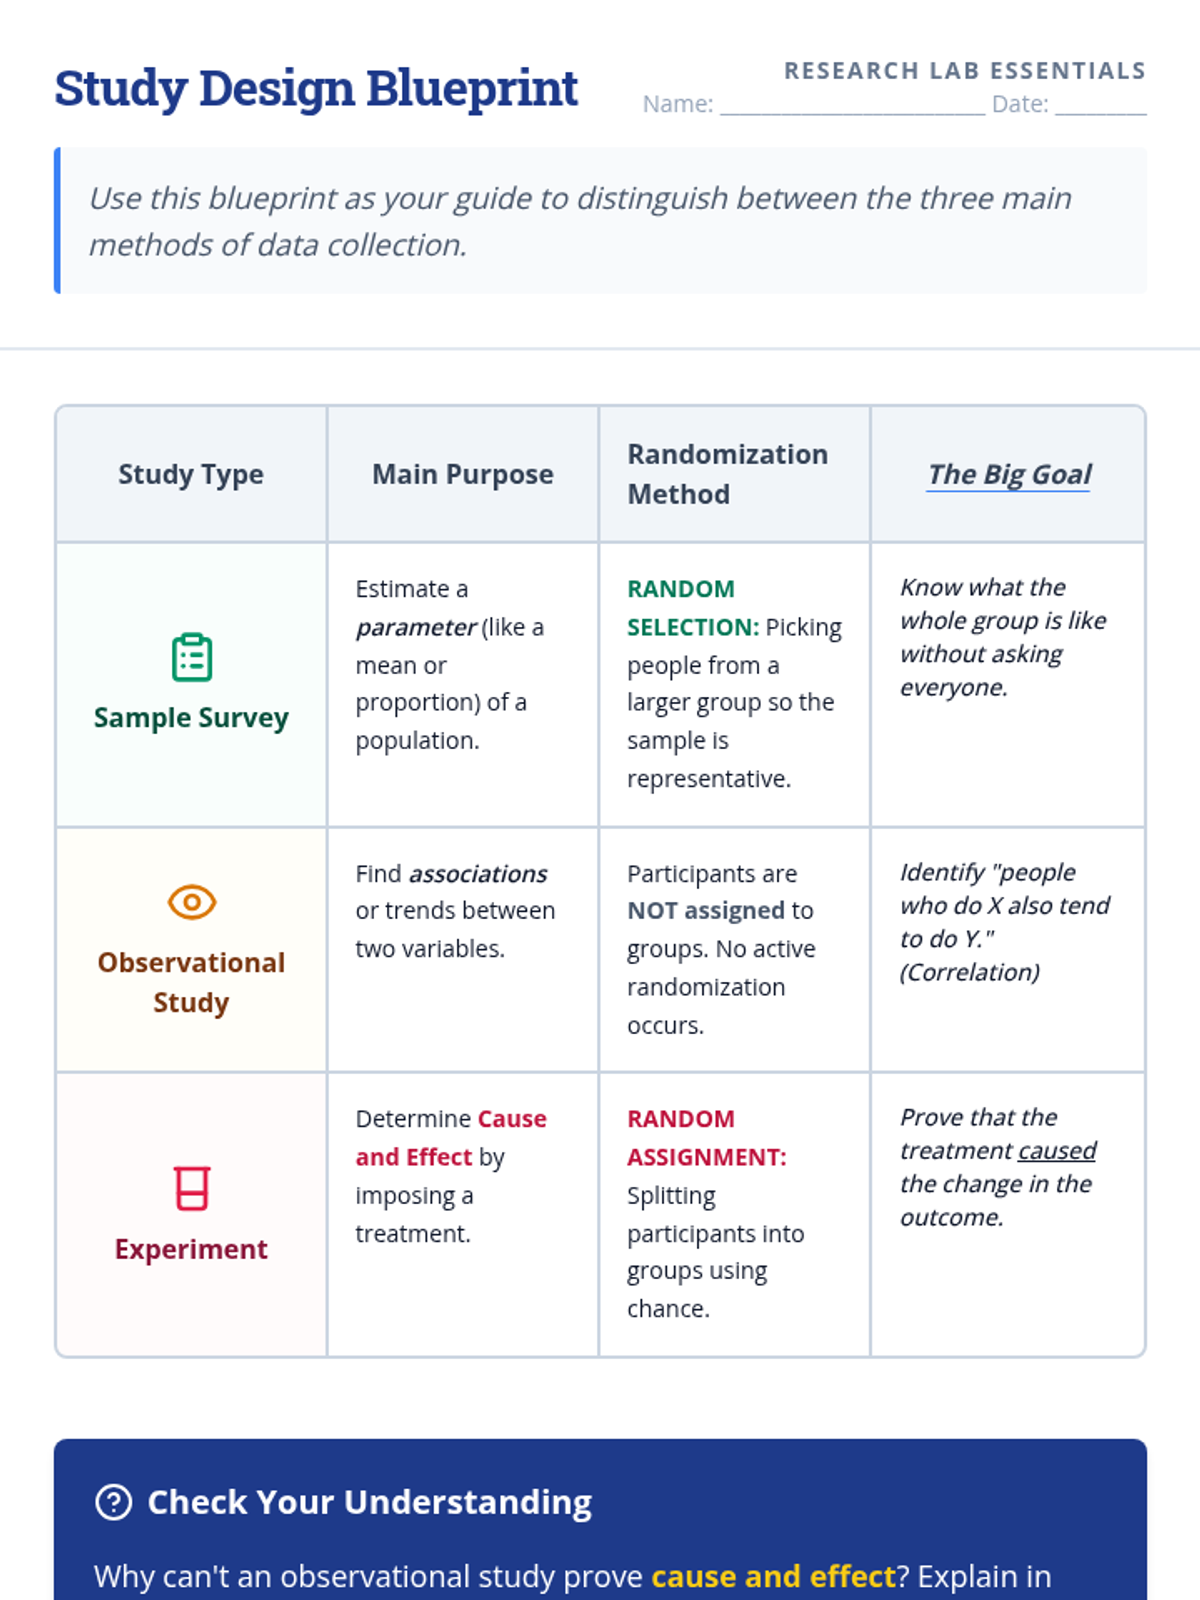
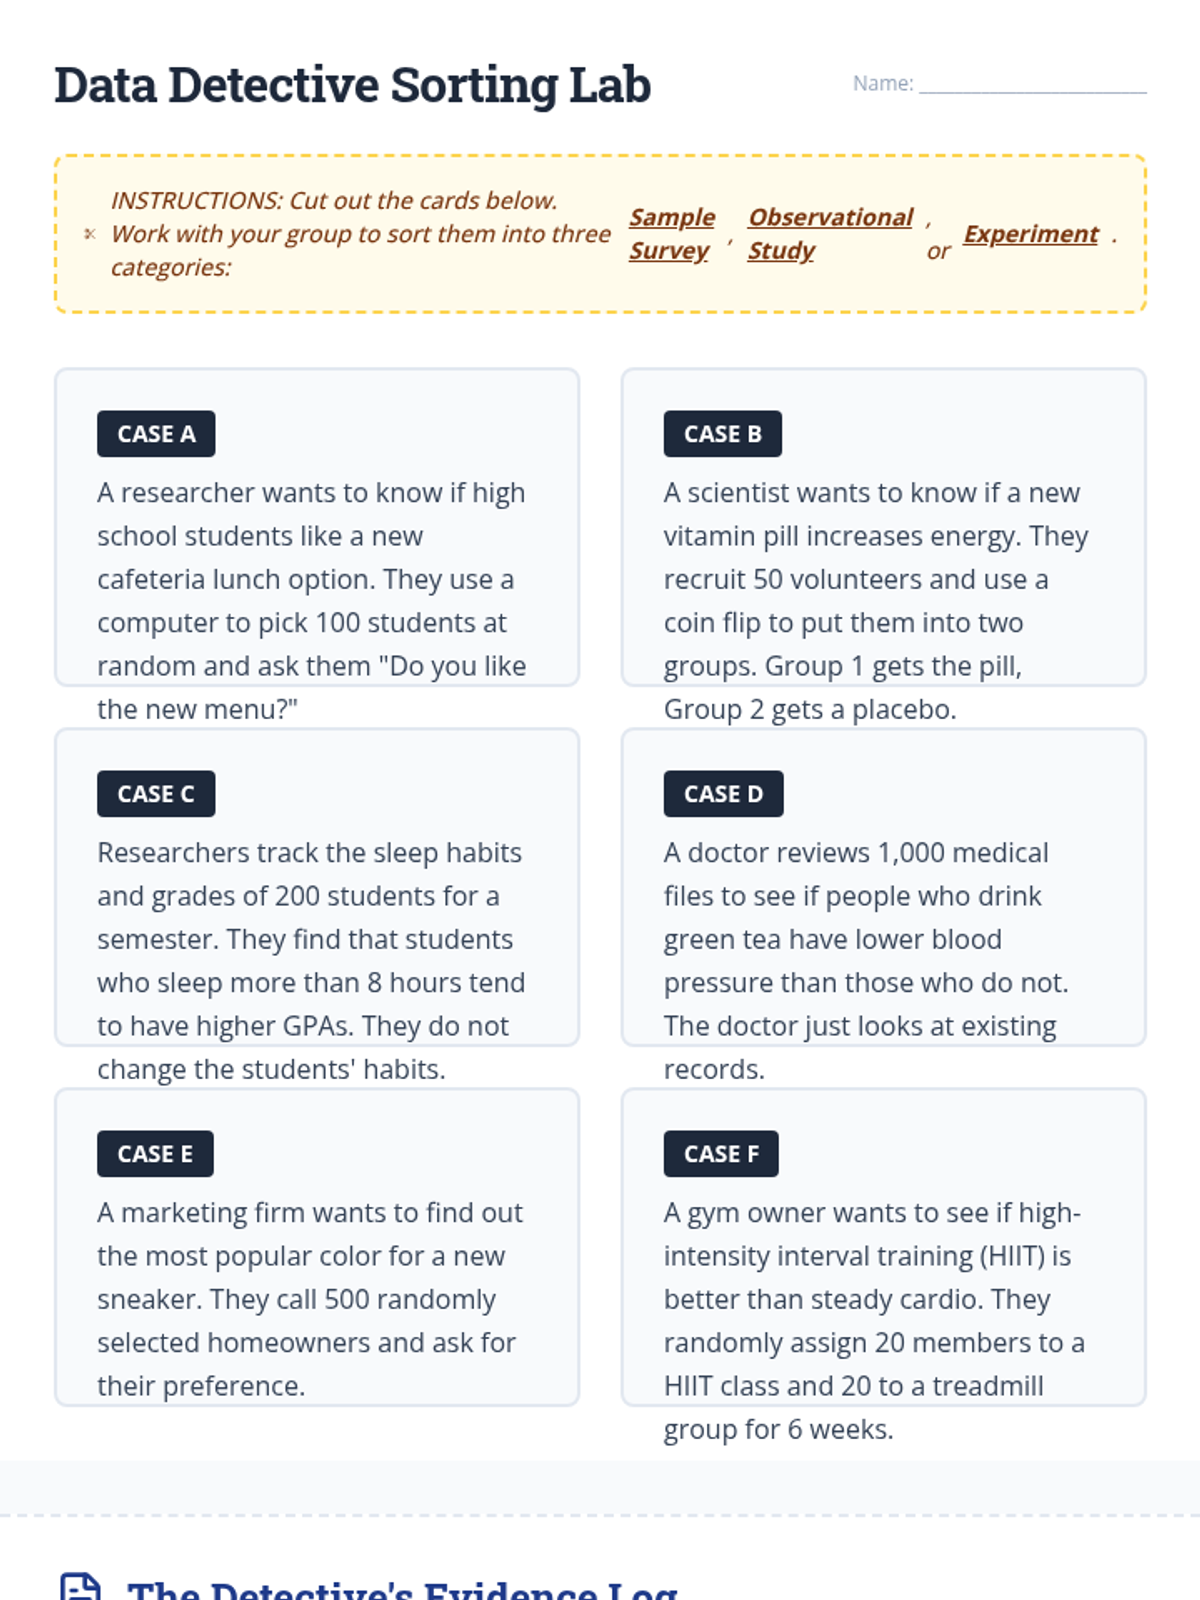
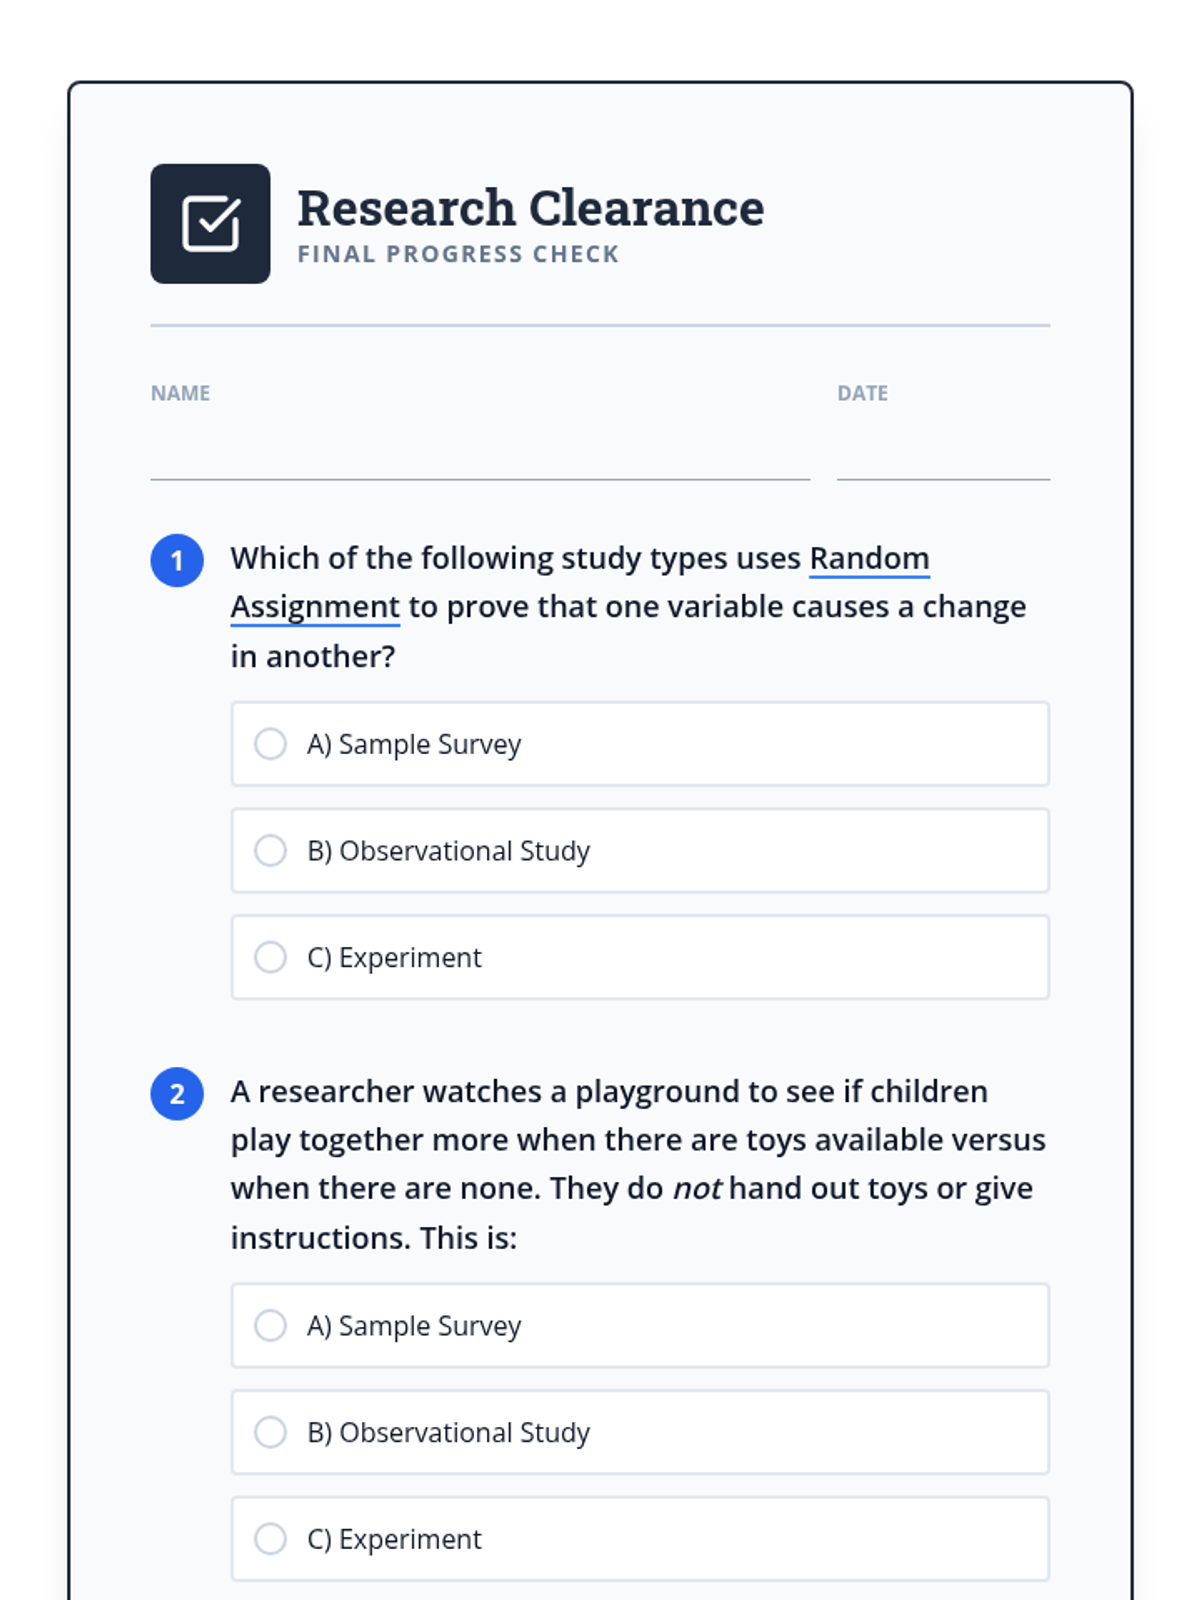
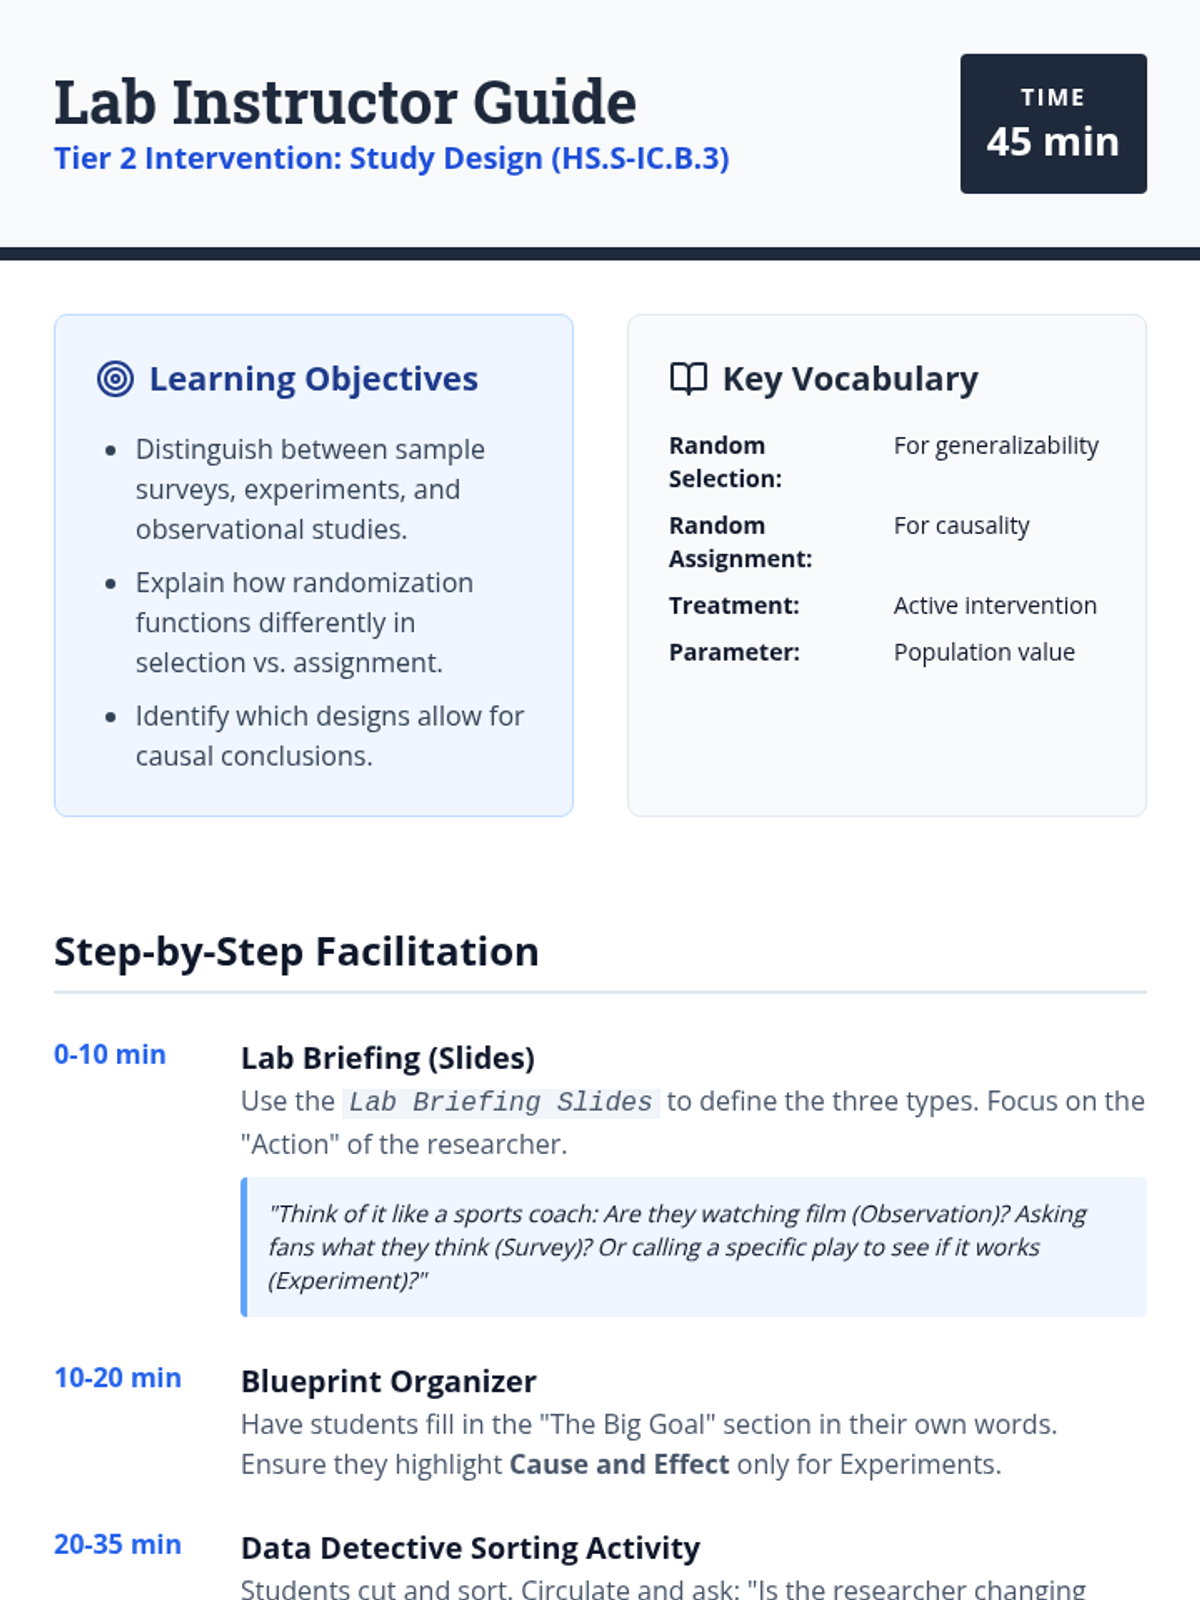
A targeted Tier 2 intervention lesson where students act as 'Study Architects' to master the design of sample surveys, experiments, and observational studies. The lesson emphasizes the critical role of randomization in each design type through collaborative mini-study planning and peer critique.
A Tier 2 intervention lesson focusing on the conceptual understanding of sampling variability and the margin of error using simulation models. Students transition from individual samples to distributions of many samples to estimate population parameters.
A scaffolded intervention lesson focusing on the relationship between populations and samples, and how statistics allow us to make educated guesses (inferences) about the world.
A Tier 2 intervention lesson focused on distinguishing between sample surveys, experiments, and observational studies, with a specific focus on the role of randomization in each. This lesson uses scaffolded comparison charts and structured research analysis to help students master Colorado standard HS.S-IC.B.3.
A targeted small-group intervention for high school statistics students to distinguish between surveys, experiments, and observational studies, emphasizing the role of randomization.
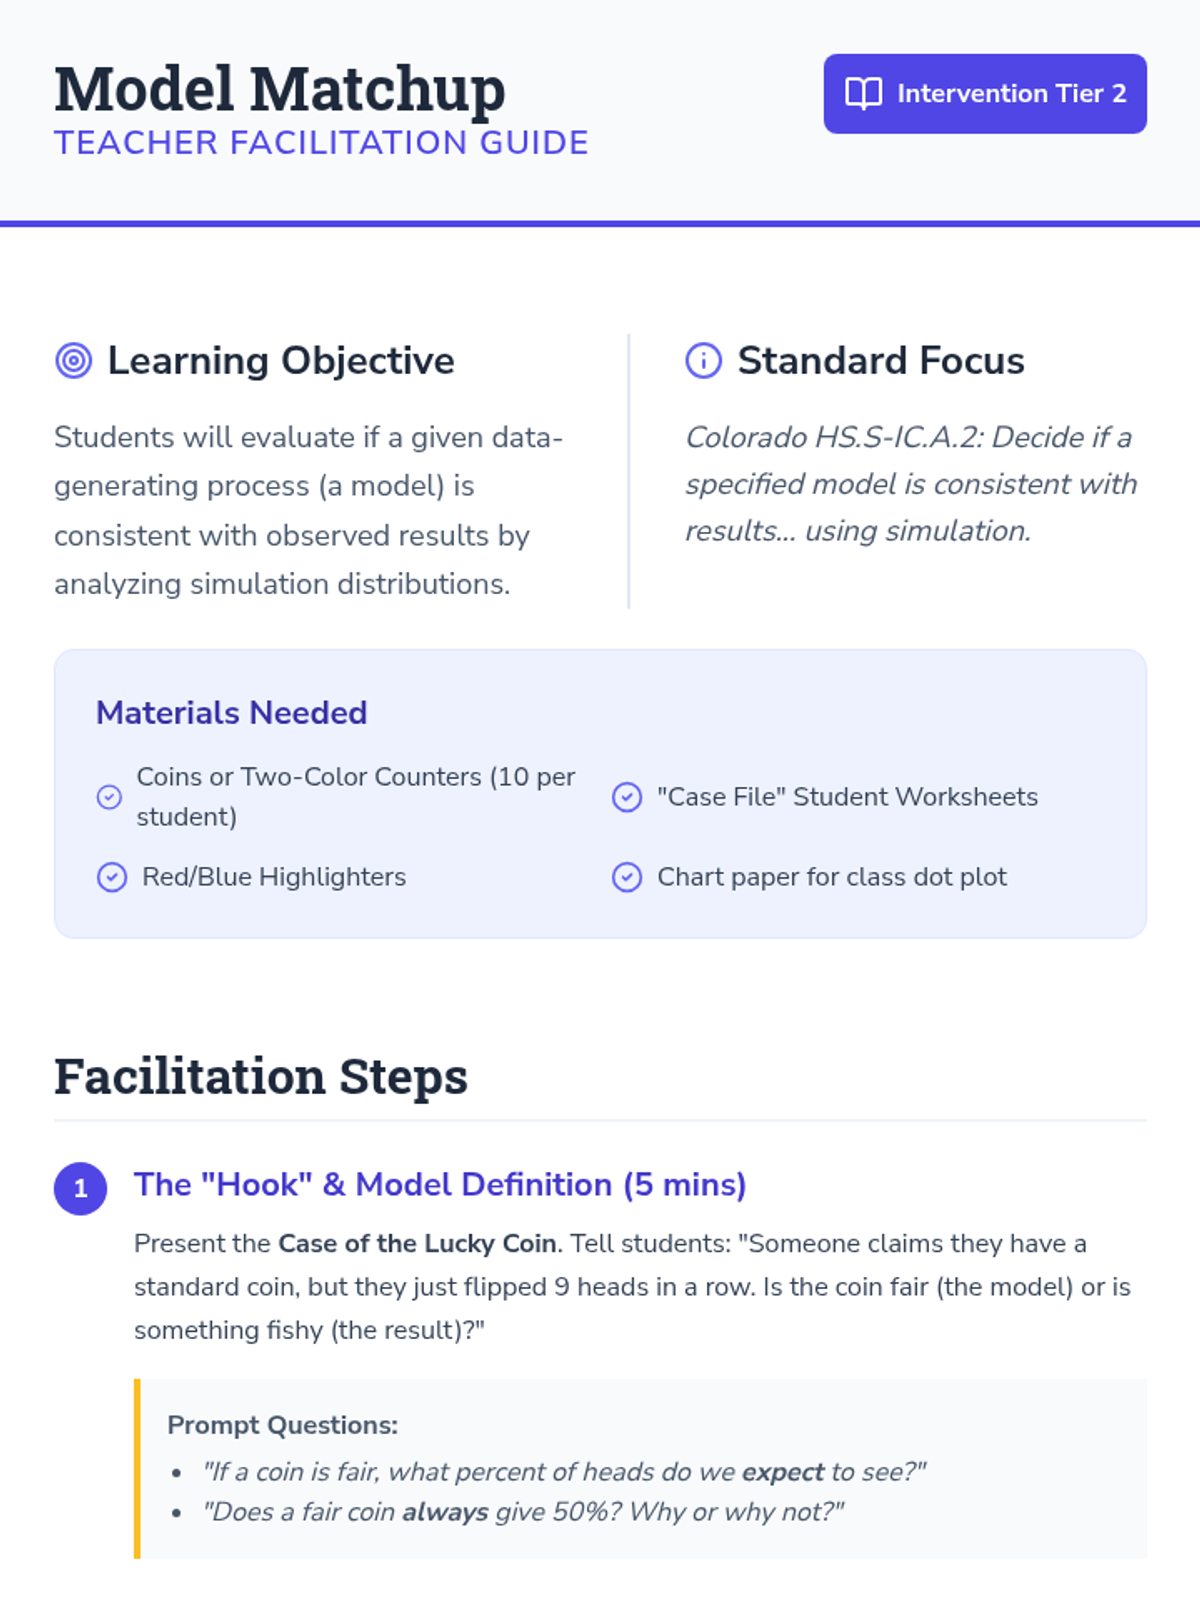
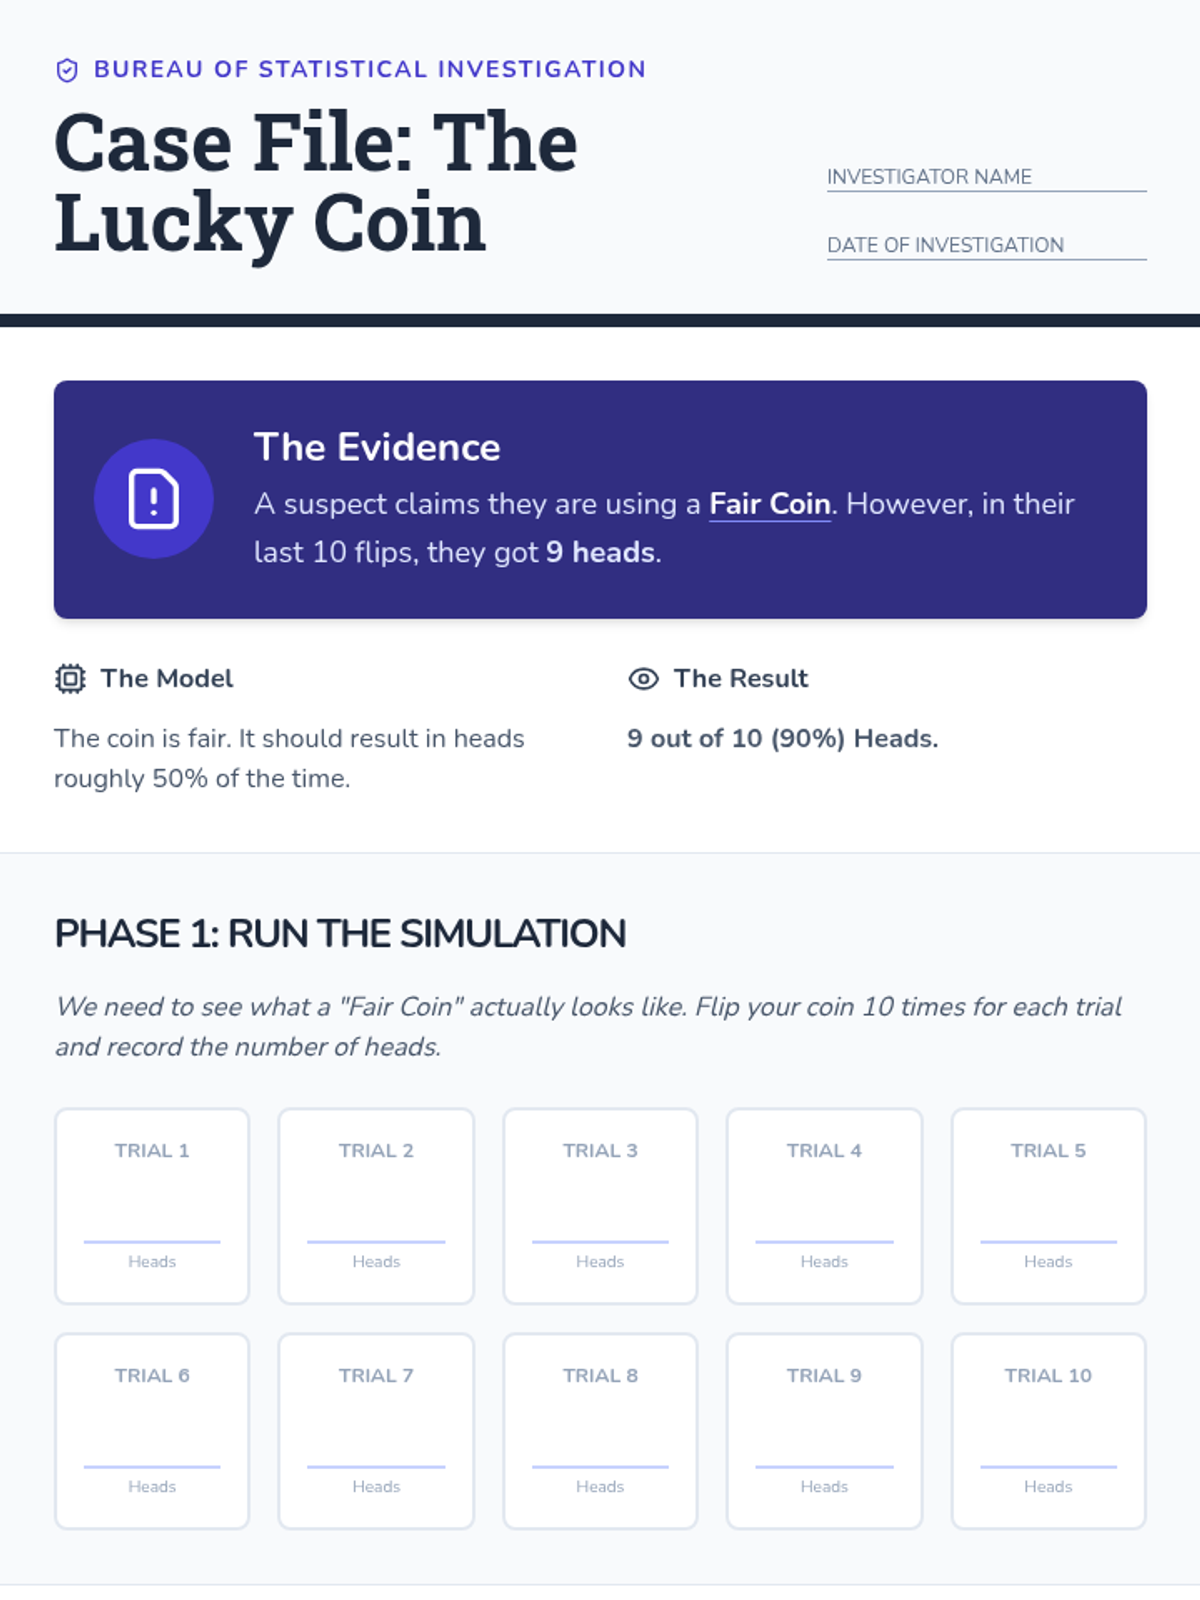
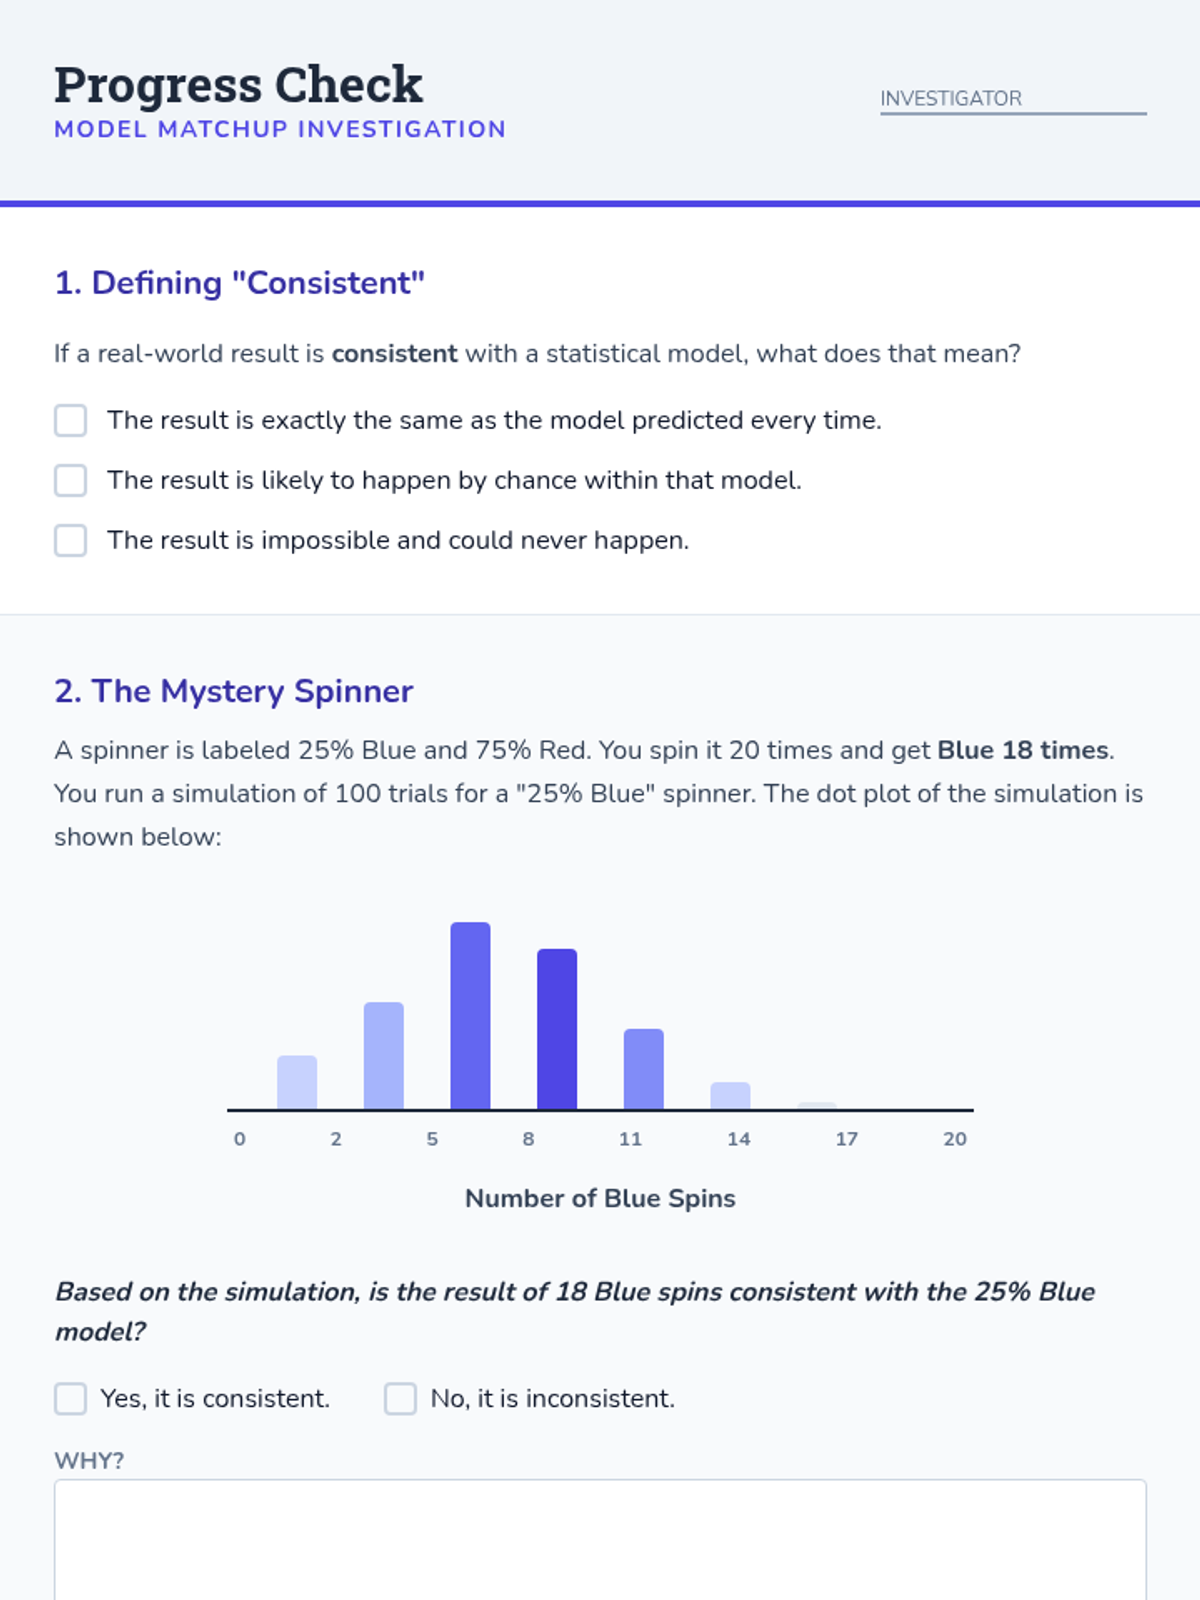
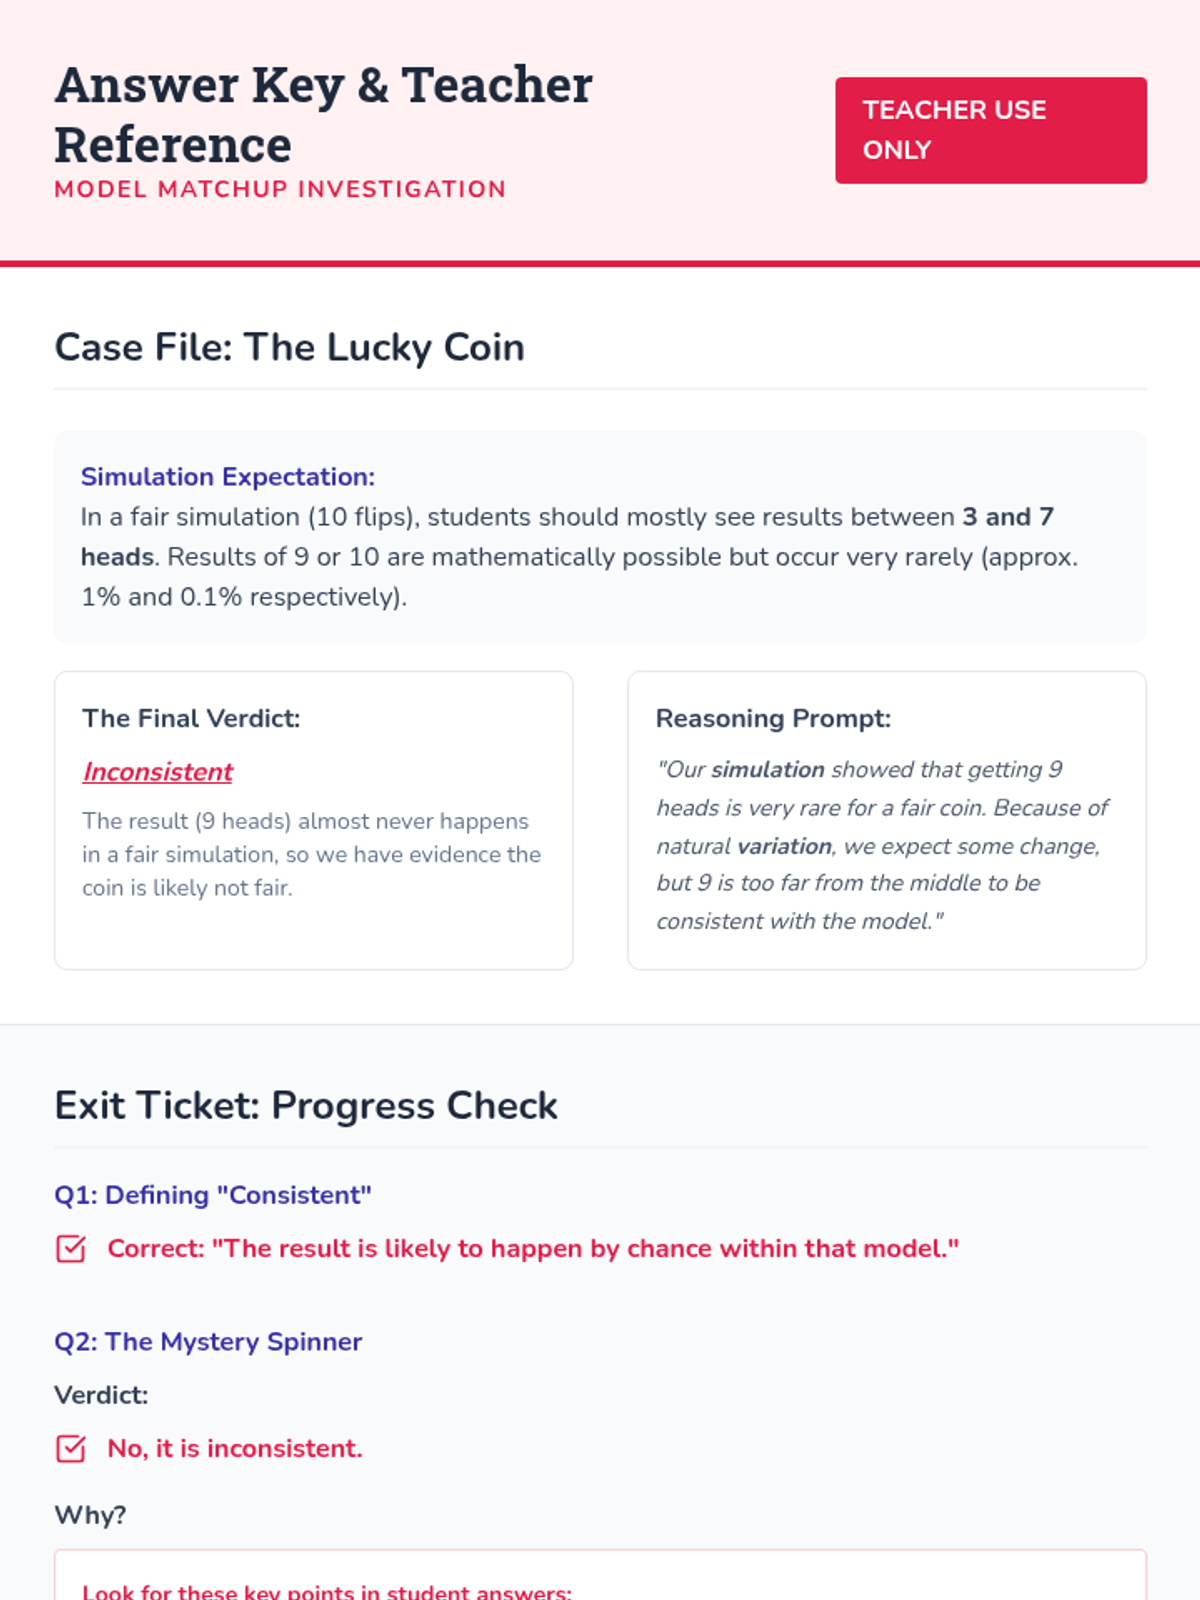
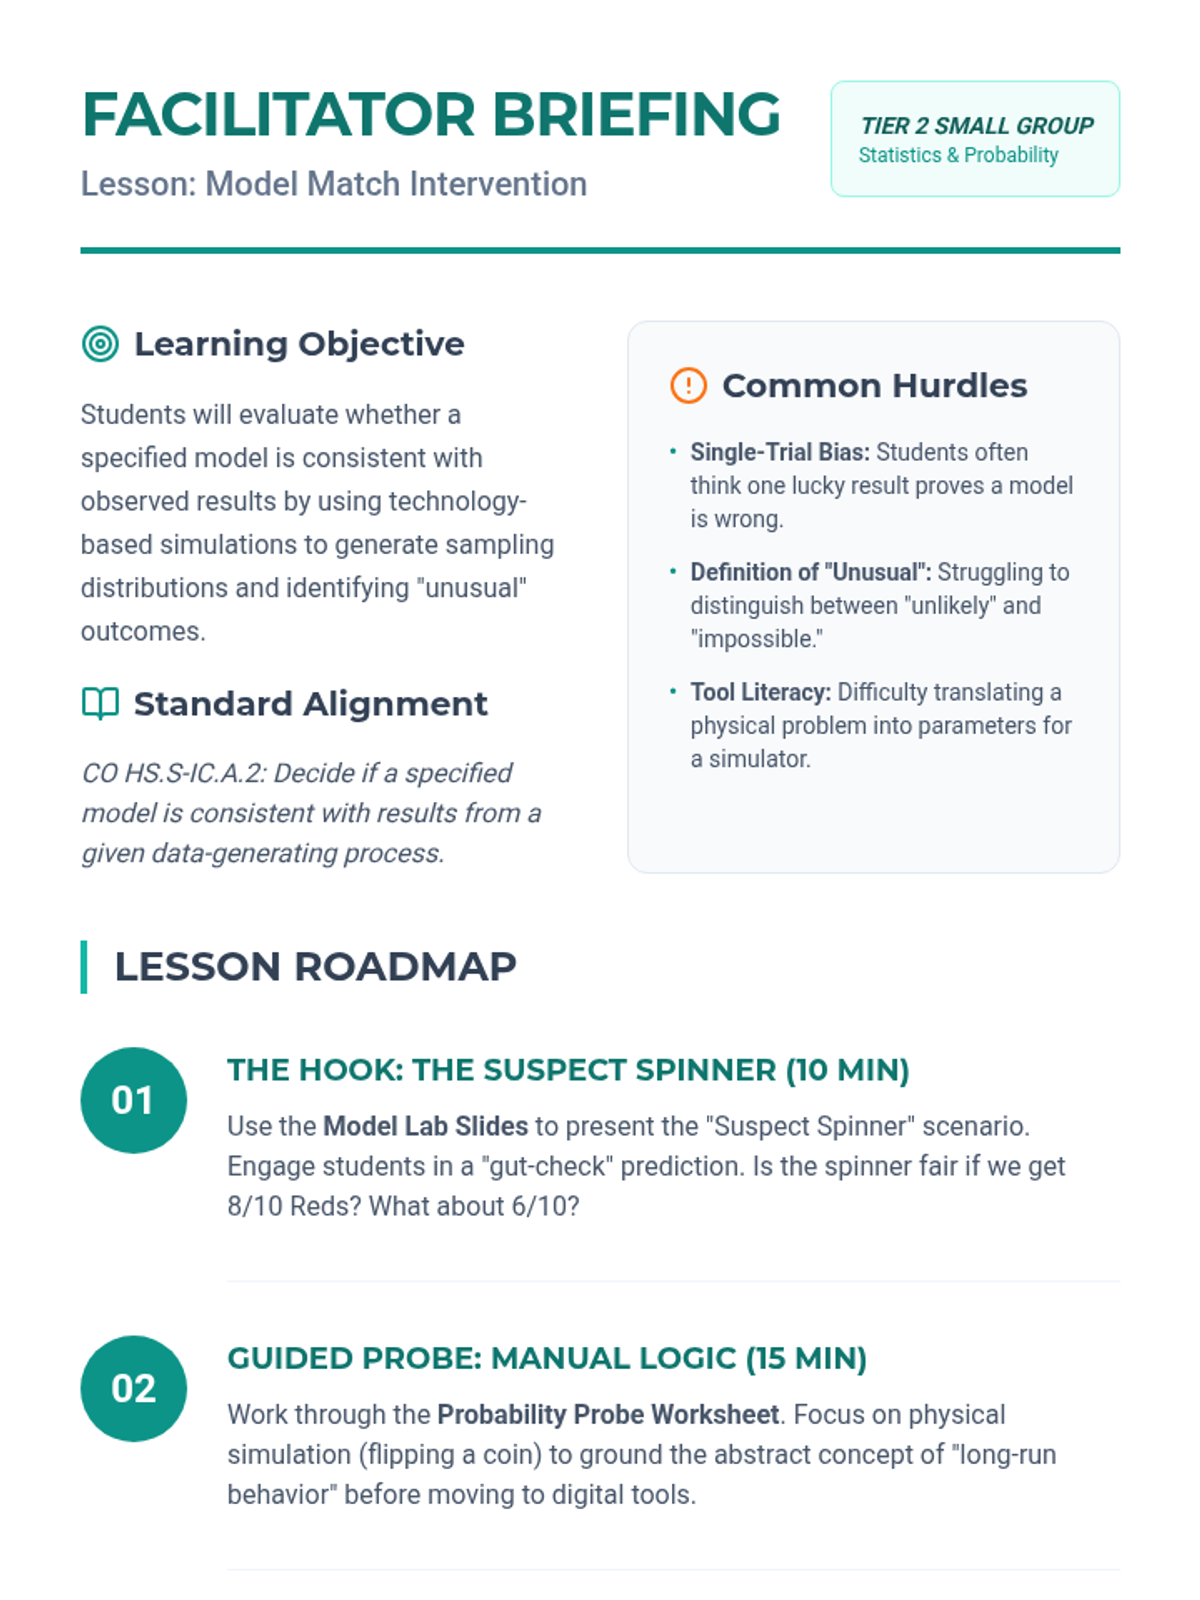
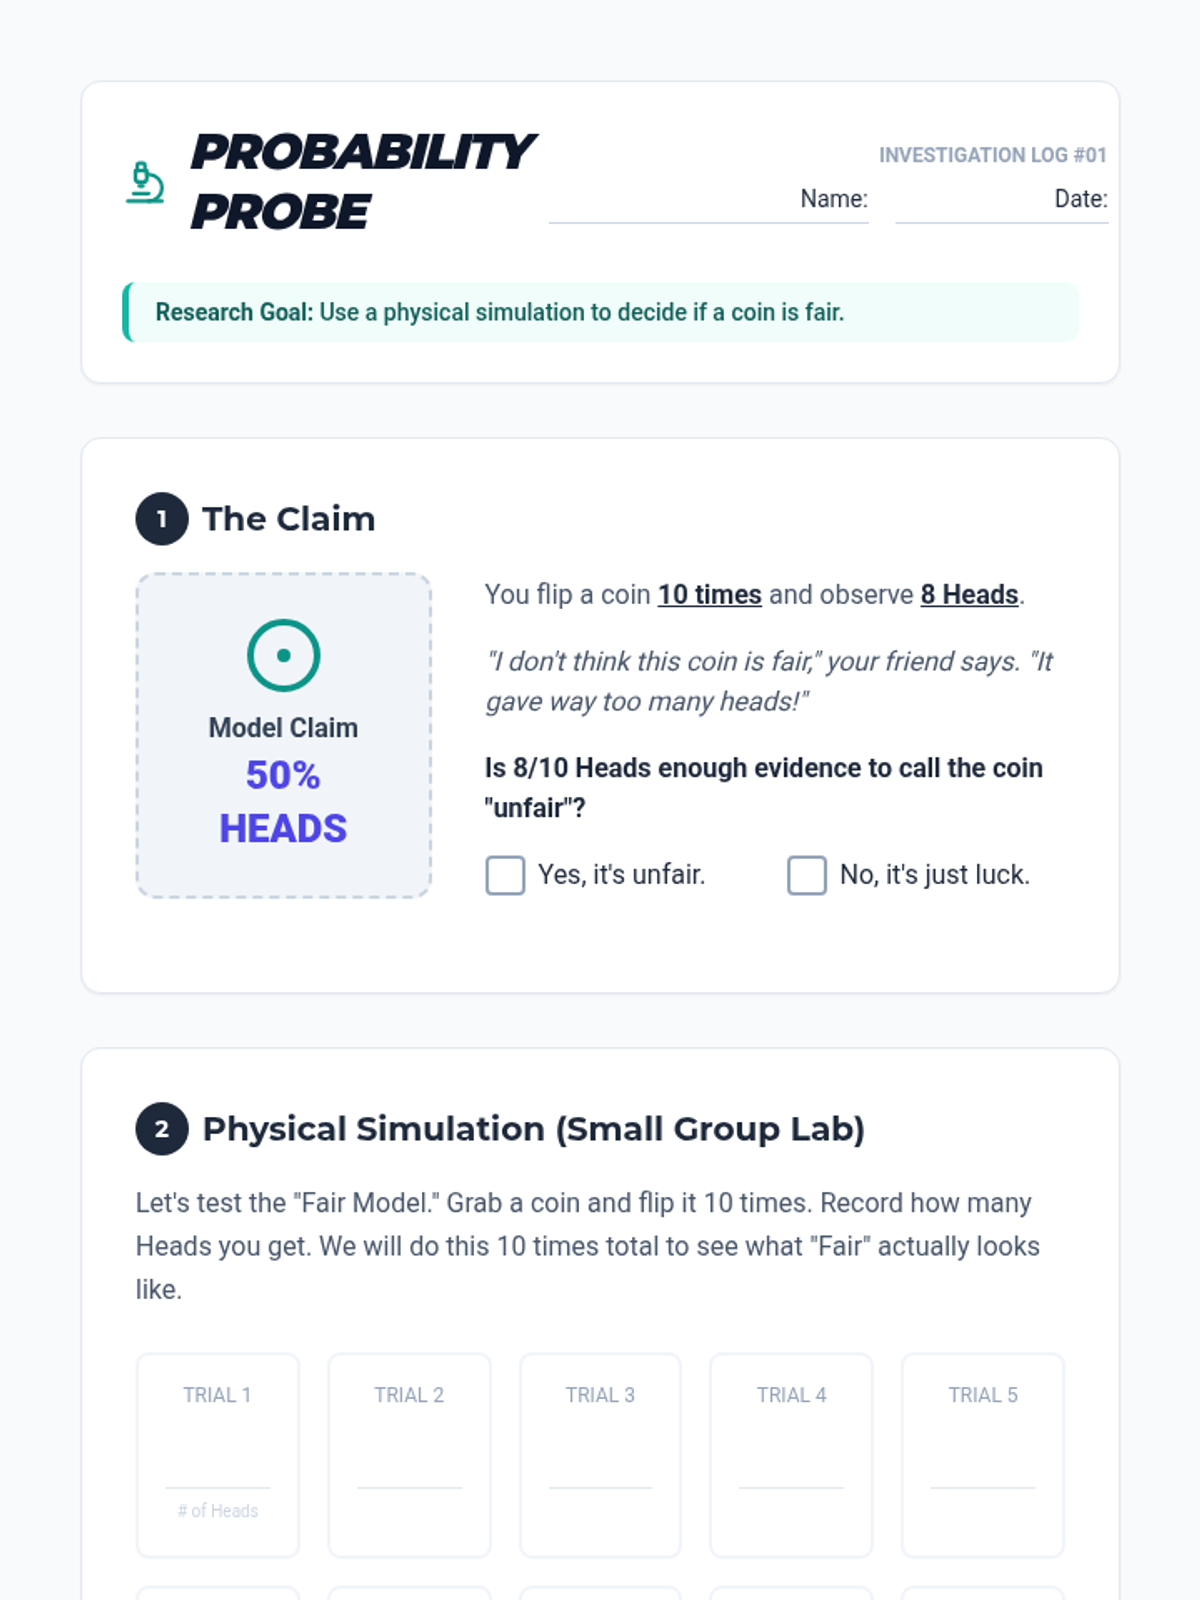
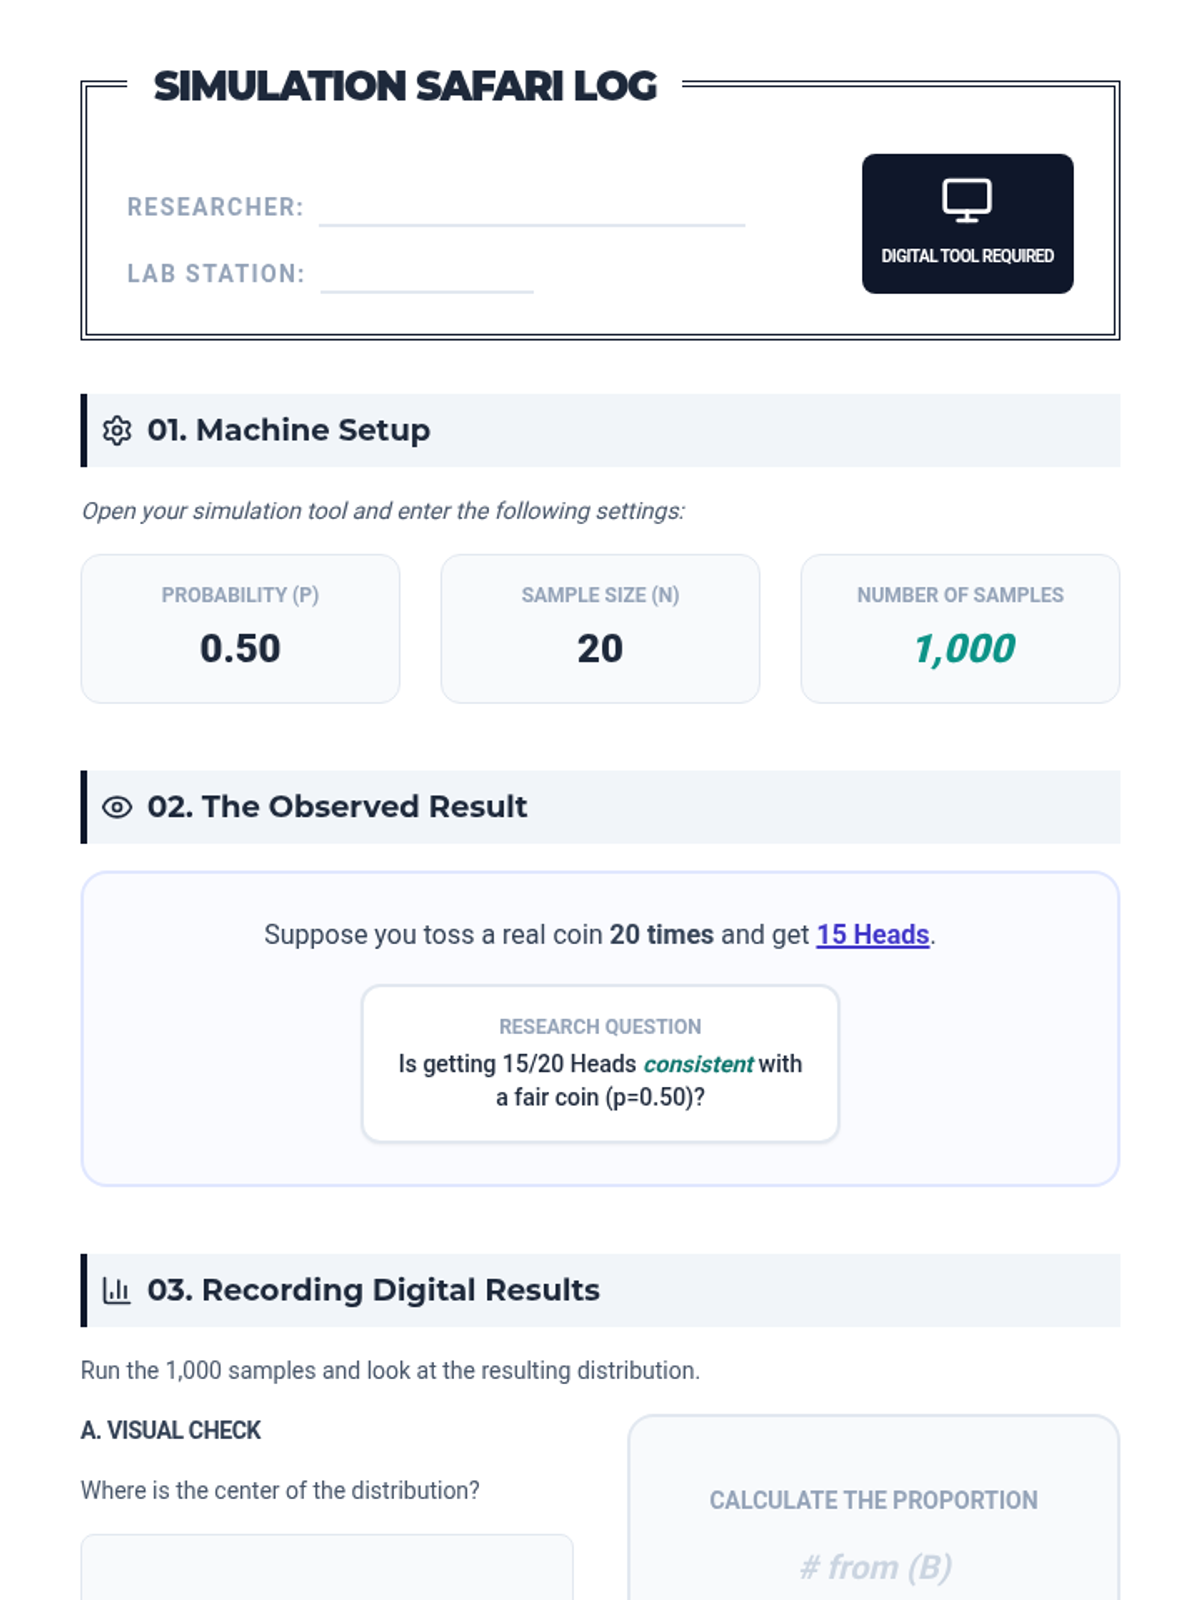
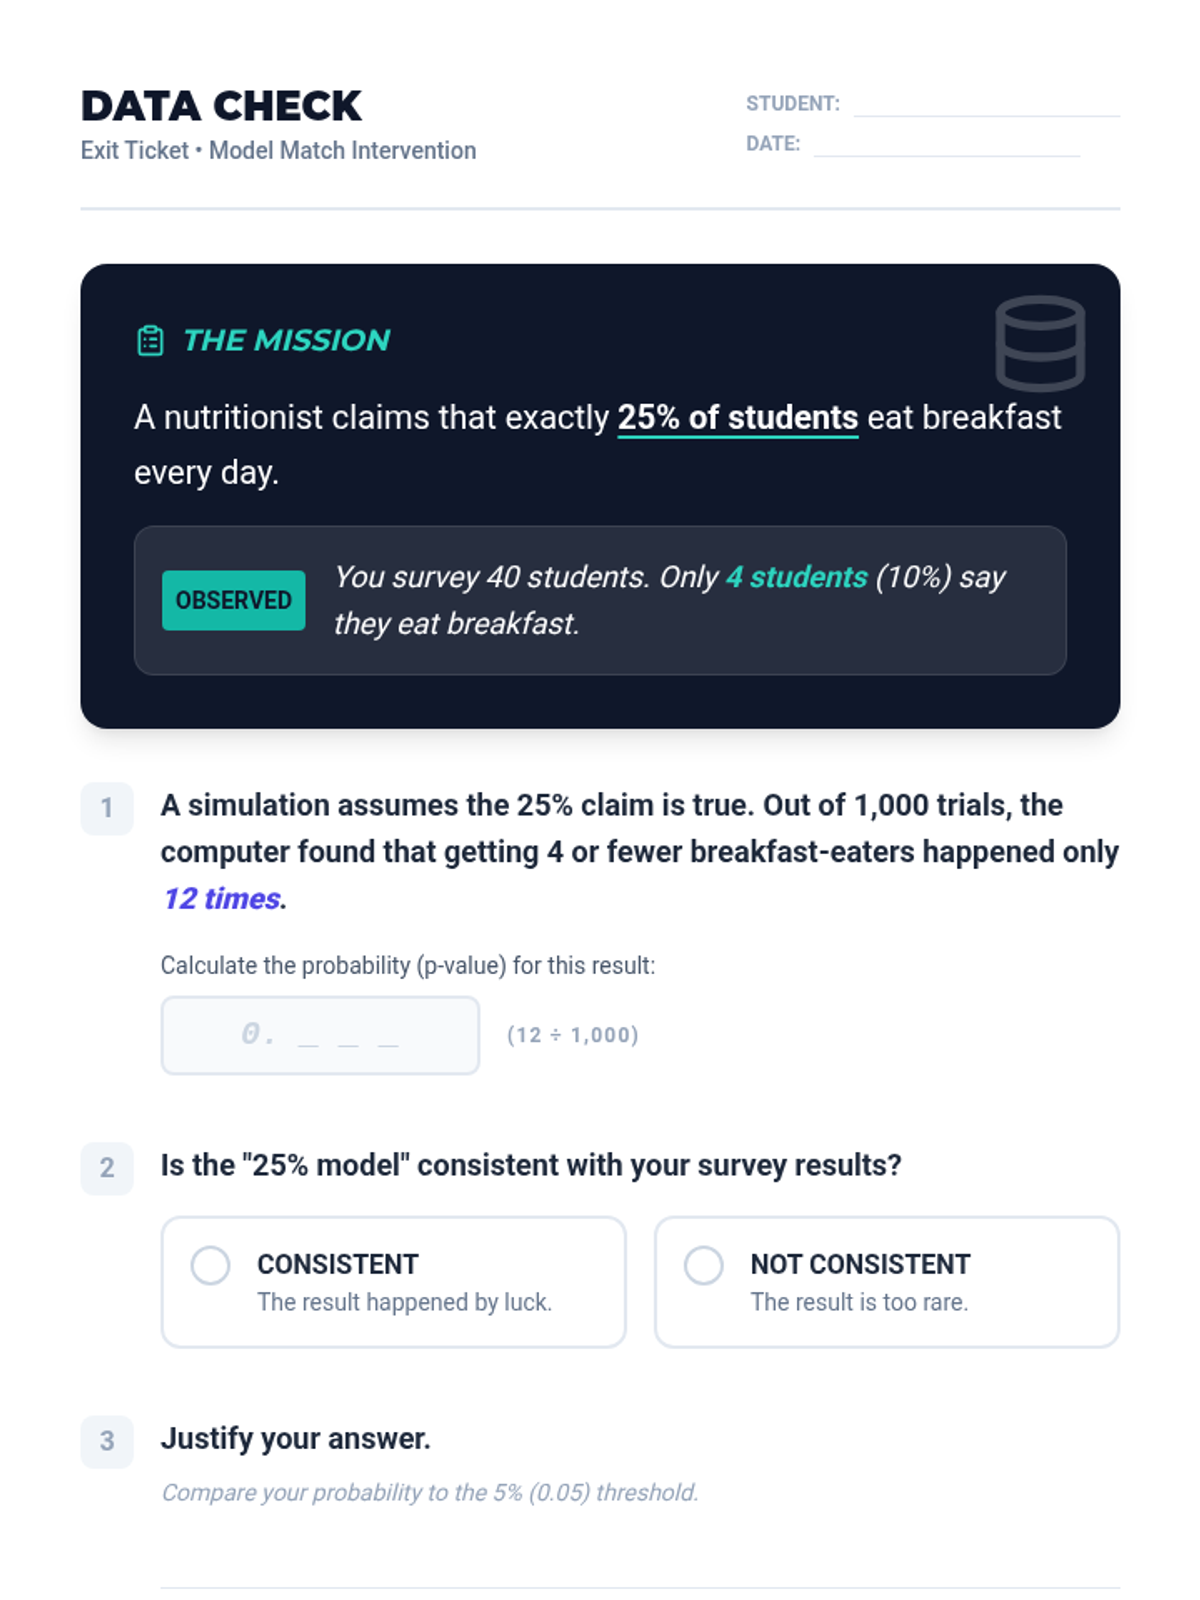
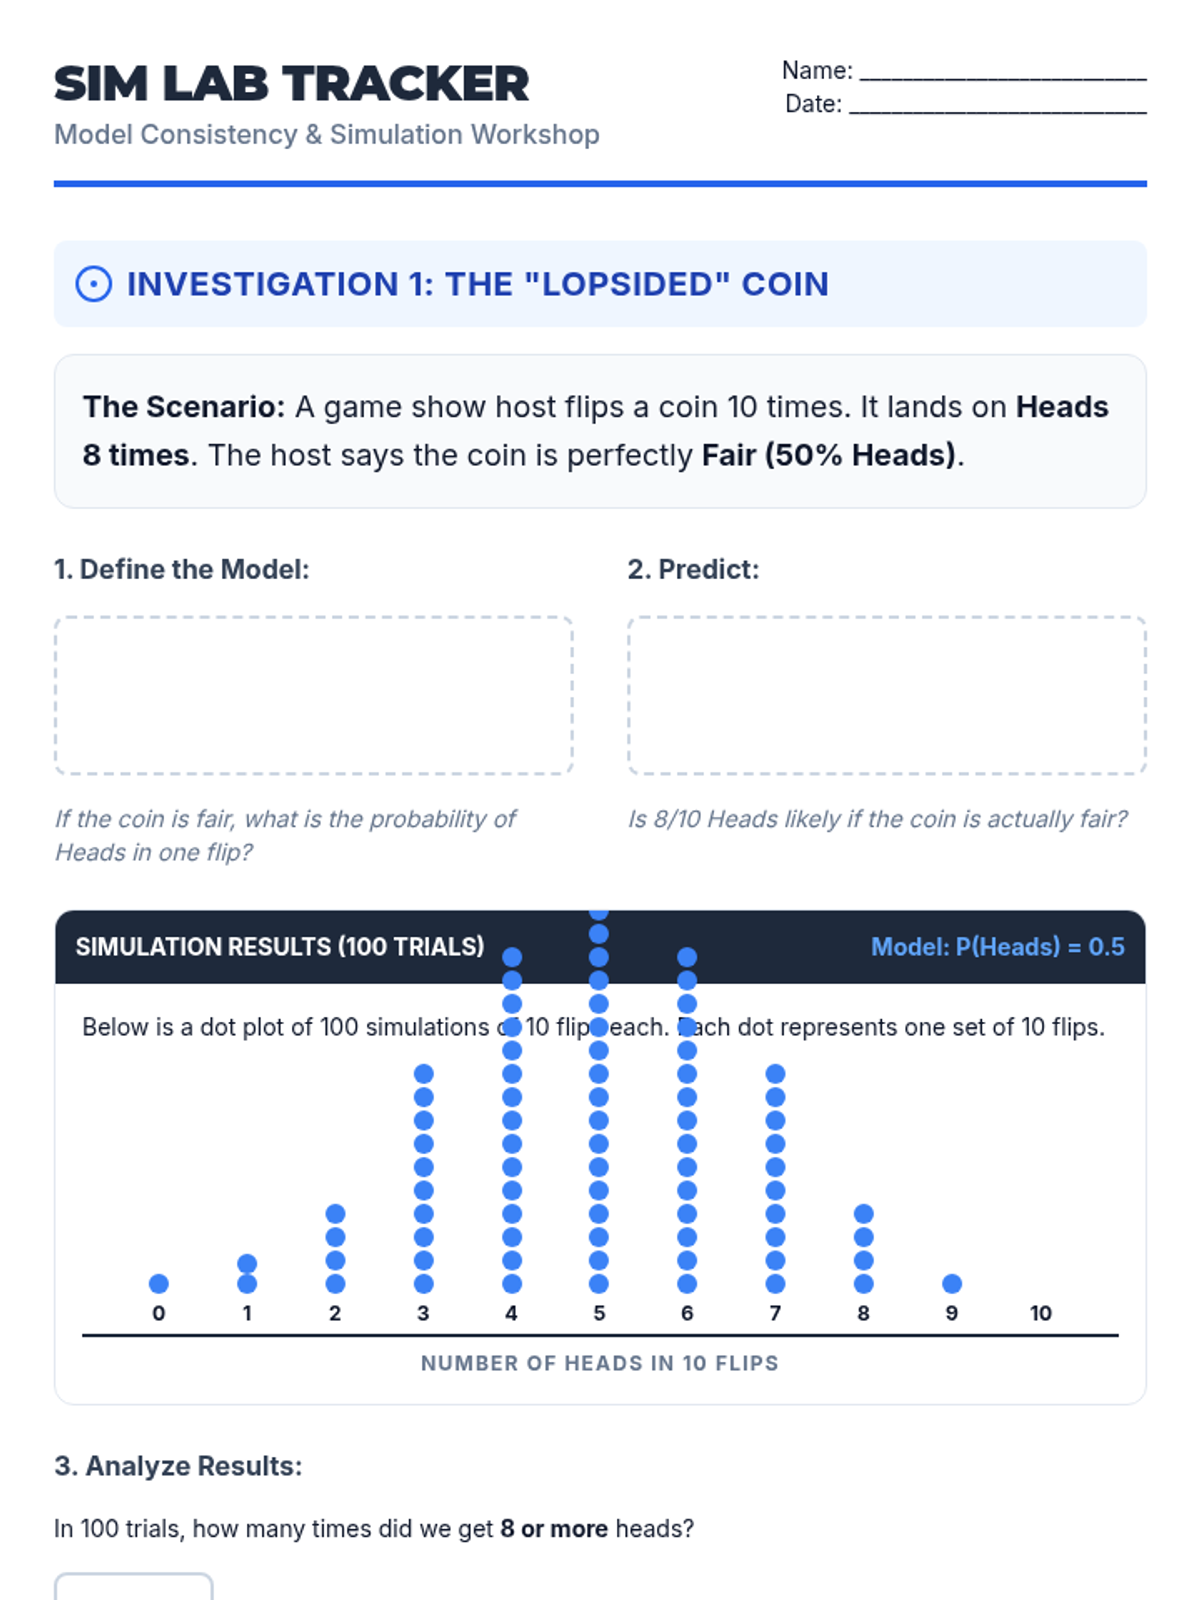
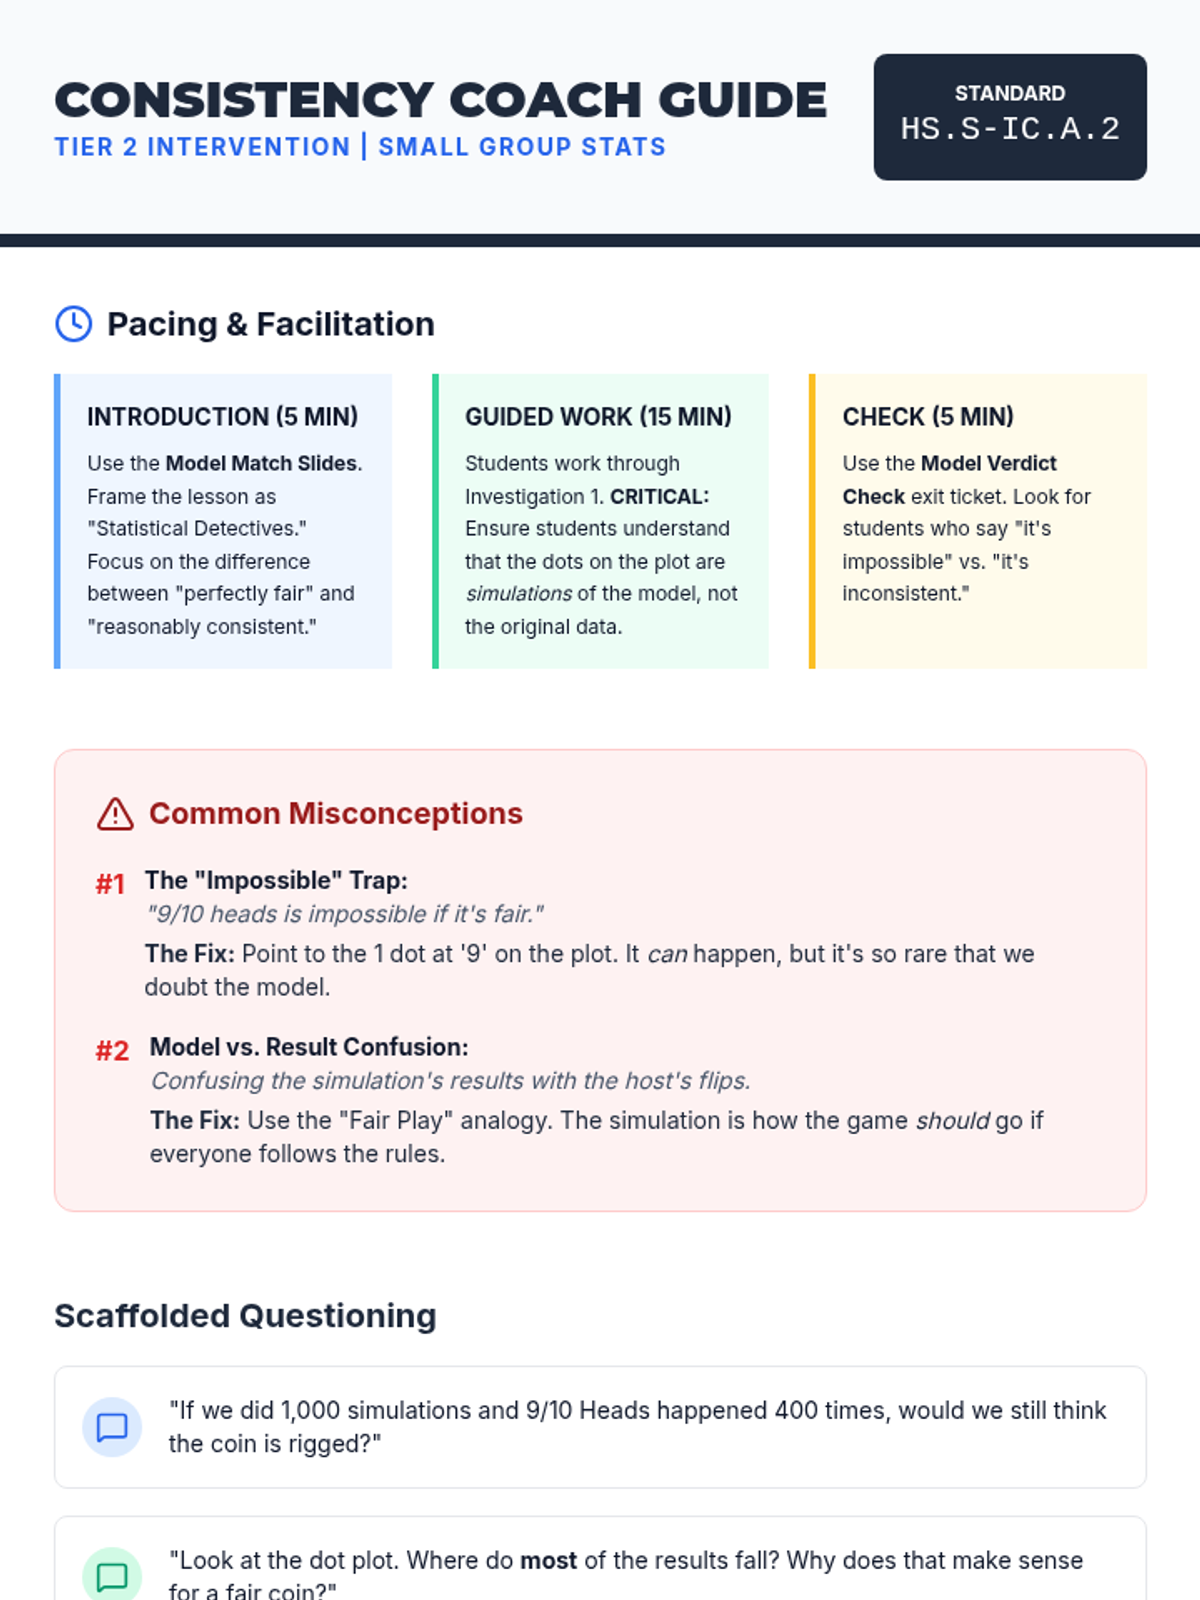
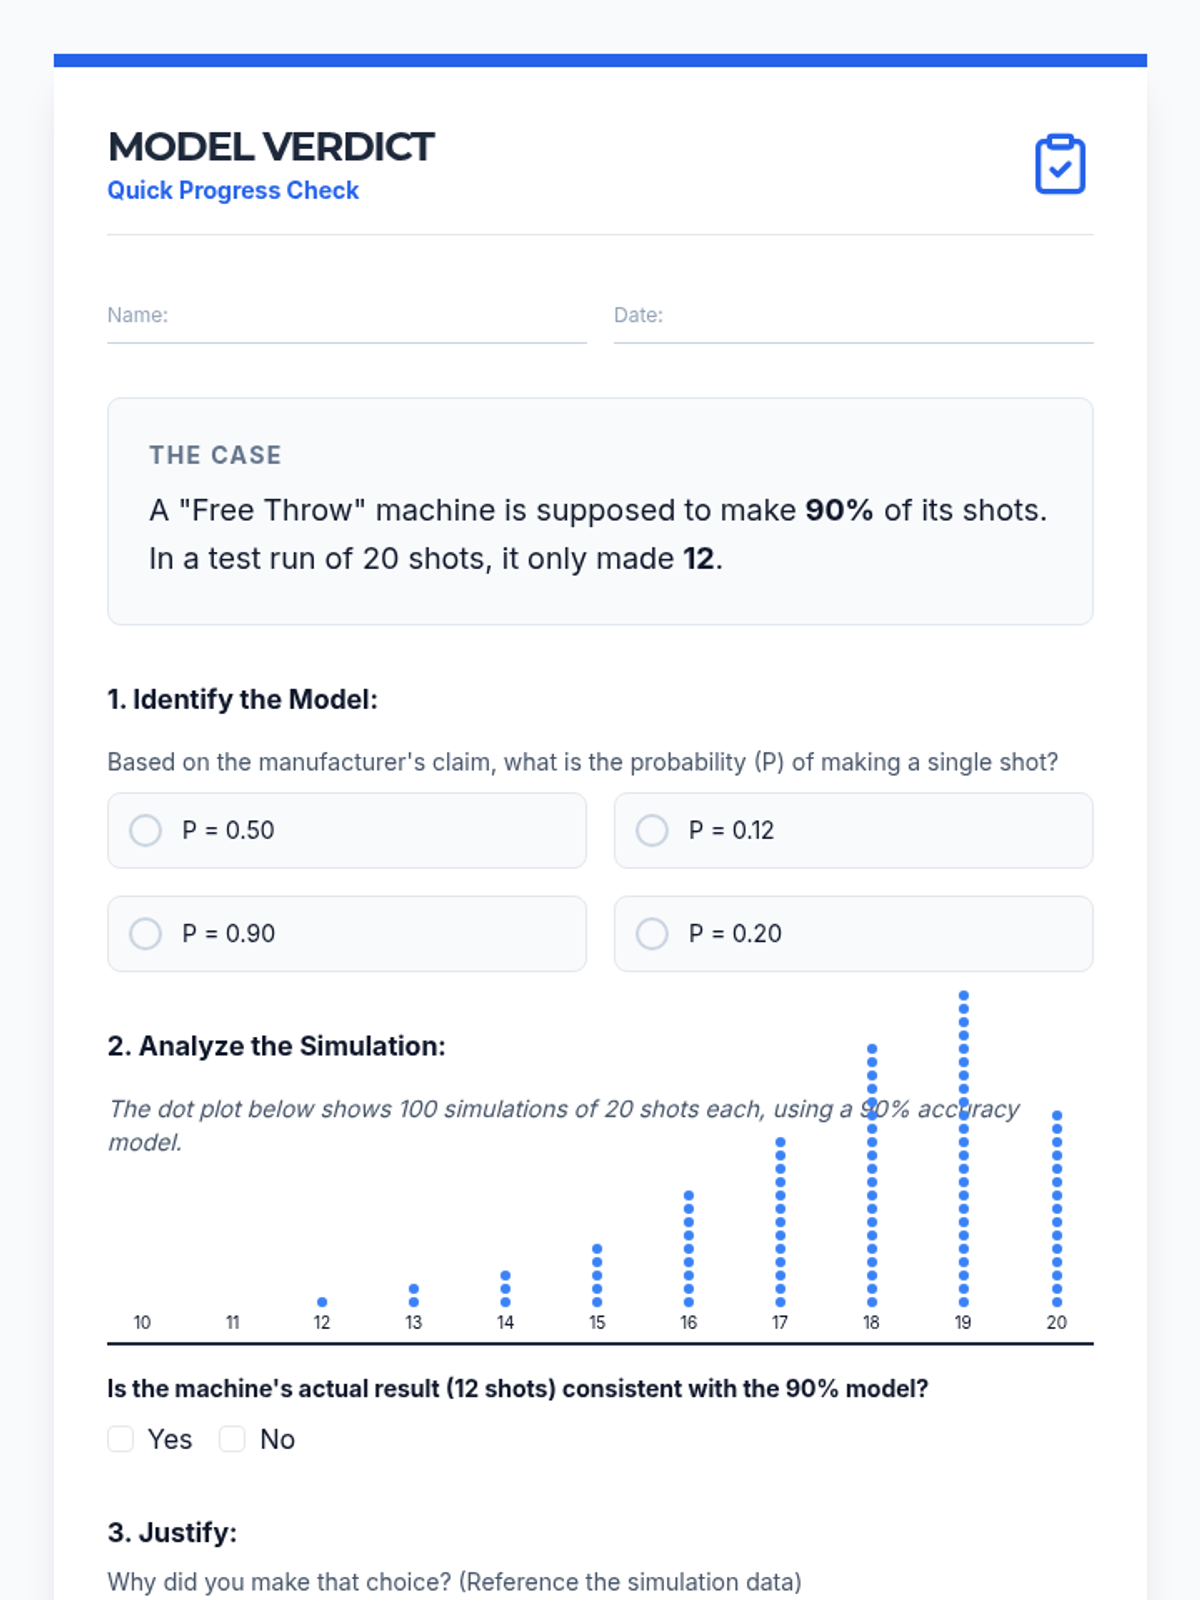
A targeted intervention lesson focused on evaluating model consistency through simulations, helping students develop intuition about natural variation and statistical significance.
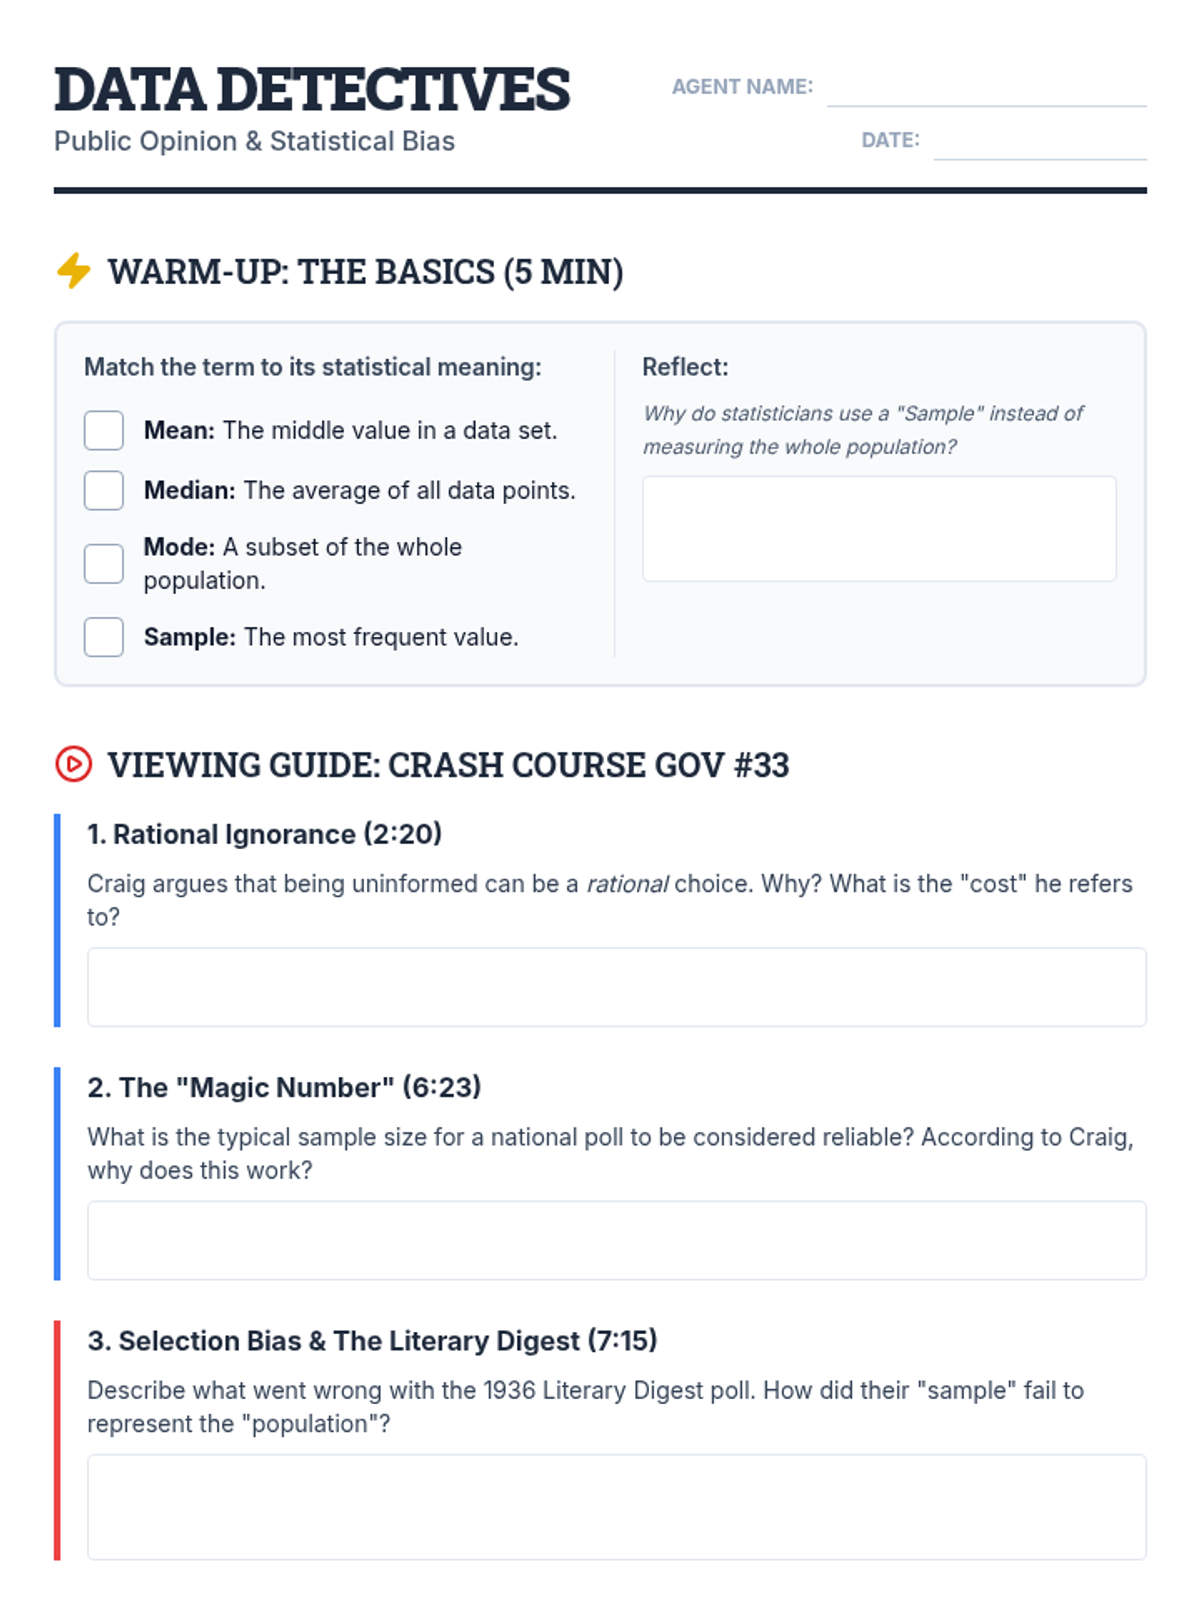
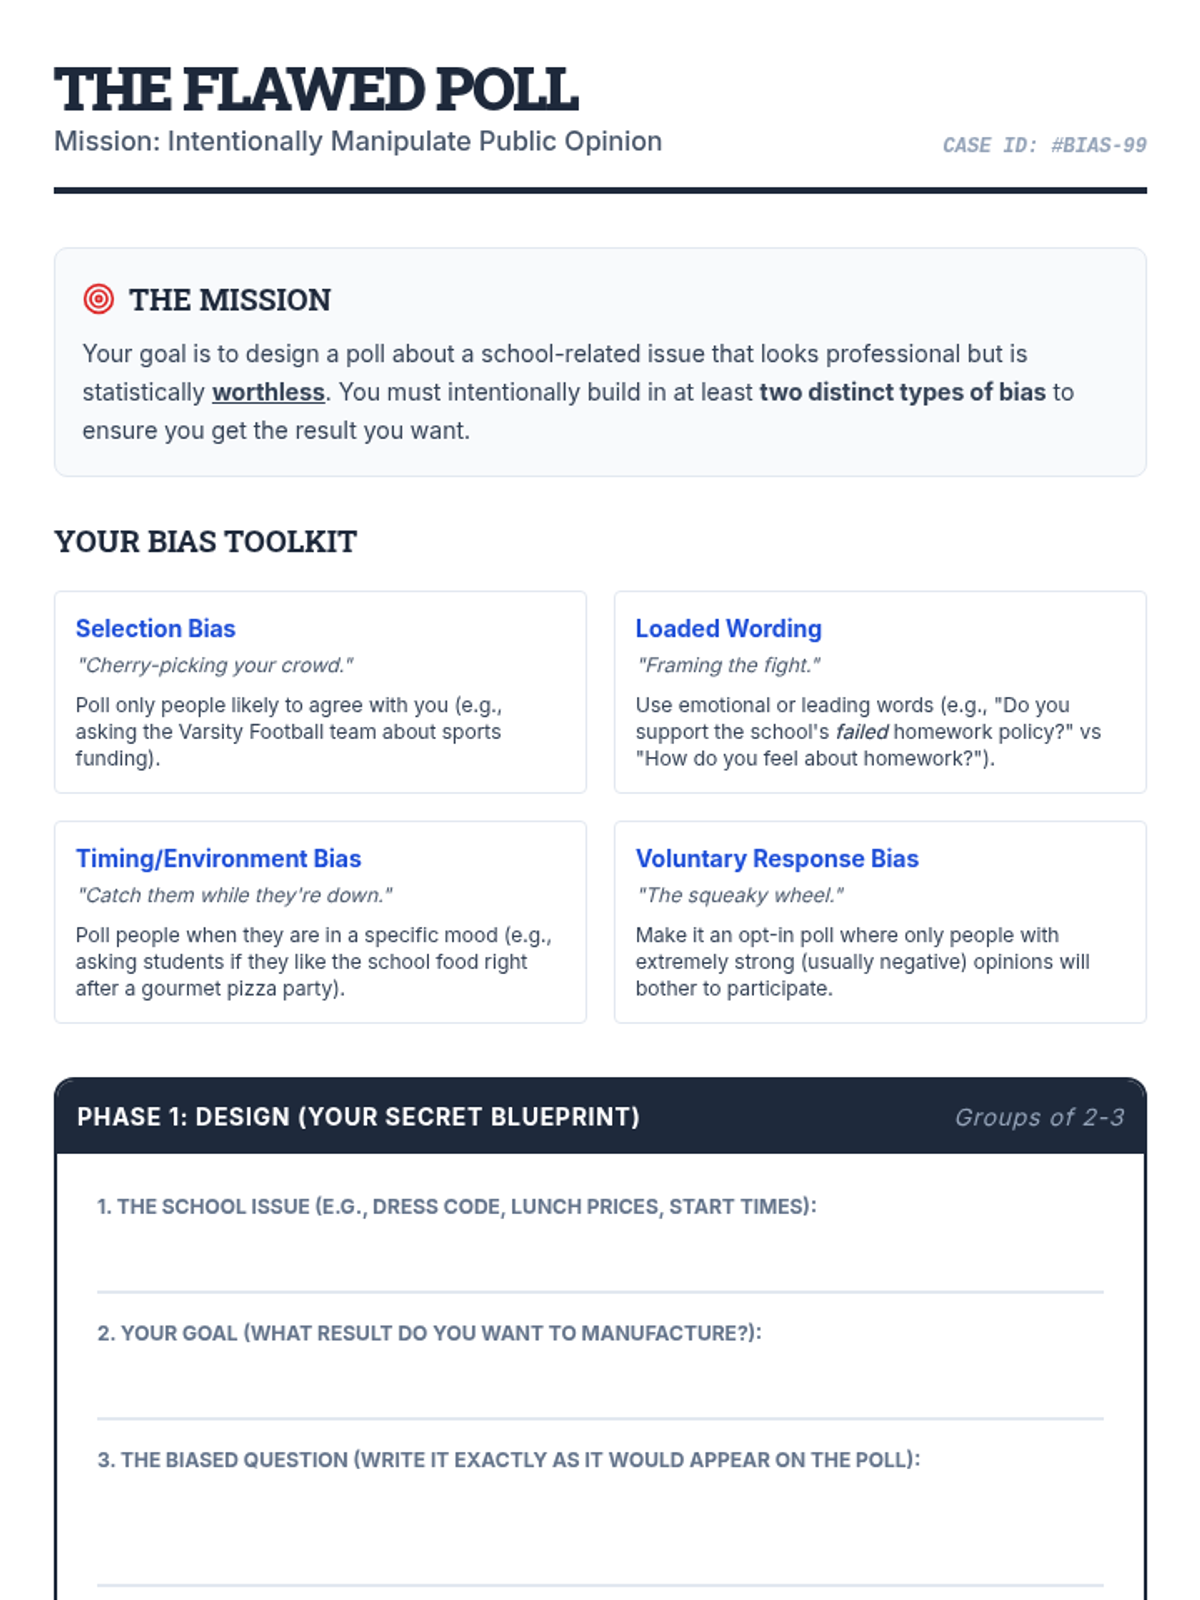
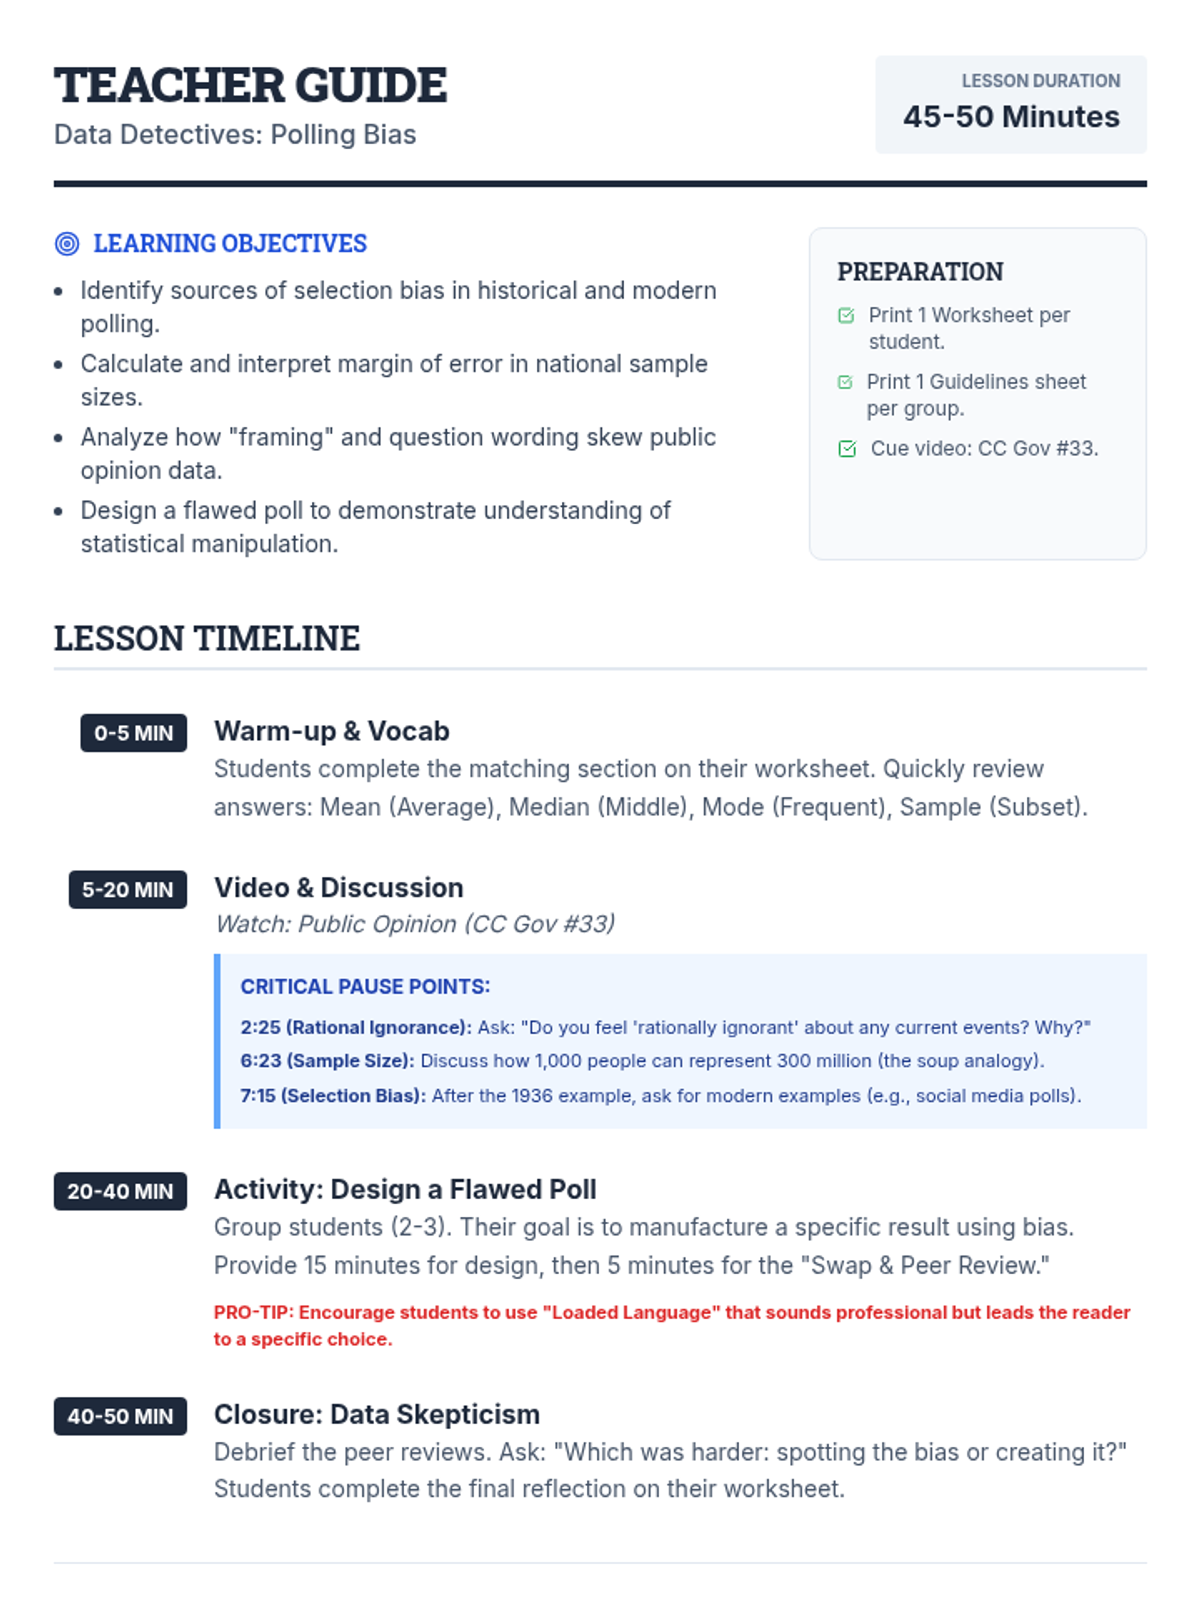
A high school statistics lesson focused on identifying and creating biased polls to understand sampling error and selection bias in political contexts.
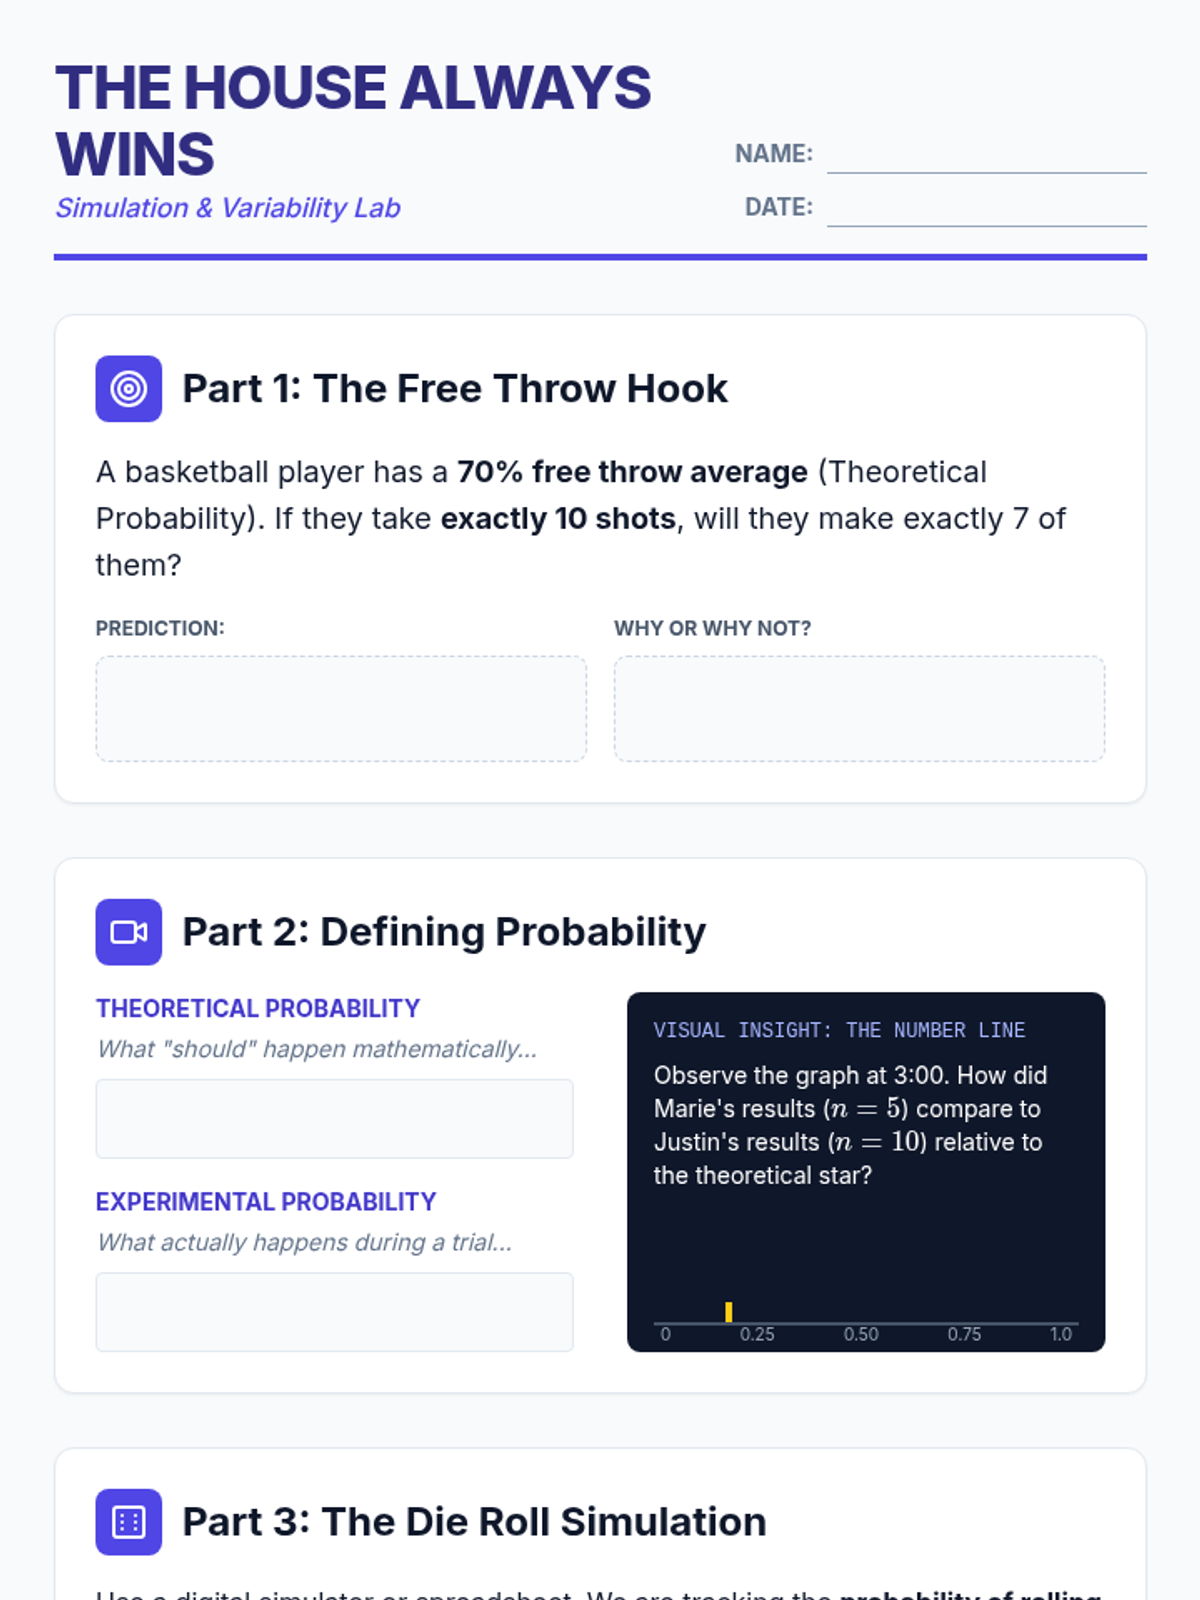
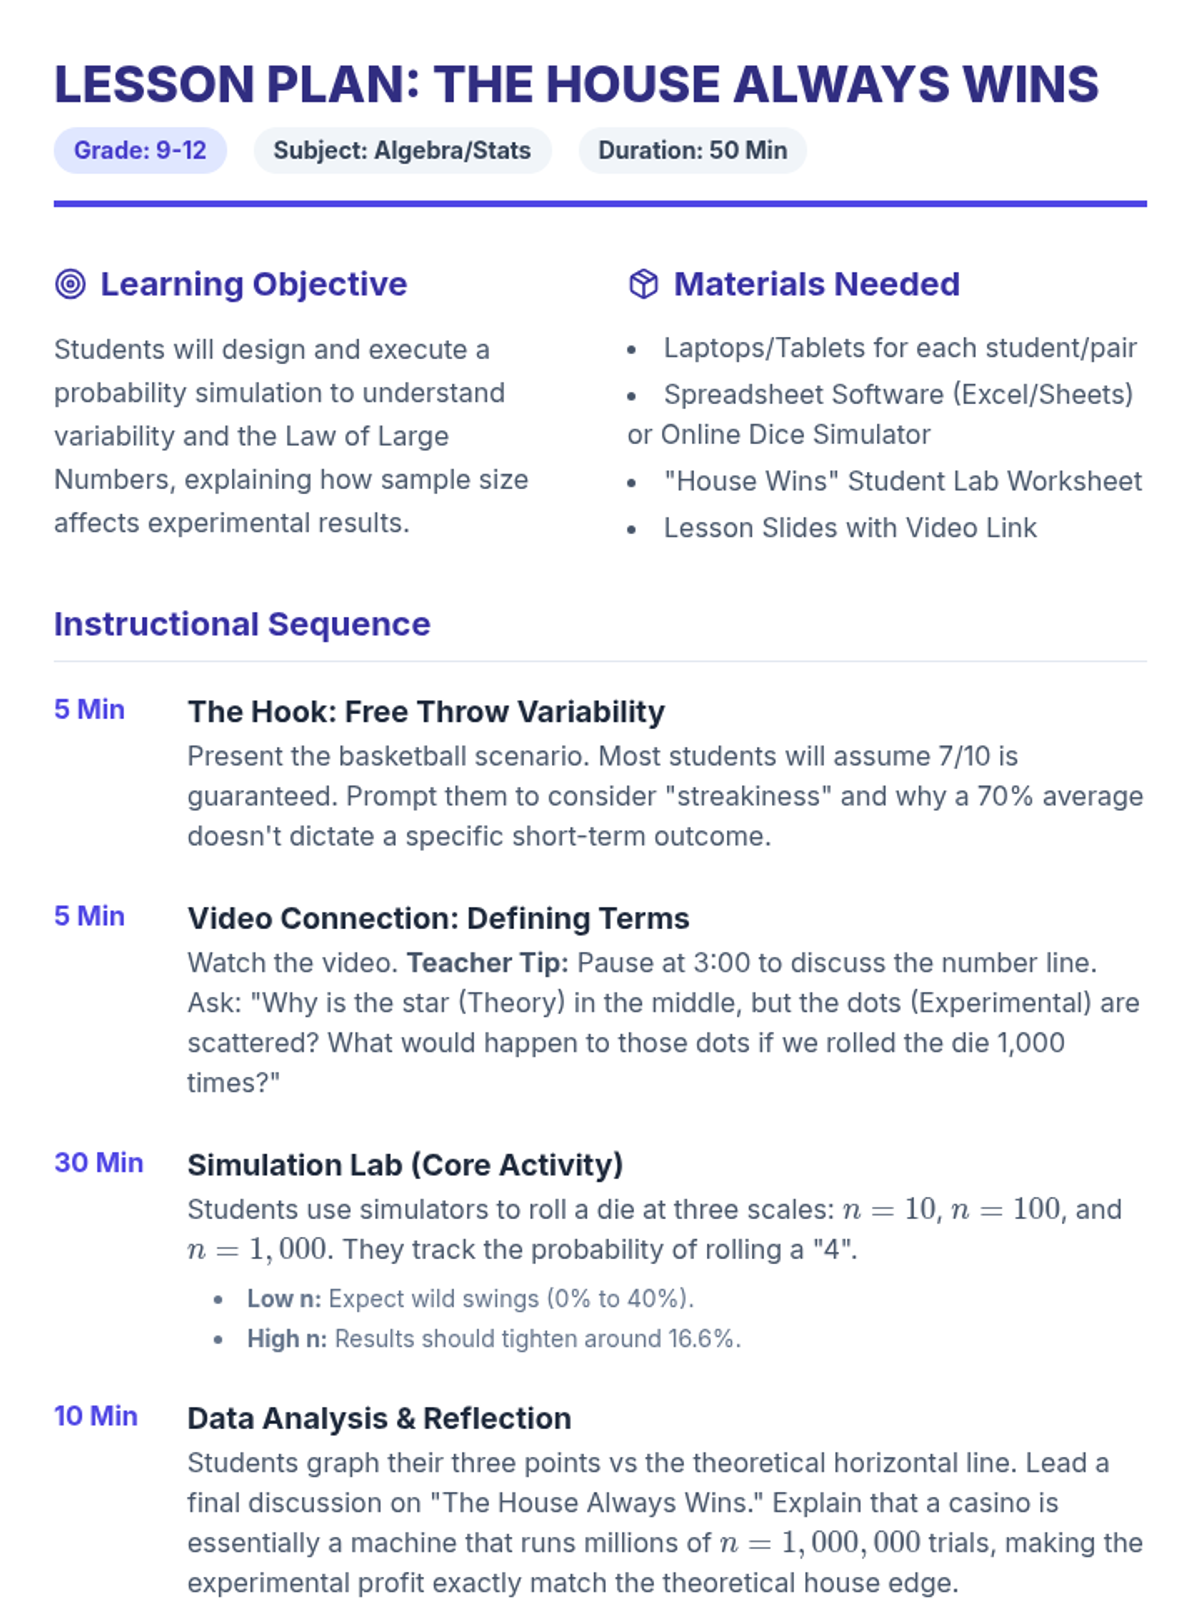
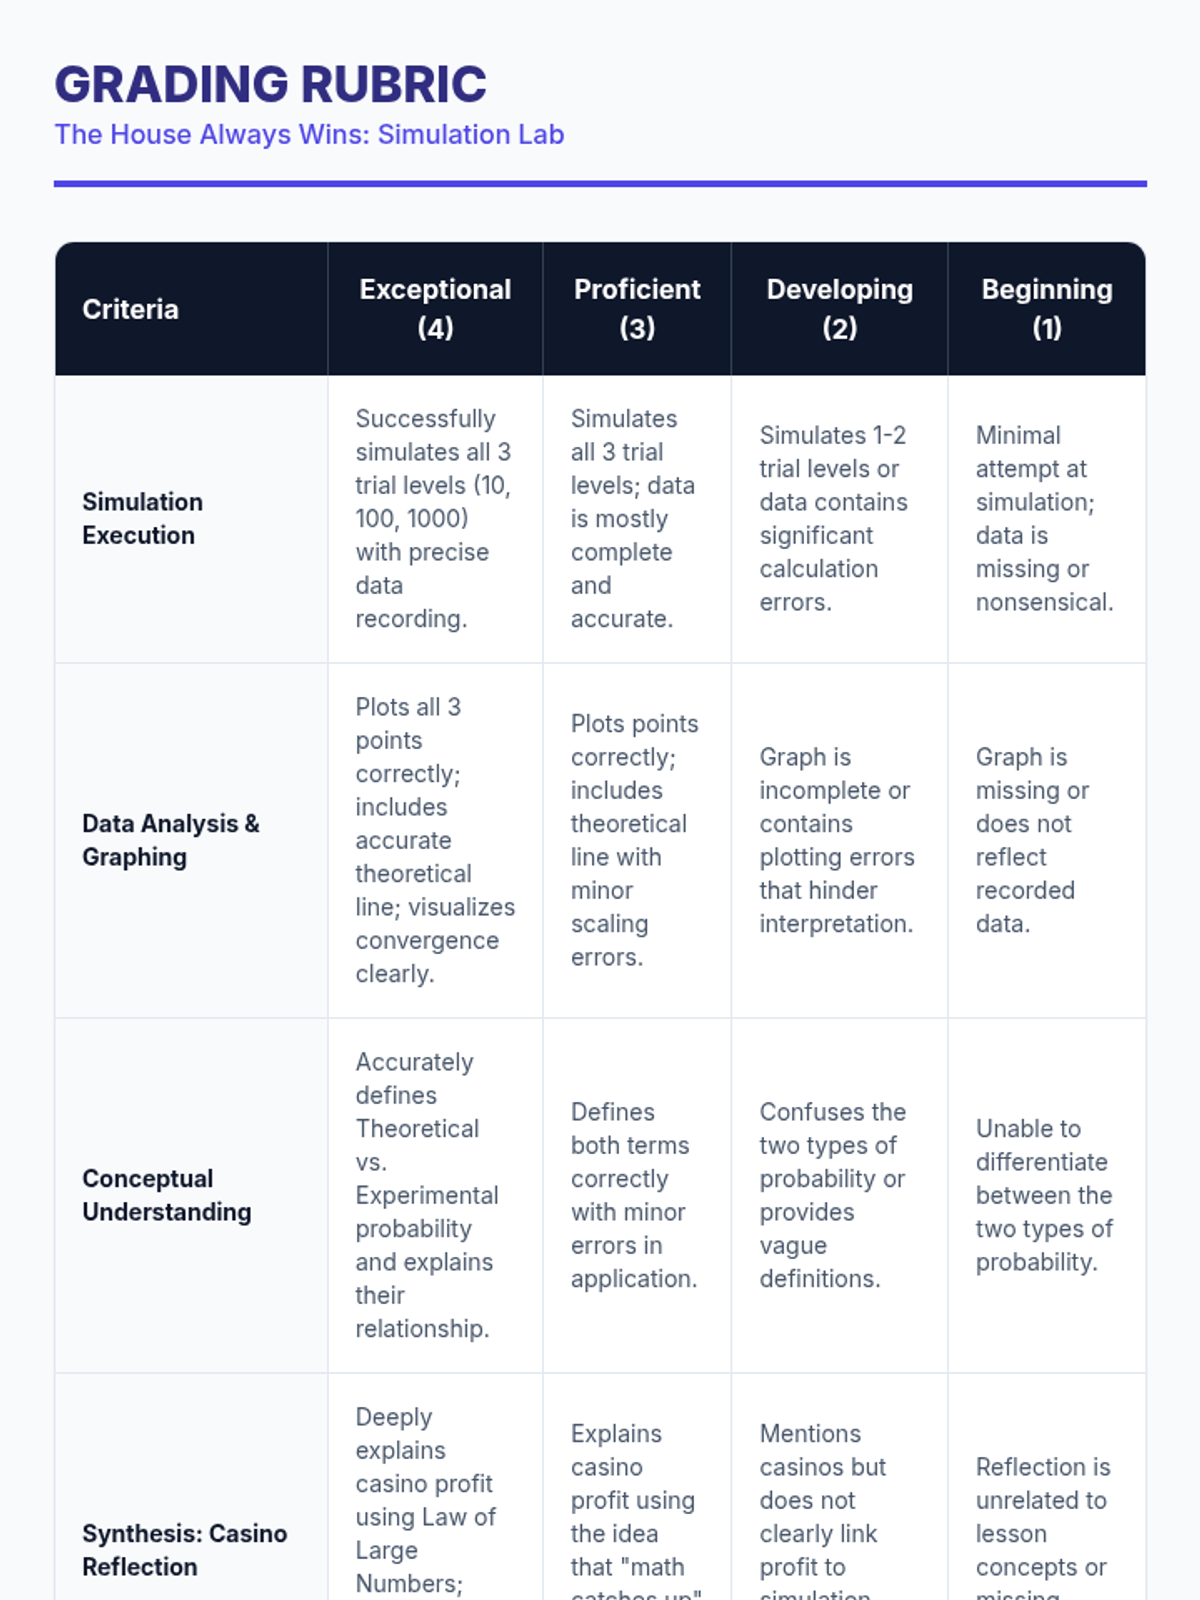
A high school math lesson exploring the gap between theoretical and experimental probability through a die-roll simulation. Students investigate the Law of Large Numbers and analyze why variability decreases as sample sizes increase, concluding with a real-world look at casino economics.
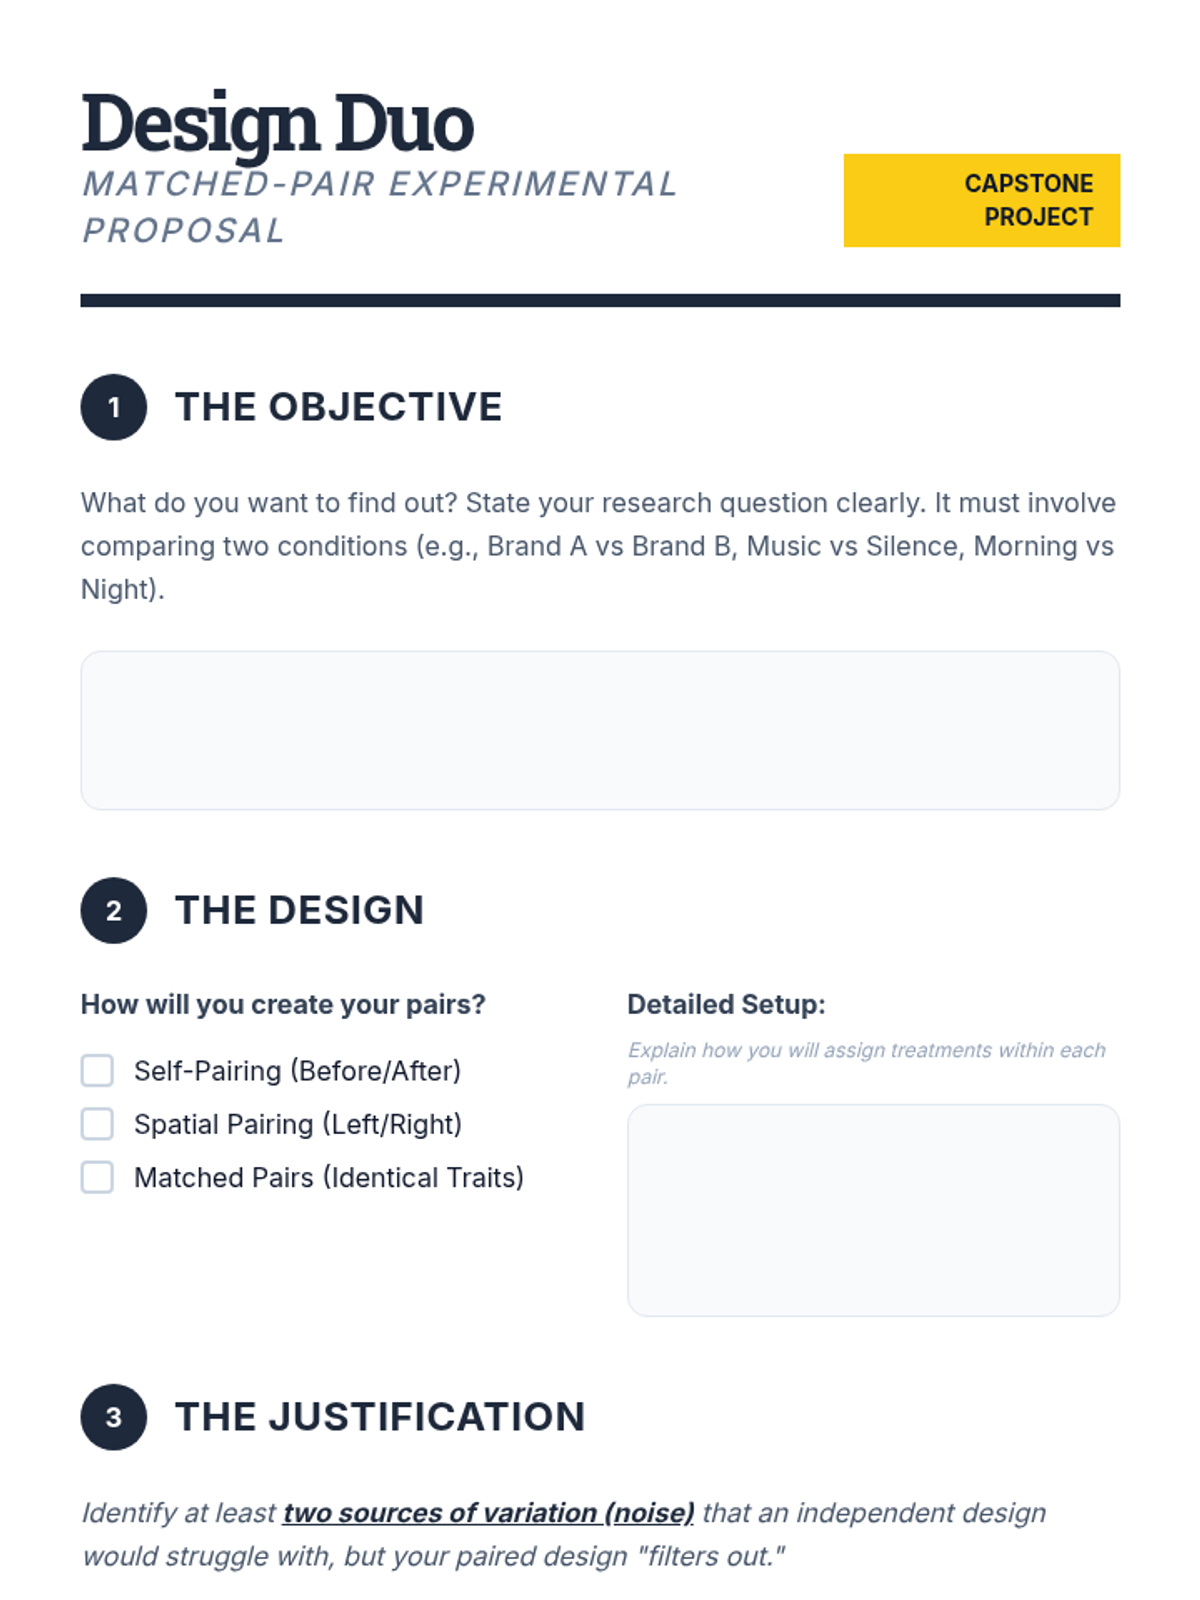
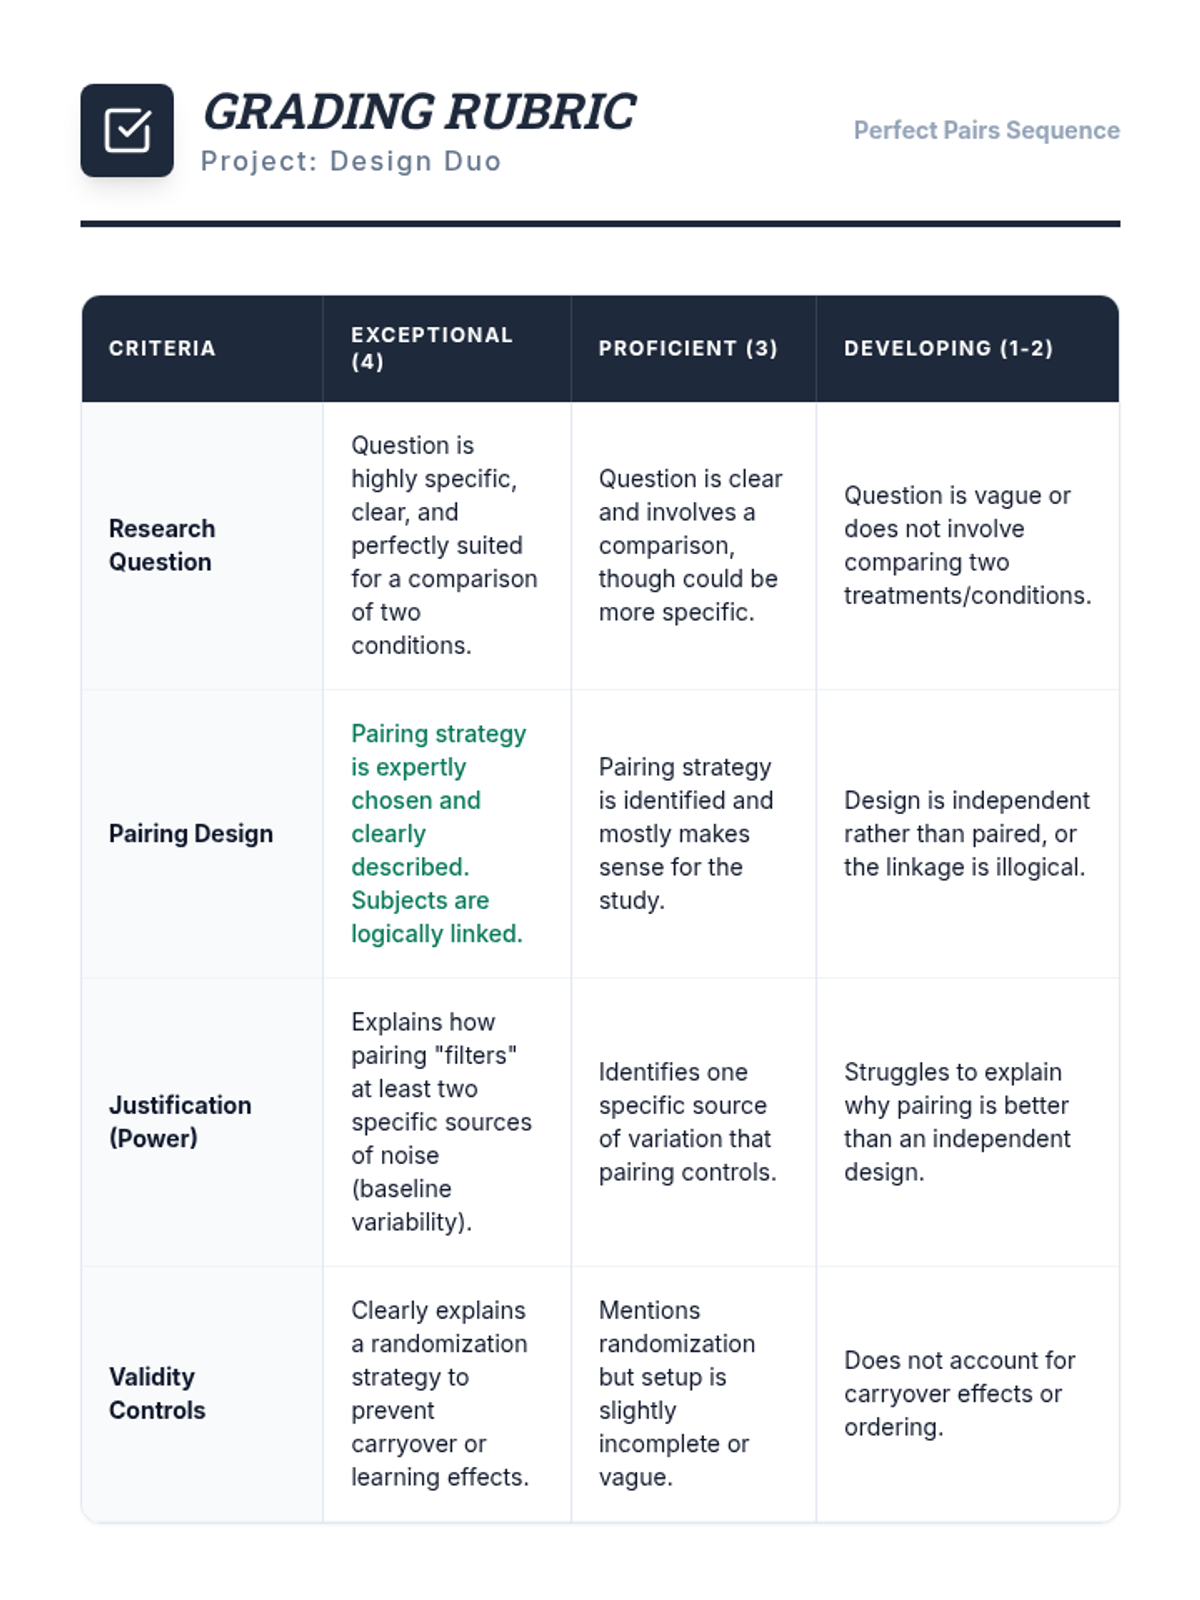
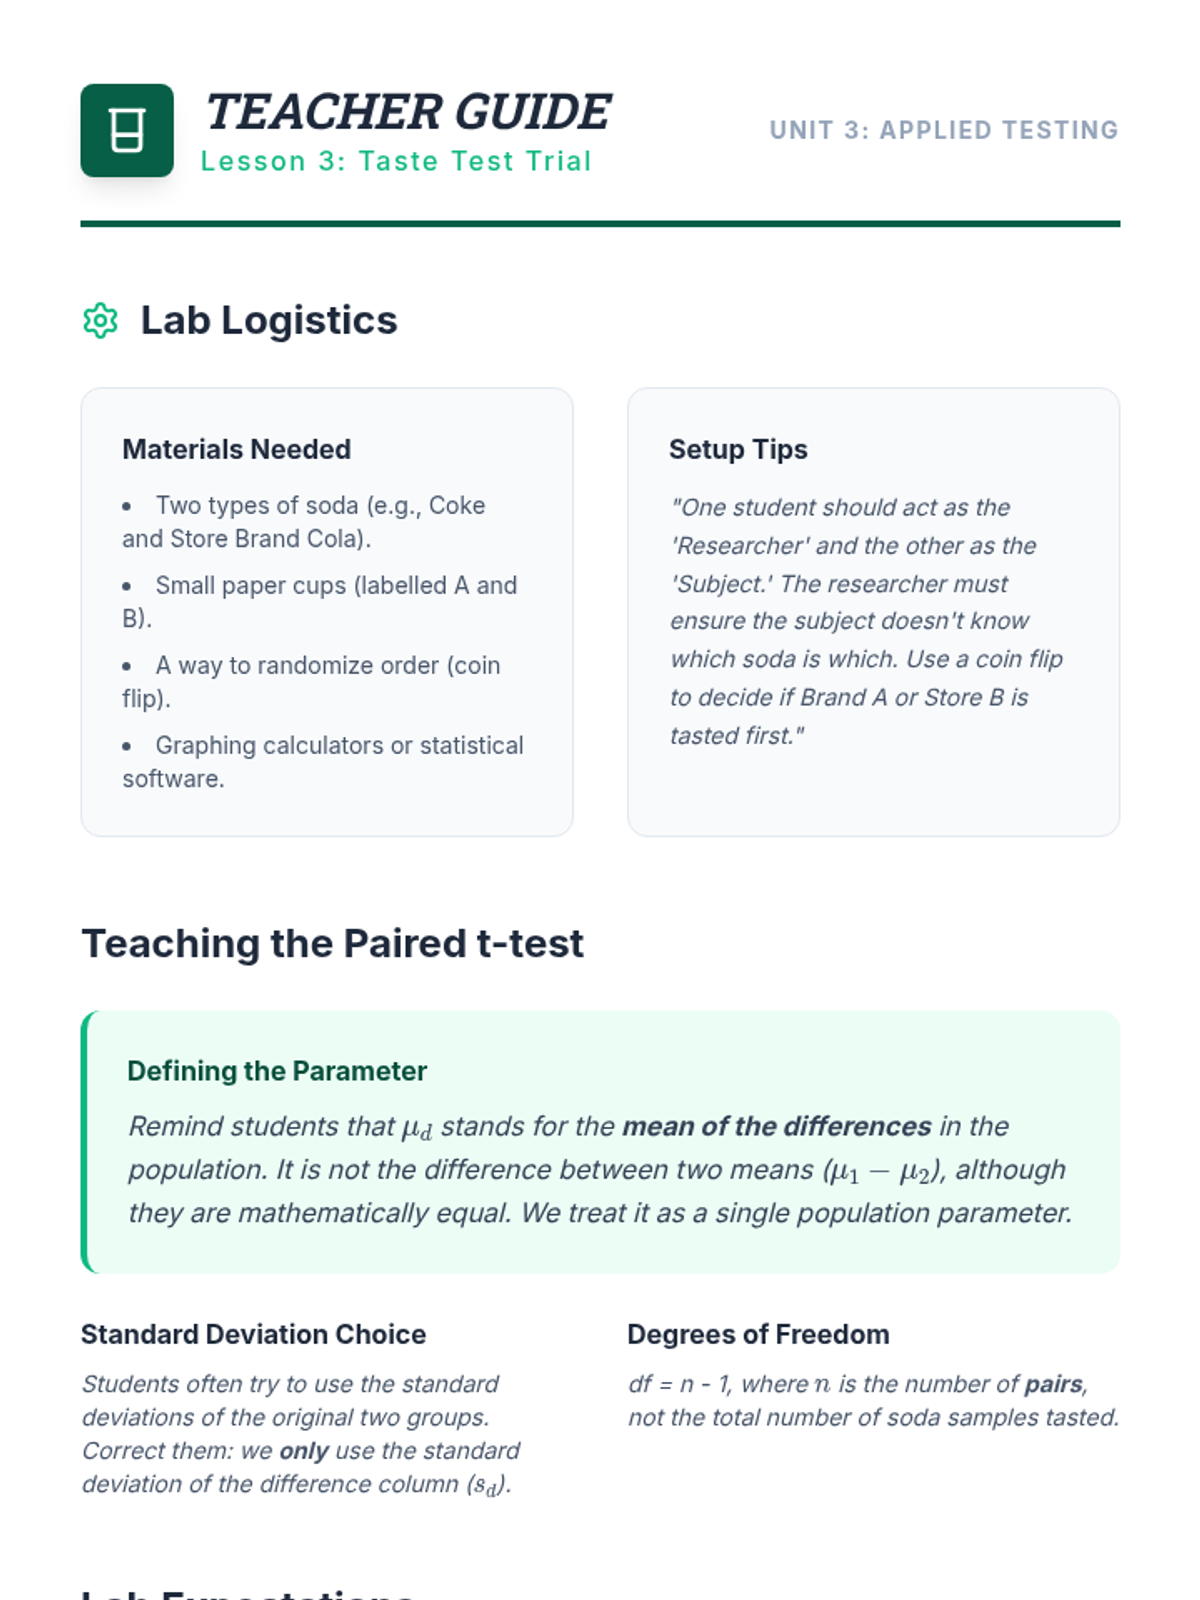
Students apply their knowledge to design their own matched-pair experiments, focusing on controlling variability through strategic blocking.
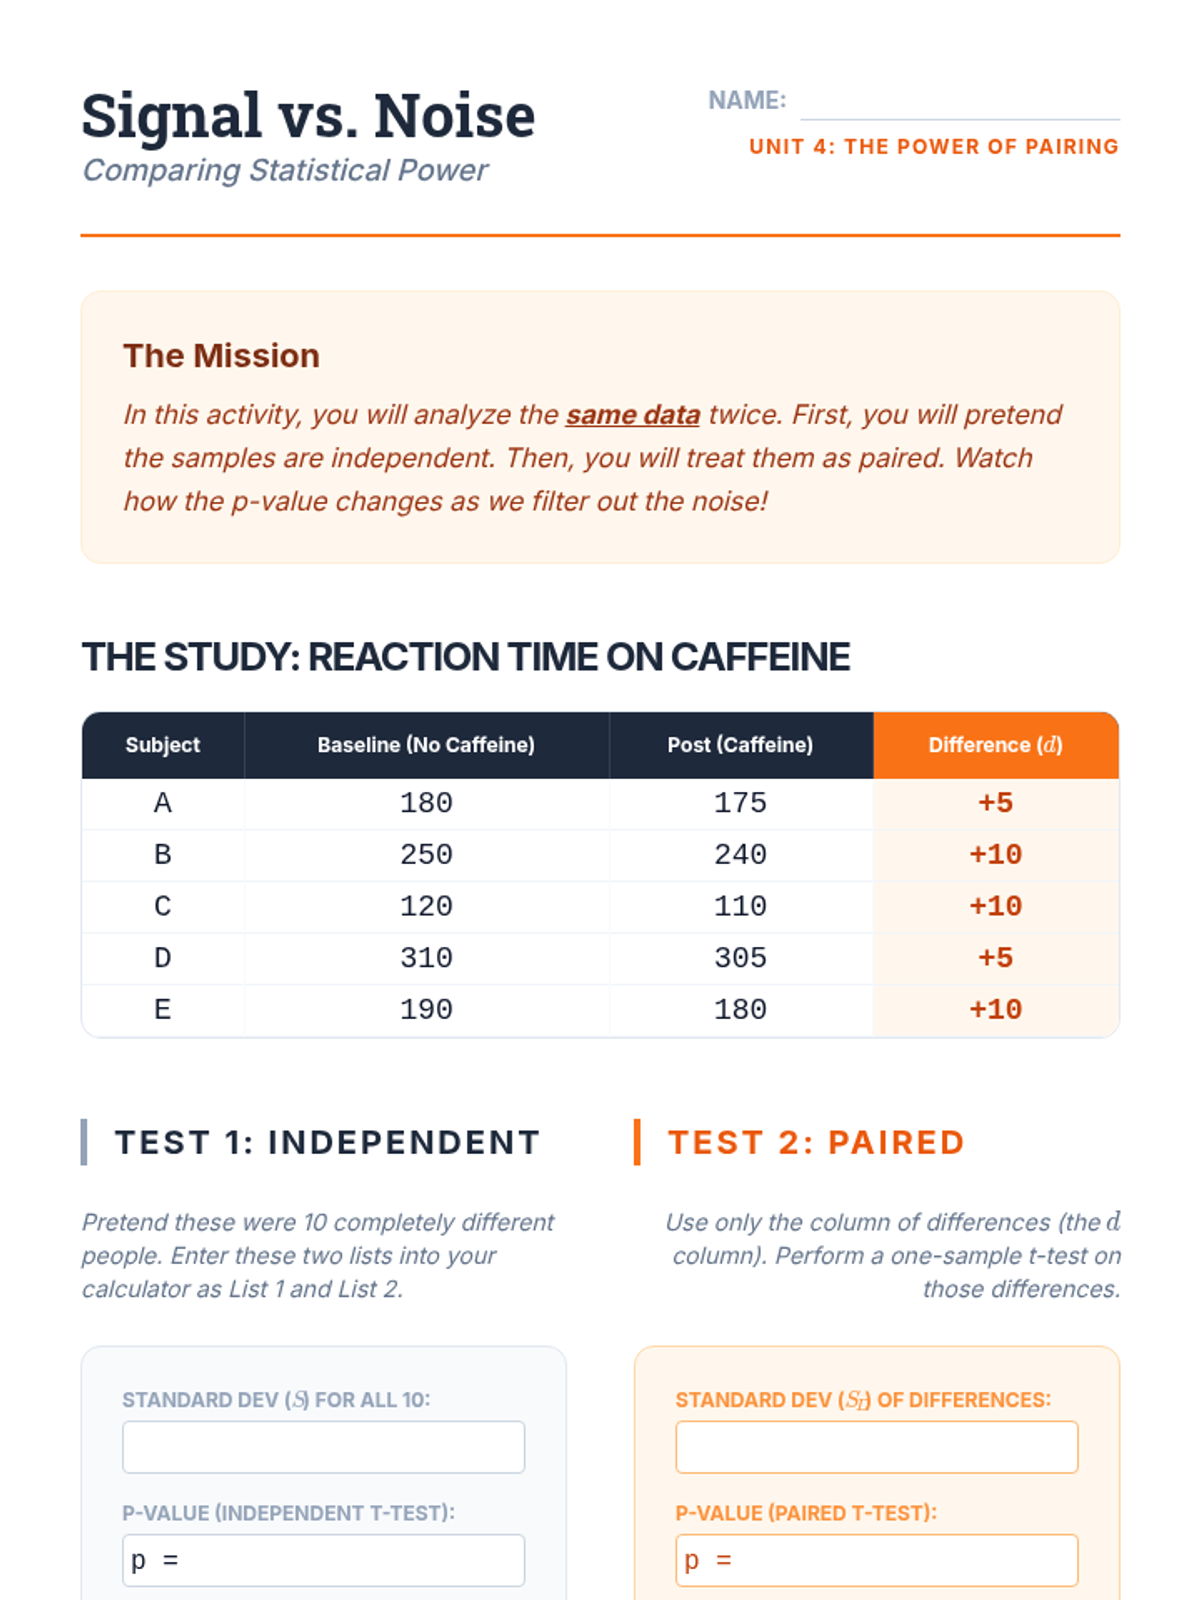
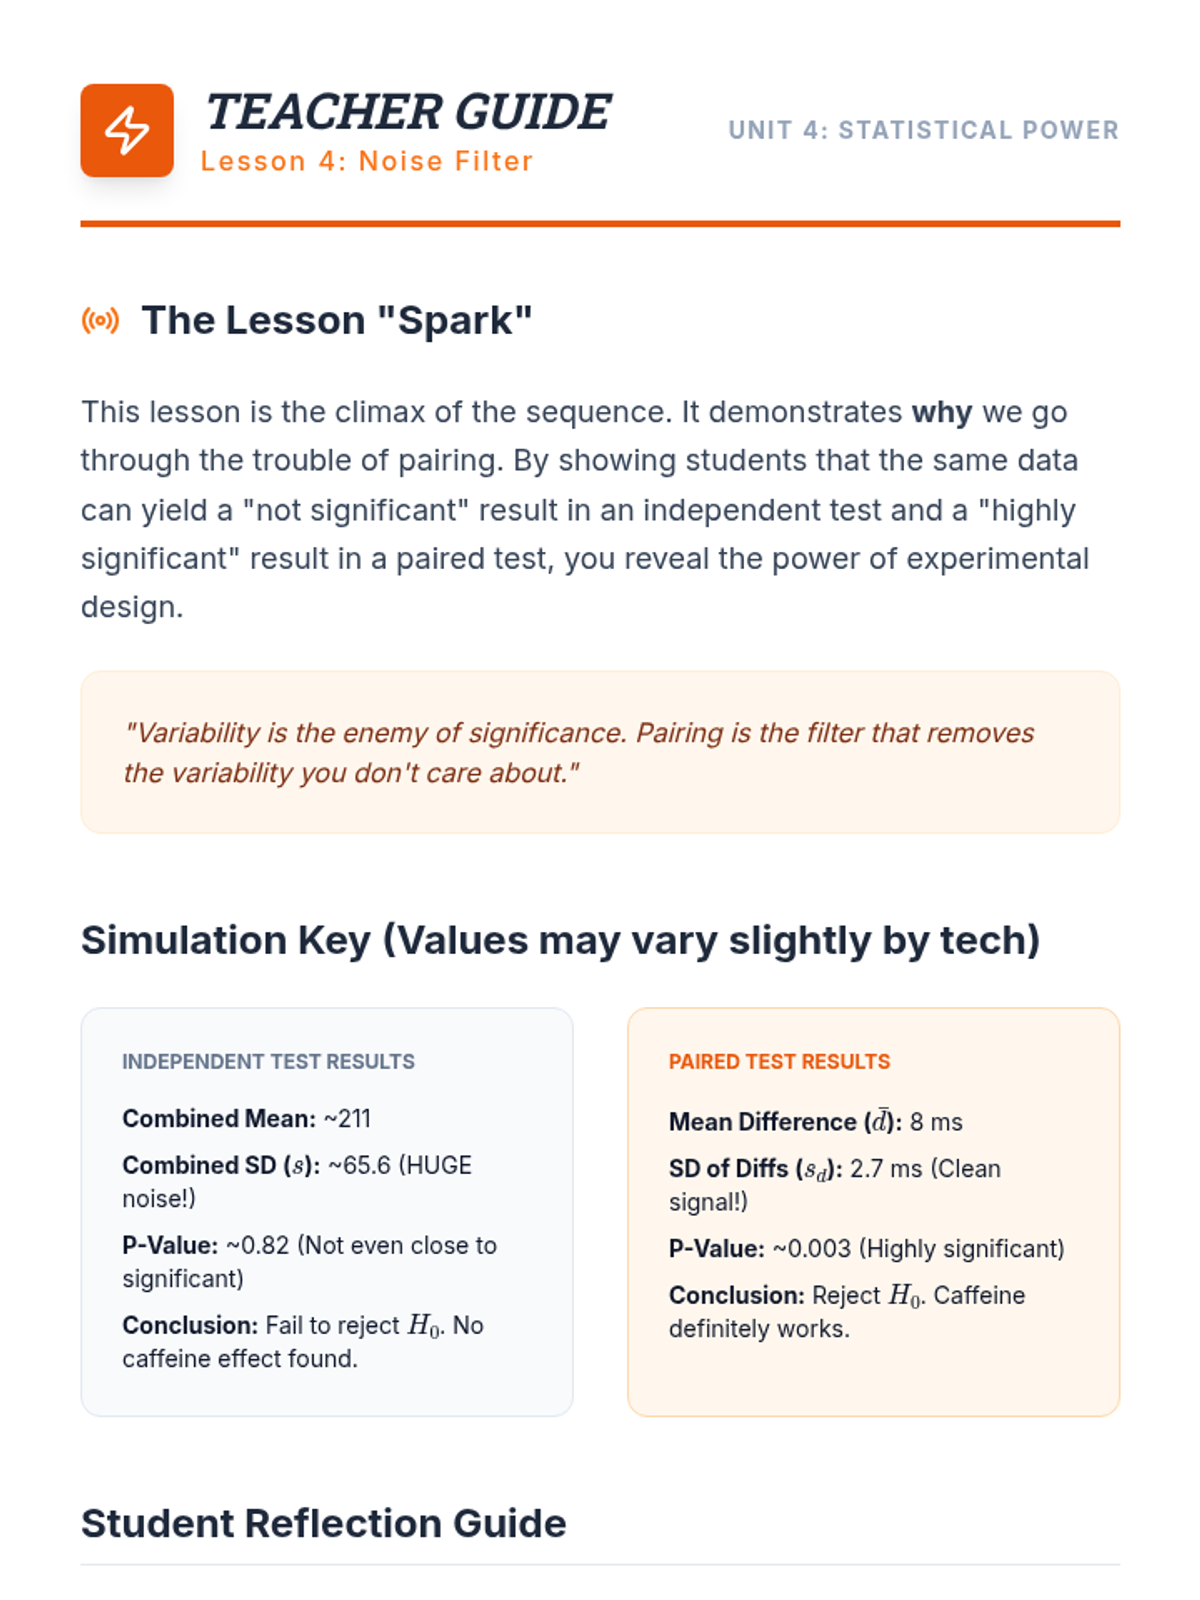
Students compare independent and paired analysis methods to understand how pairing reduces 'noise' and increases the 'signal' or power of a test.
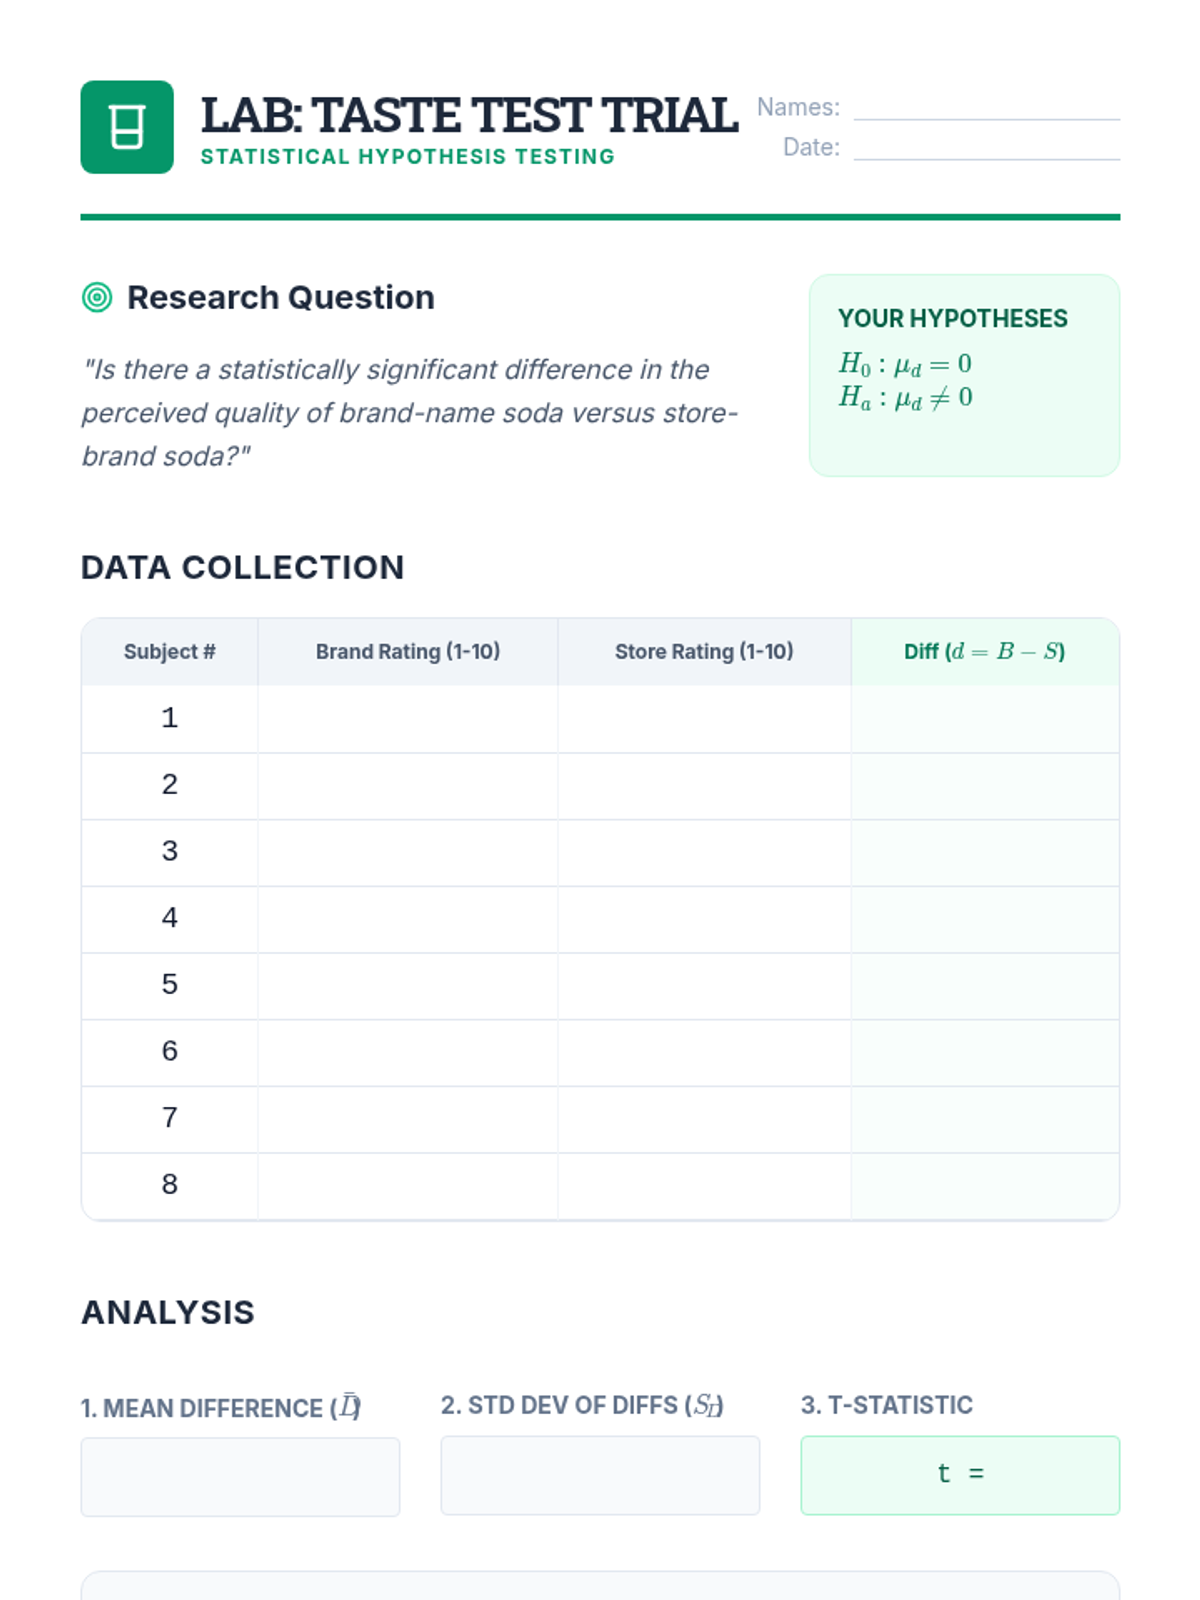
Students perform hypothesis tests on paired data using real-world scenarios like taste tests to determine if a significant difference exists.
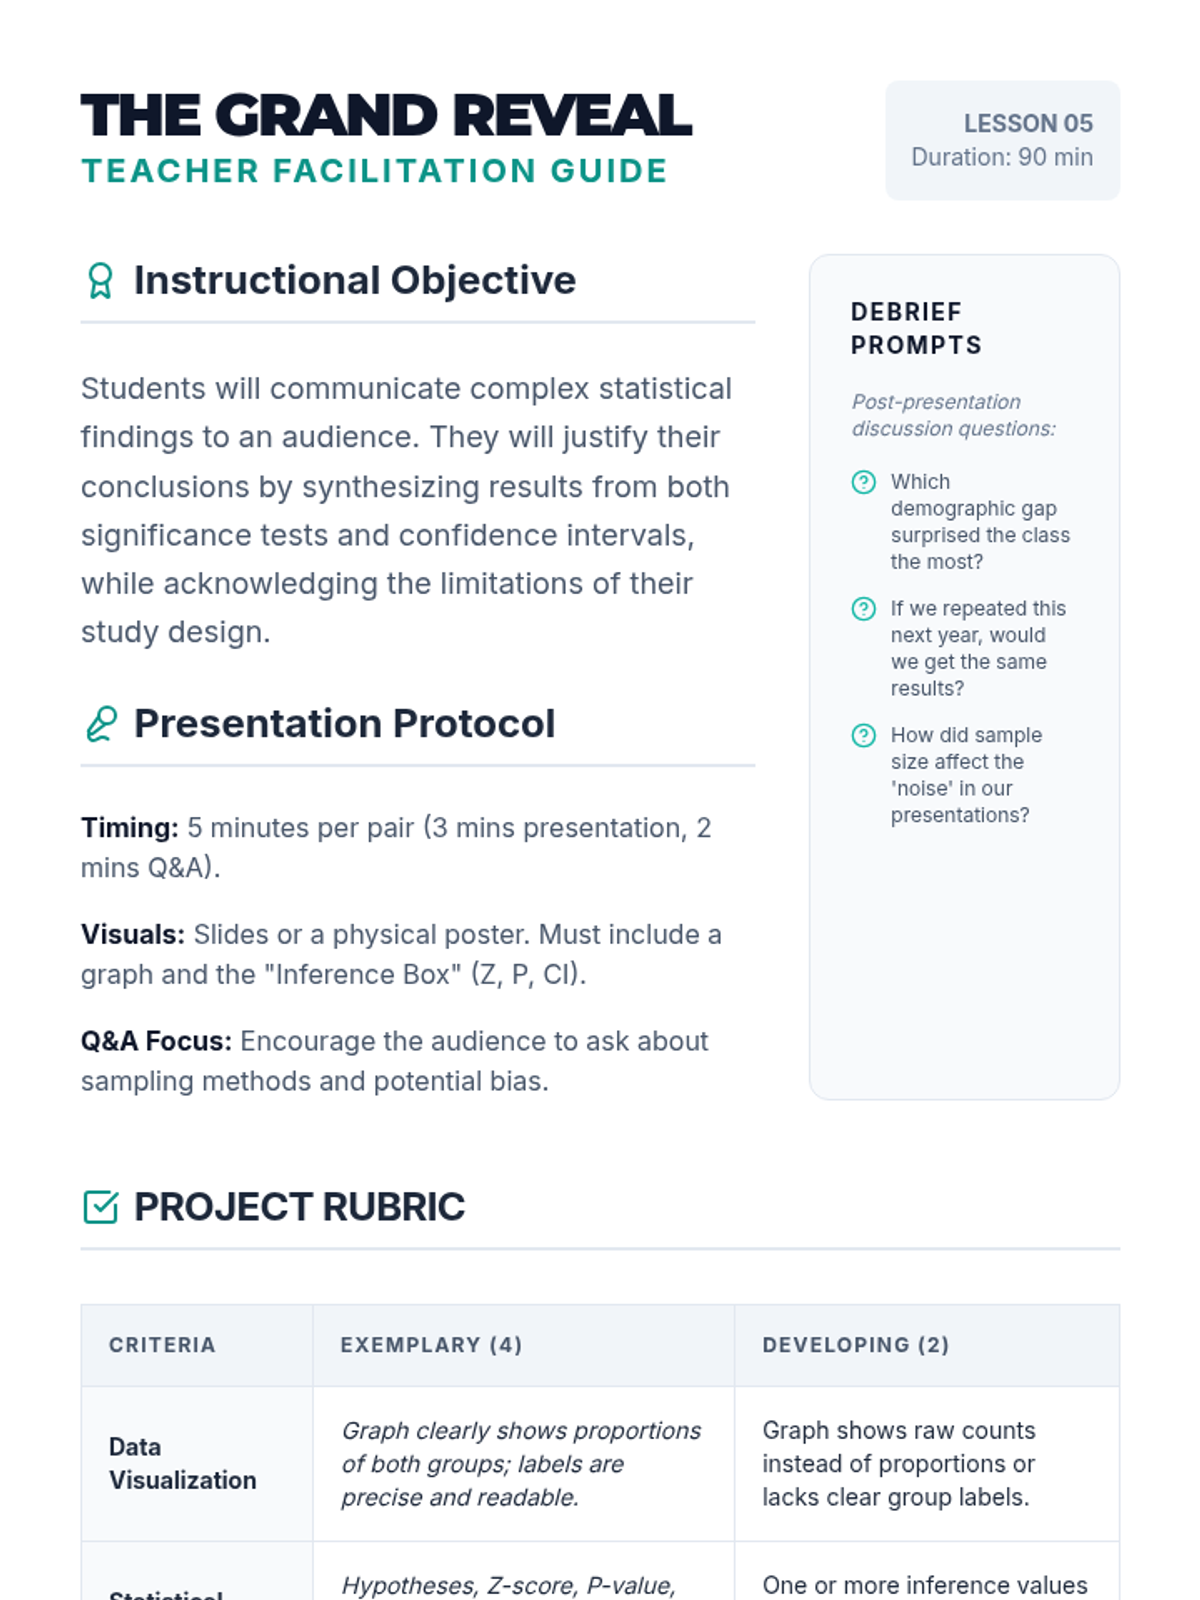
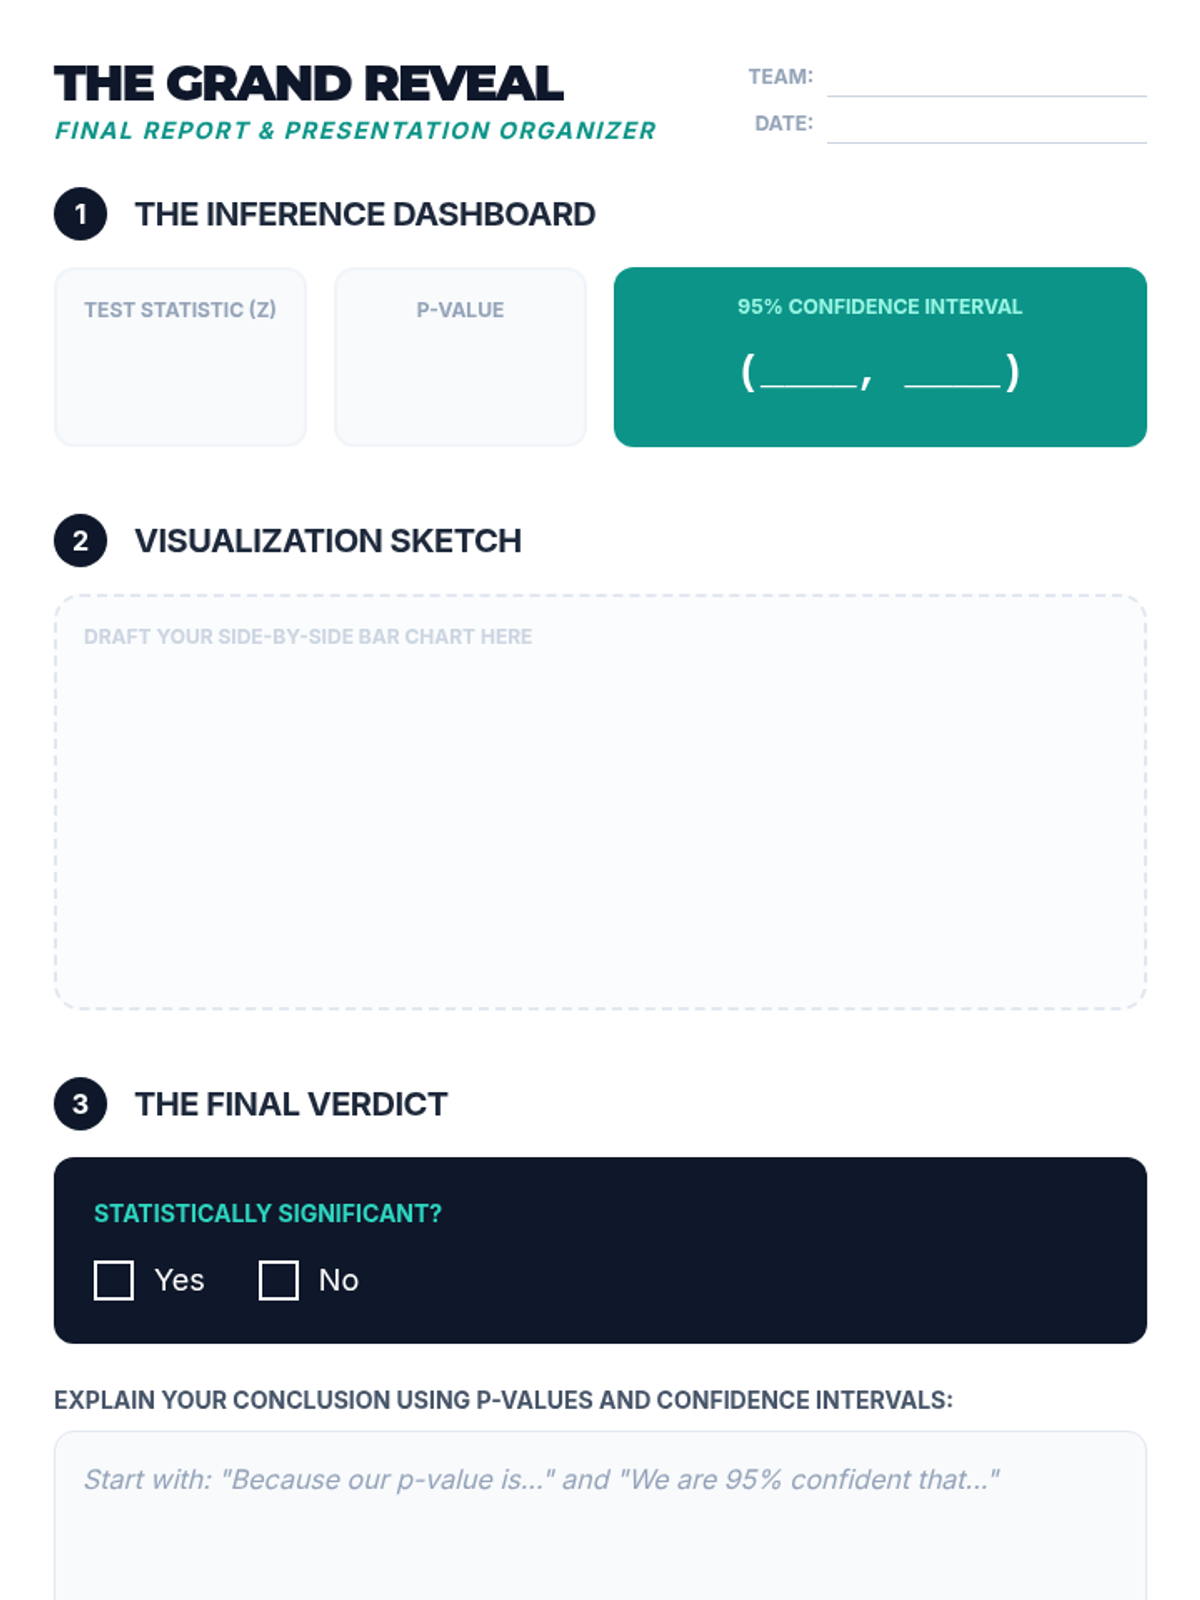
Students synthesize their data, create visualizations, and present their statistical findings to the class.
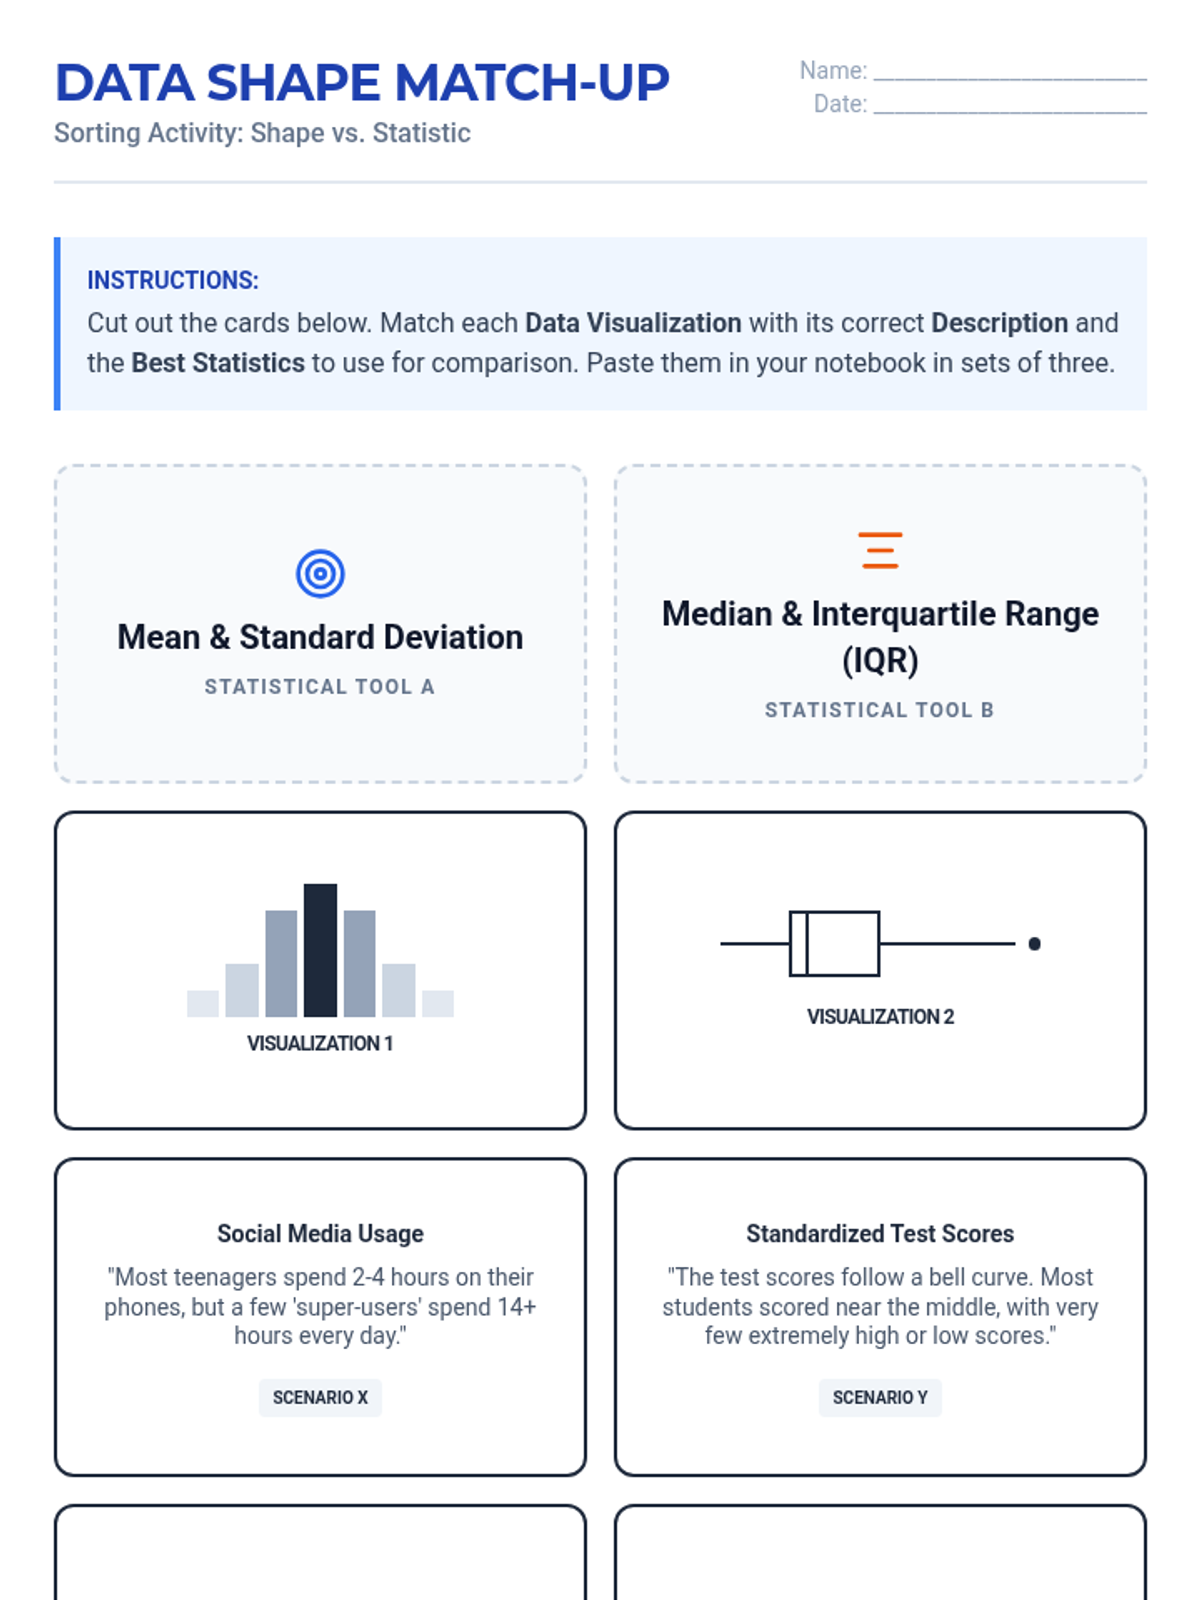
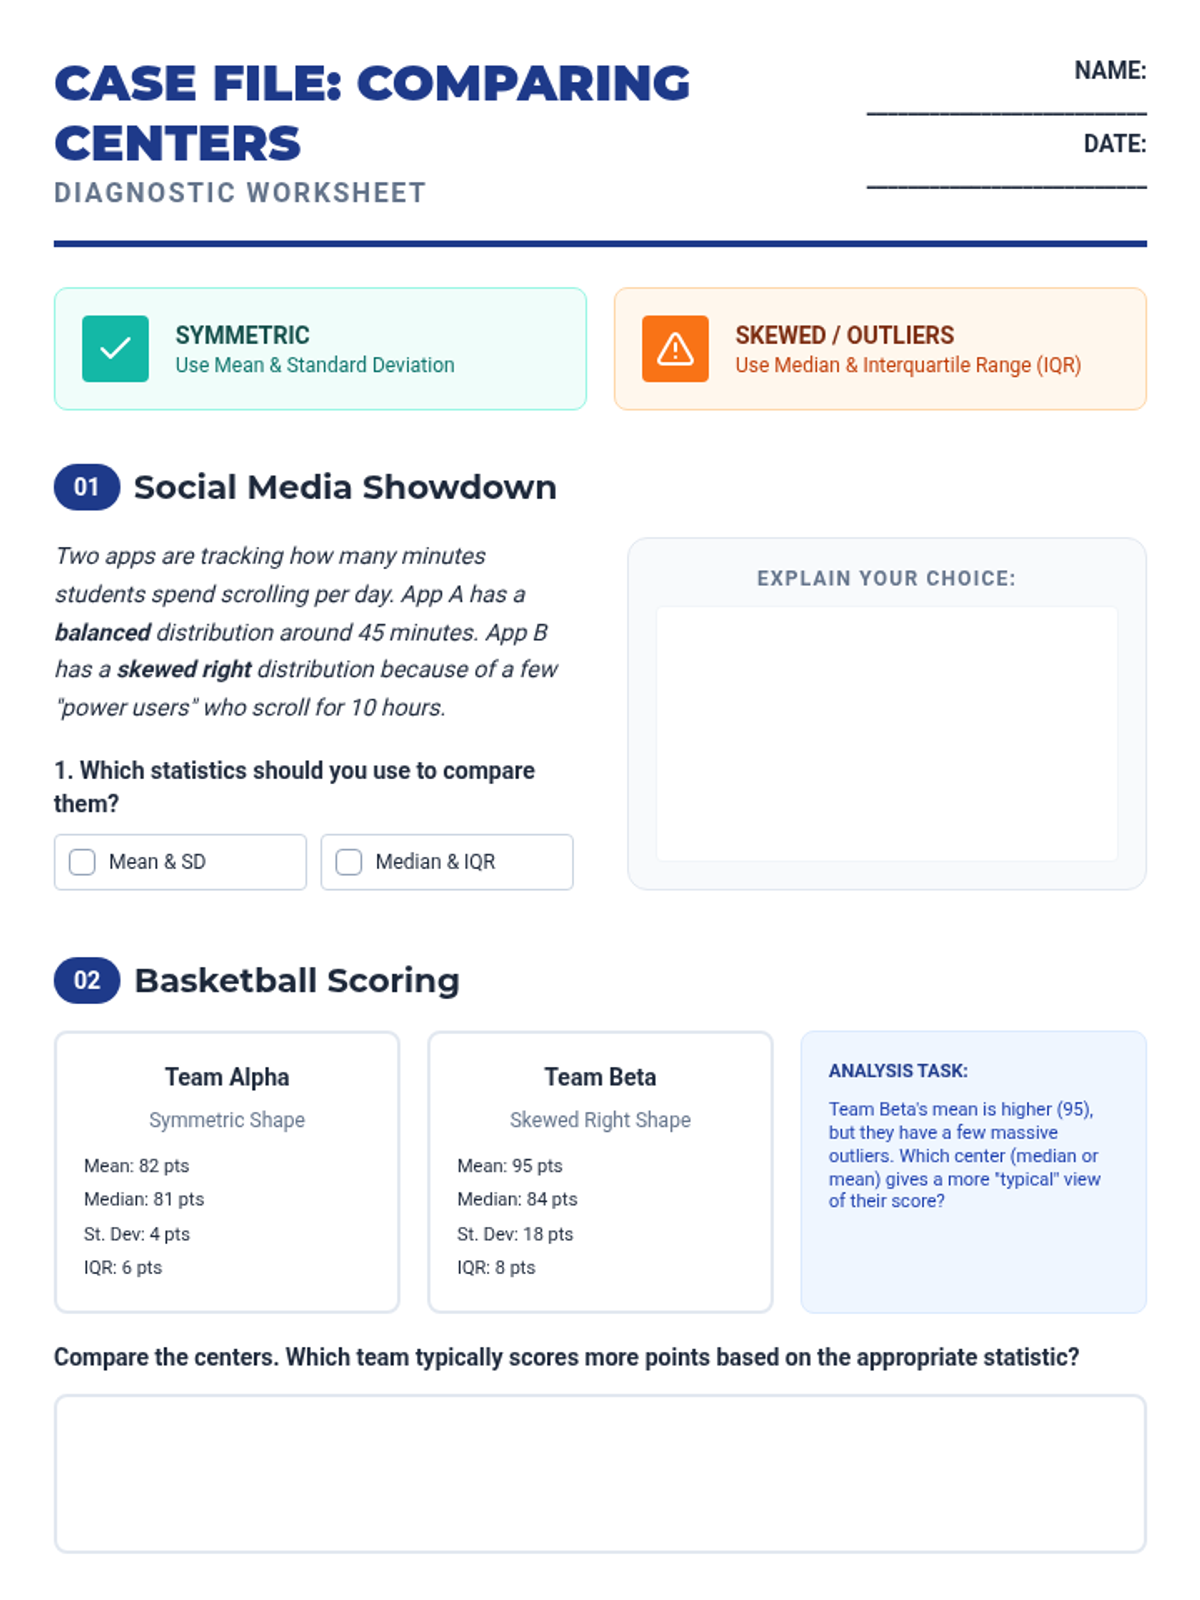
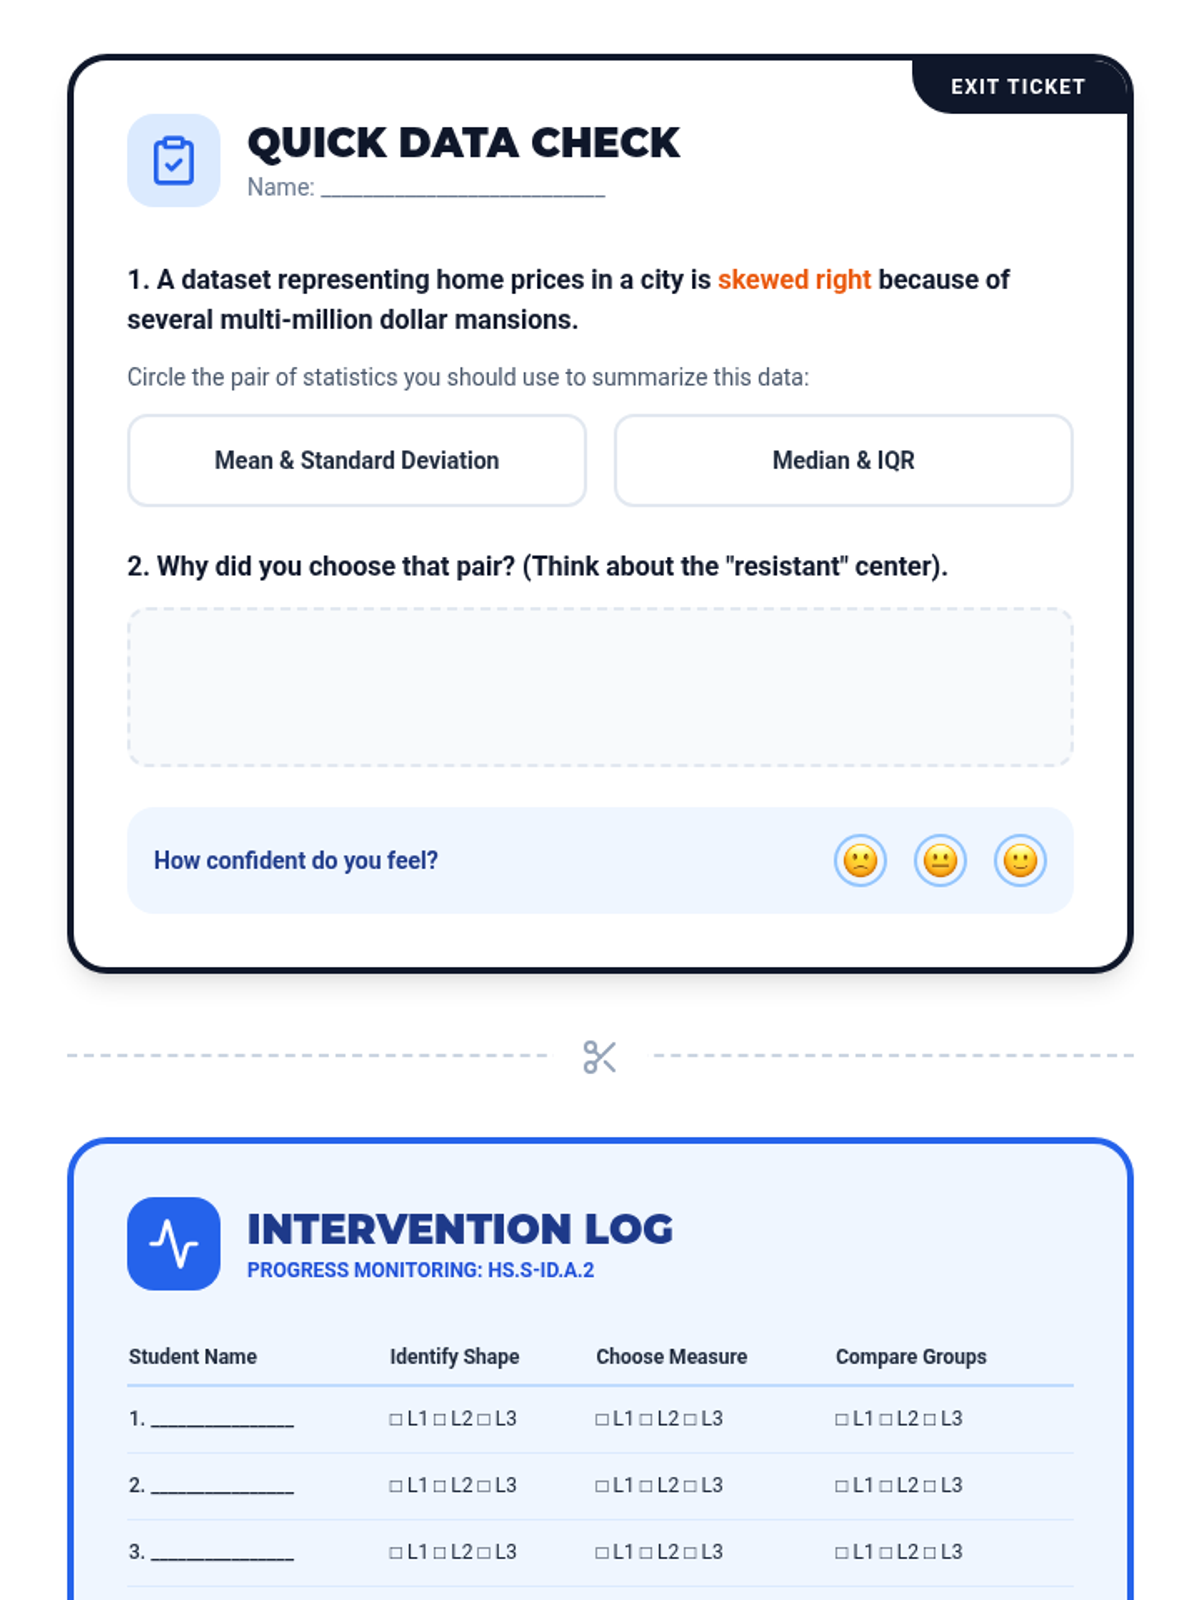
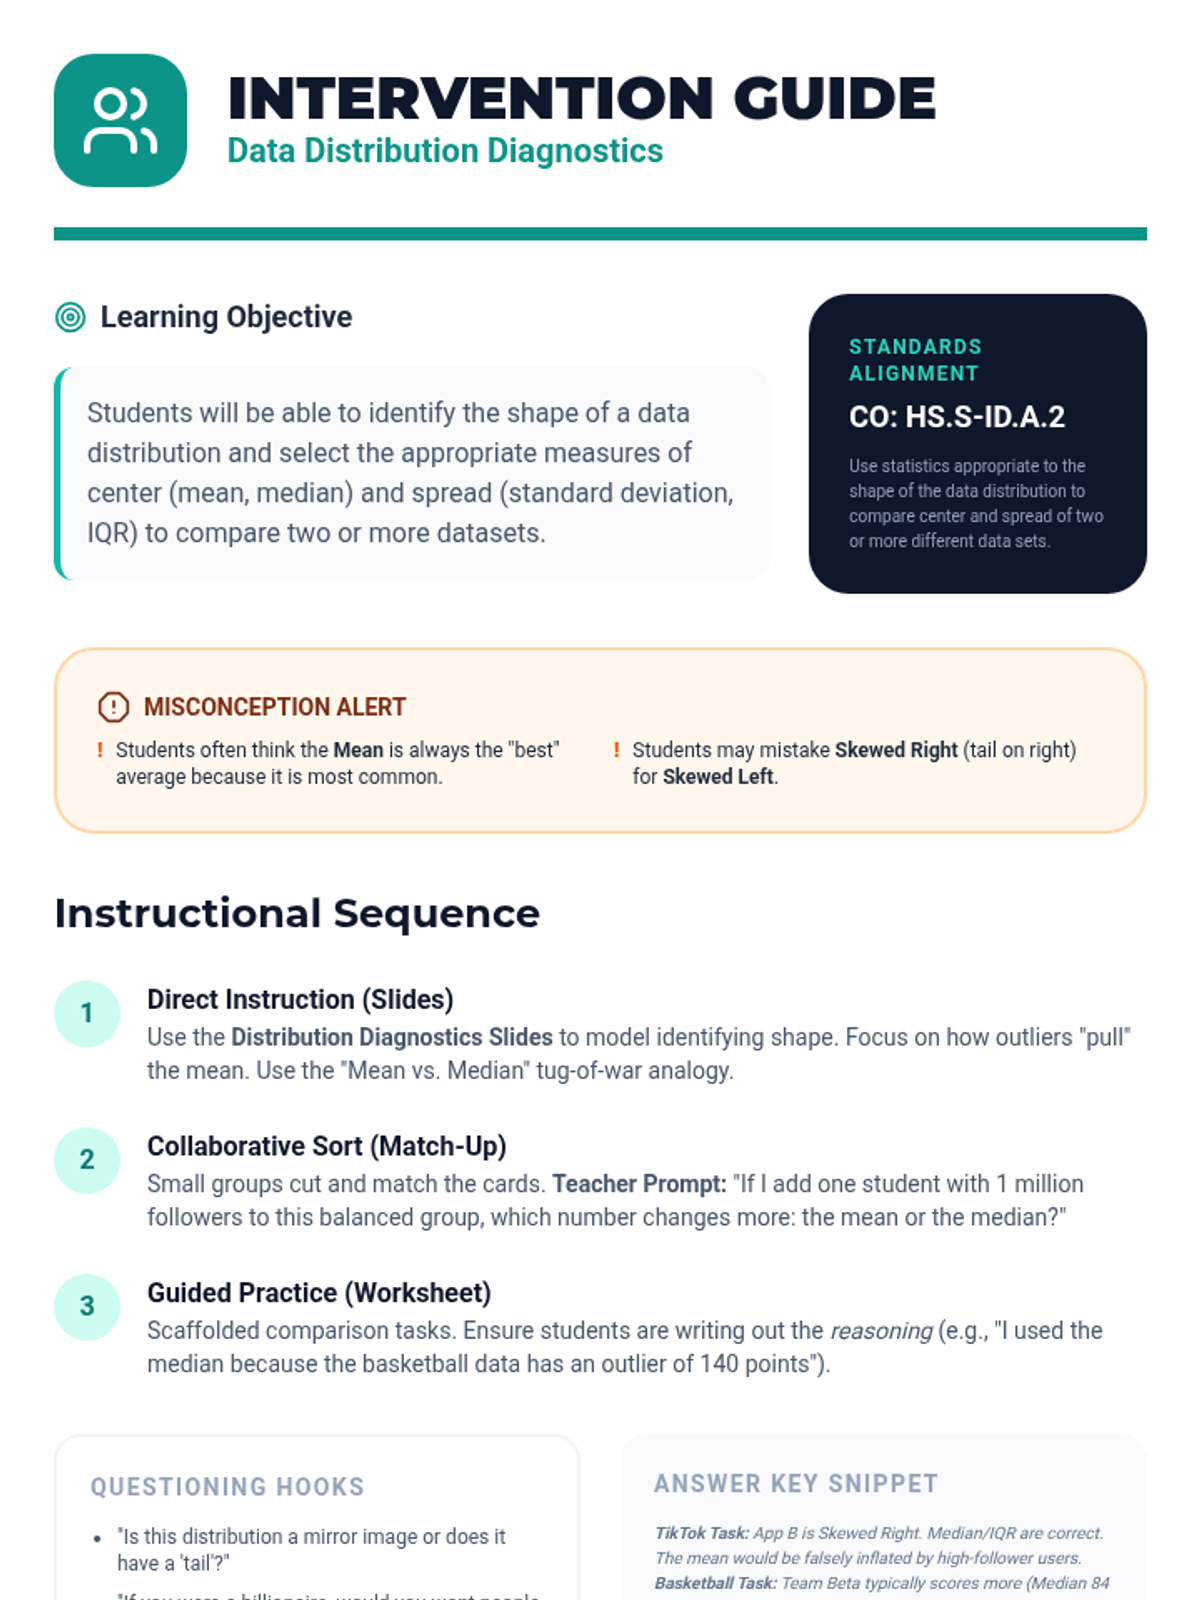
A targeted Tier 2 intervention lesson focusing on choosing the correct measures of center and spread based on data distribution shape to compare datasets. Includes scaffolded matching activities and real-world contexts like social media and sports.
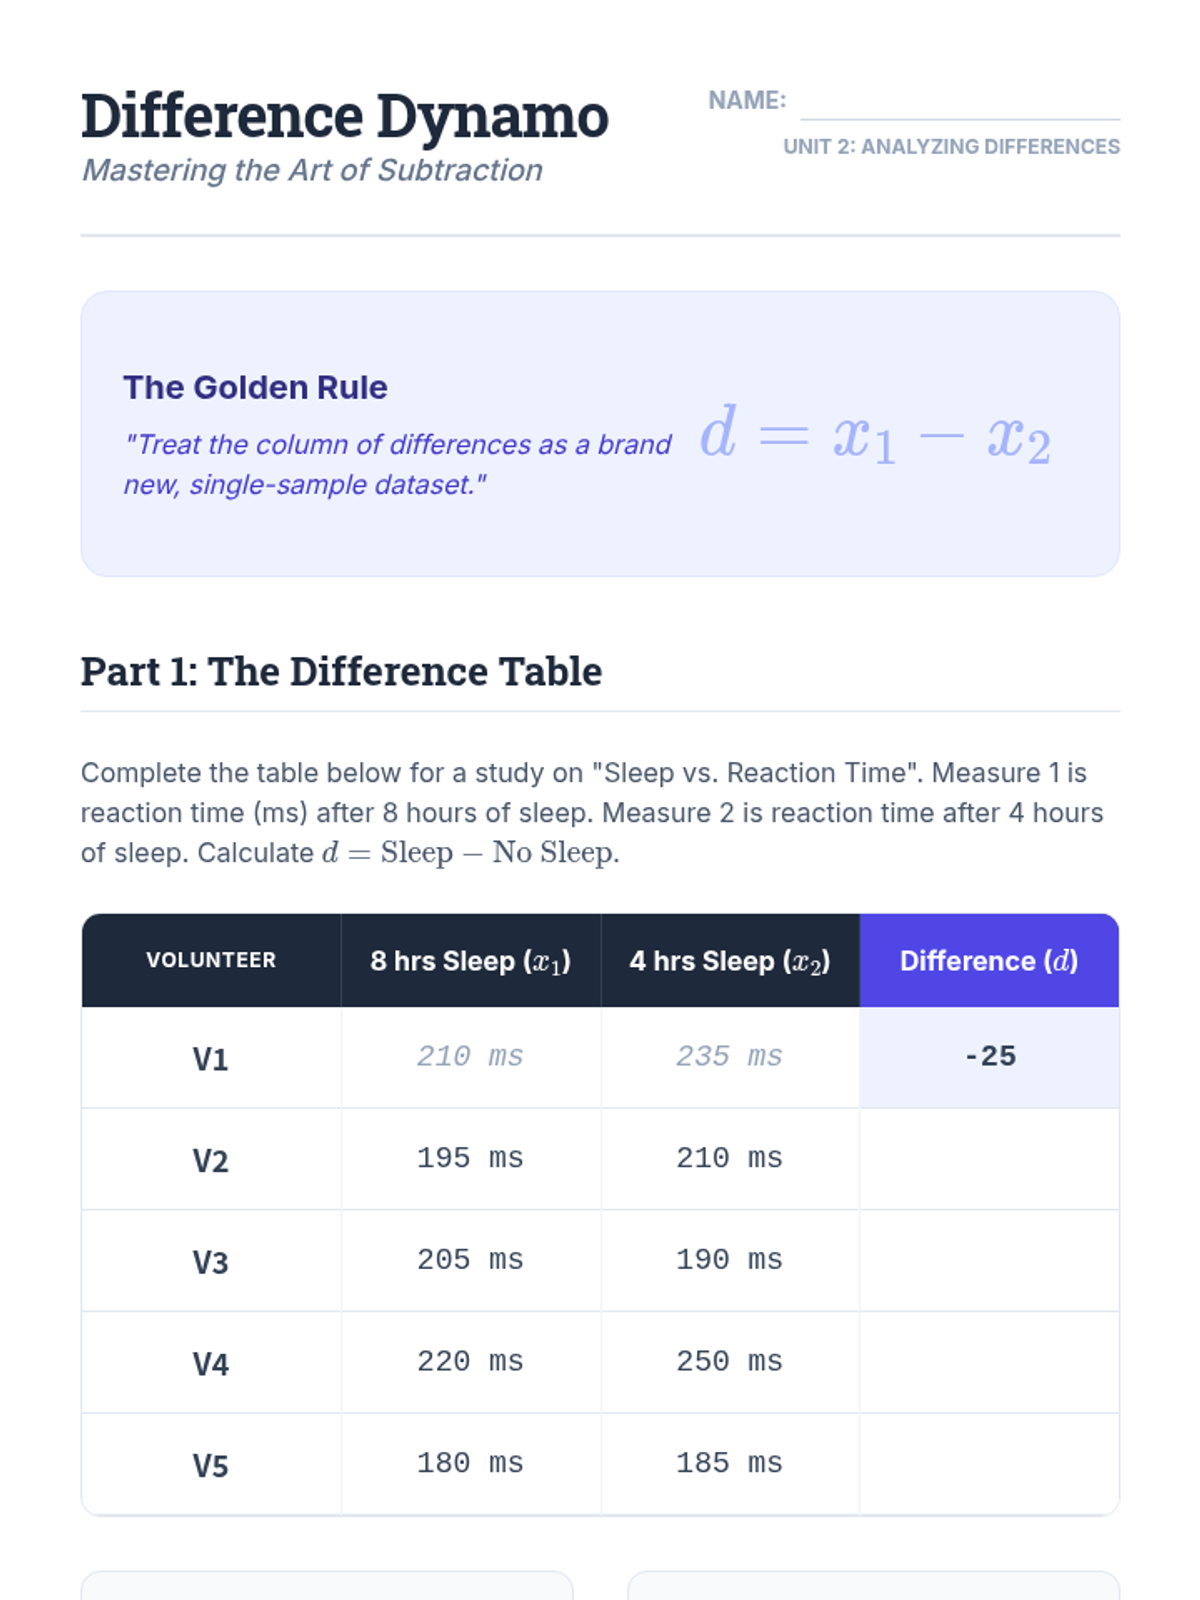
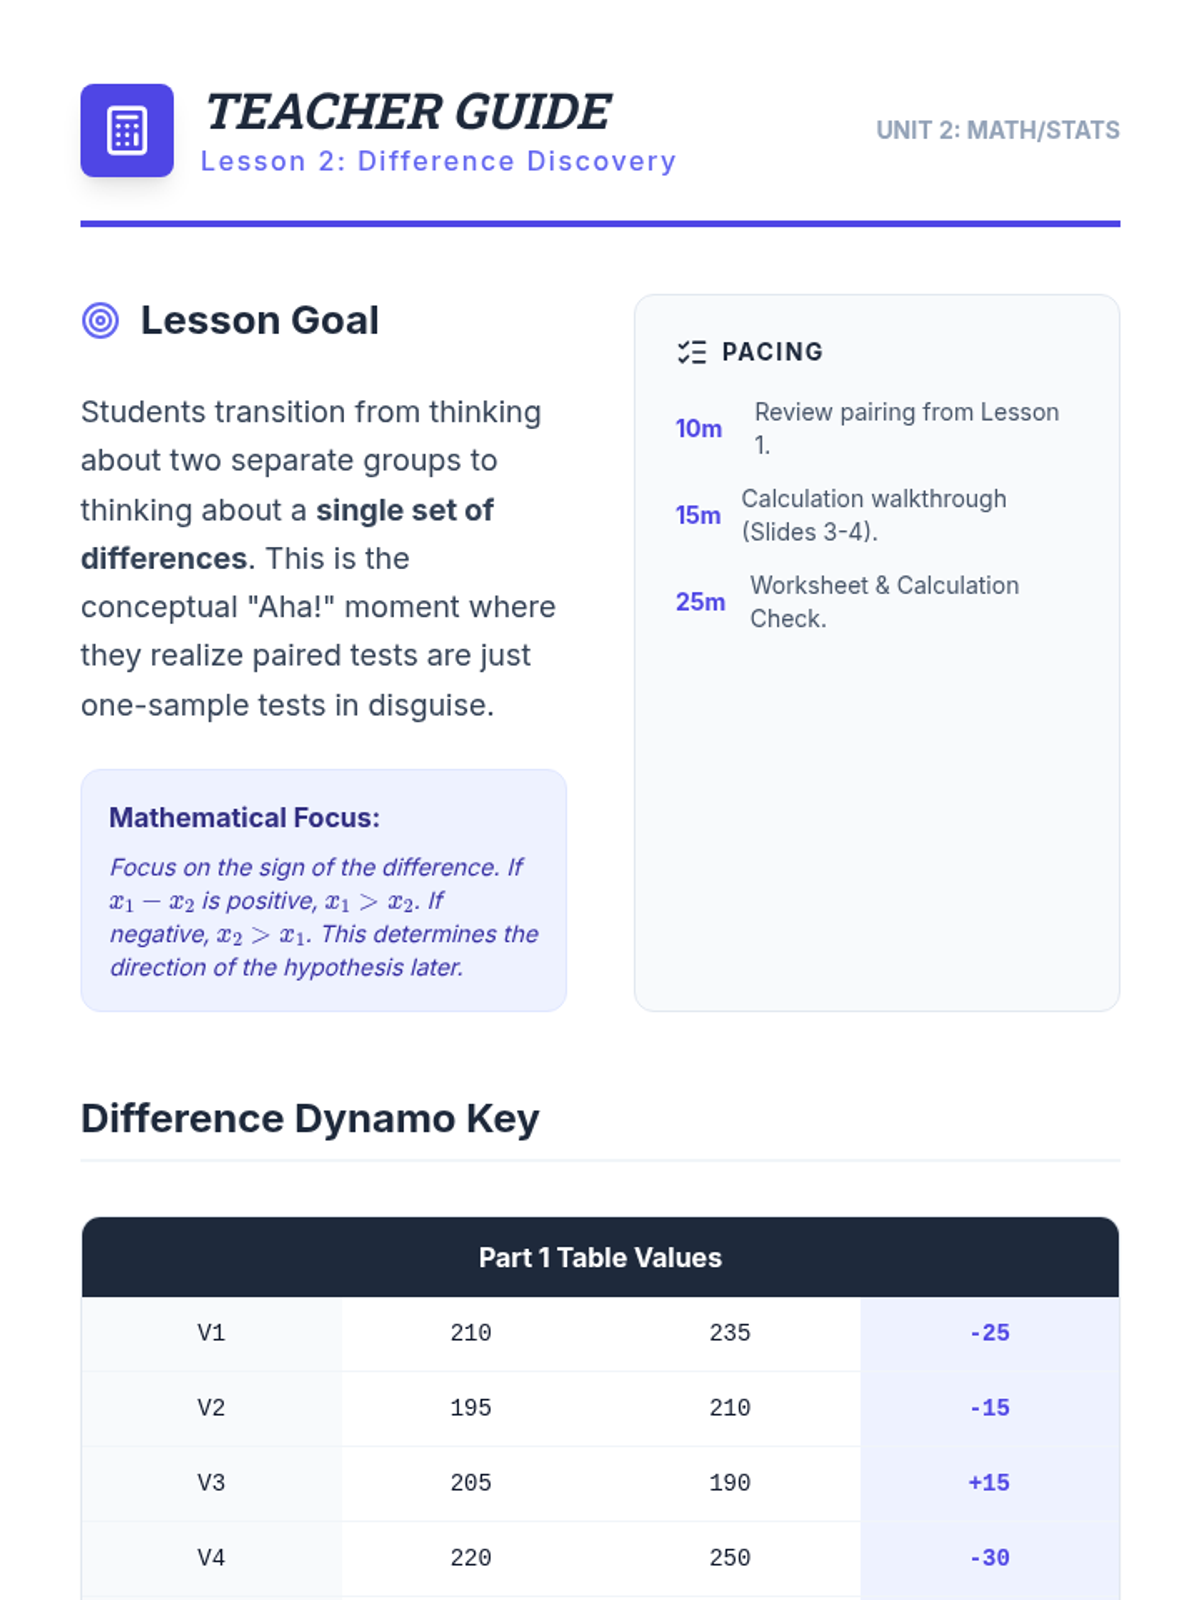
Students practice calculating differences in paired datasets and understand why paired data can be treated as a one-sample t-test of differences.
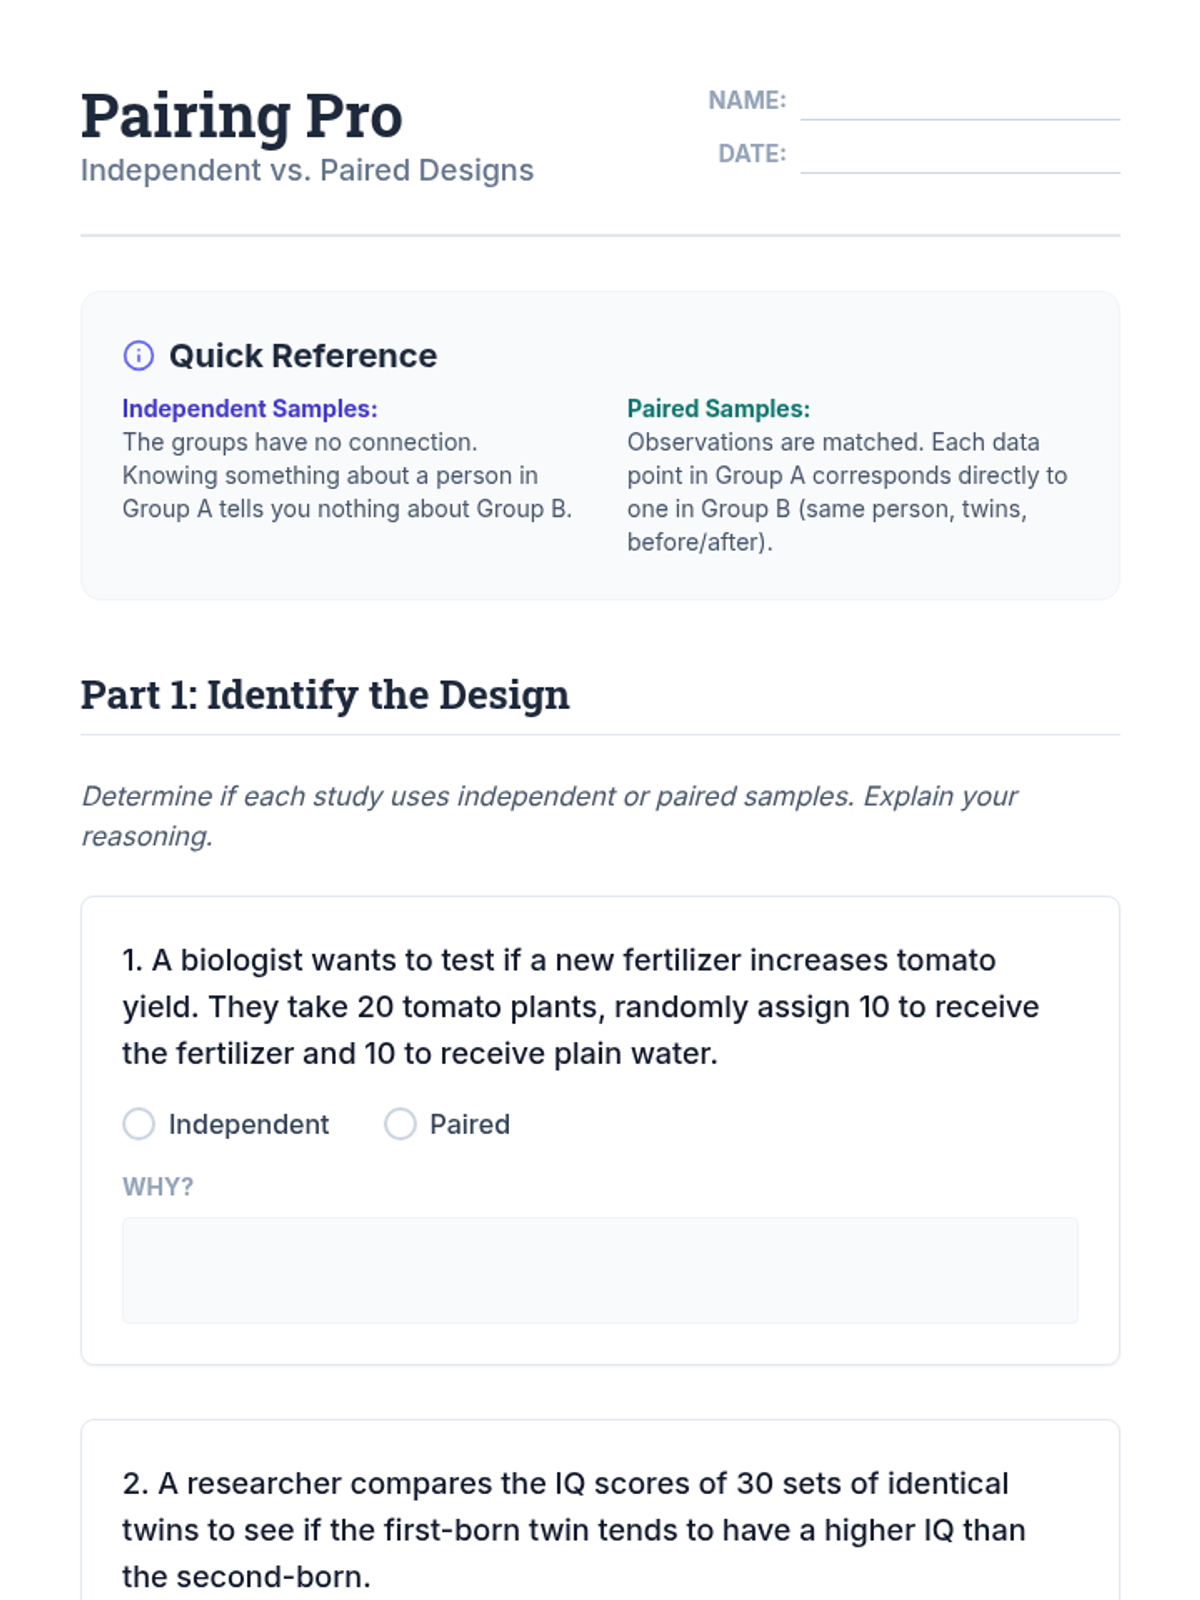
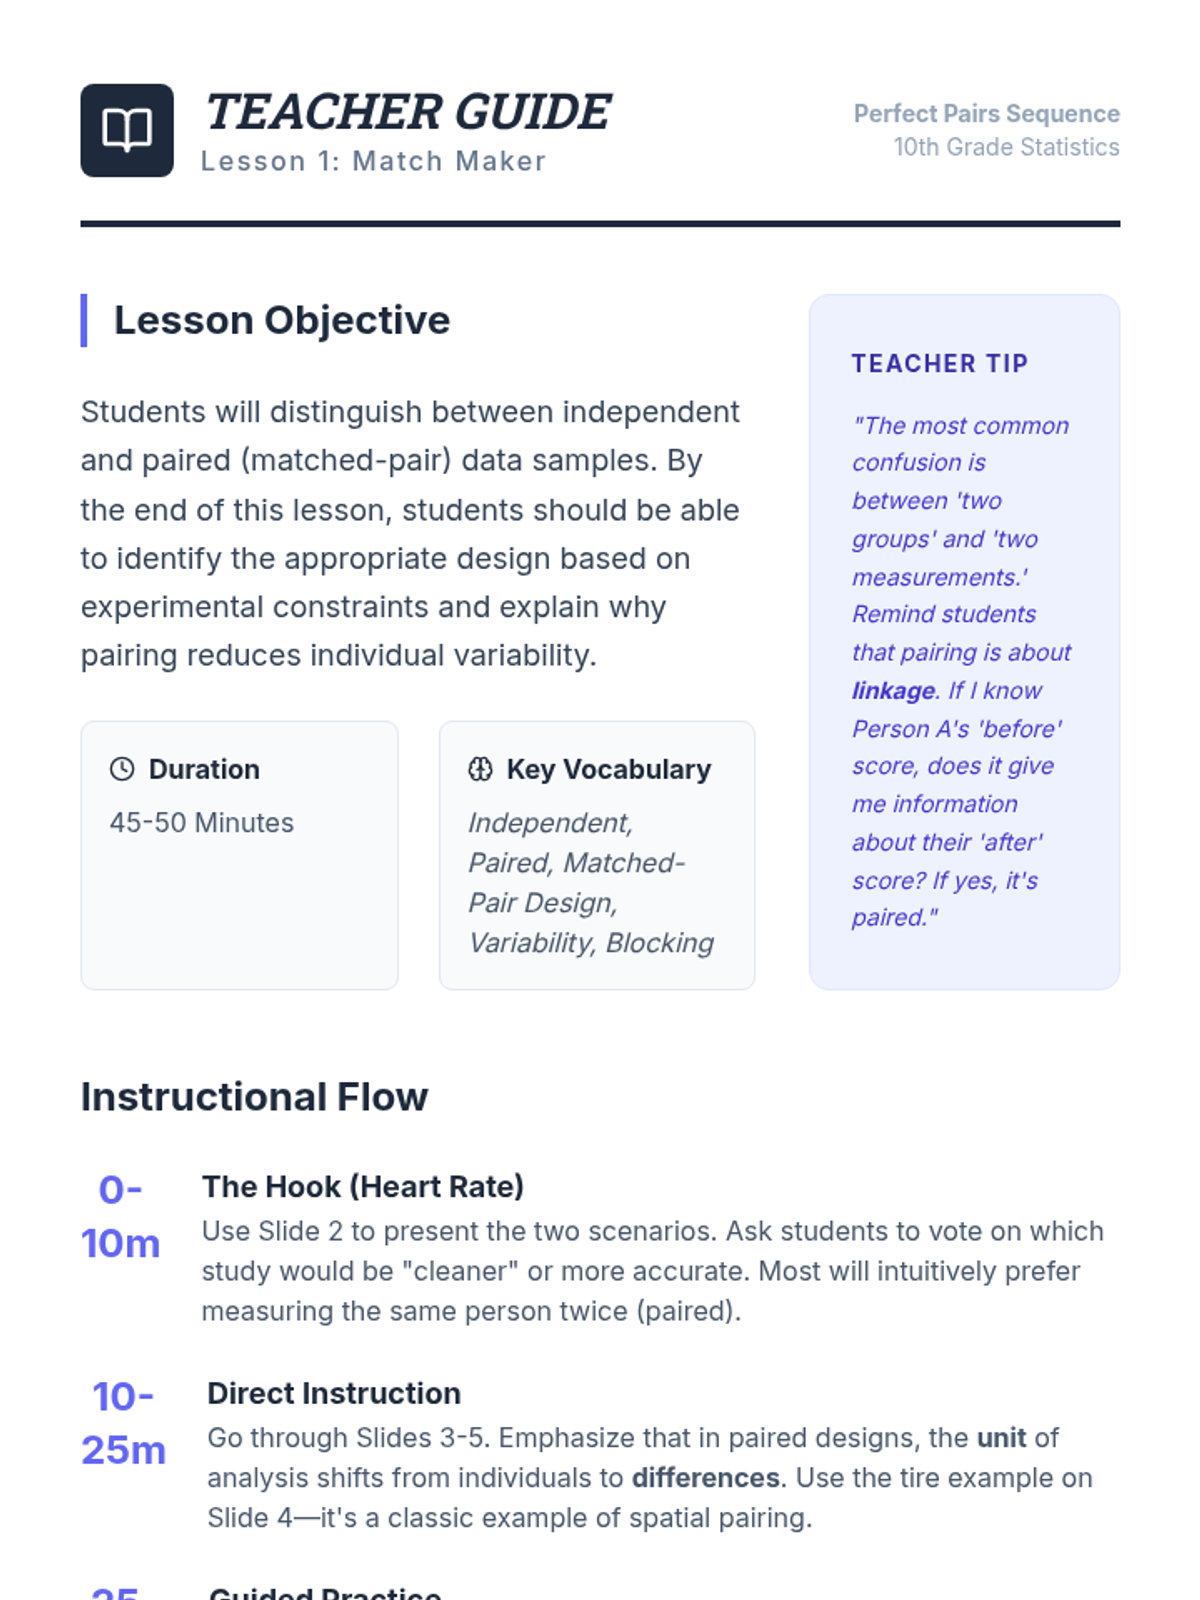
Students distinguish between independent and paired data samples and learn to identify matched-pair experimental designs.
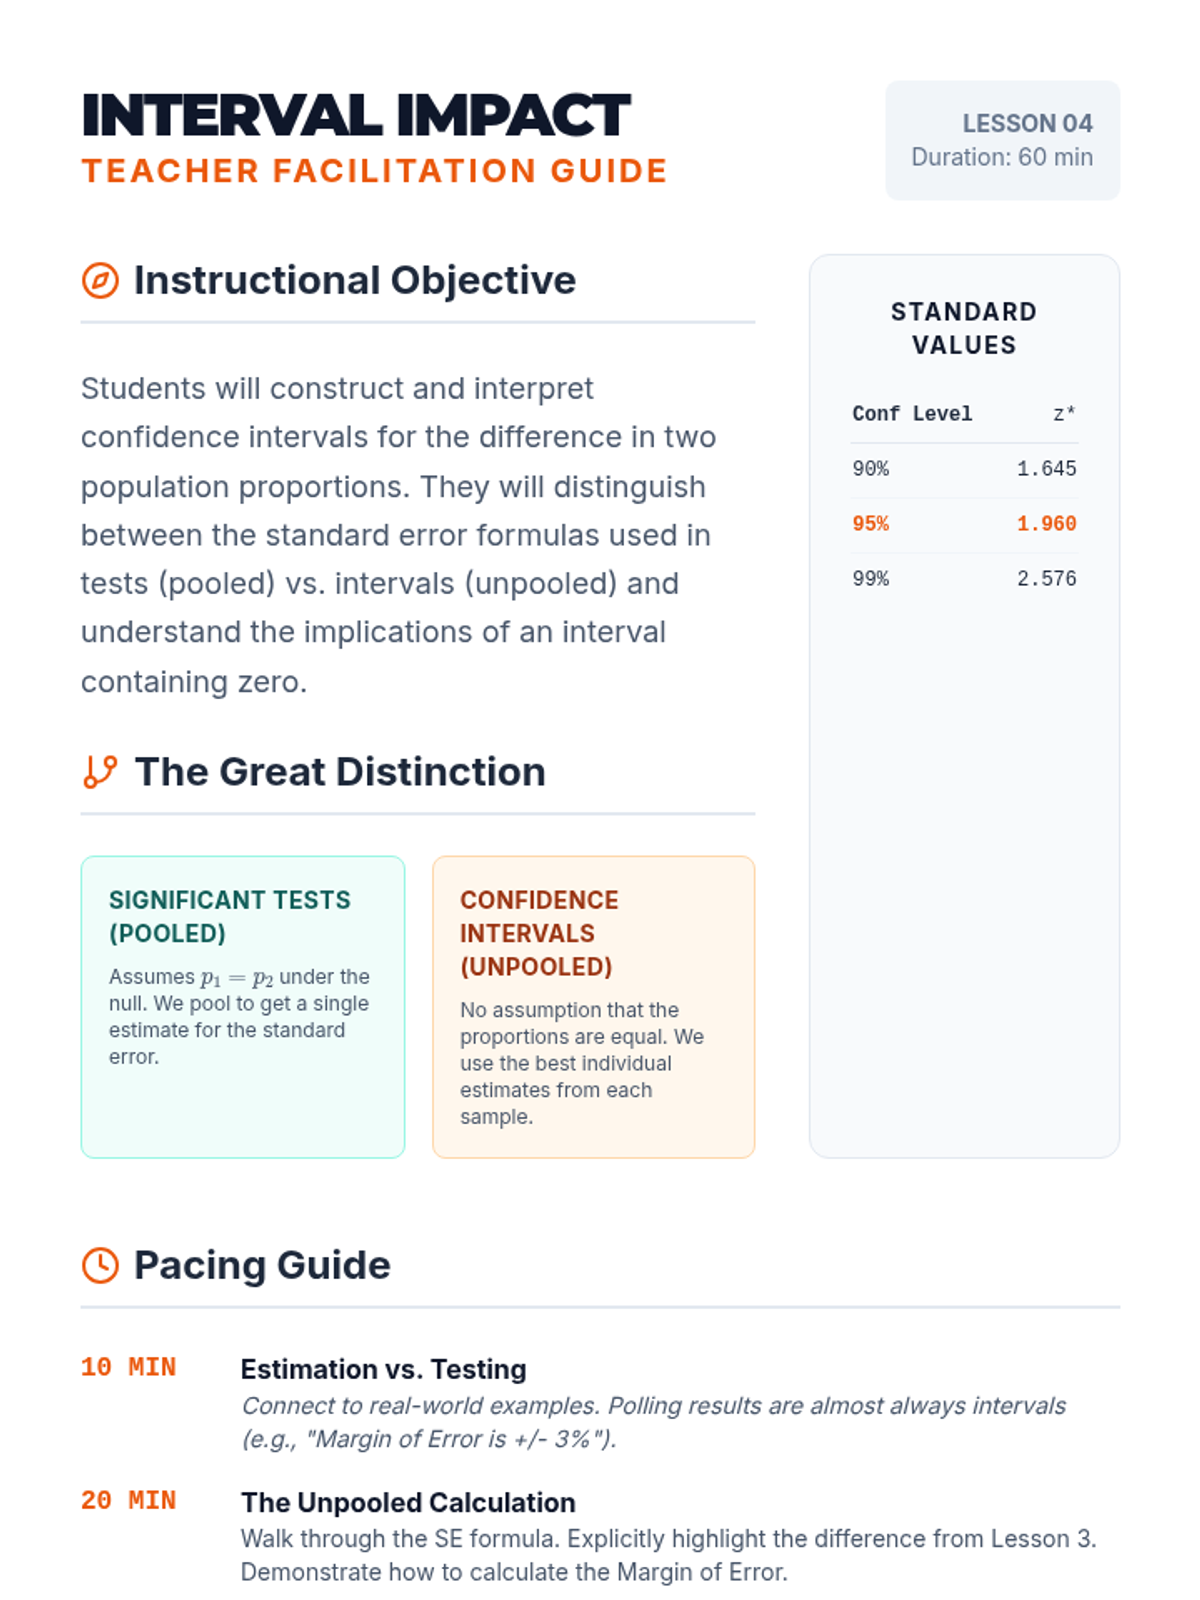
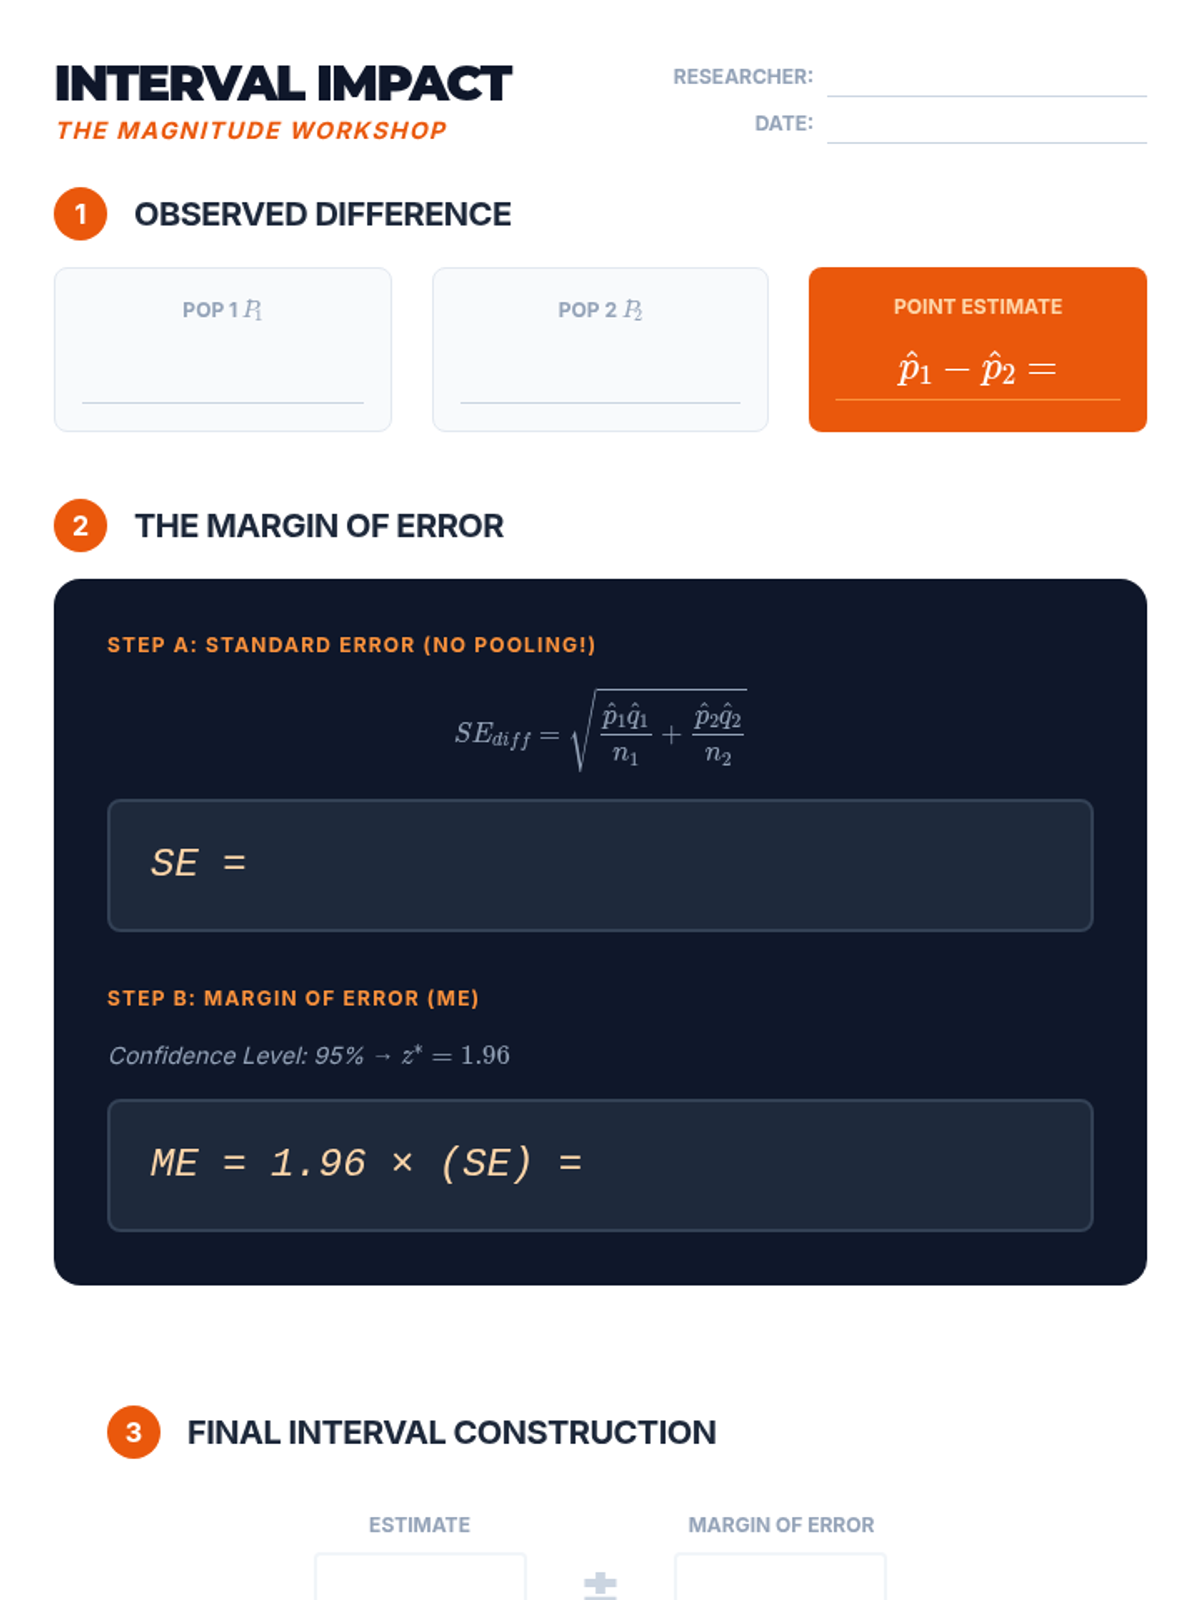
Students construct and interpret confidence intervals for the difference in proportions to estimate the magnitude of population gaps.
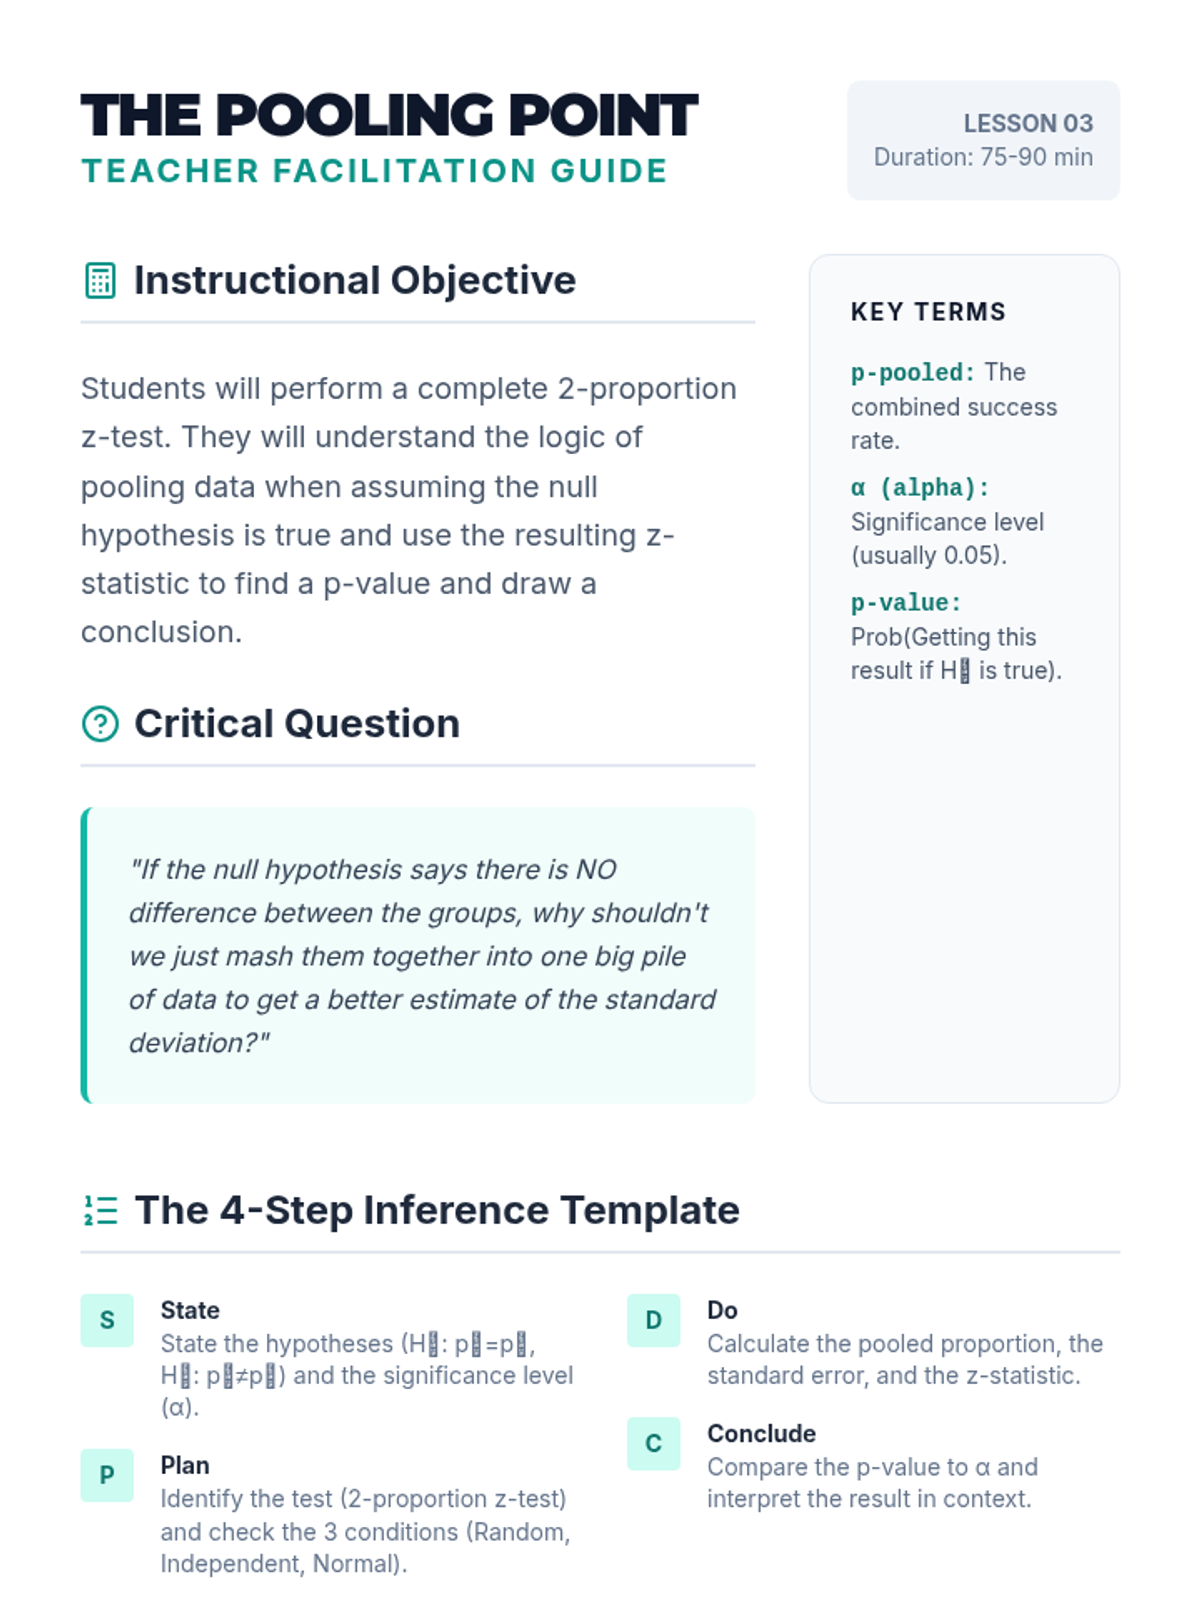
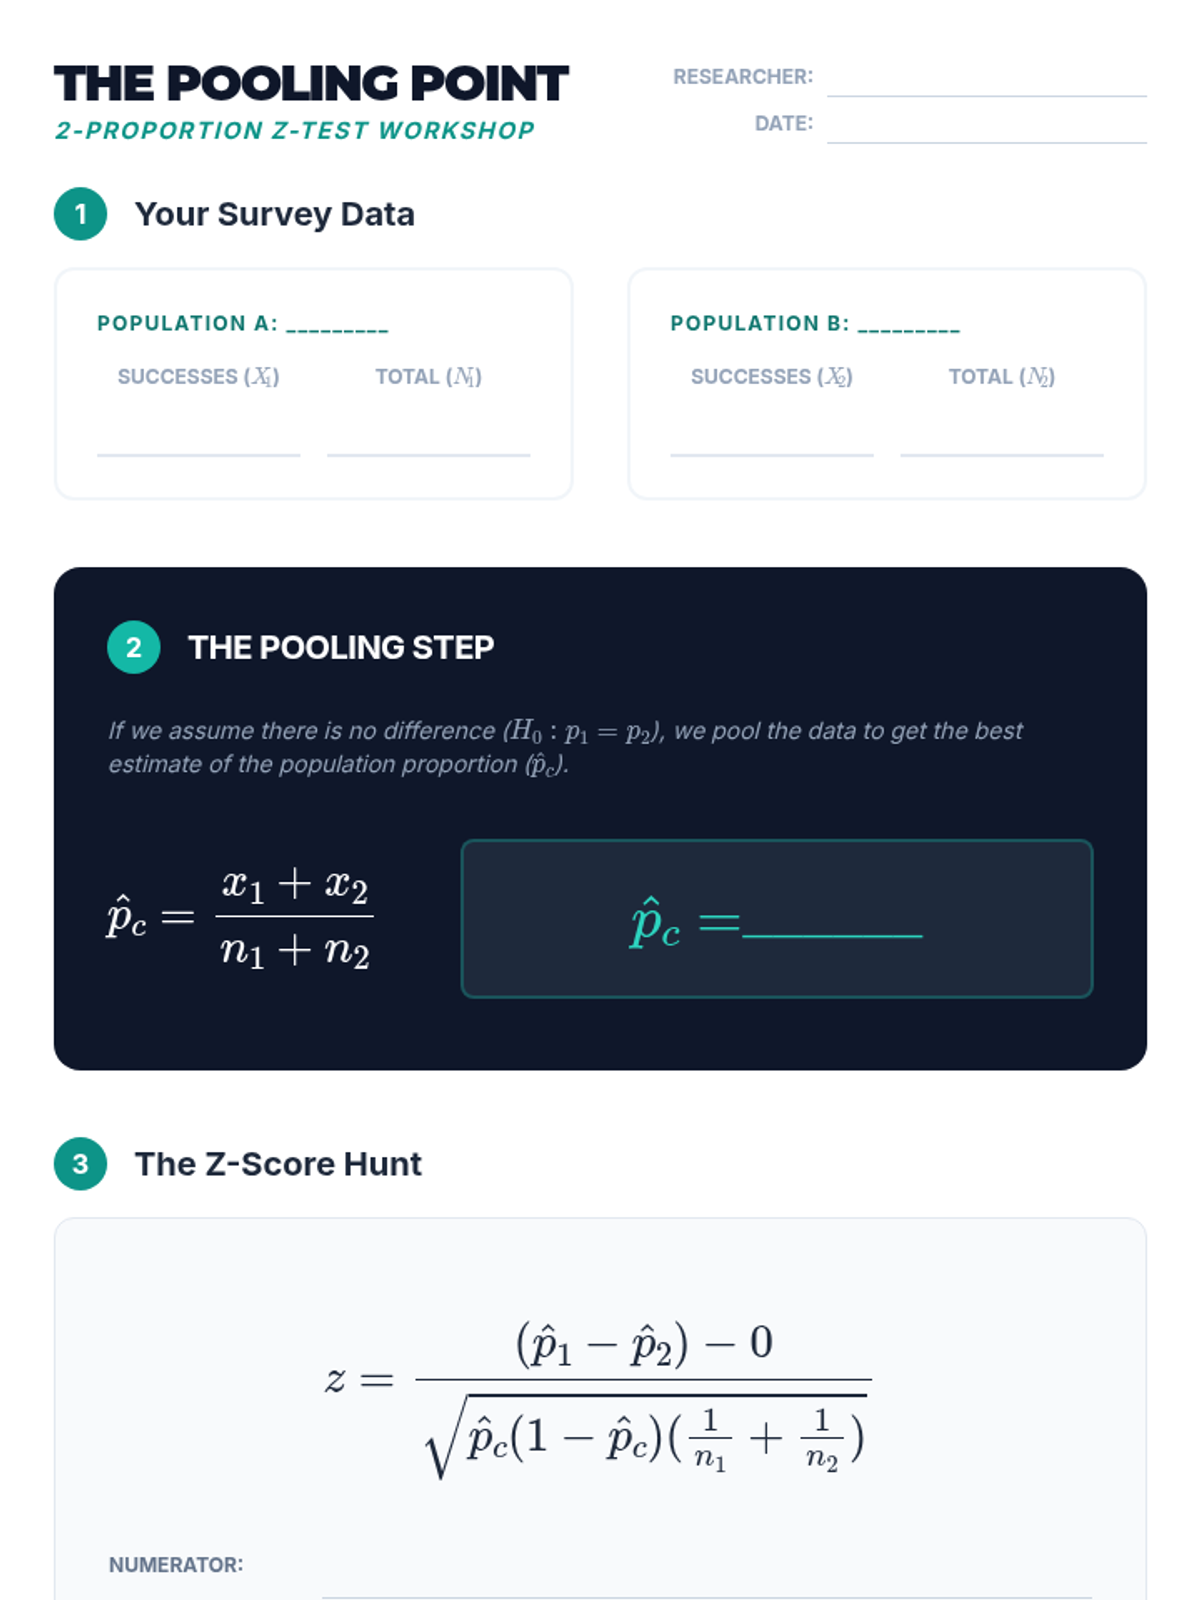
Students master the 2-proportion z-test, focusing on the logic of pooling data under the null hypothesis.
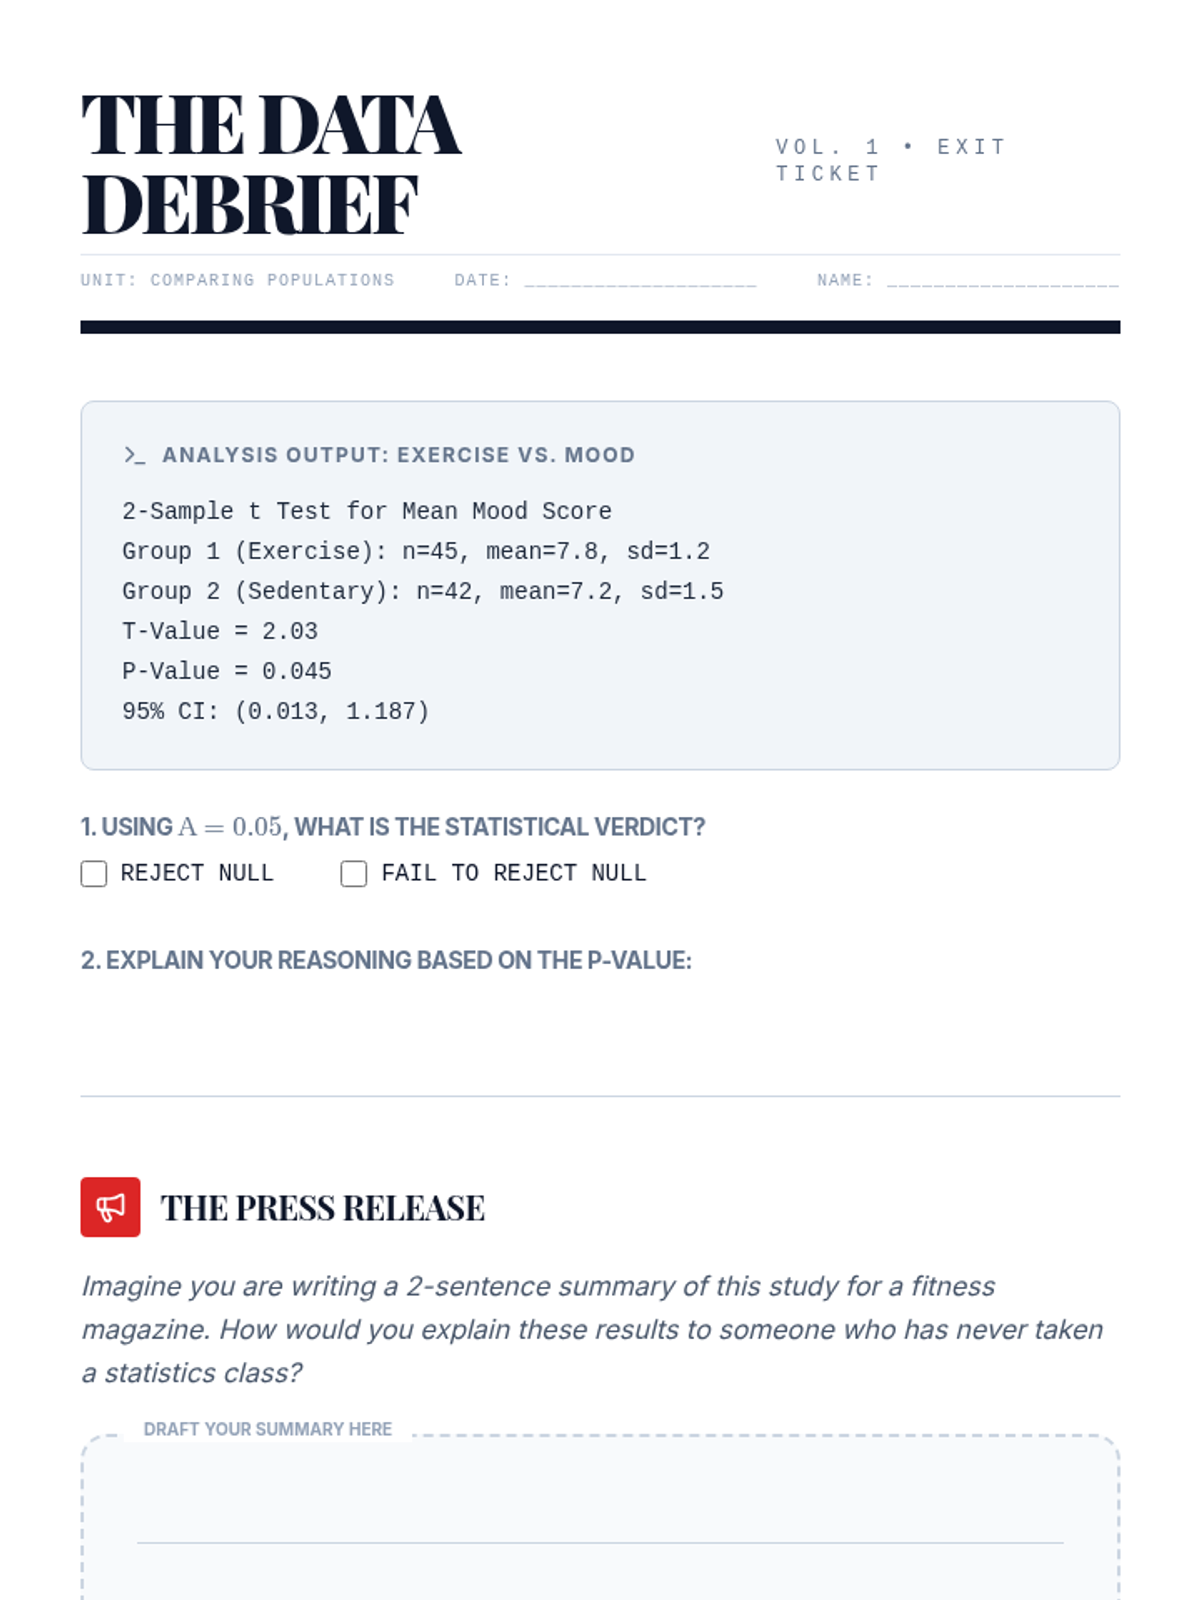
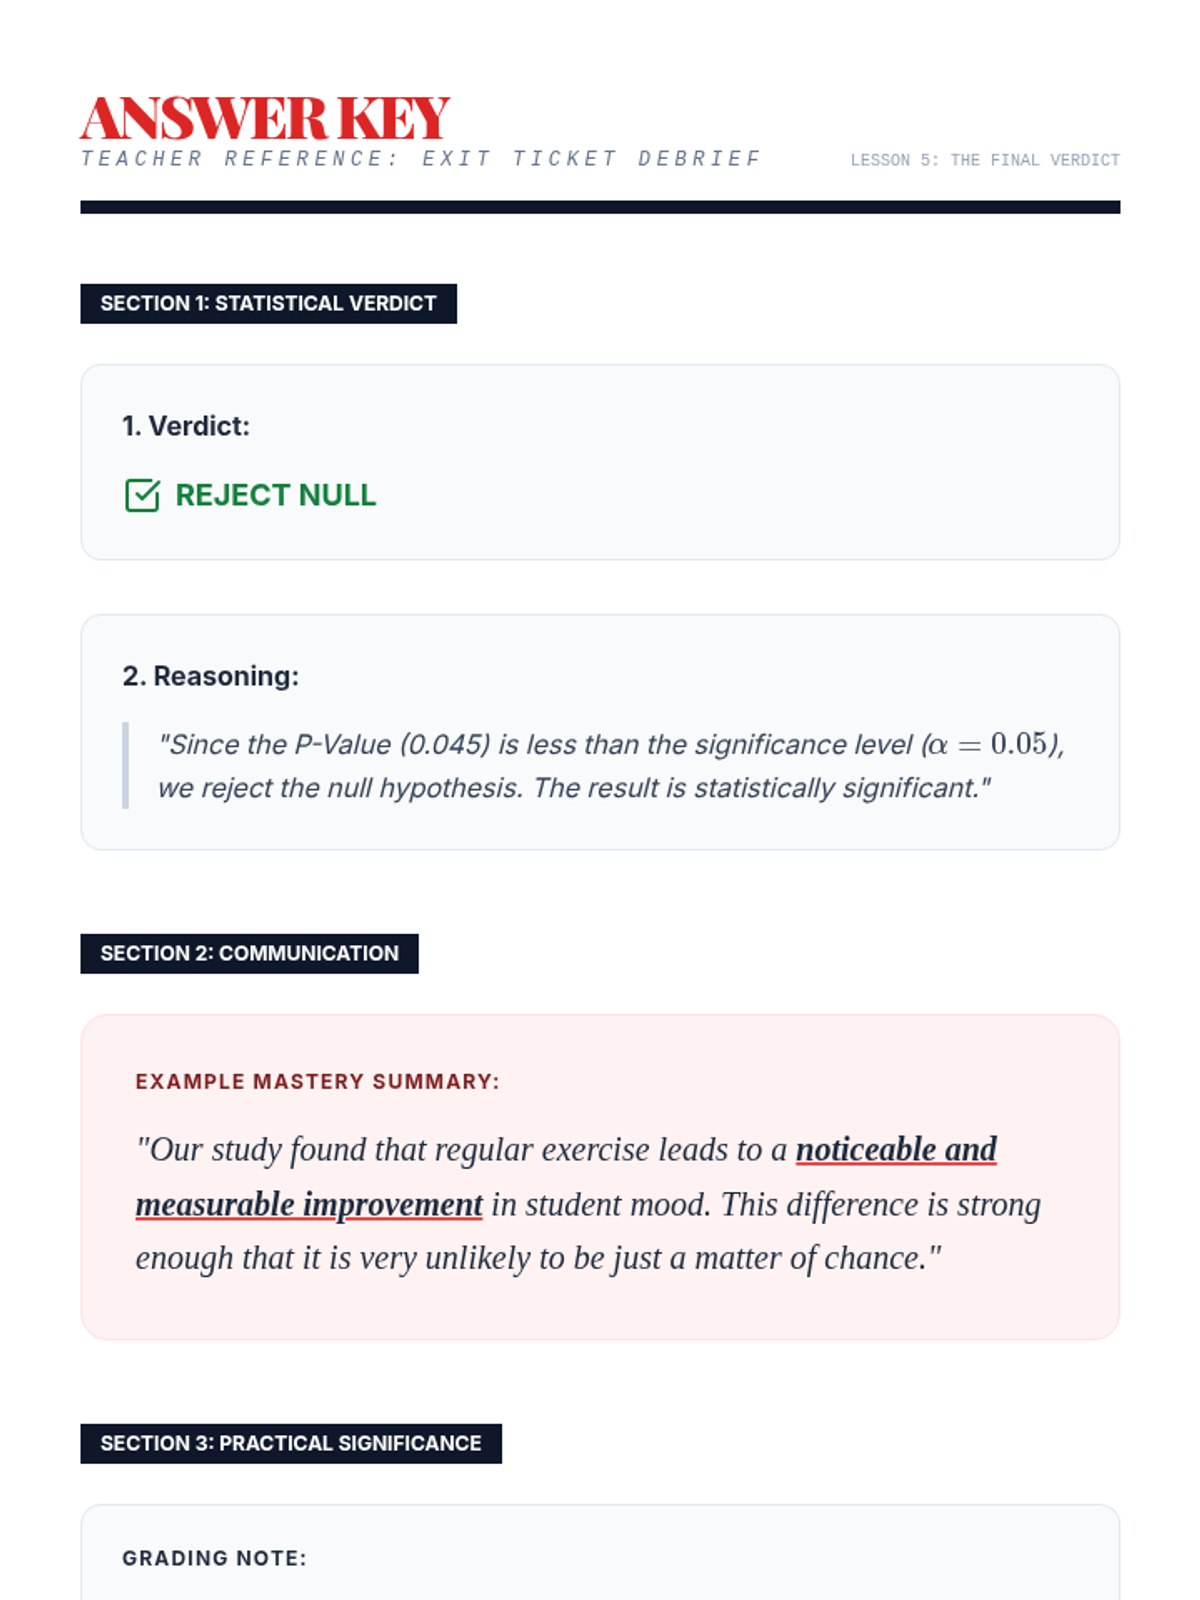
Students practice interpreting computer outputs and communicating statistical findings to a non-technical audience, focusing on the meaning of p-values in real-world contexts.
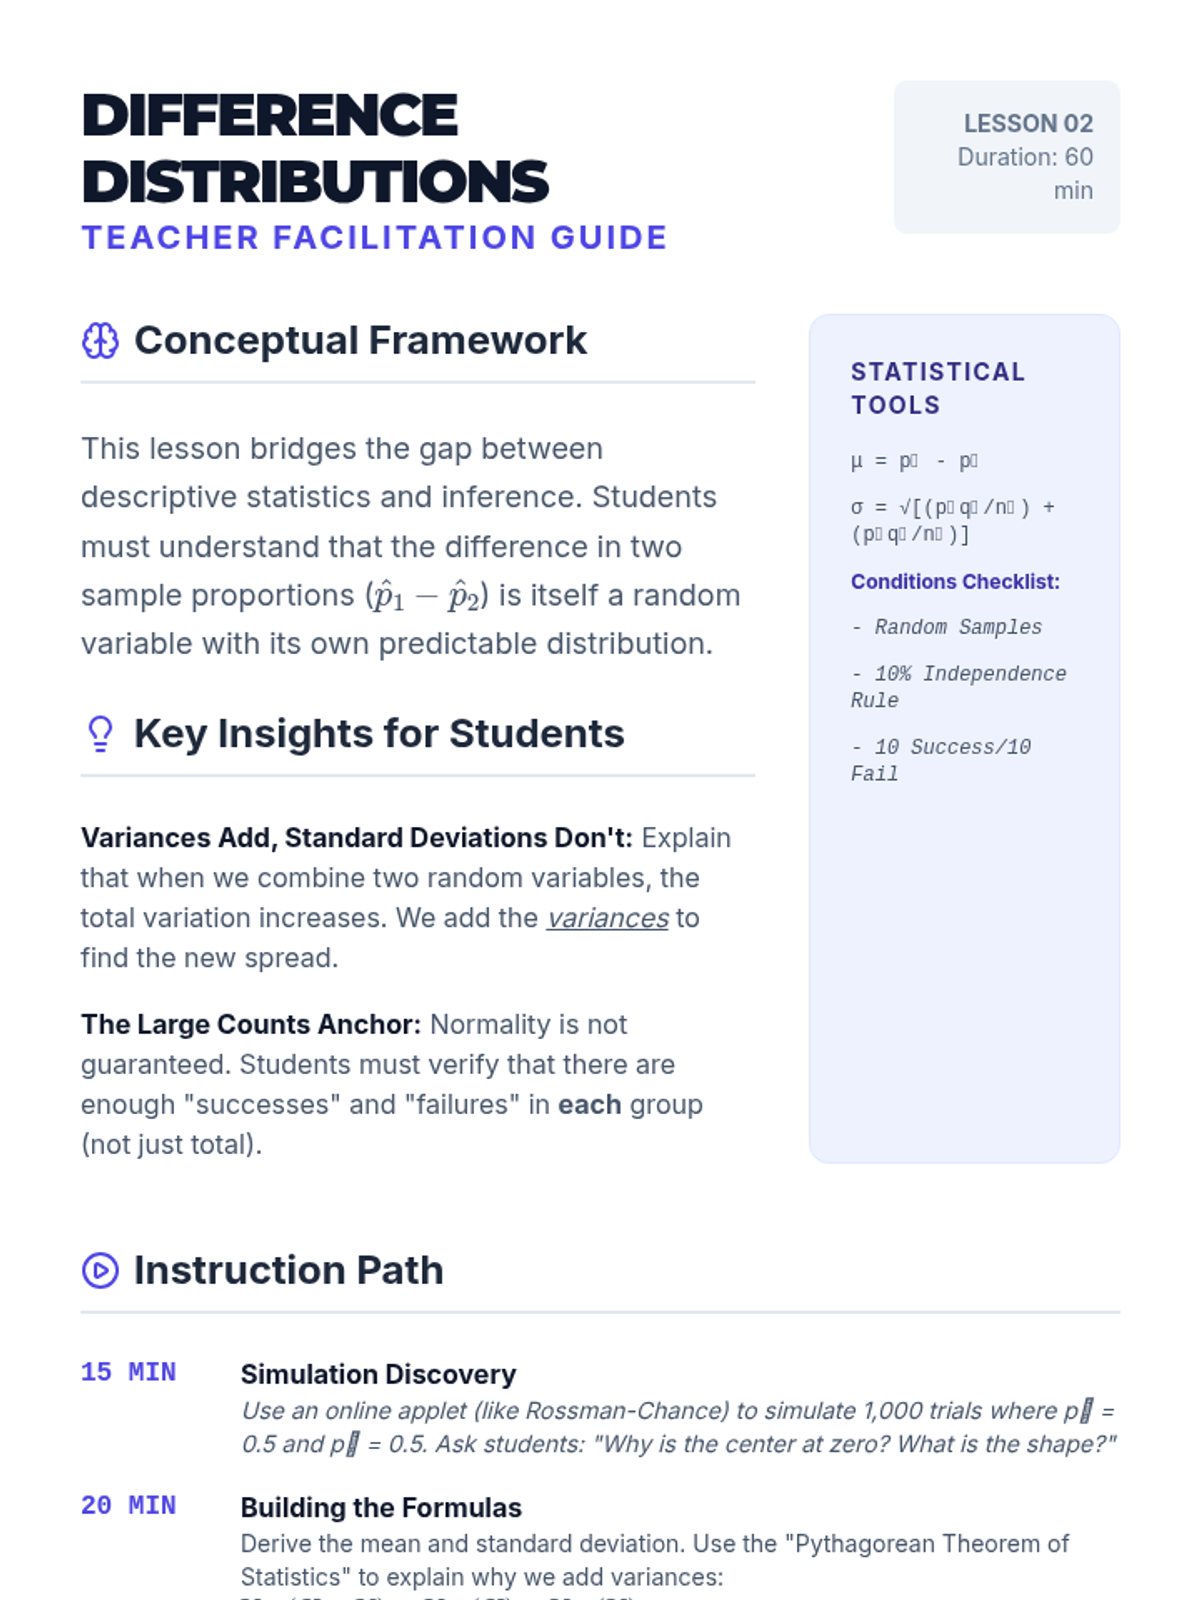
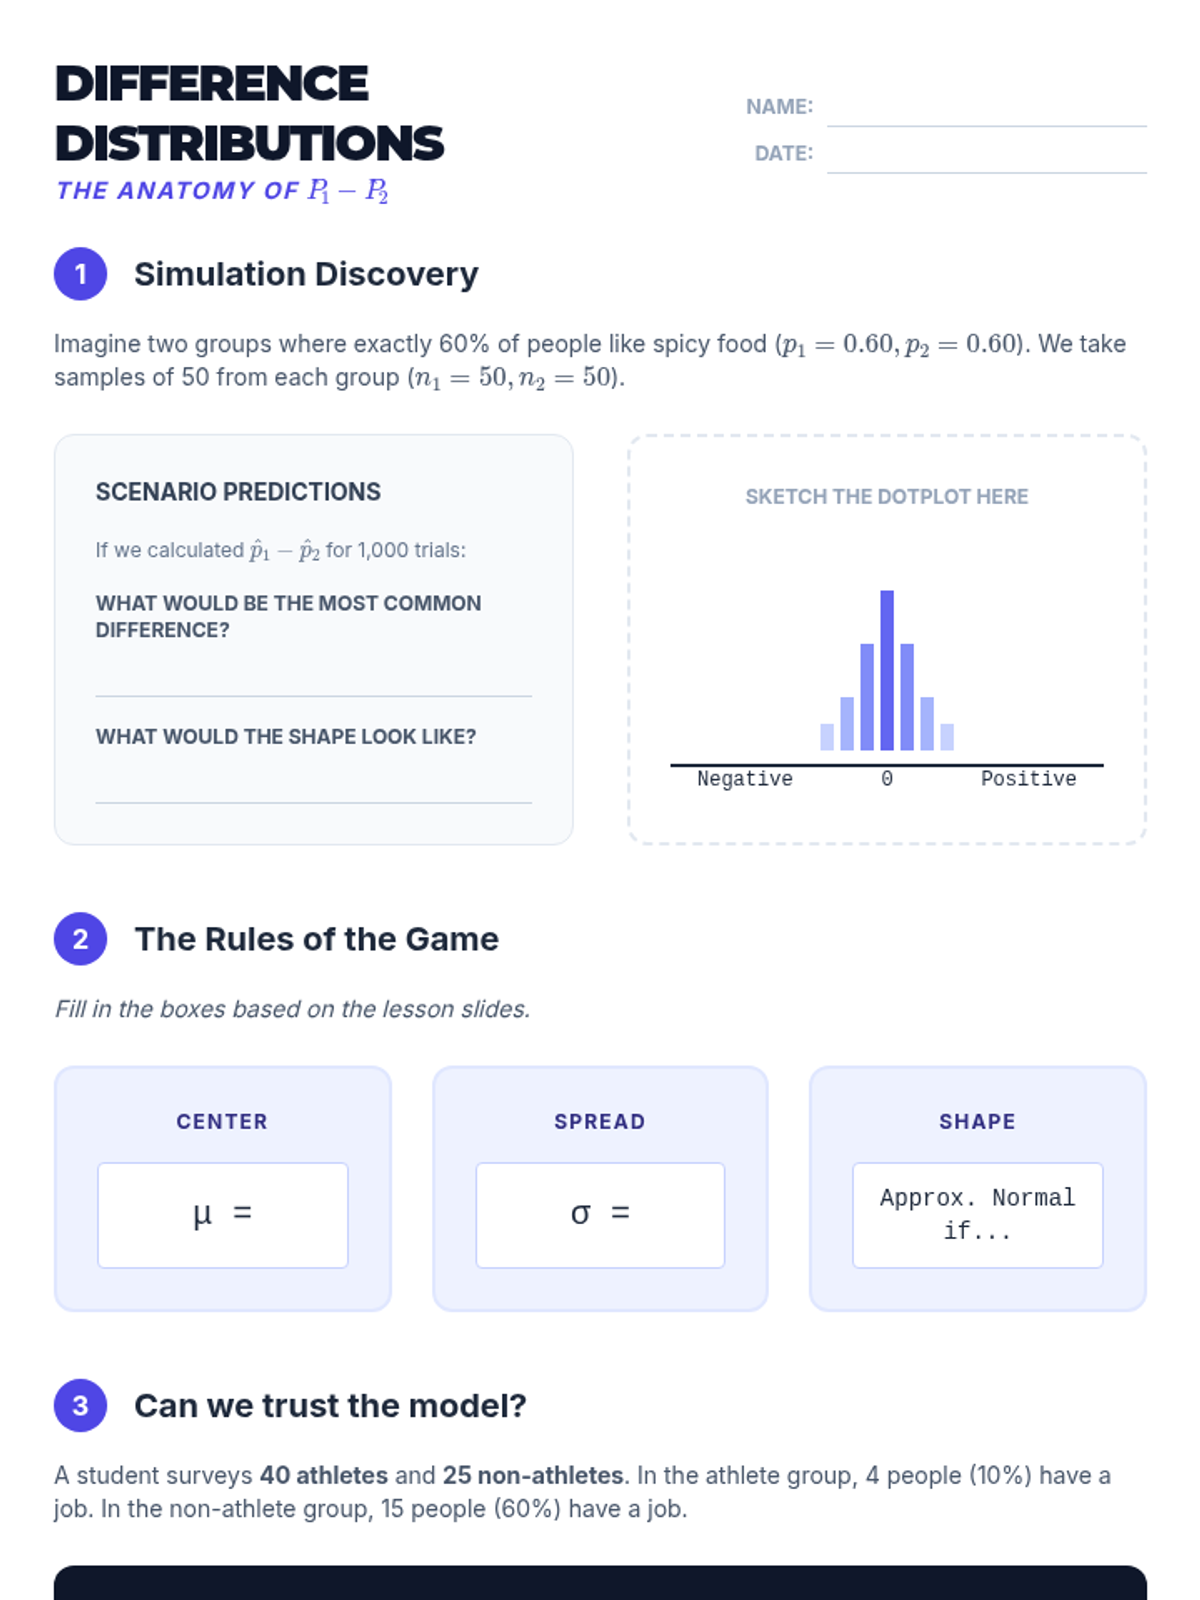
Students investigate the behavior of the difference in sample proportions through simulation and learn the conditions for normality.
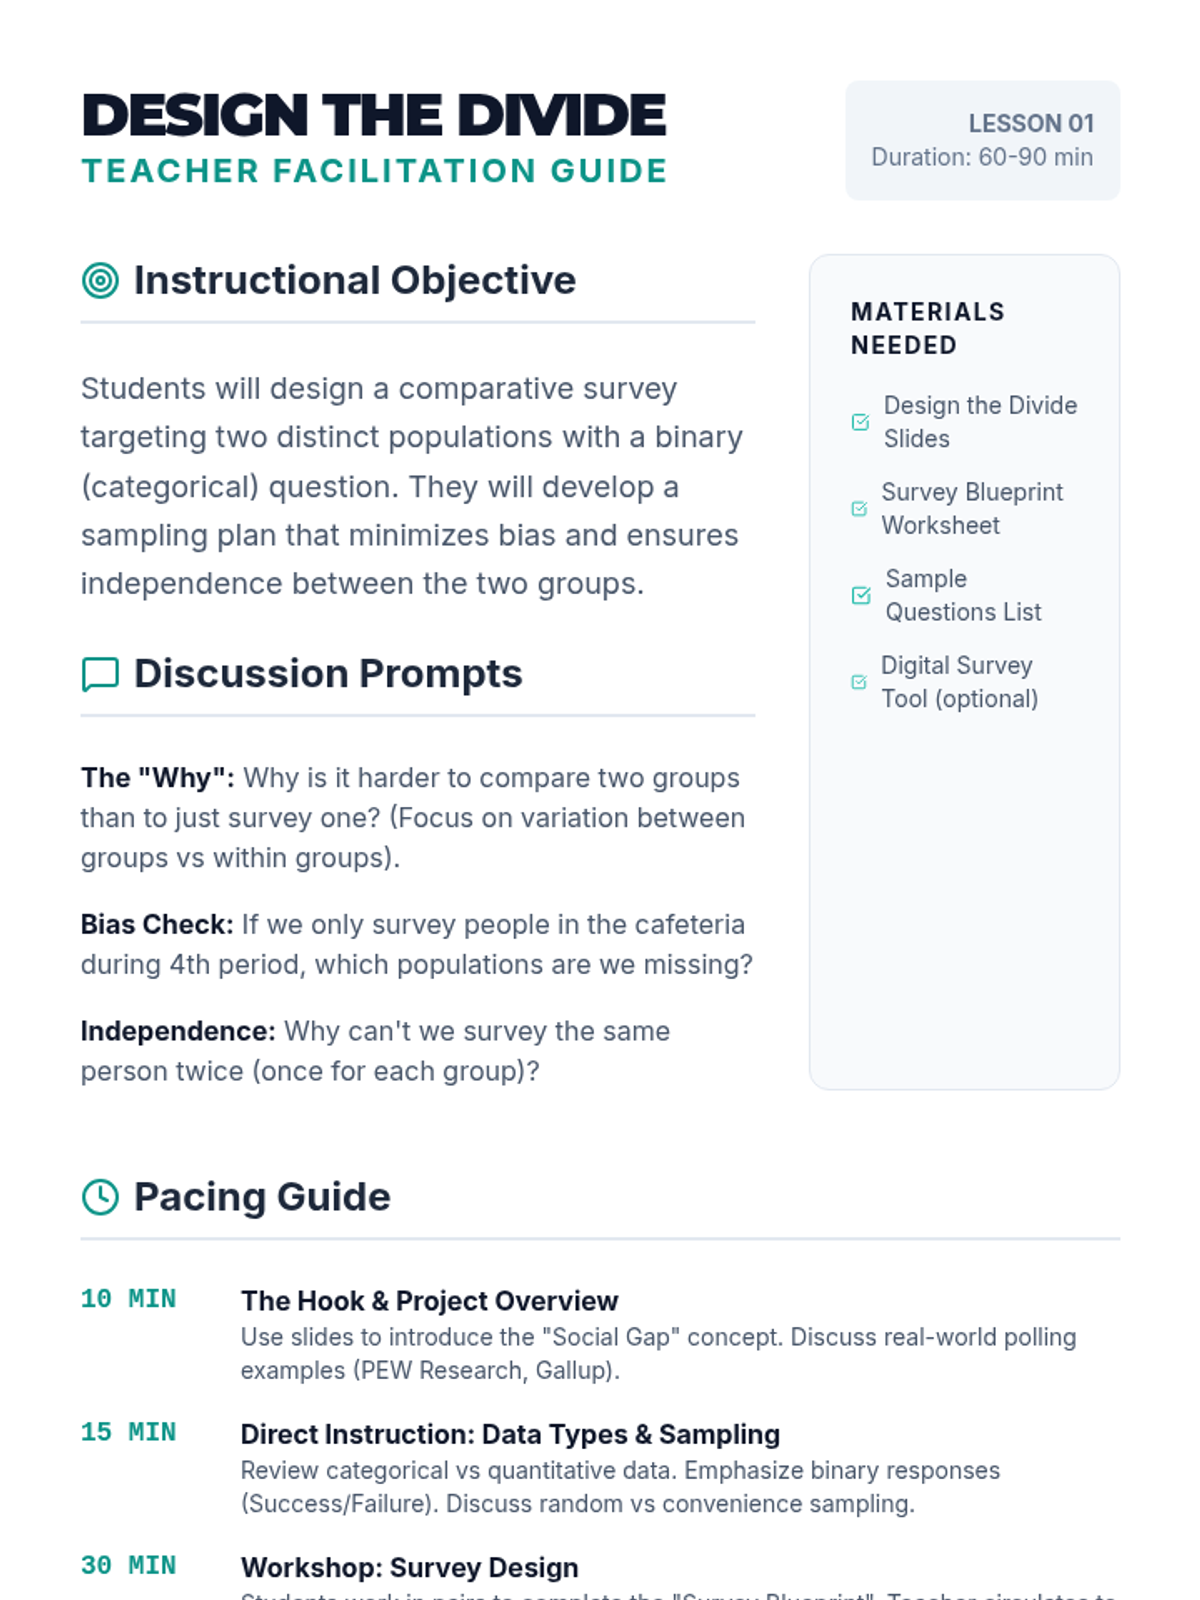
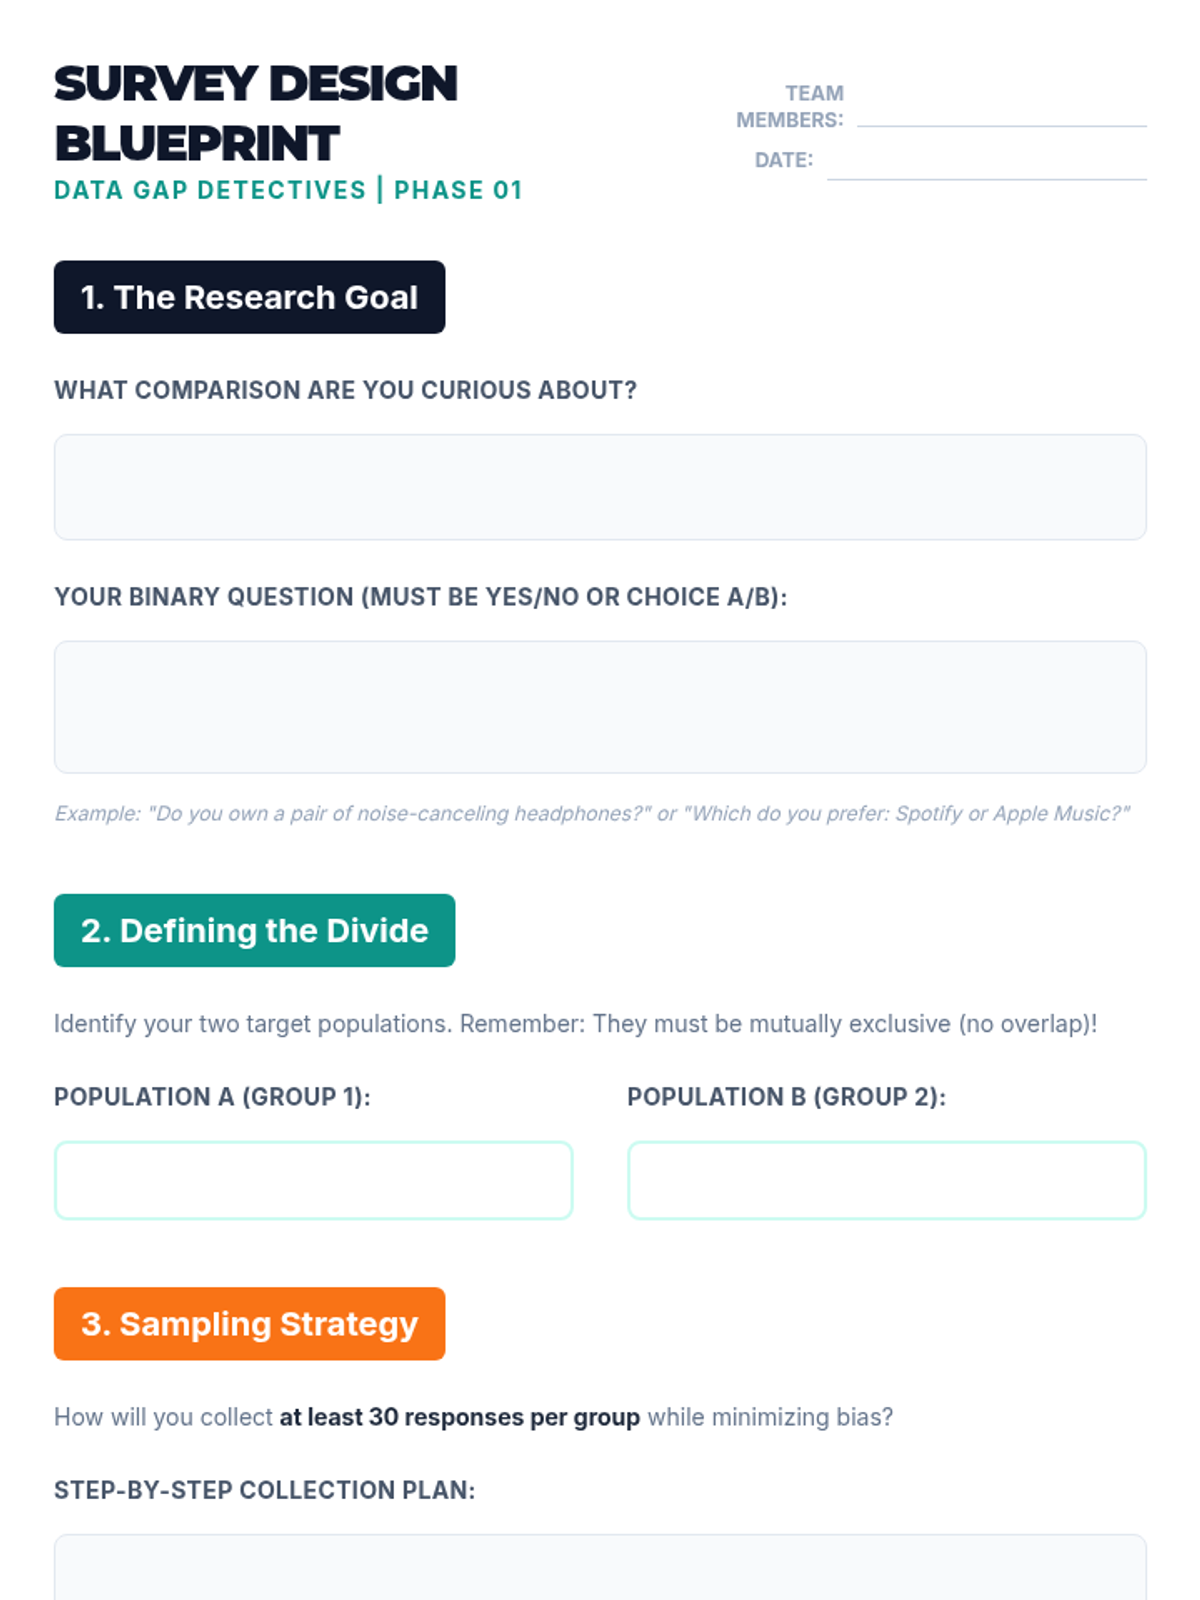
Students define target populations and design a binary survey to compare proportions between two groups, focusing on sampling methods and bias prevention.
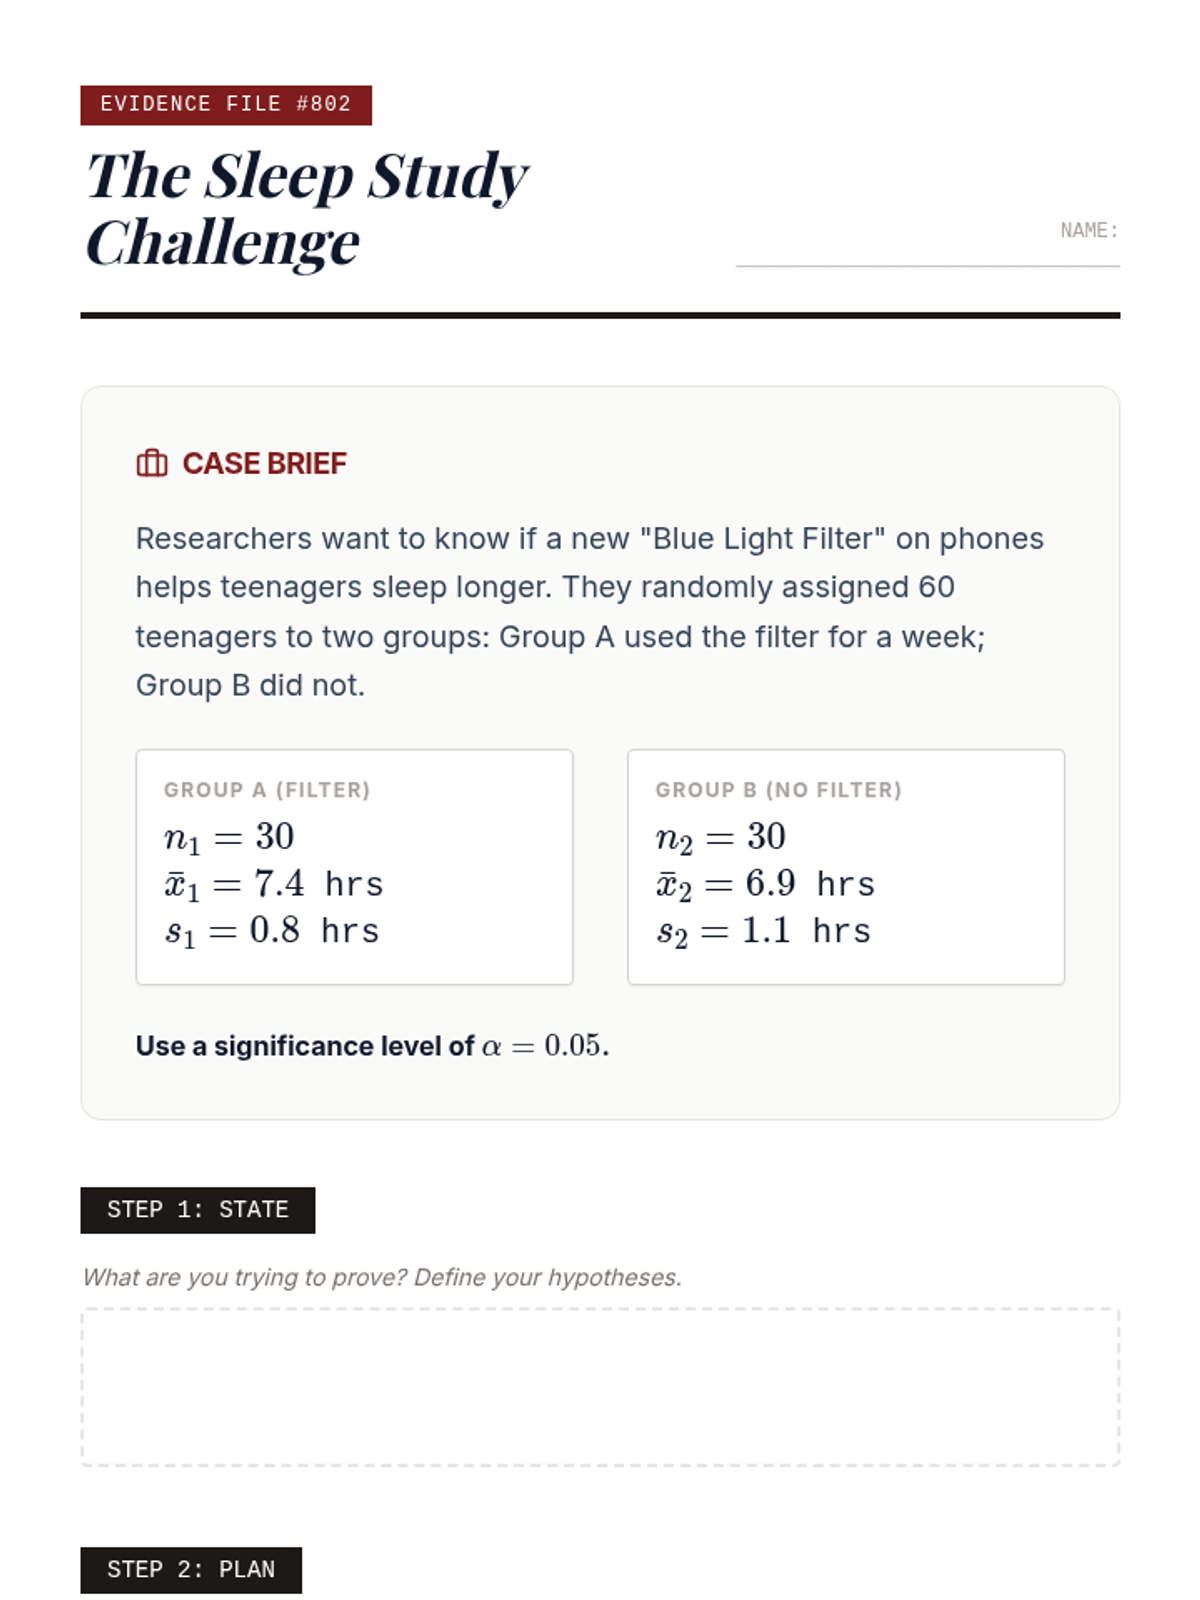
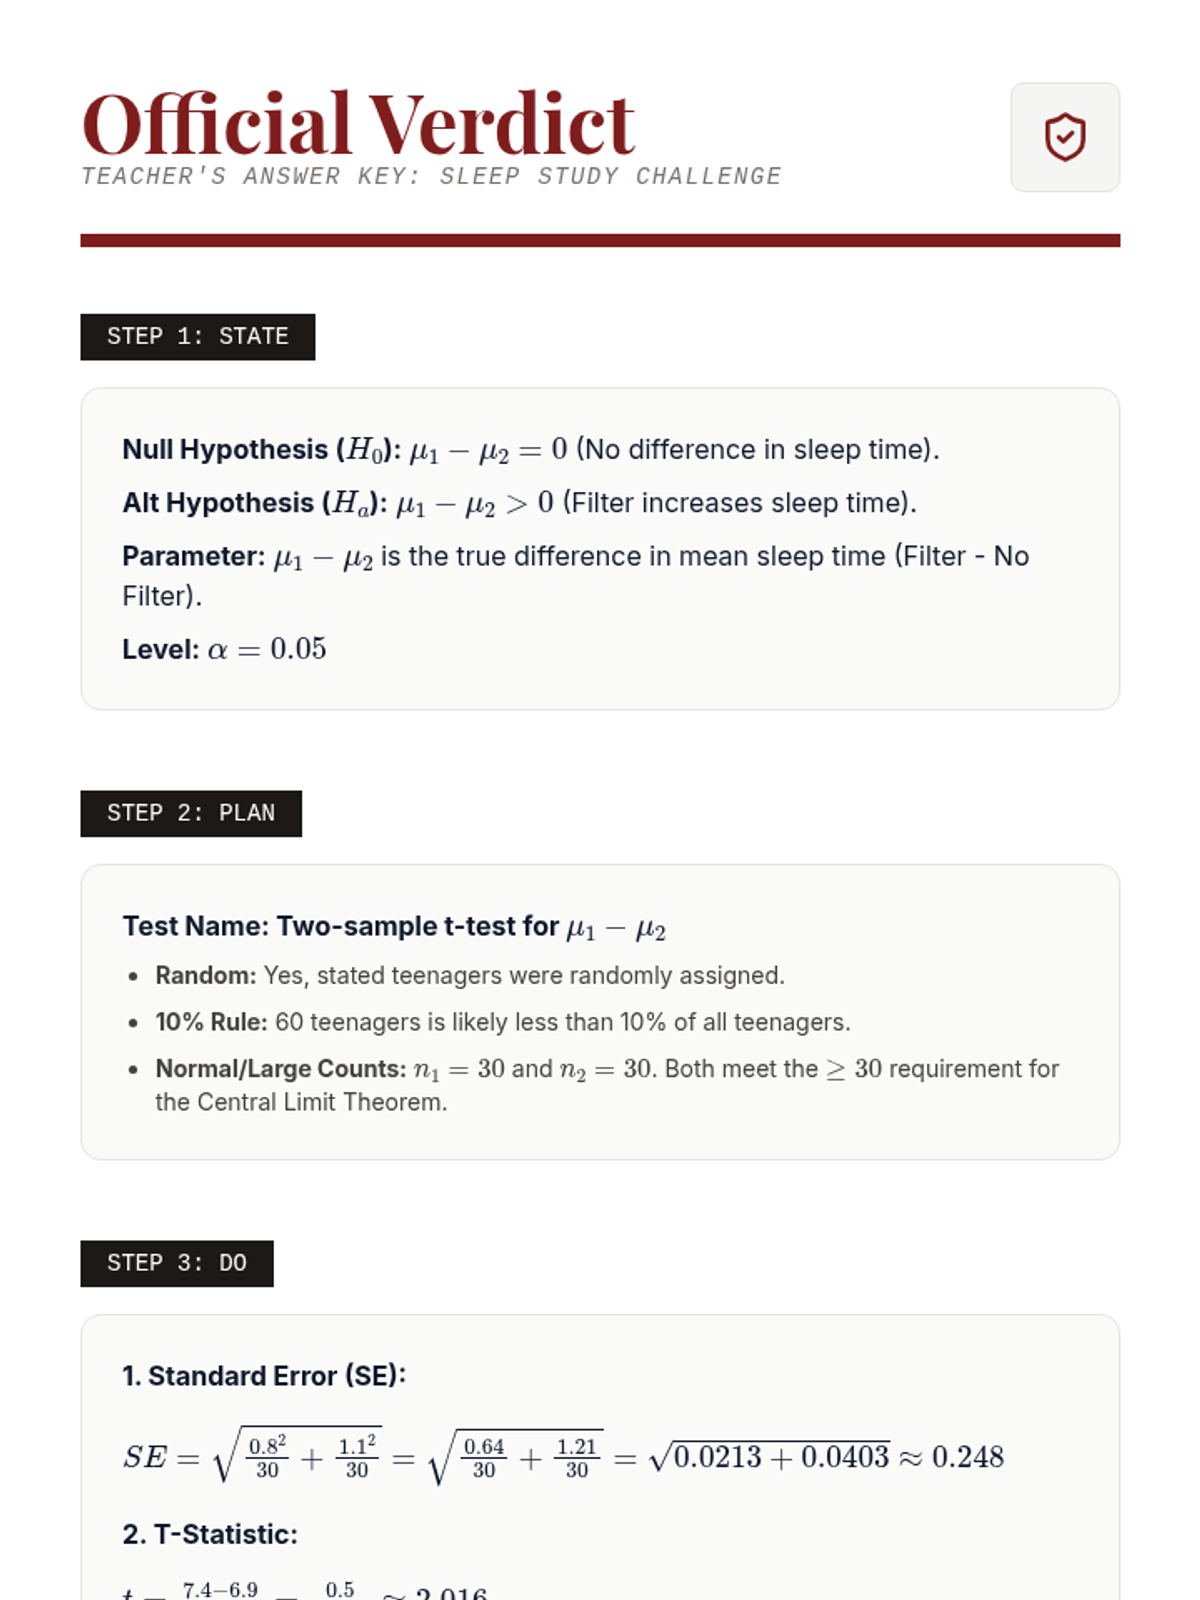
A formal introduction to the four-step hypothesis testing process for independent means, including checking conditions and deriving p-values.
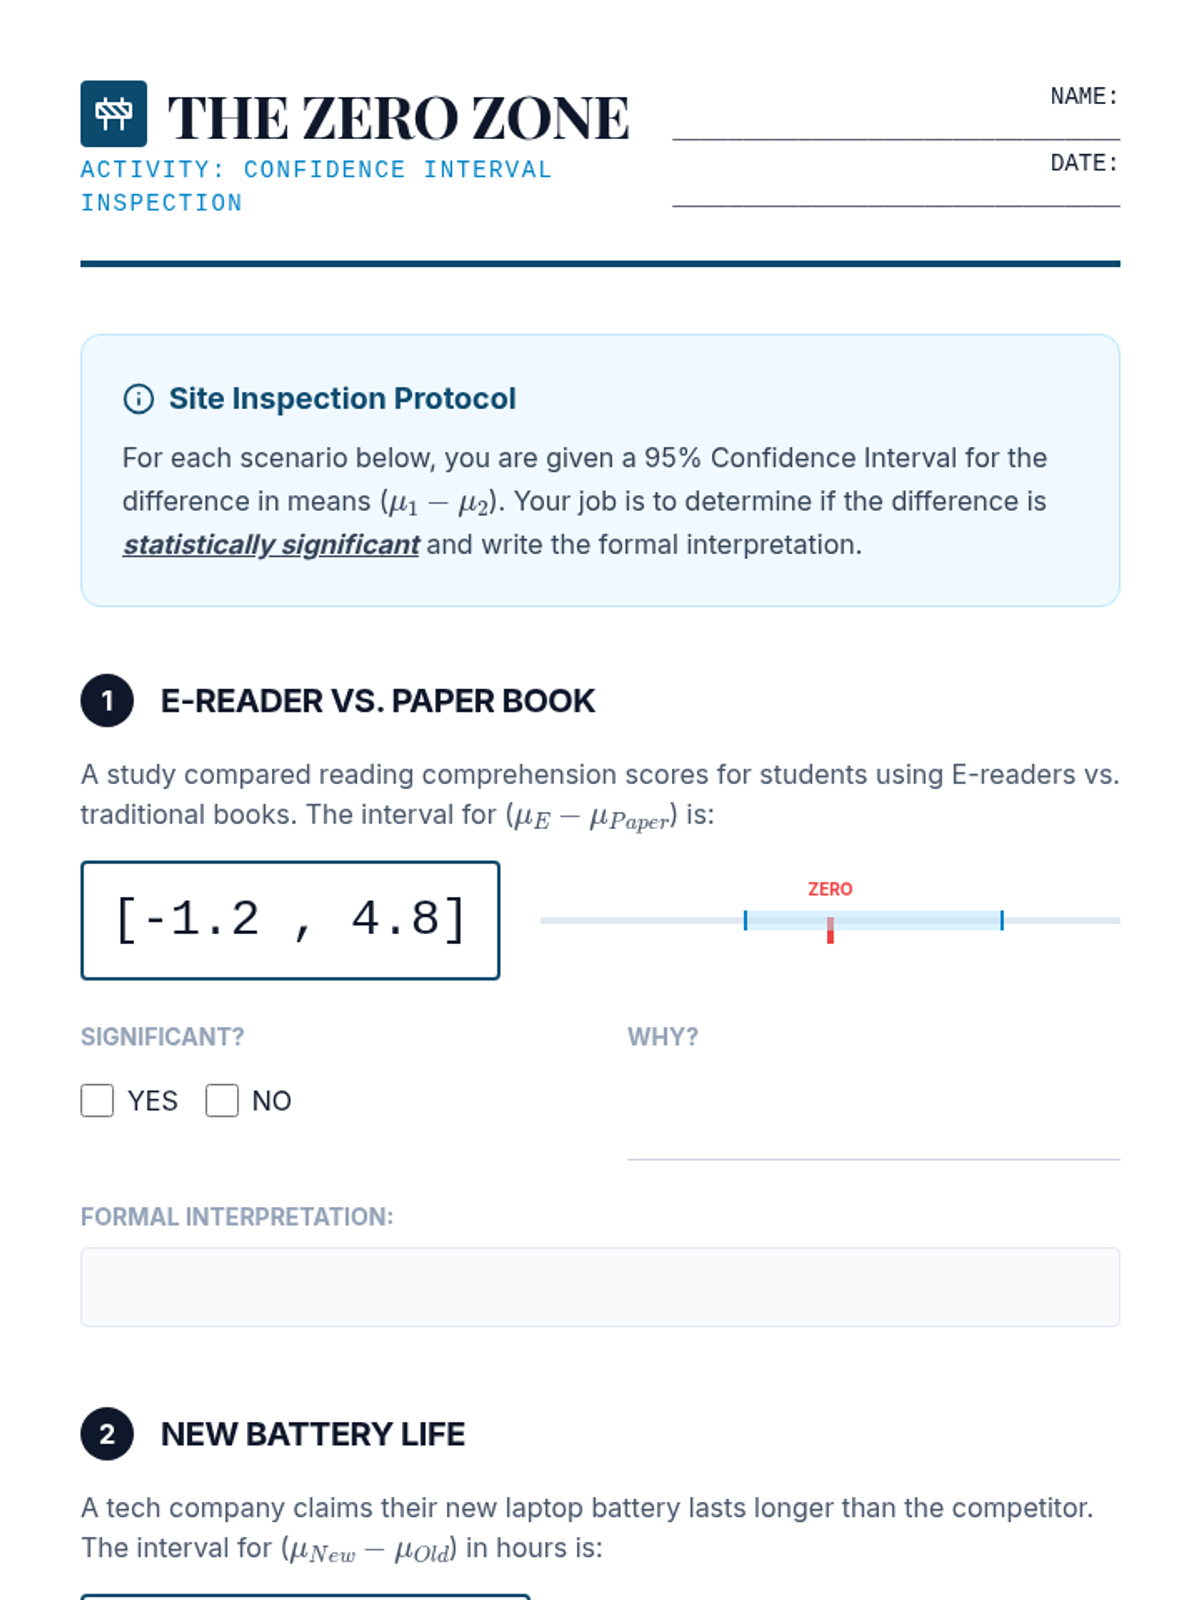
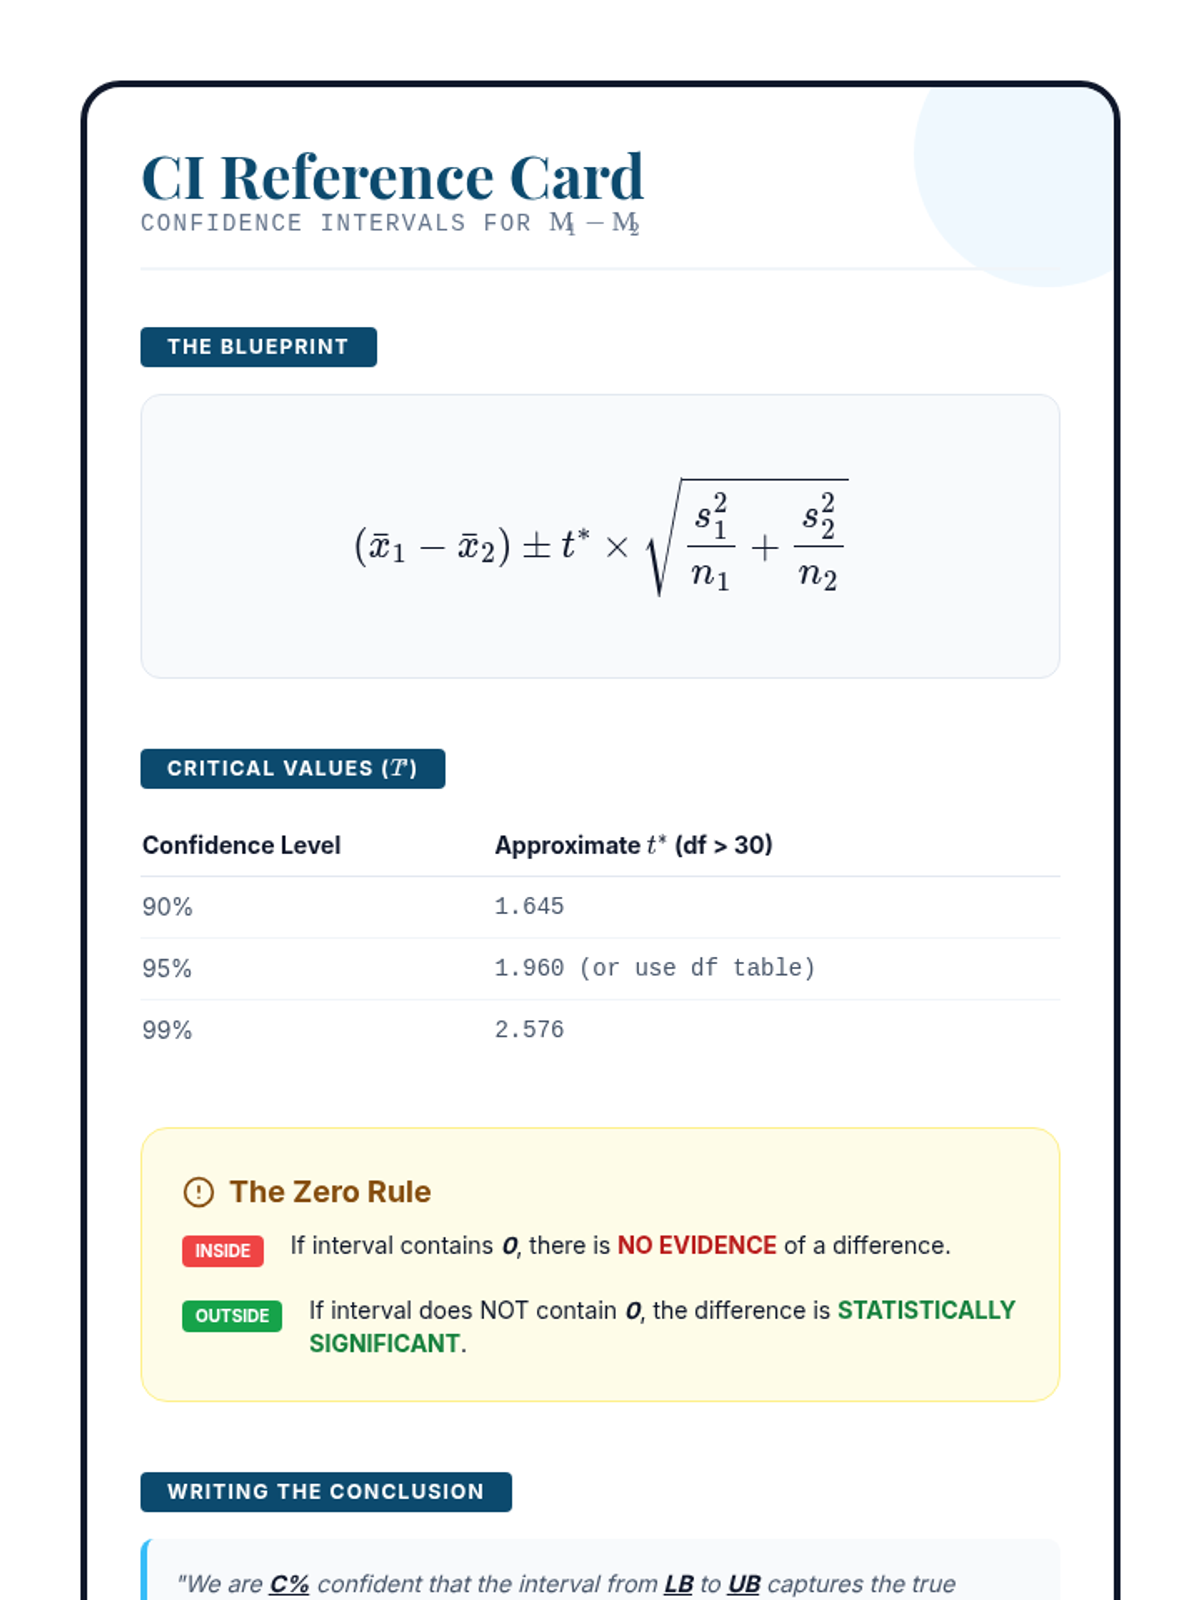
Students construct and interpret confidence intervals for the difference between two means, focusing on whether the interval contains zero as a marker of significance.
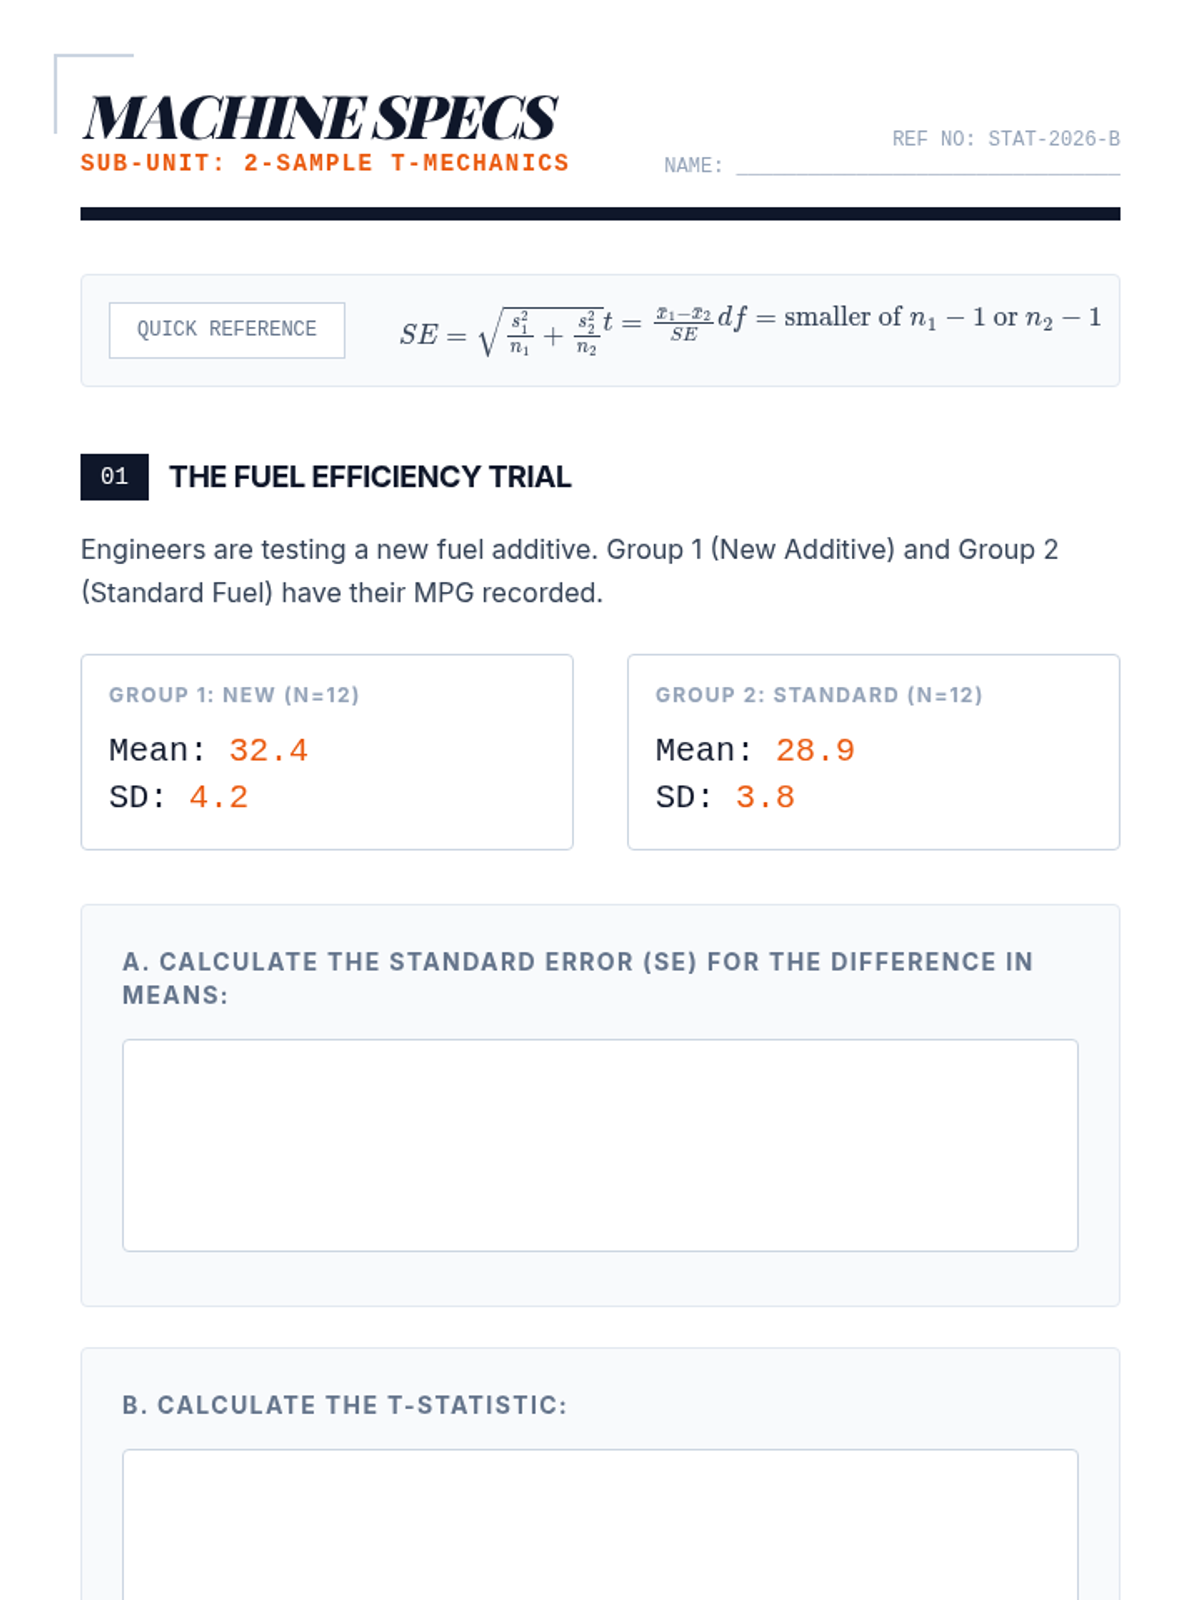
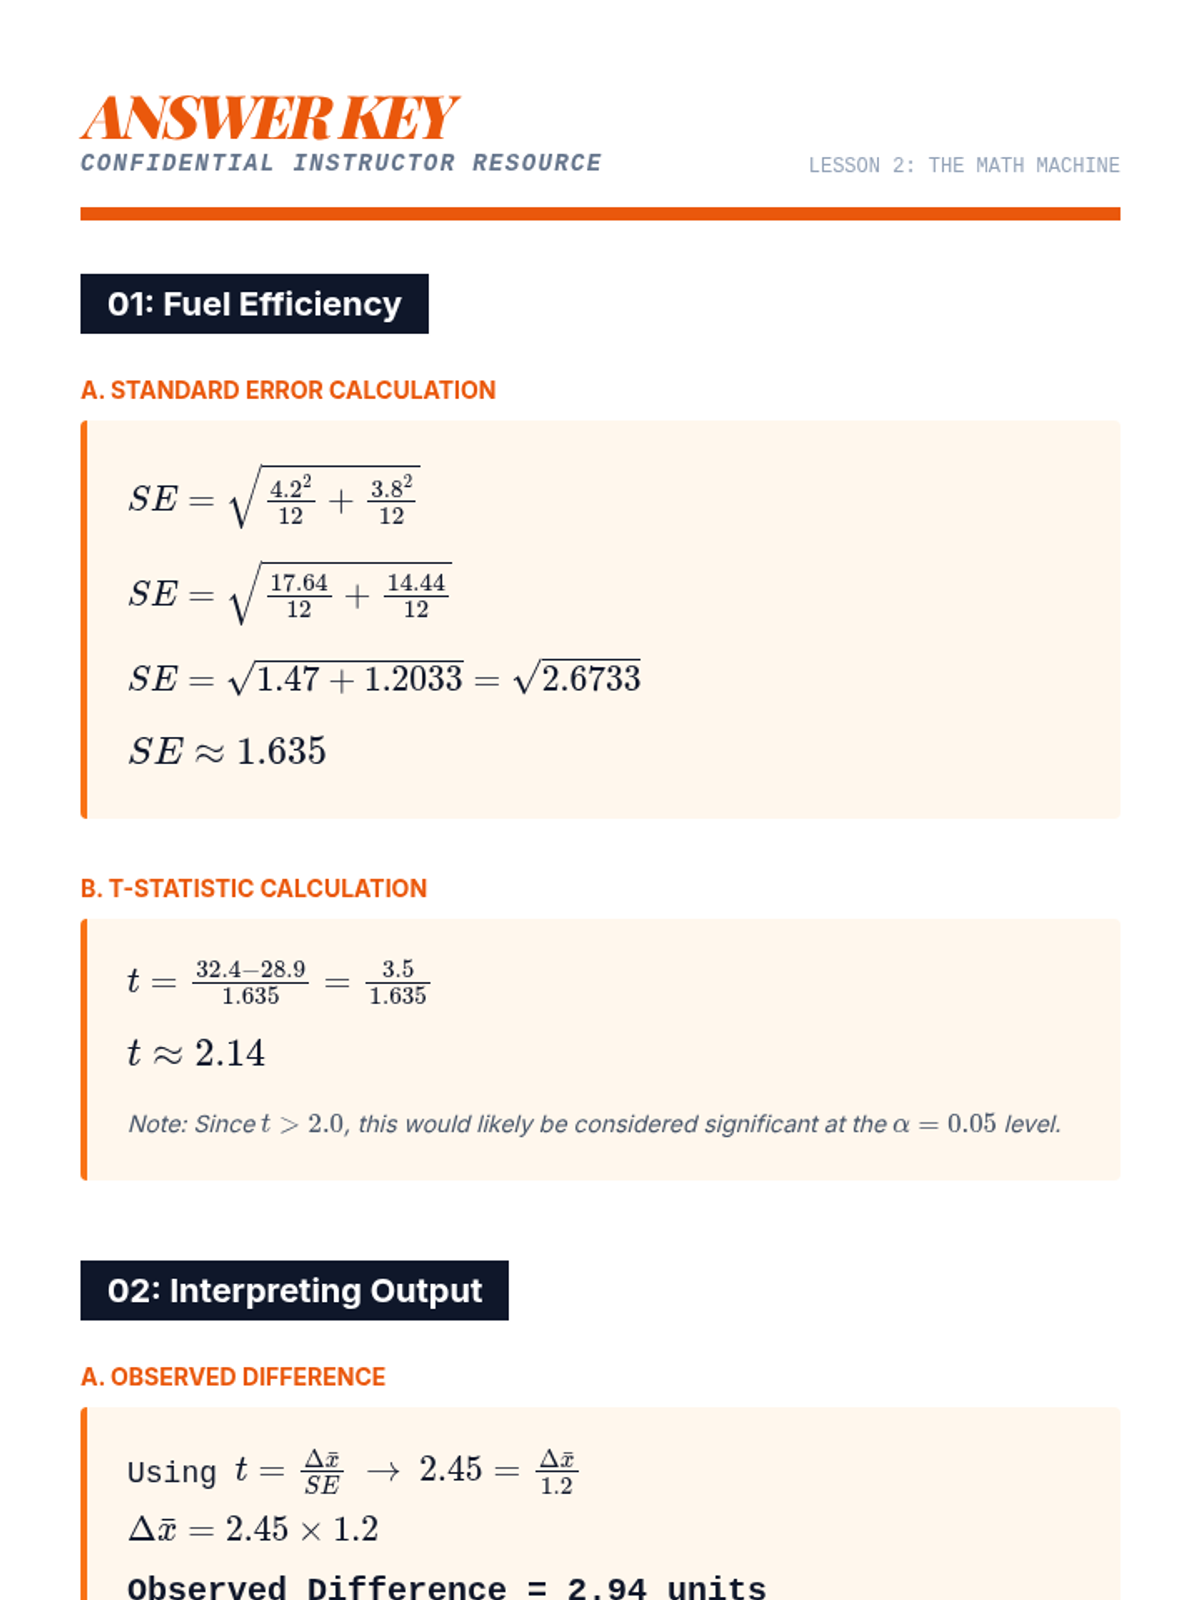
Transitioning from simulation to calculation, students learn the formula for the standard error of the difference in means and how to compute the two-sample t-statistic.
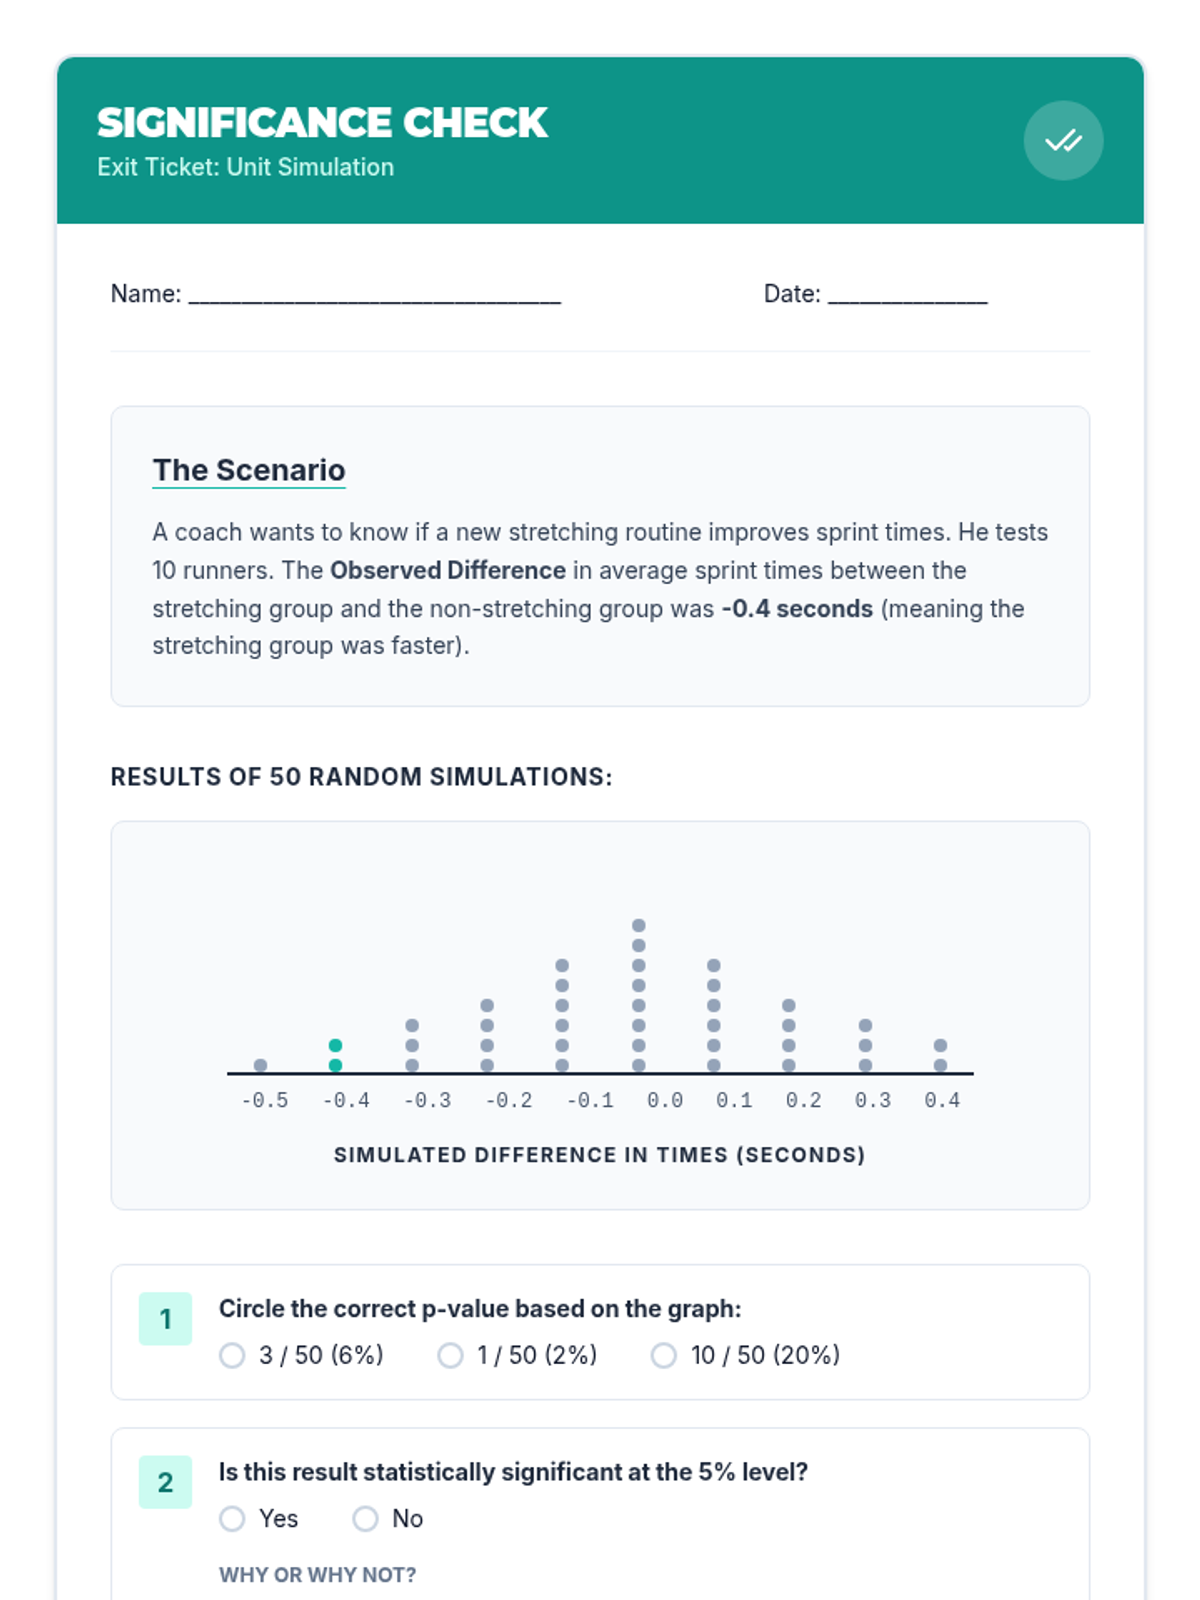
Students use simulation (randomization tests) to determine if an observed difference in means is likely to occur by chance alone. This lesson builds the conceptual foundation for p-values through hands-on activity.
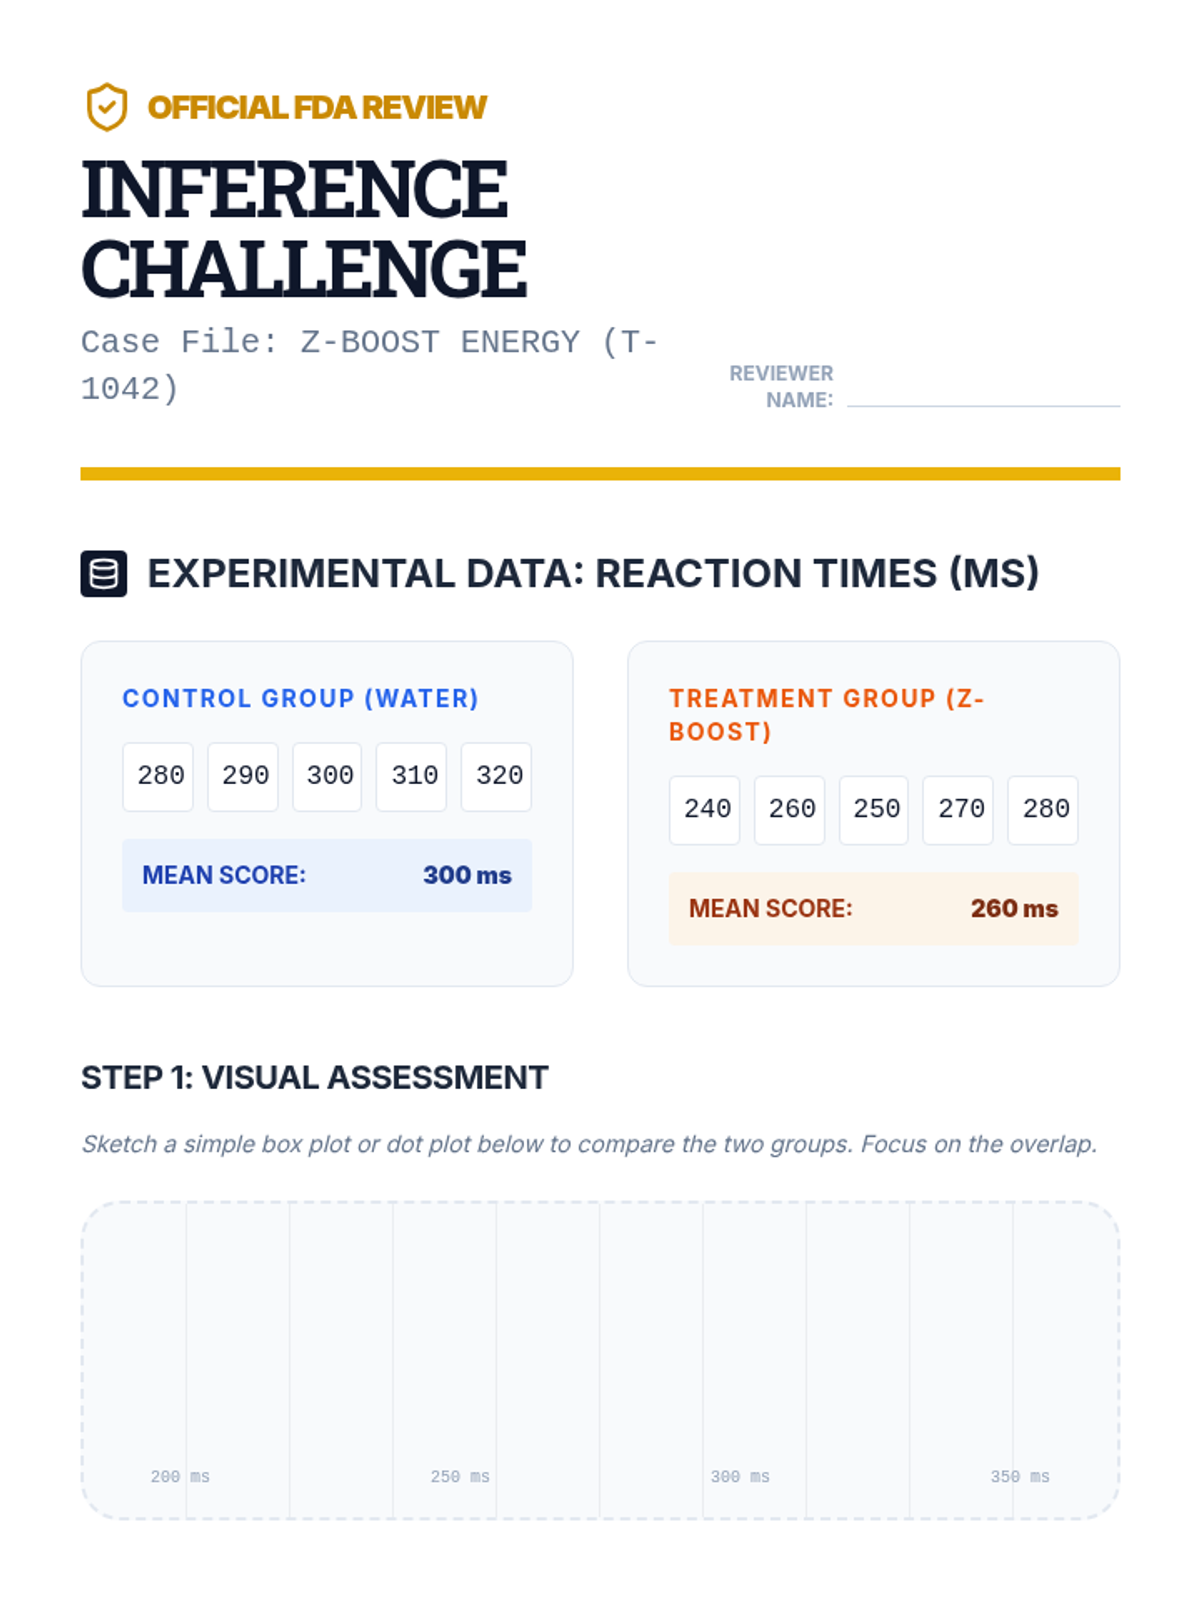
A culminating project where students analyze raw data from an experiment to draw evidence-based conclusions about population differences.
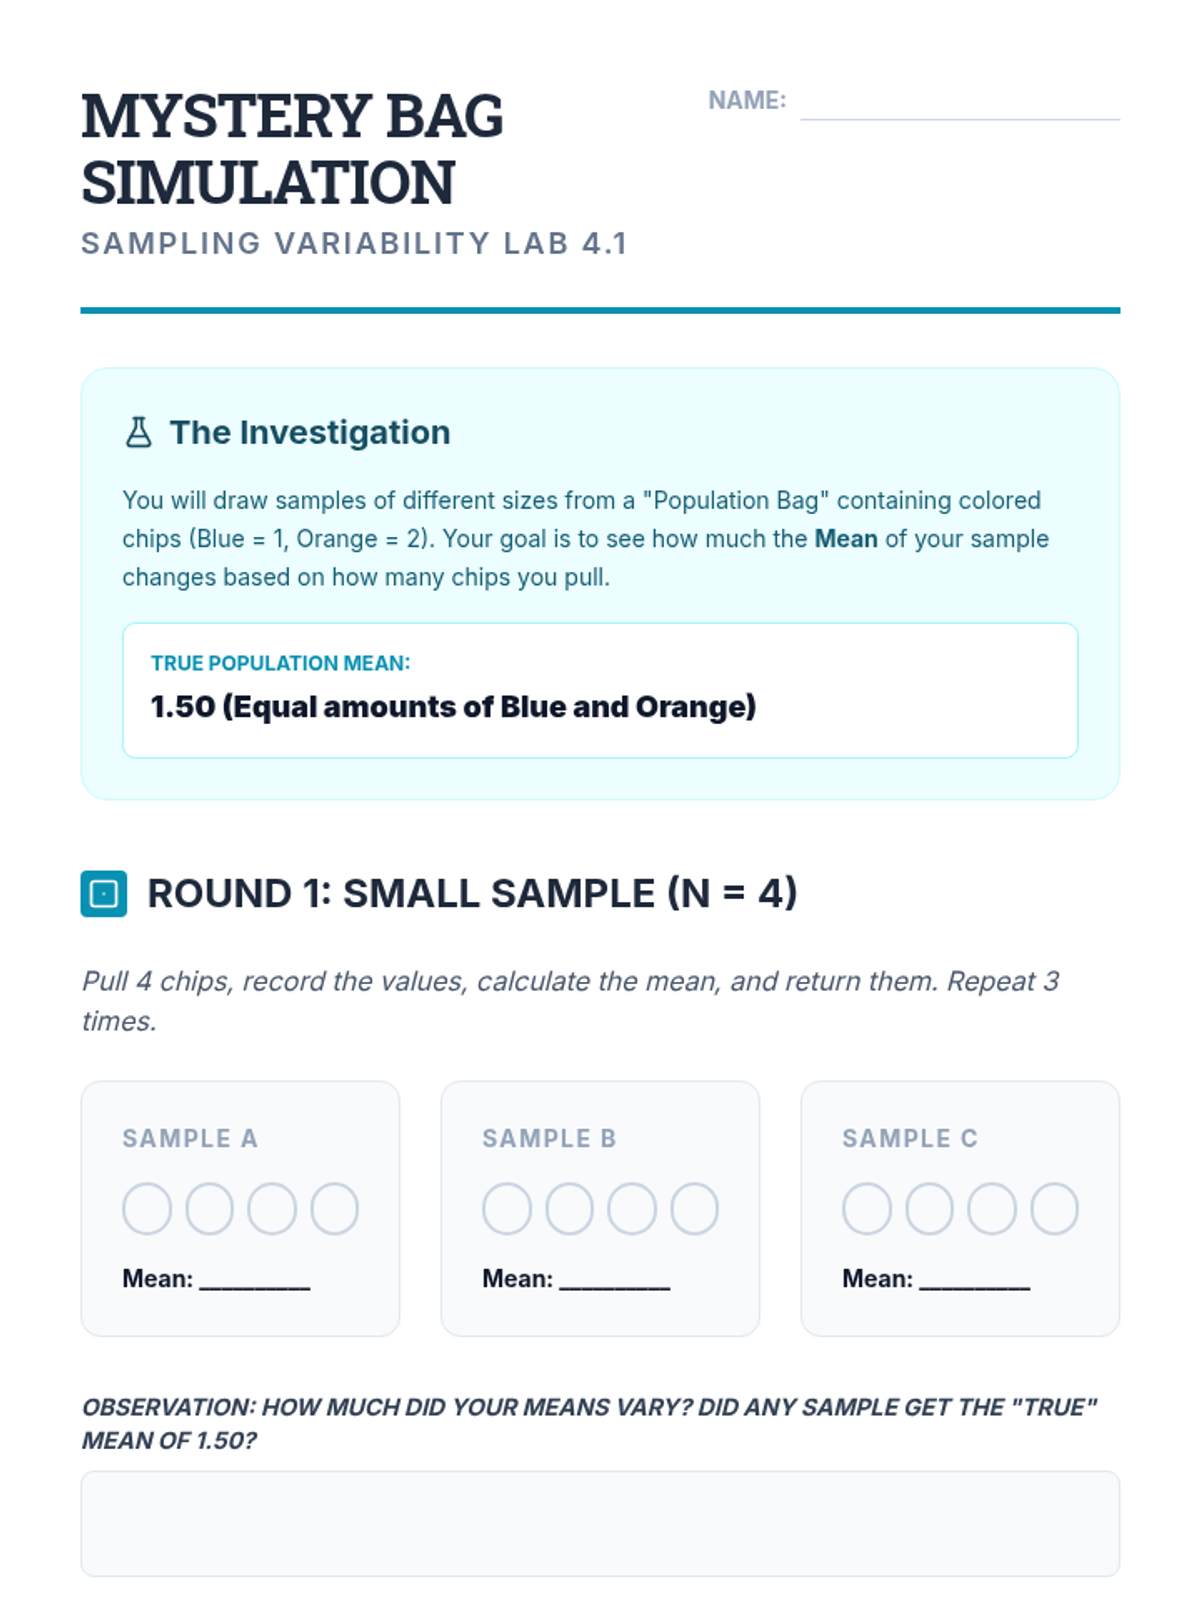
Through repeated sampling, students explore how sample size impacts the reliability of measures of center and variability.
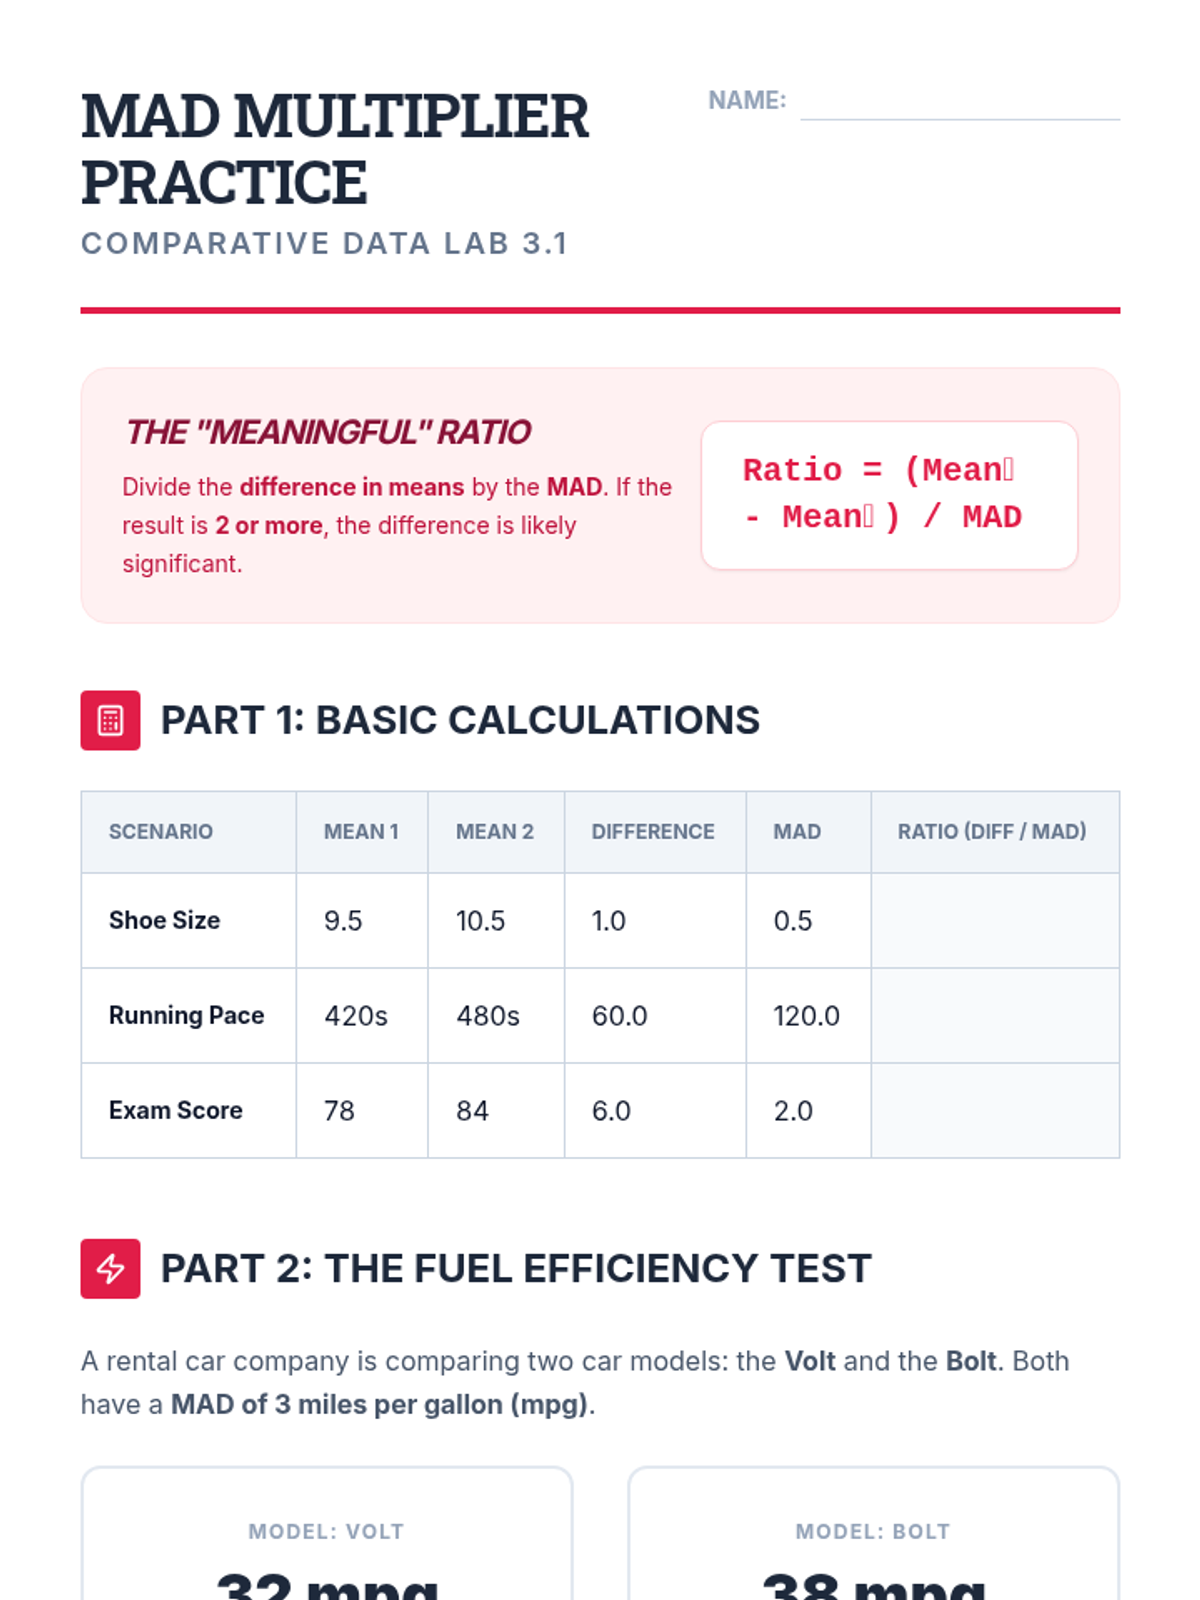
Students quantify the difference between two means by expressing it as a multiple of the Mean Absolute Deviation (MAD), introducing informal significance.
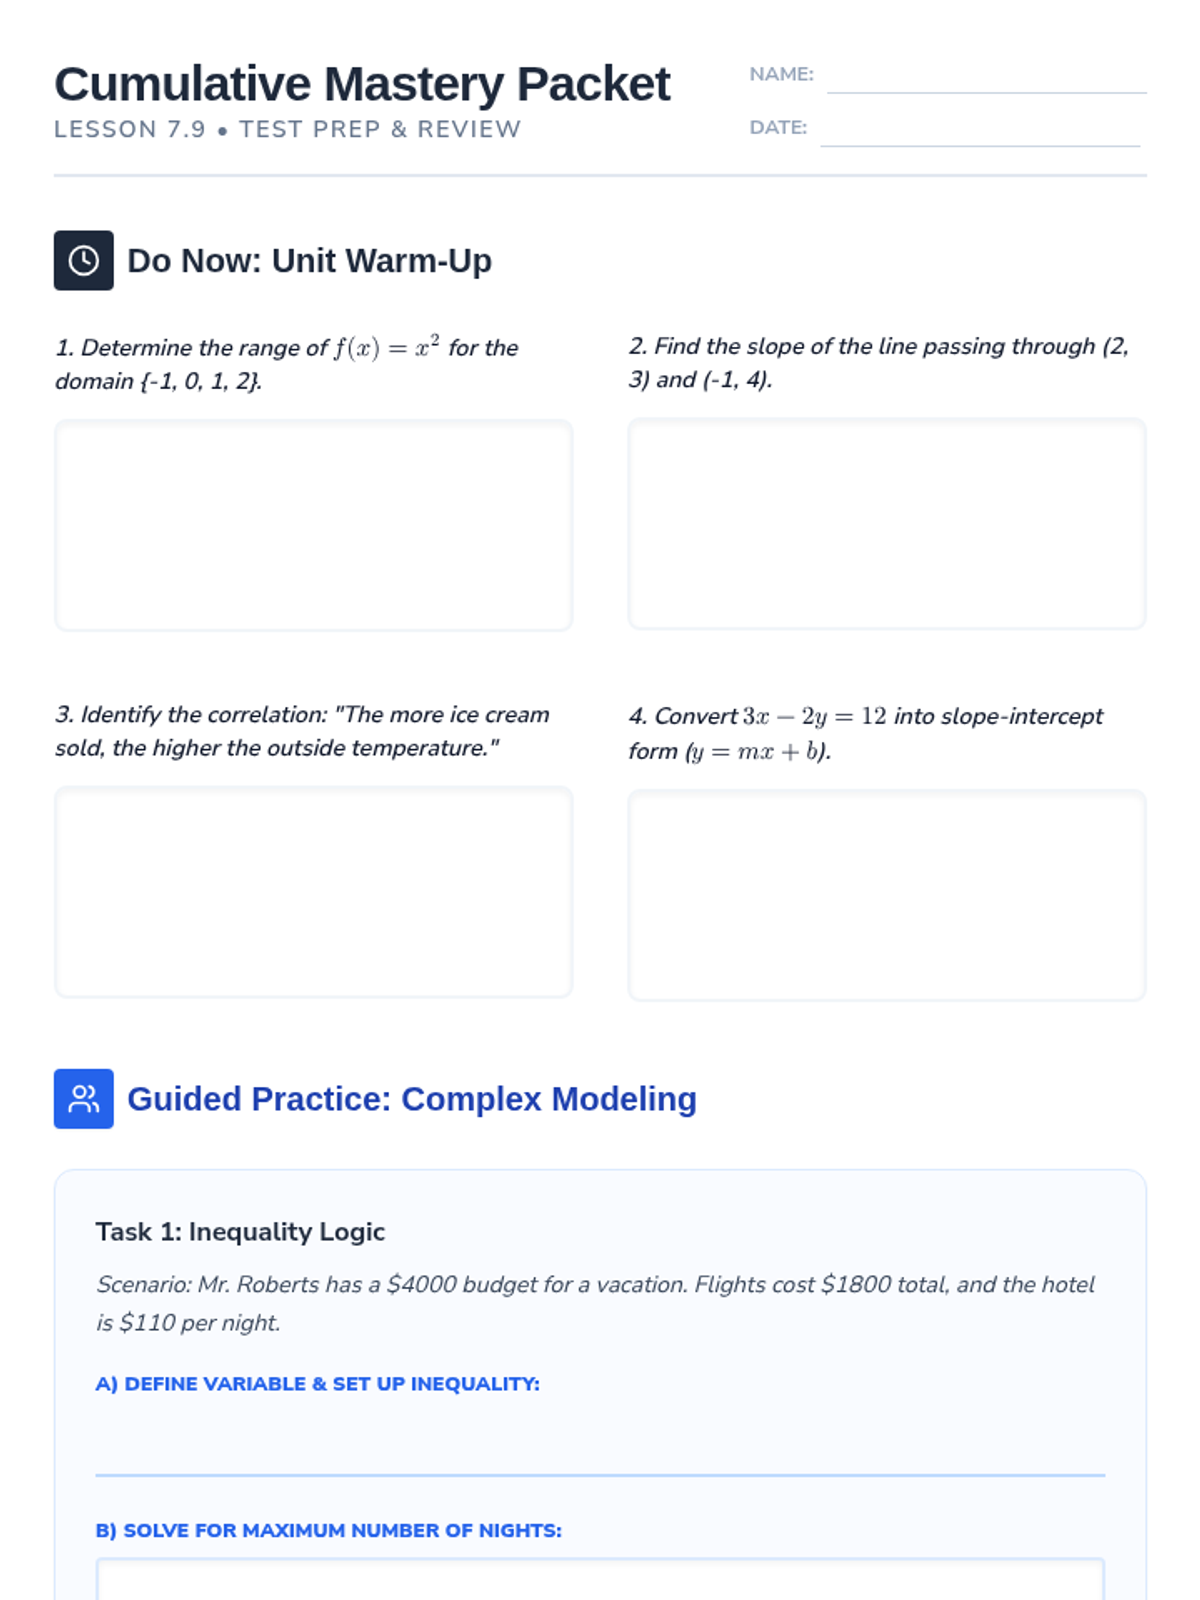
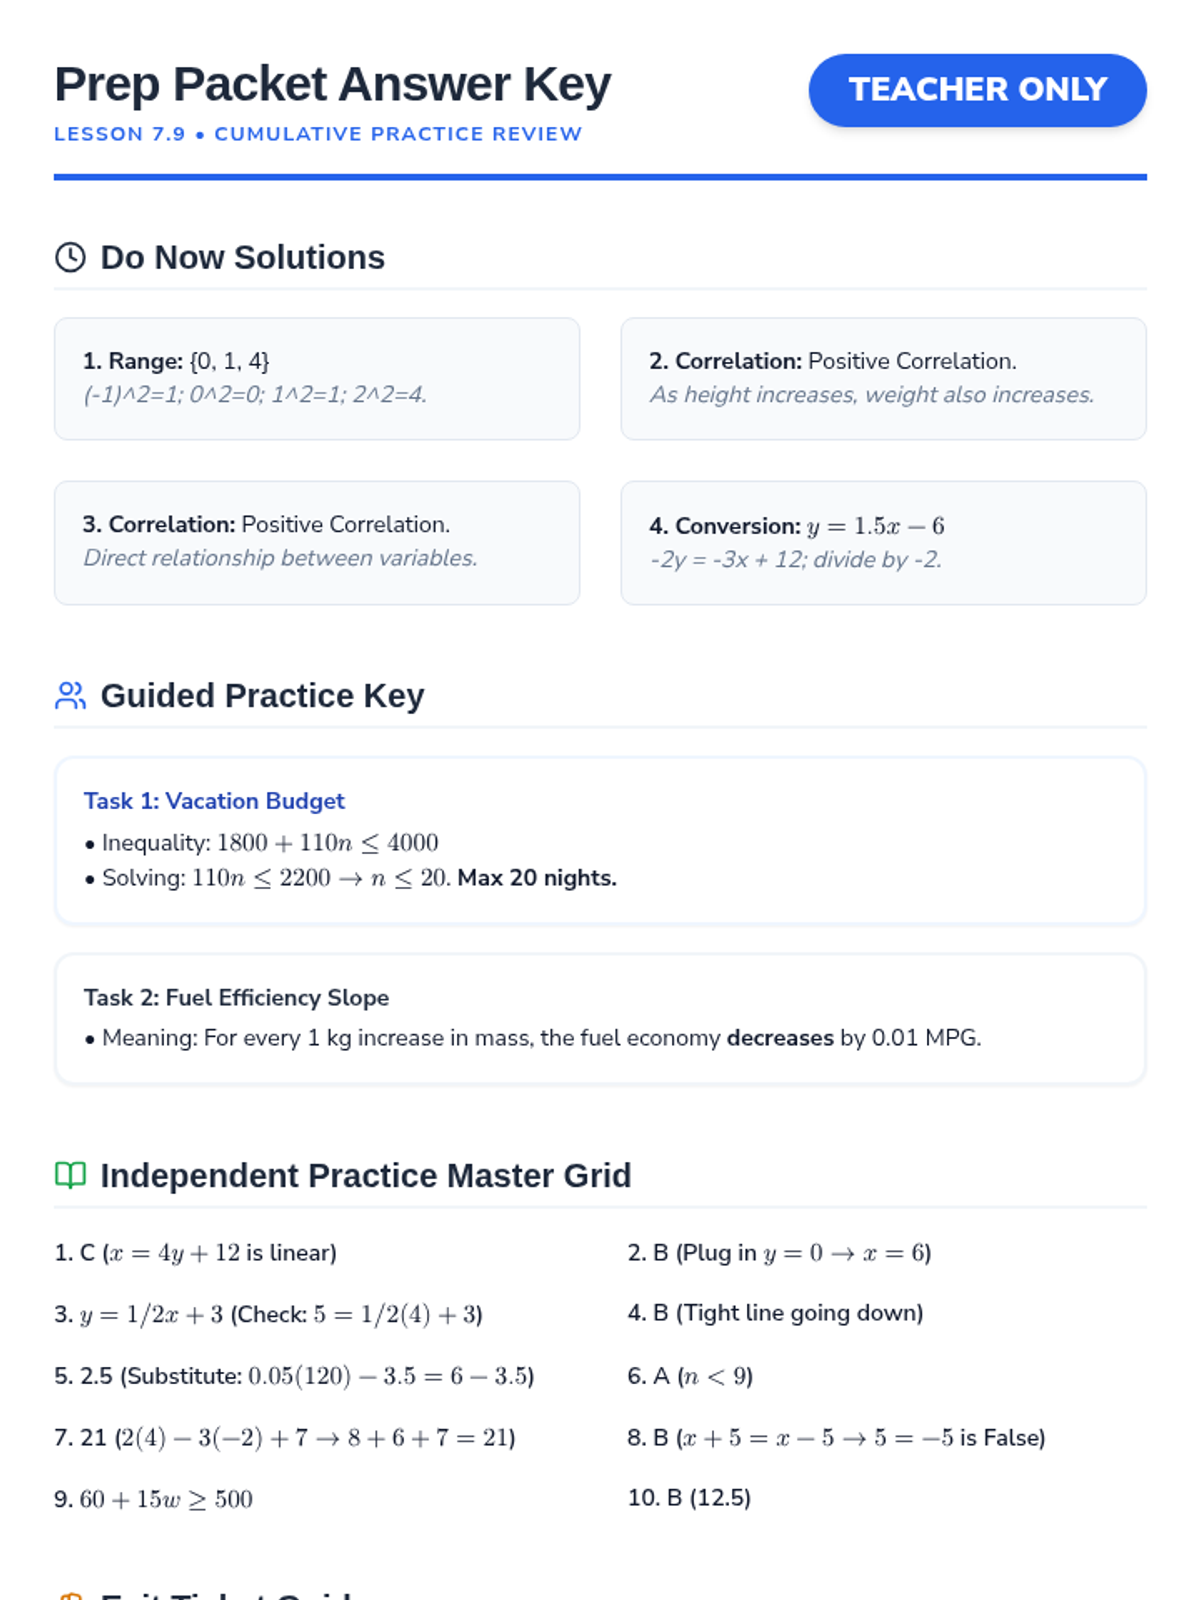
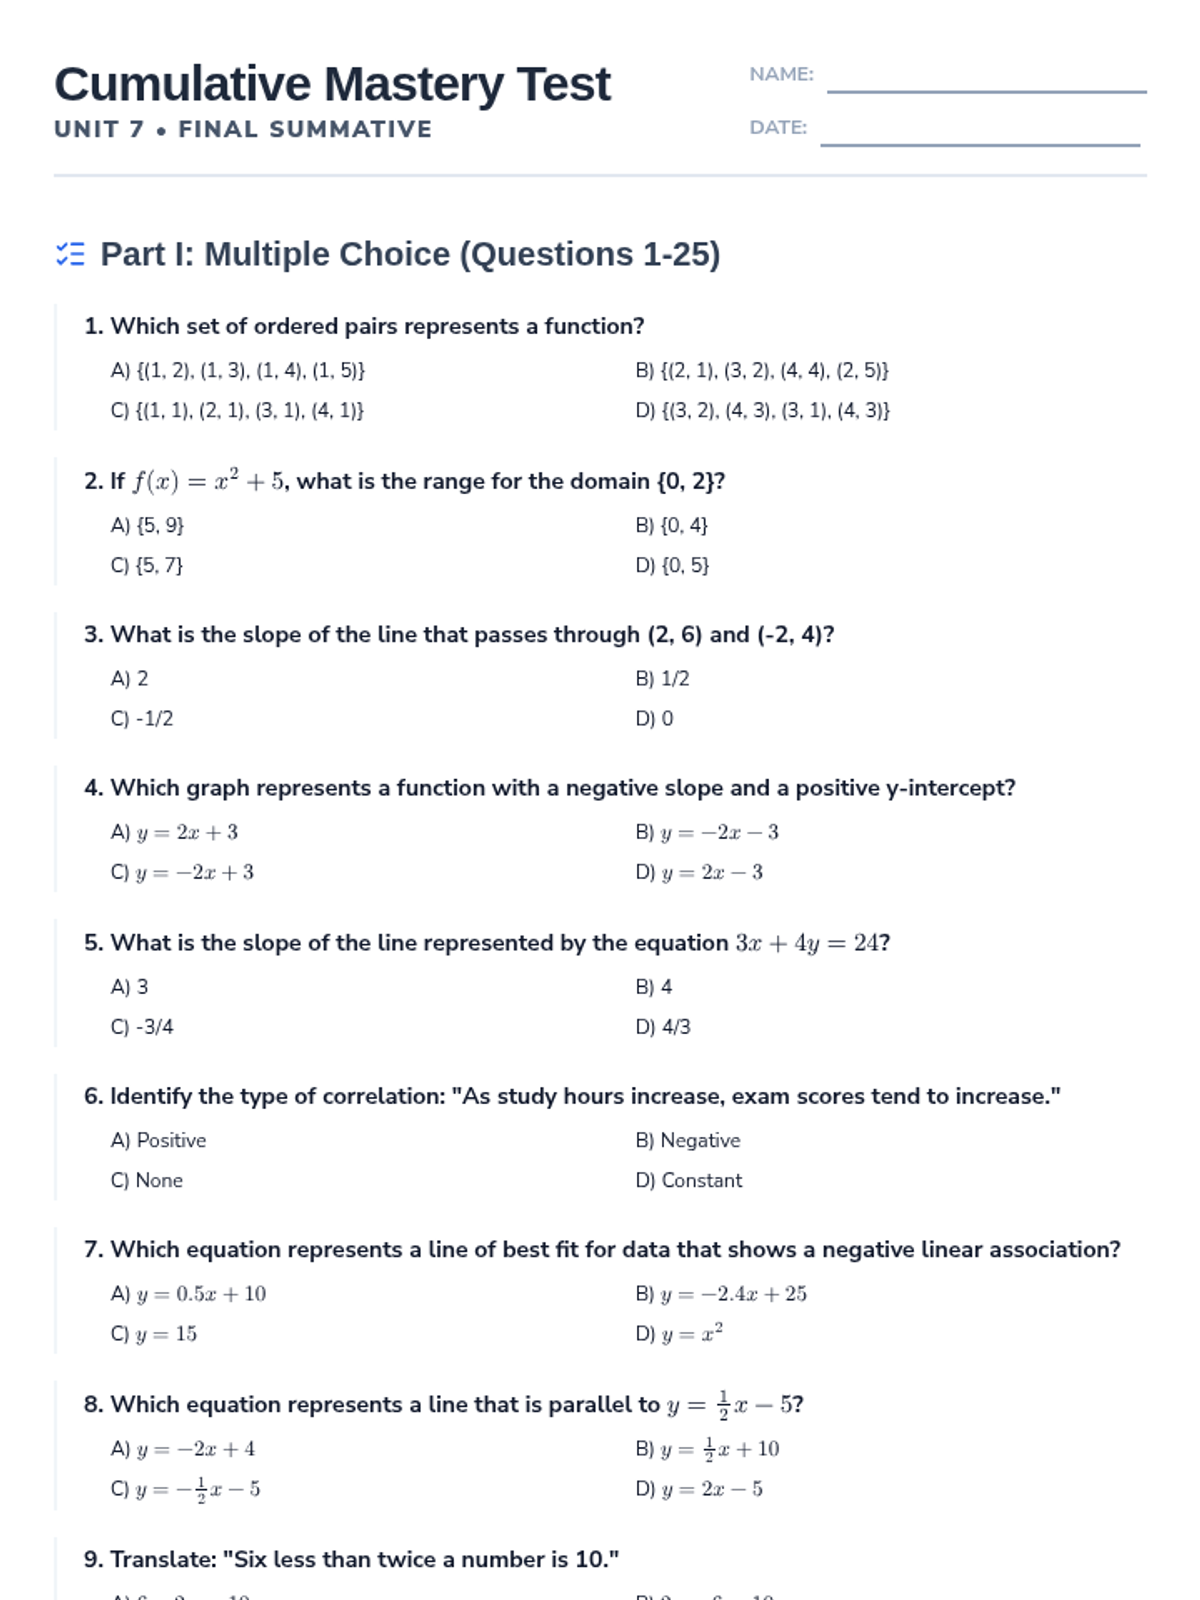
This prep lesson bridges previously mastered linear equation concepts with newer topics like scatter plots, correlation, and linear inequalities. Students will synthesize modeling techniques and algebraic conversions to prepare for the cumulative unit test.
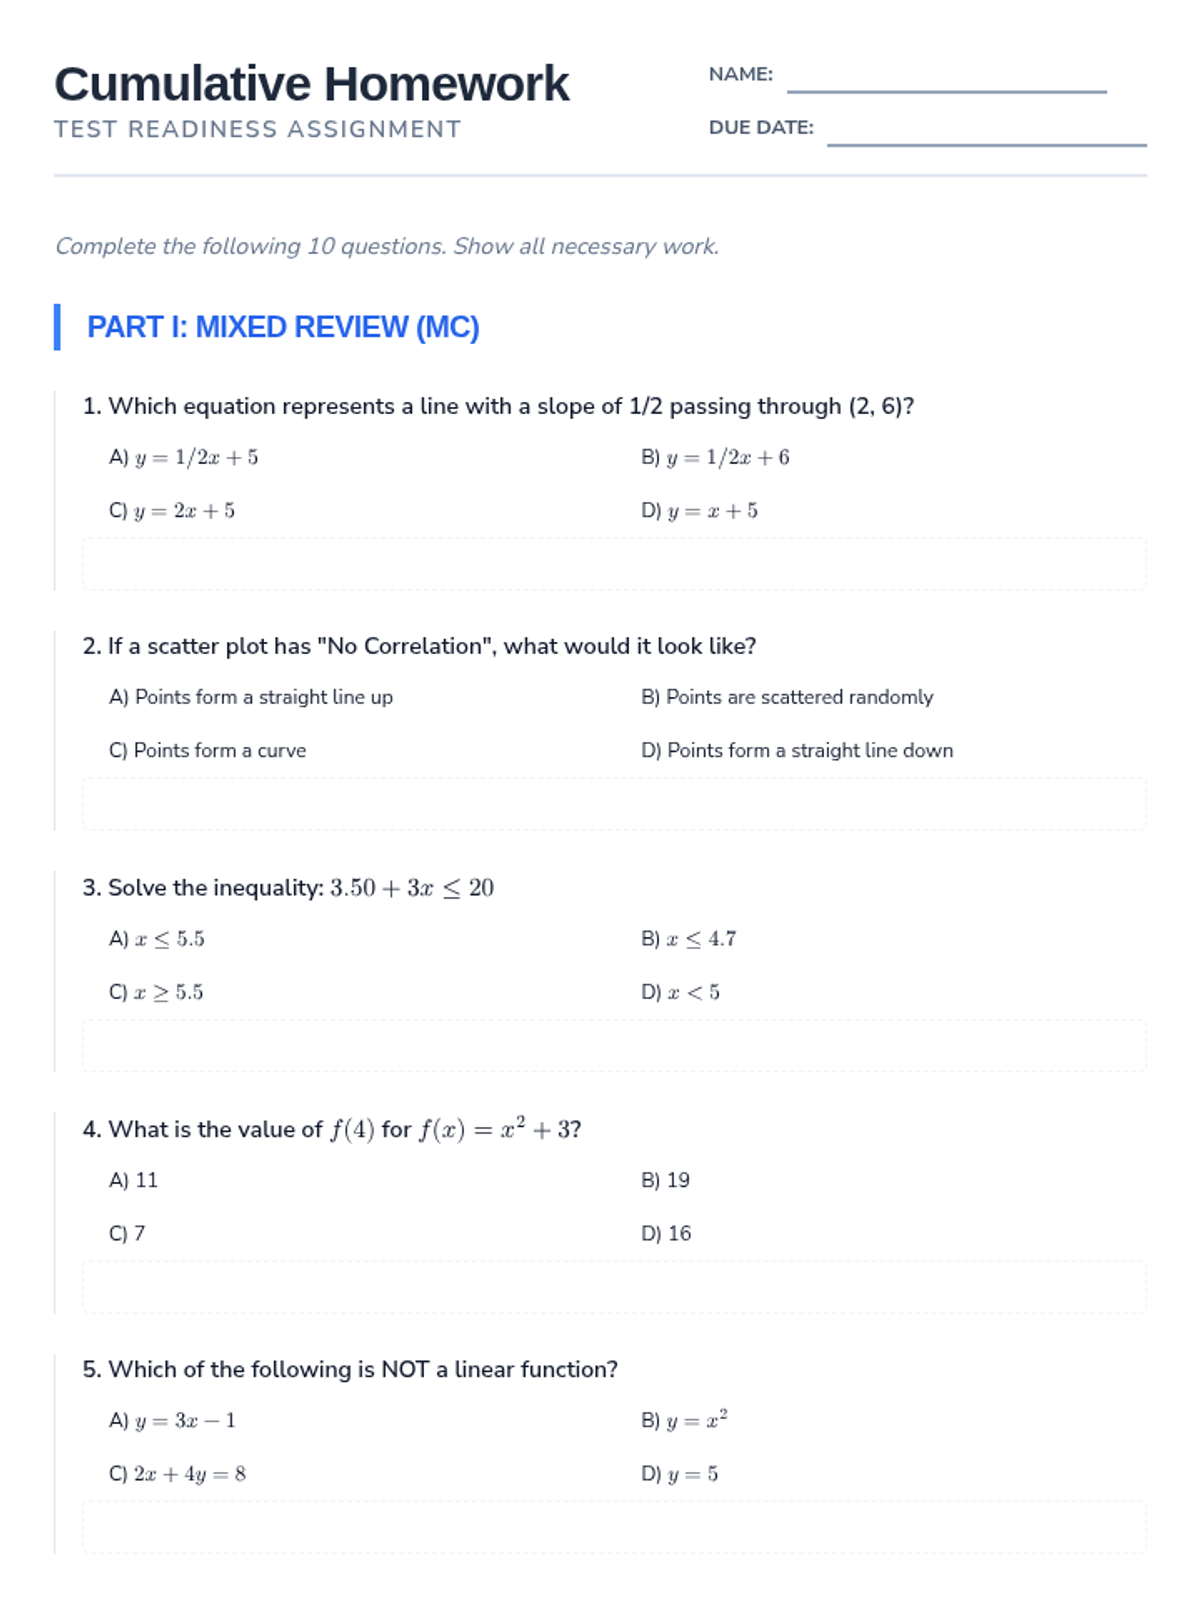
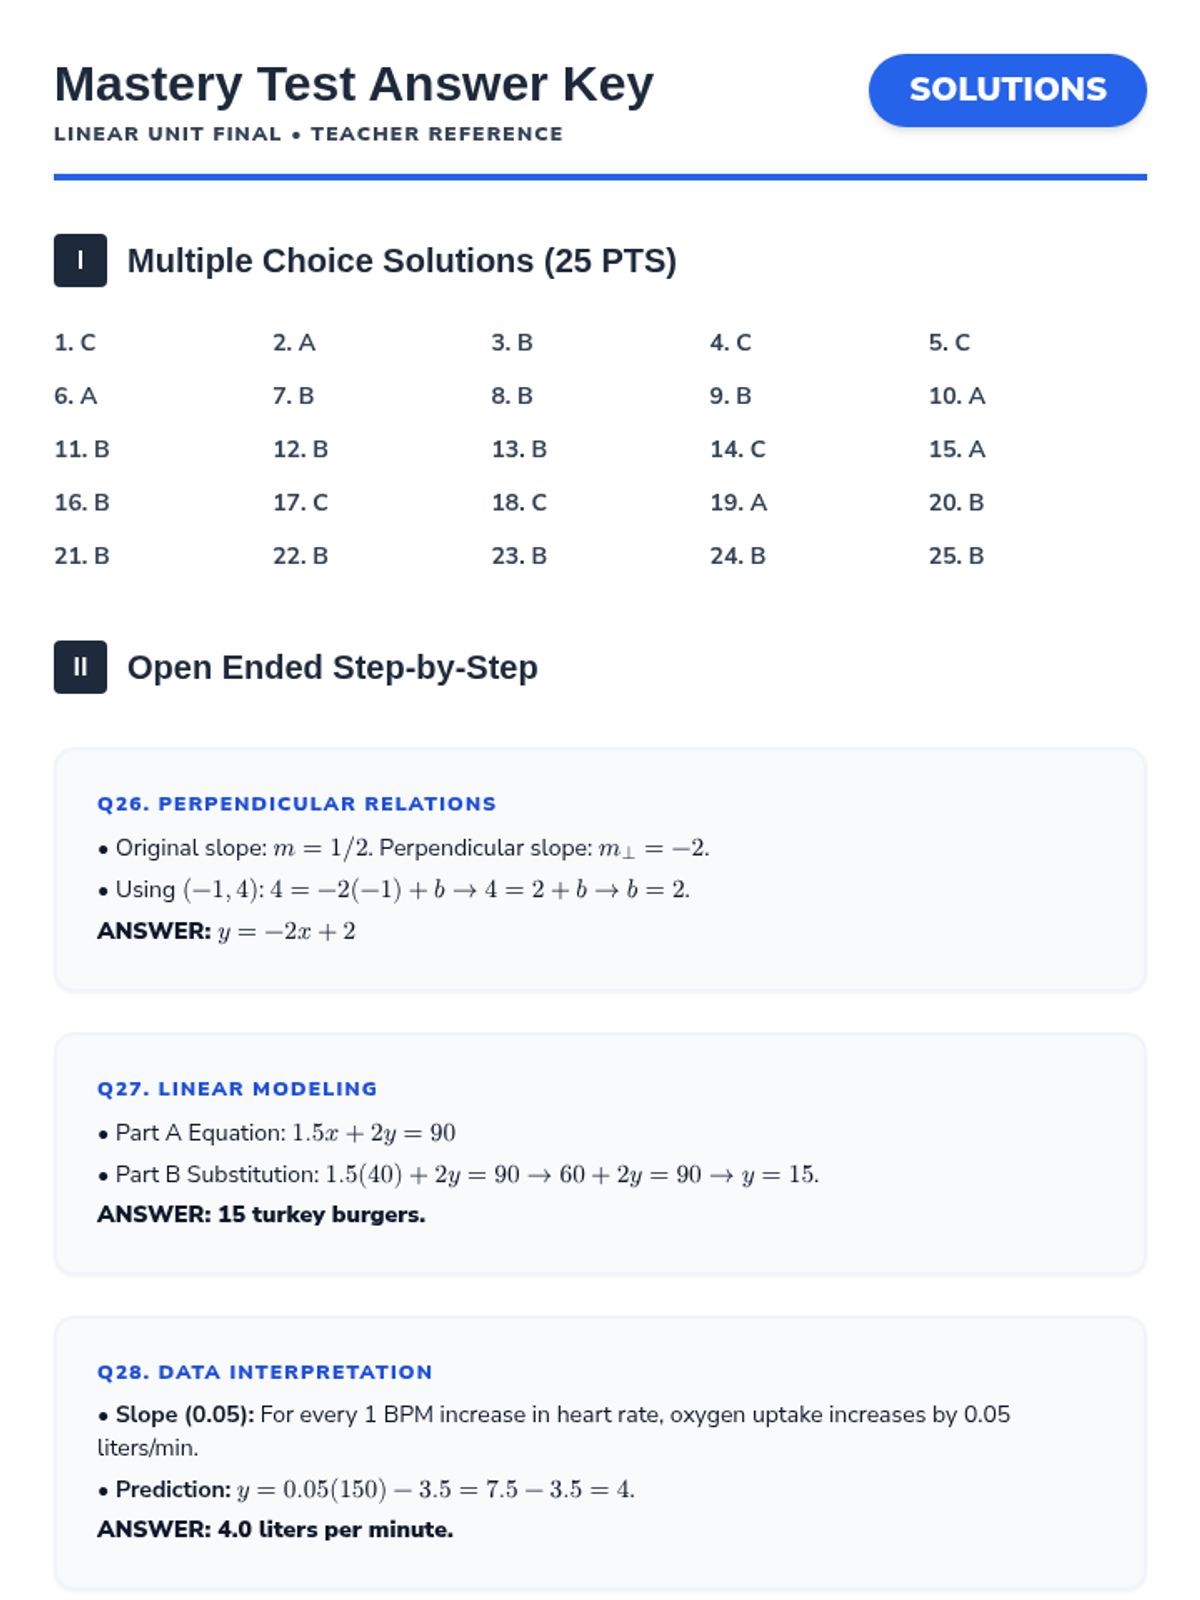
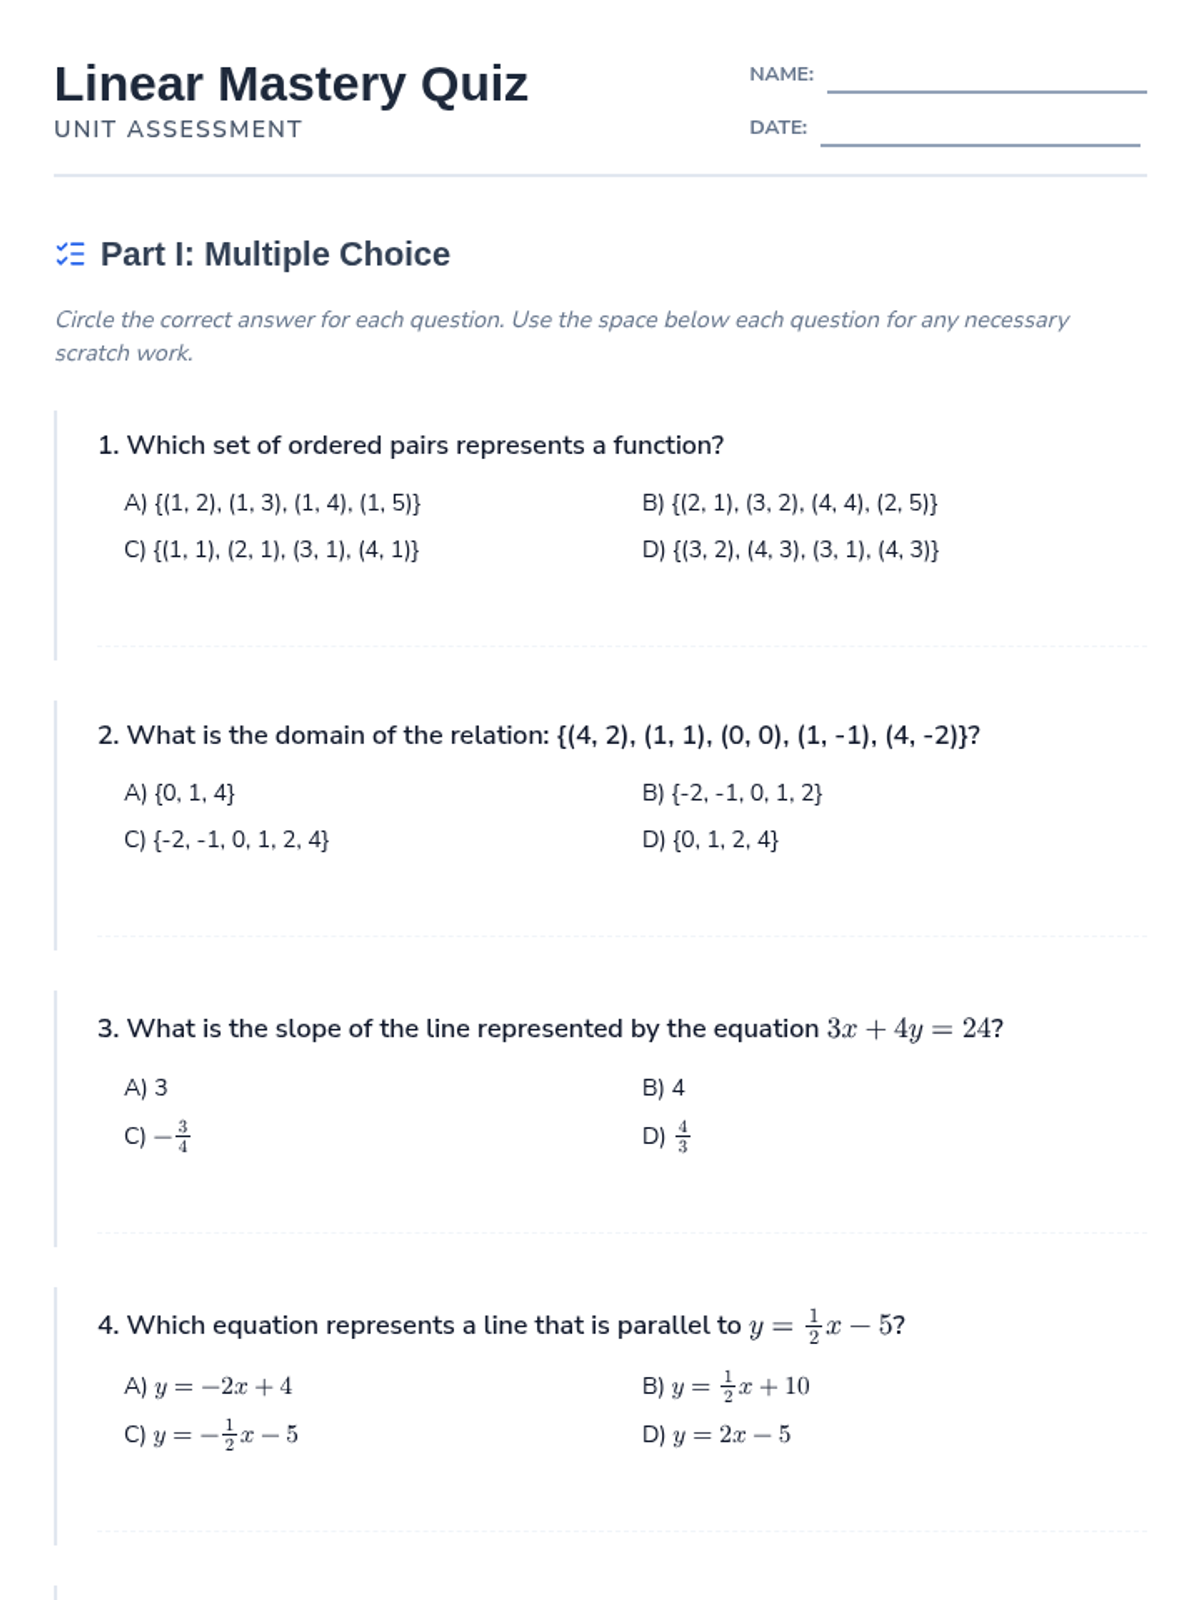
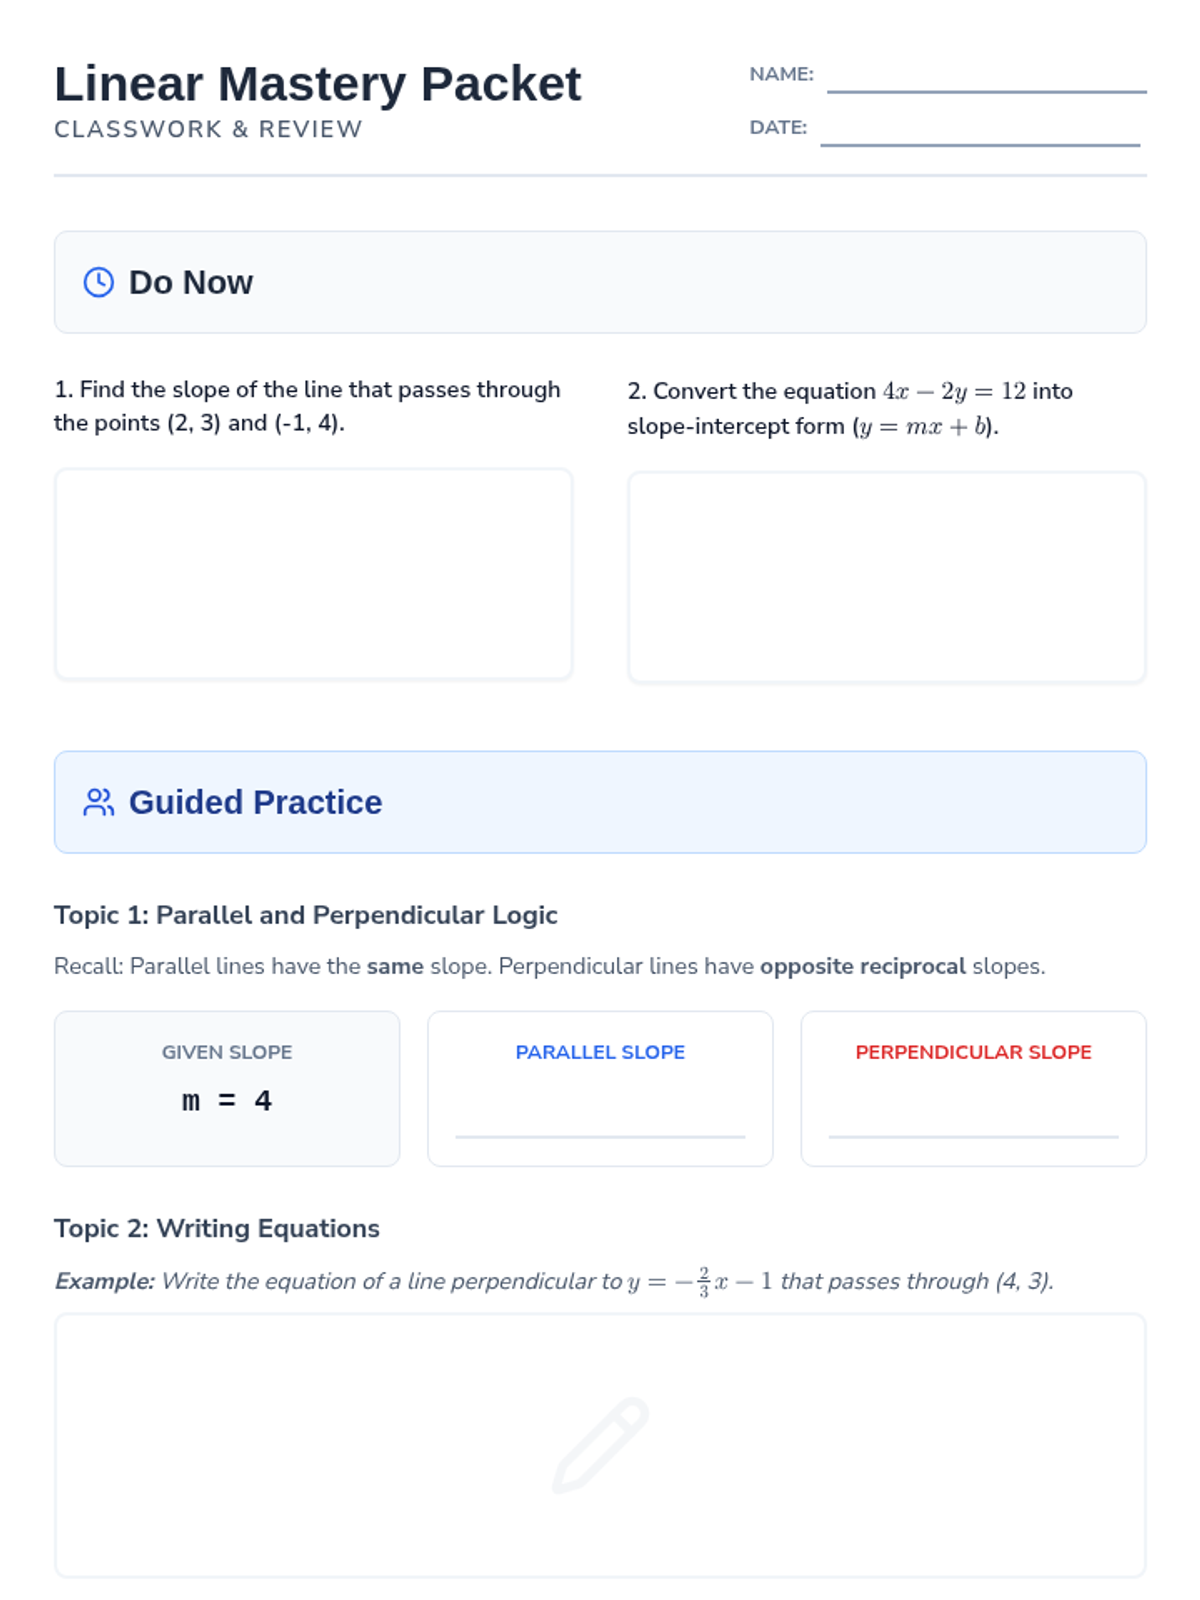
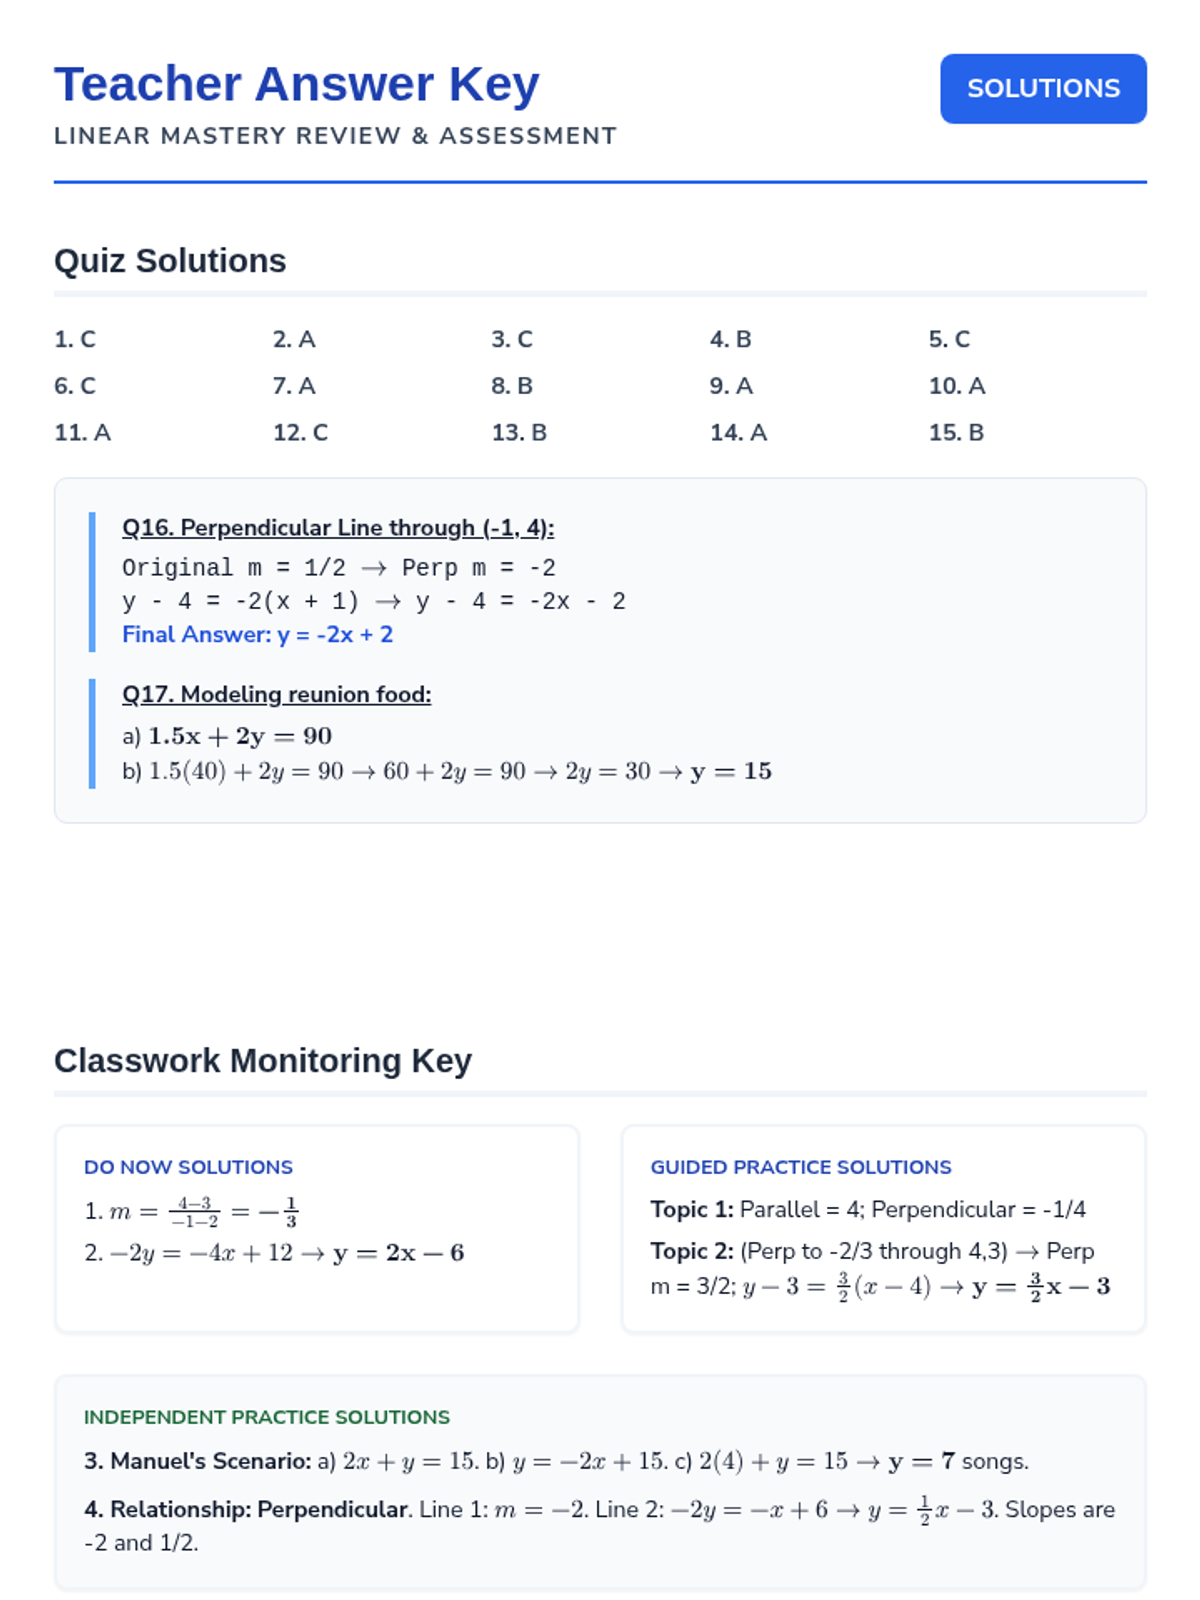
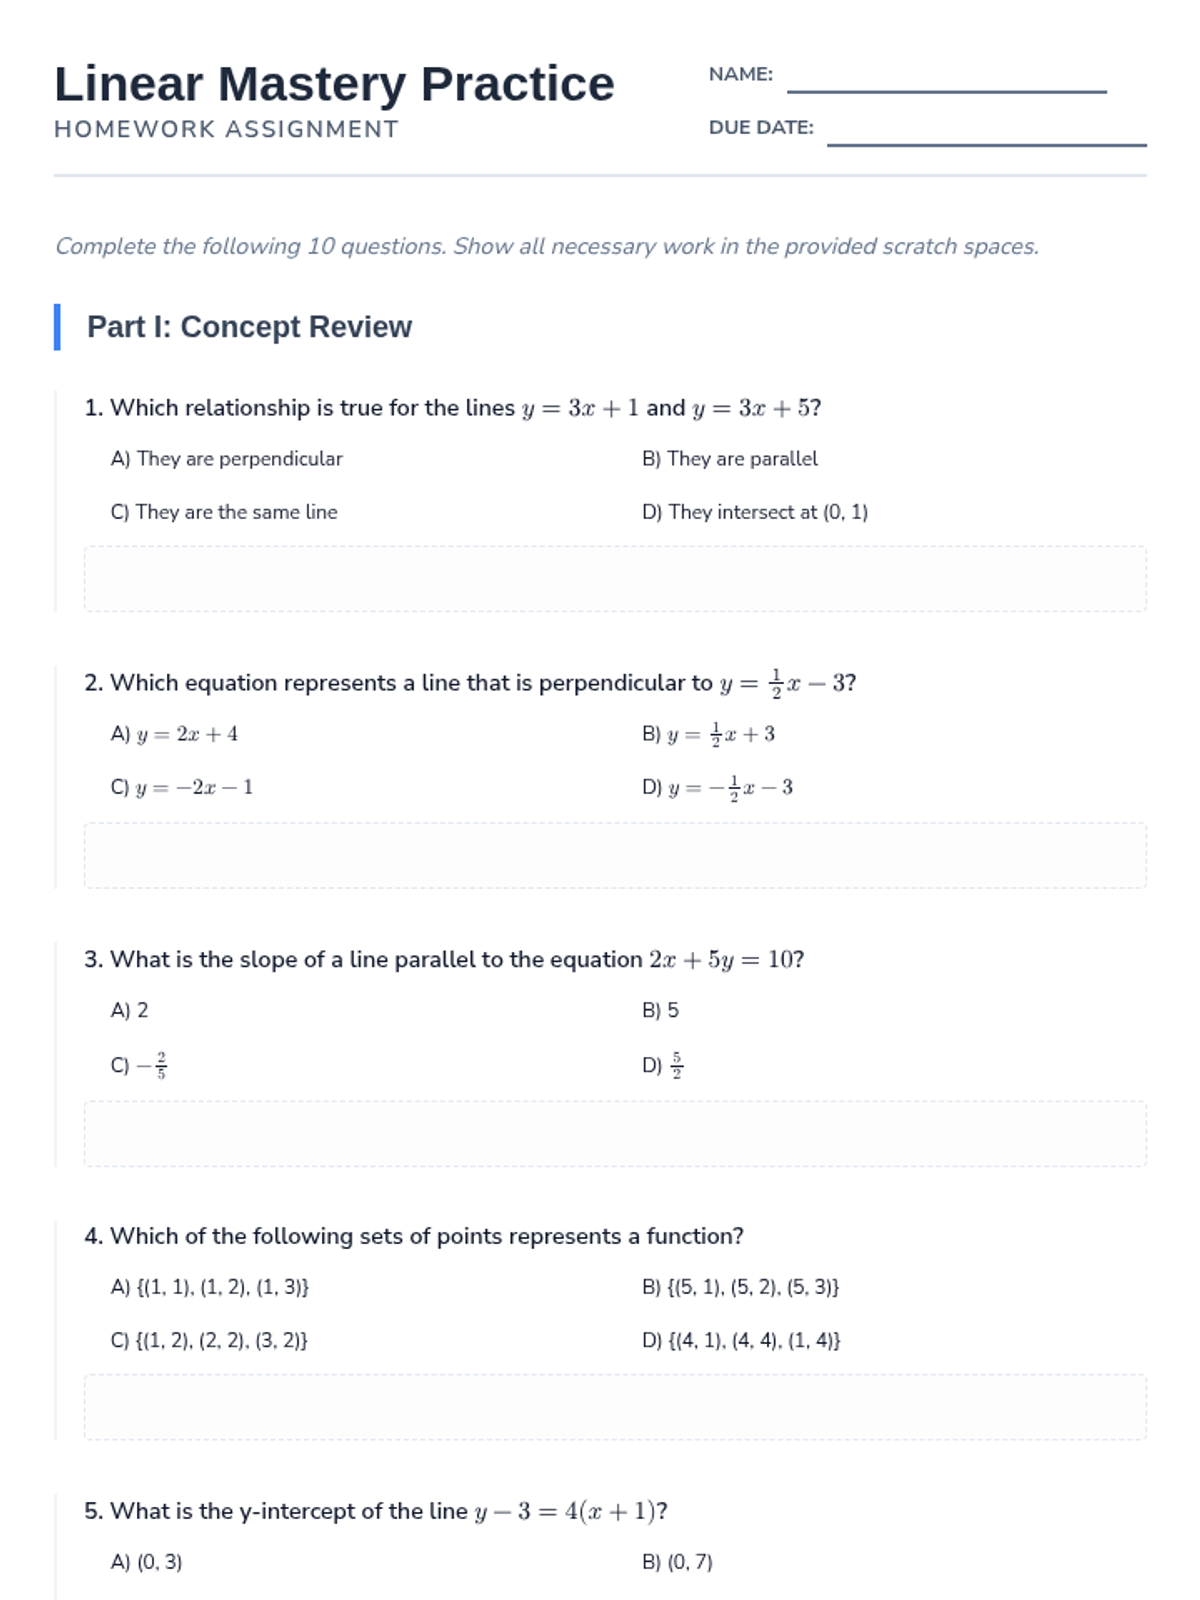
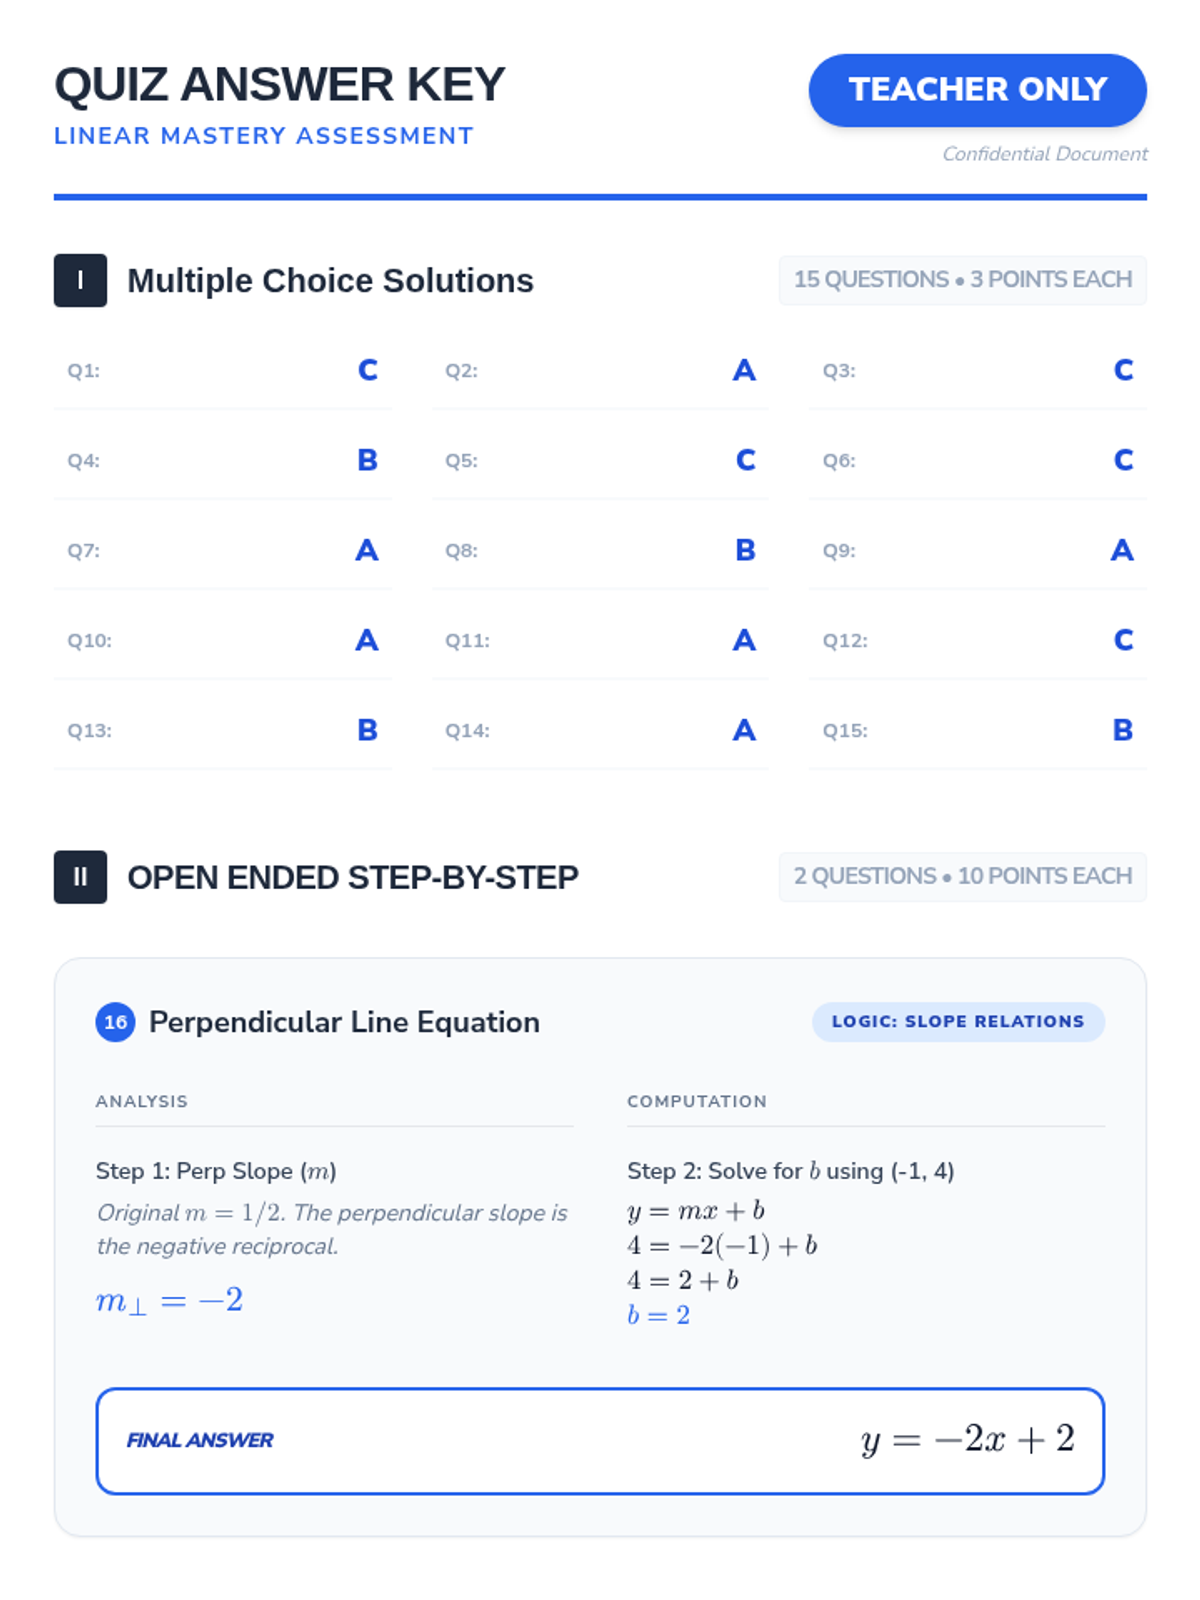
This lesson provides a comprehensive review and assessment of linear equations, covering function identification, standard form conversions, and the properties of parallel and perpendicular lines. Students will engage in guided practice, independent modeling, and summative evaluation to master linear relationships.
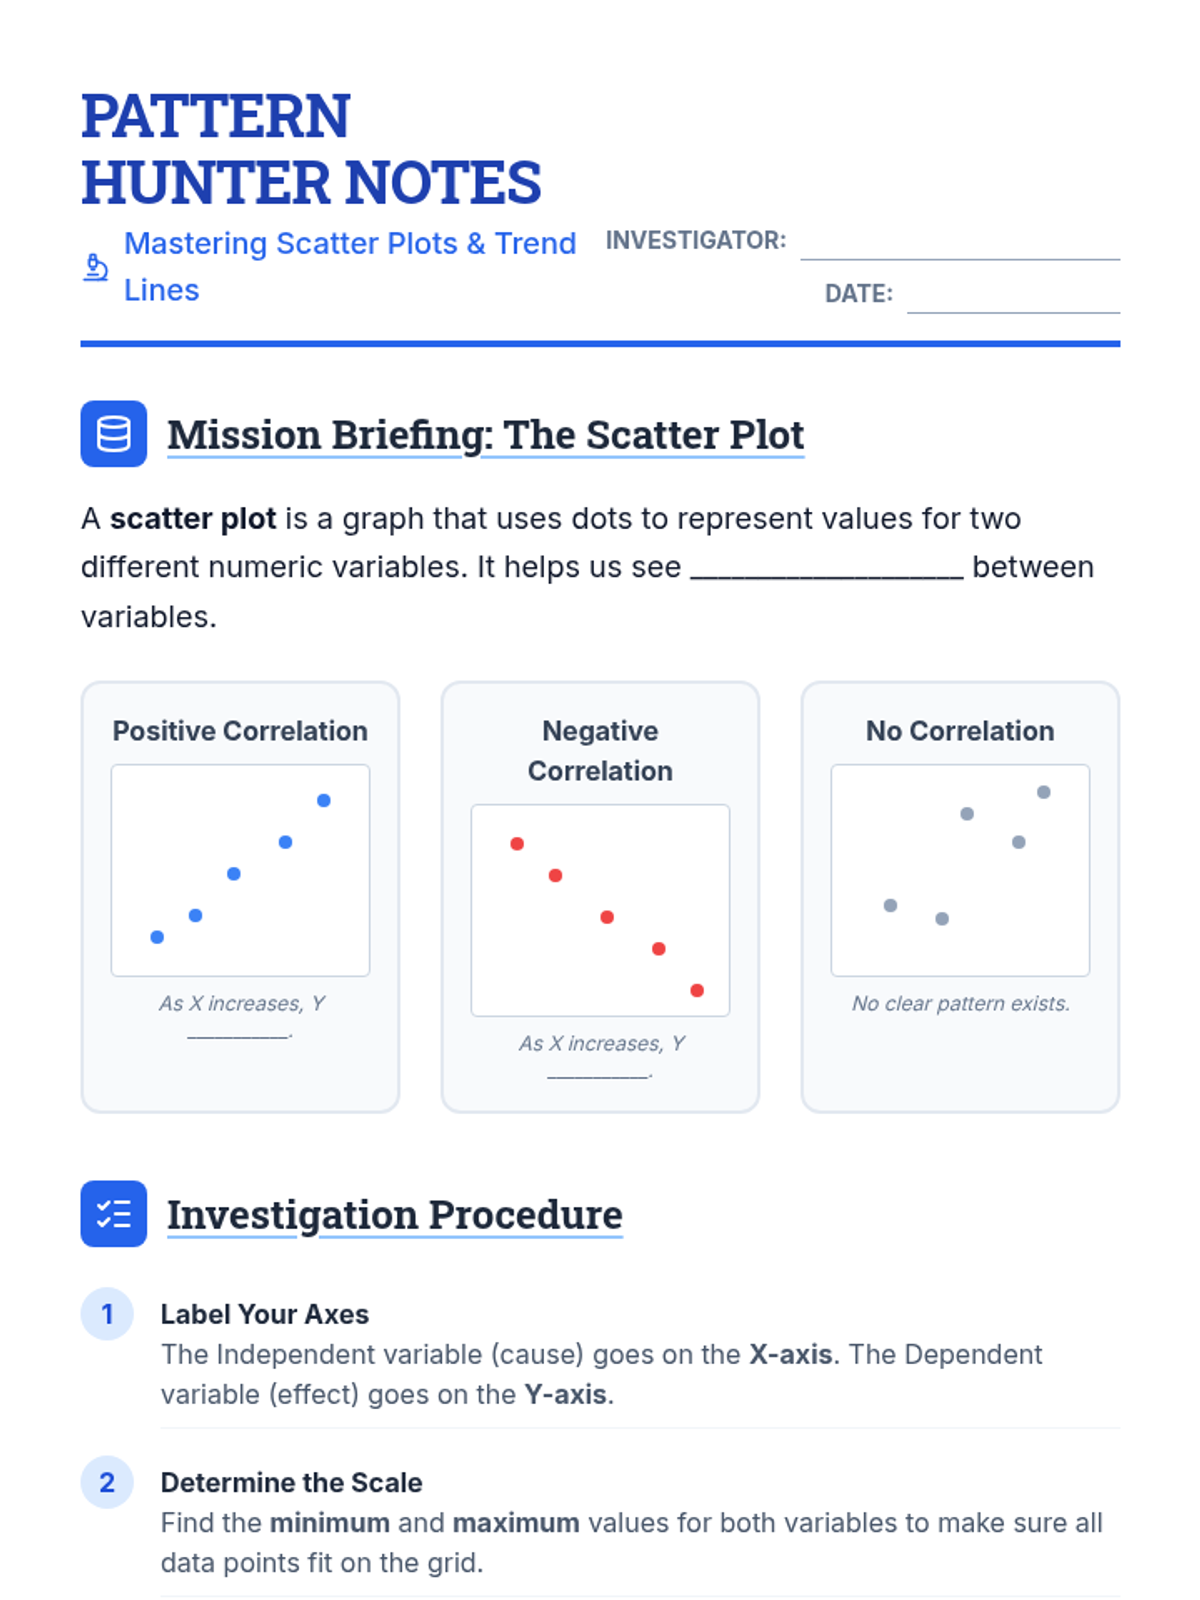
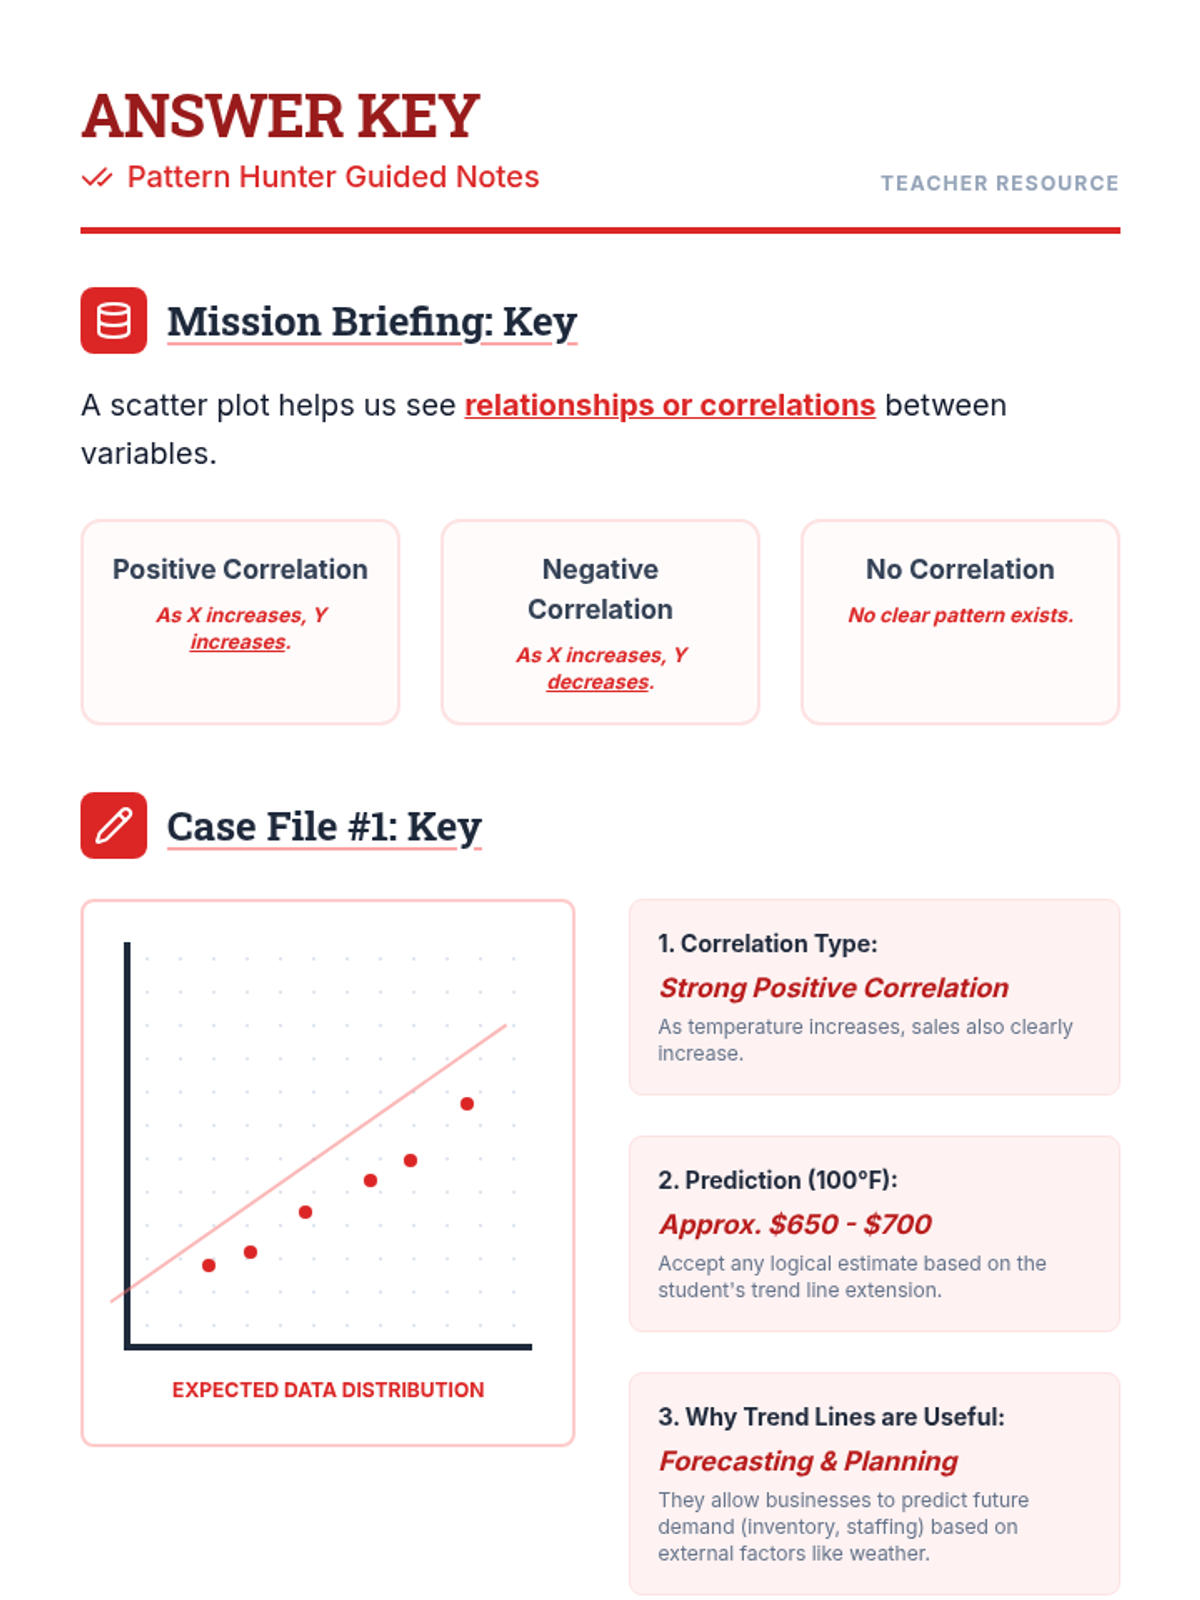
A comprehensive lesson on creating and interpreting scatter plots, identifying correlations, and drawing trend lines to make predictions. Students practice plotting real-world data and analyzing relationships between variables.
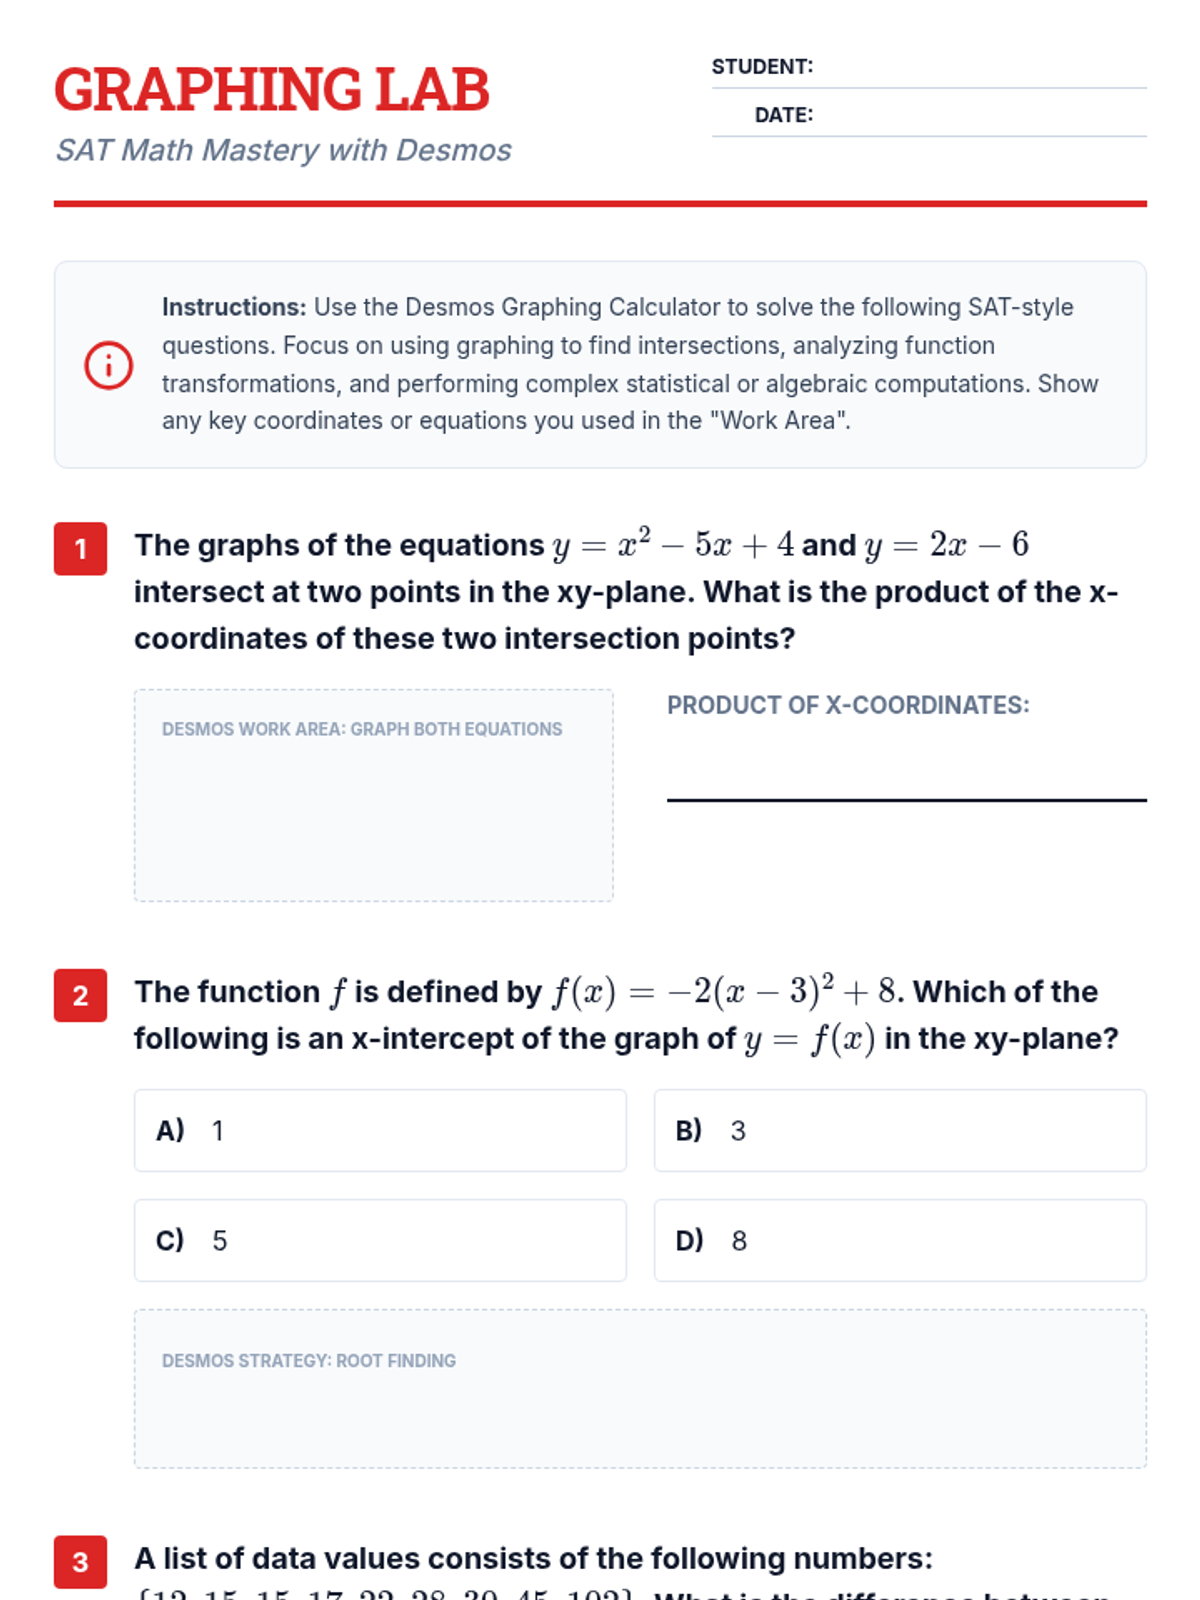
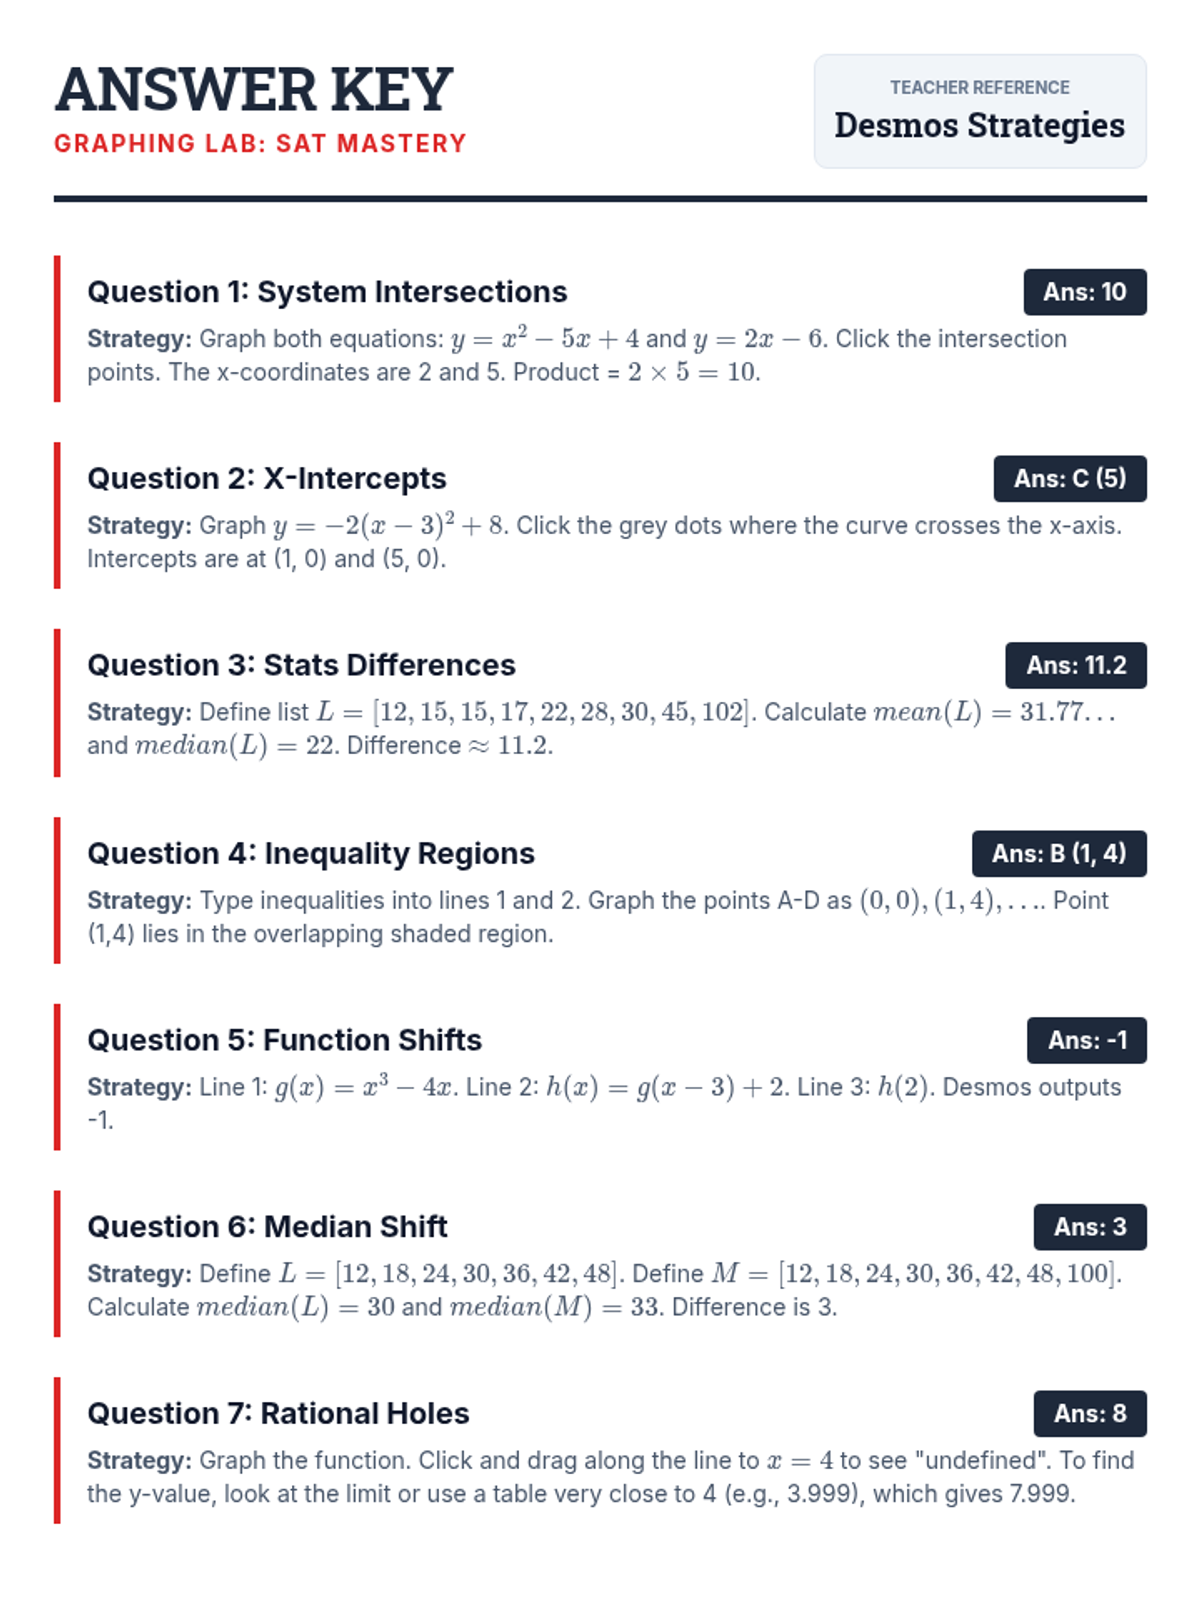
This lesson focuses on leveraging the Desmos graphing calculator to solve SAT Math problems efficiently across Heart of Algebra, Problem Solving and Data Analysis, and Passport to Advanced Math. Students will practice graphing systems, finding key features of nonlinear functions, and performing statistical calculations.
Day 1 of the EOC review focusing on the fundamental concepts of Domain and Range.
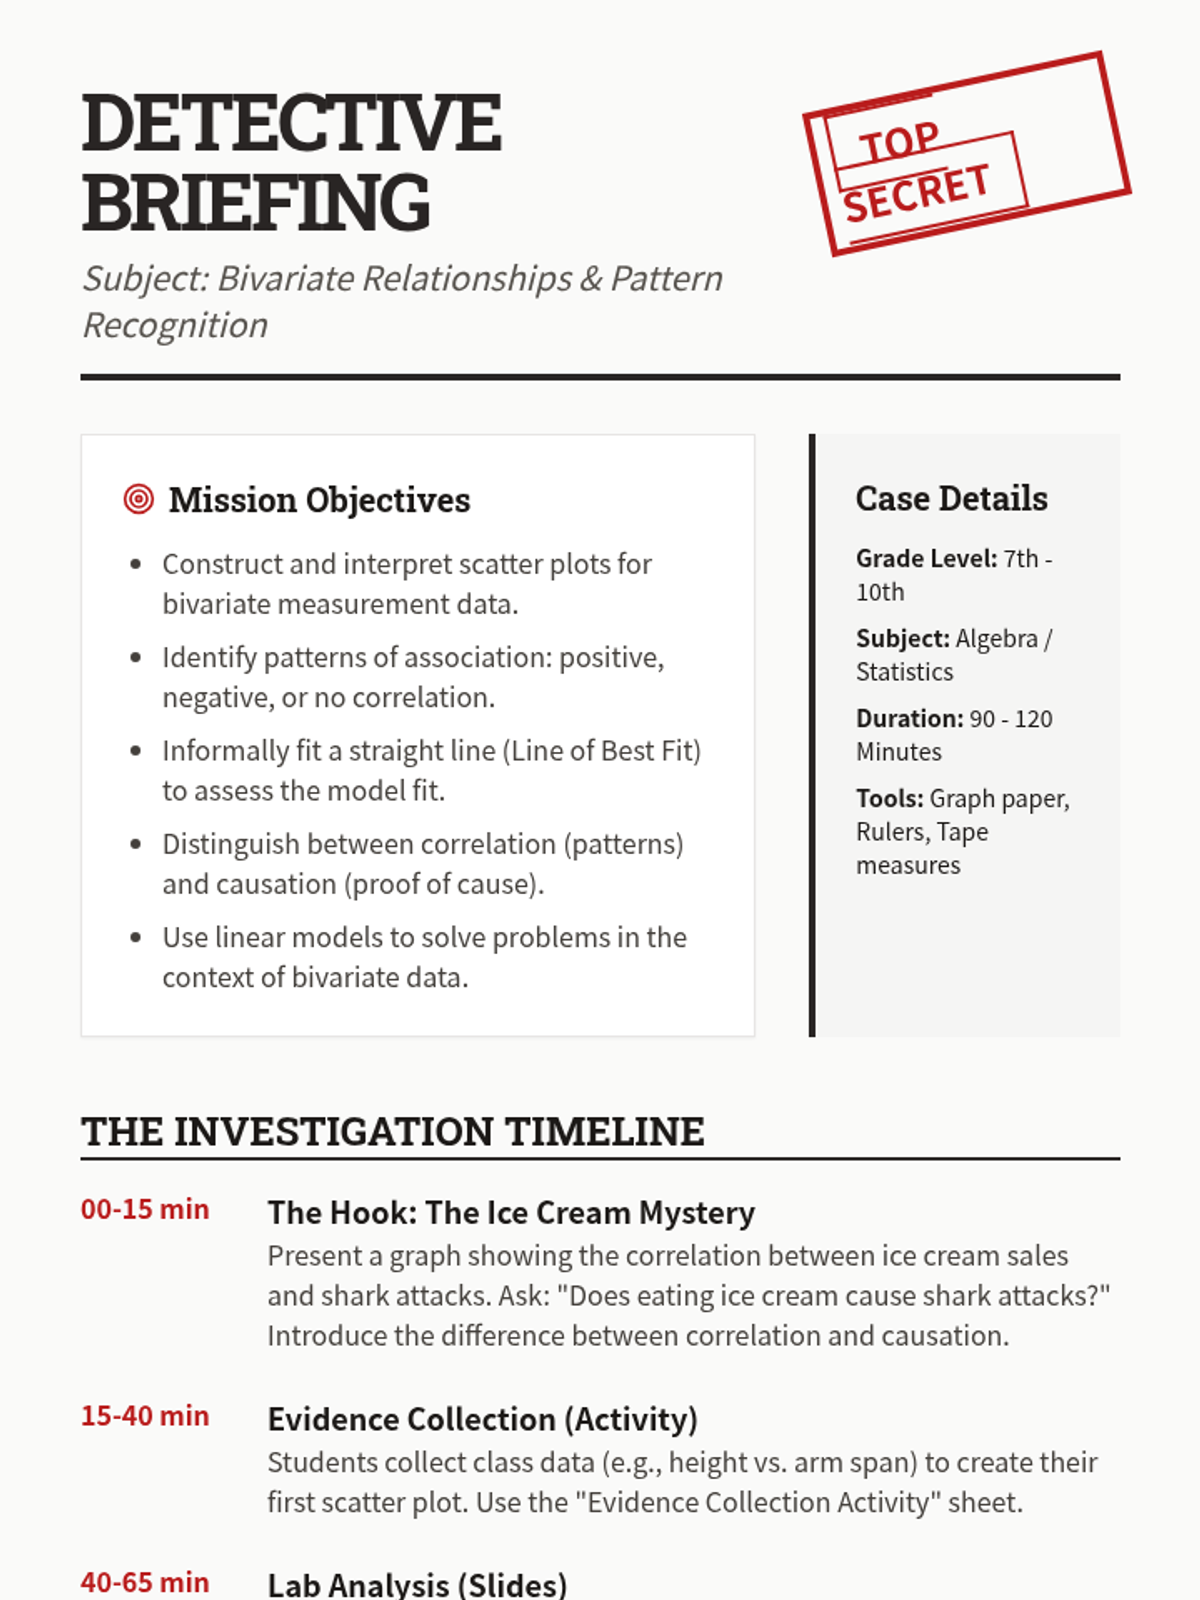
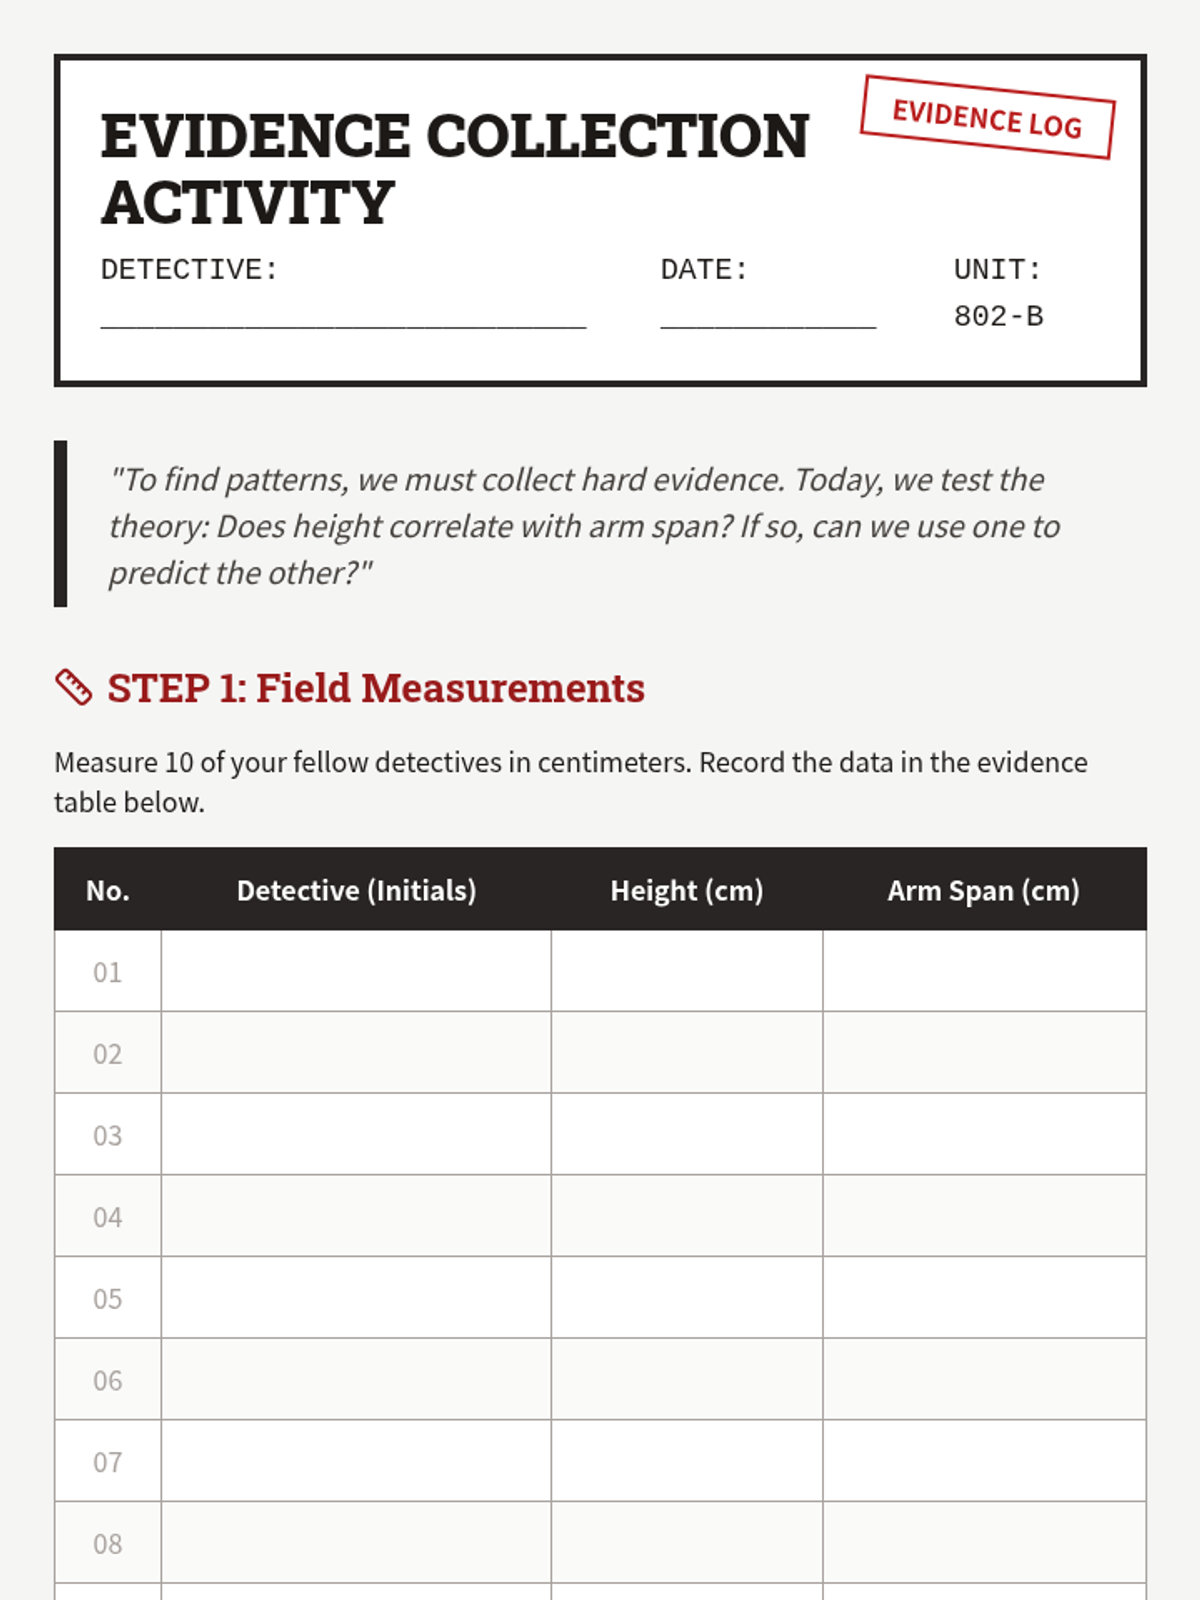
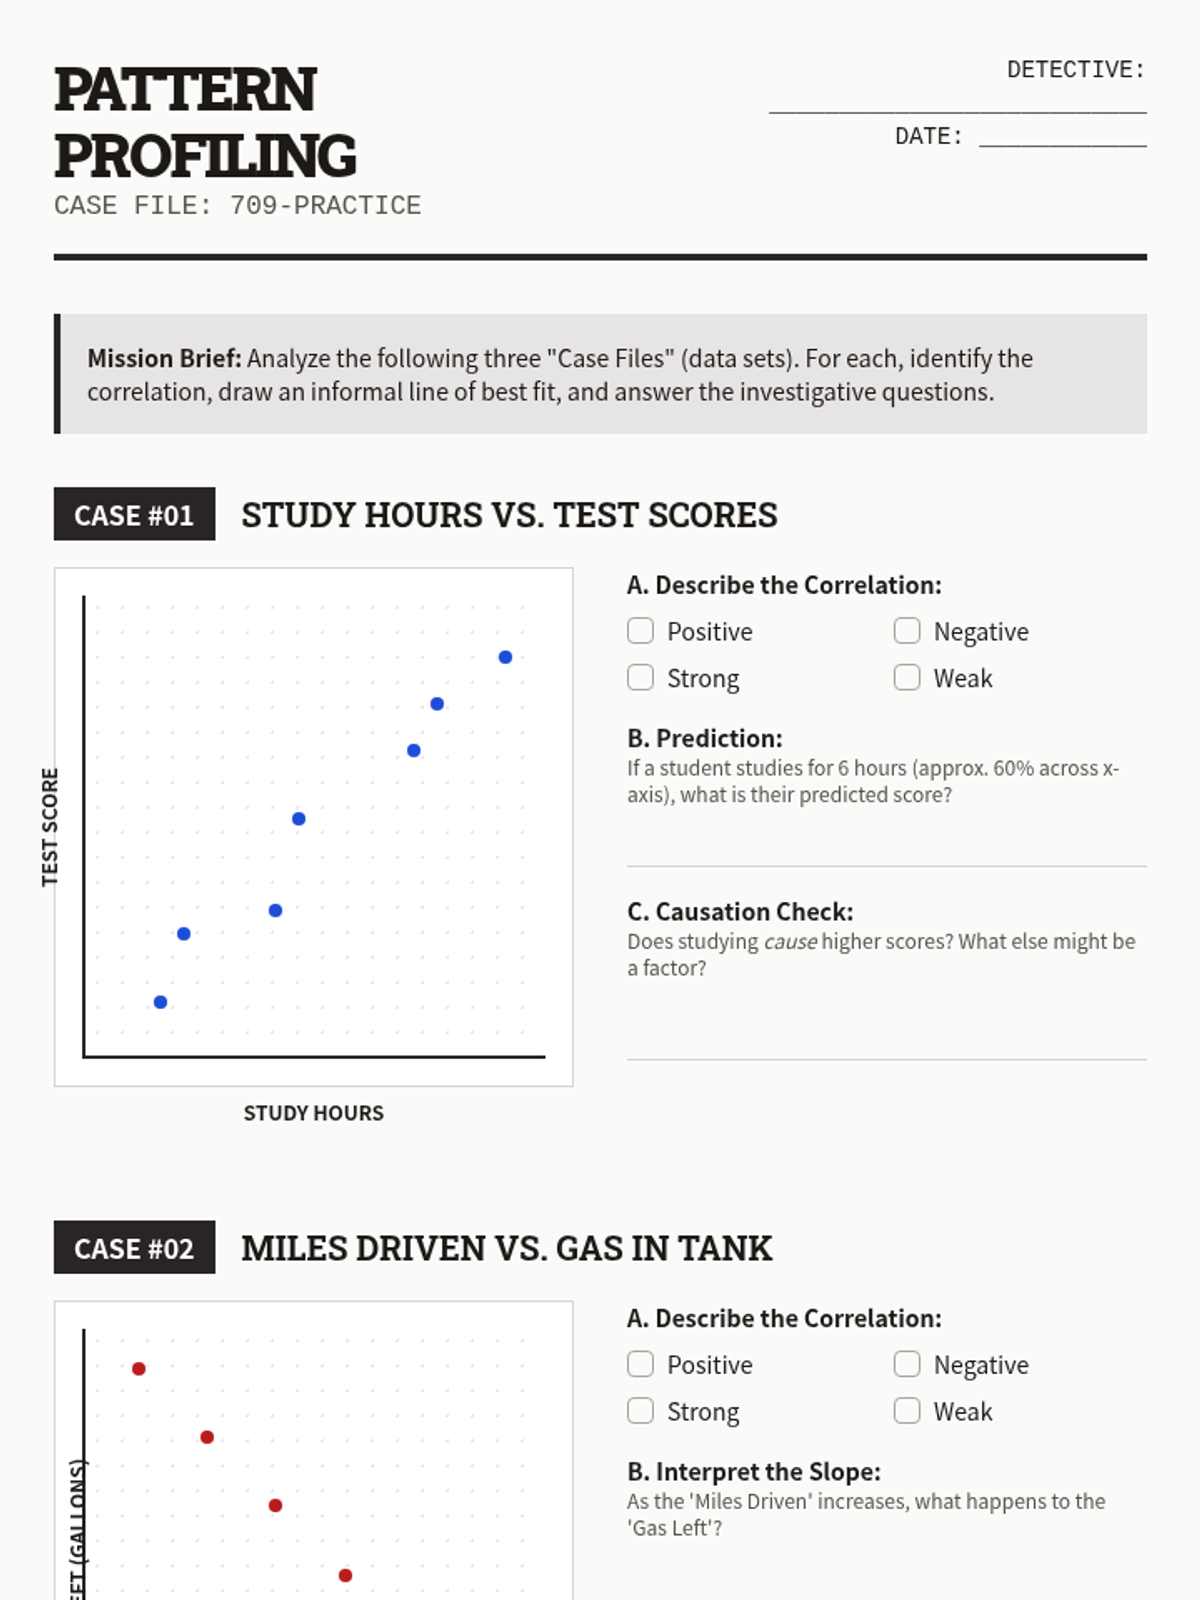
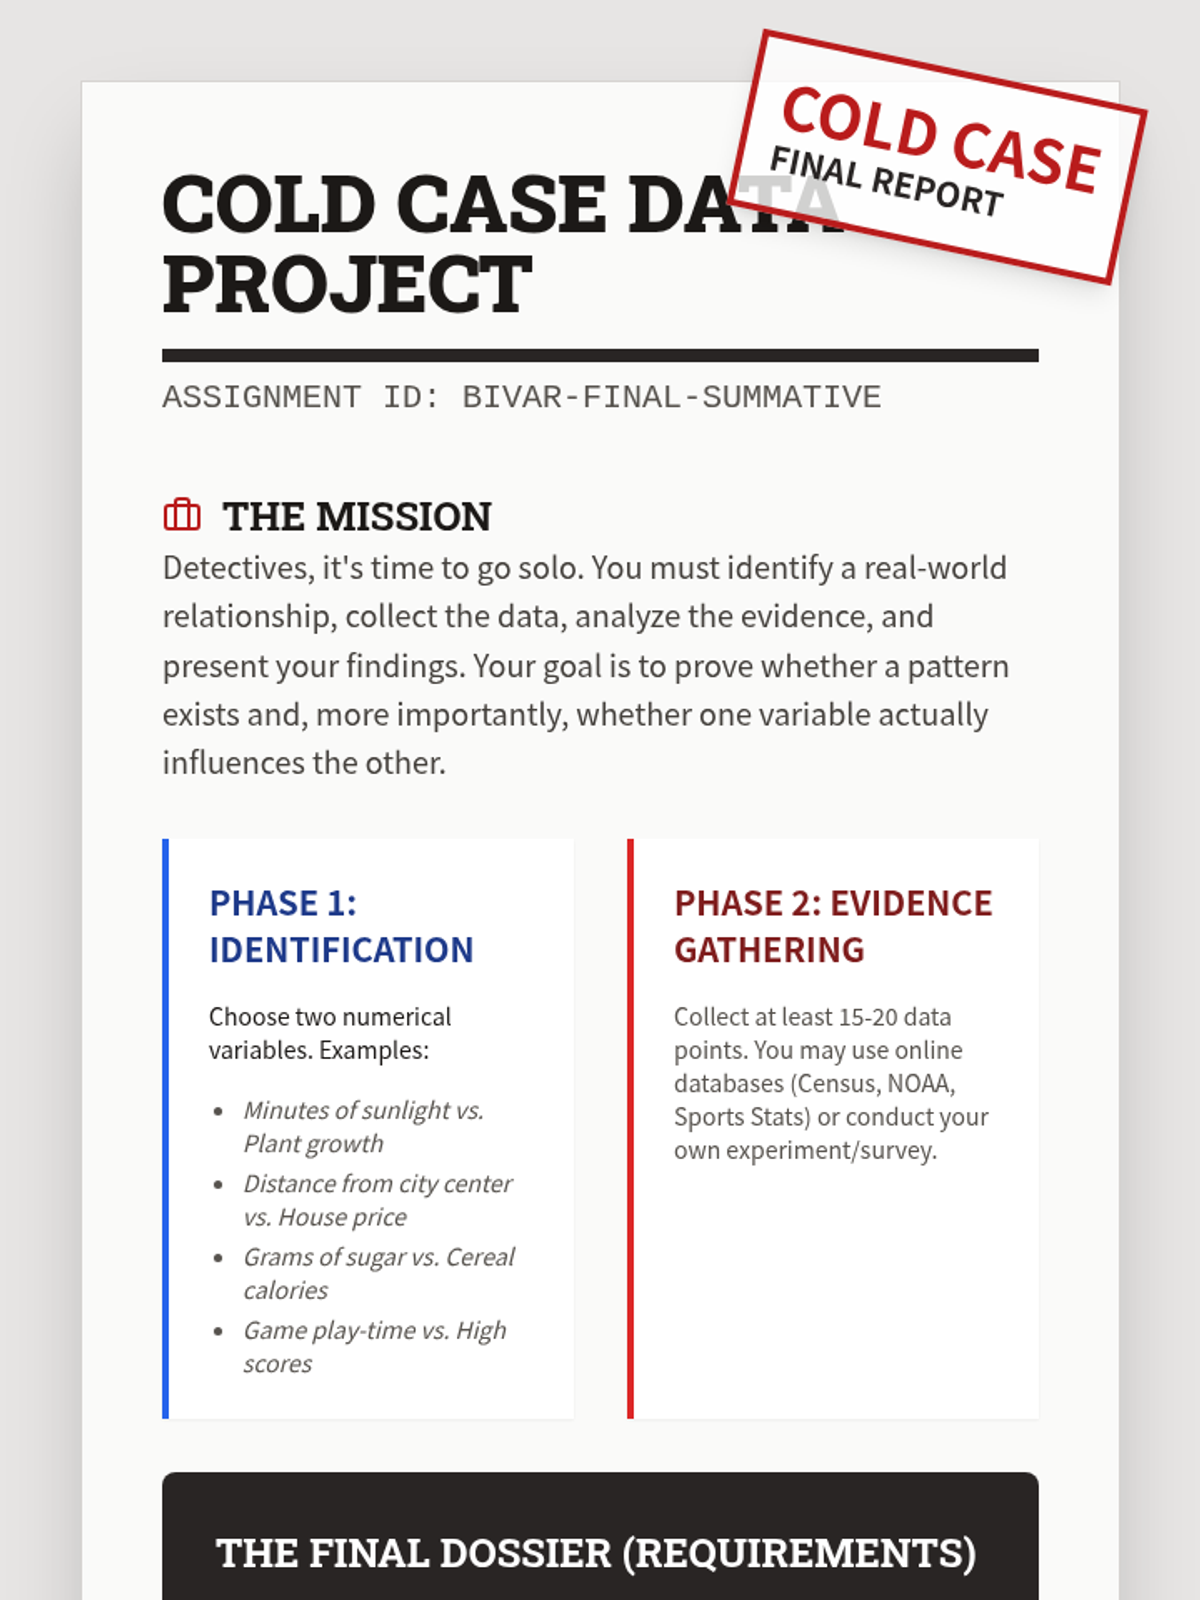
A comprehensive math lesson where students become 'Data Detectives' to explore scatter plots, lines of best fit, and the crucial distinction between correlation and causation through real-world evidence.
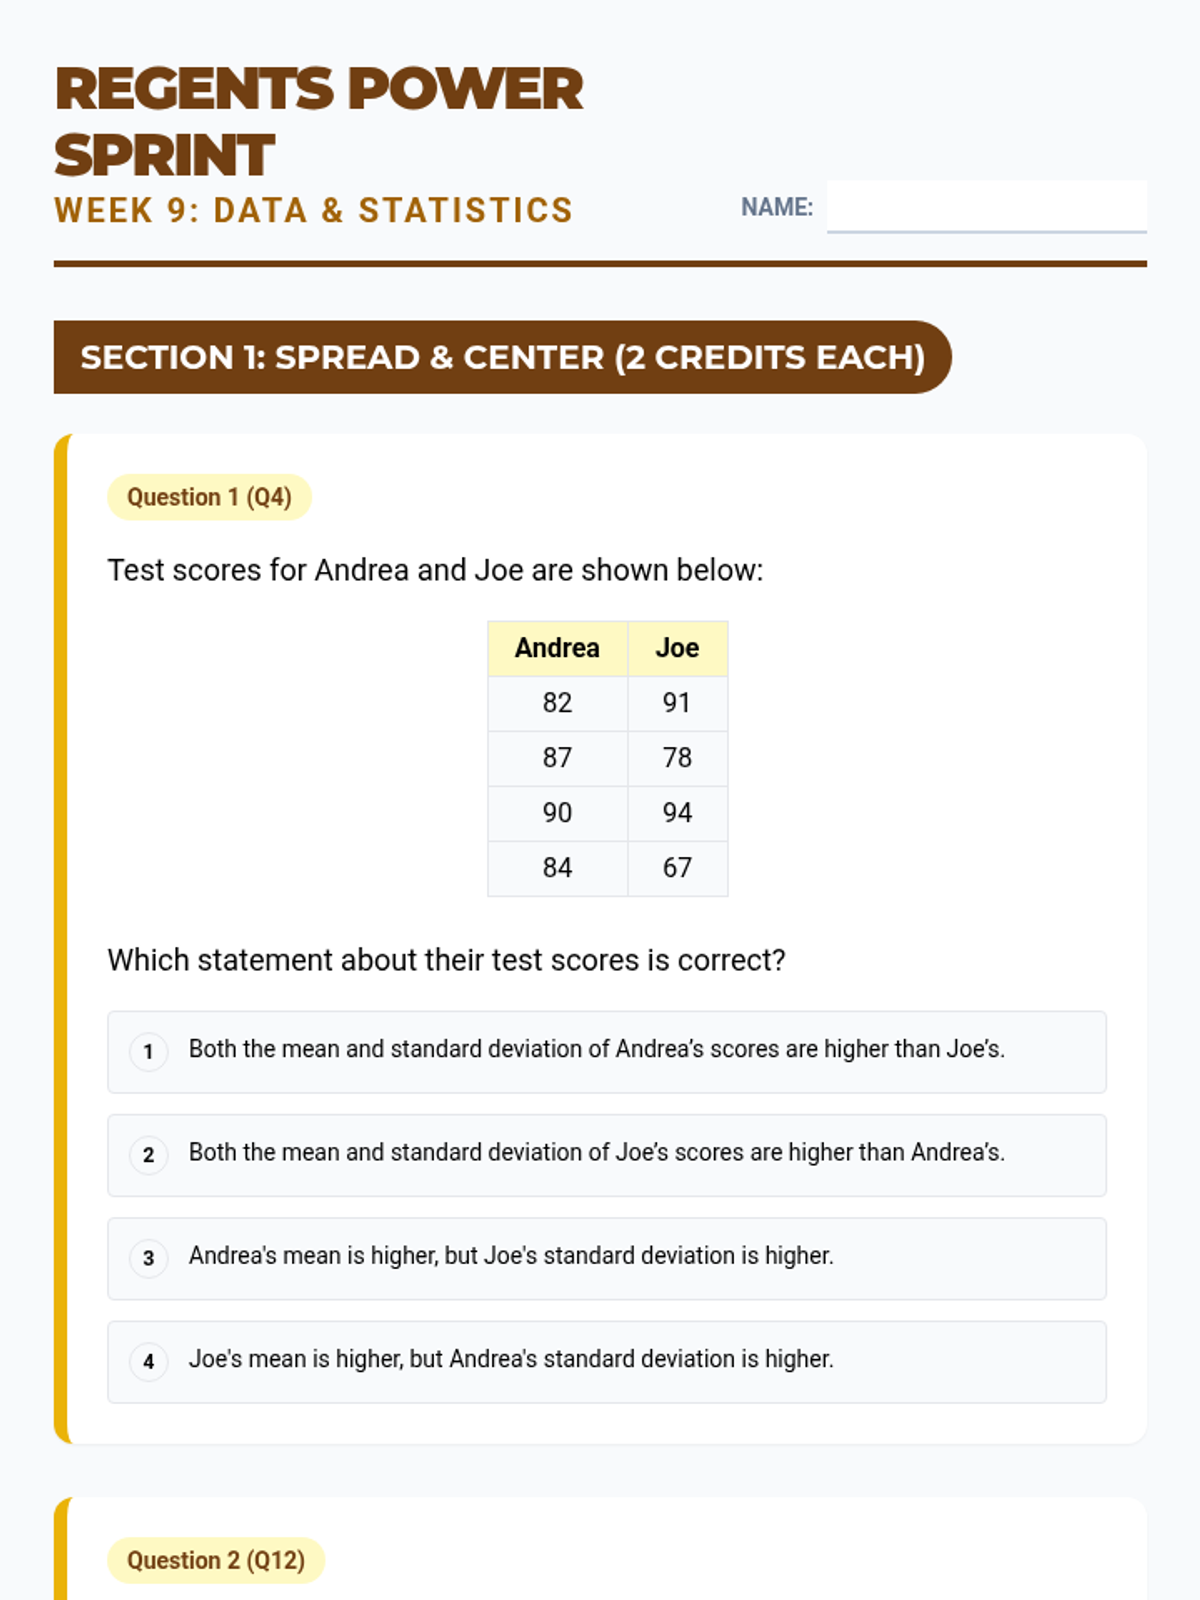
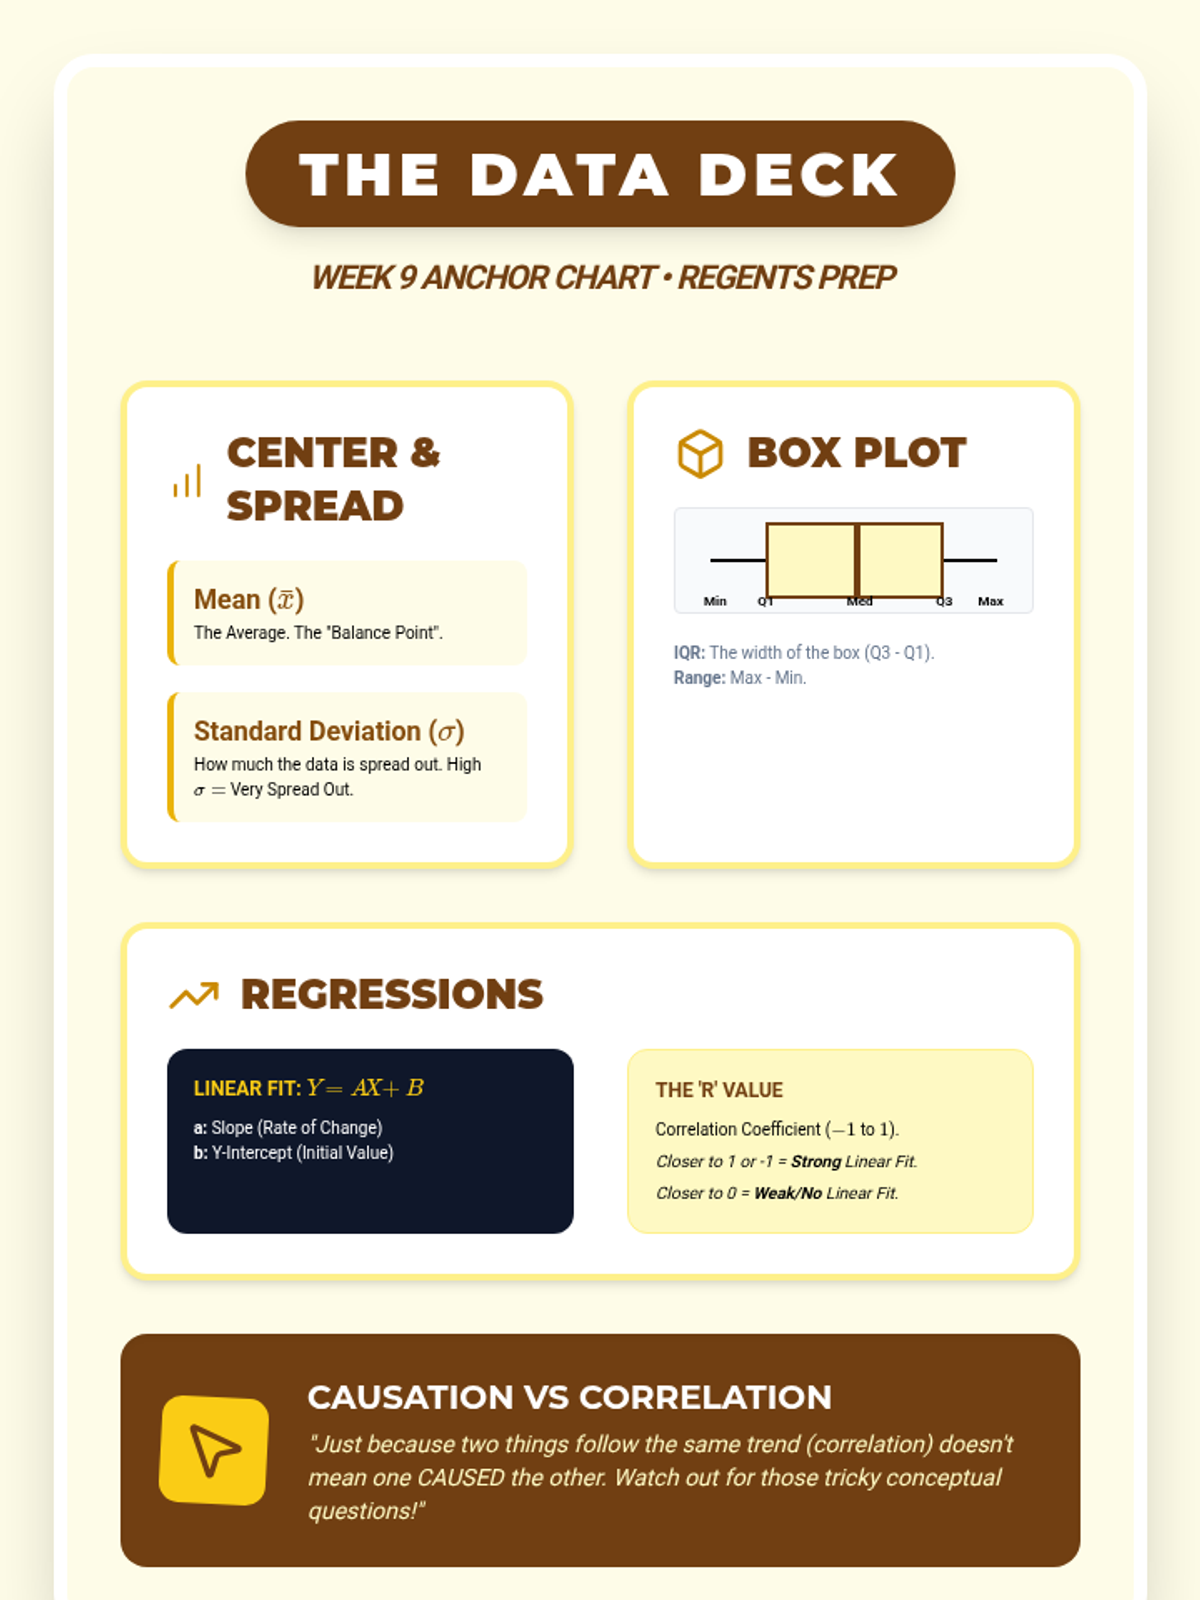
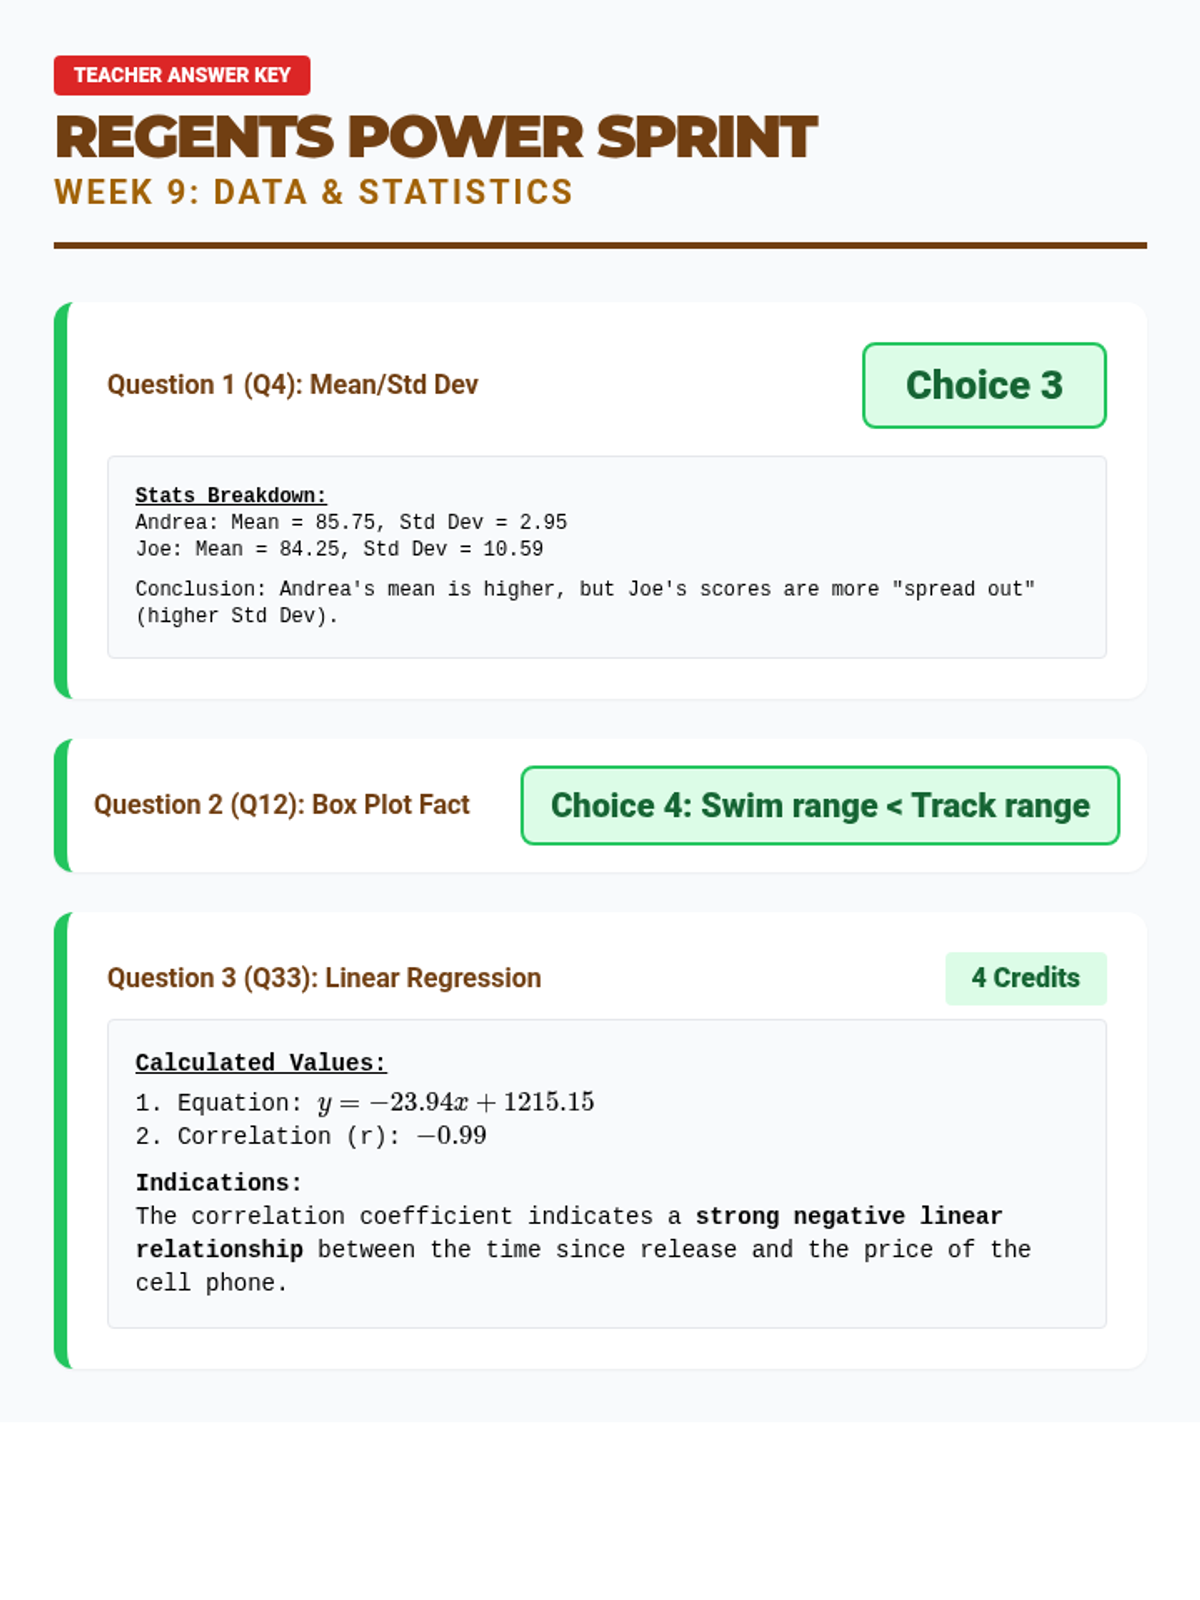
Focus on interpreting box plots, mean/standard deviation, and linear regression with correlation coefficients.
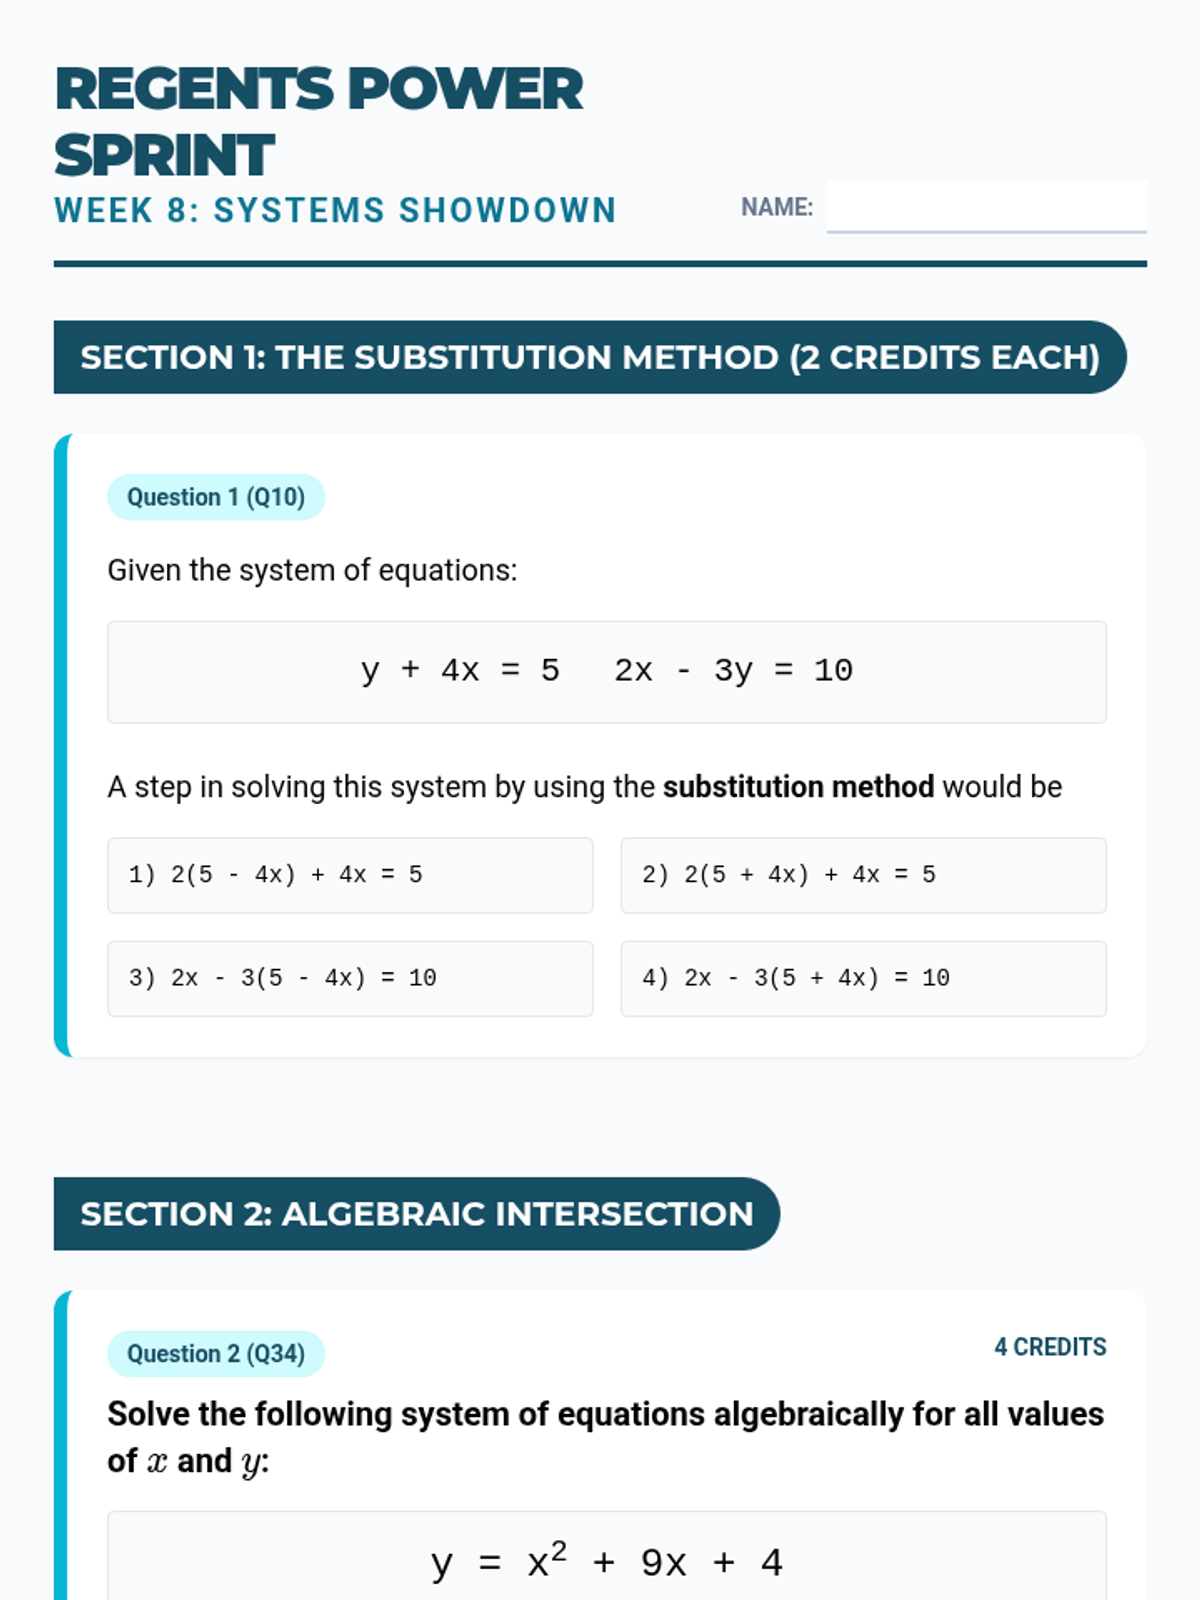
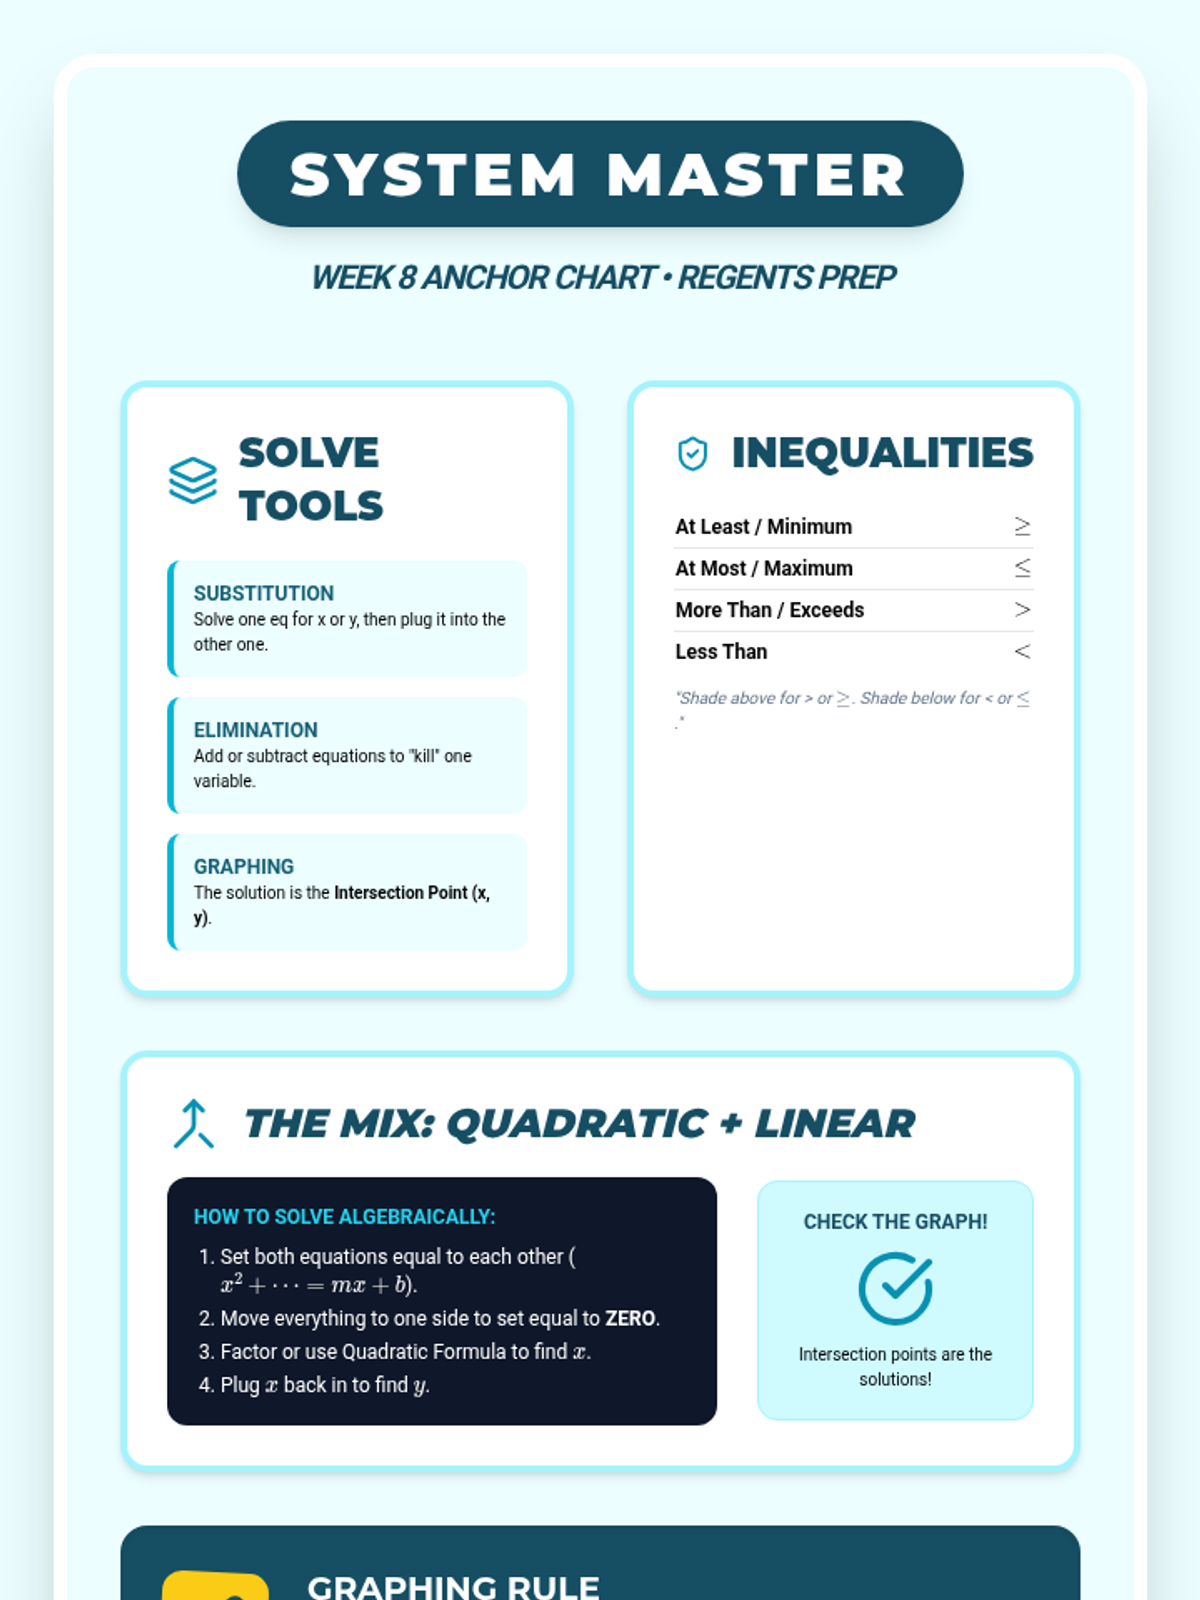
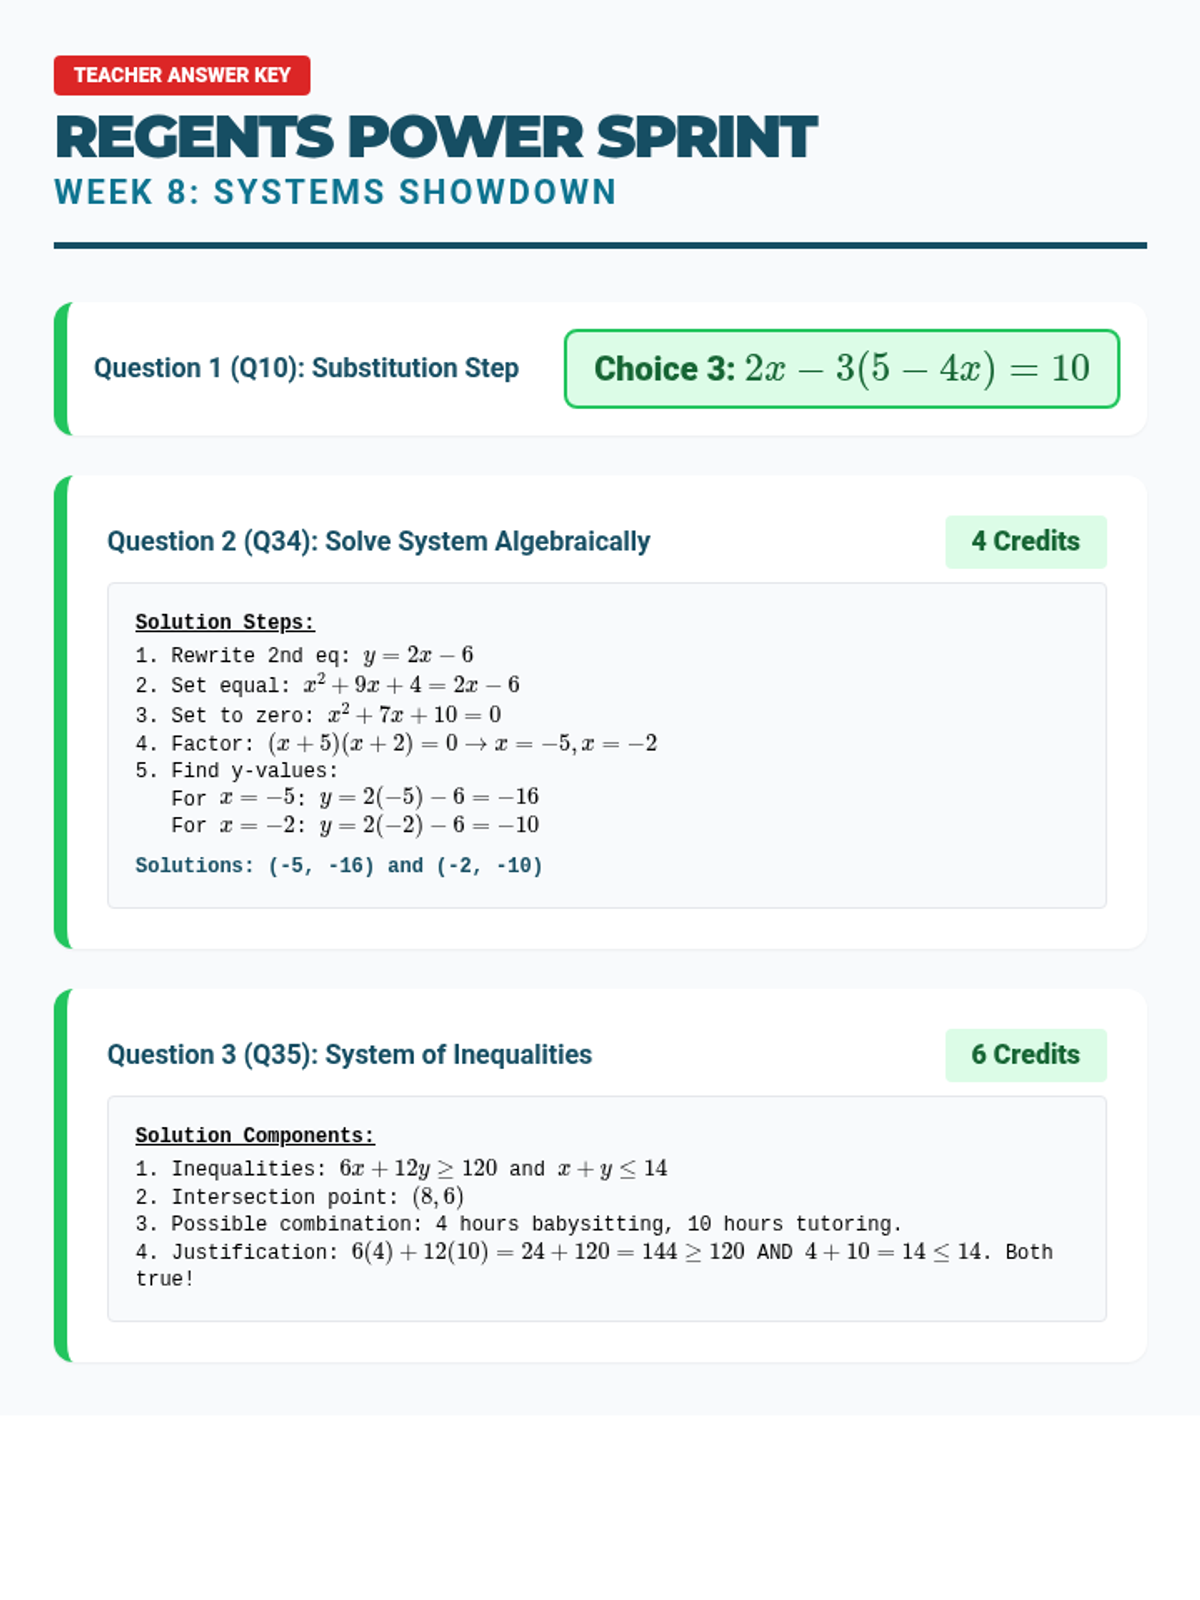
Focus on solving systems of equations algebraically and graphing systems of linear inequalities.
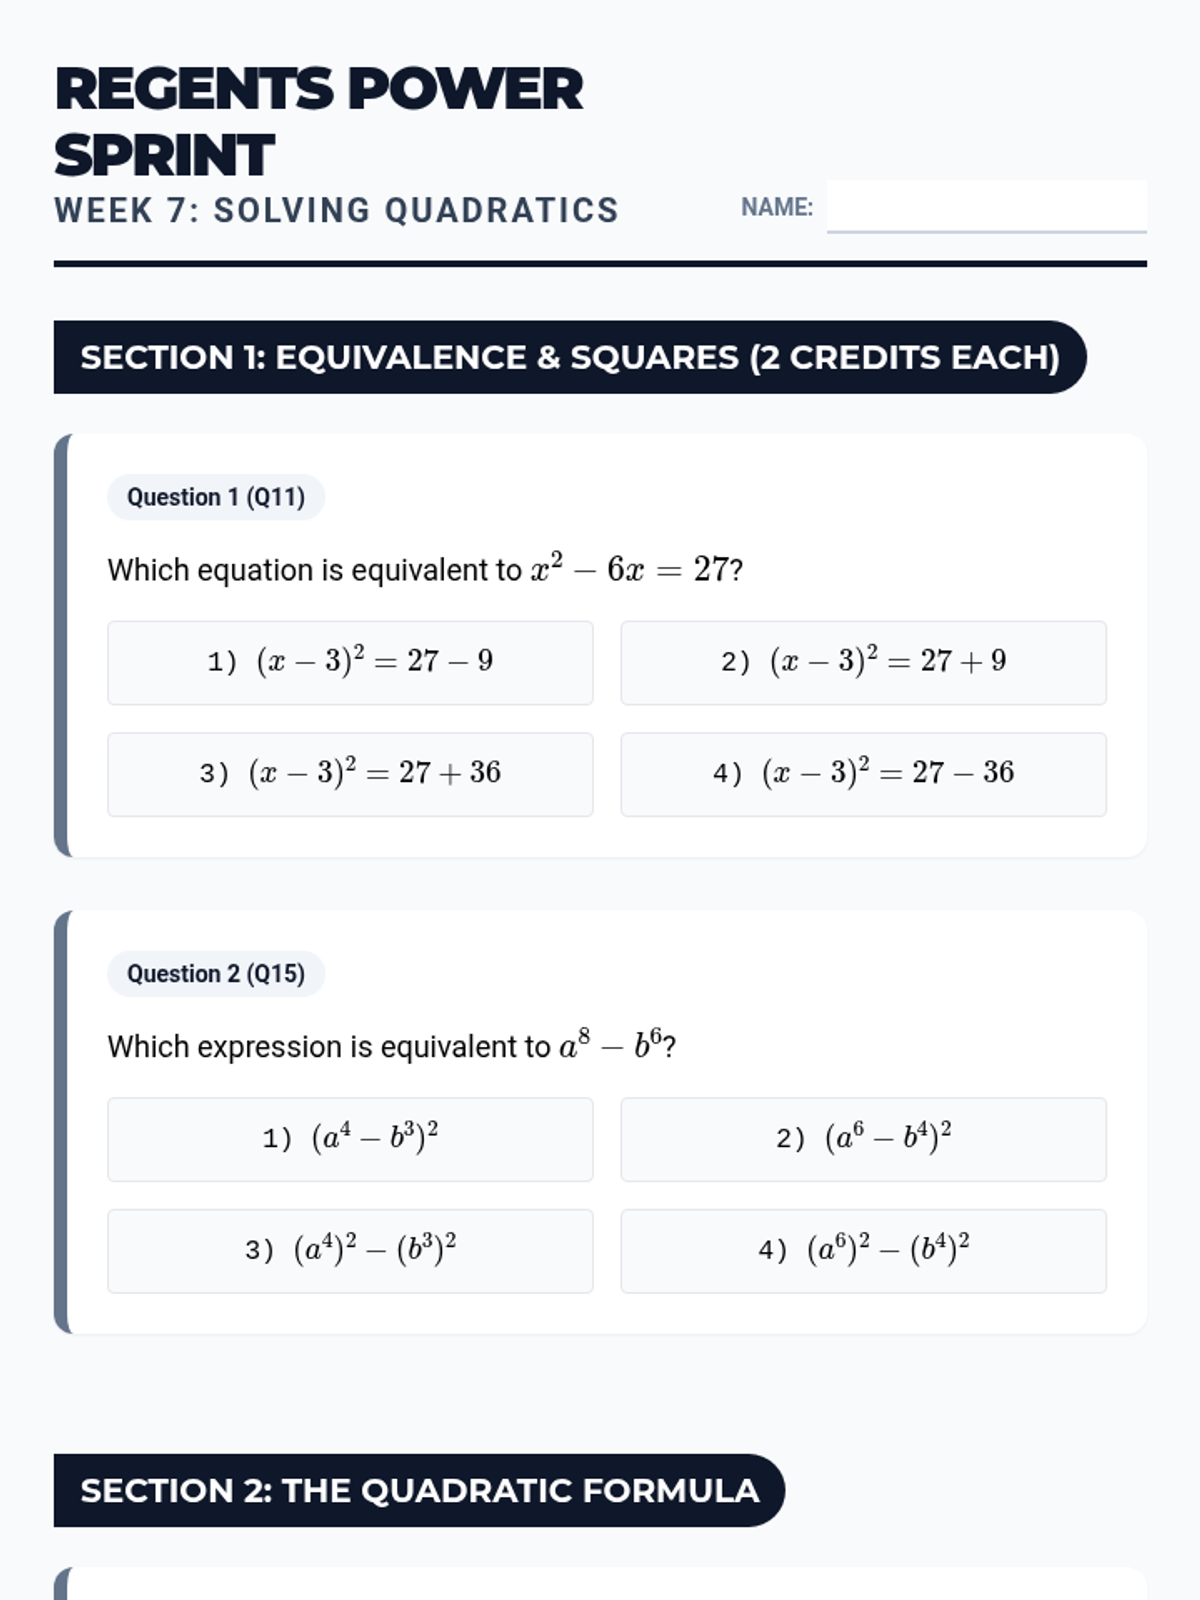
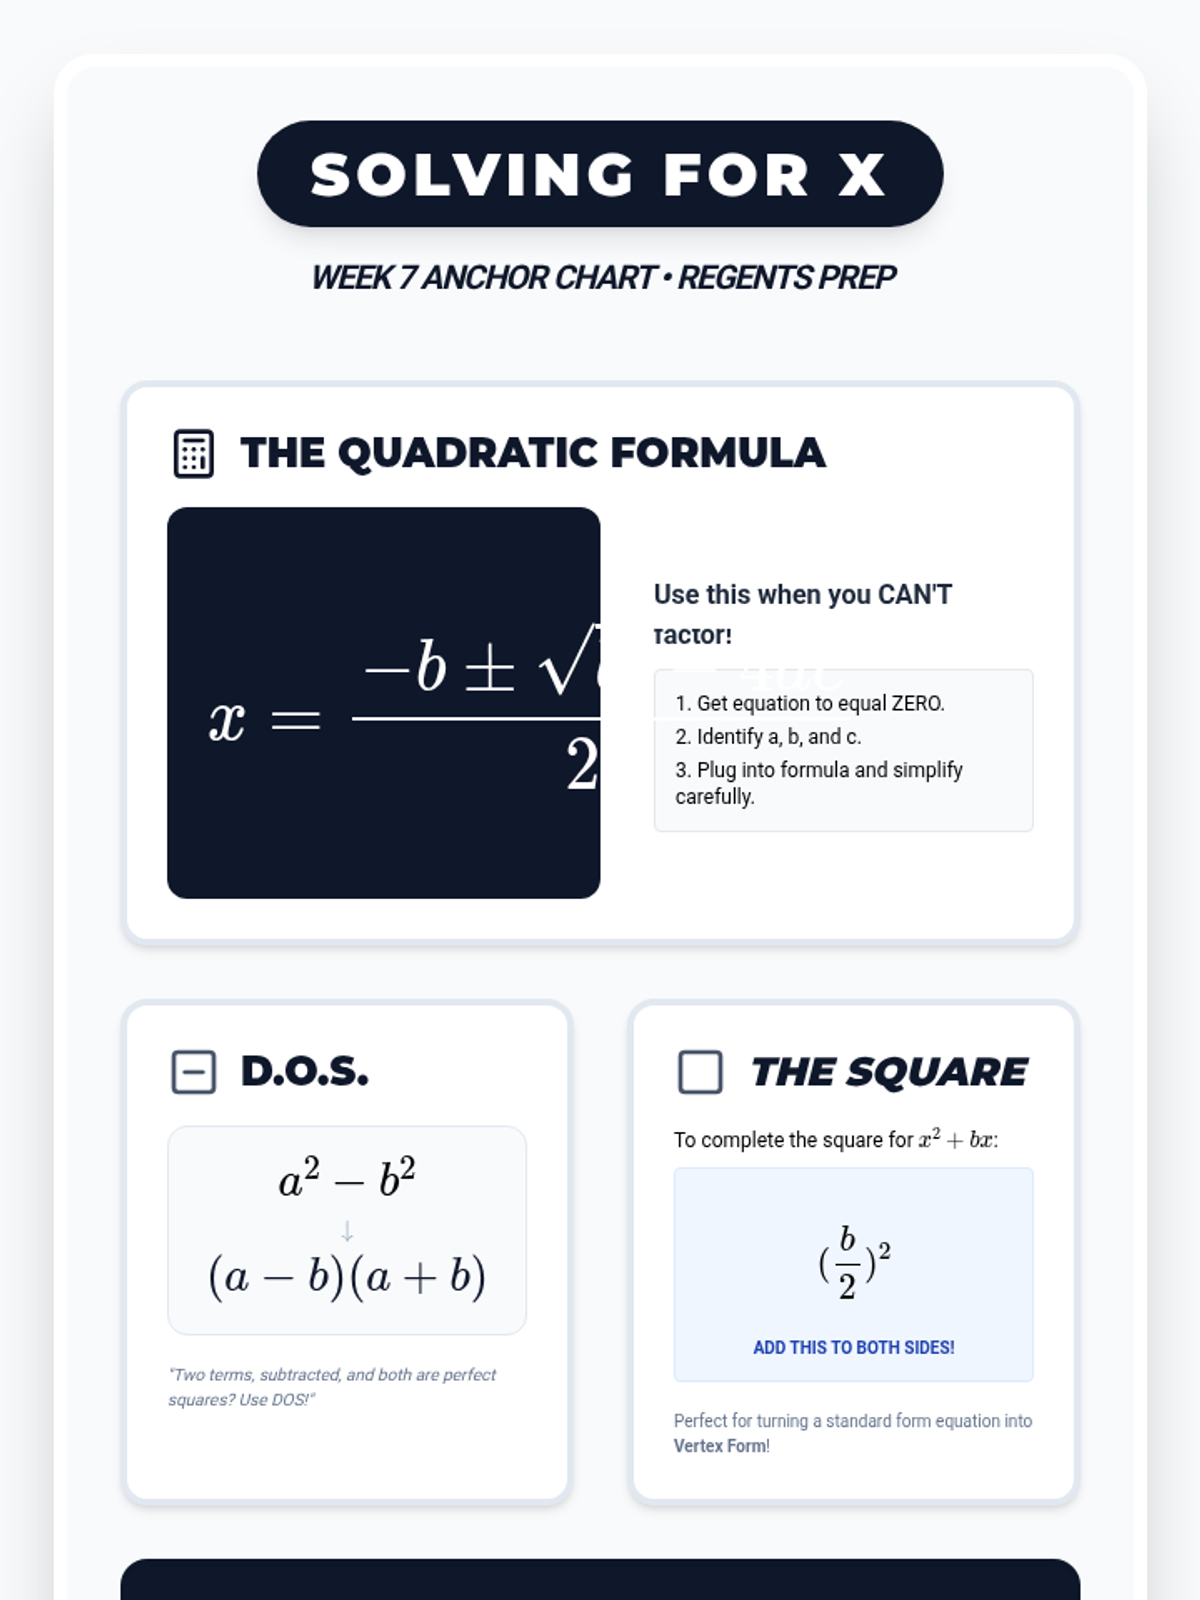
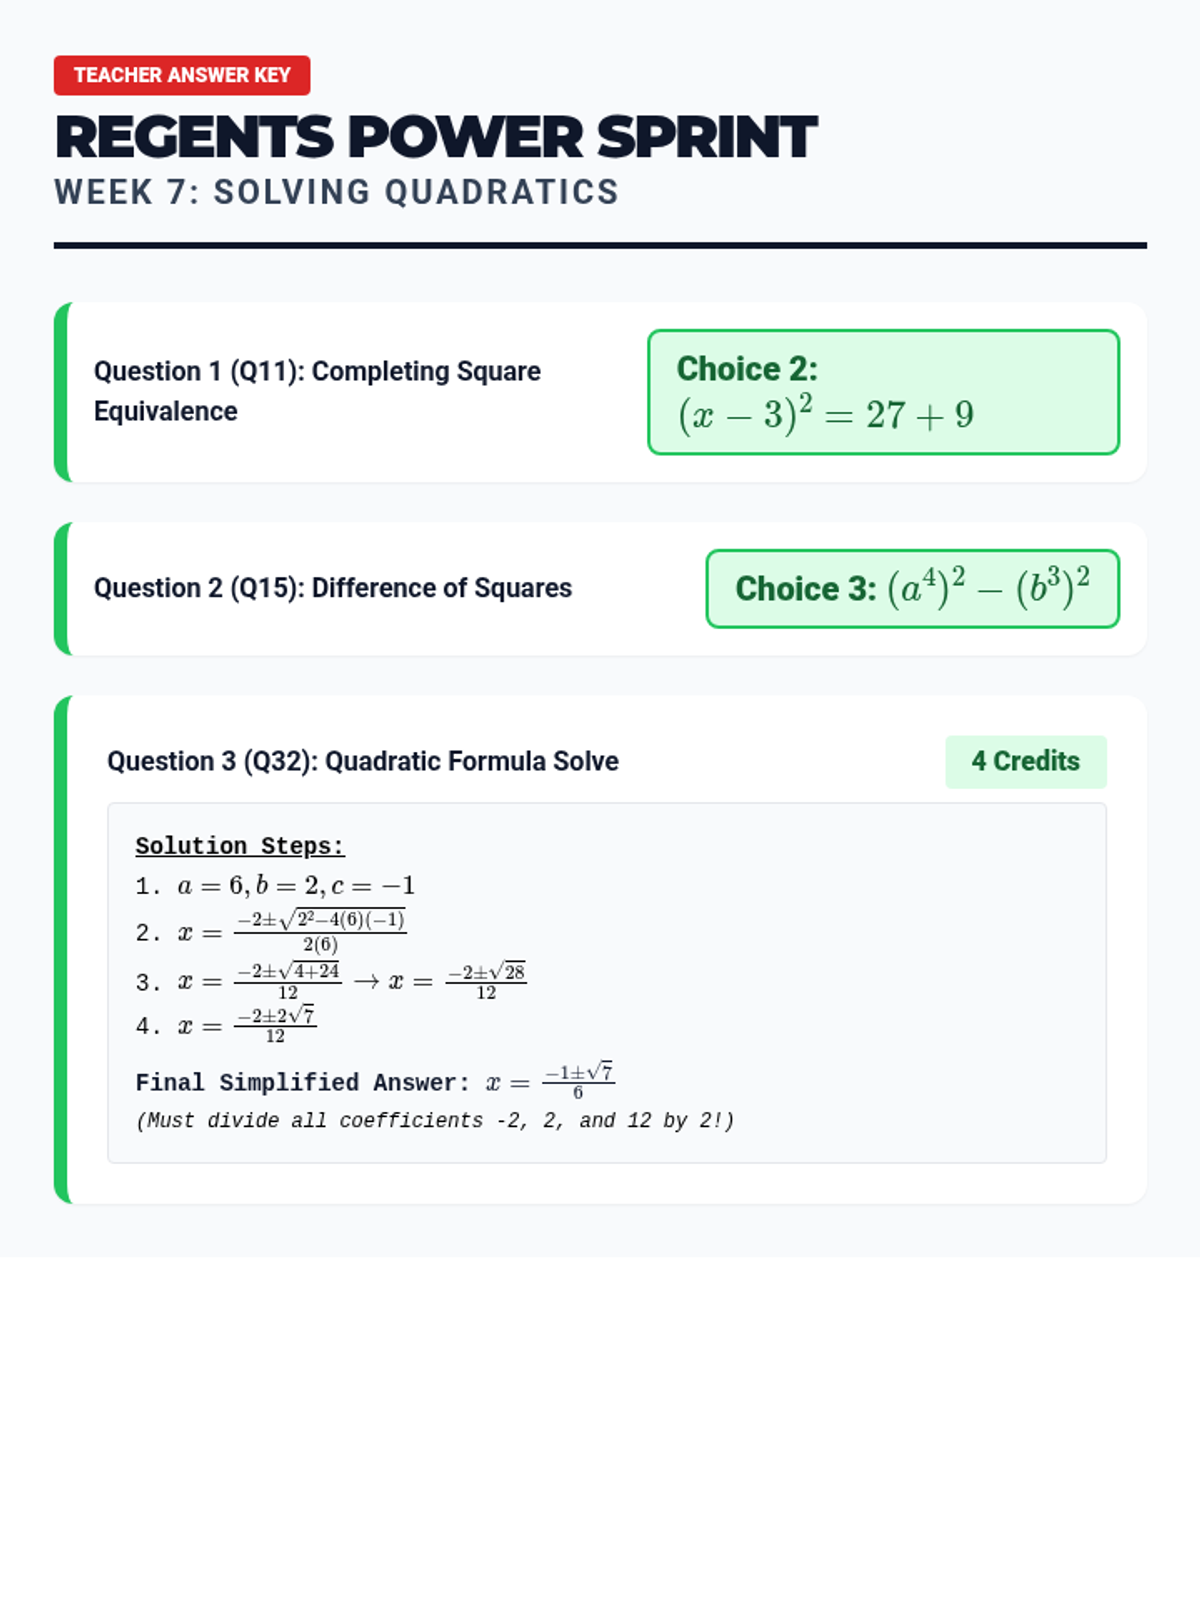
Focus on solving quadratic equations using the quadratic formula and factoring.
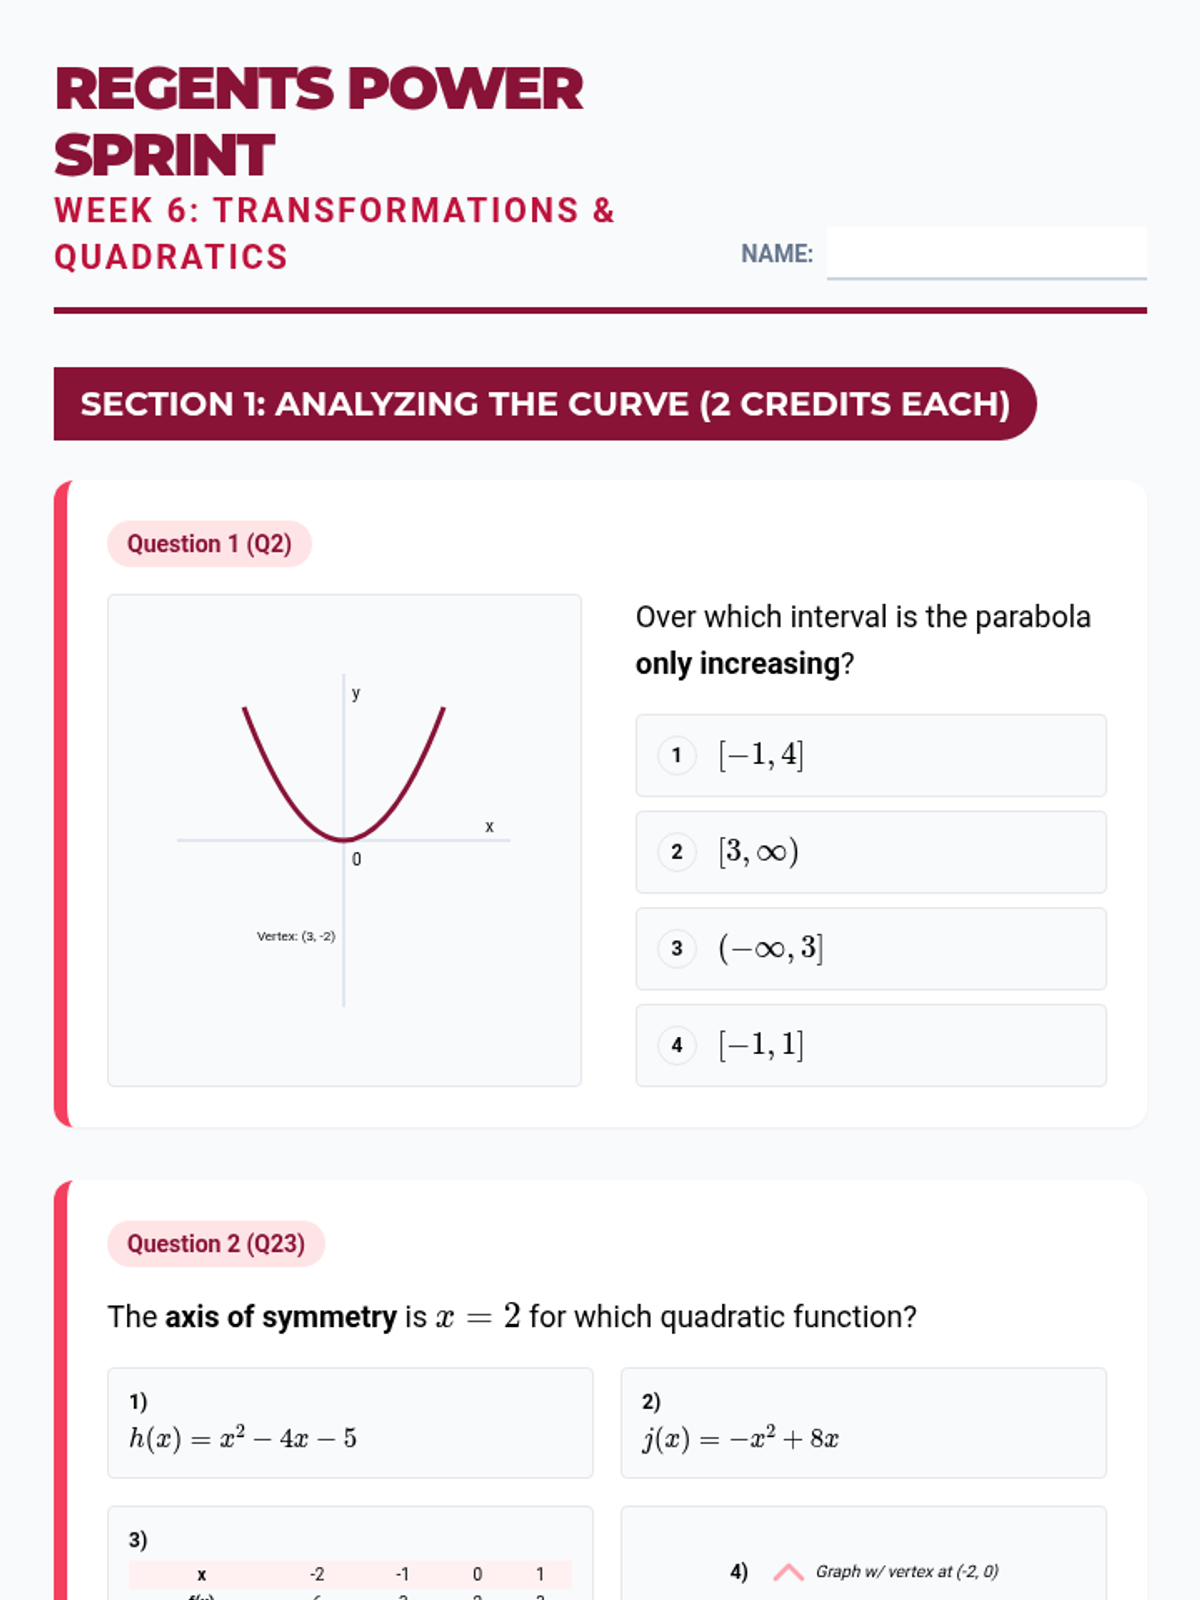
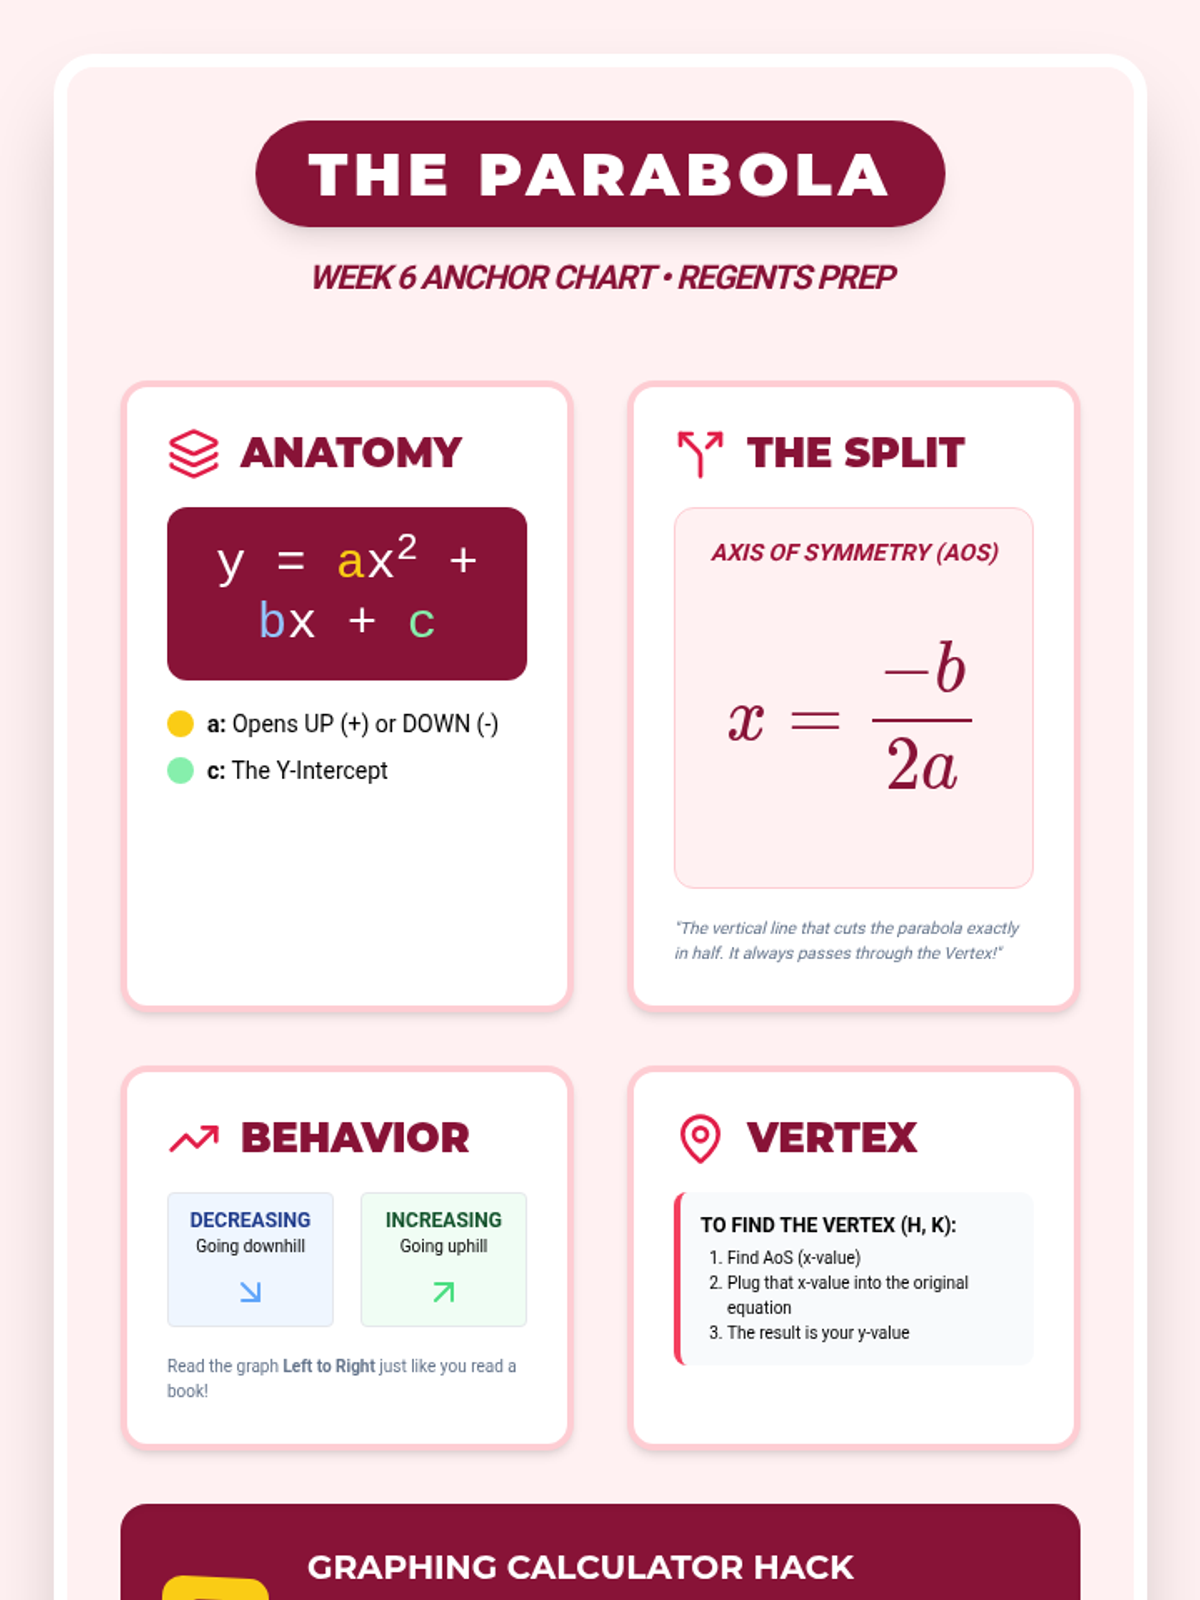
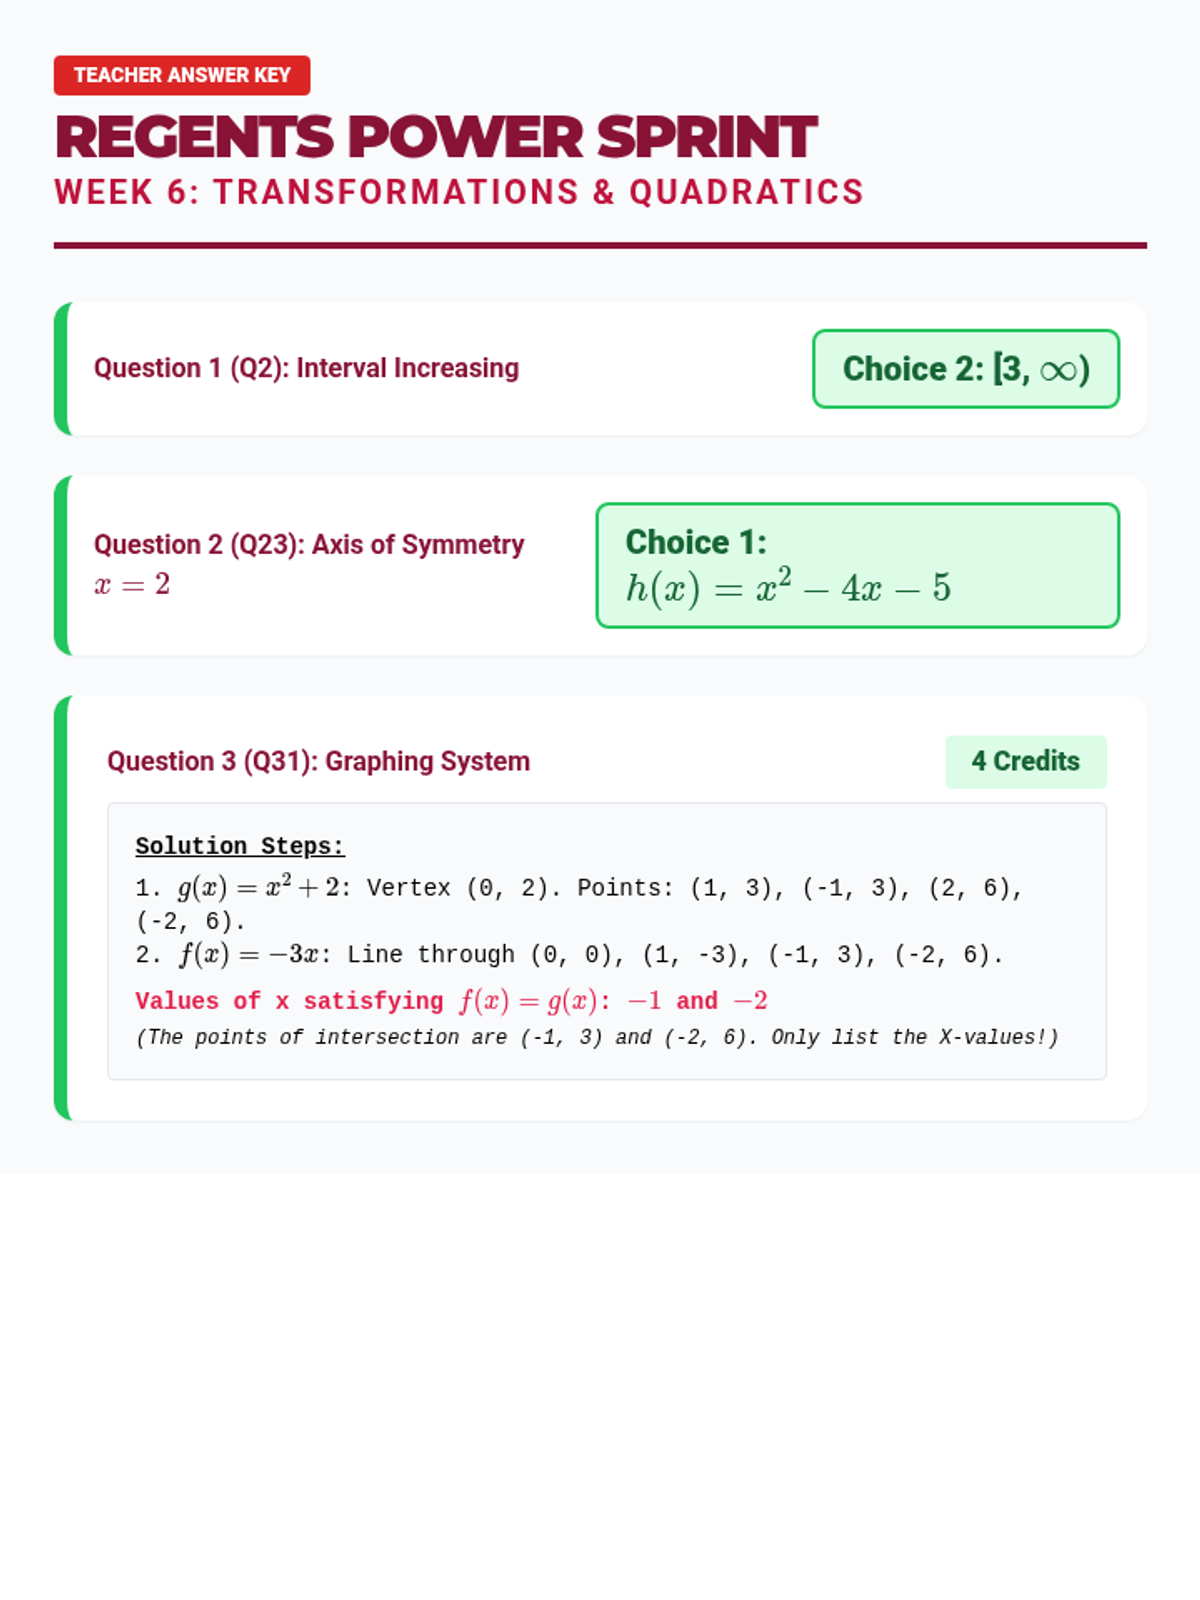
Focus on graphing absolute value and quadratic functions, including transformations and the axis of symmetry.
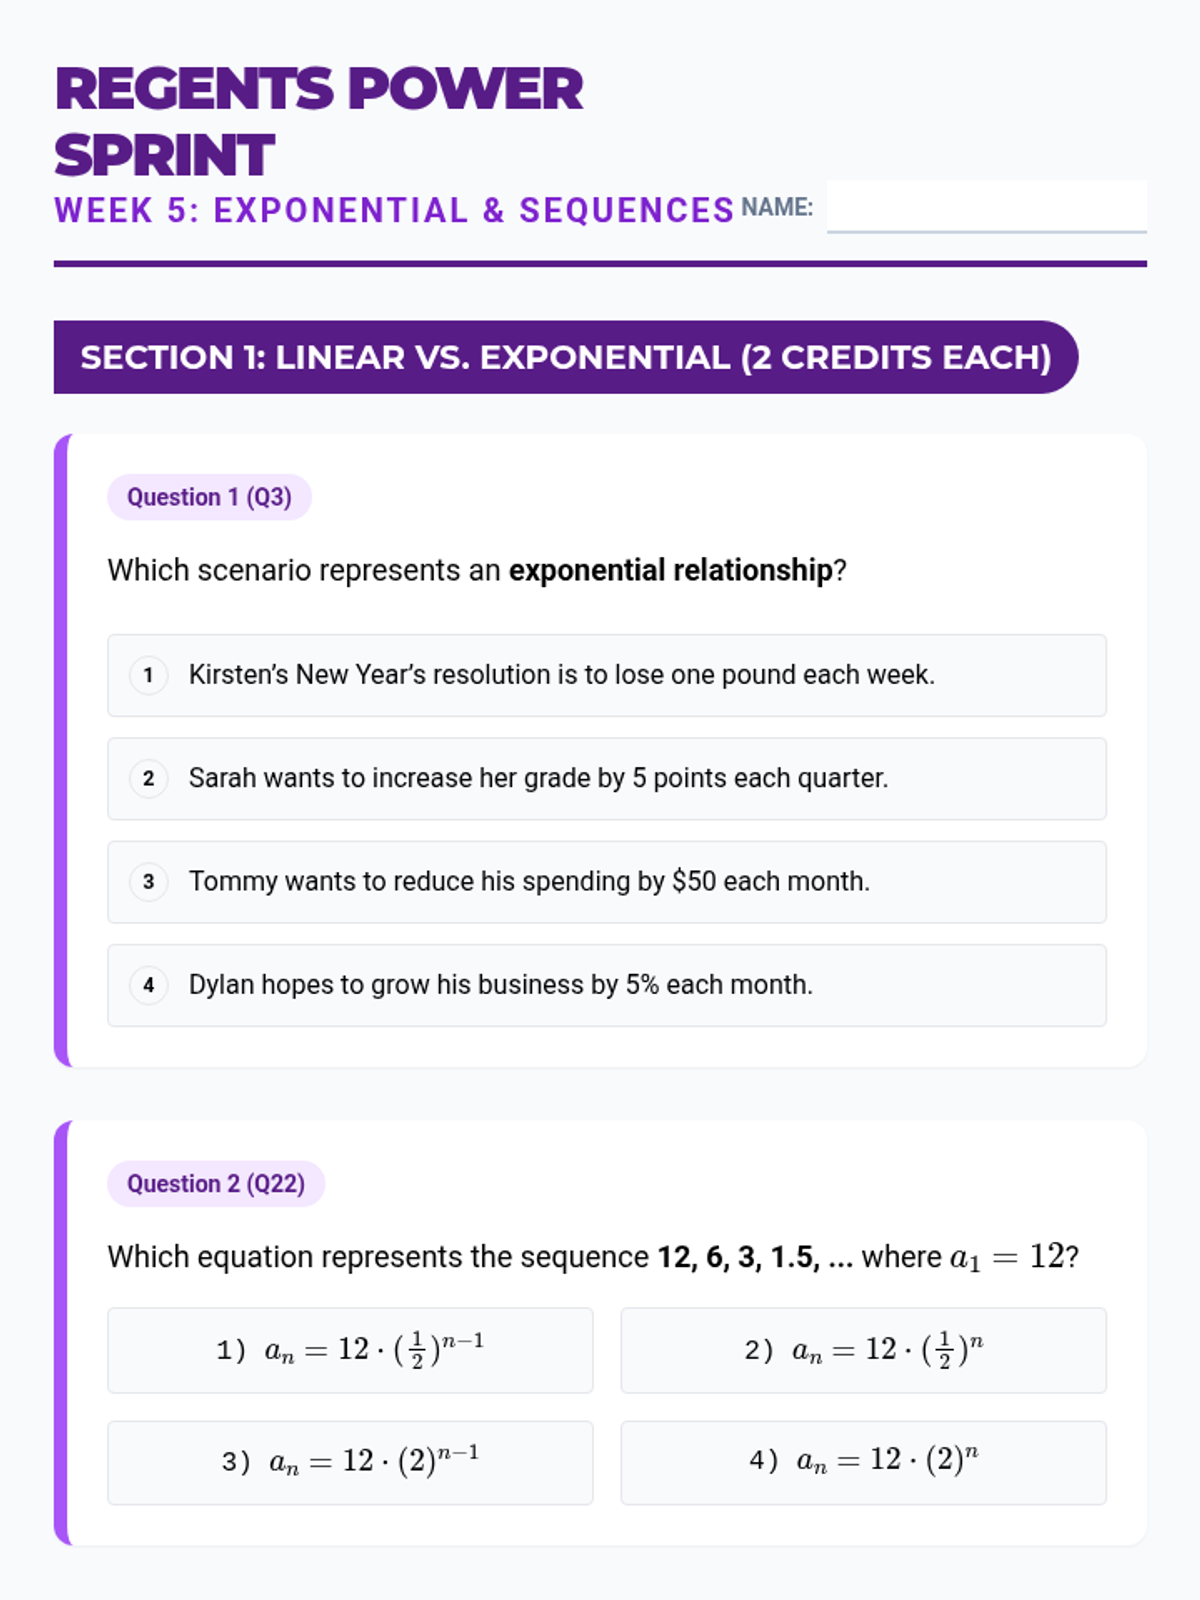
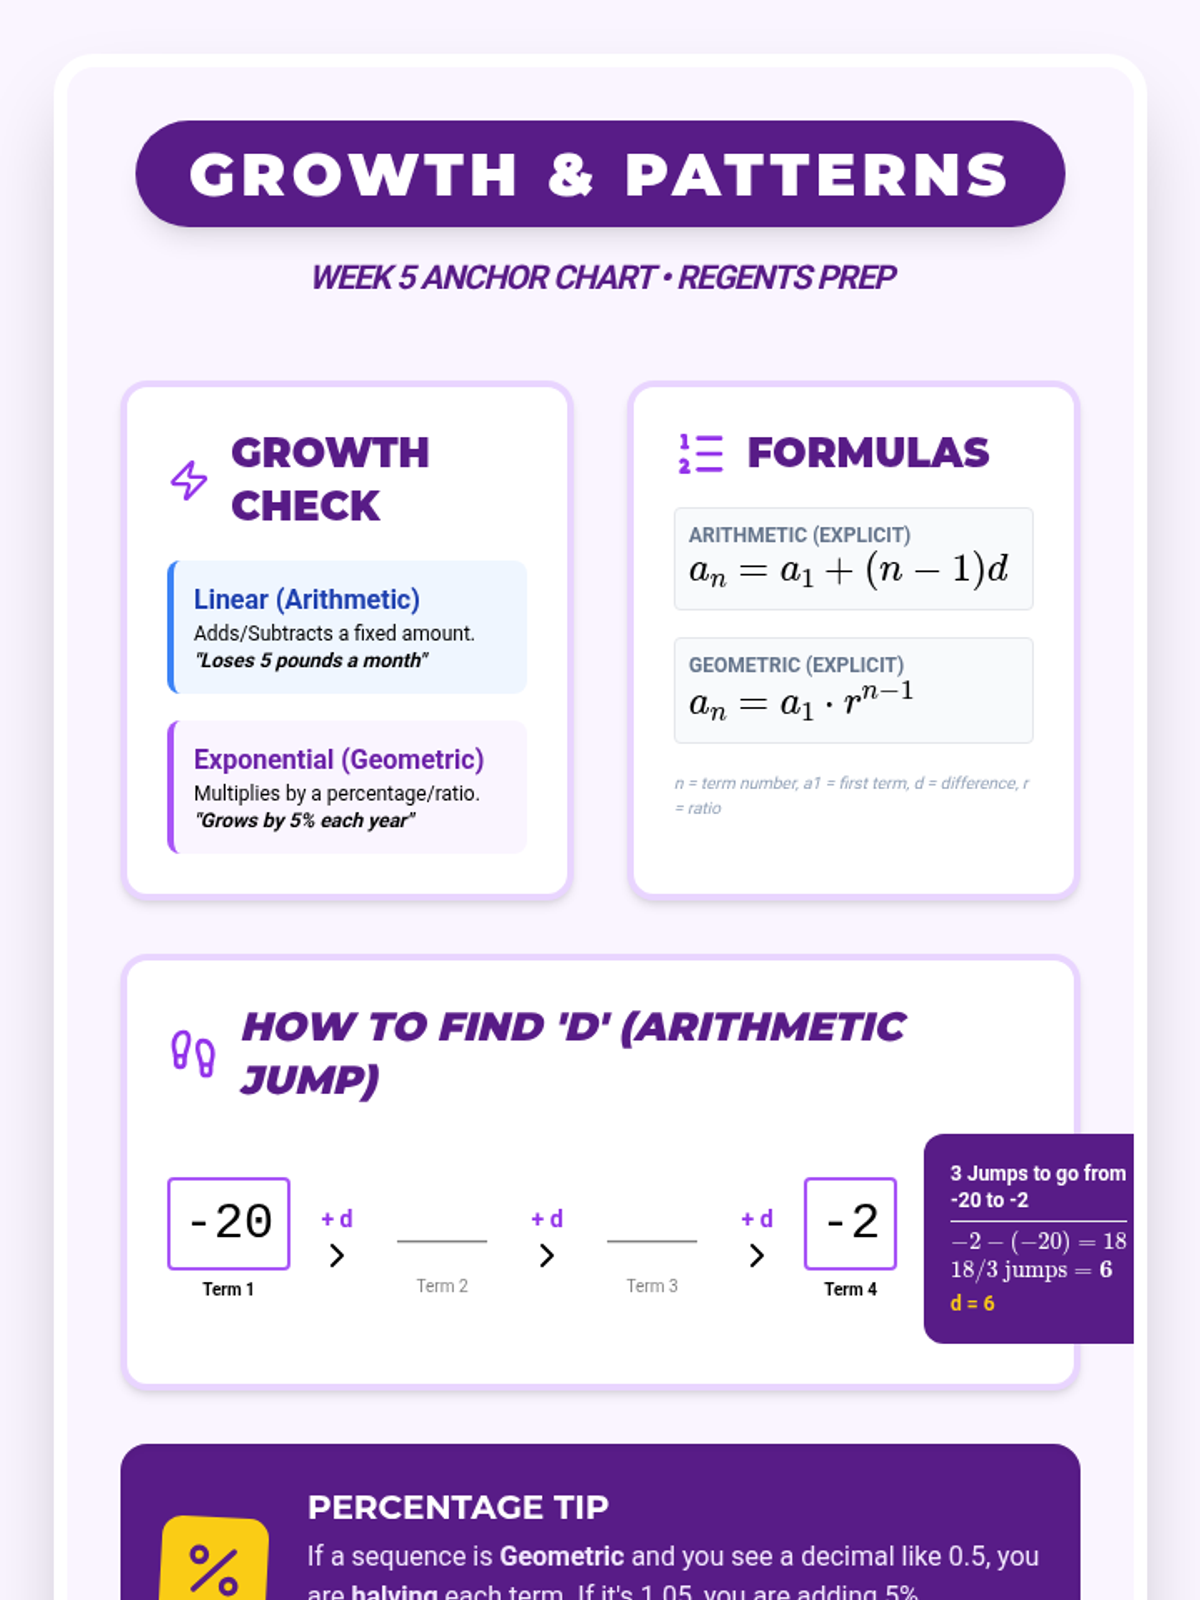
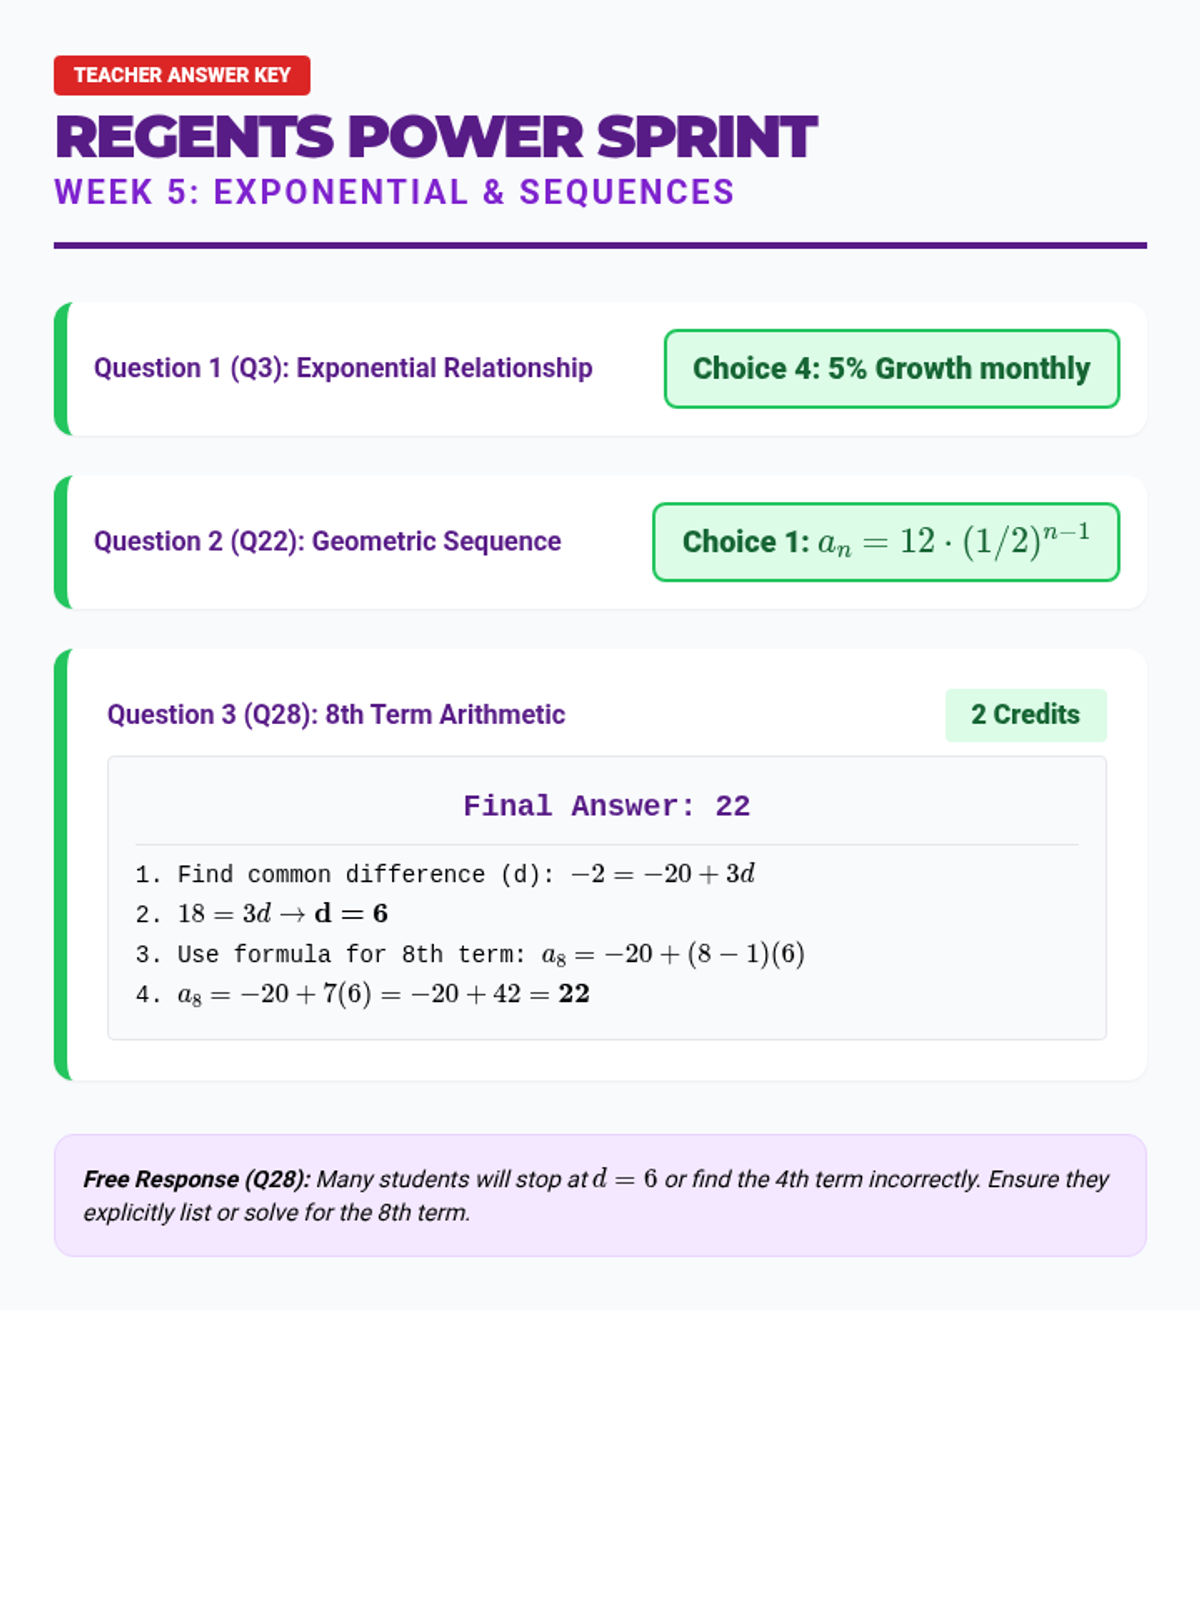
Focus on exponential growth vs. linear growth, and identifying and writing sequence formulas.
Focus on average rate of change, modeling linear scenarios, and writing equations in slope-intercept form.
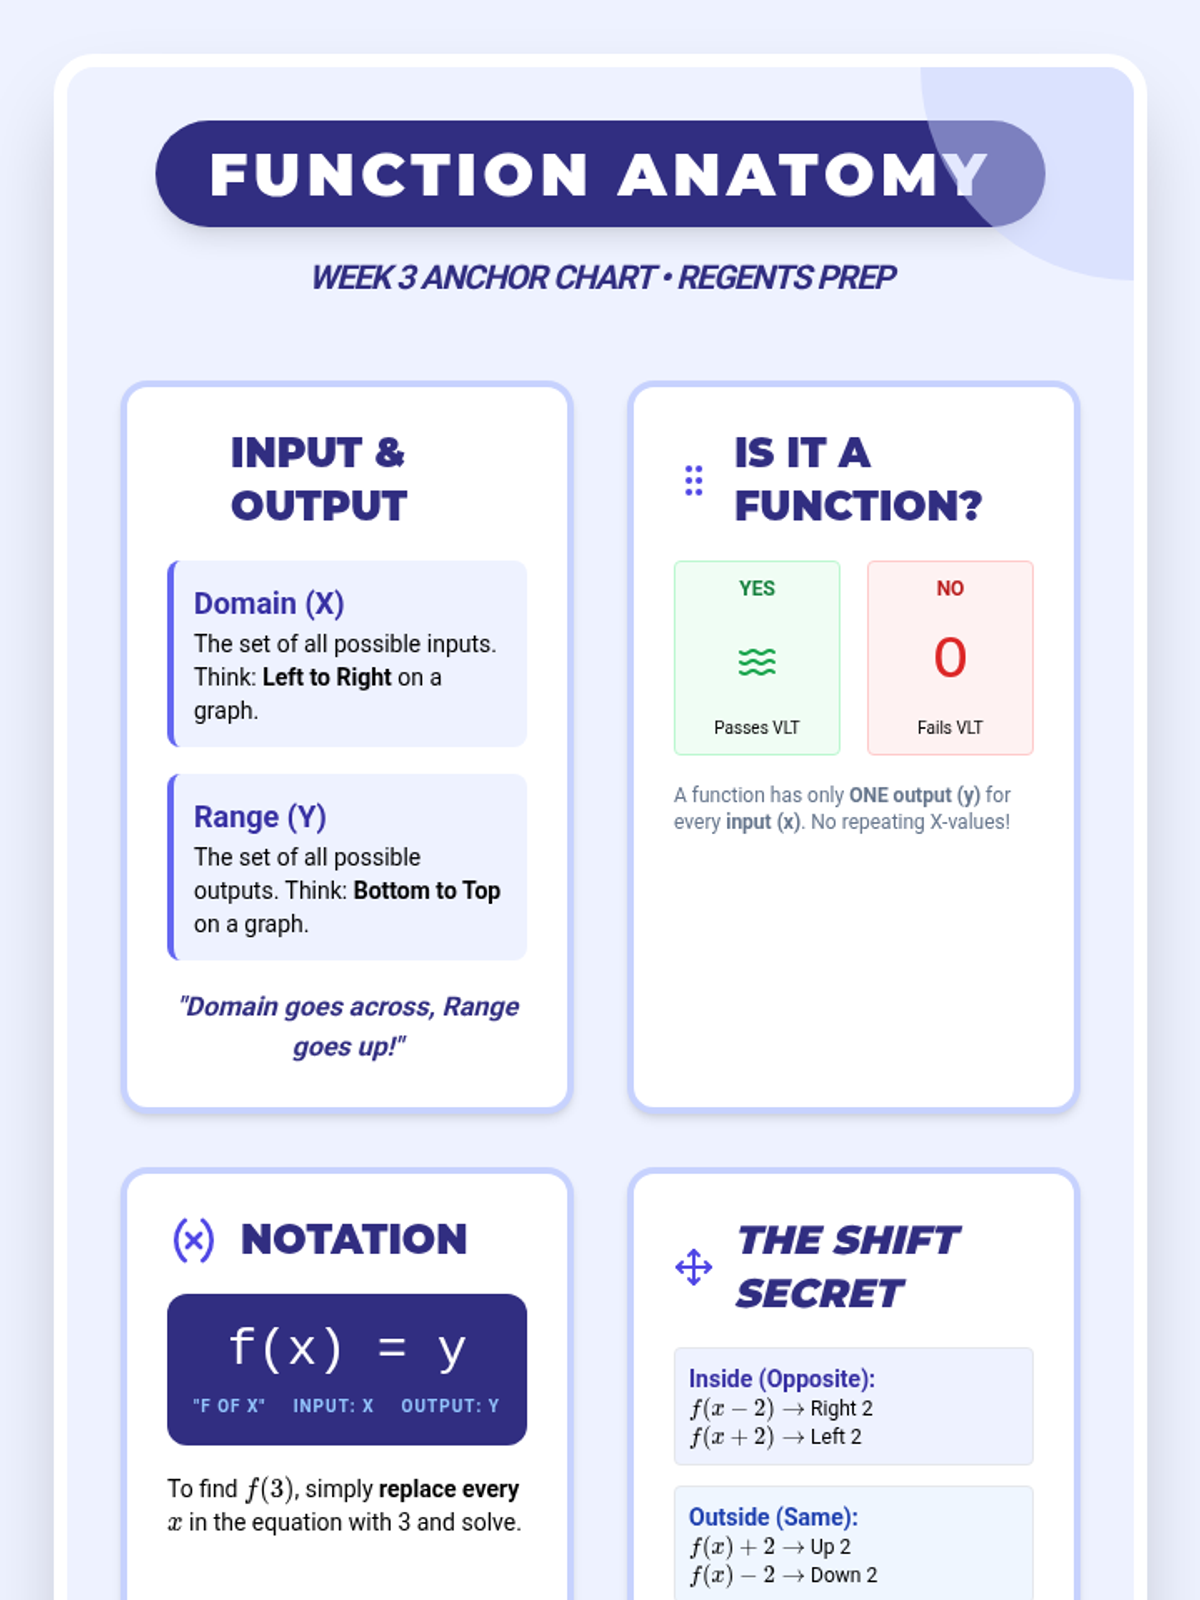
Focus on function notation, the vertical line test, and identifying domain and range from graphs.
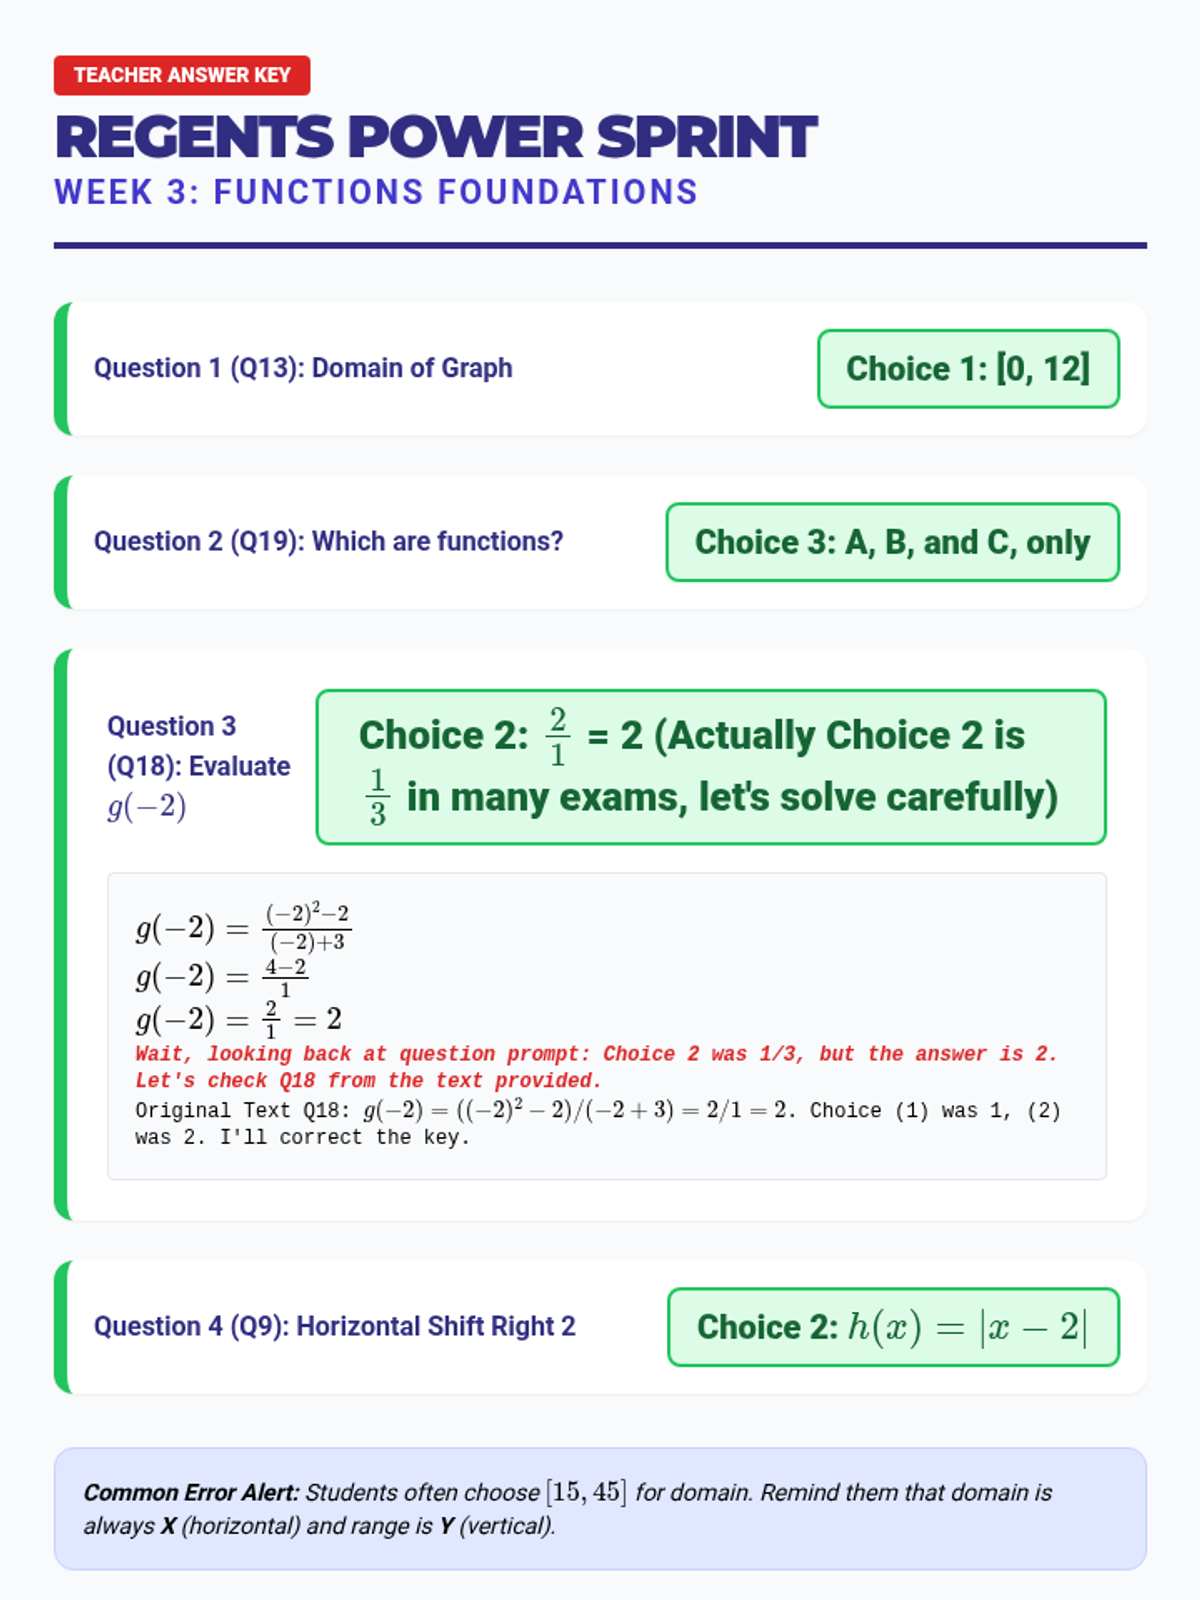
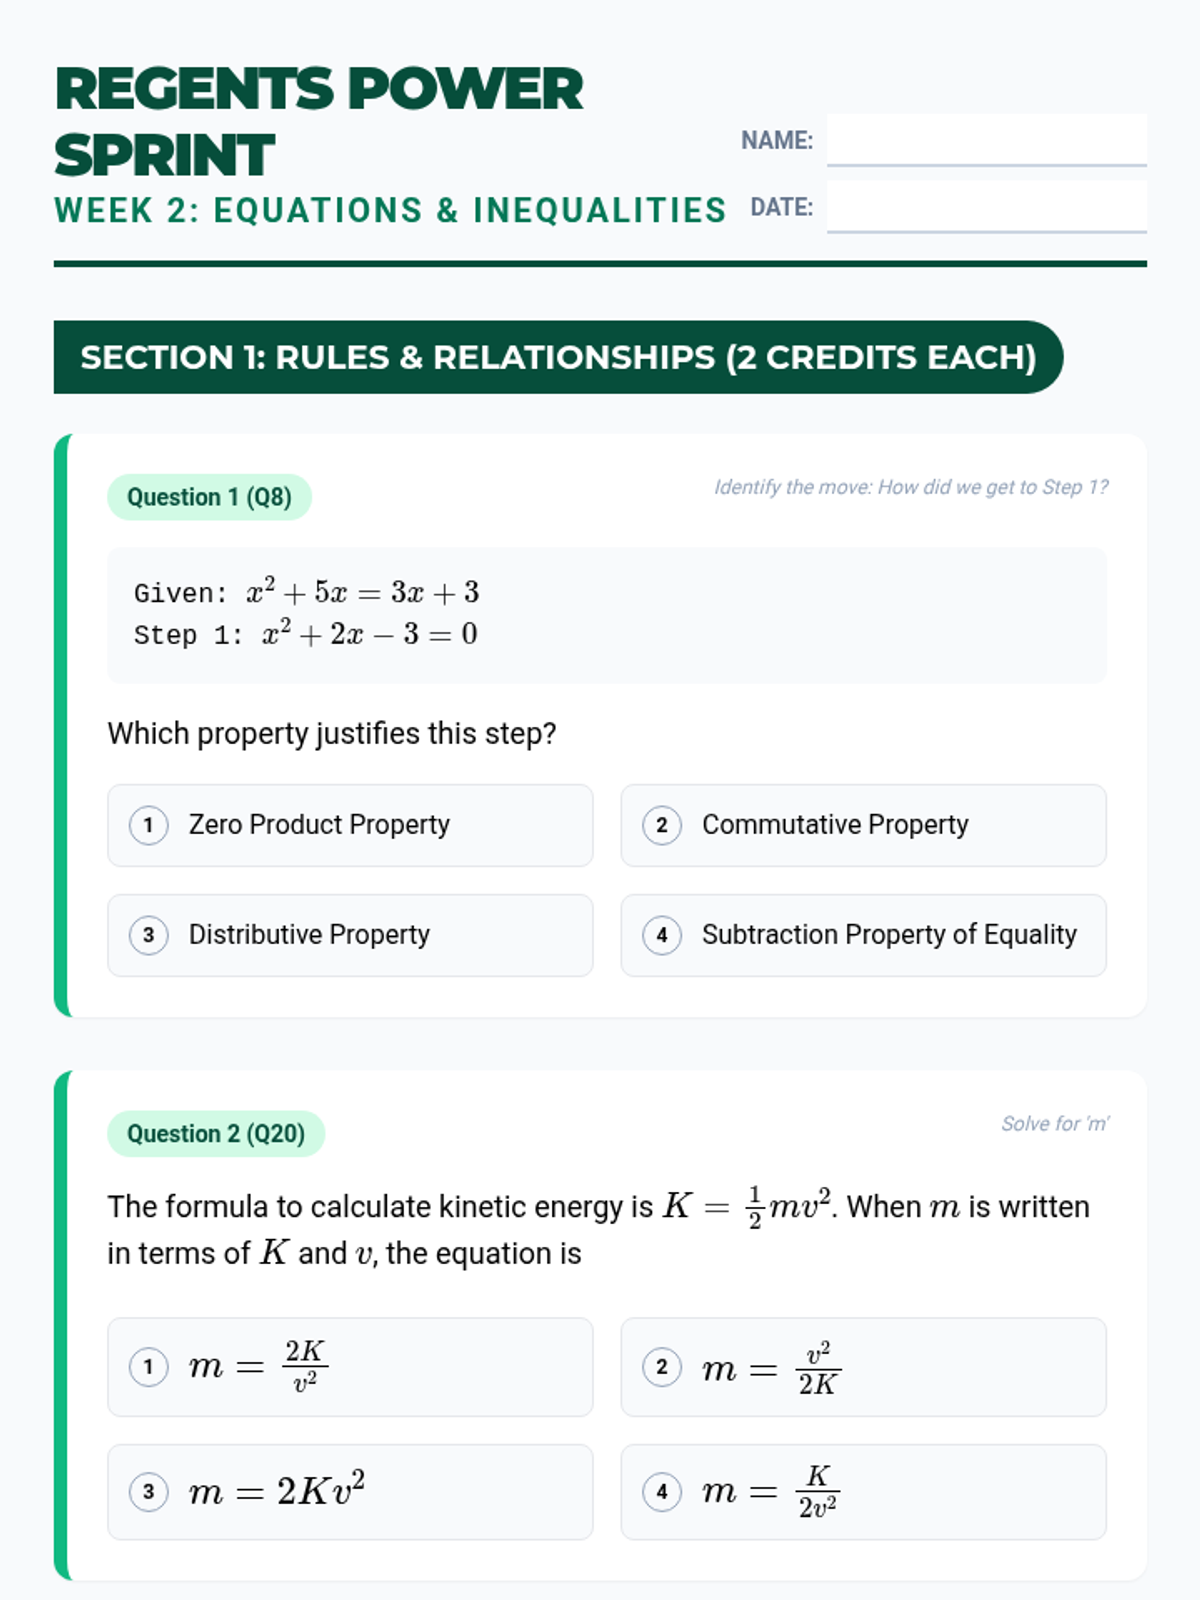
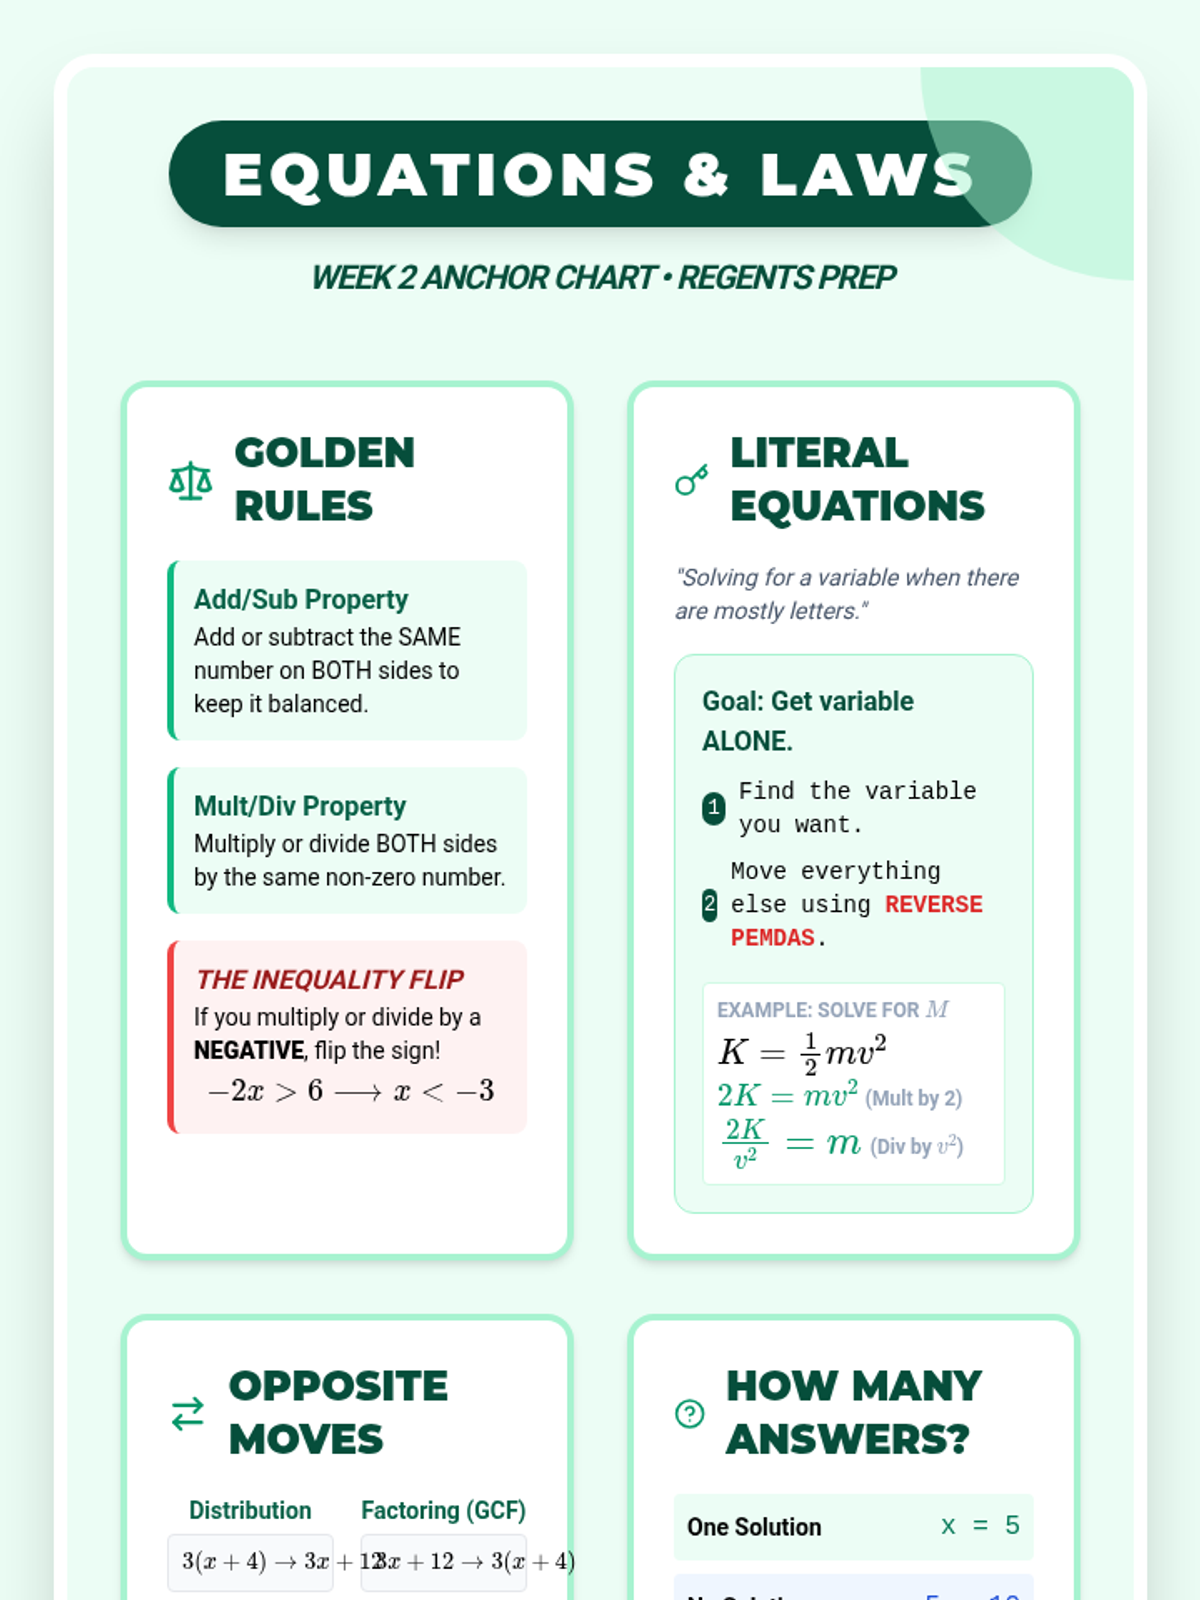
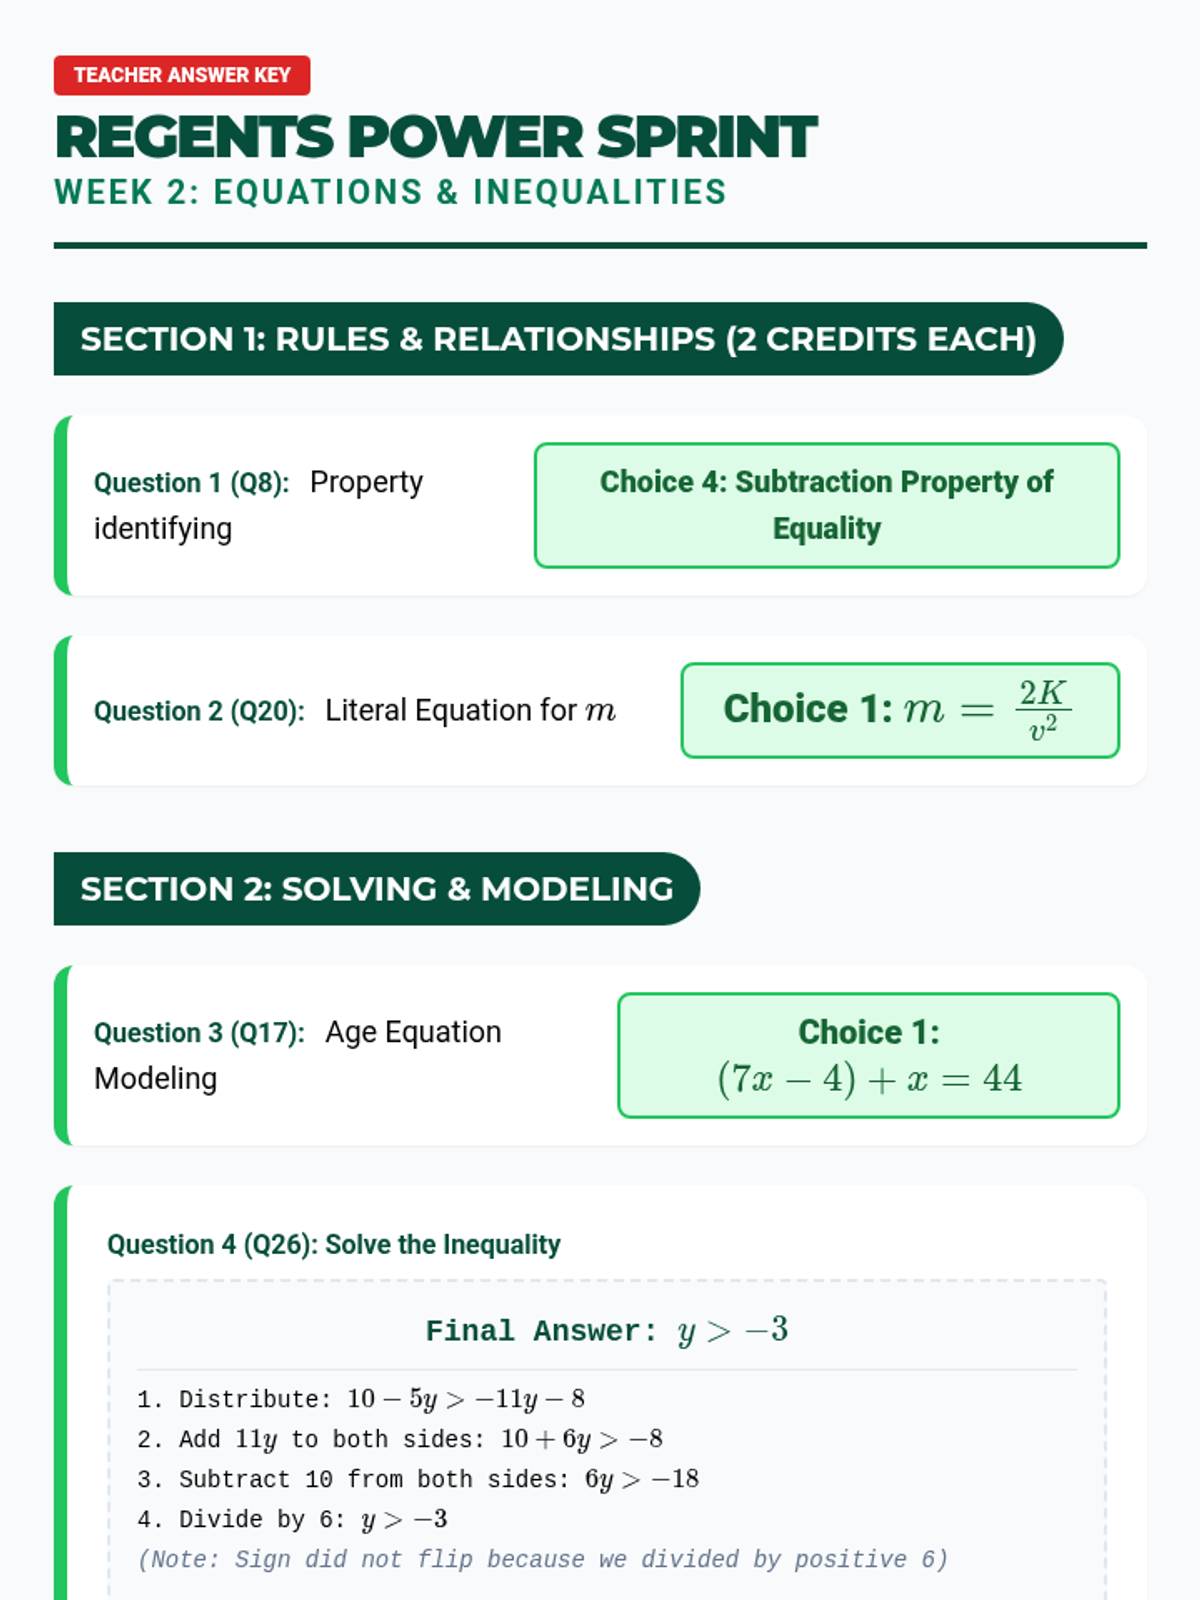
Focus on multi-step equations, literal equations (solving for a variable), and properties of equality.
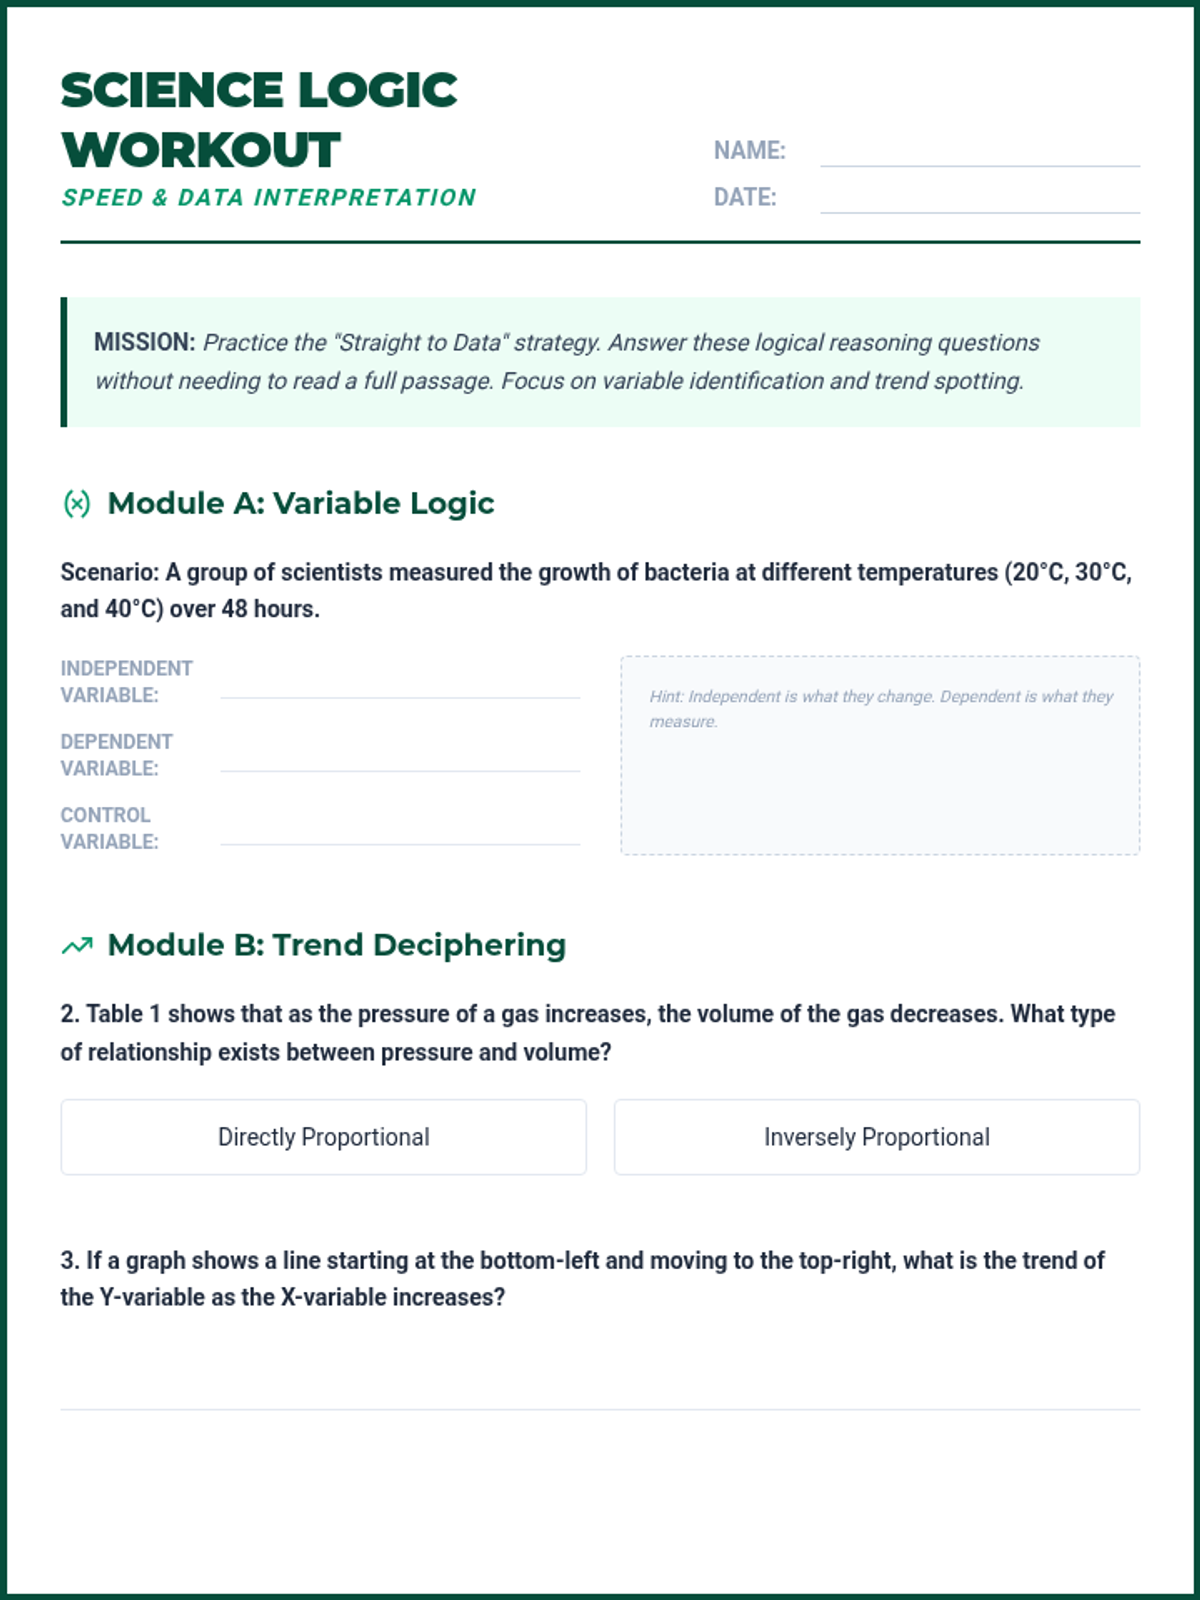
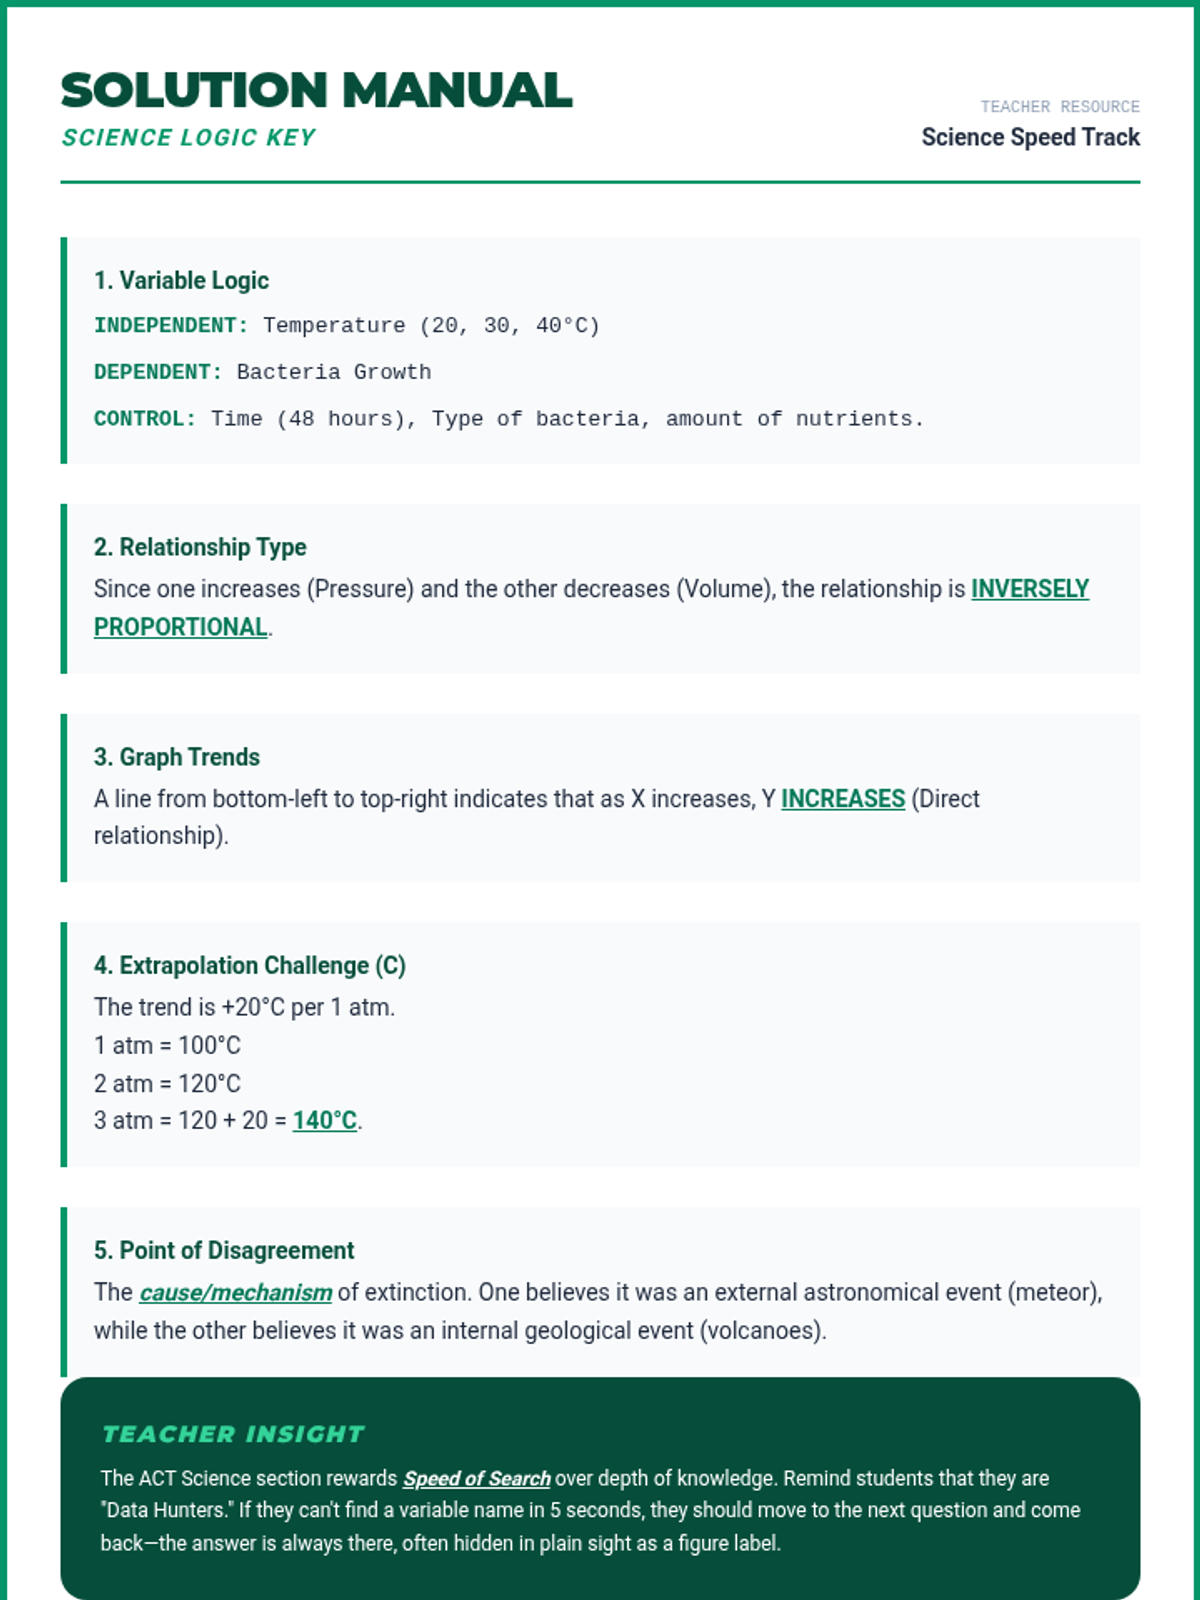
A strategic masterclass for the ACT Science section, focusing on speed-reading data sets, identifying experimental variables, and decoding scientific logic. This lesson emphasizes the 'Straight to the Data' approach to maximize score in the 35-minute time limit.
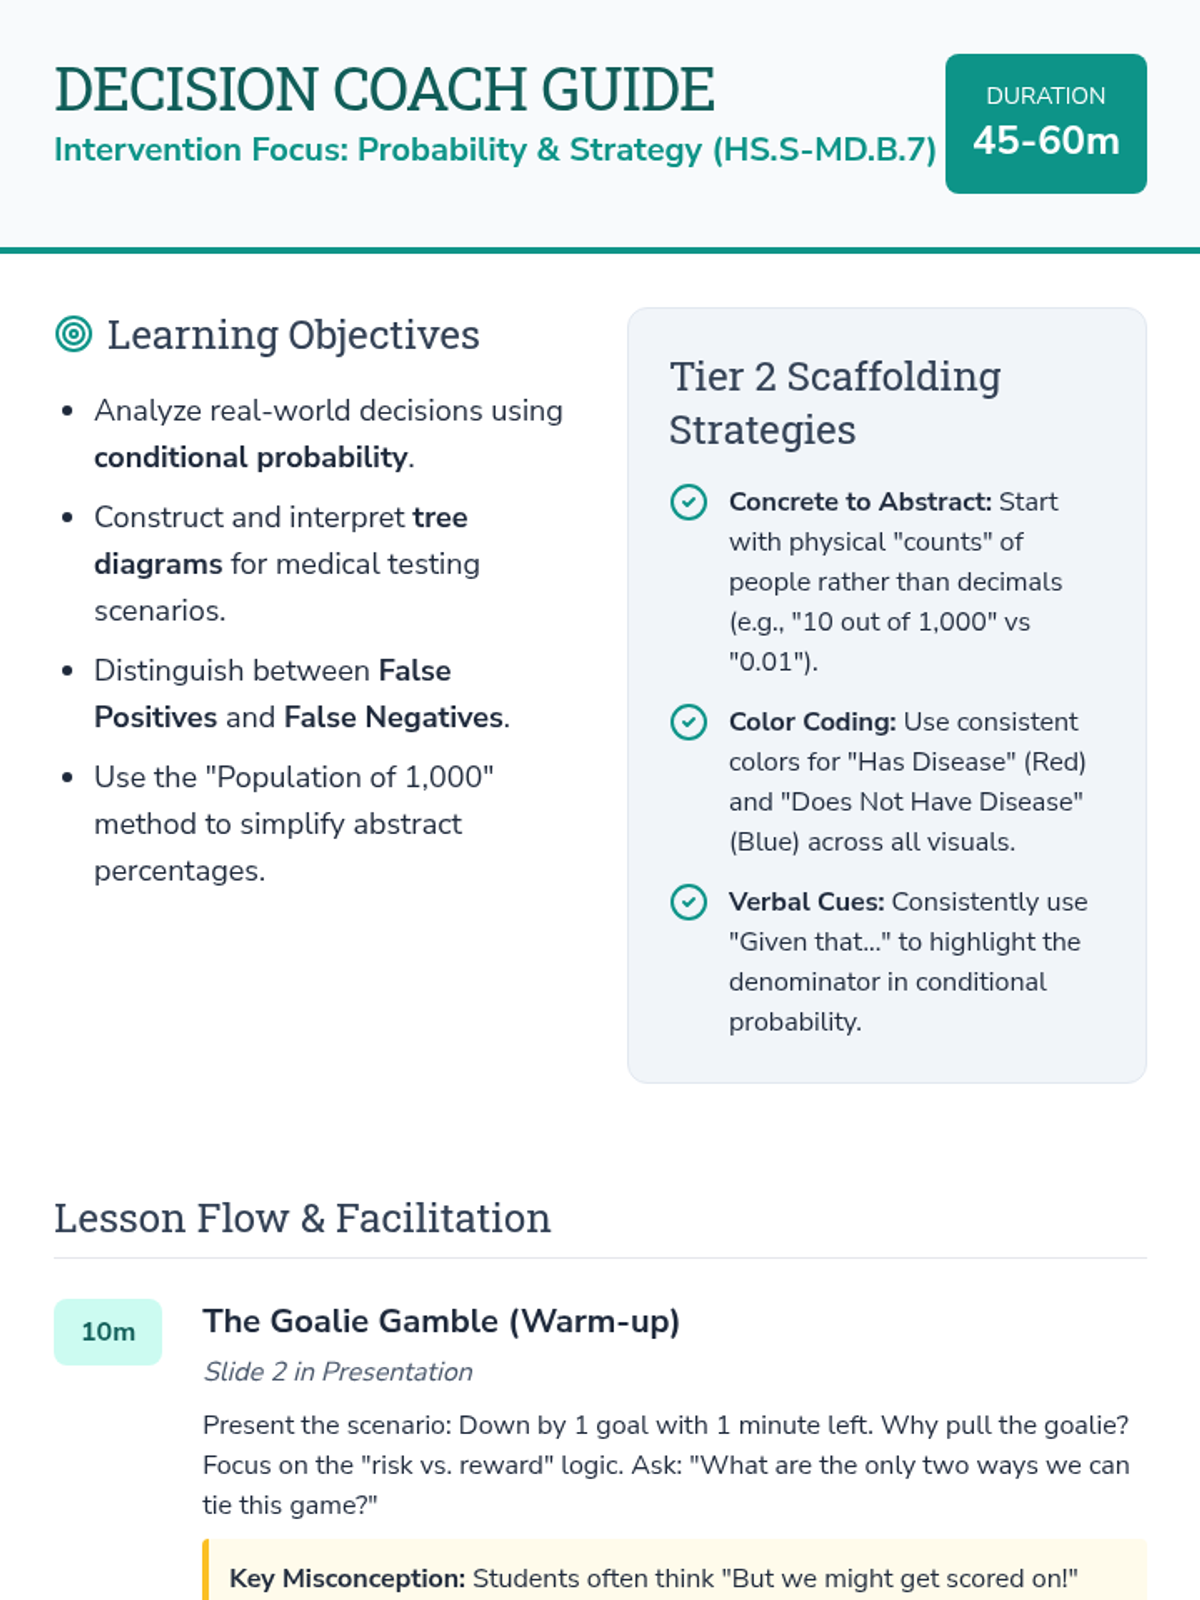
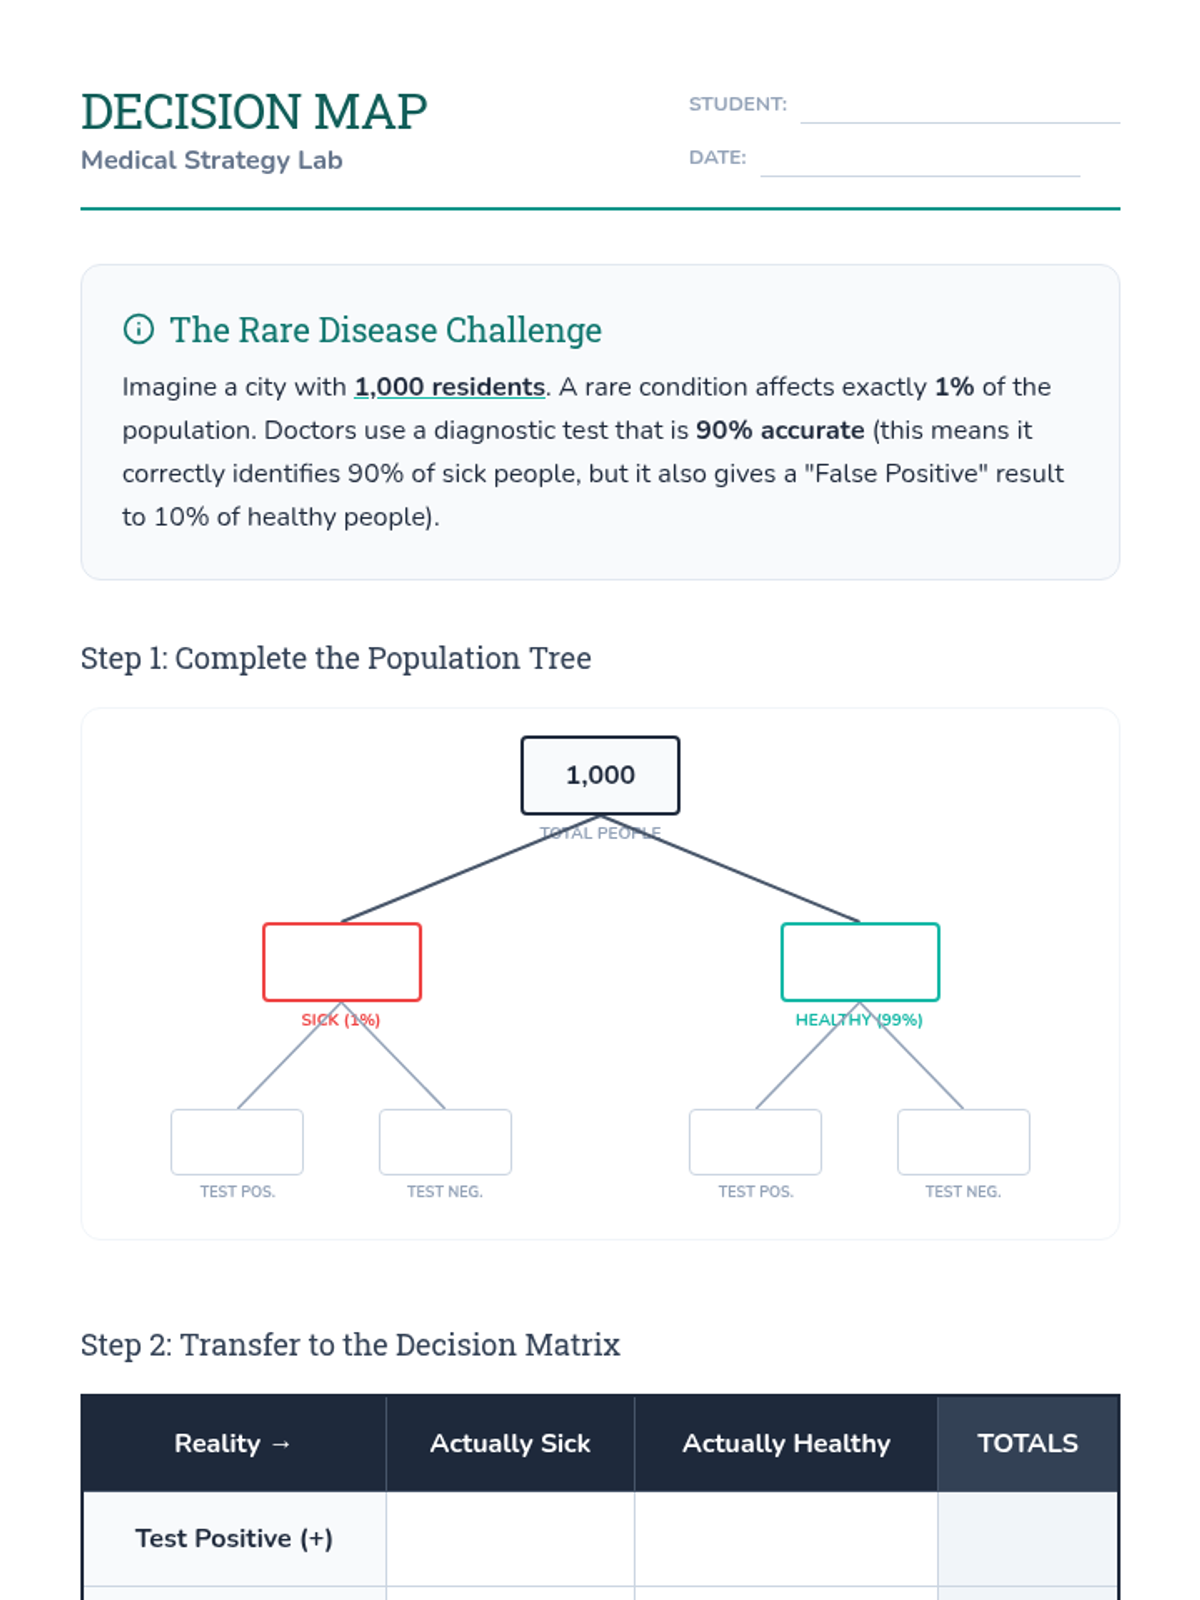
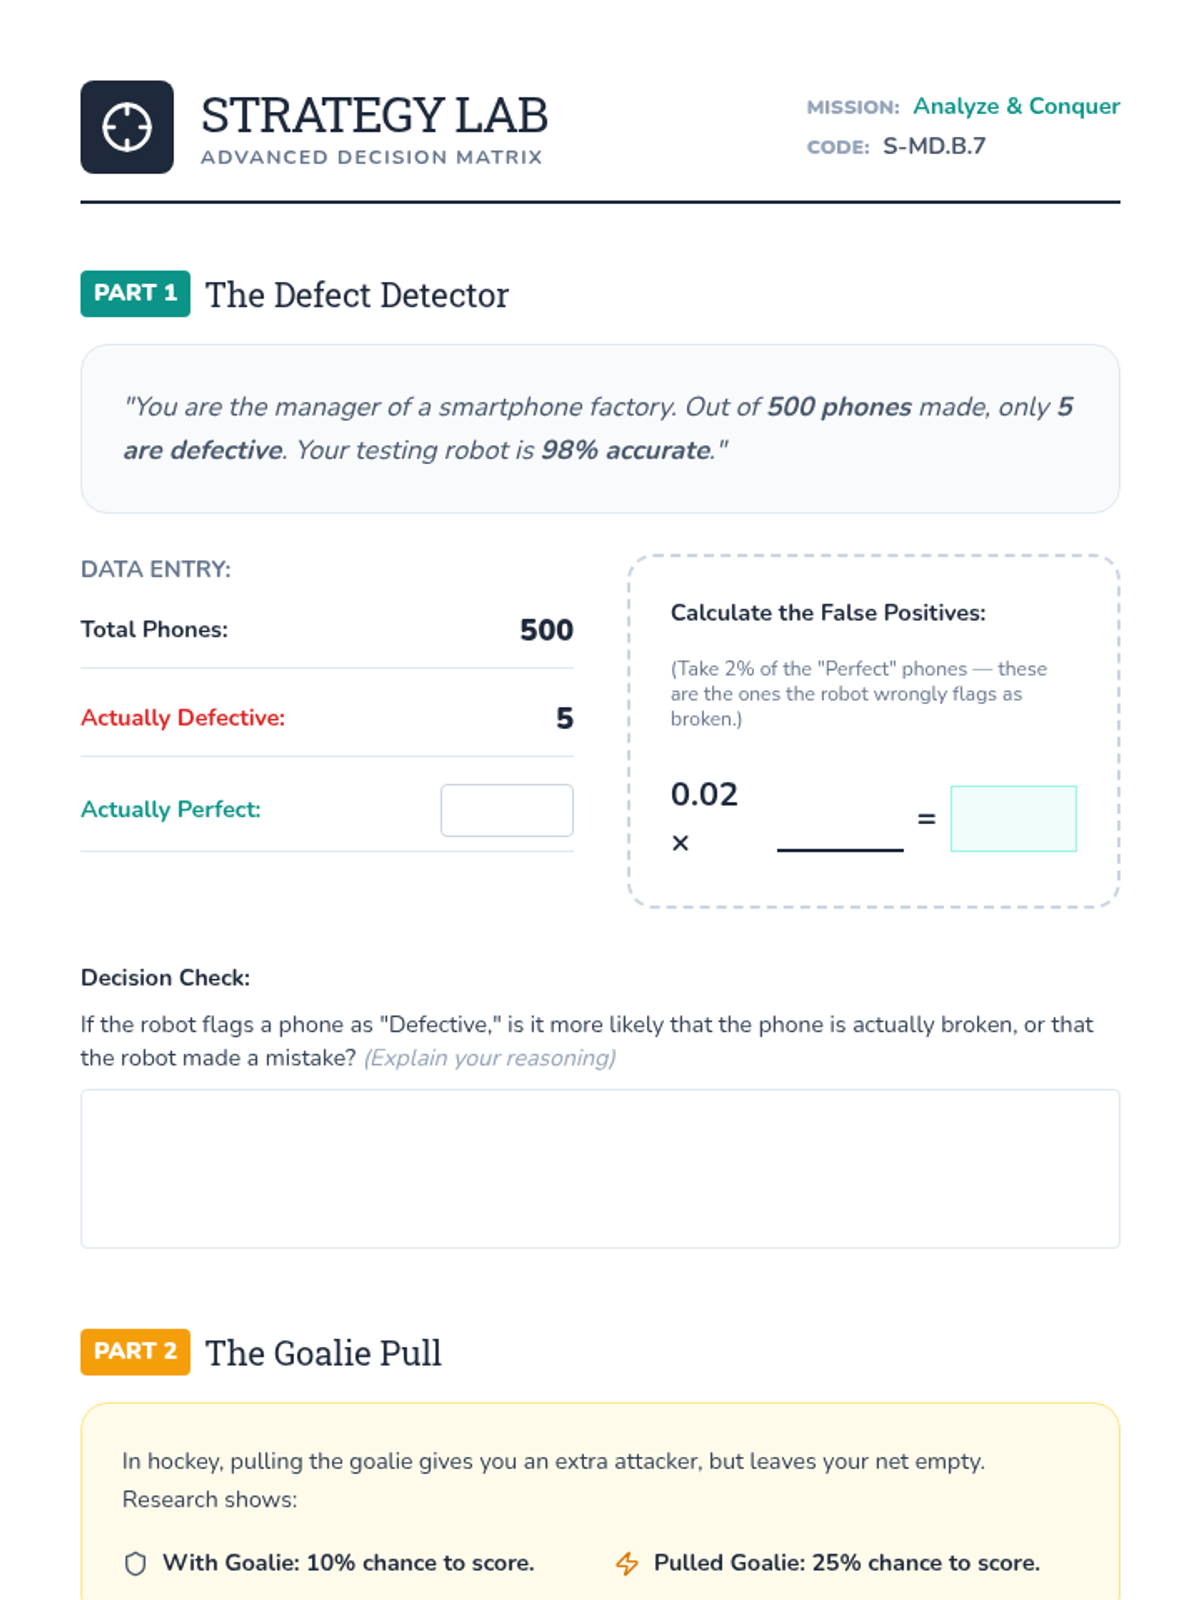
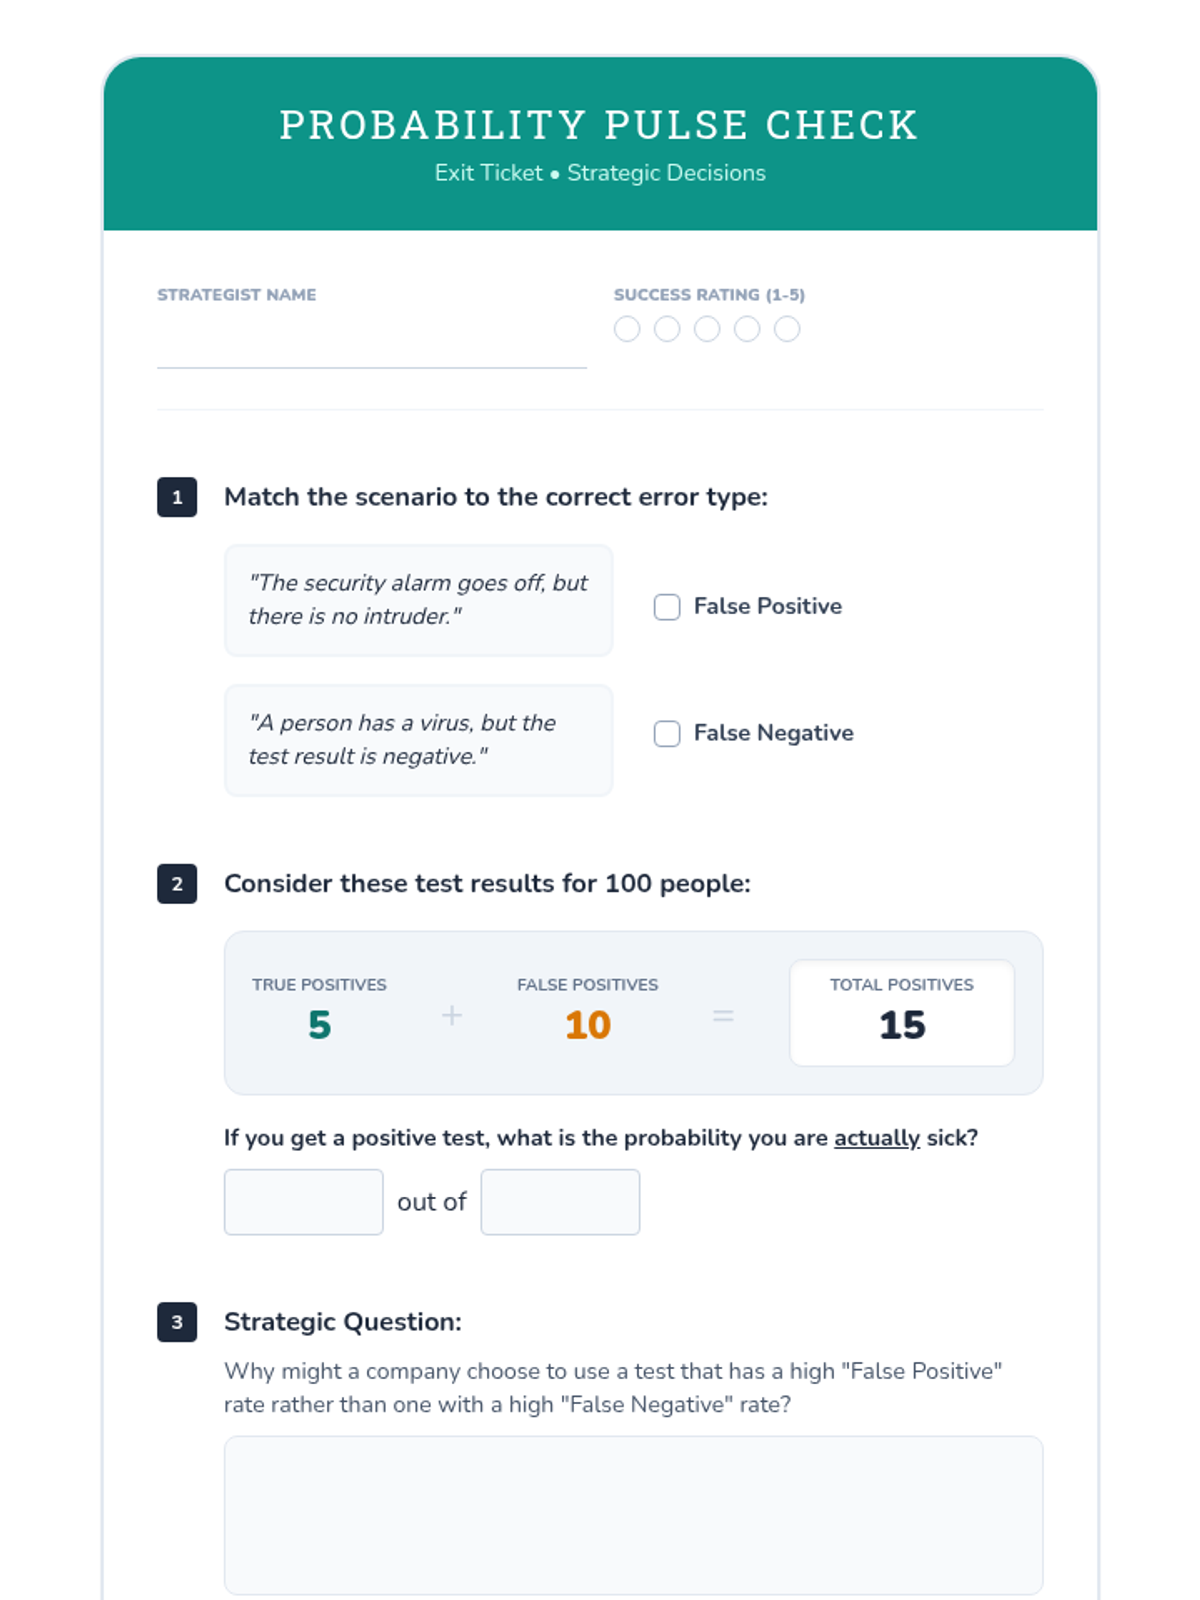
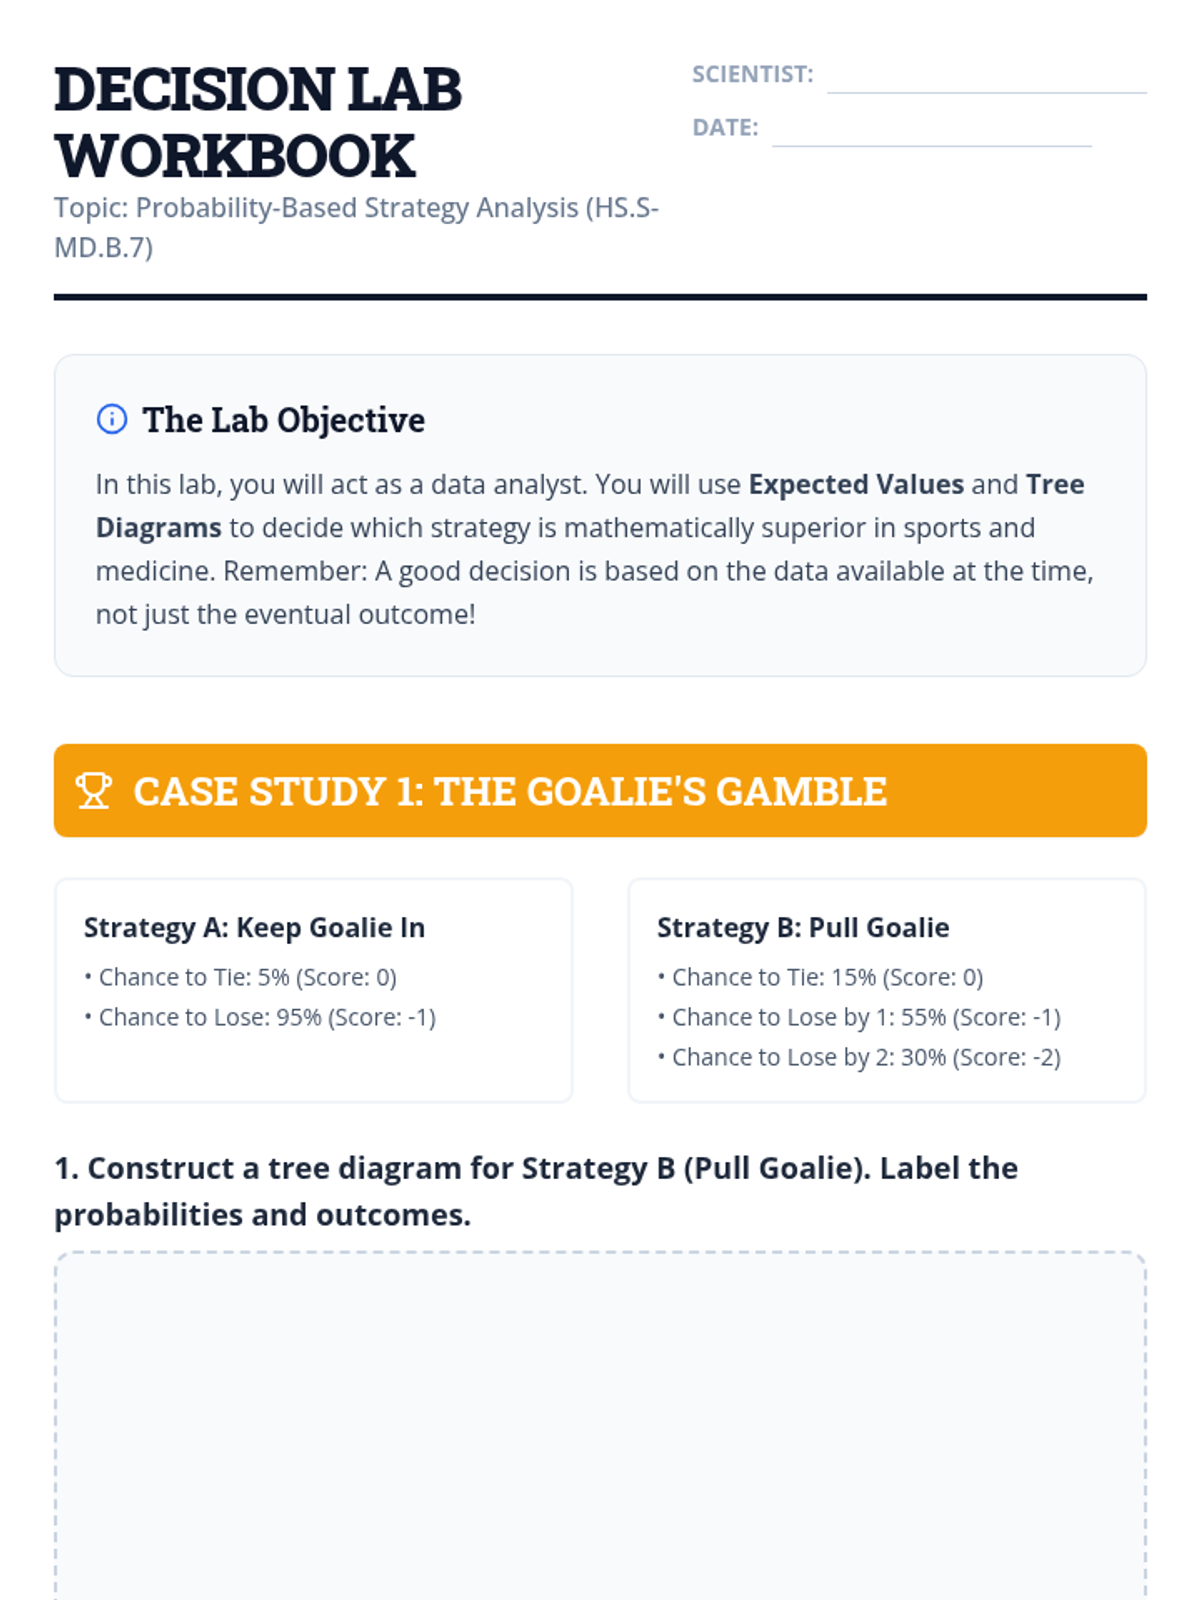
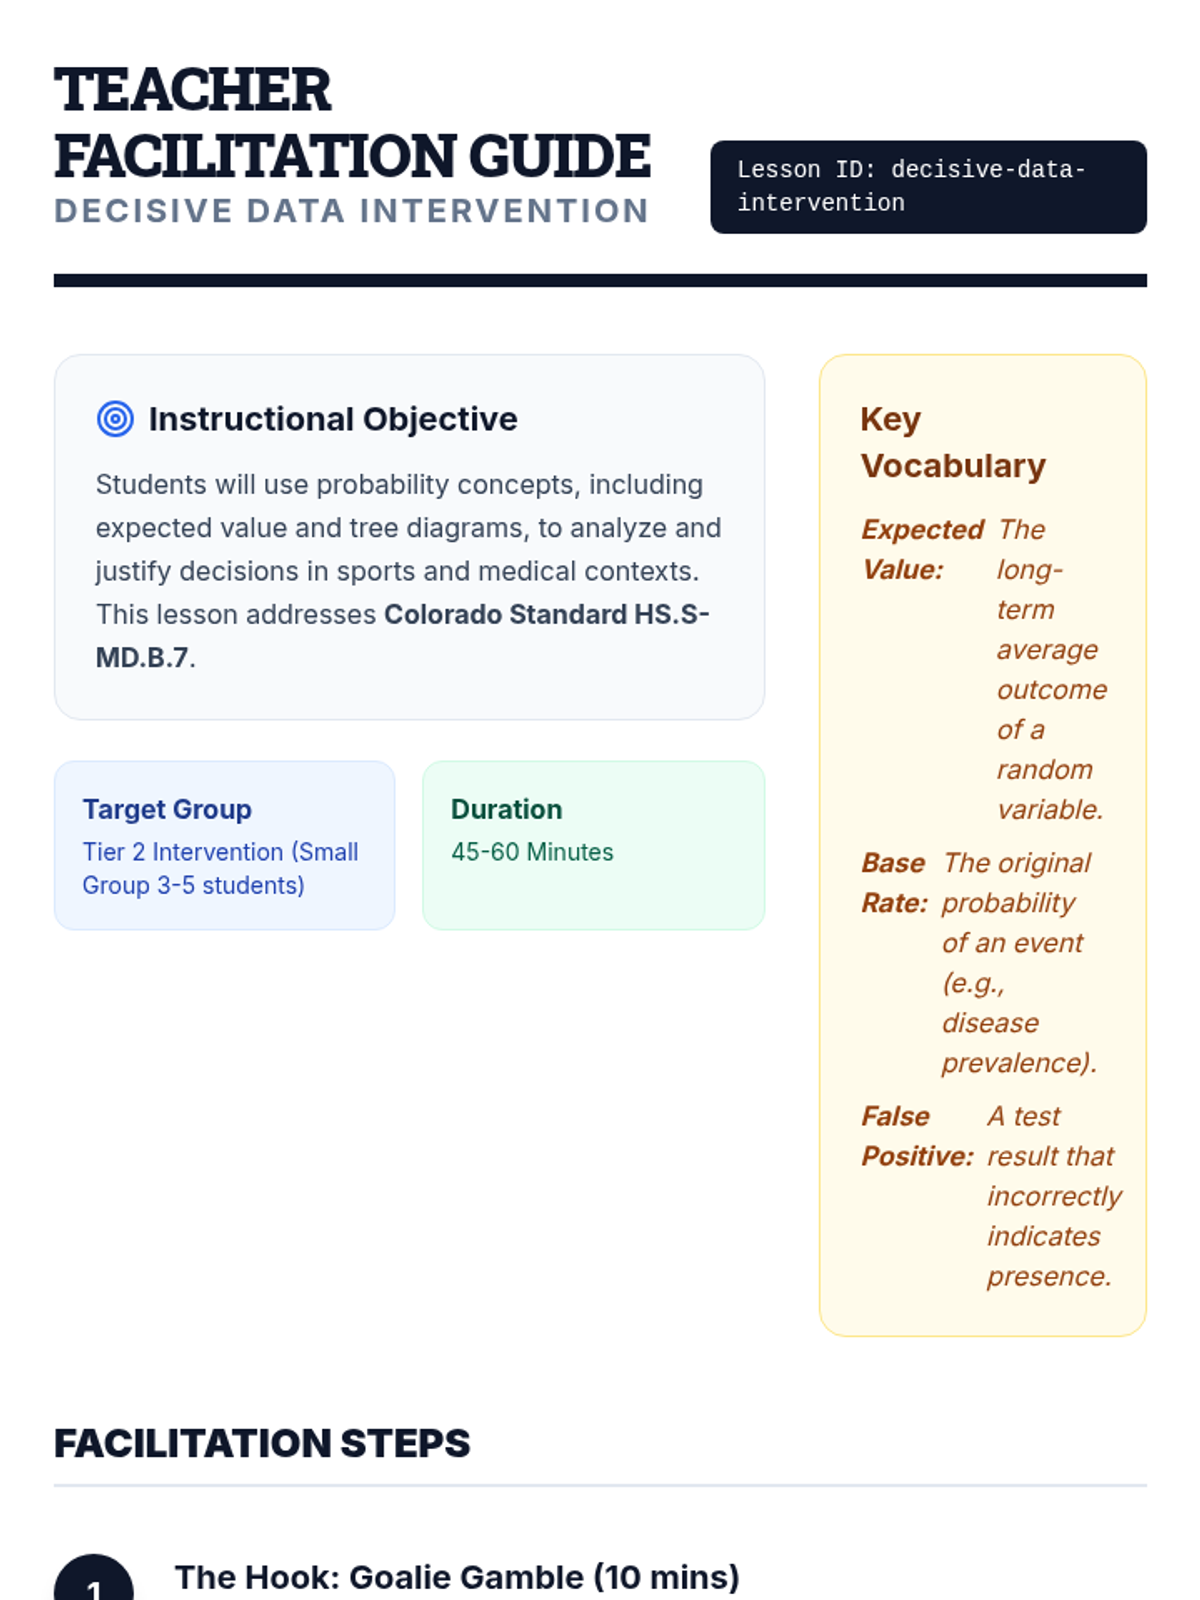
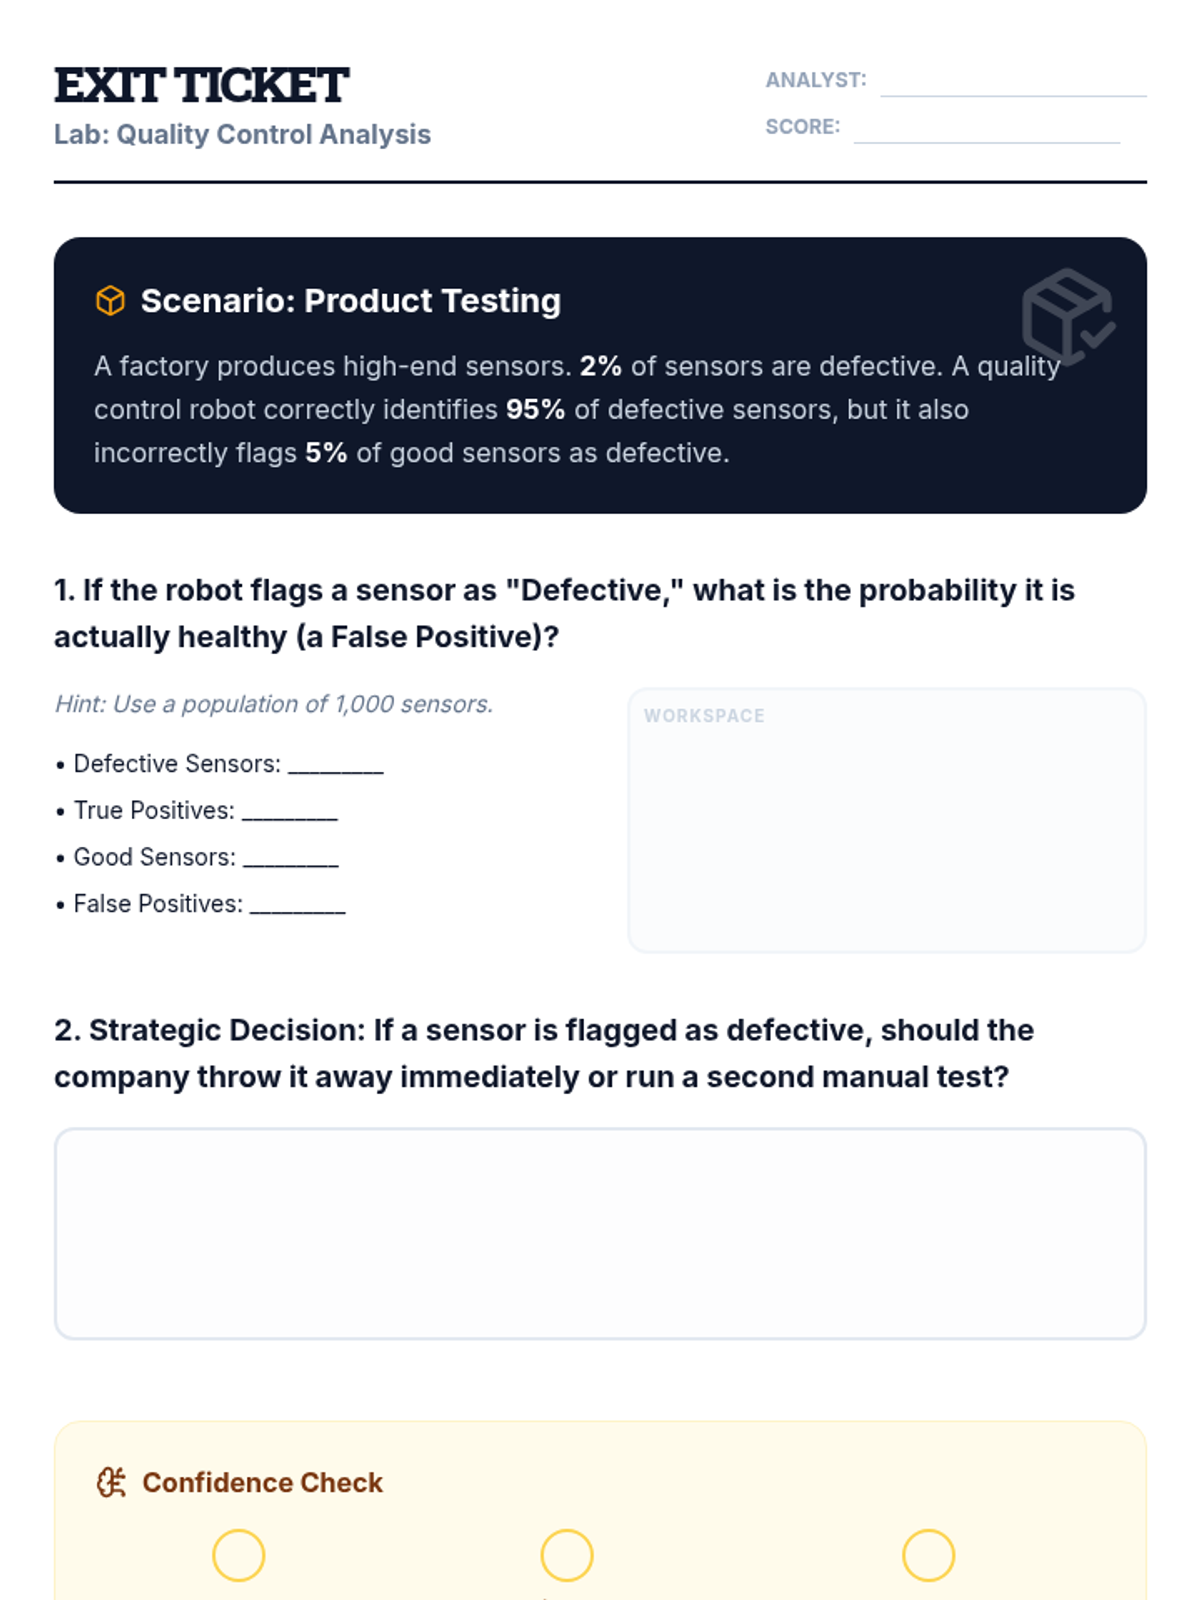
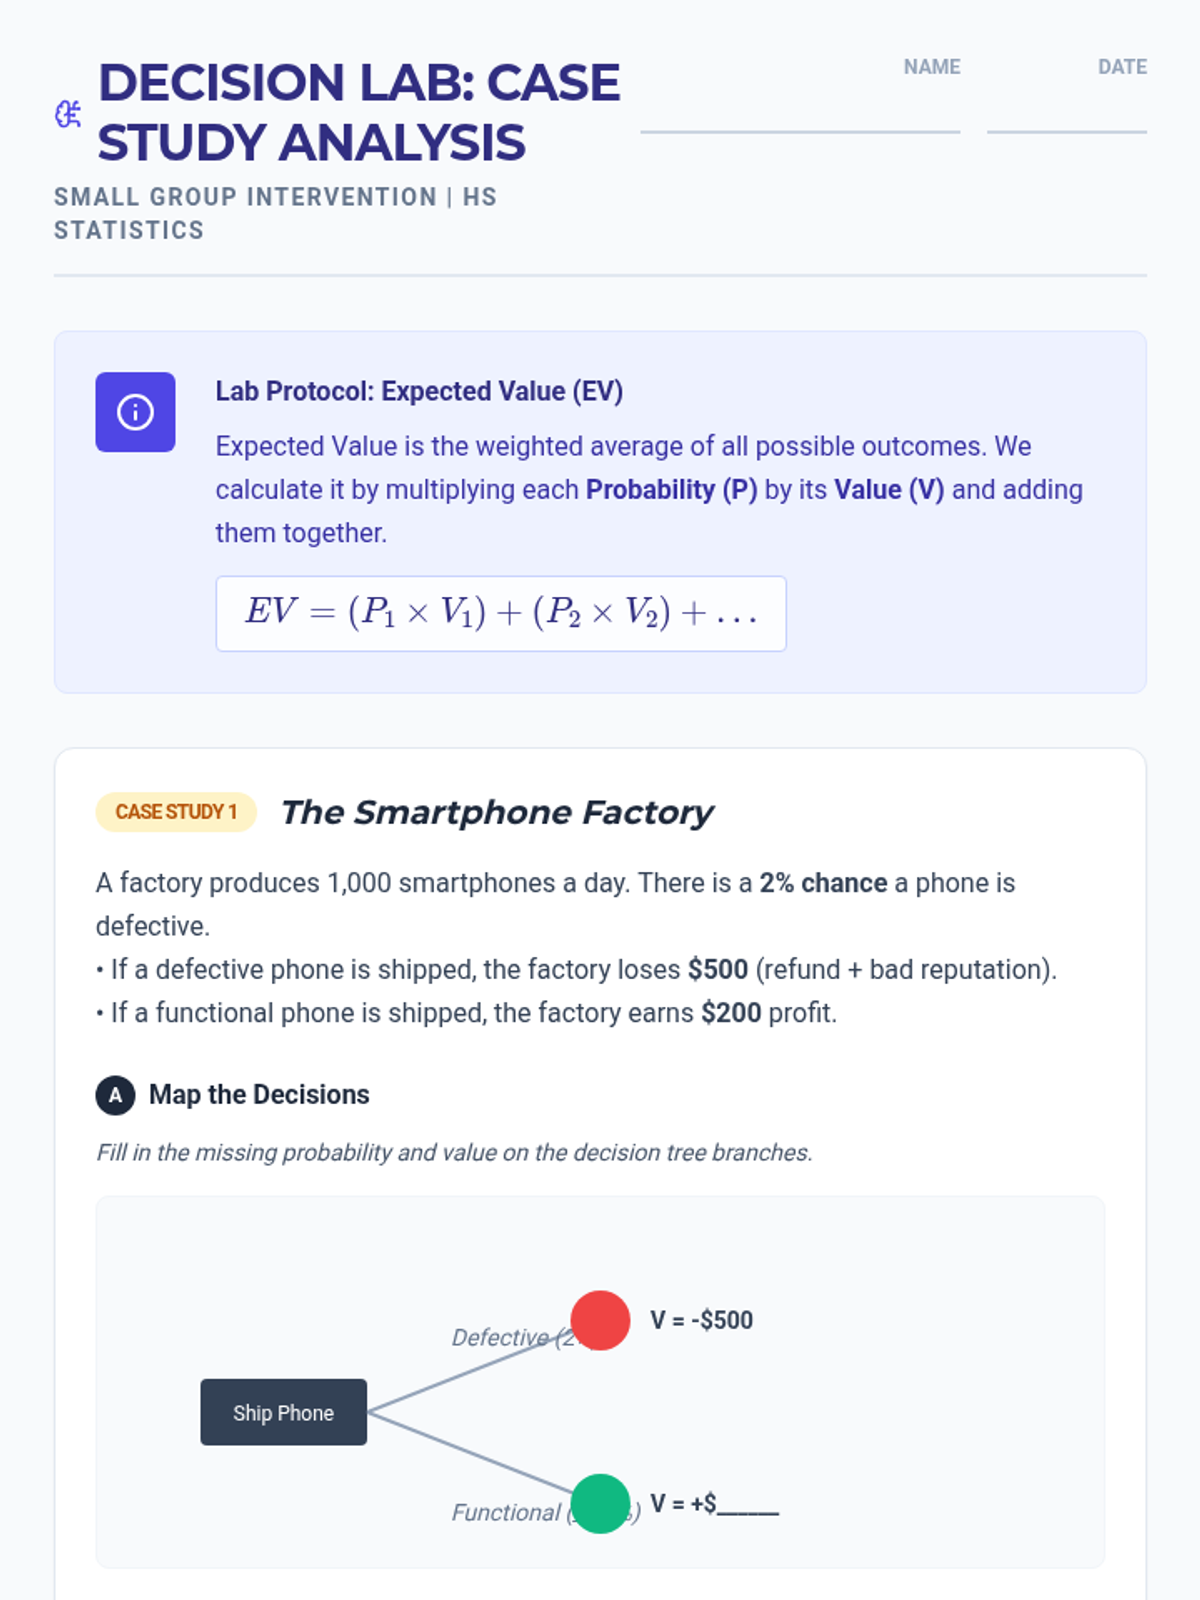
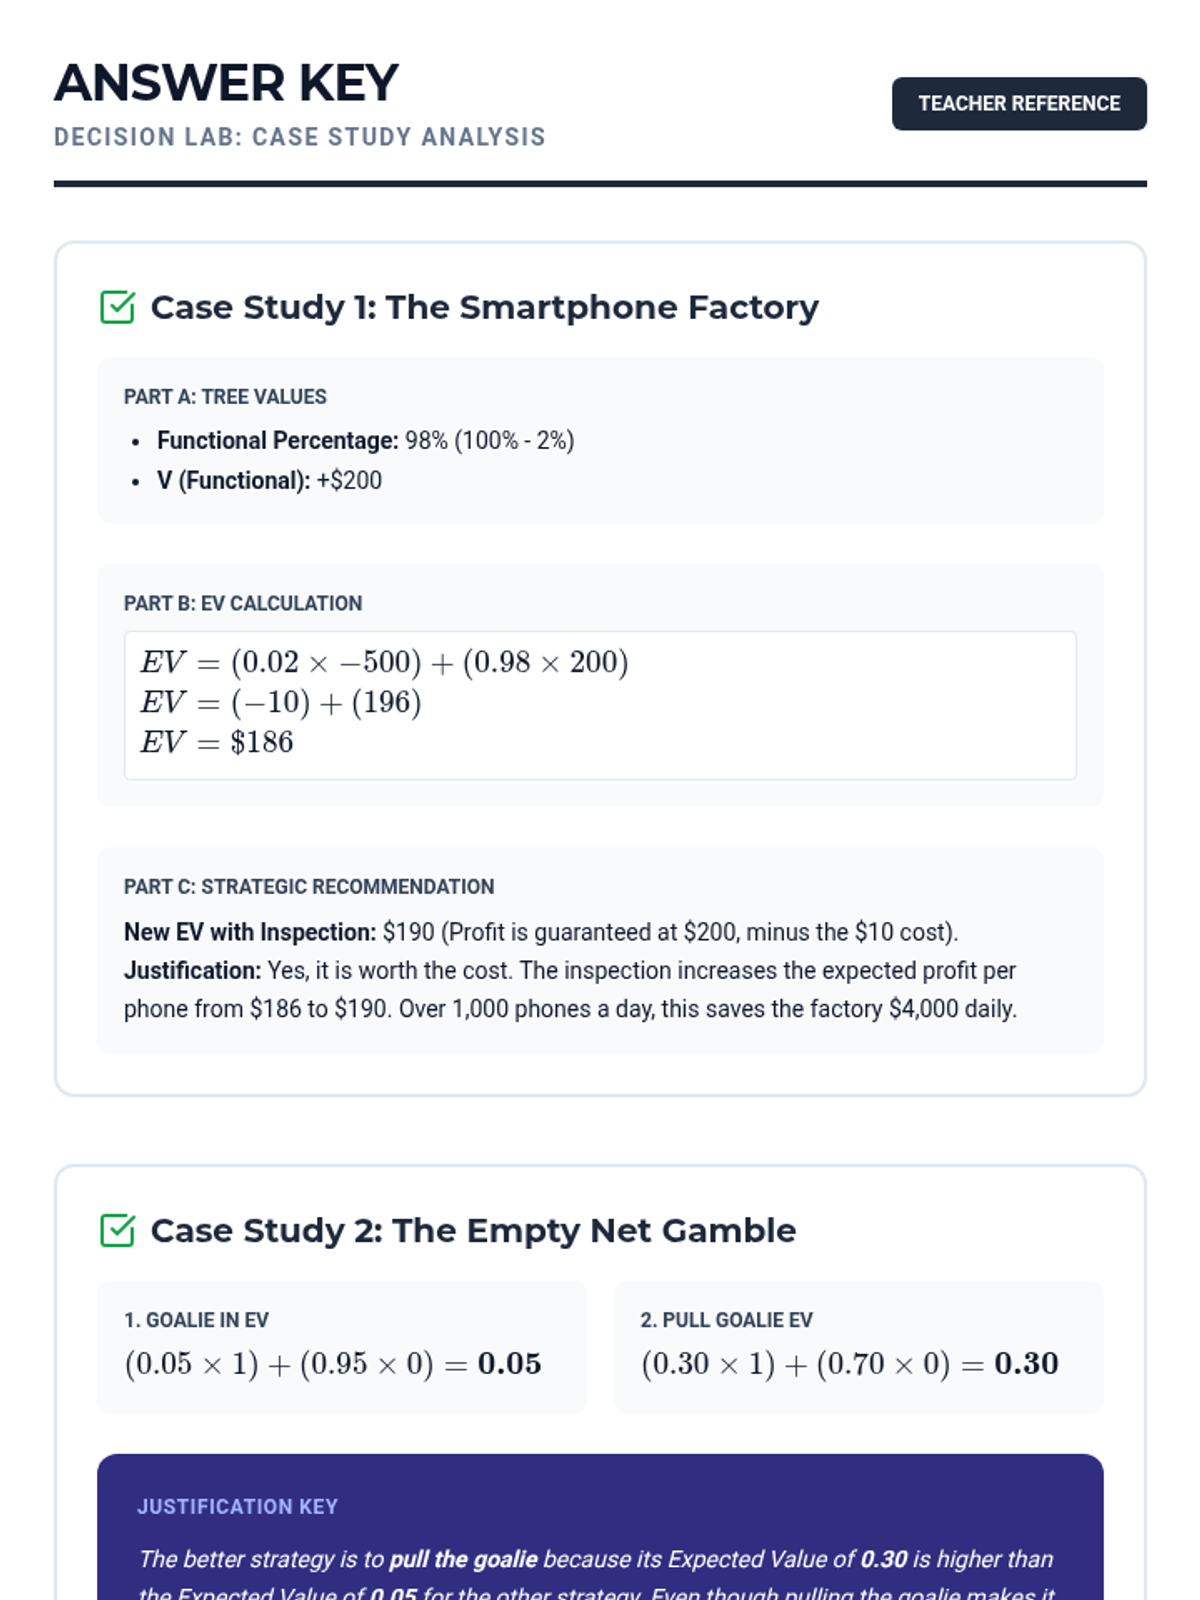
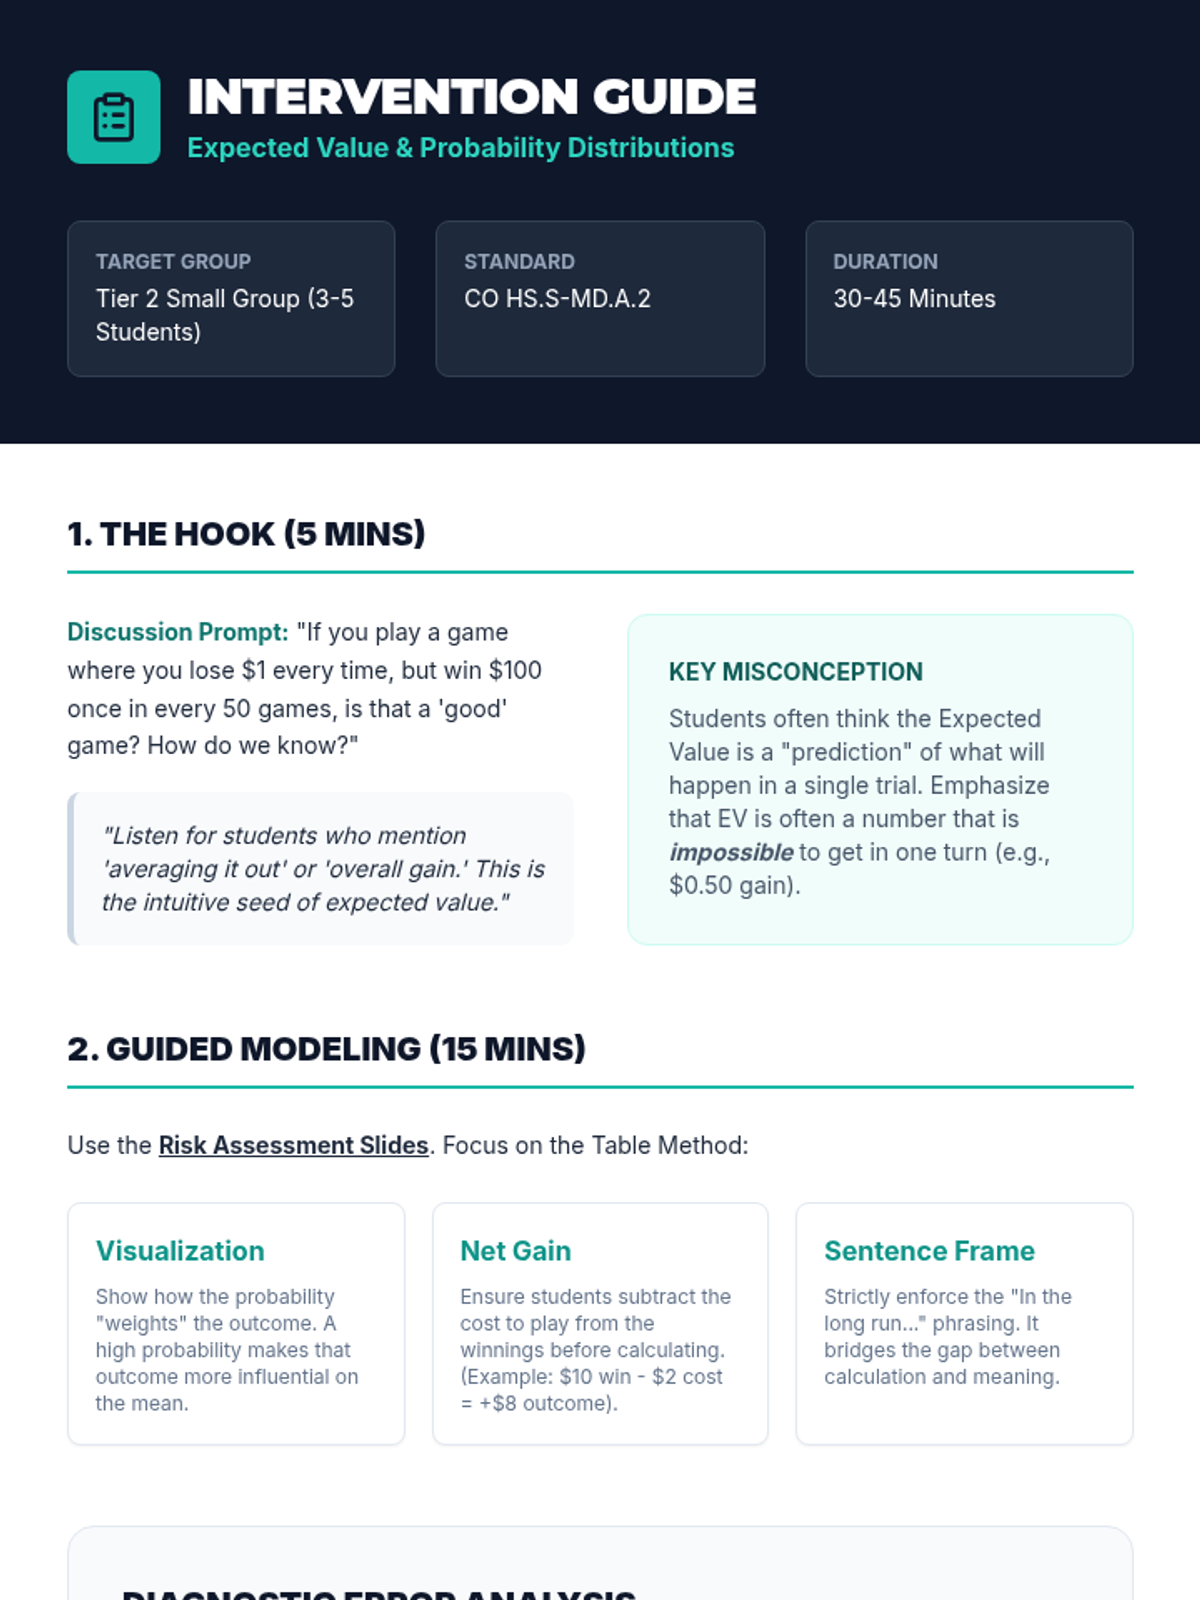
A scaffolded intervention lesson where students analyze the effectiveness of medical tests and strategic decisions using tree diagrams and expected value. Focused on High School Statistics standard HS.S-MD.B.7 with a heavy emphasis on visual logic and false positive/negative reasoning.
A targeted small group intervention lesson focused on using probability to make and analyze real-world decisions in sports and medicine. Students will use expected value and tree diagrams to justify strategies like pulling a hockey goalie or interpreting medical tests.
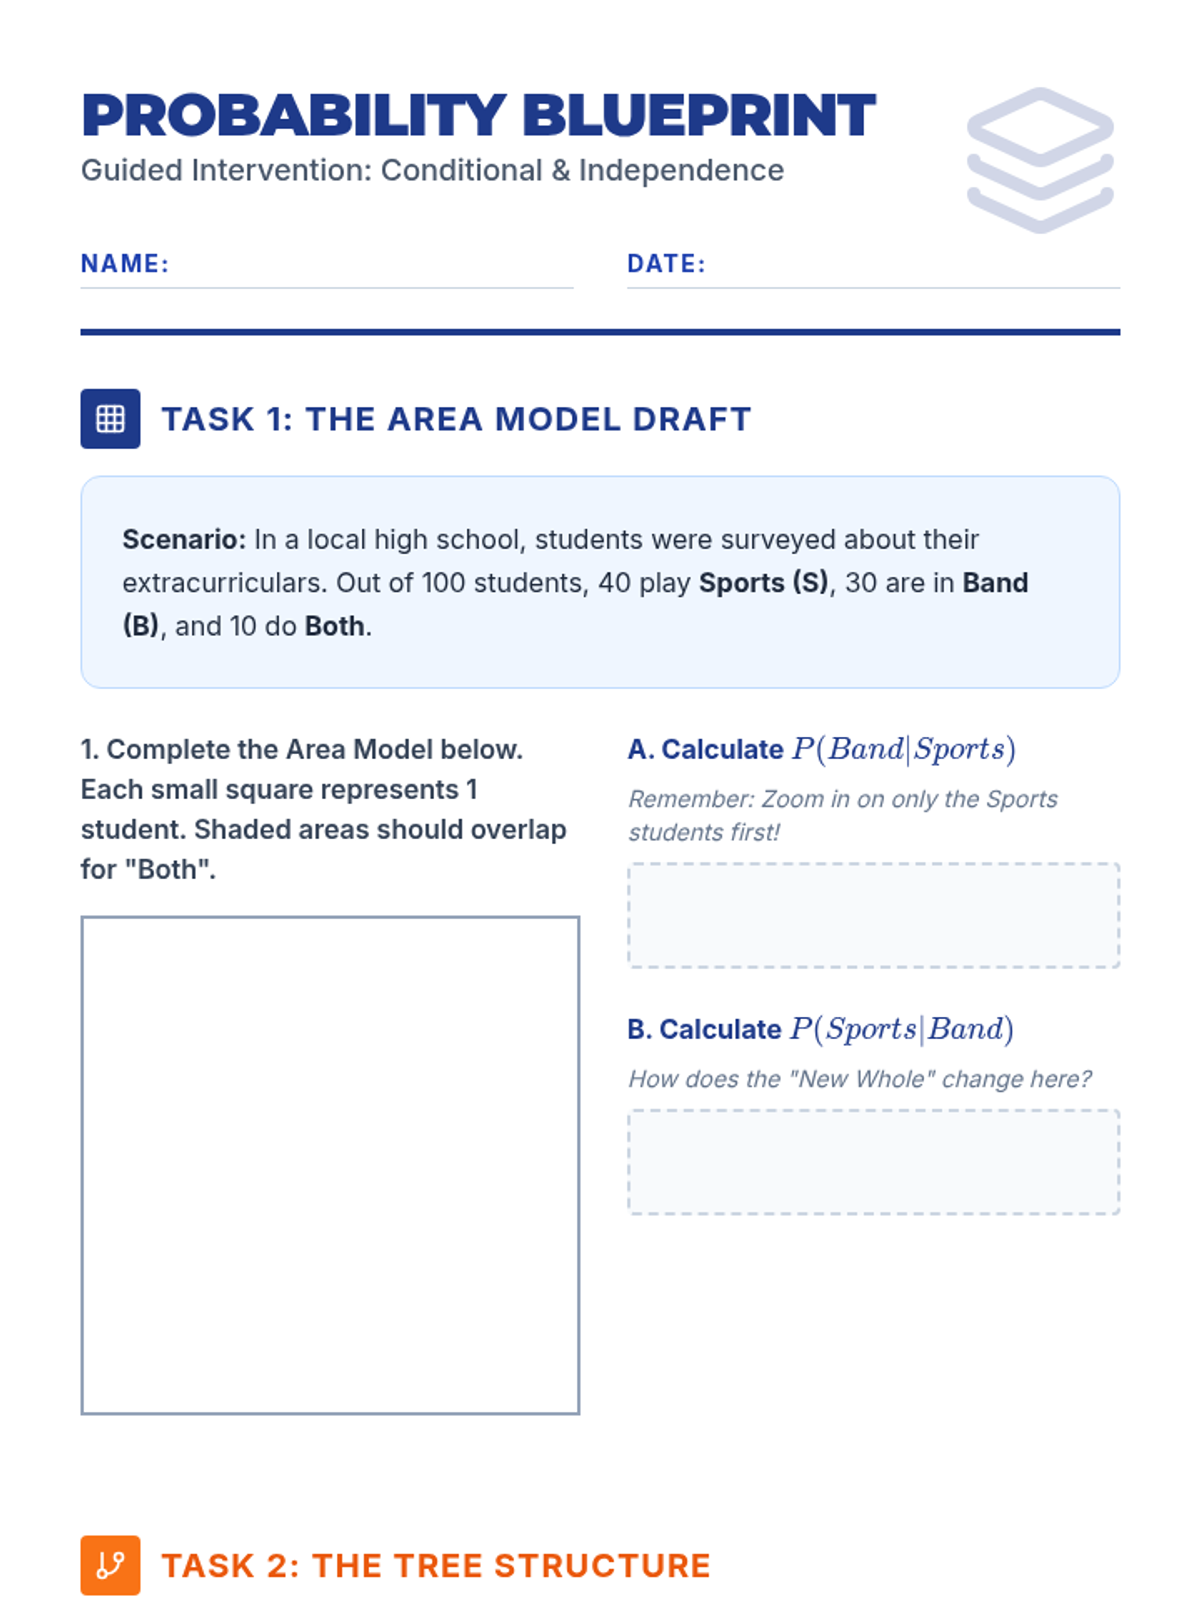
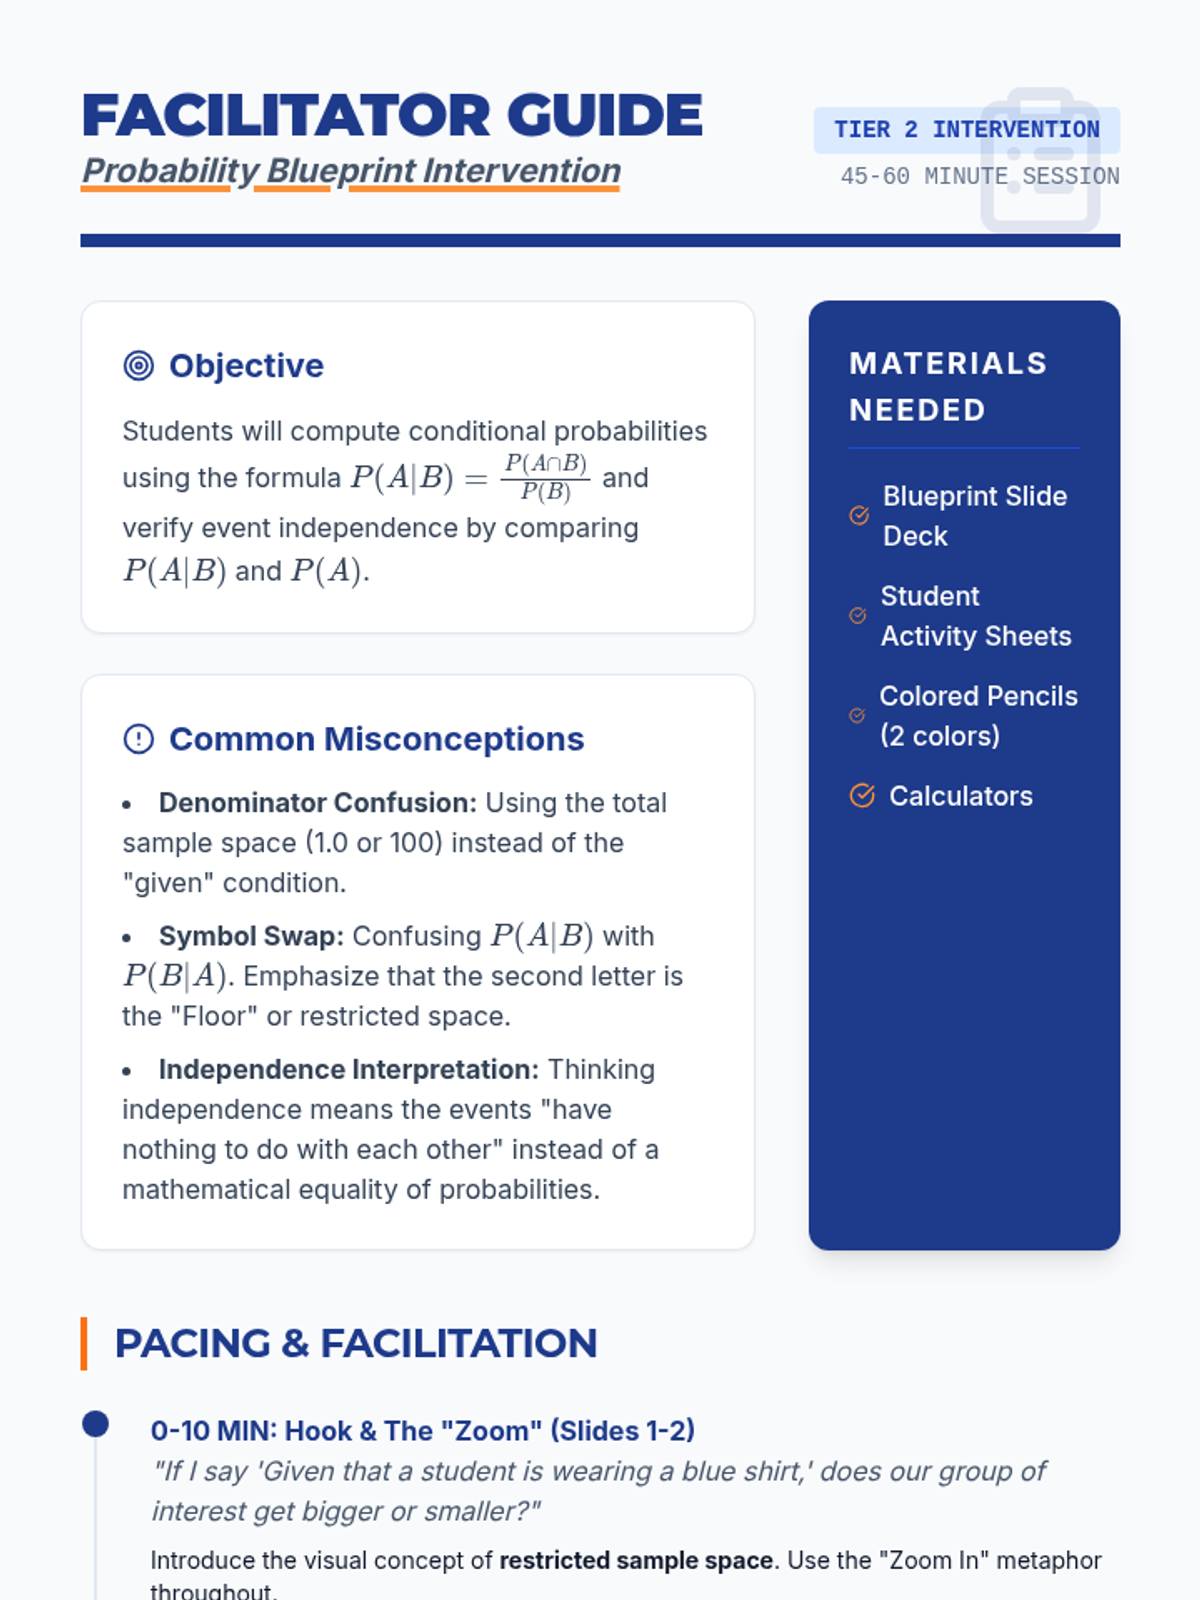
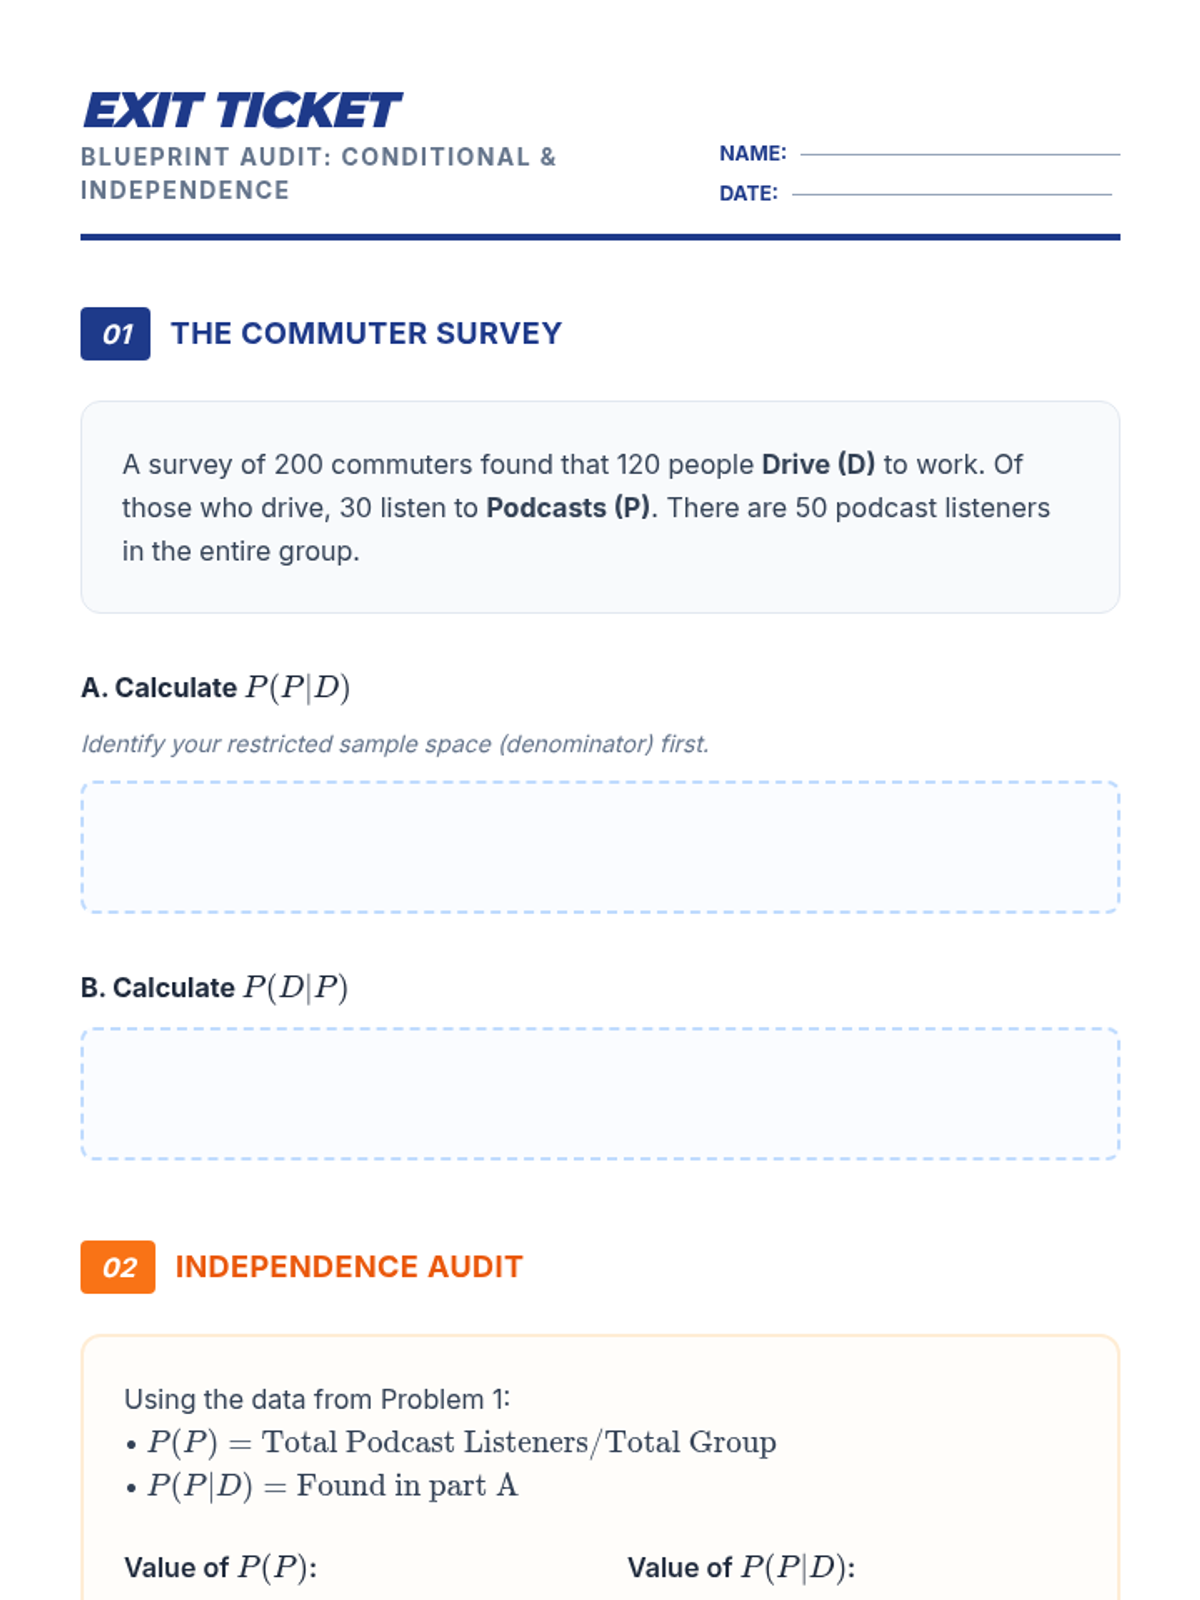
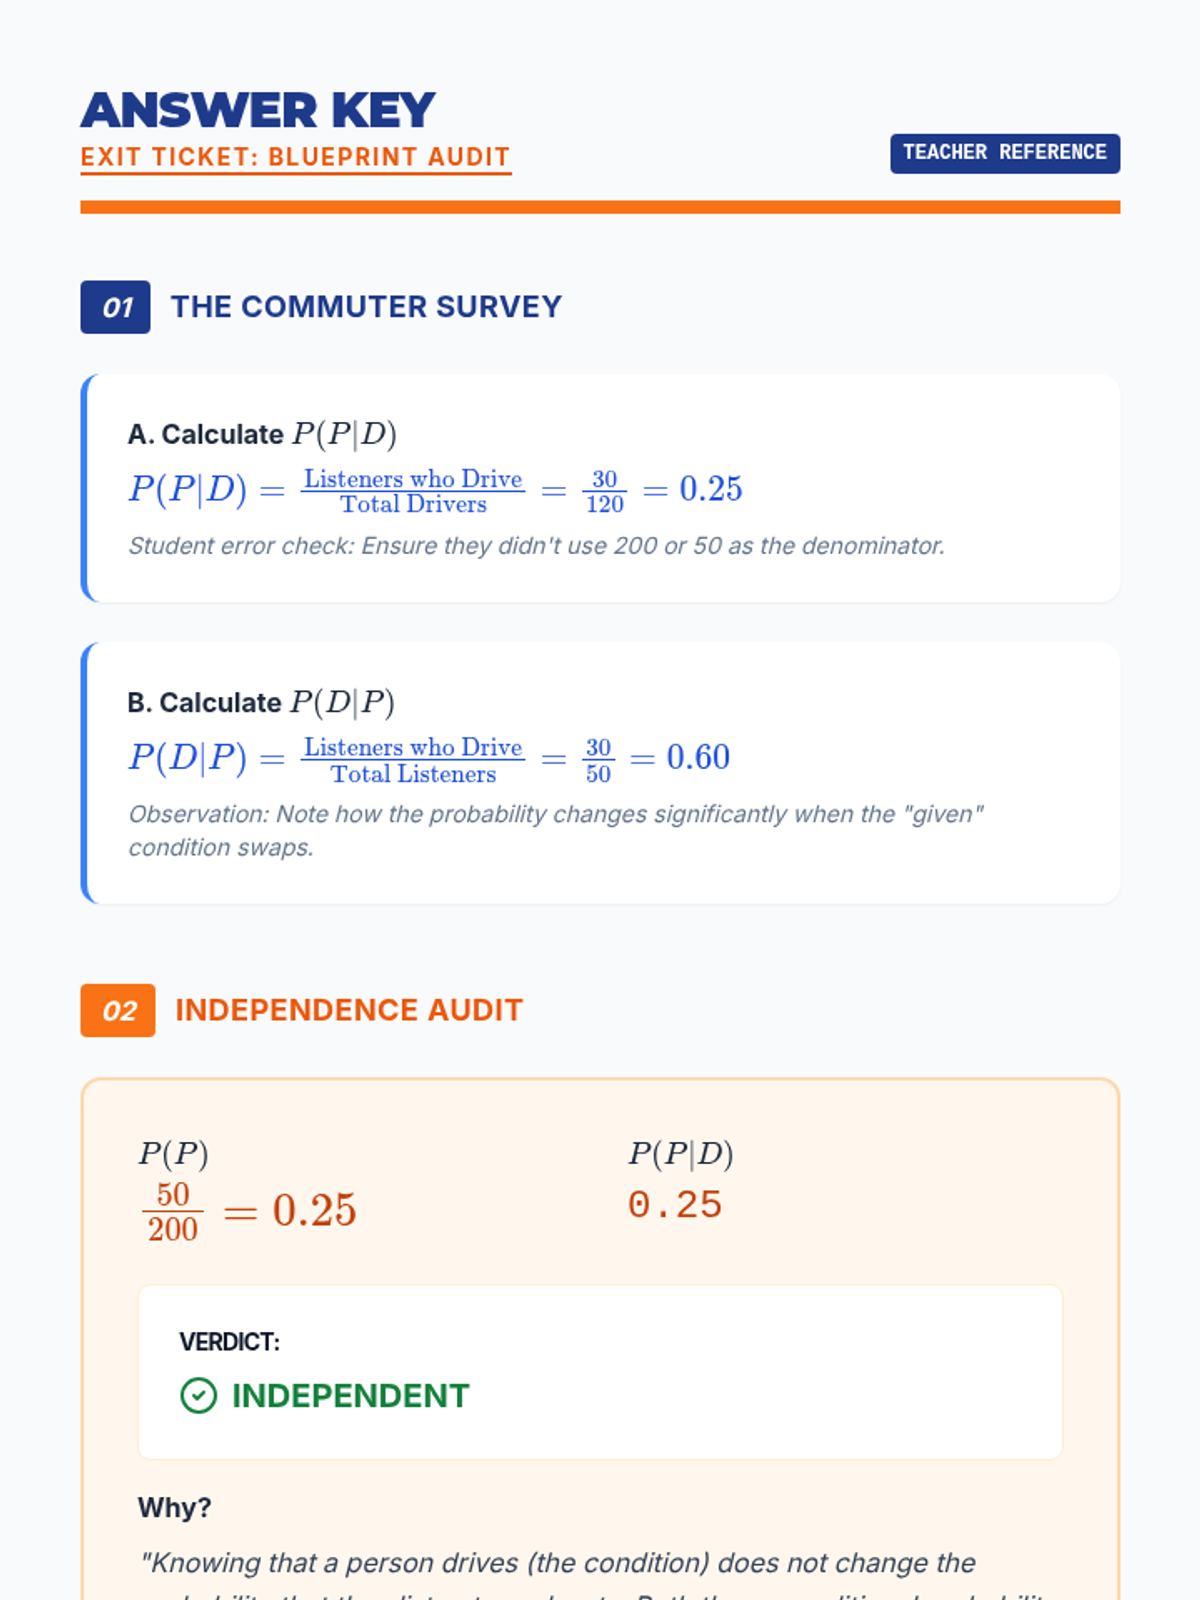
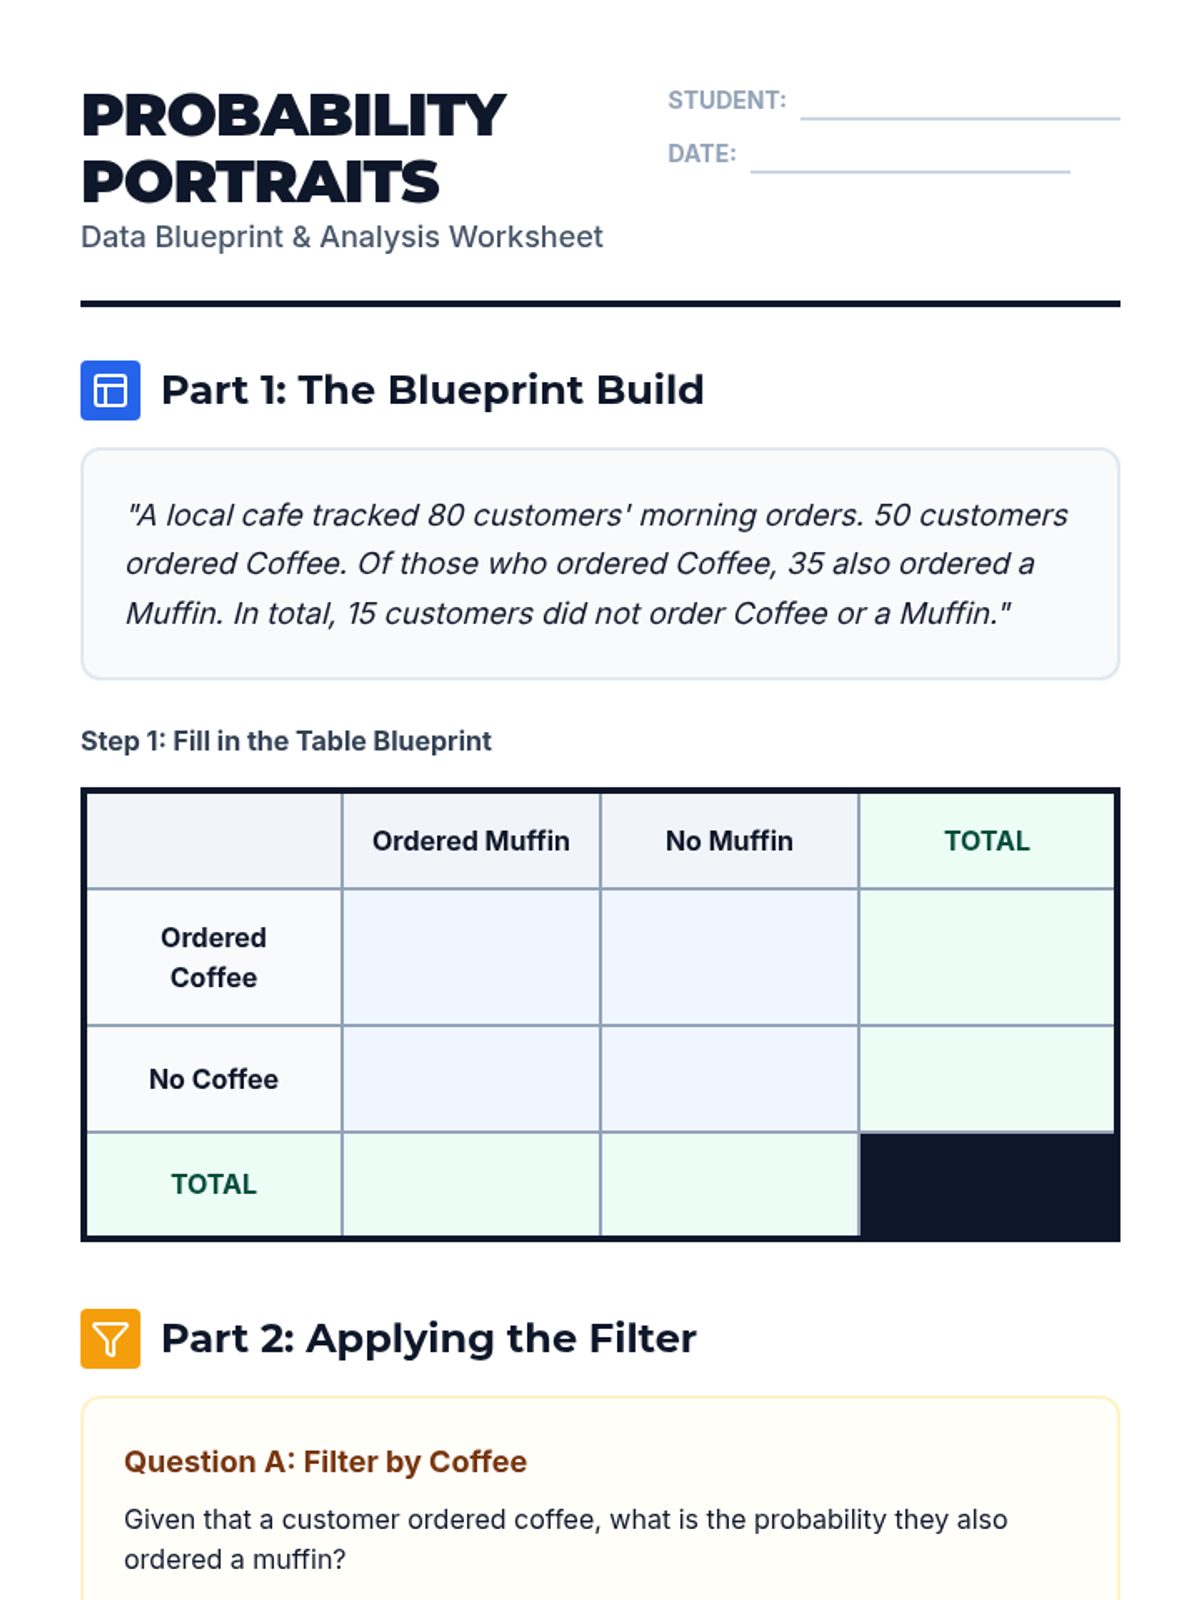
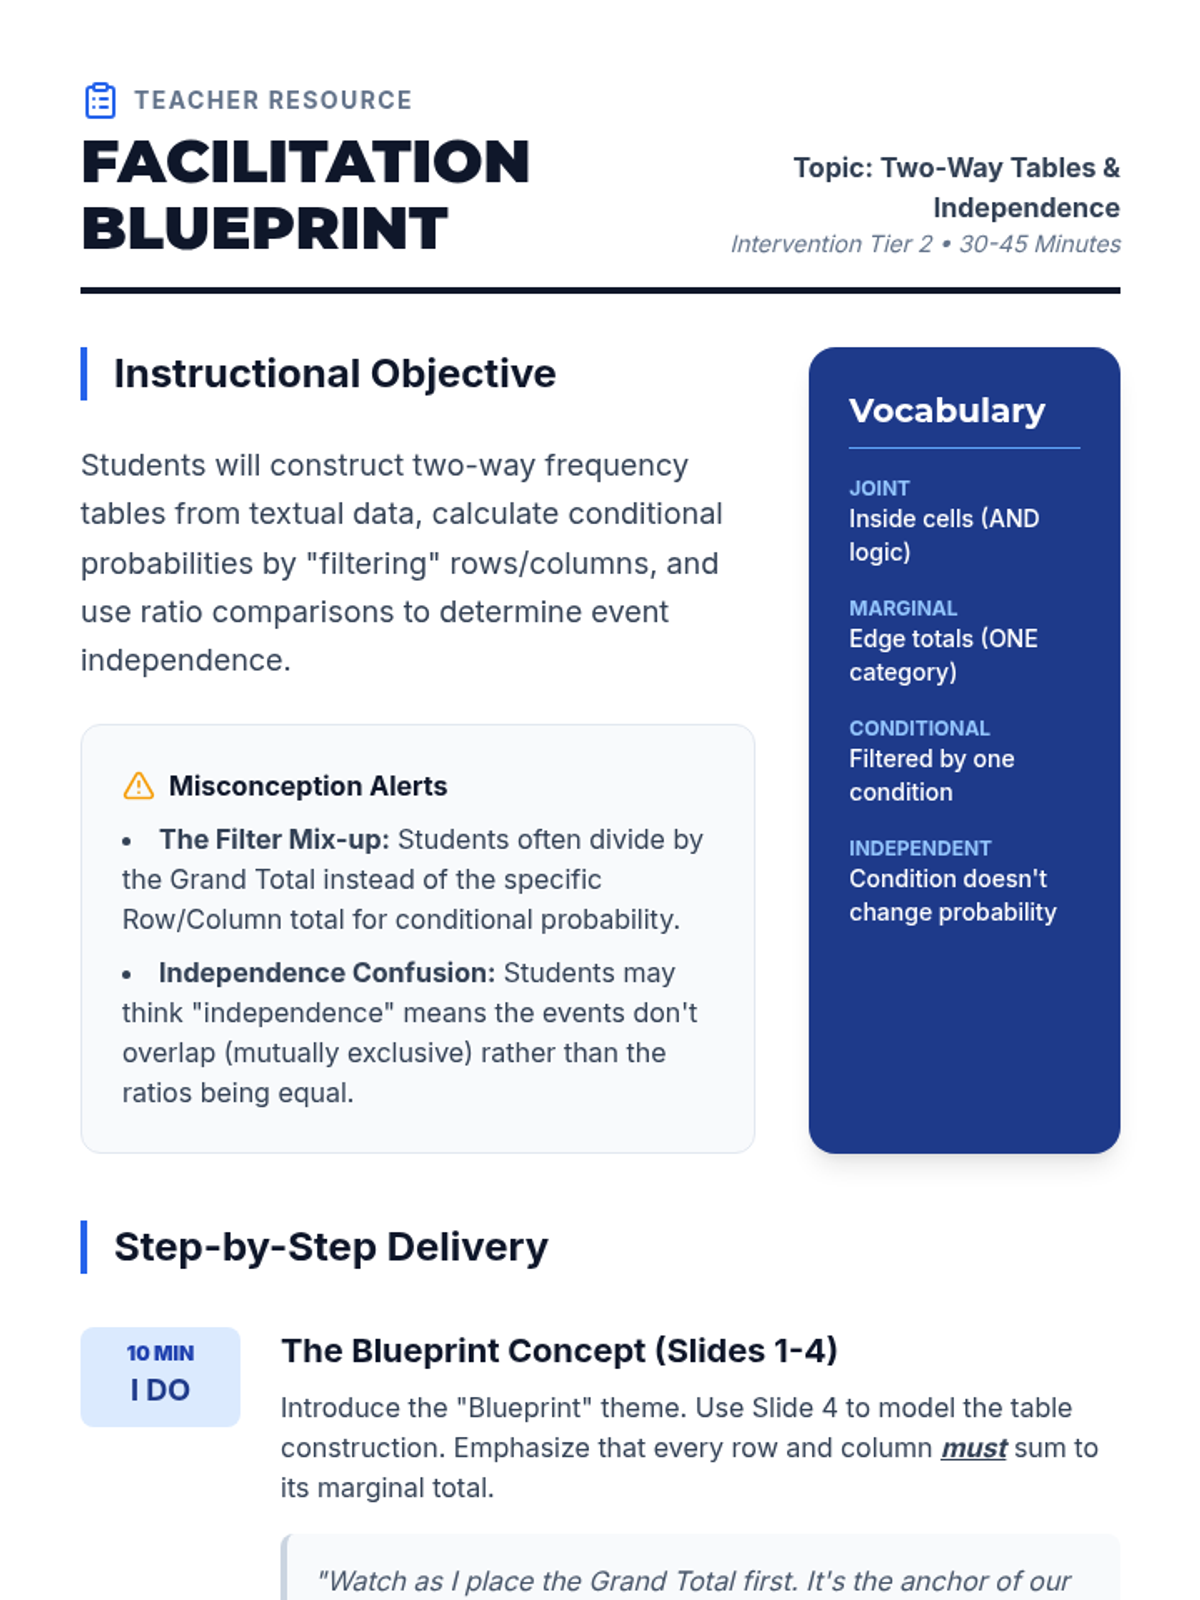
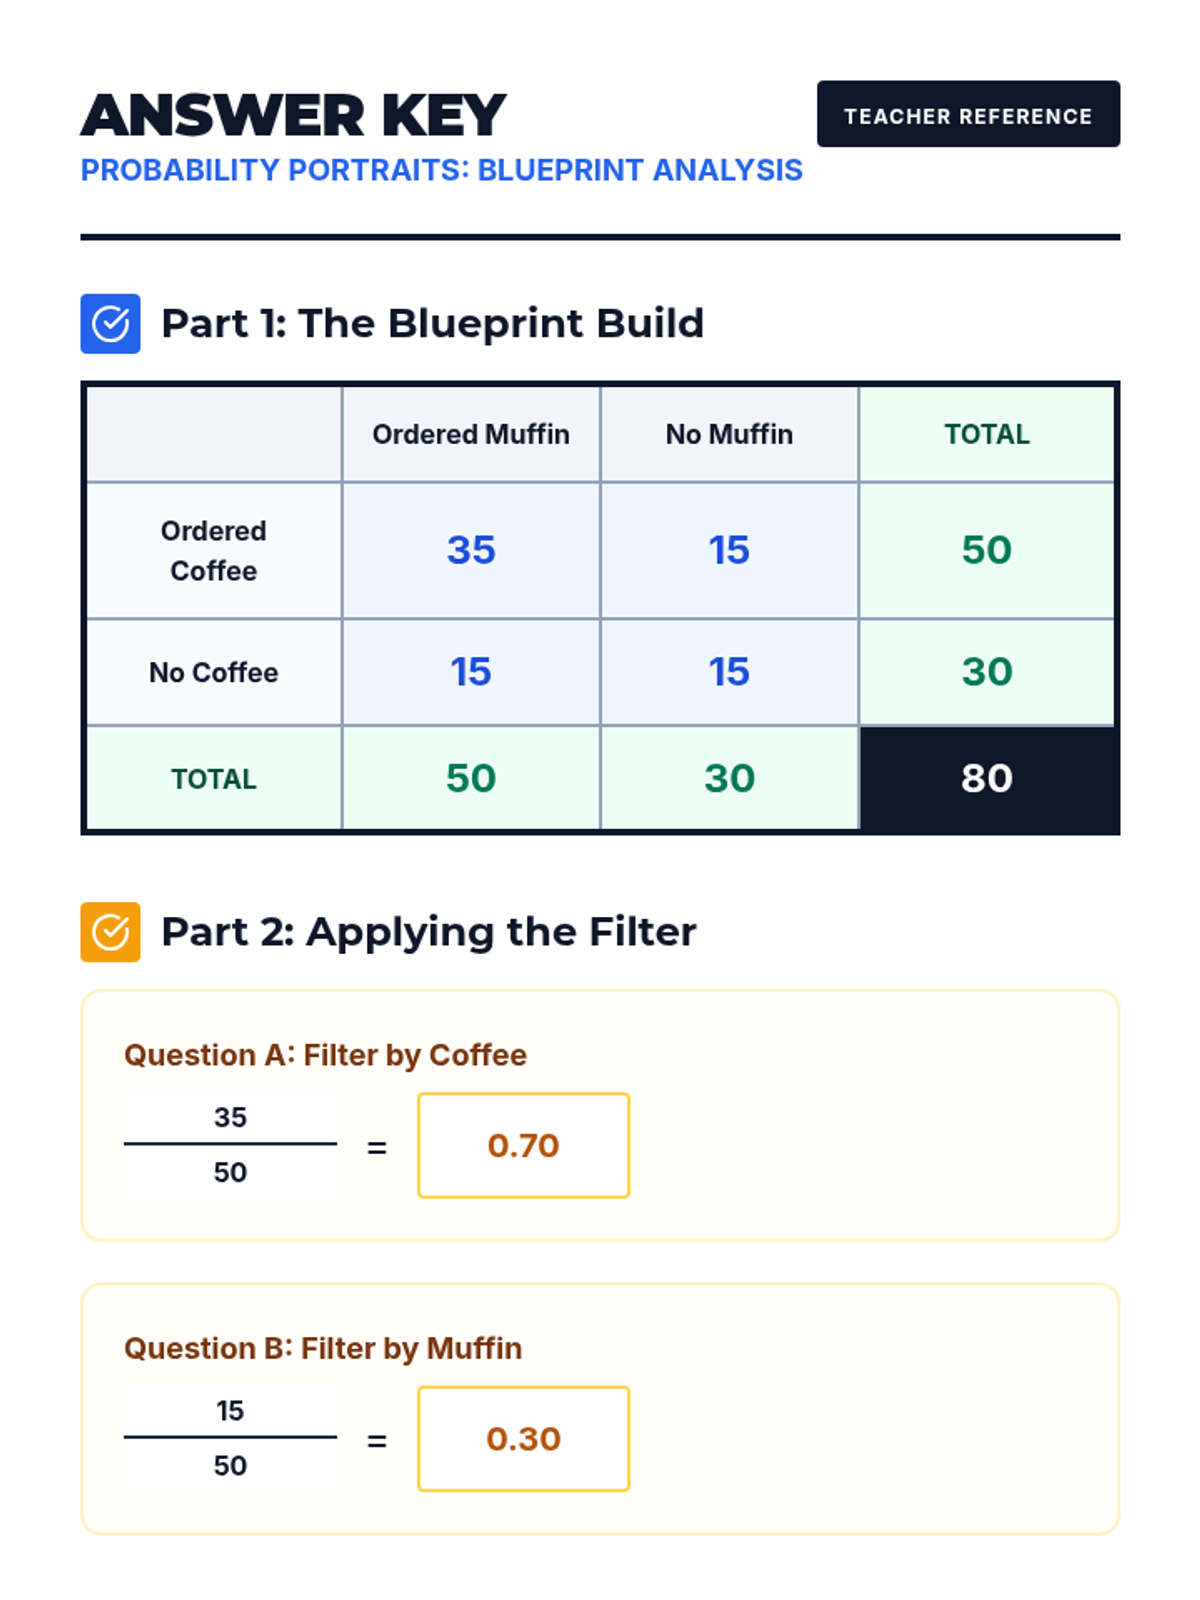
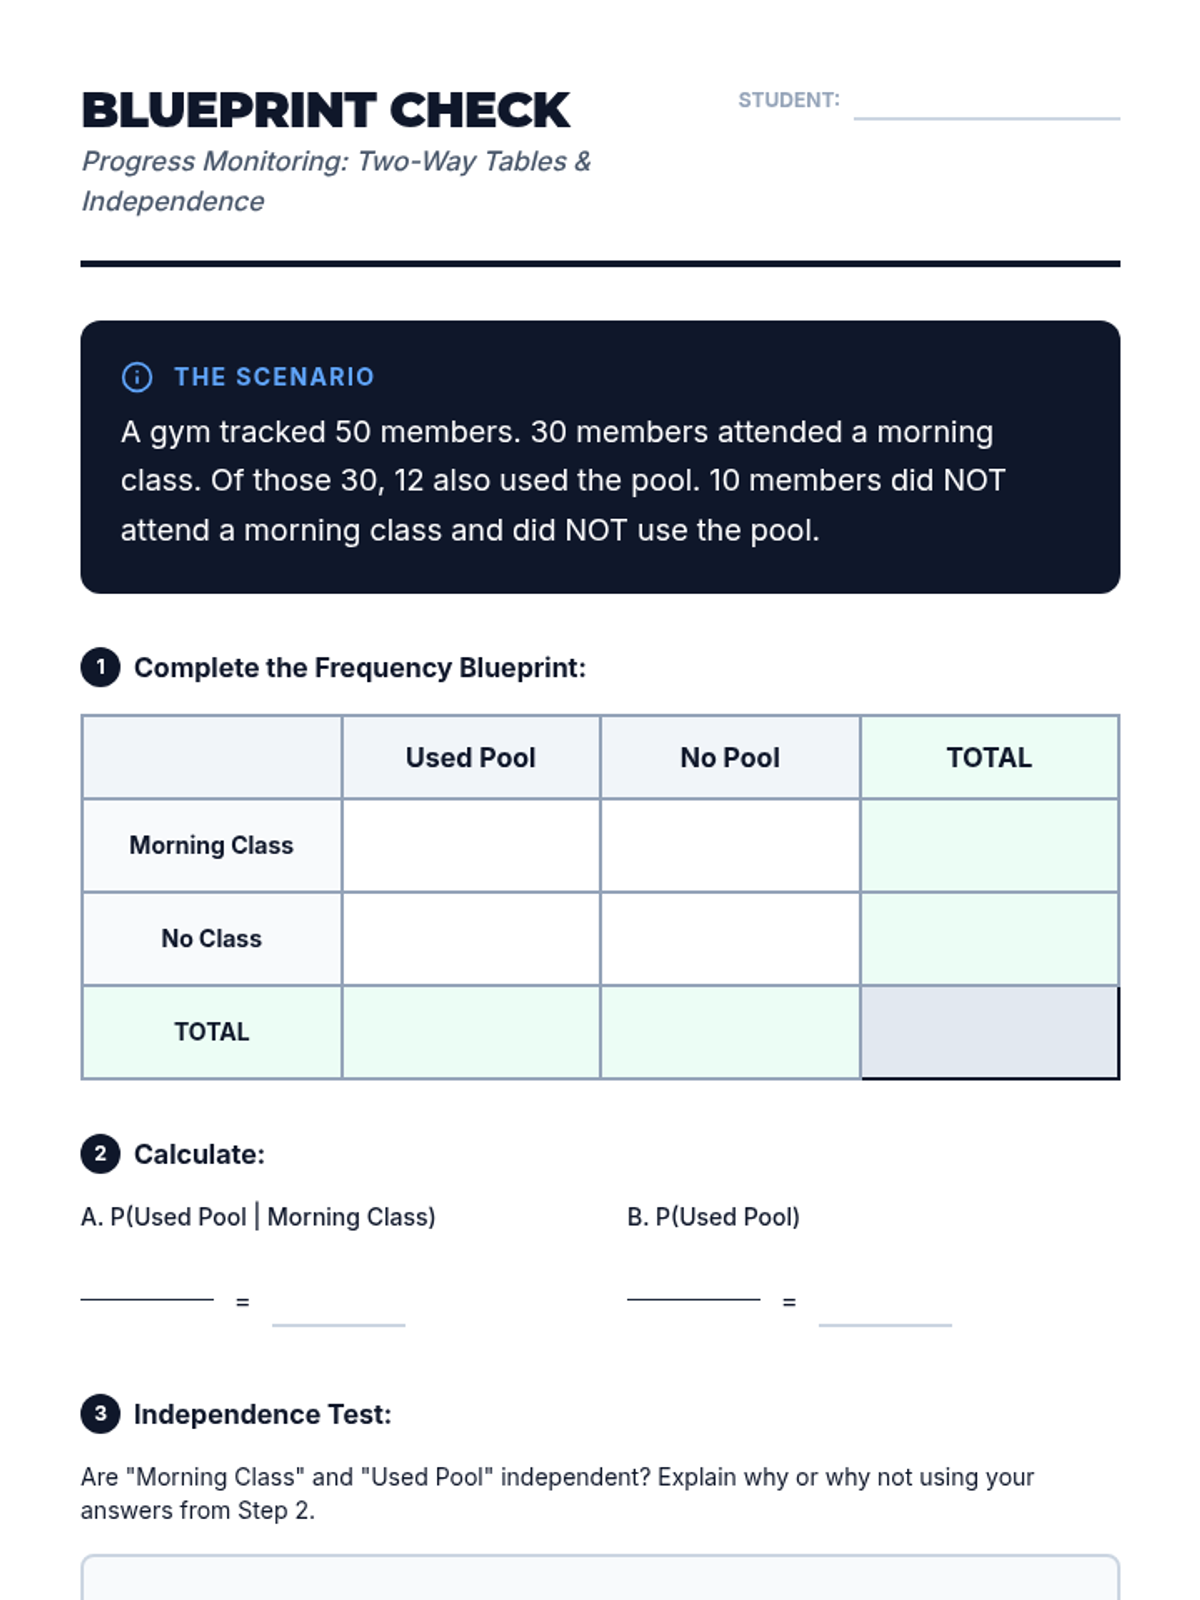
A small-group intervention lesson focusing on interpreting conditional probability as a restricted sample space and testing for independence using visual models and the formal formula.
A targeted Tier 2 intervention lesson focusing on constructing two-way frequency tables, calculating conditional probabilities, and testing for independence using a color-coded blueprint approach.
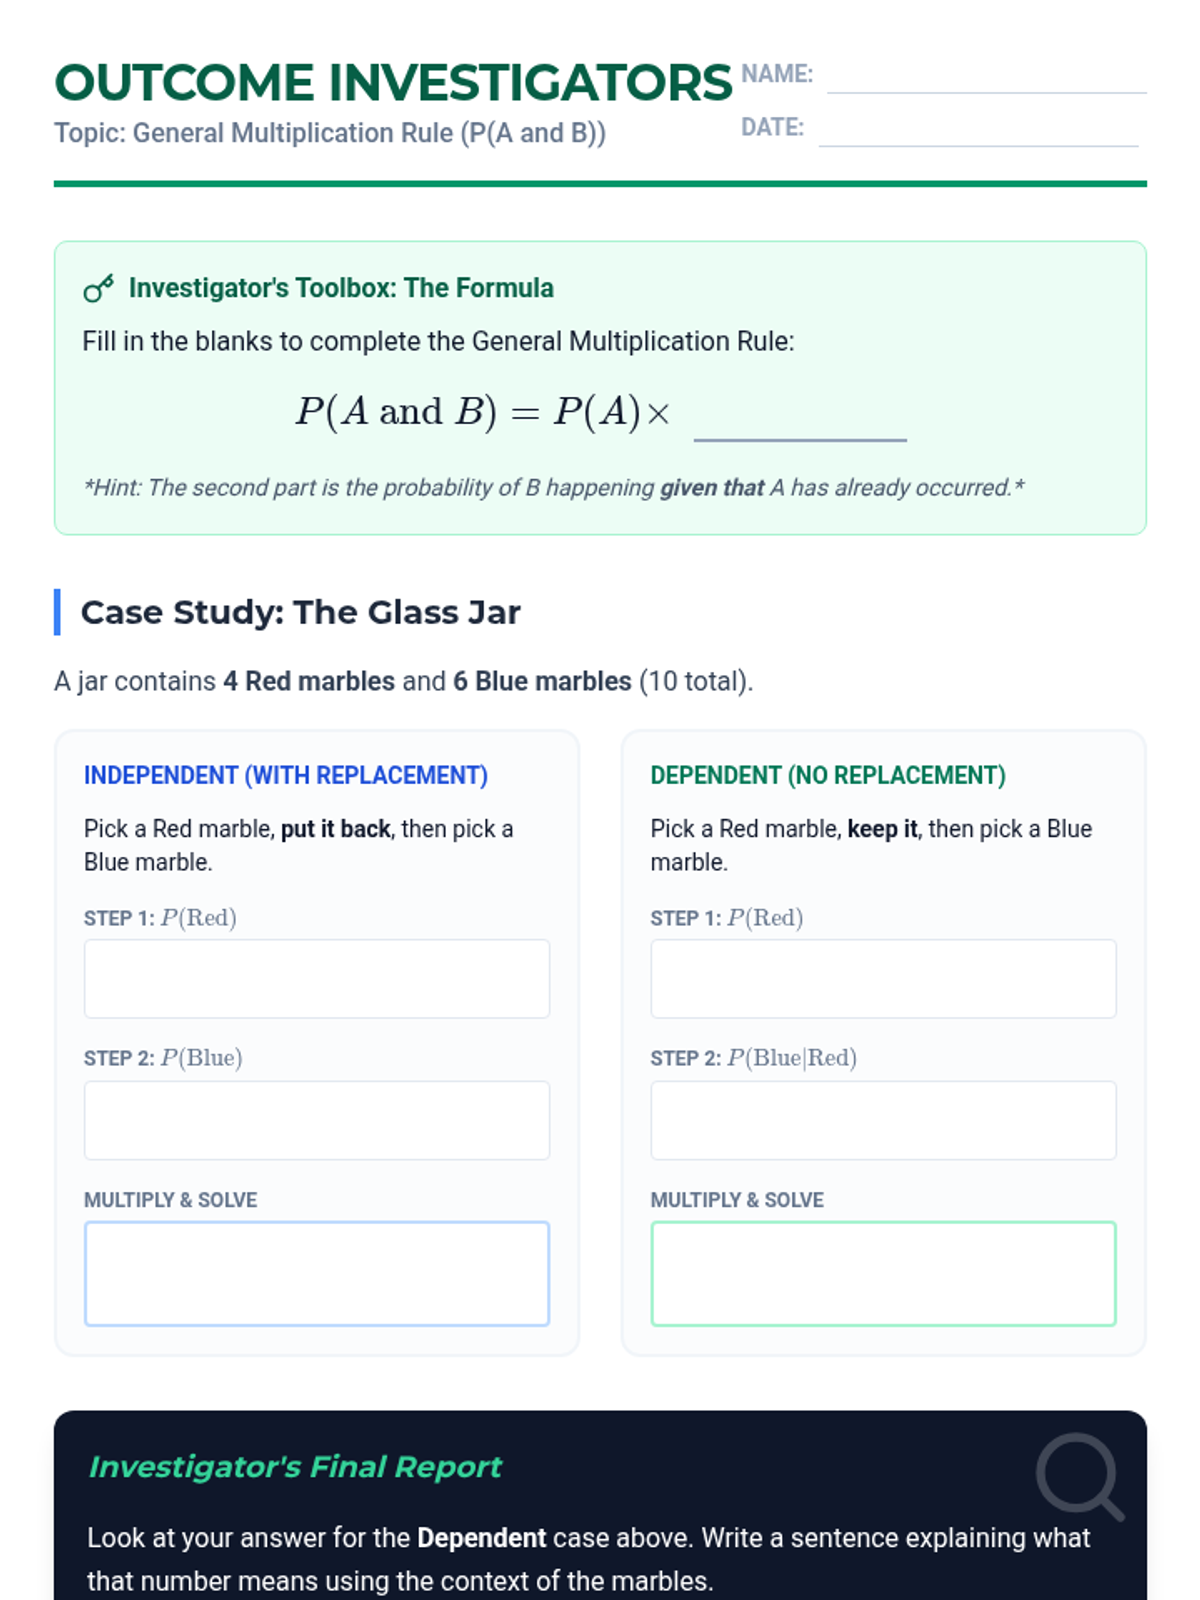
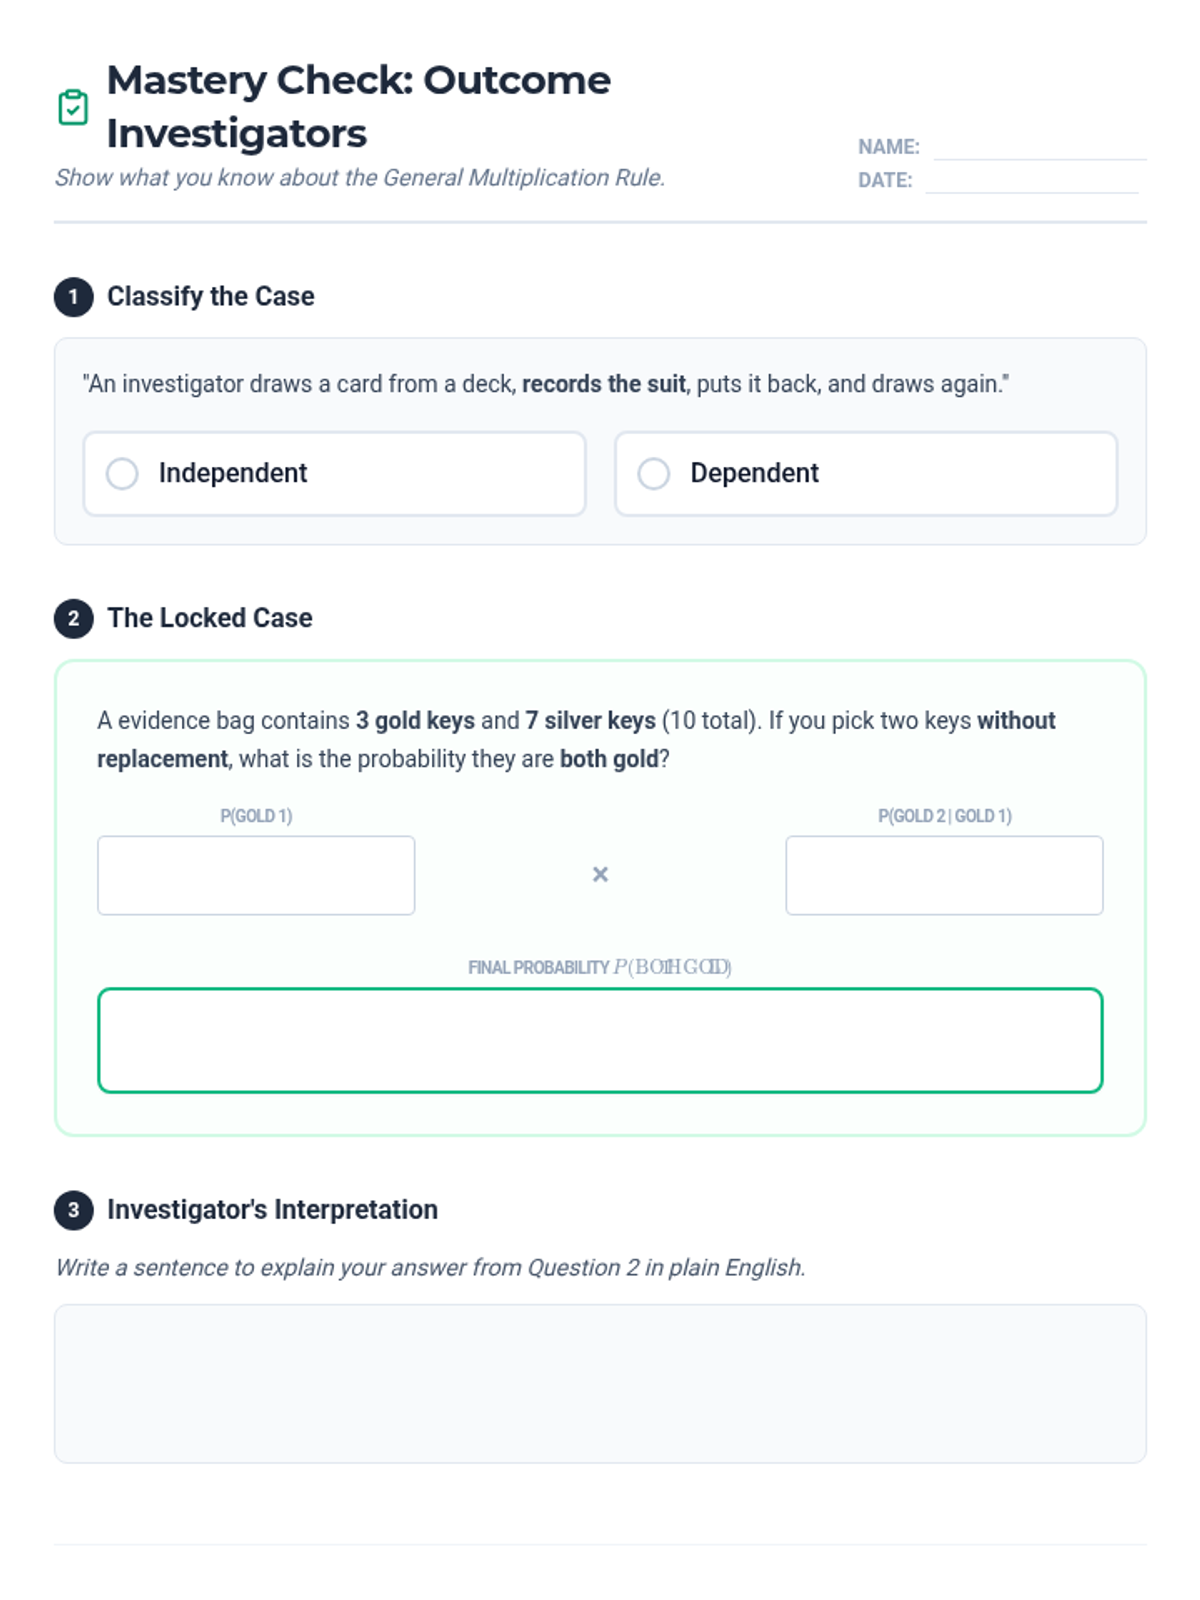
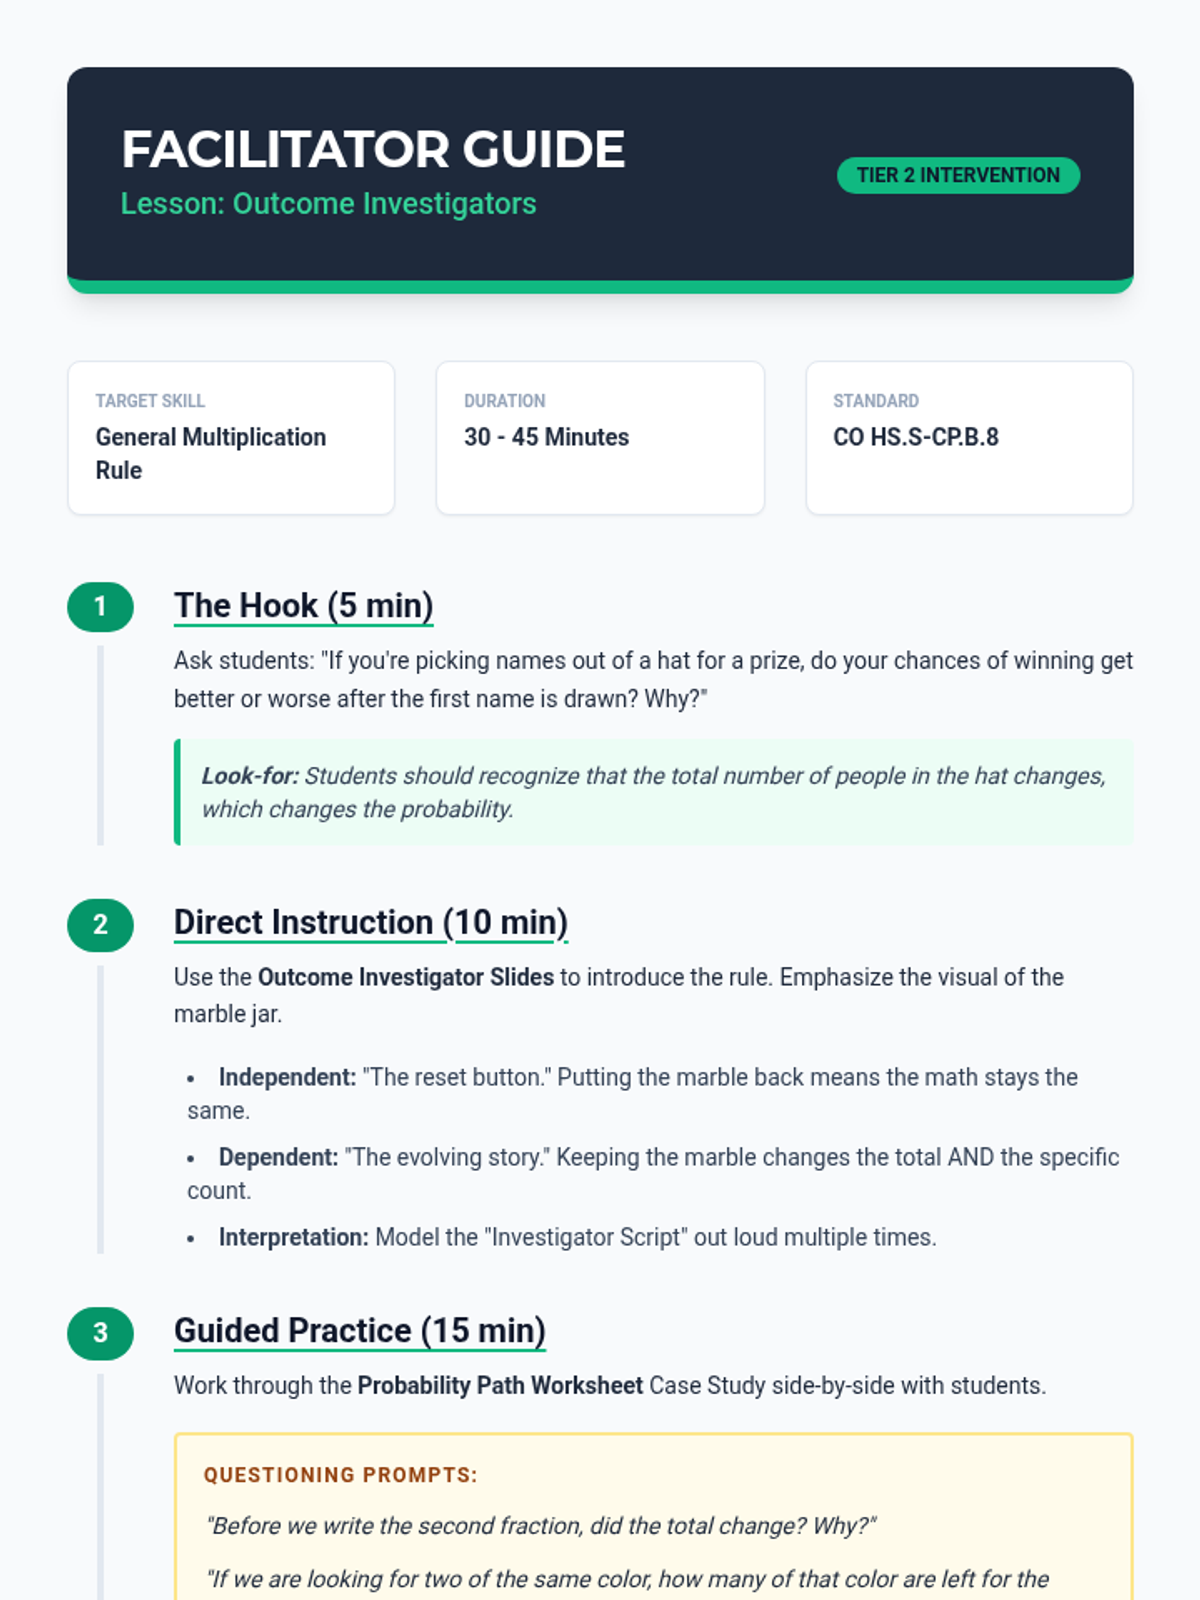
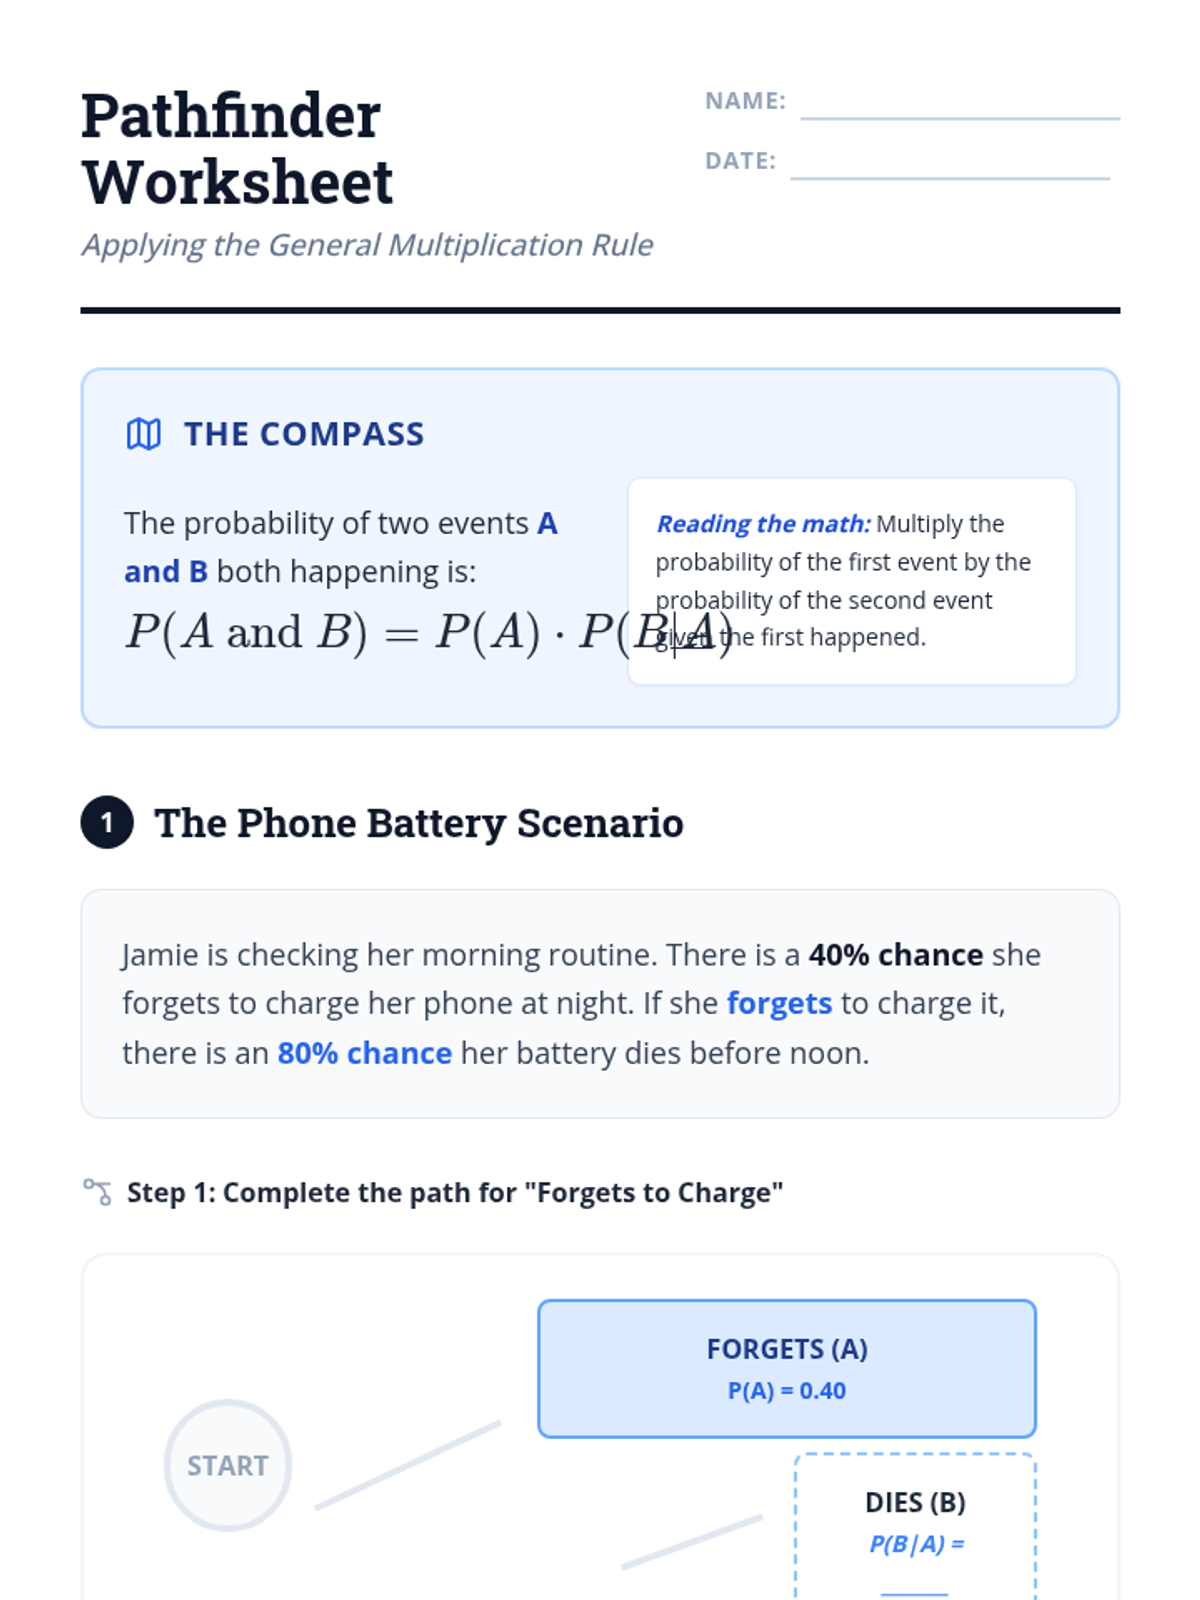
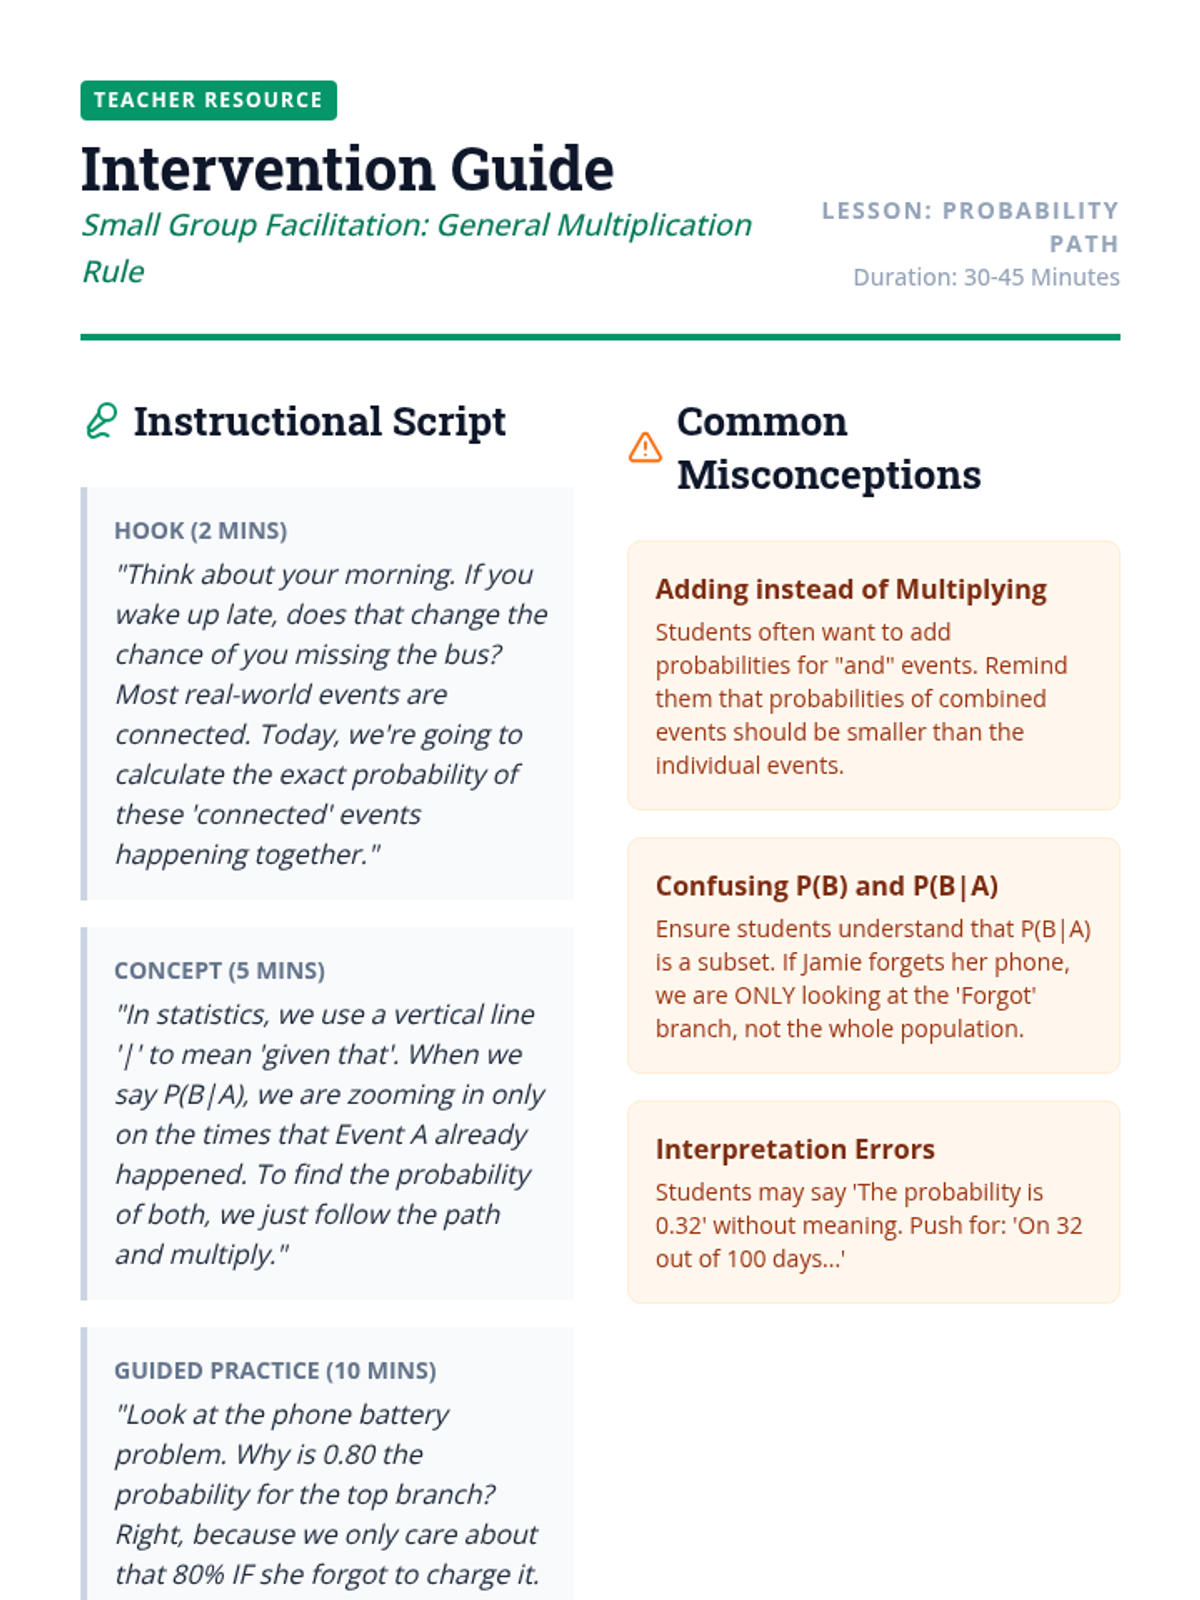
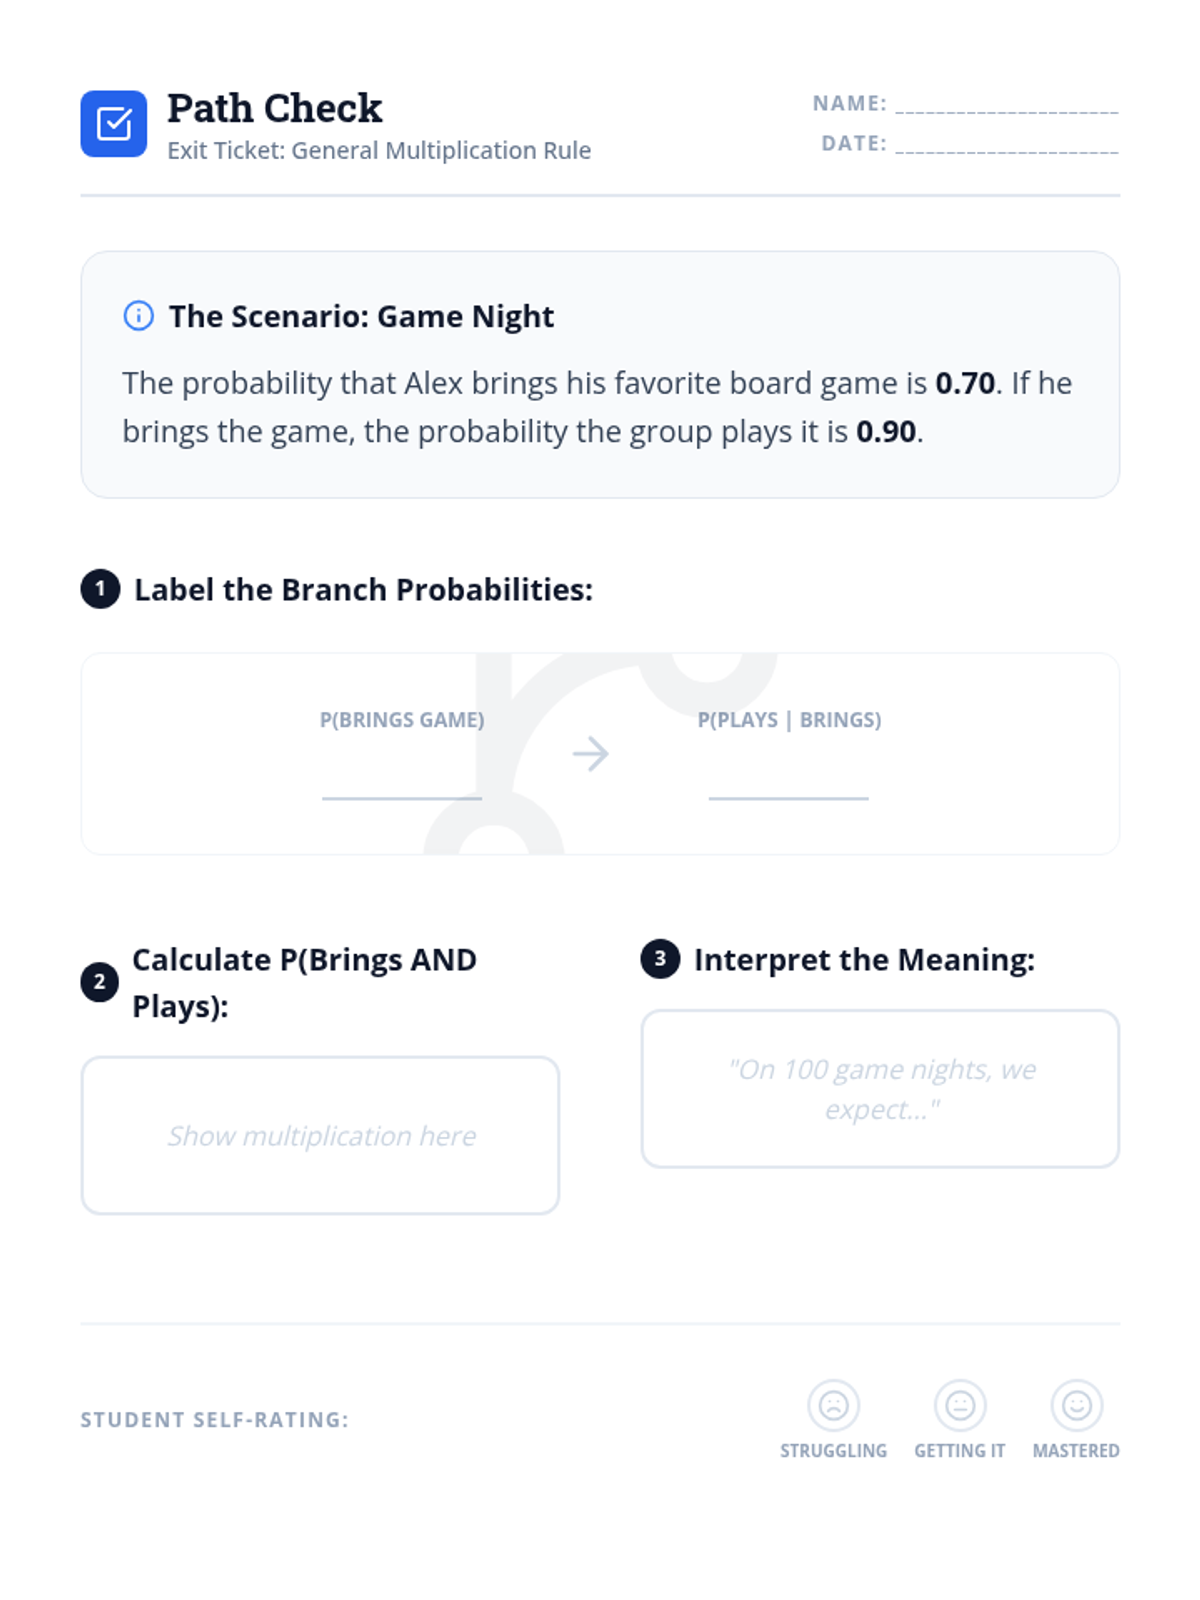
A Tier 2 intervention lesson focusing on the General Multiplication Rule for probability, specifically comparing independent and dependent events through scaffolded practice and interpretation.
A Tier 2 intervention lesson focusing on the general Multiplication Rule of probability. Students use tree diagrams to visualize dependent events and interpret joint probabilities in real-world contexts.
An introductory exploration of random variables, probability distributions, and statistical measurements including mean, standard deviation, and linear transformations.
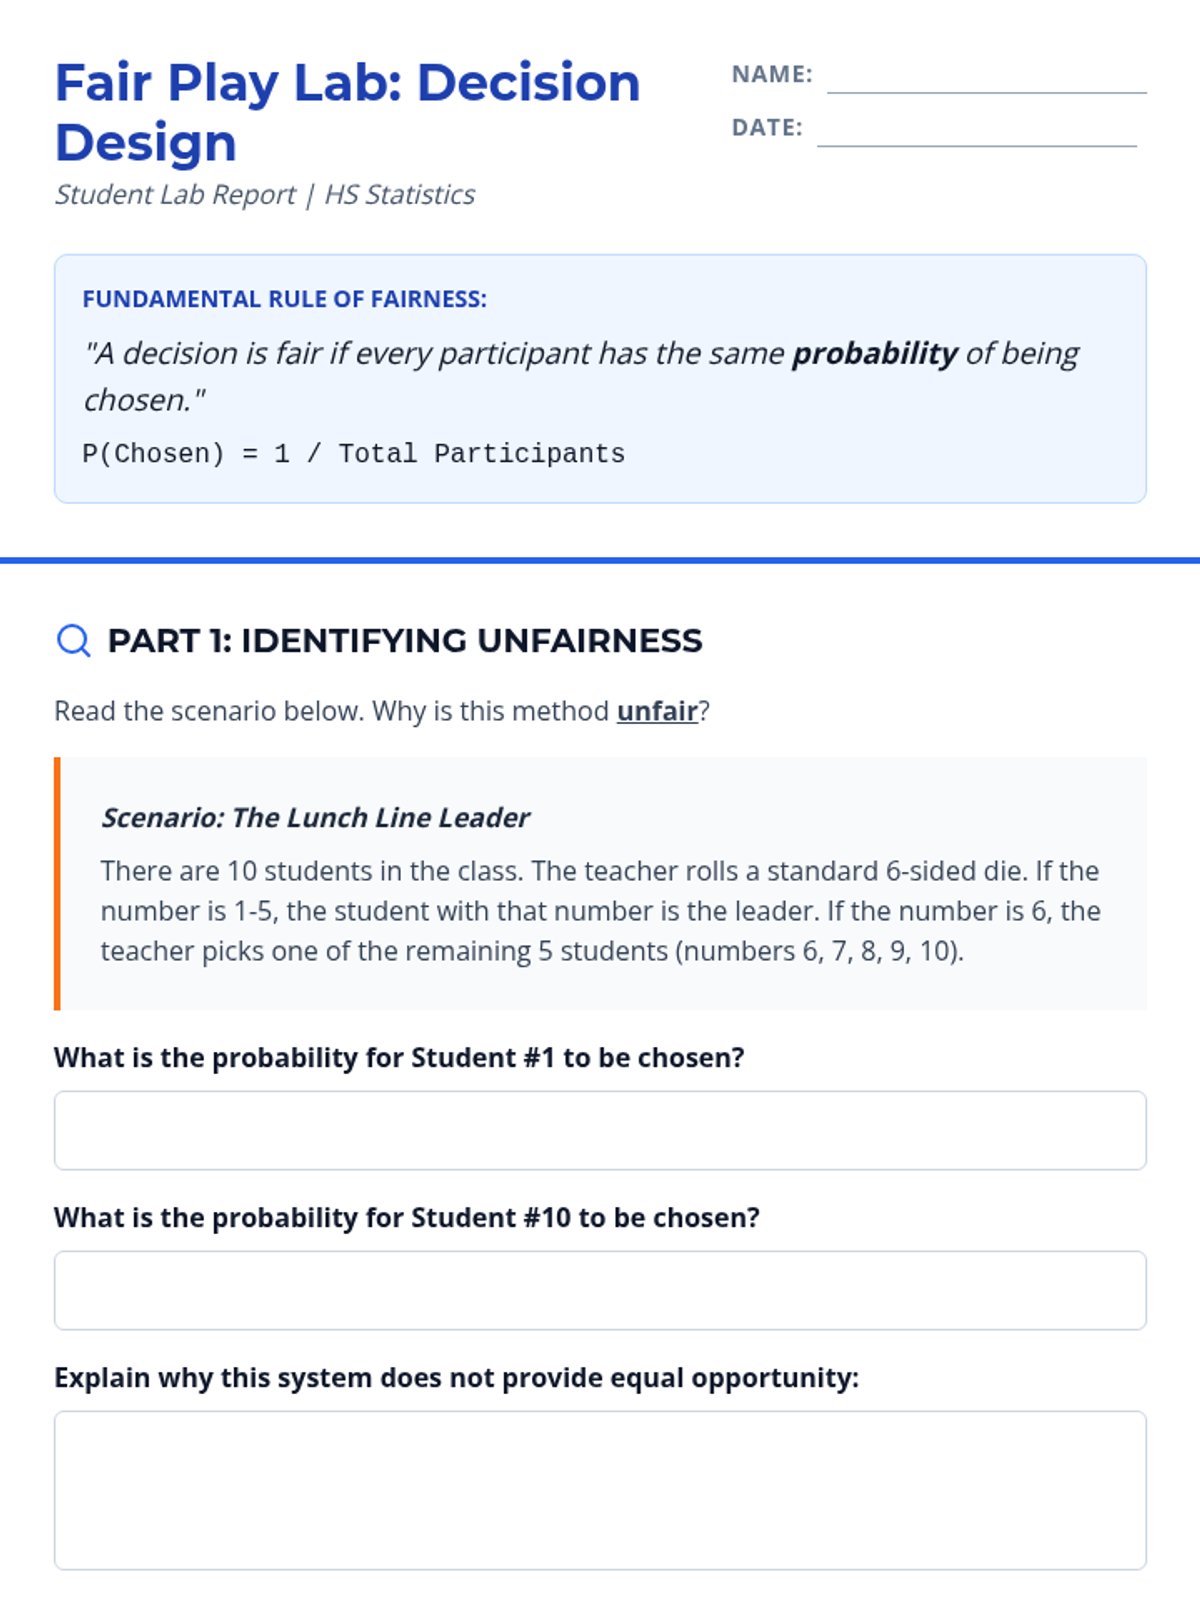
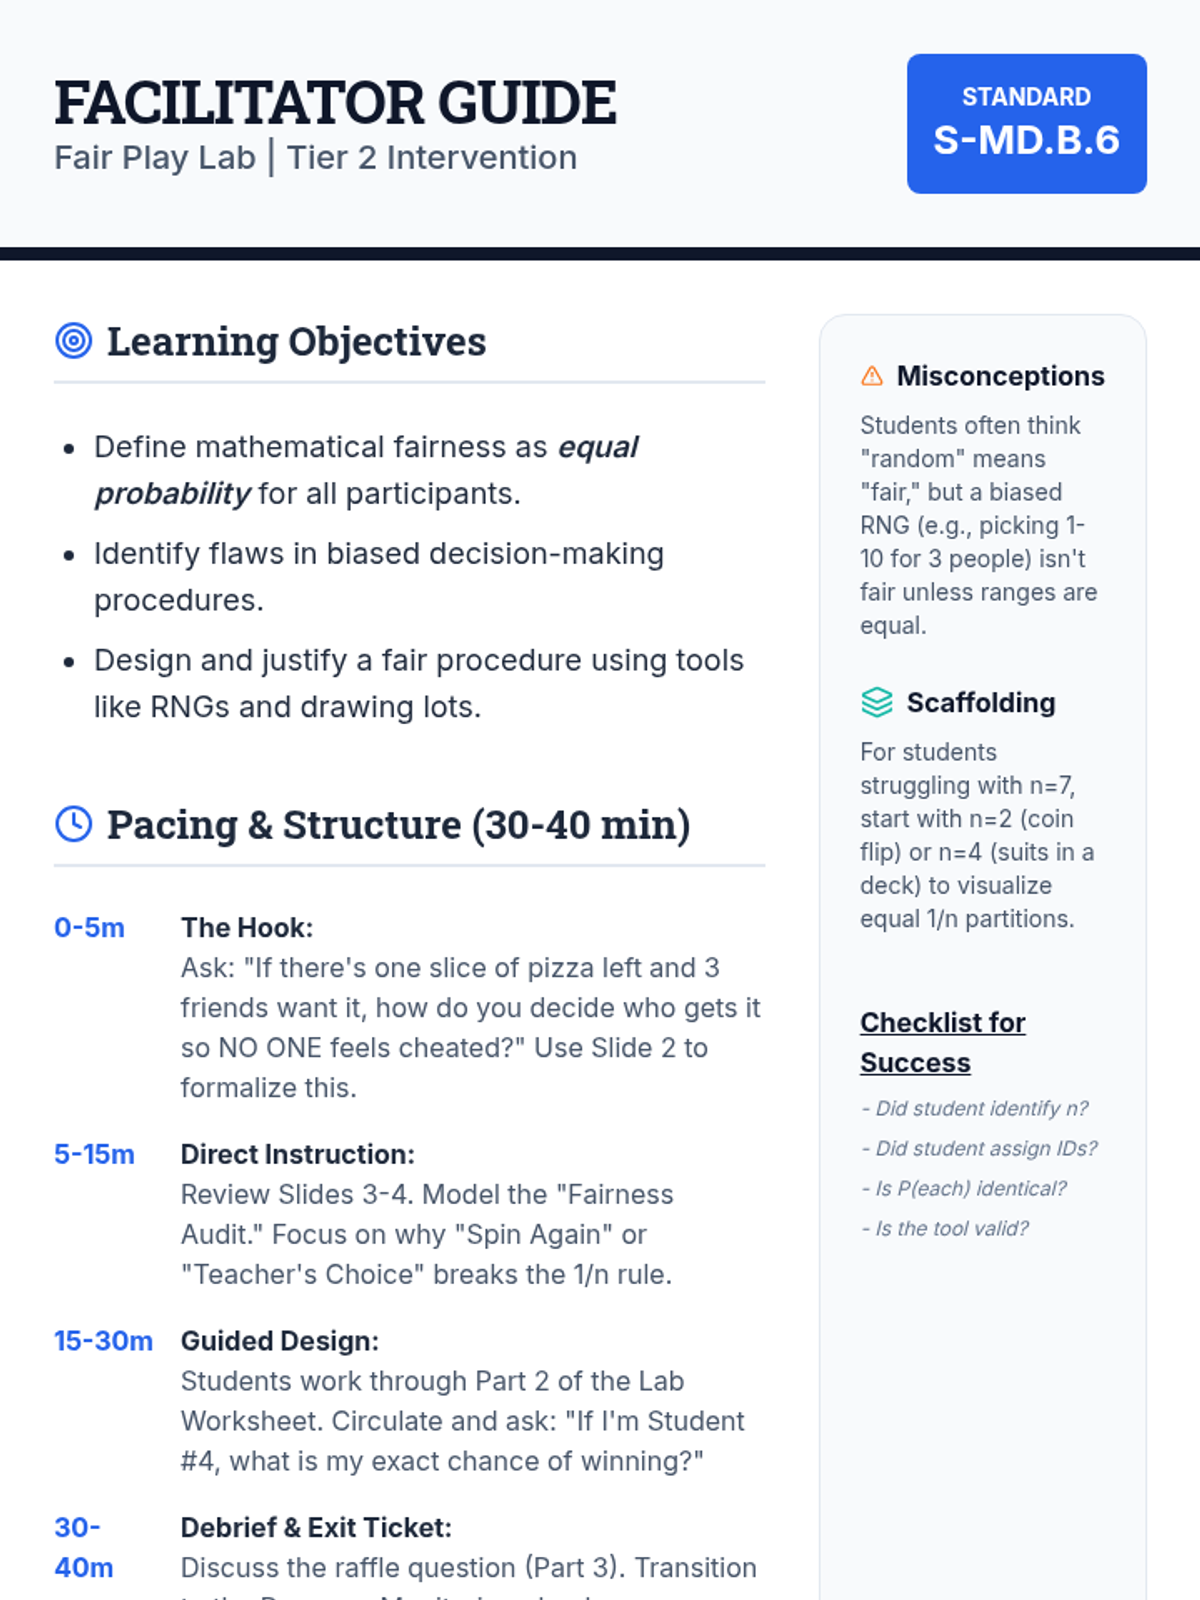
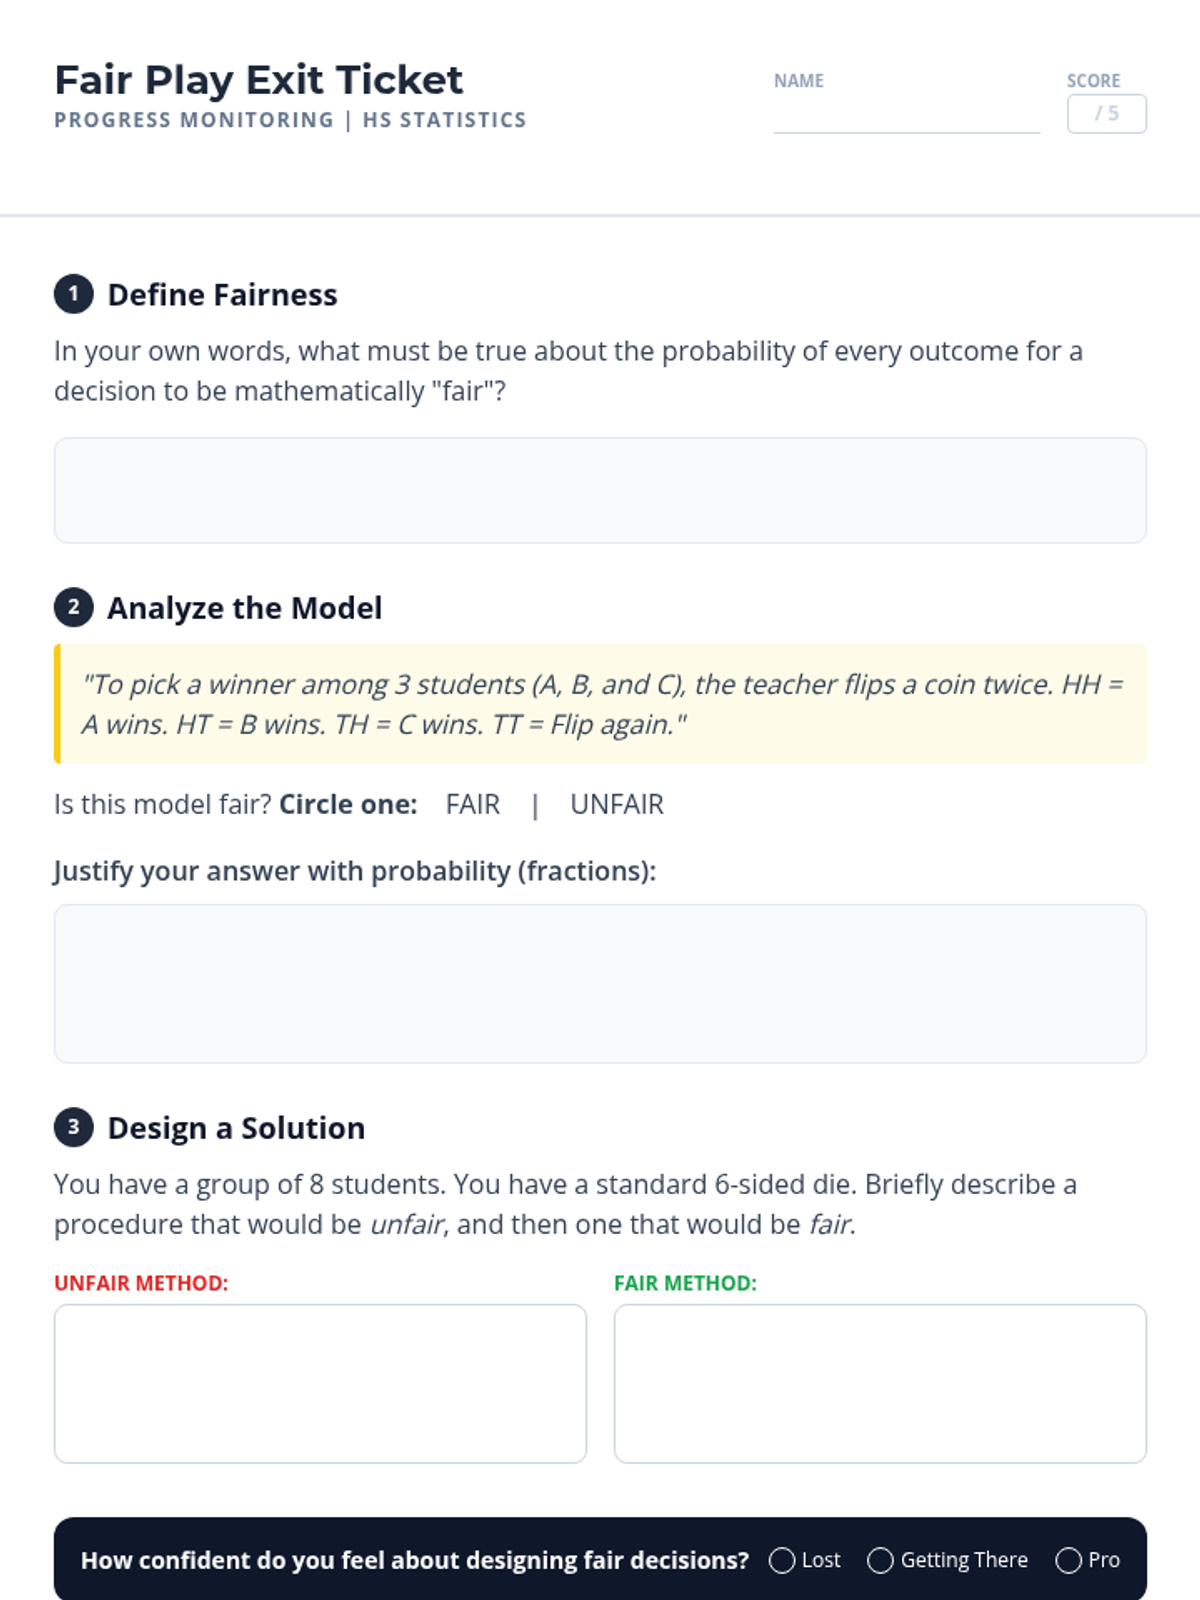
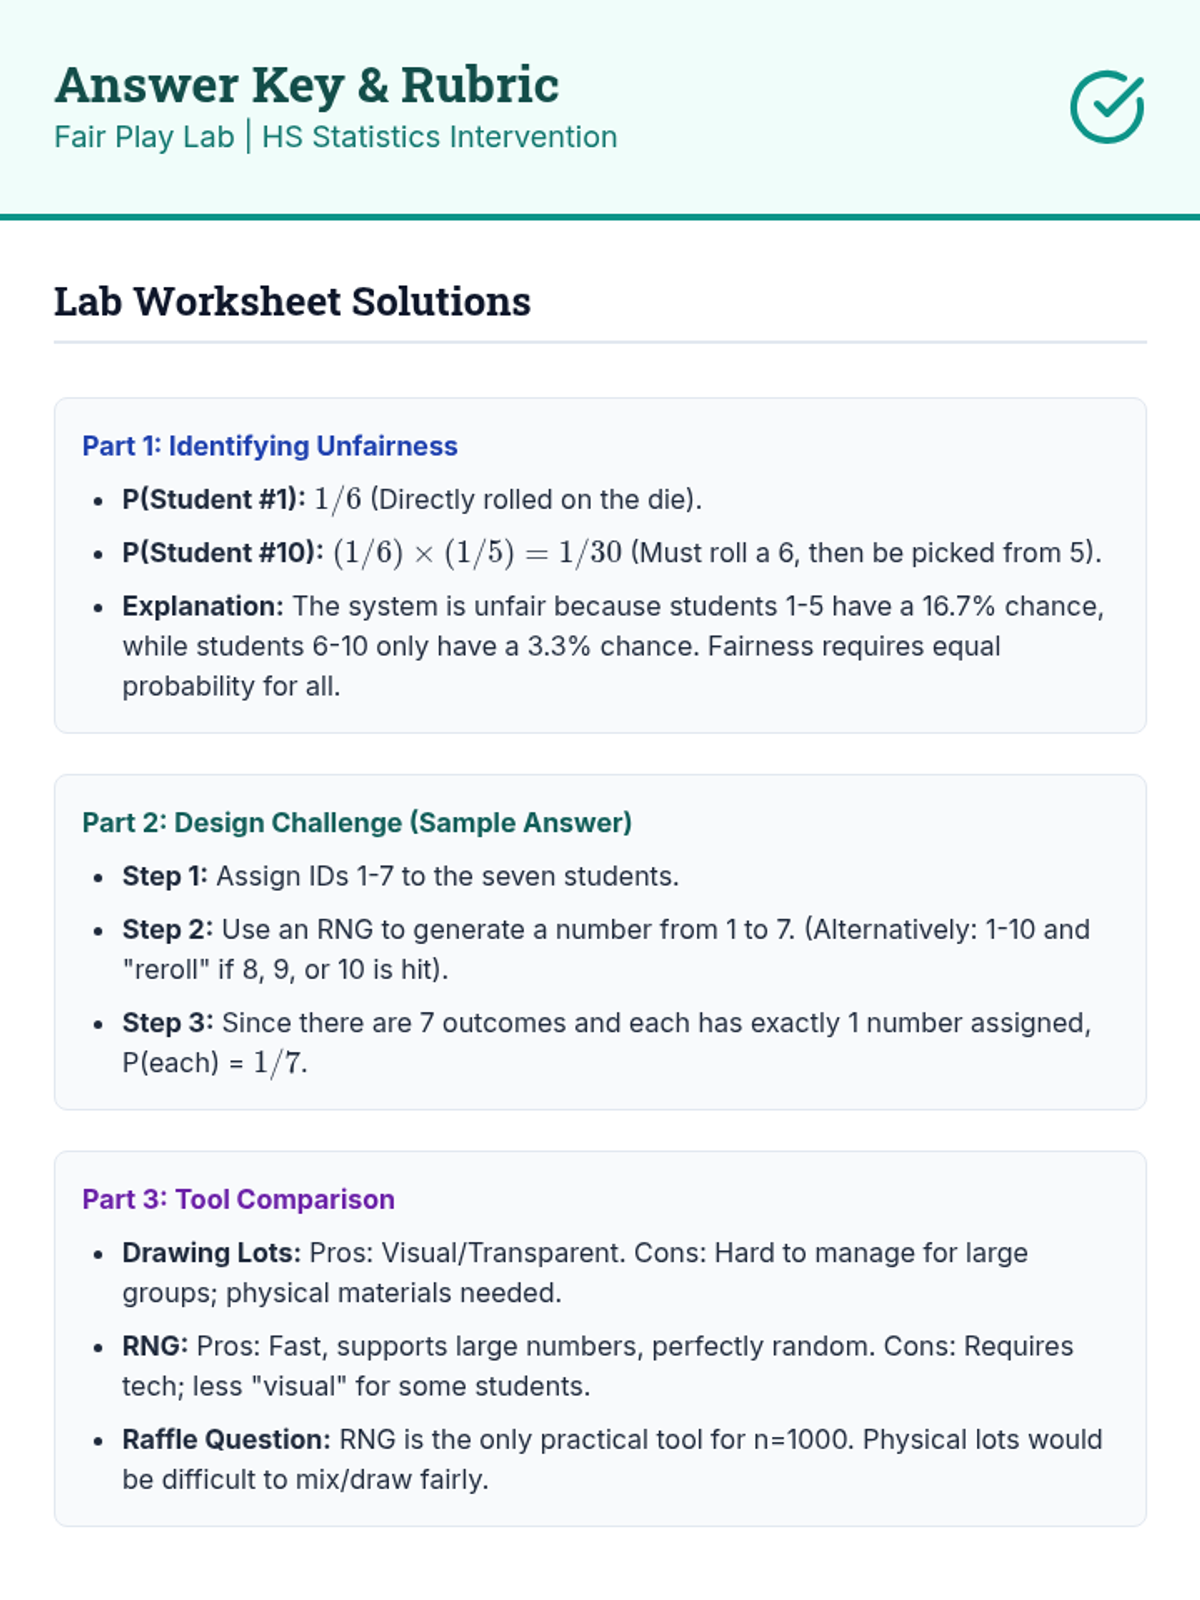
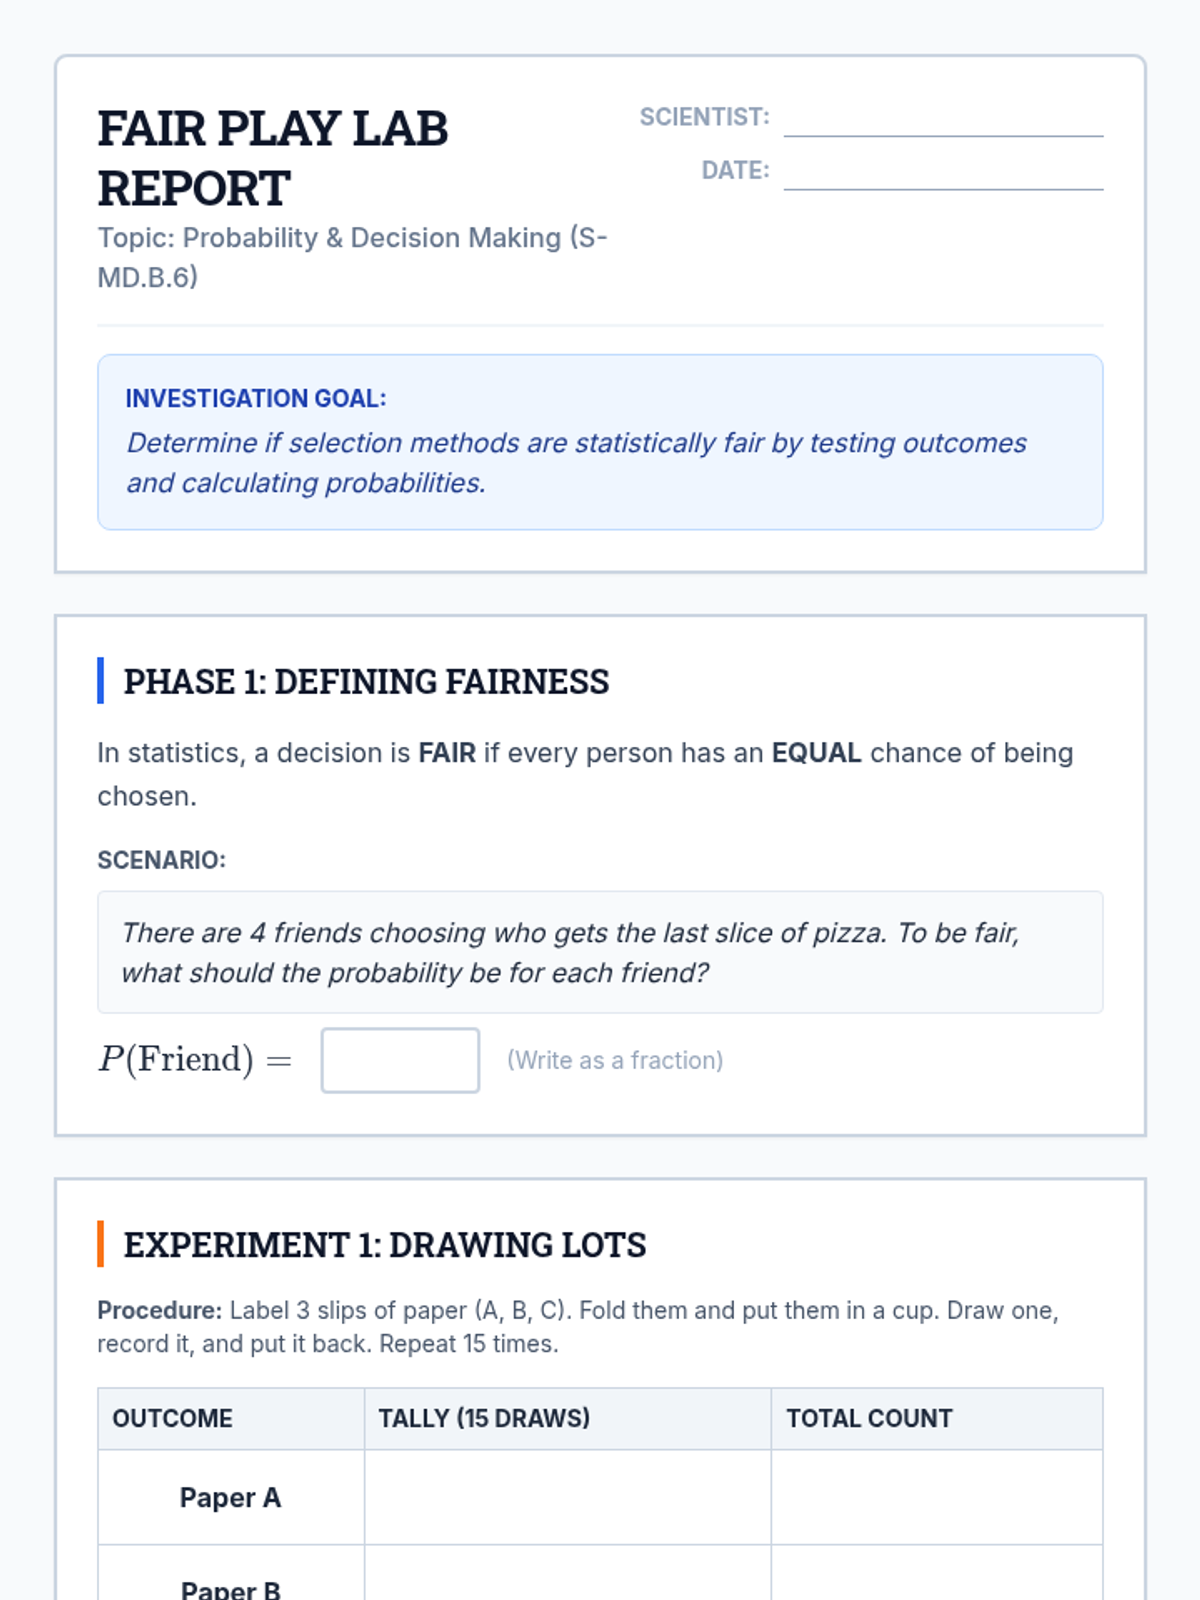
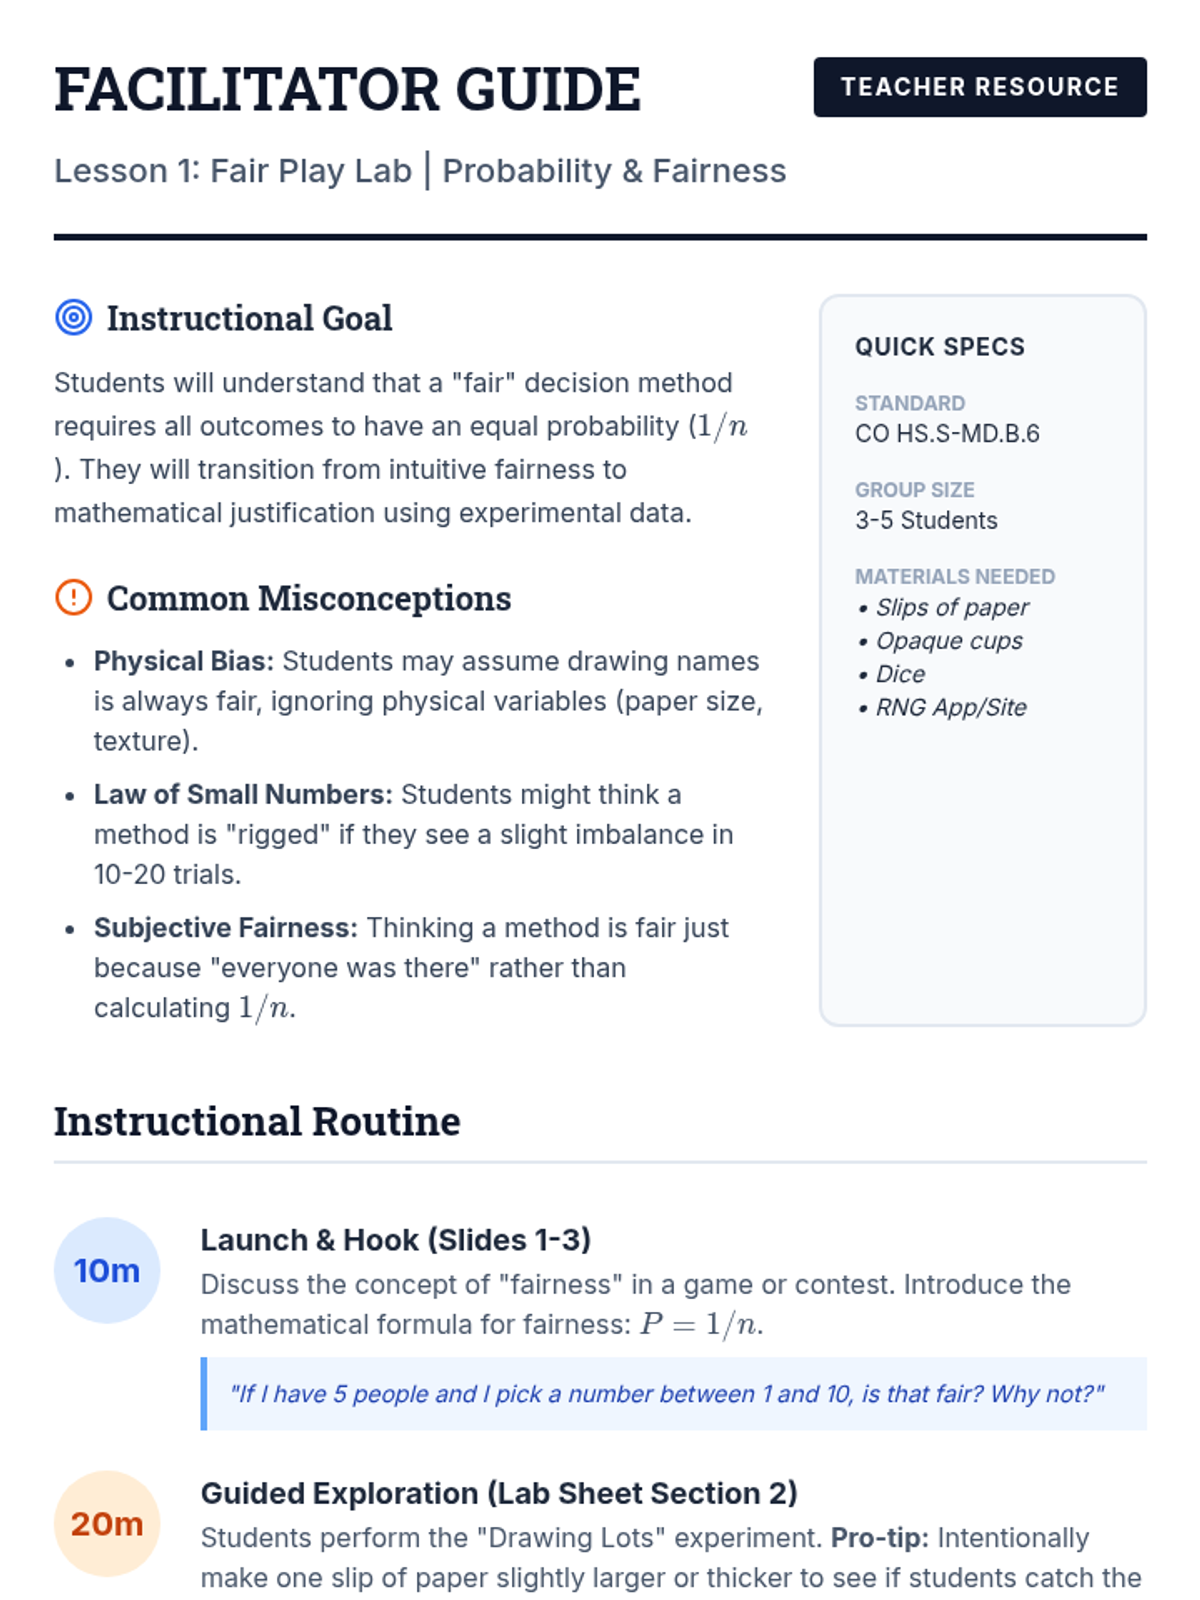
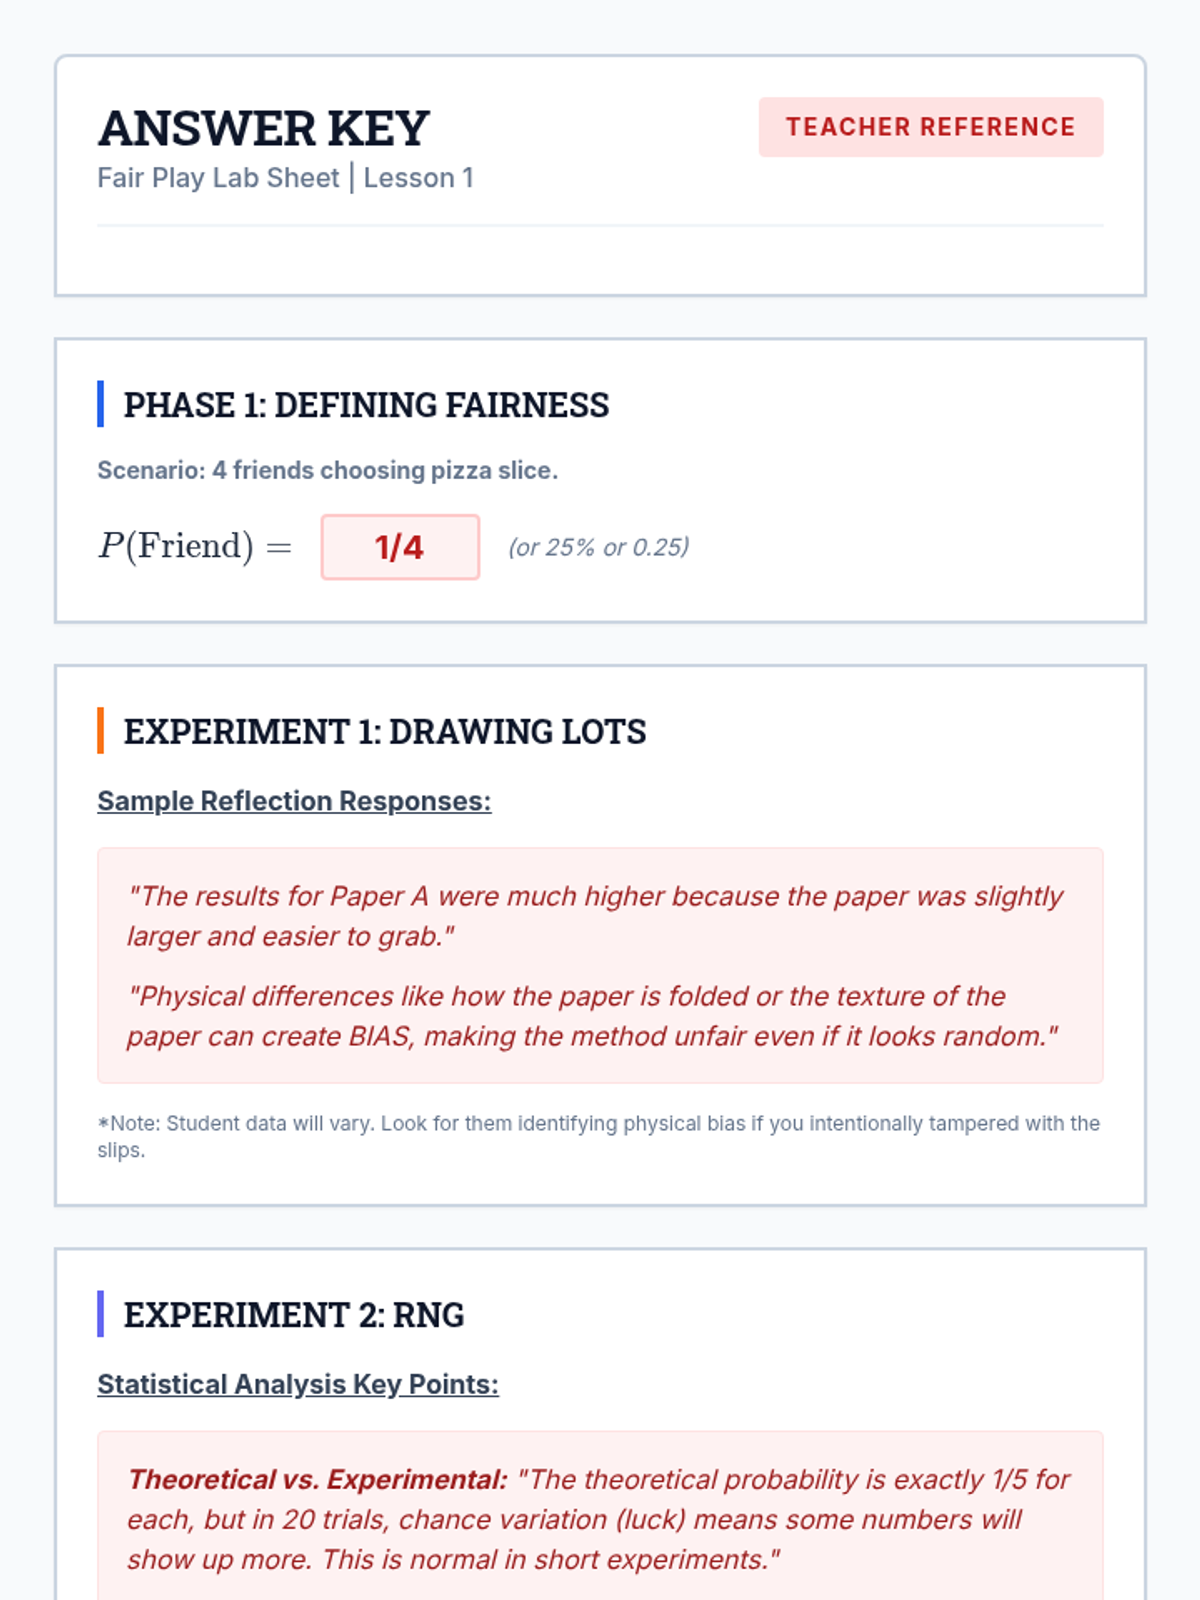
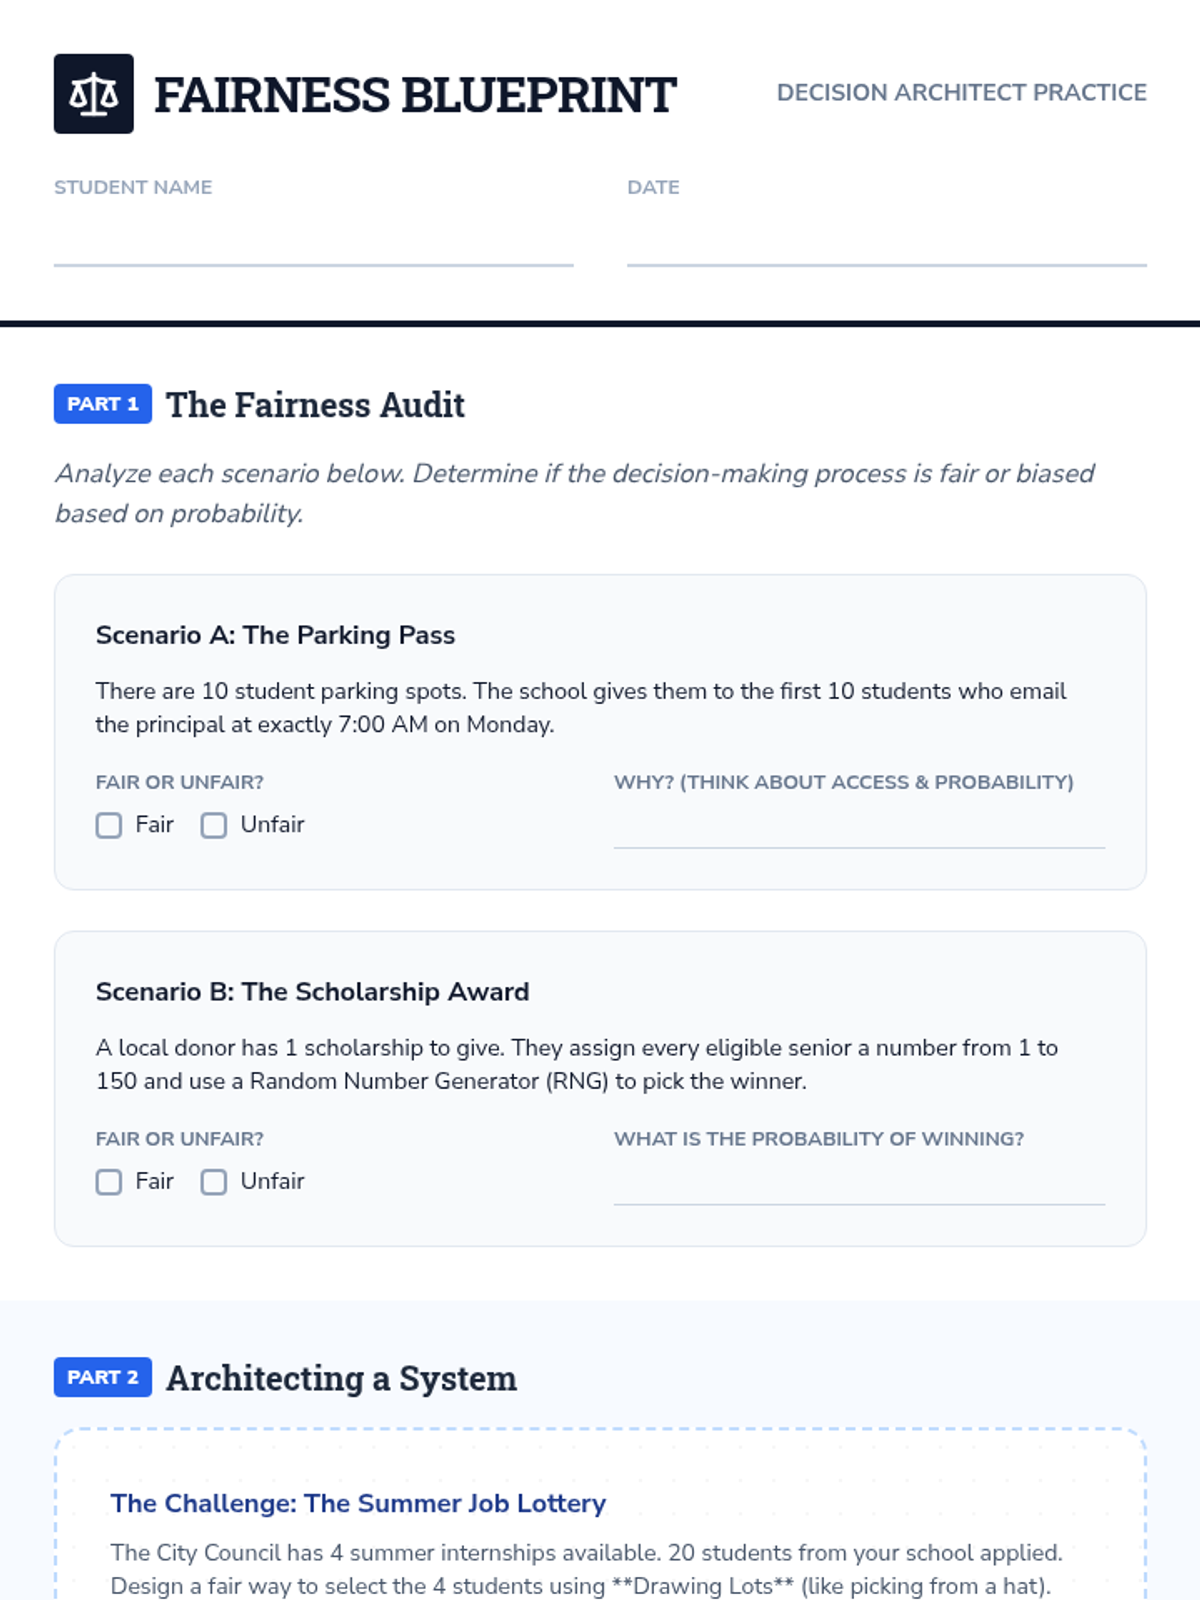
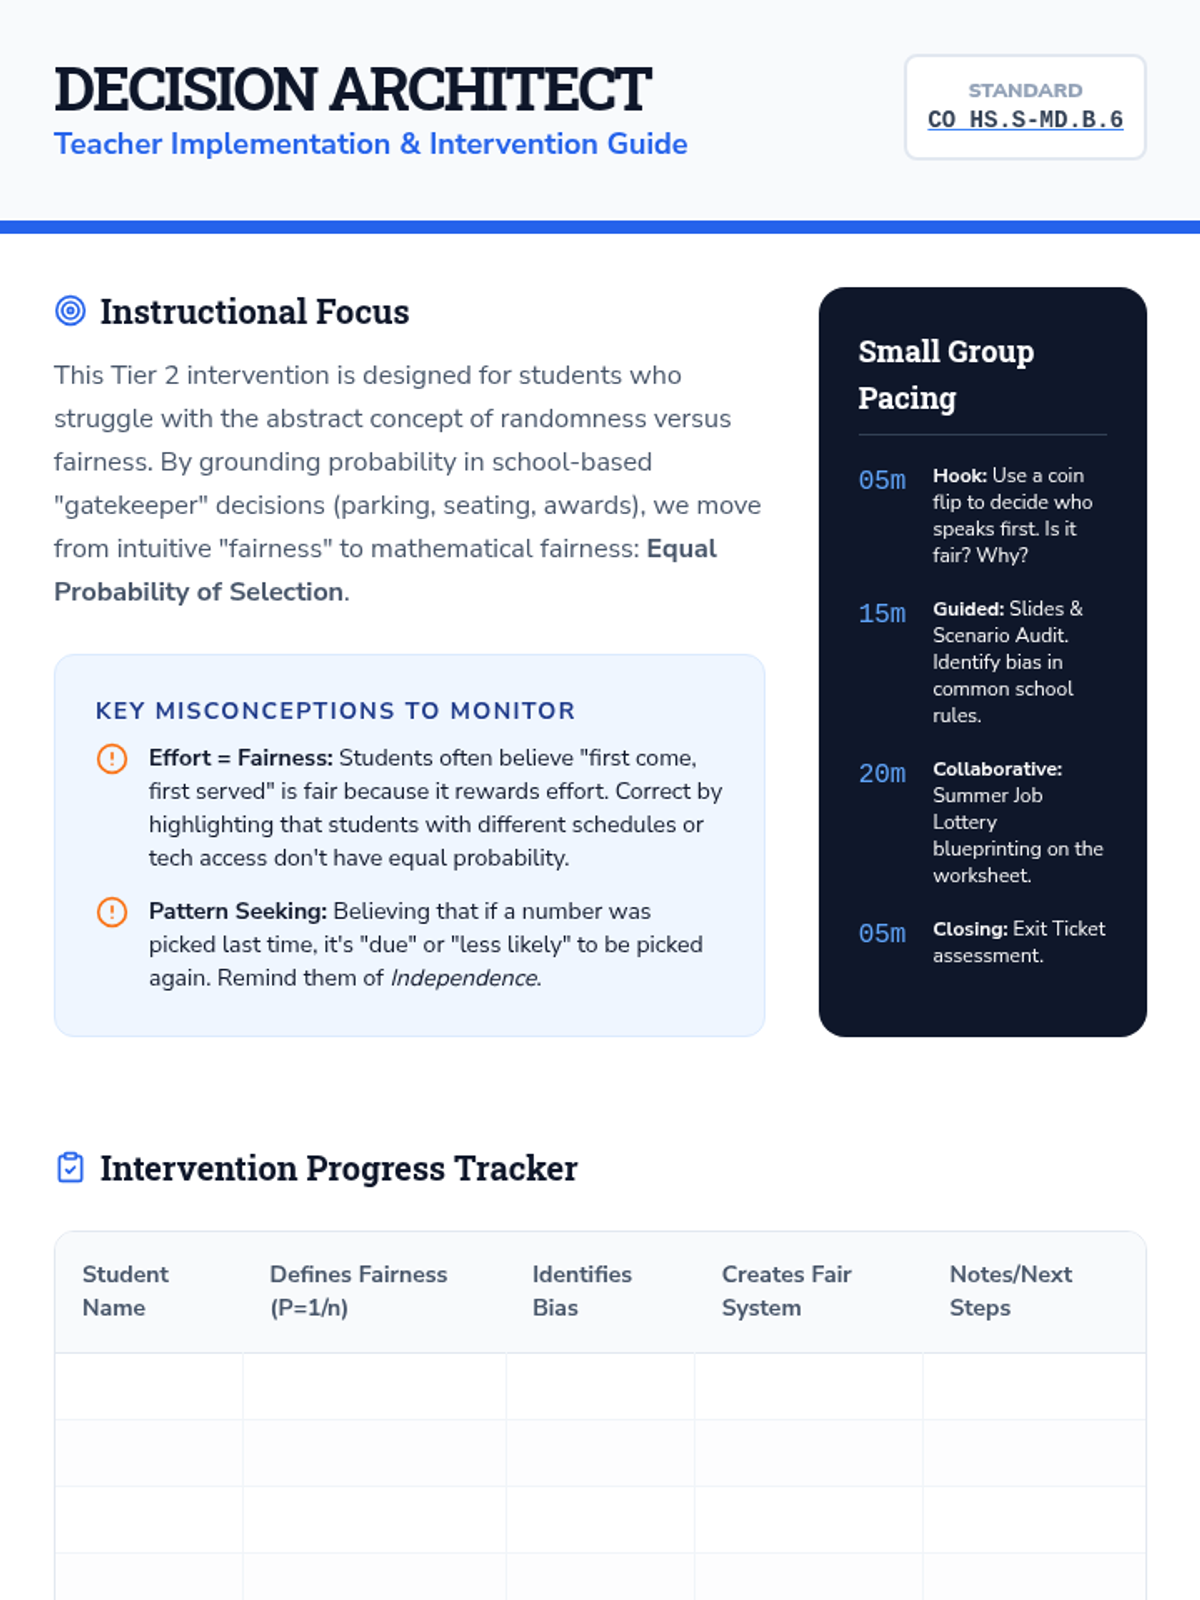
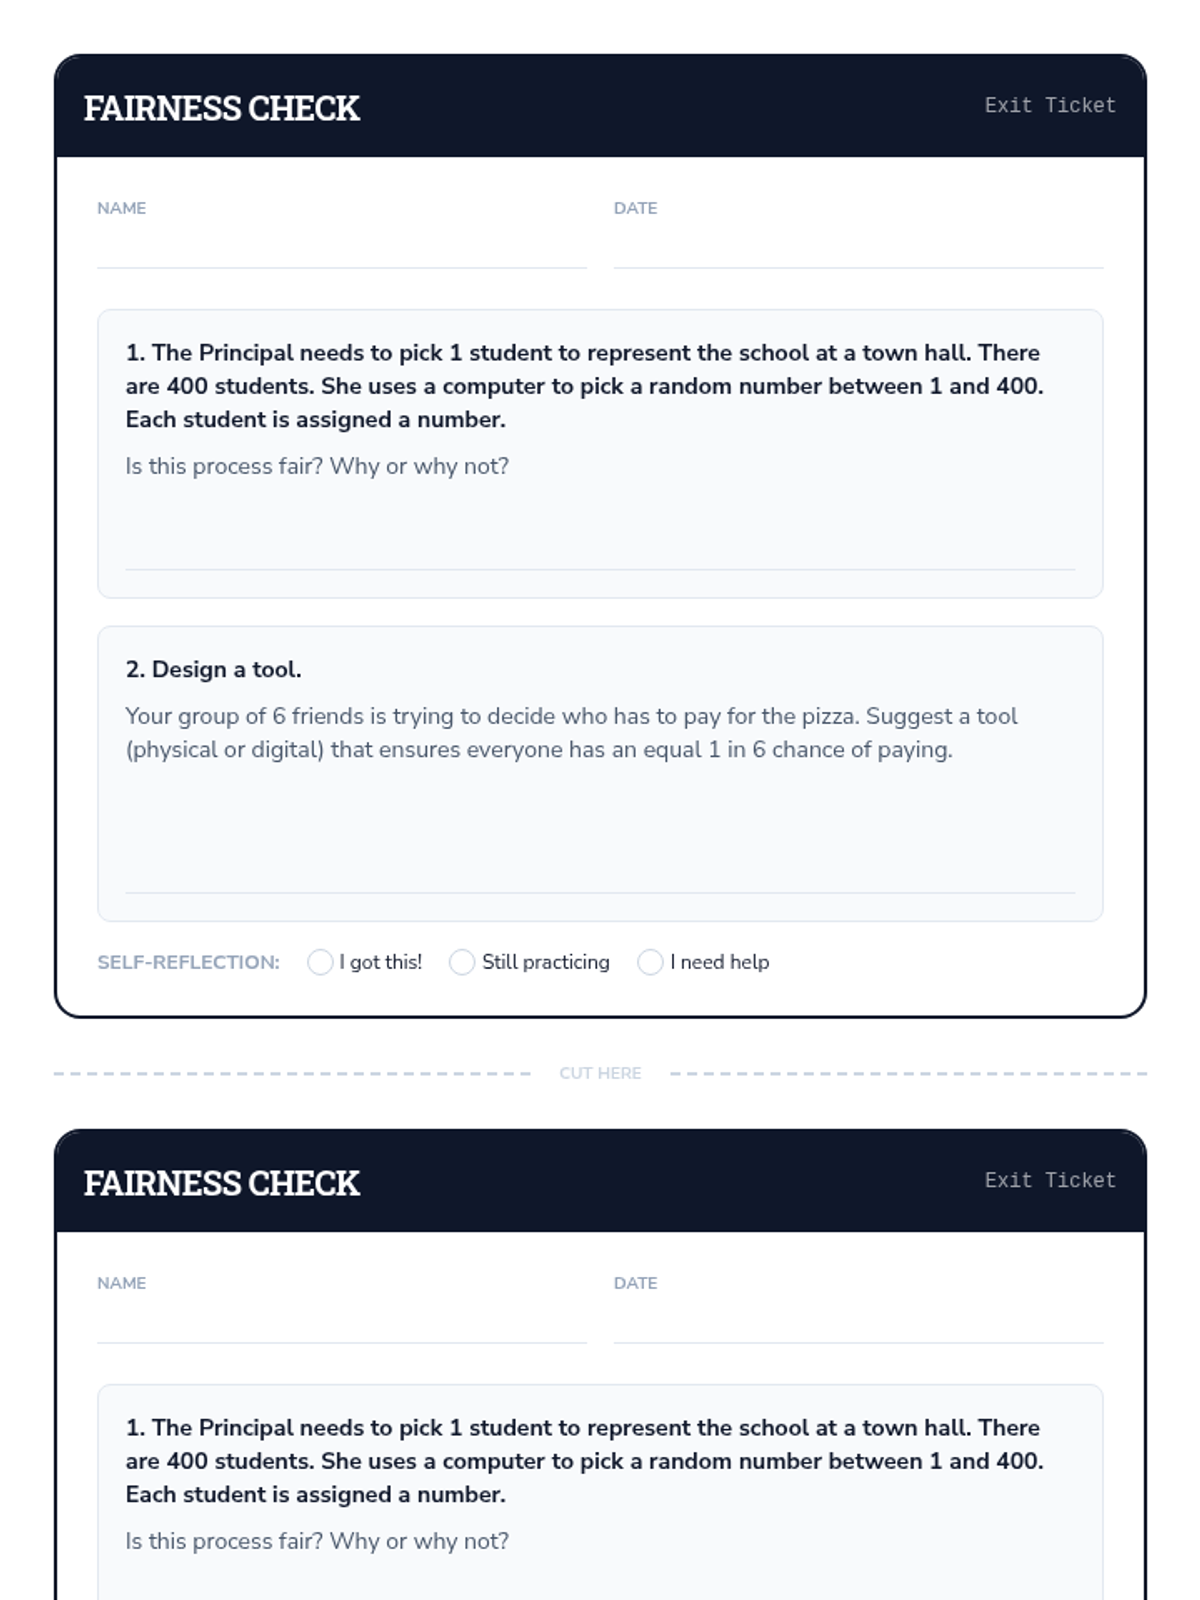
A Tier 2 intervention lesson focusing on using probability to design and evaluate fair decision-making procedures. Students learn to use tools like random number generators and drawing lots to ensure equal opportunity.
A scaffolded lesson where students test various random selection methods (drawing lots, dice, RNG) to determine if they are fair and use probability to justify their findings.
A targeted Tier 2 intervention lesson focusing on evaluating model consistency through simulations, designed for small group support in High School Statistics.
A Tier 2 intervention lesson focusing on using probability and expected value to analyze real-world decisions in medical testing, product quality, and sports strategy. Students use decision trees and justification templates to move from calculations to reasoned arguments.
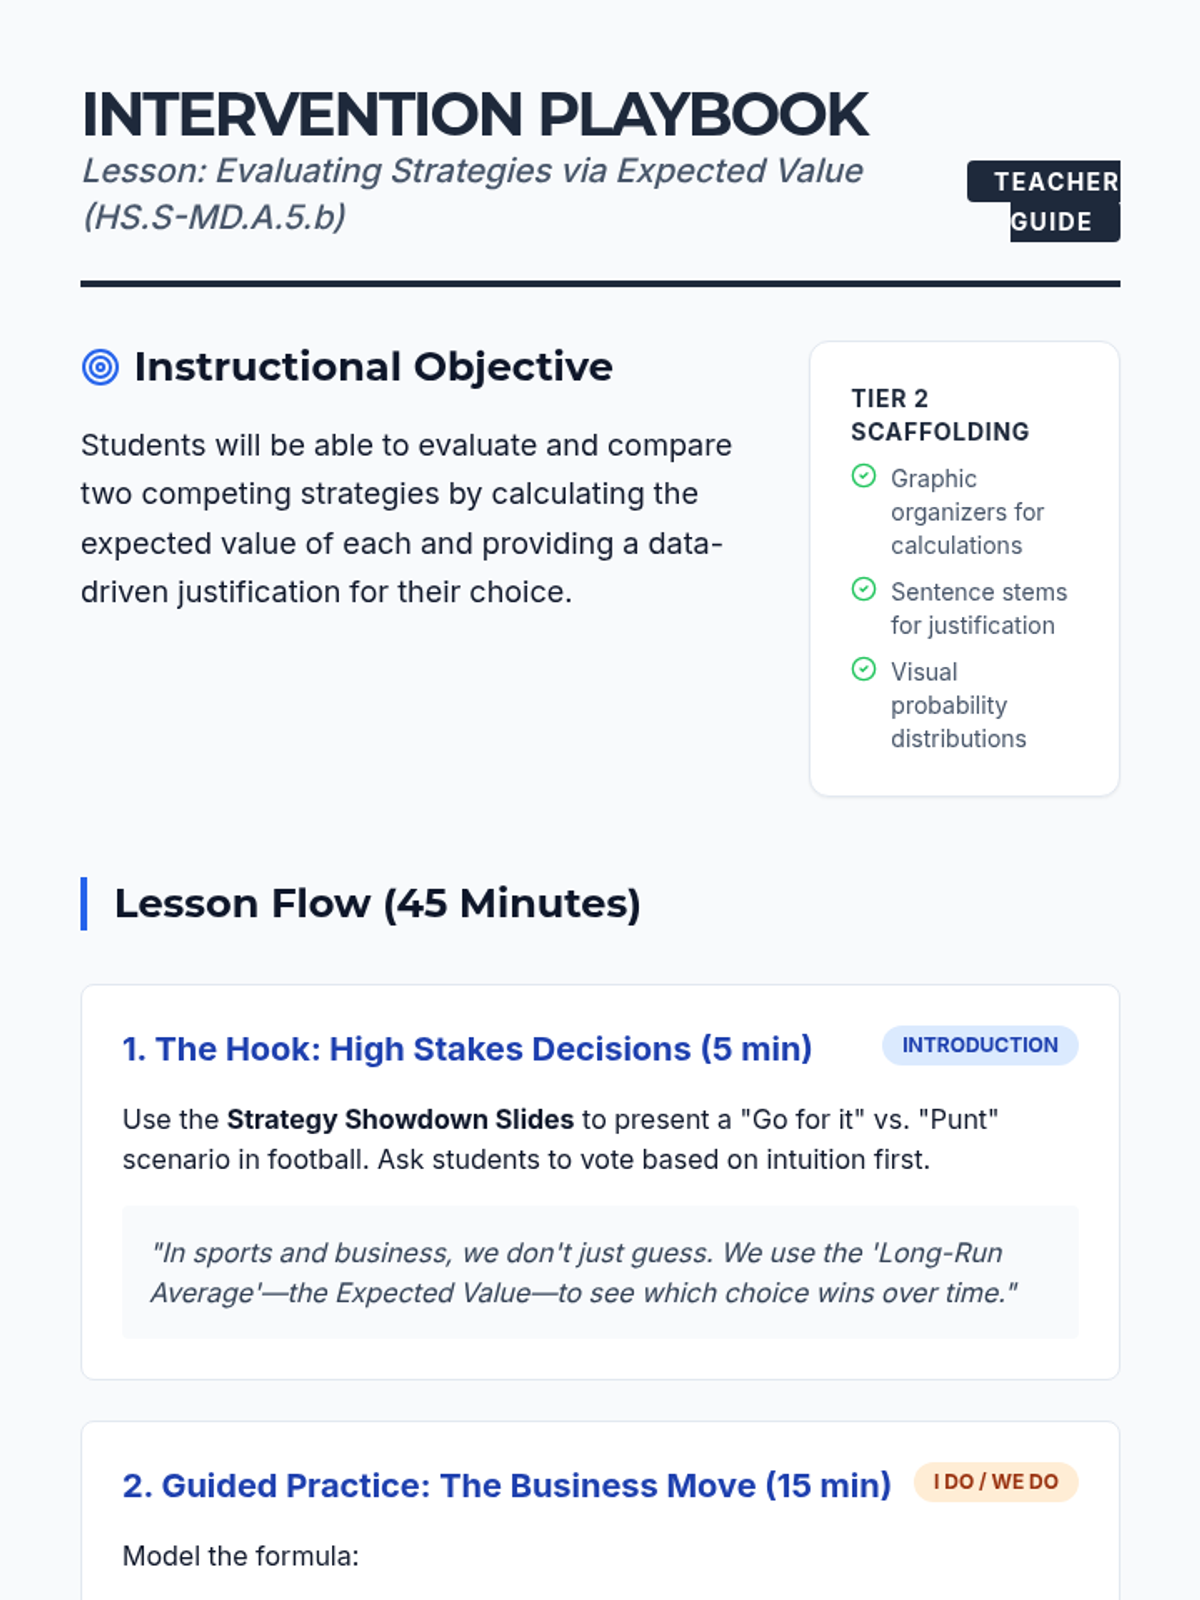
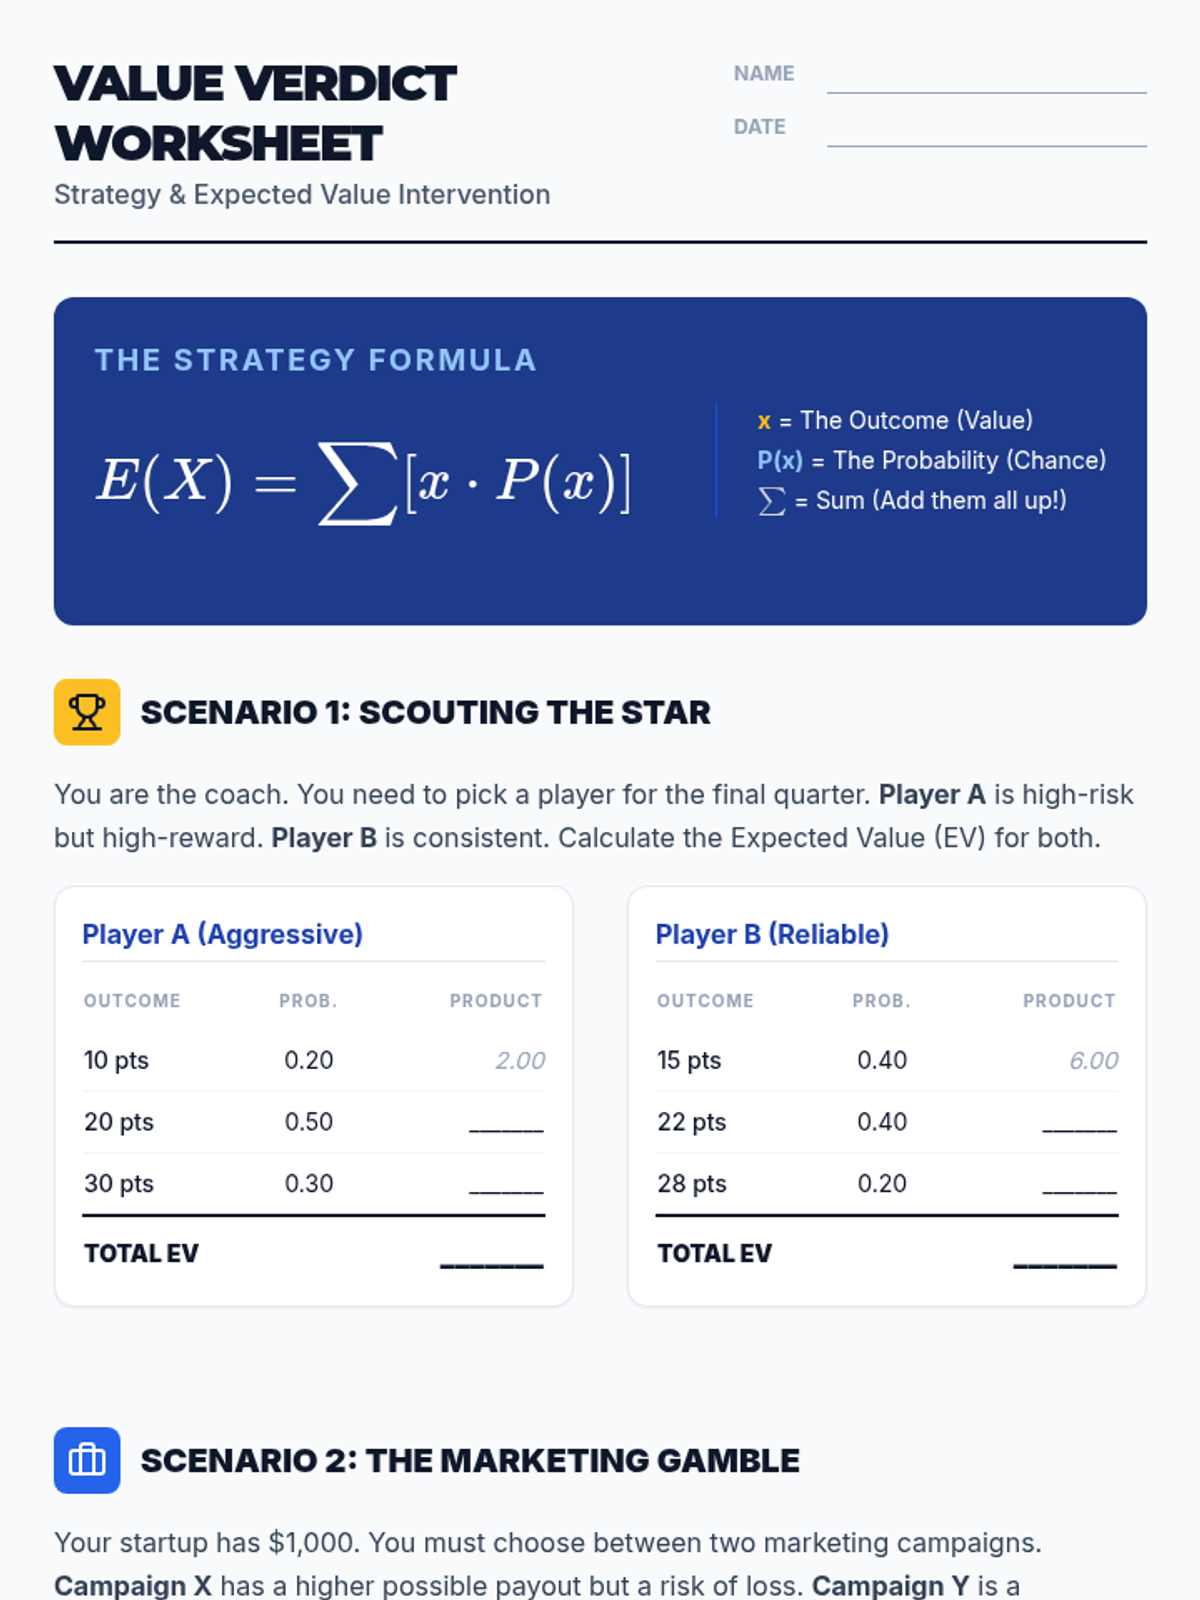
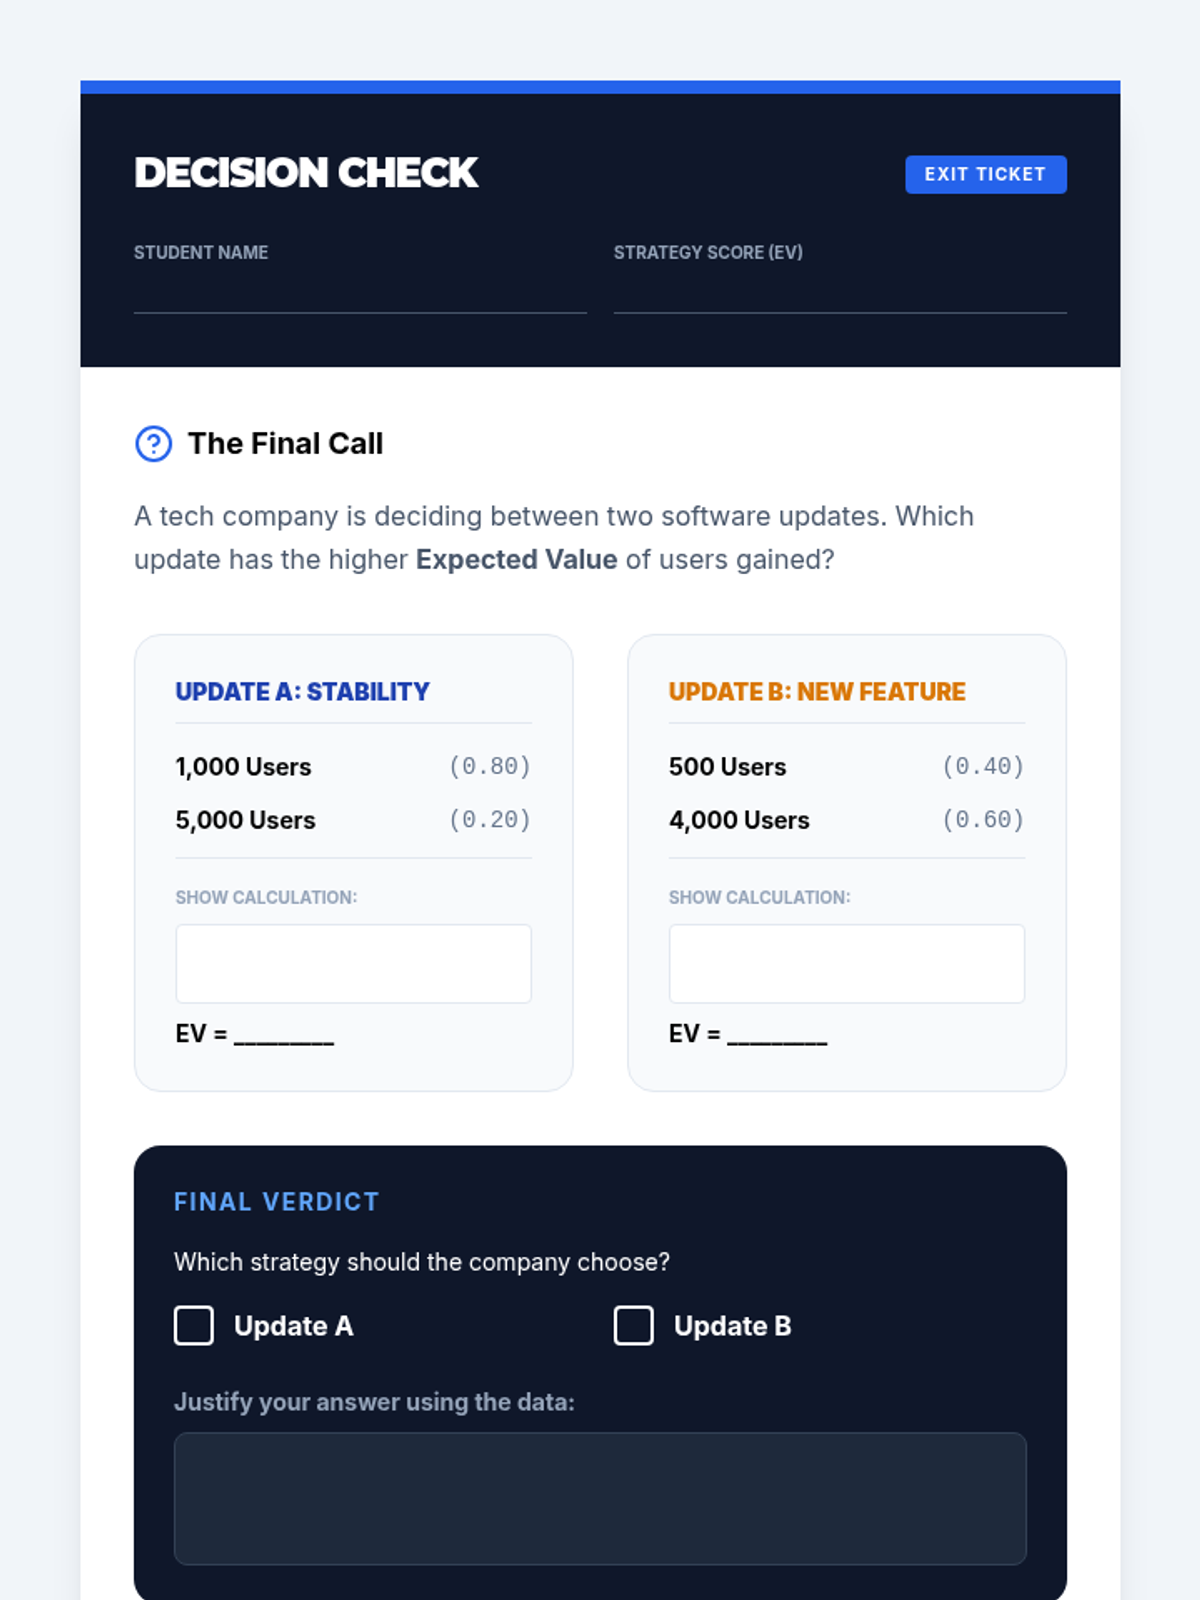
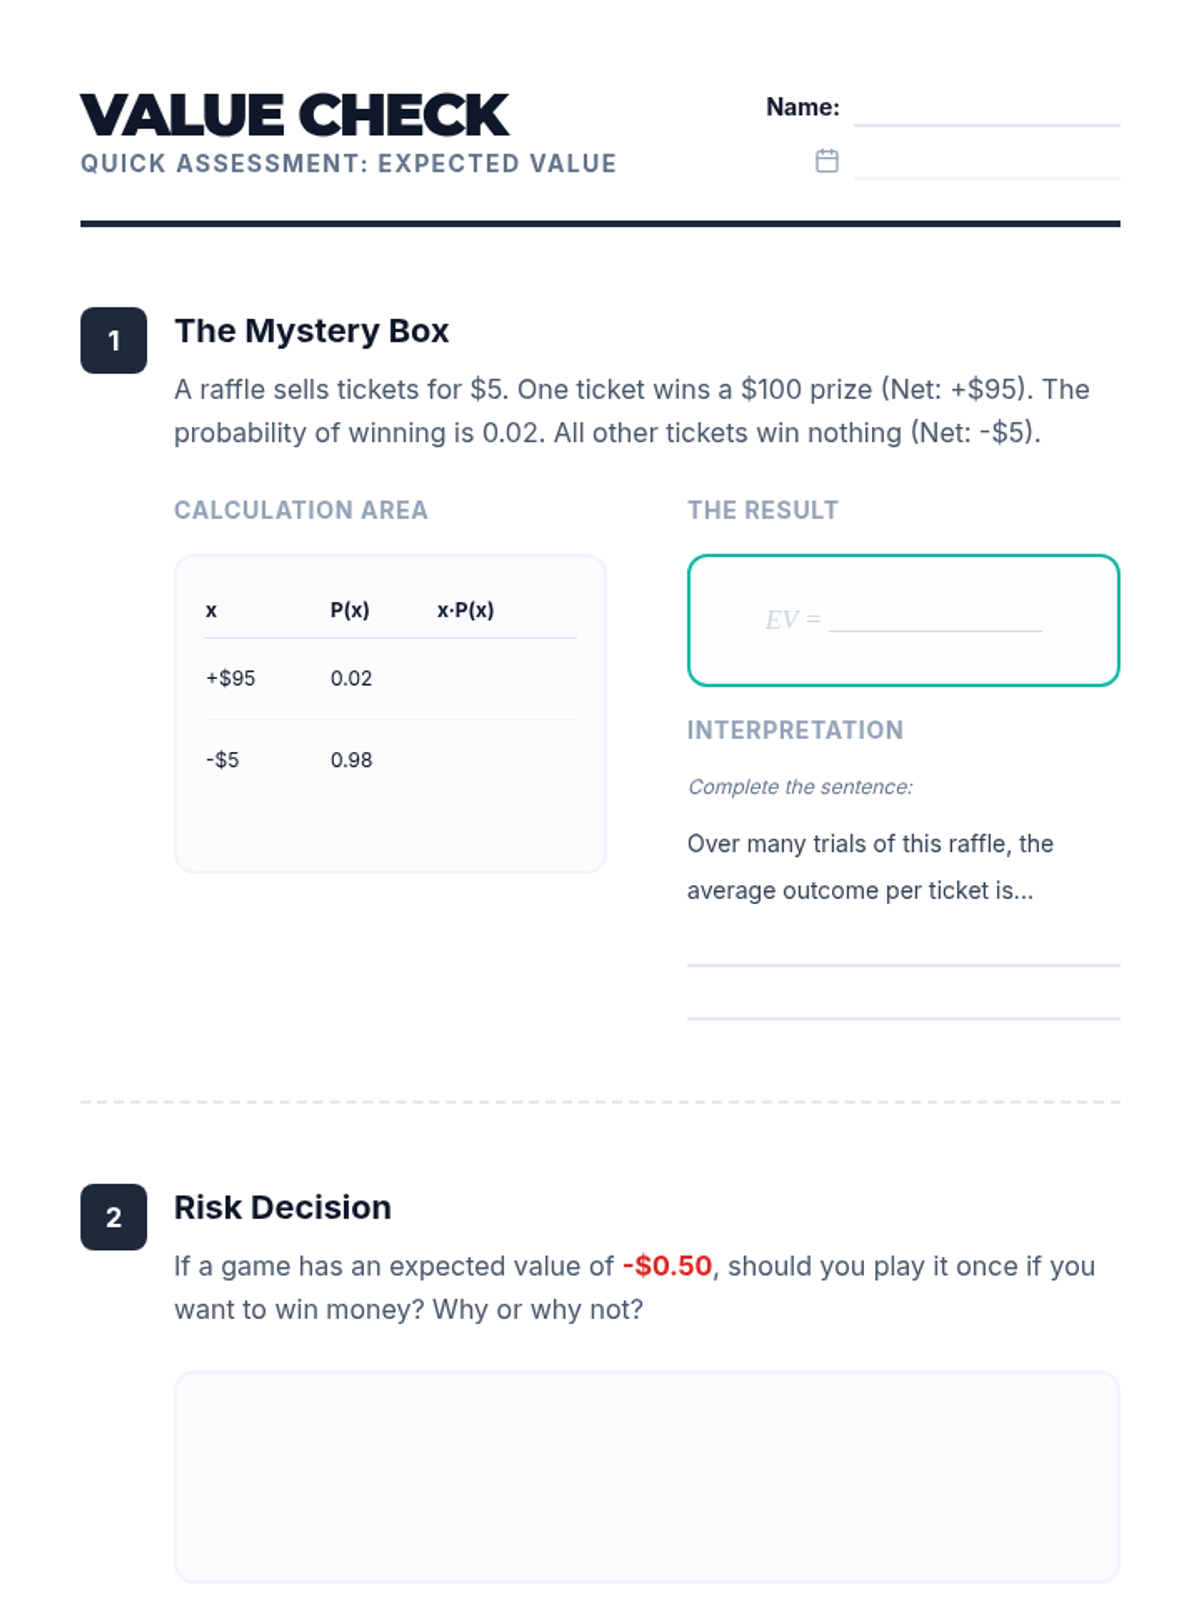
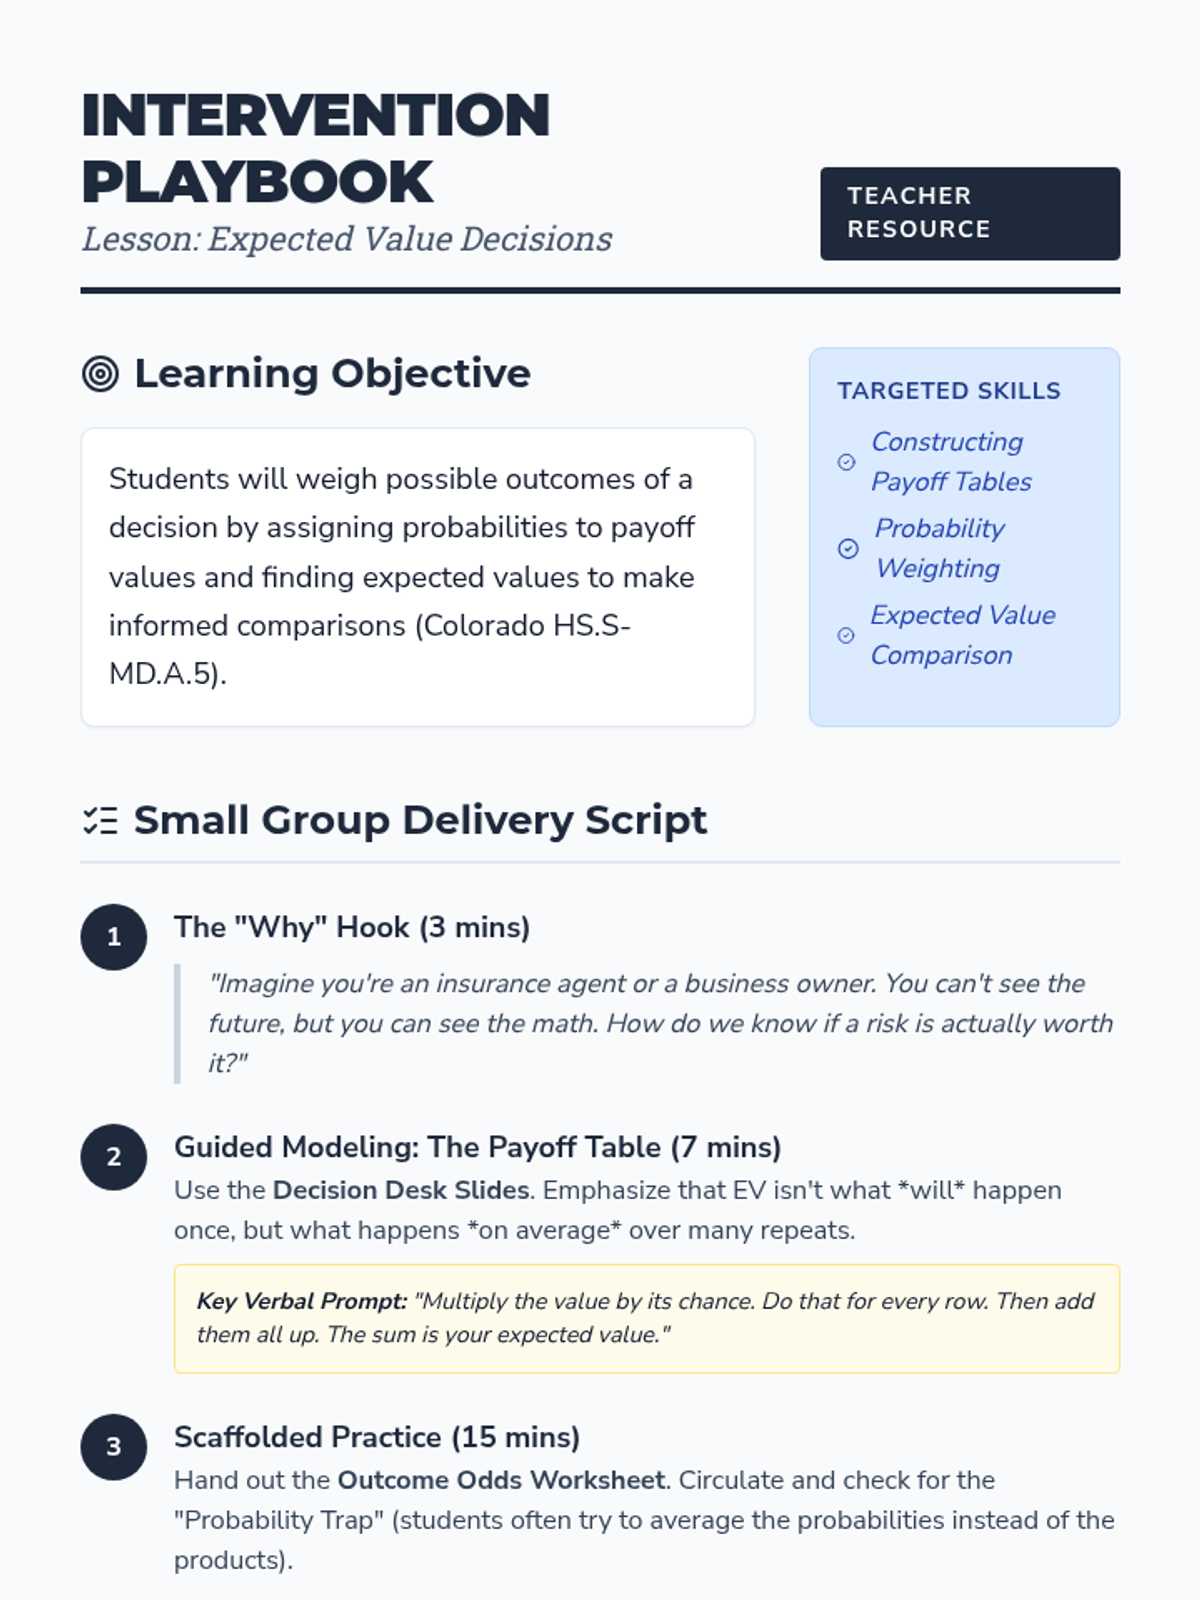
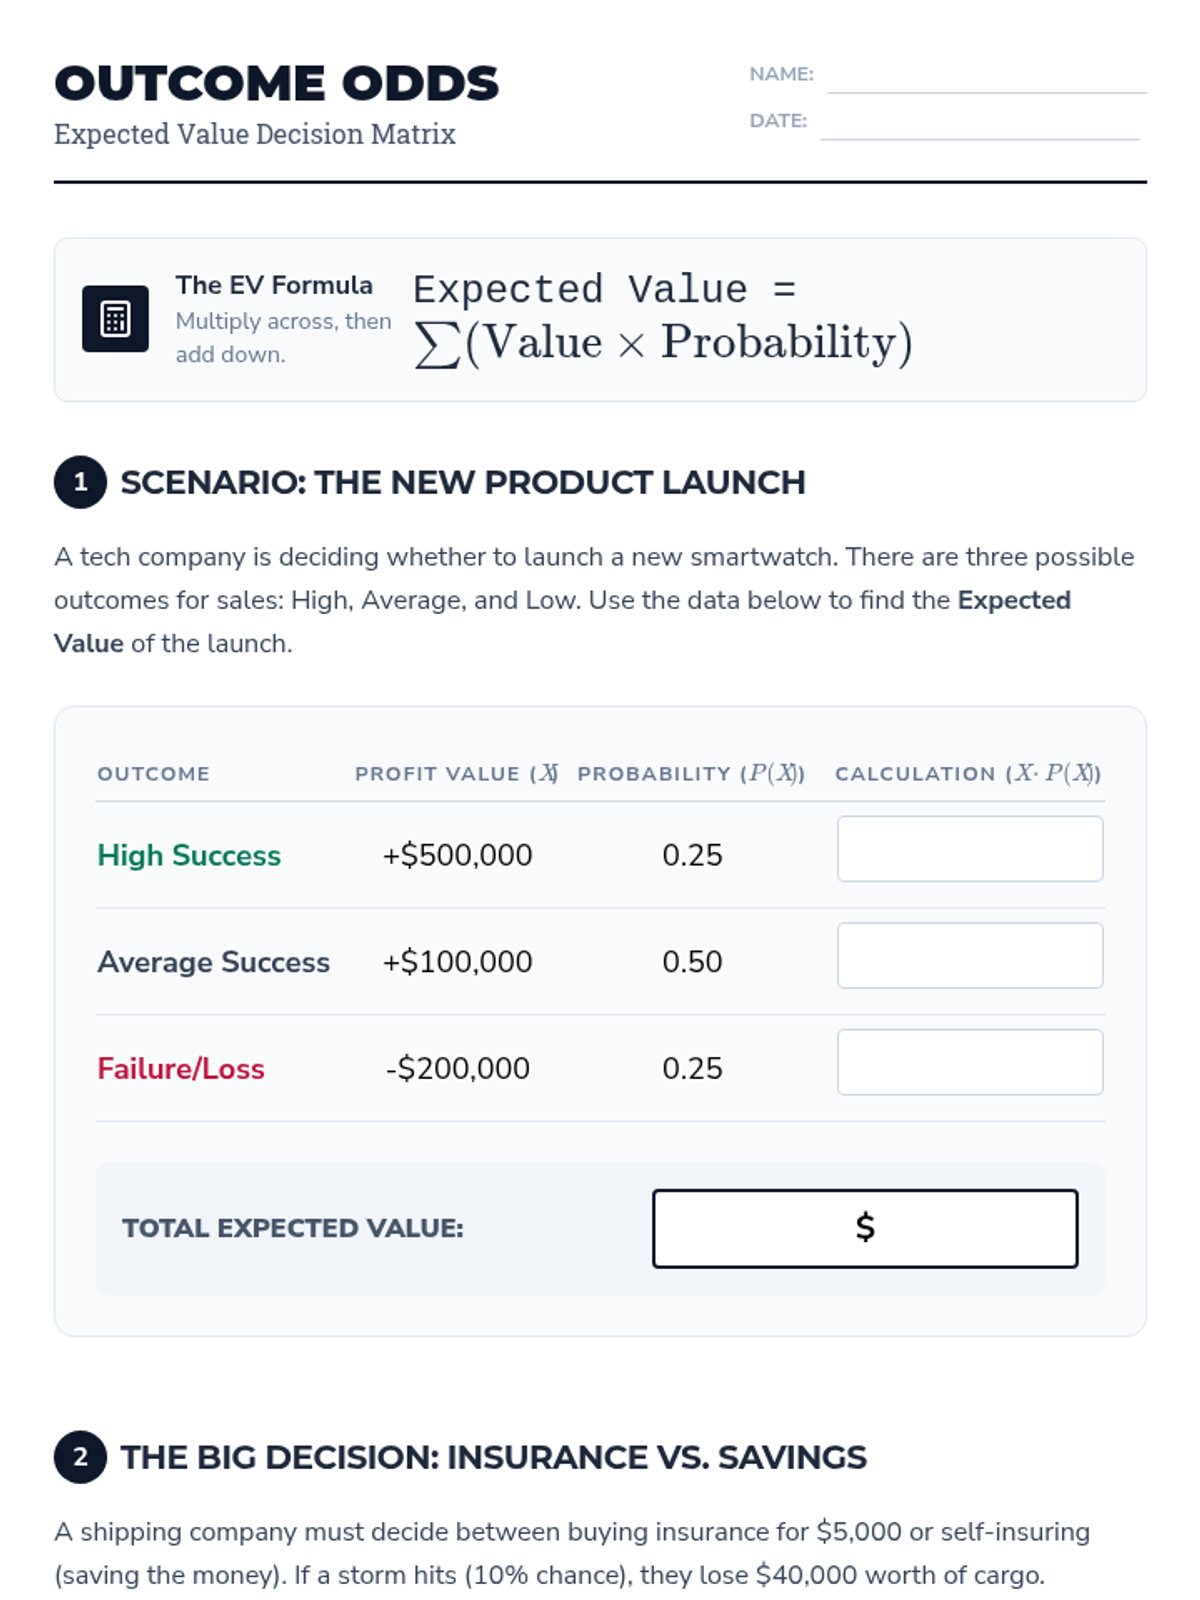
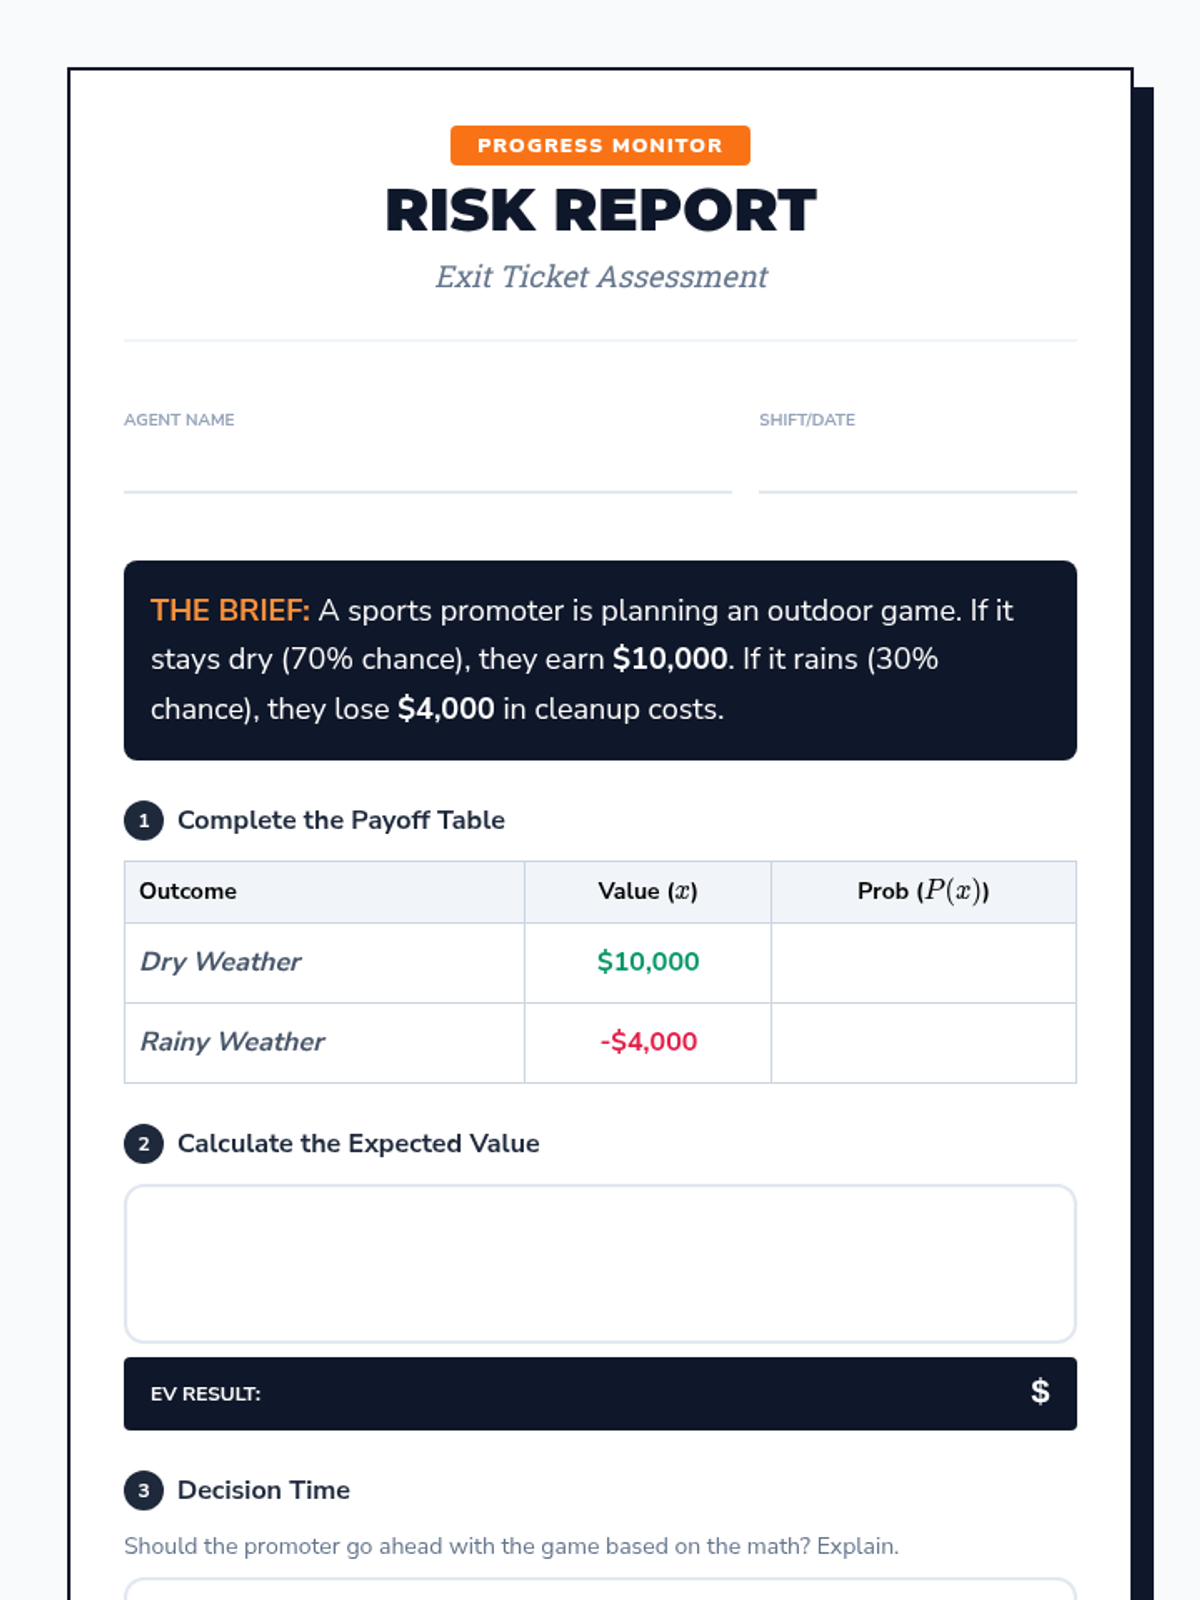
A targeted Tier 2 intervention lesson focused on calculating and comparing expected values to make informed decisions in sports and business contexts. Students will learn to evaluate competing strategies through scaffolded practice and peer justification.
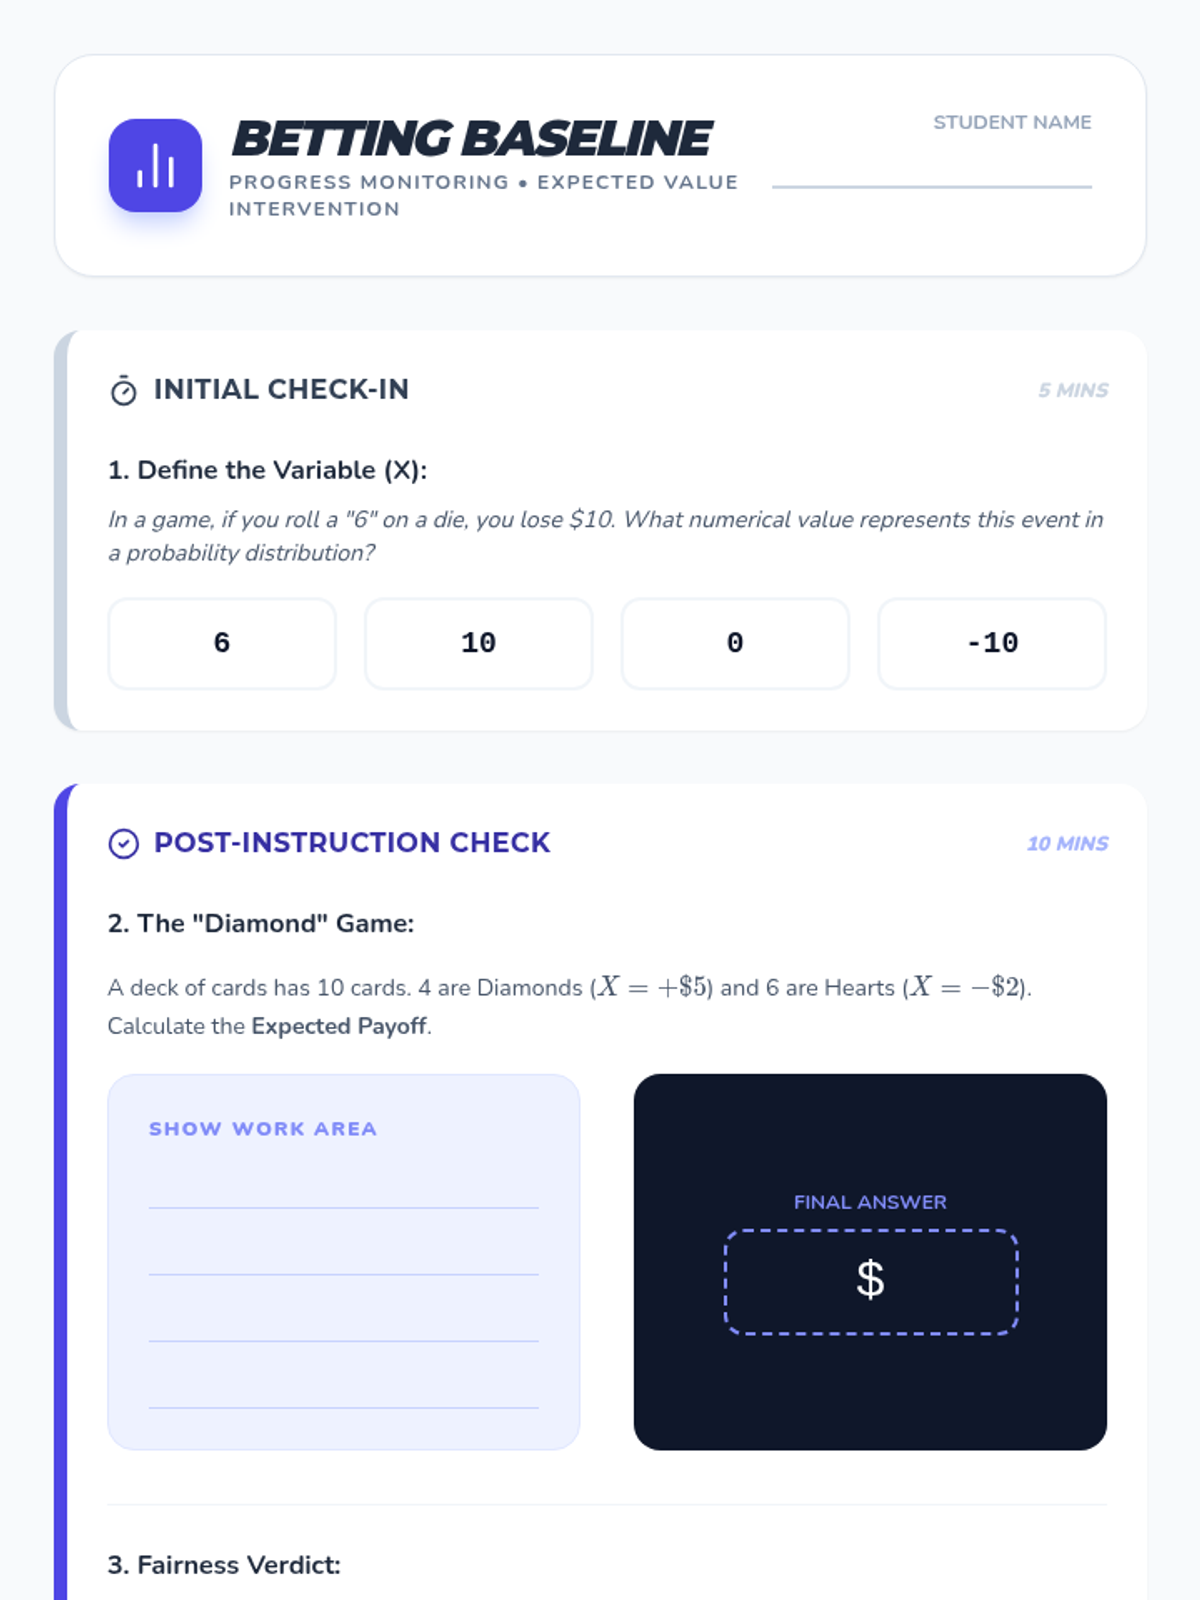
A Tier 2 intervention lesson designed for small groups to master calculating and interpreting expected value through scaffolded practice with real-world scenarios like smartphone insurance and carnival games.
A targeted intervention lesson for high school students to master calculating expected values for decision-making. Includes guided practice with payoff tables and scaffolded comparisons of multiple options.
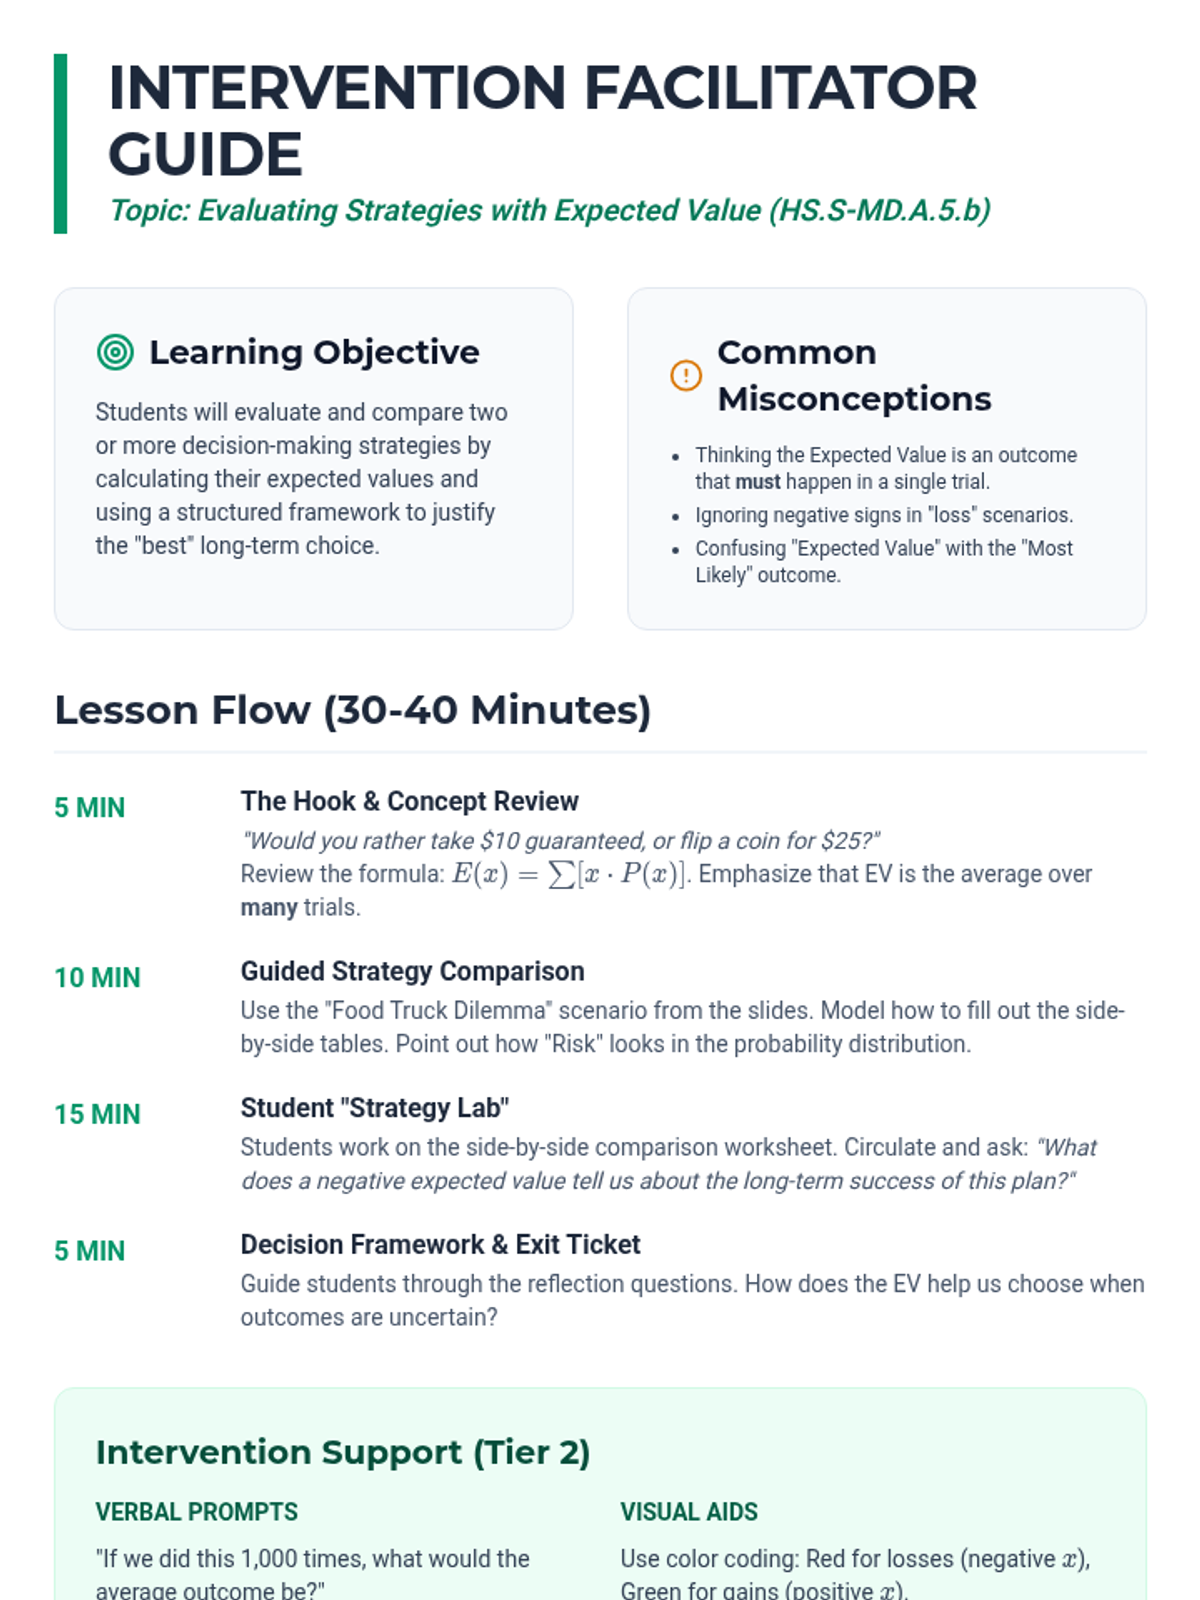
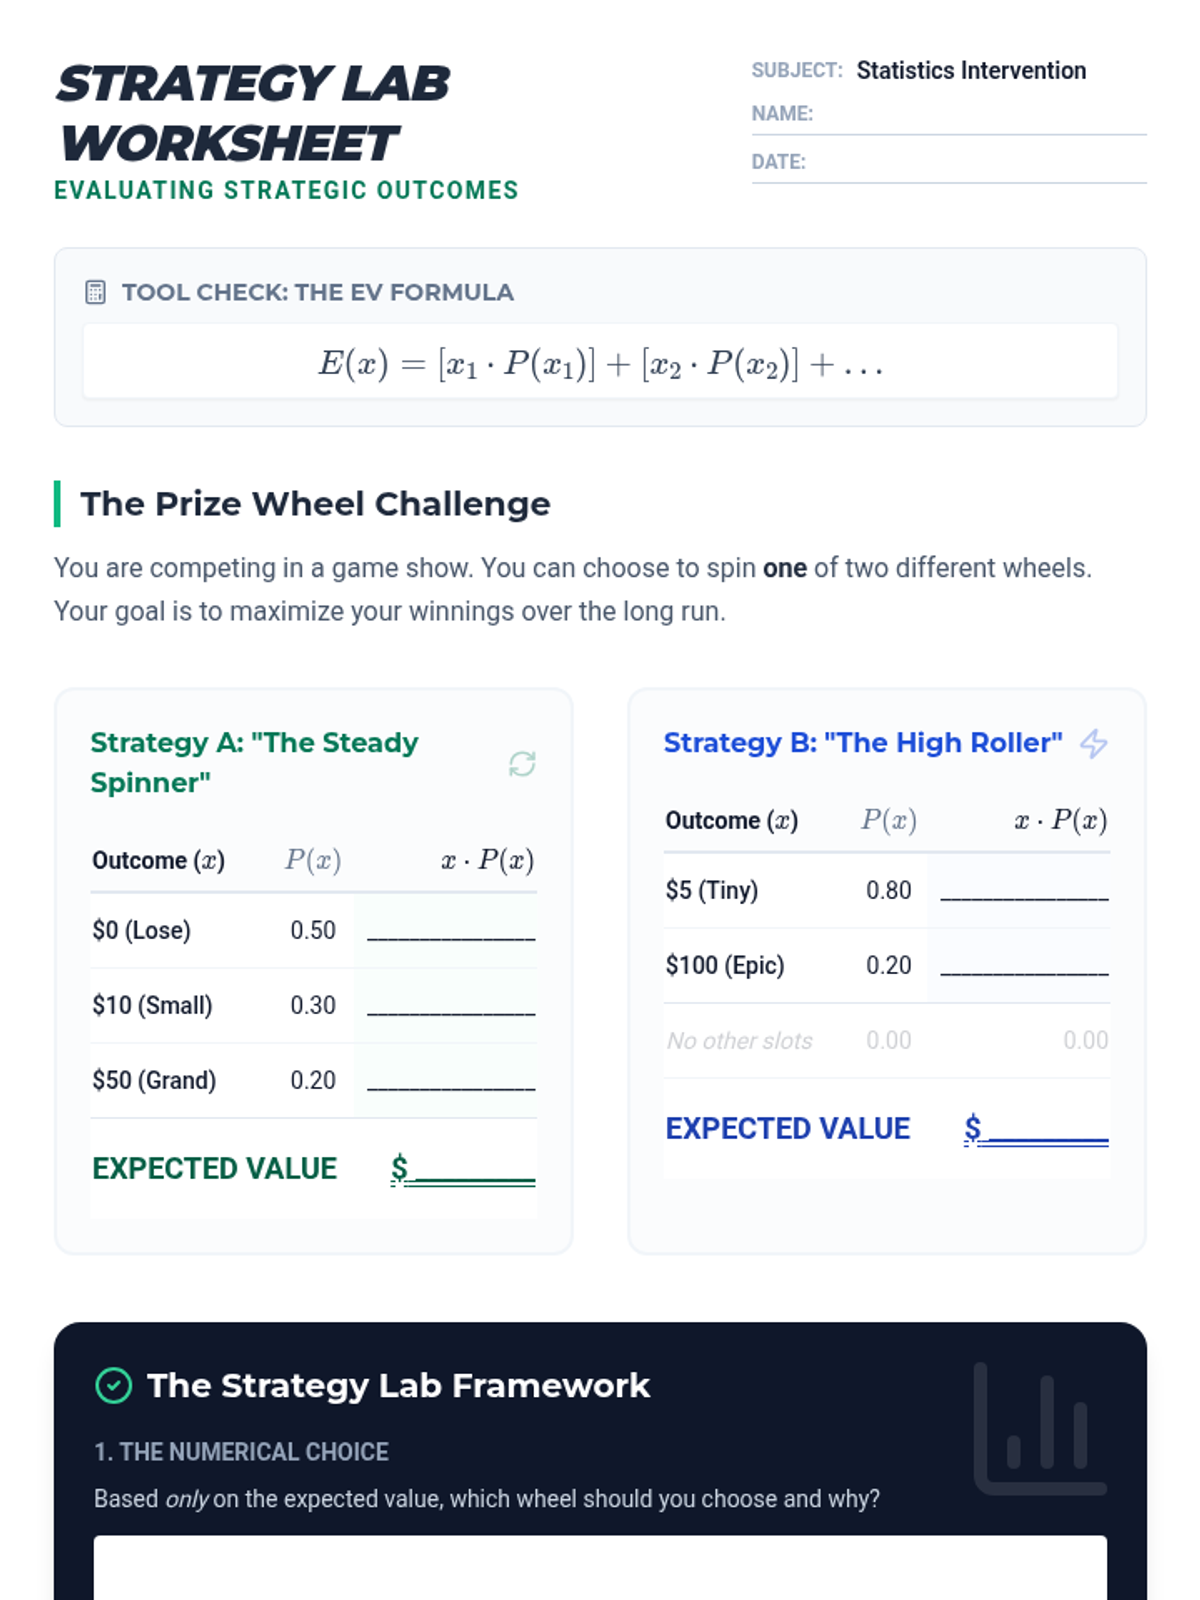
A targeted Tier 2 intervention lesson designed to help high school students evaluate and compare different strategies using expected value calculations and decision-making frameworks.
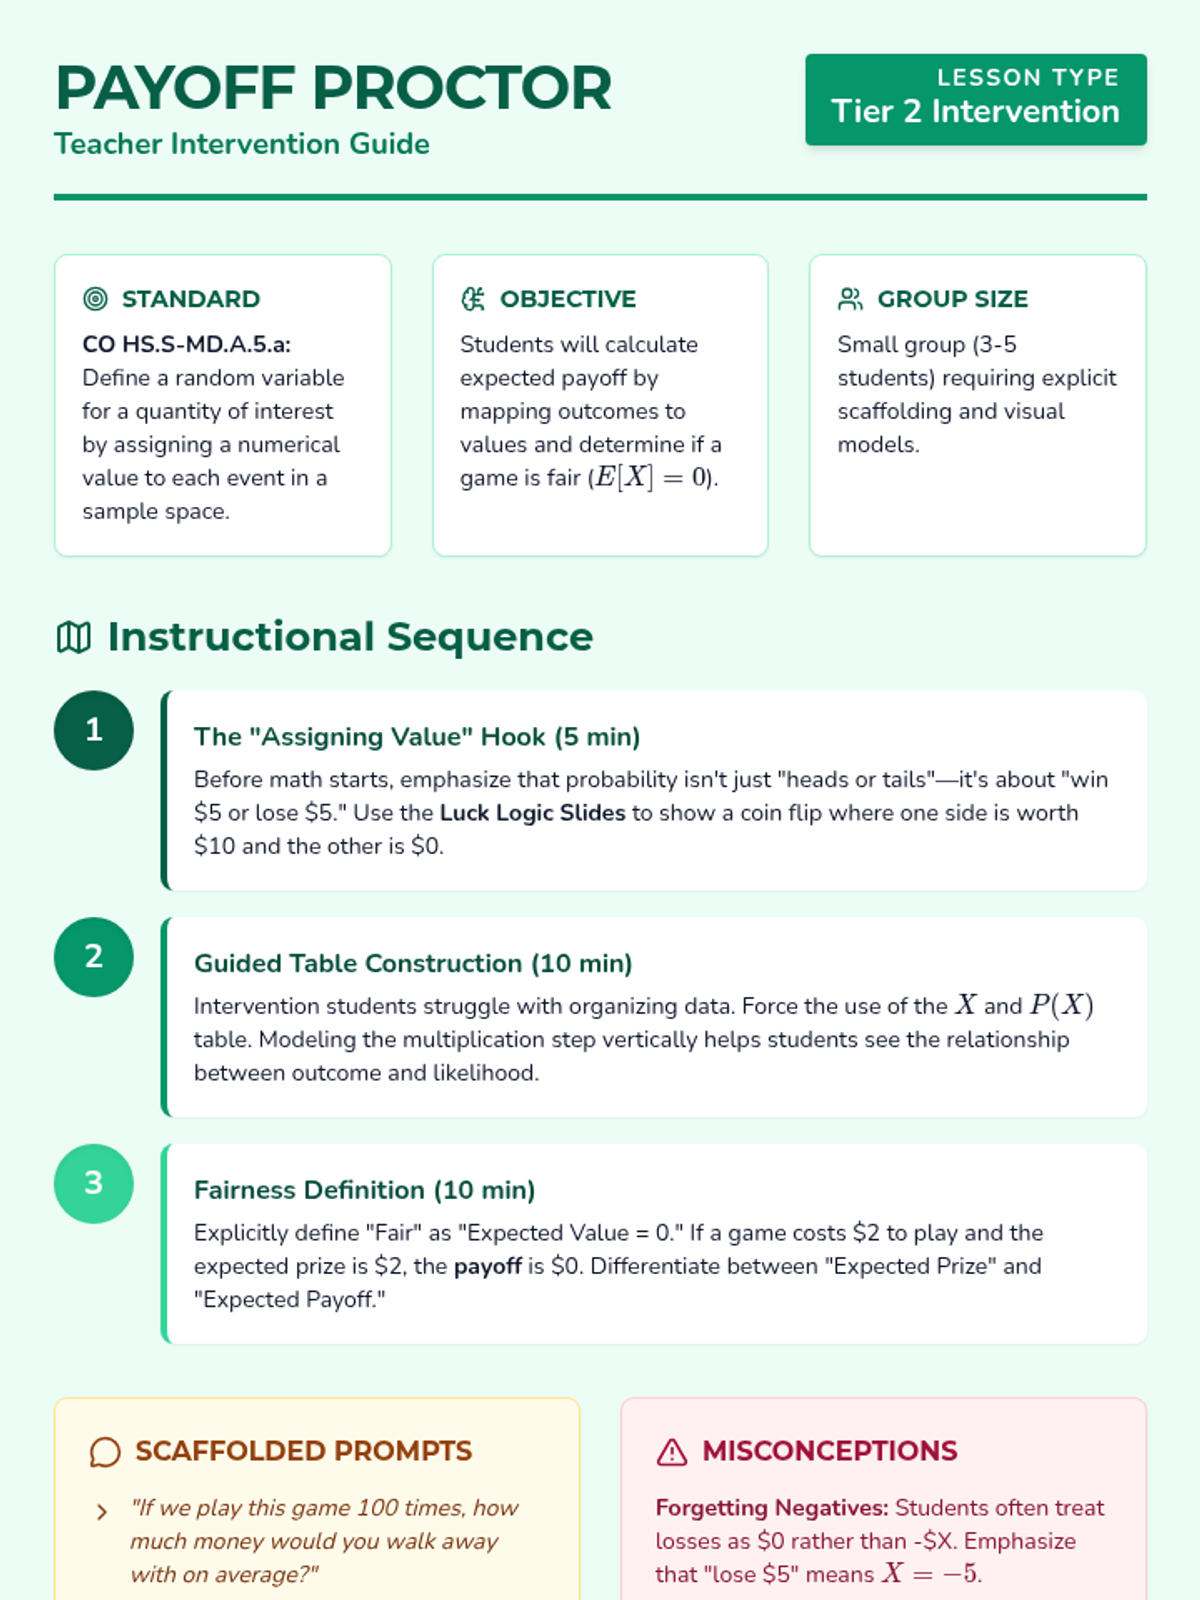
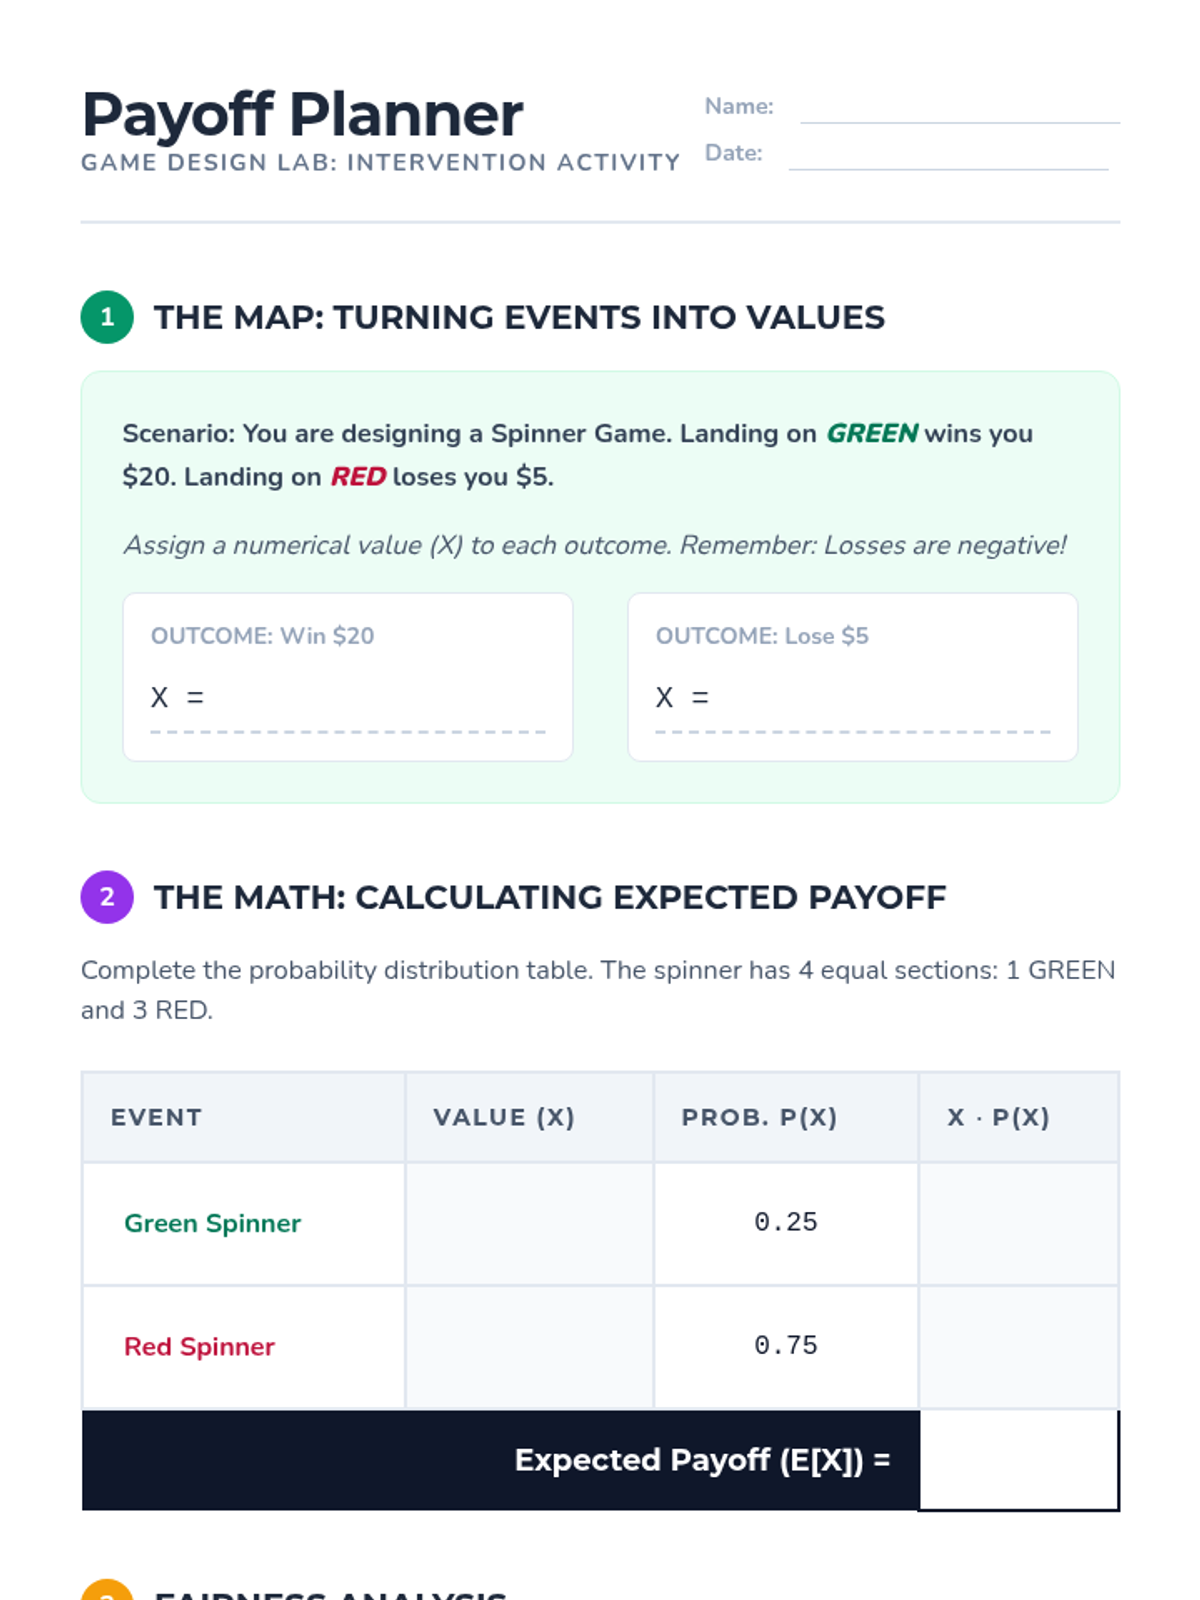
A targeted intervention lesson for high school students to master the calculation of expected value in games of chance, focusing on defining random variables and determining game fairness.
A Tier 2 intervention lesson focused on using probability to create and evaluate fair decision-making systems in school and community contexts. Students move from identifying unfairness to architecting their own fair systems using tools like random number generators and drawing lots.
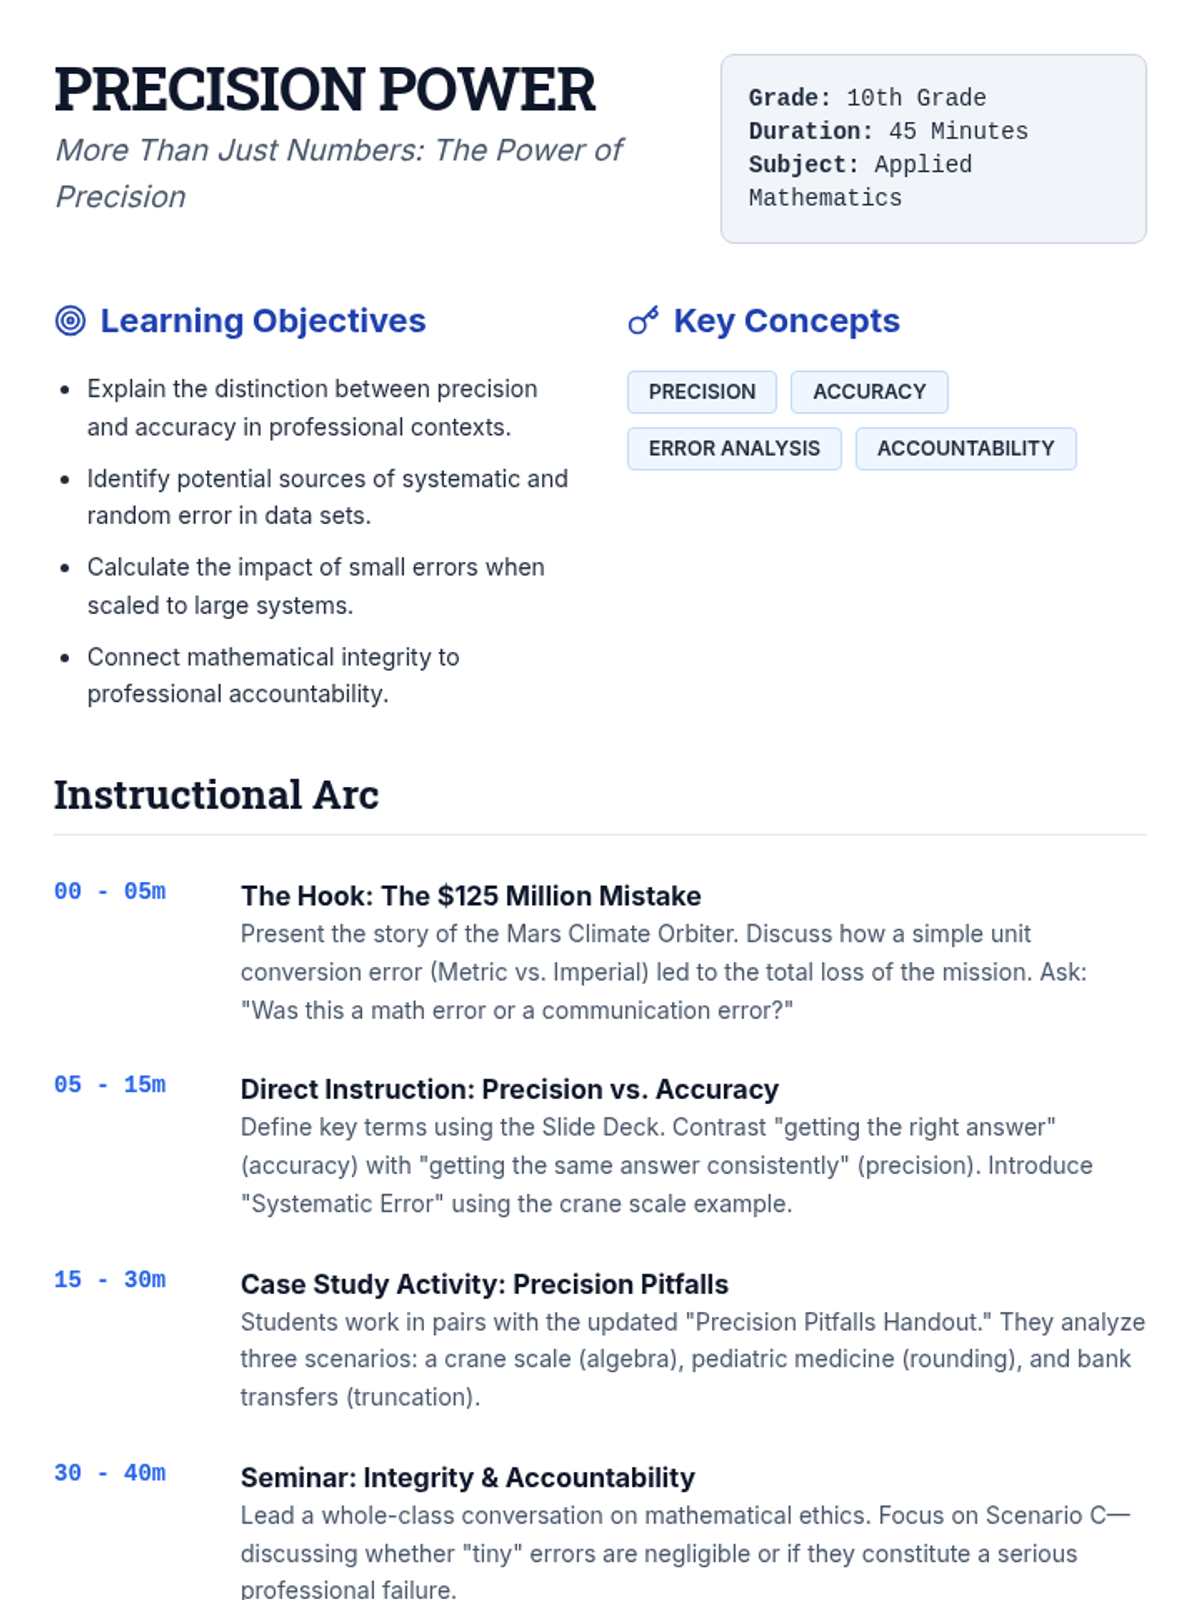
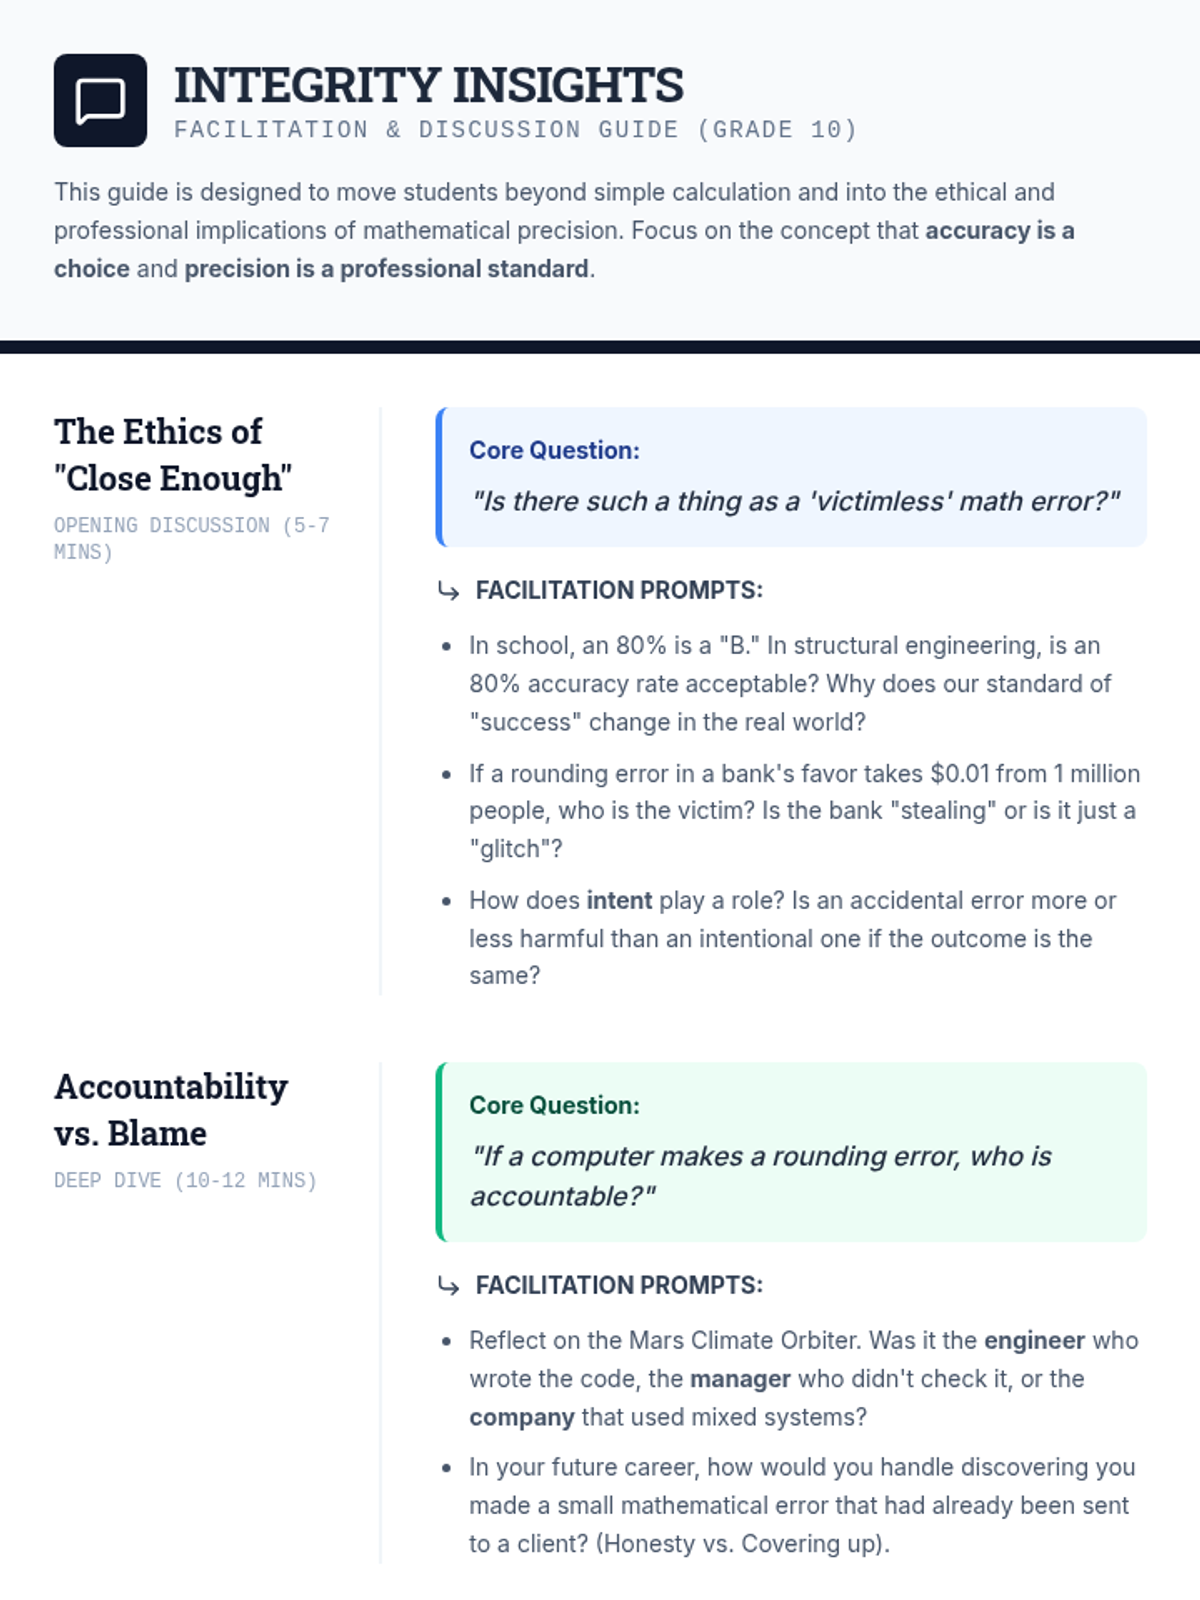
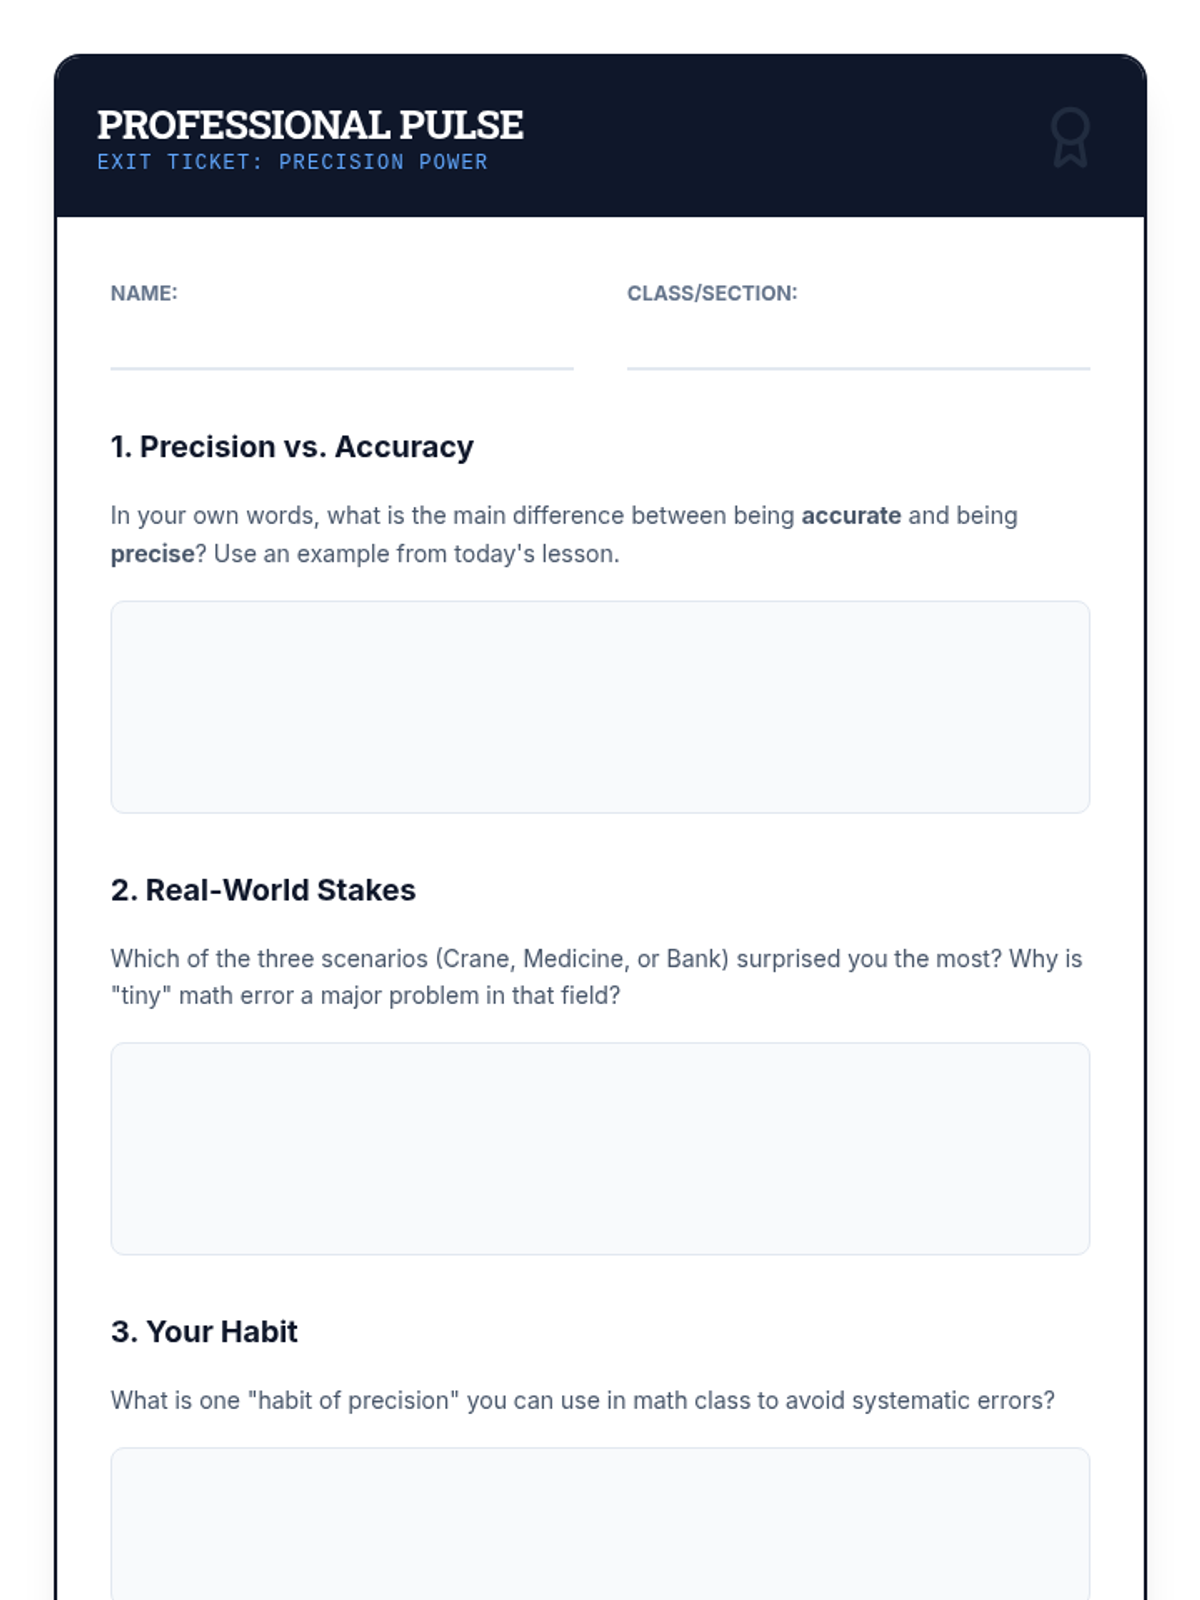
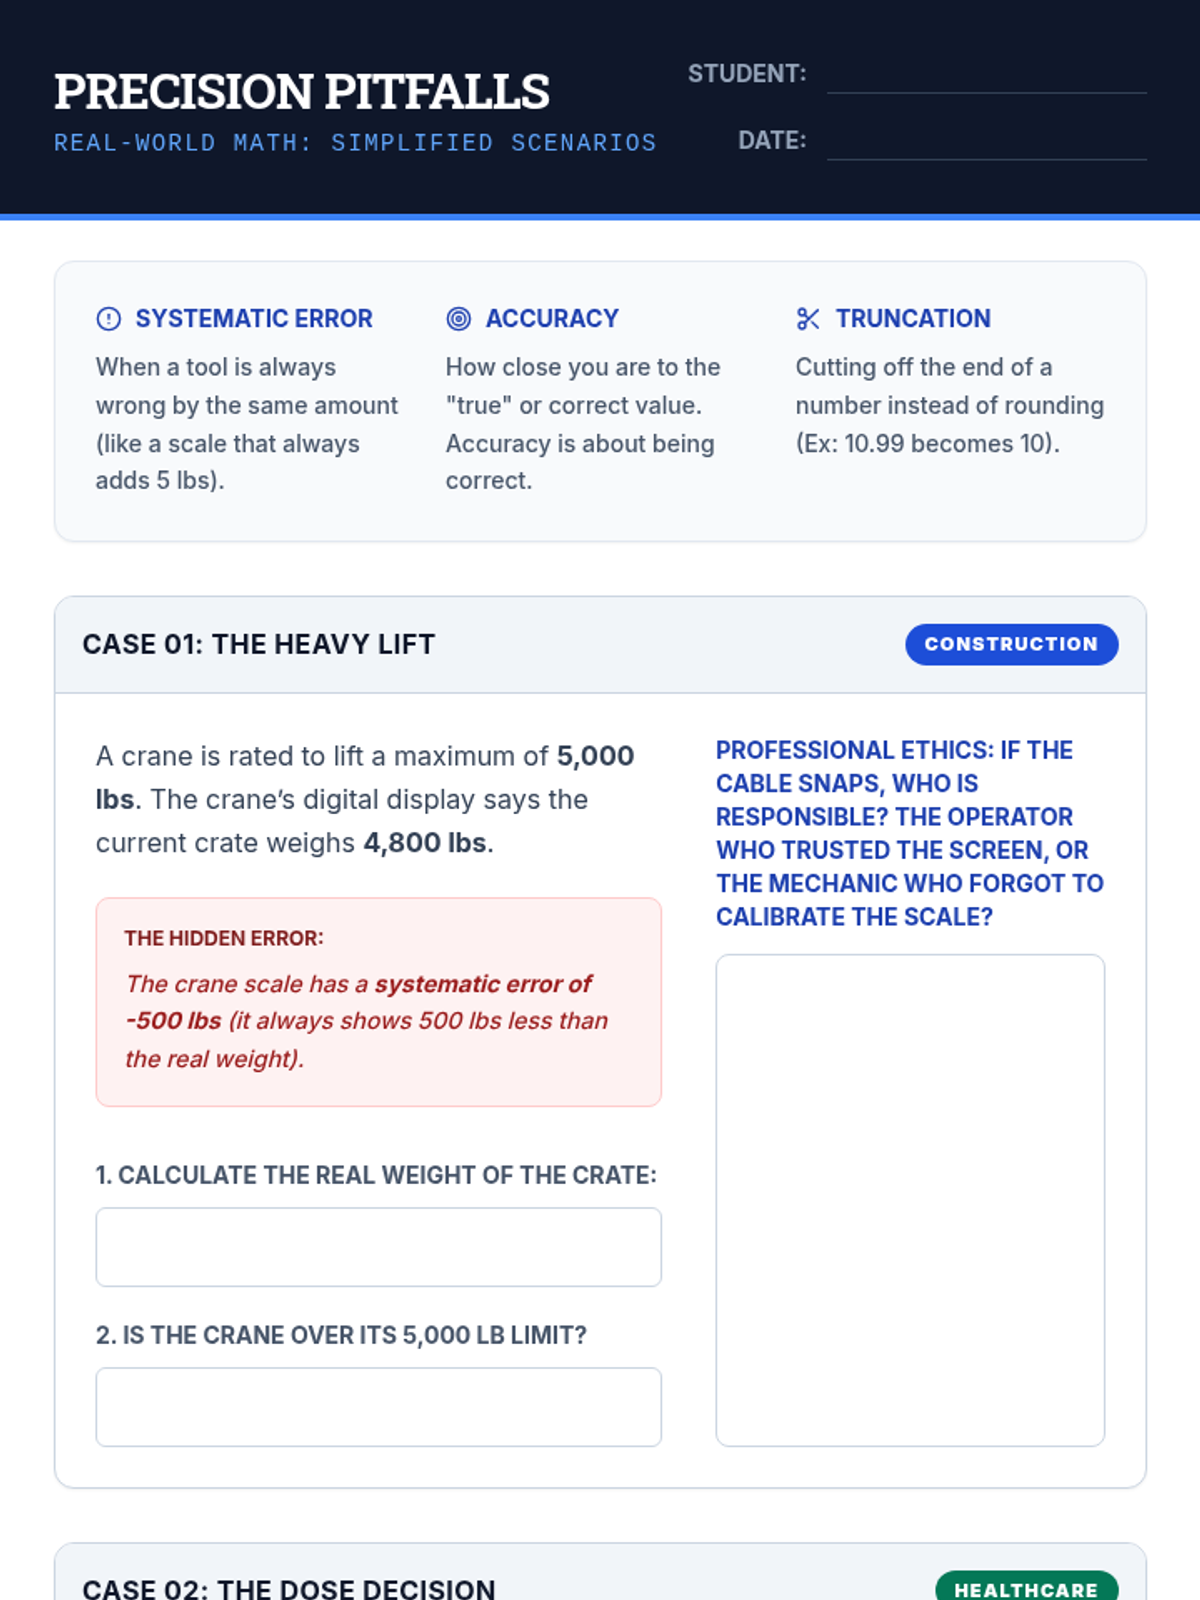
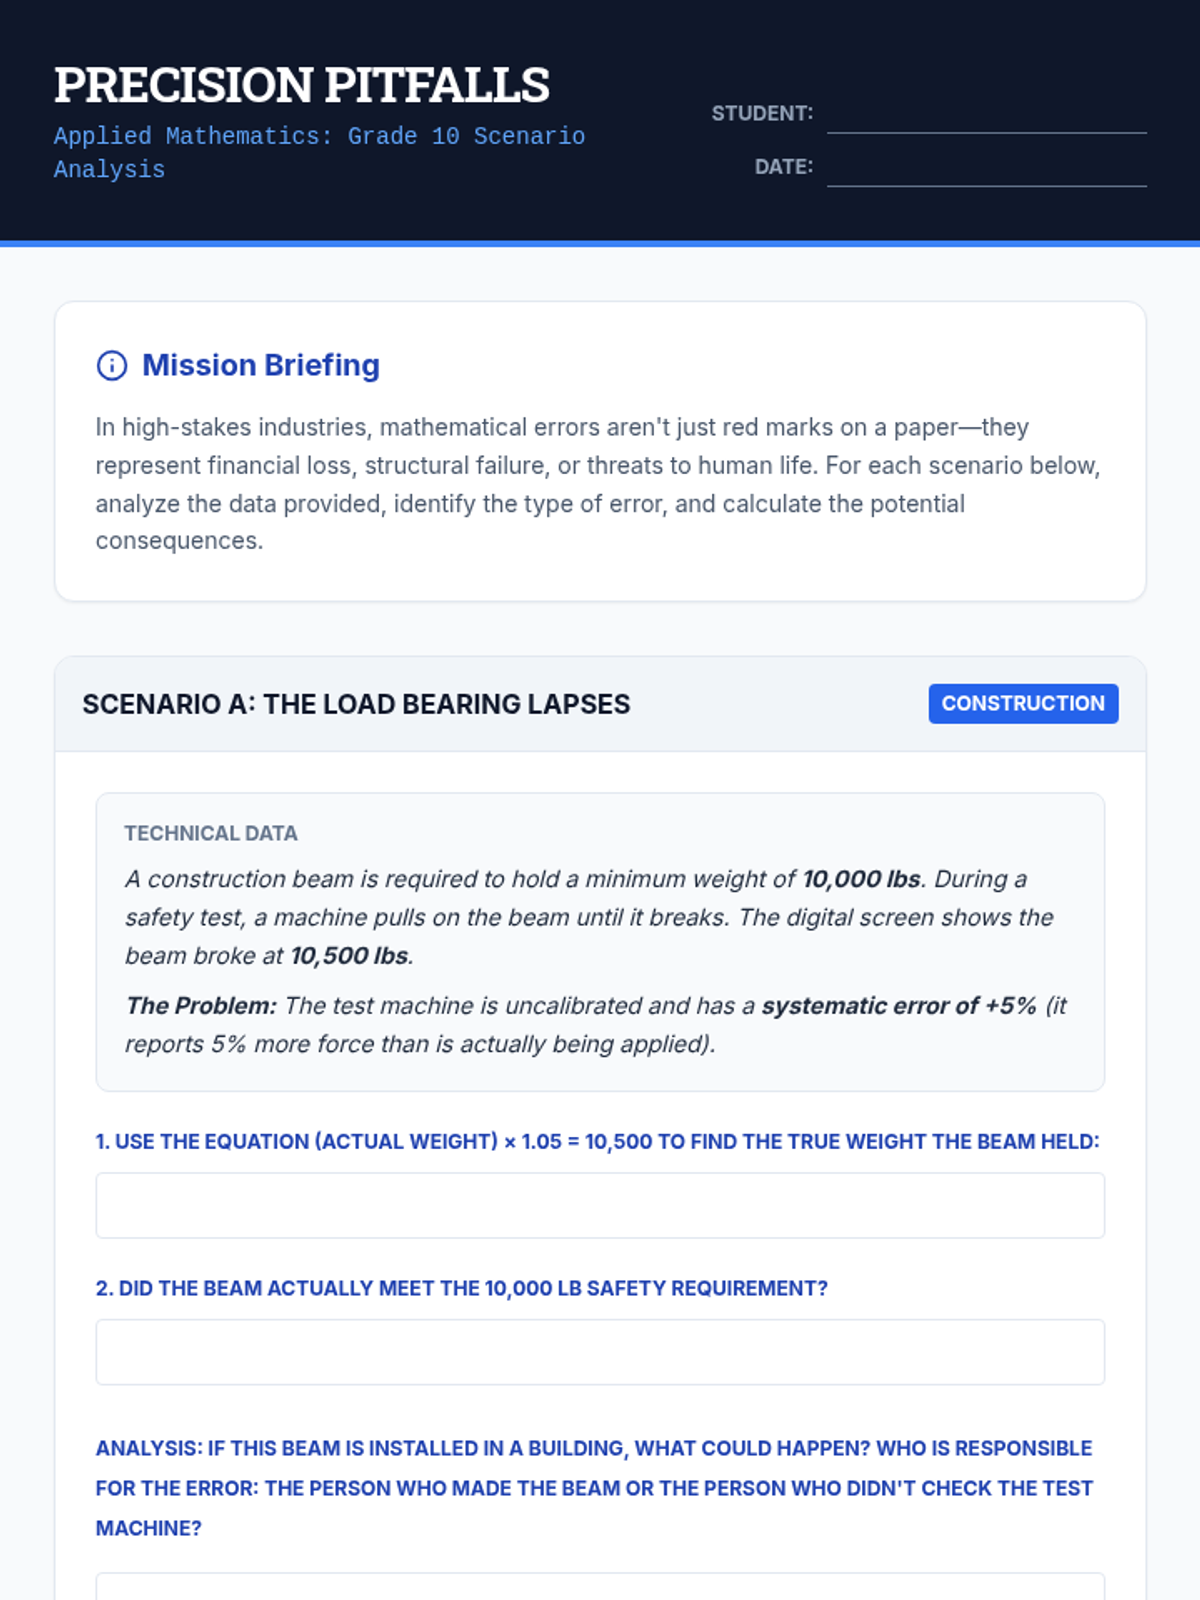
A 45-minute exploration into why mathematical precision and accuracy are critical for professional success, ethical accountability, and real-world safety. Students analyze high-stakes scenarios where small errors led to significant consequences.
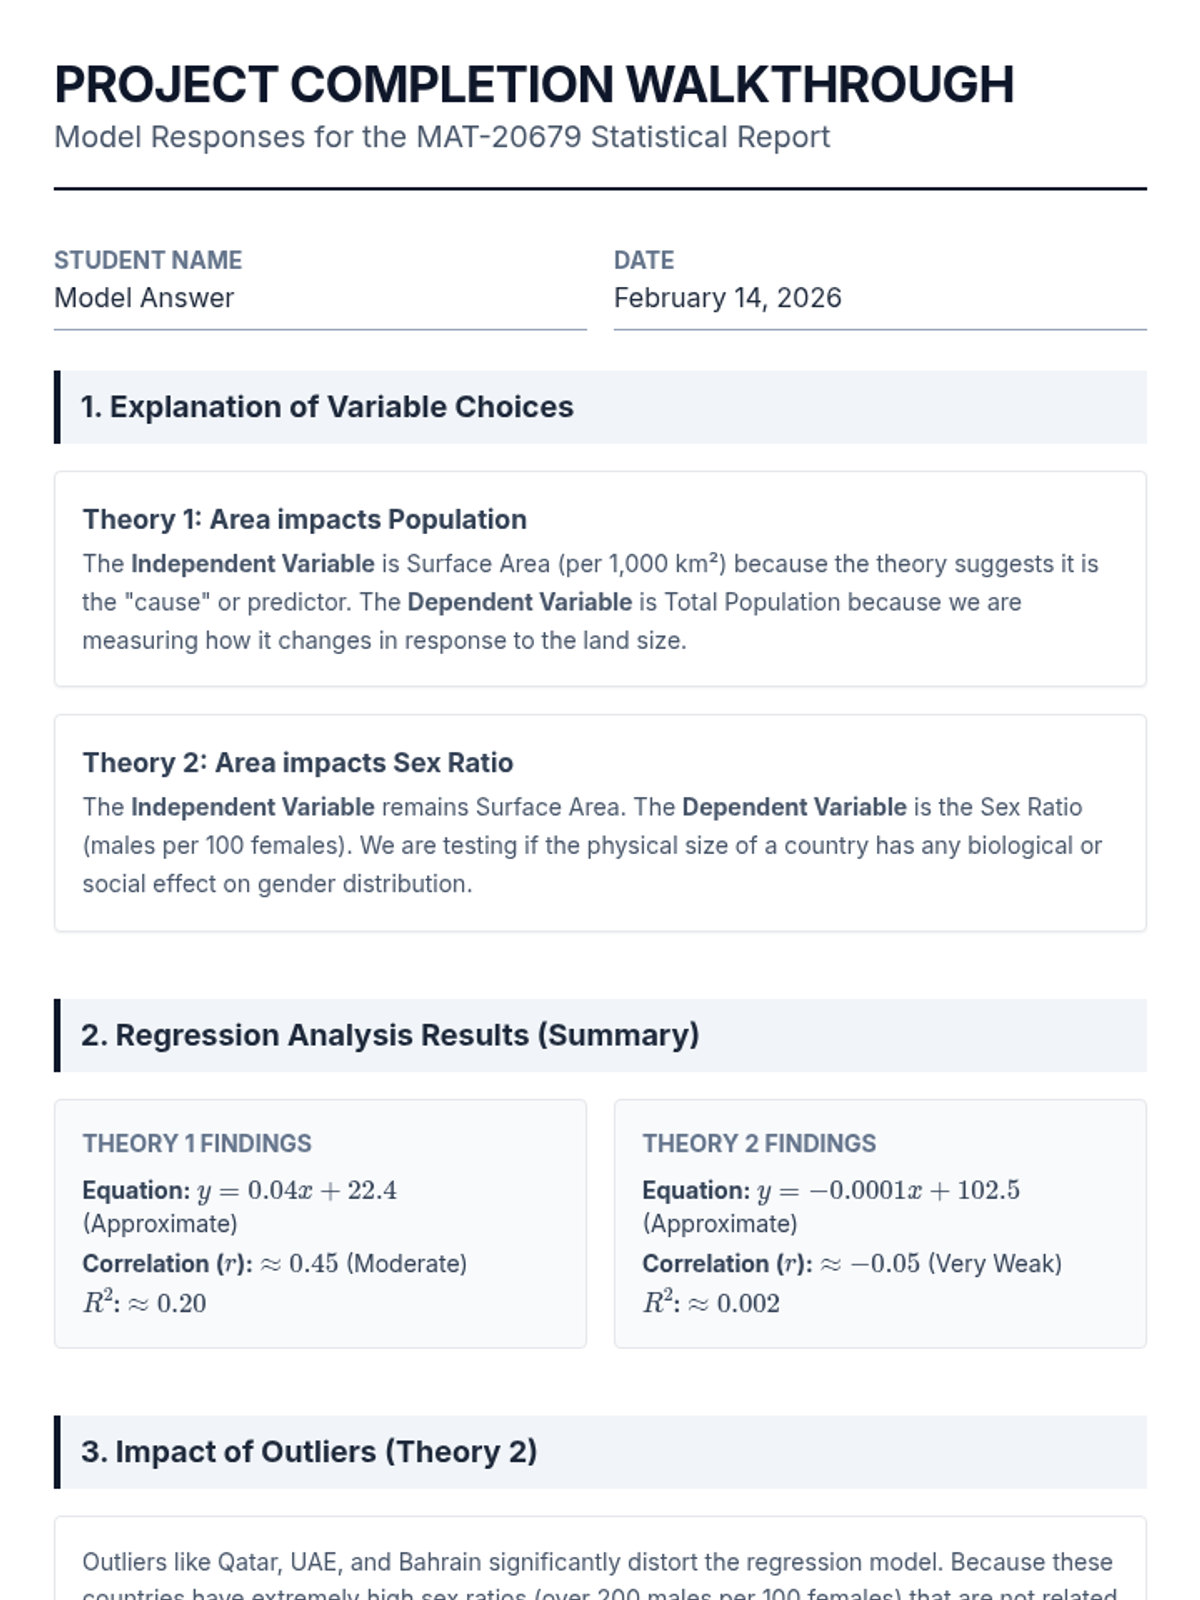
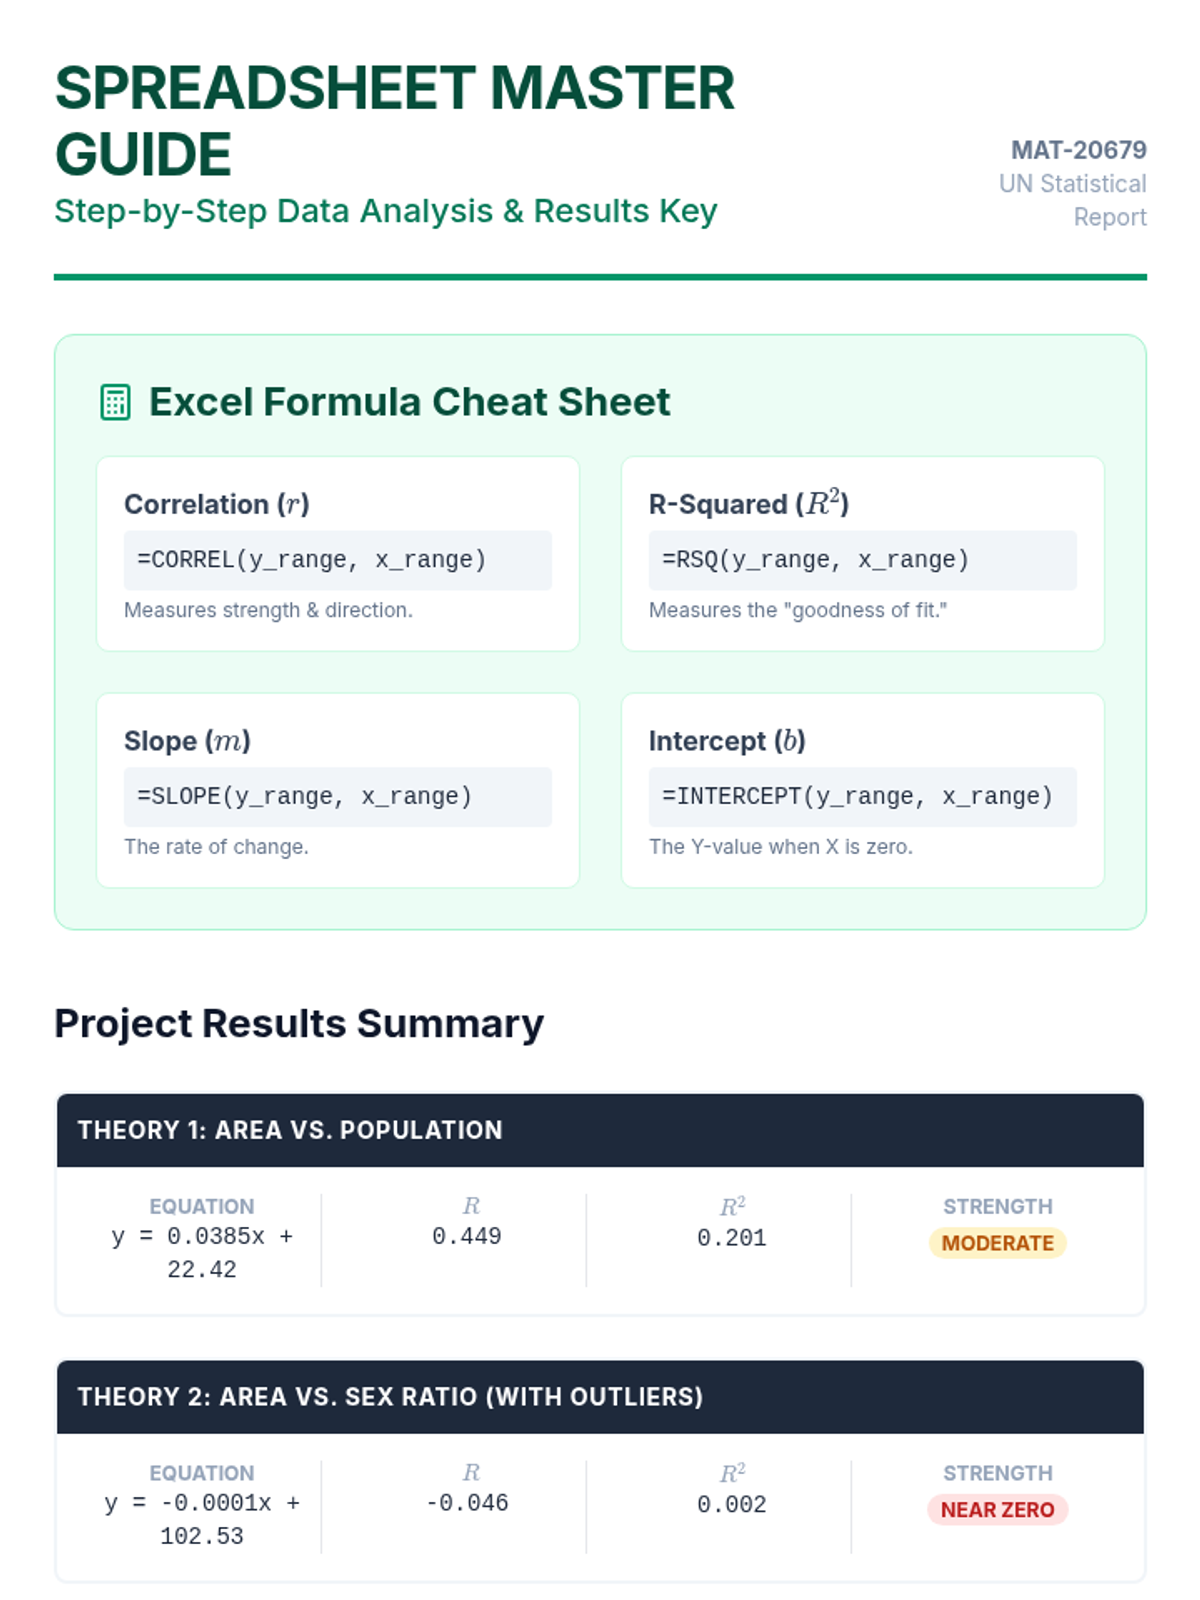
A comprehensive lesson focused on performing and interpreting linear regression analysis using real-world UN population and surface area data. Students will learn to identify variables, evaluate the impact of outliers, and draw conclusions based on correlation coefficients.
A Tier 2 intervention lesson focusing on the logic of randomization tests, using physical shuffling to simulate the null hypothesis and determine if experimental results are statistically significant.
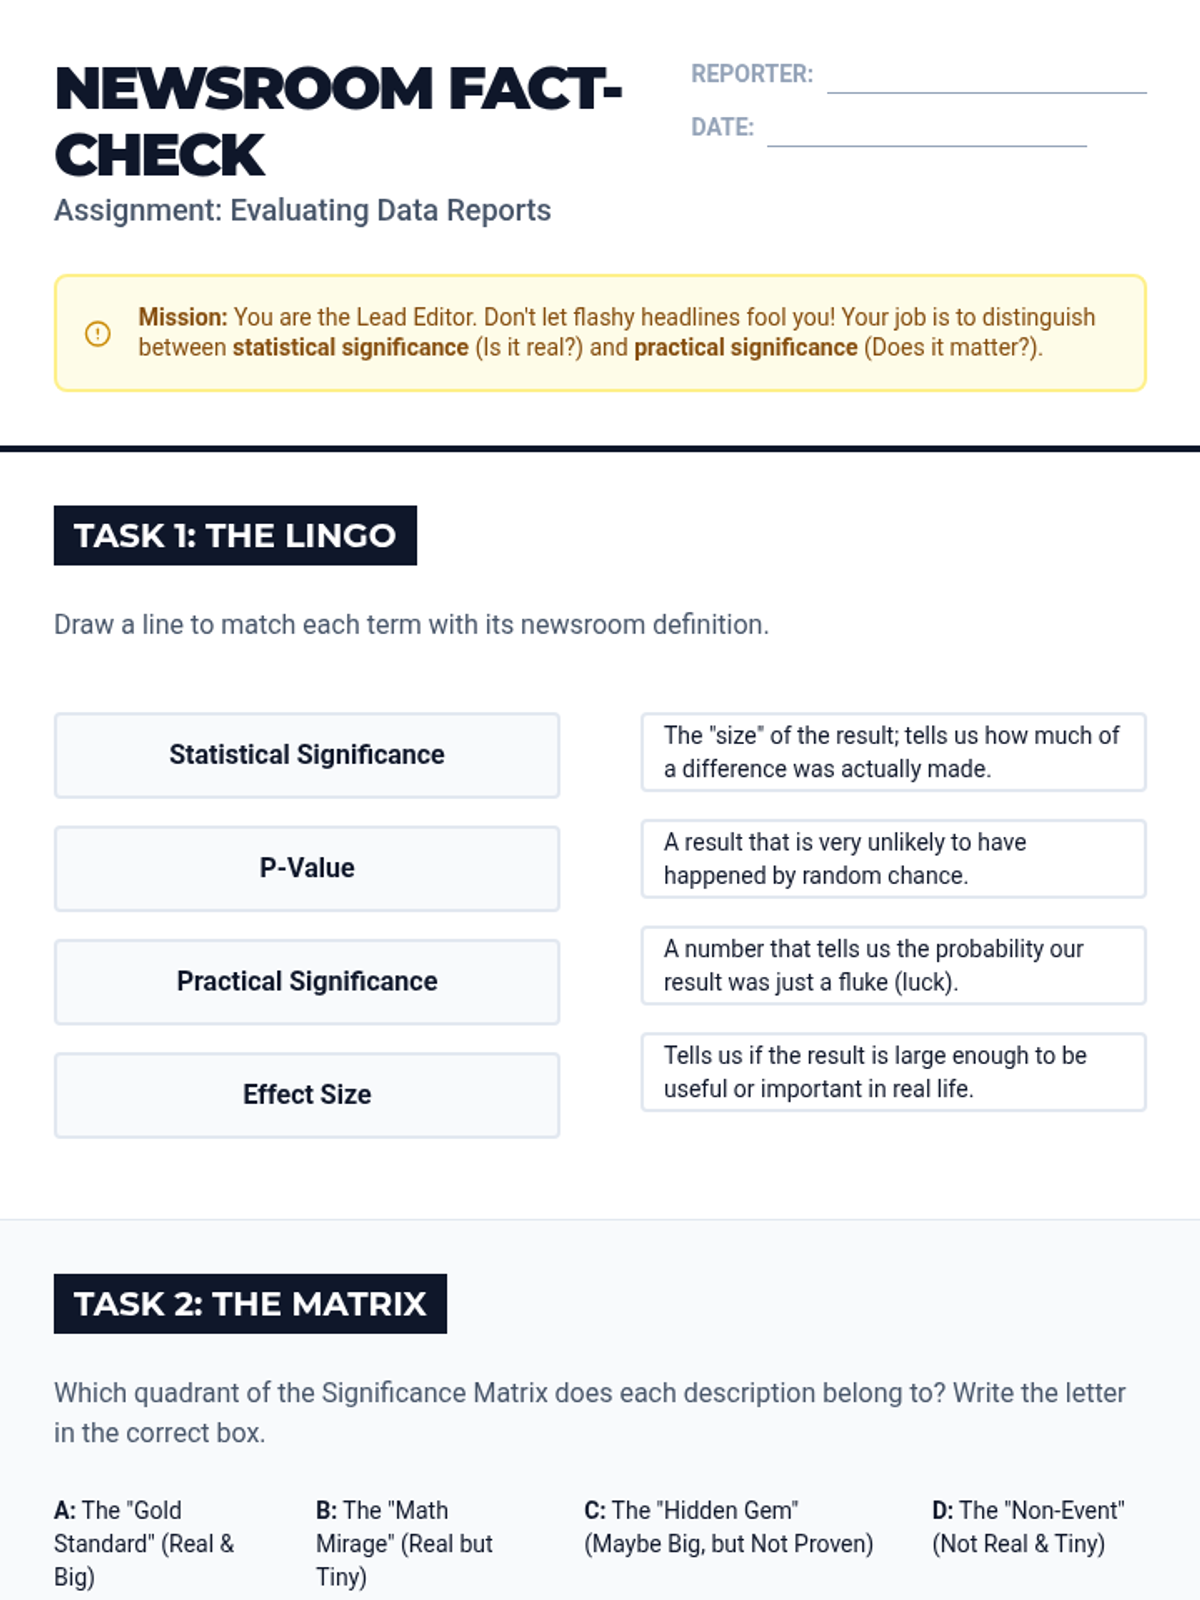
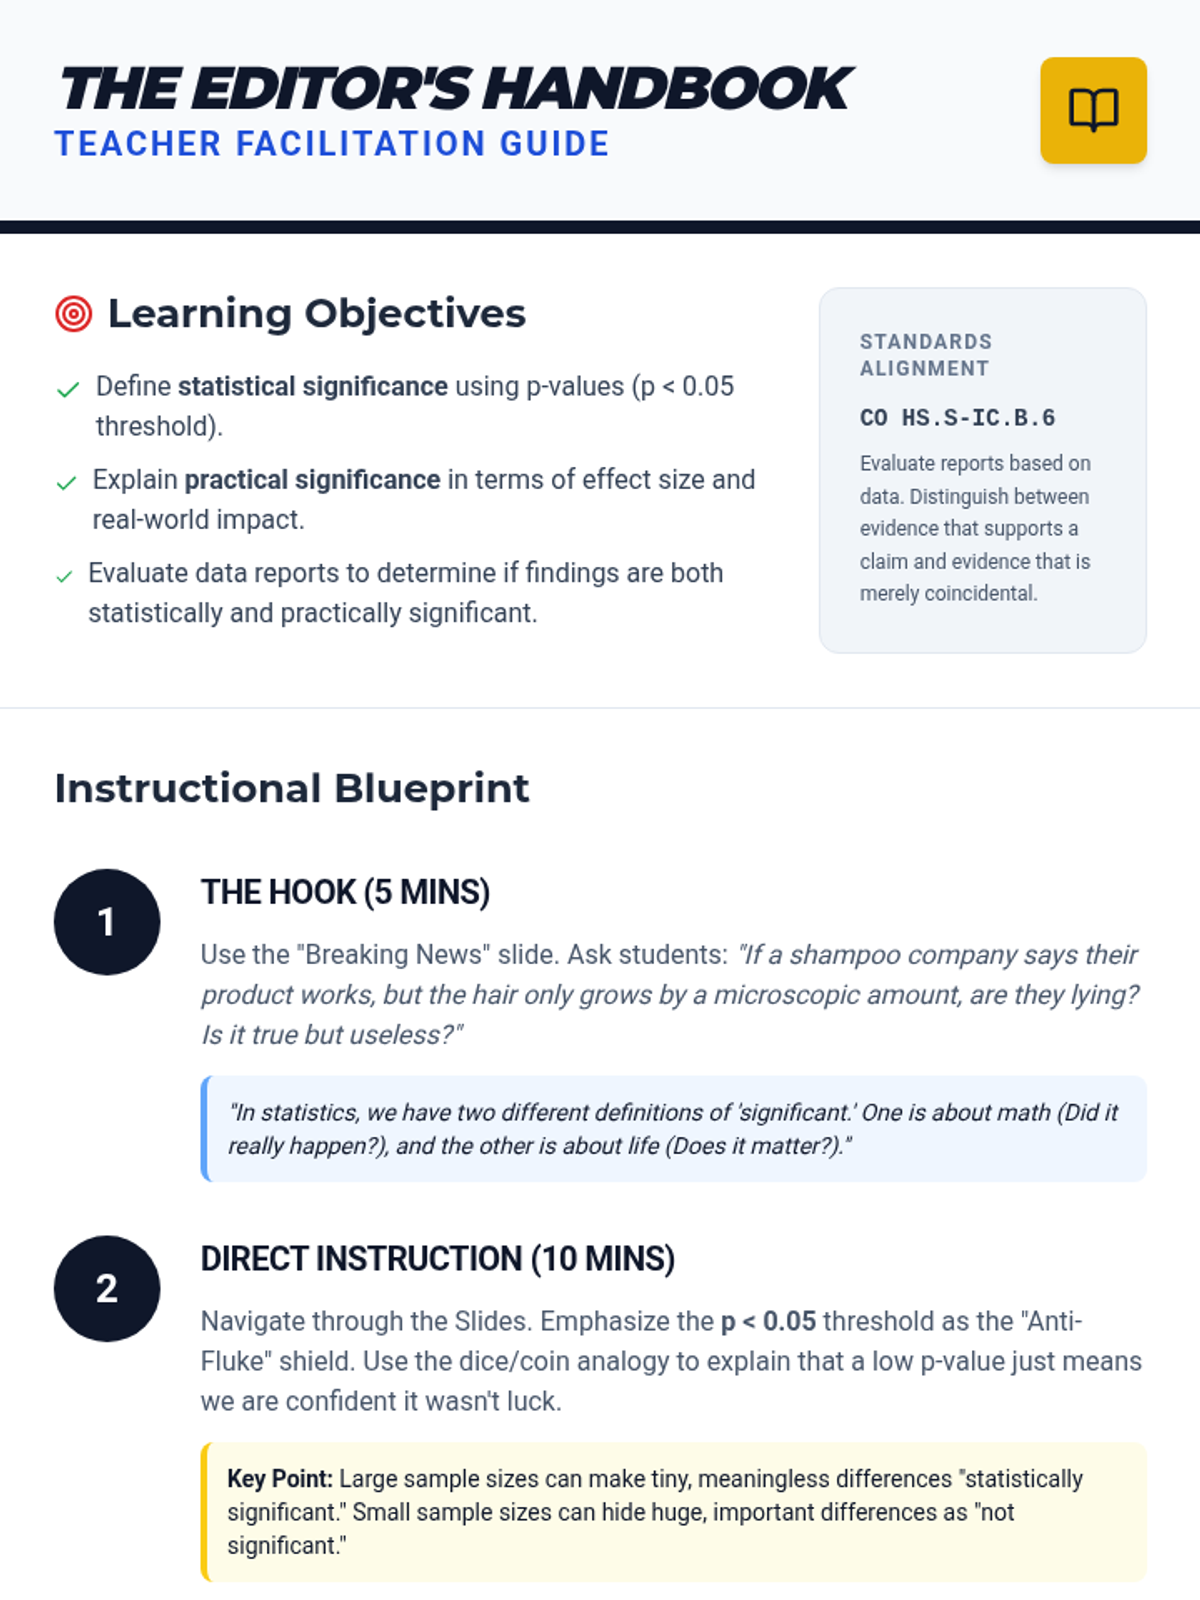
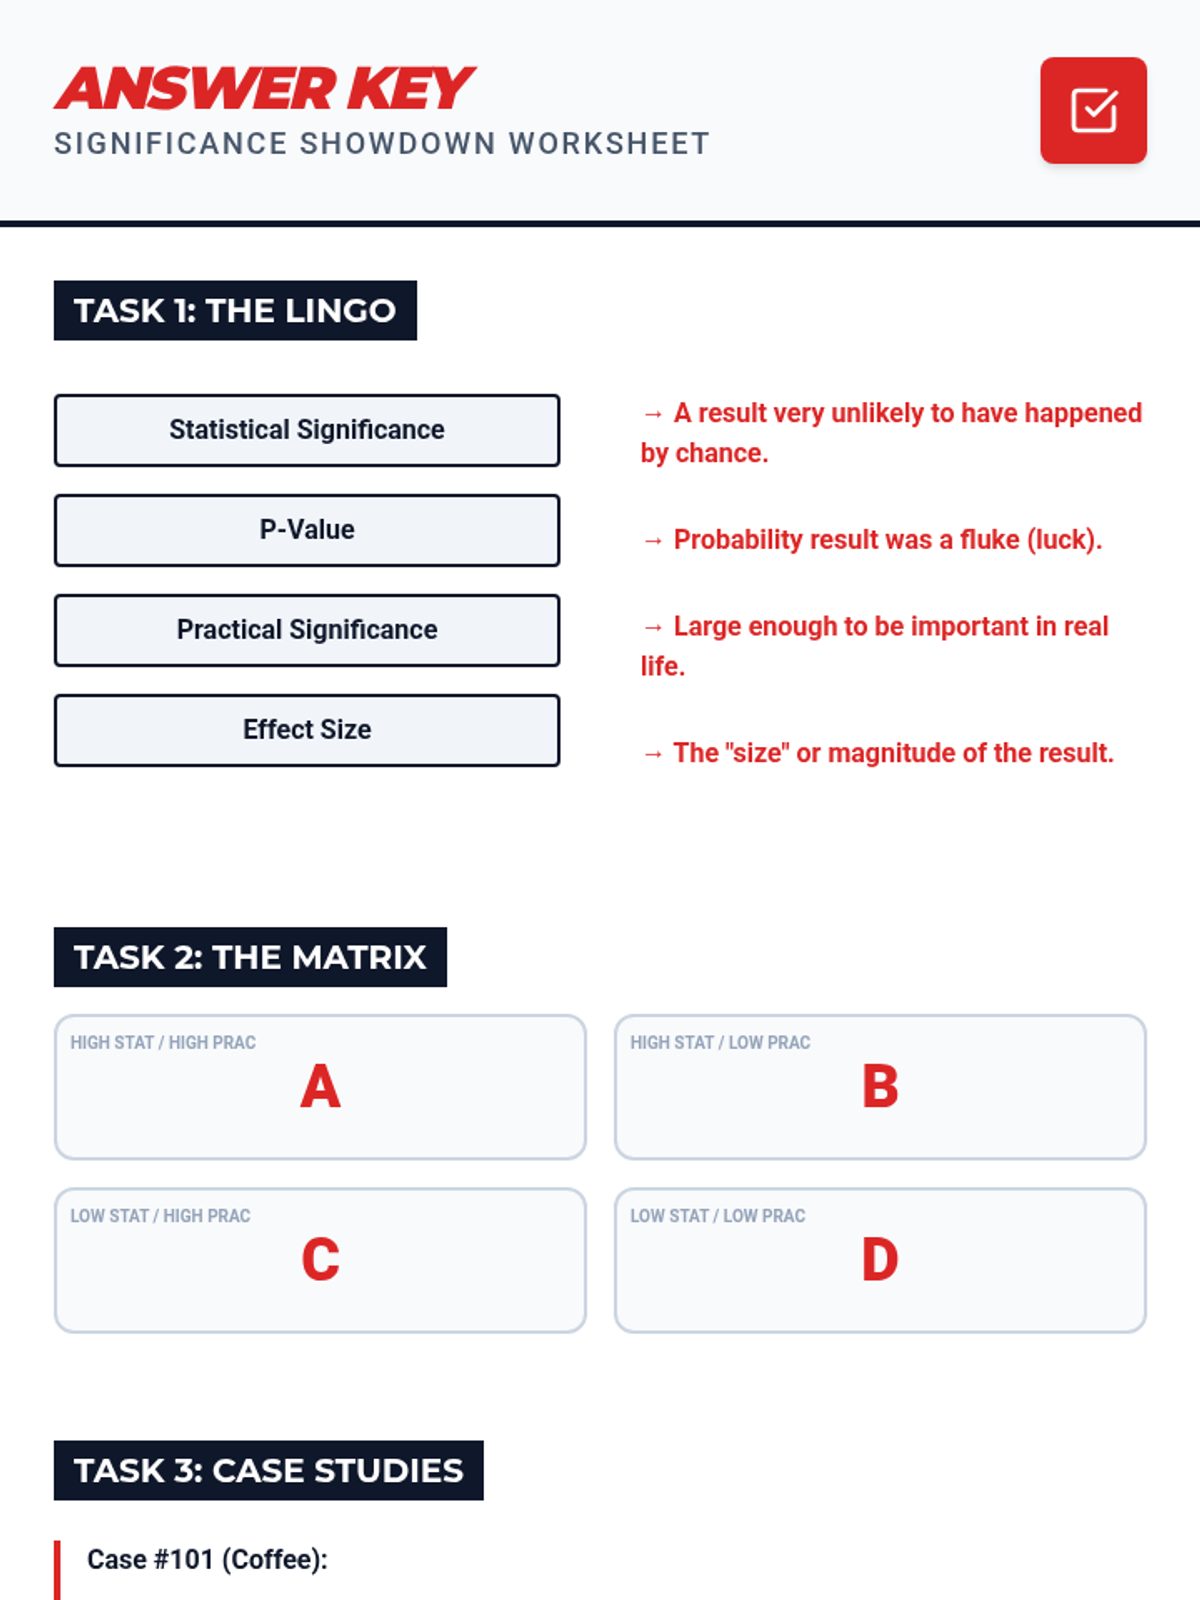
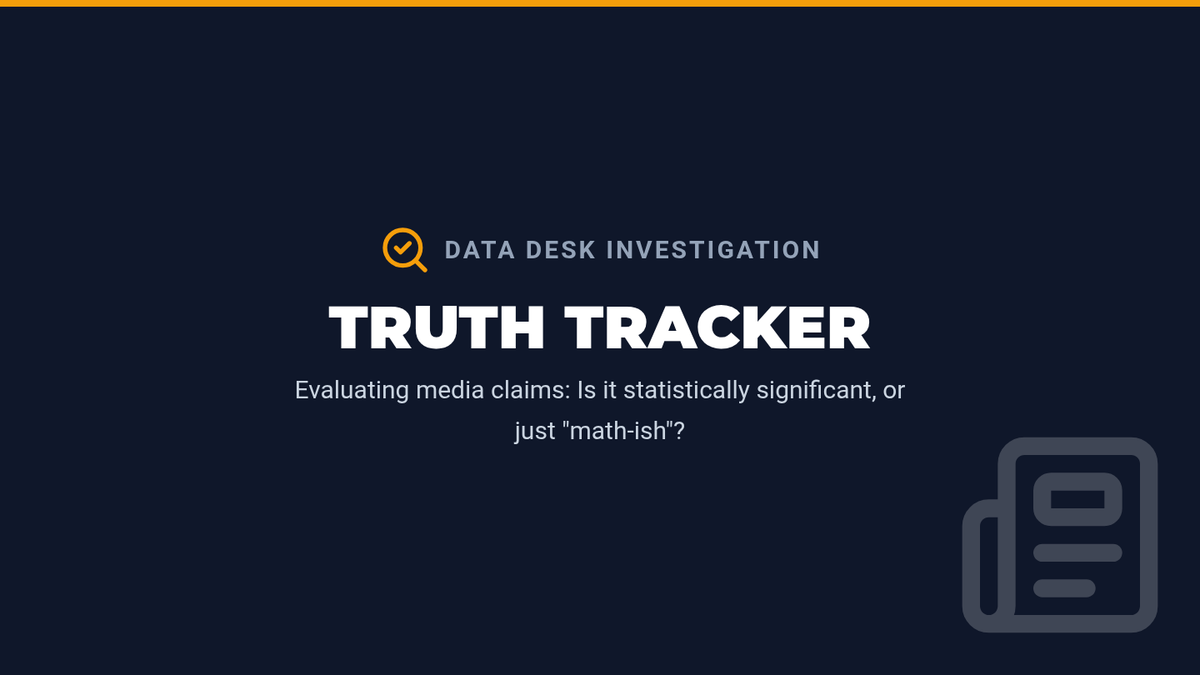
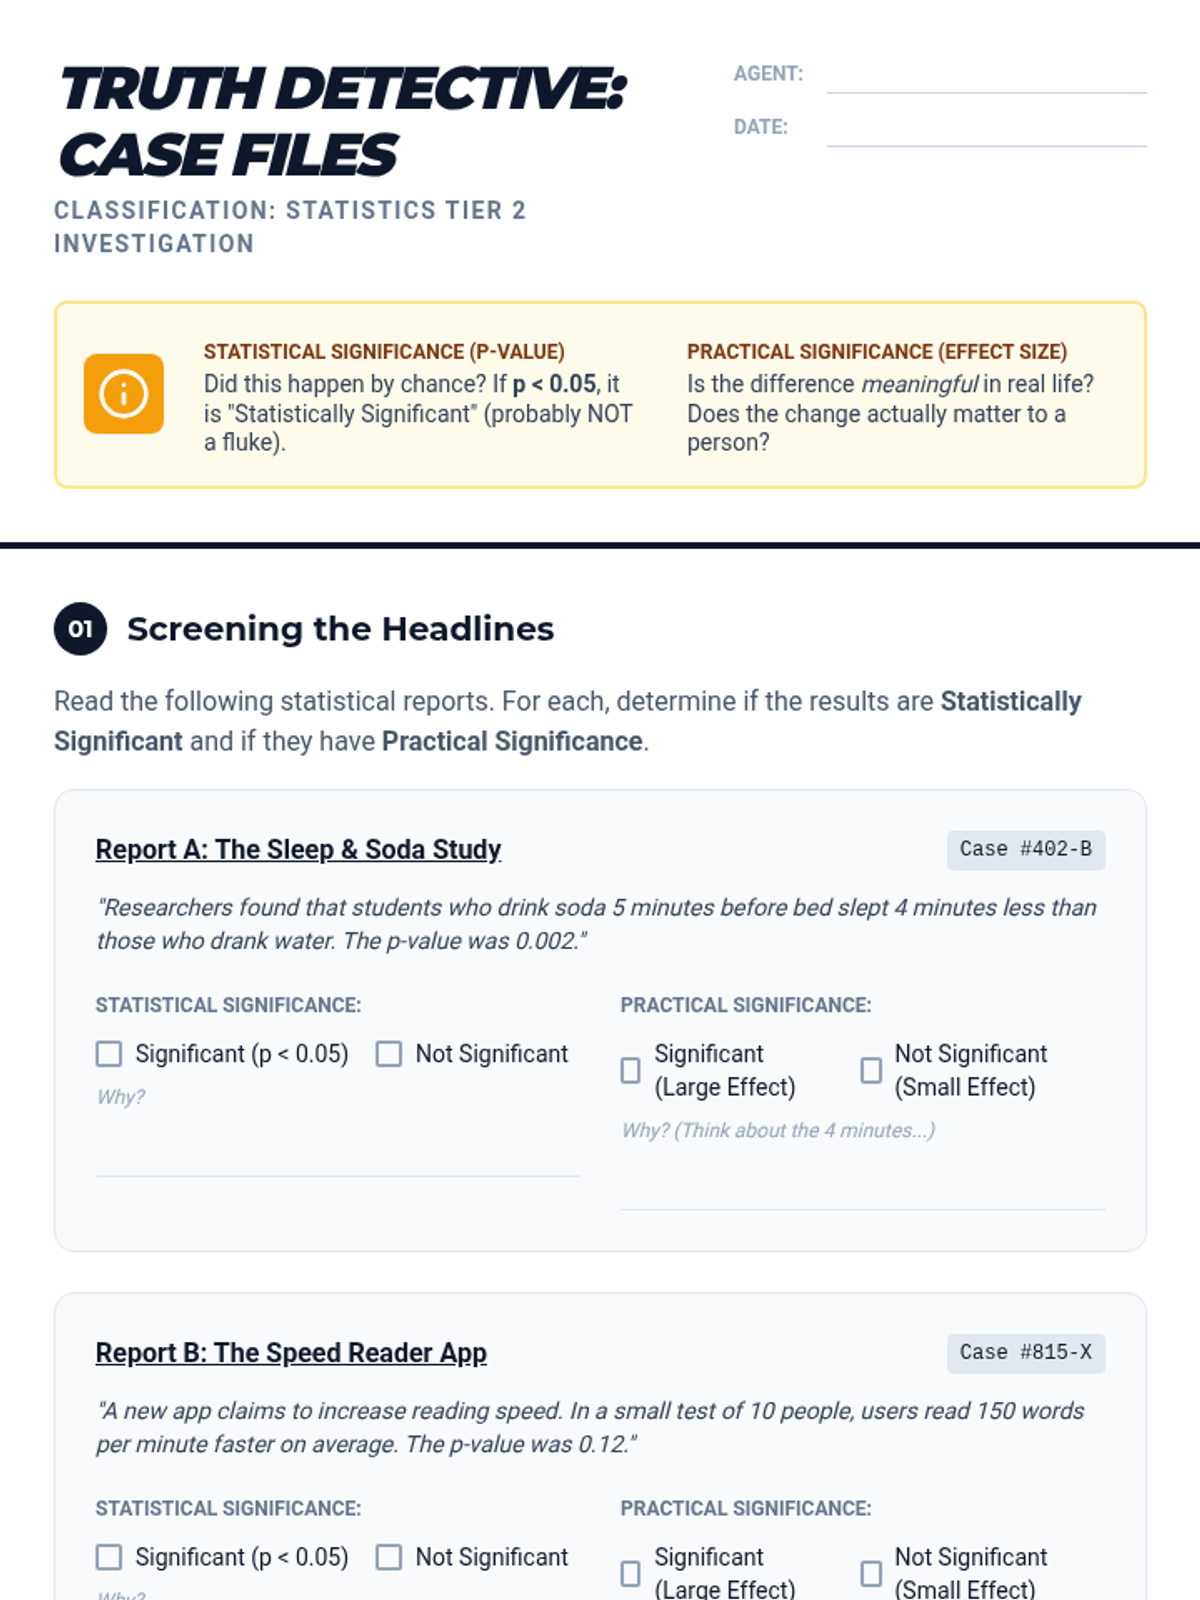
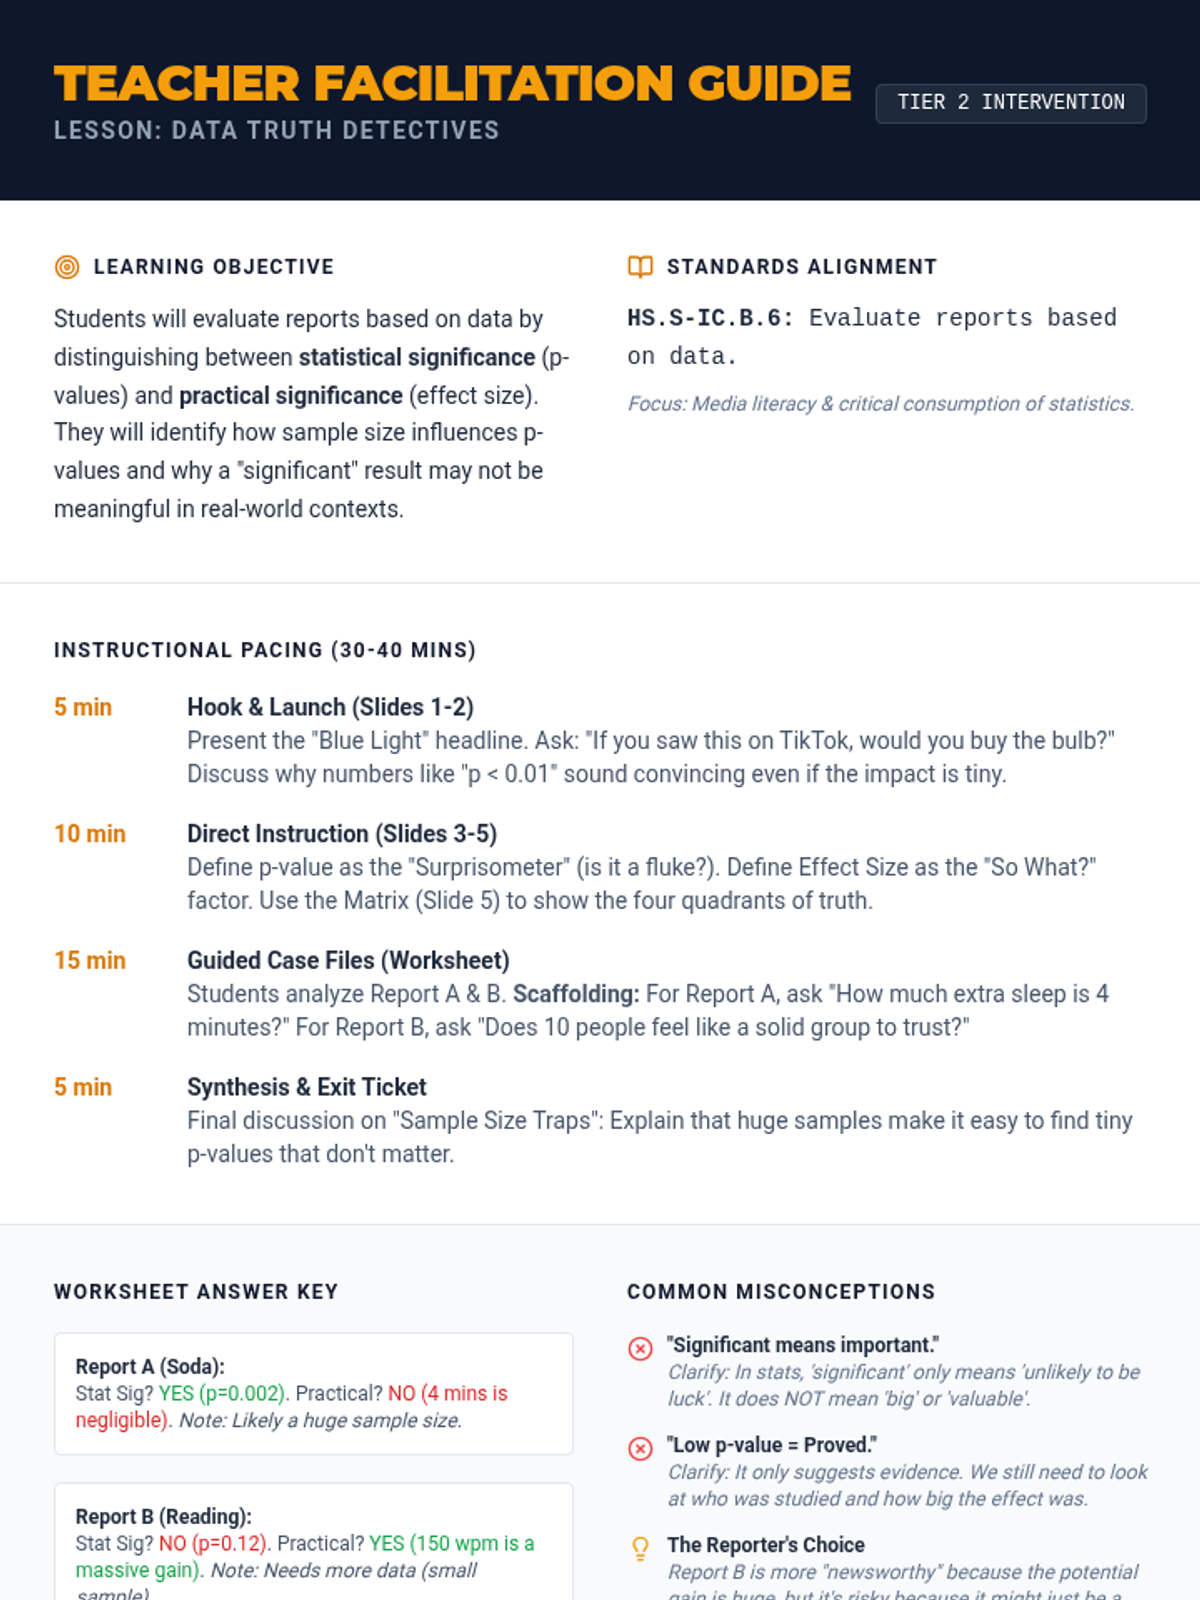
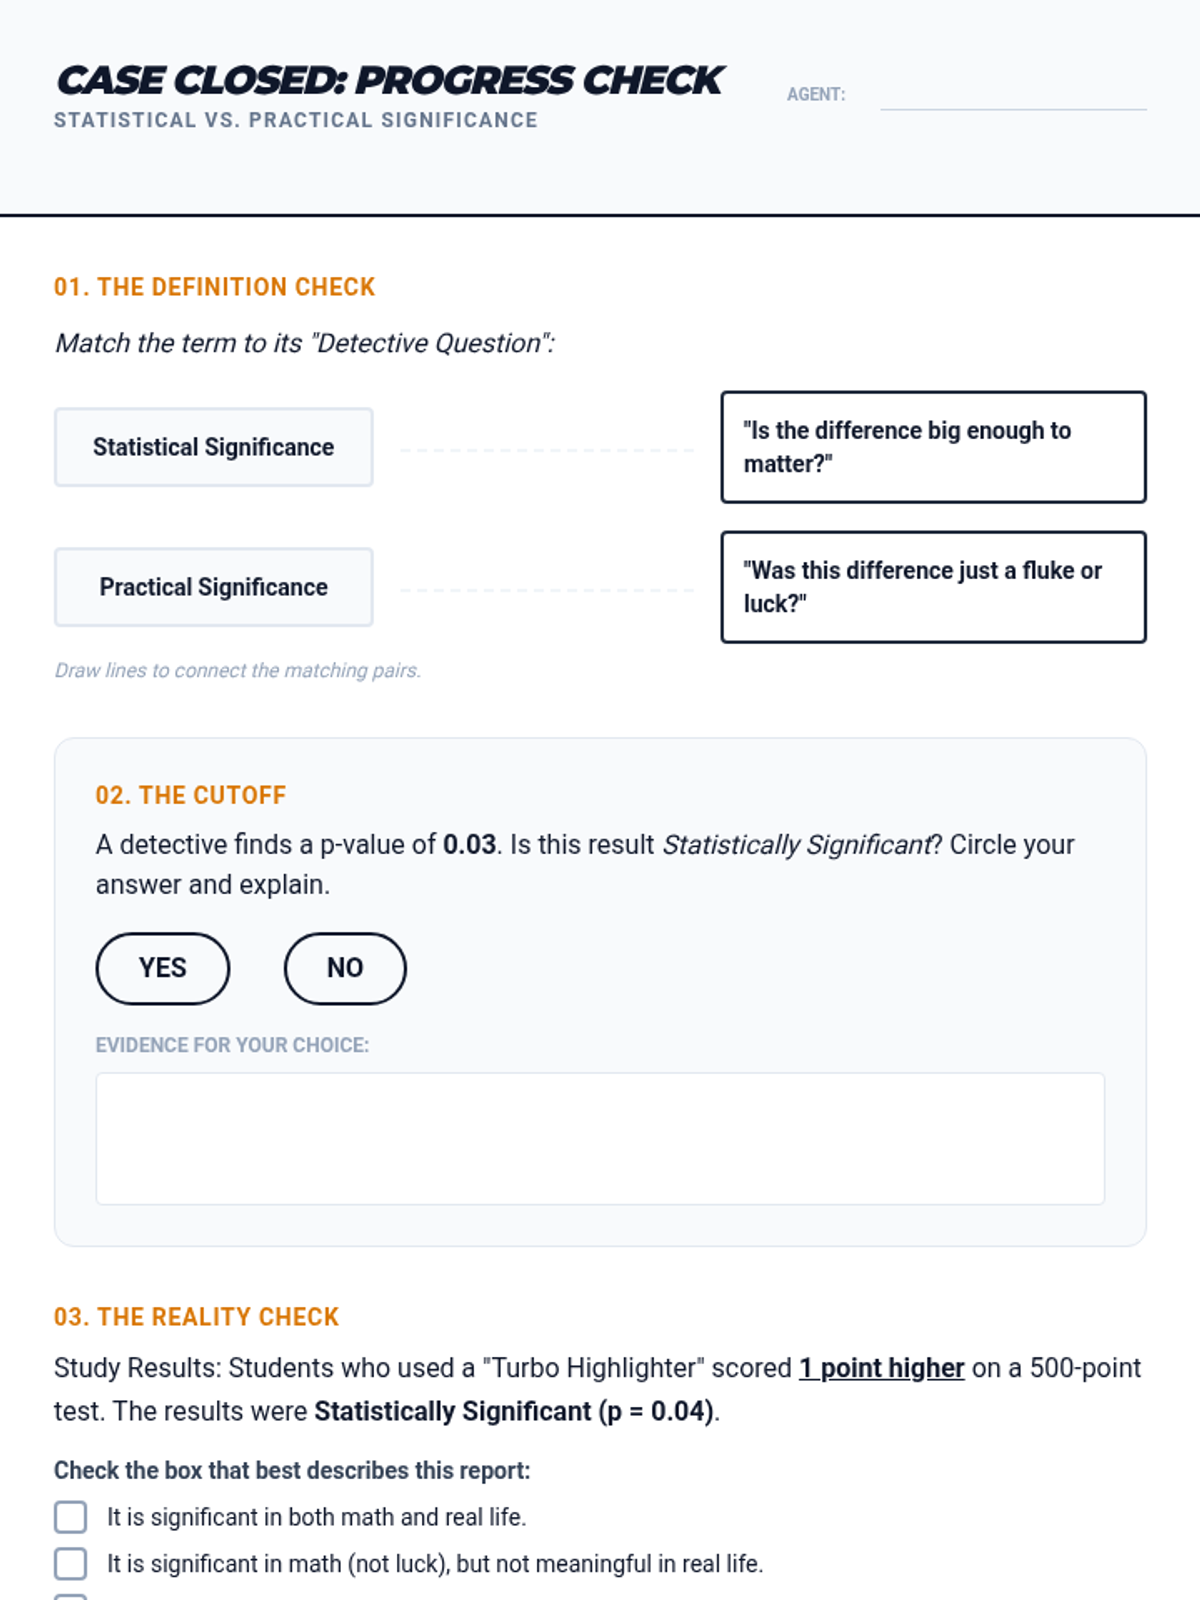
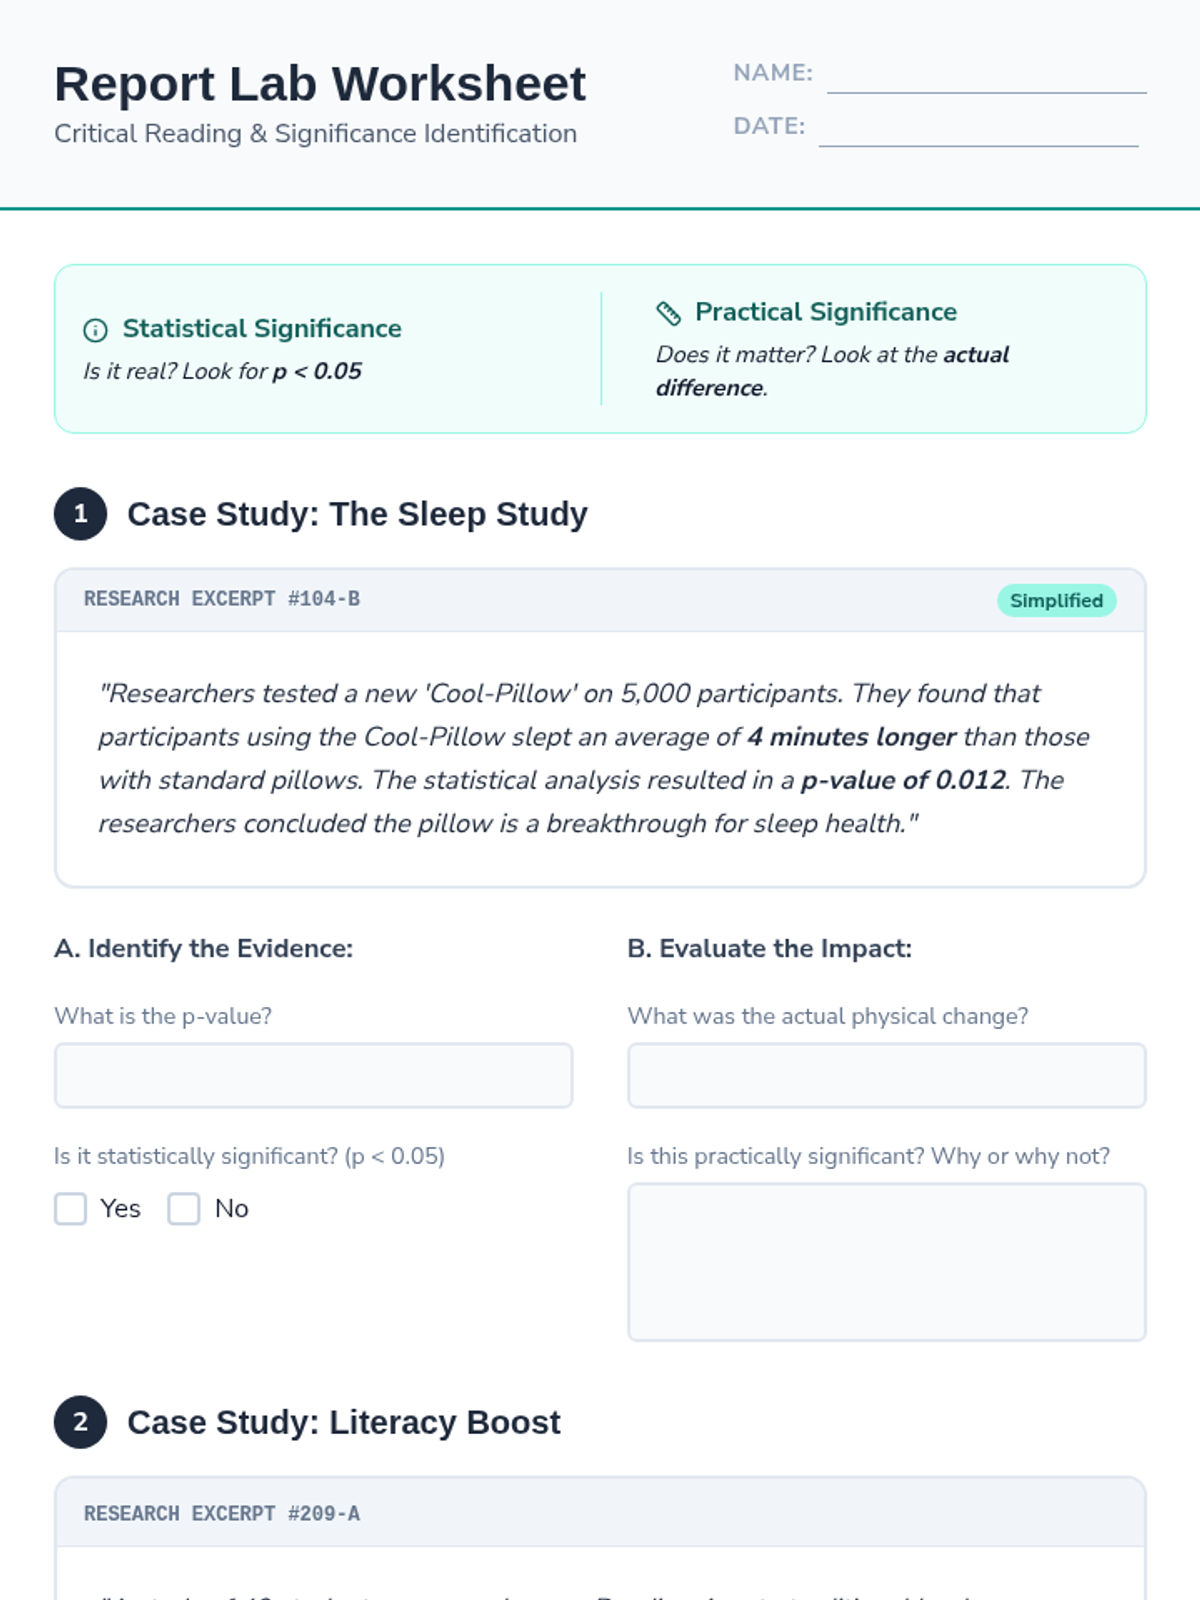
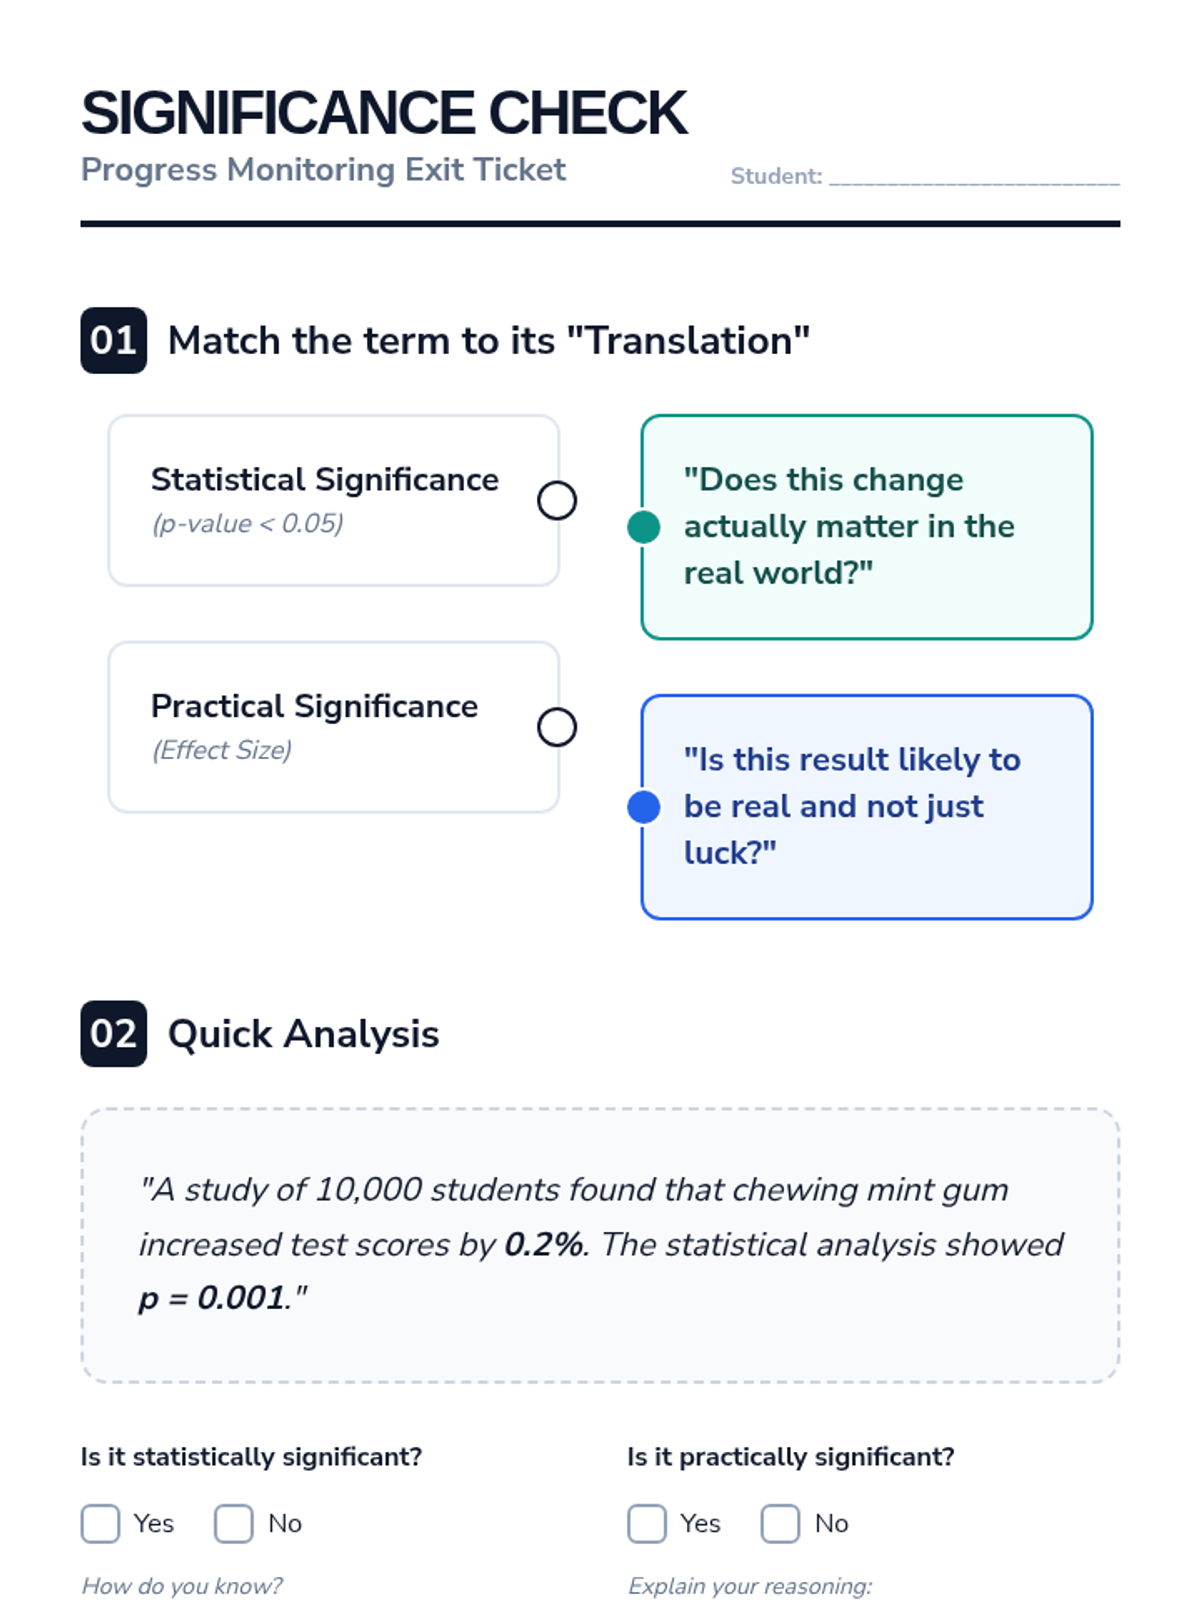
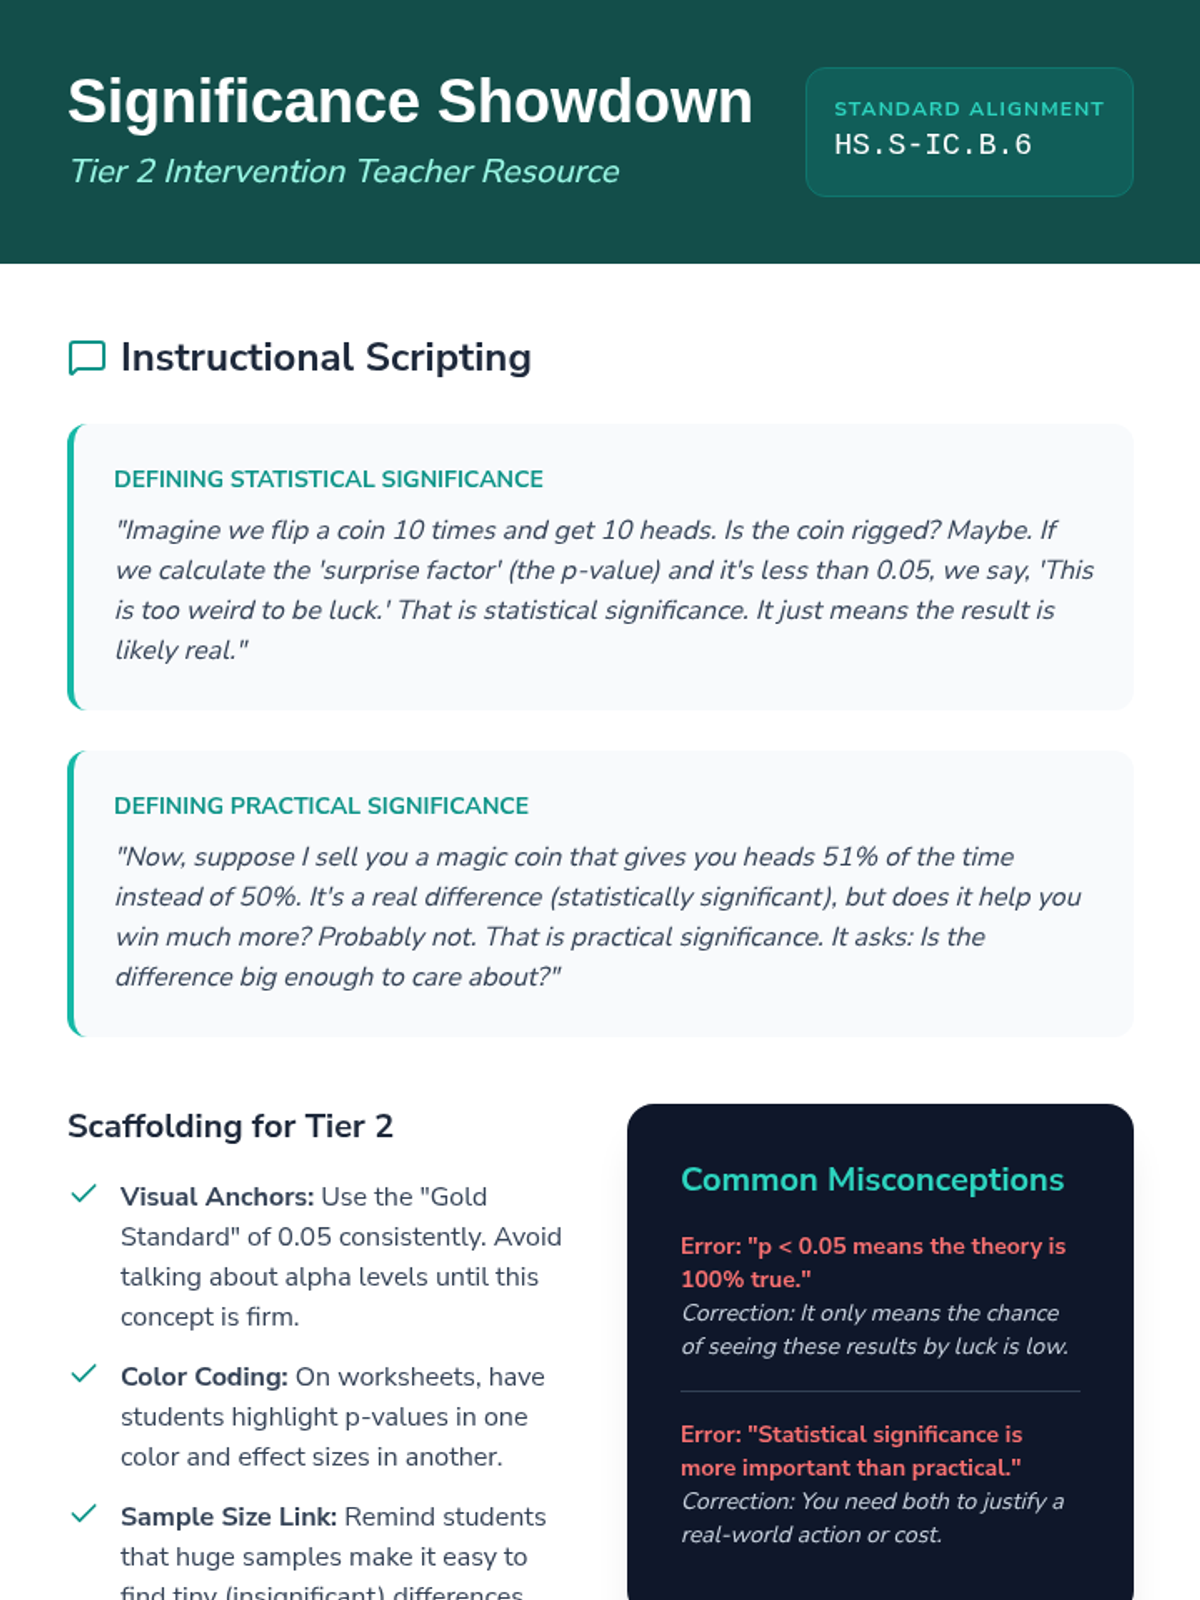
A Tier 2 intervention lesson focused on distinguishing statistical significance (p-values) from practical significance (effect size) when evaluating data reports. Students learn to critically analyze headlines and data claims through scaffolded examples and structured comparison activities.
A targeted Tier 2 intervention lesson focusing on evaluating statistical claims in the media, distinguishing between statistical significance (p-values) and practical significance (effect sizes). Students will analyze real-world scenarios to become critical consumers of data-driven reports.
A Tier 2 intervention lesson focusing on evaluating research reports, specifically distinguishing between statistical significance (p-values) and practical significance (effect size) for high school statistics students.
A Tier 2 intervention lesson for high school statistics focused on using simulations to determine if experimental results are consistent with a theoretical model. Students use coin flips and dice rolls to understand the boundary between 'random chance' and 'likely rigged' outcomes.
A targeted small group intervention lesson focused on using simulations to determine statistical significance in randomized experiments. Students will analyze experimental data and use guided reasoning templates to connect simulation results to practical conclusions.
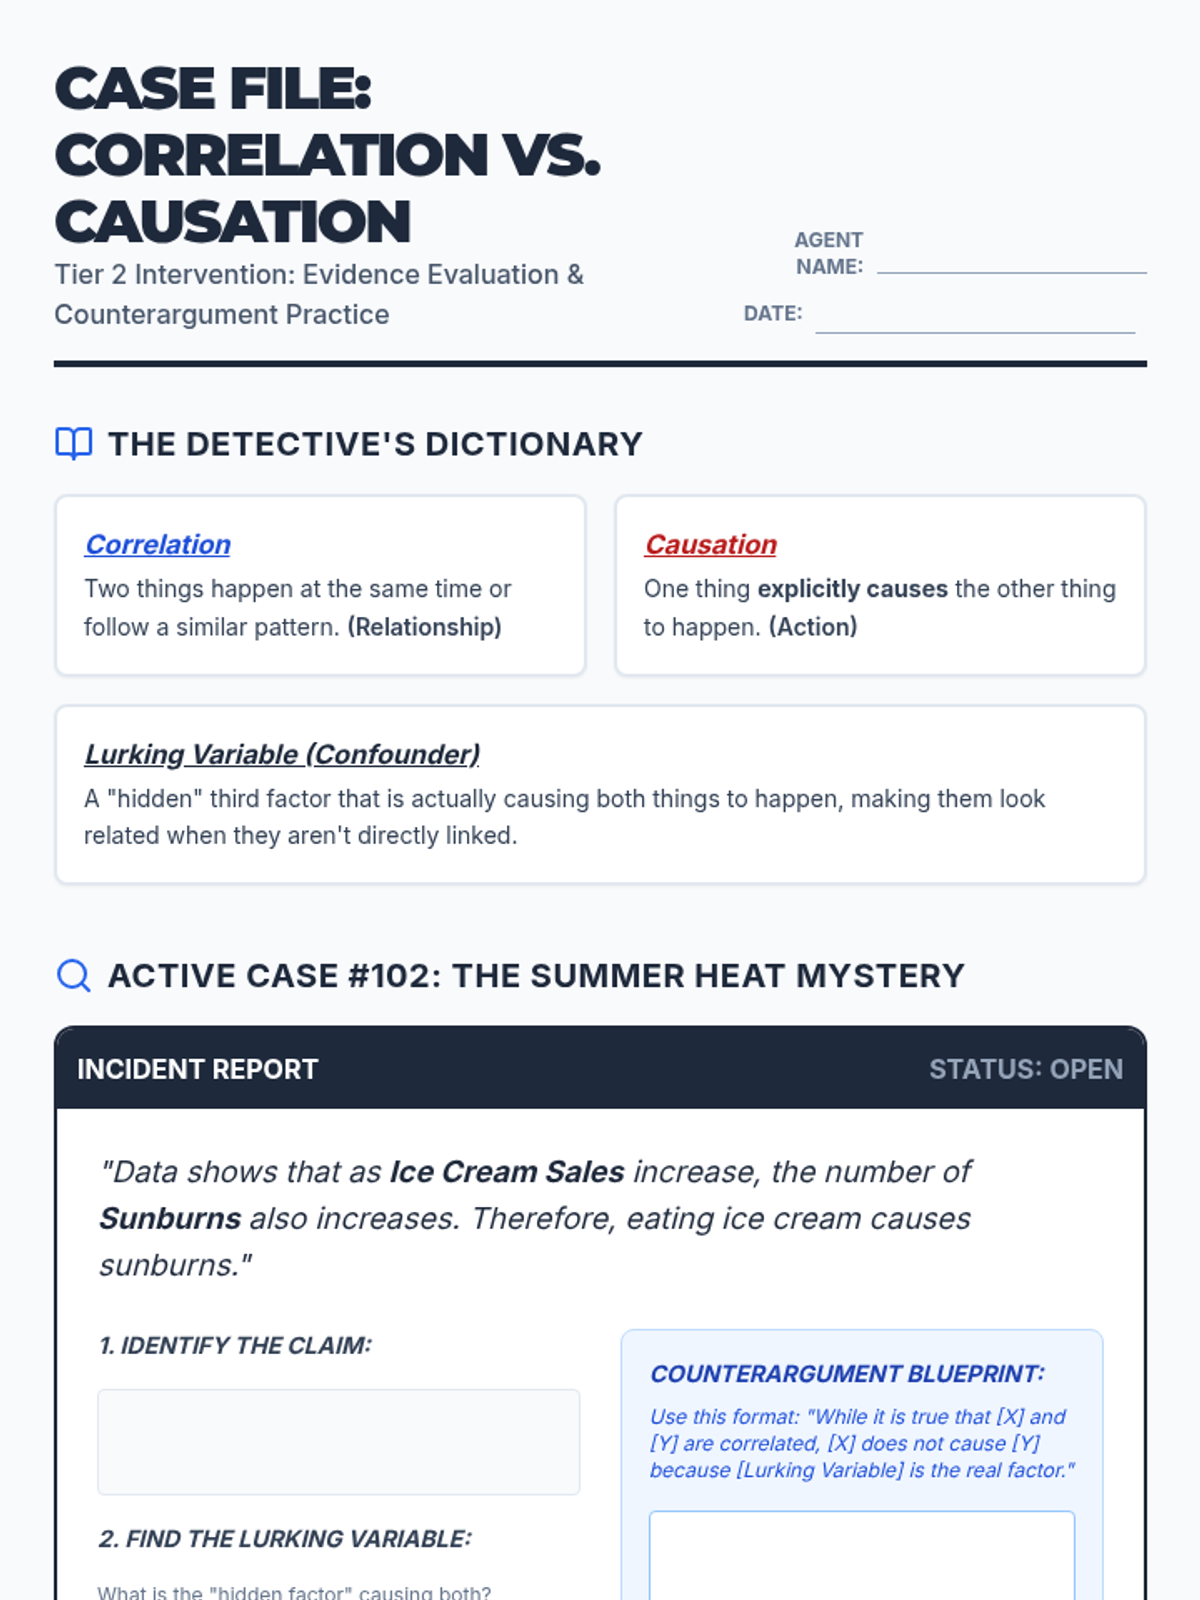
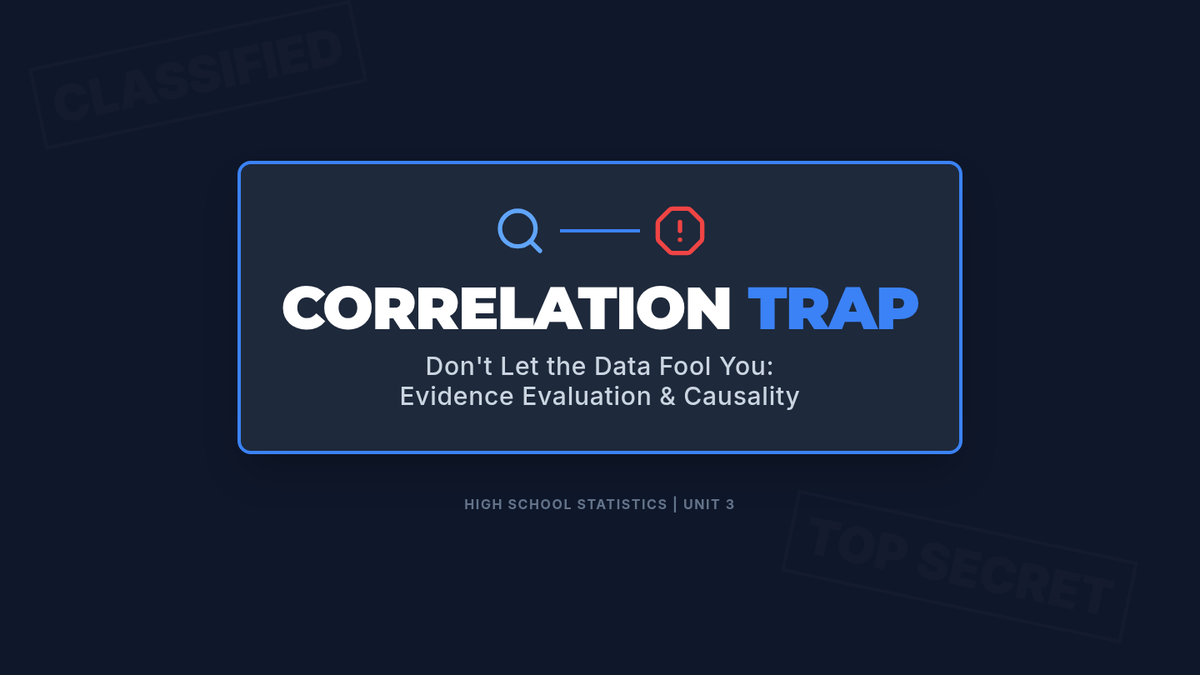
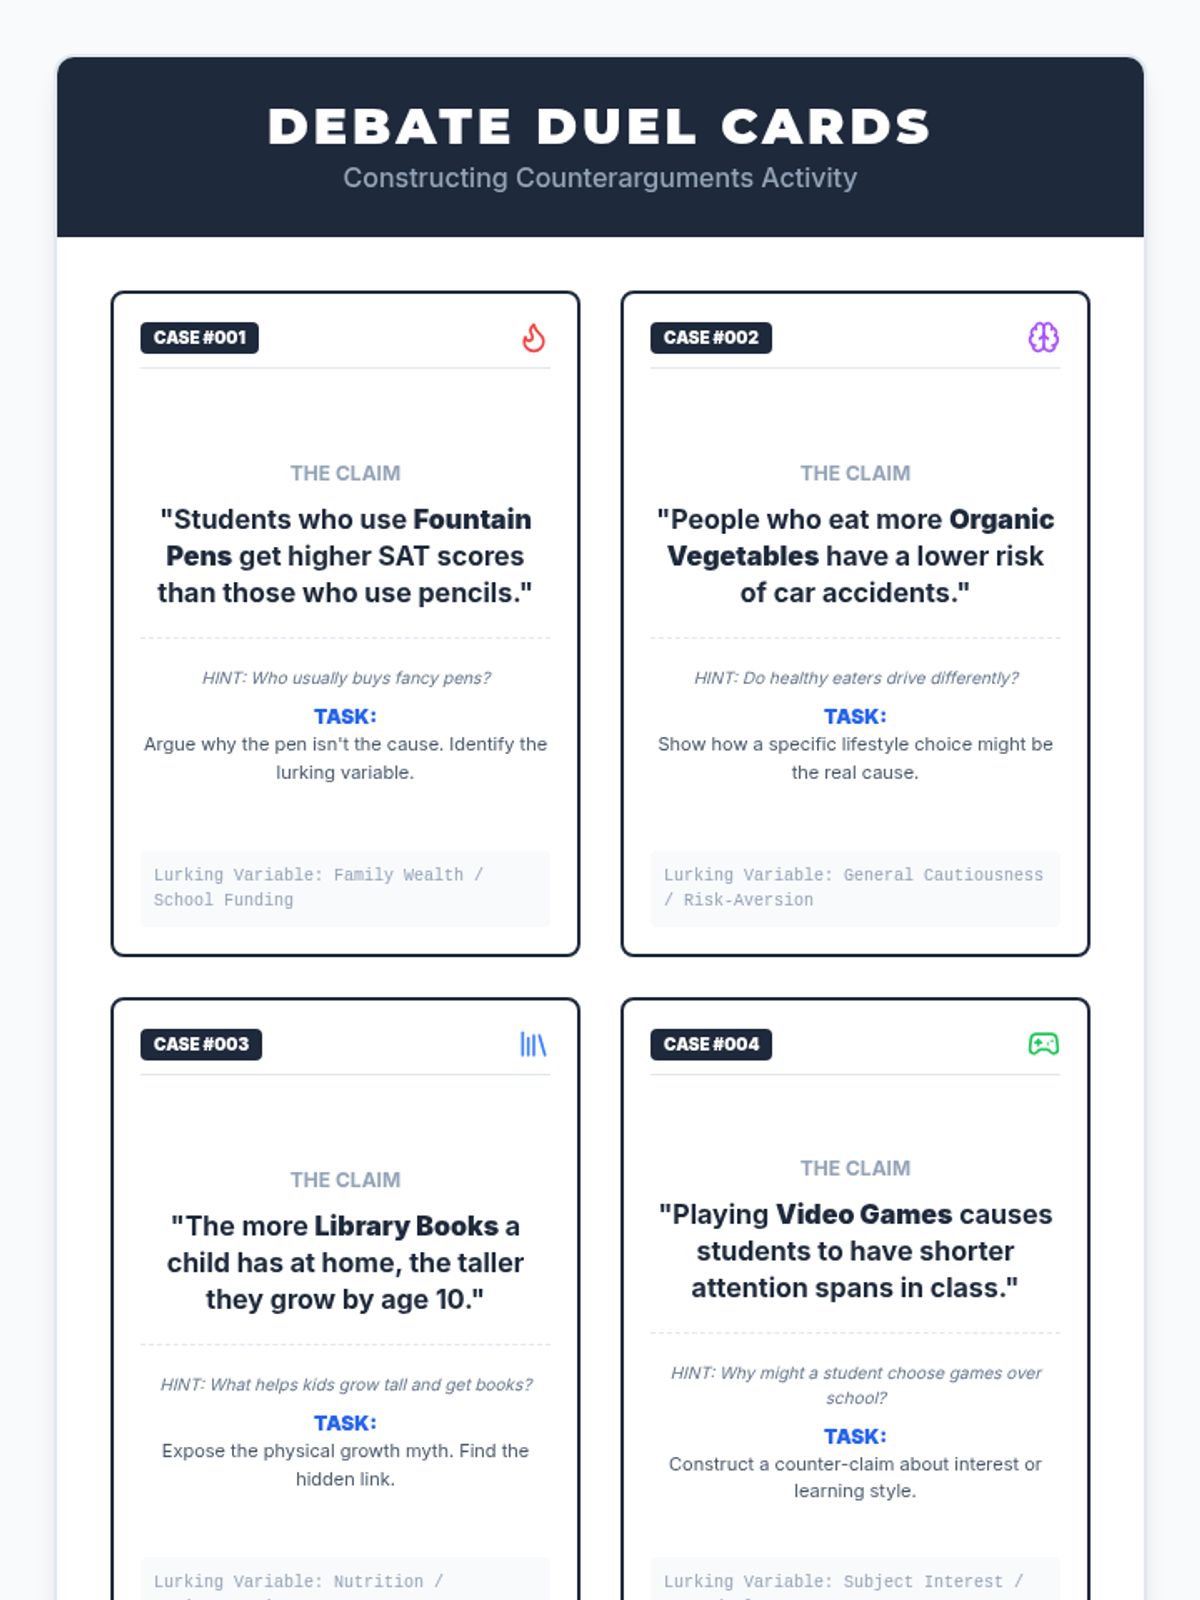
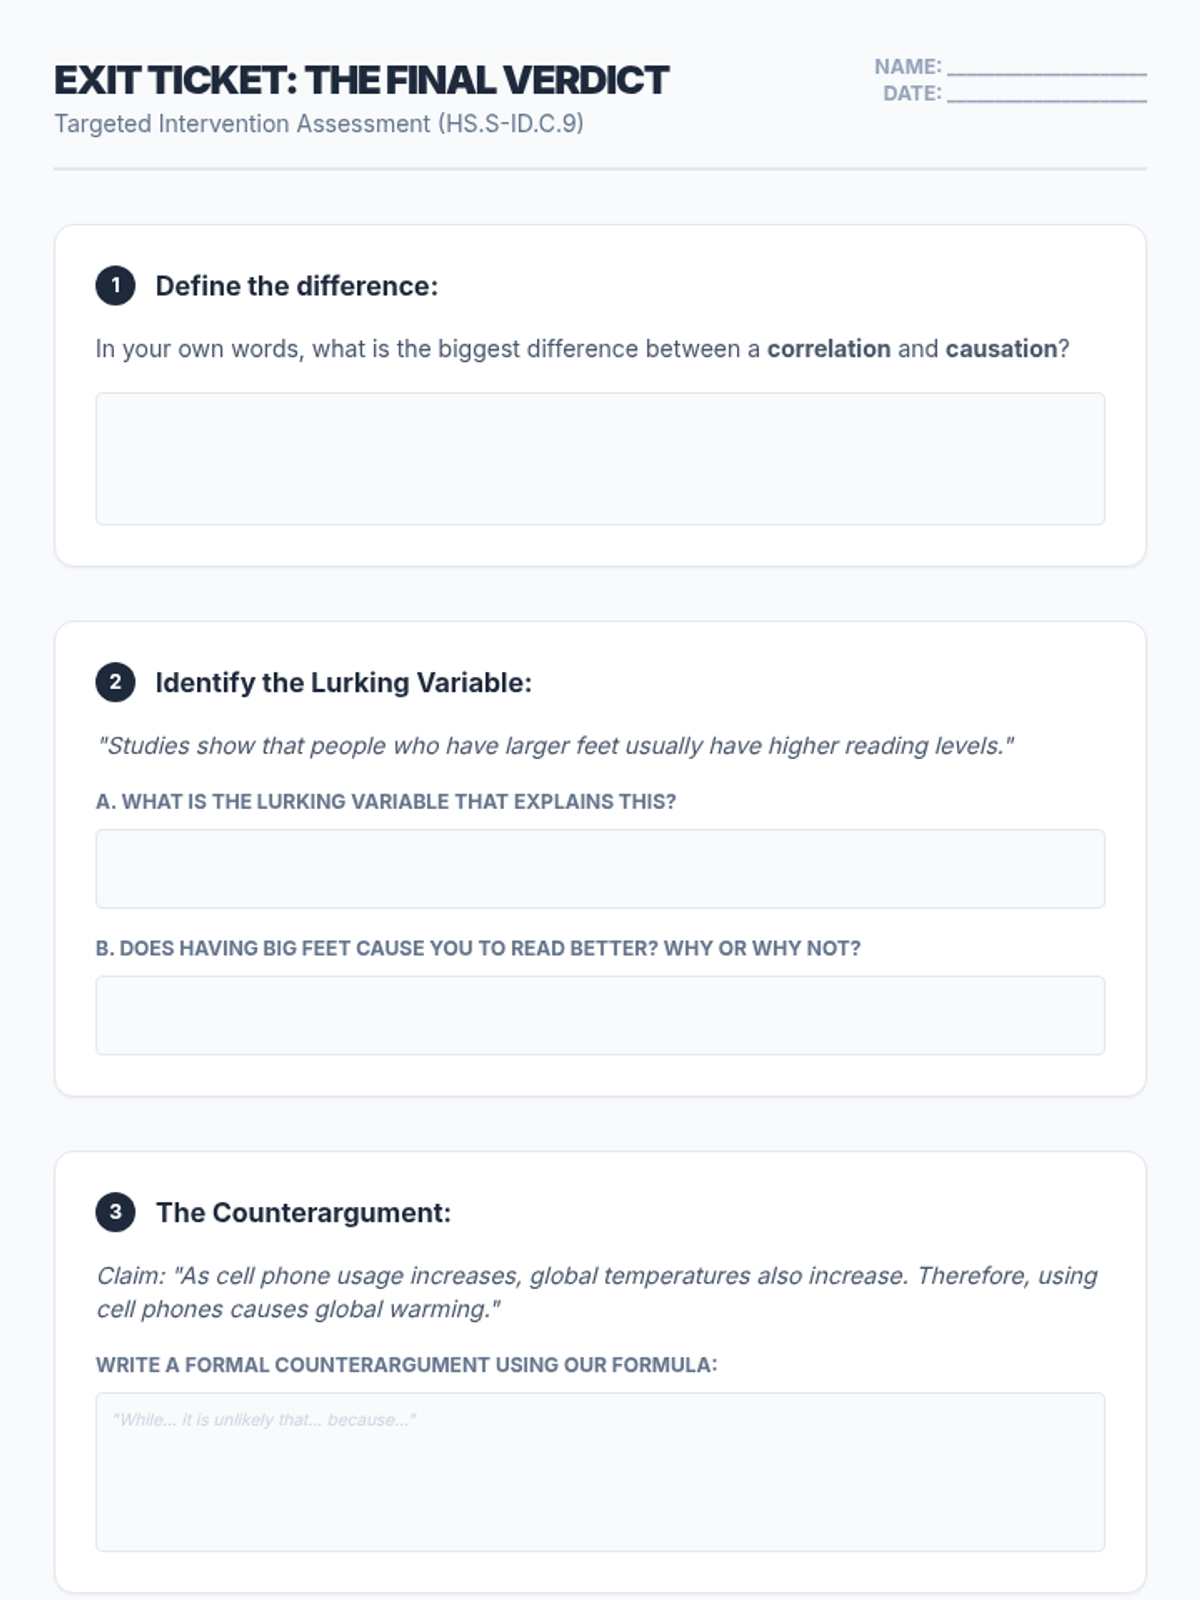
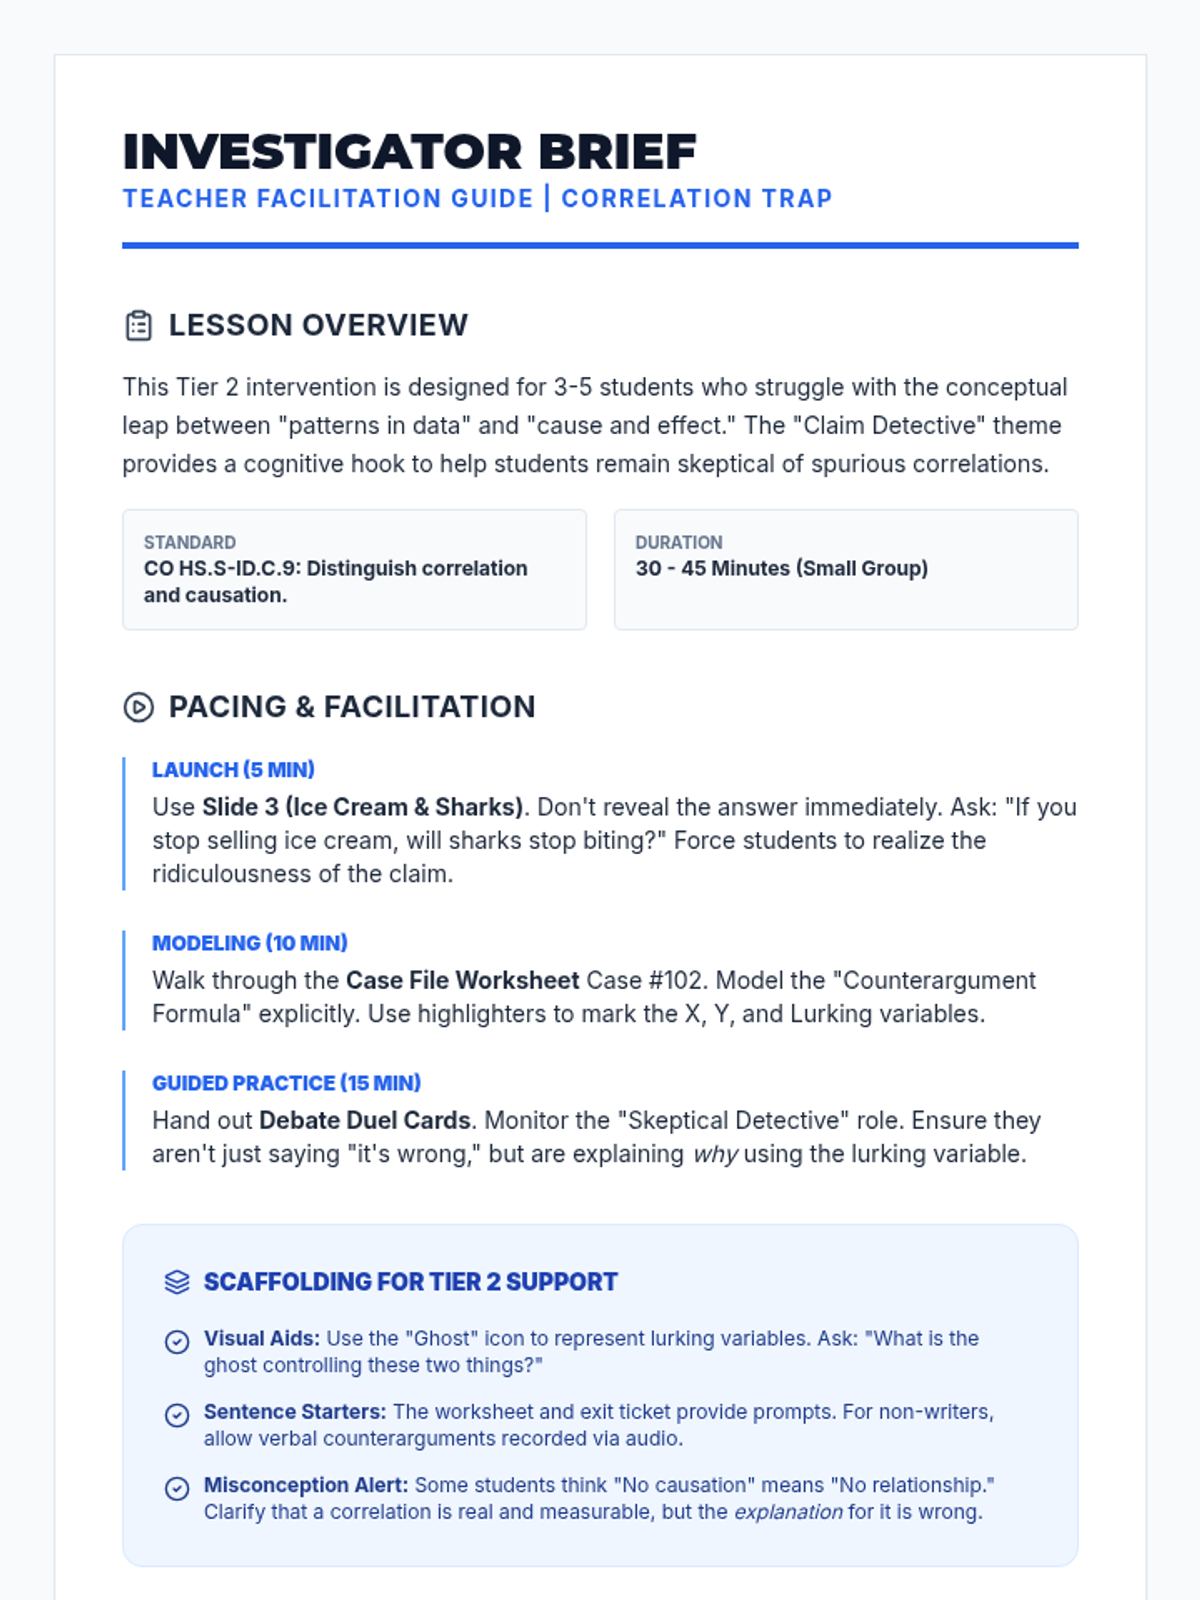
A Tier 2 intervention lesson focused on distinguishing correlation from causation through evidence evaluation and counterargument construction. Students act as 'Claim Detectives' to uncover lurking variables in spurious correlations.