Data representation, distributions, and statistical variability using sampling and inference techniques. Integrates probability models, compound events, bivariate patterns, and linear models to guide data-driven decision making.
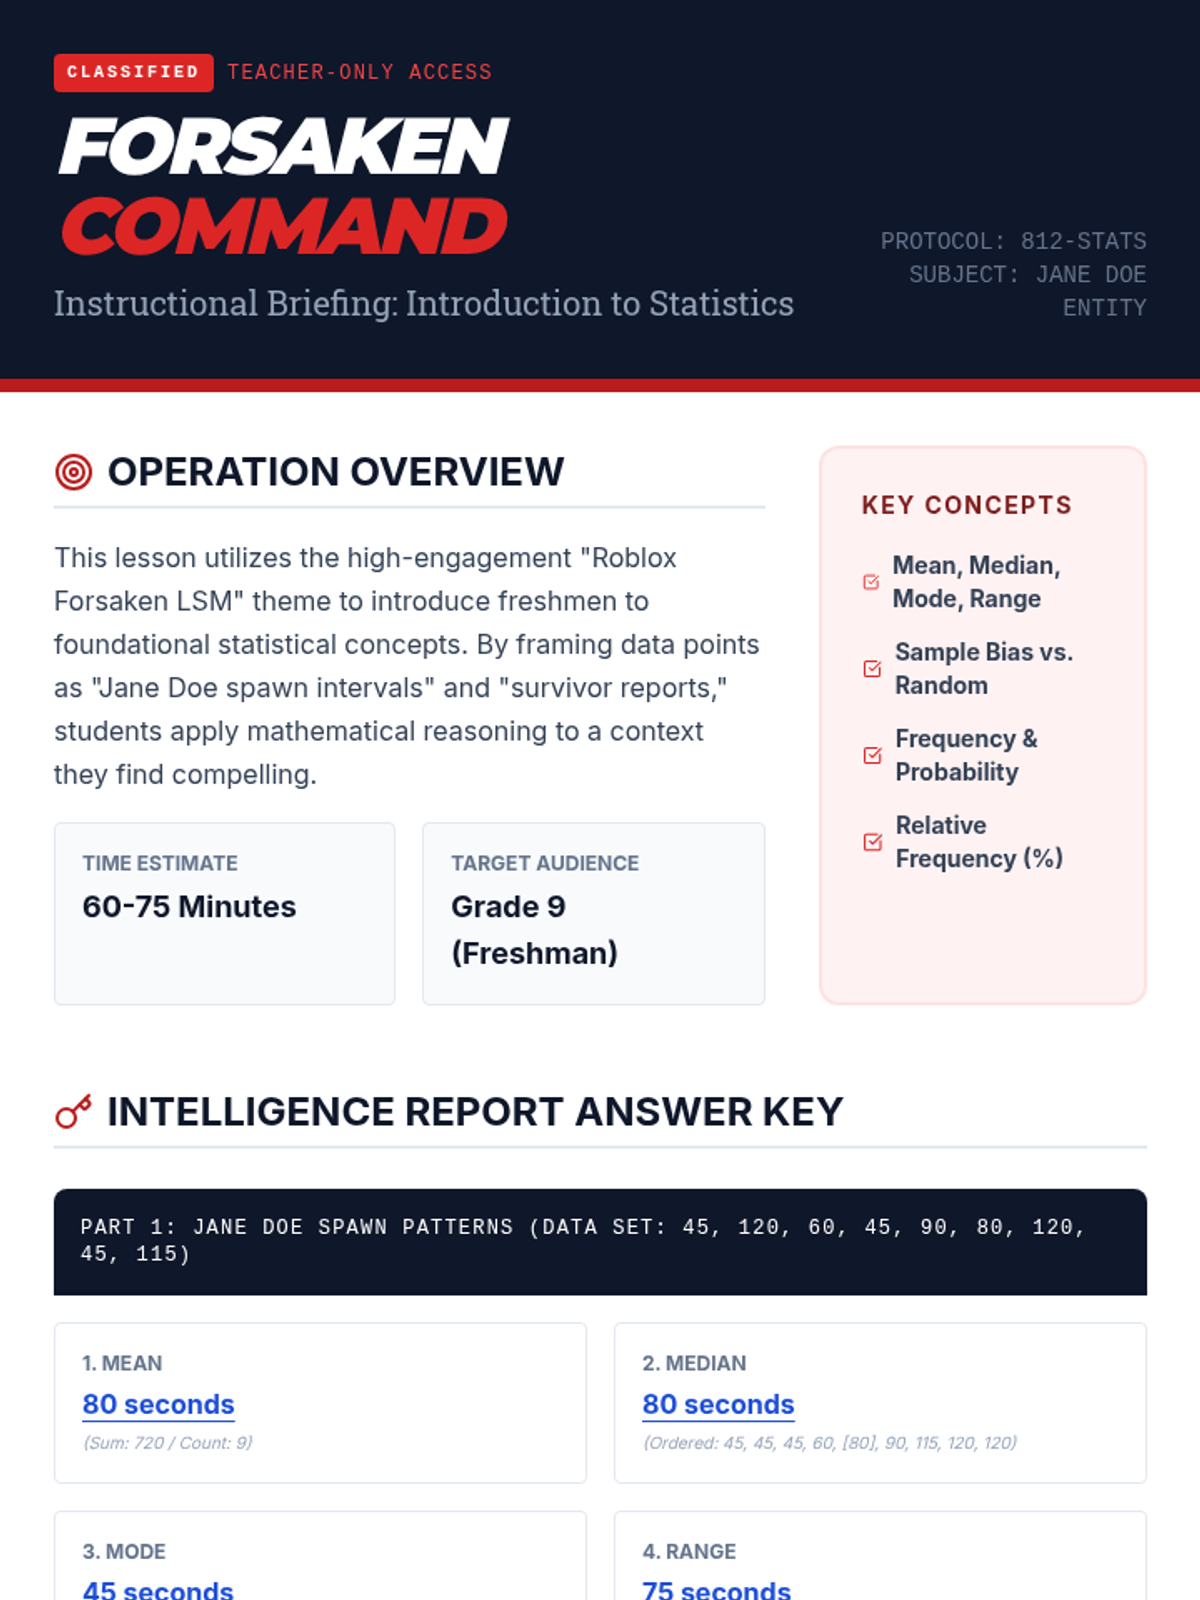
A comprehensive teacher guide for the Forsaken Stats lesson, including a worksheet answer key, facilitation tips, common student misconceptions, and extension activities.
A dynamic slide presentation themed around Roblox Forsaken LSM and the Jane Doe entity, introducing key statistics concepts: mean, median, mode, range, sampling bias, and probability.
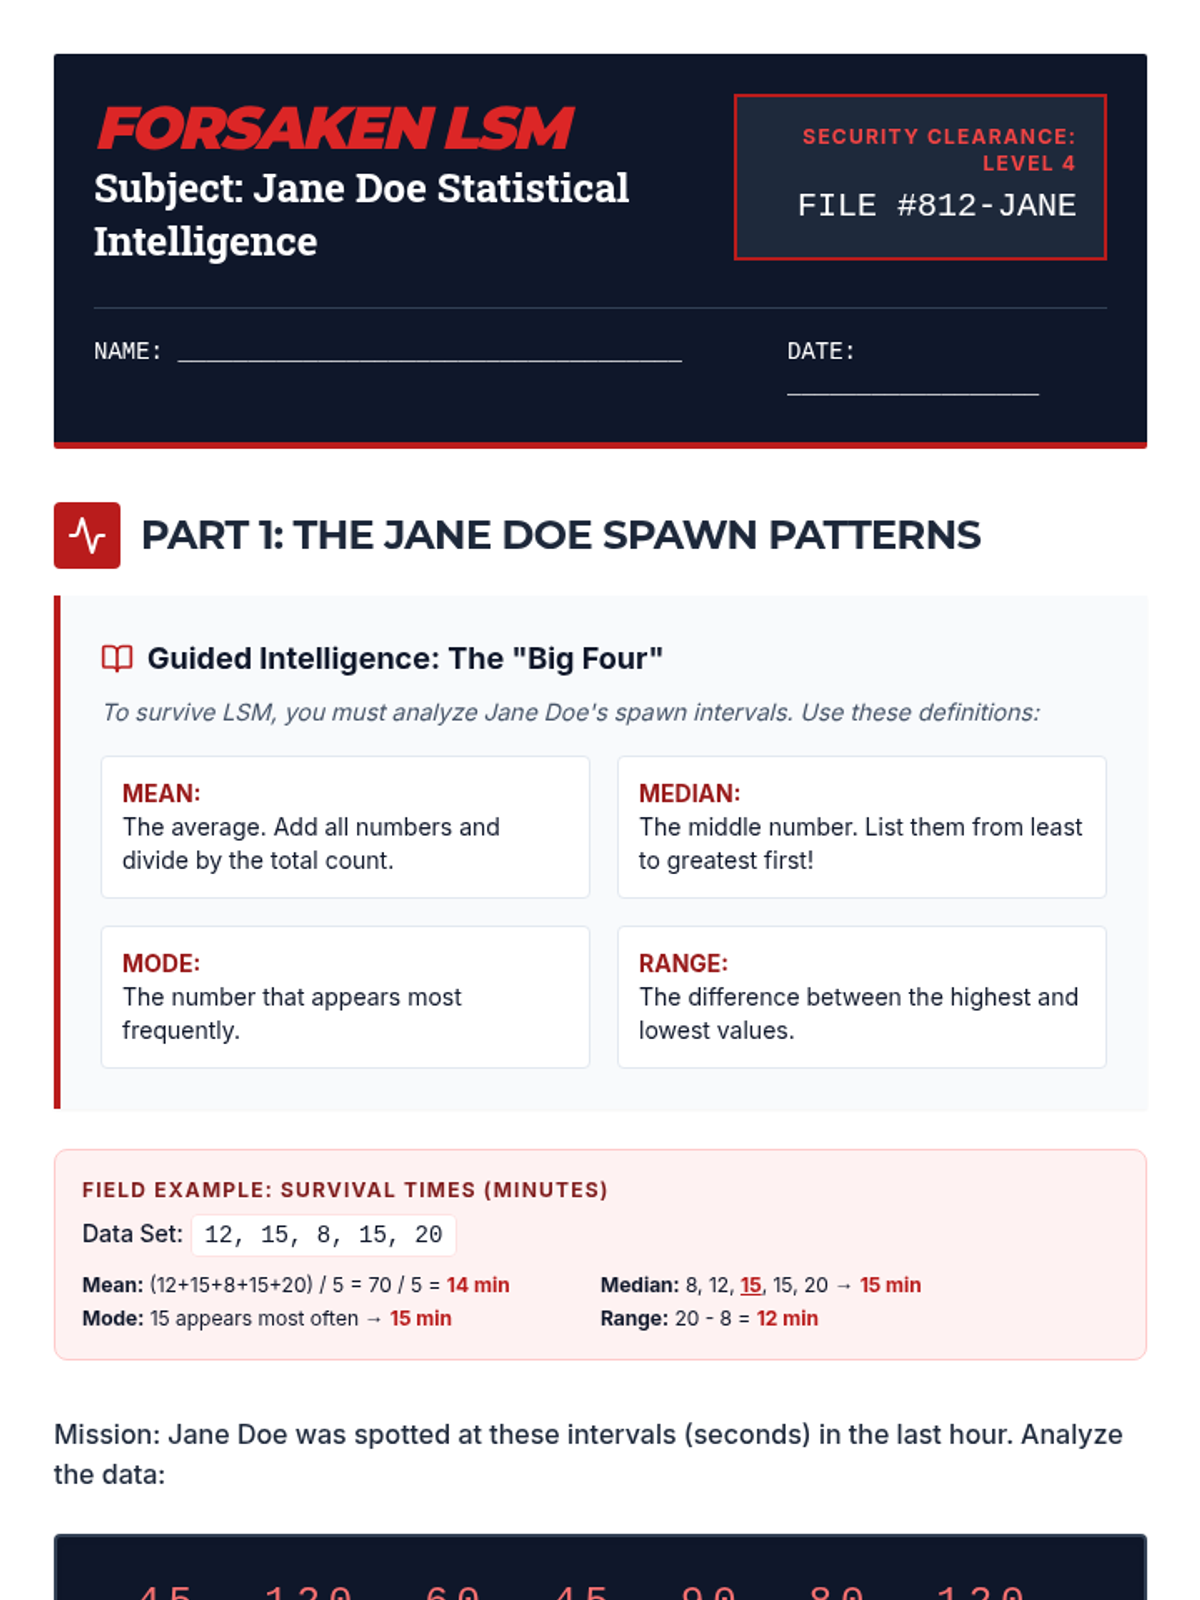
A revised guided statistics worksheet themed around Roblox Forsaken LSM, featuring Jane Doe data for central tendency, data collection bias, and frequency tables with improved layout and page breaks.
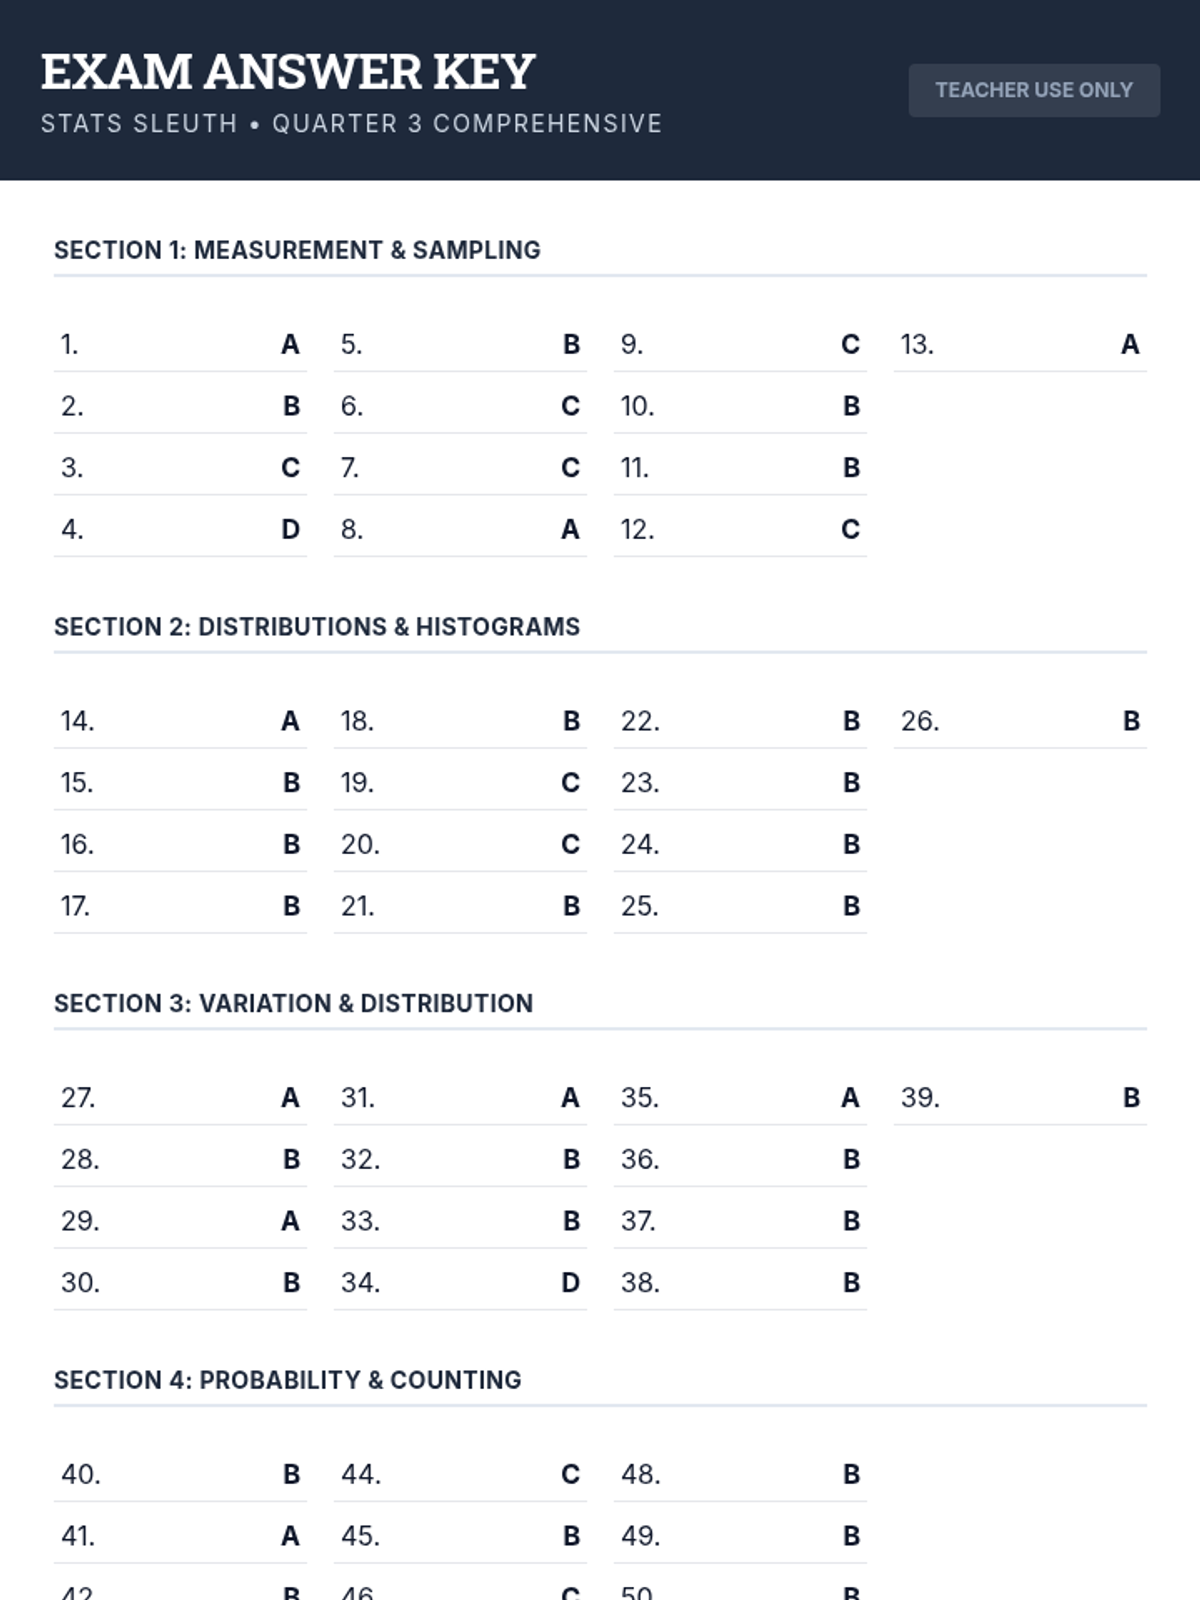
The corresponding answer key for the 50-question Statistics Quarterly Exam, including a grading scale and section breakdowns.
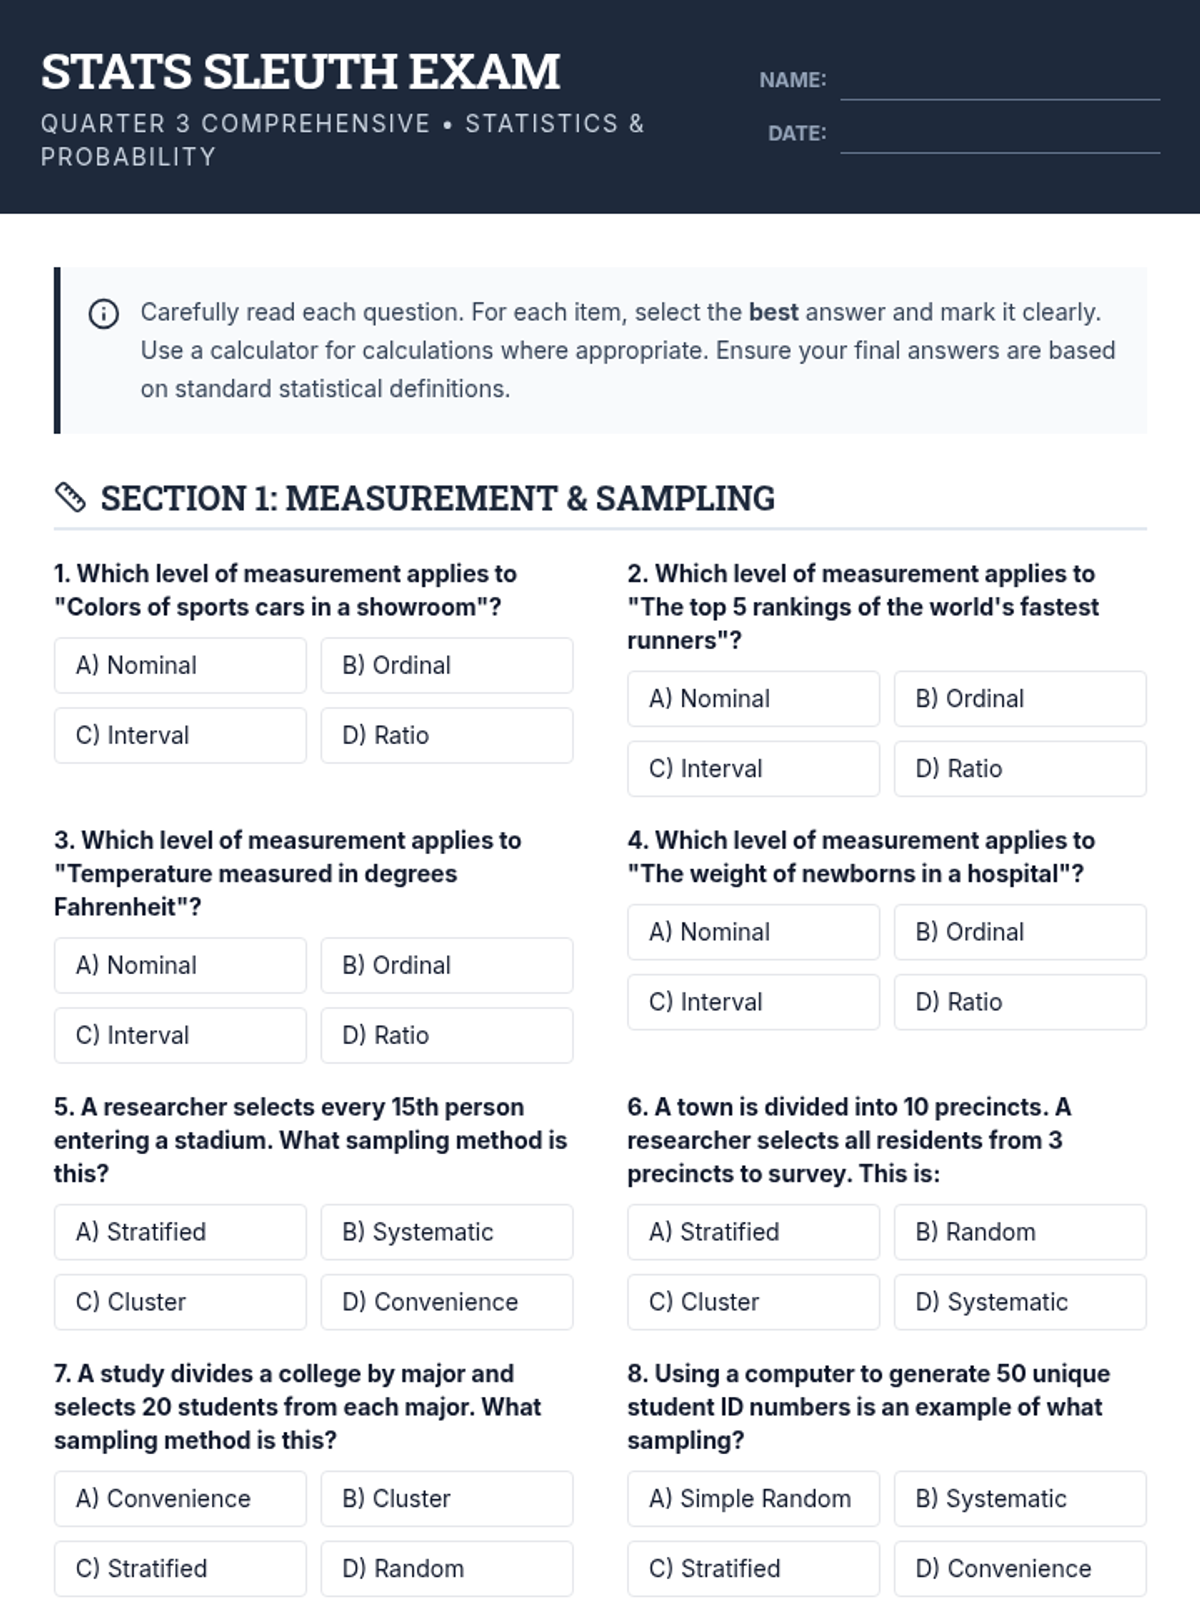
A comprehensive 50-question statistics exam with revised sections focusing on levels of measurement, sampling methods, frequency distributions, and histogram interpretation.
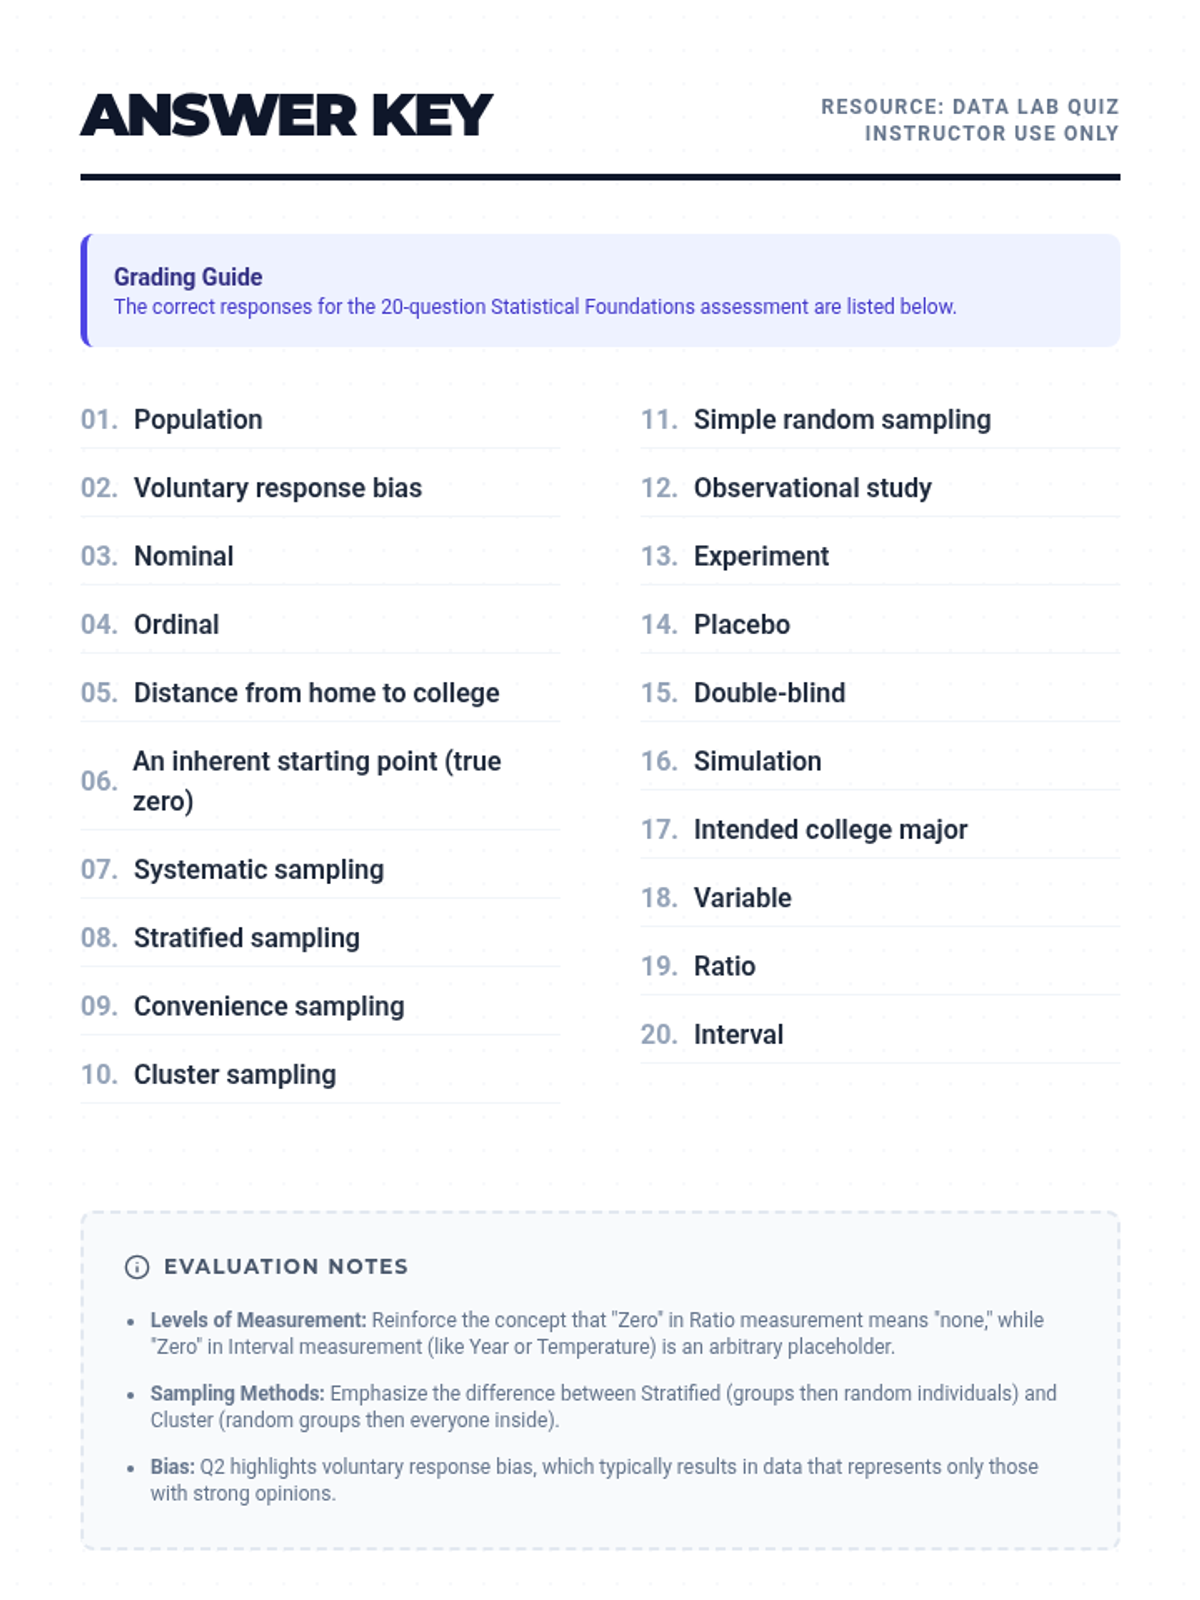
Answer key for the Data Lab Quiz, including detailed grading notes and concept clarifications for the teacher.
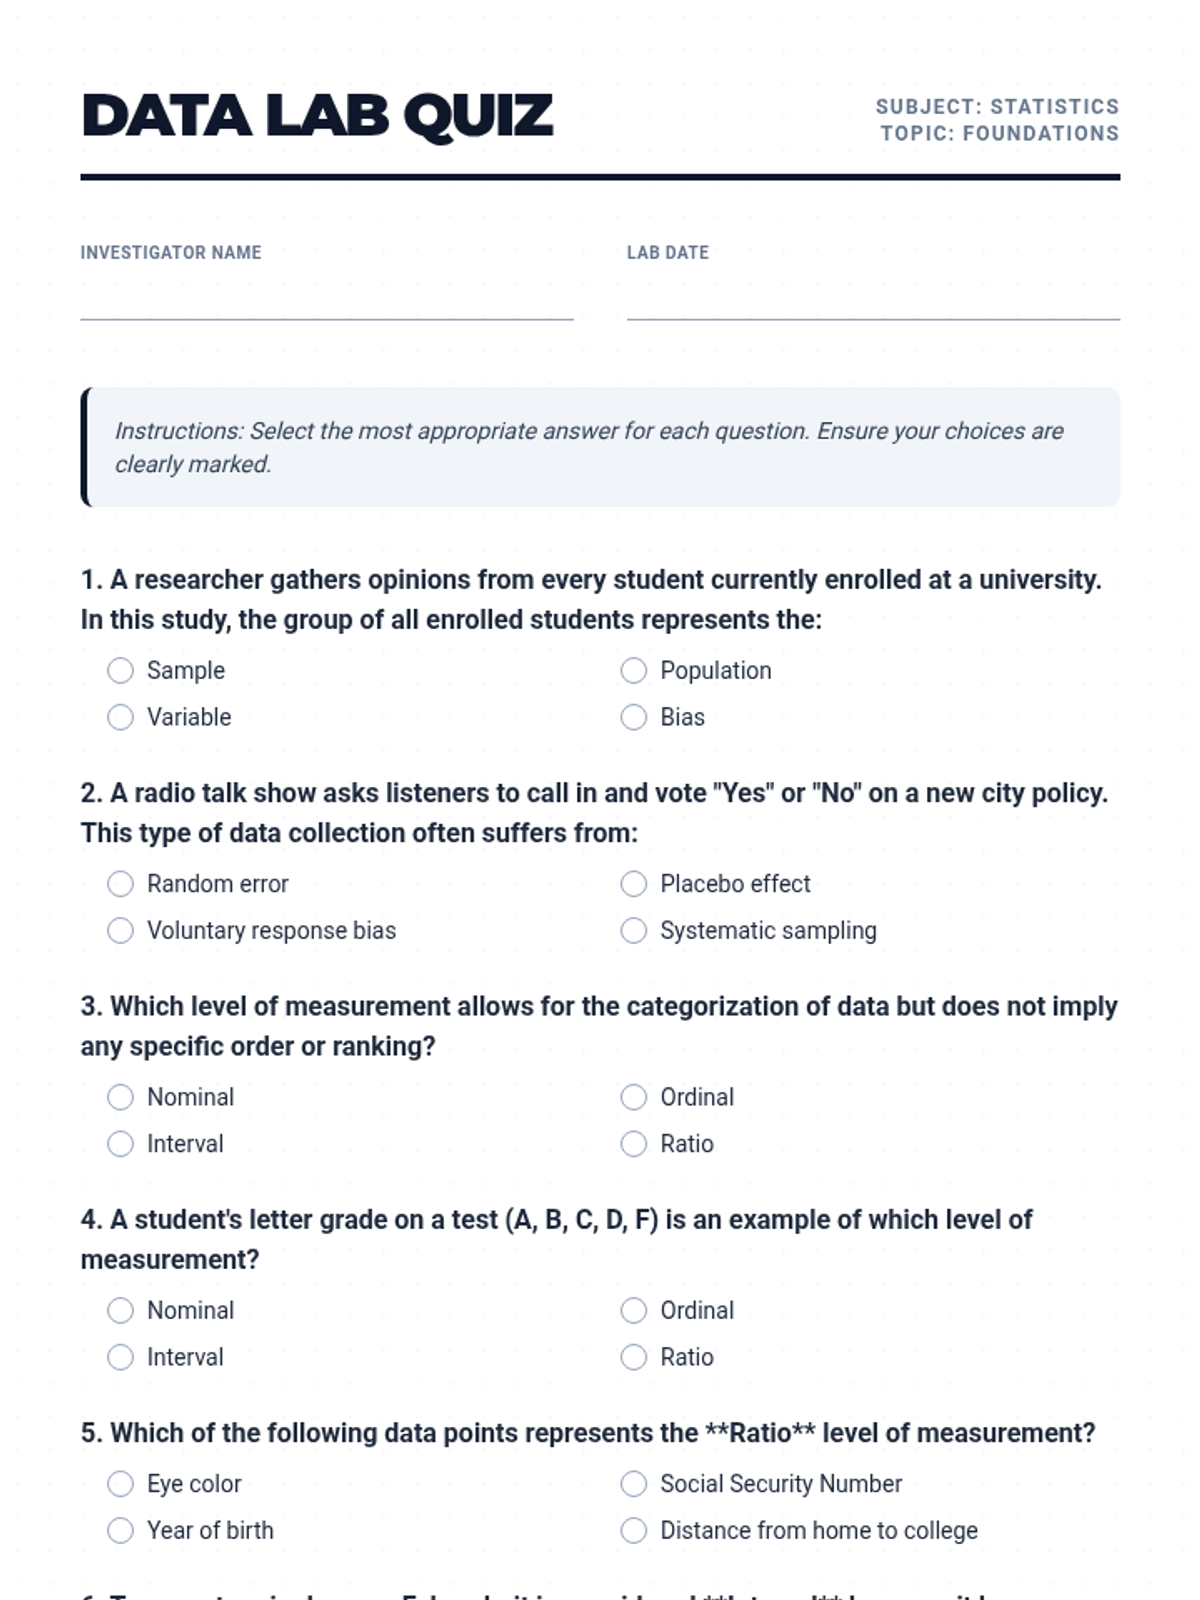
A 20-question multiple-choice quiz covering general statistics concepts, levels of measurement, sampling types, and data collection methods.
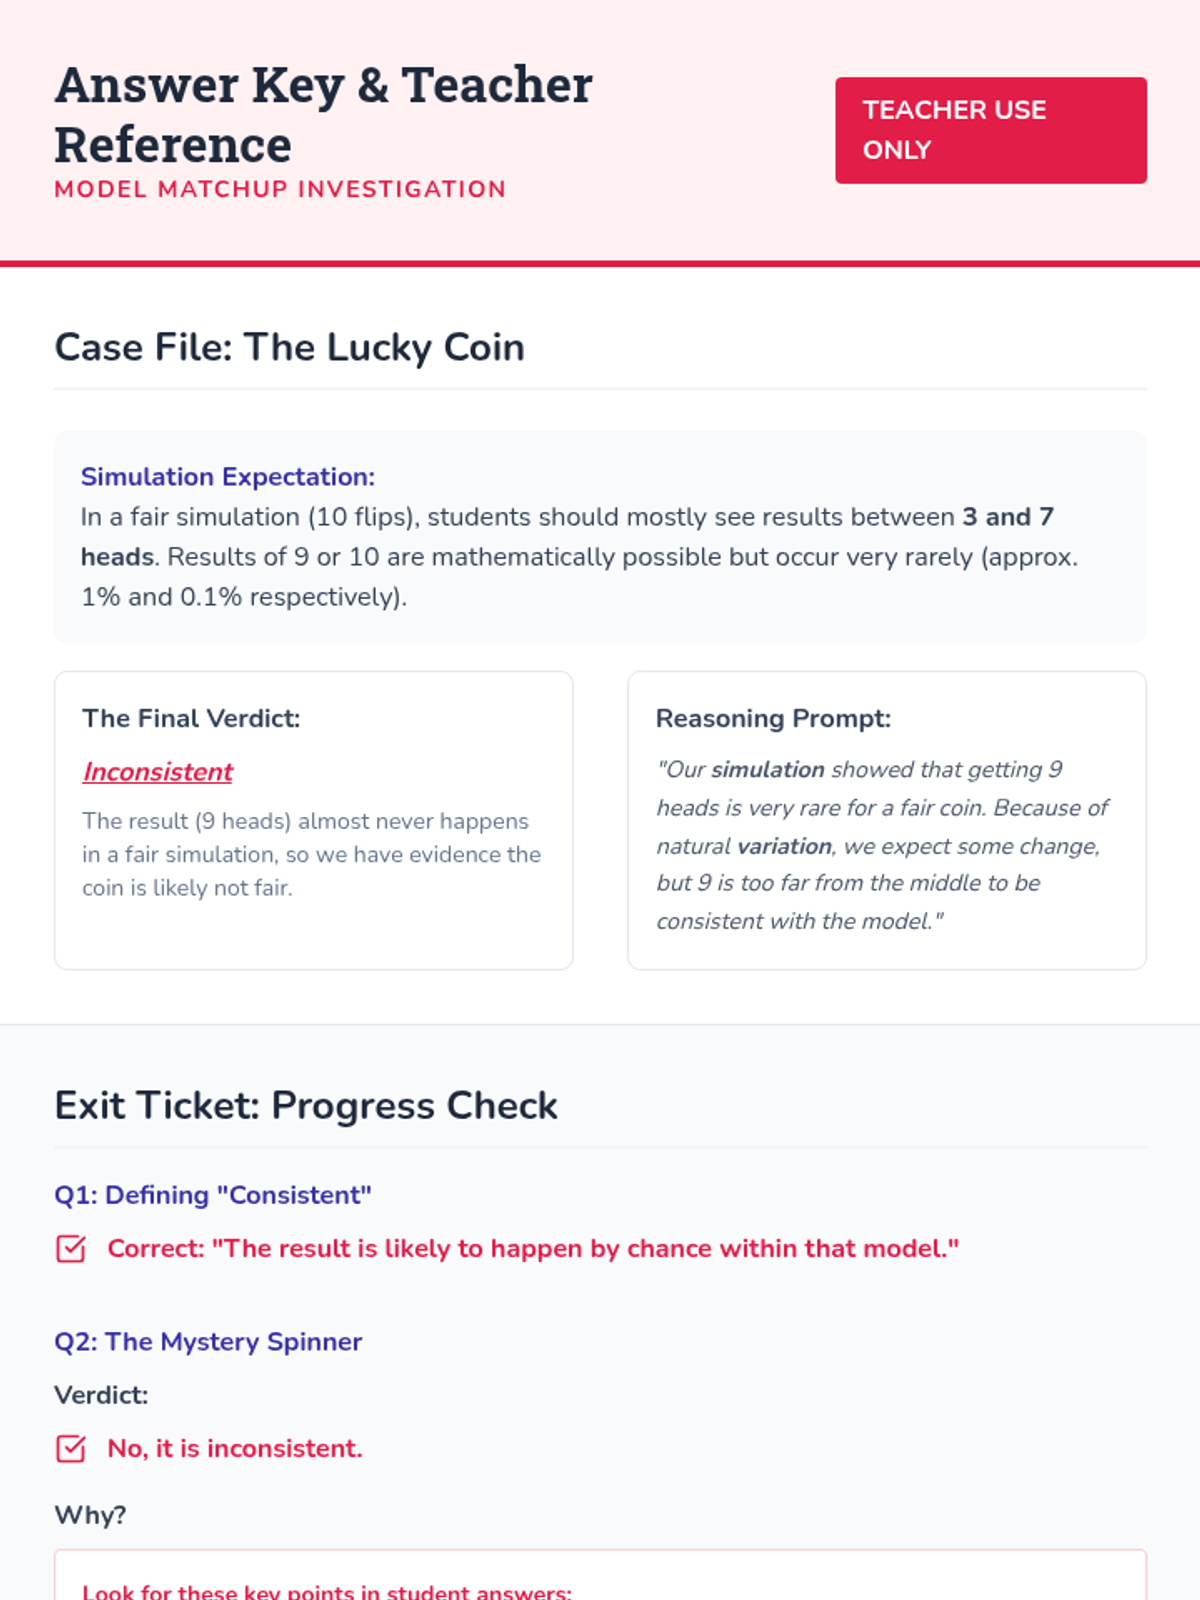
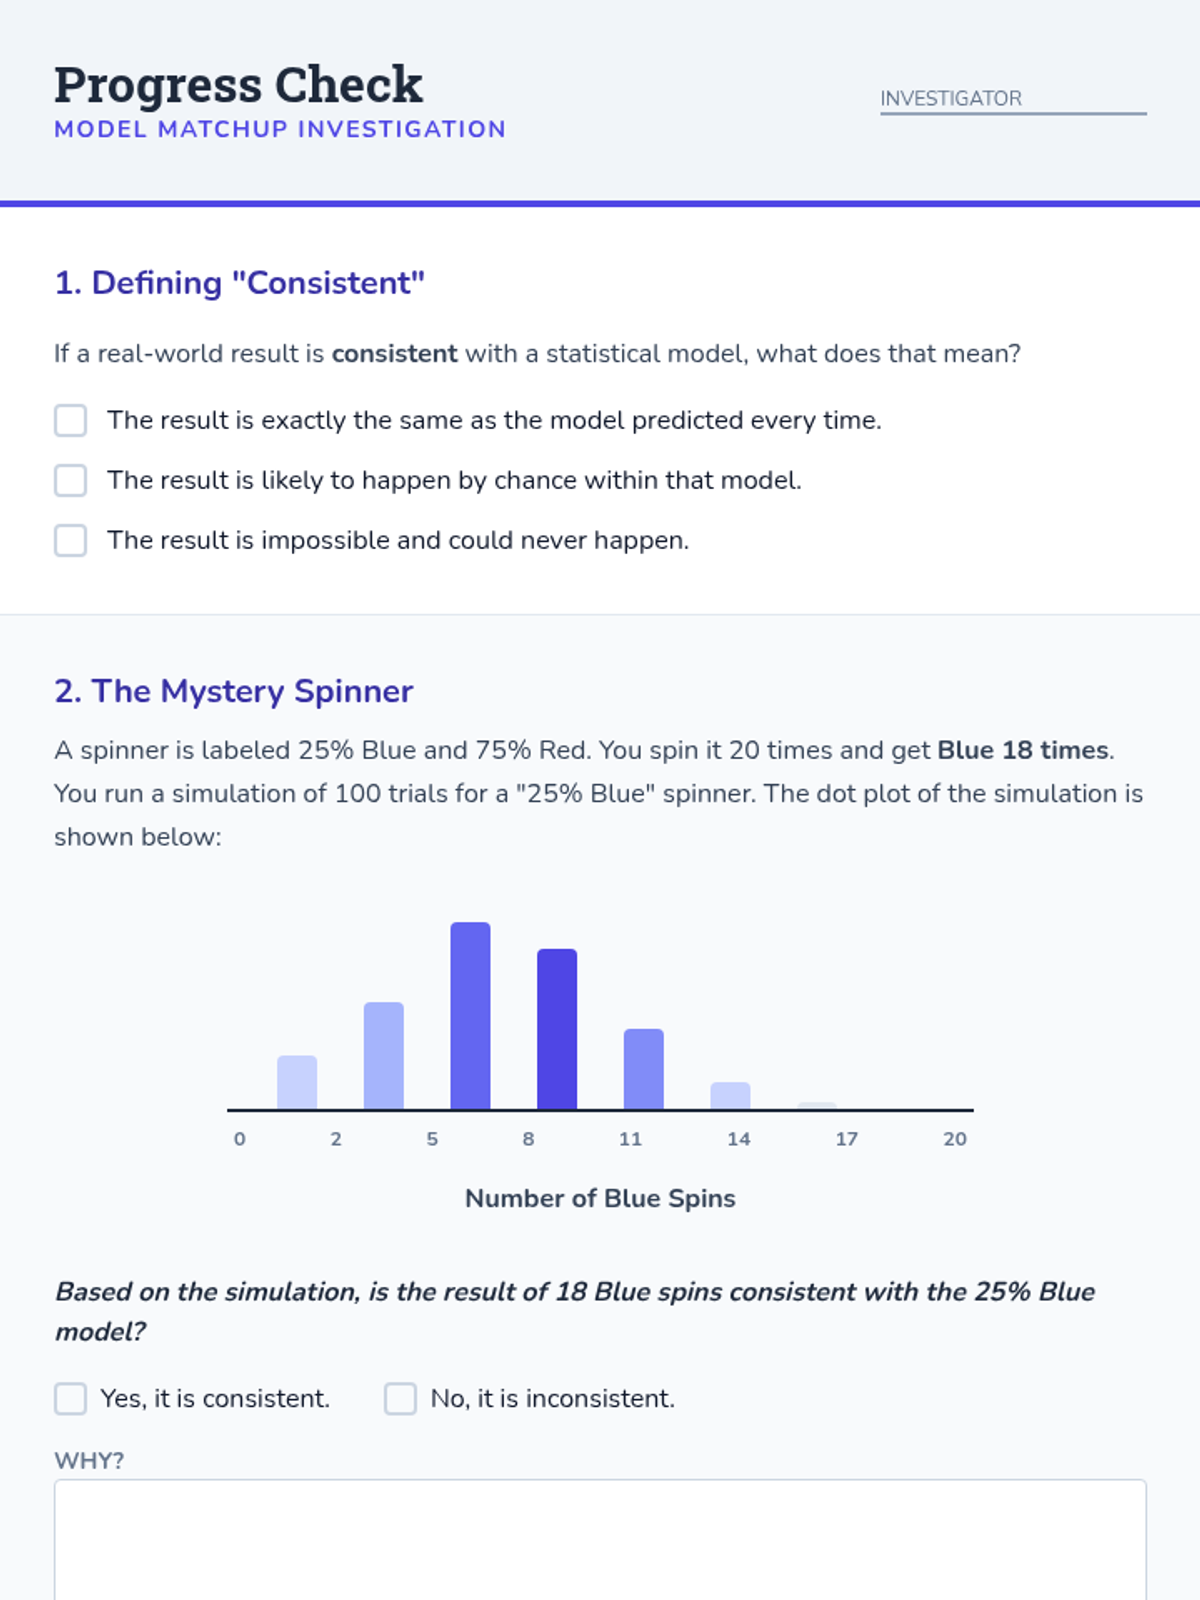
An answer key and scoring guide for the Model Matchup investigation. Provides expected simulation outcomes, correct answers for the exit ticket, and mastery criteria for Tier 2 intervention tracking.
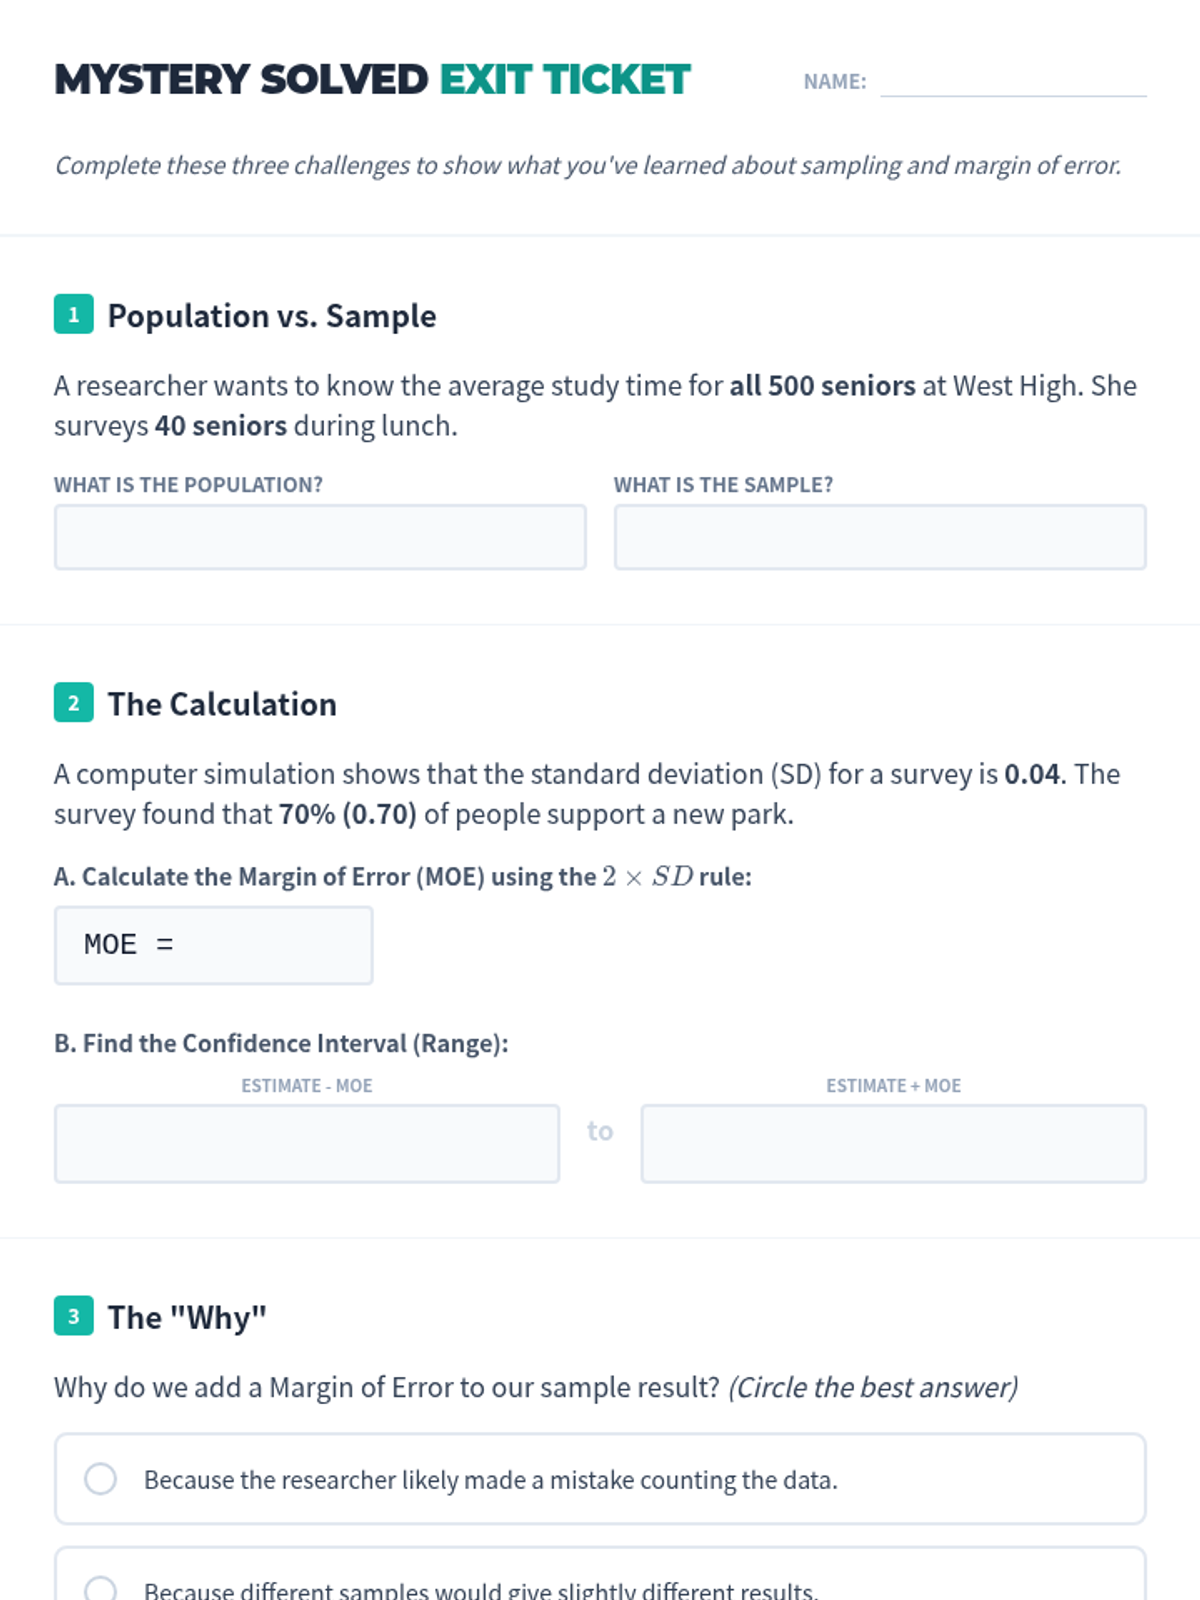
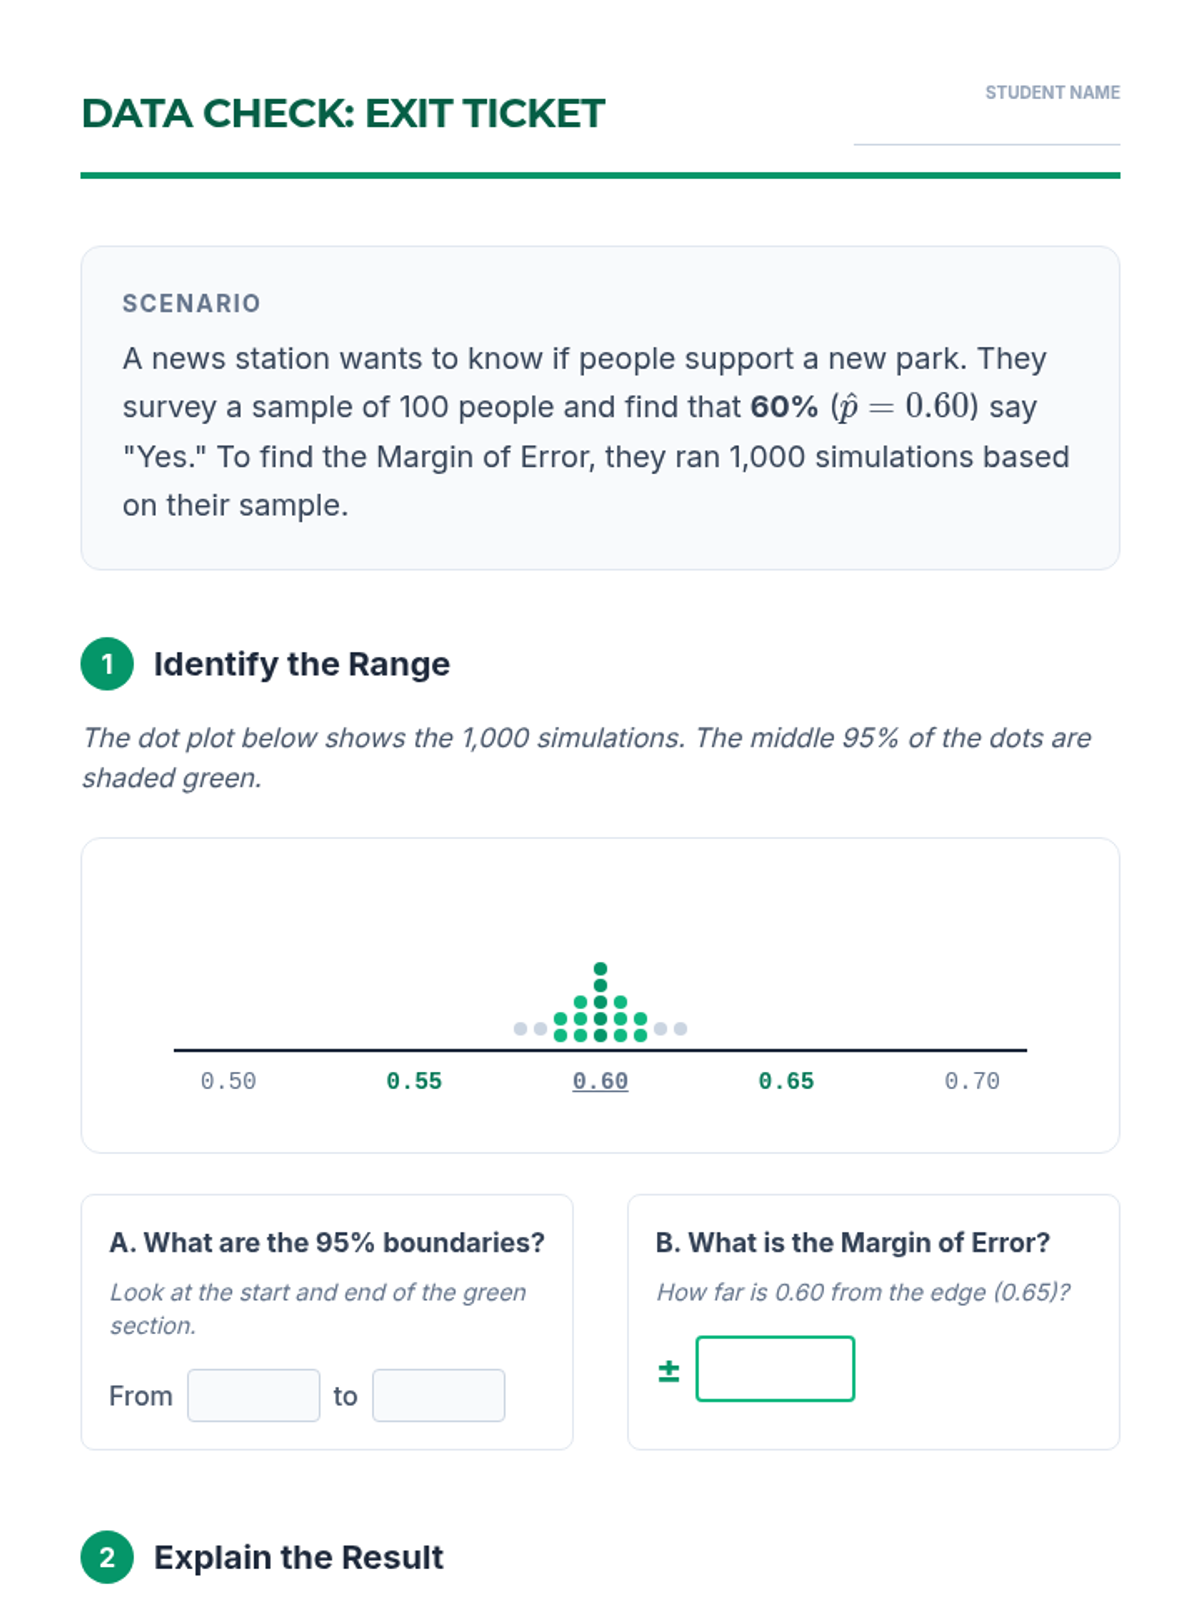
A short assessment to monitor student progress on sampling concepts, margin of error calculations, and interpretation. Designed for quick data collection during intervention sessions.
A formative assessment exit ticket for the Model Matchup lesson. It asks students to define consistency and apply it to a new spinner-based simulation scenario.
A concise, visual exit ticket designed for progress monitoring, asking students to identify a margin of error from a simulation distribution and explain its conceptual necessity.
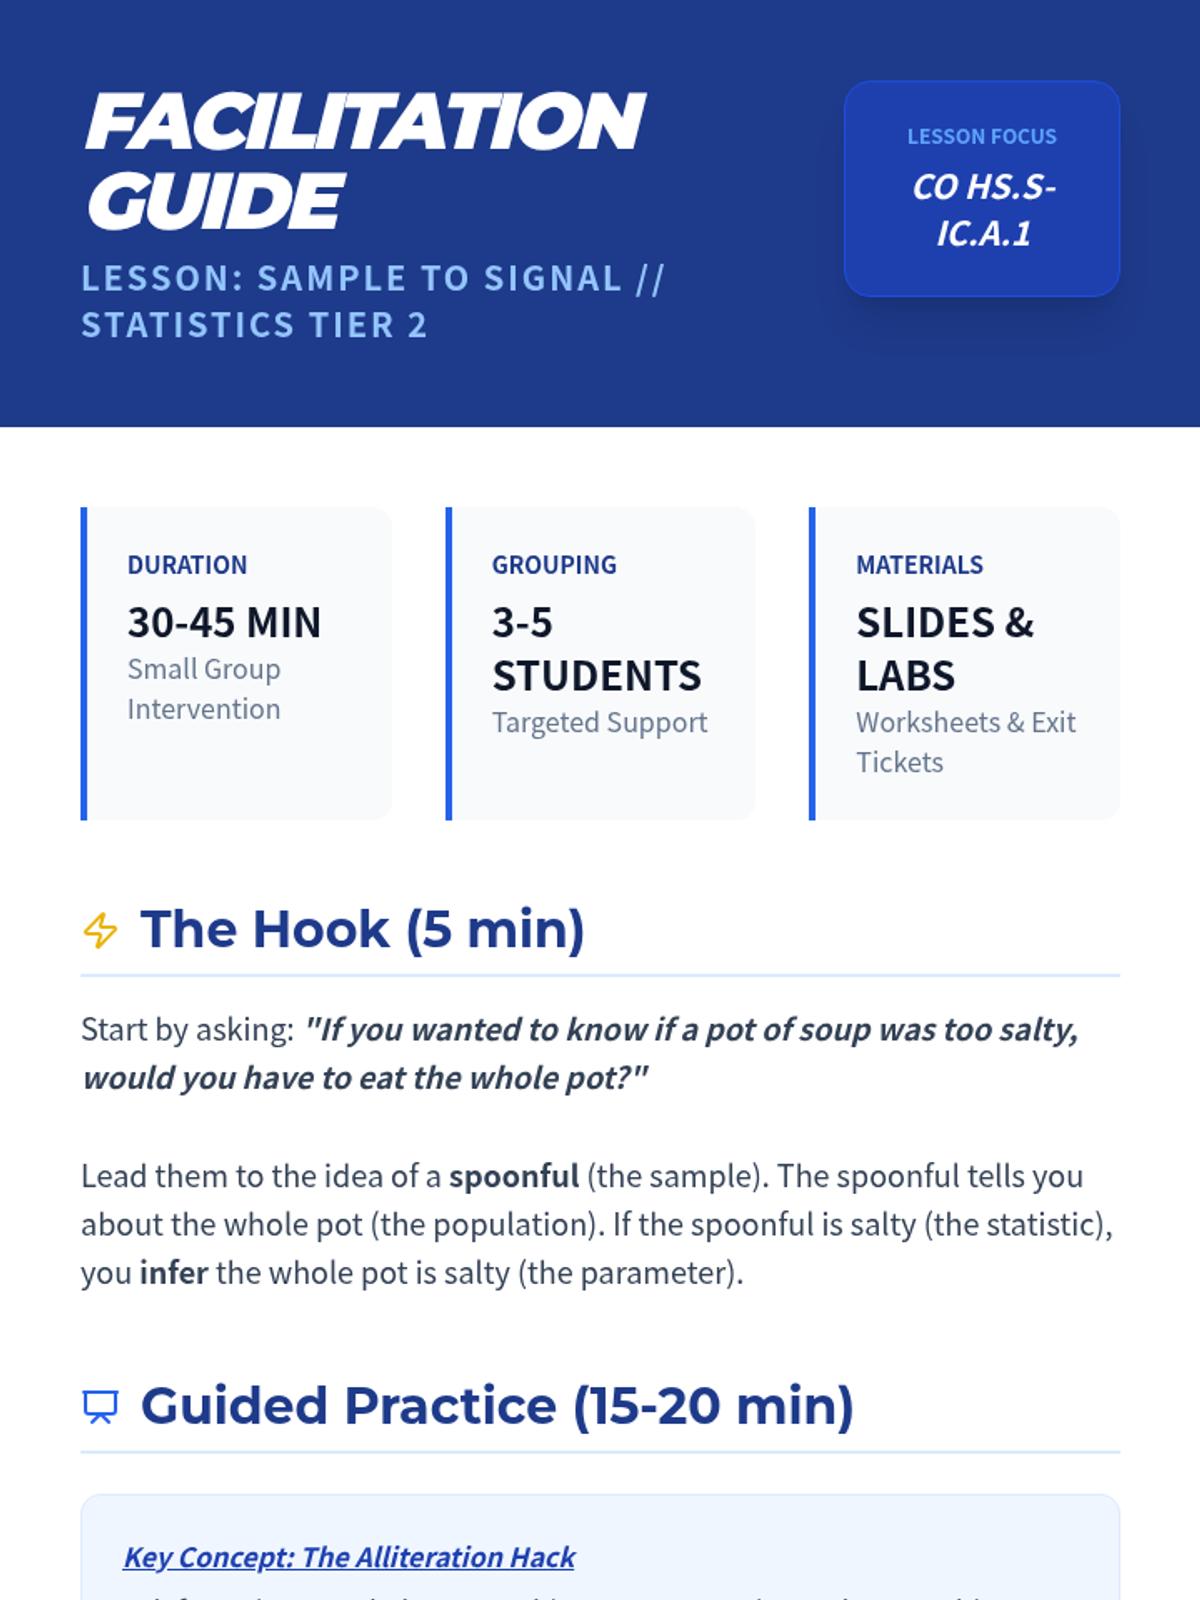
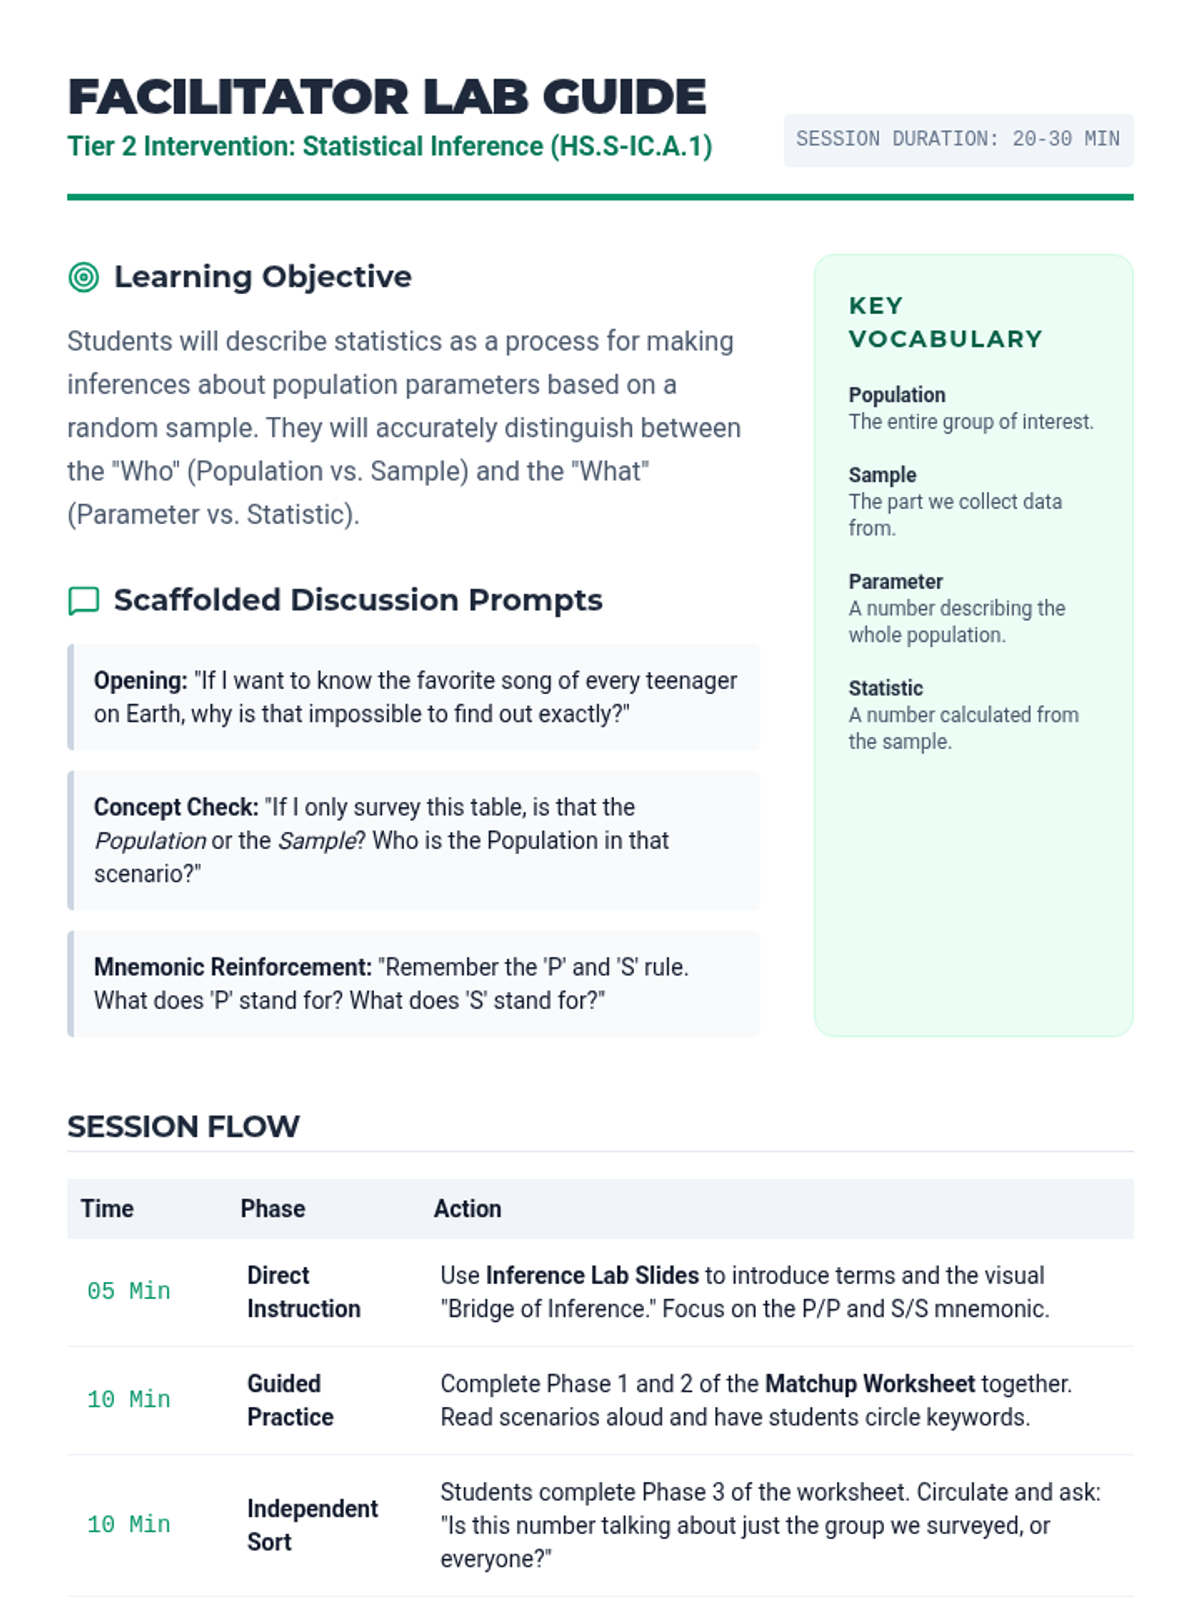
A comprehensive facilitator guide for teachers, providing pacing, discussion prompts, tiered scaffolding strategies, and an answer key for the intervention lesson.
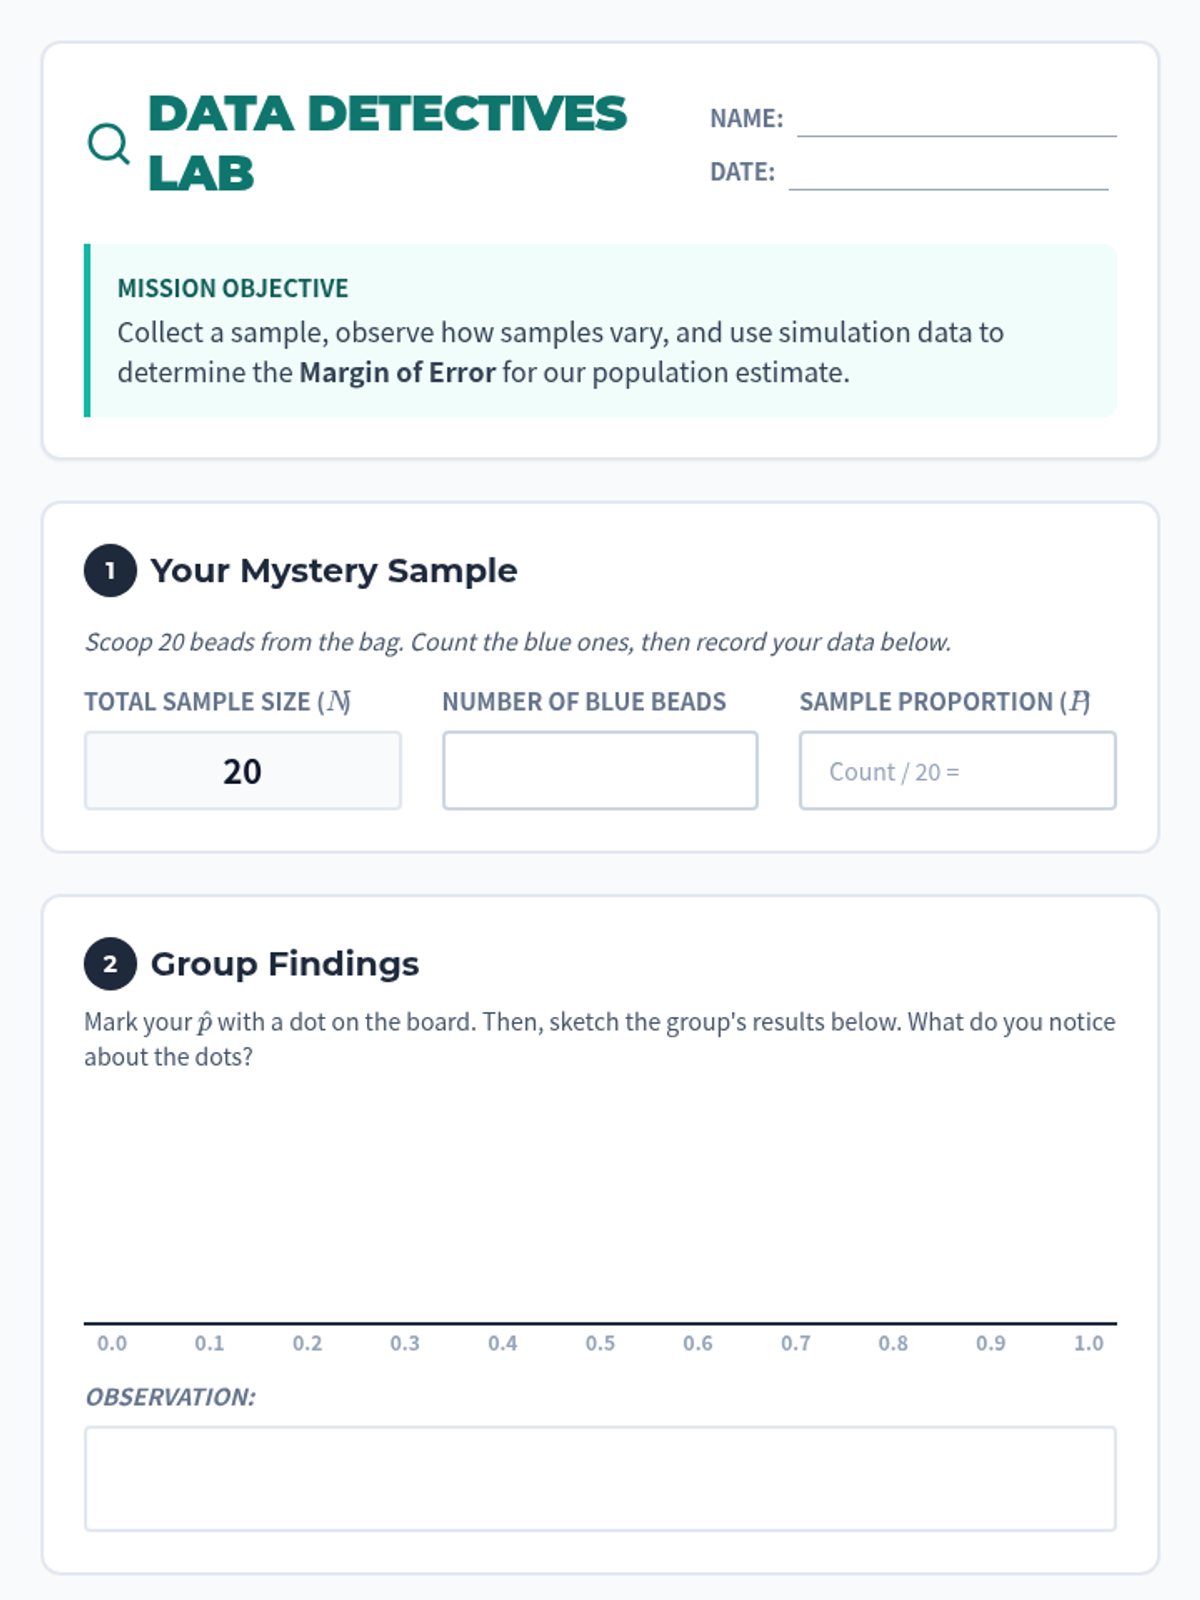
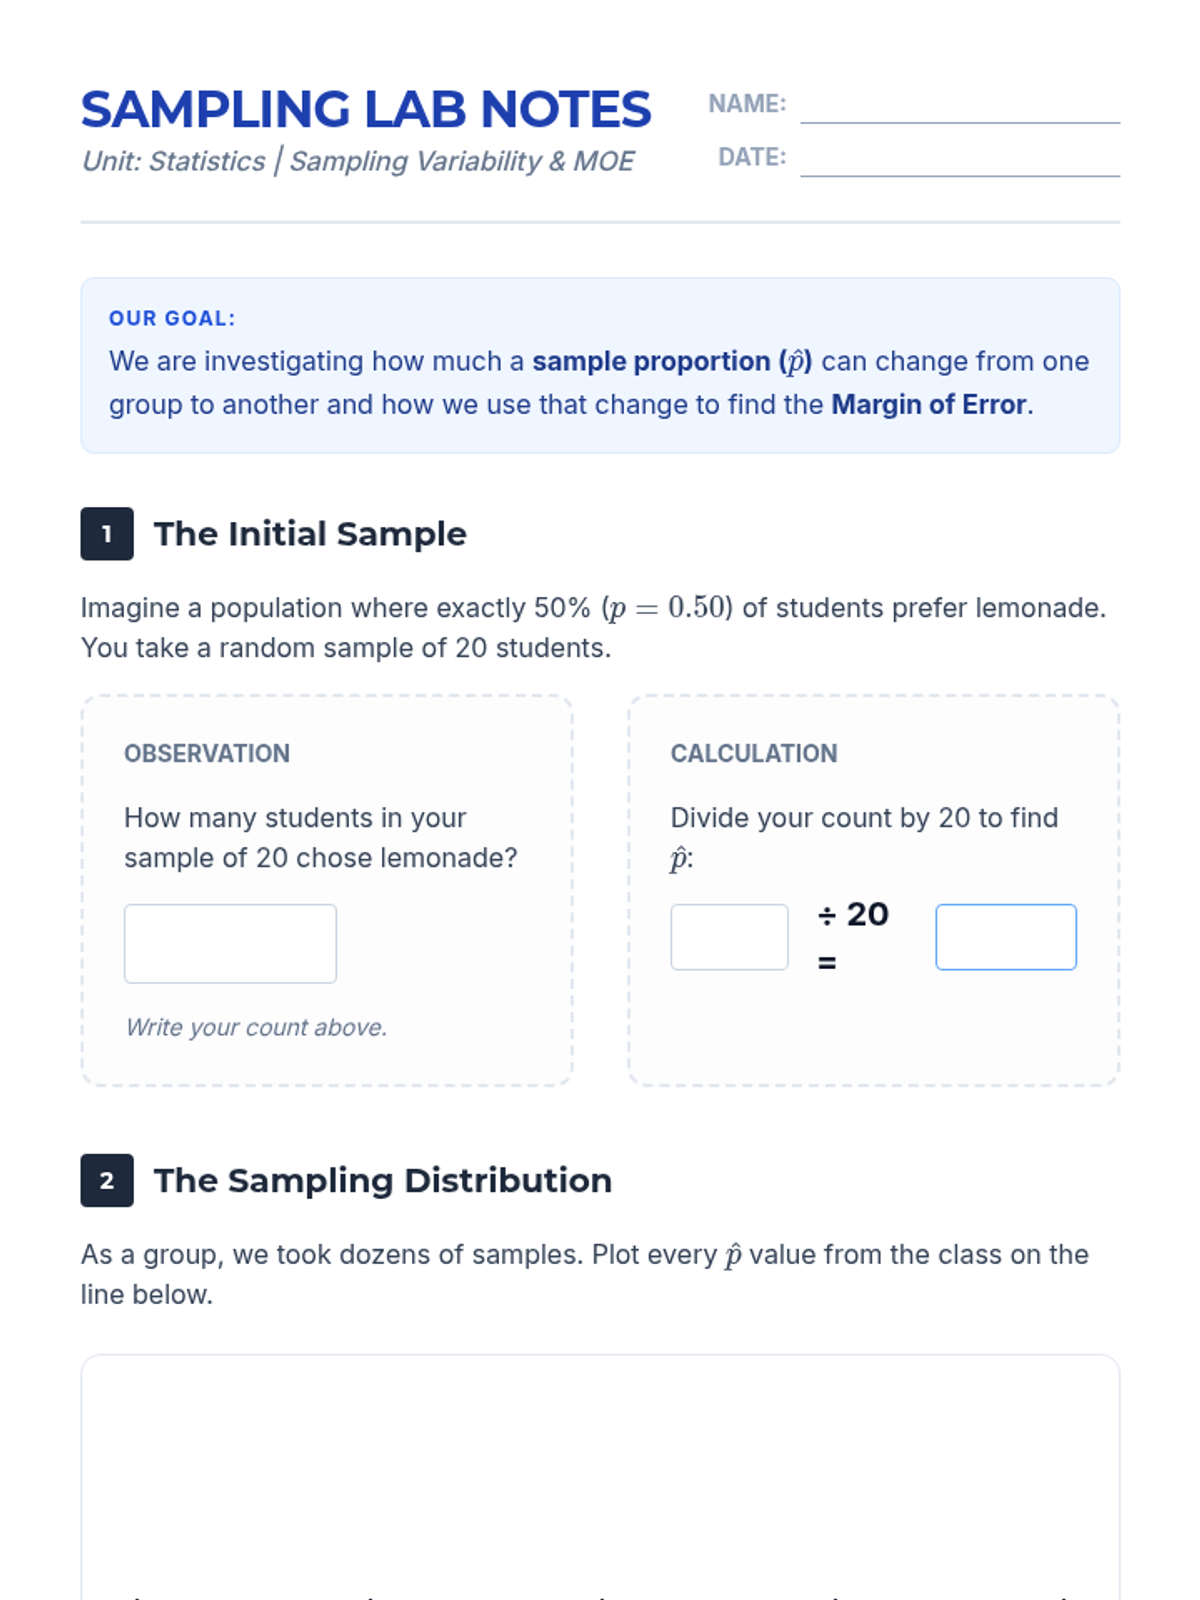
A scaffolded student lab sheet for conducting a sampling simulation. Includes space for individual sample data collection, group dot plot visualization, and a guided calculation for margin of error using the 2xSD rule.
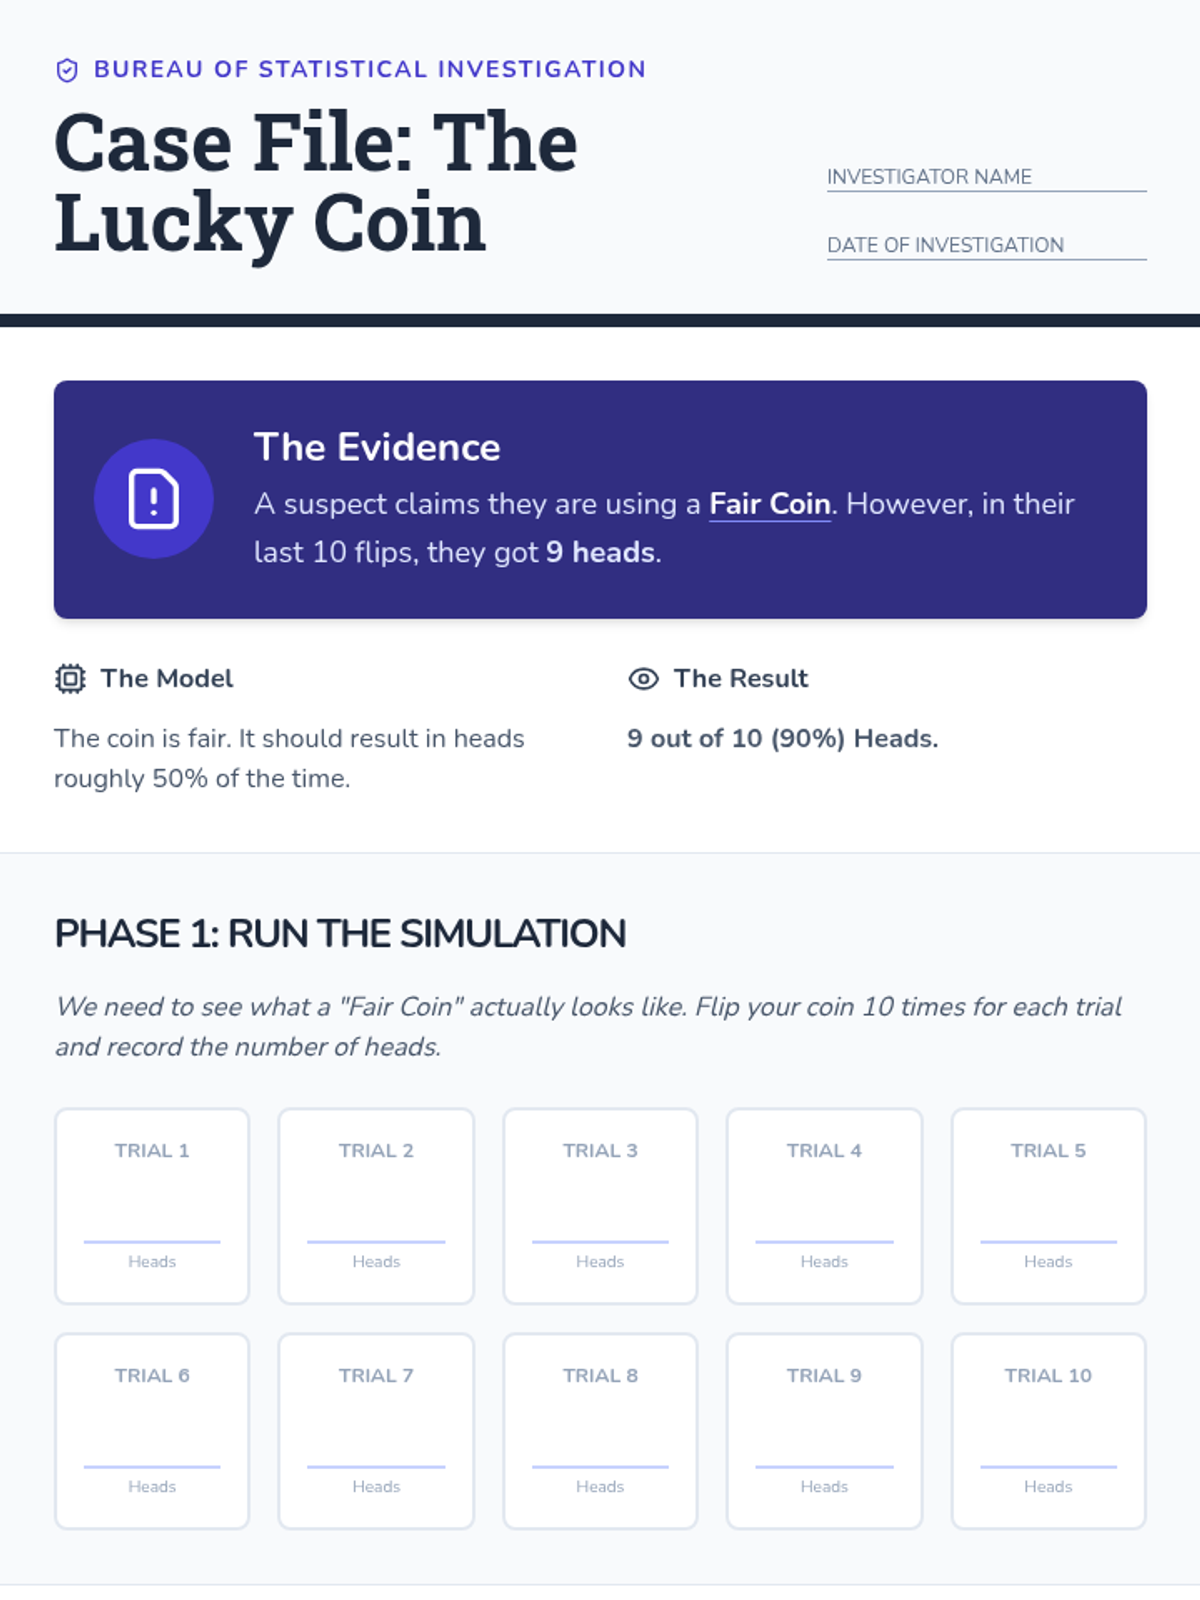
A student-facing worksheet designed as a "Case File" for investigating model consistency. Includes a recording table for 10 simulation trials and a dot plot template for collective group analysis.
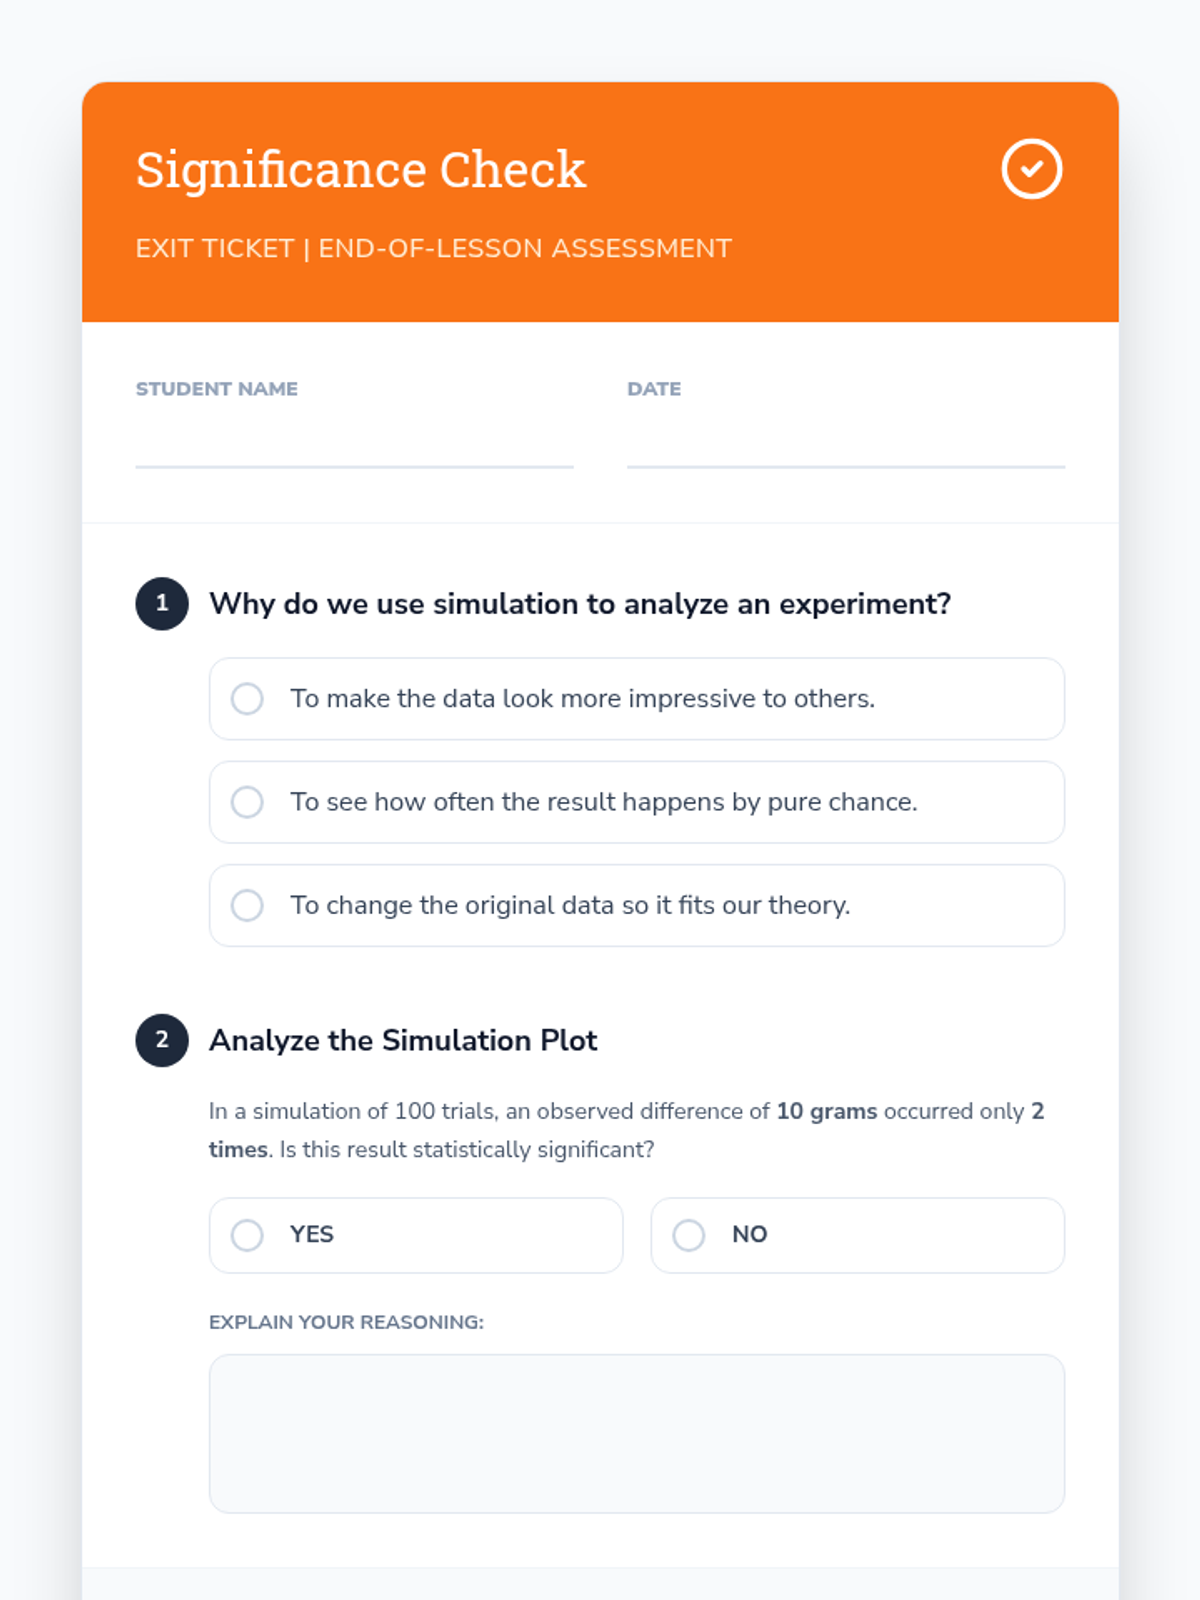
A concise exit ticket assessment for students to demonstrate their understanding of simulation-based significance. Includes conceptual multiple-choice questions and a space for justifying statistical conclusions.
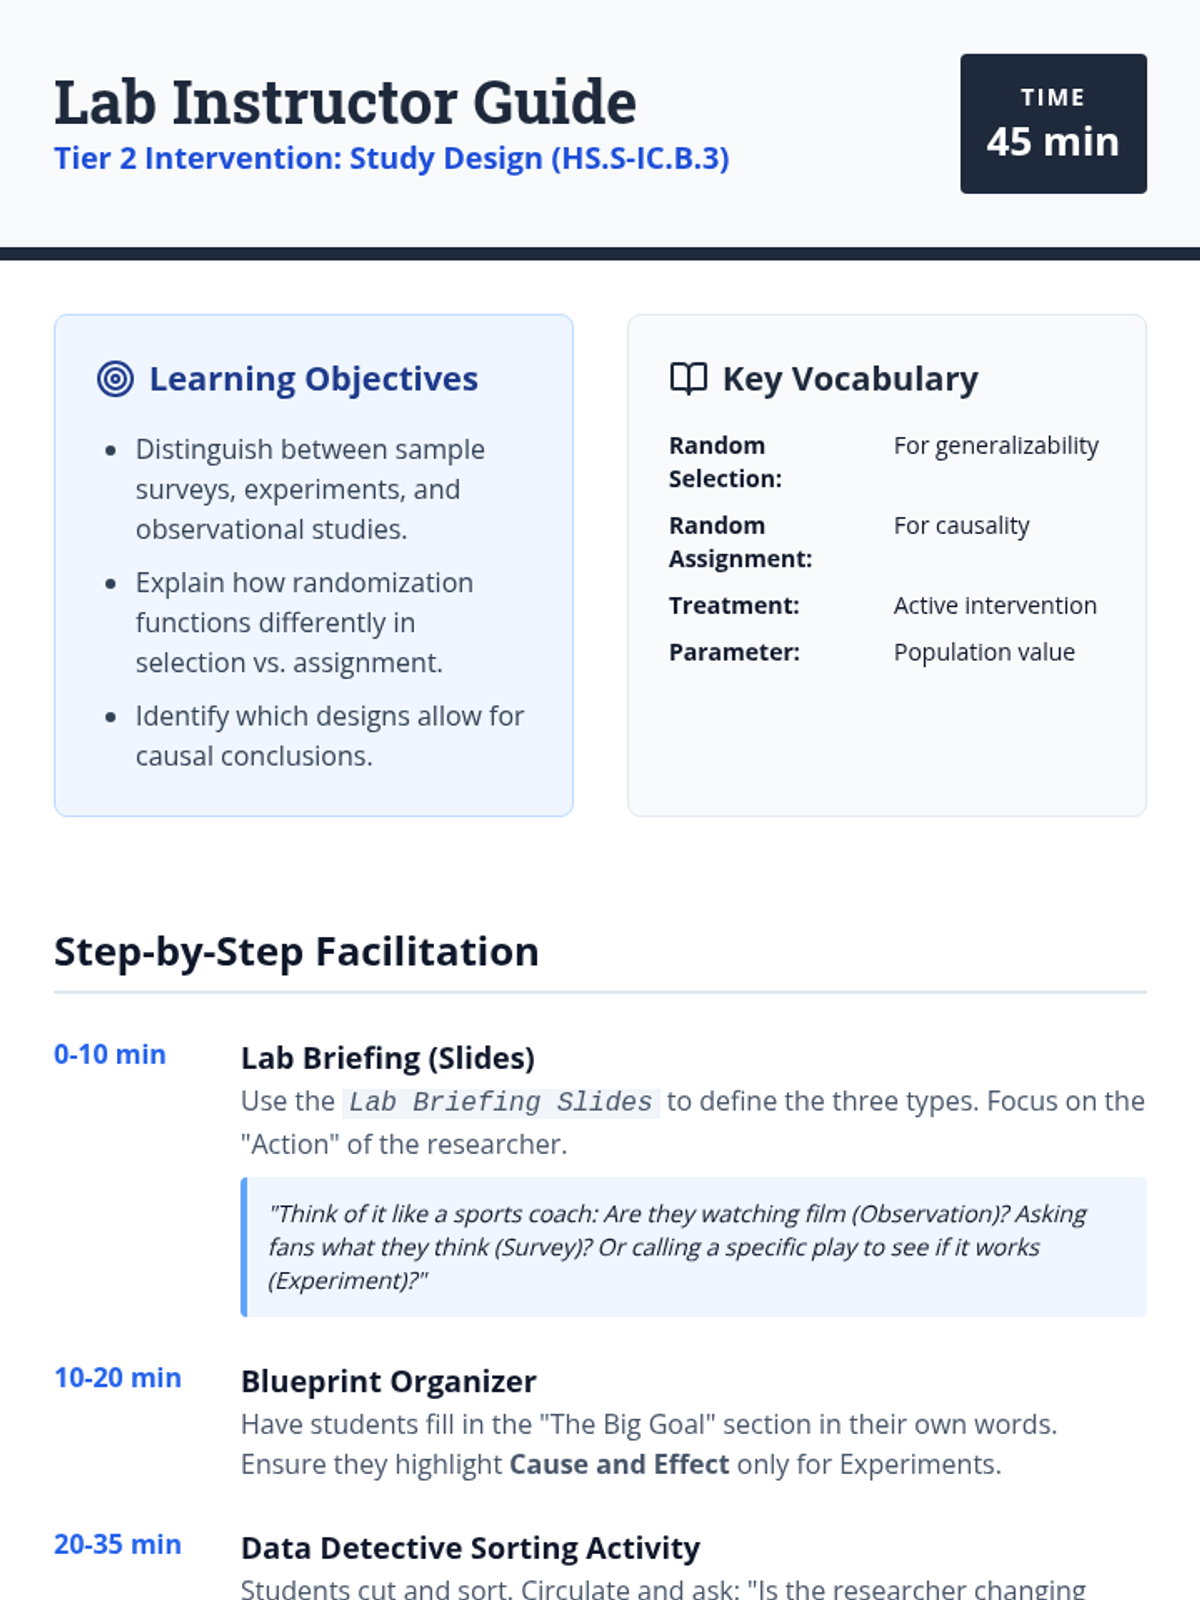
A comprehensive teacher guide for the study design intervention lesson, including a facilitation script, answer keys, and common student misconceptions to address during small group instruction.
A detailed teacher guide for facilitating a Tier 2 intervention lesson. Includes alignment to CO standards, scaffolding strategies for common misconceptions, and an answer key for progress monitoring.
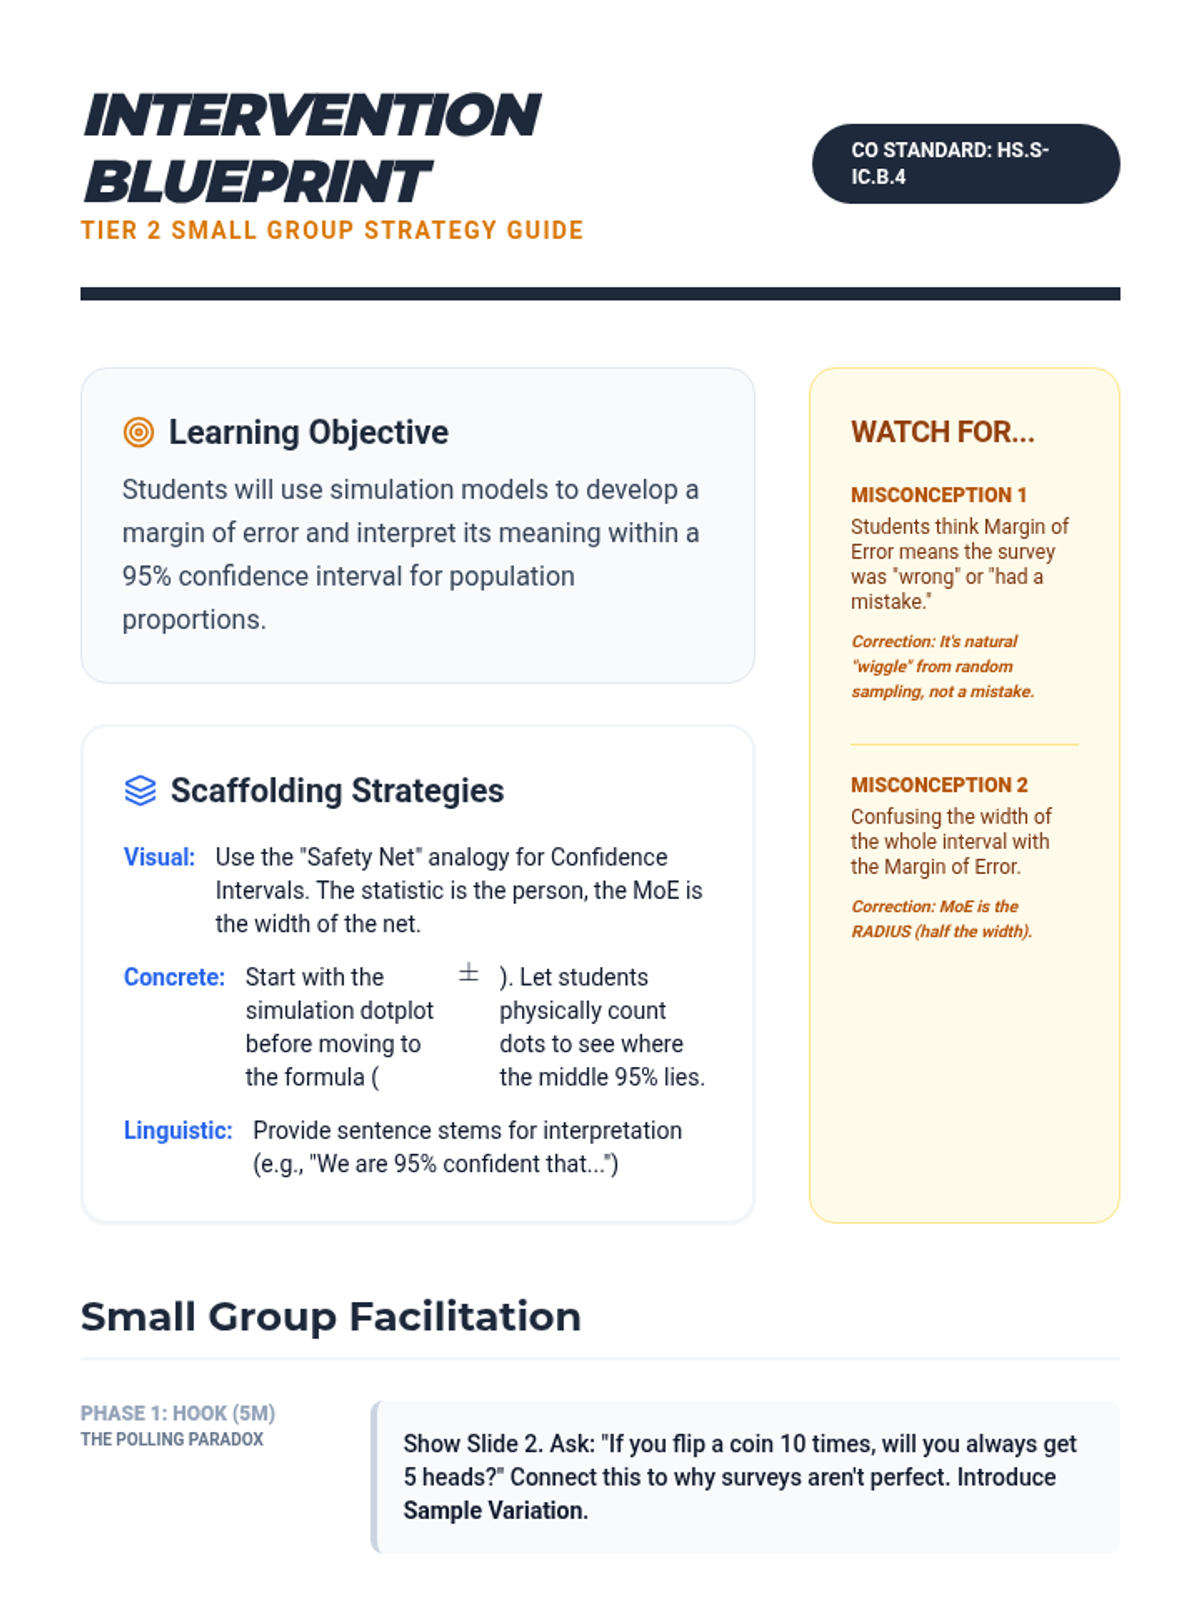
A comprehensive teacher's guide for facilitating the Tier 2 intervention. It includes learning objectives, scaffolded discussion prompts, a detailed lesson flow, common misconceptions, and differentiation strategies for students needing extra support.
A scaffolded student activity sheet for performing and analyzing a random sampling simulation, featuring space for calculations, dot-plot creation, and guided reflection.
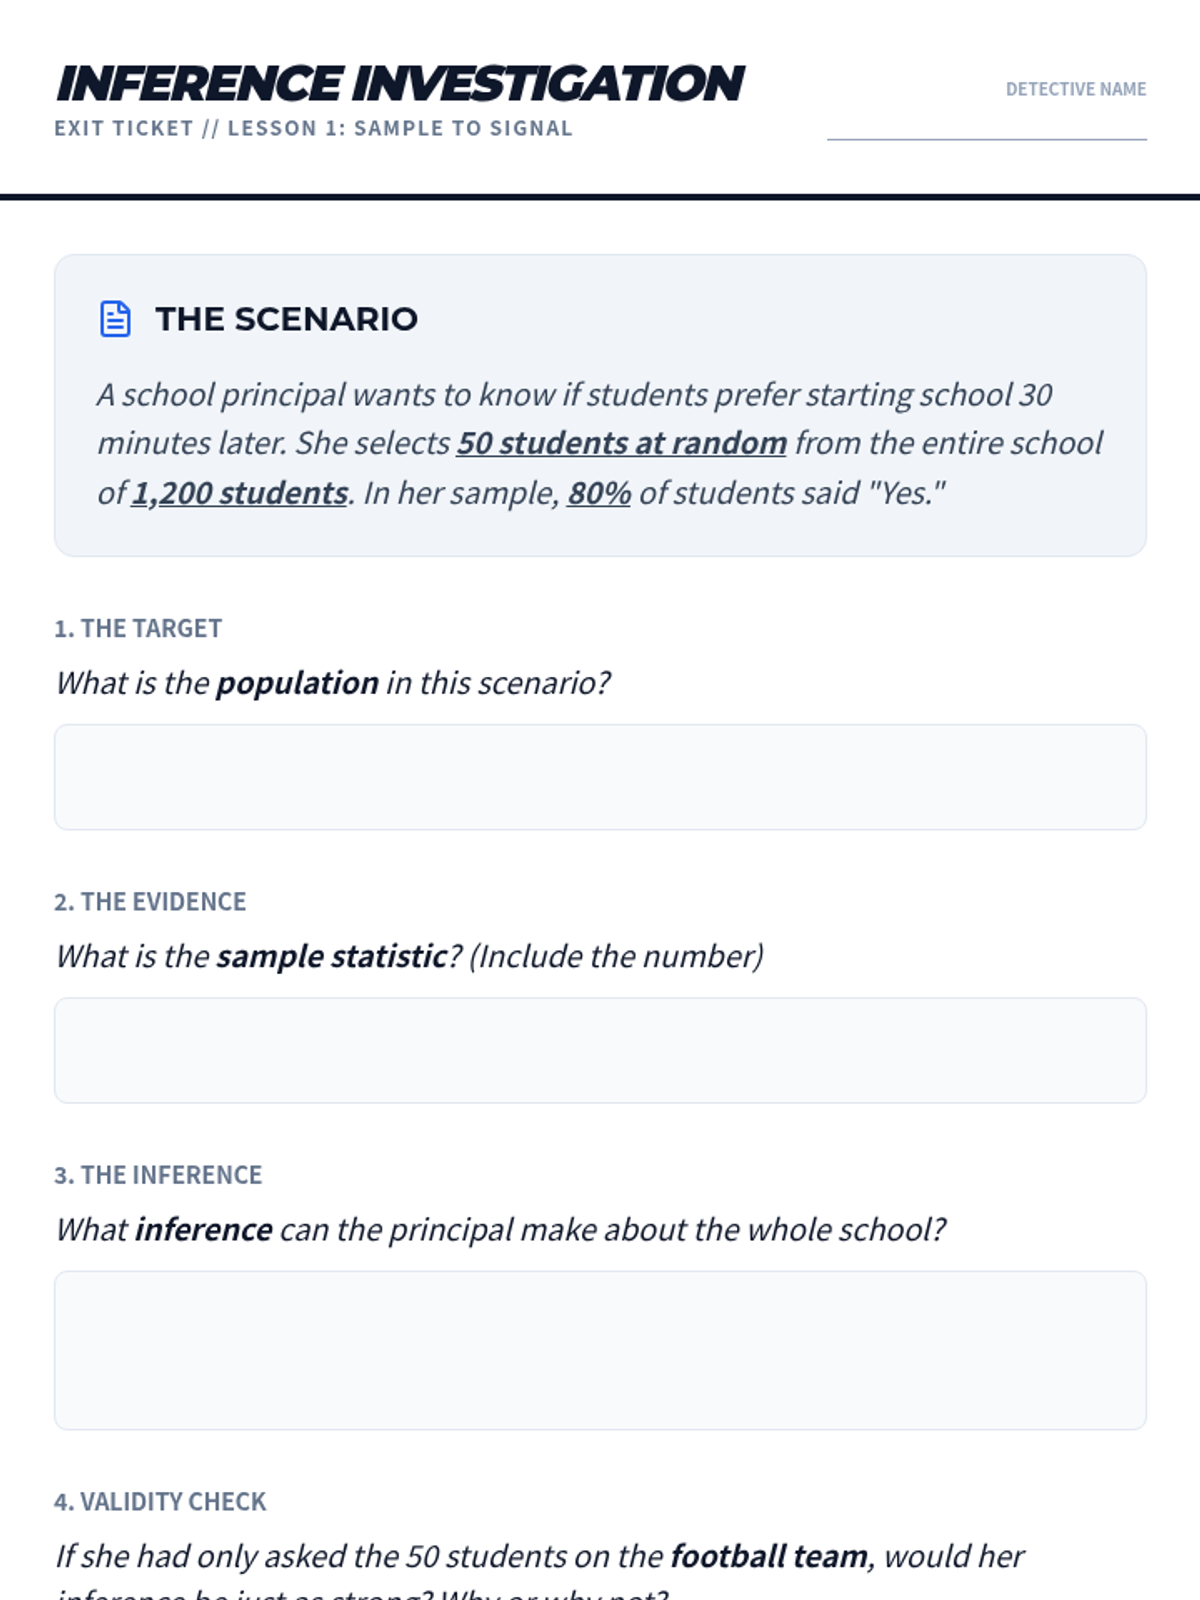
A quick progress monitoring tool to assess student understanding of population, sample, and inference in a school-based scenario.
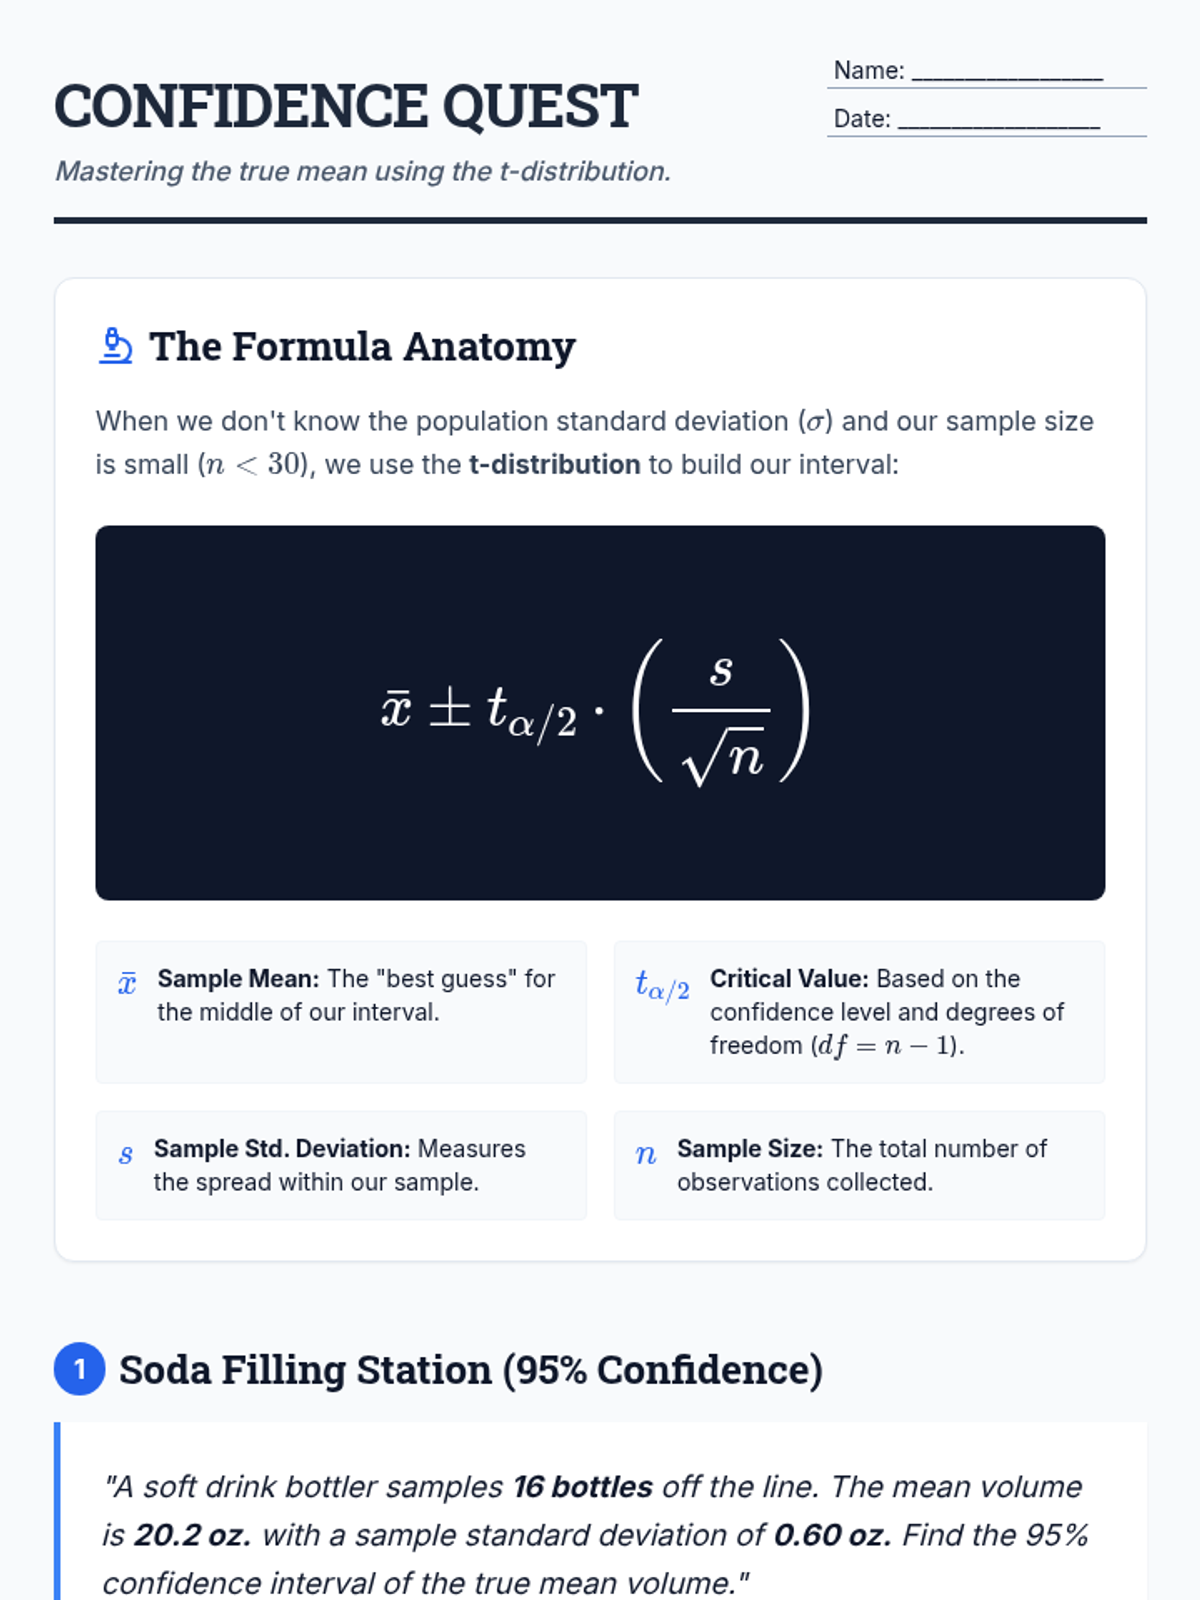
A detailed instructional handout featuring two statistics problems similar to the provided sample. It includes a formula breakdown and step-by-step walkthroughs for calculating 95% and 99% confidence intervals using the t-distribution.
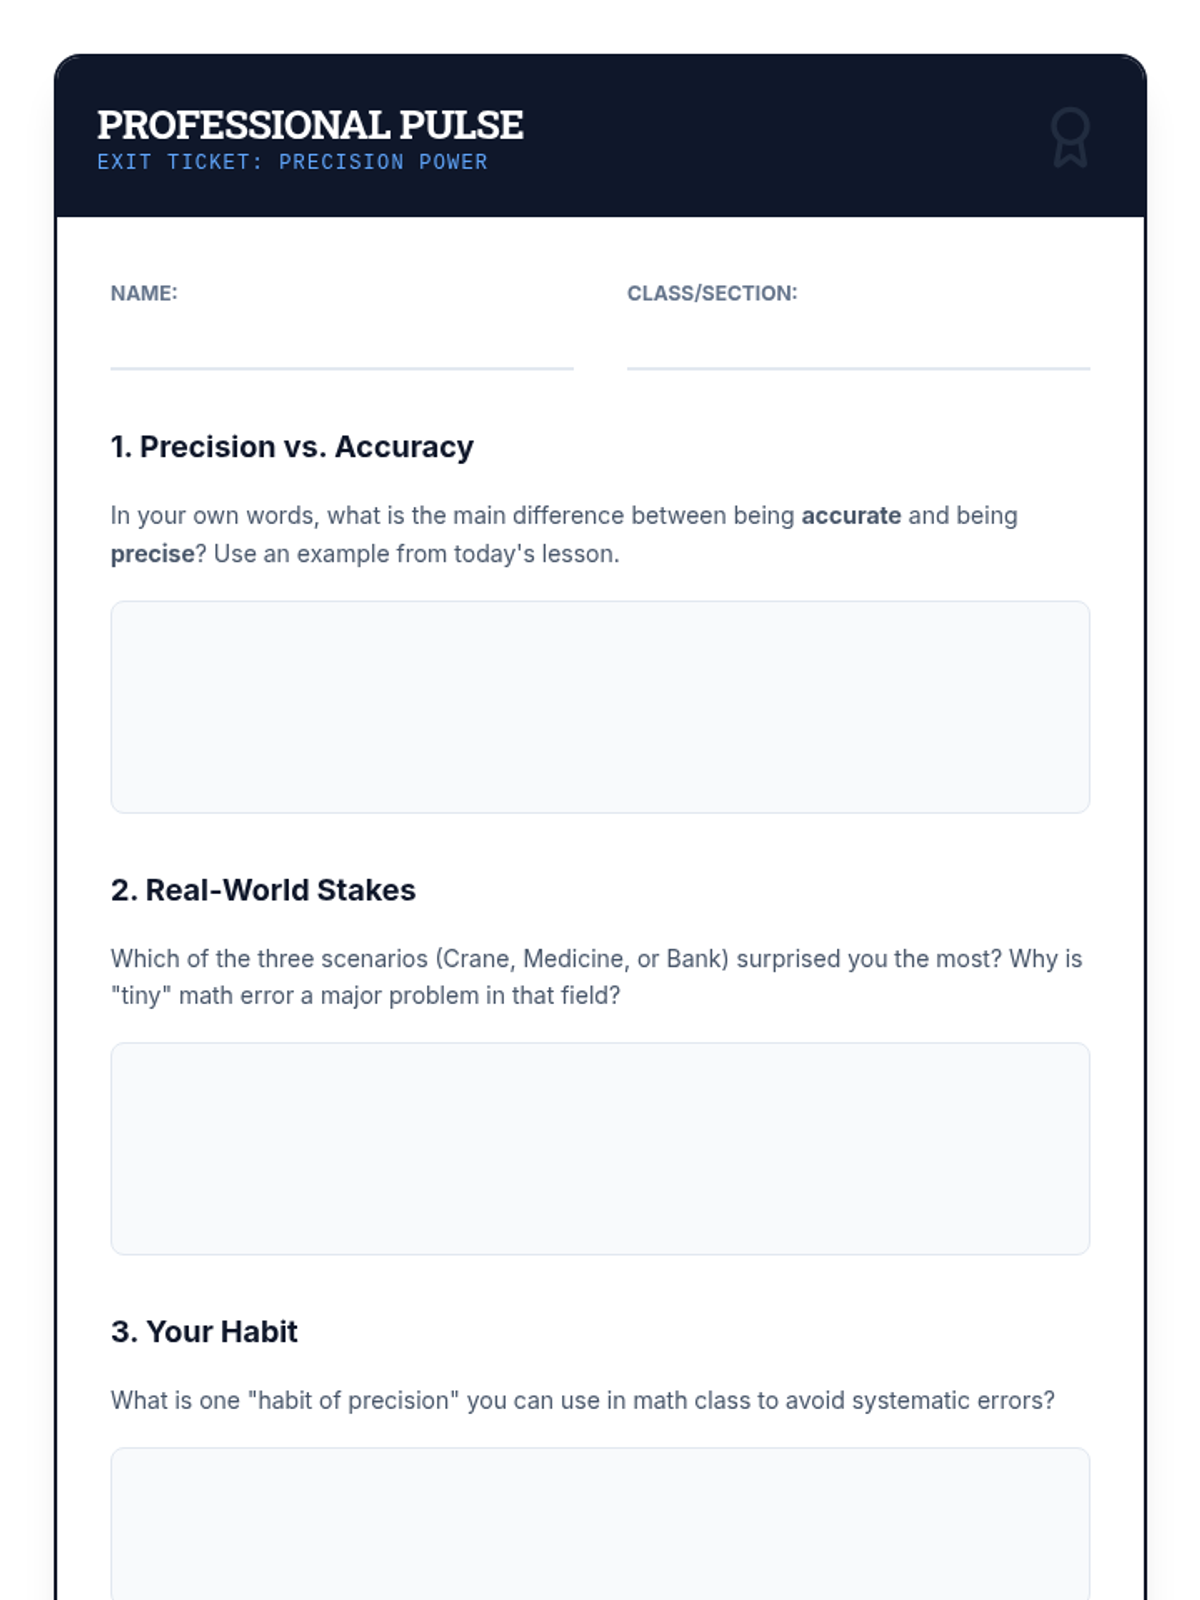
An updated exit ticket for 10th-grade students to reflect on precision, accuracy, and the real-world consequences of mathematical errors.
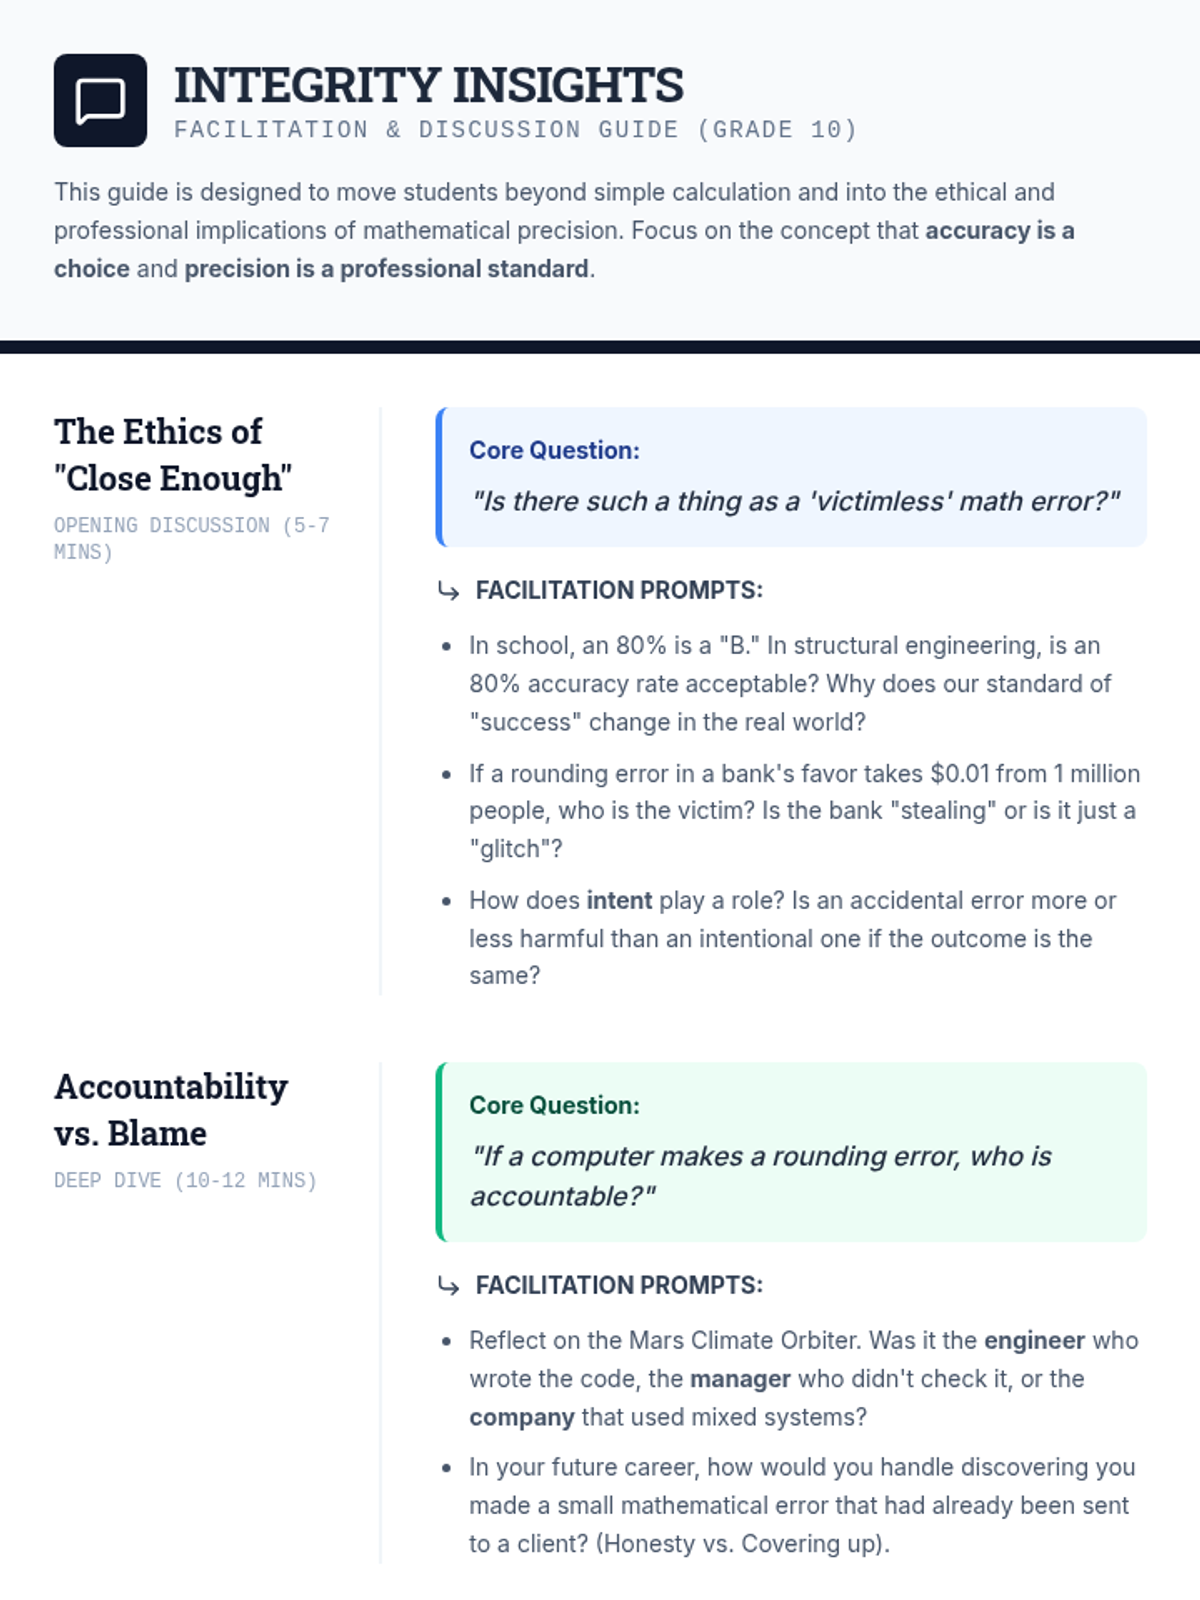
A teacher's discussion guide focusing on the ethical, legal, and professional implications of mathematical precision. Includes high-level questioning prompts and facilitation strategies for 10th-grade seminars.
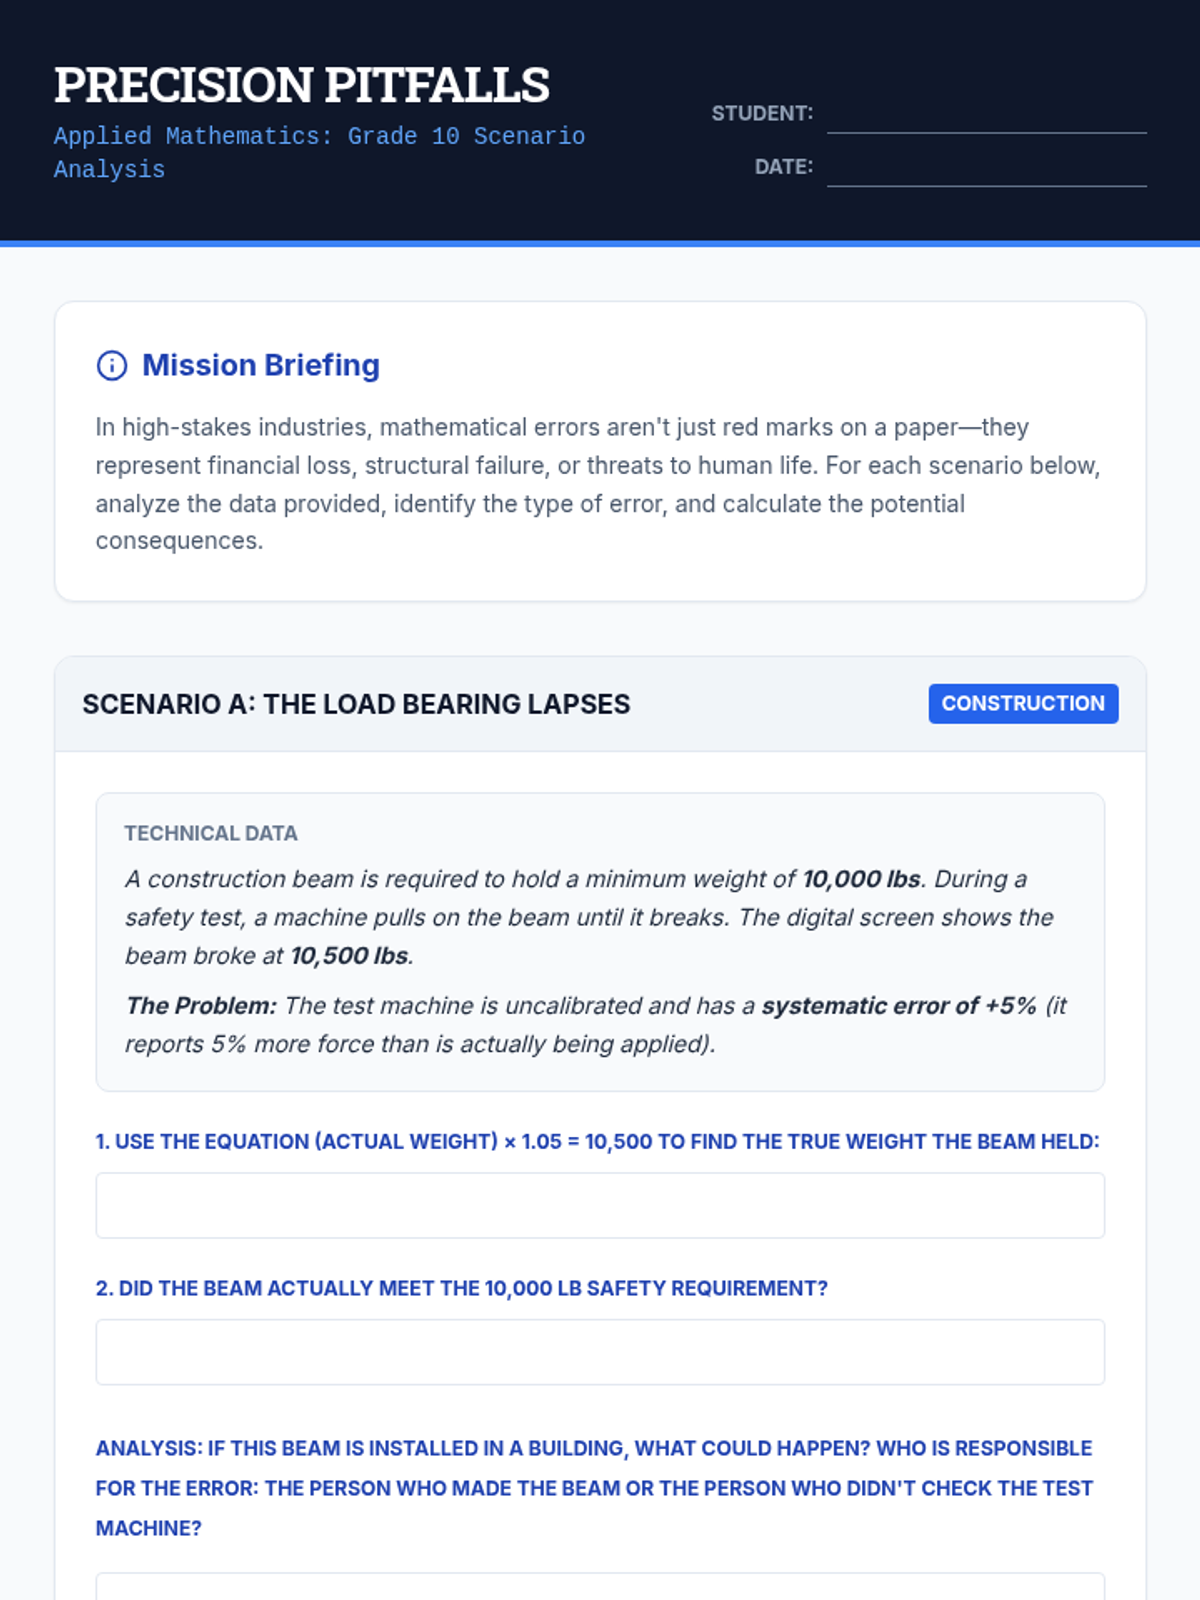
A student handout featuring three real-world case studies in construction, healthcare, and finance updated for a Grade 10 math level. Students must perform error analysis, calculate consequences, and debate accountability.
An updated slide deck for 10th-grade students exploring precision, accuracy, and systematic error. Features the Mars Climate Orbiter case study and references the simplified handout scenarios.
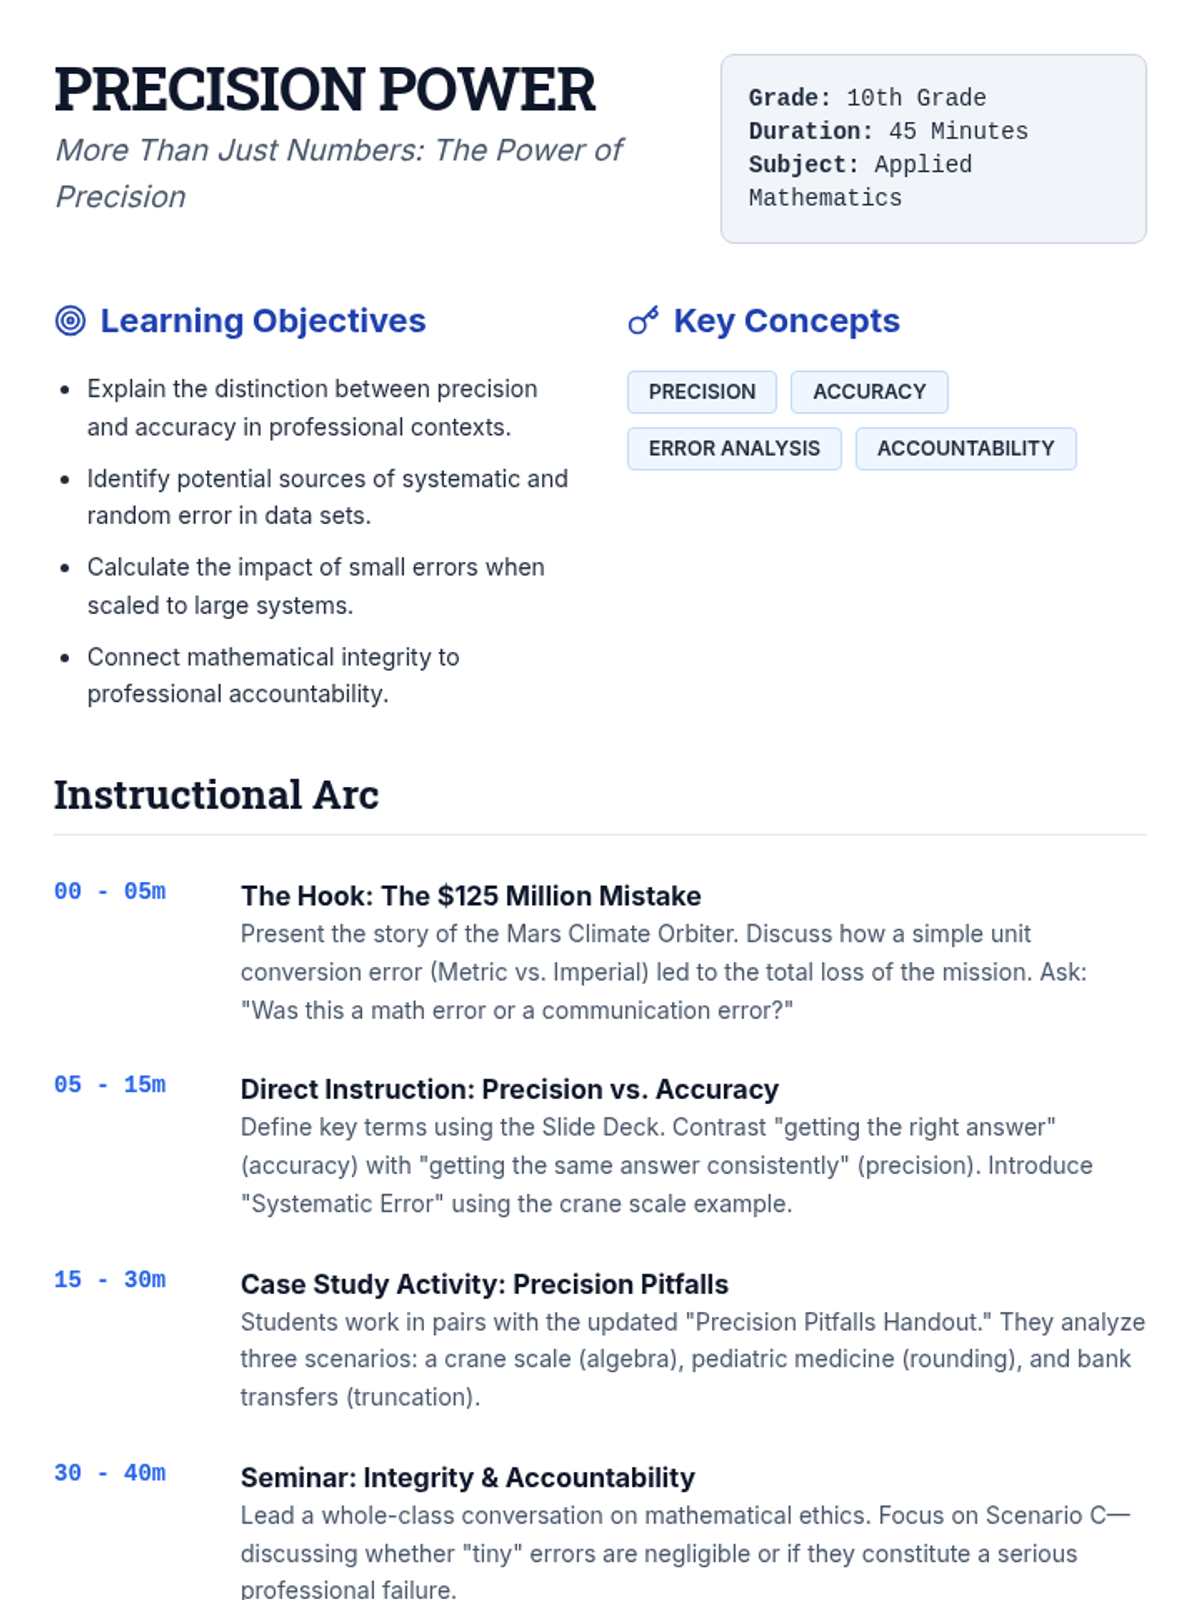
An updated lesson plan for 10th-grade students focusing on the real-world applications of mathematical precision and accuracy. Features refined learning objectives and instructional tips for high-school level math.
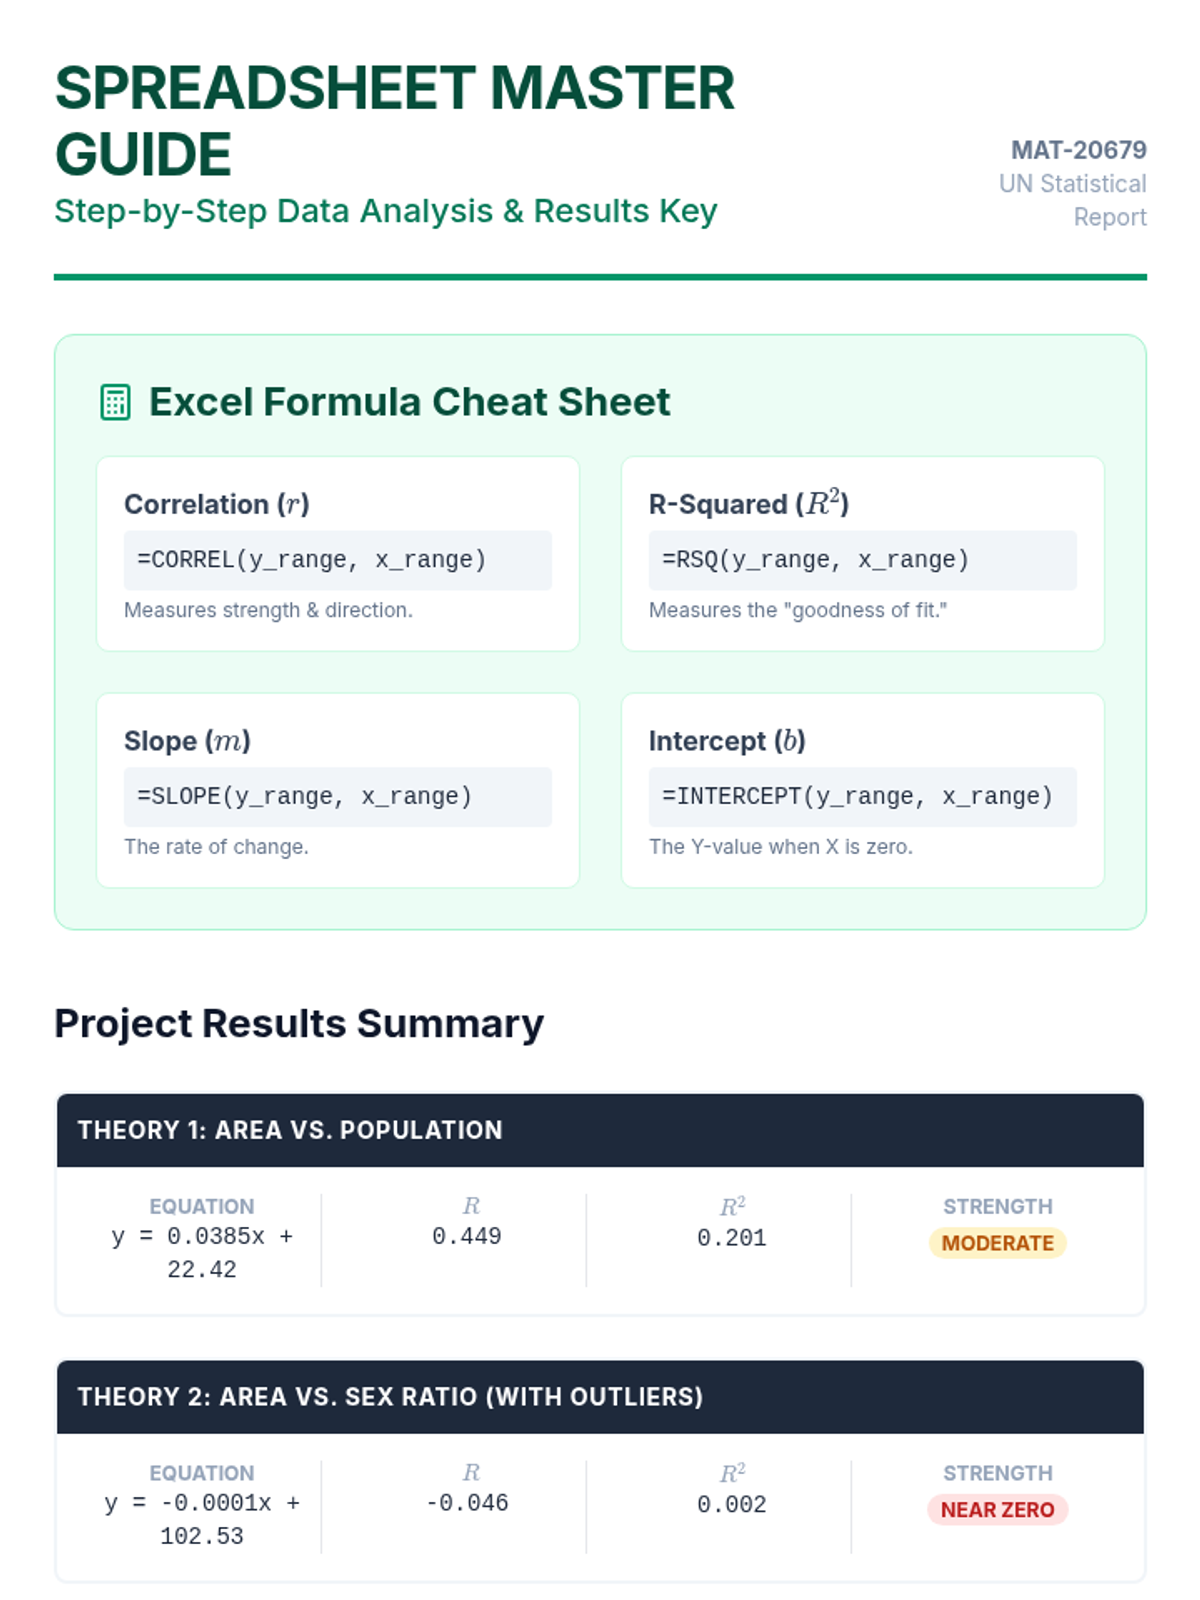
A technical guide for the spreadsheet component of the regression project, detailing Excel formulas and providing the actual calculated results for the UN population data set.
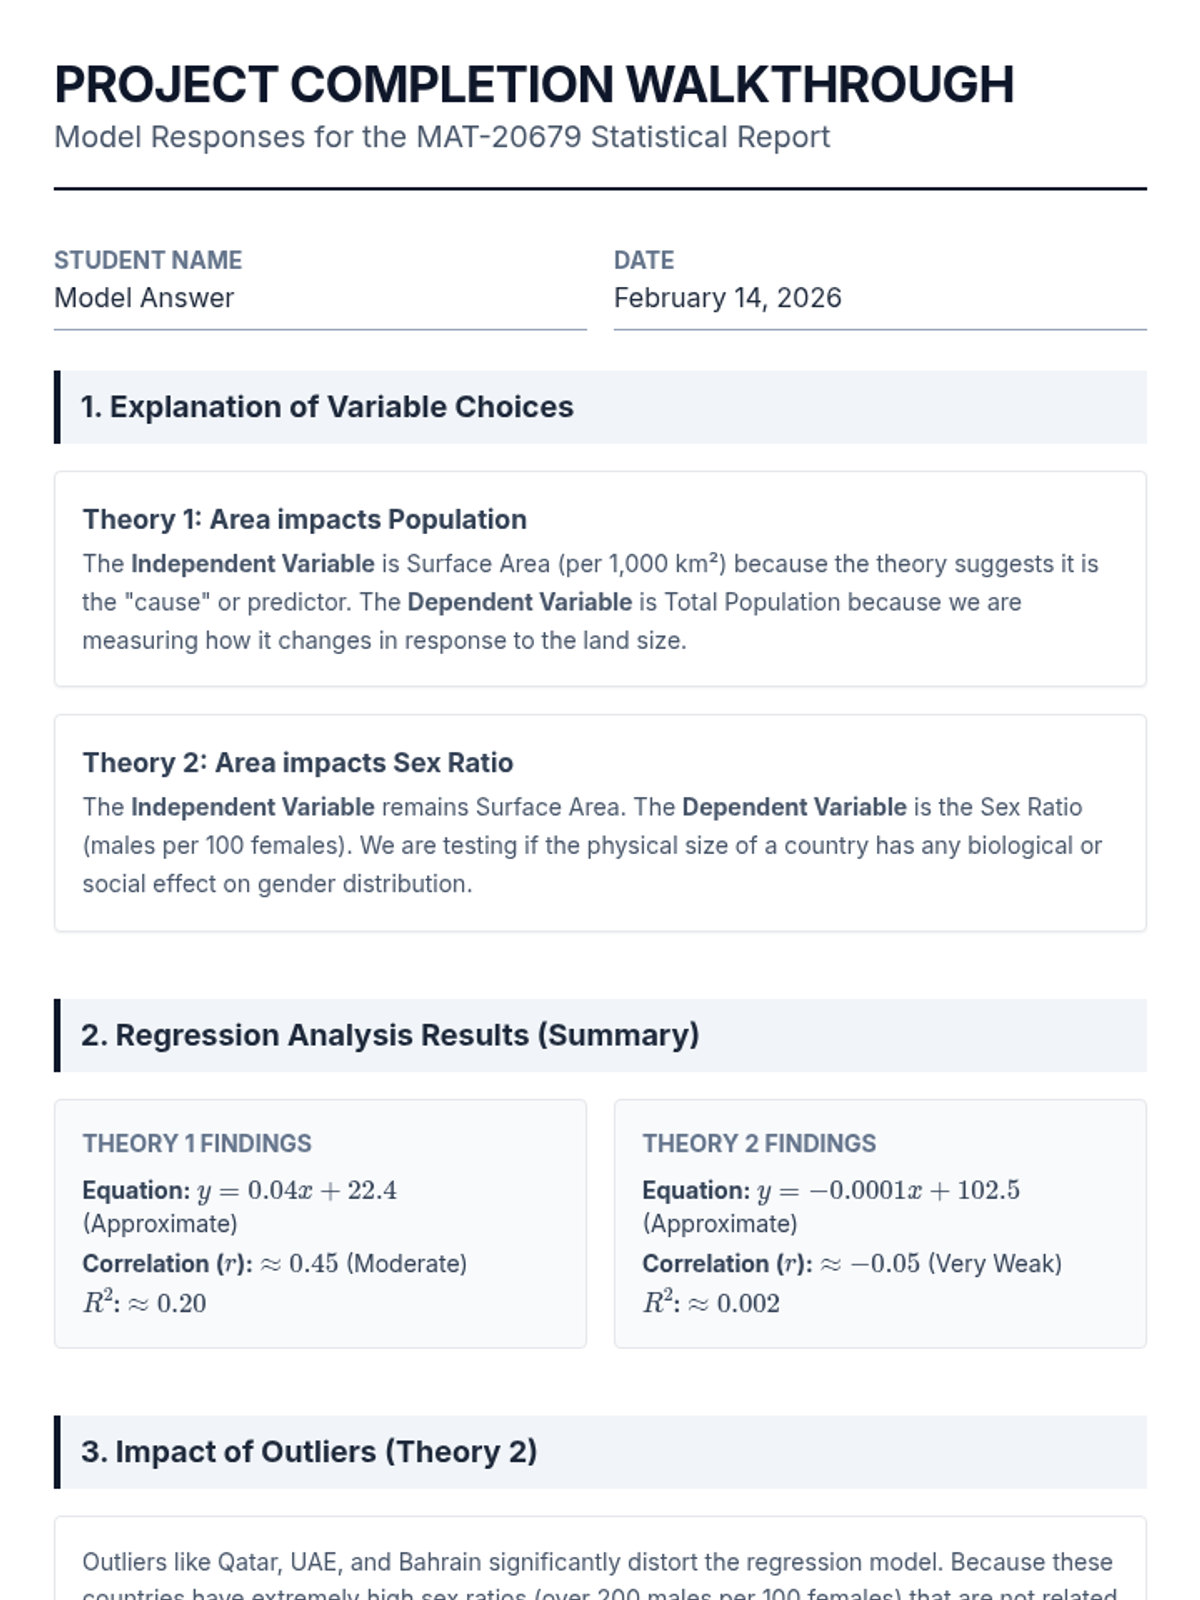
A detailed walkthrough for completing the MAT-20679 Statistical Report project, providing model answers for variable selection, outlier analysis, and interpretation of regression results.
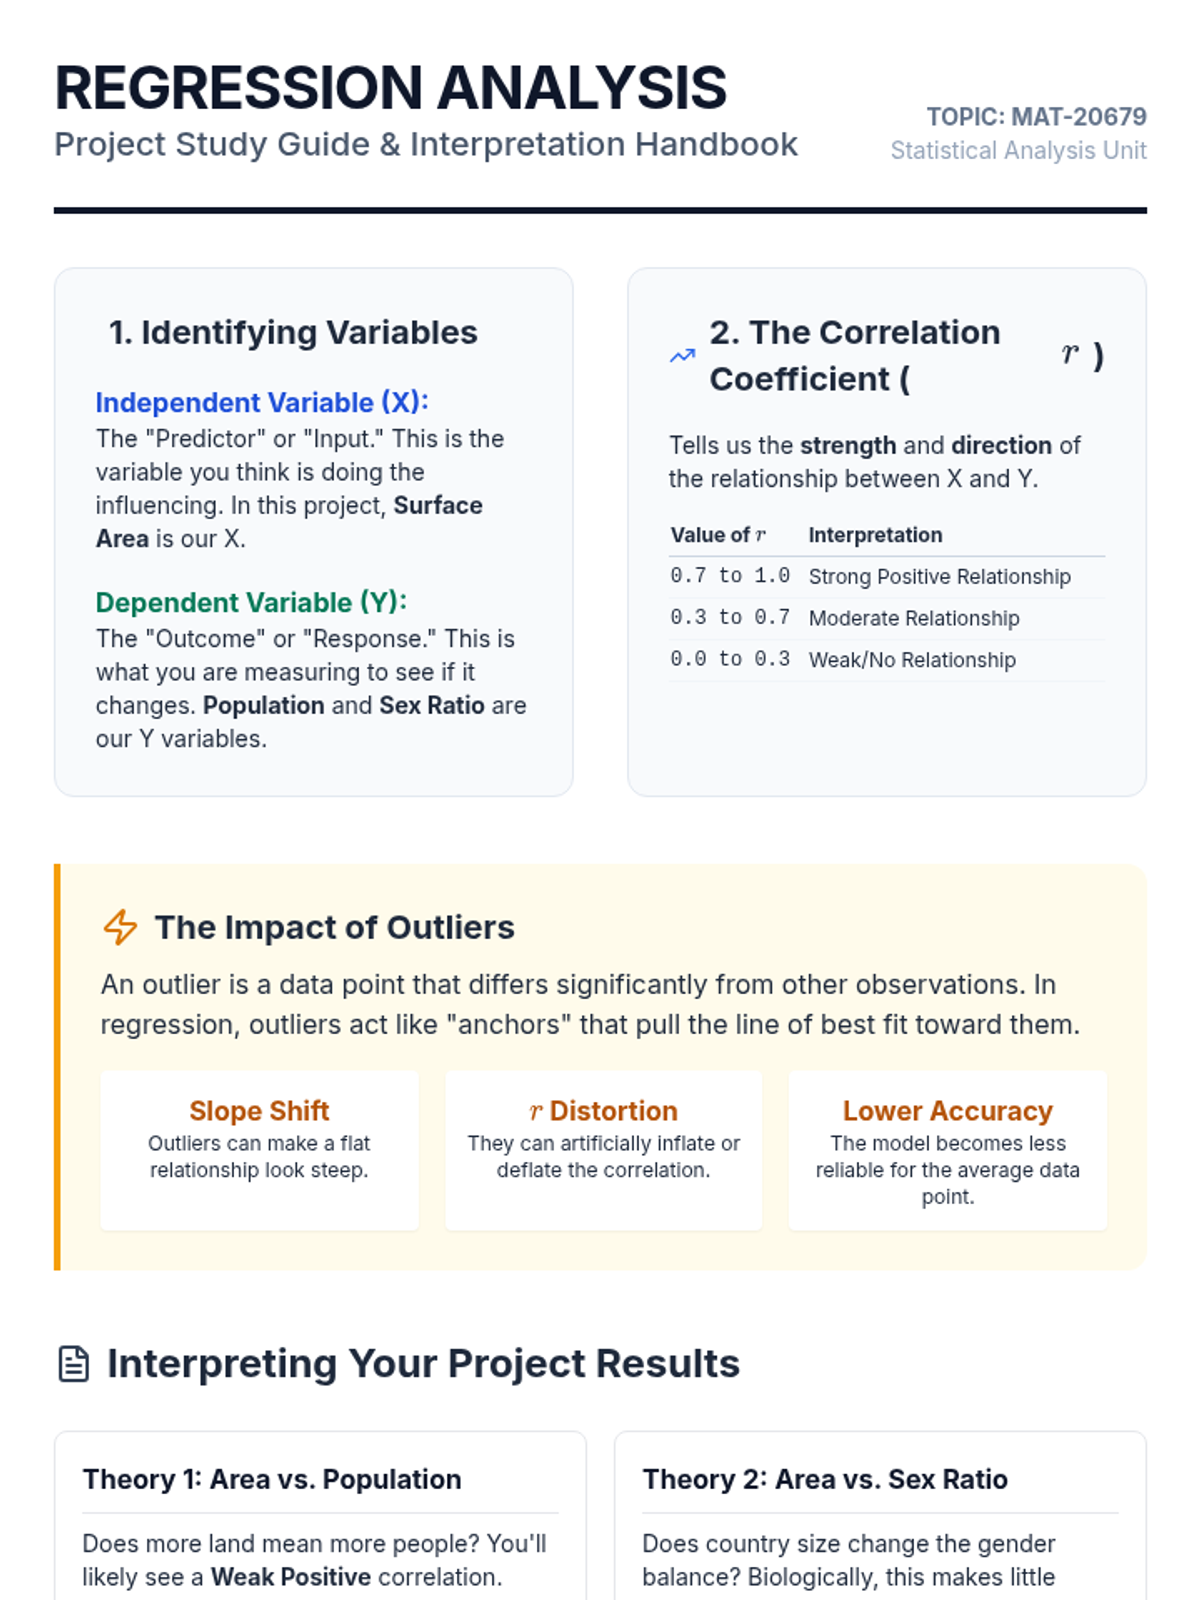
A professional study guide for a regression analysis project, explaining key concepts like independent/dependent variables, correlation coefficients, and the impact of outliers on statistical models.
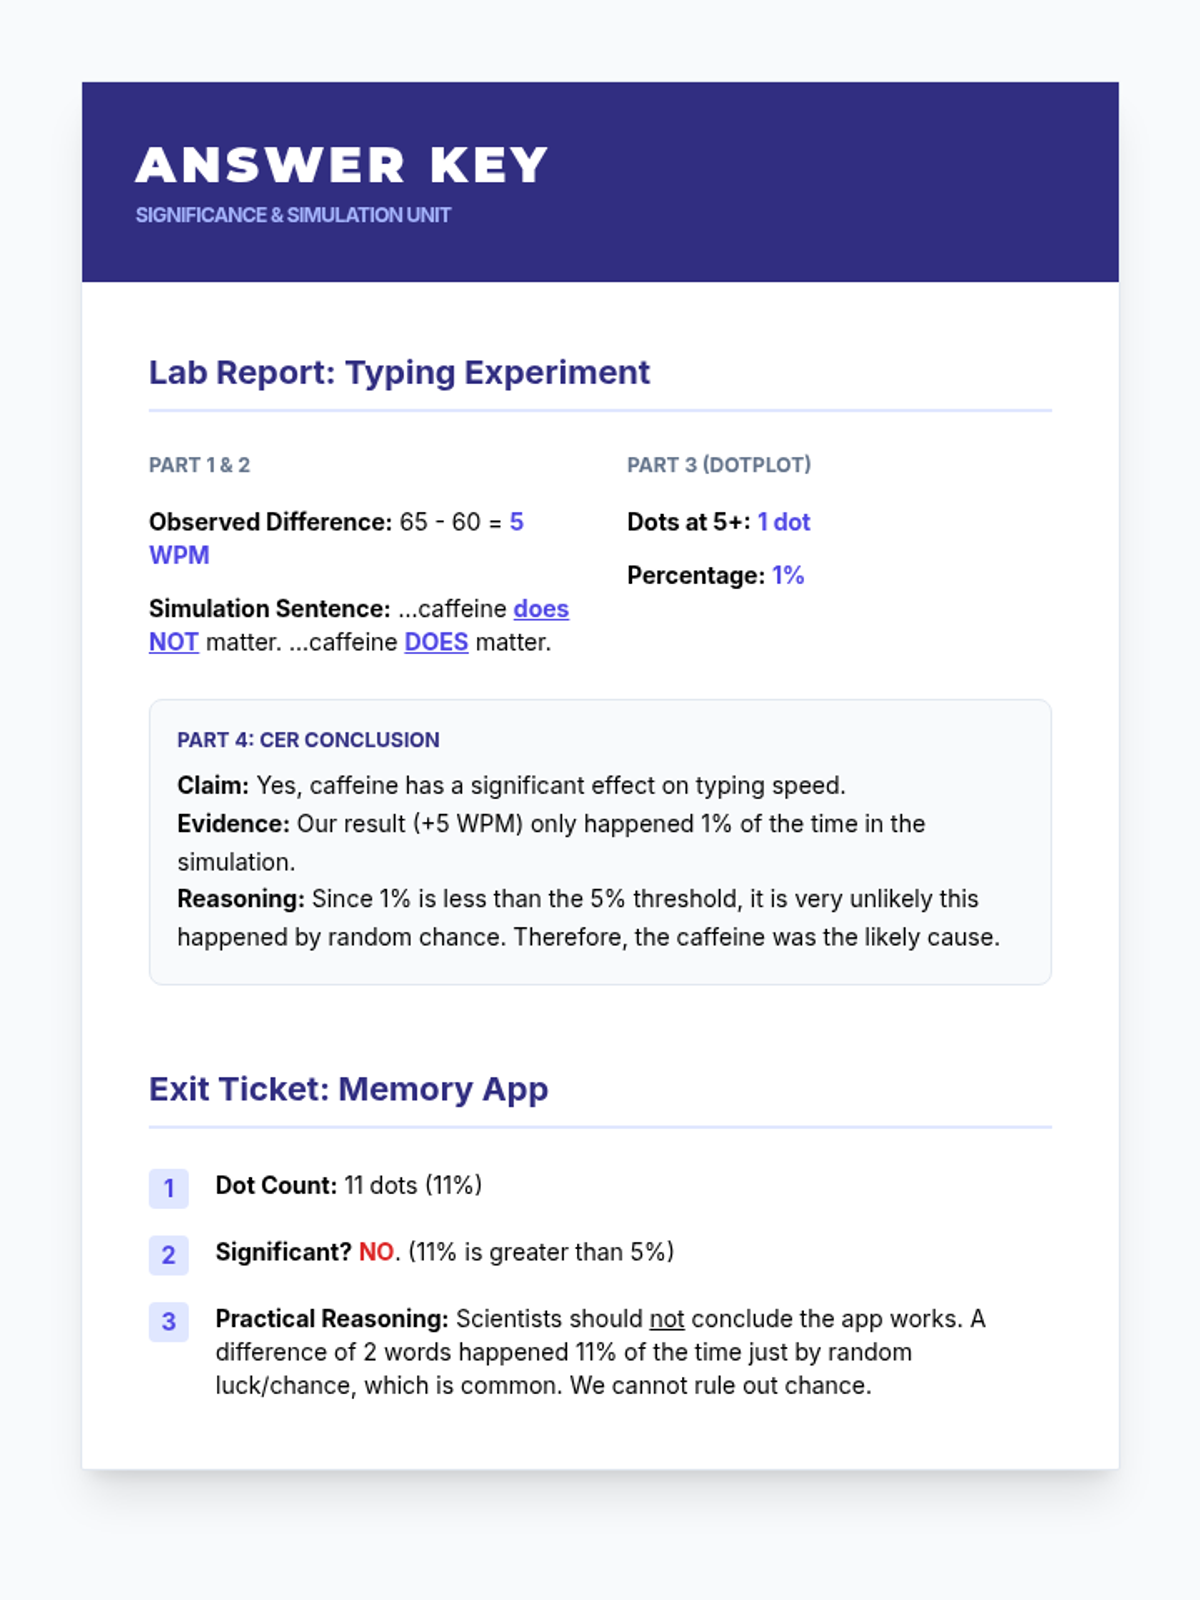
Answer key for the Lab Report and Exit Ticket, providing model responses for calculations, data analysis, and CER conclusions.
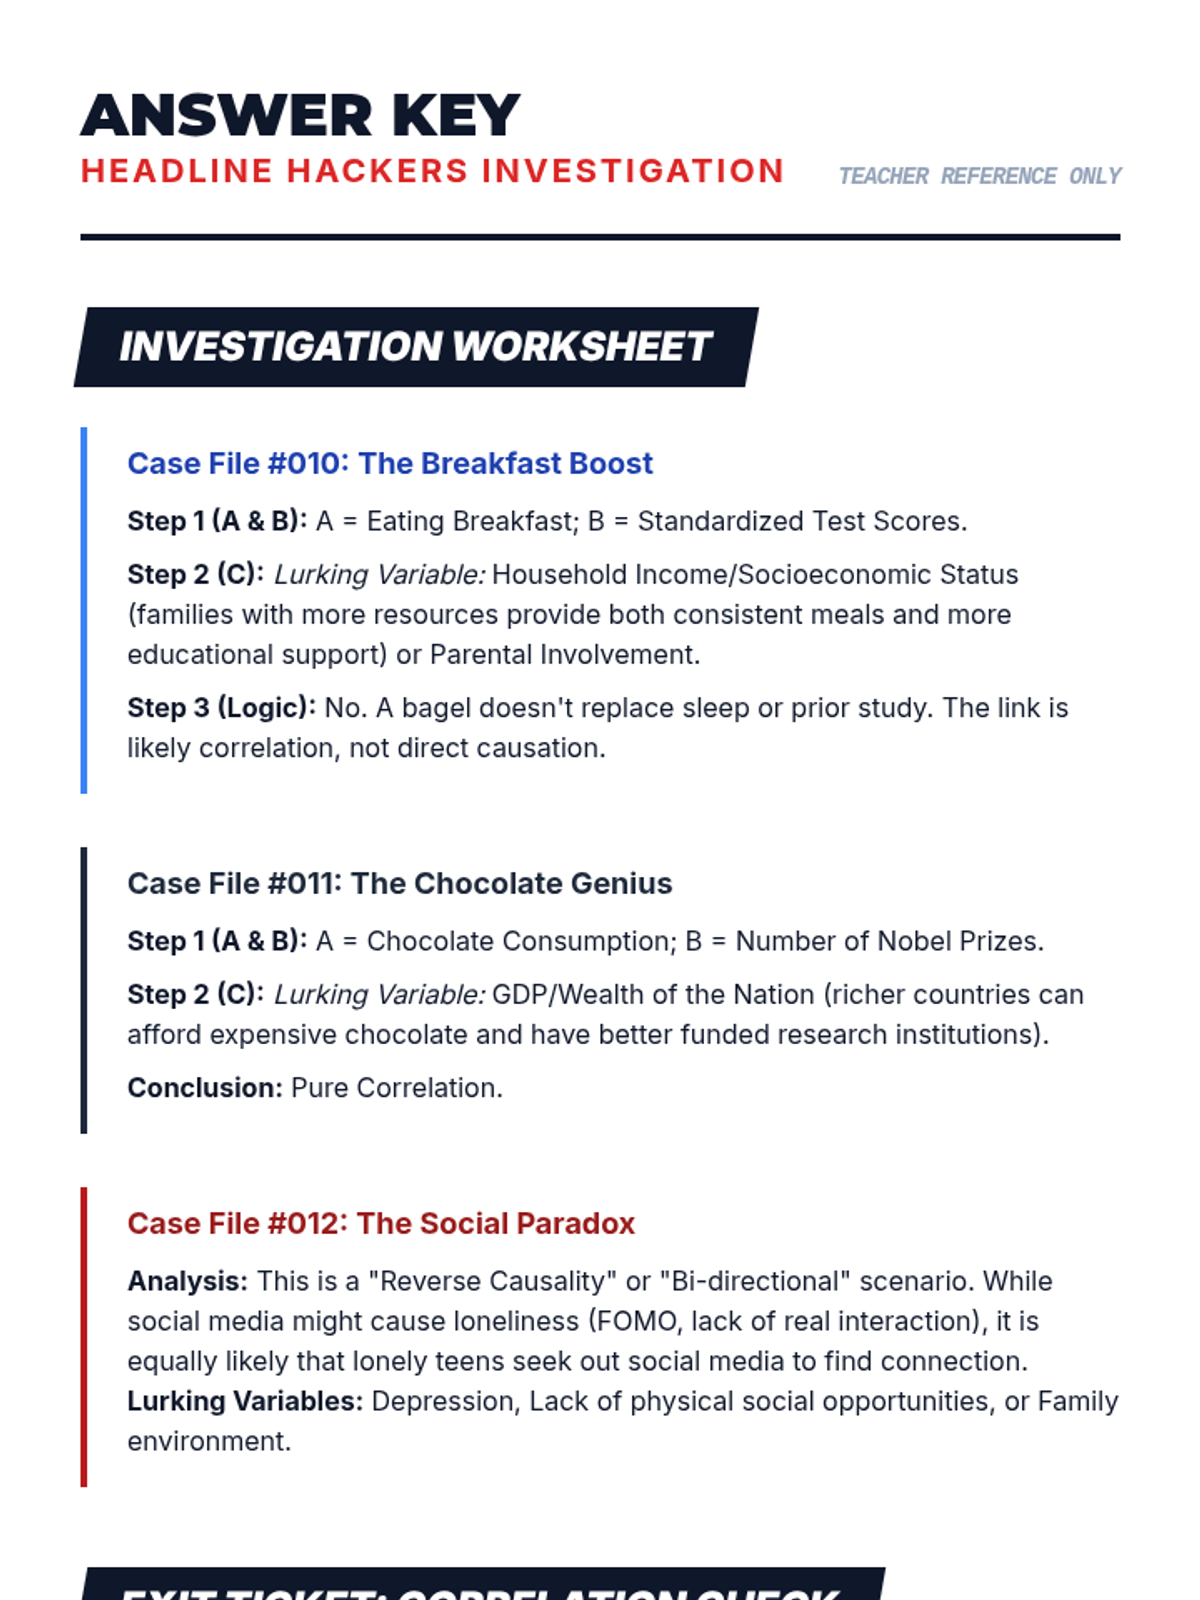
A comprehensive answer key for the Headline Hackers lesson, including expected lurking variables and analytical explanations for all case studies and the exit ticket.
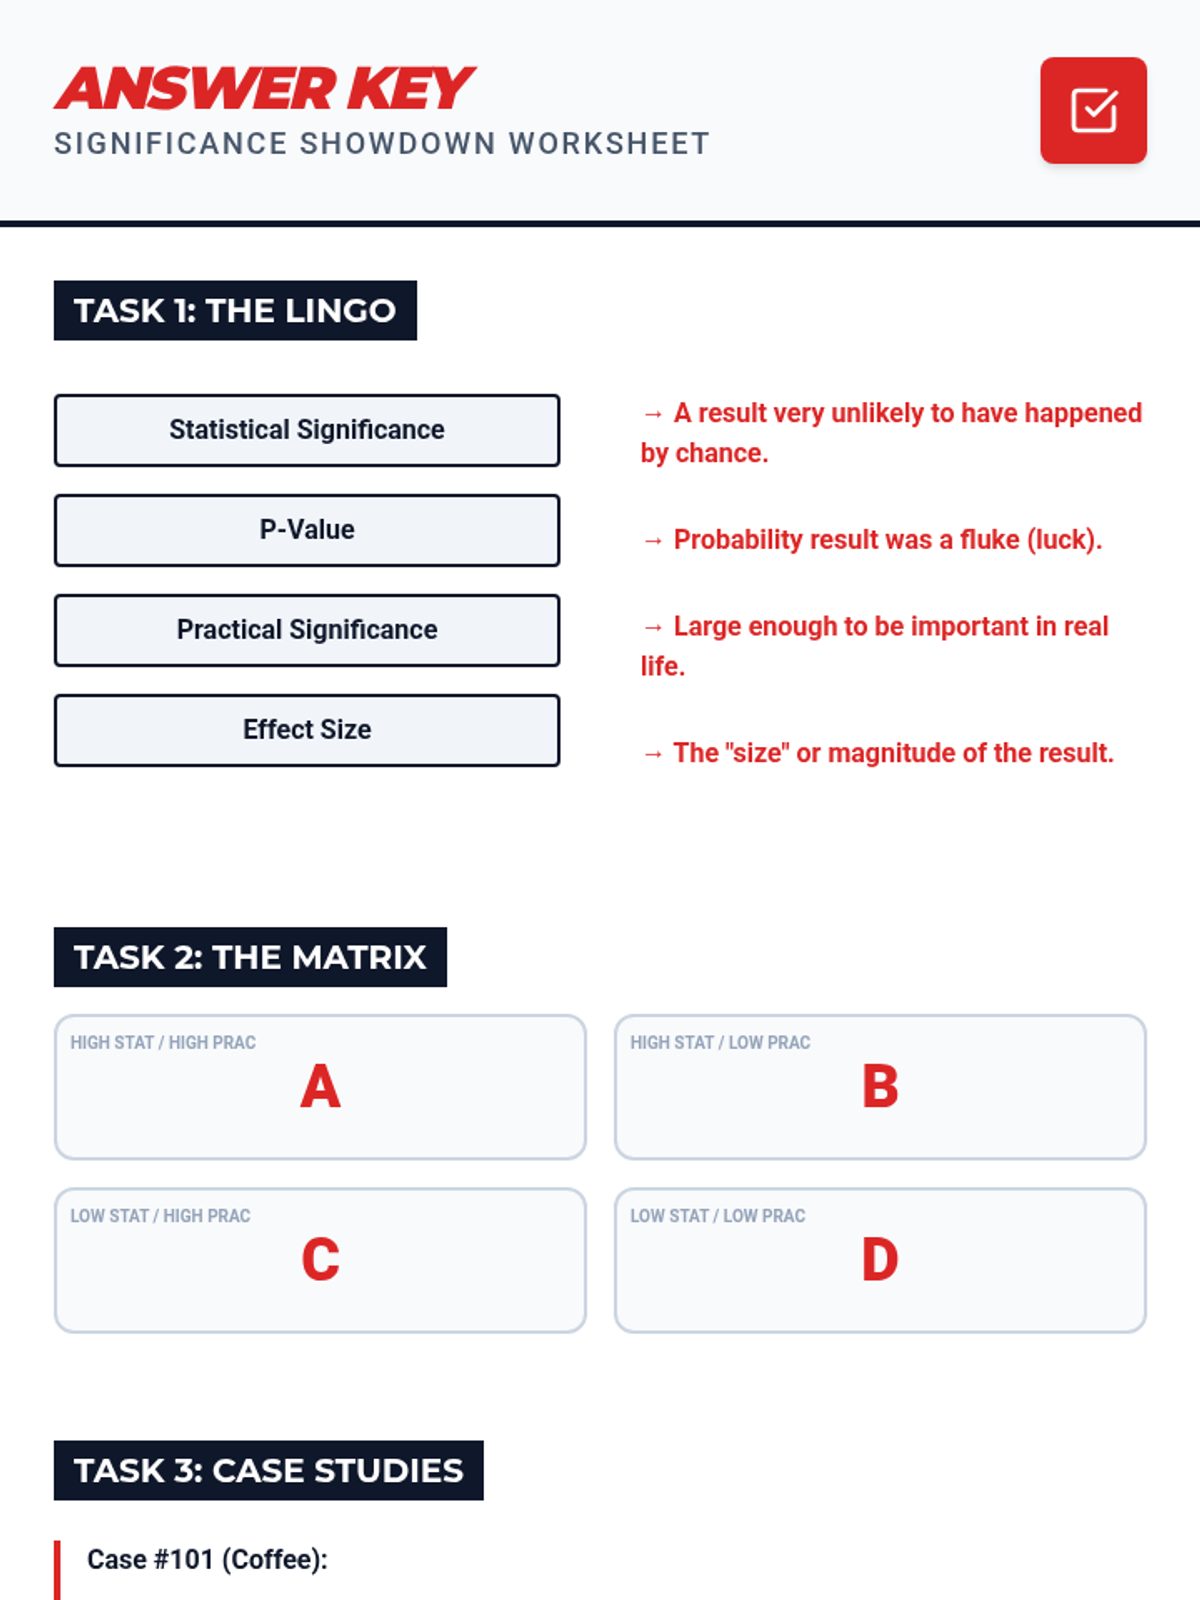
The teacher's answer key for the Significance Showdown Worksheet, providing correct p-value analysis, matrix classification, and case study evaluations.
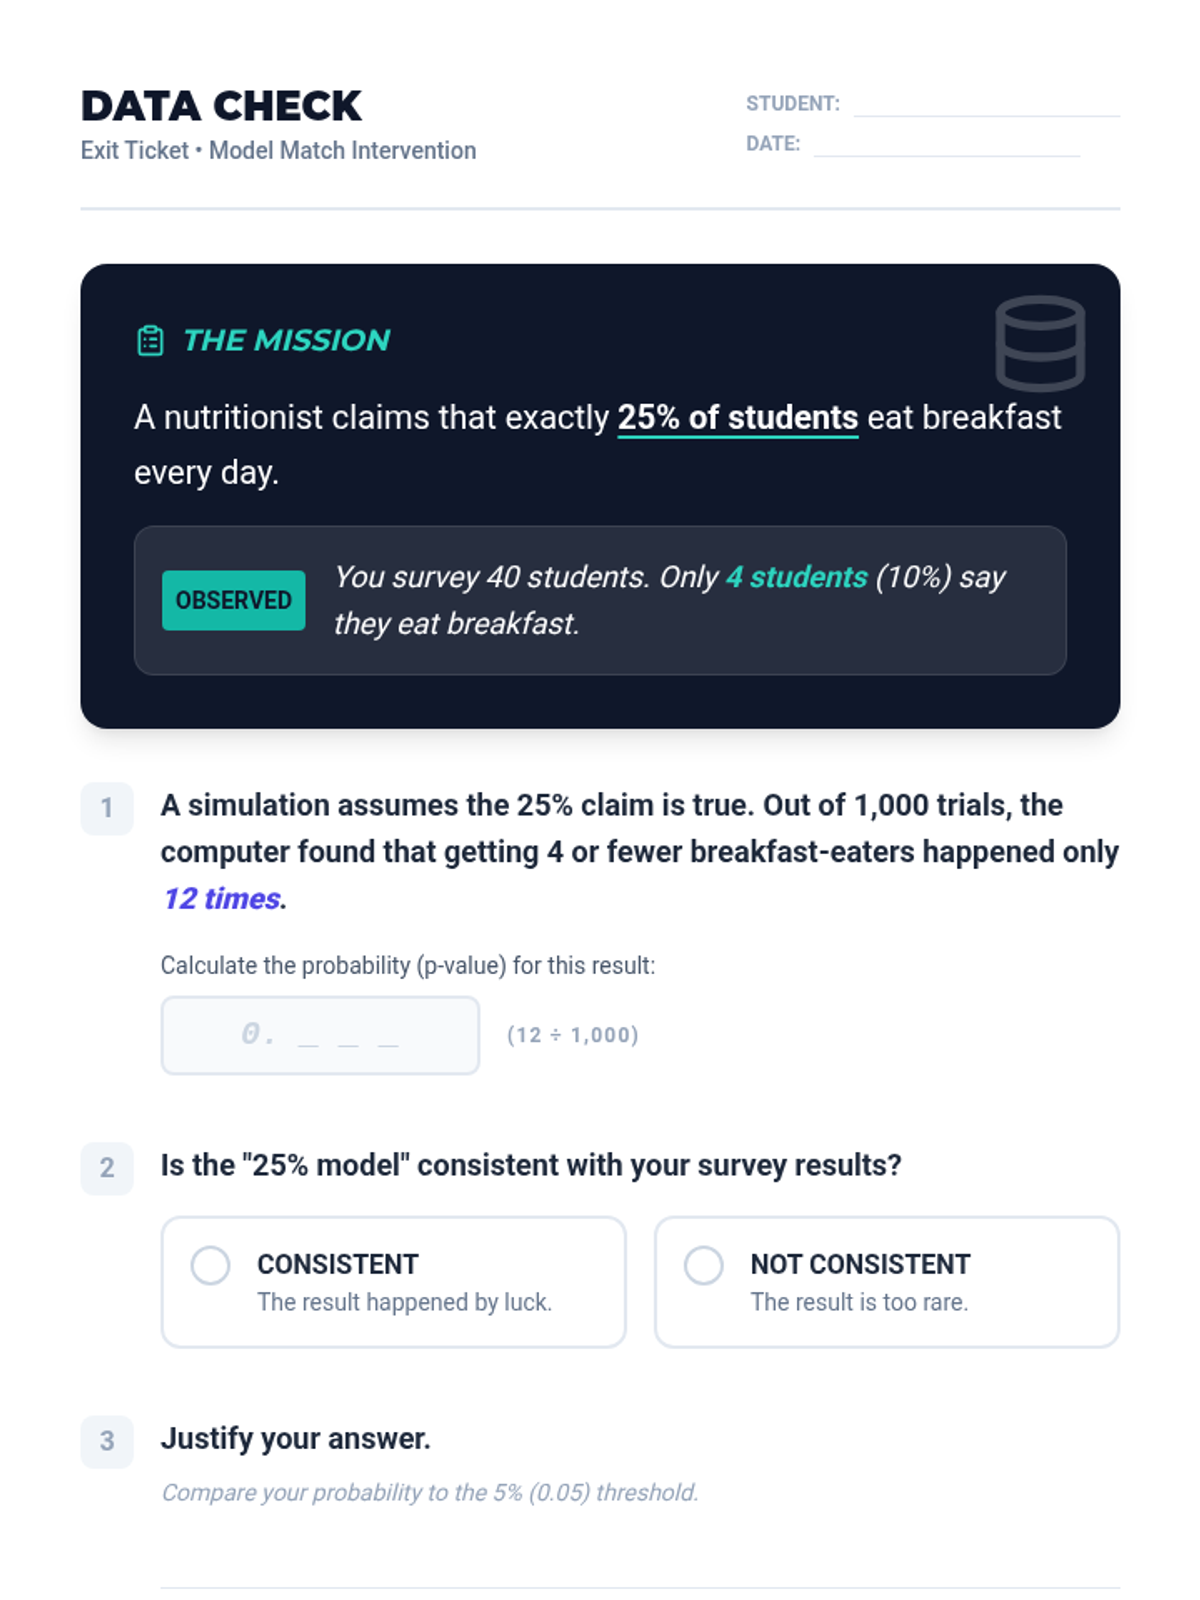
A quick progress monitoring assessment for a Tier 2 intervention. It asks students to calculate a probability from simulated results, determine model consistency, and justify their reasoning using a standard 5% threshold.
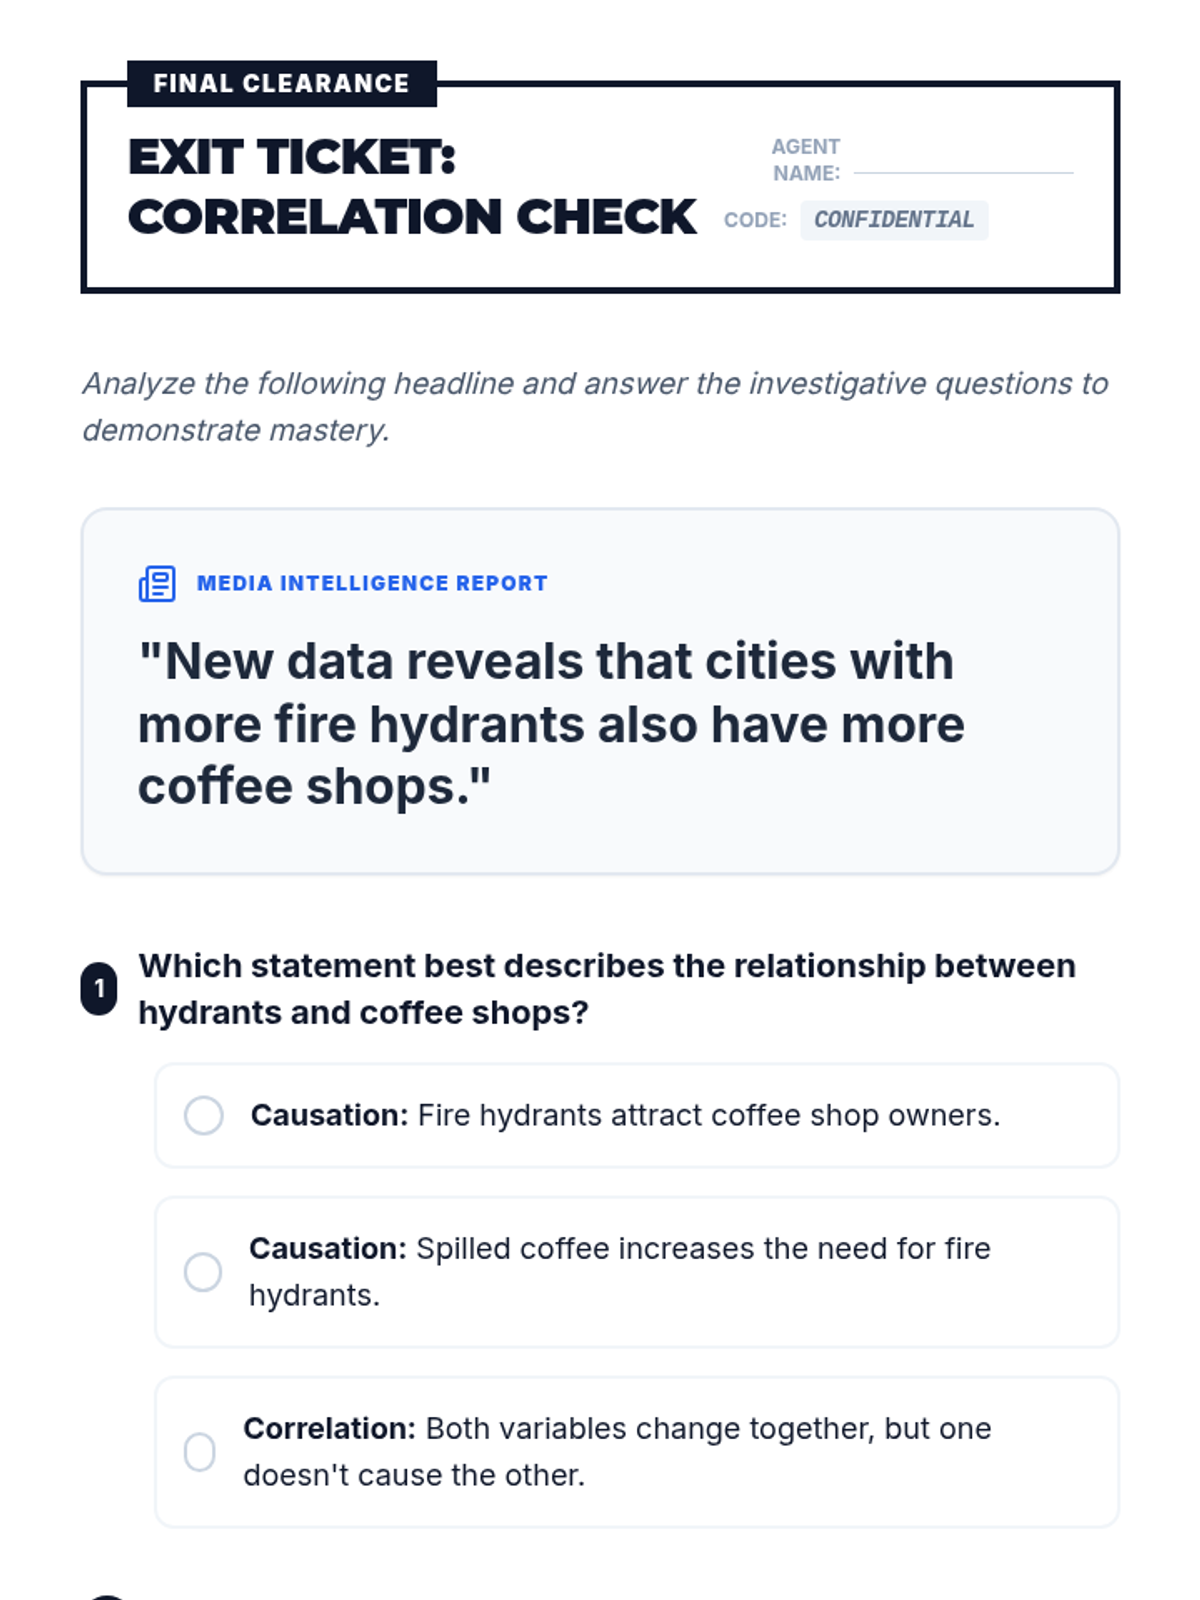
A short progress monitoring assessment (exit ticket) for students to independently identify correlation and lurking variables in a new real-world scenario.
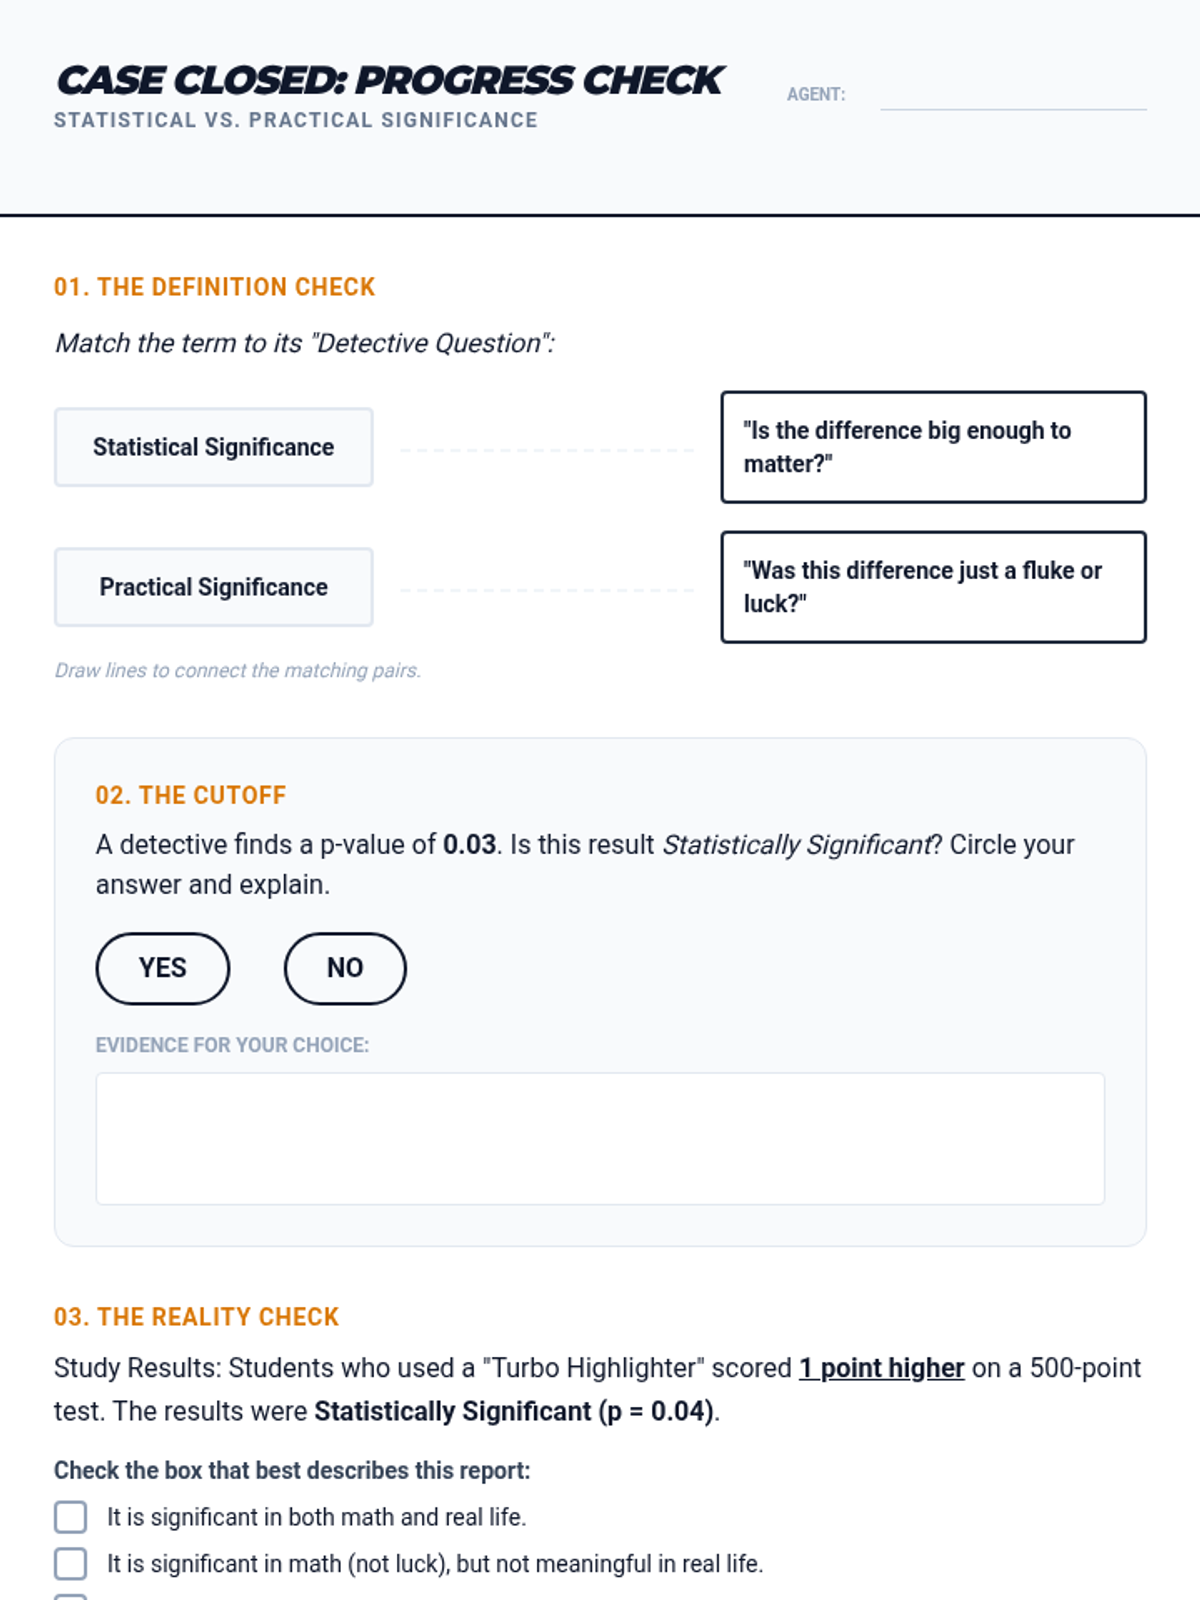
A progress monitoring exit ticket to assess student understanding of p-values and effect sizes. Includes a vocabulary match, a p-value evaluation, and a scenario-based practical significance question.
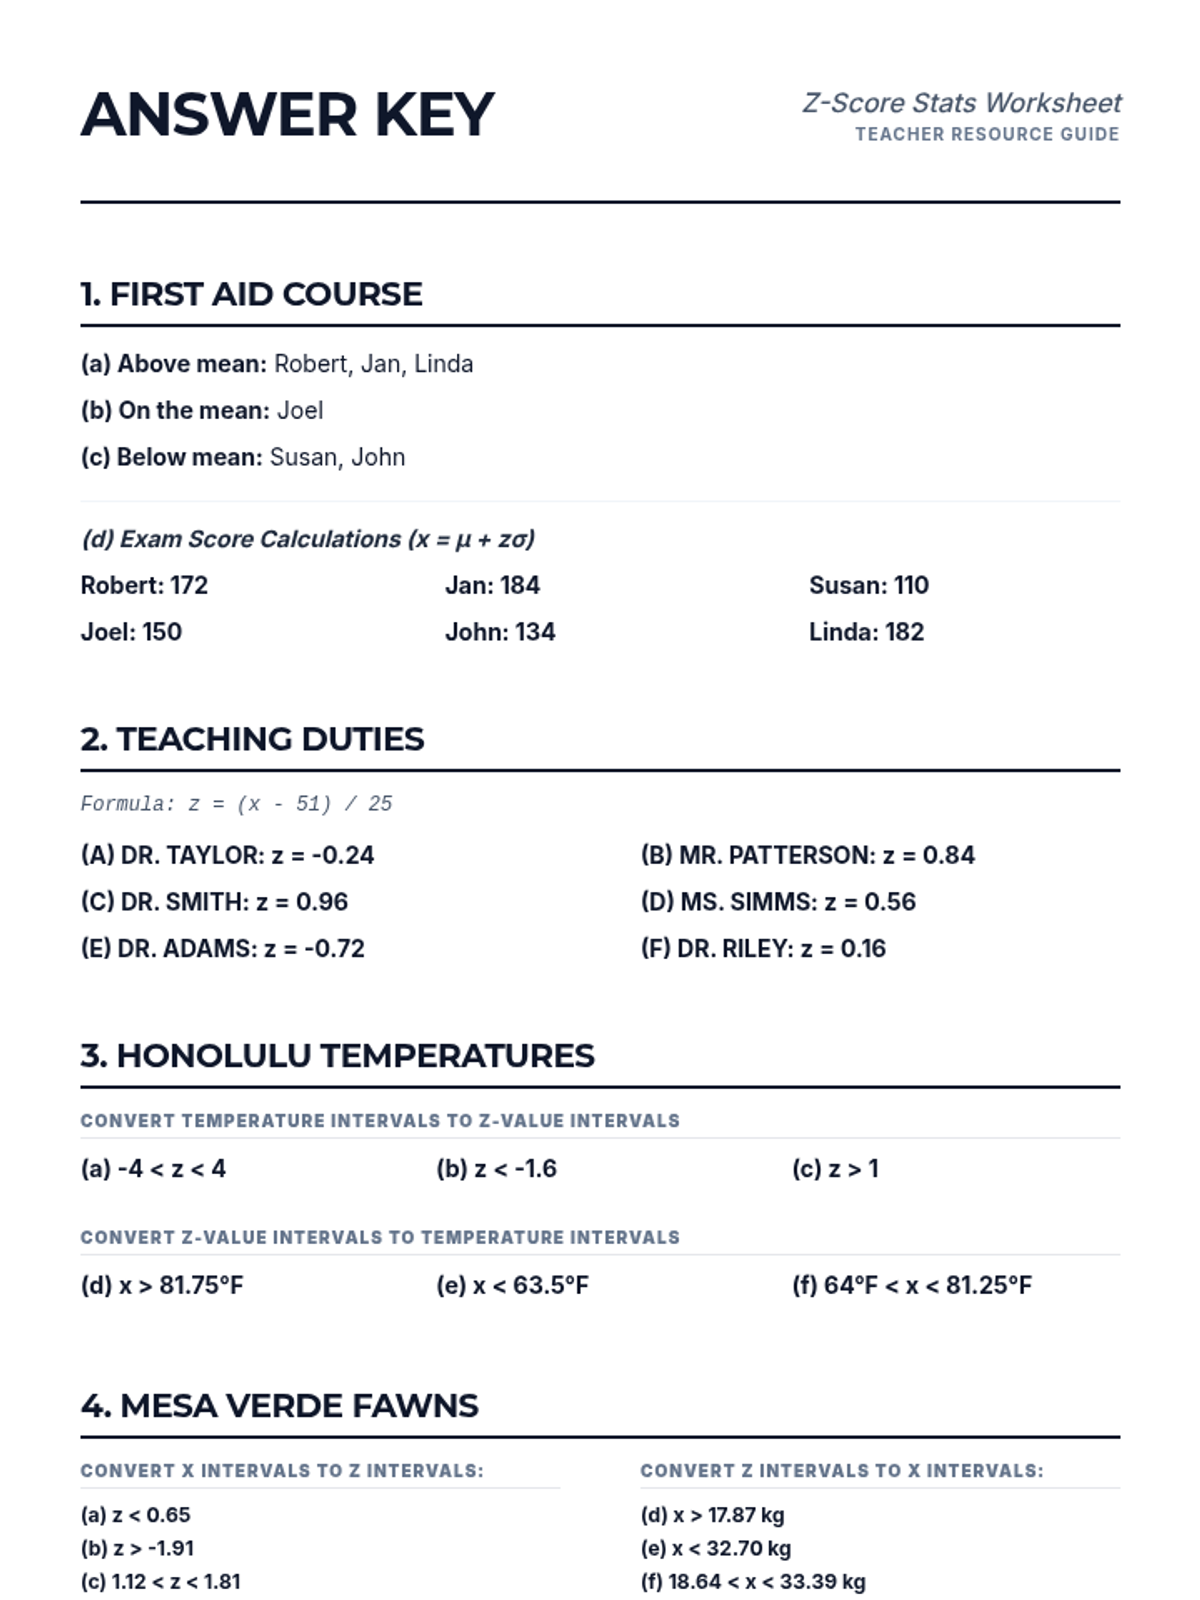
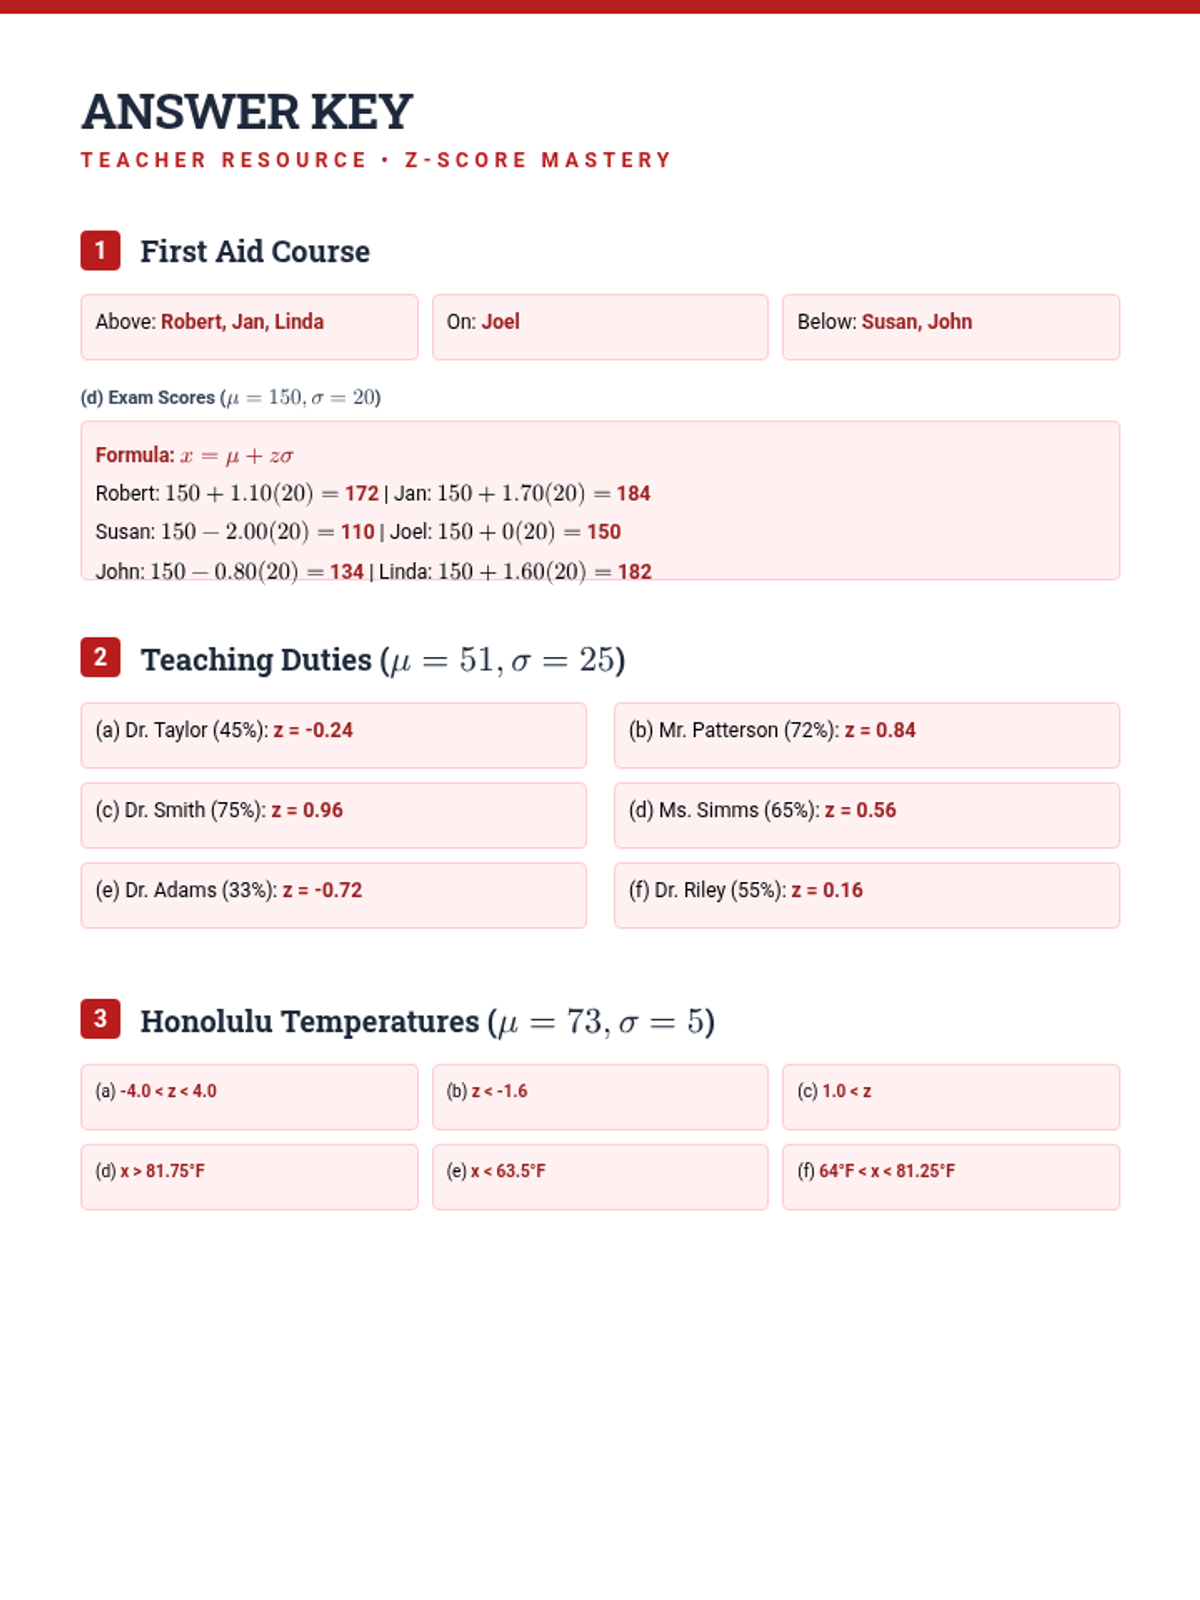
Teacher answer key for the Z-Score Mastery Worksheet, providing solutions and brief explanations for all calculation and conceptual problems.
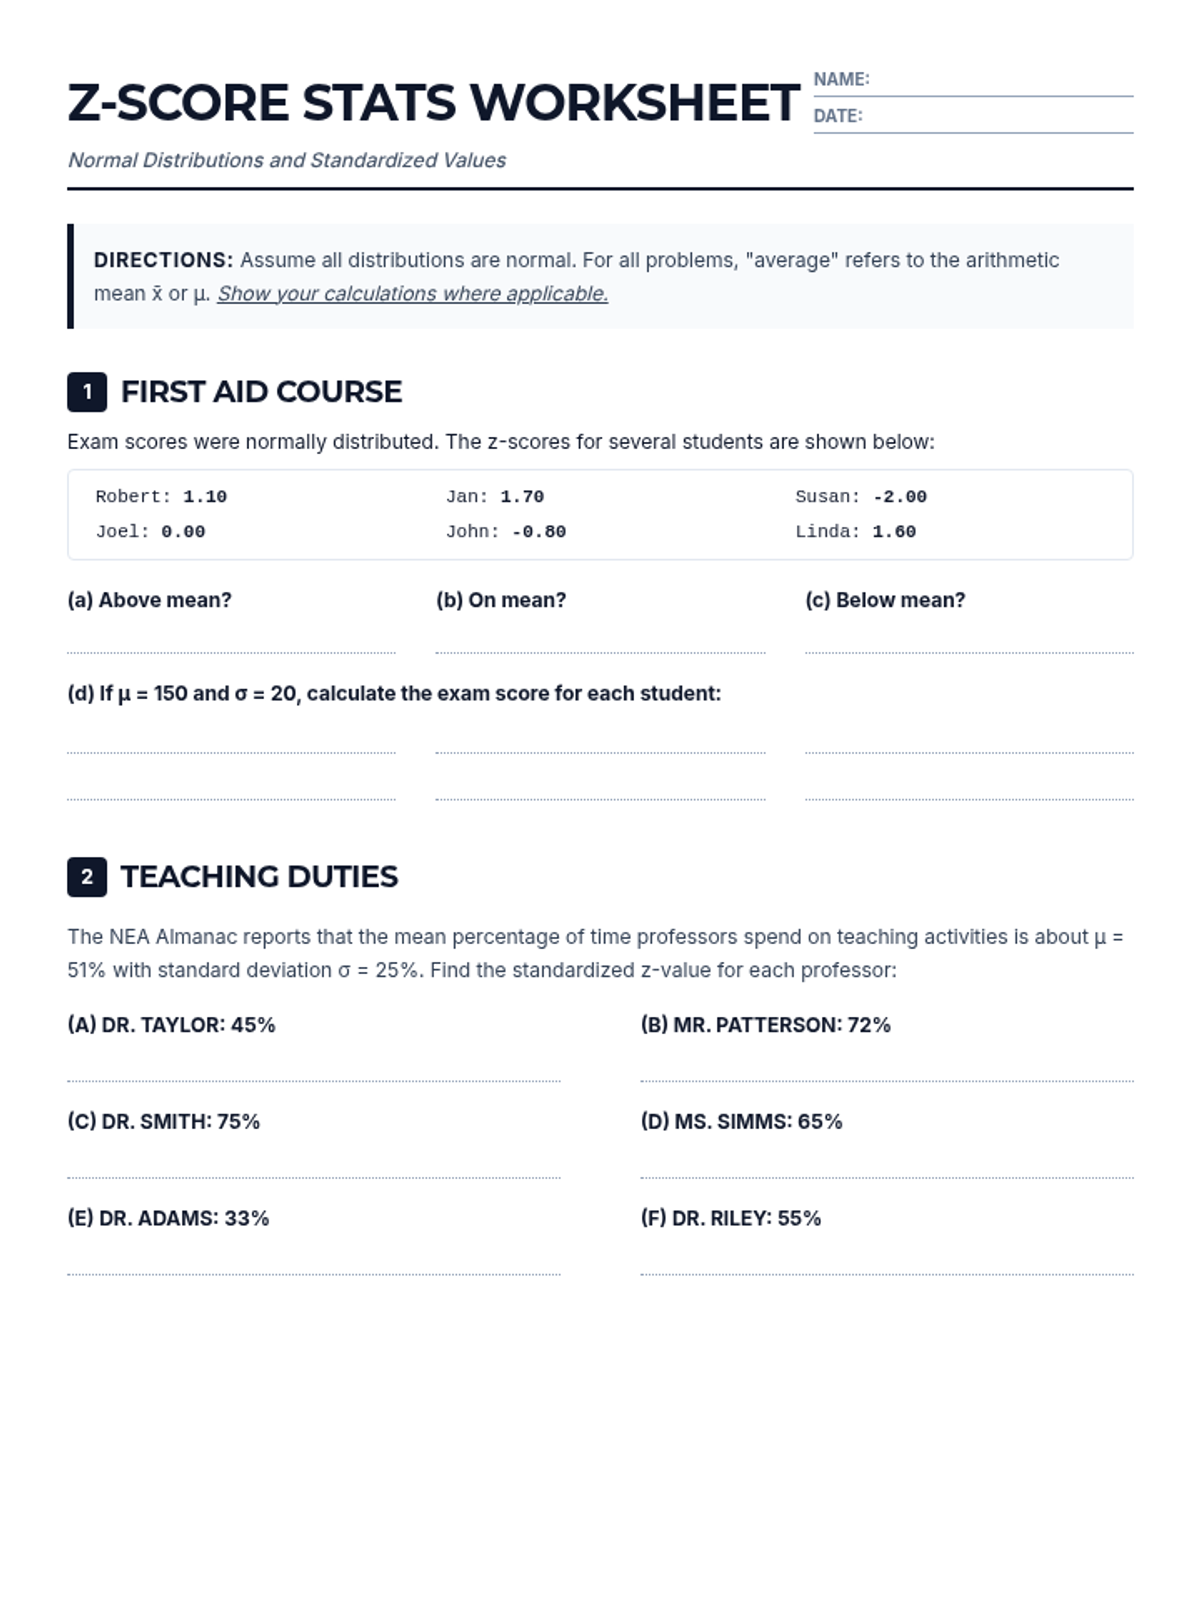
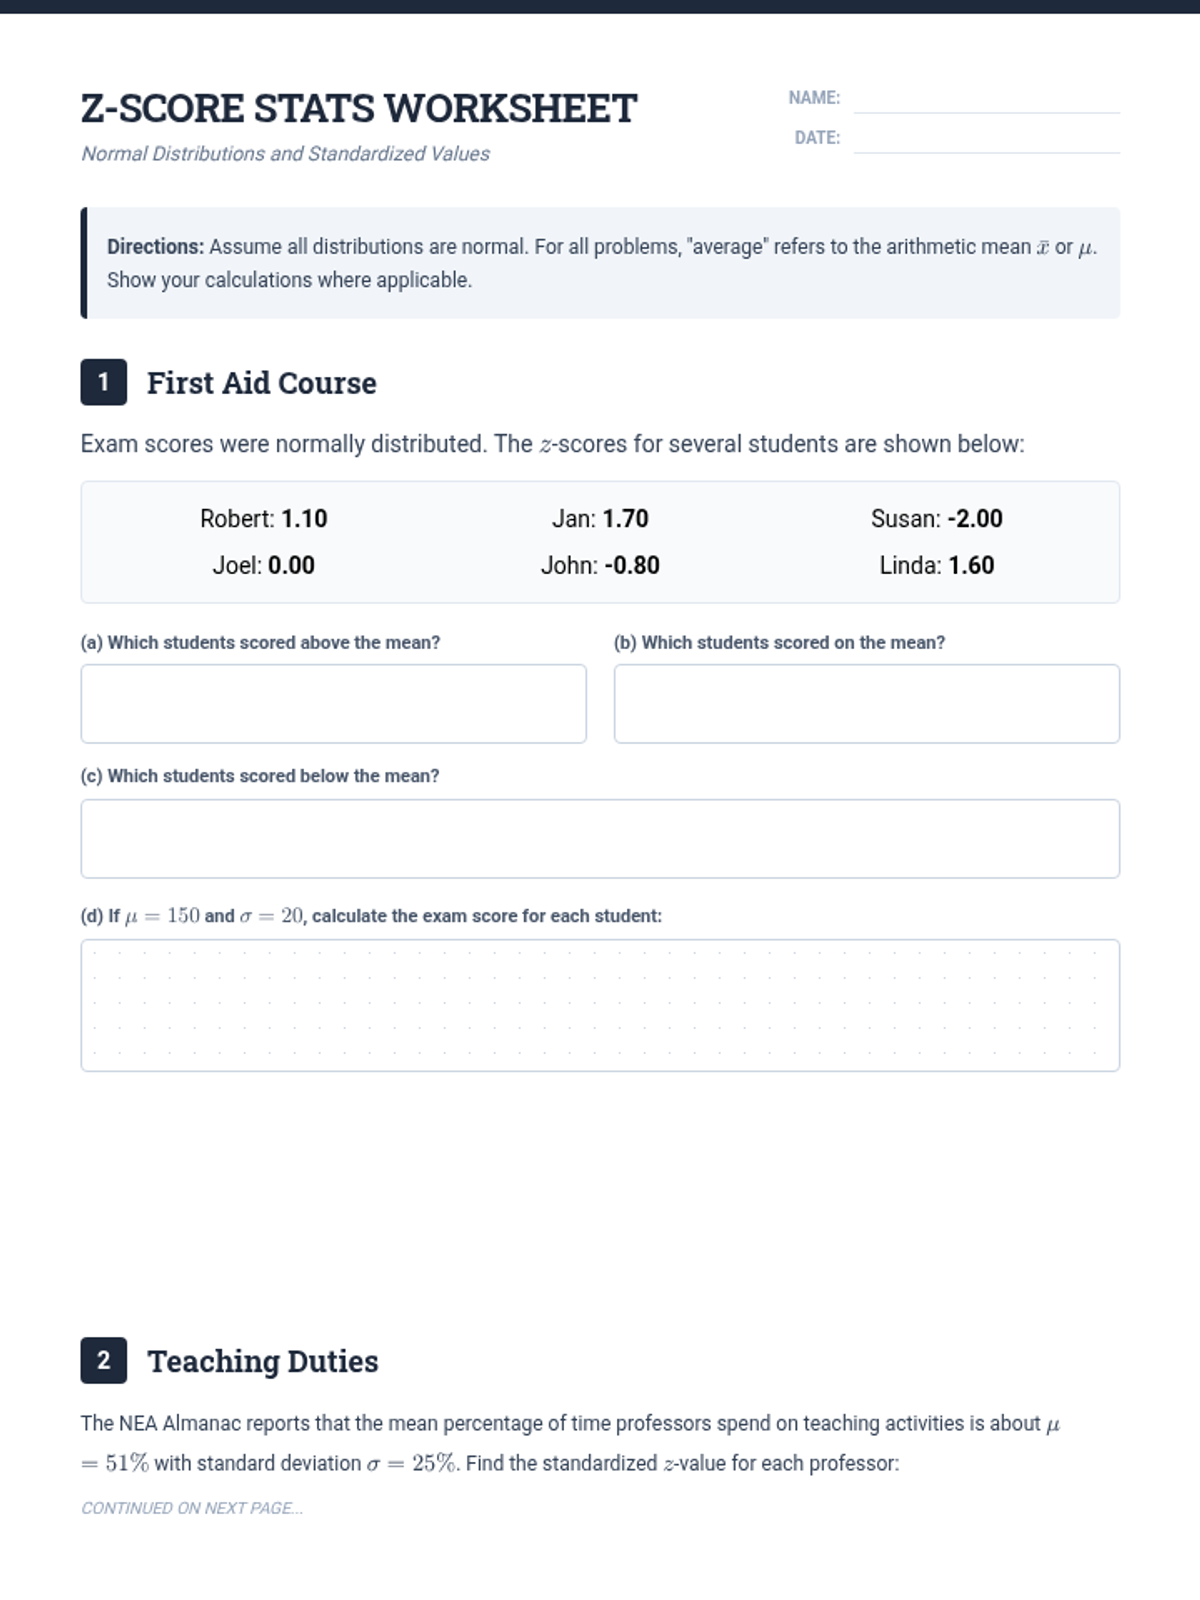
A precise 2-page Z-score worksheet that mirrors the original source material's questions exactly, featuring real-world problems on exam scores, teaching duties, temperatures, and wildlife populations.
A comprehensive teacher's answer key for the Stat Sense Worksheet, including step-by-step calculation formulas and final results for z-scores, raw values, and distribution interpretations.
A 4-page statistics worksheet featuring five detailed word problems on z-scores and normal distributions. Includes sections on first aid exams, teaching hours, regional temperatures, and wildlife population data with ample space for calculations.
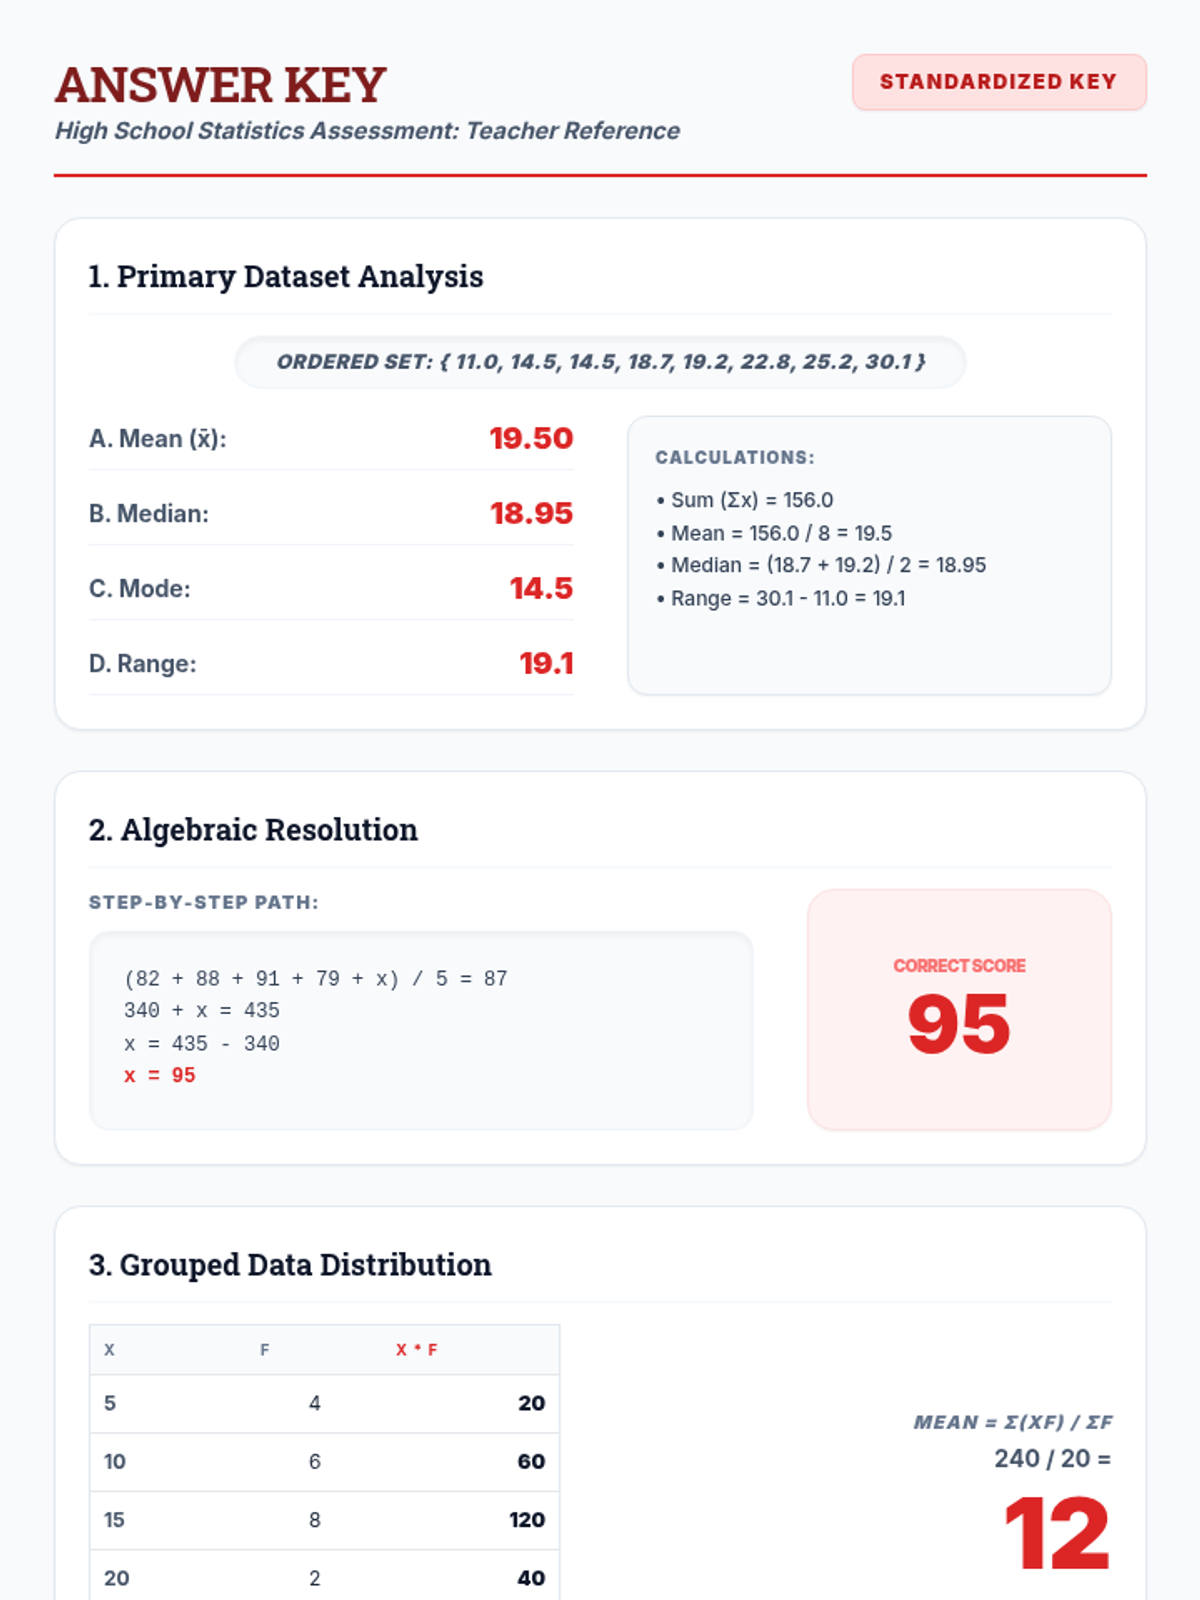
Answer key for the high-school statistics test, featuring detailed algebraic steps, frequency table summations, and conceptual justifications. Standardized layout for better teacher reference.
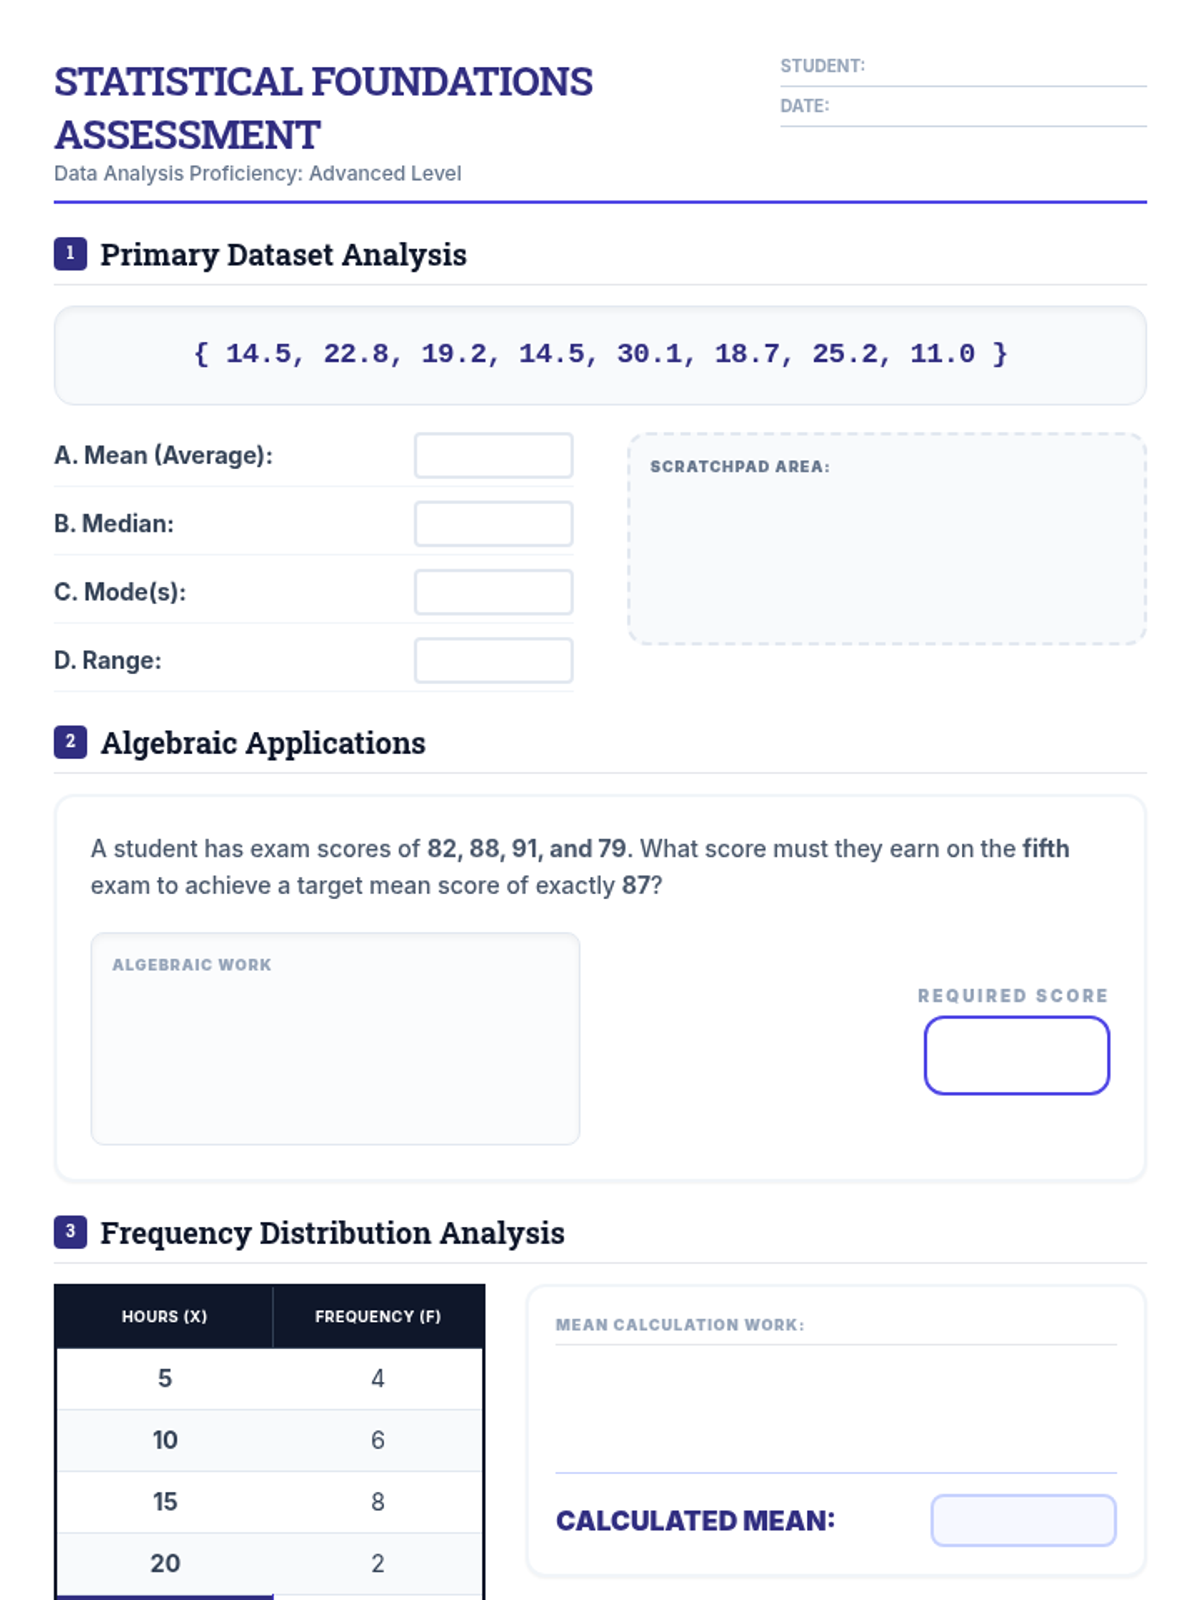
A comprehensive high-school level statistics assessment covering central tendency, algebraic solving, frequency tables, and outlier analysis with a professional academic aesthetic. Revised for improved layout and student writing space. Unicode mean symbol used for stability.
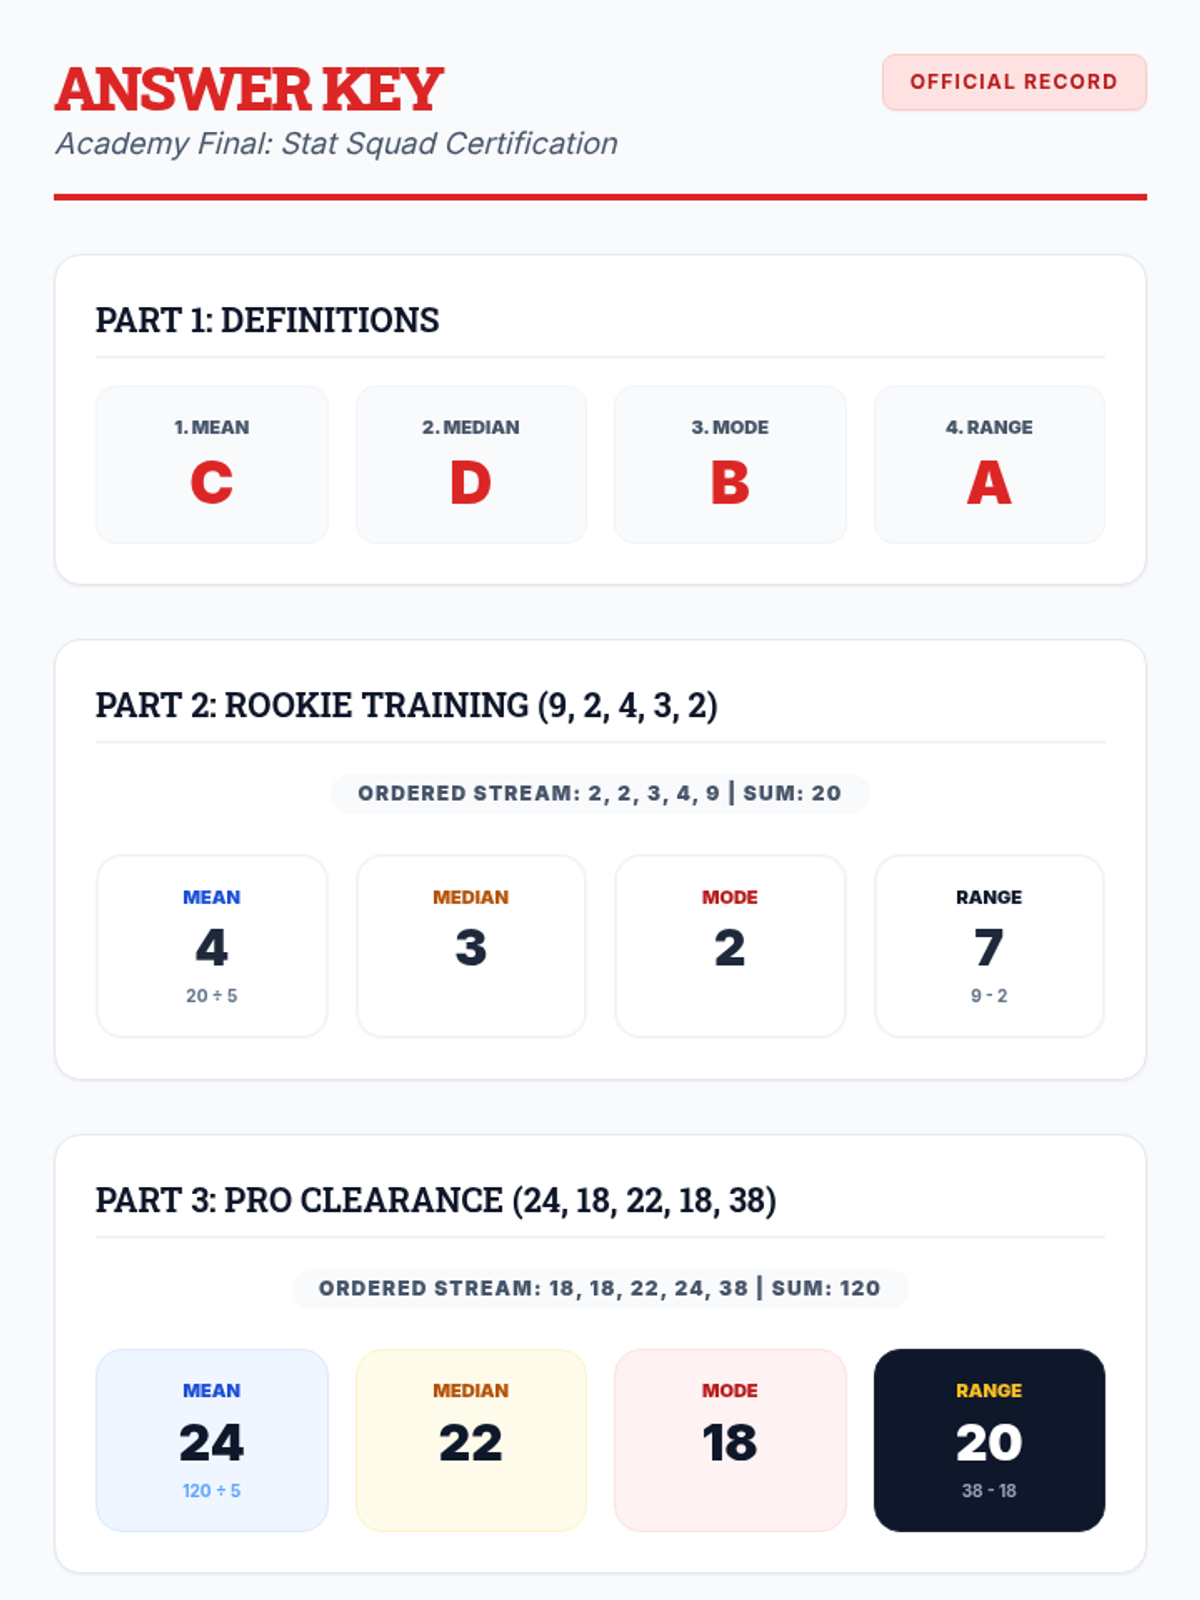
Answer key for the Academy Final Evaluation, featuring step-by-step solutions, correct extraction orders, and grading tips for the final assessment. Standardized layout for better teacher reference.
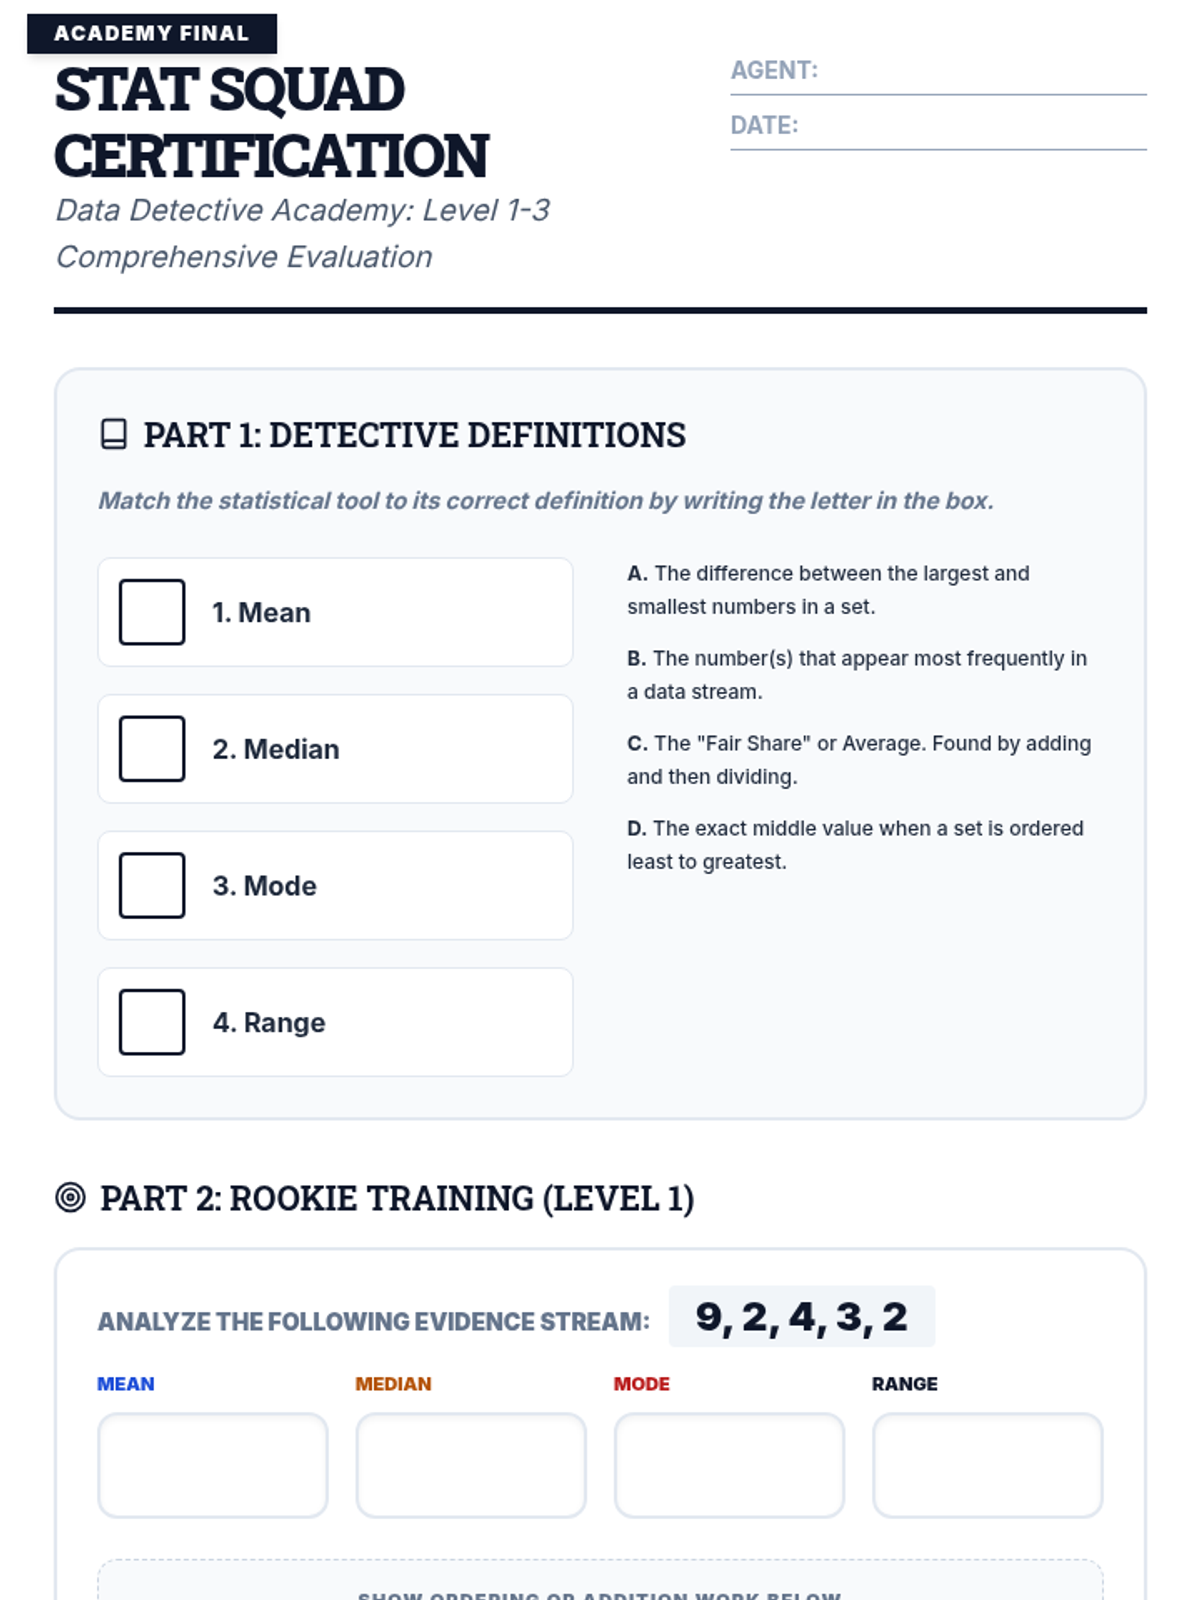
A comprehensive assessment covering Level 1, Level 2, and Level 3 data analysis, designed to evaluate mastery of mean, median, mode, and range in both numerical and narrative contexts. Improved layout for student handwriting.
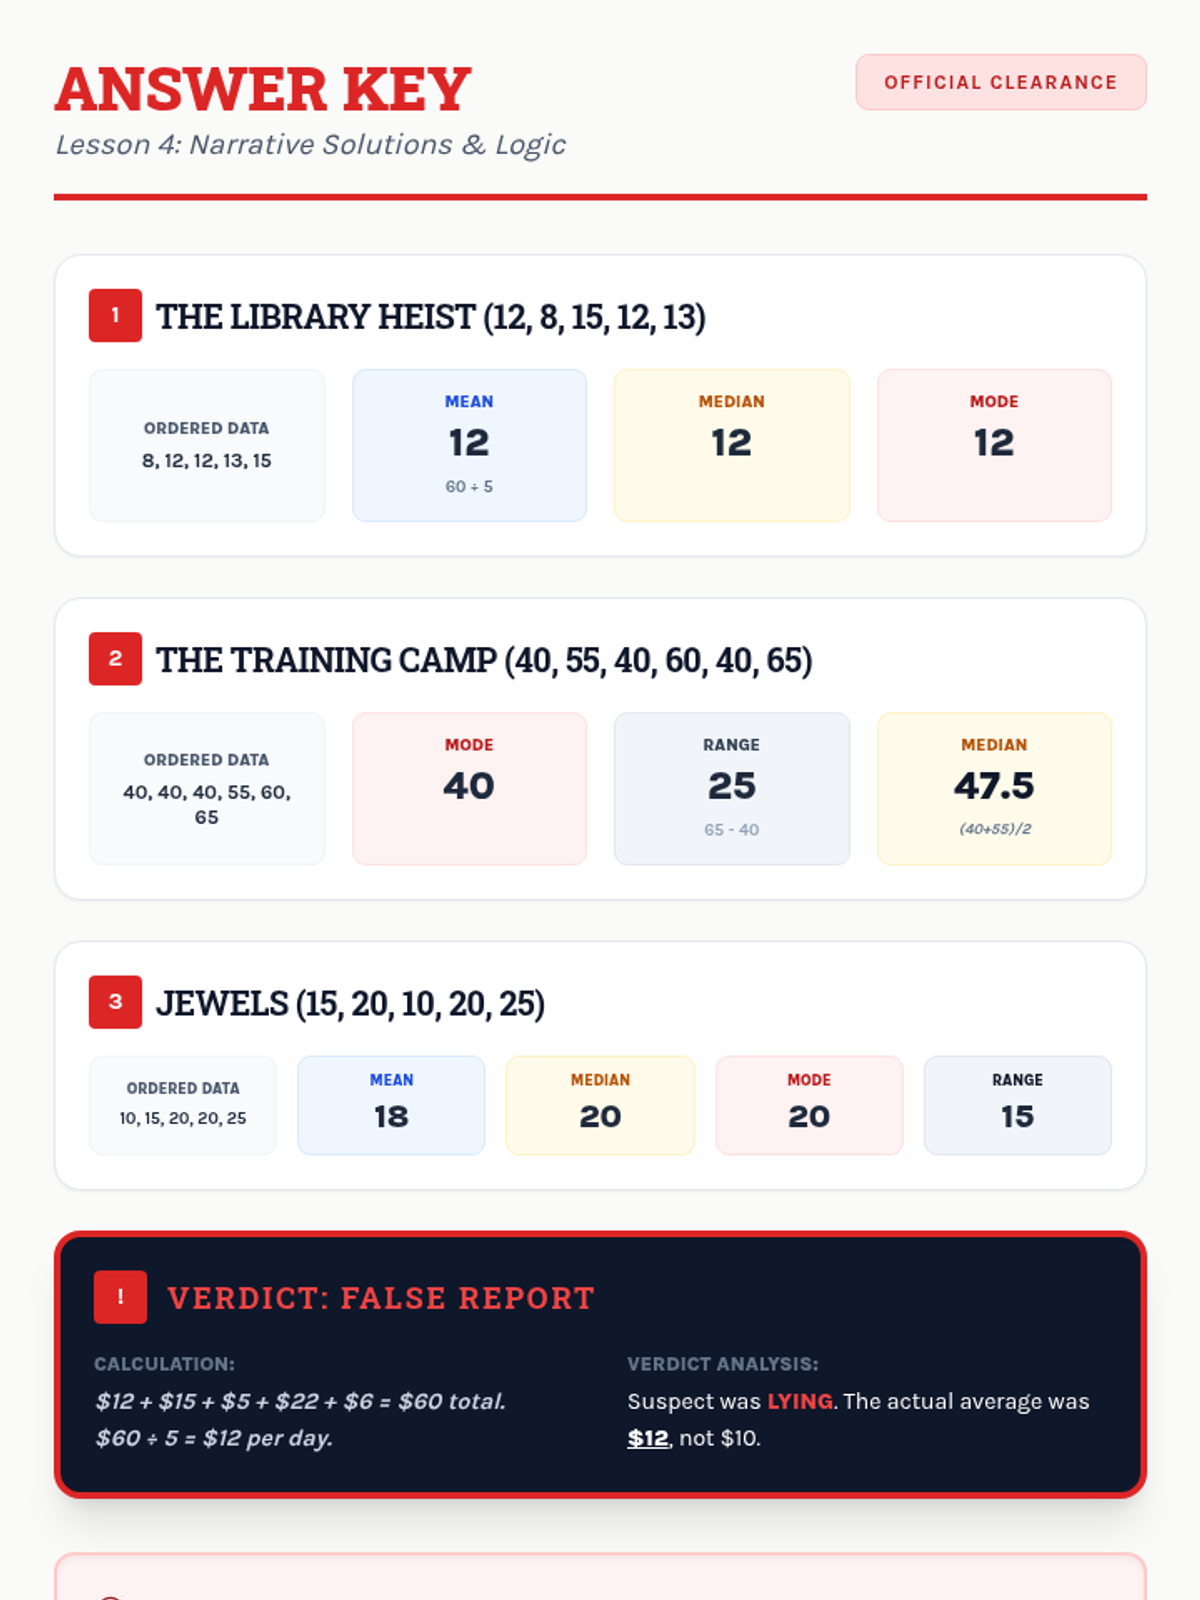
Answer key for the Mystery Logs worksheet, featuring step-by-step extraction logic, calculations, and analytical verdicts for the narrative problems. Standardized layout for better teacher reference.
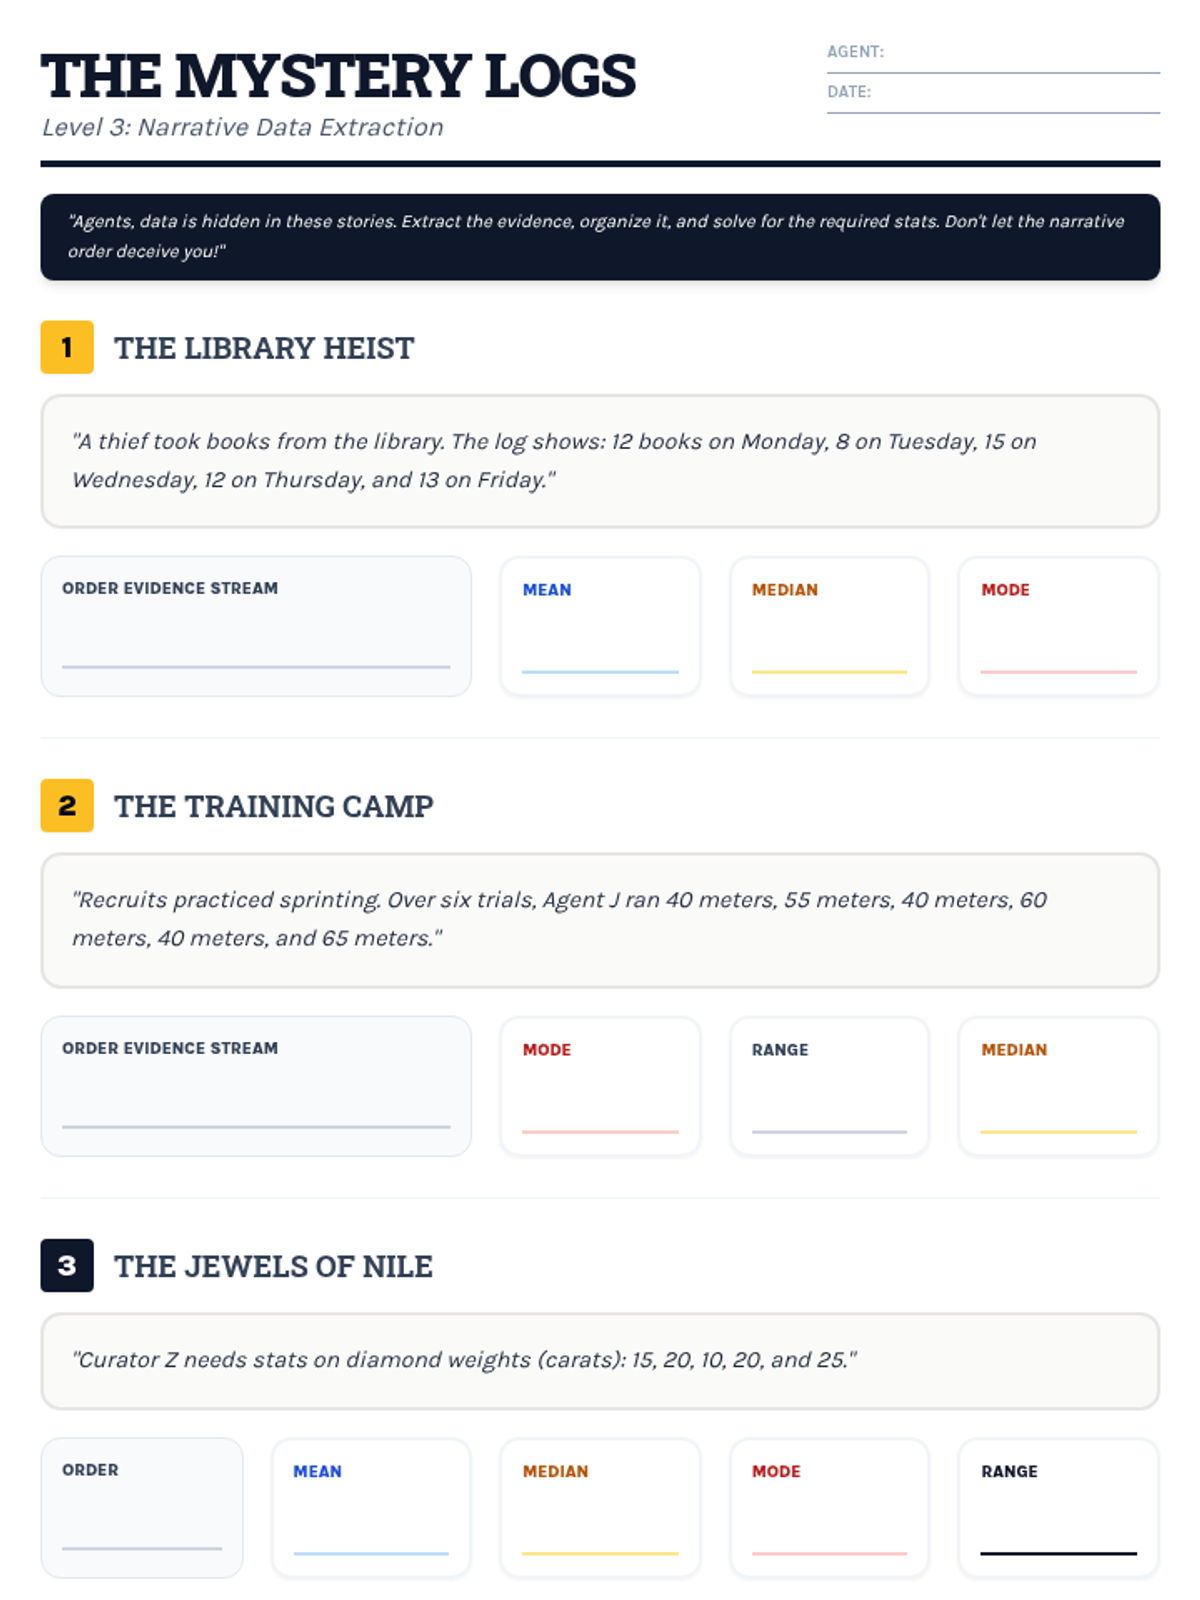
A series of narrative-based word problems themed as mystery investigations, requiring students to extract data sets from text and calculate central tendency and range. Standardized layout and improved work areas for better usability.
Instructional slides teaching students how to parse word problems for data, identify keywords like "average", and avoid common traps like selecting the median from unsorted narrative data. Now includes additional practice missions.
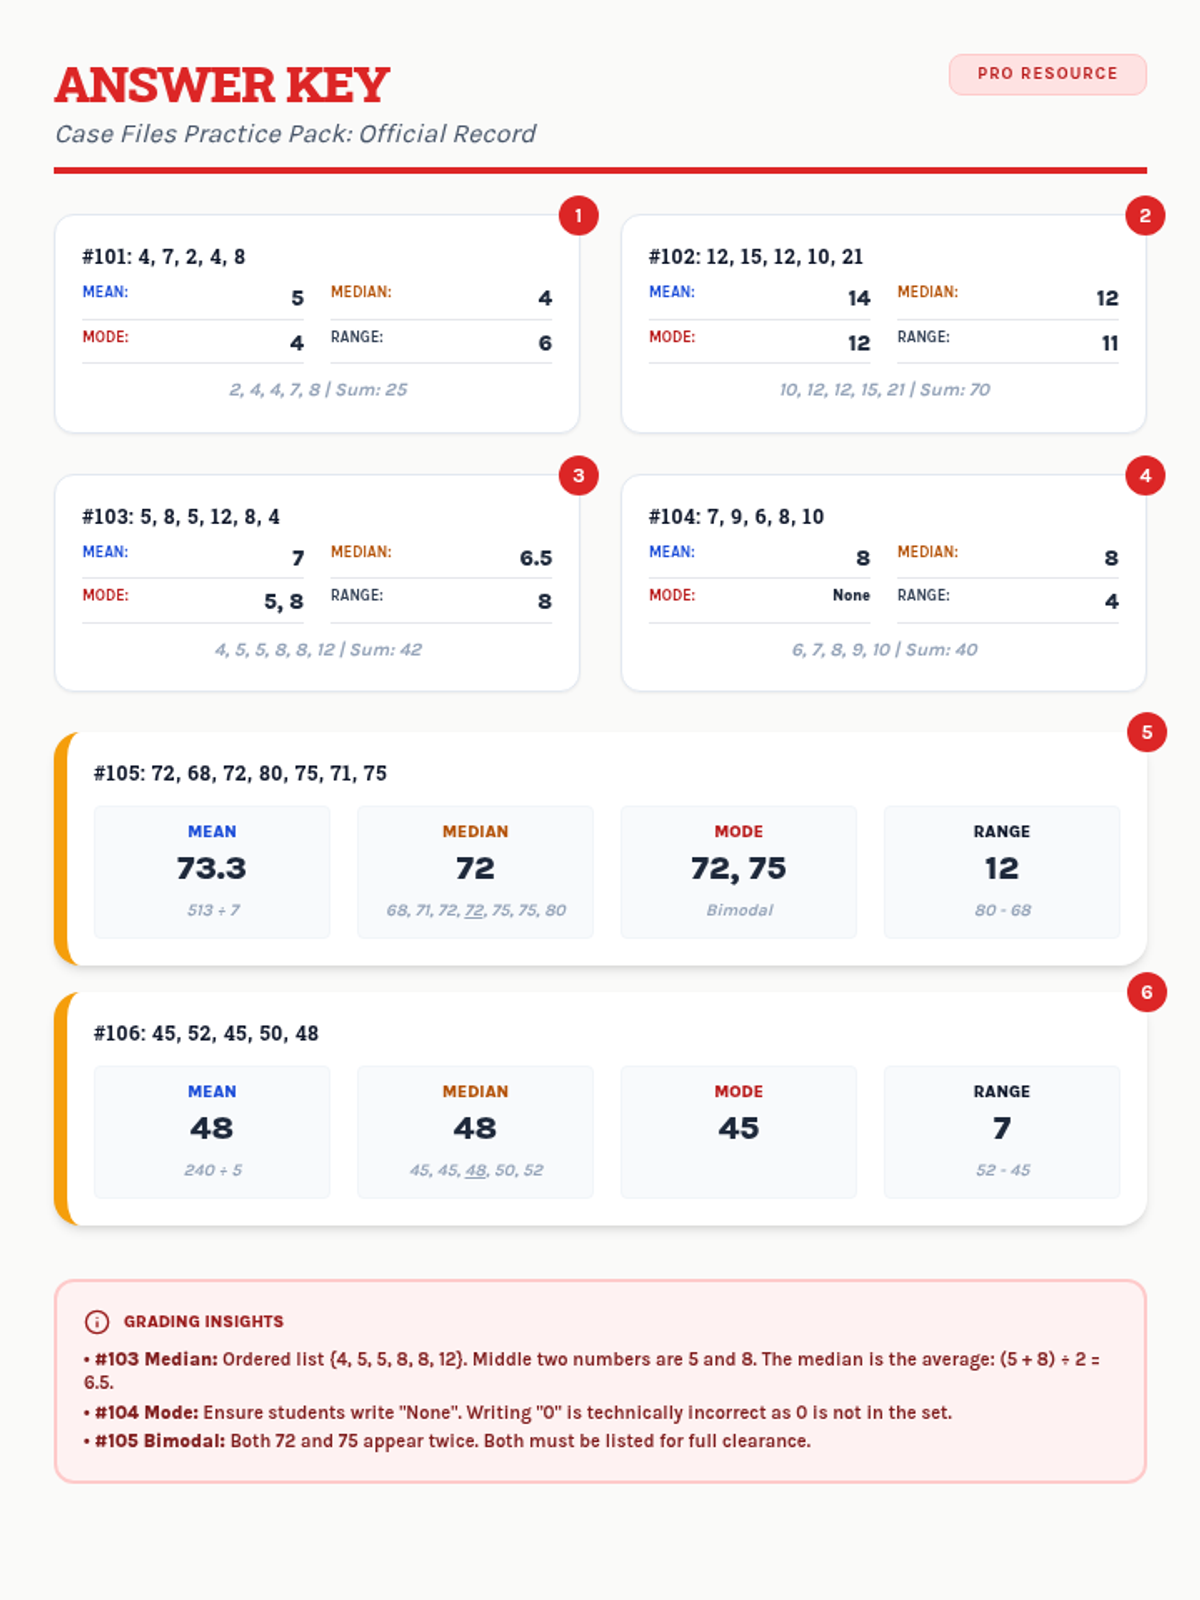
The official answer key for the Case Files Practice Pack, with detailed breakdowns and grading insights for all 6 cases. Updated for better readability and logic clarification.
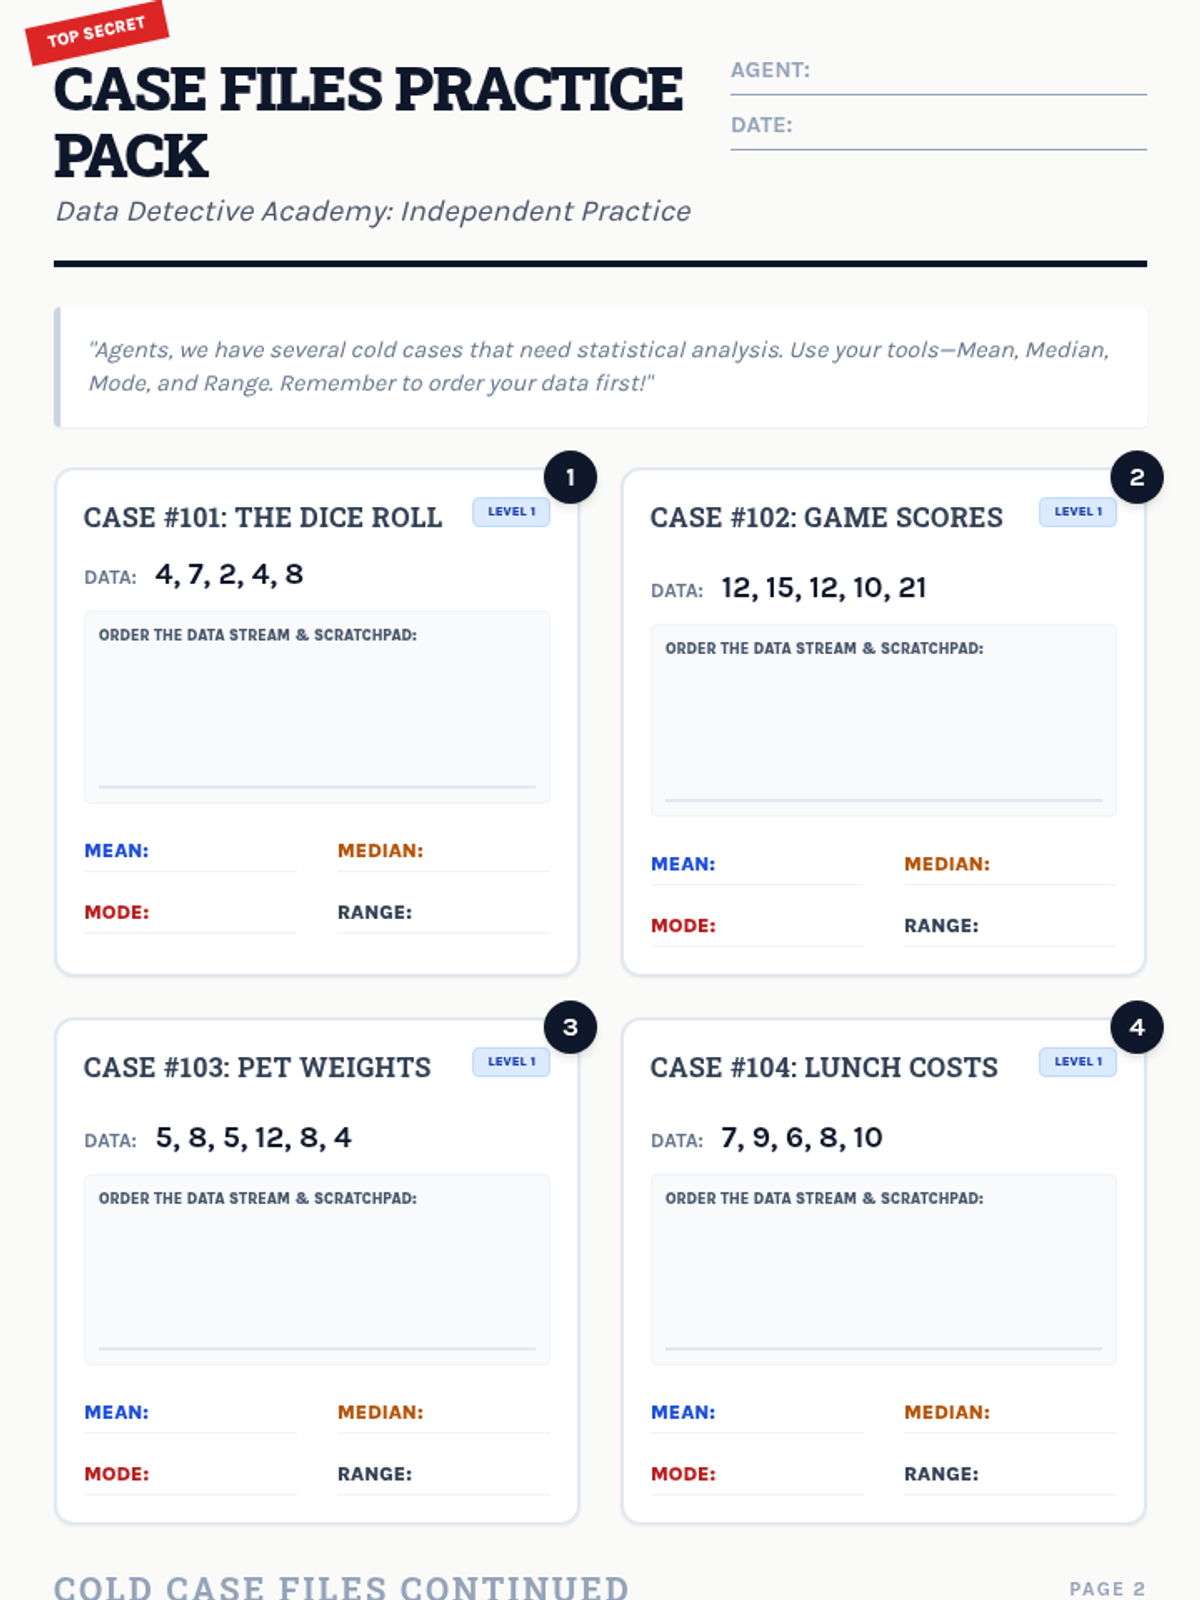
A 2-page practice worksheet with 6 detective-themed "cold cases" involving a mix of single and double-digit data sets for mean, median, mode, and range. Includes ordering scaffolds for all problems.
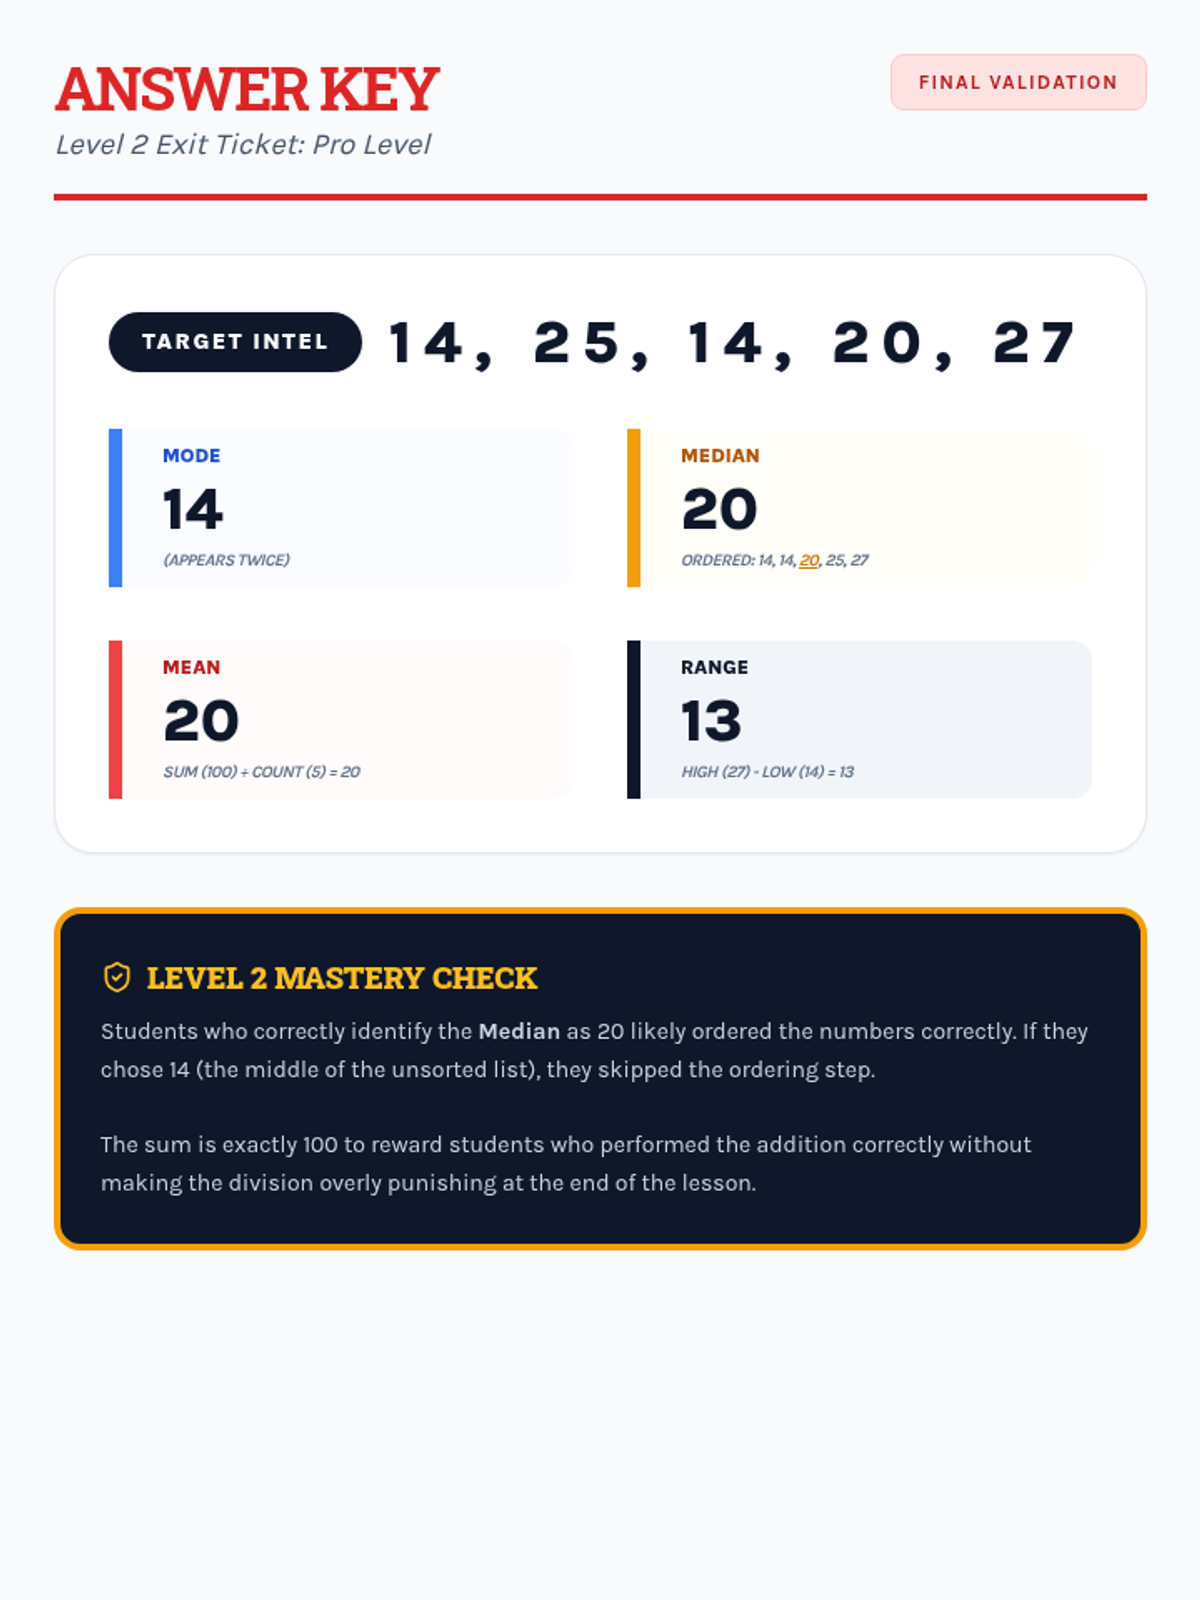
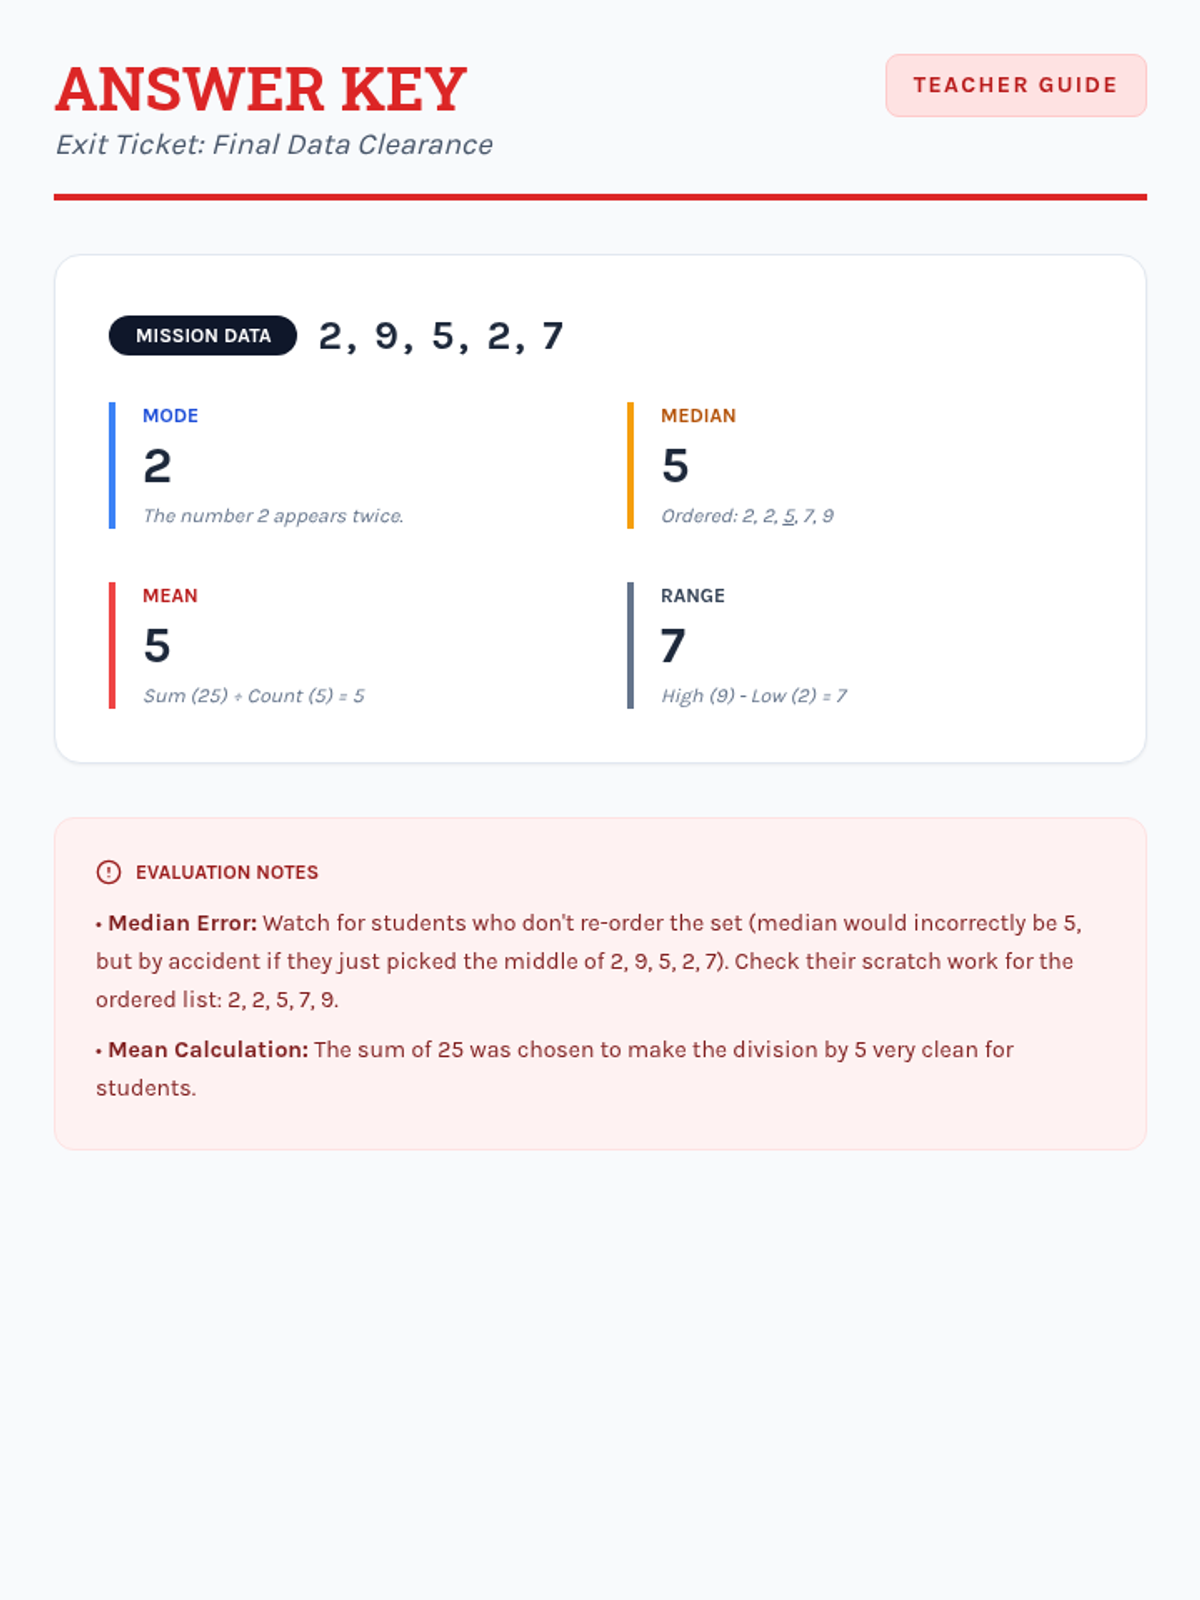
Answer key for the Level 2 Exit Ticket, with a breakdown of calculations and pedagogical notes for teachers.
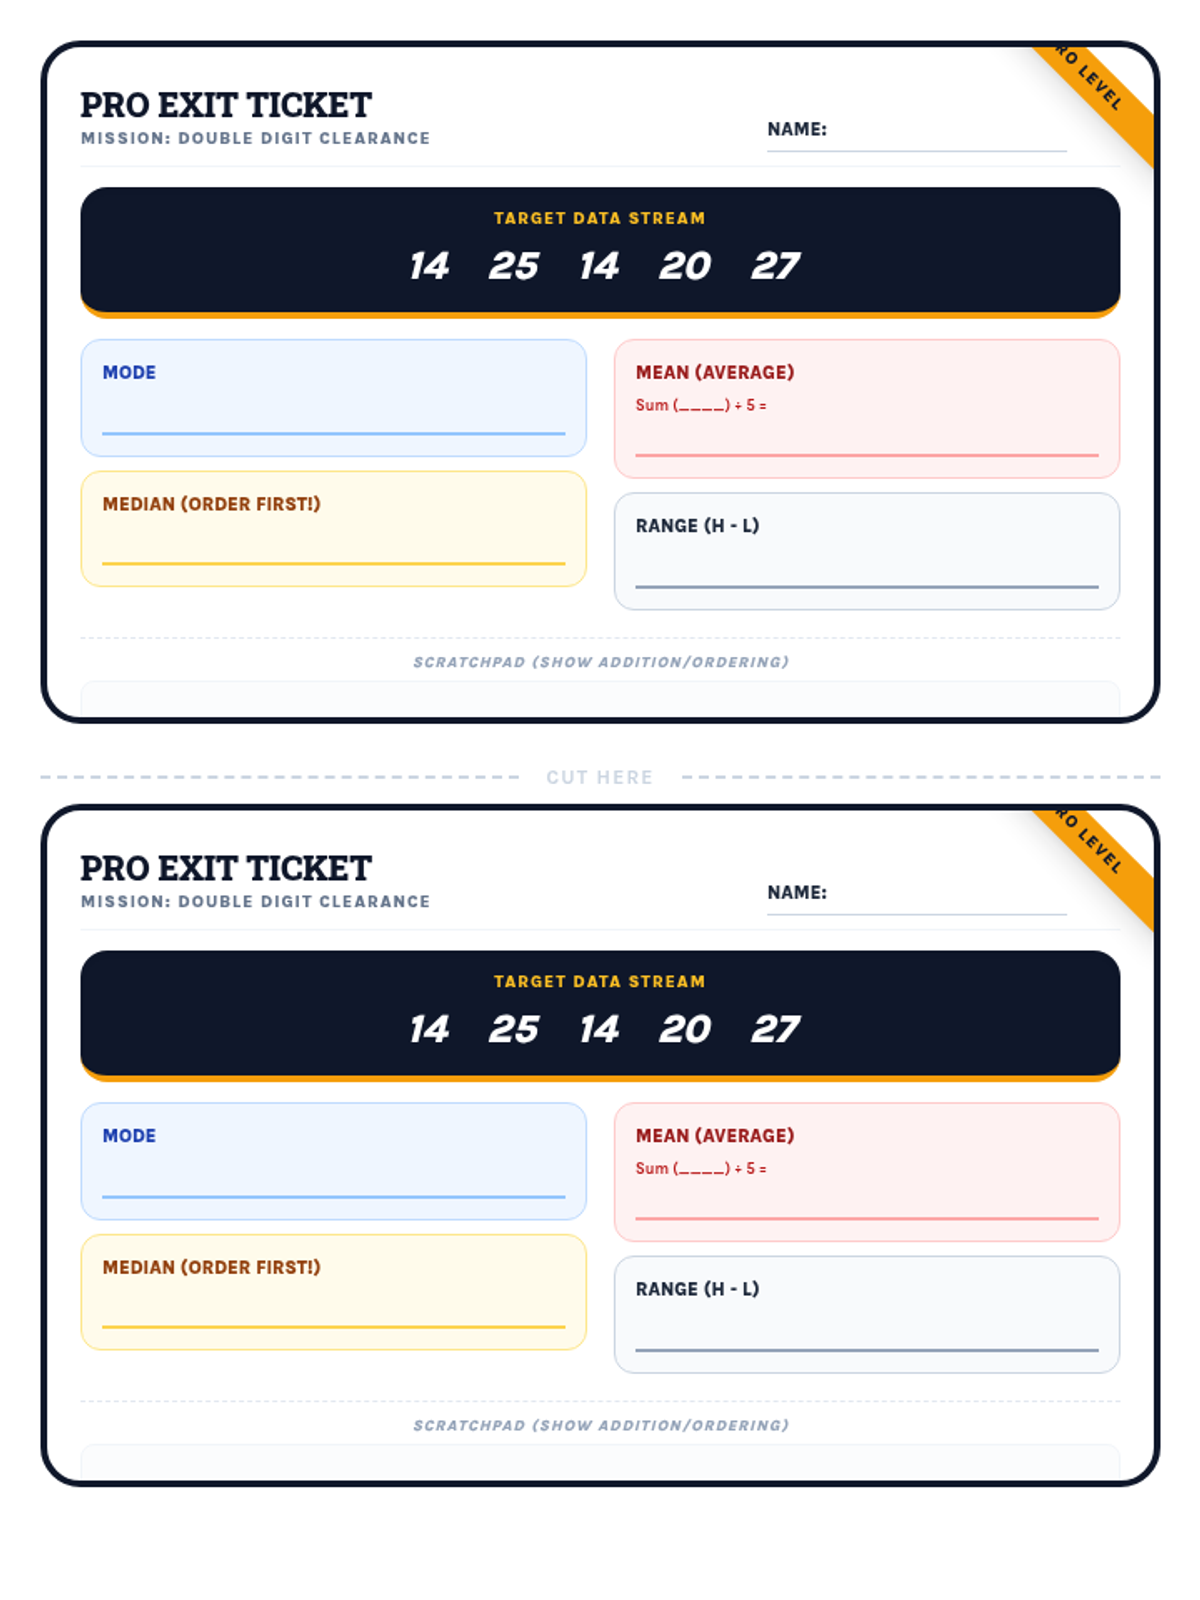
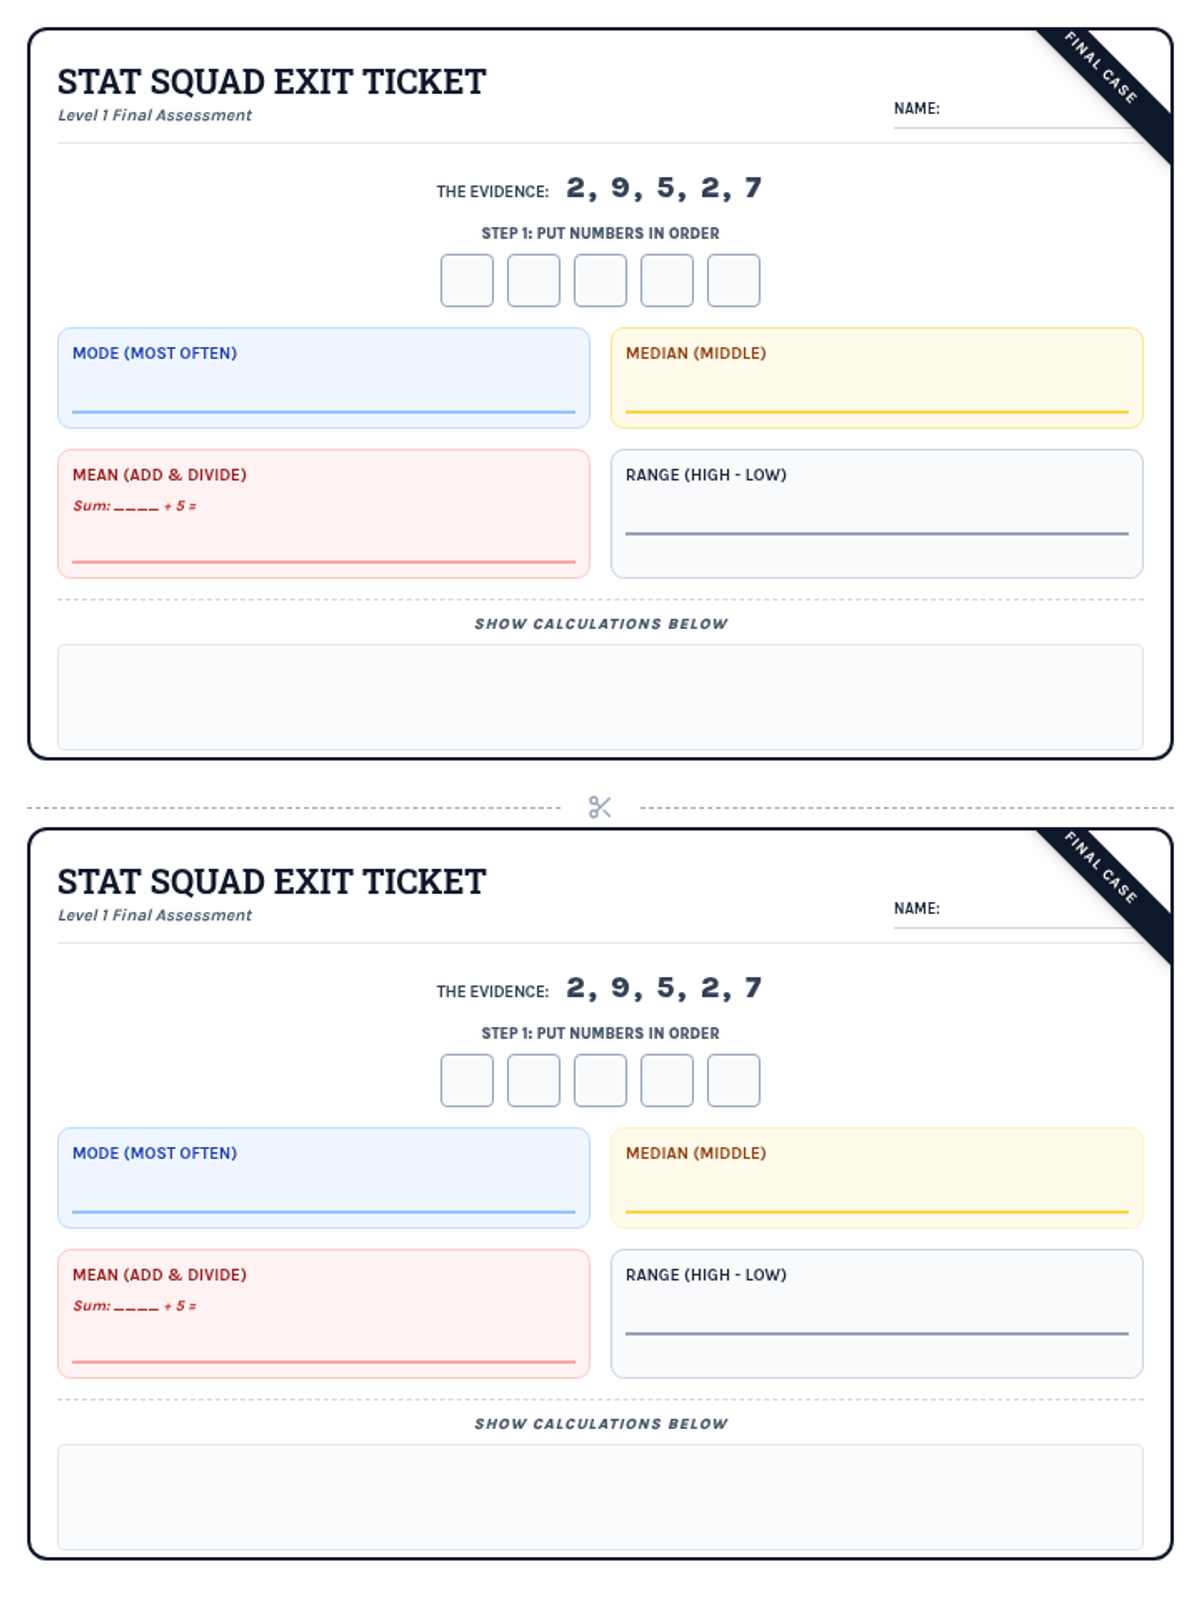
Level 2 exit ticket with double-digit numbers, duplicated on one page for paper saving. Scaffolding added to support double-digit calculations.
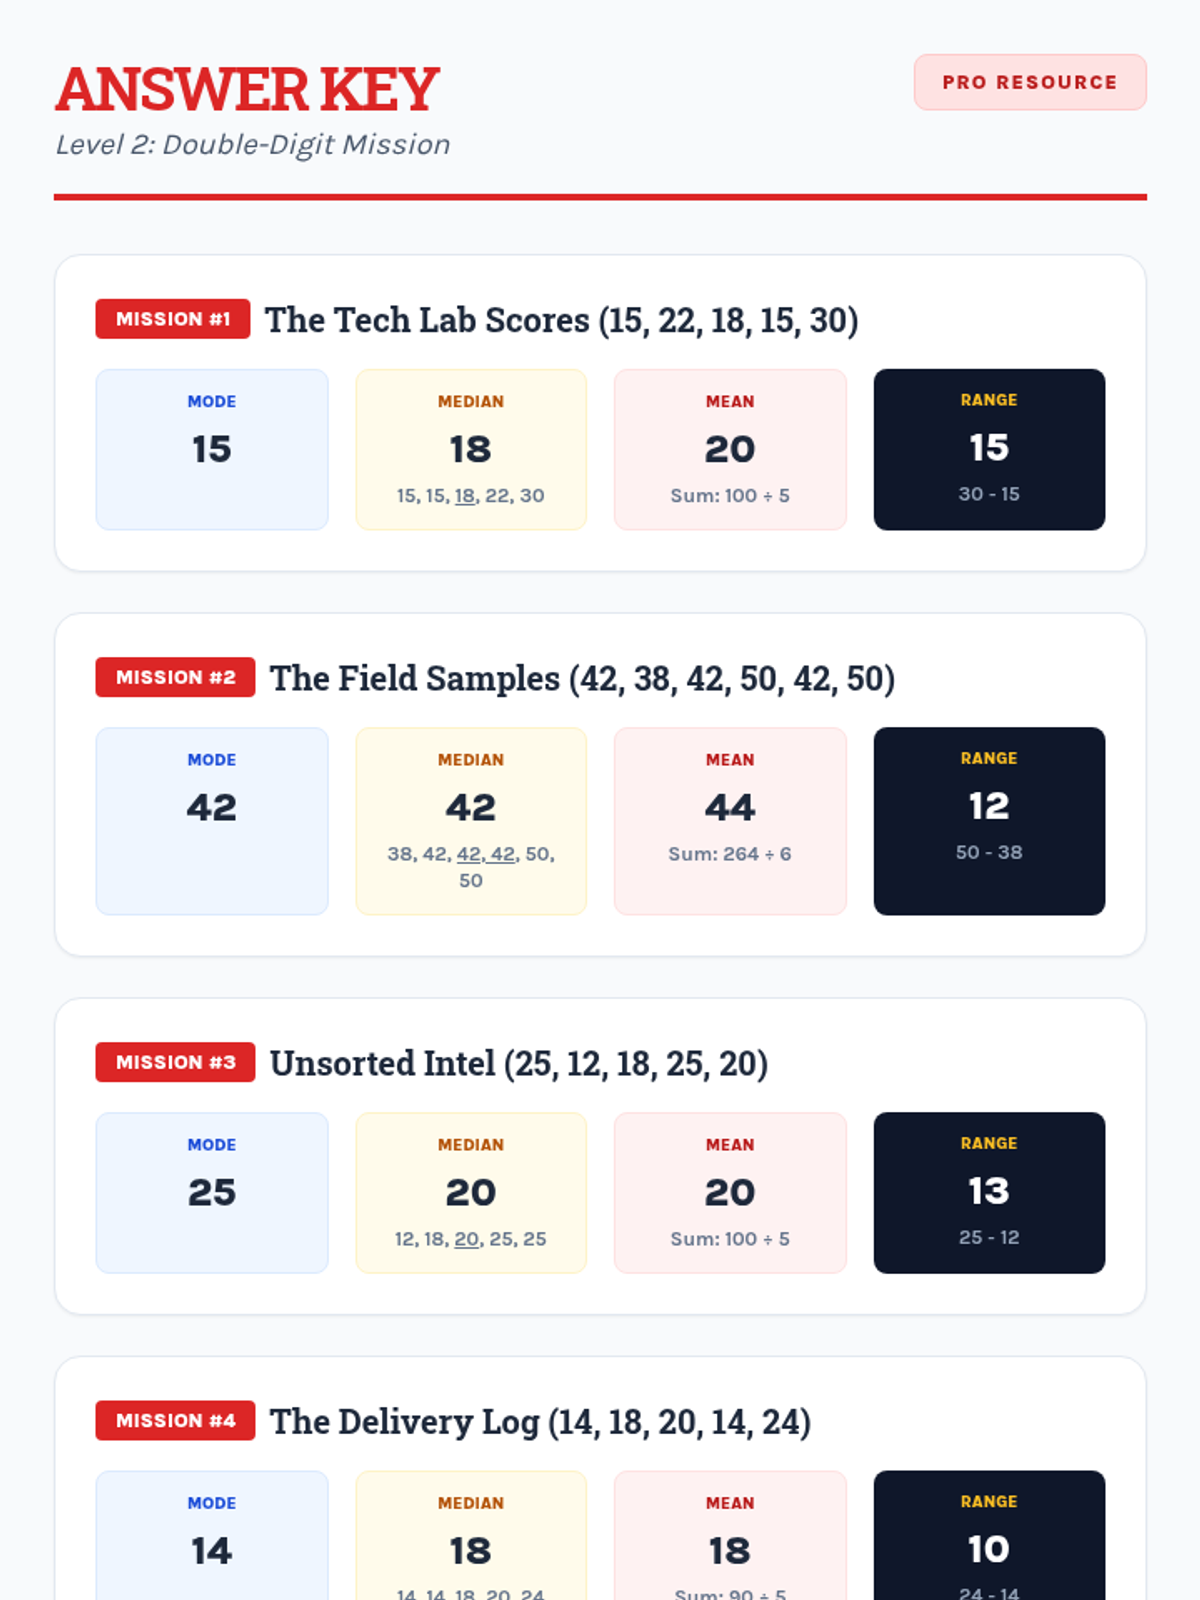
Answer key for the Level 2 worksheet, including detailed calculations for double-digit central tendency across all five missions.
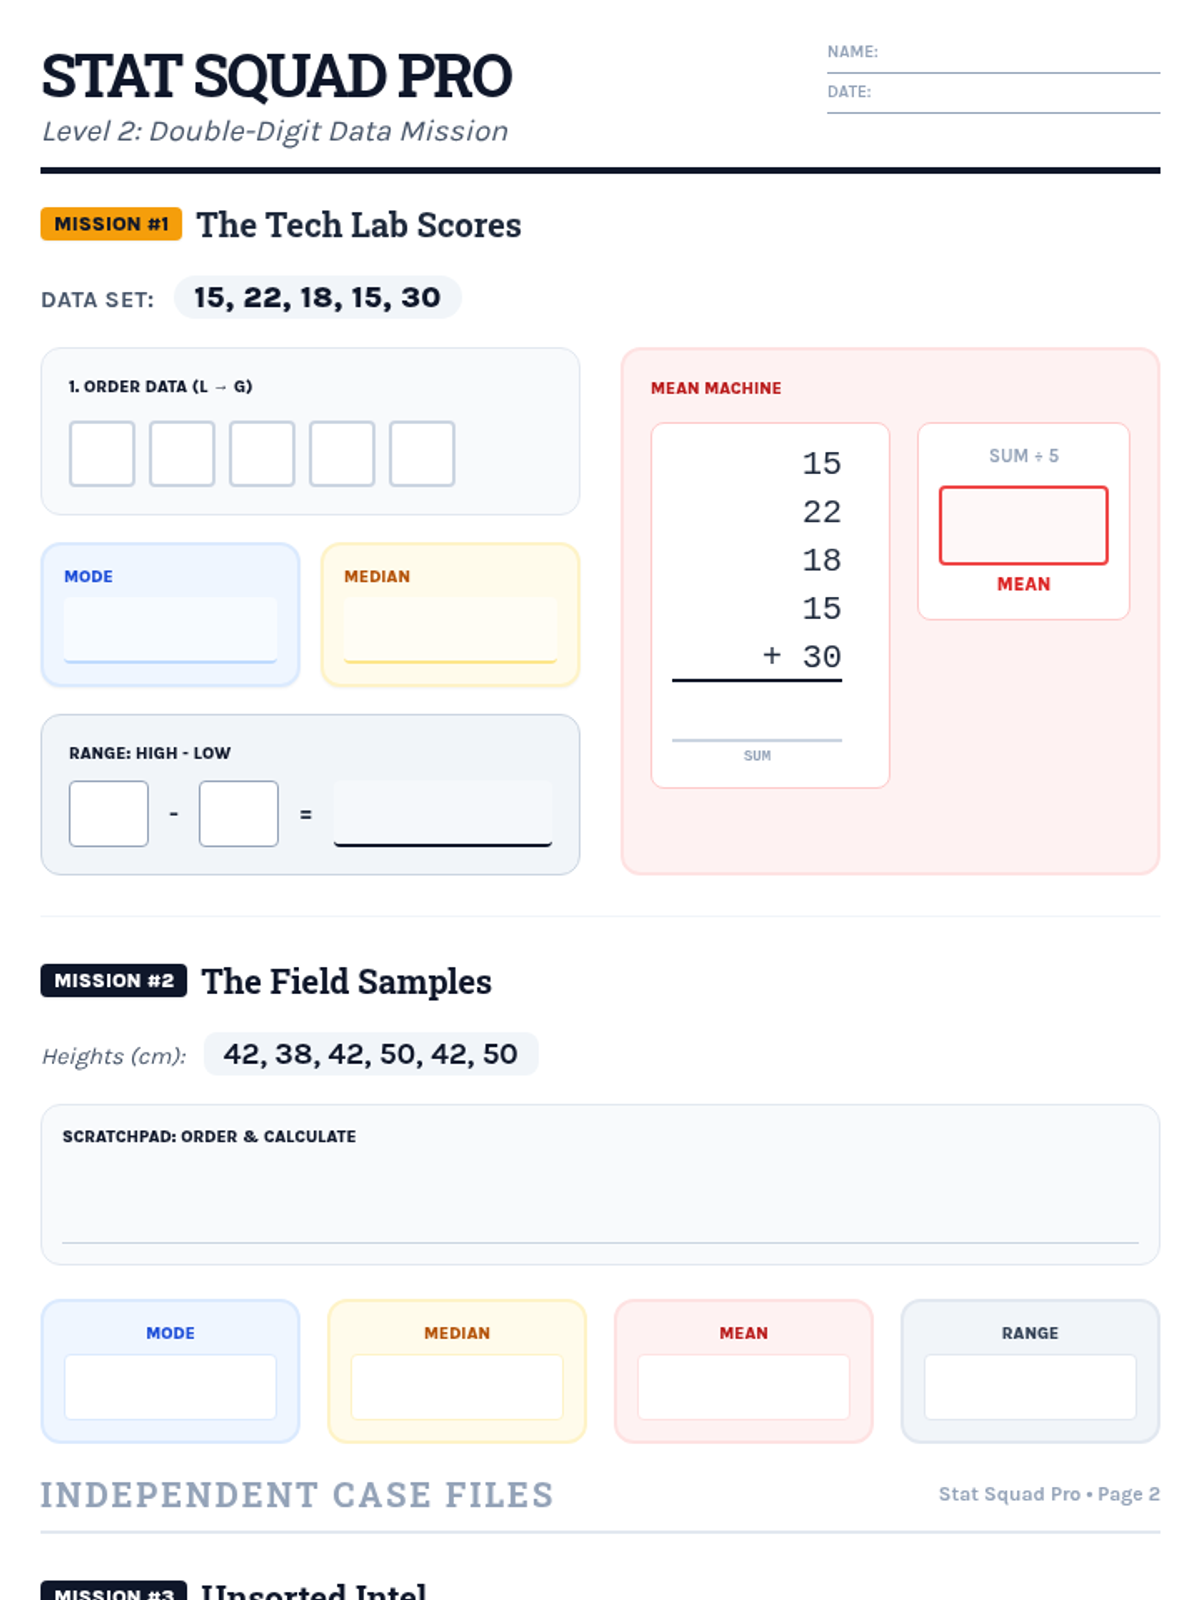
Level 2 worksheet focusing on double-digit data sets, expanded with five missions including guided practice and independent cases across two pages. Layout optimized for clean page breaks.
Instructional slides for Level 2 data analysis, focusing on the added complexity of multi-digit numbers while maintaining core statistical concepts.
Answer key for the Stat Squad Exit Ticket, featuring clear breakdowns of calculations and common error patterns.
A half-page exit ticket for a quick assessment of mean, median, mode, and range with a single-digit data set. Duplicate copies on one page to save paper.
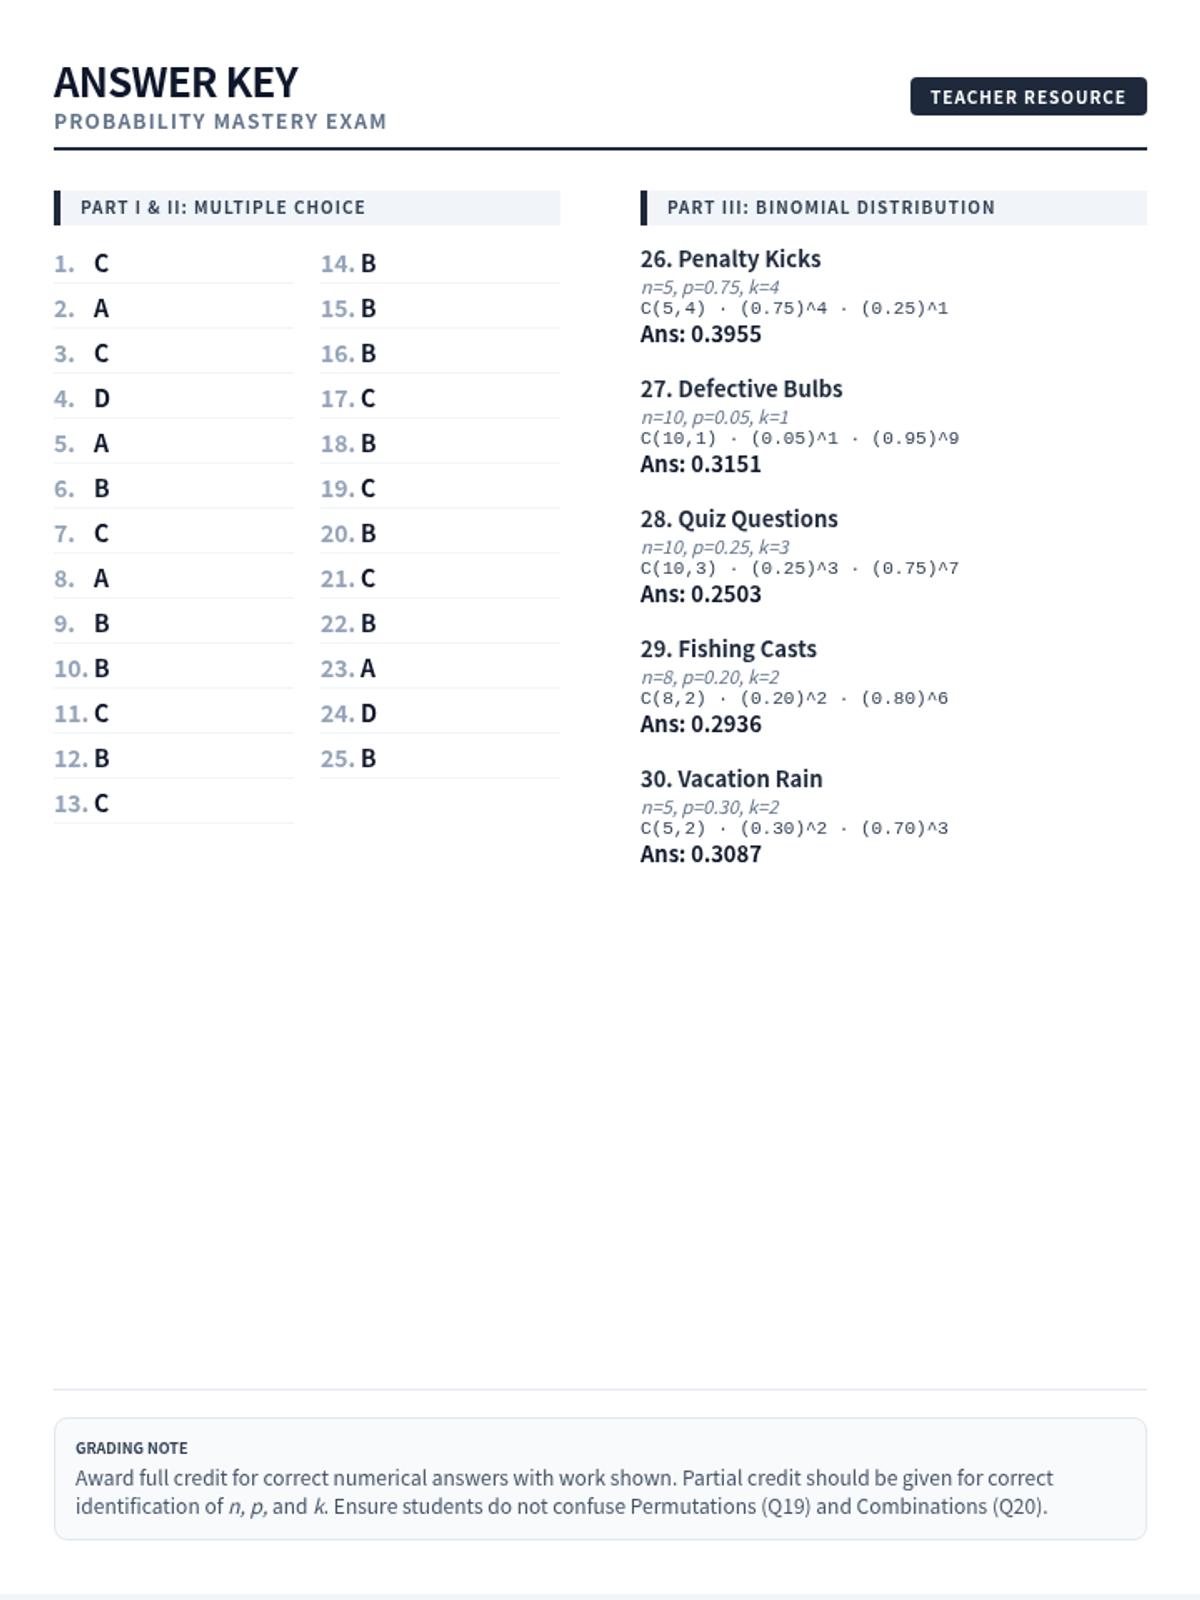
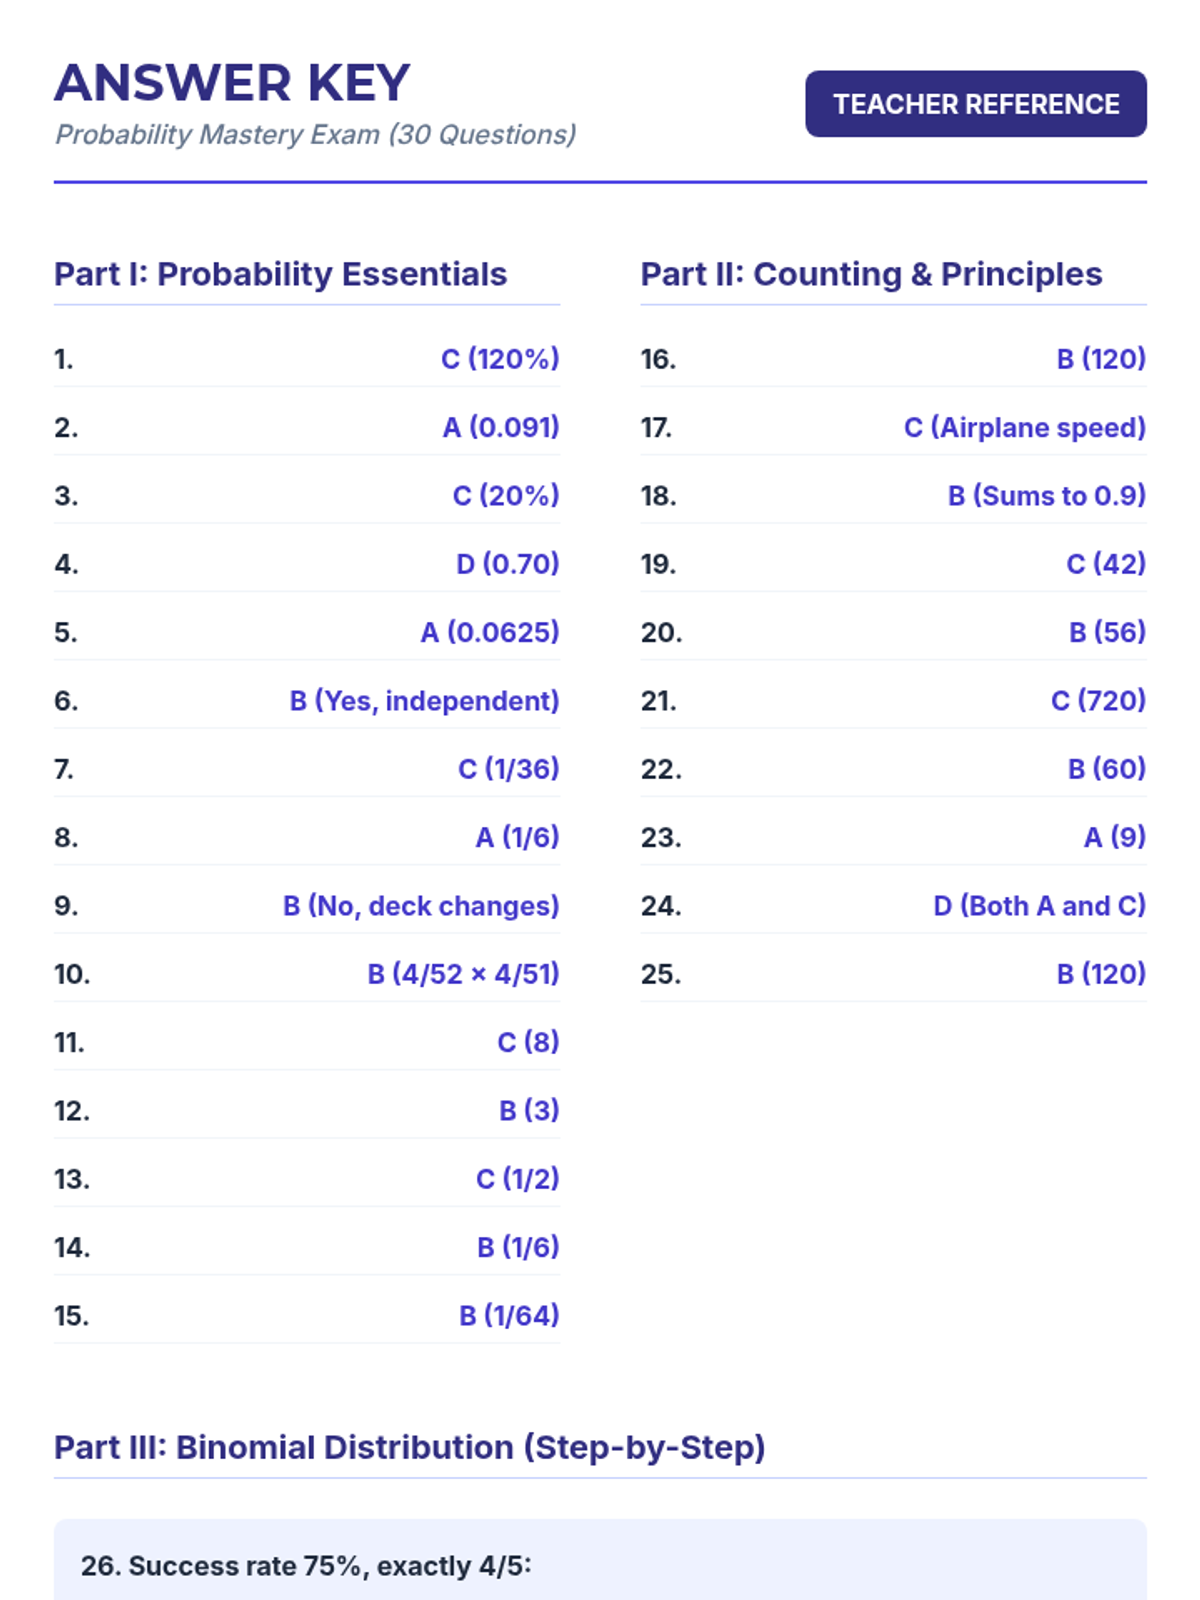
A comprehensive 1-page teacher answer key for the Probability Mastery Exam. It includes letter answers for all multiple-choice questions (Part I & II) and detailed setup and final numerical answers for the binomial distribution problems (Part III). Includes grading notes for open-ended sections.
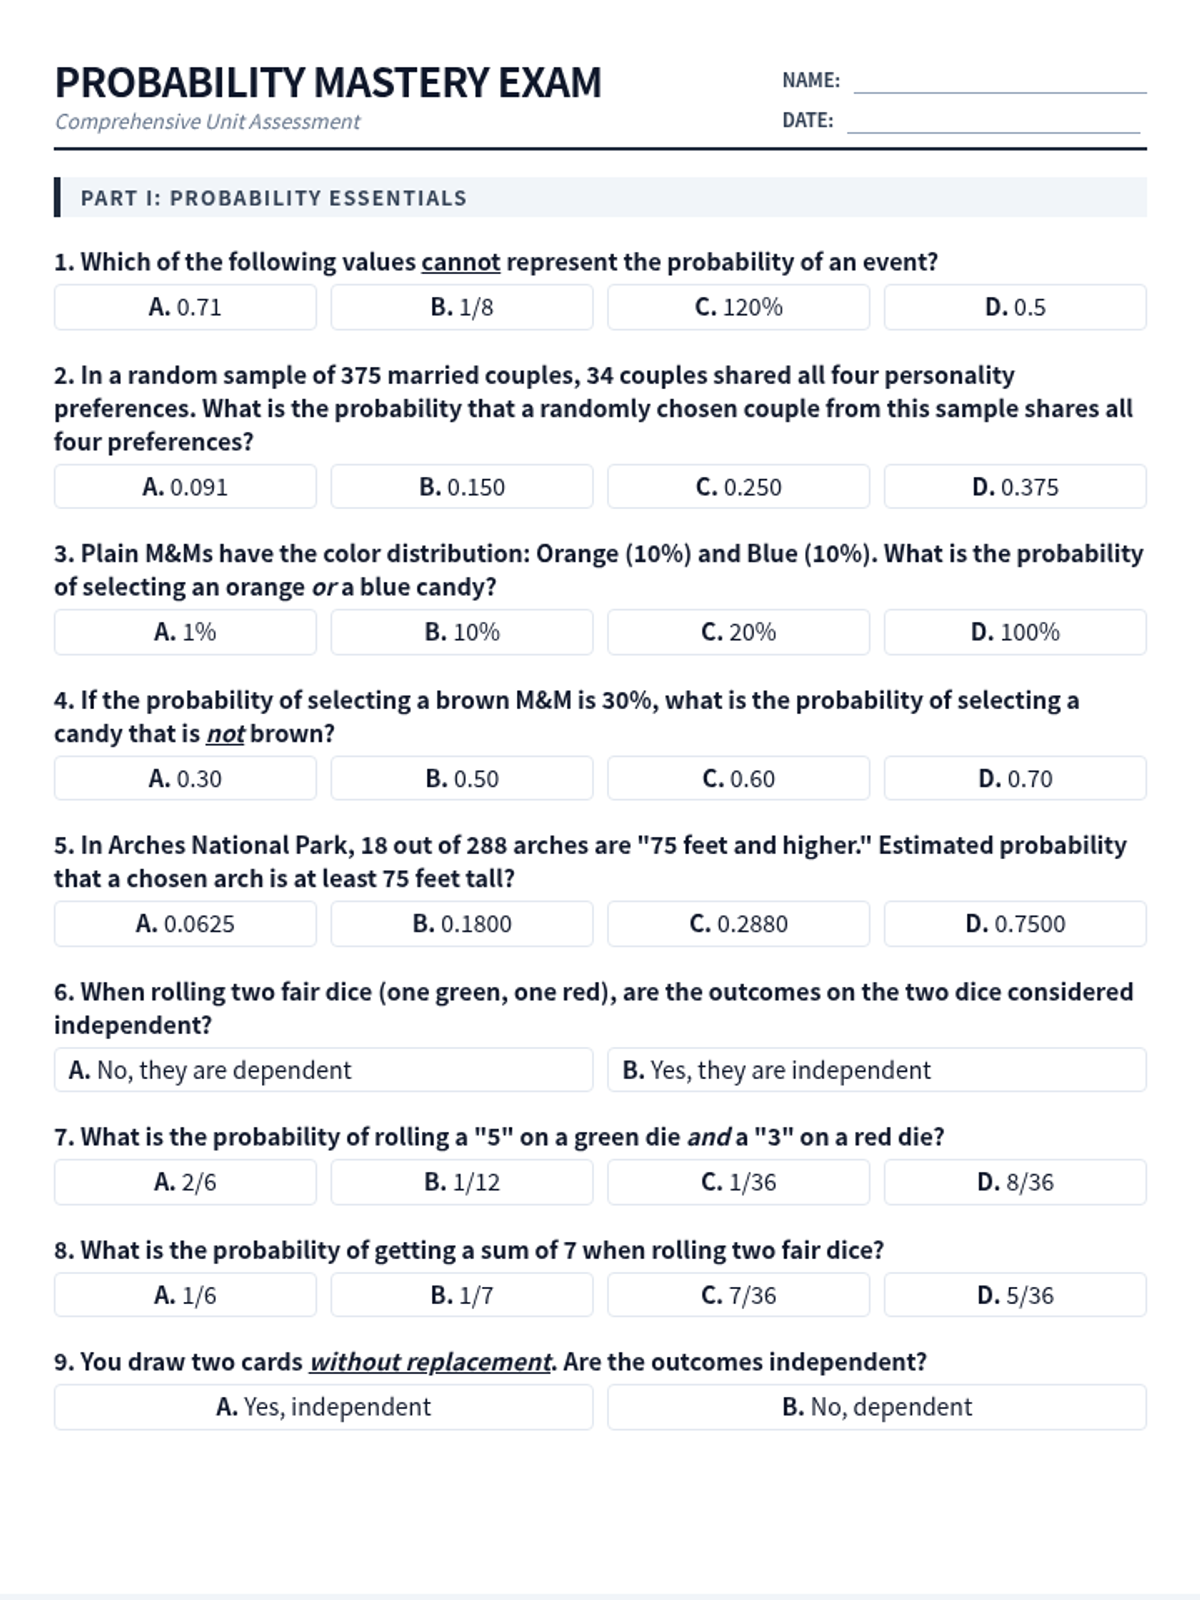
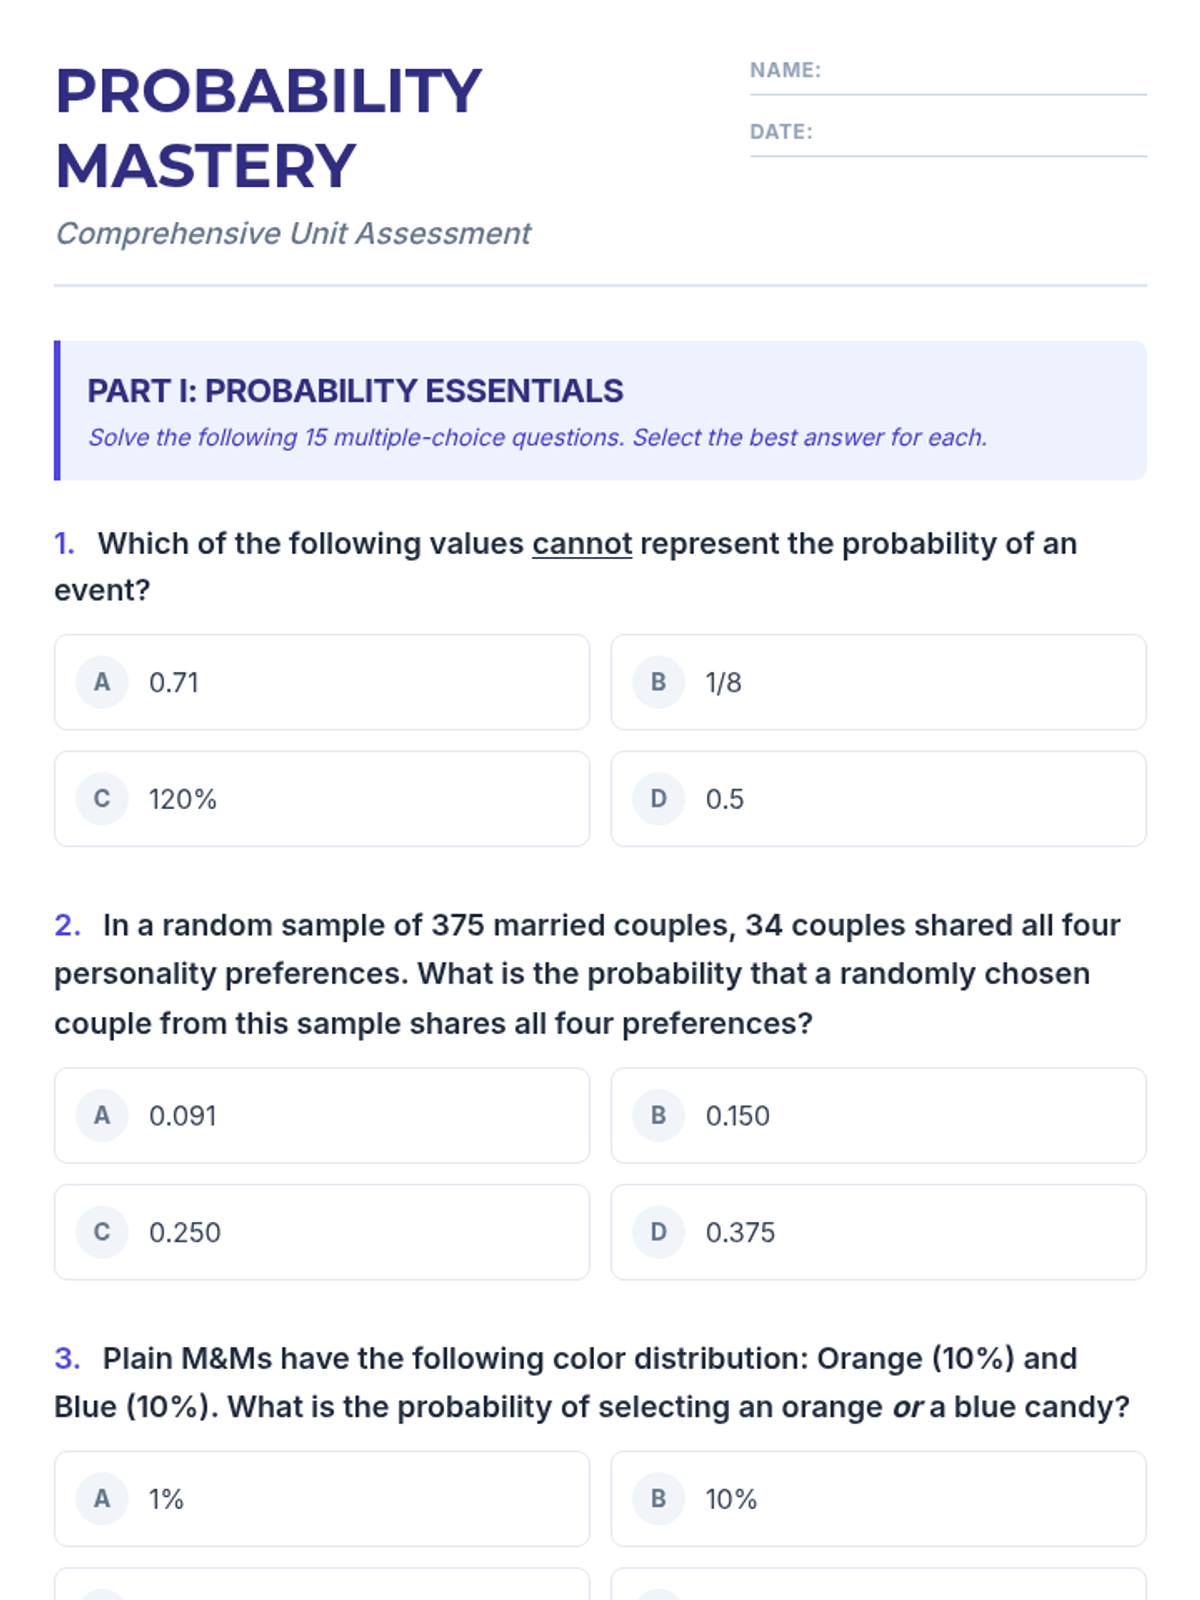
A complete 4-page Probability Mastery Exam with 30 questions. It features full multiple-choice options for Part I and II (including Q9 and Q10) and full word-problem text for Part III (Q26-30). The layout is professionally optimized with 12pt Arial-style font, single spacing, and compact h-16 work boxes. Formulas and subscripts are rendered for maximum compatibility.
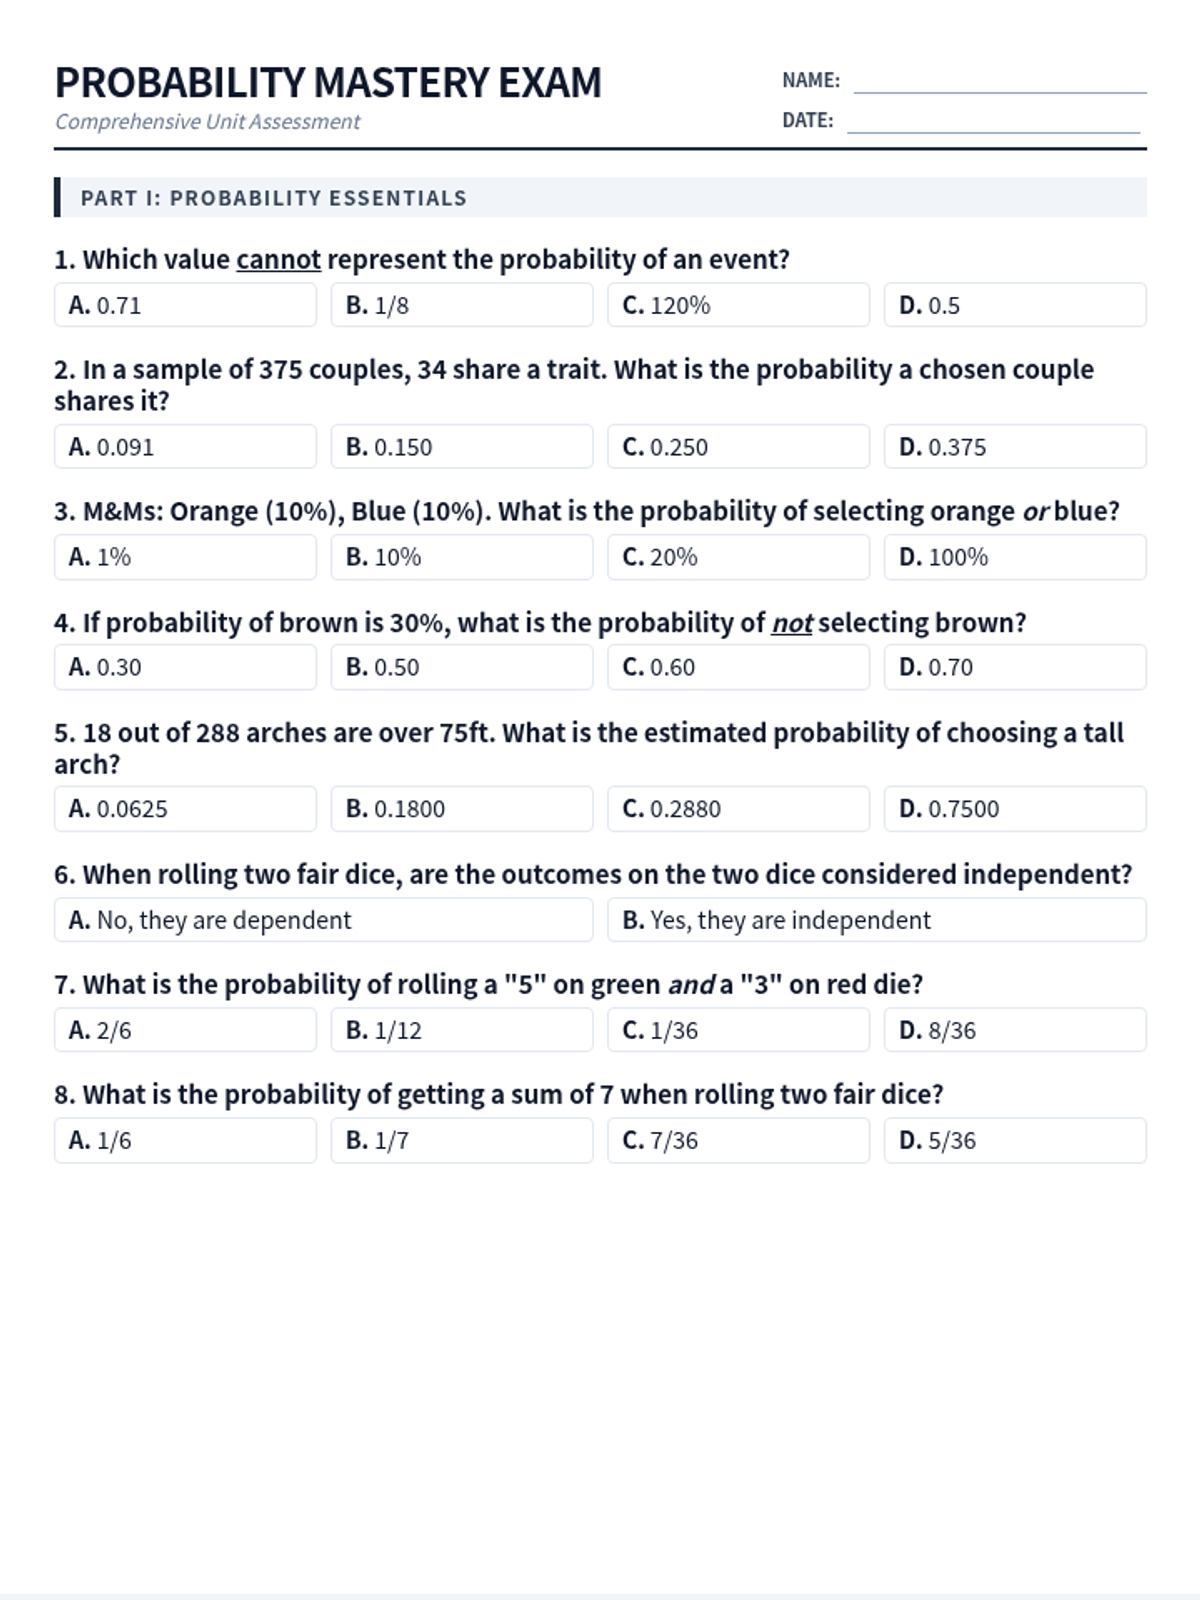
A revised 4-page Probability Mastery Exam with a complete 4-option Question 18 and standardized, smaller student work boxes (h-24) for calculations. The layout remains efficient, using a 12pt Arial-style font with single spacing to ensure all 30 questions fit perfectly within the 4-page limit. Math notation has been simplified for consistent rendering.
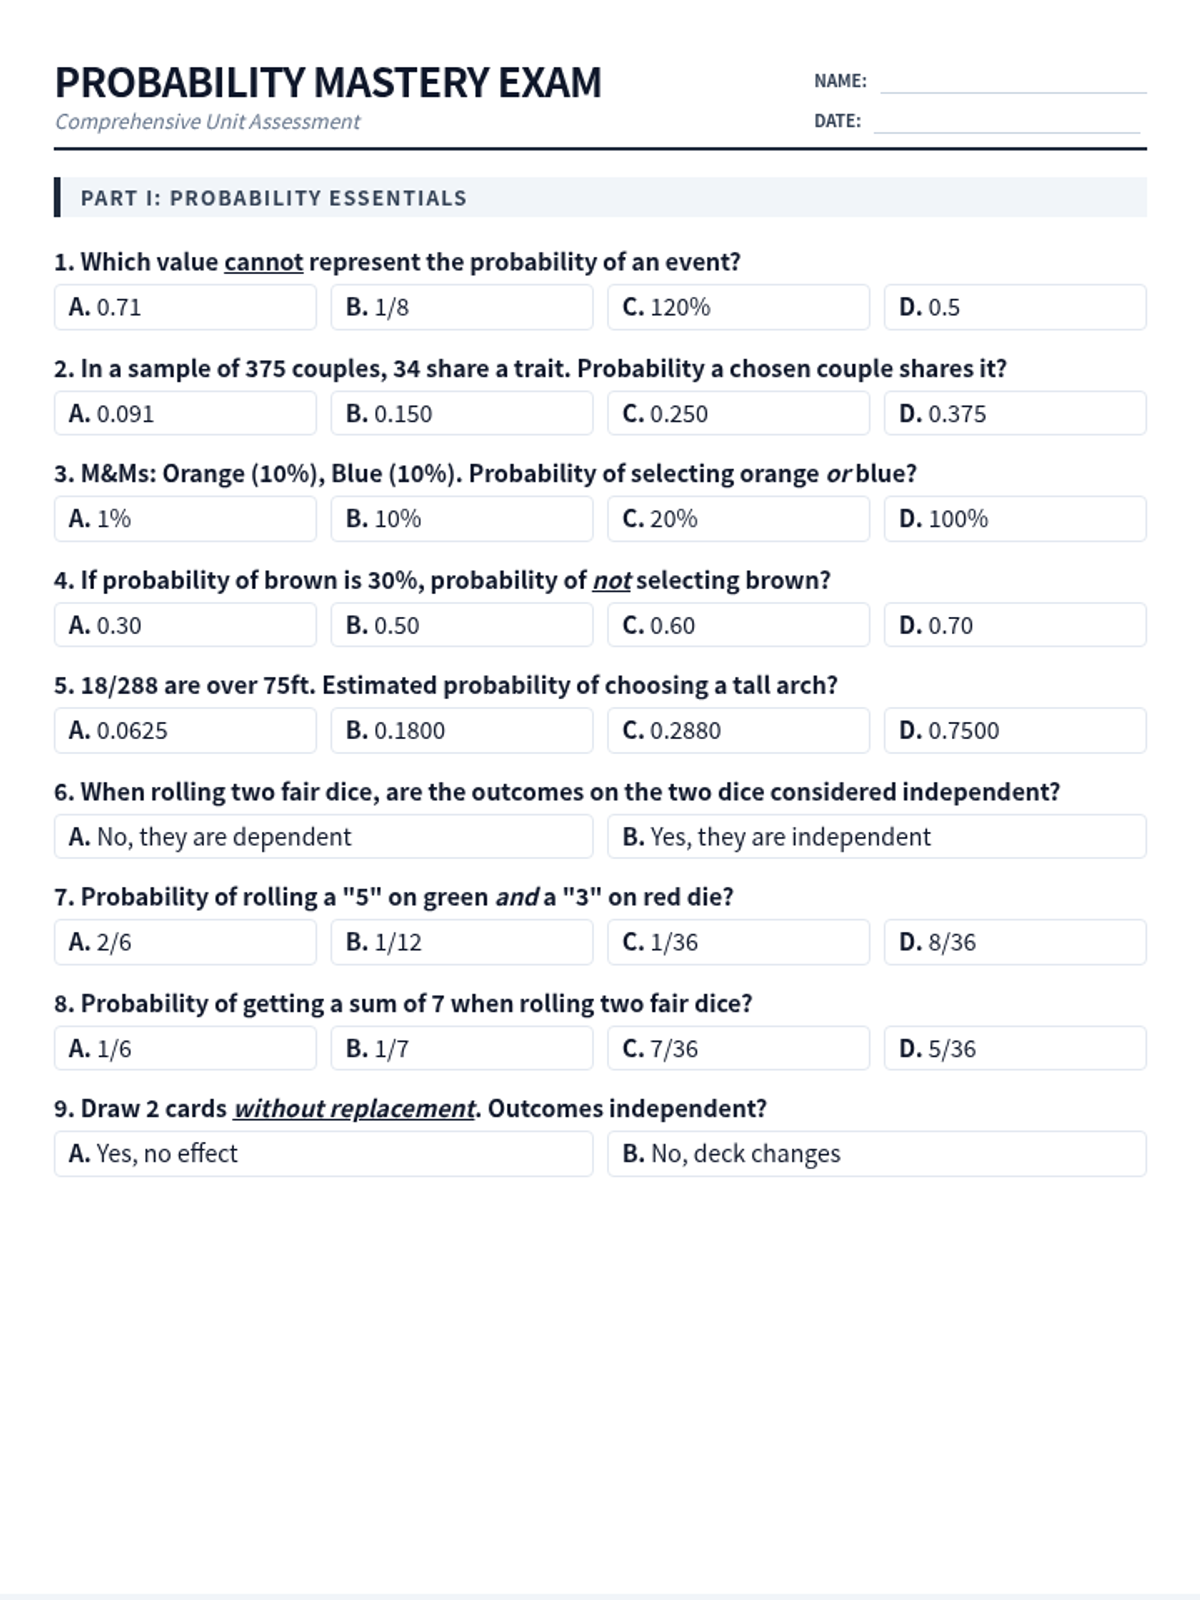
A compact 4-page Probability Mastery Exam using standard sans-serif font (Arial stack) with 12pt (16px) text and single spacing. It features 30 questions organized with space-efficient 2-column answer grids and larger work boxes for the binomial distribution section. Question 18 has been updated to include all four probability distribution options.
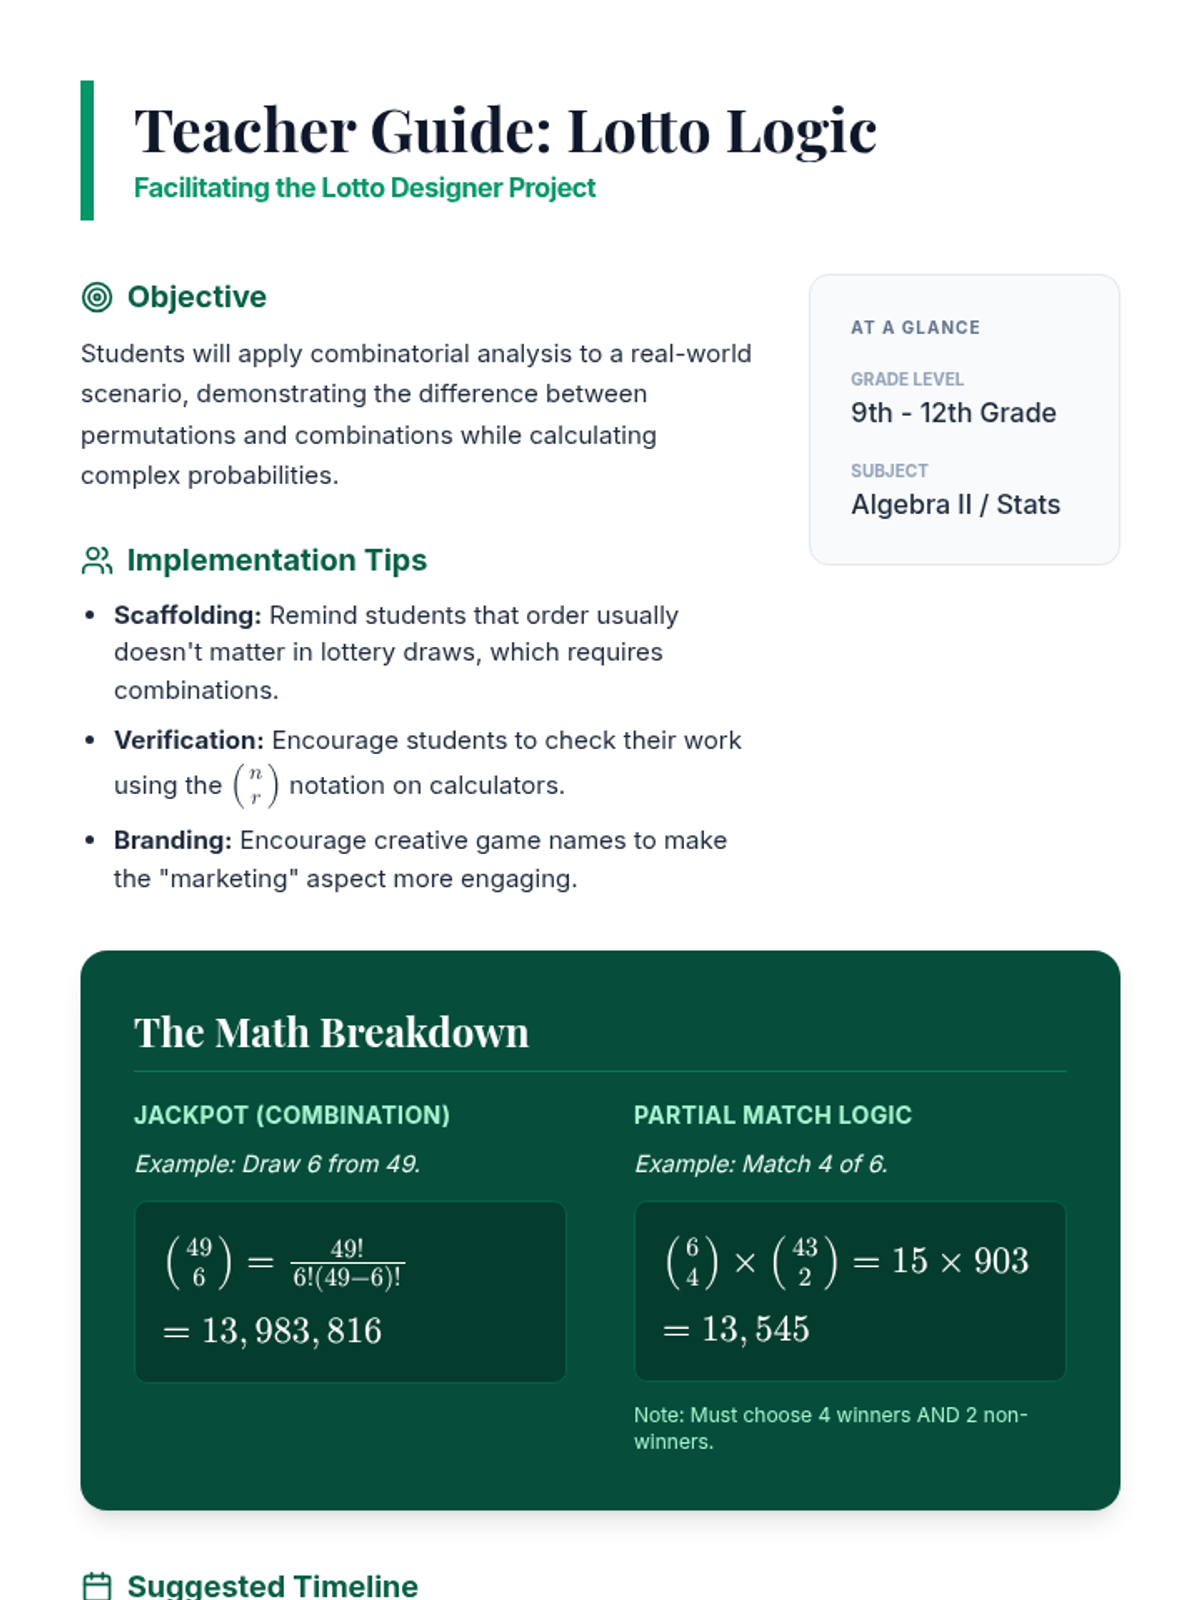
A teacher's guide for the Lotto Logic project, including pedagogical goals, implementation tips, scaffolded math examples for partial matches, and a suggested project timeline.
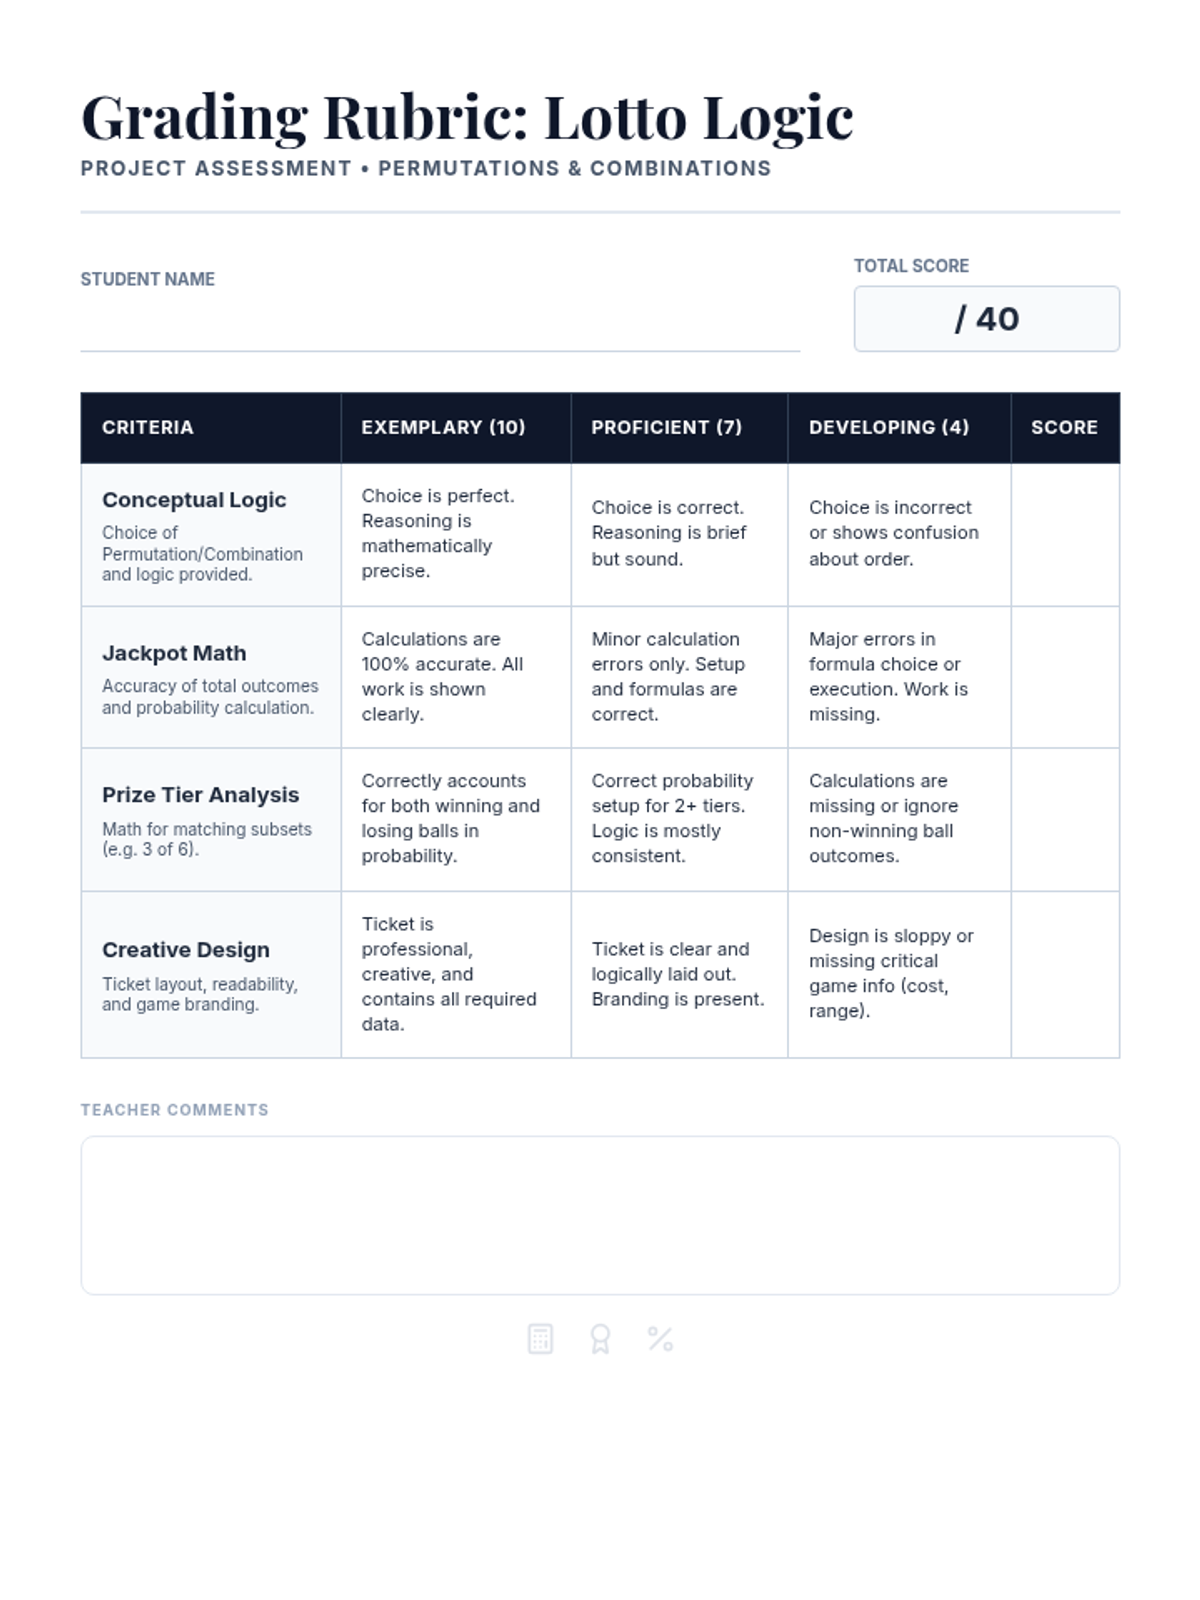
A detailed grading rubric for the Lotto Logic project, evaluating conceptual understanding, mathematical accuracy, prize tier analysis, and visual presentation.
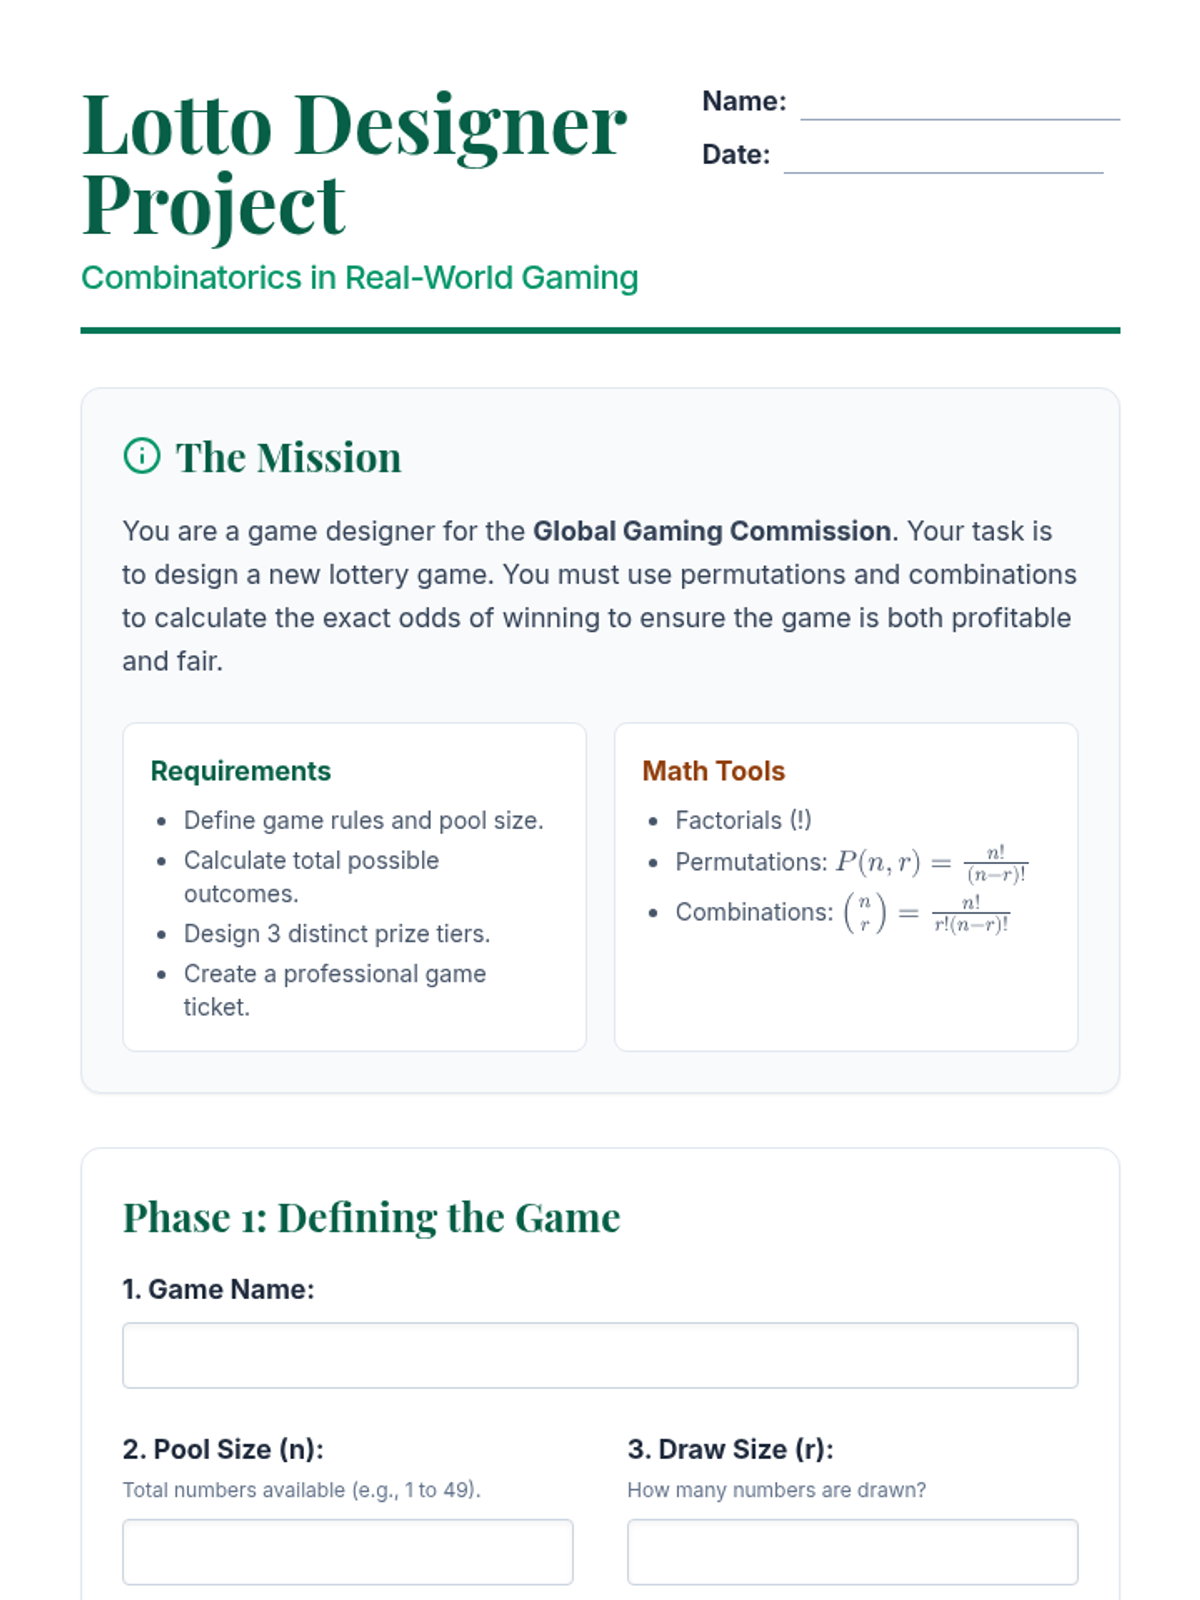
A comprehensive student project handout for designing a lottery game using permutations and combinations. Includes sections for game definition, jackpot calculations, prize tier analysis, and creative ticket design.
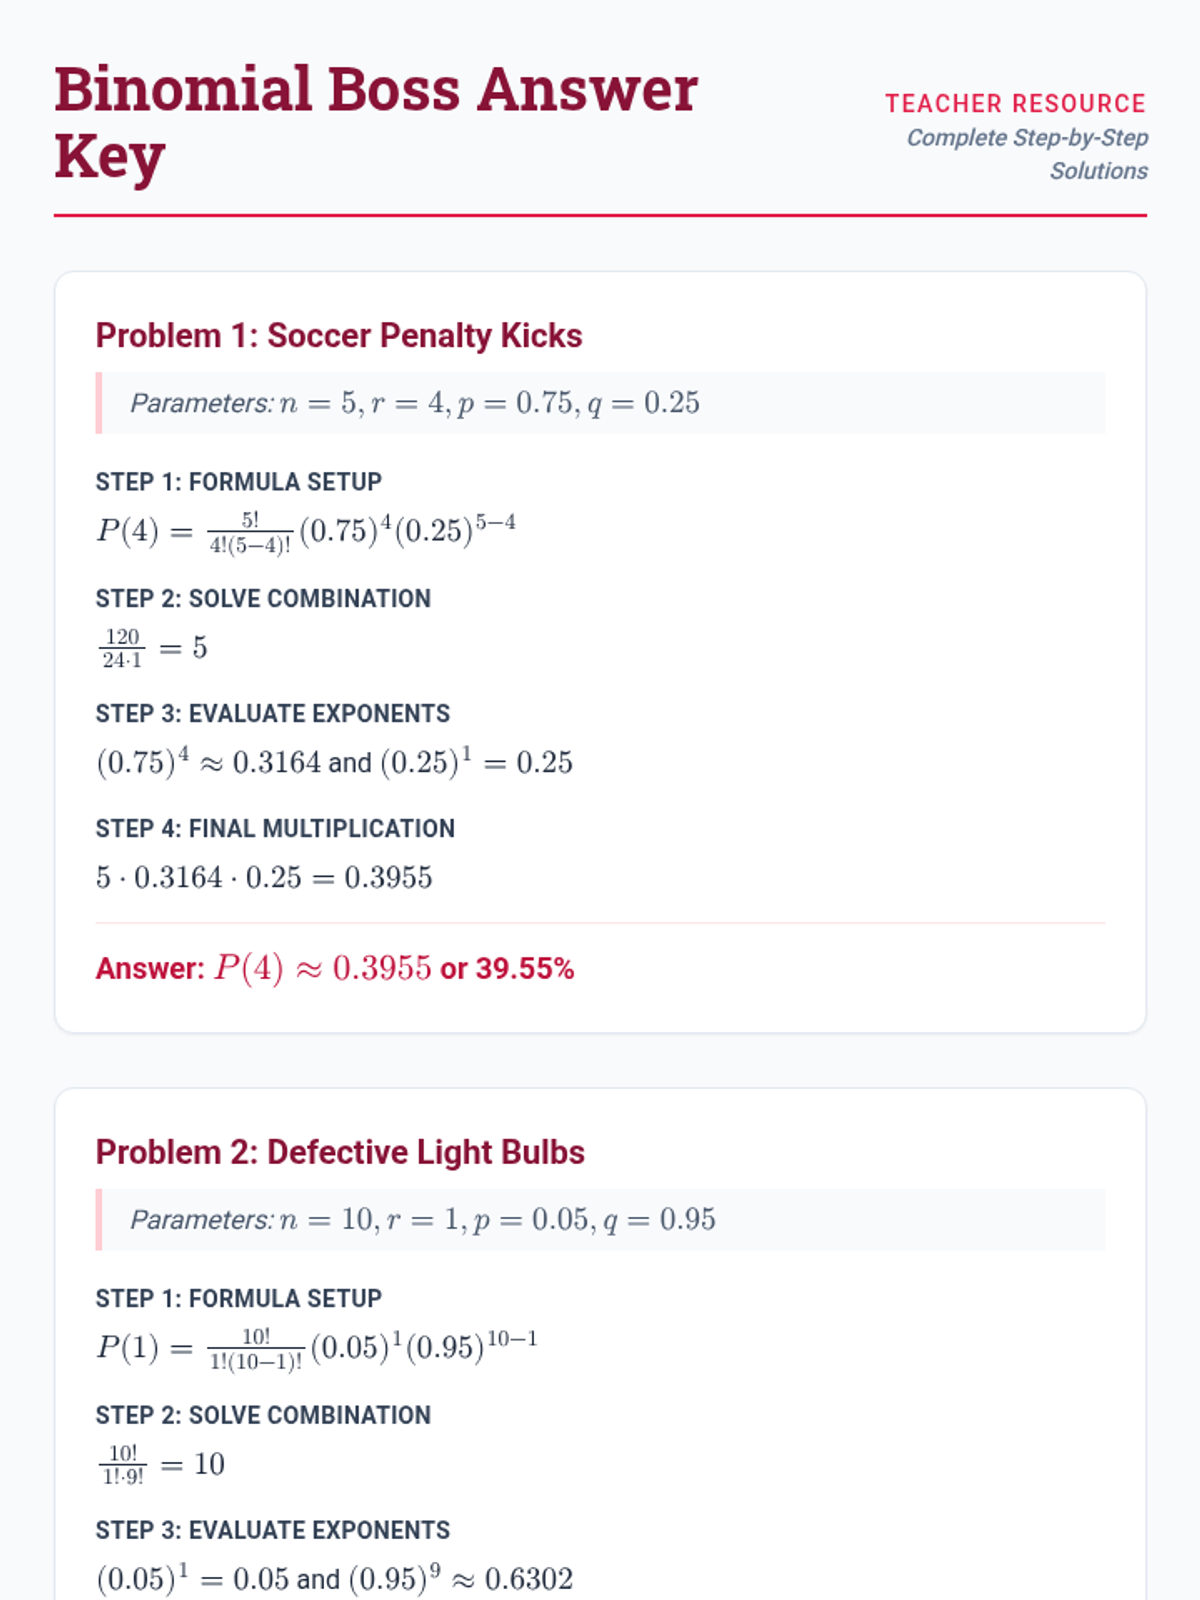
A complete teacher's answer key for the Probability Mastery Exam. Includes final answers for multiple-choice questions and detailed, step-by-step solutions using the binomial probability formula for the final section.
A comprehensive 30-question math exam on probability and statistics, covering elementary probability, counting principles, and binomial distribution problems. The material features multiple-choice and short-answer sections with clear instructions and dedicated work areas.
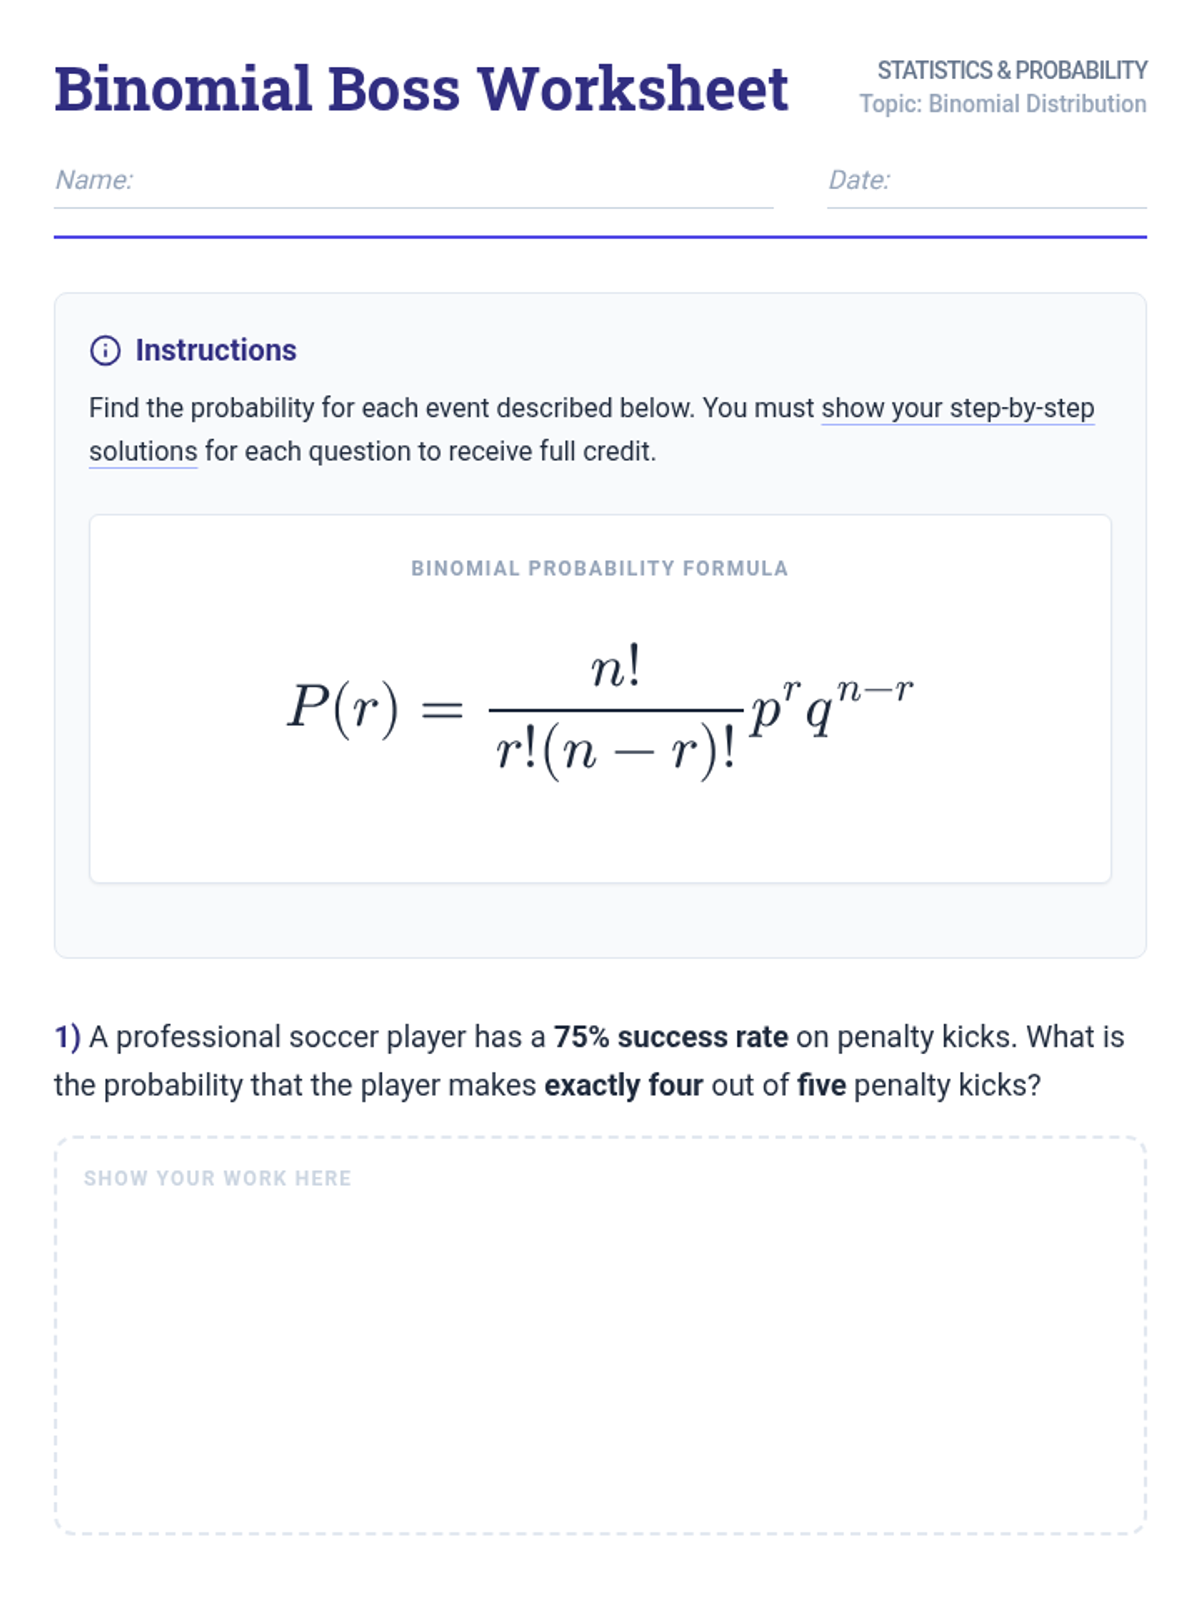
A teacher's answer key providing full, step-by-step binomial probability solutions for the problems on the Binomial Boss Worksheet. Uses the requested factorial-based formula and variable notation.
A worksheet featuring 5 binomial probability word problems with designated workspace for step-by-step student solutions. Uses the factorial-based formula for probability calculations.
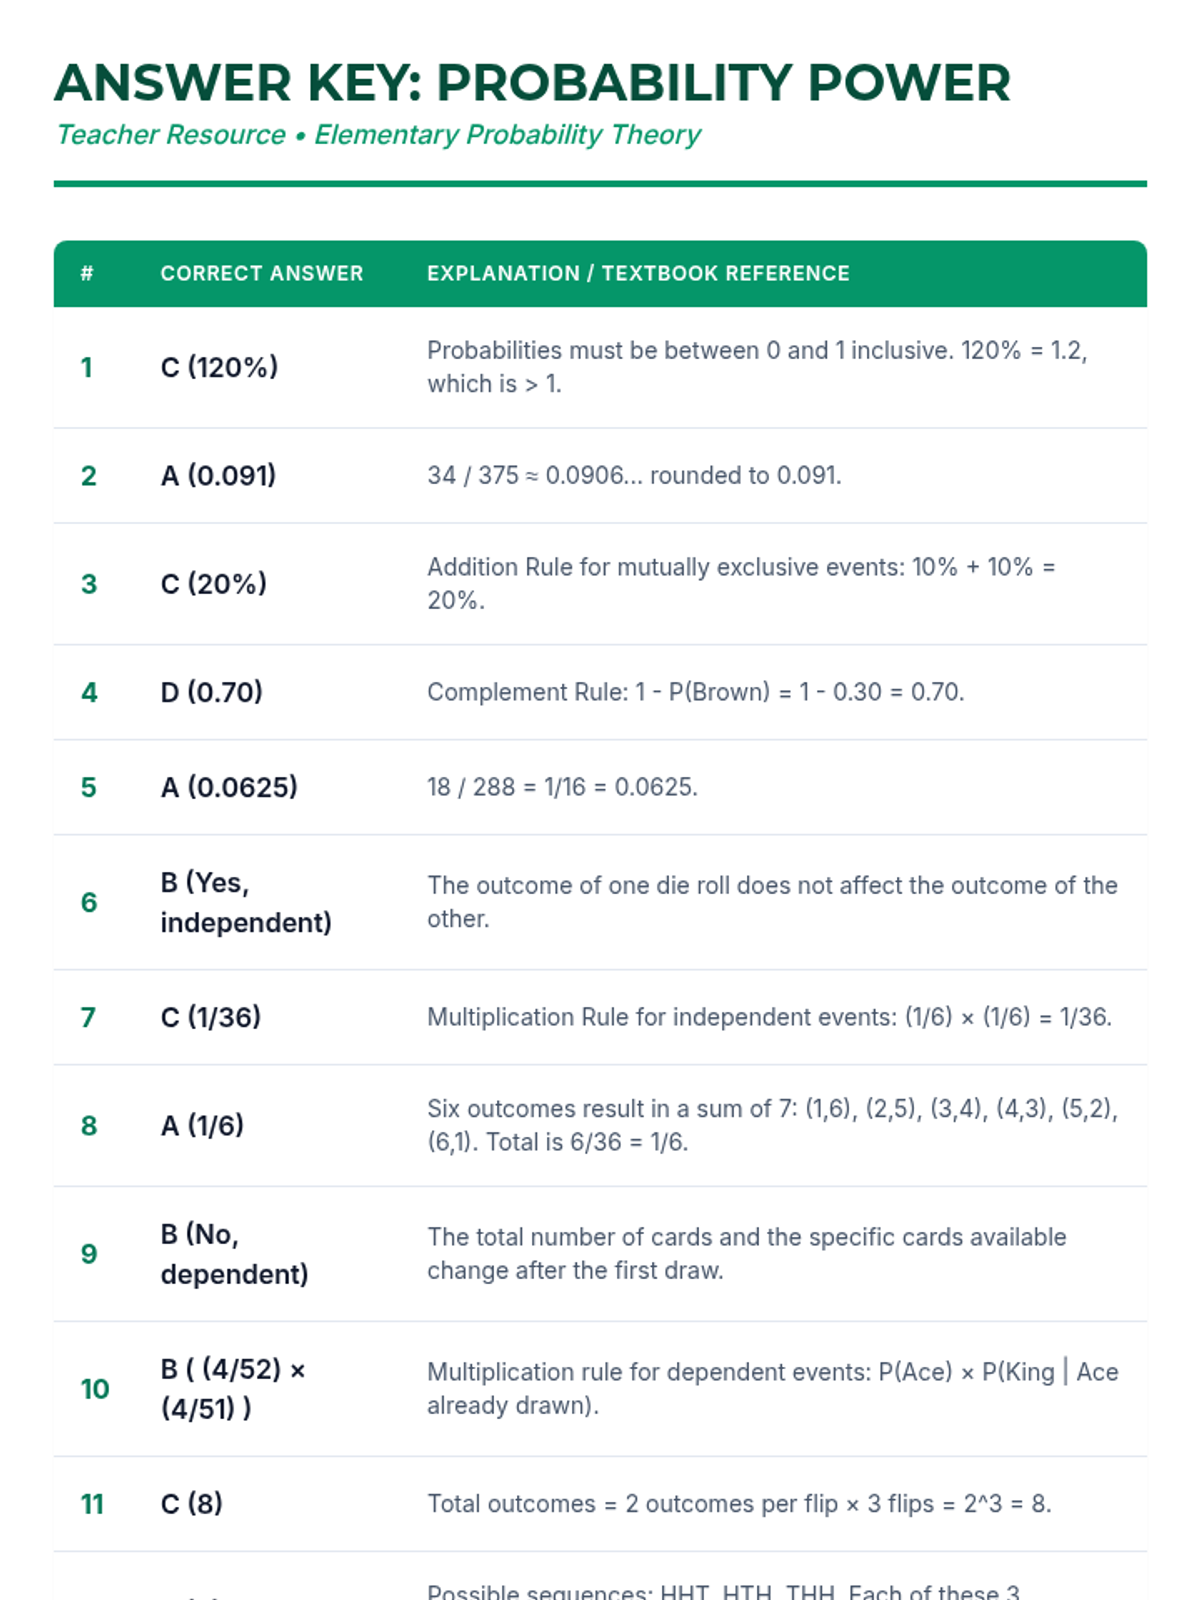
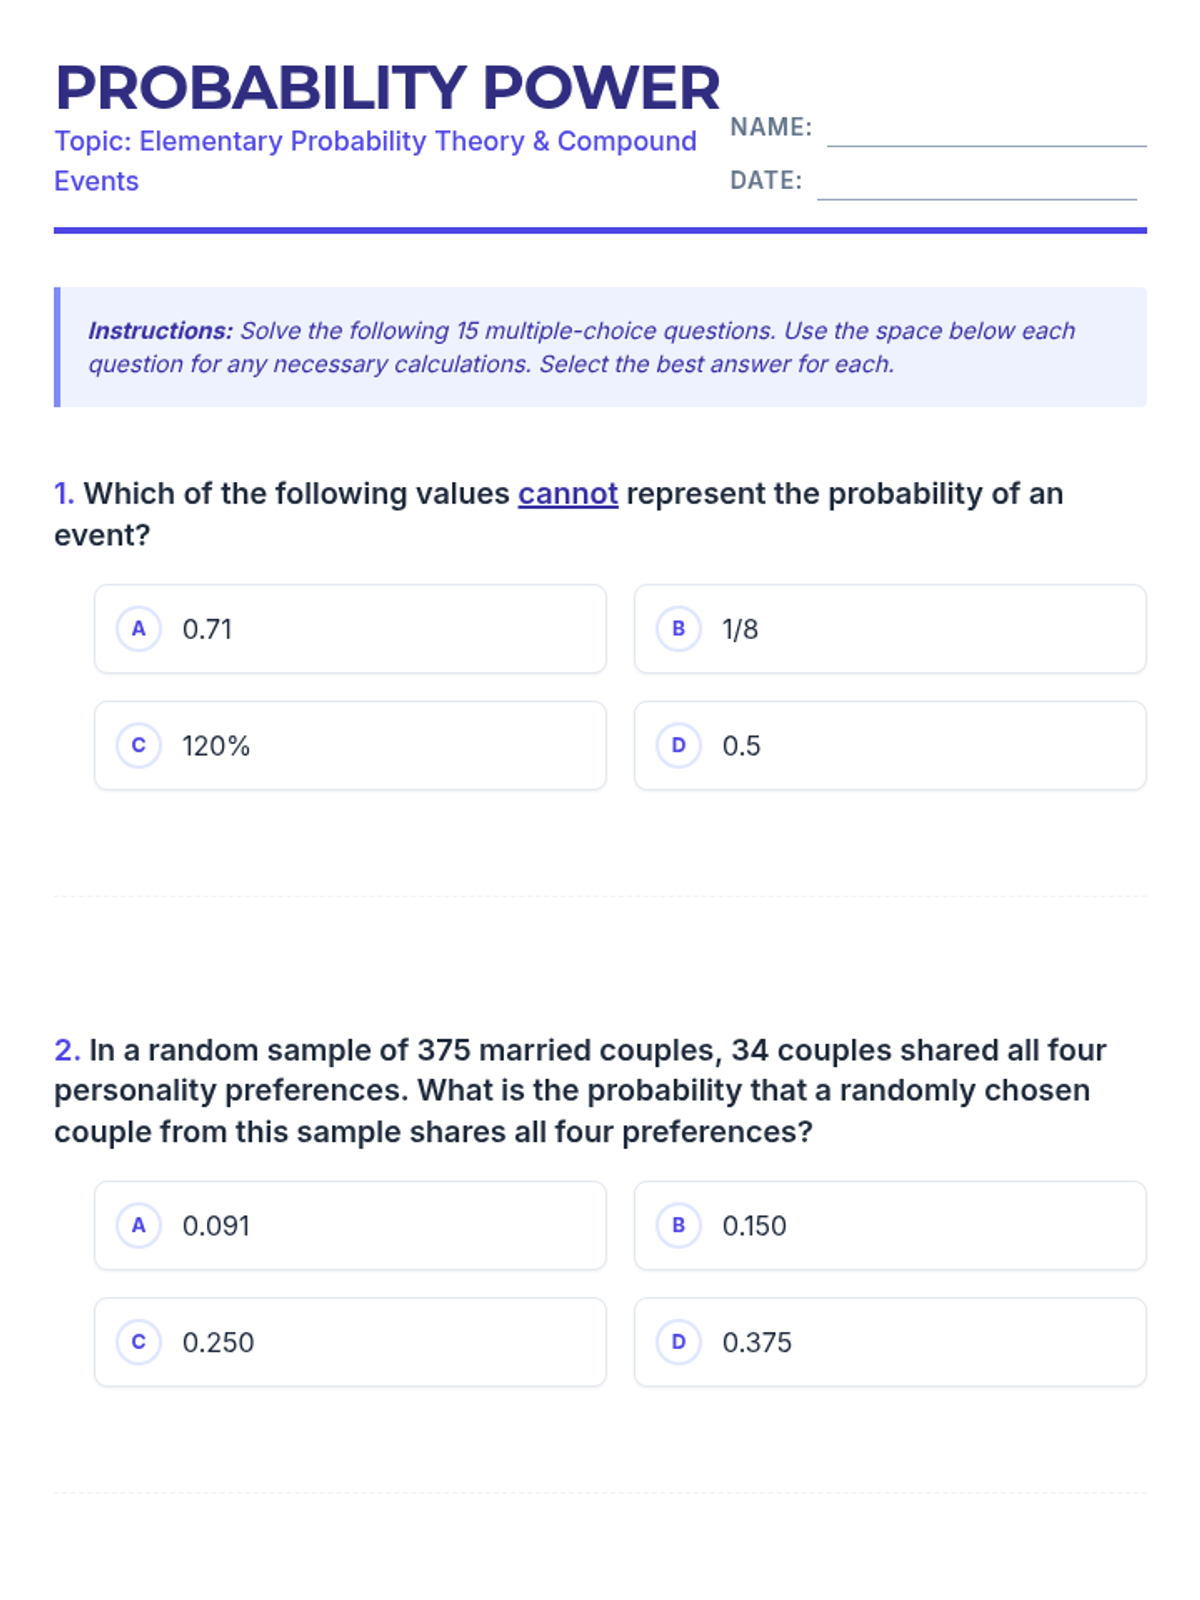
An answer key for the Probability Power Quiz, including detailed explanations and mathematical justifications for each of the 15 questions.
A 15-question multiple-choice worksheet on elementary probability theory. It covers concepts like valid probability ranges, compound events, and tree diagrams based on textbook problems. Includes designated scratch work areas.
A complete 20-question review presentation for the TSIA2 Math practice exam, featuring each question followed by a detailed step-by-step explanation slide with proper work areas. Rendering and overflow issues have been resolved. Full 20 pairs included.
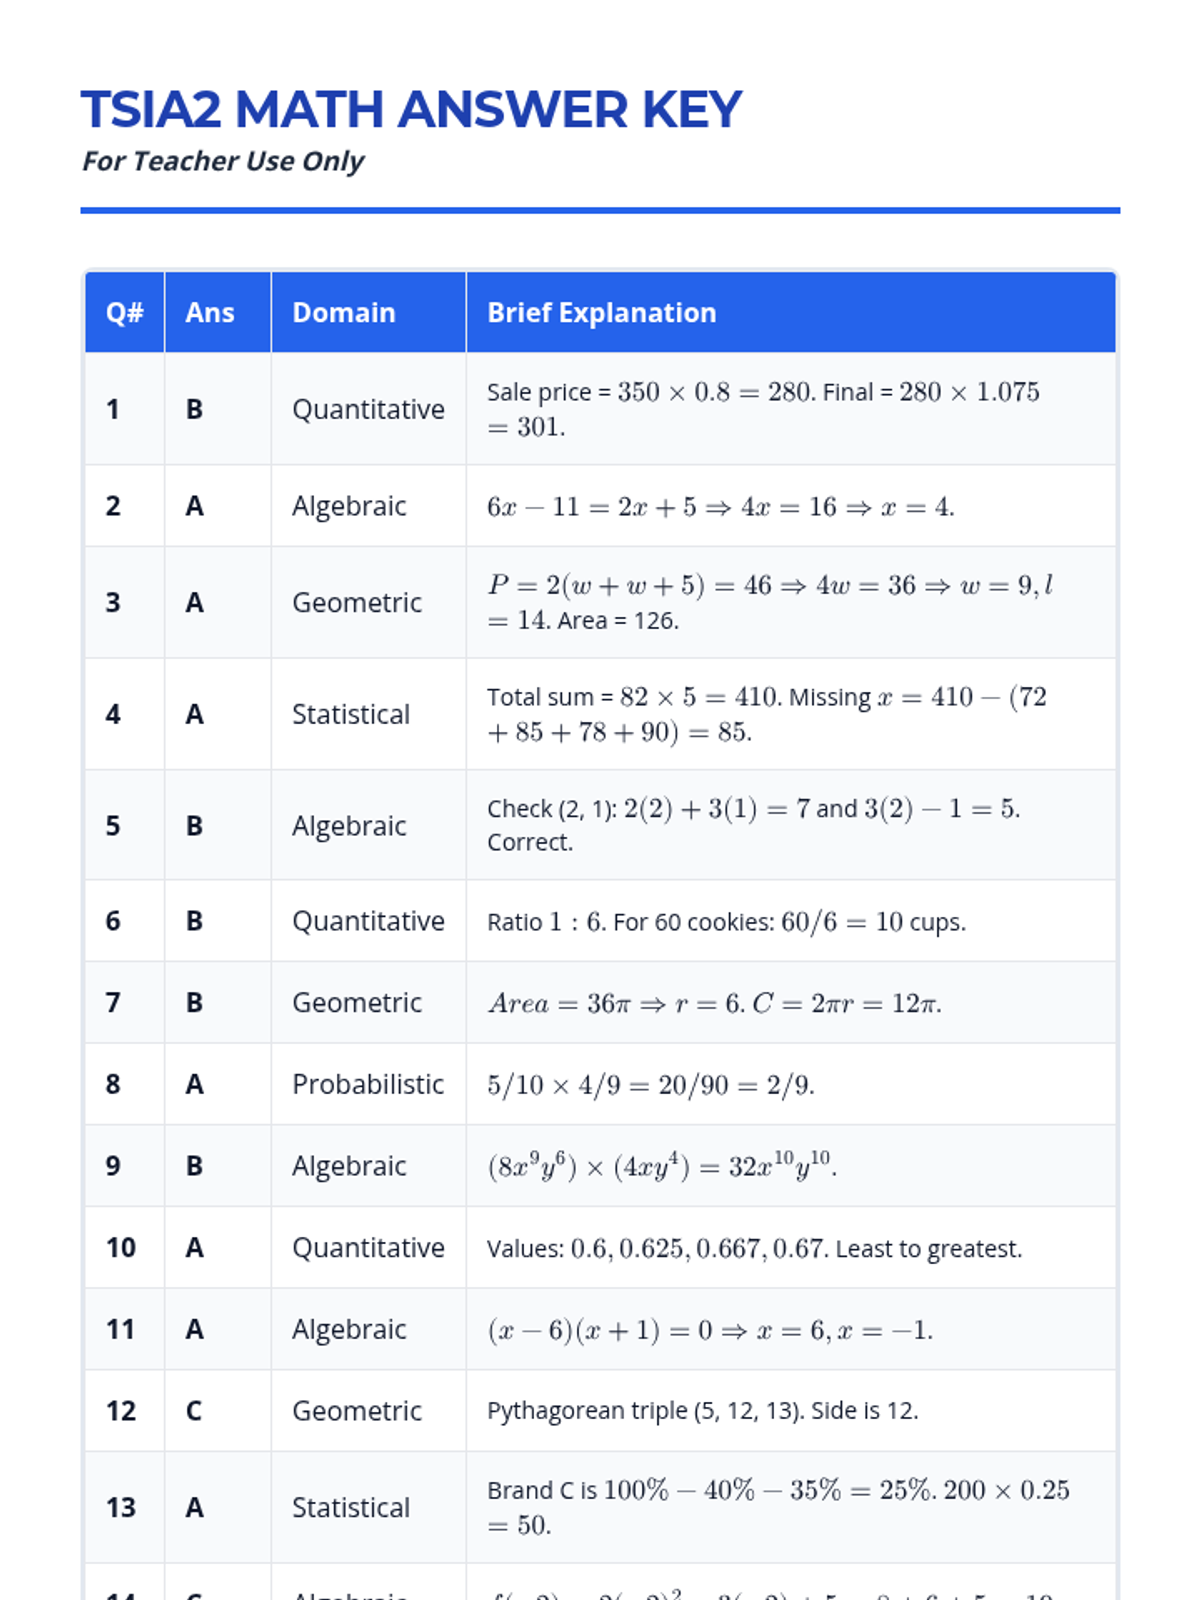
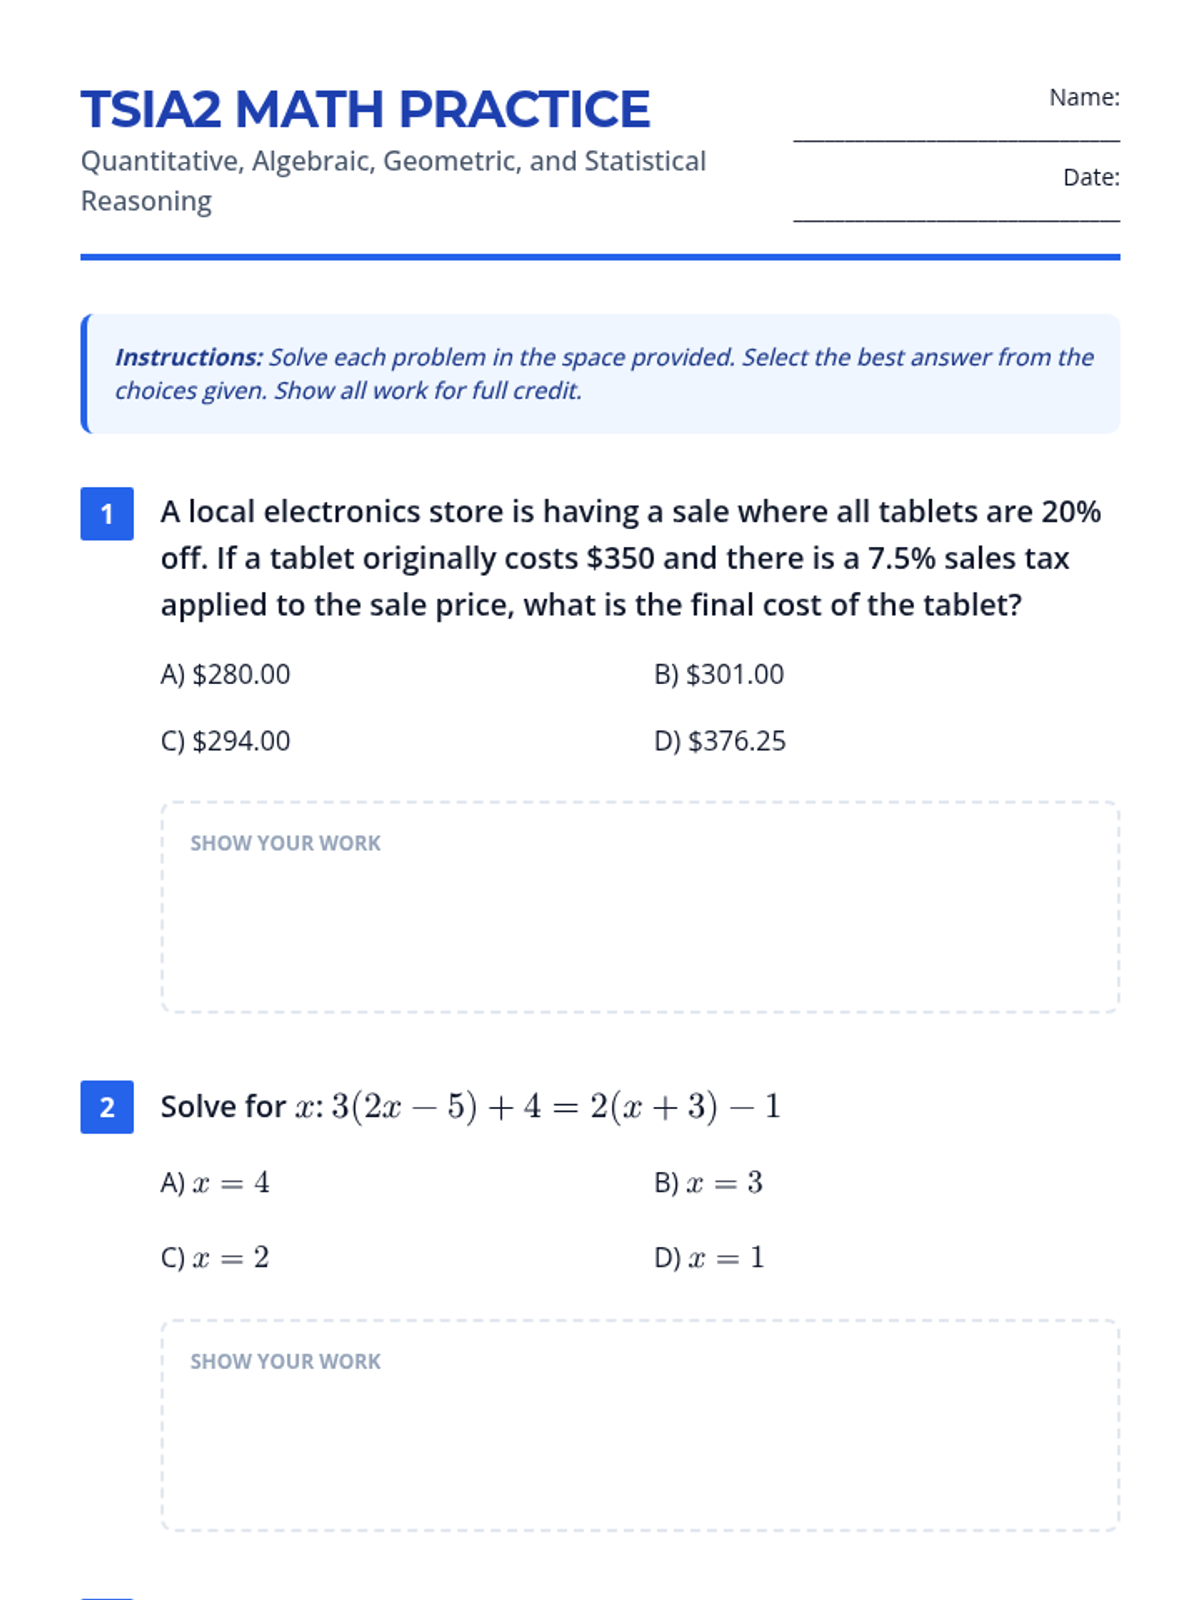
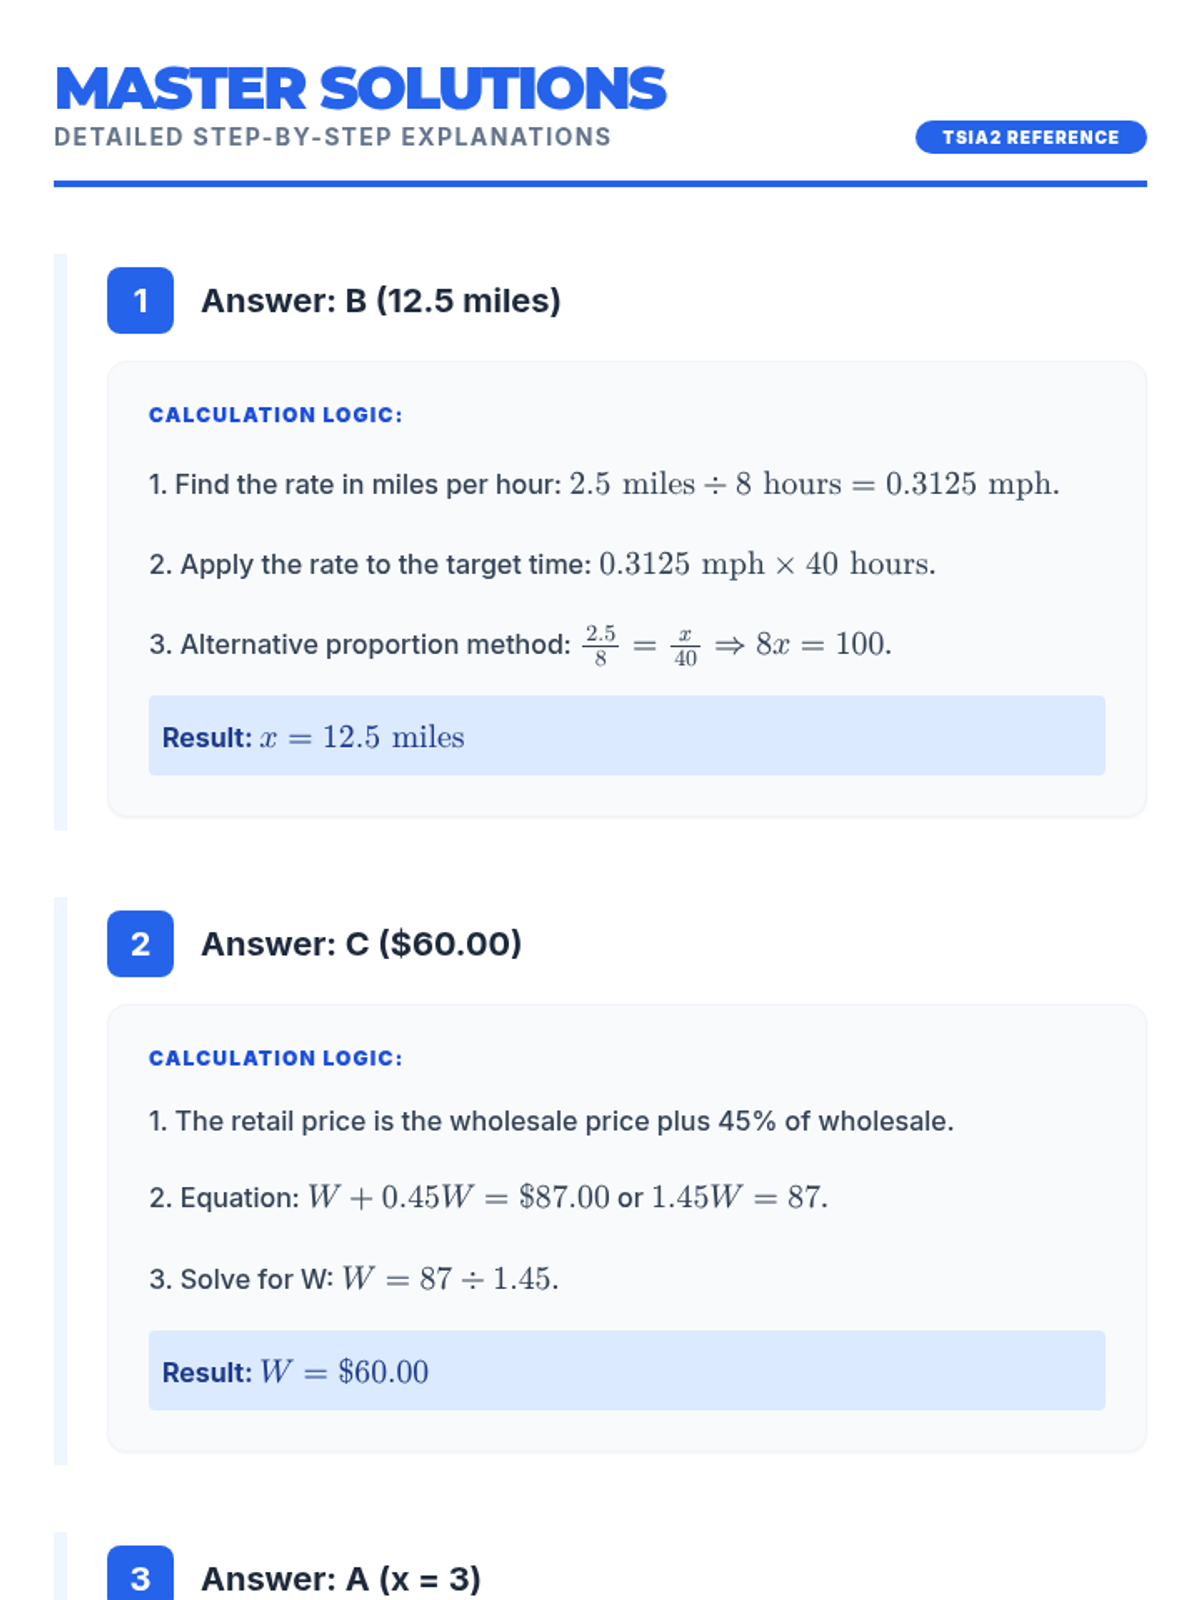
A detailed answer key for the TSIA2 Math practice exam, including correct responses, problem domains, and brief step-by-step explanations for all 20 questions. Table formatting refined for page breaks.
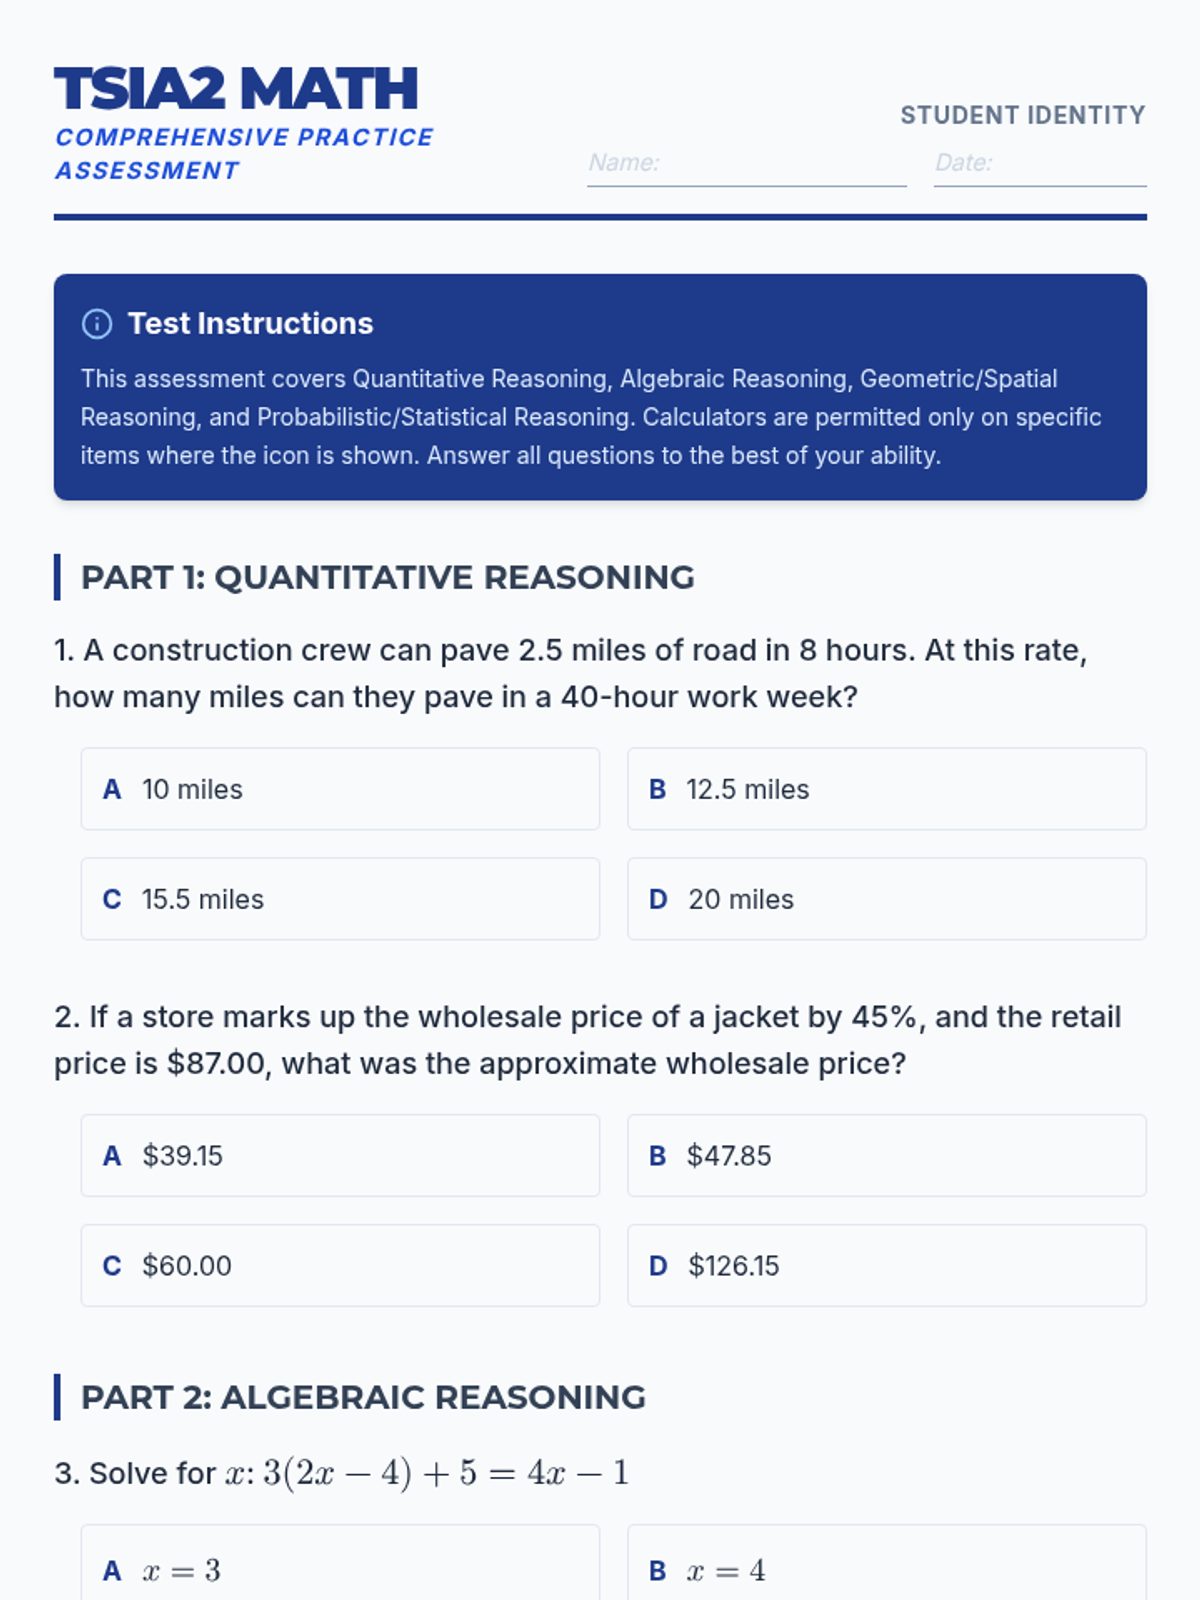
A 20-question practice exam for the TSIA2 Math assessment, featuring a balanced mix of quantitative, algebraic, geometric, and statistical reasoning problems with dedicated workspace for student calculations. Backgrounds are removed for clarity.
An engaging presentation that introduces the TSIA2 Math assessment and now includes a comprehensive 5-slide step-by-step solution guide for the mastery questions.
A detailed answer key providing step-by-step explanations for all 10 practice test questions, now with improved contrast and layout to ensure each solution stays on its own page.
A comprehensive 10-question practice test covering the core domains of the TSIA2 Math assessment, now featuring improved layouts, per-question work areas, and clear calculator icons.
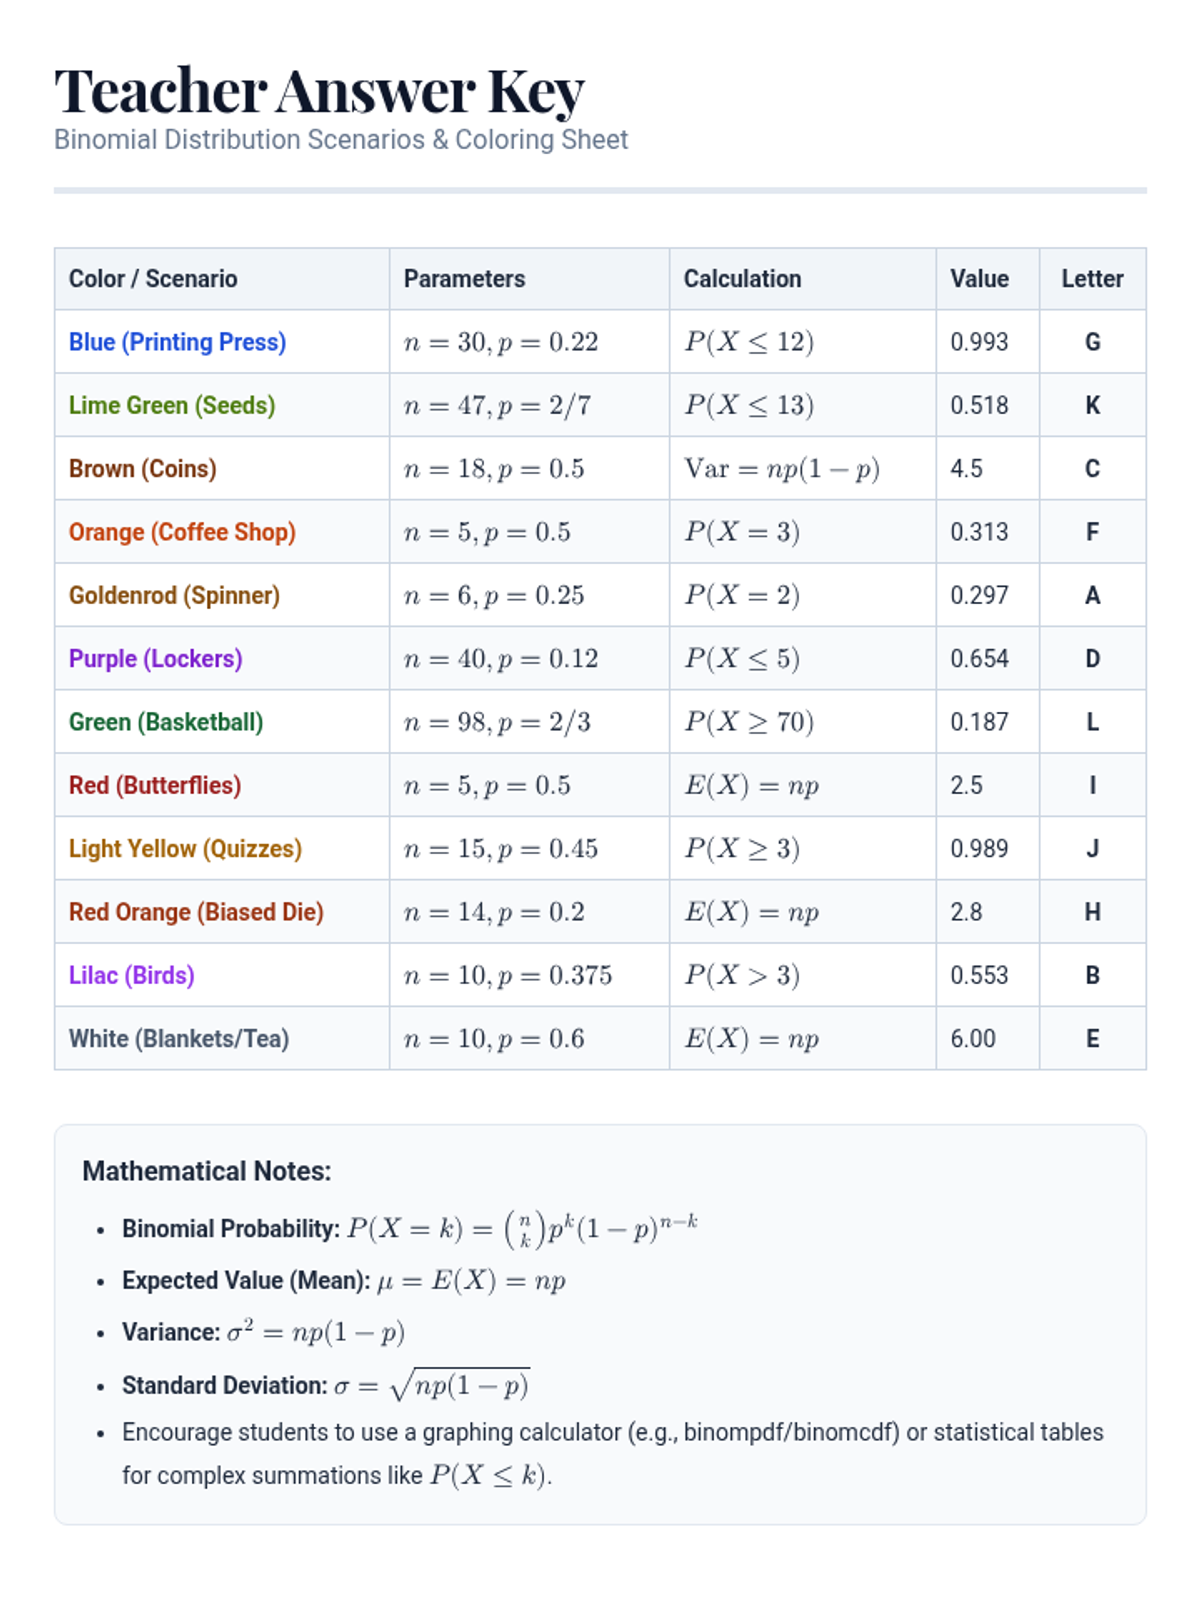
A complete answer key for the Binomial Scenarios worksheet, featuring parameter identification, calculation steps, final numerical values, and the corresponding letter for the coloring page.
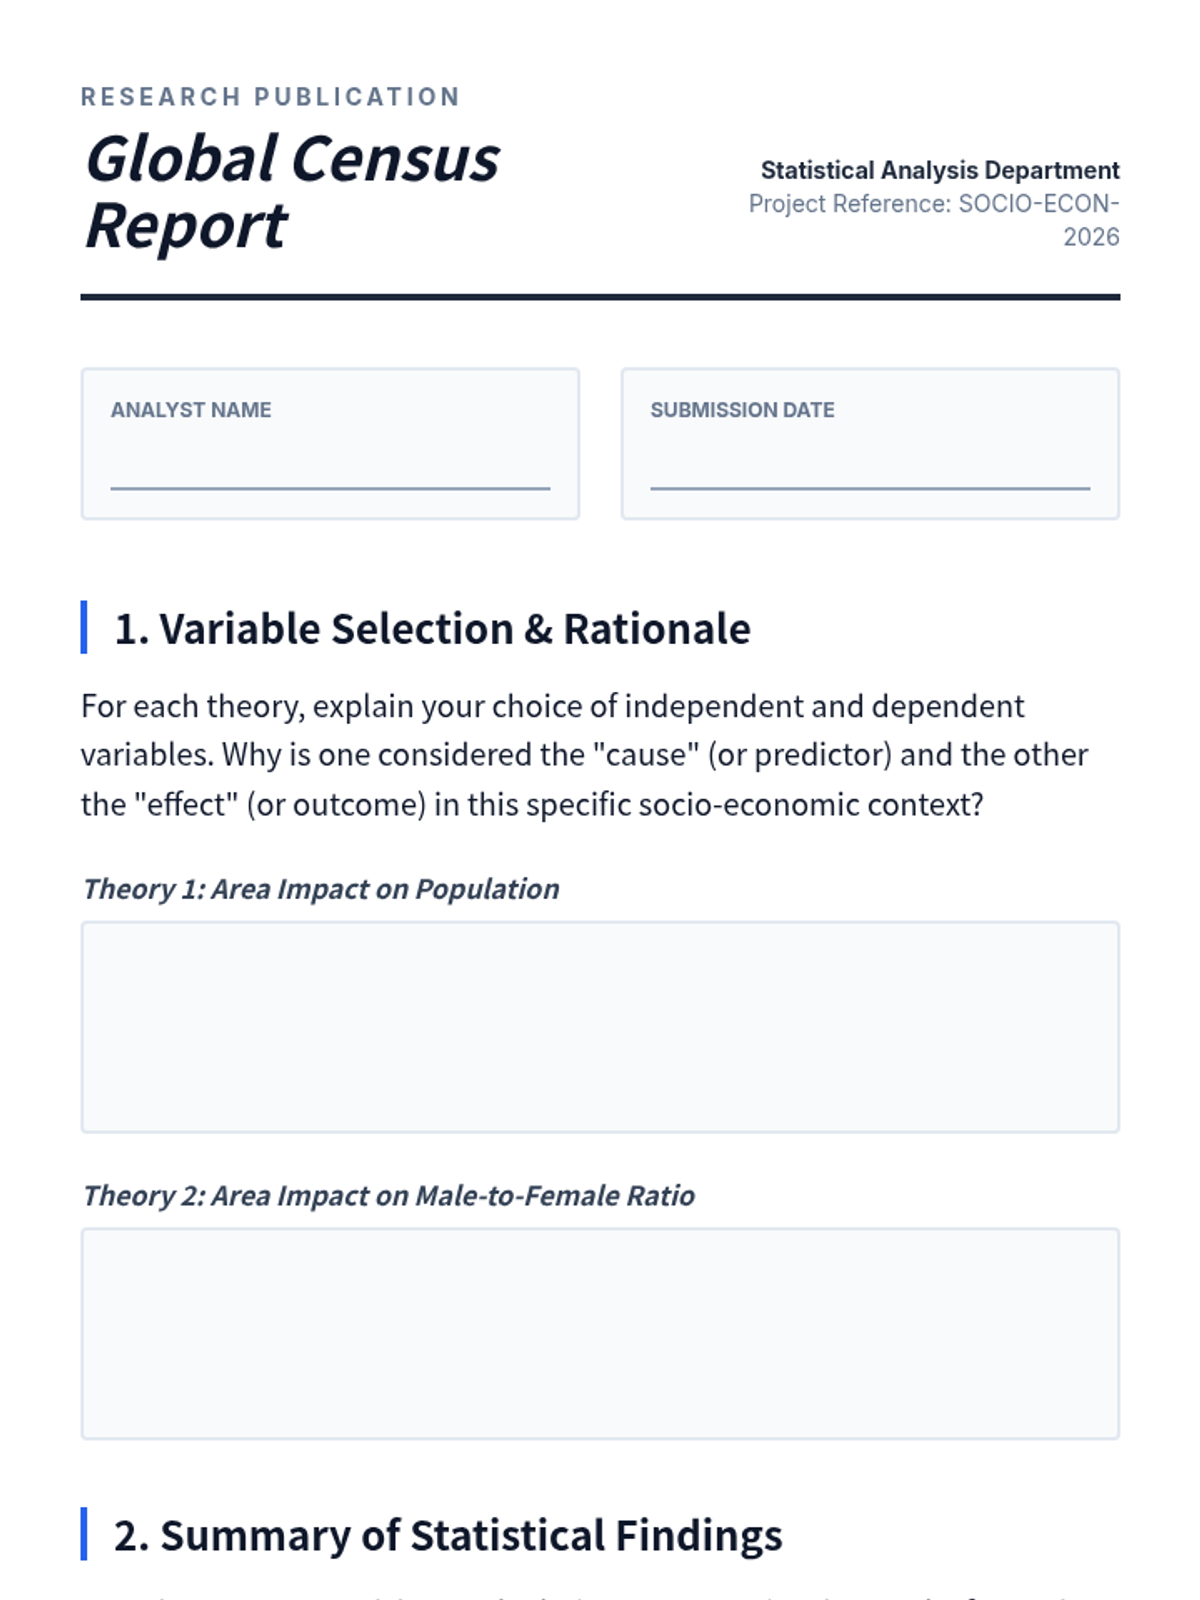
A formal research report template for synthesizing regression analysis findings, covering variable selection, statistical results summary, outlier impact evaluation, and final theoretical conclusions.
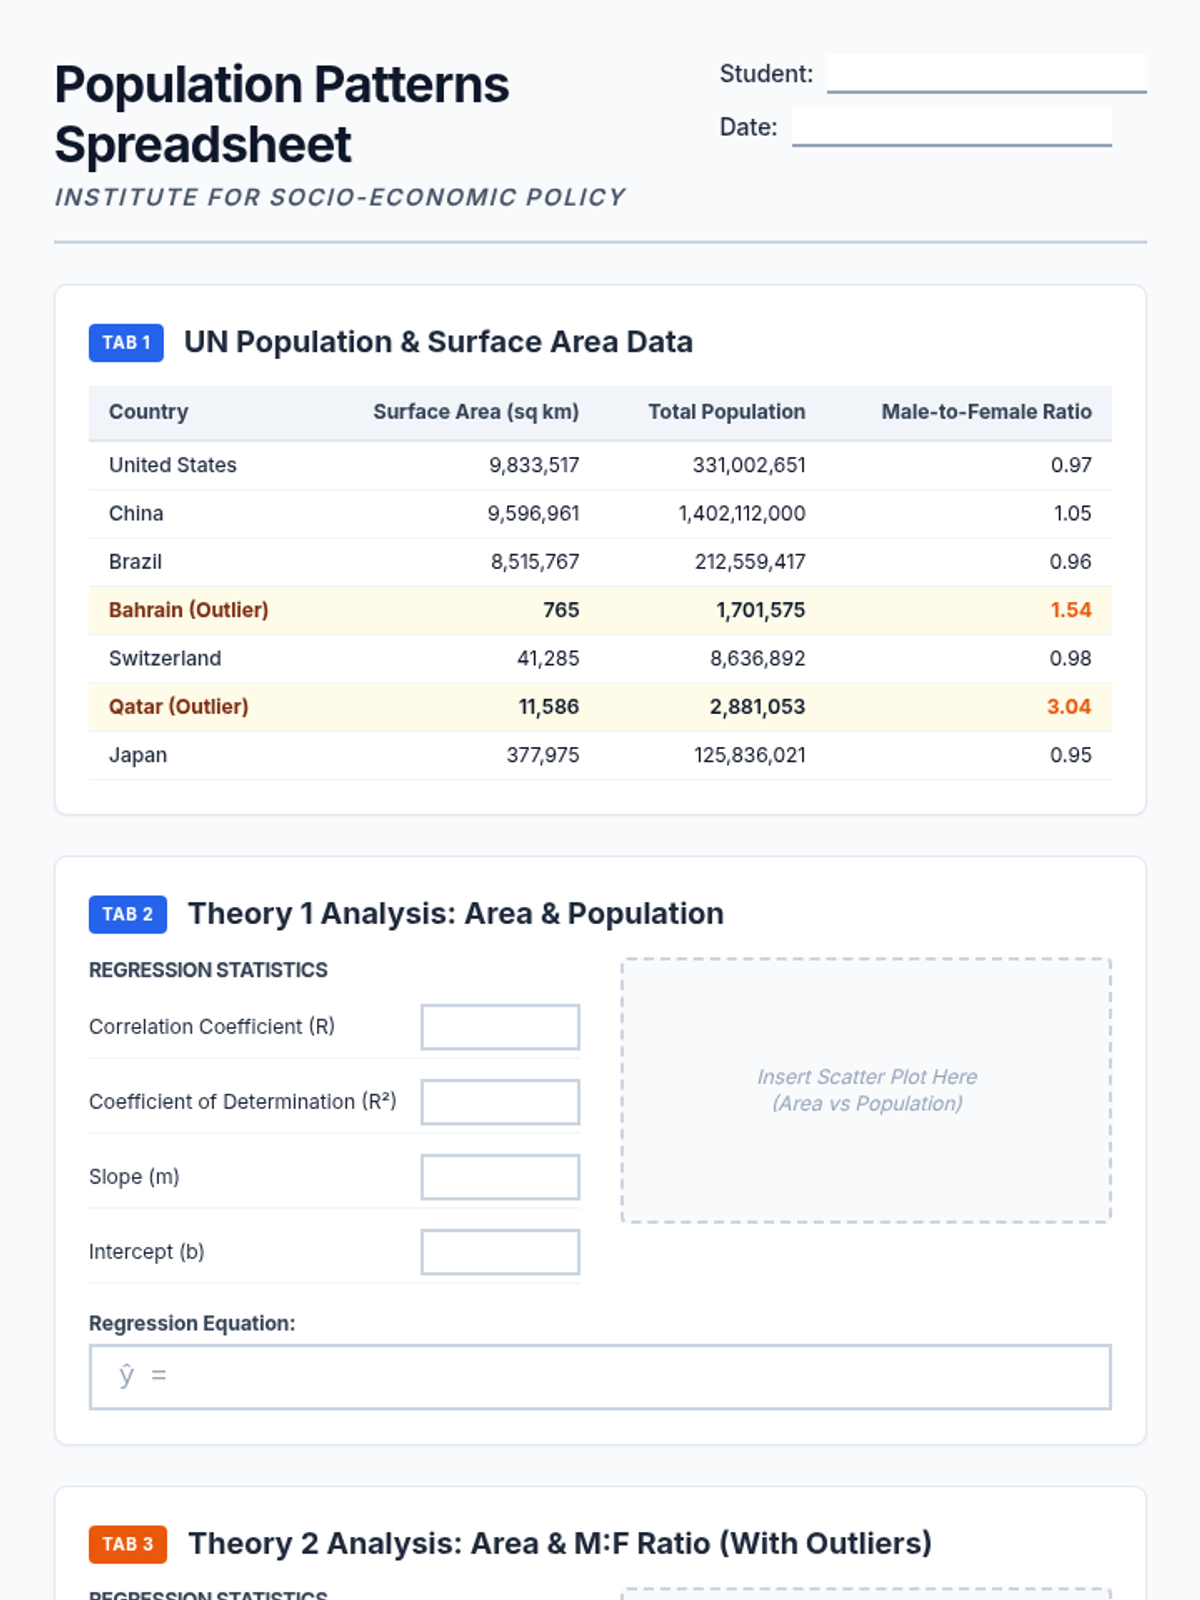
A structured spreadsheet-style document for recording regression analysis data and results across four tabs, including data for Theory 1, Theory 2 with outliers, and Theory 2 without outliers.
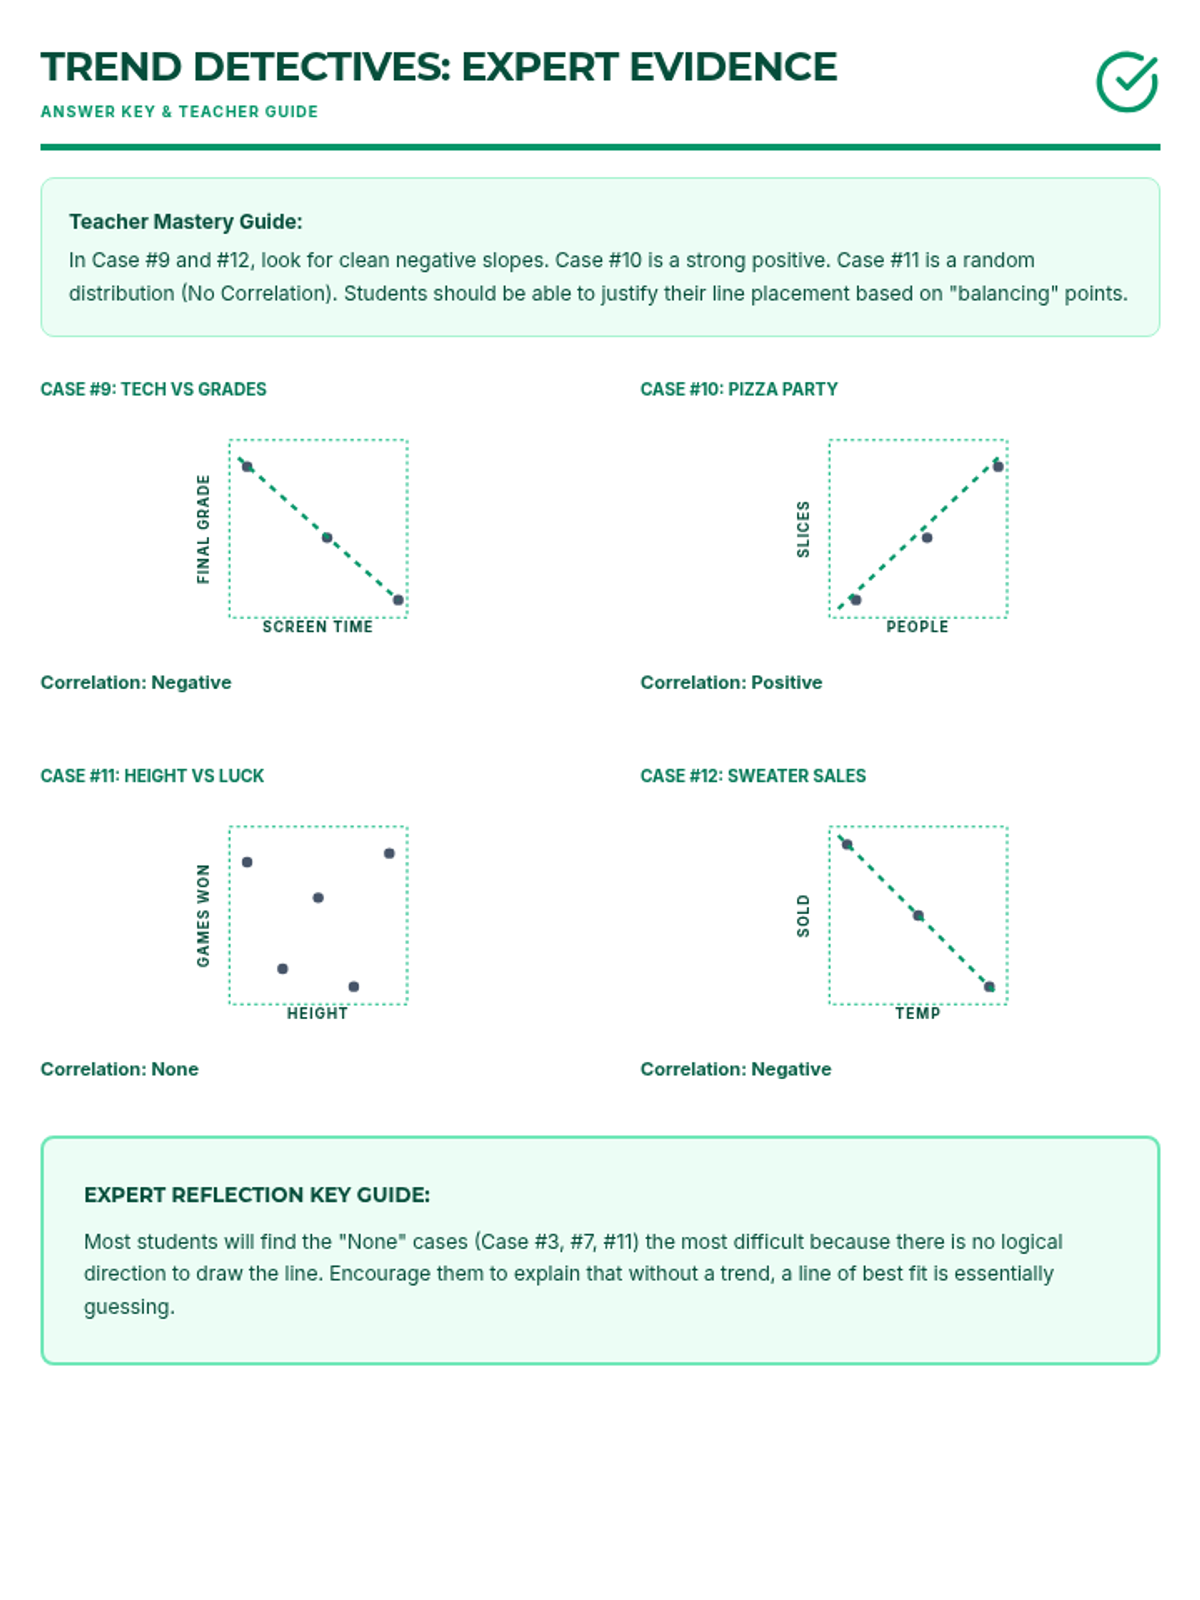
Answer key for the Expert Evidence worksheet. Provides teacher guidance on mastery-level line placement and reflection responses.
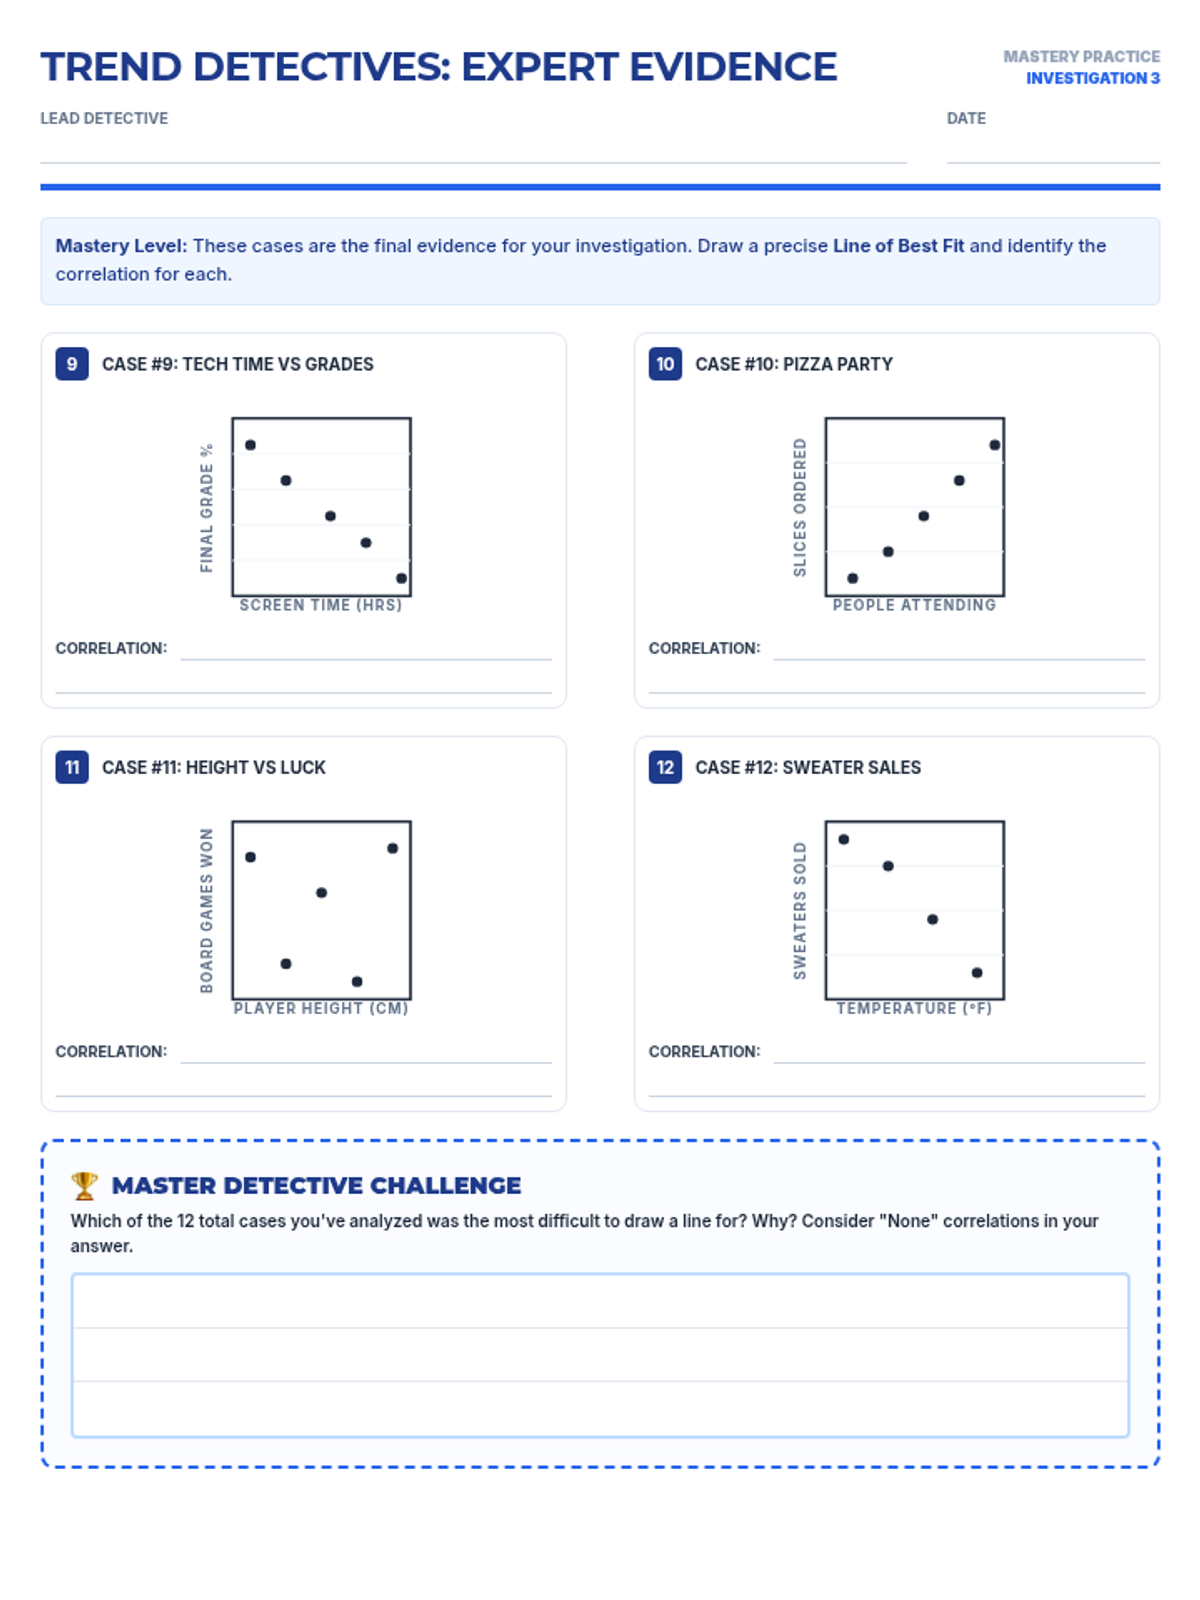
A third practice worksheet for scatter plots featuring mastery-level cases (Case 9-12) to wrap up the Trend Detectives investigation.
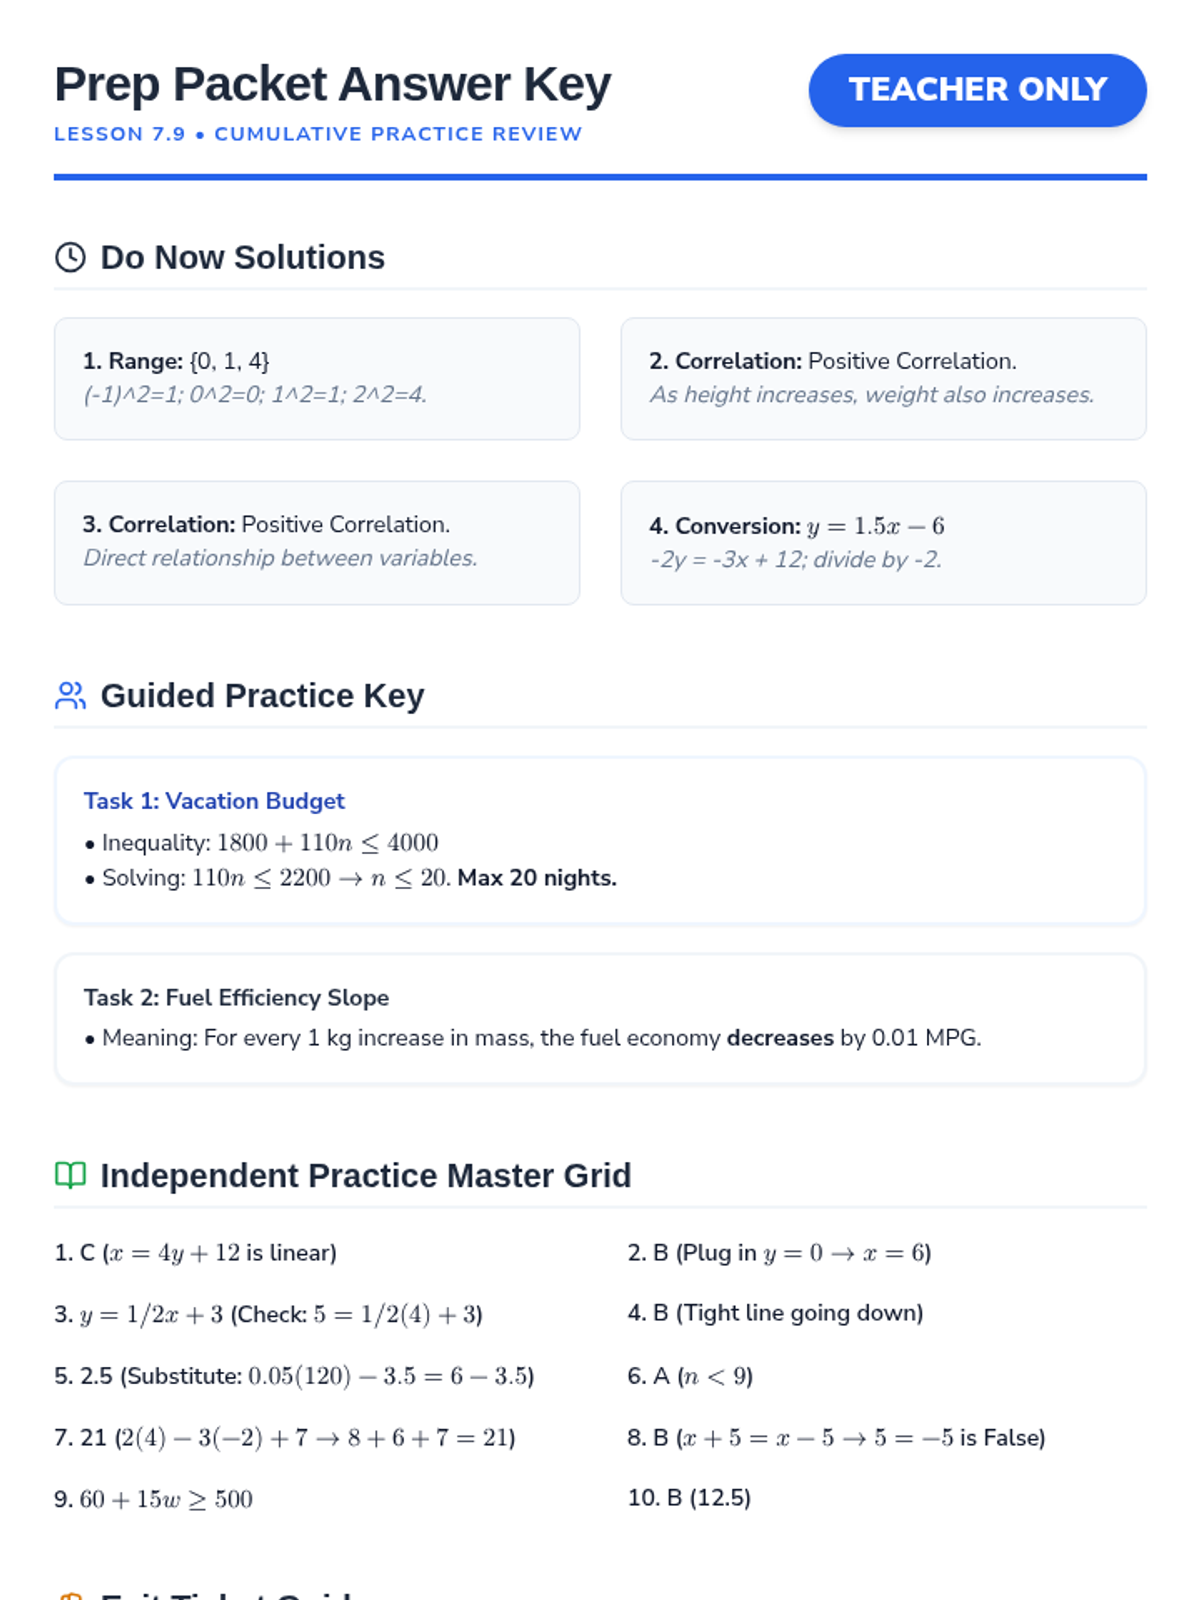
Teacher answer key for the Lesson 7.9 Prep Packet. Includes step-by-step solutions for modeling tasks, a quick-check grid for independent practice, and conceptual guidance for the exit ticket.
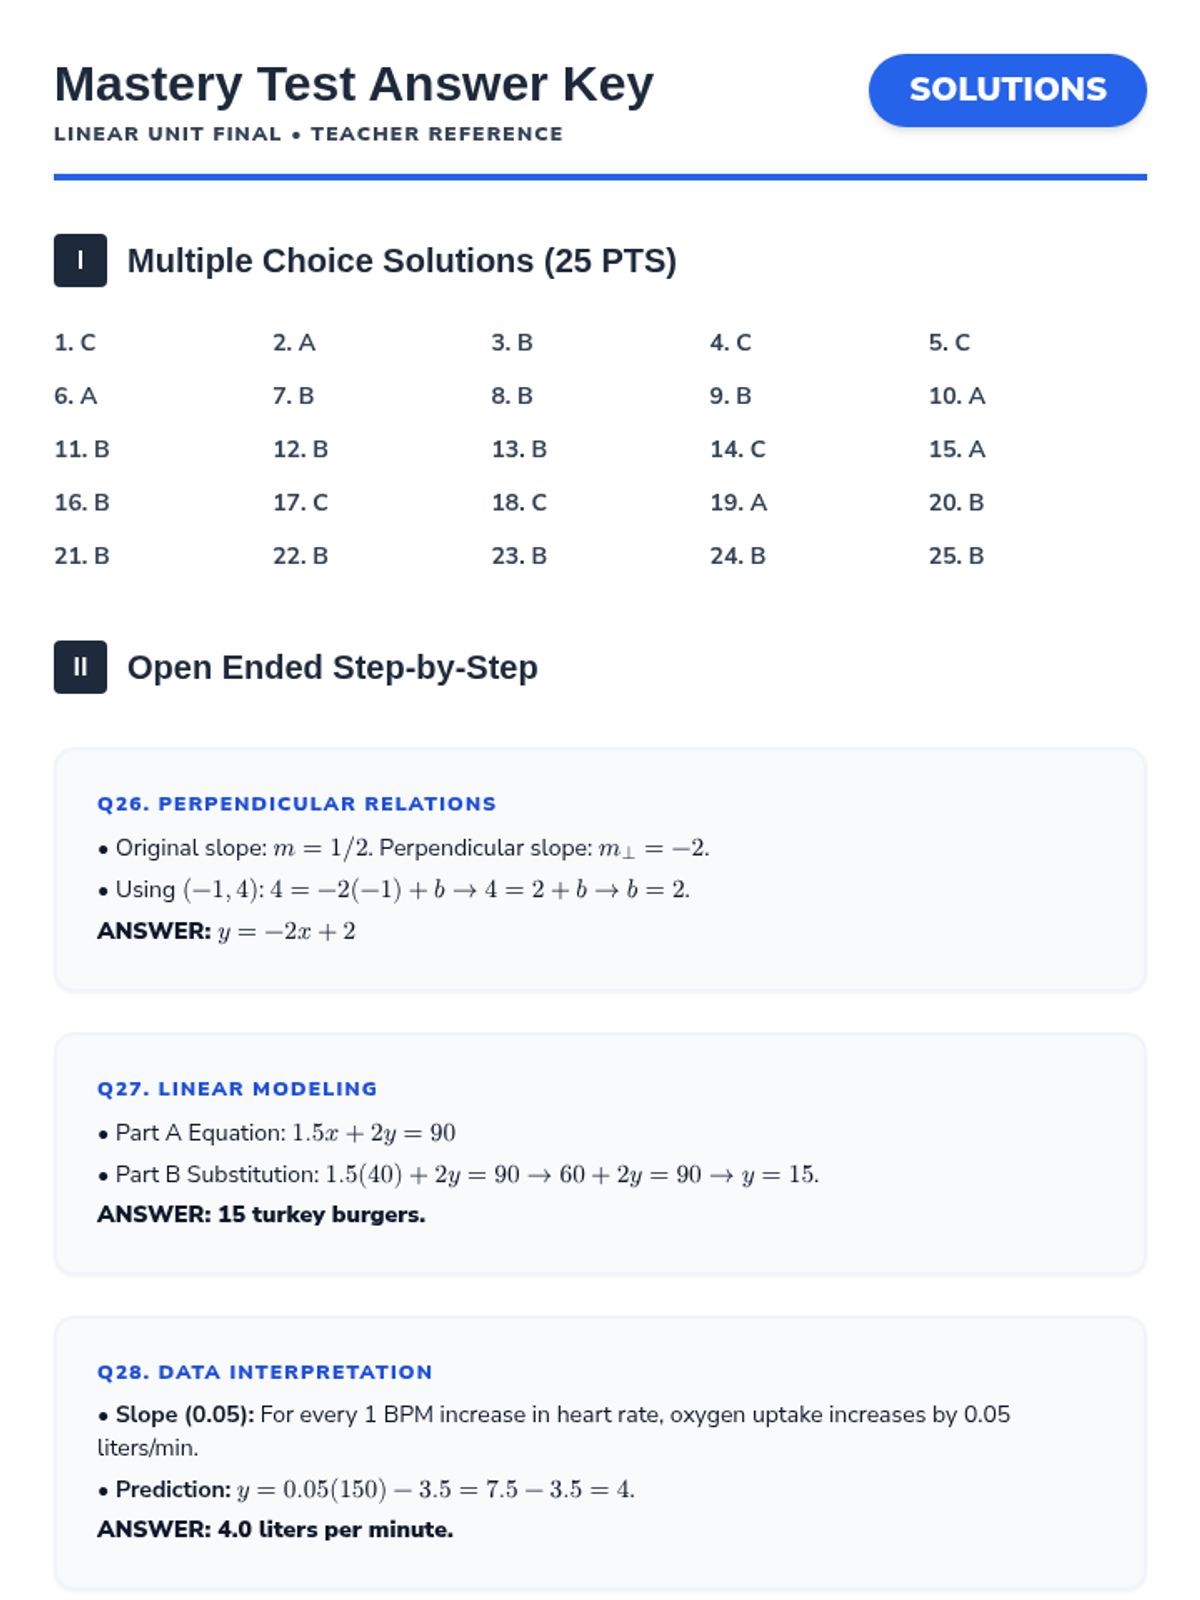
A unified teacher answer key for the cumulative mastery test and homework packet. Includes a fast-grading grid for multiple choice and step-by-step solutions for open-ended problems. Revised for LaTeX alignment and clarity.
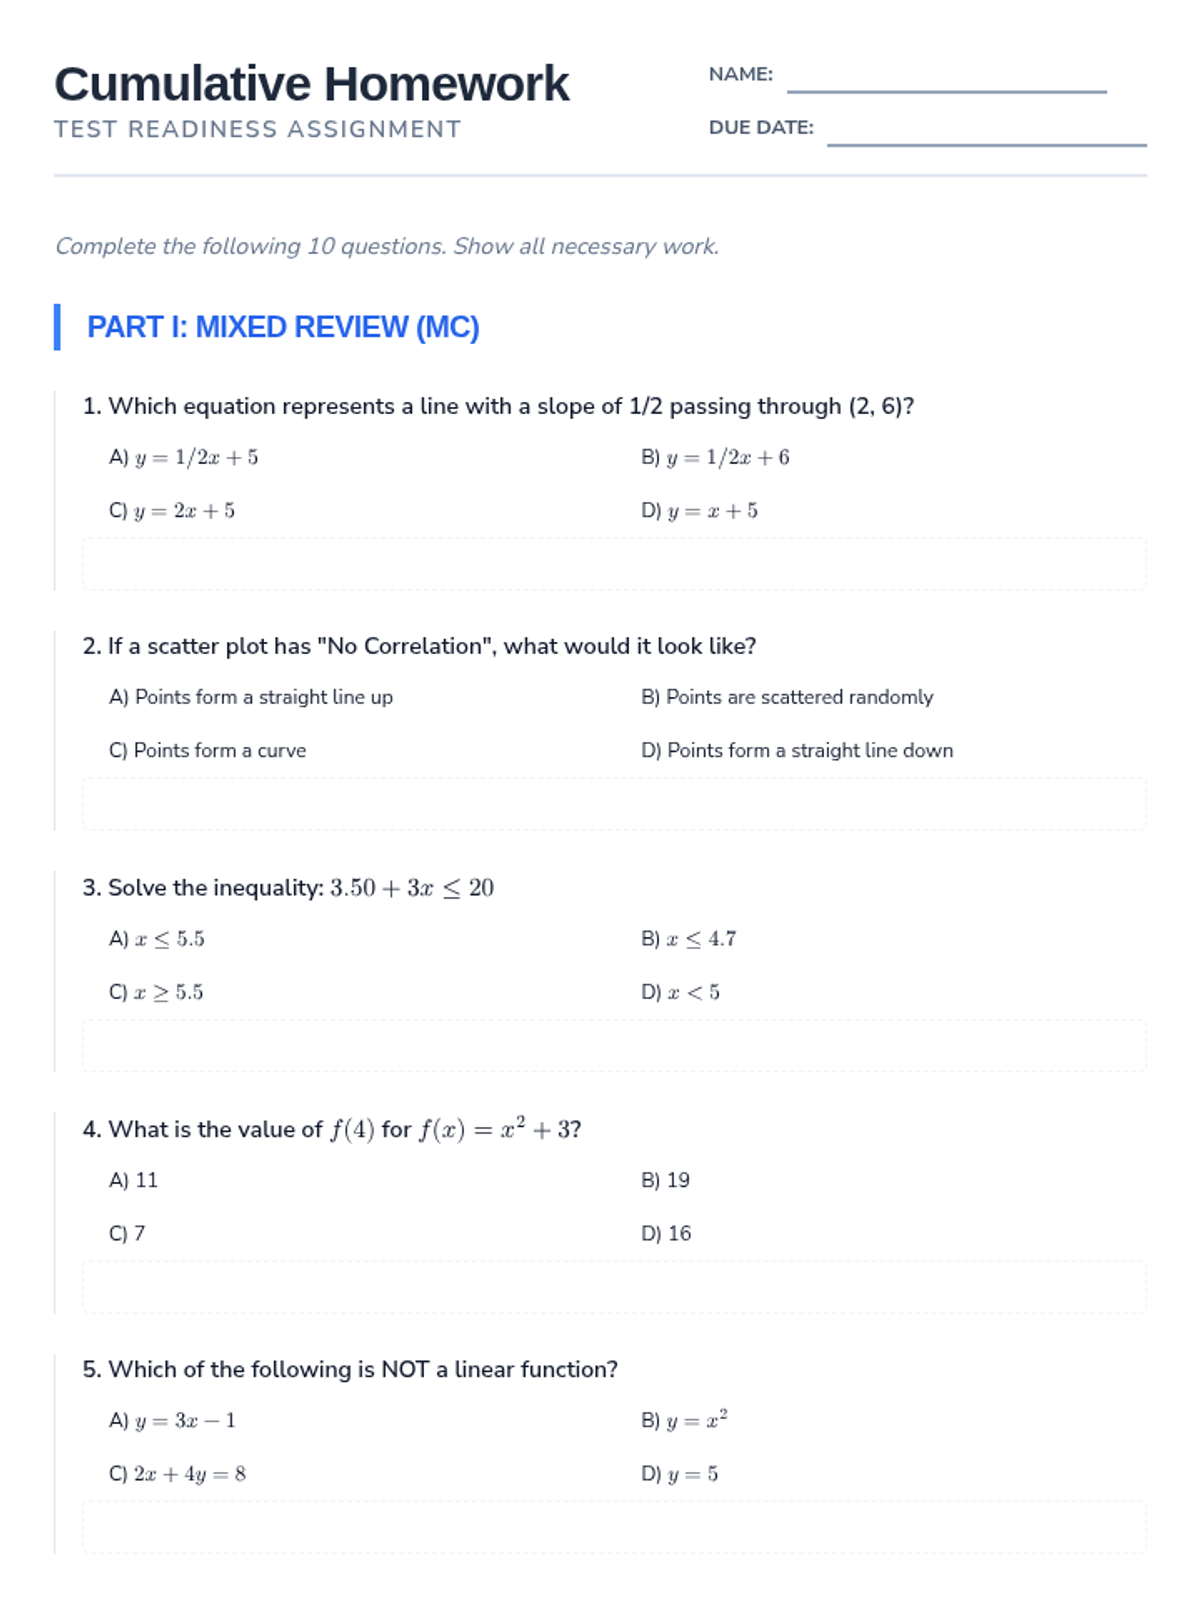
A 10-question cumulative homework packet designed to prepare students for the final mastery test. Features a mix of multiple-choice and multi-part open-ended problems covering all unit themes. Revised with workspace for all problems and a coordinate grid for sketching.
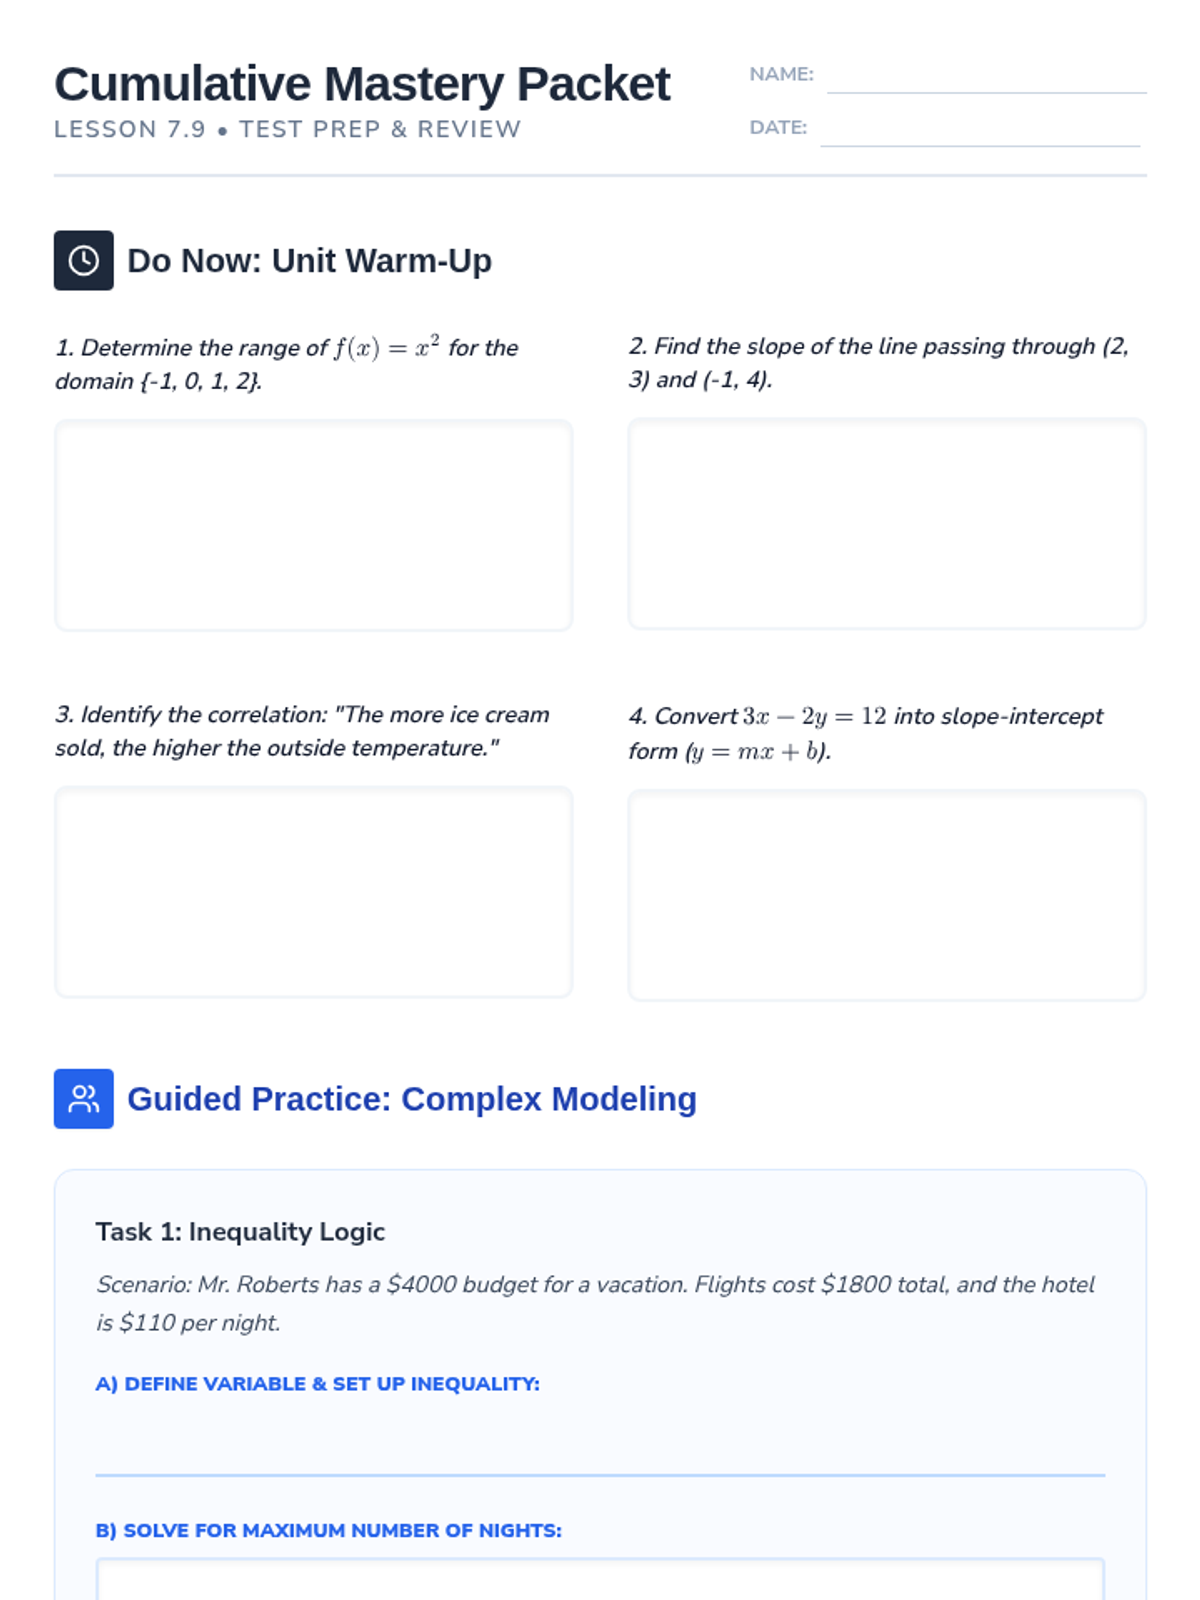
An expanded Lesson 7.9 prep packet featuring a more robust Do Now, detailed Guided Practice on modeling and best fit, and a 10-question mixed Independent Practice section. Designed to mimic the cumulative test format with both MC and Open Ended practice. Revised for layout consistency and removal of placeholder text.
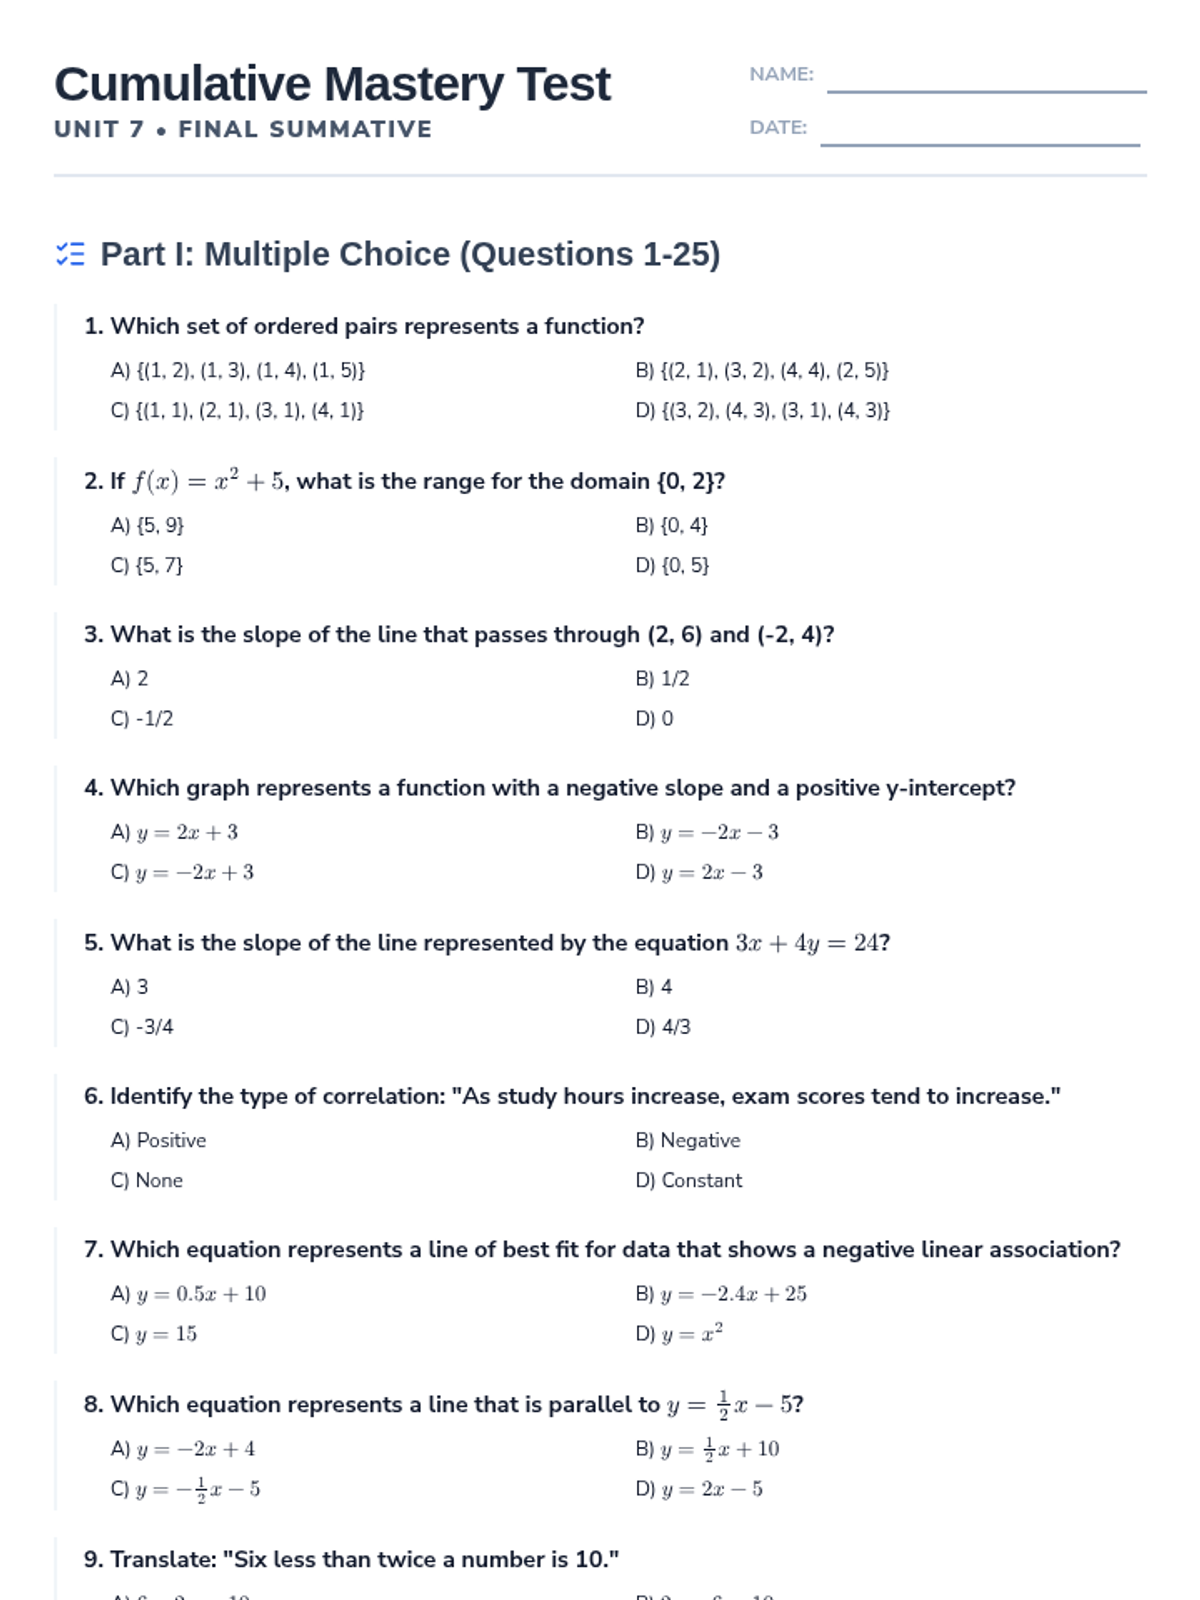
A comprehensive 29-question cumulative test covering linear functions, modeling, systems, scatter plots, and inequalities. Includes 25 multiple-choice questions (with 5 pulled from the previous quiz) and 4 multi-part open-ended questions.
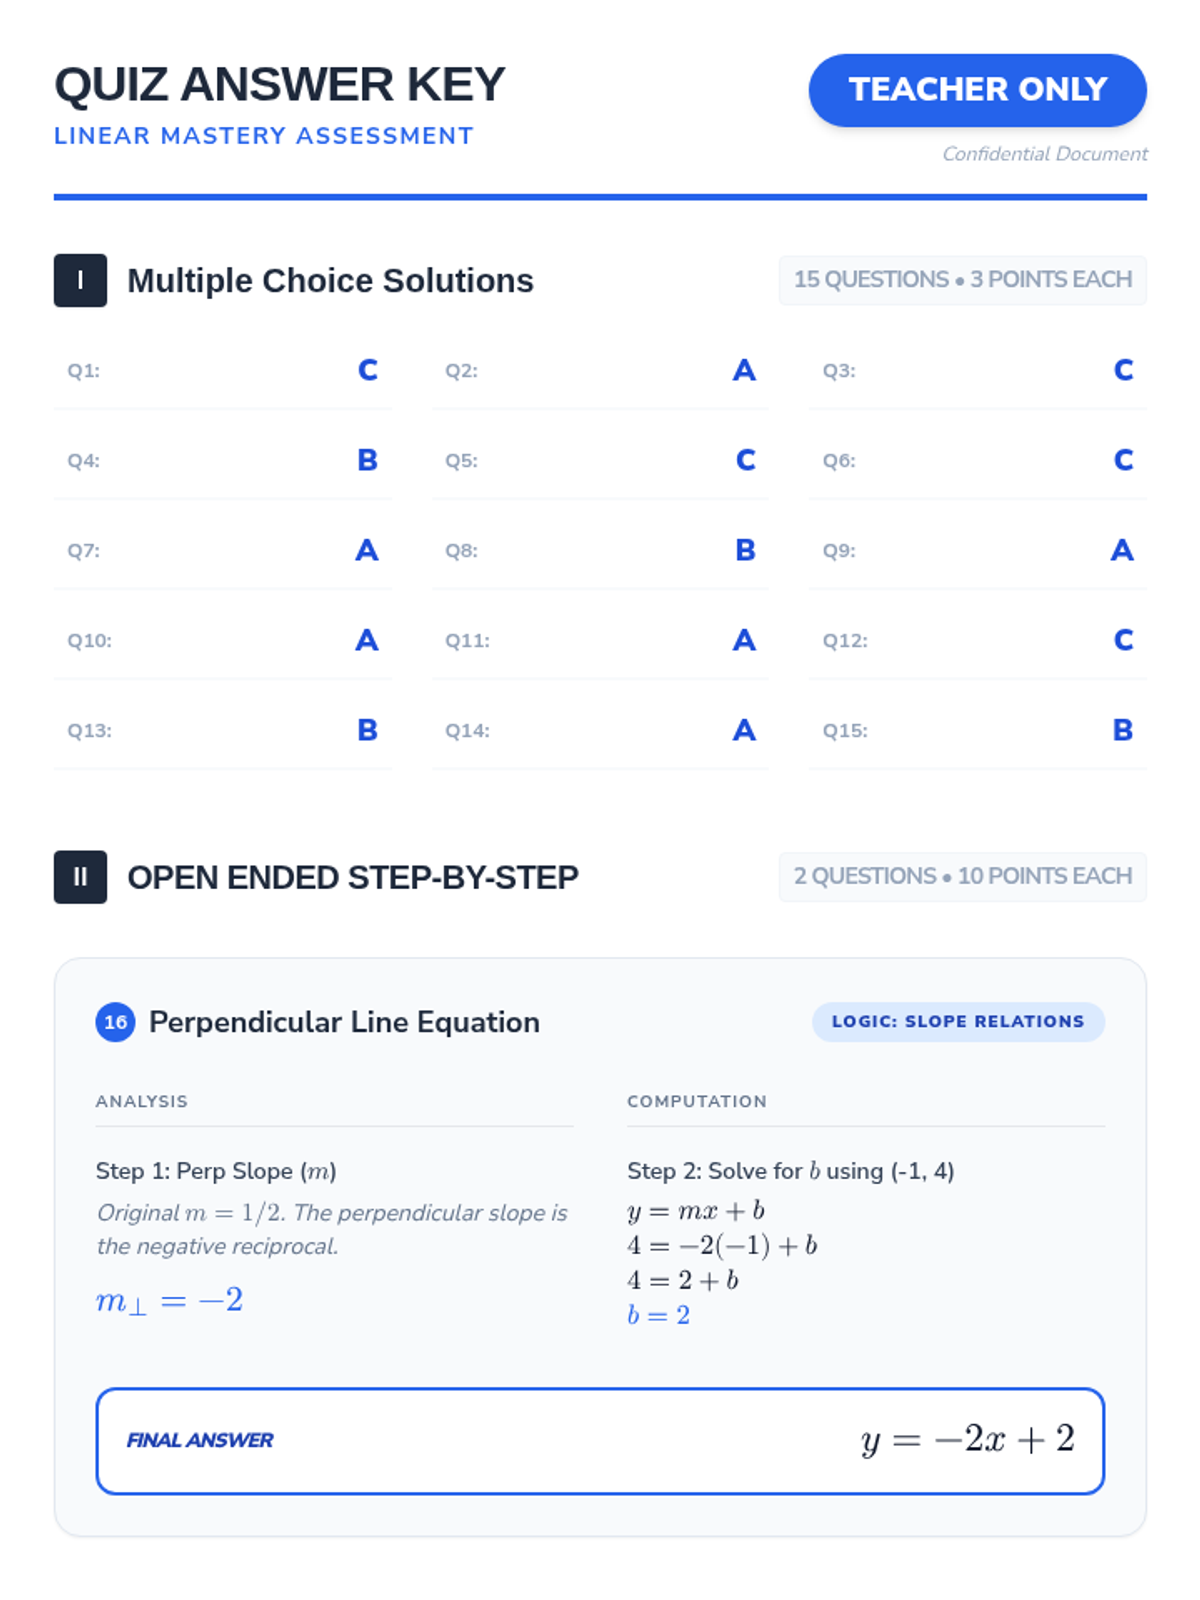
A dedicated teacher's answer key for the Linear Mastery Quiz. Features a clear key for the 15 multiple-choice questions, detailed step-by-step solutions for open-ended problems, and a point-value grading guide. Dedicated layout with improved page breaks.
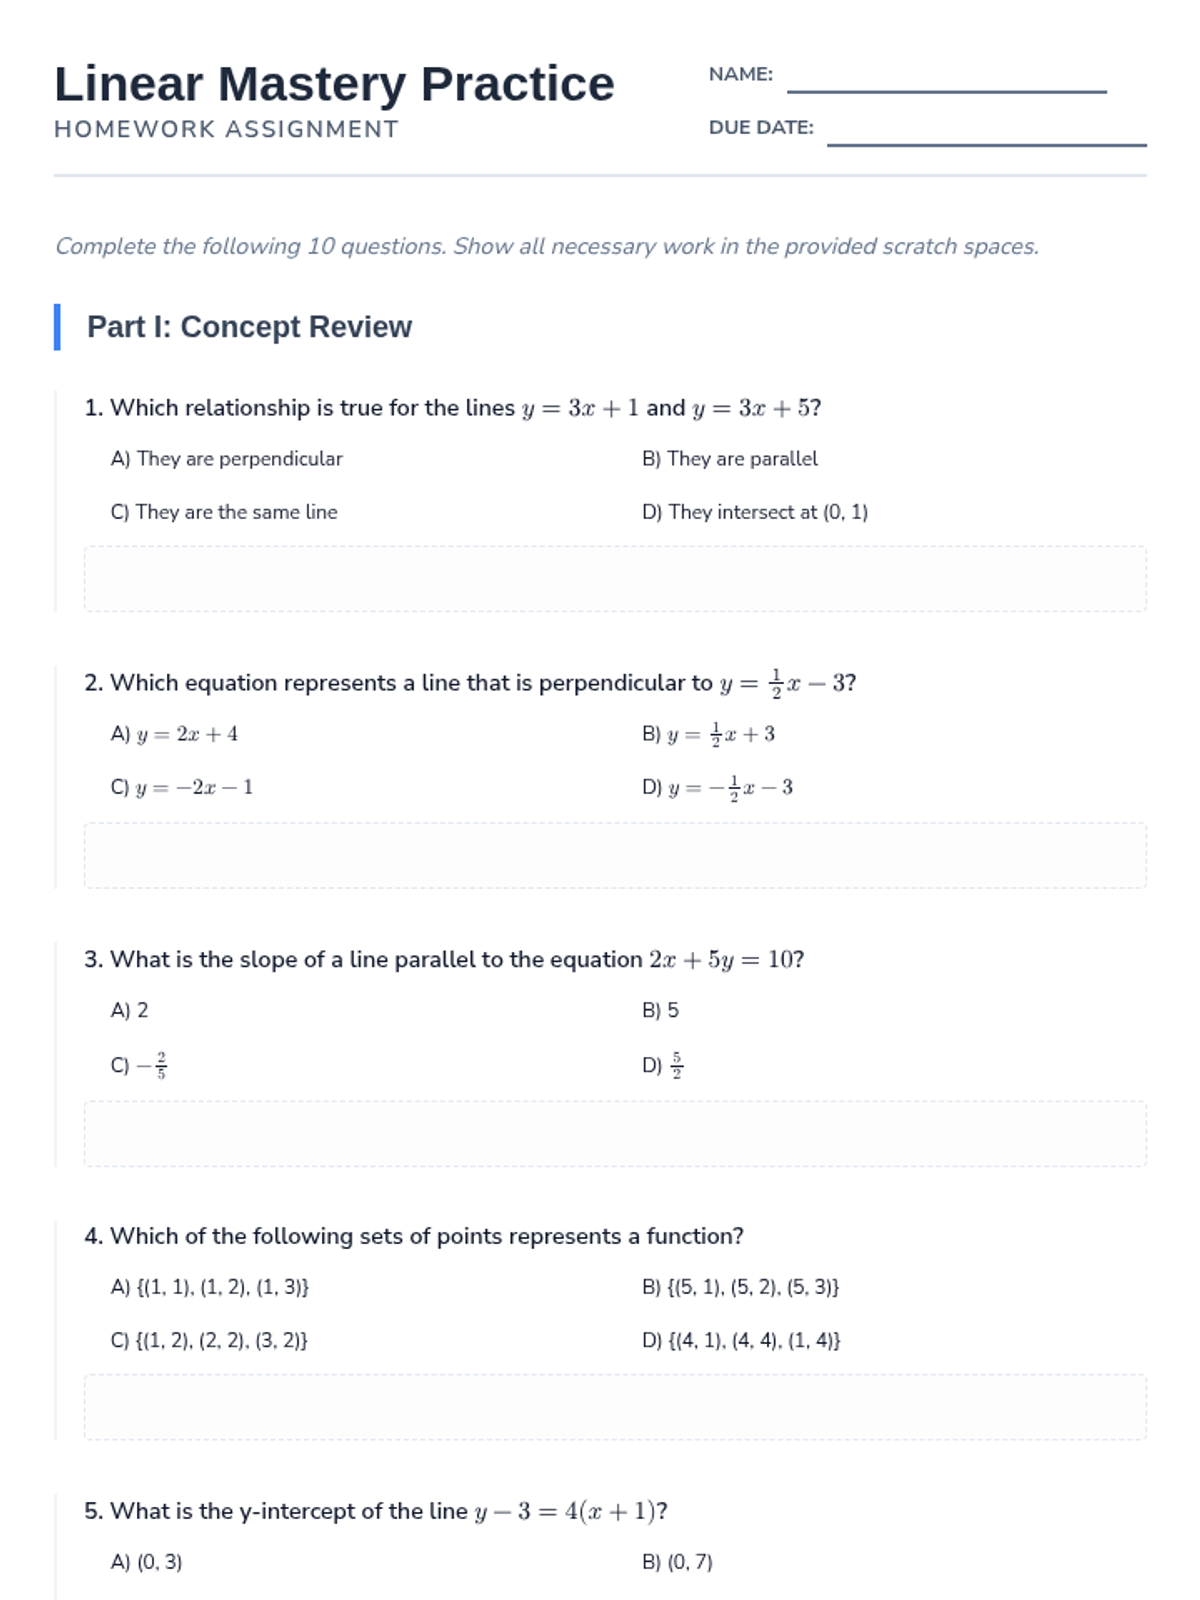
A 10-question homework assignment covering linear concepts. Includes 6 multiple-choice and 4 multi-part application problems. Fixed page breaks, standardized layouts, and improved response areas.
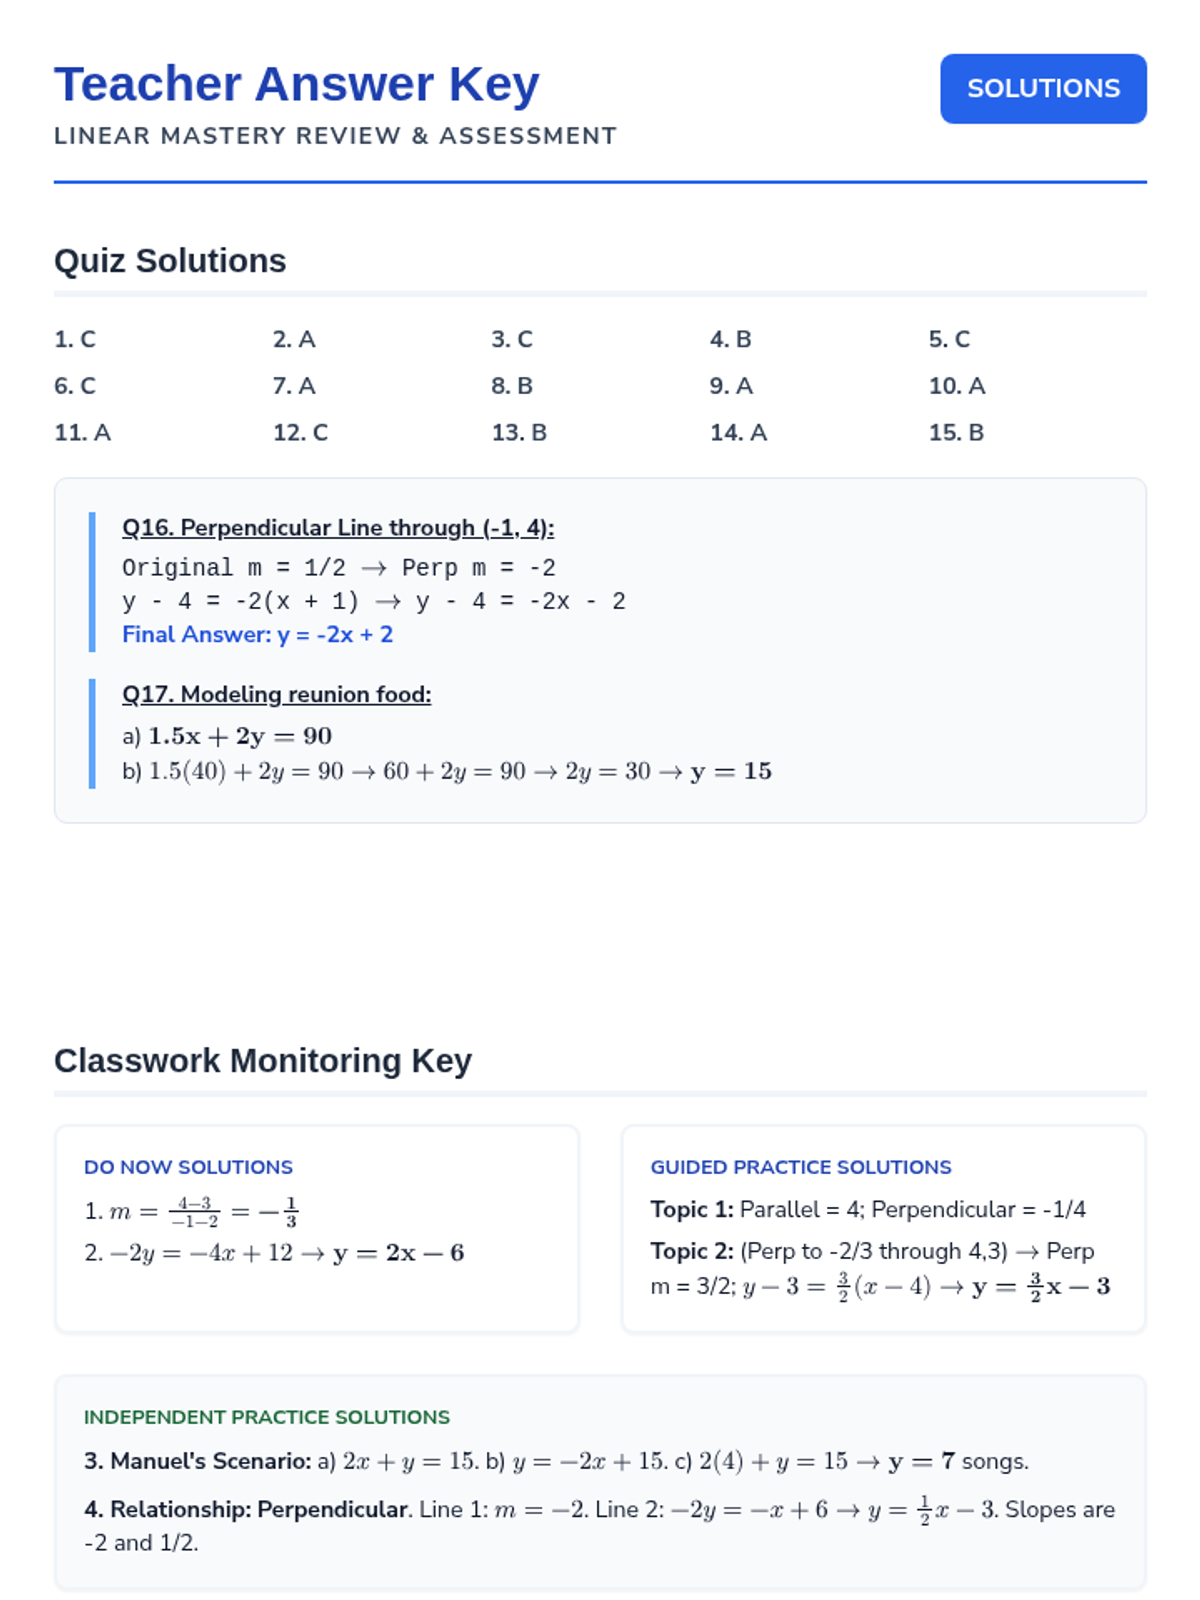
A unified teacher reference containing answers for the Linear Mastery Quiz, Classwork Packet, and Homework Assignment. Includes step-by-step justifications, corrected calculations, and missing guided practice solutions. Fixed layout and math rendering.
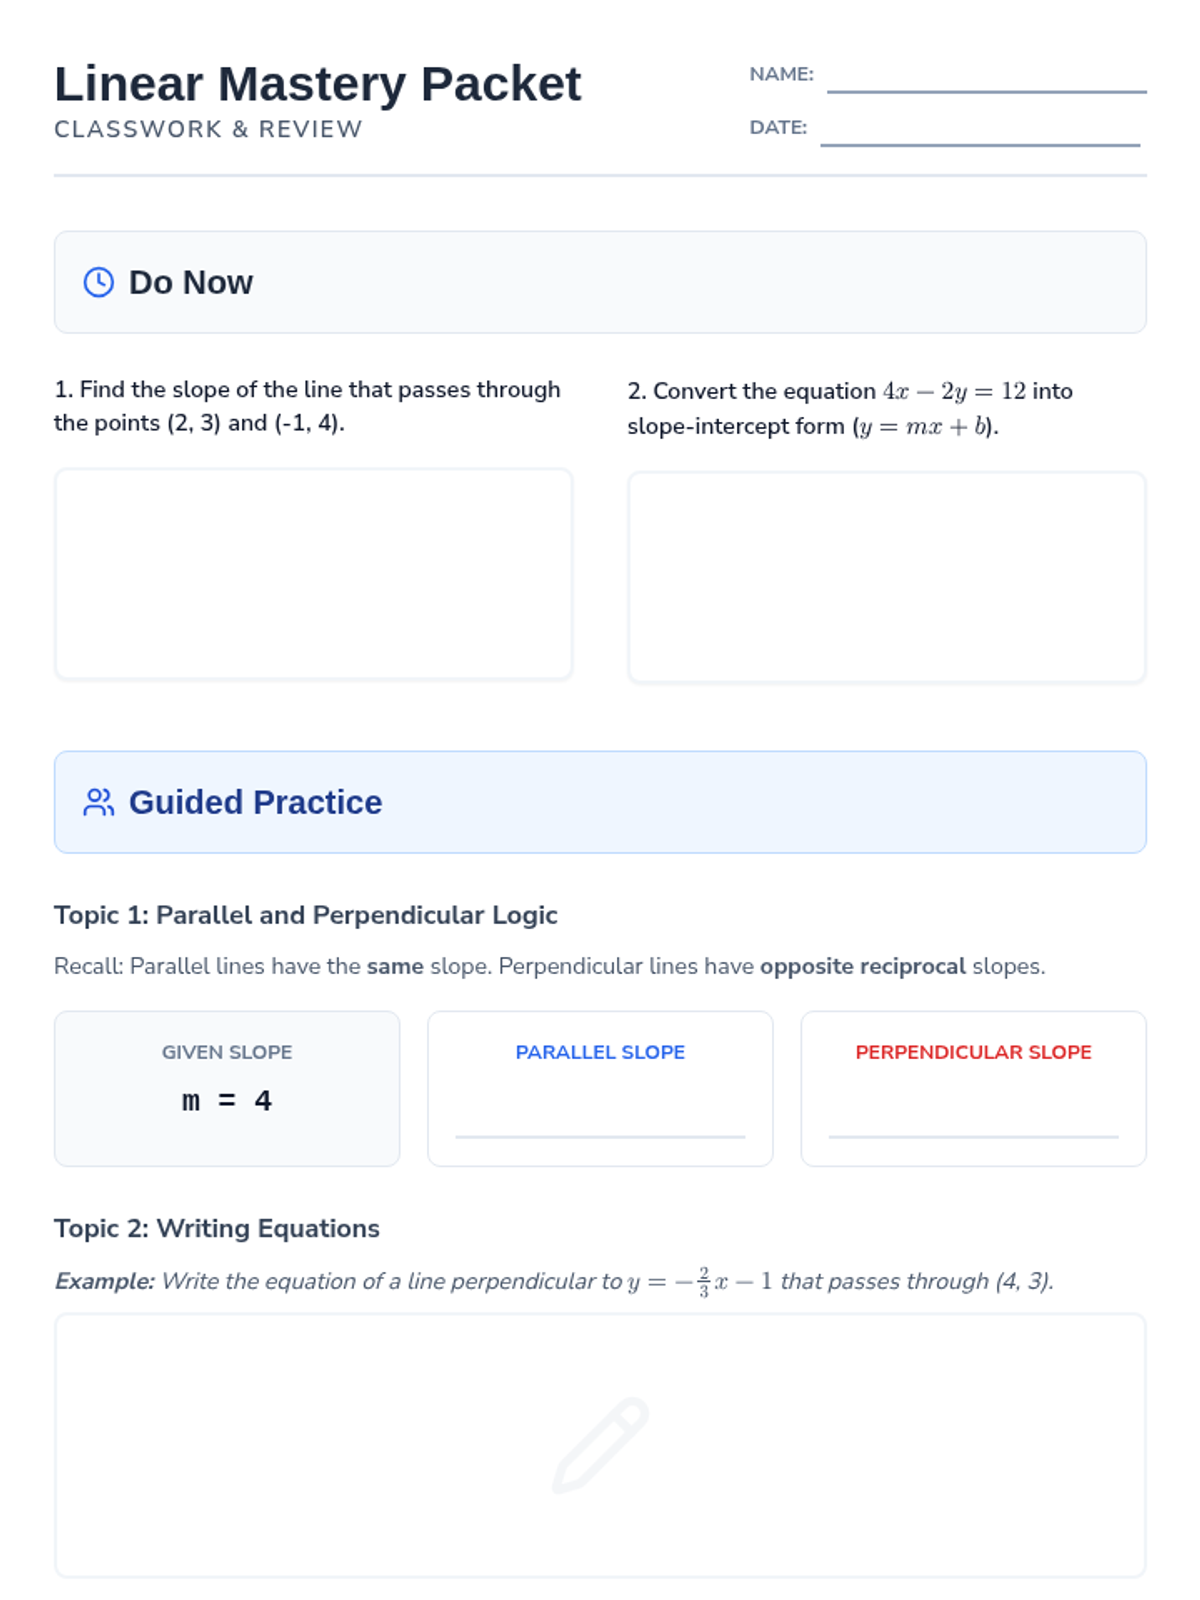
A comprehensive classwork packet following the instructional cadence of Do Now, Guided Practice, Independent Practice, and Exit Ticket. Fixed page breaks, improved graph rendering, and refined student work areas.
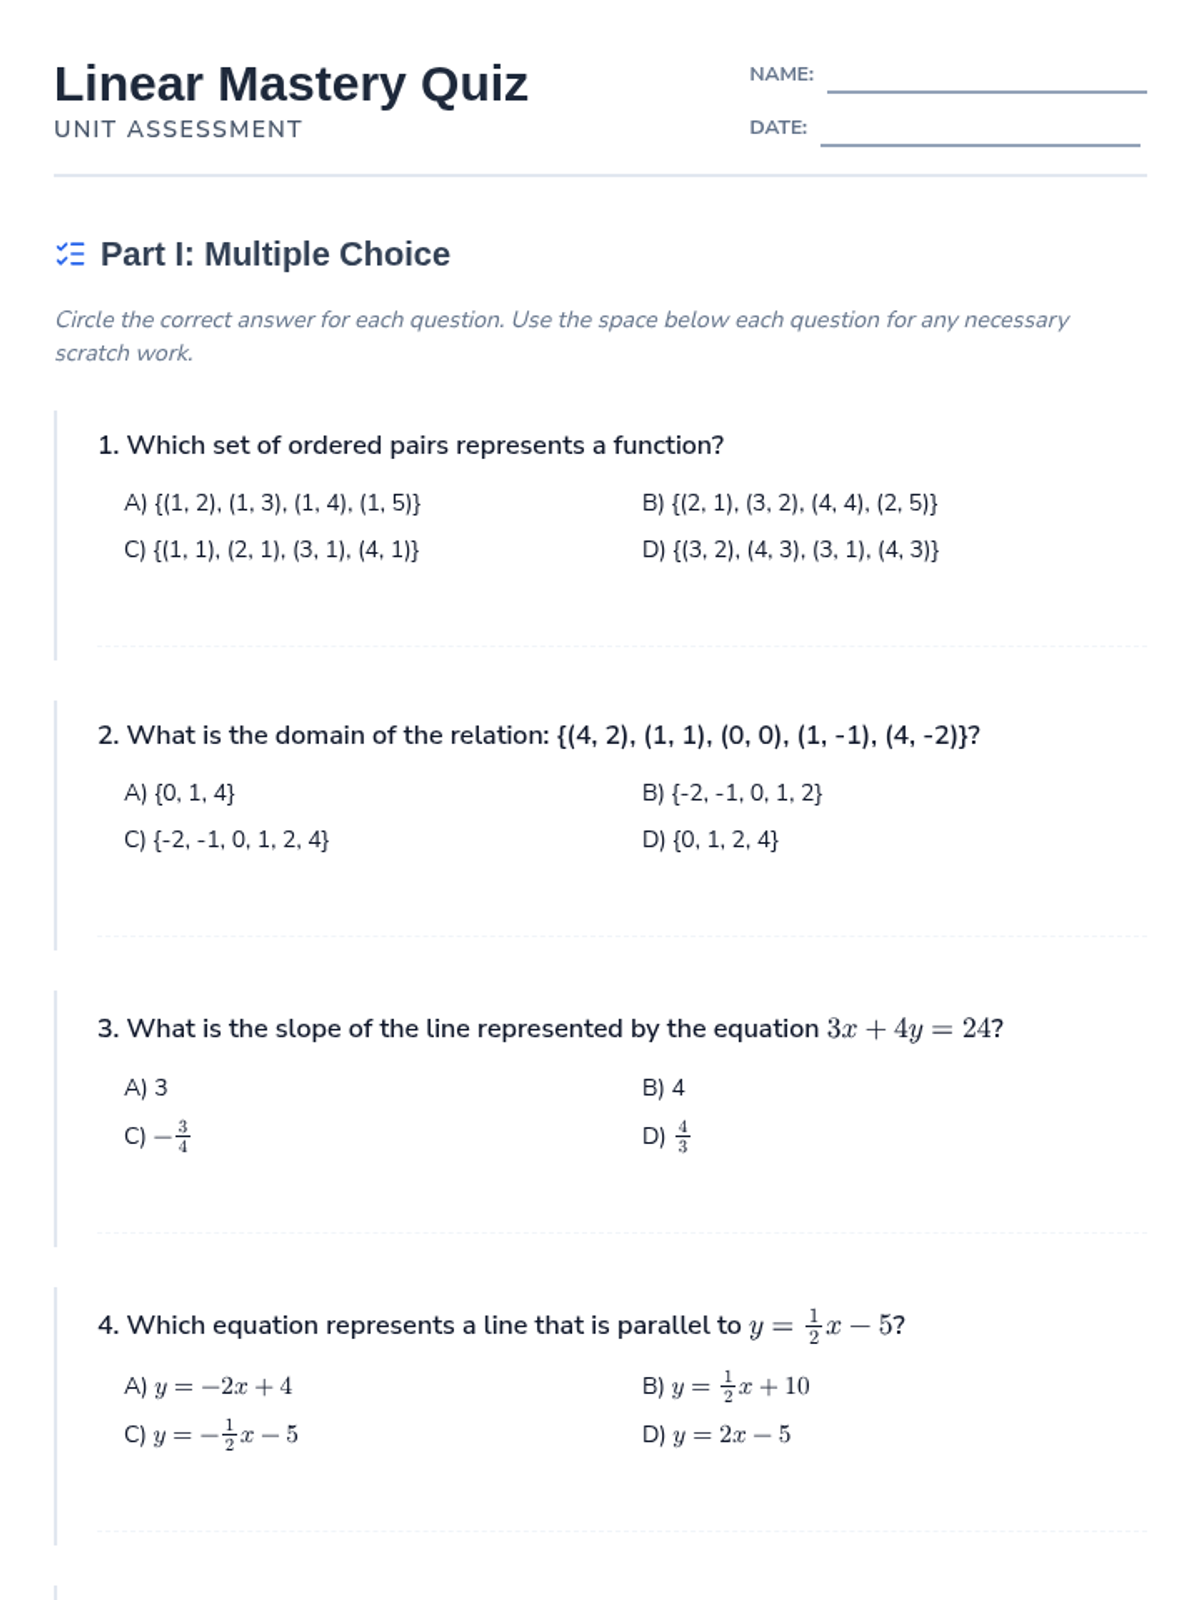
A 17-question assessment covering linear equations, functions, domain, standard form, and parallel/perpendicular lines. Includes 15 multiple choice and 2 multi-part open-ended questions. Fixed page breaks and layout consistency.
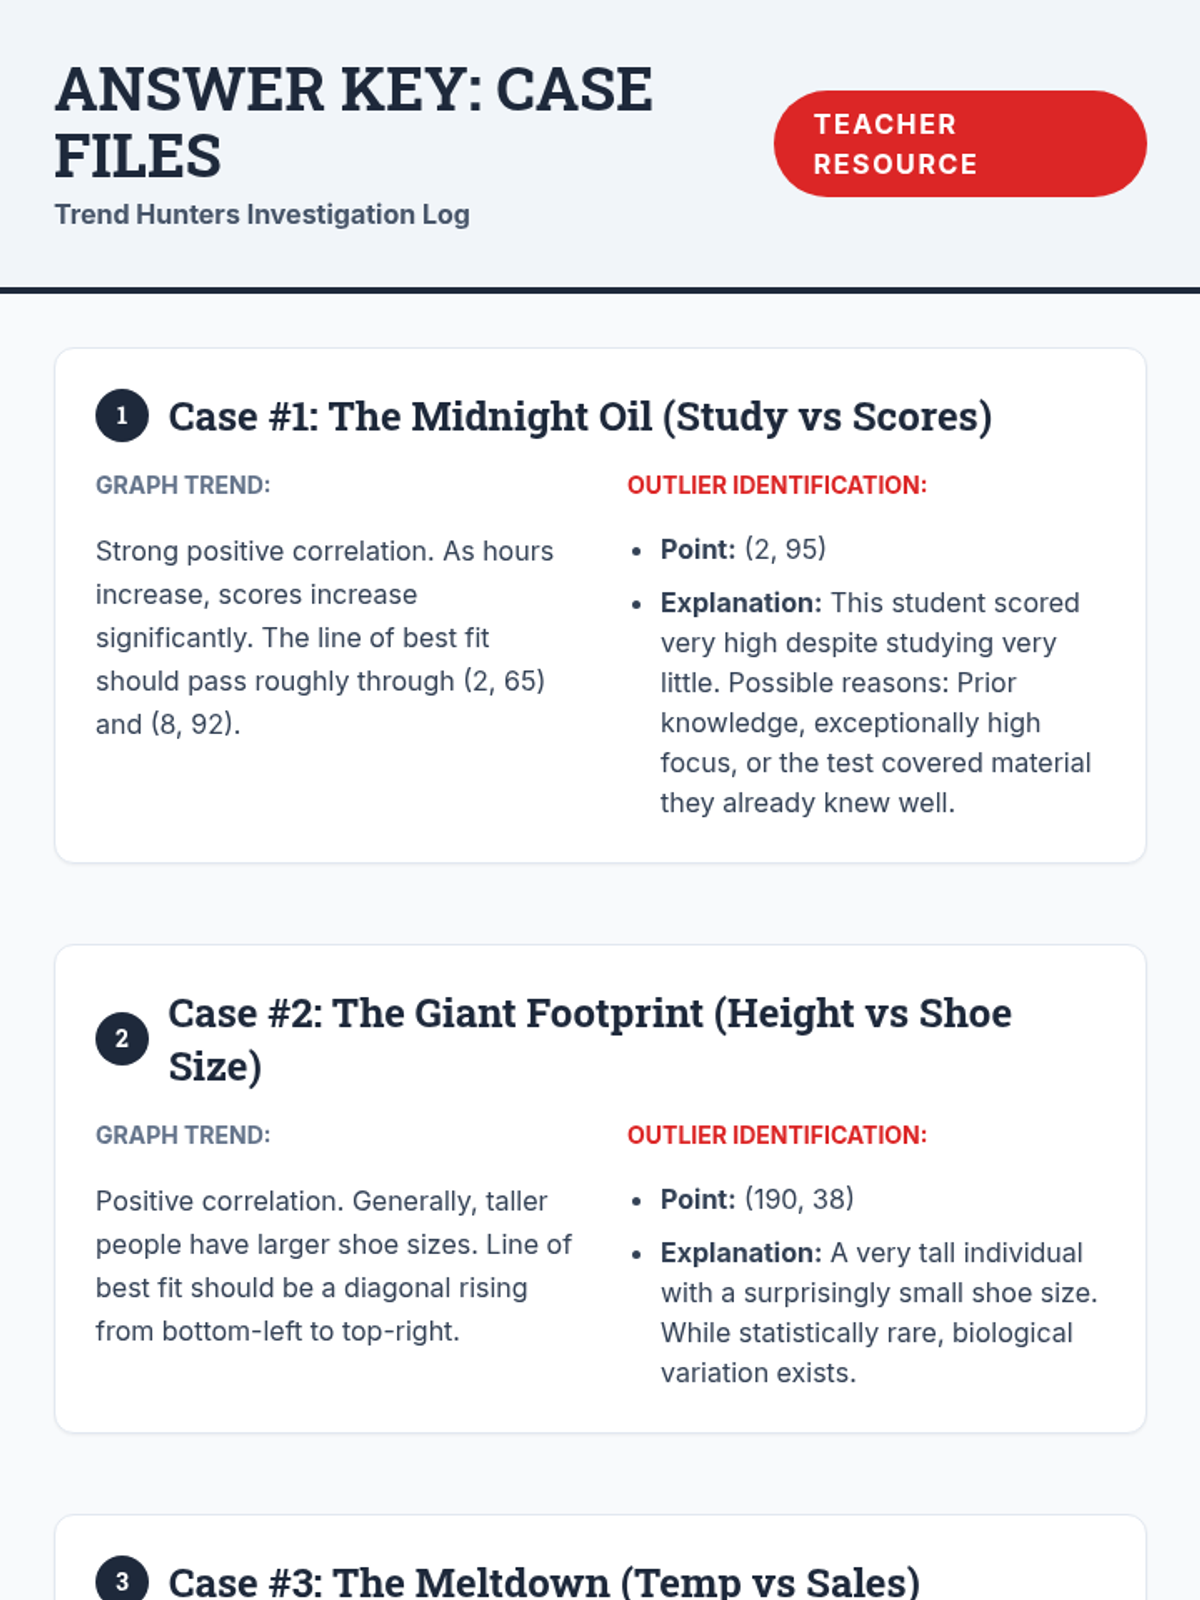
An answer key for the Case Files Worksheet, providing expected trends, outlier identifications, and explanations for all six real-world data scenarios.
A visual presentation for introducing scatter plots, plotting techniques, lines of best fit, and identifying outliers using a detective investigation theme.
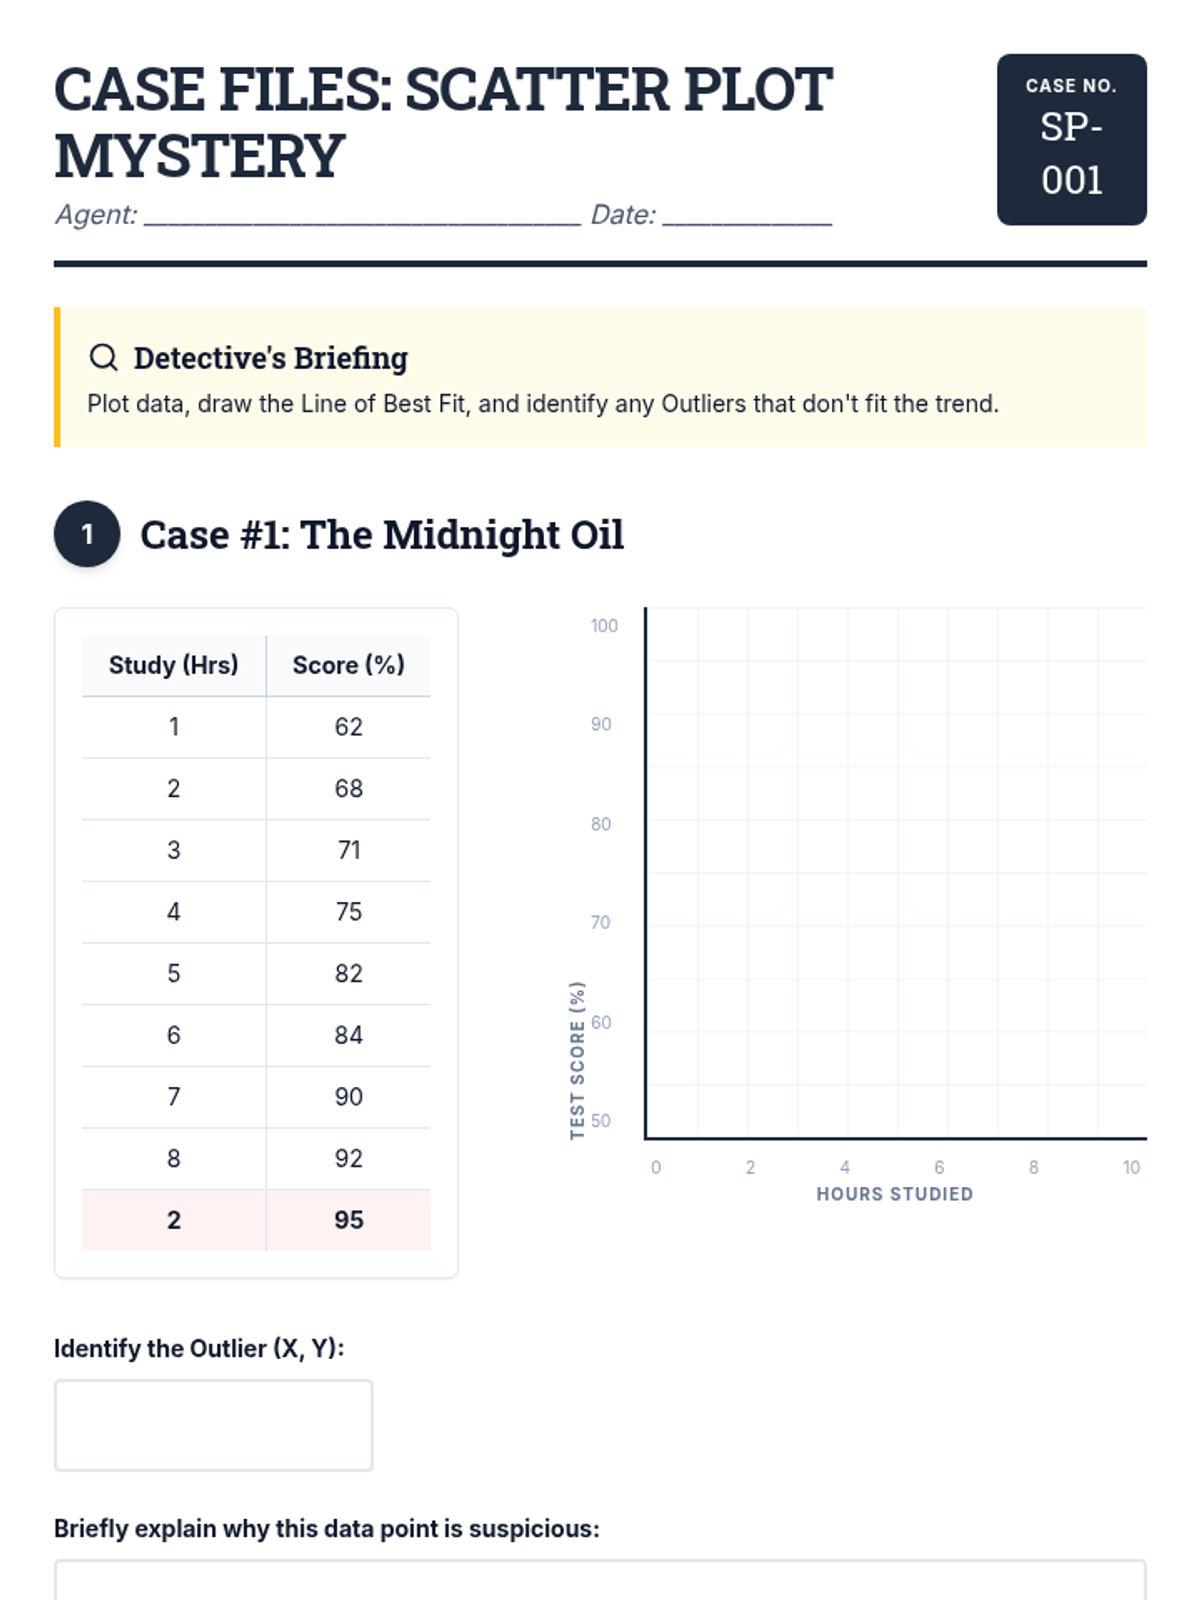
A concise 3-page worksheet featuring six real-world data sets where students plot points, draw lines of best fit, and identify outliers. Includes cases on study habits, shoe sizes, temperature/sales, sunflower growth, car depreciation, and exercise physiological data.
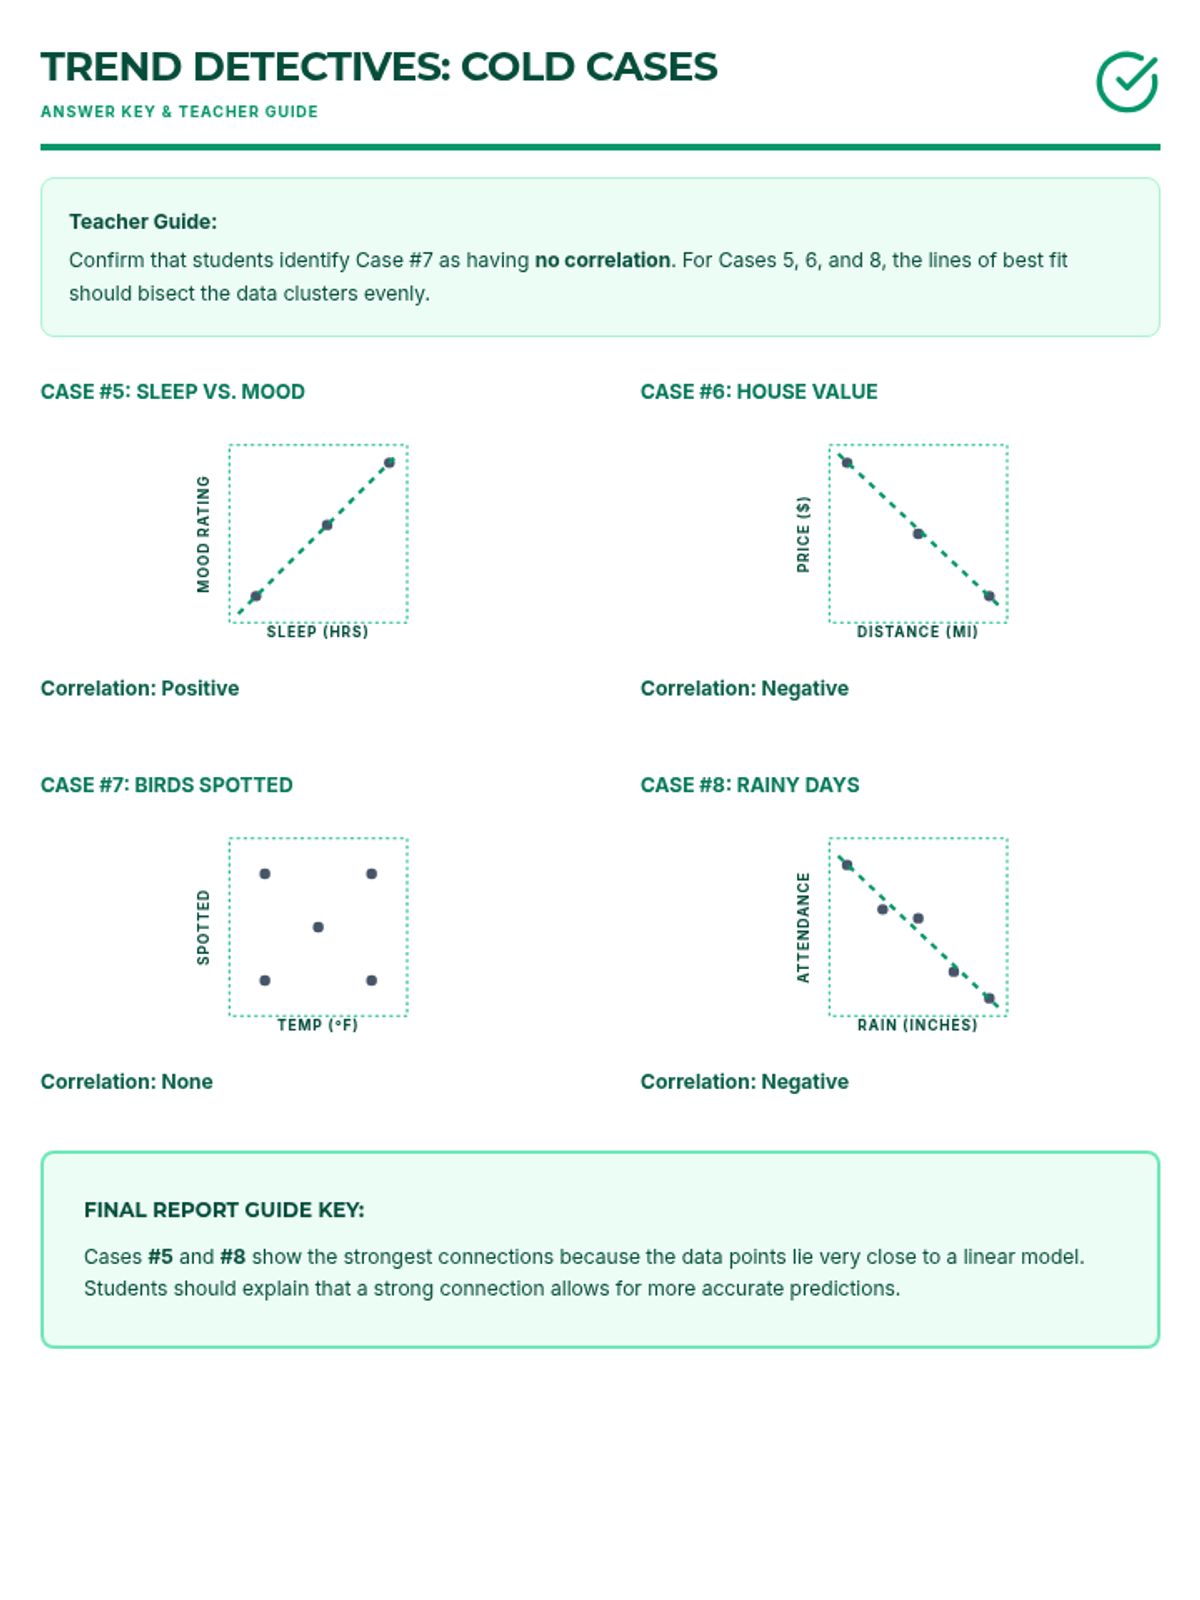
Answer key for the Cold Cases additional practice worksheet. Revised with corrected variables and improved label positioning for the answer key format.
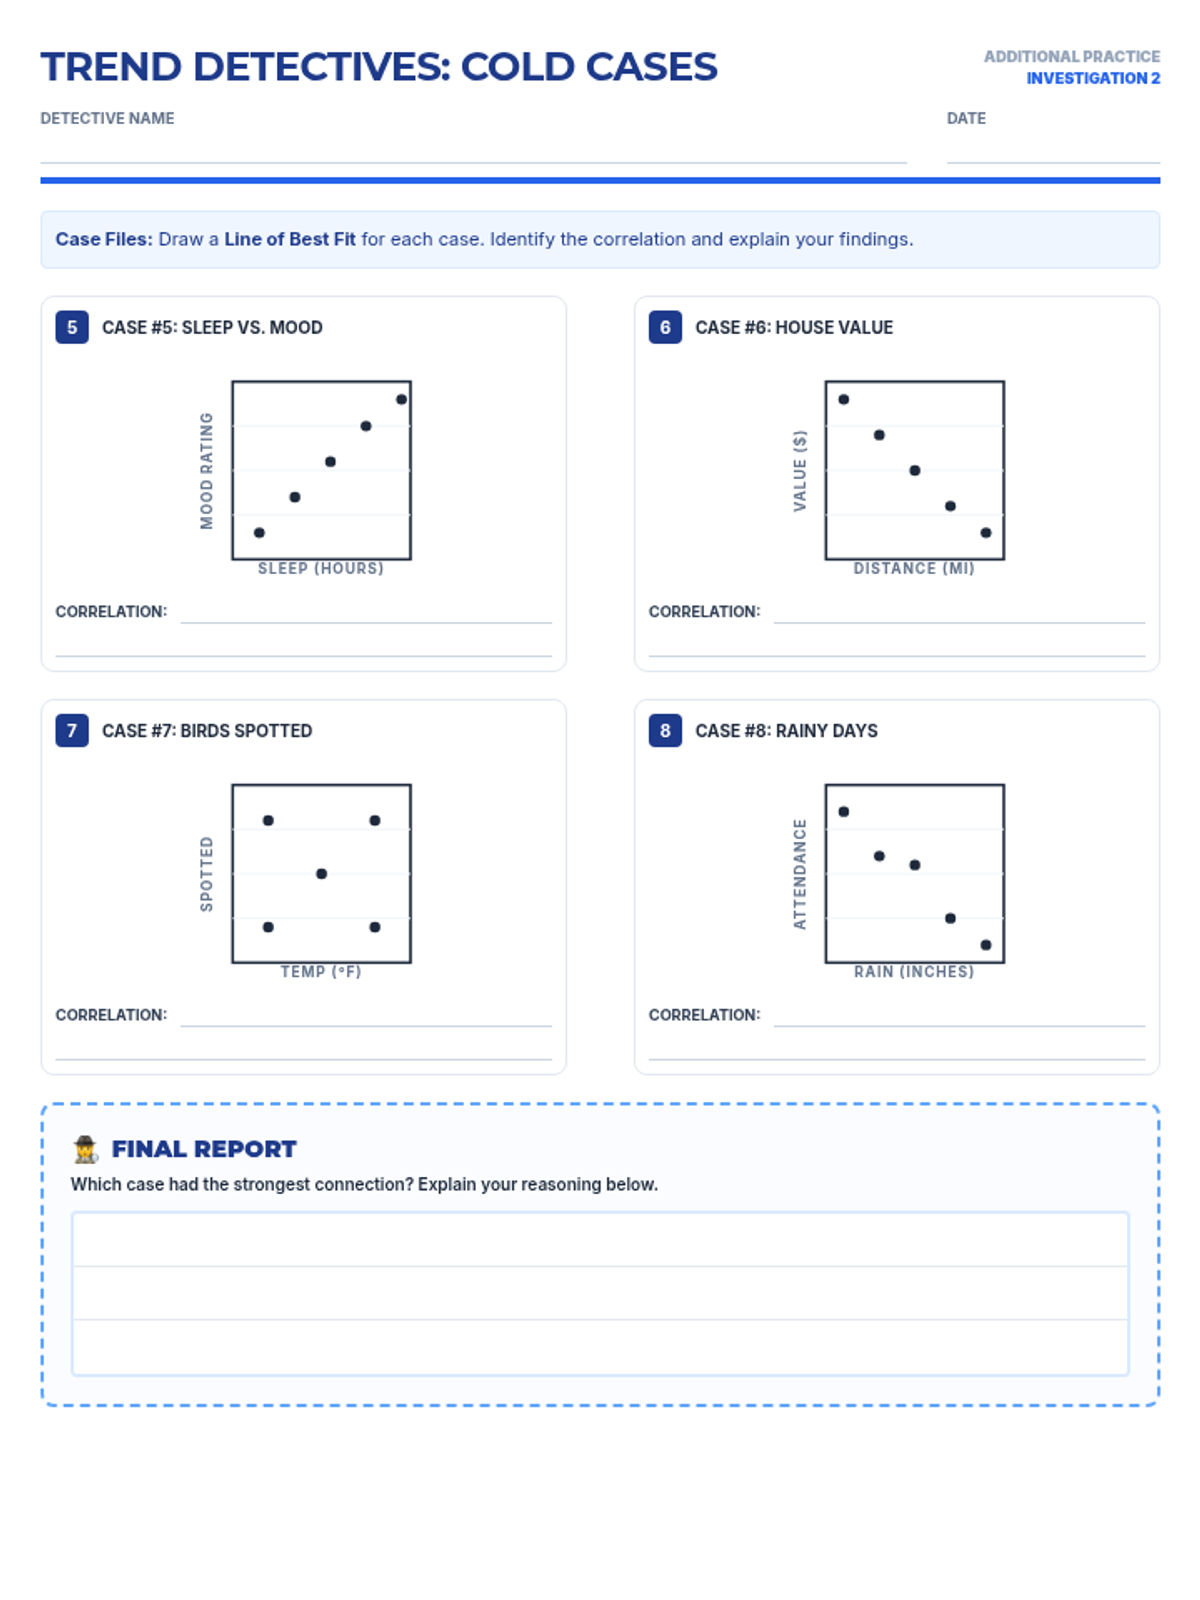
A second practice worksheet for scatter plots featuring four new cases (Mood vs Sleep, Commute vs Price, etc.) to reinforce line of best fit skills. Revised with corrected variables and improved label spacing.
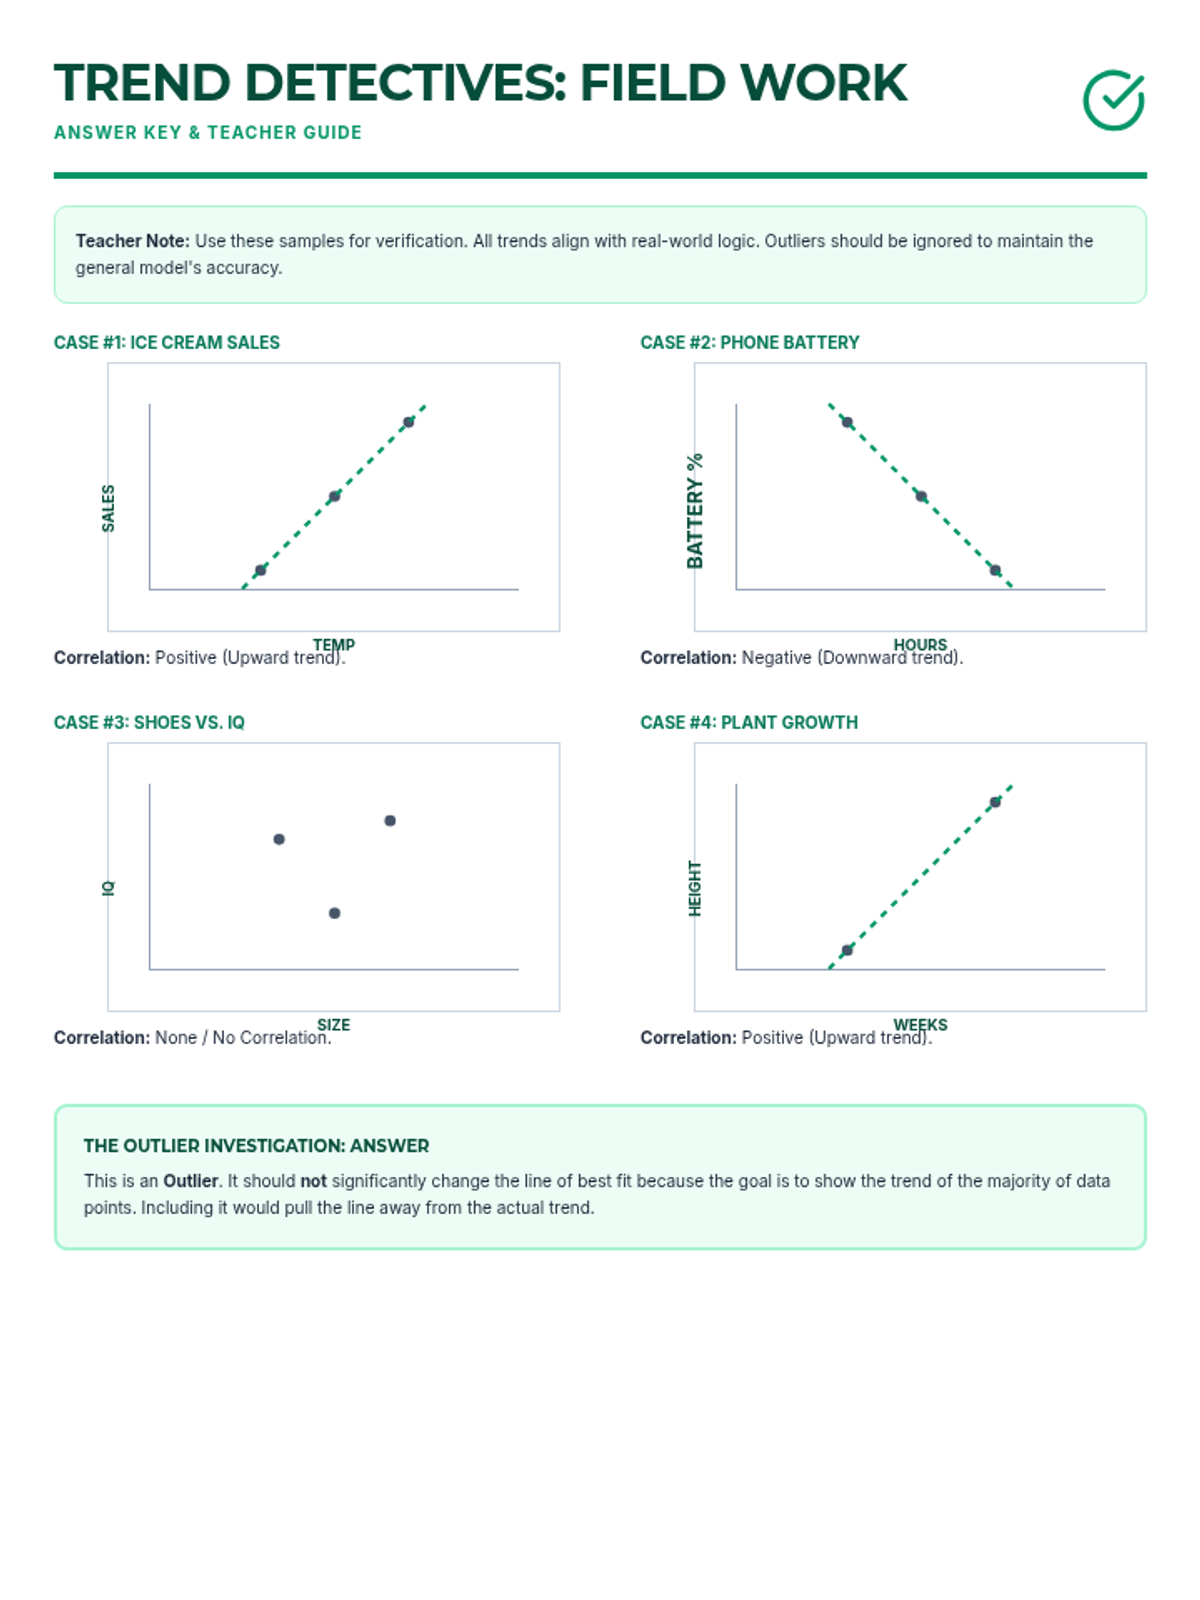
The answer key for the Trend Detectives Practice Worksheet. Updated with larger, high-contrast labels and corrected visual trends to match logical real-world correlations.
A comprehensive 15-day slide deck for the TSIA2 Math Marathon. Features daily Warm-Up questions and detailed solution slides for all 30 practice problems covering all TSIA2 domains. Updated to be fully complete and fixed rendering issues.
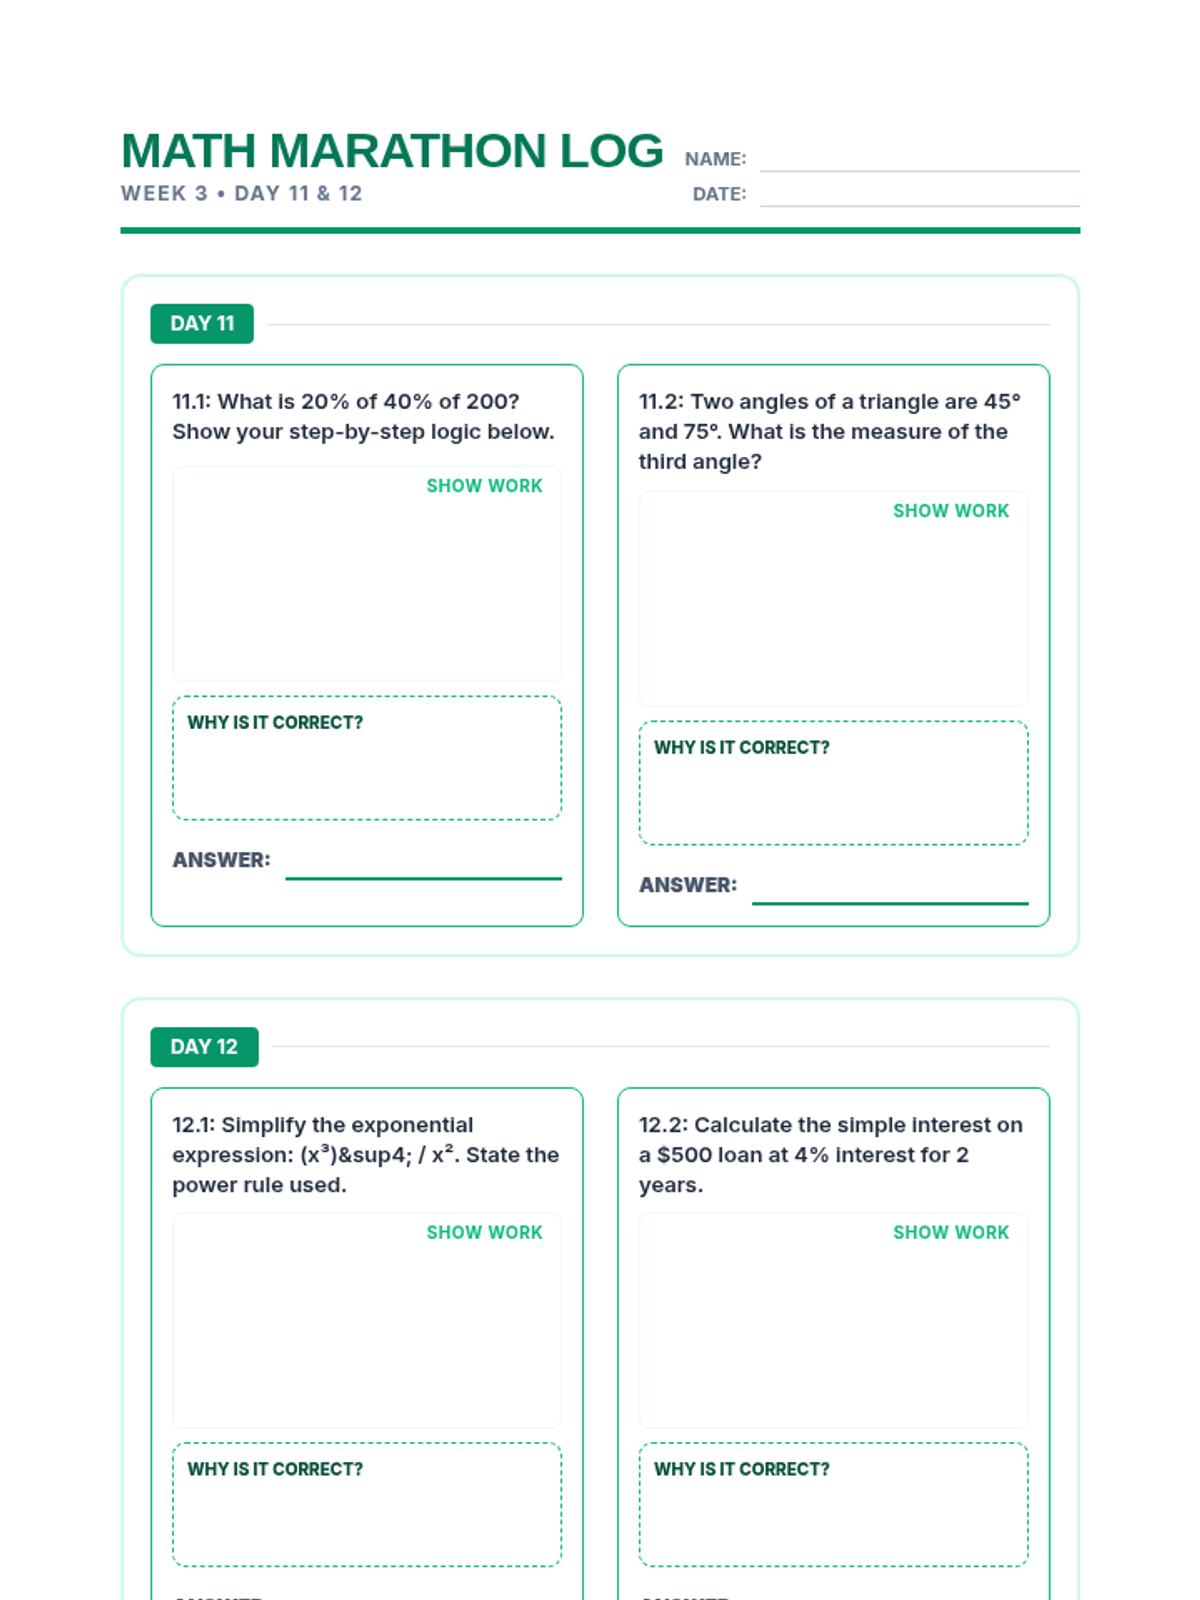
A 5-day student log for the final week of the TSIA2 Math Marathon. Covers days 11 through 15 with dedicated work areas, explanation boxes, and answer slots. Updated to optimize page breaks and increase work area size.
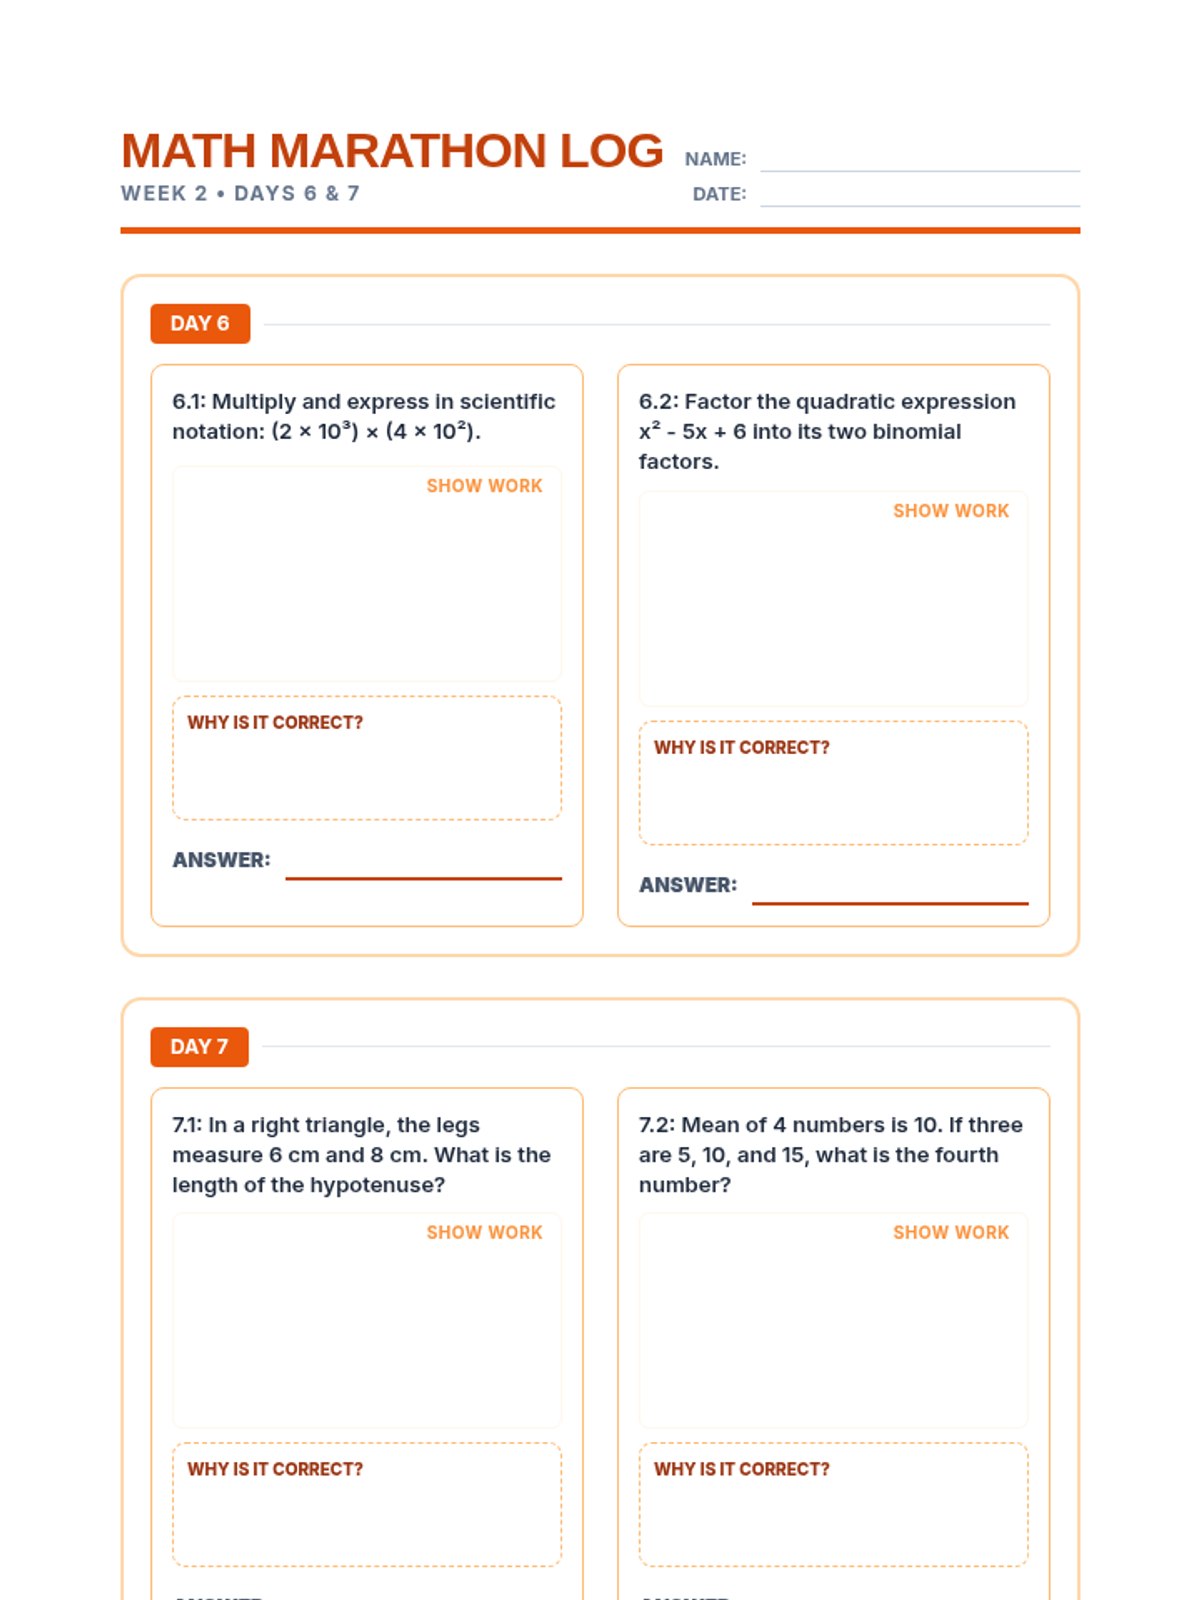
A 5-day student log for the second week of the TSIA2 Math Marathon. Provides space for daily problem-solving, work verification, and written explanations for days 6 through 10. Updated to optimize page breaks and increase work area size.
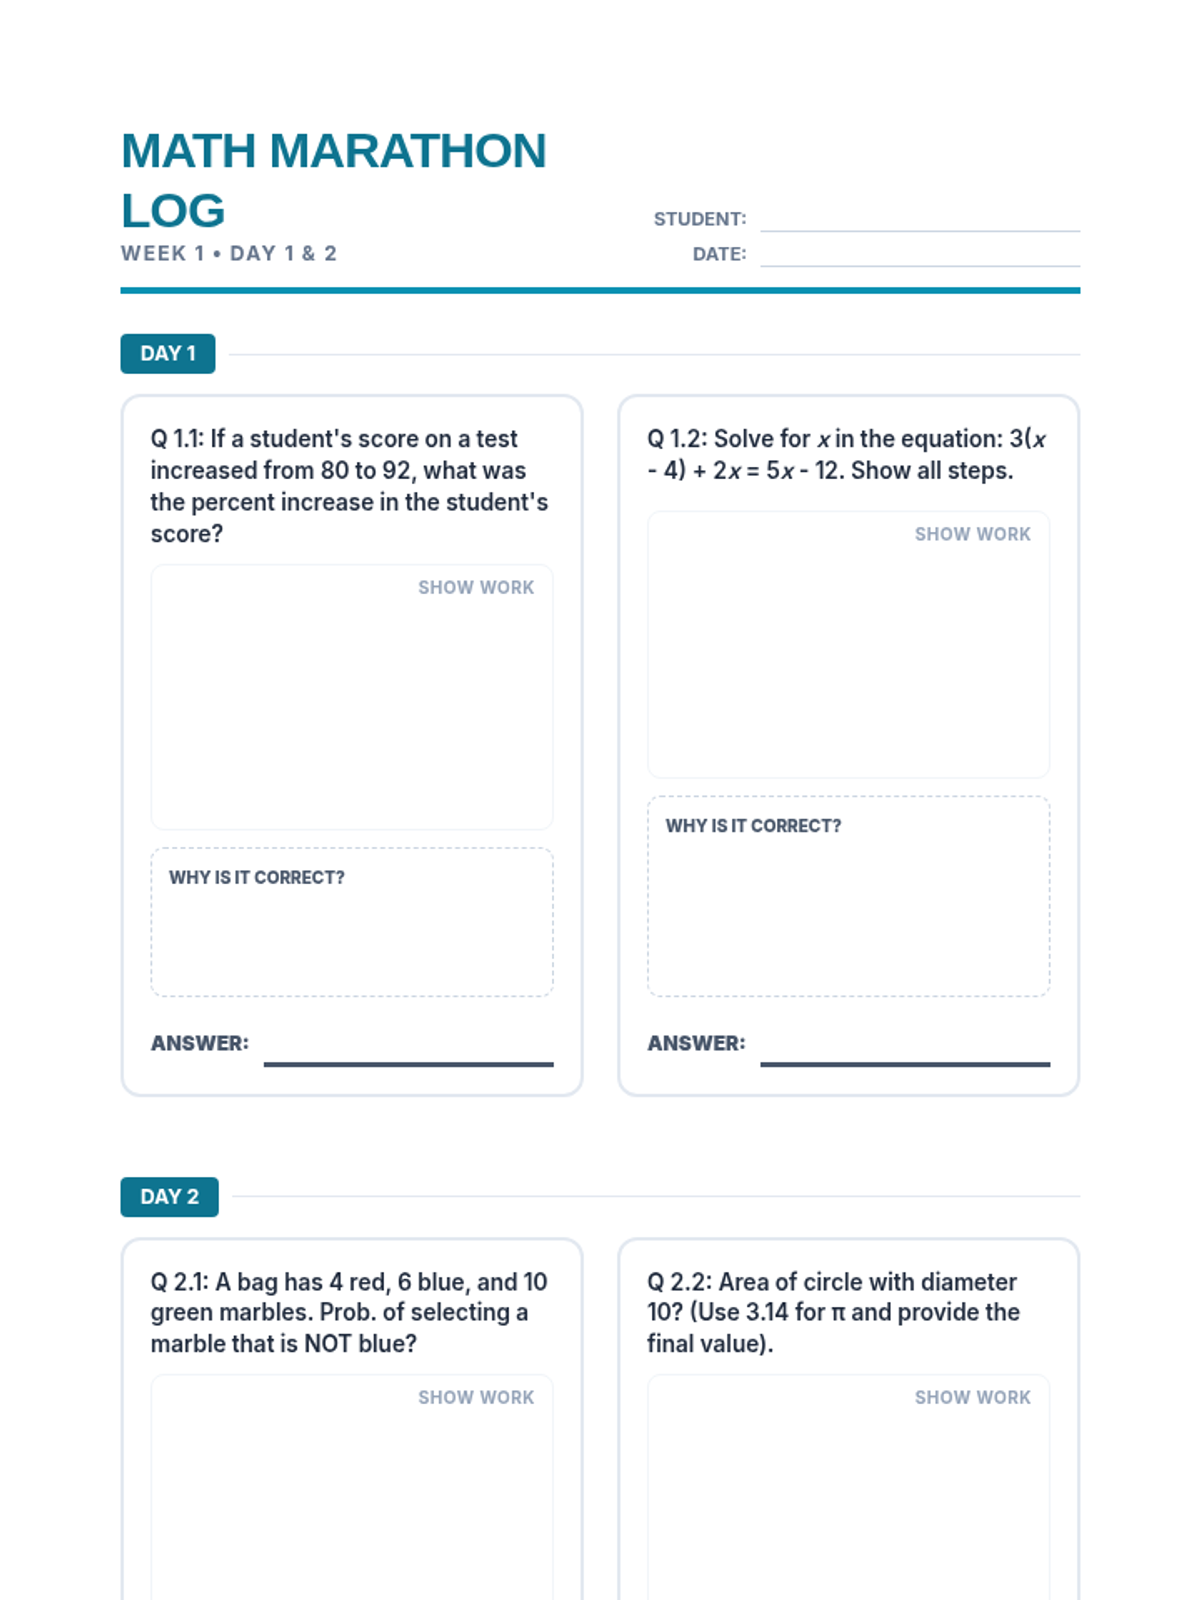
A 5-day student log for the first week of the TSIA2 Math Marathon. Includes dedicated spaces for showing work, providing a written explanation of the answer logic, and recording final answers. Updated to optimize page breaks and increase work area size.
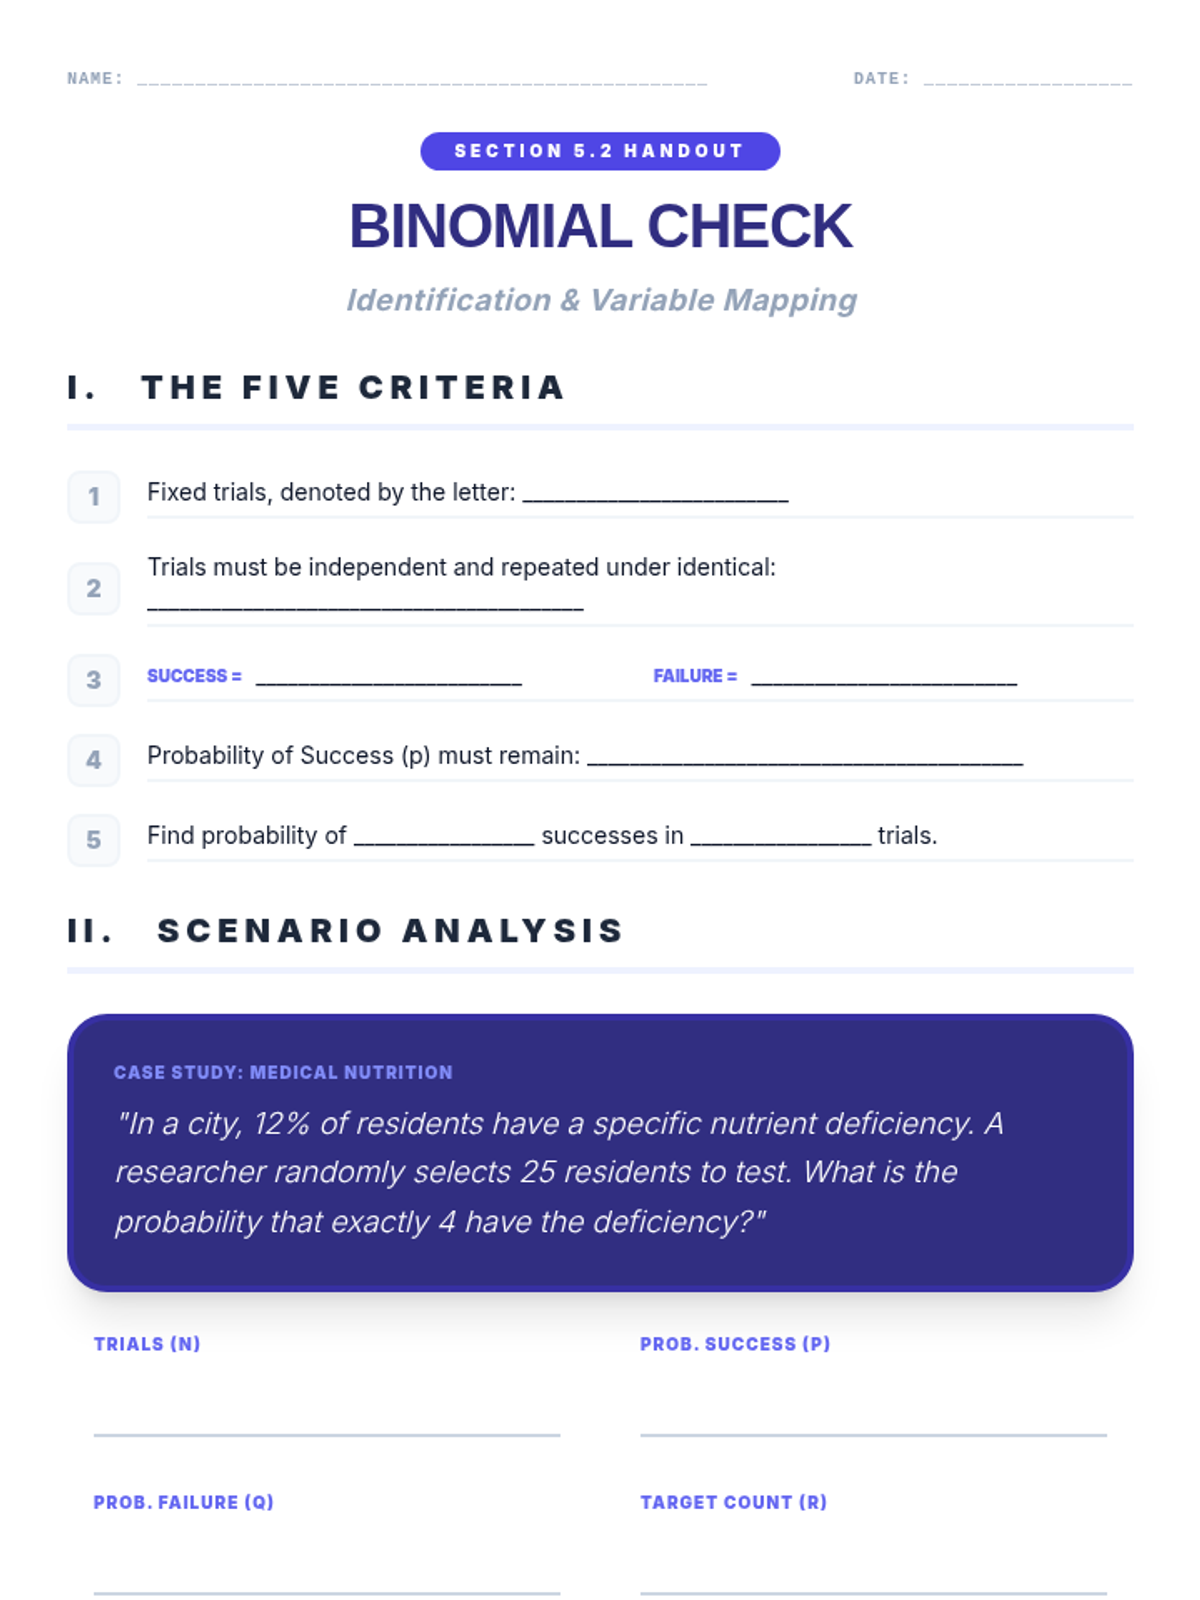
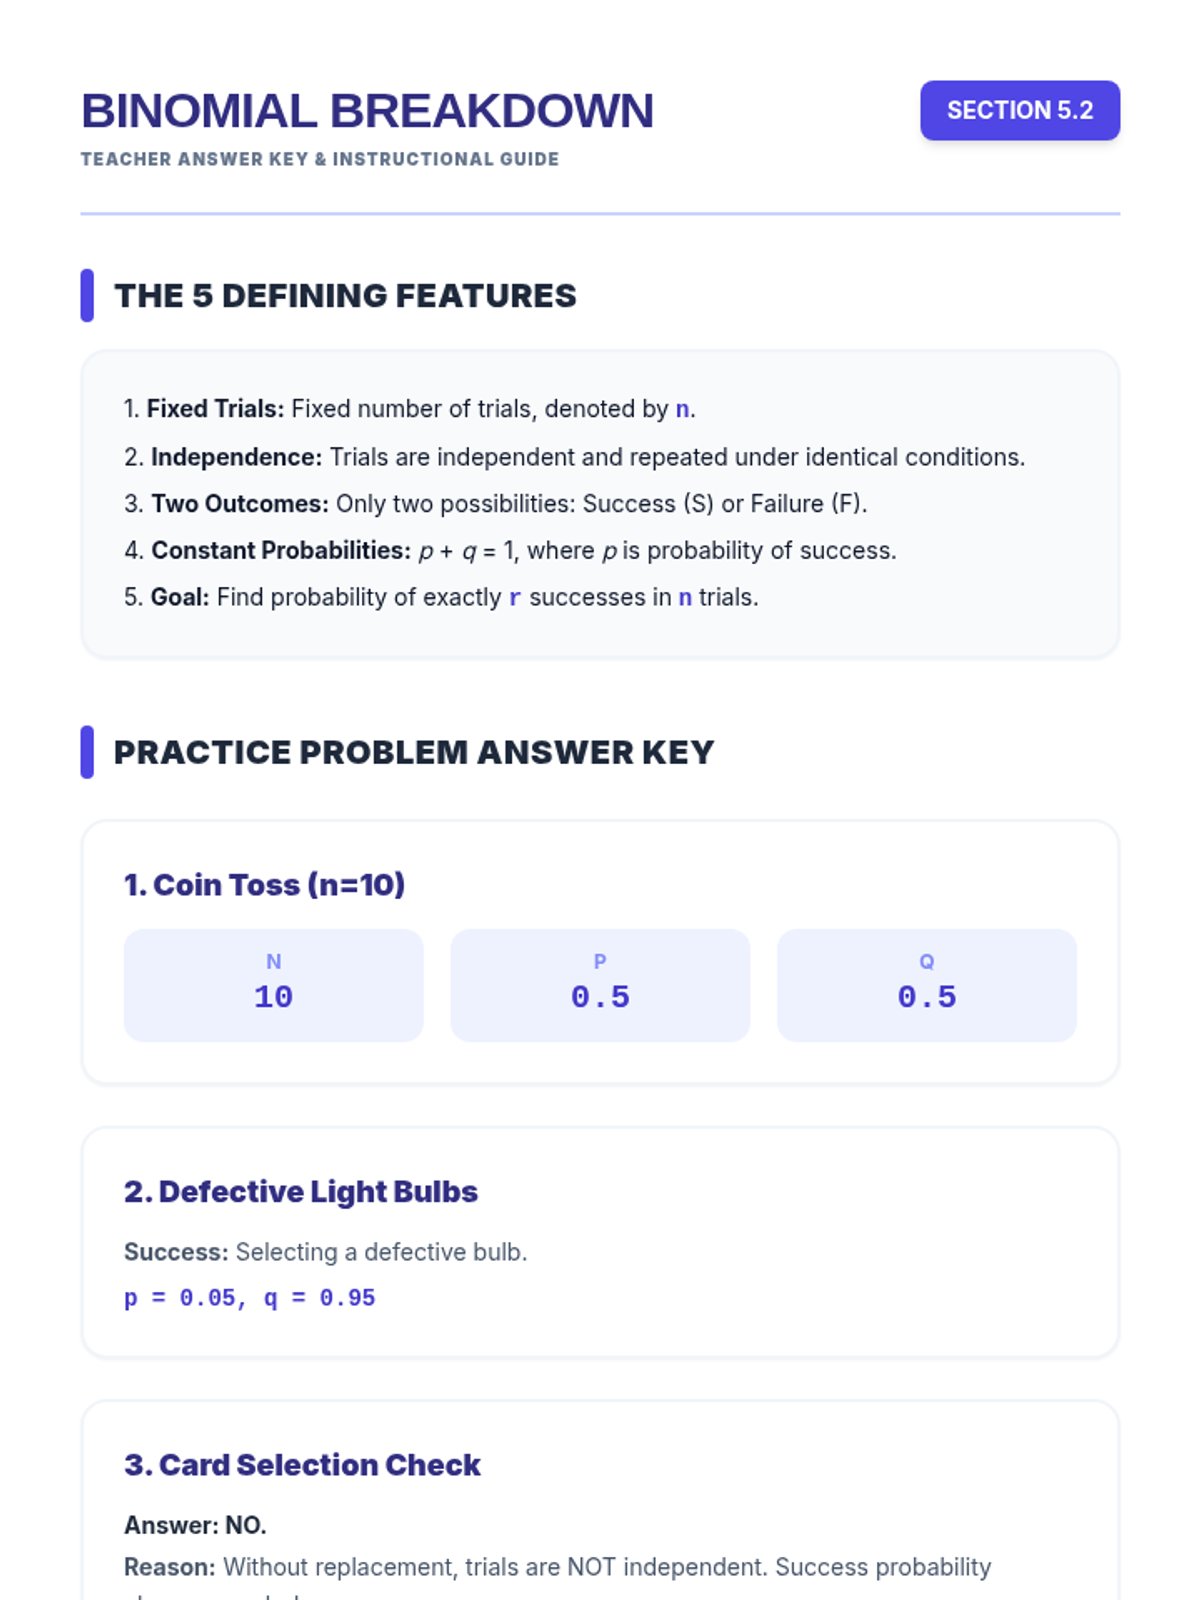
A student worksheet for identifying and applying the five features of binomial experiments, featuring scenario analysis and concept checks. Now with improved page-break handling and labeled answer areas.
Teacher answer key and instructional guide for the Binomial Breakdown lesson, providing detailed solutions and pedagogical tips. Features improved page-break handling and math rendering.
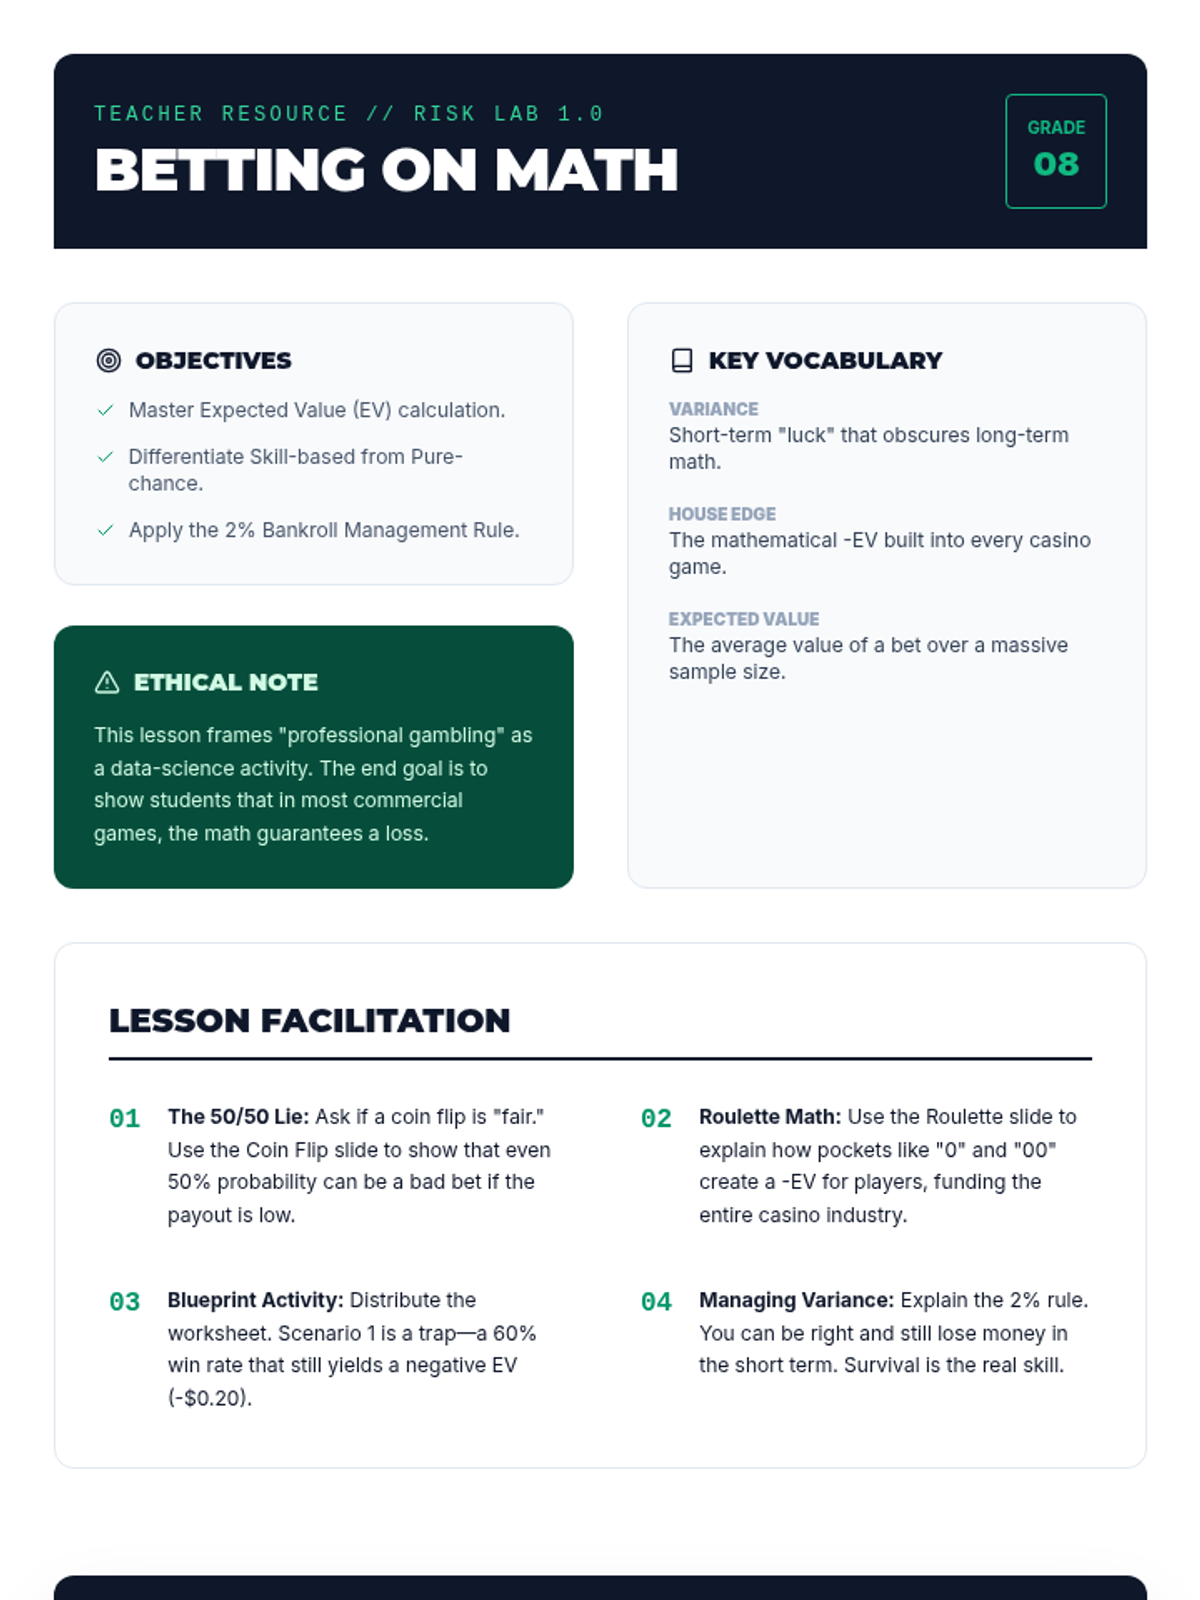
A comprehensive teacher's guide for the Risk Lab lesson, including learning objectives, instructional strategies, and a complete answer key.
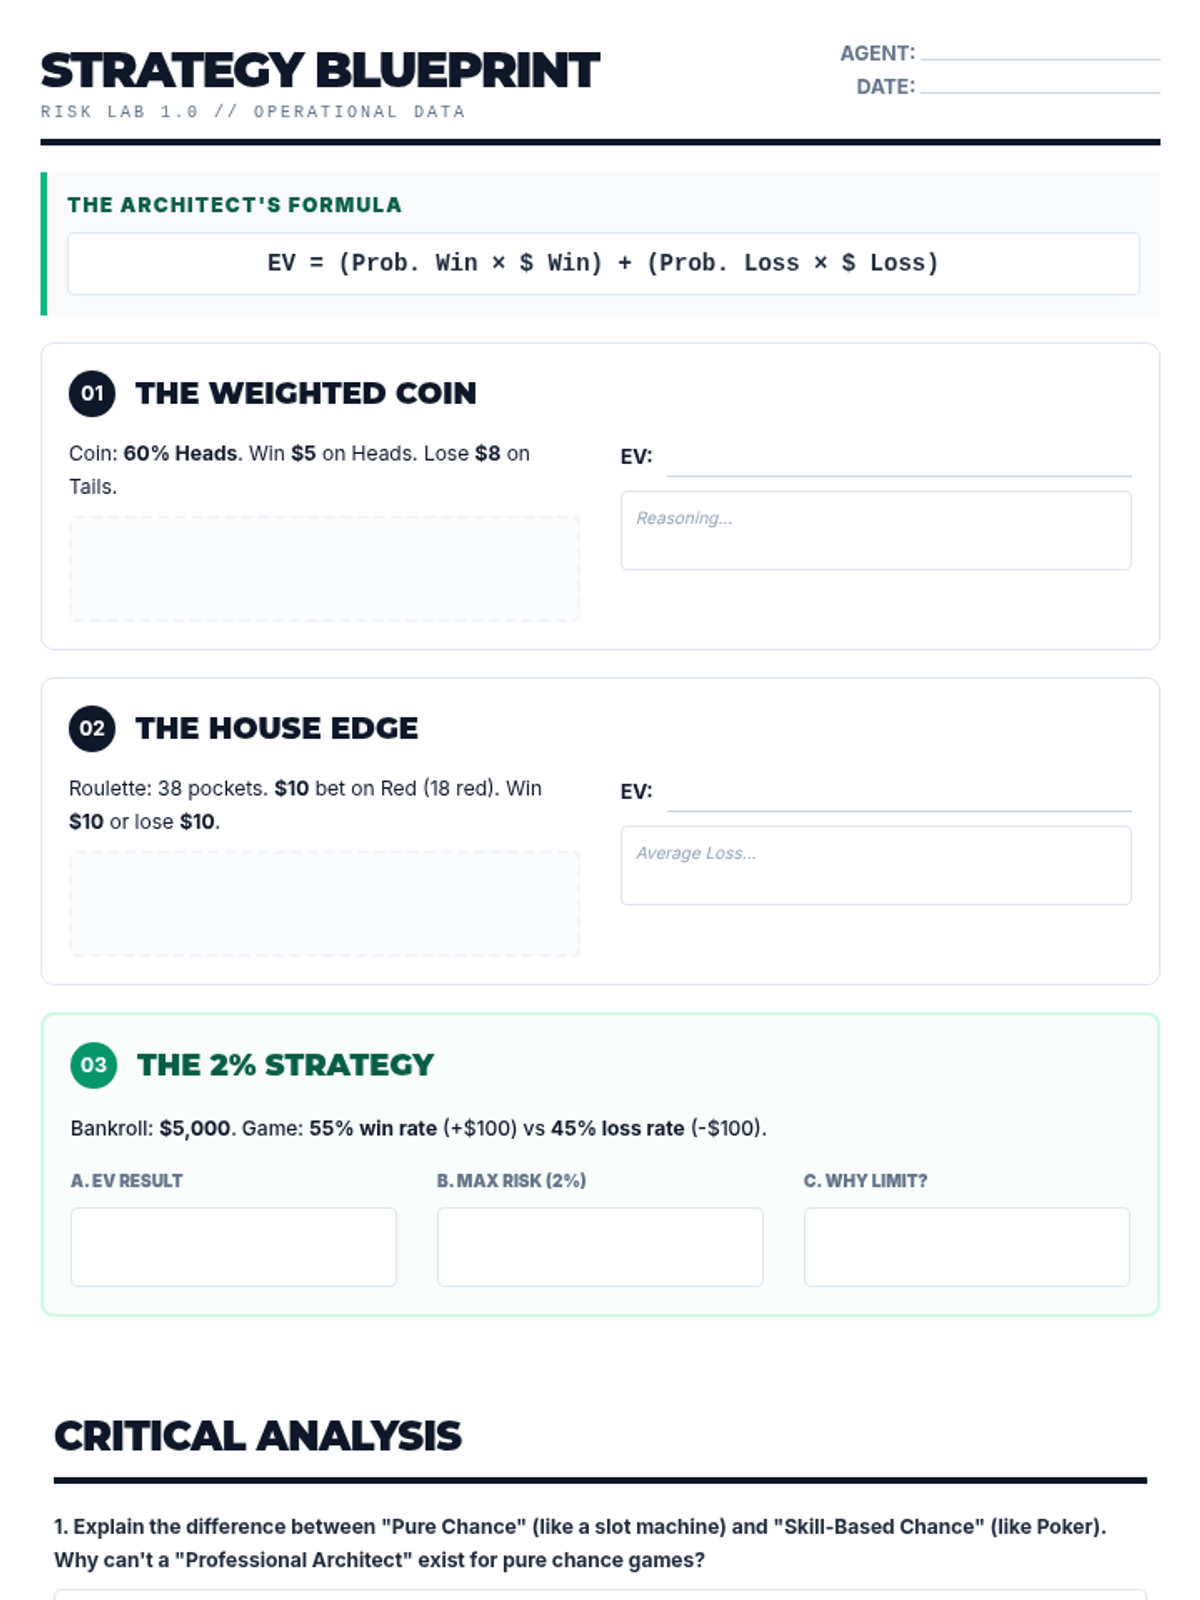
A two-page math worksheet where students calculate expected value and apply risk management strategies to various game scenarios.
A sleek, 16:9 presentation exploring the mathematics of risk, expected value, and the difference between luck and strategy in games of chance.
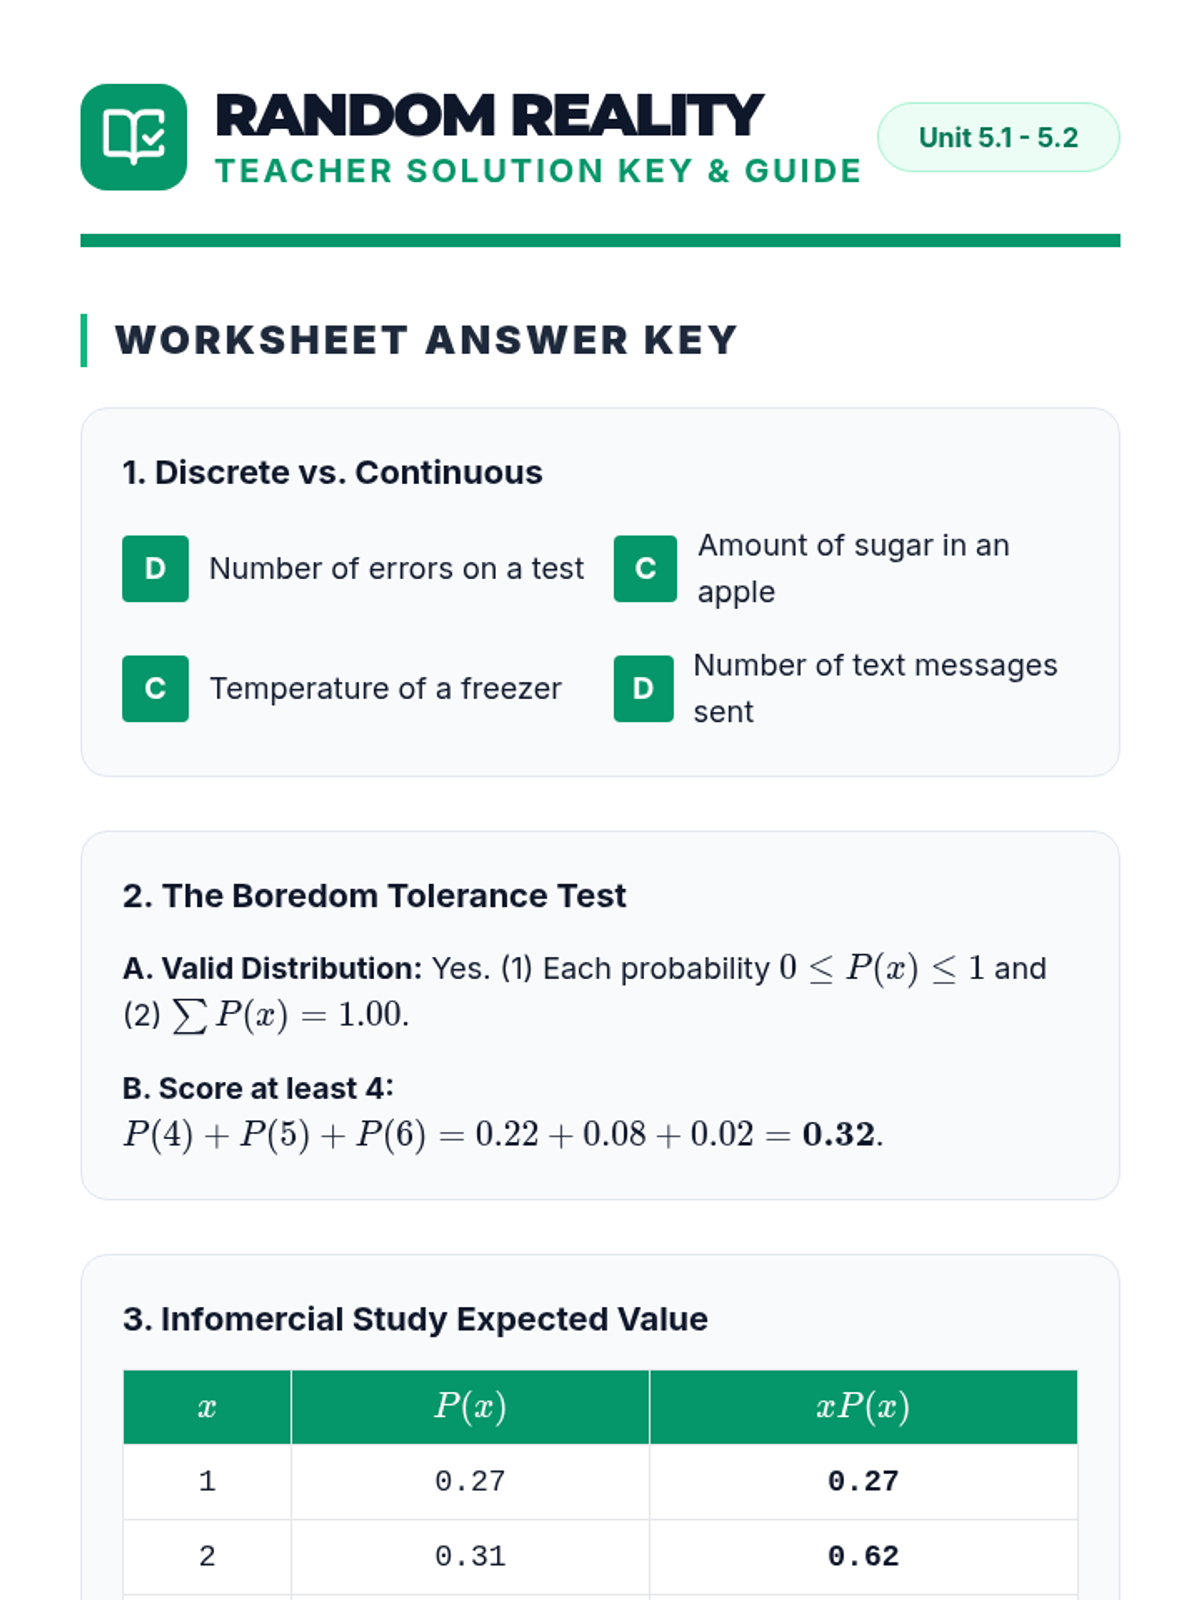
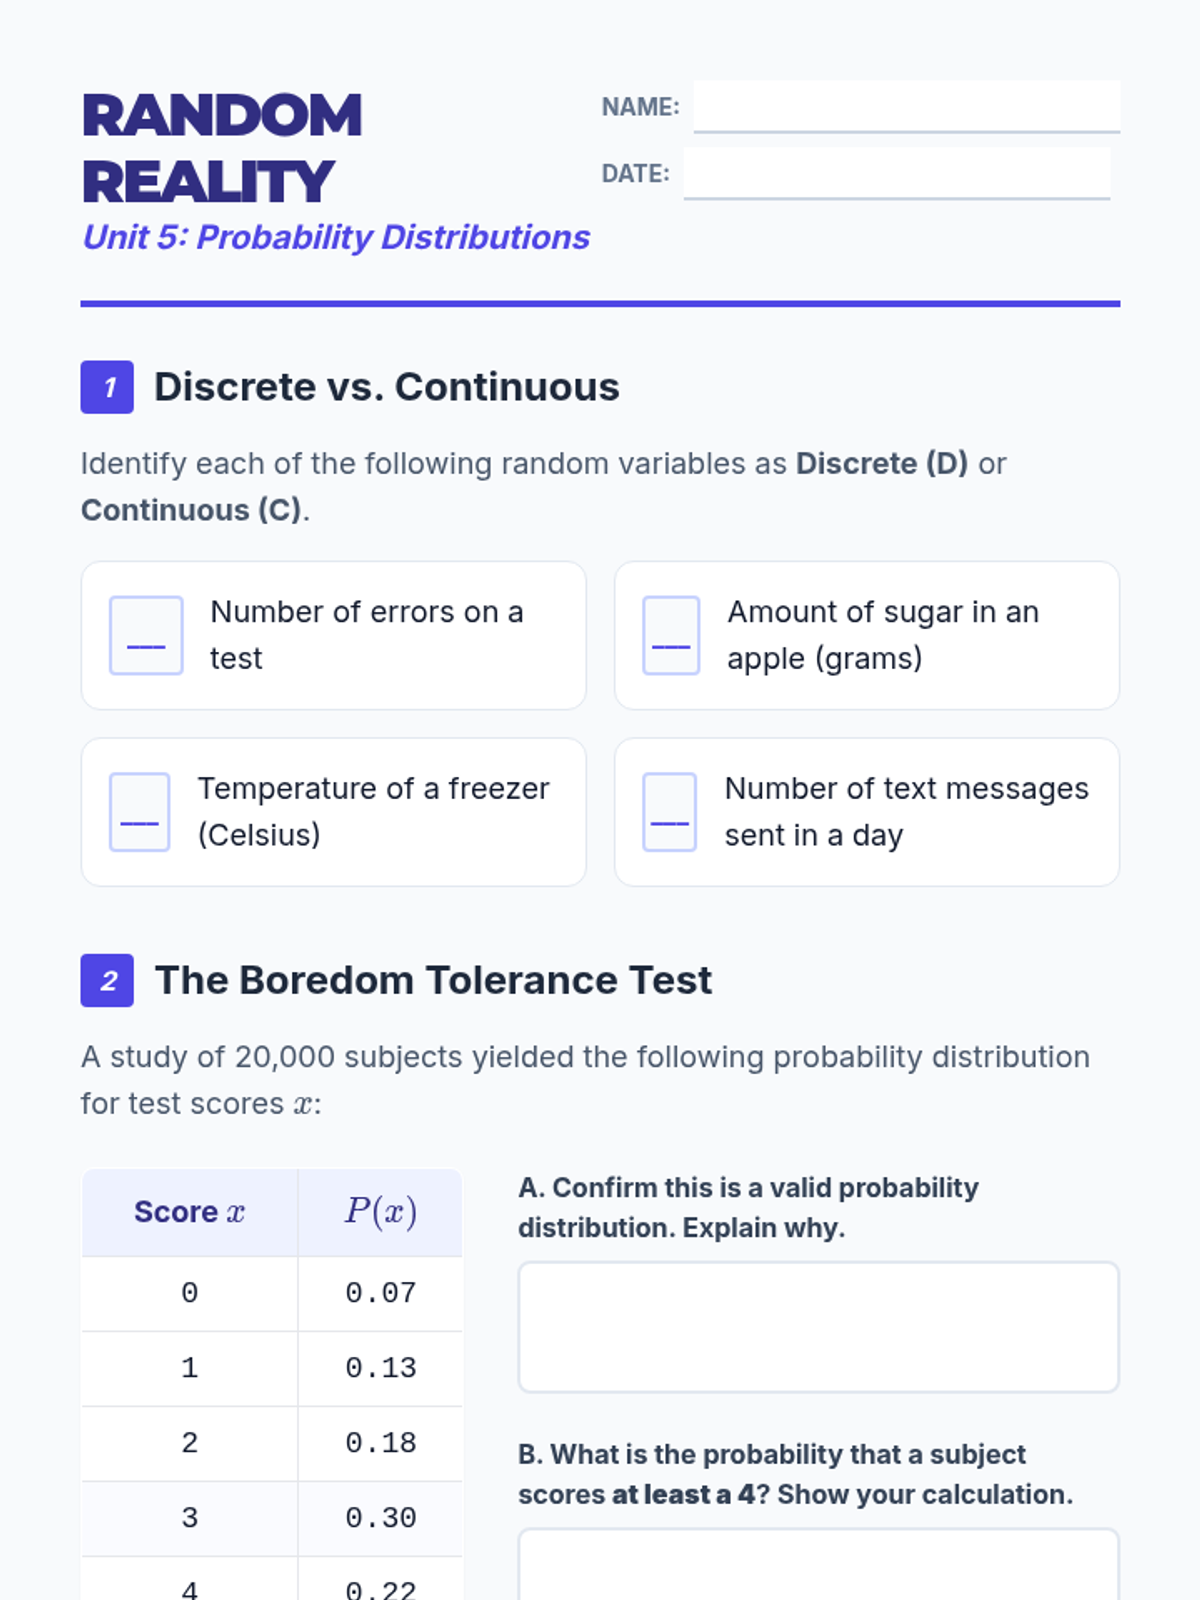
A comprehensive teacher's guide containing the answer key for the Random Reality Worksheet, along with teaching tips, common misconceptions, and pacing suggestions.
A student worksheet for practicing classification of random variables, verifying probability distributions, and calculating expected value using real-world case studies.
A comprehensive and visually engaging presentation covering random variables, probability distributions, histograms, and statistical calculations.
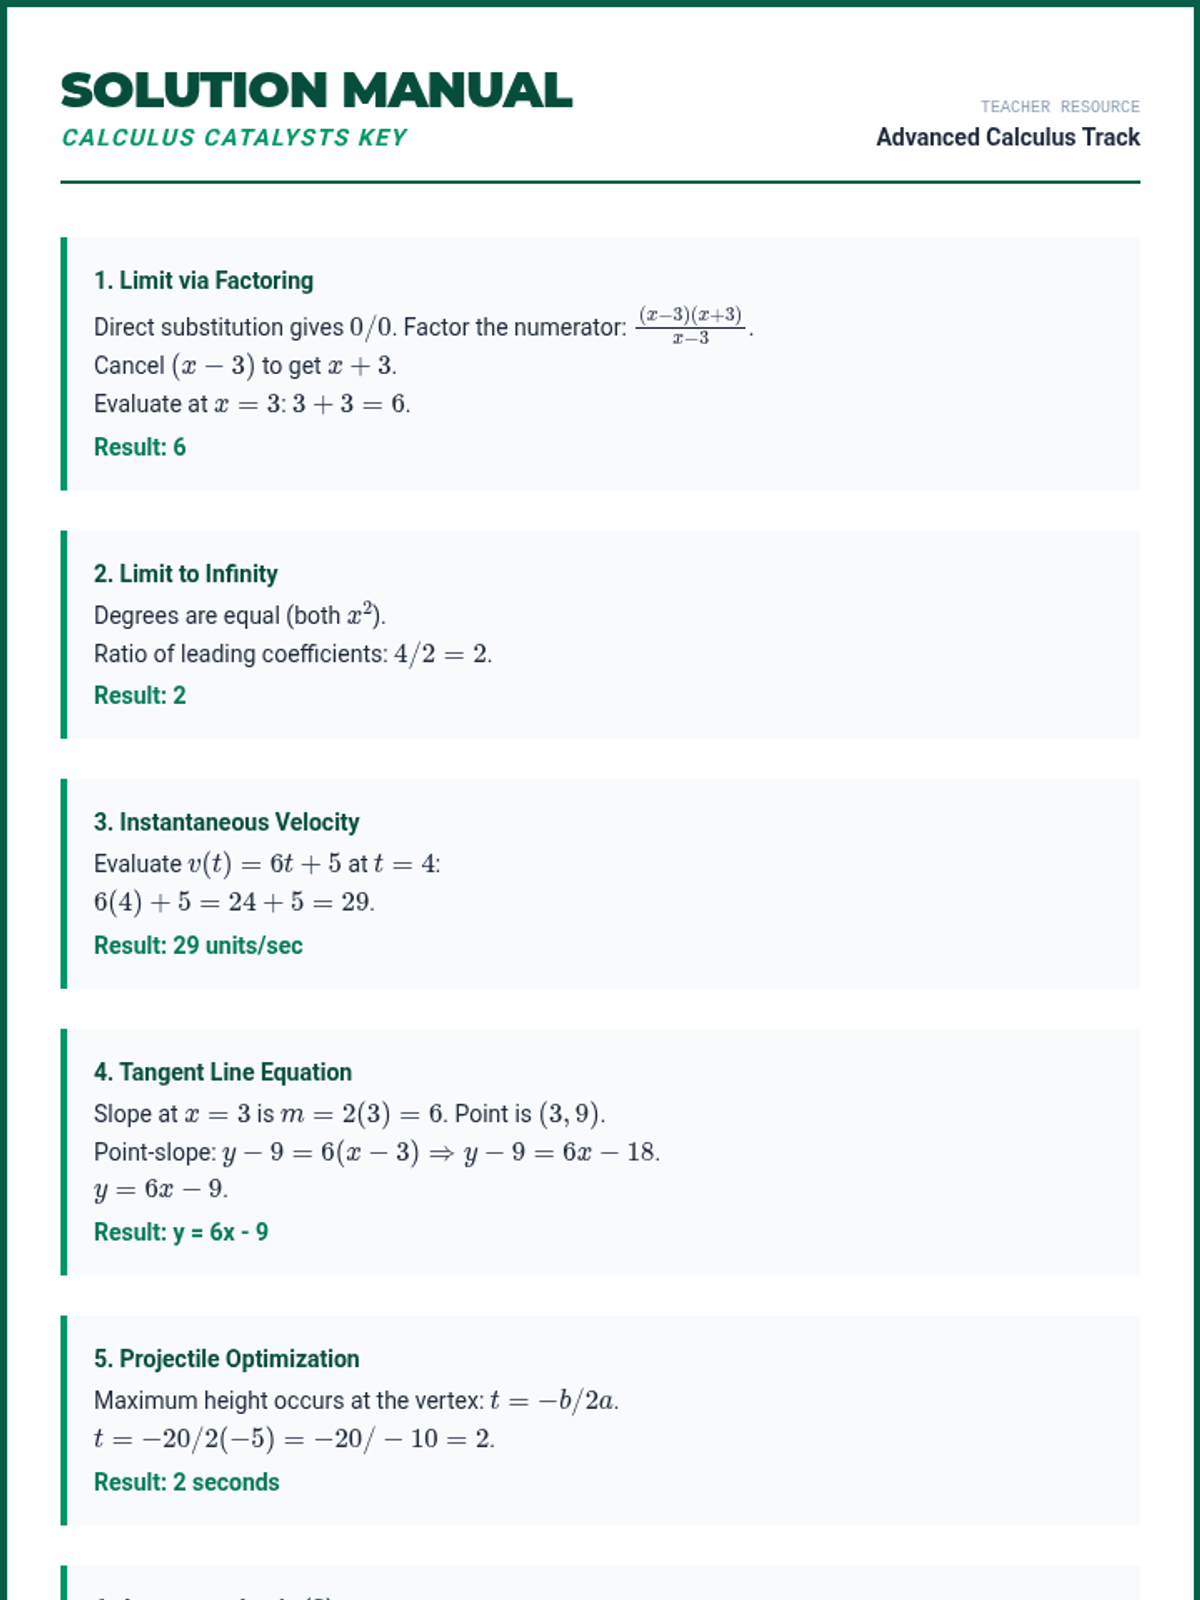
The detailed answer key for the Calculus Catalysts Workout, providing step-by-step solutions for limits, instantaneous rate of change, and basic function optimization problems.
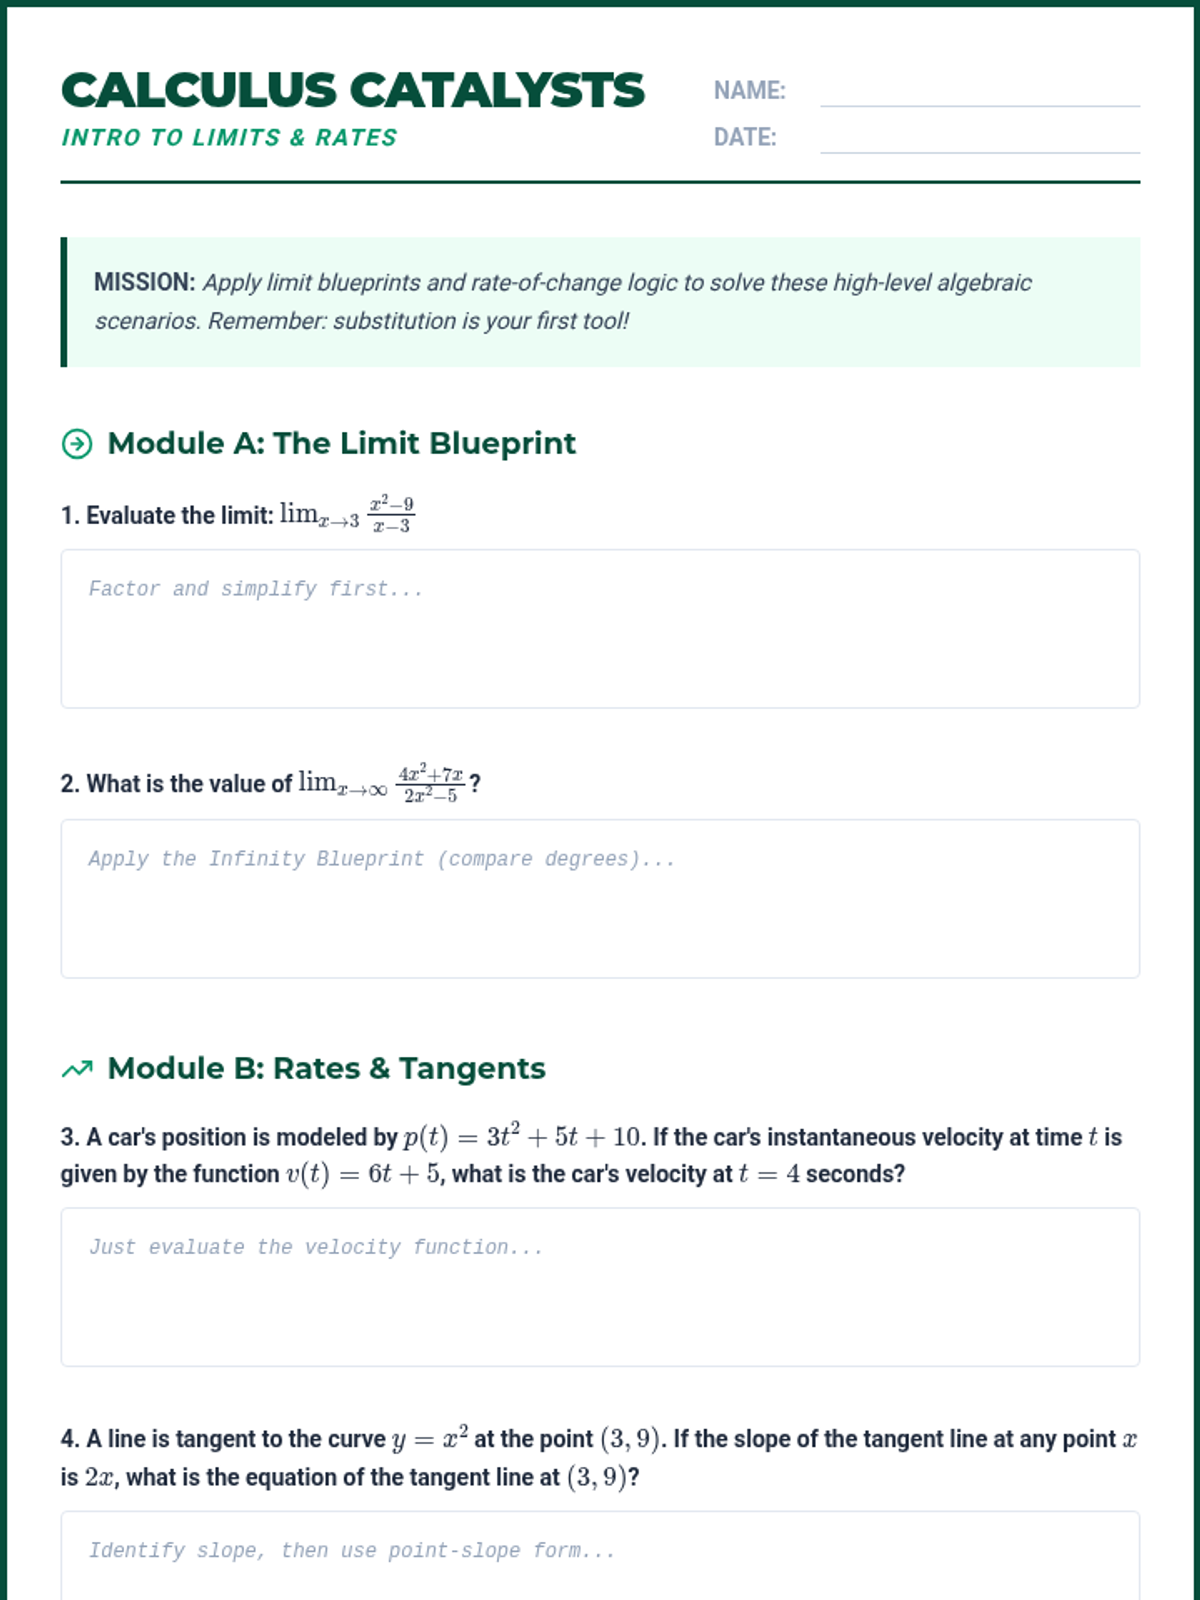
A student practice worksheet for calculus-adjacent ACT concepts, featuring limits, instantaneous rate of change logic, and function optimization problems.
A visual slide deck explaining introductory calculus concepts for the ACT, including limits, instantaneous rate of change, and basic function optimization using standard blueprints. Revised for font size compliance (min 24px).
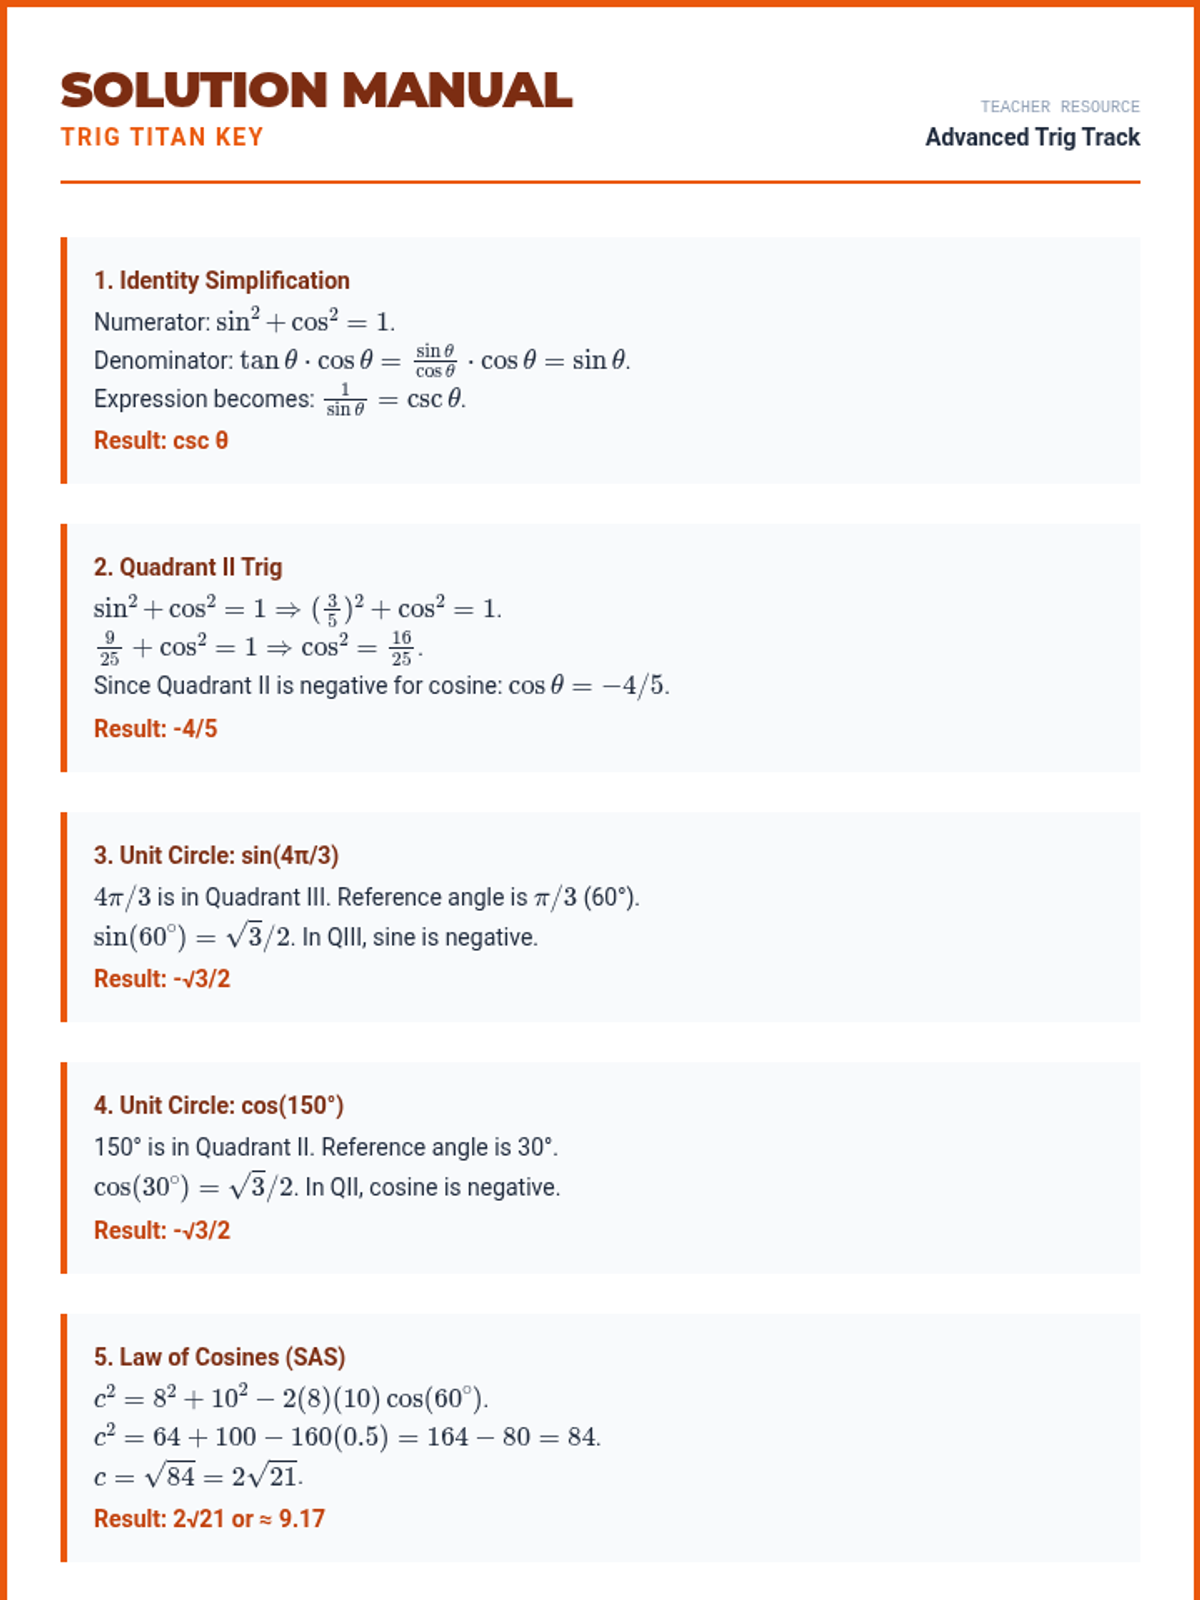
The detailed answer key for the Trig Titan Workout, including step-by-step solutions for identities, the unit circle, and non-right triangle problems.
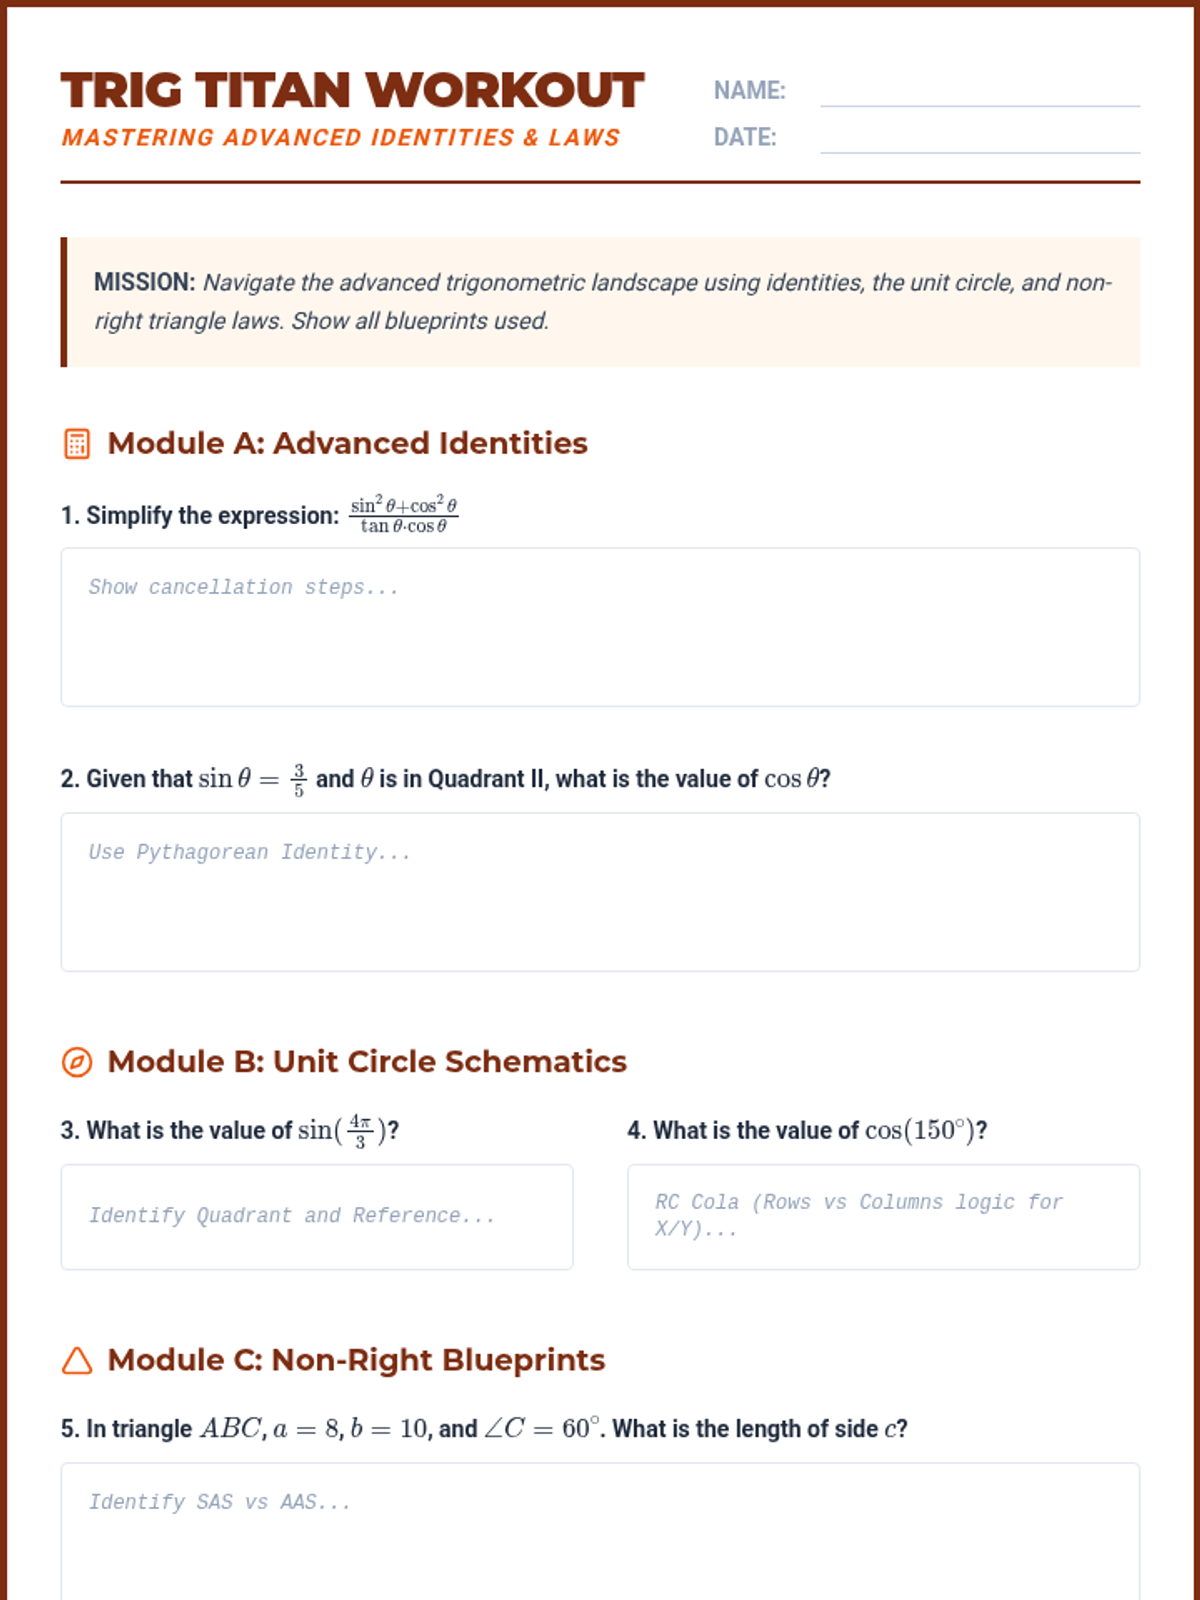
A comprehensive practice worksheet for advanced ACT trigonometry, featuring sections on identities, the unit circle, Law of Sines/Cosines, and 'Final Ten' challenge problems.
A visual slide deck covering advanced ACT trigonometry: Pythagorean identities, the unit circle, Law of Sines/Cosines, and the ambiguous SSA case. Revised for font size compliance (min 24px).
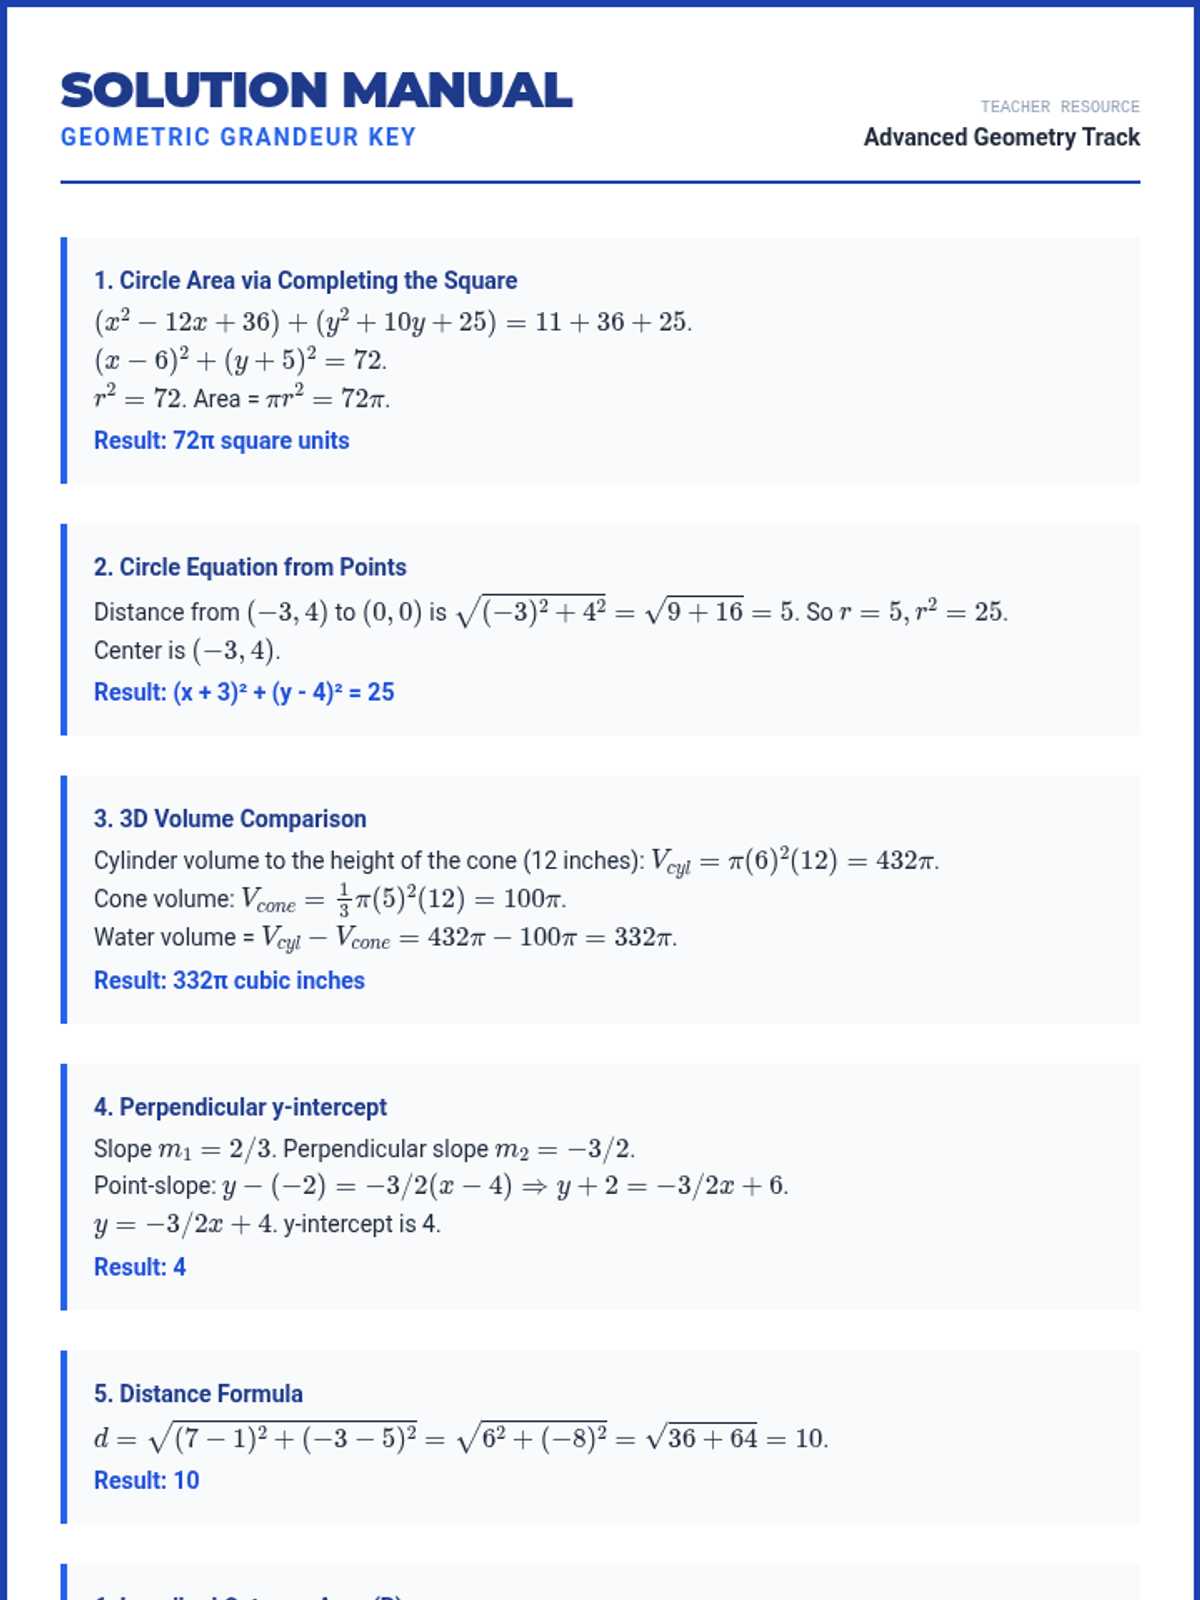
The detailed answer key for the Geometric Grandeur Workout, providing step-by-step solutions for circle equations, 3D volume, and coordinate geometry problems.
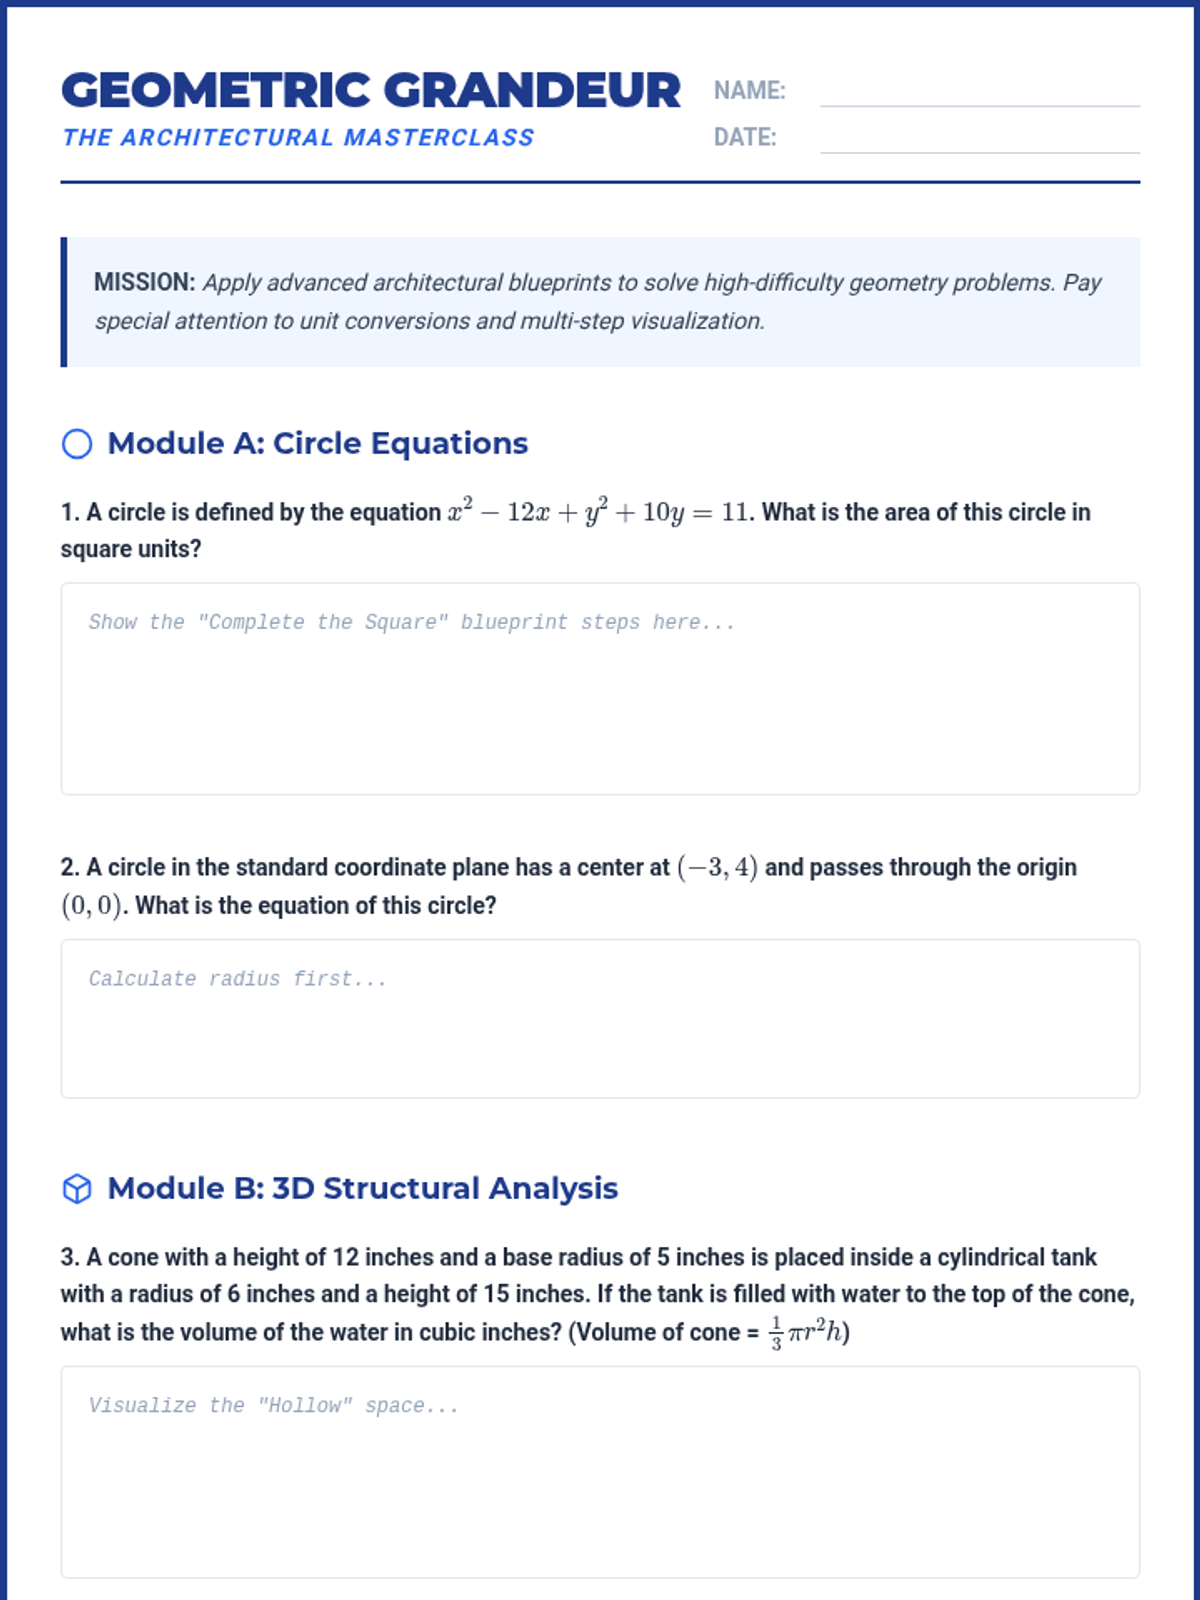
A specialized geometry workout featuring problems on circle equations, 3D volume visualization, and coordinate geometry, including advanced 'Final Ten' style challenges like inscribed octagons and 3D coordinate spheres.
A visual slide deck covering advanced ACT geometry topics: circle equations, 3D structural formulas, and coordinate geometry strategies. Revised for clarity and font size compliance.
A comprehensive 12-slide masterclass deck covering all 10 advanced subjects tested in the diagnostic quiz, including matrices, complex numbers, trig periods, circle equations, expected value, logs, remainder theorem, counting logic, vectors, and trig identities. Revised for font size compliance (min 24px).
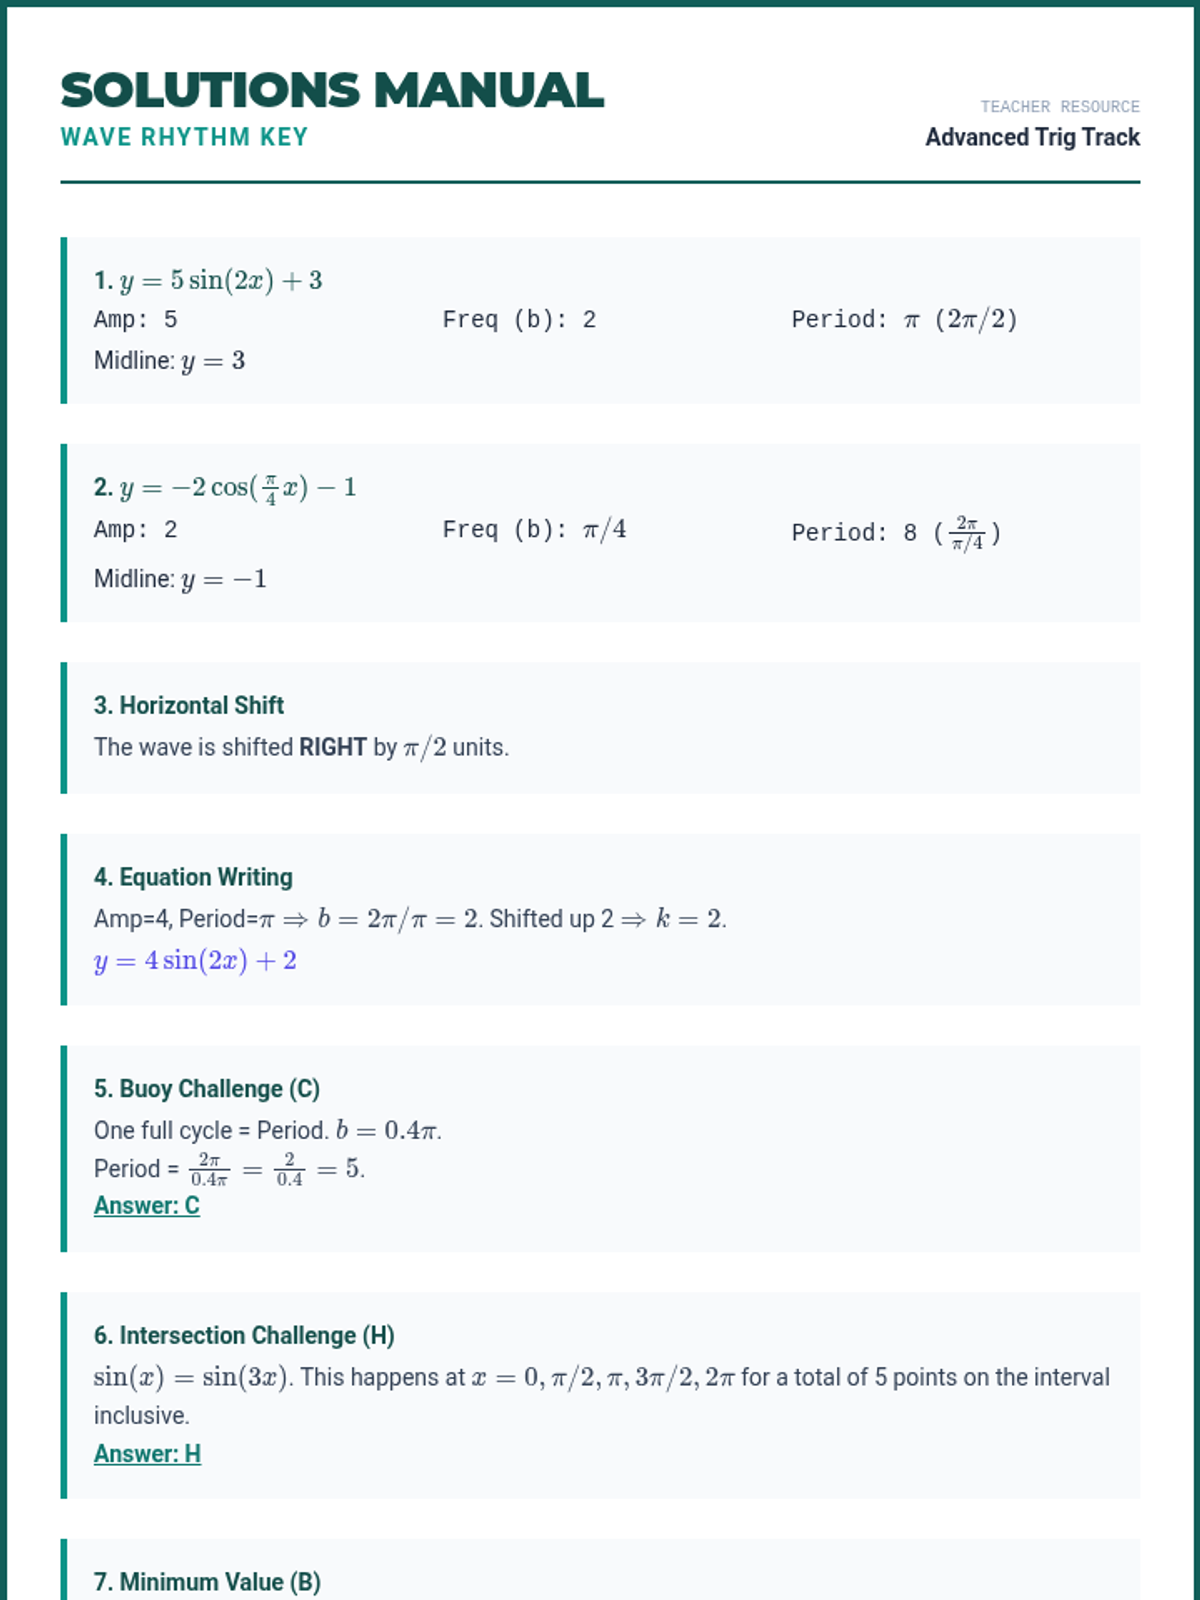
The detailed answer key for the Wave Rhythm Workout, featuring full step-by-step solutions and teacher insights for period, frequency, and wave modeling problems.
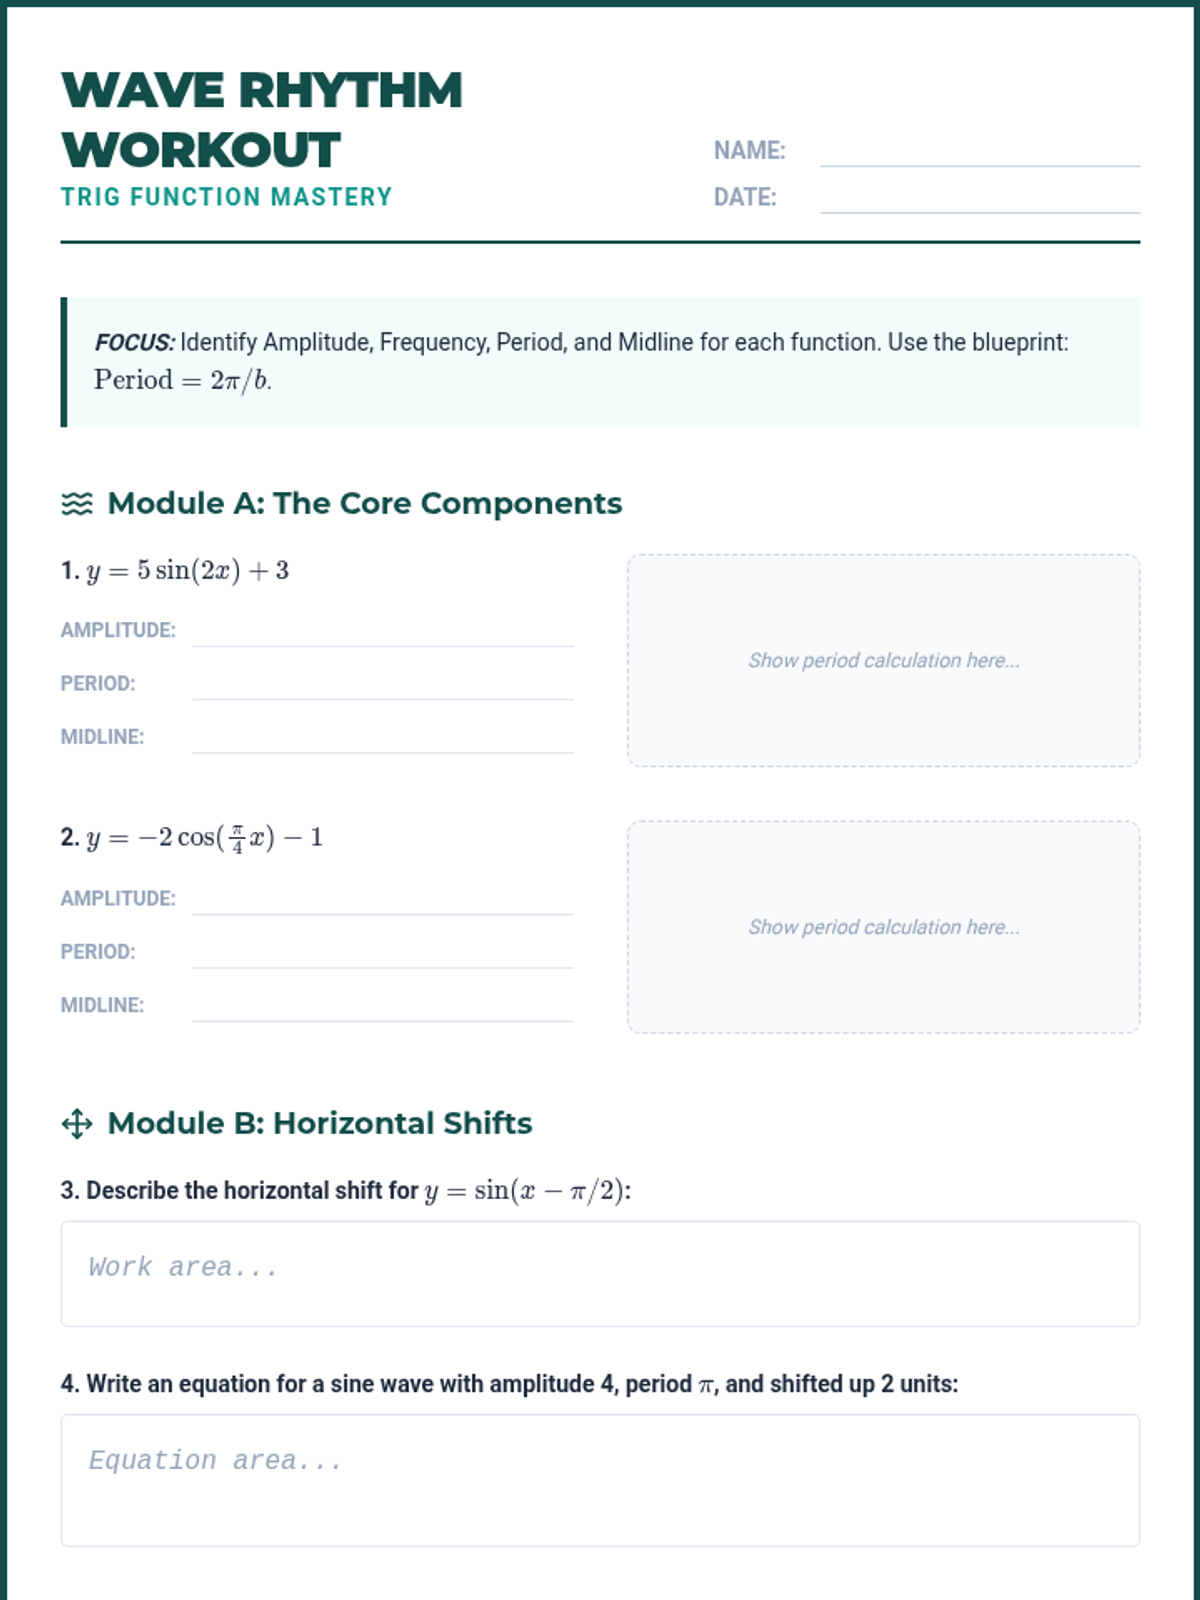
A specialized student worksheet focusing on trigonometric period, frequency, and wave components, featuring both basic identification and complex 'Final Ten' style scenario problems.
A visual slide deck explaining the components of trigonometric wave equations, with a specific focus on the 2π/b relationship for finding period from frequency. Revised for clarity and font size compliance.
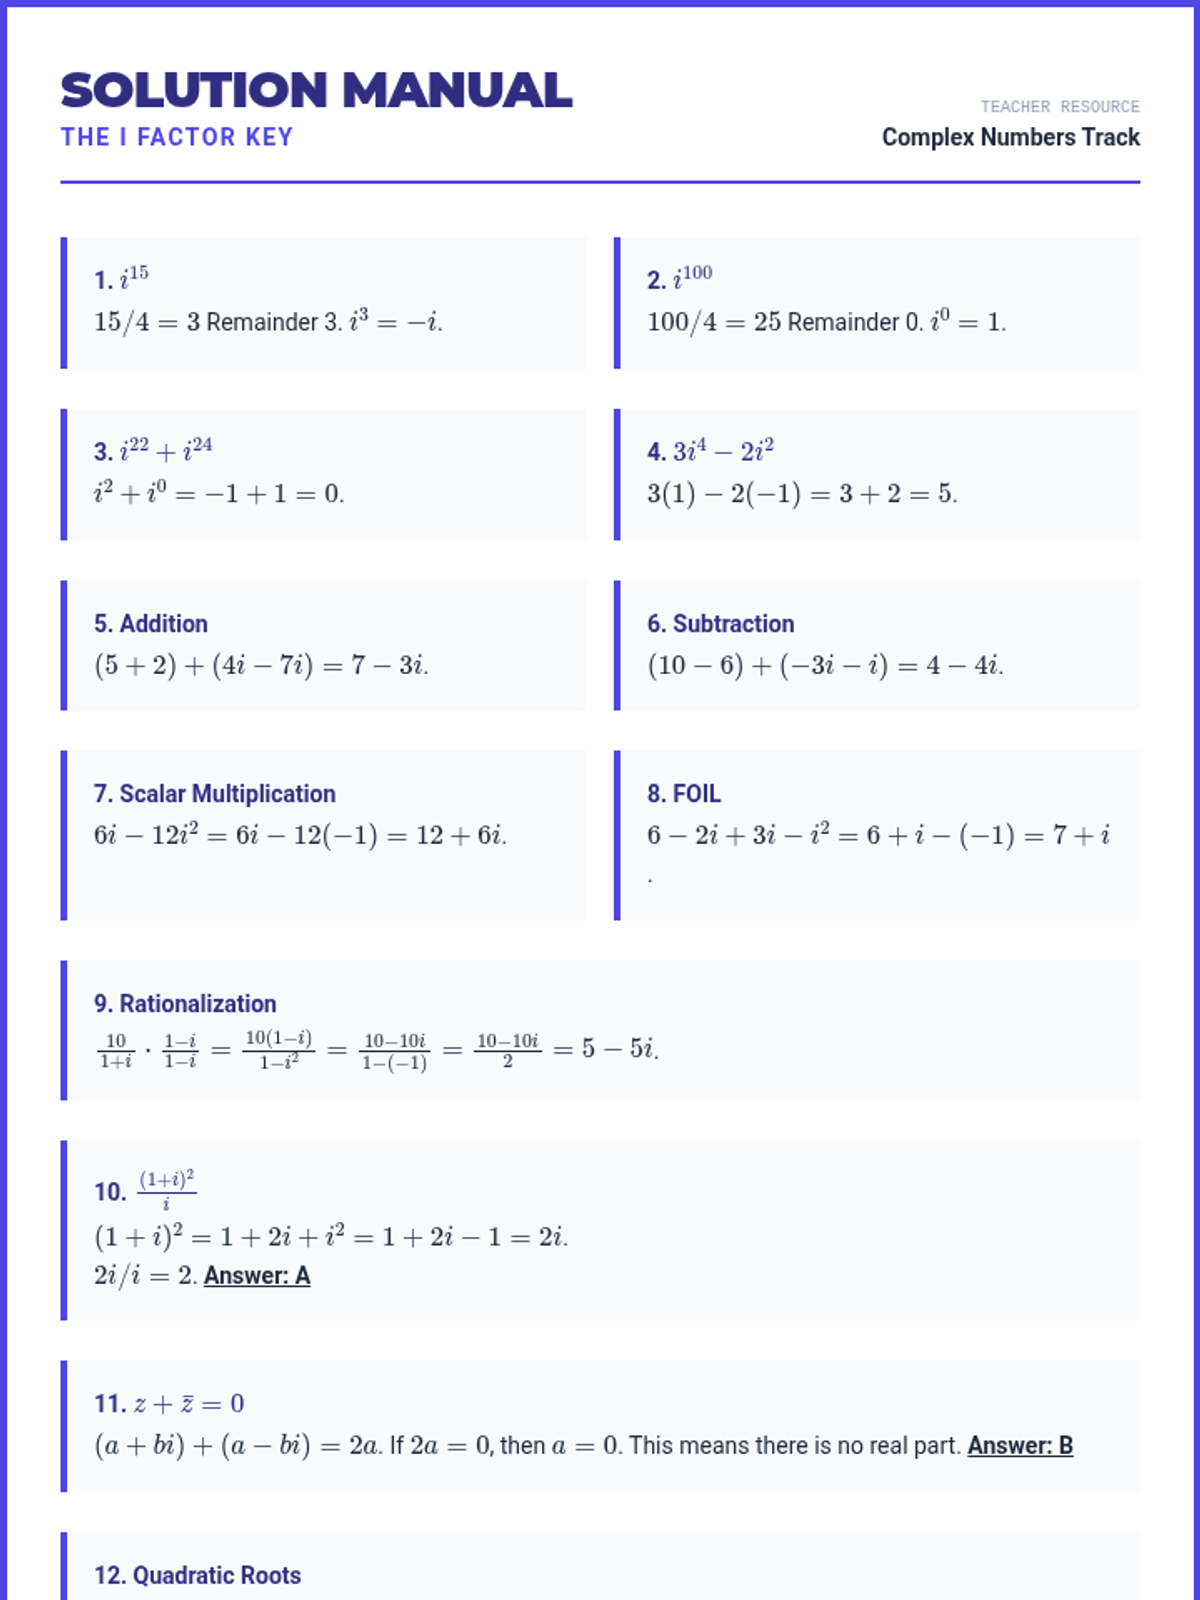
The detailed answer key for 'The i Factor Workout', featuring step-by-step solutions for powers of i, arithmetic operations, conjugates, and high-level ACT challenge problems.
A set of instructional slides introducing binomial experiments, their five defining features, and real-world calculation examples. Now with improved layouts and math rendering.
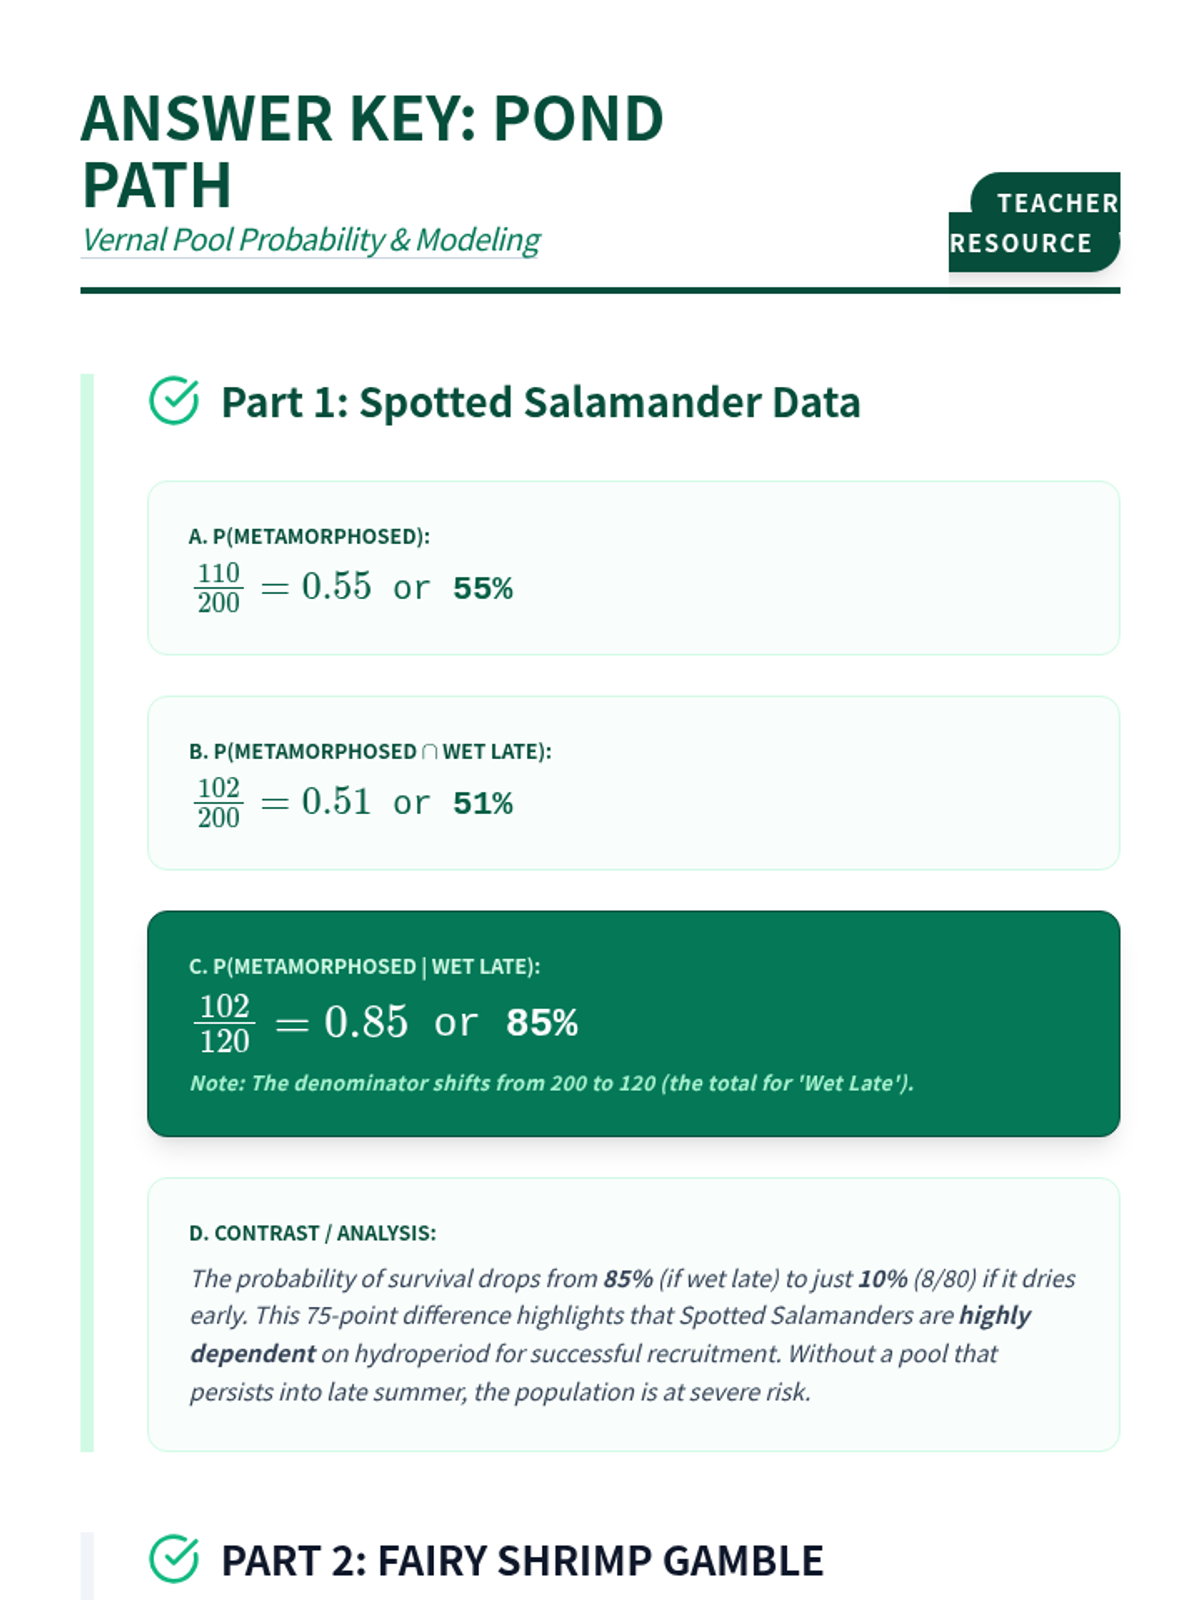
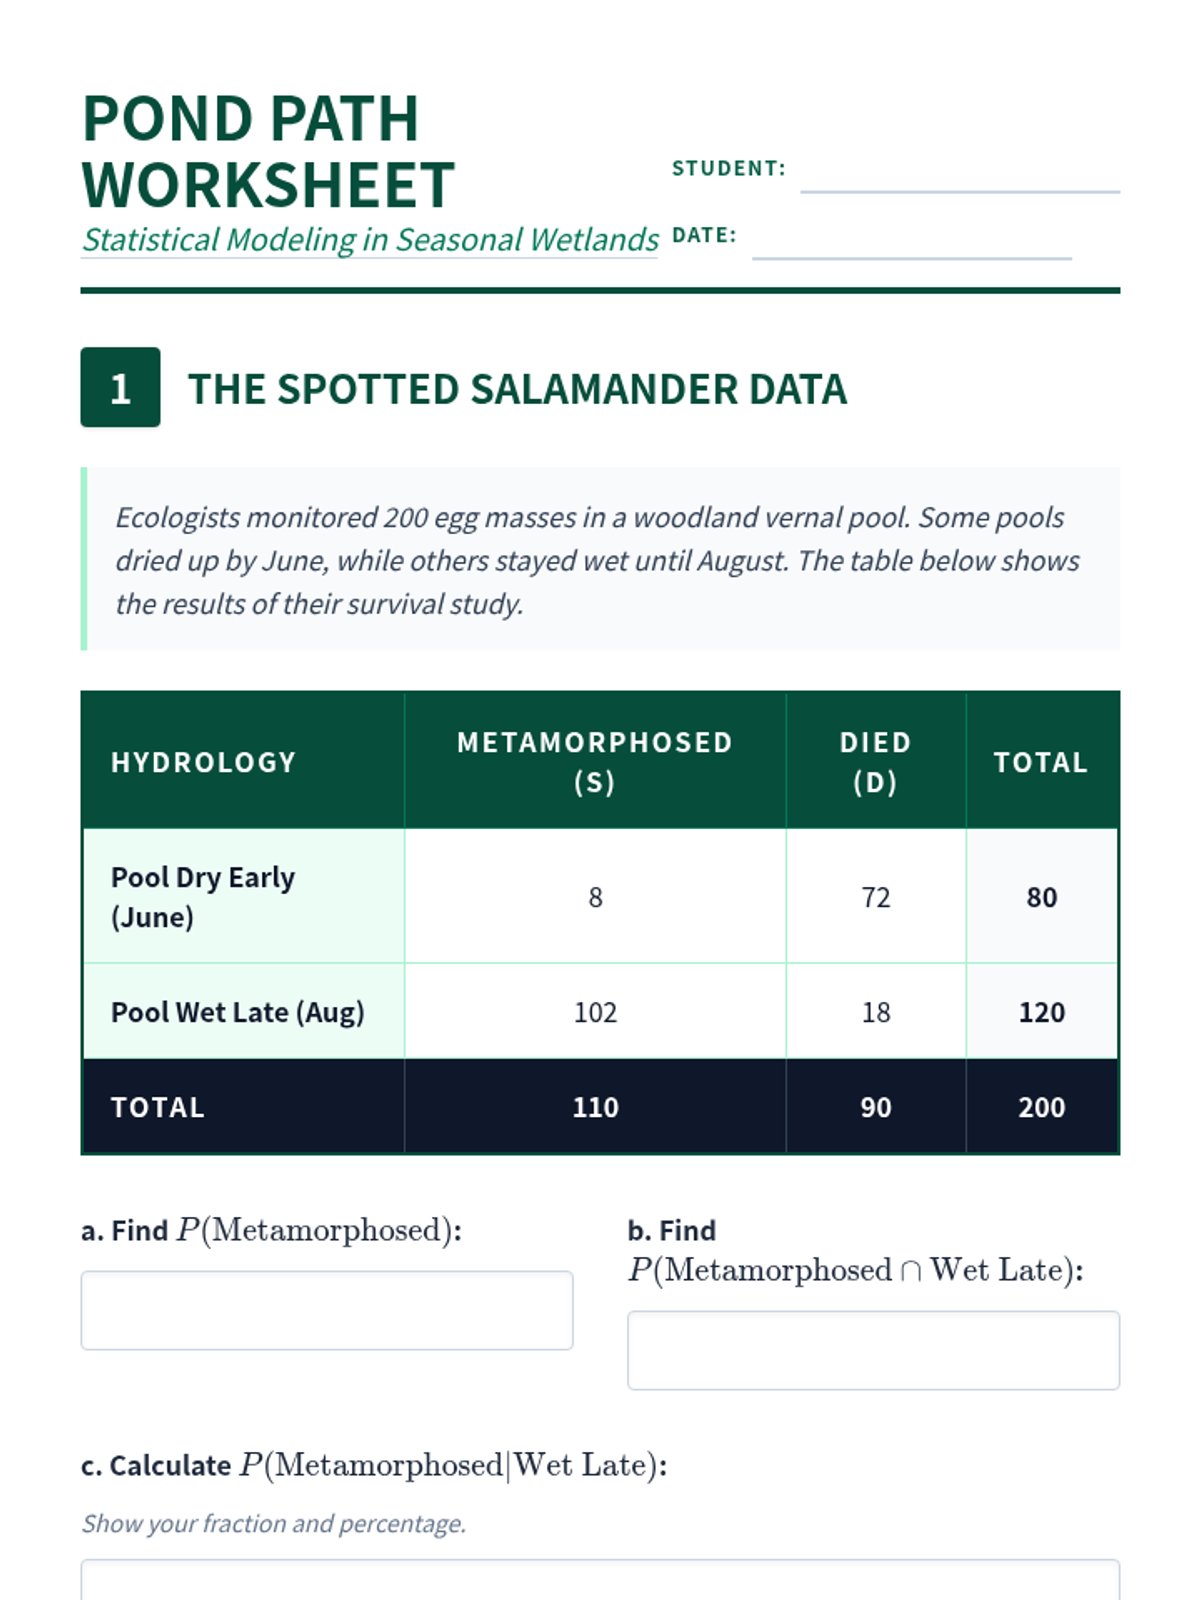
An answer key for the Pond Path Worksheet, providing solutions for the two-way tables and word problems with pedagogical notes.
A student worksheet featuring two-way tables and word problems focused on conditional probability and compound events in vernal pool ecology.
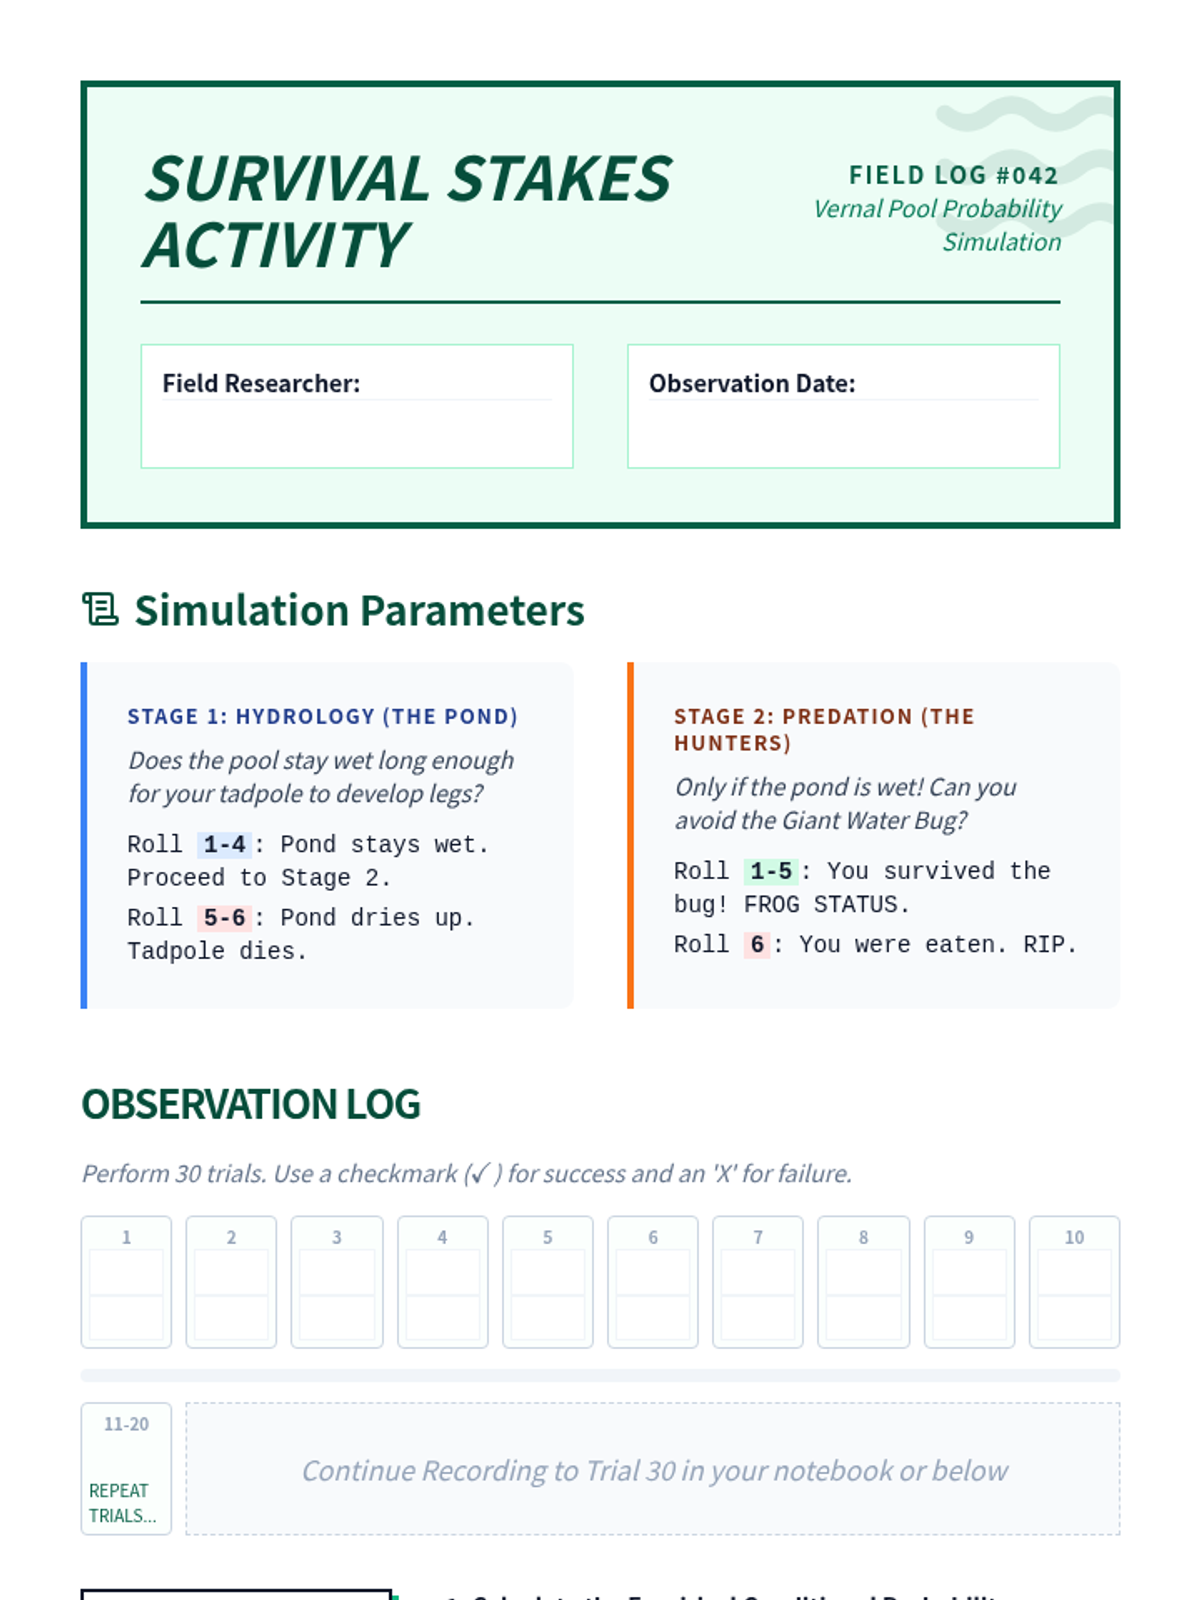
A hands-on simulation activity where students use dice to model survival rates of vernal pool species, collecting empirical data to calculate conditional probabilities.
An instructional slide deck explaining vernal pool ecology, conditional probability formulas, and tree diagrams for survival modeling.
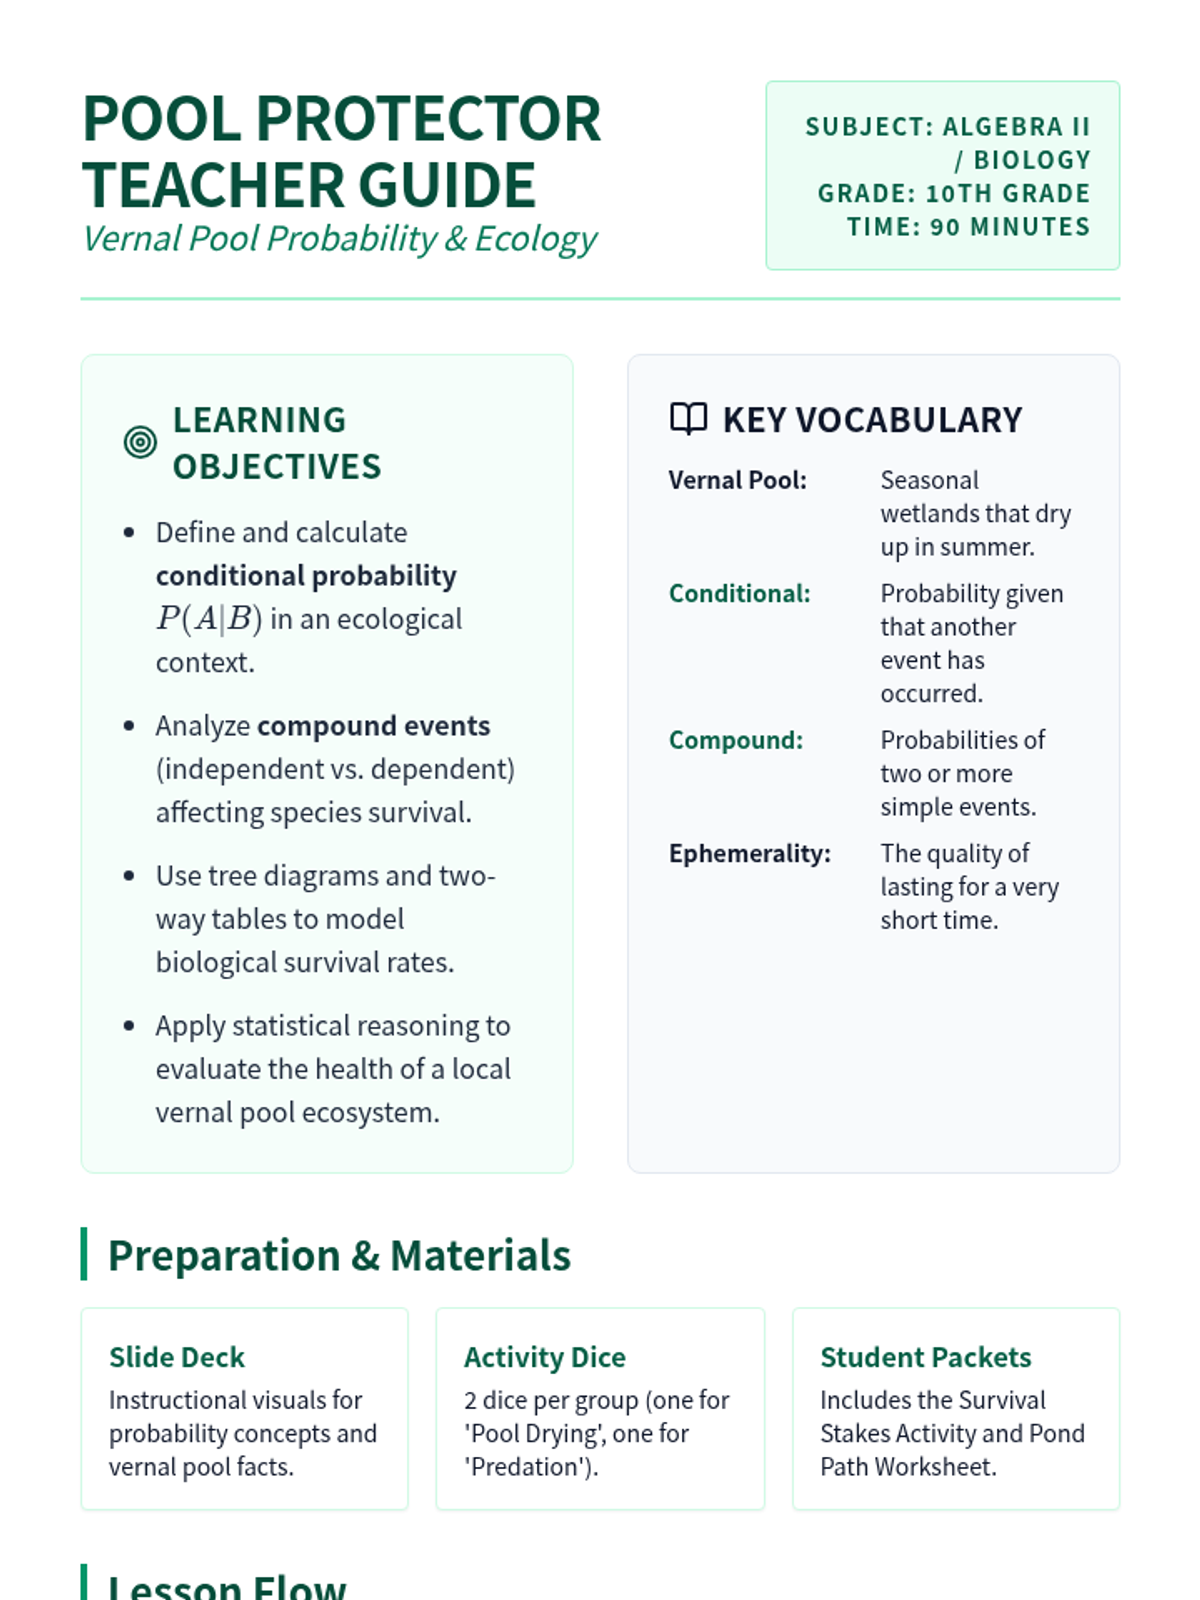
A comprehensive teacher guide for a 90-minute lesson on conditional probability using vernal pool ecology, including pacing, vocabulary, and differentiation strategies.
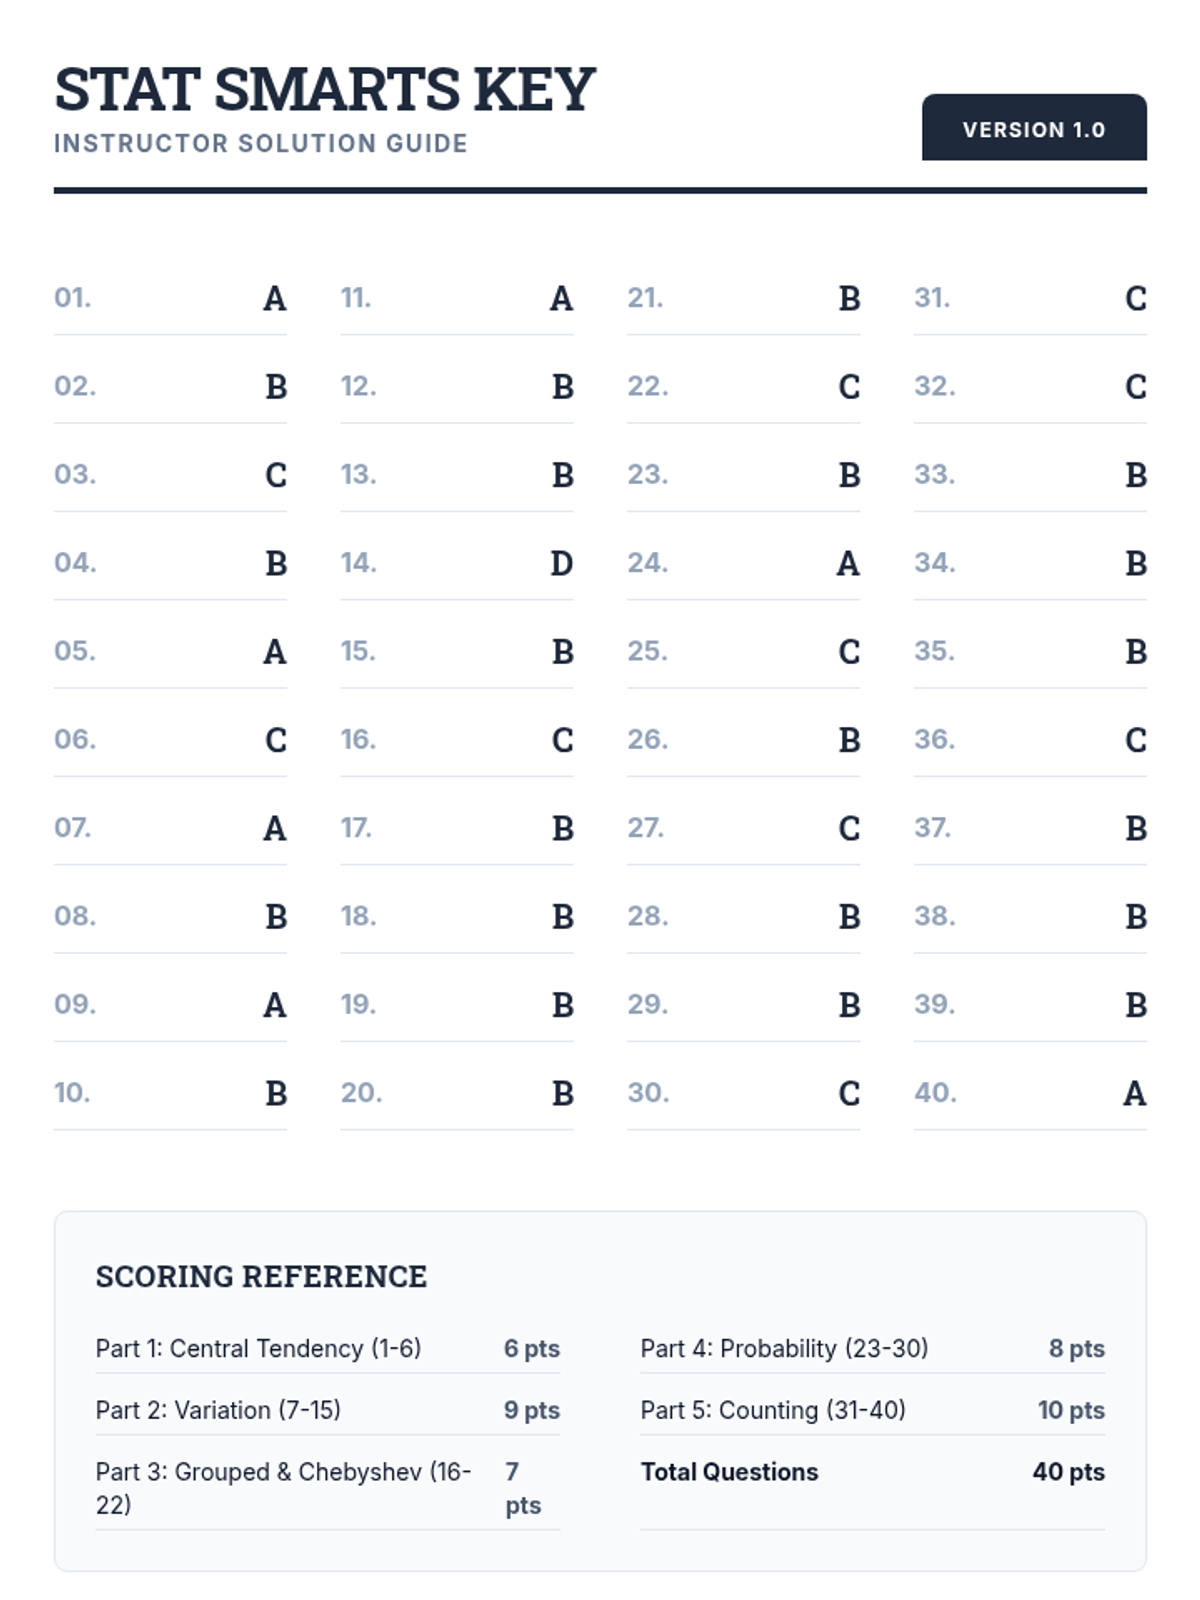
Answer key and scoring guide for the Stat Smarts Review Worksheet, including brief calculation notes for teacher reference.
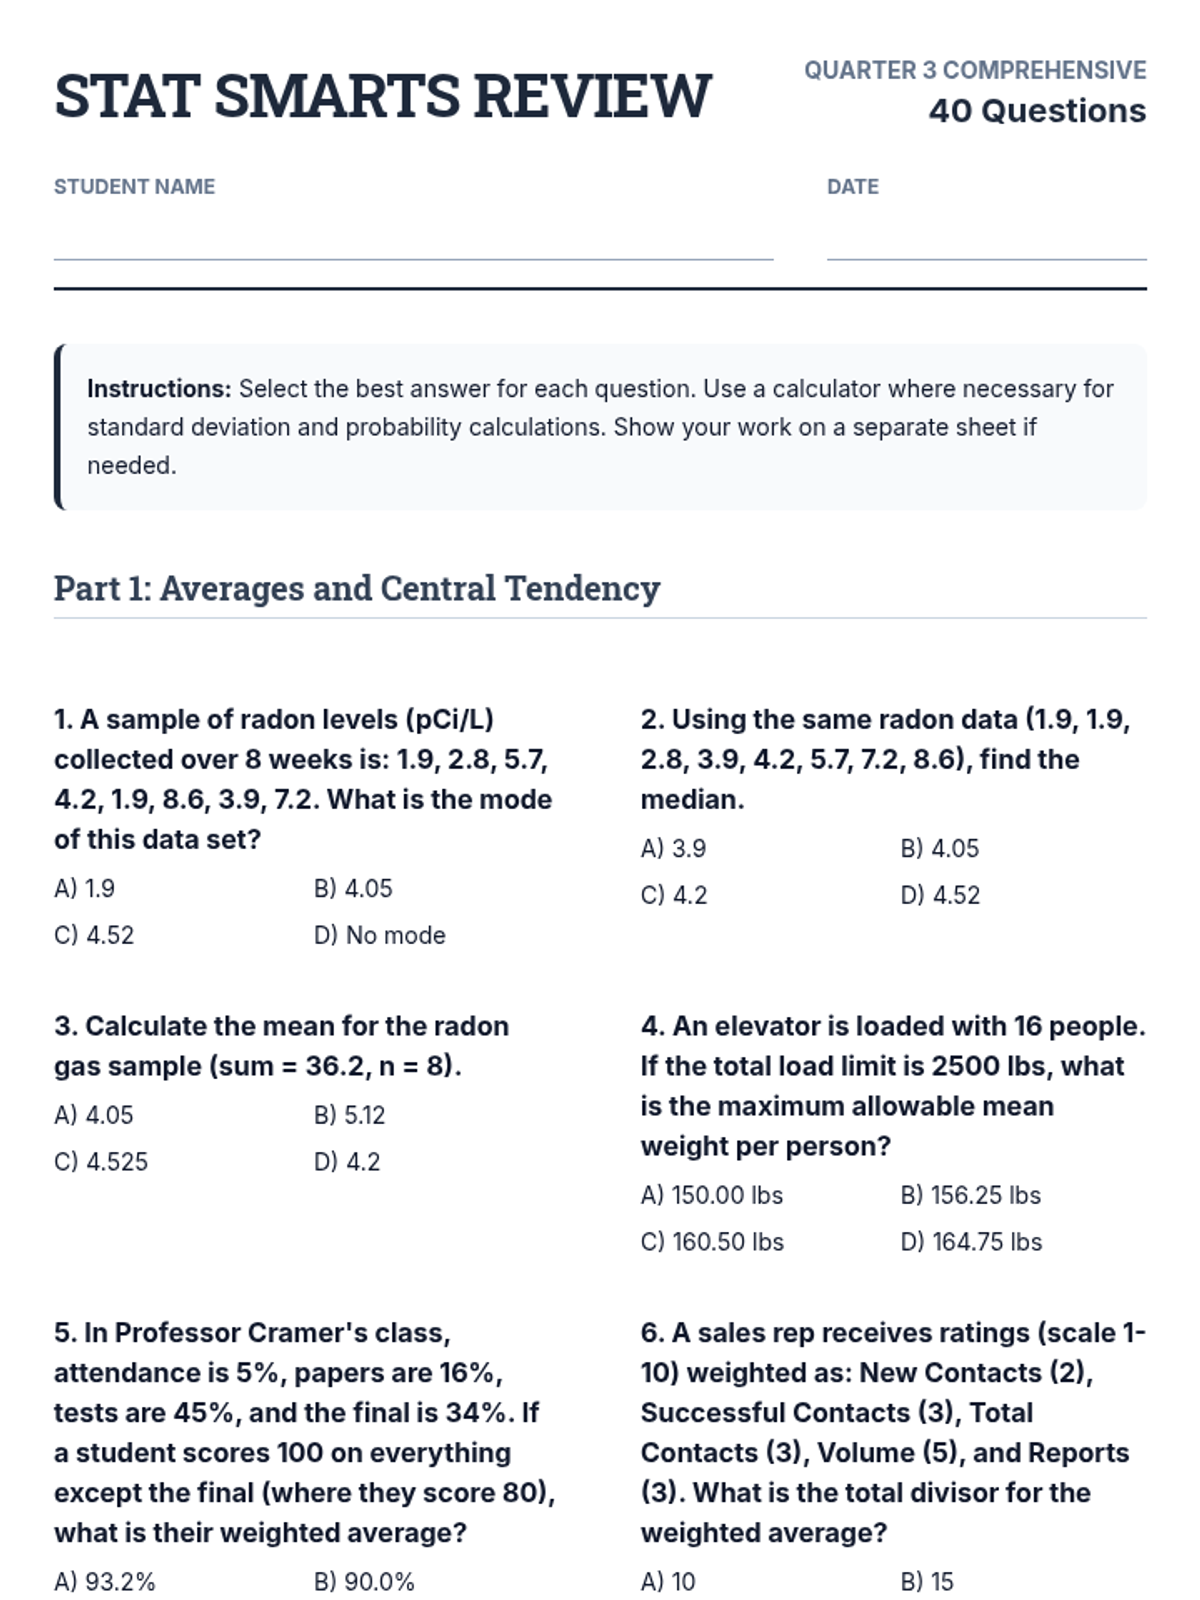
A comprehensive 40-question multiple-choice review worksheet covering Algebra 1 and Statistics topics including central tendency, variation, grouped data, Chebyshev's theorem, probability, and counting rules.
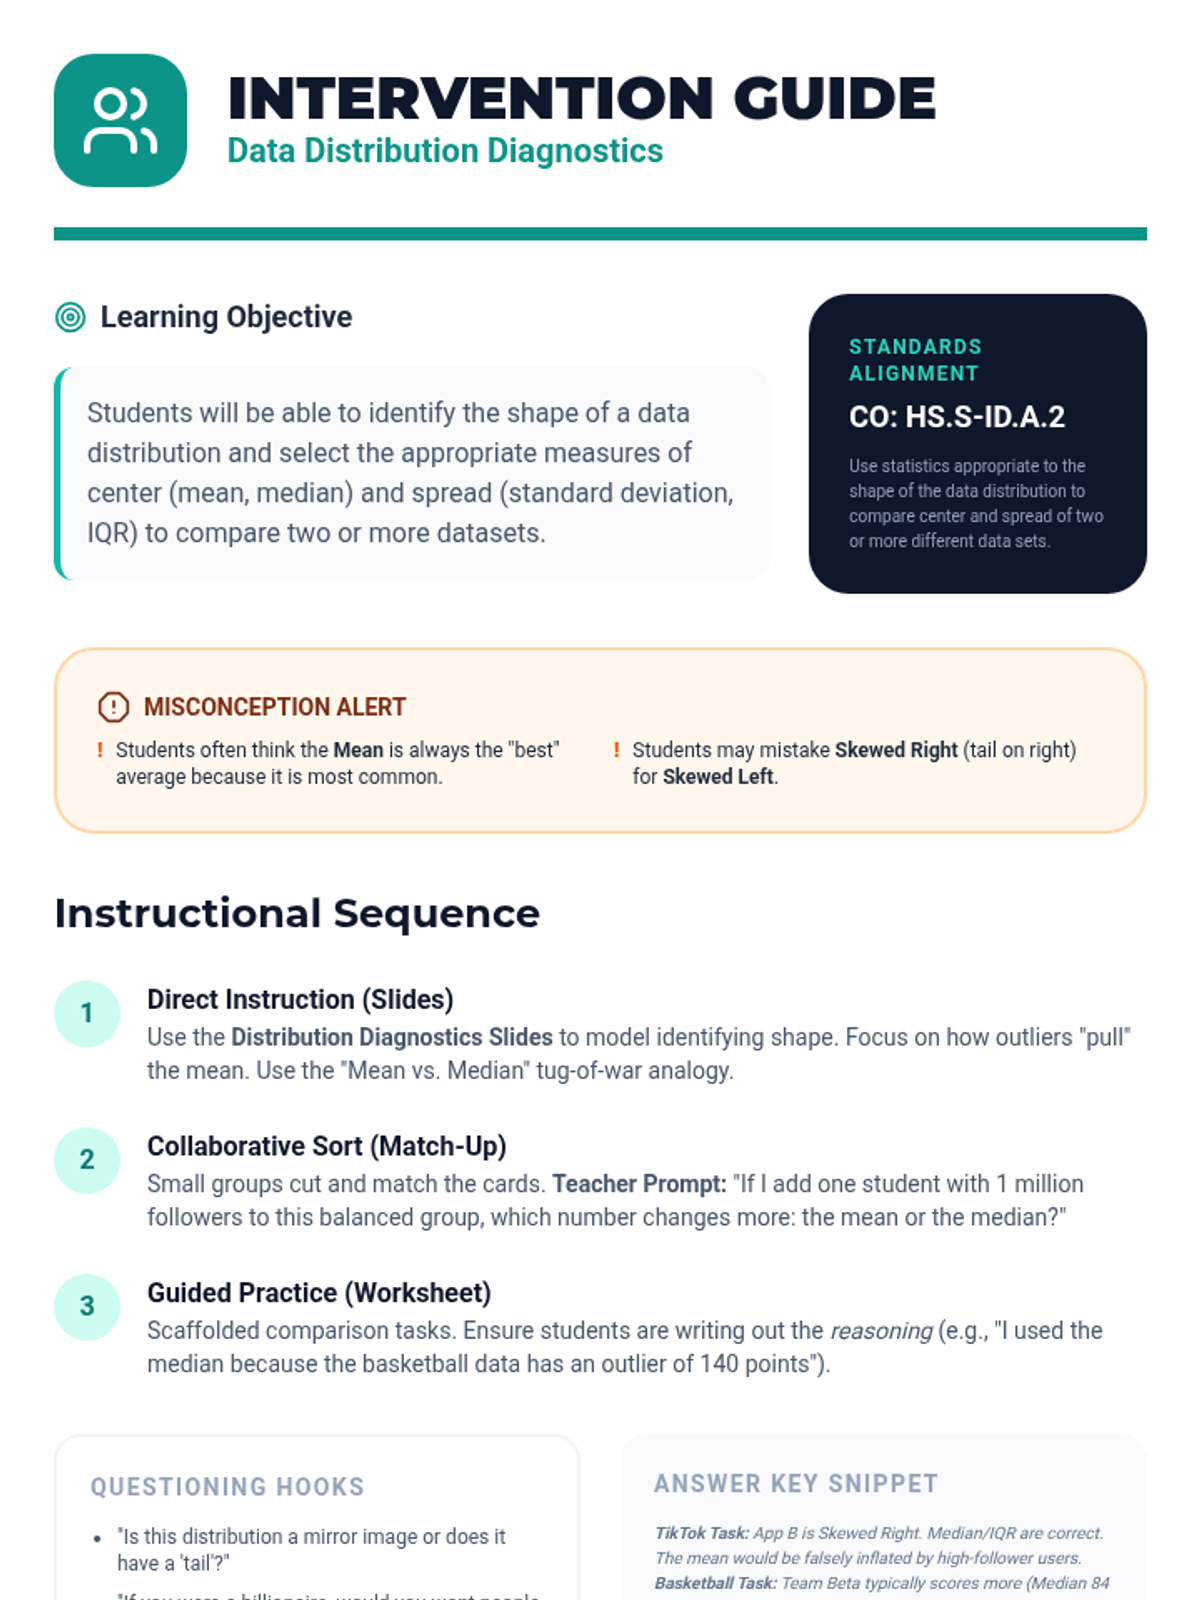
Facilitation guide for teachers featuring instructional strategies, misconception alerts, questioning hooks, and standards alignment for the intervention lesson.
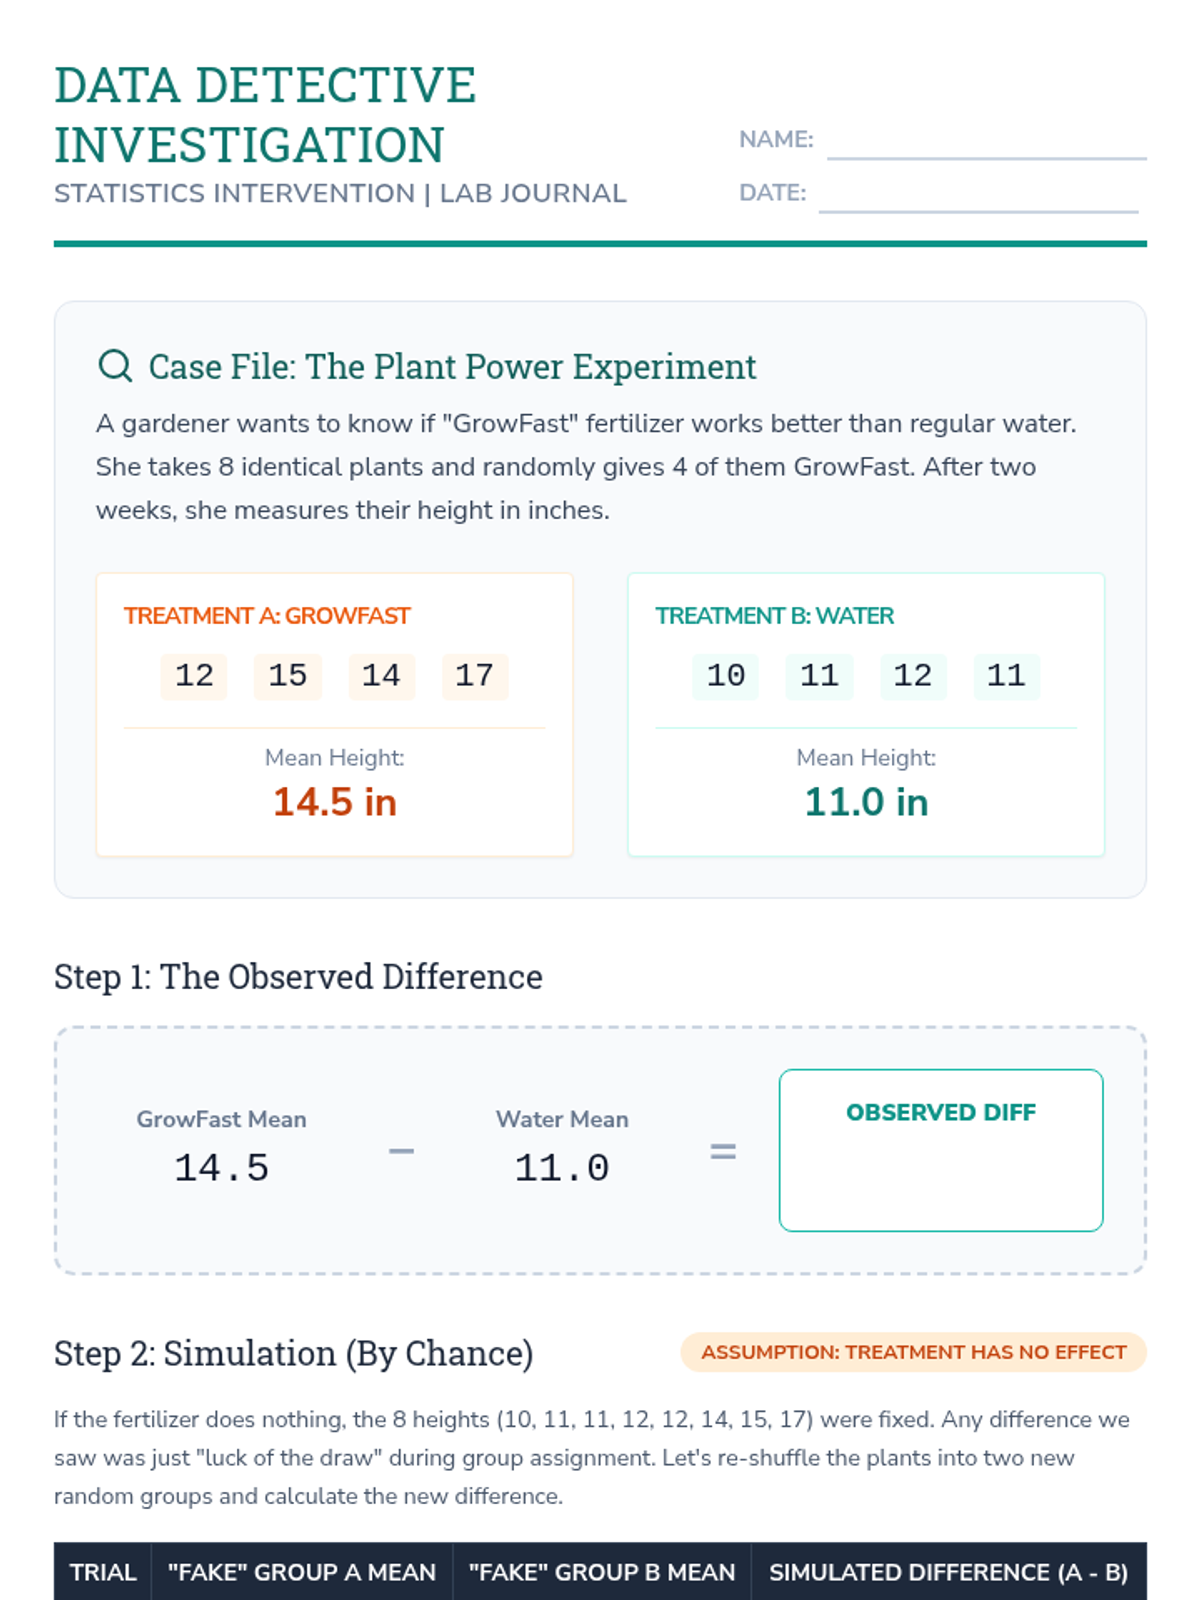
Scaffolded student worksheet for a plant fertilizer experiment. Guides students through calculating the observed difference, performing a hands-on simulation with data cards, and analyzing a dot plot to determine statistical significance.
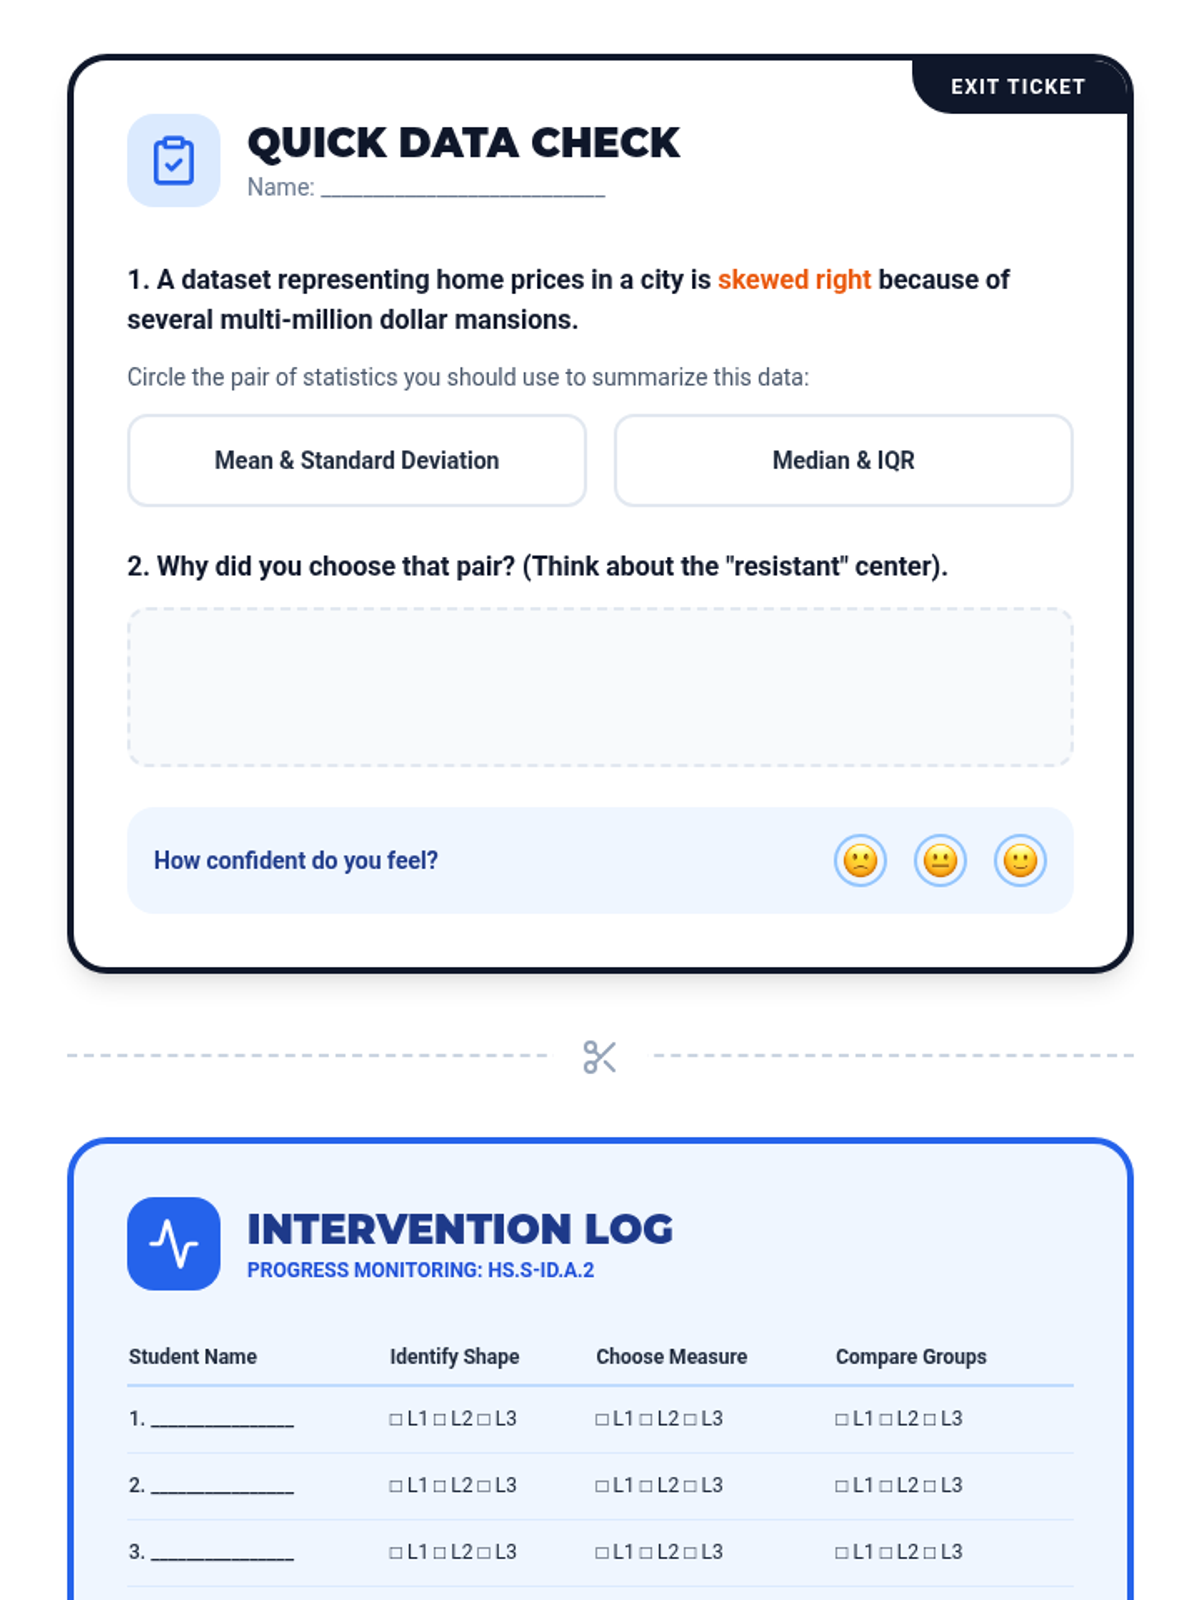
Dual-purpose progress monitoring document featuring a student exit ticket for immediate feedback and a teacher intervention log to track student mastery of choosing and using statistics.
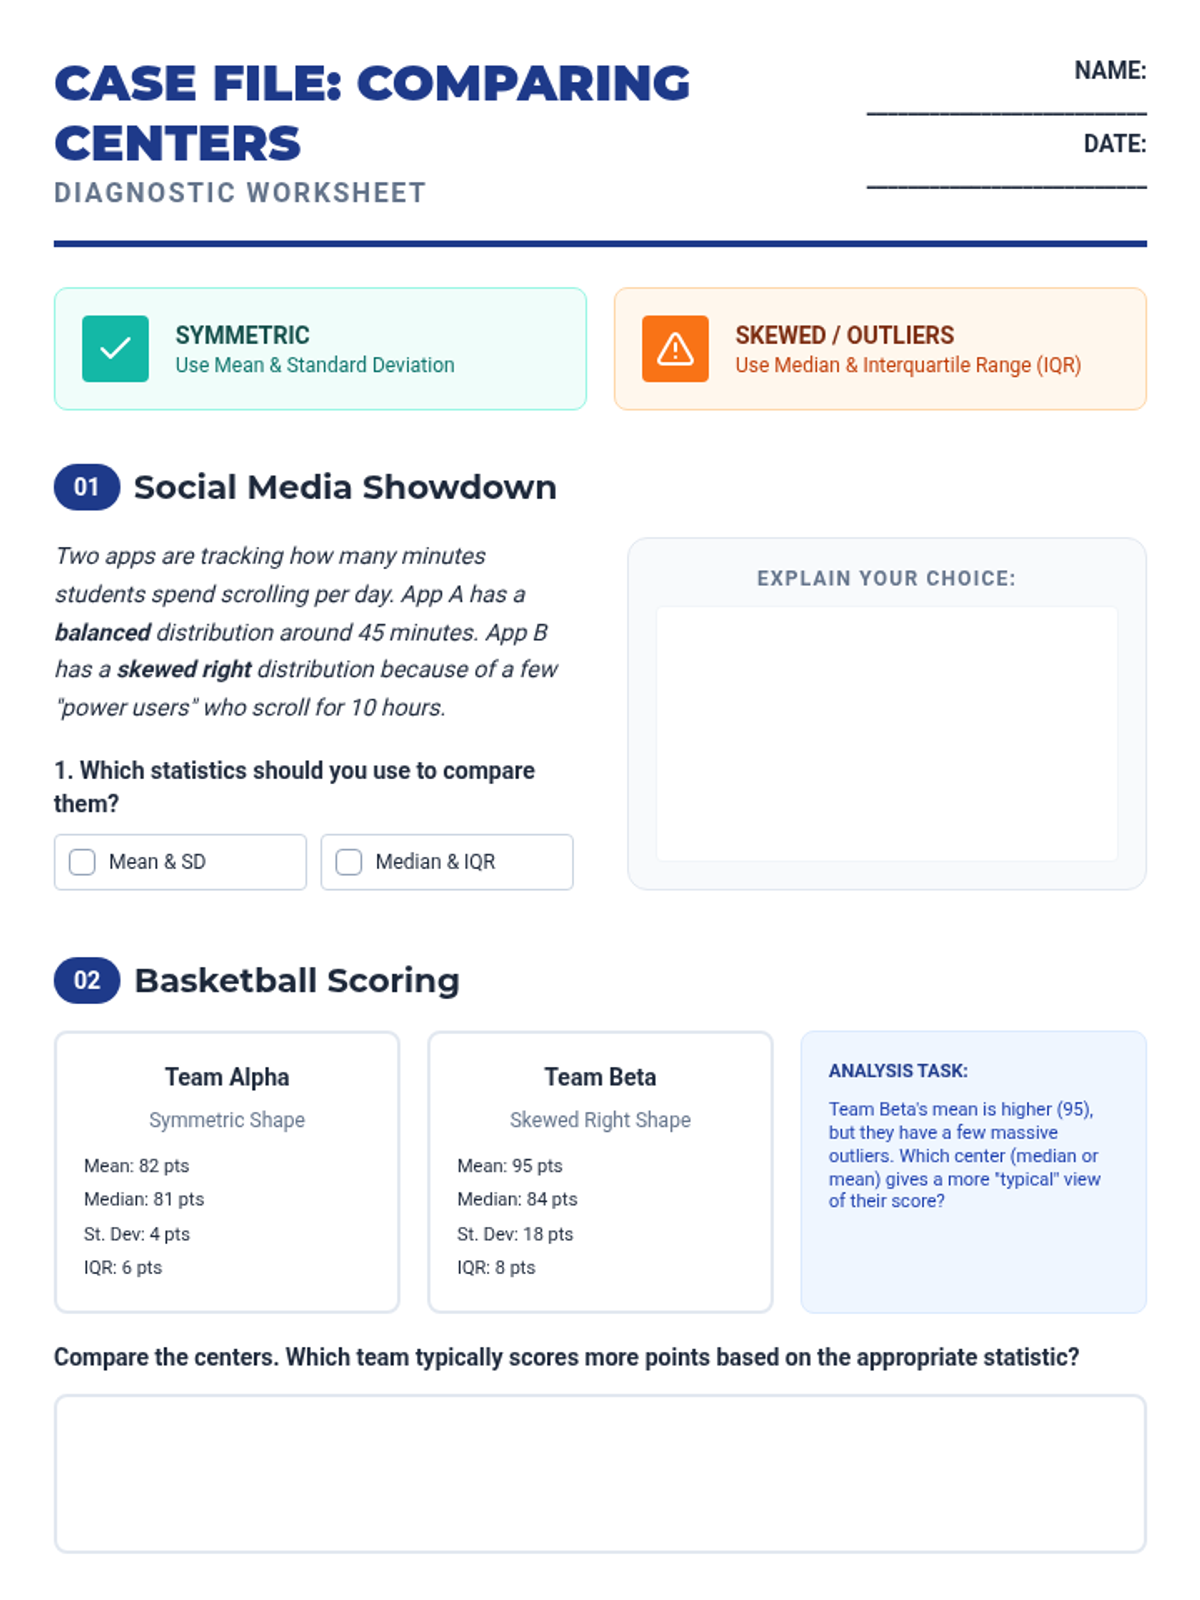
Scaffolded worksheet comparing real-world datasets (social media usage and basketball scores) where students must choose and justify the correct measure of center and spread based on distribution shape.
Engaging slide deck for a Tier 2 intervention on simulation-based significance testing. Features clear visuals, the core experiment scenario, and step-by-step logic for interpreting a randomization dot plot.
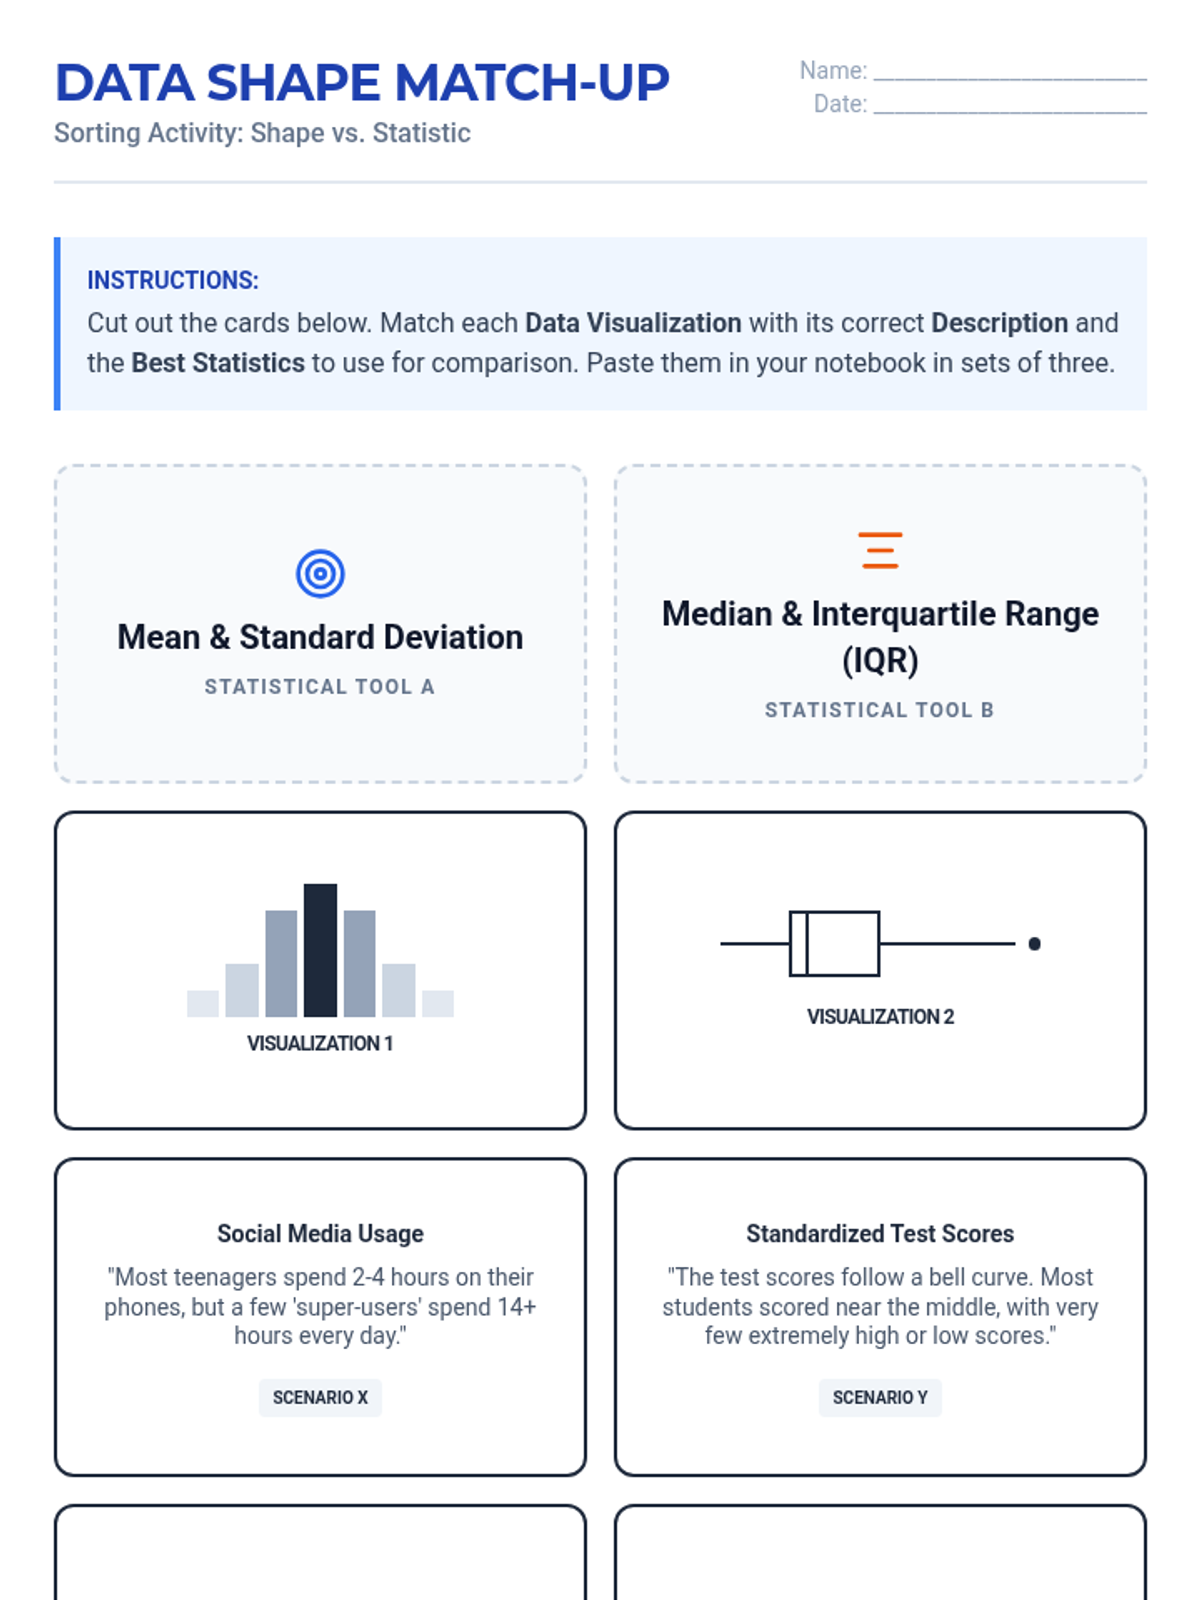
A sorting and matching activity where students pair data visualizations, real-world scenarios, and descriptive labels with the appropriate statistical measures (Mean/SD vs. Median/IQR).
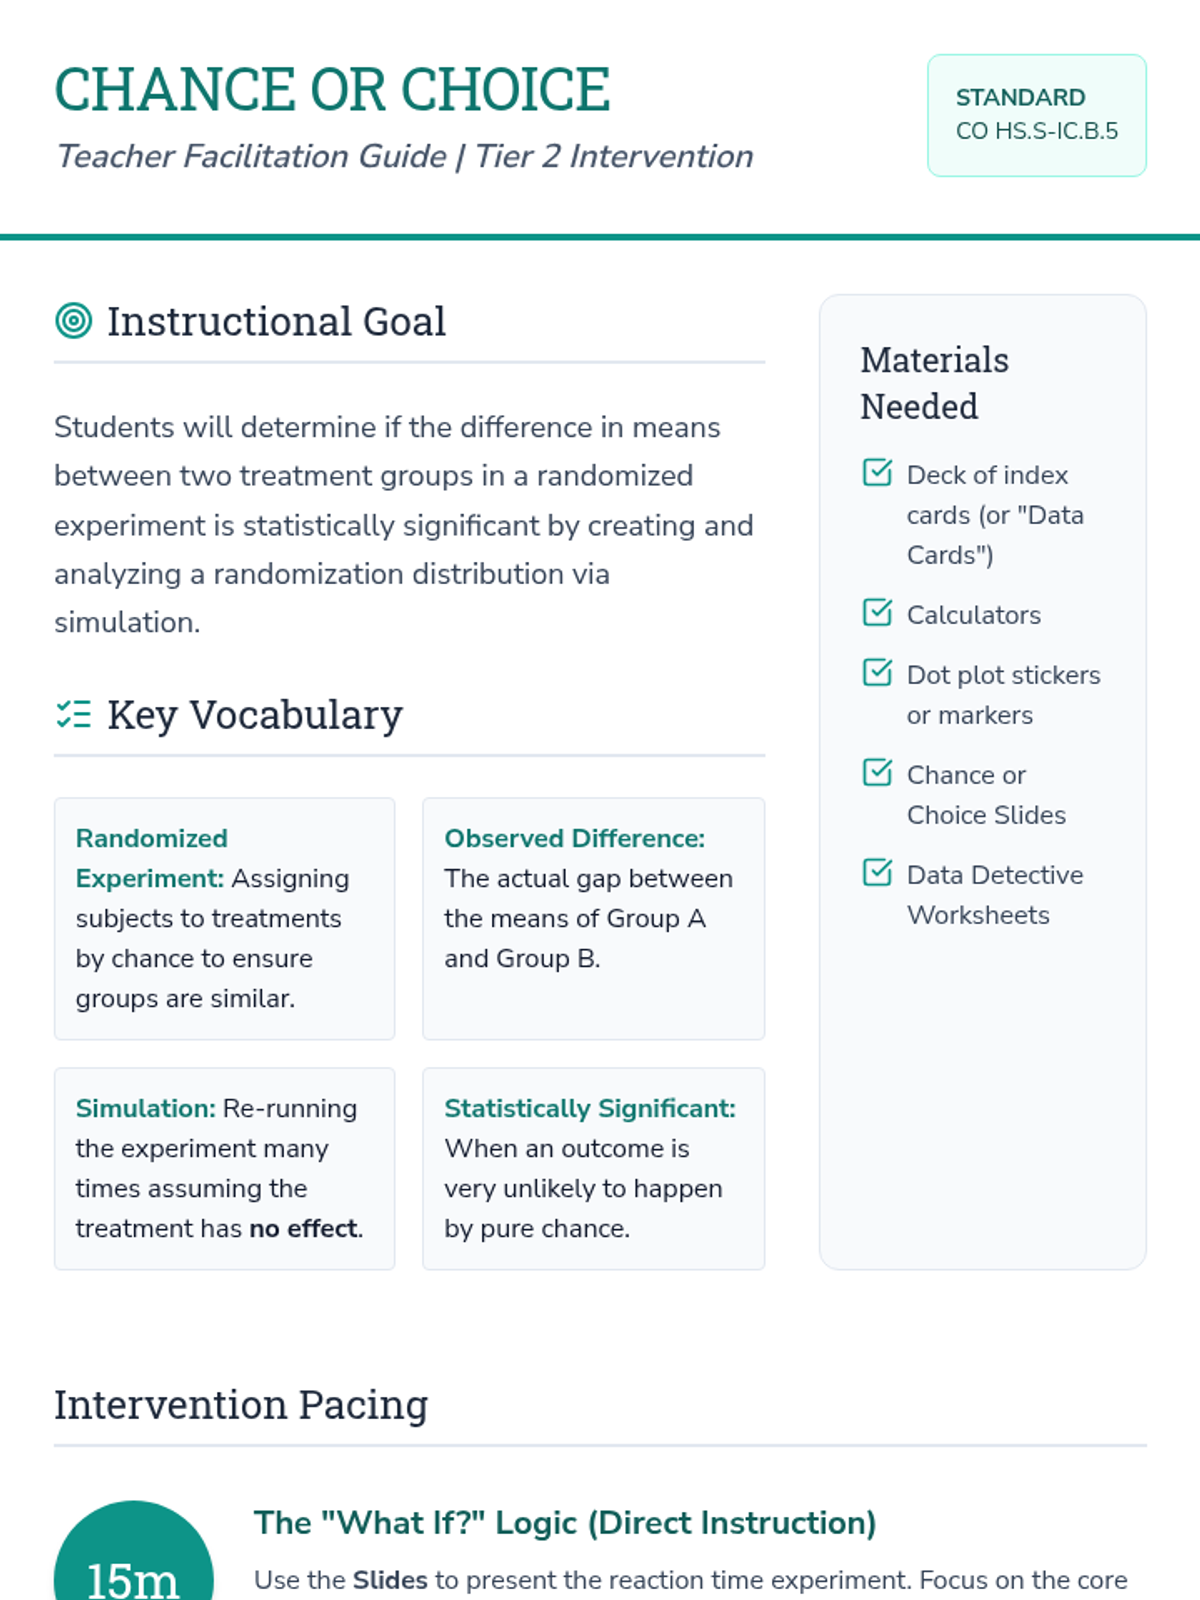
A comprehensive teacher facilitation guide for a Tier 2 intervention lesson on randomized experiments and simulations. Includes pacing, vocabulary, materials, and common student misconceptions.
Visual presentation for direct instruction on selecting appropriate statistics (Mean/SD vs. Median/IQR) based on data distribution shape. Includes real-world scenarios to anchor learning.
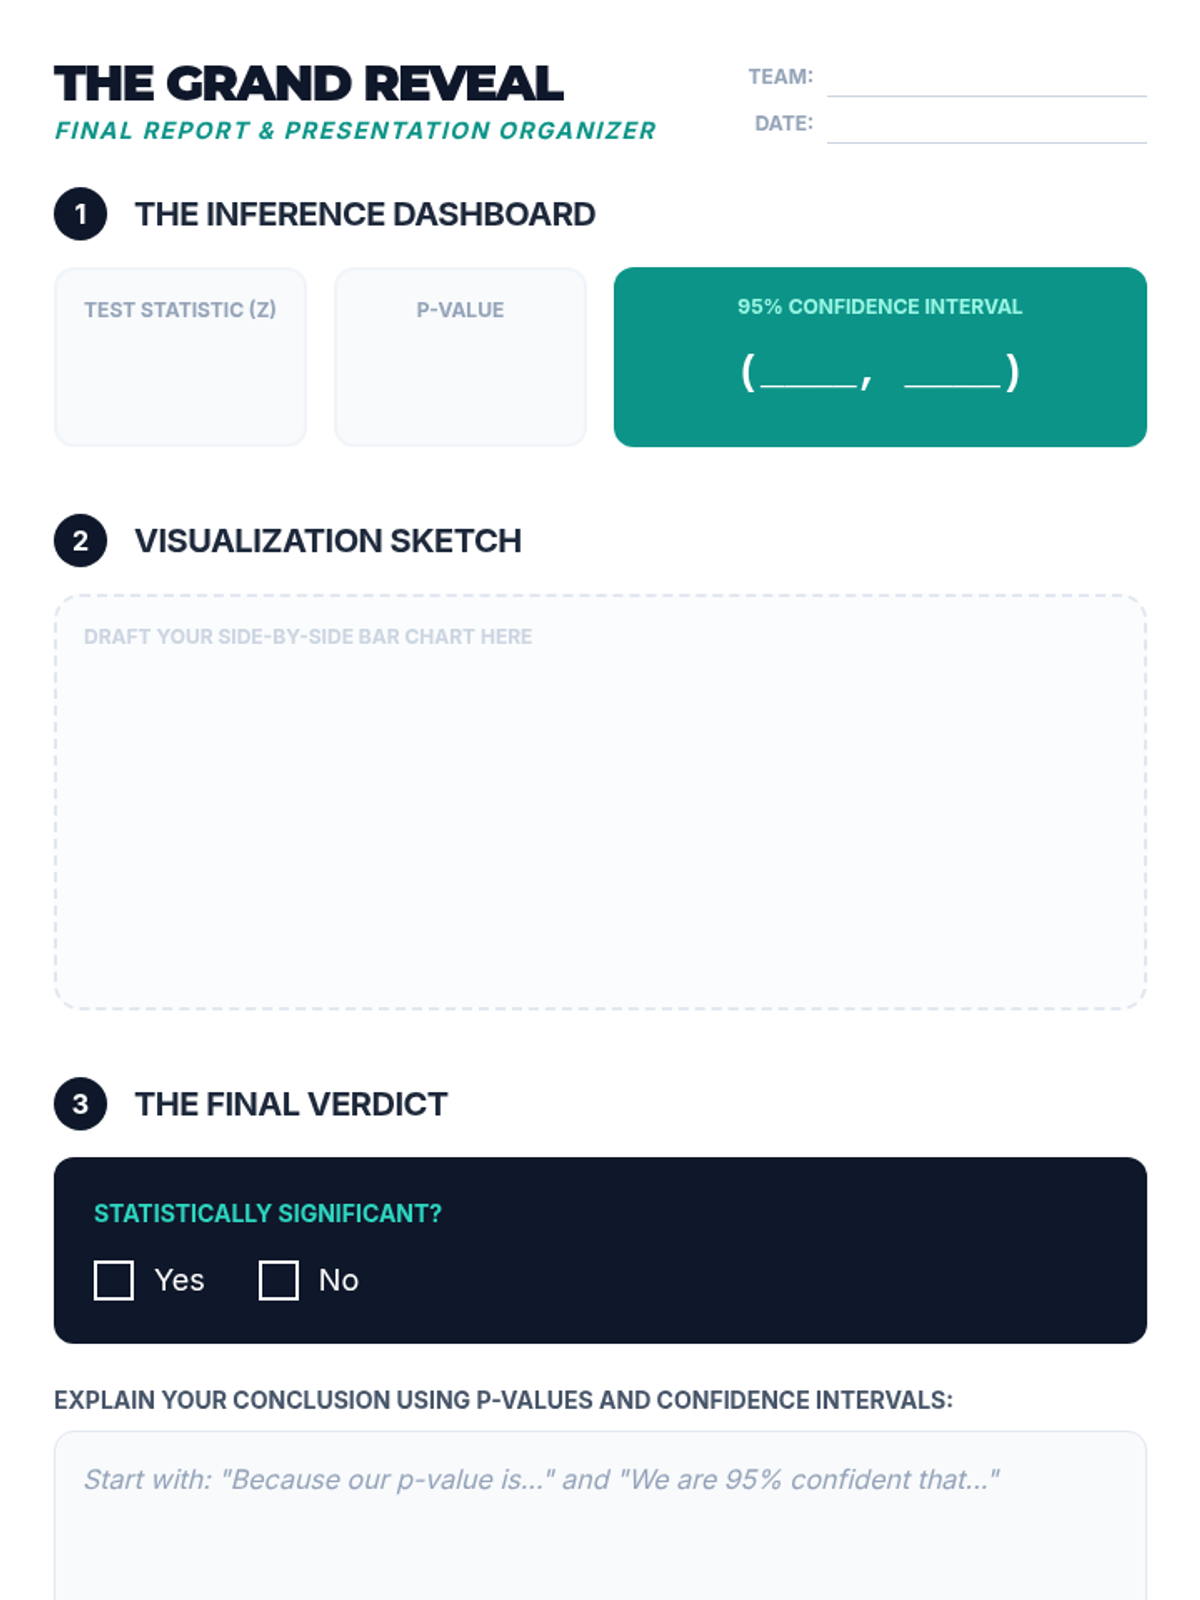
Final project report organizer for students to synthesize their data, visualizations, and statistical findings for presentation.
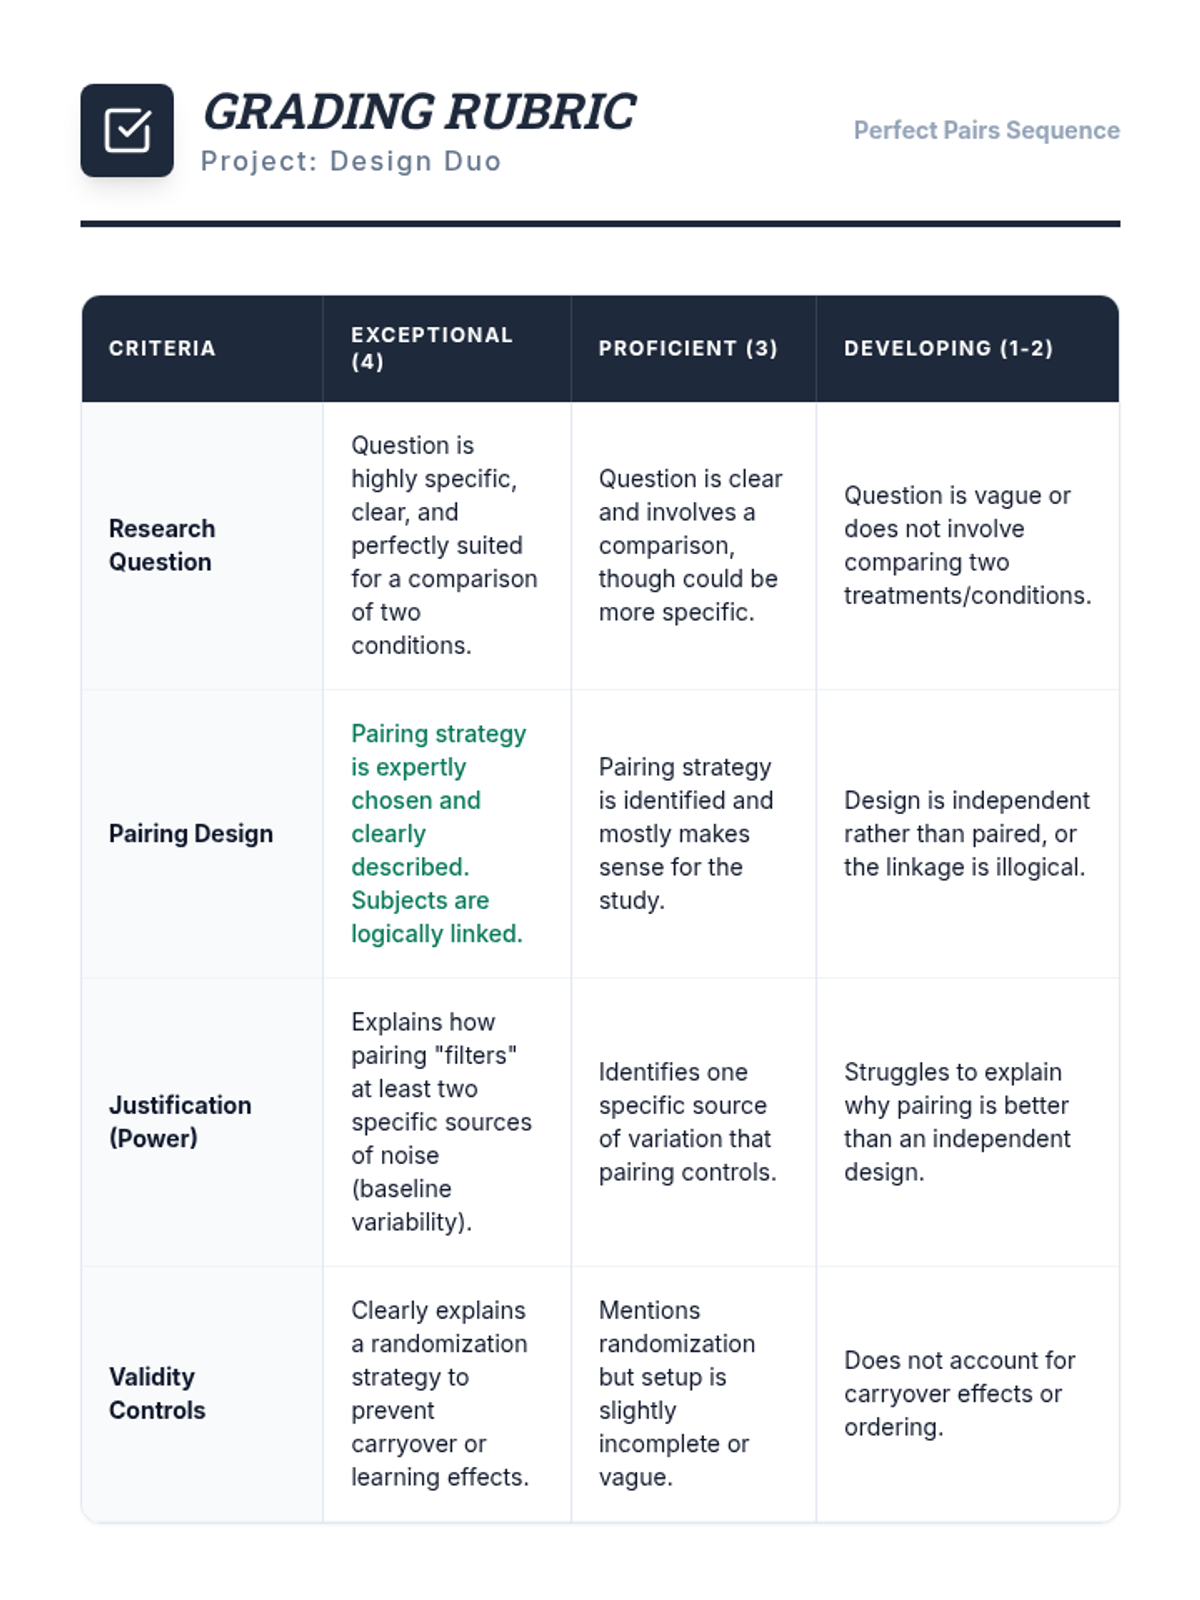
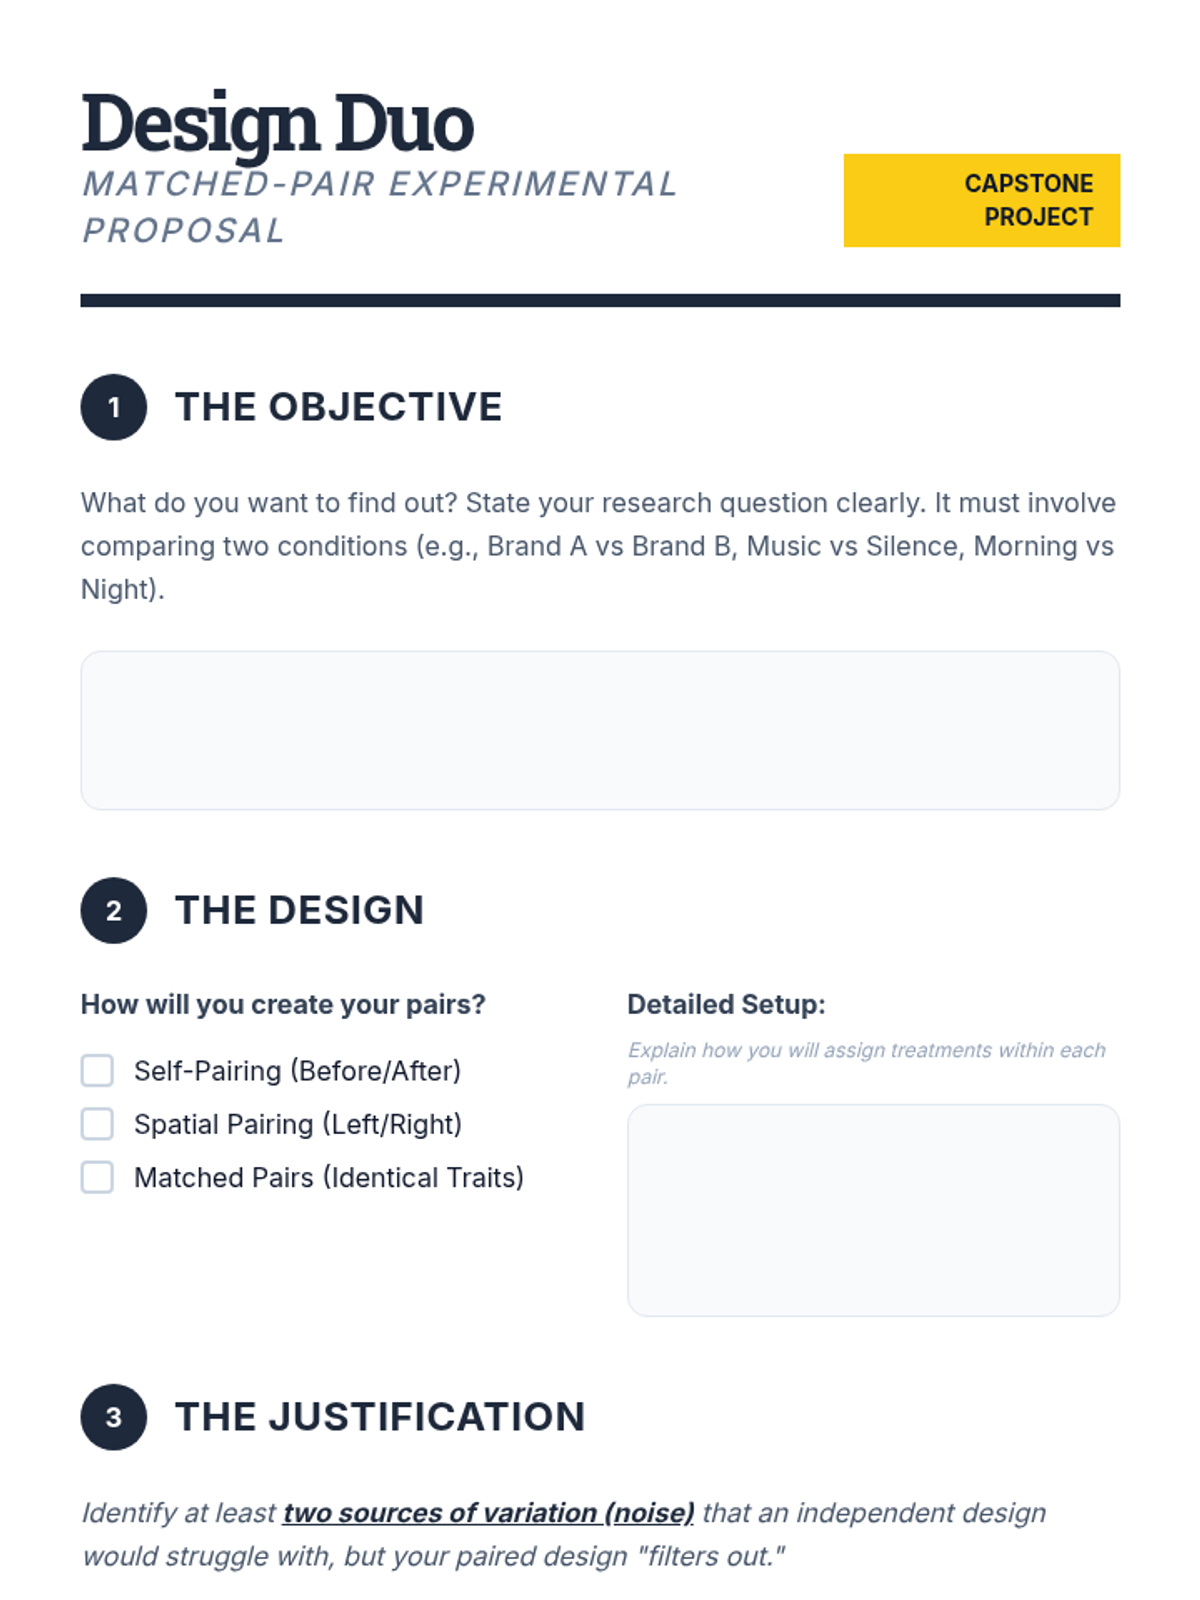
Assessment rubric for the final experimental design project, evaluating research questions, pairing strategies, and statistical justifications.
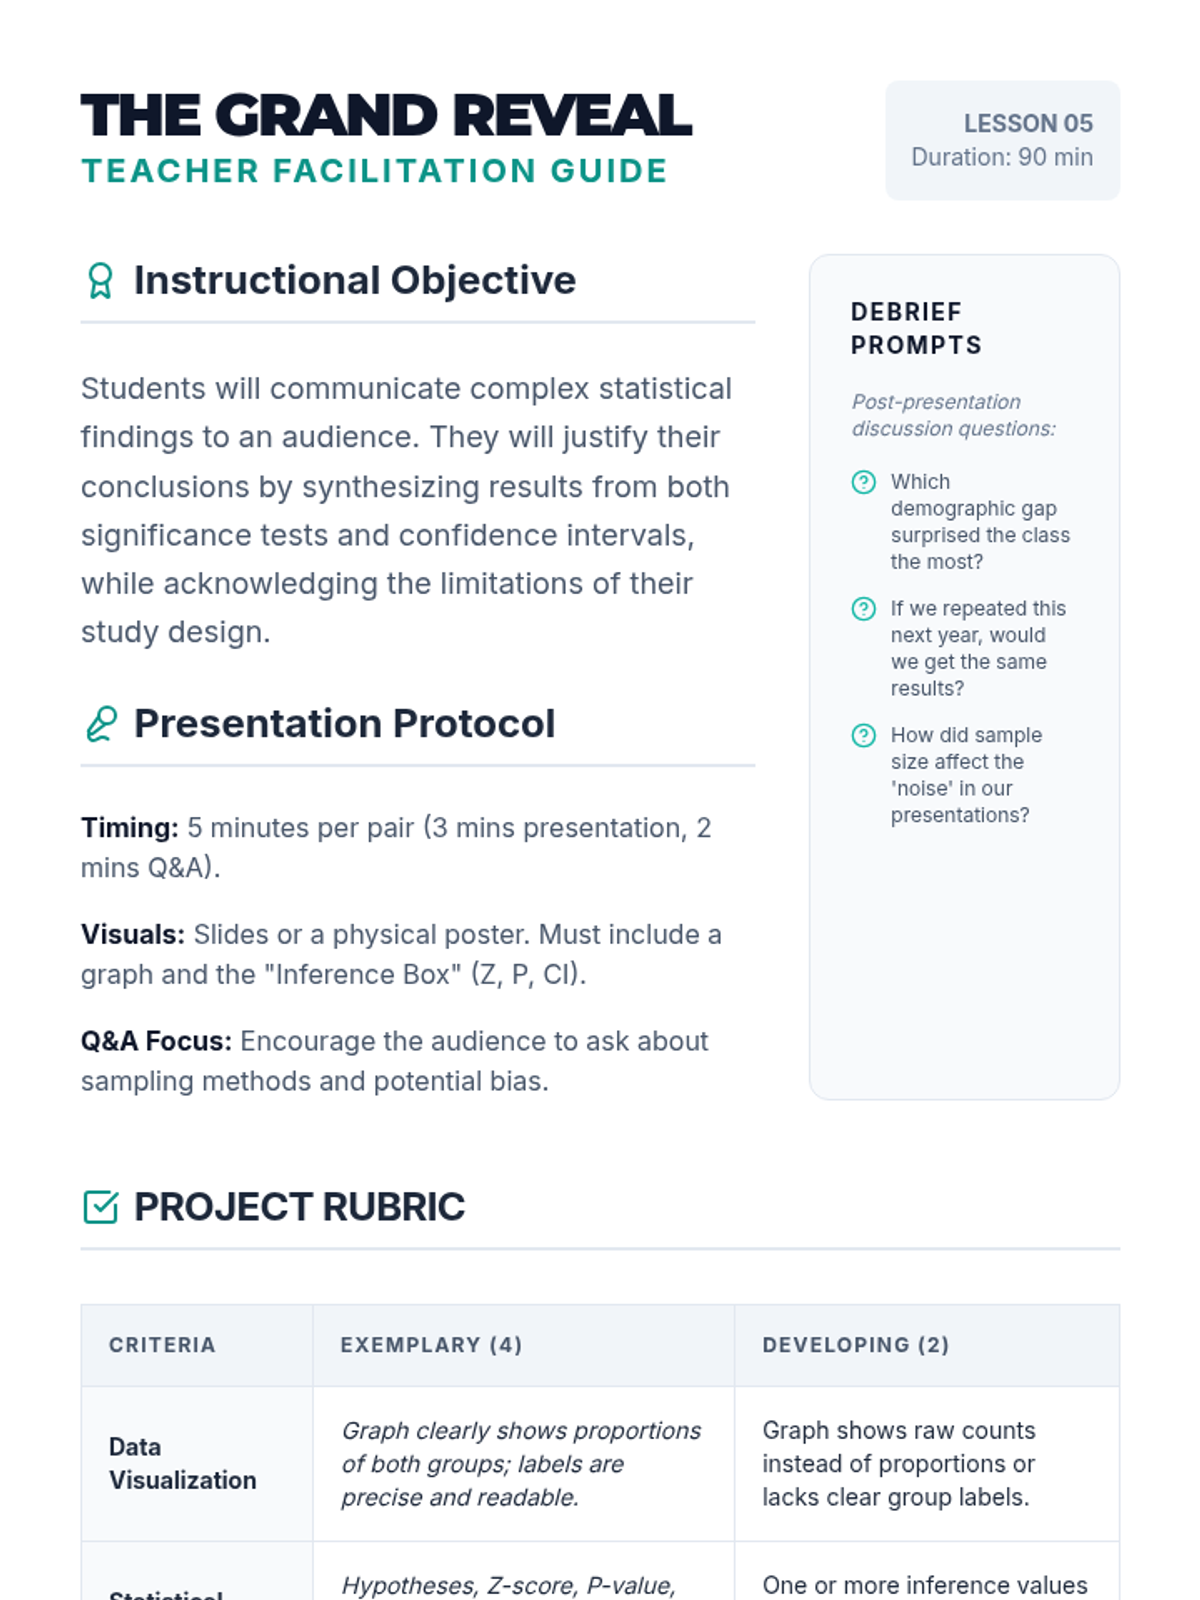
Facilitation guide for Lesson 5, focusing on data visualization, synthesis of findings, and presentation best practices.
Final project guide for students to design their own matched-pair experimental study, including sections for research questions, design strategies, and justifications.
Final slides for the sequence, focusing on experimental design strategies like crossover designs, spatial pairing, and preparing students for their design project.
Introductory slide deck for Lesson 5, focusing on data visualization, synthesis of findings, and presentation best practices.
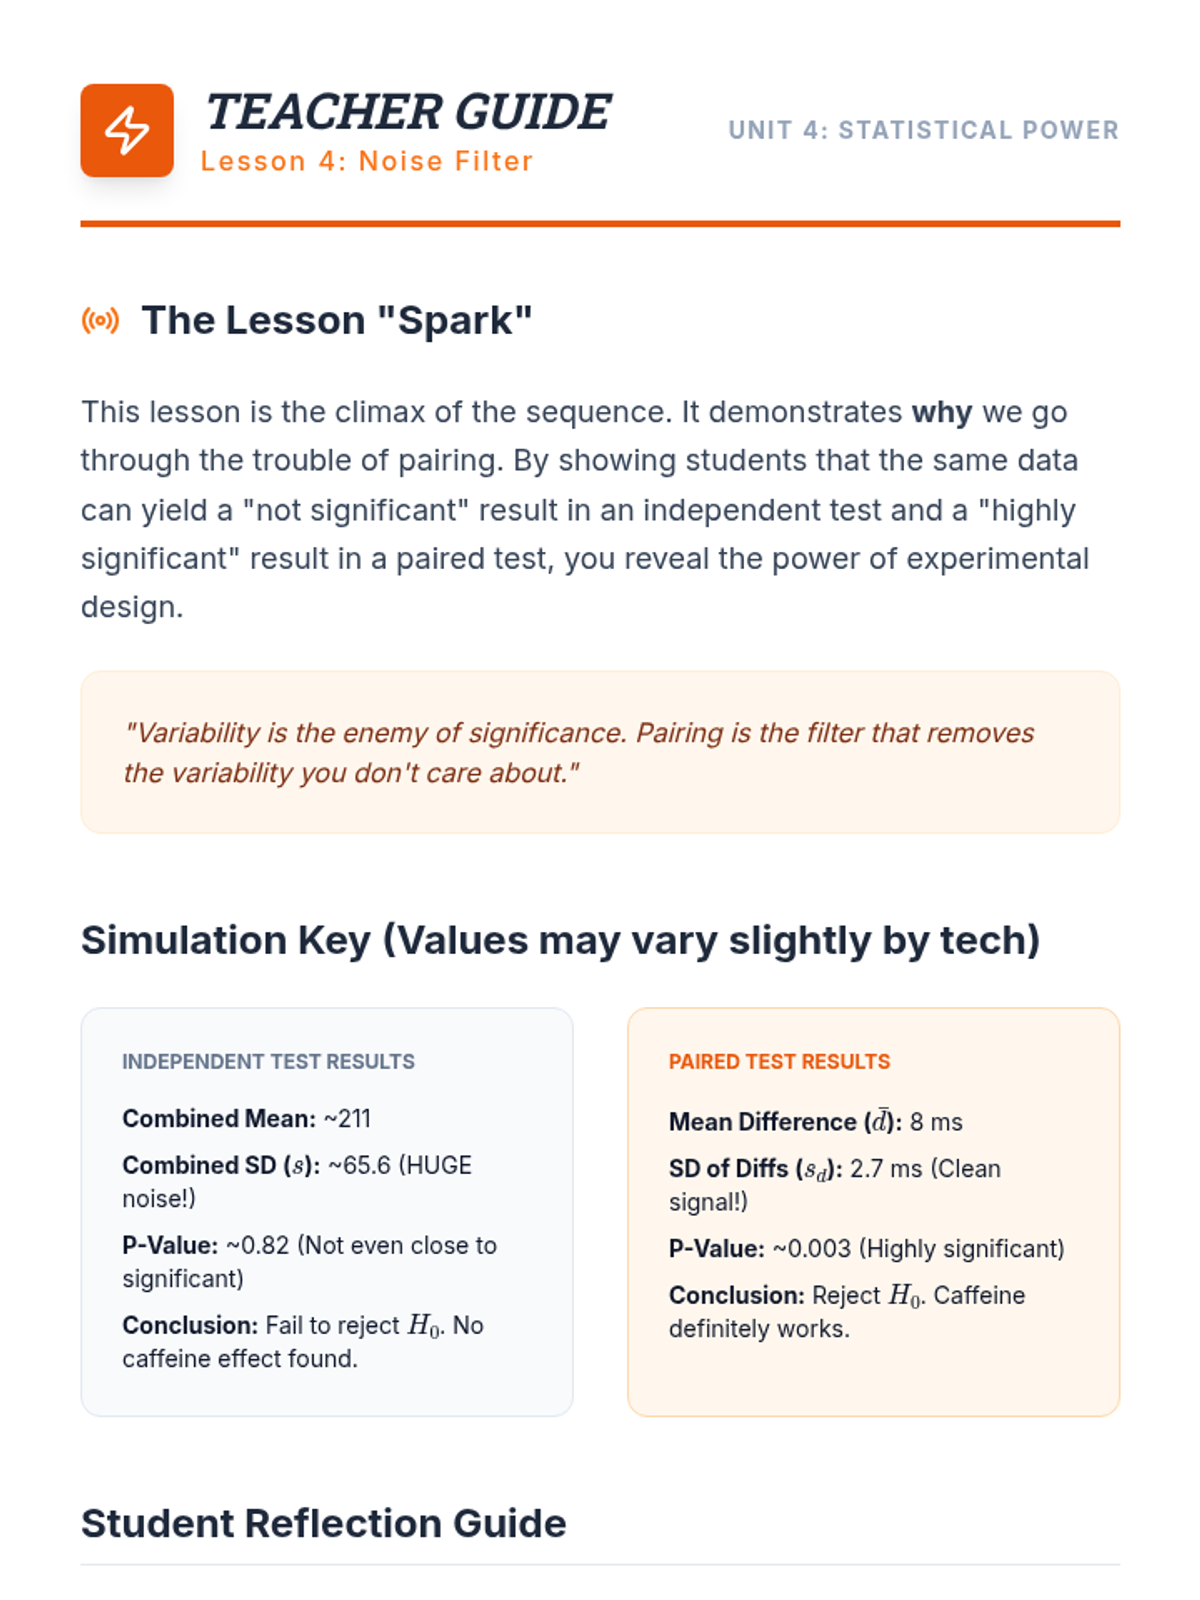
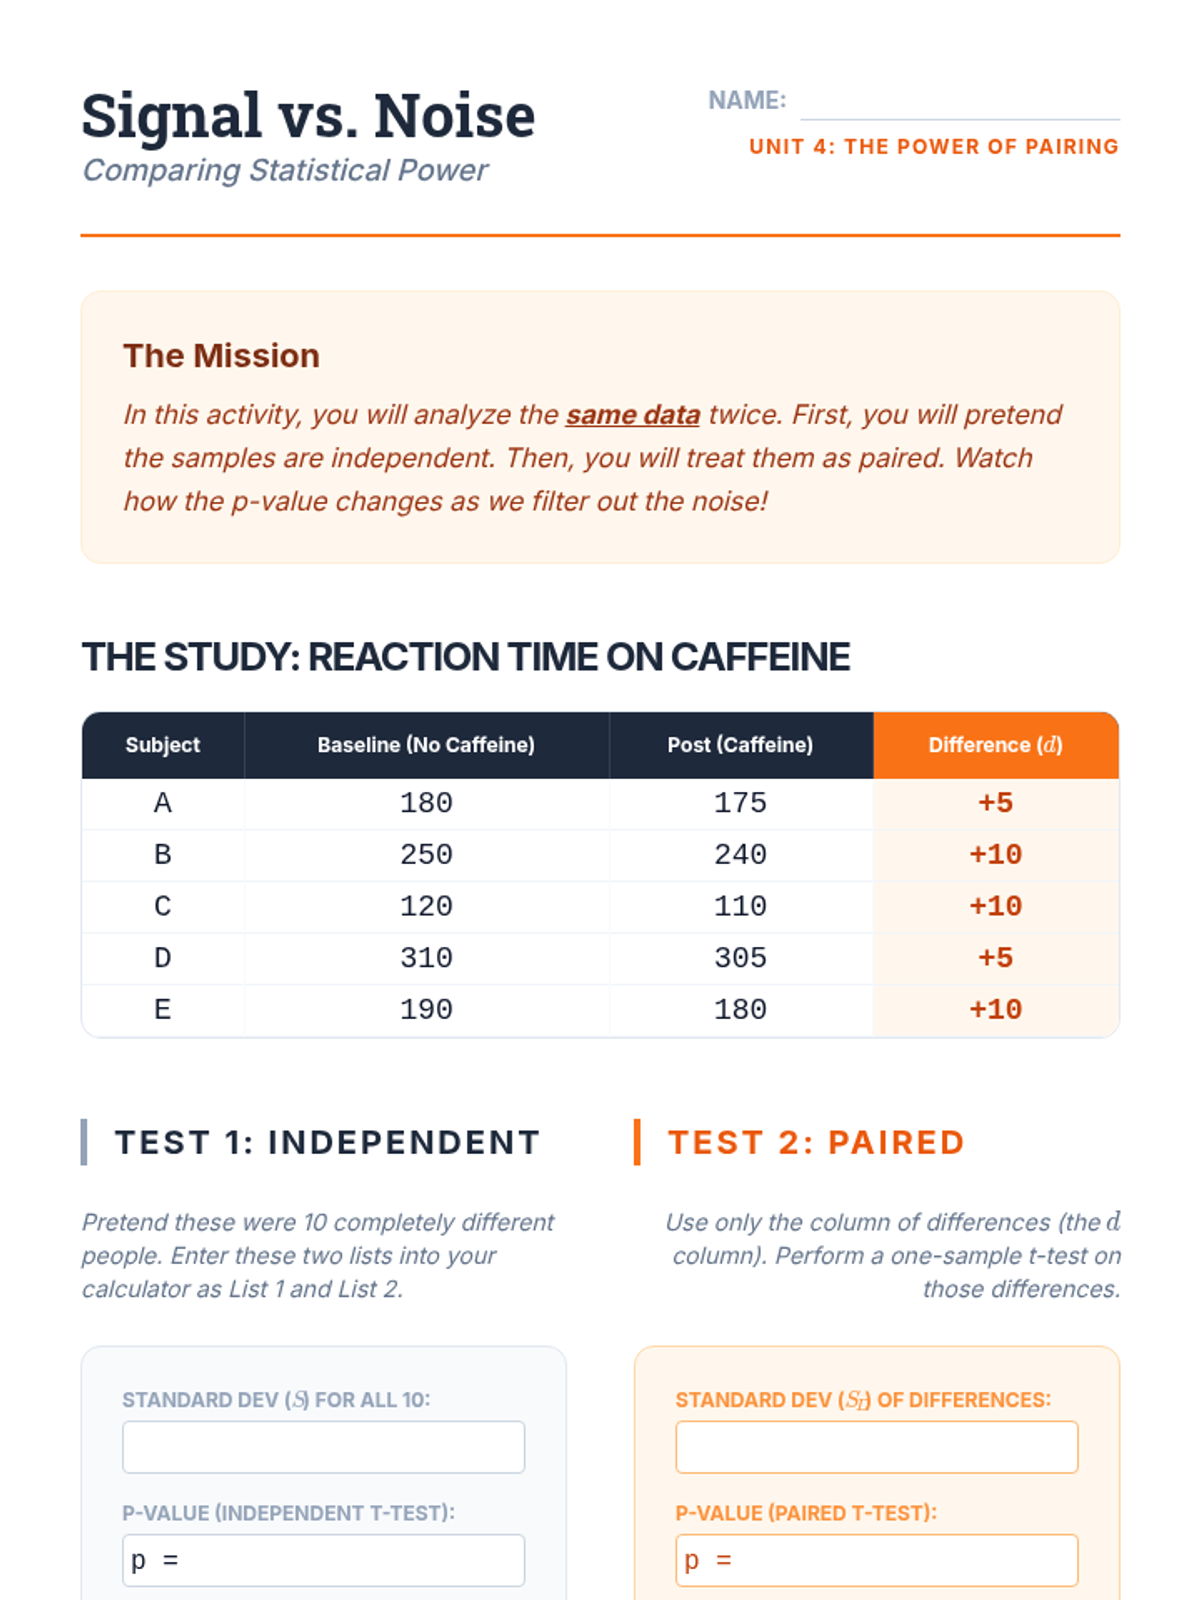
Teacher guide for Lesson 4, providing pedagogical insights into statistical power and a complete answer key for the Signal vs Noise activity.
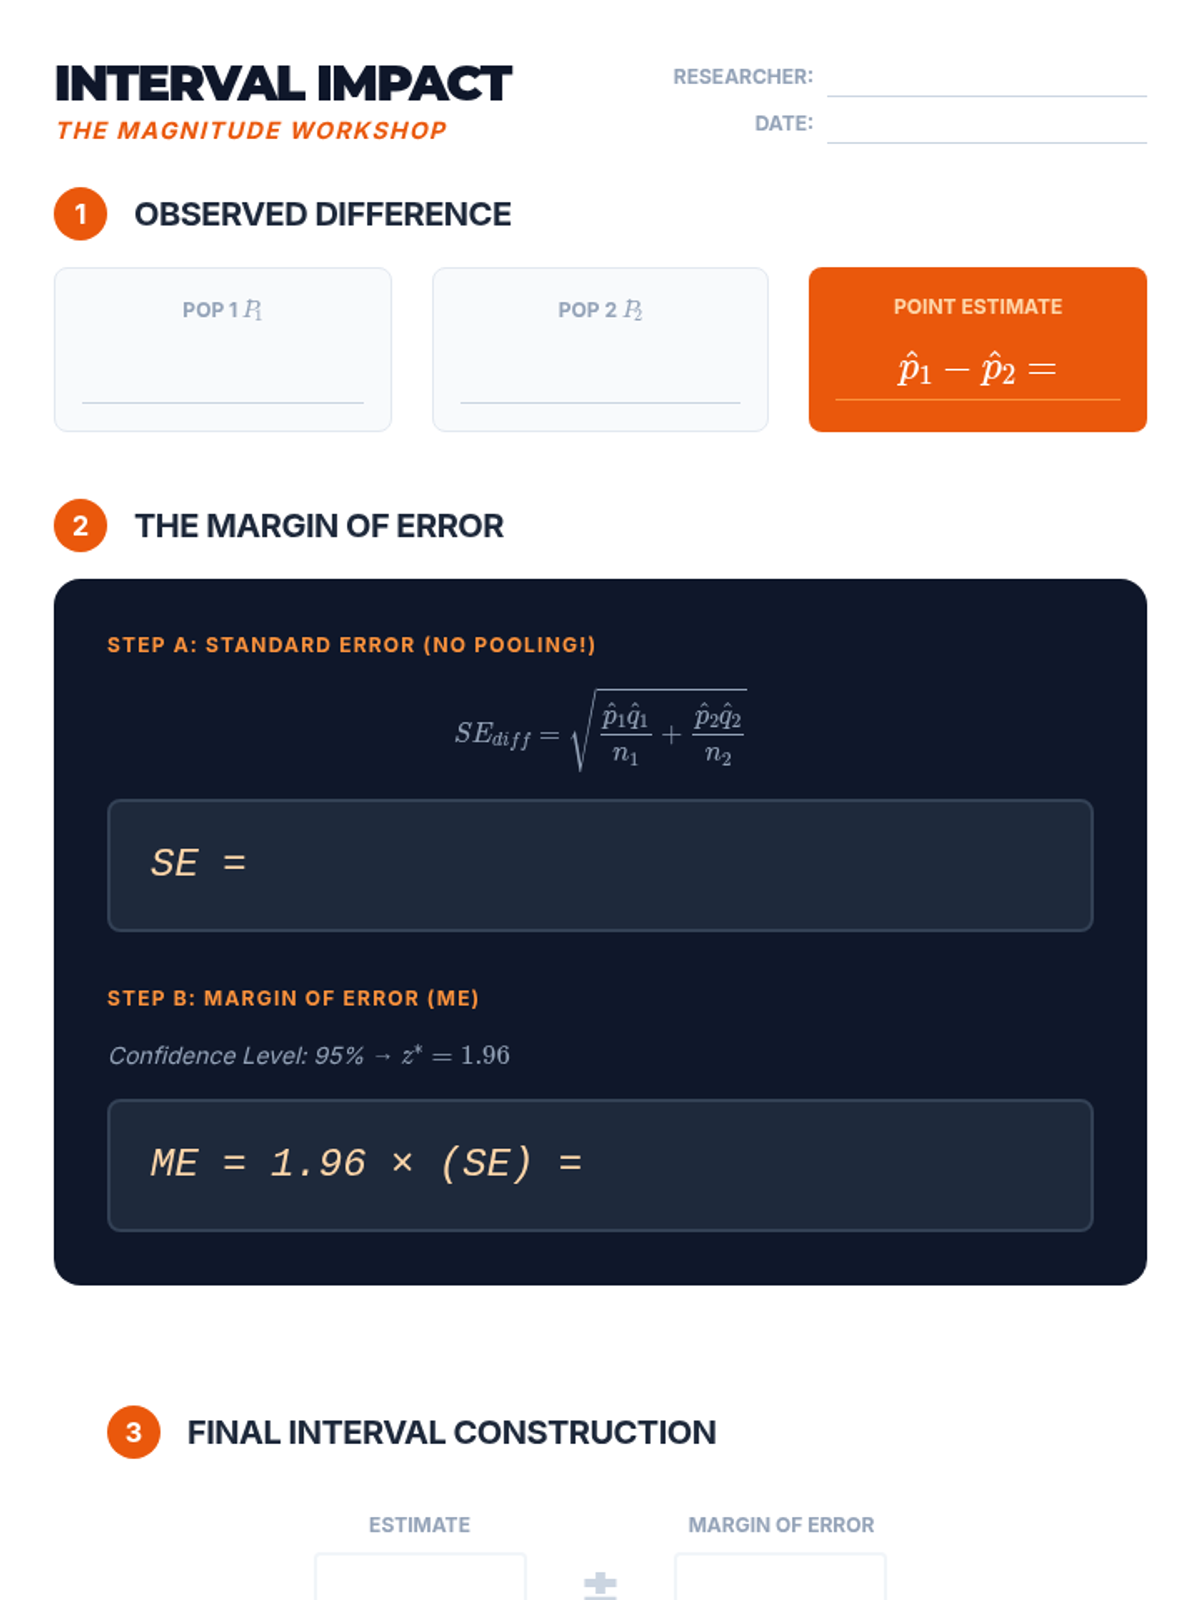
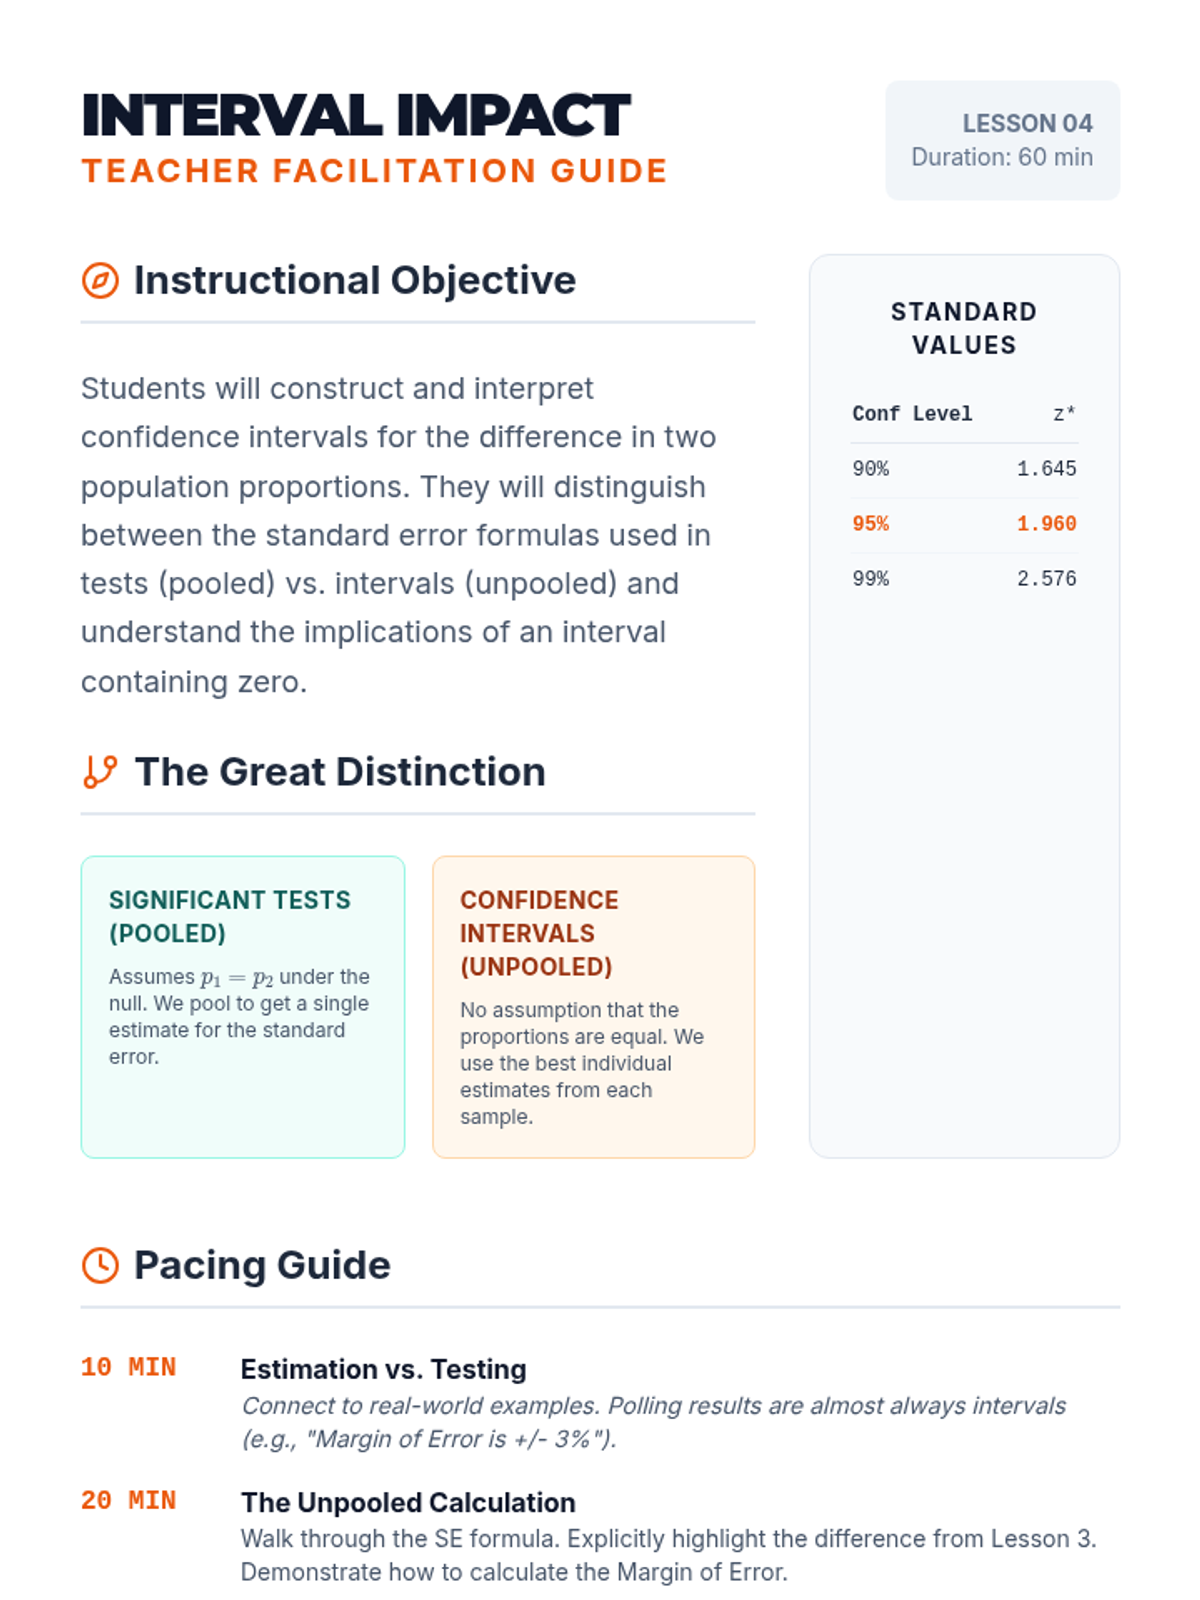
Student worksheet for Lesson 4, guiding students through the unpooled standard error calculation and confidence interval interpretation.
Worksheet comparing independent and paired analysis methods to understand how pairing reduces 'noise' and increases the 'signal' or power of a test.
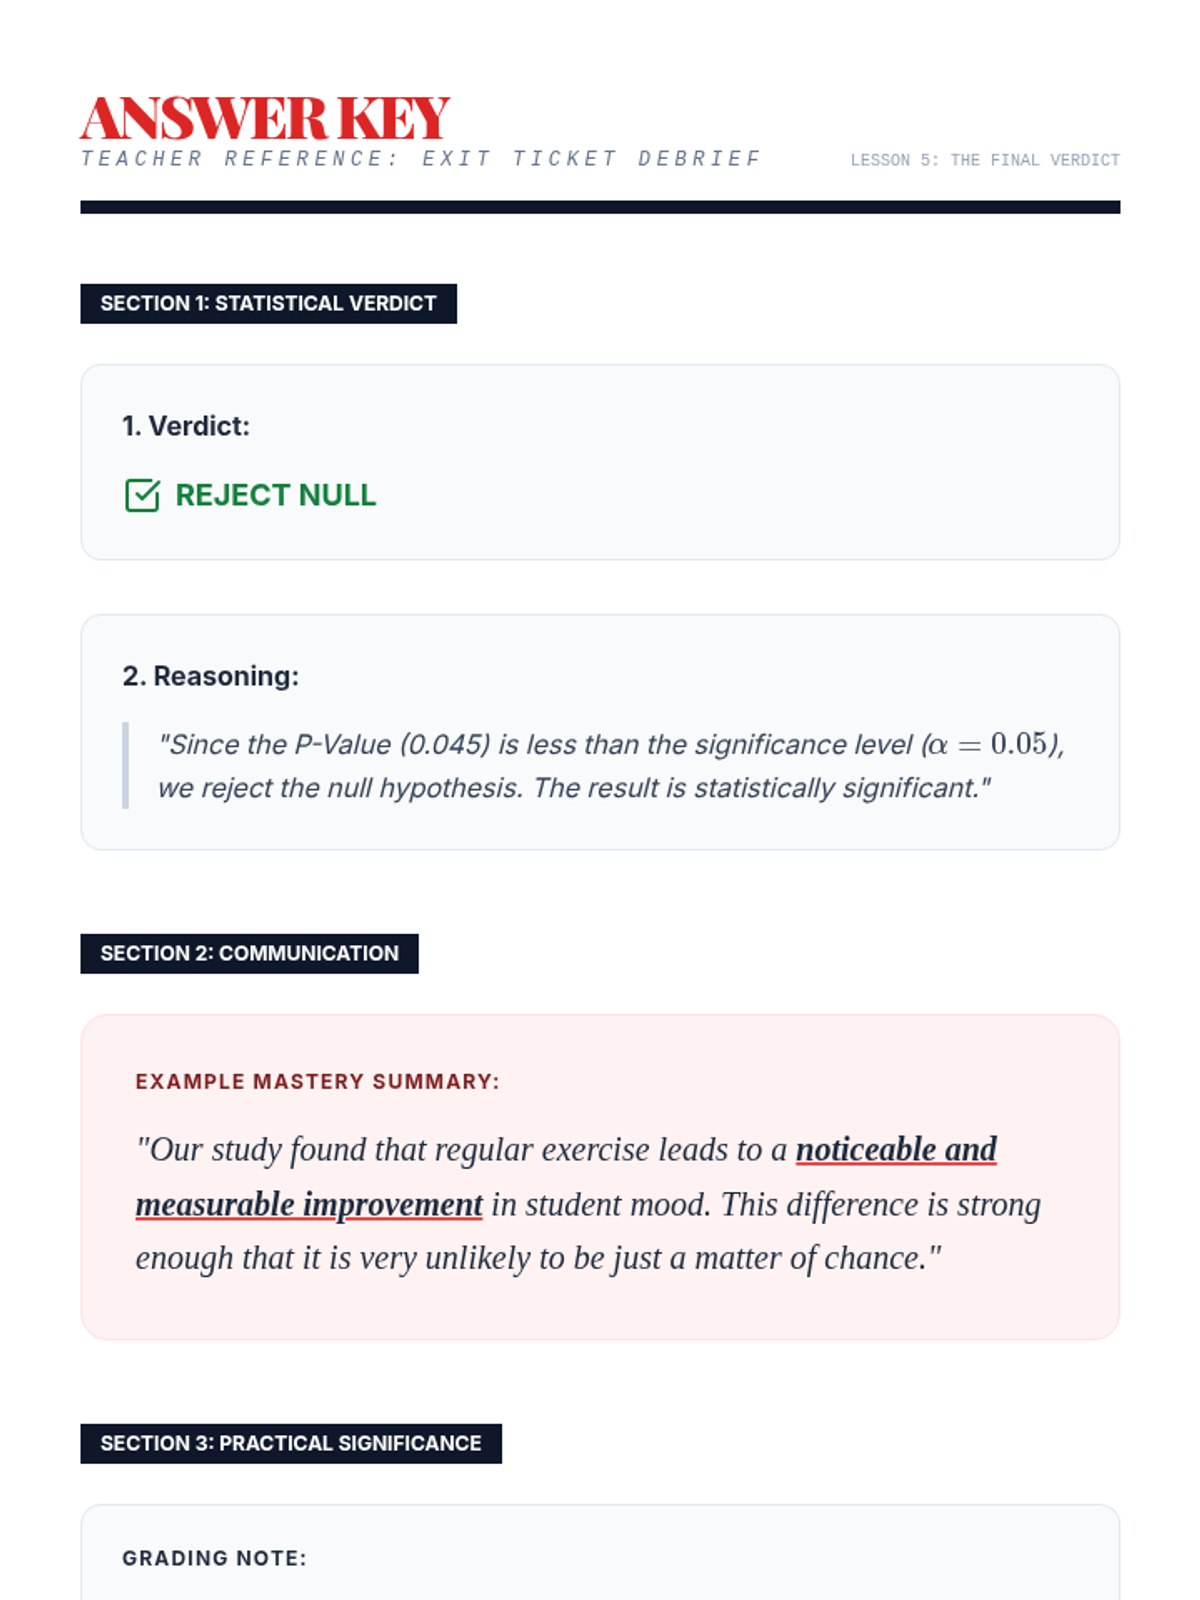
Teacher answer key for the Data Debrief Exit Ticket, including sample plain-English summaries and grading notes for practical significance.
Facilitation guide for Lesson 4, constructing and interpreting confidence intervals for the difference in proportions to estimate the magnitude of population gaps.