Data representation, distributions, and statistical variability using sampling and inference techniques. Integrates probability models, compound events, bivariate patterns, and linear models to guide data-driven decision making.
Measurement Unit Slides - Lessons 3 & 4: Mixed Fractions and Line Plots. Recreated and translated into Japanese with advanced instructional visuals, worm and leaf data examples, and rigorous synthesis prompts. Revisions made for page breaks and math rendering. Fixed 'X' alignment on plots and matched cool-down options. Fixed comma alignment and dark blue highlights.
Measurement Unit Slides - Lesson 2: Inch Fourths. Recreated and translated into Japanese with professional instructional design, clear visuals of rulers, and interactive-style prompts. Revisions made for page breaks and math rendering. Fixed wrapping for 'inches'. Fixed paperclip alignment and ruler consistency. Improved mixed number visualization.
Measurement Unit Slides - Lesson 1: Inch Halves. Recreated and translated into Japanese with clean visuals, clear diagrams, and appropriate pedagogical structure. Revisions made for page breaks and math rendering. Fixed ruler zero positioning. Fixed eraser width to 1.5 units and improved layout. Corrected fraction terminology.
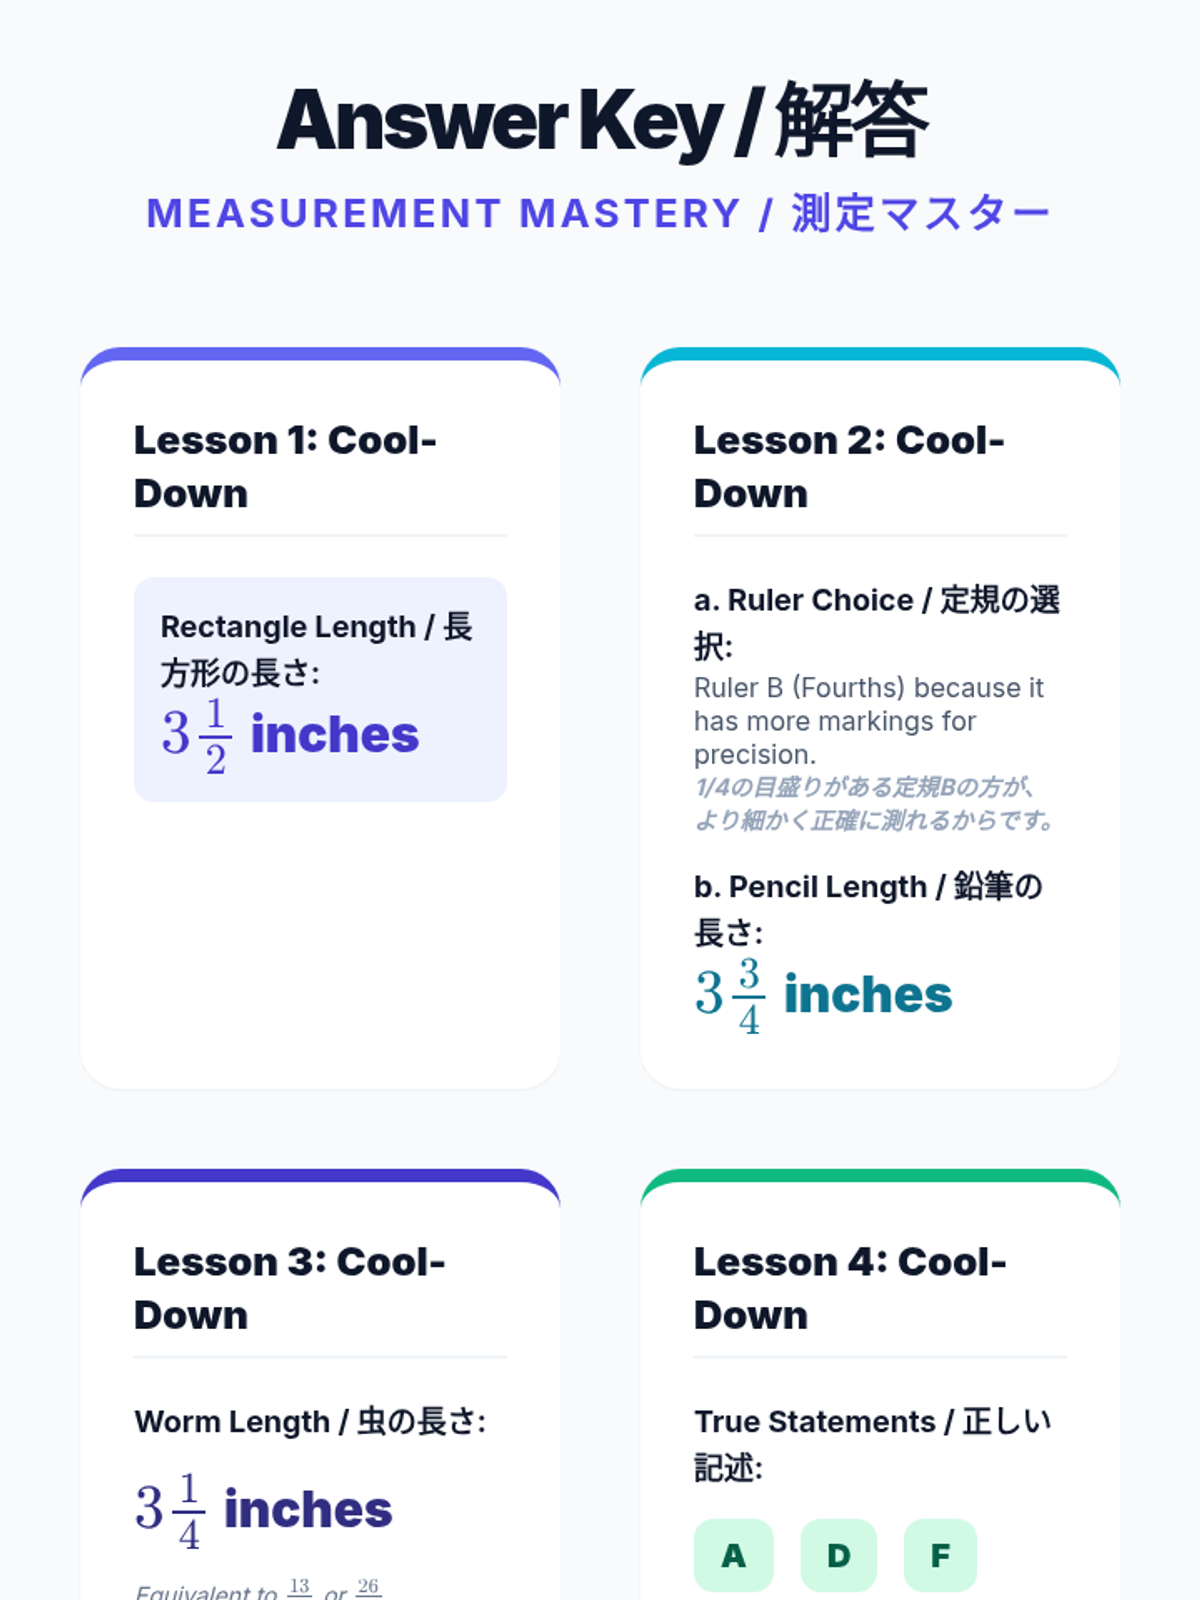
Comprehensive answer key for the unit. Revised for clarity, correct data references, and page break efficiency.
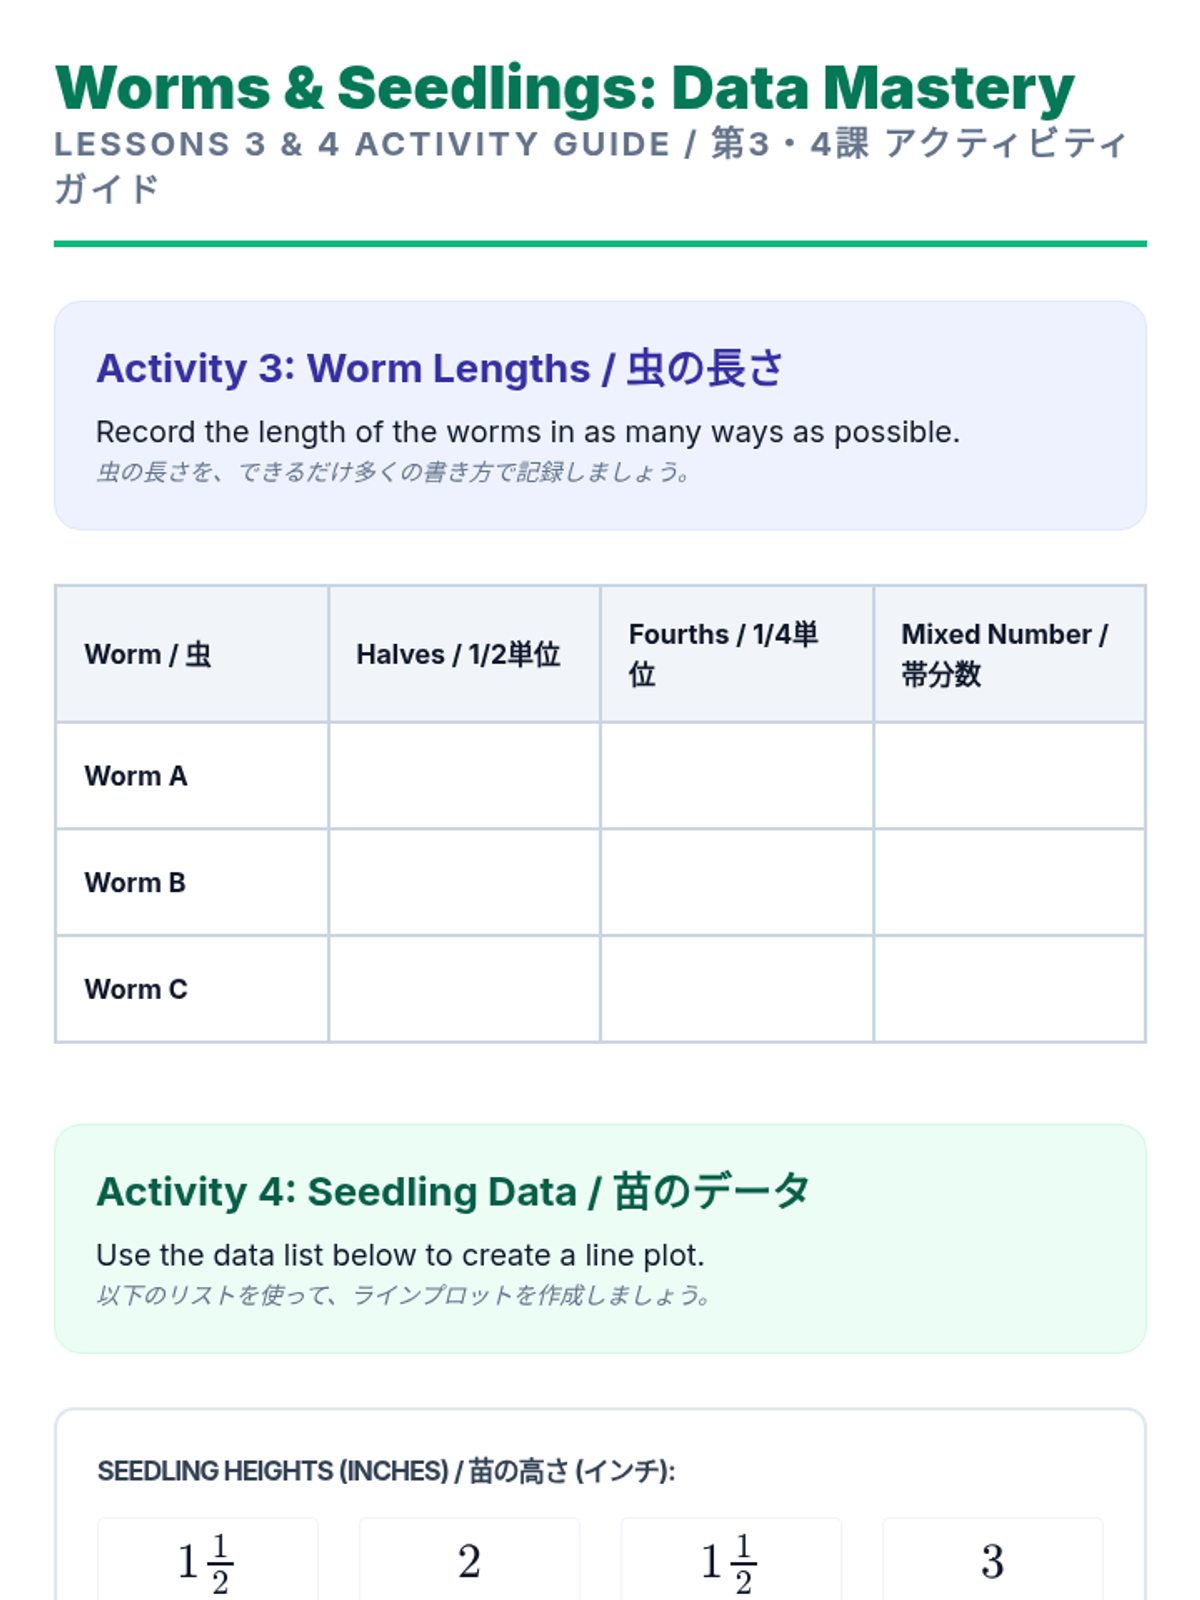
Handouts for Lessons 3 and 4. Revised to keep Activity 4 on one page, fix wrapping, and improve work area visibility.
Bilingual slides for Lesson 4 (Interpreting Line Plots). Focuses on analyzing data representations, identifying differences between lists and plots, and verifying statements based on data. Revised for populated data and alignment.
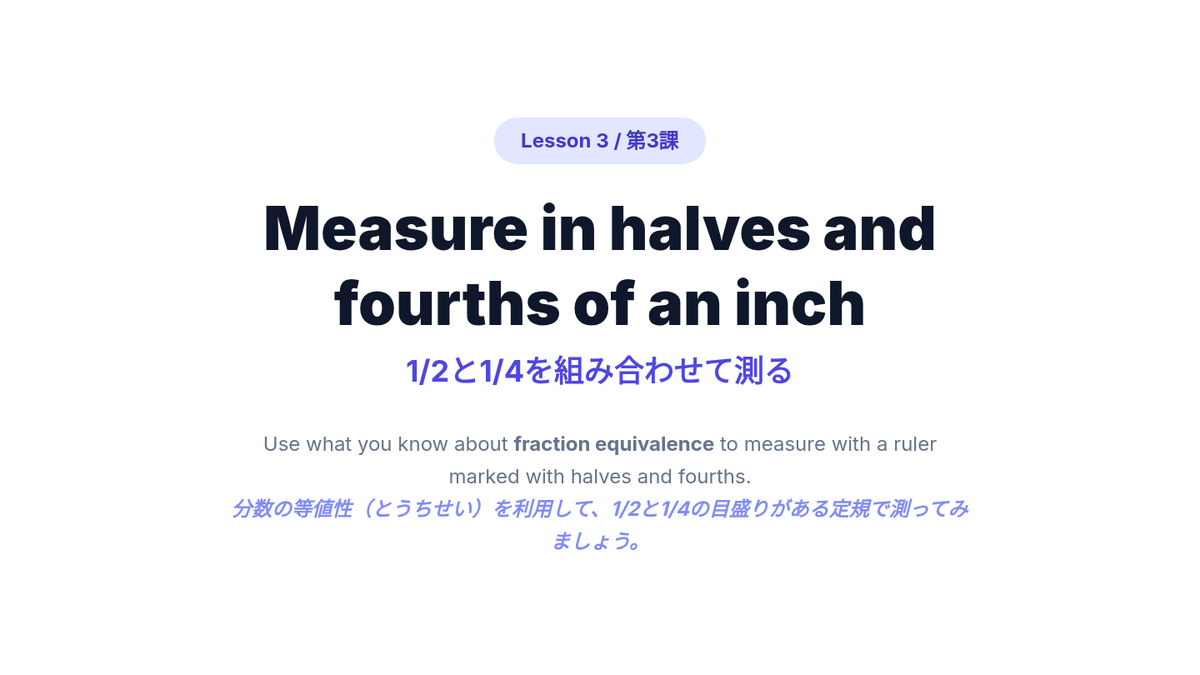
Bilingual slides for Lesson 3 (Equivalence and Mixed Numbers). Explores recording lengths in multiple ways and visualizing mixed number partitioning. Revised for ruler accuracy and visible diagrams.
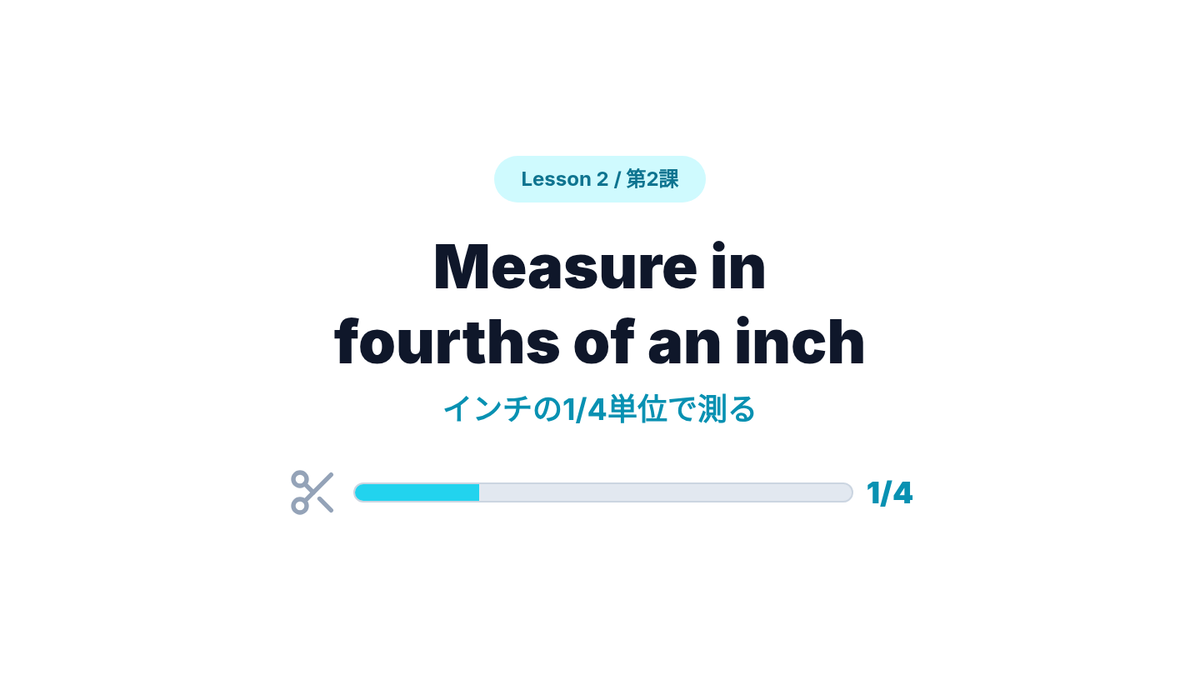
Bilingual slides for Lesson 2 (Measuring in Fourths). Includes estimation exploration, partitioning activities, and a cool-down involving choosing the right tool for precision. Revised for ruler accuracy and alignment.
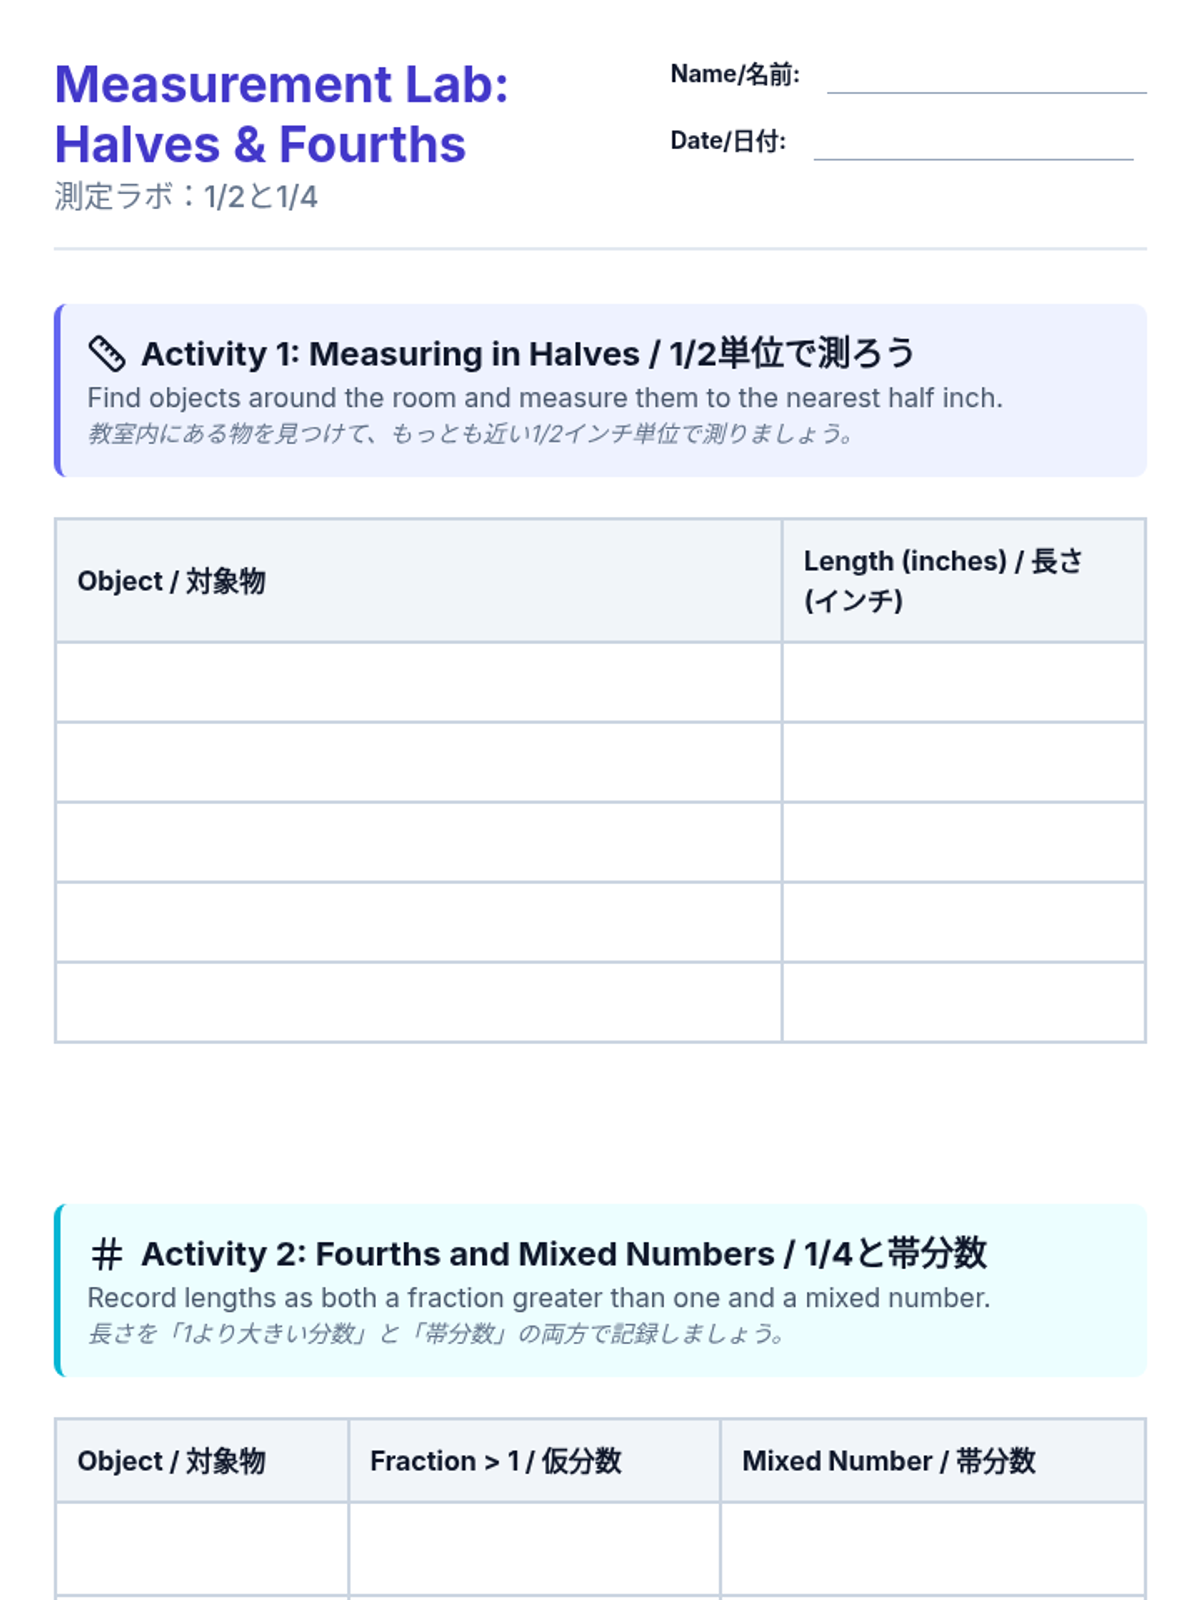
Recording sheets for measuring activities in Lessons 1 and 2. Bilingual format. Revised to prevent table splits and improve name/date formatting.
Bilingual slide deck for the Measurement unit, covering Unit Goals, Rubric, and Lesson 1 (Measuring in Halves). Includes specific terminology in both English and Japanese. Revised for ruler accuracy and alignment.
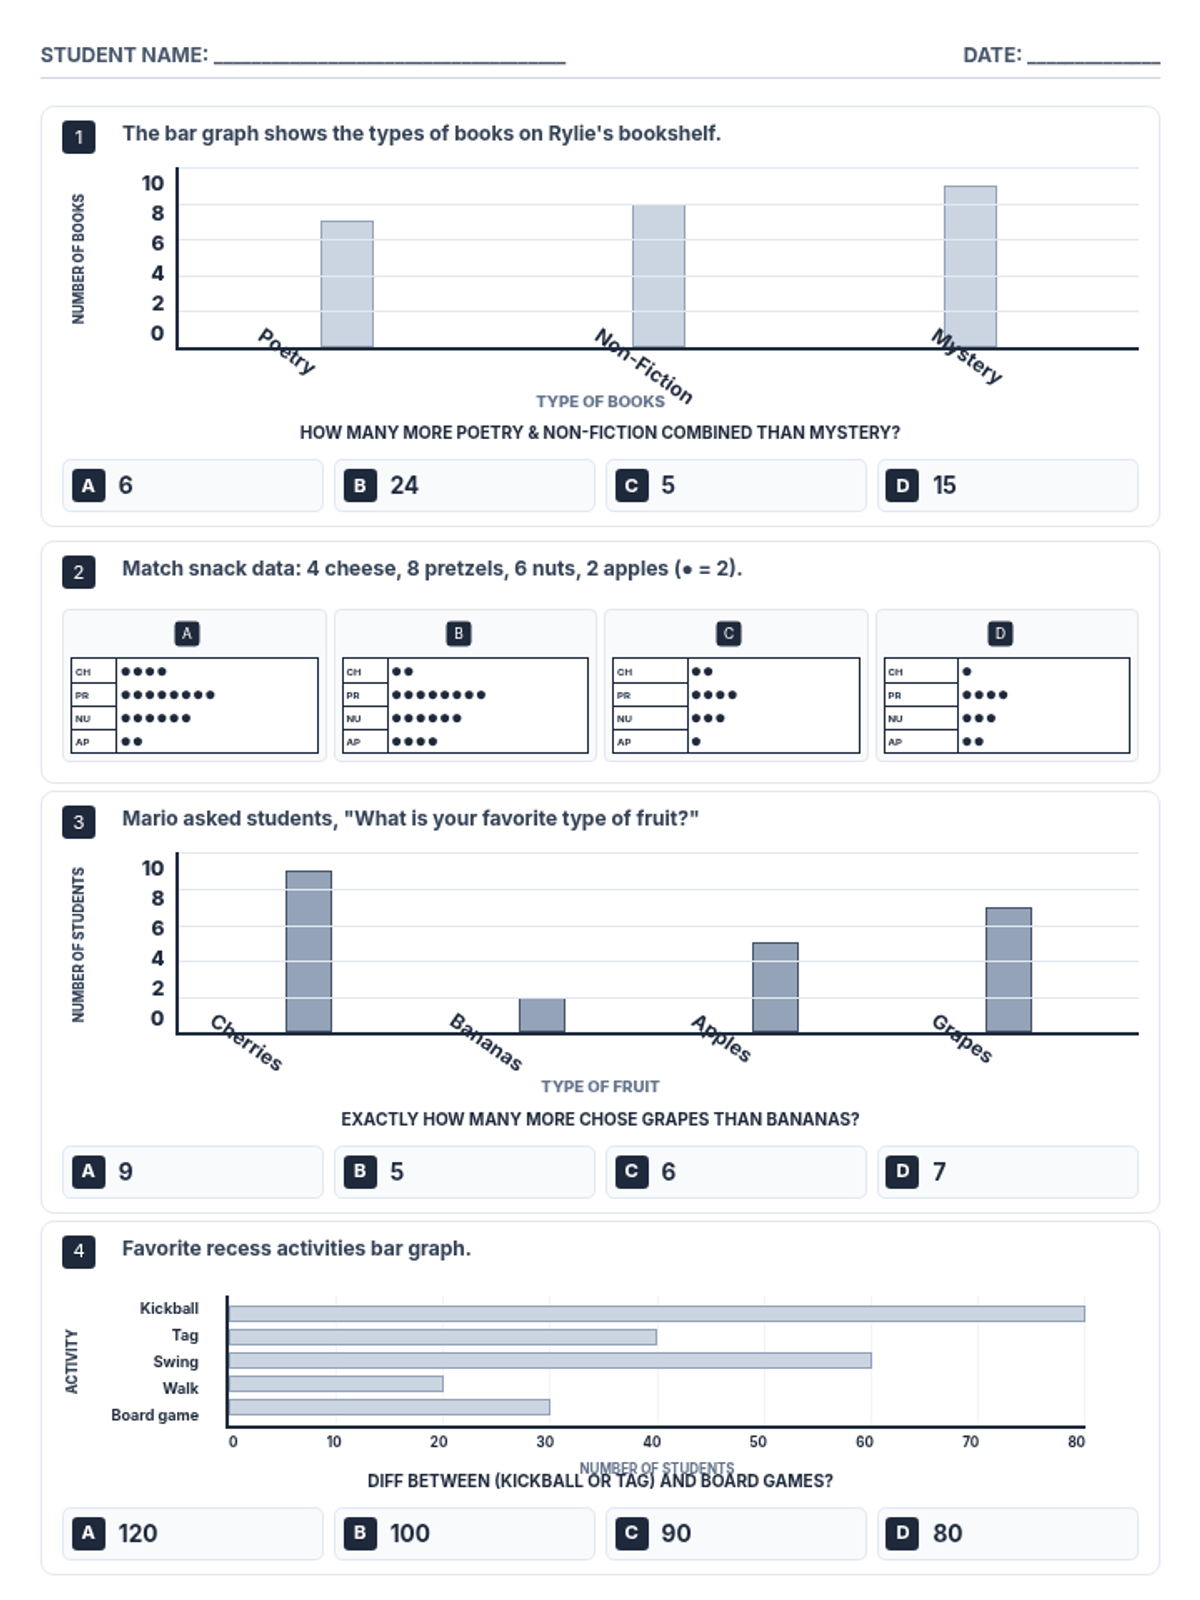
A highly compact worksheet featuring seven data analysis and graphing questions. Optimized for high readability with anchored labels and axis titles using grid layouts. Questions are organized for efficient 4/3 distribution across two pages.
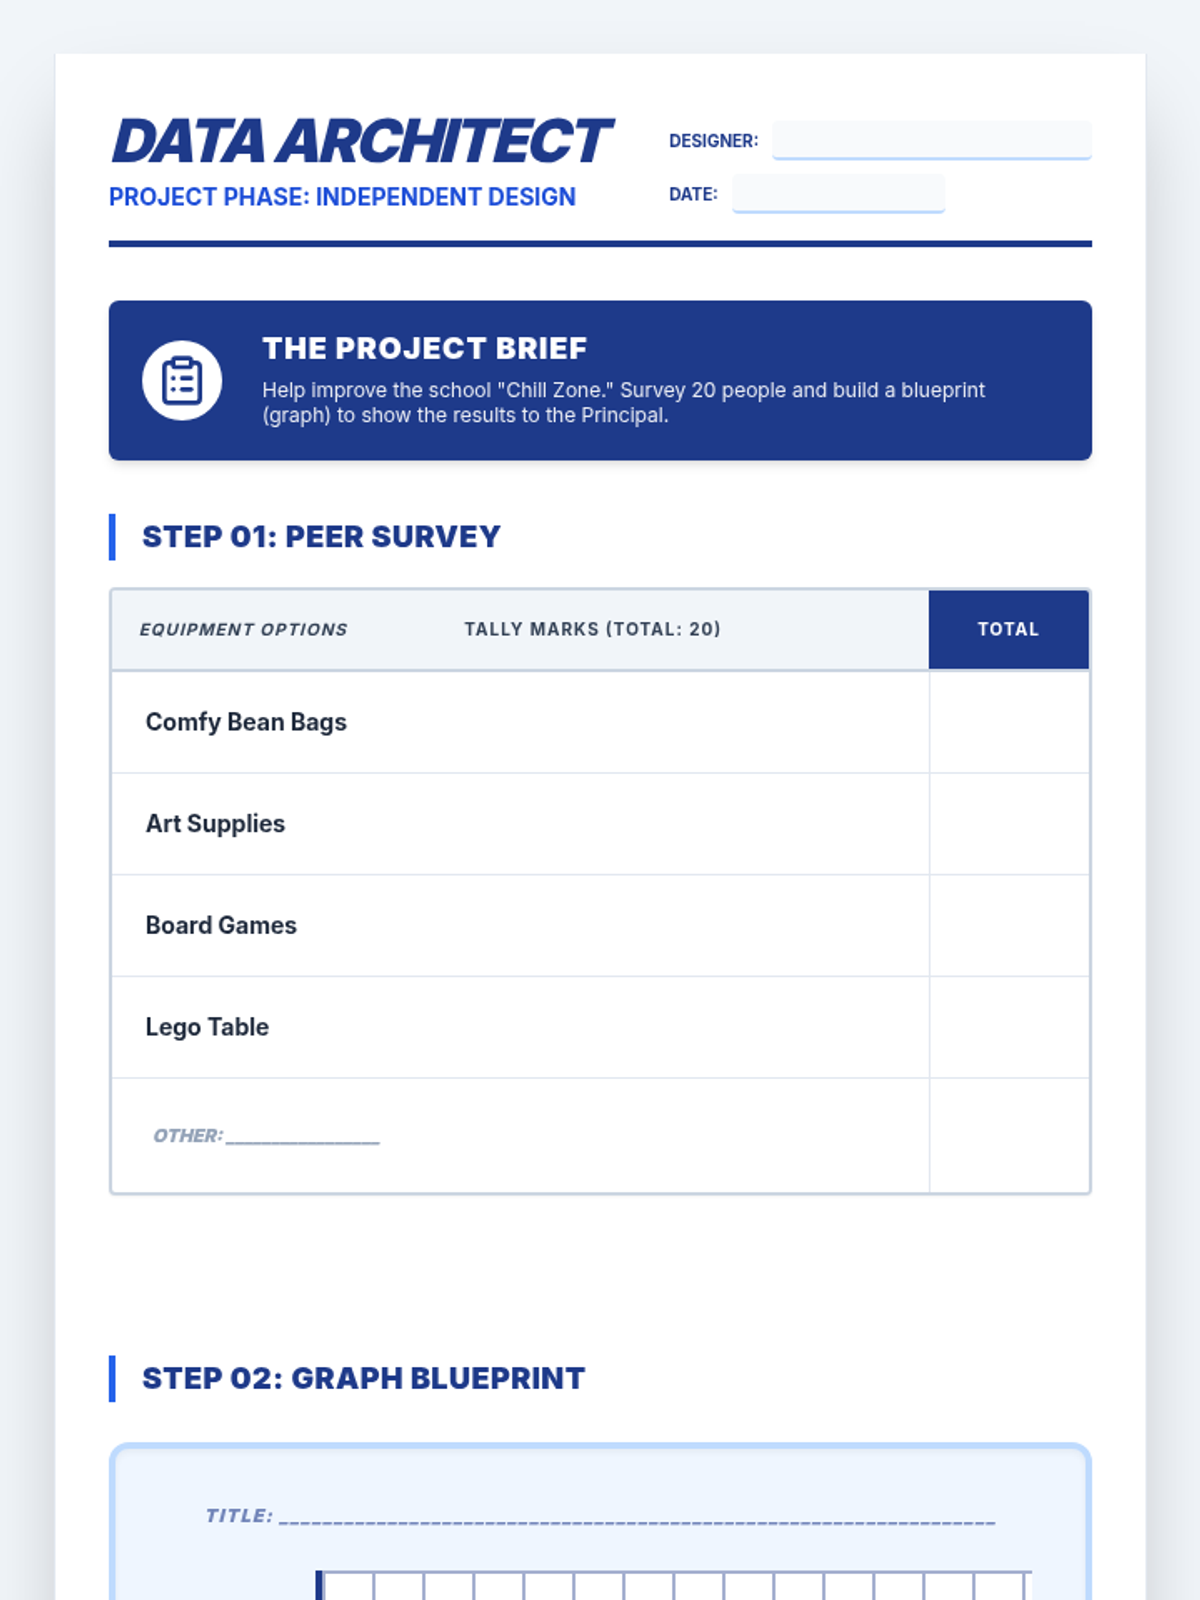
A high-engagement extension project for advanced data interpretation. Students act as 'Data Architects' to survey peers, design a customized blueprint graph, and report findings to the school principal. Optimized for clear work areas and page-break reliability.
A highly compact, high-readability worksheet featuring seven data analysis and graphing questions. Optimized to fit 4 questions on the first page and 3 on the second, ensuring no labels overlap while maximizing page space. Clear vertical and horizontal axis titles with standard rotation for high legibility.
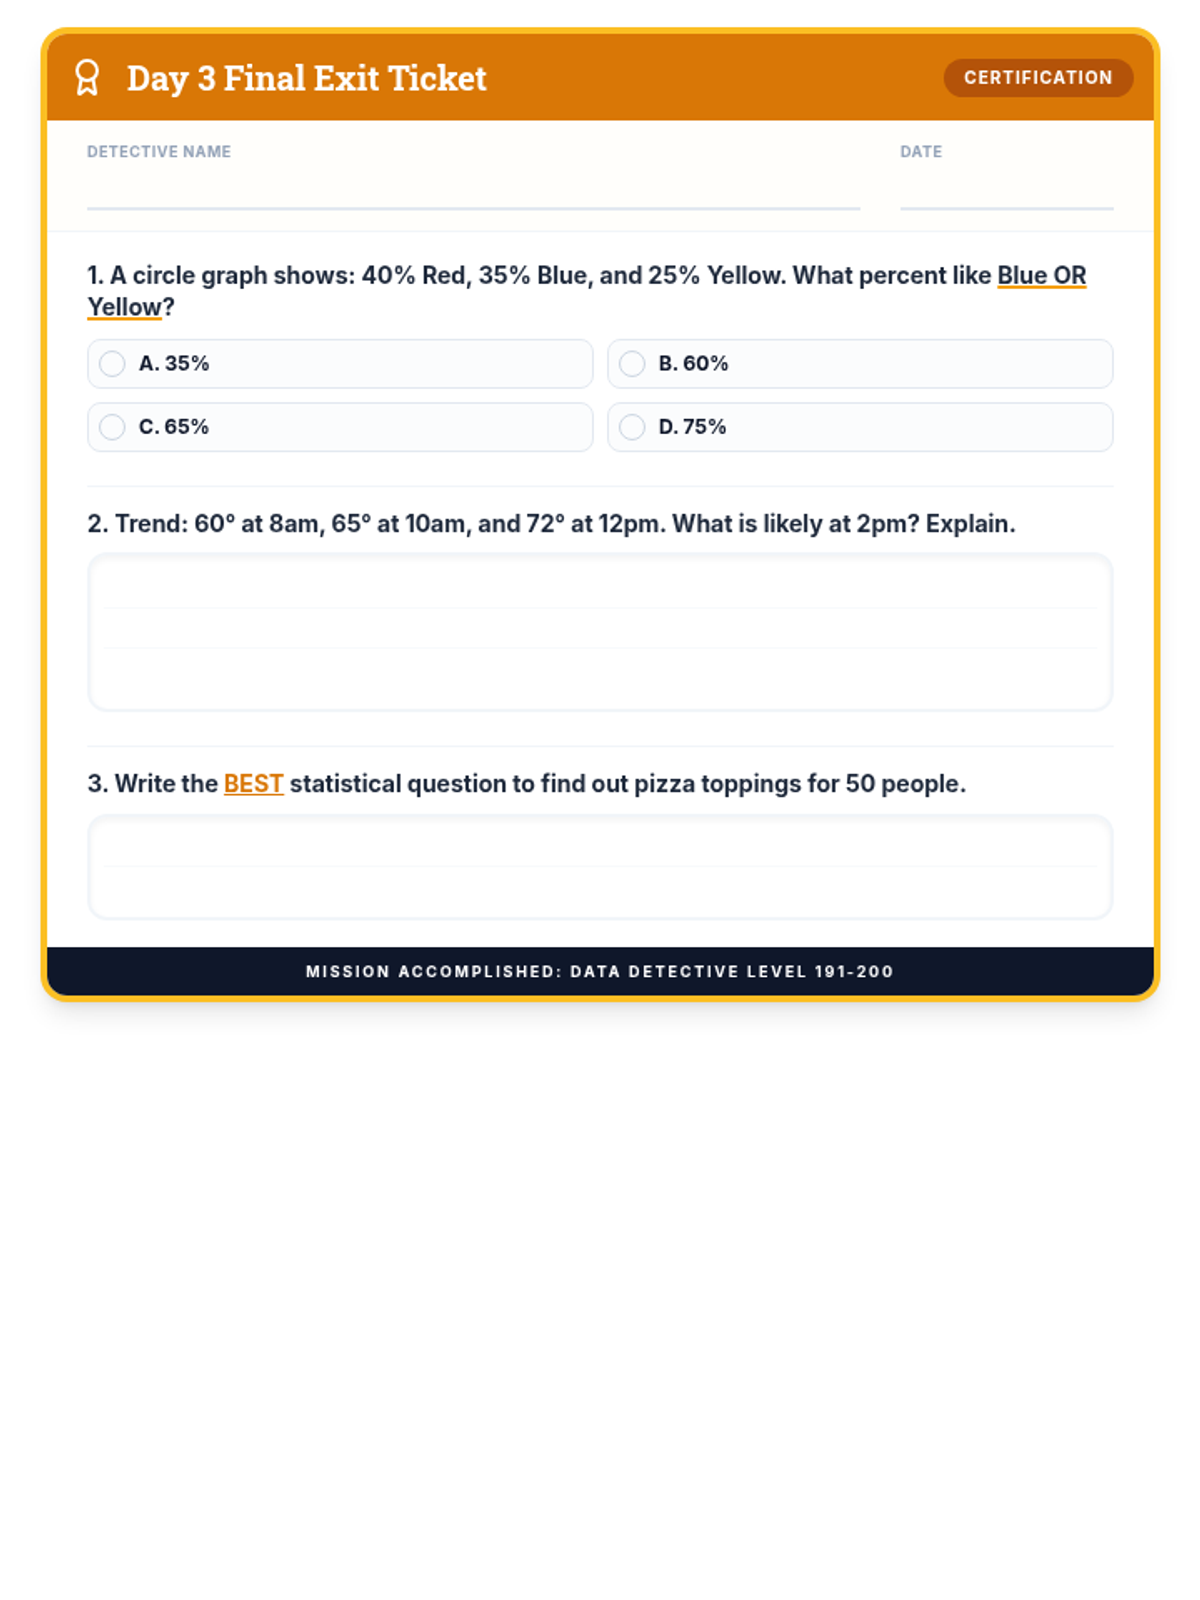
The final exit ticket for the 3-day sequence, testing statistical questioning, circle graph addition, and data prediction.
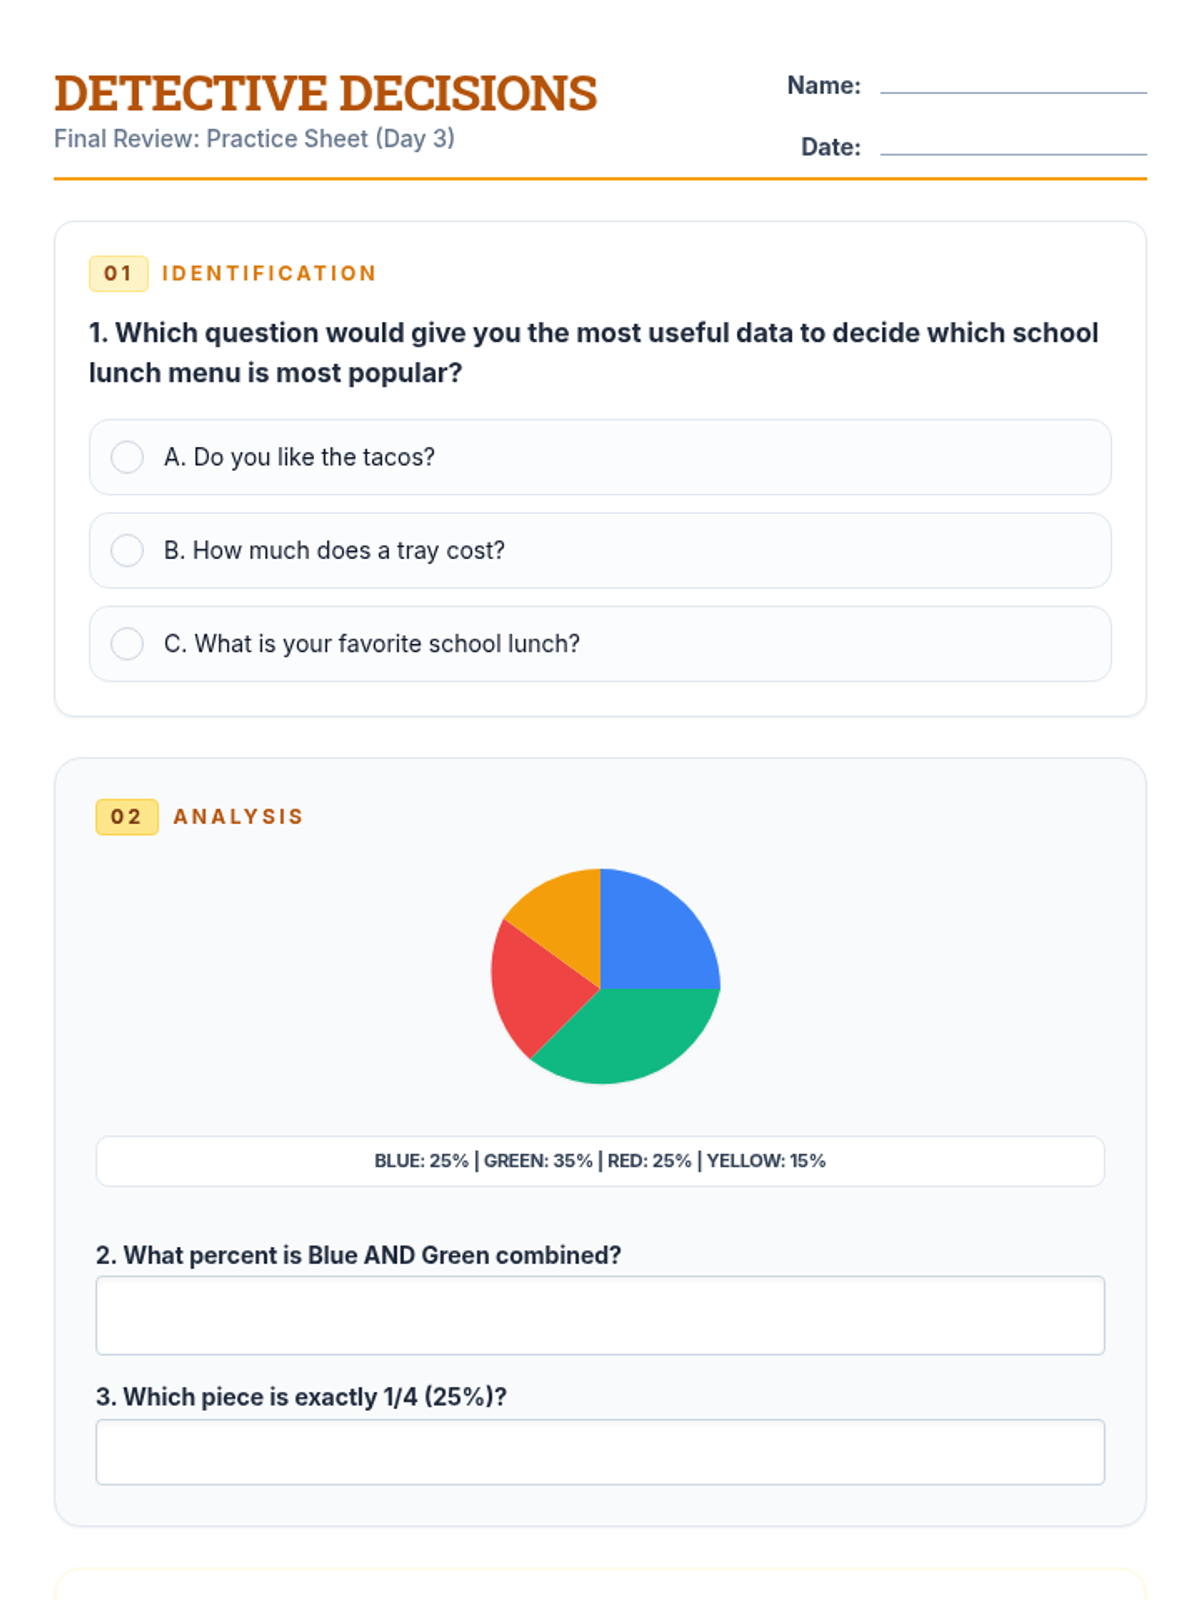
A final practice sheet for Day 3, combining all skills learned throughout the sequence into one comprehensive activity.
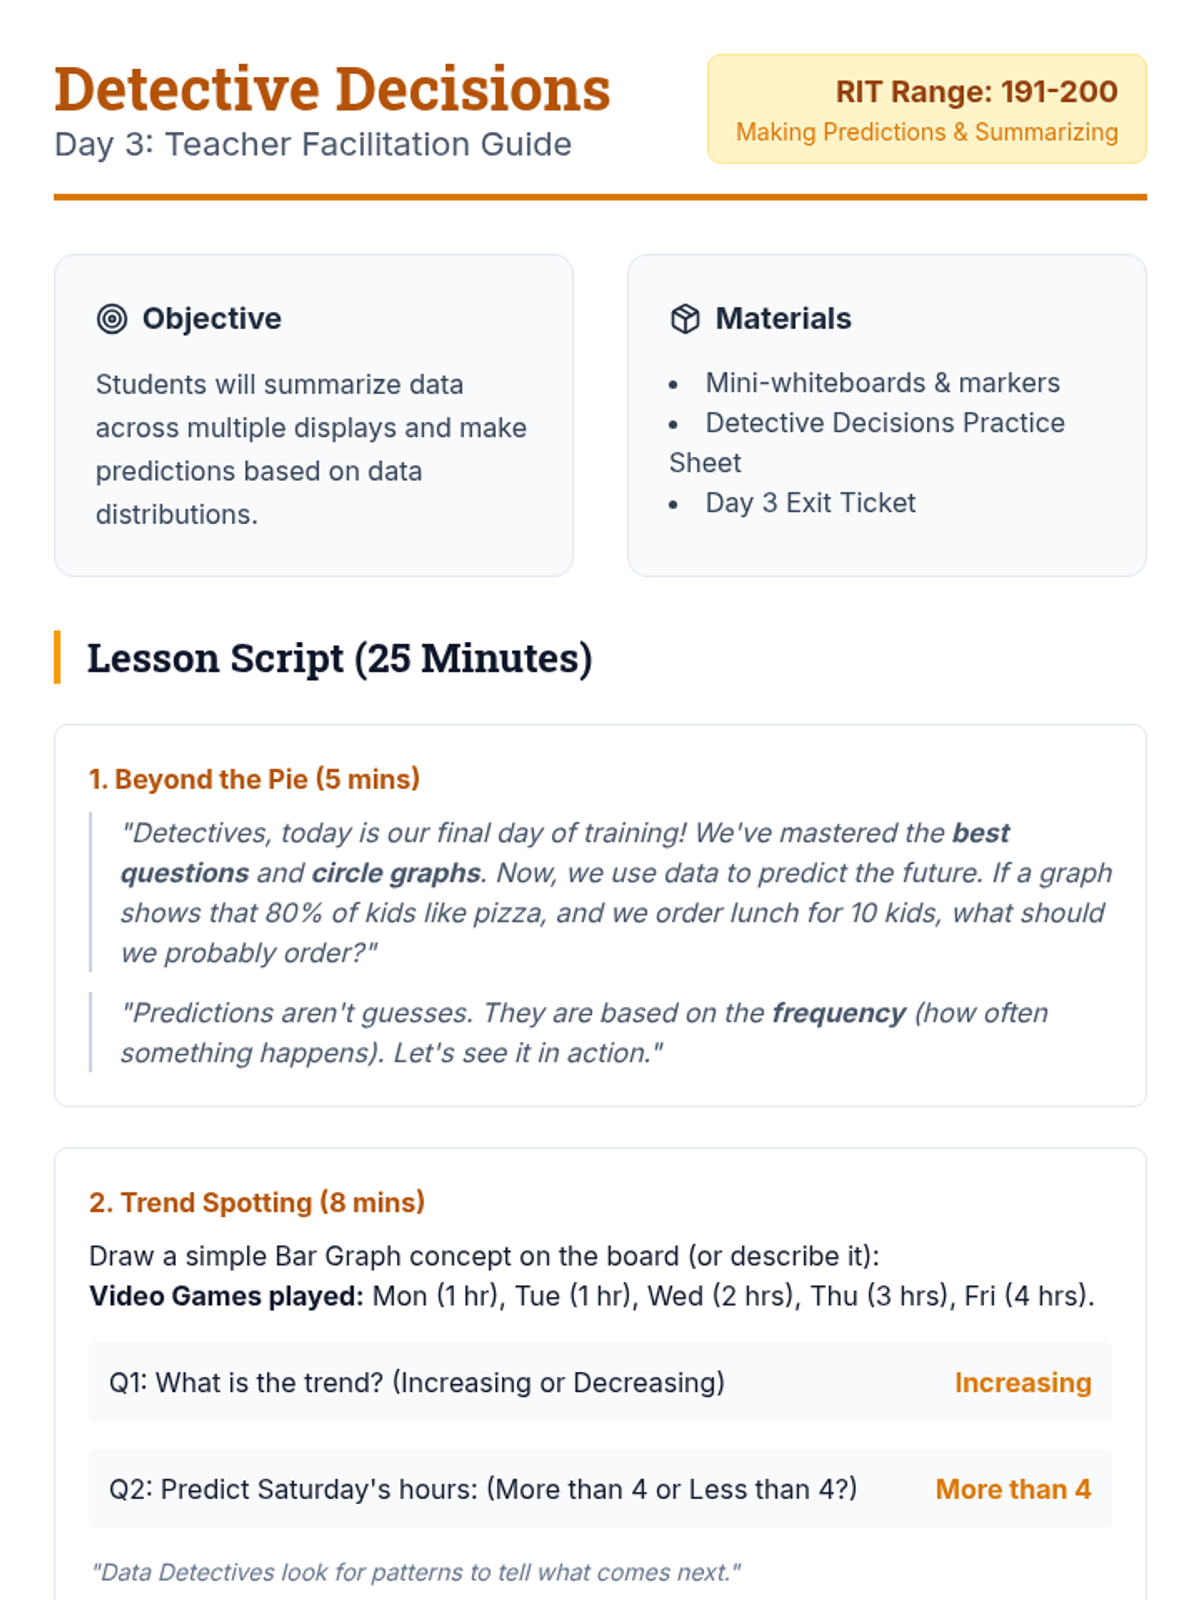
A Day 3 teacher guide focusing on data trends and predictions, synthesizing skills from previous days to meet RIT 191-200 goals.
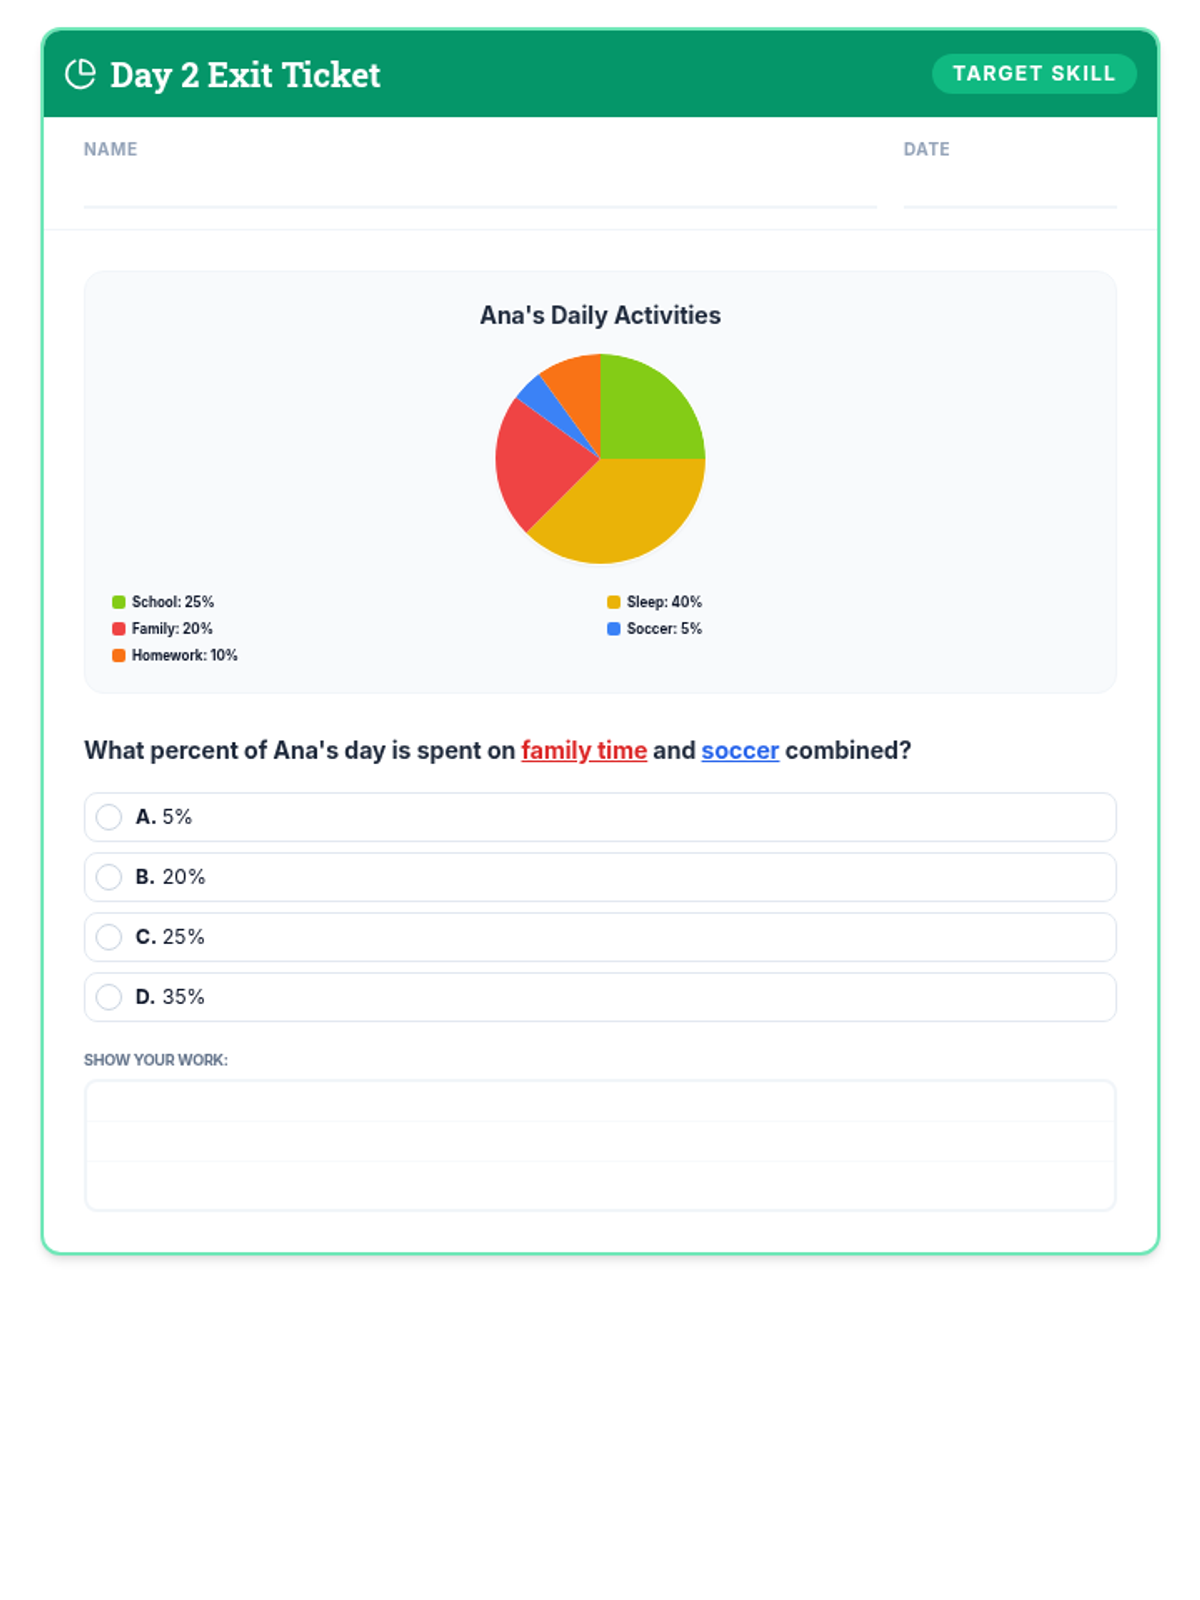
Day 2 Exit Ticket focusing on combined category analysis from a circle graph, mirroring the NWEA MAP RIT 191-200 sample.
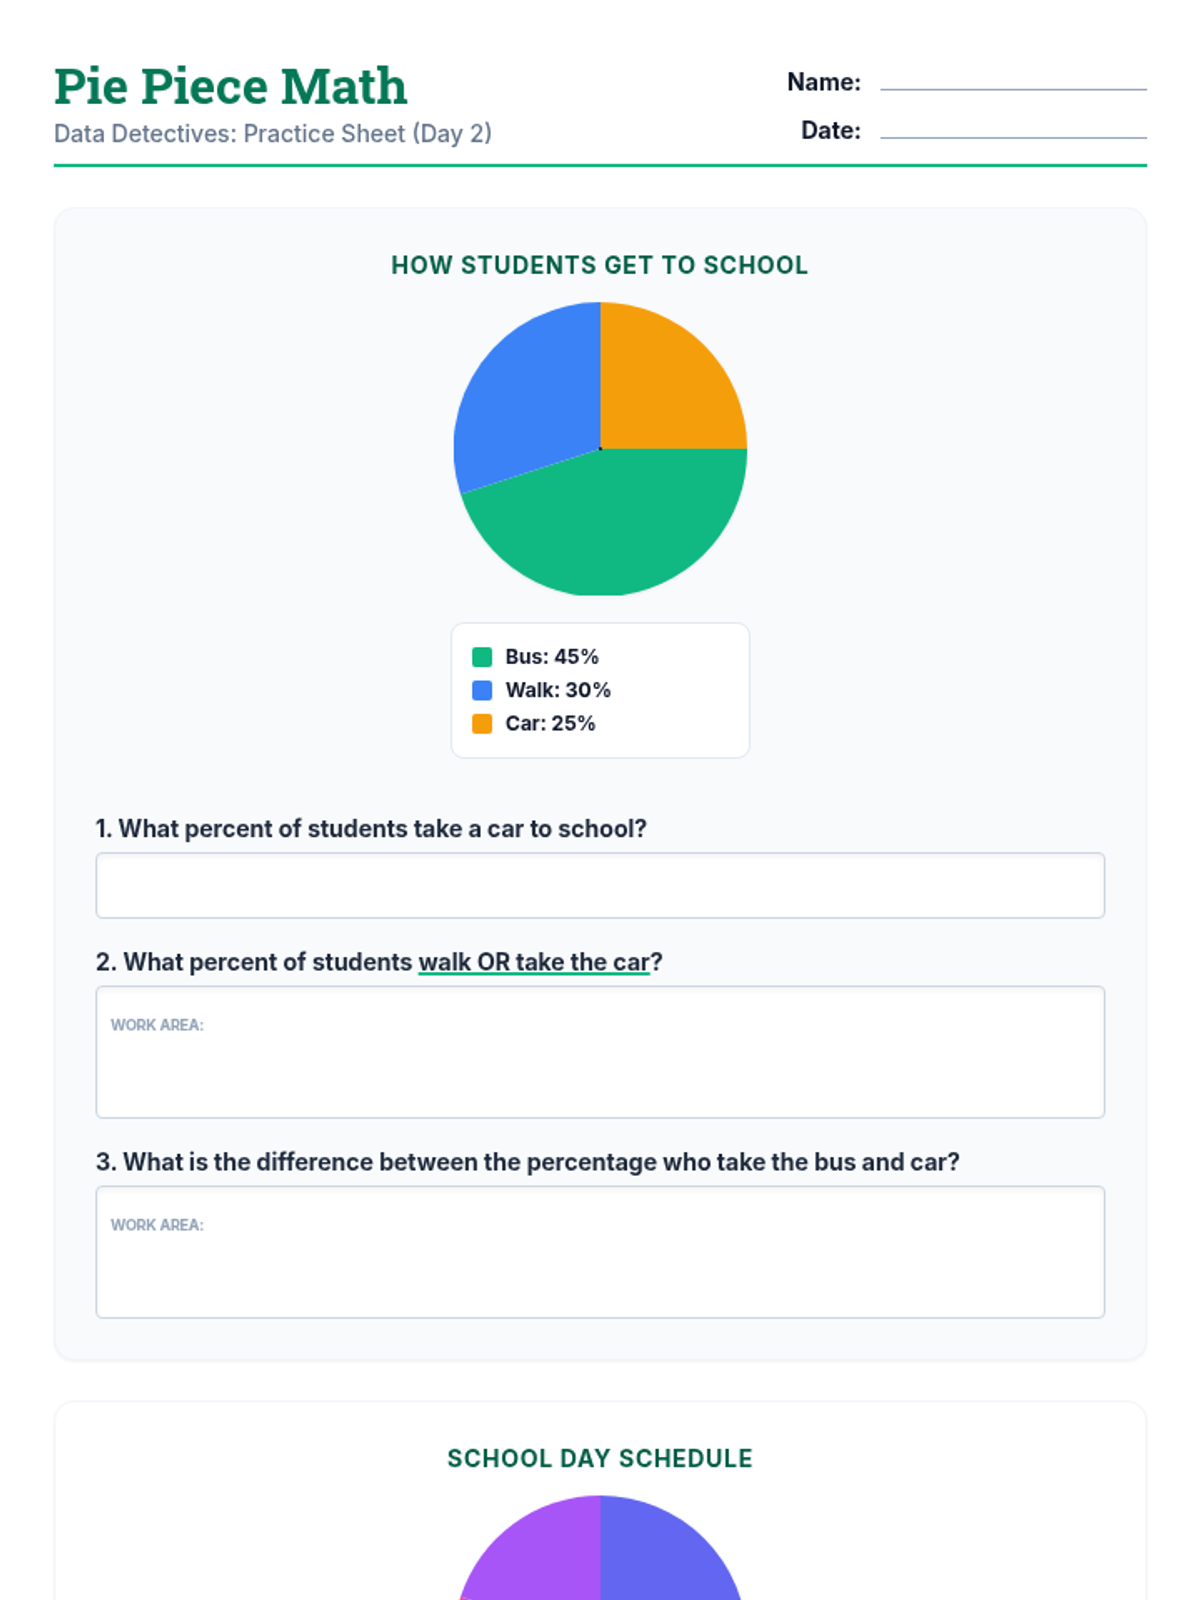
A Day 2 practice worksheet featuring two circle graphs with questions requiring students to identify percentages and combine categories (addition).
A teacher facilitation guide for Day 2, focusing on interpreting circle graphs and adding percentages with scripted instruction and whiteboard drills.
A concise exit ticket for Day 1 to assess student understanding of choosing the best statistical question.