Lenny LearningLenny
Create
Explore
Workspace
LoginSign up
MathEnglish Language ArtsScience & EngineeringSocial StudiesGlobal LanguagesHealth & Physical EducationSpecial EducationCounseling & Life SkillsArts & CreativityESL
Lenny LearningLenny
Lenny Learning
About
Training
Pricing
Support
Contact
© 2026 Lenny Learning Inc.

Statistics & Probability

SequencesLessonsMaterialsVideos
  1. Math

Statistics & Probability

SequencesLessonsMaterialsVideos

Data representation, distributions, and statistical variability using sampling and inference techniques. Integrates probability models, compound events, bivariate patterns, and linear models to guide data-driven decision making.

Represent and Interpret DataCategorical and numerical data organization using tally charts, pictographs, and bar graphs. Focuses on interpreting visual displays to solve comparison problems and summarize data sets.
MathNumbers & CountingCounting ObjectsNumber NamesComparing NumbersNumber OperationsCounting SequenceNumbers 0-10Place Value Understanding and SystemAdd and Subtract Within 20Addition and Subtraction ConceptsAddition and Subtraction EquationsAddition and Subtraction ProblemsFoundations for MultiplicationMultiplication and Division PropertiesMultiply and Divide Within 100Multiplication and Division ProblemsFactors and MultiplesProperties of OperationsPatterns and RelationshipsGenerate and Analyze PatternsMulti-Digit ArithmeticPlace Value OperationsMulti-Digit and Decimal OperationsNumerical ExpressionsFour Operations and PatternsFour Operations Problem SolvingMeasurement & DataMeasurable AttributesMeasuring LengthsMeasure and Estimate Lengths in Standard UnitsRelate Addition and Subtraction to LengthClassifying and Counting ObjectsTime and MoneyArea Concepts and MeasurementPerimeter and Area MeasuresAngle Concepts and MeasurementTime, Volume, and MassMeasurement Unit ConversionsGeometryIdentifying ShapesShapes and AttributesShape Attributes and ReasoningShapes and CompositionClassifying 2D FiguresGeometric Figures and RelationshipsLines, Angles, and ShapesAngle, Area, and VolumeGeometric MeasurementVolume of 3D ShapesCoordinate Plane ApplicationsTransformations in the PlaneCongruence and SimilarityUnderstand congruence in terms of rigid motionsSimilarity and TransformationsProve Theorems Involving SimilarityPythagorean TheoremTrigonometry for General TrianglesMake Geometric ConstructionsProve Geometric TheoremsTheorems About CirclesFind Arc Lengths And Areas of Sectors of CirclesVolume FormulasRelationships Between Two-Dimensional and Three-Dimensional ObjectsProve Simple Geometric Theorems AlgebraicallyTranslate Between Geometric Description and Equation for Conic SectionApply Geometric Concepts in Modeling SituationsFractions & DecimalsFractions as NumbersBuilding FractionsFraction Equivalence and OrderingAdding and Subtracting FractionsMultiplying and Dividing FractionsDividing FractionsDecimal FractionsMulti-Digit Computation and FactorsAdd, Subtract, Multiply, and Divide Rational NumbersRational Number SystemIrrational Numbers and ApproximationsRatiosRatios and ProportionsProportional RelationshipsUnit RateAlgebraAlgebraic ExpressionsGenerate Equivalent ExpressionsQuantitative RelationshipsProportional Relationships and Linear EquationsEquations and InequalitiesEquation Solving and ReasoningLinear Equations and SystemsGraph Equations and InequalitiesSystems of EquationsReal-World Algebraic ProblemsQuantitative Reasoning with UnitsExpression StructureEquivalent Expression FormsRadicals and Integer ExponentsRational ExponentsRational and Irrational NumbersPolynomial OperationsPolynomial IdentitiesPolynomial Zeros and FactorsRational ExpressionsComplex Number OperationsComplex Numbers in PolynomialsComplex Numbers on PlaneStatistics & ProbabilityRepresent and Interpret DataData DistributionsStatistical VariabilityProbability ModelsCompound Event ProbabilitiesStatistical SamplingInterpret Categorical and Quantitative DataBivariate Data PatternsInterpret Linear ModelsComparing Two PopulationsRandom Processes in StatisticsIndependence and Conditional ProbabilityExpected ValuesProbability-Based Decision MakingStatistical Inference and ConclusionsFunctionsFunction Concepts and NotationDefine and Compare FunctionsInterpret Functions in ContextAnalyze Function RepresentationsModel Relationships with FunctionsIdentify Linear vs Exponential GrowthDistinguish Between Function TypesCompare Growth RatesInterpret Function ExpressionsBuild Functions from RelationshipsConstruct and Model FunctionsTransform and Combine FunctionsModel Comparison and SelectionSolve Exponential EquationsTrigonometryTrigonometric Ratios Involving Right TrianglesTrigonometric Functions and Unit CircleModel with Trigonometric FunctionsTrigonometric IdentitiesVectors & MatricesIntroduction to Vectors and MatricesVector QuantitiesVector OperationsMatrix OperationsCalculusLimits and ContinuityDerivative Concepts and NotationDerivative Rules and TechniquesApplications of DerivativesOptimization ProblemsRelated RatesCurve Sketching and AnalysisIntegration Concepts and NotationAntiderivatives and Indefinite IntegralsDefinite Integrals and AreaFundamental Theorem of CalculusIntegration TechniquesApplications of IntegrationDifferential EquationsSequences and SeriesParametric and Polar FunctionsVector-Valued Functions
Sequence
Math Mastery Blueprint Checklist
Power Up Activities Worksheet
Instructional Impact Checklist
Numerical Power Checklist

Math Mastery Progression

A comprehensive collection of RIT-aligned math mastery resources for student and teacher tracking across key mathematical development ranges.

L

llocascio

Math Teacher
4/27
Sequence
The Perfect Question Teacher Guide
The Perfect Question Practice Sheet
The Perfect Question Exit Ticket

Data Detectives

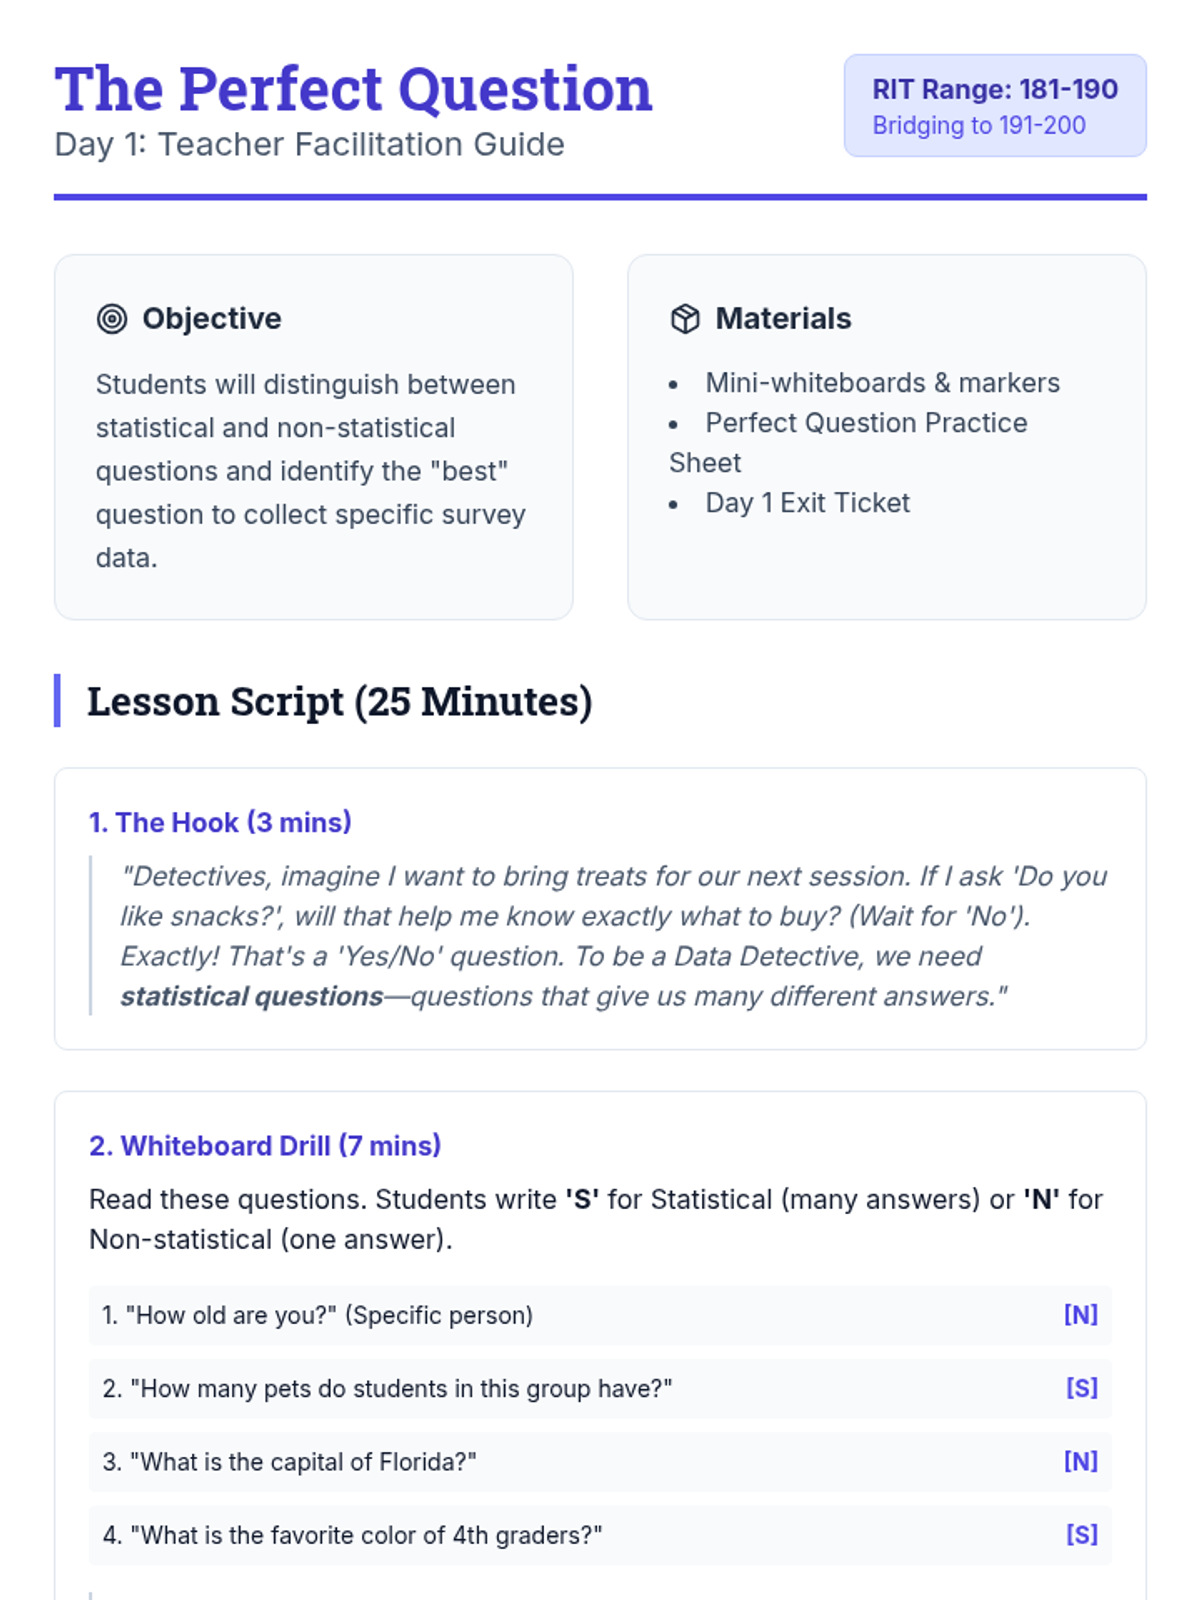
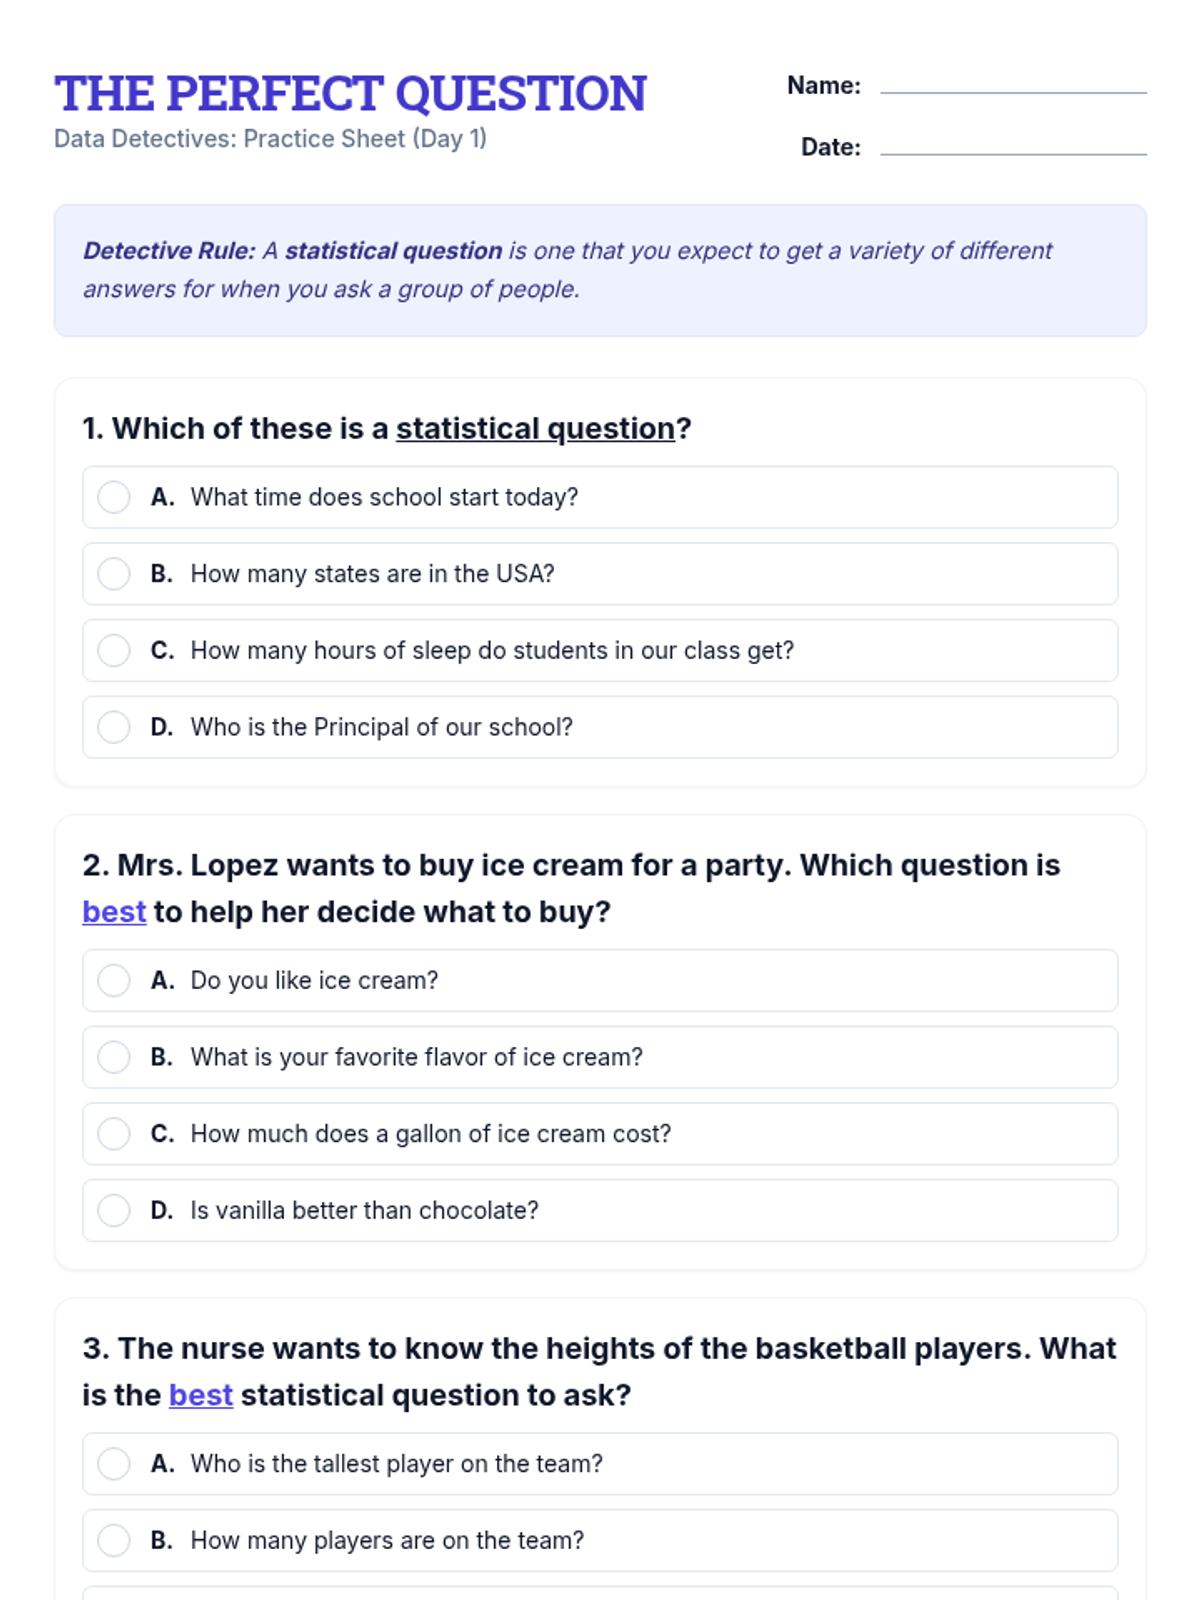
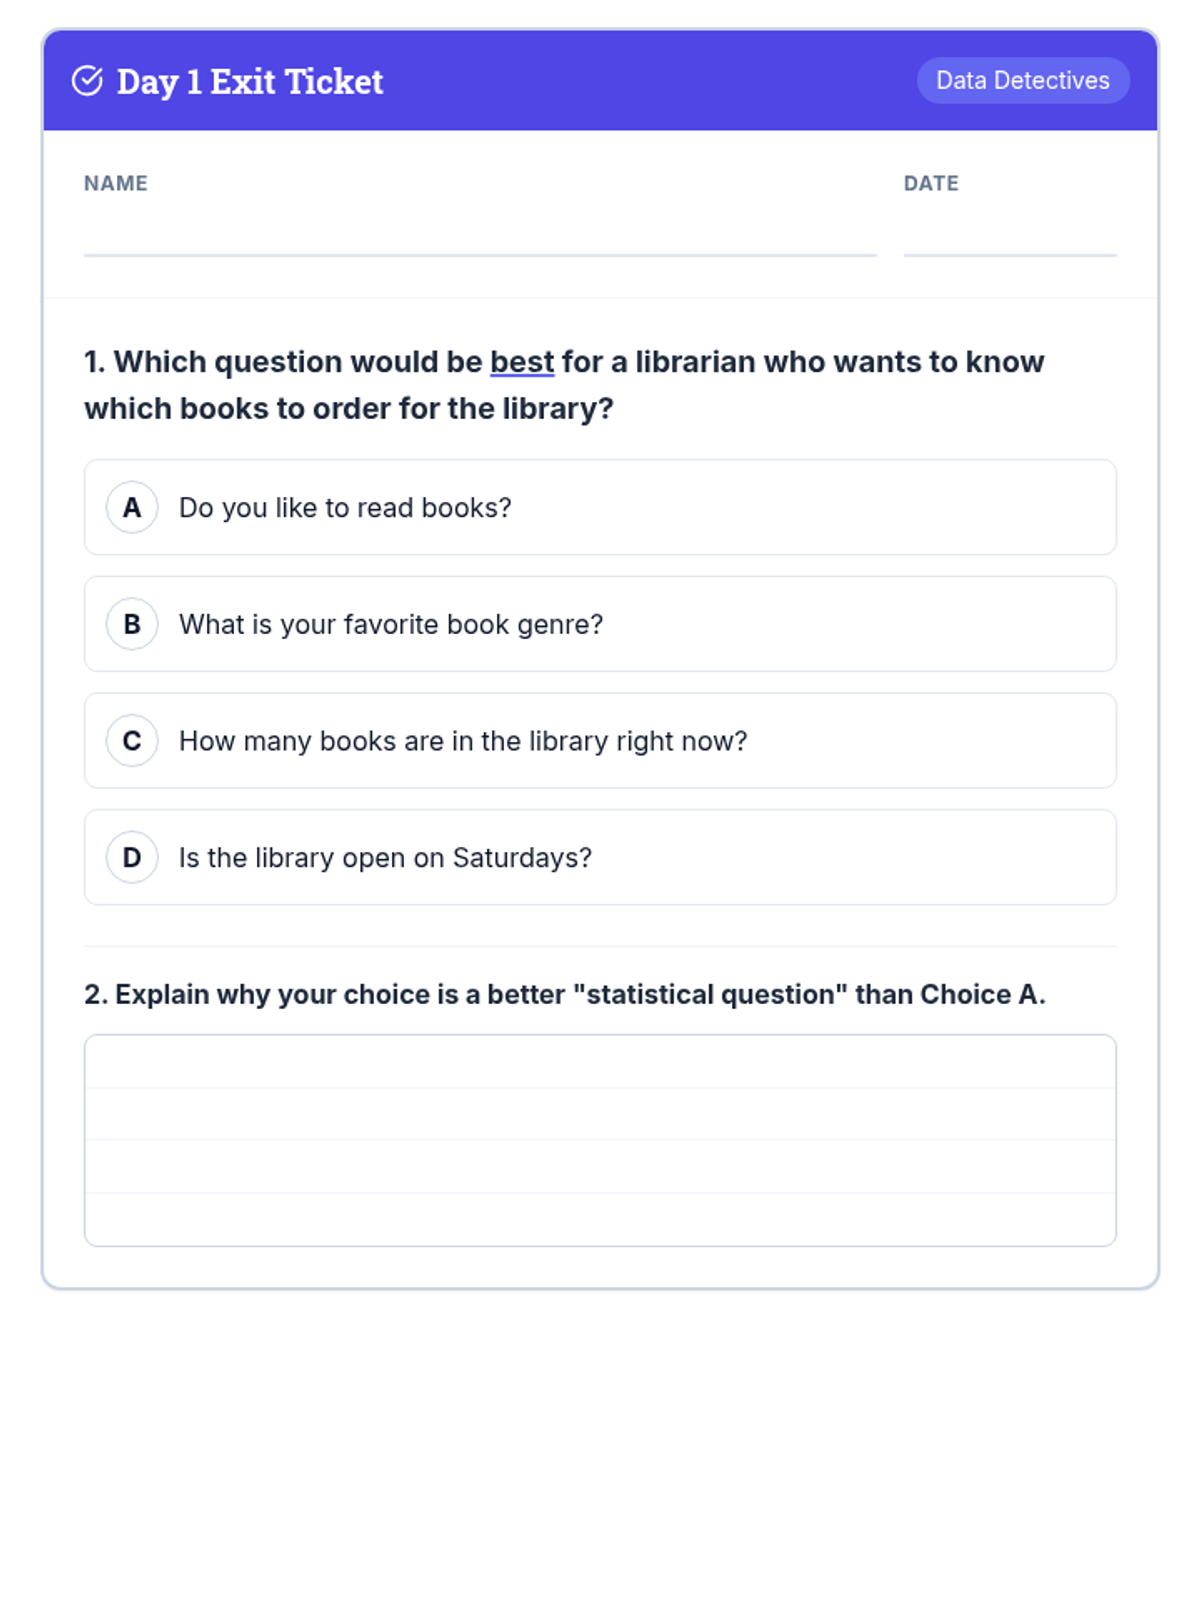
A 3-day small group math sequence designed to move students from RIT 181-190 to 191-200 in the Data Analysis domain, focusing on statistical questions and circle graph interpretation.

MC

Melinda Cortez

Other
4/20
Sequence
Math Dash Practice Packet
Math Dash Answer Key

STAAR Success Packets

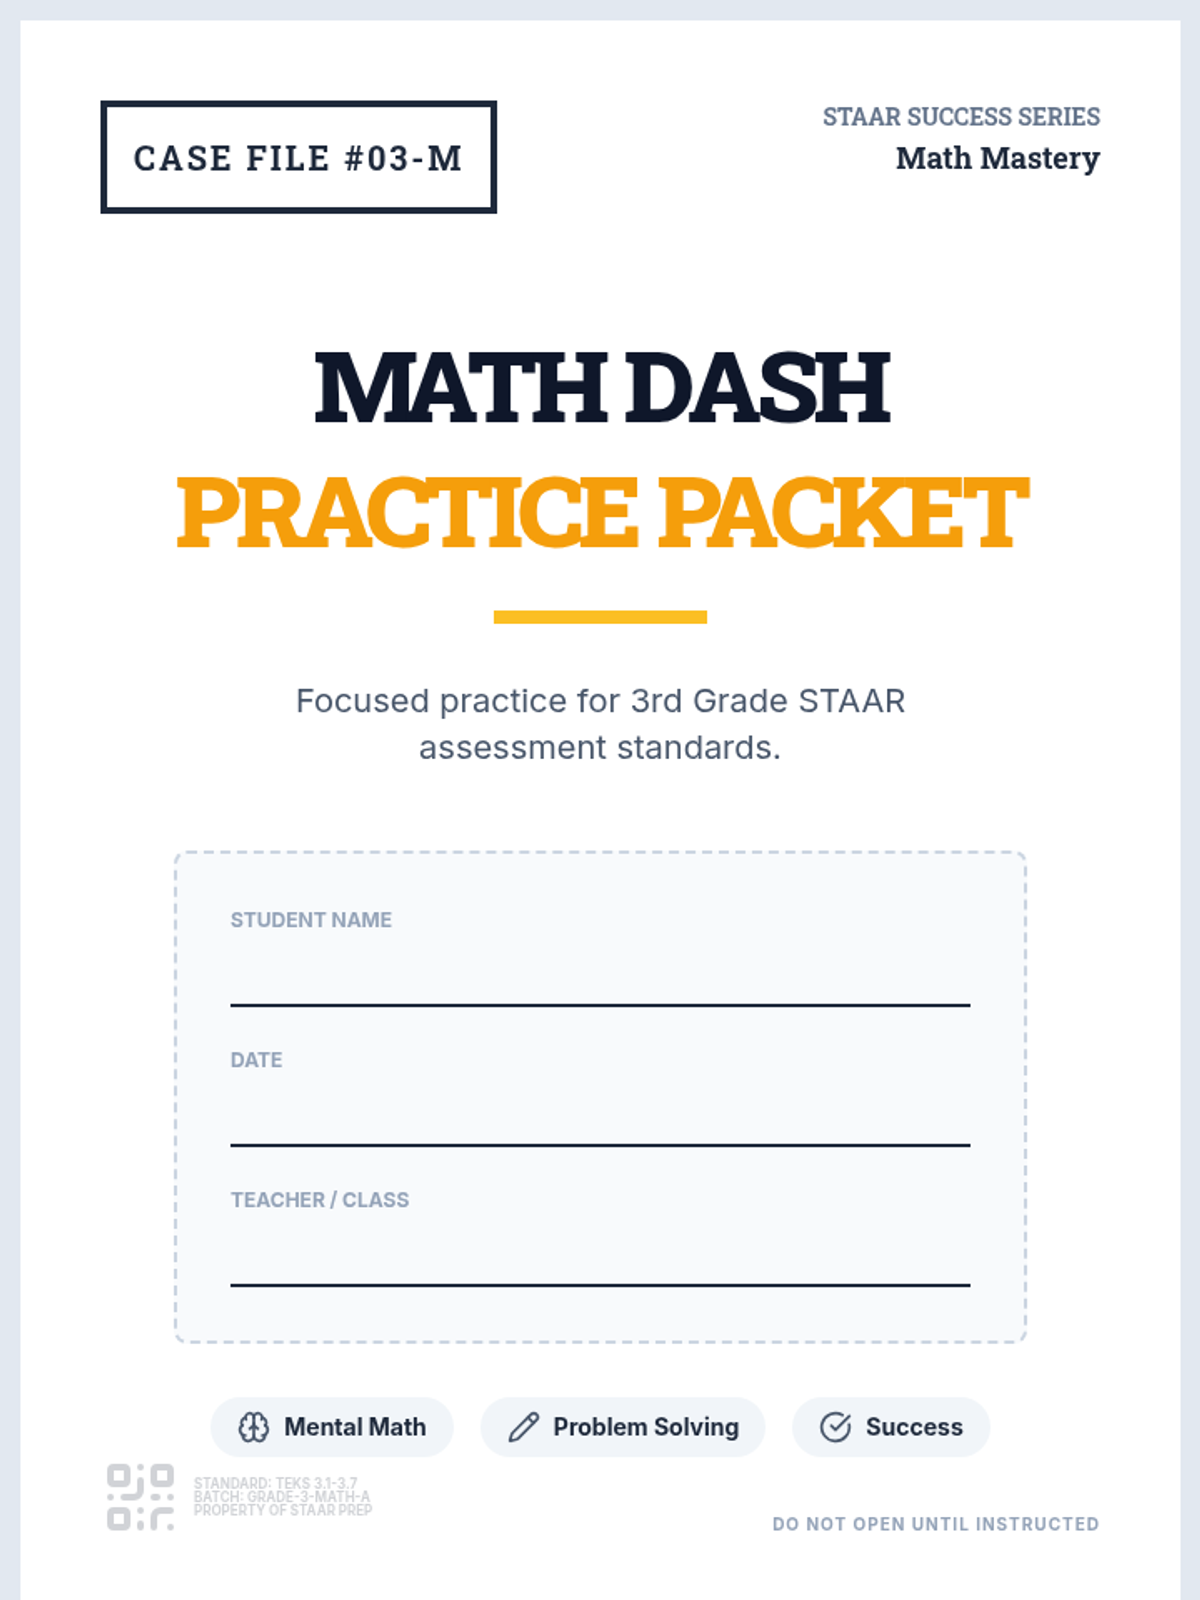
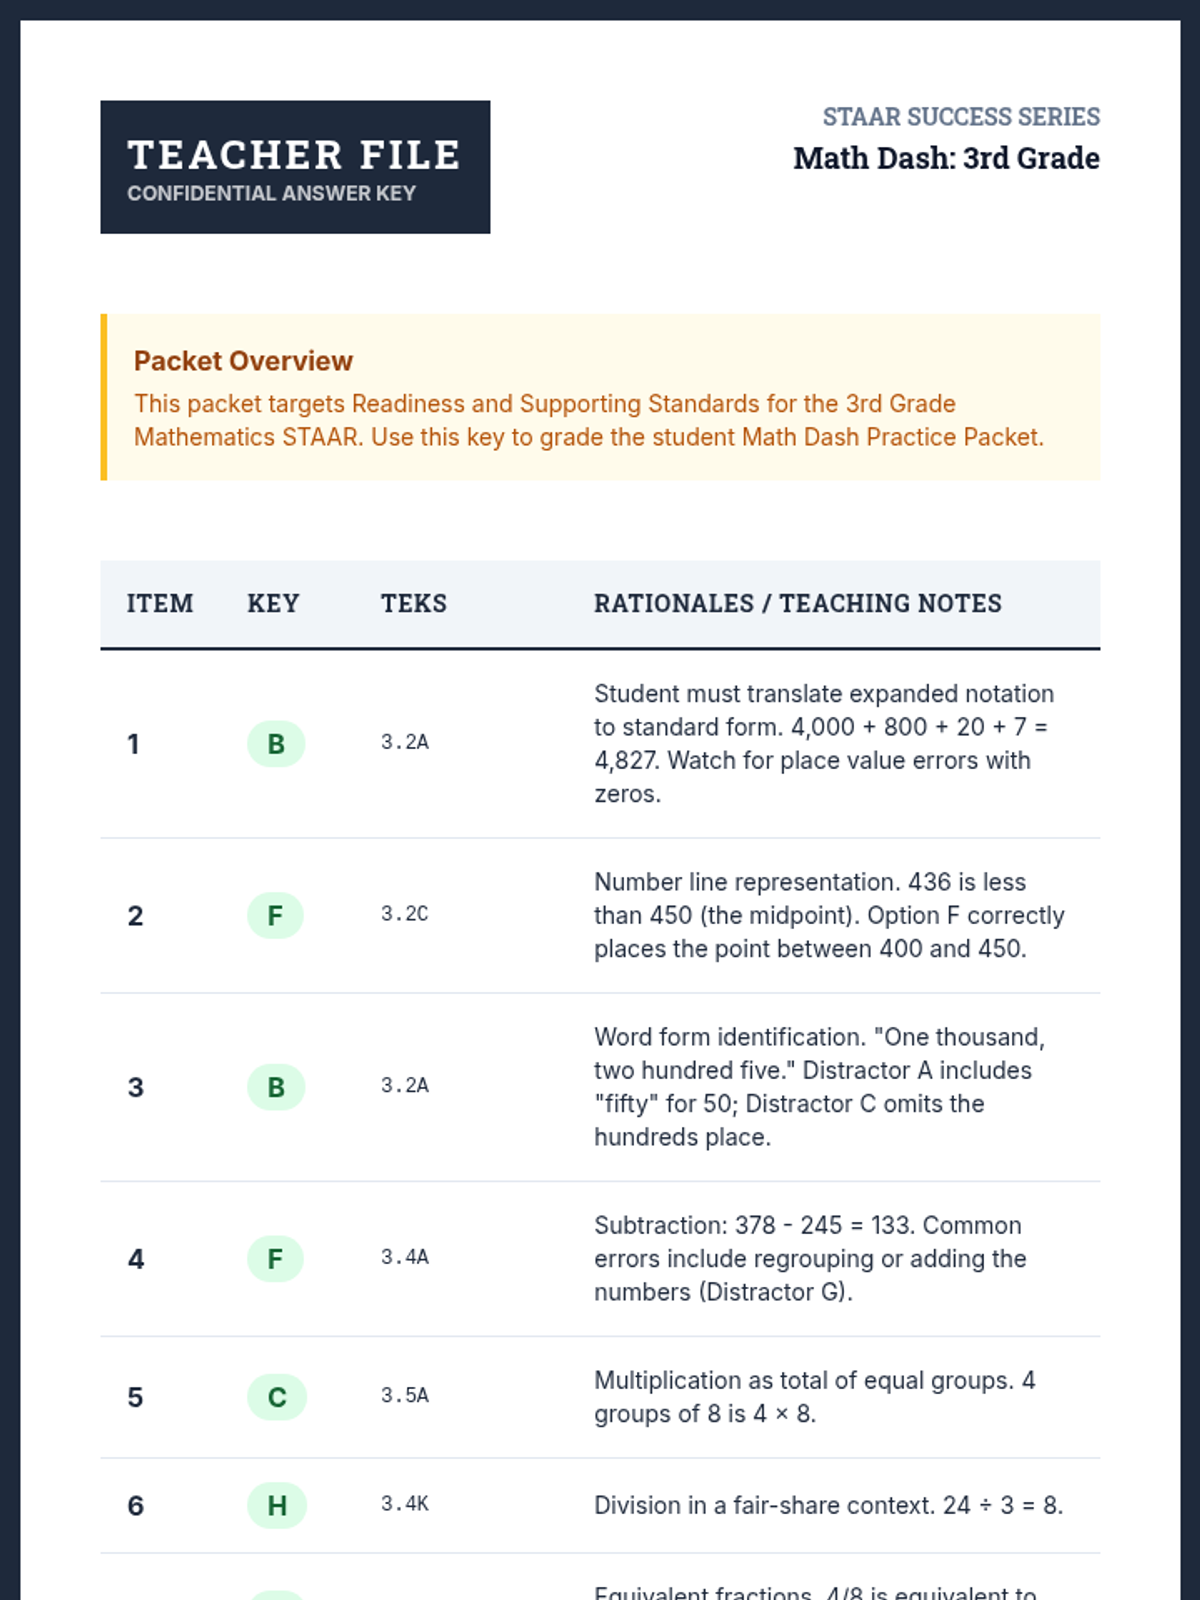
A comprehensive collection of STAAR-aligned practice packets for 3rd-5th grade Math, RLA, and 5th grade Science, designed to build confidence and mastery through authentic test-style questions.

D

duckettj

Principal
3/26
Sequence
Flavor Fleet Teacher Guide Day 1
Truck Blueprint Activity
Startup Budget Worksheet
Flavor Fleet Slides Day 1

Flavor Fleet

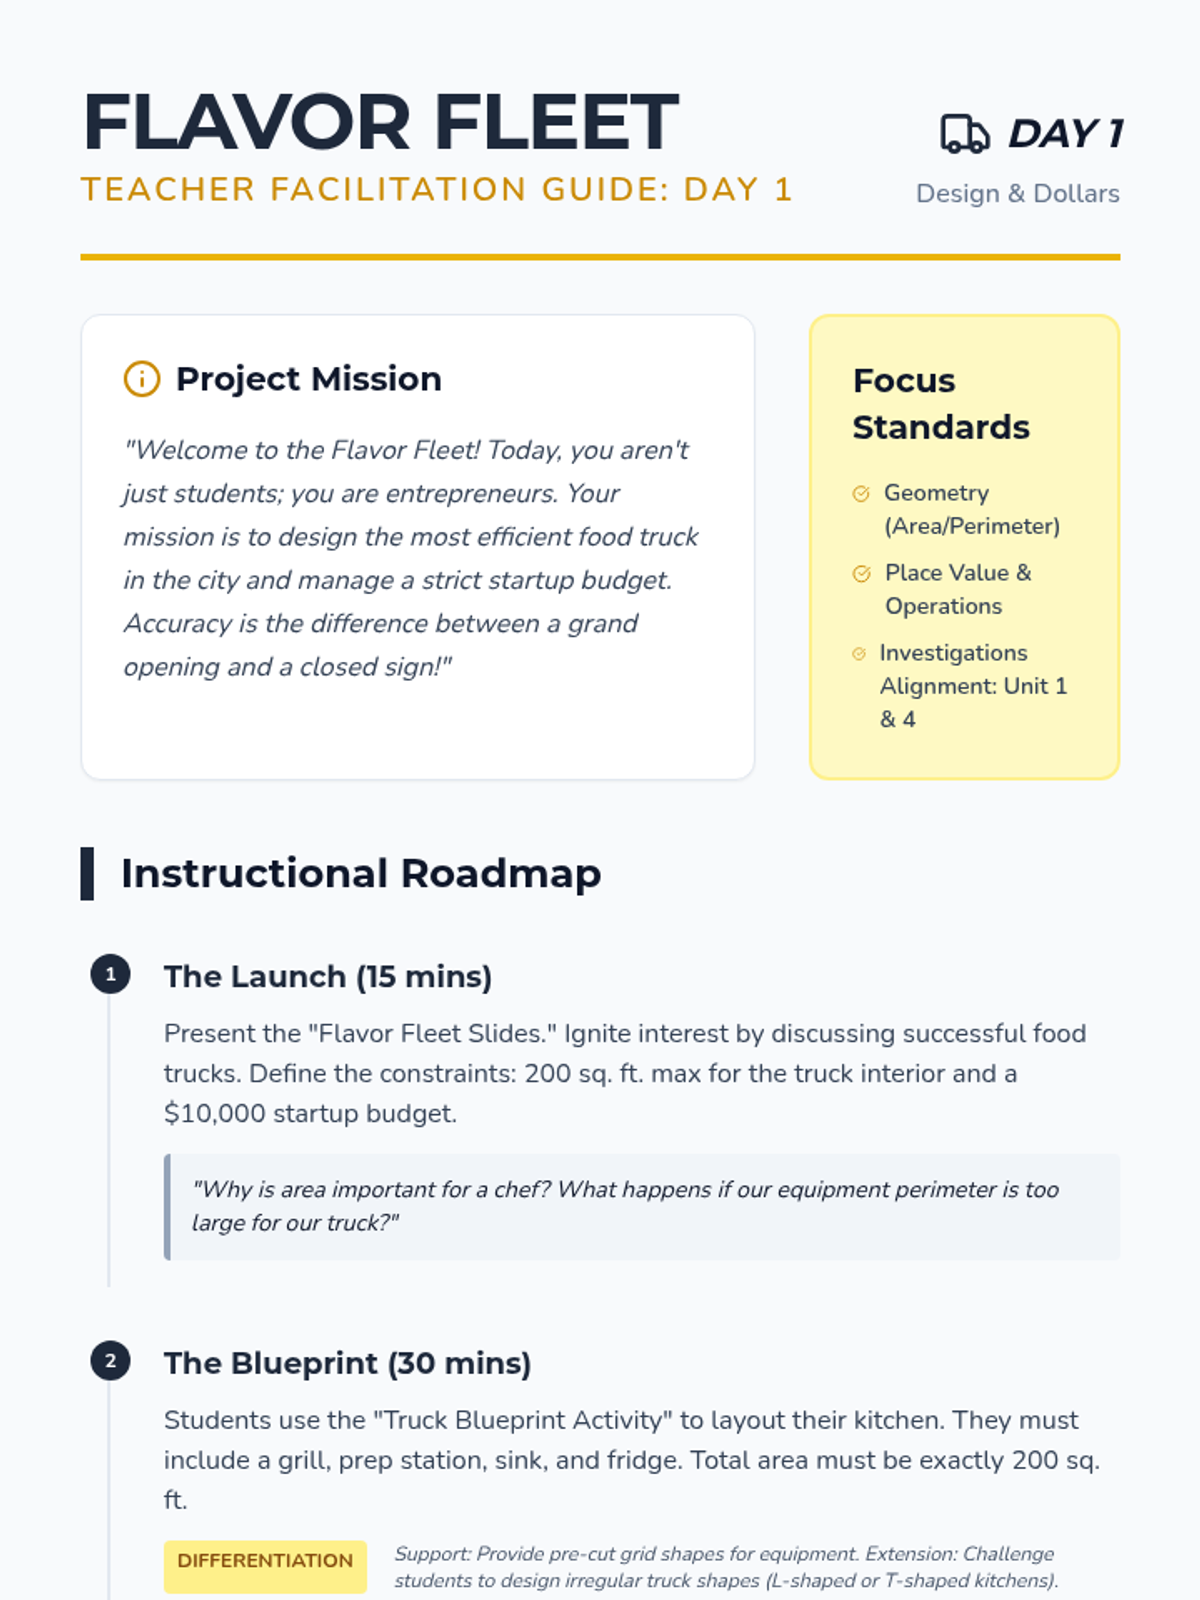
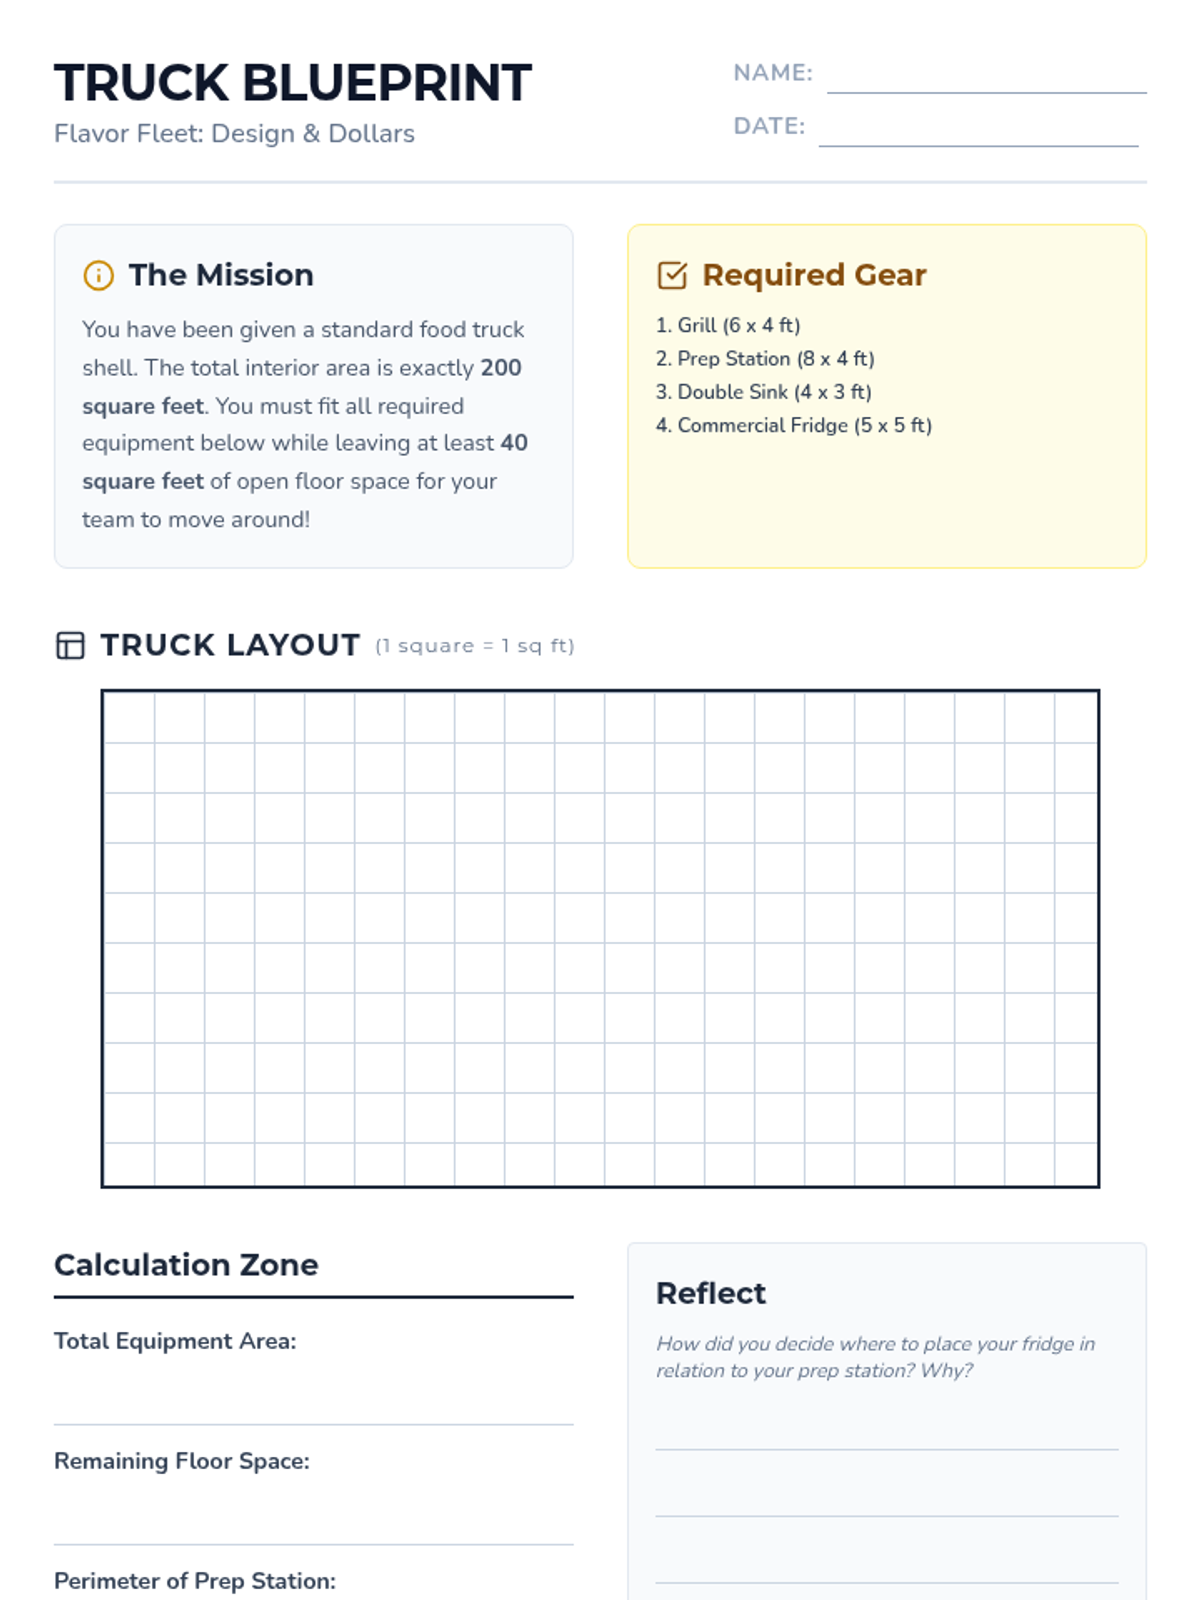
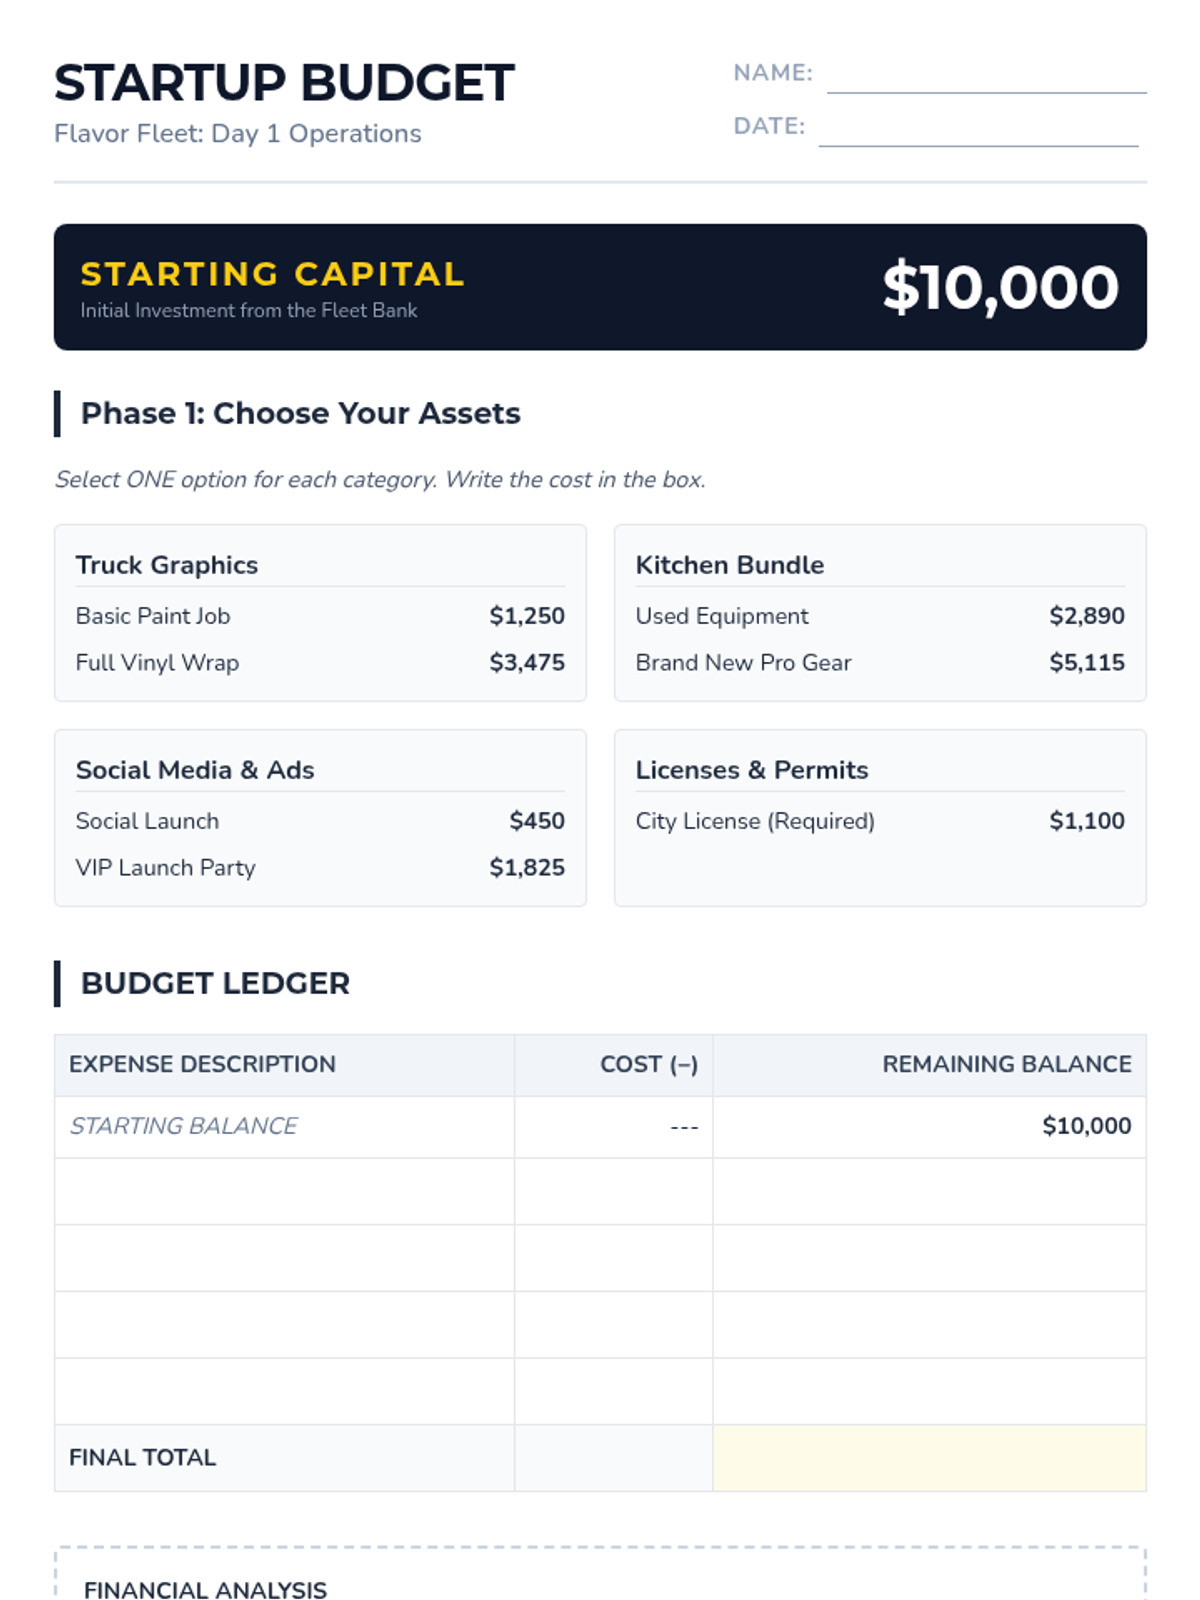
A 3-day project-based learning experience where students design, budget, and run their own food truck business, integrating fractions, geometry, operations, and data analysis.

AK

Amy Kelly

School Administrator
3/17
Sequence
Lead Investigator Lesson Plan
Lab Briefing Slides
Evidence Sorting Activity
Frequency Files Worksheet
Case Debrief Discussion Guide

Data Detectives

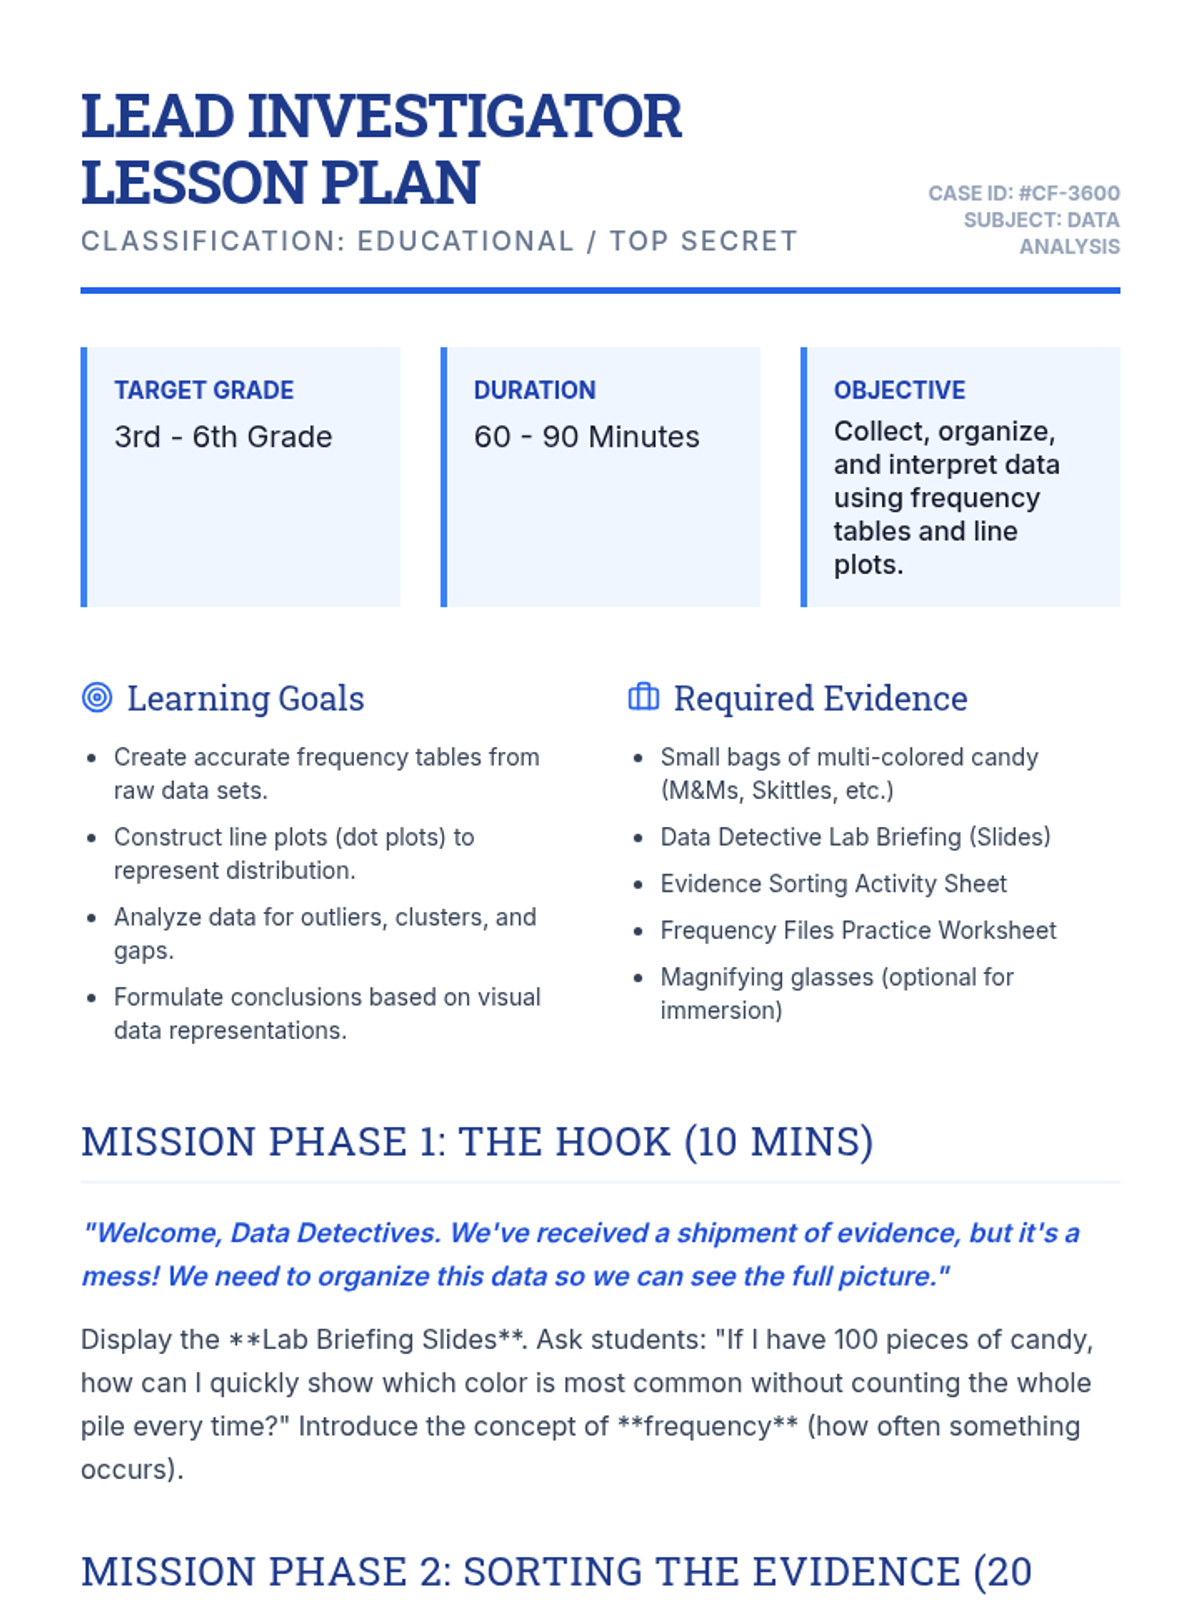
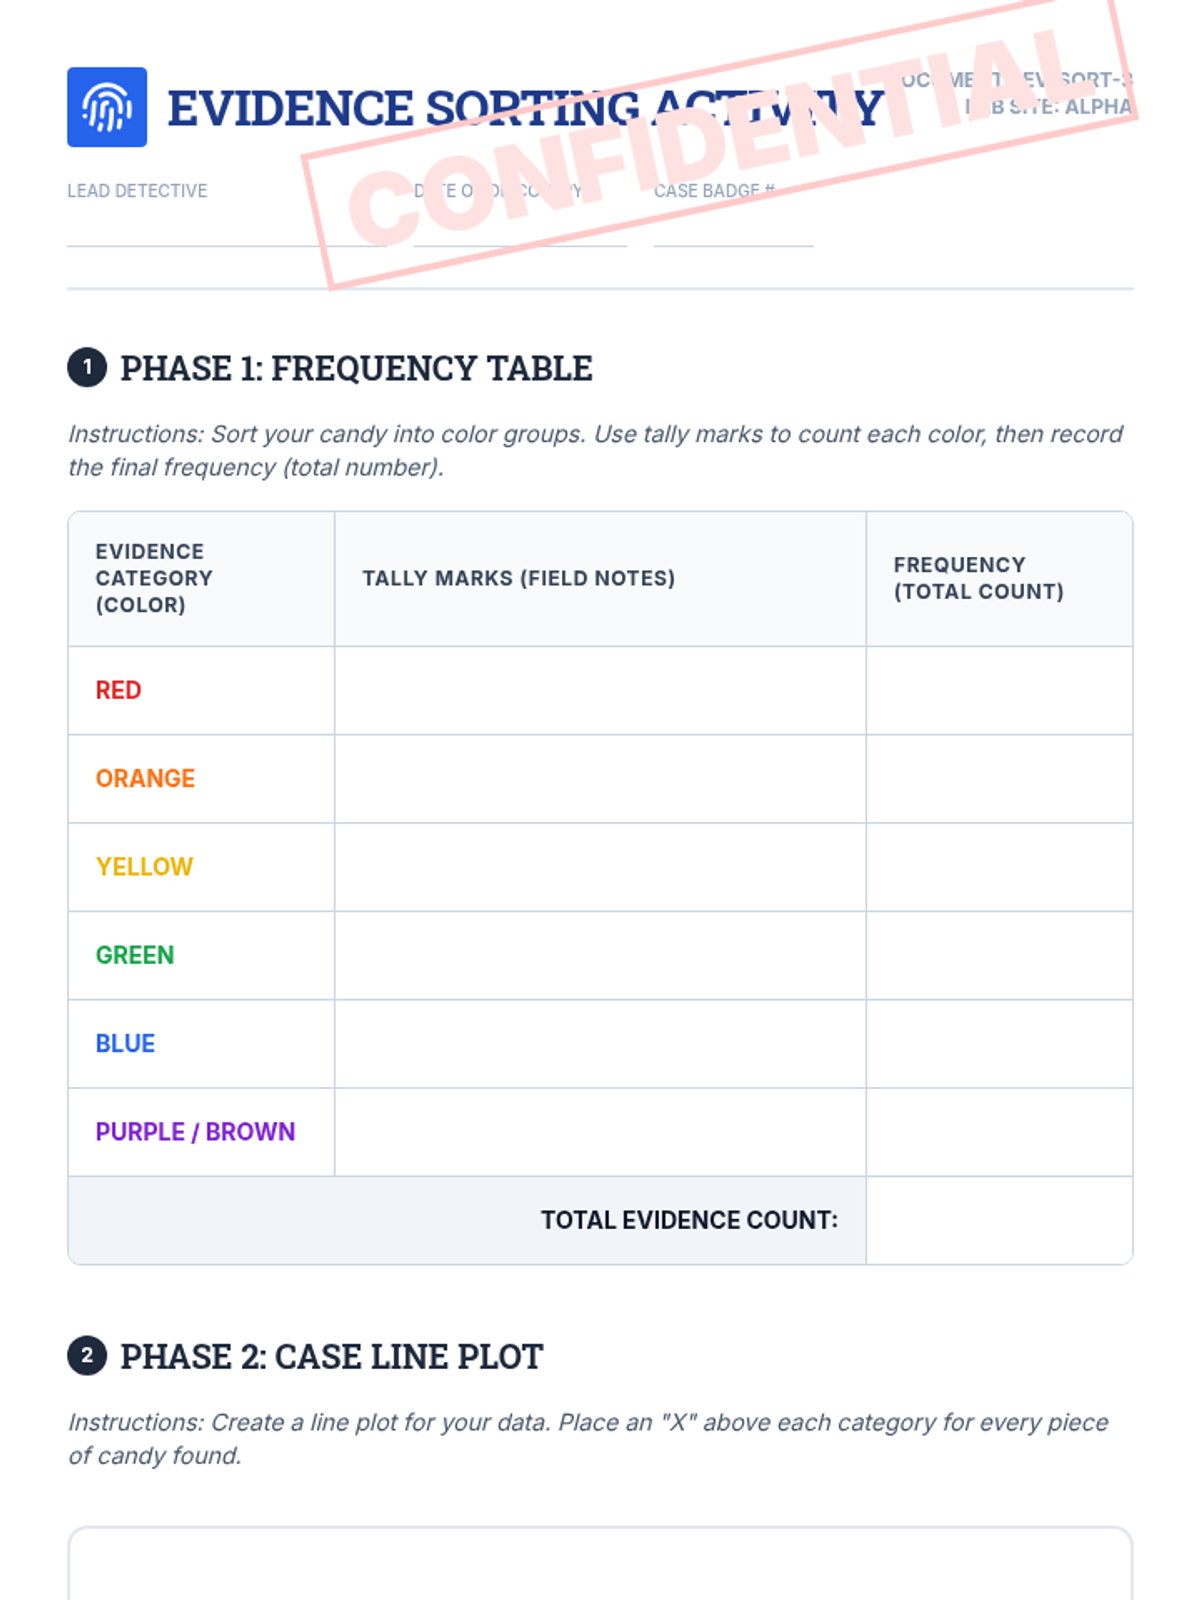
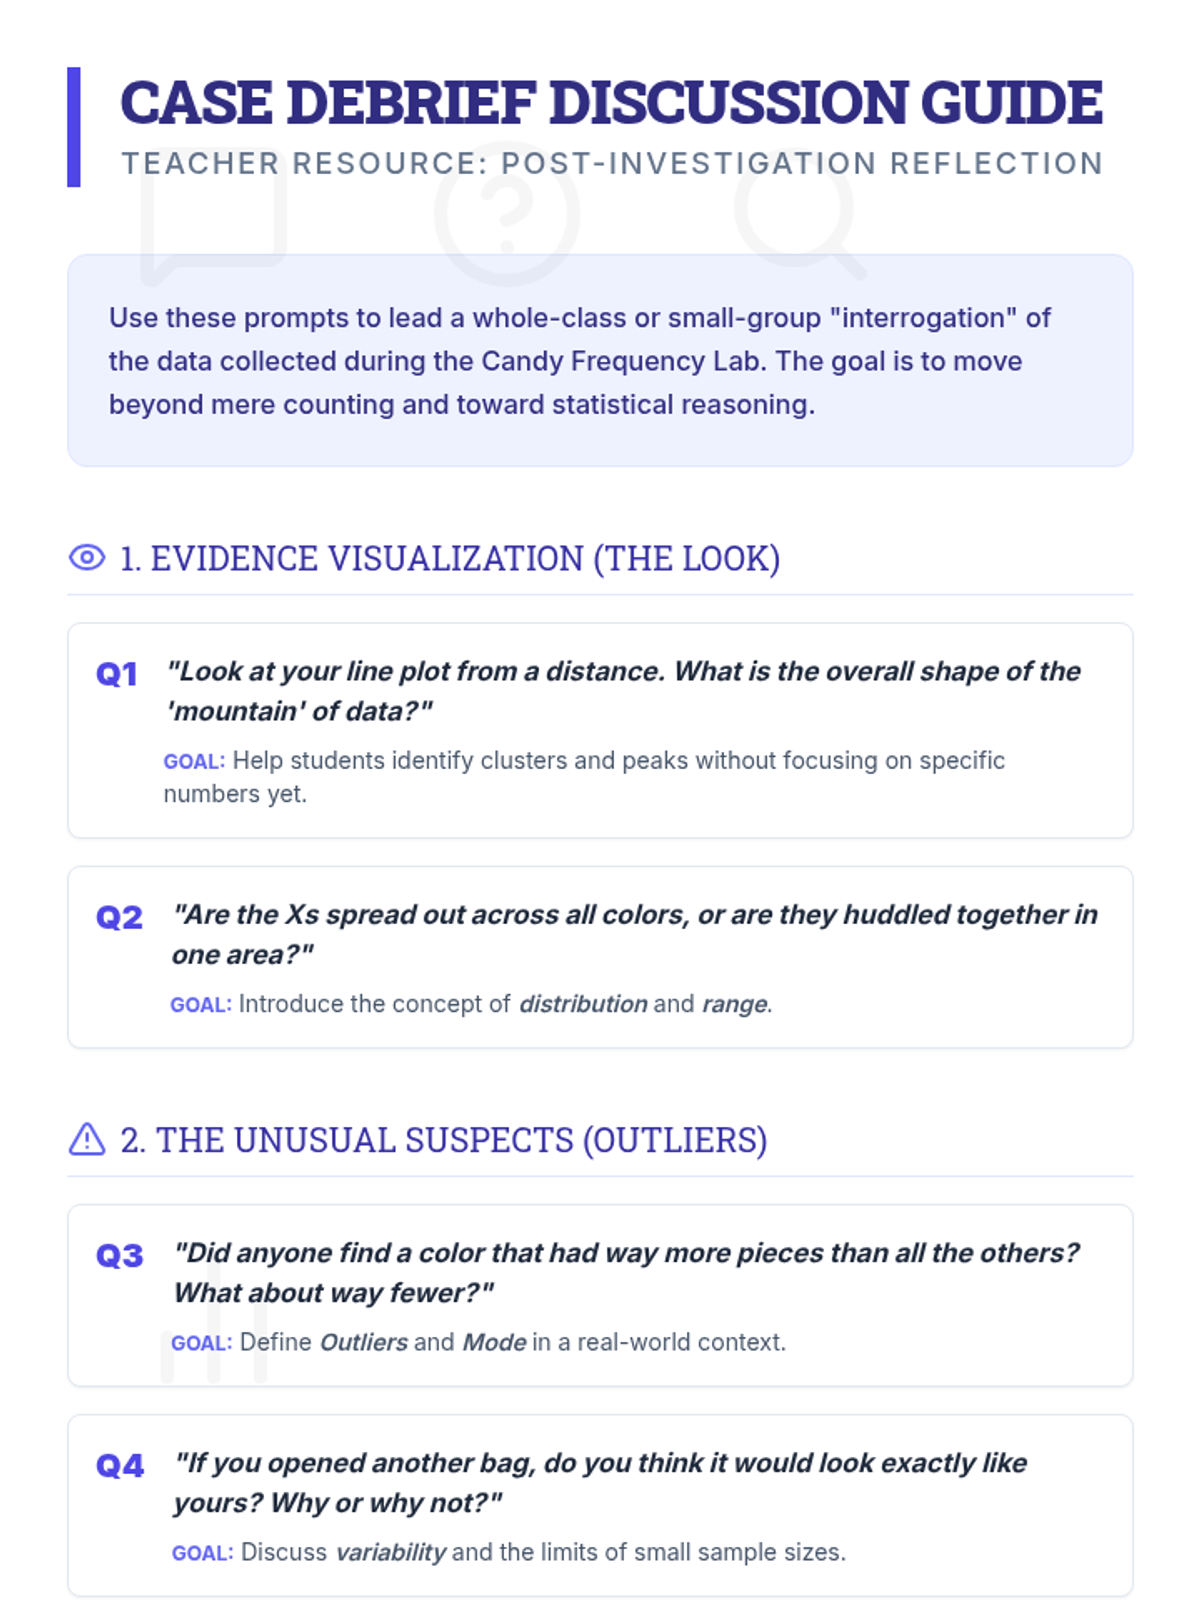
A math sequence focused on statistical analysis, data collection, and visualization through the lens of a detective agency. Students learn to create frequency tables and line plots using real-world data.

D

dfredericks

Math Teacher
3/16
Sequence
Cupid's Cafe Menu Worksheet
Pocket Change Challenge Worksheet

Cupid's Math Adventures

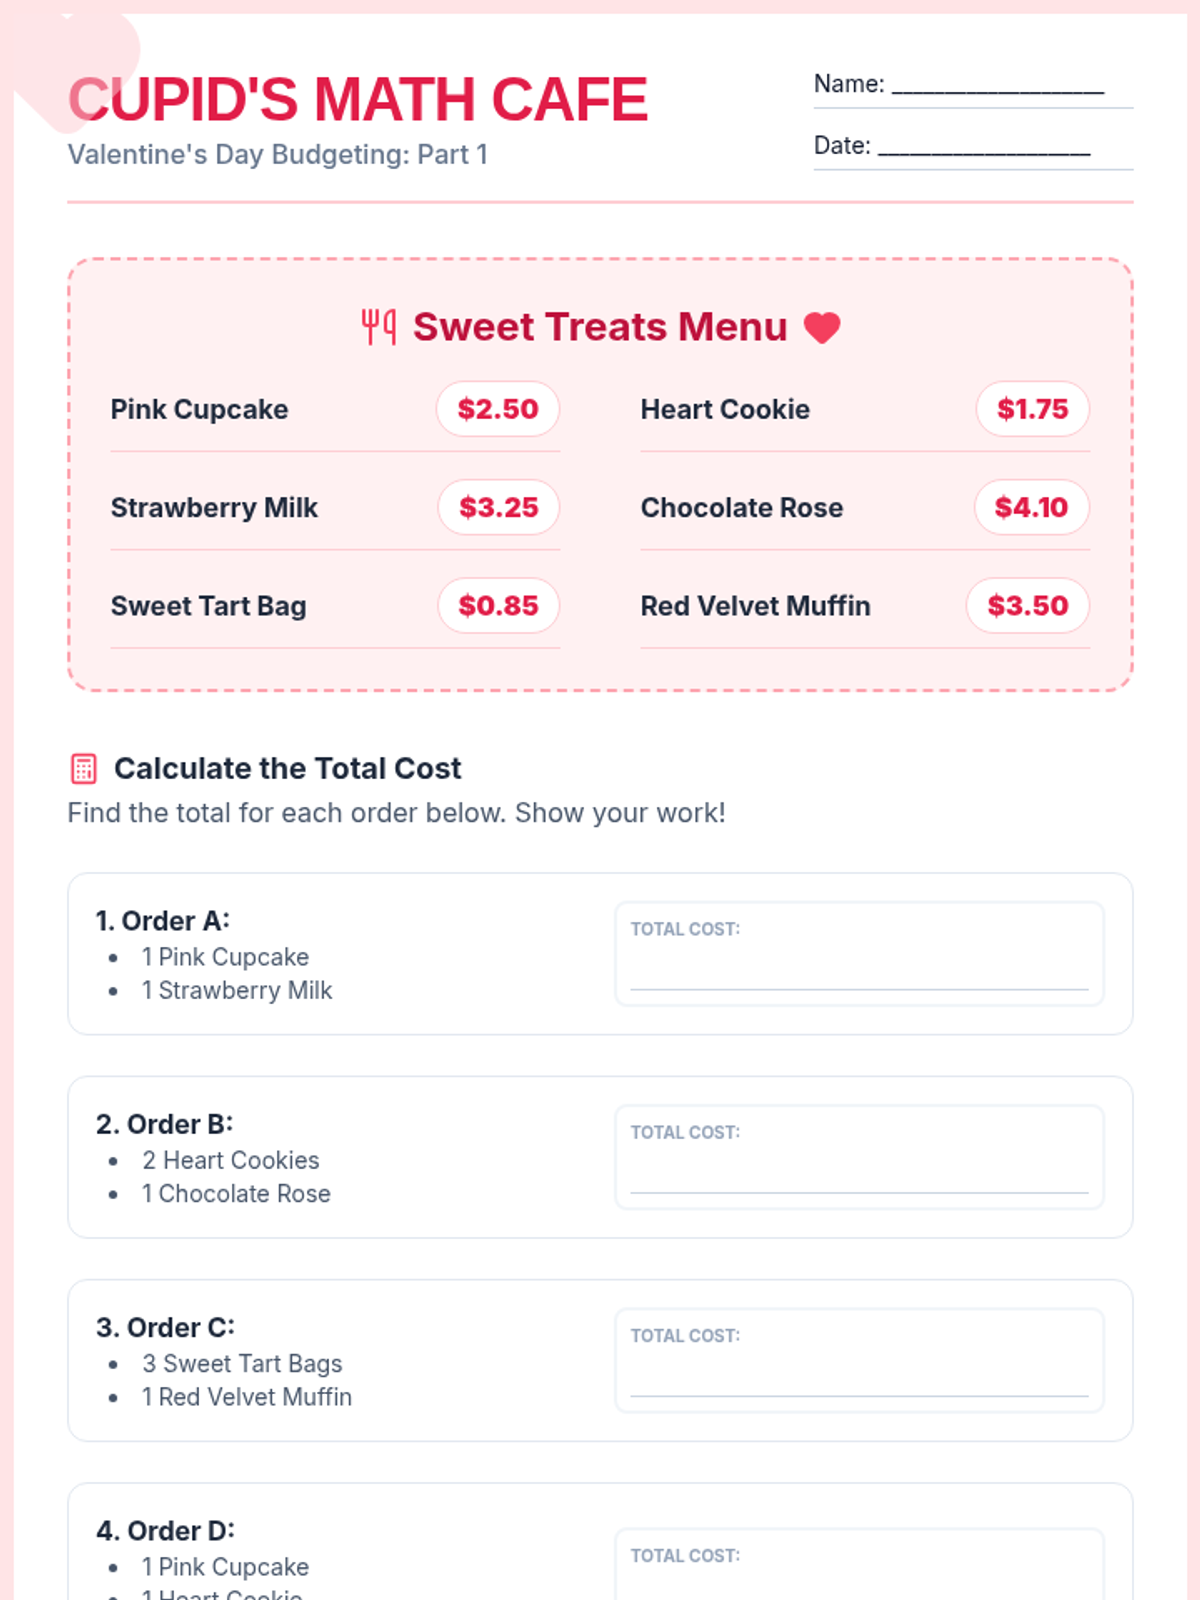
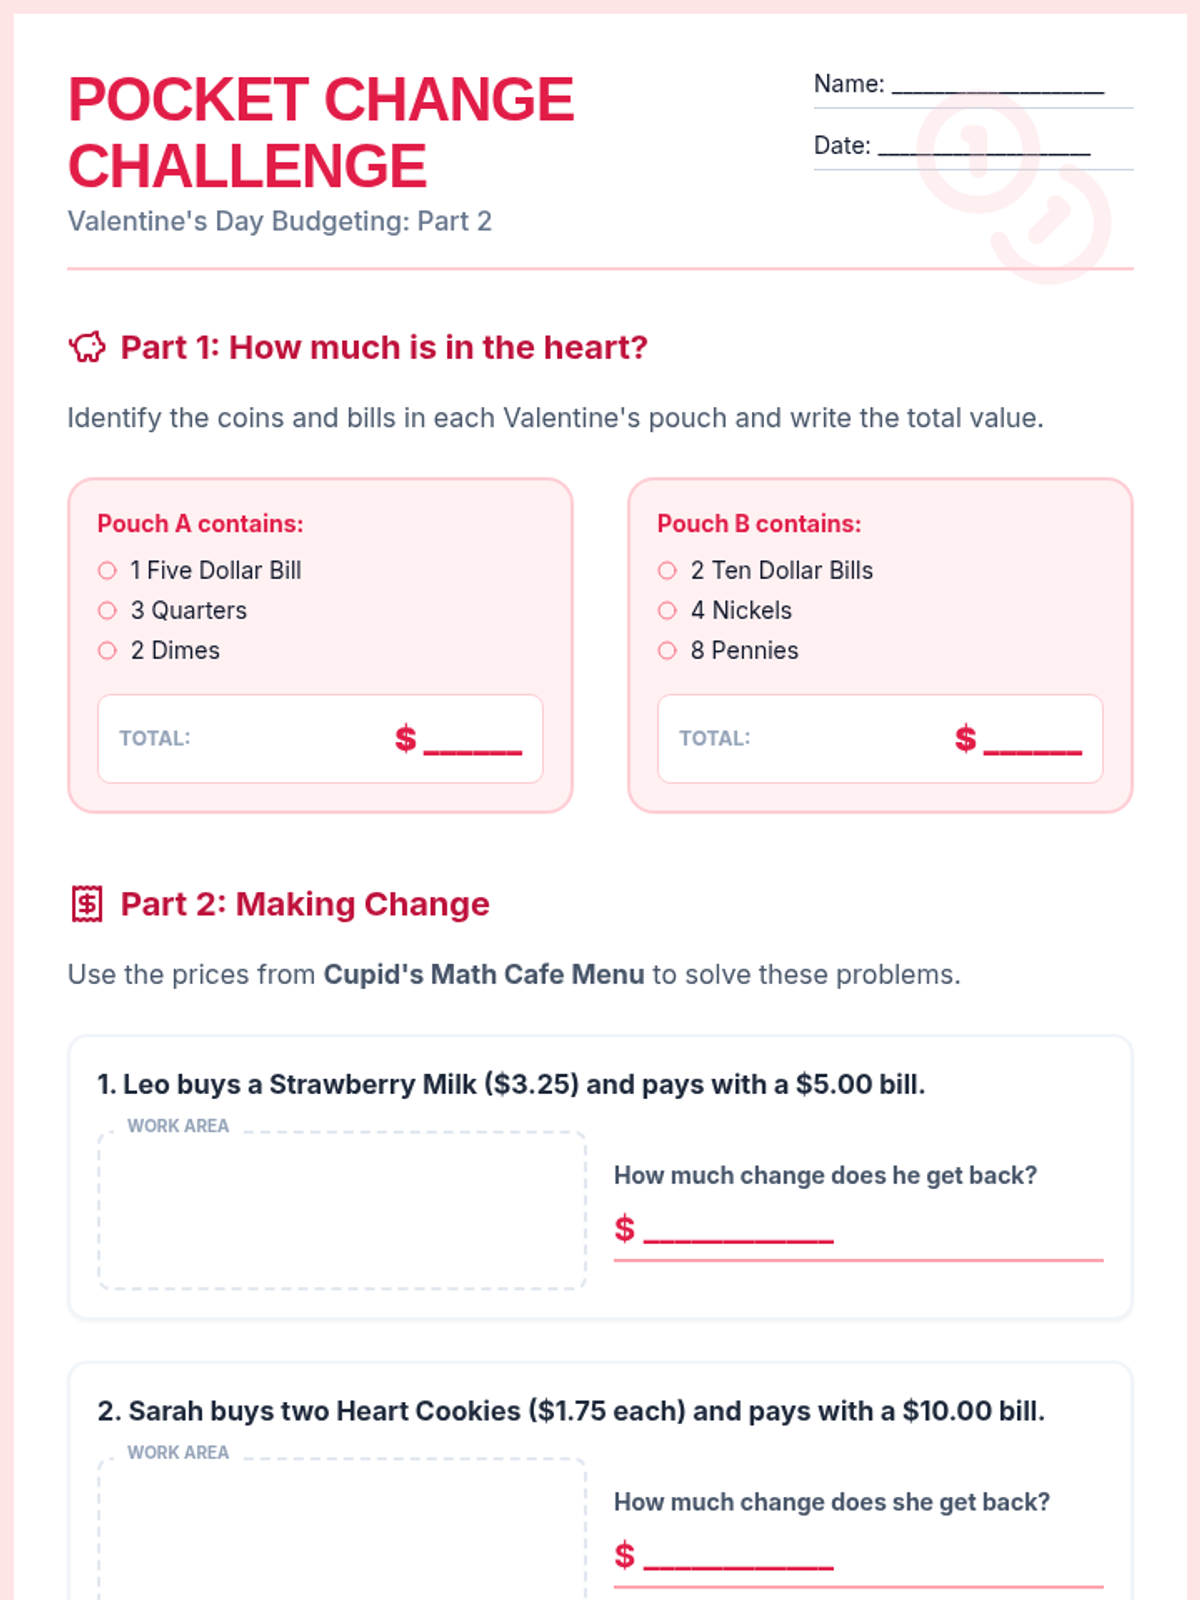
A collection of Valentine's Day math packets at two different levels (Level 1 and Quest), covering budgeting, graphing, measurement, time, and word problems.

EE

Erin Esswein

Special Education Teacher
2/13
Sequence
Data Detective Intro Slides
Inquiry Blueprint Worksheet
Facilitator Briefing Teacher Guide

Data Detectives Investigation Sequence

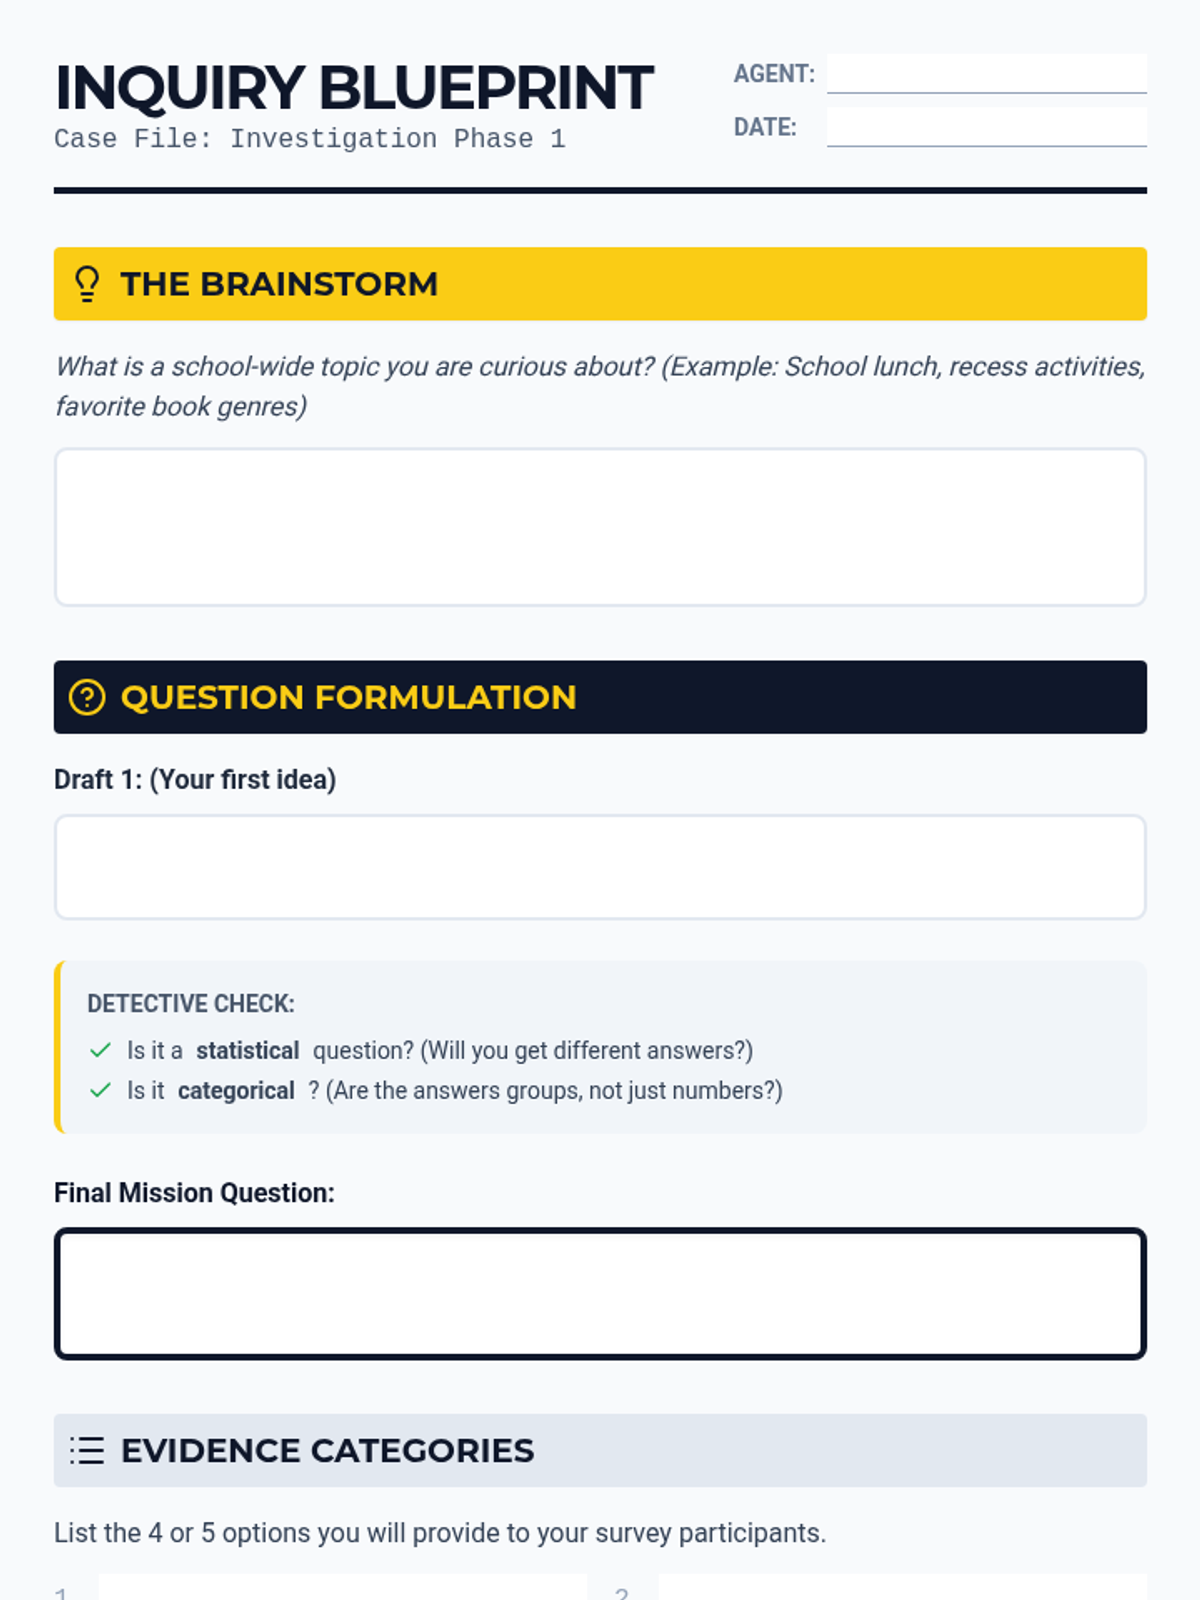
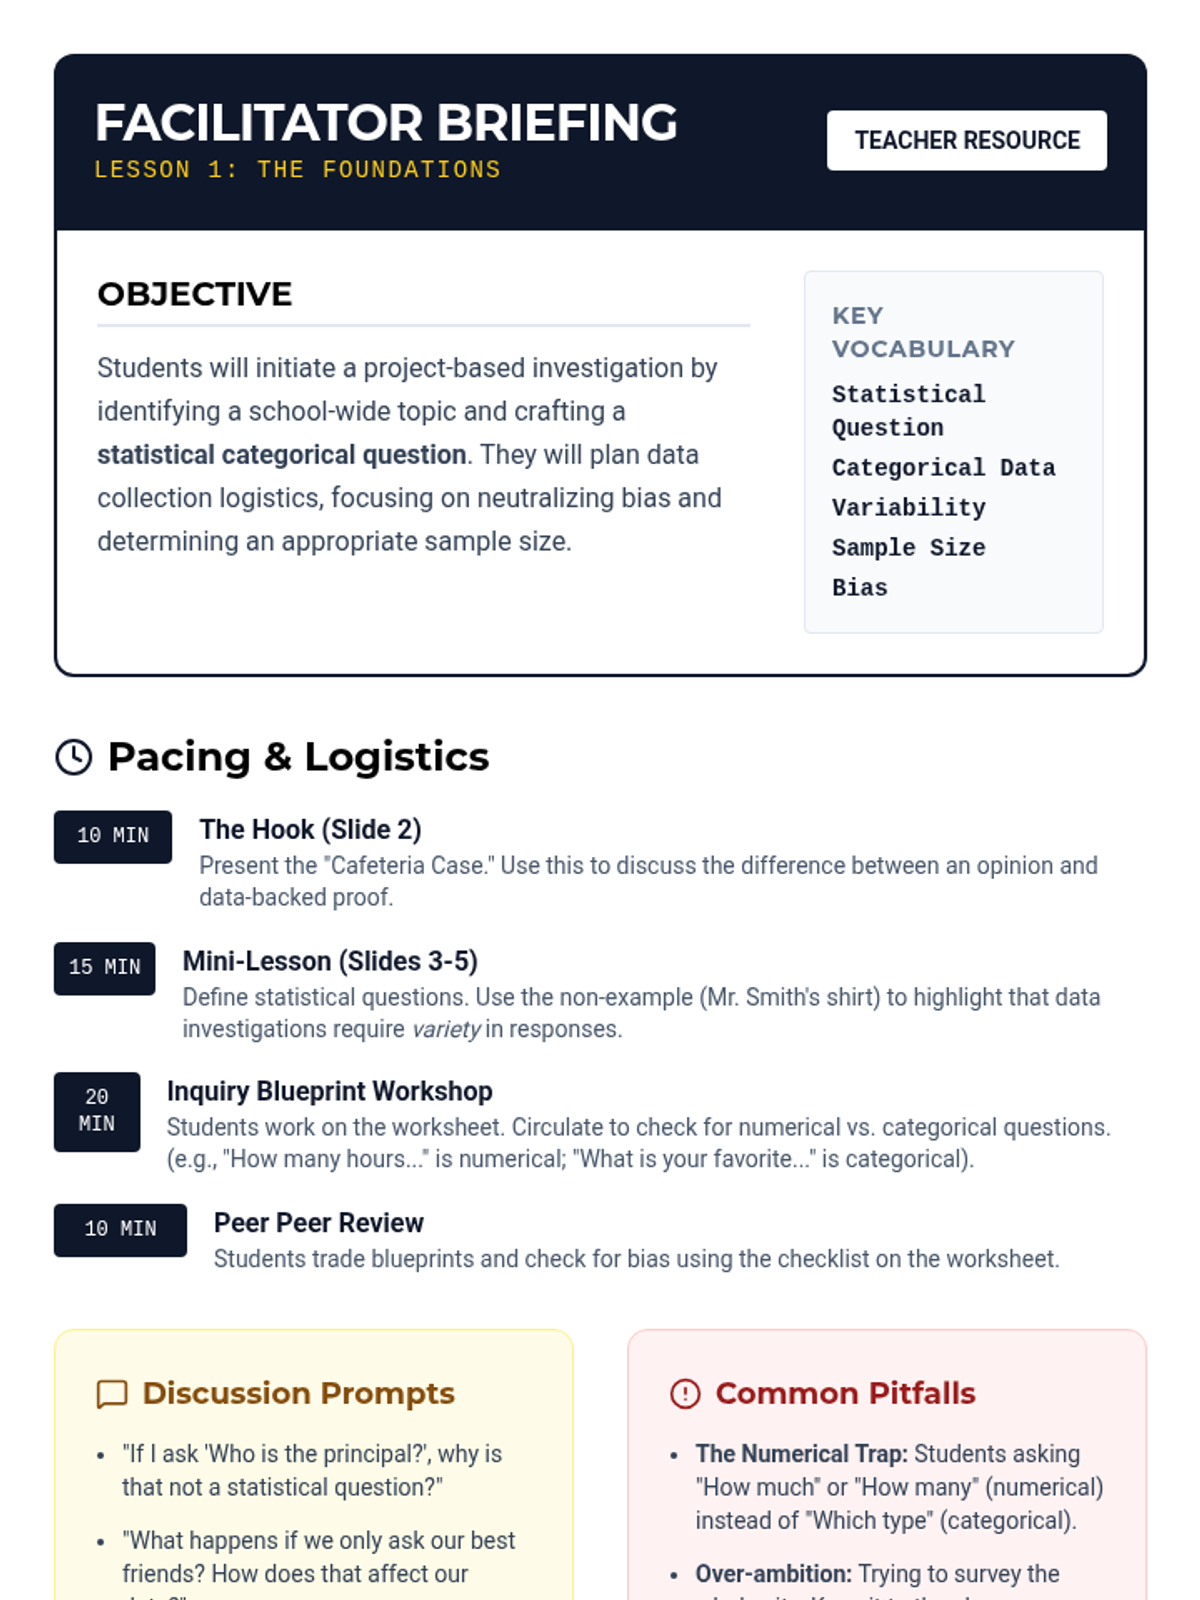
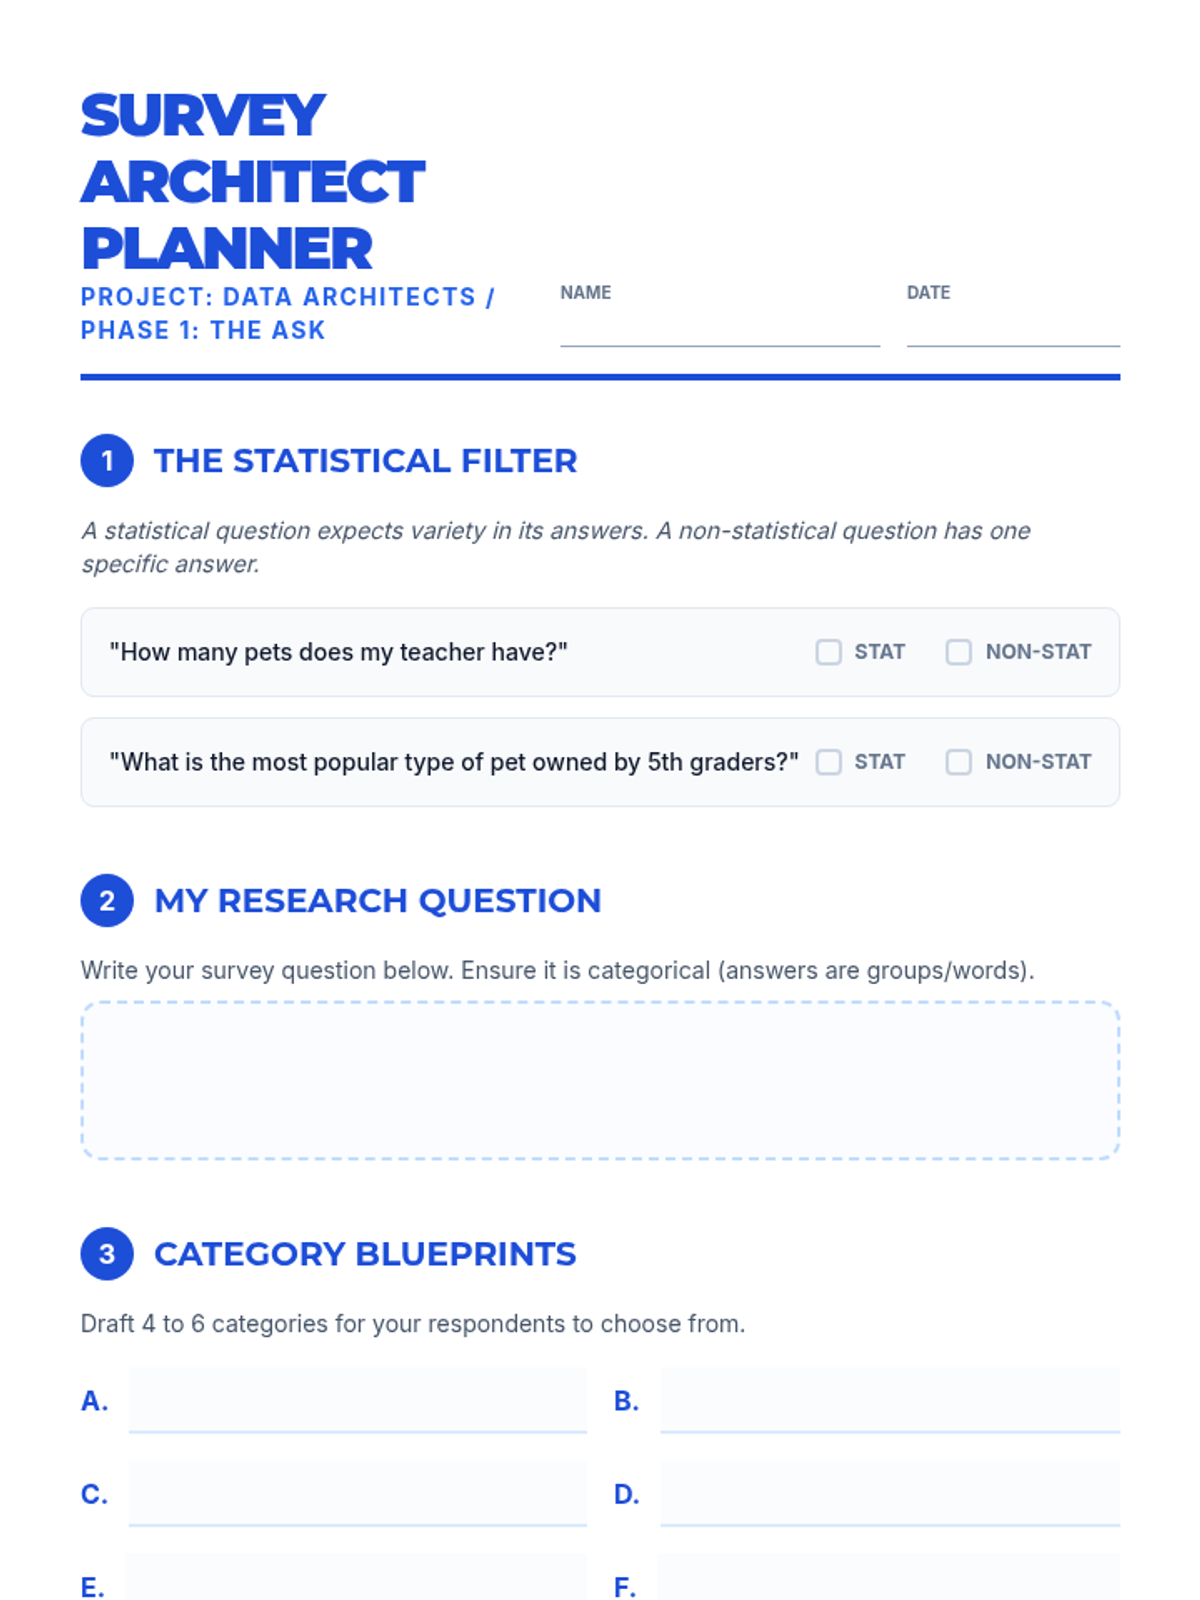
A project-based sequence where 5th-grade students act as data analysts to investigate school-wide questions, moving from question formulation to data collection, organization, visualization, and final presentation.

Lenny Avatar
Lenny
1/18
Sequence
Single Clue Slides
Case File 1 Worksheet
Case File 1 Answer Key

Data Detectives

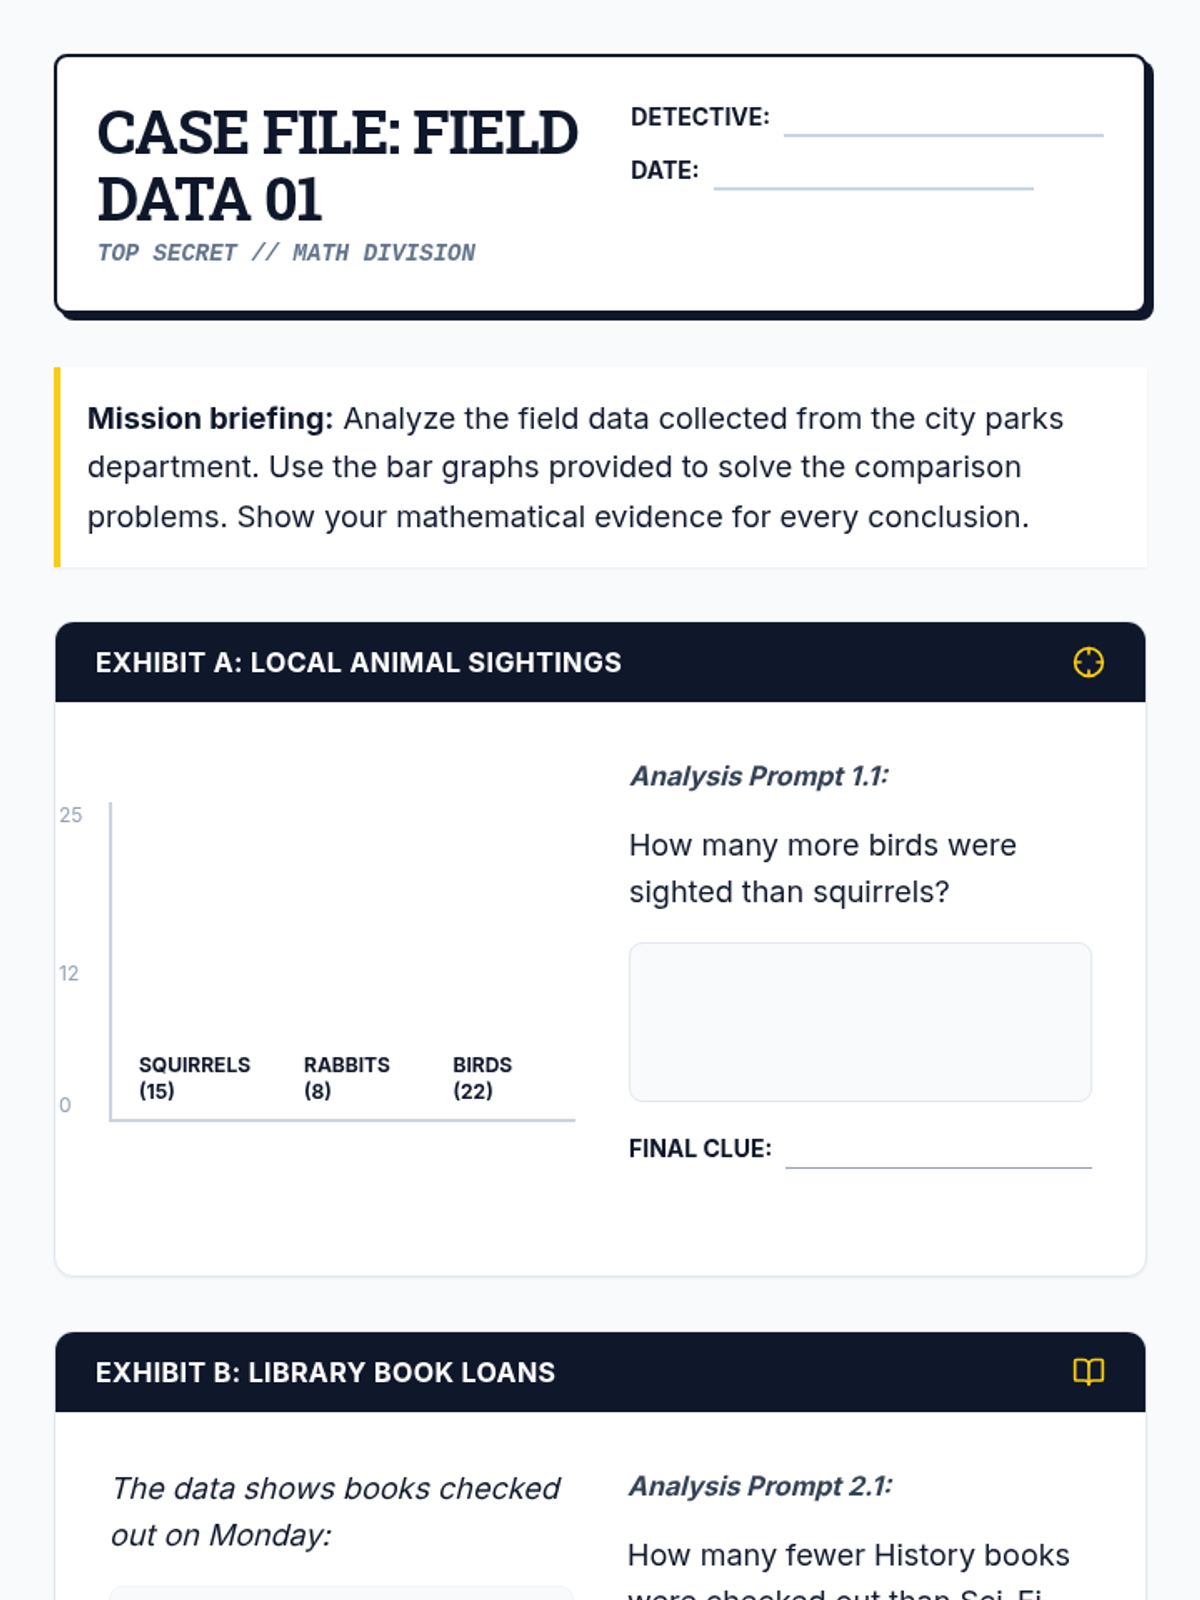
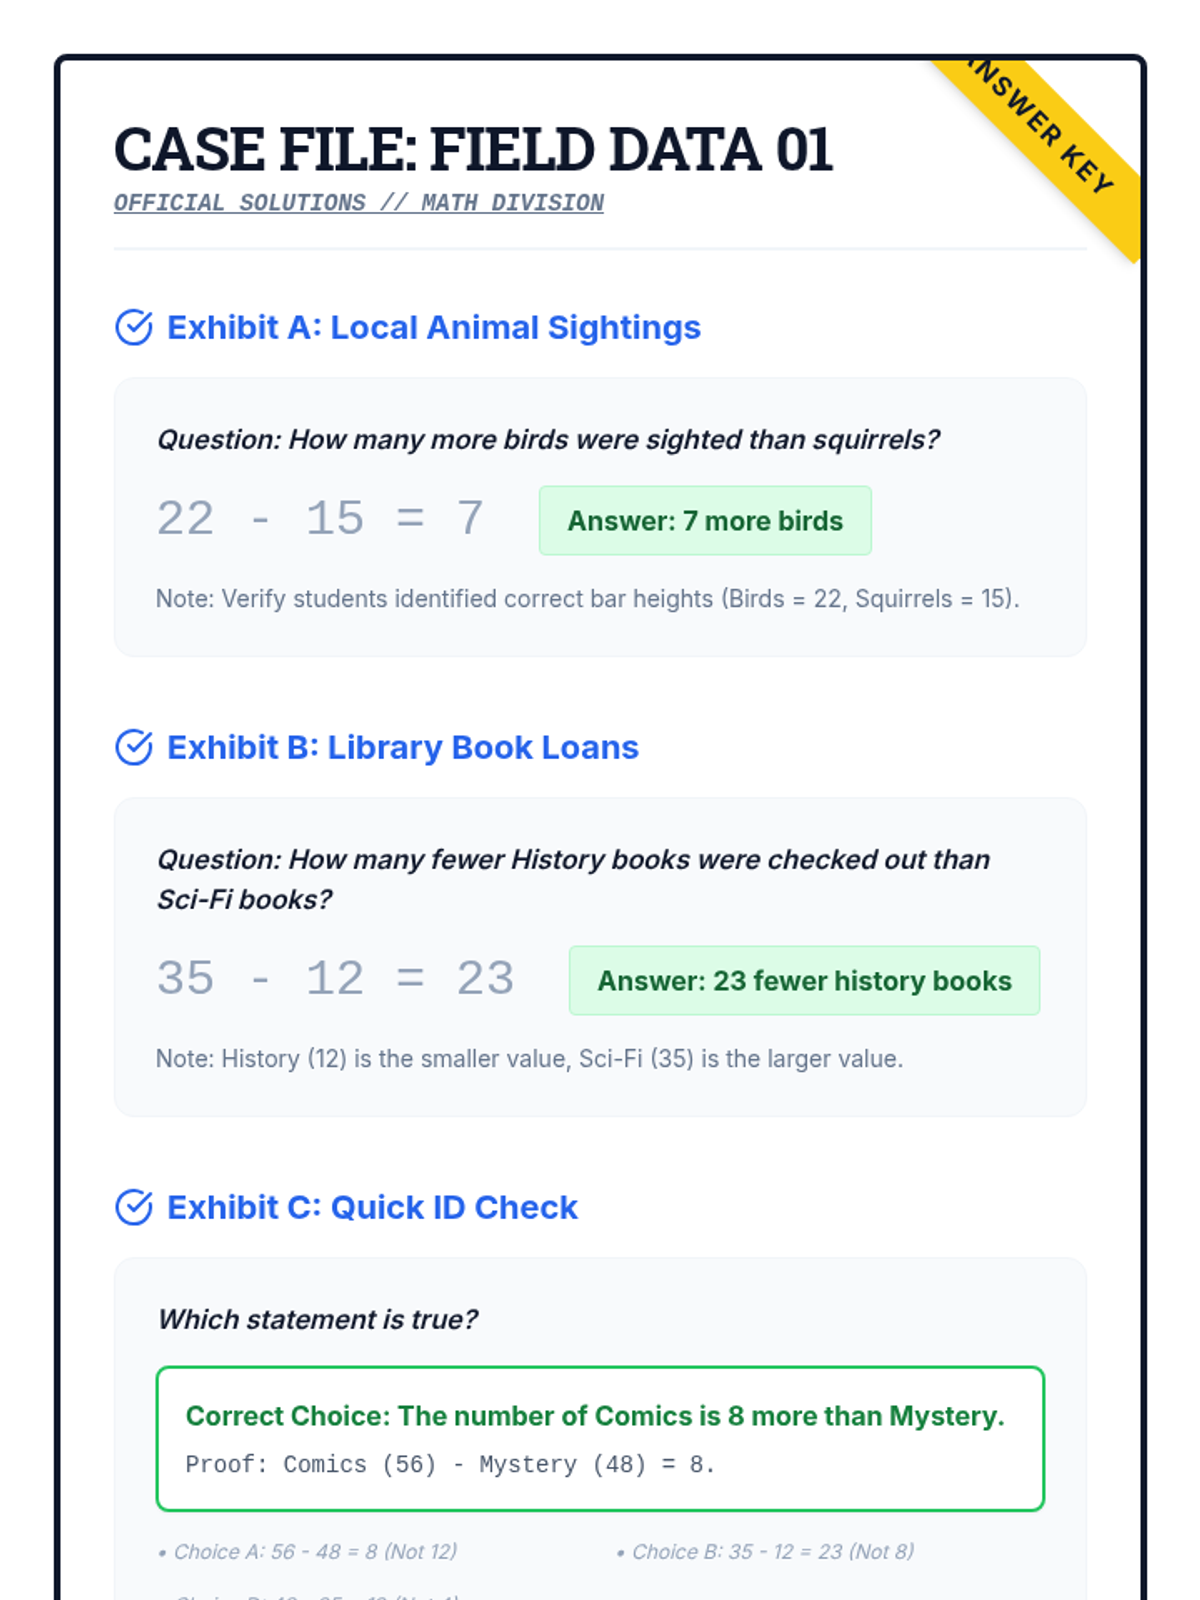
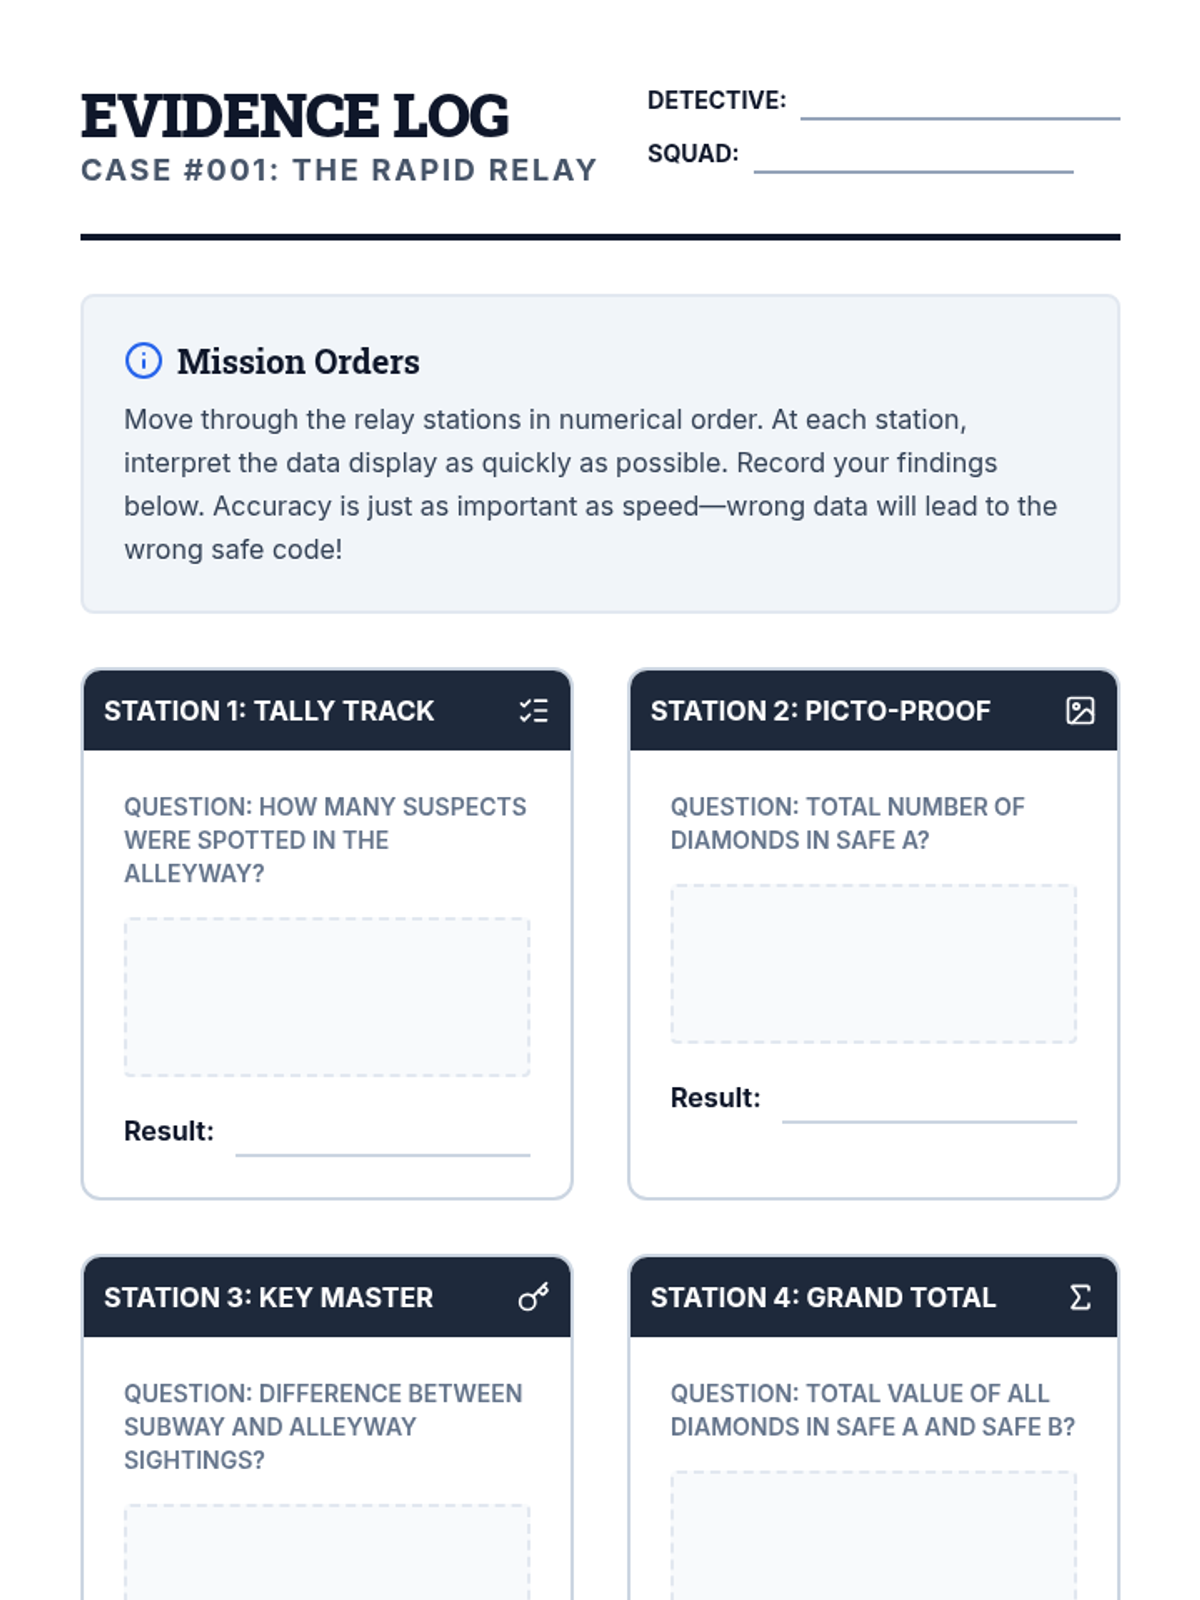
A case study approach to interpreting and analyzing data sets to solve multi-step comparison problems. Students move from simple reading of values to synthesizing complex data to make informed decisions.

Lenny Avatar
Lenny
1/18
Sequence
Speed Reading Slides
Evidence Log Worksheet

Data Detective Academy

A game-based 5th-grade math unit that frames data interpretation as a detective challenge. Students build fluency in reading charts and graphs, identify misleading data tactics, and solve mysteries using statistical evidence.

Lenny Avatar
Lenny
1/18
Sequence
The Big Ask Slides
Survey Architect Planner Worksheet

Data Architects

A project-based unit where 5th-grade students learn to formulate statistical questions, collect categorical data, organize it into frequency tables, and construct scaled bar graphs to tell visual stories with data.

Lenny Avatar
Lenny
1/17