Data representation, distributions, and statistical variability using sampling and inference techniques. Integrates probability models, compound events, bivariate patterns, and linear models to guide data-driven decision making.
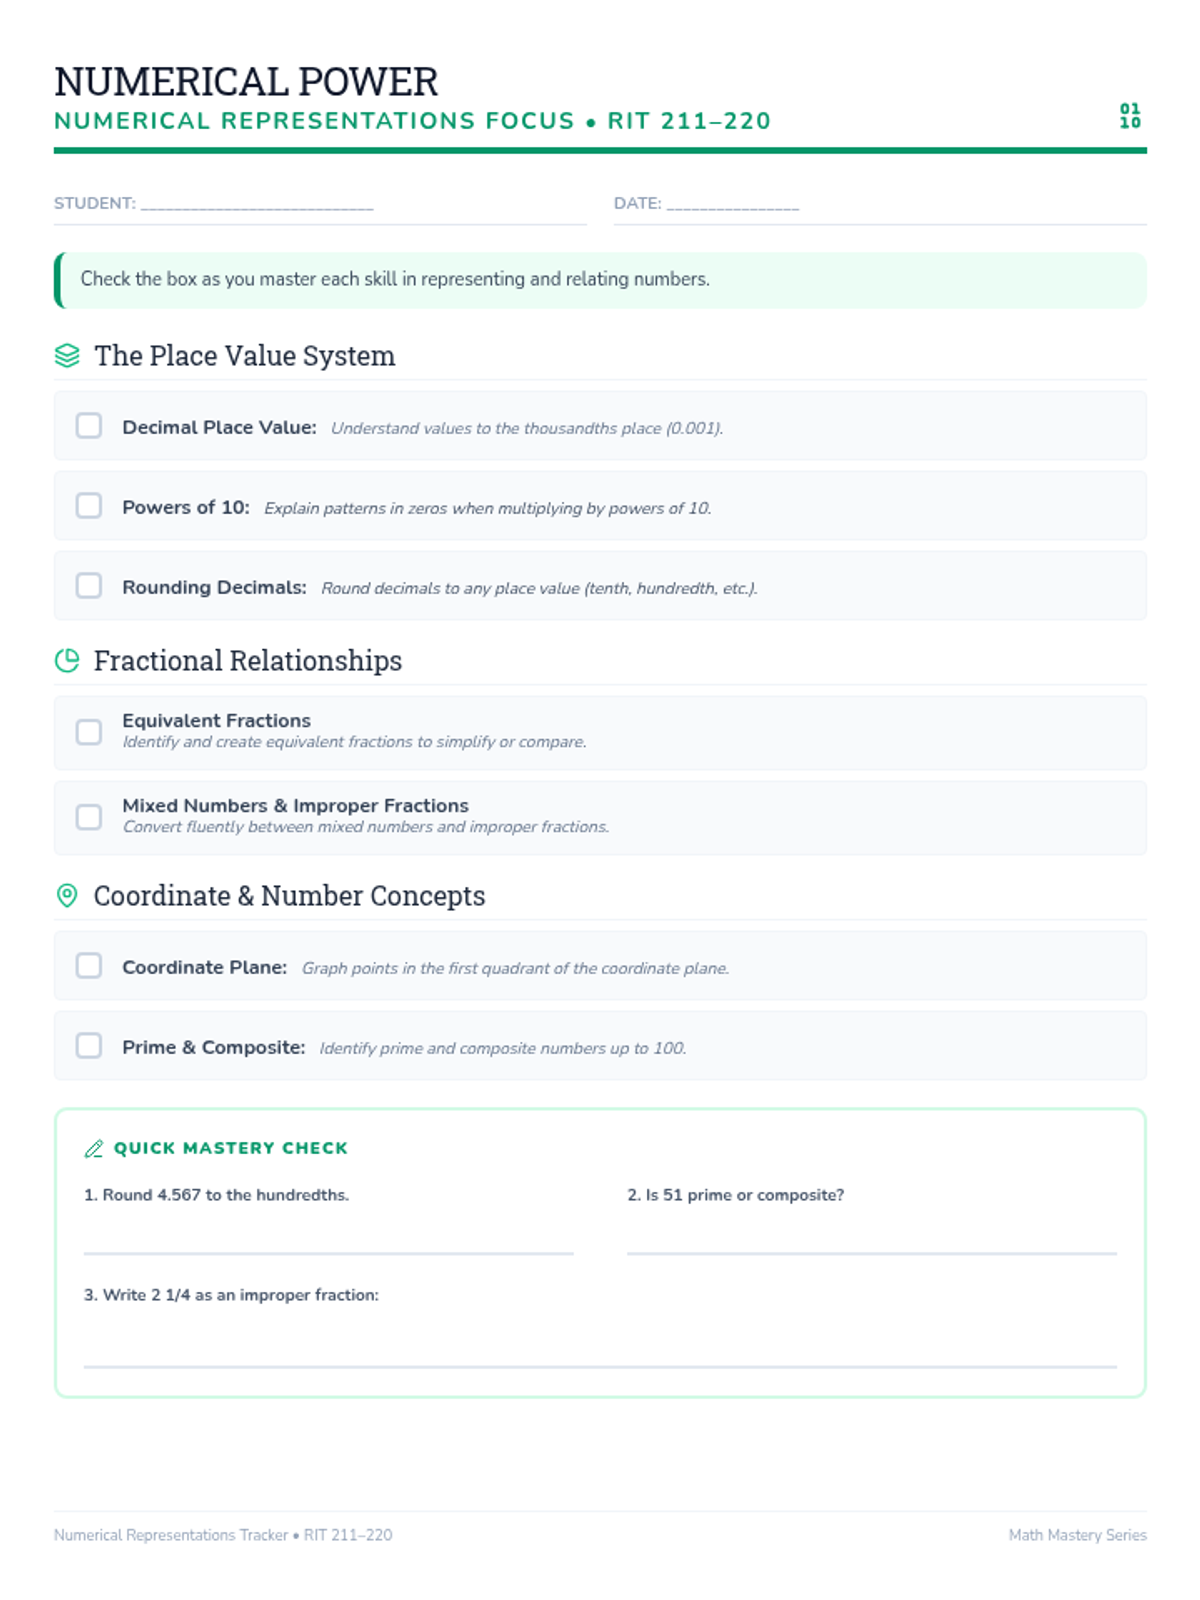
A specialized toolkit for navigating mathematical skills in the 211-220 RIT range, with a focus on foundational decimals, fractions, and place value relationships.
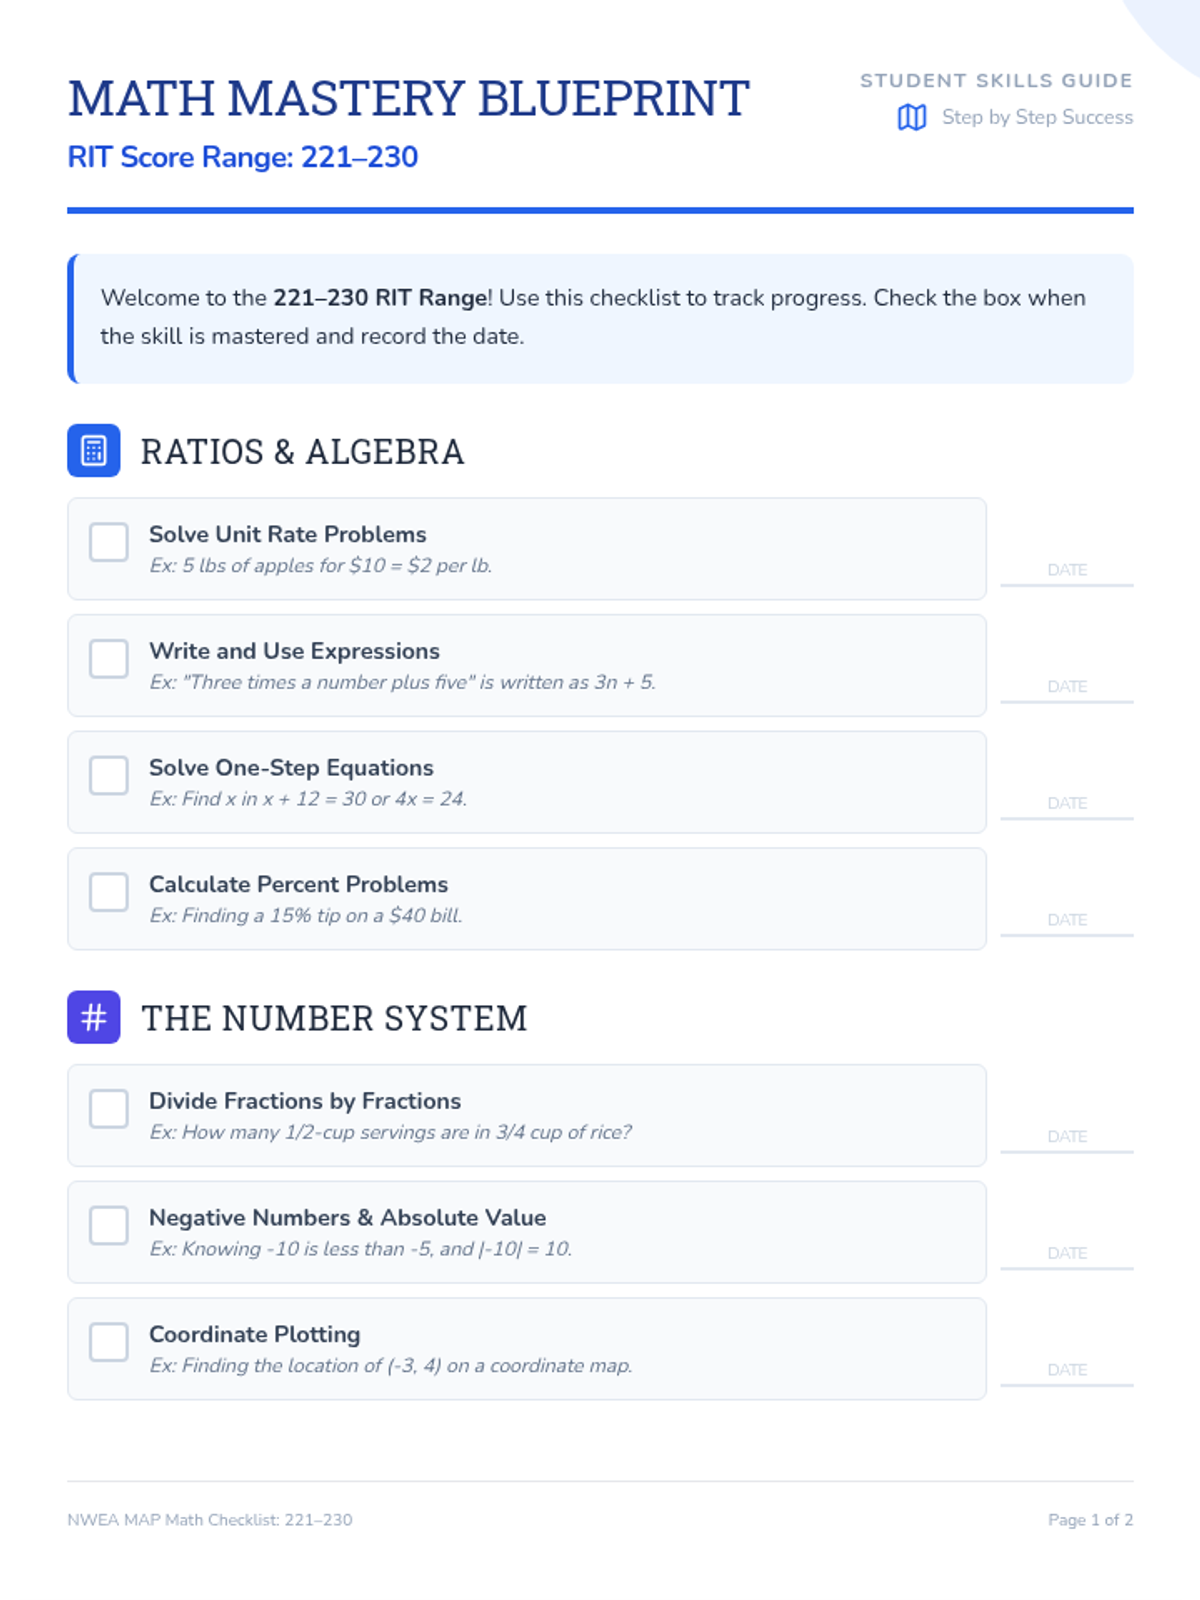
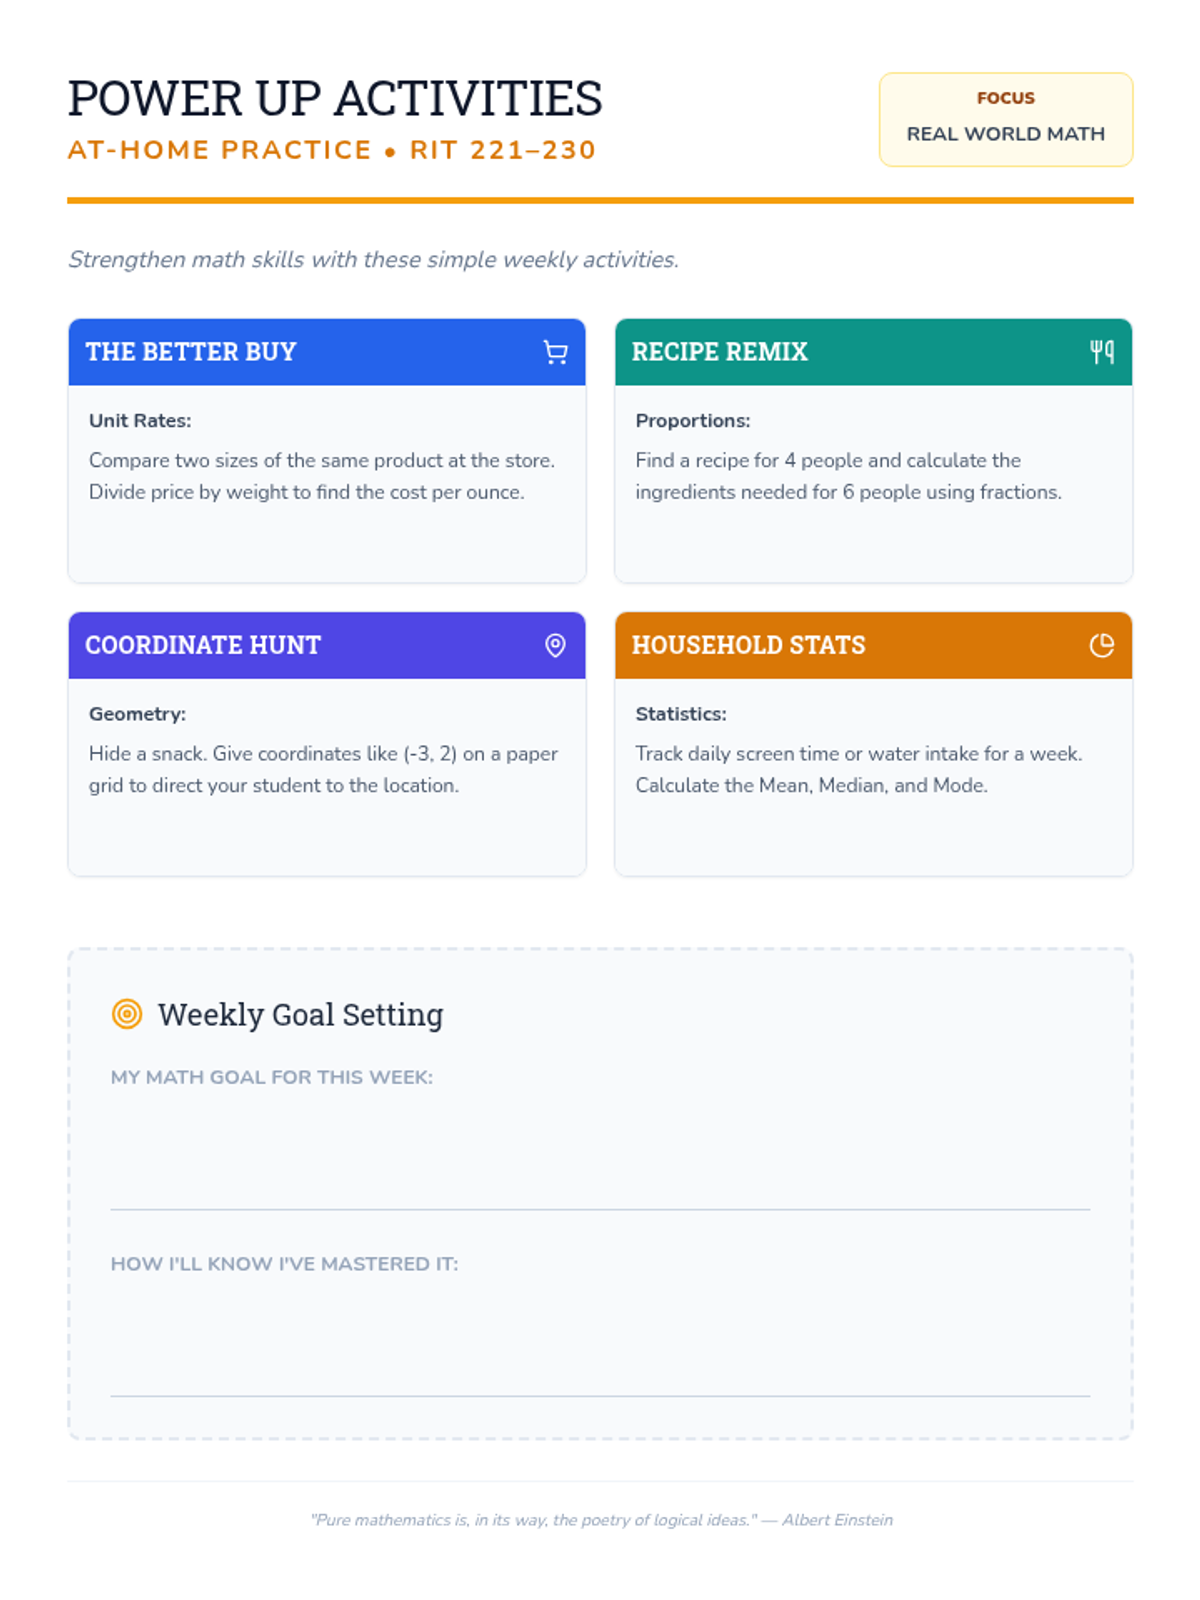
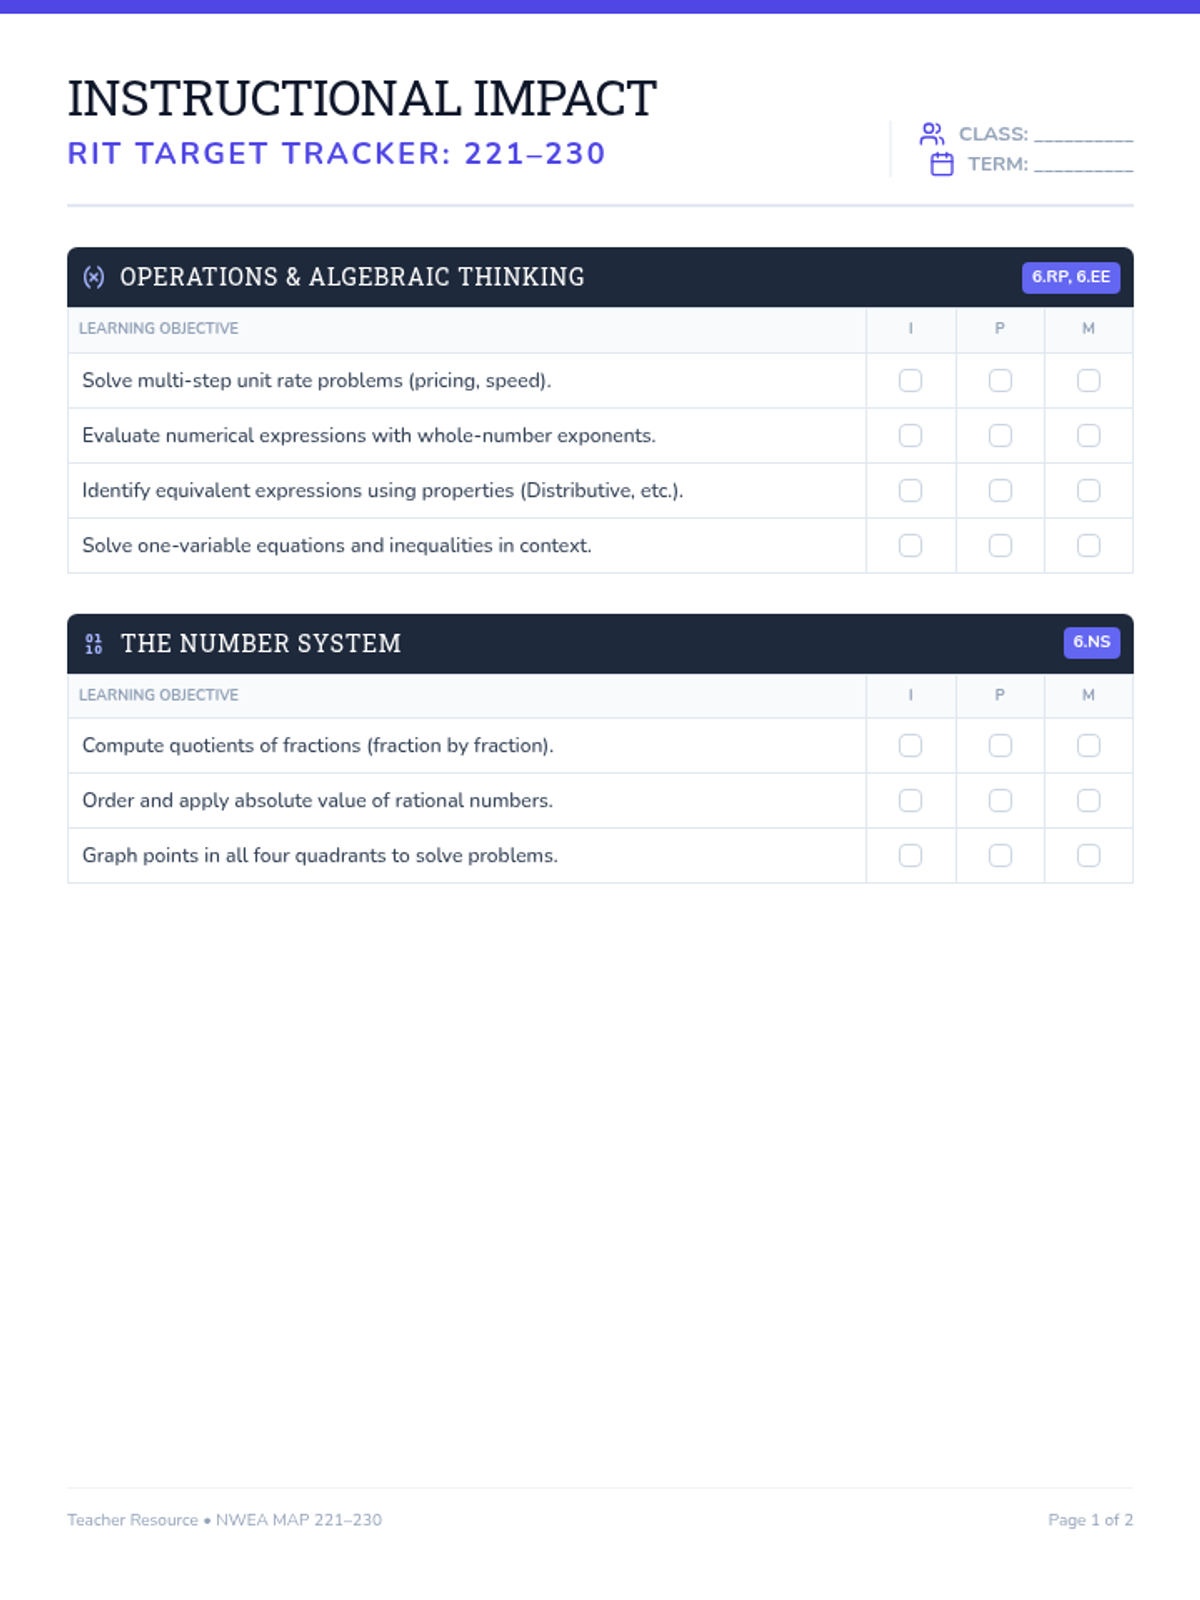
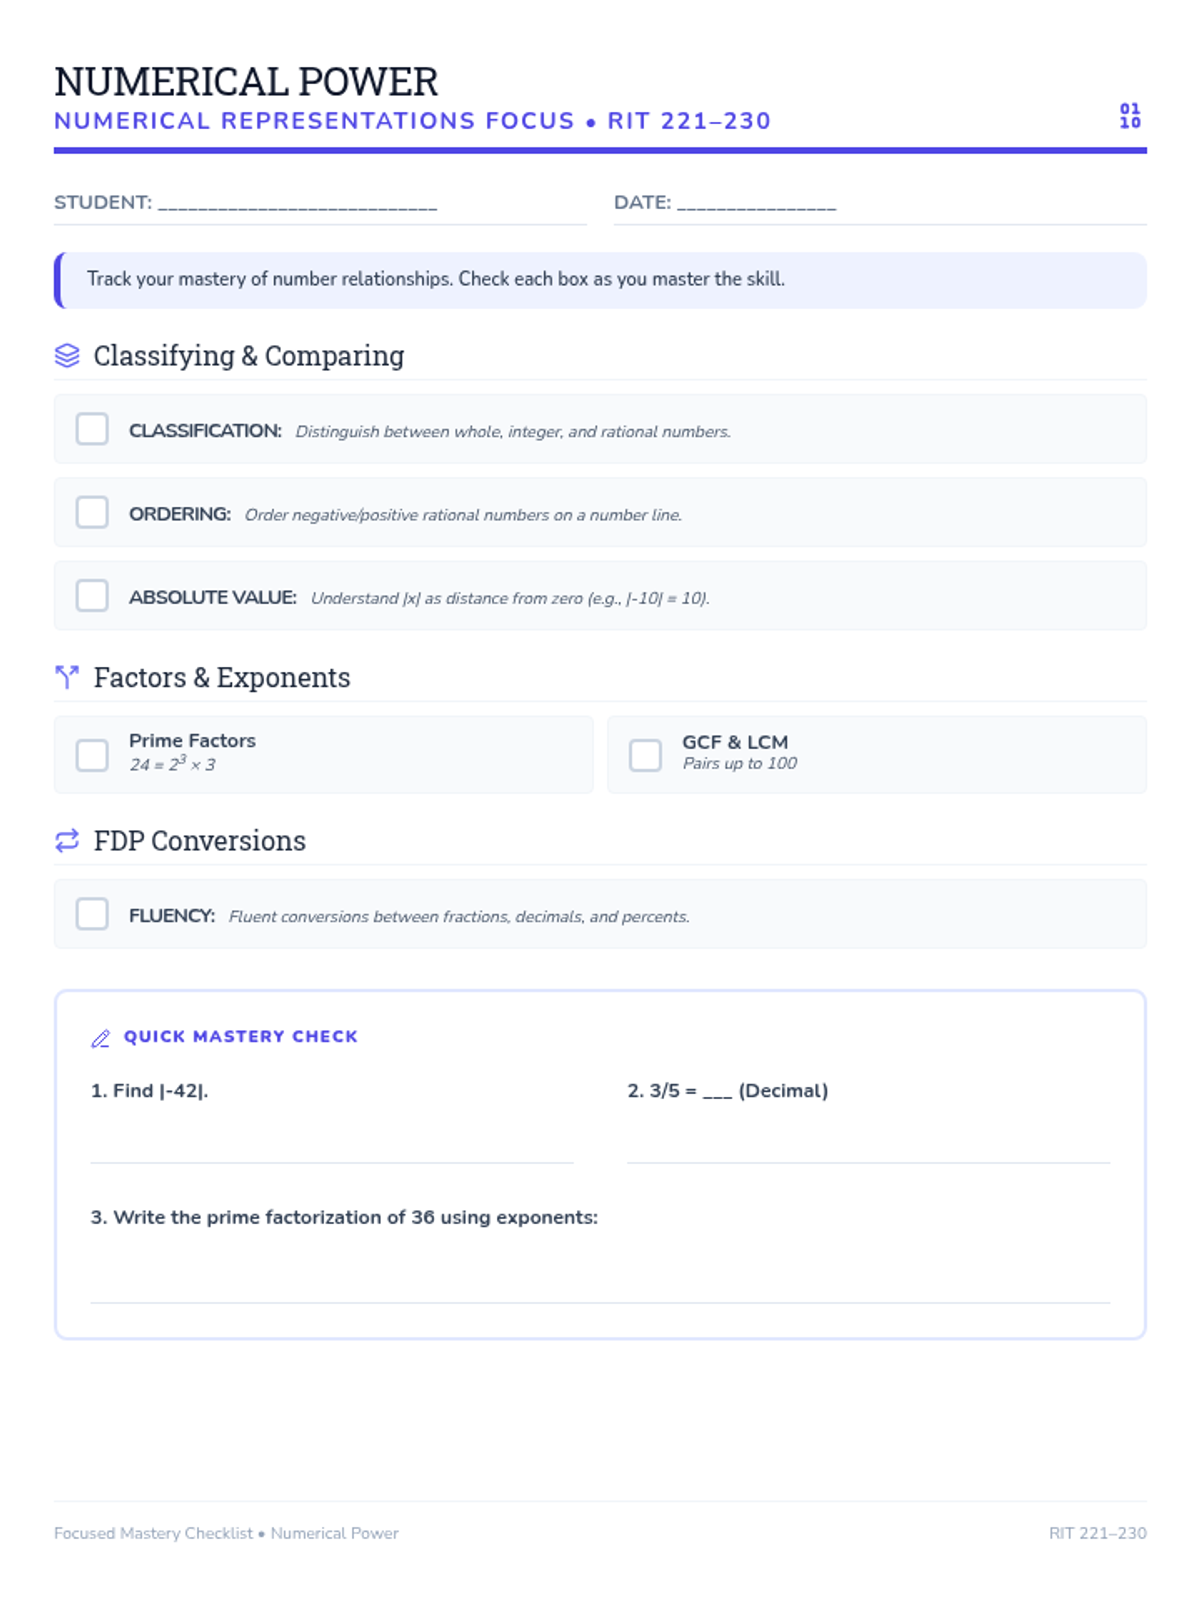
A comprehensive guide for parents and students to navigate the mathematical skills expected in the 221-230 NWEA MAP RIT range, featuring actionable checklists and home-based practice ideas.
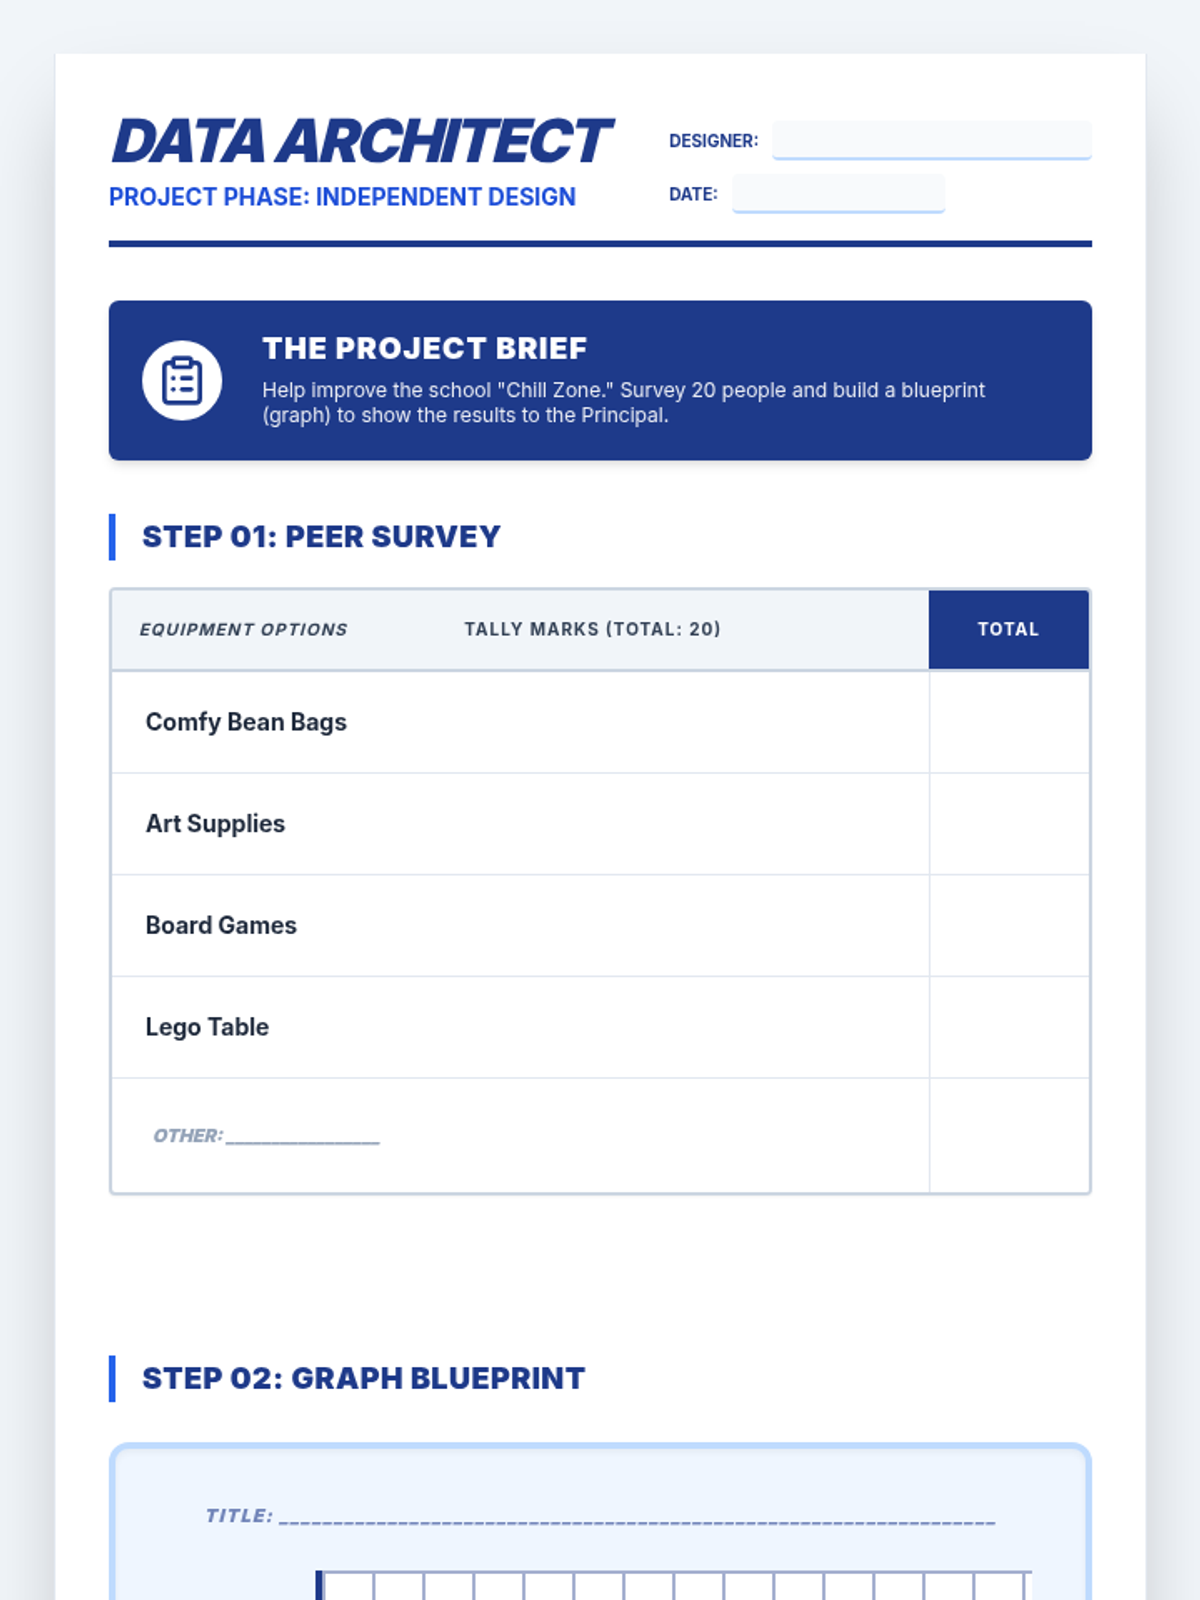
A comprehensive lesson on data interpretation and graphing, moving from foundational skill practice to an independent data collection and design project.
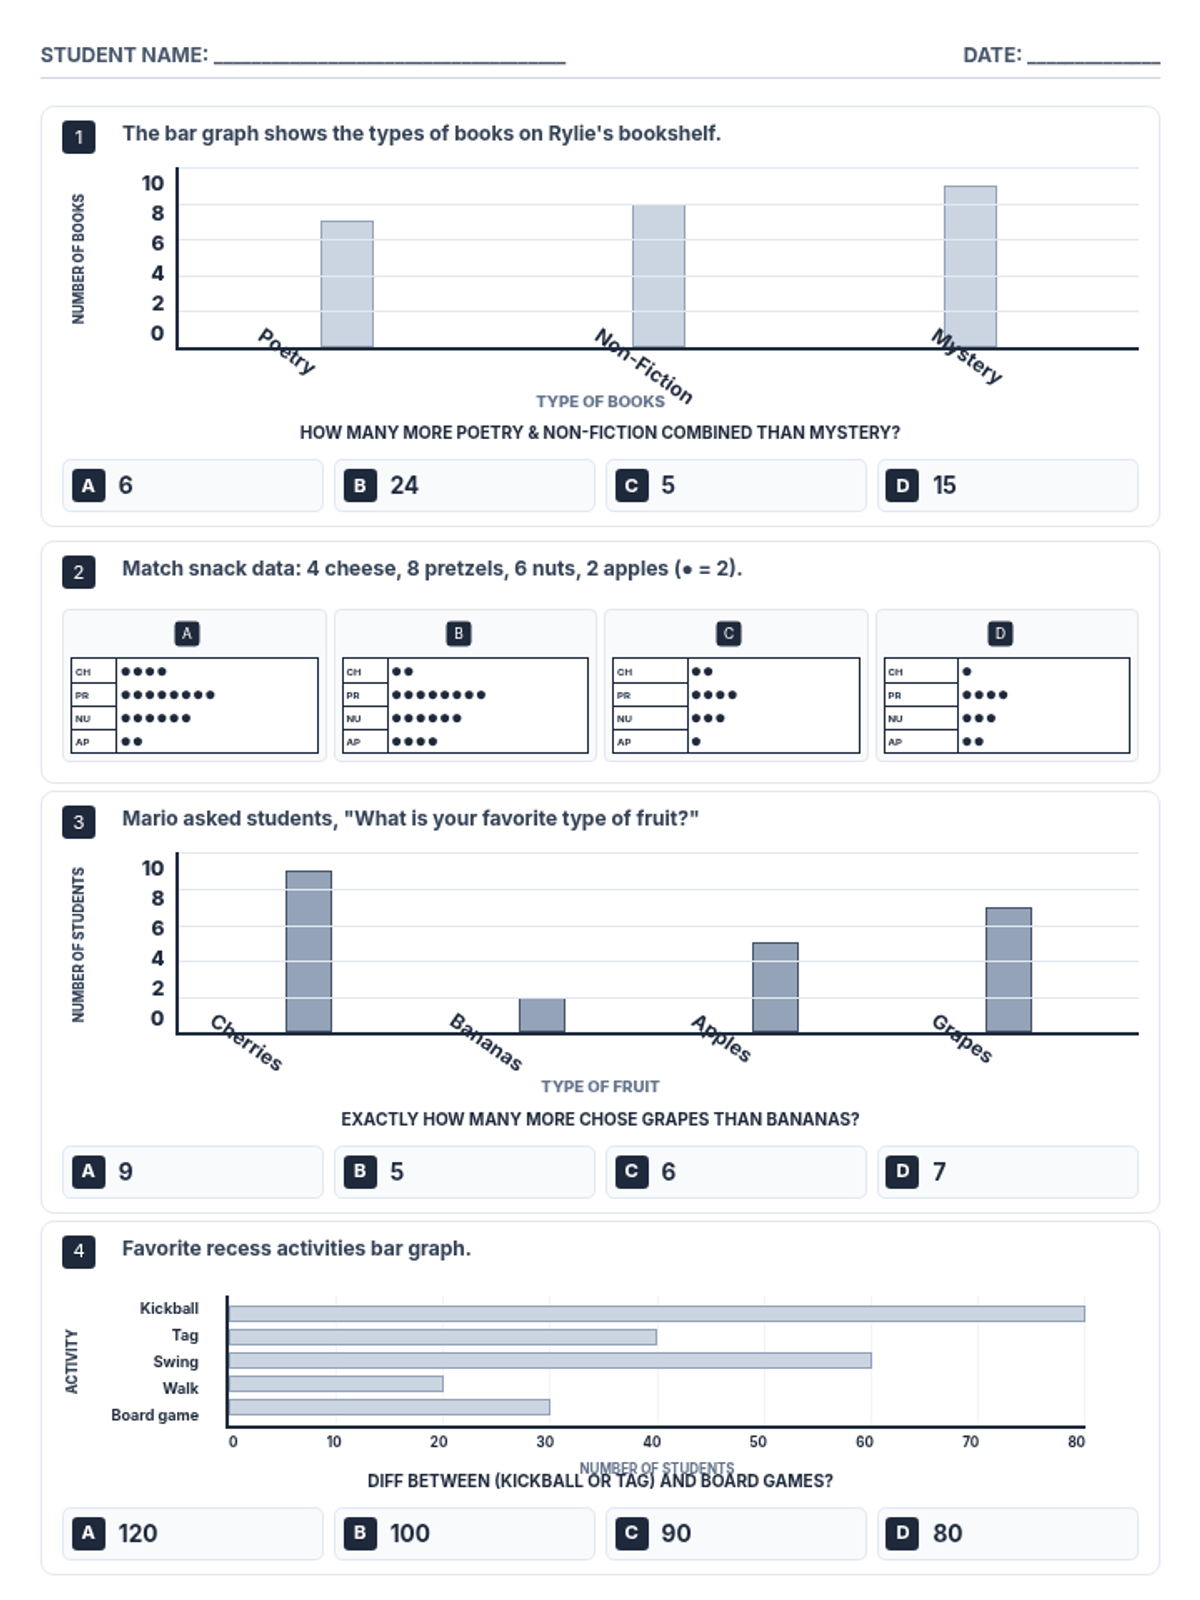
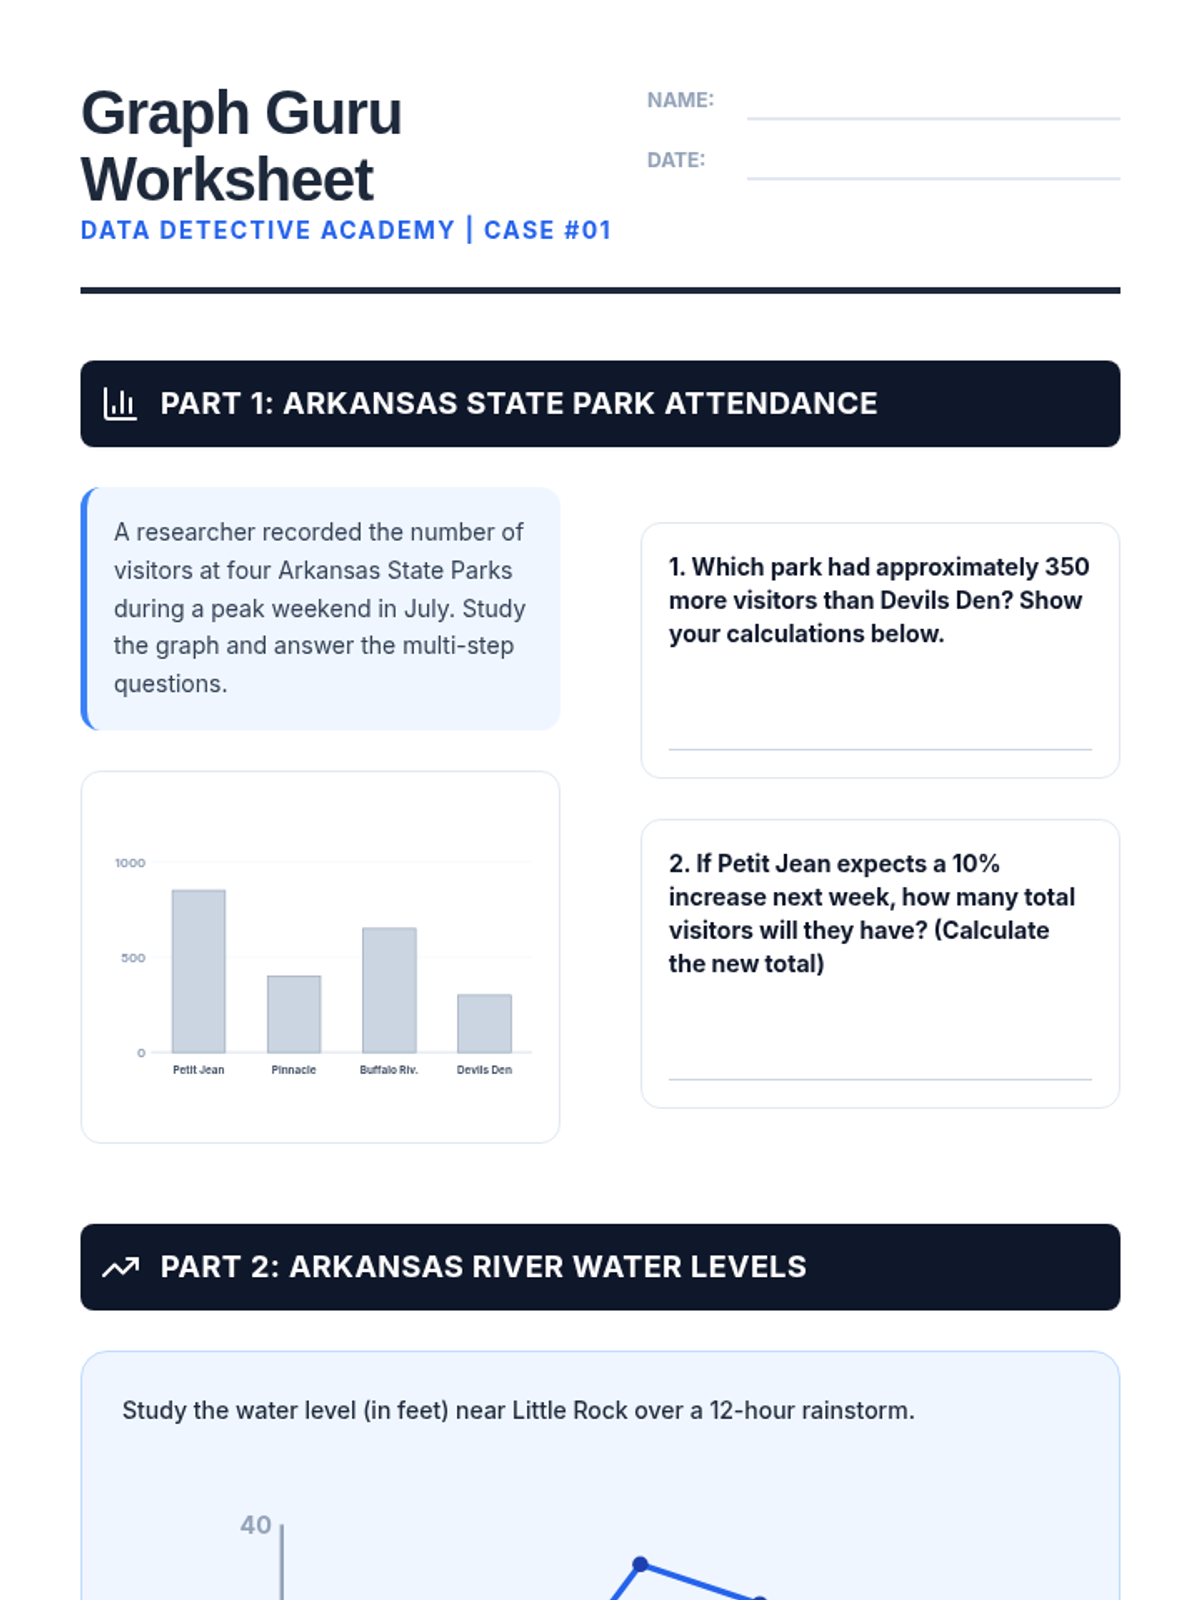
Students will use data from various displays to make predictions and solve multi-step problems.
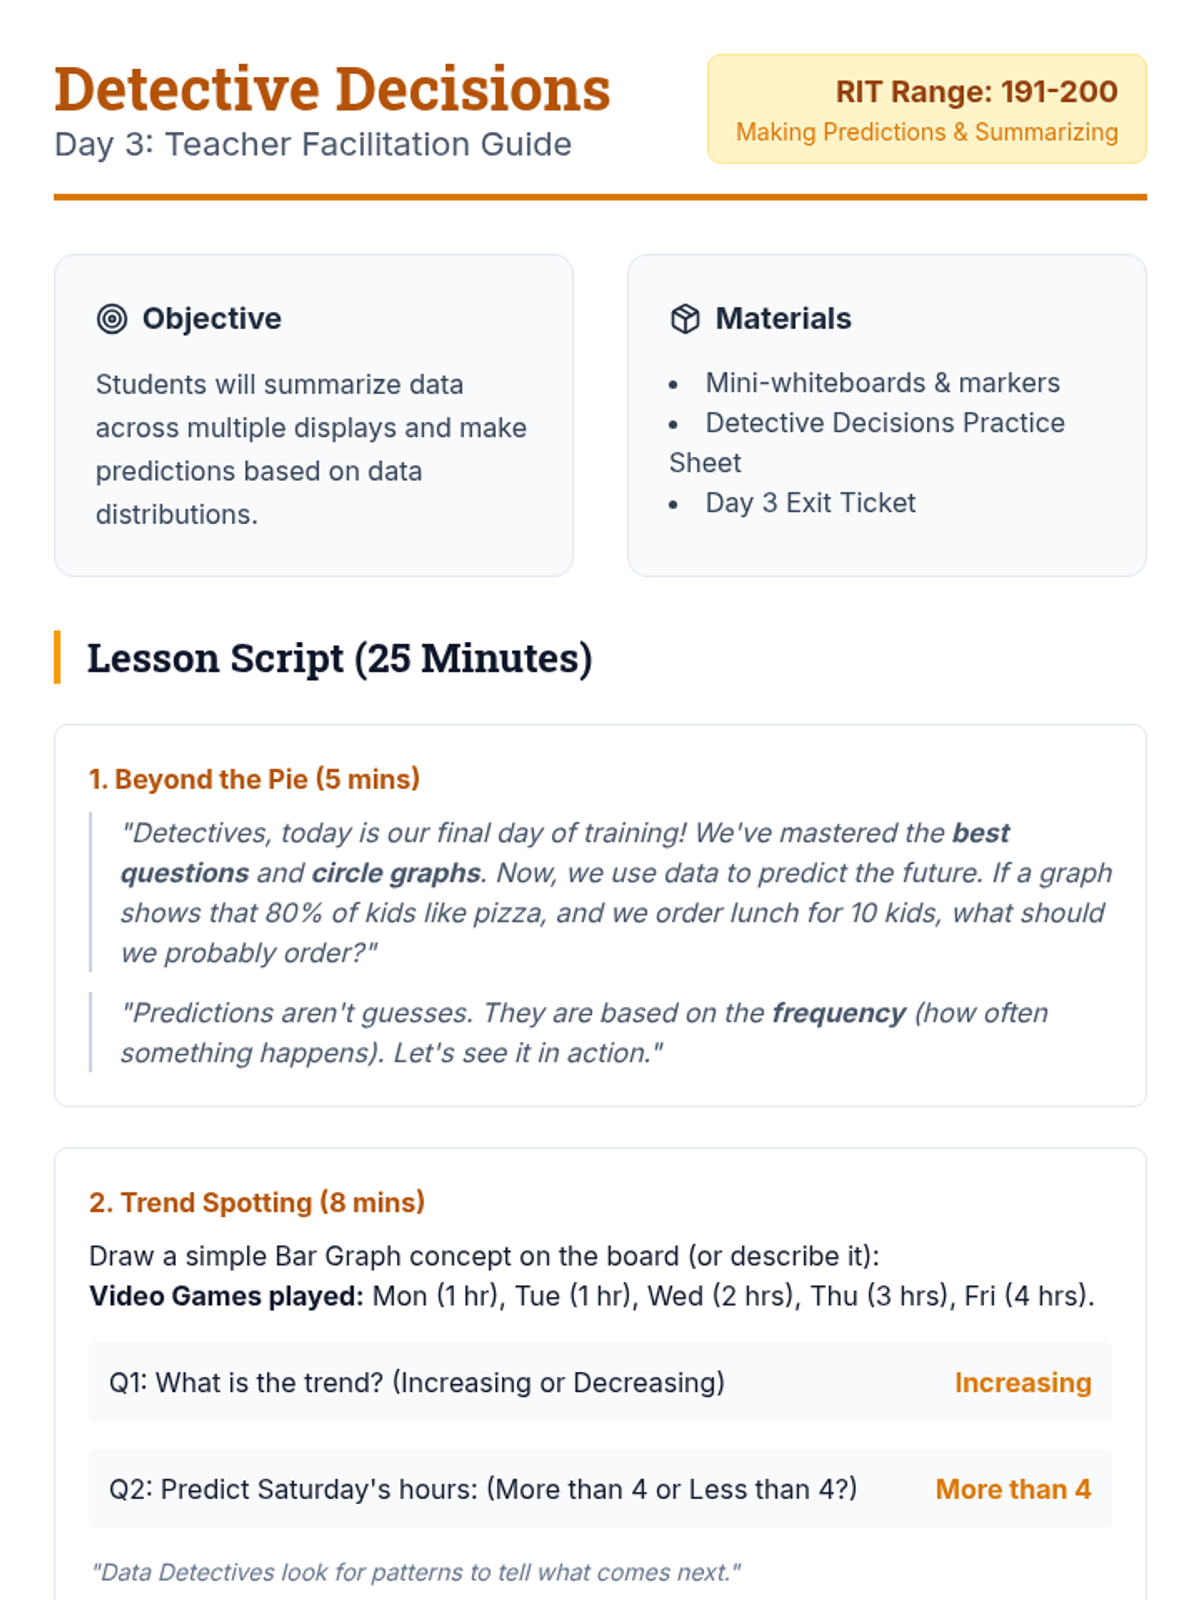
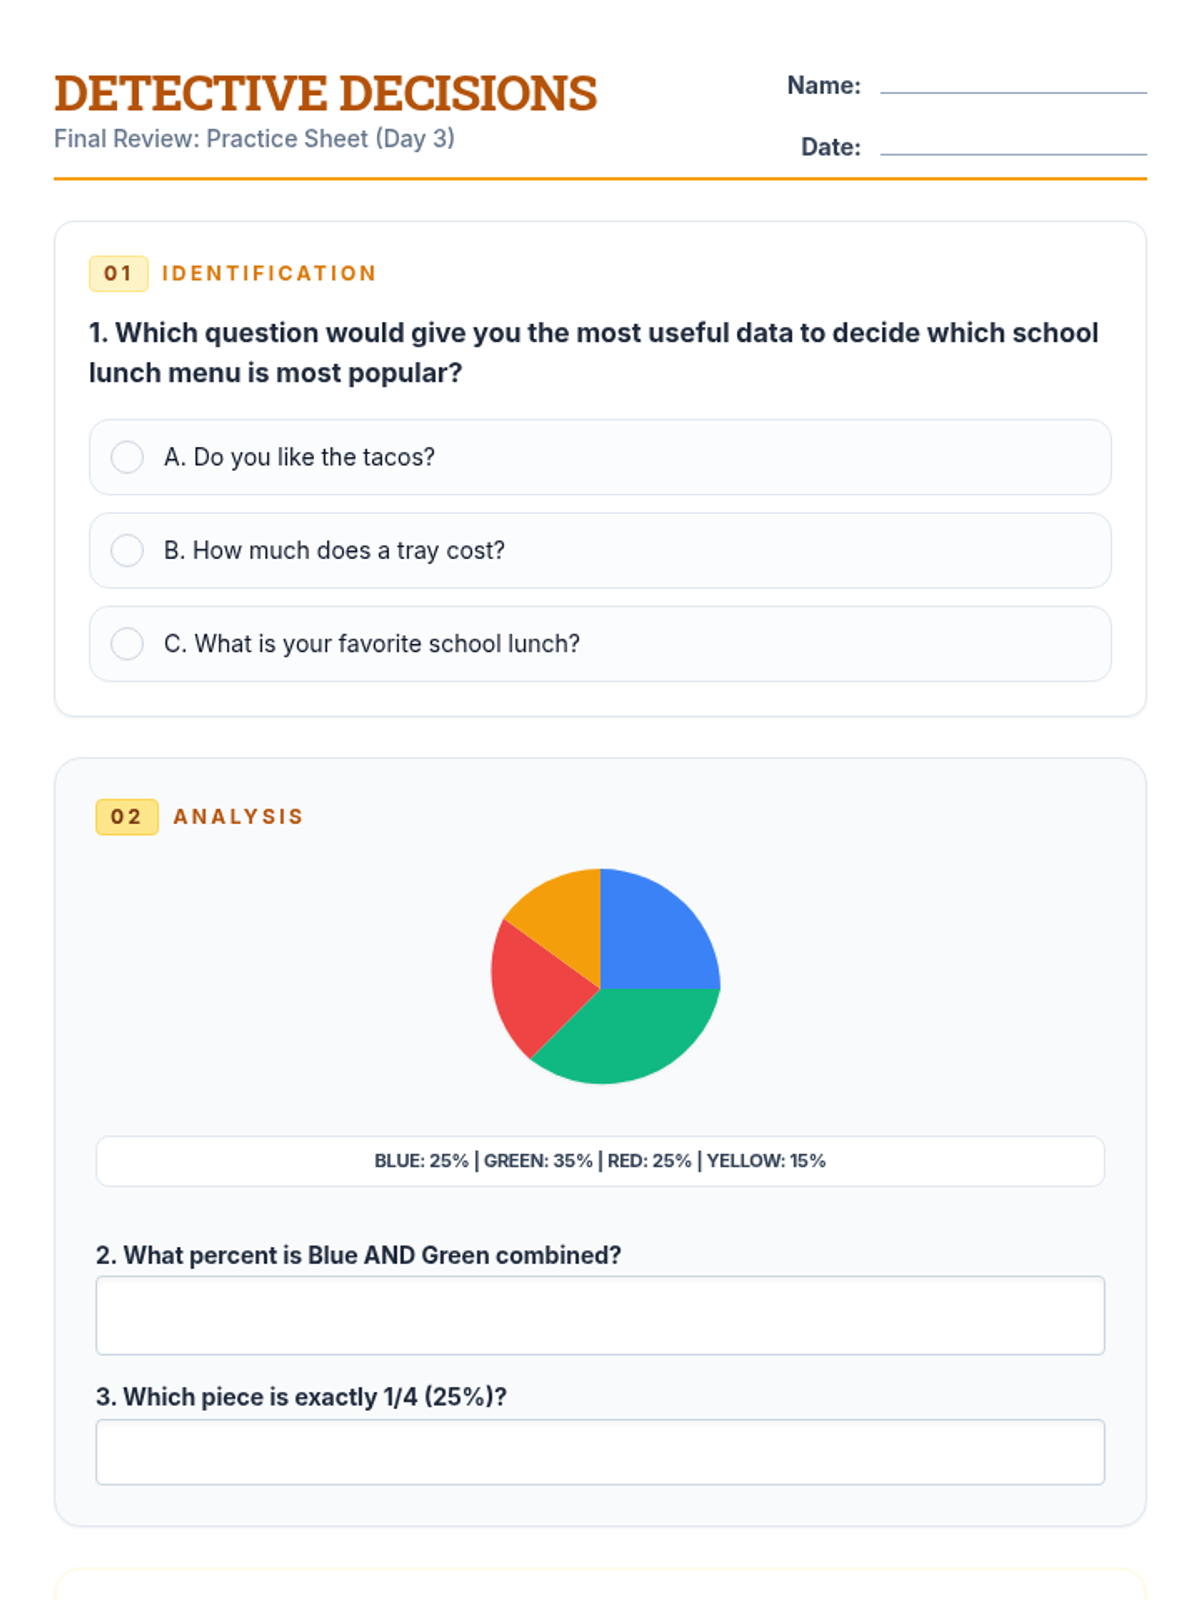
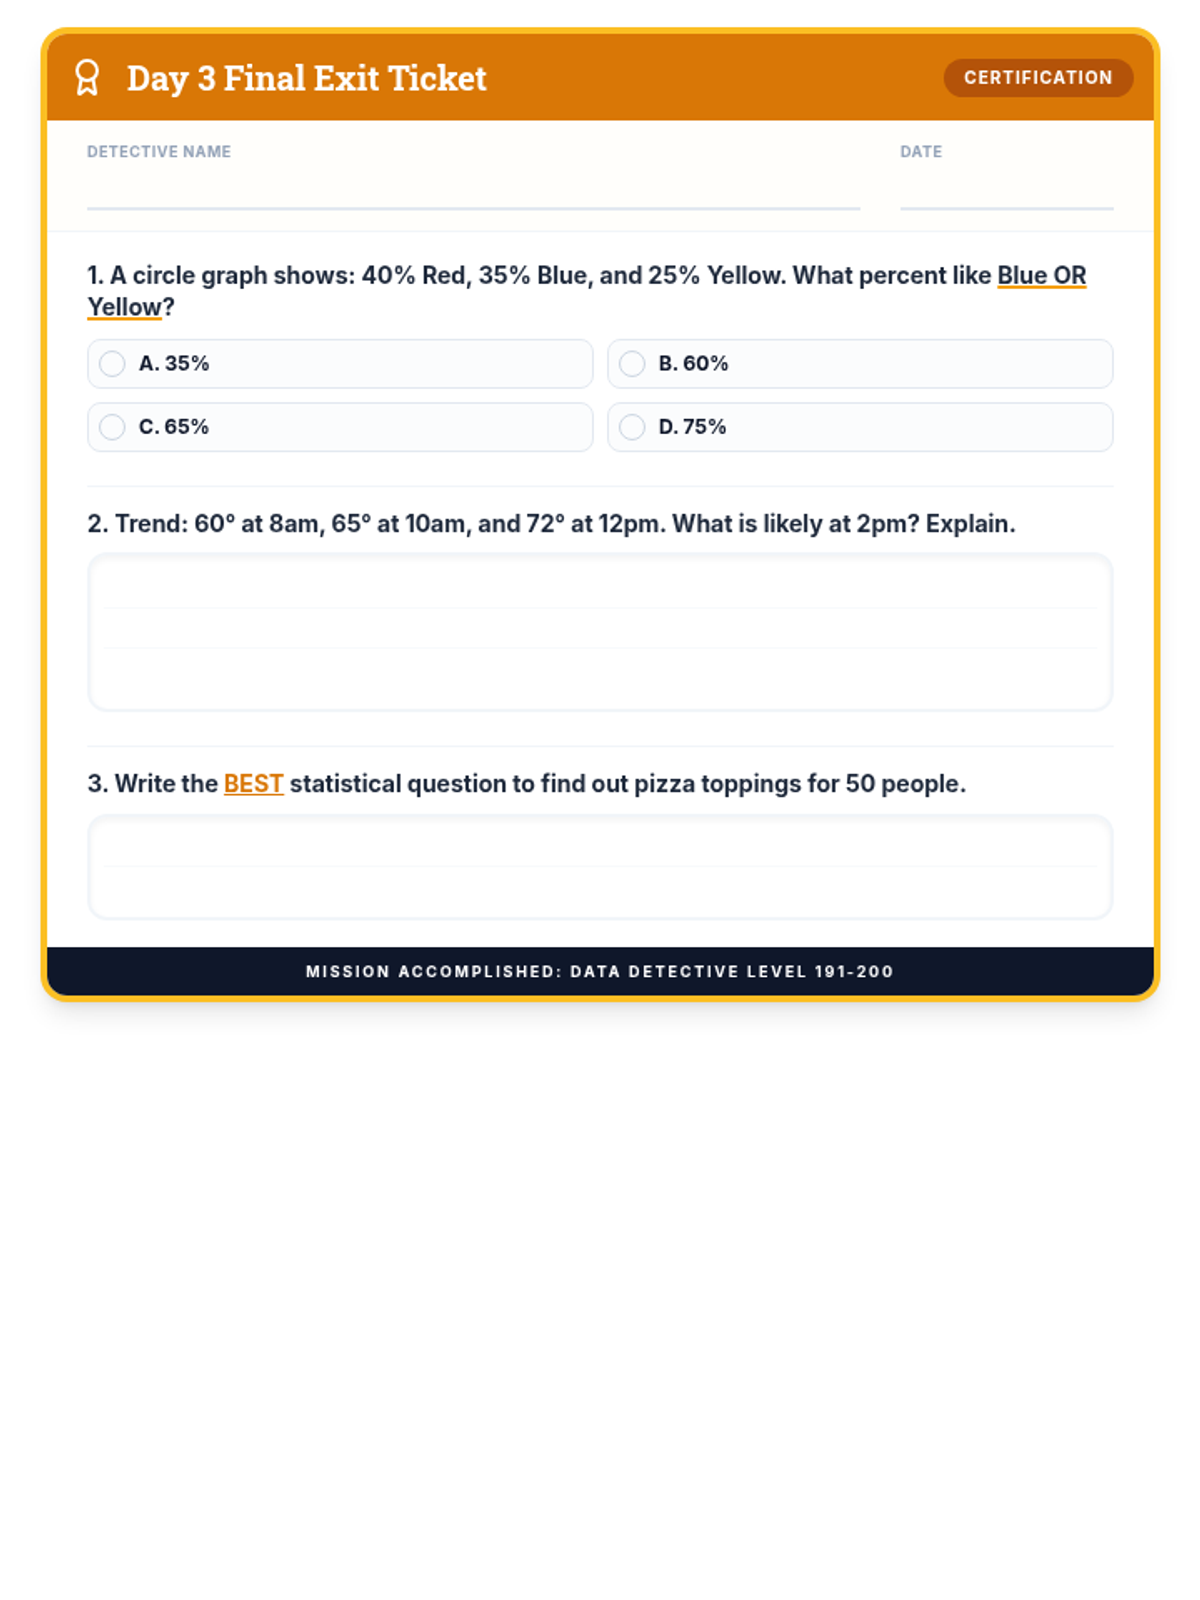
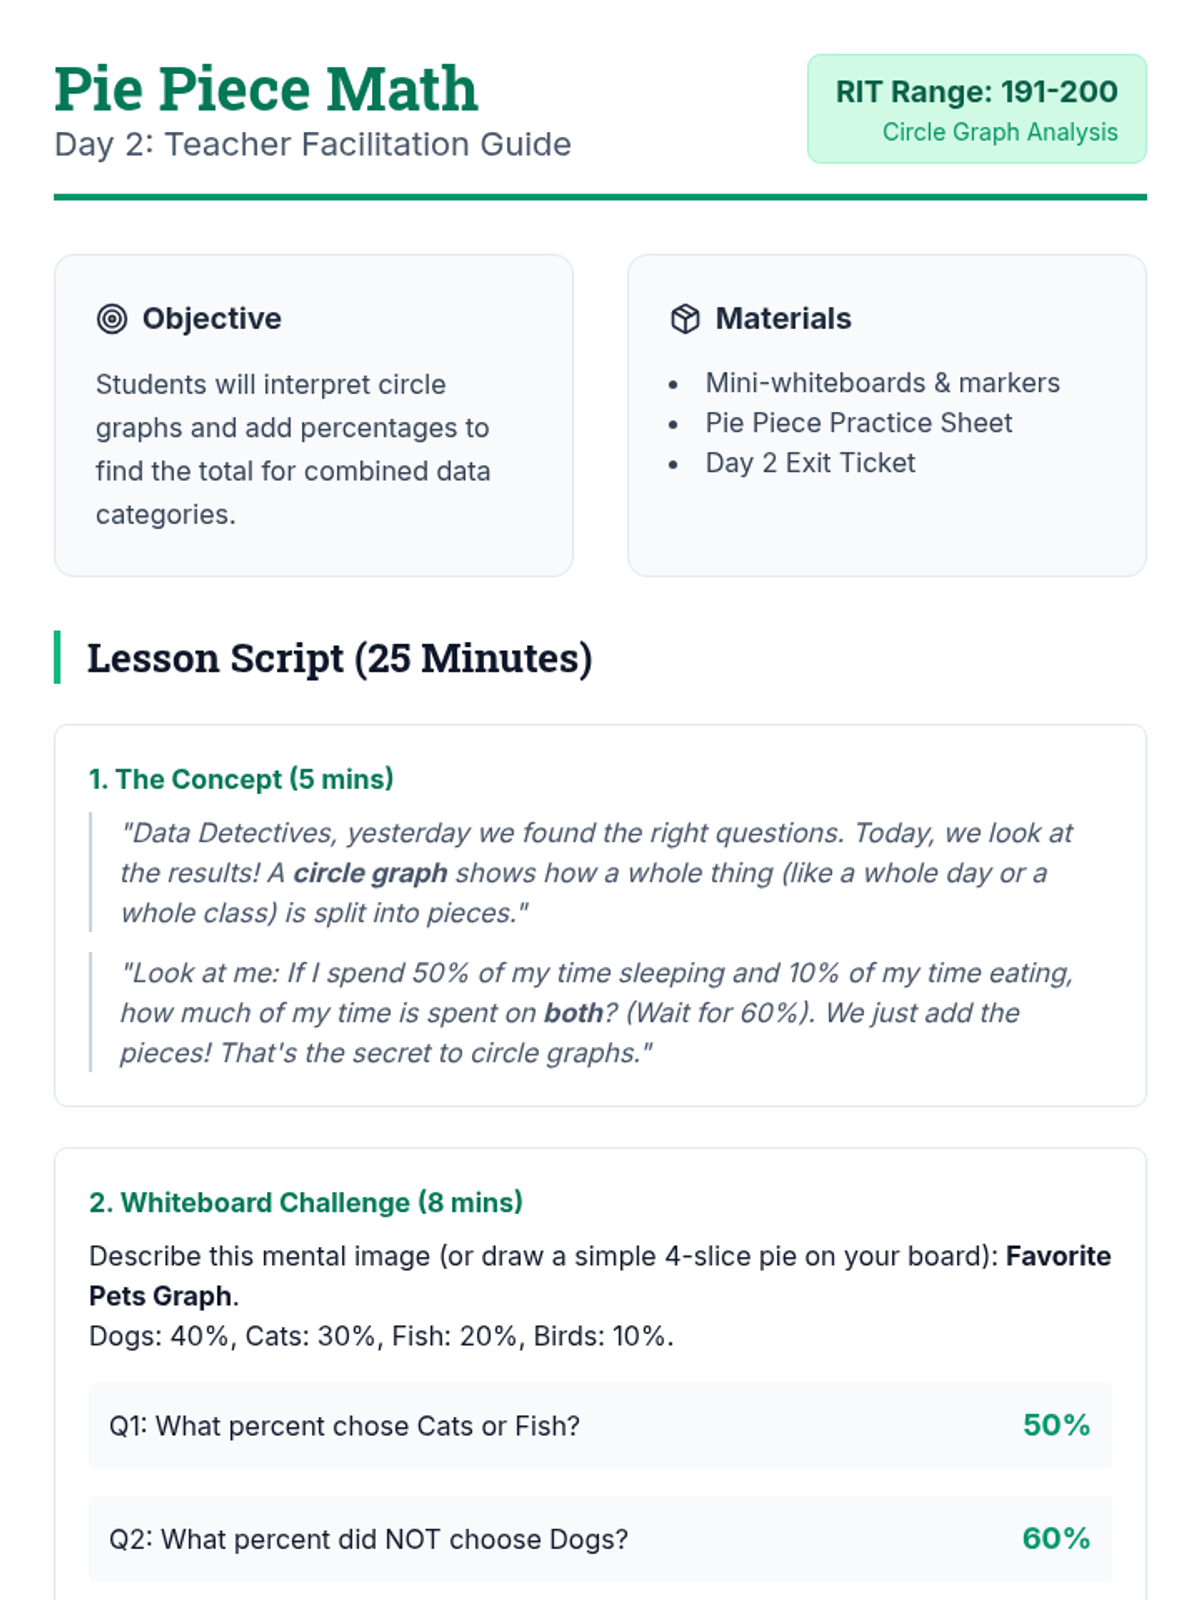
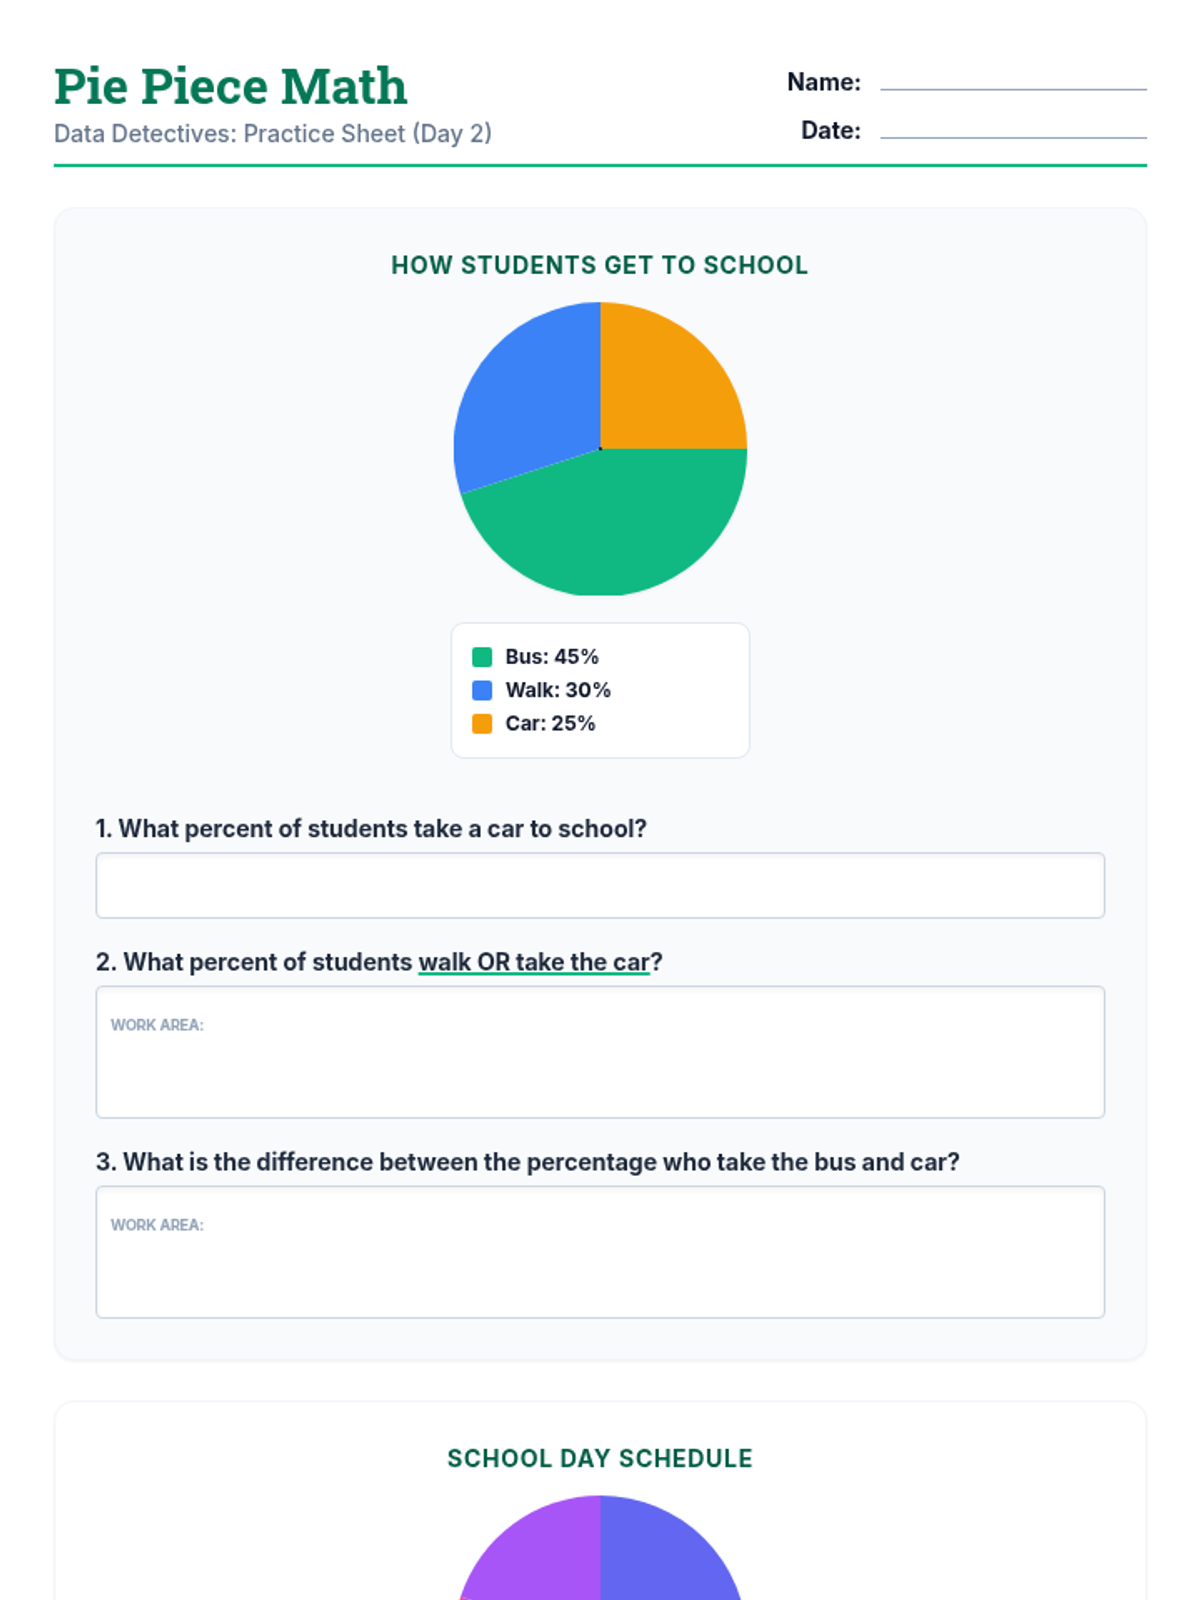
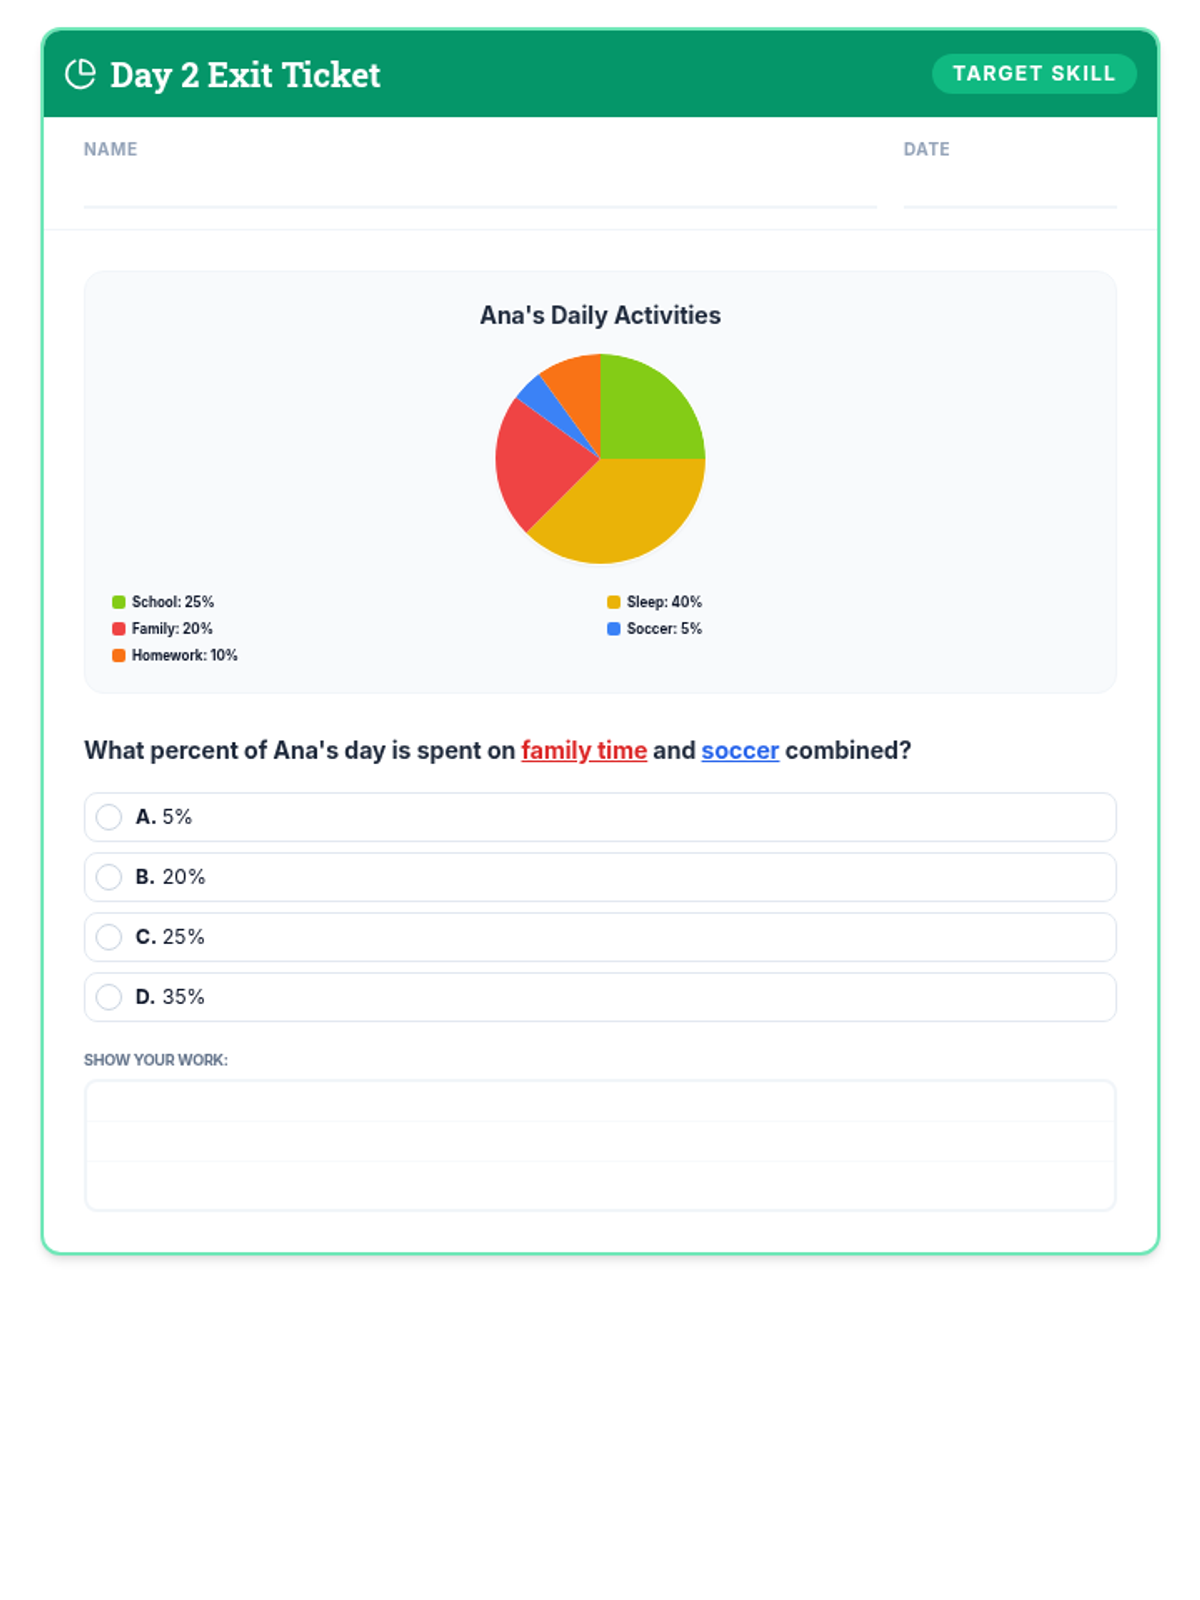
Students will interpret circle graphs and solve problems involving combining data categories, targeting RIT 191-200 skills.
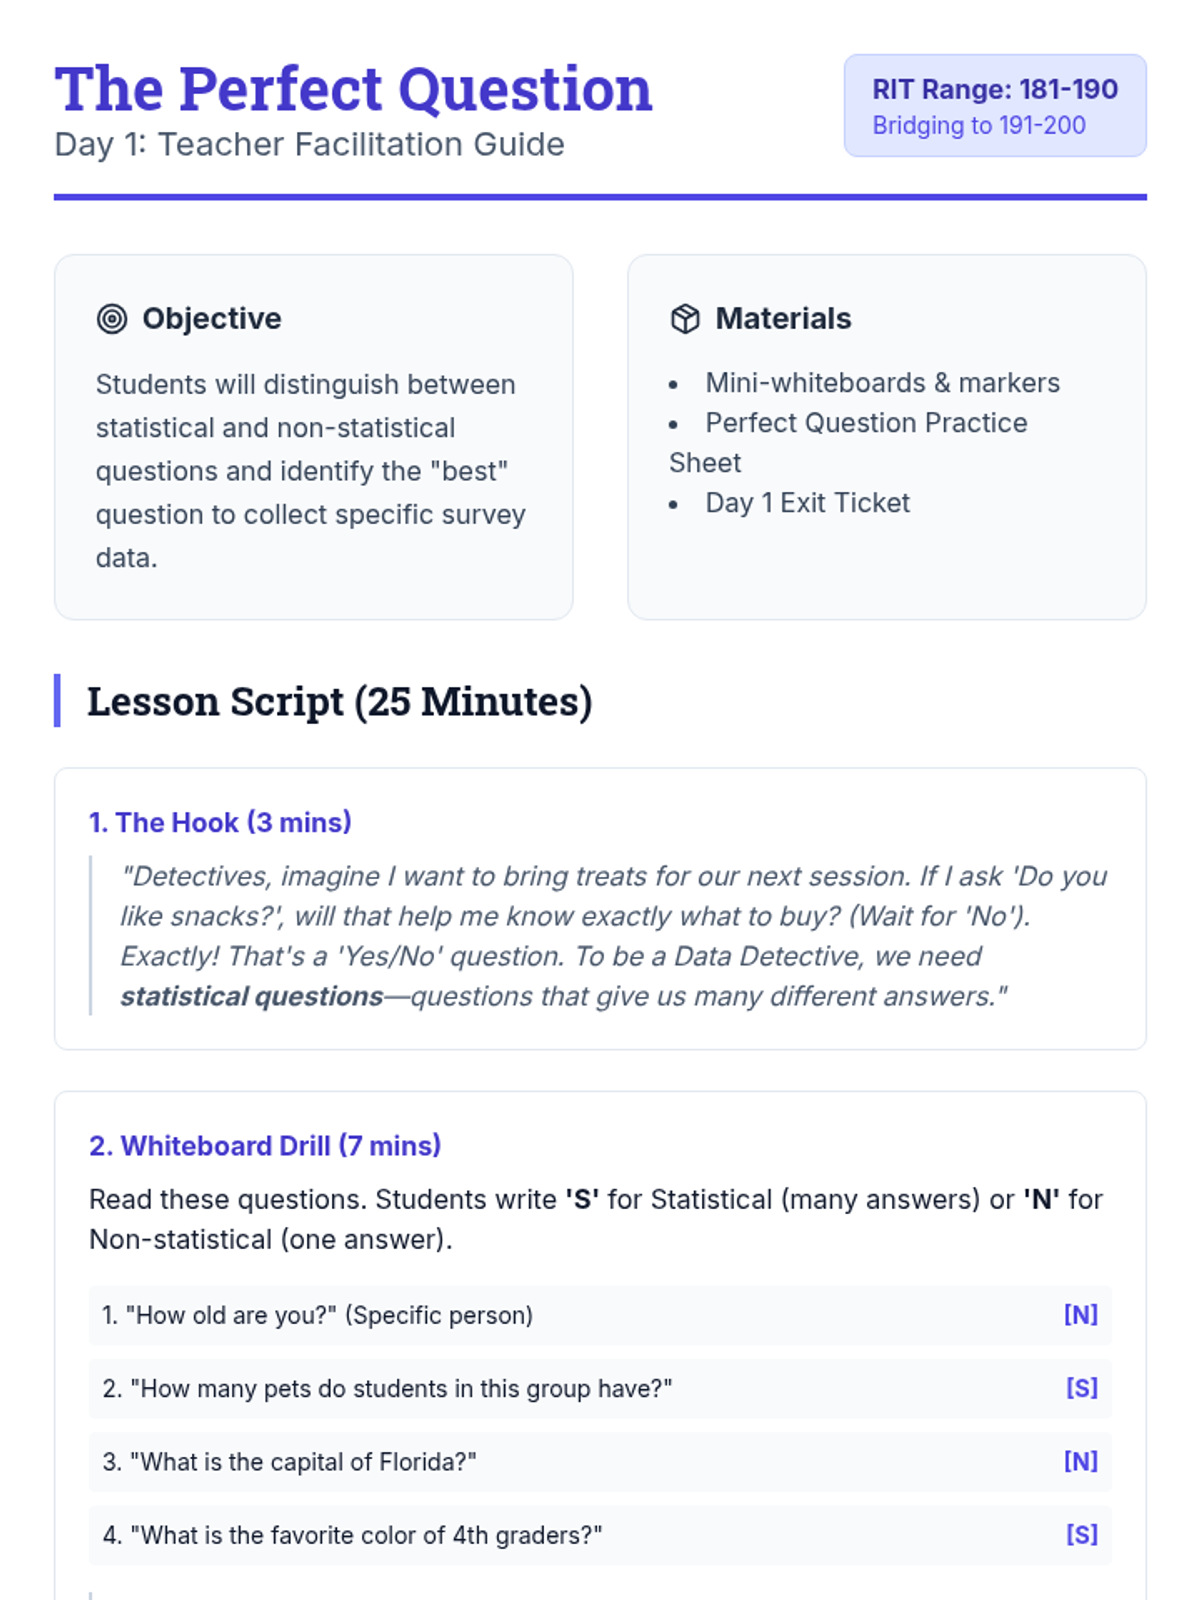
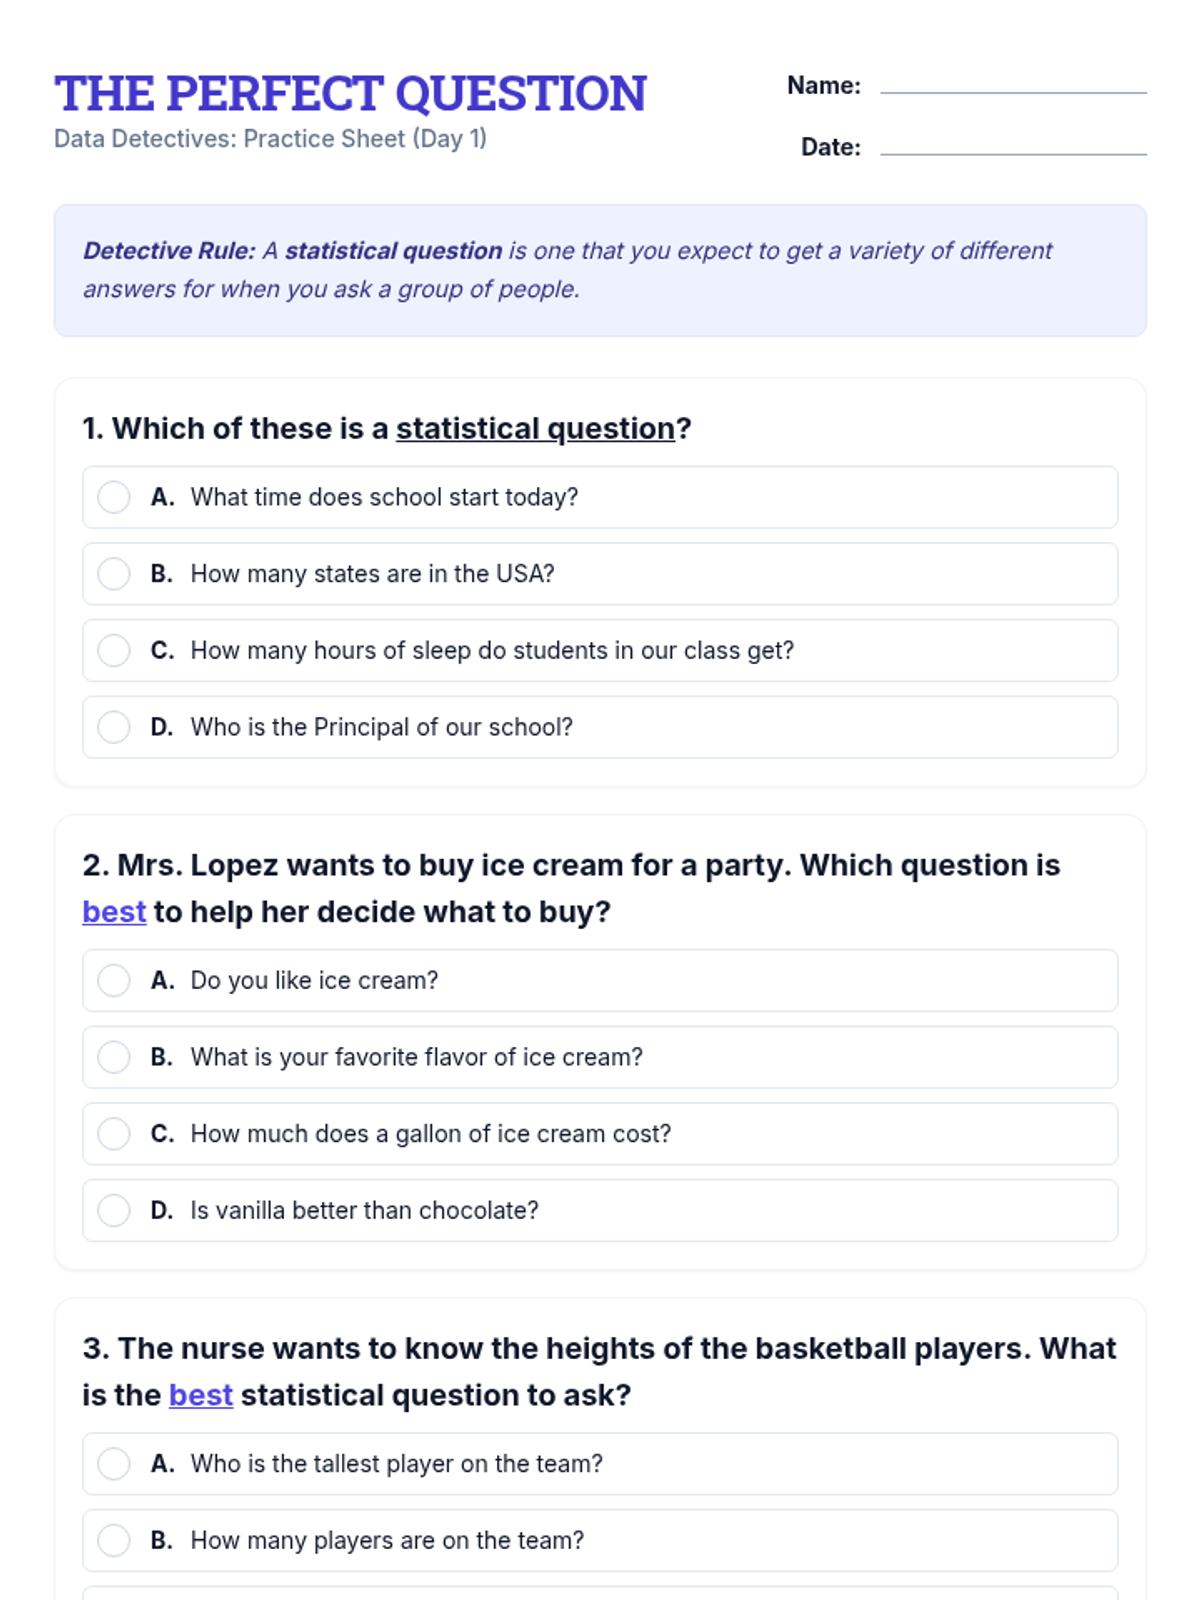
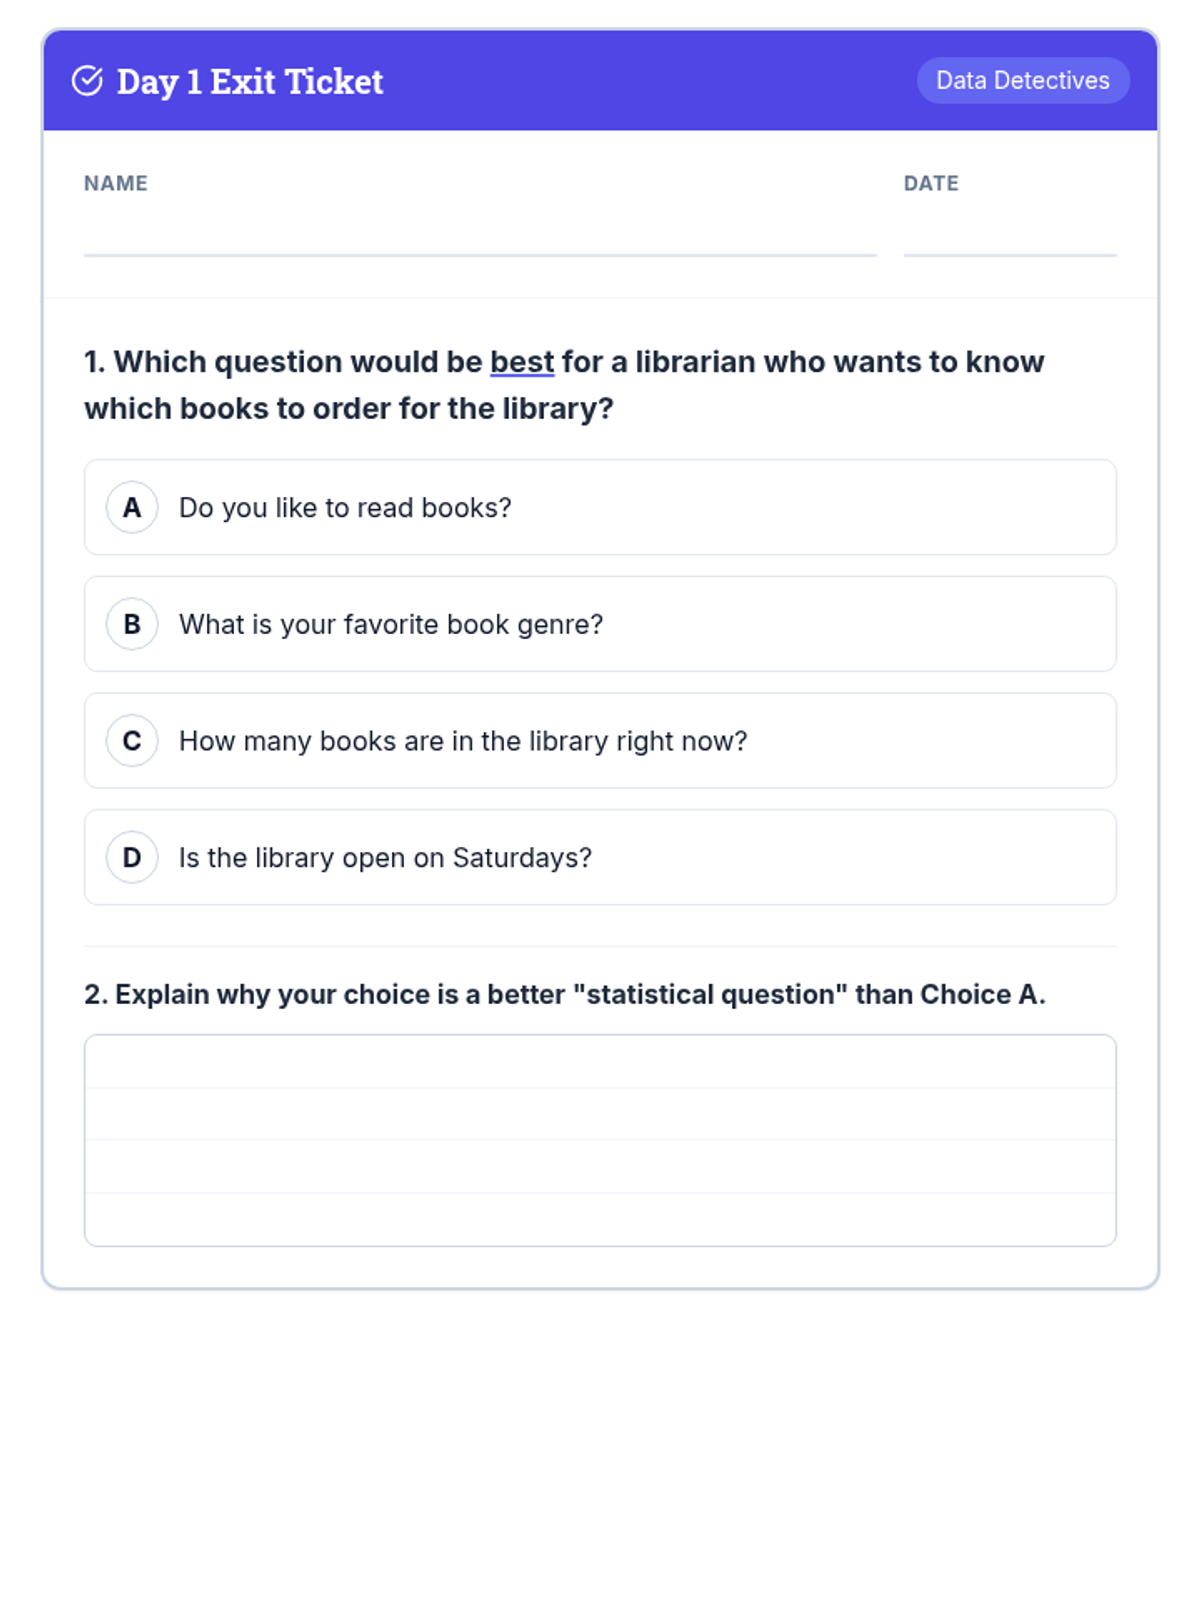
Students will learn to identify and formulate statistical questions that yield variable data, bridging the gap from RIT 181-190.
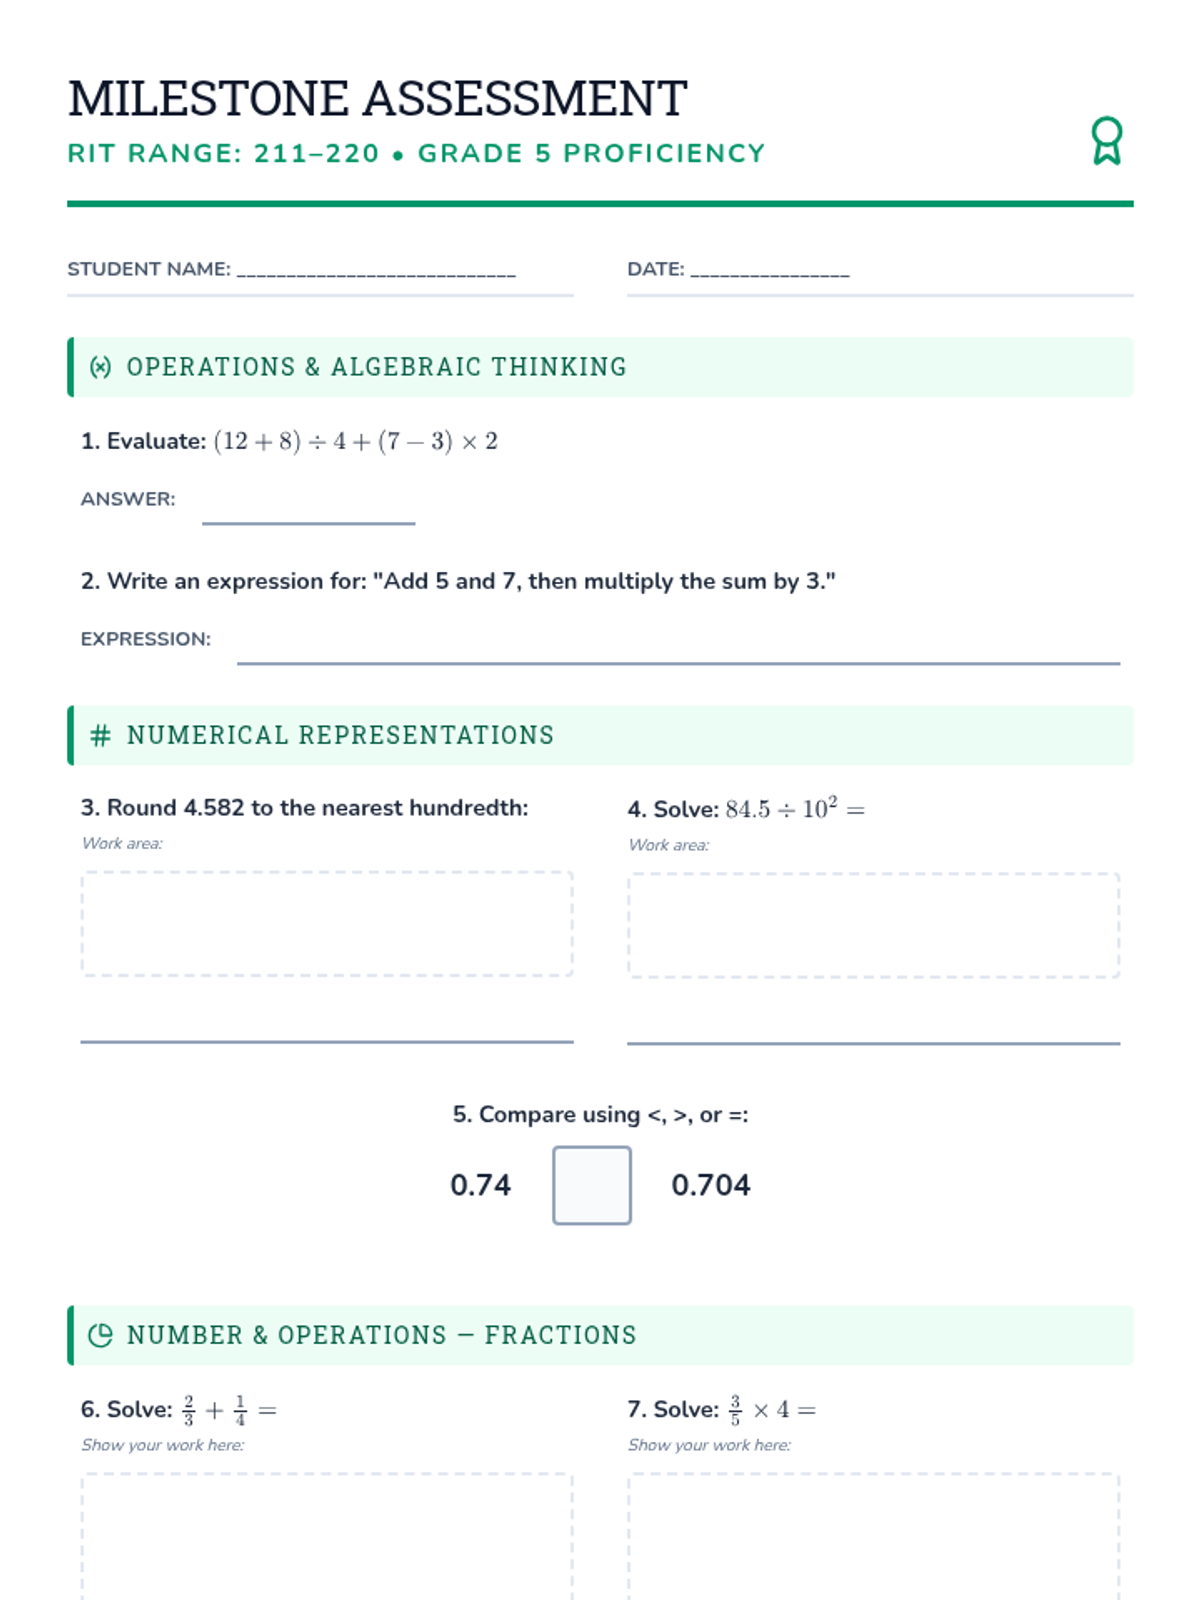
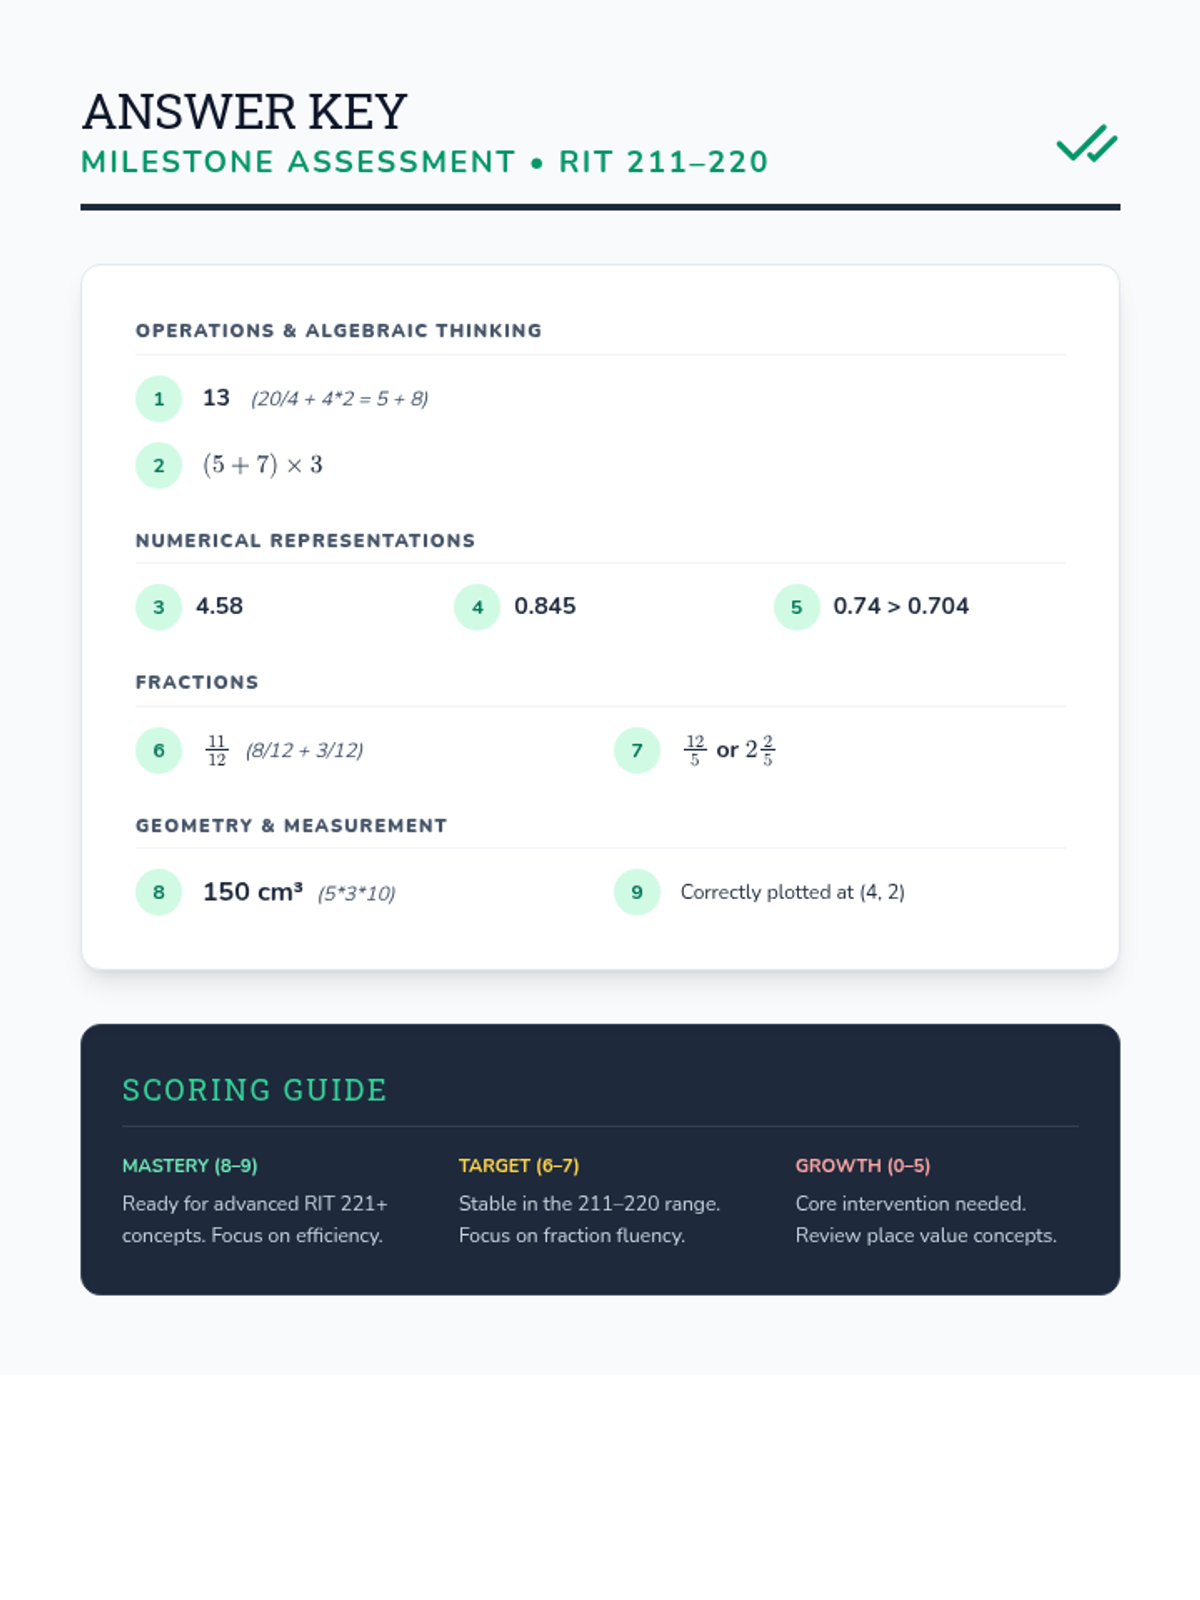
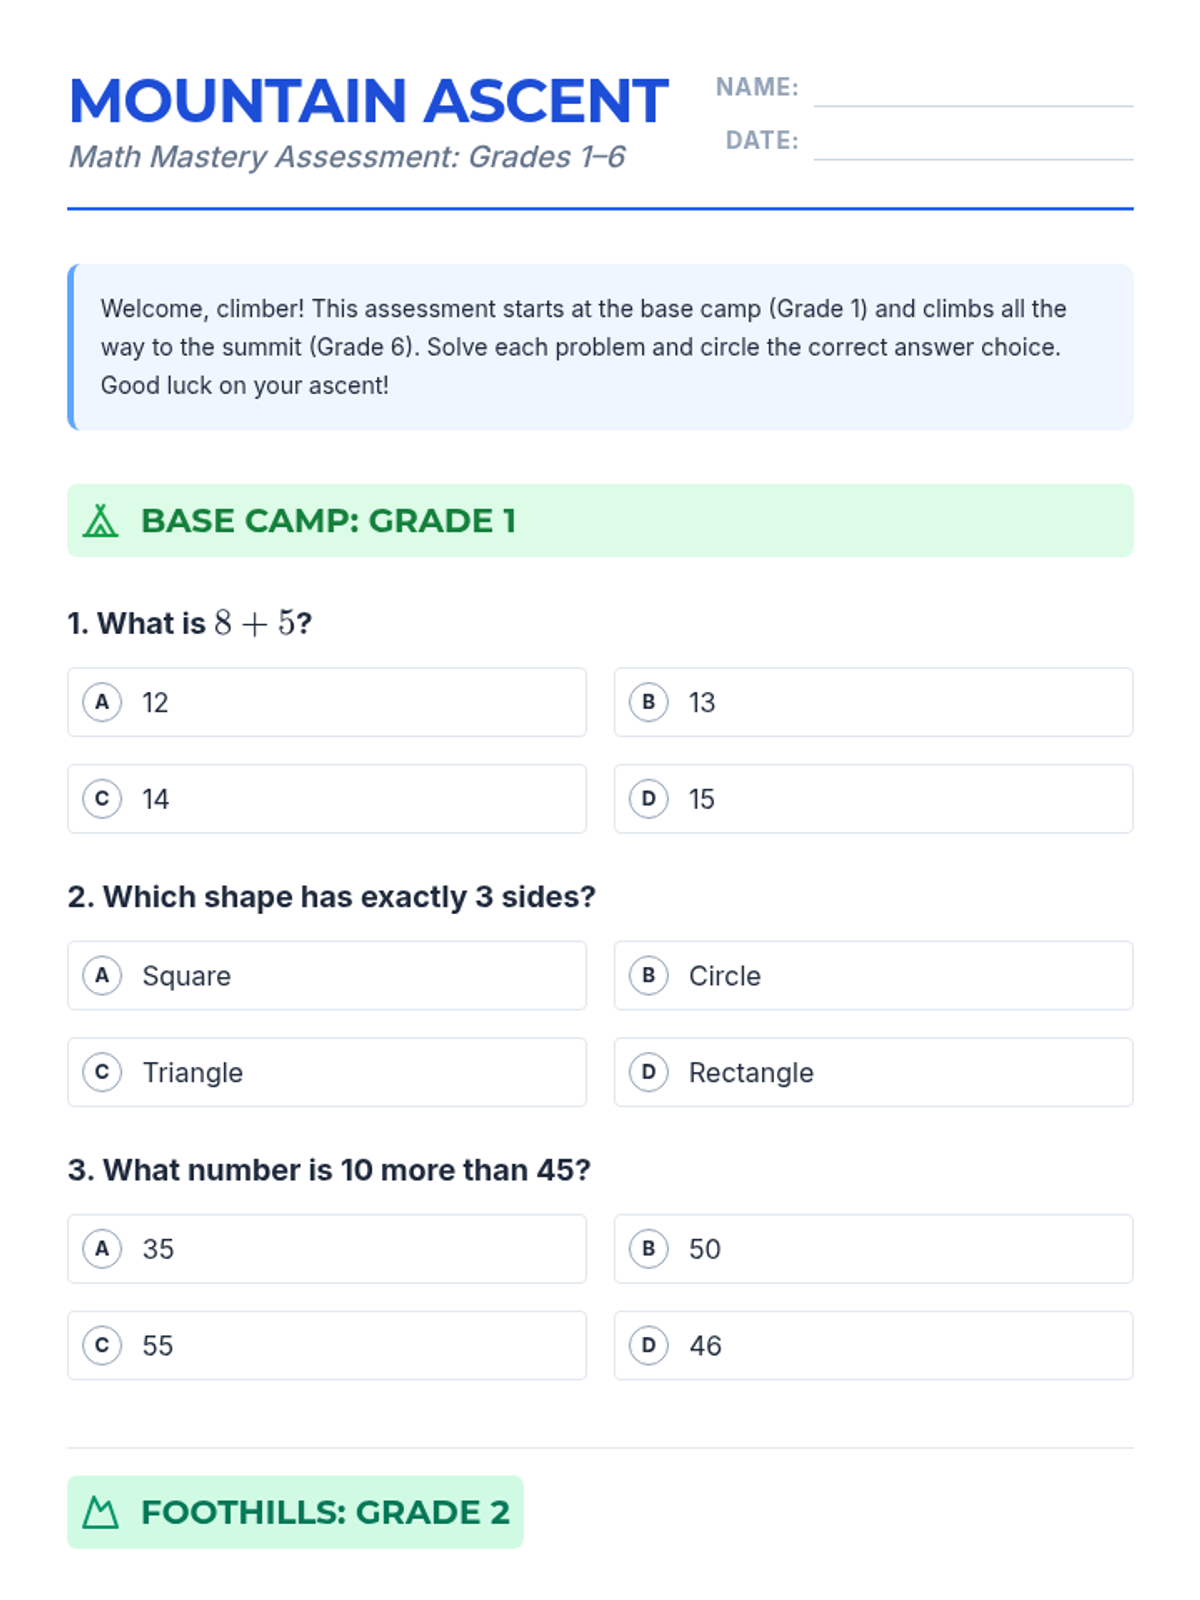
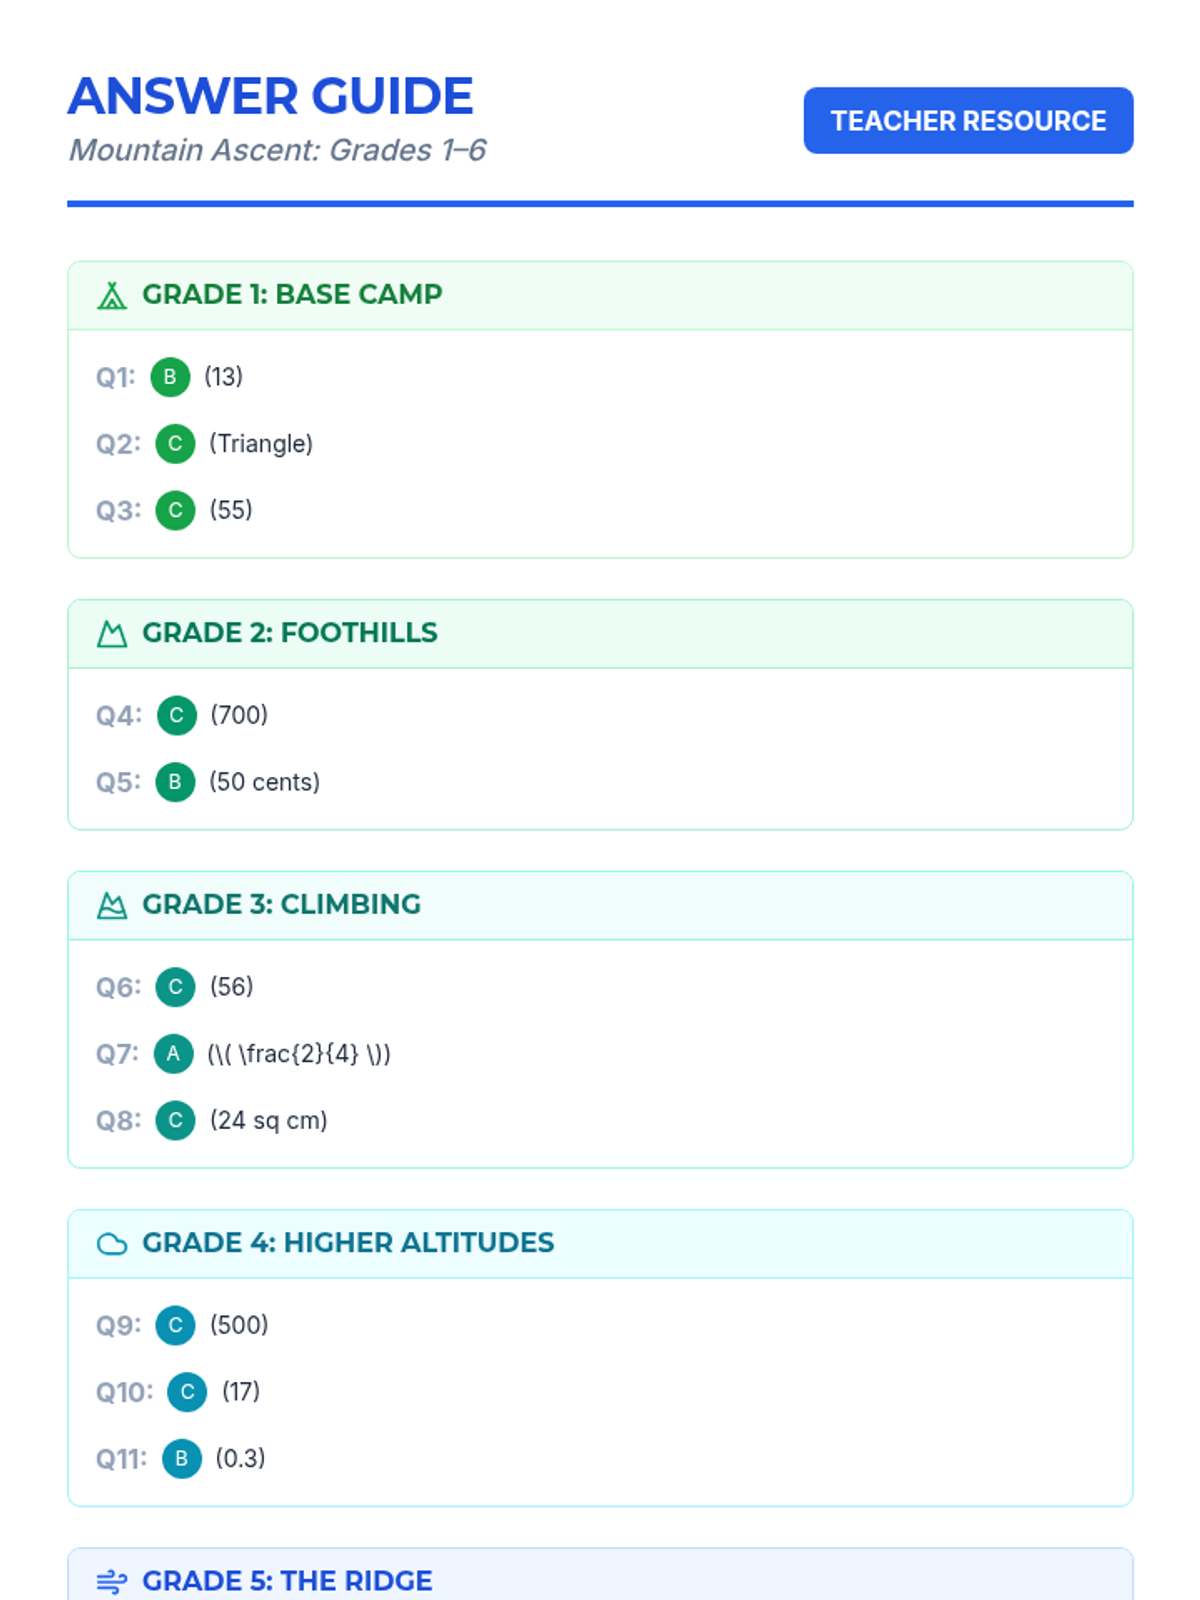
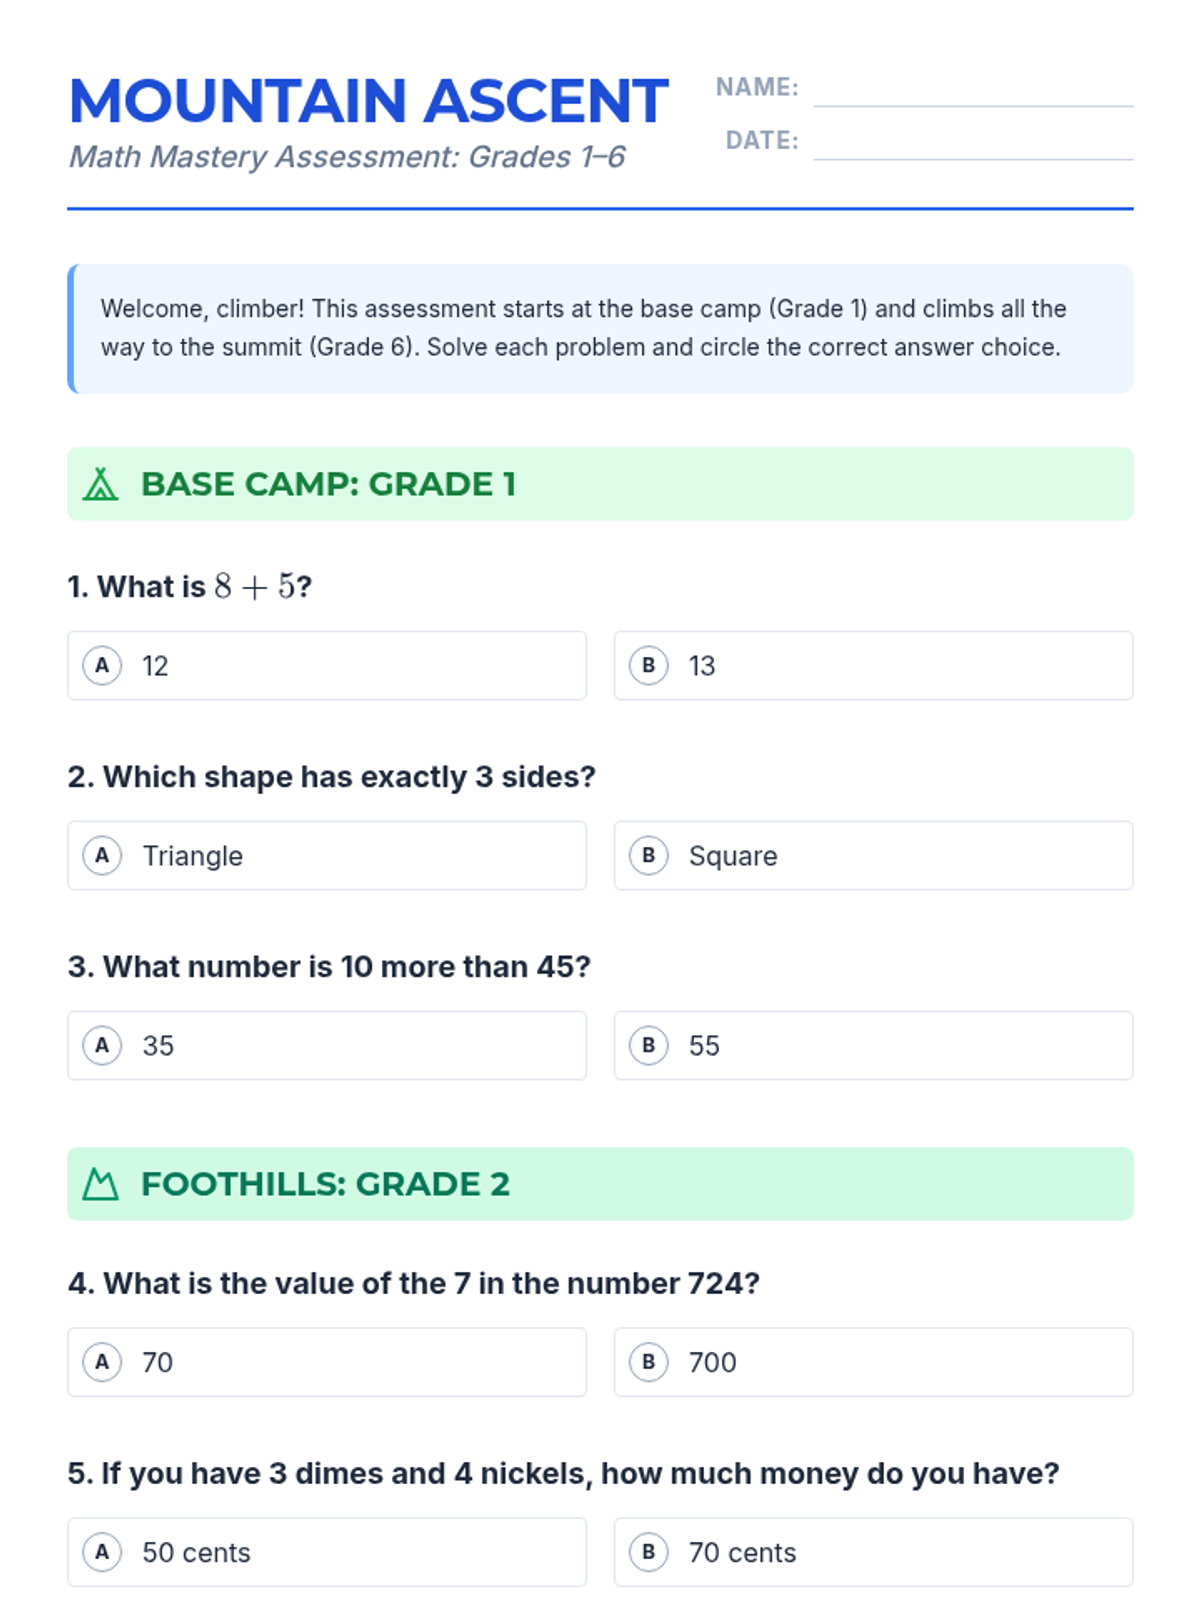
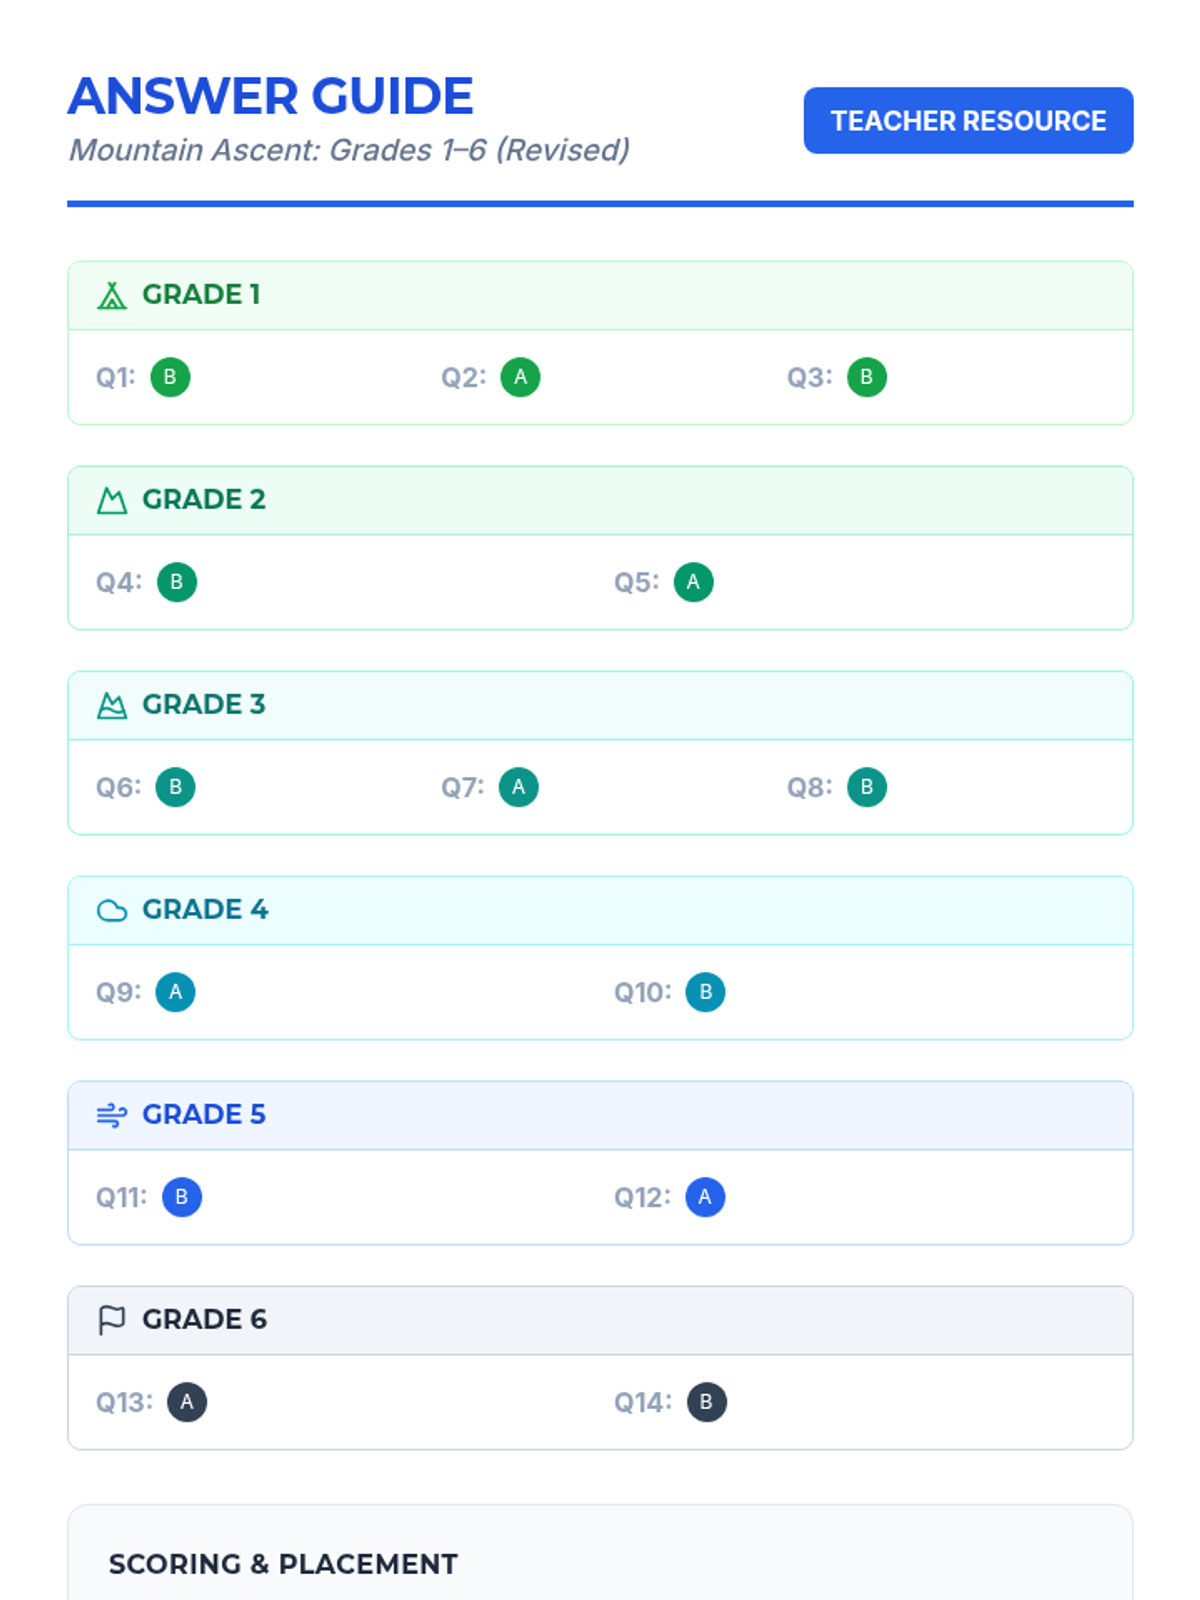
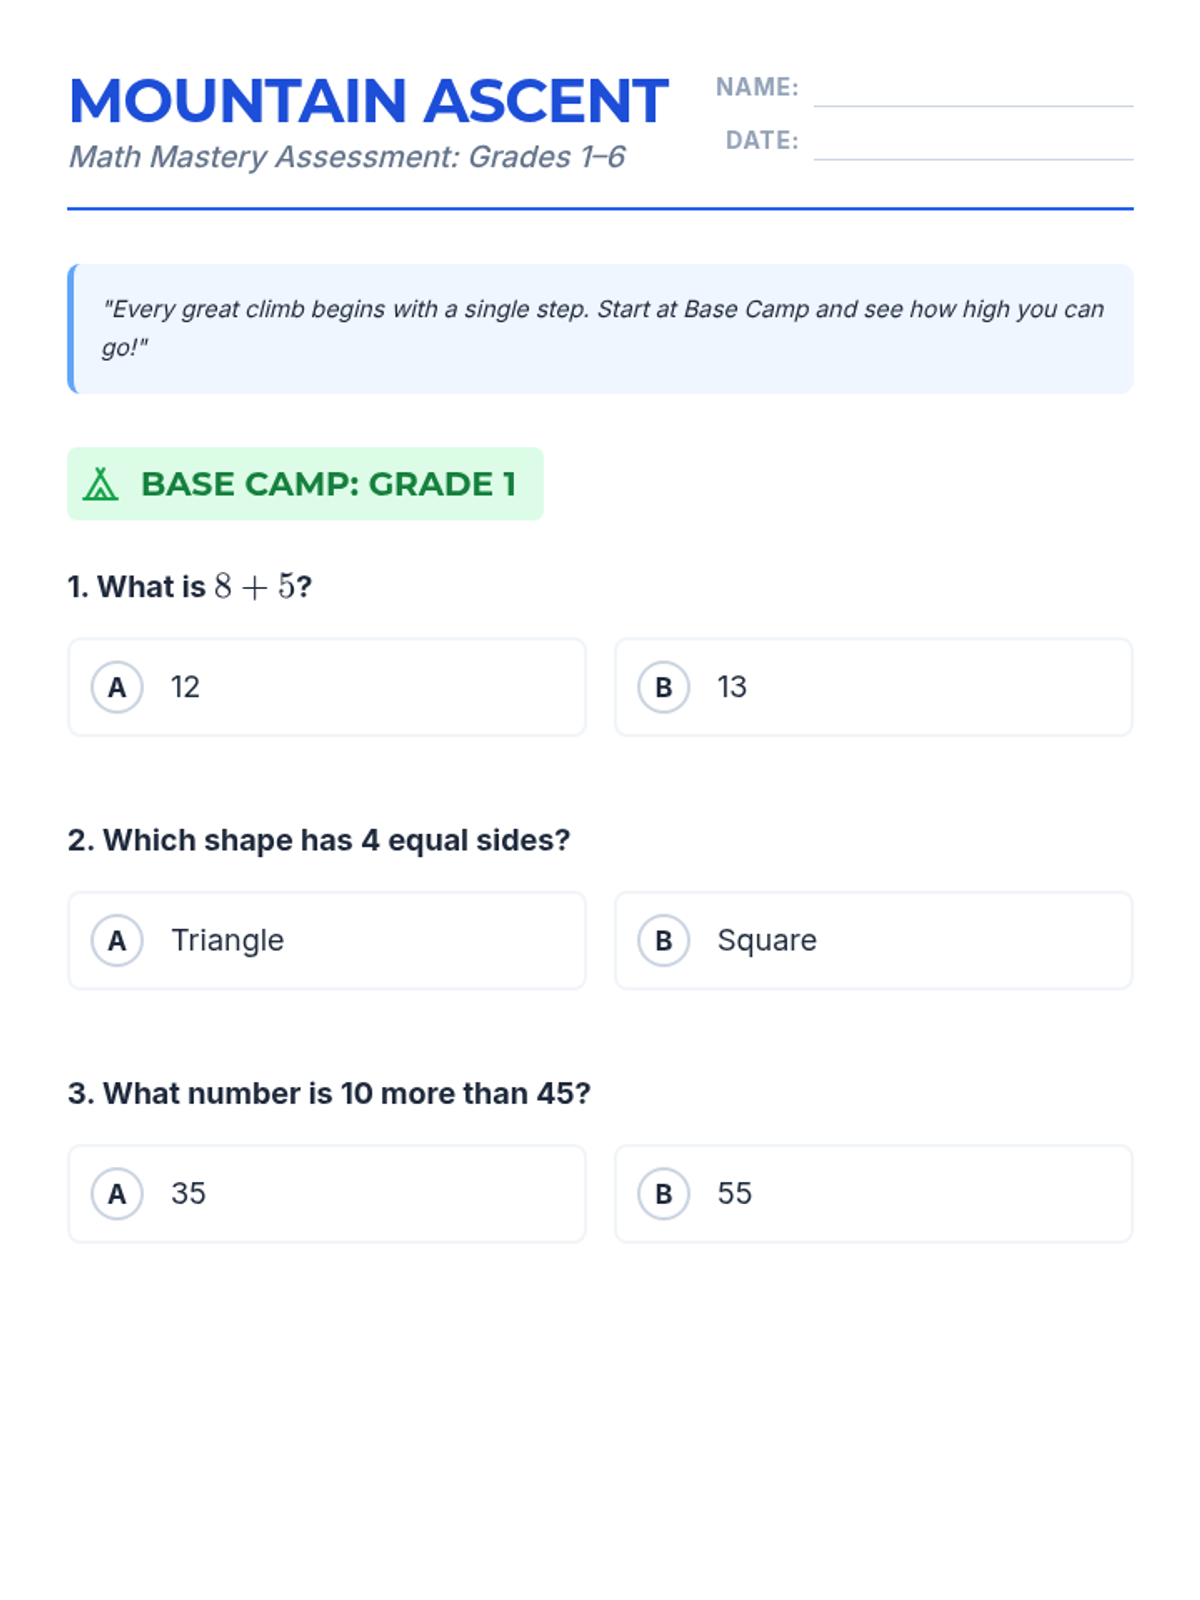
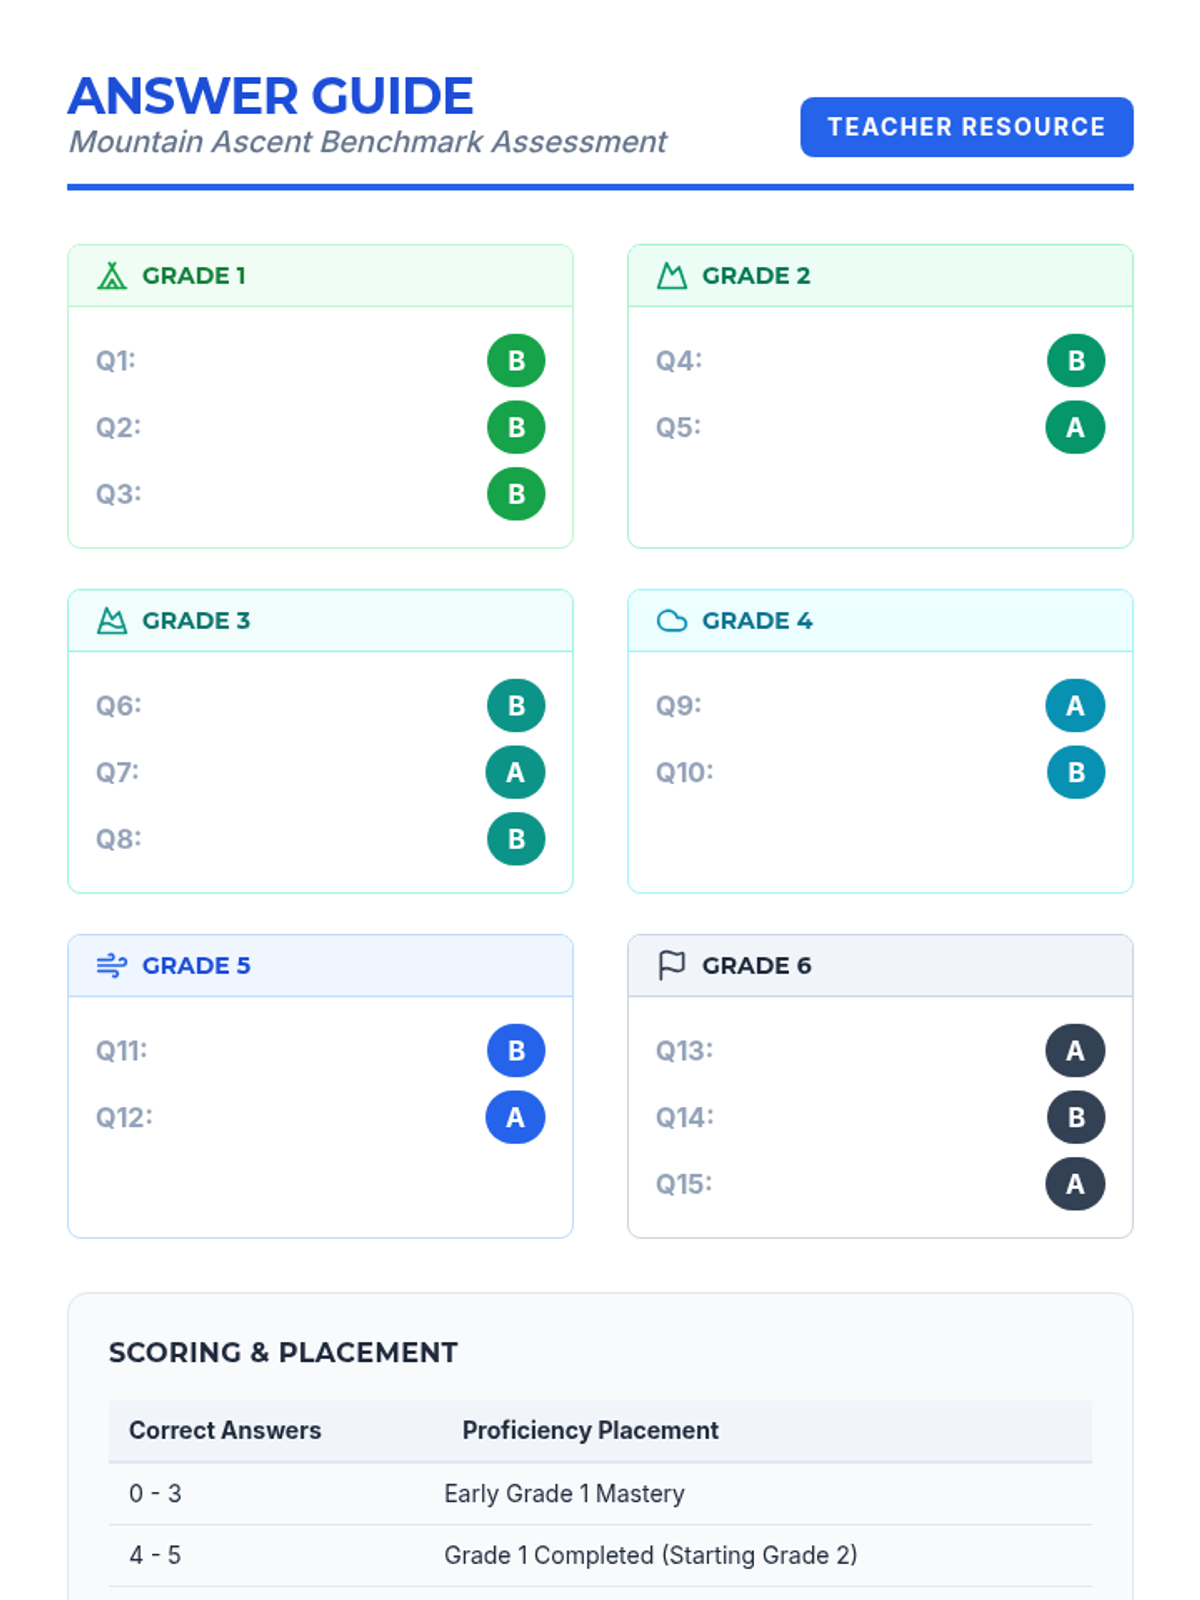
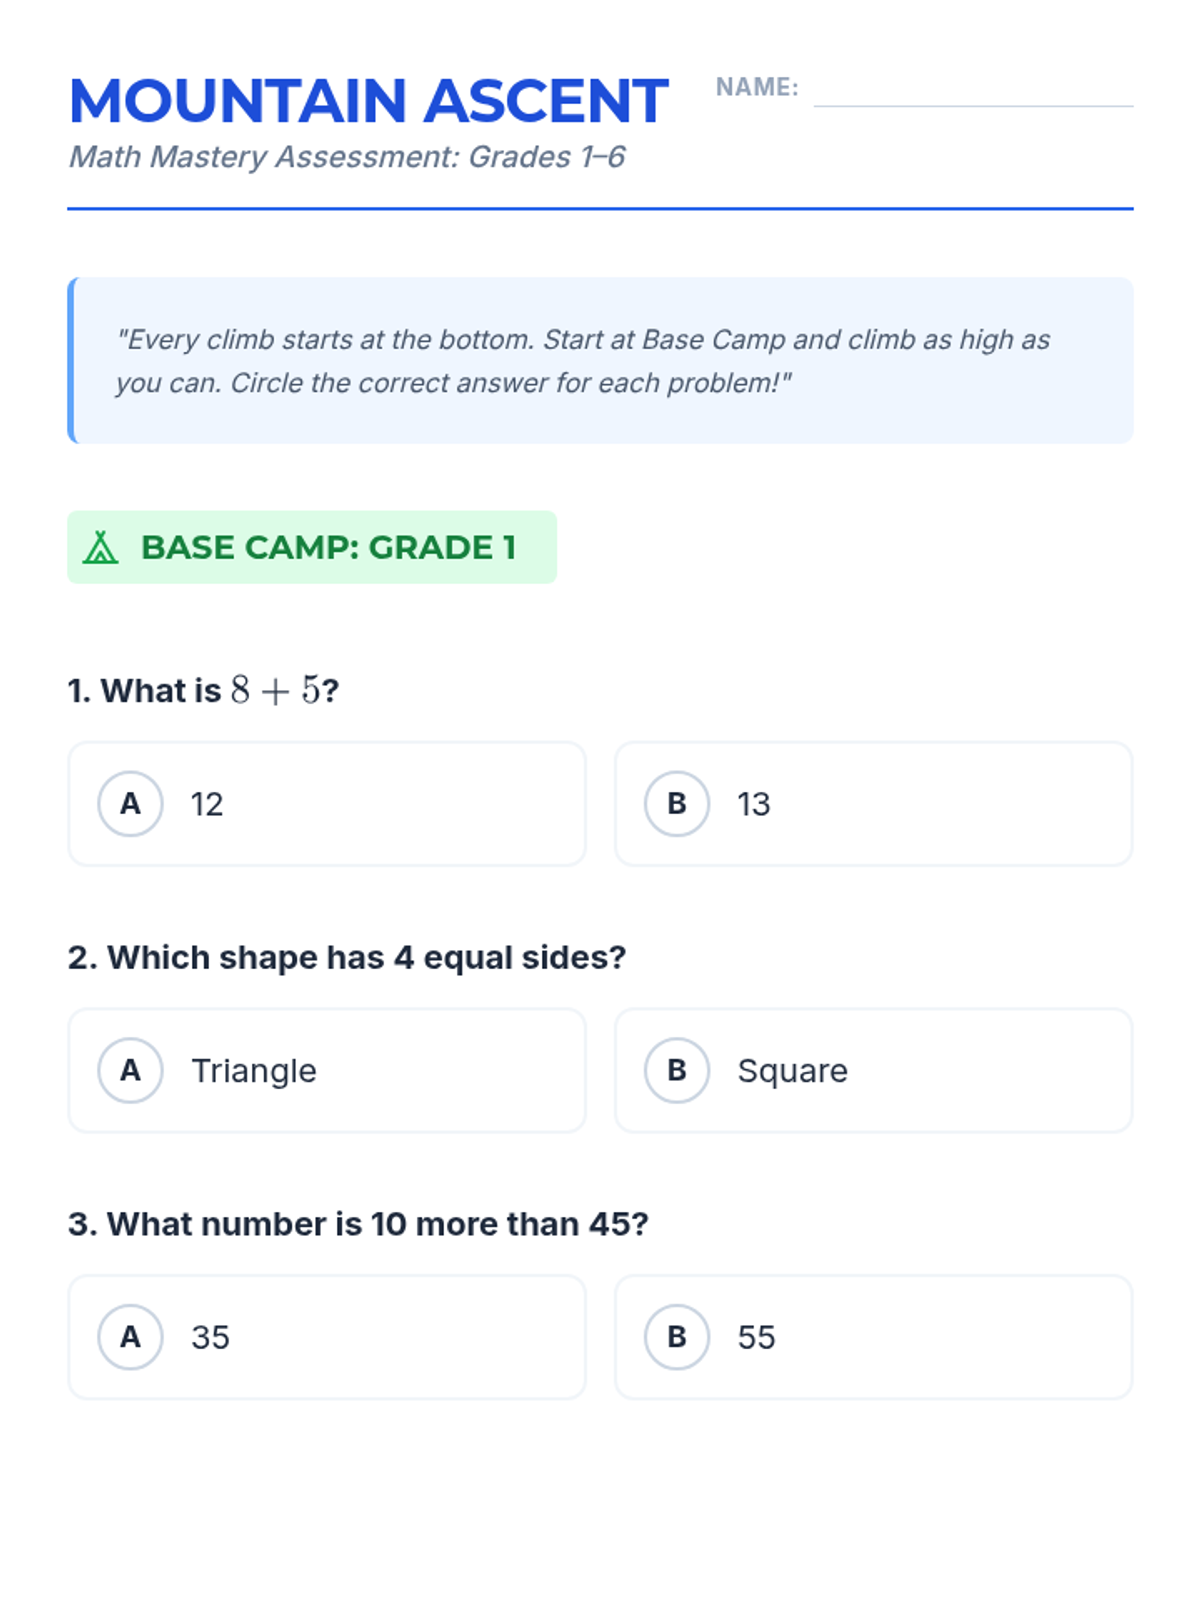
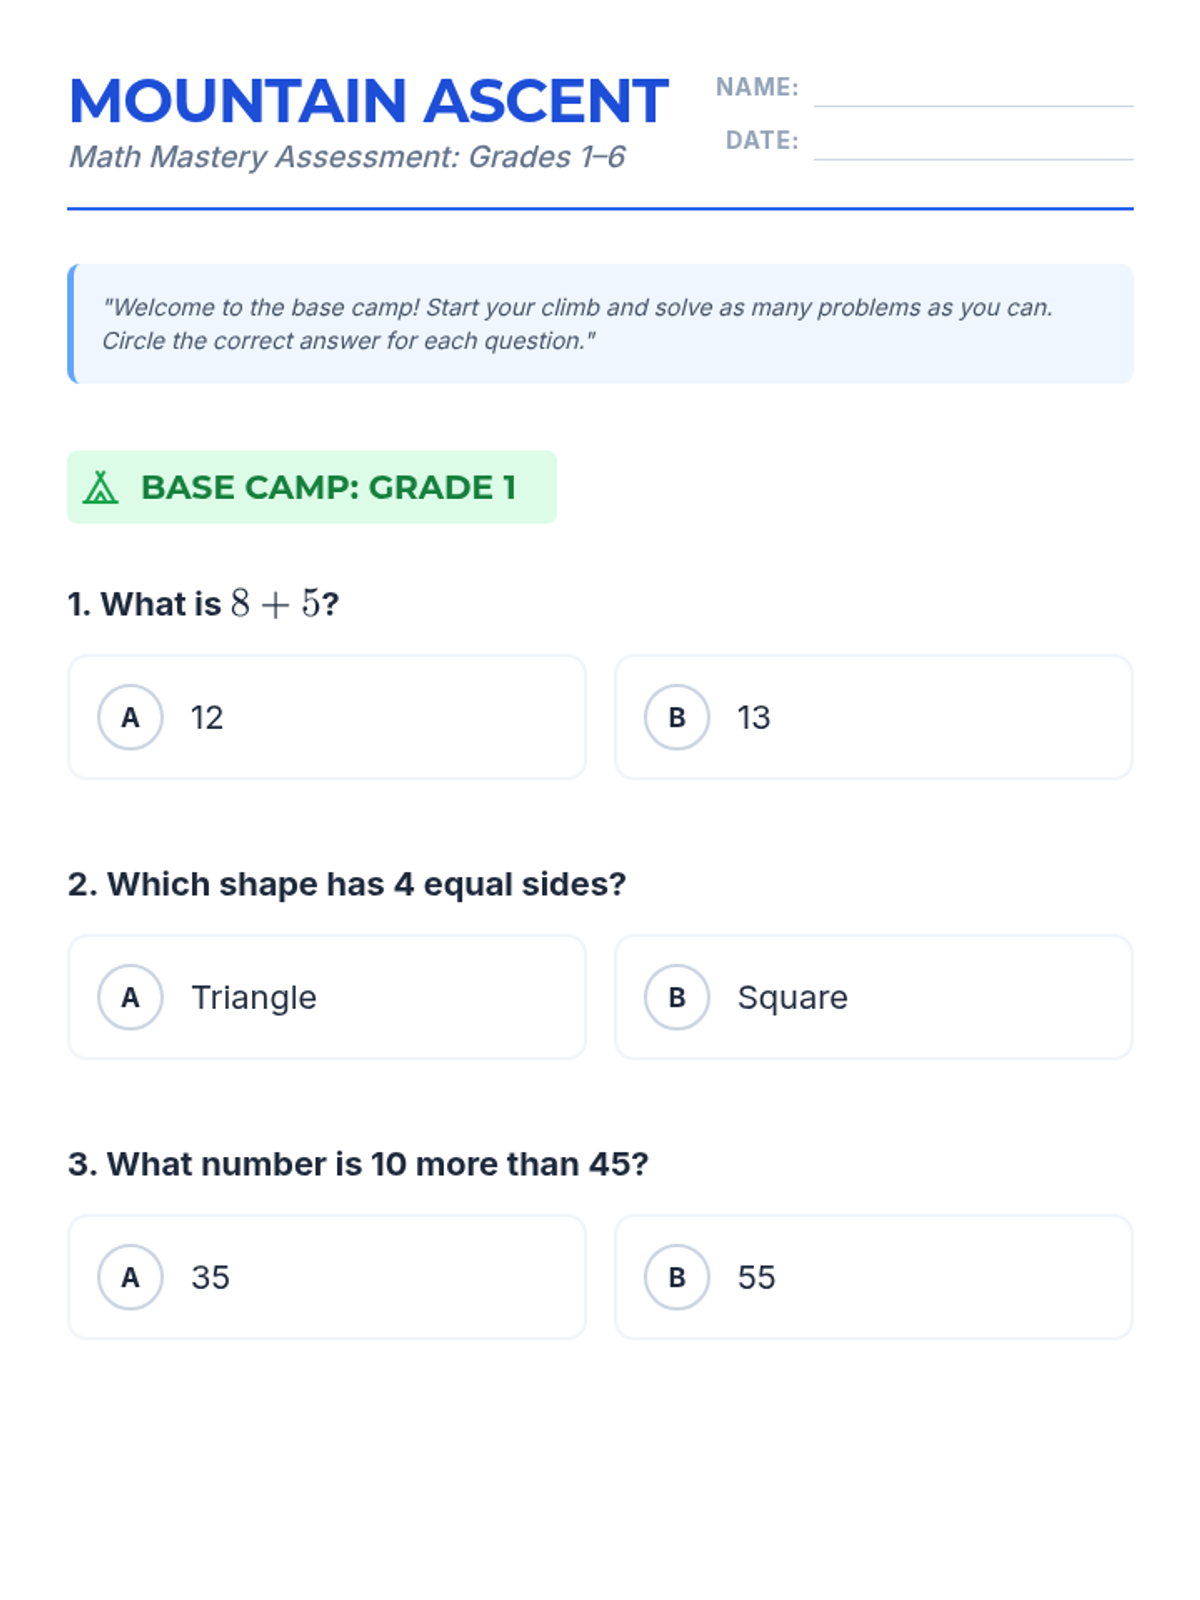
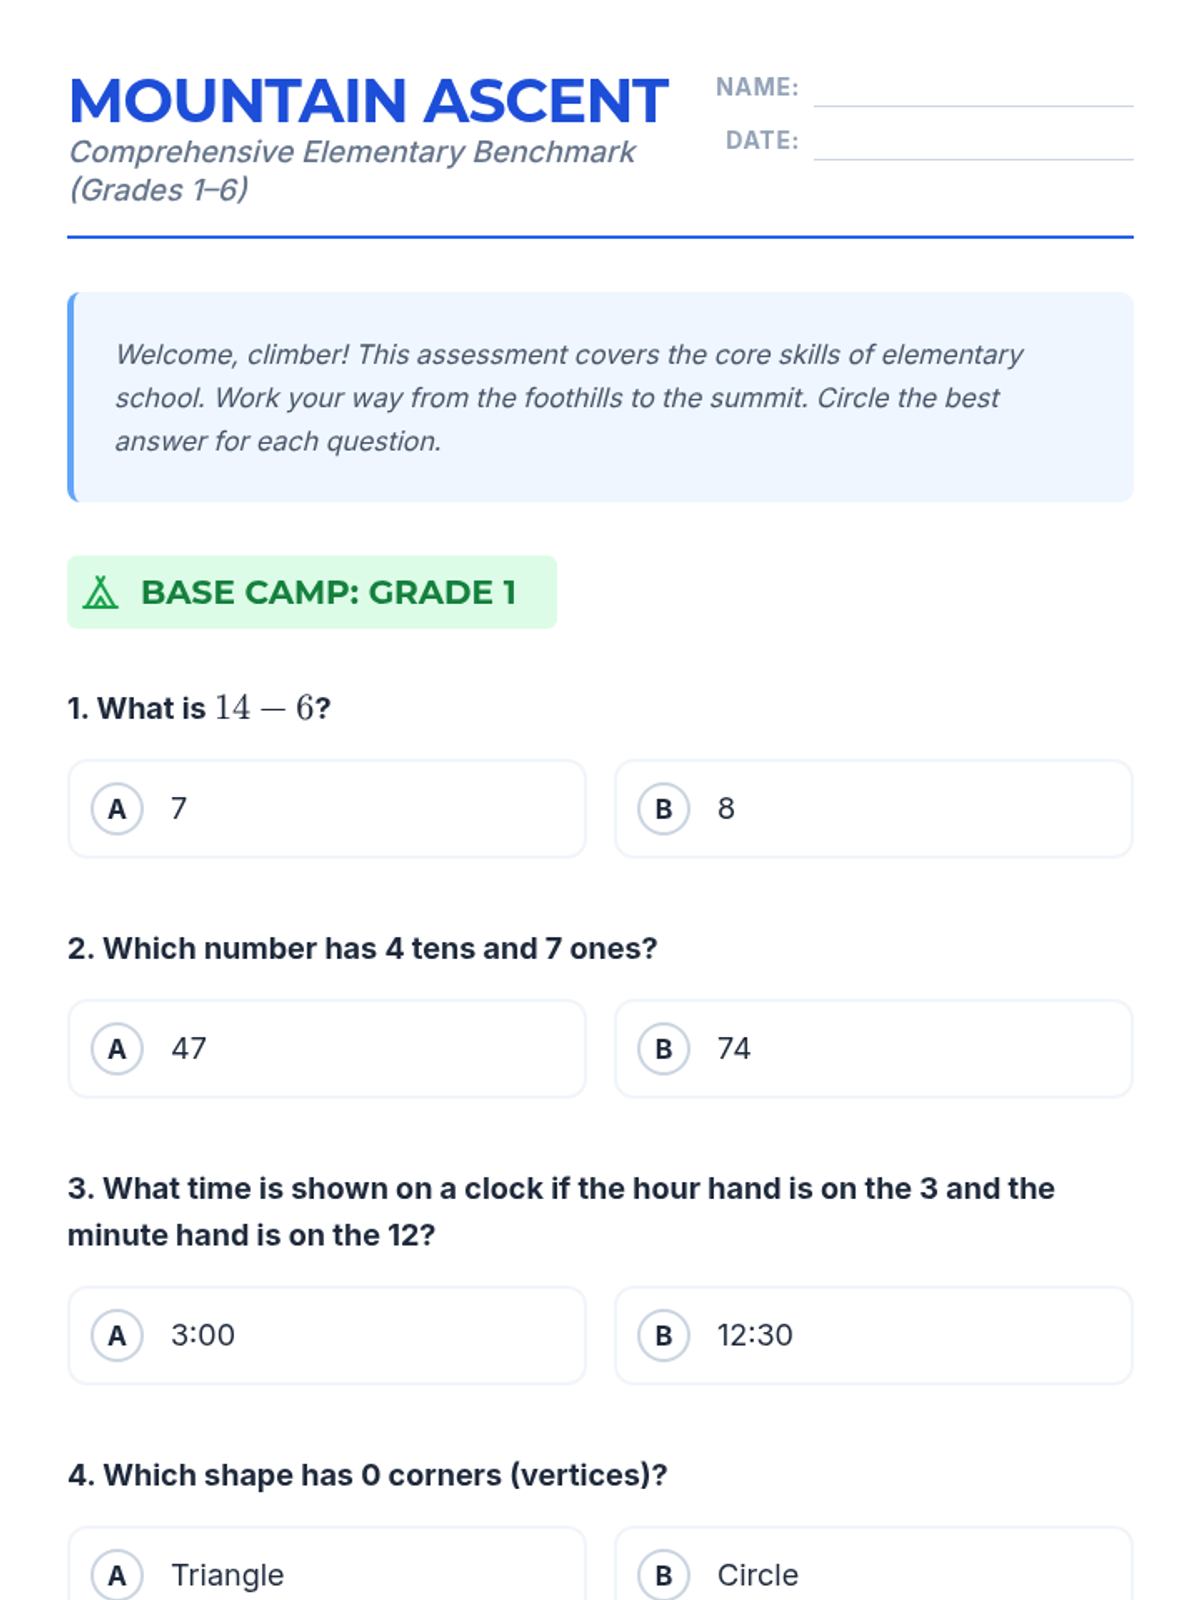
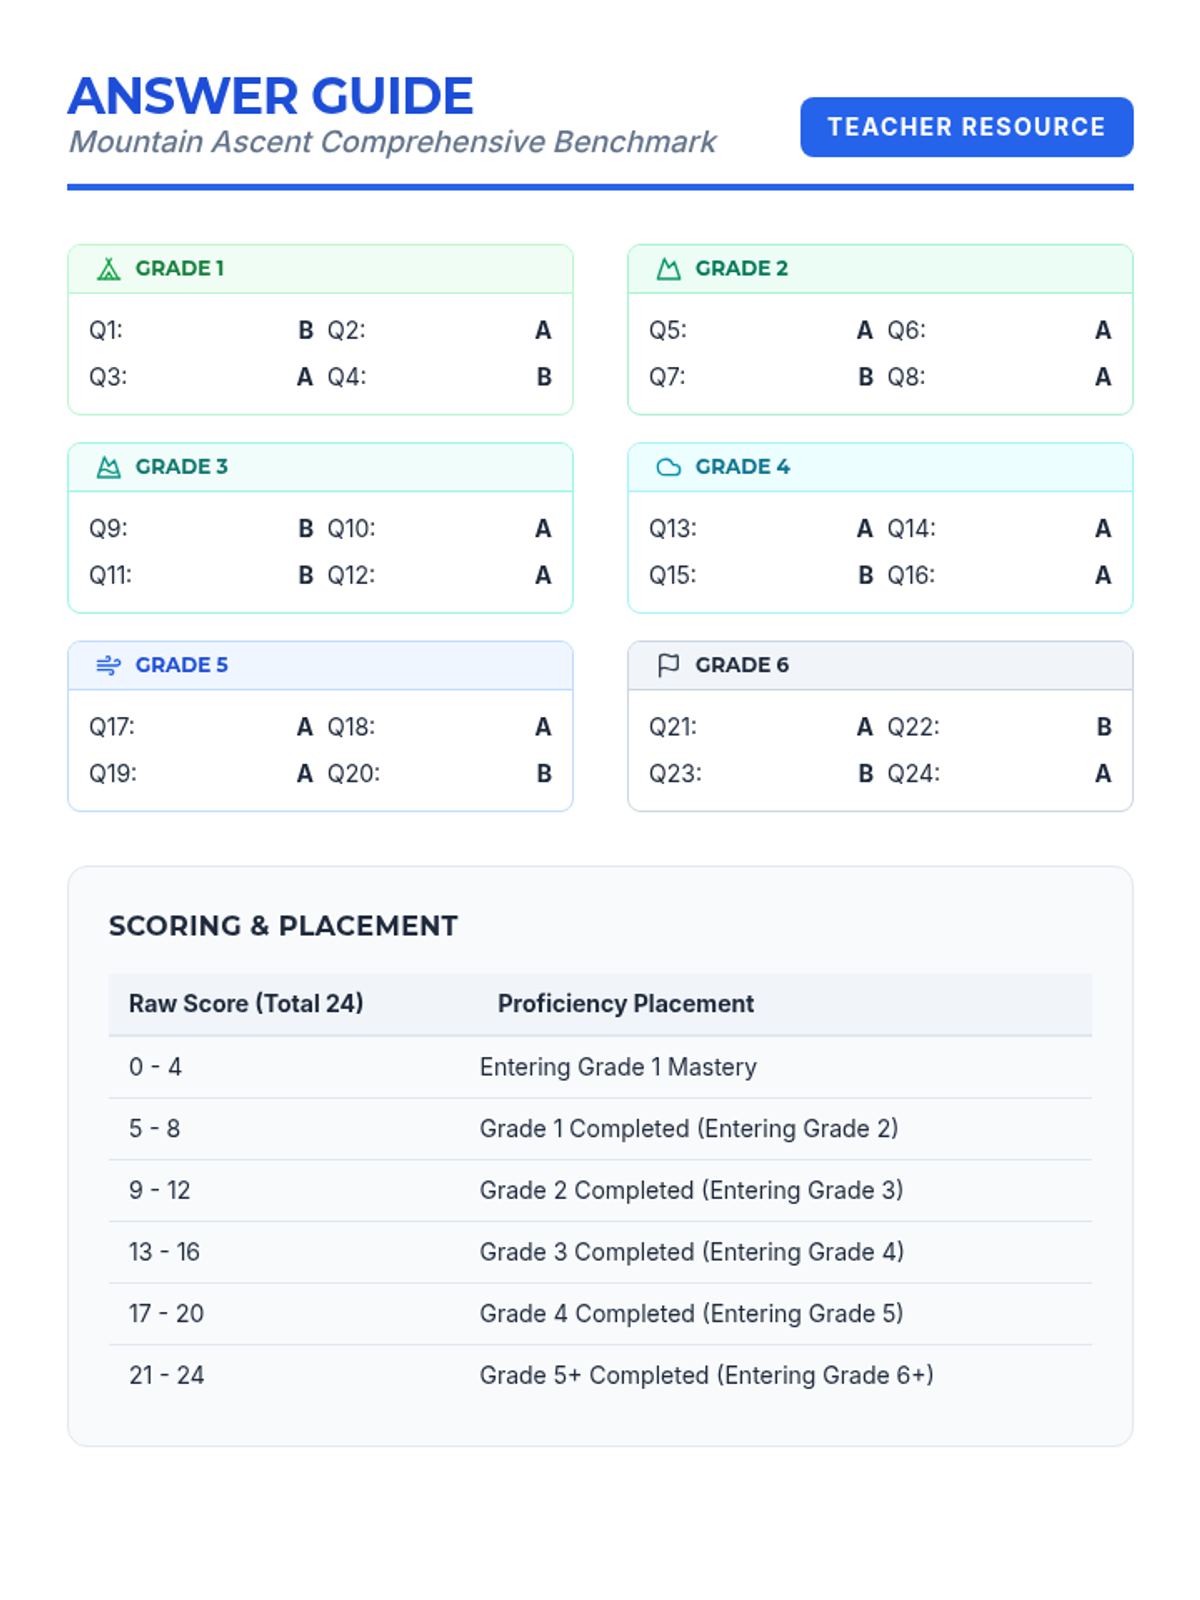
A comprehensive math benchmark assessment covering key standards from Grade 1 through Grade 6, designed to track student progress and identify skill gaps.
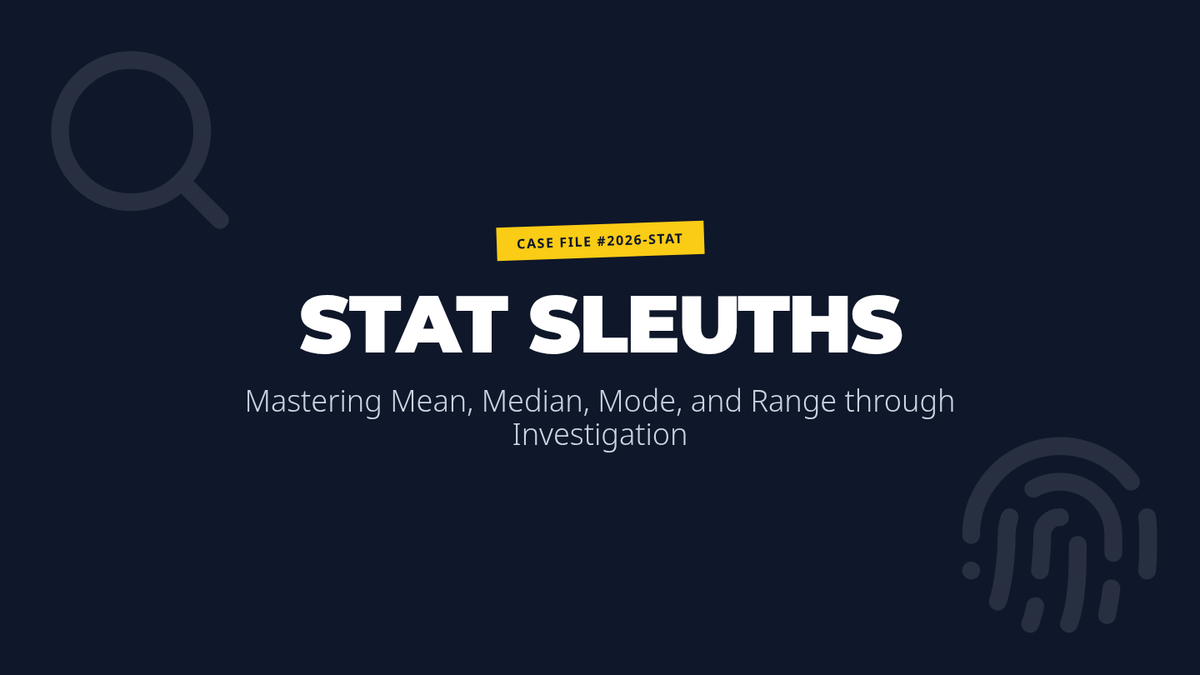
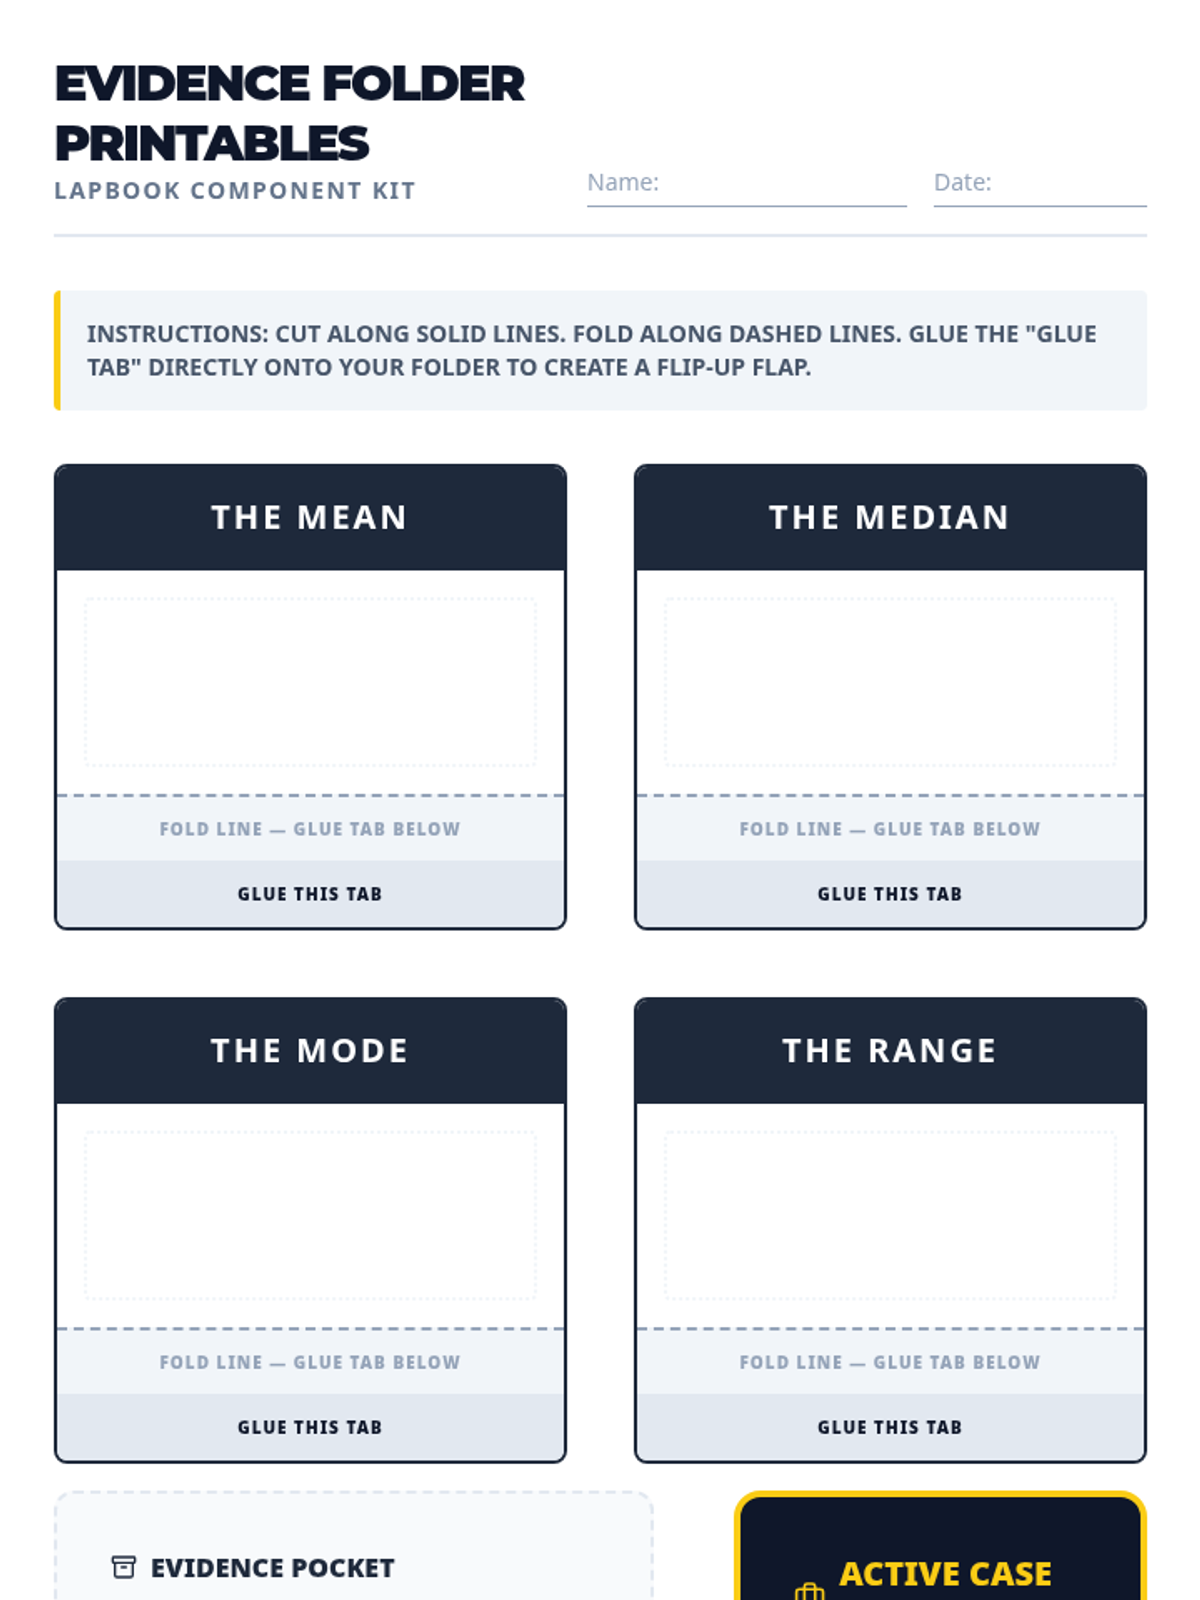
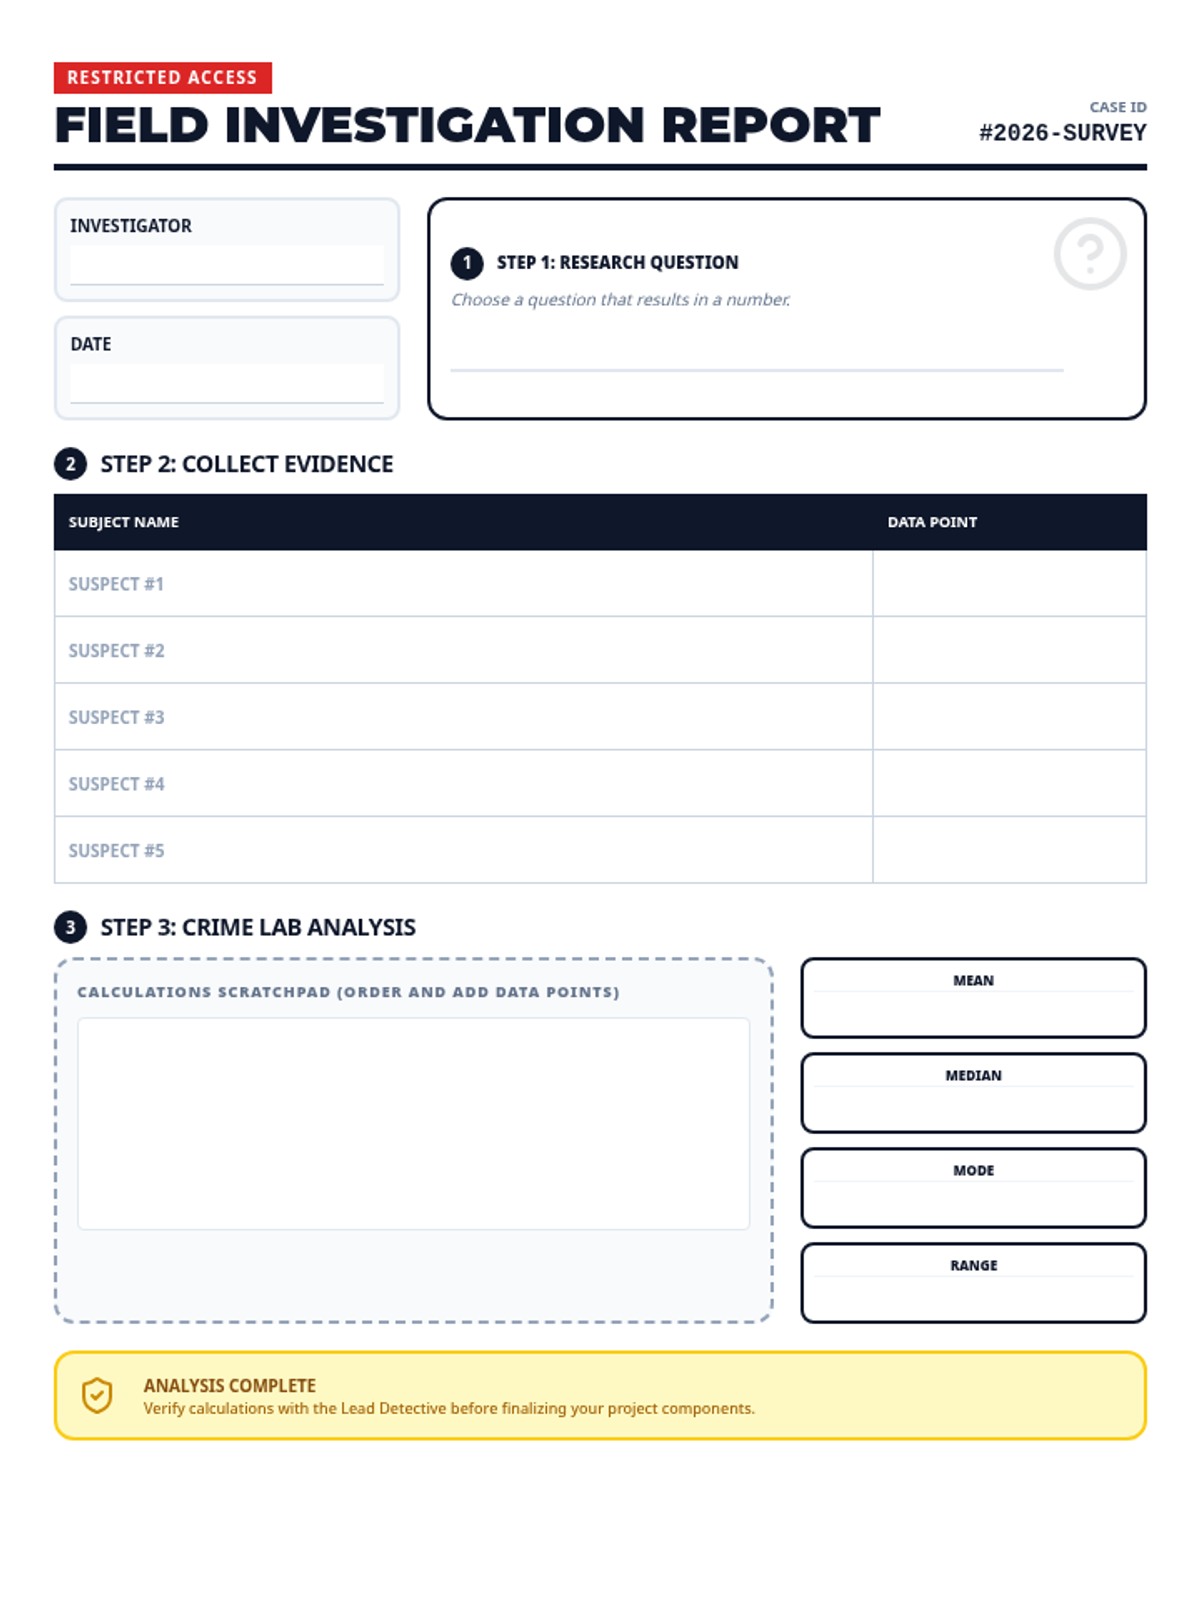
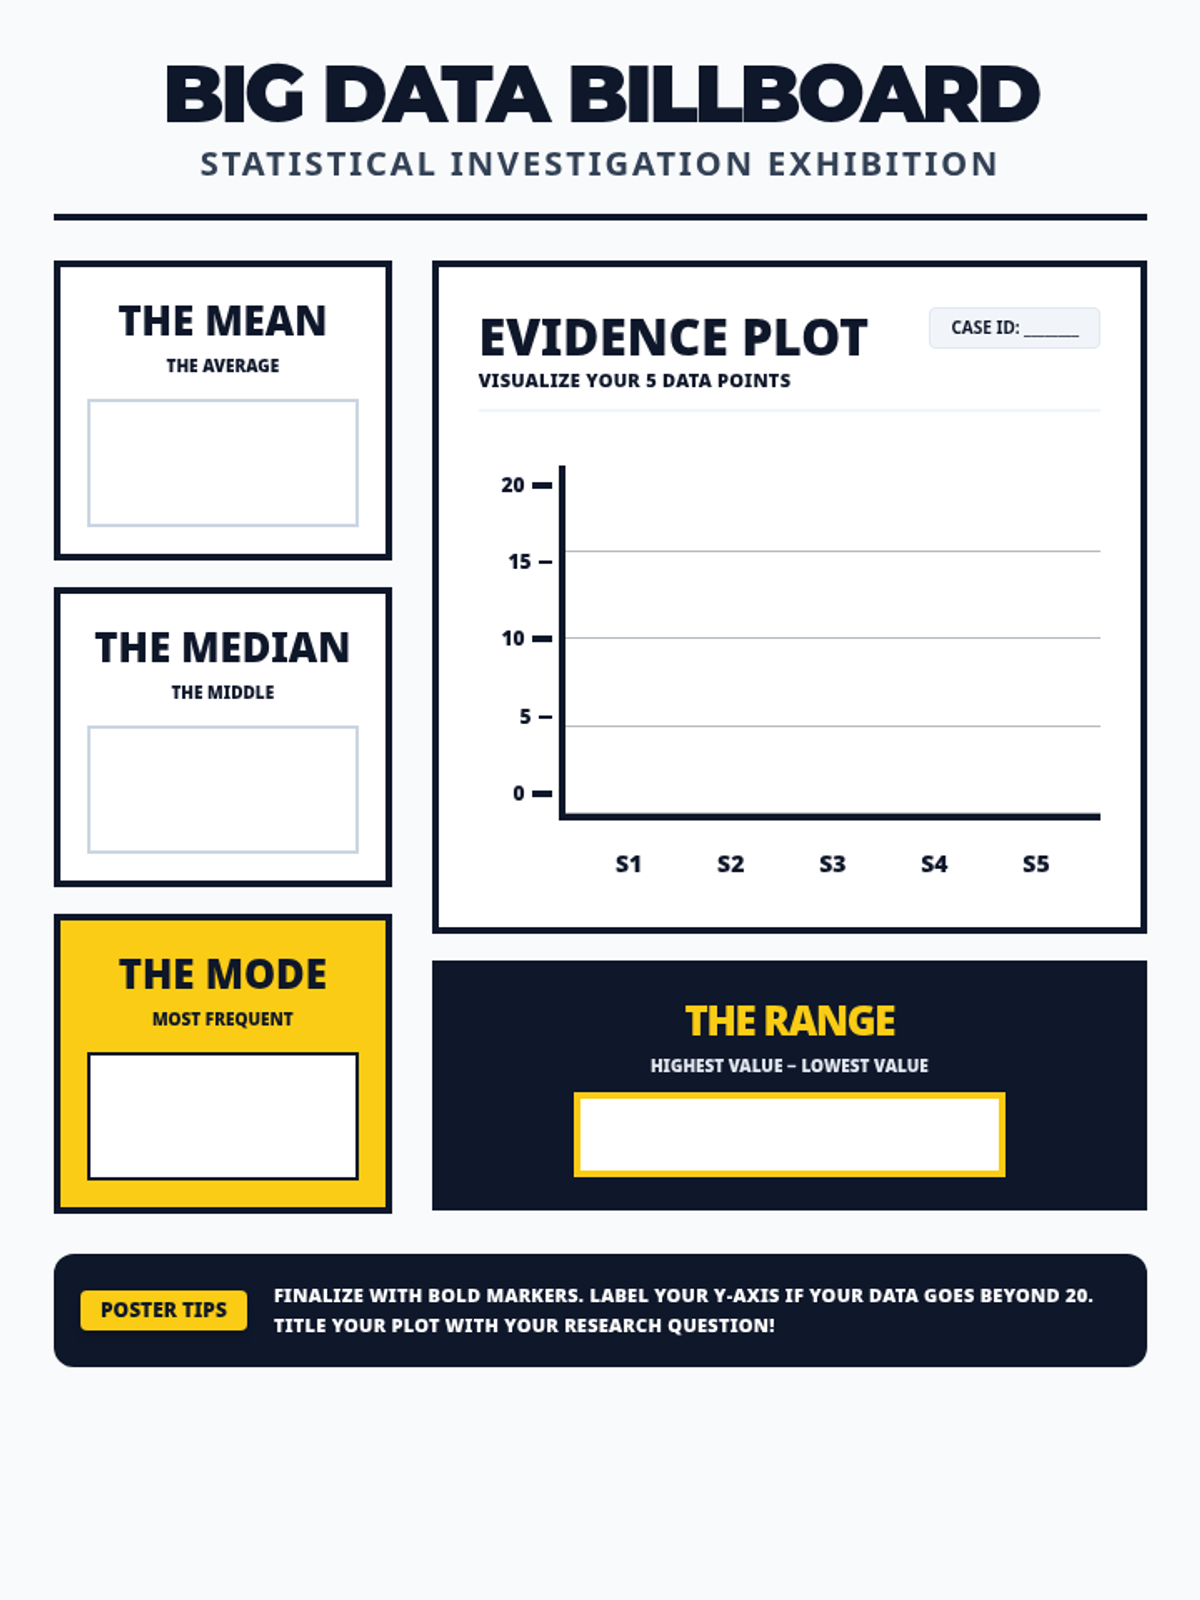
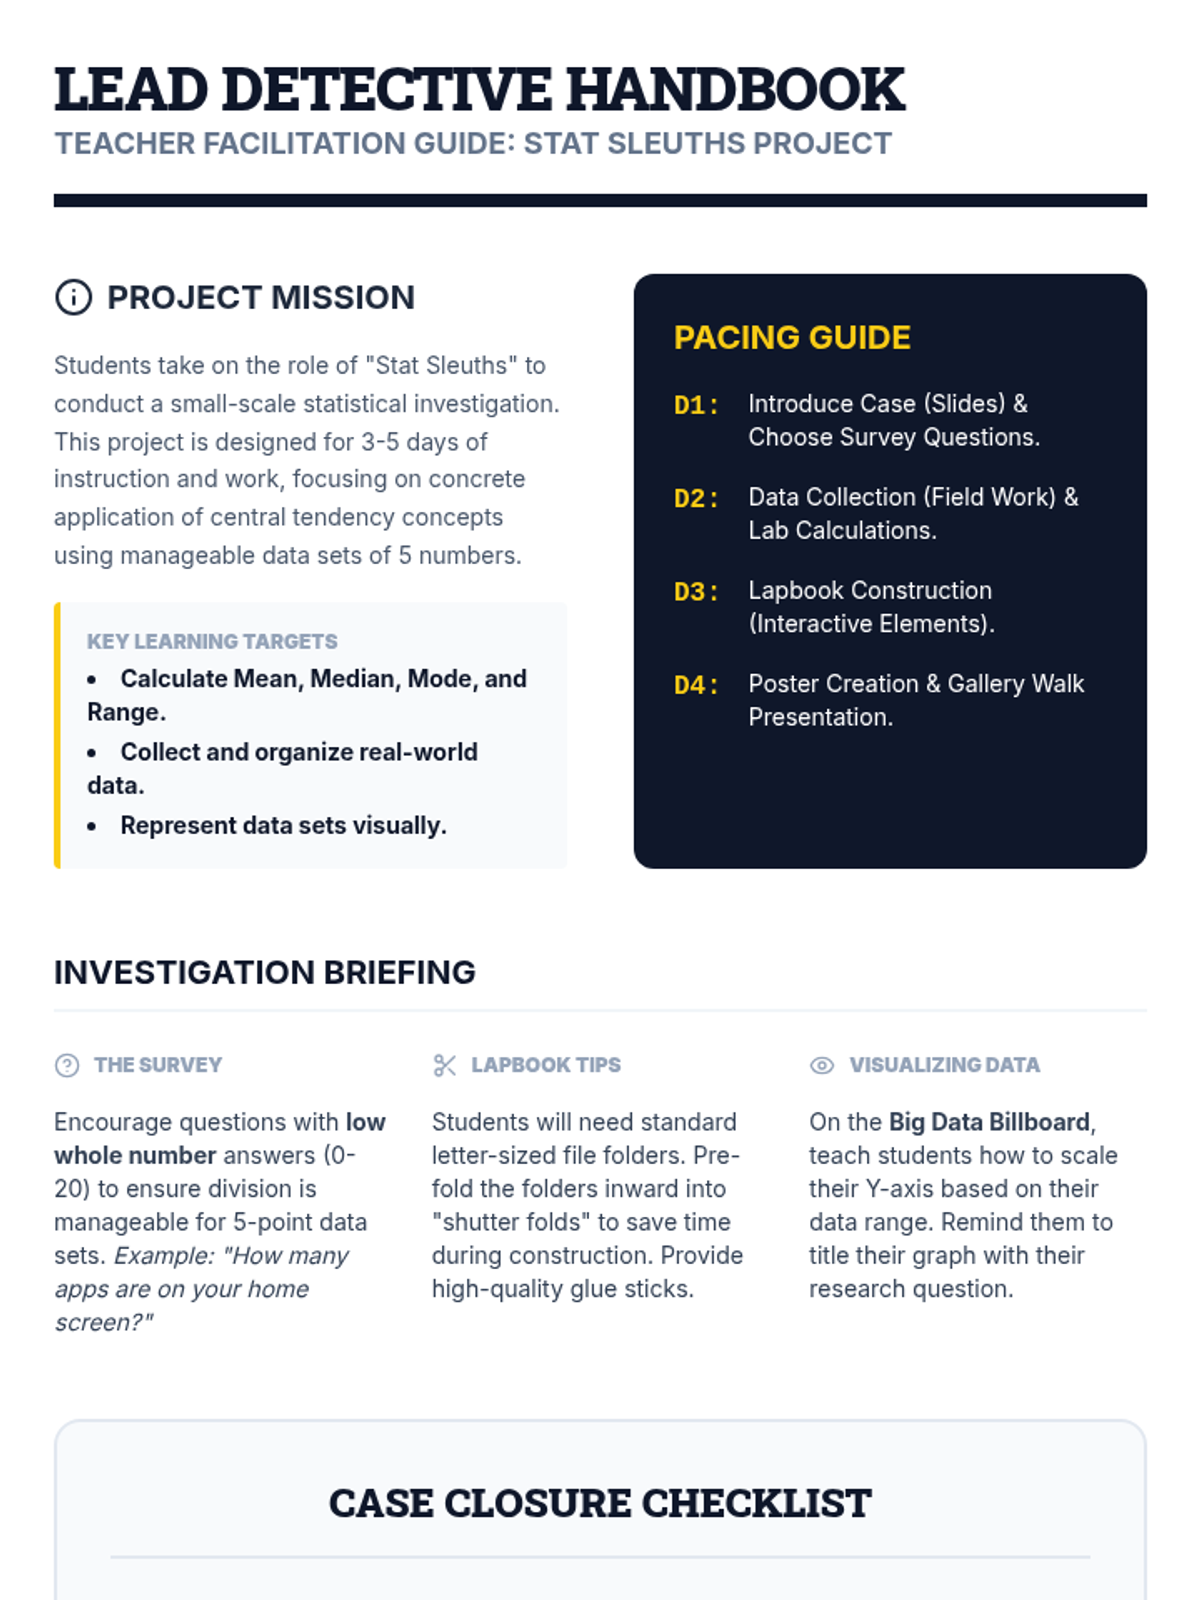
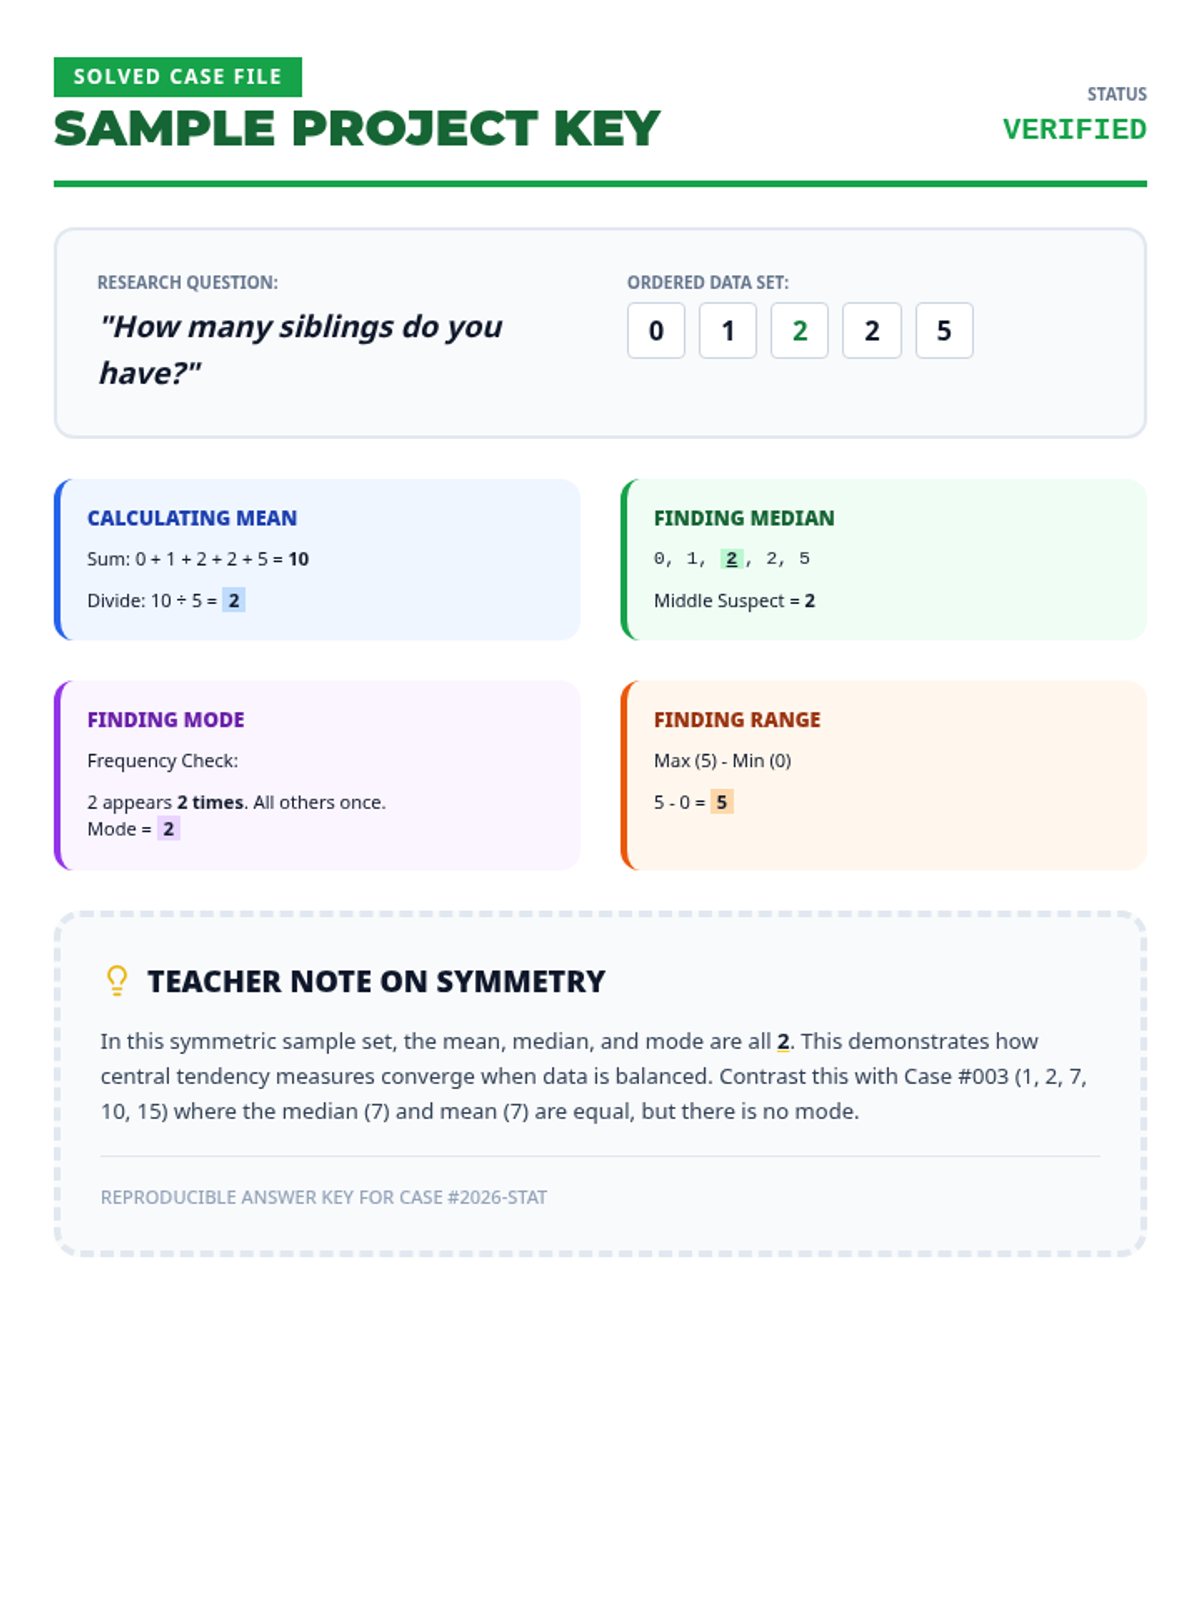
A comprehensive hands-on project where students become 'Stat Sleuths' to collect real-world data, calculate central tendencies, and present their findings through an interactive lapbook and poster.
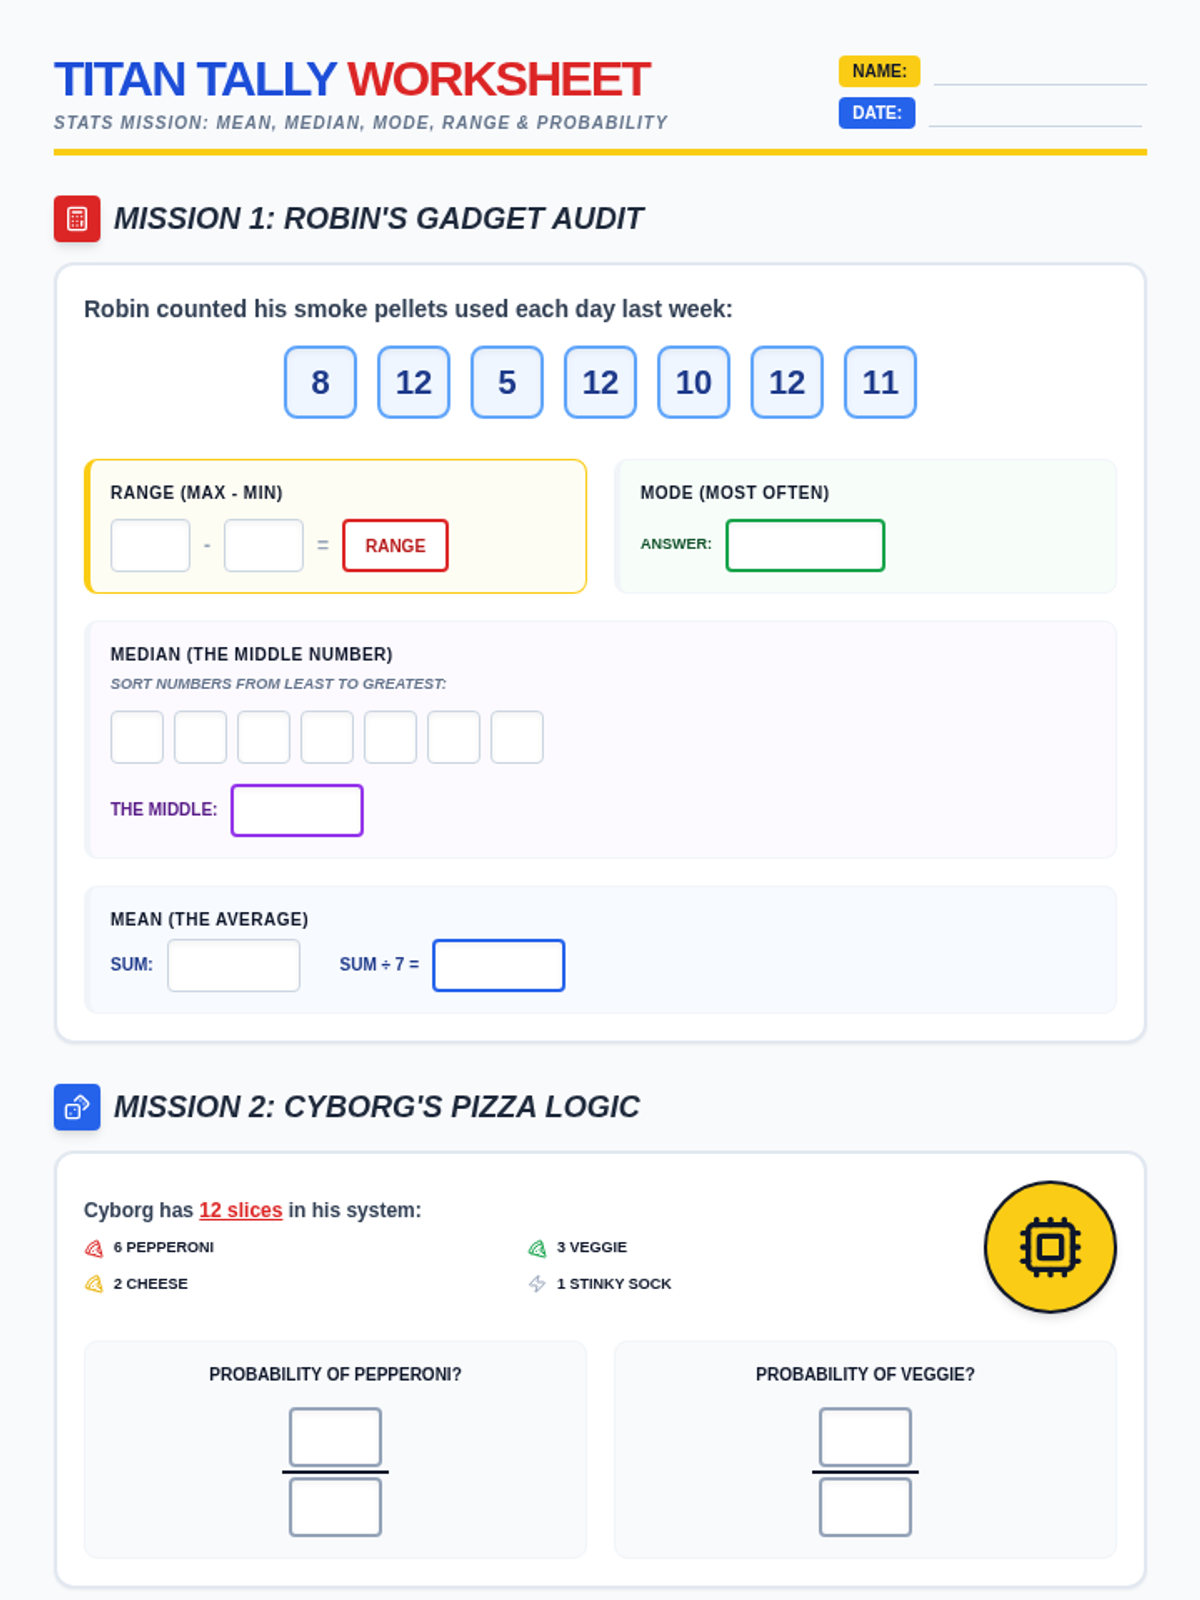
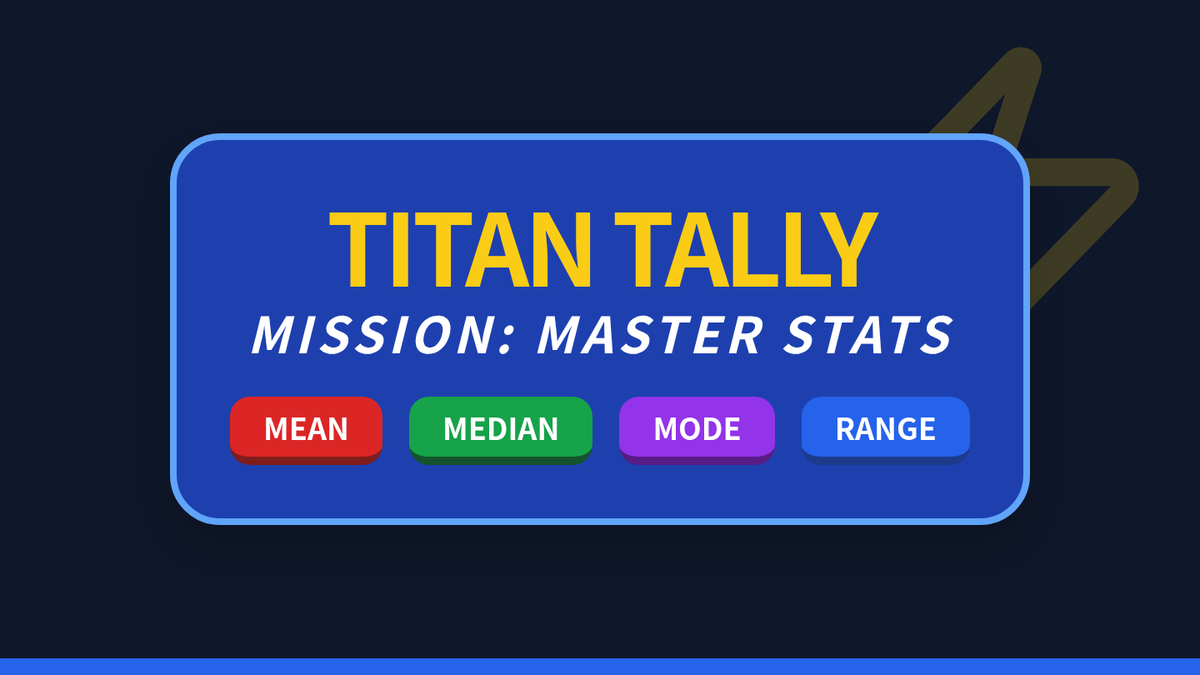
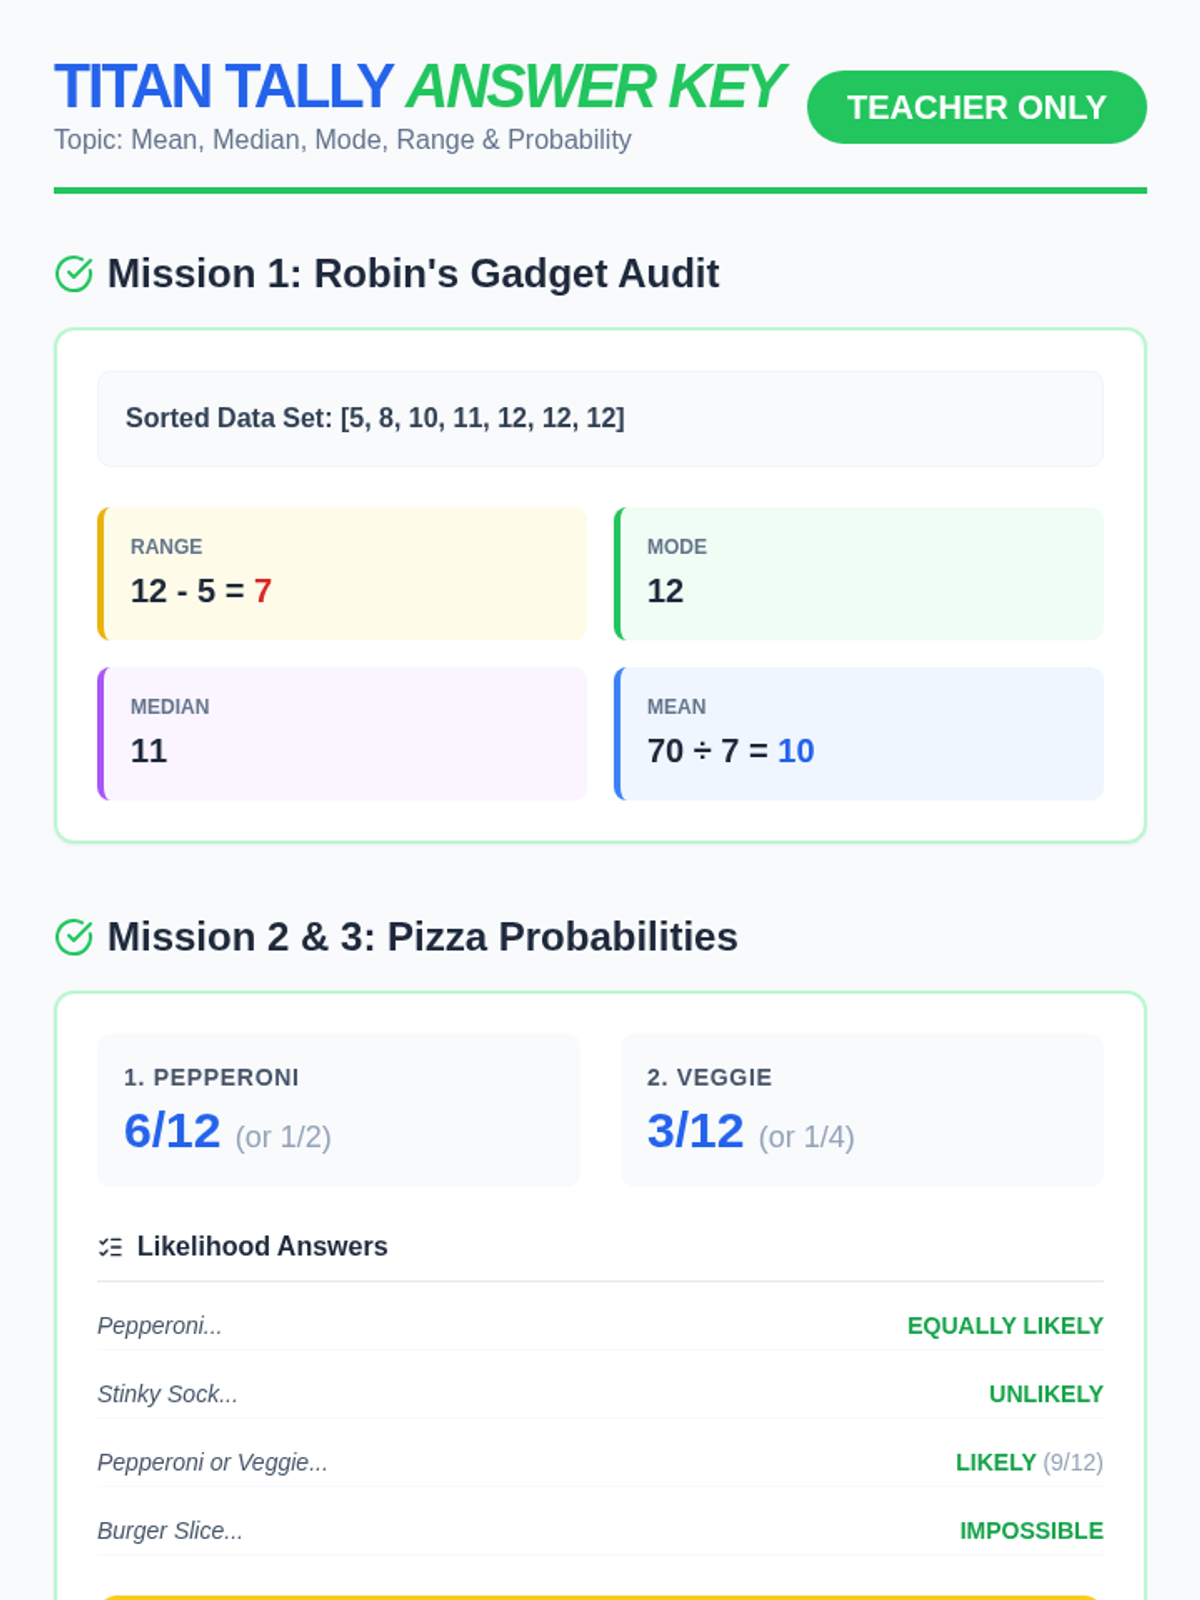
A comprehensive introduction to basic statistics using the world of the Teen Titans. Students will master Mean, Median, Mode, Range, and Probability through hands-on practice with their favorite heroes.
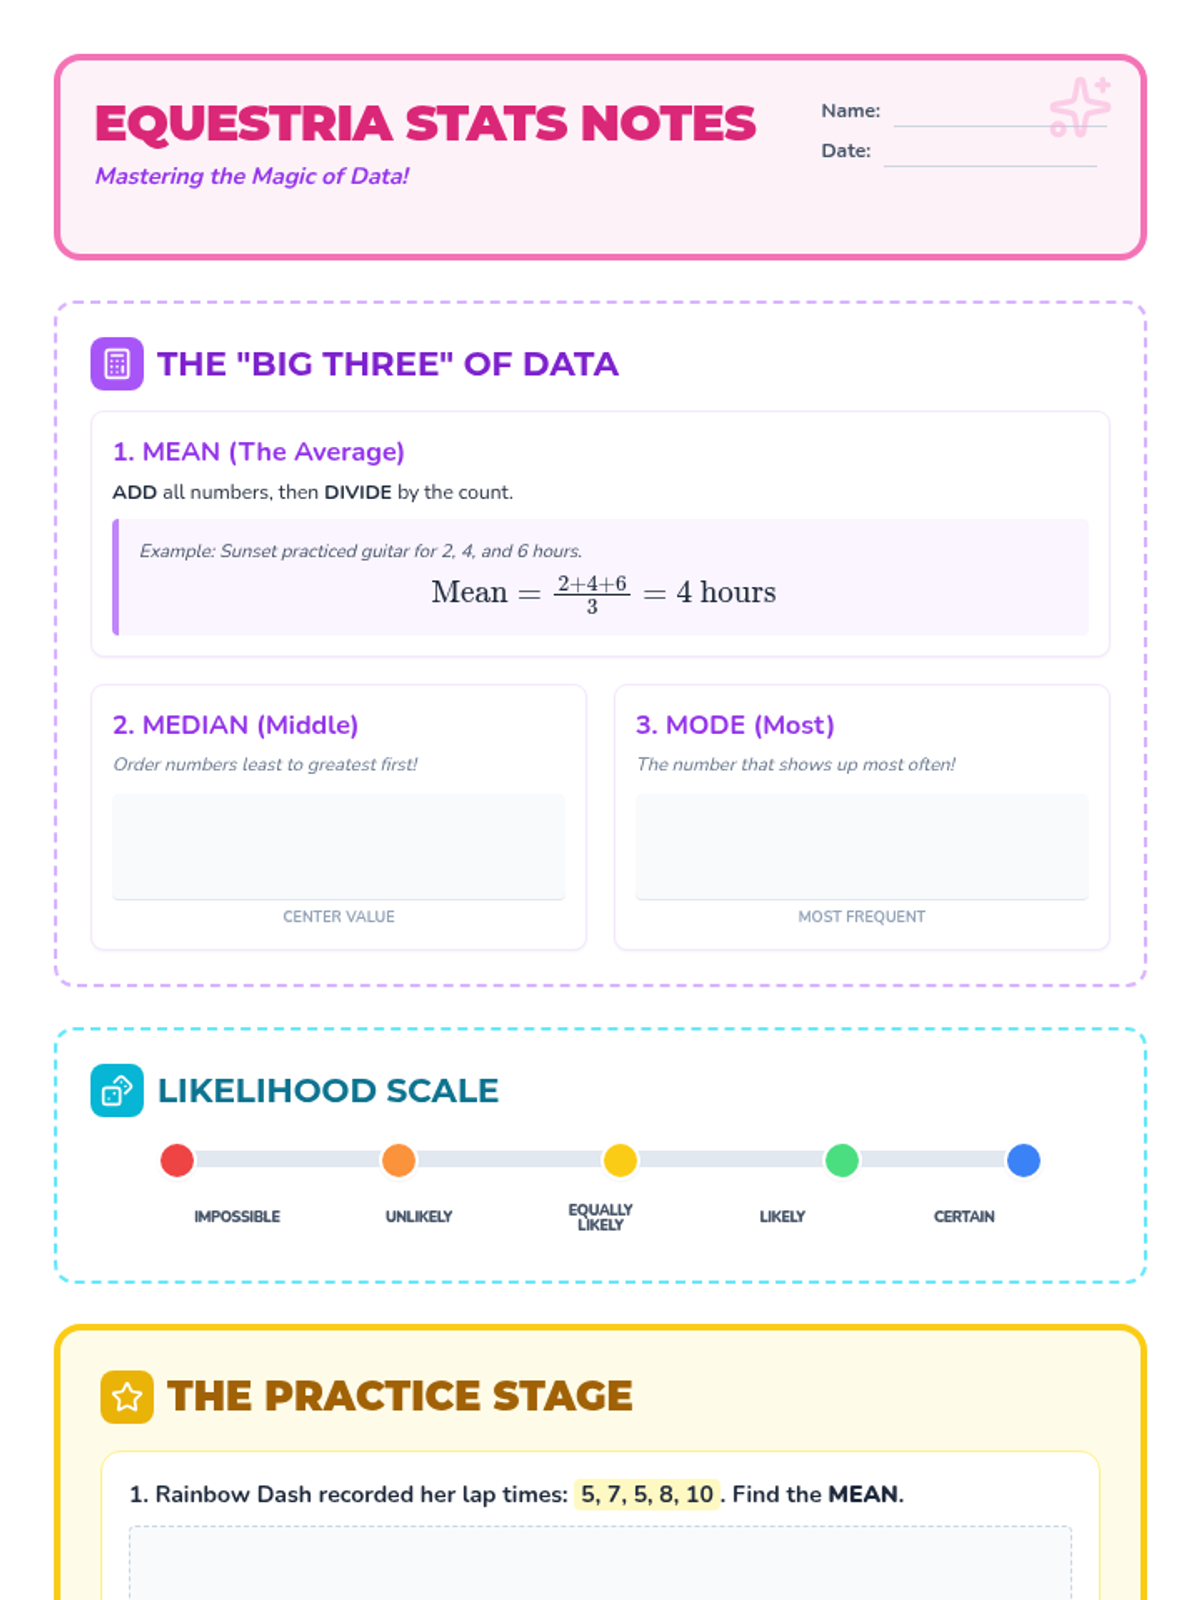
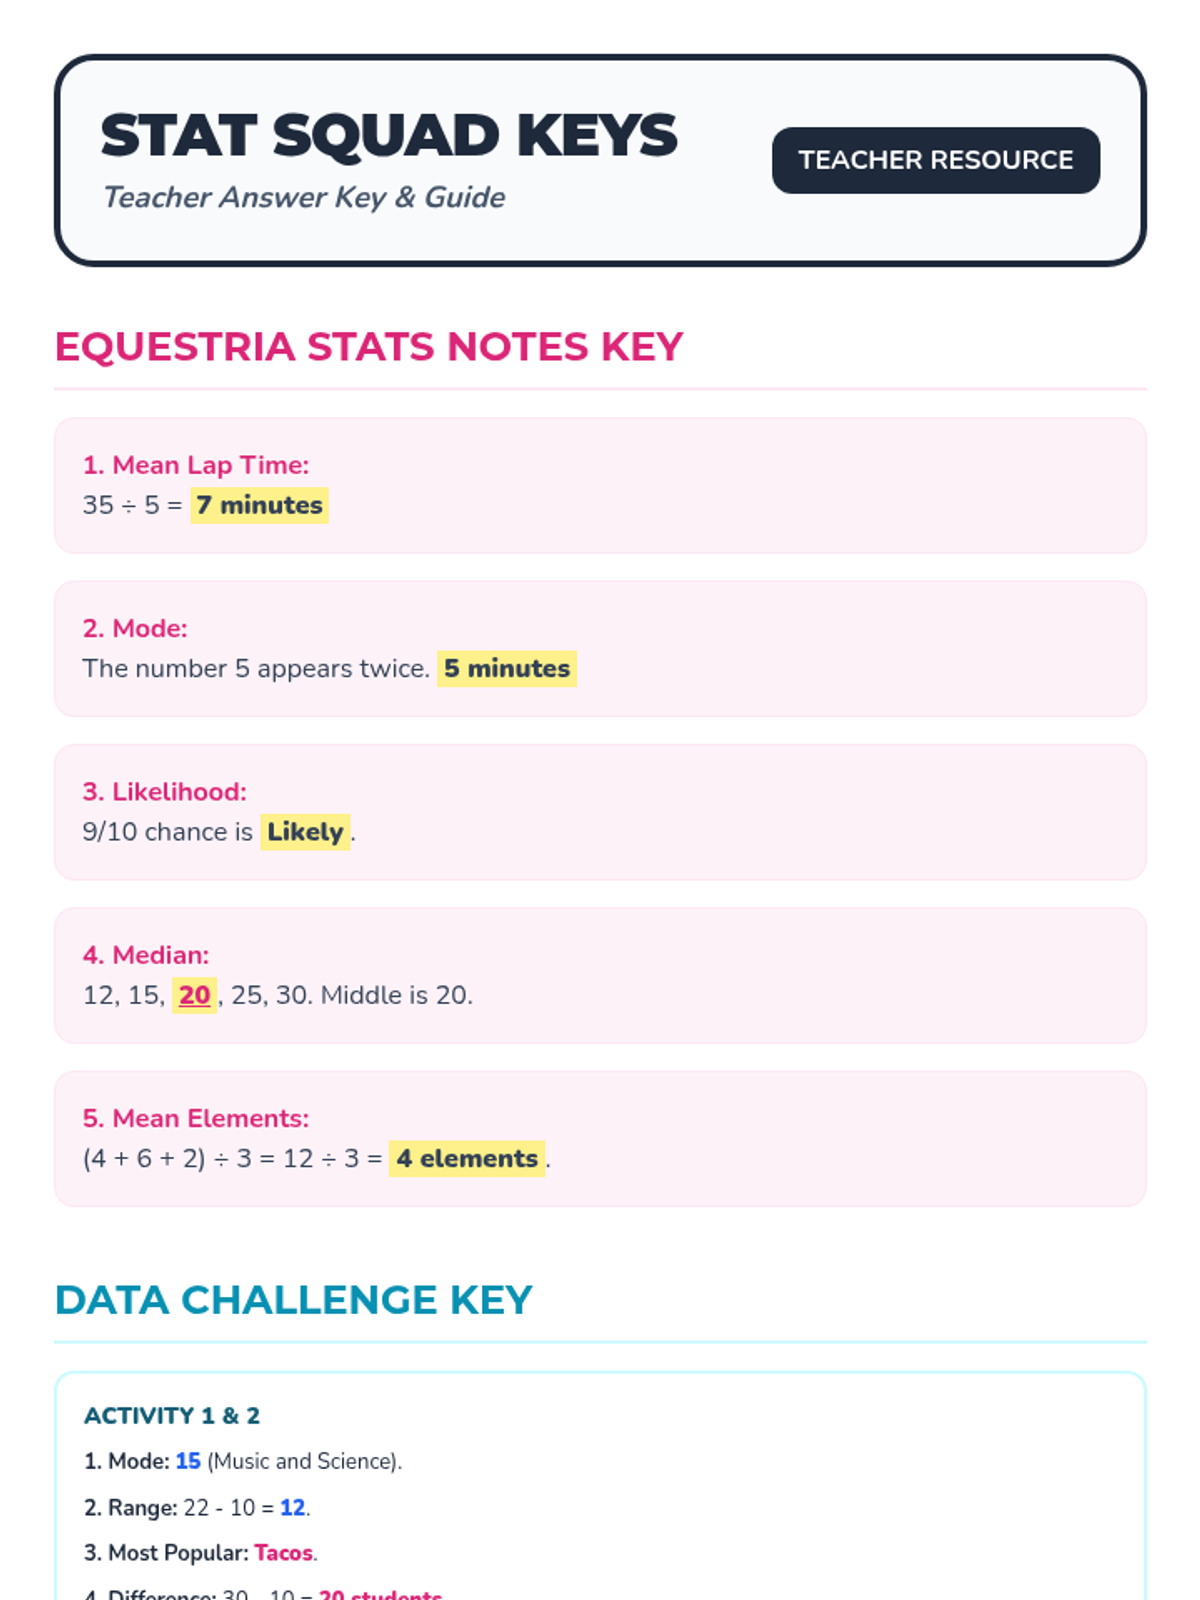
A fun, themed introduction to statistics covering central tendency, probability, and data visualization using the world of My Little Pony: Equestria Girls.
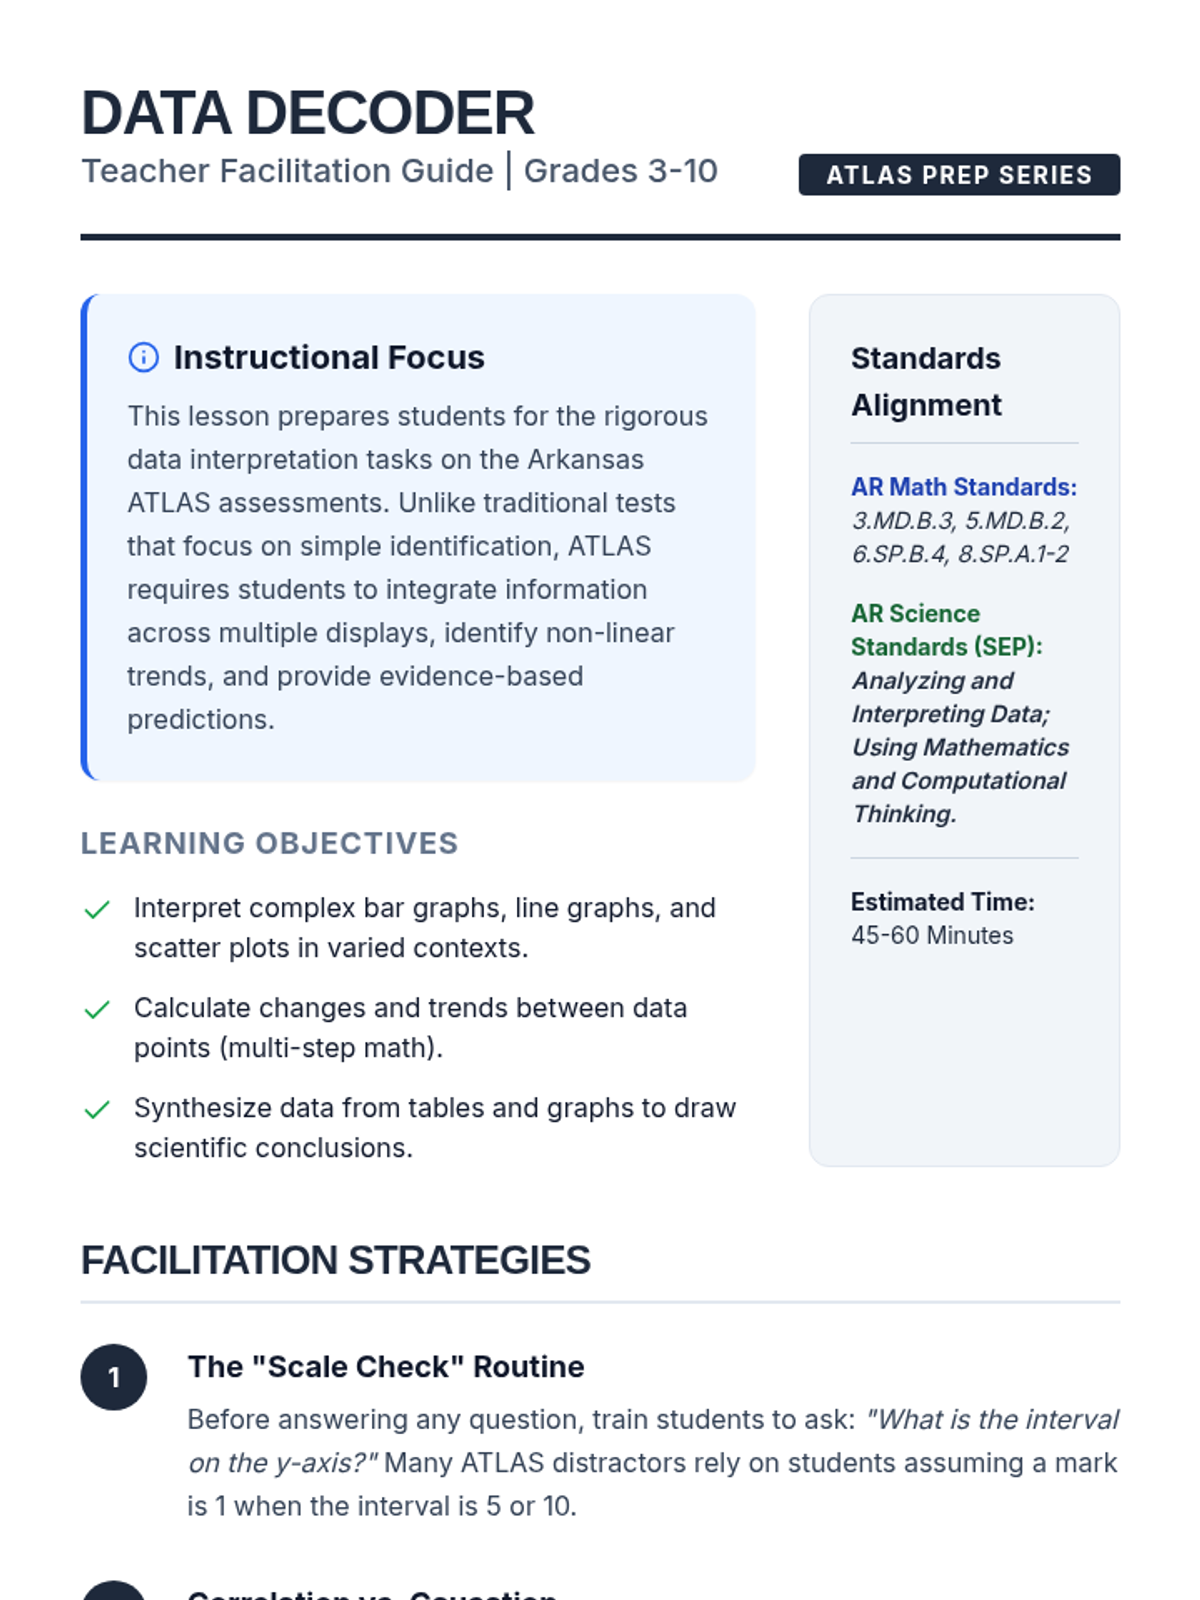
A comprehensive guide to mastering data interpretation for Arkansas ATLAS assessments, covering bar graphs, line graphs, scatter plots, and tables in math and science contexts. Students learn to decode complex visuals and draw evidence-based conclusions.
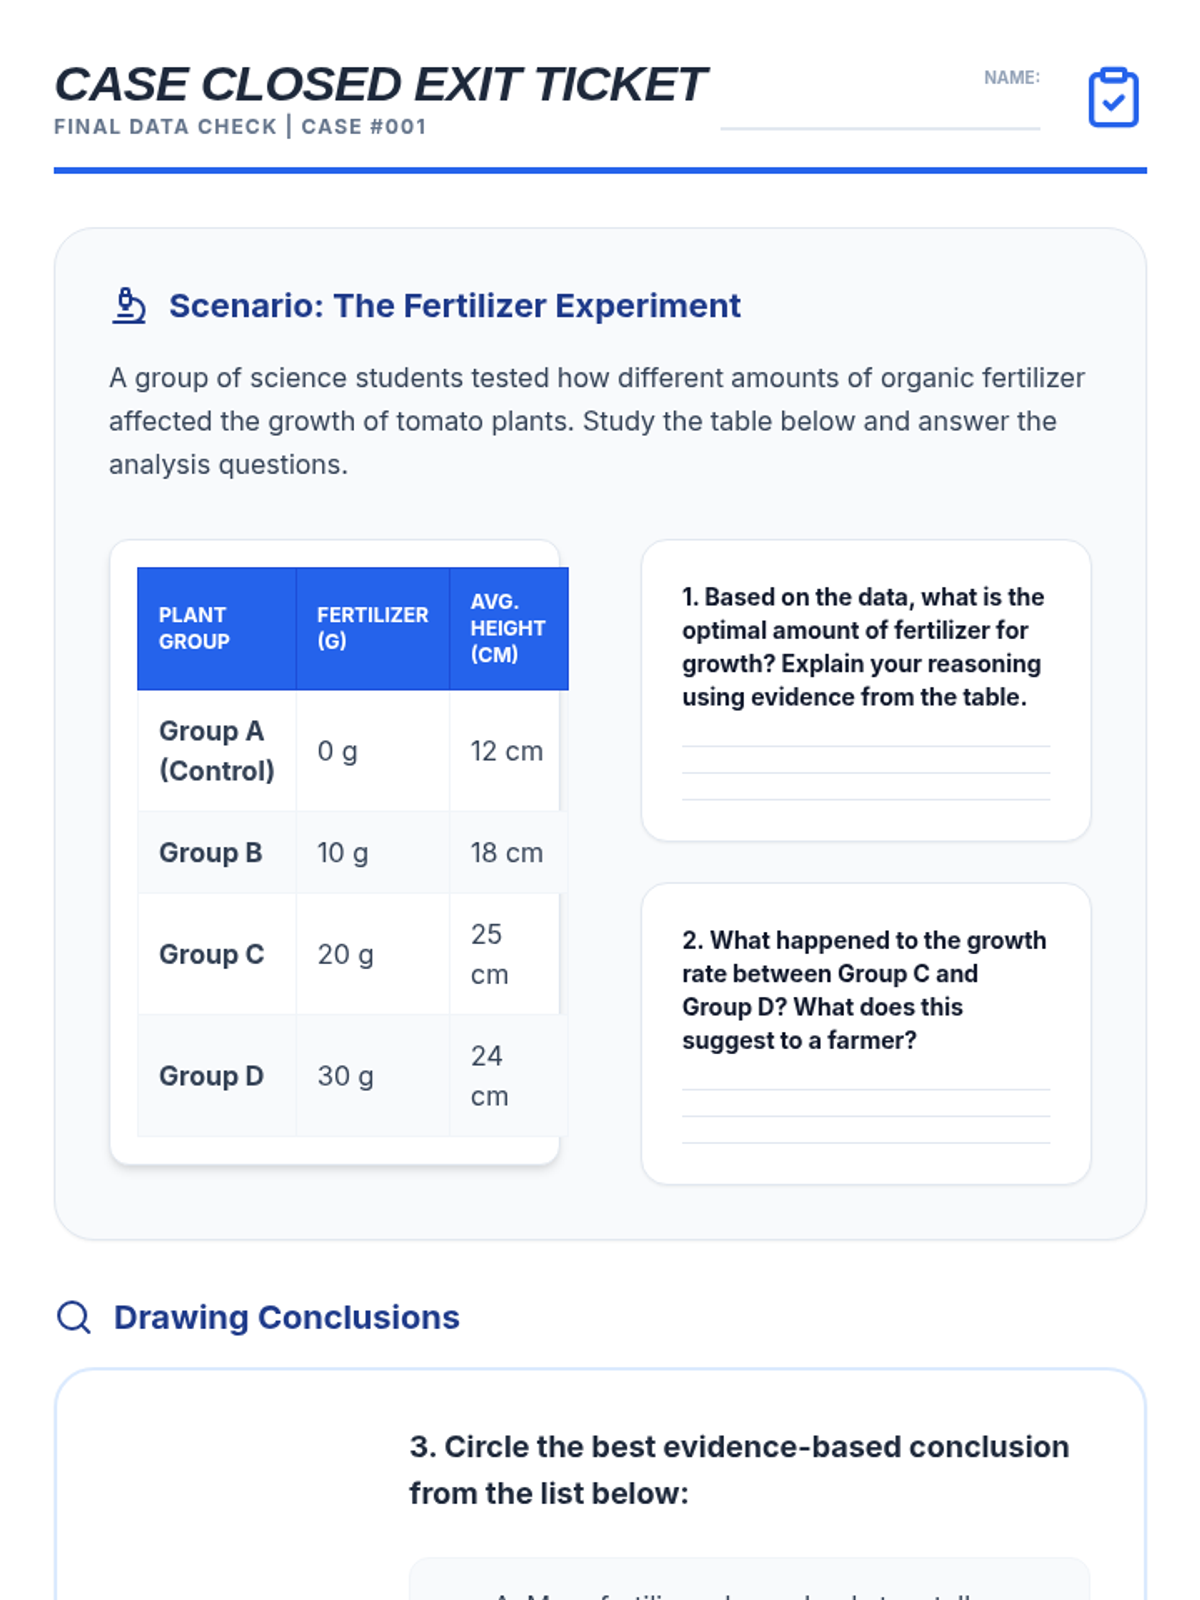
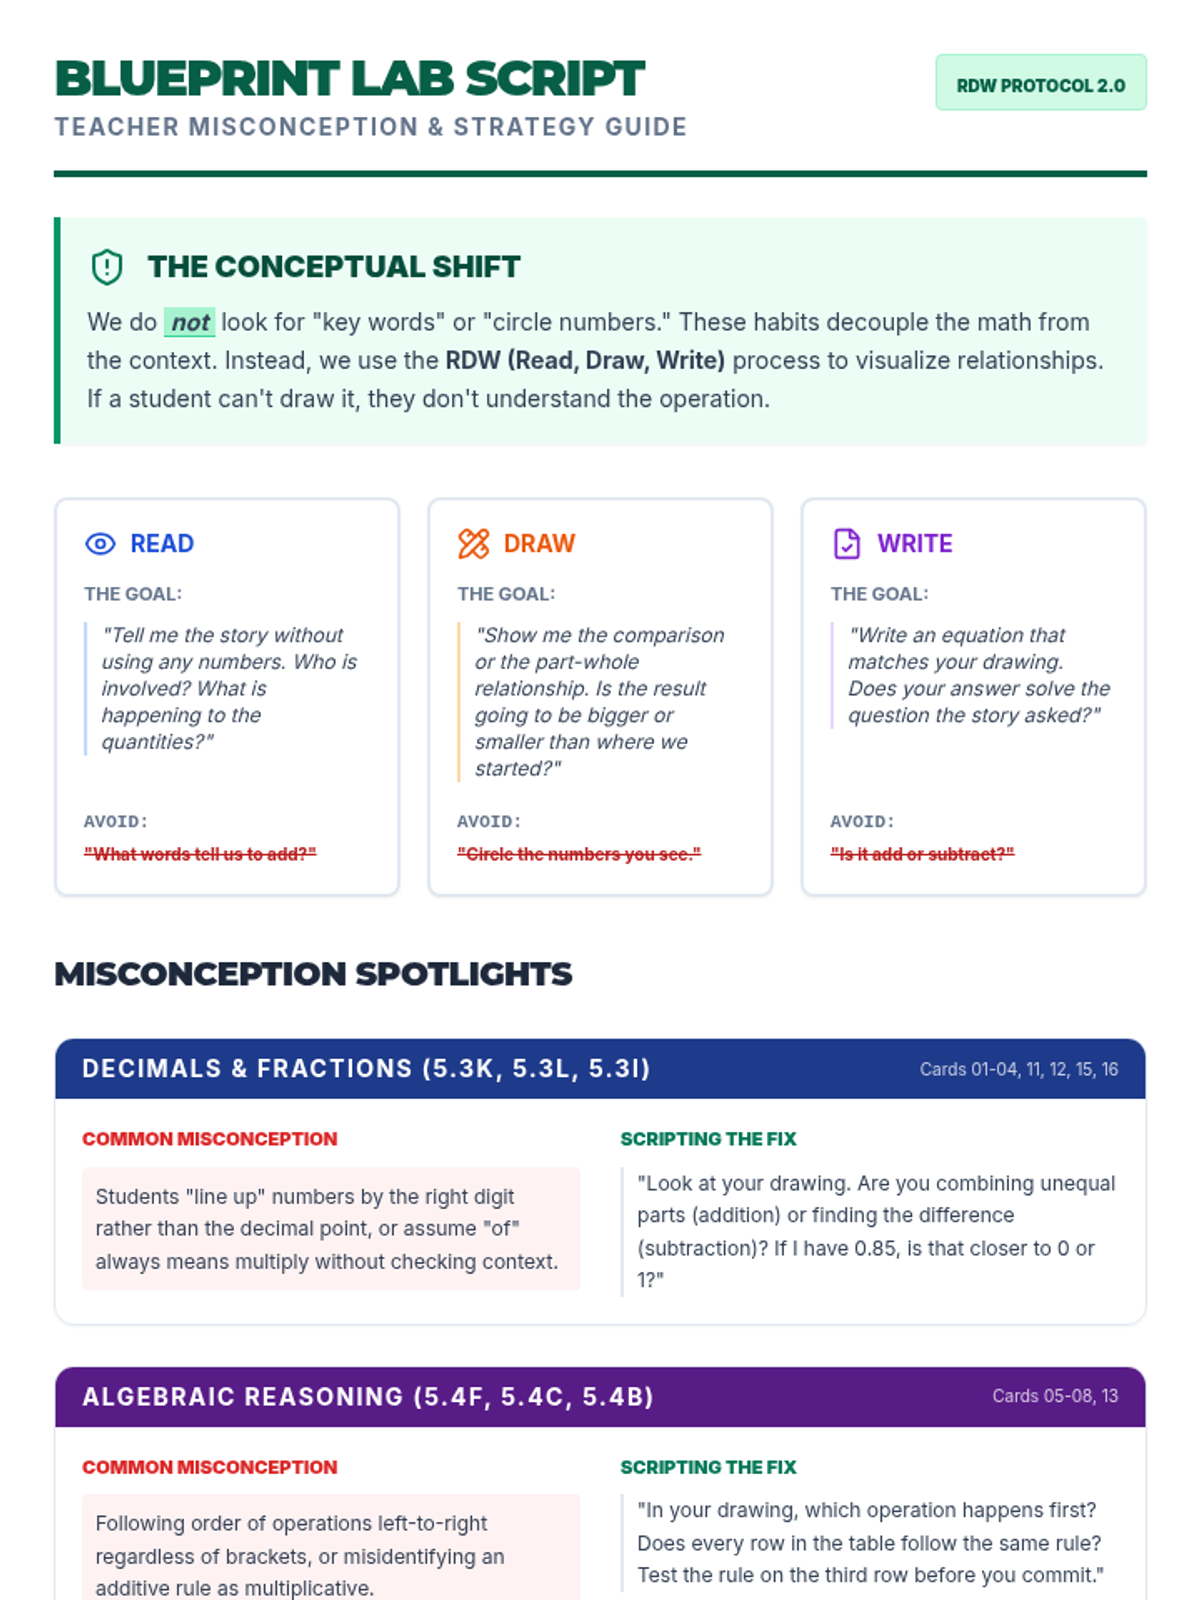
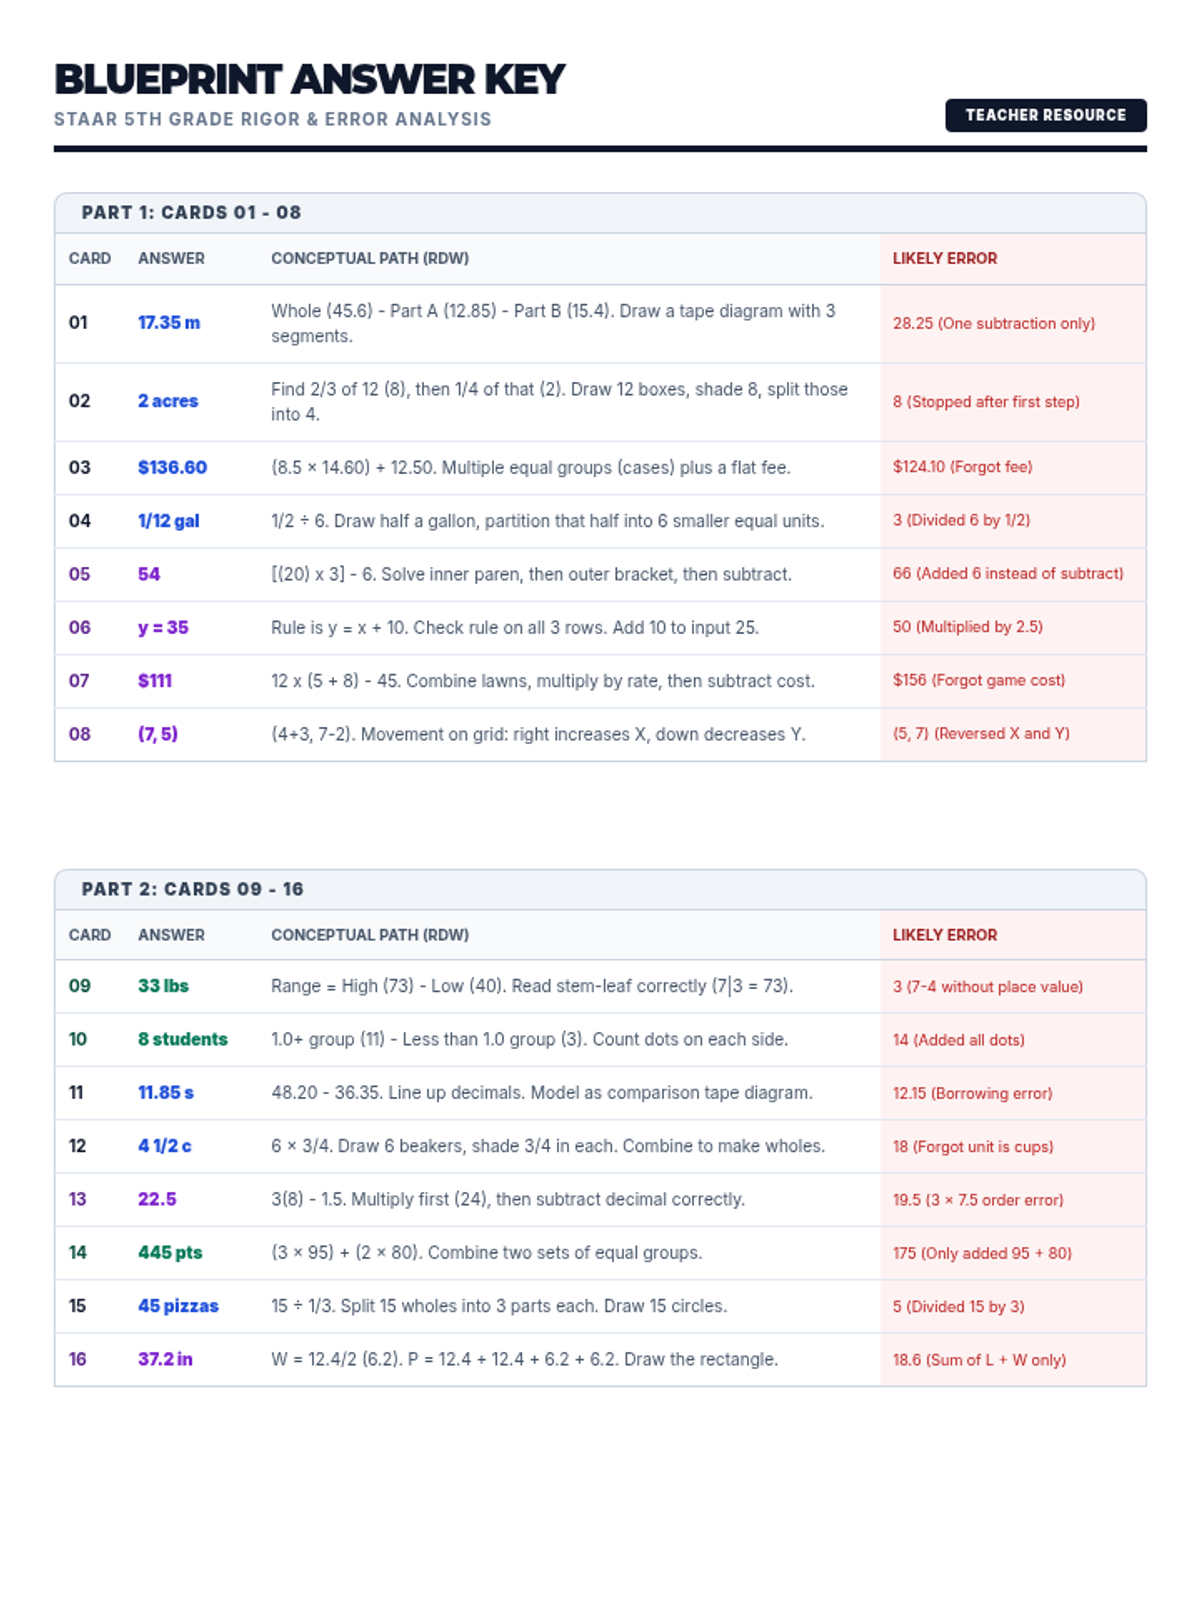
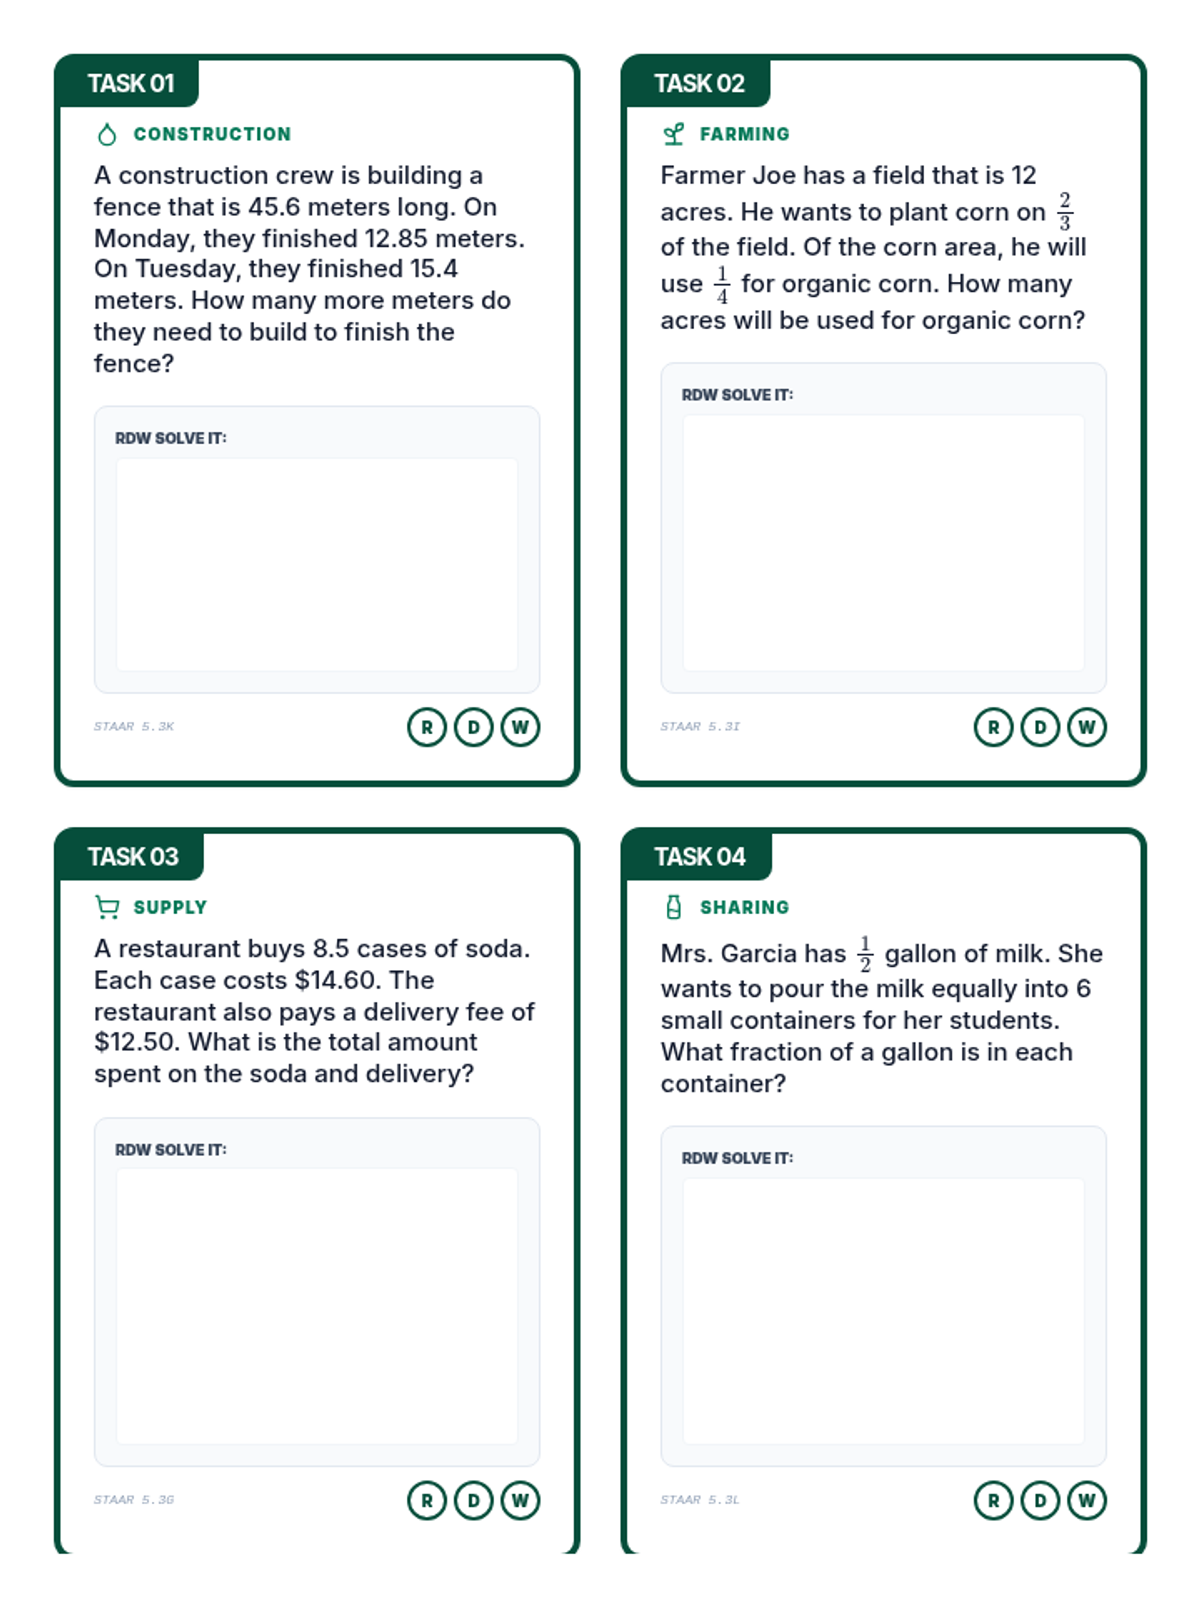
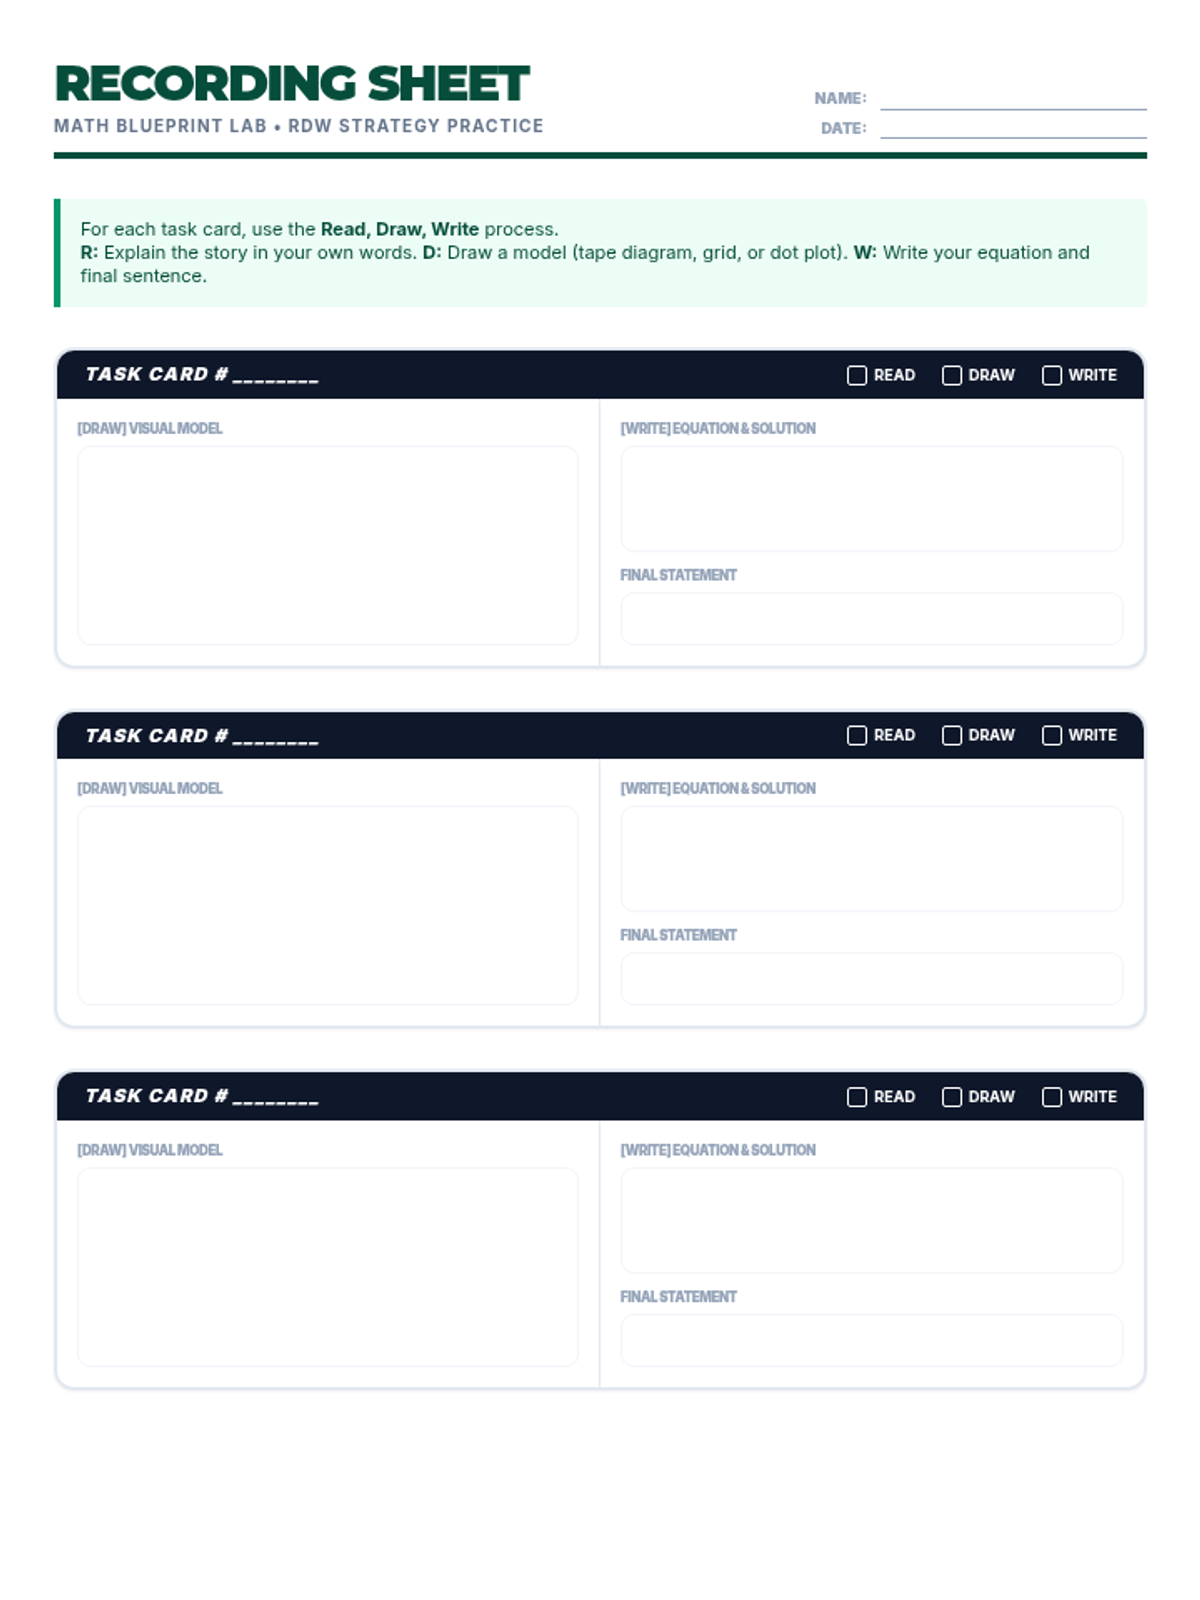
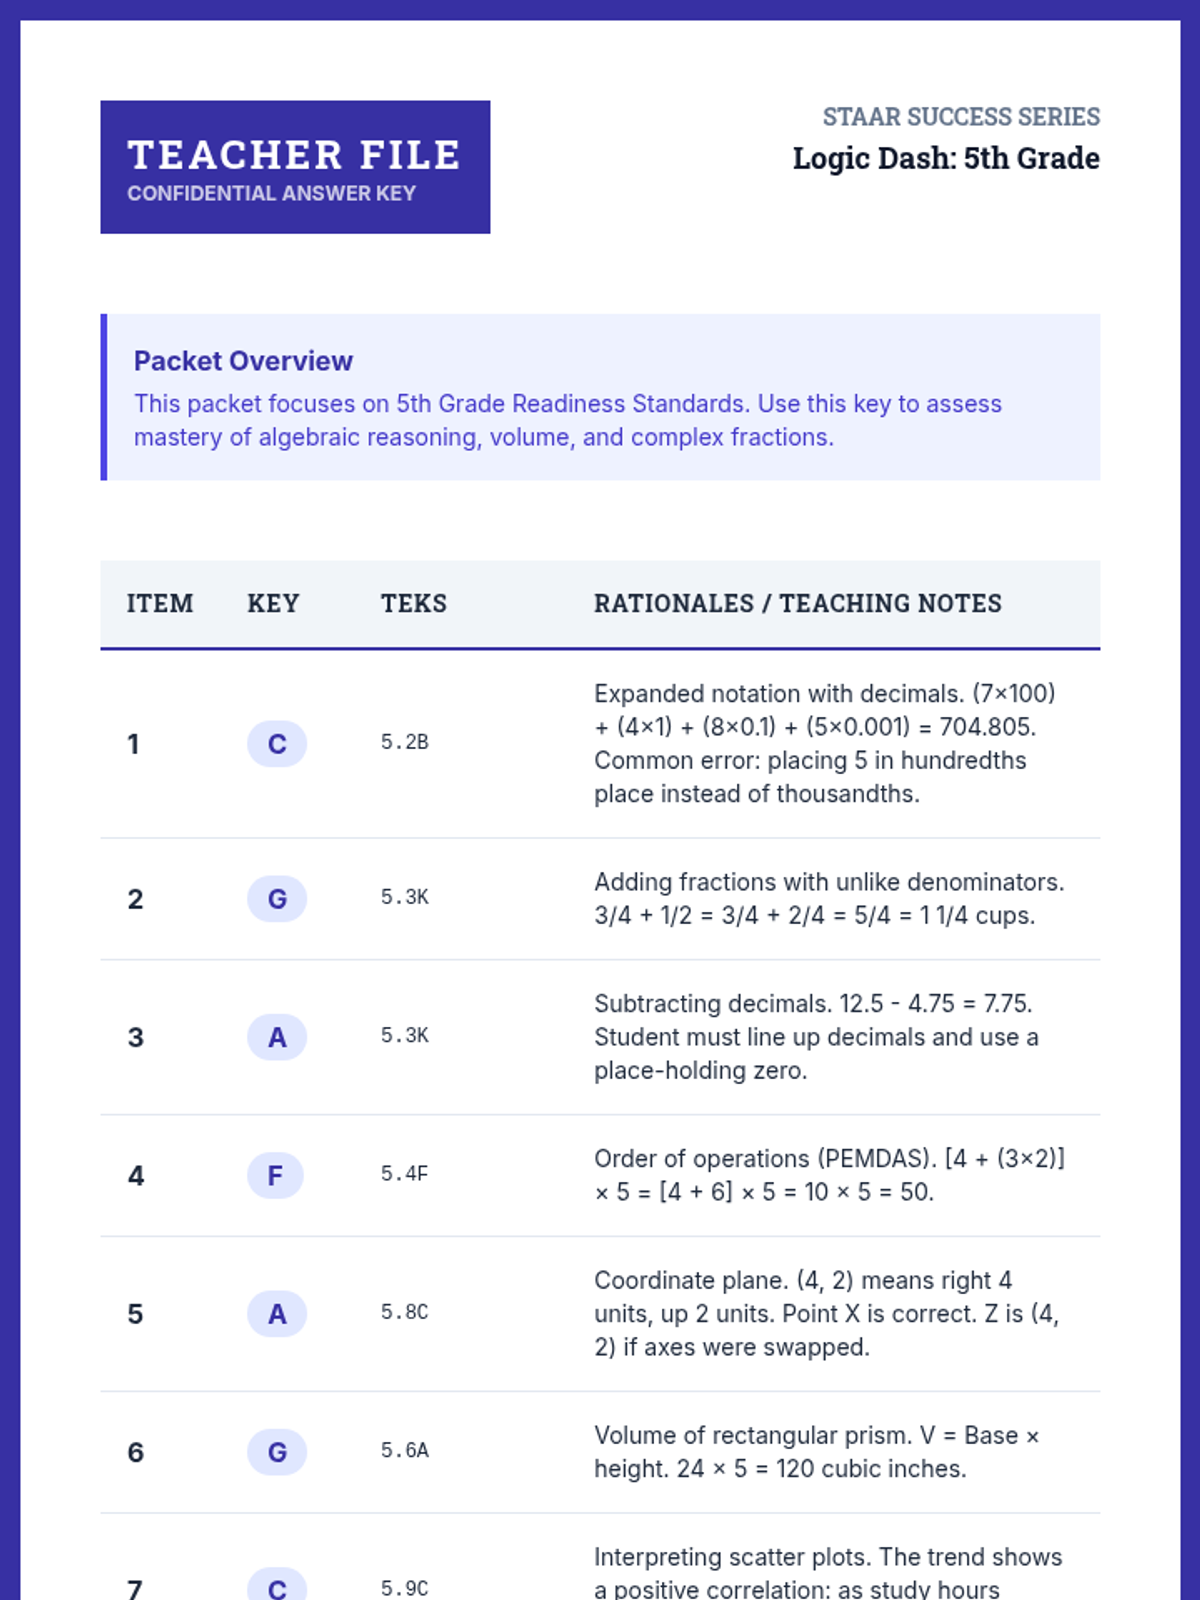
A rigorous STAAR-aligned 5th grade math lesson focusing on Decimals, Fractions, Algebraic Reasoning, and Data Analysis using the RDW (Read, Draw, Write) strategy. Includes task cards, modeling slides, and a comprehensive teacher script.
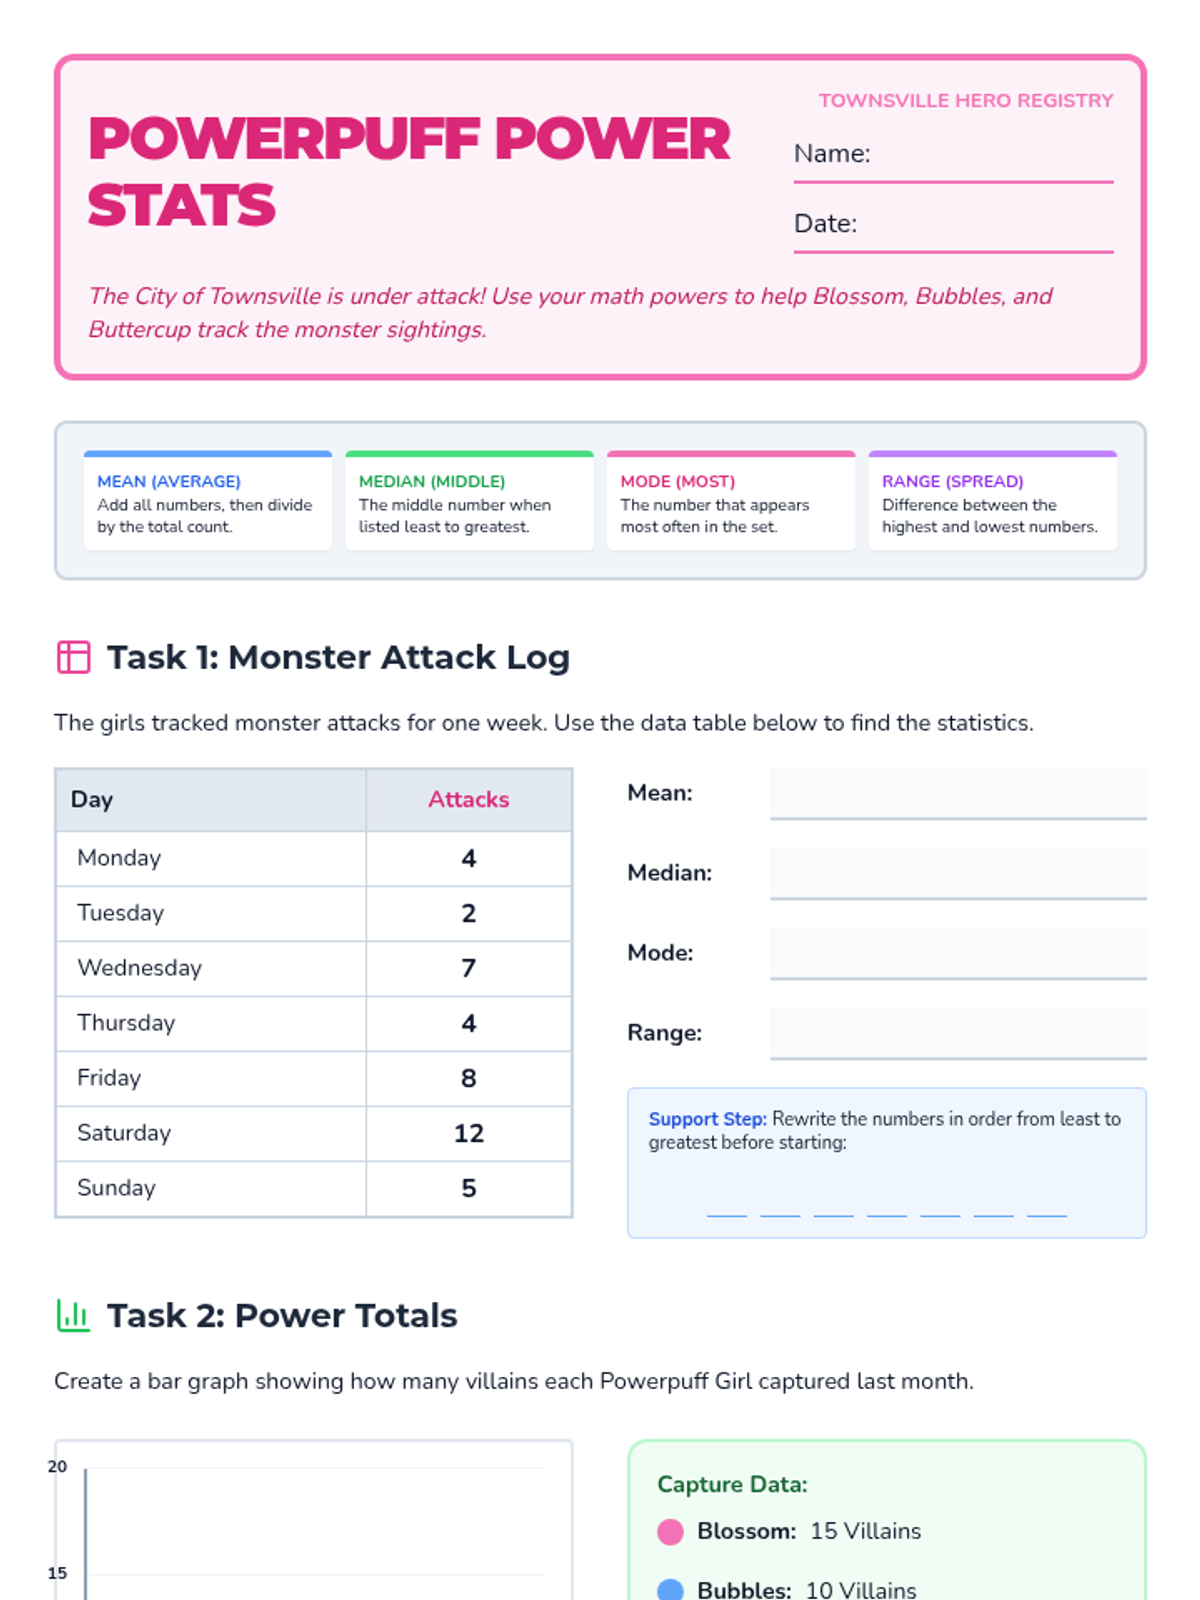
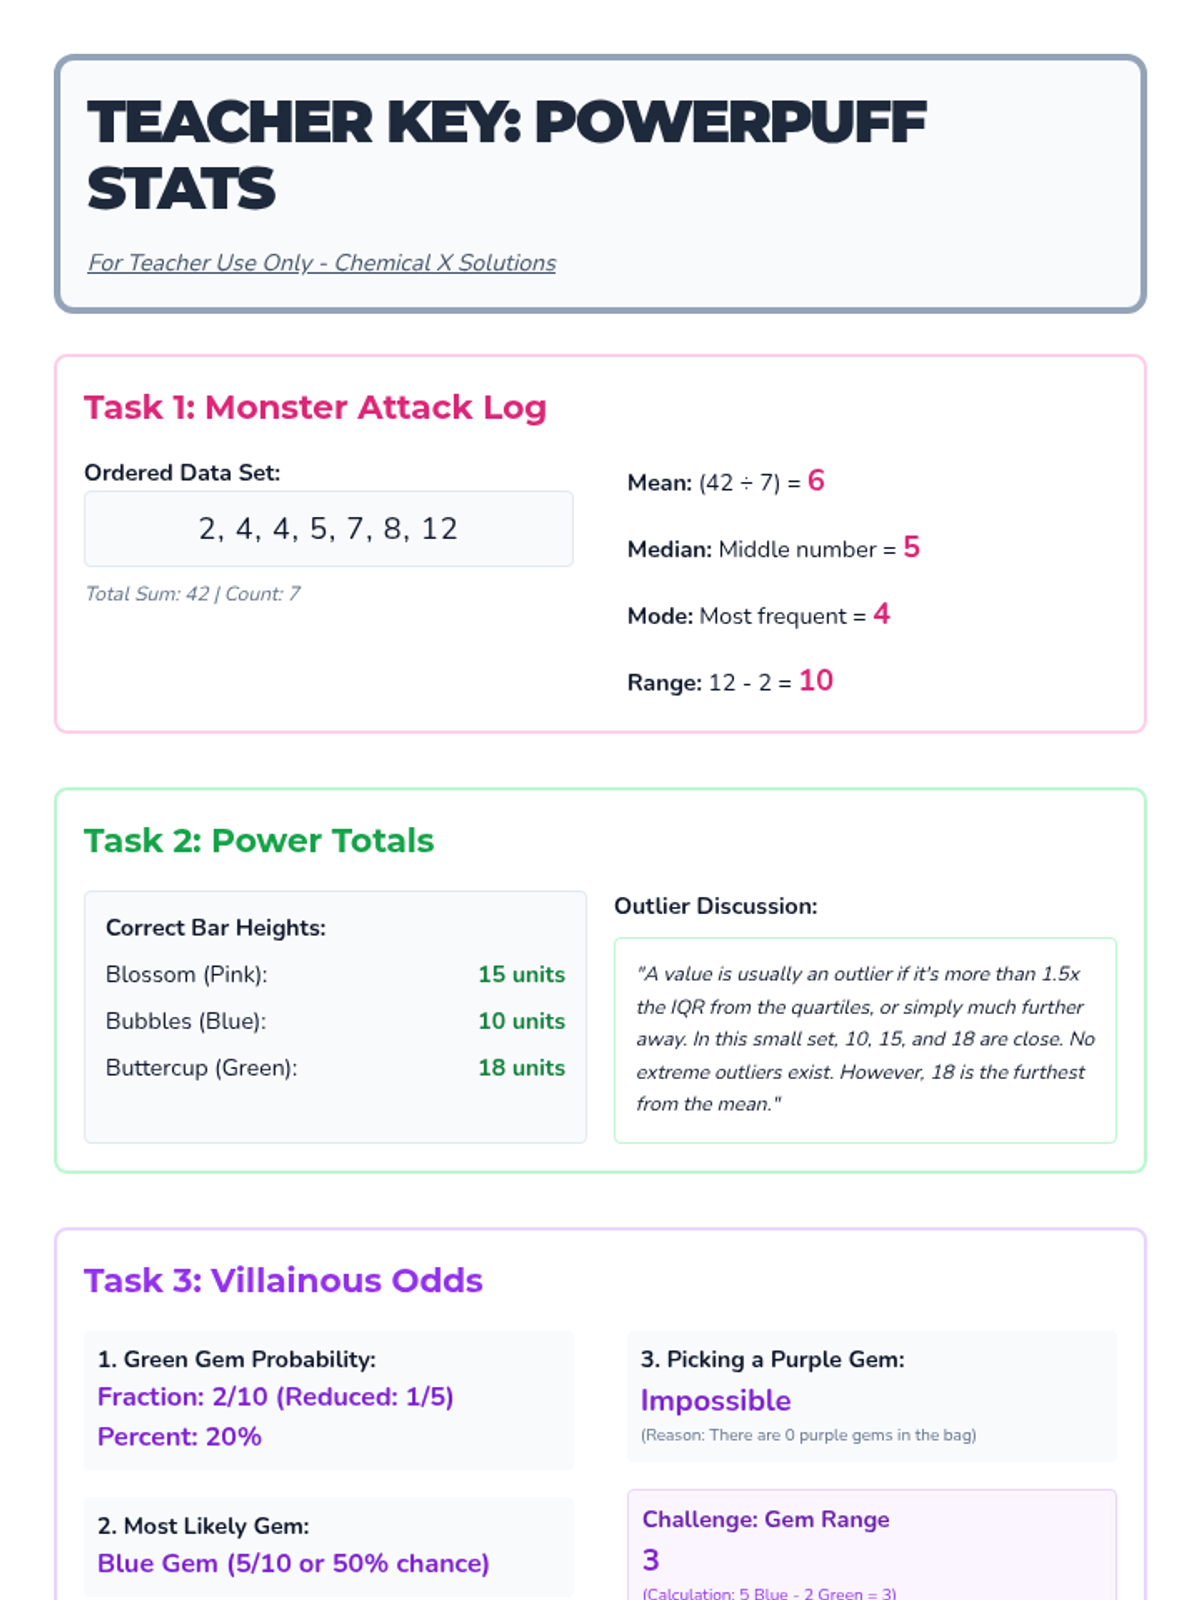
A statistics lesson themed around the Powerpuff Girls, covering central tendency, data visualization, and probability with clear visual supports for high-functioning students.
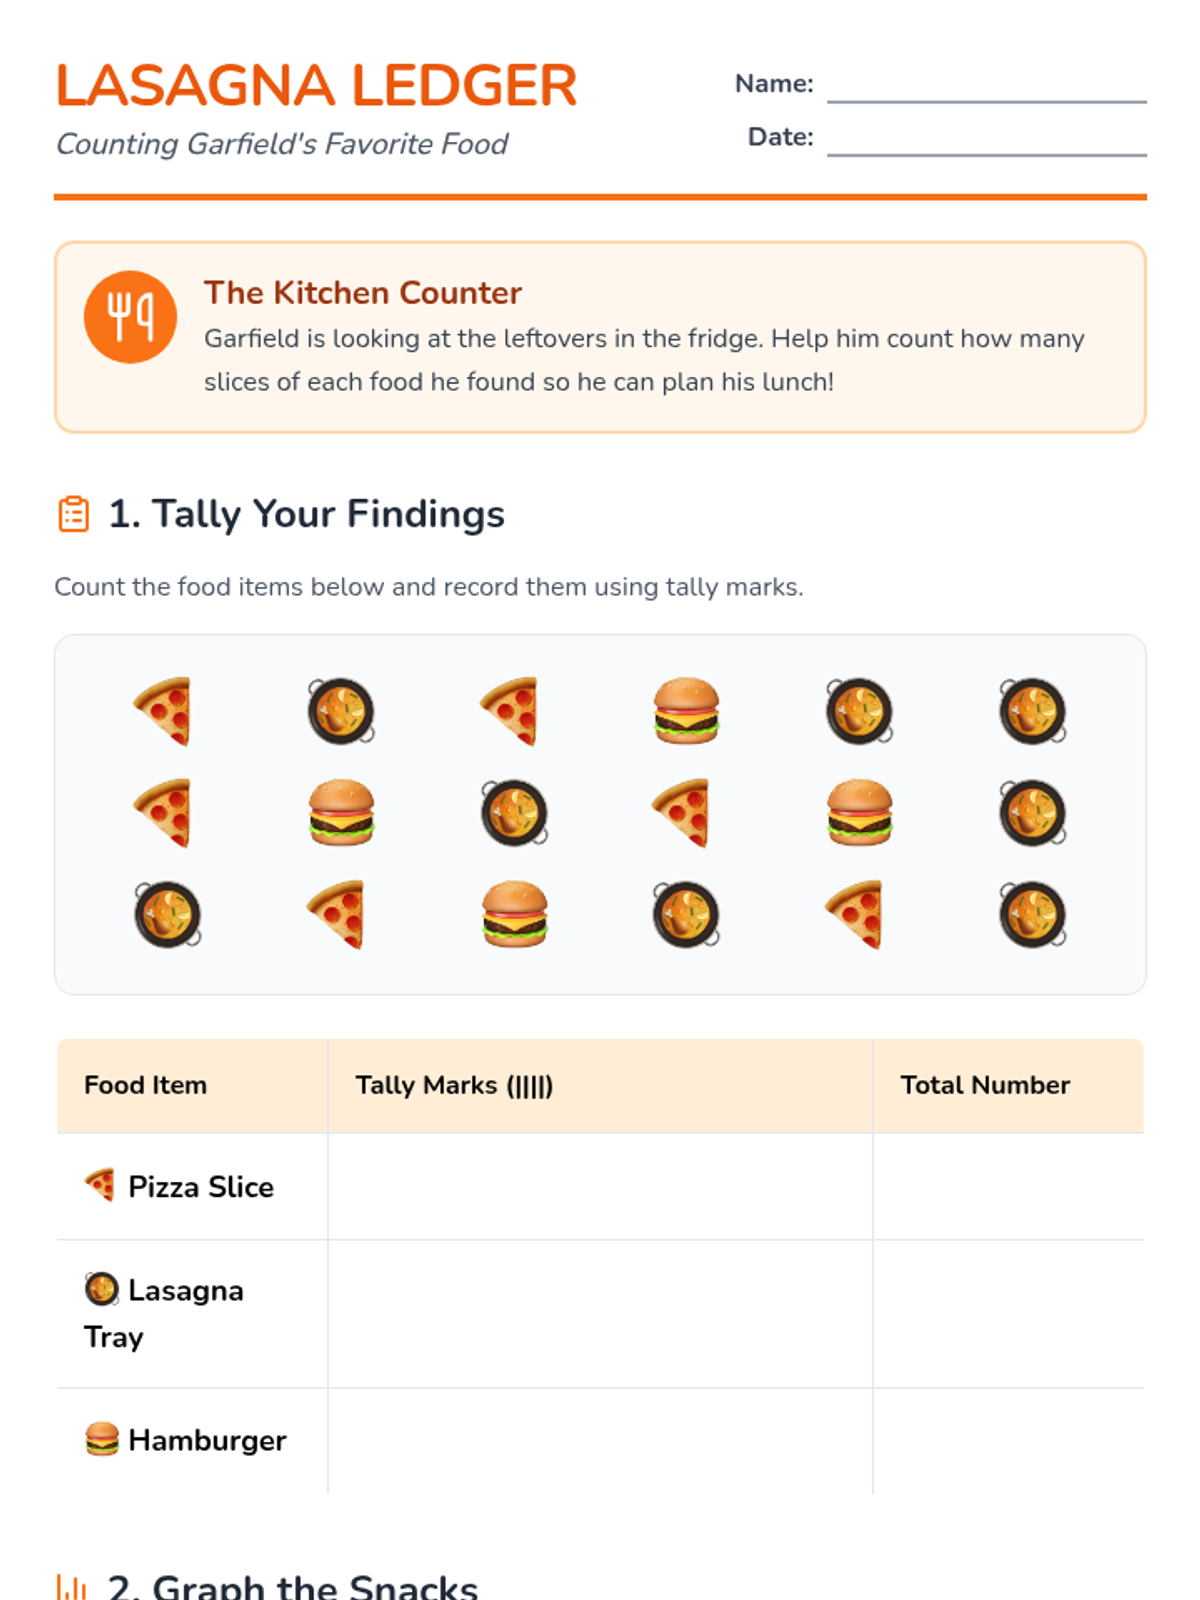
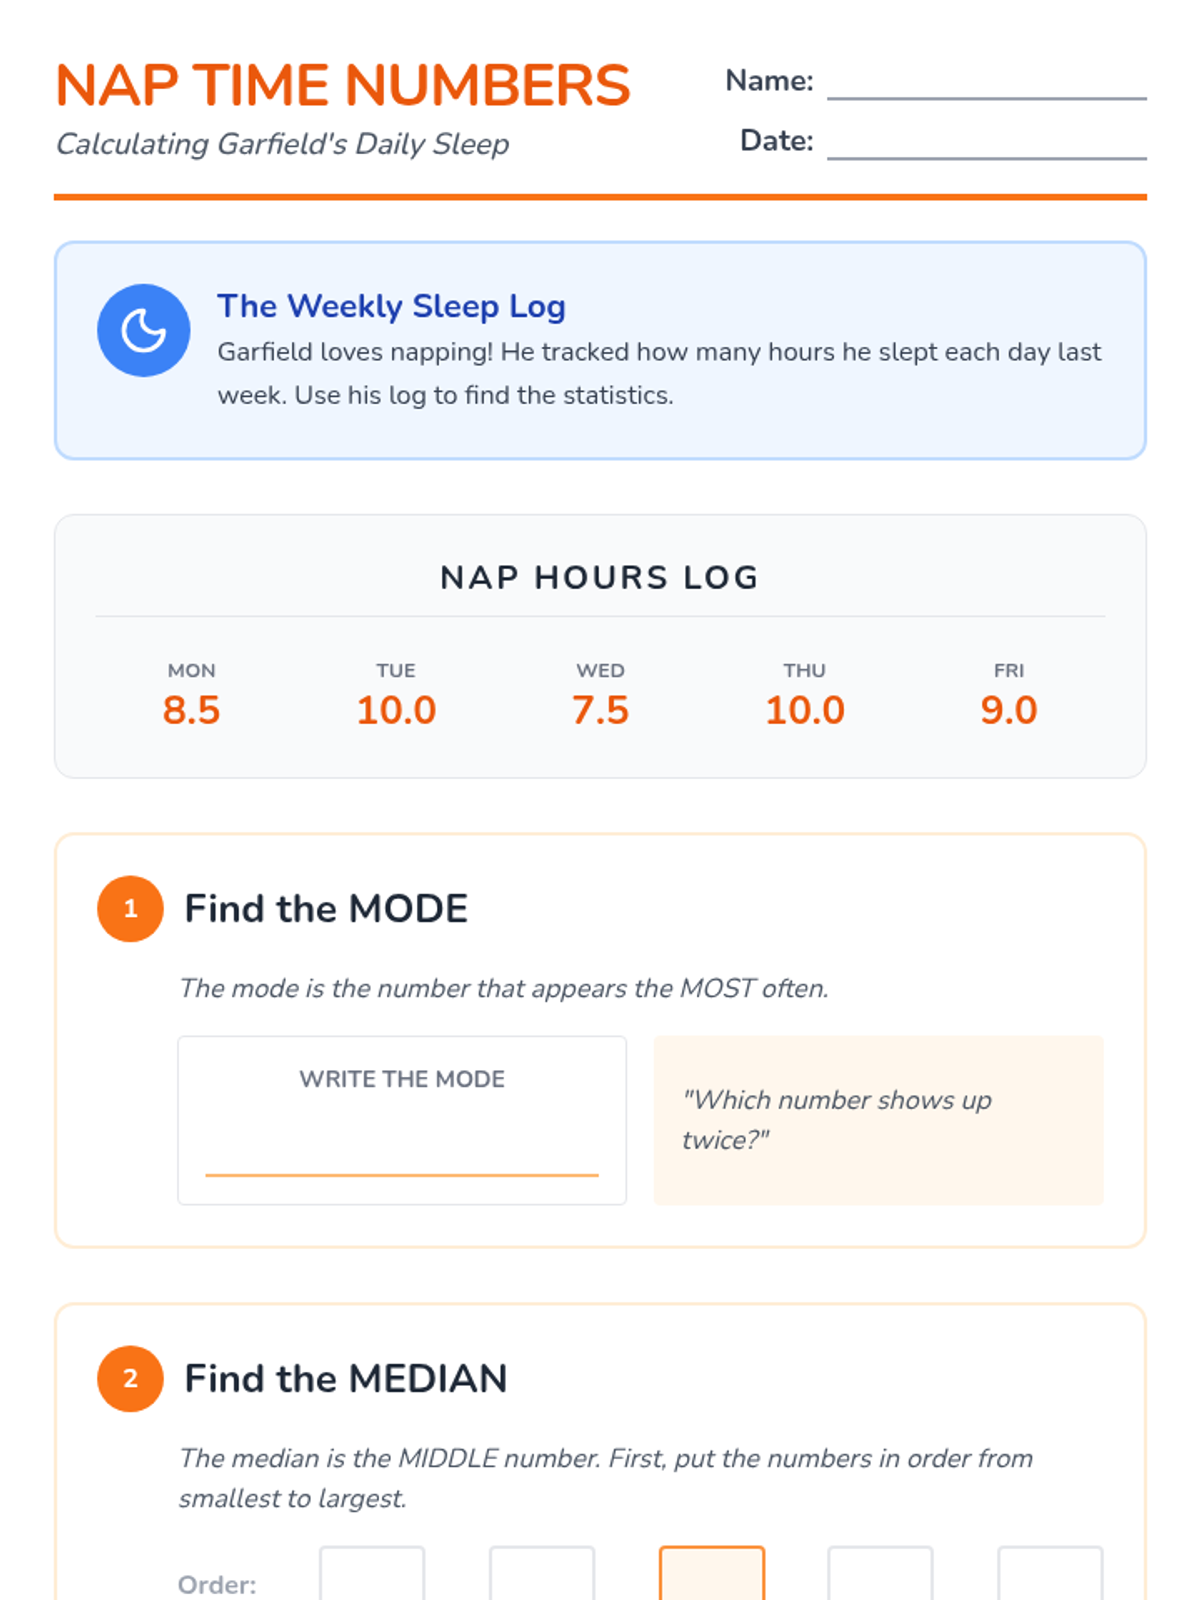
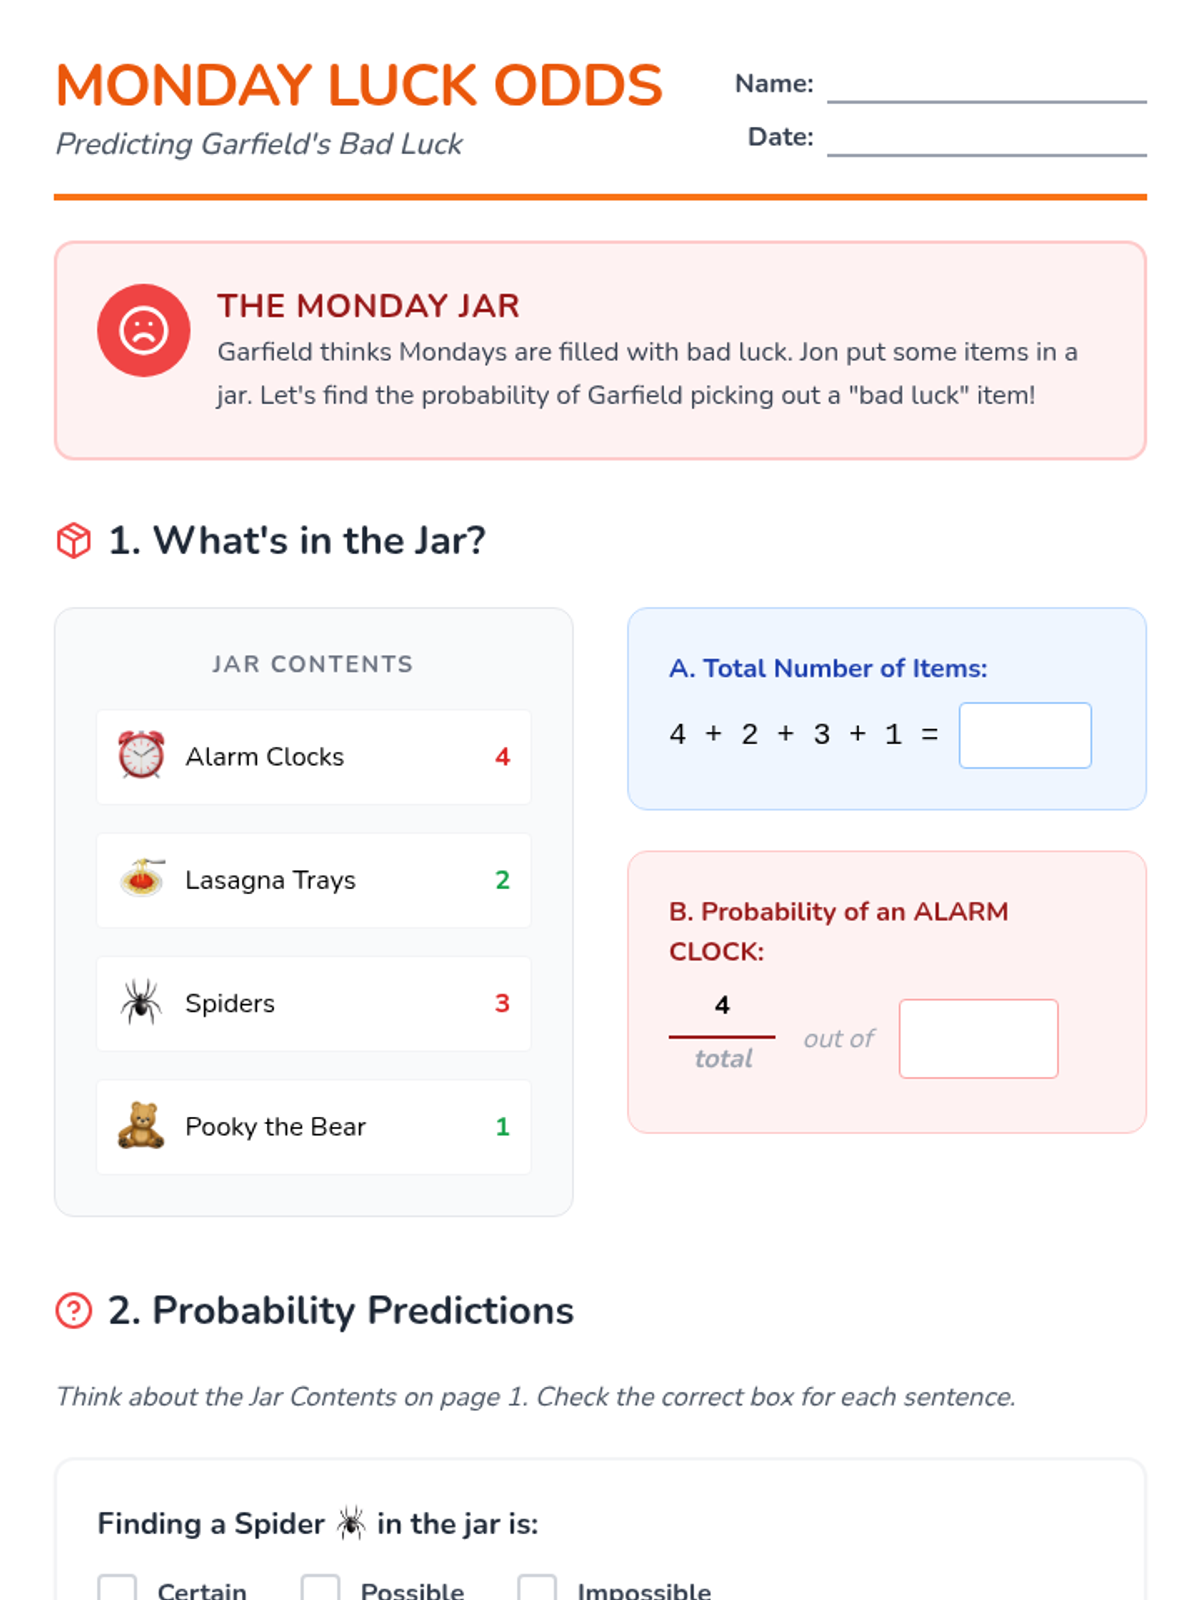
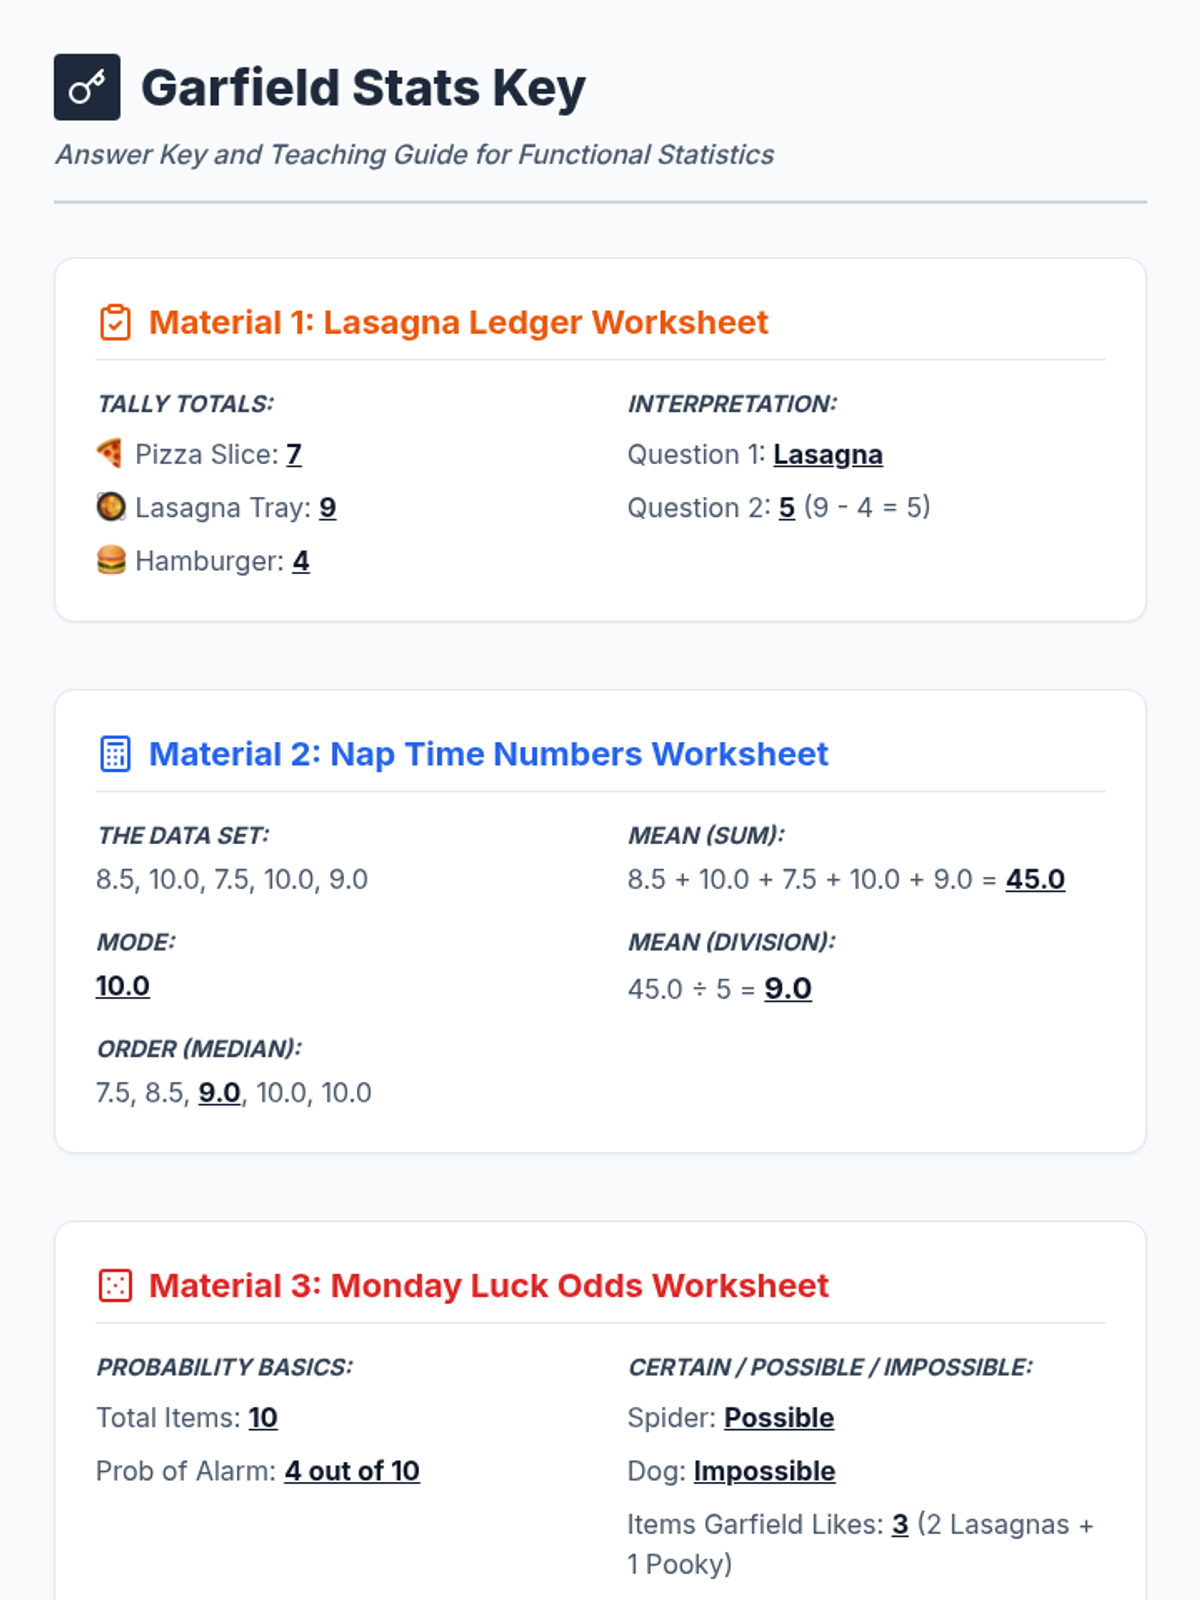
A collection of statistics activities themed around Garfield the cat, covering data collection, central tendency, and probability for students working with functional math and decimals.
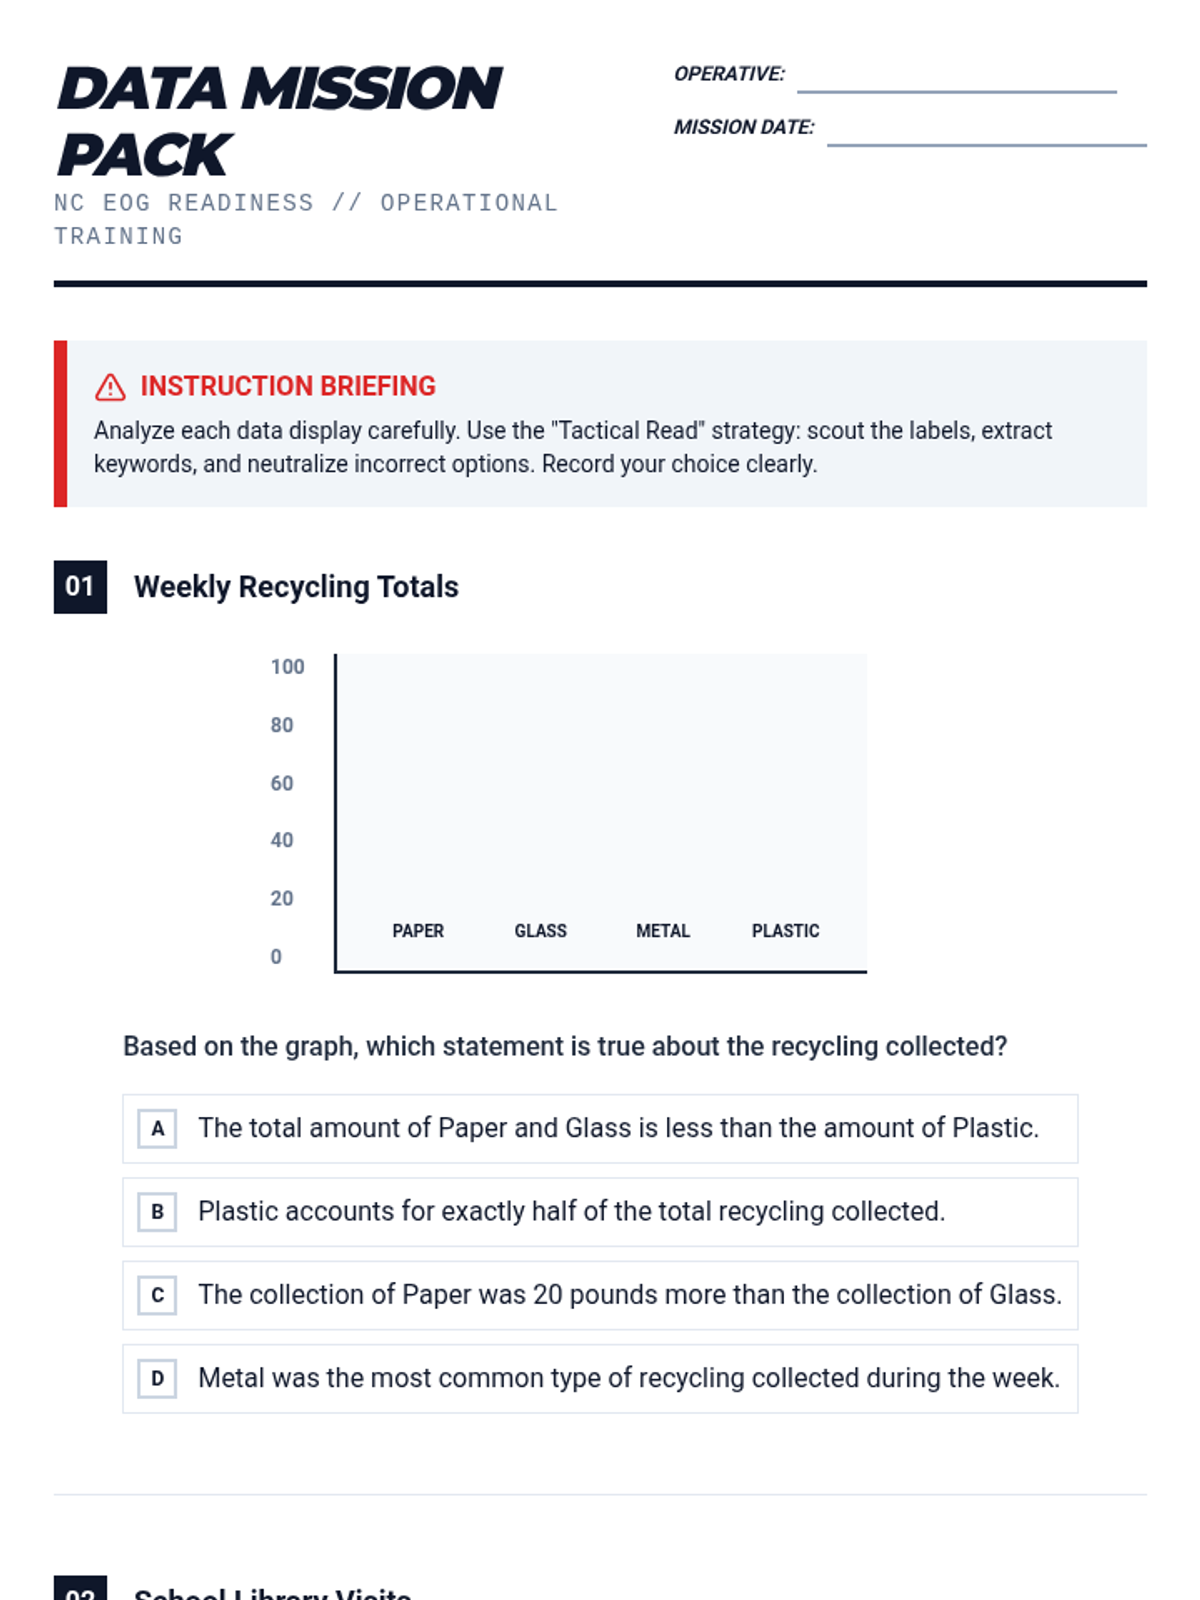
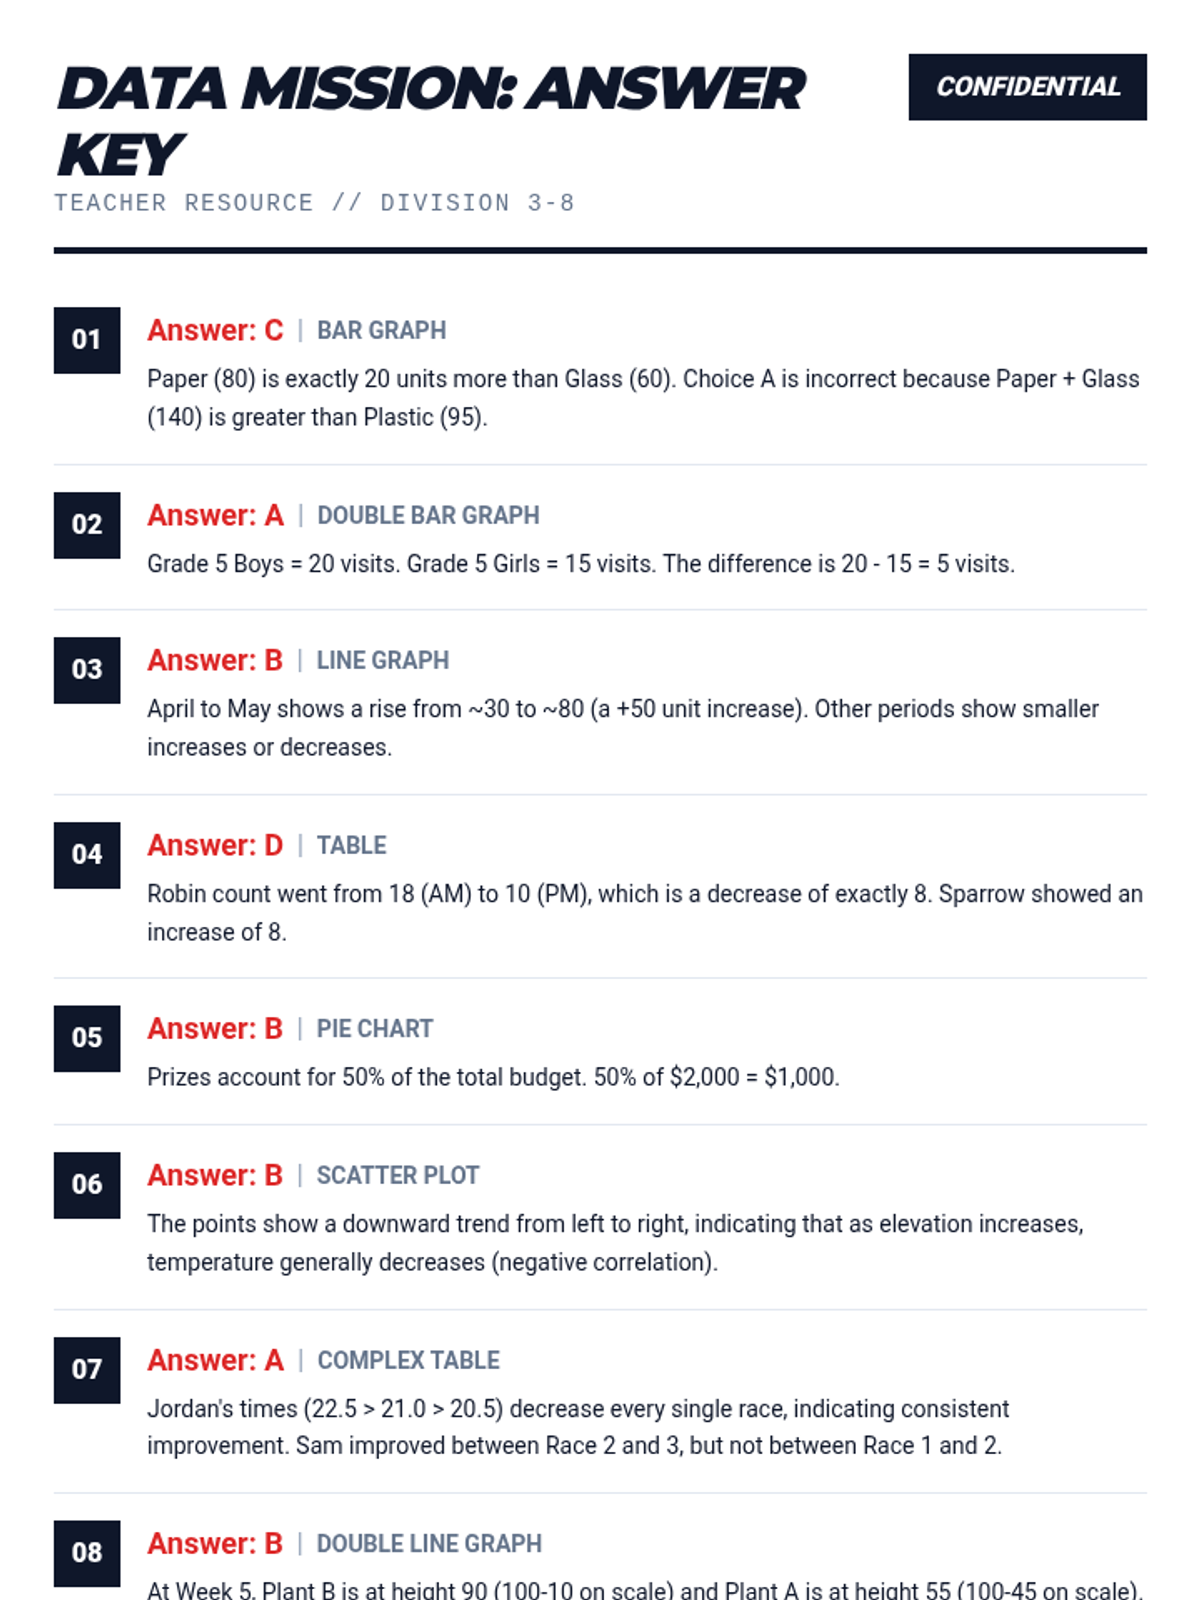
A comprehensive test preparation lesson focused on interpreting various data displays, including bar graphs, line graphs, pie charts, tables, and scatter plots, designed for NC EOG readiness.
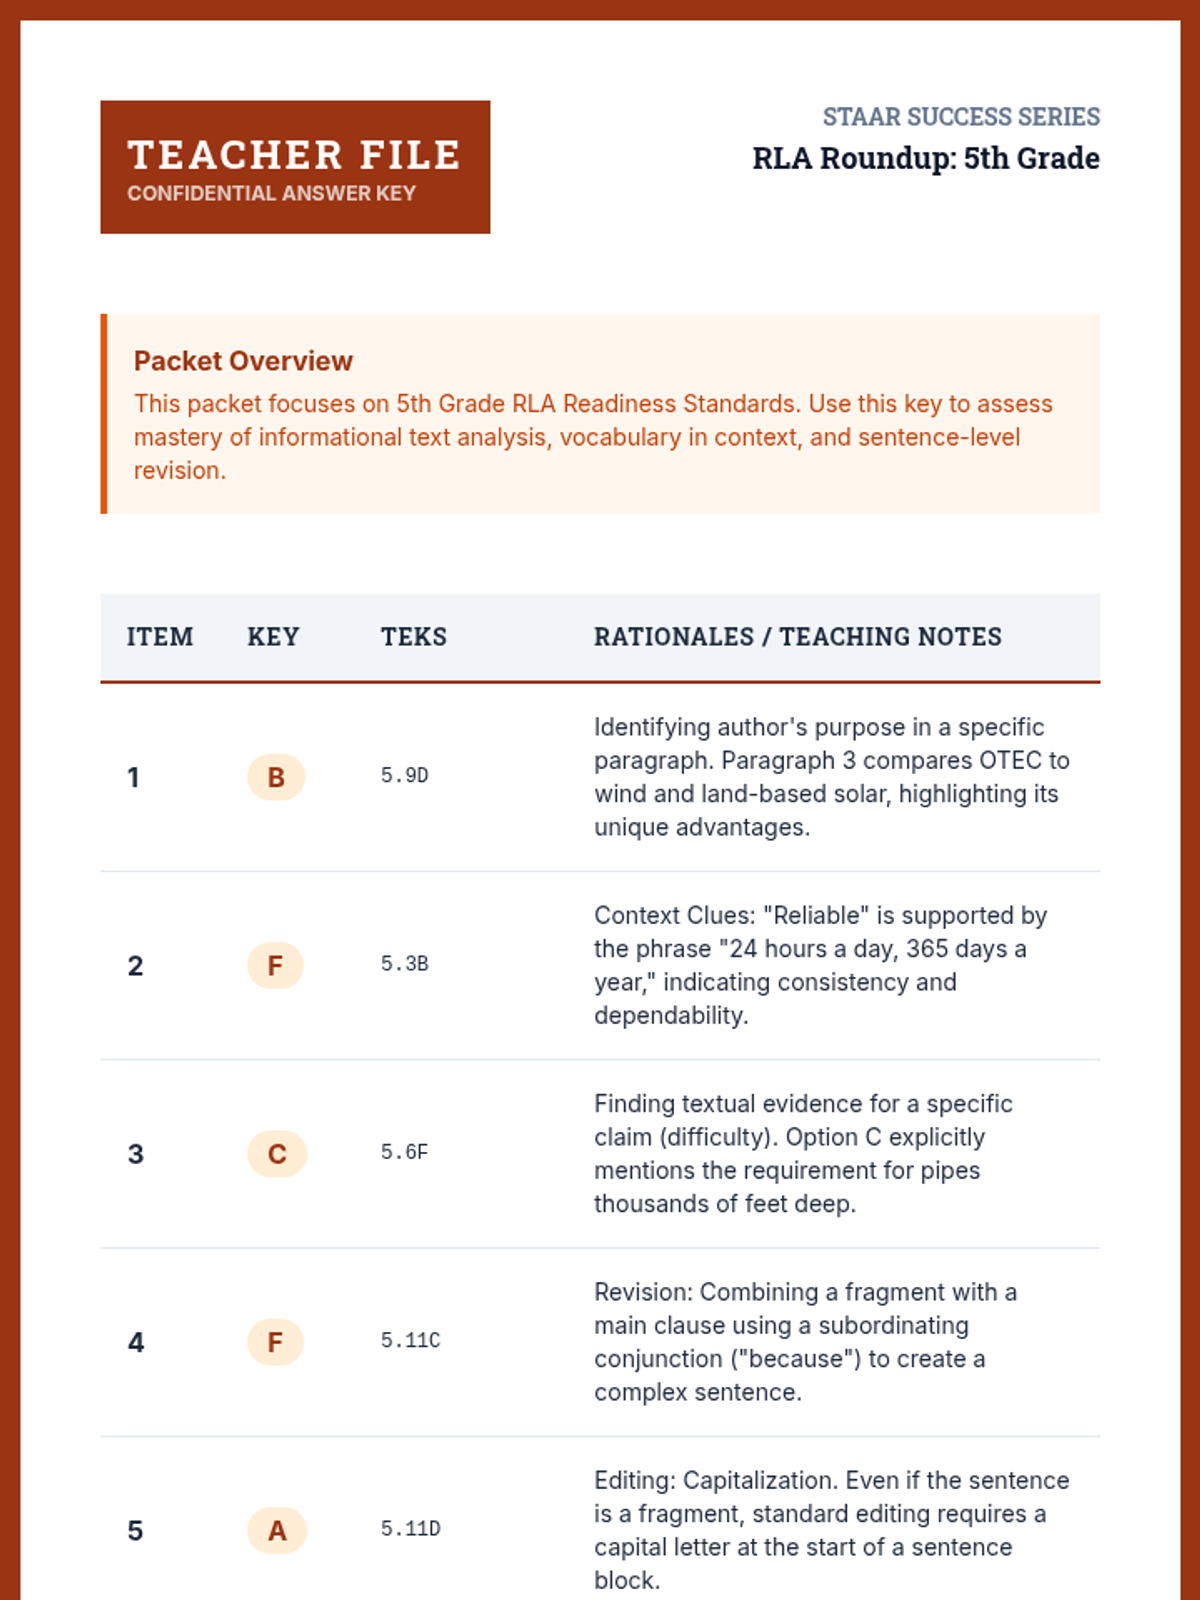
5th grade RLA review emphasizing theme, author's purpose, synthesis of information, and polished expository writing.
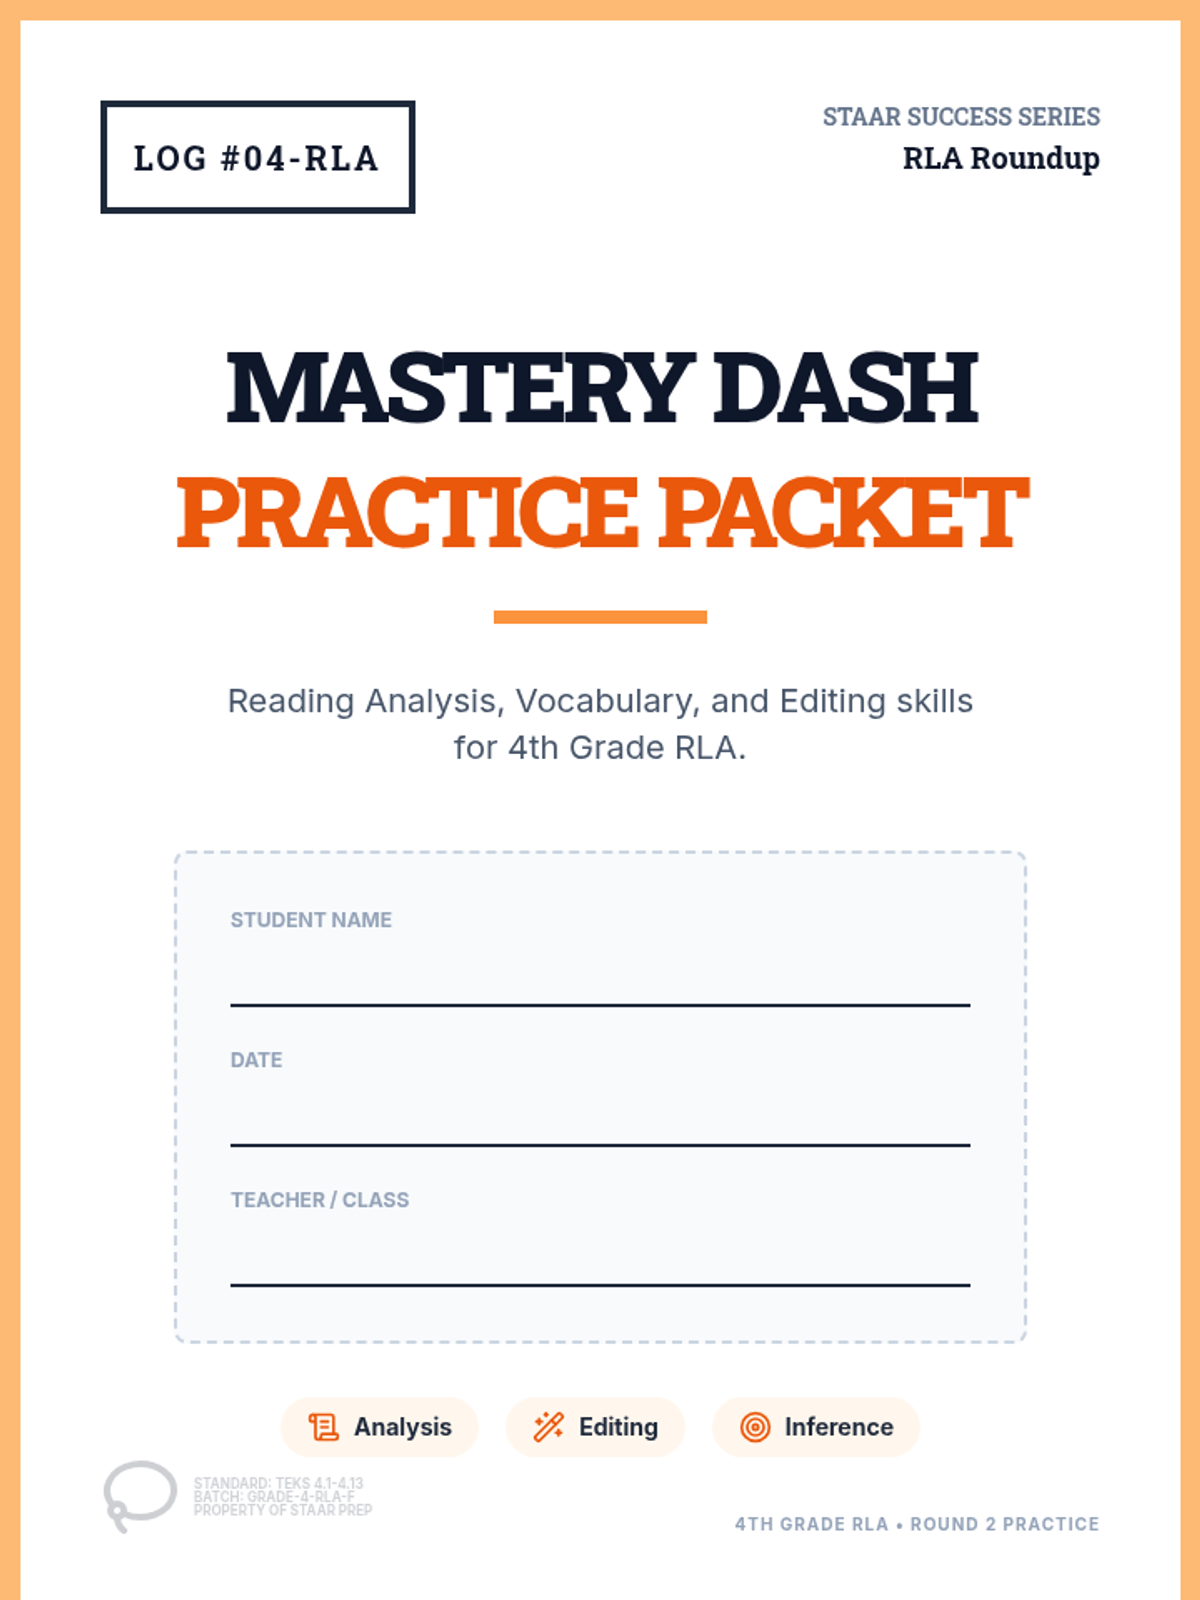
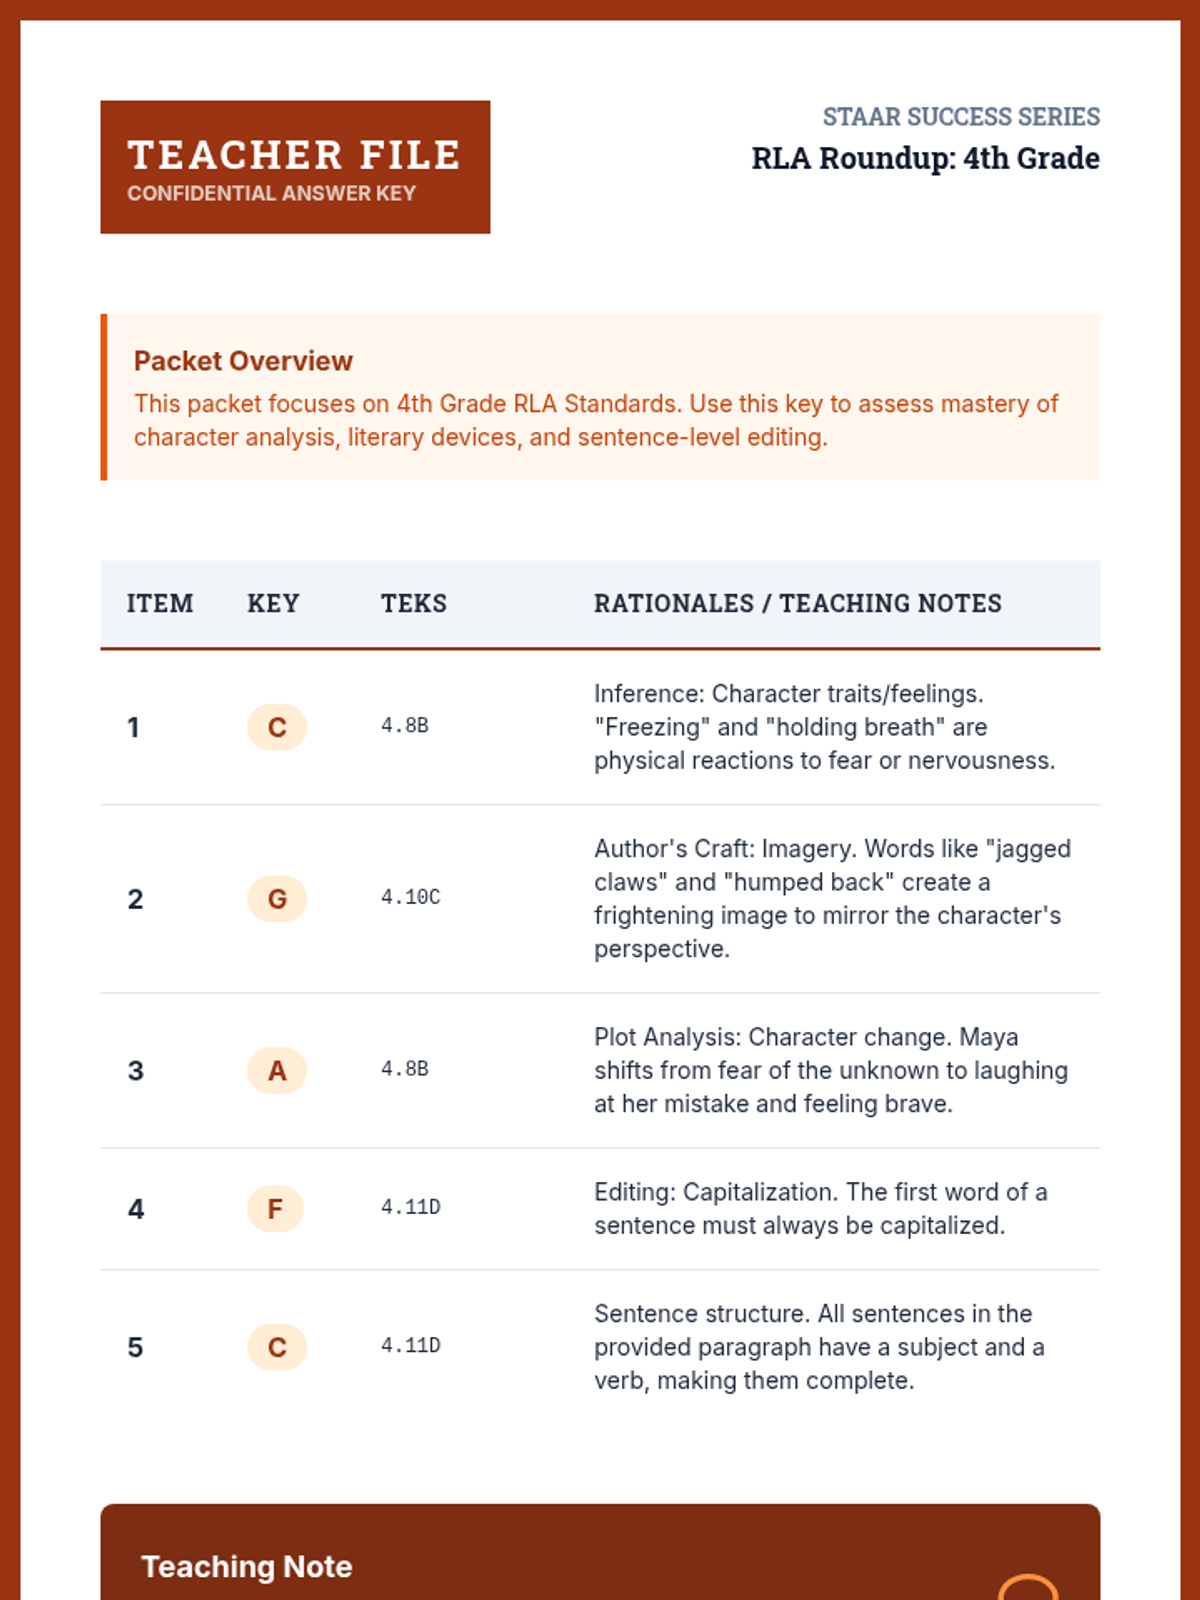
4th grade RLA mastery practice including complex text analysis, context clues, and multi-paragraph writing prompts.
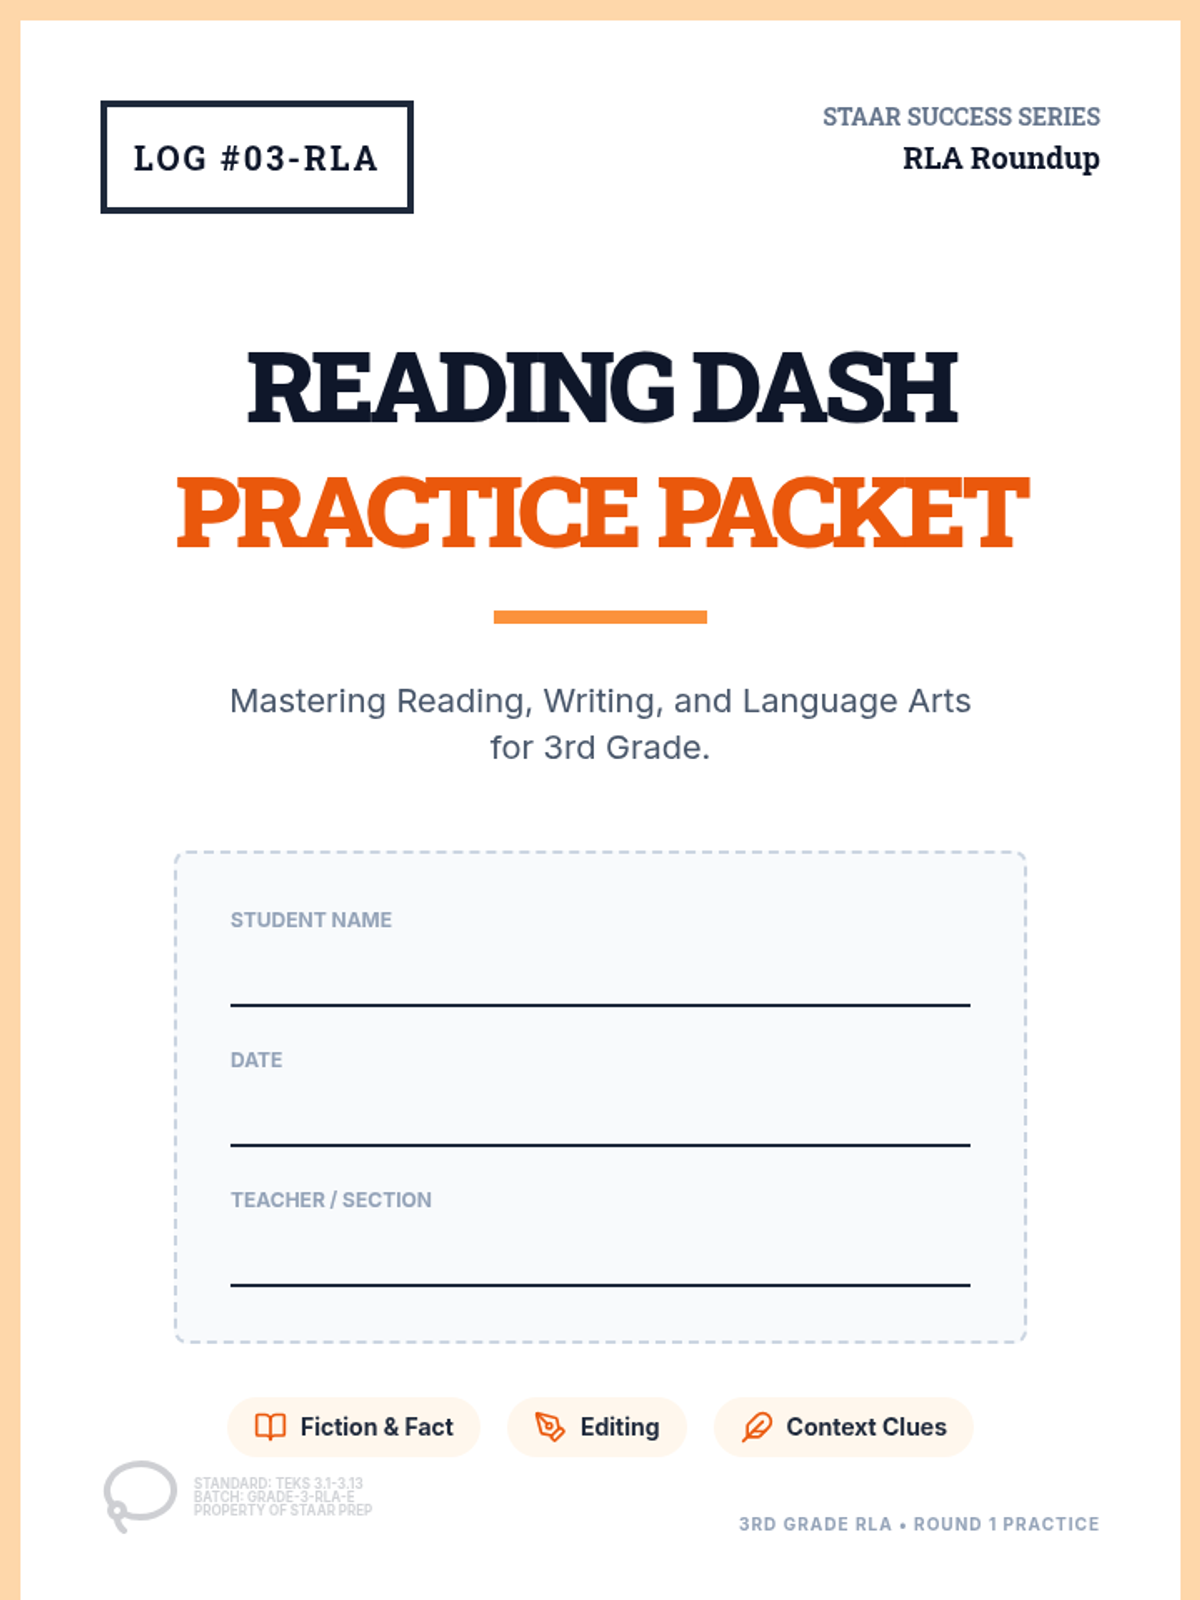
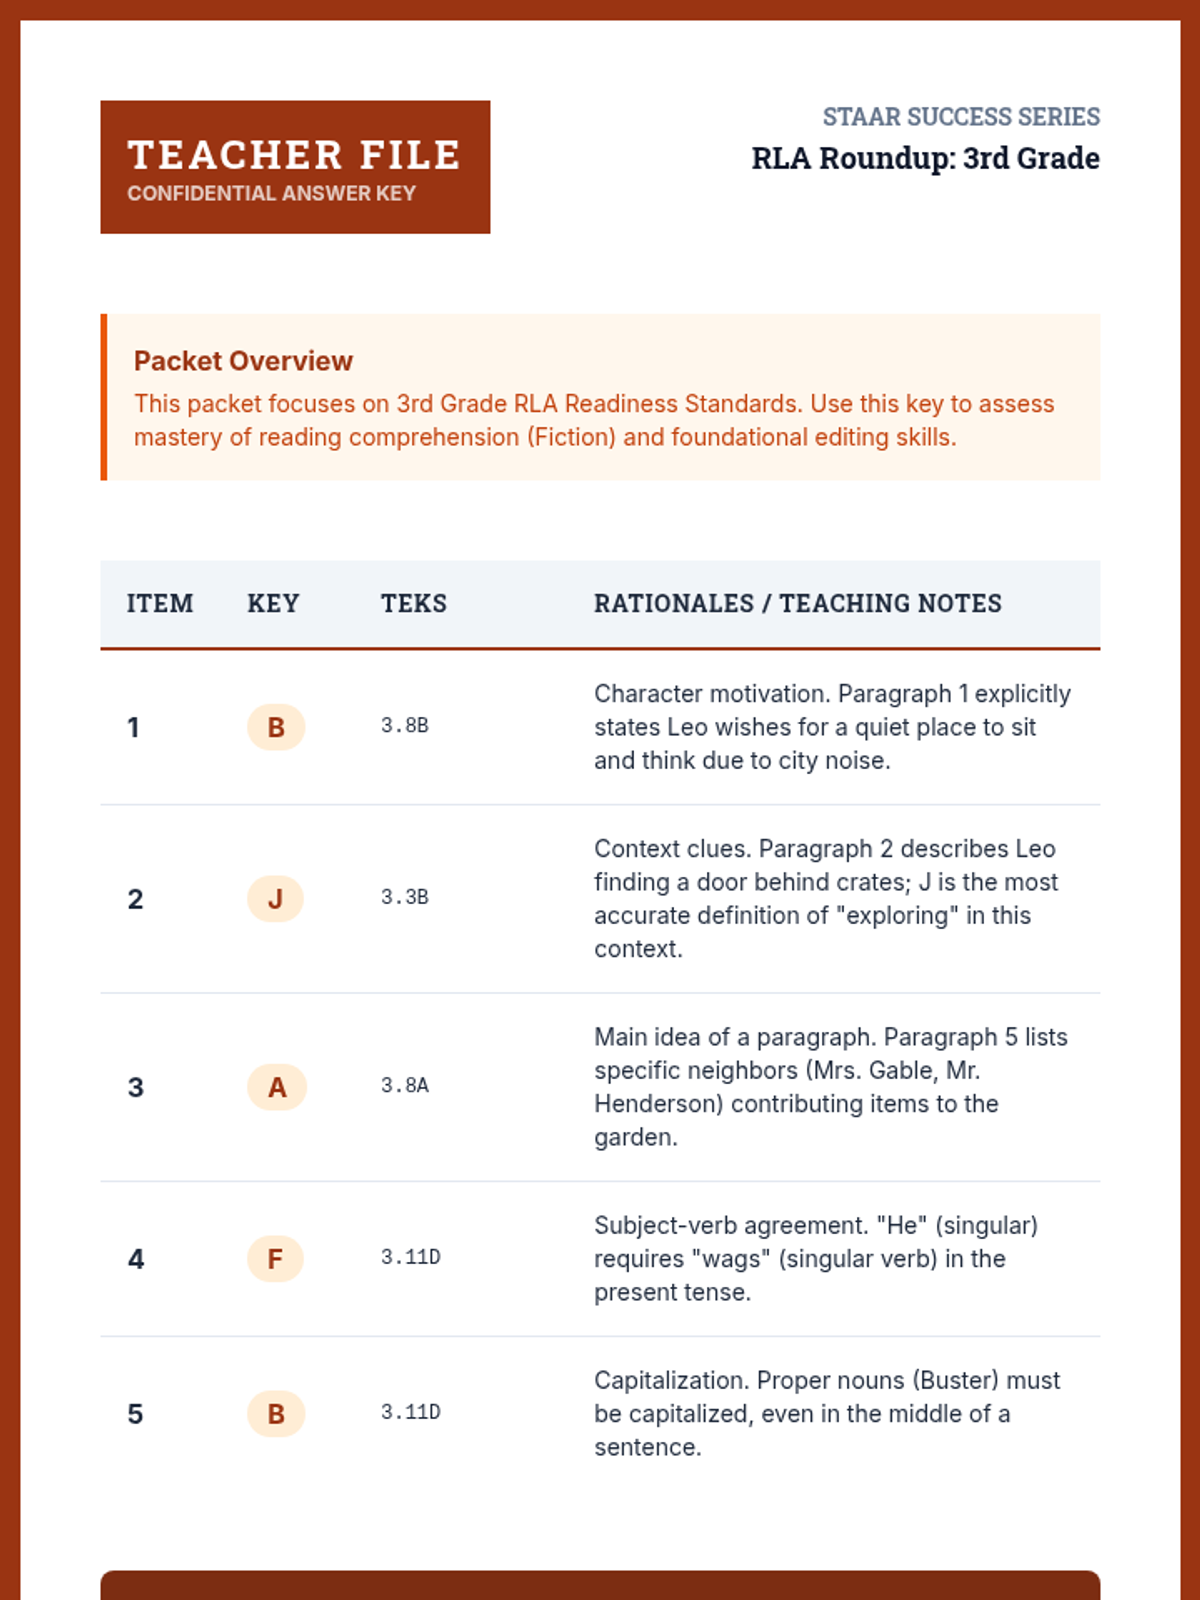
3rd grade RLA practice focusing on reading comprehension of fiction and non-fiction, as well as basic editing and revising skills.
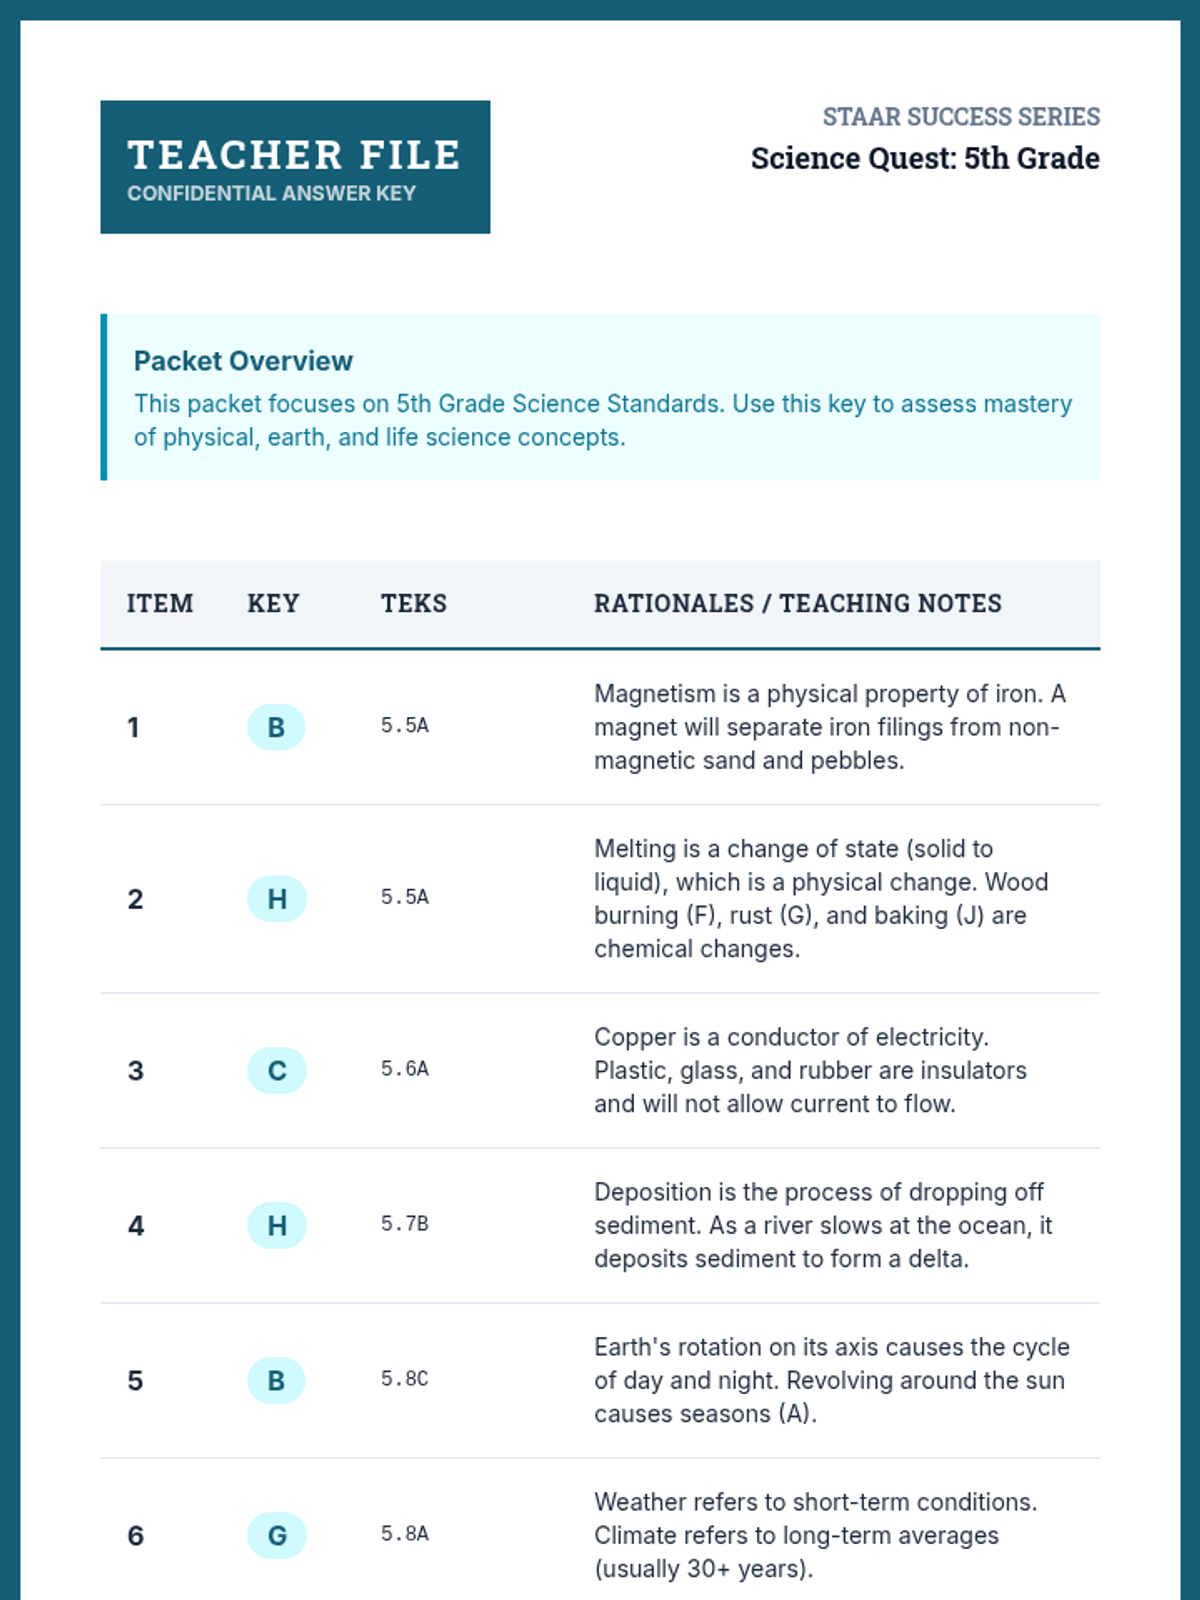
Comprehensive 5th grade science review of life, earth, and physical science topics from the TEKS curriculum.
Rigorous 5th grade math review including coordinate planes, volume, order of operations, and adding/subtracting fractions.