Data representation, distributions, and statistical variability using sampling and inference techniques. Integrates probability models, compound events, bivariate patterns, and linear models to guide data-driven decision making.
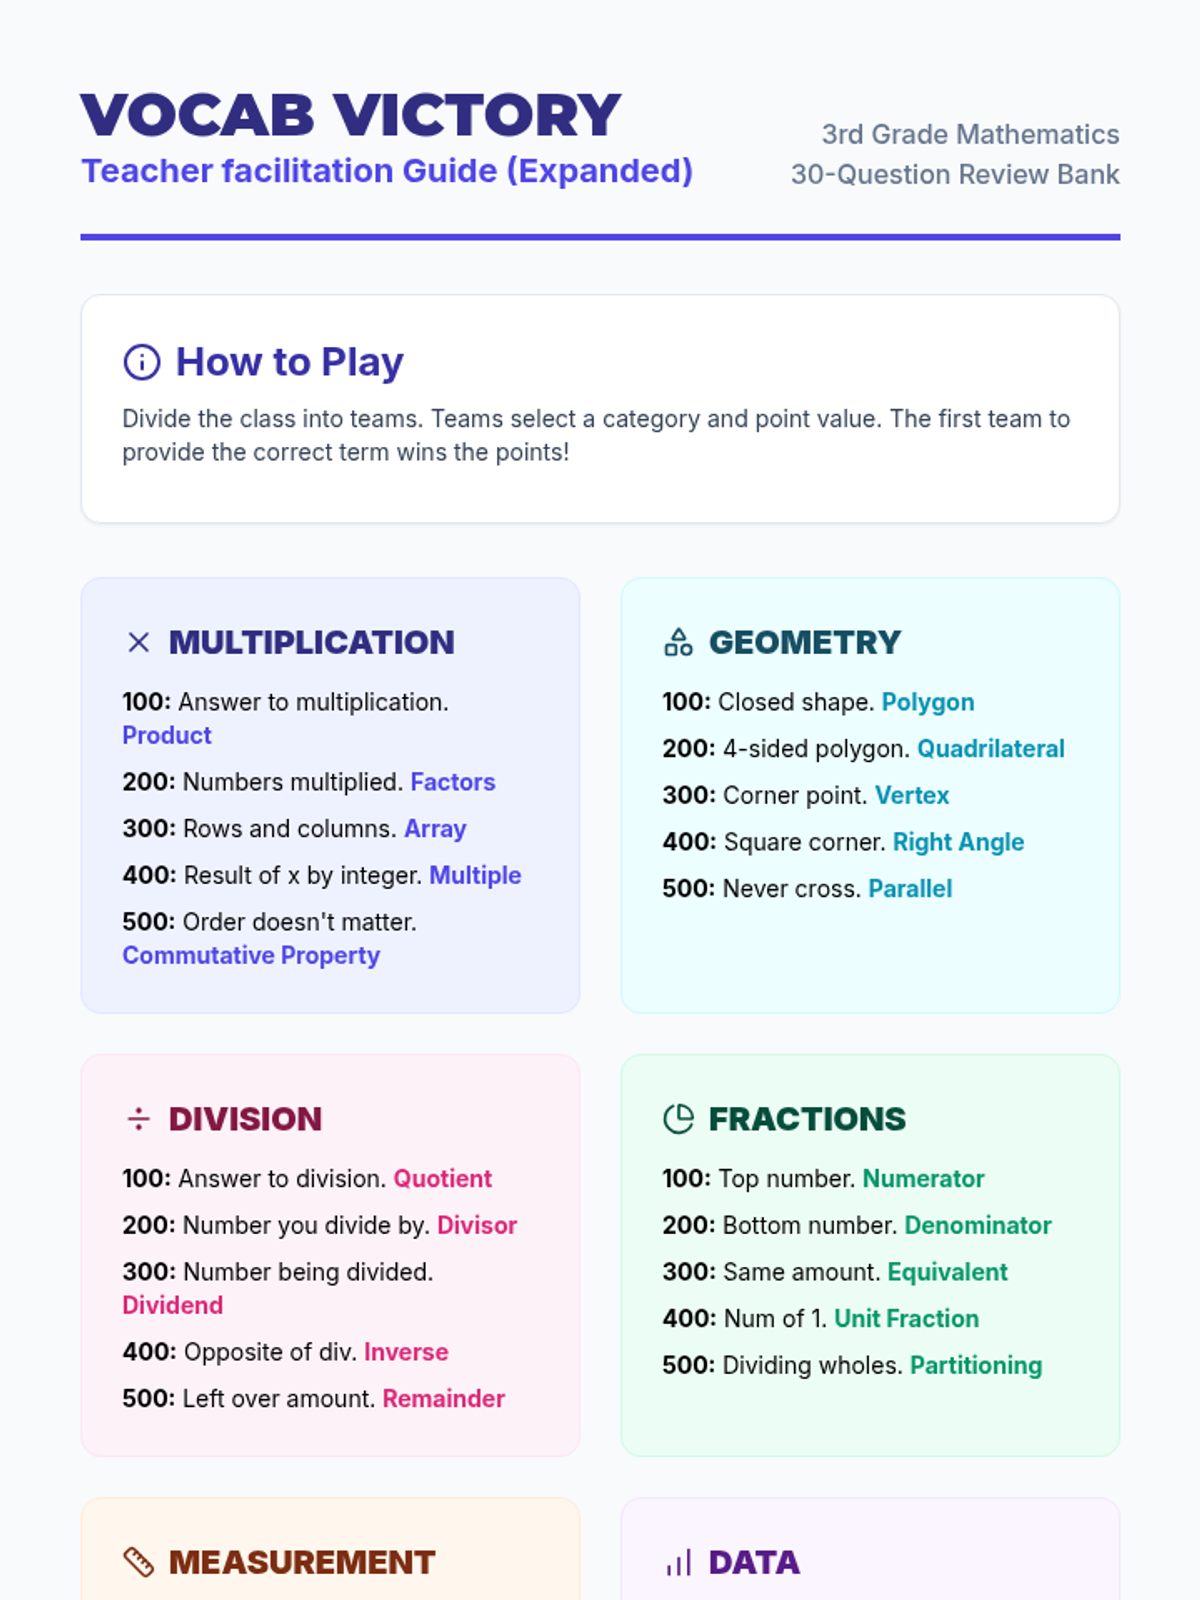
A high-energy Jeopardy-style review game focusing on essential third-grade mathematics vocabulary across six core domains, designed to reinforce terminology before assessments.
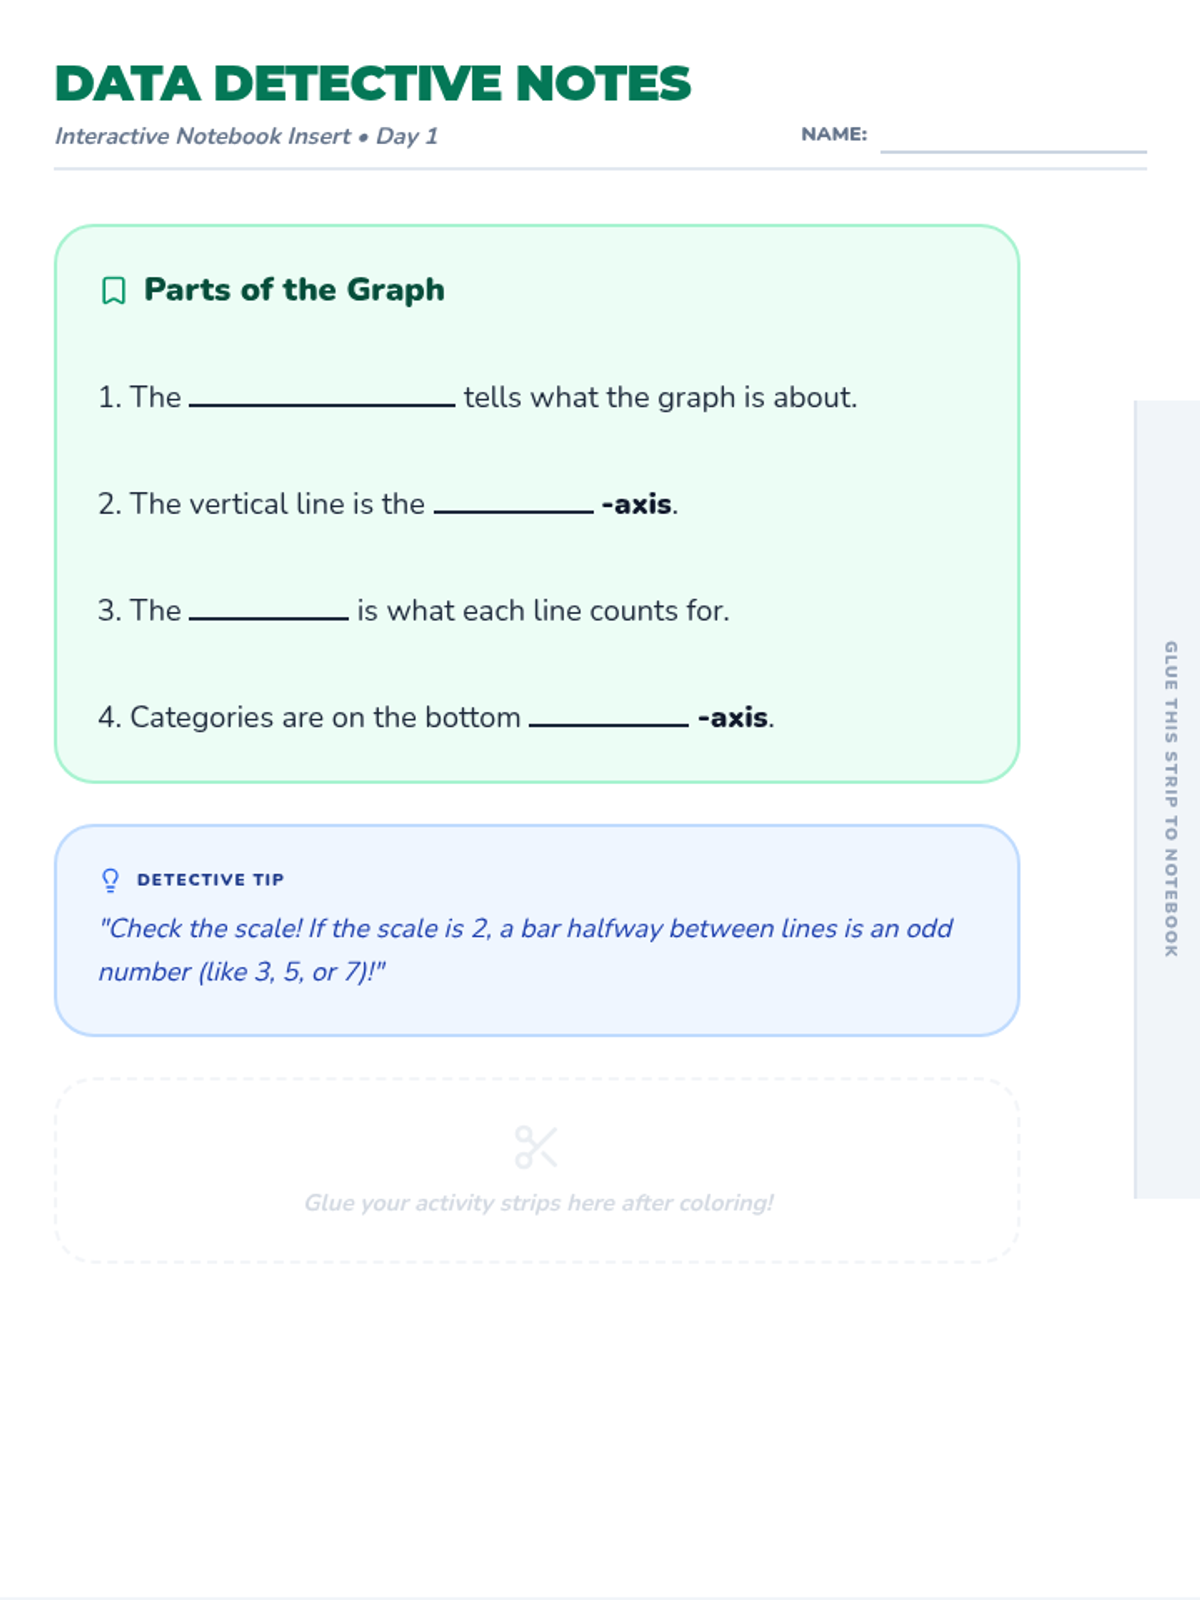
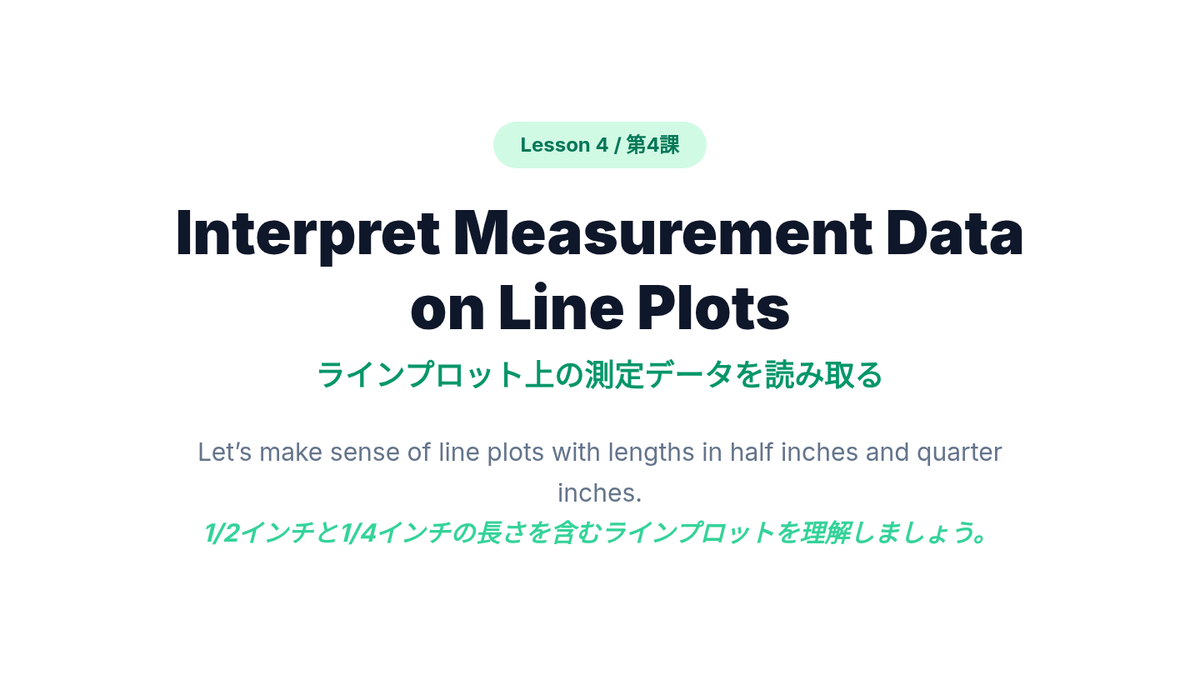
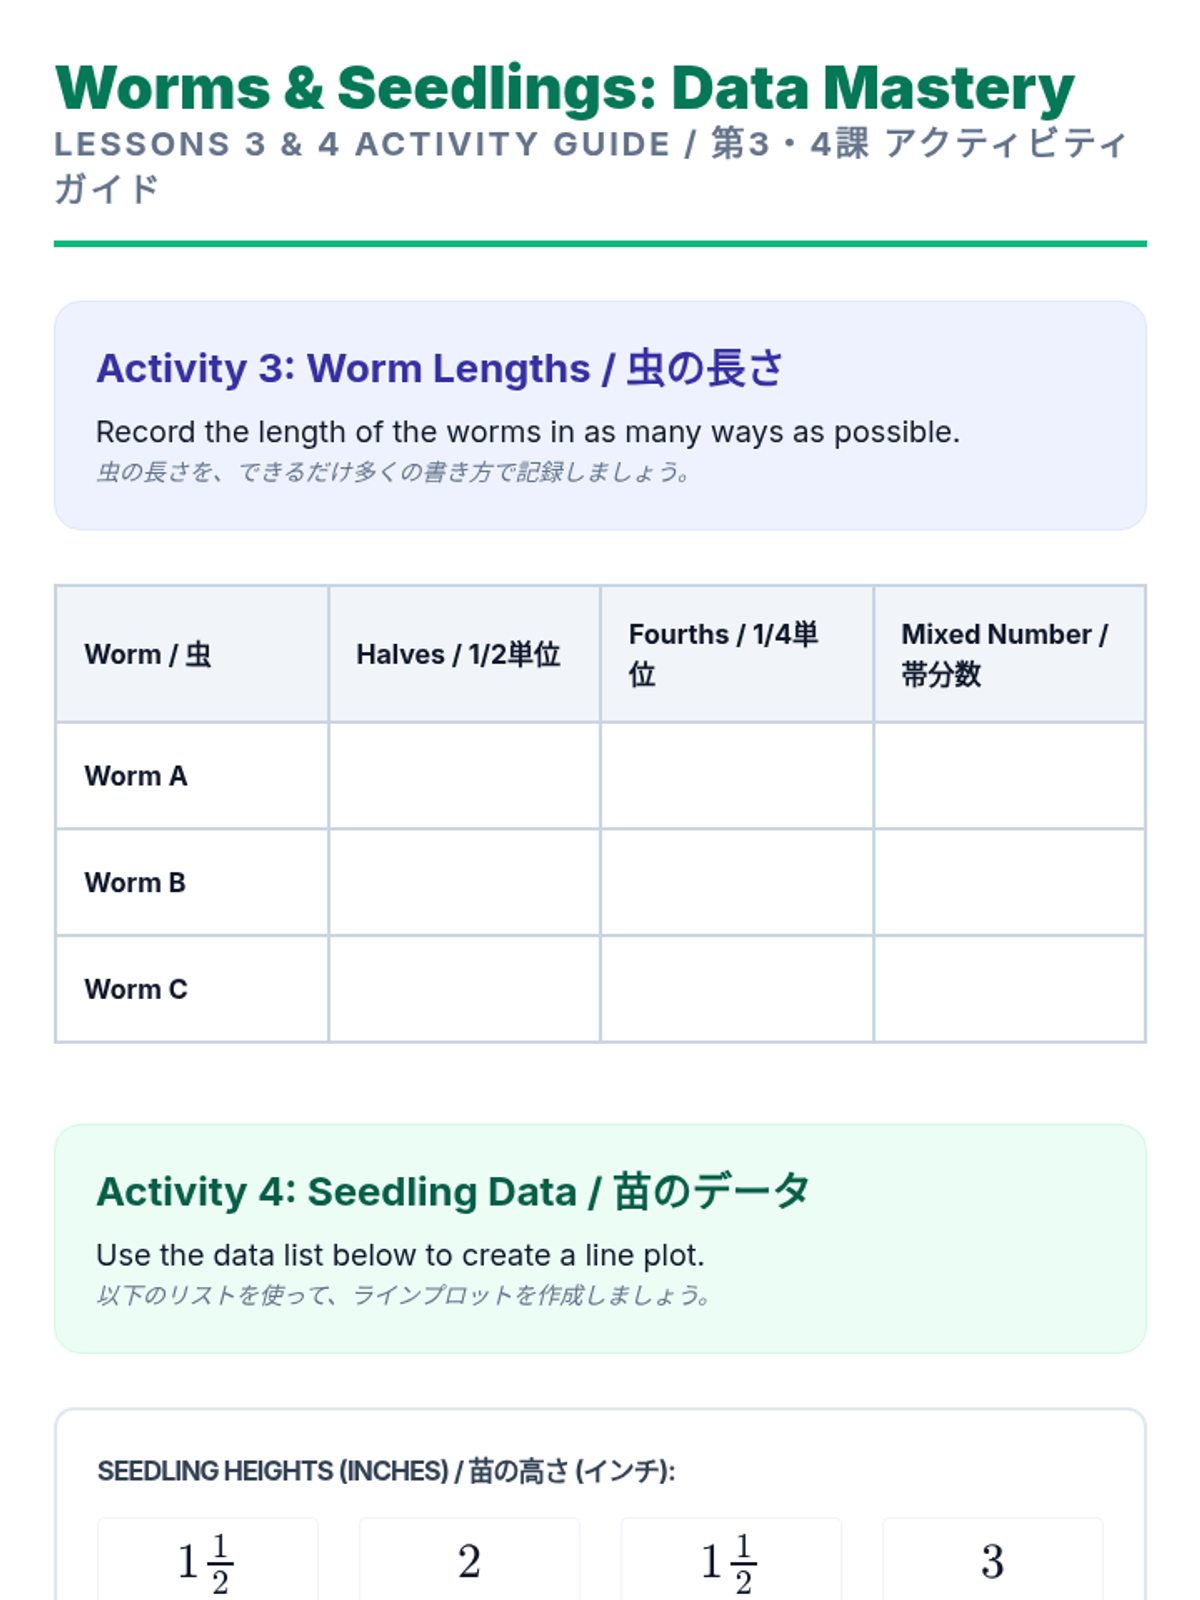
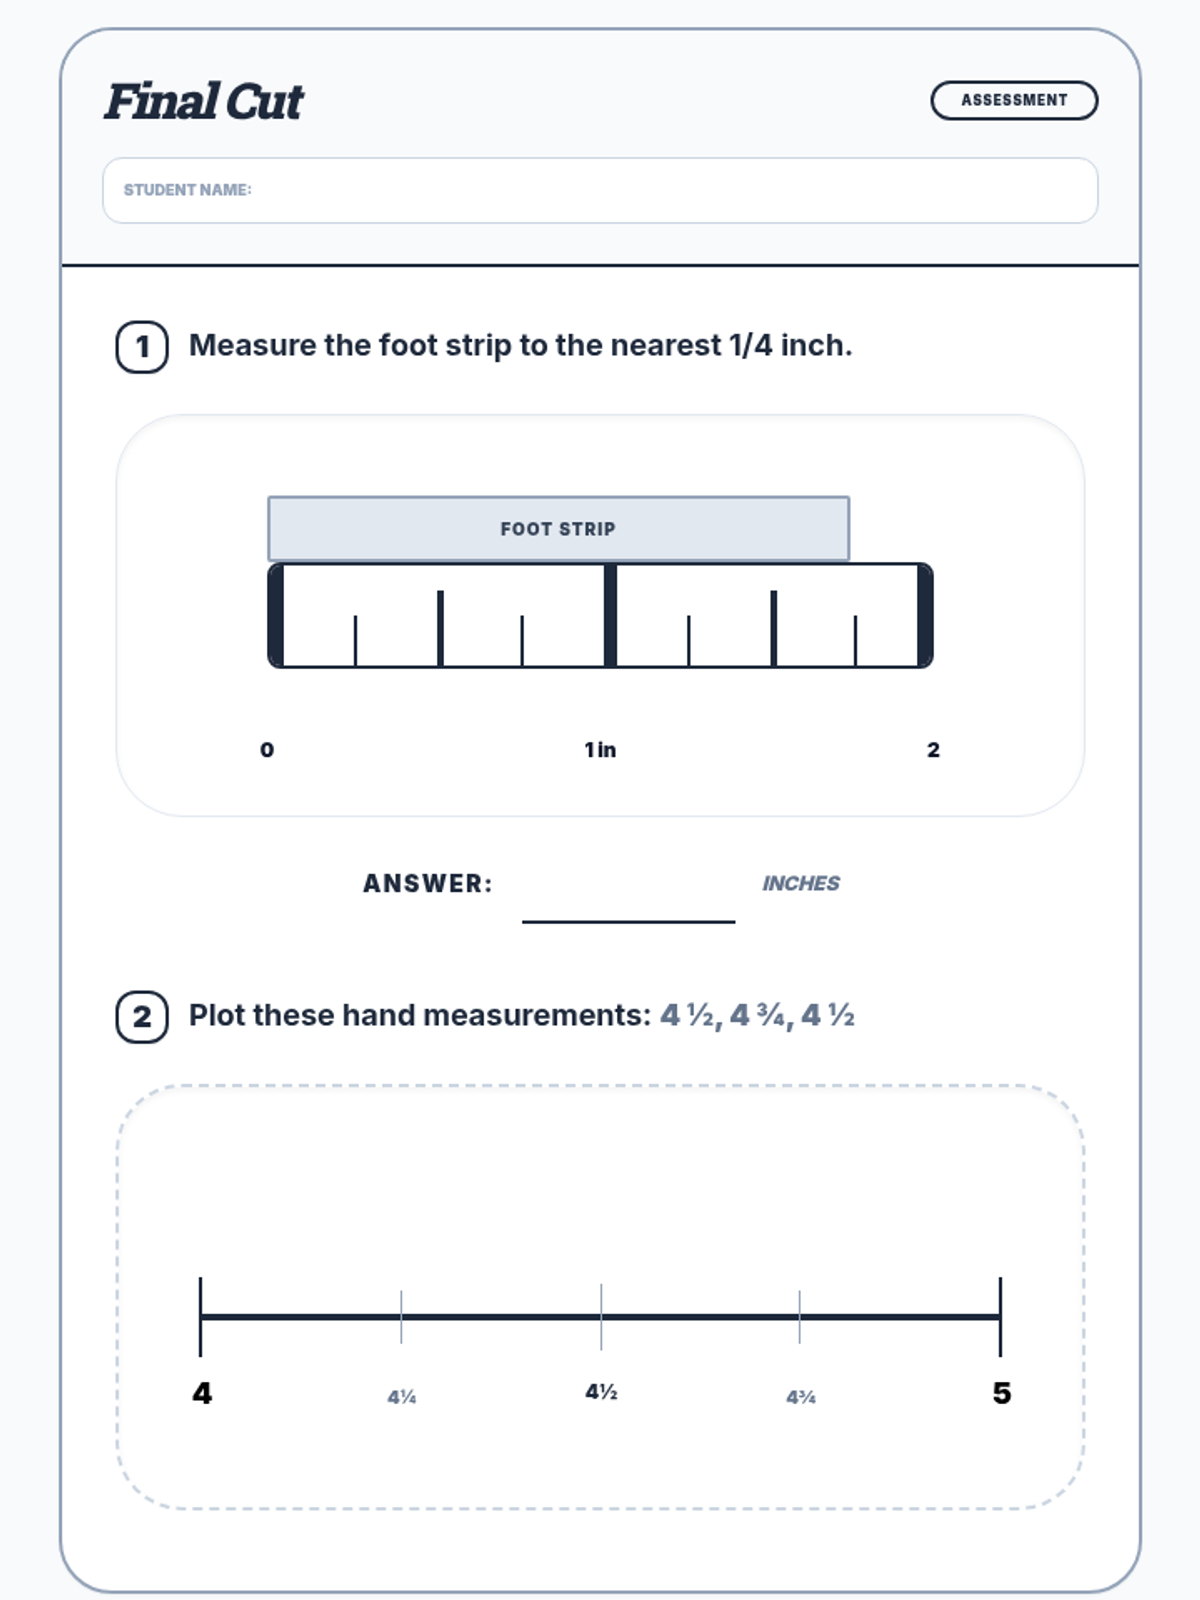
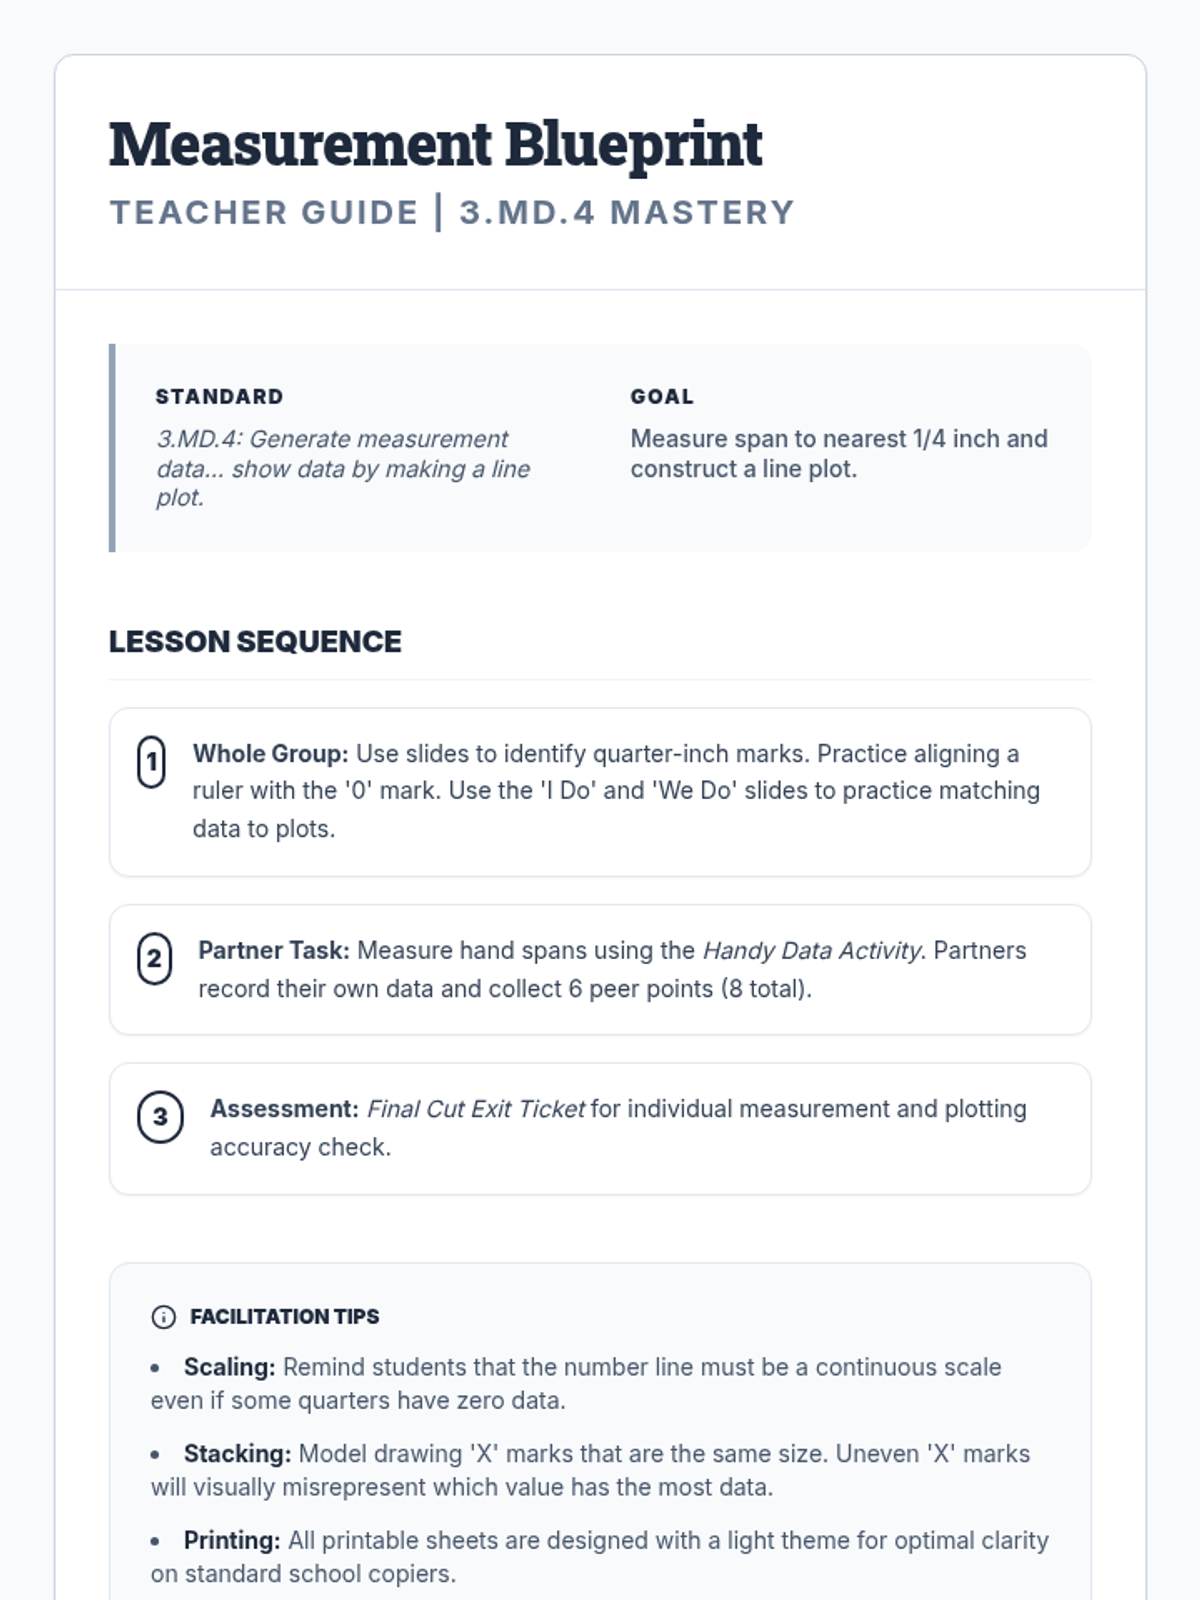
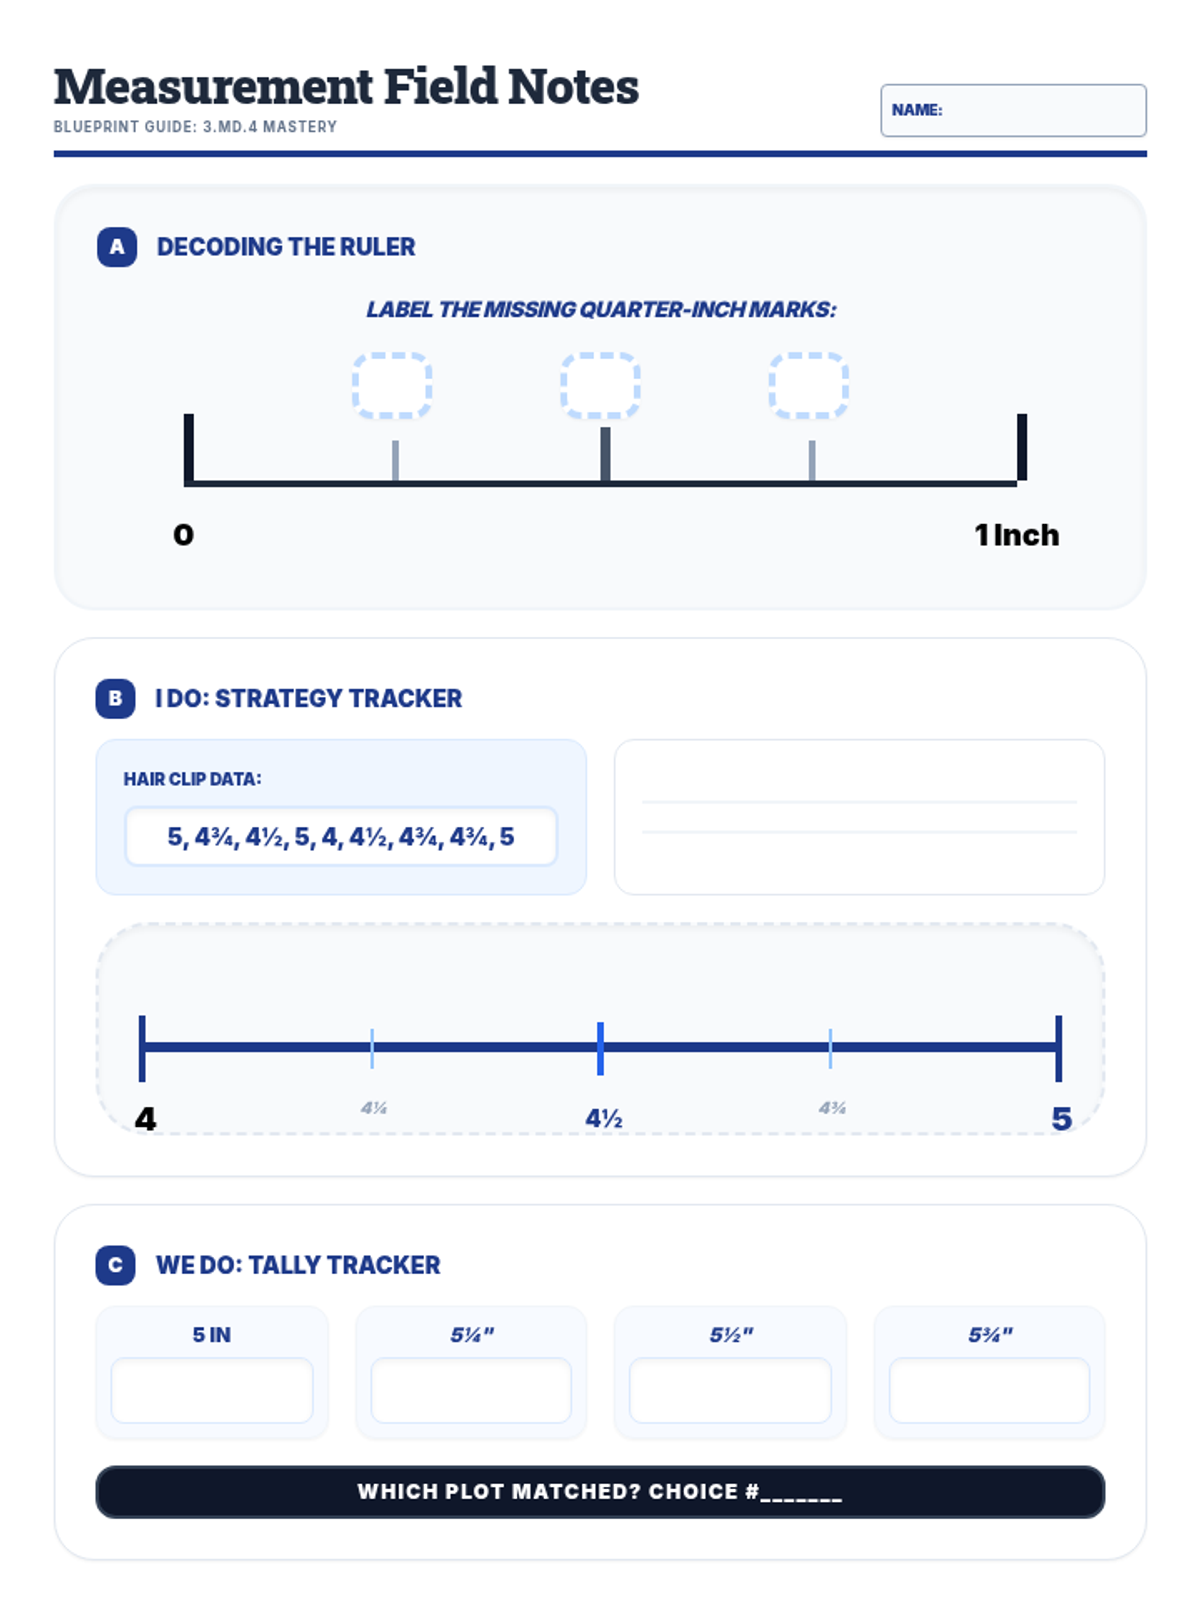
Students interpret and create line plots using measurement data involving fractions.
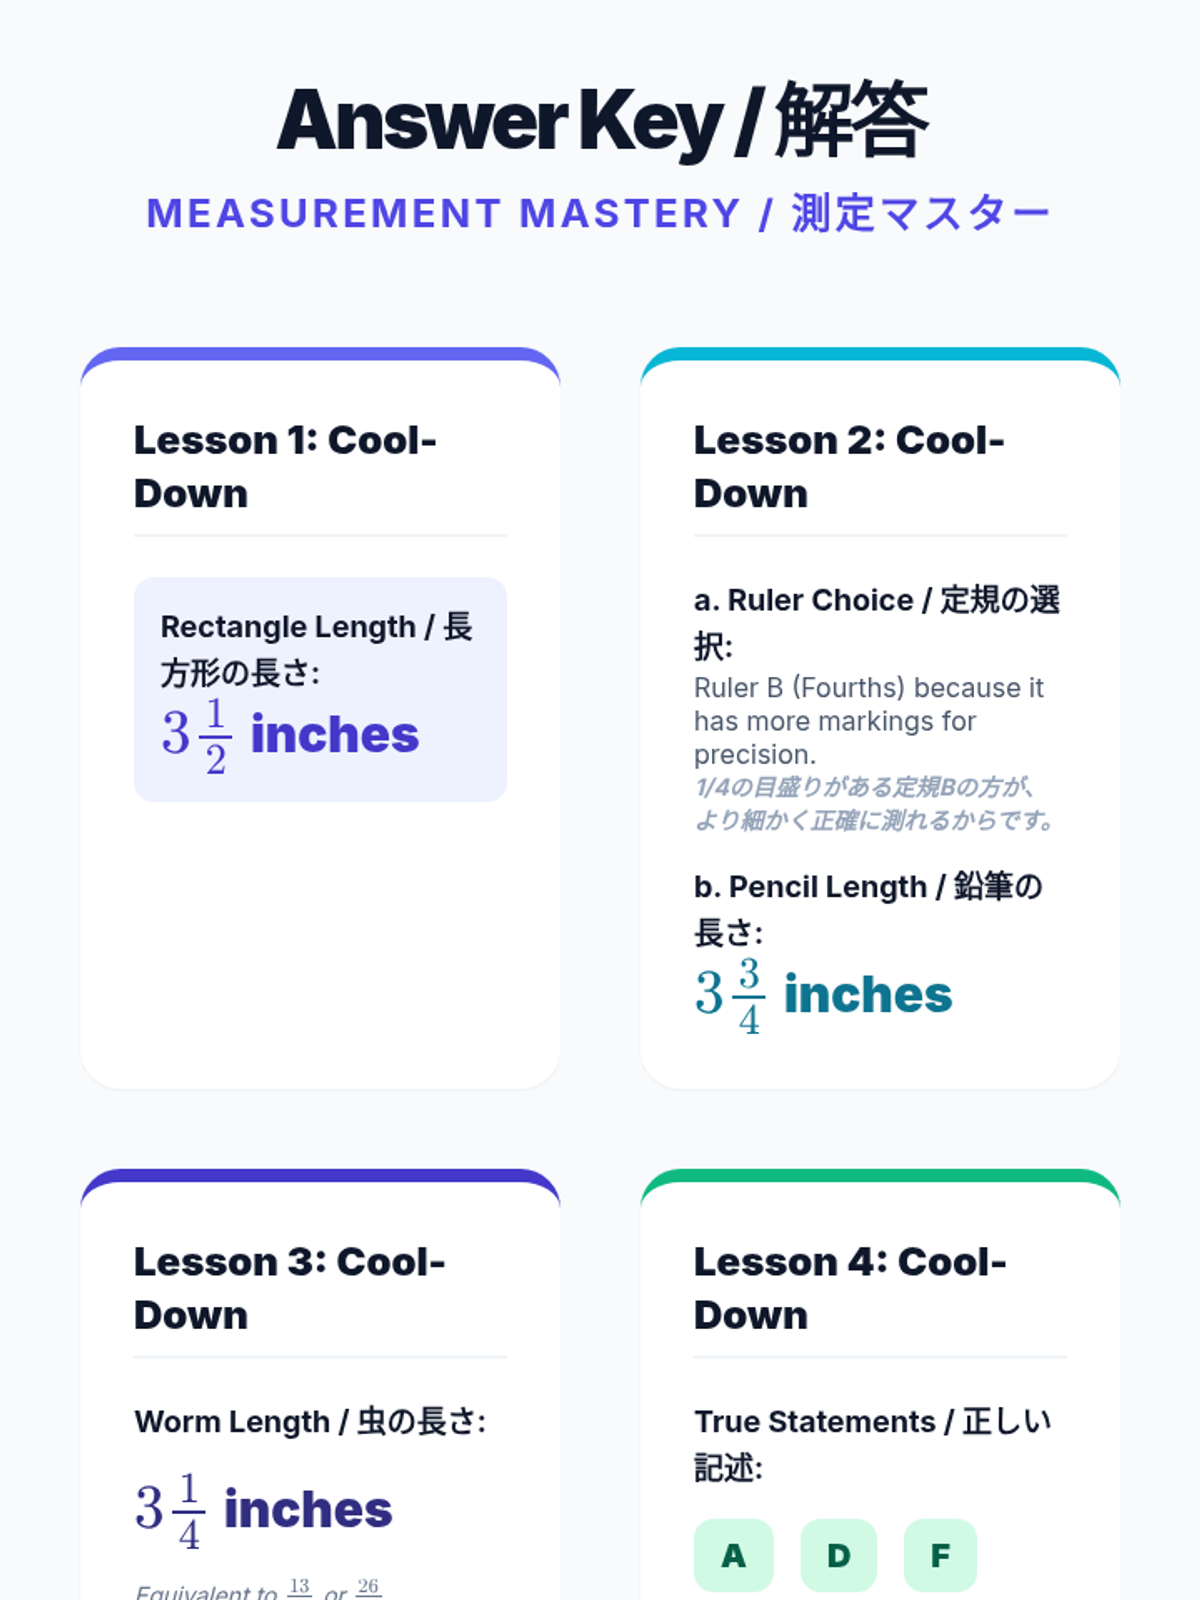
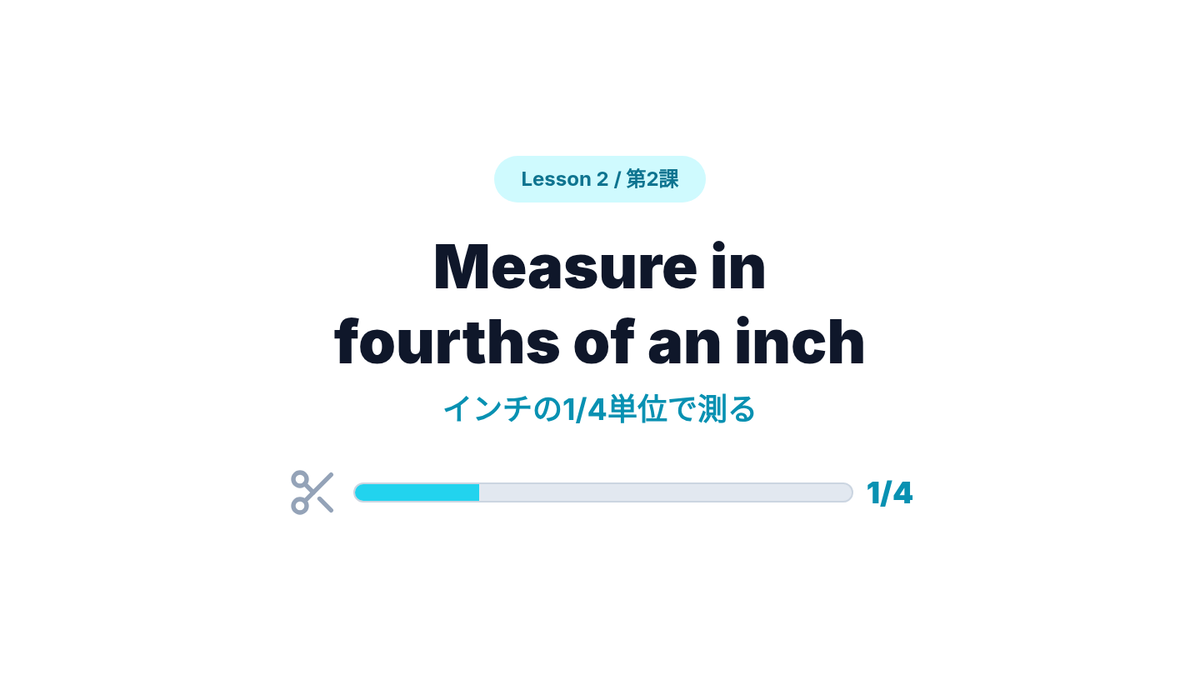
Students learn to measure objects to the nearest fourth of an inch and explore partition logic.
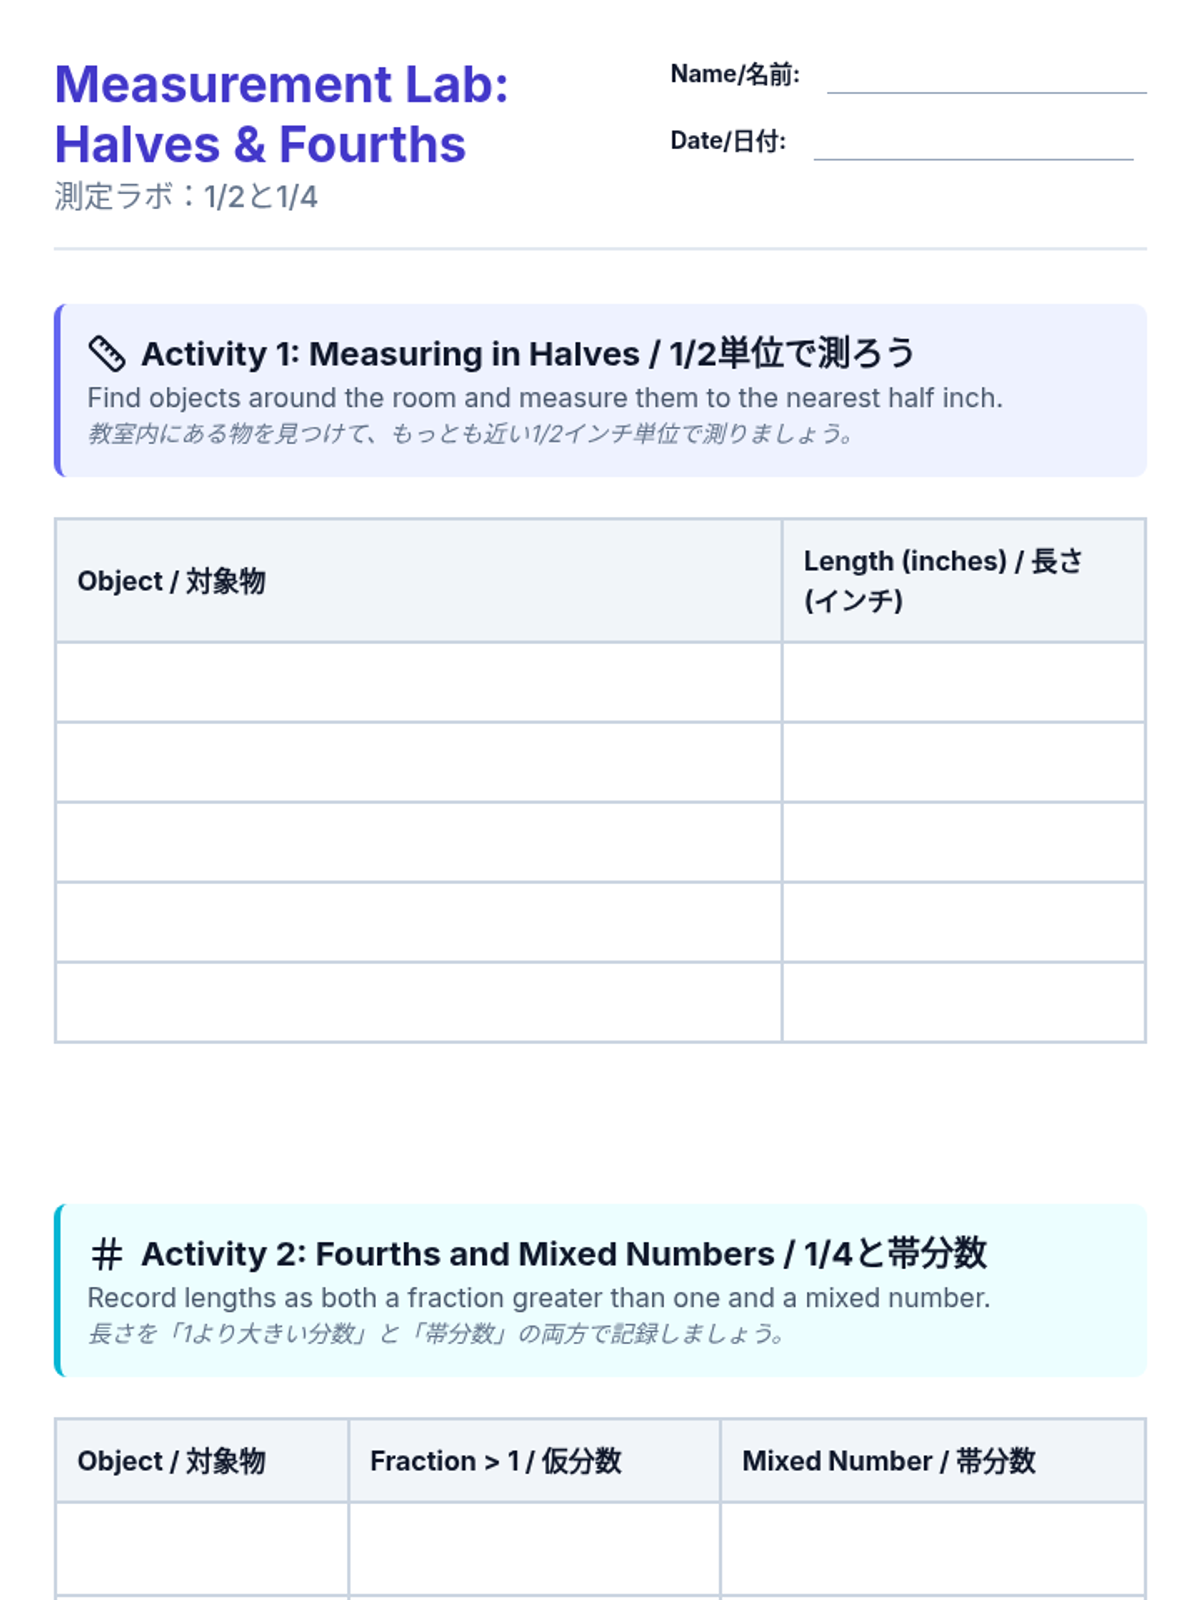
Students learn to measure objects to the nearest half-inch and are introduced to mixed numbers.
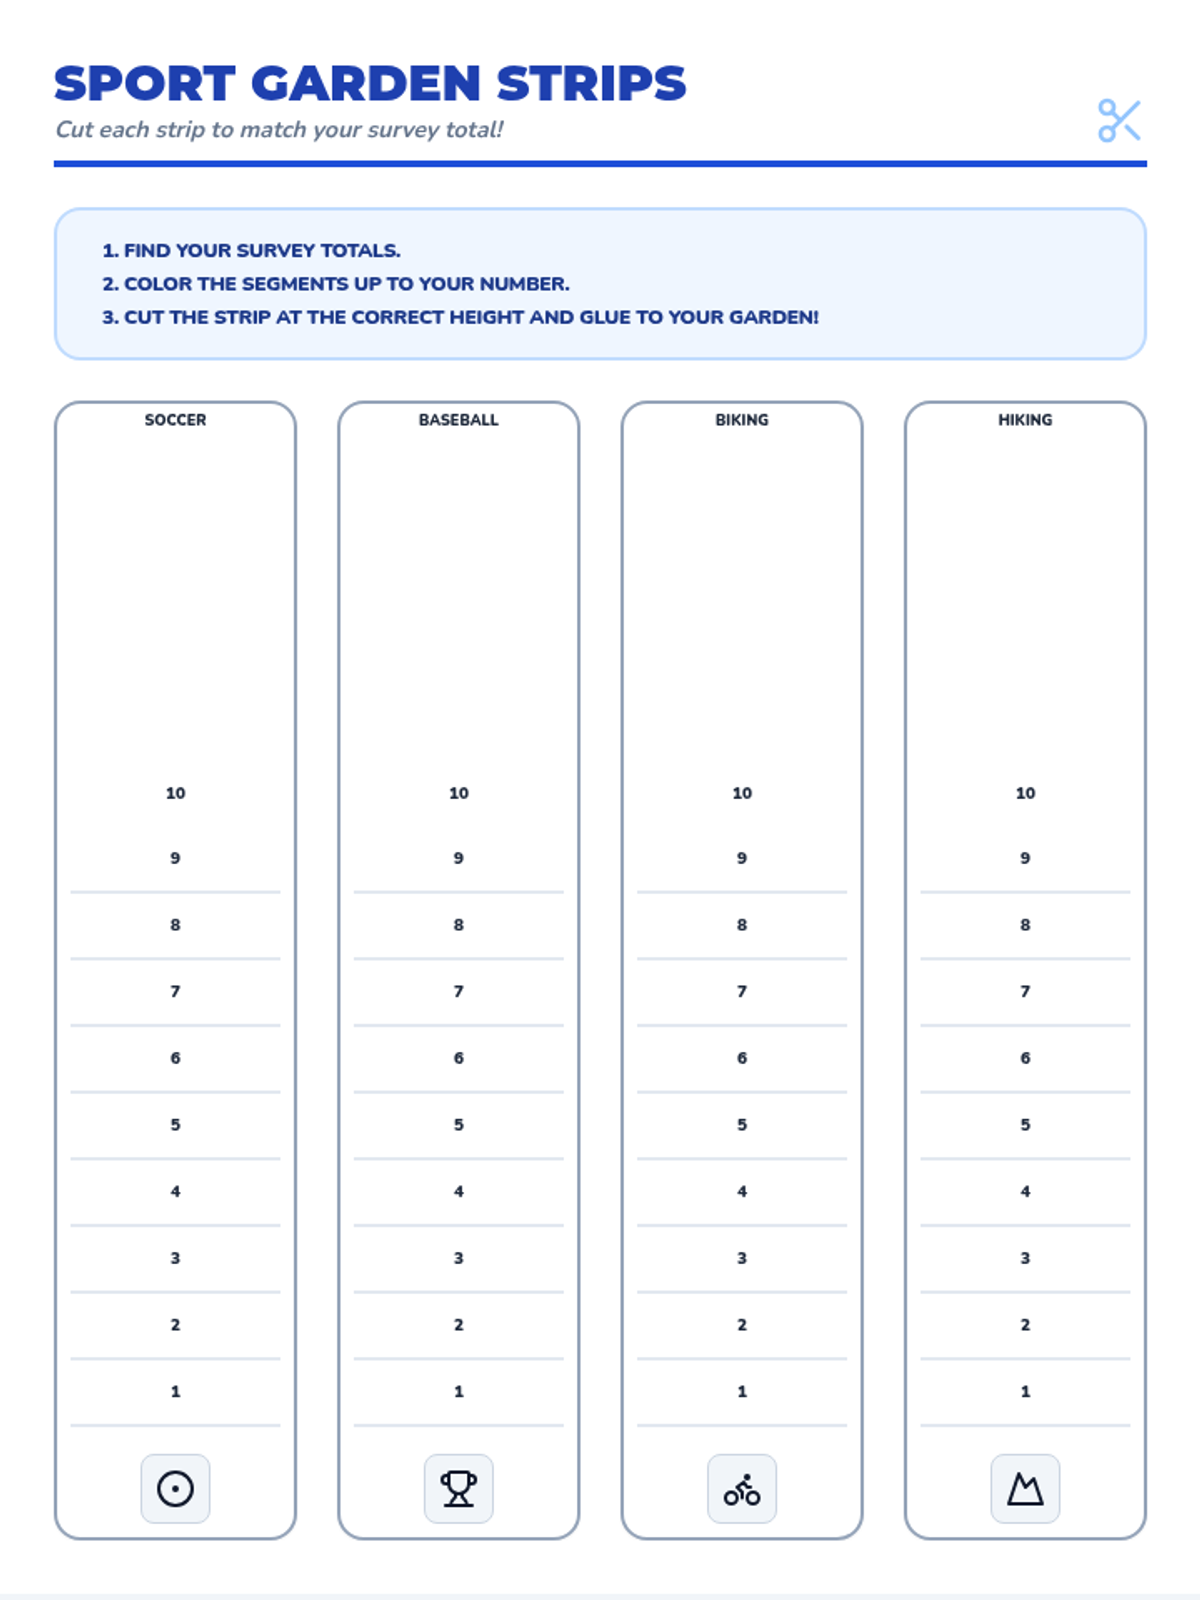
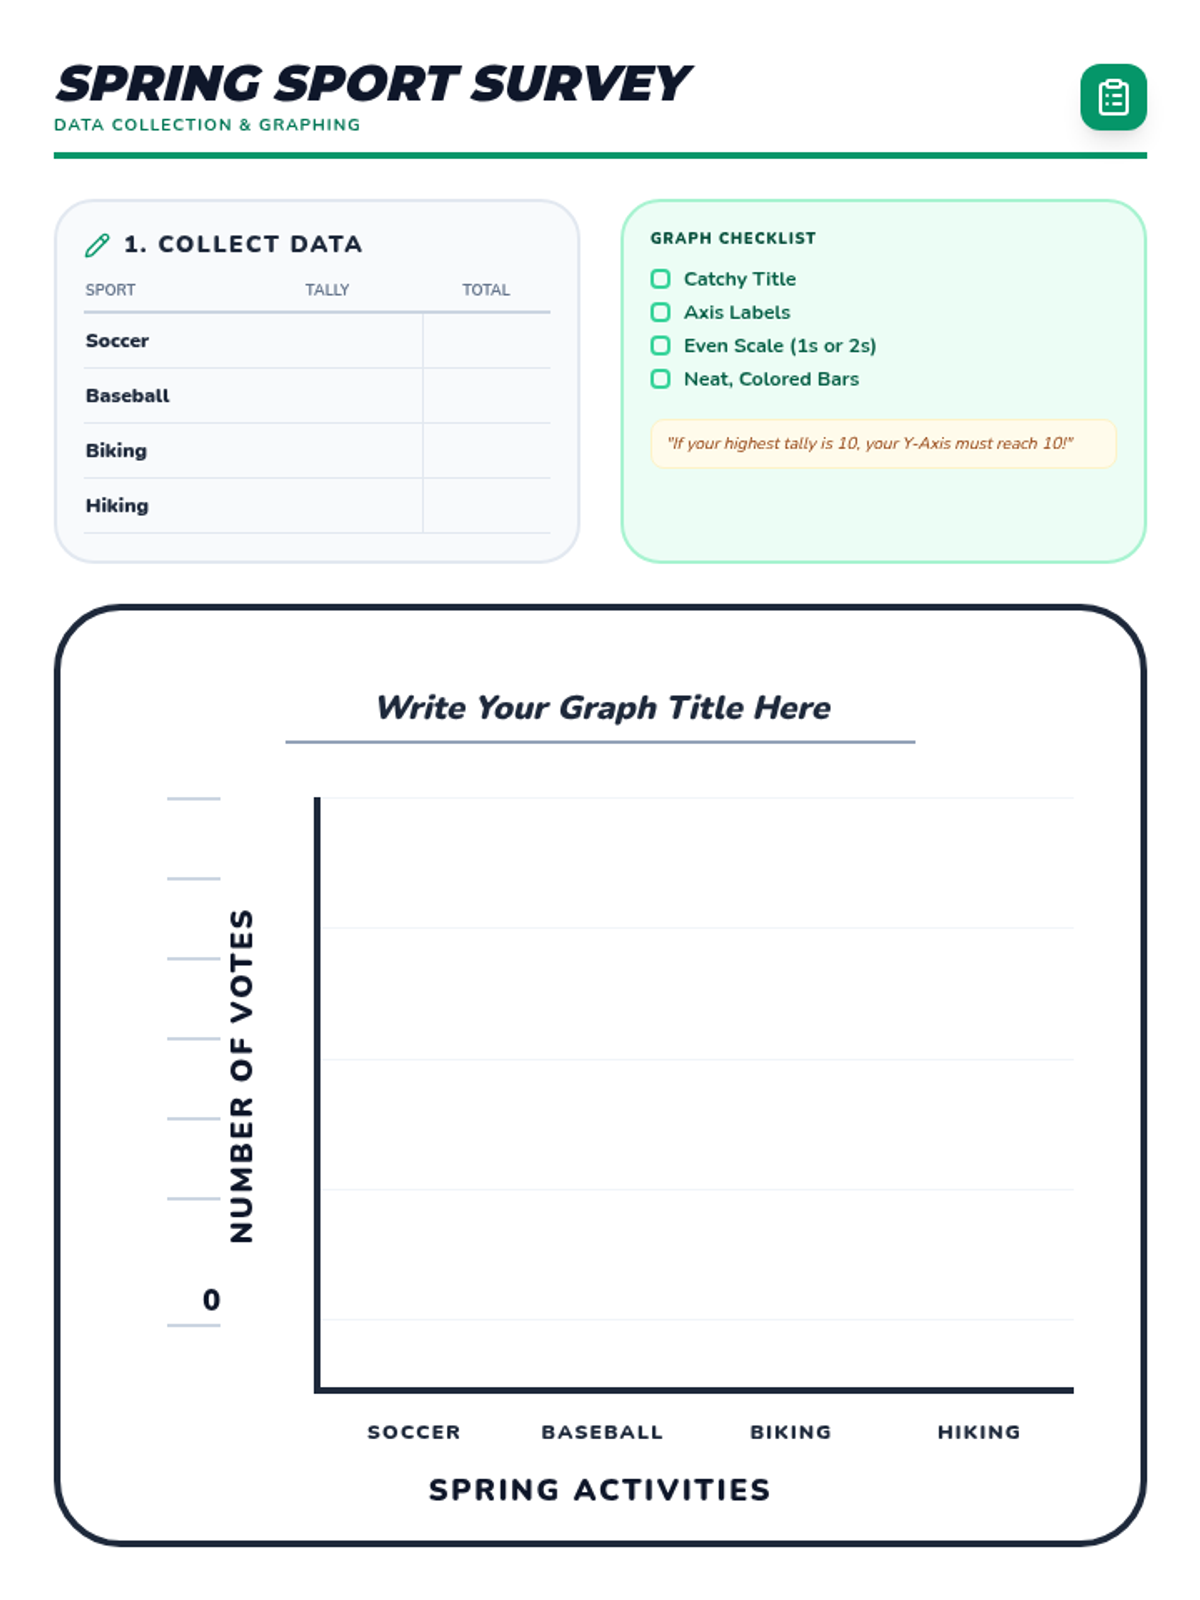
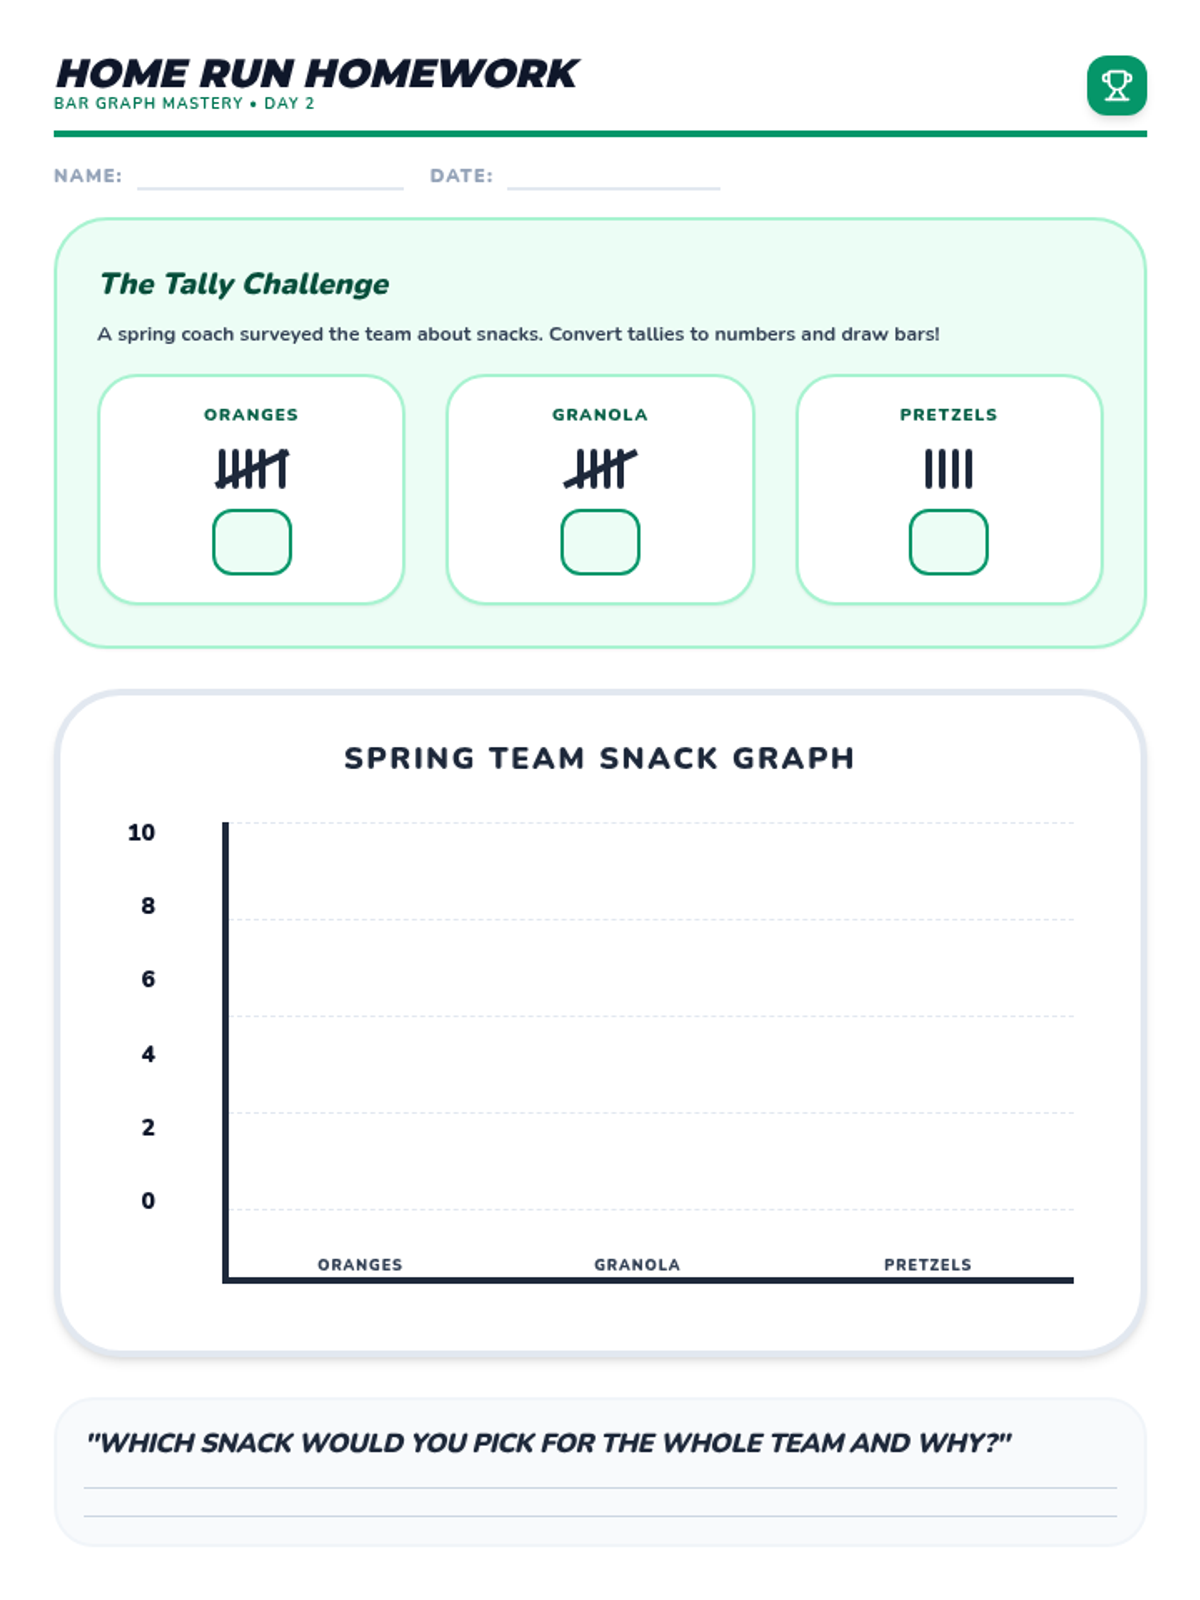
Students collect data through a class survey and create their own bar graphs, culminating in a creative spring-themed sports craft.
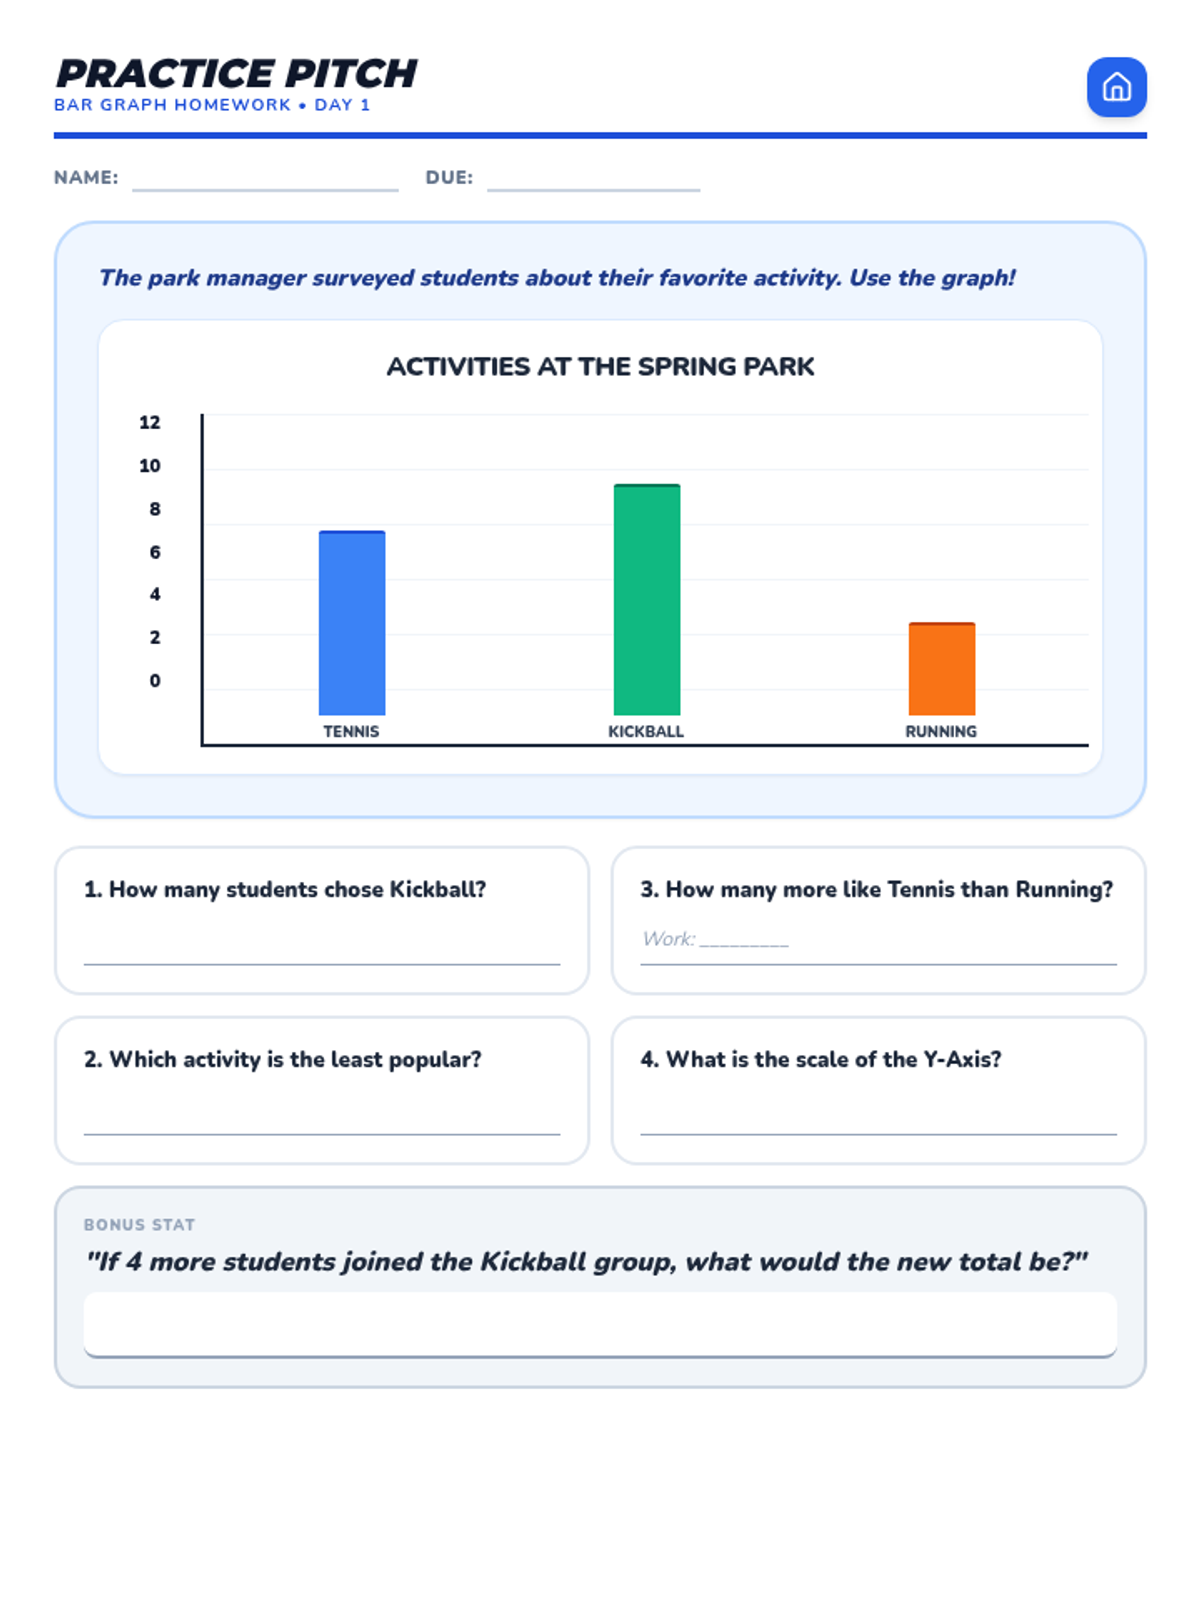
Students learn to read and analyze bar graphs by interpreting data about spring activities and answering comparative questions.
Analyzing and creating line plots to represent measurement data.
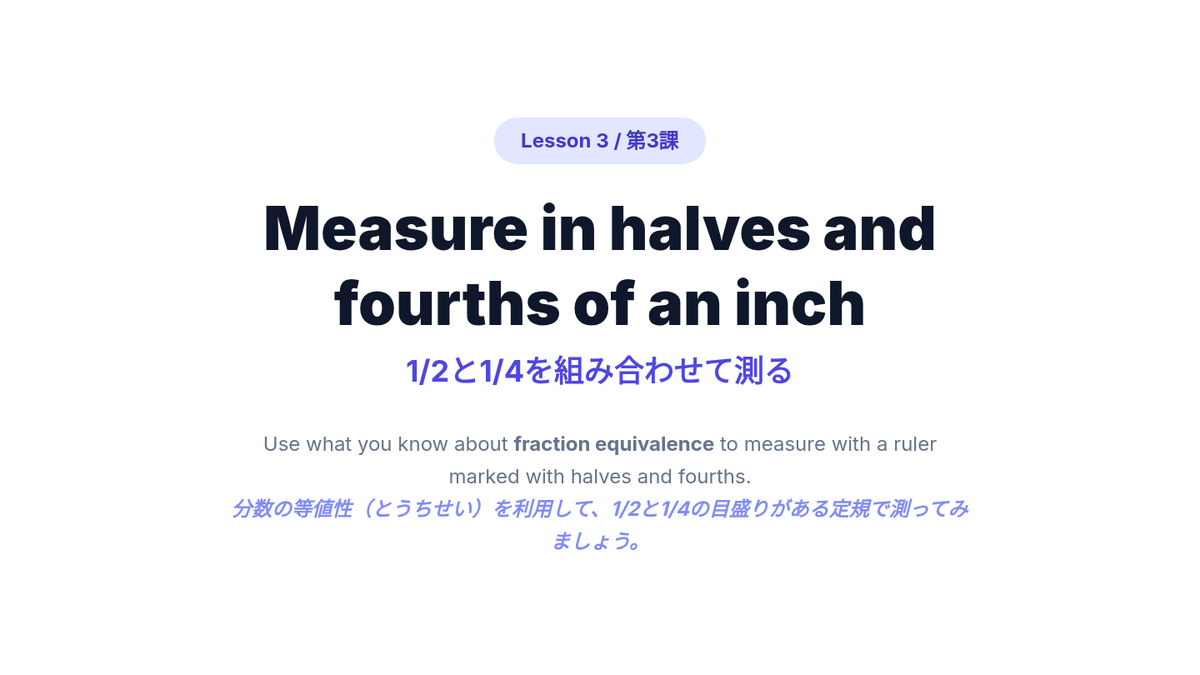
Using fraction equivalence to measure and record lengths accurately.
Expanding measurement skills to fourths of an inch and practicing with mixed numbers.
Introduction to measuring length in halves of an inch and understanding mixed numbers.
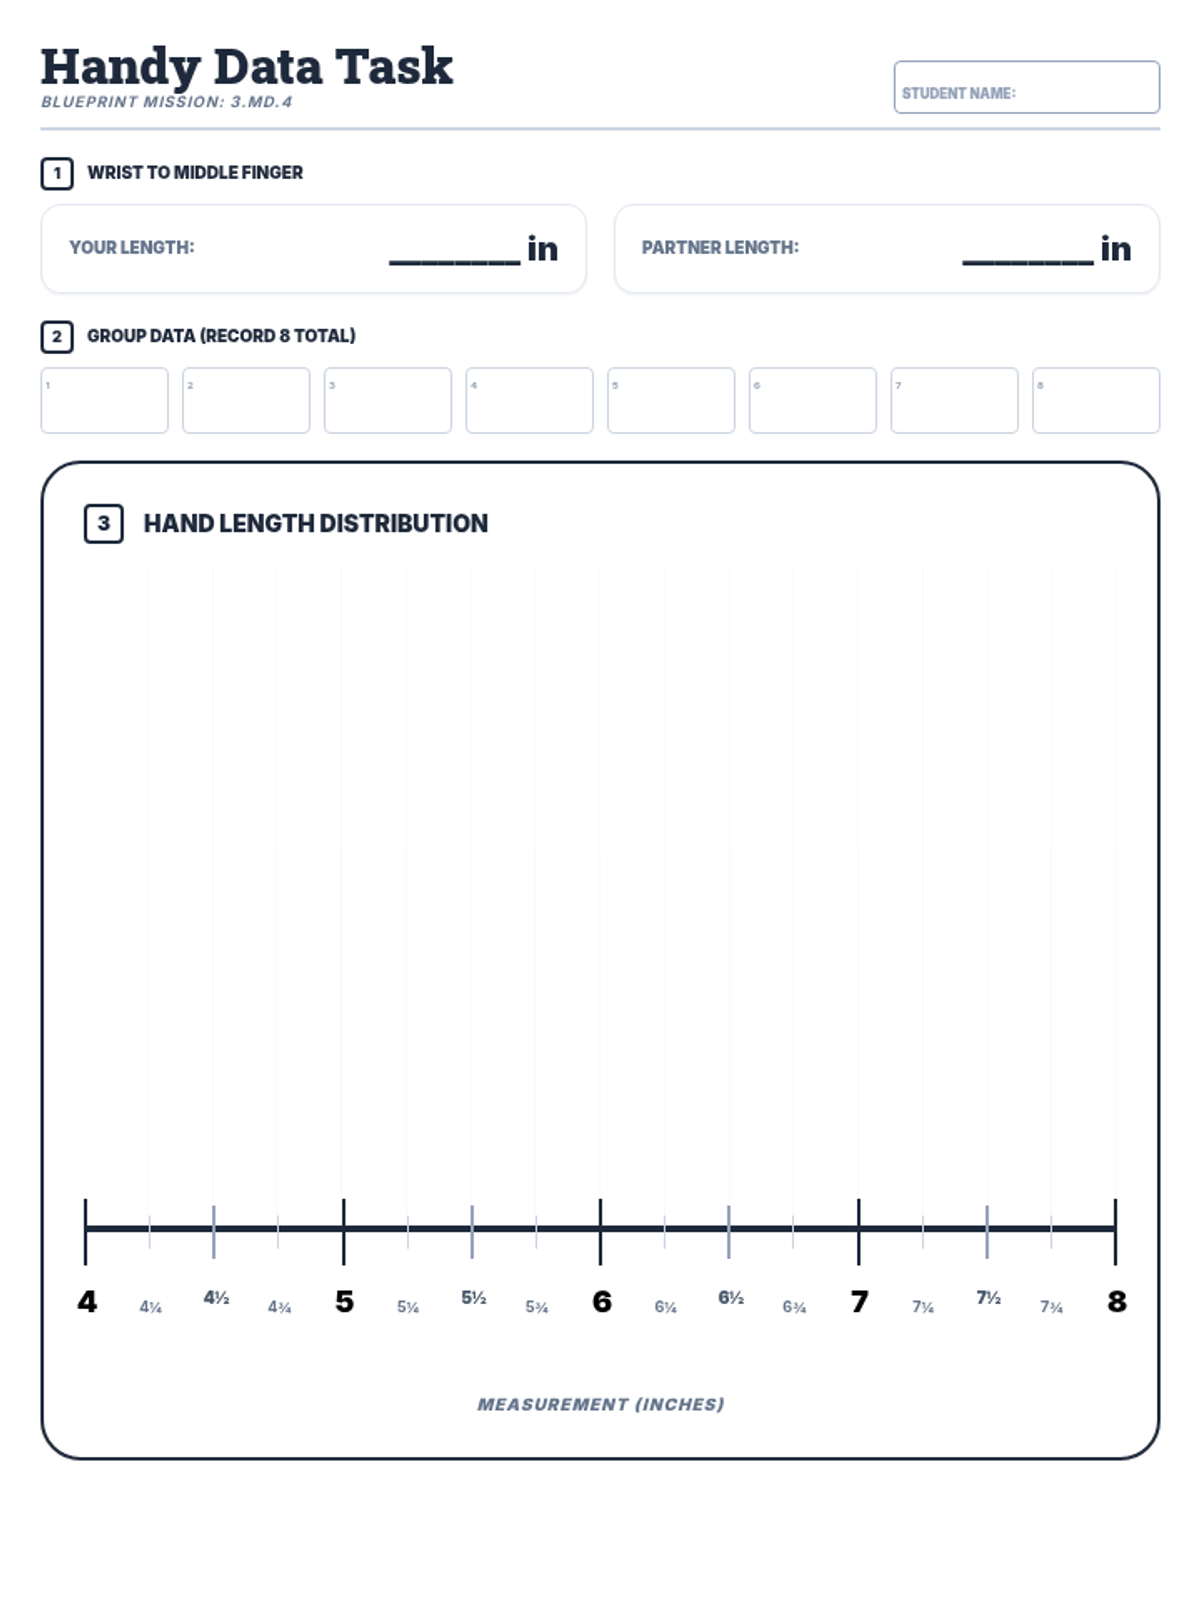
A comprehensive lesson on 3.MD.4 focusing on measuring to the nearest quarter inch and displaying that data on a line plot. Students measure their hand lengths to generate authentic data for analysis.
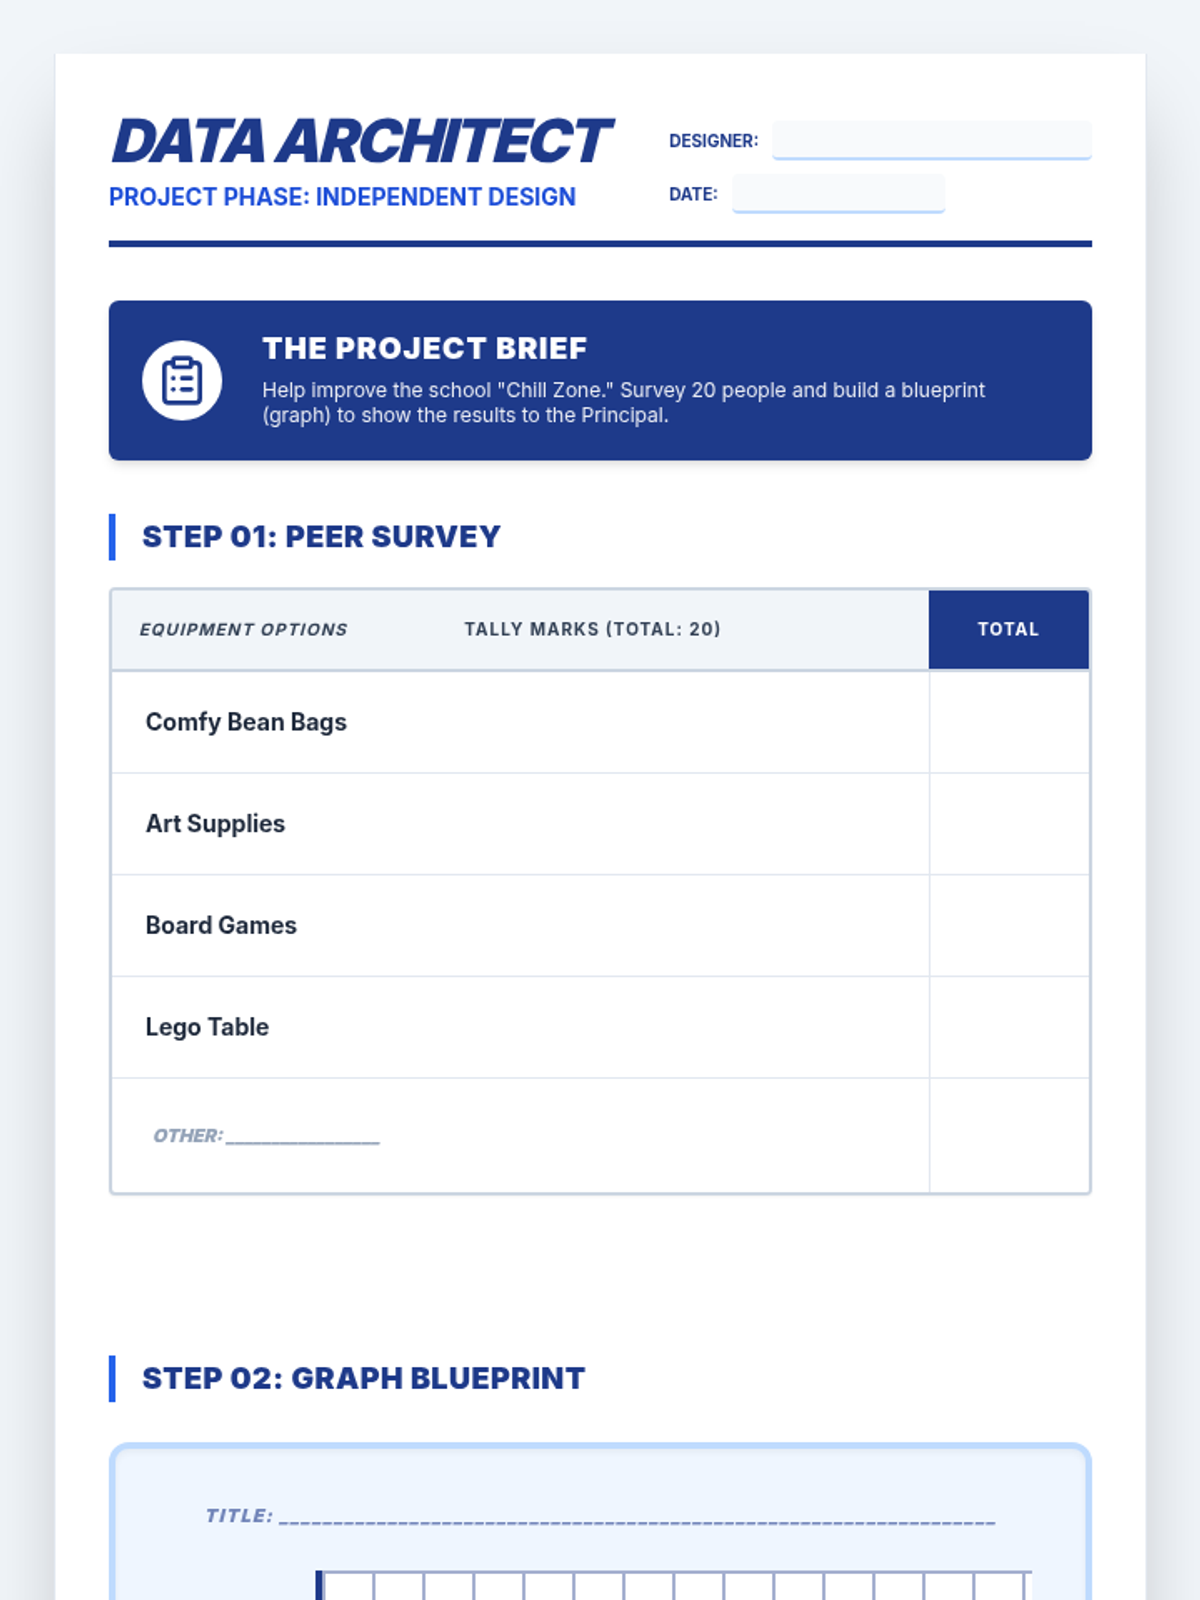
A comprehensive lesson on data interpretation and graphing, moving from foundational skill practice to an independent data collection and design project.
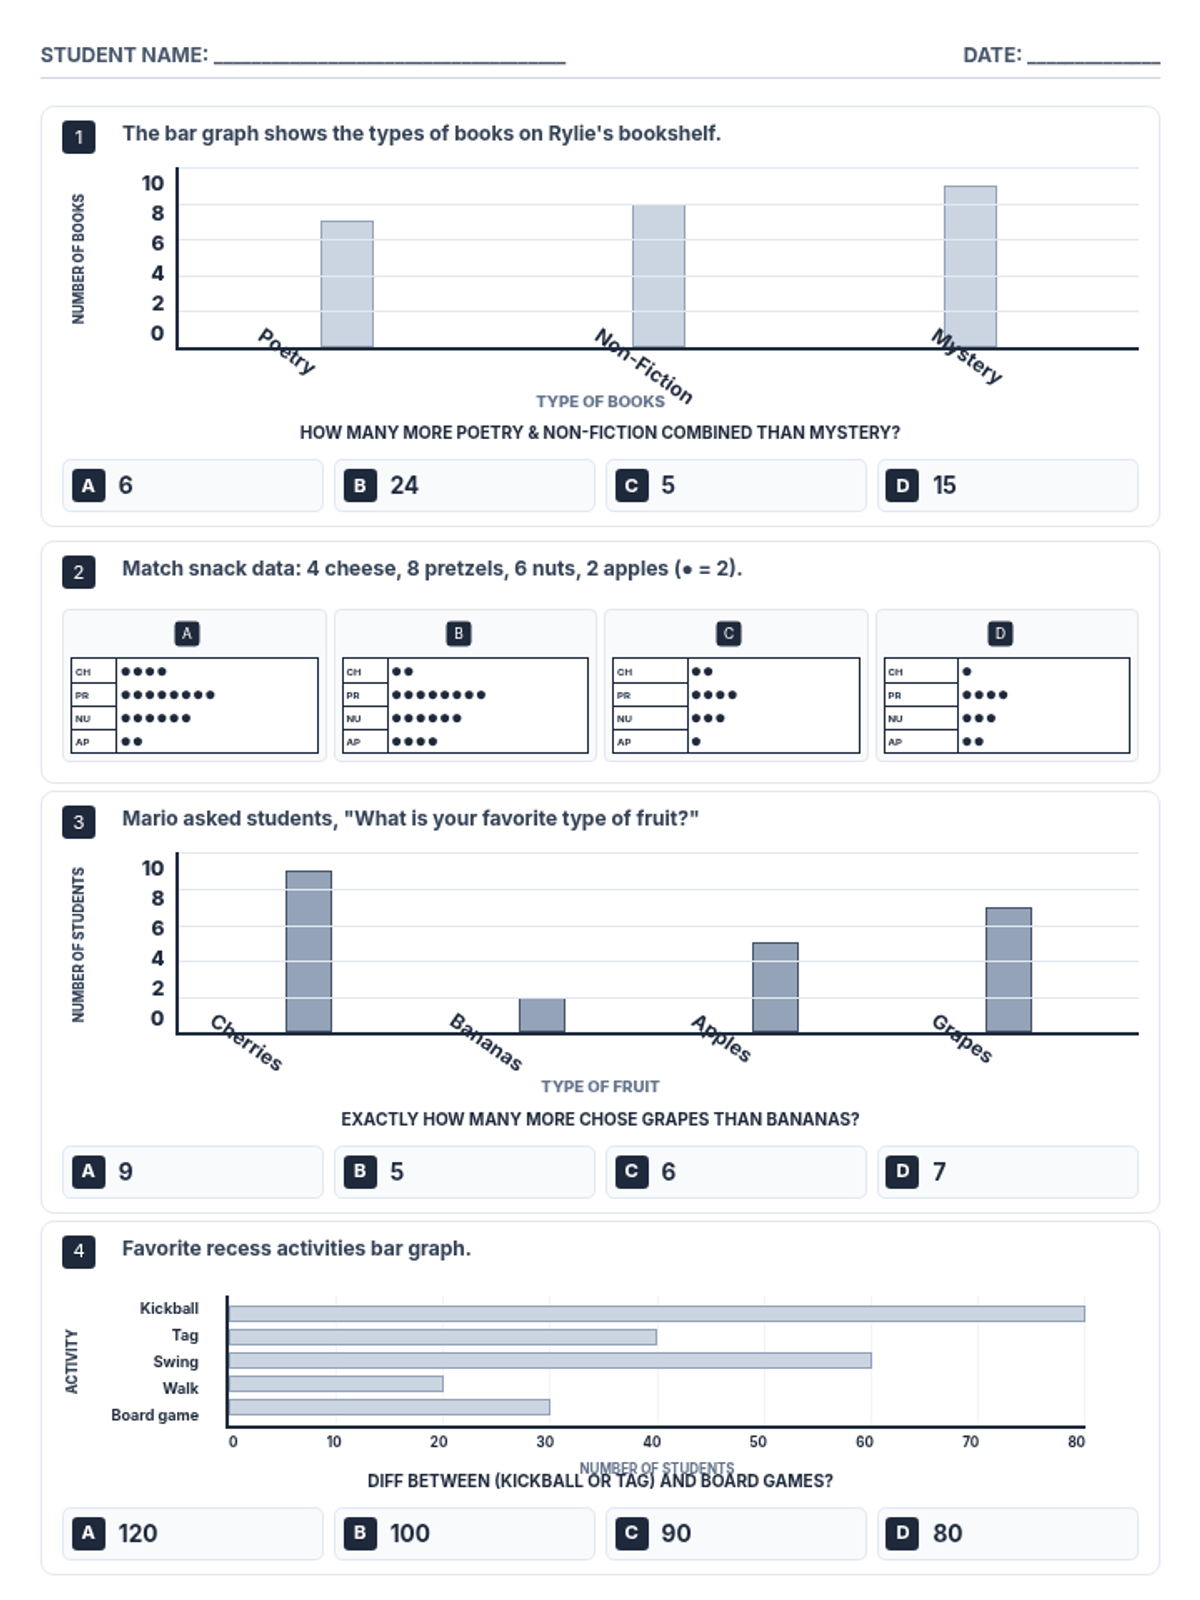
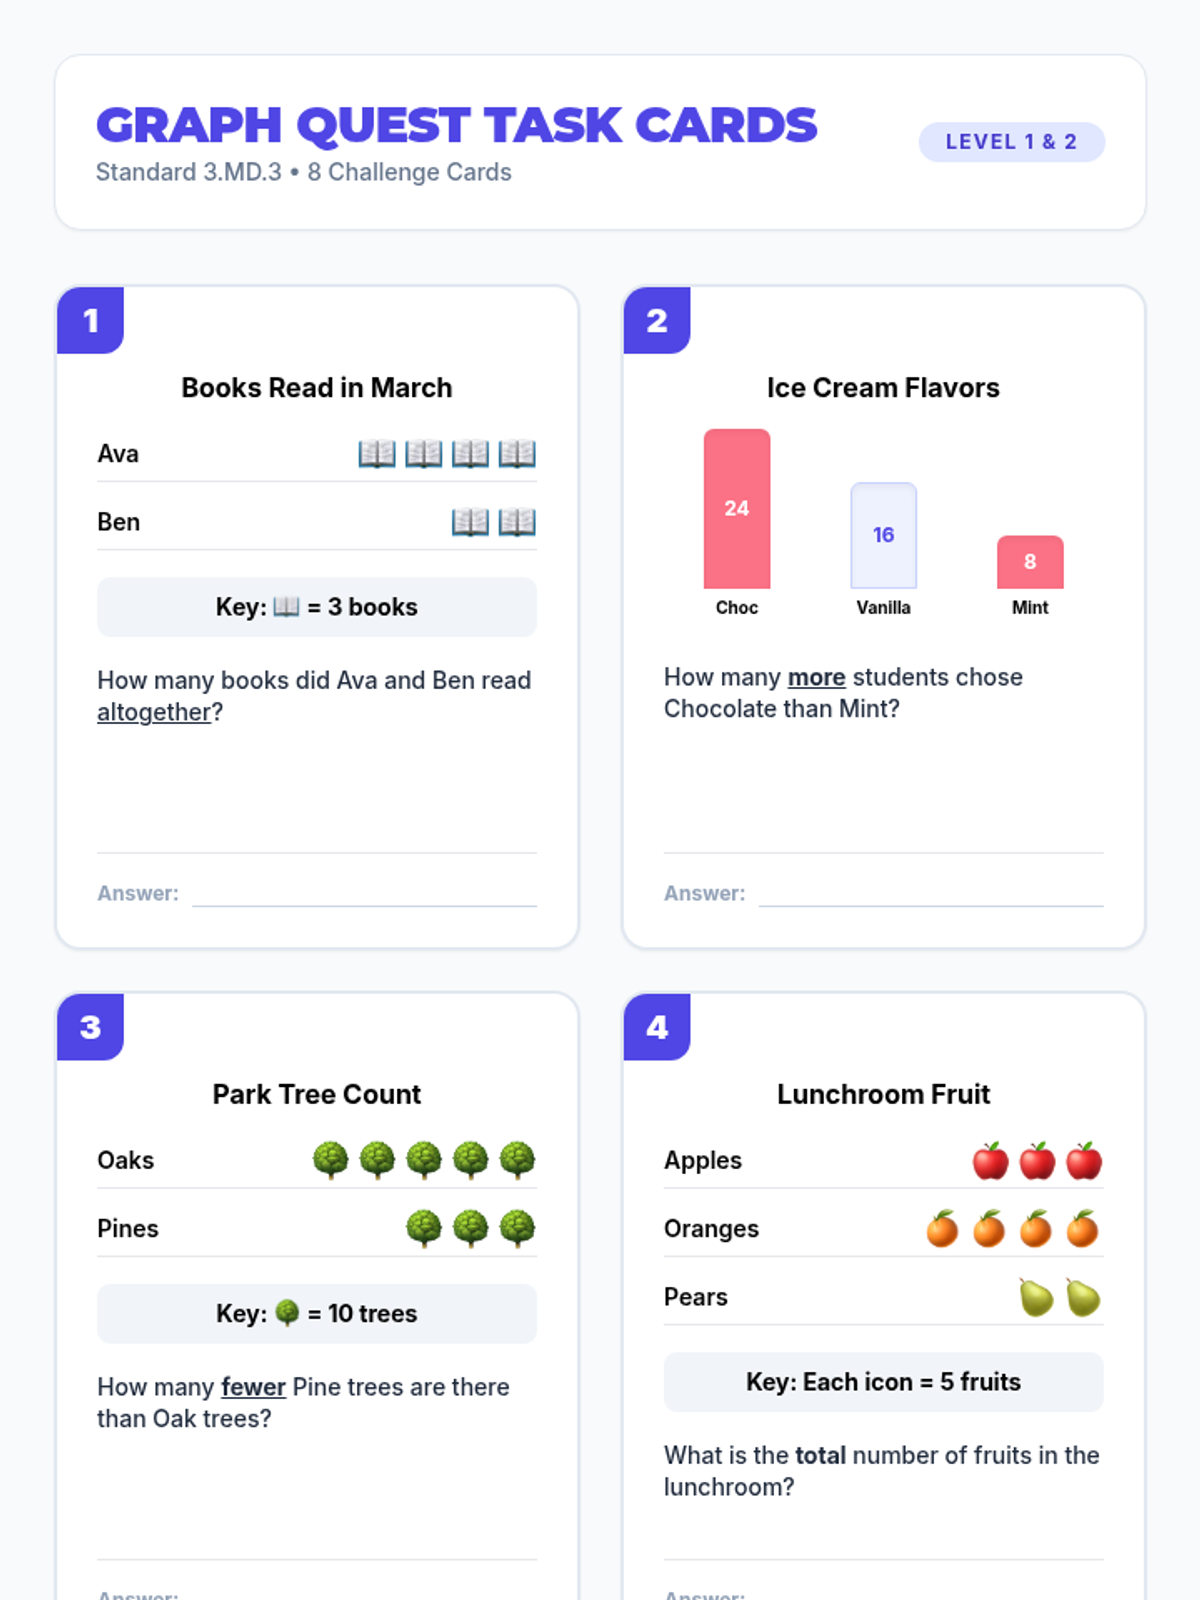
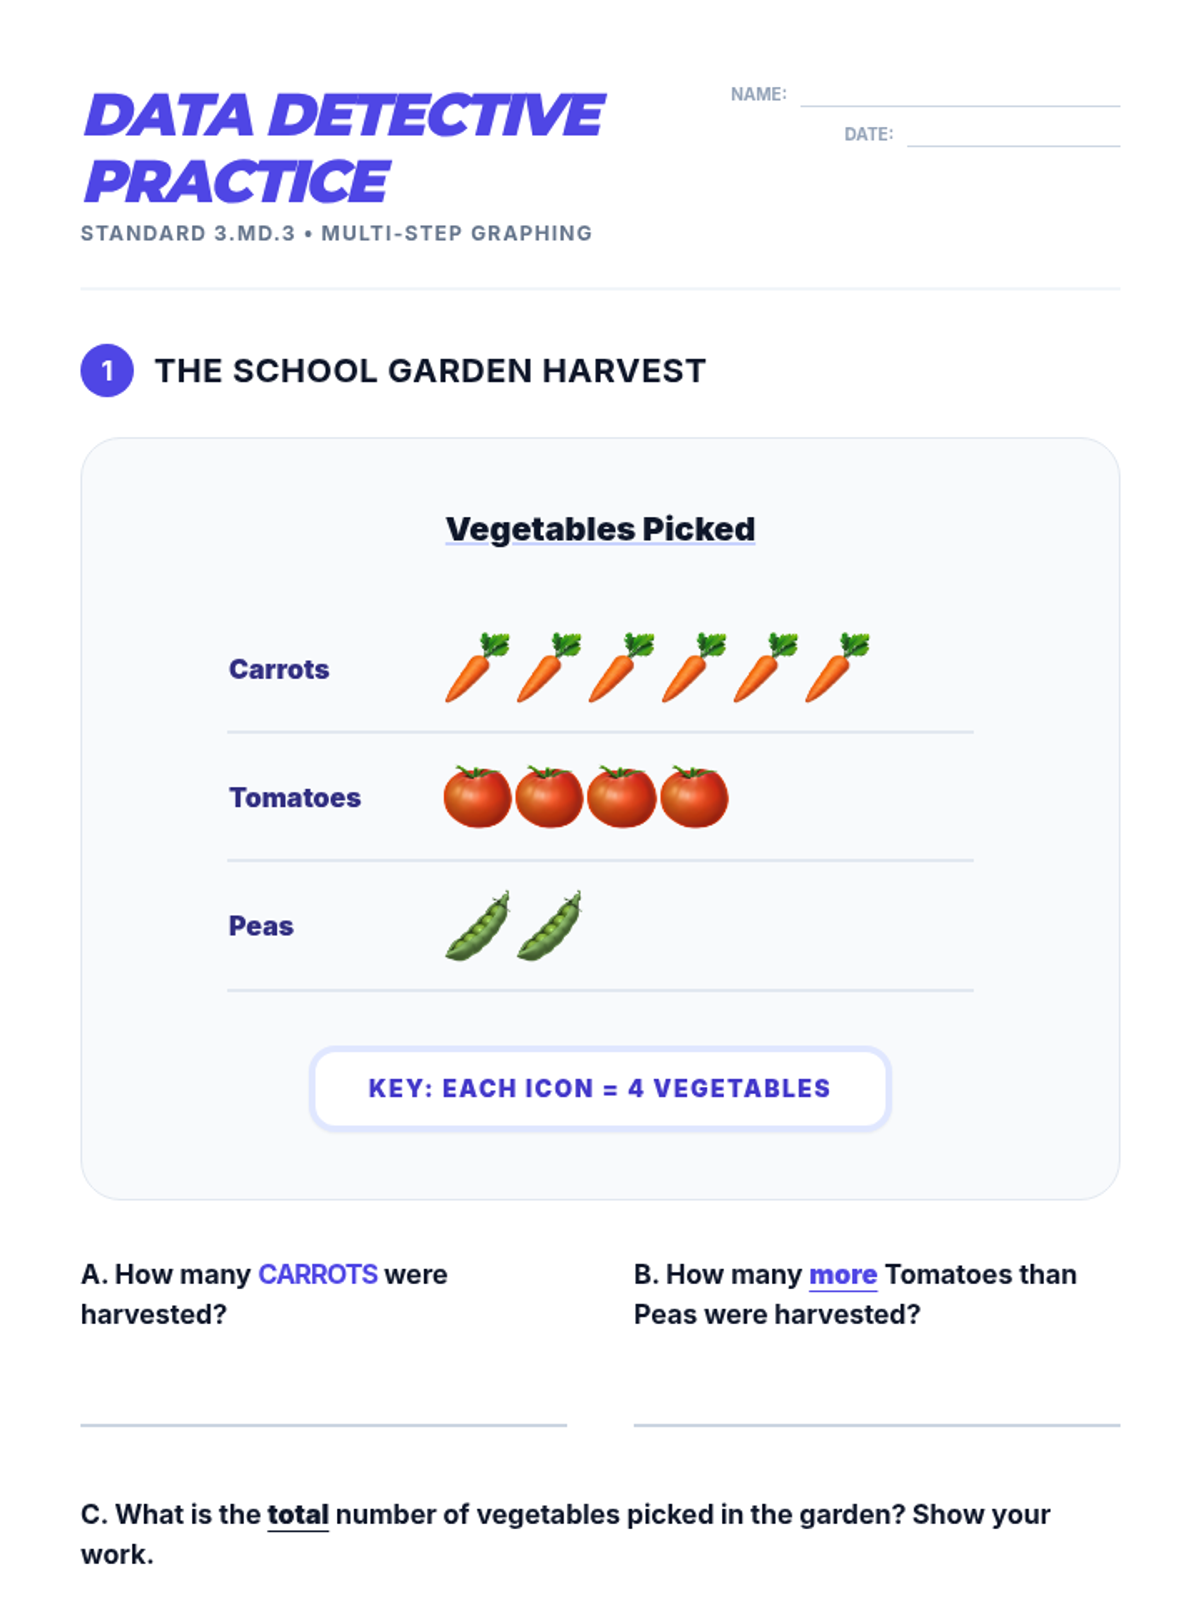
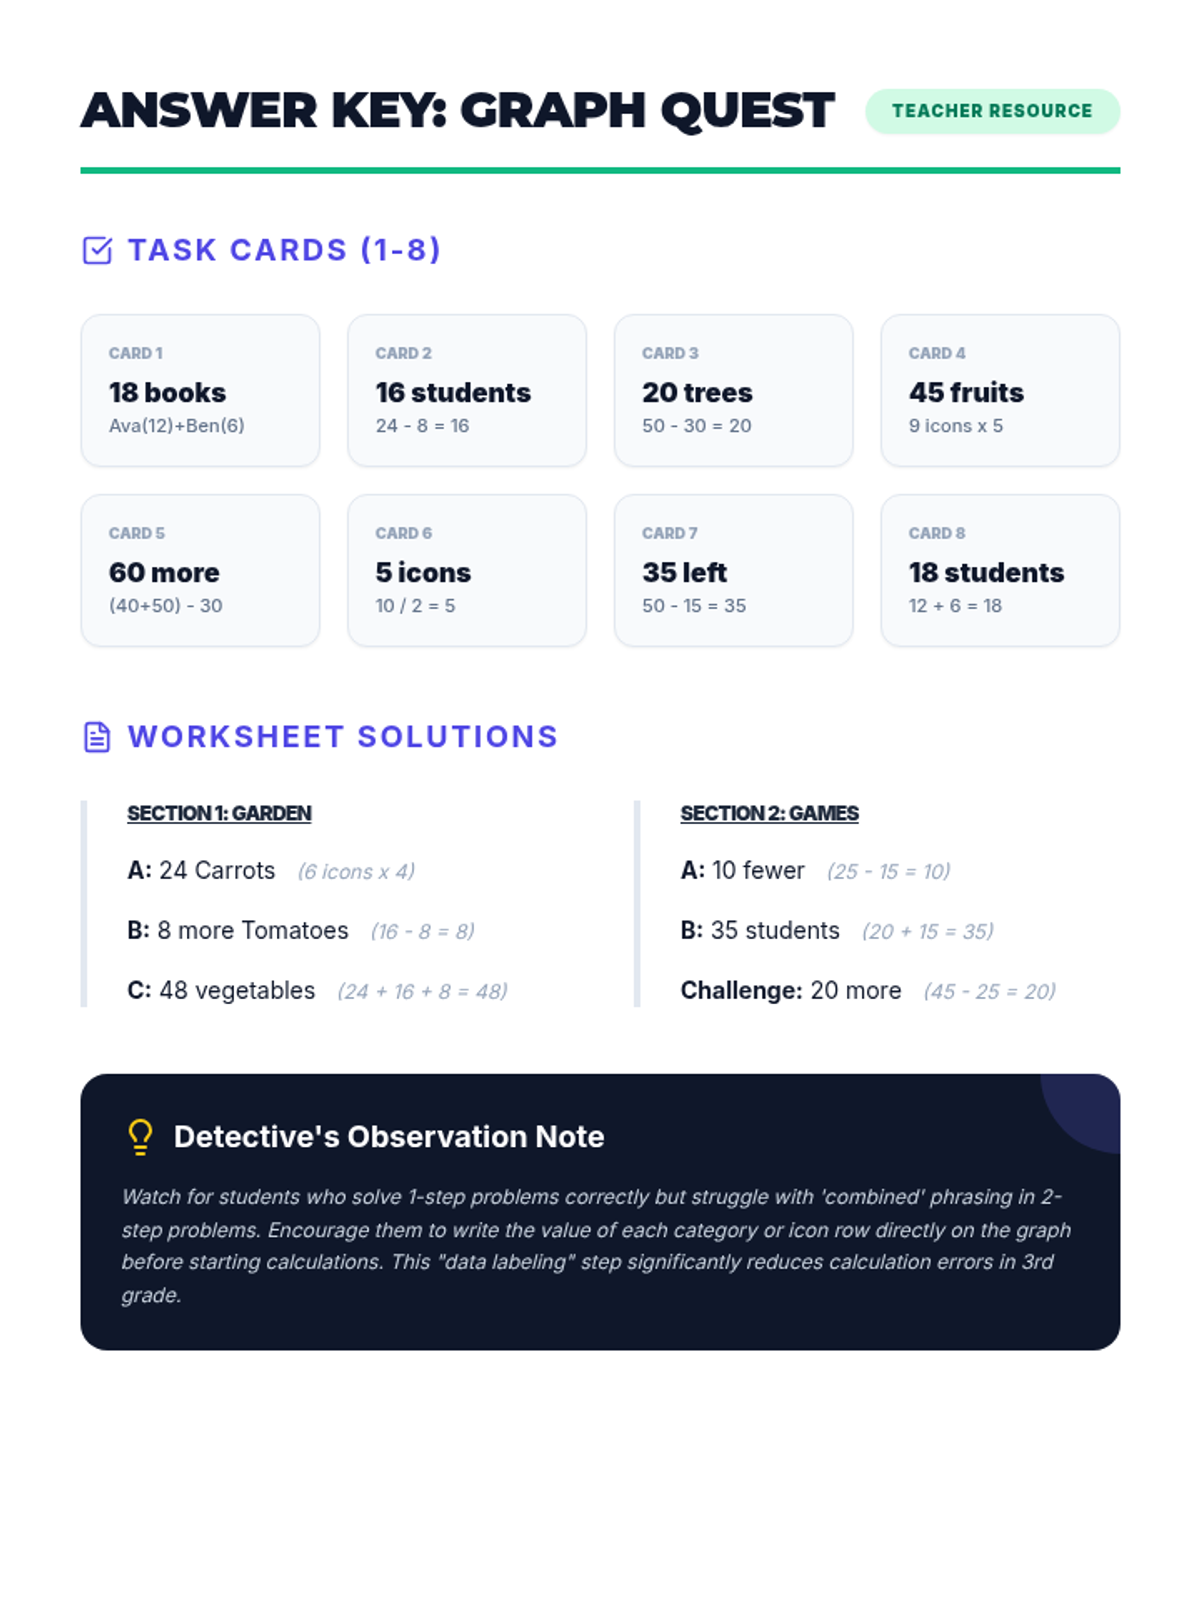
A comprehensive lesson on interpreting scaled picture graphs and bar graphs, focusing on one- and two-step data problems. Students will analyze data from a virtual 'Data Arcade' to solve 'how many more' and 'how many fewer' challenges.
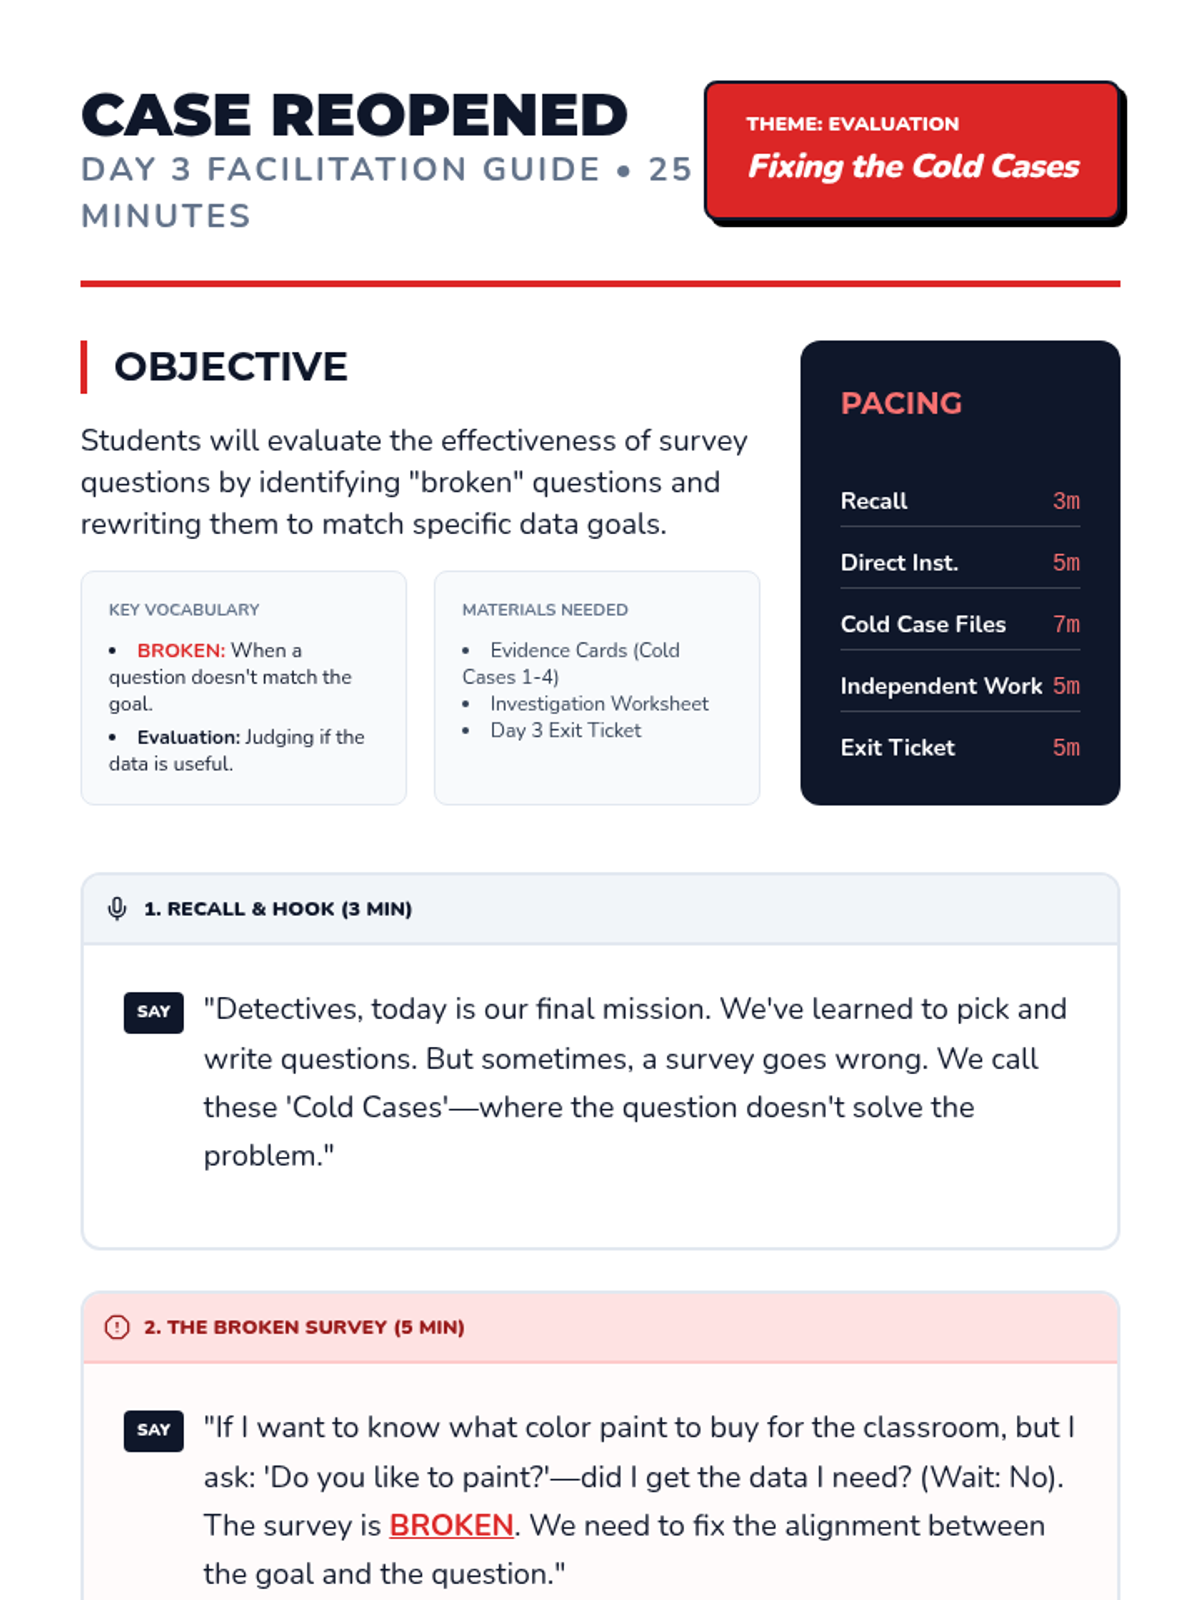
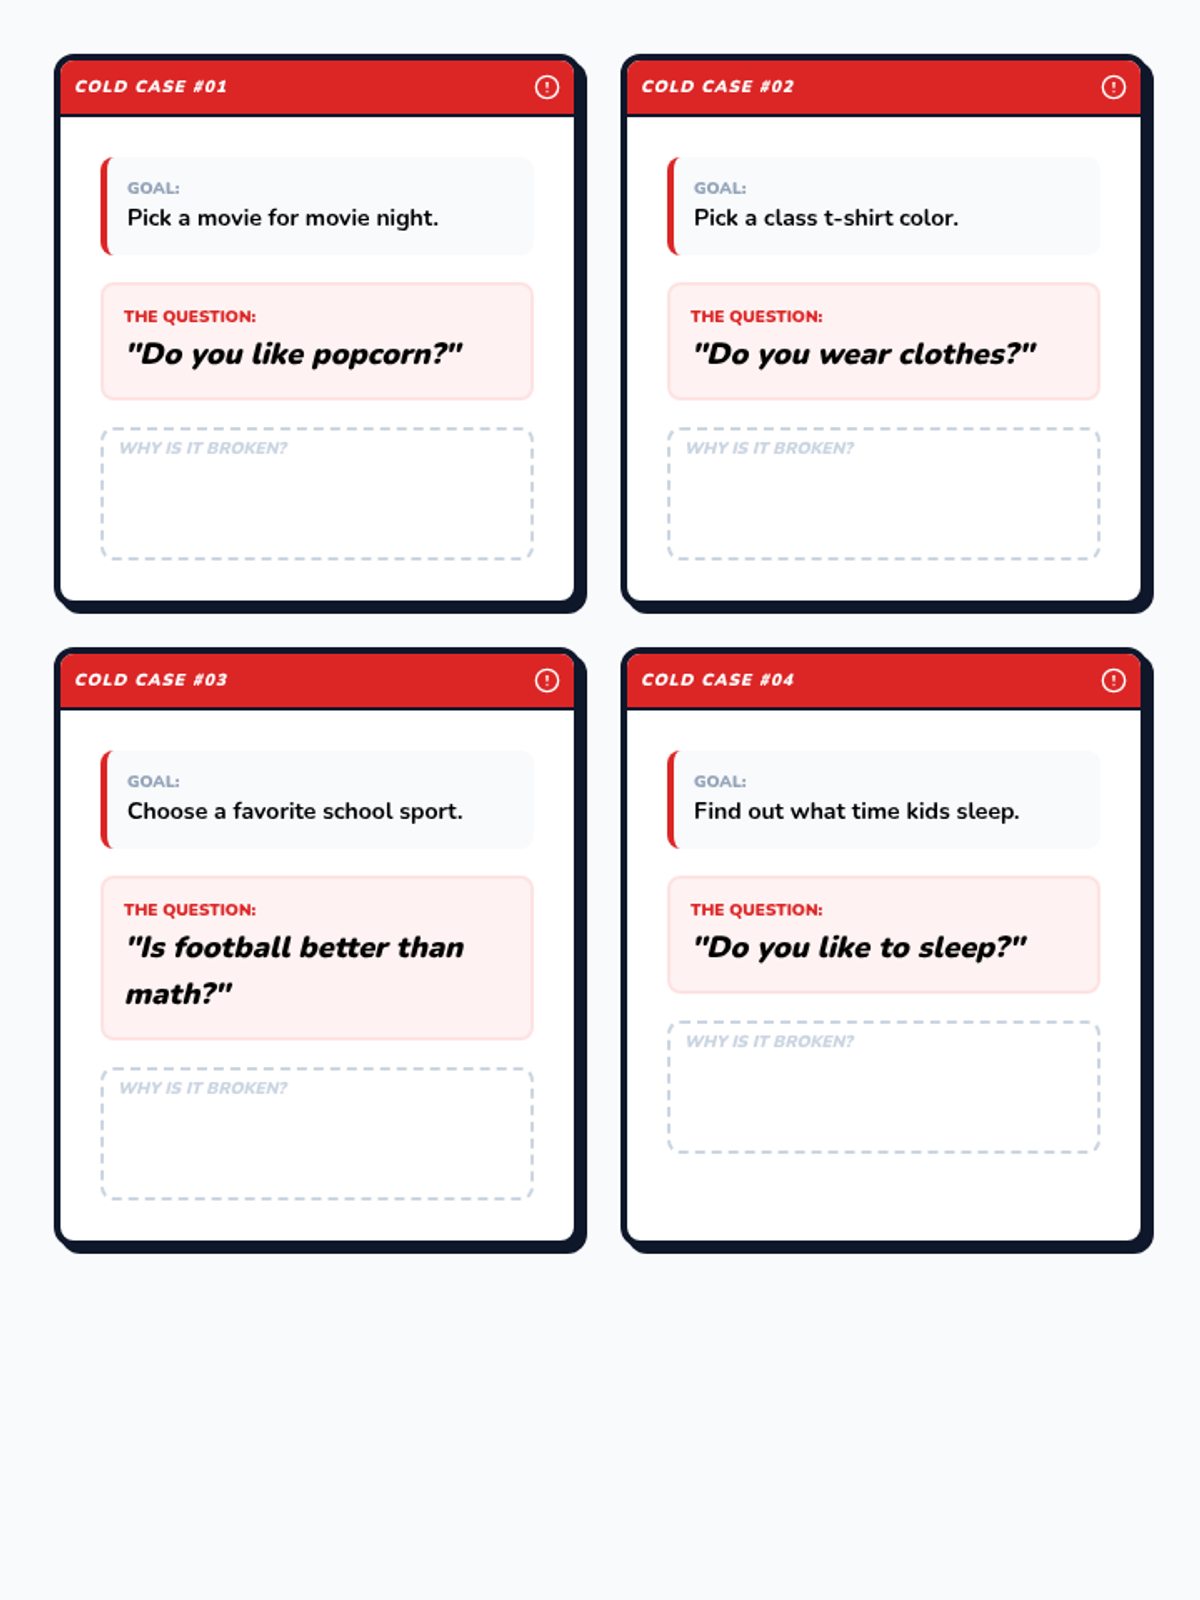
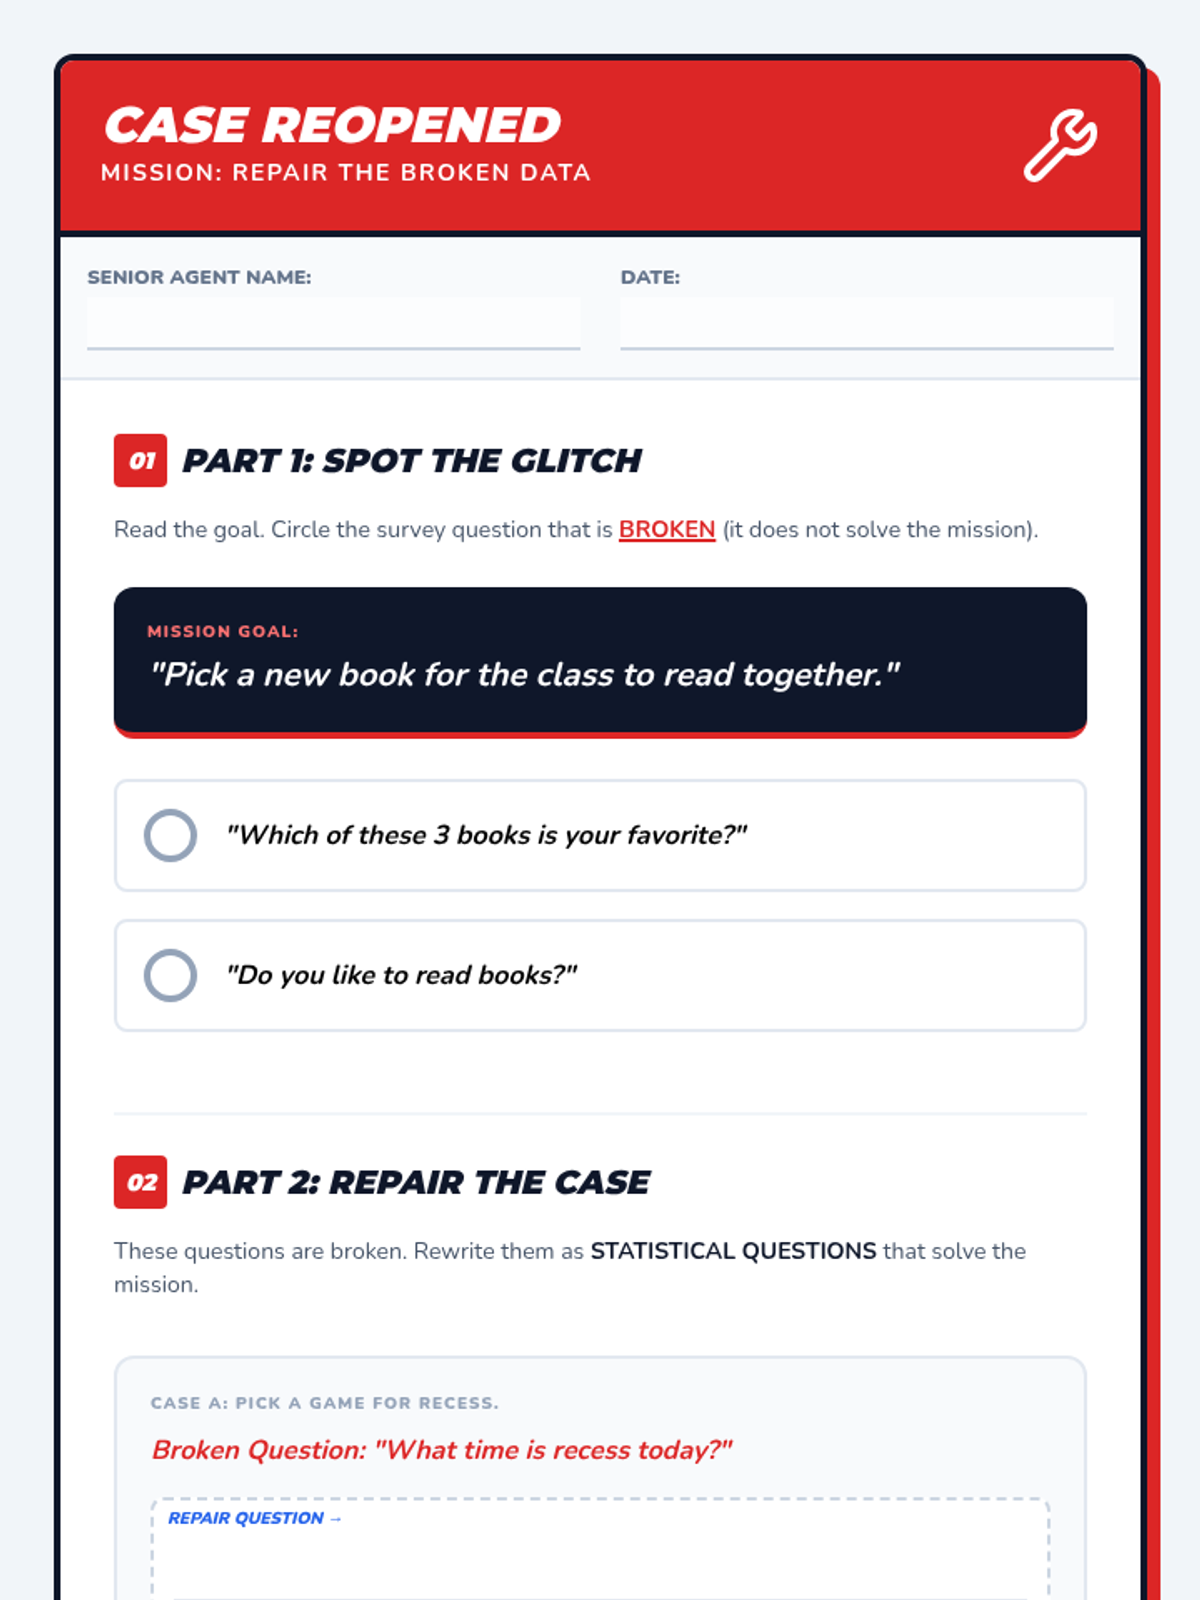
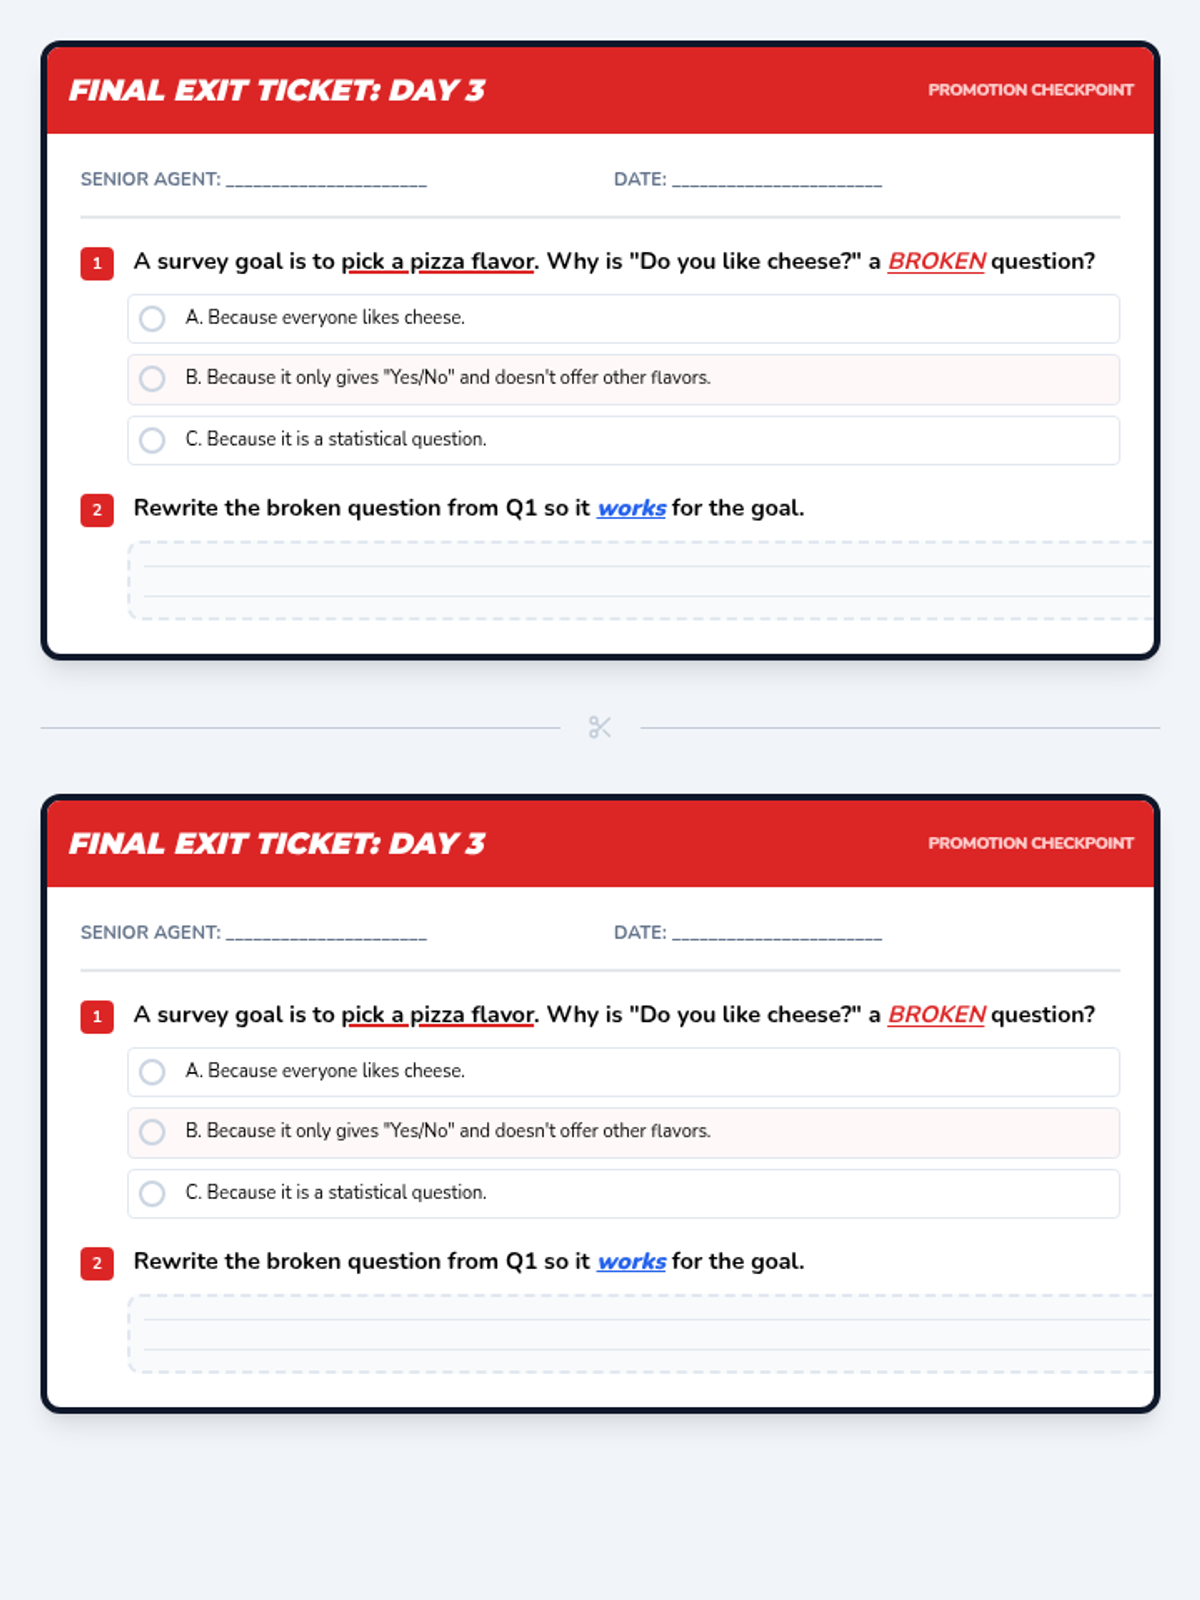
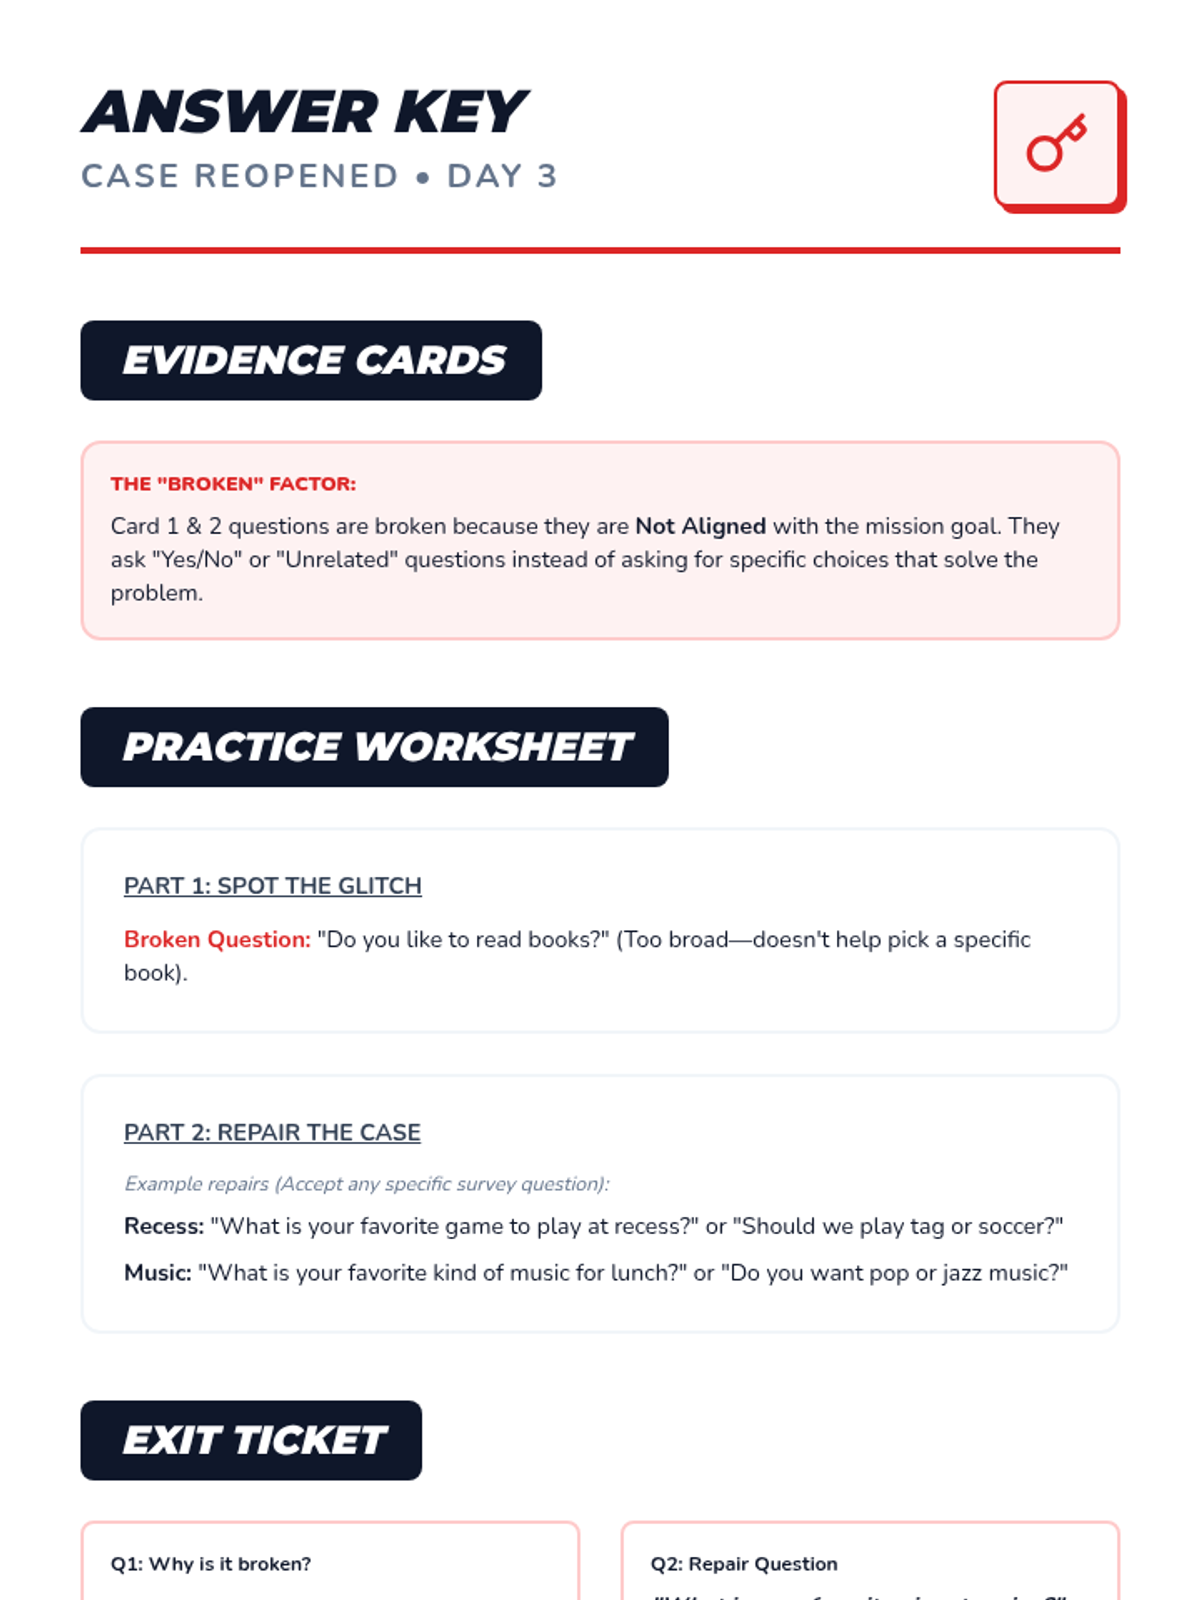
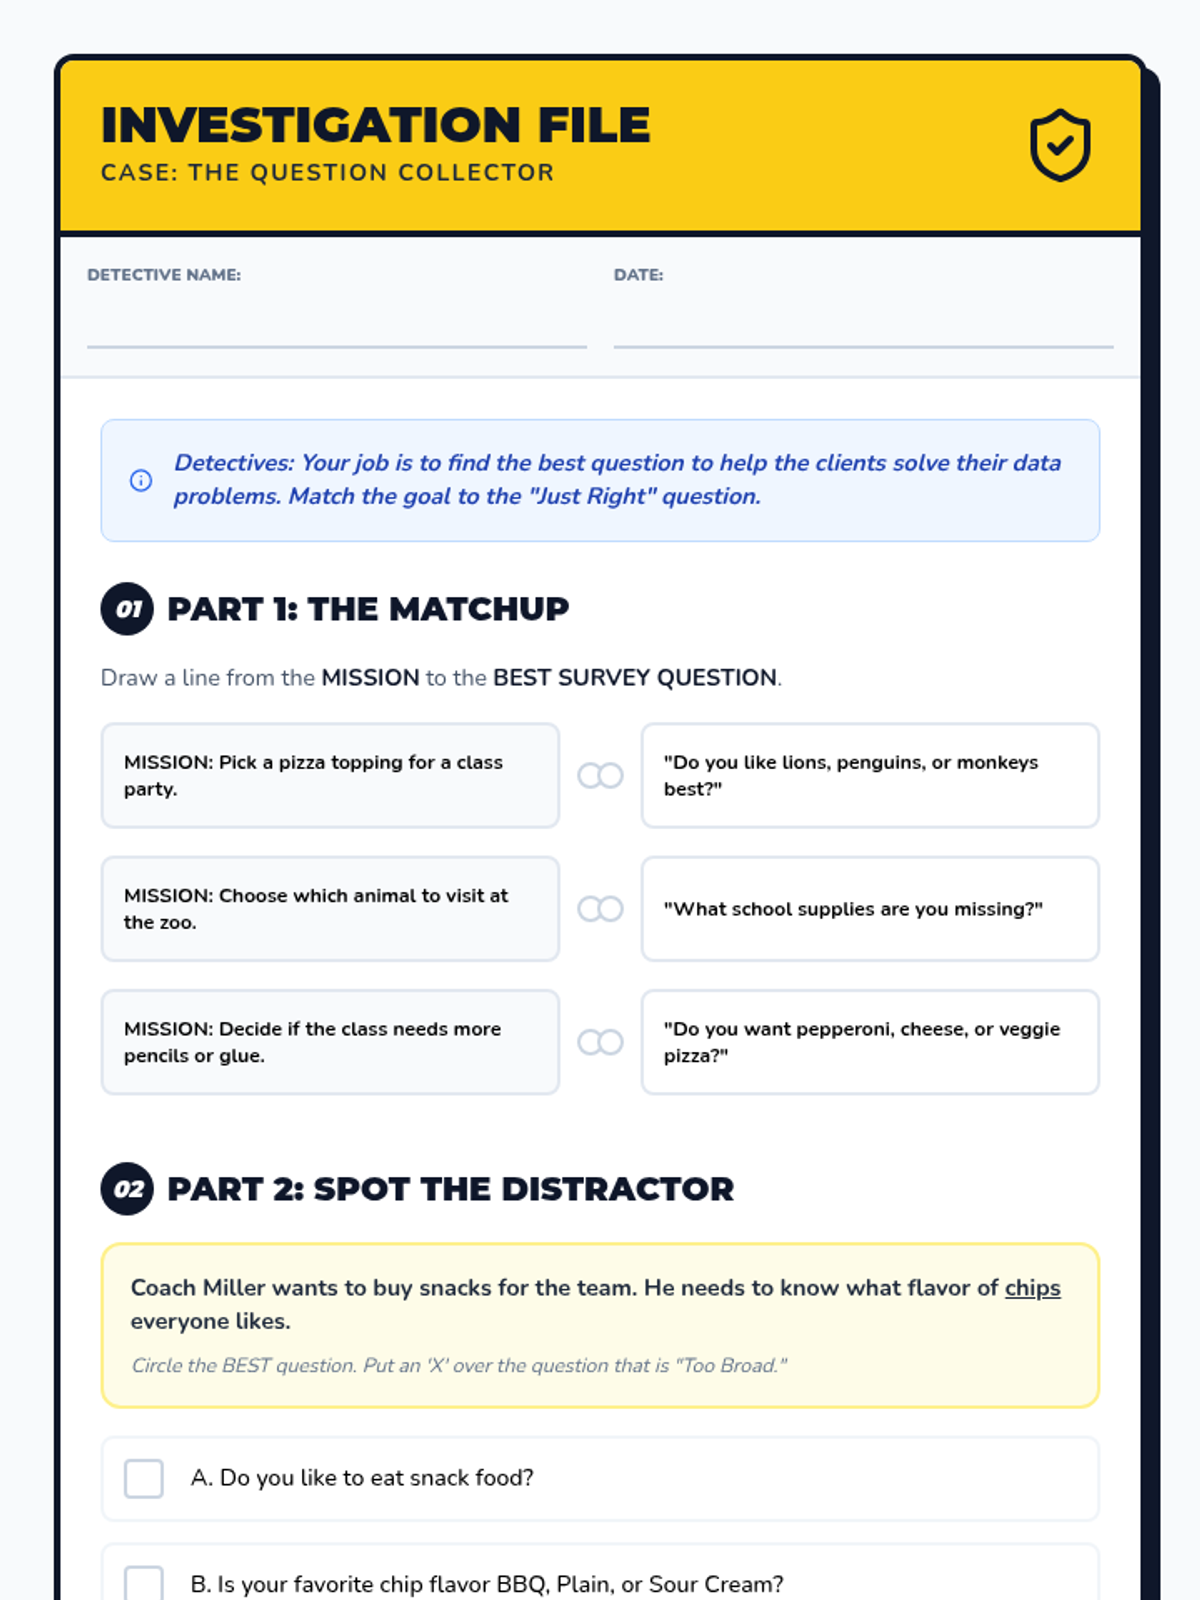
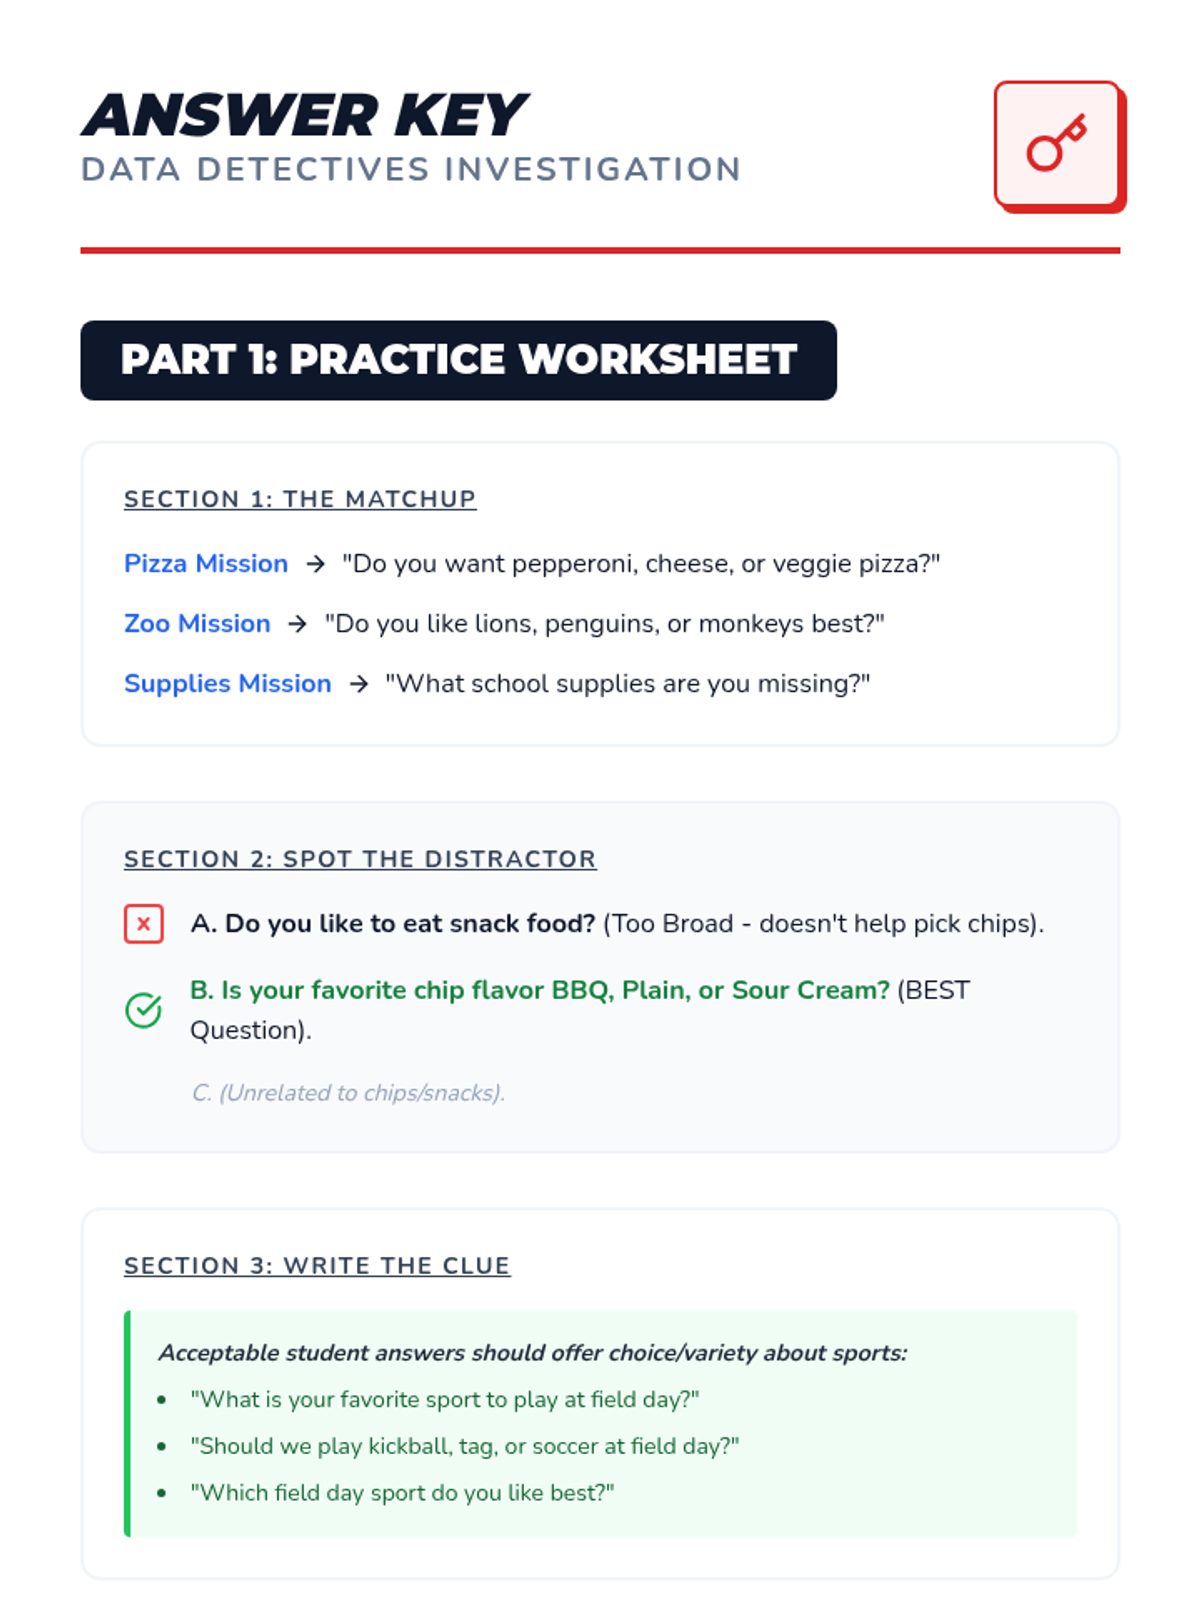
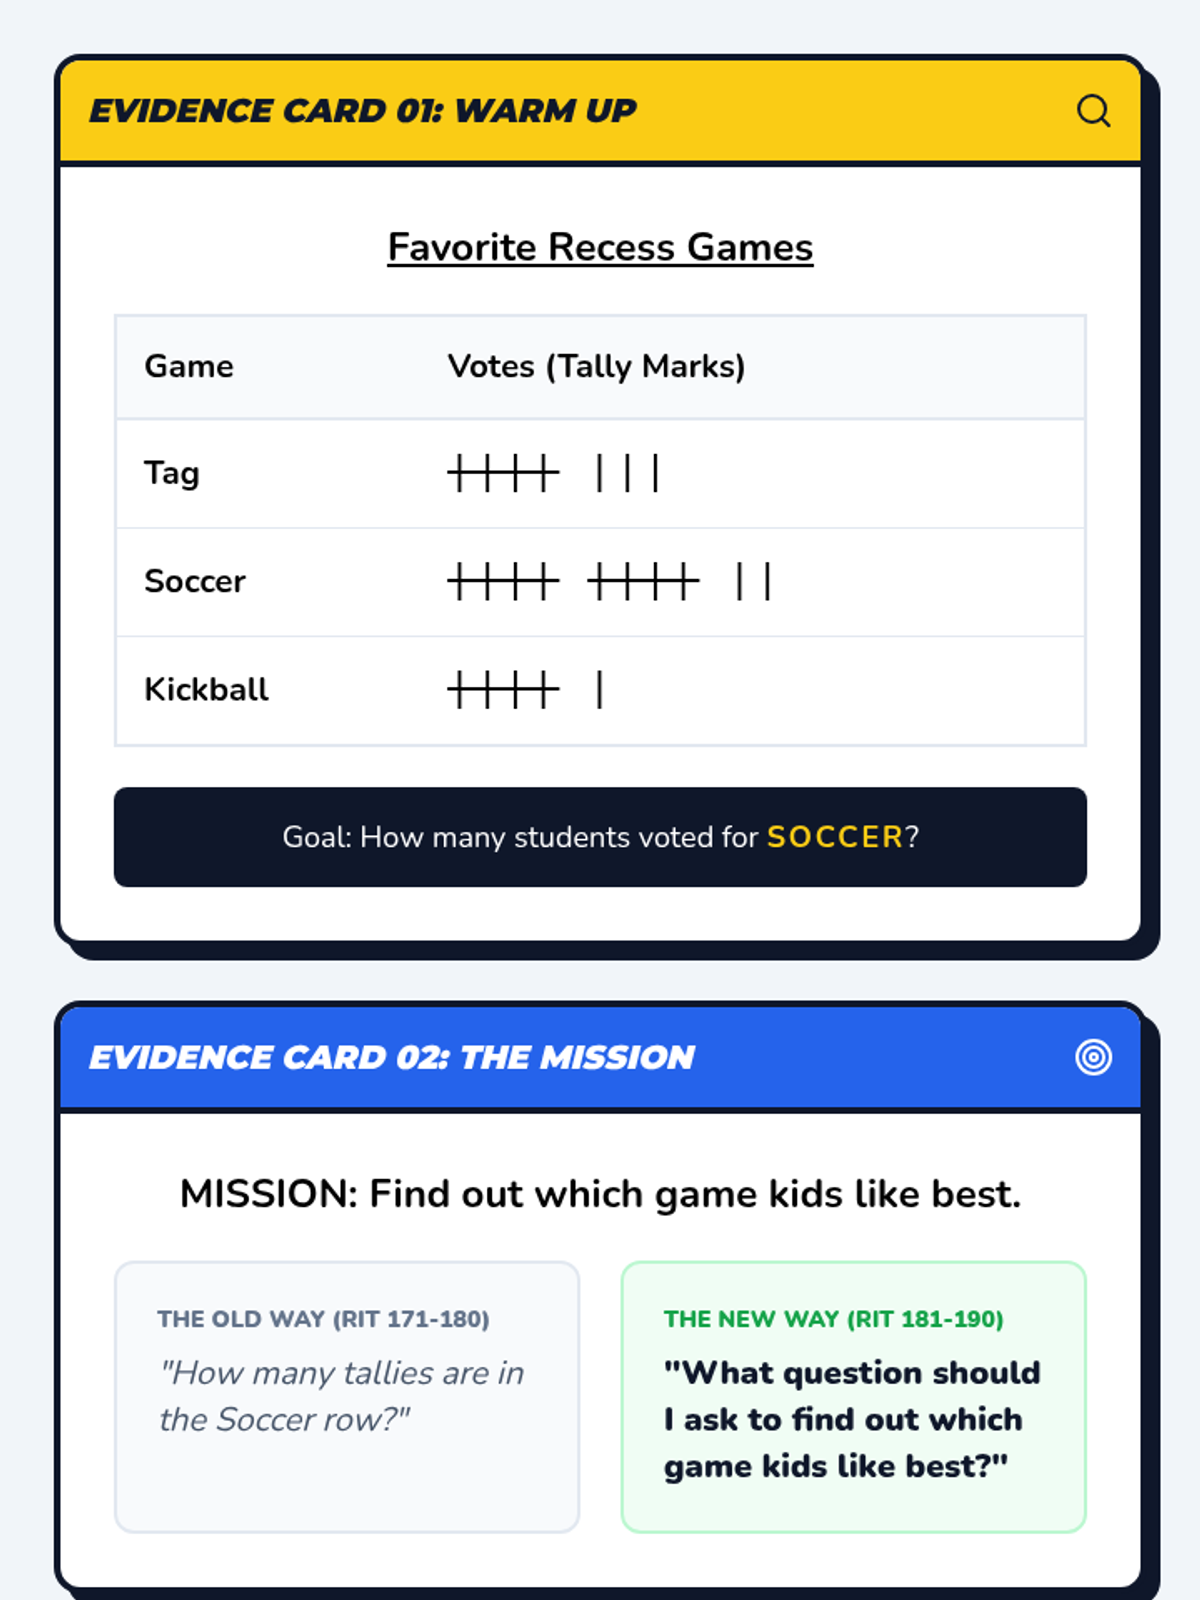
The final mission where students evaluate the effectiveness of data collection. They analyze "broken" surveys where the question didn't match the goal and practice rewriting them for accuracy.
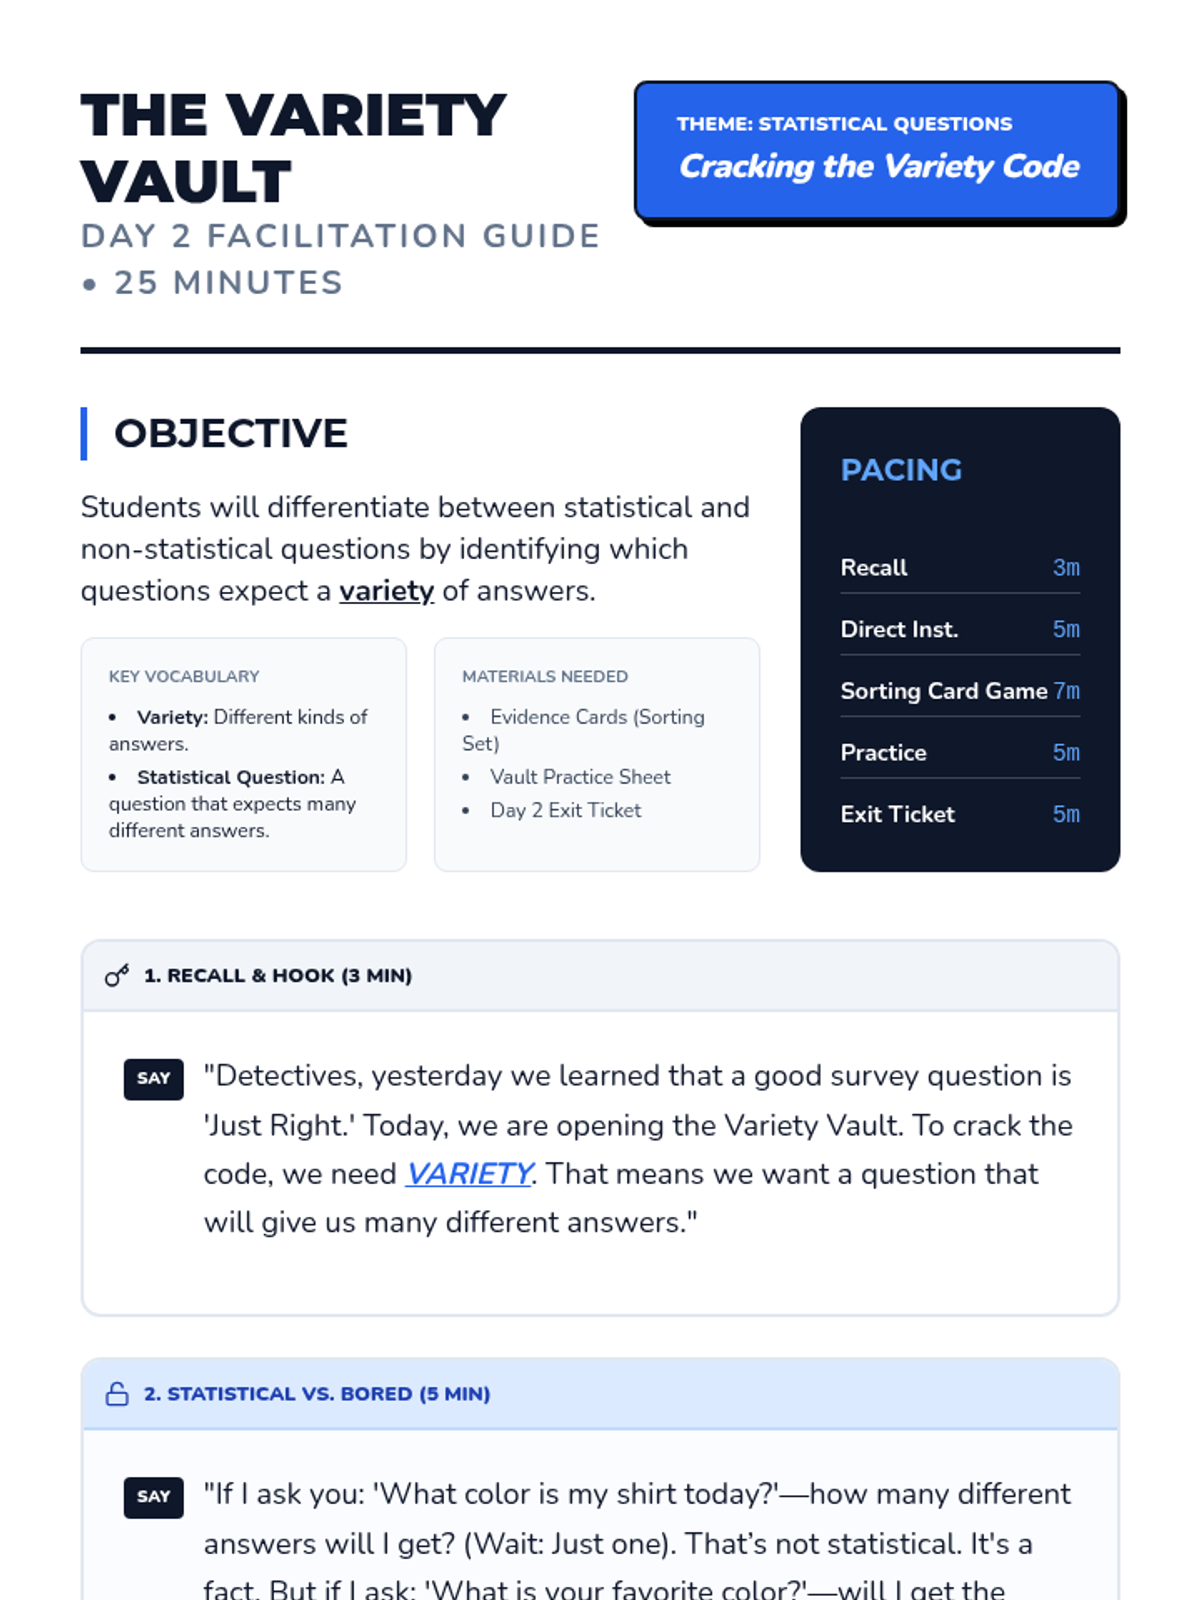
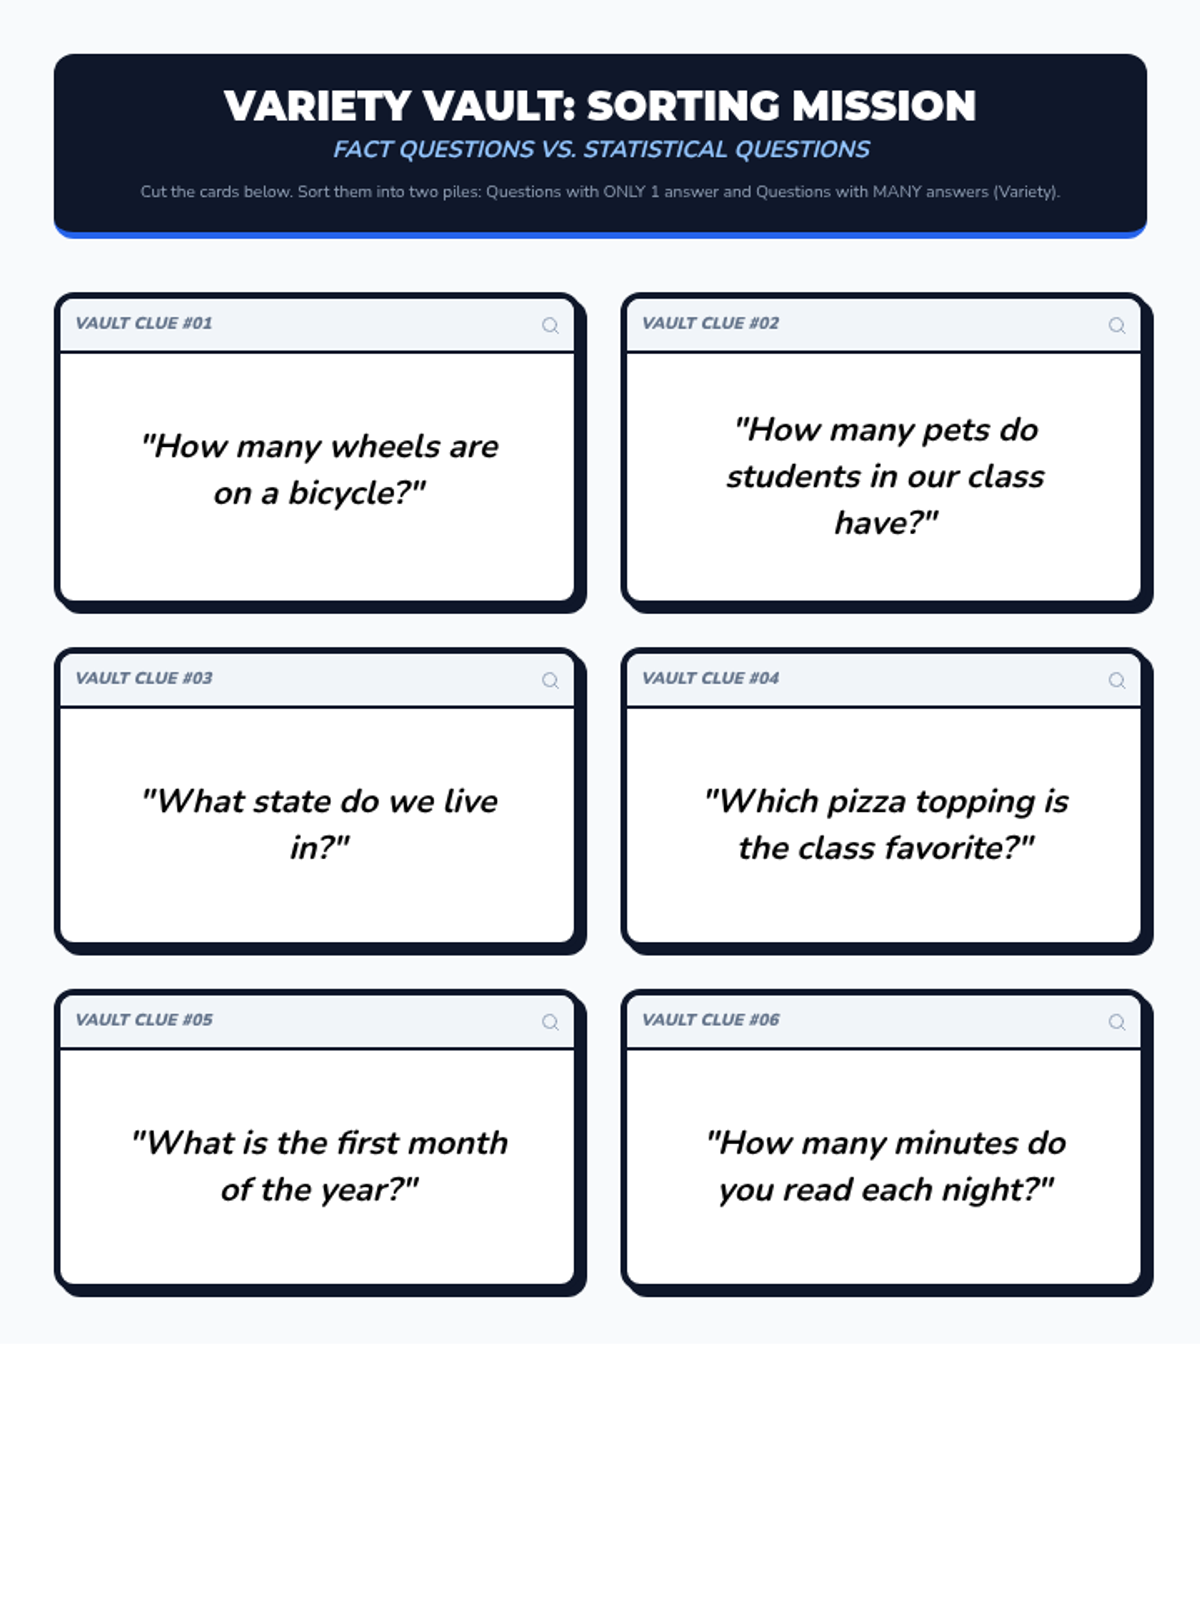
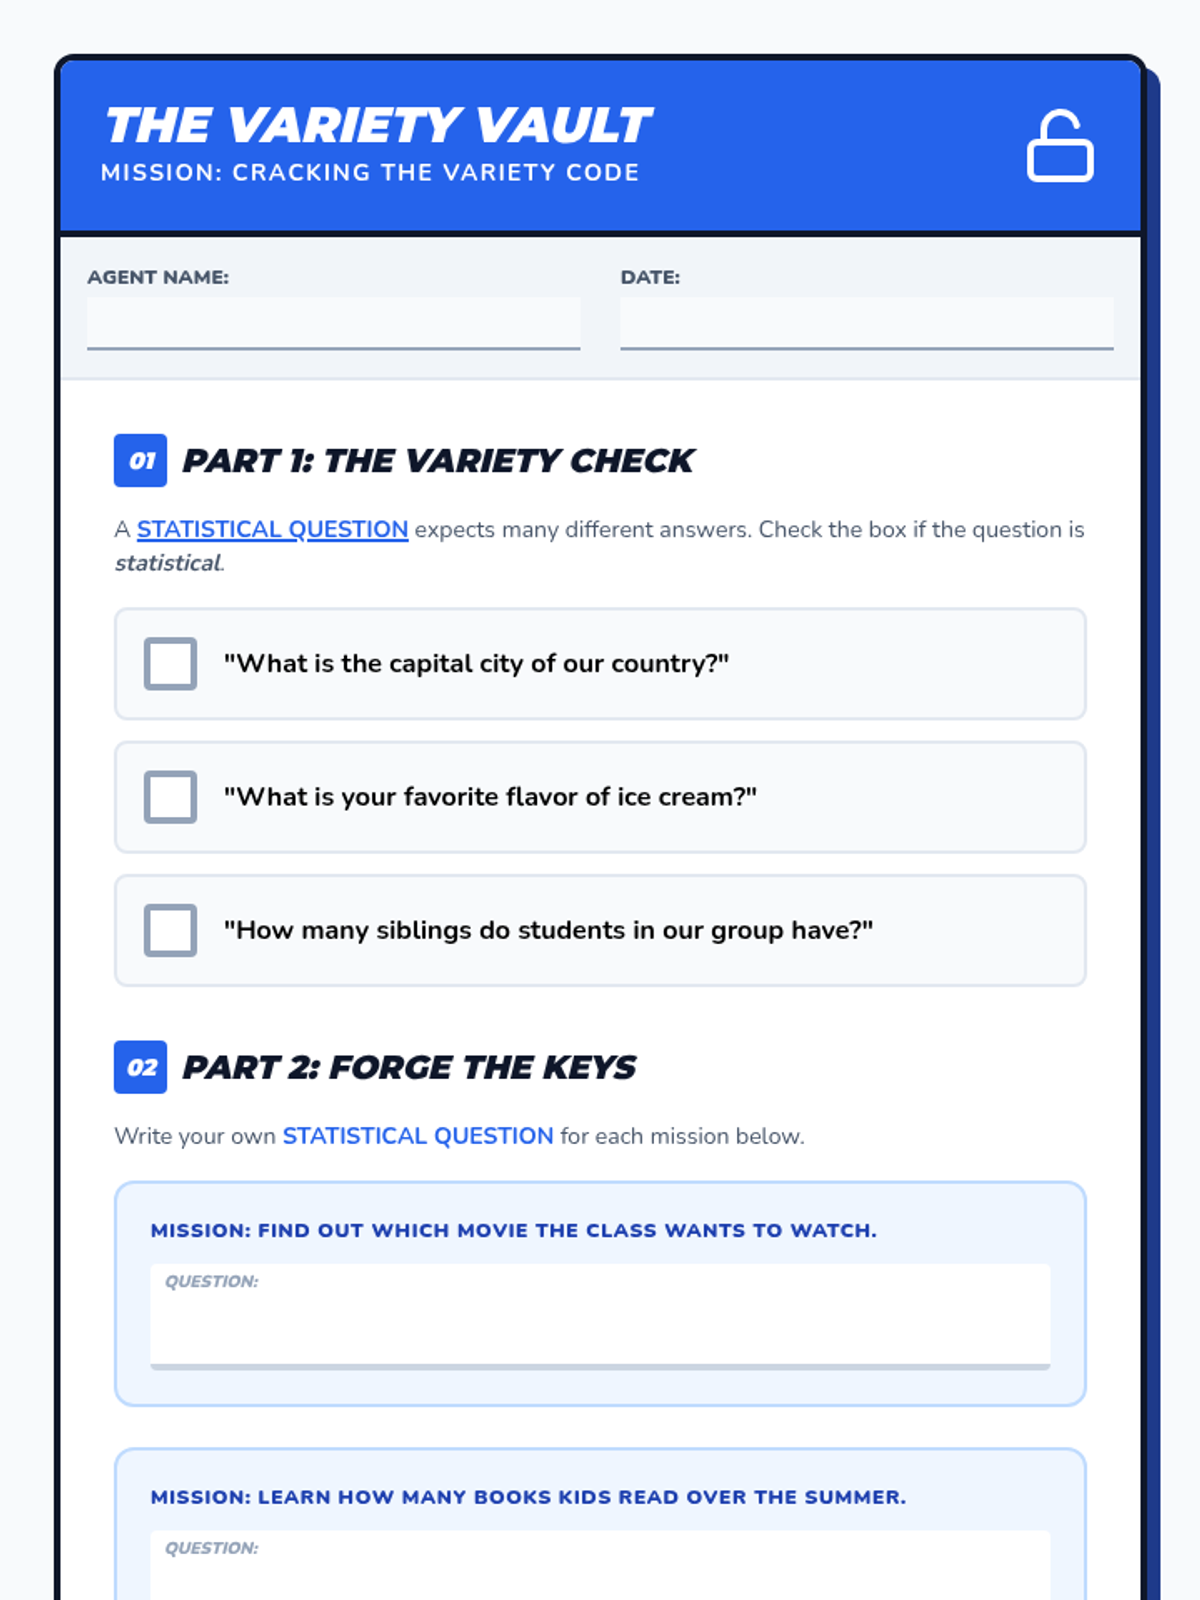
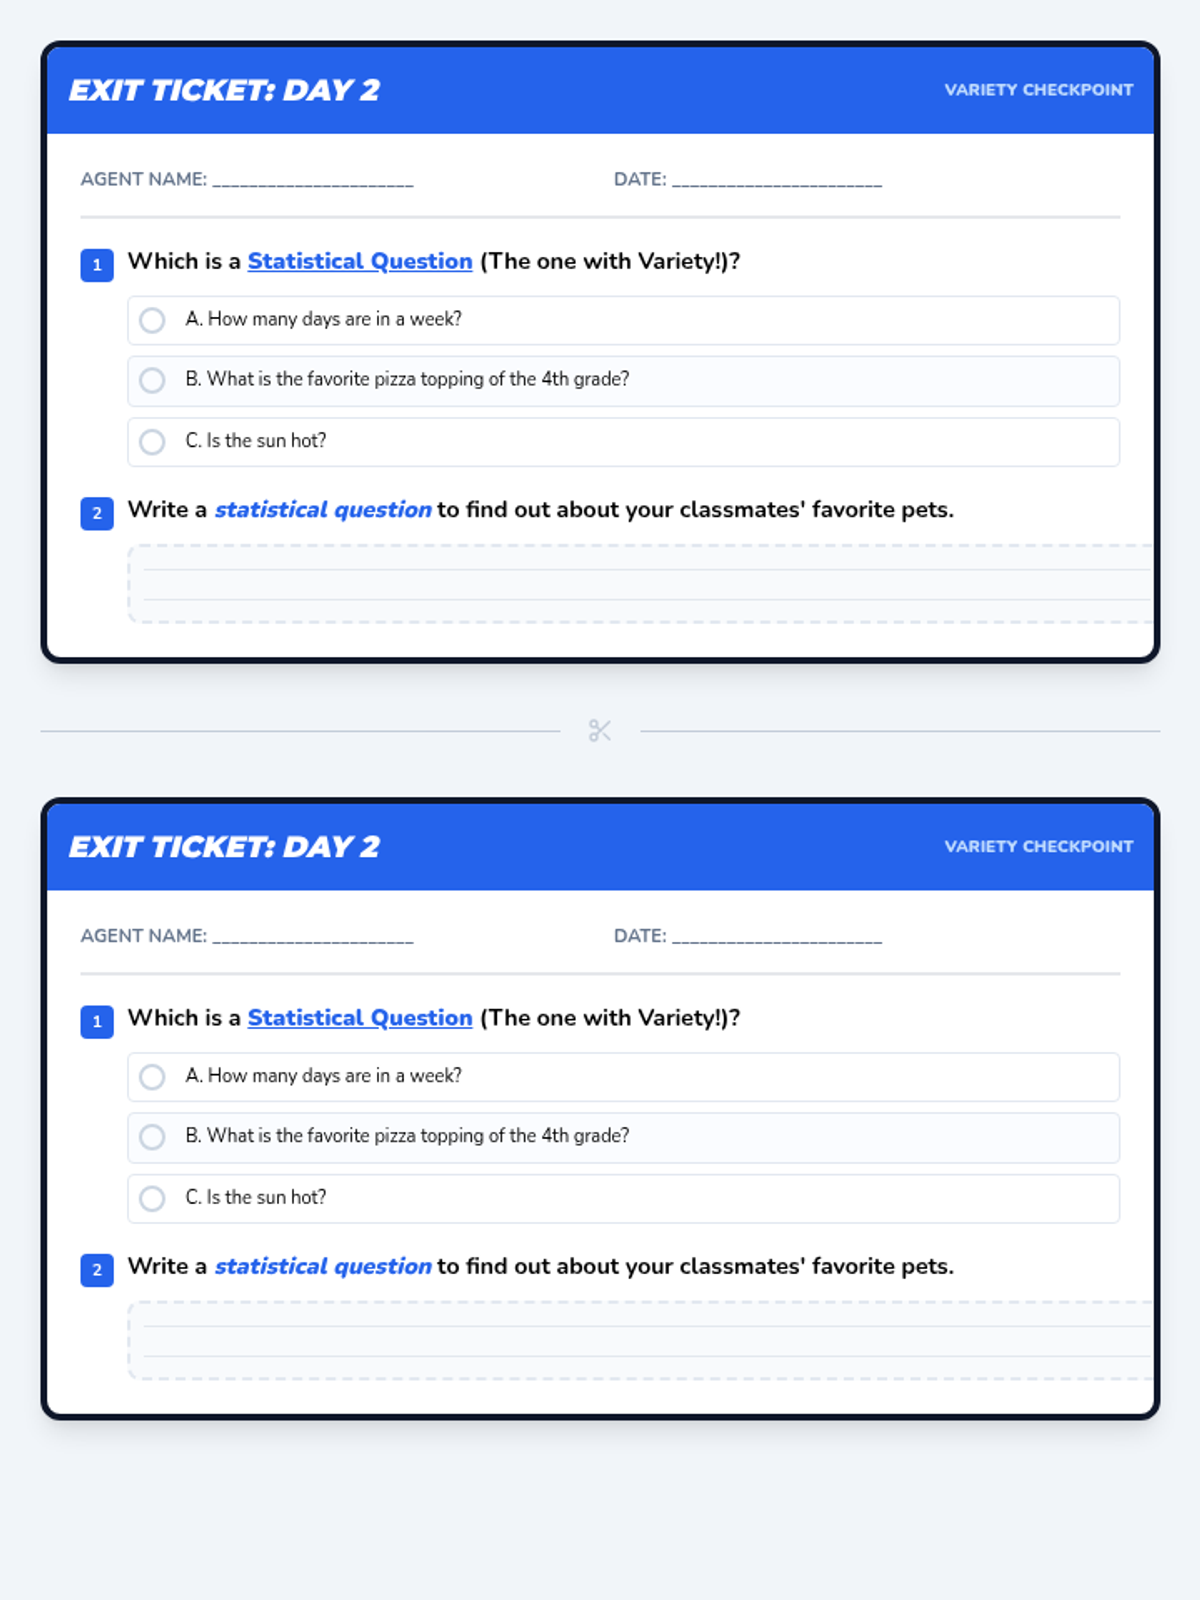
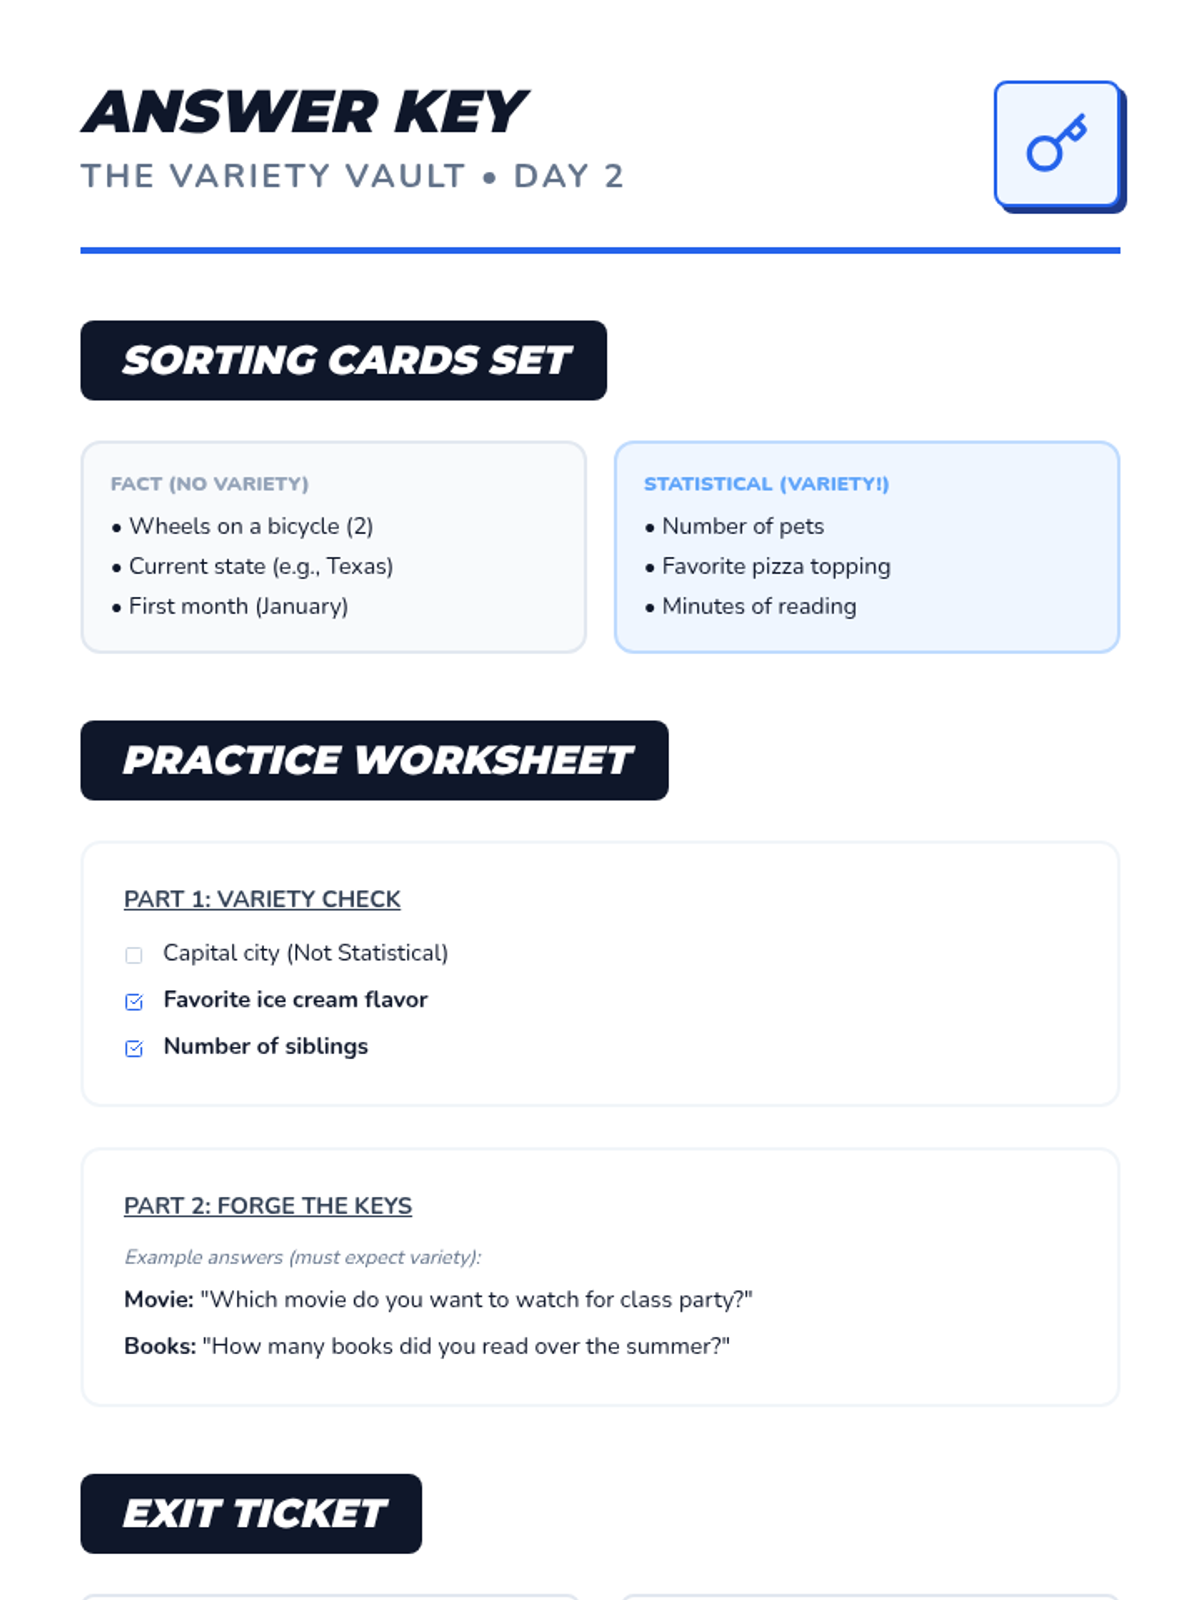
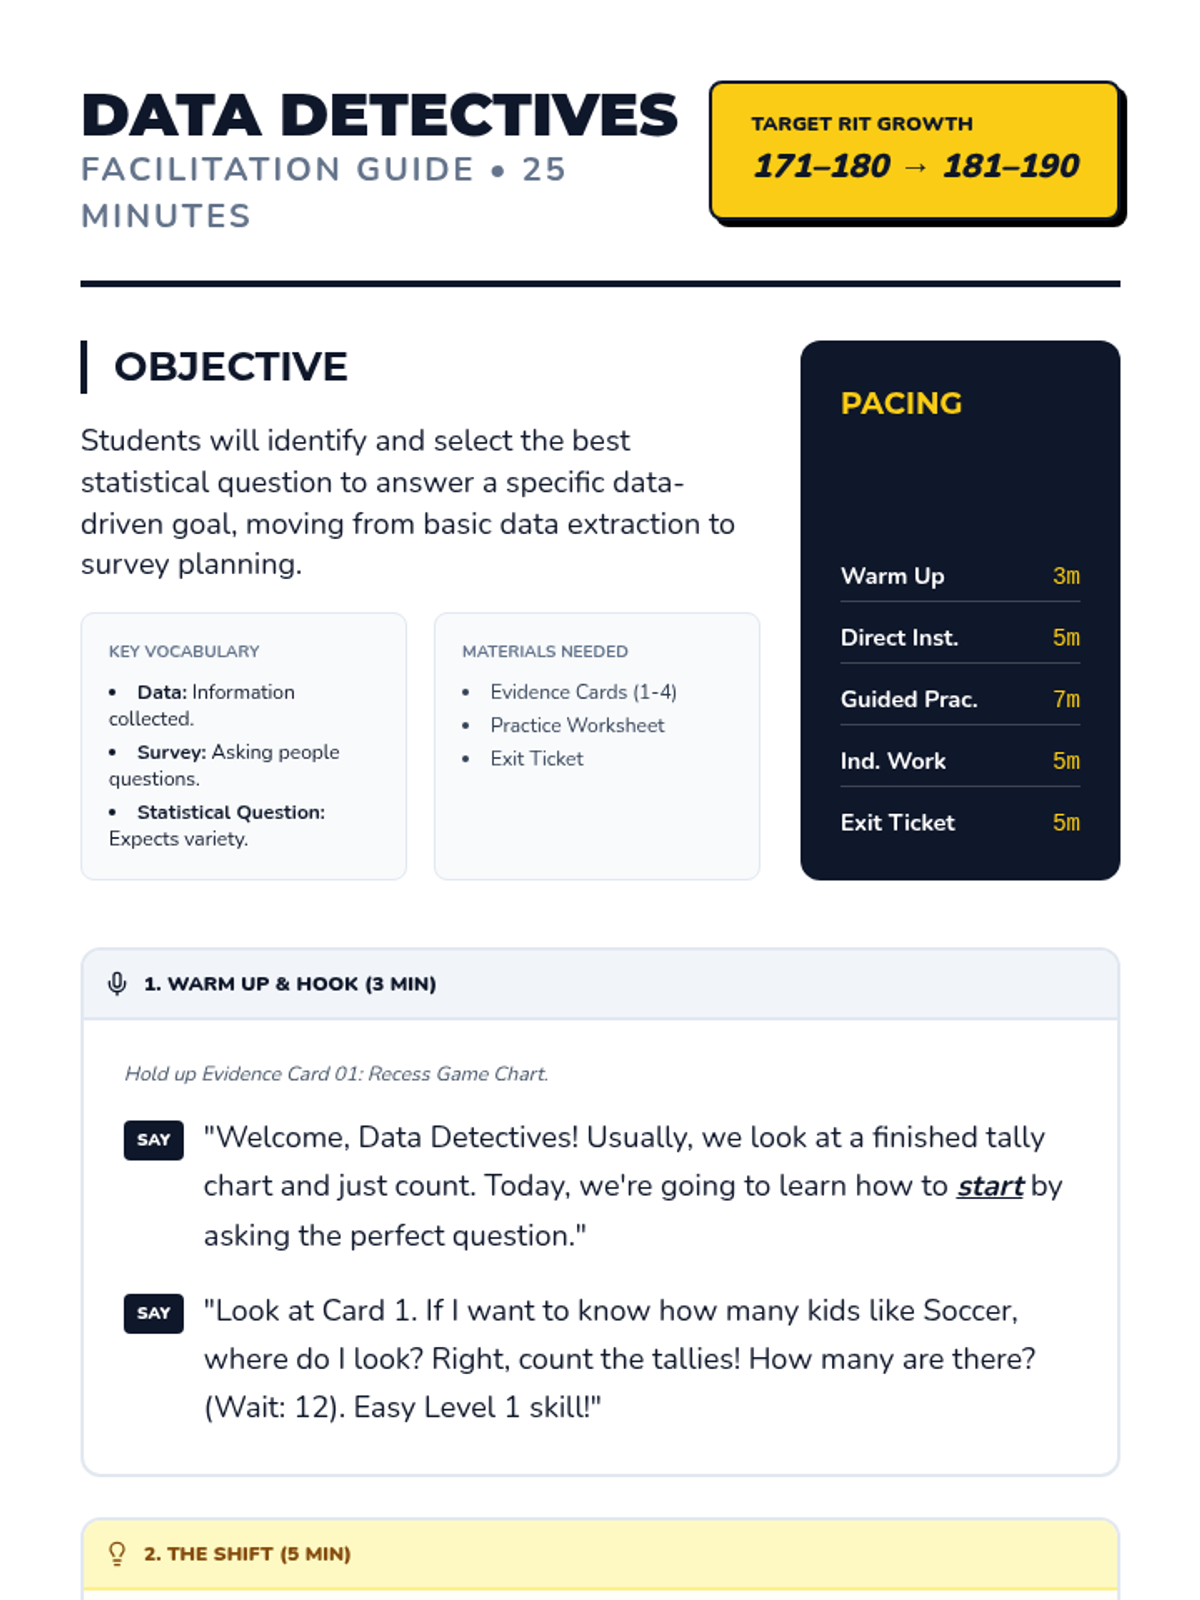
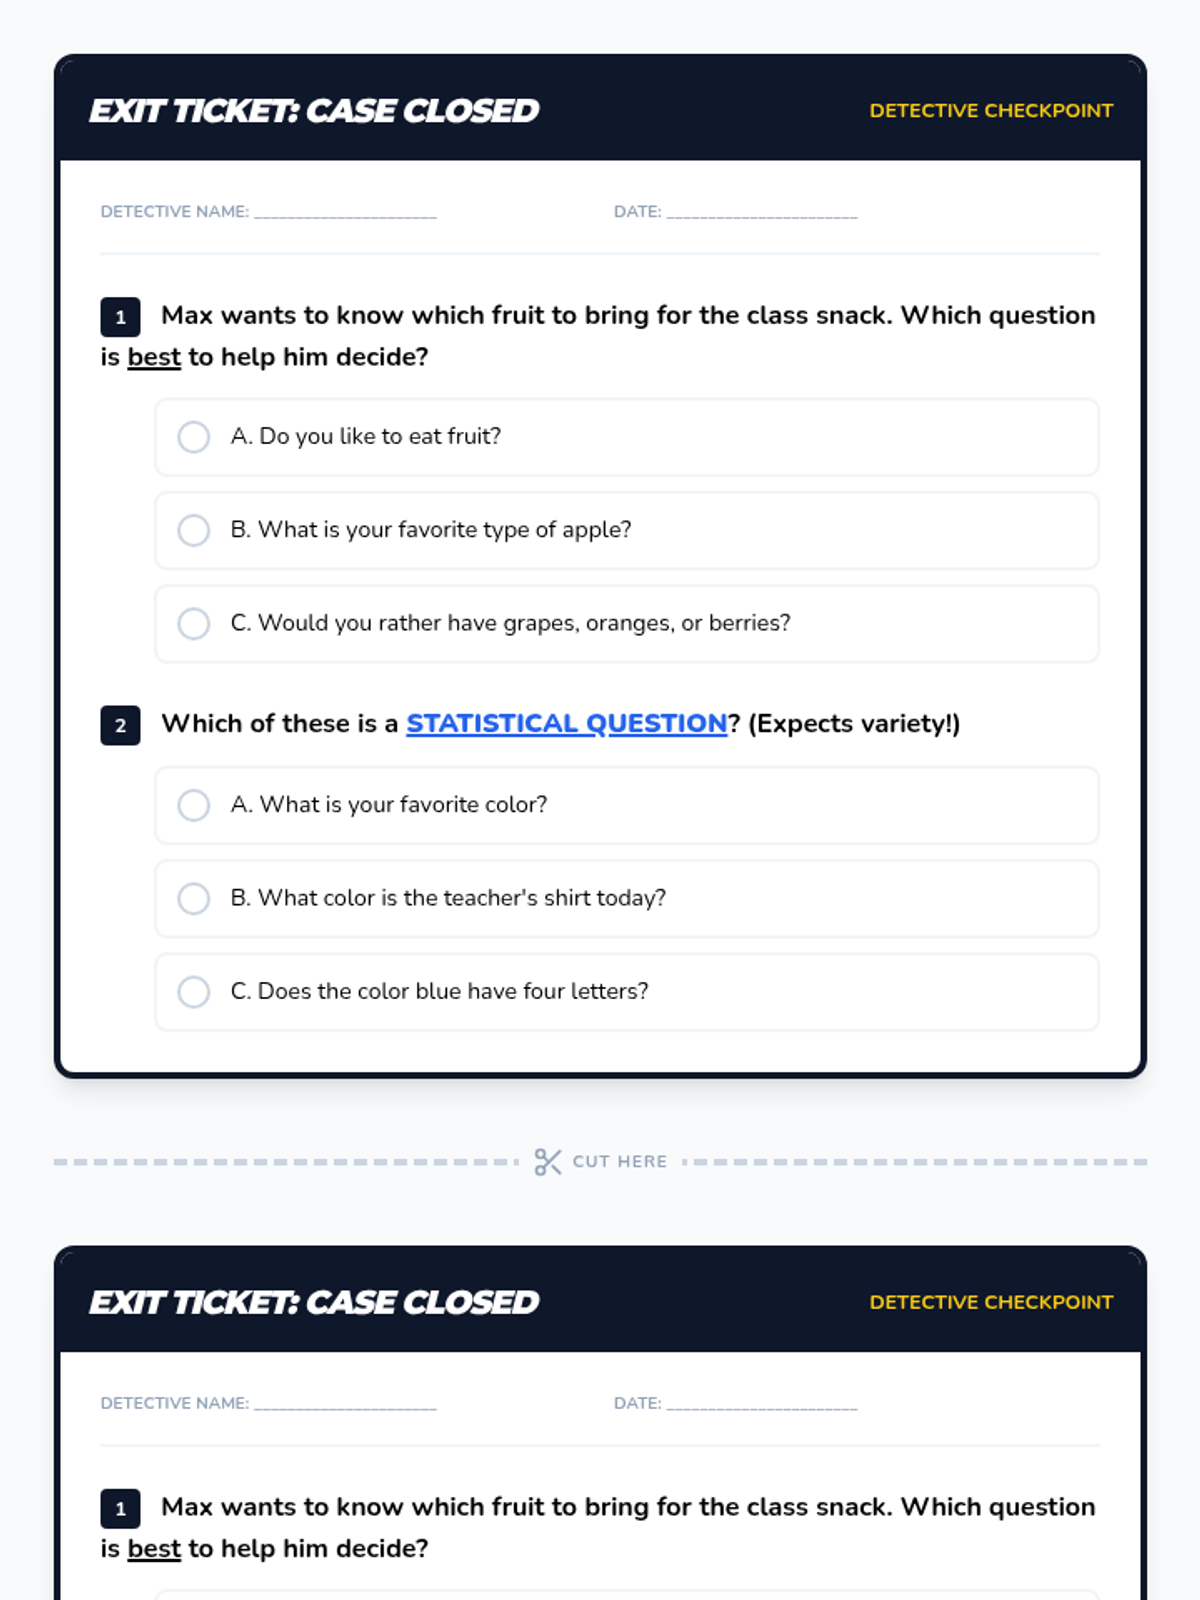
Focuses on differentiating between statistical and non-statistical questions. Students learn that a good survey question must expect a variety of answers to be useful for data collection.
A 25-minute small group lesson designed to move students from RIT 171-180 to 181-190 by shifting from basic data interpretation to formulating and selecting effective statistical questions.
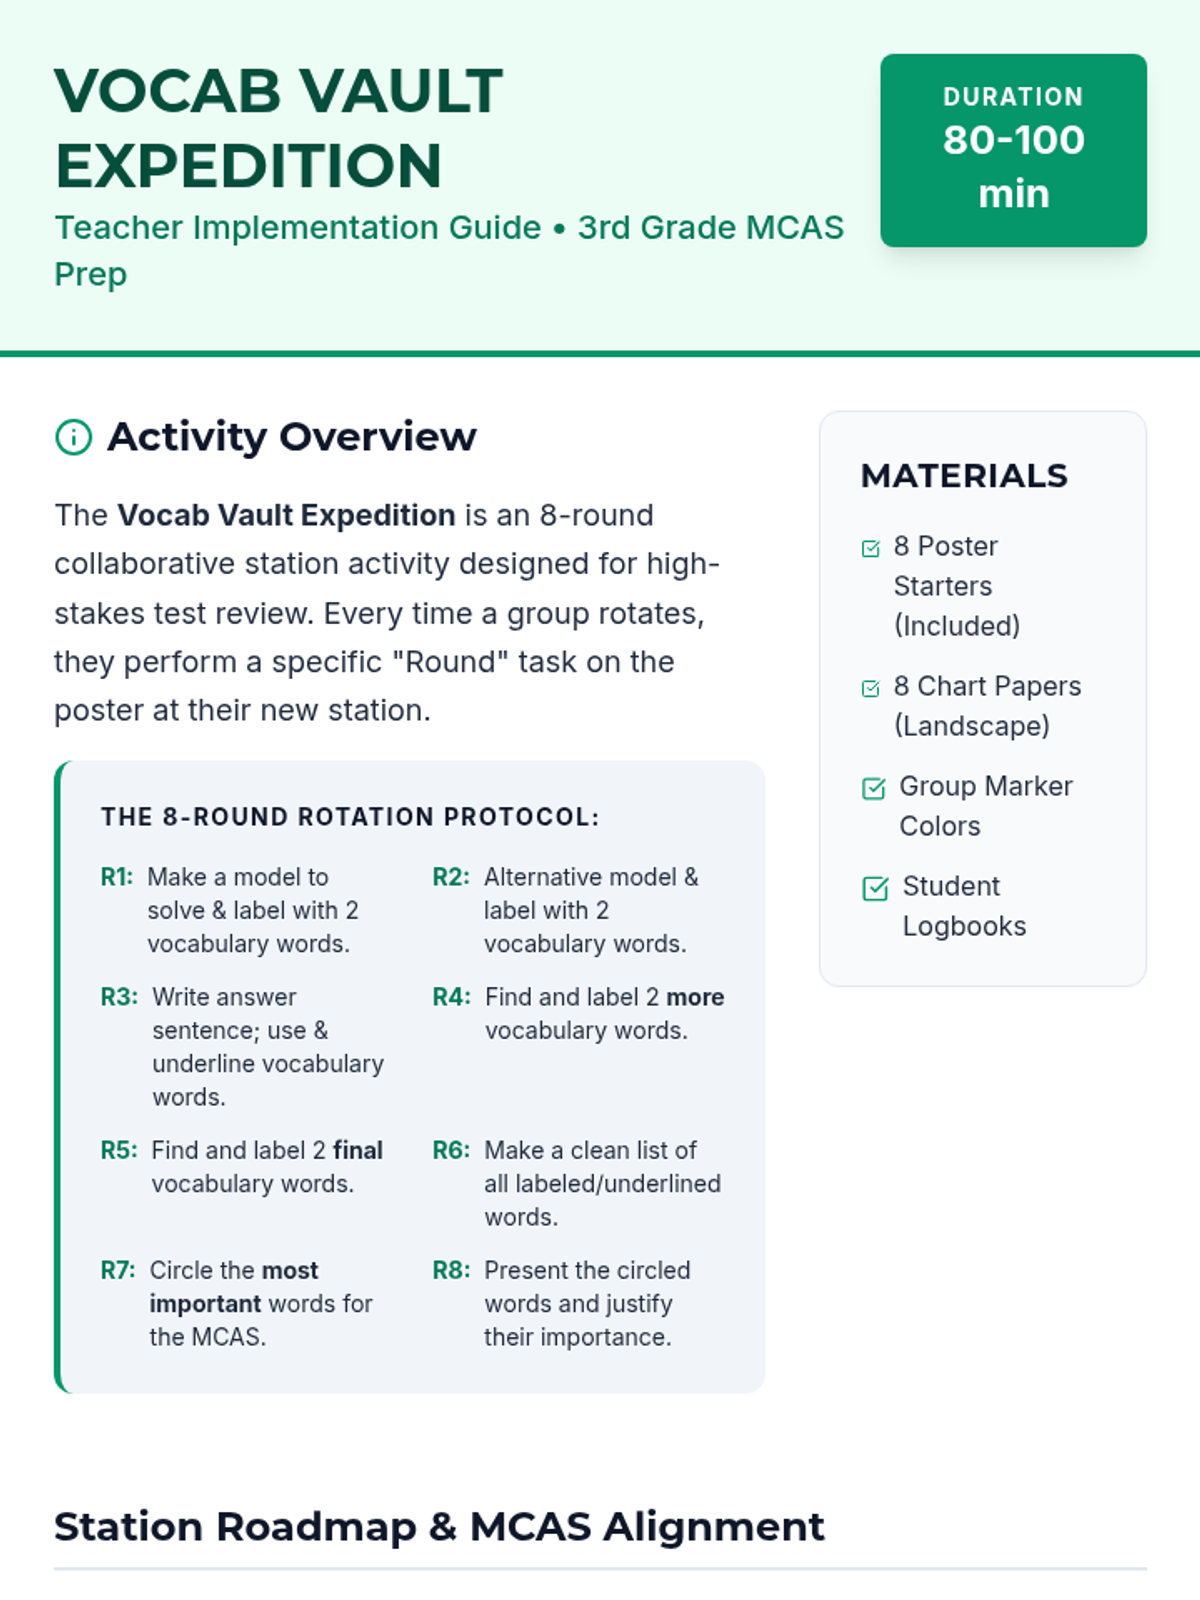
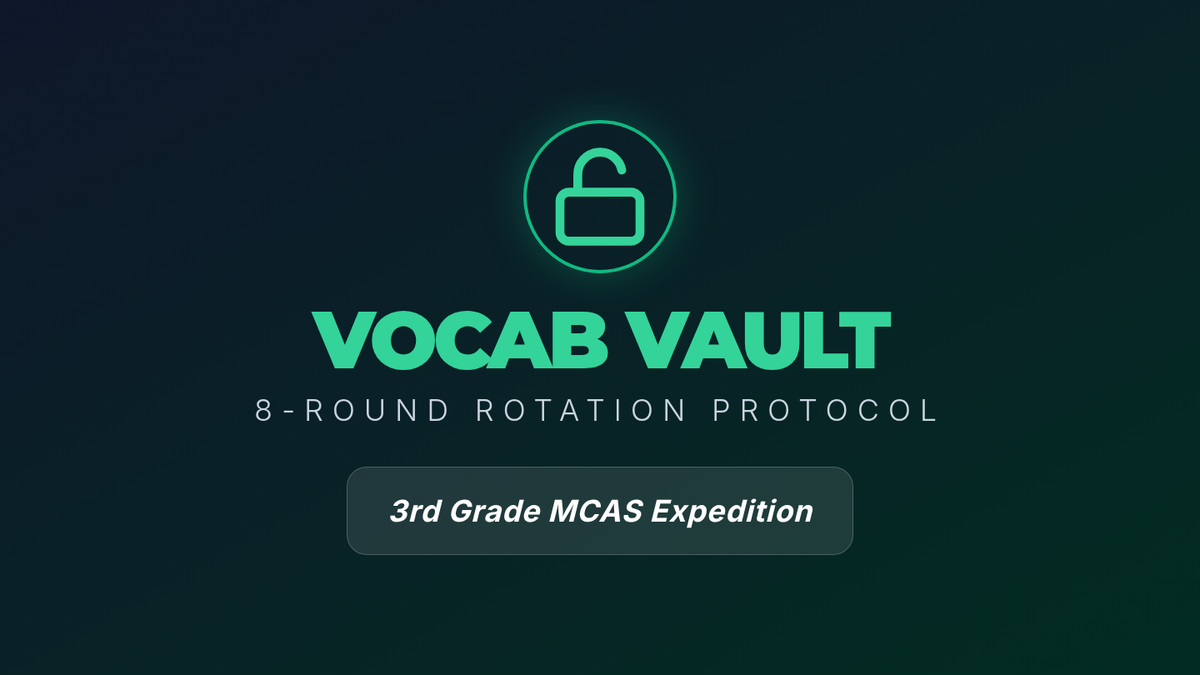
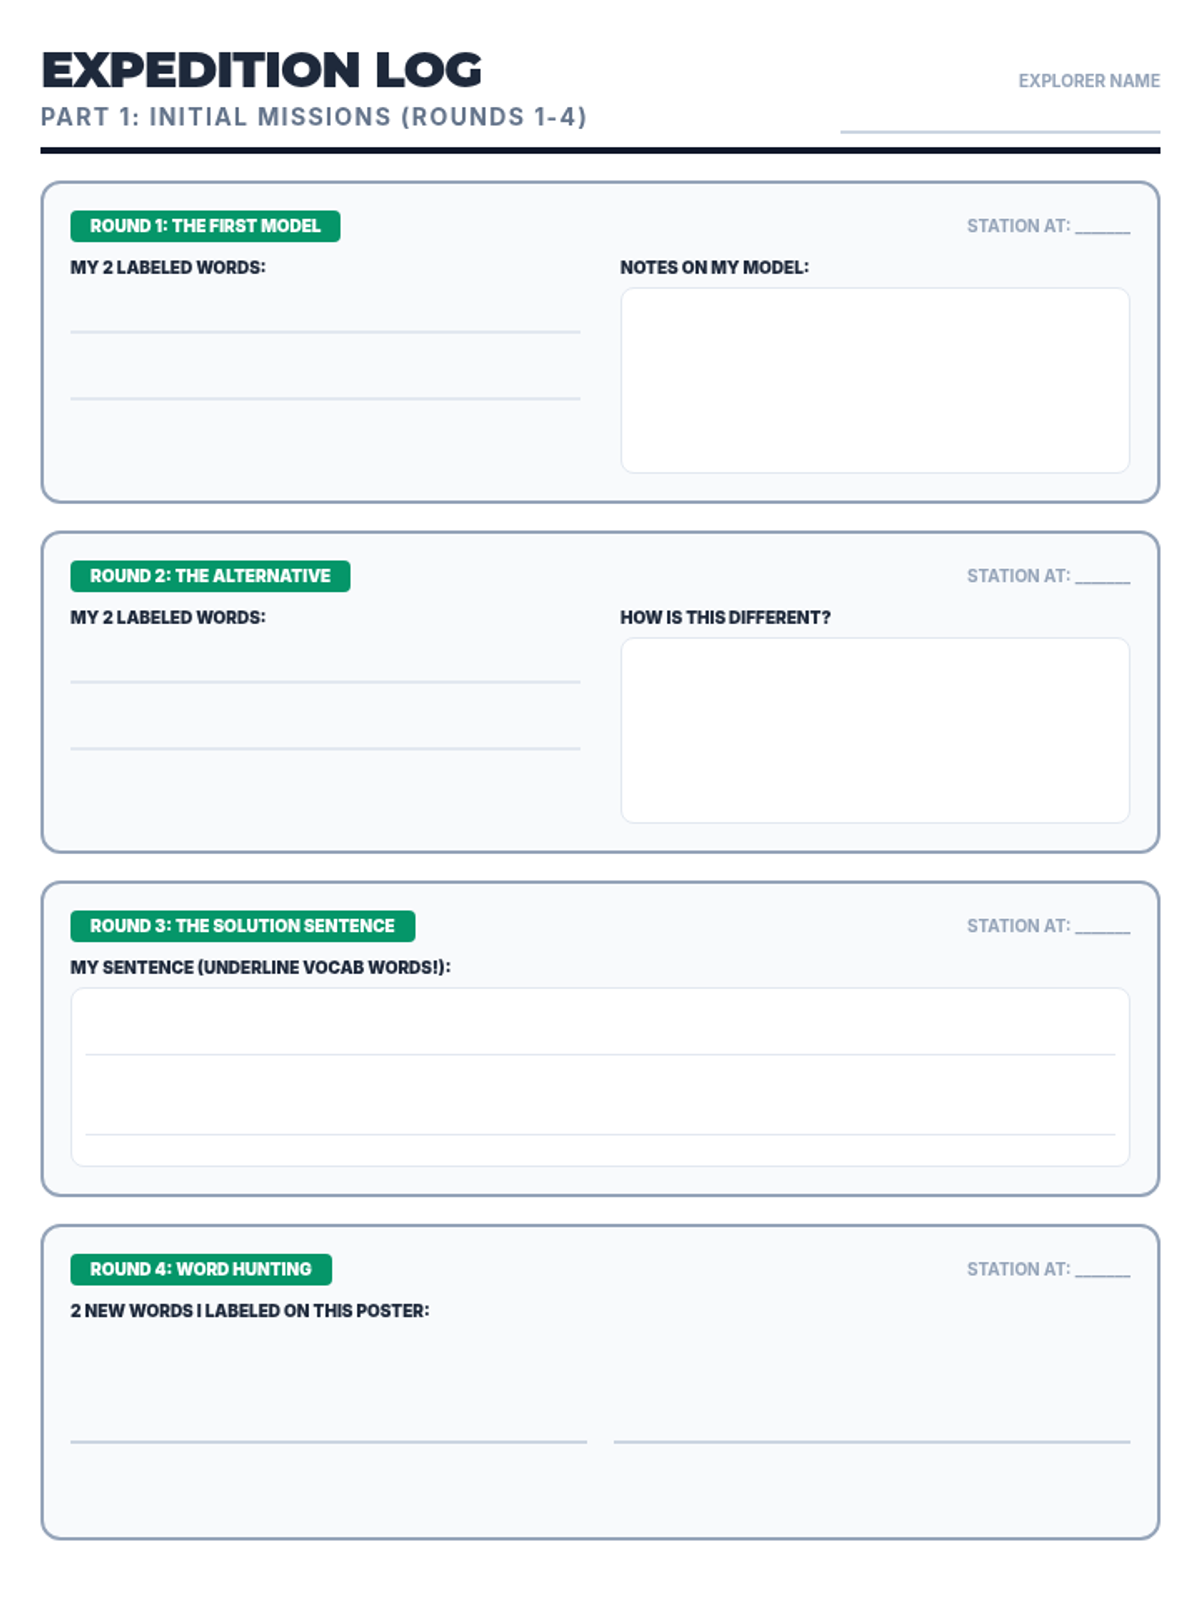
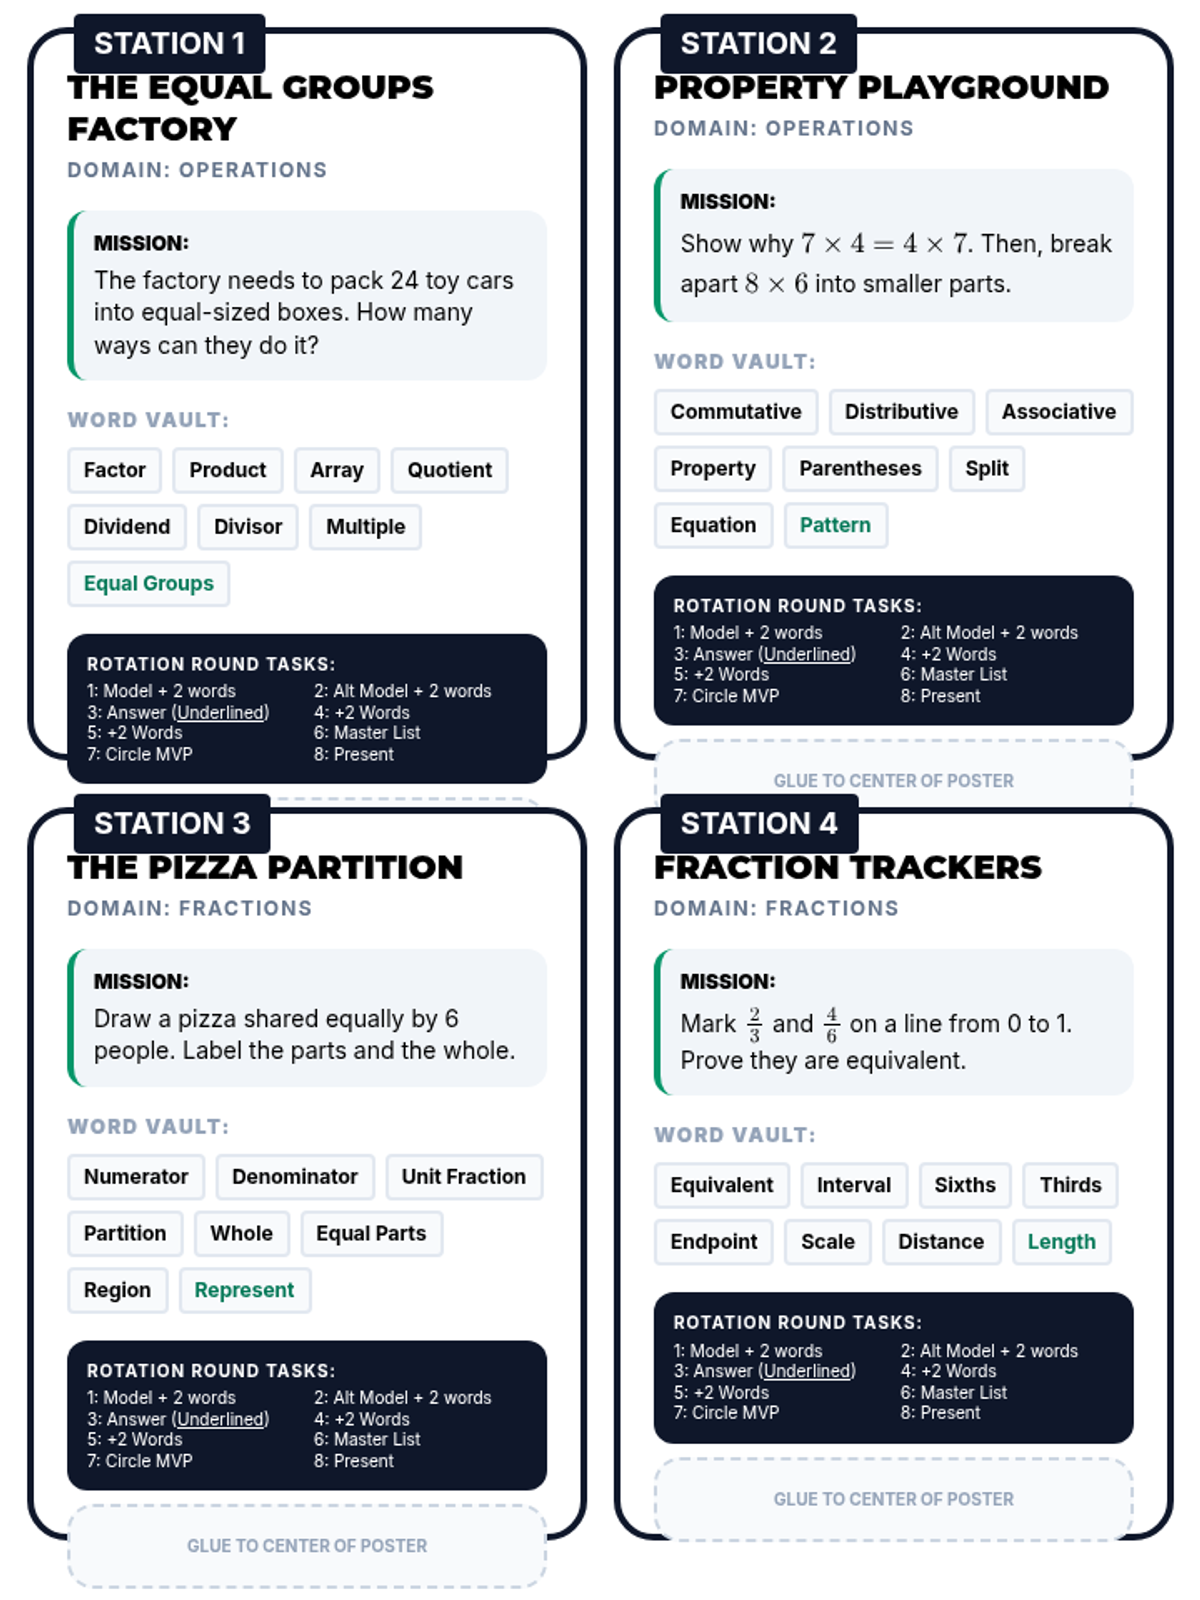
A high-energy, station-based review session where students collaborate to build 'Vocabulary Posters' covering all major 3rd-grade math domains. Students rotate through 8 stations, adding new layers of mathematical reasoning and vocabulary to shared posters at each stop.
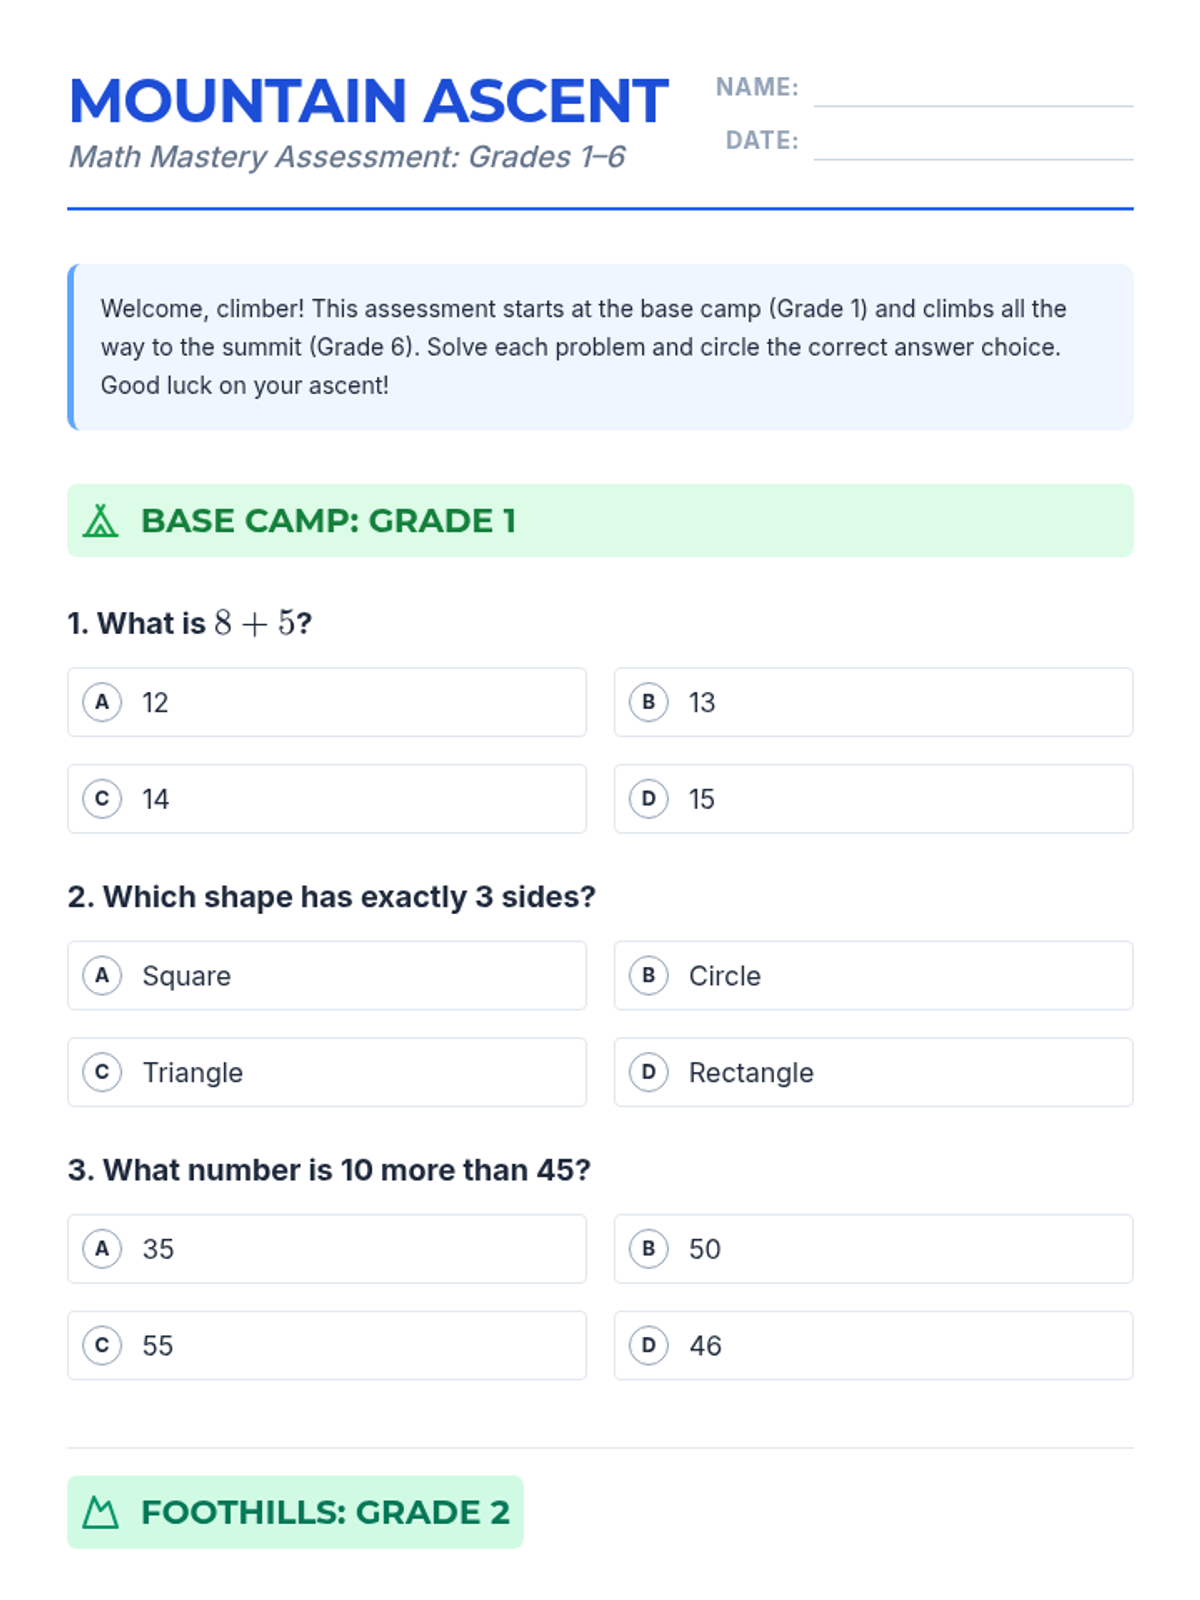
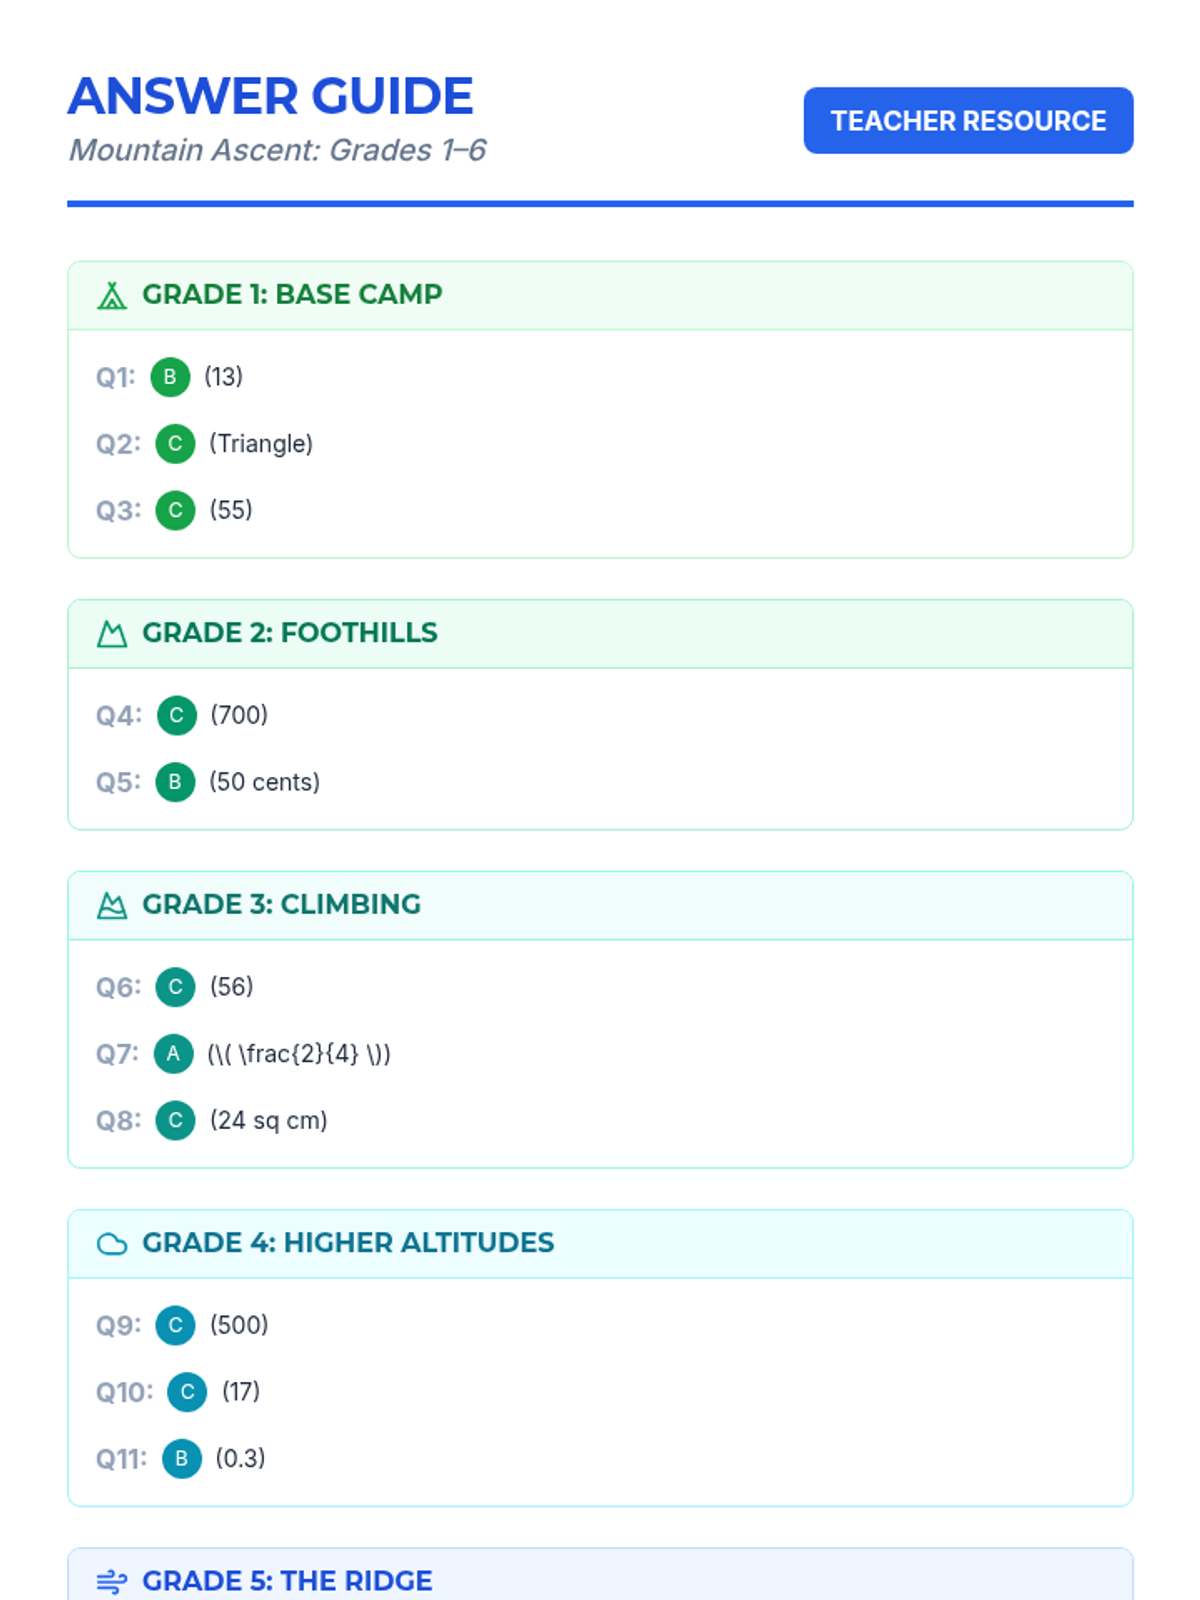
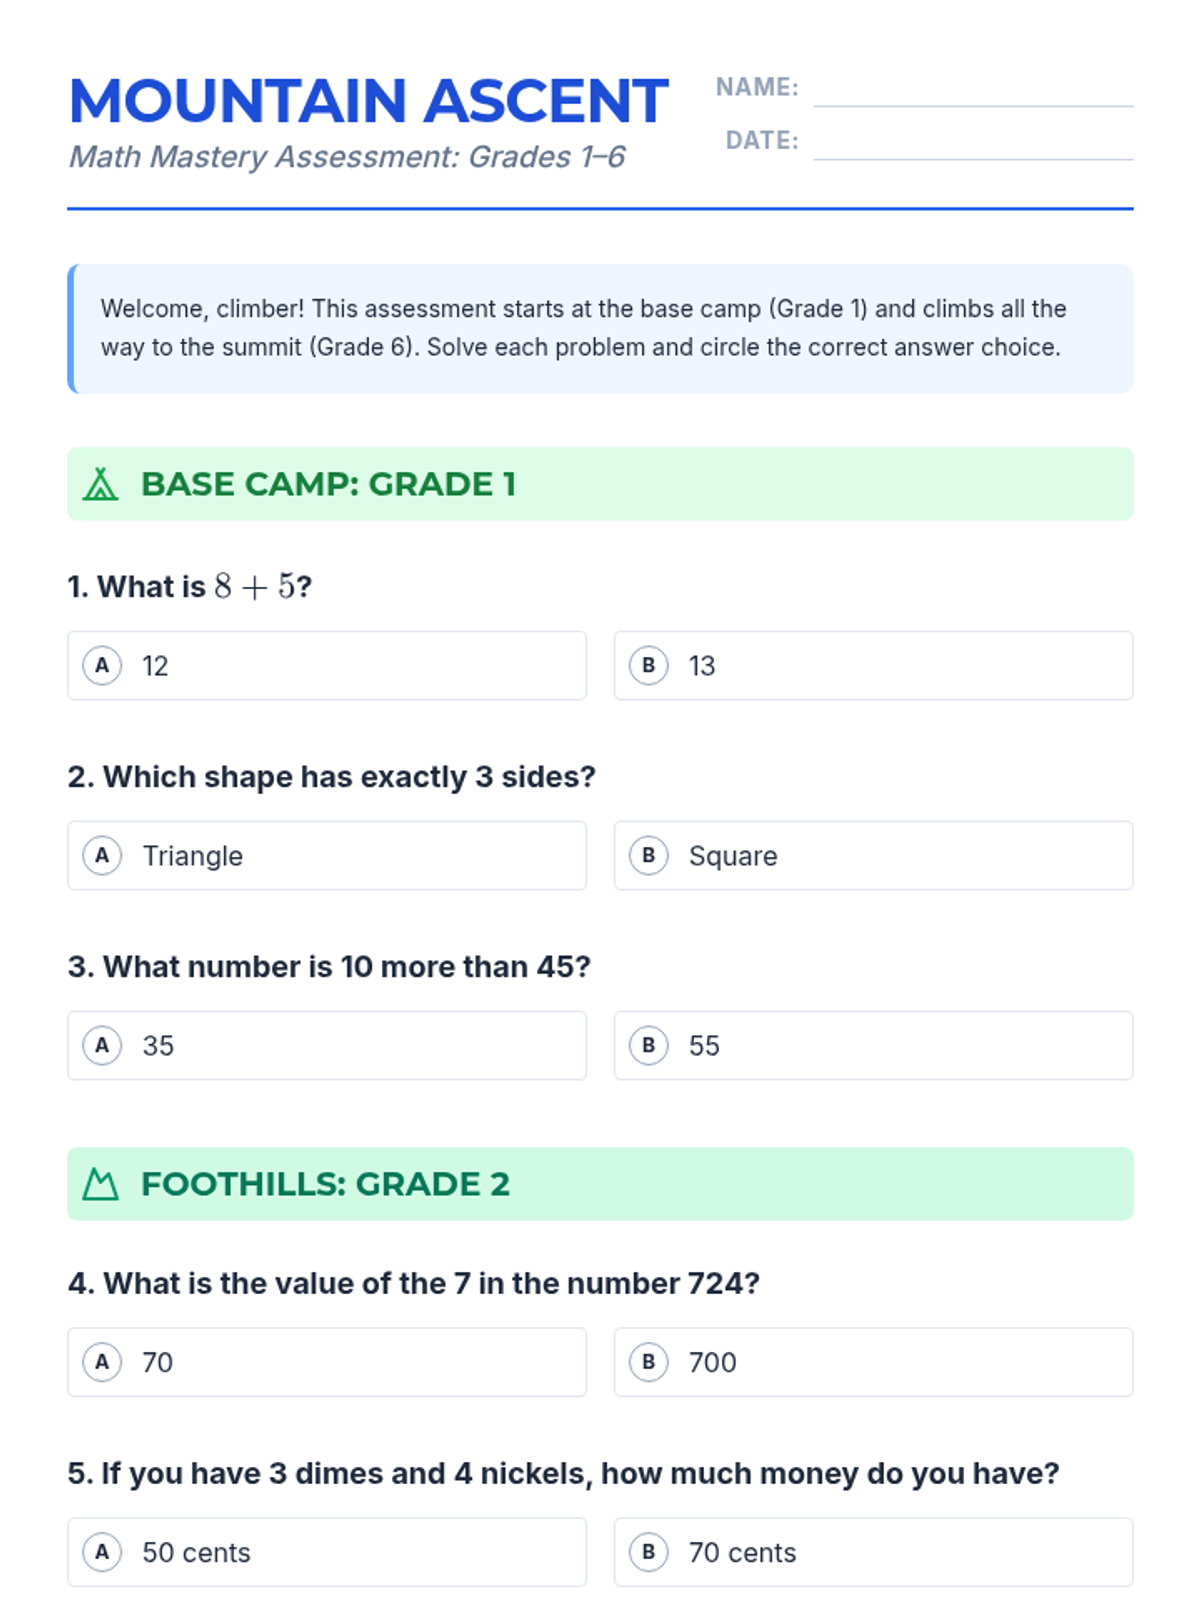
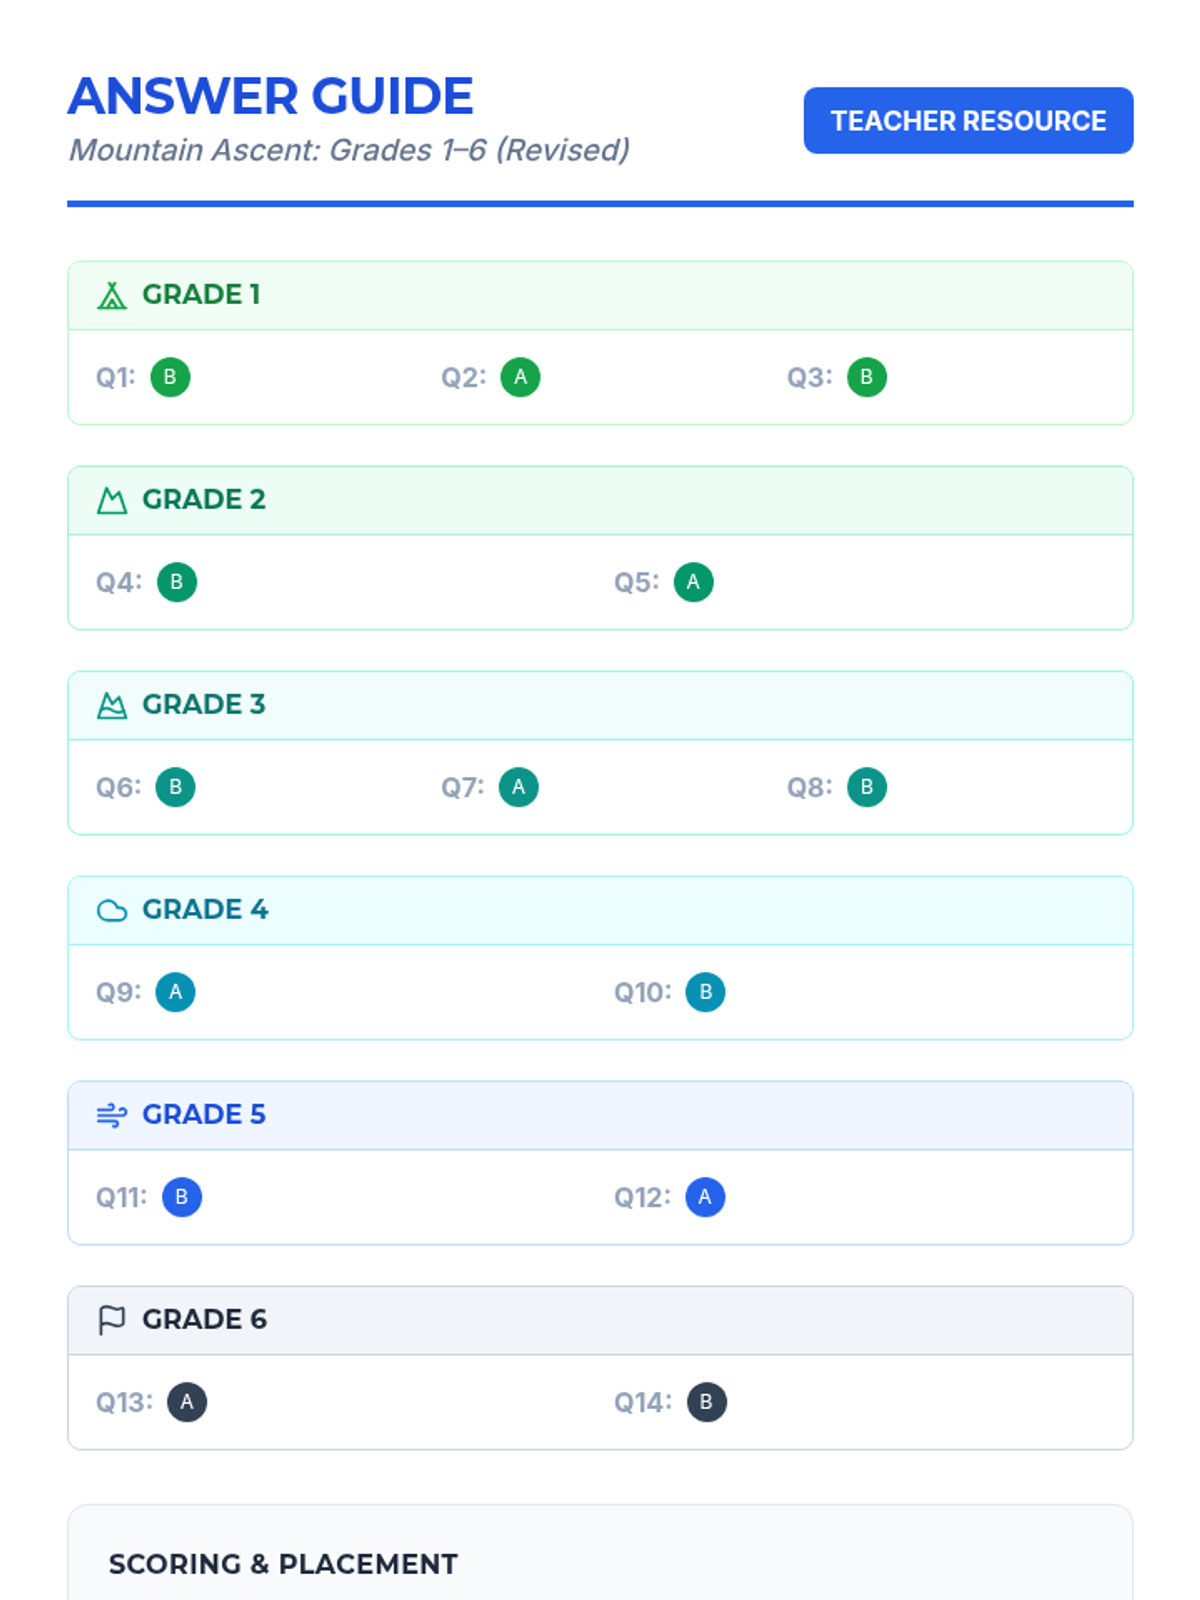
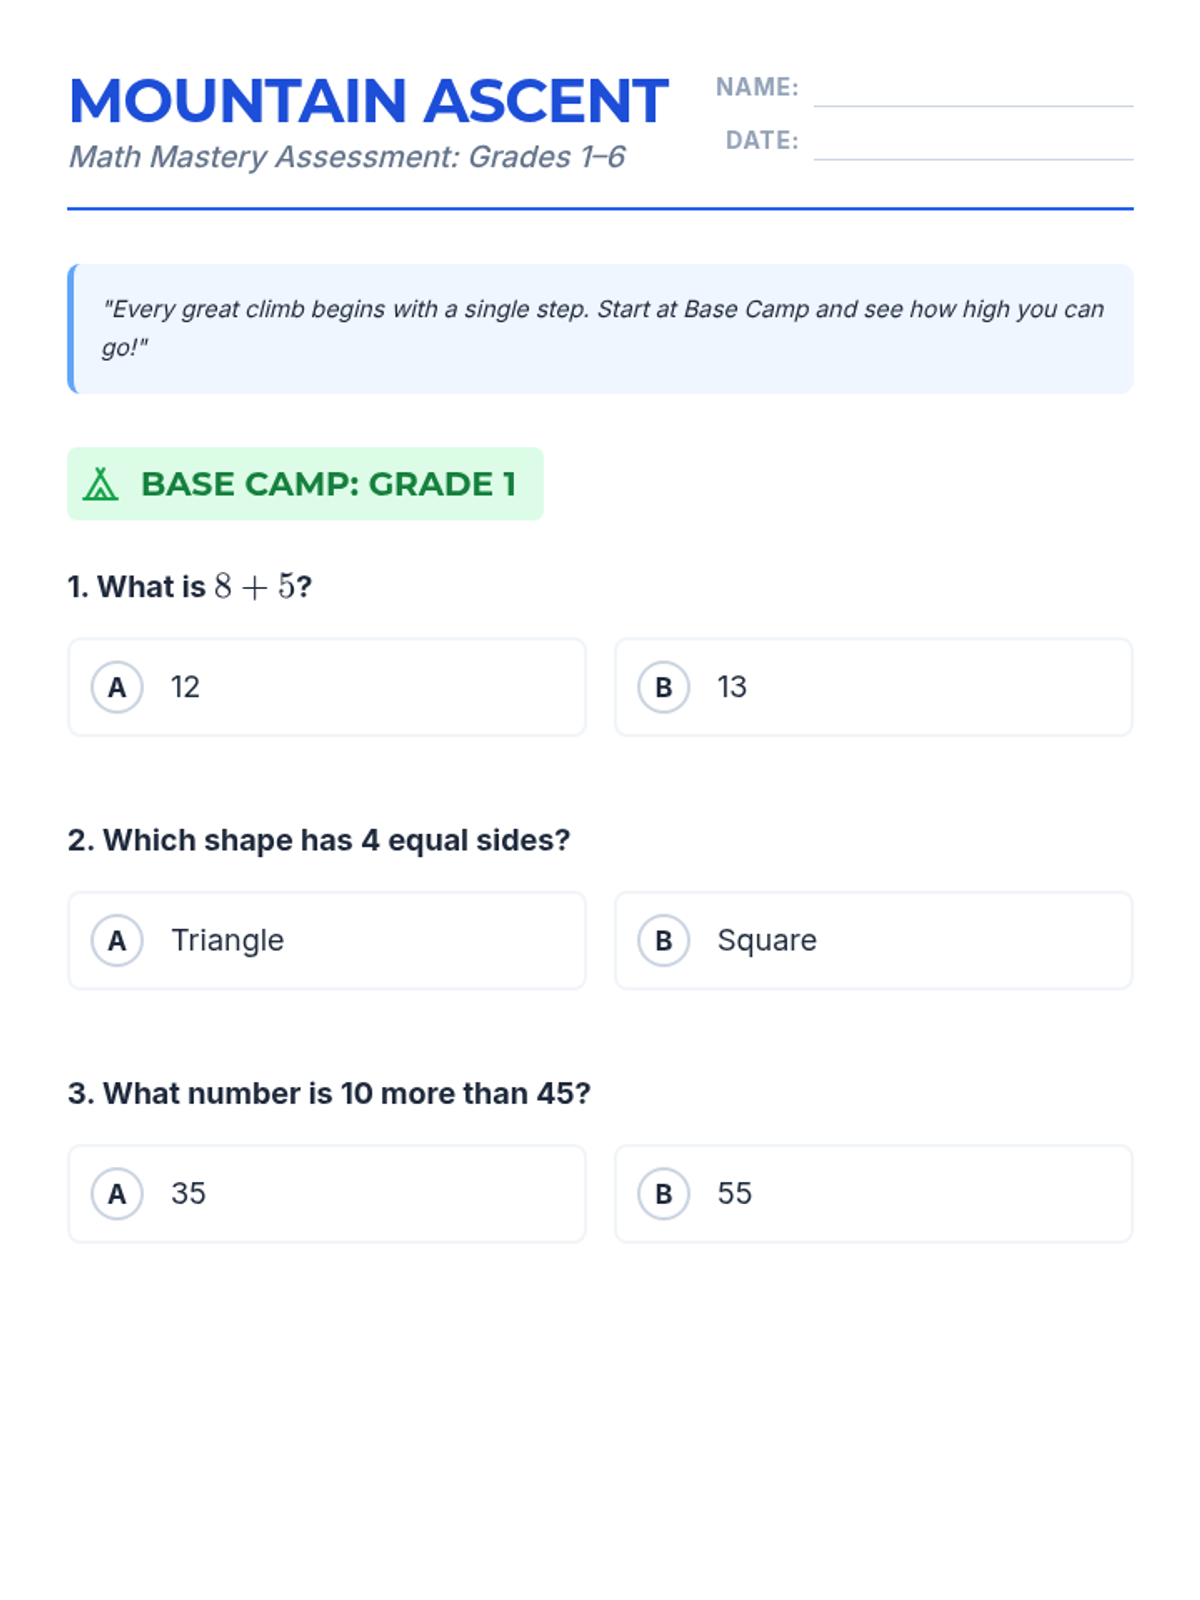
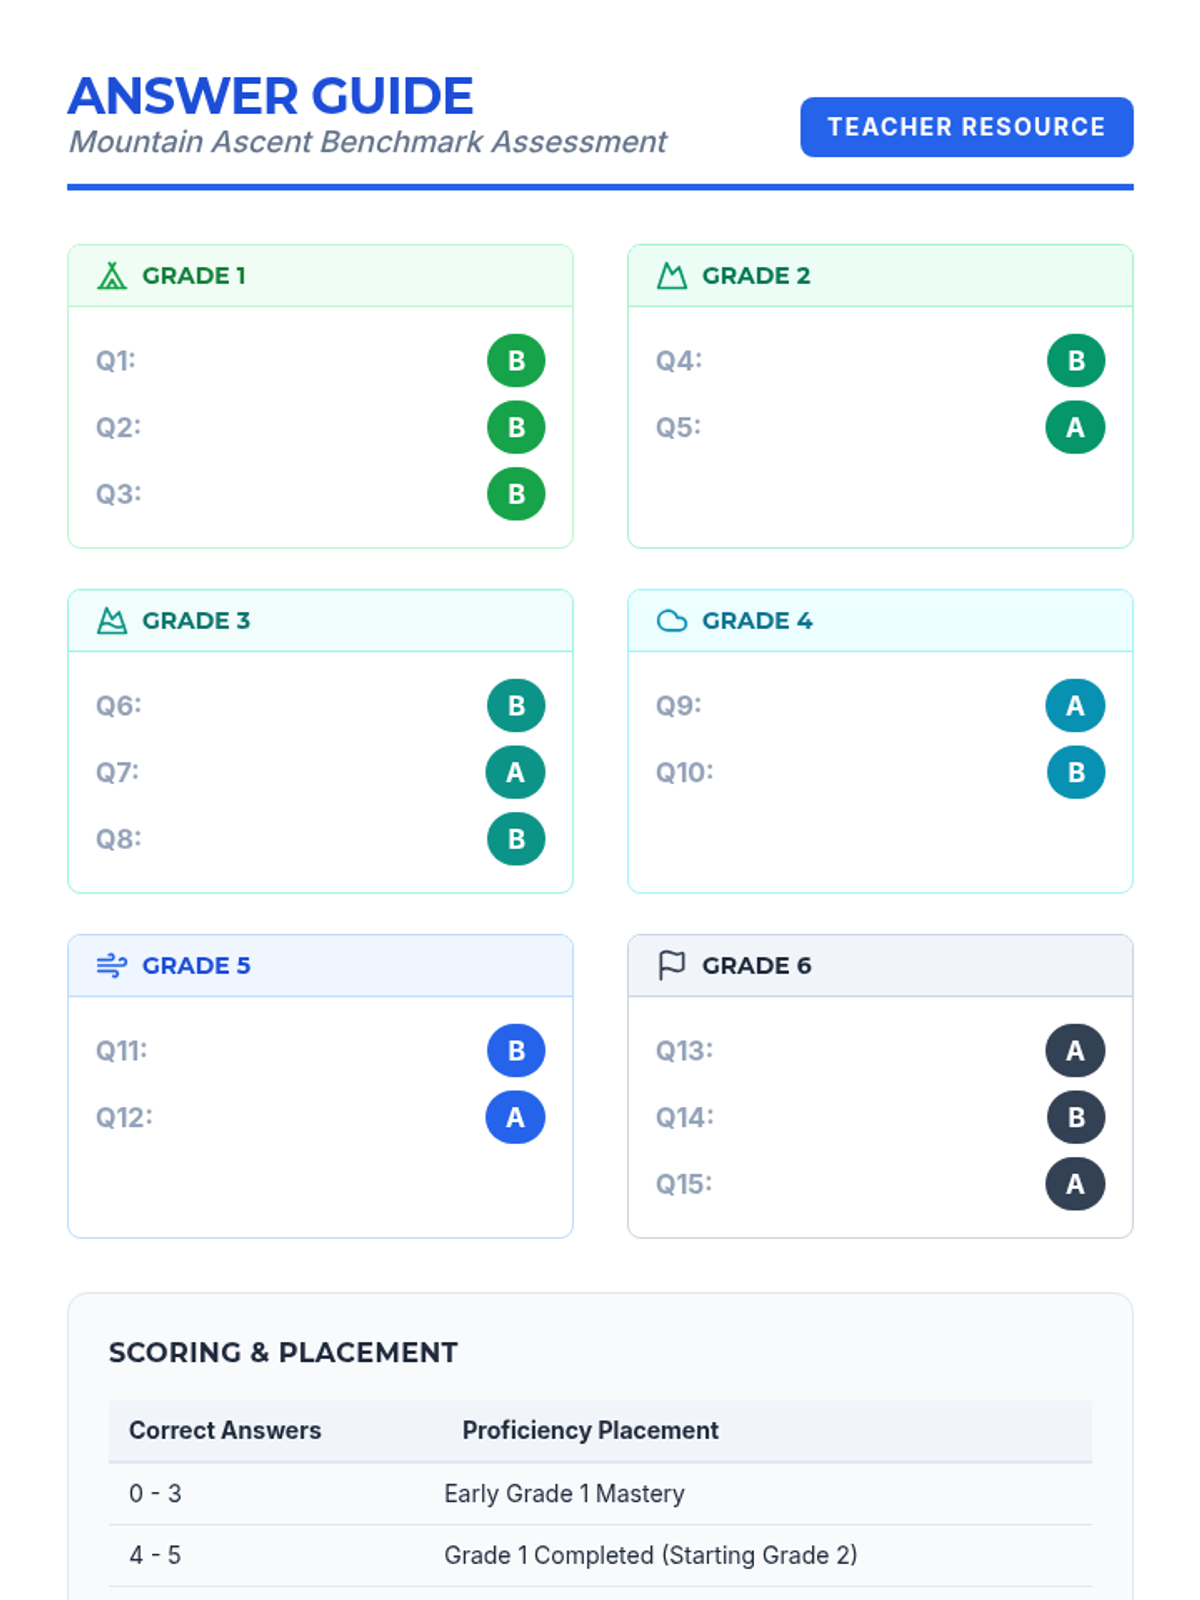
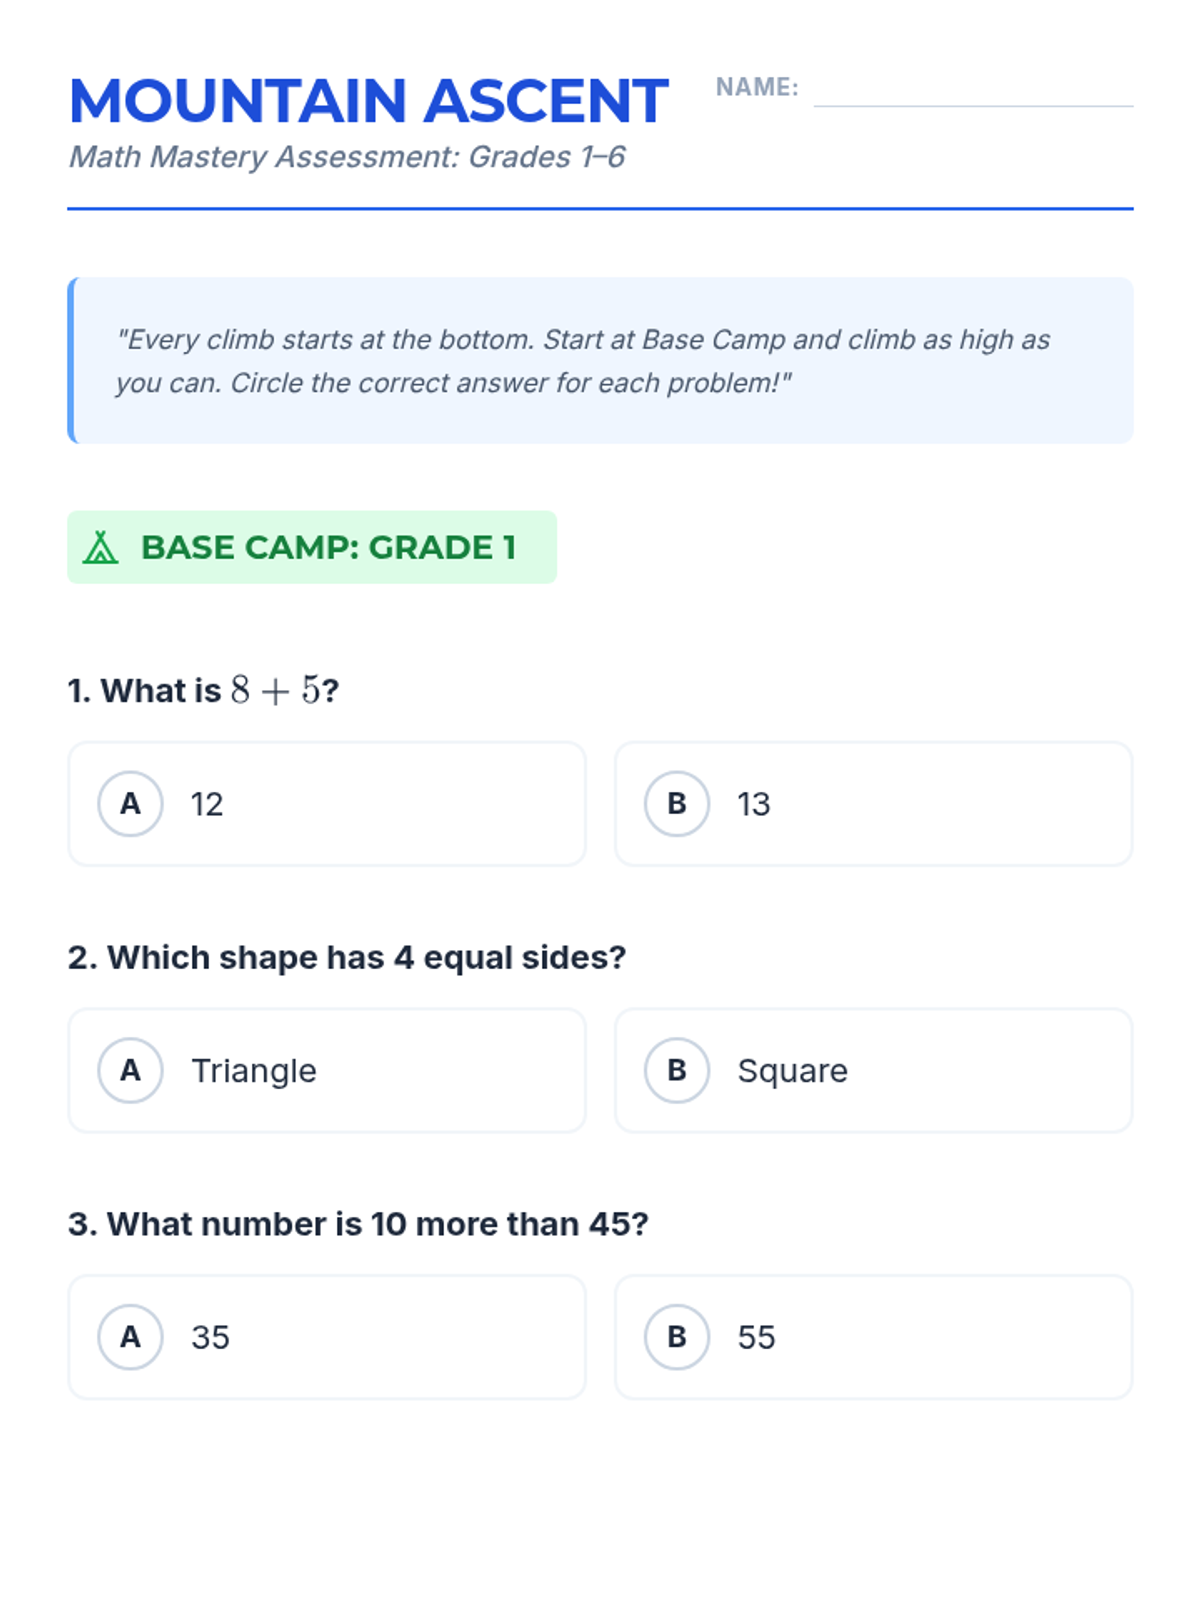
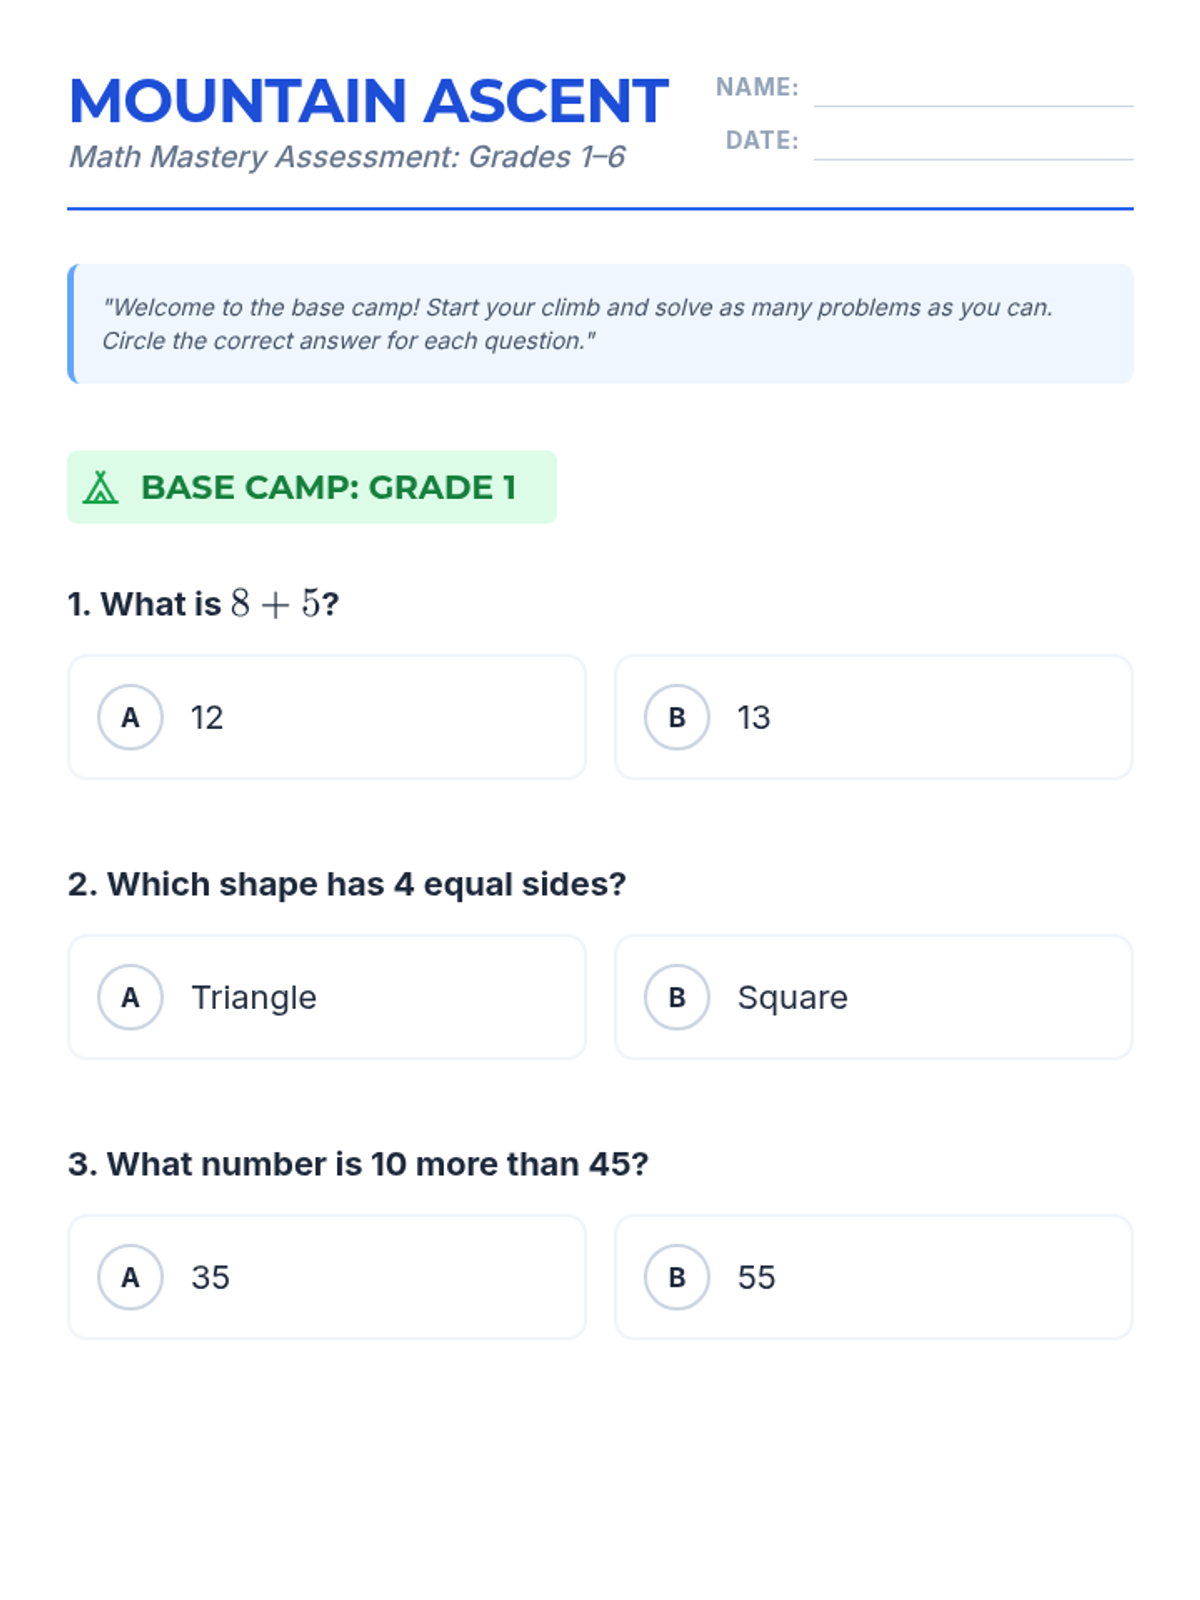
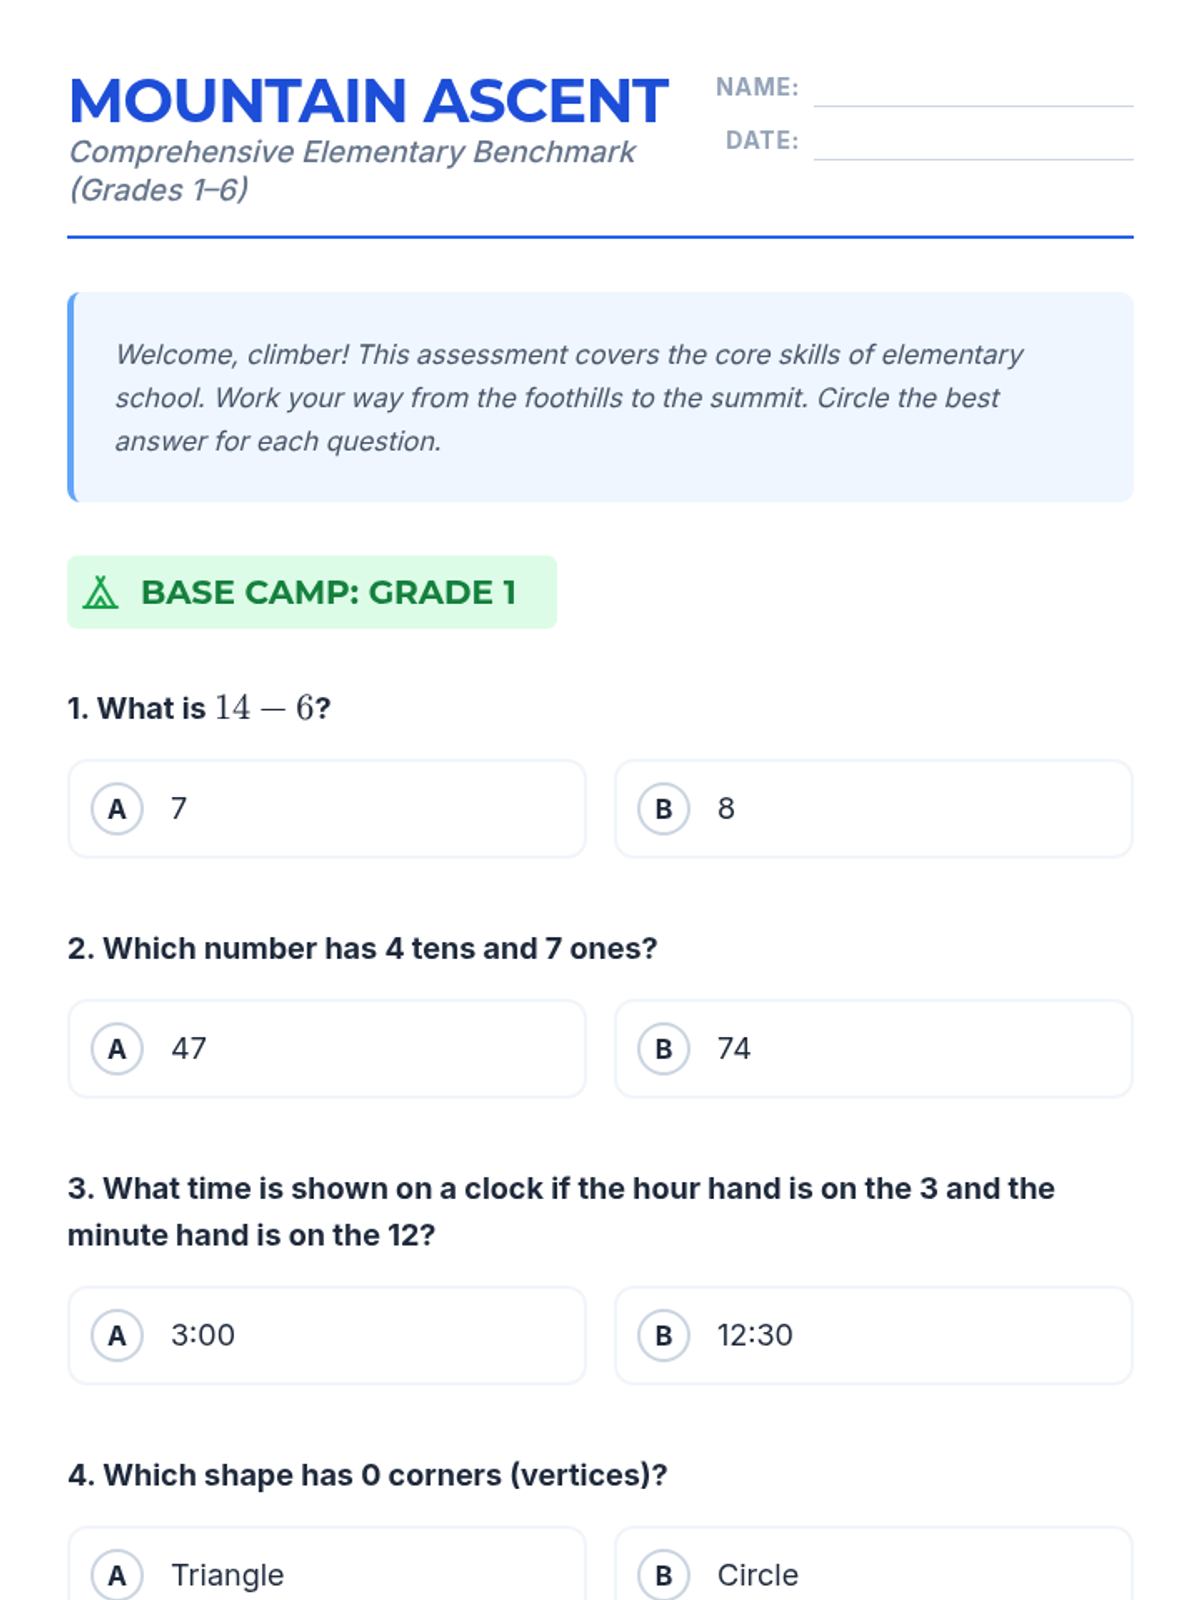
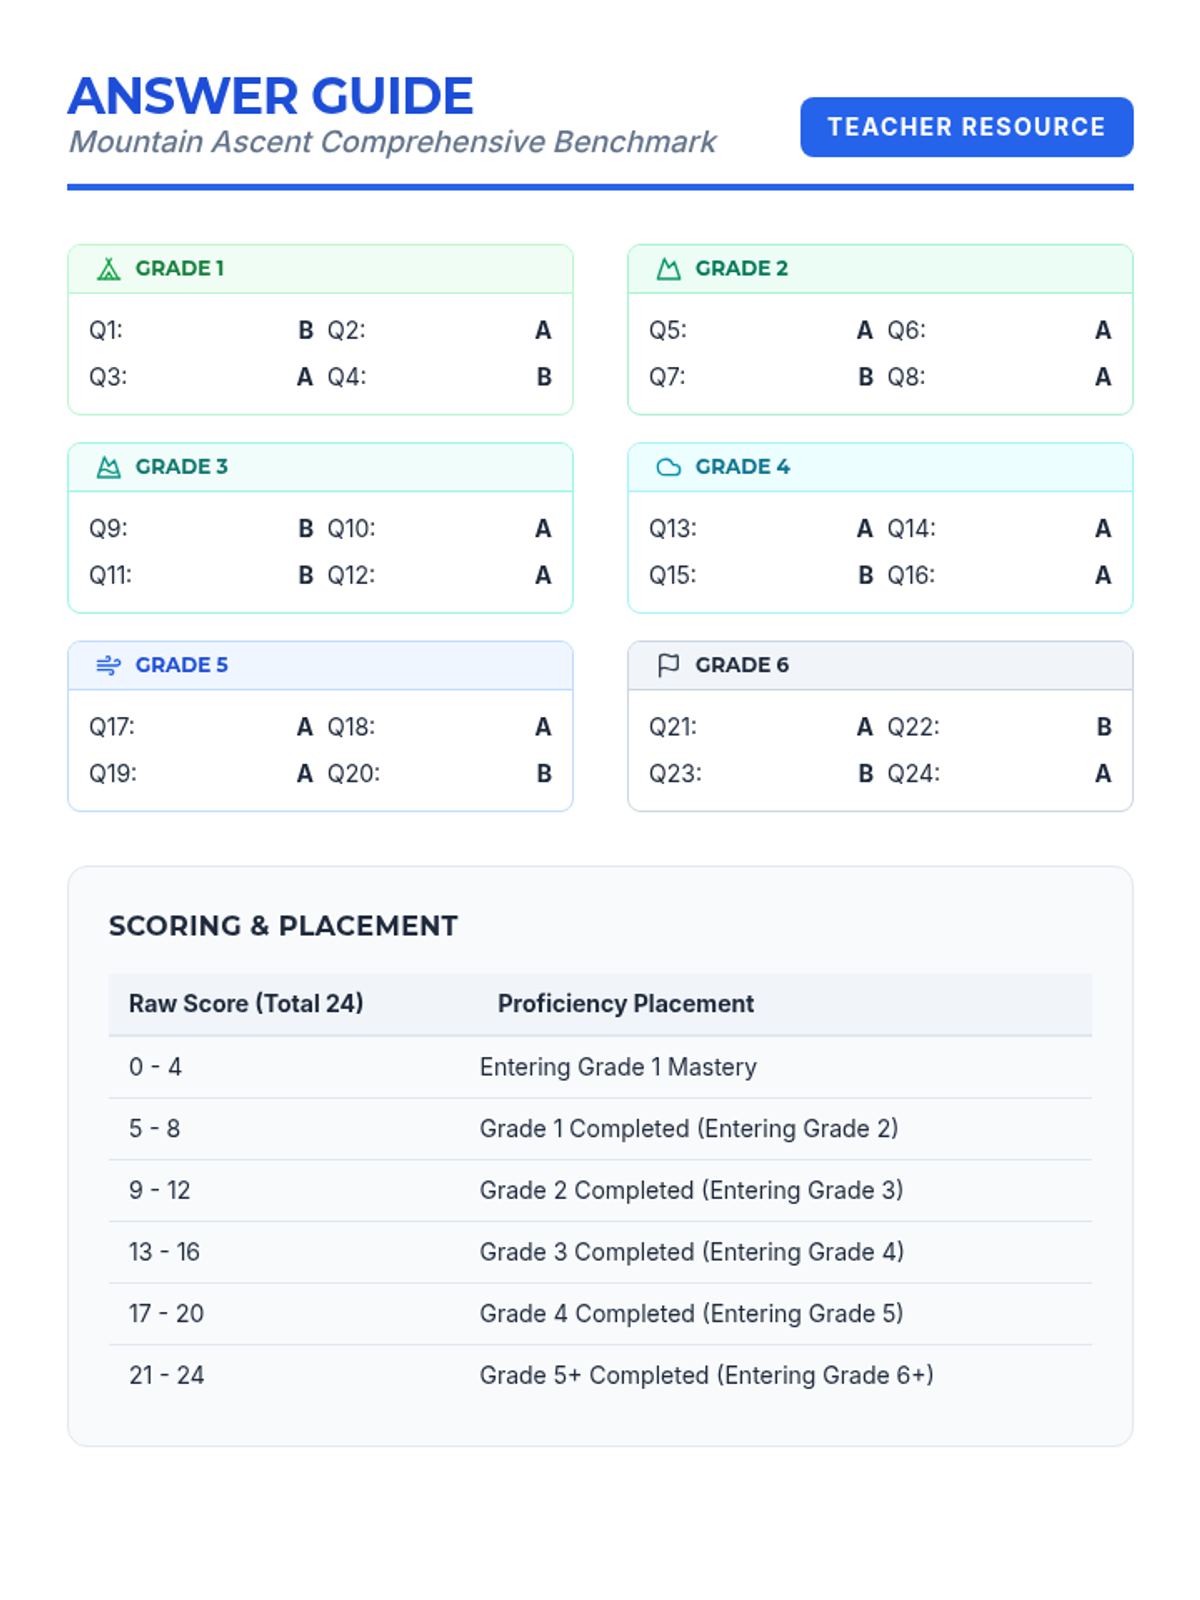
A comprehensive math benchmark assessment covering key standards from Grade 1 through Grade 6, designed to track student progress and identify skill gaps.
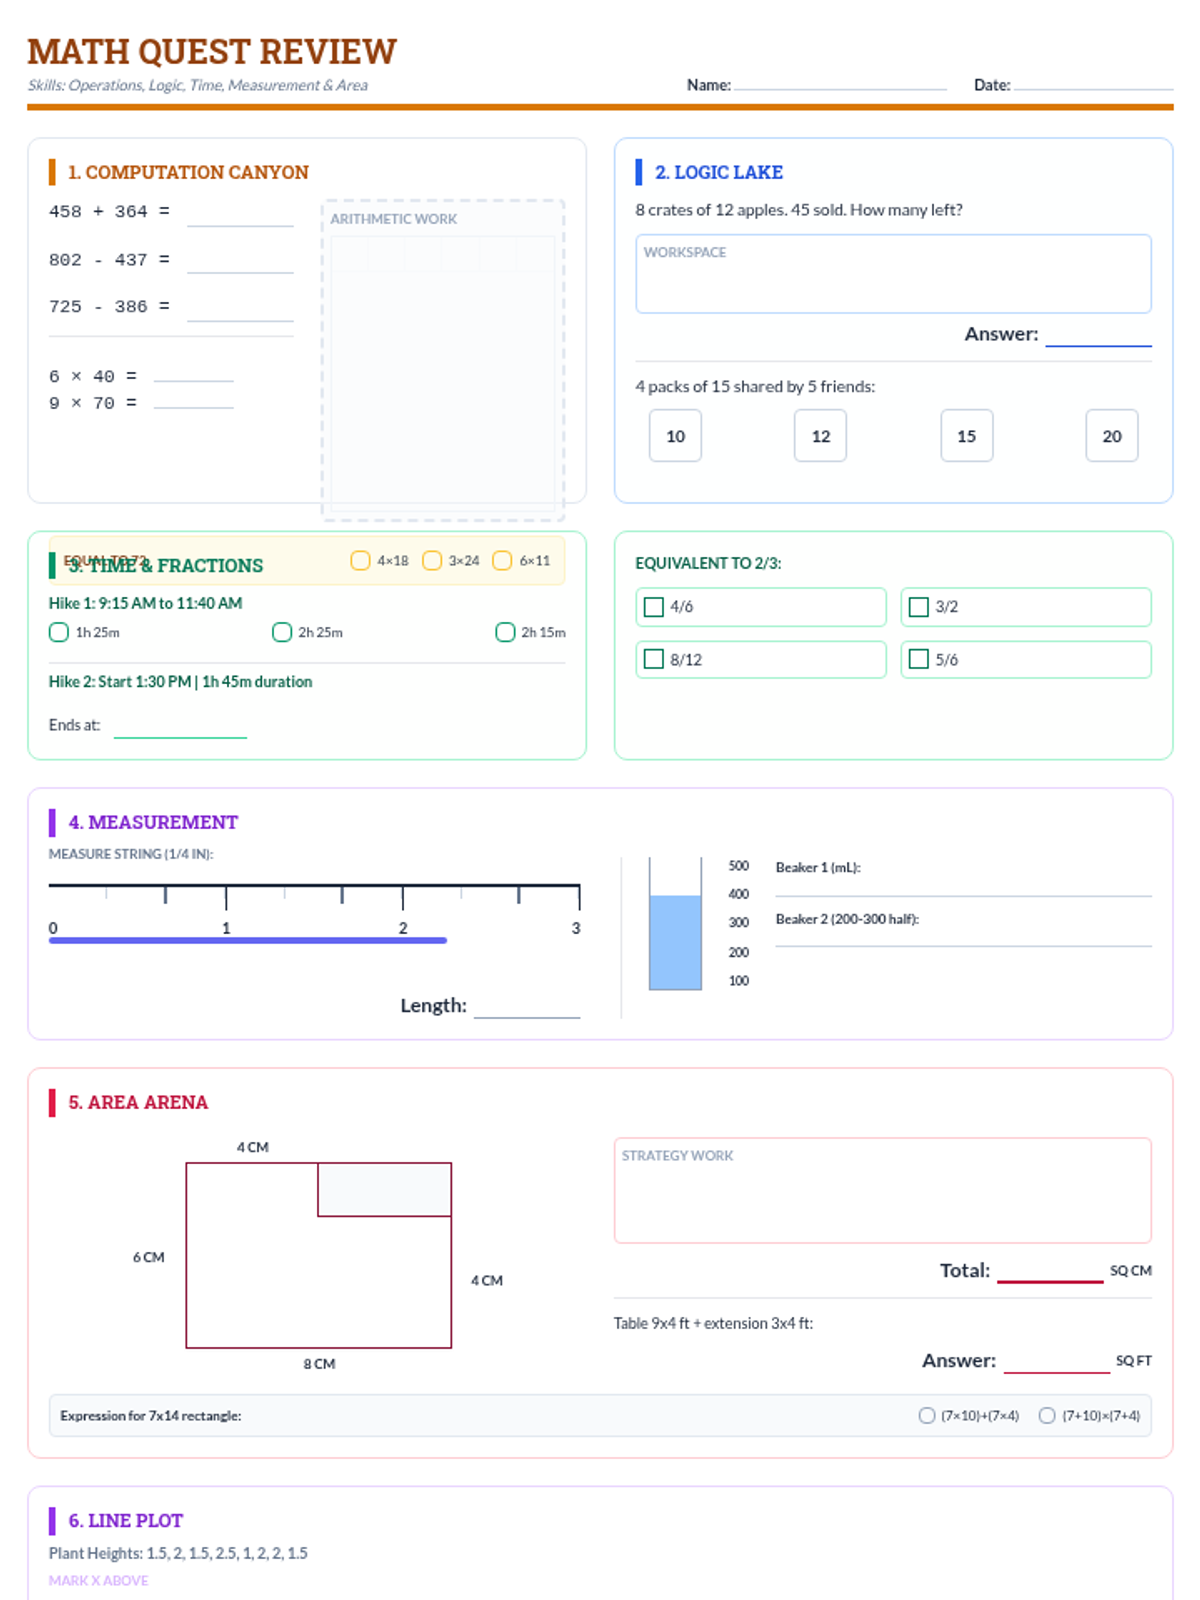
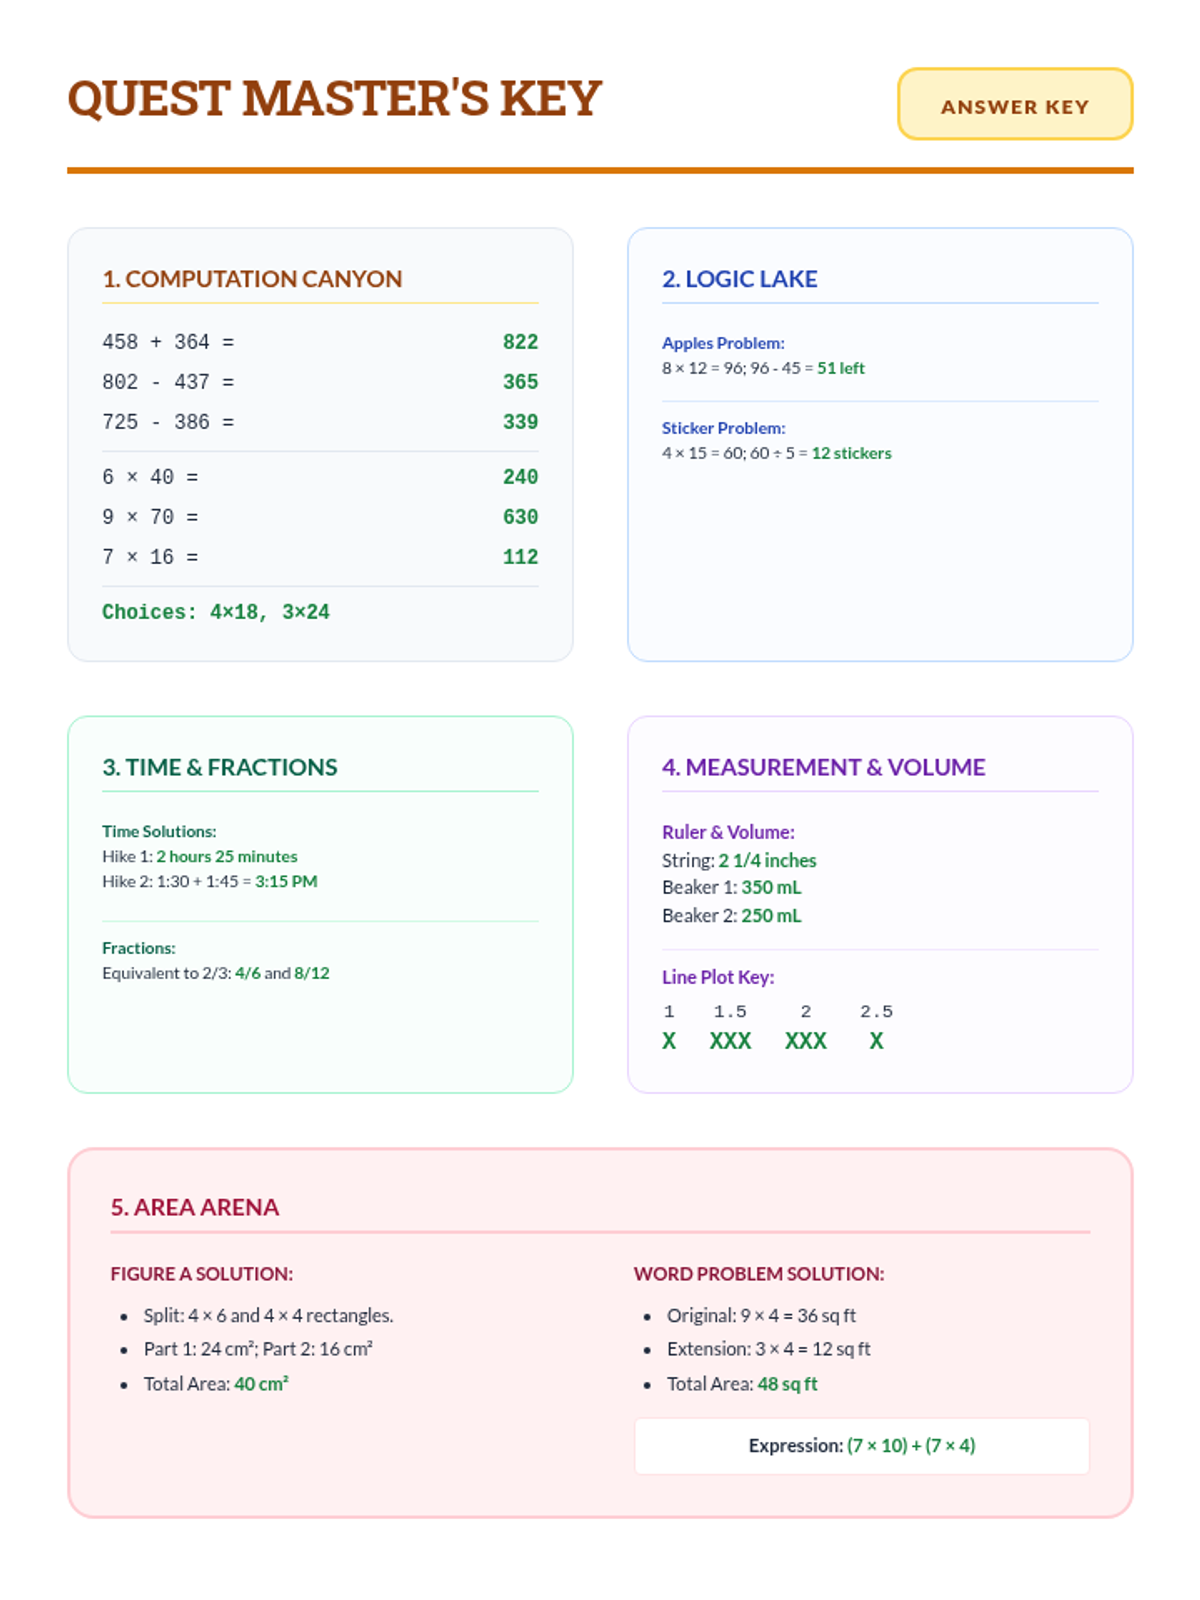
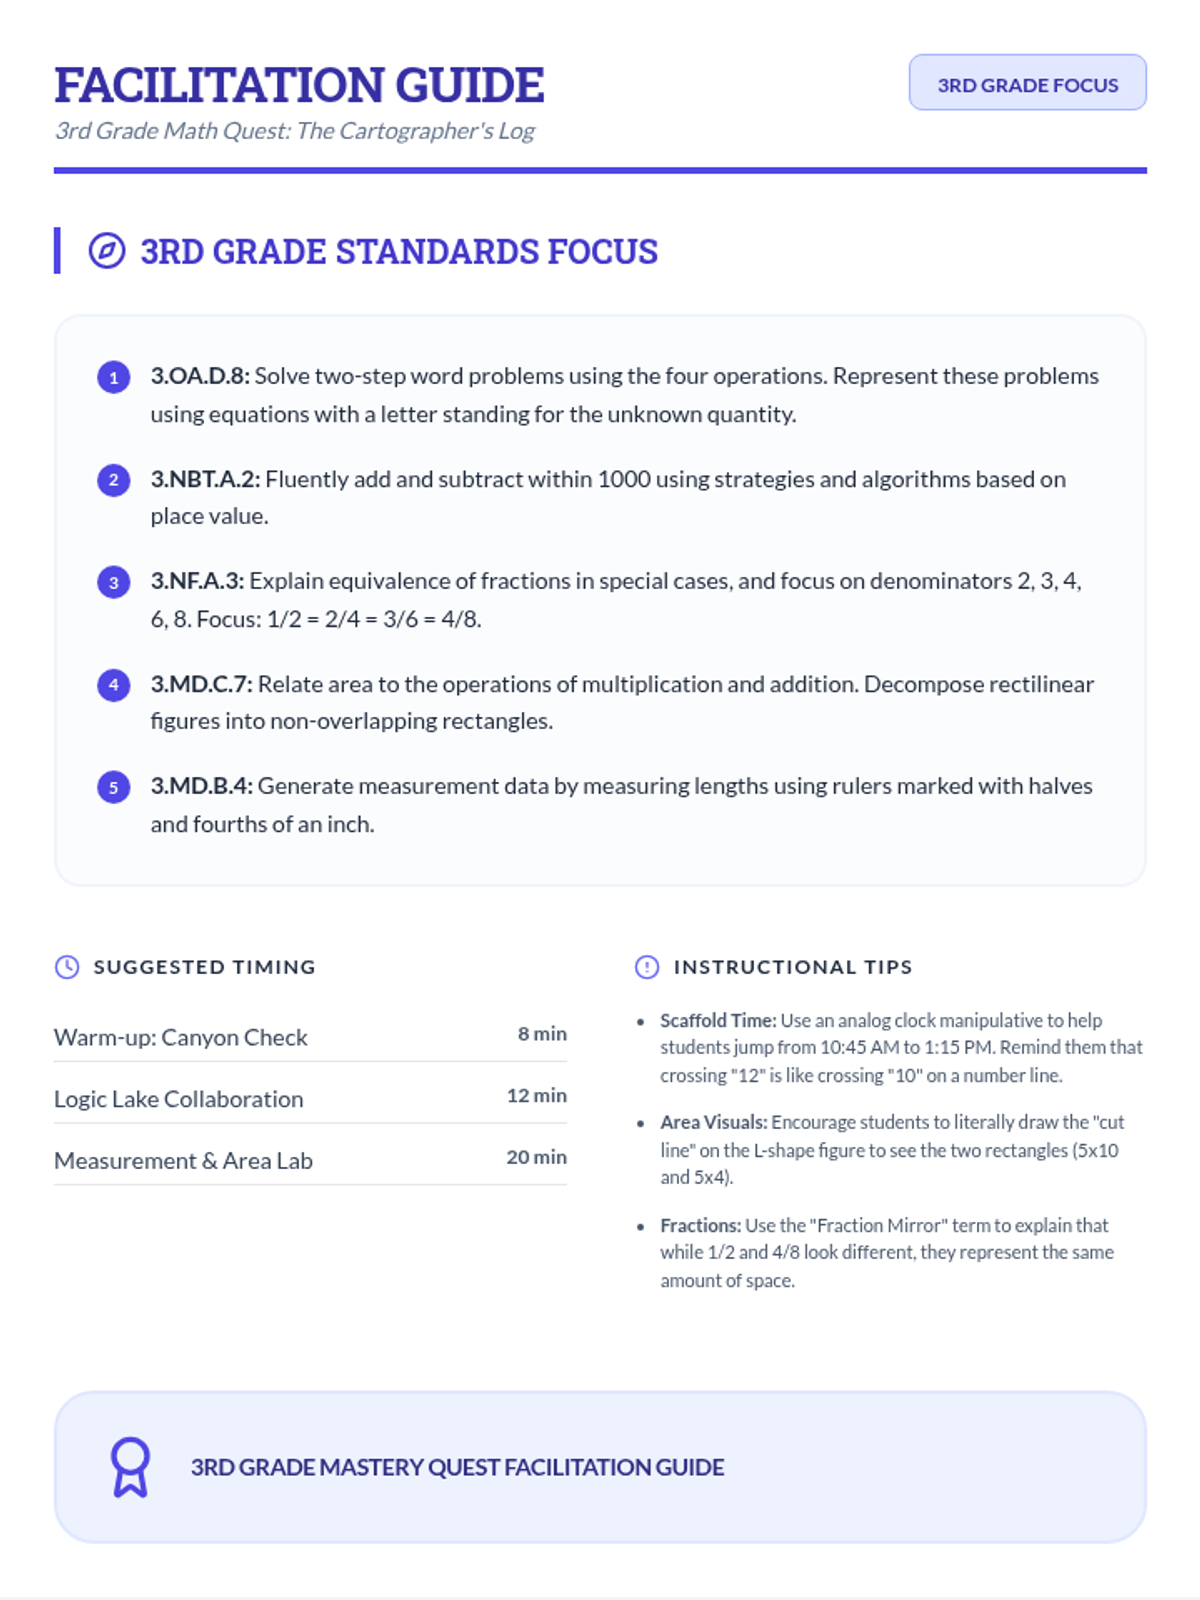
A comprehensive math review for 3rd grade students. Objectives: (1) Solve two-step word problems using four operations; (2) Perform 3-digit arithmetic and 1x2 multiplication; (3) Measure length to 1/4 inch and volume in mL; (4) Create line plots using fractional data (halves, fourths); (5) Identify equivalent fractions; (6) Calculate area of complex rectilinear figures by decomposition; (7) Calculate elapsed time.