Data representation, distributions, and statistical variability using sampling and inference techniques. Integrates probability models, compound events, bivariate patterns, and linear models to guide data-driven decision making.
Students interpret and create line plots using measurement data involving fractions.
Students learn to measure objects to the nearest fourth of an inch and explore partition logic.
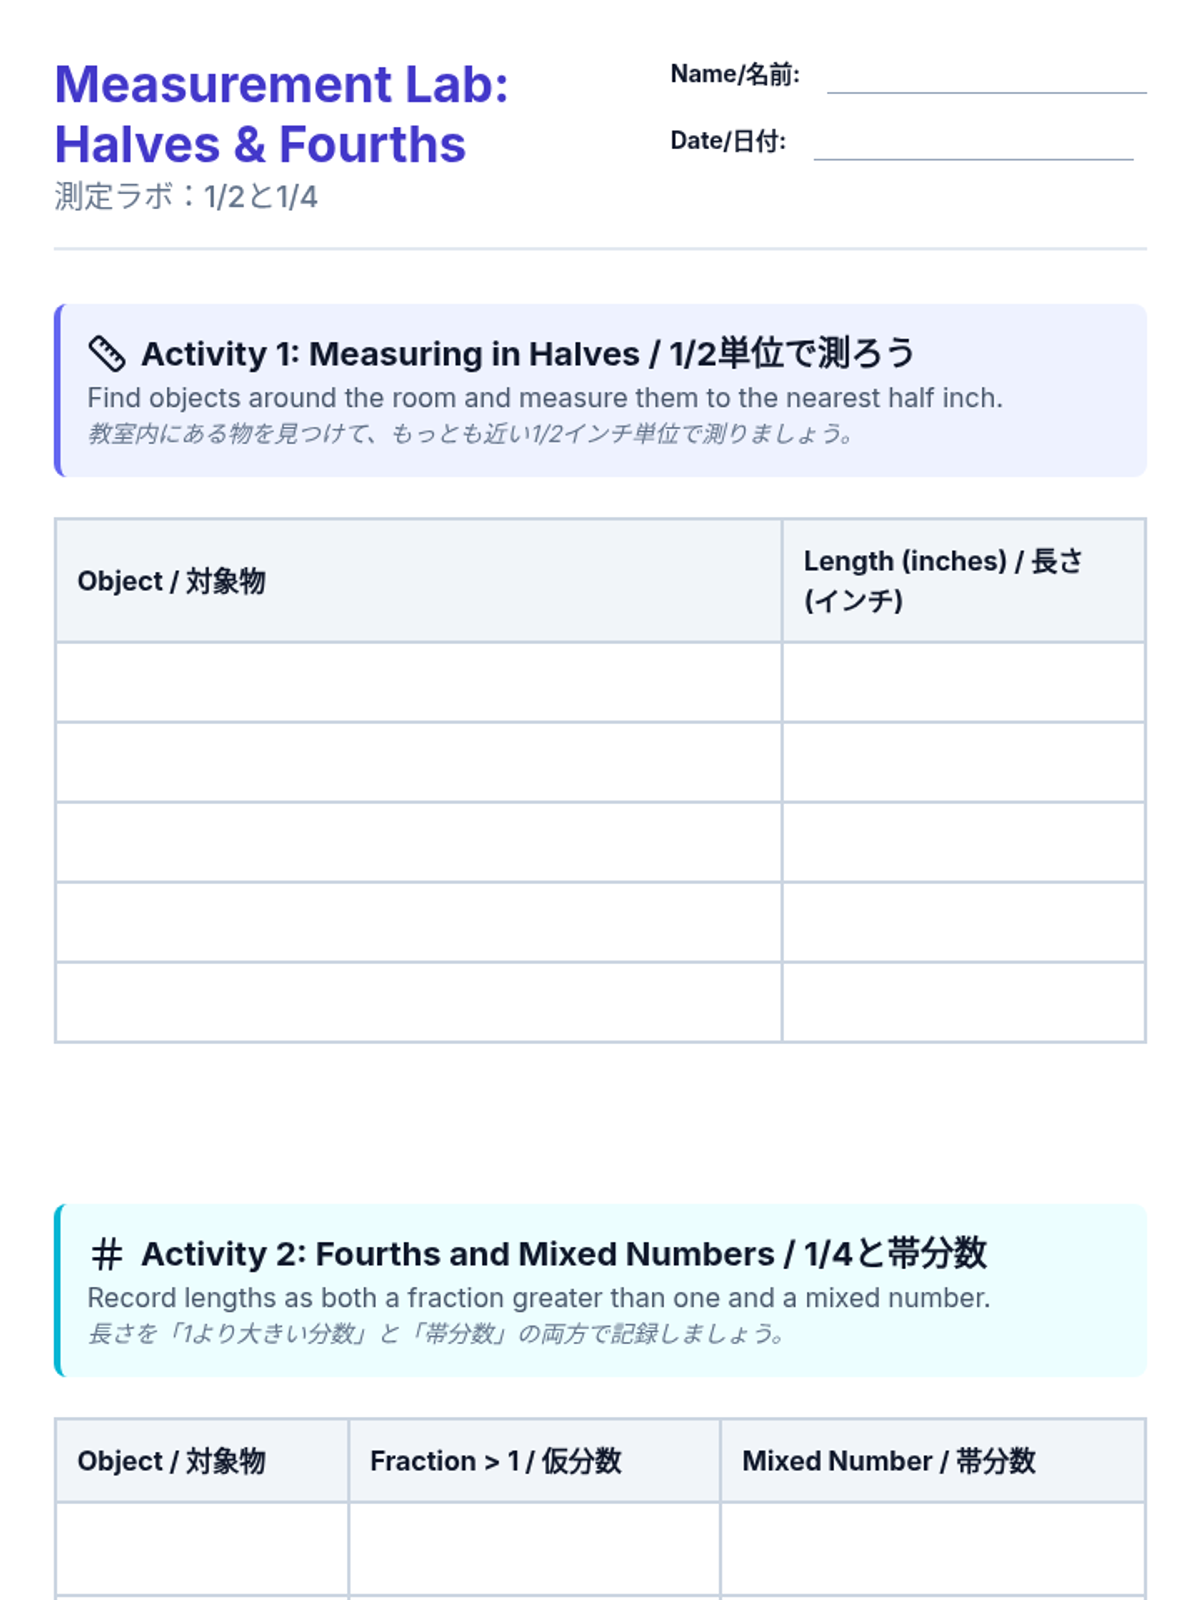
Students learn to measure objects to the nearest half-inch and are introduced to mixed numbers.
Analyzing and creating line plots to represent measurement data.
Using fraction equivalence to measure and record lengths accurately.
Expanding measurement skills to fourths of an inch and practicing with mixed numbers.
Introduction to measuring length in halves of an inch and understanding mixed numbers.
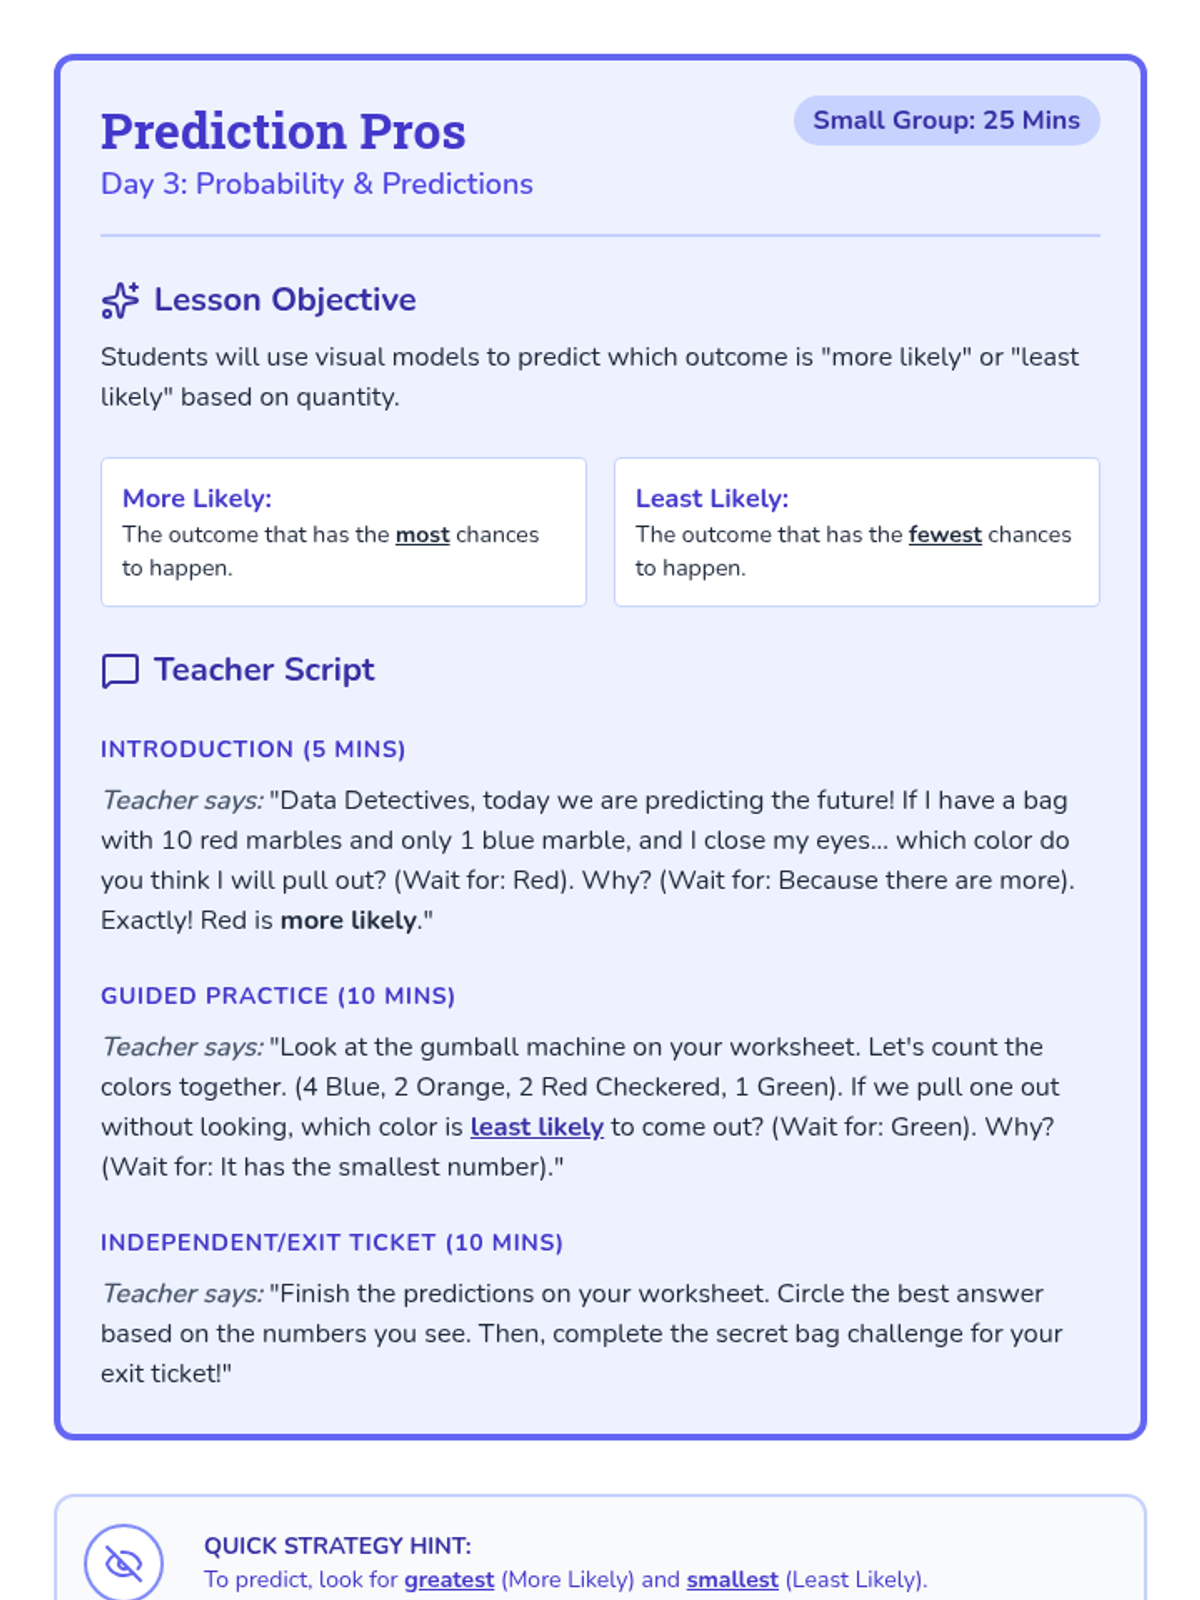
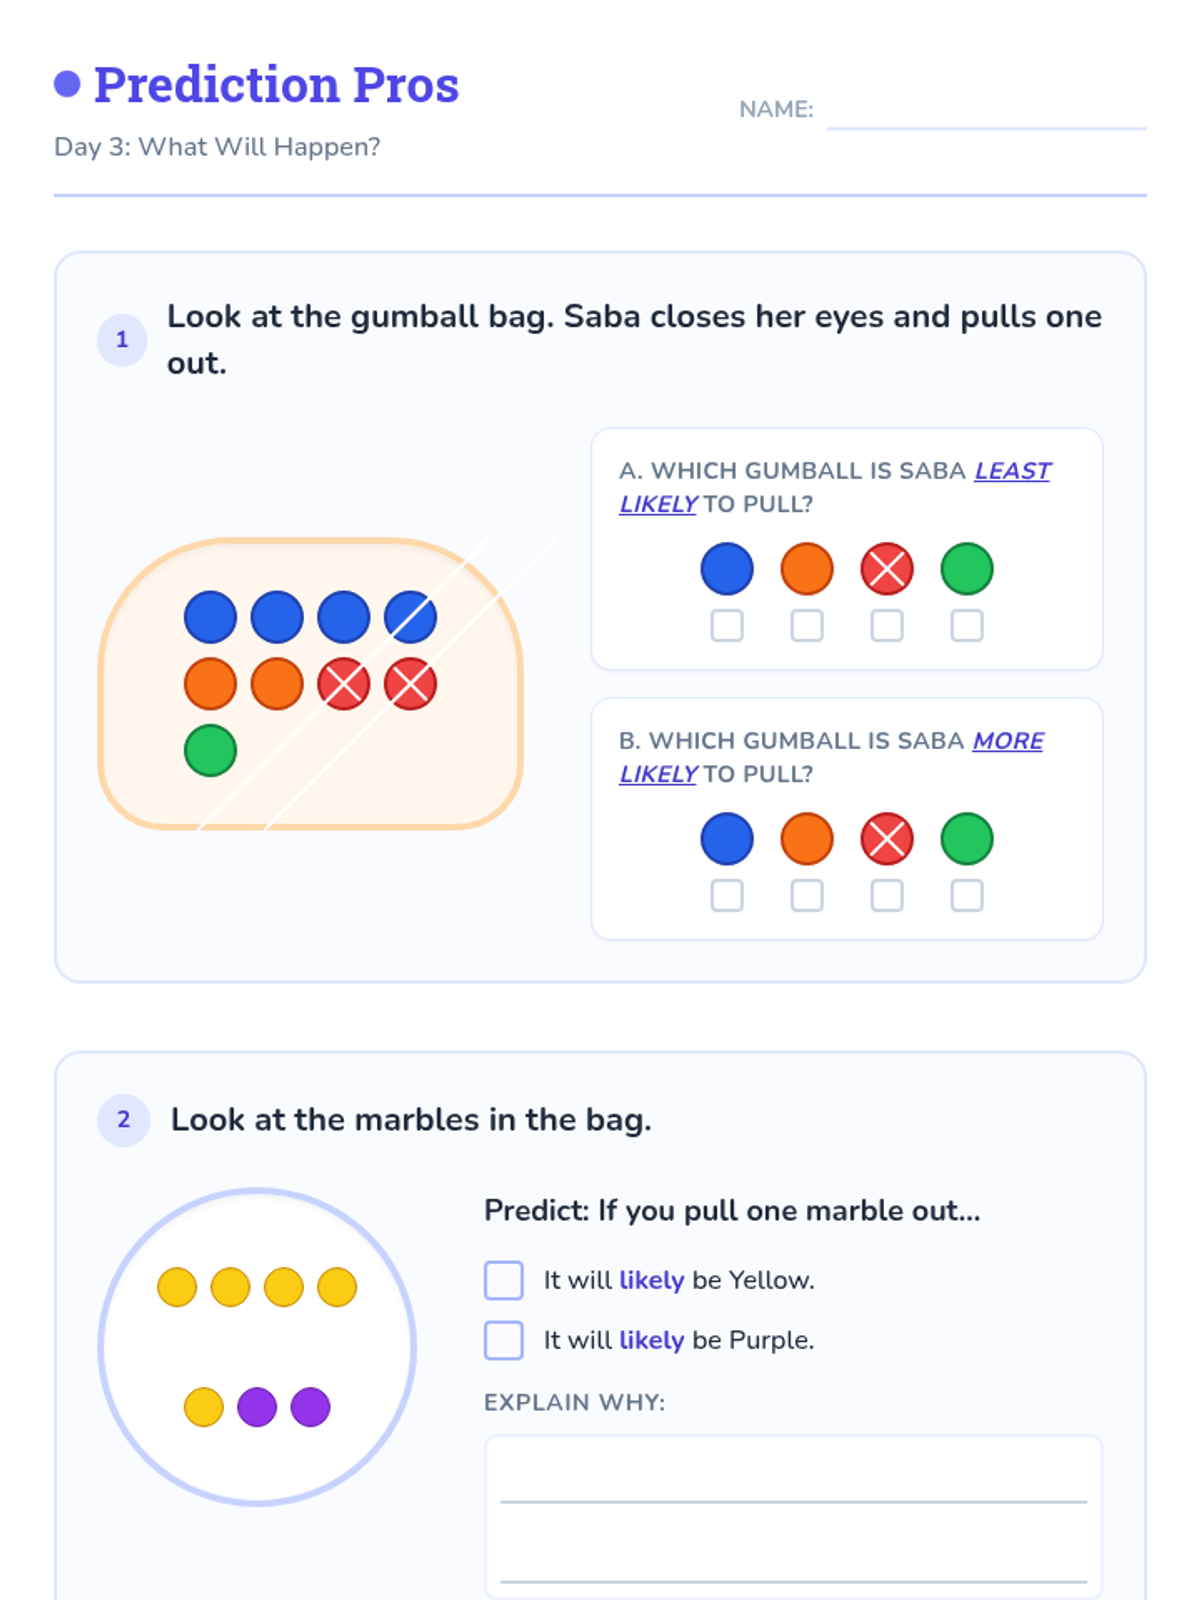
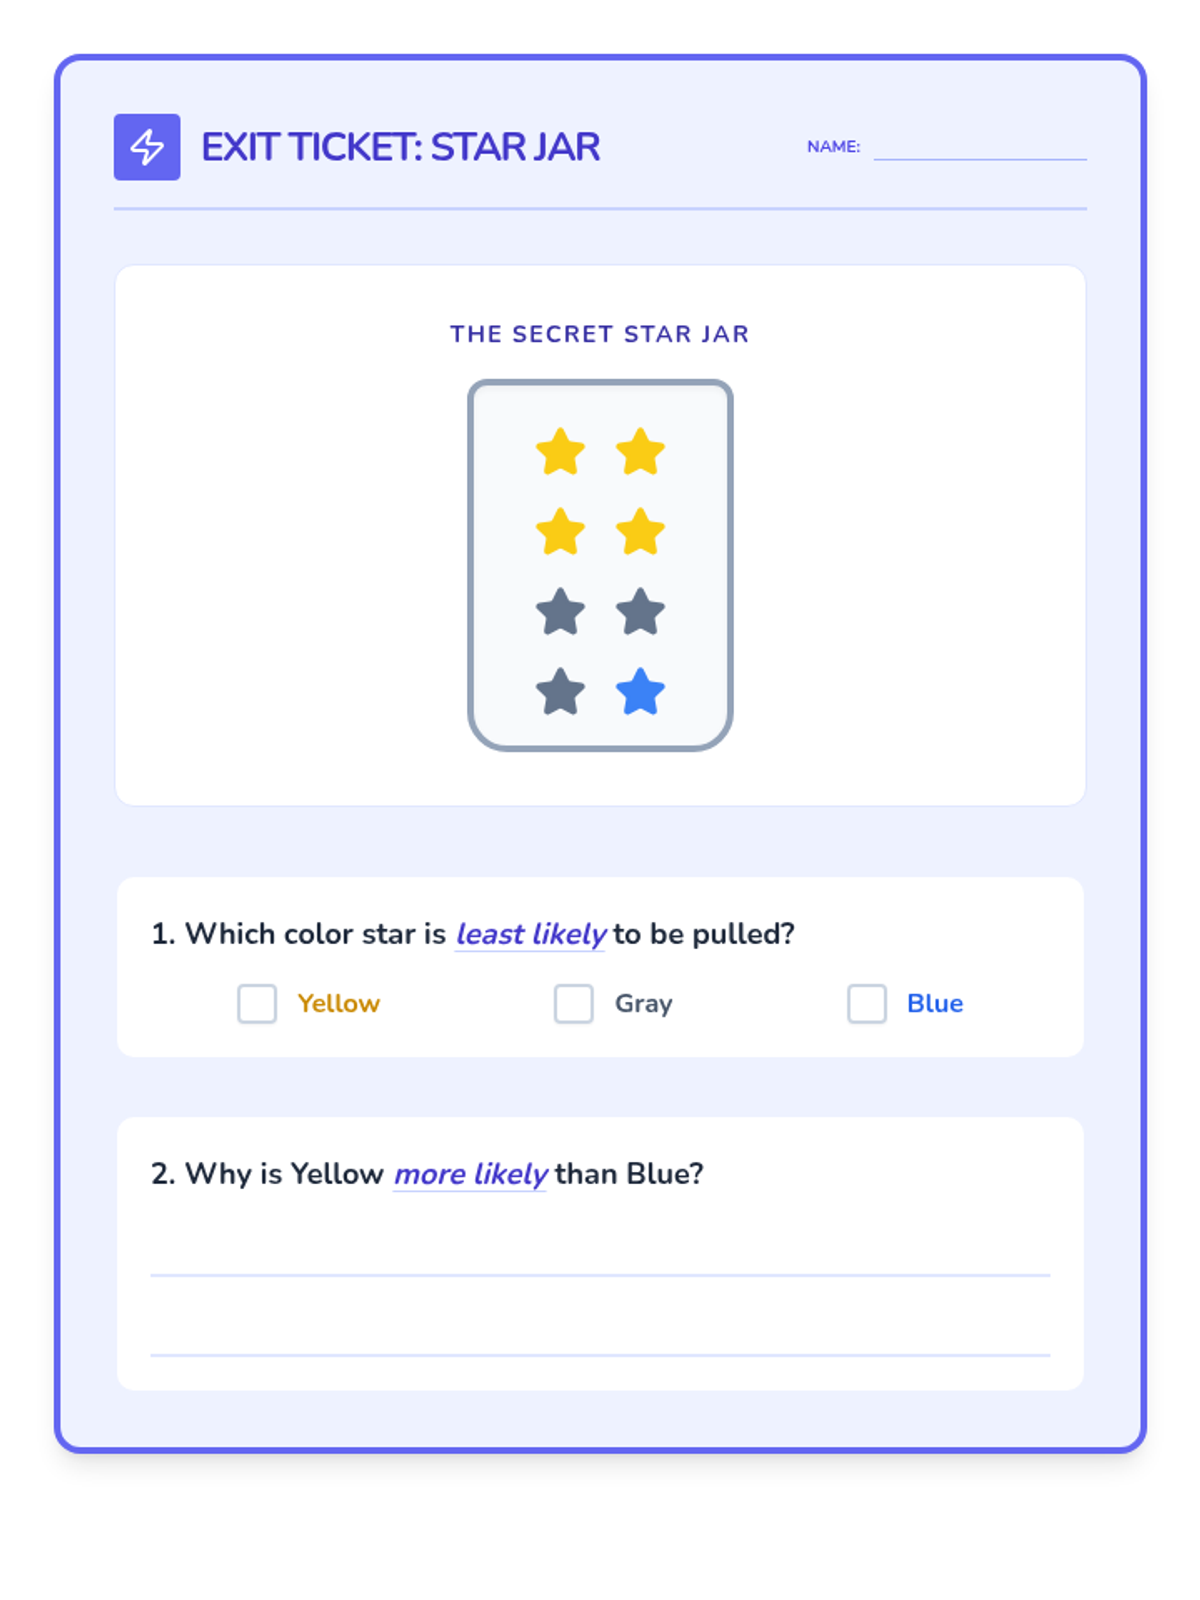
Day 3 covers probability and predictions, teaching students to identify 'more likely' and 'least likely' outcomes based on visual data.
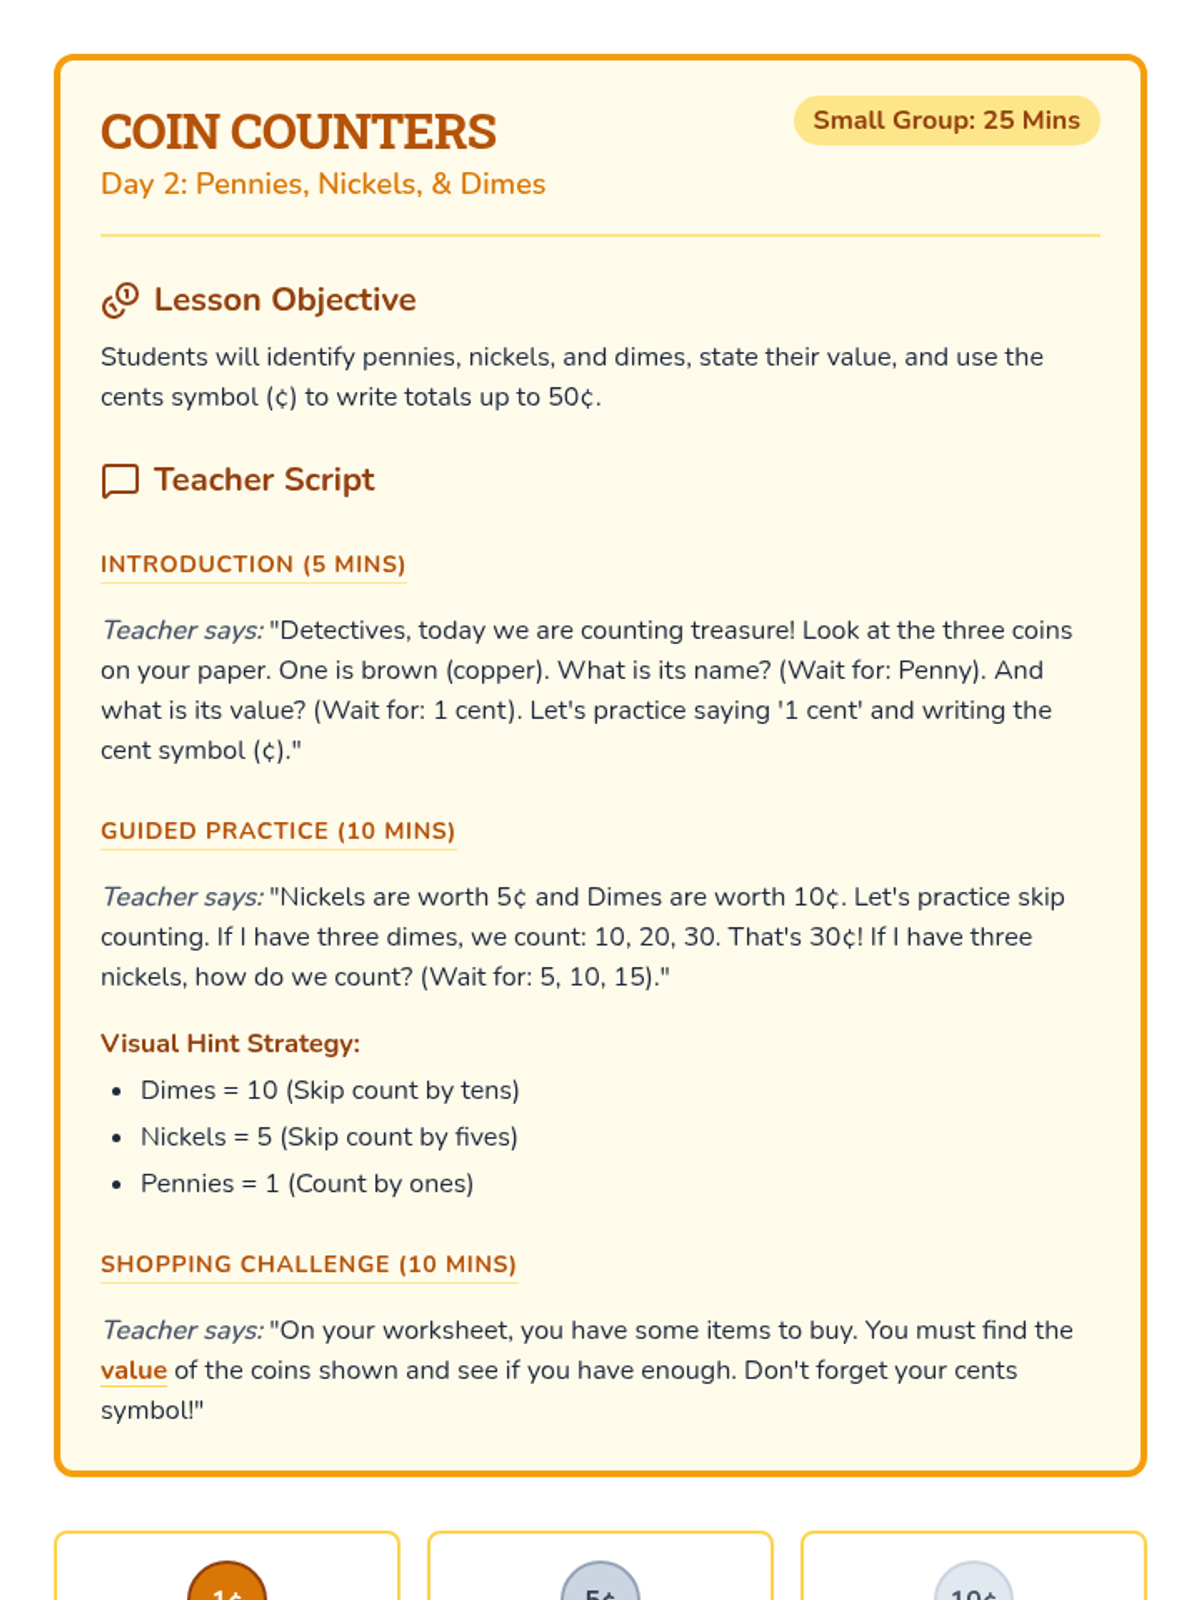
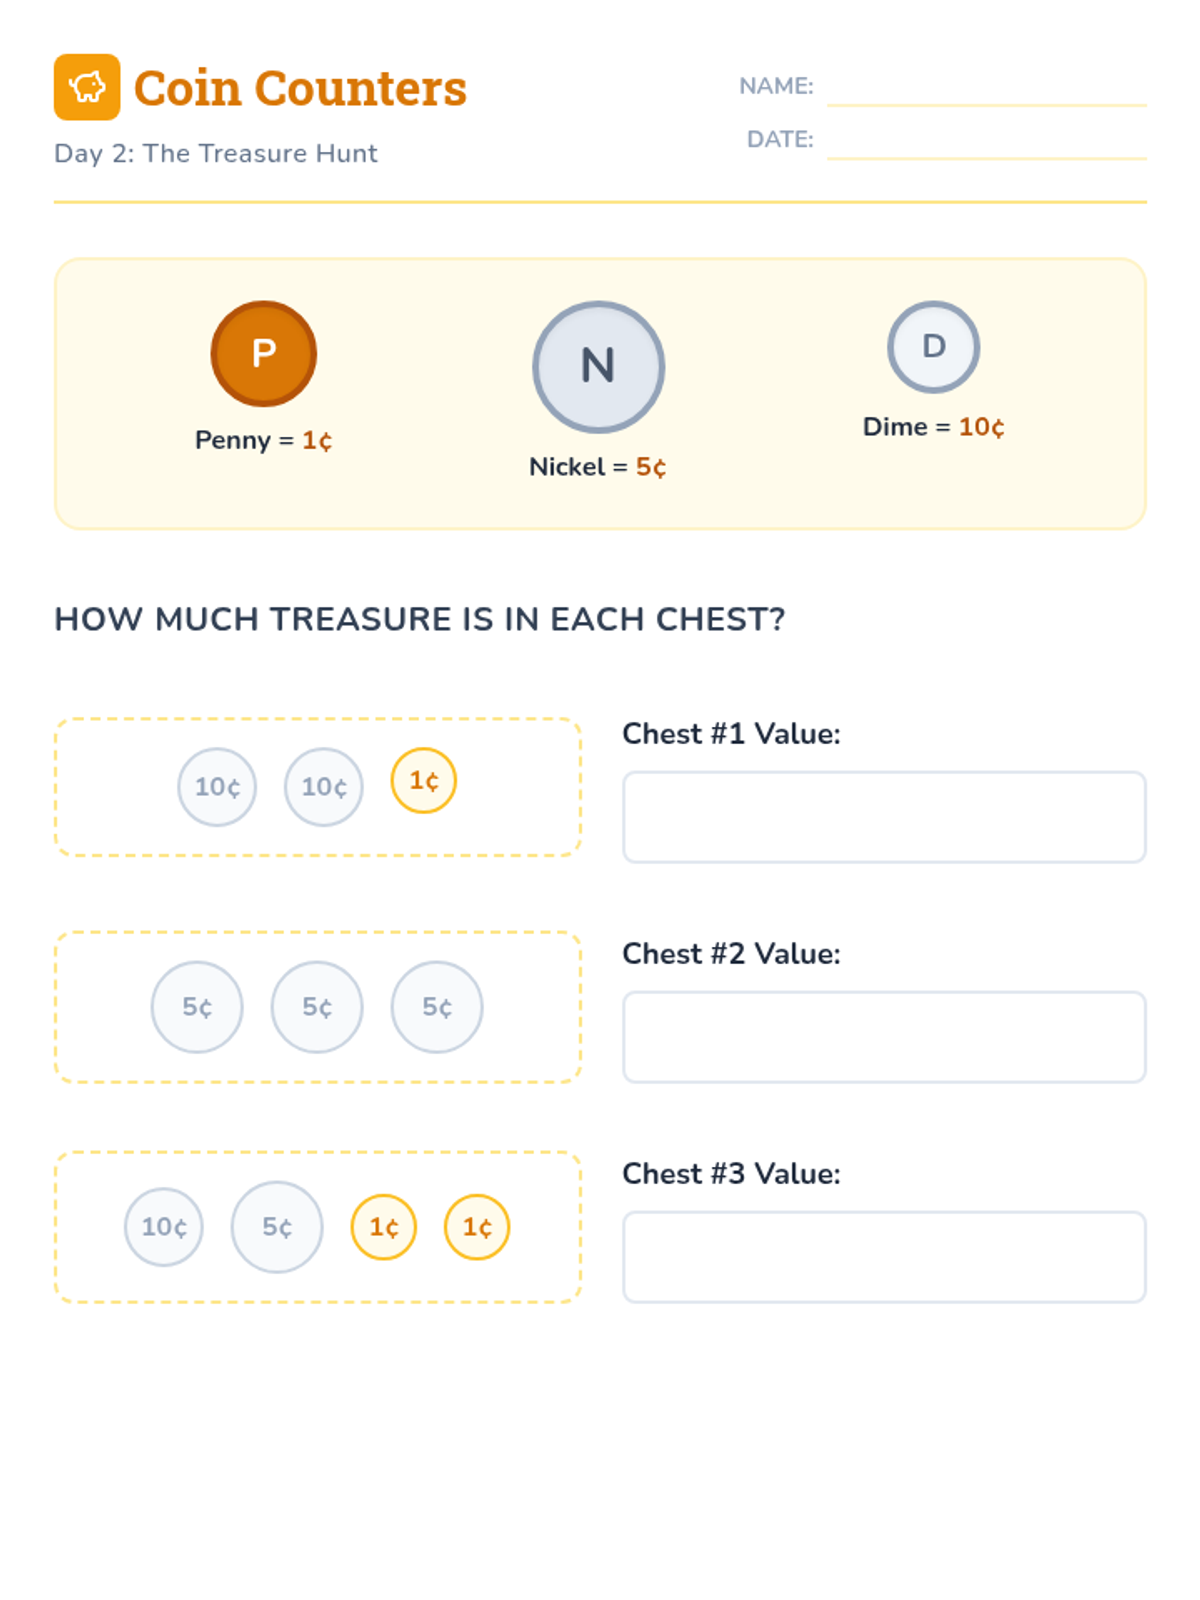
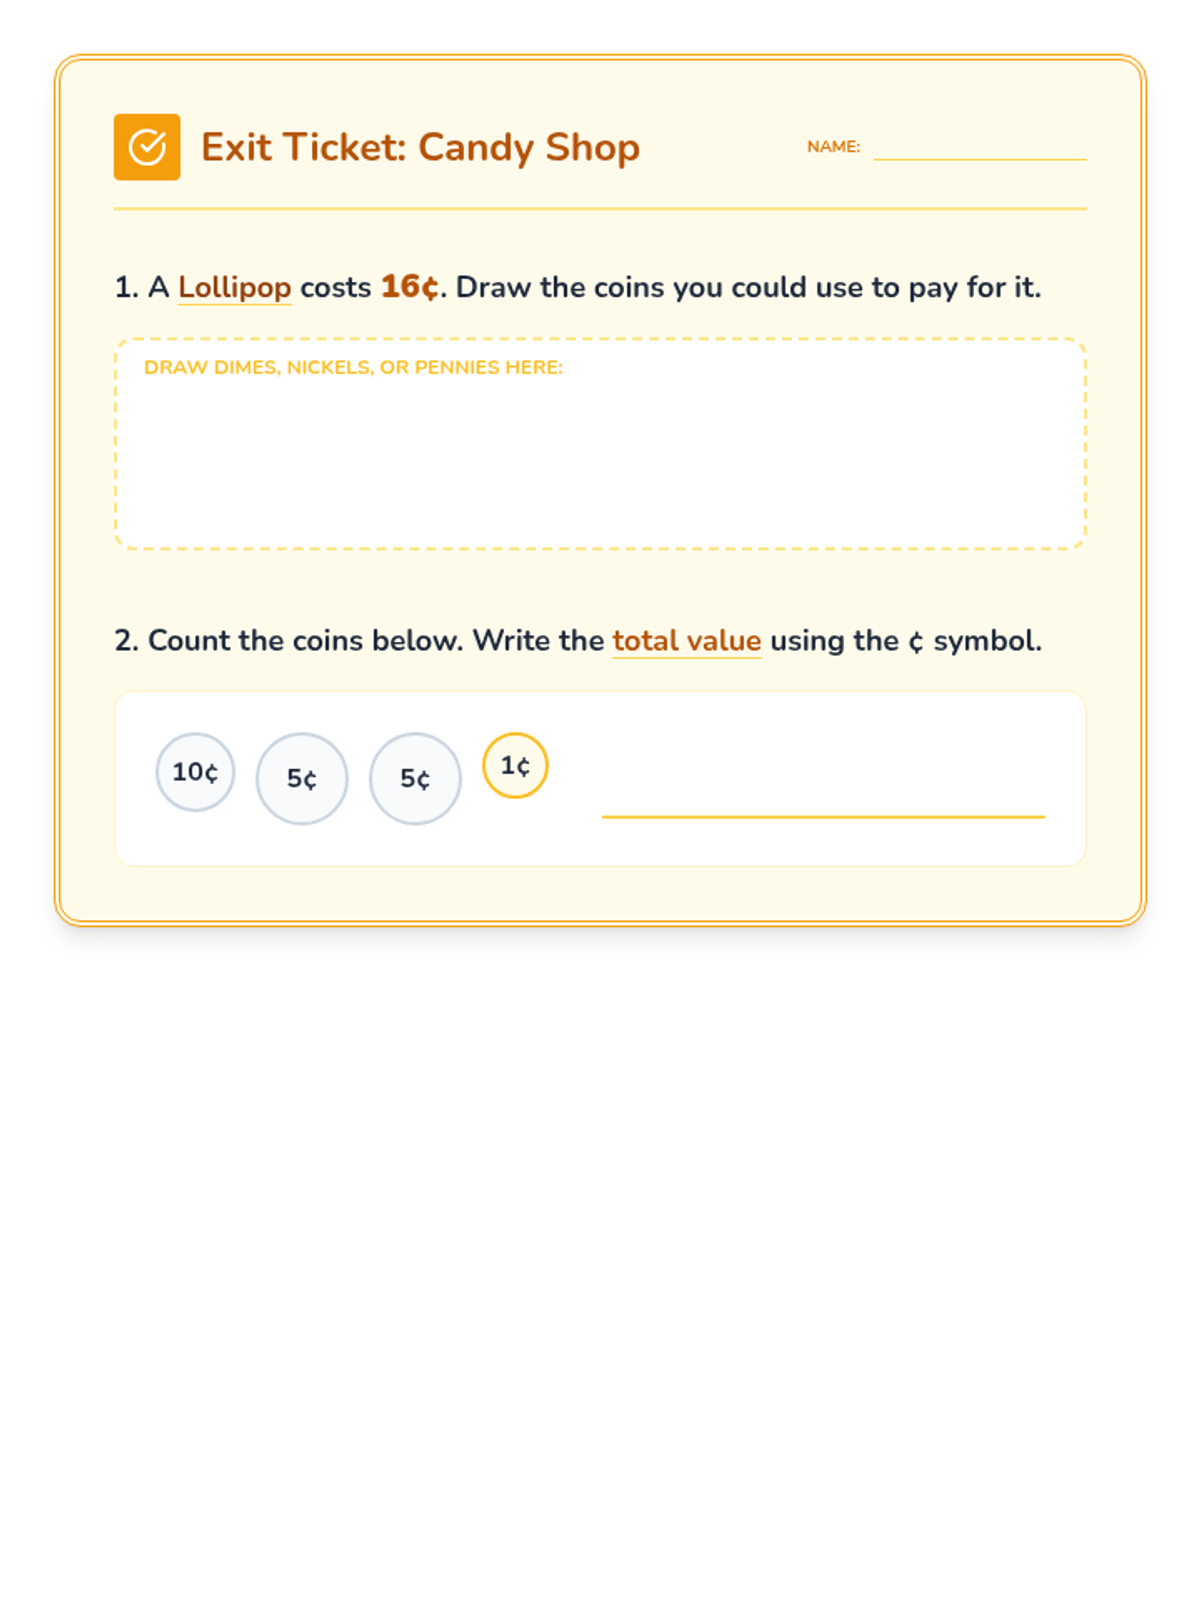
Day 2 introduces pennies, nickels, and dimes, focusing on identifying values, using the cents symbol, and counting mixed coin groups.
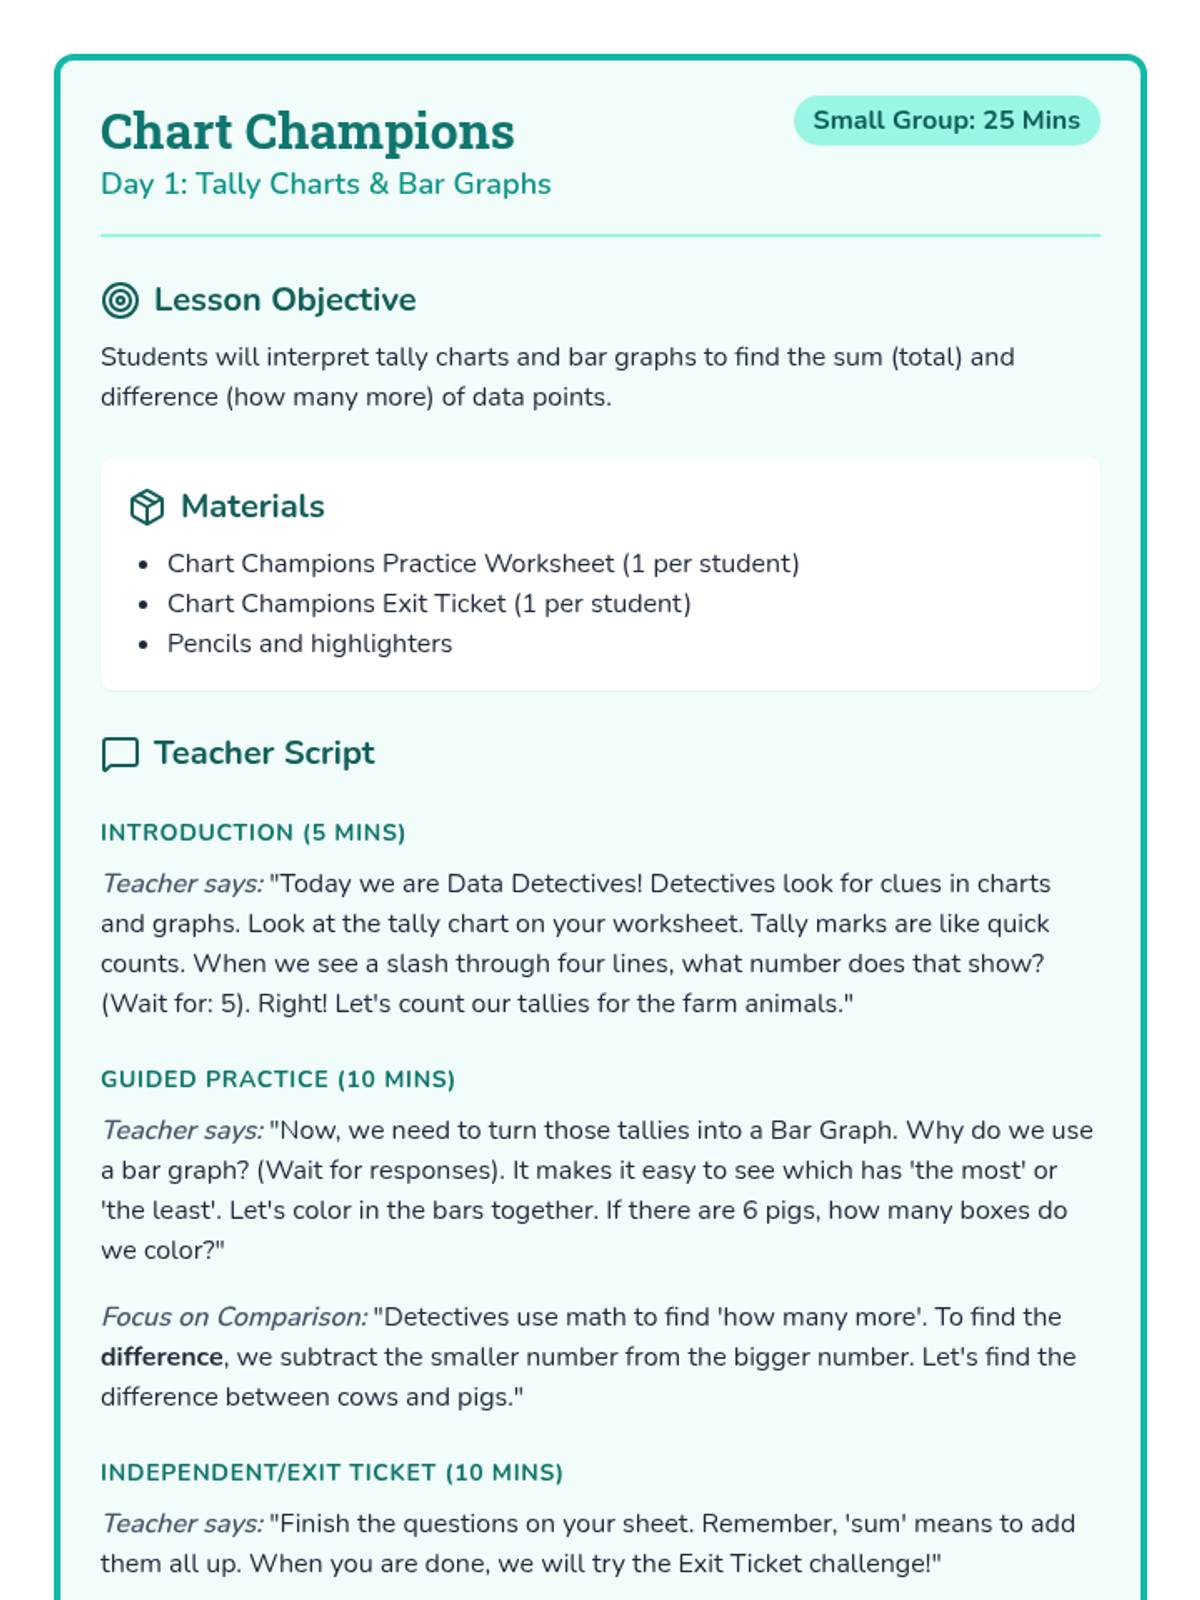
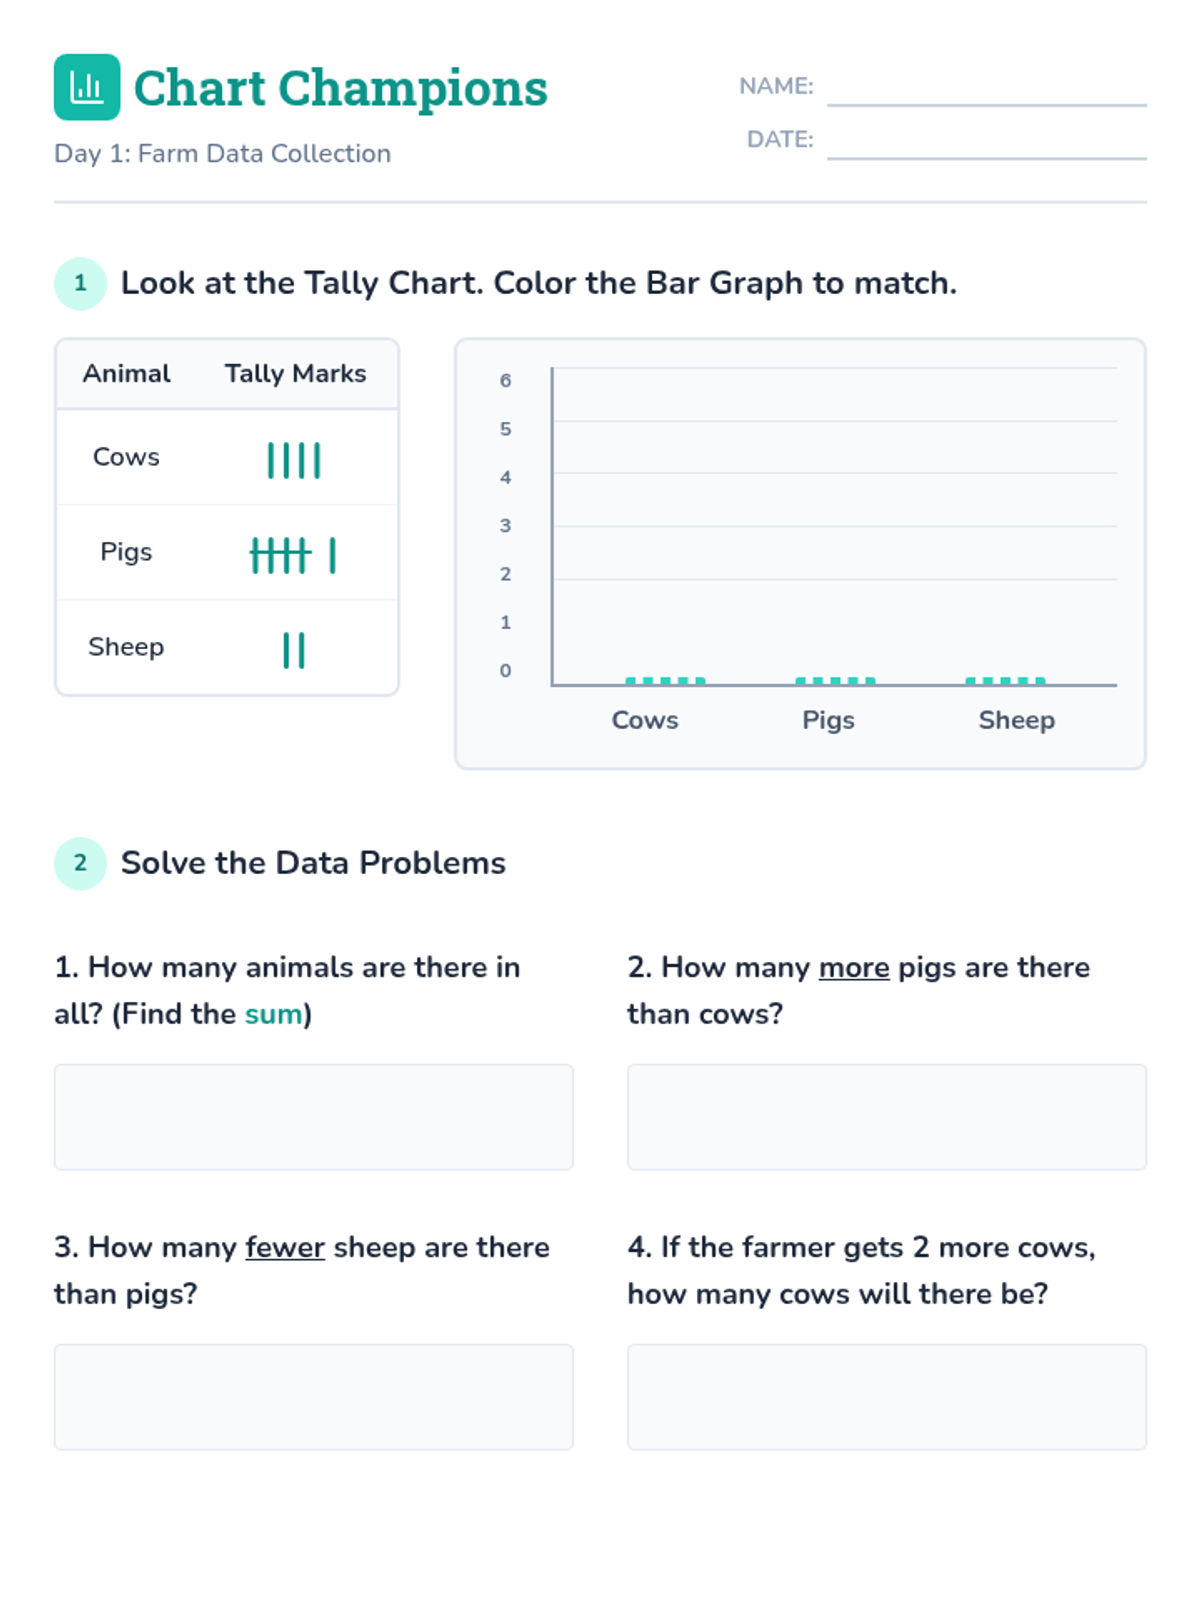
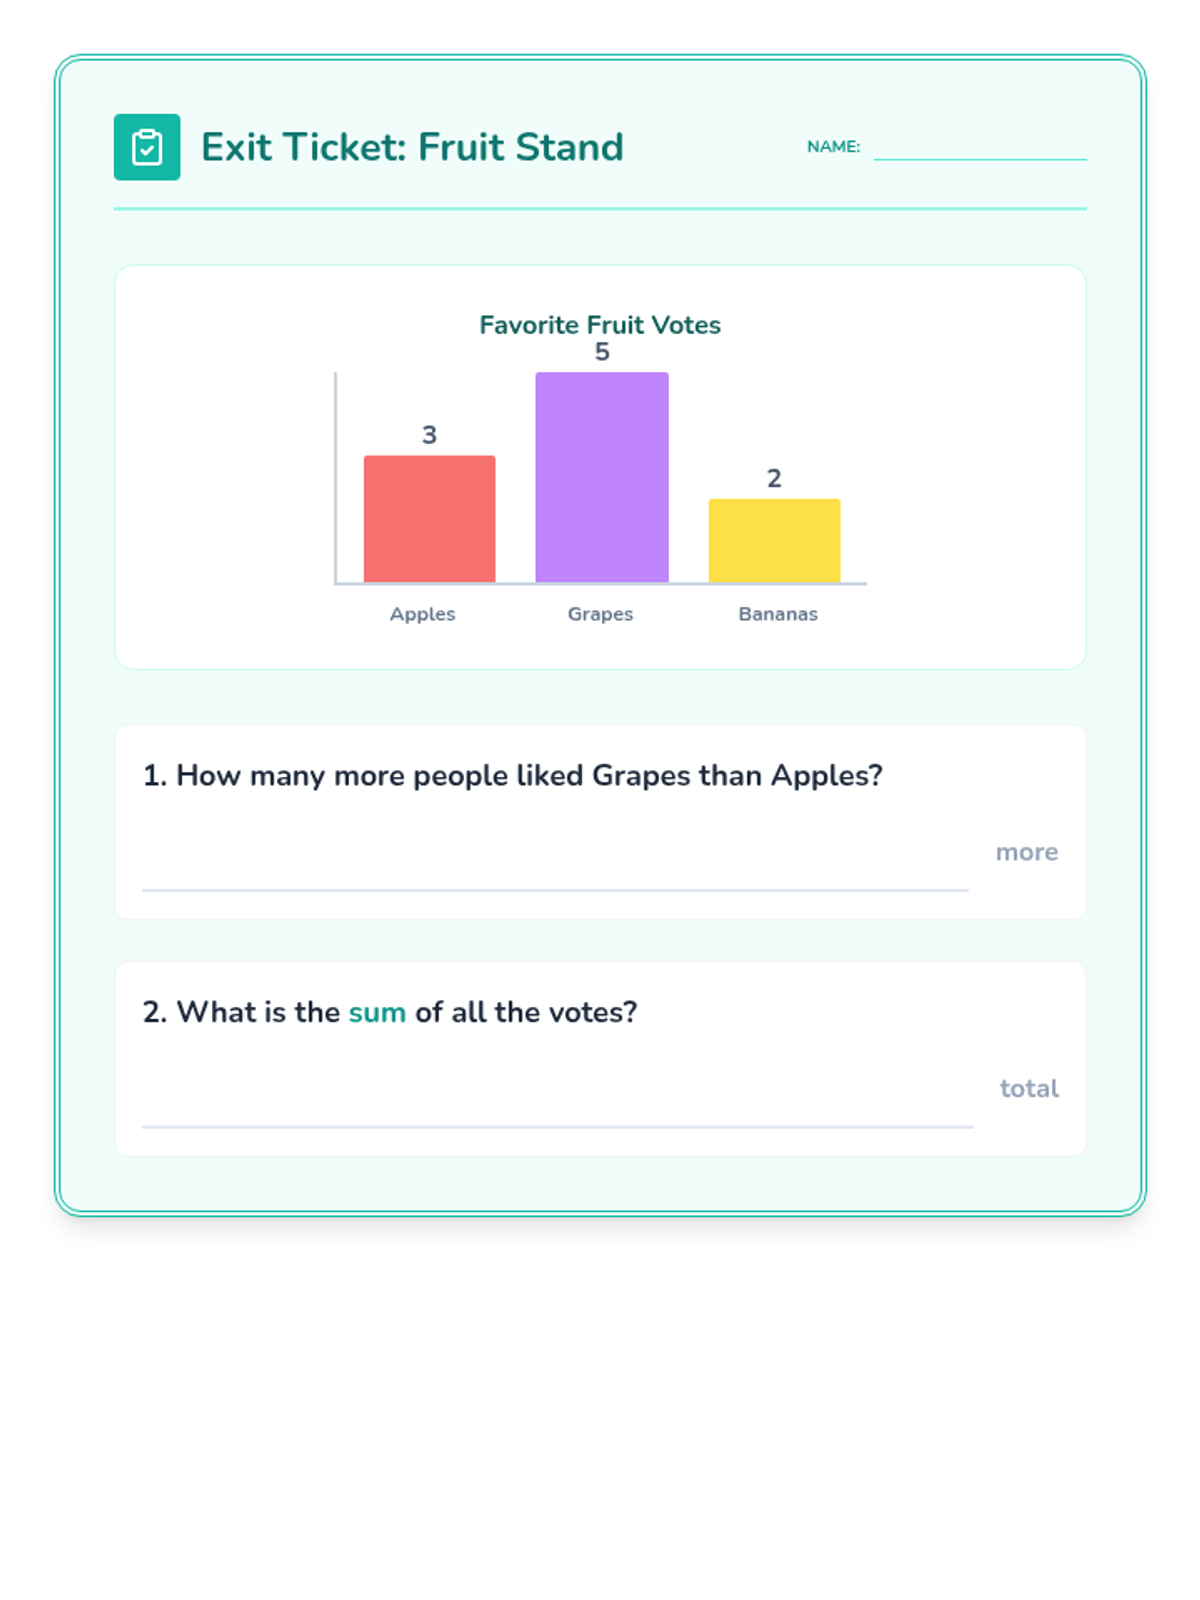
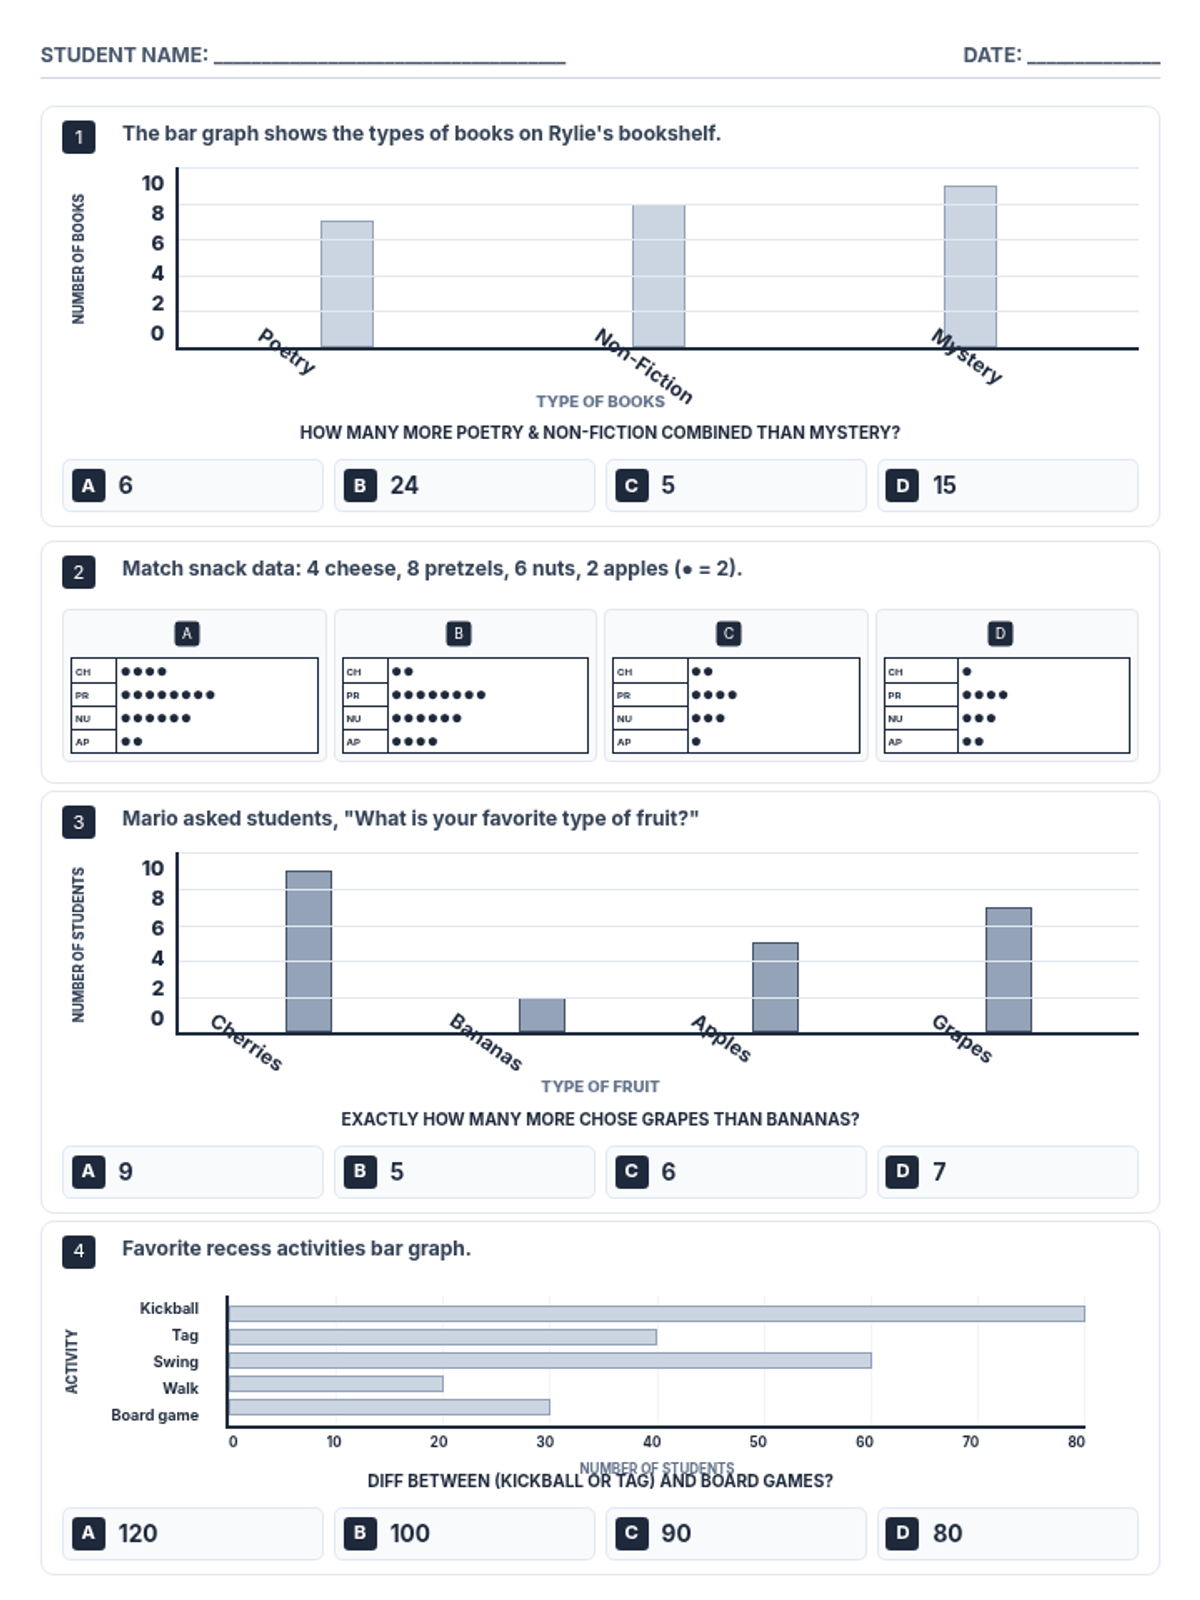
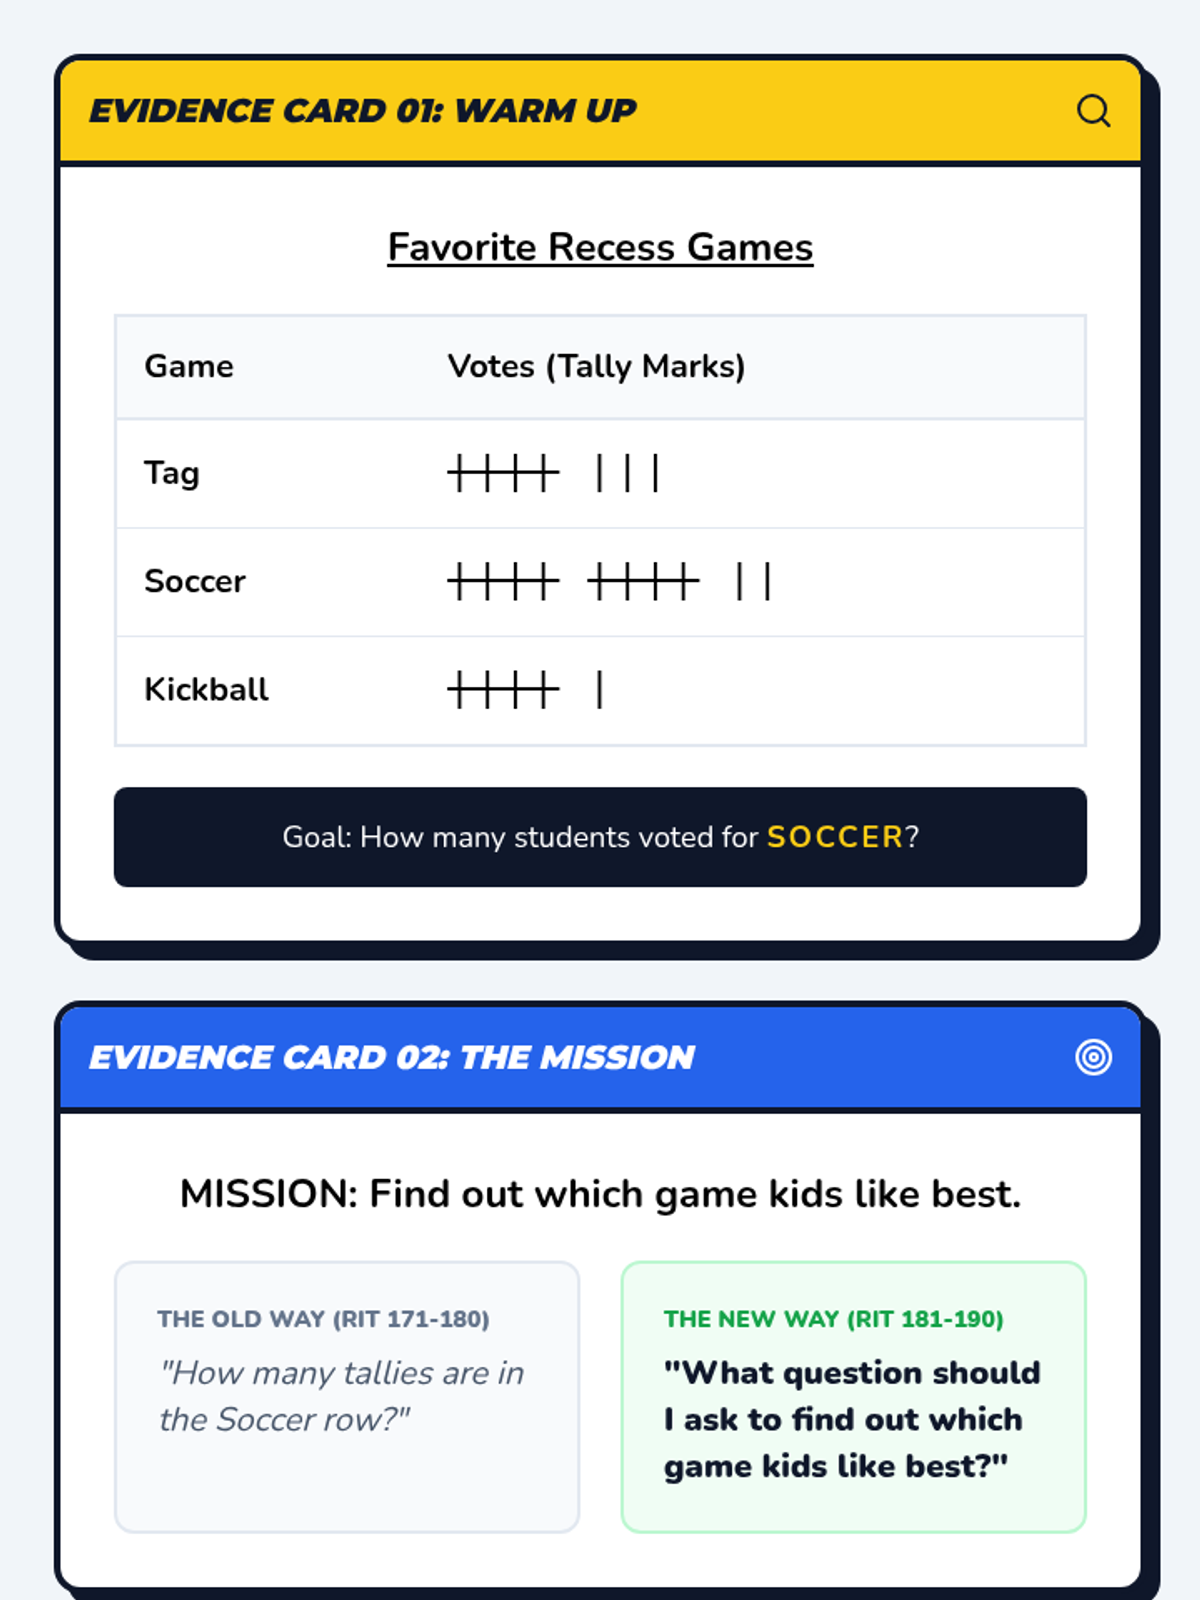
Day 1 focuses on tally charts and bar graphs, emphasizing calculating sums and differences to compare data points.
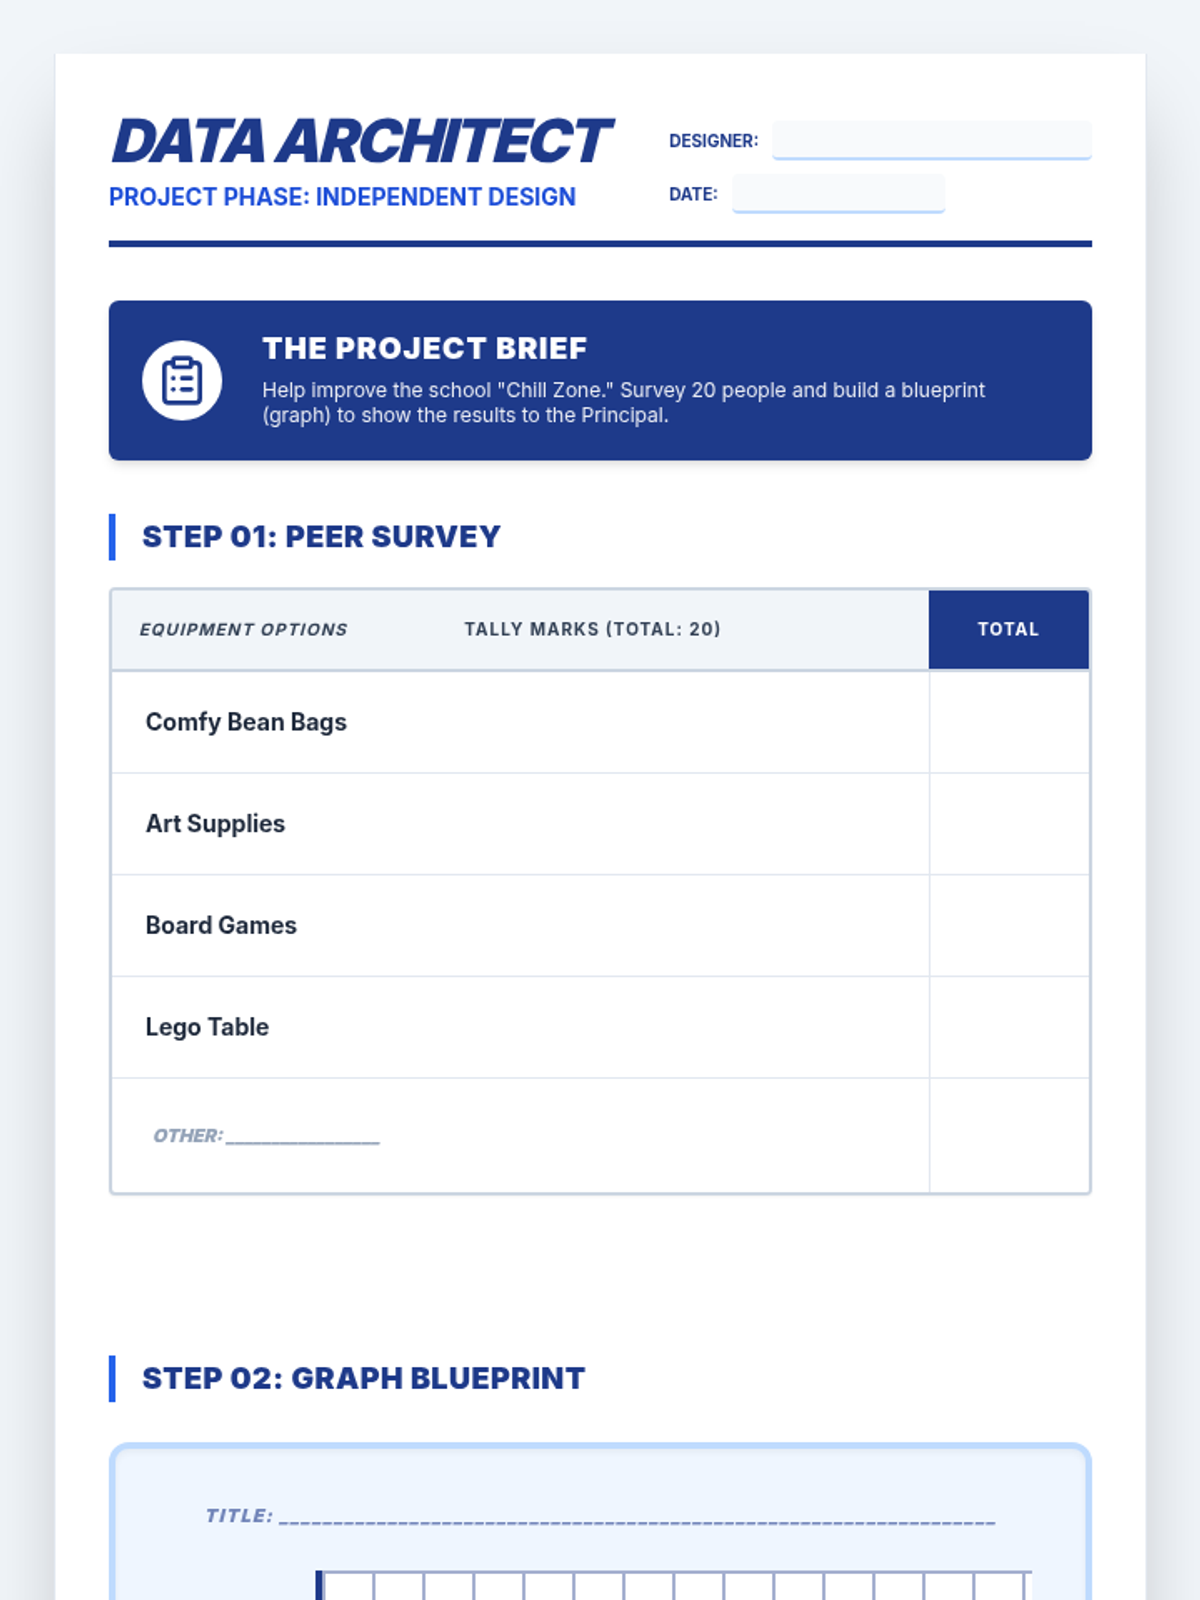
A comprehensive lesson on data interpretation and graphing, moving from foundational skill practice to an independent data collection and design project.
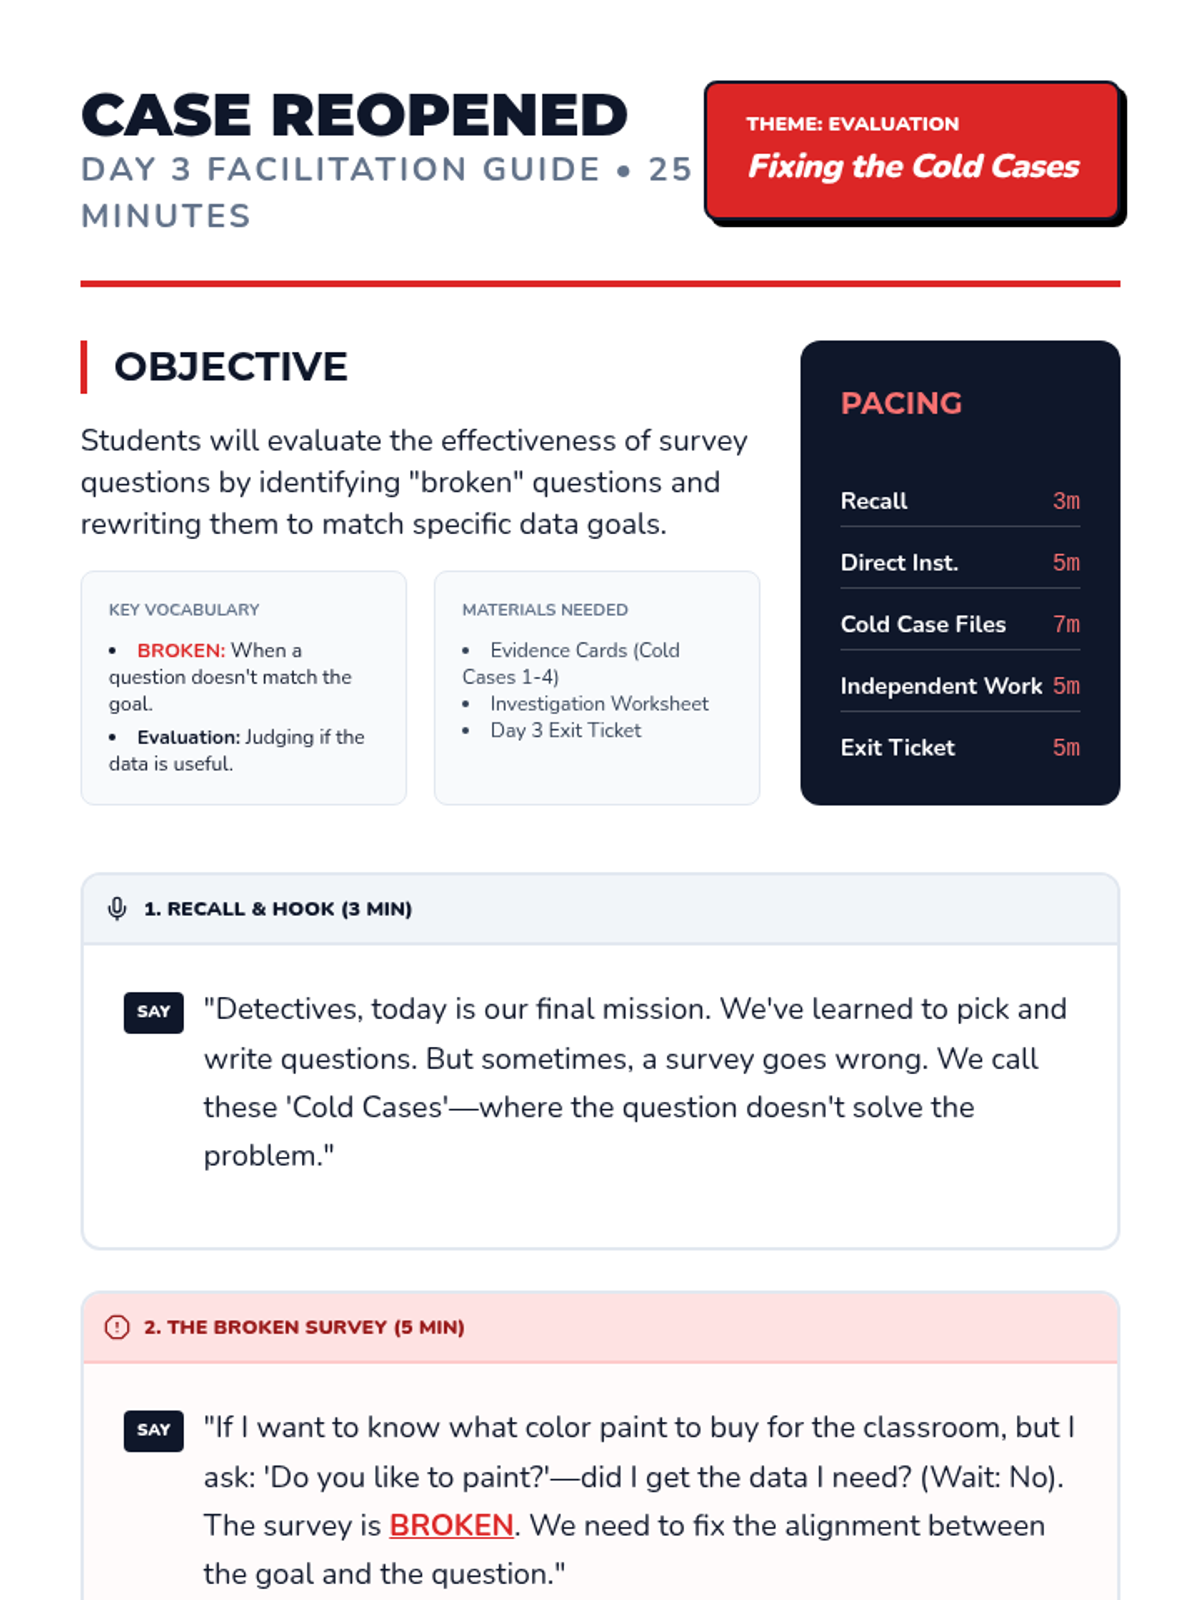
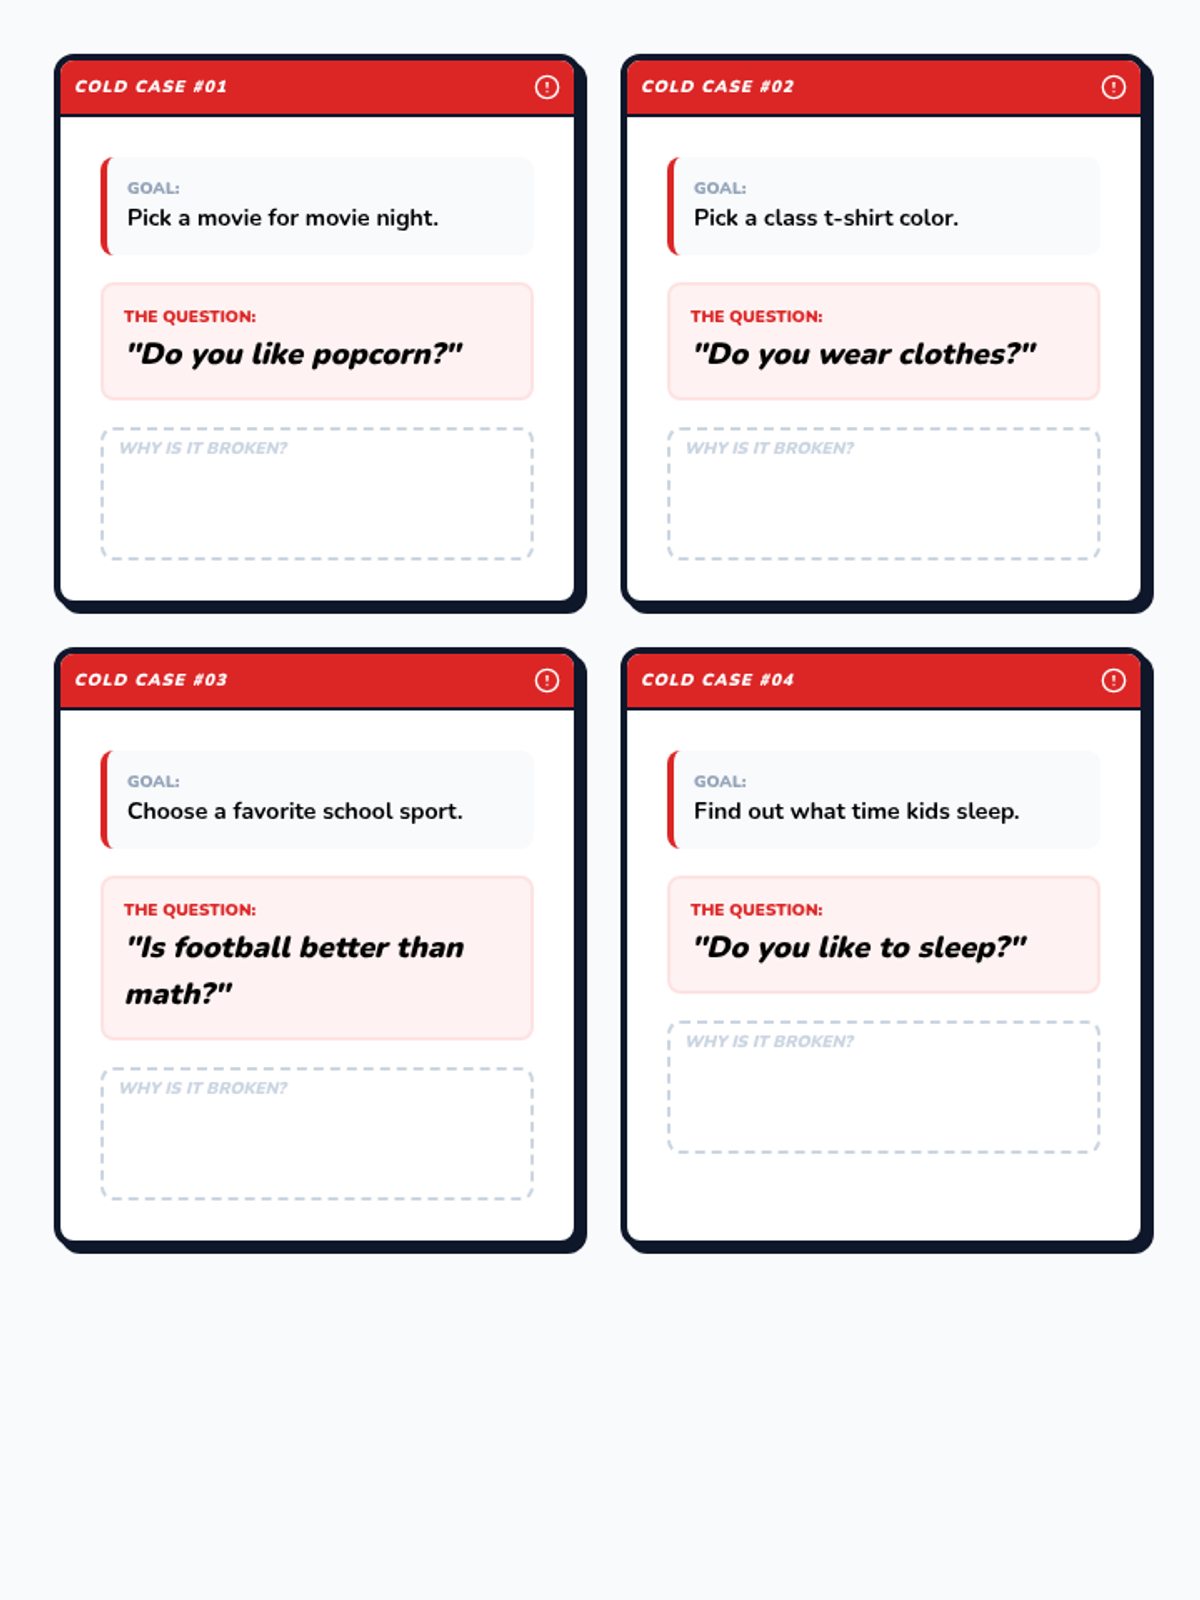
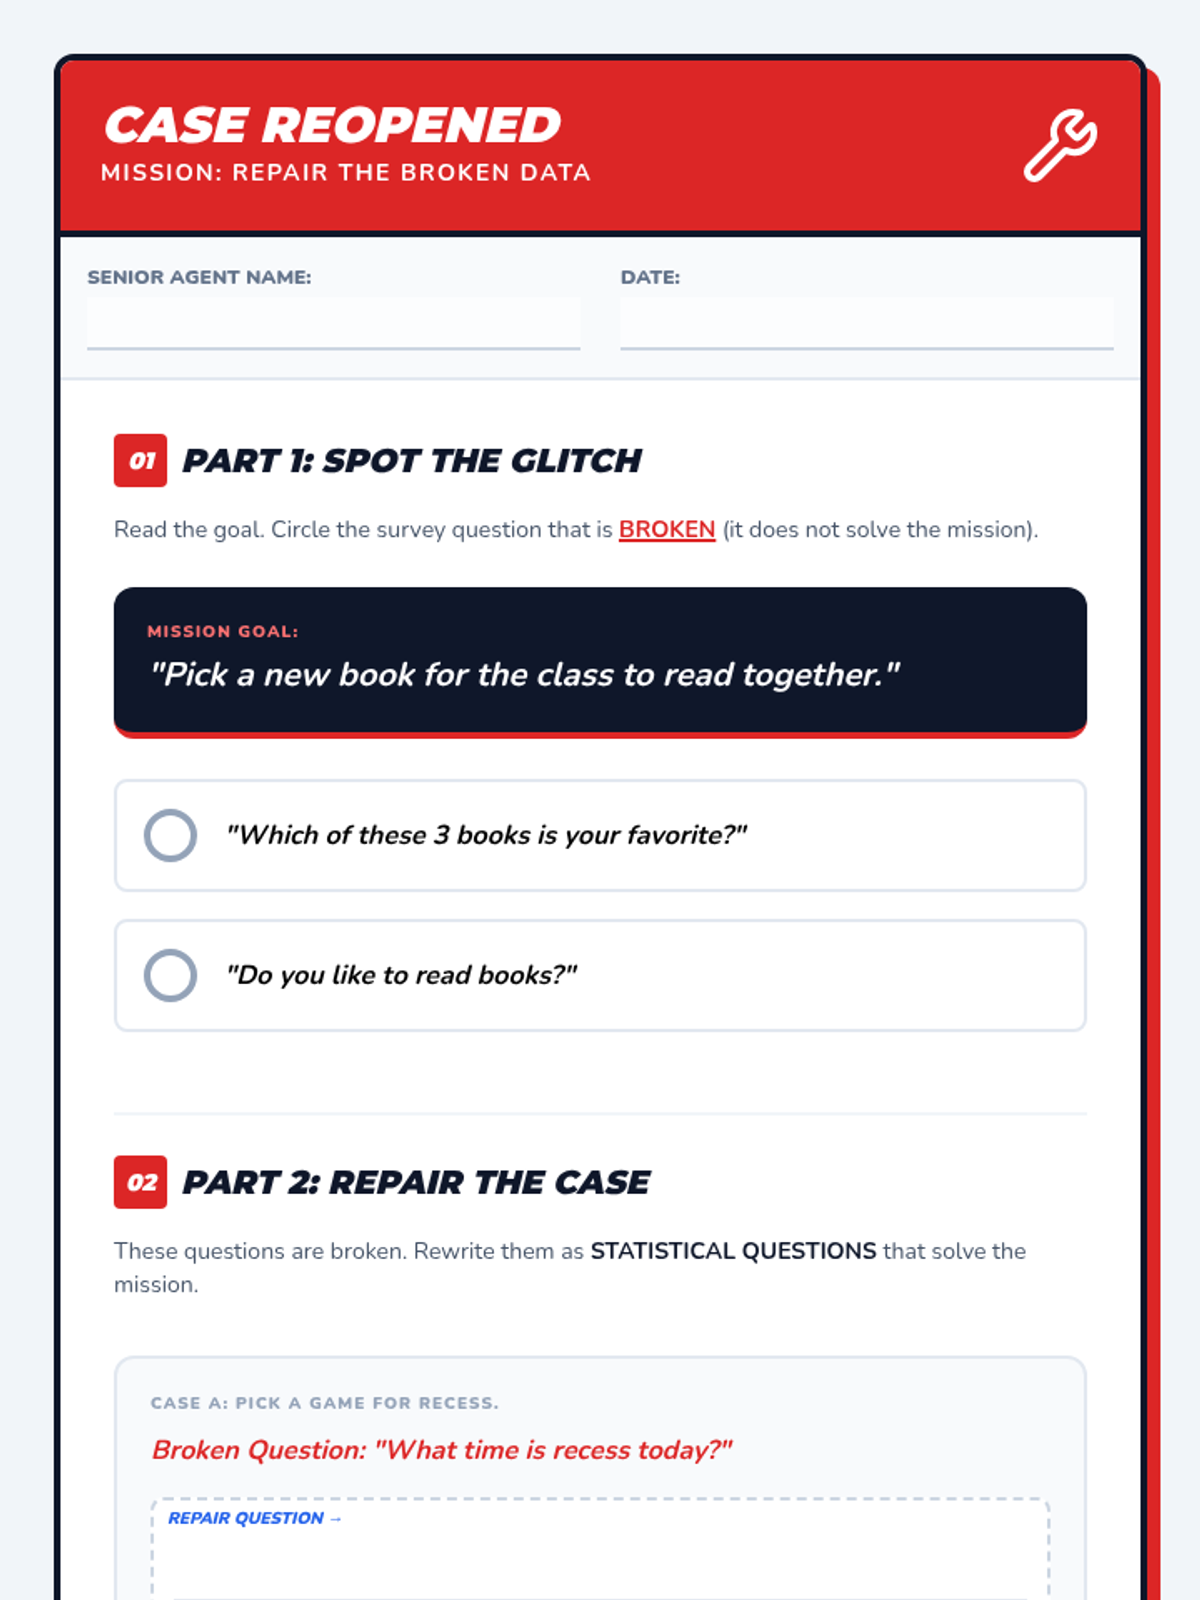
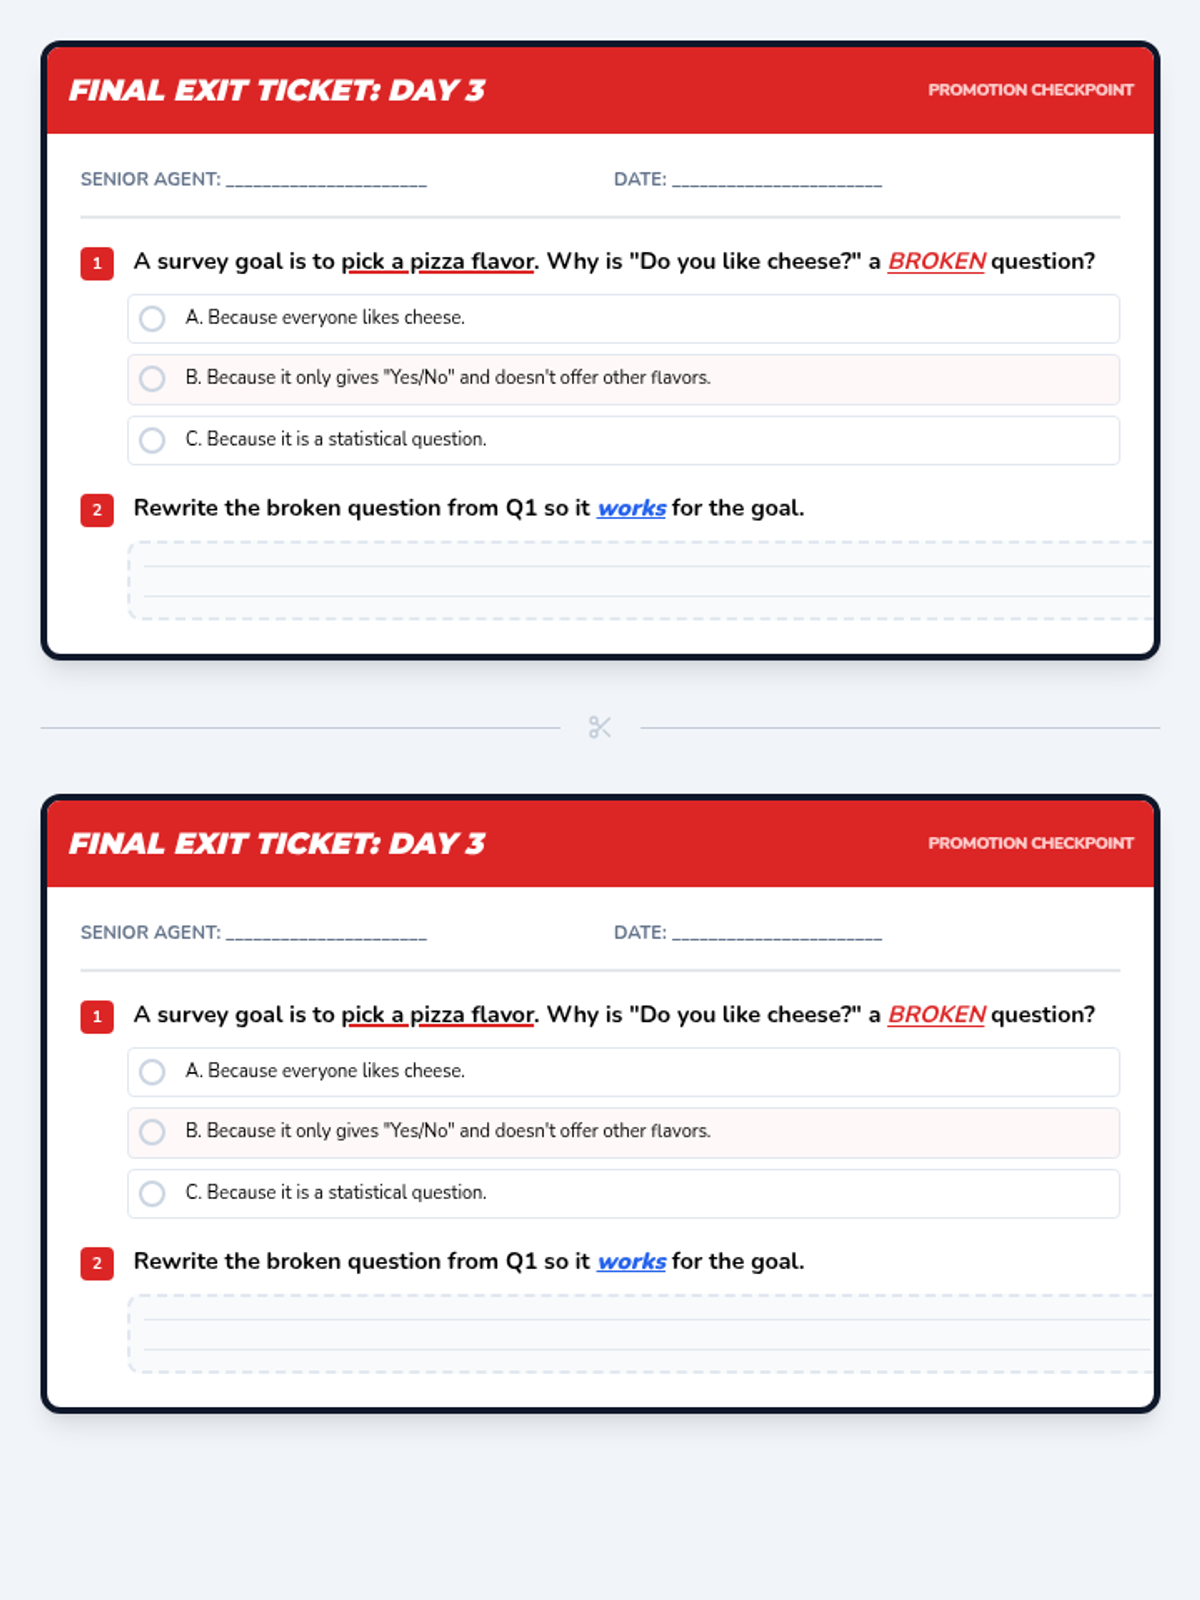
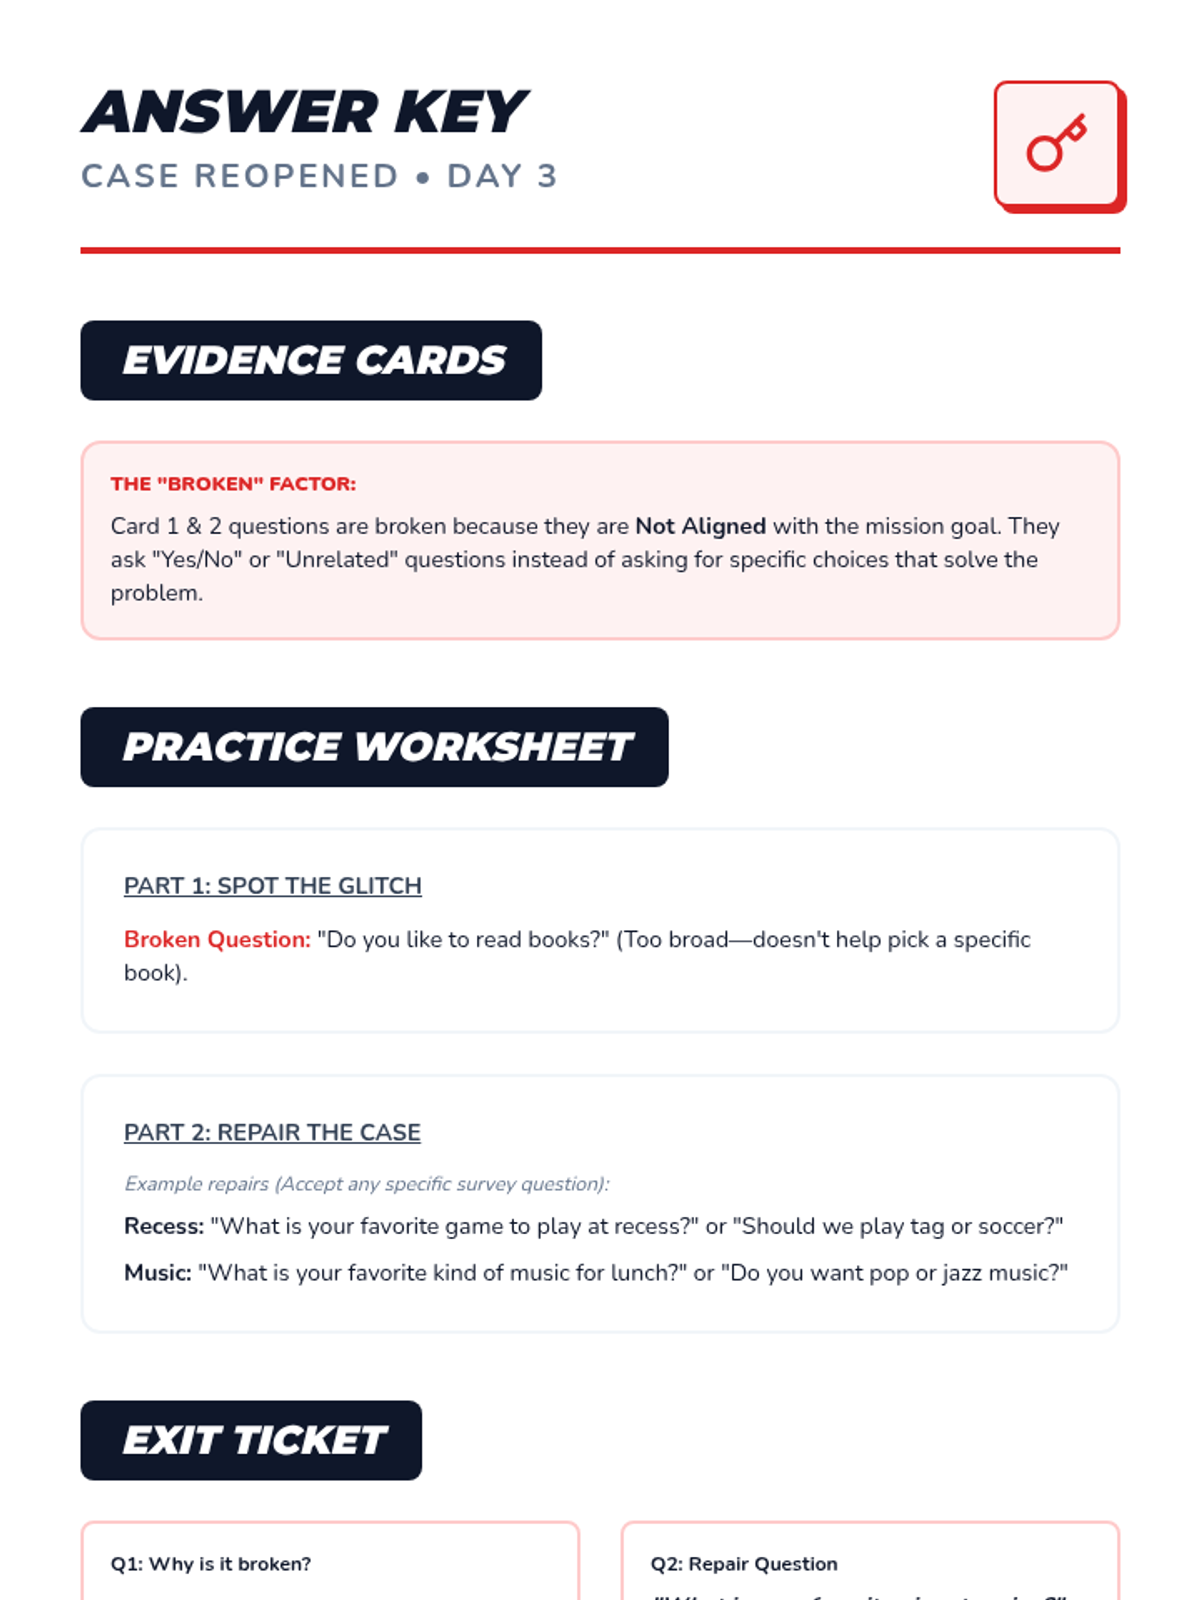
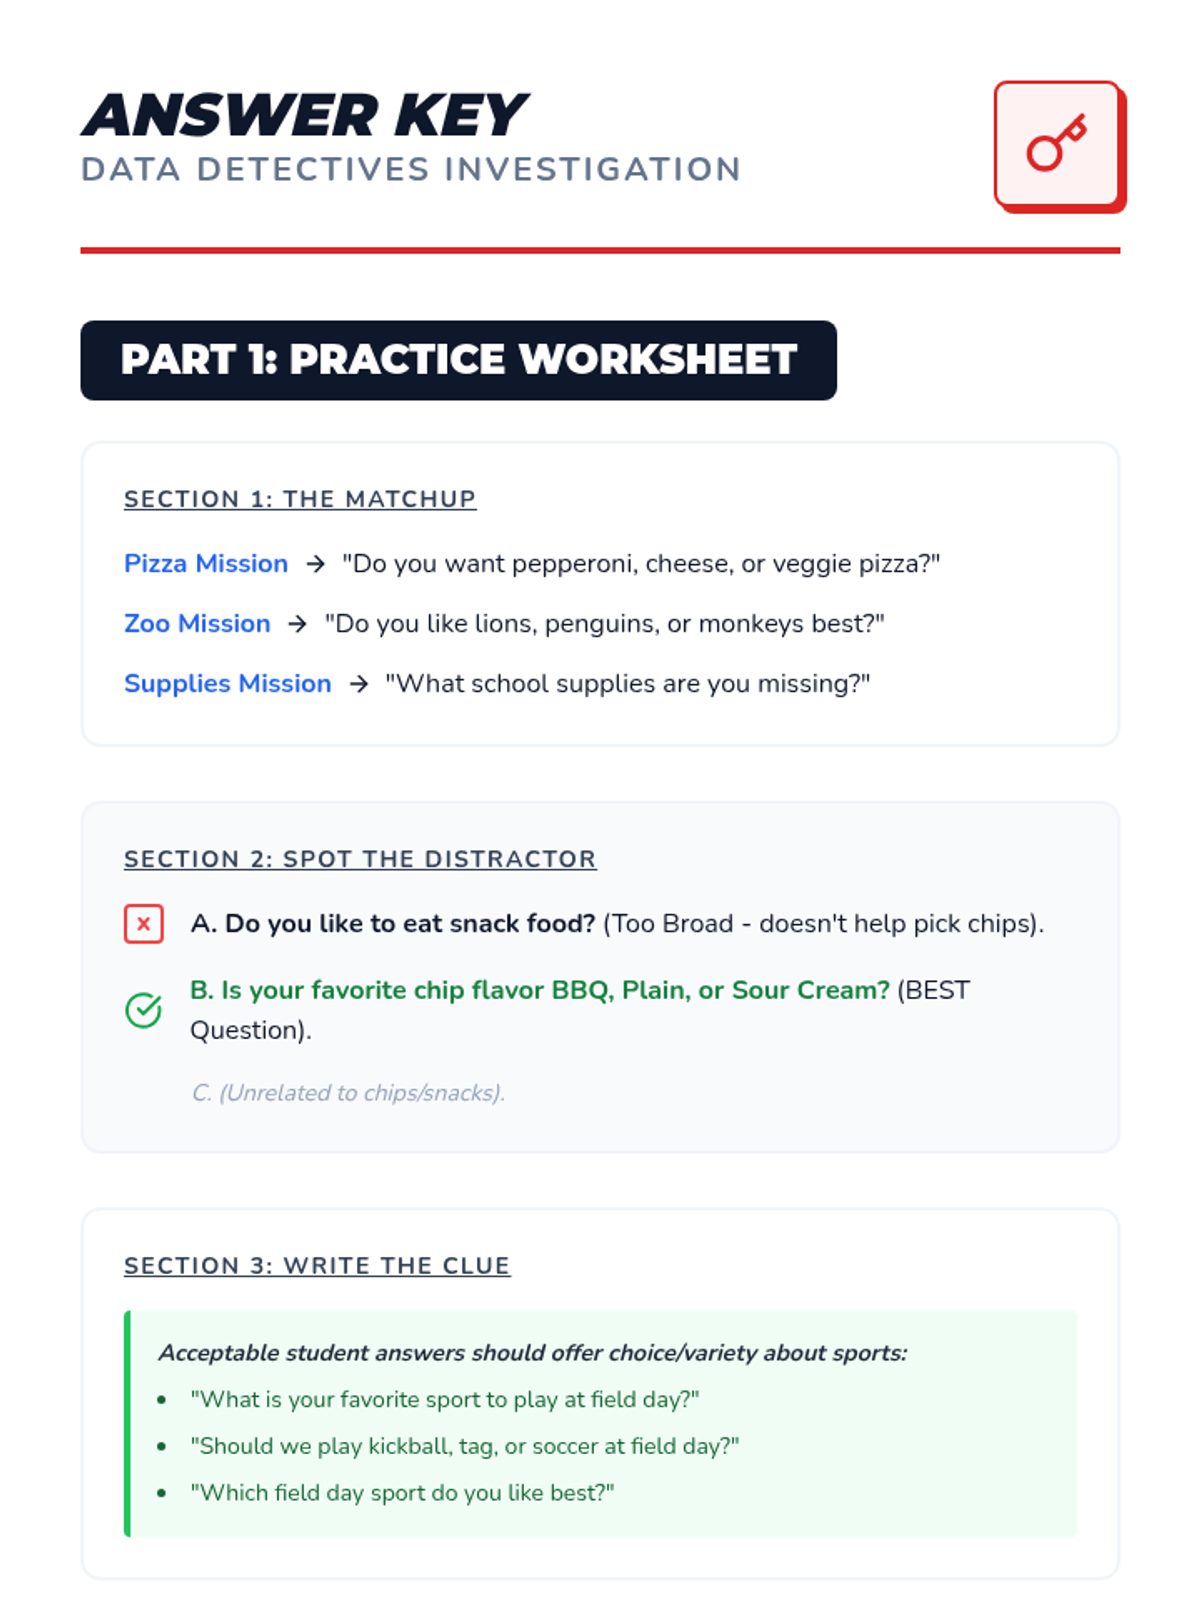
The final mission where students evaluate the effectiveness of data collection. They analyze "broken" surveys where the question didn't match the goal and practice rewriting them for accuracy.
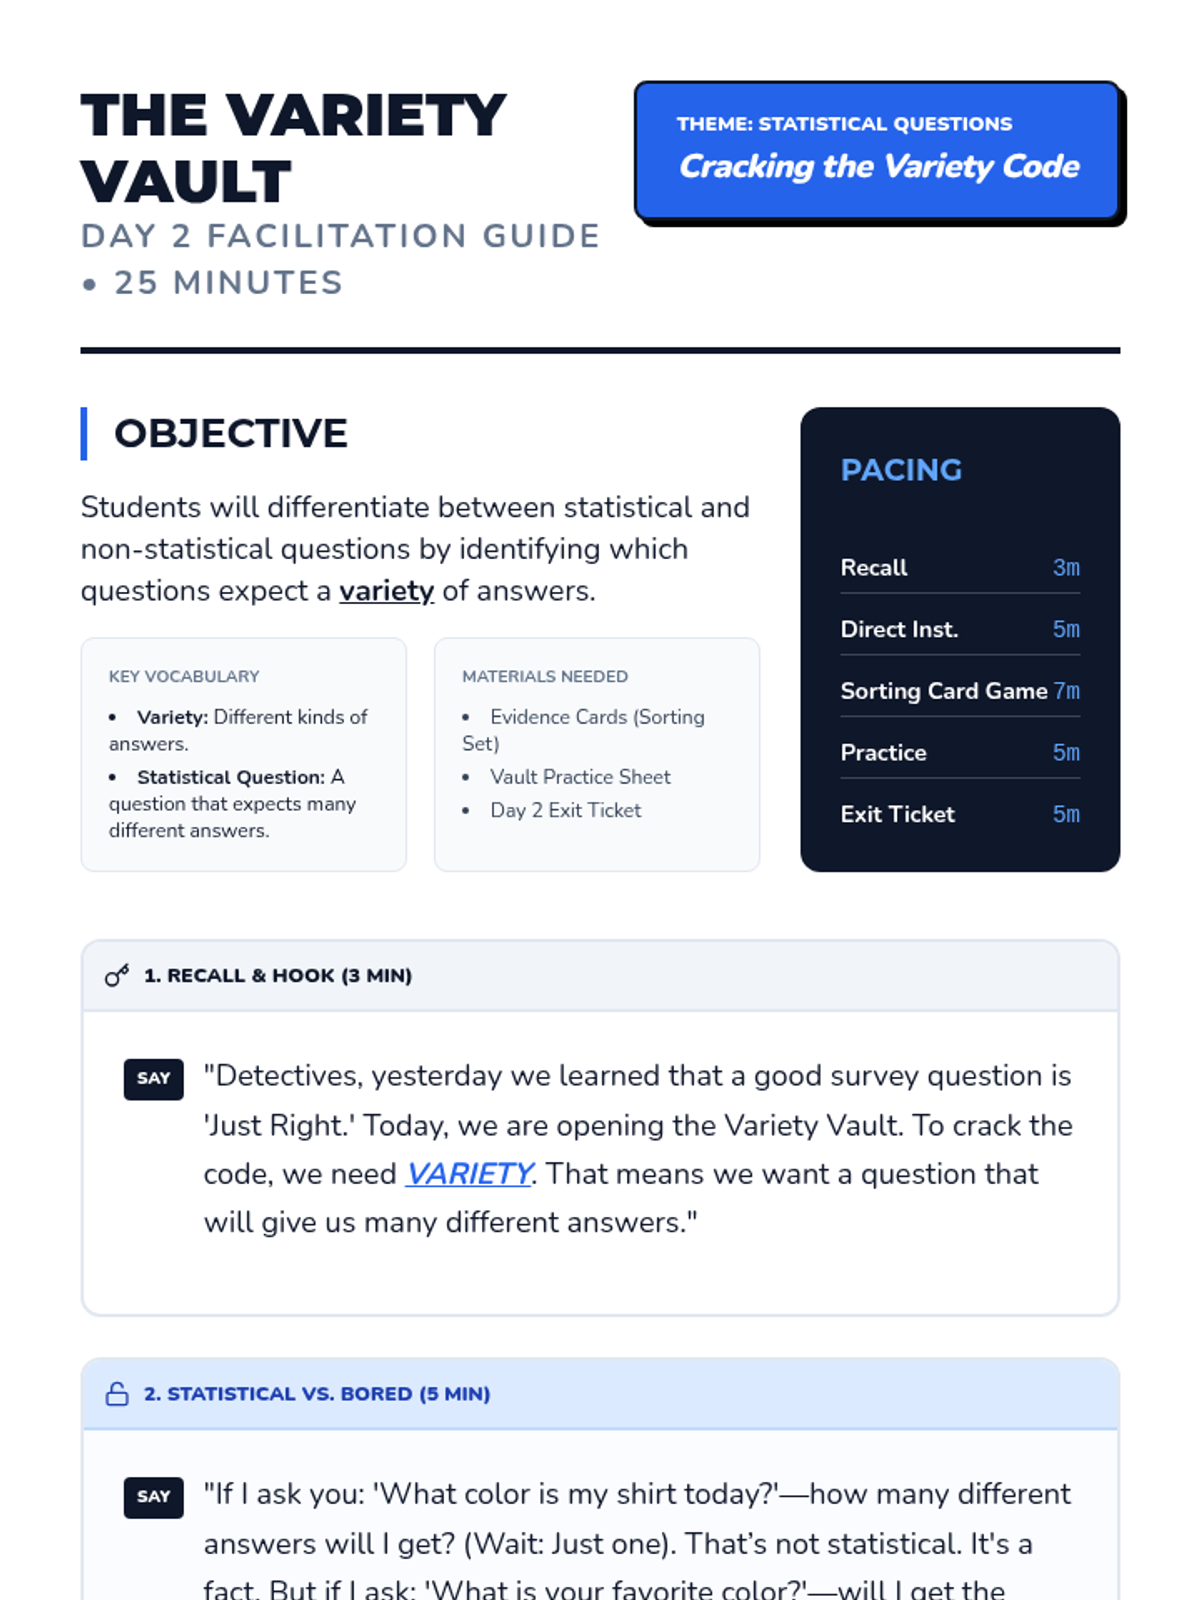
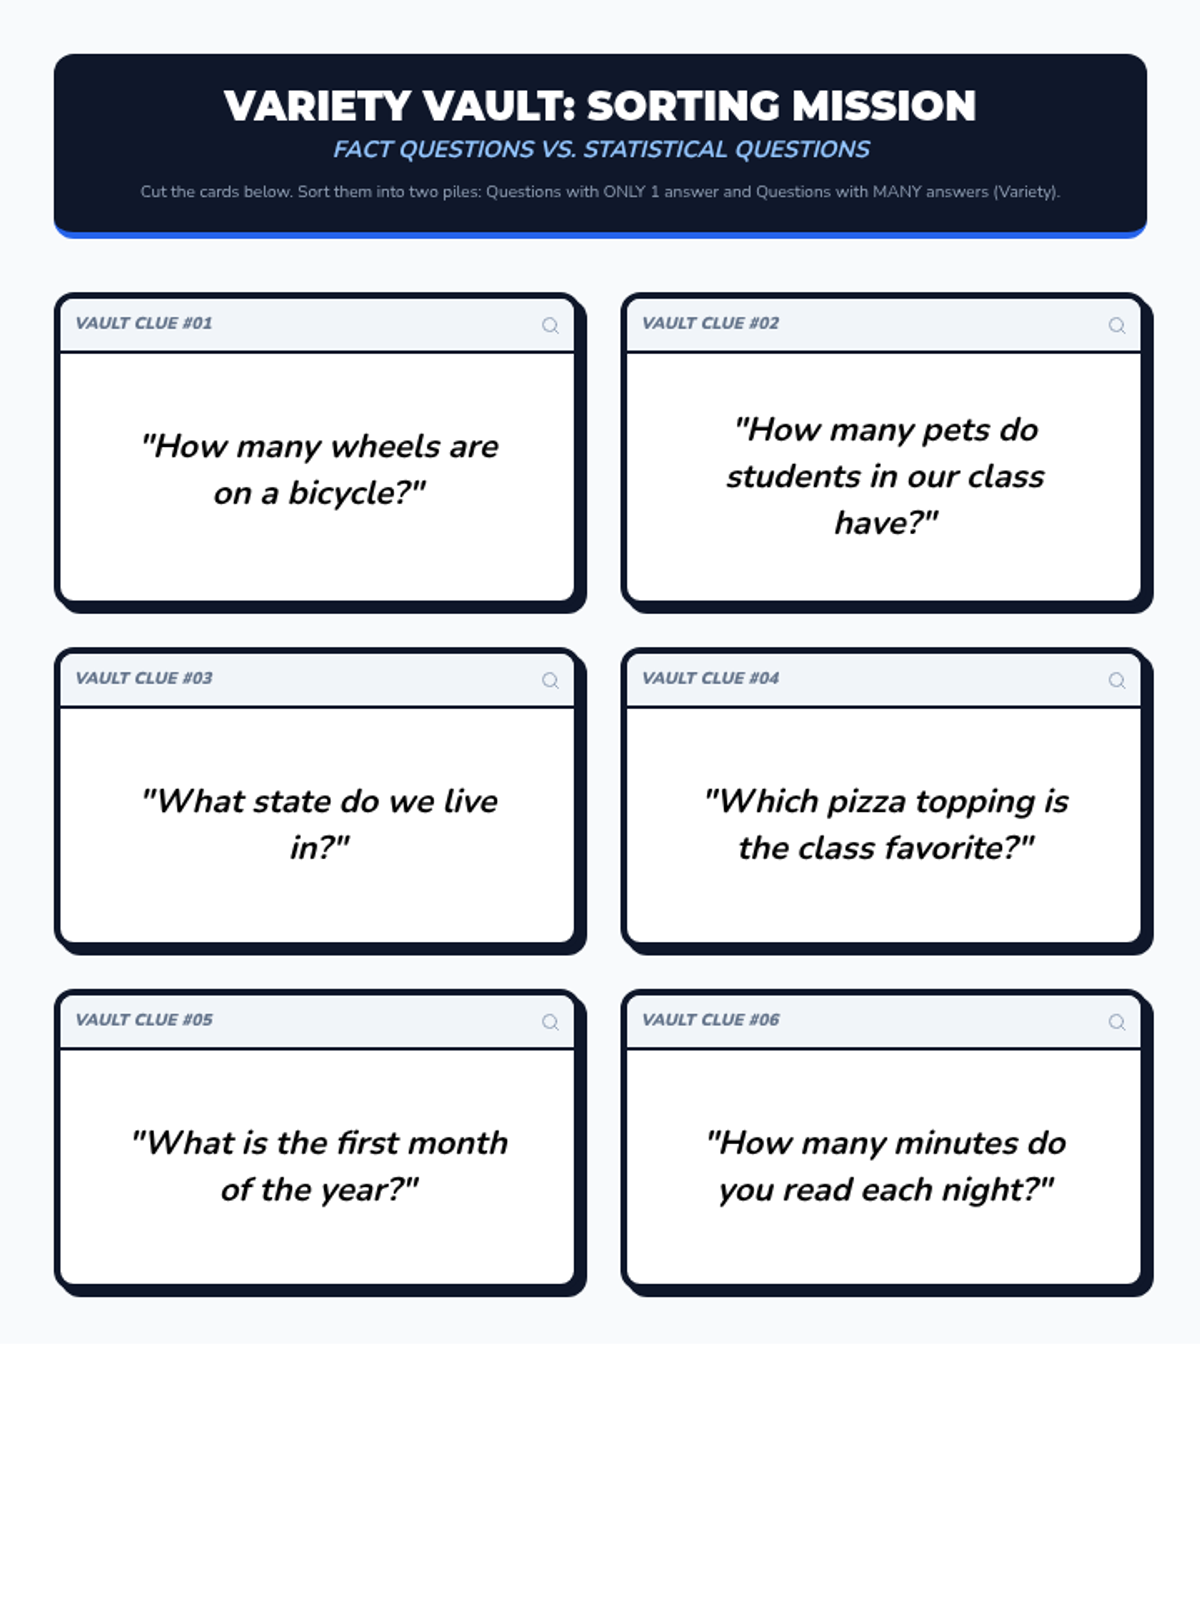
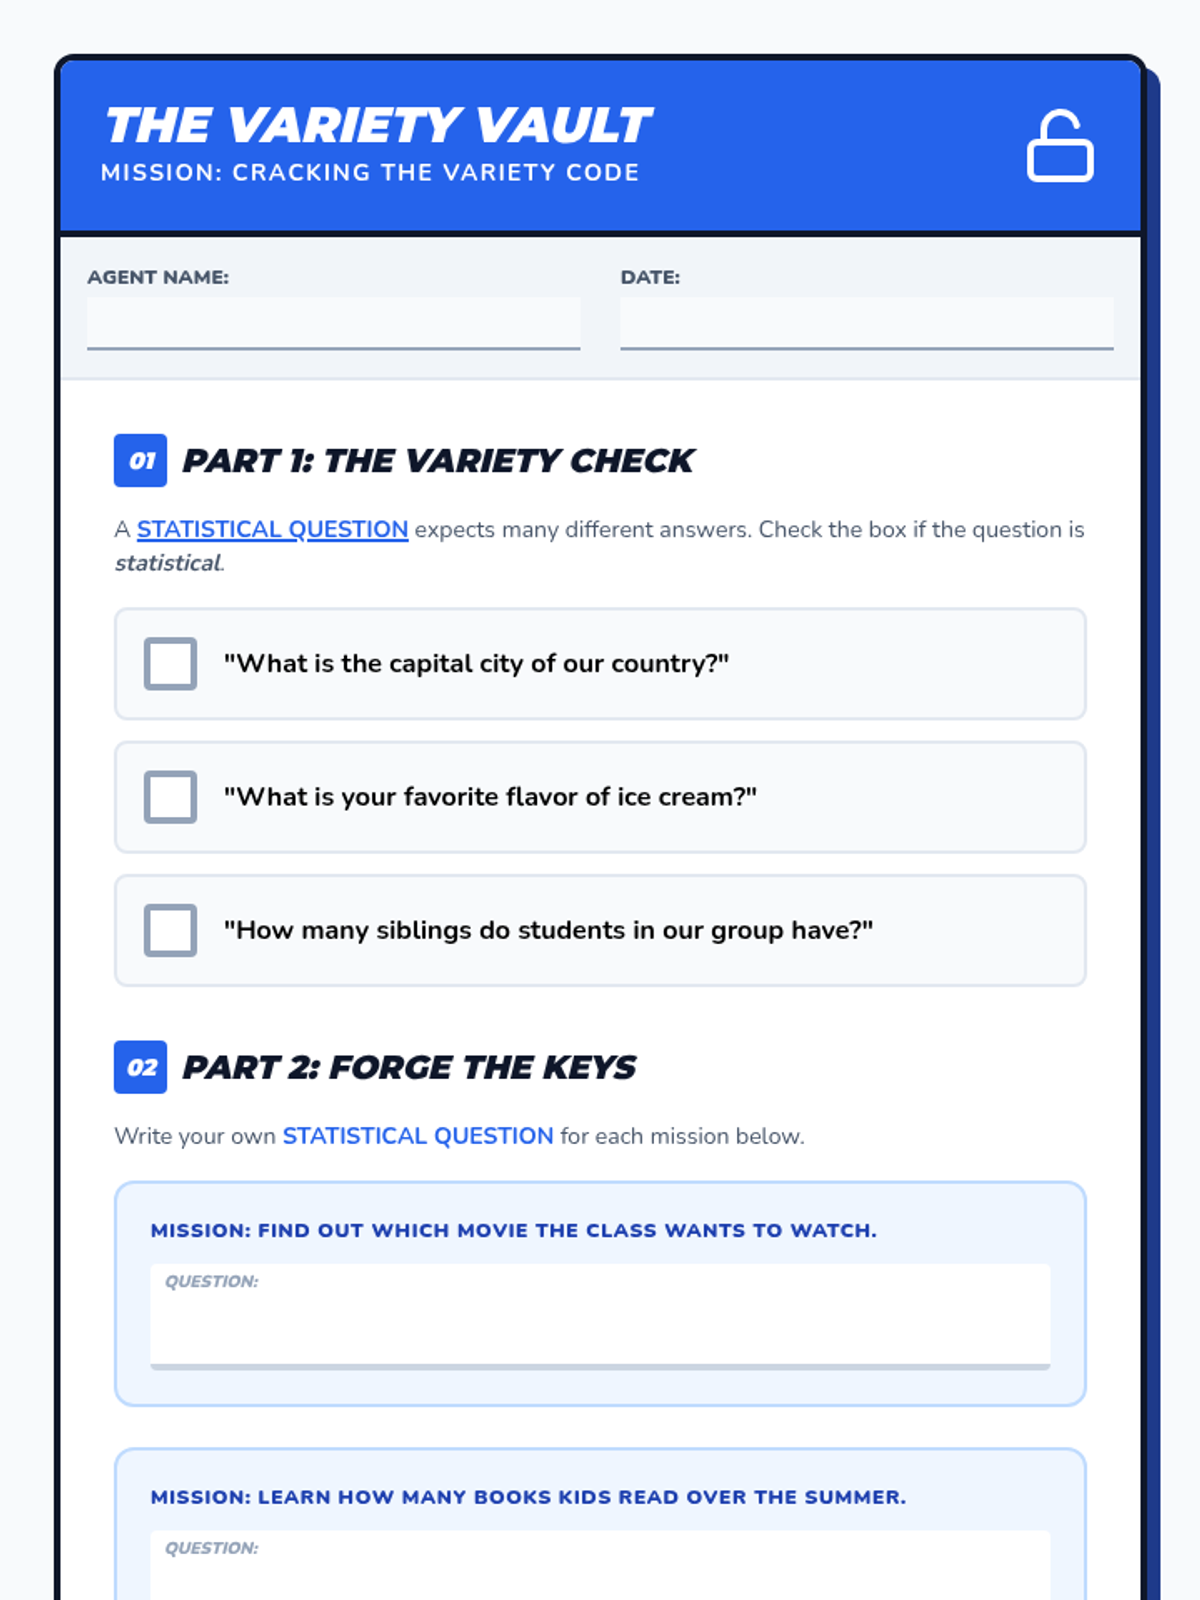
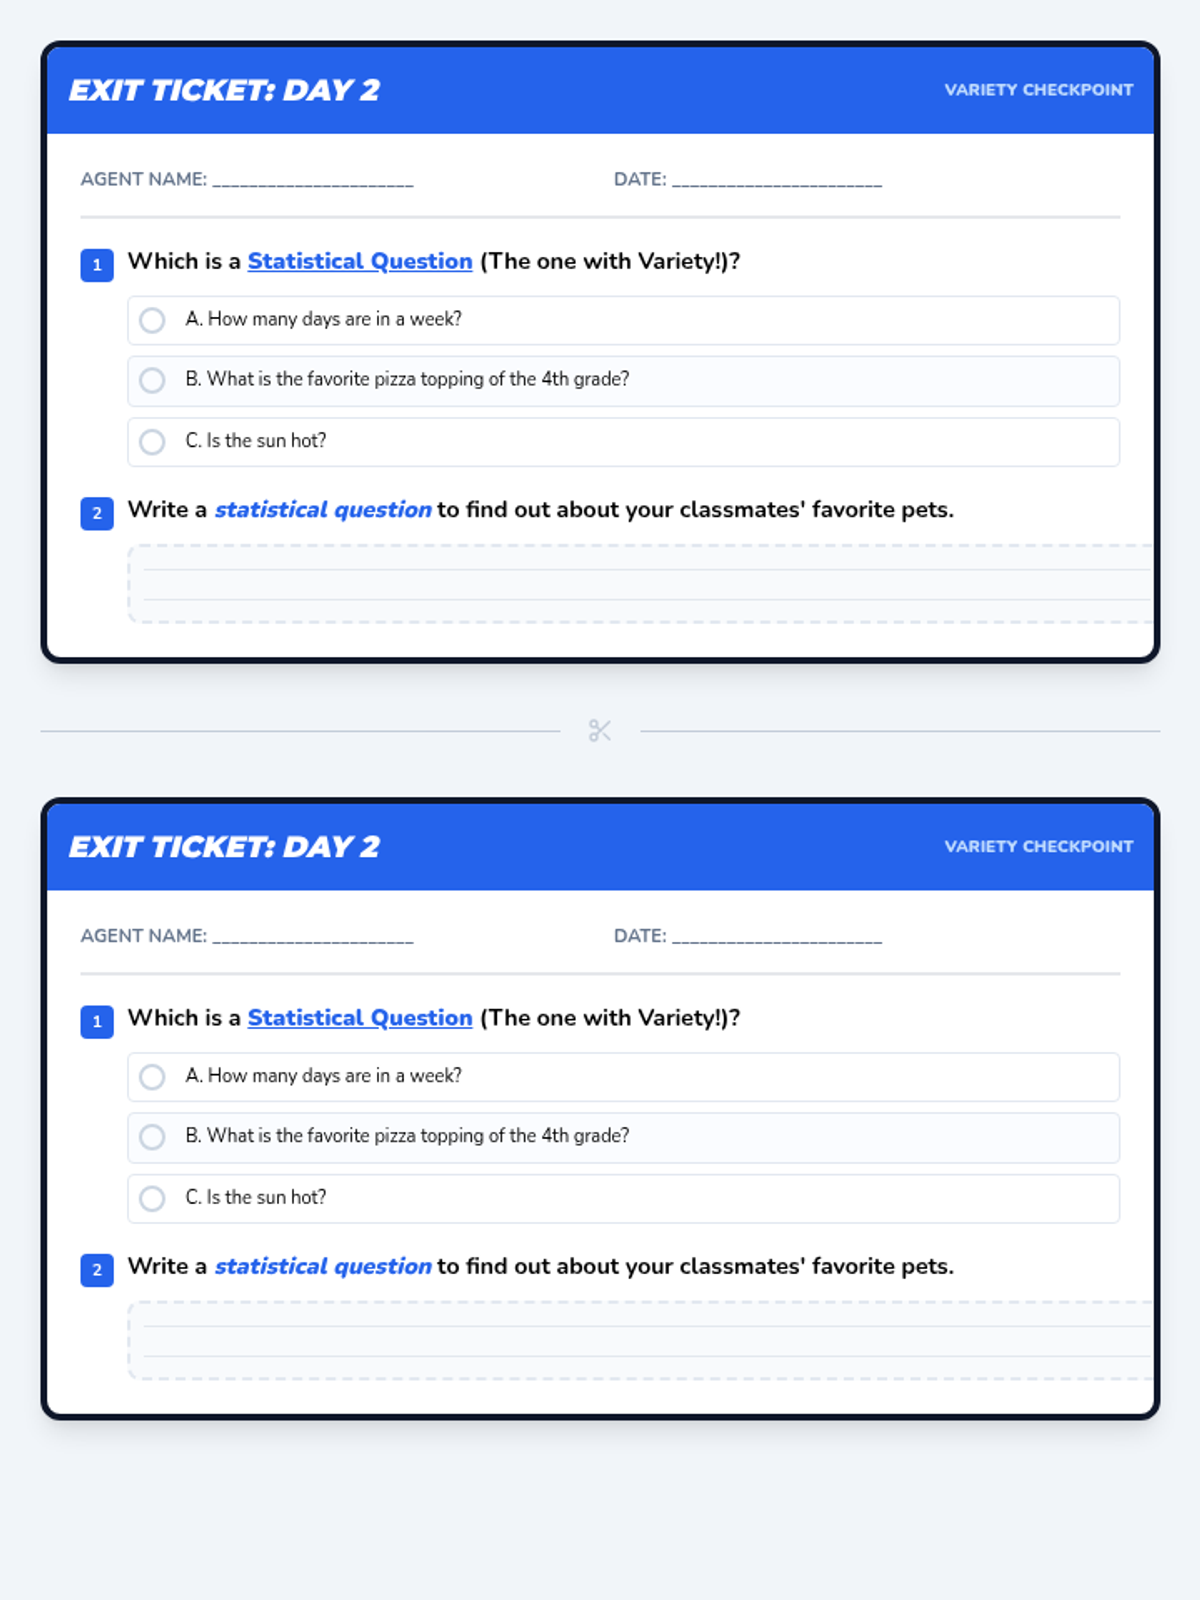
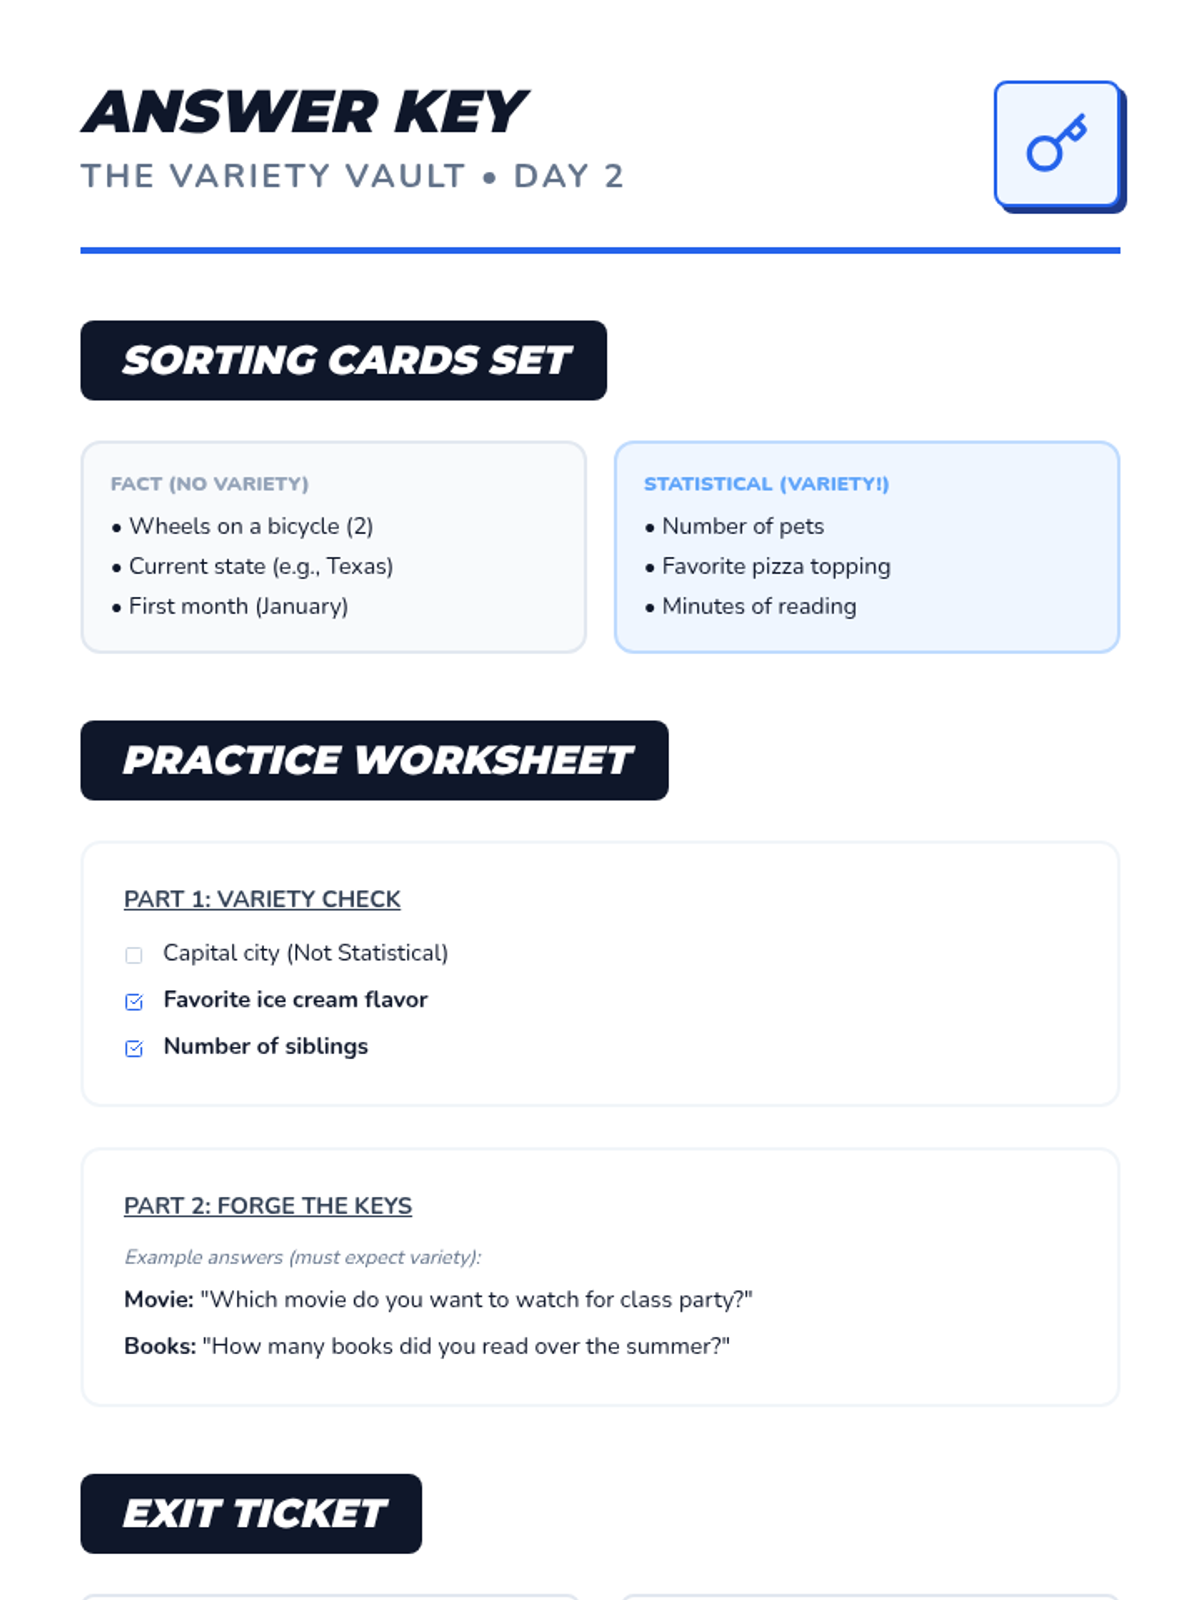
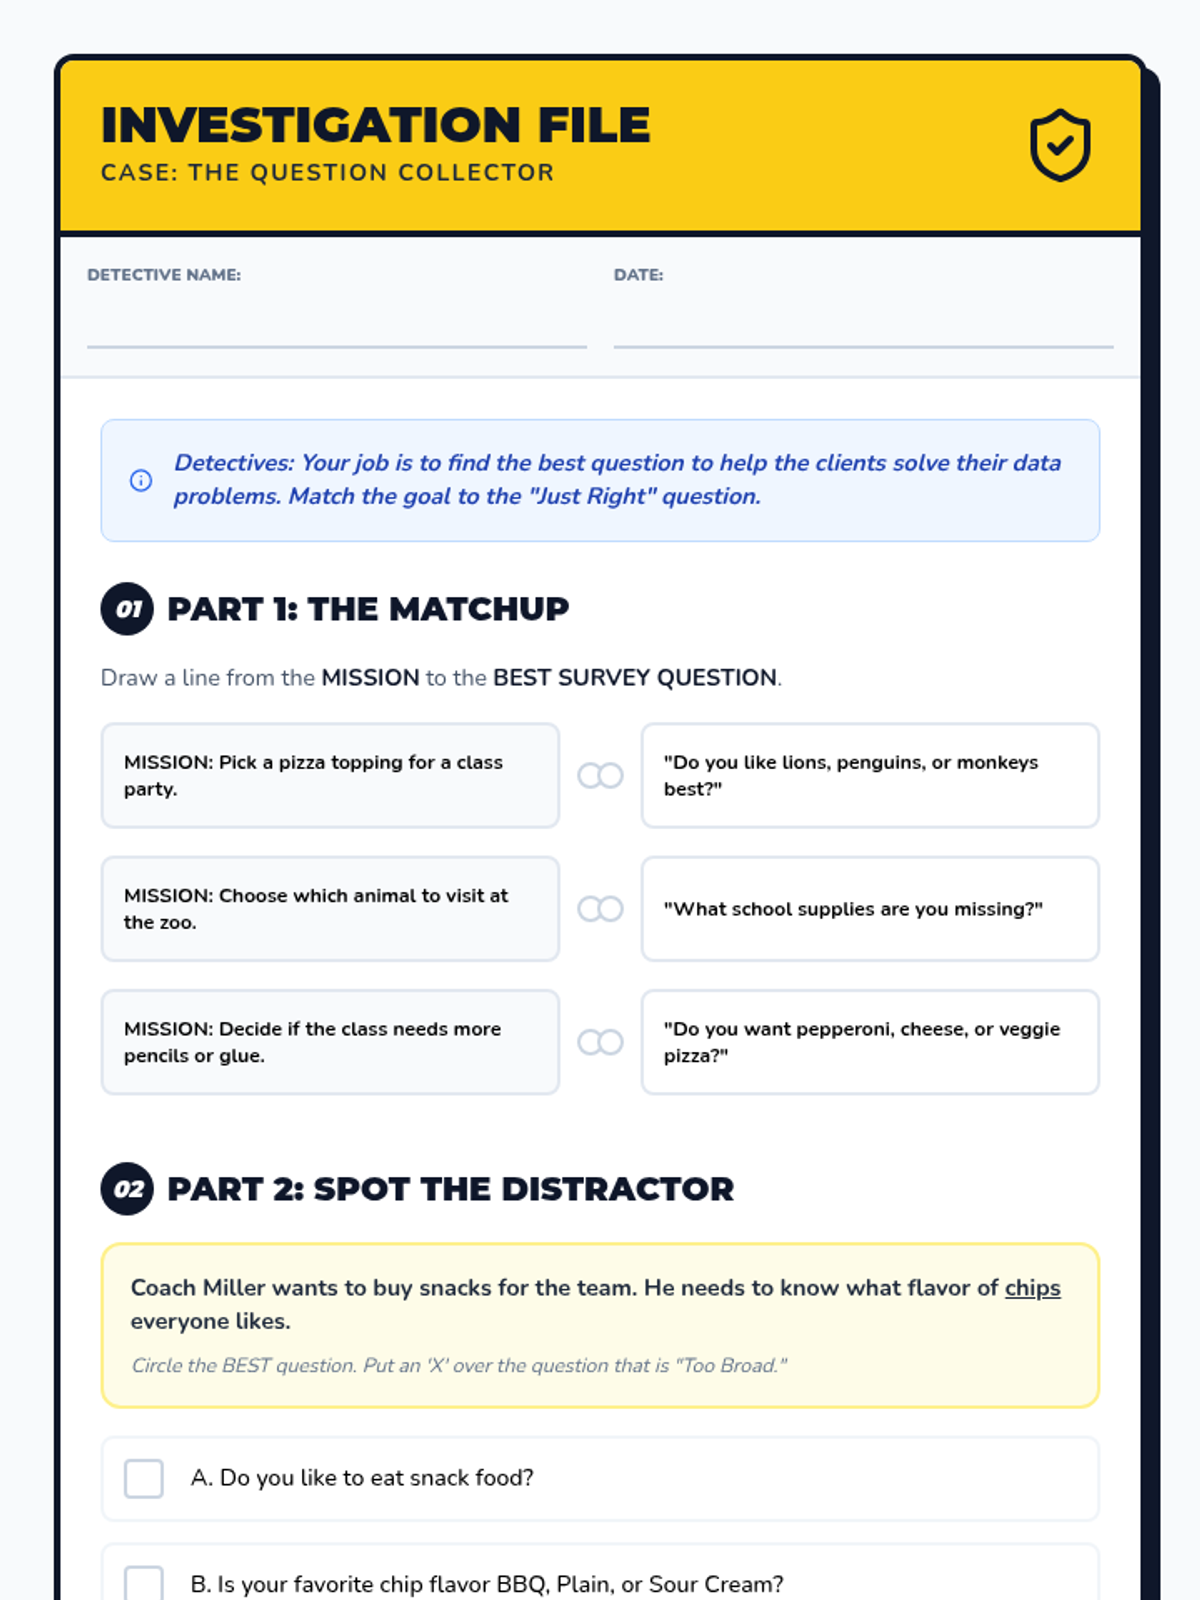
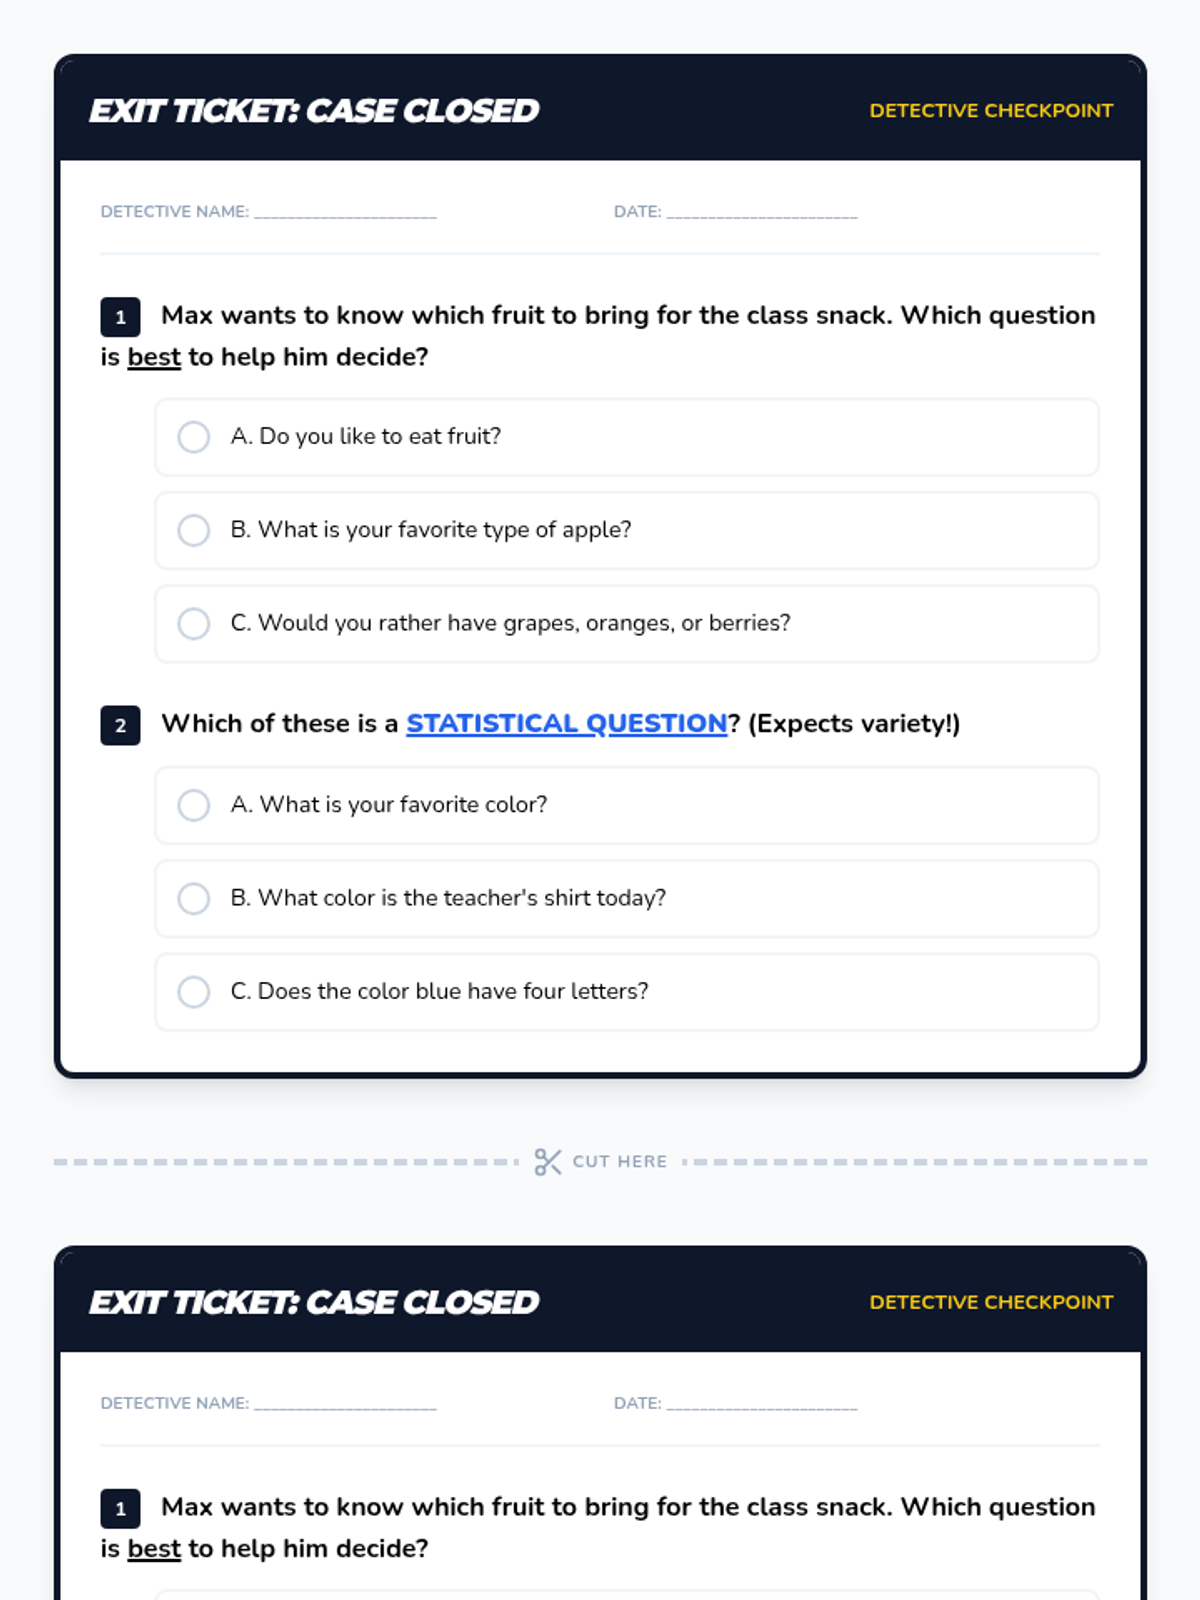
Focuses on differentiating between statistical and non-statistical questions. Students learn that a good survey question must expect a variety of answers to be useful for data collection.
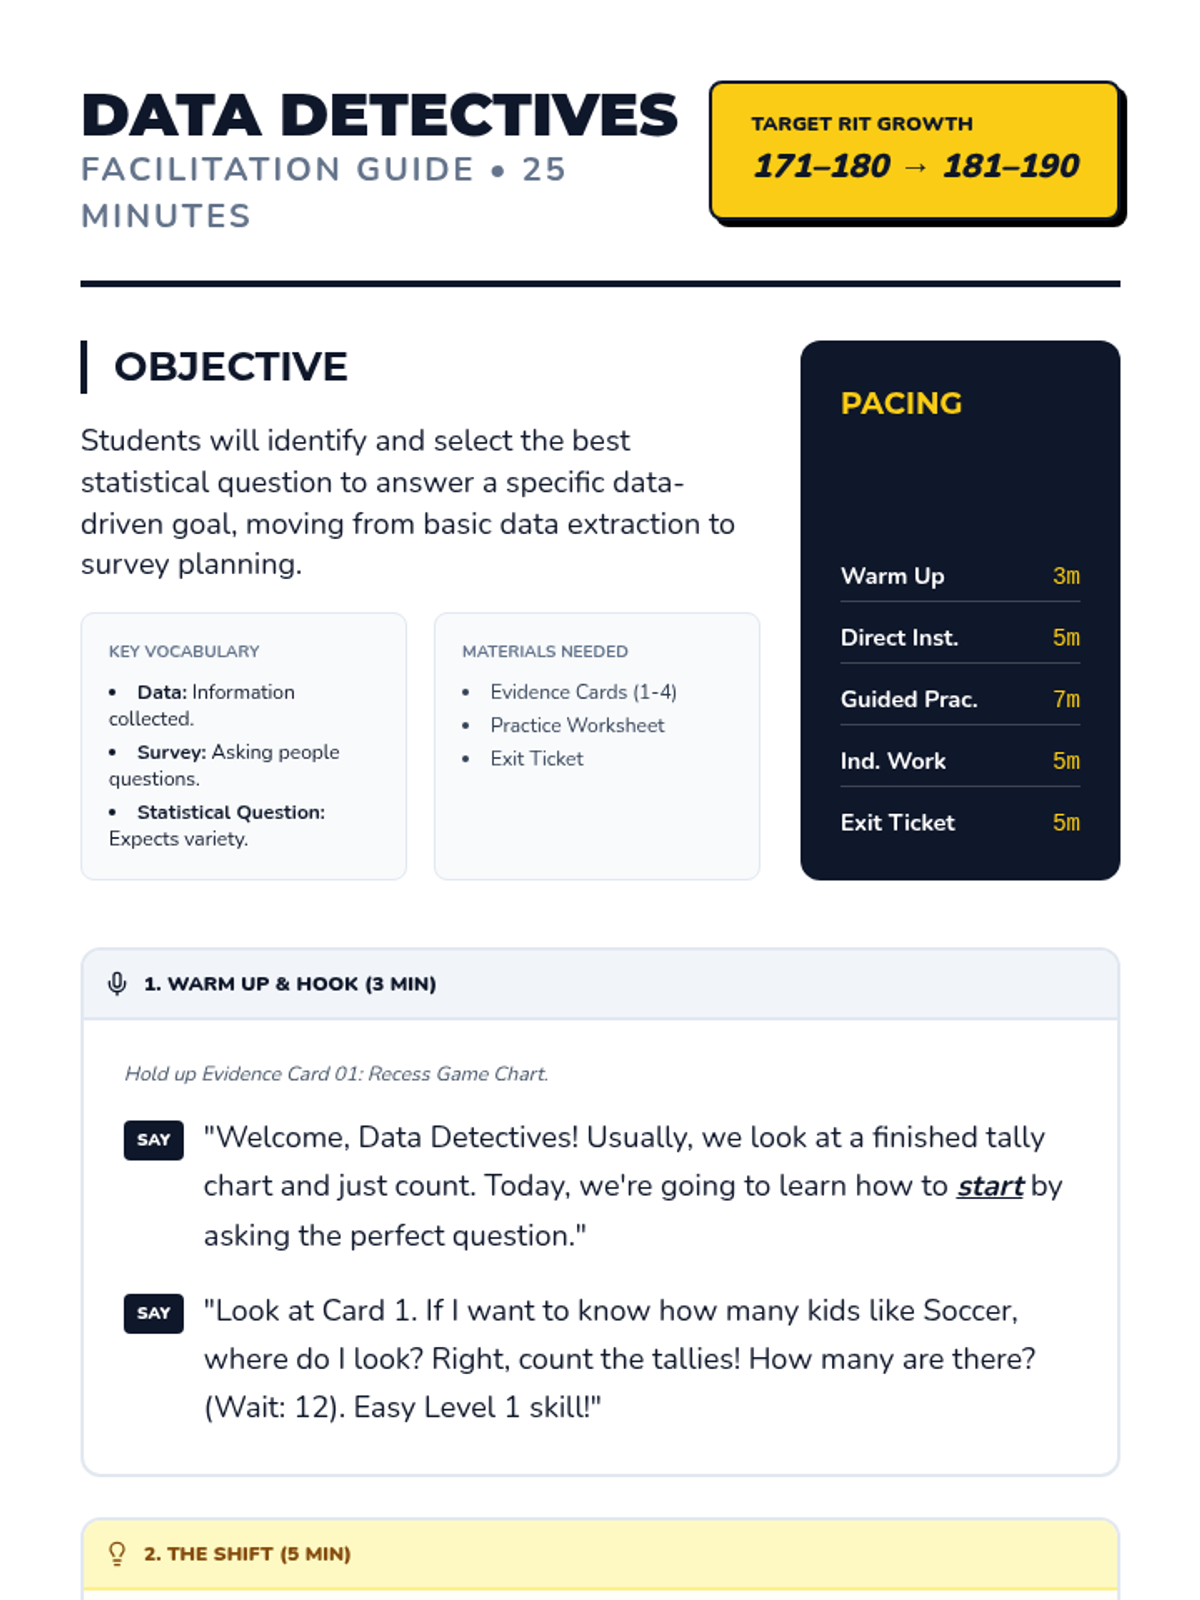
A 25-minute small group lesson designed to move students from RIT 171-180 to 181-190 by shifting from basic data interpretation to formulating and selecting effective statistical questions.
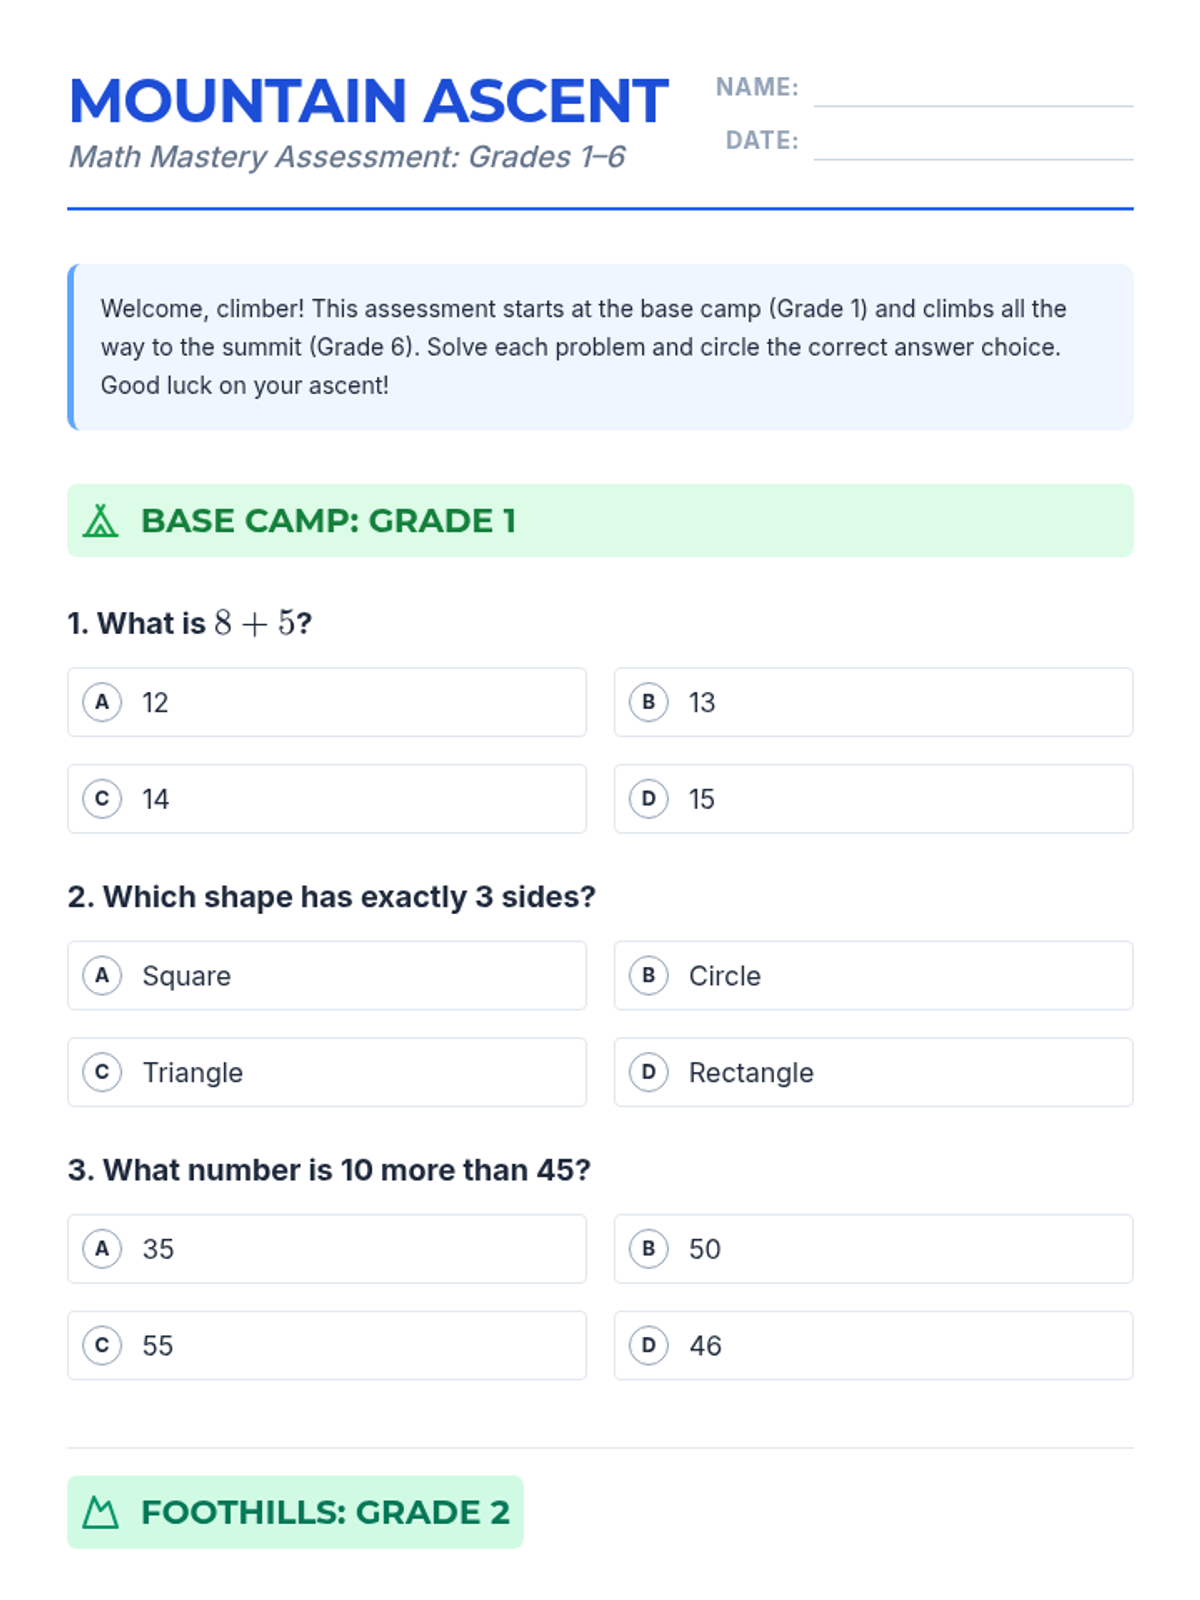
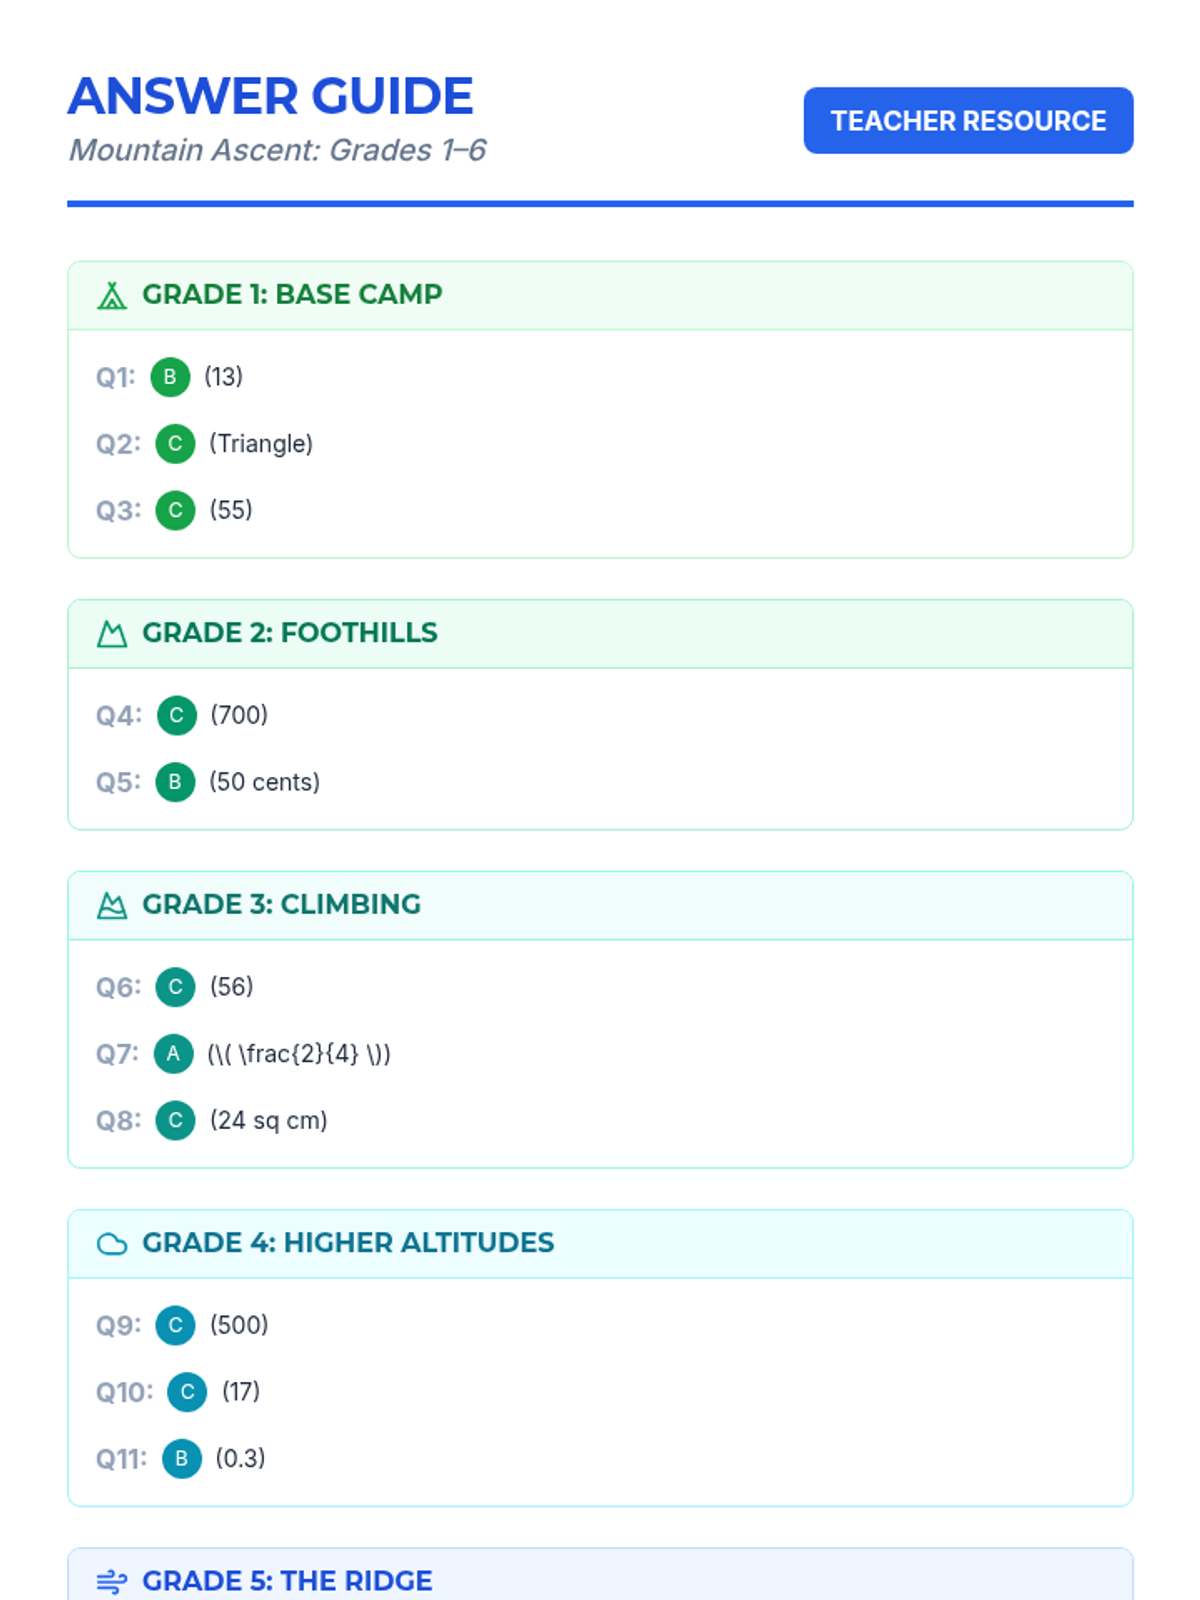
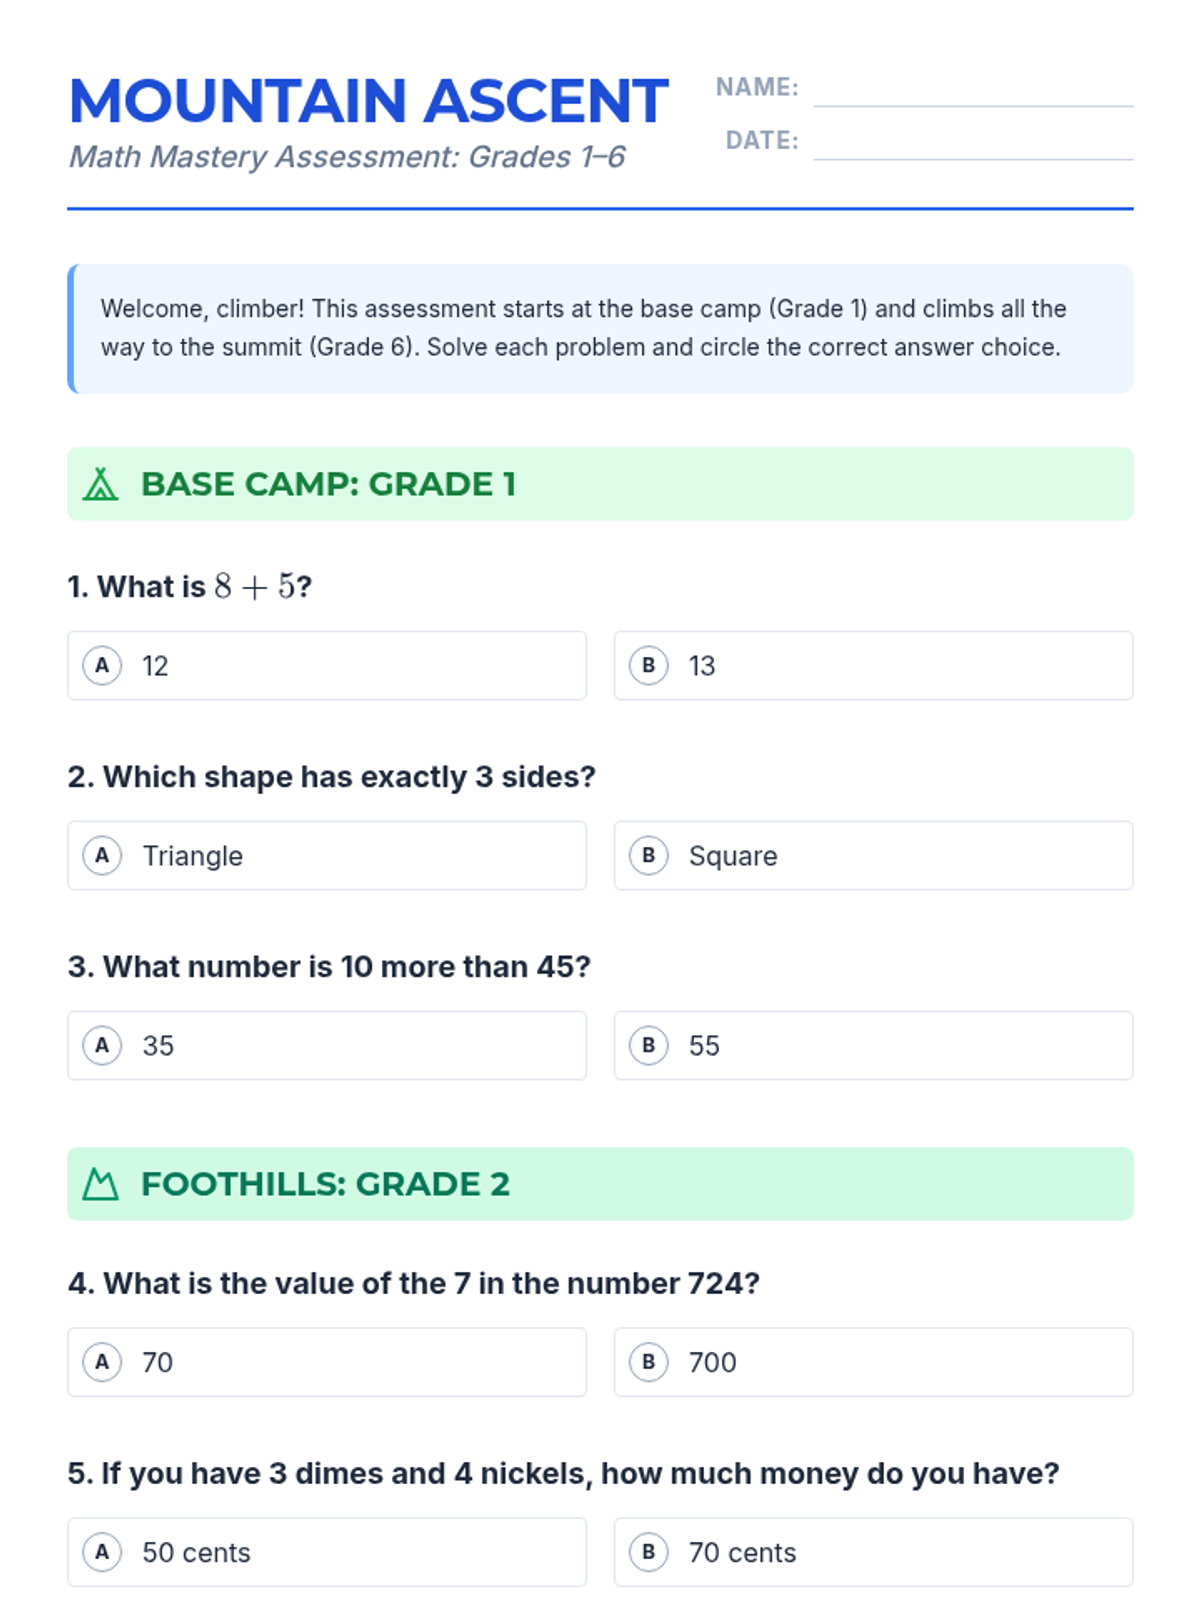
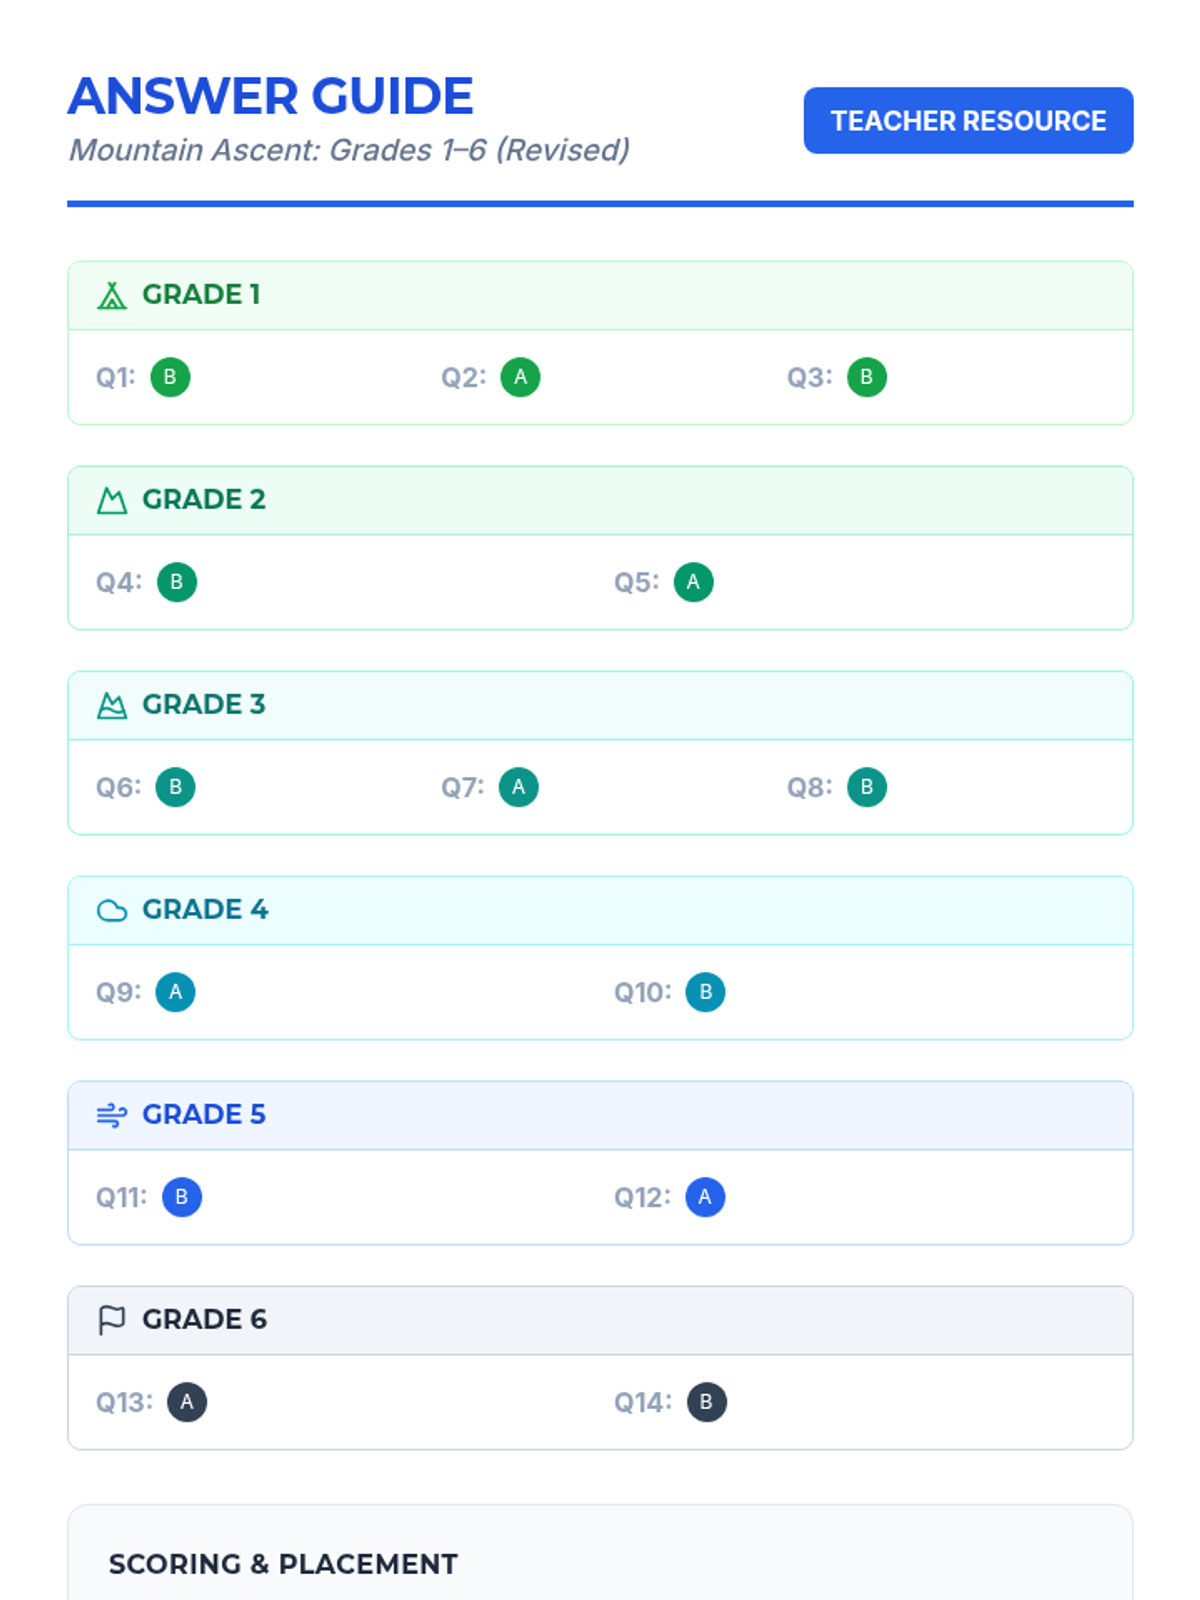
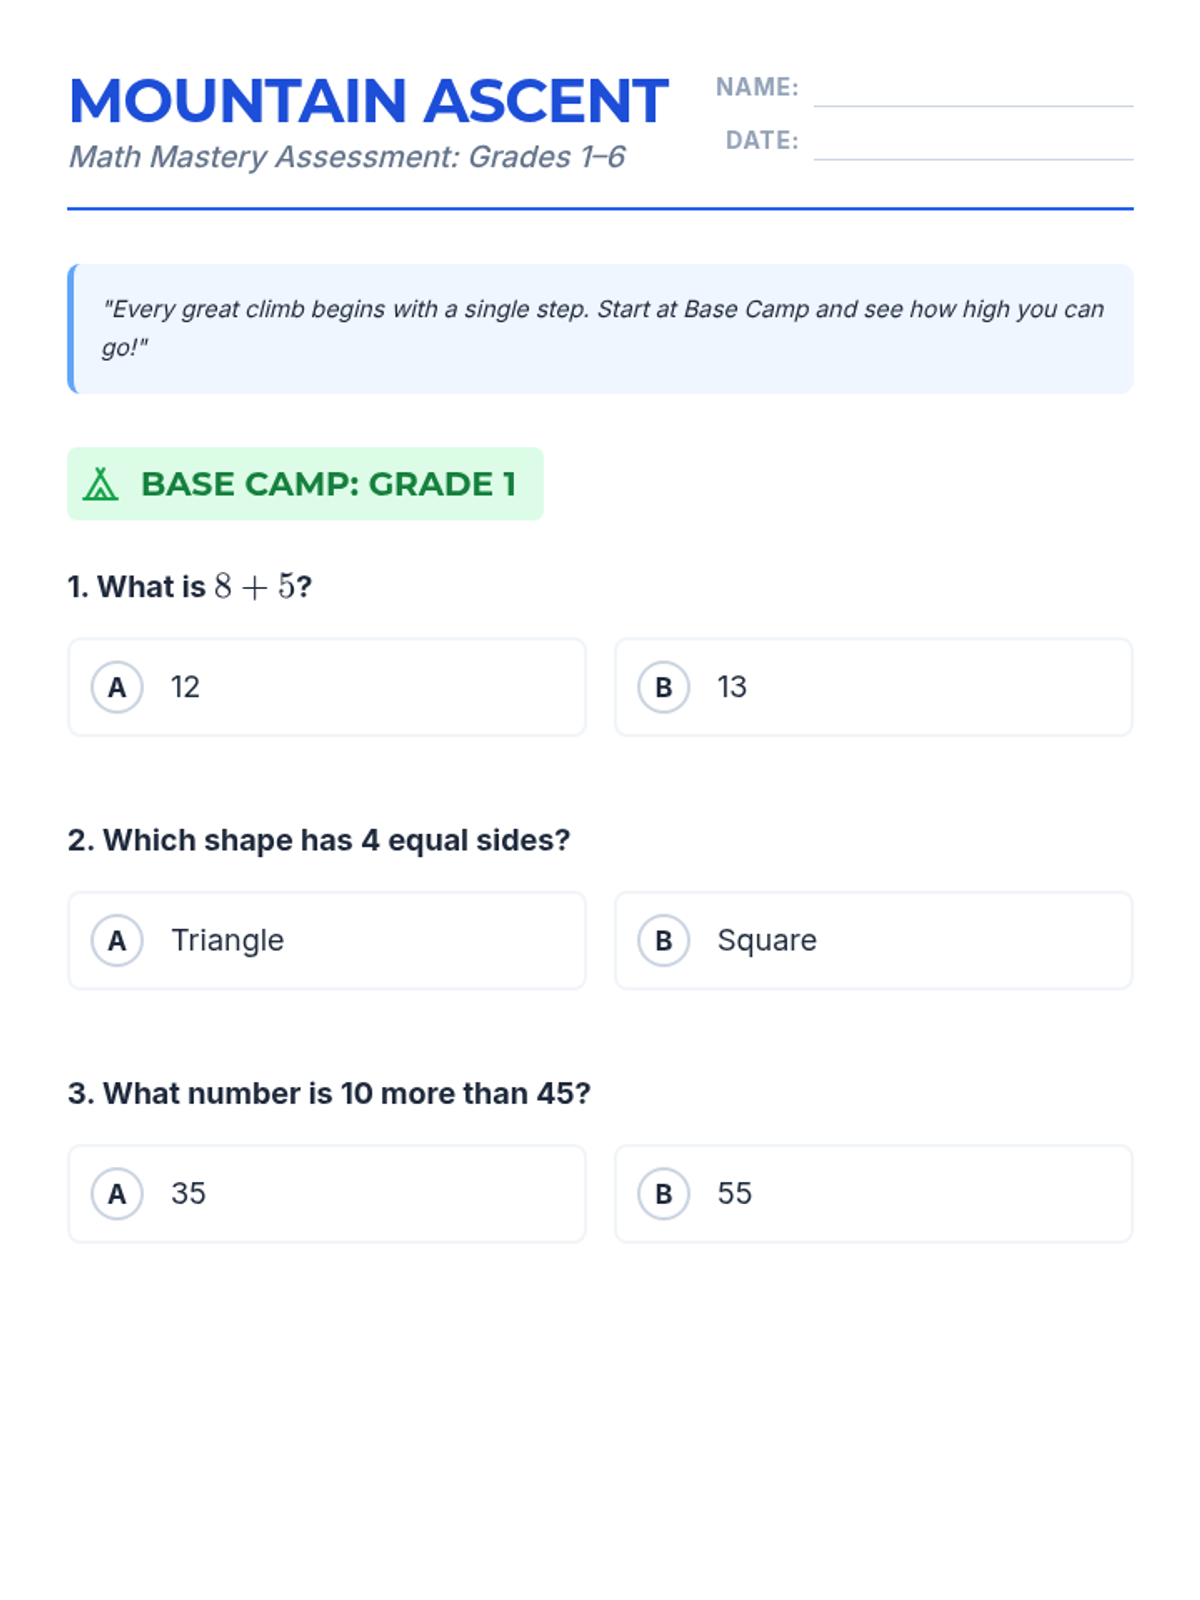
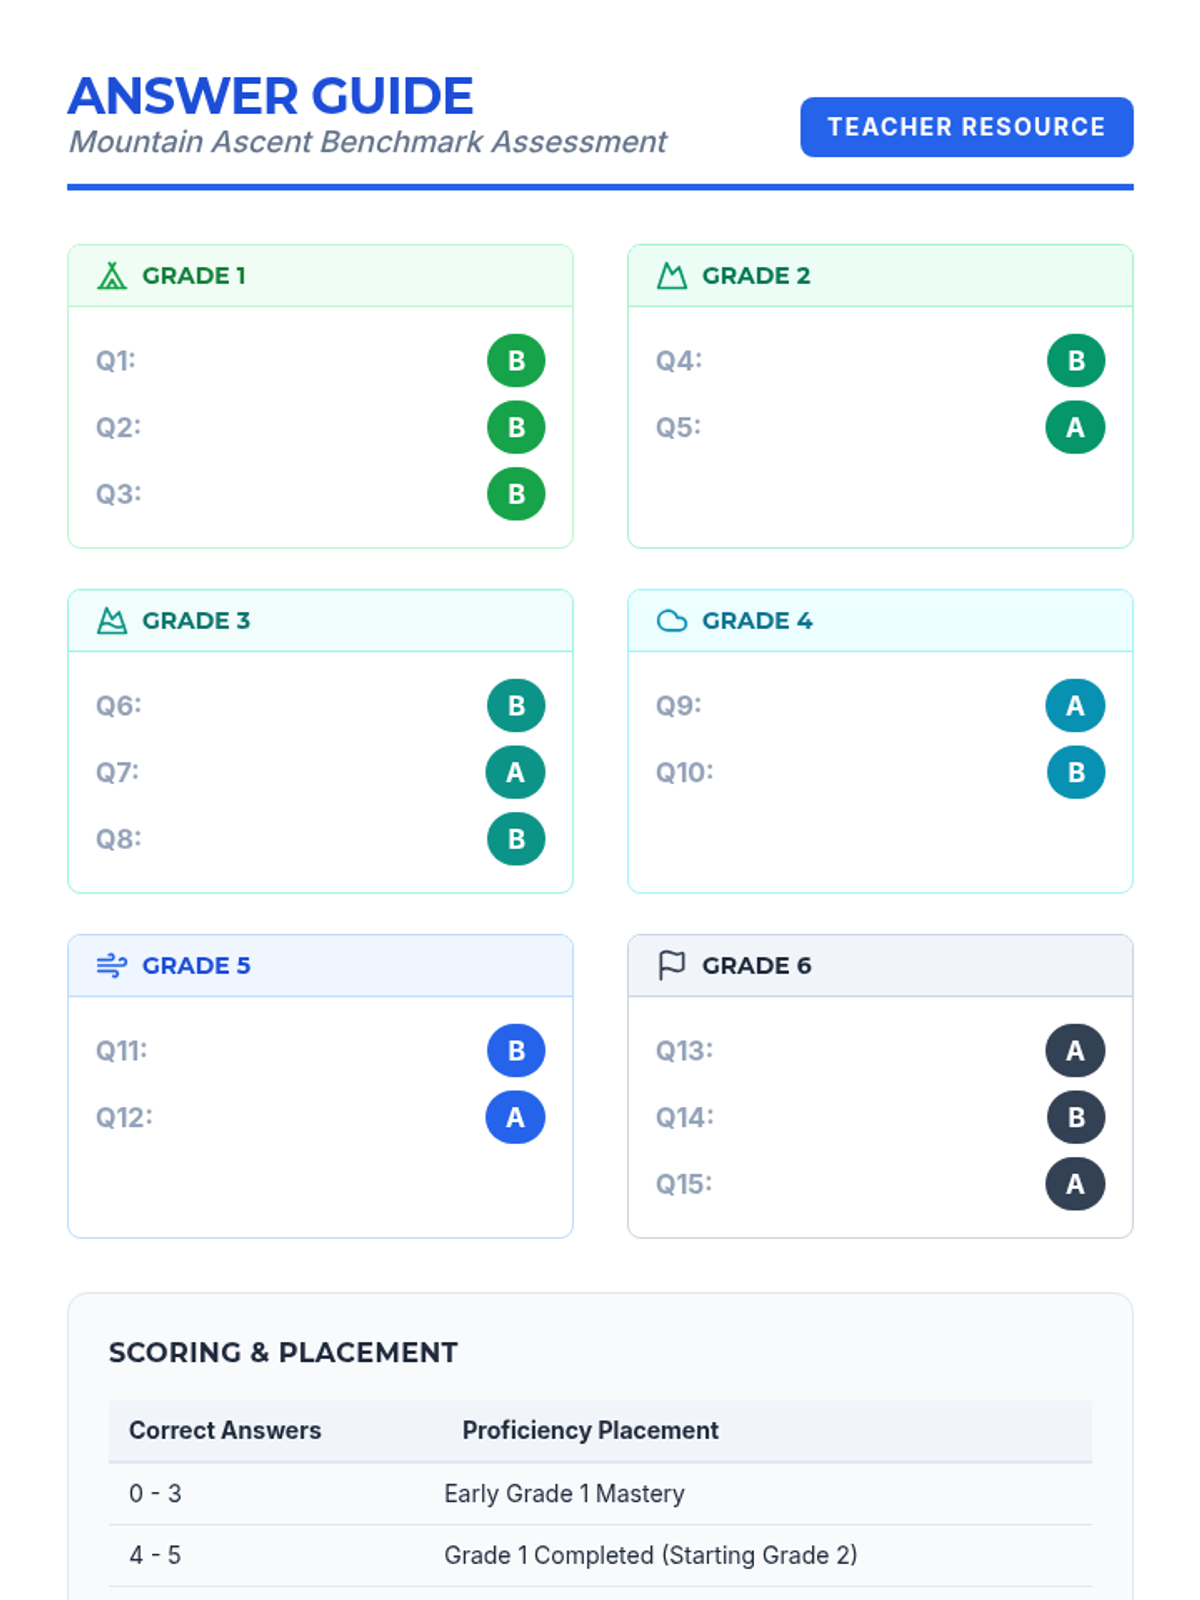
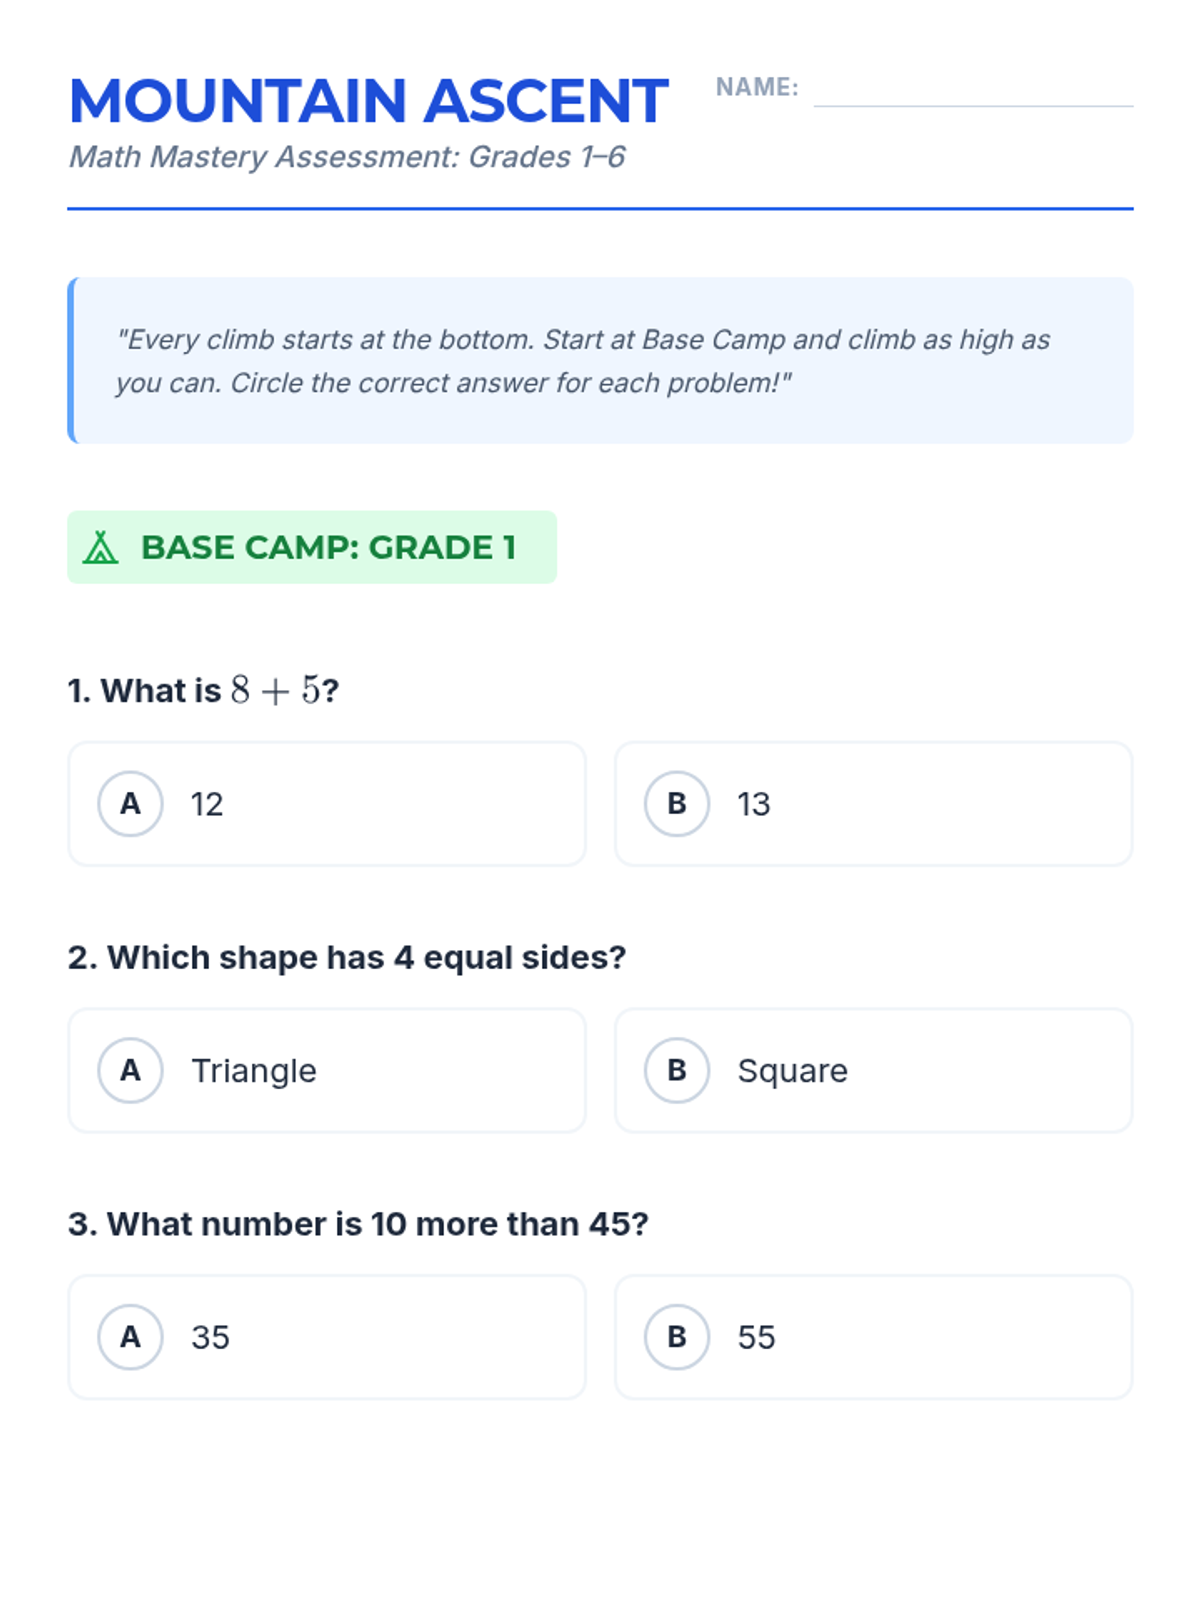
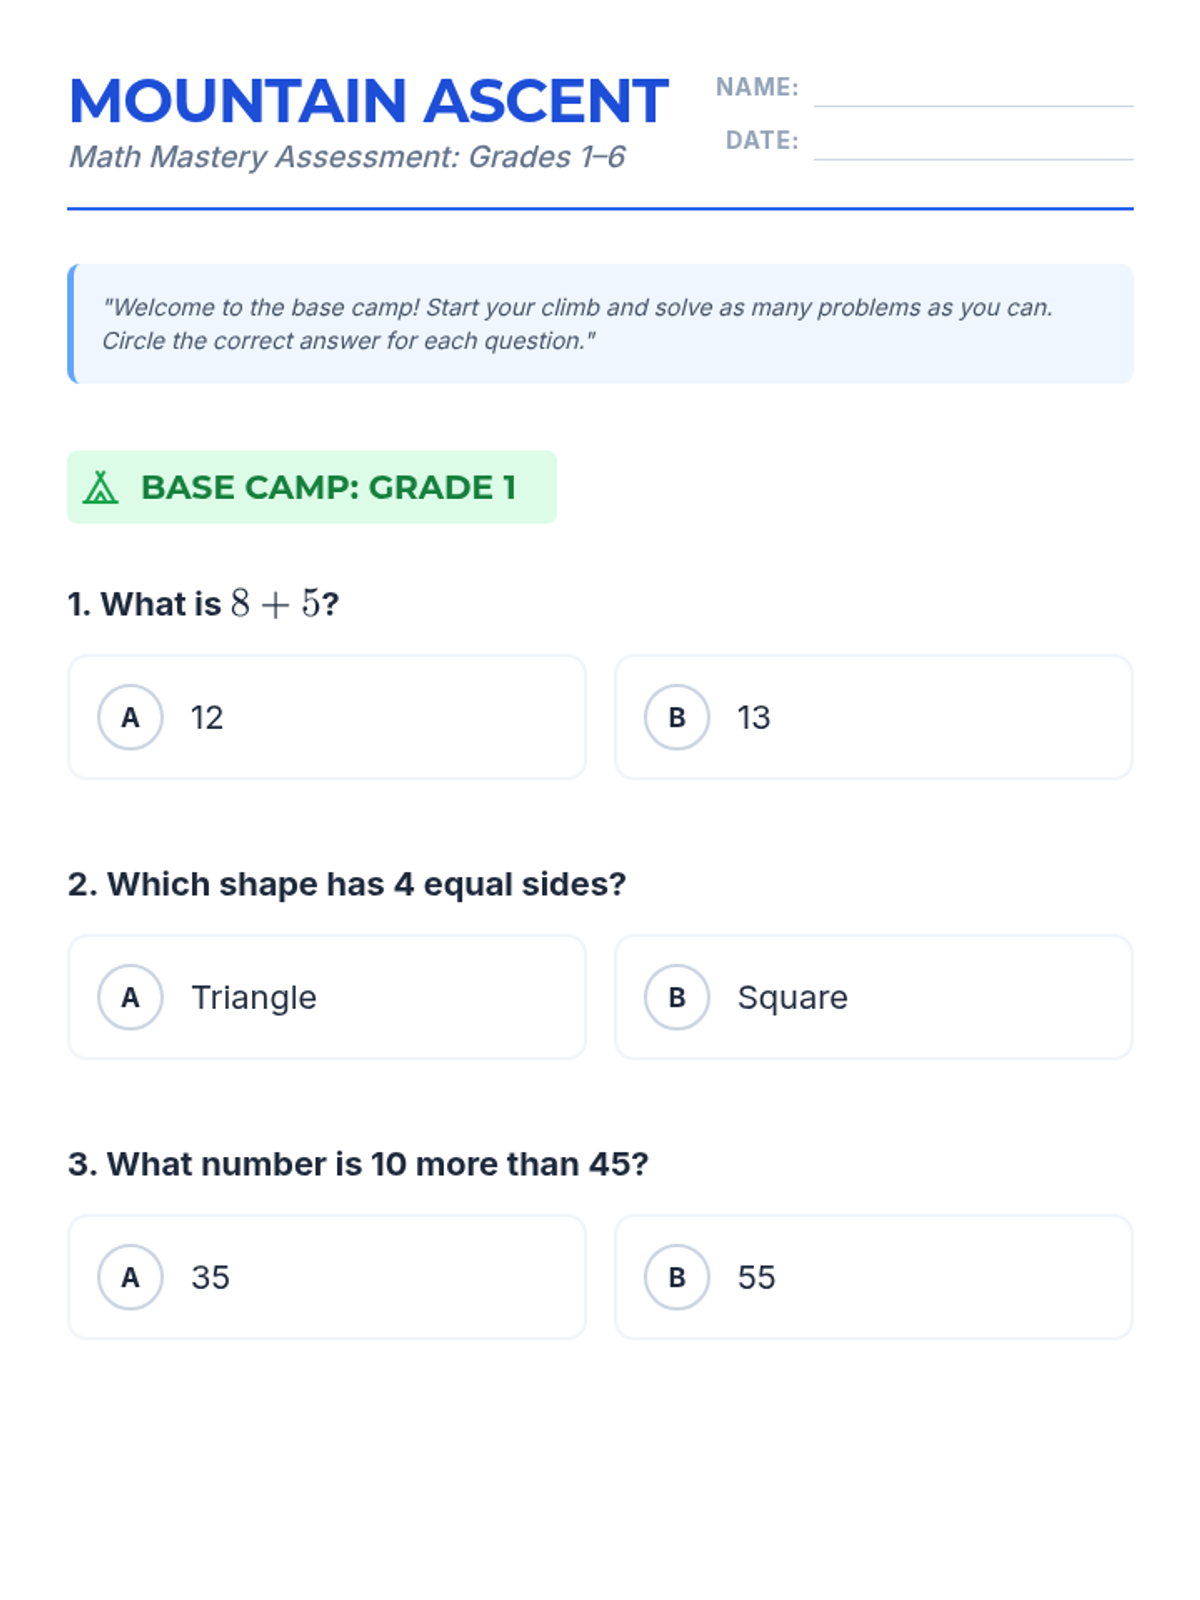
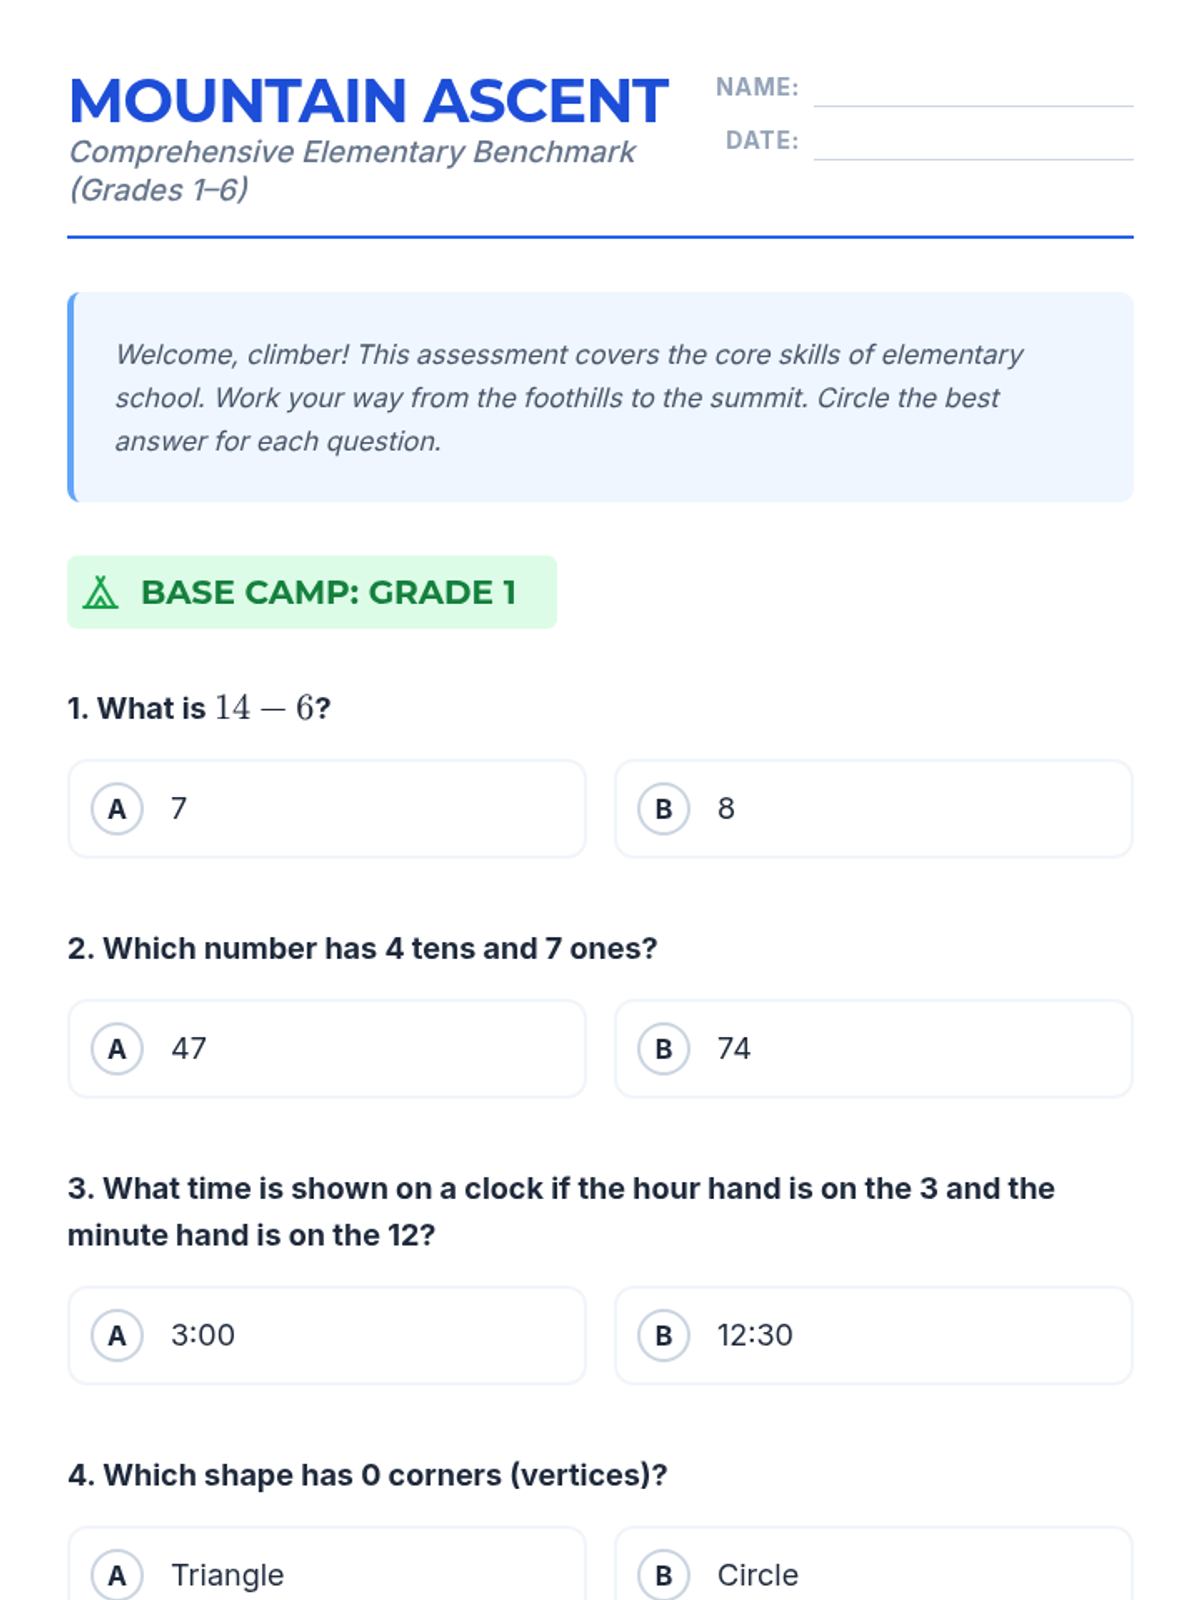
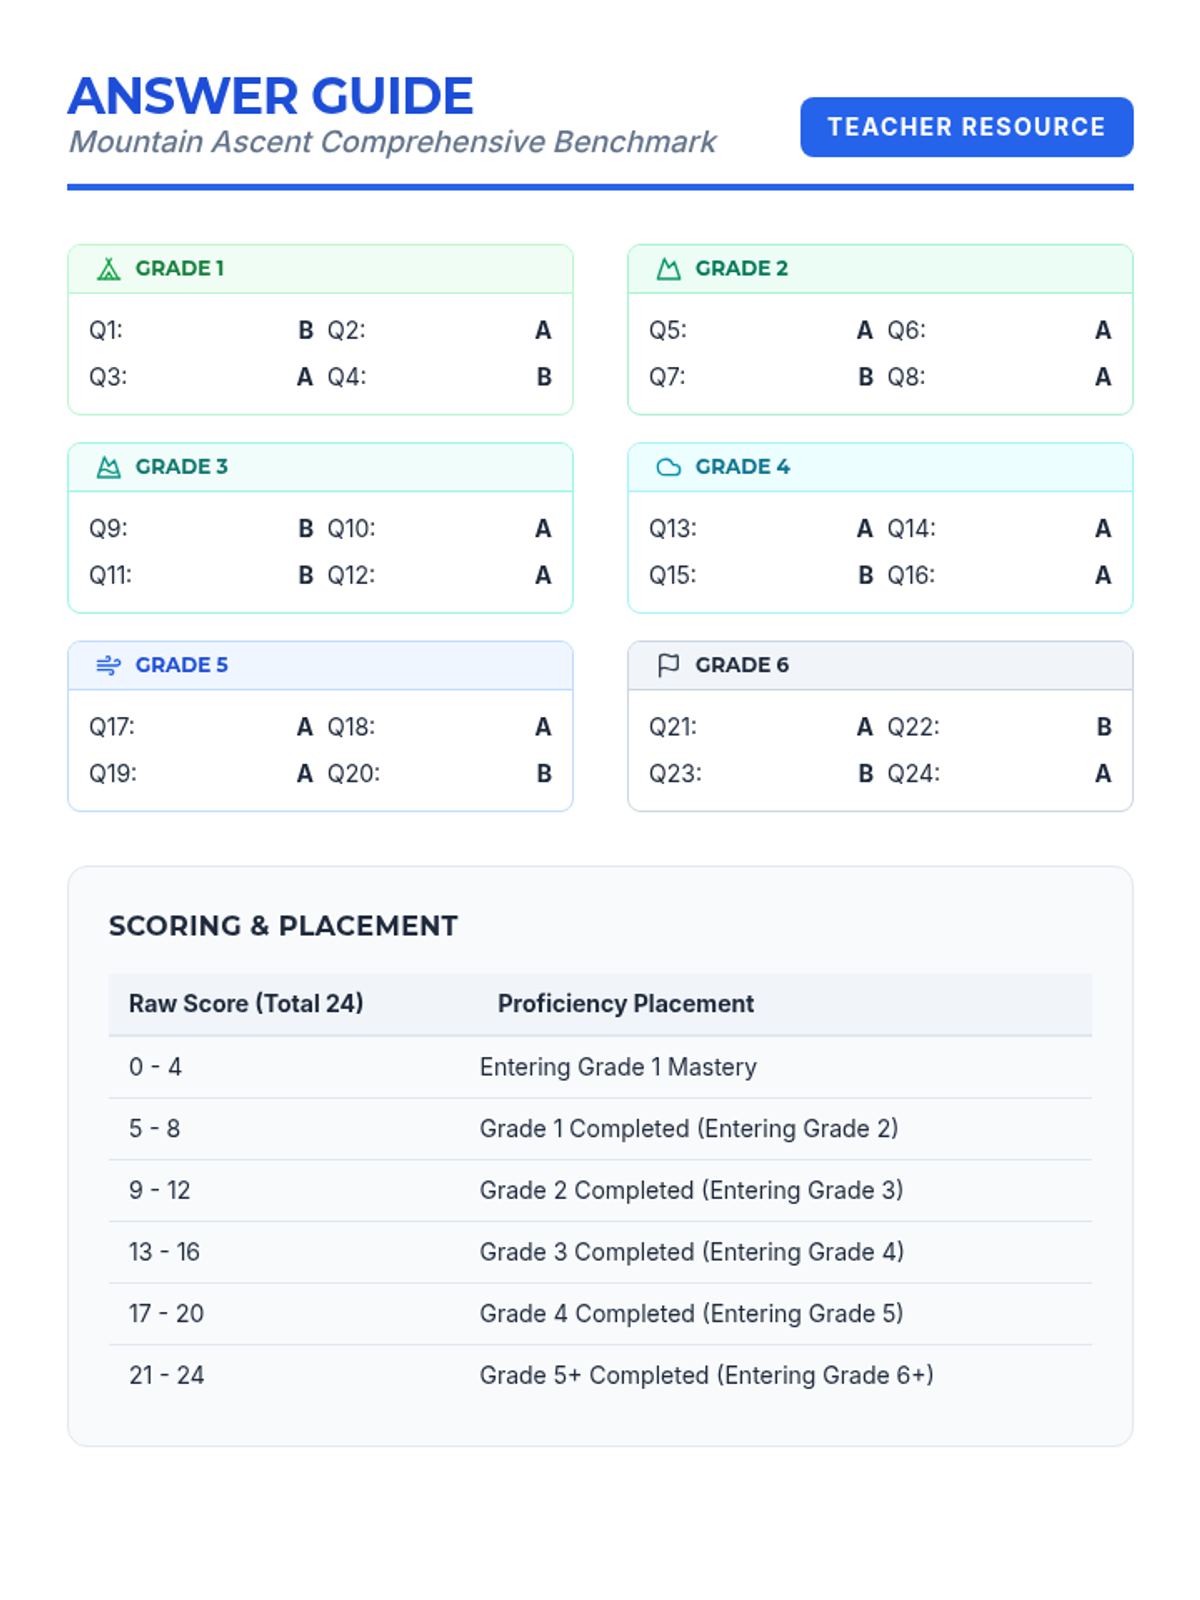
A comprehensive math benchmark assessment covering key standards from Grade 1 through Grade 6, designed to track student progress and identify skill gaps.
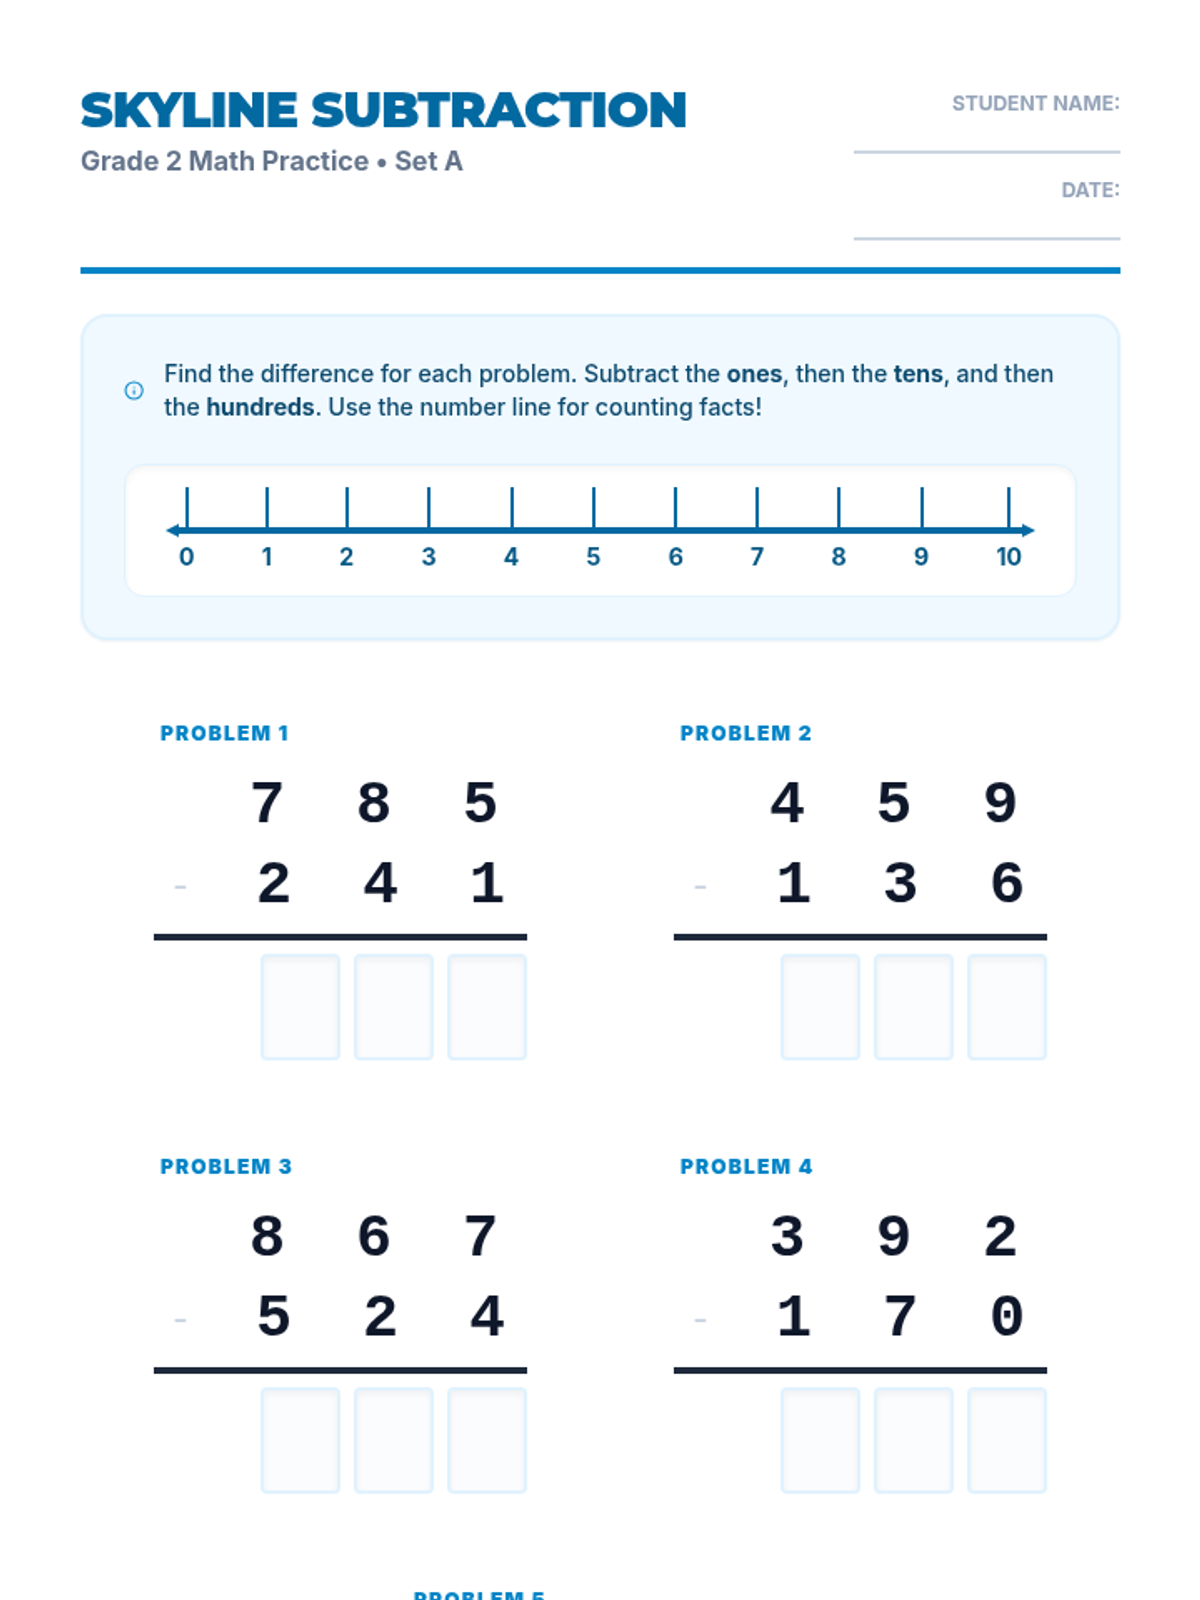
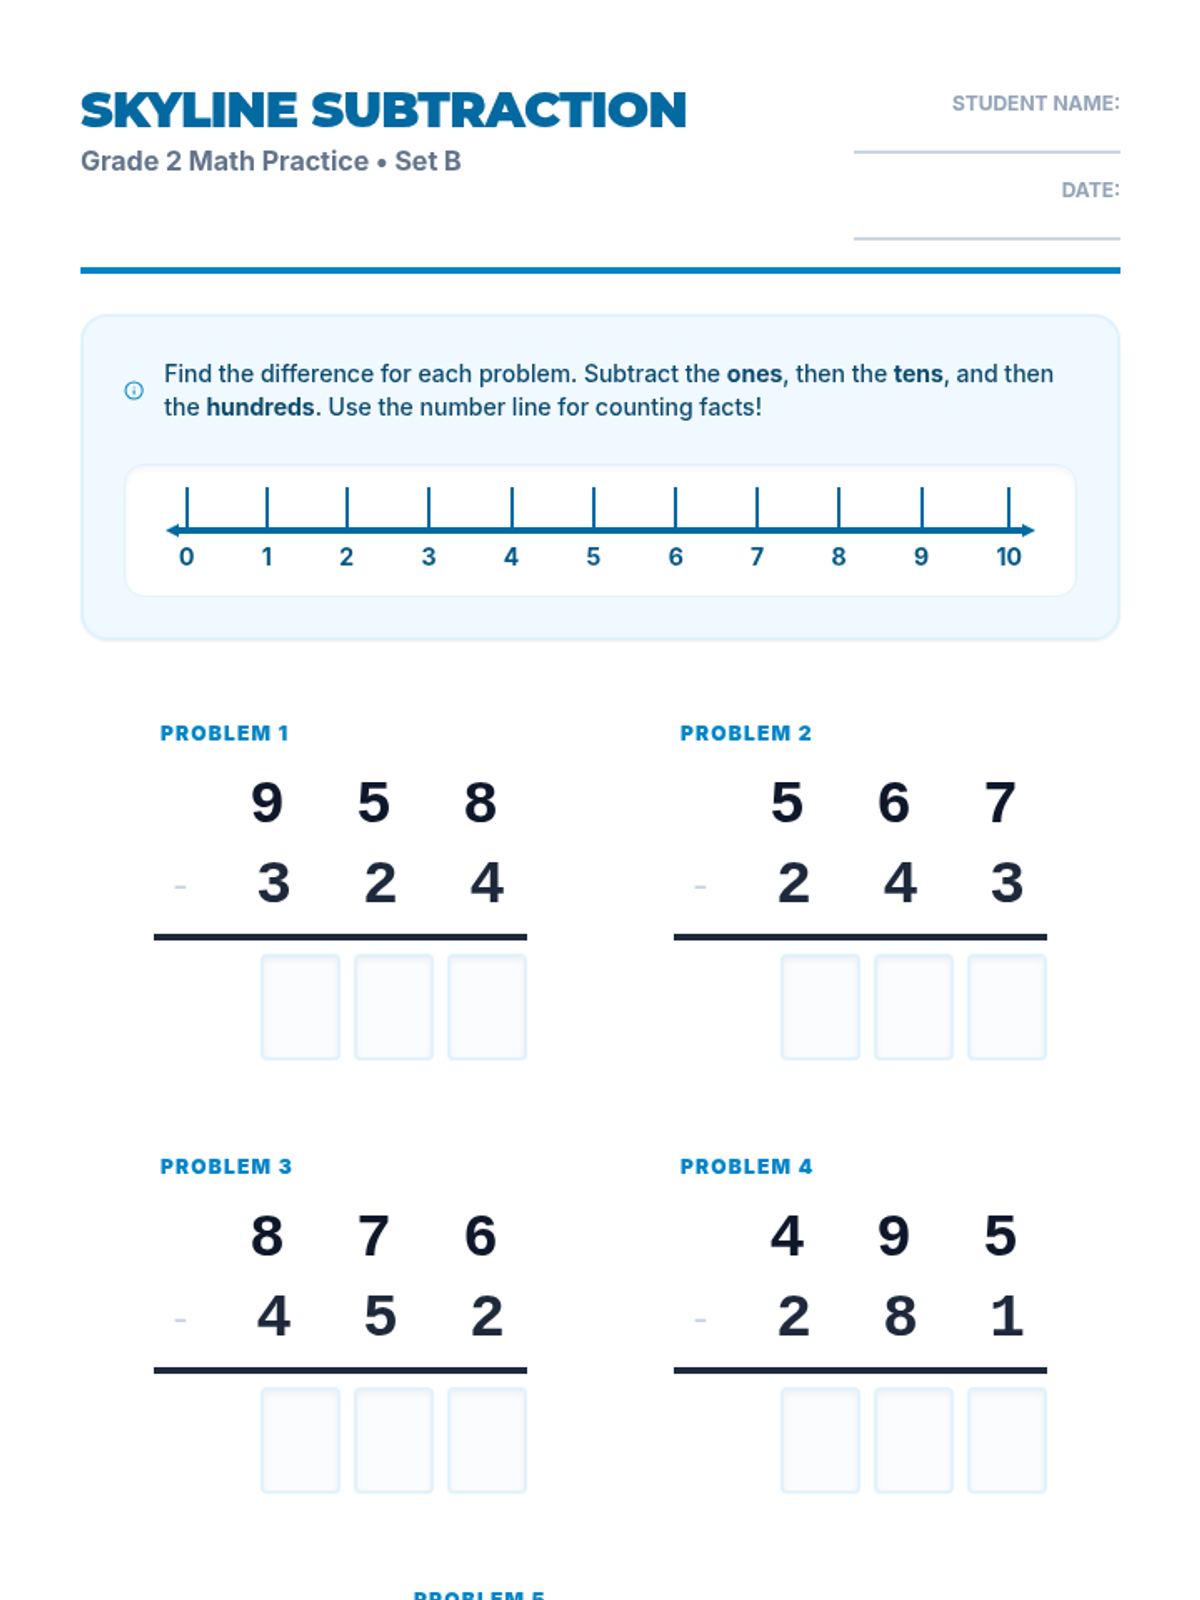
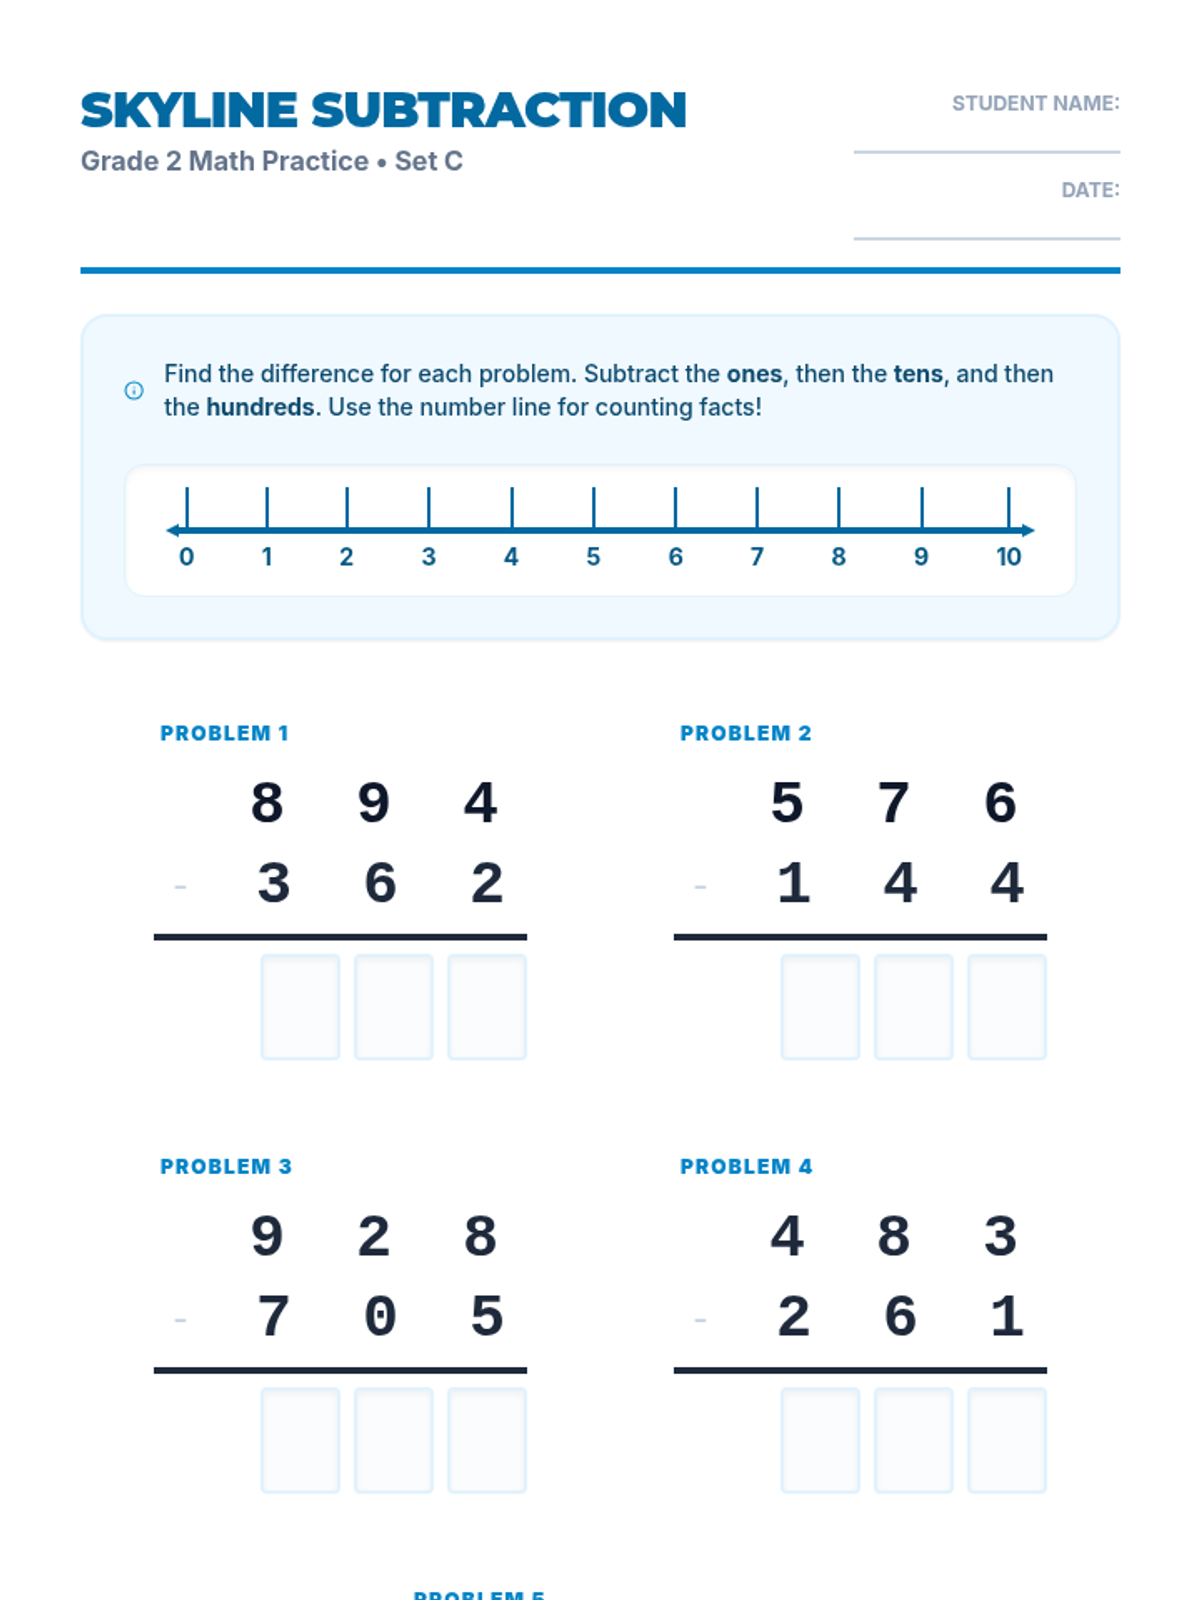
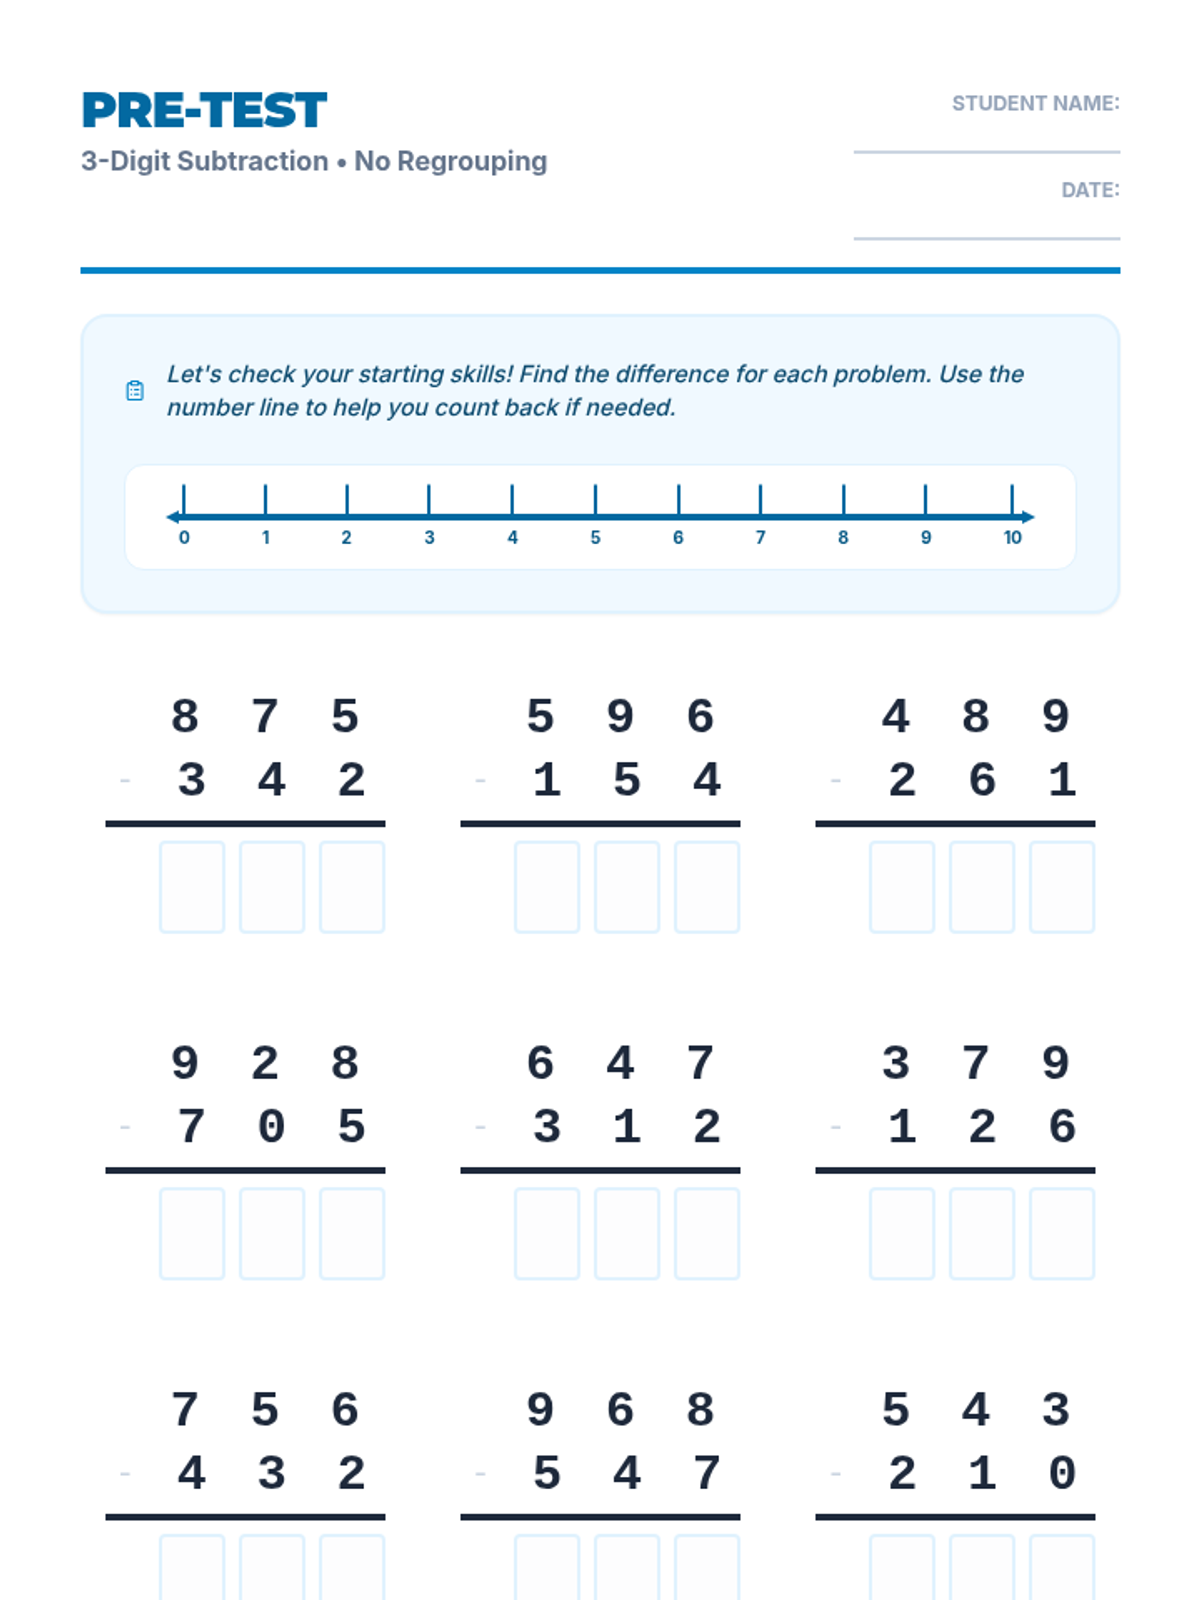
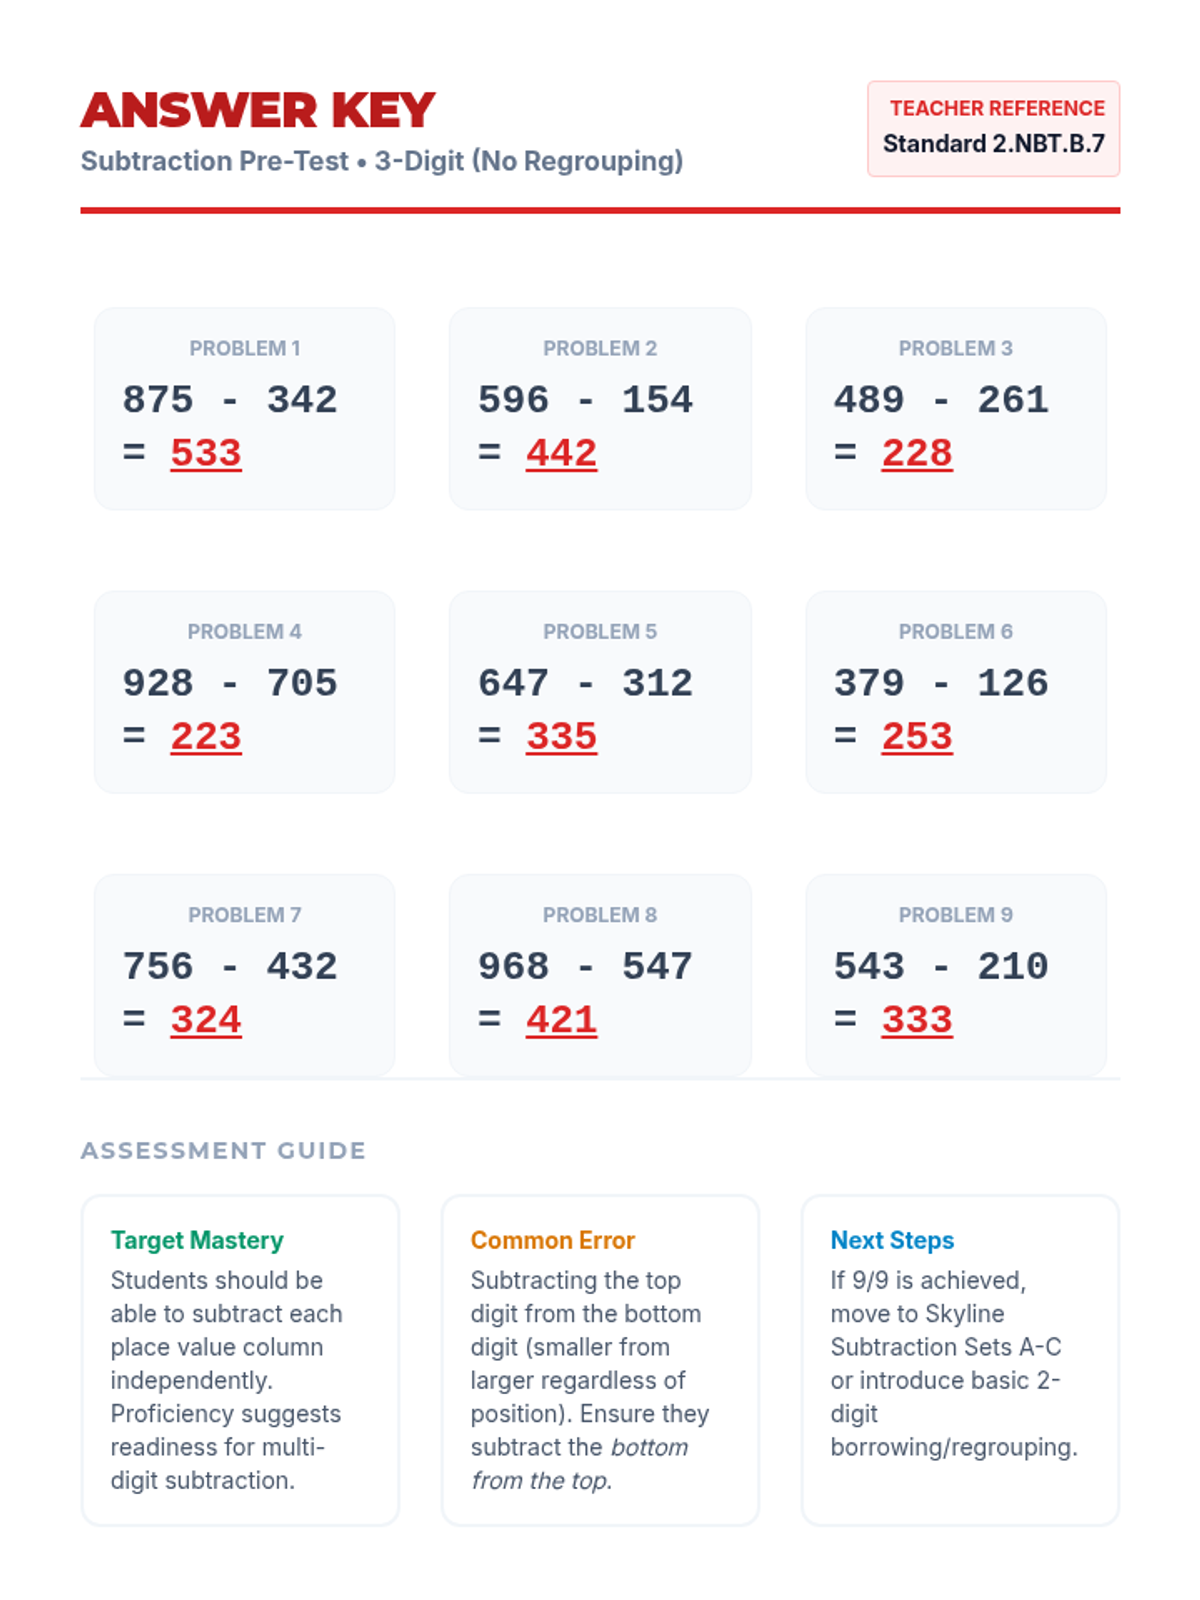
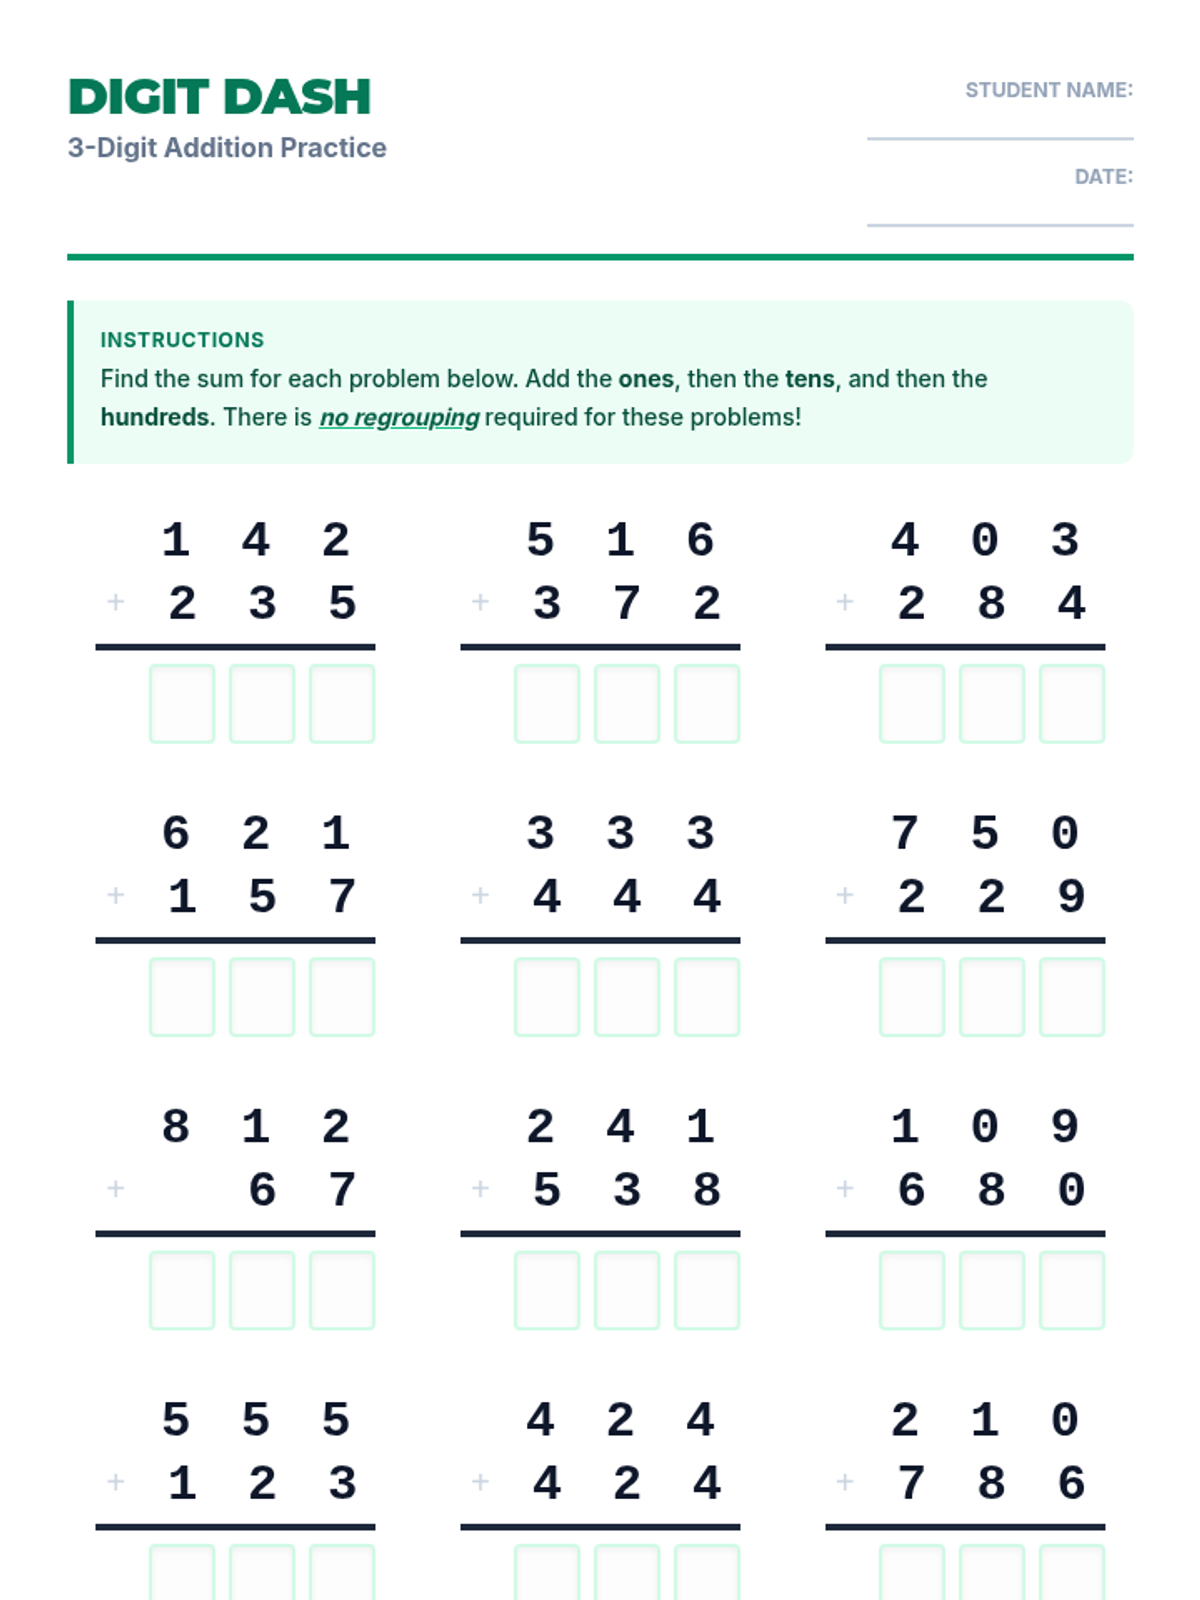
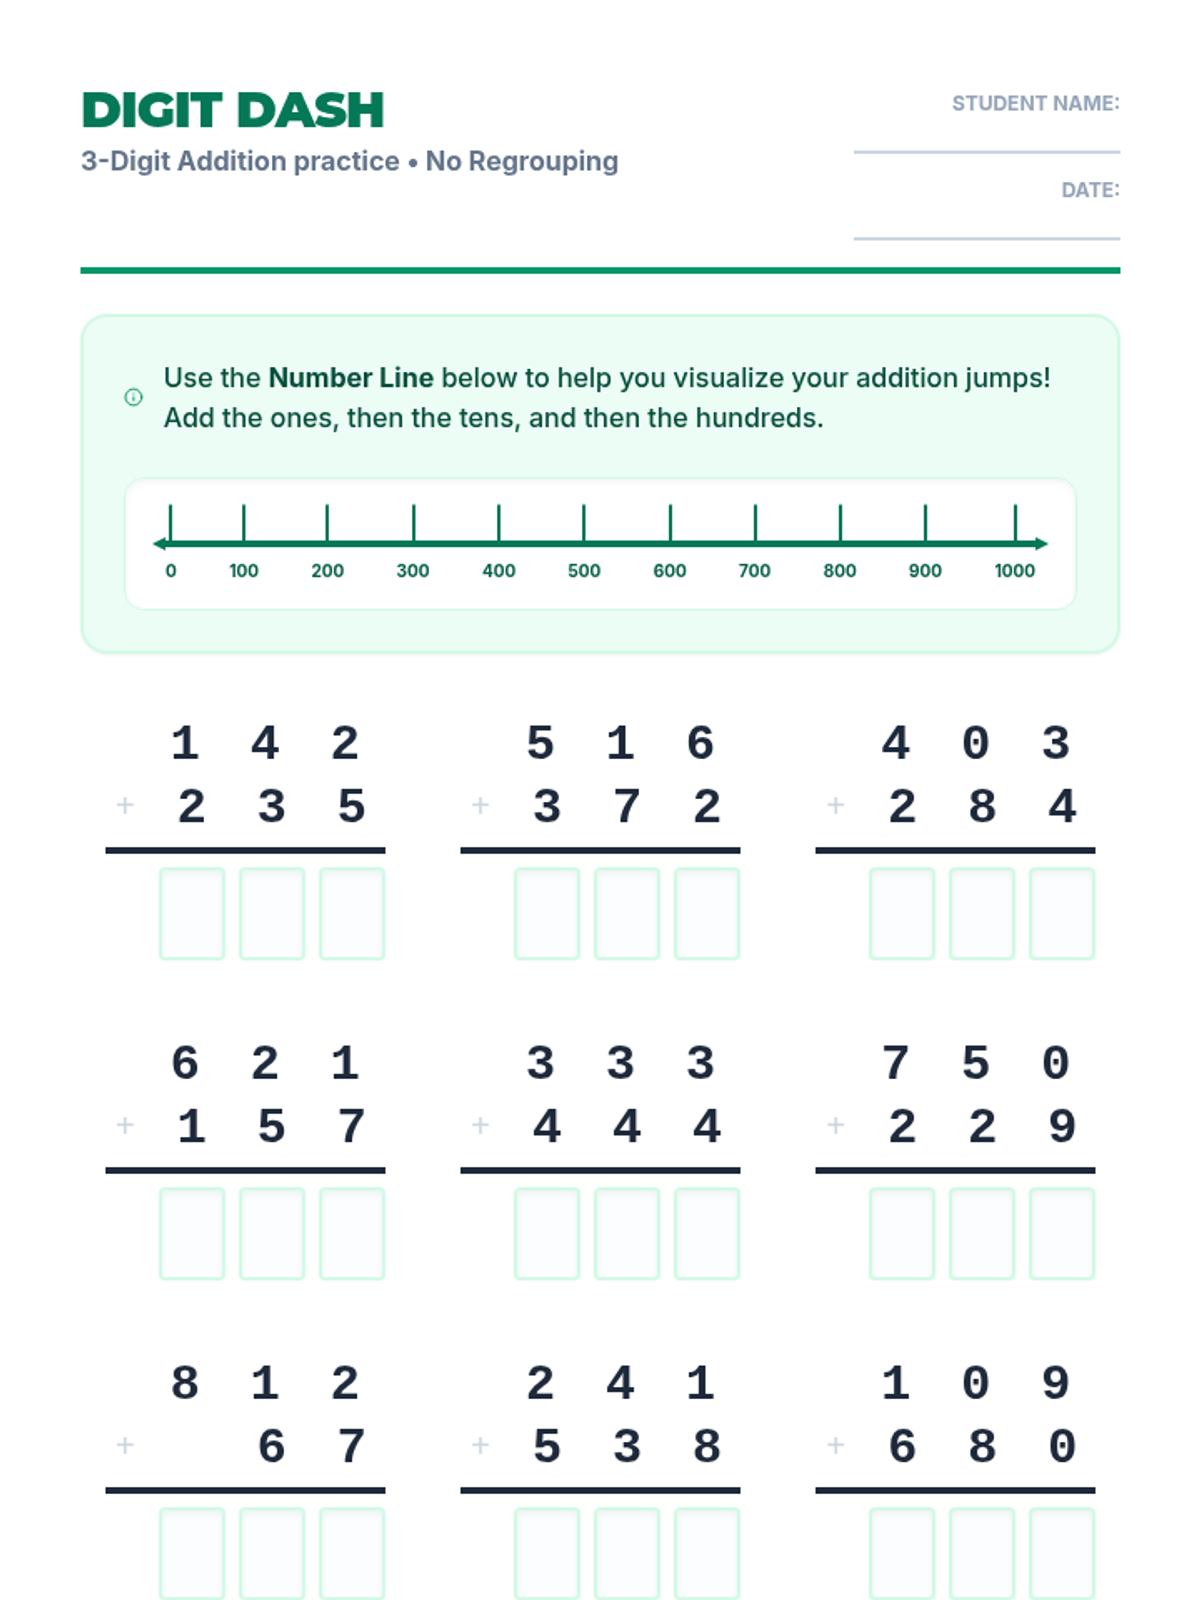
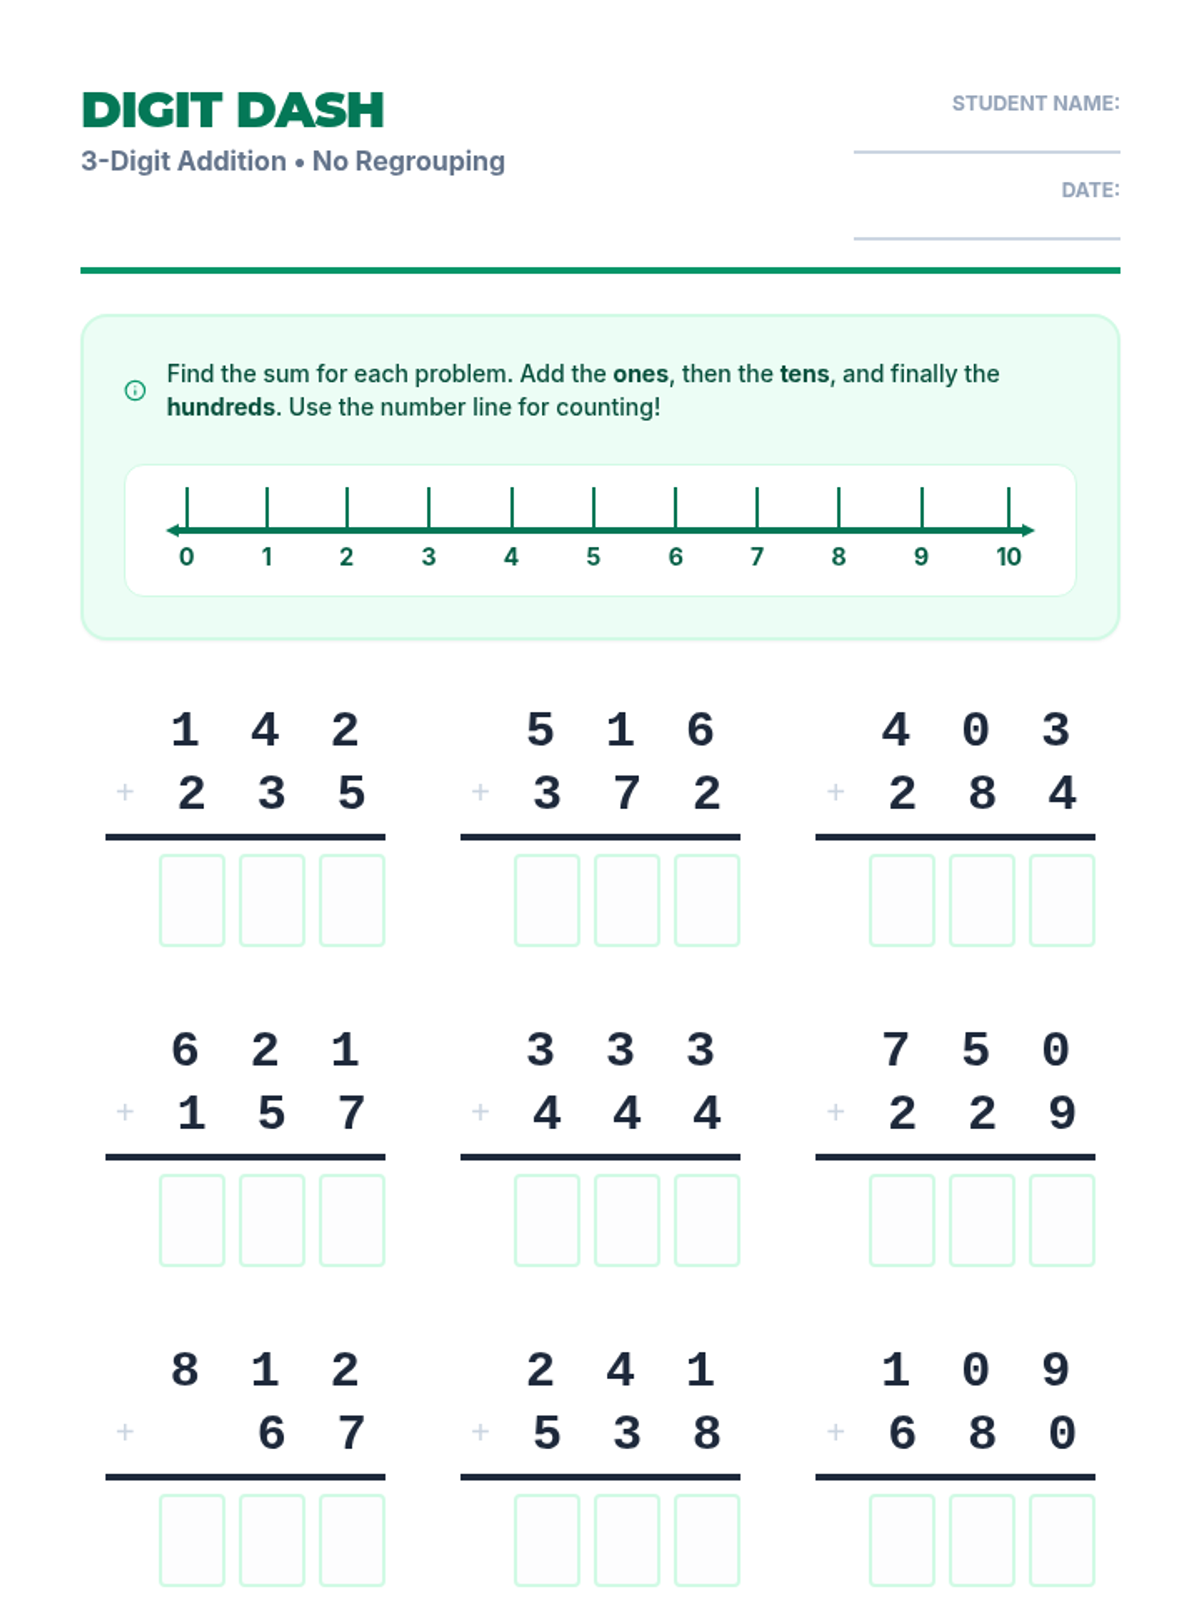
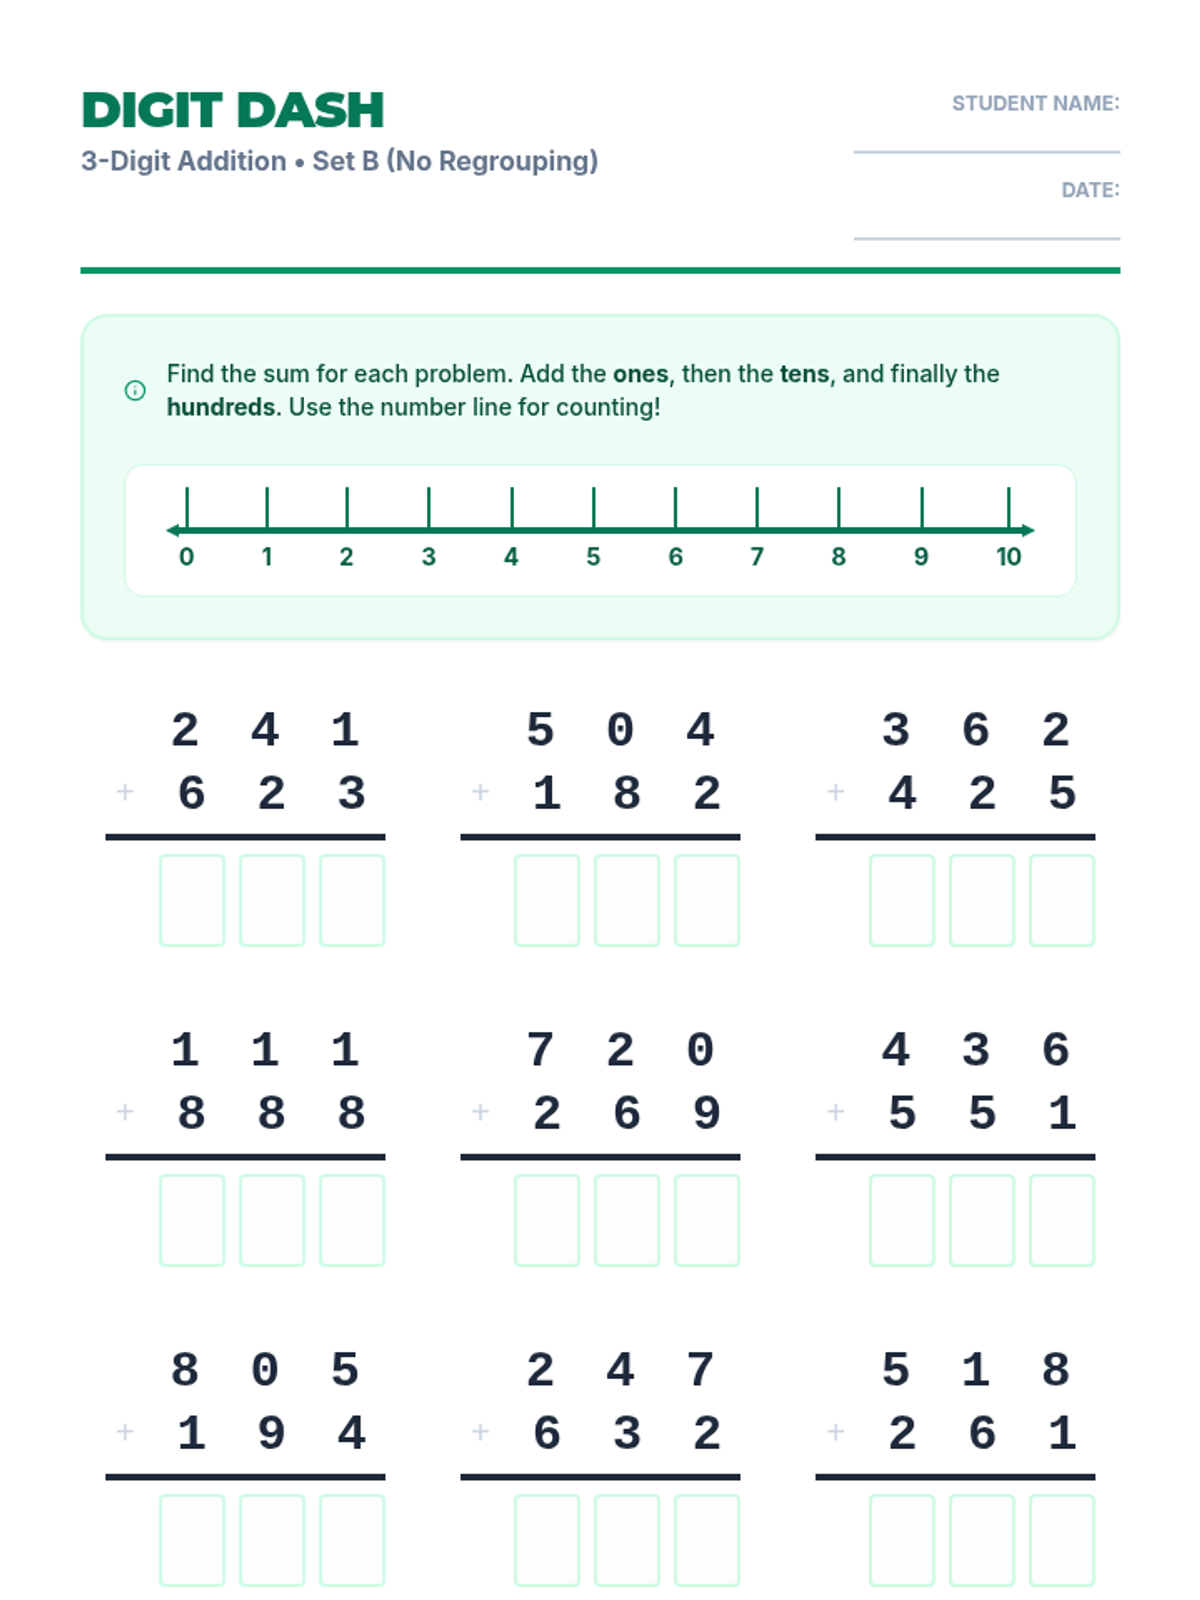
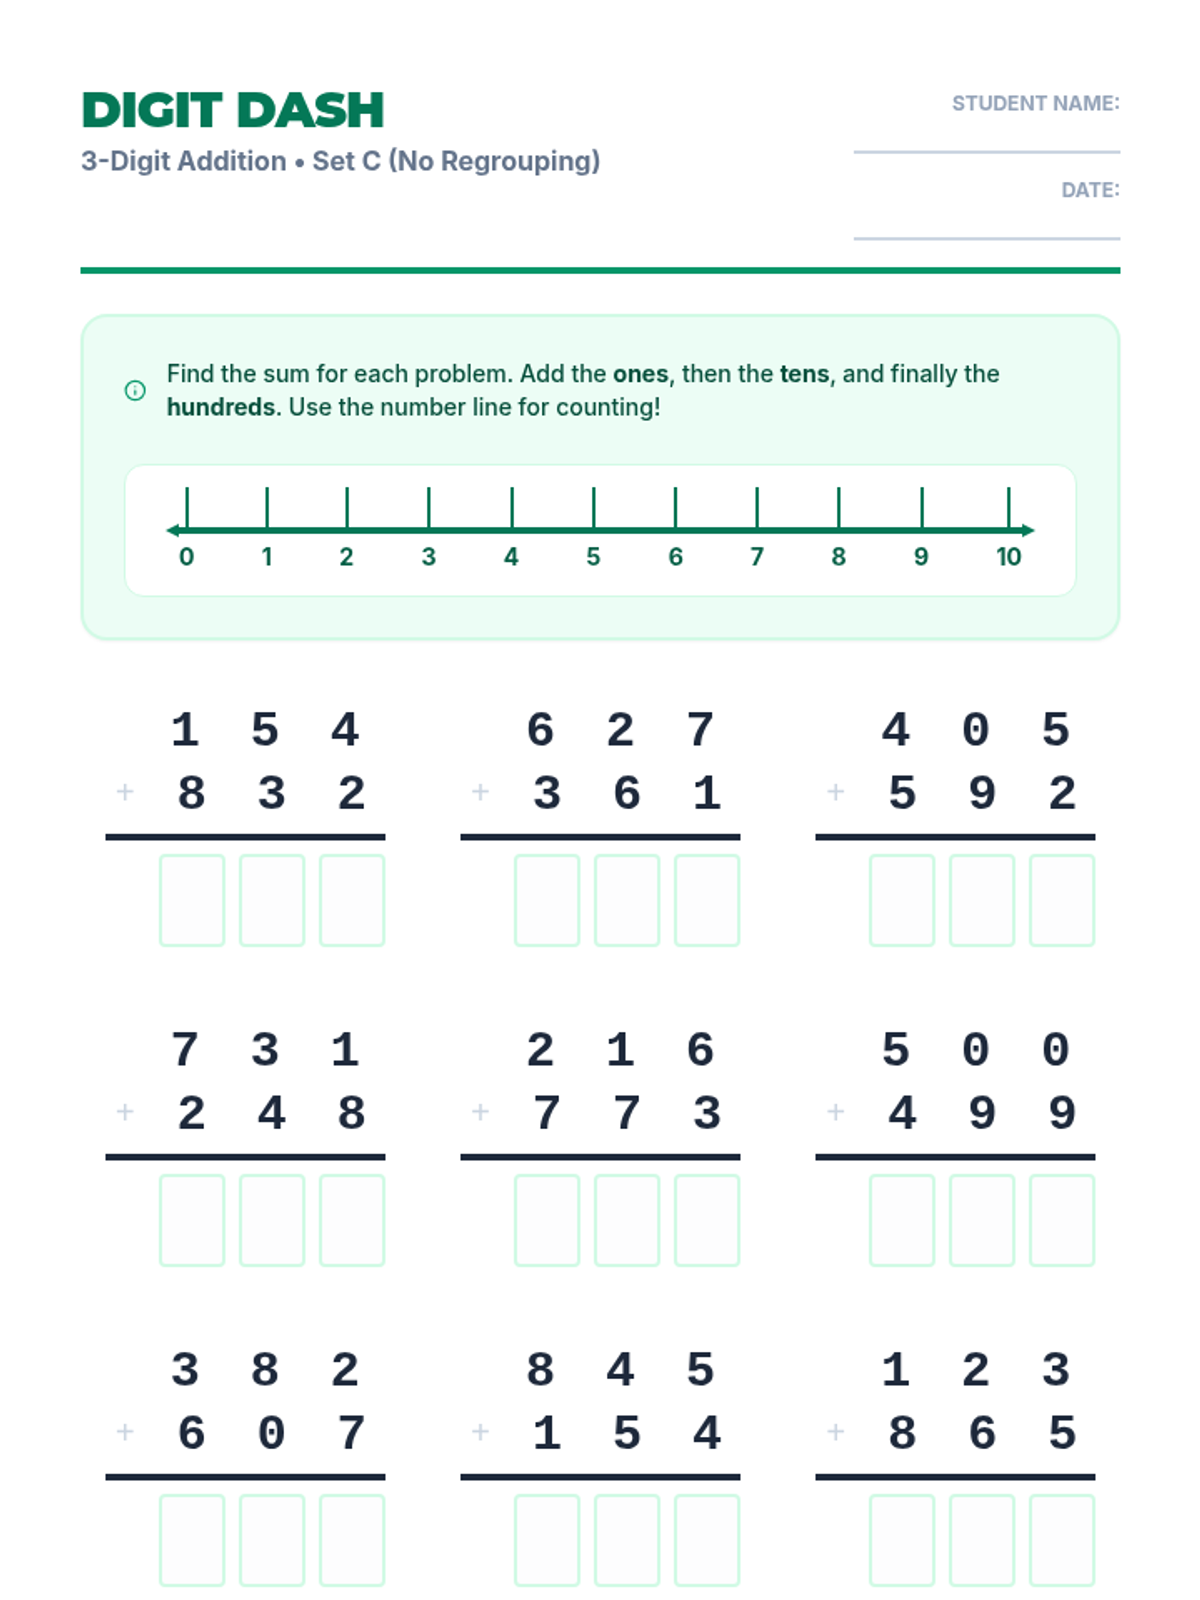
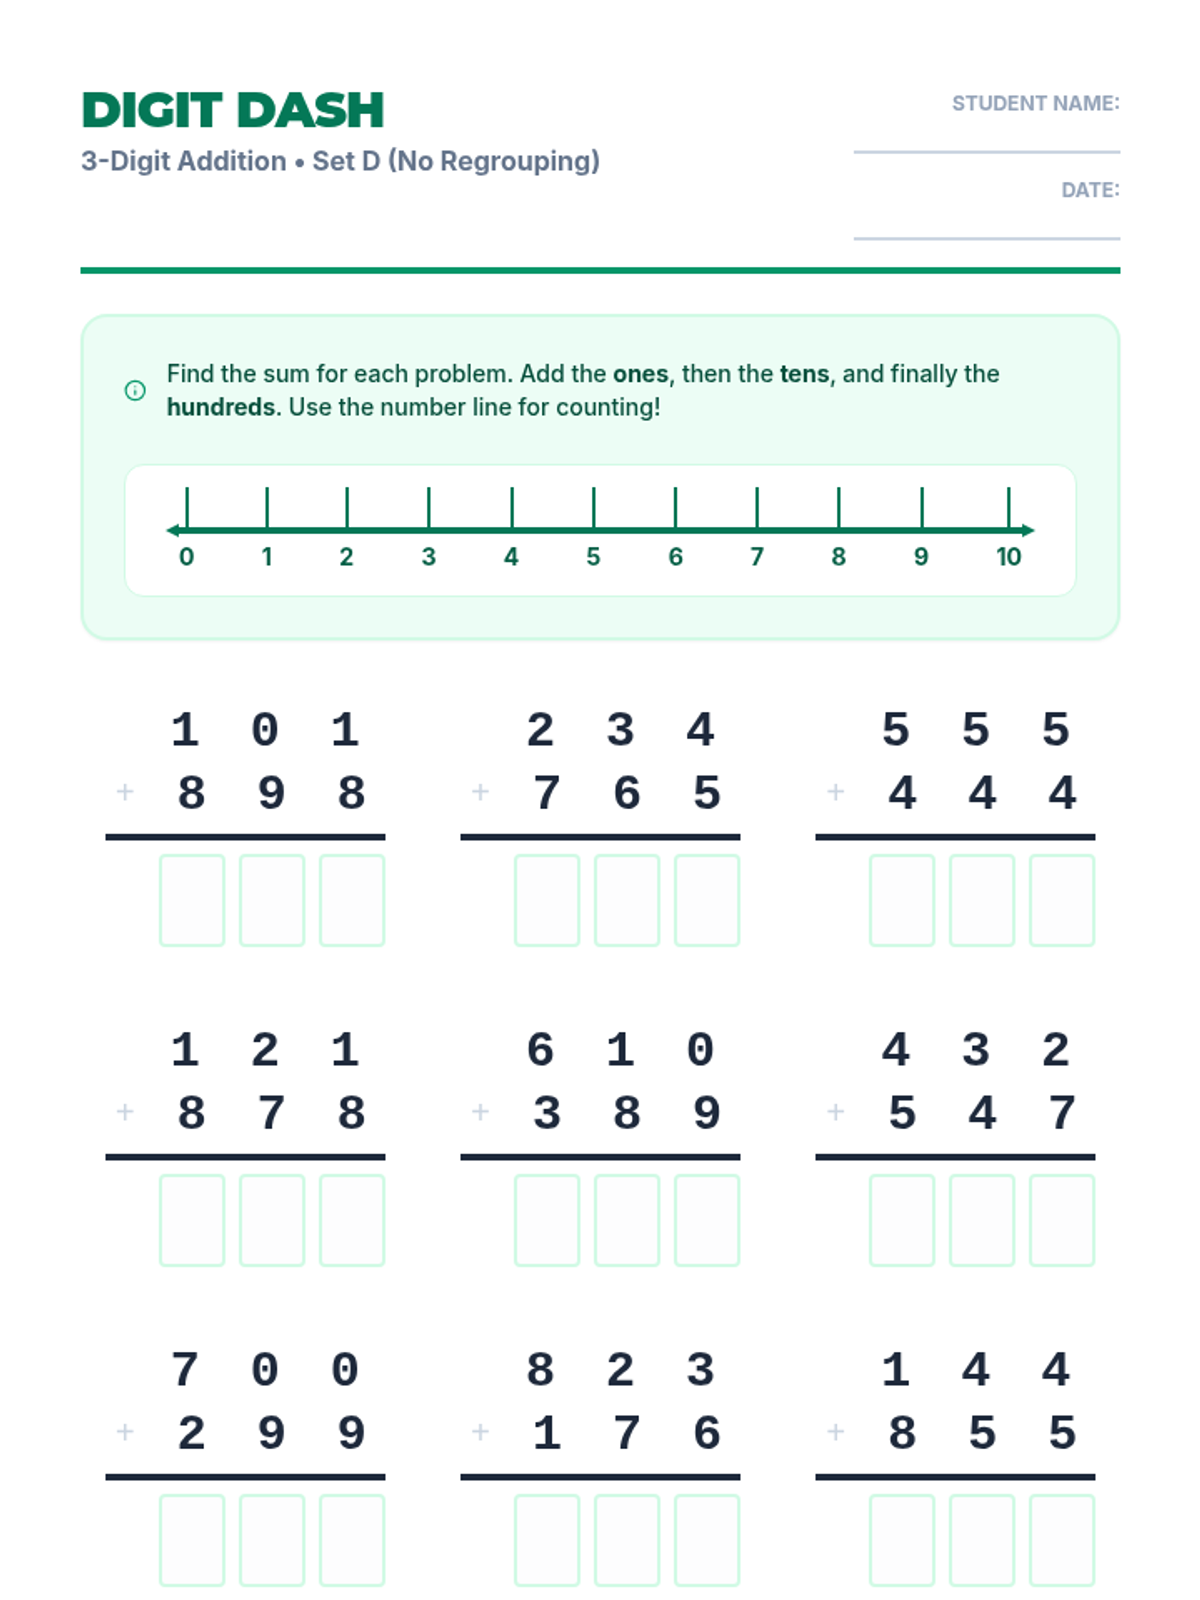
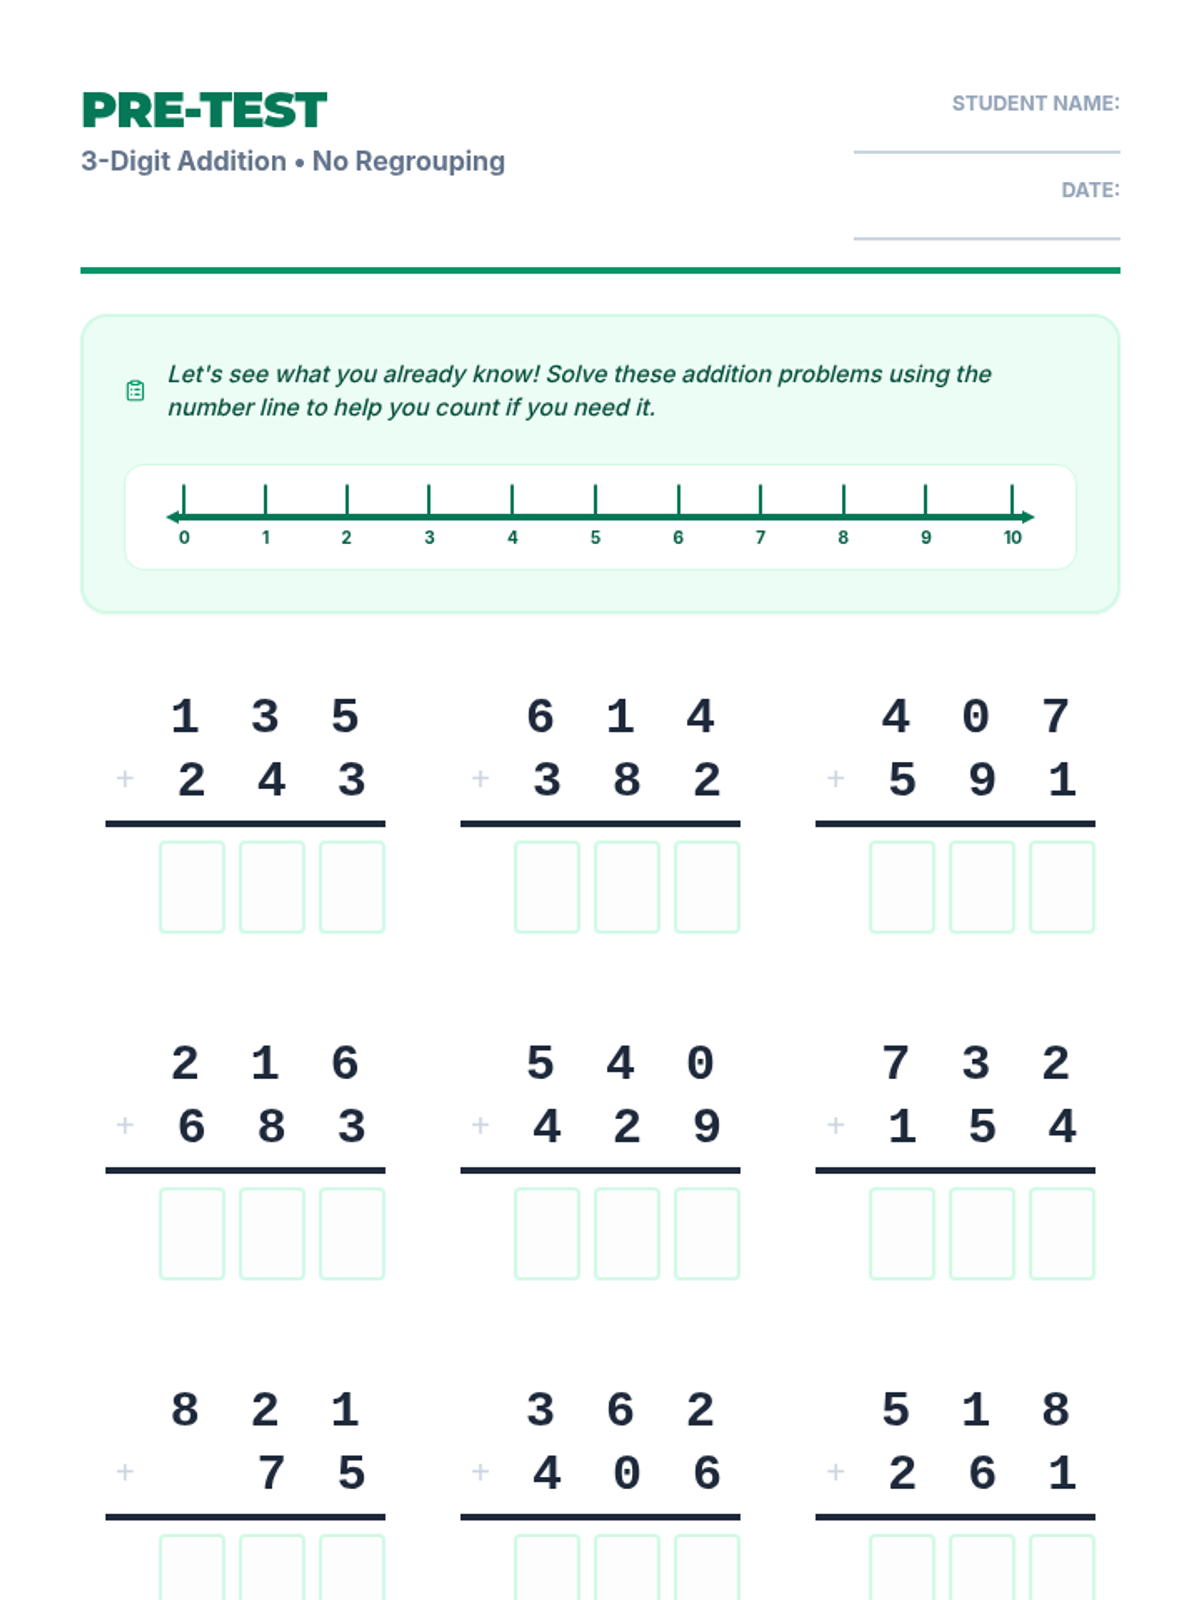
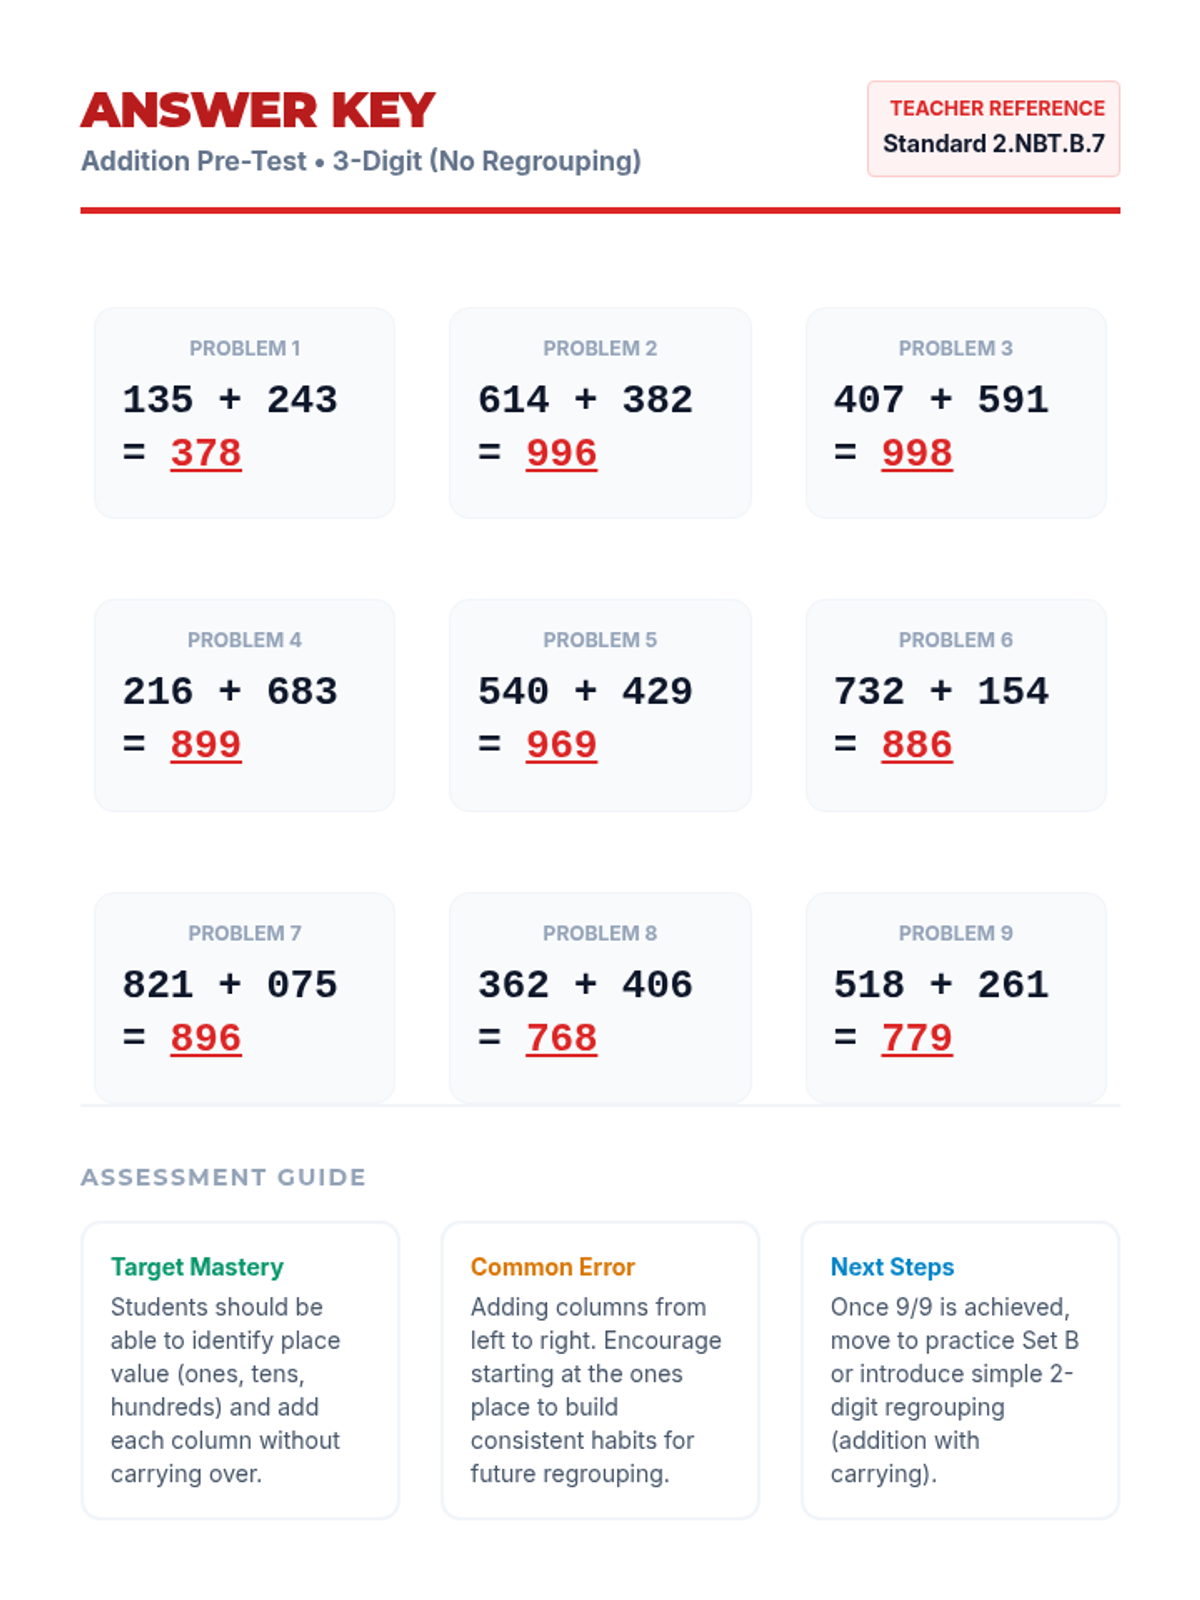
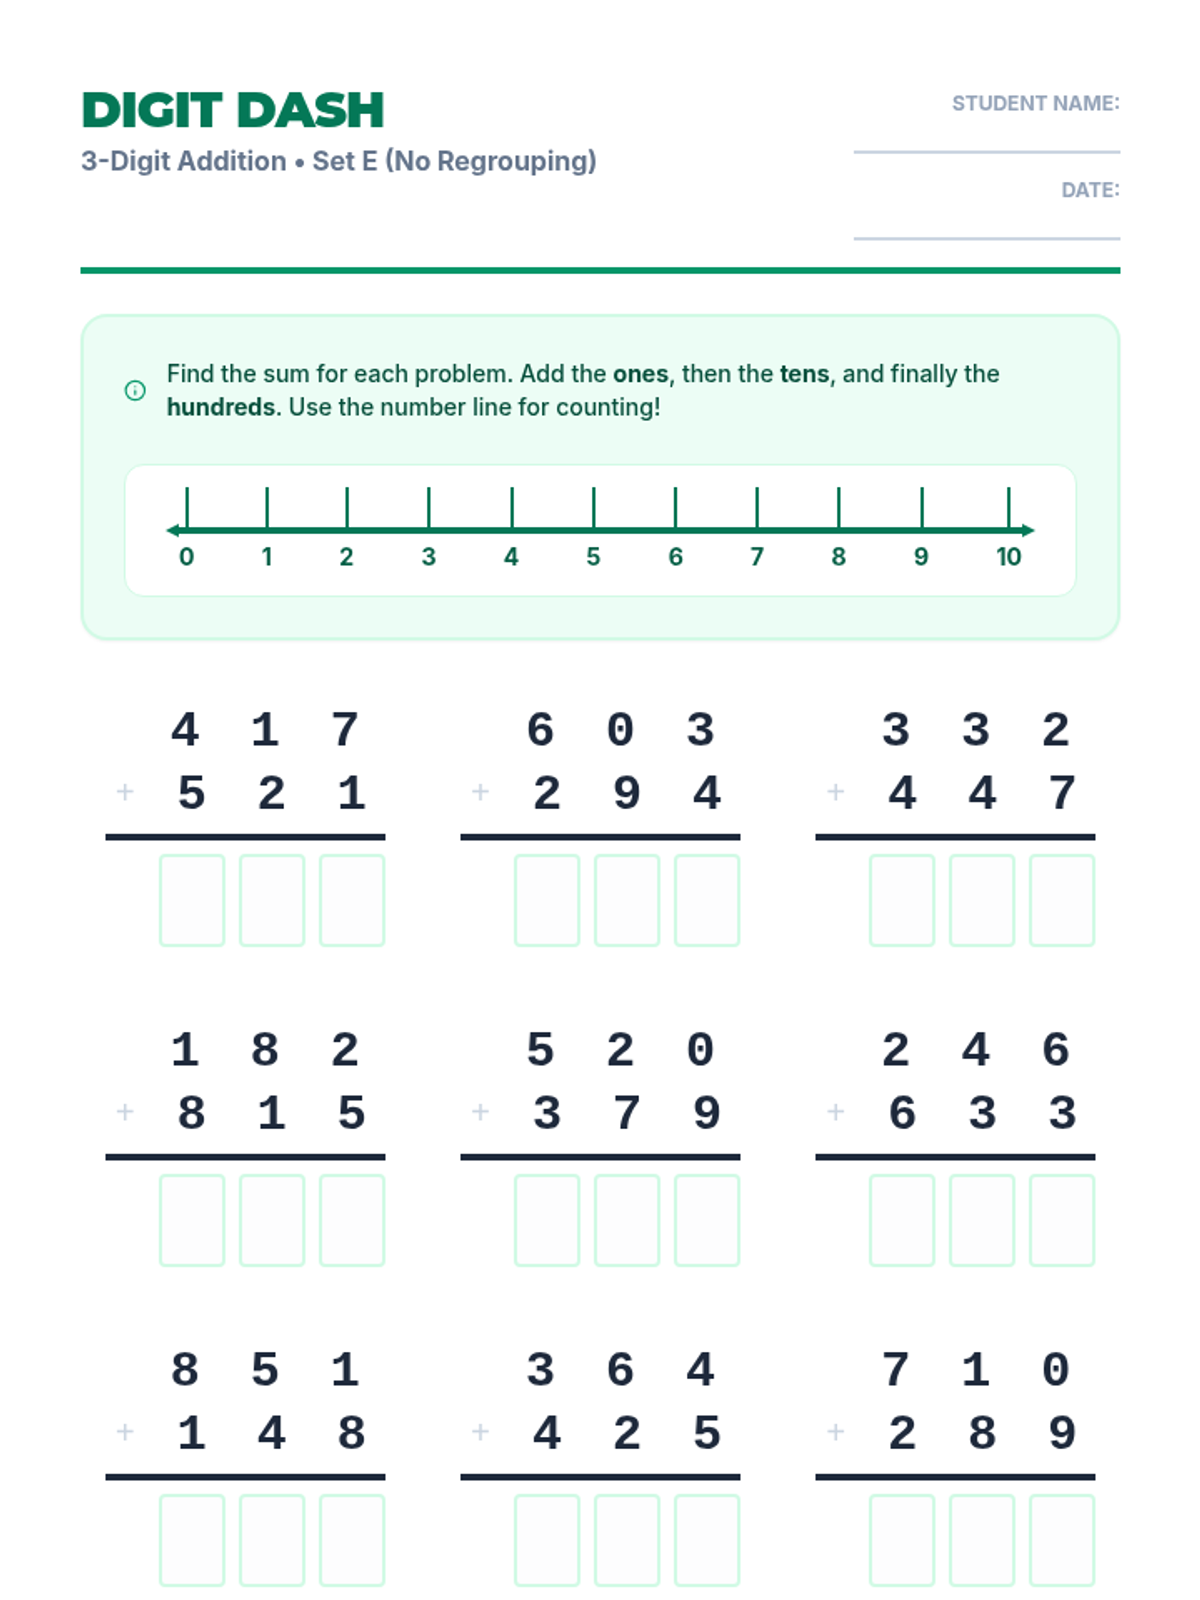
A series of practice worksheets focused on three-digit subtraction without regrouping, featuring a visual number line to assist with mental math and place value visualization.
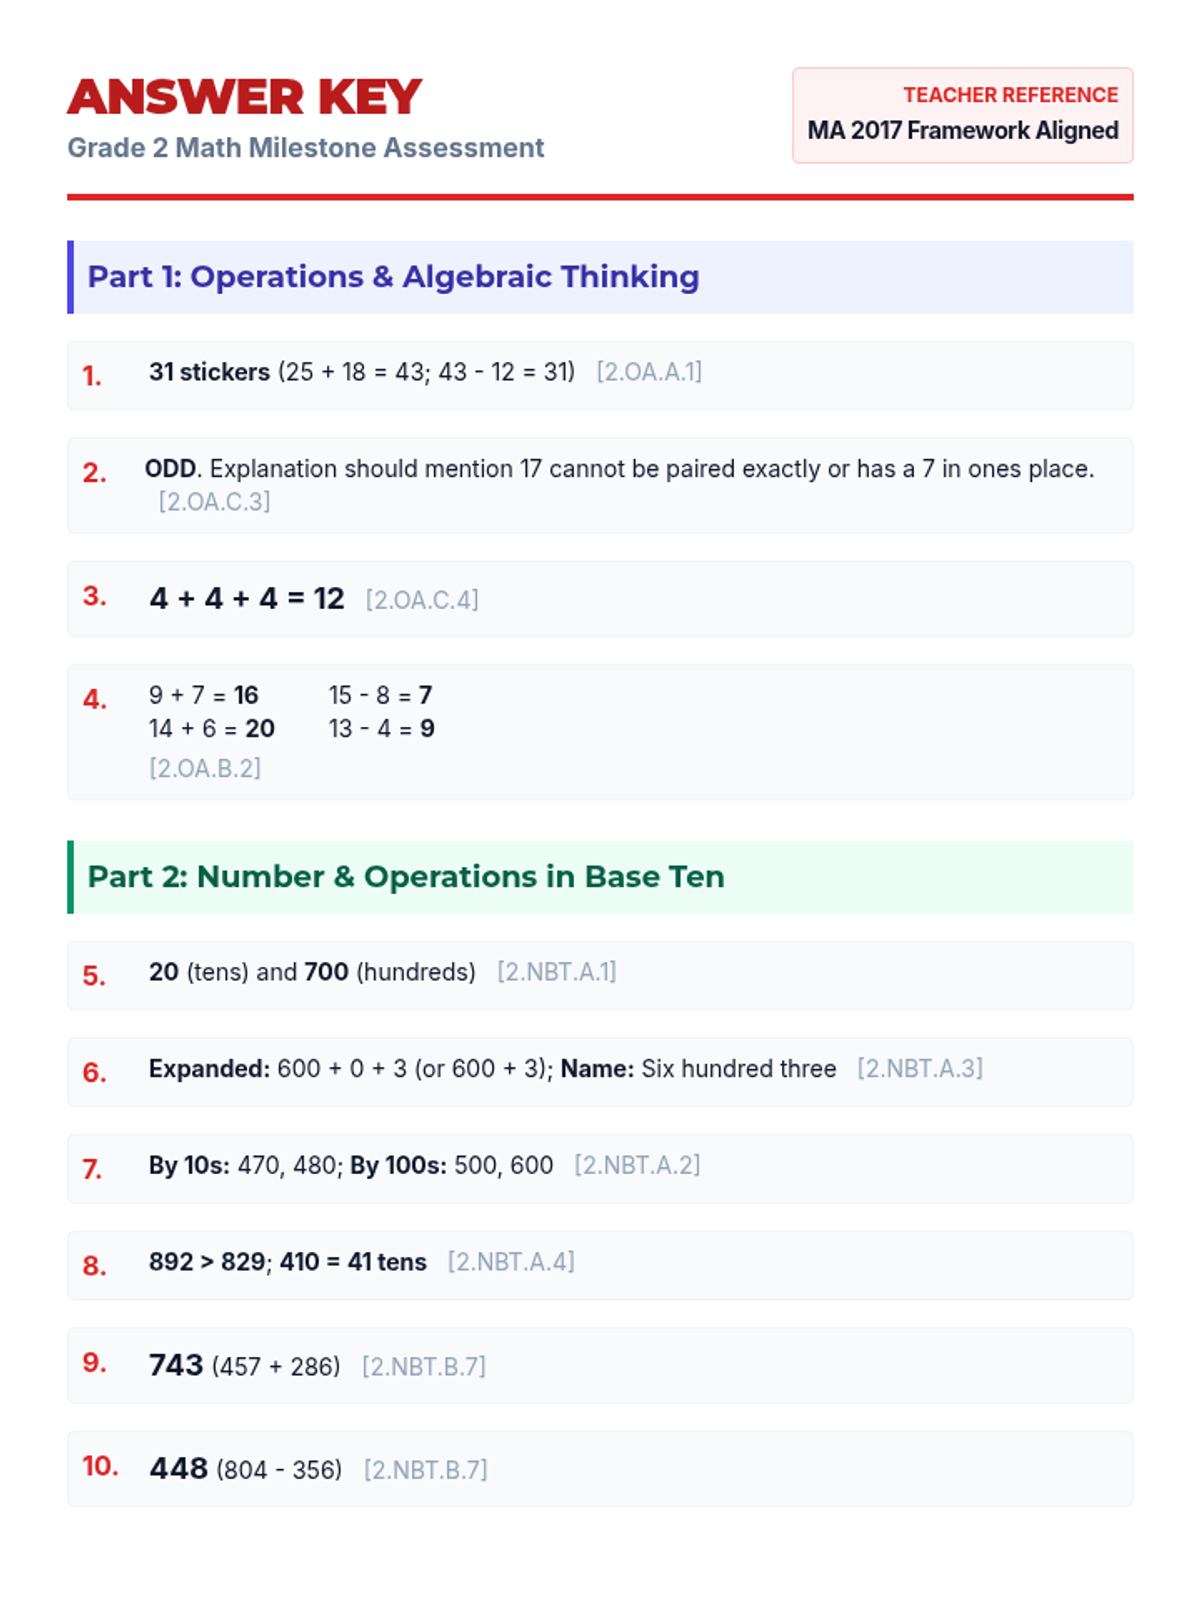
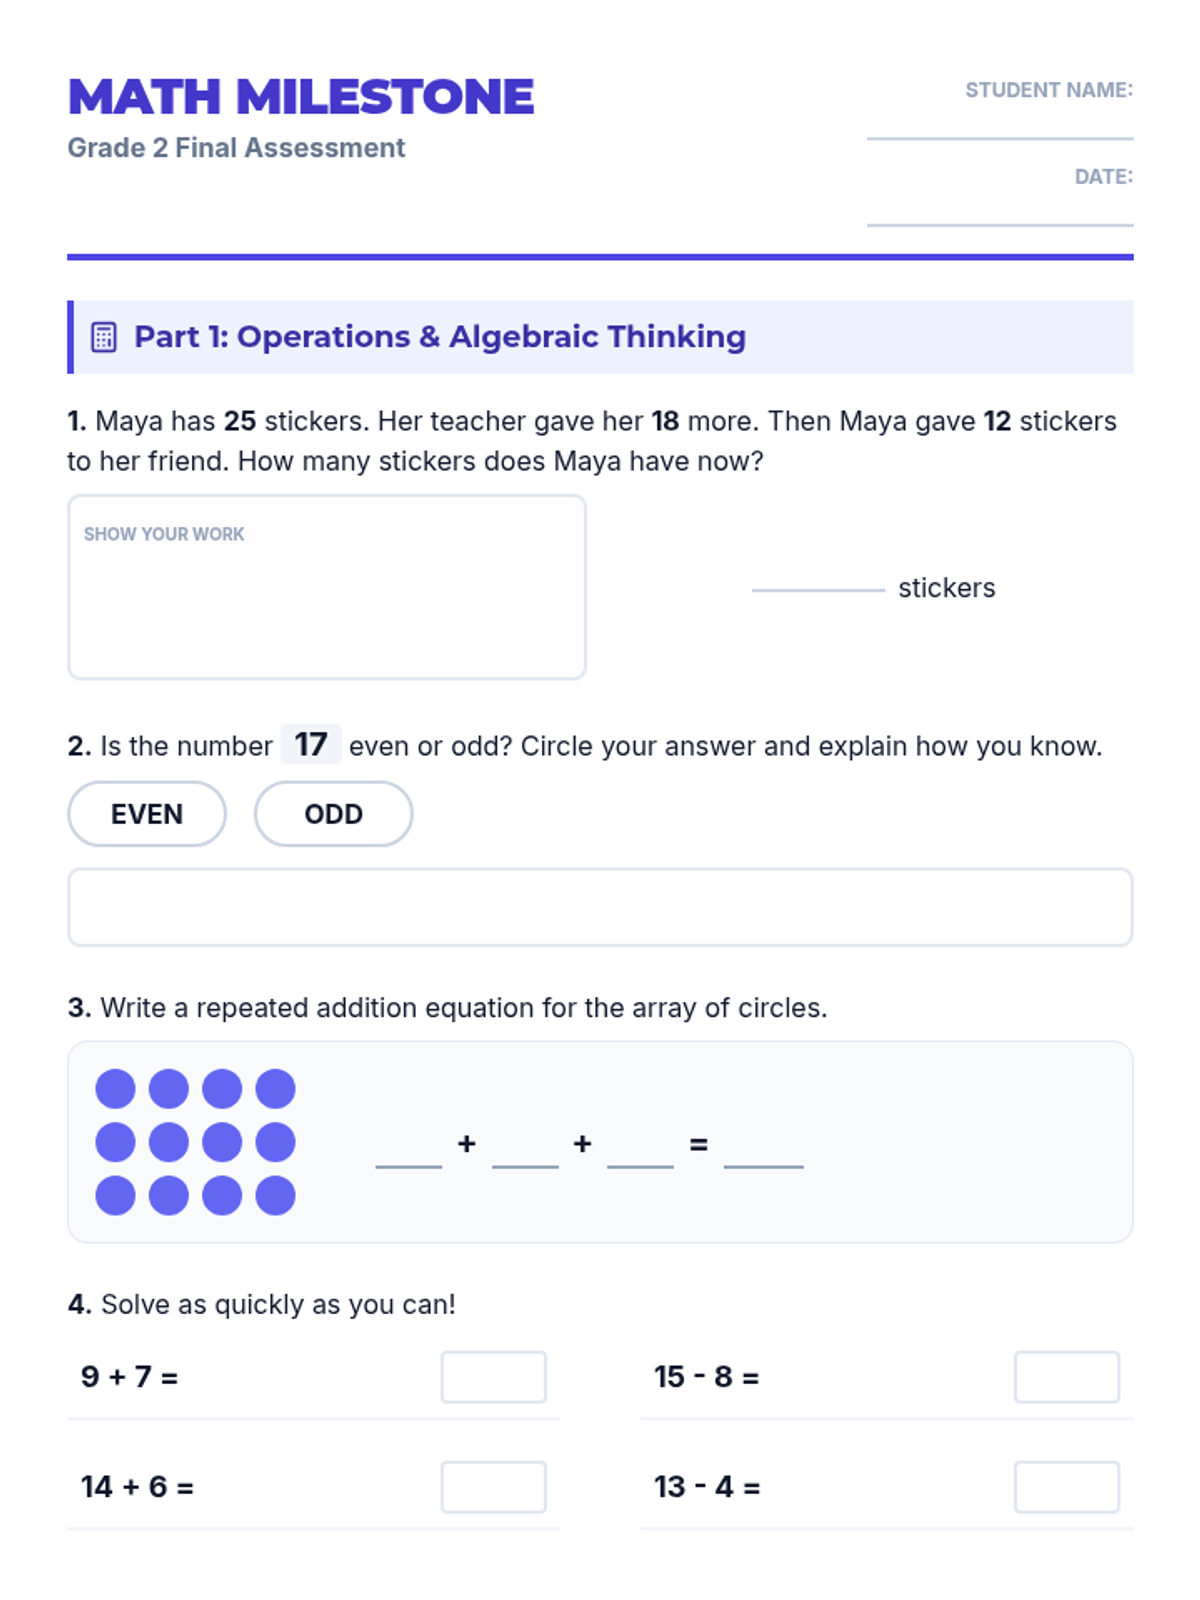
A comprehensive end-of-year assessment for second-grade students, covering all Massachusetts Mathematics Curriculum Framework standards including Operations and Algebraic Thinking, Number and Operations in Base Ten, Measurement and Data, and Geometry.
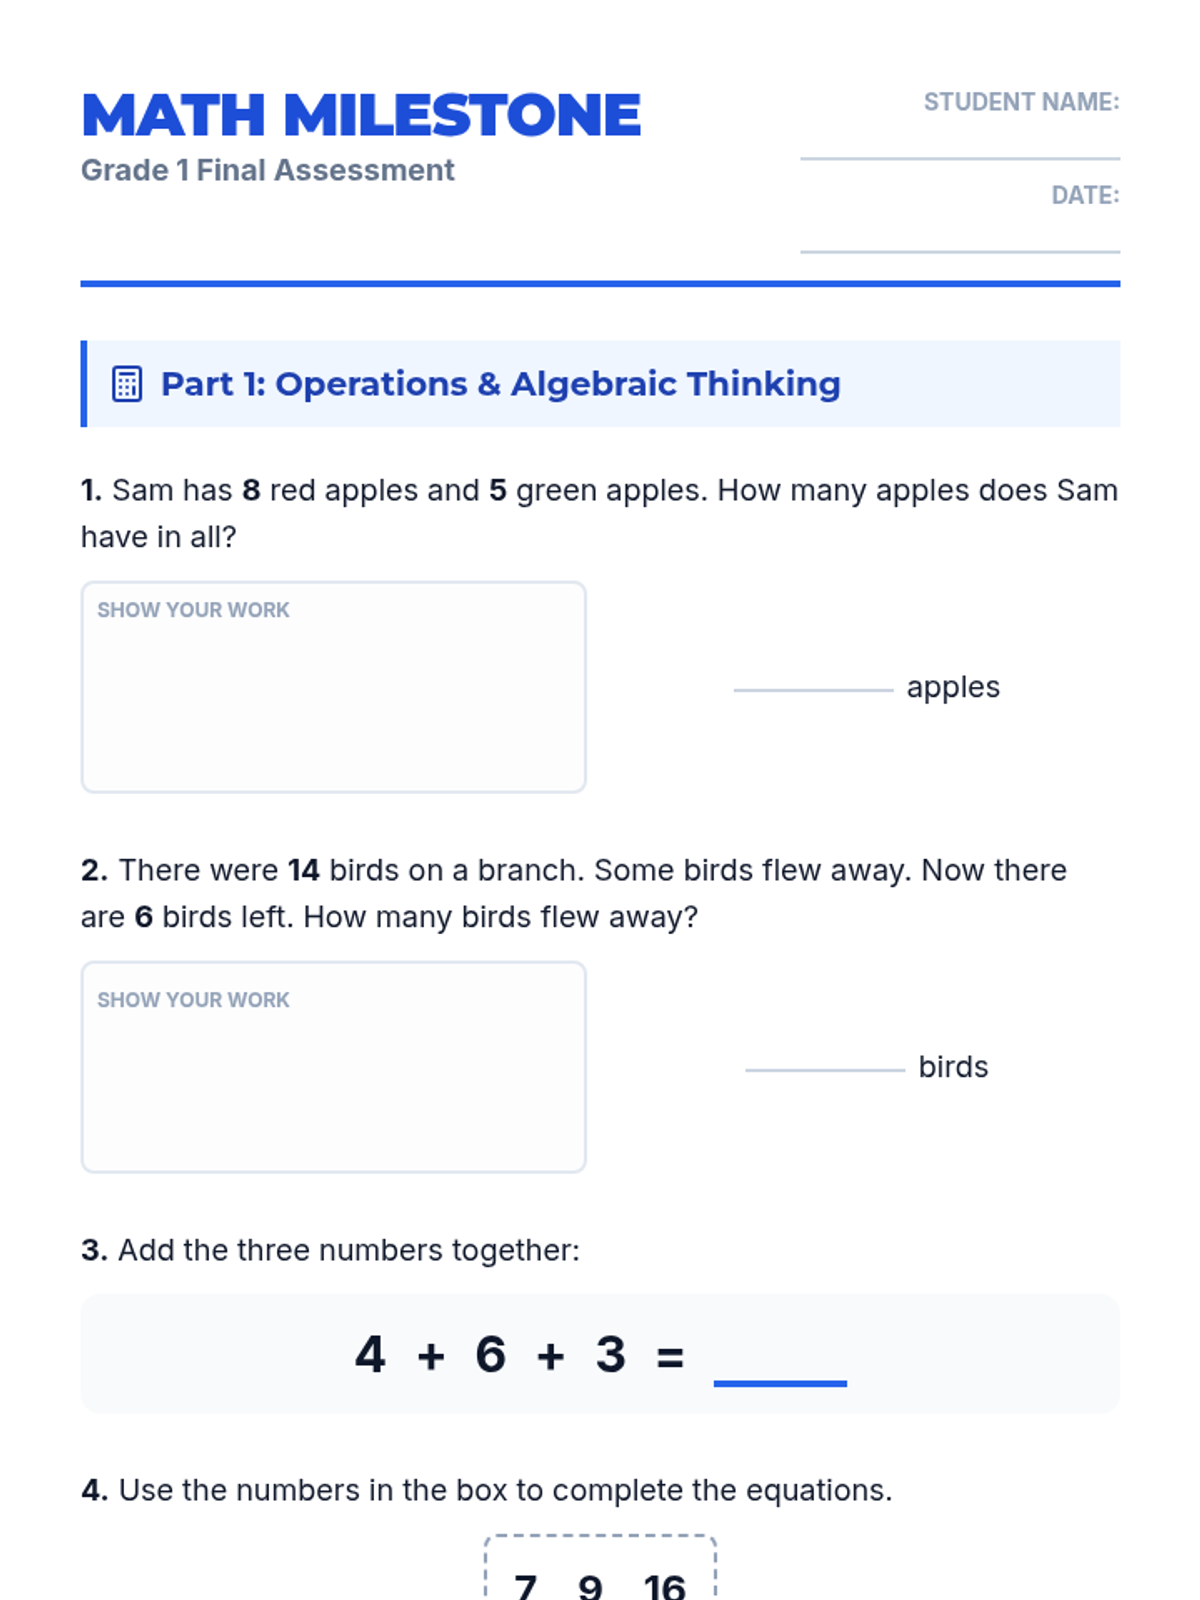
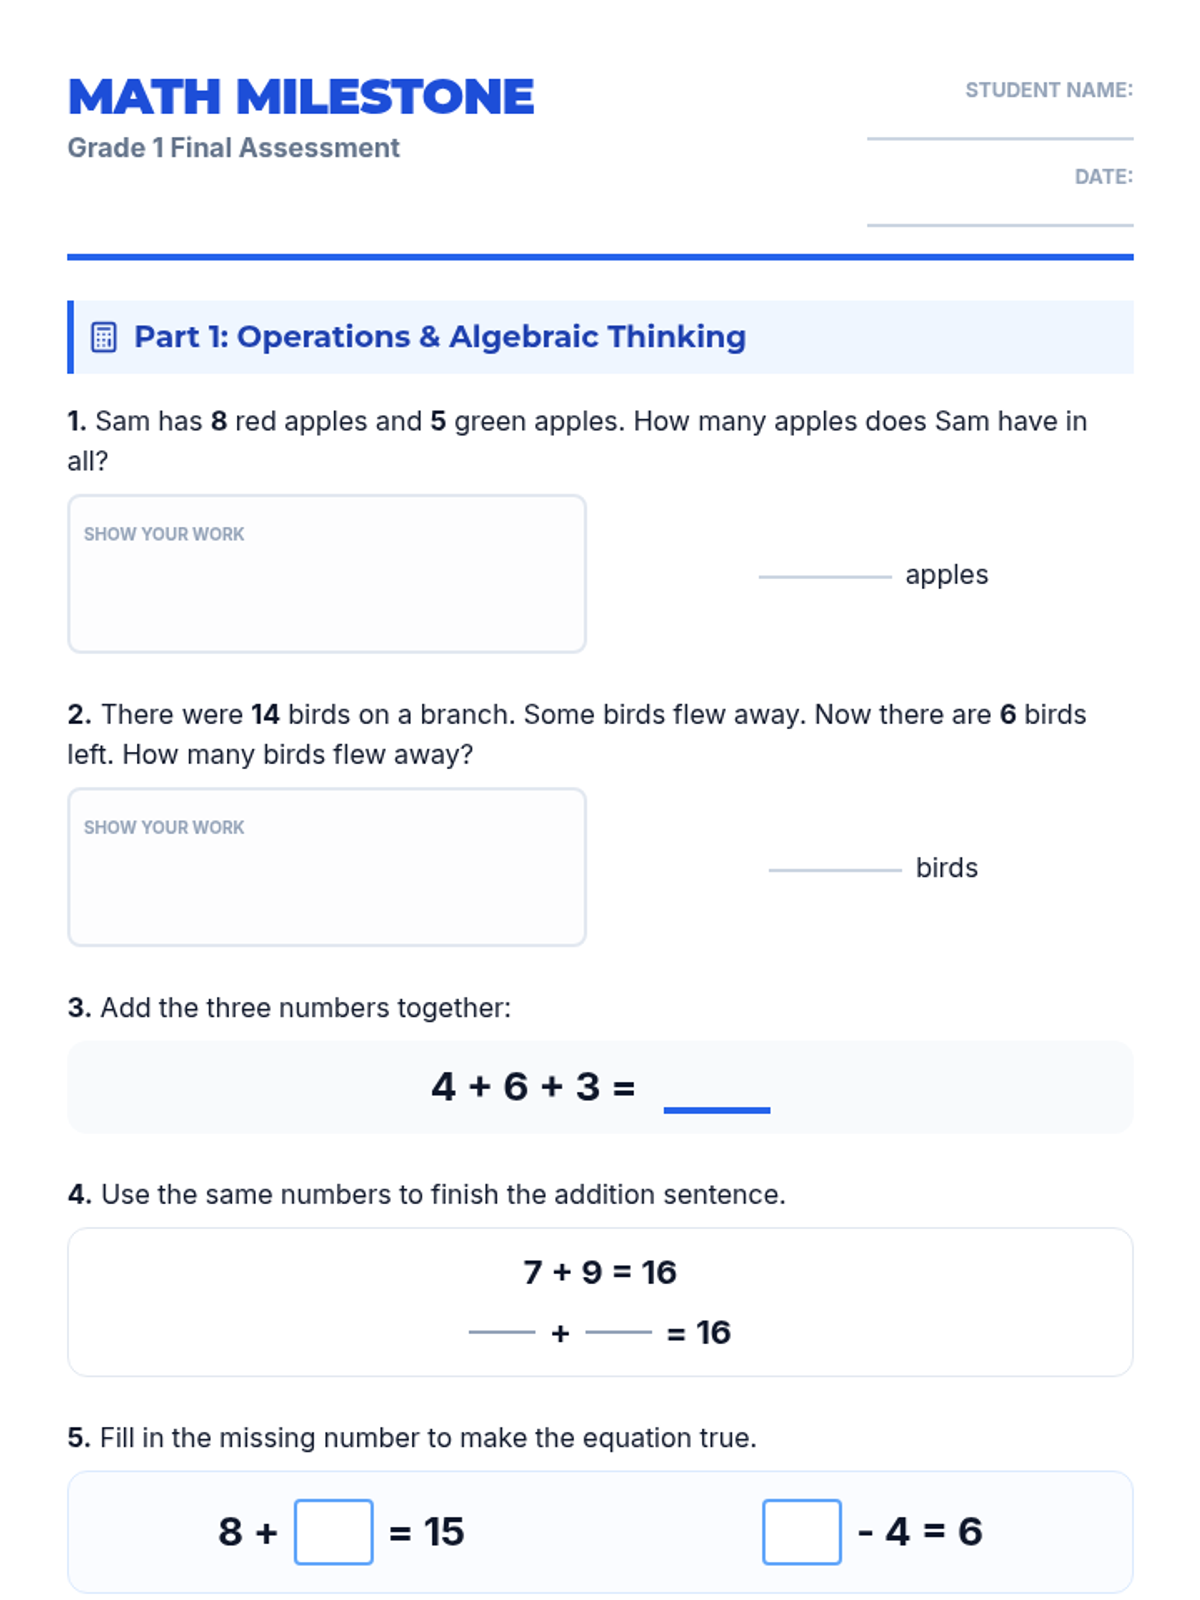
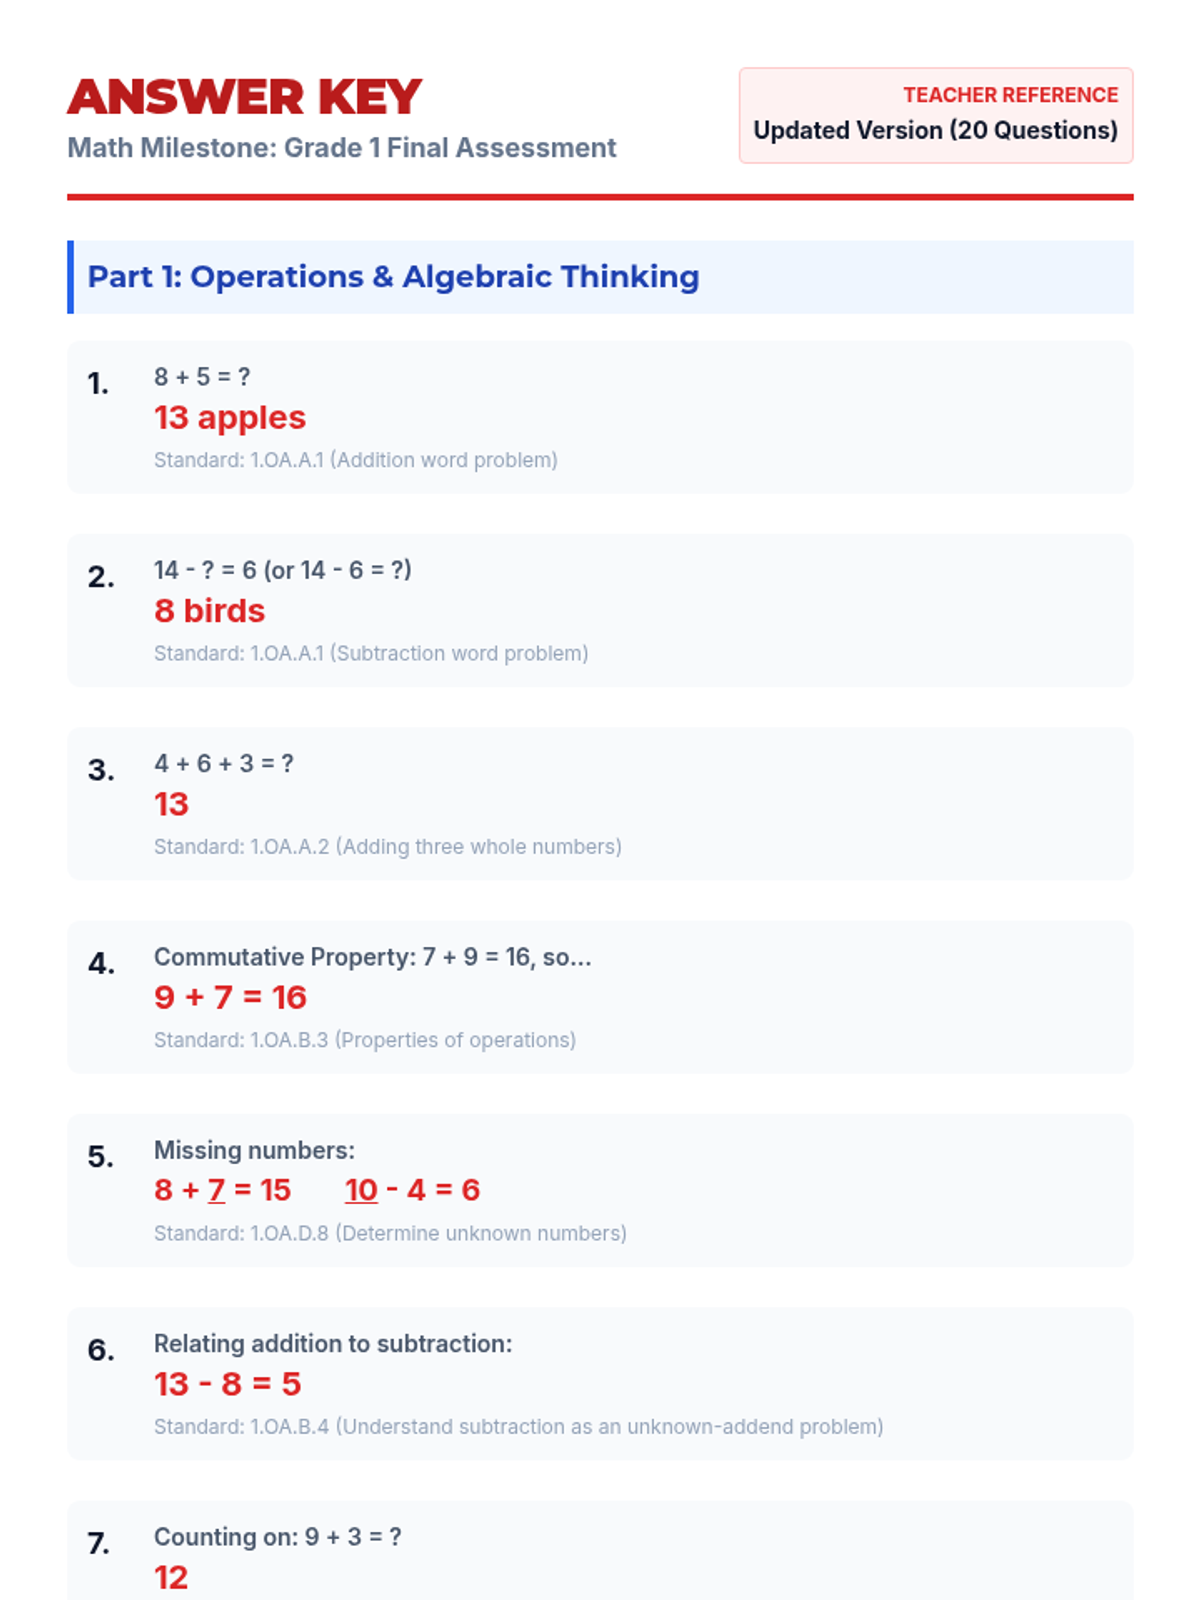
A comprehensive end-of-year assessment for first-grade students, covering all Massachusetts Mathematics Curriculum Framework standards including Operations and Algebraic Thinking, Number and Operations in Base Ten, Measurement and Data, and Geometry.
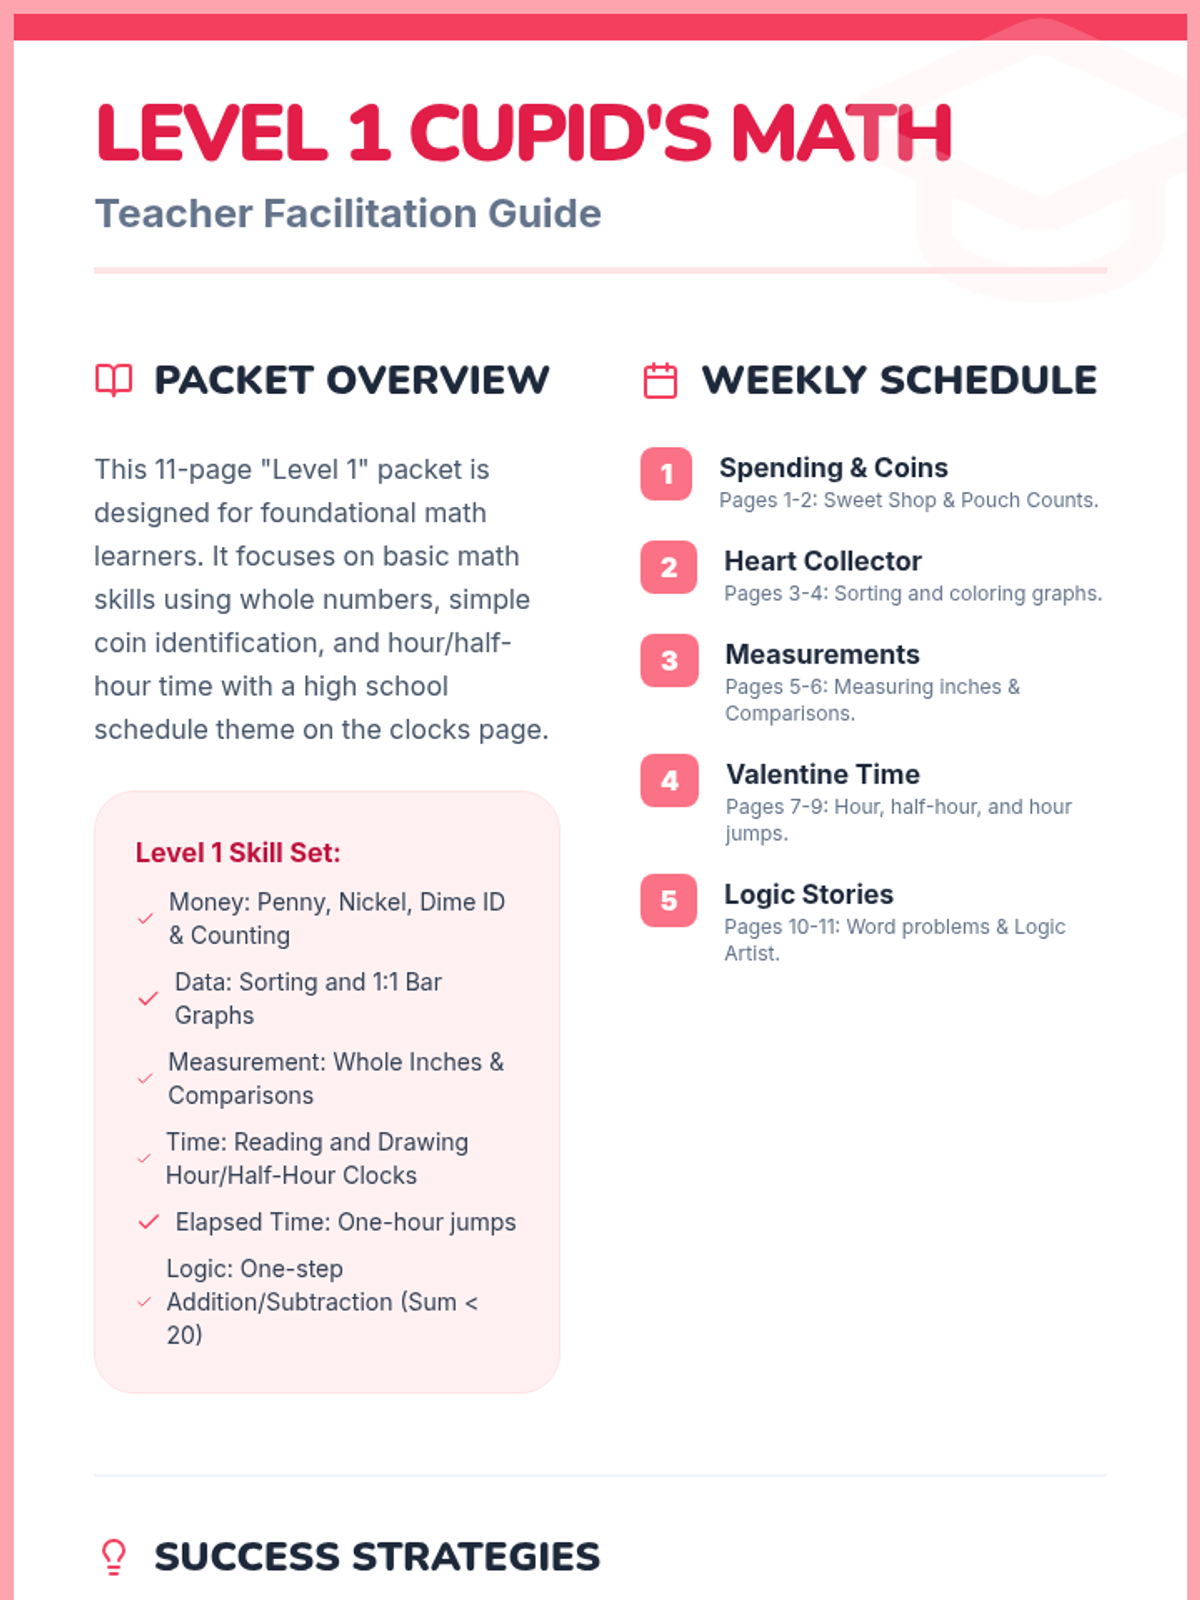
Teacher overview and answer keys for the Level 1 Valentine's Day math packet.