Data representation, distributions, and statistical variability using sampling and inference techniques. Integrates probability models, compound events, bivariate patterns, and linear models to guide data-driven decision making.
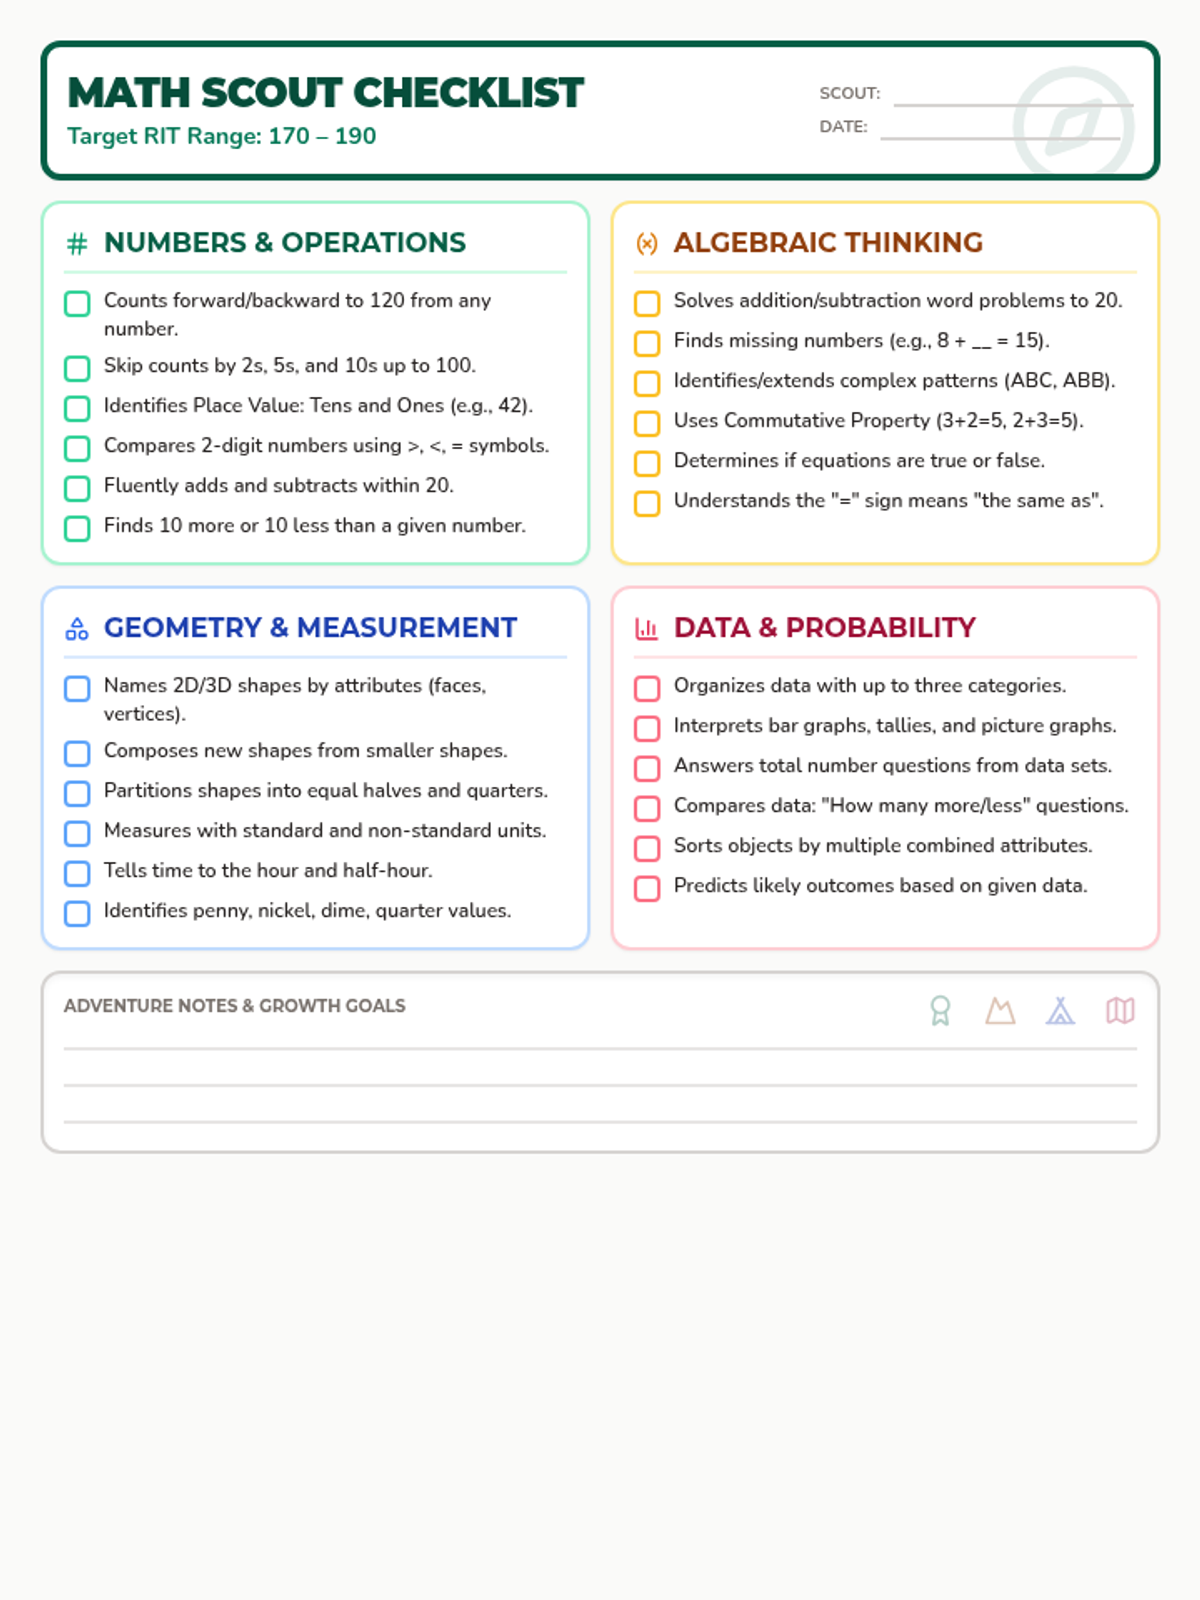
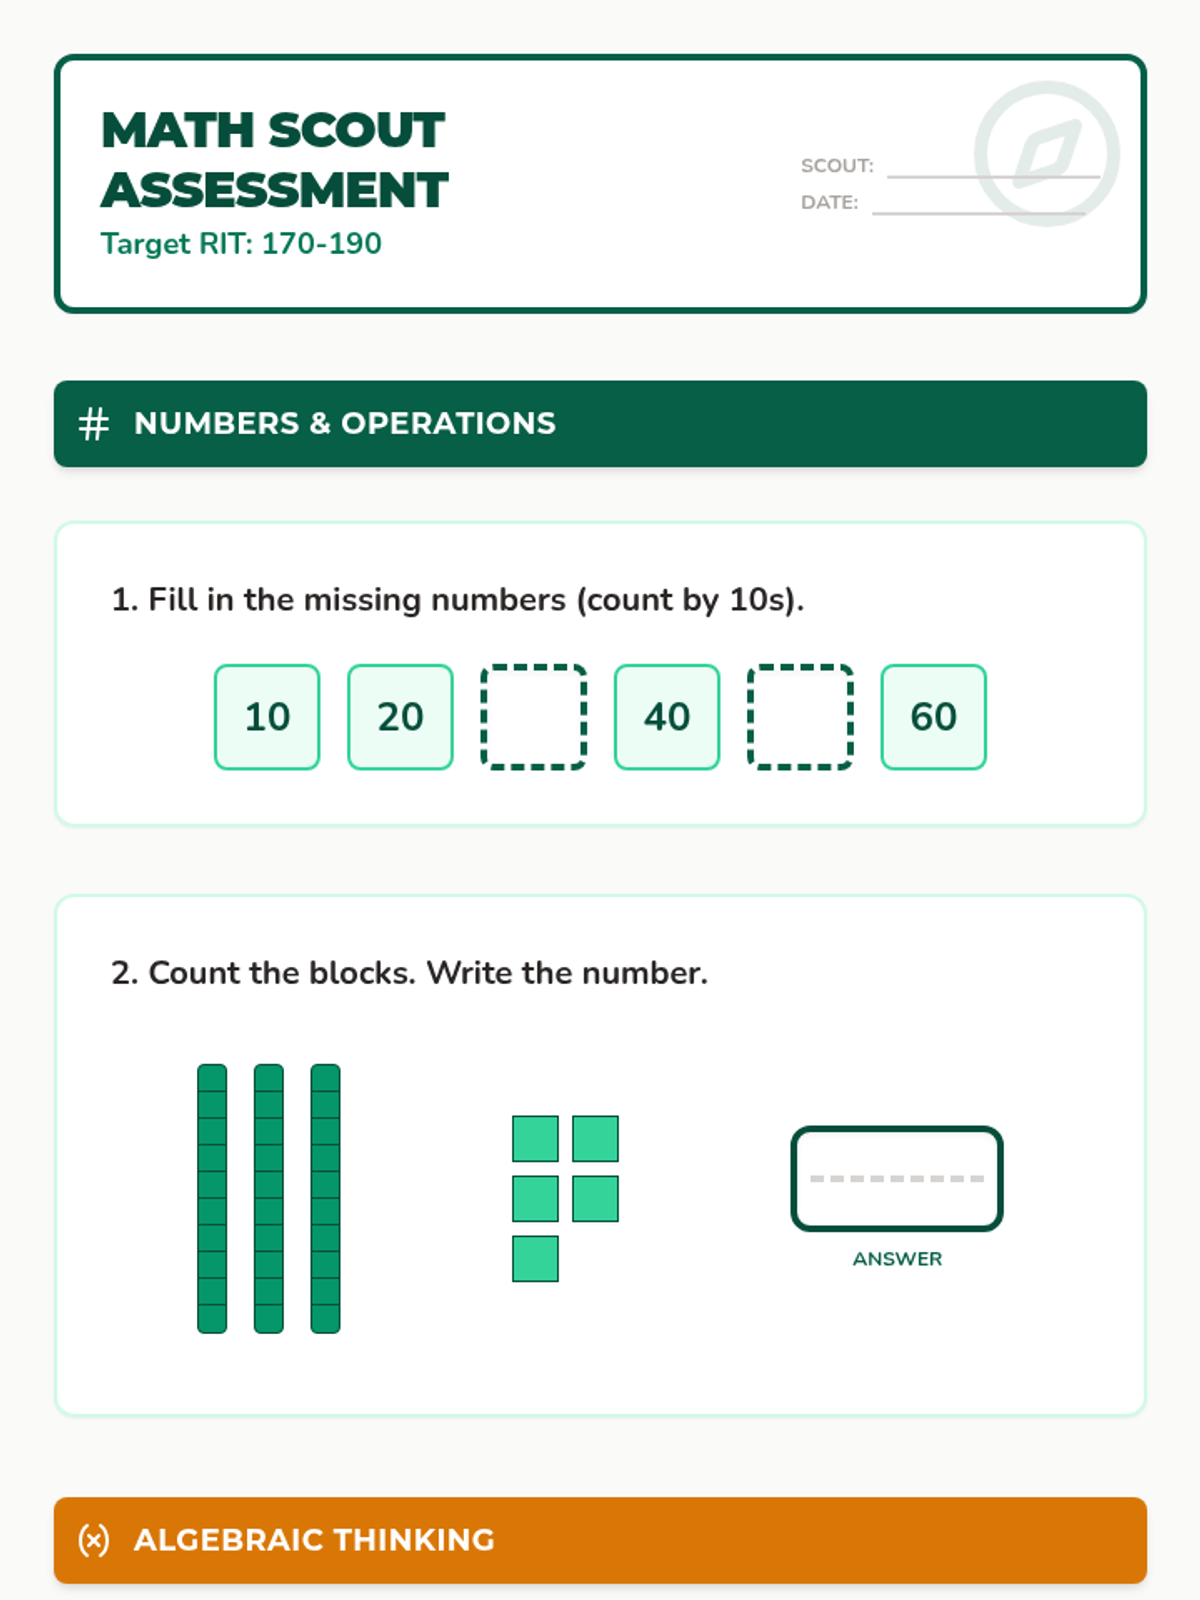
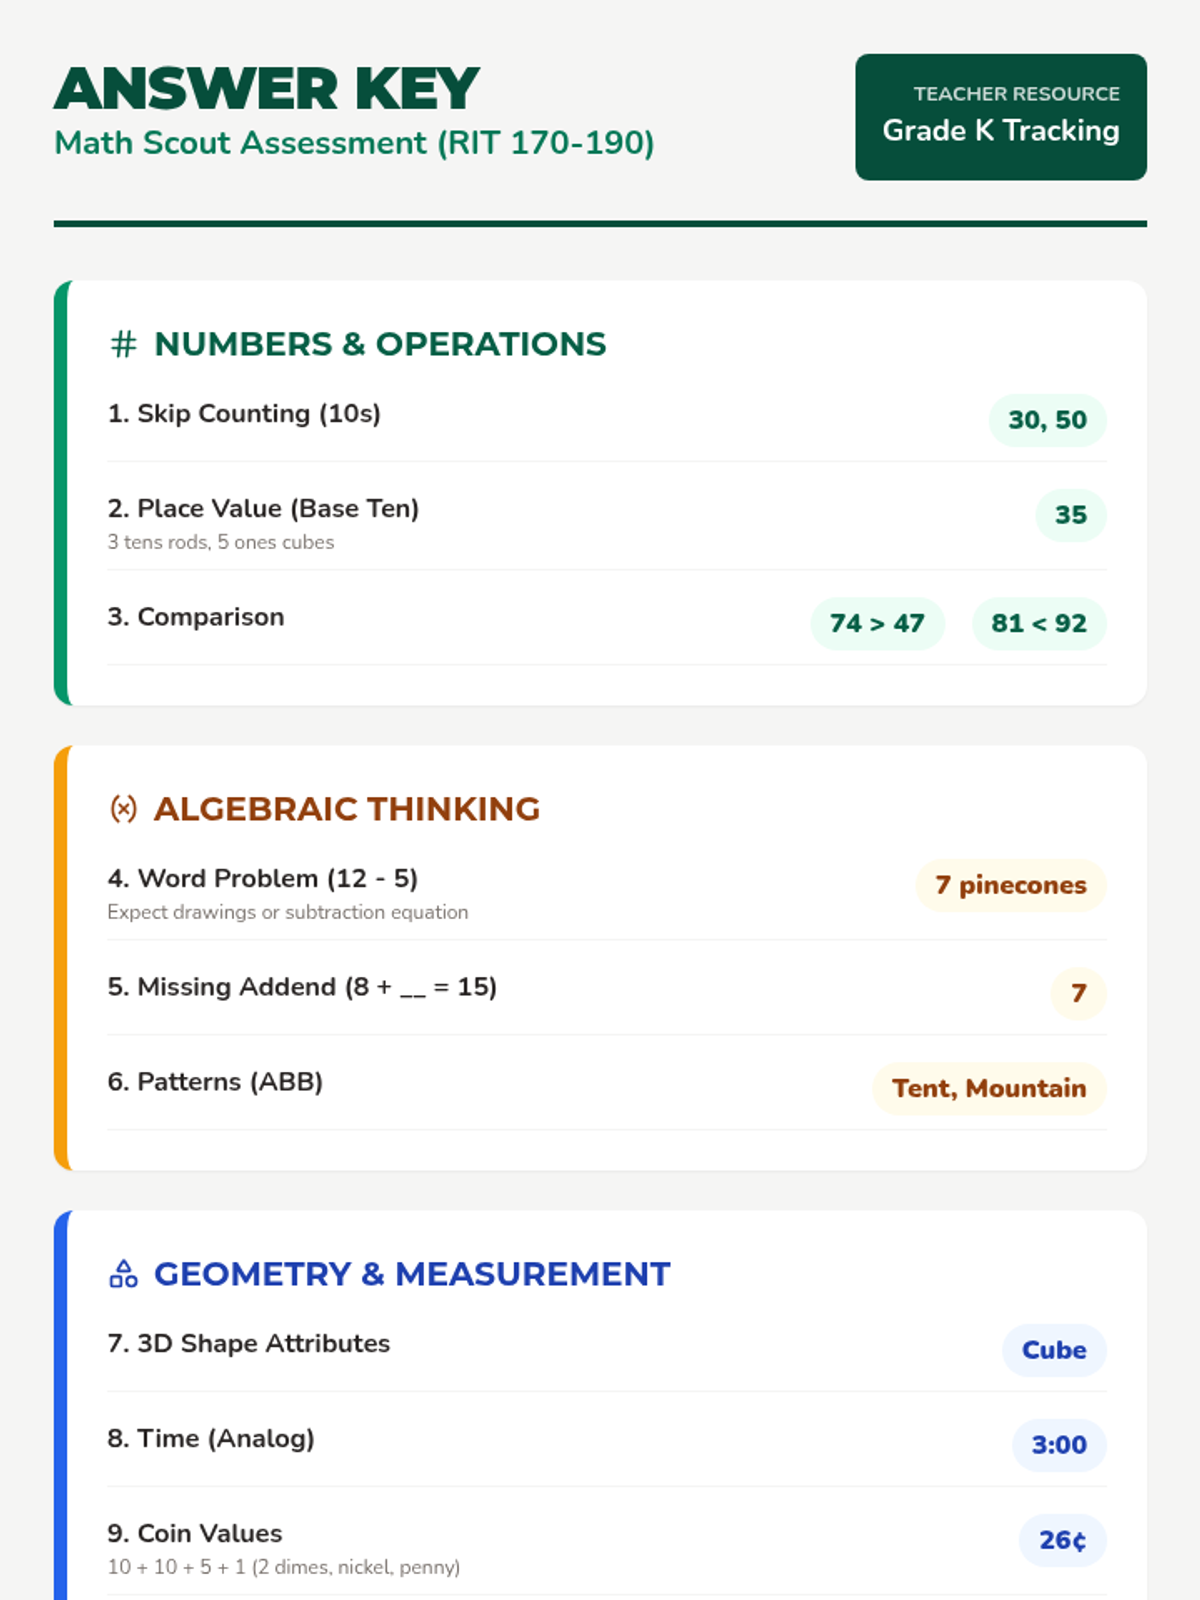
A comprehensive tracking resource for Kindergarten students aiming for advanced NWEA MAP RIT scores in mathematics, covering all key domains.
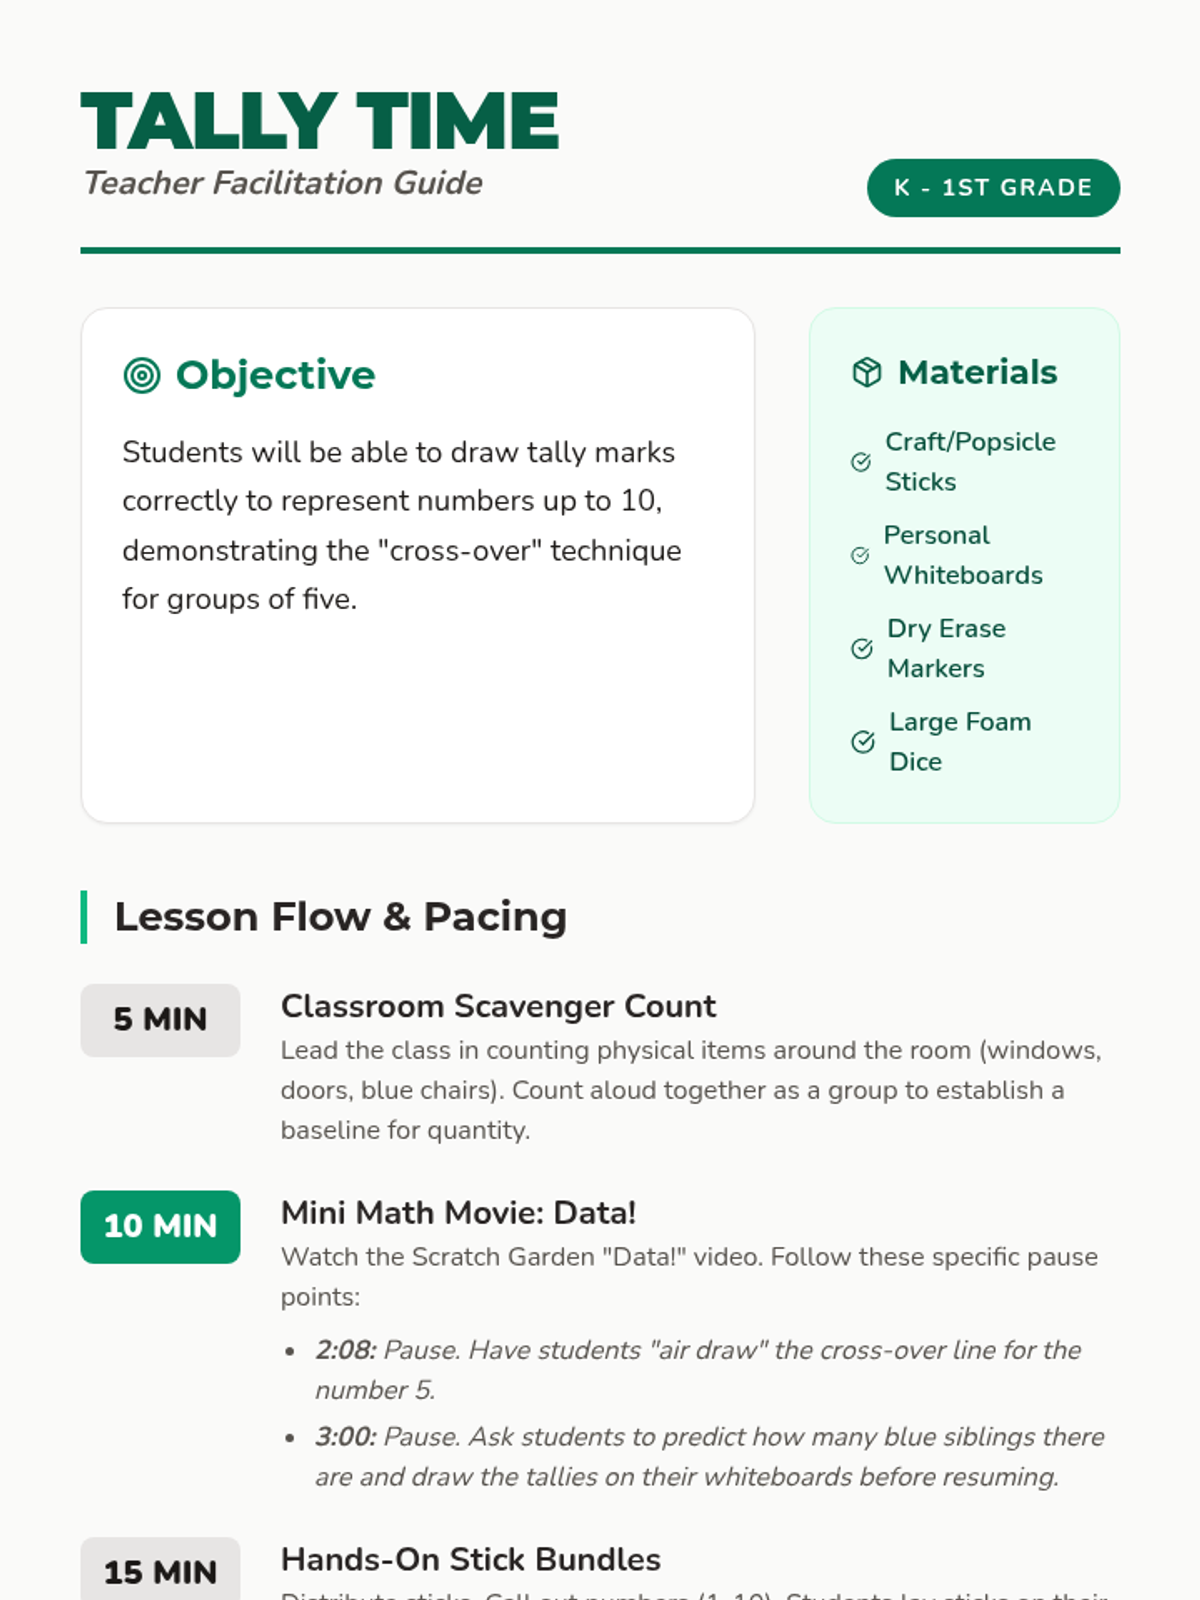
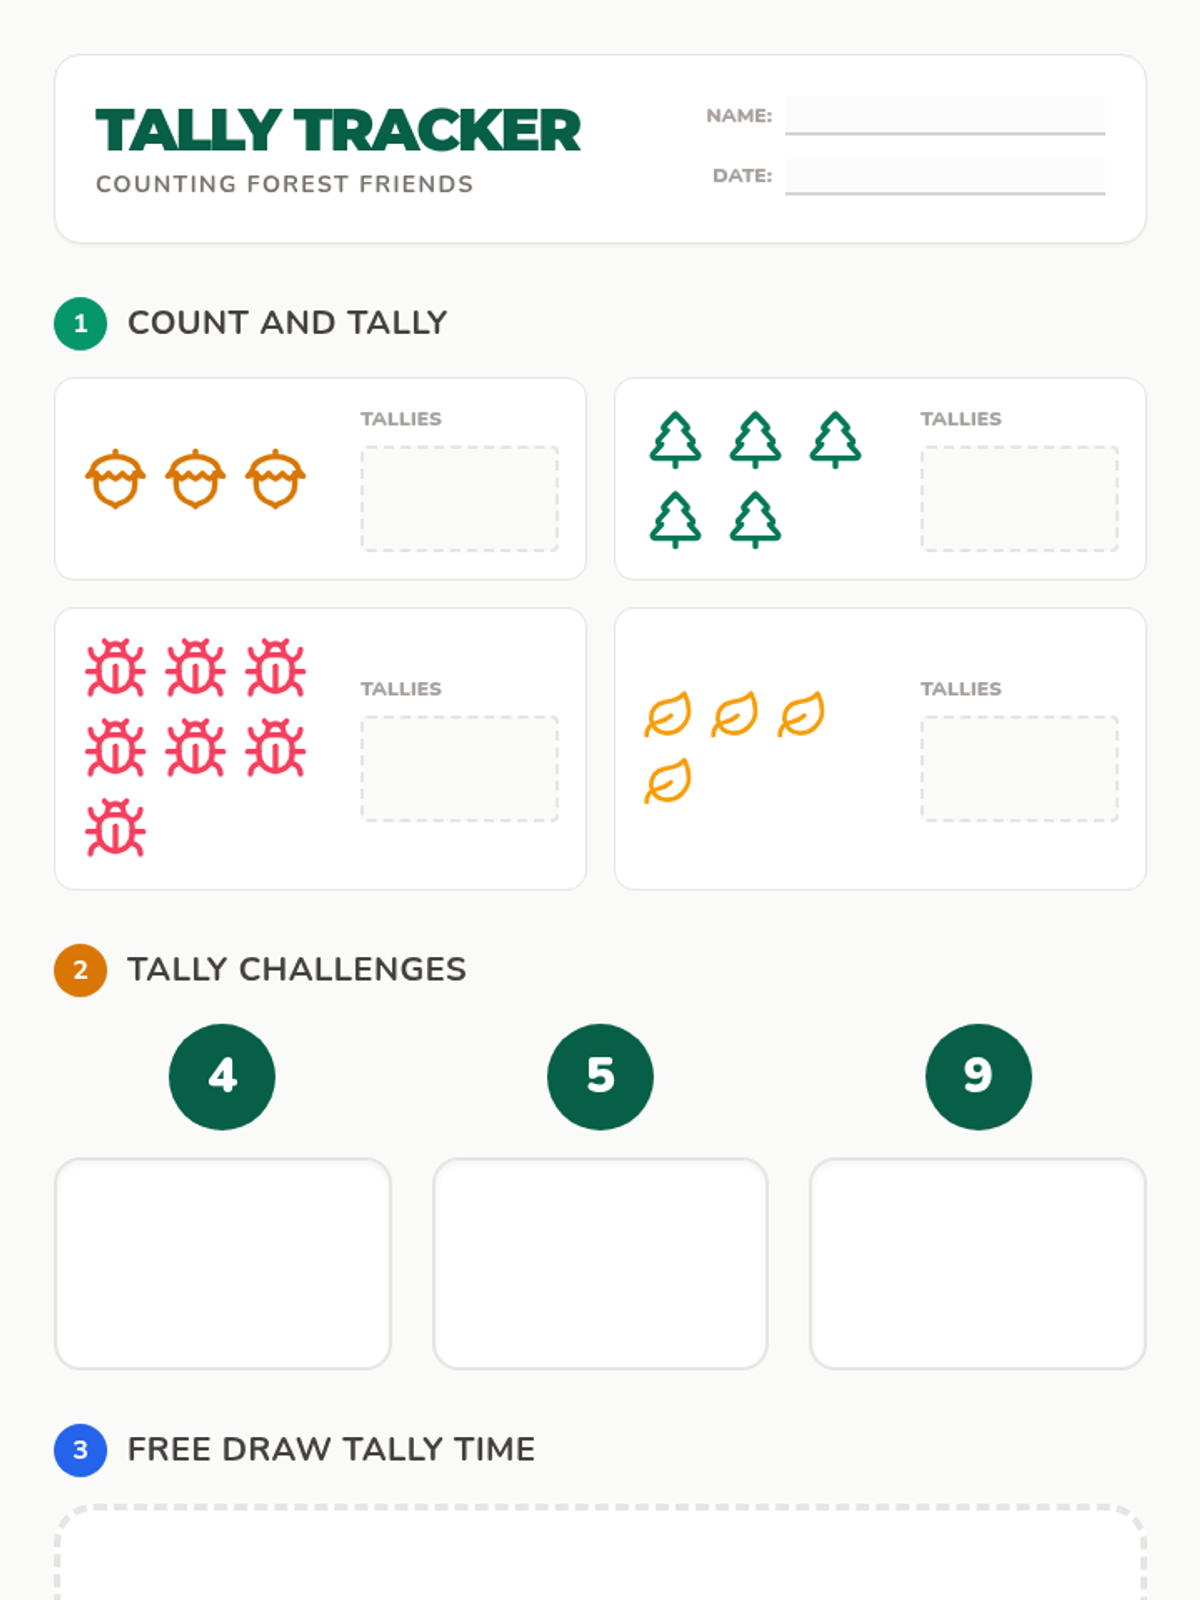
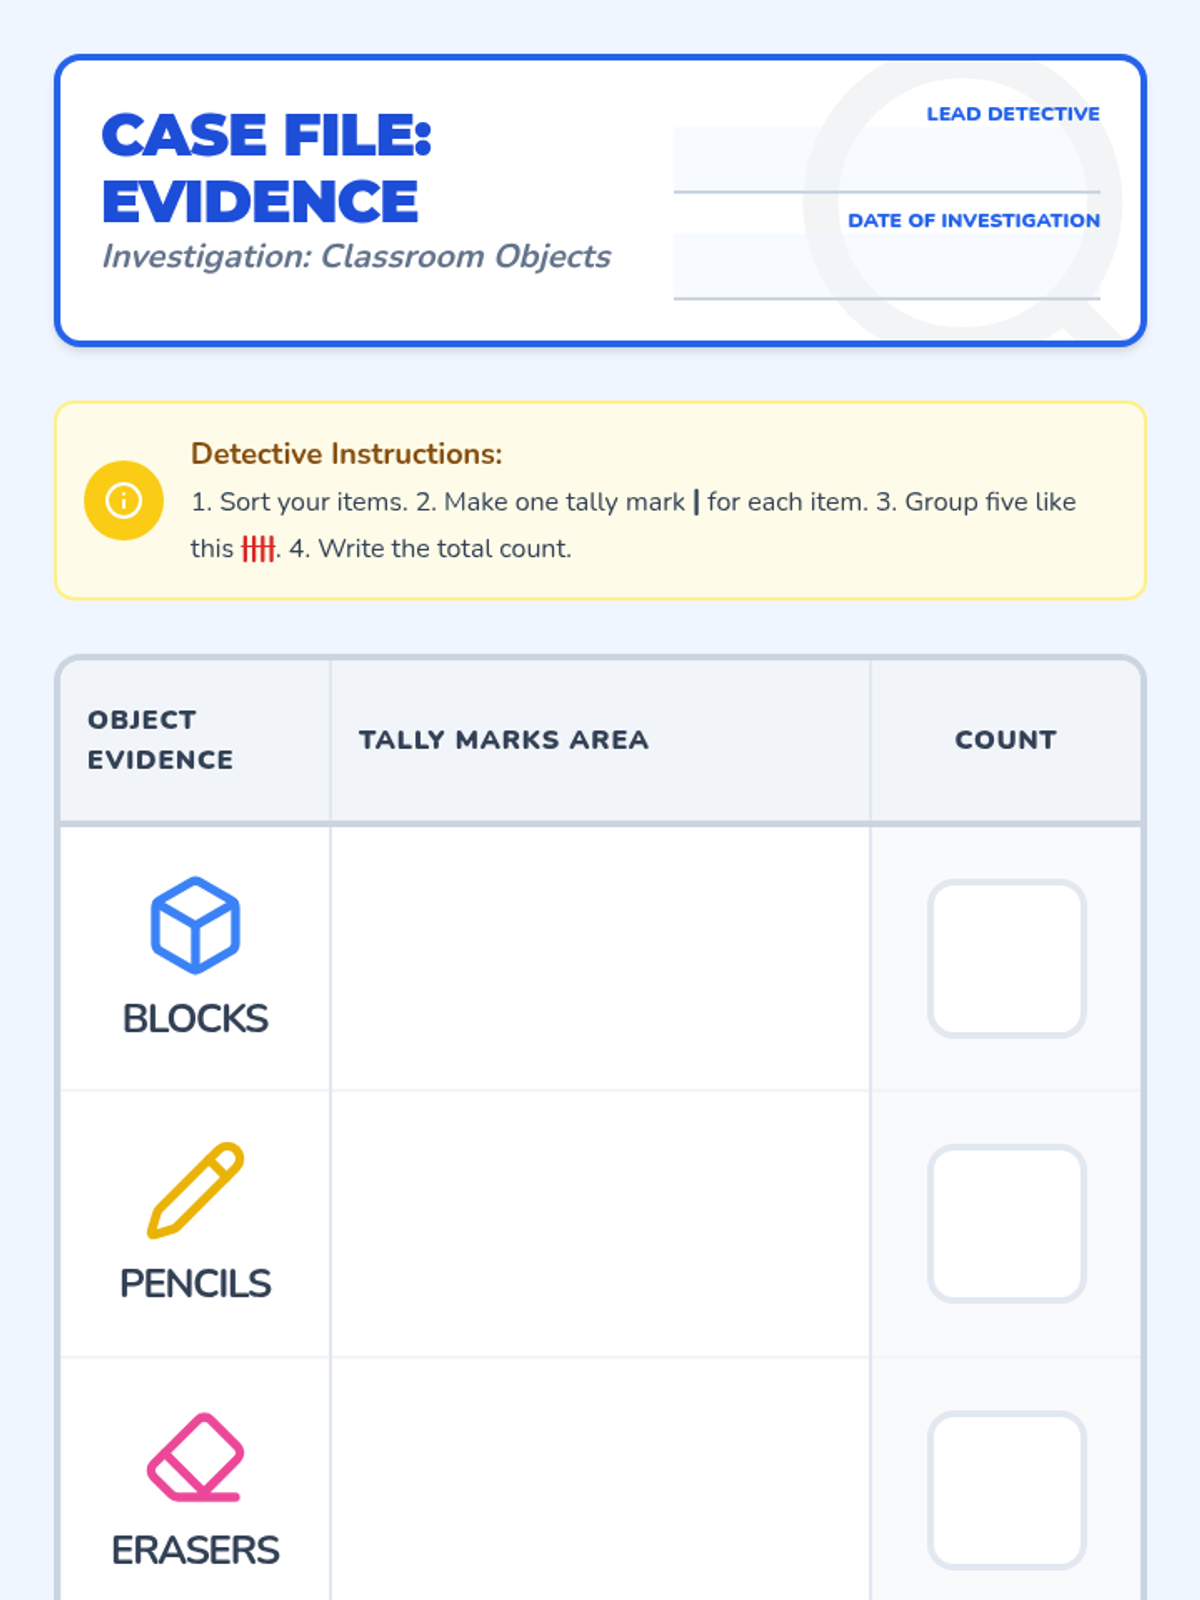
A Kindergarten to 1st Grade introduction to tally marks, focusing on the concept of bundling groups of five to count data efficiently. The lesson includes a video-guided observation activity, hands-on stick bundling, and a dice-rolling tally game.
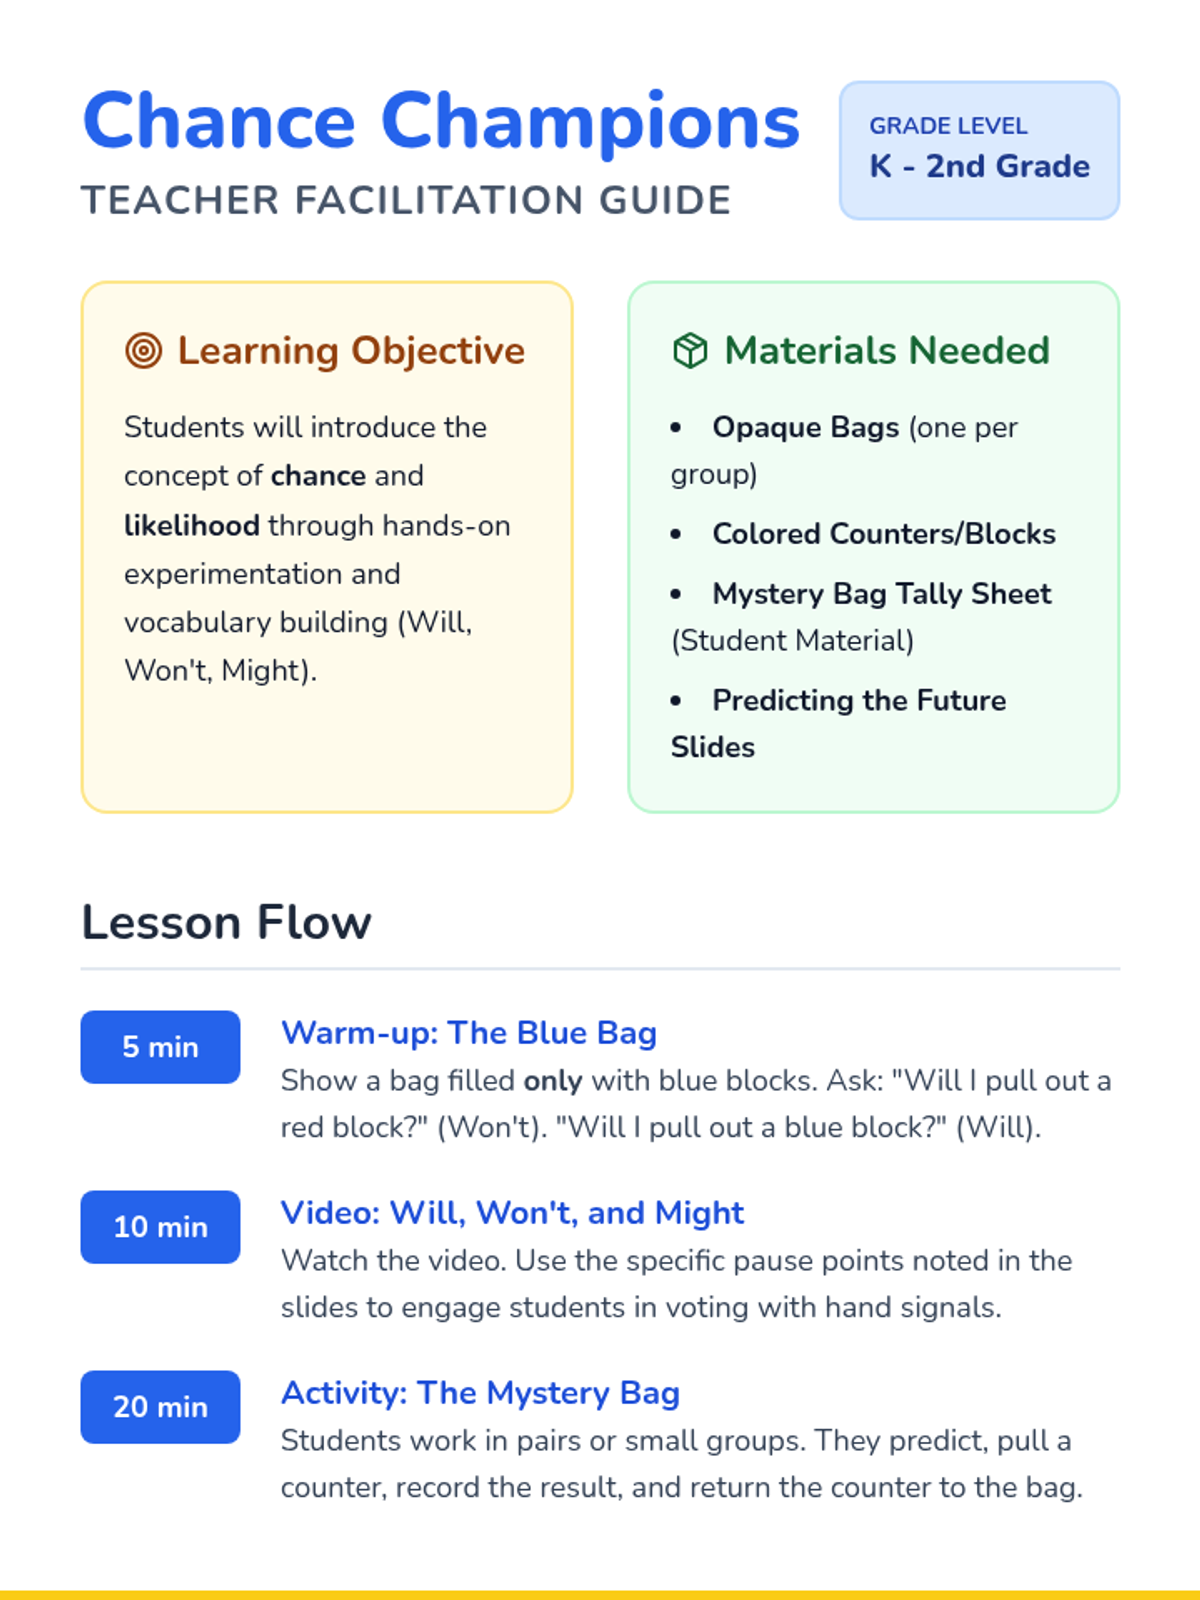
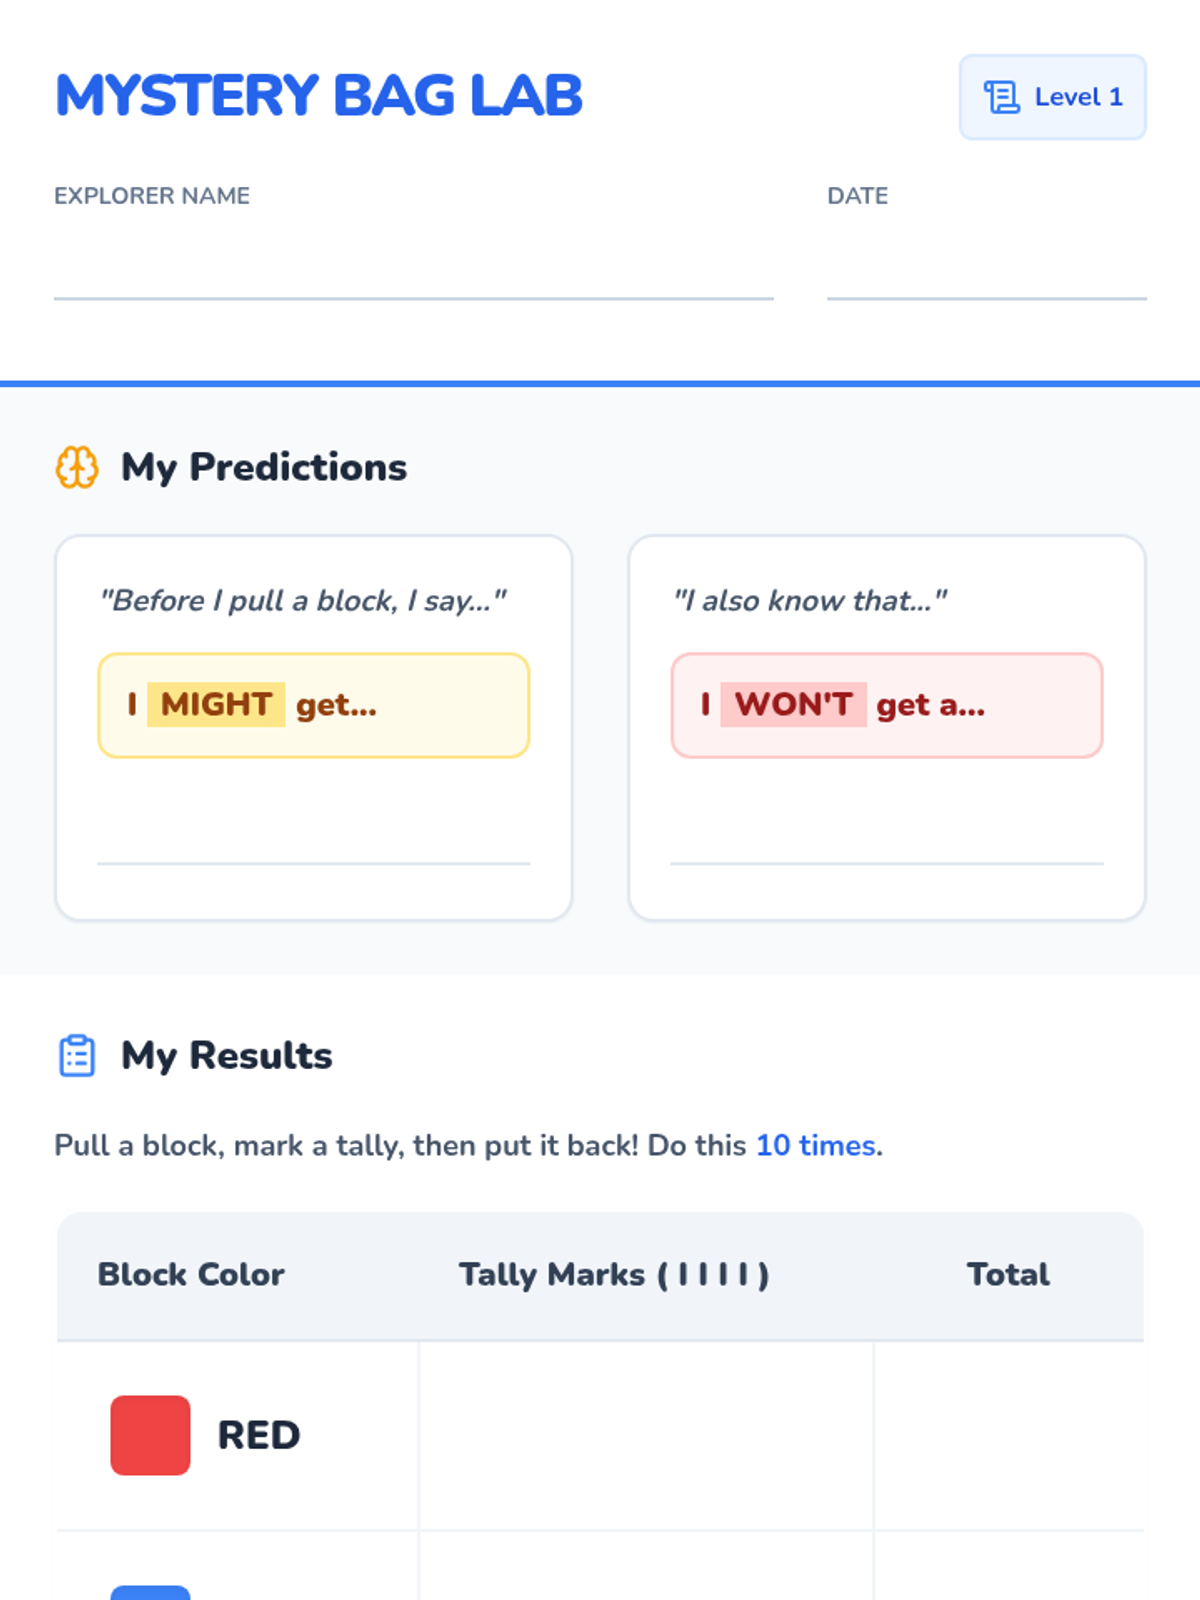
Students explore the basics of likelihood through a guided video and a hands-on mystery bag activity.
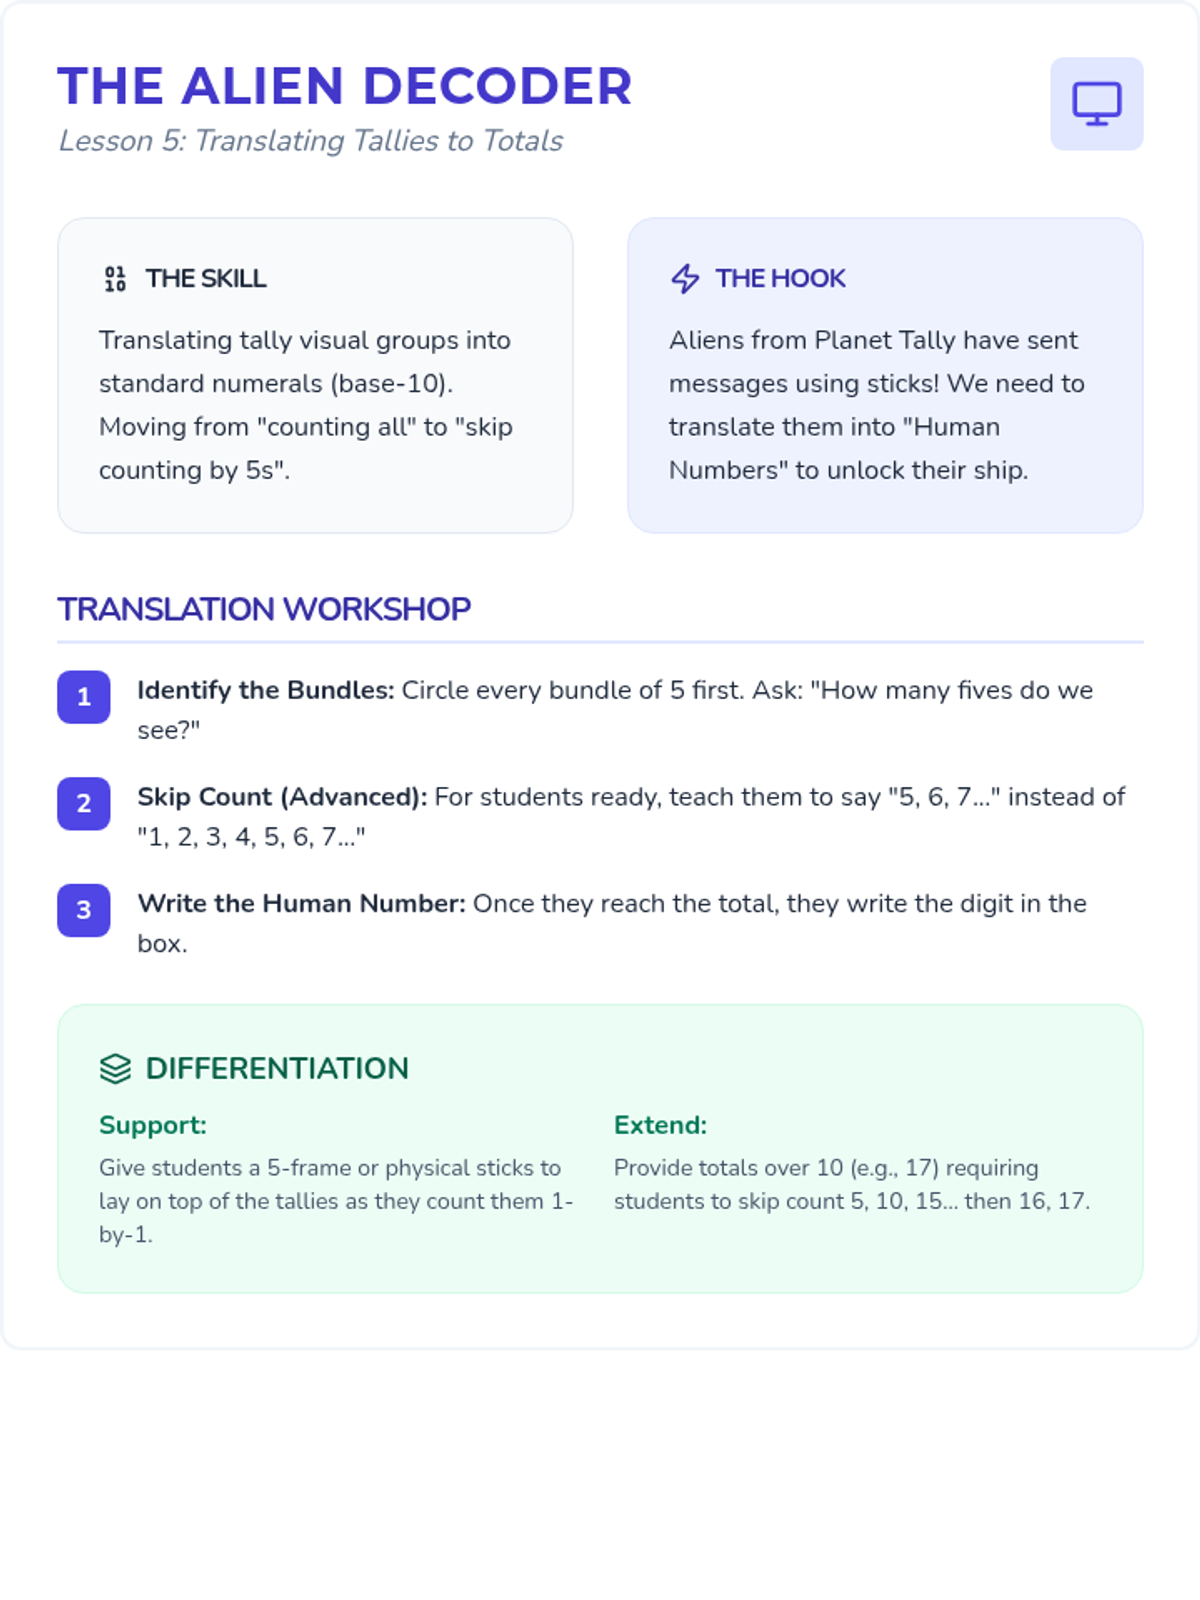
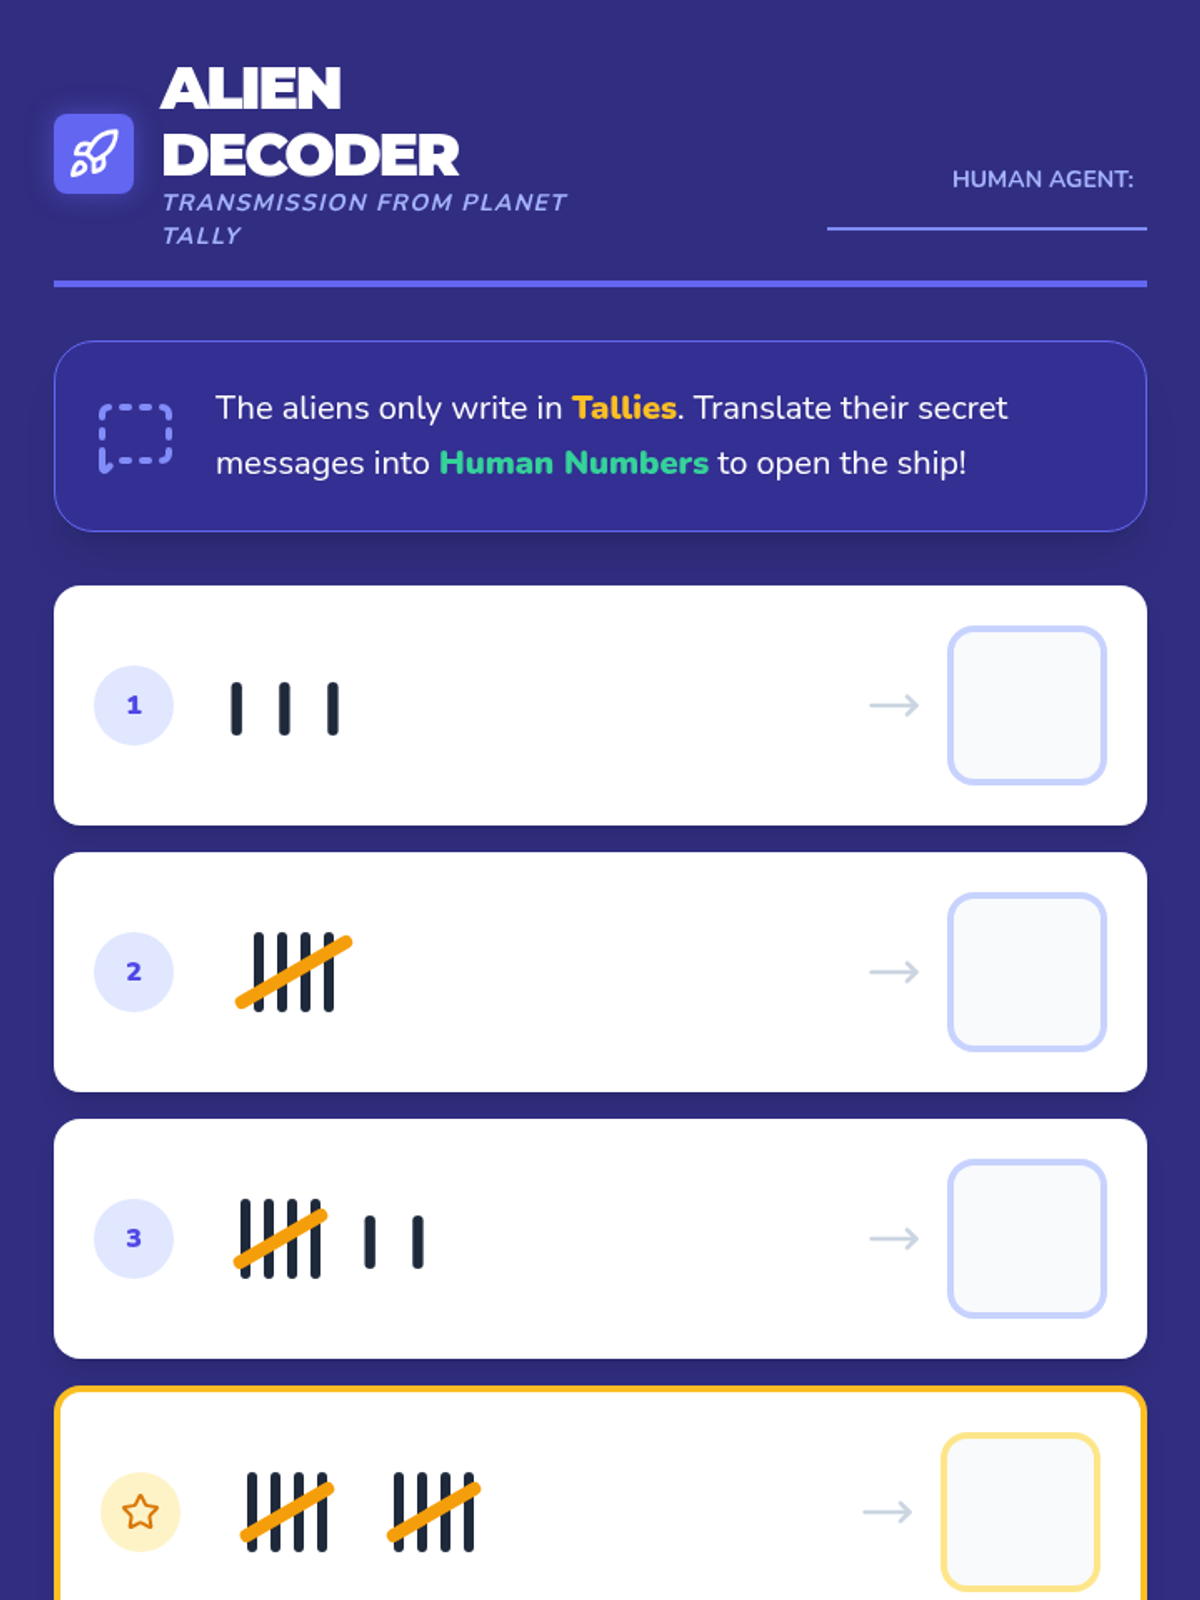
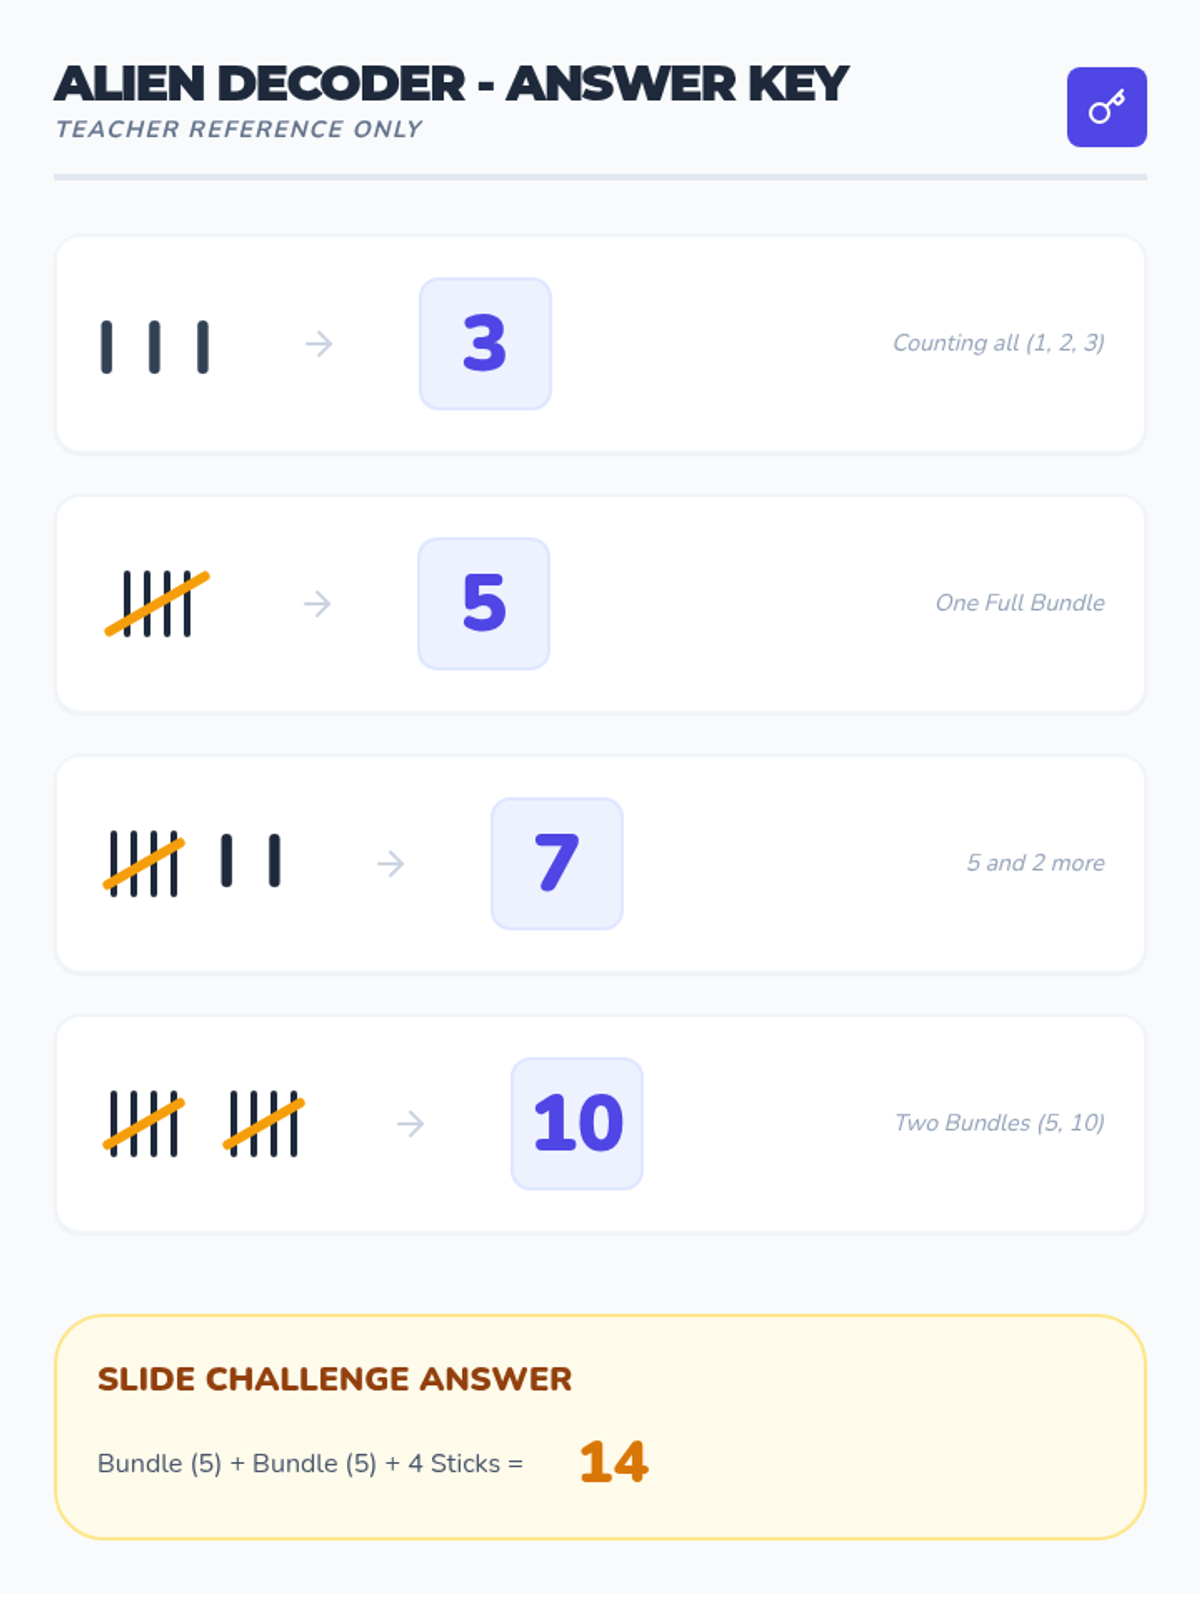
Converting tally marks back into numerals and interpreting data totals.
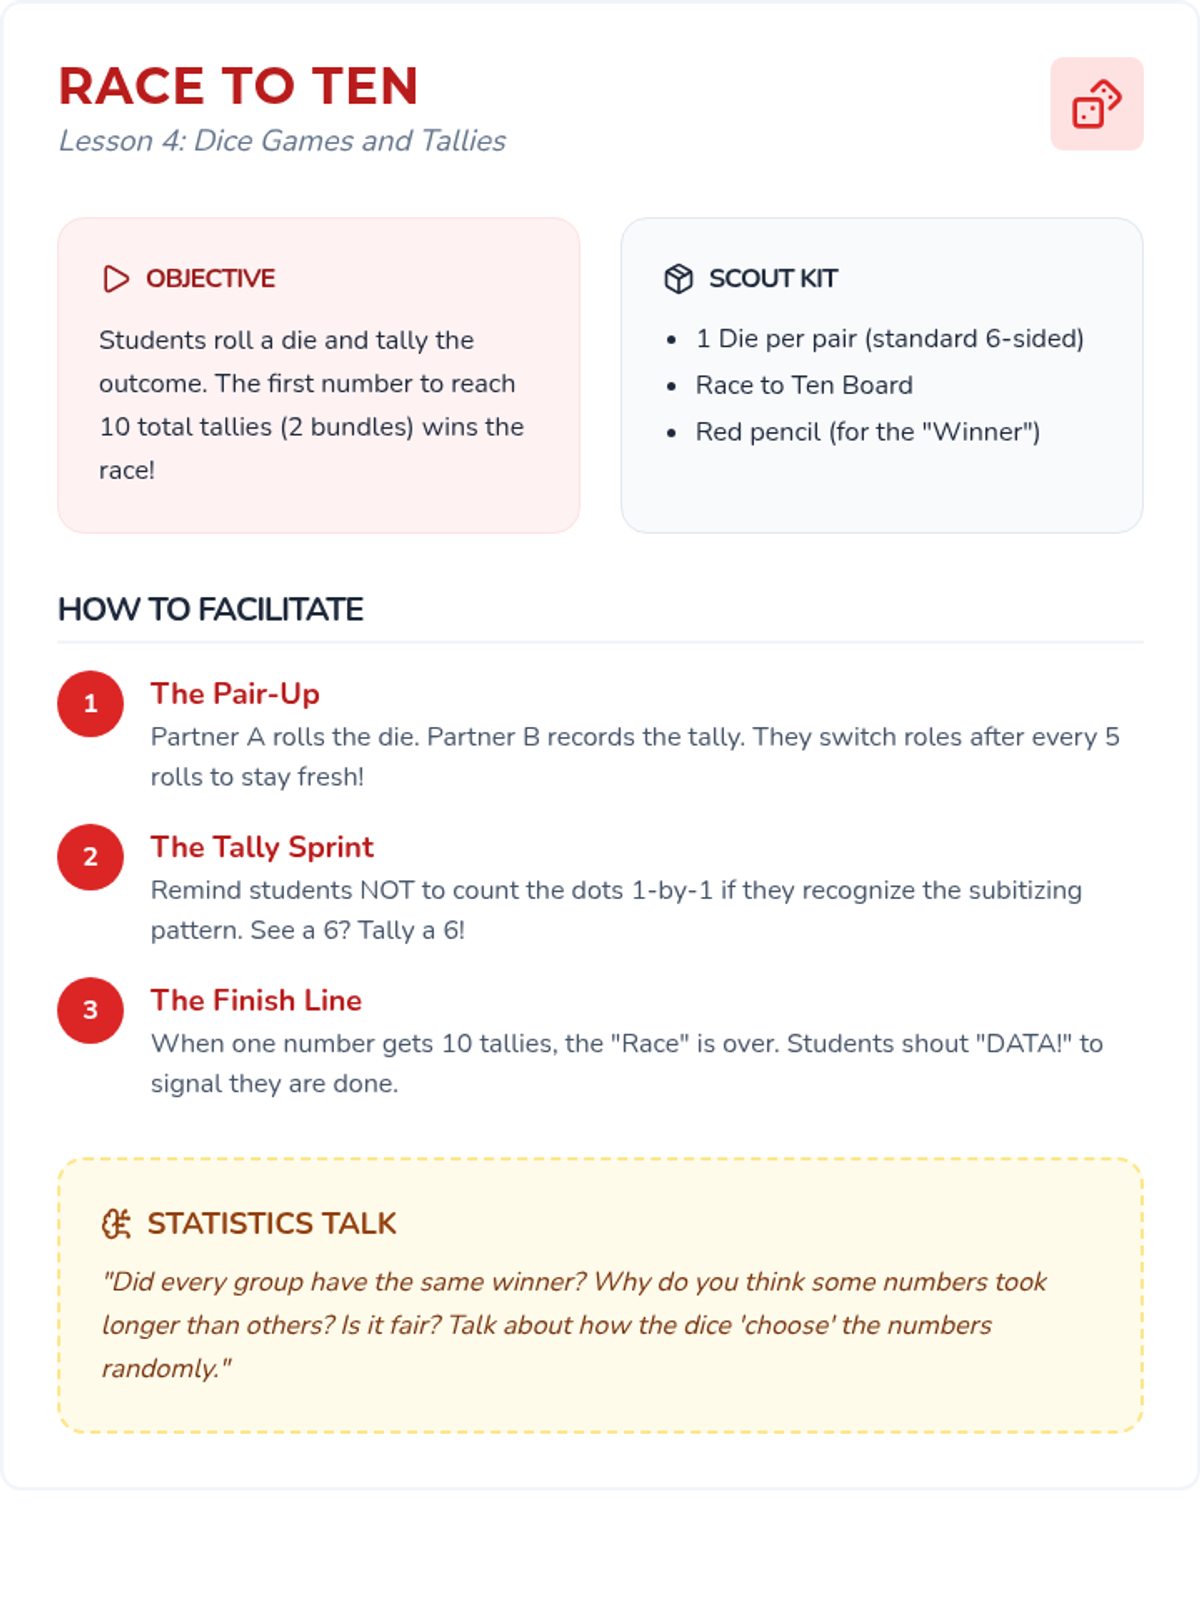
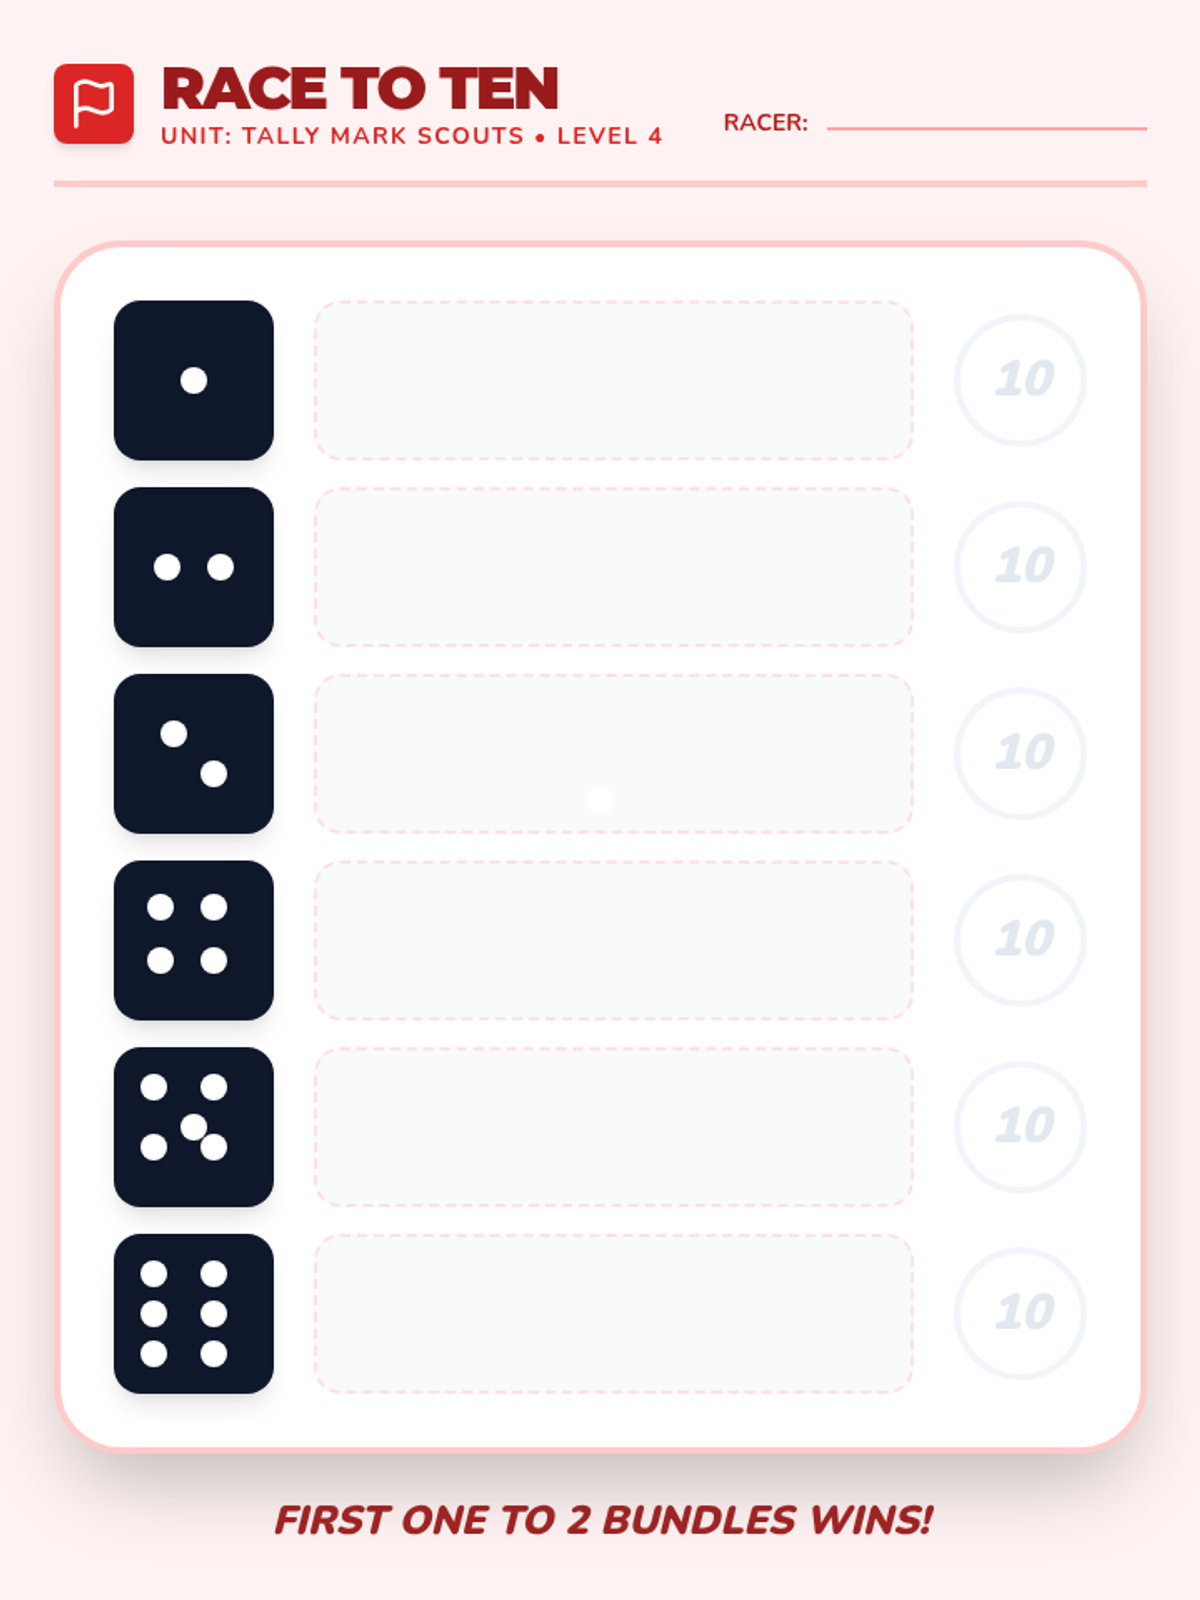
Using dice games to practice fast-paced tallying and basic probability comparisons.
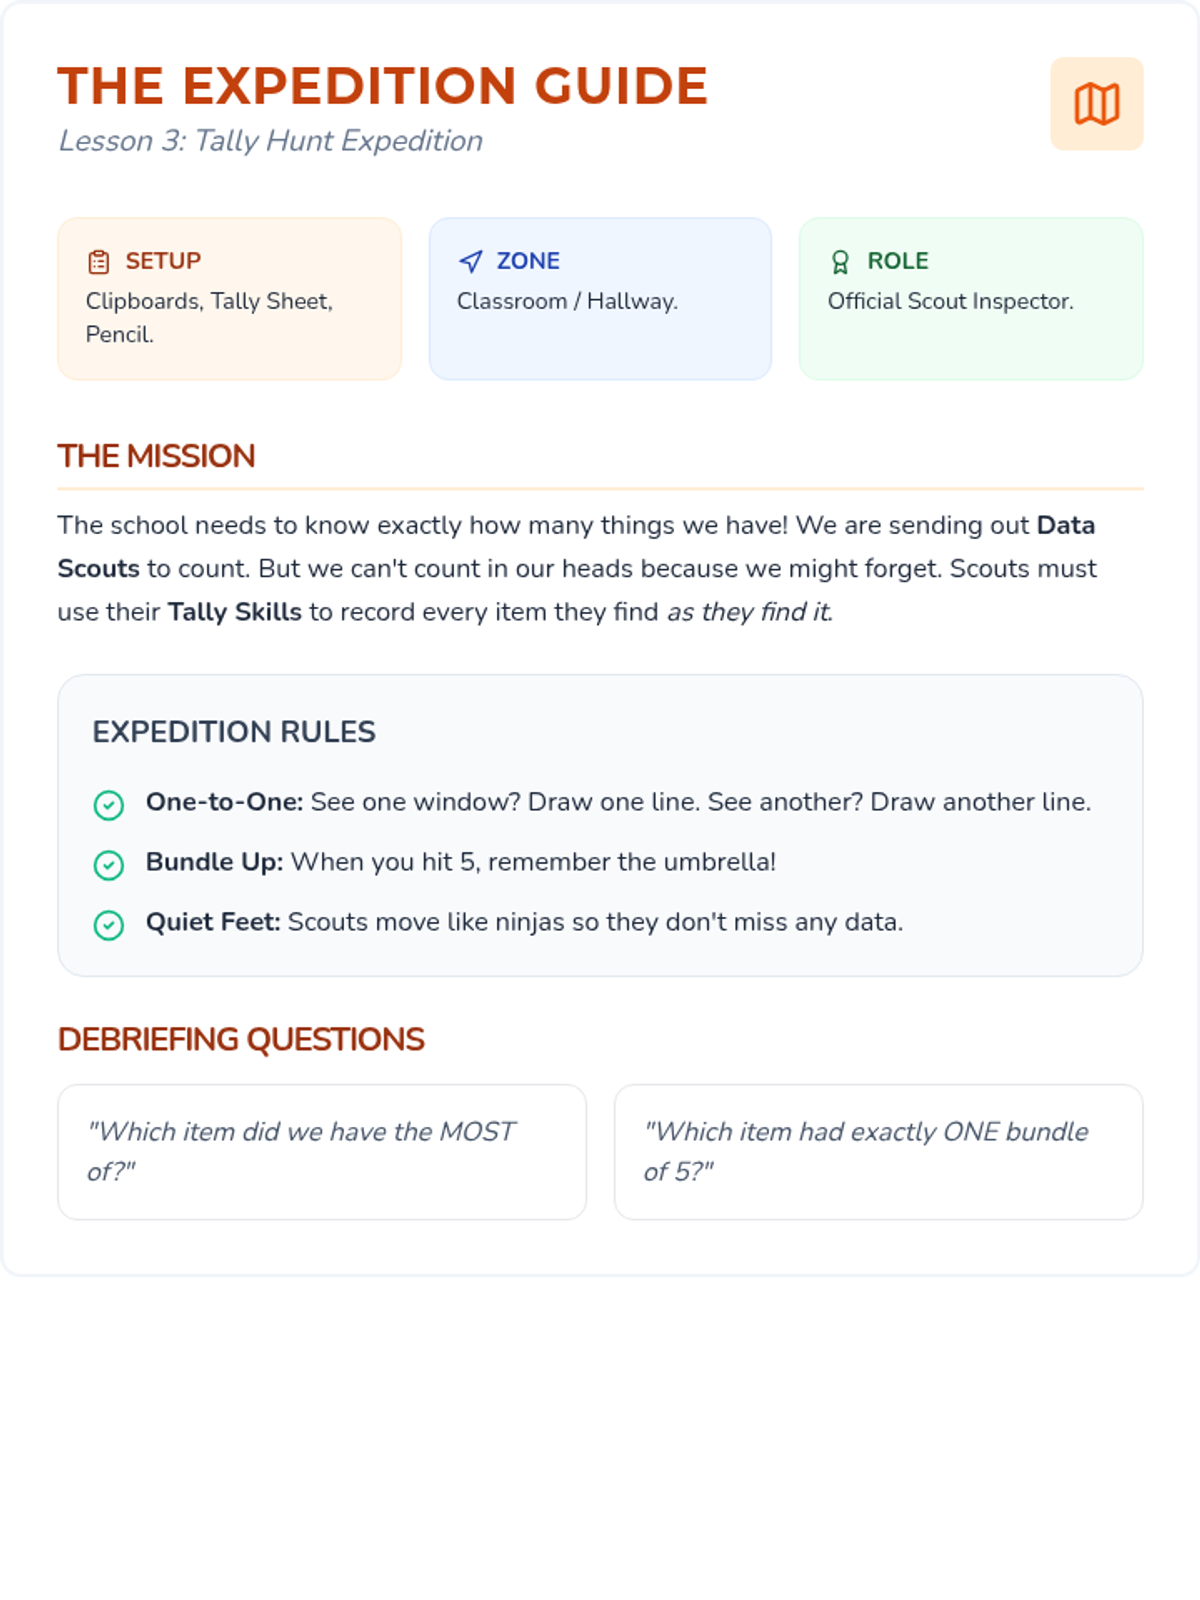
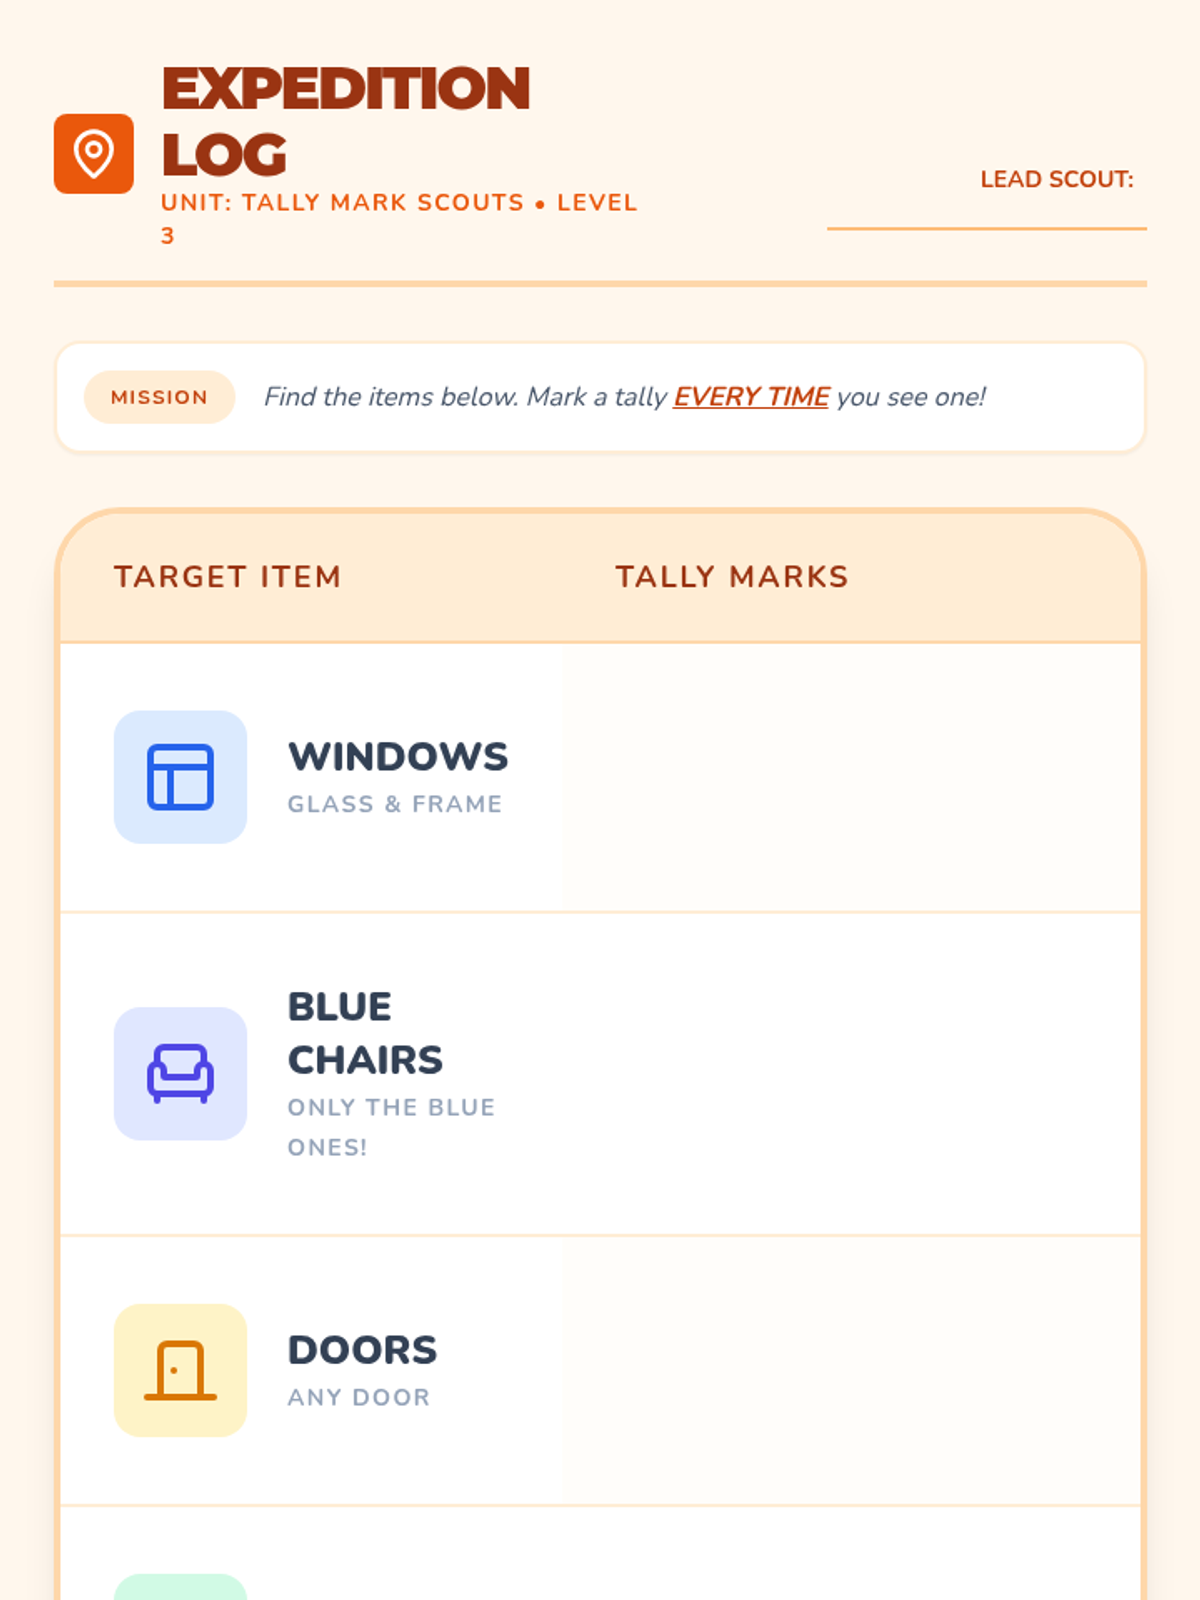
An observational hunt where students tally items in their environment to practice real-time data recording.
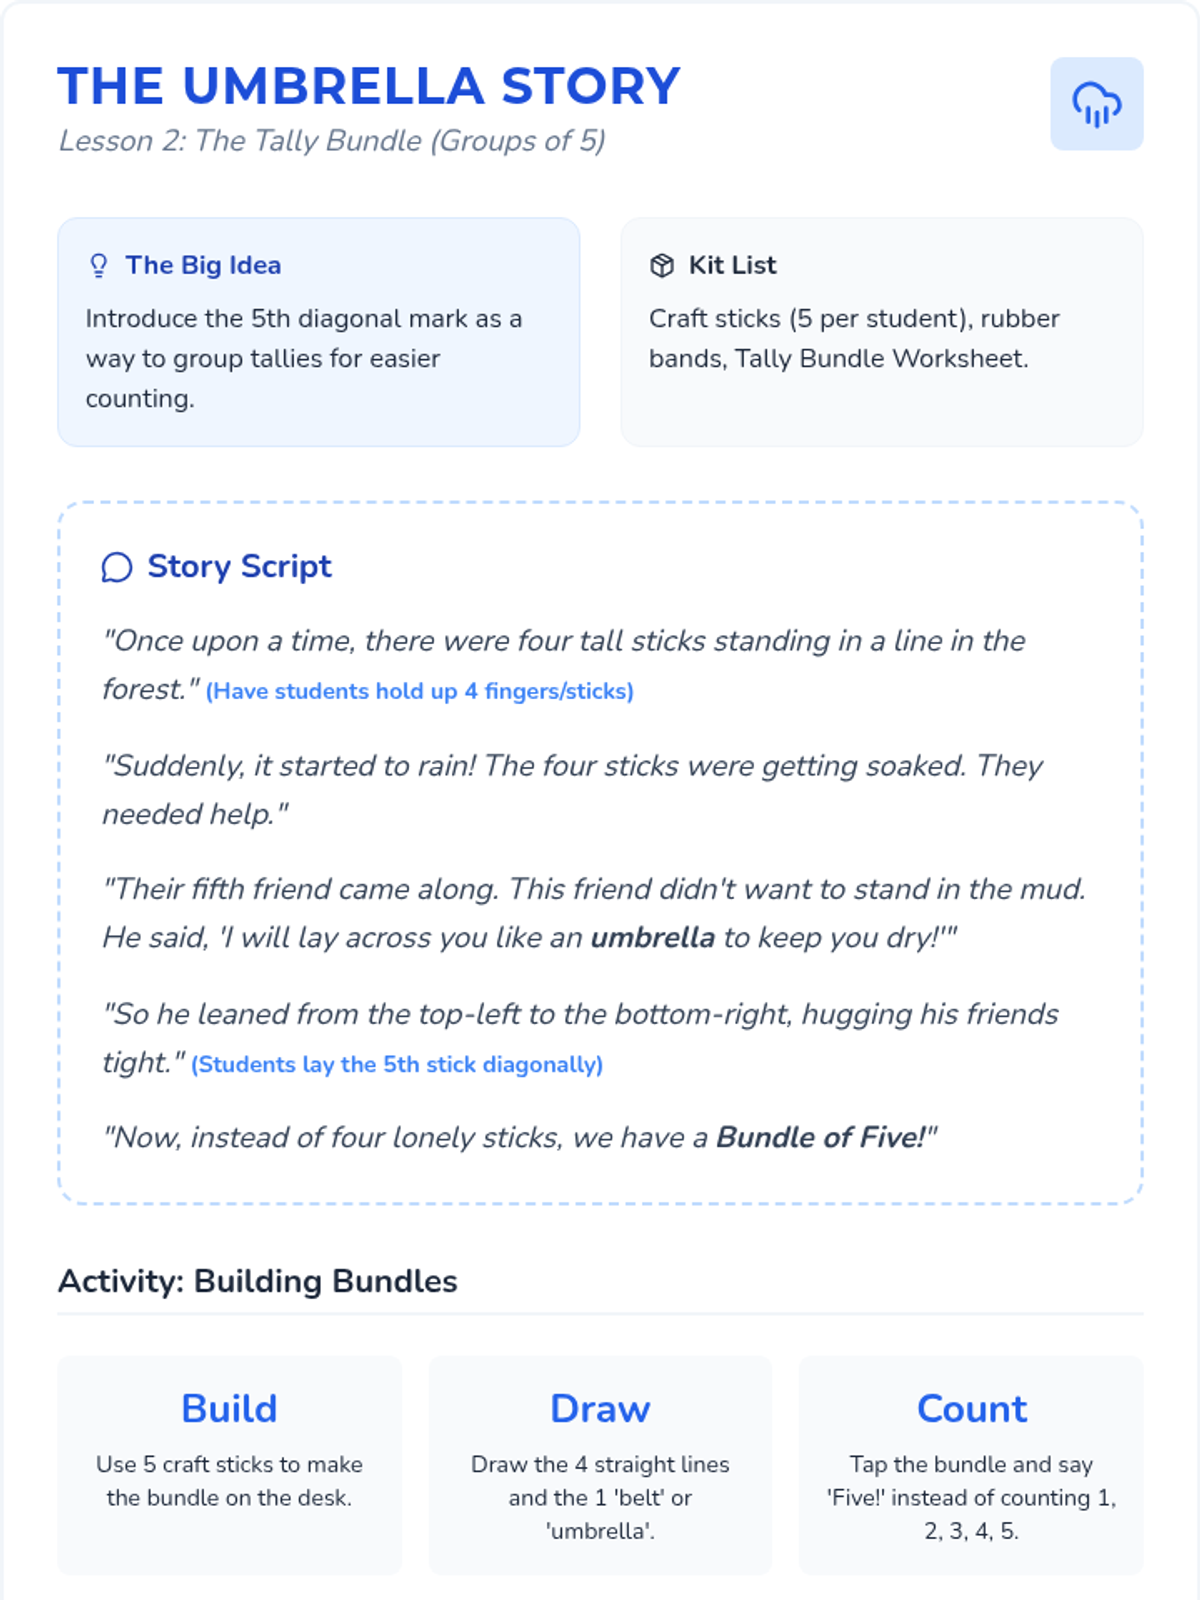
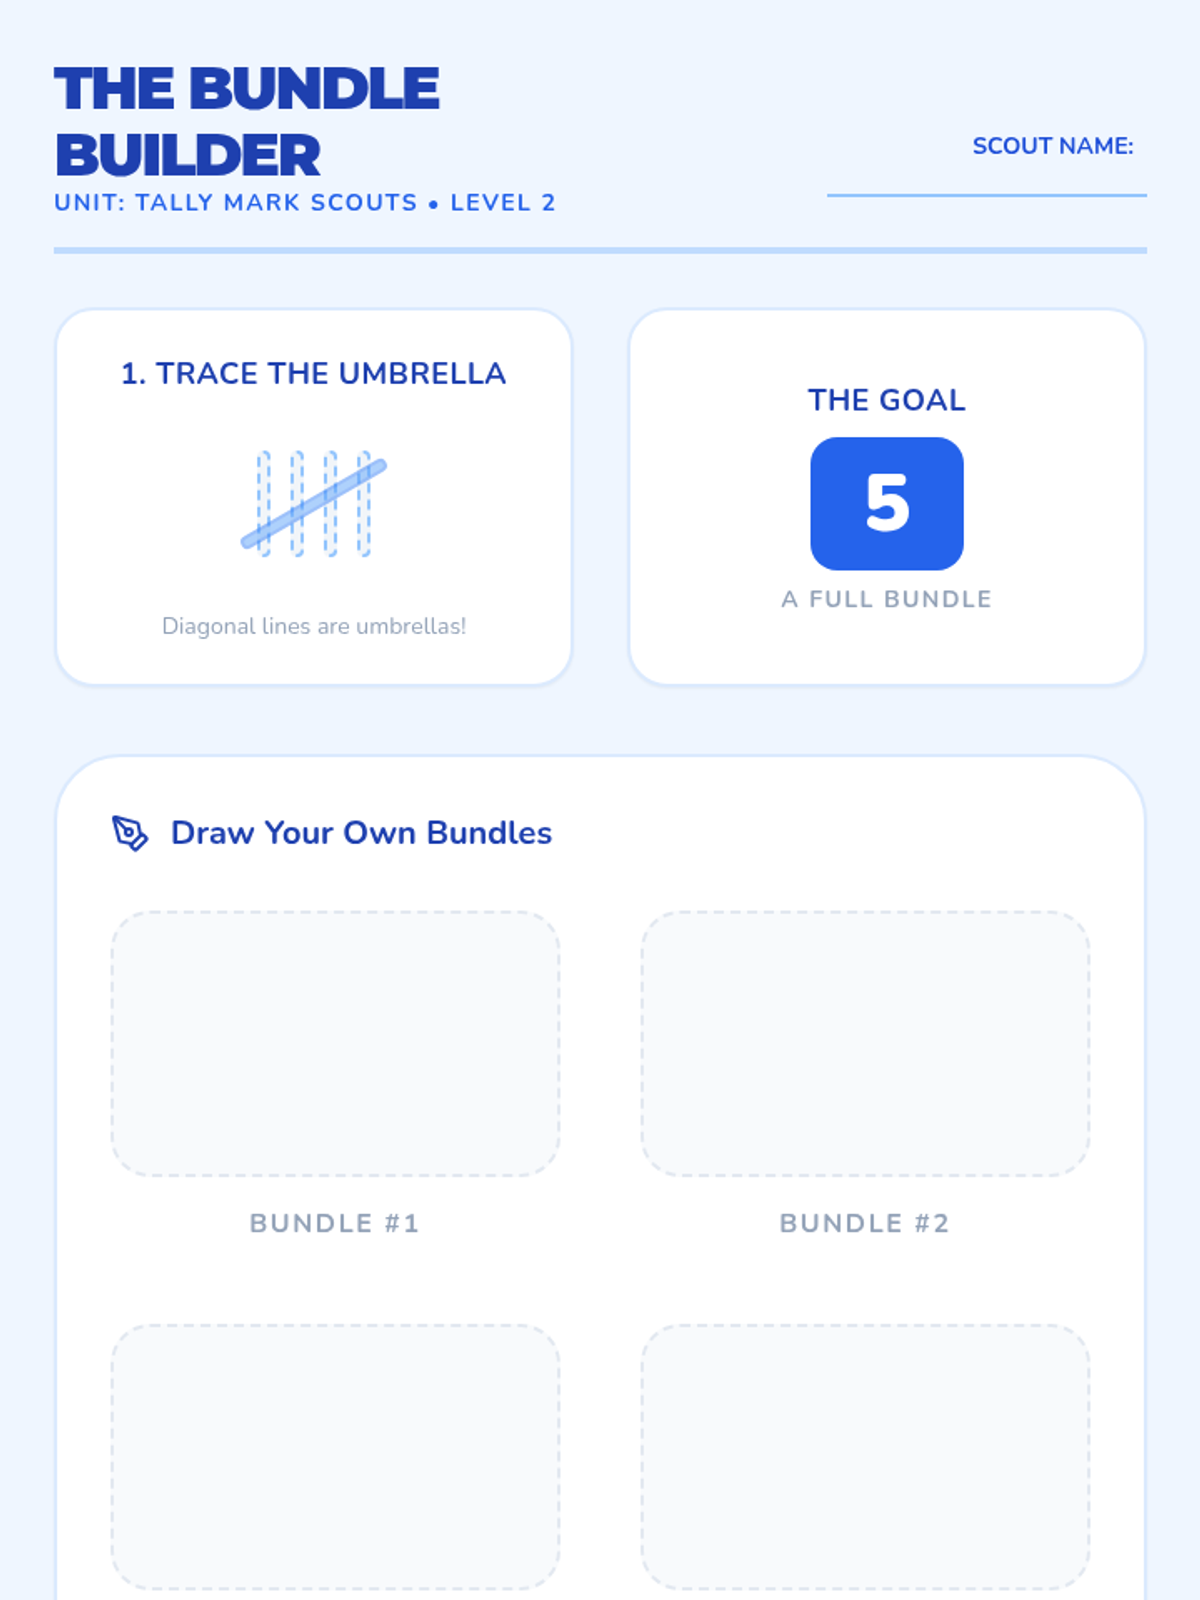
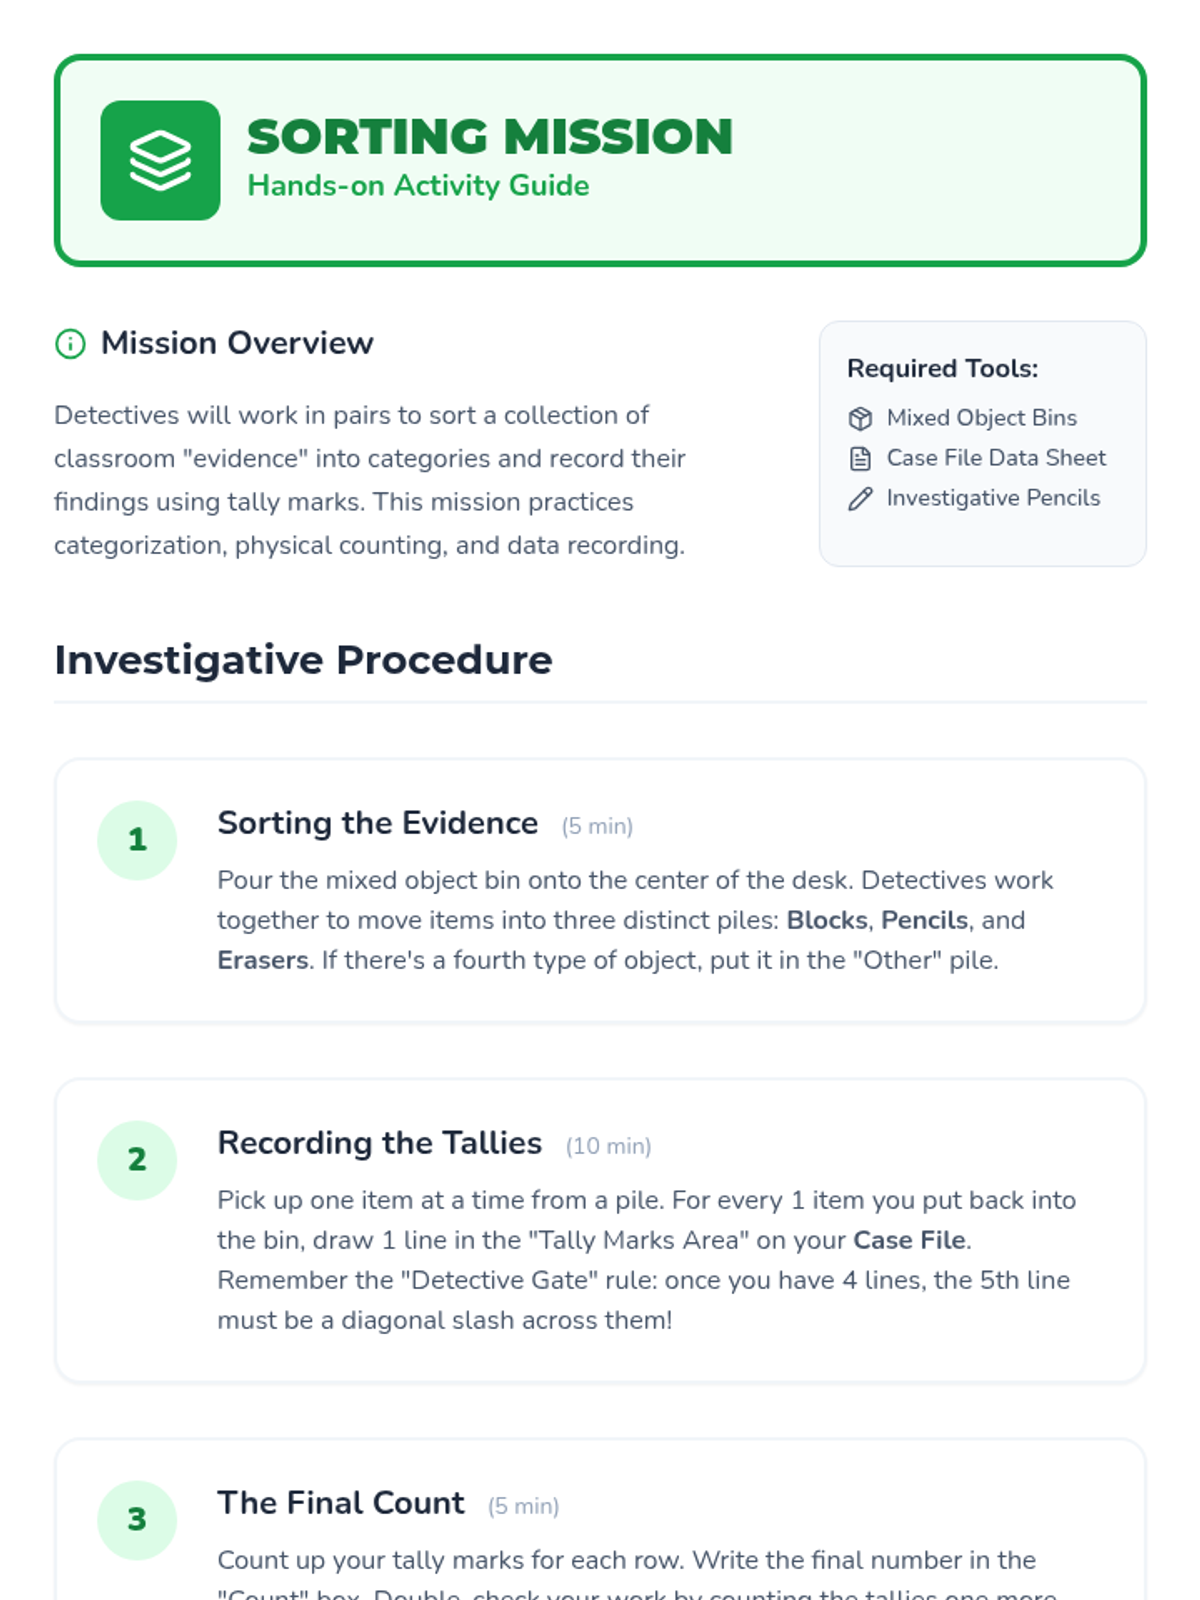
Introduction to grouping by fives using the 'umbrella' analogy for the fifth diagonal mark. Includes physical manipulation with sticks.
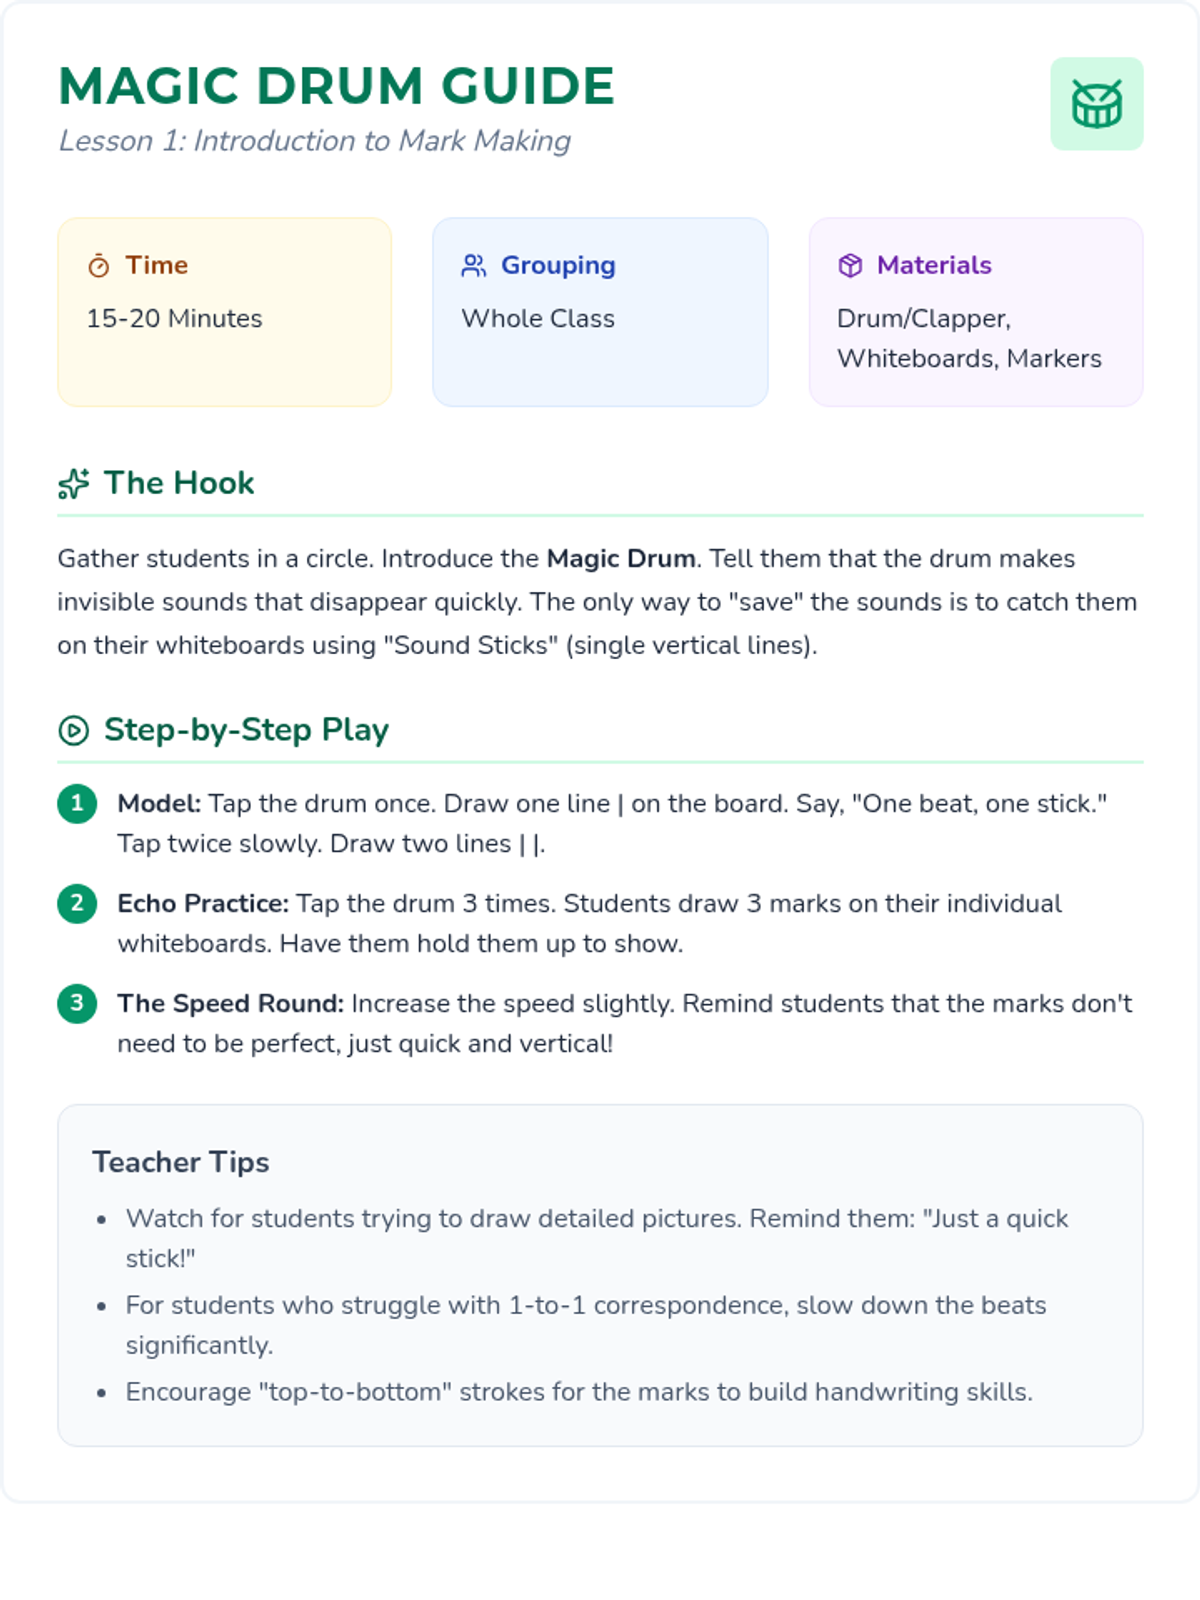
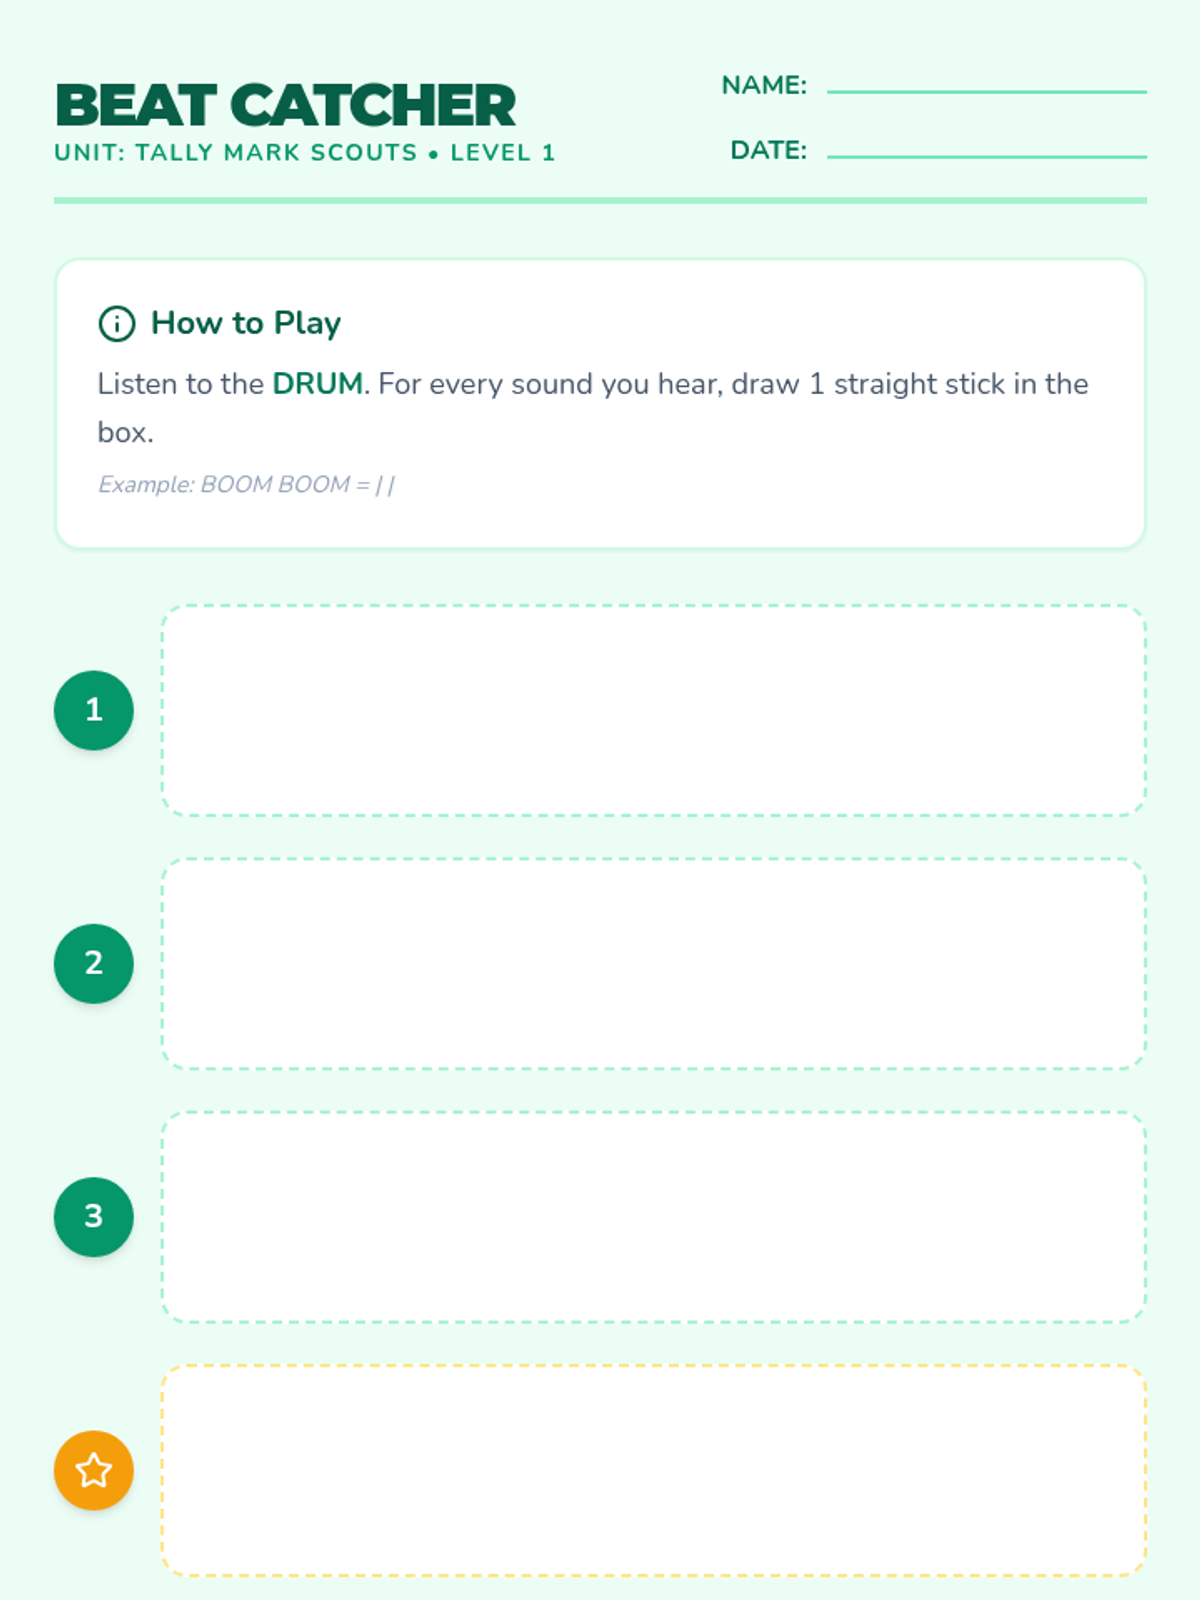
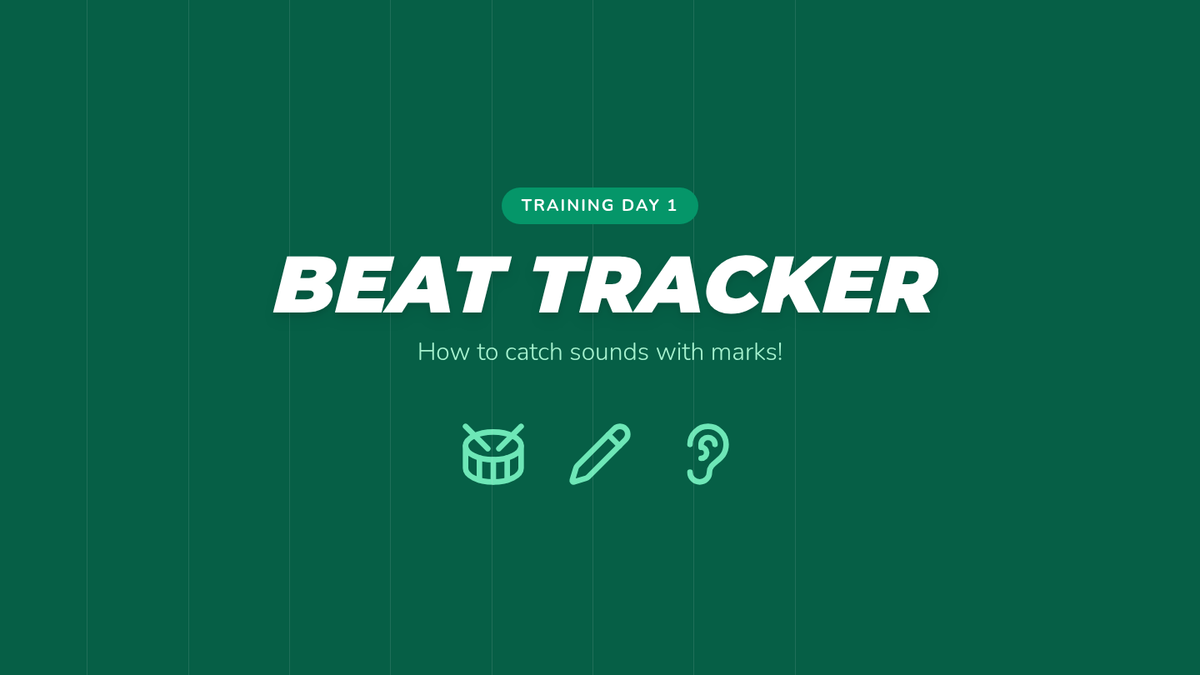
Students practice making a single vertical mark for each item counted, specifically connecting auditory sounds (drum beats) to written records.
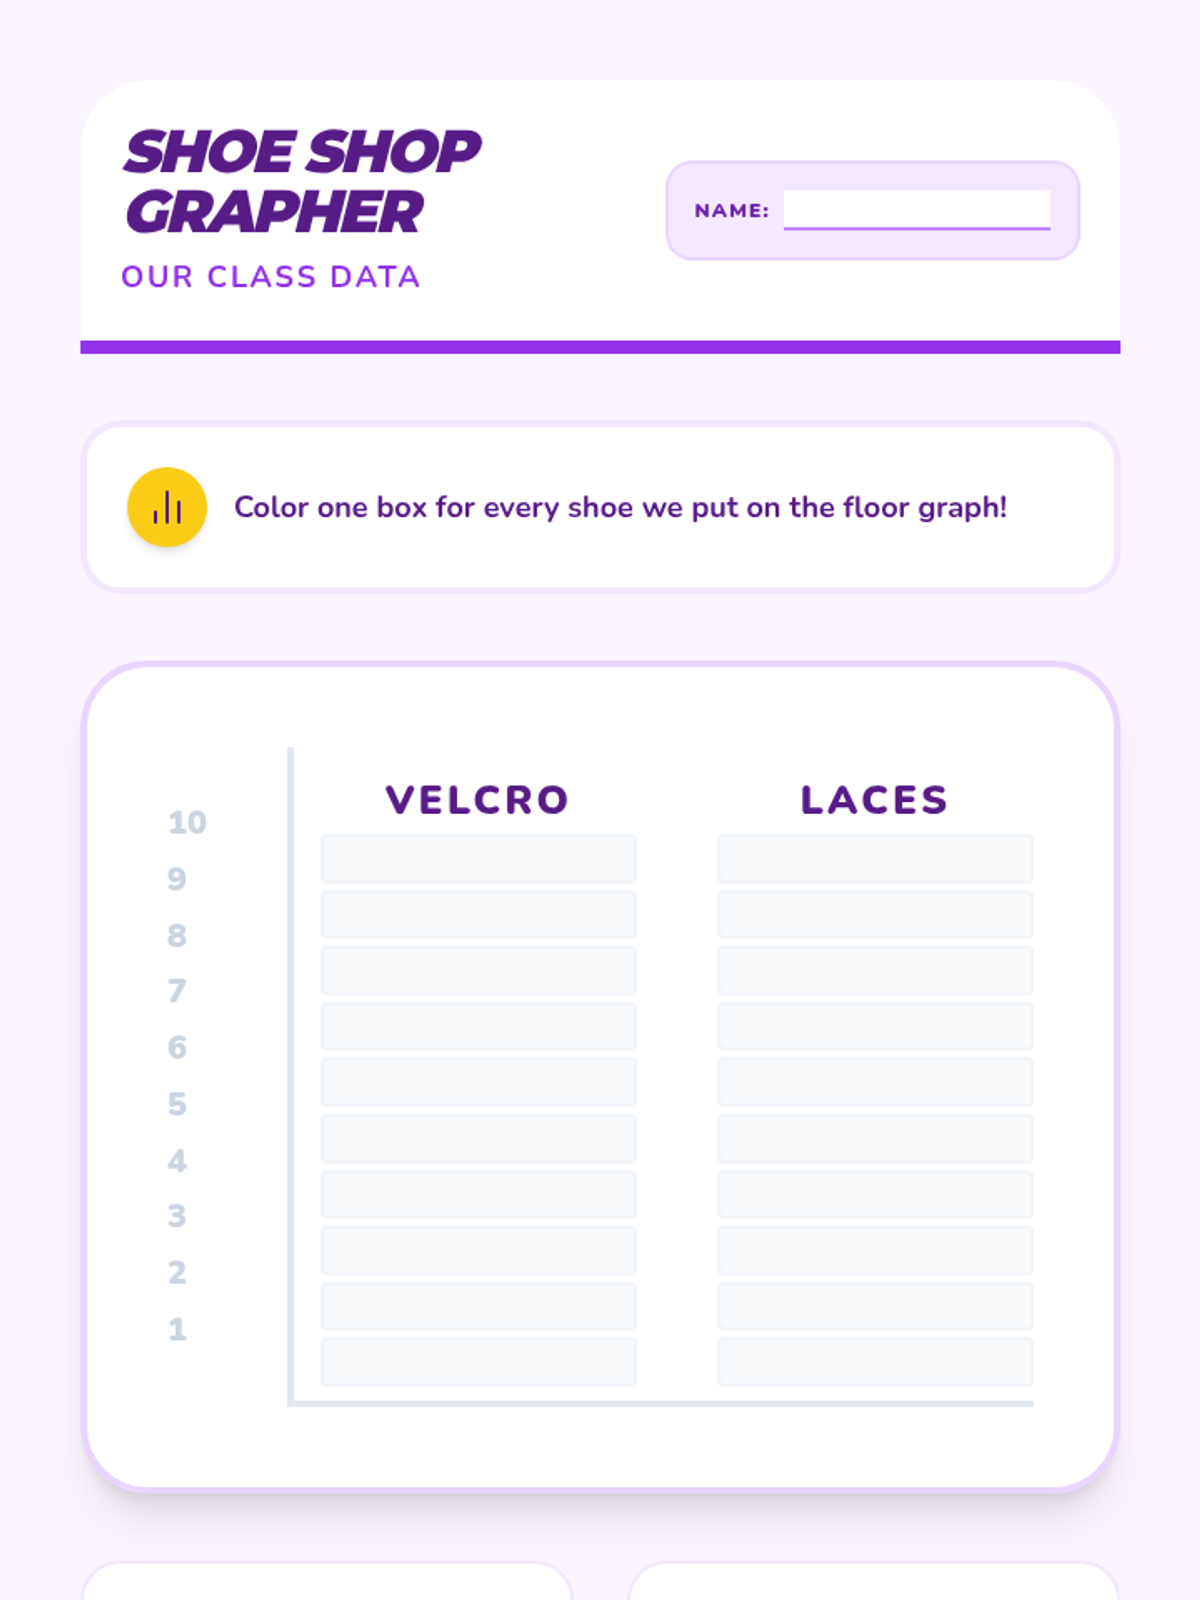
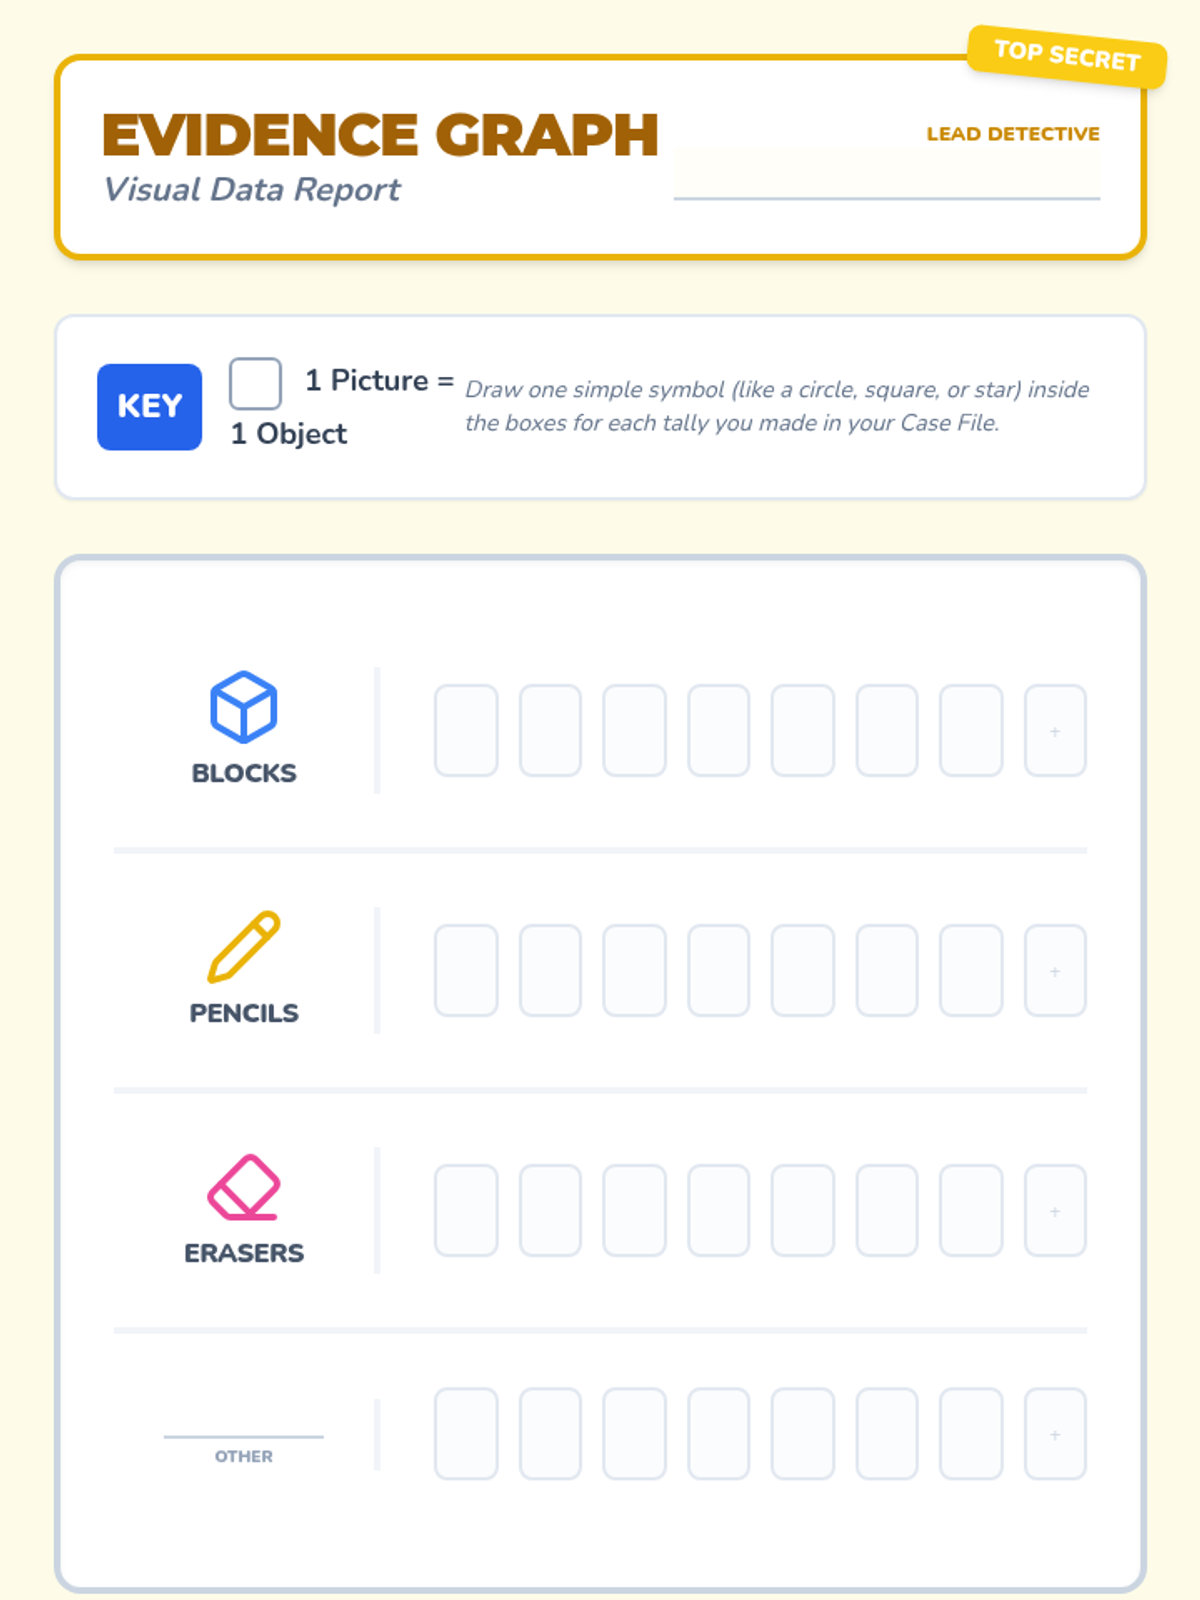
In this culminating lesson, students organize sorted collections into concrete graphs and answer simple data-driven questions.
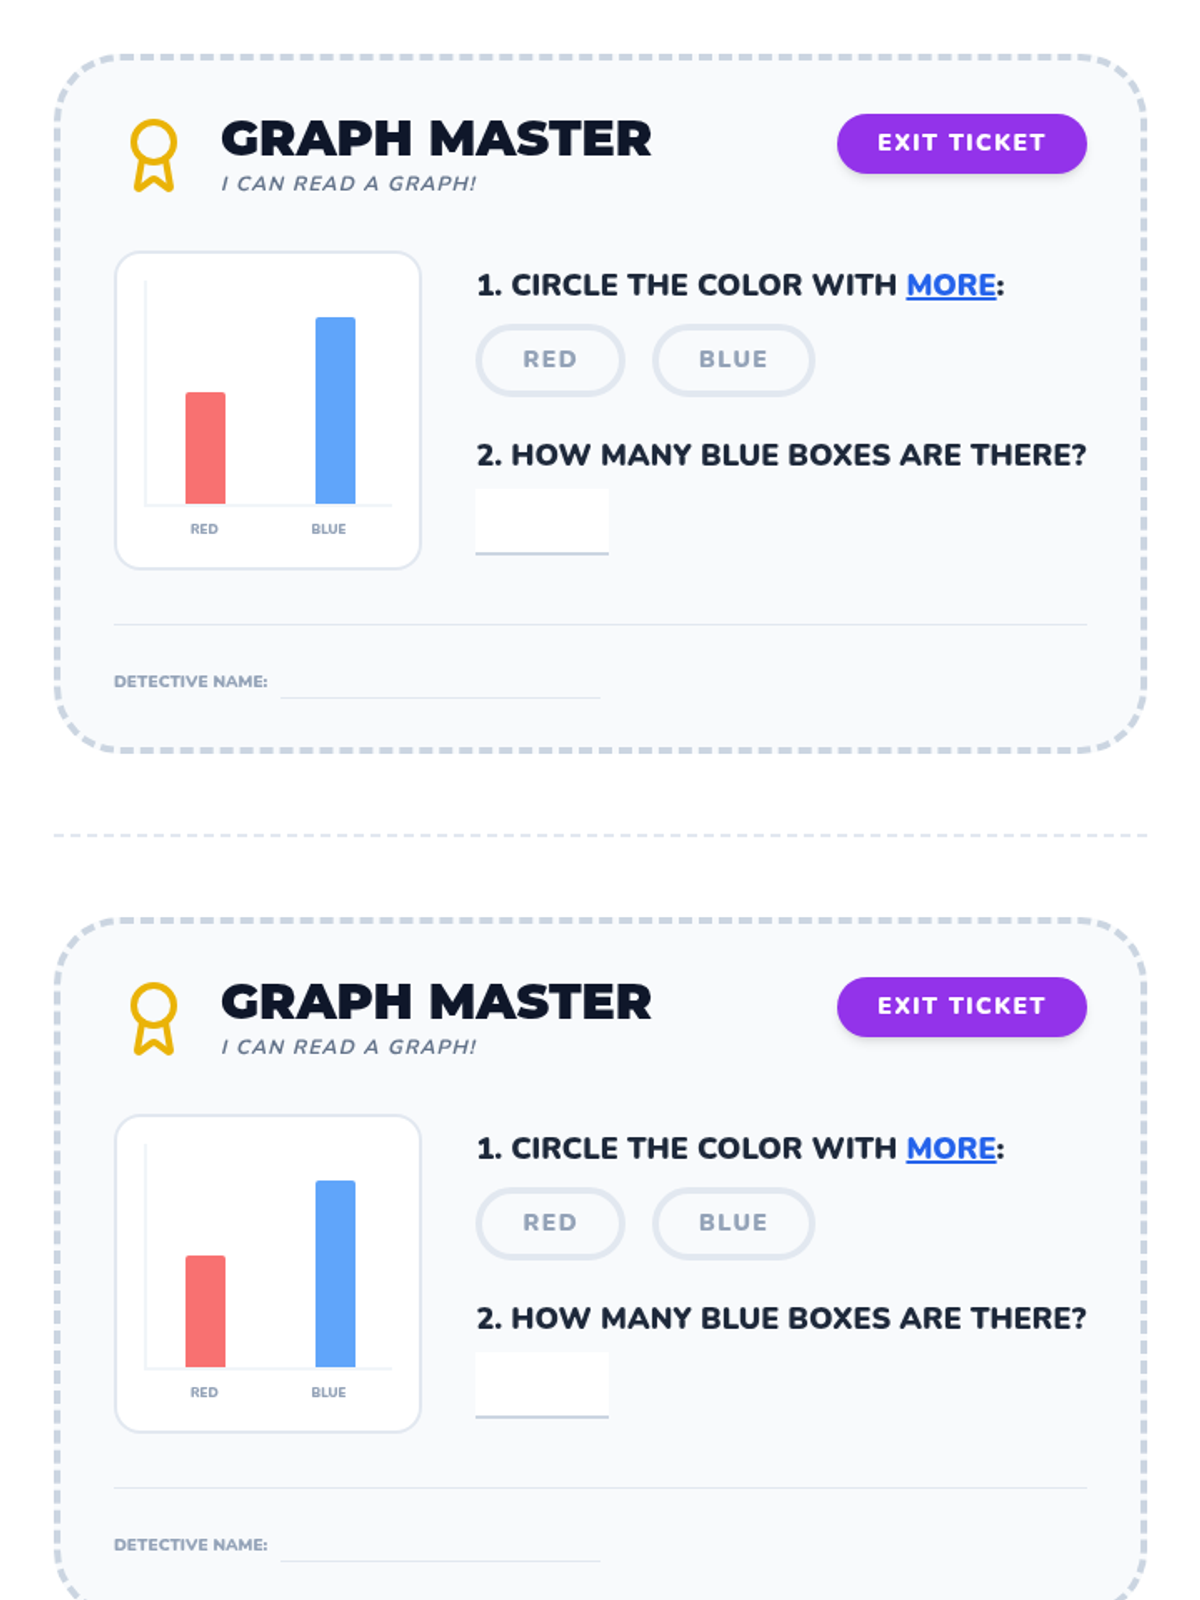
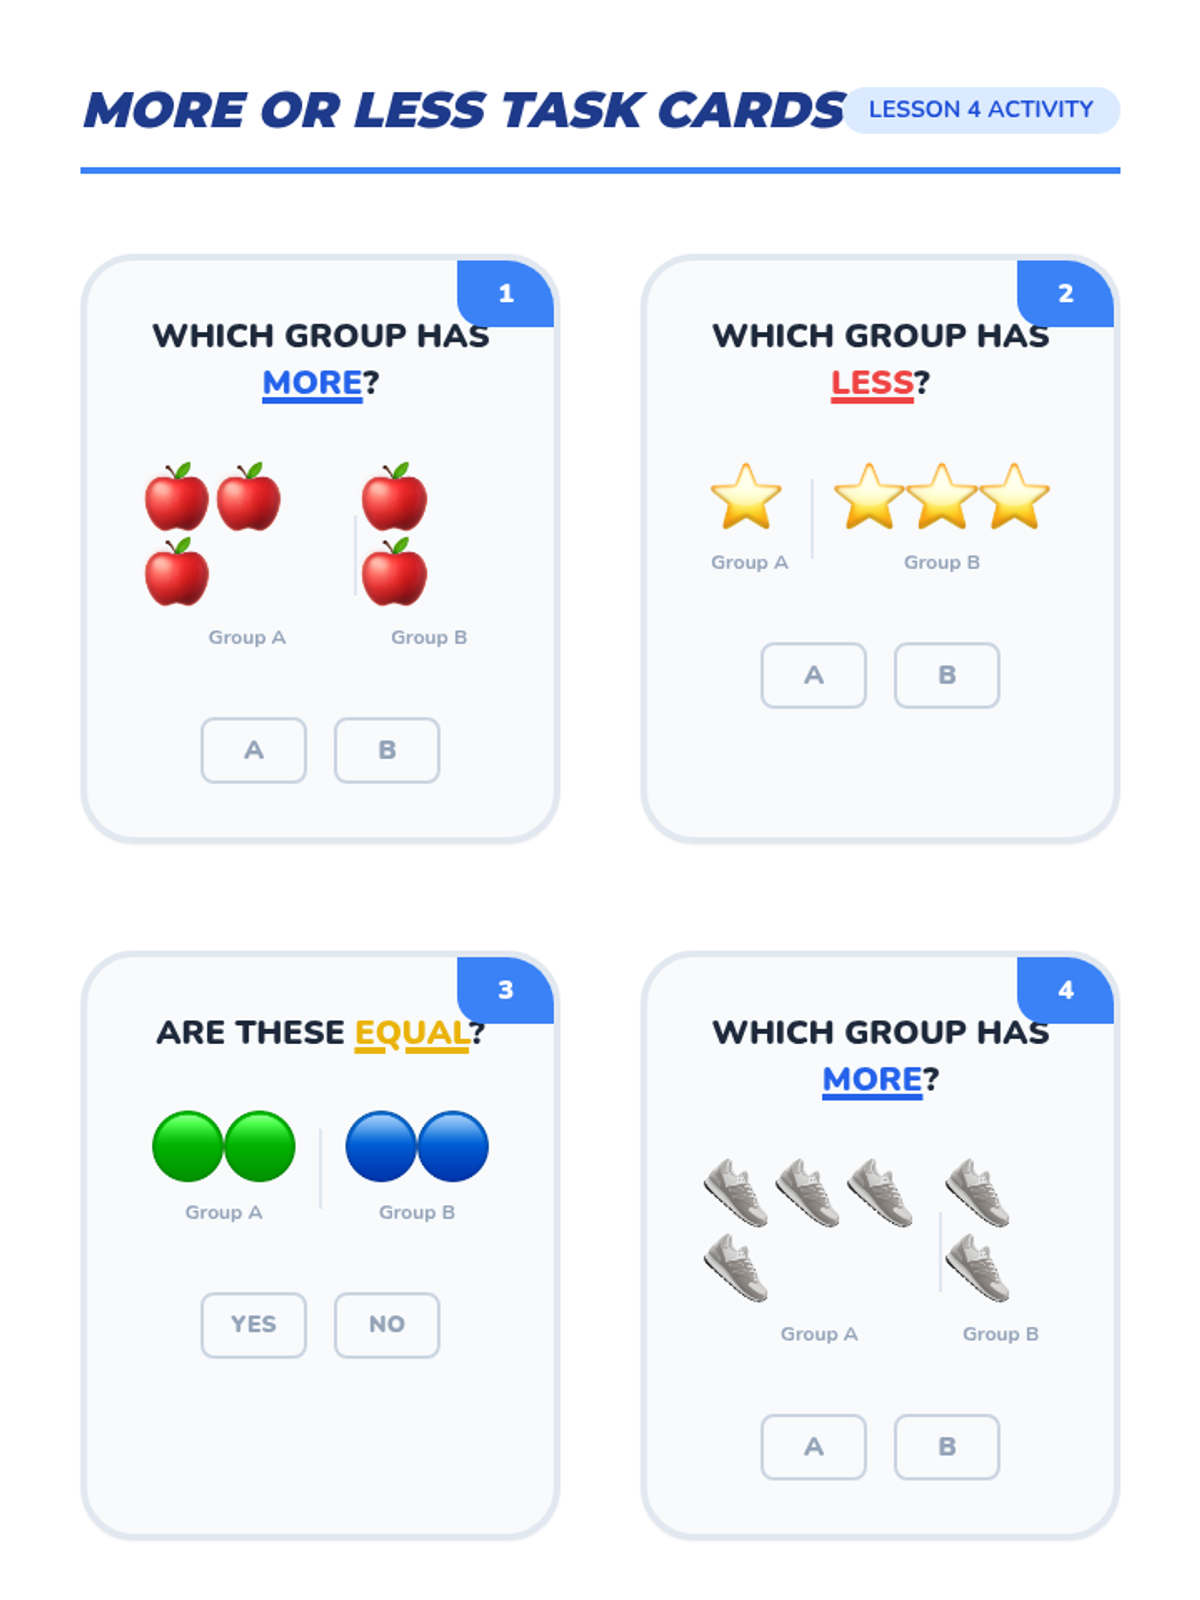
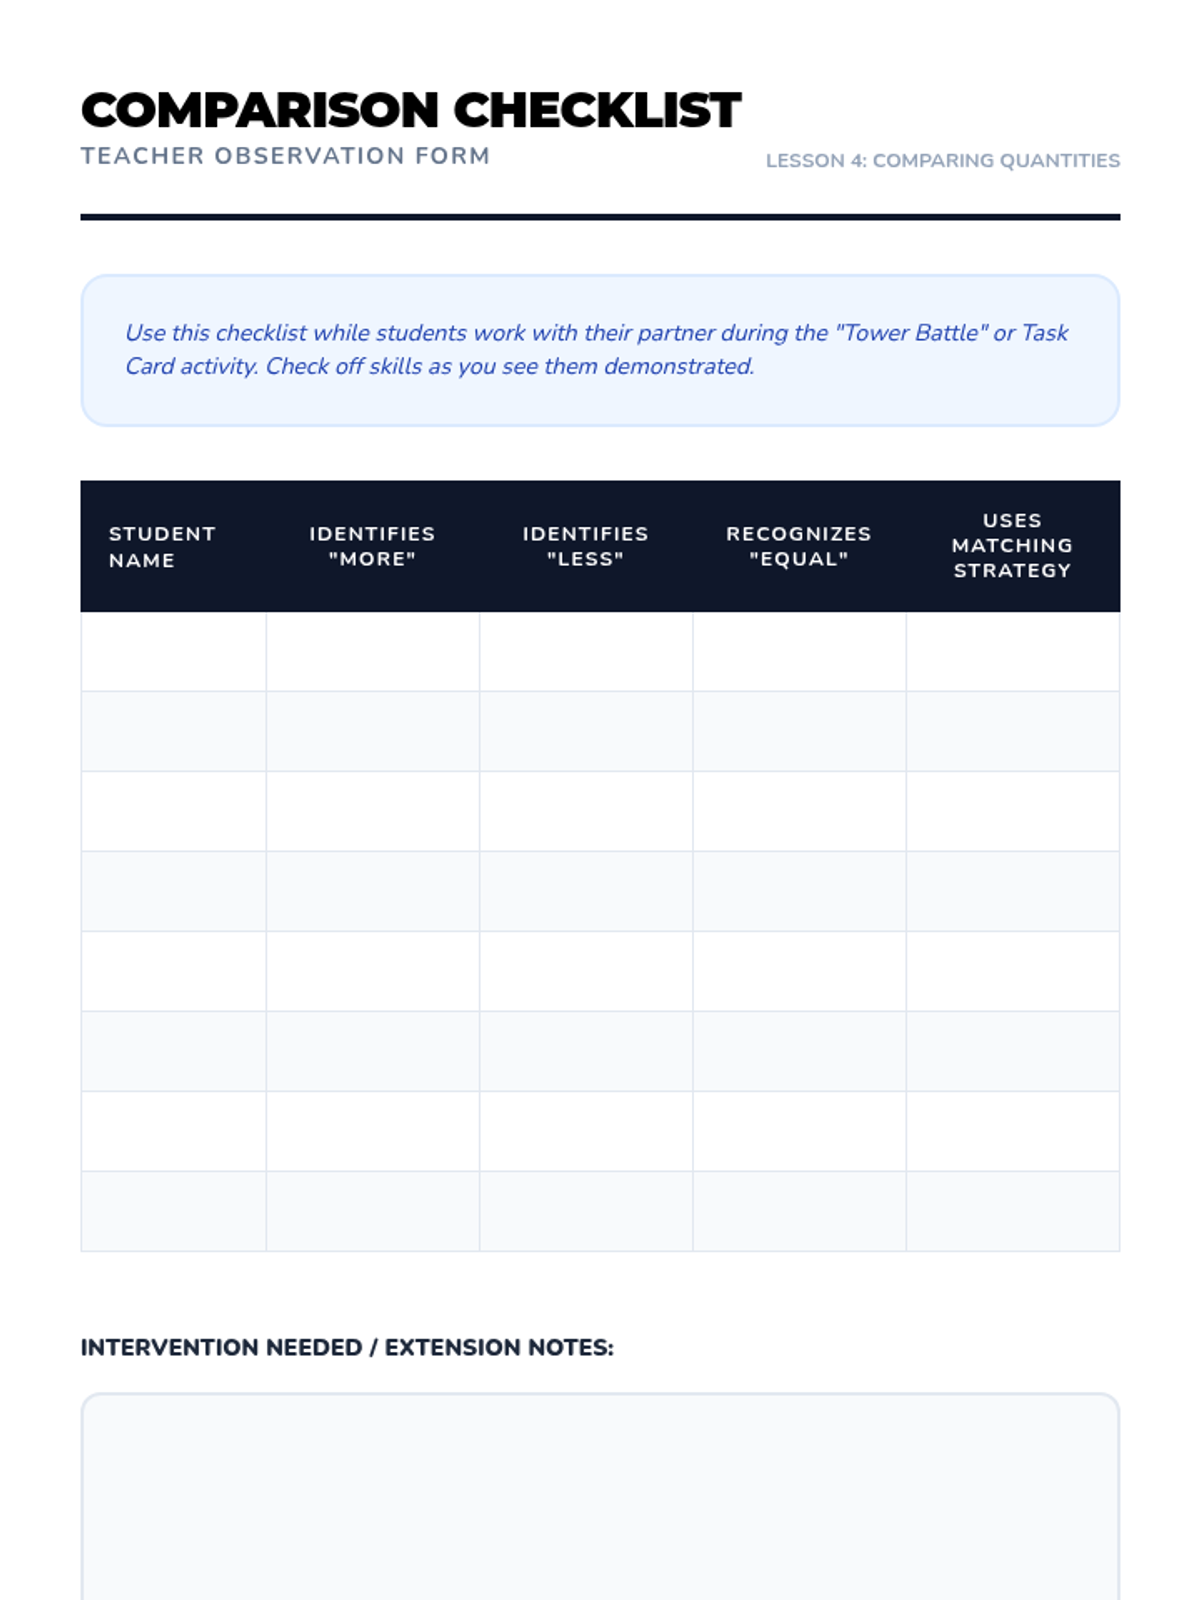
Students visually compare group sizes using matching strategies and vocabulary like 'more,' 'less,' and 'equal.'
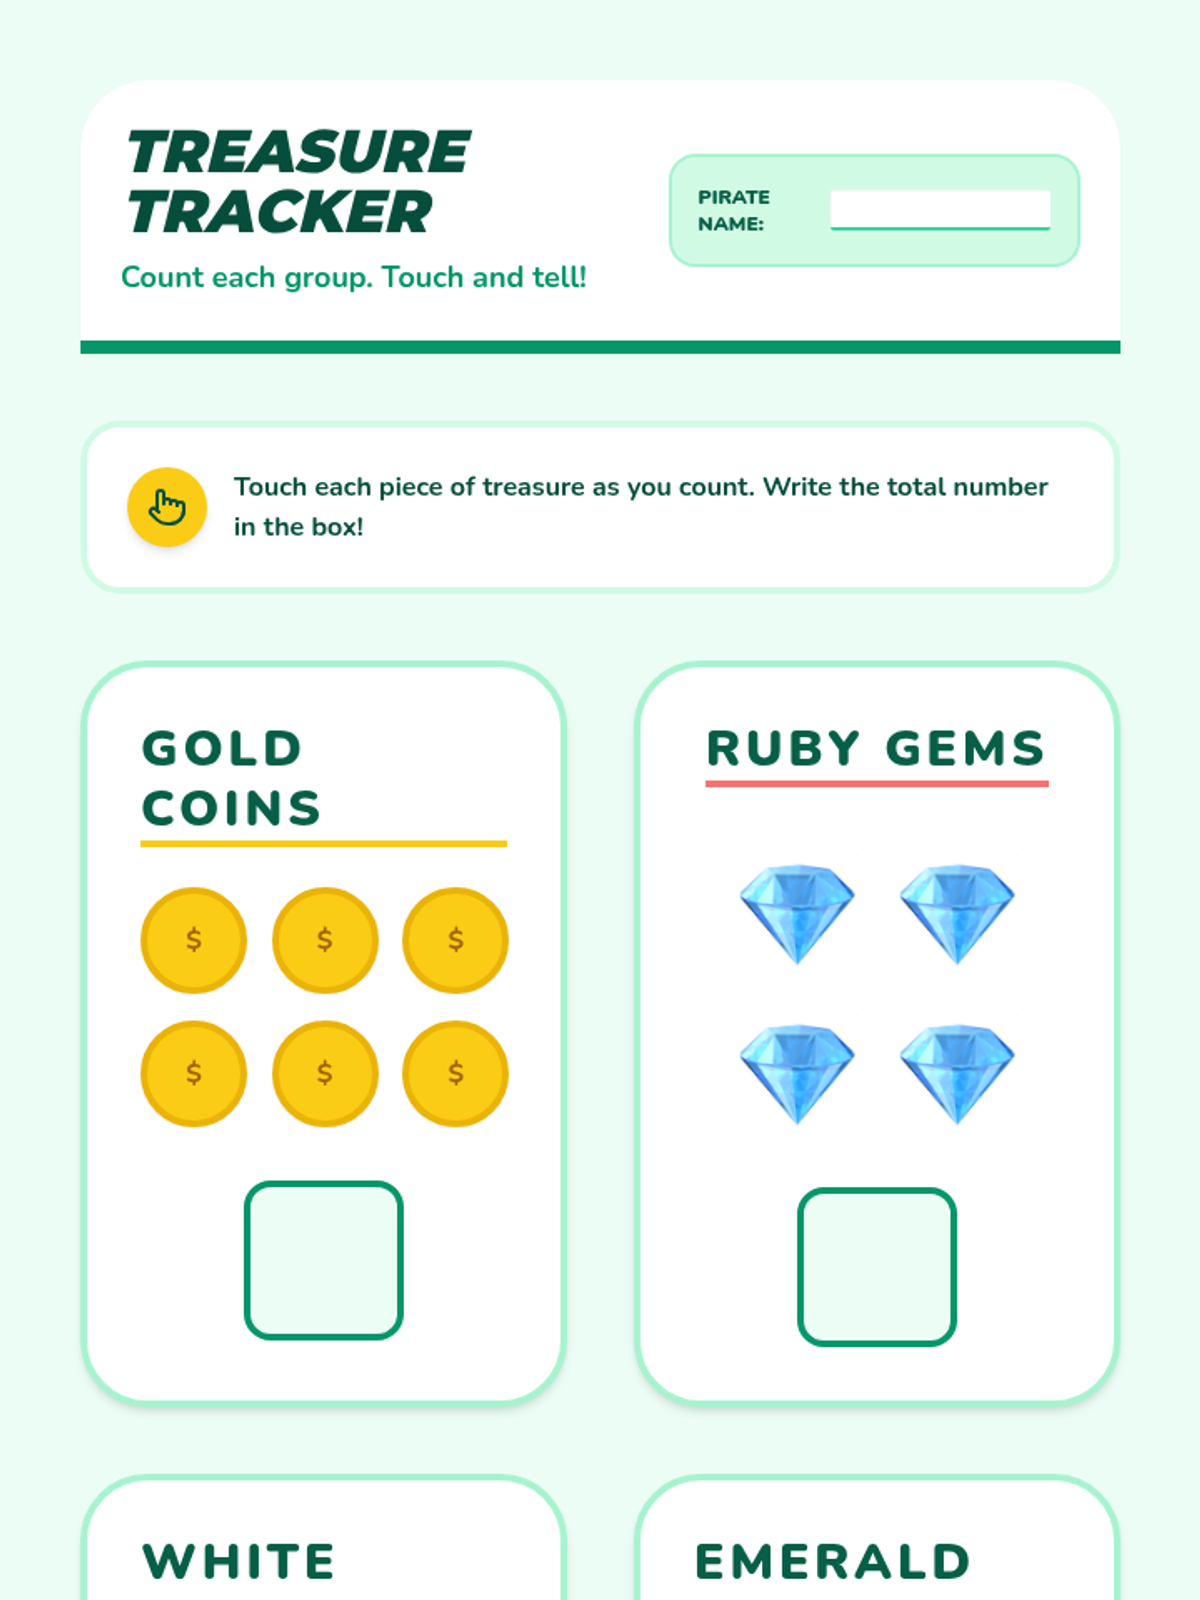
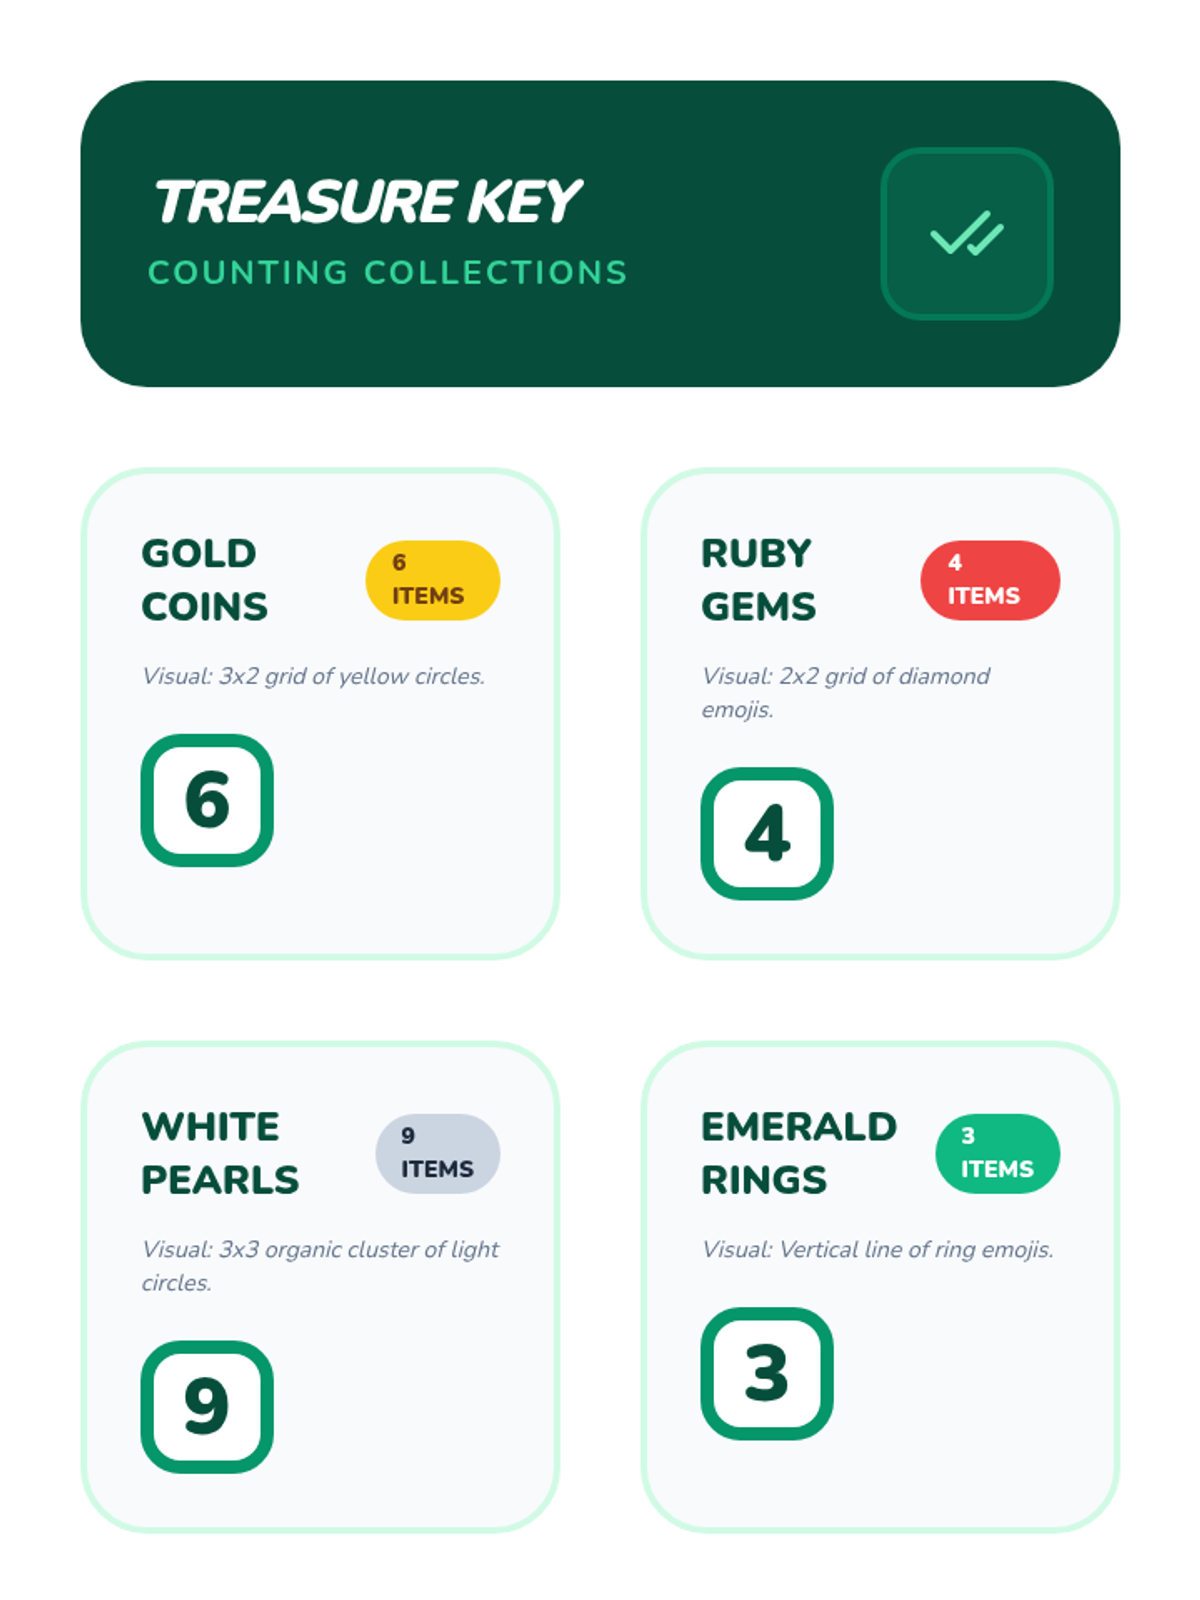
Learners apply counting skills to quantified sorted categories, emphasizing one-to-one correspondence and cardinality.
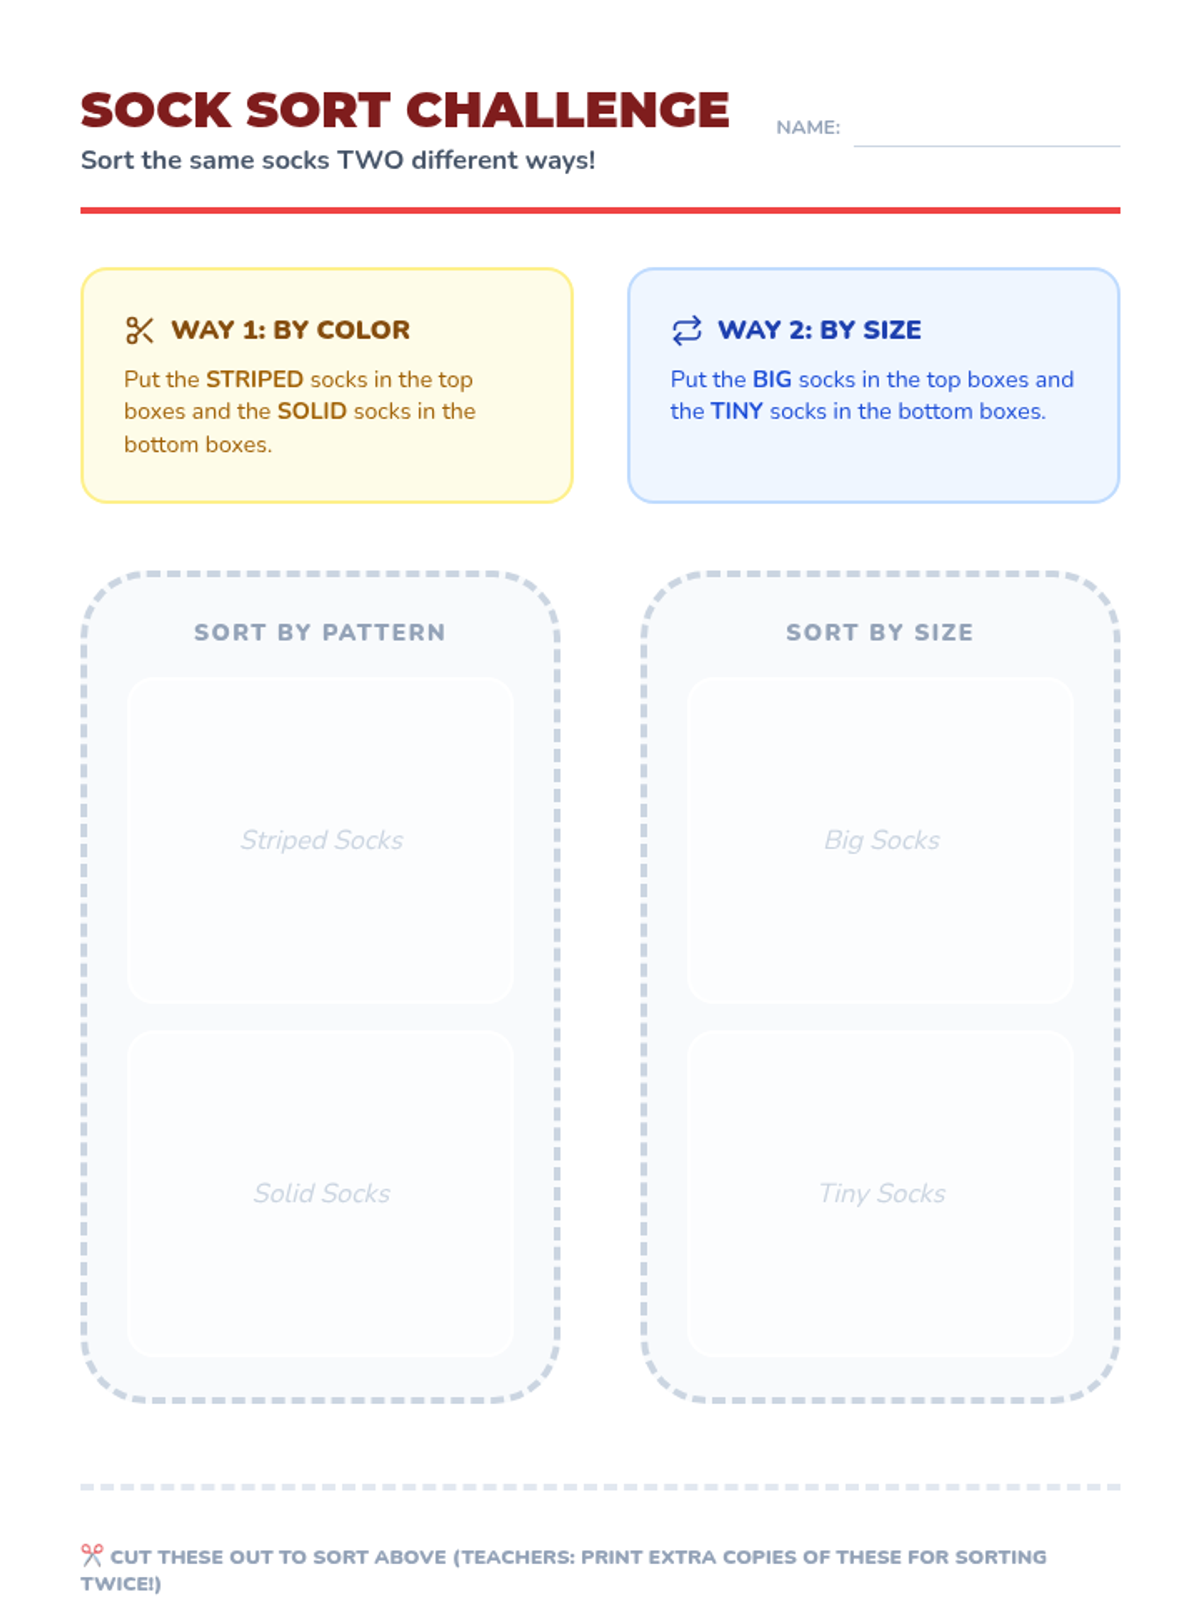
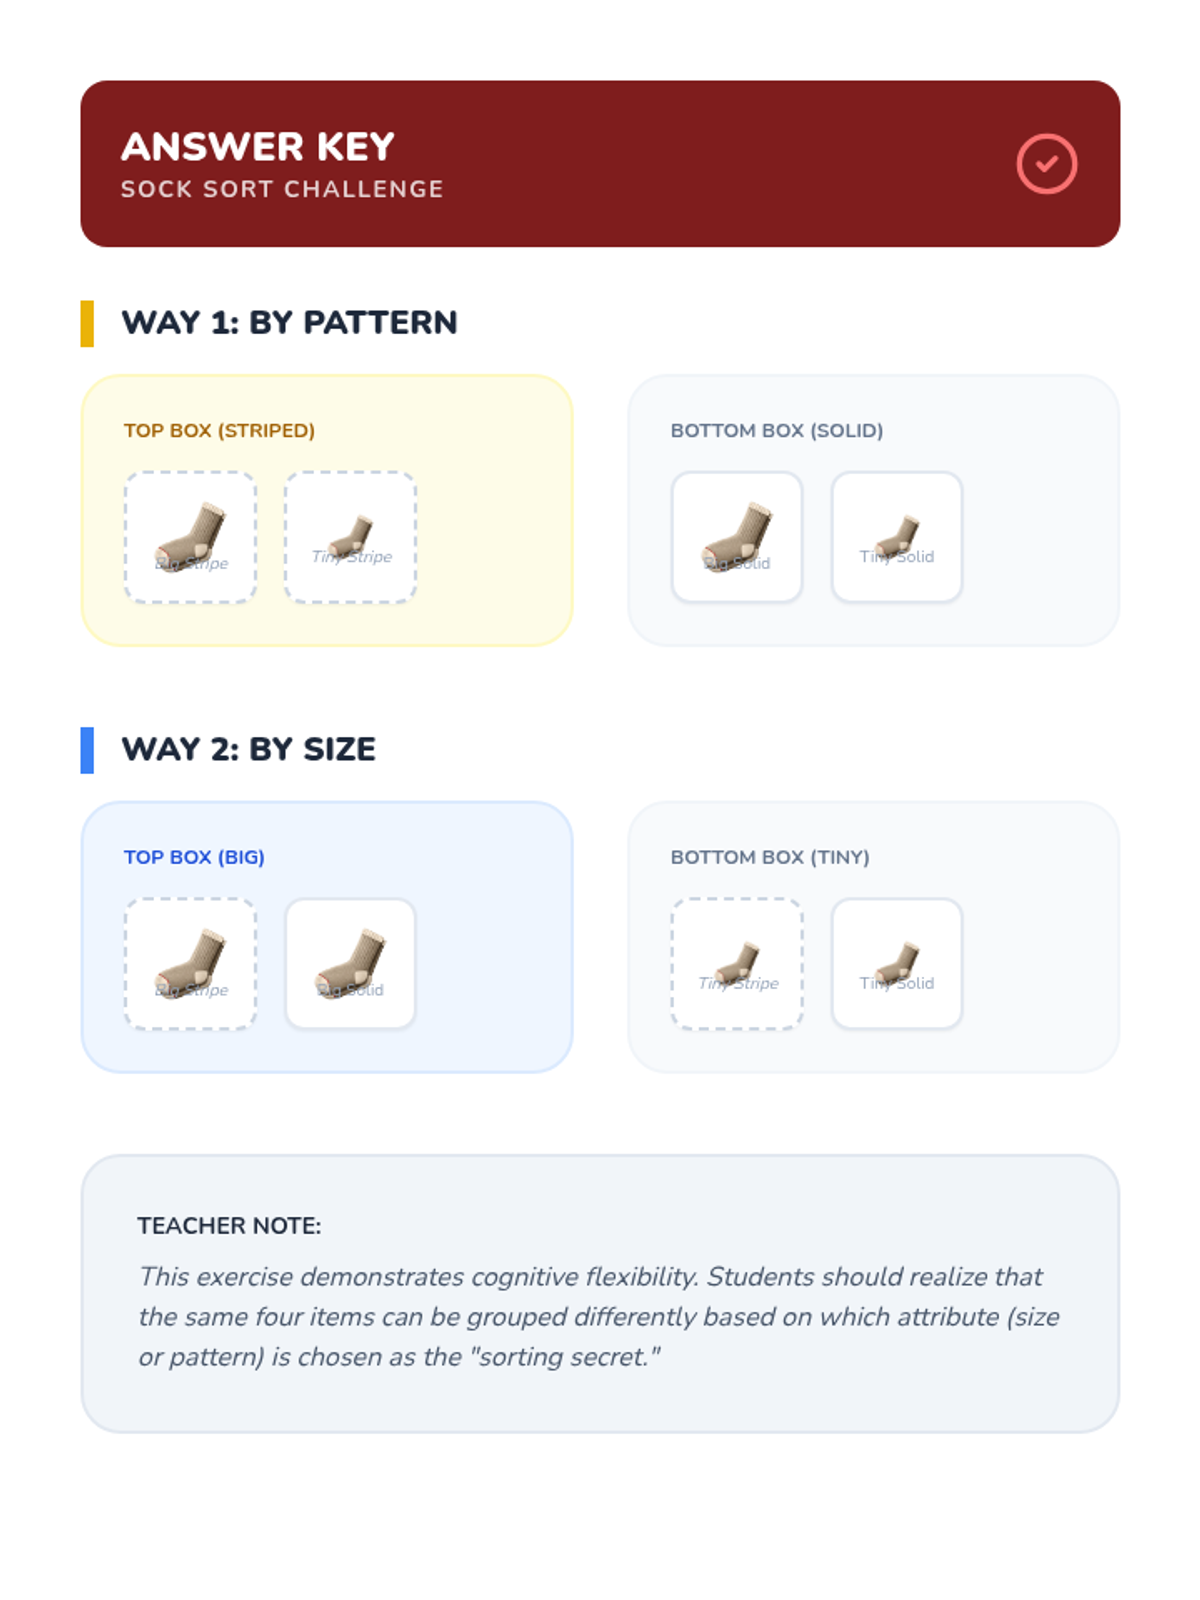
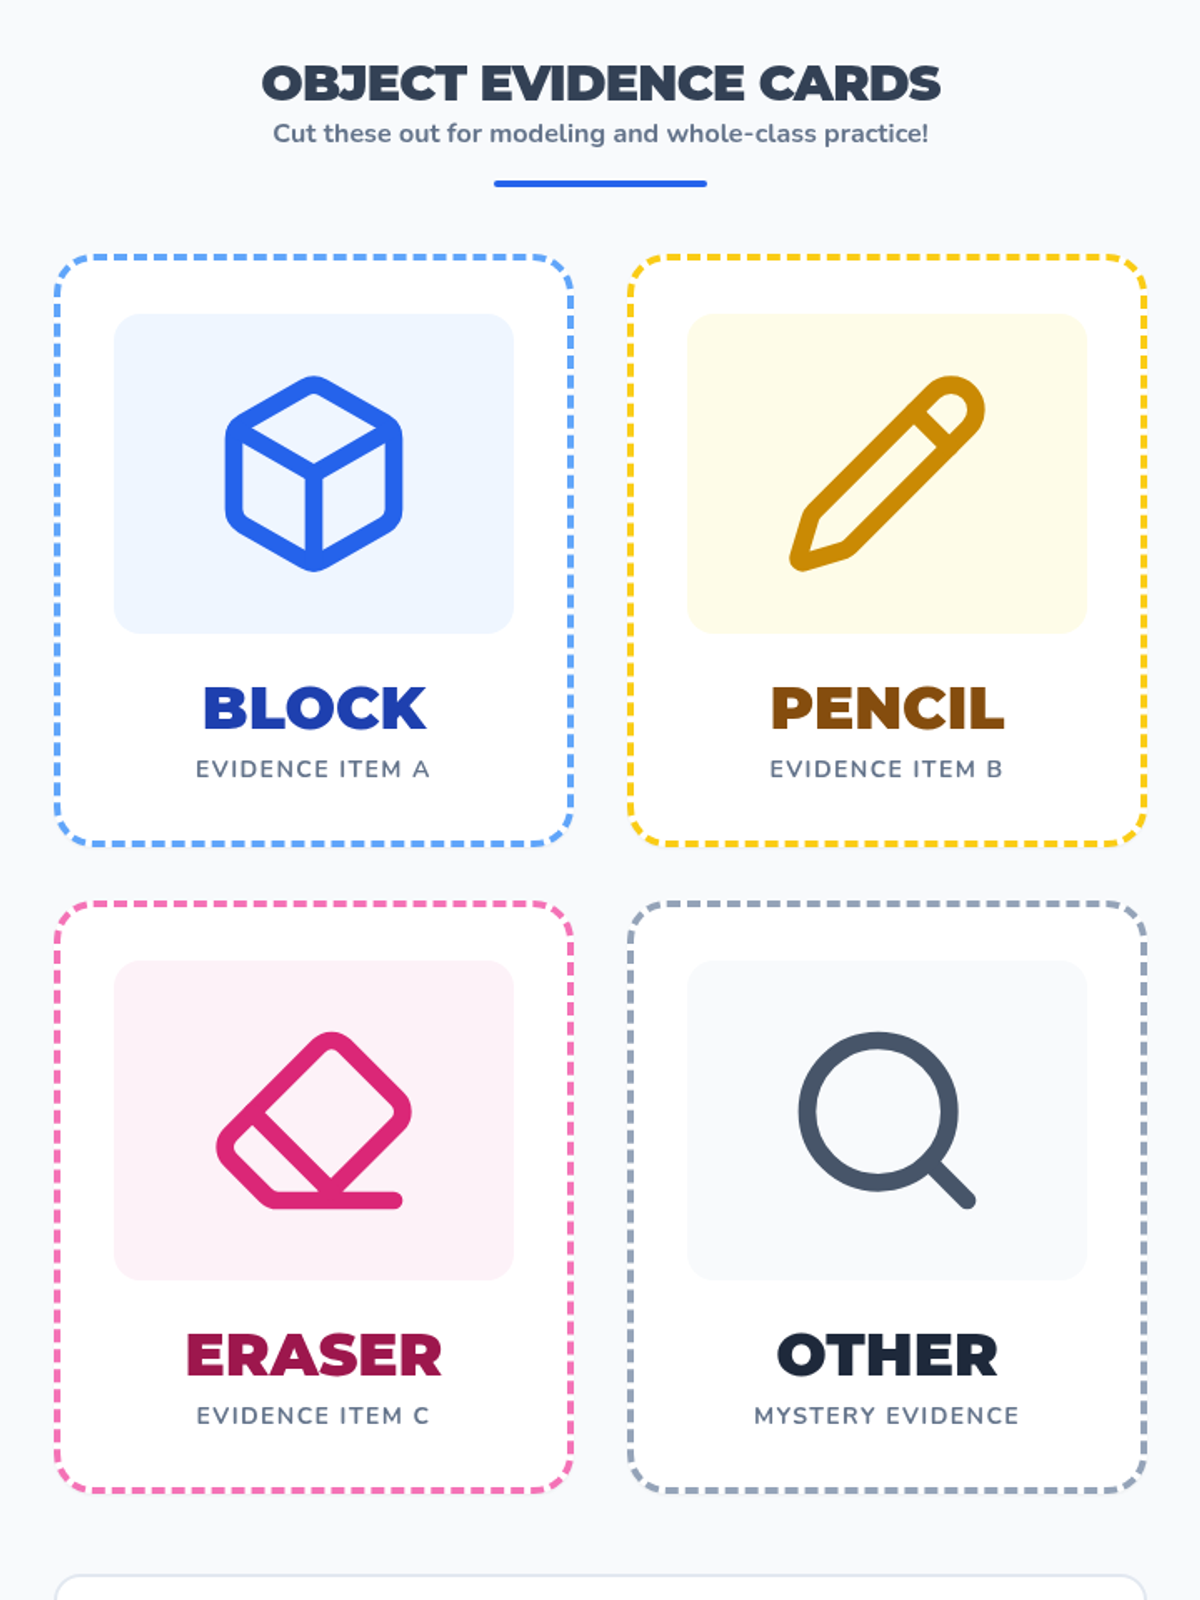
Students practice sorting objects based on a single rule, such as color or shape, and understand that objects can be grouped in different ways.
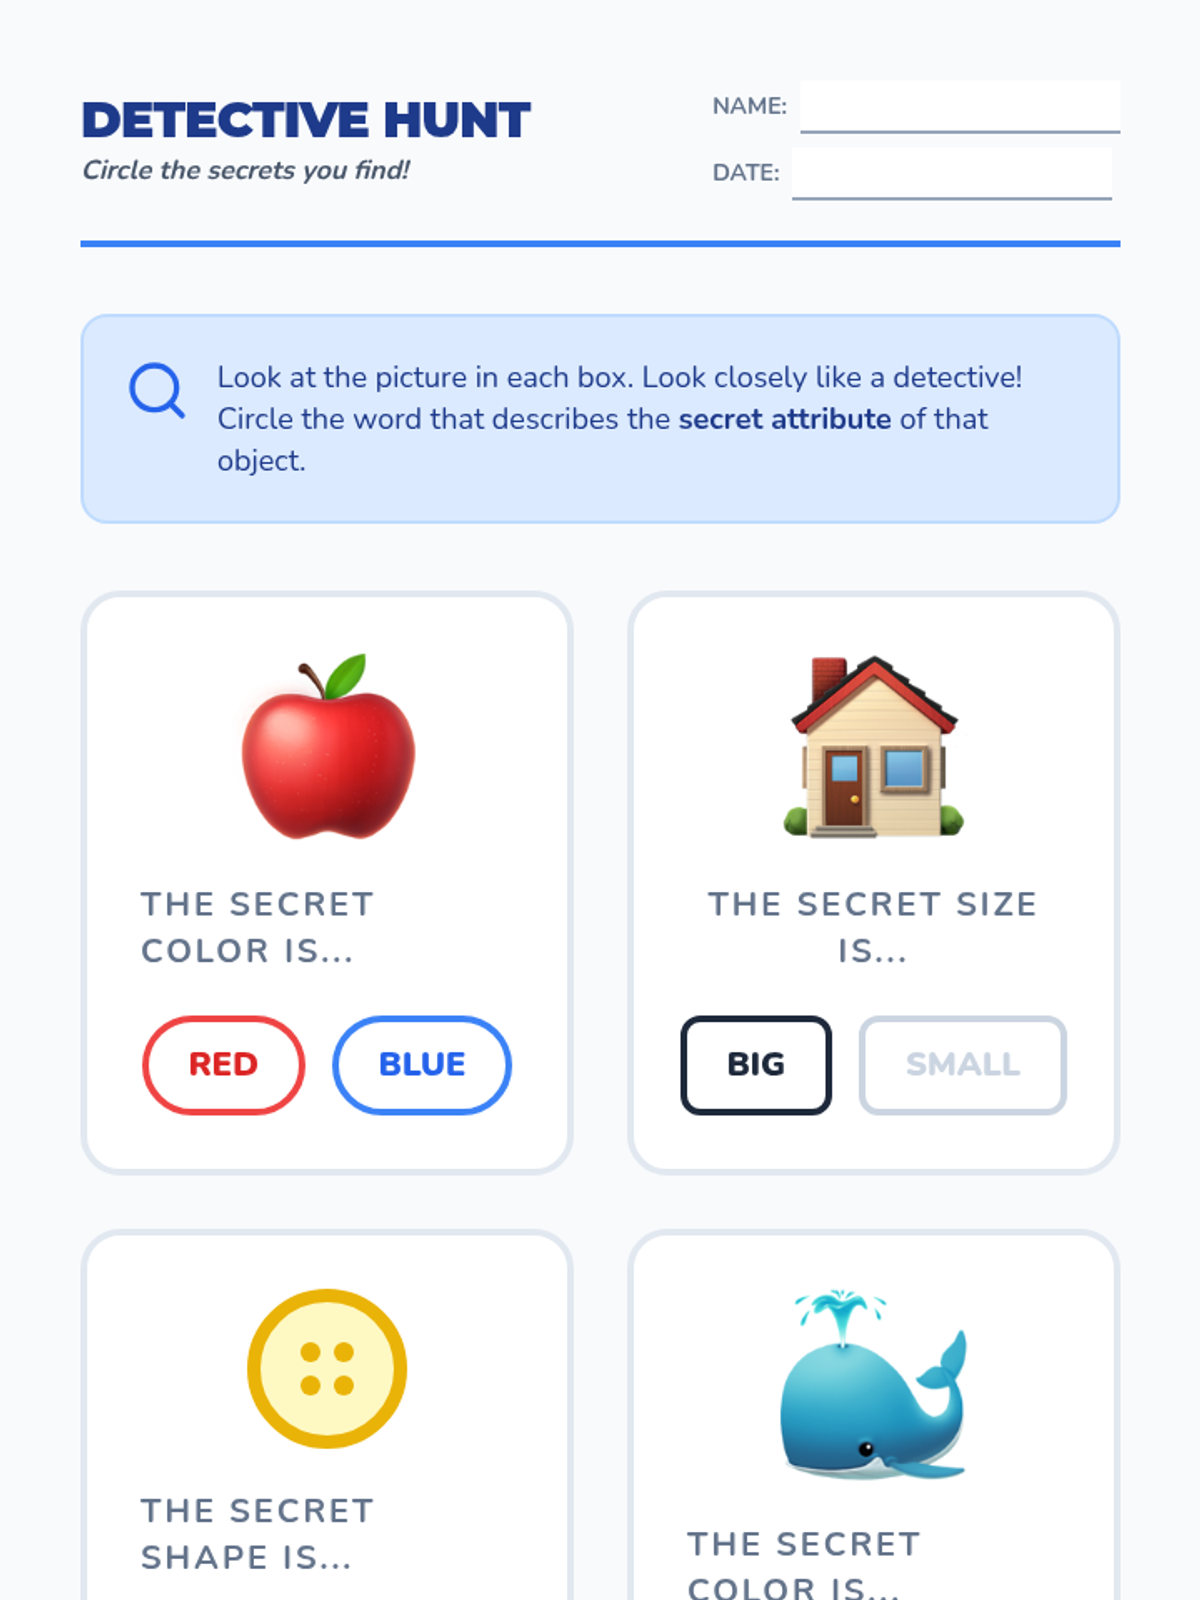
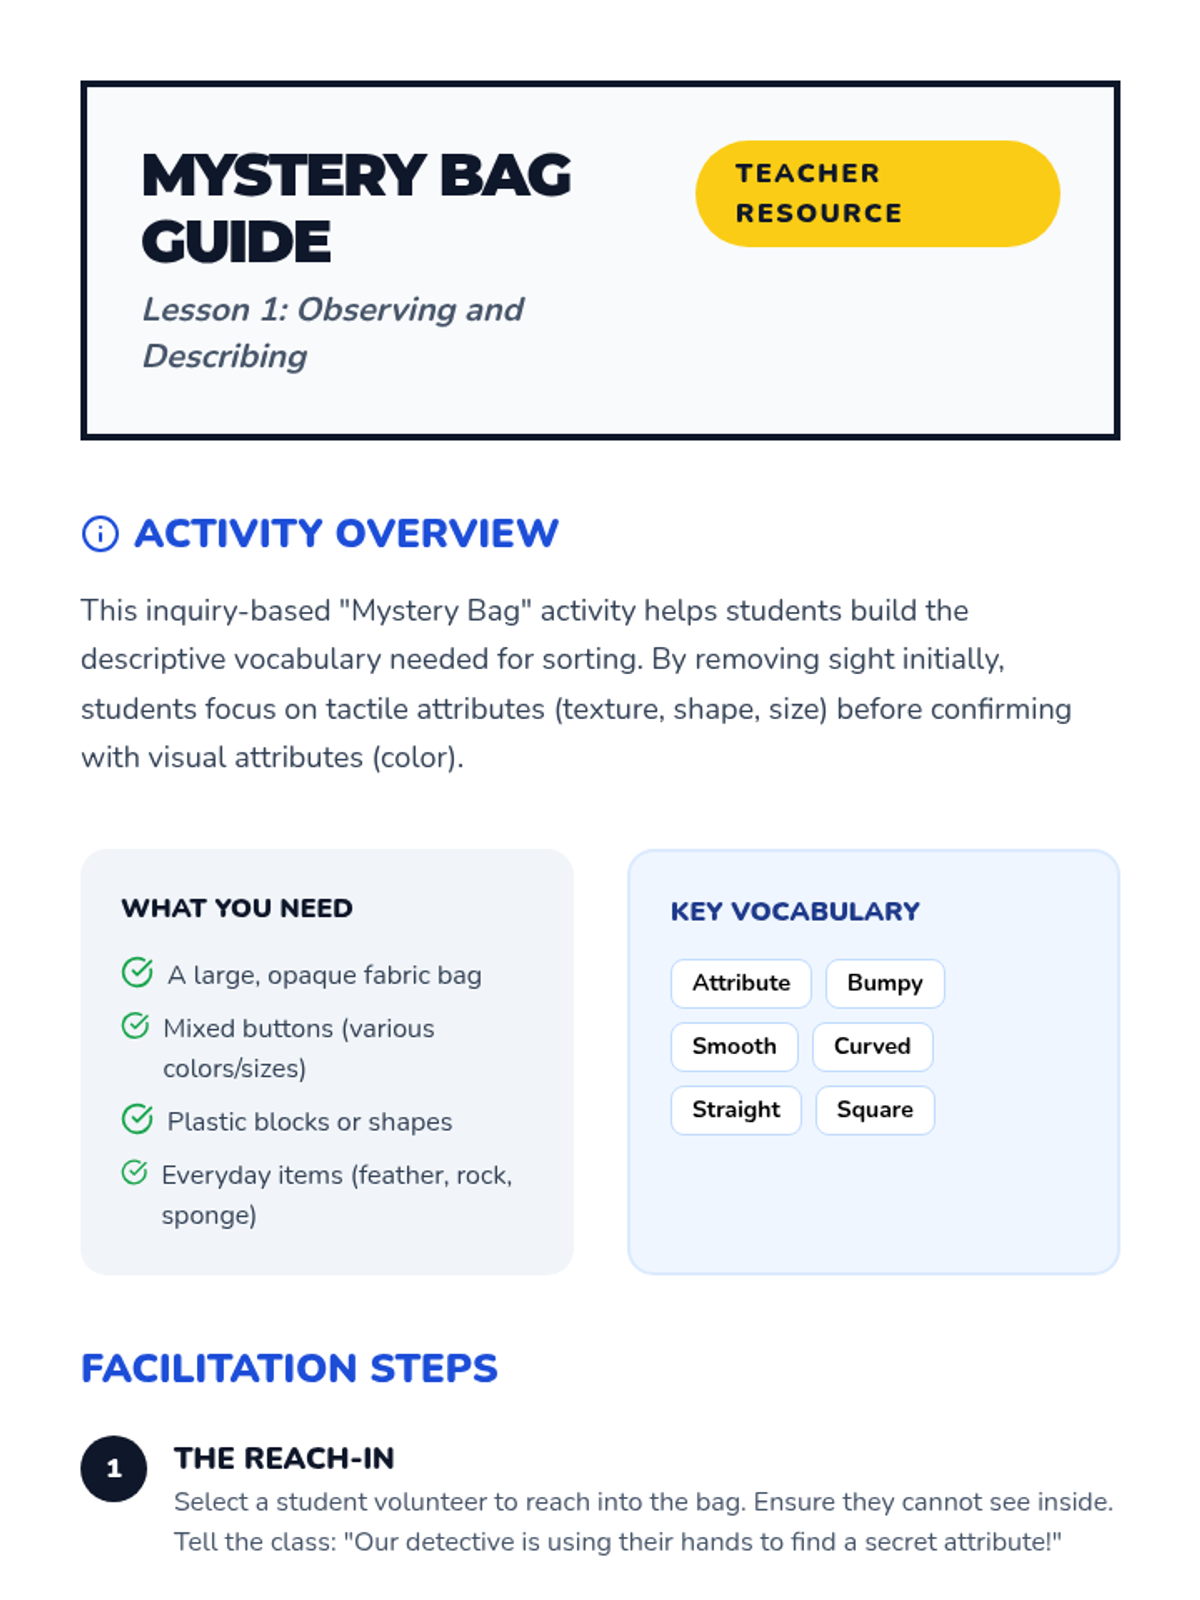
Students explore mixed collections to identify and describe physical attributes like color, shape, and size using descriptive vocabulary.
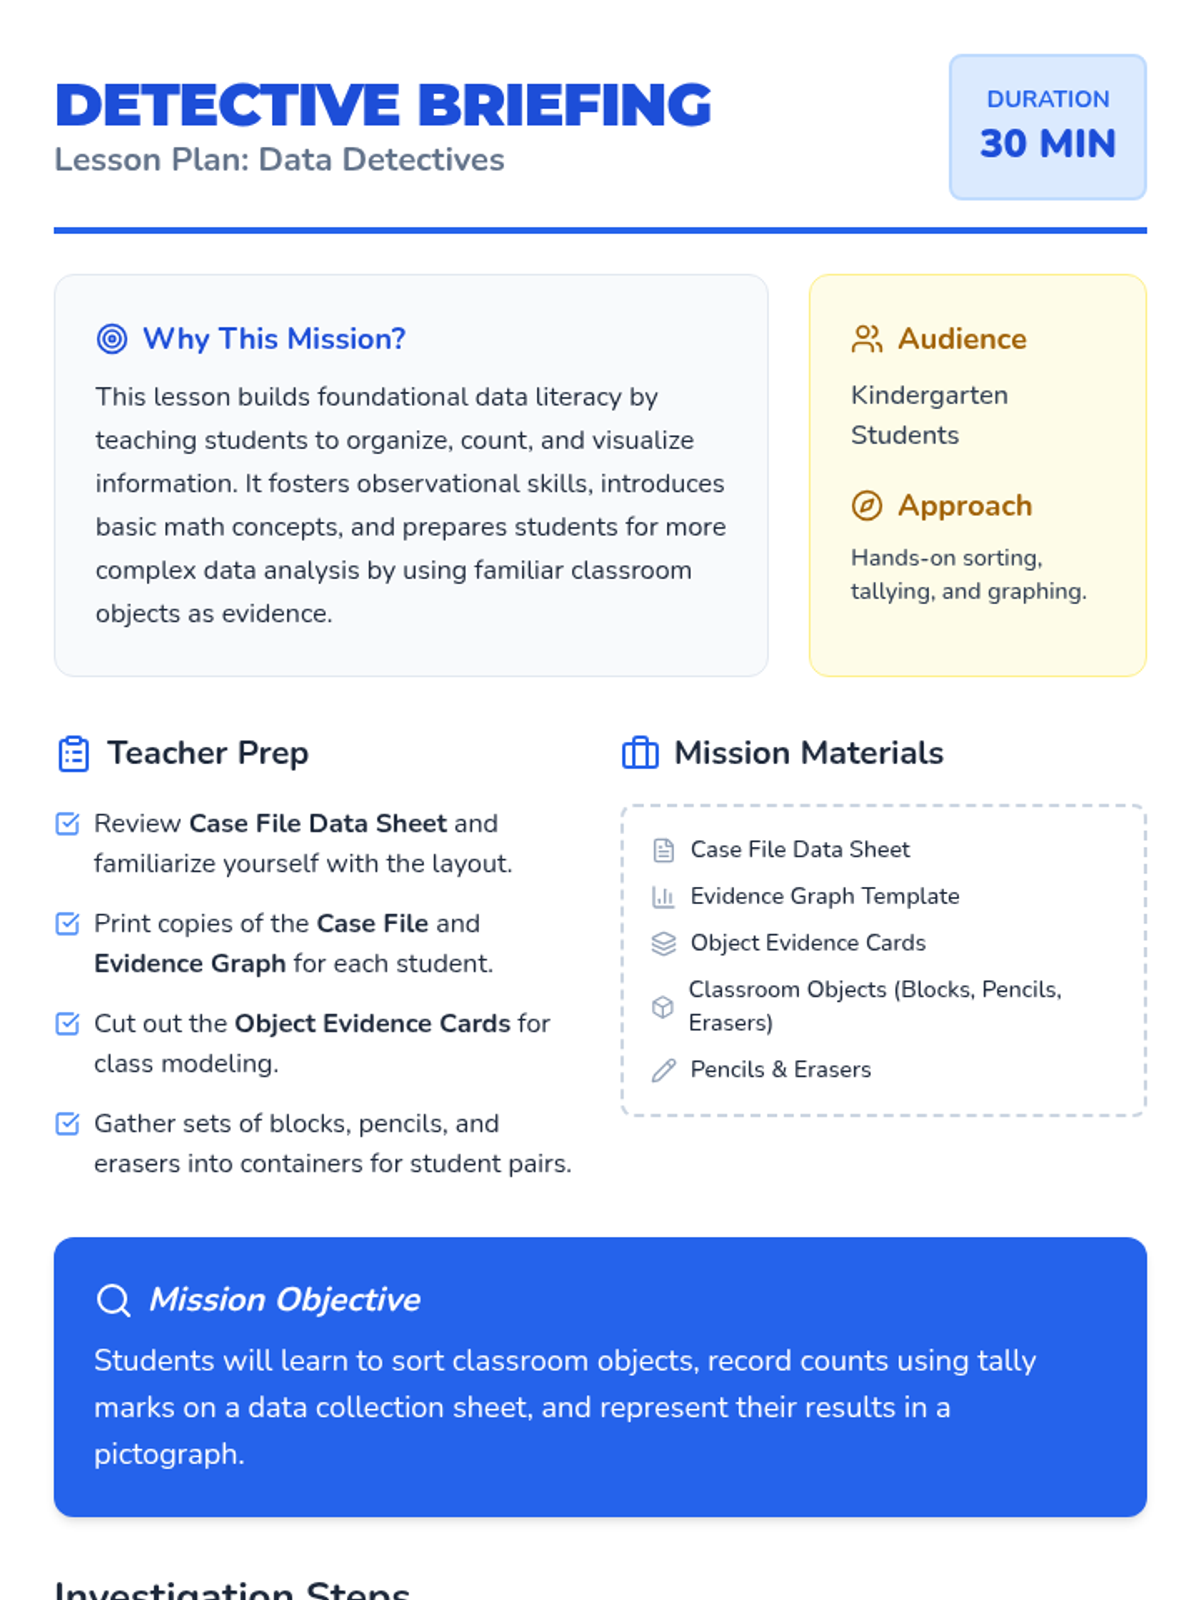
In this 30-minute kindergarten lesson, students become Data Detectives to collect and record simple data by sorting classroom objects. Students will learn to use tally marks and represent their findings in a pictograph.